UNITED STATES
SECURITIES AND EXCHANGE COMMISSION
Washington, D.C. 20549
FORM N-CSR
CERTIFIED SHAREHOLDER REPORT OF
REGISTERED MANAGEMENT INVESTMENT COMPANIES
Investment Company Act file number 811-08879
SUN CAPITAL ADVISERS TRUST
(Exact name of registrant as specified in charter)
One Sun Life Executive Park, Wellesley Hills, Massachusetts 02481
(Address of principal executive offices) (Zip code)
John T. Donnelly
Sun Capital Advisers Trust
One Sun Life Executive Park
Wellesley Hills, Massachusetts 02481
(Name and address of agent for service)
Registrant’s telephone number, including area code: (800) 432-1102 x 3330
Date of fiscal year end: December 31
Date of reporting period: December 31, 2011
| Item 1. | Reports to Stockholders. |
The following is a copy of the report transmitted to stockholders pursuant to Rule 30e-1 under the Investment Company Act of 1940, as amended:
SUN CAPITAL ADVISERS TRUST®
Annual Report December 31, 2011
SCSM AllianceBernstein International Value Fund
SCSM BlackRock International Index Fund
SCSM BlackRock Large Cap Index Fund
SCSM BlackRock Small Cap Index Fund
SCSM Goldman Sachs Mid Cap Value Fund
SCSM Columbia Small Cap Value Fund
SCSM Davis Venture Value Fund
SCSM Invesco Small Cap Growth Fund
SCSM Lord Abbett Growth & Income Fund
SCSM WMC Blue Chip Mid Cap Fund
SCSM WMC Large Cap Growth Fund
Sun Capital Global Real Estate Fund
SCSM Ibbotson Tactical Opportunities Fund
Sun Capital Investment Grade Bond Fund®
Sun Capital Money Market Fund®
SCSM BlackRock Inflation Protected Bond Fund
SCSM Goldman Sachs Short Duration Fund
SCSM PIMCO High Yield Fund
SCSM PIMCO Total Return Fund
SCSM Ibbotson Balanced Fund
SCSM Ibbotson Conservative Fund
SCSM Ibbotson Growth Fund
| | |
 | | Sun Capital Advisers Trust is registered under the Investment Company Act of 1940 as an open-end management investment company. Its investment adviser is Sun Capital Advisers LLC®, a member of the Sun Life Financial group of companies. |
TABLE OF CONTENTS
Important Information about this Report:
This report and the financial statements contained herein are submitted for the general information of the shareholders of the Funds. This report is not authorized for distribution to prospective investors in the Funds unless preceded or accompanied by an effective prospectus. Investors should consider the investment objectives, risks, charges and expenses of a Fund before investing. This and other information is contained in a Fund’s prospectus. Please read the prospectus carefully before you invest.
The views and opinions expressed in each Fund’s “Management’s Discussion and Analysis” are those of the portfolio manager(s) of the Fund. The views and opinions expressed, and the portfolio holdings described, are as of December 31, 2011, and are subject to change at any time without notice due to market or other conditions. These should not be construed as investment advice or as a recommendation to buy or sell any security. Any forecasts or other forward looking views may not come to pass.
Past performance is no guarantee of future results. Performance may have changed materially since December 31, 2011.
An investment in a Fund is not a bank deposit and is not insured by the Federal Deposit Insurance Corporation. It is possible to lose money on an investment in any of the Funds.
Country codes included within each Fund’s Portfolio of Investments are unaudited.
SC SM ALLIANCEBERNSTEIN INTERNATIONAL VALUE FUND
(subadvised by AllianceBernstein L.P.)
MANAGEMENT’S DISCUSSION & ANALYSIS:
How did the Fund perform during the year ended December 31, 2011?
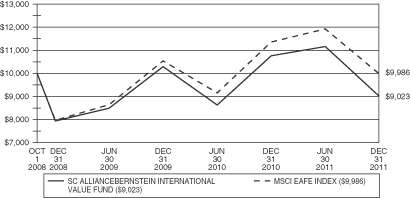
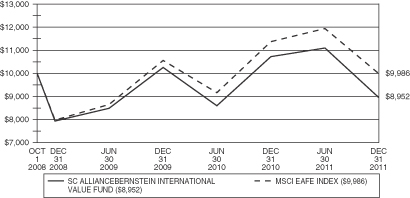
For the year ended December 31, 2011, the Initial and Service Class shares of SC AllianceBernstein International Value Fund (the “Fund”) returned (16.21)% and (16.46)%, respectively, underperforming the benchmark, the MSCI EAFE Index (the “Index”), which returned (12.14)% for the same period.
What economic and market factors most influenced the global equity markets as a whole during the year ended December 31, 2011?
Equity markets were extremely volatile in 2011, as the European sovereign debt crisis cast a shadow over the global economy. After rising early in the year, stocks fell sharply for five straight months through September, then posted a late rally as European leaders stepped up efforts to stem the crisis. But even after the Index rose 3.33% in the fourth quarter, most markets were still down for the year.
Still scarred by the 2008 crisis, market participants reacted to adverse developments by fleeing deemed risky assets, with financial stocks being affected the most. Equity market correlations were very high, as stocks generally traded in tandem based on perceived sensitivity to global macroeconomic issues, with little regard to company-specific strengths or weaknesses. In this environment, active managers struggled to beat their benchmarks.
The market environment in 2011 was particularly unforgiving for value investors. For the majority of the year, equity investors fled from risk, in the process punishing the cheapest stocks in the market, which were viewed as the riskiest of all.
How did the country allocations affect relative Fund performance during the year ended December 31, 2011?
The Fund’s country allocations are primarily a result of the bottom-up stock selection process. For the year, country and currency selection both contributed positively to relative returns. An overweight to the UK, and underweights to Sweden and Greece contributed positively to the Fund’s relative returns, while an underweight to Switzerland and Spain detracted. The Fund’s overweight to the Japanese yen, euro and British pound contributed positively to overall relative Fund performance, while an underweight to the Australian dollar detracted from performance.
Which stocks contributed most to the Fund’s returns during the year ended December 31, 2011?
During 2011, the top contributors to the Fund’s performance were Japan Tobacco, Inc., AstraZeneca PLC, Nippon Telegraph & Telephone Corp., BP PLC and Imperial Tobacco Group PLC. Many of the Fund’s contributors were in traditionally defensive sectors, such as Health Care, Consumer Staples and Telecommunications, which performed well during a volatile year as investors rewarded the relative stability of these companies.
Japan Tobacco, Inc. benefited from better-than-expected results and optimism that the company may move to return cash to shareholders through a share buyback program or increased dividend. U.K. based pharmaceutical company AstraZeneca PLC was supported by its high dividend yield and share repurchase program, and as the company increased its 2011 earnings guidance several times throughout the year. Japan based Nippon Telegraph & Telephone Corp. stock was also supported by ongoing stock buybacks, improved cost controls, and as investors became more optimistic about the company’s ability to offset declines in its legacy fixed-line business with growth in areas such as mobile data and fiber optics.
1
SC SM ALLIANCEBERNSTEIN INTERNATIONAL VALUE FUND (Continued)
U.K. Oil and gas company BP PLC benefited as the company continued to move forward after the Macondo oil spill. Additional settlements with business partners in the well, along with findings from investigations, provided comfort to investors that the ultimate cost of the spill to the company would be manageable. Shares of U.K. Imperial Tobacco Group PLC rose as the company was able to successfully raise prices across a number of markets and as shareholders favored the company’s generous dividend yield.
The Fund utilizes currency futures contracts to manage currency exposure resulting from the Fund’s holdings. During 2011, the Fund’s overall currency positioning contributed positively to returns relative to its benchmark. An overweight to the Japanese yen and British pound, along with an underweight to the Swiss franc benefited returns. This was somewhat offset by an underweight to the Australian dollar.
Which stocks detracted from the Fund’s performance results during the year ended December 31, 2011?
The stocks that detracted the most during 2011 were Société Générale, The Tokyo Electric Power Co., Inc., Lloyds Banking Group PLC, ING Groep NV-CVA and KBC Groep NV. Shares of The Tokyo Electric Power Co., Inc. collapsed as the company battled to contain a nuclear emergency at its Fukushima Dai-Ichi power plant following the Japanese tsunami. After the tsunami, the Fund continued to hold the stock with the conviction that the substantially depressed stock price more than discounted the uncertainty over how the company would emerge from the crisis. Although the stock detracted for the year, the Fund was able to recoup some losses before exiting the position later in the year.
Investor anxiety has been greatest in Europe. European banks ING Groep NV-CVA, Société Générale of France, Lloyds Banking Group PLC and Belgium’s KBC Groep NV were hurt by fears that the sovereign-debt crisis might eventually undermine their balance sheets. These companies exposure to sovereign debt of the most troubled European countries (Portugal, Ireland, Italy, Greece and Spain) is deemed manageable relative to the overall size of their assets and earnings. These companies have strong core business franchises and trade at substantial discount to tangible book value.
Did the Fund experience major changes to its top ten holdings during the year ended December 31, 2011?
There were no material changes to the December 31, 2011 top ten holdings list relative to the December 31, 2010 top ten holdings list.
How was the Fund positioned relative to its benchmark index at December 31, 2011?
The Fund is constructed using a bottom-up stock selection process. Relative sector weights are therefore a function of that approach rather than a result of top-down insights.
At the end of the period, the Fund was positioned such that its top three overweight positions compared to the Index were Energy, Consumer Discretionary and Materials sectors. The Fund’s largest underweight positions at the end of the year were in the Consumer Staples, Industrials and Information Technology sectors.
The Fund’s largest overweight country allocation versus the benchmark was to the United Kingdom and was focused mainly on companies in the Energy, Financial, Healthcare and Materials sectors. The Fund also had an overweight position in Canada, which is not part of the benchmark. Underweight positions in Australia and Switzerland were dictated by less attractive value opportunities when compared to other countries. The Fund held overweight positions in a number of individual stocks in both countries, however. In Australia, holdings included a number of financial firms that offer attractive dividend yields. Consumer goods along with pharmaceutical makers accounted for the largest Swiss holdings.
At December 31, 2011, the Fund held 30 companies that were not included in the Index. The majority of these companies were located in either Canada or Emerging Market countries, neither of which are represented in the Index, but are included in the Fund’s universe.
2
SC SM ALLIANCEBERNSTEIN INTERNATIONAL VALUE FUND (Continued)
COUNTRY ALLOCATIONS AT DECEMBER 31, 2011*
Percentage of Net Assets
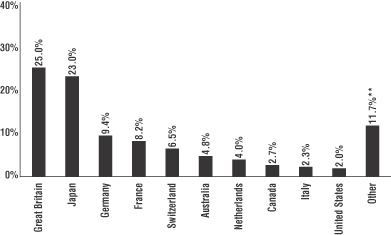
| * | The percentages shown for each country reflect the value of investments in that country as a percentage of net assets. Figures in the above graph may not total to 100% due to the exclusion of the Fund’s other assets and liabilities. |
| ** | Includes 20 countries with an allocation of less than 2% individually. |
TOP TEN EQUITY HOLDINGS AT DECEMBER 31, 2011
| | | | | | |
| | | % of Net Assets | | | Industry |
Royal Dutch Shell PLC, A Shares | | | 2.9 | % | | Oil, Gas & Consumable Fuels |
BP PLC | | | 2.8 | | | Oil, Gas & Consumable Fuels |
AstraZeneca PLC | | | 2.1 | | | Pharmaceuticals |
Nestle SA | | | 2.1 | | | Food Products |
Vodafone Group PLC | | | 1.9 | | | Wireless Telecommunication Services |
Novartis AG | | | 1.8 | | | Pharmaceuticals |
Roche Holding AG | | | 1.7 | | | Pharmaceuticals |
GlaxoSmithKline PLC | | | 1.6 | | | Pharmaceuticals |
Total SA | | | 1.4 | | | Oil, Gas & Consumable Fuels |
Rio Tinto PLC | | | 1.4 | | | Metals & Mining |
3
SC SM ALLIANCEBERNSTEIN INTERNATIONAL VALUE FUND (Continued)
Comparison of Change in Value of a $10,000 Investment in the SC AllianceBernstein International Value Fund – Initial Class and the MSCI EAFE Index
Comparison of Change in Value of a $10,000 Investment in the SC AllianceBernstein International Value Fund – Service Class and the MSCI EAFE Index
4
SC SM ALLIANCEBERNSTEIN INTERNATIONAL VALUE FUND (Continued)
Average Annual Total Returns for Periods Ended December 31, 2011**
| | | | | | | | | | | | |
| | | One Year | | | Three Years | | | Life of
Fund*** | |
SC AllianceBernstein International Value Fund–Initial Class Shares | | | (16.21 | )% | | | 4.37 | % | | | (3.11 | )% |
SC AllianceBernstein International Value Fund–Service Class Shares | | | (16.46 | )% | | | 4.12 | % | | | (3.35 | )% |
MSCI EAFE Index* | | | (12.14 | )% | | | 7.65 | % | | | (0.04 | )% |
*The performance data of the indices has been prepared from sources and data that the investment adviser believes to be reliable, but no representation is made as to their accuracy. The index is unmanaged and cannot be invested in directly. The MSCI EAFE Index (Europe, Australasia, Far East) tracks the performance of large cap international equity securities and is widely regarded as the standard for measuring large cap international stock market performance.
**Performance data is historical and includes changes in share price and reinvestment of income dividends and capital gains distributions. Past performance is no guarantee of future results. Performance may have changed materially since December 31, 2011. All Fund returns are net of fees and expenses, but do not include any insurance charges imposed in connection with your variable insurance contract. If this performance information included the effect of the insurance charges and the fees and expenses assumed by the investment adviser, performance numbers would be lower. The value of an investment in the SC AllianceBernstein International Value Fund and the return on the investment will fluctuate and redemption proceeds may be higher or lower than an investor’s original cost.
***For the period from October 1, 2008 (commencement of operations) to December 31, 2011.
5
SC SM BLACKROCK INTERNATIONAL INDEX FUND
(subadvised by BlackRock Investment Management, LLC)
MANAGEMENT’S DISCUSSION & ANALYSIS:
How did the Fund perform during the year ended December 31, 2011?
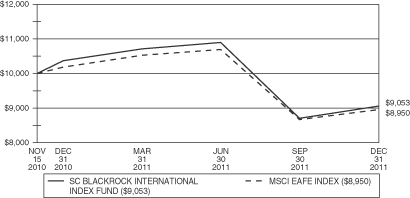
For the year ended December 31, 2011, the Initial and Service Class shares of SC BlackRock International Index Fund (the “Fund”) returned (12.46)% and (12.70)%, respectively. The Fund’s benchmark, the MSCI EAFE Index (the “Index”), returned (12.14)% for the same period.
What economic and market factors most influenced the global equity markets as a whole during the year ended December 31, 2011?
Early in the year, foreign and domestic stocks advanced at an uneven pace despite political upheaval spreading across the Middle East/North Africa region and a sharp rise in oil and other commodity prices. March brought devastating natural disasters that left Japan with massive infrastructure damage, resulting in global supply chain disruptions. Additionally, inflationary pressures persisted in developing countries; however the global economy continued to expand, albeit at a slower pace. Solid corporate profits, improving labor market conditions and reasonably upbeat leading indicators pushed most of the world’s equity markets forward.
After reaching their peak at the end of April, equities experienced a sharp reversal when the heightened possibility of Greece defaulting on its debt rekindled fears about the potential impact of the sovereign debt crisis spreading throughout Europe. It also became evident that the pace of economic growth had slowed in the United States and other developed nations. In the U.S., a prolonged debt ceiling debate revealed the ineffectiveness of the nation’s policymakers and ultimately led to Standard & Poor’s decision to downgrade the U.S. government’s credit rating in early August. This announcement was the catalyst that spurred one of the most volatile periods in equity trading history. Stock markets across the world declined as debt problems in Europe spread to Italy and Spain, and global economic indicators grew increasingly bleak.
Equities rebounded in October as stronger economic data from the U.S. helped to calm fears of a global double-dip recession and European leaders demonstrated greater unity in their pursuit to curtail the debt crisis. After months of deliberation, European leaders agreed upon a new plan to reduce Greece’s debt burden, recapitalize the region’s banks and increase the size of the euro-zone bailout fund. However, a lack of definitive details about the rescue plan raised doubts among investors and thwarted the rally at the end of October. International equities generally declined through the final two months of the year as political instability in Greece and Italy fueled uncertainty as to whether Europe’s leaders would be able to contain the crisis. Market volatility softened in December with the support of global central bank actions and improving economic data.
Of the 22 developed countries in the Index, only Ireland and New Zealand posted gains for the year. While equity markets sold off broadly across Europe, countries participating in the euro currency union saw particularly painful losses. Greece finished well below all other countries in the Index. Asian stocks were dragged down by the world’s debt problems and a weak outlook for consumer demand from Europe and the United States. Japan also suffered the effects of its appreciating yen on its export-driven economy.
How did the country allocations affect Fund performance during the year ended December 31, 2011?
The top contributor to the Fund’s relative performance was Ireland, while the top detractors were Japan, Germany and France.
Which sectors contributed most to the Fund’s performance results during the year ended December 31, 2011?
The top contributors to the Fund’s relative performance were the Health Care, Energy and Consumer Staples sectors.
Which sectors detracted most from the Fund’s performance results during the year ended December 31, 2011?
The top detractors from the Fund’s relative performance were the Financials, Materials and Industrials sectors.
6
SC SM BLACKROCK INTERNATIONAL INDEX FUND (Continued)
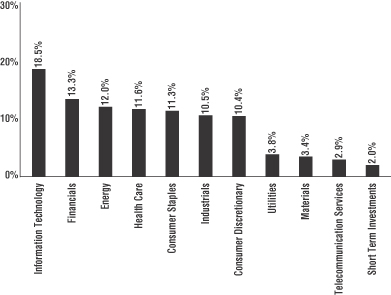
COUNTRY ALLOCATIONS AT DECEMBER 31, 2011*
Percentage of Net Assets
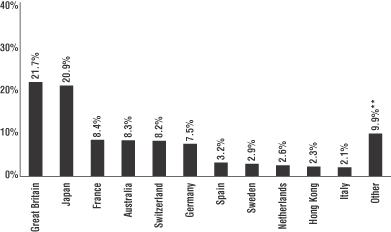
| * | The percentages shown for each country reflect the value of investments in that country as a percentage of net assets. Figures in the above graph may not total to 100% due to the exclusion of the Fund’s other assets and liabilities. |
| ** | Includes 18 countries with an allocation of less than 2% individually. |
TOP TEN EQUITY HOLDINGS AT DECEMBER 31, 2011
| | | | | | |
| | | % of Net Assets | | | Industry |
Nestle SA | | | 1.9 | % | | Food Products |
Vodafone Group PLC | | | 1.4 | | | Wireless Telecommunication Services |
HSBC Holdings PLC | | | 1.4 | | | Commercial Banks |
BP PLC | | | 1.4 | | | Oil, Gas & Consumable Fuels |
Novartis AG | | | 1.4 | | | Pharmaceuticals |
Royal Dutch Shell PLC, Class A | | | 1.4 | | | Oil, Gas & Consumable Fuels |
Roche Holding AG | | | 1.2 | | | Pharmaceuticals |
GlaxoSmithKline PLC | | | 1.2 | | | Pharmaceuticals |
BHP Billiton Ltd. | | | 1.2 | | | Metals & Mining |
Total SA | | | 1.1 | | | Oil, Gas & Consumable Fuels |
7
SC SM BLACKROCK INTERNATIONAL INDEX FUND (Continued)
Comparison of Change in Value of a $10,000 Investment in the SC BlackRock International Index Fund – Initial Class and the MSCI EAFE Index

Comparison of Change in Value of a $10,000 Investment in the SC BlackRock International Index Fund – Service Class and the MSCI EAFE Index
8
SC SM BLACKROCK INTERNATIONAL INDEX FUND (Continued)
Average Annual Total Returns for Periods Ended December 31, 2011**
| | | | | | | | |
| | | One Year | | | Life of
Fund*** | |
SC BlackRock International Index Fund–Initial Class Shares | | | (12.46 | )% | | | (8.14 | )% |
SC BlackRock International Index Fund–Service Class Shares | | | (12.70 | )% | | | (8.43 | )% |
MSCI EAFE Index* | | | (12.14 | )% | | | (9.37 | )% |
*The performance data of the index has been prepared from sources and data that the investment adviser believes to be reliable, but no representation is made as to their accuracy. The index is unmanaged and cannot be invested in directly. The MSCI EAFE Index (Europe, Australasia, Far East) tracks performance of large cap international equity securities and is widely regarded as the standard for measuring large cap international stock market performance.
**Performance data is historical and includes changes in share price and reinvestment of income dividends and capital gains distributions. Past performance is no guarantee of future results. Performance may have changed materially since December 31, 2011. All Fund returns are net of fees and expenses, but do not include any insurance charges imposed in connection with your variable insurance contract. If this performance information included the effect of the insurance charges and the fees and expenses assumed by the investment adviser, performance numbers would be lower. The value of an investment in the SC BlackRock International Index Fund and the return on the investment will fluctuate and redemption proceeds may be higher or lower than an investor’s original cost.
***For the period from November 15, 2010 (commencement of operations) to December 31, 2011.
9
SC SM BLACKROCK LARGE CAP INDEX FUND
(subadvised by BlackRock Investment Management, LLC)
MANAGEMENT’S DISCUSSION & ANALYSIS:
How did the Fund perform during the year ended December 31, 2011?
For the year ended December 31, 2011, the Initial and Service Class shares of SC BlackRock Large Cap Index Fund (the “Fund”) returned 1.58% and 1.17%, respectively. The Fund’s benchmark, the S&P 500 Index (the “Index”), returned 2.11% for the same period.
What economic and market factors most influenced the equity markets as a whole during the year ended December 31, 2011?
Early in the year, domestic stocks as correlated to the world markets advanced at an uneven pace, despite political upheaval spreading across the Middle East/North Africa region and a sharp rise in oil and other commodity prices. March brought devastating natural disasters in Japan, resulting in global supply chain disruptions. Equity markets were remarkably resilient as the global economic recovery appeared to be on track and investors were gradually increasing their appetite for risk. After peaking in late April, equities experienced a sharp reversal when the heightened possibility of Greece defaulting on its debt rekindled fears about the potential impact of the sovereign debt crisis spreading throughout Europe. In the U.S., a prolonged debt ceiling debate revealed the ineffectiveness of the nation’s policymakers and ultimately led to Standard & Poor’s decision to downgrade the U.S. government’s credit rating in early August. This announcement spurred one of the most volatile periods in trading history. Stock markets across the world experienced substantial volatility on hopes and fears driven by media news flow. Equities swooned as debt problems in Europe spread to Italy and Spain, and global economic indicators grew increasingly bleak.
U.S. stocks staged a strong rebound in October as the domestic labor market improved and corporate profits continued to beat analyst expectations. Encouraging news from Europe also contributed to the rally. After months of deliberation, European leaders agreed upon a new plan to reduce Greece’s debt burden, recapitalize the region’s banks and increase the size of the euro-zone bailout fund. However, a lack of definitive details about the rescue plan soon raised doubts among investors and thwarted the rally at the end of October. In November, political instability in Greece and Italy fueled uncertainty as to whether Europe’s leaders would be able to contain the crisis. In the U.S., wrangling among lawmakers prohibited an agreement on reducing the U.S. budget deficit, further undermining investors’ confidence in policymakers on both sides of the Atlantic. Market volatility softened in December with the support of global central bank actions and continued improvement in economic data.
Which sectors contributed most to the Fund’s performance results during the year ended December 31, 2011?
The Consumer Staples sector was the strongest relative contributor during the year, followed by the Health Care and Consumer Discretionary sectors.
Which sectors detracted most from the Fund’s performance results during the year ended December 31, 2011?
The top detractors from the Fund’s relative performance were the Financials and Materials sectors. The Fund’s exposure to equity index futures contracts that are used as a vehicle to equitize cash in order to maintain the Fund’s overall Index exposure was also a detractor to the Fund’s performance.
10
SC SM BLACKROCK LARGE CAP INDEX FUND (Continued)
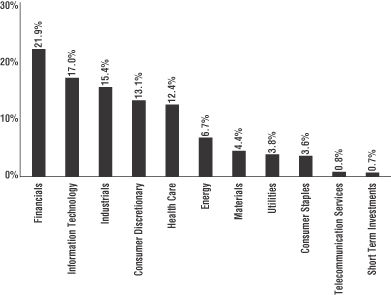
SECTOR ALLOCATIONS AT DECEMBER 31, 2011*
Percentage of Net Assets
| * | The above graph categorizes investments using Global Industry Classification Standards (“GICS”). The percentages shown for each sector reflect the value of investments in that sector as a percentage of net assets. Figures in the above graph may not total to 100% due to the exclusion of the Fund’s other assets and liabilities. |
TOP TEN EQUITY HOLDINGS AT DECEMBER 31, 2011
| | | | | | |
| | | % of Net Assets | | | Industry |
Exxon Mobil Corp. | | | 3.5 | % | | Oil, Gas & Consumable Fuels |
Apple, Inc. | | | 3.2 | | | Computers & Peripherals |
International Business Machines Corp. | | | 1.9 | | | IT Services |
Chevron Corp. | | | 1.8 | | | Oil, Gas & Consumable Fuels |
Microsoft Corp. | | | 1.7 | | | Software |
General Electric Co. | | | 1.6 | | | Industrial Conglomerates |
The Procter & Gamble Co. | | | 1.6 | | | Household Products |
AT&T, Inc. | | | 1.5 | | | Diversified Telecommunication Services |
Johnson & Johnson | | | 1.5 | | | Pharmaceuticals |
Pfizer, Inc. | | | 1.4 | | | Pharmaceuticals |
11
SC SM BLACKROCK LARGE CAP INDEX FUND (Continued)
Comparison of Change in Value of a $10,000 Investment in the SC BlackRock Large Cap Index Fund – Initial Class and the S&P 500 Index
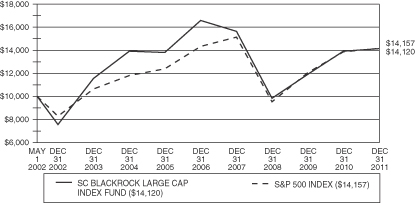
Comparison of Change in Value of a $10,000 Investment in the SC BlackRock Large Cap Index Fund – Service Class and the S&P 500 Index

12
SC SM BLACKROCK LARGE CAP INDEX FUND (Continued)
Average Annual Total Returns for Periods Ended December 31, 2011**
| | | | | | | | | | | | | | | | |
Initial Class Shares | | One Year | | | Three Years | | | Five Years | | | Life of
Fund*** | |
SC BlackRock Large Cap Index Fund | | | 1.58 | % | | | 12.82 | % | | | (3.16 | )% | | | 3.63 | % |
S&P 500 Index* | | | 2.11 | % | | | 14.11 | % | | | (0.25 | )% | | | 3.66 | % |
Service Class Shares | | | | | | | | | | | | |
SC BlackRock Large Cap Index Fund | | | 1.17 | % | | | 12.50 | % | | | (3.41 | )% | | | 1.54 | % |
S&P 500 Index* | | | 2.11 | % | | | 14.11 | % | | | (0.25 | )% | | | 3.43 | % |
*The performance data of the index has been prepared from sources and data that the investment adviser believes to be reliable, but no representation is made as to their accuracy. The index is unmanaged and cannot be invested in directly. The S&P 500 Index is an unmanaged, weighted index of the stock performance of 500 industrial, transportation, utility and financial companies.
**Performance data is historical and includes changes in share price and reinvestment of income dividends and capital gains distributions. Past performance is no guarantee of future results. Performance may have changed materially since December 31, 2011. All Fund returns are net of fees and expenses, but do not include any insurance charges imposed in connection with your variable insurance contract. If this performance information included the effect of the insurance charges and the fees and expenses assumed by the investment adviser, performance numbers would be lower. The value of an investment in the SC BlackRock Large Cap Index Fund and the return on the investment will fluctuate and redemption proceeds may be higher or lower than an investor’s original cost.
***Initial Class Shares for the period from May 1, 2002 (commencement of operations) to December 31, 2011. Service Class Shares for the period from February 1, 2004 (commencement of operations) to December 31, 2011.
13
SC SM BLACKROCK SMALL CAP INDEX FUND
(subadvised by BlackRock Investment Management, LLC)
MANAGEMENT’S DISCUSSION & ANALYSIS:
How did the Fund perform during the year ended December 31, 2011?
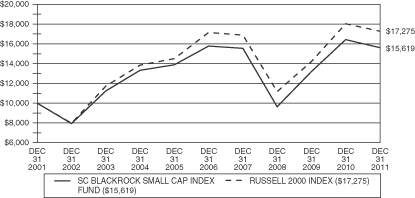
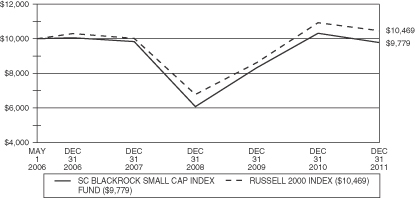
For the year ended December 31, 2011, the Initial and Service Class shares of SC BlackRock Small Cap Index Fund (the “Fund”) returned (4.87)% and (5.09)%, respectively. The Fund’s benchmark, the Russell 2000 Index (the “Index”), returned (4.18)% for the same period.
What economic and market factors most influenced the equity markets as a whole during the year ended December 31, 2011?
Early in the year, domestic stocks as correlated to the world markets advanced at an uneven pace, despite political upheaval spreading across the Middle East/North Africa region and a sharp rise in oil and other commodity prices. March brought devastating natural disasters in Japan, resulting in global supply chain disruptions. Equity markets were remarkably resilient as the global economic recovery appeared to be on track and investors were gradually increasing their appetite for risk. After peaking in late April, equities experienced a sharp reversal when the heightened possibility of Greece defaulting on its debt rekindled fears about the potential impact of the sovereign debt crisis spreading throughout Europe. In the U.S., a prolonged debt ceiling debate revealed the ineffectiveness of the nation’s policymakers and ultimately led to Standard & Poor’s decision to downgrade the U.S. government’s credit rating in early August. This announcement spurred one of the most volatile periods in trading history. Stock markets across the world experienced substantial volatility on hopes and fears driven by media news flow. Equities swooned as debt problems in Europe spread to Italy and Spain, and global economic indicators grew increasingly bleak.
U.S. stocks staged a strong rebound in October as the domestic labor market improved and corporate profits continued to beat analyst expectations. Encouraging news from Europe also contributed to the rally. After months of deliberation, European leaders agreed upon a new plan to reduce Greece’s debt burden, recapitalize the region’s banks and increase the size of the euro-zone bailout fund. However, a lack of definitive details about the rescue plan soon raised doubts among investors and thwarted the rally at the end of October. In November, political instability in Greece and Italy fueled uncertainty as to whether Europe’s leaders would be able to contain the crisis. In the U.S., wrangling among lawmakers prohibited agreement on reducing the U.S. budget deficit, further undermining investors’ confidence in policymakers on both sides of the Atlantic. Market volatility softened in December with the support of global central bank actions and continued improvement in economic data.
Which sectors contributed most to the Fund’s performance results during the year ended December 31, 2011?
The Utilities sector was the strongest contributor to the Fund’s relative performance during the year, followed by the Consumer Staples sector. The Fund’s exposure to equity index futures contracts that are used as a vehicle to equitize cash in order to maintain the Fund’s overall Index exposure was also a contributor to the Fund’s performance.
Which sectors detracted most from the Fund’s performance results during the year ended December 31, 2011?
The top detractors from the Fund’s relative performance were the Information Technology, Consumer Discretionary and Energy sectors.
14
SC SM BLACKROCK SMALL CAP INDEX FUND (Continued)
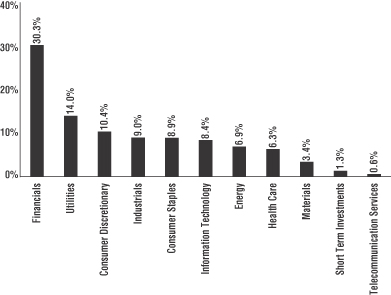
SECTOR ALLOCATIONS AT DECEMBER 31, 2011*
Percentage of Net Assets
| * | The above graph categorizes investments using GICS. The percentages shown for each sector reflect the value of investments in that sector as a percentage of net assets. Figures in the above graph may not total to 100% due to the exclusion of the Fund’s other assets and liabilities. |
TOP TEN EQUITY HOLDINGS AT DECEMBER 31, 2011^
| | | | | | |
| | | % of Net Assets | | | Industry |
Healthspring, Inc. | | | 0.3 | % | | Health Care Providers & Services |
Netlogic Microsystems, Inc. | | | 0.3 | | | Semiconductors & Semiconductor Equipment |
SuccessFactors, Inc. | | | 0.3 | | | Software |
Clean Harbors, Inc. | | | 0.3 | | | Commercial Services & Supplies |
World Fuel Services Corp. | | | 0.3 | | | Oil, Gas & Consumable Fuels |
Jack Henry & Associates, Inc. | | | 0.3 | | | IT Services |
American Campus Communities, Inc. | | | 0.3 | | | Real Estate Investment Trusts |
Salix Pharmaceuticals Ltd. | | | 0.3 | | | Pharmaceuticals |
Onyx Pharmaceuticals, Inc. | | | 0.2 | | | Biotechnology |
BioMed Realty Trust, Inc. | | | 0.2 | | | Real Estate Investment Trusts |
| ^ | As a result of the Russell Index reconstitution which took place on June 24, 2011, all of the Fund’s top ten holdings changed when compared to the Fund’s top ten holdings at December 31, 2010. |
15
SC SM BLACKROCK SMALL CAP INDEX FUND (Continued)
Comparison of Change in Value of a $10,000 Investment in the SC BlackRock Small Cap Index Fund – Initial Class and the Russell 2000 Index
Comparison of Change in Value of a $10,000 Investment in the SC BlackRock Small Cap Index Fund – Service Class and the Russell 2000 Index
16
SC SM BLACKROCK SMALL CAP INDEX FUND (Continued)
Average Annual Total Returns for Periods Ended December 31, 2011**
| | | | | | | | | | | | | | | | | | | | |
Initial Class Shares | | One Year | | | Three Years | | | Five Years | | | Ten Years | | | Life of
Fund*** | |
SC BlackRock Small Cap Index Fund | | | (4.87 | )% | | | 17.43 | % | | | (0.21 | )% | | | 4.56 | % | | | 6.57 | % |
Russell 2000 Index* | | | (4.18 | )% | | | 15.63 | % | | | 0.15 | % | | | 5.62 | % | | | 4.12 | % |
Service Class Shares | | | | | | | | | | | | | | | |
SC BlackRock Small Cap Index Fund | | | (5.09 | )% | | | 17.14 | % | | | (0.54 | )% | | | — | | | | (0.39 | )% |
Russell 2000 Index* | | | (4.18 | )% | | | 15.63 | % | | | 0.15 | % | | | — | | | | 0.81 | % |
*The performance data of the index has been prepared from sources and data that the investment adviser believes to be reliable, but no representation is made as to their accuracy. The index is unmanaged and cannot be invested in directly. The Russell 2000 Index measures the performance of the 2,000 companies with the smallest market capitalizations within the Russell 3000 Index (an index that measures the performance of the 3,000 largest U.S. companies based on total market capitalization).
**Performance data is historical and includes changes in share price and reinvestment of income dividends and capital gains distributions. Past performance is no guarantee of future results. Performance may have changed materially since December 31, 2011. All Fund returns are net of fees and expenses, but do not include any insurance charges imposed in connection with your variable insurance contract. If this performance information included the effect of the insurance charges and the fees and expenses assumed by the investment adviser, performance numbers would be lower. The value of an investment in the SC BlackRock Small Cap Index Fund and the return on the investment will fluctuate and redemption proceeds may be higher or lower than an investor’s original cost.
***Initial Class Shares for the period from July 17, 2000 (commencement of operations) to December 31, 2011. Service Class Shares for the period from May 1, 2006 (commencement of operations) to December 31, 2011.
17
SC SM GOLDMAN SACHS MID CAP VALUE FUND
(subadvised by Goldman Sachs Asset Management, L.P.)
MANAGEMENT’S DISCUSSION & ANALYSIS:
How did the Fund perform during the year ended December 31, 2011?
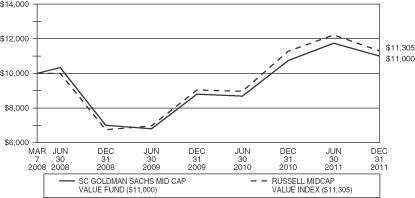
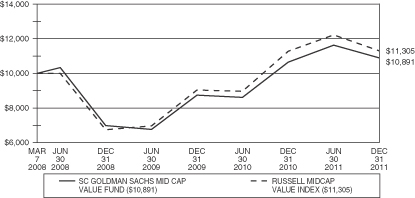
For the year ended December 31, 2011, the Initial and Service Class shares of SC Goldman Sachs Mid Cap Value Fund (the “Fund”) returned 2.47% and 2.34%, respectively, outperforming the benchmark, the Russell Midcap Value Index (the “Index”), which returned (1.38)% for the same period.
What economic and market factors most influenced the equity markets as a whole during the year ended December 31, 2011?
Despite significant volatility during the year, U.S. equity markets ended 2011 close to where they started the year. The S&P 500 Index returned 2.11% for the year, with the help of dividends, while price returns alone were virtually 0%, the smallest percentage change since 1947. Reflecting optimism that the domestic economy was improving, the S&P 500 Index started the year with the best first quarter in more than a decade and ended with a fourth quarter gain of 11.8%, after adding 1.0% in December. However, the sharp decline in the markets during the third quarter mostly offset these gains.
Overall, global stock markets were positive during the first half of the year. The majority of gains were generated during the first calendar quarter of 2011 when economic data remained relatively strong. However, as the quarter progressed, risks to the global economy proliferated. Political unrest emerged in Tunisia, followed by Egypt and the broader Middle East and North African region. Oil prices peaked around $125 per barrel on concerns about potential supply disruptions. In March, Japan was struck by the Tohoku earthquake and tsunami, leading to a nuclear emergency at the Fukushima Daiichi plant. In Europe, as policymakers struggled to avert debt restructures, Ireland and Portugal joined Greece as recipients of European Union bailouts. In April, the European Central Bank delivered its first interest-rate hike since the financial crisis in response to escalating inflation pressures.
The global equity markets experienced a much more volatile second quarter. Investors generally remained defensive, but the economic headwinds had begun to shift. Oil prices started to moderate in April, helped in June, by the International Energy Agency’s agreement to release global strategic reserves. Expectations ran high for strong corporate profit growth. Japanese industrial output improved substantially toward the end of the period, and the subsequent boost in U.S. manufacturing figures suggested that Japan’s recovery, even at these early stages, is repairing significant gaps in the global supply chain.
In August, Standard & Poor’s downgraded U.S. Treasury debt from AAA for the first time in the history of its ratings. Toward the end of September, the financial markets were further shaken when the Federal Reserve Board announced its plan for additional monetary easing due to general weakness in the labor market and lackluster consumer spending growth. Furthermore, the prospect of contagion from Europe’s debt crisis and the lack of agreement on a solution weighed on global equity markets during the period. However, U.S. equities rallied back sharply in October following a preliminary plan for the Eurozone and the announcement of a relatively strong third quarter Gross Domestic Product (GDP) growth number.
Specifically in the U.S. Value segment of the market, 2011 was marked by violent reversals roughly broken out into two periods: January to April, which was largely a continuation of the rally that extended from March 2009, and then May to December, which was a sudden de-risking, down market. During this latter part of the year, traditionally defensive Utilities and Consumer Staples were the only positive performing sectors in the Index, whereas more cyclical sectors experienced steep declines.
18
SC SM GOLDMAN SACHS MID CAP VALUE FUND (Continued)
Were there any significant sector under/over weights that materially affected Fund performance relative to the benchmark during the year ended December 31, 2011?
Within sectors, stock selection was positive overall during the year. An underweight position in the Financials sector, as well as an overweight position in the Consumer Staples sector, proved to be the Fund’s most successful positions relative to the benchmark, and in contrast, an overweight position in the Energy sector, as well as an underweight in the Materials sector were least successful allocations relative to the benchmark for the year.
Which stocks contributed most to the Fund’s returns during the year ended December 31, 2011?
Returns to the investment themes were positive overall. Profitability contributed the most to excess returns, far exceeding Quality, Management, Sentiment and Momentum. Conversely, Valuation detracted from relative performance for the period. Valuation and Profitability summarize results from the balance sheet and income statement, whereas Quality and Management measure the operating, investing, and financing activities from a company’s statement of cash flows. Momentum measures information about a wide variety of investment-relevant events that are sufficiently complex, in many cases, that it takes time for the market to fully appreciate their implications for security values. The sixth theme, Sentiment, is based on the detailed research of stock analysts, research that includes the evaluation of financial statements, discussions with management, and the study of industry trends. Sentiment allows us to incorporate a wide range of qualitative information on companies and their industries into our quantitative evaluation of stocks.
Overweight positions in tobacco company Lorillard, Inc., media company DISH Network Corp., and Real Estate Investment Trust Rayonier, Inc. were the largest positive contributors to the Fund’s relative performance. The Fund was overweight Lorillard, Inc. and Rayonier, Inc. due to our positive views on favorable profit margins and the operating efficiency of these companies. The Fund was overweight DISH Network Corp. and also Rayonier, Inc. as these companies used capital to enhance shareholder value.
Which stocks detracted from the Fund’s performance results during the year ended December 31, 2011?
Overweight positions in energy company Exterran Holdings, Inc., manufacturer of semiconductors Vishay Intertechnology, Inc. and chemical company CF Industries Holdings, Inc. were among the greatest detractors from relative performance for the year. The Fund was overweight Exterran Holdings, Inc. as we believe it was inexpensive relative to industry peers. The Fund was overweight Vishay Intertechnology, Inc. based upon perceived value in strong management decisions during the year and the Fund was overweight CF Industries Holdings, Inc. based upon the Fund’s assessment of this company’s sustainable sources of earnings.
Did the Fund experience major changes to its top ten holdings during the year ended December 31, 2011?
There were no material changes to the December 31, 2011 top ten holdings list relative to the December 31, 2010 top ten holdings list.
How was the Fund positioned relative to its benchmark index at the end of December 31, 2011?
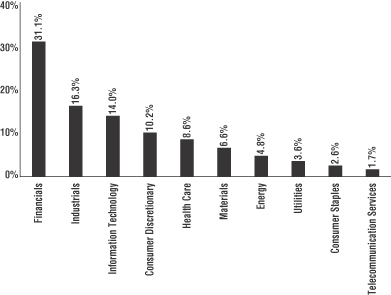
As of December 31, 2011, the Fund was overweight Consumer Staples, Healthcare, Energy, Information Technology and the Financials sectors relative to the Index. In contrast, the Fund was underweight in the Materials, Industrials, Consumer Discretionary and Utilities sectors. The Fund was also in a neutral position in the Telecommunication Services sector.
19
SC SM GOLDMAN SACHS MID CAP VALUE FUND (Continued)
SECTOR ALLOCATIONS AT DECEMBER 31, 2011*
Percentage of Net Assets
| * | The above graph categorizes investments using GICS. The percentages shown for each sector reflect the value of investments in that sector as a percentage of net assets. Figures in the above graph may not total to 100% due to the exclusion of the Fund’s other assets and liabilities. |
TOP TEN EQUITY HOLDINGS AT DECEMBER 31, 2011
| | | | | | |
| | | % of Net Assets | | | Industry |
Lorillard, Inc. | | | 4.6 | % | | Tobacco |
Valero Energy Corp. | | | 2.8 | | | Oil, Gas & Consumable Fuels |
Rayonier, Inc. | | | 2.6 | | | Real Estate Investment Trusts |
AvalonBay Communities, Inc. | | | 2.2 | | | Real Estate Investment Trusts |
NiSource, Inc. | | | 2.0 | | | Multi-Utilities |
Humana, Inc. | | | 1.9 | | | Health Care Providers & Services |
Integrys Energy Group, Inc. | | | 1.8 | | | Multi-Utilities |
Tesoro Corp. | | | 1.8 | | | Oil, Gas & Consumable Fuels |
Tyson Foods, Inc., Class A | | | 1.6 | | | Food Products |
DISH Network Corp., Class A | | | 1.5 | | | Media |
20
SC SM GOLDMAN SACHS MID CAP VALUE FUND (Continued)
Comparison of Change in Value of a $10,000 Investment in the SC Goldman Sachs Mid Cap Value Fund – Initial Class and the Russell Midcap Value Index
Comparison of Change in Value of a $10,000 Investment in the SC Goldman Sachs Mid Cap Value Fund – Service Class and the Russell Midcap Value Index
21
SC SM GOLDMAN SACHS MID CAP VALUE FUND (Continued)
Average Annual Total Returns for Periods Ended December 31, 2011**
| | | | | | | | | | | | |
| | | One Year | | | Three Years | | | Life of
Fund*** | |
SC Goldman Sachs Mid Cap Value Fund–Initial Class Shares | | | 2.47 | % | | | 16.30 | % | | | 2.52 | % |
SC Goldman Sachs Mid Cap Value Fund–Service Class Shares | | | 2.34 | % | | | 15.99 | % | | | 2.26 | % |
Russell Midcap Value Index* | | | (1.38 | )% | | | 18.19 | % | | | 3.26 | % |
*The performance data of the index has been prepared from sources and data that the investment adviser believes to be reliable, but no representation is made as to their accuracy. The index is unmanaged and cannot be invested in directly. The Russell Midcap Value Index tracks the performance of the mid-cap value segment of the U.S. equity universe. It includes those Russell Midcap Value Index companies with lower price-to-book ratios and lower forecasted growth values.
**Performance data is historical and includes changes in share price and reinvestment of income dividends and capital gains distributions. Past performance is no guarantee of future results. Performance may have changed materially since December 31, 2011. All Fund returns are net of fees and expenses, but do not include any insurance charges imposed in connection with your variable insurance contract. If this performance information included the effect of the insurance charges, performance numbers would be lower. The value of an investment in the SC Goldman Sachs Mid Cap Value Fund and the return on the investment will fluctuate and redemption proceeds may be higher or lower than an investor’s original cost.
***For the period from March 7, 2008 (commencement of operations) to December 31, 2011.
22
SC SM COLUMBIA SMALL CAP VALUE FUND
(subadvised by Columbia Management Investment Advisers, LLC)
MANAGEMENT’S DISCUSSION & ANALYSIS:
How did the Fund perform during the year ended December 31, 2011?
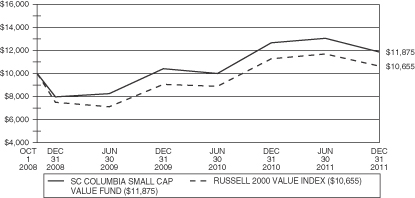
For the year ended December 31, 2011, the Initial and Service Class shares of SC Columbia Small Cap Value Fund (the “Fund”) returned (6.32)% and (6.50)%, respectively, underperforming the benchmark, the Russell 2000 Value Index (the “Index”), which returned (5.50)% for the same period.
What economic and market factors most influenced the equity markets as a whole during the year ended December 31, 2011?
2011 was characterized by surprises and challenges, not limited to, the political unrest in the Middle East, Japan’s violent earthquake, the U.S. and European debt woes and general political gridlock. The impact of natural disasters had a meaningful impact to the global supply chain, slowing the pace of economic growth in the second and third quarters. Lackluster economic data signaled a loss of momentum and affected both consumer and investor confidence leading to a significant market correction in the 3rd quarter. Housing continued to have structural impediments to a full recovery with foreclosures still creating additional supply, causing prices to weaken in the face of record affordability. Conflicting economic data was reflected in a series of disappointing new jobs reports for the majority of the year, supported by rising unemployment rates, which weighed on consumer confidence; however the most recent ‘average number of jobs added’ report over the prior three-month period showed signs of modest progress; albeit contrary to manufacturing activity that slowed as supply disruptions and adverse weather conditions hit the Midwest, where much of U.S. manufacturing activity is located.
Against this backdrop, the U.S. equity markets reflected significant volatility throughout the year. As commodity prices declined early in April and expectations ran high for strong corporate profit growth, stock prices rose to a three-year high. Economic data weakened in May and June, and concerns about Greece’s debt crisis resurfaced and pressured the U.S. stock market. Economic momentum slowed in the third quarter, raising the odds of recession and making the U.S. economy even more susceptible to financial shocks. Inflation, a continued weak job market, rising energy prices and, to a lesser degree, rising food prices more than offset a modest increase in personal income. China’s manufacturing engine showed signs of slowing, and yet despite these impediments, U.S. corporations reported relatively strong earnings, with many reporting record profits.
The current low interest rate environment has distorted some market dynamics. The extended pledge by the Federal Reserve Bank to hold U.S. Treasury yields low, led investors to place a substantial premium on dividend yield. The low interest rate environment also affects the balance sheet quality spreads of companies as companies with higher levels of debt do not suffer larger interest expenses. As such, there is very little distinction observed between higher or lower quality balance sheets. This appears to be temporary, and eventually higher borrowing costs will once again separate higher quality balance sheet companies from those with poor balance sheets. Overall the major U.S. stock market indices registered virtually flat returns, and small cap value underperformed the major markets as the uncertainty in the markets led investors to disfavor “risk” assets.
Were there any significant sector under/over weights that materially affected Fund performance relative to the benchmark during the year ended December 31, 2011?
The Fund’s underweight positions in the Utility sector and the REIT industry contributed to relative underperformance as the Utility sector was the best performing sector within the Index. Investors sought out lower volatility, and the Utility sector often receives benefits during these times of higher volatility. However, the Fund believed that the Utility sector and REITs were overvalued for non-fundamental reasons; their high dividend yields served as a replacement for traditional fixed income investment. Also, fundamental headwinds
23
SC SM COLUMBIA SMALL CAP VALUE FUND (Continued)
for the REITs sector included a potential to have the allowed return reduced by regulators given the reduction in long-term interest rates. The Fund’s positioning within REITs has focused on supply and demand imbalances, and in particular, with the lack of new supply of hotels for the next three years, the Fund tilted its exposure toward hotels. Given the macroeconomic uncertainty, the hotel exposure underperformed the more traditional REIT segment.
Which stocks contributed most to the Fund’s returns during the year ended December 31, 2011?
Stocks that contributed most to the Fund’s absolute performance during the year were ViroPharma Inc., Rent-A-Center, Inc., HealthSpring, Inc., and International Coal Group, Inc. ViroPharma Inc., a pharmaceutical company, contributed to performance as the company’s new drug Cinryze had a quicker uptake than what was previously expected and another drug Vancocin had a patent potentially extended for another 3 years with a new label. Both of these announcements led to upside cash flow generation when compared to previous expectations, benefiting the stock in 2011. Rent-A-Center, Inc. (RAC), a top ten holding of the Fund in 2010 and 2011, had strong performance, driven by strong execution in the company’s core rent-to-own business as consumers continue to require unconventional credit as well as innovative new offerings such as RAC acceptance, a kiosk that allows consumers previously denied credit during major purchases, such as furniture, to have the ability to apply for credit through Rent-A-Center, Inc.
Two acquisitions also helped the Fund’s absolute performance for the year. One of the Fund’s previous top ten holdings, HealthSpring, Inc., announced its intention to be acquired by Cigna Corp. at a premium for $55 per share in cash, which contributed significantly to the Fund’s absolute performance during the year. International Coal Group, Inc. was also acquired by Arch Coal, Inc. for a premium further adding to the Fund’s absolute performance for the year.
Which stocks detracted from the Fund’s performance results during the year ended December 31, 2011?
Economically sensitive positions were the worst performers in the Fund during the year. Two positions exposed to industrial metals, OM Group, Inc. and Thompson Creek Metals Co., Inc. had poor performance for the year as the end of the second round of quantitative easing (U.S. Treasury Bond Purchases Program by the Federal Reserve) and a weakening economy detracted from base metal pricing. The lower prices drove lower valuations. OfficeMax, Inc., a specialty retailer, also had a difficult year as white collar employment growth disappointed and the result was a detractor for this office supply company.
Did the fund experience major changes to its top ten holdings during the year ended December 31, 2011?
Four of the Fund’s top ten holdings as of December 31, 2010 remained among the Fund’s top ten holdings as of December 31, 2011. One of the Fund’s previous top ten holdings, Healthspring, Inc., had announced its intention to be acquired by Cigna Corp. and the Fund exited the position. Thompson Creek Metals Co., Inc., Global Indemnity PLC, First Citizens Bancshares, Inc., Fresh Del Monte Produce, Inc. and Knight Capital Group, Inc. all remained as holdings of the Fund at December 31, 2011, but fell out of the top ten holdings due to market fluctuations and/or a reduction in position size.
New top ten holdings include REITs Sunstone Hotels Investors, Inc. and Starwood Property Trust, Inc., regional banks Hancock Holding Co. and FirstMerit Corp., utility company Southwest Gas Corp. and machinery maker Robbins & Myers, Inc.
How was the Fund positioned relative to its benchmark index at December 31, 2011?
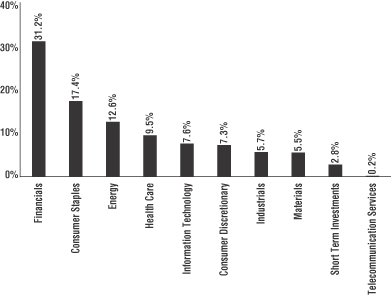
At December 31, 2011, the Fund was positioned with an economically-sensitive bias; an overweight in the Technology, Industrials and Materials sectors, and underweight to the Financials and Utilities sectors. The Fund was also underweight in the Consumer Discretionary and Consumer Staples sectors. This is mainly due to limited
24
SC SM COLUMBIA SMALL CAP VALUE FUND (Continued)
investment options of consumer companies with strong free cash flow yields and strong balance sheets that meet the Fund’s valuation criteria. The Fund continues to have an overweight exposure to the Health Care sector, with conviction and continued attempt to find attractive health care stocks, both on a valuation and a fundamental basis. At the end of the year, the Fund was weighted toward higher-quality companies, with stable positive earnings, low volatility when compared to their peers, and a consistent value bias.
SECTOR ALLOCATIONS AT DECEMBER 31, 2011*
Percentage of Net Assets
| * | The above graph categorizes investments using GICS. The percentages shown for each sector reflect the value of investments in that sector as a percentage of net assets. Figures in the above graph may not total to 100% due to the exclusion of the Fund’s other assets and liabilities. |
TOP TEN EQUITY HOLDINGS AT DECEMBER 31, 2011
| | | | | | |
| | | % of Net Assets | | | Industry |
Rent-A-Center, Inc. | | | 1.1 | % | | Specialty Retail |
Greif, Inc., Class A | | | 0.9 | | | Containers & Packaging |
OM Group, Inc. | | | 0.8 | | | Chemicals |
Hancock Holding Co. | | | 0.8 | | | Commercial Banks |
Robbins & Myers, Inc. | | | 0.8 | | | Machinery |
Starwood Property Trust, Inc. | | | 0.8 | | | Real Estate Investment Trusts |
DiamondRock Hospitality Co. | | | 0.7 | | | Real Estate Investment Trusts |
FirstMerit Corp. | | | 0.7 | | | Commercial Banks |
Southwest Gas Corp. | | | 0.7 | | | Gas Utilities |
Sunstone Hotel Investors, Inc. | | | 0.7 | | | Real Estate Investment Trusts |
25
SC SM COLUMBIA SMALL CAP VALUE FUND (Continued)
Comparison of Change in Value of a $10,000 Investment in the SC Columbia Small Cap Value Fund – Initial Class and the Russell 2000 Value Index
Comparison of Change in Value of a $10,000 Investment in the SC Columbia Small Cap Value Fund – Service Class and the Russell 2000 Value Index

26
SC SM COLUMBIA SMALL CAP VALUE FUND (Continued)
Average Annual Total Returns for Periods Ended December 31, 2011**
| | | | | | | | | | | | |
| | | One Year | | | Three Years | | | Life of
Fund*** | |
SC Columbia Small Cap Value Fund–Initial Class Shares | | | (6.32 | )% | | | 14.14 | % | | | 5.43 | % |
SC Columbia Small Cap Value Fund–Service Class Shares | | | (6.50 | )% | | | 13.84 | % | | | 5.15 | % |
Russell 2000 Value Index* | | | (5.50 | )% | | | 12.36 | % | | | 1.97 | % |
*The performance data of the index has been prepared from sources and data that the investment adviser believes to be reliable, but no representation is made as to their accuracy. The index is unmanaged and cannot be invested in directly. The Russell 2000 Value Index tracks the performance of the small value segment of the U.S. equity universe. It includes those Russell 2000 companies with lower price-to-book ratios and lower forecasted growth values.
**Performance data is historical and includes changes in share price and reinvestment of income dividends and capital gains distributions. Past performance is no guarantee of future results. Performance may have changed materially since December 31, 2011. All Fund returns are net of fees and expenses, but do not include any insurance charges imposed in connection with your variable insurance contract. If this performance information included the effect of the insurance charges and the fees and expenses assumed by the investment adviser, performance numbers would be lower. The value of an investment in the SC Columbia Small Cap Value Fund and the return on the investment will fluctuate and redemption proceeds may be higher or lower than an investor’s original cost.
***For the period from October 1, 2008 (commencement of operations) to December 31, 2011.
27
SC SM DAVIS VENTURE VALUE FUND
(subadvised by Davis Selected Advisers, L.P.)
MANAGEMENT’S DISCUSSION & ANALYSIS:
How did the Fund perform during the year ended December 31, 2011?
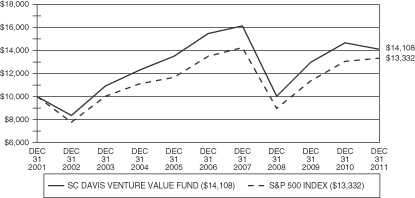
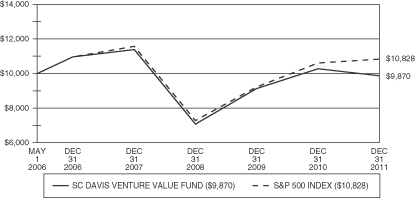
For the year ended December 31, 2011, the Initial and Service Class shares of SC Davis Venture Value Fund (the “Fund”) returned (3.77)% and (4.02)%, respectively, underperforming the benchmark, the S&P 500 Index (the “Index”), which returned 2.11% for the same period.
What economic and market factors most influenced the equity markets as a whole during the period ended December 31, 2011?
The unemployment rate in the U.S. began the year at 9.1% and declined to end the year at 8.5%. The 10-Year U.S. Treasury yield began 2011 slightly over 3% and ended the year at about 2%.
While the Index value increased slightly over the year, individual sector performance varied widely throughout the Index. The sectors within the Index that provided the strongest performance during the year were Utilities, Consumer Staples, and Health Care. The sectors that were the weakest performers during the year were Financials, Materials, and Industrials.
Were there any significant sector under/over weights that materially affected Fund performance relative to the benchmark during the period ended December 31, 2011?
The Fund’s relative performance benefited the most by being overweight in the strongly performing Consumer Staples sector. Additionally, the Fund’s stock selection within the sector outperformed consumer staples companies included in the Index.
The Fund’s overweight position in the poorly performing Financial sector detracted from relative performance. However, the Fund’s stock selection within the sector significantly outperformed the financial companies included in the Index, largely offsetting the decline in relative performance due to the Fund’s sector overweight.
Other important factors detracting from the Fund’s performance included the Fund’s stock selection within the Materials and Energy sectors, which underperformed their Index peers, and foreign companies’ underperformance in comparison to the domestic companies held by the Fund.
Which stocks contributed most to the Fund’s returns during the year ended December 31, 2011?
The Fund’s absolute performance benefitted the most from its allocation to two Consumer Staples companies, CVS Caremark Corp. and Costco Wholesale Corp., Financial company American Express Co., Industrial company Iron Mountain, Inc. and Information Technology company, Google, Inc.
Which stocks detracted from the Fund’s performance results during the year ended December 31, 2011?
The companies which detracted most from the Fund’s performance were Financial company Bank of New York Mellon Corp., Materials sector companies Sino-Forest Corp., and Sealed Air Corp., along with two Energy companies, Devon Energy Corp. and Canadian Natural Resources, Ltd.
Sino-Forest Corp. was the single most important detractor from the Fund’s performance as the company’s stock price declined by approximately 98.5% during the year, detracting from overall Fund performance by approximately 1.5%. Listed in Toronto but operating predominantly in mainland China, Sino-Forest Corp. is a commercial timber plantation manager. In August 2011, the Ontario Securities Commission halted trading in Sino-Forest Corp. common stock. Continuing developments, including the failure to release financial information
28
SC SM DAVIS VENTURE VALUE FUND (Continued)
on a timely basis and breaches under credit agreements, brought the value of this company now to zero, down from 34 cents per share at December 31, 2011. The Fund’s subadviser, Davis Selected Advisers, L.P., continues to monitor and evaluate the situation.
Did the Fund experience major changes to its top ten holdings during the year ended December 31, 2011?
There were no material changes to the Fund’s December 31, 2011 top ten holdings list relative to the December 31, 2010 top ten holdings list.
How was the Fund positioned relative to its benchmark index at December 31, 2011?
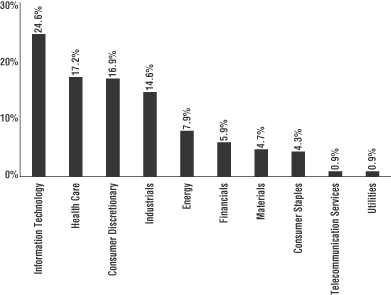
The Fund’s portfolio is positioned using a bottom-up stock selection process rather than a top down sector biased process and employs an investment strategy to perform extensive research to identify durable companies at a discount to their intrinsic values and to hold them for the long term. At December 31, 2011, the Fund was overweight in Financials, Consumer Staples, Energy, and Materials sectors and underweight in the Industrials, Consumer Discretionary, Information Technology, Telecommunications Services, Health Care and Utilities sectors.
SECTOR ALLOCATIONS AT DECEMBER 31, 2011*
Percentage of Net Assets
| * | The above graph categorizes investments using GICS. The percentages shown for each sector reflect the value of investments in that sector as a percentage of net assets. Figures in the above graph may not total to 100% due to the exclusion of the Fund’s other assets and liabilities. |
29
SC SM DAVIS VENTURE VALUE FUND (Continued)
TOP TEN EQUITY HOLDINGS AT DECEMBER 31, 2011
| | | | | | |
| | | % of Net Assets | | | Industry |
Costco Wholesale Corp. | | | 5.5 | % | | Food & Staples Retailing |
Wells Fargo & Co. | | | 5.4 | | | Commercial Banks |
CVS Caremark Corp. | | | 5.3 | | | Food & Staples Retailing |
American Express Co. | | | 5.2 | | | Consumer Finance |
EOG Resources, Inc. | | | 4.3 | | | Oil, Gas & Consumable Fuels |
Bank of New York Mellon Corp. | | | 4.1 | | | Capital Markets |
Google, Inc., Class A | | | 3.2 | | | Internet Software & Services |
Loews Corp. | | | 3.1 | | | Insurance |
Canadian Natural Resources, Ltd. | | | 3.0 | | | Oil, Gas & Consumable Fuels |
The Progressive Corp. | | | 2.9 | | | Insurance |
Comparison of Change in Value of a $10,000 Investment in the SC Davis Venture Value Fund – Initial Class and the S&P 500 Index
Comparison of Change in Value of a $10,000 Investment in the SC Davis Venture Value Fund – Service Class and the S&P 500 Index
30
SC SM DAVIS VENTURE VALUE FUND (Continued)
Average Annual Total Returns for Periods Ended December 31, 2011**
| | | | | | | | | | | | | | | | | | | | |
Initial Class Shares | | One Year | | | Three Years | | | Five Years | | | Ten Years | | | Life of
Fund*** | |
SC Davis Venture Value Fund | | | (3.77 | )% | | | 12.03 | % | | | (1.84 | )% | | | 3.50 | % | | | 1.92 | % |
S&P 500 Index* | | | 2.11 | % | | | 14.11 | % | | | (0.25 | )% | | | 2.92 | % | | | 0.28 | % |
Service Class Shares | | | | | | | | | | | | | | | |
SC Davis Venture Value Fund | | | (4.02 | )% | | | 11.74 | % | | | (2.08 | )% | | | — | | | | (0.23 | )% |
S&P 500 Index* | | | 2.11 | % | | | 14.11 | % | | | (0.25 | )% | | | — | | | | 1.41 | % |
*The performance data of the index has been prepared from sources and data that the investment adviser believes to be reliable, but no representation is made as to their accuracy. The index is unmanaged and cannot be invested in directly. The S&P 500 Index is a weighted index of the stock performance of 500 industrial, transportation, utility and financial companies.
**Performance data is historical and includes changes in share price and reinvestment of income dividends and capital gains distributions. Past performance is no guarantee of future results. Performance may have changed materially since December 31, 2011. All Fund returns are net of fees and expenses, but do not include any insurance charges imposed in connection with your variable insurance contract. If this performance information included the effect of the insurance charges and the fees and expenses assumed by the investment adviser, performance numbers would be lower. The value of an investment in the SC Davis Venture Value Fund and the return on the investment will fluctuate and redemption proceeds may be higher or lower than an investor’s original cost.
***Initial Class Shares for the period from July 17, 2000 (commencement of operations) to December 31, 2011. Service Class Shares for the period from May 1, 2006 (commencement of operations) to December 31, 2011.
31
SC SM INVESCO SMALL CAP GROWTH FUND
(subadvised by Invesco Advisers, Inc.)
MANAGEMENT’S DISCUSSION & ANALYSIS:
How did the Fund perform during the year ended December 31, 2011?
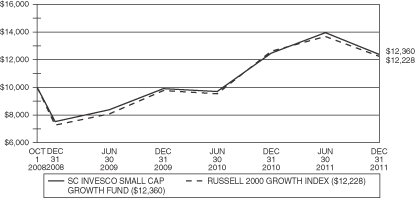
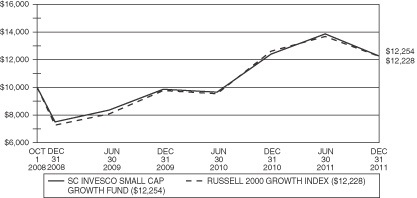
For the year ended December 31, 2011, the Initial and Service Class shares of SC Invesco Small Cap Growth Fund (the “Fund”) returned (0.92)% and (1.20)%, respectively, outperforming the benchmark, the Russell 2000 Growth Index (the “Index”), which returned (2.91)% for the same period.
What economic and market factors most influenced the equity markets as a whole during the year ended December 31, 2011?
The U.S Federal Reserve’s second round of quantitative easing or QE2 (U.S. Treasury Bond purchases) fueled the equity markets at the outset of 2011, which continued this upward trend until the spring of 2011 which brought increased volatility and significant macroeconomic distortions due to civil unrest in Egypt and Libya, flooding in Australia and a devastating earthquake and tsunami in Japan. Corporate earnings remained strong with largely positive surprises, but were often overshadowed by investor concerns about continuing high unemployment and weak housing data. Although markets stabilized and were generally in positive territory through the summer, major equity indexes declined precipitously in August as the U.S. government struggled to raise the nation’s debt ceiling. Despite an eventual agreement between the White House and Congress, credit rating agency Standard & Poor’s announced the first-ever downgrade of long-term U.S. government debt. Uncertainty created by the downgrade combined with the continuing saga surrounding the debt crisis in the Eurozone have reignited fears of a global recession. Despite the occasional signs of sustained but muted growth, these macroeconomic factors continued to weigh on markets through the end of 2011.
Were there any significant sector under/over weights that materially affected Fund performance relative to the benchmark during the year ended December 31, 2011?
There were no significant sector under/over weights that materially affected Fund performance relative to the Index during the year ended December 31, 2011. Security selection was the primary driver of relative performance during the year. The Fund’s outperformance compared to the Index was driven largely by stock selection in several sectors, including the Consumer Discretionary, Health Care, Materials and Consumer Staples sectors.
Which stocks contributed most to the Fund’s returns during the year ended December 31, 2011?
The Fund’s top five contributors to absolute performance were Frontier Oil Corp., Valeant Pharmaceuticals International Inc., TransDigm Group Inc., Nu Skin Enterprises Inc. and RightNow Technologies Inc.
Midwest oil refiner Frontier Oil Corp. made a strong contribution to performance benefitting from a merger with Holly Corp. Valeant Pharmaceuticals International Inc., a maker of pharmaceuticals in the neurology, dermatology and branded generics segments, benefited from strong demand for its products, as well as cost savings achieved from a significant acquisition, resulting in revenue and earnings growth. The Fund’s position was sold during the year as the company reached our price target. Aircraft components maker TransDigm Group Inc. was a key contributor to performance during the year. The company benefited from solid demand for the aircraft components it manufactures for commercial and military customers. Nu Skin Enterprises Inc. is a global direct selling company that develops and distributes personal care products and nutritional supplements that are sold worldwide under the Nu Skin and Pharmanex brands. The company is in the early stages of a multi-year product cycle launch which had resulted in strong results in both the skin care and nutritional segments. In October, Oracle Corp. announced that it had entered into an agreement to acquire RightNow Technologies Inc., a
leading provider of cloud-based customer service which helps organizations deliver exceptional customer
32
SC SM INVESCO SMALL CAP GROWTH FUND (Continued)
experiences across call centers, the web and social networks. The announcement of the acquisition resulted in significant share price appreciation for RightNow Technologies, Inc. and as of December 31, 2011 the acquisition was in-process and RightNowTechnologies, Inc. remained as a holding by the Fund.
Which stocks detracted from the Fund’s performance results during the year ended December 31, 2011?
The Fund’s top five detractors from absolute performance were James River Coal Co., Meritor Inc., Carrizo Oil & Gas Inc., Terex Corp. and Diamond Foods Inc.
There were production slowdowns in South Africa and Australia which offered an opportunity for coal miner, James River Coal Co., to gain market share, until the global slowdown for steam coal across all thermal coal markets caught up with the company. Meritor, Inc., a manufacturer of parts for medium and heavy duty trucks, trailers and light vehicles, had weak performance as profit margins narrowed due to rising steel costs during the period. Carrizo Oil & Gas Inc. is an oil and gas exploration and production company with most revenues coming from natural gas. Depressed natural gas prices forced the company to shift its investment focus to crude oil and liquid natural gas projects, but delays in its North Sea project and lower-than-expected results in some newer projects hurt the company and resulted in the Fund selling its position. Terex Corp., a leading global manufacturer of non-residential construction equipment, declined on a combination of fears arising from credit problems in Europe, an unclear outlook for non-residential construction, and an environment of constrained bank lending. Performance of nut and snack products maker Diamond Foods Inc. was hurt by an external communication accusing it of improper accounting issues with respect to walnut stock accounting. This accusation ultimately delayed their acquisition of Pringle from The Proctor & Gamble Co., costing the company potential higher earnings and margins.
Did the Fund experience major changes to its top ten holdings during the year ended December 31, 2011?
TransDigm Group, Inc. was the Fund’s only top ten holding as of December 31, 2010 that remained among the Fund’s top ten holdings at December 31, 2011. Several top ten holdings as of December 31, 2010 remained as holdings by the Fund at December 31, 2011, but fell out of the top ten holdings due to market fluctuation and/or a reduction in position size. Regal-Beloit Corp. and P.F. Chang’s China Bistro, Inc. were positions among the Fund’s top ten holdings as of December 31, 2010 that were completely sold during the year. There were several holdings that were held by the Fund as of December 31, 2010 that were not in the top ten holdings, however, during the course of the year, their position size expanded due to market fluctuation and/or additional purchases, such that they moved into the top ten holdings as of December 31, 2011.
Salix Pharmaceuticals Ltd. and RightNow Technologies, Inc. are the two holdings in the top ten holdings list as of December 31, 2011 that were newly added to the Fund during the year.
How was the Fund positioned relative to its benchmark index at the end of December 31, 2011?
The Consumer Discretionary sector remained the largest overweight position within the Fund. The Health Care and Financials sectors remained the largest relative underweights due to their economic sensitivity and risk from government policy. The Fund maintains a “barbell” strategy in positioning that provides exposure to cyclical growth opportunities as well as more defensive areas of the market.
33
SC SM INVESCO SMALL CAP GROWTH FUND (Continued)
SECTOR ALLOCATIONS AT DECEMBER 31, 2011*
Percentage of Net Assets
| * | The above graph categorizes investments using GICS. The percentages shown for each sector reflect the value of investments in that sector as a percentage of net assets. Figures in the above graph may not total to 100% due to the exclusion of the Fund’s other assets and liabilities. |
TOP TEN EQUITY HOLDINGS AT DECEMBER 31, 2011
| | | | | | |
| | | % of Net Assets | | | Industry |
TransDigm Group, Inc. | | | 2.0 | % | | Aerospace & Defense |
BioMarin Pharmaceutical, Inc. | | | 1.2 | | | Biotechnology |
Nu Skin Enterprises, Inc. | | | 1.2 | | | Personal Products |
Costar Group, Inc. | | | 1.2 | | | Professional Services |
Zoll Medical Corp. | | | 1.1 | | | Health Care Equipment & Supplies |
Wabtec Corp. | | | 1.1 | | | Machinery |
Salix Pharmaceuticals Ltd. | | | 1.1 | | | Pharmaceuticals |
ProAssurance Corp. | | | 1.0 | | | Insurance |
Commvault Systems, Inc. | | | 1.0 | | | Software |
RightNow Technologies, Inc. | | | 1.0 | | | Internet Software & Services |
34
SC SM INVESCO SMALL CAP GROWTH FUND (Continued)
Comparison of Change in Value of a $10,000 Investment in the SC Invesco Small Cap Growth Fund – Initial Class and the Russell 2000 Growth Index
Comparison of Change in Value of a $10,000 Investment in the SC Invesco Small Cap Growth Fund – Service Class and the Russell 2000 Growth Index
35
SC SM INVESCO SMALL CAP GROWTH FUND (Continued)
Average Annual Total Returns for Periods Ended December 31, 2011**
| | | | | | | | | | | | |
| | | One Year | | | Three Years | | | Life of
Fund*** | |
SC Invesco Small Cap Growth Fund–Initial Class Shares | | | (0.92 | )% | | | 18.07 | % | | | 6.73 | % |
SC Invesco Small Cap Growth Fund–Service Class Shares | | | (1.20 | )% | | | 17.78 | % | | | 6.45 | % |
Russell 2000 Growth Index* | | | (2.91 | )% | | | 19.00 | % | | | 6.38 | % |
*The performance data of the index has been prepared from sources and data that the investment adviser believes to be reliable, but no representation is made as to their accuracy. The index is unmanaged and cannot be invested in directly. The Russell 2000 Growth Index measures the performance of those Russell 2000 companies with higher price-to-book ratios and higher forecasted growth values.
**Performance data is historical and includes changes in share price and reinvestment of income dividends and capital gains distributions. Past performance is no guarantee of future results. Performance may have changed materially since December 31, 2011. All Fund returns are net of fees and expenses, but do not include any insurance charges imposed in connection with your variable insurance contract. If this performance information included the effect of the insurance charges and the fees and expenses assumed by the investment adviser, performance numbers would be lower. The value of an investment in the SC Invesco Small Cap Growth Fund and the return on the investment will fluctuate and redemption proceeds may be higher or lower than an investor’s original cost.
***For the period from October 1, 2008 (commencement of operations) to December 31, 2011.
36
SC SM LORD ABBETT GROWTH & INCOME FUND
(subadvised by Lord, Abbett & Co. LLC)
MANAGEMENT’S DISCUSSION & ANALYSIS:
How did the Fund perform during the year ended December 31, 2011?
For the year ended December 31, 2011, the Initial and Service Class shares of SC Lord Abbett Growth & Income Fund (the “Fund”) returned (6.15)% and (6.40)%, respectively, underperforming the benchmark, the Russell 1000 Value Index (the “Index”), which returned 0.39% for the same period.
What economic and market factors most influenced the equity markets as a whole during the year ended December 31, 2011?
The overall trend of equity markets reported positive returns during the first half of 2011, before declining in the latter part of 2011. Inconsistent growth in the economy, turmoil due to the sovereign debt crisis in Europe, and concerns about the fiscal condition of the U.S. federal government all weighed on the market’s performance.
The U.S. economy continued to expand, but March’s earthquake and tsunami in Japan, disrupted supply chains for some U.S. manufacturers, hampering economic growth in the first six months of the year. Real gross domestic product rose just 0.4% in the first quarter and 1.3% in the second quarter, while the economy expanded at a 1.8% annualized rate in the third quarter. Among the stronger contributors to this growth were personal consumption expenditures, business investment, and exports. Industrial production increased, but capacity utilization remained below average. The manufacturing sector continued to advance, as indicated by the Institute for Supply Management Manufacturing Index, although the sector weakened somewhat as the year progressed. Banks increased their lending to the business sector, but individual consumers continued to reduce their debt. Personal savings as a percentage of disposable income also declined.
The consumer segment of the economy remained relatively robust, despite high unemployment and continued weakness in the housing market, with retail sales growing approximately 8% year over year. Despite this, the overall weakness of the recovery led the Federal Reserve to suggest that its key interest rate could remain at historically low levels through at least mid-2013.
Were there any significant sector under/over weights that materially affected Fund performance relative to the benchmark during the year ended December 31, 2011?
Overall, the residual sector allocation, resulting from the stock selection process, contributed positively to the relative performance of the Fund during the year. The Fund’s underweight position within the poor performing Financials sector was a significant contributor to relative performance. The Fund’s overweight within the Health Care sector also contributed positively to relative performance. Detracting from relative performance was the Fund’s significant underweight within the Utilities sector as this was the best performing sector within the Index. The Fund’s overweight position within the Materials sector also detracted from relative performance.
Which stocks contributed most to the Fund’s returns during the year ended December 31, 2011?
Among the most significant contributors to the Fund’s overall absolute performance during the year were UnitedHealth Group within the Health Care sector and El Paso Corp. within the Energy sector. Shares of UnitedHealth Group, Inc., a health care company, rallied after the company announced its plan to acquire XLHealth Corp., a special needs Medicare health plan provider. This acquisition was expected to benefit UnitedHealth Group, Inc. and more broadly diversify the company’s business mix. In addition, shares of El Paso Corp., which owns and operates the largest natural gas pipeline system in North America, rose after the firm agreed to be acquired by Kinder Morgan, Inc.
37
SC SM LORD ABBETT GROWTH & INCOME FUND (Continued)
Which stocks detracted from the Fund’s performance results during the year ended December 31, 2011?
The most significant detractors to the Fund’s overall absolute performance during the year were Ford Motor Co. within the Consumer Discretionary sector and Teva Pharmaceuticals Industries, Ltd. within the Healthcare sector. The share price of auto manufacturer Ford Motor Co. suffered as the company reported that higher input costs were expected to dampen margin improvement over the coming quarters. Shares of Teva Pharmaceuticals Industries, Ltd., a global Pharmaceuticals company, declined due to lower-than-expected generic drug sales in North America as a result of a slowdown in new drug launches.
Did the Fund experience major changes to its top ten holdings during the year ended December 31, 2011?
The Fund experienced significant changes to the top ten holdings during the year ended December 31, 2011. Five of the 2010 top ten holdings remained in the category as of December 31, 2011. Of the five new securities included with the top ten, all were in the Fund’s portfolio at the beginning of the year. Of those that left the top ten holdings list, the Fund sold out of the entire position of two of those stocks, The Goldman Sachs Group, Inc. and Citigroup, Inc. due to investor’s concerns over the financial market turmoil and due to anticipated instability in earnings power.
How was the Fund positioned relative to its benchmark index at December 31, 2011?
At December 31, 2011, the Fund was positioned for continued moderate economic growth in the U.S., with emphasis on companies that are believed to be well-positioned financially and competitively to drive future earnings. The Energy sector was the Fund’s largest overweight, given continued expectations for favorable supply and demand dynamics. The second largest overweight in the Fund was the Health Care sector, mainly in the health care providers and services segment. The Fund’s exposure to the Materials sector was reduced, but remained an overweight in the Fund. The Utilities and Financials sectors were the largest underweights in the Fund. The Information Technology sector continued to be underweight as the Fund’s exposure to the IT services and software segments had been reduced.
38
SC SM LORD ABBETT GROWTH & INCOME FUND (Continued)
SECTOR ALLOCATIONS AT DECEMBER 31, 2011*
Percentage of Net Assets
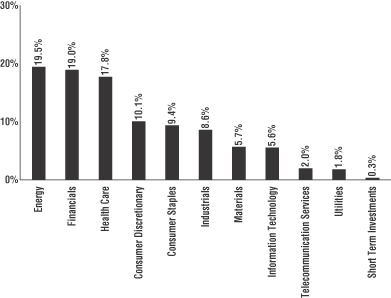
| * | The above graph categorizes investments using GICS. The percentages shown for each sector reflect the value of investments in that sector as a percentage of net assets. Figures in the above graph may not total to 100% due to the exclusion of the Fund’s other assets and liabilities. |
TOP TEN EQUITY HOLDINGS AT DECEMBER 31, 2011
| | | | | | |
| | | % of Net Assets | | | Industry |
Chevron Corp. | | | 2.8 | % | | Oil, Gas & Consumable Fuels |
Berkshire Hathaway, Inc., Class B | | | 2.8 | | | Insurance |
Exxon Mobil Corp. | | | 2.7 | | | Oil, Gas & Consumable Fuels |
Teva Pharmaceutical Industries, Ltd. ADR | | | 2.6 | | | Pharmaceuticals |
Anadarko Petroleum Corp. | | | 2.6 | | | Oil, Gas & Consumable Fuels |
PNC Financial Services Group, Inc. | | | 2.6 | | | Commercial Banks |
Archer-Daniels-Midland Co. | | | 2.5 | | | Food Products |
Time Warner, Inc. | | | 2.5 | | | Media |
State Street Corp. | | | 2.3 | | | Capital Markets |
JP Morgan Chase & Co. | | | 2.3 | | | Diversified Financial Services |
39
SC SM LORD ABBETT GROWTH & INCOME FUND (Continued)
Comparison of Change in Value of a $10,000 Investment in the SC Lord Abbett Growth & Income Fund – Initial Class and the Russell 1000 Value Index
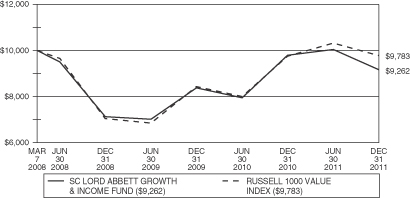
Comparison of Change in Value of a $10,000 Investment in the SC Lord Abbett Growth & Income Fund – Service Class and the Russell 1000 Value Index

40
SC SM LORD ABBETT GROWTH & INCOME FUND (Continued)
Average Annual Total Returns for Periods Ended December 31, 2011**
| | | | | | | | | | | | |
| | | One Year | | | Three Years | | | Life of
Fund*** | |
SC Lord Abbett Growth & Income Fund–Initial Class Shares | | | (6.15 | )% | | | 9.03 | % | | | (1.99 | )% |
SC Lord Abbett Growth & Income Fund–Service Class Shares | | | (6.40 | )% | | | 8.72 | % | | | (2.26 | )% |
Russell 1000 Value Index* | | | 0.39 | % | | | 11.55 | % | | | (0.57 | )% |
*The performance data of the index has been prepared from sources and data that the investment adviser believes to be reliable, but no representation is made as to their accuracy. The index is unmanaged and cannot be invested in directly. The Russell 1000 Index measures the performance of the 1,000 largest companies in the Russell 3000 Index, which measures the performance of the 3,000 largest U.S. companies based on total market capitalization. The Russell 1000 Value Index measures the performance of those Russell 1000 companies with lower price-to-book ratio and lower forecasted growth values.
**Performance data is historical and includes changes in share price and reinvestment of income dividends and capital gains distributions. Past performance is no guarantee of future results. Performance may have changed materially since December 31, 2011. All Fund returns are net of fees and expenses, but do not include any insurance charges imposed in connection with your variable insurance contract. If this performance information included the effect of the insurance charges and the fees and expenses assumed by the investment adviser, performance numbers would be lower. The value of an investment in the SC Lord Abbett Growth & Income Fund and the return on the investment will fluctuate and redemption proceeds may be higher or lower than an investor’s original cost.
***For the period from March 7, 2008 (commencement of operations) to December 31, 2011.
41
SC SM WMC BLUE CHIP MID CAP FUND
(subadvised by Wellington Management Company, LLP)
MANAGEMENT’S DISCUSSION & ANALYSIS:
How did the Fund perform during the year ended December 31, 2011?
For the year ended December 31, 2011, the Initial and Service Class shares of SC WMC Blue Chip Mid Cap Fund (the “Fund”) returned (7.78)% and (8.03)%, respectively, underperforming the benchmark, the S&P MidCap 400 Index (the “Index”), which returned (1.73)% for the same period.
What economic and market factors most influenced the equity markets as a whole during the year ended December 31, 2011?
2011 was yet another extremely volatile year for equity markets. Global equities started the year on a strong note and continued to move higher in the first quarter of 2011, driven by investors’ enthusiasm for additional government debt purchases by the U.S. Federal Reserve, the extension of tax cuts in the U.S., strong earnings growth, and generally improving economic data. This enthusiasm reversed later in the year, however, as concerns surfaced that the global economy could slip back into recession, resulting in a rapid decline in equity markets. Fears about sovereign debt and solvency in the eurozone, slowing economic expansion in China and the U.S., and uncertainty about the sustainability of corporate earnings growth combined to produce an extremely volatile stock market, and return correlations among stocks spiked as investors shed risk and fled to safety. Markets ended the year on a positive note as the final month showed encouraging employment and manufacturing data in the U.S.
Large cap stocks led mid and small cap stocks during the year, as measured by the S&P 500, S&P MidCap 400, and Russell 2000 indices, respectively. Five out of ten sectors within the Index posted positive gains during the year. Consumer Staples and Utilities had the highest gains, while Information Technology and Energy had the greatest declines for the year.
Were there any significant sector under/over weights that materially affected Fund performance relative to the benchmark during the year ended December 31, 2011?
Sector positioning, a result of bottom-up security selection, detracted from benchmark-relative returns during the year, primarily due to underweight allocations to the Consumer Staples and Utilities sectors, and an overweight allocation to the Information Technology sector. An underweight to the Financials sector and an overweight to the Health Care sector contributed positively to returns.
Which stocks contributed most to the Fund’s returns during the year ended December 31, 2011?
Top relative contributors included overweight positions in Regeneron Pharmaceuticals, Inc. and Tempur-Pedic International Inc. Shares of Regeneron Pharmaceuticals, Inc., a New York state-based biopharmaceuticals company, rose as expectations for the success of Eylea, a drug for macular degeneration treatment, increased. In addition to Eylea, the Company has a compelling antibody platform that positioned it well in drug discovery. Shares of Tempur-Pedic International Inc., a leading manufacturer of premium mattresses and pillows, benefitted as the company’s sales and profits exceeded expectations and the firm made progress in enhancing its product range and consumer marketing efforts.
Which stocks detracted from the Fund’s performance results during the year ended December 31, 2011?
Top detractors from relative performance included overweight positions in Alpha Natural Resources, Inc., PACCAR, Inc. and Netflix, Inc. Metallurgical and thermal coal producer Alpha Natural Resources, Inc. shares declined as reduced shipment guidance raised investor concerns after a slowdown in demand from China for coal products. Shares of PACCAR, Inc., a light, medium, and heavy duty truck manufacturer, disappointed based on
42
SC SM WMC BLUE CHIP MID CAP FUND (Continued)
investor concern about rising input prices and exposure to European markets. Shares of internet-based subscription digital streaming service provider Netflix, Inc. fell due to a pricing structure change that angered many members.
Did the Fund experience major changes to its top ten holdings during the year ended December 31, 2011?
Overall, four of the top ten holdings from December 31, 2010 remained in the top ten holdings as of December 31, 2011, including VeriSign, Inc., M&T Bank Corp., Watson Pharmaceuticals, Inc., and Harley-Davidson, Inc. The Fund still holds three more securities that were in the prior year top ten, although the positions are no longer significant enough to classify as top ten holdings. The Fund fully sold out of three other 2010 top ten holdings.
The Fund’s top ten holdings will change as a result of changes in the investment thesis and/or price performance. Additionally, in times of higher volatility it is not unusual to see a shift in the top ten. As a result, the composition of the Fund’s top ten holdings has changed since year end 2010, but these changes were not due to material changes in the implementation of the Fund’s investment strategy, but rather a result of the Fund’s bottom-up investment approach.
How was the Fund positioned relative to its benchmark index at December 31, 2011?
Sector exposure is predominantly a byproduct of stock selection. At the end of the year, the Fund’s largest overweight positions relative to the Index were to the Health Care, Information Technology, and Energy sectors, while the largest underweight positions were to the Financials, Consumer Discretionary, and Materials sectors.
SECTOR ALLOCATIONS AT DECEMBER 31, 2011*
Percentage of Net Assets
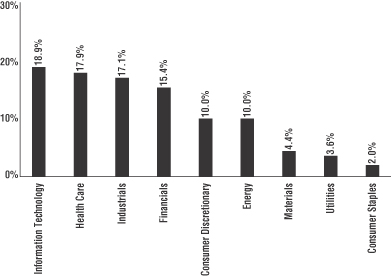
| * | The above graph categorizes investments using GICS. The percentages shown for each sector reflect the value of investments in that sector as a percentage of net assets. Figures in the above graph may not total to 100% due to the exclusion of the Fund’s other assets and liabilities. |
43
SC SM WMC BLUE CHIP MID CAP FUND (Continued)
TOP TEN EQUITY HOLDINGS AT DECEMBER 31, 2011
| | | | | | |
| | | % of Net Assets | | | Industry |
VeriSign, Inc. | | | 2.2 | % | | Internet Software & Services |
Genpact, Ltd. | | | 2.0 | | | IT Services |
M&T Bank Corp. | | | 1.9 | | | Commercial Banks |
Mylan, Inc. | | | 1.9 | | | Pharmaceuticals |
The Western Union Co. | | | 1.8 | | | IT Services |
Robert Half International, Inc. | | | 1.7 | | | Professional Services |
Pioneer Natural Resources Co. | | | 1.7 | | | Oil, Gas & Consumable Fuels |
NVR, Inc. | | | 1.7 | | | Household Durables |
Watson Pharmaceuticals, Inc. | | | 1.7 | | | Pharmaceuticals |
Harley-Davidson, Inc. | | | 1.6 | | | Automobiles |
Comparison of Change in Value of a $10,000 Investment in the SC WMC Blue Chip Mid Cap Fund – Initial Class and the S&P MidCap 400 Index
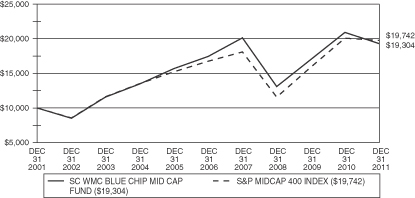
Comparison of Change in Value of a $10,000 Investment in the SC WMC Blue Chip Mid Cap Fund – Service Class and the S&P MidCap 400 Index
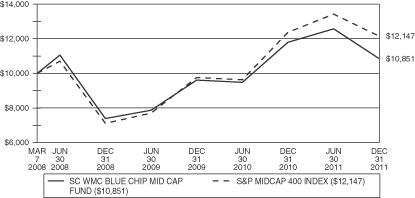
44
SC SM WMC BLUE CHIP MID CAP FUND (Continued)
Average Annual Total Returns for Periods Ended December 31, 2011**
| | | | | | | | | | | | | | | | | | | | |
Initial Class Shares | | One Year | | | Three Years | | | Five Years | | | Ten Years | | | Life of
Fund*** | |
SC WMC Blue Chip Mid Cap Fund | | | (7.78 | )% | | | 13.89 | % | | | 2.03 | % | | | 6.80 | % | | | 9.22 | % |
S&P MidCap 400 Index* | | | (1.73 | )% | | | 19.57 | % | | | 3.32 | % | | | 7.04 | % | | | 8.10 | % |
Service Class Shares | | | | | | | | | | | | | | | |
SC WMC Blue Chip Mid Cap Fund | | | (8.03 | )% | | | 13.64 | % | | | — | | | | — | | | | 2.16 | % |
S&P MidCap 400 Index* | | | (1.73 | )% | | | 19.57 | % | | | — | | | | — | | | | 5.50 | % |
*The performance data of the index has been prepared from sources and data that the investment adviser believes to be reliable, but no representation is made as to their accuracy. The index is unmanaged and cannot be invested in directly. The S&P MidCap 400 Index is a market cap weighted mid cap index broadly representing the mid cap market in the United States.
**Performance data is historical and includes changes in share price and reinvestment of income dividends and capital gains distributions. Past performance is no guarantee of future results. Performance may have changed materially since December 31, 2011. All Fund returns are net of fees and expenses, but do not include any insurance charges imposed in connection with your variable insurance contract. If this performance information included the effect of the insurance charges and the fees and expenses assumed by the investment adviser, performance numbers would be lower. The value of an investment in the SC WMC Blue Chip Mid Cap Fund and the return on the investment will fluctuate and redemption proceeds may be higher or lower than an investor’s original cost.
***Initial Class Shares for the period from September 1, 1999 (commencement of operations) to December 31, 2011. Service Class Shares for the period from March 7, 2008 (commencement of operations) to December 31, 2011.
45
SC SM WMC LARGE CAP GROWTH FUND
(subadvised by Wellington Management Company, LLP)
MANAGEMENT’S DISCUSSION & ANALYSIS:
How did the Fund perform during the year ended December 31, 2011?
For the year ended December 31, 2011, the Initial and Service Class shares of SC WMC Large Cap Growth Fund (the “Fund”) returned (4.53)% and (4.80)%, respectively, underperforming the benchmark, the Russell 1000 Growth Index (the “Index”), which returned 2.64% for the same period.
What economic and market factors most influenced the equity markets as a whole during the year ended December 31, 2011?
2011 was yet another extremely volatile year for equity markets. Global equities started the year on a strong note and continued to move higher in the first quarter of 2011, driven by investors’ enthusiasm for additional government debt purchases by the U.S. Federal Reserve, the extension of tax cuts in the U.S., strong earnings growth, and generally improving economic data. This enthusiasm reversed later in the year, however, as concerns surfaced that the global economy could slip back into recession, resulting in a rapid decline in U.S. equity markets. Fears about sovereign debt and solvency in the eurozone, slowing economic expansion in China and the U.S., and uncertainty about the sustainability of corporate earnings growth combined to produce an extremely volatile stock market, and return correlations among stocks spiked as investors shed risk and fled to safety. Markets ended the year on a positive note as the final month showed encouraging employment and manufacturing data in the U.S.
In this environment, seven of the ten sectors in the Index posted positive returns during the year. The defensive Utilities and Consumer Staples sectors increased the most. The Materials, Industrials, and Financials sectors in the Index declined during the year.
Were there any significant sector under/over weights that materially affected Fund performance relative to the benchmark during the year ended December 31, 2011?
Sector positioning, a result of bottom-up security selection, detracted from benchmark-relative returns during the year, primarily due to underweight positions in the Consumer Staples and Energy sectors. Underweight exposure to the Financials and Materials sectors and an overweight to the Information Technology sector contributed positively to the Fund’s returns.
Which stocks contributed most to the Fund’s returns during the year ended December 31, 2011?
Top relative contributors included overweight positions in UnitedHealth Group, Inc., IAC/InterActiveCorp., and International Business Machines Corp. Shares of UnitedHealth Group, Inc., a diversified health and well-being company, rose due to increases in the company’s health plan enrollment and members’ reduced use of health insurance services. Shares of IAC/InterActiveCorp., an operator of internet businesses such as ask.com and match.com, appreciated due to market share gains in the competitive search function, positive trends in personal advertisements, and shareholder friendly capital redeployment. Shares of technology and consulting corporation International Business Machines Corp. improved as the company continued to generate solid earnings per share and cash flow growth.
Which stocks detracted from the Fund’s performance results during the year ended December 31, 2011?
Top detractors from relative performance included an overweight position in NetApp, Inc., an overweight to Teck Resources, Ltd., and an underweight position in Philip Morris International, Inc. Shares of proprietary computer storage and data management company NetApp, Inc. fell after the company reported lower-than-expected first quarter earnings on reduced spending from its U.S. Financials customers. Shares of Teck
46
SC SM WMC LARGE CAP GROWTH FUND (Continued)
Resources, Ltd., a Canadian mining company, fell as concerns over decreased demand for coal fueled by a slowdown in China increased. Shares of leading international tobacco company Philip Morris International, Inc. rose as the company reported better-than-expected third quarter results.
Did the Fund experience major changes to its top ten holdings during the year ended December 31, 2011?
There were no material changes to the December 31, 2011 top ten holdings list relative to the December 31, 2010 top ten holdings list.
How was the Fund positioned relative to its benchmark index at December 31, 2011?
Sector exposure is predominantly a byproduct of stock selection. At December 31, 2011, the Fund’s largest overweight position relative to the Index was to the Information Technology sector, while the largest underweight positions were to the Consumer Staples and Financials sectors.
SECTOR ALLOCATIONS AT DECEMBER 31, 2011*
Percentage of Net Assets
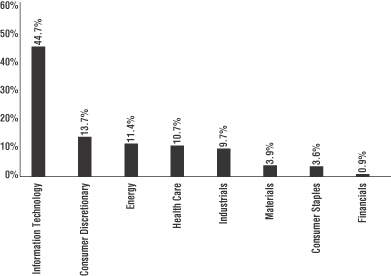
| * | The above graph categorizes investments using GICS. The percentages shown for each sector reflect the value of investments in that sector as a percentage of net assets. Figures in the above graph may not total to 100% due to the exclusion of the Fund’s other assets and liabilities. |
47
SC SM WMC LARGE CAP GROWTH FUND (Continued)
TOP TEN EQUITY HOLDINGS AT DECEMBER 31, 2011
| | | | | | |
| | | % of Net Assets | | | Industry |
Apple, Inc. | | | 6.0 | % | | Computers & Peripherals |
Cisco Systems, Inc. | | | 4.7 | | | Communications Equipment |
International Business Machines Corp. | | | 4.4 | | | IT Services |
Microsoft Corp. | | | 3.5 | | | Software |
Exxon Mobil Corp. | | | 3.3 | | | Oil, Gas & Consumable Fuels |
EMC Corp. | | | 2.8 | | | Computers & Peripherals |
Altera Corp. | | | 2.8 | | | Semiconductors & Semiconductor Equipment |
Oracle Corp. | | | 2.6 | | | Software |
Google, Inc., Class A | | | 2.2 | | | Internet Software & Services |
Caterpillar, Inc. | | | 2.0 | | | Machinery |
Comparison of Change in Value of a $10,000 Investment in the SC WMC Large Cap Growth Fund – Initial Class and the Russell 1000 Growth Index
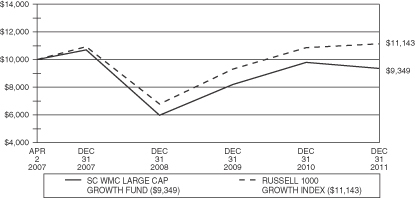
Comparison of Change in Value of a $10,000 Investment in the SC WMC Large Cap Growth Fund – Service Class and the Russell 1000 Growth Index
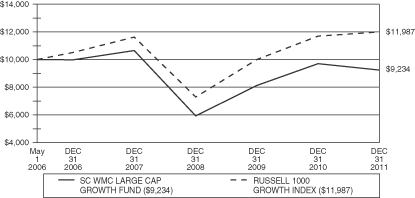
48
SC SM WMC LARGE CAP GROWTH FUND (Continued)
Average Annual Total Returns for Periods Ended December 31, 2011**
| | | | | | | | | | | | | | | | |
Initial Class Shares | | One Year | | | Three Years | | | Five Years | | | Life of
Fund*** | |
SC WMC Large Cap Growth Fund | | | (4.53 | )% | | | 16.11 | % | | | — | | | | (1.41 | )% |
Russell 1000 Growth Index* | | | 2.64 | % | | | 18.02 | % | | | — | | | | 2.31 | % |
Service Class Shares | | | | | | | | | | | | |
SC WMC Large Cap Growth Fund | | | (4.80 | )% | | | 15.87 | % | | | (1.54 | )% | | | (1.40 | )% |
Russell 1000 Growth Index* | | | 2.64 | % | | | 18.02 | % | | | 2.50 | % | | | 3.25 | % |
*The performance data of the index has been prepared from sources and data that the investment adviser believes to be reliable, but no representation is made as to their accuracy. The index is unmanaged and cannot be invested in directly. The Russell 1000 Growth Index measures the performance of those Russell 1000 Index securities with higher price-to-book ratios and higher forecasted growth values, representative of U.S. securities exhibiting growth characteristics. The Russell 1000 Growth Index includes the largest 1,000 securities in the Russell 3000 Index, based on market cap. The Russell 3000 Index consists of the 3,000 largest and most liquid stocks based and traded in the U.S.
**Performance data is historical and includes changes in share price and reinvestment of income dividends and capital gains distributions. Past performance is no guarantee of future results. Performance may have changed materially since December 31, 2011. All Fund returns are net of fees and expenses, but do not include any insurance charges imposed in connection with your variable insurance contract. If this performance information included the effect of the insurance charges and the fees and expenses assumed by the investment adviser, performance numbers would be lower. The value of an investment in the SC WMC Large Cap Growth Fund and the return on the investment will fluctuate and redemption proceeds may be higher or lower than an investor’s original cost.
***Initial Class Shares for the period from April 2, 2007 (commencement of operations) to December 31, 2011. Service Class Shares for the period from May 1, 2006 (commencement of operations) to December 31, 2011.
49
SUN CAPITAL GLOBAL REAL ESTATE FUND
(subadvised by Massachusetts Financial Services Company)
MANAGEMENT’S DISCUSSION & ANALYSIS:
How did the Fund perform during the year ended December 31, 2011?
Effective May 1, 2011, Massachusetts Financial Services Company (“MFS”) was appointed as subadviser to the Sun Capital Global Real Estate Fund (the “Fund”). For the year ended December 31, 2011, the Initial and Service class shares of the Fund returned (7.59%) and (7.74)%, respectively, underperforming the benchmark, the FTSE EPRA/NAREIT Developed Real Estate Index (the “Index”), which returned (5.82%) for the same period.
What economic and market factors most influenced the global real estate equity markets as a whole during the year ended December 31, 2011?
Early in the year, the U.S. Federal Reserve responded to weak economic growth by providing further liquidity to the market through accommodative monetary policy measures. These measures improved market sentiment and drove risk-asset prices markedly higher. The December 2010 agreement on an expansionary U.S. fiscal package also boosted market sentiment, which carried into the early months of 2011 and, coupled with better indications of global macroeconomic activity, pushed many asset valuations to post-crisis highs. At the same time, the yields of the perceived “safest” global sovereign credits rose, indicating a renewed risk-seeking environment.
Toward the middle of the year, a weakening macroeconomic backdrop and renewed concerns over peripheral euro zone sovereign debt caused a flight-to-quality move that pushed high-quality sovereign bond yields lower. In the U.S., concerns about sovereign debt default and the long-term sustainability of the trend in U.S. fiscal policy resulted in the downgrade of the U.S. credit quality by the Standard & Poor’s rating agency. Amidst this turmoil, global equity markets declined sharply, global consumer and producer sentiment indicators fell precipitously and highly-rated sovereign bond yields hit multi-decade lows. Near the end of the year, uncertainty in financial markets spiked higher as markets more seriously contemplated the possible failure of the euro zone.
How did the Fund’s country allocations affect relative performance during the year ended December 31, 2011?
The Fund’s overweight positions in Italian, Austrian, Japanese and Hong Kong real estate investments, and underweights in Canada and Switzerland all detracted from performance relative to the Index. The Fund owns only one position in both Italy and Austria, which results in the overweights, and the underperformance of these two positions was due to the macroeconomic issues in Europe, rather than company specific factors. The Japanese companies underperformed due to the natural disaster in March and persistent economic weakness. Hong Kong has been impacted by continuing efforts by the Chinese government to slow down property value appreciation and to encourage more cautious real estate lending, in both Hong Kong and mainland China. This has had a negative impact on Hong Kong based real estate companies with properties in Hong Kong and China, as well as companies focused on mainland China. Companies in Canada and Switzerland have outperformed as safe haven investments and, due to the Fund’s underweight positions in these countries, its performance was negatively affected.
Overweight positions in Brazil and in the U.S., and an underweight position in mainland Chinese real estate investments contributed to the Fund’s performance. In Brazil, the Fund has one holding that has been growing rapidly and has performed well. Brazil’s real estate stocks have attracted attention as a relatively safe high growth alternative.
Which stocks contributed most to the Fund’s returns during the year ended December 31, 2011?
Security selection in Hong Kong benefited relative performance. Specifically, an overweight position in a retail real estate investment trust (“REIT”) The Link REIT aided relative results.
50
SUN CAPITAL GLOBAL REAL ESTATE FUND (Continued)
Other top relative contributors included U.S.-based REITs, Digital Realty Trust, Inc. (Office), Equity Lifestyle Properties, Inc. (Residential), BioMed Realty Trust, Inc. (Office), Entertainment Properties Trust (Specialized), Mid-America Apartment Communities, Inc. (Residential), and Public Storage (Specialized). The Fund’s overweight positions in wholesale data center operator Dupont Fabros Technology, Inc. (Industrial) and regional shopping centers owner Taubman Centers Inc. positively contributed to relative performance as both stocks outperformed the benchmark during the reporting year. In general, each of the companies has benefitted from relatively strong trends in its specific property type which has resulted in improving fundamentals and earnings growth.
Which stocks detracted from the Fund’s performance results during the year ended December 31, 2011?
An overweight position in both Italian and Austrian listed real estate investments detracted from performance relative to the Index. An overweight position in property investment and management activities company Beni Stabili S.p.A (Italy) and exposure to commercial real estate properties company Atrium European Real Estate Ltd. (founded in Jersey and listed on the Vienna Stock Exchange) held back relative results as both stocks underperformed the benchmark during the year.
Security selection of U.S. REITs also held back relative results. Holdings of Parkway Properties Inc. (Office), and the timing of the Fund’s ownership in Health Care Properties (Specialized), hindered relative returns. Not holding shares of strong-performing REITs, Avalon Bay Communities, Inc. (Residential) and Health & Retire Property (Specialized), also hurt relative results.
Elsewhere, holdings of industrial REIT Segro PLC (United Kingdom) and retail REIT Corio NV (Netherlands), commercial properties developer and manager Capitaland Ltd. (Singapore), and self-storage company Big Yellow Group PLC (United Kingdom) dampened relative performance as all four securities underperformed the benchmark.
Did the Fund experience major changes to its top ten holdings during the year ended December 31, 2011?
Yes. The Fund experienced significant changes to the top ten holdings. Five of the Fund’s 2010 top holdings remained in the category as of December 31, 2011. The Link REIT (Hong Kong), Unibail-Rodamco (France), BioMed Realty Trust (U.S.), Public Storage (U.S.) and Vornado Realty Trust (U.S.) are new additions to the top 10 holdings, replacing BR Malls Participacoes SA (Brazil), Segro (United Kingdom), Atrium European Real Estate Ltd. (Austria), Mitsubishi Estate (Japan) and Capitaland (Singapore). The Fund still holds the five securities that are no longer in the top ten holdings list as of December 31, 2011, and continues to view each as a core holding. The changes are mostly due to volatility in share prices, and not fundamentally different viewpoints.
How was the Fund positioned relative to its benchmark index at December 31, 2011?
At December 31, 2011, as compared to positions during the year, the Fund was positioned less underweight North America, more overweight Asia ex-Japan and Japan, more underweight Europe ex-UK, and less overweight UK.
The Fund was closely aligned to the benchmark at the regional level. At the end of the year there were six non-index holdings accounting for approximately 9.0% of the Fund’s assets: BR Malls Participacoes SA, AtriumEuropean Real Estate Ltd., Plum Creek Timber Co., Inc., Weyerhaeuser Co., Starwood Property Trust, and Advance Residence Investment Corp.
51
SUN CAPITAL GLOBAL REAL ESTATE FUND (Continued)
COUNTRY ALLOCATIONS AT DECEMBER 31, 2011*
Percentage of Net Assets
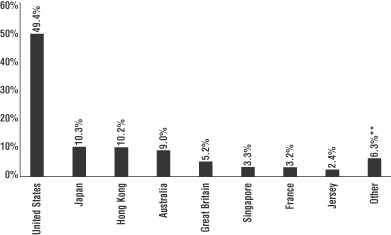
| * | The percentages shown for each country reflect the value of investments in that country as a percentage of net assets. Figures in the above graph may not total to 100% due to the exclusion of the Fund’s other assets and liabilities. |
| ** | Includes 5 countries with an allocation of less than 2% individually. |
TOP TEN EQUITY HOLDINGS AT DECEMBER 31, 2011
| | | | | | |
| | | % of Net Assets | | | Industry |
Simon Property Group, Inc. | | | 5.1 | % | | Retail |
Sun Hung Kai Properties Ltd. | | | 4.2 | | | Diversified Real Estate Activities |
The Link REIT | | | 3.4 | | | Retail |
Unibail-Rodamco | | | 3.2 | | | Retail |
BioMed Realty Trust, Inc. | | | 3.1 | | | Office |
Westfield Group | | | 2.9 | | | Retail |
Mitsui Fudosan Co., Ltd. | | | 2.8 | | | Diversified Real Estate Activities |
Public Storage | | | 2.7 | | | Specialized |
Stockland | | | 2.6 | | | Diversified |
Vornado Realty Trust | | | 2.5 | | | Diversified |
52
SUN CAPITAL GLOBAL REAL ESTATE FUND (Continued)
Comparison of Change in Value of a $10,000 Investment in the Sun Capital Global Real Estate Fund – Initial Class and the FTSE/EPRA NAREIT Developed Real Estate Index
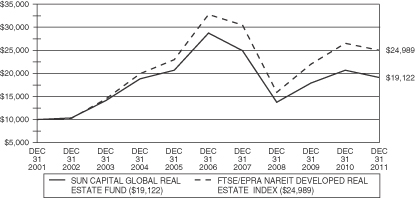
Comparison of Change in Value of a $10,000 Investment in the Sun Capital Global Real Estate Fund – Service Class and the FTSE/EPRA NAREIT Developed Real Estate Index
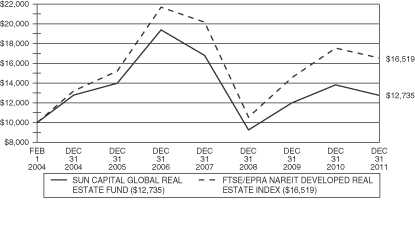
53
SUN CAPITAL GLOBAL REAL ESTATE FUND (Continued)
Average Annual Total Returns for Periods Ended December 31, 2011**
| | | | | | | | | | | | | | | | | | | | |
Initial Class Shares | | One Year | | | Three Years | | | Five Years | | | Ten Years | | | Life of
Fund*** | |
Sun Capital Global Real Estate Fund | | | (7.59 | )% | | | 11.49 | % | | | (7.82 | )% | | | 6.70 | % | | | 7.88 | % |
FTSE EPRA/NAREIT Developed Real Estate Index* | | | (5.82 | )% | | | 16.17 | % | | | (5.28 | )% | | | 9.59 | % | | | 8.68 | % |
Service Class Shares | | | | | | | | | | | | | | | |
Sun Capital Global Real Estate Fund | | | (7.74 | )% | | | 11.25 | % | | | (8.04 | )% | | | — | | | | 3.10 | % |
FTSE EPRA/NAREIT Developed Real Estate Index* | | | (5.82 | )% | | | 16.17 | % | | | (5.28 | )% | | | — | | | | 6.55 | % |
*The performance data of the index has been prepared from sources and data that the investment adviser believes to be reliable, but no representation is made as to their accuracy. The index is unmanaged and cannot be invested in directly. The FTSE EPRA/NAREIT Developed Real Estate Index is a total-return index comprising eight index families covering the world’s largest investment markets in various currencies, and is designed to track the performance of listed real estate companies and REITs worldwide.
**Performance data is historical and includes changes in share price and reinvestment of income dividends and capital gains distributions. Past performance is no guarantee of future results. Performance may have changed materially since December 31, 2011. All Fund returns are net of fees and expenses, but do not include any insurance charges imposed in connection with your variable insurance contract. If this performance information included the effect of the insurance charges and the fees and expenses assumed by the investment adviser, performance numbers would be lower. The value of an investment in the Sun Capital Global Real Estate Fund and the return on the investment will fluctuate and redemption proceeds may be higher or lower than an investor’s original cost.
***Initial Class Shares for the period from December 7, 1998 (commencement of operations) to December 31, 2011. Service Class Shares for the period from February 1, 2004 (commencement of operations) to December 31, 2011.
54
SC SM IBBOTSON TACTICAL OPPORTUNITIES FUND
(subadvised by Ibbotson Associates, Inc.)
MANAGEMENT’S DISCUSSION & ANALYSIS:
How did the Fund perform during the year ended December 31, 2011?
For the year ended December 31, 2011, the Initial Class shares of the SC Ibbotson Tactical Opportunities Fund (the “Fund”) returned (5.75)%, underperforming the benchmark, the S&P 500 Index (the “Index”), which returned 2.11% for the same period.
What key factors influenced management’s tactical opportunities allocation strategy during the year ended December 31, 2011?
The Fund is not available for investment by contract holders but serves exclusively as an investment option designed to implement a tactical strategy for SC Ibbotson Balanced Fund, SC Ibbotson Conservative Fund and SC Ibbotson Growth Fund. The Tactical Opportunities strategy (“the Model”) employs a rules based approach to tactically shift allocations among twelve defined asset classes. As such, a major influence on the Model is price momentum of the market. In general, the strategy overweights the asset classes that display positive momentum and conversely, underweights those with negative momentum. At the same time, the Model incorporates the mathematical concept of mean reversion, which argues that all prices eventually move back to their historical averages. The combination of these two factors will determine the monthly weighting scheme applied to the twelve defined asset classes within the Model.
Weighting decisions within the Model are relative to the Strategic Asset Allocation Model (“SAA Model”), a blend of 90% equity and 10% fixed income, which represents the neutral position of the Model without any over or under weights. During the year ended December 31, 2011, the Model underweighted equity by approximately 4% relative to the SAA Model. Within equity, the Model’s greatest over-weights were Mid Cap Growth, Real Estate, and Small Cap Growth, due to positive momentum signals within each asset class. Conversely, the Model’s greatest underweights were Large Cap Value, International, and Large Cap Growth, due to negative momentum signals in 2011. During the year, the Model overweighted fixed income by approximately 4% relative to the SAA Model. However, the Model maintained a 0% allocation to fixed income in the first eight months of the year. The Model’s 0% fixed income weight reversed in September to end at a 57% overweight relative to the SAA Model which reflects a reversal in momentum signals away from equity towards fixed income.
What tactical asset allocation decisions were most responsible for the Fund’s performance during the year ended December 31, 2011?
The performance of the Fund’s tactical asset allocation decisions are measured against the SAA Model, which represents the neutral position of the Model without any over or under weights, and the S&P 500 Index, the Fund’s benchmark. Relative to the SAA Model, the U.S. value equity style of investing detracted the most from performance during the year. The greatest contributors during the year, due to the over/under weight positions, were Emerging Markets, International, and equity REITS, and the SAA Model’s fixed income exposure compared to the Index contributed to performance as well. Within the SAA’s equity exposures, only U.S. Large Cap Growth and equity REITS outperformed the Index during the year.
An absolute return refers to the appreciation or depreciation of asset classes over the stated period and does not compare it to the SAA Model or any other measure. From an absolute return standpoint, most equity exposure, except for Large Cap and equity REITS, detracted from the Model’s performance during the year. The greatest positive contributors during the year were TIPS, equity REITs and U.S. aggregate bonds.
55
SC SM IBBOTSON TACTICAL OPPORTUNITIES FUND (Continued)
Which Exchange Traded Fund (“ETF”) investments contributed most to the Fund’s returns during the year ended December 31, 2011?
The ETFs within the Fund consist of passively managed baskets of stocks and bonds that are designed to deliver the performance of a stated index. Therefore, from an absolute return standpoint, we expect the individual ETF manager’s performance to closely track the Model’s corresponding asset class returns less manager fees and any trade-related impact. The Fund’s holdings may be bought and sold throughout the year due to changes in the Model weights. Therefore, some of the Fund’s listed contributors may not have been held at the end of the year. Based on that, the greatest contributors to the Fund’s absolute performance during the year were Vanguard Emerging Markets Stock ETF, iShares Russell 2000 Growth Index, and Vanguard REIT ETF.
There are two driving factors that are reflected in ETFs with the highest contribution to the Fund’s return. The first factor is determined by the performance of the index that the ETF is tracking. The second factor is the ETF’s weight within the Fund. The highest contributors relative to the Index during the year were iShares Barclays TIPS Bond, Vanguard REIT ETF, and Vanguard Total Bond Market ETF.
Which ETF investments detracted from the Fund’s performance results during the year ended December 31, 2011?
As noted above, the Fund’s holdings may be bought and sold throughout the year and some of the Fund’s listed detractors may not have been held at the end of the year. Within the Fund, the greatest detractors from performance during the year were iShares S&P MidCap 400 Index, iShares Russell 2000 Value Index, and Vanguard Europe Pacific Index ETF.
The highest detractors relative to the Index were Vanguard Emerging Markets Stock ETF which was a positive contributor to absolute performance, but was a relative detractor due to the weighting within the Model, Vanguard FTSE ALL-World ex-US Index ETF, Vanguard MSCI EAFE ETF, and iShares MSCI EAFE Index.
PORTFOLIO COMPOSITION AT DECEMBER 31, 2011*
Percentage of Net Assets
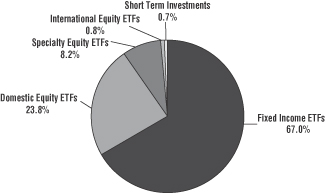
| * | The percentages shown for each investment category reflect the value of investments in that category as a percentage of net assets. Figures in the above graph may not total to 100% due to the exclusion of the Fund’s other assets and liabilities. |
56
SC SM IBBOTSON TACTICAL OPPORTUNITIES FUND (Continued)
TOP TEN INVESTMENT COMPANIES AT DECEMBER 31, 2011
| | | | | | |
| | | % of Net Assets | | | Category |
Vanguard Total Bond Market ETF | | | 25.6 | % | | Fixed Income |
iShares Barclays U.S. TIPS Bond Fund | | | 22.3 | | | Fixed Income |
Vanguard Short-Term Bond ETF | | | 19.1 | | | Fixed Income |
iShares S&P 500 Index Fund | | | 9.6 | | | Domestic Equity |
Vanguard REIT ETF | | | 8.2 | | | Specialty Equity |
iShares Russell 1000 Growth Index Fund | | | 5.5 | | | Domestic Equity |
iShares Russell 2000 Growth Index Fund | | | 4.7 | | | Domestic Equity |
iShares Russell MidCap Growth Index Fund | | | 2.4 | | | Domestic Equity |
iShares S&P MidCap 400 Index Fund | | | 1.6 | | | Domestic Equity |
Vanguard Europe Pacific ETF | | | 0.8 | | | International Equity |
Comparison of Change in Value of a $10,000 Investment in the SC Ibbotson Tactical Opportunities Fund – Initial Class and the S&P 500 Index
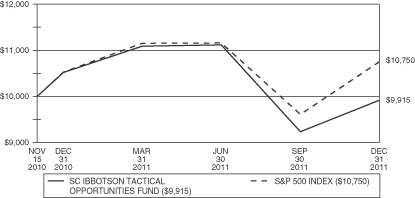
57
SC SM IBBOTSON TACTICAL OPPORTUNITIES FUND (Continued)
Average Annual Total Returns for Periods Ended December 31, 2011**
| | | | | | | | |
| | | One Year | | | Life of
Fund*** | |
SC Ibbotson Tactical Opportunities Fund–Initial Class Shares | | | (5.75 | )% | | | (0.75 | )% |
S&P 500 Index* | | | 2.11 | % | | | 6.63 | % |
*The performance data of the index has been prepared from sources and data that the investment adviser believes to be reliable, but no representation is made as to their accuracy. The index is unmanaged and cannot be invested in directly. The S&P 500 Index is a weighted index of the stock performance of 500 industrial, transportation, utility and financial companies.
**Performance data is historical and includes changes in share price and reinvestment of income dividends and capital gains distributions. Past performance is no guarantee of future results. Performance may have changed materially since December 31, 2011. All Fund returns are net of fees and expenses, but do not include any insurance charges imposed in connection with your variable insurance contract. If this performance information included the effect of the insurance charges and the fees and expenses assumed by the investment adviser, performance numbers would be lower. The value of an investment in the SC Ibbotson Tactical Opportunities Fund and the return on the investment will fluctuate and redemption proceeds may be higher or lower than an investor’s original cost.
***For the period from November 15, 2010 (commencement of operations) to December 31, 2011.
58
SUN CAPITAL INVESTMENT GRADE BOND FUND®
MANAGEMENT’S DISCUSSION & ANALYSIS:
How did the Fund perform during the year ended December 31, 2011?
For the year ended December 31, 2011, the Initial and Service Class shares of Sun Capital Investment Grade Bond Fund (the “Fund”) returned 7.06% and 6.77%, respectively, underperforming the benchmark, the Barclays Capital U.S. Aggregate Bond Index (the “Index”), which returned 7.84% for the same period.
What economic and market factors most influenced the fixed income markets as a whole during the year ended December 31, 2011?
The sovereign debt crisis in Europe was the largest driver of market sentiment throughout the year. In November, the Federal Reserve Board (the “Fed”) and other central banks, cut the cost for borrowing dollars for commercial banks in international markets by 25 basis points, in an effort to make U.S. dollars easier to obtain. More recently, the European Central Bank enhanced its Long Term Refinancing Operation (LTRO) program by offering loans for up to three years and accepting a wider array of collateral. These actions, along with recent successful government debt auctions led to a rally in risk assets across the globe.
Economic data domestically showed signs of modest improvement. Payroll growth, though still below levels that are likely to spur strong economic growth, was positive during the year and the unemployment rate declined slightly to 8.5%. The Institute for Supply Management (ISM) manufacturing Index showed signs of strength, as it increased each of the last three months of 2011. Consumer confidence was up, as indicated by The University of Michigan Consumer Sentiment Index which rose in each of the last four months of 2011, climbing over 14 points to 69.9. The real estate market continued to be a concern with existing home and new home sales experiencing pockets of strength, but remaining weak overall despite depressed valuations and very low interest rates. Commercial real estate continued to struggle though the apartment sector was a pocket of strength. In the U.S., corporate earnings were supportive for the markets and the economy. Much like the prior three periods, third quarter 2011 earnings were very strong as 75% of the companies within the S&P 500 Index reported positive earnings per share (EPS) growth and 81% had positive sales growth; figures that have consistently beat market expectations.
What key strategies were most responsible for the Fund’s performance during the year ended December 31, 2011?
The strategy that negatively affected the Fund’s relative performance for the year was the Fund’s underweight allocation to U.S. Treasuries, which substantially outperformed all other sectors within the Index. The strategy that contributed most to the Fund performance was the Fund’s yield curve positioning, which provided a higher incremental return when contrasted to the Index’s curve positioning.
What changes did you make to the Fund’s sector allocations during the year ended December 31, 2011 and how did these affect performance during the reporting period?
The most significant change was the Fund’s allocation to the credit sector, which was reduced during the year by almost 20 percentage points to 37.8%. The allocation to high yield credit was reduced 1.3% to 10.4%. These changes in allocation had a positive impact on the Fund’s relative performance compared to the Index. An increase in the allocation to long term U.S. Treasuries of over 12 percentage points to 19.4% also aided relative performance, though this increased allocation still represents a significant underweight when compared to the Index.
59
SUN CAPITAL INVESTMENT GRADE BOND FUND® (Continued)
Did the Fund experience major changes to its top ten issuers during the year ended December 31, 2011?
There were no material changes to the December 31, 2011 top ten issuers list relative to the December 31, 2010 top ten issuers list. Although U.S. Treasury remained on the top ten issuers list at December 31, 2011, the position was significantly increased during the year to more closely align the Fund’s allocation with the Index allocation to U.S. Treasuries.
How was the Fund positioned relative to its benchmark index at December 31, 2011?
At December 31, 2011, the Fund was overweight compared to the Index in Credit, Commercial Mortgage Backed Securities (CMBS), mortgage backed securities (MBS) and short term securities, while underweight in U.S. Treasuries, U.S. Government Agencies and Asset Backed Securities. Not withstanding the challenges facing the markets, we believed that risk premiums appeared relatively attractive and were good alternatives to risk-free assets and justified overweight positions in Credit, MBS and CMBS relative to the Index. The Fund’s exposure to the high yield corporate sector was a non-Index asset allocation. With a still positive outlook for earnings, solid balance sheets and low expectations for defaults, we believed that some allocation to high yield remained attractive with security selection being of paramount importance. Given the still fragile state of the economy and financial markets, we believed that prudent portfolio construction was essential. The Fund remained neutral to modestly short when compared to the benchmark duration.
PORTFOLIO COMPOSITION AT DECEMBER 31, 2011*
Percentage of Net Assets
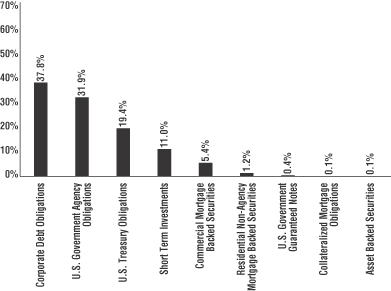
| * | The percentages shown for each investment category reflect the value of investments in that category as a percentage of net assets. Figures in the above graph may not total to 100% due to the exclusion of the Fund’s other assets and liabilities. |
60
SUN CAPITAL INVESTMENT GRADE BOND FUND® (Continued)
TOP TEN ISSUERS AT DECEMBER 31, 2011
| | | | | | |
| | | % of Net Assets | | | Category |
Federal National Mortgage Association | | | 22.3 | % | | U.S. Government Agency |
U.S. Treasury | | | 20.4 | | | U.S. Treasury |
Federal Home Loan Mortgage Corp. | | | 9.0 | | | U.S. Government Agency |
Morgan Stanley Capital I | | | 2.0 | | | Commercial Mortgage Backed Securities |
International Paper Co. | | | 1.5 | | | Corporate Debt – Paper Products |
ING Bank NV | | | 1.4 | | | Corporate Debt – Banks |
Teck Resources, Ltd. | | | 1.3 | | | Corporate Debt – Metals & Mining |
Ford Motor Credit Co. LLC | | | 1.3 | | | Corporate Debt – Automotive |
Bear Stearns Commercial Mortgage Securities | | | 1.3 | | | Commercial Mortgage Backed Securities |
LB-UBS Commercial Mortgage Trust | | | 1.1 | | | Commercial Mortgage Backed Securities |
Comparison of Change in Value of a $10,000 Investment in the Sun Capital Investment Grade Bond Fund – Initial Class and the Barclays Capital U.S. Aggregate Bond Index
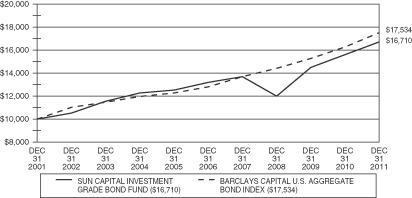
Comparison of Change in Value of a $10,000 Investment in the Sun Capital Investment Grade Bond Fund – Service Class and the Barclays Capital U.S. Aggregate Bond Index
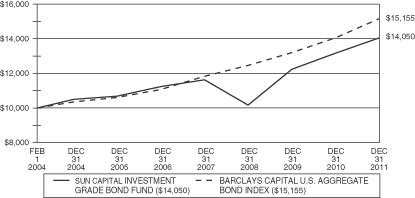
61
SUN CAPITAL INVESTMENT GRADE BOND FUND® (Continued)
Average Annual Total Returns for Periods Ended December 31, 2011**
| | | | | | | | | | | | | | | | | | | | |
Initial Class Shares | | One Year | | | Three Years | | | Five Years | | | Ten Years | | | Life of
Fund*** | |
Sun Capital Investment Grade Bond Fund | | | 7.06 | % | | | 11.73 | % | | | 4.84 | % | | | 5.27 | % | | | 5.28 | % |
Barclays Capital U.S. Aggregate Bond Index* | | | 7.84 | % | | | 6.77 | % | | | 6.50 | % | | | 5.78 | % | | | 5.86 | % |
Service Class Shares | | | | | | | | | | | | | | | |
Sun Capital Investment Grade Bond Fund | | | 6.77 | % | | | 11.44 | % | | | 4.58 | % | | | — | | | | 4.39 | % |
Barclays Capital U.S. Aggregate Bond Index* | | | 7.84 | % | | | 6.77 | % | | | 6.50 | % | | | — | | | | 5.39 | % |
*The performance data of the index has been prepared from sources and data that the investment adviser believes to be reliable, but no representation is made as to their accuracy. The index is unmanaged and cannot be invested in directly. The Barclays Capital U.S. Aggregate Bond Index is a widely recognized market value-weighted index composed of U.S. Treasuries, agencies, credit, asset-backed securities, commercial mortgage-backed securities and mortgage-backed securities.
**Performance data is historical and includes changes in share price and reinvestment of income dividends and capital gains distributions. Past performance is no guarantee of future results. Performance may have changed materially since December 31, 2011. All Fund returns are net of fees and expenses, but do not include any insurance charges imposed in connection with your variable insurance contract. If this performance information included the effect of the insurance charges and the fees and expenses assumed by the investment adviser, performance numbers would be lower. The value of an investment in the Sun Capital Investment Grade Bond Fund and the return on the investment will fluctuate and redemption proceeds may be higher or lower than an investor’s original cost.
***Initial Class Shares for the period from December 7, 1998 (commencement of operations) to December 31, 2011. Service Class Shares for the period from February 1, 2004 (commencement of operations) to December 31, 2011.
62
SUN CAPITAL MONEY MARKET FUND®
MANAGEMENT’S DISCUSSION & ANALYSIS:
How did the Fund perform during the year ended December 31, 2011?
For the year ended December 31, 2011, the Initial and Service Class shares of Sun Capital Money Market Fund (the “Fund”) returned 0.15% and 0.00%, respectively, with the Initial Class outperforming and the Service Class underperforming the benchmark, the BofA Merrill Lynch U.S. 3-Month Treasury Bill Index (the “Index”), which returned 0.10% for the same period.
What economic and market factors most influenced the money markets as a whole during the year ended December 31, 2011?
Economic data was mixed during the year, with signs pointing toward modest improvement. Nonfarm and private payrolls posted gains in each of the last 12 months, with more robust figures in the latter half of the year. The unemployment rate, which had moved up to 9.1% in June, declined gradually over the last five months to close the year at 8.5%. The manufacturing sector showed positive signs early in the year, and fourth quarter data showed an upswing following some weakness in the third quarter. The housing sector, though still depressed, experienced some areas of strength in existing and new home sales, housing starts and permits, and although business fixed investment appeared to slow, household spending continued to advance as did consumer confidence.
The zero interest rate policy of the Federal Reserve (the “Fed”), which has been in place for three years, has left the Fed Funds Rate at historically low levels, in the 0.00% to 0.25% range. The 0.75% discount rate put in place in February of 2010 remained in effect throughout 2011, and U.S. Treasury Bills and commercial paper yields remained near all-time lows. Three-month Treasury Bills traded in a very tight range, beginning the year at 0.13%, reaching a high of 0.16% in late January, and then closing the year at 0.01% which was 2.3 basis points higher than the 2011 low of -0.013%. The Federal Funds effective rate declined over the course of the year, beginning January at 0.19%, ticking up briefly in late July and early August on concerns of a possible U.S. Government technical default, then declining to close the year at the low of 0.04%. The London Inter-Bank Offering Rate (LIBOR) started the year at 0.30%, declined to a low of 0.24% in mid June, and then rose steadily for the remainder of the year in reaction to the unresolved fiscal crisis in Europe, to close December at the high of 0.58%. Despite dislocation in Europe and the heated debate on the U.S. budget deficit and subsequent downgrade of U.S. Government debt by Standard & Poor’s dominating sentiment in the financial markets as a whole, there has been little change in money market yields and spreads.
At the four Federal Open Market Committee (the “Committee”) meetings held in the first half of the year, the Fed reiterated its policy of reinvesting principal U.S. Treasury and Mortgage Backed Securities (MBS) payments, while also expanding its holdings of securities by purchasing $600 billion of longer-term U.S. Treasury Bonds (quantitative easing) by the end of the second quarter of 2011. In the second half of the year, the Fed solidified its language regarding the Federal Funds rate, stating that conditions are likely to warrant exceptionally low levels through at least mid-2013, and announced “Operation Twist”, a program to extend the average maturity of the Fed’s holdings by purchasing $400 billion of Treasury securities with remaining maturities between 6 and 30 years, funded by maturities and sales of securities with remaining maturities inside of 3 years. This new program would be completed by the end of June 2012. The Committee discussed changes to their communication strategy at the December 13th meeting, whereby participants would begin providing more information about “their projections of appropriate monetary policy” into the Summary of Economic Projections, including their forecast of the federal funds rate over time, as well as the likely timing of an increase in the target rate. The Fed consistently noted that it would “continue to assess the economic outlook in light of incoming information and is prepared to employ (its range of policy) tools to promote a stronger economic recovery in a context of price stability”, leaving the door open for further action if necessary.
Commercial paper issuance, which had increased $66 billion over the first half of 2011, declined over the second half of the year. At December 31st, commercial paper supply had fallen 10.5% on the year to approximately $970 billion. Tier-1 securities and domestic financial commercial paper posted the greatest declines, falling 20.0% to $701.3 billion and 17.3% to $291.7 billion, respectively. Tier-2 securities increased 66.7% to $67.2 billion, due in part to the downgrades of several financial names which fell out of the Tier-1 classification.
63
SUN CAPITAL MONEY MARKET FUND® (Continued)
Investors continue to show a somewhat greater tolerance for risk, and the shift away from money market funds in favor of fixed income funds has been persistent. AMG Data Services reported that $150 billion was withdrawn from money market funds during 2011. This shift has had little impact on yields.
What key factors were most responsible for the Fund’s performance during the year ended December 31, 2011?
The Fed’s zero interest rate policy and the market’s persistent demand for quality were the most influential factors on the performance of the Fund. Market conditions forced the Fund’s gross portfolio yield below its net operating expenses, causing the adviser to further subsidize the Fund.
How did you manage the Fund’s weighted average maturity during the year ended December 31, 2011?
The Fund’s average maturity ranged from 24 to 41 days during the year, slightly shorter than the market average. On December 31, 2011, the Fund had a weighted average maturity of 30 days, 12 days shorter than the average taxable money market fund maturity of 42 days as reported in the Money Fund Report, published by iMoneyNet Inc. The credit curve between 30 day and 90 day commercial paper has remained consistently narrow, averaging 9 basis points for the period; offering little compensation to invest in longer dated securities.
How was the Fund invested during the year ended December 31, 2011?
Holdings in U.S. Government Guaranteed Temporary Liquidity Guarantee Program paper matured during the first quarter, while U.S. Government Agency obligations were reduced by 7.4%, as they ceased to provide competitive yields. Corporate floating rate notes increased 2.6% during the period as a way to add yield to the Fund.
At December 31, 2011, the Fund was invested in commercial paper, U.S. Treasury Bills, mutual funds, corporate floating rate notes, and U.S. agency discount paper. The Fund had no exposure to Portugal, Ireland, Italy, Greece, Spain or France.
PORTFOLIO COMPOSITION AT DECEMBER 31, 2011*
Percentage of Net Assets
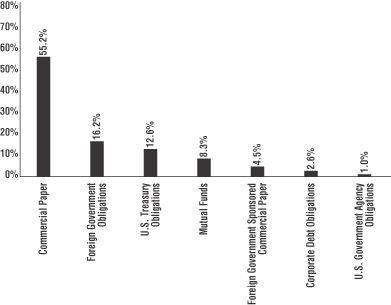
| * | The percentages shown for each investment category reflect the value of investments in that category as a percentage of net assets. Figures in the above graph may not total to 100% due to the exclusion of the Fund’s other assets and liabilities. |
64
SUN CAPITAL MONEY MARKET FUND® (Continued)
TOP TEN ISSUERS AT DECEMBER 31, 2011
| | | | | | |
| | | % of Net Assets | | | Category |
U.S. Treasury | | | 12.6 | % | | U.S. Treasury |
Province of Ontario | | | 3.2 | | | Foreign Government |
Pfizer, Inc. | | | 3.1 | | | Commercial Paper |
PepsiCo, Inc. | | | 3.1 | | | Commercial Paper |
International Business Machines Corp. | | | 3.1 | | | Commercial Paper |
Philip Morris International, Inc. | | | 3.1 | | | Commercial Paper |
E.I. du Pont de Nemours and Co. | | | 3.1 | | | Commercial Paper |
Province of British Columbia | | | 3.1 | | | Foreign Government |
Procter & Gamble Co. | | | 3.1 | | | Commercial Paper |
Coca-Cola Co. | | | 3.1 | | | Commercial Paper |
Comparison of Change in Value of a $10,000 Investment in the Sun Capital Money Market Fund – Initial Class and the BofA Merrill Lynch U.S. 3-Month Treasury Bill Index
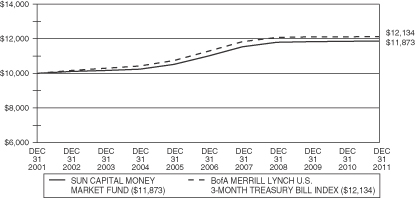
Comparison of Change in Value of a $10,000 Investment in the Sun Capital Money Market Fund – Service Class and the BofA Merrill Lynch U.S. 3-Month Treasury Bill Index

65
SUN CAPITAL MONEY MARKET FUND® (Continued)
Average Annual Total Returns for Periods Ended December 31, 2011**
| | | | | | | | | | | | | | | | | | | | |
Initial Class Shares | | One Year | | | Three Years | | | Five Years | | | Ten Years | | | Life of
Fund*** | |
Sun Capital Money Market Fund | | | 0.15 | % | | | 0.19 | % | | | 1.52 | % | | | 1.73 | % | | | 2.42 | % |
BofA Merrill Lynch U.S. 3-Month Treasury Bill Index* | | | 0.10 | % | | | 0.15 | % | | | 1.49 | % | | | 1.95 | % | | | 2.69 | % |
Service Class Shares | | | | | | | | | | | | | | | |
Sun Capital Money Market Fund | | | 0.00 | % | | | 0.01 | % | | | 1.31 | % | | | — | | | | 1.91 | % |
BofA Merrill Lynch U.S. 3-Month Treasury Bill Index* | | | 0.10 | % | | | 0.15 | % | | | 1.49 | % | | | — | | | | 2.17 | % |
*The performance data of the index has been prepared from sources and data that the investment adviser believes to be reliable, but no representation is made as to their accuracy. The index is unmanaged and cannot be invested in directly. The BofA Merrill Lynch U.S. 3-Month Treasury Bill Index is a measure of the performance of the 3-month U.S. Treasury bill.
**Performance data is historical and includes changes in share price and reinvestment of income dividends and capital gains distributions. Past performance is no guarantee of future results. Performance may have changed materially since December 31, 2011. All Fund returns are net of fees and expenses, but do not include any insurance charges imposed in connection with your variable insurance contract. If this performance information included the effect of the insurance charges and the fees and expenses assumed by the investment adviser, performance numbers would be lower. Although the Fund seeks to maintain a stable net asset value of $1 per share there can be no assurance that it will do so. The value of an investment in the Sun Capital Money Market Fund and the return on the investment may fluctuate and redemption proceeds may be higher or lower than an investor’s original cost.
***Initial Class Shares for the period from December 7, 1998 (commencement of operations) to December 31, 2011. Service Class Shares for the period from April 25, 2005 (commencement of operations) to December 31, 2011.
66
SC SM BLACKROCK INFLATION PROTECTED BOND FUND
(subadvised by BlackRock Financial Management, Inc.)
MANAGEMENT’S DISCUSSION & ANALYSIS:
How did the Fund perform during the year ended December 31, 2011?
For the year ended December 31, 2011, the Initial and Service Class shares of the SC BlackRock Inflation Protected Bond Fund (the “Fund”) returned 11.90% and 11.70%, respectively, underperforming the benchmark, the Barclays Capital Global Real Index: U.S. TIPS (the “Index”), which returned 12.56% for the same period.
What economic and market factors most influenced the fixed income markets as a whole during the year ended December 31, 2011?
When the year opened, there was a widespread sense that the economic recovery that began in 2009 would persevere. While Europe’s debt problems were a significant issue, they appeared to be relatively well contained. However, it was only a few months before the world encountered a renewed recession scare sparked largely by deteriorating debt conditions in the euro zone as well as some weaker-than-expected U.S. economic data. This Europe-induced uncertainty combined with political unrest in the Middle East and the rating downgrade of U.S. Treasury debt, resulted in a dramatic rally in U.S. Treasury Inflation-Protected Securities (TIPS) led by the shorter maturity portion of the yield curve. At year end, positive forces reemerged as the U.S. economic growth picture had brightened and signs of progress regarding Europe’s debt crisis began to take hold.
What key strategies were most responsible for the Fund’s performance during the year ended December 31, 2011?
As the Fund’s investment mandate requires that 80% of its assets be invested in inflation-protected bonds, there are limited opportunities to add value through sector rotation. The Fund’s portfolio management team uses the limited ability it has to own nominal U.S. Treasuries during times when U.S. TIPS appear to be overvalued. Investment value is determined in many ways; however, a commonly used metric looks at the difference between the yield on a nominal U.S. Treasury bond and a TIP bond with a similar maturity, known as the breakeven level. Breakeven levels reflect broad expectations of the level of inflation. When the portfolio management team was of the opinion that TIPS had priced in too high a level of inflation expectations, the Fund sold TIPS and bought nominal U.S. Treasuries and vice versa. Key strategies include active positioning along the real yield curve and duration management.
For the year, the Fund maintained a real yield curve-flattening bias by holding an underweight position in TIPS on the 10-year portion of the yield curve and an overweight position in TIPS on the 30-year portion of the curve based on the view that improving economic data would pressure the intermediate portion of the curve to move higher. This positioning detracted from relative performance for a majority of the year as the real yield curve steepened due to a confluence of factors including weakening U.S. economic data, political tensions in the Arab states, the U.S. Treasury debt rating downgrade and escalating fears about the sovereign debt crisis in Europe. In addition, the Fund’s short duration compared to the benchmark Index detracted from performance. Toward the end of the year, the Fund’s positioning was beneficial as U.S. economic data began to show signs of resilience and fears of a euro-zone collapse abated.
The Fund used interest rate derivatives such as futures, options, swaps and swaptions to manage duration and convexity risk in the Fund during the period. Finally, derivatives enabled the Fund to be positioned based on the views on inflation expectations.
What changes did you make to the Fund’s sector allocations during the year ended December 31, 2011 and how did these affect performance during the reporting period?
As discussed above, single sector funds have limited flexibility to rotate between sectors. While some peer funds may use this limited flexibility to buy higher risk assets such as mortgage-backed securities or corporate bonds
67
SC SM BLACKROCK INFLATION PROTECTED BOND FUND (Continued)
that is not a central tenet of the portfolio management team’s management style. The Fund is mainly limited to TIPS, nominal Treasury and Treasury alternatives such as Treasury futures and options. In some instances the Fund does make use of higher risk assets, but exposure is minimal.
Over the course of the year, the Fund actively traded exposure across the yield curve to take advantage of Treasury auctions and buybacks, including those under the Federal Reserve’s operation “twist” program. During the second half of the year, the Fund added to its nominal yield curve steepening position to take advantage of rising inflation expectations.
How was the Fund positioned relative to its benchmark index at December 31, 2011?
Our fundamental view continues to be that inflation expectations priced into the market make valuations more attractive on the longer maturity portion of the real yield curve. The Fund maintains a real yield curve-flattening bias and a nominal yield curve-steepening position between the 10-year and 30-year points on the curve given our view that improving economic data should pressure the intermediate portion of the curve to move higher and cause inflation expectations to rise. The Fund ended the year with a shorter duration compared to the Index as economic data in the U.S. has proven to be resilient in the near term.
68
SC SM BLACKROCK INFLATION PROTECTED BOND FUND (Continued)
PORTFOLIO COMPOSITION AT DECEMBER 31, 2011*
Percentage of Net Assets
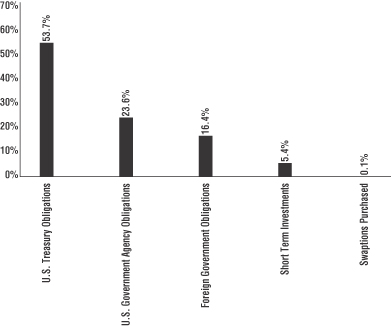
| * | The percentages shown for each investment category reflect the value of investments in that category as a percentage of net assets. Figures in the above graph may not total to 100% due to the exclusion of the Fund’s other assets and liabilities. |
TOP ISSUERS AT DECEMBER 31, 2011
| | | | | | |
| | | % of Net Assets | | | Category |
U.S. Treasury | | | 53.7 | % | | U.S. Treasury |
Government of Germany | | | 9.4 | | | Foreign Government |
Government National Mortgage Association | | | 8.0 | | | U.S. Government Agency |
Federal Home Loan Mortgage Corp. | | | 7.9 | | | U.S. Government Agency |
Federal National Mortgage Association | | | 7.7 | | | U.S. Government Agency |
Government of France | | | 6.8 | | | Foreign Government |
Government of Italy | | | 0.2 | | | Foreign Government |
Government of Greece | | | 0.0 | * | | Foreign Government |
| * | Amount is less than 0.05%. |
69
SC SM BLACKROCK INFLATION PROTECTED BOND FUND (Continued)
Comparison of Change in Value of a $10,000 Investment in the SC BlackRock Inflation Protected Bond Fund – Initial Class and the Barclays Capital Global Real Index: U.S. TIPS
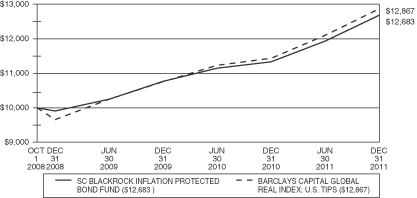
Comparison of Change in Value of a $10,000 Investment in the SC BlackRock Inflation Protected Bond Fund – Service Class and the Barclays Capital Global Real Index: U.S. TIPS
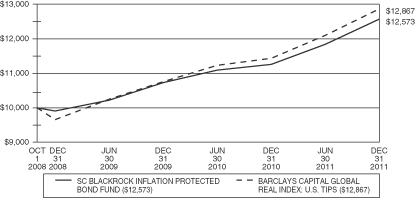
70
SC SM BLACKROCK INFLATION PROTECTED BOND FUND (Continued)
Average Annual Total Returns for Periods Ended December 31, 2011**
| | | | | | | | | | | | |
| | | One Year | | | Three Years | | | Life of
Fund*** | |
SC BlackRock Inflation Protected Bond Fund–Initial Class Shares | | | 11.90 | % | | | 8.59 | % | | | 7.58 | % |
SC BlackRock Inflation Protected Bond Fund–Service Class Shares | | | 11.70 | % | | | 8.28 | % | | | 7.30 | % |
Barclays Capital Global Real Index: U.S. TIPS* | | | 12.56 | % | | | 10.06 | % | | | 8.07 | % |
*The performance data of the index has been prepared from sources and data that the investment adviser believes to be reliable, but no representation is made as to their accuracy. The index is unmanaged and cannot be invested in directly. Barclays Capital Global Real Index: U.S. TIPS is comprised of all U.S. Treasury Inflation Protected Securities rated investment grade (Baa3 or better) that have at least one year to final maturity and at least $250 million par amount outstanding.
**Performance data is historical and includes changes in share price and reinvestment of income dividends and capital gains distributions. Past performance is no guarantee of future results. Performance may have changed materially since December 31, 2011. All Fund returns are net of fees and expenses, but do not include any insurance charges imposed in connection with your variable insurance contract. If this performance information included the effect of the insurance charges and the fees and expenses assumed by the investment adviser, performance numbers would be lower. The value of an investment in the SC BlackRock Inflation Protected Bond Fund and the return on the investment will fluctuate and redemption proceeds may be higher or lower than an investor’s original cost.
***For the period from October 1, 2008 (commencement of operations) to December 31, 2011.
71
SC SM GOLDMAN SACHS SHORT DURATION FUND
(Subadvised by Goldman Sachs Asset Management, L.P.)
MANAGEMENT’S DISCUSSION & ANALYSIS:
How did the Fund perform during the year ended December 31, 2011?
Effective May 1, 2011, the SC Goldman Sachs Short Duration Fund (the “Fund”) changed its benchmark from the BofA Merrill Lynch 1-3 Year U.S. Treasury Index to the Barclays Capital 1-3 Year U.S. Government/Credit Index (the “Index”). For the year ended December 31, 2011, the Initial and Service Class shares of the Fund returned 0.53% and 0.17%, respectively, underperforming both the former benchmark, the BofA Merrill Lynch 1-3 Year U.S. Treasury Index and the Index, which returned 1.55% and 1.59%, respectively for the same period.
What economic and market factors most influenced the fixed income markets as a whole during the year ended December 31, 2011?
At the beginning of 2011, the global economic data supported a theme of robust and broadening growth. However, as the first quarter ended, this positive momentum gave way to softer economic data, as well as concern over the effects of exogenous shocks, including significant unrest and political upheaval in the Middle East and the Japanese earthquake and tsunami. These developments were exacerbated by a weakening of growth indicators across major economies, deepening of economic problems in peripheral Europe, and in May, the failure of the Greek government to meet its fiscal targets as well as European Union approval of a €78 billion bailout package for Portugal. In the U.S., the second quarter saw a broad weakening of economic data, including slowed U.S. Gross Domestic Product (GDP) growth, low consumer confidence which hit a six-month bottom and payroll data that came in weaker than expected. As a result, risk assets underperformed after beginning the year strongly. The third quarter saw a continuation of this risk aversion theme, as the U.S. debt ceiling debate dragged on until the end of July deadline, when a last second deal averted a technical default on U.S. debt. This was followed by Standard & Poor’s first ever downgrade of the U.S. sovereign credit rating in early August, with both developments putting upward pressure on risk asset spreads.
Weak U.S. economic data prompted the Federal Reserve Board (the “Fed”) to announce that it expected to hold short-term interest rates at very low levels through at least mid-2013, as well as announce “Operation Twist,” an extension of the average maturity of the Fed’s securities holdings. In addition to a deteriorating macroeconomic environment in the U.S., late spring and summer also saw an intensification of the Eurozone sovereign debt crisis and incremental policy responses, including an expansion of the European Central Bank’s (ECB) Securities Market Program to include the bonds of Italy and Spain. A July European Union summit resulted in an expansion of the European Financial Stability Fund (EFSF). However, economic data suggested that weakness in the peripheral economies was beginning to spread to core Eurozone countries, including Germany, and peripheral yields remained elevated. The European sovereign debt crisis was the primary driver of markets in the fourth quarter, as developments included consensus agreements on a voluntary debt restructuring for Greece, a short-lived plan for a Greek referendum on the country’s bailout, a continuation of bond purchases by the ECB, and sovereign credit rating downgrades in Belgium and Portugal. Coordinated central bank action to reduce the cost of dollar funding boosted risk assets in early December, and the ECB cut its policy rate to 1%. At year-end, significant uncertainty remained around the Eurozone, including the potential for greater fiscal union in exchange for strict, enforceable budgetary rules.
U.S. Treasury yields ended 2011 lower on the year, driven by a number of factors, including geopolitical uncertainty, a weakening global economy, and an intensification of the Eurozone sovereign debt crisis. After rising over the first three months of the year, Treasury yields fell in April, as concerns about the potential market impact of political upheaval in the Middle East and North Africa decreased investors’ appetite for risk. Yields fell sharply in the summer months, as a combination of weak U.S. economic data and concerns around Eurozone sovereign debt drove risk aversion higher. In September, the Fed announcement of Operation Twist narrowed the spreads between long and short-term U.S. Treasury yields. The beginning of fourth quarter saw corporate yields
72
SC SM GOLDMAN SACHS SHORT DURATION FUND (Continued)
advance from their lows, as U.S. economic data began to show improvement. Additionally, year-end buying within the corporate credit sector propelled an end of December rally in U.S. Treasury yields
What key strategies were most responsible for the Fund’s performance during the year ended December 31, 2011?
A combination of top-down and bottom-up strategies influenced the Fund’s performance during the year. Top-down strategies included a duration strategy and cross-sector exposures. Duration is a measure of the Fund’s sensitivity to changes in interest rates. The cross-sector strategy is one in which the Fund invests assets across a variety of fixed income sectors, including some that may not be included in the Fund’s benchmark. The Fund’s interest rate and yield curve positioning detracted from relative returns during the year, particularly from an underweight position in the two and three-year nodes of the yield curve, as yields fell during the spring and summer months. This more than offset the positive impact of an overweight position in the intermediate portion of the yield curve during the summer. The Fund’s cross-sector positioning also negatively affected relative performance, largely due to the overweight risk exposure to Agency Mortgage-Backed Securities (MBS) over the summer. These securities underperformed as a result of broad risk aversion due to the Eurozone sovereign debt crisis and heightened prepayment risk from continual discourse about government measures concerning potential homeowner relief. In addition, a short position in U.S. government securities which were established through the use of futures contracts, had a negative influence on relative performance, as swap spreads widened modestly. Security selection strategies were additive to relative performance, particularly through the selection of corporate bonds, as well as government and agency issues. The Fund’s selection of government and agency issues and its exposure to short-maturity Treasury Inflation-Protected Securities (TIPS) earlier in the year benefited as breakeven spreads widened.
What changes did you make to the Fund’s sector allocations during the year ended December 31, 2011 and how did these affect performance during the reporting period?
The most significant change in the Fund’s allocation between December 2010 and December 2011 was a decrease in allocation to Agency MBS. The decrease in Agency MBS weighting was reallocated across agency debentures and corporate bonds. The Fund’s decreased allocation to Agency MBS mitigated the negative impact from the Fund’s exposure to the sector, while the Fund’s increased allocation to corporate bonds negatively impacted performance, however, the Fund’s selection of corporate bonds added to performance. Additionally, the increased exposure to agency debentures added to performance.
Did the Fund experience major changes to its top ten issuers during the year ended December 31, 2011?
There were five issuers on the top ten issuers list as of December 31, 2010 that were still on the Fund’s top ten issuers list as of December 31, 2011. Four of those five issuers that are no longer on the Fund’s top ten issuers list remained as holdings by the Fund with the exception of The Bear Stearns Cos., LLC. In addition, all five new issuers in the top ten issuers list as of December 31, 2011 were owned by the Fund at the end of 2010.
How was the Fund positioned relative to its benchmark index at December 31, 2011?
At December, 2011, the Fund continued to hold a short duration position relative to the benchmark. The Fund was overweight in the Investment Grade corporate, Agency MBS, covered bonds (securities formed from the public sector or through the use of mortgage loans where the security is backed by a separate pool of loans), and Asset Backed Securities (ABS). The Fund targeted a modest underweight position in duration as bond yields in the earlier maturity portion of the curve are at very low levels as a result of Fed policy, with limited room for any further decrease. In addition, recent U.S. economic data releases have continued the trend of coming in above consensus. The Fund continued to favor covered bonds as a high-quality spread sector, but is cautious in the short run due to European sovereign debt concerns and their potential effect on overall market liquidity. In ABS, the
73
SC SM GOLDMAN SACHS SHORT DURATION FUND (Continued)
Fund remains positive on student loan ABS backed by the Federal Family Education Loan Program (FFELP). Investment Grade credit fundamentals are strong and improving in many sectors, with profit margins near all-time highs, and companies holding healthy cash balances.
At the end of the period, roughly 42% of the Fund’s assets were in government/agency securities, versus approximately 81% for the benchmark. Though the sector allocations differ, the benchmark continues to maintain a relatively short duration (1.88 years), with the Fund just short of this at 1.78 years. With respect to spread duration, the Fund was longer than the benchmark, at 2.06 years versus 1.88 years for the Index.
PORTFOLIO COMPOSITION AT DECEMBER 31, 2011*
Percentage of Net Assets
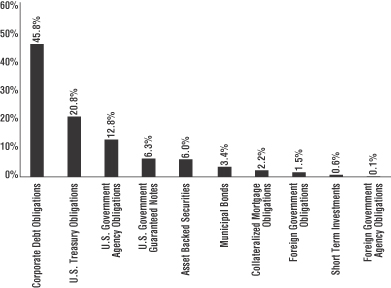
| * | The percentages shown for each investment category reflect the value of investments in that category as a percentage of net assets. Figures in the above graph may not total to 100% due to the exclusion of the Fund’s other assets and liabilities. |
TOP TEN ISSUERS AT DECEMBER 31, 2011
| | | | | | |
| | | % of Net Assets | | | Category |
U.S. Treasury | | | 20.7 | % | | U.S. Treasury |
Federal National Mortgage Association | | | 9.6 | | | U.S. Government Agency |
Federal Home Loan Mortgage Corp. | | | 4.0 | | | U.S. Government Agency |
Citigroup, Inc. | | | 2.8 | | | Corporate Debt – Banks & TLGP |
Landwirtschaftliche Rentenbank | | | 2.3 | | | Corporate Debt – Special Purpose Banks |
National Credit Union Administration | | | 2.2 | | | U.S. Government Guaranteed Notes |
Brazos Higher Education Authority | | | 2.0 | | | Asset Backed Securities |
Kreditanstalt fuer Wiederaufbau | | | 1.5 | | | Corporate Debt – Special Purpose Banks |
SpareBank 1 Boligkreditt | | | 1.5 | | | Corporate Debt – Banks |
Canadian Imperial Bank of Commerce | | | 1.4 | | | Corporate Debt – Banks |
74
SC SM GOLDMAN SACHS SHORT DURATION FUND (Continued)
Comparison of Change in Value of a $10,000 Investment in the SC Goldman Sachs Short Duration Fund – Initial Class, BofA Merrill Lynch 1-3 Year U.S. Treasury Index, and the Barclays Capital 1-3 Year U.S. Government/Credit Index
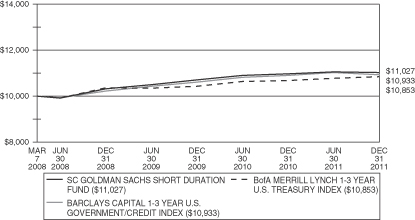
Comparison of Change in Value of a $10,000 Investment in the SC Goldman Sachs Short Duration Fund – Service Class, BofA Merrill Lynch 1-3 Year U.S. Treasury Index, and the Barclays Capital 1-3 Year U.S. Government/Credit Index

75
SC SM GOLDMAN SACHS SHORT DURATION FUND (Continued)
Average Annual Total Returns for Periods Ended December 31, 2011***
| | | | | | | | | | | | |
| | | One Year | | | Three Years | | | Life of
Fund**** | |
SC Goldman Sachs Short Duration Fund–Initial Class Shares | | | 0.53 | % | | | 2.23 | % | | | 2.59 | % |
SC Goldman Sachs Short Duration Fund–Service Class Shares | | | 0.17 | % | | | 1.94 | % | | | 2.31 | % |
BofA Merrill Lynch 1-3 Year U.S. Treasury Index* | | | 1.55 | % | | | 1.56 | % | | | 2.17 | % |
Barclays Capital 1-3 Year U.S. Government/Credit Index** | | | 1.59 | % | | | 2.74 | % | | | 2.36 | % |
*The performance data of the indices has been prepared from sources and data that the investment adviser believes to be reliable, but no representation is made as to their accuracy. The indices are unmanaged and cannot be invested in directly. The BofA Merrill Lynch 1-3 Year U.S. Treasury Index tracks the performance of the direct Sovereign debt of the U.S. Government and includes all U.S. dollar-denominated U.S. Treasury Notes and Bonds having at least one year remaining to maturity.
**The Barclays Capital 1-3 Year U.S. Government/Credit Index includes all medium and larger issues of U.S. government, investment-grade corporate, and investment-grade international dollar-denominated bonds that have maturities of between one and three years and are publicly issued.
***Performance data is historical and includes changes in share price and reinvestment of income dividends and capital gains distributions. Past performance is no guarantee of future results. Performance may have changed materially since December 31, 2011. All Fund returns are net of fees and expenses, but do not include any insurance charges imposed in connection with your variable insurance contract. If this performance information included the effect of the insurance charges and the fees and expenses assumed by the investment adviser, performance numbers would be lower. The value of an investment in the SC Goldman Sachs Short Duration Fund and the return on the investment will fluctuate and redemption proceeds may be higher or lower than an investor’s original cost.
****For the period from March 7, 2008 (commencement of operations) to December 31, 2011.
76
SC SM PIMCO HIGH YIELD FUND
(subadvised by Pacific Investment Management Company LLC)
MANAGEMENT’S DISCUSSION & ANALYSIS:
How did the Fund perform during the year ended December 31, 2011?
For the year ended December 31, 2011, the Initial and Service Class shares of SC PIMCO High Yield Fund (the “Fund”) returned 4.26% and 4.01%, respectively, underperforming the benchmark, the BofA Merrill Lynch BB-B U.S. High Yield Constrained Index (the “Index”), which returned 5.40% for the same period.
What economic and market factors most influenced the fixed income markets as a whole during the year ended December 31, 2011?
In 2011, the global financial markets consistently made headlines for their persistent volatility resulting from a variety of forces on both Main Street and Wall Street. At the start of 2011, fixed income sectors including Agency Fixed Rate Mortgages, Investment Grade Credit, and High Yield Credit generated positive returns, as measured by the excess return of these sectors relative to U.S. Treasuries as global markets struggled to absorb implications of intensified political unrest across the Middle East and North Africa, rising commodity prices and the earthquake and nuclear accidents in Japan. Yields on U.S. Treasuries rose overall amid signs of economic recovery in the U.S. and concerns the Federal Reserve’s (Fed’s) second round of U.S. Treasury bond purchases known as quantitative easing (QE2) might spark inflation. At the end of the first quarter of 2011, a confluence of events prompted a move toward the perceived safety of U.S. Treasuries.
With this flight to quality, U.S. Treasury yields fell in the second quarter as higher gasoline prices and lingering effects from Japan’s earthquake on the global supply chains curtailed U.S. growth. Concern about the sovereign debt crisis in the Eurozone further boosted demand for U.S. Treasuries. On June 30, the Fed ended its $600 billion QE2 program and indicated its intention to continue buying Treasuries with proceeds from maturing debt on its $2.9 trillion balance sheet. The Fed also reiterated its “extended period” language for a near-zero federal funds rate.
With the Fed’s continued participation in the financial markets, U.S. Treasury yields continued to fall in the third quarter as the U.S. debt ceiling debate, Standard & Poor’s downgrade of the U.S. long-term credit rating and concern about the sovereign debt crisis in Europe sparked a flight to safety and boosted demand for U.S. Treasuries. Additionally, the Eurozone sovereign debt crisis intensified as the likelihood of a Greek debt restructuring increased. Other European countries, including Ireland, Italy, and Spain continued to struggle with sovereign debt levels, increasing pressure on European leaders to develop a comprehensive policy response. In an effort to reinvigorate the faltering economy, the Fed launched “Operation Twist,” signaling its intent to buy $400 billion of long-dated U.S. Treasuries by the end of June 2012. To finance this program, the Fed agreed to sell Treasury securities with remaining maturities of 3 years or less to make financial conditions more accommodative by putting downward pressure on longer-term interest rates.
Following the Fed’s announcement of “Operation Twist”, most bonds gained during the fourth quarter, as global financial markets digested improving U.S. economic data and uncertainty surrounding the Eurozone sovereign debt crisis. A rebound in U.S. consumption towards the end of the year improved investor risk appetites and helped most fixed income sectors outperform U.S. Treasuries. Despite improving consumer confidence in the U.S., the Eurozone sovereign debt crisis continued to fuel volatility in the global financial markets. In response to these pressures, the International Monetary Fund (IMF) announced a liquidity program designed to provide more favorable financing conditions for countries struggling with escalating borrowing costs. Despite the IMF’s efforts and the growth of the European Financial Stability Fund (EFSF), many Eurozone countries still faced increasing unemployment and worsening debt-to-Gross Domestic Product (GDP) ratios into the year end.
77
SC SM PIMCO HIGH YIELD FUND (Continued)
What key strategies were most responsible for the Fund’s performance during the year ended December 31, 2011?
The following strategies contributed to relative performance for the year:
| | • | | An overweight allocation to the Cable sector as select issuers benefited from merger and acquisition transactions in the sector. |
| | • | | An underweight to the Building Products sector as positive U.S. economic data negatively affected sectors that are more correlated to future economic growth. |
| | • | | Security selection within the Industrial sector as select issuers reported strong operating results. |
The following strategies detracted from relative performance for the year:
| | • | | An underweight allocation to the Energy sector as the sector outperformed given its defensive nature, in particular gas distributors and oil refiners. |
| | • | | Security selection within the Telecommunications sector as fixed-line and integrated providers outperformed their wireless provider counterparts. |
| | • | | An overweight allocation to the Transportation sector as a large default in the airline industry caused pressure on the sector, in addition to elevated fuel prices. |
What changes did you make to the Fund’s sector allocations during the year ended December 31, 2011 and how did these affect performance during the reporting period?
During the year, while maintaining an underweight to the Index, the Fund slightly increased its exposure to the Building Products sector and increased its overweight allocation to the Cable sector, which were positive contributors for performance. The Fund also reduced exposure to investment grade credit over the year. The reduction was positive in the latter part of the year as the market’s appetite for risk increased.
Did the Fund experience major changes to its top ten issuers during the year ended December 31, 2011?
There were no material changes to the December 31, 2011 top ten issuers list relative to the December 31, 2010 top ten issuers list.
How was the Fund positioned relative to its benchmark index at December 31, 2011?
At the end of the year, the Fund was positioned with an underweight to duration relative to the benchmark, as well as a slight curve flattening bias. From a sector perspective, the Fund was most overweight (ex-U.S. Treasuries) in developed Sovereigns, Chemicals, and Wireless. The three largest sector underweights in the Fund were to the Wirelines, Real Estate, and Home Construction credit sectors.
78
SC SM PIMCO HIGH YIELD FUND (Continued)
PORTFOLIO COMPOSITION AT DECEMBER 31, 2011*
Percentage of Net Assets
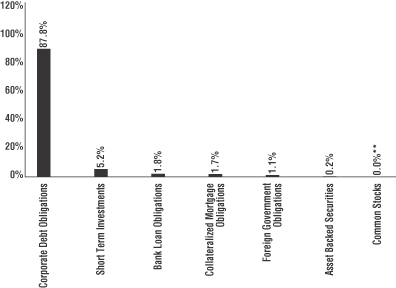
| * | The percentages shown for each investment category reflect the value of investments in that category as a percentage of net assets. Figures in the above graph may not total to 100% due to the exclusion of the Fund’s other assets and liabilities. |
| ** | Amount is less than 0.05%. |
TOP TEN ISSUERS AT DECEMBER 31, 2011
| | | | | | |
| | | % of Net Assets | | | Category |
U.S. Treasury | | | 4.8 | % | | U.S. Treasury |
Ford Motor Credit Co. LLC | | | 2.1 | | | Corporate Debt – Automotive |
Intelsat Jackson SA | | | 2.1 | | | Corporate Debt – Telecommunications |
Ally Financial, Inc. | | | 1.7 | | | Corporate Debt – Banks |
CIT Group, Inc. | | | 1.7 | | | Corporate Debt – Financials |
HCA, Inc. | | | 1.7 | | | Corporate Debt – Health Care |
Reynolds Group Issuer, Inc. | | | 1.6 | | | Corporate Debt – Holding Companies |
MGM Resorts International | | | 1.5 | | | Corporate Debt – Gaming |
International Lease Finance Corp. | | | 1.5 | | | Corporate Debt – Financials |
Sprint Nextel Corp. | | | 1.5 | | | Corporate Debt – Telecommunications |
79
SC SM PIMCO HIGH YIELD FUND (Continued)
Comparison of Change in Value of a $10,000 Investment in the SC PIMCO High Yield Fund – Initial Class and the BofA Merrill Lynch BB-B U.S. High Yield Constrained Index
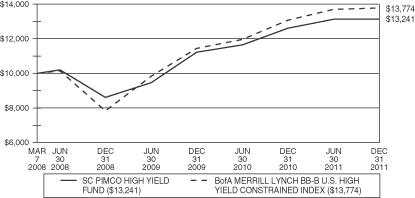
Comparison of Change in Value of a $10,000 Investment in the SC PIMCO High Yield Fund – Service Class and the BofA Merrill Lynch BB-B U.S. High Yield Constrained Index
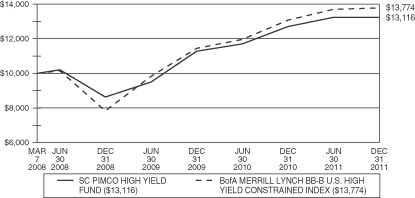
80
SC SM PIMCO HIGH YIELD FUND (Continued)
Average Annual Total Returns for Periods Ended December 31, 2011**
| | | | | | | | | | | | |
| | | One Year | | | Three Years | | | Life of
Fund*** | |
SC PIMCO High Yield Fund–Initial Class Shares | | | 4.26 | % | | | 15.36 | % | | | 7.62 | % |
SC PIMCO High Yield Fund–Service Class Shares | | | 4.01 | % | | | 15.07 | % | | | 7.36 | % |
BofA Merrill Lynch BB-B U.S. High Yield Constrained Index* | | | 5.40 | % | | | 20.71 | % | | | 8.75 | % |
*The performance data of the index has been prepared from sources and data that the investment adviser believes to be reliable, but no representation is made as to their accuracy. The index is unmanaged and cannot be invested in directly. The BofA Merrill Lynch BB-B U.S. High Yield Constrained Index contains all securities in the BofA Merrill Lynch U.S. High Yield Index rated BB1 through B3, based on an average of Moody’s, S&P and Fitch, but caps issuer exposure at 2%.
**Performance data is historical and includes changes in share price and reinvestment of income dividends and capital gains distributions. Past performance is no guarantee of future results. Performance may have changed materially since December 31, 2011. All Fund returns are net of fees and expenses, but do not include any insurance charges imposed in connection with your variable insurance contract. If this performance information included the effect of the insurance charges and the fees and expenses assumed by the investment adviser, performance numbers would be lower. The value of an investment in the SC PIMCO High Yield Fund and the return on the investment will fluctuate and redemption proceeds may be higher or lower than an investor’s original cost.
***For the period from March 7, 2008 (commencement of operations) to December 31, 2011.
81
SC SM PIMCO TOTAL RETURN FUND
(subadvised by Pacific Investment Management Company LLC)
MANAGEMENT’S DISCUSSION & ANALYSIS:
How did the Fund perform during the year ended December 31, 2011?
For the year ended December 31, 2011, the Initial and Service Class shares of SC PIMCO Total Return Fund (the “Fund”) returned 3.70% and 3.35%, respectively, underperforming the benchmark, the Barclays Capital U.S. Aggregate Bond Index (the “Index”), which returned 7.84% for the same period.
What economic and market factors most influenced the fixed income markets as a whole during the year ended December 31, 2011?
In 2011, the global financial markets consistently made headlines for their persistent volatility resulting from a variety of forces on both Main Street and Wall Street. At the start of 2011, fixed income sectors including Agency Fixed Rate Mortgages, Investment Grade Credit, and High Yield Credit generated positive returns, as measured by the excess return of these sectors relative to U.S. Treasuries as global markets struggled to absorb implications of intensified political unrest across the Middle East and North Africa, rising commodity prices and the earthquake and nuclear accidents in Japan. Yields on U.S. Treasuries rose overall amid signs of economic recovery in the U.S. and concerns the Federal Reserve’s (Fed’s) second round of U.S. Treasury bond purchases known as quantitative easing (QE2) might spark inflation. At the end of the first quarter of 2011, a confluence of events prompted a move toward the perceived safety of U.S. Treasuries.
With this flight to quality, U.S. Treasury yields fell in the second quarter as higher gasoline prices and lingering effects from Japan’s earthquake on the global supply chains curtailed U.S. growth. Concern about the sovereign debt crisis in the Eurozone further boosted demand for U.S. Treasuries. On June 30, the Fed ended its $600 billion QE2 program and indicated its intention to continue buying Treasuries with proceeds from maturing debt on its $2.9 trillion balance sheet. The Fed also reiterated its “extended period” language for a near-zero federal funds rate.
With the Fed’s continued participation in the financial markets, U.S. Treasury yields continued to fall in the third quarter as the U.S. debt ceiling debate, Standard & Poor’s downgrade of the U.S. long-term credit rating and concern about the sovereign debt crisis in Europe sparked a flight to safety and boosted demand for U.S. Treasuries. Additionally, the Eurozone sovereign debt crisis intensified as the likelihood of a Greek debt restructuring increased. Other European countries, including Ireland, Italy, and Spain continued to struggle with sovereign debt levels, increasing pressure on European leaders to develop a comprehensive policy response. In an effort to reinvigorate the faltering economy, the Fed launched “Operation Twist,” signaling its intent to buy $400 billion of long-dated U.S. Treasuries by the end of June 2012. To finance this program, the Fed agreed to sell Treasury securities with remaining maturities of 3 years or less to make financial conditions more accommodative by putting downward pressure on longer-term interest rates.
Following the Fed’s announcement of “Operation Twist”, most bonds gained during the fourth quarter, as global financial markets digested improving U.S. economic data and uncertainty surrounding the Eurozone sovereign debt crisis. A rebound in U.S. consumption towards the end of the year improved investor risk appetites and helped most fixed income sectors outperform U.S. Treasuries. Despite improving consumer confidence in the U.S., the Eurozone sovereign debt crisis continued to fuel volatility in the global financial markets. In response to these pressures, the International Monetary Fund (IMF) announced a liquidity program designed to provide more favorable financing conditions for countries struggling with escalating borrowing costs. Despite the IMF’s efforts and the growth of the European Financial Stability Fund (EFSF), many Eurozone countries still faced increasing unemployment and worsening debt-to-Gross Domestic Product (GDP) ratios into the year end.
82
SC SM PIMCO TOTAL RETURN FUND (Continued)
What key strategies were most responsible for the Fund’s performance during the year ended December 31, 2011?
The following strategies contributed to relative performance for the year:
| | • | | Exposure to non-U.S. interest rates in developed countries, particularly core Europe; where rates declined as investors searched for bonds of nations with stronger balance sheets and top credit ratings. |
| | • | | Exposure to money market futures, including Eurodollar and Euribor futures, as these contracts increased in price over the year. |
The following strategies detracted from relative performance for the year:
| | • | | U.S. duration and curve positioning during the year as rates fell as sequential balance sheet contamination reached European sovereign debt, and U.S. political dysfunction fed economic weakness and resulted in an historic sovereign debt downgrade. |
| | • | | An overweight to Financials which lagged the broader corporate market amid fears of a slowdown in global growth and uncertainty surrounding contagion related to European sovereign risk. |
| | • | | Exposure to emerging market currencies, as the U.S. Dollar strengthened as investors sought safety. |
| | • | | Mortgage positioning during the year as this sector underperformed U.S. Treasuries. |
| | • | | An underweight to longer dated U.S. Treasuries on the Treasury yield curve via interest rate swaps was a detractor to performance as the 30-year yield fell 144 basis points over the year. |
| | • | | An overweight to investment grade corporate debt, partially implemented via credit default swaps, was negative for performance as this sector underperformed U.S. Treasuries for the year. |
What changes did you make to the Fund’s sector allocations during the year ended December 31, 2011 and how did these affect performance during the reporting period?
Agency Mortgage Backed Securities (MBS) was an active component within the Fund, and the position relative to the benchmark moved meaningfully during the year. At the beginning of the year, the Fund was overweight Agency MBS before tactically moving to an underweight position during the summer and mid-year. This position was reversed and moved to an overweight position at the end of the third quarter, and the overweight was maintained at year-end. Agency MBS positioning was a detractor to performance as this sector underperformed like-duration U.S. Treasuries for the year. Additionally, the Fund decreased its exposure to high yield debt. High yield underperformed like-duration U.S. Treasuries over the year, a casualty of the risk averse environment. Finally, the Fund increased exposure to non-U.S. developed countries throughout the year. This exposure to non-U.S. interest rates, particularly in core Europe, added to returns as investors searched for bonds of nations with stronger balance sheets and top credit ratings.
Did the Fund experience major changes to its top ten issuers during the year ended December 31, 2011?
The Fund experienced material changes to its top ten issuers in 2011 as six new issuers joined the top ten issuers list at the end of 2011. Except for Government National Mortgage Association (GNMA) and Arkle Master Issuer PLC., the four issuers which were no longer on the Fund’s top ten issuers list when compared to the December 31, 2010 issuers list were still held by the Fund, but in reduced positions. The Fund’s positions in GNMA and Arkle Master Issuer PLC were eliminated during the year. Kells Funding LLC, Barclays Bank PLC and
83
SC SM PIMCO TOTAL RETURN FUND (Continued)
American International Group, Inc. were three new issuers on the Fund’s top ten issuers list at December 31, 2011 that were held by the Fund at December 31, 2010, but during the year, their position size expanded due to market fluctuations and/or additional purchases by the Fund such that they moved into the top ten issuers list. HBOS PLC, Springleaf Finance Corp. and BellSouth Corp. were three new issuers on the Fund’s top ten issuers list as of December 31, 2011 that the Fund invested during the year. Although FNMA and U.S. Treasury remained on the top ten issuers list at December 31, 2011, their positions were materially altered during the year as the Fund increased exposure to agency mortgages, as they are a source of high quality yield and offer favorable risk-adjusted returns relative to other sectors, and decreased the market value weight to U.S. Government debt. However, the Fund increased exposure to U.S. duration moving to an overweight relative to the benchmark, as the Fund concentrated on intermediate maturities that offer the best potential for price appreciation and “roll down” given the suppression of yields on shorter maturities.
How was the Fund positioned relative to its benchmark index at December 31, 2011?
At the end of the year, the Fund was positioned with a moderate overweight to duration relative to the benchmark, and a bias towards a steepening yield curve. From a sector perspective, the Fund is overweight mortgages and underweight investment grade credit. However, within the Fund’s investment grade credit allocation, the Fund was overweight in the Banks and Financials sectors. The Fund’s emerging markets allocation was also an overweight position relative to the Index.
PORTFOLIO COMPOSITION AT DECEMBER 31, 2011*
Percentage of Net Assets
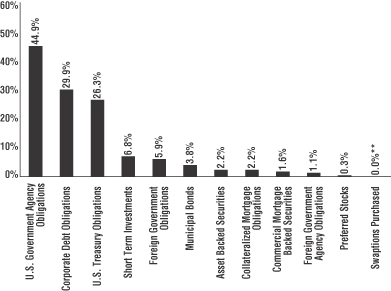
| * | The percentages shown for each investment category reflect the value of investments in that category as a percentage of net assets. Figures in the above graph may not total to 100% due to the exclusion of the Fund’s other assets and liabilities. |
| ** | Amount is less than 0.05%. |
84
SC SM PIMCO TOTAL RETURN FUND (Continued)
TOP TEN ISSUERS AT DECEMBER 31, 2011
| | | | | | |
| | | % of Net Assets | | | Category |
Federal National Mortgage Association | | | 44.6 | % | | U.S. Government Agency |
U.S. Treasury | | | 28.3 | | | U.S. Treasury |
Province of Ontario | | | 3.8 | | | Foreign Government |
Kells Funding LLC | | | 3.4 | | | Short Term Investments – Commercial Paper |
Citigroup, Inc. | | | 1.9 | | | Corporate Debt & Preferred Stocks – Banks |
Barclays Bank PLC | | | 1.5 | | | Corporate Debt – Banks |
HBOS PLC | | | 1.4 | | | Corporate Debt – Banks |
Springleaf Finance Corp. | | | 1.3 | | | Corporate Debt – Financials |
American International Group, Inc. | | | 1.0 | | | Corporate Debt – Insurance |
BellSouth Corp. | | | 1.0 | | | Corporate Debt – Telecommunications |
Comparison of Change in Value of a $10,000 Investment in the SC PIMCO Total Return Fund – Initial Class and the Barclays Capital U.S. Aggregate Bond Index
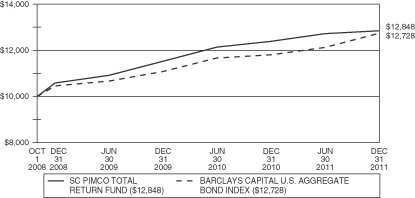
Comparison of Change in Value of a $10,000 Investment in the SC PIMCO Total Return Fund – Service Class and the Barclays Capital U.S. Aggregate Bond Index
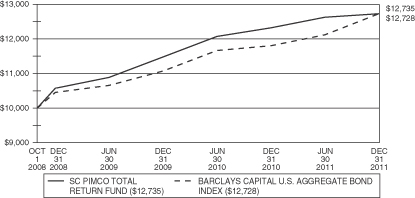
85
SC SM PIMCO TOTAL RETURN FUND (Continued)
Average Annual Total Returns for Periods Ended December 31, 2011**
| | | | | | | | | | | | |
| | | One Year | | | Three Years | | | Life of
Fund*** | |
SC PIMCO Total Return Fund–Initial Class Shares | | | 3.70 | % | | | 6.68 | % | | | 8.01 | % |
SC PIMCO Total Return Fund–Service Class Shares | | | 3.35 | % | | | 6.39 | % | | | 7.72 | % |
Barclays Capital U.S. Aggregate Bond Index* | | | 7.84 | % | | | 6.77 | % | | | 7.71 | % |
*The performance data of the index has been prepared from sources and data that the investment adviser believes to be reliable, but no representation is made as to their accuracy. The index is unmanaged and cannot be invested in directly. The Barclays Capital U.S. Aggregate Bond Index is a widely recognized market value-weighted index composed of U.S. Treasuries, agencies, credit, asset-backed securities, commercial mortgage-backed securities and mortgage-backed securities.
**Performance data is historical and includes changes in share price and reinvestment of income dividends and capital gains distributions. Past performance is no guarantee of future results. Performance may have changed materially since December 31, 2011. All Fund returns are net of fees and expenses, but do not include any insurance charges imposed in connection with your variable insurance contract. If this performance information included the effect of the insurance charges and the fees and expenses assumed by the investment adviser, performance numbers would be lower. The value of an investment in the SC PIMCO Total Return Fund and the return on the investment will fluctuate and redemption proceeds may be higher or lower than an investor’s original cost.
***For the period from October 1, 2008 (commencement of operations) to December 31, 2011.
86
SC SM IBBOTSON BALANCED, CONSERVATIVEAND GROWTH FUNDS
(subadvised by Ibbotson Associates, Inc.)
MANAGEMENT’S DISCUSSION & ANALYSIS:
How did the Funds perform during the year ended December 31, 2011?
For the year ended December 31, 2011, the Initial and Service Class shares of SC Ibbotson Balanced Fund (the “Balanced Fund”) returned (1.56)% and (1.81)%, respectively, underperforming the benchmark, the Dow Jones Moderate U.S. Relative Risk Portfolio Index, which returned 3.32% for the same period.
For the year ended December 31, 2011, the Initial and Service Class shares of SC Ibbotson Conservative Fund (the “Conservative Fund”) returned 0.97% and 0.63%, respectively, underperforming the benchmark, the Dow Jones Moderately Conservative U.S. Relative Risk Portfolio Index, which returned 5.07% for the same period.
For the year ended December 31, 2011, the Initial and Service Class shares of SC Ibbotson Growth Fund (the “Growth Fund”) returned (3.66)% and (3.90)%, respectively, underperforming the benchmark, the Dow Jones Moderately Aggressive U.S. Relative Risk Portfolio Index, which returned 1.45% for the same period.
What key economic and market factors most influenced management’s tactical asset allocation strategy for the Balanced, Conservative and Growth Funds (the “Funds”) during the year ended December 31, 2011?
2011 was dominated by sovereign debt issues. The year was a turbulent period with bond asset classes ending with positive returns, U.S. large cap equities ending with muted but positive returns, and U.S. small- and mid-cap equities and international equities performing poorly. To counteract the high volatility and uncertainty in the markets, the Funds aimed to balance diversification and de-risking throughout the year.
Stock prices in the U.S. increased in January and February on the back of positive economic data, positive earnings announcements, and a continued appetite for risk. It was not until the earthquake in Japan that the market saw large losses as evidenced by the S&P 500 Index, which lost approximately 5% of its value between March 10 and March 16. Over the following two weeks the index recovered all of the losses, closing the first quarter with a 4.6% gain. Emerging market equities underperformed developed market equities in January and February and strong growth and rising commodity prices forced policymakers to put in place inflation-fighting policies.
In the second quarter of 2011, risky assets reversed course and performed poorly as the global economy slowed down and markets feared the consequences of possible sovereign debt defaults in the Eurozone. Consequently, AAA-rated sovereign debt appreciated, credit spreads widened, developed market equities ended the quarter either flat or with small losses, and emerging market asset classes underperformed their developed market counterparts once again. Commodity prices fell, with the exception of oil, which suffered from the loss of Libyan output and OPEC’s decision to maintain current production levels. Real Estate Investment Trusts (REITs) outperformed equities, in a rally that left their valuations stretched.
For most of the first half of 2011, the Funds were positioned neutrally relative to strategic targets due to the Ibbotson Policy Committee’s (IPC) expectations that stocks and bonds would perform in-line with forecasts. At the end of June, Ibbotson’s IPC deemed the recent outperformance of U.S. property stocks left them with stretched valuation ratios that were hard to justify by fundamentals. Large-cap stocks exhibited the cheapest valuation within the U.S. equity space. As a result, the IPC recommended to underweight U.S. REITs and overweight U.S. large cap equities.
During the second half of the year, the world economy took a turn for the worse on concerns about looming sovereign debt defaults and the solvency of European banks, which in turn, triggered a large increase in financial volatility. Volatility rose initially after the downgrade of the U.S. credit rating by Standard and Poor’s. Continued
87
SC SM IBBOTSON BALANCED, CONSERVATIVEAND GROWTH FUNDS (Continued)
bad news from the Eurozone, and weaker-than-expected macroeconomic data continued the economic uncertainty. Along with higher volatility came higher correlation across asset classes. Overall, equity markets moved in unison, and sovereign yields in developed countries dropped. Broadly speaking, investors shunned equities in favor of fixed income; corporate debt in favor of sovereign debt; high-yield debt in favor of investment grade debt; and international equities in favor of U.S. equities. Sharp losses in the U.S. equity market and the widening of credit spreads combined with the downward revision of the economic outlook in the third quarter, increased the probability of another economic recession within the next six months in the U.S. Nearing the end of the year, better than-expected economic news in the U.S. and distance from the sovereign debt issues plaguing other parts of the world buoyed U.S. equities, with the S&P 500 Index making gains on earlier loses.
What changes did you make to the Funds’ allocations during the reporting year and how did it affect performance during the year ended December 31, 2011?
With the exception of the REIT underweight which contributed positively to performance, the tactical asset allocations slightly detracted from the Funds’ performance for the year.
The first half of the year was quiet in terms of tactical changes to the Funds’ allocations. At the beginning of June, the IPC conducted its annual review of the strategic asset allocations, which serve as long-term, neutral targets, and adjusted the underlying fund exposures accordingly. The Balanced and Conservative Funds initiated allocations to the SC BlackRock Small Cap Index Fund by reducing their exposure to the SC Goldman Sachs Mid Cap Value Fund. In the Growth Fund, the strategic exposure to small- and mid-cap equities was raised at the expense of large cap equities. The Funds slightly increased their allocations in SC BlackRock Small Cap Index, SC Invesco Small Cap Growth and SC WMC Blue Chip Mid Cap Funds, whereas the allocations to the SC Lord Abbett Growth & Income and MFS Value Funds were slightly reduced. The strategic adjustments detracted from performance in the Funds since large cap equities outperformed mid cap which, in turn, outperformed small cap equities for the year.
At the end of June, the IPC recommended an underweight in REITs and an overweight in U.S. large cap equities. In August, the IPC recommended to underweight U.S. small cap equities and high yield debt as well as to overweight U.S. large cap equities and investment grade corporate debt. As a result of these changes, the exposure to small cap equities was reduced in the Balanced and Conservative Funds by reducing the allocation to the SC Columbia Small Cap Value Fund and increasing the allocations to the MFS Value and SC BlackRock Large Cap Index Funds. The Balanced and Conservative Funds also reduced their exposure in the SC PIMCO High Yield Fund and reallocated assets to SC PIMCO Total Return and Sun Capital Investment Grade Bond Funds. In the Growth Fund, reduced positions in the SC Invesco Small Cap Growth, SC BlackRock Small Cap Index and SC Columbia Small Cap Value Funds were reallocated to the MFS Value and SC BlackRock Large Cap Index Funds.
In late September, the IPC recommended to further reduce risk in the Funds and overweight cash equivalents or short-term bonds at the expense of equities. This resulted in reduced exposures to the SC Davis Venture Value, SC Goldman Sachs Mid Cap Value, SC AllianceBernstein International Value and MFS International Growth Funds and reallocations to the SC Goldman Sachs Short Duration Fund.
In December, the IPC recommended to remove the underweight in high yield debt. However, no changes were made at the fund level since the asset class targets were effectively achieved due to increases in the underlying high yield exposures of the SC PIMCO Total Return and Sun Capital Investment Grade Bond Funds.
What key factors were responsible for the Funds’ performance during the year ended December 31, 2011?
In the volatile year of 2011, fixed income assets outperformed equities and among equity asset classes, U.S. equities outperformed non-U.S. developed and emerging market equities, growth stocks outperformed value
88
SC SM IBBOTSON BALANCED, CONSERVATIVEAND GROWTH FUNDS (Continued)
stocks, and large-cap equities outperformed mid-cap and small-cap equities. Among the fixed income asset classes, Treasury Inflation Protected Securities (TIPS) significantly outperformed all other bonds, and investment-grade bonds outperformed high yield and short-term bonds. Relative to basic, blended benchmarks of the S&P 500 and Barclays Capital U.S. Aggregate Bond indices, the SC Funds’ asset allocations and asset class diversification detracted from relative performance mainly due to strategic exposure to non-U.S. equities and short-term bonds.
The dynamic asset allocation weightings, discussed earlier, took an increasingly defensive posturing over the last half of the year which, in the third quarter contributed positively to performance relative to strategic targets but wound up slightly detracting from relative performance due to the strong outperformance of equities relative to bonds in the fourth quarter. Additionally, the underweight in REITs contributed positively to performance.
In the Balanced, Conservative, and Growth Funds, underlying fund-level performance detracted from overall performance relative to a weighted-average of indices representing our targeted asset class exposure across all Funds. The SC Lord Abbett Growth & Income, SC WMC Large Cap Growth, SC WMC Blue Chip Mid Cap, SC Ibbotson Tactical Opportunities and SC Davis Venture Value Funds experienced the largest underperformance relative to their respective benchmarks during the year.
Which underlying funds were the most significant contributors/detractors to the Funds’ performance for the year ended December 31, 2011?
Balanced Fund
The SC BlackRock Inflation Protected Bond, Sun Capital Investment Grade Bond, SC PIMCO Total Return, SC Goldman Sachs Mid Cap Value and SC PIMCO High Yield Funds were the top positive contributors to the Balanced Fund’s absolute performance. The SC Ibbotson Tactical Opportunities, MFS International Growth, SC AllianceBernstein International Value, MFS Emerging Markets Equity and SC BlackRock International Index Funds were the most significant detractors to the Balanced Fund’s absolute performance for the year.
Conservative Fund
The SC BlackRock Inflation Protected Bond, Sun Capital Investment Grade Bond, SC PIMCO Total Return, SC PIMCO High Yield, and SC Goldman Sachs Mid Cap Value Funds were the top positive contributors to the Conservative Fund’s absolute performance. The SC Ibbotson Tactical Opportunities, SC AllianceBernstein International Value, MFS International Growth, SC WMC Blue Chip Mid Cap and SC BlackRock International Index Funds were the most significant detractors to the Conservative Fund’s absolute performance for the year.
Growth Fund
The SC BlackRock Inflation Protected Bond, SC PIMCO Total Return, Sun Capital Investment Grade Bond, MFS Value and SC Goldman Sachs Mid Cap Value Funds were the top positive contributors to the Growth Fund’s absolute performance. The SC Ibbotson Tactical Opportunities, MFS International Growth, SC AllianceBernstein International Value, SC WMC Blue Chip Mid Cap and MFS Emerging Markets Equity Funds were the most significant detractors to the Growth Fund’s absolute performance for the year.
89
SC SM IBBOTSON BALANCED FUND
PORTFOLIO COMPOSITION AT DECEMBER 31, 2011*
Percentage of Net Assets
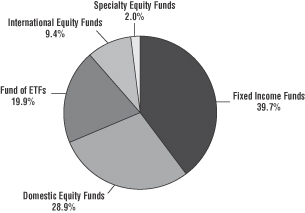
| * | The percentages shown for each investment category reflect the value of investments in that category as a percentage of net assets. Figures in the above graph may not total to 100% due to the exclusion of the Fund’s other assets and liabilities. |
TOP TEN INVESTMENT COMPANIES AT DECEMBER 31, 2011
| | | | | | |
| | | % of Net Assets | | | Category |
SC Ibbotson Tactical Opportunities Fund | | | 19.9 | % | | Fund of ETFs |
SC Goldman Sachs Short Duration Fund | | | 11.9 | | | Fixed Income |
SC PIMCO Total Return Fund | | | 10.0 | | | Fixed Income |
Sun Capital Investment Grade Bond Fund | | | 8.0 | | | Fixed Income |
SC BlackRock Inflation Protected Bond Fund | | | 6.9 | | | Fixed Income |
MFS Value Portfolio | | | 5.5 | | | Domestic Equity |
SC WMC Large Cap Growth Fund | | | 4.5 | | | Domestic Equity |
SC BlackRock Large Cap Index Fund | | | 3.8 | | | Domestic Equity |
SC Davis Venture Value Fund | | | 3.6 | | | Domestic Equity |
MFS International Growth Portfolio | | | 3.5 | | | International Equity |
90
SC SM IBBOTSON BALANCED FUND (Continued)
Comparison of Change in Value of a $10,000 Investment in the SC Ibbotson Balanced Fund – Initial Class and the Dow Jones Moderate U.S. Relative Risk Portfolio Index
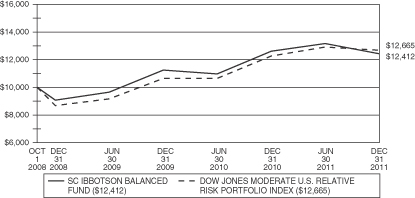
Comparison of Change in Value of a $10,000 Investment in the SC Ibbotson Balanced Fund – Service Class and the Dow Jones Moderate U.S. Relative Risk Portfolio Index
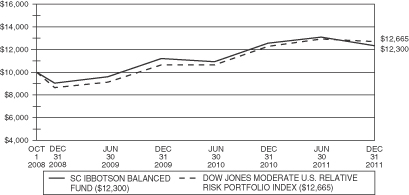
91
SC SM IBBOTSON BALANCED FUND (Continued)
Average Annual Total Returns for Periods Ended December 31, 2011**
| | | | | | | | | | | | |
| | | One Year | | | Three Years | | | Life of
Fund*** | |
SC Ibbotson Balanced Fund–Initial Class Shares | | | (1.56 | )% | | | 11.02 | % | | | 6.87 | % |
SC Ibbotson Balanced Fund–Service Class Shares | | | (1.81 | )% | | | 10.73 | % | | | 6.57 | % |
Dow Jones Moderate U.S. Relative Risk Portfolio Index* | | | 3.32 | % | | | 13.43 | % | | | 7.54 | % |
*The performance data of the index has been prepared from sources and data that the investment adviser believes to be reliable, but no representation is made as to their accuracy. The index is unmanaged and cannot be invested in directly. The Dow Jones Relative Risk Indices measure the performance of conservative, moderate and aggressive portfolios based on incremental levels of potential risk. The indices are designed to systematically measure various levels of risk relative to the risk of a U.S. all-stock index. The Dow Jones Moderate U.S. Relative Risk Portfolio Index consists of 60% equities and 40% fixed income.
**Performance data is historical and includes changes in share price and reinvestment of income dividends and capital gains distributions. Past performance is no guarantee of future results. Performance may have changed materially since December 31, 2011. All Fund returns are net of fees and expenses, but do not include any insurance charges imposed in connection with your variable insurance contract. If this performance information included the effect of the insurance charges and the fees and expenses assumed by the investment adviser, performance numbers would be lower. The value of an investment in the SC Ibbotson Balanced Fund and the return on the investment will fluctuate and redemption proceeds may be higher or lower than an investor’s original cost.
***For the period from October 1, 2008 (commencement of operations) to December 31, 2011.
92
SC SM IBBOTSON CONSERVATIVE FUND
PORTFOLIO COMPOSITION AT DECEMBER 31, 2011*
Percentage of Net Assets
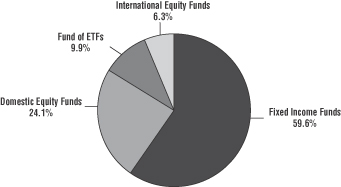
| * | The percentages shown for each investment category reflect the value of investments in that category as a percentage of net assets. Figures in the above graph may not total to 100% due to the exclusion of the Fund’s other assets and liabilities. |
TOP TEN INVESTMENT COMPANIES AT DECEMBER 31, 2011
| | | | | | |
| | | % of Net Assets | | | Category |
SC Goldman Sachs Short Duration Fund | | | 19.3 | % | | Fixed Income |
SC PIMCO Total Return Fund | | | 12.7 | | | Fixed Income |
SC BlackRock Inflation Protected Bond Fund | | | 11.8 | | | Fixed Income |
Sun Capital Investment Grade Bond Fund | | | 11.7 | | | Fixed Income |
SC Ibbotson Tactical Opportunities Fund | | | 9.9 | | | Fund of ETFs |
MFS Value Portfolio | | | 4.8 | | | Domestic Equity |
SC PIMCO High Yield Fund | | | 4.0 | | | Fixed Income |
SC WMC Large Cap Growth Fund | | | 4.0 | | | Domestic Equity |
SC BlackRock Large Cap Index Fund | | | 3.3 | | | Domestic Equity |
SC WMC Blue Chip Mid Cap Fund | | | 3.0 | | | Domestic Equity |
93
SC SM IBBOTSON CONSERVATIVE FUND (Continued)
Comparison of Change in Value of a $10,000 Investment in the SC Ibbotson Conservative Fund – Initial Class and the Dow Jones Moderately Conservative U.S. Relative Risk Portfolio Index
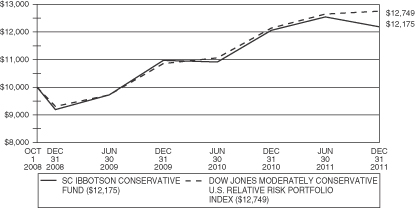
Comparison of Change in Value of a $10,000 Investment in the SC Ibbotson Conservative Fund – Service Class and the Dow Jones Moderately Conservative U.S. Relative Risk Portfolio Index

94
SC SM IBBOTSON CONSERVATIVE FUND (Continued)
Average Annual Total Returns for Periods Ended December 31, 2011**
| | | | | | | | | | | | |
| | | One Year | | | Three Years | | | Life of
Fund*** | |
SC Ibbotson Conservative Fund–Initial Class Shares | | | 0.97 | % | | | 9.83 | % | | | 6.24 | % |
SC Ibbotson Conservative Fund–Service Class Shares | | | 0.63 | % | | | 9.57 | % | | | 5.97 | % |
Dow Jones Moderately Conservative U.S. Relative Risk Portfolio Index* | | | 5.07 | % | | | 11.09 | % | | | 7.76 | % |
*The performance data of the index has been prepared from sources and data that the investment adviser believes to be reliable, but no representation is made as to their accuracy. The index is unmanaged and cannot be invested in directly. The Dow Jones Relative Risk Indices measure the performance of conservative, moderate and aggressive portfolios based on incremental levels of potential risk. The indices are designed to systematically measure various levels of risk relative to the risk of a U.S. all-stock index. The Dow Jones Moderately Conservative U.S. Relative Risk Portfolio Index consists of 40% equities and 60% fixed income.
**Performance data is historical and includes changes in share price and reinvestment of income dividends and capital gains distributions. Past performance is no guarantee of future results. Performance may have changed materially since December 31, 2011. All Fund returns are net of fees and expenses, but do not include any insurance charges imposed in connection with your variable insurance contract. If this performance information included the effect of the insurance charges and the fees and expenses assumed by the investment adviser, performance numbers would be lower. The value of an investment in the SC Ibbotson Conservative Fund and the return on the investment will fluctuate and redemption proceeds may be higher or lower than an investor’s original cost.
***For the period from October 1, 2008 (commencement of operations) to December 31, 2011.
95
SC SM IBBOTSON GROWTH FUND
PORTFOLIO COMPOSITION AT DECEMBER 31, 2011*
Percentage of Net Assets
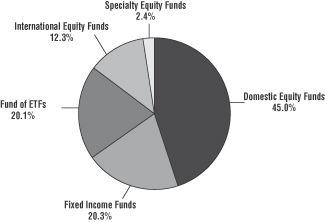
| * | The percentages shown for each investment category reflect the value of investments in that category as a percentage of net assets. Figures in the above graph may not total to 100% due to the exclusion of the Fund’s other assets and liabilities. |
TOP TEN INVESTMENT COMPANIES AT DECEMBER 31, 2011
| | | | | | |
| | | % of Net Assets | | | Category |
SC Ibbotson Tactical Opportunities Fund | | | 20.1 | % | | Fund of ETFs |
SC PIMCO Total Return Fund | | | 8.3 | | | Fixed Income |
SC Davis Venture Value Fund | | | 7.7 | | | Domestic Equity |
SC WMC Large Cap Growth Fund | | | 7.3 | | | Domestic Equity |
MFS Value Portfolio | | | 6.7 | | | Domestic Equity |
SC BlackRock Large Cap Index Fund | | | 5.6 | | | Domestic Equity |
MFS International Growth Portfolio | | | 5.5 | | | International Equity |
SC WMC Blue Chip Mid Cap Fund | | | 5.1 | | | Domestic Equity |
SC Goldman Sachs Mid Cap Value Fund | | | 4.7 | | | Domestic Equity |
Sun Capital Investment Grade Bond Fund | | | 4.4 | | | Fixed Income |
96
SC SM IBBOTSON GROWTH FUND (Continued)
Comparison of Change in Value of a $10,000 Investment in the SC Ibbotson Growth Fund – Initial Class and the Dow Jones Moderately Aggressive U.S. Relative Risk Portfolio Index

Comparison of Change in Value of a $10,000 Investment in the SC Ibbotson Growth Fund – Service Class and the Dow Jones Moderately Aggressive U.S. Relative Risk Portfolio Index
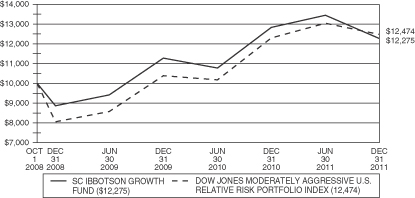
97
SC SM IBBOTSON GROWTH FUND (Continued)
Average Annual Total Returns for Periods Ended December 31, 2011**
| | | | | | | | | | | | |
| | | One Year | | | Three Years | | | Life of
Fund*** | |
SC Ibbotson Growth Fund–Initial Class Shares | | | (3.66 | )% | | | 11.71 | % | | | 6.75 | % |
SC Ibbotson Growth Fund–Service Class Shares | | | (3.90 | )% | | | 11.44 | % | | | 6.51 | % |
Dow Jones Moderately Aggressive U.S. Relative Risk Portfolio Index* | | | 1.45 | % | | | 15.64 | % | | | 7.04 | % |
*The performance data of the index has been prepared from sources and data that the investment adviser believes to be reliable, but no representation is made as to their accuracy. The index is unmanaged and cannot be invested in directly. The Dow Jones Relative Risk Indices measure the performance of conservative, moderate and aggressive portfolios based on incremental levels of potential risk. The indices are designed to systematically measure various levels of risk relative to the risk of a U.S. all-stock index. The Dow Jones Moderately Aggressive U.S. Relative Risk Portfolio Index consists of 80% equities and 20% fixed income.
**Performance data is historical and includes changes in share price and reinvestment of income dividends and capital gains distributions. Past performance is no guarantee of future results. Performance may have changed materially since December 31, 2011. All Fund returns are net of fees and expenses, but do not include any insurance charges imposed in connection with your variable insurance contract. If this performance information included the effect of the insurance charges and the fees and expenses assumed by the investment adviser, performance numbers would be lower. The value of an investment in the SC Ibbotson Growth Fund and the return on the investment will fluctuate and redemption proceeds may be higher or lower than an investor’s original cost.
***For the period from October 1, 2008 (commencement of operations) to December 31, 2011.
98
EXPENSE INFORMATION
December 31, 2011 (Unaudited)
Information About Your Fund’s Expenses
All mutual funds incur ongoing operating expenses, including management fees and administrative services, among others. The following table is intended to increase your understanding of the ongoing costs of investing in each Fund. The following example is based on the investment of $1,000 at the beginning of the period and held for the entire period, July 1, 2011 to December 31, 2011. Expense information does not include any insurance charges imposed in connection with your variable insurance contract.
Actual Expenses: The table below provides information about actual account values and actual expenses. You may use the actual account values and actual expense information below, together with the amount you invested, to estimate the expenses you paid over the period. To do so, simply divide your account value by $1,000 (for example, an $8,600 account value divided by $1,000 = 8.6), then multiply the result by the number given for your Fund under the heading “Actual Expenses Paid During Period”. In addition, SC Ibbotson Tactical Opportunities Fund, SC Ibbotson Balanced Fund, SC Ibbotson Conservative Fund and SC Ibbotson Growth Fund, as shareholders in underlying funds, indirectly bear a pro rata share of the fees and expenses incurred by the underlying funds. These fees and expenses are not included in the annualized expense ratios used to calculate the “Net Expense Ratio During Period” for the Funds.
Hypothetical (5% annual return before expenses): The table below also provides information about hypothetical account values and hypothetical expenses for comparison purposes. The hypothetical account values and hypothetical expenses are based on each Fund’s actual expense ratio and an assumed rate of return of 5% per year before expenses, which is not the actual return of the Fund. The hypothetical account values and expenses may not be used to estimate the actual ending account balance or expenses you paid for the period. However, you may use this information to compare the ongoing costs of investing in the Funds with the hypothetical examples that appear in the shareholder reports of other mutual funds. In addition, SC Ibbotson Tactical Opportunities Fund, SC Ibbotson Balanced Fund, SC Ibbotson Conservative Fund and SC Ibbotson Growth Fund, as shareholders in underlying funds, indirectly bear a pro rata share of the fees and expenses incurred by the underlying funds. These fees and expenses are not included in the annualized expense ratios used to calculate the “Net Expense Ratio During Period” for the Funds.
Expense Information
| | | | | | | | | | | | | | | | | | | | | | | | |
| | | Beginning
Account
Value
7/1/11 | | | Actual
Ending
Account
Value
12/31/11 | | | Hypothetical
Ending
Account
Value
12/31/11 | | | Actual
Expenses
Paid
During
Period* | | | Hypothetical
Expenses
Paid During
Period* | | | Net
Expense
Ratio
During
Period | |
SC AllianceBernstein International Value Fund | | | | | | | | | | | | | | | | | | | | | | | | |
Initial Class | | $ | 1,000.00 | | | $ | 807.50 | | | $ | 1,021.37 | | | $ | 3.46 | | | $ | 3.87 | | | | 0.76 | % |
Service Class | | | 1,000.00 | | | | 807.40 | | | | 1,020.11 | | | | 4.60 | | | | 5.14 | | | | 1.01 | |
SC BlackRock International Index Fund | | | | | | | | | | | | | | | | | | | | | |
Initial Class | | | 1,000.00 | | | | 832.10 | | | | 1,022.13 | | | | 2.82 | | | | 3.11 | | | | 0.61 | |
Service Class | | | 1,000.00 | | | | 830.60 | | | | 1,020.87 | | | | 3.97 | | | | 4.38 | | | | 0.86 | |
SC BlackRock Large Cap Index Fund | | | | | | | | | | | | | | | | | | | | | | | | |
Initial Class | | | 1,000.00 | | | | 960.50 | | | | 1,022.63 | | | | 2.52 | | | | 2.60 | | | | 0.51 | |
Service Class | | | 1,000.00 | | | | 958.80 | | | | 1,021.37 | | | | 3.75 | | | | 3.87 | | | | 0.76 | |
SC BlackRock Small Cap Index Fund | | | | | | | | | | | | | | | | | | | | | | | | |
Initial Class | | | 1,000.00 | | | | 899.20 | | | | 1,022.13 | | | | 2.92 | | | | 3.11 | | | | 0.61 | |
Service Class | | | 1,000.00 | | | | 897.80 | | | | 1,020.87 | | | | 4.11 | | | | 4.38 | | | | 0.86 | |
SC Goldman Sachs Mid Cap Value Fund | | | | | | | | | | | | | | | | | | | | | |
Initial Class | | | 1,000.00 | | | | 937.40 | | | | 1,019.86 | | | | 5.18 | | | | 5.40 | | | | 1.06 | |
Service Class | | | 1,000.00 | | | | 936.80 | | | | 1,018.60 | | | | 6.40 | | | | 6.67 | | | | 1.31 | |
SC Columbia Small Cap Value Fund | | | | | | | | | | | | | | | | | | | | | | | | |
Initial Class | | | 1,000.00 | | | | 908.40 | | | | 1,019.36 | | | | 5.58 | | | | 5.90 | | | | 1.16 | |
Service Class | | | 1,000.00 | | | | 907.30 | | | | 1,018.10 | | | | 6.78 | | | | 7.17 | | | | 1.41 | |
| * | For each class of the Fund, expenses are equal to the six-month annualized expense ratio for the class, multiplied by the average account value over the period, multiplied by 184/365 to reflect the most recent six-month period. |
99
EXPENSE INFORMATION (Continued)
December 31, 2011 (Unaudited)
| | | | | | | | | | | | | | | | | | | | | | | | |
| | | Beginning
Account
Value
7/1/11 | | | Actual
Ending
Account
Value
12/31/11 | | | Hypothetical
Ending
Account
Value
12/31/11 | | | Actual
Expenses
Paid
During
Period* | | | Hypothetical
Expenses
Paid During
Period* | | | Net
Expense
Ratio
During
Period | |
SC Davis Venture Value Fund | | | | | | | | | | | | | | | | | | | | | | | | |
Initial Class | | $ | 1,000.00 | | | $ | 936.00 | | | $ | 1,020.92 | | | $ | 4.15 | | | $ | 4.33 | | | | 0.85 | % |
Service Class | | | 1,000.00 | | | | 935.00 | | | | 1,019.66 | | | | 5.36 | | | | 5.60 | | | | 1.10 | |
SC Invesco Small Cap Growth Fund | | | | | | | | | | | | | | | | | | | | | | | | |
Initial Class | | | 1,000.00 | | | | 885.90 | | | | 1,019.36 | | | | 5.51 | | | | 5.90 | | | | 1.16 | |
Service Class | | | 1,000.00 | | | | 884.90 | | | | 1,018.10 | | | | 6.70 | | | | 7.17 | | | | 1.41 | |
SC Lord Abbett Growth & Income Fund | | | | | | | | | | | | | | | | | | | | | |
Initial Class | | | 1,000.00 | | | | 914.70 | | | | 1,020.77 | | | | 4.25 | | | | 4.48 | | | | 0.88 | |
Service Class | | | 1,000.00 | | | | 913.20 | | | | 1,019.51 | | | | 5.45 | | | | 5.75 | | | | 1.13 | |
SC WMC Blue Chip Mid Cap Fund | | | | | | | | | | | | | | | | | | | | | |
Initial Class | | | 1,000.00 | | | | 864.20 | | | | 1,020.37 | | | | 4.51 | | | | 4.89 | | | | 0.96 | |
Service Class | | | 1,000.00 | | | | 862.70 | | | | 1,019.11 | | | | 5.68 | | | | 6.16 | | | | 1.21 | |
SC WMC Large Cap Growth Fund | | | | | | | | | | | | | | | | | | | | | |
Initial Class | | | 1,000.00 | | | | 908.80 | | | | 1,020.62 | | | | 4.38 | | | | 4.63 | | | | 0.91 | |
Service Class | | | 1,000.00 | | | | 907.80 | | | | 1,019.36 | | | | 5.58 | | | | 5.90 | | | | 1.16 | |
Sun Capital Global Real Estate Fund | | | | | | | | | | | | | | | | | | | | | |
Initial Class | | | 1,000.00 | | | | 874.40 | | | | 1,019.71 | | | | 5.15 | | | | 5.55 | | | | 1.09 | |
Service Class | | | 1,000.00 | | | | 874.10 | | | | 1,018.45 | | | | 6.33 | | | | 6.82 | | | | 1.34 | |
SC Ibbotson Tactical Opportunities Fund | | | | | | | | | | | | | | | | | | | | | |
Initial Class | | | 1,000.00 | | | | 891.60 | | | | 1,022.99 | | | | 2.10 | | | | 2.24 | | | | 0.44 | |
Sun Capital Investment Grade Bond Fund | | | | | | | | | | | | | | | | | | | | | |
Initial Class | | | 1,000.00 | | | | 1,030.80 | | | | 1,021.68 | | | | 3.58 | | | | 3.57 | | | | 0.70 | |
Service Class | | | 1,000.00 | | | | 1,029.50 | | | | 1,020.42 | | | | 4.86 | | | | 4.84 | | | | 0.95 | |
Sun Capital Money Market Fund | | | | | | | | | | | | | | | | | | | | | |
Initial Class | | | 1,000.00 | | | | 1,000.60 | | | | 1,025.21 | | | | 0.00 | | | | 0.00 | | | | 0.00 | |
Service Class | | | 1,000.00 | | | | 1,000.00 | | | | 1,024.60 | | | | 0.60 | | | | 0.61 | | | | 0.12 | |
SC BlackRock Inflation Protected Bond Fund | | | | | | | | | | | | | | | | | | | | | |
Initial Class | | | 1,000.00 | | | | 1,062.90 | | | | 1,021.88 | | | | 3.43 | | | | 3.36 | | | | 0.66 | |
Service Class | | | 1,000.00 | | | | 1,062.10 | | | | 1,020.62 | | | | 4.73 | | | | 4.63 | | | | 0.91 | |
SC Goldman Sachs Short Duration Fund | | | | | | | | | | | | | | | | | | | | | |
Initial Class | | | 1,000.00 | | | | 997.60 | | | | 1,021.93 | | | | 3.27 | | | | 3.31 | | | | 0.65 | |
Service Class | | | 1,000.00 | | | | 995.30 | | | | 1,020.67 | | | | 4.53 | | | | 4.58 | | | | 0.90 | |
SC PIMCO High Yield Fund | | | | | | | | | | | | | | | | | | | | | |
Initial Class | | | 1,000.00 | | | | 1,000.50 | | | | 1,021.42 | | | | 3.78 | | | | 3.82 | | | | 0.75 | |
Service Class | | | 1,000.00 | | | | 999.30 | | | | 1,020.16 | | | | 5.04 | | | | 5.09 | | | | 1.00 | |
SC PIMCO Total Return Fund | | | | | | | | | | | | | | | | | | | | | |
Initial Class | | | 1,000.00 | | | | 1,010.40 | | | | 1,021.88 | | | | 3.34 | | | | 3.36 | | | | 0.66 | |
Service Class | | | 1,000.00 | | | | 1,008.20 | | | | 1,020.62 | | | | 4.61 | | | | 4.63 | | | | 0.91 | |
SC Ibbotson Balanced Fund | | | | | | | | | | | | | | | | | | | | | |
Initial Class | | | 1,000.00 | | | | 942.50 | | | | 1,024.30 | | | | 0.88 | | | | 0.92 | | | | 0.18 | |
Service Class | | | 1,000.00 | | | | 940.80 | | | | 1,023.04 | | | | 2.10 | | | | 2.19 | | | | 0.43 | |
SC Ibbotson Conservative Fund | | | | | | | | | | | | | | | | | | | | | |
Initial Class | | | 1,000.00 | | | | 971.00 | | | | 1,024.20 | | | | 0.99 | | | | 1.02 | | | | 0.20 | |
Service Class | | | 1,000.00 | | | | 969.30 | | | | 1,022.94 | | | | 2.23 | | | | 2.29 | | | | 0.45 | |
SC Ibbotson Growth Fund | | | | | | | | | | | | | | | | | | | | | |
Initial Class | | | 1,000.00 | | | | 919.10 | | | | 1,024.15 | | | | 1.02 | | | | 1.07 | | | | 0.21 | |
Service Class | | | 1,000.00 | | | | 918.30 | | | | 1,022.89 | | | | 2.22 | | | | 2.35 | | | | 0.46 | |
| * | For each class of the Fund, expenses are equal to the six-month annualized expense ratio for the class, multiplied by the average account value over the period, multiplied by 184/365 to reflect the most recent six-month period. |
100
SC SM ALLIANCEBERNSTEIN INTERNATIONAL VALUE FUND
| | |
PORTFOLIOOF INVESTMENTS December 31, 2011 | | Sun Capital Advisers Trust |
| | | | | | | | | | | | |
| | | Country
Code** | | | Shares | | | Value | |
| | | | | | | | | | | | |
| | | | | | | | | | | | |
COMMON STOCKS – 96.5% | |
AEROSPACE & DEFENSE – 0.6% | | | | | |
BAE Systems PLC | | | GB | | | | 48,700 | | | $ | 215,624 | |
Saab AB, Class B | | | SE | | | | 12,100 | | | | 250,367 | |
| | | | | | | | | | | | |
| | | | | | | | | | | 465,991 | |
| | | | | | | | | | | | |
AIRLINES – 0.6% | | | | | |
Cathay Pacific Airways Ltd. | | | HK | | | | 137,000 | | | | 234,960 | |
Deutsche Luftansa AG | | | DE | | | | 17,400 | | | | 206,846 | |
| | | | | | | | | | | | |
| | | | | | | | | | | 441,806 | |
| | | | | | | | | | | | |
AUTO COMPONENTS – 2.3% | | | | | |
Bridgestone Corp. | | | JP | | | | 22,400 | | | | 507,834 | |
Compagnie Generale Des Etablissements Michelin, Class B | | | FR | | | | 2,400 | | | | 141,876 | |
Faurecia | | | FR | | | | 7,400 | | | | 140,310 | |
GKN PLC | | | GB | | | | 112,200 | | | | 318,871 | |
Magna International, Inc. | | | CA | | | | 10,900 | | | | 363,779 | |
Sumitomo Rubber Industries Ltd. | | | JP | | | | 16,700 | | | | 200,478 | |
| | | | | | | | | | | | |
| | | | | | | | | | | 1,673,148 | |
| | | | | | | | | | | | |
AUTOMOBILES – 3.8% | | | | | |
Bayerische Motoren Werke AG | | | DE | | | | 5,500 | | | | 368,447 | |
Daimler AG | | | DE | | | | 5,800 | | | | 254,626 | |
Mazda Motor Corp.* | | | JP | | | | 190,000 | | | | 335,715 | |
Nissan Motor Co., Ltd. | | | JP | | | | 75,900 | | | | 682,380 | |
Renault SA | | | FR | | | | 15,050 | | | | 522,023 | |
Toyota Motor Corp. | | | JP | | | | 18,500 | | | | 616,507 | |
| | | | | | | | | | | | |
| | | | | | | | | | | 2,779,698 | |
| | | | | | | | | | | | |
BEVERAGES – 0.6% | | | | | |
Asahi Breweries Ltd. | | | JP | | | | 20,400 | | | | 447,915 | |
| | | | | | | | | | | | |
BUILDING PRODUCTS – 0.8% | | | | | |
Asahi Glass Co., Ltd. | | | JP | | | | 53,000 | | | | 444,823 | |
Compagnie de Saint-Gobain | | | FR | | | | 2,660 | | | | 102,128 | |
| | | | | | | | | | | | |
| | | | | | | | | | | 546,951 | |
| | | | | | | | | | | | |
CAPITAL MARKETS – 1.1% | | | | | |
Deutsche Bank AG | | | DE | | | | 13,880 | | | | 528,776 | |
Macquarie Group Ltd. | | | AU | | | | 10,600 | | | | 257,924 | |
| | | | | | | | | | | | |
| | | | | | | | | | | 786,700 | |
| | | | | | | | | | | | |
| | | | | | | | | | | | |
| | | Country
Code** | | | Shares | | | Value | |
| | | | | | | | | | | | |
| | | | | | | | | | | | |
CHEMICALS – 3.7% | | | | | |
Agrium, Inc. | | | CA | | | | 2,200 | | | $ | 147,667 | |
BASF SE | | | DE | | | | 6,600 | | | | 460,331 | |
DIC Corp. | | | JP | | | | 80,000 | | | | 145,511 | |
Incitec Pivot Ltd. | | | AU | | | | 87,000 | | | | 276,739 | |
JSR Corp. | | | JP | | | | 15,400 | | | | 284,111 | |
Koninklijke DSM NV | | | NL | | | | 13,010 | | | | 603,649 | |
Linde AG | | | DE | | | | 1,100 | | | | 163,651 | |
Mitsubishi Gas Chemical Co., Inc. | | | JP | | | | 22,000 | | | | 122,048 | |
Syngenta AG* | | | CH | | | | 727 | | | | 212,845 | |
Tosoh Corp. | | | JP | | | | 32,000 | | | | 85,644 | |
Ube Industries Ltd. | | | JP | | | | 73,000 | | | | 200,117 | |
| | | | | | | | | | | | |
| | | | | | | | | | | 2,702,313 | |
| | | | | | | | | | | | |
COMMERCIAL BANKS – 9.4% | | | | | |
Australia & New Zealand Banking Group Ltd. | | | AU | | | | 31,300 | | | | 657,240 | |
Banco Bilbao Vizcaya Argentaria SA | | | ES | | | | 29,000 | | | | 250,722 | |
Banco do Brasil SA | | | BR | | | | 8,100 | | | | 102,919 | |
Banco Santander SA | | | ES | | | | 18,100 | | | | 137,510 | |
Barclays PLC | | | GB | | | | 98,700 | | | | 269,851 | |
BNP Paribas | | | FR | | | | 10,519 | | | | 413,192 | |
BOC Hong Kong Holdings Ltd. | | | HK | | | | 104,000 | | | | 246,388 | |
HSBC Holdings PLC | | | GB | | | | 109,225 | | | | 832,951 | |
KB Financial Group, Inc. ADR* | | | KR | | | | 2,247 | | | | 70,421 | |
KBC GROEP NV | | | BE | | | | 14,400 | | | | 181,359 | |
Lloyds Banking Group PLC* | | | GB | | | | 810,700 | | | | 326,148 | |
Mitsubishi UFJ Financial Group, Inc. | | | JP | | | | 158,800 | | | | 674,647 | |
Mizuho Financial Group, Inc. | | | JP | | | | 175,200 | | | | 236,726 | |
National Australia Bank Ltd. | | | AU | | | | 35,900 | | | | 857,745 | |
National Bank of Canada | | | CA | | | | 3,700 | | | | 262,005 | |
Societe Generale | | | FR | | | | 25,064 | | | | 558,115 | |
Sumitomo Mitsui Financial Group, Inc. | | | JP | | | | 18,900 | | | | 526,460 | |
The Bank of Yokohama Ltd. | | | JP | | | | 31,000 | | | | 146,603 | |
Turkiye Is Bankasi, C Shares | | | TR | | | | 30,700 | | | | 53,659 | |
| | | | | | | | | | | | |
| | | | | | | | | | | 6,804,661 | |
| | | | | | | | | | | | |
See Notes to Financial Statements.
101
SC SM ALLIANCEBERNSTEIN INTERNATIONAL VALUE FUND
| | |
PORTFOLIOOF INVESTMENTS (Continued) December 31, 2011 | | Sun Capital Advisers Trust |
| | | | | | | | | | | | |
| | | Country
Code** | | | Shares | | | Value | |
| | | | | | | | | | | | |
| | | | | | | | | | | | |
COMMUNICATIONS EQUIPMENT – 0.3% | | | | | |
Telefonaktiebolaget LM Ericsson | | | SE | | | | 22,309 | | | $ | 228,210 | |
| | | | | | | | | | | | |
COMPUTERS & PERIPHERALS – 1.3% | | | | | |
Fujitsu Ltd. | | | JP | | | | 86,000 | | | | 446,928 | |
NEC Corp.* | | | JP | | | | 59,000 | | | | 119,579 | |
Toshiba Corp. | | | JP | | | | 98,000 | | | | 401,065 | |
| | | | | | | | | | | | |
| | | | | | | | | | | 967,572 | |
| | | | | | | | | | | | |
CONSTRUCTION & ENGINEERING – 0.9% | |
Balfour Beatty PLC | | | GB | | | | 53,500 | | | | 220,010 | |
Bouygues SA | | | FR | | | | 13,045 | | | | 411,029 | |
| | | | | | | | | | | | |
| | | | | | | | | | | 631,039 | |
| | | | | | | | | | | | |
DISTRIBUTORS – 0.4% | | | | | |
Imperial Holdings Ltd. | | | ZA | | | | 7,450 | | | | 113,976 | |
Inchcape PLC | | | GB | | | | 43,900 | | | | 200,030 | |
| | | | | | | | | | | | |
| | | | | | | | | | | 314,006 | |
| | | | | | | | | | | | |
DIVERSIFIED FINANCIAL SERVICES – 1.4% | |
ING Groep NV - CVA* | | | NL | | | | 95,378 | | | | 686,343 | |
Orix Corp. | | | JP | | | | 4,060 | | | | 335,476 | |
| | | | | | | | | | | | |
| | | | | | | | | | | 1,021,819 | |
| | | | | | | | | | | | |
DIVERSIFIED TELECOMMUNICATION SERVICES – 5.7% | |
BT Group PLC | | | GB | | | | 56,850 | | | | 168,542 | |
France Telecom SA | | | FR | | | | 13,900 | | | | 218,310 | |
Koninklijke KPN NV | | | NL | | | | 12,800 | | | | 153,156 | |
Nippon Telegraph & Telephone Corp. | | | JP | | | | 19,600 | | | | 1,002,027 | |
Tele2 AB, B Shares | | | SE | | | | 11,700 | | | | 227,640 | |
Telecom Italia SpA | | | IT | | | | 512,400 | | | | 551,097 | |
Telecom Italia SpA RSP | | | IT | | | | 163,600 | | | | 146,524 | |
Telefonica SA | | | ES | | | | 11,470 | | | | 198,701 | |
Telenor ASA | | | NO | | | | 16,500 | | | | 270,639 | |
TeliaSonera AB | | | SE | | | | 46,500 | | | | 316,011 | |
Telstra Corp., Ltd. | | | AU | | | | 115,790 | | | | 394,372 | |
Vivendi | | | FR | | | | 23,690 | | | | 518,781 | |
| | | | | | | | | | | | |
| | | | 4,165,800 | |
| | | | | | | | | | | | |
ELECTRIC UTILITIES – 2.0% | | | | | |
E.ON AG | | | DE | | | | 38,200 | | | | 824,171 | |
EDP - Energias de Portugal SA | | | PT | | | | 102,000 | | | | 315,644 | |
| | | | | | | | | | | | |
| | | Country
Code** | | | Shares | | | Value | |
| | | | | | | | | | | | |
Enel SpA | | | IT | | | | 47,928 | | | $ | 195,025 | |
Scottish & Southern Energy PLC | | | GB | | | | 7,000 | | | | 140,345 | |
| | | | | | | | | | | | |
| | | | | | | | | | | 1,475,185 | |
| | | | | | | | | | | | |
ELECTRICAL EQUIPMENT – 1.2% | | | | | |
Furukawa Electric Co., Ltd. | | | JP | | | | 54,000 | | | | 124,178 | |
Mitsubishi Electric Corp. | | | JP | | | | 38,000 | | | | 364,350 | |
Sumitomo Electric Industries Ltd. | | | JP | | | | 37,800 | | | | 411,542 | |
| | | | | | | | | | | | |
| | | | | | | | | | | 900,070 | |
| | | | | | | | | | | | |
ELECTRONIC EQUIPMENT, INSTRUMENTS & COMPONENTS – 0.7% | |
AU Optronics Corp. ADR | | | TW | | | | 25,934 | | | | 112,035 | |
Celestica, Inc.* | | | CA | | | | 14,300 | | | | 105,135 | |
Hitachi Ltd. | | | JP | | | | 41,000 | | | | 215,201 | |
LG Display Co., Ltd. ADR* | | | KR | | | | 7,700 | | | | 81,081 | |
| | | | | | | | | | | | |
| | | | | | | | | | | 513,452 | |
| | | | | | | | | | | | |
ENERGY EQUIPMENT & SERVICES –1.0% | | | | | |
Aker Solutions ASA | | | NO | | | | 19,100 | | | | 201,033 | |
Seadrill Ltd. | | | BM | | | | 12,290 | | | | 410,978 | |
Transocean Ltd. | | | CH | | | | 3,100 | | | | 119,703 | |
| | | | | | | | | | | | |
| | | | | | | | | | | 731,714 | |
| | | | | | | | | | | | |
FOOD & STAPLES RETAILING – 1.7% | | | | | |
Aeon Co., Ltd. | | | JP | | | | 9,200 | | | | 126,340 | |
Delhaize Group | | | BE | | | | 4,835 | | | | 271,615 | |
Empire Co., Ltd., Class A | | | CA | | | | 3,600 | | | | 208,880 | |
Koninklijke Ahold NV | | | NL | | | | 29,890 | | | | 402,519 | |
Metro, Inc., Class A | | | CA | | | | 2,400 | | | | 127,215 | |
Tesco PLC | | | GB | | | | 19,500 | | | | 122,179 | |
| | | | | | | | | | | | |
| | | | | | | | | | | 1,258,748 | |
| | | | | | | | | | | | |
FOOD PRODUCTS – 3.2% | | | | | |
Danone SA | | | FR | | | | 4,400 | | | | 276,592 | |
Goodman Fielder Ltd. | | | AU | | | | 273,842 | | | | 121,837 | |
Nestle SA | | | CH | | | | 25,988 | | | | 1,494,040 | |
Unilever NV | | | NL | | | | 11,800 | | | | 405,781 | |
| | | | | | | | | | | | |
| | | | | | | | | | | 2,298,250 | |
| | | | | | | | | | | | |
See Notes to Financial Statements.
102
SC SM ALLIANCEBERNSTEIN INTERNATIONAL VALUE FUND
| | |
PORTFOLIOOF INVESTMENTS (Continued) December 31, 2011 | | Sun Capital Advisers Trust |
| | | | | | | | | | | | |
| | | Country
Code** | | | Shares | | | Value | |
| | | | | | | | | | | | |
| | | | | | | | | | | | |
GAS UTILITIES – 1.0% | | | | | |
Gas Natural SDG SA | | | ES | | | | 26,200 | | | $ | 449,807 | |
Tokyo Gas Co., Ltd. | | | JP | | | | 61,000 | | | | 280,551 | |
| | | | | | | | | | | | |
| | | | | | | | | | | 730,358 | |
| | | | | | | | | | | | |
| | | | | | | | | | | | |
HEALTH CARE PROVIDERS & SERVICES – 0.4% | |
Medipal Holdings Corp. | | | JP | | | | 25,100 | | | | 262,185 | |
| | | | | | | | | | | | |
HOTELS, RESTAURANTS & LEISURE – 0.8% | |
Compass Group PLC | | | GB | | | | 14,080 | | | | 133,603 | |
Tui Travel PLC | | | GB | | | | 81,600 | | | | 210,110 | |
William Hill PLC | | | GB | | | | 84,220 | | | | 265,249 | |
| | | | | | | | | | | | |
| | | | | | | | | | | 608,962 | |
| | | | | | | | | | | | |
HOUSEHOLD DURABLES – 1.5% | | | | | |
Sharp Corp. | | | JP | | | | 52,000 | | | | 454,671 | |
Sony Corp. | | | JP | | | | 22,500 | | | | 403,989 | |
Taylor Wimpey PLC* | | | GB | | | | 332,800 | | | | 193,814 | |
| | | | | | | | | | | | |
| | | | | | | | | | | 1,052,474 | |
| | | | | | | | | | | | |
INDUSTRIAL CONGLOMERATES – 1.2% | | | | | |
Cookson Group PLC | | | GB | | | | 24,900 | | | | 196,829 | |
Hutchison Whampoa Ltd. | | | HK | | | | 16,000 | | | | 134,525 | |
Siemens AG | | | DE | | | | 5,700 | | | | 545,472 | |
| | | | | | | | | | | | |
| | | | | | | | | | | 876,826 | |
| | | | | | | | | | | | |
INSURANCE – 6.0% | | | | | |
Aegon NV* | | | NL | | | | 97,510 | | | | 391,354 | |
Allianz SE | | | DE | | | | 8,760 | | | | 837,965 | |
Assicurazioni Generali SpA | | | IT | | | | 9,600 | | | | 144,500 | |
Aviva PLC | | | GB | | | | 79,300 | | | | 370,444 | |
Catlin Group Ltd. | | | BM | | | | 43,500 | | | | 269,344 | |
Hannover Rueckversicherung AG | | | DE | | | | 3,900 | | | | 193,448 | |
Insurance Australia Group Ltd. | | | AU | | | | 44,800 | | | | 136,548 | |
Legal & General Group PLC | | | GB | | | | 296,230 | | | | 472,926 | |
Muenchener Rueckversicherungs AG | | | DE | | | | 3,660 | | | | 448,969 | |
Prudential PLC | | | GB | | | | 19,000 | | | | 188,402 | |
Resolution Ltd. | | | GG | | | | 78,740 | | | | 307,420 | |
Suncorp Group Ltd. | | | AU | | | | 42,500 | | | | 364,270 | |
| | | | | | | | | | | | |
| | | Country
Code** | | | Shares | | | Value | |
| | | | | | | | | | | | |
Zurich Financial Services AG* | | | CH | | | | 1,070 | | | $ | 242,069 | |
| | | | | | | | | | | | |
| | | | | | | | | | | 4,367,659 | |
| | | | | | | | | | | | |
IT SERVICES �� 0.2% | | | | | |
Nomura Research Institute Ltd. | | | JP | | | | 6,500 | | | | 146,940 | |
| | | | | | | | | | | | |
LEISURE EQUIPMENT & PRODUCTS – 0.2% | |
Namco Bandai Holdings, Inc. | | | JP | | | | 10,600 | | | | 150,937 | |
| | | | | | | | | | | | |
MACHINERY – 0.5% | | | | | |
IHI Corp. | | | JP | | | | 95,000 | | | | 230,804 | |
Volvo AB, B Shares | | | SE | | | | 12,850 | | | | 140,599 | |
| | | | | | | | | | | | |
| | | | | | | | | | | 371,403 | |
| | | | | | | | | | | | |
MARINE – 0.4% | | | | | | | | | | | | |
AP Moller – Maersk A/S, Class B | | | DK | | | | 47 | | | | 310,316 | |
| | | | | | | | | | | | |
MEDIA – 1.1% | | | | | |
Fairfax Media Ltd. | | | AU | | | | 228,700 | | | | 168,419 | |
Groupe Aeroplan, Inc. | | | CA | | | | 9,700 | | | | 113,686 | |
ITV PLC | | | GB | | | | 324,500 | | | | 343,441 | |
Lagardere SCA | | | FR | | | | 6,600 | | | | 174,258 | |
| | | | | | | | | | | | |
| | | | | | | | | | | 799,804 | |
| | | | | | | | | | | | |
METALS & MINING – 6.6% | | | | | |
Anglo American PLC | | | GB | | | | 18,990 | | | | 701,602 | |
ArcelorMittal | | | LU | | | | 7,800 | | | | 142,645 | |
BHP Billiton Ltd. | | | AU | | | | 5,000 | | | | 176,024 | |
BHP Billiton PLC | | | GB | | | | 28,800 | | | | 839,738 | |
Dowa Holdings Co., Ltd. | | | JP | | | | 35,000 | | | | 221,450 | |
Exxaro Resources Ltd. | | | ZA | | | | 5,240 | | | | 109,051 | |
Fortescue Metals Group Ltd. | | | AU | | | | 19,300 | | | | 84,290 | |
IAMGOLD Corp. | | | CA | | | | 12,400 | | | | 196,939 | |
JFE Holdings, Inc. | | | JP | | | | 18,700 | | | | 338,675 | |
KGHM Polska Miedz SA | | | PL | | | | 3,000 | | | | 96,152 | |
Mitsubishi Materials Corp. | | | JP | | | | 79,000 | | | | 214,512 | |
Rio Tinto PLC | | | GB | | | | 21,310 | | | | 1,034,201 | |
ThyssenKrupp AG | | | DE | | | | 16,600 | | | | 380,814 | |
Vale SA ADR | | | BR | | | | 4,100 | | | | 84,460 | |
Xstrata PLC | | | GB | | | | 9,957 | | | | 151,230 | |
| | | | | | | | | | | | |
| | | | | | | | | | | 4,771,783 | |
| | | | | | | | | | | | |
See Notes to Financial Statements.
103
SC SM ALLIANCEBERNSTEIN INTERNATIONAL VALUE FUND
| | |
PORTFOLIOOF INVESTMENTS (Continued) December 31, 2011 | | Sun Capital Advisers Trust |
| | | | | | | | | | | | |
| | | Country
Code** | | | Shares | | | Value | |
| | | | | | | | | | | | |
| | | | | | | | | | | | |
MULTI-UTILITIES – 0.5% | | | | | |
GDF Suez | | | FR | | | | 8,300 | | | $ | 226,877 | |
RWE AG | | | DE | | | | 3,250 | | | | 114,201 | |
| | | | | | | | | | | | |
| | | | | | | | | | | 341,078 | |
| | | | | | | | | | | | |
OFFICE ELECTRONICS – 0.3% | | | | | |
Konica Minolta Holdings, Inc. | | | JP | | | | 29,500 | | | | 219,995 | |
| | | | | | | | | | | | |
OIL, GAS & CONSUMABLE FUELS – 10.8% | |
Banpu Public Co., Ltd. | | | TH | | | | 5,950 | | | | 102,970 | |
BG Group PLC | | | GB | | | | 6,000 | | | | 128,262 | |
BP PLC | | | GB | | | | 285,340 | | | | 2,040,628 | |
China Petroleum & Chemical Corp. | | | CN | | | | 142,000 | | | | 149,741 | |
Eni SpA | | | IT | | | | 29,500 | | | | 611,268 | |
Gazprom OAO ADR | | | RU | | | | 16,080 | | | | 171,751 | |
Inpex Corp. | | | JP | | | | 22 | | | | 138,626 | |
JX Holdings, Inc. | | | JP | | | | 51,400 | | | | 310,524 | |
Lukoil ADR | | | RU | | | | 2,100 | | | | 111,676 | |
Nexen, Inc. | | | CA | | | | 27,404 | | | | 436,043 | |
Petroleo Brasileiro SA ADR | | | BR | | | | 4,200 | | | | 98,658 | |
Repsol YPF SA | | | ES | | | | 5,800 | | | | 178,170 | |
Royal Dutch Shell PLC, A Shares | | | GB | | | | 56,877 | | | | 2,072,208 | |
Statoil ASA | | | NO | | | | 8,650 | | | | 222,004 | |
Total SA | | | FR | | | | 20,500 | | | | 1,048,019 | |
| | | | | | | | | | | | |
| | | | | | | | | | | 7,820,548 | |
| | | | | | | | | | | | |
PAPER & FOREST PRODUCTS – 0.4% | | | | | |
Oji Paper Co., Ltd. | | | JP | | | | 55,000 | | | | 282,253 | |
| | | | | | | | | | | | |
PERSONAL PRODUCTS – 0.6% | | | | | |
Kao Corp. | | | JP | | | | 8,700 | | | | 237,704 | |
L’oreal SA | | | FR | | | | 2,000 | | | | 208,892 | |
| | | | | | | | | | | | |
| | | | | | | | | | | 446,596 | |
| | | | | | | | | | | | |
PHARMACEUTICALS – 9.7% | | | | | |
AstraZeneca PLC | | | GB | | | | 33,000 | | | | 1,524,658 | |
Bayer AG | | | DE | | | | 9,600 | | | | 613,785 | |
GlaxoSmithKline PLC | | | GB | | | | 52,300 | | | | 1,195,180 | |
Novartis AG | | | CH | | | | 23,290 | | | | 1,331,495 | |
Otsuka Holdings Co., Ltd. | | | JP | | | | 13,300 | | | | 373,927 | |
Roche Holding AG | | | CH | | | | 7,200 | | | | 1,220,313 | |
Sanofi-Aventis SA | | | FR | | | | 10,949 | | | | 804,190 | |
| | | | | | | | | | | | |
| | | | | | | | | | | 7,063,548 | |
| | | | | | | | | | | | |
| | | | | | | | | | | | |
| | | Country
Code** | | | Shares | | | Value | |
| | | | | | | | | | | | |
PROFESSIONAL SERVICES – 0.3% | | | | | |
Randstad Holding NV | | | NL | | | | 7,700 | | | $ | 227,817 | |
| | | | | | | | | | | | |
REAL ESTATE INVESTMENT TRUSTS – 0.7% | |
Land Securities Group PLC | | | GB | | | | 9,402 | | | | 92,791 | |
The Link REIT | | | HK | | | | 63,000 | | | | 231,993 | |
Unibail-Rodamco | | | FR | | | | 960 | | | | 172,581 | |
| | | | | | | | | | | | |
| | | | | | | | | | | 497,365 | |
| | | | | | | | | | | | |
REAL ESTATE MANAGEMENT & DEVELOPMENT – 1.2% | | | | | |
Cheung Kong Holdings Ltd. | | | HK | | | | 27,000 | | | | 321,743 | |
Mitsui Fudosan Co., Ltd. | | | JP | | | | 15,000 | | | | 218,657 | |
New World Development Ltd. | | | HK | | | | 297,908 | | | | 240,118 | |
Sumitomo Realty & Development Co., Ltd. | | | JP | | | | 7,000 | | | | 122,593 | |
| | | | | | | | | | | | |
| | | | | | | | | | | 903,111 | |
| | | | | | | | | | | | |
ROAD & RAIL – 1.7% | | | | | |
Central Japan Railway Co. | | | JP | | | | 16 | | | | 135,118 | |
East Japan Railway Co. | | | JP | | | | 4,300 | | | | 273,743 | |
FirstGroup PLC | | | GB | | | | 43,700 | | | | 229,387 | |
Nippon Express Co., Ltd. | | | JP | | | | 79,000 | | | | 307,912 | |
West Japan Railway Co. | | | JP | | | | 6,300 | | | | 273,789 | |
| | | | | | | | | | | | |
| | | | | | | | | | | 1,219,949 | |
| | | | | | | | | | | | |
SEMICONDUCTORS & SEMICONDUCTOR EQUIPMENT – 0.6% | |
Advanced Semiconductor Engineering, Inc. ADR | | | TW | | | | 24,416 | | | | 105,965 | |
GCL-Poly Energy Holdings Ltd. | | | KY | | | | 637,000 | | | | 177,979 | |
Samsung Electronics Co., Ltd. GDR | | | KR | | | | 300 | | | | 138,210 | |
| | | | | | | | | | | | |
| | | | | | | | | | | 422,154 | |
| | | | | | | | | | | | |
SPECIALTY RETAIL – 0.5% | | | | | |
Kingfisher PLC | | | GB | | | | 90,500 | | | | 352,350 | |
| | | | | | | | | | | | |
See Notes to Financial Statements.
104
SC SM ALLIANCEBERNSTEIN INTERNATIONAL VALUE FUND
| | |
PORTFOLIOOF INVESTMENTS (Continued) December 31, 2011 | | Sun Capital Advisers Trust |
| | | | | | | | | | | | |
| | | Country
Code** | | | Shares | | | Value | |
| | | | | | | | | | | | |
| | | | | | | | | | | | |
TEXTILES, APPAREL & LUXURY GOODS – 0.3% | |
Adidas AG | | | DE | | | | 1,570 | | | $ | 102,127 | |
Compagnie Financiere Richemont SA | | | CH | | | | 2,200 | | | | 111,276 | |
| | | | | | | | | | | | |
| | | | | | | | | | | 213,403 | |
| | | | | | | | | | | | |
TOBACCO – 2.8% | | | | | | | | | |
British American Tobacco PLC | | | GB | | | | 12,600 | | | | 597,894 | |
Imperial Tobacco Group PLC | | | GB | | | | 16,700 | | | | 631,520 | |
Japan Tobacco, Inc. | | | JP | | | | 163 | | | | 766,610 | |
| | | | | | | | | | | | |
| | | | | | | | | | | 1,996,024 | |
| | | | | | | | | | | | |
TRADING COMPANIES & DISTRIBUTORS – 1.4% | |
Marubeni Corp. | | | JP | | | | 18,000 | | | | 109,679 | |
Mitsubishi Corp. | | | JP | | | | 24,500 | | | | 494,966 | |
Mitsui & Co., Ltd. | | | JP | | | | 21,100 | | | | 328,137 | |
Sumitomo Corp. | | | JP | | | | 8,400 | | | | 113,717 | |
| | | | | | | | | | | | |
| | | | | | | | | | | 1,046,499 | |
| | | | | | | | | | | | |
WIRELESS TELECOMMUNICATION SERVICES – 2.1% | |
KDDI Corp. | | | JP | | | | 21 | | | | 135,053 | |
Vodafone Group PLC | | | GB | | | | 497,800 | | | | 1,383,046 | |
| | | | | | | | | | | | |
| | | | | | | | | | | 1,518,099 | |
| | | | | | | | | | | | |
Total Common Stocks
(Cost $77,012,656) | | | | 70,175,484 | |
| | | | | | | | | | | | |
EQUITY LINKED SECURITIES – 0.2% | |
COMMERCIAL BANKS – 0.1% + | | | | | |
Hana Financial Group, Inc. (Deutsche Bank AG), expires 11/18/19* (1) | | | DE | | | | 3,400 | | | | 104,815 | |
| | | | | | | | | | | | |
ELECTRONIC EQUIPMENT, INSTRUMENTS & COMPONENTS – 0.0% ^+ | |
AU Optronics Corp., (Credit Suisse Group AG), expires 2/17/12* (1) | | | CH | | | | 19,947 | | | | 8,597 | |
| | | | | | | | | | | | |
METALS & MINING – 0.1% | | | | | |
Tata Steel Ltd., (Merrill Lynch & Co., Inc.), expires 12/23/14* (1) | | | | | | | 7,300 | | | | 46,098 | |
| | | | | | | | | | | | |
Total Equity Linked Securities
(Cost $210,047) | | | | 159,510 | |
| | | | | | | | | | | | |
| | | | | | | | | | | | |
| | | Country
Code** | | | Shares | | | Value | |
| | | | | | | | | | | | |
| | | | | | | | | | | | |
PREFERRED STOCKS – 0.9% | | | | | |
AUTOMOBILES – 0.9% | | | | | |
Volkswagen AG (Cost $733,945) | | | DE | | | | 4,390 | | | $ | 657,664 | |
| | | | | | | | | | | | |
SHORT TERM INVESTMENTS – 2.0% | | | | | |
MUTUAL FUNDS – 2.0% | | | | | | | | | |
AllianceBernstein Government Short Term Investment Fund, 0.08% (Cost $1,451,445) | | | | 1,451,445 | | | | 1,451,445 | |
| | | | | | | | | | | | |
TOTAL INVESTMENTS – 99.6% | |
(Cost $79,408,093) | | | | | | | | 72,444,103 | |
Other assets less liabilities – 0.4% | | | | | | | | 315,906 | |
| | | | | | | | | | | | |
NET ASSETS – 100.0% | | | | | | | $ | 72,760,009 | |
| | | | | | | | | | | | |
| | |
| ADR | | American Depositary Receipt |
| GDR | | Global Depositary Receipt |
| REIT | | Real Estate Investment Trust |
| AU | | Australia |
| BE | | Belgium |
| BM | | Bermuda |
| BR | | Brazil |
| CA | | Canada |
| CH | | Switzerland |
| CN | | China |
| DE | | Germany |
| DK | | Denmark |
| ES | | Spain |
| FR | | France |
| GB | | Great Britain |
| GG | | Guernsey |
| HK | | Hong Kong |
| IT | | Italy |
| JP | | Japan |
| KR | | Korea, Republic of |
| KY | | Cayman Islands |
| LU | | Luxembourg |
| NL | | Netherlands |
| NO | | Norway |
| PL | | Poland |
| PT | | Portugal |
| RU | | Russia |
| SE | | Sweden |
| TH | | Thailand |
| TR | | Turkey |
| TW | | Taiwan, Province of China |
| ZA | | South Africa |
See Notes to Financial Statements.
105
SC SM ALLIANCEBERNSTEIN INTERNATIONAL VALUE FUND
| | |
PORTFOLIOOF INVESTMENTS (Continued) December 31, 2011 | | Sun Capital Advisers Trust |
| * | Non-income producing security. |
| ** | Unless otherwise noted the issuer country code for all securities is United States. |
| ^ | Amount is less than 0.05%. |
| + | Country listed is the country in which the broker is domiciled. |
| (1) | Eligible for resale under rule 144A of the Securities Act of 1933. These securities may be resold in transactions exempt from registration, normally to qualified institutional buyers. At the period end, the value of these securities amounted to $159,510, representing 0.2% of net assets. |
Distribution of investments by country of issuer, as a percentage of net assets, is as follows. Figures may not total to 100% due to the exclusion of the Fund’s other assets and liabilities. (Unaudited)
| | | | |
Great Britain | | | 25.0 | % |
Japan | | | 23.0 | |
Germany | | | 9.4 | |
France | | | 8.2 | |
Switzerland | | | 6.5 | |
Australia | | | 4.8 | |
Netherlands | | | 4.0 | |
Canada | | | 2.7 | |
Italy | | | 2.3 | |
United States | | | 2.0 | |
Other (individually less than 2%) | | | 11.7 | |
| (2) | At the period end, cash of $19,934 has been pledged to cover margin requirements for the following open futures contracts: |
| | | | | | | | | | | | |
Type | | Description | | Expiration
Date | | Contracts | | | Unrealized
Appreciation ($) | |
Long | | DJ Euro Stoxx 50 Index March Futures | | 3/16/12 | | | 9 | | | | 3,275 | |
| (3) | At the period end, open forward foreign currency exchange contracts were as follows: |
| | | | | | | | | | | | | | | | | | | | |
Counterparty | | Contracts to Deliver | | | In Exchange For | | | Settlement
Date | | | Unrealized
Appreciation/
(Depreciation) ($) | |
Deutsche Bank AG (London) | | CAD | | | 189,000 | | | USD | | | 185,392 | | | | 2/15/12 | | | | 38 | |
Standard Chartered Bank | | JPY | | | 52,640,000 | | | USD | | | 678,989 | | | | 2/15/12 | | | | (5,393 | ) |
UBS AG | | CAD | | | 2,072,000 | | | USD | | | 2,037,245 | | | | 2/15/12 | | | | 5,207 | |
UBS AG | | USD | | | 287,720 | | | CAD | | | 302,000 | | | | 2/15/12 | | | | 8,455 | |
| | | | | | | | | | | | | | | | | | | | |
Net unrealized appreciation | | | | | | | | | | | | | | | | | | | 8,307 | |
| | | | | | | | | | | | | | | | | | | | |
| | |
| CAD | | Canadian Dollar |
| JPY | | Japanese Yen |
| USD | | United States Dollar |
See Notes to Financial Statements.
106
| | |
SC SM ALLIANCEBERNSTEIN INTERNATIONAL VALUE FUND PORTFOLIOOF INVESTMENTS (Continued) |
| December 31, 2011 | | Sun Capital Advisers Trust |
| (4) | Fair Value Measurements † |
The following table summarizes the inputs used to value the Fund’s assets and liabilities, as applicable, measured at fair value at the period end:
| | | | | | | | | | | | | | | | |
Assets | | Quoted Prices
in Active
Markets for
Identical
Assets and
Liabilities
(Level 1) | | | Significant
Other
Observable
Inputs
(Level 2) | | | Significant
Unobservable
Inputs
(Level 3) | | | Total | |
Common Stocks | | | | | | | | | | | | | | | | |
Aerospace & Defense | | $ | — | | | $ | 465,991 | | | $ | — | | | $ | 465,991 | |
Airlines | | | — | | | | 441,806 | | | | — | | | | 441,806 | |
Auto Components | | | 363,779 | | | | 1,309,369 | | | | — | | | | 1,673,148 | |
Automobiles | | | — | | | | 2,779,698 | | | | — | | | | 2,779,698 | |
Beverages | | | — | | | | 447,915 | | | | — | | | | 447,915 | |
Building Products | | | — | | | | 546,951 | | | | — | | | | 546,951 | |
Capital Markets | | | — | | | | 786,700 | | | | — | | | | 786,700 | |
Chemicals | | | 147,667 | | | | 2,554,646 | | | | — | | | | 2,702,313 | |
Commercial Banks | | | 332,426 | | | | 6,472,235 | | | | — | | | | 6,804,661 | |
Communications Equipment | | | — | | | | 228,210 | | | | — | | | | 228,210 | |
Computers & Peripherals | | | — | | | | 967,572 | | | | — | | | | 967,572 | |
Construction & Engineering | | | — | | | | 631,039 | | | | — | | | | 631,039 | |
Distributors | | | — | | | | 314,006 | | | | — | | | | 314,006 | |
Diversified Financial Services | | | — | | | | 1,021,819 | | | | — | | | | 1,021,819 | |
Diversified Telecommunication Services | | | — | | | | 4,165,800 | | | | — | | | | 4,165,800 | |
Electric Utilities | | | — | | | | 1,475,185 | | | | — | | | | 1,475,185 | |
Electrical Equipment | | | — | | | | 900,070 | | | | — | | | | 900,070 | |
Electronic Equipment, Instruments & Components | | | 298,251 | | | | 215,201 | | | | — | | | | 513,452 | |
Energy Equipment & Services | | | — | | | | 731,714 | | | | — | | | | 731,714 | |
Food & Staples Retailing | | | 336,095 | | | | 922,653 | | | | — | | | | 1,258,748 | |
Food Products | | | — | | | | 2,298,250 | | | | — | | | | 2,298,250 | |
Gas Utilities | | | — | | | | 730,358 | | | | — | | | | 730,358 | |
Health Care Providers & Services | | | — | | | | 262,185 | | | | — | | | | 262,185 | |
Hotels, Restaurants & Leisure | | | — | | | | 608,962 | | | | — | | | | 608,962 | |
Household Durables | | | — | | | | 1,052,474 | | | | — | | | | 1,052,474 | |
Industrial Conglomerates | | | — | | | | 876,826 | | | | — | | | | 876,826 | |
Insurance | | | — | | | | 4,367,659 | | | | — | | | | 4,367,659 | |
IT Services | | | — | | | | 146,940 | | | | — | | | | 146,940 | |
Leisure Equipment & Products | | | — | | | | 150,937 | | | | — | | | | 150,937 | |
Machinery | | | — | | | | 371,403 | | | | — | | | | 371,403 | |
Marine | | | — | | | | 310,316 | | | | — | | | | 310,316 | |
Media | | | 113,686 | | | | 686,118 | | | | — | | | | 799,804 | |
Metals & Mining | | | 281,399 | | | | 4,490,384 | | | | — | | | | 4,771,783 | |
Multi-Utilities | | | — | | | | 341,078 | | | | — | | | | 341,078 | |
Office Electronics | | | — | | | | 219,995 | | | | — | | | | 219,995 | |
Oil, Gas & Consumable Fuels | | | 706,452 | | | | 7,114,096 | | | | — | | | | 7,820,548 | |
Paper & Forest Products | | | — | | | | 282,253 | | | | — | | | | 282,253 | |
Personal Products | | | — | | | | 446,596 | | | | — | | | | 446,596 | |
See Notes to Financial Statements.
107
| | |
SC SM ALLIANCEBERNSTEIN INTERNATIONAL VALUE FUND PORTFOLIOOF INVESTMENTS (Continued) |
| December 31, 2011 | | Sun Capital Advisers Trust |
| | | | | | | | | | | | | | | | |
Assets (Continued) | | Quoted Prices
in Active
Markets for
Identical
Assets and
Liabilities
(Level 1) | | | Significant
Other
Observable
Inputs
(Level 2) | | | Significant
Unobservable
Inputs
(Level 3) | | | Total | |
Pharmaceuticals | | $ | — | | | $ | 7,063,548 | | | $ | — | | | $ | 7,063,548 | |
Professional Services | | | — | | | | 227,817 | | | | — | | | | 227,817 | |
Real Estate Investment Trusts | | | — | | | | 497,365 | | | | — | | | | 497,365 | |
Real Estate Management & Development | | | — | | | | 903,111 | | | | — | | | | 903,111 | |
Road & Rail | | | — | | | | 1,219,949 | | | | — | | | | 1,219,949 | |
Semiconductors & Semiconductor Equipment | | | 105,965 | | | | 316,189 | | | | — | | | | 422,154 | |
Specialty Retail | | | — | | | | 352,350 | | | | — | | | | 352,350 | |
Textiles, Apparel & Luxury Goods | | | — | | | | 213,403 | | | | — | | | | 213,403 | |
Tobacco | | | — | | | | 1,996,024 | | | | — | | | | 1,996,024 | |
Trading Companies & Distributors | | | — | | | | 1,046,499 | | | | — | | | | 1,046,499 | |
Wireless Telecommunication Services | | | — | | | | 1,518,099 | | | | — | | | | 1,518,099 | |
| | | | | | | | | | | | | | | | |
Total Common Stocks | | | 2,685,720 | | | | 67,489,764 | | | | — | | | | 70,175,484 | |
| | | | | | | | | | | | | | | | |
Equity Linked Securities (a) | | | — | | | | 159,510 | | | | — | | | | 159,510 | |
Preferred Stocks (a) | | | — | | | | 657,664 | | | | — | | | | 657,664 | |
Short Term Investments | | | | | | | | | | | | | | | | |
Mutual Funds | | | 1,451,445 | | | | — | | | | — | | | | 1,451,445 | |
| | | | | | | | | | | | | | | | |
Total Investments | | | 4,137,165 | | | | 68,306,938 | | | | — | | | | 72,444,103 | |
| | | | | | | | | | | | | | | | |
Financial Derivative Instruments | | | | | | | | | | | | | | | | |
Futures Contracts | | | — | | | | 3,275 | | | | — | | | | 3,275 | |
Forward Foreign Currency Exchange Contracts | | | — | | | | 13,700 | | | | — | | | | 13,700 | |
| | | | | | | | | | | | | | | | |
Total Financial Derivative Instruments | | $ | — | | | $ | 16,975 | | | $ | — | | | $ | 16,975 | |
| | | | | | | | | | | | | | | | |
| | | | |
Liabilities | | | | | | | | | | | | |
Financial Derivative Instruments | | | | | | | | | | | | | | | | |
Forward Foreign Currency Exchange Contracts | | $ | — | | | $ | (5,393 | ) | | $ | — | | | $ | (5,393 | ) |
| | | | | | | | | | | | | | | | |
Total Financial Derivative Instruments | | $ | — | | | $ | (5,393 | ) | | $ | — | | | $ | (5,393 | ) |
| | | | | | | | | | | | | | | | |
| † | See Note 2b in the Notes to Financial Statements for additional information. |
| (a) | See Portfolio of Investments for additional detailed categorizations. |
See Notes to Financial Statements.
108
SC SM BLACKROCK INTERNATIONAL INDEX FUND
| | |
PORTFOLIOOF INVESTMENTS December 31, 2011 | | Sun Capital Advisers Trust |
| | | | | | | | | | | | |
| | | Country
Code** | | | Shares | | | Value | |
| | | | | | | | | | | | |
| | | | | | | | | | | | |
COMMON STOCKS – 96.1% | |
AEROSPACE & DEFENSE – 0.7% | |
BAE Systems PLC | | | GB | | | | 24,694 | | | $ | 109,335 | |
Cobham PLC | | | GB | | | | 8,528 | | | | 24,289 | |
Elbit Systems Ltd. | | | IL | | | | 153 | | | | 6,283 | |
European Aeronautic Defense and Space Co., NV | | | NL | | | | 3,024 | | | | 94,519 | |
Finmeccanica SpA | | | IT | | | | 3,136 | | | | 11,600 | |
Meggitt PLC | | | GB | | | | 5,538 | | | | 30,343 | |
Rolls-Royce Holdings PLC* | | | GB | | | | 13,811 | | | | 160,113 | |
Safran SA | | | FR | | | | 1,252 | | | | 37,601 | |
Singapore Technologies Engineering Ltd. | | | SG | | | | 12,000 | | | | 24,887 | |
Thales SA | | | FR | | | | 743 | | | | 23,464 | |
| | | | | | | | | | | | |
| | | | 522,434 | |
| | | | | | | | | | | | |
AIR FREIGHT & LOGISTICS – 0.3% | |
Deutsche Post AG | | | DE | | | | 6,248 | | | | 96,067 | |
TNT Express NV | | | NL | | | | 2,509 | | | | 18,750 | |
Toll Holdings Ltd. | | | AU | | | | 5,123 | | | | 22,112 | |
Yamato Holdings Co., Ltd. | | | JP | | | | 2,800 | | | | 47,182 | |
| | | | | | | | | | | | |
| | | | 184,111 | |
| | | | | | | | | | | | |
AIRLINES – 0.2% | |
All Nippon Airways Co., Ltd. | | | JP | | | | 6,000 | | | | 16,760 | |
Cathay Pacific Airways Ltd. | | | HK | | | | 10,000 | | | | 17,150 | |
Deutsche Luftansa AG | | | DE | | | | 1,656 | | | | 19,686 | |
International Consolidated Airlines Group SA* | | | ES | | | | 7,730 | | | | 17,408 | |
Qantas Airways Ltd.* | | | AU | | | | 9,427 | | | | 14,077 | |
Ryanair Holdings PLC ADR* | | | IE | | | | 303 | | | | 8,442 | |
Singapore Airlines Ltd. | | | SG | | | | 4,000 | | | | 31,302 | |
| | | | | | | | | | | | |
| | | | 124,825 | |
| | | | | | | | | | | | |
AUTO COMPONENTS – 0.8% | |
Aisin Seiki Co., Ltd. | | | JP | | | | 1,400 | | | | 39,906 | |
Bridgestone Corp. | | | JP | | | | 4,800 | | | | 108,822 | |
Compagnie Generale Des Etablissements Michelin, Class B | | | FR | | | | 1,330 | | | | 78,623 | |
Continental AG* | | | DE | | | | 591 | | | | 36,788 | |
Denso Corp. | | | JP | | | | 3,600 | | | | 99,436 | |
GKN PLC | | | GB | | | | 11,050 | | | | 31,404 | |
| | | | | | | | | | | | |
| | | Country
Code** | | | Shares | | | Value | |
| | | | | | | | | | | | |
Koito Manufacturing Co., Ltd. | | | JP | | | | 1,000 | | | $ | 14,031 | |
NGK Spark Plug Co., Ltd. | | | JP | | | | 1,000 | | | | 12,407 | |
NHK Spring Co., Ltd. | | | JP | | | | 1,000 | | | | 8,861 | |
NOK Corp. | | | JP | | | | 800 | | | | 13,751 | |
Nokian Renkaat OYJ | | | FI | | | | 779 | | | | 25,084 | |
Pirelli & C. SpA | | | IT | | | | 1,663 | | | | 14,001 | |
Stanley Electric Co., Ltd. | | | JP | | | | 1,000 | | | | 14,694 | |
Sumitomo Rubber Industries Ltd. | | | JP | | | | 1,200 | | | | 14,406 | |
Toyoda Gosei Co., Ltd. | | | JP | | | | 400 | | | | 6,376 | |
Toyota Boshoku Corp. | | | JP | | | | 600 | | | | 6,260 | |
Toyota Industries Corp. | | | JP | | | | 1,300 | | | | 35,384 | |
| | | | | | | | | | | | |
| | | | 560,234 | |
| | | | | | | | | | | | |
AUTOMOBILES – 2.8% | |
Bayerische Motoren Werke AG | | | DE | | | | 2,437 | | | | 163,256 | |
Daihatsu Motor Co., Ltd. | | | JP | | | | 2,000 | | | | 35,702 | |
Daimler AG | | | DE | | | | 6,658 | | | | 292,293 | |
Fiat SpA | | | IT | | | | 5,540 | | | | 25,454 | |
Fuji Heavy Industries Ltd. | | | JP | | | | 4,000 | | | | 24,165 | |
Honda Motor Co., Ltd. | | | JP | | | | 12,000 | | | | 366,065 | |
Isuzu Motors Ltd. | | | JP | | | | 9,000 | | | | 41,627 | |
Mazda Motor Corp.* | | | JP | | | | 12,000 | | | | 21,203 | |
Mitsubishi Motors Corp.* | | | JP | | | | 29,000 | | | | 34,286 | |
Nissan Motor Co., Ltd. | | | JP | | | | 18,200 | | | | 163,627 | |
Peugeot SA | | | FR | | | | 1,139 | | | | 17,852 | |
Renault SA | | | FR | | | | 1,390 | | | | 48,213 | |
Suzuki Motor Corp. | | | JP | | | | 2,400 | | | | 49,640 | |
Toyota Motor Corp. | | | JP | | | | 20,300 | | | | 676,491 | |
Volkswagen AG | | | DE | | | | 228 | | | | 30,586 | |
Yamaha Motor Co., Ltd. | | | JP | | | | 2,000 | | | | 25,309 | |
| | | | | | | | | | | | |
| | | | 2,015,769 | |
| | | | | | | | | | | | |
BEVERAGES – 2.1% | |
Anheuser-Busch Inbev NV | | | BE | | | | 5,916 | | | | 362,204 | |
Asahi Breweries Ltd. | | | JP | | | | 2,900 | | | | 63,674 | |
Carlsberg A/S, Class B | | | DK | | | | 776 | | | | 54,721 | |
Coca-Cola Amatil Ltd. | | | AU | | | | 4,110 | | | | 48,385 | |
Coca-Cola Hellenic Bottling Co. SA* | | | GR | | | | 1,393 | | | | 23,528 | |
Coca-Cola West Co., Ltd. | | | JP | | | | 400 | | | | 6,938 | |
Diageo PLC | | | GB | | | | 18,421 | | | | 402,369 | |
Heineken Holding NV | | | NL | | | | 819 | | | | 33,517 | |
See Notes to Financial Statements.
109
SC SM BLACKROCK INTERNATIONAL INDEX FUND
| | |
PORTFOLIOOF INVESTMENTS (Continued) December 31, 2011 | | Sun Capital Advisers Trust |
| | | | | | | | | | | | |
| | | Country
Code** | | | Shares | | | Value | |
| | | | | | | | | | | | |
| | | | | | | | | | | | |
Heineken NV | | | NL | | | | 1,908 | | | $ | 88,331 | |
Kirin Holdings Co., Ltd. | | | JP | | | | 6,000 | | | | 72,963 | |
Pernod-Ricard SA | | | FR | | | | 1,460 | | | | 135,409 | |
SABMiller PLC | | | GB | | | | 7,002 | | | | 246,462 | |
| | | | | | | | | | | | |
| | | | 1,538,501 | |
| | | | | | | | | | | | |
BIOTECHNOLOGY – 0.2% | |
Actelion Ltd.* | | | CH | | | | 800 | | | | 27,467 | |
CSL Ltd. | | | AU | | | | 3,867 | | | | 126,566 | |
Grifols SA* | | | ES | | | | 1,019 | | | | 17,145 | |
| | | | | | | | | | | | |
| | | | 171,178 | |
| | | | | | | | | | | | |
BUILDING PRODUCTS – 0.5% | |
Asahi Glass Co., Ltd. | | | JP | | | | 7,000 | | | | 58,750 | |
Assa Abloy AB | | | SE | | | | 2,291 | | | | 57,458 | |
Compagnie de Saint-Gobain | | | FR | | | | 2,944 | | | | 113,032 | |
Daikin Industries Ltd. | | | JP | | | | 1,700 | | | | 46,558 | |
Geberit AG* | | | CH | | | | 282 | | | | 54,340 | |
JS Group Corp. | | | JP | | | | 1,900 | | | | 36,410 | |
Nippon Sheet Glass Co., Ltd. | | | JP | | | | 6,000 | | | | 11,225 | |
TOTO Ltd. | | | JP | | | | 2,000 | | | | 15,435 | |
| | | | | | | | | | | | |
| | | | 393,208 | |
| | | | | | | | | | | | |
CAPITAL MARKETS – 1.7% | |
3i Group PLC | | | GB | | | | 7,061 | | | | 19,848 | |
Credit Suisse Group AG* | | | CH | | | | 8,376 | | | | 196,804 | |
Daiwa Securities Group, Inc. | | | JP | | | | 12,000 | | | | 37,417 | |
Deutsche Bank AG | | | DE | | | | 6,831 | | | | 260,236 | |
GAM Holding AG* | | | CH | | | | 1,424 | | | | 15,463 | |
ICAP PLC | | | GB | | | | 4,033 | | | | 21,727 | |
Investec PLC | | | GB | | | | 3,773 | | | | 19,864 | |
Julius Baer Group Ltd.* | | | CH | | | | 1,521 | | | | 59,493 | |
Macquarie Group Ltd. | | | AU | | | | 2,559 | | | | 62,267 | |
Man Group PLC | | | GB | | | | 13,964 | | | | 27,259 | |
Mediobanca SpA | | | IT | | | | 3,819 | | | | 21,976 | |
Nomura Holdings, Inc. | | | JP | | | | 26,600 | | | | 80,522 | |
Partners Group Holding AG | | | CH | | | | 94 | | | | 16,402 | |
Ratos AB | | | SE | | | | 1,442 | | | | 16,920 | |
SBI Holdings, Inc. | | | JP | | | | 171 | | | | 12,530 | |
Schroders PLC | | | GB | | | | 842 | | | | 17,182 | |
UBS AG* | | | CH | | | | 26,756 | | | | 318,463 | |
| | | | | | | | | | | | |
| | | | 1,204,373 | |
| | | | | | | | | | | | |
| | | | | | | | | | | | |
| | | Country
Code** | | | Shares | | | Value | |
| | | | | | | | | | | | |
CHEMICALS – 3.5% | |
Air Liquide SA | | | FR | | | | 2,086 | | | $ | 258,074 | |
Air Water, Inc. | | | JP | | | | 1,000 | | | | 12,732 | |
Akzo Nobel NV | | | NL | | | | 1,697 | | | | 82,055 | |
Arkema SA | | | FR | | | | 413 | | | | 29,239 | |
Asahi Kasei Corp. | | | JP | | | | 9,000 | | | | 54,255 | |
BASF SE | | | DE | | | | 6,750 | | | | 470,793 | |
Daicel Chemical Industries Ltd. | | | JP | | | | 2,000 | | | | 12,187 | |
Denki Kagaku Kogyo KK | | | JP | | | | 4,000 | | | | 14,811 | |
Givaudan SA* | | | CH | | | | 60 | | | | 57,170 | |
Hitachi Chemical Co., Ltd. | | | JP | | | | 800 | | | | 14,094 | |
Incitec Pivot Ltd. | | | AU | | | | 11,834 | | | | 37,643 | |
Israel Chemicals Ltd. | | | IL | | | | 3,429 | | | | 35,541 | |
Johnson Matthey PLC | | | GB | | | | 1,524 | | | | 43,454 | |
JSR Corp. | | | JP | | | | 1,400 | | | | 25,828 | |
K+S AG | | | DE | | | | 1,271 | | | | 57,443 | |
Kaneka Corp. | | | JP | | | | 2,000 | | | | 10,654 | |
Kansai Paint Co., Ltd. | | | JP | | | | 2,000 | | | | 17,851 | |
Koninklijke DSM NV | | | NL | | | | 1,118 | | | | 51,874 | |
Kuraray Co., Ltd. | | | JP | | | | 2,500 | | | | 35,566 | |
Lanxess AG | | | DE | | | | 605 | | | | 31,321 | |
Linde AG | | | DE | | | | 1,254 | | | | 186,563 | |
Mitsubishi Chemical Holdings Corp. | | | JP | | | | 10,000 | | | | 55,086 | |
Mitsubishi Gas Chemical Co., Inc. | | | JP | | | | 3,000 | | | | 16,643 | |
Mitsui Chemicals, Inc. | | | JP | | | | 6,000 | | | | 18,319 | |
Nitto Denko Corp. | | | JP | | | | 1,200 | | | | 42,936 | |
Novozymes A/S, B Shares | | | DK | | | | 1,678 | | | | 51,801 | |
Orica Ltd. | | | AU | | | | 2,612 | | | | 64,758 | |
Shin-Etsu Chemical Co., Ltd. | | | JP | | | | 3,000 | | | | 147,720 | |
Showa Denko KK | | | JP | | | | 12,000 | | | | 24,321 | |
Sika AG | | | CH | | | | 16 | | | | 30,150 | |
Solvay SA | | | BE | | | | 423 | | | | 34,852 | |
Sumitomo Chemical Co., Ltd. | | | JP | | | | 12,000 | | | | 43,809 | |
Syngenta AG* | | | CH | | | | 693 | | | | 202,890 | |
Taiyo Nippon Sanso Corp. | | | JP | | | | 2,000 | | | | 13,953 | |
Teijin Ltd. | | | JP | | | | 7,000 | | | | 21,554 | |
The Israel Corporation Ltd. | | | IL | | | | 15 | | | | 9,368 | |
Toray Industries, Inc. | | | JP | | | | 11,000 | | | | 78,745 | |
Tosoh Corp. | | | JP | | | | 4,000 | | | | 10,705 | |
Ube Industries Ltd. | | | JP | | | | 8,000 | | | | 21,931 | |
See Notes to Financial Statements.
110
SC SM BLACKROCK INTERNATIONAL INDEX FUND
| | |
PORTFOLIOOF INVESTMENTS (Continued) December 31, 2011 | | Sun Capital Advisers Trust |
| | | | | | | | | | | | |
| | | Country
Code** | | | Shares | | | Value | |
| | | | | | | | | | | | |
| | | | | | | | | | | | |
Umicore | | | BE | | | | 811 | | | $ | 33,452 | |
Wacker Chemie AG | | | DE | | | | 117 | | | | 9,411 | |
Yara International ASA | | | NO | | | | 1,386 | | | | 55,618 | |
| | | | | | | | | | | | |
| | | | | | | | | | | 2,527,170 | |
| | | | | | | | | | | | |
COMMERCIAL BANKS – 10.9% | |
Aozora Bank Ltd. | | | JP | | | | 4,000 | | | | 11,017 | |
Australia & New Zealand Banking Group Ltd. | | | AU | | | | 19,384 | | | | 407,027 | |
Banca Carige SpA | | | IT | | | | 4,663 | | | | 8,932 | |
Banca Monte dei Paschi di Siena SpA | | | IT | | | | 34,961 | | | | 11,398 | |
Banco Bilbao Vizcaya Argentaria SA | | | ES | | | | 33,793 | | | | 292,160 | |
Banco De Sabadell SA | | | ES | | | | 8,297 | | | | 31,506 | |
Banco Espirito Santo SA | | | PT | | | | 3,060 | | | | 5,347 | |
Banco Popolare SC | | | IT | | | | 13,882 | | | | 17,967 | |
Banco Popular Espanol SA | | | ES | | | | 6,964 | | | | 31,726 | |
Banco Santander SA | | | ES | | | | 62,218 | | | | 472,686 | |
Bank Hapoalim BM | | | IL | | | | 7,964 | | | | 25,955 | |
Bank Leumi Le-Israel | | | IL | | | | 8,877 | | | | 25,413 | |
Bankia SAU* | | | ES | | | | 6,264 | | | | 29,145 | |
Bankinter SA | | | ES | | | | 1,360 | | | | 8,361 | |
Barclays PLC | | | GB | | | | 83,786 | | | | 229,076 | |
Bendigo and Adelaide Bank Ltd. | | | AU | | | | 2,761 | | | | 22,676 | |
BNP Paribas | | | FR | | | | 7,100 | | | | 278,892 | |
BOC Hong Kong Holdings Ltd. | | | HK | | | | 27,500 | | | | 65,151 | |
CaixaBank | | | ES | | | | 5,465 | | | | 26,842 | |
Chuo Mitsui Trust Holdings, Inc. | | | JP | | | | 23,000 | | | | 67,533 | |
Commerzbank AG* | | | DE | | | | 26,392 | | | | 44,508 | |
Commonwealth Bank of Australia | | | AU | | | | 11,495 | | | | 578,684 | |
Credit Agricole SA | | | FR | | | | 7,424 | | | | 41,893 | |
Danske Bank A/S* | | | DK | | | | 4,802 | | | | 60,994 | |
DBS Group Holdings Ltd. | | | SG | | | | 13,000 | | | | 115,462 | |
DnB NOR ASA | | | NO | | | | 7,233 | | | | 70,808 | |
Erste Group Bank AG | | | AT | | | | 1,344 | | | | 23,631 | |
Fukuoka Financial Group, Inc. | | | JP | | | | 6,000 | | | | 25,179 | |
Hang Seng Bank Ltd. | | | HK | | | | 5,500 | | | | 65,257 | |
Hokuhoku Financial Group, Inc. | | | JP | | | | 10,000 | | | | 19,488 | |
HSBC Holdings PLC | | | GB | | | | 131,433 | | | | 1,002,309 | |
Intesa Sanpaolo | | | IT | | | | 72,549 | | | | 121,502 | |
| | | | | | | | | | | | |
| | | Country
Code** | | | Shares | | | Value | |
| | | | | | | | | | | | |
Intesa Sanpaolo RSP | | | IT | | | | 9,099 | | | $ | 11,347 | |
Israel Discount Bank, Class A* | | | IL | | | | 7,807 | | | | 10,447 | |
KBC GROEP NV | | | BE | | | | 1,245 | | | | 15,680 | |
Lloyds Banking Group PLC* | | | GB | | | | 302,603 | | | | 121,739 | |
Mitsubishi UFJ Financial Group, Inc. | | | JP | | | | 93,500 | | | | 397,226 | |
Mizrahi Tefahot Bank Ltd. | | | IL | | | | 788 | | | | 6,230 | |
Mizuho Financial Group, Inc. | | | JP | | | | 167,400 | | | | 226,187 | |
National Australia Bank Ltd. | | | AU | | | | 16,217 | | | | 387,466 | |
National Bank of Greece SA* | | | GR | | | | 6,898 | | | | 14,463 | |
Natixis | | | FR | | | | 6,818 | | | | 17,154 | |
Nordea Bank AB | | | SE | | | | 19,386 | | | | 150,000 | |
Oversea-Chinese Banking Corp., Ltd. | | | SG | | | | 18,000 | | | | 108,662 | |
Raiffeisen Bank International AG | | | AT | | | | 441 | | | | 11,452 | |
Resona Holdings, Inc. | | | JP | | | | 14,000 | | | | 61,660 | |
Royal Bank of Scotland Group PLC* | | | GB | | | | 129,791 | | | | 40,676 | |
Seven Bank Ltd. | | | JP | | | | 3,000 | | | | 5,885 | |
Shinsei Bank Ltd. | | | JP | | | | 11,000 | | | | 11,433 | |
Skandinaviska Enskilda Banken AB, Class A | | | SE | | | | 10,339 | | | | 60,228 | |
Societe Generale | | | FR | | | | 4,831 | | | | 107,575 | |
Standard Chartered PLC | | | GB | | | | 17,530 | | | | 383,587 | |
Sumitomo Mitsui Financial Group, Inc. | | | JP | | | | 9,900 | | | | 275,765 | |
Suruga Bank Ltd. | | | JP | | | | 1,000 | | | | 8,951 | |
Svenska Handelsbanken AB | | | SE | | | | 3,627 | | | | 95,391 | |
Swedbank AB, Class A | | | SE | | | | 5,941 | | | | 76,960 | |
The Bank of East Asia Ltd. | | | HK | | | | 11,600 | | | | 43,986 | |
The Bank of Kyoto Ltd. | | | JP | | | | 2,000 | | | | 17,227 | |
The Bank of Yokohama Ltd. | | | JP | | | | 9,000 | | | | 42,562 | |
The Chiba Bank Ltd. | | | JP | | | | 5,000 | | | | 32,220 | |
The Chugoku Bank Ltd. | | | JP | | | | 2,000 | | | | 27,881 | |
The Gunma Bank Ltd. | | | JP | | | | 3,000 | | | | 16,487 | |
The Hachijuni Bank Ltd. | | | JP | | | | 3,000 | | | | 17,111 | |
The Hiroshima Bank Ltd. | | | JP | | | | 4,000 | | | | 18,605 | |
The Iyo Bank Ltd. | | | JP | | | | 2,000 | | | | 19,748 | |
See Notes to Financial Statements.
111
SC SM BLACKROCK INTERNATIONAL INDEX FUND
| | |
PORTFOLIOOF INVESTMENTS (Continued) December 31, 2011 | | Sun Capital Advisers Trust |
| | | | | | | | | | | | |
| | | Country
Code** | | | Shares | | | Value | |
| | | | | | | | | | | | |
| | | | | | | | | | | | |
The Joyo Bank Ltd. | | | JP | | | | 5,000 | | | $ | 22,086 | |
The Nishi-Nippon City Bank Ltd. | | | JP | | | | 5,000 | | | | 14,356 | |
The Shizuoka Bank Ltd. | | | JP | | | | 4,000 | | | | 42,146 | |
UniCredit SpA | | | IT | | | | 9,912 | | | | 82,360 | |
Unione Di Banche Italiane SCPA | | | IT | | | | 6,118 | | | | 25,069 | |
United Overseas Bank Ltd. | | | SG | | | | 9,000 | | | | 105,956 | |
Westpac Banking Corp. | | | AU | | | | 22,328 | | | | 456,742 | |
Wing Hang Bank Ltd. | | | HK | | | | 1,500 | | | | 12,303 | |
Yamaguchi Financial Group, Inc. | | | JP | | | | 2,000 | | | | 19,098 | |
| | | | | | | | | | | | |
| | | | | | | | | | | 7,860,632 | |
| | | | | | | | | | | | |
COMMERCIAL SERVICES & SUPPLIES – 0.6% | |
Aggreko PLC | | | GB | | | | 1,917 | | | | 60,048 | |
Babcock International Group PLC | | | GB | | | | 2,664 | | | | 30,429 | |
Brambles Ltd. | | | AU | | | | 10,874 | | | | 79,633 | |
Dai Nippon Printing Co., Ltd. | | | JP | | | | 4,000 | | | | 38,457 | |
Edenred | | | FR | | | | 1,190 | | | | 29,294 | |
G4S PLC | | | GB | | | | 10,278 | | | | 43,384 | |
Secom Co., Ltd. | | | JP | | | | 1,500 | | | | 69,183 | |
Securitas AB | | | SE | | | | 2,211 | | | | 19,083 | |
Serco Group PLC | | | GB | | | | 3,701 | | | | 27,244 | |
Societe BIC SA | | | FR | | | | 209 | | | | 18,529 | |
Toppan Printing Co., Ltd. | | | JP | | | | 4,000 | | | | 29,414 | |
| | | | | | | | | | | | |
| | | | | | | | | | | 444,698 | |
| | | | | | | | | | | | |
COMMUNICATIONS EQUIPMENT – 0.5% | |
Alcatel-lucent* | | | FR | | | | 17,000 | | | | 26,557 | |
Nokia OYJ | | | FI | | | | 27,589 | | | | 134,687 | |
Telefonaktiebolaget LM Ericsson | | | SE | | | | 22,159 | | | | 226,676 | |
| | | | | | | | | | | | |
| | | | 387,920 | |
| | | | | | | | | | | | |
COMPUTERS & PERIPHERALS – 0.3% | |
Fujitsu Ltd. | | | JP | | | | 14,000 | | | | 72,756 | |
NEC Corp.* | | | JP | | | | 19,000 | | | | 38,508 | |
Seiko Epson Corp. | | | JP | | | | 1,000 | | | | 13,291 | |
Toshiba Corp. | | | JP | | | | 29,000 | | | | 118,683 | |
| | | | | | | | | | | | |
| | | | | | | | | | | 243,238 | |
| | | | | | | | | | | | |
| | | | | | | | | | | | |
| | | Country
Code** | | | Shares | | | Value | |
| | | | | | | | | | | | |
| | | | | | | | | | | | |
CONSTRUCTION & ENGINEERING – 0.8% | |
Acs Actividades De Construccion Y Servicios SA | | | ES | | | | 1,030 | | | $ | 30,527 | |
Balfour Beatty PLC | | | GB | | | | 5,290 | | | | 21,754 | |
Bouygues SA | | | FR | | | | 1,382 | | | | 43,545 | |
Chiyoda Corp. | | | JP | | | | 1,000 | | | | 10,173 | |
Eiffage SA | | | FR | | | | 236 | | | | 5,713 | |
Ferrovial SA | | | ES | | | | 2,695 | | | | 32,526 | |
Fomento de Construcciones y Contratas SA | | | ES | | | | 313 | | | | 8,118 | |
Hochtief AG | | | DE | | | | 318 | | | | 18,395 | |
JGC Corp. | | | JP | | | | 2,000 | | | | 48,019 | |
Kajima Corp. | | | JP | | | | 7,000 | | | | 21,463 | |
Kinden Corp. | | | JP | | | | 1,000 | | | | 8,445 | |
Koninklijke Boskalis Westminster NV | | | NL | | | | 514 | | | | 18,886 | |
Leighton Holdings Ltd. | | | AU | | | | 1,147 | | | | 22,337 | |
Obayashi Corp. | | | JP | | | | 5,000 | | | | 22,216 | |
Shimizu Corp. | | | JP | | | | 4,000 | | | | 16,786 | |
Skanska AB, Class B | | | SE | | | | 2,995 | | | | 49,612 | |
Taisei Corp. | | | JP | | | | 8,000 | | | | 20,268 | |
Vinci SA | | | FR | | | | 3,323 | | | | 145,195 | |
| | | | | | | | | | | | |
| | | | | | | | | | | 543,978 | |
| | | | | | | | | | | | |
CONSTRUCTION MATERIALS – 0.5% | |
Boral Ltd. | | | AU | | | | 5,722 | | | | 21,069 | |
Cimpor Cimentos de Portugal SGPS SA | | | PT | | | | 1,464 | | | | 10,075 | |
CRH PLC | | | IE | | | | 5,160 | | | | 102,579 | |
Fletcher Building Ltd. | | | NZ | | | | 5,030 | | | | 24,040 | |
HeidelbergCement AG | | | DE | | | | 1,023 | | | | 43,414 | |
Holcim Ltd.* | | | CH | | | | 1,812 | | | | 96,937 | |
Imerys SA | | | FR | | | | 210 | | | | 9,673 | |
James Hardie Industries SE CDI | | | IE | | | | 3,315 | | | | 23,124 | |
Lafarge SA | | | FR | | | | 1,468 | | | | 51,603 | |
| | | | | | | | | | | | |
| | | | | | | | | | | 382,514 | |
| | | | | | | | | | | | |
CONSUMER FINANCE – 0.1% | |
Aeon Credit Service Co., Ltd. | | | JP | | | | 600 | | | | 9,479 | |
Credit Saison Co., Ltd. | | | JP | | | | 1,200 | | | | 24,056 | |
| | | | | | | | | | | | |
| | | | | | | | | | | 33,535 | |
| | | | | | | | | | | | |
See Notes to Financial Statements.
112
SC SM BLACKROCK INTERNATIONAL INDEX FUND
| | |
PORTFOLIOOF INVESTMENTS (Continued) December 31, 2011 | | Sun Capital Advisers Trust |
| | | | | | | | | | | | |
| | | Country
Code** | | | Shares | | | Value | |
| | | | | | | | | | | | |
| | | | | | | | | | | | |
CONTAINERS & PACKAGING – 0.2% | |
Amcor Ltd. | | | AU | | | | 9,021 | | | $ | 66,524 | |
Rexam PLC | | | GB | | | | 6,473 | | | | 35,466 | |
Toyo Seikan Kaisha Ltd. | | | JP | | | | 1,100 | | | | 15,006 | |
| | | | | | | | | | | | |
| | | | | | | | | | | 116,996 | |
| | | | | | | | | | | | |
DISTRIBUTORS – 0.2% | |
Jardine Cycle & Carriage Ltd. | | | SG | | | | 1,000 | | | | 37,099 | |
Li & Fung Ltd. | | | BM | | | | 42,000 | | | | 77,656 | |
| | | | | | | | | | | | |
| | | | | | | | | | | 114,755 | |
| | | | | | | | | | | | |
DIVERSIFIED CONSUMER SERVICES – 0.0% + | |
Benesse Holdings, Inc. | | | JP | | | | 500 | | | | 24,198 | |
| | | | | | | | | | | | |
DIVERSIFIED FINANCIAL SERVICES – 1.1% | |
ASX Ltd. | | | AU | | | | 1,274 | | | | 39,847 | |
Deutsche Boerse AG* | | | DE | | | | 1,402 | | | | 73,507 | |
Eurazeo | | | FR | | | | 236 | | | | 8,398 | |
Exor SpA | | | IT | | | | 399 | | | | 8,030 | |
First Pacific Co., Ltd. | | | BM | | | | 14,000 | | | | 14,601 | |
Groupe Bruxelles Lambert SA | | | BE | | | | 596 | | | | 39,733 | |
Hong Kong Exchanges and Clearing Ltd. | | | HK | | | | 7,500 | | | | 120,420 | |
Industrivarden AB | | | SE | | | | 894 | | | | 10,665 | |
ING Groep NV – CVA* | | | NL | | | | 28,096 | | | | 202,180 | |
Investor AB | | | SE | | | | 3,378 | | | | 63,024 | |
Kinnevik Investment AB, Class B | | | SE | | | | 1,603 | | | | 31,235 | |
London Stock Exchange Group PLC | | | GB | | | | 1,207 | | | | 14,902 | |
Mitsubishi UFJ Lease & Finance Co., Ltd. | | | JP | | | | 410 | | | | 16,247 | |
Orix Corp. | | | JP | | | | 750 | | | | 61,972 | |
Pargesa Holding SA | | | CH | | | | 191 | | | | 12,506 | |
Pohjola Bank PLC | | | FI | | | | 1,063 | | | | 10,332 | |
Singapore Exchange Ltd. | | | SG | | | | 7,000 | | | | 33,083 | |
| | | | | | | | | | | | |
| | | | | | | | | | | 760,682 | |
| | | | | | | | | | | | |
DIVERSIFIED TELECOMMUNICATION
SERVICES – 3.6% | |
Belgacom SA | | | BE | | | | 1,097 | | | | 34,416 | |
Bezeq Israeli Telecommunication Corp Ltd. | | | IL | | | | 12,469 | | | | 22,844 | |
BT Group PLC | | | GB | | | | 57,156 | | | | 169,449 | |
Deutsche Telekom AG | | | DE | | | | 20,718 | | | | 237,709 | |
| | | | | | | | | | | | |
| | | Country
Code** | | | Shares | | | Value | |
| | | | | | | | | | | | |
| | | | | | | | | | | | |
Elisa OYJ | | | FI | | | | 1,078 | | | $ | 22,505 | |
France Telecom SA | | | FR | | | | 13,704 | | | | 215,231 | |
Hellenic Telecommunications Organization SA | | | GR | | | | 1,822 | | | | 6,579 | |
| | | | | | | | | | | | |
HKT Trust and HKT Ltd.* MULT | | | | | | | 673 | | | | 389 | |
Iliad SA | | | FR | | | | 149 | | | | 18,388 | |
Inmarsat PLC | | | GB | | | | 3,451 | | | | 21,689 | |
Koninklijke KPN NV | | | NL | | | | 10,928 | | | | 130,757 | |
Nippon Telegraph & Telephone Corp. | | | JP | | | | 3,500 | | | | 178,933 | |
PCCW Ltd. | | | HK | | | | 31,000 | | | | 10,657 | |
Portugal Telecom SGPS SA | | | PT | | | | 4,978 | | | | 28,670 | |
Singapore Telecommunications Ltd. | | | SG | | | | 58,000 | | | | 138,175 | |
Swisscom AG | | | CH | | | | 173 | | | | 65,550 | |
TDC A/S | | | DK | | | | 2,678 | | | | 21,477 | |
Tele2 AB, B Shares | | | SE | | | | 2,366 | | | | 46,034 | |
Telecom Corp. of New Zealand Ltd. | | | NZ | | | | 14,020 | | | | 22,590 | |
Telecom Italia SpA | | | IT | | | | 70,368 | | | | 75,682 | |
Telecom Italia SpA RSP | | | IT | | | | 42,939 | | | | 38,457 | |
Telefonica SA | | | ES | | | | 30,332 | | | | 525,458 | |
Telekom Austria AG | | | AT | | | | 2,359 | | | | 28,205 | |
Telenor ASA | | | NO | | | | 5,298 | | | | 86,900 | |
TeliaSonera AB | | | SE | | | | 15,981 | | | | 108,606 | |
Telstra Corp., Ltd. | | | AU | | | | 32,164 | | | | 109,548 | |
Vivendi | | | FR | | | | 9,174 | | | | 200,899 | |
| | | | | | | | | | | | |
| | | | | | | | | | | 2,565,797 | |
| | | | | | | | | | | | |
ELECTRIC UTILITIES – 2.3% | |
Acciona S.A | | | ES | | | | 198 | | | | 17,100 | |
Cheung Kong Infrastructure Holdings Ltd. | | | BM | | | | 3,000 | | | | 17,479 | |
Chubu Electric Power Co., Inc. | | | JP | | | | 5,000 | | | | 93,348 | |
CLP Holdings Ltd. | | | HK | | | | 14,000 | | | | 119,151 | |
Contact Energy Ltd.* | | | NZ | | | | 2,626 | | | | 10,772 | |
E.ON AG | | | DE | | | | 13,252 | | | | 285,914 | |
EDP – Energias de Portugal SA | | | PT | | | | 14,148 | | | | 43,782 | |
Electricite de France | | | FR | | | | 1,793 | | | | 43,627 | |
Enel SpA | | | IT | | | | 48,512 | | | | 197,401 | |
Fortum OYJ | | | FI | | | | 3,285 | | | | 70,109 | |
Hokkaido Electric Power Co. | | | JP | | | | 1,500 | | | | 21,359 | |
See Notes to Financial Statements.
113
SC SM BLACKROCK INTERNATIONAL INDEX FUND
| | |
PORTFOLIOOF INVESTMENTS (Continued) December 31, 2011 | | Sun Capital Advisers Trust |
| | | | | | | | | | | | |
| | | Country
Code** | | | Shares | | | Value | |
| | | | | | | | | | | | |
| | | | | | | | | | | | |
Hokuriku Electric Power Co. | | | JP | | | | 1,200 | | | $ | 22,403 | |
Hongkong Electric Holdings Ltd. | | | HK | | | | 10,000 | | | | 73,971 | |
Iberdrola SA | | | ES | | | | 28,274 | | | | 177,077 | |
| | | | | | | | | | | | |
Kyushu Electric Power Co., Inc. | | | JP | | | | 3,000 | | | | 42,952 | |
Red Electrica Corp. SA | | | ES | | | | 787 | | | | 33,679 | |
Scottish & Southern Energy PLC | | | GB | | | | 6,915 | | | | 138,640 | |
Shikoku Electric Power Co., Inc. | | | JP | | | | 1,300 | | | | 37,259 | |
SP Ausnet | | | AU | | | | 8,617 | | | | 8,285 | |
Terna Rete Elettrica Nazionale SpA | | | IT | | | | 8,655 | | | | 29,169 | |
The Chugoku Electric Power Co., Inc. | | | JP | | | | 2,200 | | | | 38,558 | |
The Kansai Electric Power Co., Inc. | | | JP | | | | 5,500 | | | | 84,390 | |
The Tokyo Electric Power Co., Inc.* | | | JP | | | | 10,700 | | | | 25,440 | |
Tohoku Electric Power Co., Inc. | | | JP | | | | 3,400 | | | | 32,644 | |
Verbund AG | | | AT | | | | 561 | | | | 15,055 | |
| | | | | | | | | | | | |
| | | | | | | | | | | 1,679,564 | |
| | | | | | | | | | | | |
ELECTRICAL EQUIPMENT – 1.3% | |
ABB Ltd.* | | | CH | | | | 16,103 | | | | 303,099 | |
Alstom SA | | | FR | | | | 1,507 | | | | 45,699 | |
Bekaert NV | | | BE | | | | 289 | | | | 9,270 | |
Fuji Electric Holdings Co., Ltd. | | | JP | | | | 4,000 | | | | 10,965 | |
Furukawa Electric Co., Ltd. | | | JP | | | | 4,000 | | | | 9,198 | |
GS Yuasa Corp. | | | JP | | | | 2,000 | | | | 10,757 | |
Legrand SA | | | FR | | | | 1,640 | | | | 52,746 | |
Mabuchi Motor Co., Ltd. | | | JP | | | | 200 | | | | 8,328 | |
Mitsubishi Electric Corp. | | | JP | | | | 14,000 | | | | 134,234 | |
Nidec Corp. | | | JP | | | | 800 | | | | 69,534 | |
Prysmian SpA | | | IT | | | | 1,478 | | | | 18,354 | |
Schneider Electric SA | | | FR | | | | 3,599 | | | | 189,488 | |
Sumitomo Electric Industries Ltd. | | | JP | | | | 5,400 | | | | 58,792 | |
Ushio, Inc. | | | JP | | | | 800 | | | | 11,558 | |
Vestas Wind Systems A/S* | | | DK | | | | 1,568 | | | | 16,927 | |
| | | | | | | | | | | | |
| | | | | | | | | | | 948,949 | |
| | | | | | | | | | | | |
| | | | | | | | | | | | |
| | | Country
Code** | | | Shares | | | Value | |
| | | | | | | | | | | | |
| | | | | | | | | | | | |
ELECTRONIC EQUIPMENT, INSTRUMENTS & COMPONENTS – 1.1% | |
Citizen Holdings Co., Ltd. | | | JP | | | | 1,900 | | | $ | 11,034 | |
Foxconn International Holdings Ltd.* | | | KY | | | | 14,000 | | | | 9,031 | |
FUJIFILM Holdings Corp. | | | JP | | | | 3,400 | | | | 80,527 | |
Hamamatsu Photonics KK | | | JP | | | | 500 | | | | 17,494 | |
Hexagon AB, Class B | | | SE | | | | 1,937 | | | | 28,962 | |
Hirose Electric Co., Ltd. | | | JP | | | | 200 | | | | 17,539 | |
Hitachi High-Technologies Corp. | | | JP | | | | 400 | | | | 8,679 | |
Hitachi Ltd. | | | JP | | | | 33,000 | | | | 173,210 | |
Hoya Corp. | | | JP | | | | 3,200 | | | | 68,931 | |
Ibiden Co., Ltd. | | | JP | | | | 900 | | | | 17,797 | |
Keyence Corp. | | | JP | | | | 300 | | | | 72,340 | |
Kyocera Corp. | | | JP | | | | 1,100 | | | | 88,463 | |
Murata Manufacturing Co., Ltd. | | | JP | | | | 1,500 | | | | 77,075 | |
Nippon Electric Glass Co., Ltd. | | | JP | | | | 3,000 | | | | 29,700 | |
Omron Corp. | | | JP | | | | 1,500 | | | | 30,148 | |
Shimadzu Corp. | | | JP | | | | 2,000 | | | | 16,942 | |
TDK Corp. | | | JP | | | | 900 | | | | 39,873 | |
Yaskawa Electric Corp. | | | JP | | | | 2,000 | | | | 17,020 | |
Yokogawa Electric Corp.* | | | JP | | | | 1,600 | | | | 14,447 | |
| | | | | | | | | | | | |
| | | | | | | | | | | 819,212 | |
| | | | | | | | | | | | |
ENERGY EQUIPMENT & SERVICES – 0.9% | |
Aker Solutions ASA | | | NO | | | | 1,192 | | | | 12,546 | |
Amec PLC | | | GB | | | | 2,468 | | | | 34,783 | |
Compagnie Generale de Geophysique-Veritas* | | | FR | | | | 1,111 | | | | 26,069 | |
Fugro NV | | | NL | | | | 513 | | | | 29,808 | |
Petrofac Ltd. | | | JE | | | | 1,924 | | | | 43,057 | |
Saipem SpA | | | IT | | | | 1,966 | | | | 83,587 | |
SBM Offshore NV | | | NL | | | | 1,217 | | | | 25,076 | |
Seadrill Ltd. | | | BM | | | | 2,419 | | | | 80,891 | |
Subsea 7 SA* | | | LU | | | | 2,048 | | | | 38,009 | |
Technip SA | | | FR | | | | 730 | | | | 68,612 | |
Tenaris SA | | | LU | | | | 3,516 | | | | 64,982 | |
Transocean Ltd. | | | CH | | | | 2,532 | | | | 97,770 | |
Worleyparsons Ltd. | | | AU | | | | 1,409 | | | | 36,994 | |
| | | | | | | | | | | | |
| | | | | | | | | | | 642,184 | |
| | | | | | | | | | | | |
See Notes to Financial Statements.
114
SC SM BLACKROCK INTERNATIONAL INDEX FUND
| | |
PORTFOLIOOF INVESTMENTS (Continued) December 31, 2011 | | Sun Capital Advisers Trust |
| | | | | | | | | | | | |
| | | Country
Code** | | | Shares | | | Value | |
| | | | | | | | | | | | |
| | | | | | | | | | | | |
FOOD & STAPLES RETAILING – 2.3% | |
Aeon Co., Ltd. | | | JP | | | | 4,400 | | | $ | 60,423 | |
Carrefour SA | | | FR | | | | 4,253 | | | | 96,961 | |
Casino Guichard-Perrachon SA | | | FR | | | | 396 | | | | 33,355 | |
Colruyt SA | | | BE | | | | 591 | | | | 22,373 | |
Delhaize Group | | | BE | | | | 724 | | | | 40,672 | |
Distribuidora Internacional de Alimentacion SA* | | | ES | | | | 4,054 | | | | 18,338 | |
FamilyMart Co., Ltd. | | | JP | | | | 500 | | | | 20,203 | |
J Sainsbury PLC | | | GB | | | | 9,008 | | | | 42,374 | |
Jeronimo Martins SGPS SA* | | | PT | | | | 1,636 | | | | 27,081 | |
Kesko OYJ, Class B | | | FI | | | | 494 | | | | 16,598 | |
Koninklijke Ahold NV | | | NL | | | | 8,579 | | | | 115,531 | |
Lawson, Inc. | | | JP | | | | 400 | | | | 24,971 | |
Metcash Ltd. | | | AU | | | | 5,440 | | | | 22,479 | |
Metro AG | | | DE | | | | 942 | | | | 34,381 | |
Olam International Ltd. | | | SG | | | | 11,000 | | | | 18,064 | |
Seven & I Holdings Co., Ltd. | | | JP | | | | 5,500 | | | | 153,274 | |
Tesco PLC | | | GB | | | | 59,052 | | | | 369,995 | |
Wesfarmers Ltd. | | | AU | | | | 7,395 | | | | 223,126 | |
William Morrison Supermarkets PLC | | | GB | | | | 16,099 | | | | 81,556 | |
Woolworths Ltd. | | | AU | | | | 8,960 | | | | 230,024 | |
| | | | | | | | | | | | |
| | | | | | | | | | | 1,651,779 | |
| | | | | | | | | | | | |
FOOD PRODUCTS – 4.0% | |
Ajinomoto Co., Inc. | | | JP | | | | 5,000 | | | | 60,023 | |
Aryzta AG | | | CH | | | | 617 | | | | 29,822 | |
Associated British Foods PLC | | | GB | | | | 2,605 | | | | 44,784 | |
Barry Callebaut AG* | | | CH | | | | 13 | | | | 12,809 | |
Danone SA | | | FR | | | | 4,300 | | | | 270,306 | |
Golden Agri-resources Ltd. | | | MU | | | | 51,000 | | | | 28,114 | |
Kerry Group PLC, Class A | | | IE | | | | 1,001 | | | | 36,729 | |
Kikkoman Corp. | | | JP | | | | 1,000 | | | | 11,485 | |
Lindt & Spruengli AG | | | CH | | | | 7 | | | | 51,266 | |
MEIJI Holdings Co., Ltd. | | | JP | | | | 500 | | | | 20,755 | |
Nestle SA | | | CH | | | | 24,287 | | | | 1,396,250 | |
Nippon Meat Packers, Inc. | | | JP | | | | 2,000 | | | | 24,841 | |
Nisshin Seifun Group, Inc. | | | JP | | | | 1,500 | | | | 18,182 | |
| | | | | | | | | | | | |
| | | Country
Code** | | | Shares | | | Value | |
| | | | | | | | | | | | |
| | | | | | | | | | | | |
Nissin Foods Holdings Co., Ltd. | | | JP | | | | 400 | | | $ | 15,668 | |
Suedzucker AG | | | DE | | | | 464 | | | | 14,803 | |
Tate & Lyle PLC | | | GB | | | | 3,335 | | | | 36,488 | |
Toyo Suisan Kaisha Ltd. | | | JP | | | | 1,000 | | | | 24,230 | |
Unilever NV | | | NL | | | | 12,003 | | | | 412,762 | |
Unilever PLC | | | GB | | | | 9,444 | | | | 317,237 | |
Wilmar International Ltd. | | | SG | | | | 14,000 | | | | 53,969 | |
Yakult Honsha Co., Ltd. | | | JP | | | | 700 | | | | 22,054 | |
Yamazaki Baking Co., Ltd. | | | JP | | | | 1,000 | | | | 13,135 | |
| | | | | | | | | | | | |
| | | | | | | | | | | 2,915,712 | |
| | | | | | | | | | | | |
GAS UTILITIES – 0.5% | | | | | | | | | | | | |
Enagas | | | ES | | | | 1,330 | | | | 24,598 | |
Gas Natural SDG SA | | | ES | | | | 2,581 | | | | 44,311 | |
Hong Kong & China Gas Co., Ltd. | | | HK | | | | 34,500 | | | | 80,047 | |
Osaka Gas Co., Ltd. | | | JP | | | | 14,000 | | | | 55,294 | |
Snam Rete Gas SpA | | | IT | | | | 11,718 | | | | 51,656 | |
Toho Gas Co., Ltd. | | | JP | | | | 3,000 | | | | 19,098 | |
Tokyo Gas Co., Ltd. | | | JP | | | | 18,000 | | | | 82,786 | |
| | | | | | | | | | | | |
| | | | | | | | | | | 357,790 | |
| | | | | | | | | | | | |
HEALTH CARE EQUIPMENT & SUPPLIES – 0.7% | |
Cochlear Ltd. | | | AU | | | | 405 | | | | 25,683 | |
Coloplast A/S, Class B | | | DK | | | | 175 | | | | 25,168 | |
Essilor International SA | | | FR | | | | 1,488 | | | | 105,055 | |
Getinge AB, Class B | | | SE | | | | 1,437 | | | | 36,415 | |
Olympus Corp. | | | JP | | | | 1,600 | | | | 21,037 | |
Smith & Nephew PLC | | | GB | | | | 6,603 | | | | 64,142 | |
Sonova Holding AG* | | | CH | | | | 358 | | | | 37,446 | |
Straumann Holding AG | | | CH | | | | 61 | | | | 10,527 | |
Synthes, Inc. (1) | | | | | | | 481 | | | | 80,653 | |
Sysmex Corp. | | | JP | | | | 500 | | | | 16,292 | |
Terumo Corp. | | | JP | | | | 1,200 | | | | 56,516 | |
William Demant Holding A/S* | | | DK | | | | 197 | | | | 16,382 | |
| | | | | | | | | | | | |
| | | | | | | | | | | 495,316 | |
| | | | | | | | | | | | |
HEALTH CARE PROVIDERS & SERVICES – 0.4% | |
Alfresa Holdings Corp. | | | JP | | | | 300 | | | | 12,648 | |
Celesio AG | | | DE | | | | 652 | | | | 10,329 | |
Fresenius Medical Care AG & Co. | | | DE | | | | 1,545 | | | | 104,980 | |
Fresenius SE | | | DE | | | | 841 | | | | 77,803 | |
See Notes to Financial Statements.
115
SC SM BLACKROCK INTERNATIONAL INDEX FUND
| | |
PORTFOLIOOF INVESTMENTS (Continued) December 31, 2011 | | Sun Capital Advisers Trust |
| | | | | | | | | | | | |
| | | Country
Code** | | | Shares | | | Value | |
| | | | | | | | | | | | |
| | | | | | | | | | | | |
Medipal Holdings Corp. | | | JP | | | | 900 | | | $ | 9,401 | |
Miraca Holdings, Inc. | | | JP | | | | 400 | | | | 15,928 | |
Ramsay Health Care Ltd. | | | AU | | | | 1,013 | | | | 19,976 | |
Sonic Healthcare Ltd. | | | AU | | | | 2,720 | | | | 31,381 | |
Suzuken Co., Ltd. | | | JP | | | | 500 | | | | 13,863 | |
| | | | | | | | | | | | |
| | | | | | | | | | | 296,309 | |
| | | | | | | | | | | | |
HOTELS, RESTAURANTS & LEISURE – 1.0% | |
Accor SA | | | FR | | | | 1,060 | | | | 26,869 | |
Autogrill SpA | | | IT | | | | 707 | | | | 6,899 | |
Carnival PLC | | | GB | | | | 1,336 | | | | 44,111 | |
Compass Group PLC | | | GB | | | | 13,944 | | | | 132,312 | |
Crown Ltd. | | | AU | | | | 3,323 | | | | 27,496 | |
Echo Entertainment Group Ltd.* | | | AU | | | | 5,038 | | | | 18,499 | |
Galaxy Entertainment Group Ltd.* | | | HK | | | | 10,000 | | �� | | 18,283 | |
Genting Singapore PLC* | | | IM | | | | 45,000 | | | | 52,388 | |
Intercontinental Hotels Group PLC | | | GB | | | | 2,141 | | | | 38,470 | |
McDonald’s Holdings Co. Japan Ltd. | | | JP | | | | 600 | | | | 16,191 | |
OPAP SA | | | GR | | | | 1,624 | | | | 14,356 | |
Oriental Land Co., Ltd. | | | JP | | | | 400 | | | | 42,250 | |
Sands China Ltd.* | | | KY | | | | 17,600 | | | | 49,741 | |
Shangri-La Asia Ltd. | | | BM | | | | 10,500 | | | | 18,116 | |
SJM Holdings Ltd. | | | HK | | | | 13,000 | | | | 21,090 | |
Sky City Entertainment Group Ltd. | | | NZ | | | | 4,326 | | | | 11,584 | |
Sodexo | | | FR | | | | 691 | | | | 49,608 | |
Tabcorp Holdings Ltd. | | | AU | | | | 4,525 | | | | 12,635 | |
Tatts Group Ltd. | | | AU | | | | 9,318 | | | | 23,254 | |
Tui Travel PLC | | | GB | | | | 3,336 | | | | 8,590 | |
Whitbread PLC | | | GB | | | | 1,289 | | | | 31,308 | |
Wynn Macau Ltd. | | | KY | | | | 11,200 | | | | 28,092 | |
| | | | | | | | | | | | |
| | | | | | | | | | | 692,142 | |
| | | | | | | | | | | | |
HOUSEHOLD DURABLES – 0.6% | |
Casio Computer Co., Ltd. | | | JP | | | | 1,800 | | | | 10,921 | |
Electrolux AB, Series B | | | SE | | | | 1,820 | | | | 29,011 | |
Husqvarna AB | | | SE | | | | 3,229 | | | | 14,878 | |
Panosonic Corp. | | | JP | | | | 16,200 | | | | 137,649 | |
Rinnai Corp. | | | JP | | | | 200 | | | | 14,317 | |
Sekisui Chemical Co., Ltd. | | | JP | | | | 3,000 | | | | 24,750 | |
Sekisui House Ltd. | | | JP | | | | 4,000 | | | | 35,494 | |
| | | | | | | | | | | | |
| | | Country
Code** | | | Shares | | | Value | |
| | | | | | | | | | | | |
| | | | | | | | | | | | |
Sharp Corp. | | | JP | | | | 7,000 | | | $ | 61,206 | |
Sony Corp. | | | JP | | | | 7,400 | | | | 132,867 | |
| | | | | | | | | | | | |
| | | | | | | | | | | 461,093 | |
| | | | | | | | | | | | |
HOUSEHOLD PRODUCTS – 0.4% | |
Henkel AG & Co. KgaA | | | DE | | | | 981 | | | | 47,485 | |
Reckitt Benckiser Group PLC | | | GB | | | | 4,561 | | | | 225,247 | |
Unicharm Corp. | | | JP | | | | 800 | | | | 39,444 | |
| | | | | | | | | | | | |
| | | | | | | | | | | 312,176 | |
| | | | | | | | | | | | |
INDEPENDENT POWER PRODUCERS & ENERGY TRADERS – 0.2% | |
EDP Renovaveis SA* | | | ES | | | | 1,604 | | | | 9,815 | |
Electric Power Development Co., Ltd. | | | JP | | | | 900 | | | | 23,935 | |
Enel Green Power SPA | | | IT | | | | 12,427 | | | | 25,959 | |
International Power PLC | | | GB | | | | 11,092 | | | | 58,086 | |
| | | | | | | | | | | | |
| | | | | | | | | | | 117,795 | |
| | | | | | | | | | | | |
INDUSTRIAL CONGLOMERATES – 1.6% | |
Delek Group Ltd. | | | IL | | | | 28 | | | | 5,269 | |
Fraser and Neave Ltd. | | | SG | | | | 7,000 | | | | 33,461 | |
Hutchison Whampoa Ltd. | | | HK | | | | 16,000 | | | | 134,525 | |
Keppel Corp Ltd. | | | SG | | | | 10,700 | | | | 76,720 | |
Koninklijke Philips Electronics NV | | | NL | | | | 7,430 | | | | 156,553 | |
NWS Holdings Ltd. | | | BM | | | | 10,000 | | | | 14,730 | |
Orkla ASA | | | NO | | | | 5,495 | | | | 41,023 | |
SembCorp Industries Ltd. | | | SG | | | | 8,000 | | | | 24,980 | |
Siemens AG | | | DE | | | | 6,059 | | | | 579,827 | |
Smiths Group PLC | | | GB | | | | 2,821 | | | | 40,086 | |
Wendel | | | FR | | | | 249 | | | | 16,597 | |
| | | | | | | | | | | | |
| | | | | | | | | | | 1,123,771 | |
| | | | | | | | | | | | |
INSURANCE – 4.1% | |
Admiral Group PLC | | | GB | | | | 1,458 | | | | 19,292 | |
Aegon NV* | | | NL | | | | 13,144 | | | | 52,753 | |
Ageas | | | BE | | | | 17,420 | | | | 27,055 | |
AIA Group Ltd. | | | HK | | | | 61,800 | | | | 192,961 | |
Allianz SE | | | DE | | | | 3,342 | | | | 319,689 | |
AMP Ltd. | | | AU | | | | 20,827 | | | | 86,699 | |
Assicurazioni Generali SpA | | | IT | | | | 8,622 | | | | 129,780 | |
Aviva PLC | | | GB | | | | 20,950 | | | | 97,866 | |
See Notes to Financial Statements.
116
SC SM BLACKROCK INTERNATIONAL INDEX FUND
| | |
PORTFOLIOOF INVESTMENTS (Continued) December 31, 2011 | | Sun Capital Advisers Trust |
| | | | | | | | | | | | |
| | | Country
Code** | | | Shares | | | Value | |
| | | | | | | | | | | | |
| | | | | | | | | | | | |
AXA SA | | | FR | | | | 12,769 | | | $ | 166,007 | |
Baloise Holding AG | | | CH | | | | 343 | | | | 23,517 | |
CNP Assurances | | | FR | | | | 1,113 | | | | 13,797 | |
Delta Lloyd NV | | | NL | | | | 880 | | | | 14,806 | |
Gjensidige Forsikring ASA | | | NO | | | | 1,584 | | | | 18,354 | |
Hannover Rueckversicherung AG | | | DE | | | | 426 | | | | 21,131 | |
Insurance Australia Group Ltd. | | | AU | | | | 15,162 | | | | 46,213 | |
Legal & General Group PLC | | | GB | | | | 43,110 | | | | 68,824 | |
Mapfre SA | | | ES | | | | 5,662 | | | | 17,990 | |
MS&AD Insurance Group Holdings, Inc. | | | JP | | | | 4,200 | | | | 77,812 | |
Muenchener Rueckversicherungs AG | | | DE | | | | 1,325 | | | | 162,537 | |
NKSJ Holdings, Inc. | | | JP | | | | 2,700 | | | | 52,969 | |
Old Mutual PLC | | | GB | | | | 40,554 | | | | 85,338 | |
Prudential PLC | | | GB | | | | 18,724 | | | | 185,665 | |
QBE Insurance Group Ltd. | | | AU | | | | 8,015 | | | | 106,161 | |
Resolution Ltd. | | | GG | | | | 10,815 | | | | 42,224 | |
Rsa Insurance Group PLC | | | GB | | | | 25,752 | | | | 42,072 | |
Sampo OYJ, Class A | | | FI | | | | 3,101 | | | | 76,938 | |
SCOR SE | | | FR | | | | 1,227 | | | | 28,680 | |
Sony Financial Holdings, Inc. | | | JP | | | | 1,300 | | | | 19,153 | |
Standard Life PLC | | | GB | | | | 16,863 | | | | 54,026 | |
Suncorp Group Ltd. | | | AU | | | | 9,426 | | | | 80,791 | |
Swiss Life Holding AG* | | | CH | | | | 231 | | | | 21,248 | |
Swiss Re Ltd.* | | | CH | | | | 2,523 | | | | 128,581 | |
T&D Holdings, Inc. | | | JP | | | | 4,200 | | | | 39,124 | |
The Dai-ichi Life Insurance Co., Ltd. | | | JP | | | | 67 | | | | 65,895 | |
Tokio Marine Holdings, Inc. | | | JP | | | | 5,300 | | | | 117,403 | |
Tryg A/S | | | DK | | | | 157 | | | | 8,720 | |
Vienna Insurance Group AG Wiener Versicherung Gruppe | | | AT | | | | 291 | | | | 11,532 | |
Zurich Financial Services AG* | | | CH | | | | 1,068 | | | | 241,616 | |
| | | | | | | | | | | | |
| | | | | | | | | | | 2,965,219 | |
| | | | | | | | | | | | |
| | | | | | | | | | | | |
| | | Country
Code** | | | Shares | | | Value | |
| | | | | | | | | | | | |
| | | | | | | | | | | | |
INTERNET & CATALOG RETAIL – 0.1% | |
Rakuten, Inc. | | | JP | | | | 53 | | | $ | 57,014 | |
| | | | | | | | | | | | |
INTERNET SOFTWARE & SERVICES – 0.1% | |
Dena Co., Ltd. | | | JP | | | | 700 | | | | 20,999 | |
Gree, Inc. | | | JP | | | | 700 | | | | 24,118 | |
United Internet AG | | | DE | | | | 806 | | | | 14,396 | |
Yahoo Japan Corp. | | | JP | | | | 104 | | | | 33,496 | |
| | | | | | | | | | | | |
| | | | | | | | | | | 93,009 | |
| | | | | | | | | | | | |
IT SERVICES – 0.3% | |
Amadeus IT Holding SA, Class A | | | ES | | | | 2,294 | | | | 37,217 | |
Atos Origin SA | | | FR | | | | 392 | | | | 17,204 | |
Cap Gemini SA | | | FR | | | | 1,073 | | | | 33,531 | |
Computershare Ltd. | | | AU | | | | 3,284 | | | | 26,905 | |
Indra Sistemas SA | | | ES | | | | 745 | | | | 9,485 | |
Itochu Techno-Solutions Corp. | | | JP | | | | 200 | | | | 8,977 | |
Nomura Research Institute Ltd. | | | JP | | | | 800 | | | | 18,085 | |
NTT Data Corp. | | | JP | | | | 10 | | | | 31,934 | |
Otsuka Corp. | | | JP | | | | 100 | | | | 6,886 | |
| | | | | | | | | | | | |
| | | | | | | | | | | 190,224 | |
| | | | | | | | | | | | |
LEISURE EQUIPMENT & PRODUCTS – 0.2% | |
Namco Bandai Holdings, Inc. | | | JP | | | | 1,400 | | | | 19,935 | |
Nikon Corp. | | | JP | | | | 2,500 | | | | 55,671 | |
Sankyo Co., Ltd. | | | JP | | | | 400 | | | | 20,242 | |
Sega Sammy Holdings, Inc. | | | JP | | | | 1,500 | | | | 32,409 | |
Shimano, Inc. | | | JP | | | | 500 | | | | 24,295 | |
Yamaha Corp. | | | JP | | | | 1,000 | | | | 9,172 | |
| | | | | | | | | | | | |
| | | | | | | | | | | 161,724 | |
| | | | | | | | | | | | |
LIFE SCIENCES TOOLS & SERVICES – 0.1% | |
Lonza Group AG* | | | CH | | | | 356 | | | | 21,035 | |
QIAGEN NV* | | | NL | | | | 1,650 | | | | 22,743 | |
| | | | | | | | | | | | |
| | | | | | | | | | | 43,778 | |
| | | | | | | | | | | | |
MACHINERY – 2.6% | | | | | | | | | | | | |
Alfa Laval AB | | | SE | | | | 2,464 | | | | 46,687 | |
Amada Co., Ltd. | | | JP | | | | 3,000 | | | | 19,020 | |
Atlas Copco AB, Shares A | | | SE | | | | 4,992 | | | | 107,354 | |
Atlas Copco AB, Shares B | | | SE | | | | 2,848 | | | | 54,129 | |
Cosco Corp. Singapore Ltd. | | | SG | | | | 6,000 | | | | 4,048 | |
See Notes to Financial Statements.
117
SC SM BLACKROCK INTERNATIONAL INDEX FUND
| | |
PORTFOLIOOF INVESTMENTS (Continued) December 31, 2011 | | Sun Capital Advisers Trust |
| | | | | | | | | | | | |
| | | Country
Code** | | | Shares | | | Value | |
| | | | | | | | | | | | |
| | | | | | | | | | | | |
FANUC Corp. | | | JP | | | | 1,400 | | | $ | 214,265 | |
Fiat Industrial SPA* | | | IT | | | | 5,545 | | | | 47,545 | |
GEA Group AG | | | DE | | | | 1,242 | | | | 35,123 | |
Hino Motors Ltd. | | | JP | | | | 2,000 | | | | 12,135 | |
Hitachi Construction Machinery Co., Ltd. | | | JP | | | | 700 | | | | 11,786 | |
IHI Corp. | | | JP | | | | 10,000 | | | | 24,295 | |
Invensys PLC | | | GB | | | | 6,047 | | | | 19,815 | |
JTEKT Corp. | | | JP | | | | 1,500 | | | | 14,753 | |
Kawasaki Heavy Industries Ltd. | | | JP | | | | 10,000 | | | | 24,945 | |
Komatsu Ltd. | | | JP | | | | 7,000 | | | | 163,609 | |
Kone OYJ, Class B | | | FI | | | | 1,153 | | | | 59,840 | |
Kubota Corp. | | | JP | | | | 8,000 | | | | 67,039 | |
Kurita Water Industries Ltd. | | | JP | | | | 800 | | | | 20,787 | |
Makita Corp. | | | JP | | | | 900 | | | | 29,127 | |
Man AG | | | DE | | | | 456 | | | | 40,545 | |
Metso Corp. | | | FI | | | | 953 | | | | 35,338 | |
Mitsubishi Heavy Industries Ltd. | | | JP | | | | 22,000 | | | | 93,751 | |
Nabtesco Corp. | | | JP | | | | 800 | | | | 14,582 | |
NGK Insulators Ltd. | | | JP | | | | 2,000 | | | | 23,750 | |
NSK Ltd. | | | JP | | | | 3,000 | | | | 19,488 | |
NTN Corp. | | | JP | | | | 4,000 | | | | 16,110 | |
Sandvik AB | | | SE | | | | 7,398 | | | | 90,781 | |
Scania AB, Class A | | | SE | | | | 2,304 | | | | 34,148 | |
Schindler Holding AG | | | CH | | | | 509 | | | | 59,238 | |
Sembcorp Marine Ltd. | | | SG | | | | 6,000 | | | | 17,671 | |
SKF AB, Class B | | | SE | | | | 2,882 | | | | 60,973 | |
SMC Corp. | | | JP | | | | 400 | | | | 64,545 | |
Sulzer AG | | | CH | | | | 177 | | | | 18,919 | |
Sumitomo Heavy Industries Ltd. | | | JP | | | | 4,000 | | | | 23,334 | |
The Japan Steel Works Ltd. | | | JP | | | | 2,000 | | | | 13,902 | |
The Weir Group PLC | | | GB | | | | 1,536 | | | | 48,471 | |
THK Co., Ltd. | | | JP | | | | 900 | | | | 17,738 | |
Vallourec SA | | | FR | | | | 836 | | | | 54,273 | |
Volvo AB, B Shares | | | SE | | | | 10,181 | | | | 111,395 | |
Wartsila OYJ | | | FI | | | | 1,218 | | | | 35,185 | |
Yangzijiang Shipbuilding Holdings Ltd. | | | SG | | | | 15,000 | | | | 10,524 | |
Zardoya Otis SA | | | ES | | | | 1,030 | | | | 14,131 | |
| | | | | | | | | | | | |
| | | | | | | | | | | 1,895,094 | |
| | | | | | | | | | | | |
MARINE – 0.3% | |
AP Moller – Maersk A/S, Class A | | | DK | | | | 4 | | | | 24,961 | |
| | | | | | | | | | | | |
| | | Country
Code** | | | Shares | | | Value | |
| | | | | | | | | | | | |
| | | | | | | | | | | | |
AP Moller – Maersk A/S, Class B | | | DK | | | | 10 | | | $ | 66,025 | |
Kawasaki Kisen Kaisha Ltd. | | | JP | | | | 5,000 | | | | 9,029 | |
Kuehne & Nagel International AG | | | CH | | | | 391 | | | | 43,916 | |
Mitsui Osk Lines Ltd. | | | JP | | | | 9,000 | | | | 34,845 | |
Neptune Orient Lines Ltd. | | | SG | | | | 5,000 | | | | 4,337 | |
Nippon Yusen KK | | | JP | | | | 12,000 | | | | 30,713 | |
Orient Overseas International Ltd. | | | BM | | | | 1,500 | | | | 8,759 | |
| | | | | | | | | | | | |
| | | | | | | | | | | 222,585 | |
| | | | | | | | | | | | |
MEDIA – 1.2% | |
Axel Springer AG | | | DE | | | | 260 | | | | 11,174 | |
British Sky Broadcasting Group PLC | | | GB | | | | 8,476 | | | | 96,421 | |
Dentsu, Inc. | | | JP | | | | 1,300 | | | | 39,674 | |
Eutelsat Communications | | | FR | | | | 716 | | | | 27,939 | |
Fairfax Media Ltd. | | | AU | | | | 18,433 | | | | 13,574 | |
Hakuhodo Dy Holdings, Inc. | | | JP | | | | 150 | | | | 8,614 | |
ITV PLC | | | GB | | | | 27,887 | | | | 29,515 | |
JC Decaux SA* | | | FR | | | | 562 | | | | 12,944 | |
Jupiter Telecommunications Co., Ltd. | | | JP | | | | 13 | | | | 13,174 | |
Kabel Deutschland Holding AG* | | | DE | | | | 642 | | | | 32,584 | |
Lagardere SCA | | | FR | | | | 899 | | | | 23,736 | |
Mediaset SpA | | | IT | | | | 5,569 | | | | 15,410 | |
Modern Times Group, Class B | | | SE | | | | 348 | | | | 16,626 | |
Pearson PLC | | | GB | | | | 5,995 | | | | 112,654 | |
Publicis Groupe SA | | | FR | | | | 1,063 | | | | 48,902 | |
Reed Elsevier NV | | | NL | | | | 4,949 | | | | 57,692 | |
Reed Elsevier PLC | | | GB | | | | 8,957 | | | | 72,194 | |
Sanoma OYJ | | | FI | | | | 494 | | | | 5,668 | |
SES SA | | | LU | | | | 2,194 | | | | 52,660 | |
Singapore Press Holdings Ltd. | | | SG | | | | 11,000 | | | | 31,294 | |
Societe Television Francaise 1 | | | FR | | | | 911 | | | | 8,892 | |
Toho Co., Ltd. | | | JP | | | | 900 | | | | 16,043 | |
Wolters Kluwer NV | | | NL | | | | 2,162 | | | | 37,370 | |
WPP PLC | | | JE | | | | 9,248 | | | | 97,016 | |
| | | | | | | | | | | | |
| | | | | | | | | | | 881,770 | |
| | | | | | | | | | | | |
See Notes to Financial Statements.
118
SC SM BLACKROCK INTERNATIONAL INDEX FUND
| | |
PORTFOLIOOF INVESTMENTS (Continued) December 31, 2011 | | Sun Capital Advisers Trust |
| | | | | | | | | | | | |
| | | Country
Code** | | | Shares | | | Value | |
| | | | | | | | | | | | |
| | | | | | | | | | | | |
METALS & MINING – 5.3% | |
Acerinox SA | | | ES | | | | 765 | | | $ | 9,812 | |
Alumina Ltd. | | | AU | | | | 17,422 | | | | 19,868 | |
Anglo American PLC | | | GB | | | | 9,723 | | | | 359,225 | |
Antofagasta PLC | | | GB | | | | 2,851 | | | | 53,795 | |
ArcelorMittal | | | LU | | | | 6,299 | | | | 115,195 | |
BHP Billiton Ltd. | | | AU | | | | 23,635 | | | | 832,065 | |
BHP Billiton PLC | | | GB | | | | 15,528 | | | | 452,759 | |
Boliden AB | | | SE | | | | 1,938 | | | | 28,301 | |
Daido Steel Co., Ltd. | | | JP | | | | 2,000 | | | | 12,550 | |
Eurasian Natural Resources Corp. | | | GB | | | | 2,037 | | | | 20,104 | |
Fortescue Metals Group Ltd. | | | AU | | | | 9,158 | | | | 39,996 | |
Fresnillo PLC | | | GB | | | | 1,313 | | | | 31,137 | |
Glencore International PLC | | | JE | | | | 6,180 | | | | 37,622 | |
Hitachi Metals Ltd. | | | JP | | | | 1,000 | | | | 10,874 | |
Iluka Resources Ltd. | | | AU | | | | 3,043 | | | | 48,242 | |
JFE Holdings, Inc. | | | JP | | | | 3,400 | | | | 61,577 | |
Kazakhmys PLC | | | GB | | | | 1,557 | | | | 22,415 | |
Kobe Steel Ltd. | | | JP | | | | 18,000 | | | | 27,829 | |
Lonmin PLC | | | GB | | | | 1,214 | | | | 18,476 | |
Lynas Corp., Ltd.* | | | AU | | | | 12,774 | | | | 13,653 | |
Maruichi Steel Tube Ltd. | | | JP | | | | 300 | | | | 6,692 | |
Mitsubishi Materials Corp. | | | JP | | | | 8,000 | | | | 21,723 | |
Newcrest Mining Ltd. | | | AU | | | | 5,639 | | | | 170,720 | |
Nippon Steel Corp. | | | JP | | | | 38,000 | | | | 94,790 | |
Nisshin Steel Co., Ltd. | | | JP | | | | 4,000 | | | | 6,132 | |
Norsk Hydro ASA | | | NO | | | | 6,691 | | | | 31,034 | |
OneSteel Ltd. | | | AU | | | | 8,260 | | | | 5,914 | |
OZ Minerals Ltd. | | | AU | | | | 2,465 | | | | 25,237 | |
Randgold Resources Ltd. | | | JE | | | | 666 | | | | 68,109 | |
Rio Tinto Ltd. | | | AU | | | | 3,200 | | | | 197,360 | |
Rio Tinto PLC | | | GB | | | | 10,279 | | | | 498,853 | |
Salzgitter AG | | | DE | | | | 290 | | | | 14,499 | |
Sims Metal Management Ltd. | | | AU | | | | 1,227 | | | | 15,875 | |
SSAB AB, Class A | | | SE | | | | 1,208 | | | | 10,646 | |
Sumitomo Metal Industries Ltd. | | | JP | | | | 25,000 | | | | 45,472 | |
Sumitomo Metal Mining Co., Ltd. | | | JP | | | | 4,000 | | | | 51,397 | |
ThyssenKrupp AG | | | DE | | | | 2,847 | | | | 65,312 | |
Vedanta Resources PLC | | | GB | | | | 971 | | | | 15,306 | |
Voestalpine AG | | | AT | | | | 819 | | | | 22,970 | |
| | | | | | | | | | | | |
| | | Country
Code** | | | Shares | | | Value | |
| | | | | | | | | | | | |
| | | | | | | | | | | | |
Xstrata PLC | | | GB | | | | 15,225 | | | $ | 231,243 | |
Yamato Kogyo Co., Ltd. | | | JP | | | | 300 | | | | 8,614 | |
| | | | | | | | | | | | |
| | | | | | | | | | | 3,823,393 | |
| | | | | | | | | | | | |
MULTI-LINE RETAIL – 0.4% | |
Harvey Norman Holdings Ltd. | | | AU | | | | 5,391 | | | | 10,118 | |
Isetan Mitsukoshi Holdings Ltd. | | | JP | | | | 2,800 | | | | 29,357 | |
J Front Retailing Co., Ltd. | | | JP | | | | 4,000 | | | | 19,332 | |
Lifestyle International Holdings Ltd. | | | KY | | | | 4,500 | | | | 9,896 | |
Marks & Spencer Group PLC | | | GB | | | | 11,422 | | | | 55,166 | |
Marui Group Co., Ltd. | | | JP | | | | 1,400 | | | | 10,914 | |
Next PLC | | | GB | | | | 1,232 | | | | 52,367 | |
PPR | | | FR | | | | 548 | | | | 78,479 | |
Takashimaya Co., Ltd. | | | JP | | | | 2,000 | | | | 14,473 | |
| | | | | | | | | | | | |
| | | | | | | | | | | 280,102 | |
| | | | | | | | | | | | |
MULTI-UTILITIES – 1.3% | |
A2A SpA | | | IT | | | | 6,481 | | | | 6,094 | |
AGL Energy Ltd. | | | AU | | | | 3,323 | | | | 48,704 | |
Centrica PLC | | | GB | | | | 38,124 | | | | 171,285 | |
GDF Suez | | | FR | | | | 9,115 | | | | 249,155 | |
National Grid PLC | | | GB | | | | 26,290 | | | | 255,177 | |
RWE AG | | | DE | | | | 3,543 | | | | 124,497 | |
Suez Environnement Co. | | | FR | | | | 1,983 | | | | 22,844 | |
Veolia Environnement | | | FR | | | | 2,670 | | | | 29,266 | |
| | | | | | | | | | | | |
| | | | | | | | | | | 907,022 | |
| | | | | | | | | | | | |
OFFICE ELECTRONICS – 0.7% | |
Brother Industries Ltd. | | | JP | | | | 1,800 | | | | 22,099 | |
Canon, Inc. | | | JP | | | | 8,300 | | | | 367,715 | |
Konica Minolta Holdings, Inc. | | | JP | | | | 3,500 | | | | 26,101 | |
Neopost SA | | | FR | | | | 245 | | | | 16,508 | |
Ricoh Co., Ltd. | | | JP | | | | 5,000 | | | | 43,588 | |
| | | | | | | | | | | | |
| | | | | | | | | | | 476,011 | |
| | | | | | | | | | | | |
OIL, GAS & CONSUMABLE FUELS – 8.0% | |
BG Group PLC | | | GB | | | | 24,936 | | | | 533,058 | |
BP PLC | | | GB | | | | 139,361 | | | | 996,649 | |
Cairn Energy PLC* | | | GB | | | | 10,275 | | | | 42,334 | |
Caltex Australia Ltd. | | | AU | | | | 980 | | | | 11,798 | |
Cosmo Oil Co., Ltd. | | | JP | | | | 5,000 | | | | 13,966 | |
Eni SpA | | | IT | | | | 17,703 | | | | 366,823 | |
See Notes to Financial Statements.
119
SC SM BLACKROCK INTERNATIONAL INDEX FUND
| | |
PORTFOLIOOF INVESTMENTS (Continued) December 31, 2011 | | Sun Capital Advisers Trust |
| | | | | | | | | | | | |
| | | Country
Code** | | | Shares | | | Value | |
| | | | | | | | | | | | |
| | | | | | | | | | | | |
Essar Energy Ltd.* | | | GB | | | | 2,399 | | | $ | 6,386 | |
Galp Energia SGPS SA | | | PT | | | | 1,666 | | | | 24,538 | |
Idemitsu Kosan Co., Ltd. | | | JP | | | | 200 | | | | 20,631 | |
Inpex Corp. | | | JP | | | | 16 | | | | 100,819 | |
Japan Petroleum Exploration Co., Ltd. | | | JP | | | | 200 | | | | 7,821 | |
JX Holdings, Inc. | | | JP | | | | 16,300 | | | | 98,473 | |
Lundin Petroleum AB* | | | SE | | | | 1,656 | | | | 40,714 | |
Neste Oil OYJ | | | FI | | | | 951 | | | | 9,607 | |
OMV AG | | | AT | | | | 1,168 | | | | 35,434 | |
Origin Energy Ltd. | | | AU | | | | 7,810 | | | | 106,561 | |
Repsol YPF SA | | | ES | | | | 5,851 | | | | 179,737 | |
Royal Dutch Shell PLC, Class A | | | GB | | | | 26,624 | | | | 980,339 | |
Royal Dutch Shell PLC, Class B | | | GB | | | | 19,750 | | | | 752,685 | |
Santos Ltd. | | | AU | | | | 6,900 | | | | 86,382 | |
Showa Shell Sekiyu KK | | | JP | | | | 1,500 | | | | 10,114 | |
Statoil ASA | | | NO | | | | 8,241 | | | | 211,507 | |
Tonengeneral Sekiyu KK | | | JP | | | | 2,000 | | | | 21,853 | |
Total SA | | | FR | | | | 15,625 | | | | 798,795 | |
Tullow Oil PLC | | | GB | | | | 6,641 | | | | 144,595 | |
Woodside Petroleum Ltd. | | | AU | | | | 4,658 | | | | 145,880 | |
| | | | | | | | | | | | |
| | | | | | | | | | | 5,747,499 | |
| | | | | | | | | | | | |
PAPER & FOREST PRODUCTS – 0.3% | |
Holmen AB, Class B | | | SE | | | | 402 | | | | 11,548 | |
Nippon Paper Group, Inc. | | | JP | | | | 800 | | | | 17,461 | |
Oji Paper Co., Ltd. | | | JP | | | | 7,000 | | | | 35,923 | |
Stora Enso OYJ | | | FI | | | | 4,511 | | | | 27,020 | |
Svenska Cellulosa AB, Class A | | | SE | | | | 4,158 | | | | 61,627 | |
UPM-Kymmene OYJ | | | FI | | | | 3,711 | | | | 40,873 | |
| | | | | | | | | | | | |
| | | | | | | | | | | 194,452 | |
| | | | | | | | | | | | |
PERSONAL PRODUCTS – 0.5% | |
Beiersdorf AG | | | DE | | | | 750 | | | | 42,535 | |
Kao Corp. | | | JP | | | | 3,900 | | | | 106,557 | |
L’oreal SA | | | FR | | | | 1,775 | | | | 185,392 | |
Shiseido Co., Ltd. | | | JP | | | | 2,600 | | | | 47,798 | |
| | | | | | | | | | | | |
| | | | | | | | | | | 382,282 | |
| | | | | | | | | | | | |
PHARMACEUTICALS – 8.2% | |
Astellas Pharma, Inc. | | | JP | | | | 3,200 | | | | 130,129 | |
AstraZeneca PLC | | | GB | | | | 9,898 | | | | 457,305 | |
Bayer AG | | | DE | | | | 6,085 | | | | 389,050 | |
| | | | | | | | | | | | |
| | | Country
Code** | | | Shares | | | Value | |
| | | | | | | | | | | | |
| | | | | | | | | | | | |
Chugai Pharmaceutical Co., Ltd. | | | JP | | | | 1,700 | | | $ | 28,028 | |
Daiichi Sankyo Co., Ltd. | | | JP | | | | 4,900 | | | | 97,147 | |
Dainippon Sumitomo Pharma Co., Ltd. | | | JP | | | | 1,000 | | | | 11,394 | |
Eisai Co., Ltd. | | | JP | | | | 1,800 | | | | 74,484 | |
Elan Corp. PLC* | | | IE | | | | 3,547 | | | | 49,212 | |
GlaxoSmithKline PLC | | | GB | | | | 37,370 | | | | 853,994 | |
Hisamitsu Pharmaceutical Co., Inc. | | | JP | | | | 500 | | | | 21,177 | |
Kyowa Hakko Kirin Co., Ltd. | | | JP | | | | 2,000 | | | | 24,477 | |
Merck KgaA | | | DE | | | | 478 | | | | 47,655 | |
Mitsubishi Tanabe Pharma Corp. | | | JP | | | | 1,700 | | | | 26,901 | |
Novartis AG | | | CH | | | | 17,176 | | | | 981,956 | |
Novo Nordisk AS | | | DK | | | | 3,131 | | | | 359,804 | |
Ono Pharmaceutical Co., Ltd. | | | JP | | | | 600 | | | | 33,675 | |
Orion OYJ, Class B | | | FI | | | | 767 | | | | 14,940 | |
Otsuka Holdings Co., Ltd. | | | JP | | | | 1,800 | | | | 50,607 | |
Roche Holding AG | | | CH | | | | 5,173 | | | | 876,761 | |
Sanofi-Aventis SA | | | FR | | | | 8,441 | | | | 619,981 | |
Santen Pharmaceutical Co., Ltd. | | | JP | | | | 500 | | | | 20,592 | |
Shionogi & Co. | | | JP | | | | 2,300 | | | | 29,553 | |
Shire PLC | | | JE | | | | 4,139 | | | | 144,177 | |
Taisho Pharmaceutical Holdings Co., Ltd.* | | | JP | | | | 300 | | | | 23,152 | |
Takeda Pharmaceutical Co., Ltd. | | | JP | | | | 5,800 | | | | 254,697 | |
Teva Pharmaceutical Industries Ltd. | | | IL | | | | 6,929 | | | | 278,905 | |
Tsumura & Co. | | | JP | | | | 400 | | | | 11,797 | |
UCB SA | | | BE | | | | 728 | | | | 30,631 | |
| | | | | | | | | | | | |
| | | | | | | | | | | 5,942,181 | |
| | | | | | | | | | | | |
PROFESSIONAL SERVICES – 0.5% | |
Adecco SA* | | | CH | | | | 961 | | | | 40,259 | |
Bureau Veritas SA | | | FR | | | | 388 | | | | 28,272 | |
Campbell Brothers Ltd. | | | AU | | | | 478 | | | | 23,951 | |
Capita Group PLC | | | GB | | | | 4,537 | | | | 44,284 | |
Experian PLC | | | JE | | | | 7,411 | | | | 100,764 | |
Intertek Group PLC | | | GB | | | | 1,186 | | | | 37,482 | |
Randstad Holding NV | | | NL | | | | 878 | | | | 25,977 | |
SGS SA | | | CH | | | | 40 | | | | 66,219 | |
| | | | | | | | | | | | |
| | | | | | | | | | | 367,208 | |
| | | | | | | | | | | | |
See Notes to Financial Statements.
120
SC SM BLACKROCK INTERNATIONAL INDEX FUND
| | |
PORTFOLIOOF INVESTMENTS (Continued) December 31, 2011 | | Sun Capital Advisers Trust |
| | | | | | | | | | | | |
| | | Country
Code** | | | Shares | | | Value | |
| | | | | | | | | | | | |
| | | | | | | | | | | | |
REAL ESTATE INVESTMENT TRUSTS – 1.3% | |
Ascendas Real Estate Investment Trust | | | SG | | | | 12,000 | | | $ | 16,931 | |
British Land Co. PLC | | | GB | | | | 6,192 | | | | 44,475 | |
Capital Shopping Centres Group PLC | | | GB | | | | 4,101 | | | | 19,890 | |
CapitaMall Trust | | | SG | | | | 15,000 | | | | 19,660 | |
CFS Retail Property Trust | | | AU | | | | 13,075 | | | | 22,534 | |
Corio NV | | | NL | | | | 454 | | | | 19,746 | |
Dexus Property Group | | | AU | | | | 35,555 | | | | 30,183 | |
Fonciere Des Regions | | | FR | | | | 209 | | | | 13,417 | |
Gecina SA | | | FR | | | | 159 | | | | 13,376 | |
Goodman Group | | | AU | | | | 51,175 | | | | 29,835 | |
GPT Group | | | AU | | | | 12,931 | | | | 40,603 | |
Hammerson PLC | | | GB | | | | 5,255 | | | | 29,380 | |
ICADE | | | FR | | | | 168 | | | | 13,218 | |
Japan Prime Realty Investment Corp. | | | JP | | | | 5 | | | | 11,777 | |
Japan Real Estate Investment Corp. | | | JP | | | | 3 | | | | 23,386 | |
Japan Retail Fund Investment Corp. | | | JP | | | | 13 | | | | 19,254 | |
Klepierre | | | FR | | | | 748 | | | | 21,337 | |
Land Securities Group PLC | | | GB | | | | 5,739 | | | | 56,640 | |
Mirvac Group | | | AU | | | | 26,477 | | | | 31,955 | |
Nippon Building Fund, Inc. | | | JP | | | | 4 | | | | 32,740 | |
Nomura Real Estate Office Fund, Inc. | | | JP | | | | 2 | | | | 10,277 | |
Segro PLC | | | GB | | | | 5,234 | | | | 16,948 | |
Stockland | | | AU | | | | 17,442 | | | | 56,909 | |
The Link REIT | | | HK | | | | 17,000 | | | | 62,601 | |
Unibail-Rodamco | | | FR | | | | 683 | | | | 122,784 | |
Westfield Group | | | AU | | | | 16,300 | | | | 130,205 | |
Westfield Retail Trust | | | AU | | | | 21,300 | | | | 54,246 | |
| | | | | | | | | | | | |
| | | | | | | | | | | 964,307 | |
| | | | | | | | | | | | |
REAL ESTATE MANAGEMENT &
DEVELOPMENT – 1.6% | |
Aeon Mall Co., Ltd. | | | JP | | | | 600 | | | | 12,737 | |
Capitaland Ltd. | | | SG | | | | 19,000 | | | | 32,373 | |
CapitaMalls Asia Ltd. | | | SG | | | | 9,000 | | | | 7,841 | |
Cheung Kong Holdings Ltd. | | | HK | | | | 10,000 | | | | 119,164 | |
City Developments Ltd. | | | SG | | | | 4,000 | | | | 27,447 | |
Daito Trust Construction Co., Ltd. | | | JP | | | | 600 | | | | 51,449 | |
| | | | | | | | | | | | |
| | | Country
Code** | | | Shares | | | Value | |
| | | | | | | | | | | | |
| | | | | | | | | | | | |
Daiwa House Industry Co., Ltd. | | | JP | | | | 3,000 | | | $ | 35,780 | |
Global Logistic Properties Ltd.* | | | SG | | | | 13,000 | | | | 17,590 | |
Hang Lung Group, Ltd. | | | HK | | | | 7,000 | | | | 38,125 | |
Hang Lung Properties Ltd. | | | HK | | | | 18,000 | | | | 51,219 | |
Henderson Land Development Co., Ltd. | | | HK | | | | 7,000 | | | | 34,790 | |
Hopewell Holdings Ltd. | | | HK | | | | 3,500 | | | | 8,950 | |
Hysan Development Co., Ltd. | | | HK | | | | 5,000 | | | | 16,416 | |
Immofinanz AG* | | | AT | | | | 6,797 | | | | 20,409 | |
Keppel Land Ltd. | | | SG | | | | 5,000 | | | | 8,558 | |
Kerry Properties Ltd. | | | BM | | | | 5,500 | | | | 18,200 | |
Lend Lease Group | | | AU | | | | 3,998 | | | | 29,278 | |
Mitsubishi Estate Co., Ltd. | | | JP | | | | 9,000 | | | | 134,468 | |
Mitsui Fudosan Co., Ltd. | | | JP | | | | 6,000 | | | | 87,463 | |
New World Development Ltd. | | | HK | | | | 27,000 | | | | 21,762 | |
Nomura Real Estate Holdings, Inc. | | | JP | | | | 800 | | | | 11,911 | |
NTT Urban Development Corp. | | | JP | | | | 6 | | | | 4,093 | |
Sino Land Co., Ltd. | | | HK | | | | 22,000 | | | | 31,329 | |
Sumitomo Realty & Development Co., Ltd. | | | JP | | | | 3,000 | | | | 52,540 | |
Sun Hung Kai Properties Ltd. | | | HK | | | | 11,000 | | | | 137,879 | |
Swire Pacific Ltd., Class A | | | HK | | | | 5,500 | | | | 66,425 | |
Tokyu Land Corp. | | | JP | | | | 3,000 | | | | 11,342 | |
UOL Group Ltd. | | | SG | | | | 3,000 | | | | 9,252 | |
Wharf Holdings Ltd. | | | HK | | | | 10,700 | | | | 48,495 | |
Wheelock & Co., Ltd. | | | HK | | | | 6,000 | | | | 14,864 | |
| | | | | | | | | | | | |
| | | | | | | | | | | 1,162,149 | |
| | | | | | | | | | | | |
ROAD & RAIL – 1.0% | |
Asciano Group | | | AU | | | | 6,944 | | | | 31,961 | |
Central Japan Railway Co. | | | JP | | | | 11 | | | | 92,893 | |
ComfortDelGro Corp., Ltd. | | | SG | | | | 14,000 | | | | 15,273 | |
DSV A/S | | | DK | | | | 1,448 | | | | 25,968 | |
East Japan Railway Co. | | | JP | | | | 2,500 | | | | 159,153 | |
See Notes to Financial Statements.
121
SC SM BLACKROCK INTERNATIONAL INDEX FUND
| | |
PORTFOLIOOF INVESTMENTS (Continued) December 31, 2011 | | Sun Capital Advisers Trust |
| | | | | | | | | | | | |
| | | Country
Code** | | | Shares | | | Value | |
| | | | | | | | | | | | |
| | | | | | | | | | | | |
Keikyu Corp. | | | JP | | | | 3,000 | | | $ | 26,933 | |
Keio Corp. | | | JP | | | | 4,000 | | | | 28,219 | |
Keisei Electric Railway Co., Ltd. | | | JP | | | | 2,000 | | | | 14,707 | |
Kintetsu Corp. | | | JP | | | | 12,000 | | | | 46,927 | |
MTR Corp. | | | HK | | | | 10,500 | | | | 34,069 | |
Nippon Express Co., Ltd. | | | JP | | | | 7,000 | | | | 27,283 | |
Odakyu Electric Railway Co., Ltd. | | | JP | | | | 4,000 | | | | 38,664 | |
QR National Ltd. | | | AU | | | | 12,391 | | | | 43,344 | |
Tobu Railway Co., Ltd. | | | JP | | | | 8,000 | | | | 40,847 | |
Tokyu Corp. | | | JP | | | | 8,000 | | | | 39,392 | |
West Japan Railway Co. | | | JP | | | | 1,200 | | | | 52,150 | |
| | | | | | | | | | | | |
| | | | | | | | | | | 717,783 | |
| | | | | | | | | | | | |
SEMICONDUCTORS & SEMICONDUCTOR EQUIPMENT – 0.6% | |
Advantest Corp. | | | JP | | | | 1,100 | | | | 10,476 | |
ARM Holdings PLC | | | GB | | | | 9,952 | | | | 91,496 | |
Asm Pacific Technology Ltd. | | | KY | | | | 1,500 | | | | 16,832 | |
Asml Holding NV | | | NL | | | | 3,172 | | | | 133,322 | |
Elpida Memory, Inc.* | | | JP | | | | 1,900 | | | | 8,837 | |
Infineon Technologies AG | | | DE | | | | 7,967 | | | | 59,970 | |
Rohm Co., Ltd. | | | JP | | | | 700 | | | | 32,649 | |
STMicroelectronics NV | | | NL | | | | 4,708 | | | | 27,975 | |
Sumco Corp.* | | | JP | | | | 1,000 | | | | 7,392 | |
Tokyo Electron Ltd. | | | JP | | | | 1,200 | | | | 61,037 | |
| | | | | | | | | | | | |
| | | | | | | | | | | 449,986 | |
| | | | | | | | | | | | |
SOFTWARE – 0.9% | | | | | | | | | | | | |
Dassault Systemes SA | | | FR | | | | 442 | | | | 35,428 | |
Konami Corp. | | | JP | | | | 700 | | | | 20,963 | |
NICE Systems Ltd.* | | | IL | | | | 428 | | | | 14,555 | |
Nintendo Co., Ltd. | | | JP | | | | 700 | | | | 96,401 | |
Oracle Corp. | | | JP | | | | 300 | | | | 9,927 | |
SAP AG | | | DE | | | | 6,782 | | | | 358,565 | |
Square Enix Holdings Co., Ltd. | | | JP | | | | 500 | | | | 9,815 | |
The Sage Group PLC | | | GB | | | | 9,666 | | | | 44,163 | |
Trend Micro, Inc. | | | JP | | | | 800 | | | | 23,916 | |
| | | | | | | | | | | | |
| | | | | | | | | | | 613,733 | |
| | | | | | | | | | | | |
SPECIALTY RETAIL – 0.9% | |
ABC-Mart, Inc. | | | JP | | | | 200 | | | | 7,606 | |
Fast Retailing Co., Ltd. | | | JP | | | | 400 | | | | 72,756 | |
Hennes & Mauritz AB | | | SE | | | | 7,532 | | | | 242,200 | |
| | | | | | | | | | | | |
| | | Country
Code** | | | Shares | | | Value | |
| | | | | | | | | | | | |
| | | | | | | | | | | | |
Industria de Diseno Textil SA | | | ES | | | | 1,592 | | | $ | 130,385 | |
Kingfisher PLC | | | GB | | | | 16,975 | | | | 66,090 | |
Nitori Holdings Co., Ltd. | | | JP | | | | 250 | | | | 23,451 | |
Sanrio Co., Ltd. | | | JP | | | | 300 | | | | 15,415 | |
Shimamura Co., Ltd. | | | JP | | | | 200 | | | | 20,449 | |
USS Co., Ltd. | | | JP | | | | 160 | | | | 14,468 | |
Yamada Denki Co., Ltd. | | | JP | | | | 590 | | | | 40,166 | |
| | | | | | | | | | | | |
| | | | | | | | | | | 632,986 | |
| | | | | | | | | | | | |
TEXTILES, APPAREL & LUXURY GOODS – 1.1% | |
Adidas AG | | | DE | | | | 1,546 | | | | 100,566 | |
Asics Corp. | | | JP | | | | 1,000 | | | | 11,277 | |
Burberry Group PLC | | | GB | | | | 3,198 | | | | 58,853 | |
Christian Dior SA | | | FR | | | | 397 | | | | 47,071 | |
Compagnie Financiere Richemont SA | | | CH | | | | 3,839 | | | | 194,177 | |
Luxottica Group SpA | | | IT | | | | 883 | | | | 24,799 | |
LVMH Moet Hennessy Louis Vuitton SA | | | FR | | | | 1,876 | | | | 265,625 | |
Swatch Group AG | | | CH | | | | 562 | | | | 106,658 | |
Yue Yuen Industrial Holdings Ltd. | | | BM | | | | 5,500 | | | | 17,385 | |
| | | | | | | | | | | | |
| | | | | | | | | | | 826,411 | |
| | | | | | | | | | | | |
TOBACCO – 1.6% | |
British American Tobacco PLC | | | GB | | | | 14,546 | | | | 690,236 | |
| | | | | | | | | | | | |
Imperial Tobacco Group PLC | | | GB | | | | 7,454 | | | | 281,877 | |
Japan Tobacco, Inc. | | | JP | | | | 33 | | | | 155,203 | |
Swedish Match AB | | | SE | | | | 1,526 | | | | 54,170 | |
| | | | | | | | | | | | |
| | | | | | | | | | | 1,181,486 | |
| | | | | | | | | | | | |
TRADING COMPANIES & DISTRIBUTORS – 1.2% | |
Brenntag AG | | | DE | | | | 247 | | | | 23,001 | |
Bunzl PLC | | | GB | | | | 2,351 | | | | 32,276 | |
ITOCHU Corp. | | | JP | | | | 11,000 | | | | 111,758 | |
Marubeni Corp. | | | JP | | | | 12,000 | | | | 73,119 | |
Mitsubishi Corp. | | | JP | | | | 10,300 | | | | 208,088 | |
Mitsui & Co., Ltd. | | | JP | | | | 12,700 | | | | 197,504 | |
Noble Group Ltd. | | | BM | | | | 28,000 | | | | 24,394 | |
Sojitz Corp. | | | JP | | | | 8,800 | | | | 13,605 | |
Sumitomo Corp. | | | JP | | | | 8,300 | | | | 112,363 | |
Toyota Tsusho Corp. | | | JP | | | | 1,600 | | | | 28,291 | |
Wolseley PLC | | | JE | | | | 2,080 | | | | 68,869 | |
| | | | | | | | | | | | |
| | | | | | | | | | | 893,268 | |
| | | | | | | | | | | | |
See Notes to Financial Statements.
122
SC SM BLACKROCK INTERNATIONAL INDEX FUND
| | |
PORTFOLIOOF INVESTMENTS (Continued) December 31, 2011 | | Sun Capital Advisers Trust |
| | | | | | | | | | | | |
| | | Country
Code** | | | Shares | | | Value | |
| | | | | | | | | | | | |
| | | | | | | | | | | | |
TRANSPORTATION INFRASTRUCTURE – 0.4% | |
Abertis Infraestructuras SA | | | ES | | | | 2,869 | | | $ | 45,821 | |
Aeroports de Paris | | | FR | | | | 253 | | | | 17,355 | |
Atlantia SpA | | | IT | | | | 2,290 | | | | 36,663 | |
Auckland International Airport Ltd. | | | NZ | | | | 6,793 | | | | 13,325 | |
Fraport AG | | | DE | | | | 272 | | | | 13,377 | |
Groupe Eurotunnel SA | | | FR | | | | 3,993 | | | | 27,183 | |
Hutchison Port Holdings Trust | | | SG | | | | 38,000 | | | | 23,560 | |
Kamigumi Co., Ltd. | | | JP | | | | 2,000 | | | | 17,254 | |
Koninklijke Vopak NV | | | NL | | | | 528 | | | | 27,898 | |
Mitsubishi Logistics Corp. | | | JP | | | | 1,000 | | | | 11,108 | |
Sydney Airport | | | AU | | | | 2,431 | | | | 6,614 | |
Transurban Group | | | AU | | | | 9,557 | | | | 54,935 | |
| | | | | | | | | | | | |
| | | | | | | | | | | 295,093 | |
| | | | | | | | | | | | |
WATER UTILITIES – 0.1% | |
Severn Trent PLC | | | GB | | | | 1,698 | | | | 39,449 | |
United Utilities Group PLC | | | GB | | | | 5,038 | | | | 47,414 | |
| | | | | | | | | | | | |
| | | | | | | | | | | 86,863 | |
| | | | | | | | | | | | |
WIRELESS TELECOMMUNICATION SERVICES – 2.3% | |
Cellcom Israel Ltd. | | | IL | | | | 319 | | | | 5,335 | |
KDDI Corp. | | | JP | | | | 21 | | | | 135,053 | |
Millicom International Cellular SA | | | LU | | | | 556 | | | | 55,705 | |
Mobistar SA | | | BE | | | | 219 | | | | 11,476 | |
NTT DOCOMO, Inc. | | | JP | | | | 112 | | | | 205,898 | |
Partner Communications Co., Ltd. | | | IL | | | | 525 | | | | 4,637 | |
Softbank Corp. | | | JP | | | | 6,500 | | | | 191,445 | |
StarHub Ltd. | | | SG | | | | 4,000 | | | | 8,974 | |
Vodafone Group PLC | | | GB | | | | 374,308 | | | | 1,039,946 | |
| | | | | | | | | | | | |
| | | | | | | | | | | 1,658,469 | |
| | | | | | | | | | | | |
Total Common Stocks
(Cost $77,794,102) | | | | 69,347,639 | |
| | | | | | | | | | | | |
PREFERRED STOCKS – 0.5% | |
AUTOMOBILES – 0.4% | |
Bayerische Motoren Werke AG | | | DE | | | | 379 | | | | 17,928 | |
Porsche Automobil Holding SE | | | DE | | | | 1,127 | | | | 60,314 | |
Volkswagen AG | | | DE | | | | 1,057 | | | | 158,349 | |
| | | | | | | | | | | | |
| | | | | | | | | | | 236,591 | |
| | | | | | | | | | | | |
| | | | | | | | | | | | |
| | | Country
Code** | | | Shares | | | Value | |
| | | | | | | | | | | | |
| | | | | | | | | | | | |
HOUSEHOLD PRODUCTS – 0.1% | |
Henkel AG & Co. KgaA | | | DE | | | | 1,307 | | | $ | 75,428 | |
| | | | | | | | | | | | |
MEDIA – 0.0% + | |
ProSiebenSat.1 Media AG | | | DE | | | | 582 | | | | 10,632 | |
| | | | | | | | | | | | |
MULTI-UTILITIES – 0.0% + | |
RWE AG | | | DE | | | | 366 | | | | 12,049 | |
| | | | | | | | | | | | |
Total Preferred Stocks
(Cost $369,649) | | | | 334,700 | |
| | | | | | | | | | | | |
SHORT TERM INVESTMENTS – 1.4% | |
MUTUAL FUNDS – 1.4% | |
State Street Institutional U.S. Government Money Market Fund, 0.00% (Cost $1,015,198) | | | | 1,015,198 | | | | 1,015,198 | |
| | | | | | | | | | | | |
TOTAL INVESTMENTS – 98.0% | | | | | |
(Cost $79,178,949) | | | | | | | | 70,697,537 | |
Other assets less
liabilities – 2.0% | | | | | | | | 1,433,181 | |
| | | | | | | | | | | | |
NET ASSETS – 100.0% | | | | | | | $ | 72,130,718 | |
| | | | | | | | | | | | |
| | |
| ADR | | American Depositary Receipt |
| CDI | | Chess Depositary Receipt |
| MULT | | Multi-National |
| REIT | | Real Estate Investment Trust |
| |
| AT | | Austria |
| AU | | Australia |
| BE | | Belgium |
| BM | | Bermuda |
| CH | | Switzerland |
| DE | | Germany |
| DK | | Denmark |
| ES | | Spain |
| FI | | Finland |
| FR | | France |
| GB | | Great Britain |
| GG | | Guernsey |
| GR | | Greece |
| HK | | Hong Kong |
| IE | | Ireland |
| IL | | Israel |
| IM | | Isle of Man |
| IT | | Italy |
| JE | | Jersey |
| JP | | Japan |
See Notes to Financial Statements.
123
SC SM BLACKROCK INTERNATIONAL INDEX FUND
| | |
PORTFOLIOOF INVESTMENTS (Continued) December 31, 2011 | | Sun Capital Advisers Trust |
| | |
| KY | | Cayman Islands |
| LU | | Luxembourg |
| MU | | Mauritius |
| NL | | Netherlands |
| NO | | Norway |
| NZ | | New Zealand |
| PT | | Portugal |
| SE | | Sweden |
| SG | | Singapore |
| * | Non-income producing security. |
| ** | Unless otherwise noted the issuer country code for all securities is United States. |
| + | Amount is less than 0.05%. |
| (1) | Eligible for resale under rule 144A of the Securities Act of 1933. These securities may be resold in transactions exempt from registration, normally to qualified institutional buyers. At the period end, the value of these securities amounted to $80,653, representing 0.1% of net assets. |
Distribution of investments by country of issuer, as a percentage of net assets, is as follows. Figures may not total to 100% due to the exclusion of the Fund’s other assets and liabilities. (Unaudited)
| | | | |
Great Britain | | | 21.7 | % |
Japan | | | 20.9 | |
France | | | 8.4 | |
Australia | | | 8.3 | |
Switzerland | | | 8.2 | |
Germany | | | 7.5 | |
Spain | | | 3.2 | |
Sweden | | | 2.9 | |
Netherlands | | | 2.6 | |
Hong Kong | | | 2.3 | |
Italy | | | 2.1 | |
Other (individually less than 2%) | | | 9.9 | |
| (2) | At the period end, cash of $202,000 has been pledged to cover margin requirements for the following open futures contracts: |
| | | | | | | | | | | | |
Type | | Description | | Expiration
Date | | Contracts | | | Unrealized
Appreciation /
(Depreciation) ($) | |
Long | | ASX SPI 200 Index March Futures | | 3/15/12 | | | 2 | | | | (4,607 | ) |
Long | | DJ Euro Stoxx 50 Index March Futures | | 3/16/12 | | | 15 | | | | 17,481 | |
Long | | FTSE 100 Index March Futures | | 3/16/12 | | | 5 | | | | 9,867 | |
Long | | MSCI EAFE E-Mini Index March Futures | | 3/16/12 | | | 14 | | | | 5,446 | |
Long | | NIKKEI 225 Index March Futures | | 3/8/12 | | | 6 | | | | 1,039 | |
| | | | | | | | | | | | |
Net unrealized appreciation | | | | | | | 29,226 | |
| | | | | | | | | | | | |
See Notes to Financial Statements.
124
SC SM BLACKROCK INTERNATIONAL INDEX FUND
| | |
PORTFOLIOOF INVESTMENTS (Continued) December 31, 2011 | | Sun Capital Advisers Trust |
| (3) | Fair Value Measurements † |
The following table summarizes the inputs used to value the Fund’s assets and liabilities, as applicable, measured at fair value at the period end:
| | | | | | | | | | | | | | | | |
Assets | | Quoted Prices
in Active
Markets for
Identical
Assets and
Liabilities
(Level 1) | | | Significant
Other
Observable
Inputs
(Level 2) | | | Significant
Unobservable
Inputs
(Level 3) | | | Total | |
Common Stocks (a) | | $ | 8,442 | | | $ | 69,339,197 | | | $ | — | | | $ | 69,347,639 | |
Preferred Stocks (b) | | | — | | | | 334,700 | | | | — | | | | 334,700 | |
Short Term Investments | | | | | | | | | | | | | | | | |
Mutual Funds | | | 1,015,198 | | | | — | | | | — | | | | 1,015,198 | |
| | | | | | | | | | | | | | | | |
Total Investments | | | 1,023,640 | | | | 69,673,897 | | | | — | | | | 70,697,537 | |
| | | | | | | | | | | | | | | | |
Financial Derivative Instruments | | | | | | | | | | | | | | | | |
Futures Contracts | | | 5,446 | | | | 28,387 | | | | — | | | | 33,833 | |
| | | | | | | | | | | | | | | | |
Total Financial Derivative Instruments | | $ | 5,446 | | | $ | 28,387 | | | $ | — | | | $ | 33,833 | |
| | | | | | | | | | | | | | | | |
| | | | |
Liabilities | | | | | | | | | | | | |
Financial Derivative Instruments | | | | | | | | | | | | | | | | |
Futures Contracts | | $ | — | | | $ | (4,607 | ) | | $ | — | | | $ | (4,607 | ) |
| | | | | | | | | | | | | | | | |
Total Financial Derivative Instruments | | $ | — | | | $ | (4,607 | ) | | $ | — | | | $ | (4,607 | ) |
| | | | | | | | | | | | | | | | |
| † | See Note 2b in the Notes to Financial Statements for additional information. |
| (a) | See Portfolio of Investments for additional detailed categorization of Level 2 securities. The Level 1 security is within the Airlines industry in the Portfolio of Investments. |
| (b) | See Portfolio of Investments for additional detailed categorizations. |
See Notes to Financial Statements.
125
SC SM BLACKROCK LARGE CAP INDEX FUND
| | |
PORTFOLIOOF INVESTMENTS December 31, 2011 | | Sun Capital Advisers Trust |
| | | | | | | | | | |
| | | Country
Code** | | Shares | | | Value | |
| | | | | | | | | | |
| | | | | | | | | | |
COMMON STOCKS – 97.7% | | | | | |
AEROSPACE & DEFENSE – 2.6% | | | | | |
General Dynamics Corp. | | | | | 4,946 | | | $ | 328,464 | |
Goodrich Corp. | | | | | 1,739 | | | | 215,114 | |
Honeywell International, Inc. | | | | | 10,742 | | | | 583,828 | |
L-3 Communications Holdings, Inc. | | | | | 1,387 | | | | 92,485 | |
Lockheed Martin Corp. | | | | | 3,685 | | | | 298,117 | |
Northrop Grumman Corp. | | | | | 3,629 | | | | 212,224 | |
Precision Castparts Corp. | | | | | 2,002 | | | | 329,910 | |
Raytheon Co. | | | | | 4,807 | | | | 232,563 | |
Rockwell Collins, Inc. | | | | | 2,101 | | | | 116,332 | |
Textron, Inc. | | | | | 3,860 | | | | 71,371 | |
The Boeing Co. | | | | | 10,321 | | | | 757,045 | |
United Technologies Corp. | | | | | 12,583 | | | | 919,691 | |
| | | | | | | | | | |
| | | | | | | | | 4,157,144 | |
| | | | | | | | | | |
AIR FREIGHT & LOGISTICS – 1.0% | | | | | |
C.H. Robinson Worldwide, Inc. | | | | | 2,279 | | | | 159,029 | |
Expeditors International of Washington, Inc. | | | | | 2,943 | | | | 120,545 | |
FedEx Corp. | | | | | 4,405 | | | | 367,862 | |
United Parcel Services, Inc., Class B | | | | | 13,402 | | | | 980,892 | |
| | | | | | | | | | |
| | | | | | | | | 1,628,328 | |
| | | | | | | | | | |
AIRLINES – 0.1% | | | | | |
Southwest Airlines Co. | | | | | 10,812 | | | | 92,551 | |
| | | | | | | | | | |
AUTO COMPONENTS – 0.3% | | | | | |
BorgWarner, Inc.* | | | | | 1,523 | | | | 97,076 | |
Johnson Controls, Inc. | | | | | 9,447 | | | | 295,313 | |
The Goodyear Tire & Rubber Co.* | | | | | 3,357 | | | | 47,569 | |
| | | | | | | | | | |
| | | | | | | | | 439,958 | |
| | | | | | | | | | |
AUTOMOBILES – 0.4% | | | | | |
Ford Motor Co.* | | | | | 52,771 | | | | 567,816 | |
Harley-Davidson, Inc. | | | | | 3,227 | | | | 125,433 | |
| | | | | | | | | | |
| | | | | | | | | 693,249 | |
| | | | | | | | | | |
| | | | | | | | | | | | |
| | | Country
Code** | | | Shares | | | Value | |
| | | | | | | | | | | | |
| | | | | | | | | | | | |
BEVERAGES – 2.6% | | | | | |
Beam, Inc. | | | | | | | 2,158 | | | $ | 110,554 | |
Brown-Forman Corp., Class B | | | | | | | 1,400 | | | | 112,714 | |
Coca-Cola Enterprises, Inc. | | | | | | | 4,333 | | | | 111,705 | |
Constellation Brands, Inc., Class A* | | | | | | | 2,418 | | | | 49,980 | |
Dr Pepper Snapple Group, Inc. | | | | | | | 2,977 | | | | 117,532 | |
Molson Coors Brewing Co., Class B | | | | | | | 2,188 | | | | 95,265 | |
PepsiCo, Inc. | | | | | | | 21,713 | | | | 1,440,658 | |
The Coca-Cola Co. | | | | | | | 31,543 | | | | 2,207,064 | |
| | | | | | | | | | | | |
| | | | | | | | | | | 4,245,472 | |
| | | | | | | | | | | | |
BIOTECHNOLOGY – 1.2% | | | | | |
Amgen, Inc. | | | | | | | 11,016 | | | | 707,337 | |
Biogen Idec, Inc.* | | | | | | | 3,373 | | | | 371,199 | |
Celgene Corp.* | | | | | | | 6,165 | | | | 416,754 | |
Gilead Sciences, Inc.* | | | | | | | 10,432 | | | | 426,982 | |
| | | | | | | | | | | | |
| | | | | | | | | | | 1,922,272 | |
| | | | | | | | | | | | |
BUILDING PRODUCTS – 0.0% + | | | | | |
Masco Corp. | | | | | | | 4,894 | | | | 51,289 | |
| | | | | | | | | | | | |
CAPITAL MARKETS – 1.8% | | | | | |
Ameriprise Financial, Inc. | | | | | | | 3,142 | | | | 155,969 | |
Bank of New York Mellon Corp. | | | | | | | 16,841 | | | | 335,304 | |
BlackRock, Inc. | | | | | | | 1,391 | | | | 247,932 | |
E*TRADE Financial Corp.* | | | | | | | 3,524 | | | | 28,051 | |
Federated Investors, Inc., Class B | | | | | | | 1,339 | | | | 20,286 | |
Franklin Resources, Inc. | | | | | | | 2,021 | | | | 194,137 | |
Invesco Ltd. | | | BM | | | | 6,261 | | | | 125,783 | |
Legg Mason, Inc. | | | | | | | 1,735 | | | | 41,727 | |
Morgan Stanley | | | | | | | 20,608 | | | | 311,799 | |
Northern Trust Corp. | | | | | | | 3,346 | | | | 132,702 | |
State Street Corp. | | | | | | | 6,832 | | | | 275,398 | |
T. Rowe Price Group, Inc. | | | | | | | 3,509 | | | | 199,838 | |
See Notes to Financial Statements.
126
| | |
SC SM BLACKROCK LARGE CAP INDEX FUND PORTFOLIOOF INVESTMENTS (Continued) December 31, 2011 | | Sun Capital Advisers Trust |
| | | | | | | | | | |
| | | Country
Code** | | Shares | | | Value | |
| | | | | | | | | | |
| | | | | | | | | | |
The Charles Schwab Corp. | | | | | 14,987 | | | $ | 168,754 | |
The Goldman Sachs Group, Inc. | | | | | 6,837 | | | | 618,270 | |
| | | | | | | | | | |
| | | | | | | | | 2,855,950 | |
| | | | | | | | | | |
CHEMICALS – 2.2% | | | | | | | | |
Air Products & Chemicals, Inc. | | | | | 2,923 | | | | 249,010 | |
Airgas, Inc. | | | | | 948 | | | | 74,020 | |
CF Industries Holdings, Inc. | | | | | 908 | | | | 131,642 | |
E.I. du Pont de Nemours & Co. | | | | | 12,832 | | | | 587,449 | |
Eastman Chemical Co. | | | | | 1,910 | | | | 74,605 | |
Ecolab, Inc. | | | | | 4,168 | | | | 240,952 | |
FMC Corp. | | | | | 967 | | | | 83,201 | |
International Flavors & Fragrances, Inc. | | | | | 1,123 | | | | 58,868 | |
Monsanto Co. | | | | | 7,435 | | | | 520,970 | |
PPG Industries, Inc. | | | | | 2,145 | | | | 179,086 | |
Praxair, Inc. | | | | | 4,163 | | | | 445,025 | |
Sigma-Aldrich Corp. | | | | | 1,673 | | | | 104,495 | |
The Dow Chemical Co. | | | | | 16,411 | | | | 471,980 | |
The Mosaic Co. | | | | | 4,134 | | | | 208,478 | |
The Sherwin-Williams Co. | | | | | 1,196 | | | | 106,767 | |
| | | | | | | | | | |
| | | | | | | | | 3,536,548 | |
| | | | | | | | | | |
COMMERCIAL BANKS – 2.6% | | | | | |
BB&T Corp. | | | | | 9,679 | | | | 243,621 | |
Comerica, Inc. | | | | | 2,793 | | | | 72,059 | |
Fifth Third Bancorp | | | | | 12,770 | | | | 162,434 | |
First Horizon National Corp. | | | | | 3,674 | | | | 29,392 | |
Huntington Bancshares, Inc. | | | | | 12,123 | | | | 66,555 | |
KeyCorp | | | | | 13,227 | | | | 101,716 | |
M&T Bank Corp. | | | | | 1,744 | | | | 133,137 | |
PNC Financial Services Group, Inc. | | | | | 7,306 | | | | 421,337 | |
Regions Financial Corp. | | | | | 17,561 | | | | 75,512 | |
SunTrust Banks, Inc. | | | | | 7,455 | | | | 131,954 | |
U.S. Bancorp | | | | | 26,502 | | | | 716,879 | |
| | | | | | | | | | |
| | | Country
Code** | | Shares | | | Value | |
| | | | | | | | | | |
| | | | | | | | | | |
Wells Fargo & Co. | | | | | 73,237 | | | $ | 2,018,412 | |
Zions Bancorporation | | | | | 2,605 | | | | 42,409 | |
| | | | | | | | | | |
| | | | | | | | | 4,215,417 | |
| | | | | | | | | | |
COMMERCIAL SERVICES & SUPPLIES – 0.4% | |
Avery Dennison Corp. | | | | | 1,462 | | | | 41,930 | |
Cintas Corp. | | | | | 1,536 | | | | 53,468 | |
Iron Mountain, Inc. | | | | | 2,578 | | | | 79,402 | |
Pitney Bowes, Inc. | | | | | 2,778 | | | | 51,504 | |
R.R. Donnelley & Sons Co. | | | | | 2,598 | | | | 37,489 | |
Republic Services, Inc. | | | | | 4,381 | | | | 120,697 | |
Stericycle, Inc.* | | | | | 1,181 | | | | 92,024 | |
Waste Management, Inc. | | | | | 6,393 | | | | 209,115 | |
| | | | | | | | | | |
| | | | | | | | | 685,629 | |
| | | | | | | | | | |
COMMUNICATIONS EQUIPMENT – 2.1% | | | | | |
Cisco Systems, Inc. | | | | | 74,661 | | | | 1,349,871 | |
F5 Networks, Inc.* | | | | | 1,107 | | | | 117,475 | |
Harris Corp. | | | | | 1,600 | | | | 57,664 | |
JDS Uniphase Corp.* | | | | | 3,222 | | | | 33,638 | |
Juniper Networks, Inc.* | | | | | 7,303 | | | | 149,054 | |
Motorola Mobility Holdings, Inc.* | | | | | 3,659 | | | | 141,969 | |
Motorola Solutions, Inc. | | | | | 3,979 | | | | 184,188 | |
QUALCOMM, Inc. | | | | | 23,344 | | | | 1,276,917 | |
| | | | | | | | | | |
| | | | | | | | | 3,310,776 | |
| | | | | | | | | | |
COMPUTERS & PERIPHERALS – 4.5% | |
Apple, Inc.* | | | | | 12,908 | | | | 5,227,740 | |
Dell, Inc.* | | | | | 21,208 | | | | 310,273 | |
EMC Corp.* | | | | | 28,331 | | | | 610,250 | |
Hewlett-Packard Co. | | | | | 27,595 | | | | 710,847 | |
Lexmark International, Inc., Class A | | | | | 997 | | | | 32,971 | |
NetApp, Inc.* | | | | | 4,980 | | | | 180,625 | |
SanDisk Corp.* | | | | | 3,336 | | | | 164,164 | |
Western Digital Corp.* | | | | | 3,245 | | | | 100,433 | |
| | | | | | | | | | |
| | | | | | | | | 7,337,303 | |
| | | | | | | | | | |
See Notes to Financial Statements.
127
| | |
SC SM BLACKROCK LARGE CAP INDEX FUND PORTFOLIOOF INVESTMENTS (Continued) December 31, 2011 | | Sun Capital Advisers Trust |
| | | | | | | | | | |
| | | Country
Code** | | Shares | | | Value | |
| | | | | | | | | | |
| | | | | | | | | | |
CONSTRUCTION & ENGINEERING – 0.2% | |
Fluor Corp. | | | | | 2,356 | | | $ | 118,389 | |
Jacobs Engineering Group, Inc.* | | | | | 1,778 | | | | 72,151 | |
Quanta Services, Inc.* | | | | | 2,937 | | | | 63,263 | |
| | | | | | | | | | |
| | | | | | | | | 253,803 | |
| | | | | | | | | | |
CONSTRUCTION MATERIALS – 0.0% + | | | | | |
Vulcan Materials Co. | | | | | 1,815 | | | | 71,420 | |
| | | | | | | | | | |
CONSUMER FINANCE – 0.8% | | | | | |
American Express Co. | | | | | 14,034 | | | | 661,984 | |
Capital One Financial Corp. | | | | | 6,383 | | | | 269,937 | |
Discover Financial Services | | | | | 7,631 | | | | 183,144 | |
SLM Corp. | | | | | 7,061 | | | | 94,617 | |
| | | | | | | | | | |
| | | | | | | | | 1,209,682 | |
| | | | | | | | | | |
CONTAINERS & PACKAGING – 0.1% | | | | | |
Ball Corp. | | | | | 2,257 | | | | 80,597 | |
Bemis Co. | | | | | 1,420 | | | | 42,714 | |
Owens- Ilinois, Inc.* | | | | | 2,330 | | | | 45,155 | |
Sealed Air Corp. | | | | | 2,237 | | | | 38,499 | |
| | | | | | | | | | |
| | | | | | | | | 206,965 | |
| | | | | | | | | | |
DISTRIBUTORS – 0.1% | | | | | | | | |
Genuine Parts Co. | | | | | 2,161 | | | | 132,253 | |
| | | | | | | | | | |
DIVERSIFIED CONSUMER SERVICES – 0.1% | |
Apollo Group, Inc., Class A* | | | | | 1,614 | | | | 86,946 | |
DeVry, Inc. | | | | | 849 | | | | 32,653 | |
H&R Block, Inc. | | | | | 4,068 | | | | 66,430 | |
| | | | | | | | | | |
| | | | | | | | | 186,029 | |
| | | | | | | | | | |
DIVERSIFIED FINANCIAL SERVICES – 2.6% | |
Bank of America Corp. | | | | | 140,758 | | | | 782,614 | |
Citigroup, Inc. | | | | | 40,603 | | | | 1,068,265 | |
CME Group, Inc. | | | | | 922 | | | | 224,664 | |
IntercontinentalExchange, Inc.* | | | | | 1,011 | | | | 121,876 | |
JP Morgan Chase & Co. | | | | | 52,772 | | | | 1,754,669 | |
Leucadia National Corp. | | | | | 2,771 | | | | 63,013 | |
| | | | | | | | | | | | |
| | | Country
Code** | | | Shares | | | Value | |
| | | | | | | | | | | | |
| | | | | | | | | | | | |
Moody’s Corp. | | | | | | | 2,713 | | | $ | 91,374 | |
NASDAQ OMX Group, Inc.* | | | | | | | 1,771 | | | | 43,407 | |
NYSE Euronext | | | | | | | 3,637 | | | | 94,926 | |
| | | | | | | | | | | | |
| | | | | | | | | | | 4,244,808 | |
| | | | | | | | | | | | |
DIVERSIFIED TELECOMMUNICATION SERVICES – 2.8% | | | | | |
AT&T, Inc. | | | | | | | 82,299 | | | | 2,488,722 | |
CenturyLink, Inc. | | | | | | | 8,576 | | | | 319,027 | |
Frontier Communications Corp. | | | | | | | 13,810 | | | | 71,121 | |
Verizon Communications, Inc. | | | | | | | 39,317 | | | | 1,577,398 | |
Windstream Corp. | | | | | | | 8,089 | | | | 94,965 | |
| | | | | | | | | | | | |
| | | | | | | | | | | 4,551,233 | |
| | | | | | | | | | | | |
ELECTRIC UTILITIES – 2.0% | | | | | |
American Electric Power Co., Inc. | | | | | | | 6,705 | | | | 276,983 | |
Duke Energy Corp. | | | | | | | 18,507 | | | | 407,154 | |
Edison International | | | | | | | 4,524 | | | | 187,294 | |
Entergy Corp. | | | | | | | 2,445 | | | | 178,607 | |
Exelon Corp. | | | | | | | 9,207 | | | | 399,307 | |
FirstEnergy Corp. | | | | | | | 5,807 | | | | 257,250 | |
NextEra Energy, Inc. | | | | | | | 5,867 | | | | 357,183 | |
Northeast Utilities | | | | | | | 2,457 | | | | 88,624 | |
Pepco Holdings, Inc. | | | | | | | 3,160 | | | | 64,148 | |
Pinnacle West Capital Corp. | | | | | | | 1,516 | | | | 73,041 | |
PPL Corp. | | | | | | | 8,030 | | | | 236,243 | |
Progress Energy, Inc. | | | | | | | 4,096 | | | | 229,458 | |
Southern Co. | | | | | | | 11,969 | | | | 554,045 | |
| | | | | | | | | | | | |
| | | | | | | | | | | 3,309,337 | |
| | | | | | | | | | | | |
ELECTRICAL EQUIPMENT – 0.5% | | | | | |
Cooper Industries PLC | | | IE | | | | 2,196 | | | | 118,913 | |
Emerson Electric Co. | | | | | | | 10,218 | | | | 476,057 | |
Rockwell Automation, Inc. | | | | | | | 1,970 | | | | 144,539 | |
Roper Industries, Inc. | | | | | | | 1,339 | | | | 116,319 | |
| | | | | | | | | | | | |
| | | | | | | | | | | 855,828 | |
| | | | | | | | | | | | |
See Notes to Financial Statements.
128
| | |
SC SM BLACKROCK LARGE CAP INDEX FUND PORTFOLIOOF INVESTMENTS (Continued) December 31, 2011 | | Sun Capital Advisers Trust |
| | | | | | | | | | | | |
| | | Country
Code** | | | Shares | | | Value | |
| | | | | | | | | | | | |
| | | | | | | | | | | | |
ELECTRONIC EQUIPMENT, INSTRUMENTS & COMPONENTS – 0.4% | |
Amphenol Corp., Class A | | | | | | | 2,302 | | | $ | 104,488 | |
Corning, Inc. | | | | | | | 21,822 | | | | 283,249 | |
Flir Systems, Inc. | | | | | | | 2,166 | | | | 54,302 | |
Jabil Circuit, Inc. | | | | | | | 2,523 | | | | 49,602 | |
Molex, Inc. | | | | | | | 1,902 | | | | 45,382 | |
TE Connectivity Ltd. | | | CH | | | | 5,895 | | | | 181,625 | |
| | | | | | | | | | | | |
| | | | | | | | | | | 718,648 | |
| | | | | | | | | | | | |
ENERGY EQUIPMENT & SERVICES – 1.9% | |
Baker Hughes, Inc. | | | | | | | 6,061 | | | | 294,807 | |
Cameron International Corp.* | | | | | | | 3,404 | | | | 167,443 | |
Diamond Offshore Drilling, Inc. | | | | | | | 981 | | | | 54,210 | |
FMC Technologies, Inc.* | | | | | | | 3,308 | | | | 172,777 | |
Halliburton Co. | | | | | | | 12,778 | | | | 440,969 | |
Helmerich & Payne, Inc. | | | | | | | 1,487 | | | | 86,781 | |
Nabors Industries Ltd.* | | | BM | | | | 4,043 | | | | 70,106 | |
National-Oilwell Varco, Inc. | | | | | | | 5,886 | | | | 400,189 | |
Noble Corp.* | | | CH | | | | 3,504 | | | | 105,891 | |
Rowan Cos., Inc.* | | | | | | | 1,732 | | | | 52,531 | |
Schlumberger Ltd. | | | AN | | | | 18,639 | | | | 1,273,230 | |
| | | | | | | | | | | | |
| | | | | | | | | | | 3,118,934 | |
| | | | | | | | | | | | |
FOOD & STAPLES RETAILING – 2.4% | | | | | |
Costco Wholesale Corp. | | | | | | | 6,019 | | | | 501,503 | |
CVS Caremark Corp. | | | | | | | 18,077 | | | | 737,180 | |
Kroger Co. | | | | | | | 8,291 | | | | 200,808 | |
Safeway, Inc. | | | | | | | 4,721 | | | | 99,330 | |
SUPERVALU, Inc. | | | | | | | 3,001 | | | | 24,368 | |
Sysco Corp. | | | | | | | 8,191 | | | | 240,242 | |
Wal-Mart Stores, Inc. | | | | | | | 24,256 | | | | 1,449,539 | |
Walgreen Co. | | | | | | | 12,351 | | | | 408,324 | |
Whole Foods Market, Inc. | | | | | | | 2,218 | | | | 154,328 | |
| | | | | | | | | | | | |
| | | | | | | | | | | 3,815,622 | |
| | | | | | | | | | | | |
| | | | | | | | | | | | |
| | | Country
Code** | | | Shares | | | Value | |
| | | | | | | | | | | | |
| | | | | | | | | | | | |
FOOD PRODUCTS – 1.9% | | | | | |
Archer-Daniels-Midland Co. | | | | | | | 9,275 | | | $ | 265,265 | |
Campbell Soup Co. | | | | | | | 2,506 | | | | 83,299 | |
ConAgra Foods, Inc. | | | | | | | 5,755 | | | | 151,932 | |
Dean Foods Co.* | | | | | | | 2,546 | | | | 28,515 | |
General Mills, Inc. | | | | | | | 8,935 | | | | 361,063 | |
HJ Heinz Co. | | | | | | | 4,446 | | | | 240,262 | |
Hormel Foods Corp. | | | | | | | 1,903 | | | | 55,739 | |
Kellogg Co. | | | | | | | 3,441 | | | | 174,011 | |
Kraft Foods, Inc., Class A | | | | | | | 24,535 | | | | 916,628 | |
McCormick & Co., Inc. | | | | | | | 1,841 | | | | 92,823 | |
Mead Johnson Nutrition Co., Class A | | | | | | | 2,826 | | | | 194,231 | |
Sara Lee Corp. | | | | | | | 8,201 | | | | 155,163 | |
The Hershey Co. | | | | | | | 2,125 | | | | 131,283 | |
The J. M. Smucker Co. | | | | | | | 1,580 | | | | 123,509 | |
Tyson Foods, Inc., Class A | | | | | | | 4,057 | | | | 83,736 | |
| | | | | | | | | | | | |
| | | | | | | | | | | 3,057,459 | |
| | | | | | | | | | | | |
GAS UTILITIES – 0.1% | | | | | | | | | |
AGL Resources, Inc. | | | | | | | 1,620 | | | | 68,461 | |
ONEOK, Inc. | | | | | | | 1,430 | | | | 123,967 | |
| | | | | | | | | | | | |
| | | | | | | | | | | 192,428 | |
| | | | | | | | | | | | |
HEALTH CARE EQUIPMENT & SUPPLIES – 1.7% | |
Bard (C.R.), Inc. | | | | | | | 1,193 | | | | 102,002 | |
Baxter International, Inc. | | | | | | | 7,830 | | | | 387,428 | |
Becton, Dickinson & Co. | | | | | | | 2,984 | | | | 222,964 | |
Boston Scientific Corp.* | | | | | | | 20,575 | | | | 109,871 | |
CareFusion Corp.* | | | | | | | 3,117 | | | | 79,203 | |
Covidien PLC | | | IE | | | | 6,700 | | | | 301,567 | |
Dentsply International, Inc. | | | | | | | 1,964 | | | | 68,720 | |
Edwards Lifesciences Corp.* | | | | | | | 1,585 | | | | 112,060 | |
Intuitive Surgical, Inc.* | | | | | | | 541 | | | | 250,488 | |
Medtronic, Inc. | | | | | | | 14,655 | | | | 560,554 | |
St. Jude Medical, Inc. | | | | | | | 4,430 | | | | 151,949 | |
Stryker Corp. | | | | | | | 4,517 | | | | 224,540 | |
See Notes to Financial Statements.
129
| | |
SC SM BLACKROCK LARGE CAP INDEX FUND PORTFOLIOOF INVESTMENTS (Continued) December 31, 2011 | | Sun Capital Advisers Trust |
| | | | | | | | | | | | |
| | | Country
Code** | | | Shares | | | Value | |
| | | | | | | | | | | | |
| | | | | | | | | | | | |
Varian Medical Systems, Inc.* | | | | | | | 1,563 | | | $ | 104,924 | |
Zimmer Holdings, Inc.* | | | | | | | 2,488 | | | | 132,909 | |
| | | | | | | | | | | | |
| | | | | | | | | | | 2,809,179 | |
| | | | | | | | | | | | |
HEALTH CARE PROVIDERS & SERVICES – 2.1% | |
Aetna, Inc. | | | | | | | 5,032 | | | | 212,300 | |
AmerisourceBergen Corp. | | | | | | | 3,588 | | | | 133,438 | |
Cardinal Health, Inc. | | | | | | | 4,797 | | | | 194,806 | |
CIGNA Corp. | | | | | | | 3,963 | | | | 166,446 | |
Coventry Health Care, Inc.* | | | | | | | 2,004 | | | | 60,862 | |
DaVita, Inc.* | | | | | | | 1,298 | | | | 98,401 | |
Express Scripts, Inc.* | | | | | | | 6,755 | | | | 301,881 | |
Humana, Inc. | | | | | | | 2,271 | | | | 198,962 | |
Laboratory Corp. of America Holdings* | | | | | | | 1,376 | | | | 118,295 | |
McKesson Corp. | | | | | | | 3,410 | | | | 265,673 | |
Medco Health Solutions, Inc.* | | | | | | | 5,376 | | | | 300,518 | |
Patterson Cos., Inc. | | | | | | | 1,323 | | | | 39,055 | |
Quest Diagnostics, Inc. | | | | | | | 2,190 | | | | 127,151 | |
Tenet Healthcare Corp.* | | | | | | | 6,032 | | | | 30,944 | |
UnitedHealth Group, Inc. | | | | | | | 14,805 | | | | 750,318 | |
WellPoint, Inc. | | | | | | | 4,831 | | | | 320,054 | |
| | | | | | | | | | | | |
| | | | | | | | | | | 3,319,104 | |
| | | | | | | | | | | | |
HEALTH CARE TECHNOLOGY – 0.1% | | | | | |
Cerner Corp.* | | | | | | | 2,022 | | | | 123,848 | |
| | | | | | | | | | | | |
HOTELS, RESTAURANTS & LEISURE – 2.0% | |
Carnival Corp. | | | PA | | | | 6,285 | | | | 205,142 | |
Chipotle Mexican Grill, Inc.* | | | | | | | 434 | | | | 146,579 | |
Darden Restaurants, Inc. | | | | | | | 1,831 | | | | 83,457 | |
International Game Technology | | | | | | | 4,187 | | | | 72,016 | |
Marriott International, Inc., Class A | | | | | | | 3,723 | | | | 108,600 | |
McDonald’s Corp. | | | | | | | 14,211 | | | | 1,425,790 | |
Starbucks Corp. | | | | | | | 10,351 | | | | 476,249 | |
| | | | | | | | | | | | |
| | | Country
Code** | | | Shares | | | Value | |
| | | | | | | | | | | | |
| | | | | | | | | | | | |
Starwood Hotels & Resorts Worldwide, Inc. | | | | | | | 2,668 | | | $ | 127,984 | |
Wyndham Worldwide Corp. | | | | | | | 2,120 | | | | 80,200 | |
Wynn Resorts, Ltd. | | | | | | | 1,099 | | | | 121,429 | |
Yum! Brands, Inc. | | | | | | | 6,395 | | | | 377,369 | |
| | | | | | | | | | | | |
| | | | | | | | | | | 3,224,815 | |
| | | | | | | | | | | | |
HOUSEHOLD DURABLES – 0.2% | | | | | |
D.R. Horton, Inc. | | | | | | | 3,858 | | | | 48,649 | |
Harman International Industries, Inc. | | | | | | | 998 | | | | 37,964 | |
Leggett & Platt, Inc. | | | | | | | 1,958 | | | | 45,112 | |
Lennar Corp., Class A | | | | | | | 2,276 | | | | 44,724 | |
Newell Rubbermaid, Inc. | | | | | | | 4,017 | | | | 64,875 | |
Pulte Homes, Inc.* | | | | | | | 4,684 | | | | 29,556 | |
Whirlpool Corp. | | | | | | | 1,080 | | | | 51,246 | |
| | | | | | | | | | | | |
| | | | | | | | | | | 322,126 | |
| | | | | | | | | | | | |
HOUSEHOLD PRODUCTS – 2.3% | | | | | |
Clorox Co. | | | | | | | 1,831 | | | | 121,872 | |
Colgate-Palmolive Co. | | | | | | | 6,721 | | | | 620,953 | |
Kimberly-Clark Corp. | | | | | | | 5,473 | | | | 402,594 | |
The Procter & Gamble Co. | | | | | | | 38,210 | | | | 2,548,989 | |
| | | | | | | | | | | | |
| | | | | | | | | | | 3,694,408 | |
| | | | | | | | | | | | |
INDEPENDENT POWER PRODUCERS & ENERGY TRADERS – 0.2% | |
AES Corp.* | | | | | | | 8,950 | | | | 105,968 | |
Constellation Energy Group | | | | | | | 2,798 | | | | 110,997 | |
NRG Energy, Inc.* | | | | | | | 3,194 | | | | 57,875 | |
| | | | | | | | | | | | |
| | | | | | | | | | | 274,840 | |
| | | | | | | | | | | | |
INDUSTRIAL CONGLOMERATES – 2.5% | | | | | |
3M Co. | | | | | | | 9,733 | | | | 795,478 | |
Danaher Corp. | | | | | | | 7,910 | | | | 372,086 | |
General Electric Co. | | | | | | | 146,619 | | | | 2,625,946 | |
Tyco International Ltd. | | | CH | | | | 6,415 | | | | 299,645 | |
| | | | | | | | | | | | |
| | | | | | | | | | | 4,093,155 | |
| | | | | | | | | | | | |
See Notes to Financial Statements.
130
| | |
SC SM BLACKROCK LARGE CAP INDEX FUND PORTFOLIOOF INVESTMENTS (Continued) December 31, 2011 | | Sun Capital Advisers Trust |
| | | | | | | | | | | | |
| | | Country
Code** | | | Shares | | | Value | |
| | | | | | | | | | | | |
| | | | | | | | | | | | |
INSURANCE – 3.5% | | | | | | | | | |
ACE Ltd. | | | CH | | | | 4,677 | | | $ | 327,951 | |
Aflac, Inc. | | | | | | | 6,482 | | | | 280,411 | |
American International Group, Inc.* | | | | | | | 6,064 | | | | 140,685 | |
Aon Corp. | | | | | | | 4,489 | | | | 210,085 | |
Assurant, Inc. | | | | | | | 1,279 | | | | 52,516 | |
Berkshire Hathaway, Inc., Class B* | | | | | | | 24,415 | | | | 1,862,864 | |
Cincinnati Financial Corp. | | | | | | | 2,275 | | | | 69,297 | |
Genworth Financial Inc., Class A* | | | | | | | 6,924 | | | | 45,352 | |
Lincoln National Corp. | | | | | | | 4,199 | | | | 81,545 | |
Loews Corp. | | | | | | | 4,241 | | | | 159,674 | |
Marsh & McLennan Cos., Inc. | | | | | | | 7,470 | | | | 236,201 | |
MetLife, Inc. | | | | | | | 14,687 | | | | 457,941 | |
Prudential Financial, Inc. | | | | | | | 6,555 | | | | 328,537 | |
The Allstate Corp. | | | | | | | 7,018 | | | | 192,363 | |
The Chubb Corp. | | | | | | | 3,862 | | | | 267,328 | |
The Hartford Financial Services Group, Inc. | | | | | | | 6,187 | | | | 100,539 | |
The Principal Financial Group, Inc. | | | | | | | 4,238 | | | | 104,255 | |
The Progressive Corp. | | | | | | | 8,565 | | | | 167,103 | |
Torchmark Corp. | | | | | | | 1,416 | | | | 61,440 | |
Travelers Cos., Inc. | | | | | | | 5,733 | | | | 339,222 | |
Unum Group | | | | | | | 4,061 | | | | 85,565 | |
XL Group PLC | | | IE | | | | 4,490 | | | | 88,767 | |
| | | | | | | | | | | | |
| | | | | | | | | | | 5,659,641 | |
| | | | | | | | | | | | |
INTERNET & CATALOG RETAIL – 0.8% | | | | | |
Amazon.com, Inc.* | | | | | | | 5,052 | | | | 874,501 | |
Expedia, Inc. | | | | | | | 1,302 | | | | 37,784 | |
Netflix, Inc.* | | | | | | | 768 | | | | 53,215 | |
Priceline.com, Inc.* | | | | | | | 691 | | | | 323,188 | |
TripAdvisor, Inc.* | | | | | | | 1,302 | | | | 32,823 | |
| | | | | | | | | | | | |
| | | | | | | | | | | 1,321,511 | |
| | | | | | | | | | | | |
INTERNET SOFTWARE & SERVICES – 2.0% | |
Akamai Technologies, Inc.* | | | | | | | 2,523 | | | | 81,443 | |
eBay, Inc.* | | | | | | | 15,955 | | | | 483,915 | |
Google, Inc., Class A* | | | | | | | 3,508 | | | | 2,265,817 | |
| | | | | | | | | | | | |
| | | Country
Code** | | | Shares | | | Value | |
| | | | | | | | | | | | |
| | | | | | | | | | | | |
VeriSign, Inc. | | | | | | | 2,209 | | | $ | 78,906 | |
Yahoo!, Inc.* | | | | | | | 17,225 | | | | 277,839 | |
| | | | | | | | | | | | |
| | | | | | | | | | | 3,187,920 | |
| | | | | | | | | | | | |
IT SERVICES – 3.8% | | | | | | | | | |
Accenture PLC, Class A | | | IE | | | | 8,900 | | | | 473,747 | |
Automatic Data Processing, Inc. | | | | | | | 6,786 | | | | 366,512 | |
Cognizant Technology Solutions Corp., Class A* | | | | | | | 4,195 | | | | 269,780 | |
Computer Sciences Corp. | | | | | | | 2,181 | | | | 51,690 | |
Fidelity National Information Services, Inc. | | | | | | | 3,369 | | | | 89,582 | |
Fiserv, Inc.* | | | | | | | 1,955 | | | | 114,837 | |
International Business Machines Corp. | | | | | | | 16,369 | | | | 3,009,932 | |
MasterCard, Inc., Class A | | | | | | | 1,480 | | | | 551,774 | |
Paychex, Inc. | | | | | | | 4,477 | | | | 134,802 | |
SAIC, Inc.* | | | | | | | 3,832 | | | | 47,095 | |
Teradata Corp.* | | | | | | | 2,324 | | | | 112,737 | |
The Western Union Co. | | | | | | | 8,596 | | | | 156,963 | |
Total System Services, Inc. | | | | | | | 2,229 | | | | 43,599 | |
Visa, Inc., Class A | | | | | | | 7,063 | | | | 717,106 | |
| | | | | | | | | | | | |
| | | | | | | | | | | 6,140,156 | |
| | | | | | | | | | | | |
LEISURE EQUIPMENT & PRODUCTS – 0.1% | |
Hasbro, Inc. | | | | | | | 1,600 | | | | 51,024 | |
Mattel, Inc. | | | | | | | 4,701 | | | | 130,500 | |
| | | | | | | | | | | | |
| | | | | | | | | | | 181,524 | |
| | | | | | | | | | | | |
LIFE SCIENCES TOOLS & SERVICES – 0.4% | |
Agilent Technologies, Inc.* | | | | | | | 4,821 | | | | 168,397 | |
Life Technologies Corp.* | | | | | | | 2,492 | | | | 96,964 | |
PerkinElmer, Inc. | | | | | | | 1,599 | | | | 31,980 | |
Thermo Fisher Scientific, Inc.* | | | | | | | 5,252 | | | | 236,182 | |
Waters Corp.* | | | | | | | 1,256 | | | | 93,007 | |
| | | | | | | | | | | | |
| | | | | | | | | | | 626,530 | |
| | | | | | | | | | | | |
See Notes to Financial Statements.
131
| | |
SC SM BLACKROCK LARGE CAP INDEX FUND PORTFOLIOOF INVESTMENTS (Continued) December 31, 2011 | | Sun Capital Advisers Trust |
| | | | | | | | | | | | |
| | | Country
Code** | | | Shares | | | Value | |
| | | | | | | | | | | | |
| | | | | | | | | | | | |
MACHINERY – 2.0% | | | | | | | | | |
Caterpillar, Inc. | | | | | | | 8,980 | | | $ | 813,588 | |
Cummins, Inc. | | | | | | | 2,678 | | | | 235,717 | |
Deere & Co. | | | | | | | 5,748 | | | | 444,608 | |
Dover Corp. | | | | | | | 2,574 | | | | 149,421 | |
Eaton Corp. | | | | | | | 4,641 | | | | 202,023 | |
Flowserve Corp. | | | | | | | 778 | | | | 77,271 | |
Illinois Tool Works, Inc. | | | | | | | 6,711 | | | | 313,471 | |
Ingersoll-Rand PLC | | | IE | | | | 4,336 | | | | 132,118 | |
Joy Global, Inc. | | | | | | | 1,459 | | | | 109,381 | |
PACCAR, Inc. | | | | | | | 4,975 | | | | 186,413 | |
Pall Corp. | | | | | | | 1,600 | | | | 91,440 | |
Parker Hannifin Corp. | | | | | | | 2,098 | | | | 159,972 | |
Snap-On, Inc. | | | | | | | 807 | | | | 40,850 | |
Stanley Black & Decker, Inc. | | | | | | | 2,345 | | | | 158,522 | |
Xylem, Inc. | | | | | | | 2,585 | | | | 66,409 | |
| | | | | | | | | | | | |
| | | | | | | | | | | 3,181,204 | |
| | | | | | | | | | | | |
MEDIA – 3.0% | | | | | | | | | | | | |
Cablevision Systems Corp., Class A | | | | | | | 3,015 | | | | 42,873 | |
CBS Corp., Class B | | | | | | | 9,089 | | | | 246,675 | |
Comcast Corp., Class A | | | | | | | 37,843 | | | | 897,258 | |
DIRECTV, Class A* | | | | | | | 9,799 | | | | 419,005 | |
Discovery Communications, Inc., Class A* | | | | | | | 3,670 | | | | 150,360 | |
Gannett Co., Inc. | | | | | | | 3,329 | | | | 44,509 | |
News Corp., Class A | | | | | | | 30,456 | | | | 543,335 | |
Omnicom Group, Inc. | | | | | | | 3,831 | | | | 170,786 | |
Scripps Networks Interactive, Inc., Class A | | | | | | | 1,352 | | | | 57,352 | |
The Interpublic Group of Cos., Inc. | | | | | | | 6,405 | | | | 62,321 | |
The McGraw-Hill Cos., Inc. | | | | | | | 4,075 | | | | 183,253 | |
The Walt Disney Co. | | | | | | | 24,950 | | | | 935,625 | |
The Washington Post Co., Class B | | | | | | | 66 | | | | 24,869 | |
Time Warner Cable, Inc. | | | | | | | 4,432 | | | | 281,742 | |
Time Warner, Inc. | | | | | | | 13,900 | | | | 502,346 | |
Viacom, Inc. | | | | | | | 7,669 | | | | 348,249 | |
| | | | | | | | | | | | |
| | | | | | | | | | | 4,910,558 | |
| | | | | | | | | | | | |
| | | | | | | | | | |
| | | Country
Code** | | Shares | | | Value | |
| | | | | | | | | | |
| | | | | | | | | | |
METALS & MINING – 0.9% | | | | | | | | |
Alcoa, Inc. | | | | | 14,775 | | | $ | 127,804 | |
Allegheny Technologies, Inc. | | | | | 1,491 | | | | 71,270 | |
Cliffs Natural Resources, Inc. | | | | | 1,986 | | | | 123,827 | |
Freeport-McMoRan Copper & Gold, Inc. | | | | | 13,163 | | | | 484,267 | |
Newmont Mining Corp. | | | | | 6,871 | | | | 412,329 | |
Nucor Corp. | | | | | 4,397 | | | | 173,989 | |
Titanium Metals Corp. | | | | | 1,173 | | | | 17,571 | |
United States Steel Corp. | | | | | 1,982 | | | | 52,444 | |
| | | | | | | | | | |
| | | | | | | | | 1,463,501 | |
| | | | | | | | | | |
MULTI-LINE RETAIL – 0.8% | | | | | |
Big Lots, Inc.* | | | | | 922 | | | | 34,815 | |
Dollar Tree, Inc.* | | | | | 1,652 | | | | 137,298 | |
Family Dollar Stores, Inc. | | | | | 1,632 | | | | 94,101 | |
J.C. Penney Co., Inc. | | | | | 1,983 | | | | 69,702 | |
Kohl’s Corp. | | | | | 3,520 | | | | 173,712 | |
Macy’s, Inc. | | | | | 5,831 | | | | 187,641 | |
Nordstrom, Inc. | | | | | 2,246 | | | | 111,649 | |
Sears Holdings Corp.* | | | | | 549 | | | | 17,447 | |
Target Corp. | | | | | 9,326 | | | | 477,678 | |
| | | | | | | | | | |
| | | | | | | | | 1,304,043 | |
| | | | | | | | | | |
MULTI-UTILITIES – 1.4% | | | | | |
Ameren Corp. | | | | | 3,363 | | | | 111,416 | |
Centerpoint Energy, Inc. | | | | | 5,913 | | | | 118,792 | |
CMS Energy Corp. | | | | | 3,497 | | | | 77,214 | |
Consolidated Edison, Inc. | | | | | 4,067 | | | | 252,276 | |
Dominion Resources, Inc. | | | | | 7,910 | | | | 419,863 | |
DTE Energy Co. | | | | | 2,350 | | | | 127,957 | |
Integrys Energy Group, Inc. | | | | | 1,081 | | | | 58,568 | |
NiSource, Inc. | | | | | 3,902 | | | | 92,907 | |
PG&E Corp. | | | | | 5,636 | | | | 232,316 | |
See Notes to Financial Statements.
132
| | |
SC SM BLACKROCK LARGE CAP INDEX FUND PORTFOLIOOF INVESTMENTS (Continued) December 31, 2011 | | Sun Capital Advisers Trust |
| | | | | | | | | | |
| | | Country
Code** | | Shares | | | Value | |
| | | | | | | | | | |
| | | | | | | | | | |
Public Service Enterprise Group, Inc. | | | | | 7,024 | | | $ | 231,862 | |
SCANA Corp. | | | | | 1,601 | | | | 72,141 | |
Sempra Energy | | | | | 3,327 | �� | | | 182,985 | |
TECO Energy, Inc. | | | | | 2,947 | | | | 56,406 | |
Wisconsin Energy Corp. | | | | | 3,210 | | | | 112,222 | |
Xcel Energy, Inc. | | | | | 6,733 | | | | 186,100 | |
| | | | | | | | | | |
| | | | | | | | | 2,333,025 | |
| | | | | | | | | | |
OFFICE ELECTRONICS – 0.1% | | | | | |
Xerox Corp. | | | | | 19,257 | | | | 153,286 | |
| | | | | | | | | | |
OIL, GAS & CONSUMABLE FUELS – 10.1% | |
Alpha Natural Resources, Inc.* | | | | | 3,024 | | | | 61,780 | |
Anadarko Petroleum Corp. | | | | | 6,915 | | | | 527,822 | |
Apache Corp. | | | | | 5,333 | | | | 483,063 | |
Cabot Oil & Gas Corp. | | | | | 1,451 | | | | 110,131 | |
Chesapeake Energy Corp. | | | | | 9,154 | | | | 204,043 | |
Chevron Corp. | | | | | 27,657 | | | | 2,942,705 | |
ConocoPhillips | | | | | 18,440 | | | | 1,343,723 | |
Consol Energy, Inc. | | | | | 3,149 | | | | 115,568 | |
Denbury Resources, Inc.* | | | | | 5,514 | | | | 83,261 | |
Devon Energy Corp. | | | | | 5,609 | | | | 347,758 | |
El Paso Corp. | | | | | 10,708 | | | | 284,512 | |
EOG Resources, Inc. | | | | | 3,733 | | | | 367,738 | |
EQT Corp. | | | | | 2,074 | | | | 113,634 | |
Exxon Mobil Corp. | | | | | 66,569 | | | | 5,642,388 | |
Hess Corp. | | | | | 4,139 | | | | 235,095 | |
Marathon Oil Corp. | | | | | 9,773 | | | | 286,056 | |
Marathon Petroleum Corp. | | | | | 4,950 | | | | 164,785 | |
Murphy Oil Corp. | | | | | 2,687 | | | | 149,773 | |
Newfield Exploration Co.* | | | | | 1,839 | | | | 69,385 | |
Noble Energy, Inc. | | | | | 2,438 | | | | 230,123 | |
Occidental Petroleum Corp. | | | | | 11,274 | | | | 1,056,374 | |
Peabody Energy Corp. | | | | | 3,760 | | | | 124,494 | |
Pioneer Natural Resources Co. | | | | | 1,700 | | | | 152,116 | |
QEP Resources, Inc. | | | | | 2,456 | | | | 71,961 | |
| | | | | | | | | | |
| | | Country
Code** | | Shares | | | Value | |
| | | | | | | | | | |
| | | | | | | | | | |
Range Resources Corp. | | | | | 2,172 | | | $ | 134,534 | |
Southwestern Energy Co.* | | | | | 4,823 | | | | 154,047 | |
Spectra Energy Corp. | | | | | 9,030 | | | | 277,672 | |
Sunoco, Inc. | | | | | 1,483 | | | | 60,833 | |
Tesoro Corp.* | | | | | 1,937 | | | | 45,248 | |
The Williams Cos., Inc. | | | | | 8,184 | | | | 270,236 | |
Valero Energy Corp. | | | | | 7,774 | | | | 163,643 | |
| | | | | | | | | | |
| | | | | | | | | 16,274,501 | |
| | | | | | | | | | |
PAPER & FOREST PRODUCTS – 0.2% | | | | | |
International Paper Co. | | | | | 6,068 | | | | 179,613 | |
MeadWestvaco Corp. | | | | | 2,369 | | | | 70,951 | |
| | | | | | | | | | |
| | | | | | | | | 250,564 | |
| | | | | | | �� | | | |
PERSONAL PRODUCTS – 0.2% | | | | | |
Avon Products, Inc. | | | | | 5,980 | | | | 104,471 | |
The Estee Lauder Cos., Inc., Class A | | | | | 1,551 | | | | 174,208 | |
| | | | | | | | | | |
| | | | | | | | | 278,679 | |
| | | | | | | | | | |
PHARMACEUTICALS – 6.1% | | | | | |
Abbott Laboratories | | | | | 21,634 | | | | 1,216,480 | |
Allergan, Inc. | | | | | 4,236 | | | | 371,667 | |
Bristol-Myers Squibb Co. | | | | | 23,532 | | | | 829,268 | |
Eli Lilly & Co. | | | | | 14,148 | | | | 587,991 | |
Forest Laboratories, Inc.* | | | | | 3,710 | | | | 112,264 | |
Hospira, Inc.* | | | | | 2,286 | | | | 69,426 | |
Johnson & Johnson | | | | | 37,926 | | | | 2,487,187 | |
Merck & Co., Inc. | | | | | 42,330 | | | | 1,595,841 | |
Mylan, Inc.* | | | | | 5,921 | | | | 127,065 | |
Perrigo Co. | | | | | 1,294 | | | | 125,906 | |
Pfizer, Inc. | | | | | 106,758 | | | | 2,310,243 | |
Watson Pharmaceuticals, Inc.* | | | | | 1,765 | | | | 106,500 | |
| | | | | | | | | | |
| | | | | | | | | 9,939,838 | |
| | | | | | | | | | |
PROFESSIONAL SERVICES – 0.1% | | | | | |
Equifax, Inc. | | | | | 1,680 | | | | 65,083 | |
Robert Half International, Inc. | | | | | 1,960 | | | | 55,782 | |
The Dun & Bradstreet Corp. | | | | | 663 | | | | 49,612 | |
| | | | | | | | | | |
| | | | | | | | | 170,477 | |
| | | | | | | | | | |
See Notes to Financial Statements.
133
| | |
SC SM BLACKROCK LARGE CAP INDEX FUND PORTFOLIOOF INVESTMENTS (Continued) December 31, 2011 | | Sun Capital Advisers Trust |
| | | | | | | | | | |
| | | Country
Code** | | Shares | | | Value | |
| | | | | | | | | | |
| | | | | | | | | | |
REAL ESTATE INVESTMENT TRUSTS – 1.8% | |
Apartment Investment & Management Co., Class A | | | | | 1,656 | | | $ | 37,939 | |
AvalonBay Communities, Inc. | | | | | 1,320 | | | | 172,392 | |
Boston Properties, Inc. | | | | | 2,050 | | | | 204,180 | |
Equity Residential | | | | | 4,119 | | | | 234,907 | |
HCP, Inc. | | | | | 5,662 | | | | 234,577 | |
Health Care REIT, Inc. | | | | | 2,635 | | | | 143,687 | |
Host Hotels & Resorts, Inc. | | | | | 9,804 | | | | 144,805 | |
Kimco Realty Corp. | | | | | 5,648 | | | | 91,723 | |
Plum Creek Timber Co., Inc. | | | | | 2,238 | | | | 81,821 | |
ProLogis, Inc. | | | | | 6,362 | | | | 181,890 | |
Public Storage | | | | | 1,971 | | | | 265,021 | |
Simon Property Group, Inc. | | | | | 4,080 | | | | 526,075 | |
Ventas, Inc. | | | | | 3,998 | | | | 220,410 | |
Vornado Realty Trust | | | | | 2,562 | | | | 196,915 | |
Weyerhaeuser Co. | | | | | 7,447 | | | | 139,035 | |
| | | | | | | | | | |
| | | | | | | | | 2,875,377 | |
| | | | | | | | | | |
REAL ESTATE MANAGEMENT & DEVELOPMENT – 0.0% + | | | | | |
CBRE Group, Inc.* | | | | | 4,500 | | | | 68,490 | |
| | | | | | | | | | |
ROAD & RAIL – 0.9% | | | | | | | | |
CSX Corp. | | | | | 14,582 | | | | 307,097 | |
Norfolk Southern Corp. | | | | | 4,668 | | | | 340,111 | |
Ryder System, Inc. | | | | | 692 | | | | 36,773 | |
Union Pacific Corp. | | | | | 6,709 | | | | 710,751 | |
| | | | | | | | | | |
| | | | | | | | | 1,394,732 | |
| | | | | | | | | | |
SEMICONDUCTORS & SEMICONDUCTOR EQUIPMENT – 2.3% | |
Advanced Micro Devices, Inc.* | | | | | 8,120 | | | | 43,848 | |
Altera Corp. | | | | | 4,455 | | | | 165,280 | |
Analog Devices, Inc. | | | | | 4,137 | | | | 148,022 | |
Applied Materials, Inc. | | | | | 18,128 | | | | 194,151 | |
| | | | | | | | | | |
| | | Country
Code** | | Shares | | | Value | |
| | | | | | | | | | |
| | | | | | | | | | |
Broadcom Corp., Class A* | | | | | 6,735 | | | $ | 197,740 | |
First Solar, Inc.* | | | | | 835 | | | | 28,190 | |
Intel Corp. | | | | | 70,718 | | | | 1,714,911 | |
Kla-Tencor Corp. | | | | | 2,314 | | | | 111,650 | |
Linear Technology Corp. | | | | | 3,161 | | | | 94,925 | |
LSI Corp.* | | | | | 7,987 | | | | 47,523 | |
Microchip Technology, Inc. | | | | | 2,653 | | | | 97,179 | |
Micron Technology, Inc.* | | | | | 13,706 | | | | 86,211 | |
Novellus Systems, Inc.* | | | | | 921 | | | | 38,028 | |
NVIDIA Corp.* | | | | | 8,477 | | | | 117,491 | |
Teradyne, Inc.* | | | | | 2,490 | | | | 33,939 | |
Texas Instruments, Inc. | | | | | 15,869 | | | | 461,947 | |
Xilinx, Inc. | | | | | 3,643 | | | | 116,794 | |
| | | | | | | | | | |
| | | | | | | | | 3,697,829 | |
| | | | | | | | | | |
SOFTWARE – 3.4% | | | | | | | | | | |
Adobe Systems, Inc.* | | | | | 6,816 | | | | 192,688 | |
Autodesk, Inc.* | | | | | 3,157 | | | | 95,752 | |
BMC Software, Inc.* | | | | | 2,364 | | | | 77,492 | |
CA, Inc. | | | | | 5,149 | | | | 104,087 | |
Citrix Systems, Inc.* | | | | | 2,589 | | | | 157,204 | |
Electronic Arts, Inc.* | | | | | 4,628 | | | | 95,337 | |
Intuit, Inc. | | | | | 4,128 | | | | 217,092 | |
Microsoft Corp. | | | | | 103,976 | | | | 2,699,217 | |
Oracle Corp. | | | | | 54,645 | | | | 1,401,644 | |
Red Hat, Inc.* | | | | | 2,677 | | | | 110,533 | |
Salesforce.com, Inc.* | | | | | 1,888 | | | | 191,556 | |
Symantec Corp.* | | | | | 10,238 | | | | 160,225 | |
| | | | | | | | | | |
| | | | | | | | | 5,502,827 | |
| | | | | | | | | | |
SPECIALTY RETAIL – 1.9% | | | | | |
Abercrombie & Fitch Co., Class A | | | | | 1,178 | | | | 57,534 | |
AutoNation, Inc.* | | | | | 656 | | | | 24,187 | |
AutoZone, Inc.* | | | | | 388 | | | | 126,088 | |
Bed Bath & Beyond, Inc.* | | | | | 3,334 | | | | 193,272 | |
Best Buy Co., Inc. | | | | | 4,076 | | | | 95,256 | |
CarMax, Inc.* | | | | | 3,143 | | | | 95,799 | |
GameStop Corp., Class A* | | | | | 1,903 | | | | 45,919 | |
Limited Brands, Inc. | | | | | 3,415 | | | | 137,795 | |
See Notes to Financial Statements.
134
| | |
SC SM BLACKROCK LARGE CAP INDEX FUND PORTFOLIOOF INVESTMENTS (Continued) December 31, 2011 | | Sun Capital Advisers Trust |
| | | | | | | | | | |
| | | Country
Code** | | Shares | | | Value | |
| | | | | | | | | | |
| | | | | | | | | | |
Lowe’s Cos., Inc. | | | | | 17,394 | | | $ | 441,460 | |
O’Reilly Automotive, Inc.* | | | | | 1,782 | | | | 142,471 | |
Orchard Supply Hardware Stores Corp., Class A* | | | | | 22 | | | | 83 | |
Ross Stores, Inc. | | | | | 3,108 | | | | 147,723 | |
Staples, Inc. | | | | | 9,710 | | | | 134,872 | |
The Gap, Inc. | | | | | 4,826 | | | | 89,522 | |
The Home Depot, Inc. | | | | | 21,409 | | | | 900,034 | |
Tiffany & Co. | | | | | 1,762 | | | | 116,750 | |
TJX Cos., Inc. | | | | | 5,237 | | | | 338,048 | |
Urban Outfitters, Inc.* | | | | | 1,542 | | | | 42,498 | |
| | | | | | | | | | |
| | | | | | | | | 3,129,311 | |
| | | | | | | | | | |
TEXTILES, APPAREL & LUXURY GOODS – 0.6% | |
Coach, Inc. | | | | | 4,052 | | | | 247,334 | |
Nike, Inc., Class B | | | | | 5,152 | | | | 496,498 | |
Ralph Lauren Corp. | | | | | 895 | | | | 123,582 | |
VF Corp. | | | | | 1,210 | | | | 153,658 | |
| | | | | | | | | | |
| | | | | | | | | 1,021,072 | |
| | | | | | | | | | |
THRIFT & MORTGAGE FINANCE – 0.1% | |
Hudson City Bancorp, Inc. | | | | | 7,383 | | | | 46,144 | |
People’s United Financial, Inc. | | | | | 5,009 | | | | 64,365 | |
| | | | | | | | | | |
| | | | | | | | | 110,509 | |
| | | | | | | | | | |
TOBACCO – 1.9% | | | | | | | | | | |
Altria Group, Inc. | | | | | 28,558 | | | | 846,745 | |
Lorillard, Inc. | | | | | 1,875 | | | | 213,750 | |
Philip Morris International, Inc. | | | | | 24,123 | | | | 1,893,173 | |
Reynolds American, Inc. | | | | | 4,694 | | | | 194,425 | |
| | | | | | | | | | |
| | | | | | | | | 3,148,093 | |
| | | | | | | | | | |
TRADING COMPANIES & DISTRIBUTORS – 0.2% | |
Fastenal Co. | | | | | 4,099 | | | | 178,757 | |
W.W. Grainger, Inc. | | | | | 842 | | | | 157,614 | |
| | | | | | | | | | |
| | | | | | | | | 336,371 | |
| | | | | | | | | | |
| | | | | | | | | | |
| | | Country
Code** | | Shares | | | Value | |
| | | | | | | | | | |
| | | | | | | | | | |
WIRELESS TELECOMMUNICATION SERVICES – 0.3% | | | | | |
American Tower Corp., Class A | | | | | 5,457 | | | $ | 327,475 | |
MetroPCS Communications, Inc.* | | | | | 4,113 | | | | 35,701 | |
Sprint Nextel Corp.* | | | | | 41,583 | | | | 97,304 | |
| | | | | | | | | | |
| | | | | | | | | 460,480 | |
| | | | | | | | | | |
Total Common Stocks | | | | | | | | |
(Cost $151,929,337) | | | | | | | 158,079,859 | |
| | | | | | | | | | |
PREFERRED STOCKS – 0.0% + | | | | | |
SPECIALTY RETAIL – 0.0% + | | | | | |
Orchard Supply Hardware Stores Corp., Series A* (Cost $130) | | | 22 | | | | 83 | |
| | | | | | | | | | |
SHORT TERM INVESTMENTS – 2.0% | | | | | |
MUTUAL FUNDS – 2.0% | | | | | | | | |
State Street Institutional Treasury Plus Money Market Fund, 0.00% (Cost $3,178,449) | | | 3,178,449 | | | | 3,178,449 | |
| | | | | | | | | | |
TOTAL INVESTMENTS – 99.7% | | | | | |
(Cost $155,107,916) | | | | | | $ | 161,258,391 | |
Other assets less liabilities – 0.3% | | | | | | | 454,590 | |
| | | | | | | | | | |
NET ASSETS – 100.0% | | | | | | $ | 161,712,981 | |
| | | | | | | | | | |
| | |
| REIT | | Real Estate Investment Trust |
| |
| AN | | Netherlands Antilles |
| BM | | Bermuda |
| CH | | Switzerland |
| IE | | Ireland |
| PA | | Panama |
| * | Non-income producing security. |
| ** | Unless otherwise noted the issuer country code for all securities is United States. |
| + | Amount is less than 0.05%. |
See Notes to Financial Statements.
135
| | |
SC SM BLACKROCK LARGE CAP INDEX FUND PORTFOLIOOF INVESTMENTS (Continued) December 31, 2011 | | Sun Capital Advisers Trust |
| (1) | At the period end, cash of $264,000 has been pledged to cover margin requirements for the following open futures contracts: |
| | | | | | | | | | | | |
Type | | Description | | Expiration
Date | | Contracts | | | Unrealized
Depreciation ($) | |
Long | | S&P 500 E-Mini Index March Futures | | 3/16/12 | | | 58 | | | | (3,190 | ) |
| (2) | Fair Value Measurements |
All investments and financial derivative instruments are categorized as Level 1 under the fair value hierarchy. See Note 2b in the Notes to Financial Statements for additional information.
See Notes to Financial Statements.
136
SC SM BLACKROCK SMALL CAP INDEX FUND
| | |
PORTFOLIOOF INVESTMENTS December 31, 2011 | | Sun Capital Advisers Trust |
| | | | | | | | | | |
| | | Country
Code** | | Shares | | | Value | |
| | | | | | | | | | |
| | | | | | | | | | |
COMMON STOCKS – 99.1% | |
AEROSPACE & DEFENSE – 1.9% | |
AAR Corp. | | | | | 6,709 | | | $ | 128,612 | |
AeroVironment, Inc.* | | | | | 2,829 | | | | 89,029 | |
American Science & Engineering, Inc. | | | | | 1,526 | | | | 103,936 | |
Astronics Corp.* | | | | | 1,760 | | | | 63,026 | |
Ceradyne, Inc.* | | | | | 4,203 | | | | 112,556 | |
Cubic Corp. | | | | | 2,666 | | | | 116,211 | |
Curtiss-Wright Corp. | | | | | 7,846 | | | | 277,199 | |
DigitalGlobe, Inc.* | | | | | 5,954 | | | | 101,873 | |
Ducommun, Inc. | | | | | 1,718 | | | | 21,904 | |
Esterline Technologies Corp.* | | | | | 5,152 | | | | 288,357 | |
GenCorp, Inc.* | | | | | 10,157 | | | | 54,035 | |
Geoeye, Inc.* | | | | | 3,726 | | | | 82,792 | |
Heico Corp. | | | | | 7,059 | | | | 412,810 | |
Hexcel Corp.* | | | | | 16,597 | | | | 401,813 | |
Kratos Defense & Security Solutions, Inc.* | | | | | 5,517 | | | | 32,936 | |
LMI Aerospace, Inc.* | | | | | 1,563 | | | | 27,431 | |
Moog, Inc.* | | | | | 7,658 | | | | 336,416 | |
National Presto Industries, Inc. | | | | | 801 | | | | 74,974 | |
Orbital Sciences Corp.* | | | | | 9,874 | | | | 143,469 | |
Taser International, Inc.* | | | | | 9,387 | | | | 48,061 | |
Teledyne Technologies, Inc.* | | | | | 6,208 | | | | 340,509 | |
The Keyw Holding Corp.* | | | | | 3,077 | | | | 22,770 | |
Triumph Group, Inc. | | | | | 6,368 | | | | 372,210 | |
| | | | | | | | | | |
| | | | | | | | | 3,652,929 | |
| | | | | | | | | | |
AIR FREIGHT & LOGISTICS – 0.3% | |
Air Transport Services Group, Inc.* | | | | | 9,282 | | | | 43,811 | |
Atlas Air Worldwide Holdings, Inc.* | | | | | 4,436 | | | | 170,476 | |
Forward Air Corp. | | | | | 4,959 | | | | 158,936 | |
HUB Group, Inc.* | | | | | 6,203 | | | | 201,163 | |
| | | | | | | | | | |
| | | Country
Code** | | Shares | | | Value | |
| | | | | | | | | | |
| | | | | | | | | | |
Pacer International, Inc.* | | | | | 5,894 | | | $ | 31,533 | |
Park-Ohio Holdings Corp.* | | | | | 1,413 | | | | 25,208 | |
| | | | | | | | | | |
| | | | | | | | | 631,127 | |
| | | | | | | | | | |
AIRLINES – 0.6% | |
Alaska Air Group, Inc.* | | | | | 6,089 | | | | 457,223 | |
Allegiant Travel Co.* | | | | | 2,514 | | | | 134,097 | |
Hawaiian Holdings, Inc.* | | | | | 8,660 | | | | 50,228 | |
JetBlue Airways Corp.* | | | | | 41,694 | | | | 216,809 | |
Republic Airways Holdings, Inc.* | | | | | 8,170 | | | | 28,023 | |
SkyWest, Inc. | | | | | 8,942 | | | | 112,580 | |
Spirit Airlines, Inc.* | | | | | 2,635 | | | | 41,106 | |
US Airways Group, Inc.* | | | | | 27,425 | | | | 139,044 | |
| | | | | | | | | | |
| | | | | | | | | 1,179,110 | |
| | | | | | | | | | |
AUTO COMPONENTS – 0.8% | |
American Axle & Manufacturing Holdings, Inc.* | | | | | 11,266 | | | | 111,421 | |
Amerigon, Inc.* | | | | | 3,821 | | | | 54,488 | |
Cooper Tire & Rubber Co. | | | | | 10,524 | | | | 147,441 | |
Dana Holding Corp.* | | | | | 24,782 | | | | 301,101 | |
Dorman Products, Inc.* | | | | | 1,805 | | | | 66,659 | |
Drew Industries, Inc.* | | | | | 3,210 | | | | 78,741 | |
Exide Technologies* | | | | | 12,909 | | | | 33,951 | |
Fuel Systems Solutions, Inc.* | | | | | 2,838 | | | | 46,799 | |
Modine Manufacturing Co.* | | | | | 7,809 | | | | 73,873 | |
Motorcar Parts of America, Inc.* | | | | | 2,016 | | | | 15,120 | |
Shiloh Industries, Inc.* | | | | | 884 | | | | 7,408 | |
Spartan Motors, Inc. | | | | | 5,562 | | | | 26,753 | |
Standard Motor Products, Inc. | | | | | 3,383 | | | | 67,829 | |
Stoneridge, Inc.* | | | | | 4,580 | | | | 38,609 | |
Superior Industries International, Inc. | | | | | 4,017 | | | | 66,441 | |
See Notes to Financial Statements.
137
SC SM BLACKROCK SMALL CAP INDEX FUND
| | |
PORTFOLIOOF INVESTMENTS (Continued) December 31, 2011 | | Sun Capital Advisers Trust |
| | | | | | | | | | | | |
| | | Country
Code** | | | Shares | | | Value | |
| | | | | | | | | | | | |
| | | | | | | | | | | | |
Tenneco, Inc.* | | | | | | | 10,240 | | | $ | 304,947 | |
Tower International, Inc.* | | | | | | | 1,080 | | | | 11,599 | |
| | | | | | | | | | | | |
| | | | | | | | | | | 1,453,180 | |
| | | | | | | | | | | | |
AUTOMOBILES – 0.0%+ | |
Winnebago Industries, Inc.* | | | | | | | 5,102 | | | | 37,653 | |
| | | | | | | | | | | | |
BEVERAGES – 0.2% | |
Boston Beer Co., Inc.* | | | | | | | 1,381 | | | | 149,921 | |
Central European Distribution Corp.* | | | | | | | 12,519 | | | | 54,771 | |
Coca-Cola Bottling Co. Consolidated | | | | | | | 765 | | | | 44,791 | |
Craft Brewers Alliance, Inc.* | | | | | | | 1,678 | | | | 10,102 | |
Heckmann Corp.* | | | | | | | 16,794 | | | | 111,680 | |
MGP Ingredients, Inc. | | | | | | | 2,271 | | | | 11,446 | |
National Beverage Corp.* | | | | | | | 1,856 | | | | 29,826 | |
Primo Water Corp.* | | | | | | | 2,683 | | | | 8,156 | |
| | | | | | | | | | | | |
| | | | | | | | | | | 420,693 | |
| | | | | | | | | | | | |
BIOTECHNOLOGY – 3.7% | |
Achillion Pharmaceuticals, Inc.* | | | | | | | 8,112 | | | | 61,813 | |
Acorda Therapeutics, Inc.* | | | | | | | 6,641 | | | | 158,321 | |
Aegerion Pharmaceuticals, Inc.* | | | | | | | 1,522 | | | | 25,478 | |
Affymax, Inc.* | | | | | | | 5,965 | | | | 39,429 | |
Alkermes PLC* | | | IE | | | | 16,158 | | | | 280,503 | |
Allos Therapeutics, Inc.* | | | | | | | 12,904 | | | | 18,324 | |
Alnylam Pharmaceuticals, Inc.* | | | | | | | 6,388 | | | | 52,062 | |
AMAG Pharmaceuticals, Inc.* | | | | | | | 3,623 | | | | 68,511 | |
Amicus Therapeutics, Inc.* | | | | | | | 2,611 | | | | 8,982 | |
| | | | | | | | | | |
| | | Country
Code** | | Shares | | | Value | |
| | | | | | | | | | |
| | | | | | | | | | |
Anacor Pharmaceuticals, Inc.* | | | | | 1,785 | | | $ | 11,067 | |
Anthera Pharmaceuticals, Inc.* | | | | | 3,598 | | | | 22,092 | |
Ardea Biosciences, Inc.* | | | | | 2,885 | | | | 48,497 | |
Arena Pharmaceuticals, Inc.* | | | | | 24,879 | | | | 46,524 | |
Ariad Pharmaceuticals, Inc.* | | | | | 22,311 | | | | 273,310 | |
ArQule, Inc.* | | | | | 9,250 | | | | 52,170 | |
Array Biopharma, Inc.* | | | | | 9,628 | | | | 20,797 | |
Astex Pharmaceuticals, Inc.* | | | | | 10,367 | | | | 19,594 | |
Aveo Pharmaceuticals, Inc.* | | | | | 5,235 | | | | 90,042 | |
AVI Biopharma, Inc.* | | | | | 23,878 | | | | 17,789 | |
BioCryst Pharmaceuticals, Inc.* | | | | | 4,755 | | | | 11,745 | |
BioMimetic Therapeutics, Inc.* | | | | | 3,227 | | | | 9,197 | |
BioSante Pharmaceuticals, Inc.* | | | | | 18,565 | | | | 9,322 | |
BioSpecifics Technologies Corp.* | | | | | 800 | | | | 13,296 | |
BioTime, Inc.* | | | | | 4,237 | | | | 24,617 | |
Cell Therapeutics, Inc.* | | | | | 33,000 | | | | 38,280 | |
Celldex Therapeutics, Inc.* | | | | | 7,367 | | | | 19,154 | |
Cepheid, Inc.* | | | | | 10,457 | | | | 359,825 | |
Chelsea Therapeutics International Ltd.* | | | | | 8,869 | | | | 45,498 | |
Cleveland Biolabs, Inc.* | | | | | 4,729 | | | | 13,525 | |
Clovis Oncology, Inc.* | | | | | 1,831 | | | | 25,799 | |
Codexis, Inc.* | | | | | 4,306 | | | | 22,822 | |
Cubist Pharmaceuticals, Inc.* | | | | | 10,151 | | | | 402,183 | |
Curis, Inc.* | | | | | 12,909 | | | | 60,414 | |
See Notes to Financial Statements.
138
SC SM BLACKROCK SMALL CAP INDEX FUND
| | |
PORTFOLIOOF INVESTMENTS (Continued) December 31, 2011 | | Sun Capital Advisers Trust |
| | | | | | | | | | |
| | | Country
Code** | | Shares | | | Value | |
| | | | | | | | | | |
| | | | | | | | | | |
Cytori Therapeutics, Inc.* | | | | | 8,469 | | | $ | 18,632 | |
DUSA Pharmaceuticals, Inc.* | | | | | 4,259 | | | | 18,654 | |
Dyax Corp.* | | | | | 16,286 | | | | 22,149 | |
Dynavax Technologies Corp.* | | | | | 25,681 | | | | 85,261 | |
Emergent Biosolutions, Inc.* | | | | | 4,182 | | | | 70,425 | |
Enzon Pharmaceuticals, Inc.* | | | | | 6,339 | | | | 42,471 | |
Exact Sciences Corp.* | | | | | 9,439 | | | | 76,645 | |
Exelixis, Inc.* | | | | | 21,521 | | | | 101,902 | |
Genomic Health, Inc.* | | | | | 2,914 | | | | 73,986 | |
Geron Corp.* | | | | | 21,735 | | | | 32,168 | |
GTx, Inc.* | | | | | 4,164 | | | | 13,991 | |
Halozyme Therapeutics, Inc.* | | | | | 13,839 | | | | 131,609 | |
Horizon Pharma, Inc.* | | | | | 766 | | | | 3,064 | |
Idenix Pharmaceuticals, Inc.* | | | | | 10,022 | | | | 74,614 | |
ImmunoGen, Inc.* | | | | | 12,681 | | | | 146,846 | |
Immunomedics, Inc.* | | | | | 11,492 | | | | 38,268 | |
Incyte Corp.* | | | | | 14,915 | | | | 223,874 | |
Infinity Pharmaceuticals, Inc.* | | | | | 3,219 | | | | 28,456 | |
Inhibitex, Inc.* | | | | | 10,676 | | | | 116,795 | |
Insmed, Inc.* | | | | | 4,280 | | | | 13,054 | |
InterMune, Inc.* | | | | | 9,099 | | | | 114,647 | |
Ironwood Pharmaceuticals, Inc.* | | | | | 8,477 | | | | 101,470 | |
Isis Pharmaceuticals, Inc.* | | | | | 16,717 | | | | 120,530 | |
Keryx Biopharmaceuticals, Inc.* | | | | | 11,729 | | | | 29,674 | |
Lexicon Genetics, Inc.* | | | | | 29,660 | | | | 38,261 | |
Ligand Pharmaceuticals, Inc.* | | | | | 3,312 | | | | 39,313 | |
Mannkind Corp.* | | | | | 12,870 | | | | 32,175 | |
Maxygen, Inc.* | | | | | 4,694 | | | | 26,427 | |
Medivation, Inc.* | | | | | 5,285 | | | | 243,691 | |
Metabolix, Inc.* | | | | | 6,023 | | | | 27,405 | |
| | | | | | | | | | | | |
| | | Country
Code** | | | Shares | | | Value | |
| | | | | | | | | | | | |
| | | | | | | | | | | | |
Micromet, Inc.* | | | | | | | 15,369 | | | $ | 110,503 | |
Momenta Pharmaceuticals, Inc.* | | | | | | | 7,781 | | | | 135,312 | |
Nabi Biopharmaceuticals* | | | | | | | 7,155 | | | | 13,451 | |
Neurocrine Biosciences, Inc.* | | | | | | | 8,514 | | | | 72,369 | |
NewLink Genetics Corp.* | | | | | | | 1,190 | | | | 8,378 | |
Novavax, Inc.* | | | | | | | 17,183 | | | | 21,651 | |
NPS Pharmaceuticals, Inc.* | | | | | | | 14,426 | | | | 95,067 | |
Nymox Pharmaceutical Corp.* | | | CA | | | | 3,272 | | | | 26,896 | |
OncoGenex Pharmaceutical, Inc.* | | | | | | | 1,684 | | | | 19,770 | |
Oncothyreon, Inc.* | | | | | | | 7,139 | | | | 54,114 | |
Onyx Pharmaceuticals, Inc.* | | | | | | | 10,718 | | | | 471,056 | |
Opko Health, Inc.* | | | | | | | 18,247 | | | | 89,410 | |
Orexigen Therapeutics, Inc.* | | | | | | | 6,093 | | | | 9,810 | |
Osiris Therapeutics, Inc.* | | | | | | | 3,088 | | | | 16,521 | |
PDL BioPharma, Inc. | | | | | | | 23,787 | | | | 147,479 | |
Peregrine Pharmaceuticals, Inc.* | | | | | | | 13,444 | | | | 13,847 | |
Pharmacyclics, Inc.* | | | | | | | 7,726 | | | | 114,499 | |
PharmAthene, Inc.* | | | | | | | 6,236 | | | | 7,920 | |
Progenics Pharmaceuticals, Inc.* | | | | | | | 5,086 | | | | 43,434 | |
Raptor Pharmaceutical Corp.* | | | | | | | 8,052 | | | | 50,406 | |
Rigel Pharmaceuticals, Inc.* | | | | | | | 11,510 | | | | 90,814 | |
Sangamo BioSciences, Inc.* | | | | | | | 8,631 | | | | 24,512 | |
Savient Pharmaceuticals, Inc.* | | | | | | | 11,678 | | | | 26,042 | |
SciClone Pharmaceuticals, Inc.* | | | | | | | 6,016 | | | | 25,809 | |
Seattle Genetics, Inc.* | | | | | | | 16,308 | | | | 272,588 | |
See Notes to Financial Statements.
139
SC SM BLACKROCK SMALL CAP INDEX FUND
| | |
PORTFOLIOOF INVESTMENTS (Continued) December 31, 2011 | | Sun Capital Advisers Trust |
| | | | | | | | | | |
| | | Country
Code** | | Shares | | | Value | |
| | | | | | | | | | |
| | | | | | | | | | |
Siga Technologies, Inc.* | | | | | 5,942 | | | $ | 14,974 | |
Spectrum Pharmaceuticals, Inc.* | | | | | 9,660 | | | | 141,326 | |
Sunesis Pharmaceuticals, Inc.* | | | | | 4,968 | | | | 5,813 | |
Synta Pharmaceuticals Corp.* | | | | | 3,935 | | | | 18,376 | |
Targacept, Inc.* | | | | | 4,620 | | | | 25,733 | |
Theravance, Inc.* | | | | | 11,636 | | | | 257,156 | |
Trius Therapeutics, Inc.* | | | | | 1,342 | | | | 9,595 | |
Vanda Pharmaceuticals, Inc.* | | | | | 5,037 | | | | 23,976 | |
Vical, Inc.* | | | | | 11,923 | | | | 52,580 | |
Zalicus, Inc.* | | | | | 13,134 | | | | 15,892 | |
Ziopharm Oncology, Inc.* | | | | | 10,057 | | | | 44,351 | |
Zogenix, Inc.* | | | | | 4,129 | | | | 9,249 | |
| | | | | | | | | | |
| | | | | | | | | 7,058,118 | |
| | | | | | | | | | |
BUILDING PRODUCTS – 0.7% | |
A.O. Smith Corp. | | | | | 6,452 | | | | 258,854 | |
Aaon, Inc. | | | | | 3,240 | | | | 66,388 | |
Ameresco, Inc., Class A* | | | | | 3,076 | | | | 42,203 | |
American Woodmark Corp. | | | | | 1,630 | | | | 22,266 | |
Apogee Enterprises, Inc. | | | | | 4,874 | | | | 59,755 | |
Builders FirstSource, Inc.* | | | | | 7,550 | | | | 15,402 | |
Gibraltar Industries, Inc.* | | | | | 5,218 | | | | 72,843 | |
Griffon Corp. | | | | | 8,217 | | | | 75,021 | |
Insteel Industries, Inc. | | | | | 2,985 | | | | 32,805 | |
NCI Building Systems, Inc.* | | | | | 3,320 | | | | 36,089 | |
Quanex Building Products Corp. | | | | | 6,377 | | | | 95,783 | |
Simpson Manufacturing Co., Inc. | | | | | 7,049 | | | | 237,269 | |
Trex Co., Inc.* | | | | | 2,680 | | | | 61,399 | |
| | | | | | | | | | |
| | | Country
Code** | | Shares | | | Value | |
| | | | | | | | | | |
| | | | | | | | | | |
Universal Forest Products, Inc. | | | | | 3,276 | | | $ | 101,130 | |
USG Corp.* | | | | | 11,989 | | | | 121,808 | |
| | | | | | | | | | |
| | | | | | | | | 1,299,015 | |
| | | | | | | | | | |
CAPITAL MARKETS – 1.9% | |
Apollo Investment Corp. | | | | | 33,046 | | | | 212,816 | |
Arlington Asset Investment Corp., Class A | | | | | 1,127 | | | | 24,039 | |
Artio Global Investors, Inc. | | | | | 5,524 | | | | 26,957 | |
BGC Partners, Inc. | | | | | 12,764 | | | | 75,818 | |
BlackRock Kelso Capital Corp. | | | | | 12,262 | | | | 100,058 | |
Calamos Asset Management, Inc. | | | | | 3,332 | | | | 41,683 | |
Capital Southwest Corp. | | | | | 476 | | | | 38,818 | |
CIFC Corp.* | | | | | 2,230 | | | | 12,042 | |
Cohen & Steers, Inc. | | | | | 2,996 | | | | 86,584 | |
Cowen Group, Inc., Class A* | | | | | 11,677 | | | | 30,243 | |
Diamond Hill Investment Group | | | | | 432 | | | | 31,959 | |
Duff & Phelps Corp., Class A | | | | | 5,142 | | | | 74,559 | |
Edelman Financial Group, Inc. | | | | | 3,483 | | | | 22,883 | |
Epoch Holding Corp. | | | | | 2,547 | | | | 56,620 | |
Evercore Partners, Inc. | | | | | 3,555 | | | | 94,634 | |
FBR Capital Markets Corp.* | | | | | 7,363 | | | | 15,094 | |
Fidus Investment Corp. | | | | | 833 | | | | 10,804 | |
Fifth Street Finance Corp. | | | | | 12,281 | | | | 117,529 | |
Financial Engines, Inc.* | | | | | 6,470 | | | | 144,475 | |
FXCM, Inc., Class A | | | | | 3,010 | | | | 29,348 | |
GAMCO Investors, Inc. | | | | | 1,158 | | | | 50,361 | |
GFI Group, Inc. | | | | | 11,884 | | | | 48,962 | |
Gladstone Capital Corp. | | | | | 3,579 | | | | 27,308 | |
Gladstone Investment Corp. | | | | | 3,753 | | | | 27,284 | |
See Notes to Financial Statements.
140
SC SM BLACKROCK SMALL CAP INDEX FUND
| | |
PORTFOLIOOF INVESTMENTS (Continued) December 31, 2011 | | Sun Capital Advisers Trust |
| | | | | | | | | | |
| | | Country
Code** | | Shares | | | Value | |
| | | | | | | | | | |
| | | | | | | | | | |
Gleacher & Co., Inc.* | | | | | 11,830 | | | $ | 19,874 | |
Golub Capital BDC, Inc. | | | | | 1,773 | | | | 27,482 | |
Harris & Harris Group, Inc.* | | | | | 5,219 | | | | 18,058 | |
Hercules Technology Growth Capital, Inc. | | | | | 7,369 | | | | 69,563 | |
HFF, Inc., Class A* | | | | | 5,053 | | | | 52,198 | |
ICG Group, Inc.* | | | | | 6,328 | | | | 48,852 | |
INTL FCStone, Inc.* | | | | | 2,271 | | | | 53,528 | |
Investment Technology Group, Inc.* | | | | | 6,909 | | | | 74,686 | |
JMP Group, Inc. | | | | | 2,668 | | | | 19,076 | |
KBW, Inc. | | | | | 5,581 | | | | 84,720 | |
Knight Capital Group, Inc.* | | | | | 17,012 | | | | 201,082 | |
Kohlberg Capital Corp. | | | | | 3,198 | | | | 20,179 | |
Ladenburg Thalmann Financial Services, Inc.* | | | | | 18,402 | | | | 45,637 | |
Main Street Capital Corp. | | | | | 3,844 | | | | 81,647 | |
Manning & Napier, Inc.* | | | | | 2,138 | | | | 26,704 | |
MCG Capital Corp. | | | | | 13,345 | | | | 53,247 | |
Medallion Financial Corp. | | | | | 2,612 | | | | 29,725 | |
Medley Capital Corp. | | | | | 1,827 | | | | 19,001 | |
MVC Capital, Inc. | | | | | 4,089 | | | | 47,392 | |
New Mountain Finance Corp. | | | | | 1,303 | | | | 17,473 | |
NGP Capital Resources Co. | | | | | 3,660 | | | | 26,315 | |
Oppenheimer Holdings, Inc., Class A | | | | | 1,693 | | | | 27,257 | |
PennantPark Investment Corp. | | | | | 7,659 | | | | 77,279 | |
Piper Jaffray Cos., Inc.* | | | | | 2,718 | | | | 54,904 | |
Prospect Capital Corp. | | | | | 18,556 | | | | 172,385 | |
Pzena Investment Management, Inc., Class A | | | | | 1,359 | | | | 5,884 | |
Safeguard Scientifics, Inc.* | | | | | 3,558 | | | | 56,181 | |
| | | | | | | | | | |
| | | Country
Code** | | Shares | | | Value | |
| | | | | | | | | | |
| | | | | | | | | | |
Solar Capital Ltd. | | | | | 6,214 | | | $ | 137,267 | |
Solar Senior Capital Ltd. | | | | | 1,293 | | | | 20,365 | |
Stifel Financial Corp.* | | | | | 9,101 | | | | 291,687 | |
SWS Group, Inc. | | | | | 5,034 | | | | 34,584 | |
ThL Credit, Inc. | | | | | 1,588 | | | | 19,390 | |
TICC Capital Corp. | | | | | 5,392 | | | | 46,641 | |
Triangle Capital Corp. | | | | | 3,686 | | | | 70,476 | |
Virtus Investment Partners, Inc.* | | | | | 941 | | | | 71,525 | |
Walter Investment Management Corp. | | | | | 4,404 | | | | 90,326 | |
Westwood Holdings Group, Inc. | | | | | 1,025 | | | | 37,464 | |
| | | | | | | | | | |
| | | | | | | | | 3,650,932 | |
| | | | | | | | | | |
CHEMICALS – 2.0% | |
American Vanguard Corp. | | | | | 3,734 | | | | 49,812 | |
Balchem Corp. | | | | | 4,872 | | | | 197,511 | |
Calgon Carbon Corp.* | | | | | 9,550 | | | | 150,031 | |
Chase Corp. | | | | | 1,059 | | | | 14,720 | |
Chemtura Corp.* | | | | | 16,233 | | | | 184,082 | |
Ferro Corp.* | | | | | 14,940 | | | | 73,057 | |
Flotek Industries, Inc.* | | | | | 8,558 | | | | 85,238 | |
FutureFuel Corp. | | | | | 3,133 | | | | 38,912 | |
Georgia Gulf Corp.* | | | | | 5,717 | | | | 111,424 | |
H.B. Fuller Co. | | | | | 8,375 | | | | 193,546 | |
Hawkins, Inc. | | | | | 1,453 | | | | 53,558 | |
Innophos Holdings, Inc. | | | | | 3,677 | | | | 178,555 | |
Innospec, Inc.* | | | | | 4,004 | | | | 112,392 | |
KMG Chemicals, Inc. | | | | | 1,194 | | | | 20,620 | |
Koppers Holdings, Inc. | | | | | 3,481 | | | | 119,607 | |
Kraton Performance Polymers, Inc.* | | | | | 5,388 | | | | 109,376 | |
Landec Corp.* | | | | | 4,379 | | | | 24,172 | |
LSB Industries, Inc.* | | | | | 3,078 | | | | 86,276 | |
Minerals Technologies, Inc. | | | | | 3,077 | | | | 173,943 | |
NewMarket Corp. | | | | | 1,534 | | | | 303,901 | |
Olin Corp. | | | | | 13,435 | | | | 263,998 | |
OM Group, Inc.* | | | | | 5,236 | | | | 117,234 | |
See Notes to Financial Statements.
141
SC SM BLACKROCK SMALL CAP INDEX FUND
| | |
PORTFOLIOOF INVESTMENTS (Continued) December 31, 2011 | | Sun Capital Advisers Trust |
| | | | | | | | | | | | |
| | | Country
Code** | | | Shares | | | Value | |
| | | | | | | | | | | | |
| | | | | | | | | | | | |
Omnova Solutions, Inc.* | | | | | | | 7,853 | | | $ | 36,202 | |
PolyOne Corp. | | | | | | | 15,818 | | | | 182,698 | |
Quaker Chemical Corp. | | | | | | | 2,158 | | | | 83,925 | |
Schulman A, Inc. | | | | | | | 5,193 | | | | 109,988 | |
Senomyx, Inc.* | | | | | | | 6,631 | | | | 23,076 | |
Sensient Technologies Corp. | | | | | | | 8,448 | | | | 320,179 | |
Spartech Corp.* | | | | | | | 5,114 | | | | 24,189 | |
Stepan Co. | | | | | | | 1,364 | | | | 109,338 | |
TPC Group, Inc.* | | | | | | | 2,255 | | | | 52,609 | |
Tredegar Corp. | | | | | | | 4,027 | | | | 89,480 | |
Zep, Inc. | | | | | | | 3,766 | | | | 52,649 | |
Zoltek Cos., Inc.* | | | | | | | 4,691 | | | | 35,745 | |
| | | | | | | | | | | | |
| | | | | | | | | | | 3,782,043 | |
| | | | | | | | | | | | |
COMMERCIAL BANKS – 6.2% | |
1st Source Corp. | | | | | | | 2,610 | | | | 66,111 | |
1st United Bancorp, Inc.* | | | | | | | 4,661 | | | | 25,869 | |
Alliance Financial Corp. | | | | | | | 850 | | | | 26,248 | |
Ameris Bancorp* | | | | | | | 4,113 | | | | 42,282 | |
Ames National Corp. | | | | | | | 1,489 | | | | 29,035 | |
Arrow Financial Corp. | | | | | | | 1,716 | | | | 40,223 | |
Bancfirst Corp. | | | | | | | 1,127 | | | | 42,308 | |
Banco Latinoamericano de Comercio Exterior SA, Class E | | | PA | | | | 4,763 | | | | 76,446 | |
Bancorp Rhode Island, Inc. | | | | | | | 647 | | | | 25,686 | |
BancorpSouth, Inc. | | | | | | | 14,126 | | | | 155,669 | |
Bank of Kentucky Financial Corp. | | | | | | | 1,030 | | | | 20,651 | |
Bank of Marin Bancorp | | | | | | | 915 | | | | 34,395 | |
Bank of The Ozarks, Inc. | | | | | | | 4,799 | | | | 142,194 | |
Banner Corp. | | | | | | | 2,722 | | | | 46,682 | |
BBCN Bancorp, Inc.* | | | | | | | 12,616 | | | | 119,221 | |
Boston Private Financial Holdings, Inc. | | | | | | | 13,095 | | | | 103,974 | |
Bridge Bancorp, Inc. | | | | | | | 1,053 | | | | 20,955 | |
Bridge Capital Holdings* | | | | | | | 1,593 | | | | 16,567 | |
| | | | | | | | | | |
| | | Country
Code** | | Shares | | | Value | |
| | | | | | | | | | |
| | | | | | | | | | |
Bryn Mawr Bank Corp. | | | | | 1,887 | | | $ | 36,778 | |
Camden National Corp. | | | | | 1,250 | | | | 40,750 | |
Capital Bank Corp.* | | | | | 2,292 | | | | 4,607 | |
Capital City Bank Group, Inc. | | | | | 2,070 | | | | 19,768 | |
Cardinal Financial Corp. | | | | | 5,062 | | | | 54,366 | |
Cascade Bancorp* | | | | | 1,260 | | | | 5,519 | |
Cathay General Bancorp | | | | | 13,271 | | | | 198,136 | |
Center Bancorp, Inc. | | | | | 2,125 | | | | 20,761 | |
Centerstate Banks, Inc. | | | | | 5,224 | | | | 34,583 | |
Central Pacific Financial Corp.* | | | | | 2,582 | | | | 33,359 | |
Century Bancorp, Inc., Class A | | | | | 642 | | | | 18,130 | |
Chemical Financial Corp. | | | | | 4,627 | | | | 98,648 | |
Citizens & Northern Corp. | | | | | 2,137 | | | | 39,470 | |
City Holding Co. | | | | | 2,567 | | | | 86,996 | |
CNB Financial Corp. | | | | | 2,189 | | | | 34,542 | |
Cobiz Financial, Inc. | | | | | 5,762 | | | | 33,247 | |
Columbia Banking System, Inc. | | | | | 6,735 | | | | 129,783 | |
Community Banking Systems, Inc. | | | | | 6,238 | | | | 173,416 | |
Community Trust Bancorp, Inc. | | | | | 2,317 | | | | 68,166 | |
CVB Financial Corp. | | | | | 15,274 | | | | 153,198 | |
Eagle Bancorp, Inc.* | | | | | 2,763 | | | | 40,174 | |
Encore Bancshares, Inc.* | | | | | 1,501 | | | | 20,294 | |
Enterprise Bancorp, Inc. | | | | | 1,044 | | | | 14,929 | |
Enterprise Financial Services Corp. | | | | | 2,726 | | | | 40,345 | |
F.N.B. Corp. | | | | | 21,552 | | | | 243,753 | |
Financial Institutions, Inc. | | | | | 2,378 | | | | 38,381 | |
First Bancorp | | | | | 2,673 | | | | 29,804 | |
First Bancorp, Inc. | | | | | 1,561 | | | | 23,993 | |
First Busey Corp. | | | | | 13,276 | | | | 66,380 | |
First Commonwealth Financial Corp. | | | | | 17,983 | | | | 94,591 | |
See Notes to Financial Statements.
142
SC SM BLACKROCK SMALL CAP INDEX FUND
| | |
PORTFOLIOOF INVESTMENTS (Continued) December 31, 2011 | | Sun Capital Advisers Trust |
| | | | | | | | | | |
| | | Country
Code** | | Shares | | | Value | |
| | | | | | | | | | |
| | | | | | | | | | |
First Community Bancshares, Inc. | | | | | 2,778 | | | $ | 34,669 | |
First Connecticut Bancorp, Inc. | | | | | 3,068 | | | | 39,915 | |
First Financial Bancorp | | | | | 9,860 | | | | 164,070 | |
First Financial Bankshares, Inc. | | | | | 5,327 | | | | 178,082 | |
First Financial Corp. | | | | | 1,928 | | | | 64,164 | |
First Interstate BancSystem, Inc. | | | | | 2,709 | | | | 35,298 | |
First Merchants Corp. | | | | | 4,393 | | | | 37,209 | |
First Midwest Bancorp, Inc. | | | | | 12,728 | | | | 128,935 | |
FirstMerit Corp. | | | | | 18,540 | | | | 280,510 | |
German American Bancorp, Inc. | | | | | 2,153 | | | | 39,163 | |
Glacier Bancorp, Inc. | | | | | 12,157 | | | | 146,249 | |
Great Southern Bancorp, Inc. | | | | | 1,725 | | | | 40,693 | |
Hampton Roads Bankshares, Inc.* | | | | | 1,759 | | | | 4,820 | |
Hancock Holding Co. | | | | | 12,961 | | | | 414,363 | |
Hanmi Financial Corp.* | | | | | 5,282 | | | | 39,087 | |
Heartland Financial USA, Inc. | | | | | 2,272 | | | | 34,852 | |
Heritage Commerce Corp.* | | | | | 3,565 | | | | 16,898 | |
Heritage Financial Corp. | | | | | 2,661 | | | | 33,422 | |
Home Bancshares, Inc. | | | | | 3,841 | | | | 99,520 | |
Hudson Valley Holding Corp. | | | | | 2,623 | | | | 55,660 | |
IBERIABANK Corp. | | | | | 4,998 | | | | 246,401 | |
Independent Bank Corp. Massachusetts | | | | | 3,608 | | | | 98,462 | |
International Bancshares Corp. | | | | | 8,961 | | | | 164,300 | |
Investors Bancorp, Inc.* | | | | | 7,837 | | | | 105,643 | |
Lakeland Bancorp, Inc. | | | | | 3,837 | | | | 33,075 | |
Lakeland Financial Corp. | | | | | 2,766 | | | | 71,556 | |
| | | | | | | | | | | | |
| | | Country
Code** | | | Shares | | | Value | |
| | | | | | | | | | | | |
| | | | | | | | | | | | |
MainSource Financial Group, Inc. | | | | | | | 3,438 | | | $ | 30,358 | |
MB Financial, Inc. | | | | | | | 9,283 | | | | 158,739 | |
Merchants Bancshares, Inc. | | | | | | | 808 | | | | 23,594 | |
Metro Bancorp, Inc.* | | | | | | | 2,309 | | | | 19,349 | |
MidSouth Bancorp, Inc. | | | | | | | 1,373 | | | | 17,863 | |
National Bankshares, Inc. | | | | | | | 1,195 | | | | 33,364 | |
National Penn Bancshares, Inc. | | | | | | | 20,875 | | | | 176,185 | |
NBT Bancorp, Inc. | | | | | | | 5,829 | | | | 128,996 | |
Old National Bancorp | | | | | | | 16,024 | | | | 186,680 | |
OmniAmerican Bancorp, Inc.* | | | | | | | 1,987 | | | | 31,196 | |
Oriental Financial Group | | | PR | | | | 7,699 | | | | 93,235 | |
Orrstown Financial Services, Inc. | | | | | | | 1,291 | | | | 10,651 | |
Pacific Capital Bancorp* | | | | | | | 643 | | | | 18,158 | |
Pacific Continental Corp. | | | | | | | 3,275 | | | | 28,984 | |
PacWest Bancorp | | | | | | | 5,144 | | | | 97,479 | |
Park National Corp. | | | | | | | 2,180 | | | | 141,831 | |
Park Sterling Corp.* | | | | | | | 5,420 | | | | 22,114 | |
Penns Woods Bancorp, Inc. | | | | | | | 643 | | | | 24,936 | |
Peoples Bancorp, Inc. | | | | | | | 1,854 | | | | 27,458 | |
Pinnacle Financial Partners, Inc.* | | | | | | | 5,793 | | | | 93,557 | |
PrivateBancorp, Inc. | | | | | | | 10,132 | | | | 111,249 | |
Prosperity Bancshares, Inc. | | | | | | | 7,959 | | | | 321,146 | |
Renasant Corp. | | | | | | | 4,321 | | | | 64,815 | |
Republic Bancorp, Inc. | | | | | | | 1,736 | | | | 39,754 | |
S&T Bancorp, Inc. | | | | | | | 4,728 | | | | 92,432 | |
S.Y. Bancorp, Inc. | | | | | | | 2,093 | | | | 42,969 | |
Sandy Spring Bancorp, Inc. | | | | | | | 4,104 | | | | 72,025 | |
SCBT Financial Corp. | | | | | | | 2,414 | | | | 70,030 | |
Seacoast Banking Corp. of Florida* | | | | | | | 12,514 | | | | 19,021 | |
Sierra Bancorp | | | | | | | 2,135 | | | | 18,788 | |
Signature Bank* | | | | | | | 7,813 | | | | 468,702 | |
See Notes to Financial Statements.
143
SC SM BLACKROCK SMALL CAP INDEX FUND
| | |
PORTFOLIOOF INVESTMENTS (Continued) December 31, 2011 | | Sun Capital Advisers Trust |
| | | | | | | | | | |
| | | Country
Code** | | Shares | | | Value | |
| | | | | | | | | | |
| | | | | | | | | | |
Simmons First National Corp., Class A | | | | | 2,903 | | | $ | 78,933 | |
Southside Bancshares, Inc. | | | | | 2,841 | | | | 61,536 | |
Southwest Bancorp, Inc.* | | | | | 3,368 | | | | 20,073 | |
State Bancorp, Inc. | | | | | 2,611 | | | | 31,854 | |
State Bank Financial Corp.* | | | | | 5,399 | | | | 81,579 | |
Stellarone Corp. | | | | | 3,979 | | | | 45,281 | |
Sterling Bancorp | | | | | 5,143 | | | | 44,436 | |
Sterling Financial Corp.* | | | | | 4,543 | | | | 75,868 | |
Suffolk Bancorp* | | | | | 1,766 | | | | 19,055 | |
Sun Bancorp, Inc.* | | | | | 7,214 | | | | 17,458 | |
Susquehanna Bancshares, Inc. | | | | | 26,457 | | | | 221,710 | |
SVB Financial Group* | | | | | 7,269 | | | | 346,659 | |
Taylor Capital Group, Inc.* | | | | | 2,014 | | | | 19,576 | |
Texas Capital Bancshares, Inc* | | | | | 6,324 | | | | 193,578 | |
The Bancorp, Inc.* | | | | | 4,995 | | | | 36,114 | |
The First of Long Island Corp. | | | | | 1,321 | | | | 34,769 | |
Tompkins Financial Corp. | | | | | 1,343 | | | | 51,719 | |
Tower Bancorp, Inc. | | | | | 1,785 | | | | 50,944 | |
TowneBank | | | | | 4,241 | | | | 51,910 | |
Trico Bancshares | | | | | 2,404 | | | | 34,185 | |
Trustmark Corp. | | | | | 10,863 | | | | 263,862 | |
UMB Financial Corp. | | | | | 5,424 | | | | 202,044 | |
Umpqua Holdings Corp. | | | | | 19,383 | | | | 240,155 | |
Union First Market Bankshares Corp. | | | | | 3,536 | | | | 46,993 | |
United Bankshares, Inc. | | | | | 5,778 | | | | 163,344 | |
United Community Banks, Inc.* | | | | | 7,160 | | | | 50,048 | |
Univest Corp. of Pennsylvania | | | | | 2,768 | | | | 40,524 | |
Virginia Commerce Bancorp, Inc.* | | | | | 4,131 | | | | 31,933 | |
Washington Banking Co. | | | | | 2,748 | | | | 32,729 | |
Washington Trust Bancorp, Inc. | | | | | 2,433 | | | | 58,051 | |
| | | | | | | | | | |
| | | Country
Code** | | Shares | | | Value | |
| | | | | | | | | | |
| | | | | | | | | | |
Webster Financial Corp. | | | | | 12,178 | | | $ | 248,309 | |
WesBanco, Inc. | | | | | 3,983 | | | | 77,549 | |
West Bancorporation | | | | | 2,725 | | | | 26,105 | |
West Coast Bancorp* | | | | | 3,057 | | | | 47,689 | |
Westamerica Bancorporation | | | | | 4,904 | | | | 215,286 | |
Western Alliance Bancorp* | | | | | 11,775 | | | | 73,358 | |
Wilshire Bancorp, Inc.* | | | | | 10,133 | | | | 36,783 | |
Wintrust Financial Corp. | | | | | 5,903 | | | | 165,579 | |
| | | | | | | | | | |
| | | | | | | | | 11,761,635 | |
| | | | | | | | | | |
COMMERCIAL SERVICES & SUPPLIES – 2.6% | |
ABM Industries, Inc. | | | | | 8,950 | | | | 184,549 | |
Acco Brands Corp.* | | | | | 9,285 | | | | 89,600 | |
American Reprographics Co.* | | | | | 6,484 | | | | 29,762 | |
AT Cross Co.,
Class A* | | | | | 1,538 | | | | 17,349 | |
Casella Waste Systems, Inc., Class A* | | | | | 4,310 | | | | 27,584 | |
Cenveo, Inc.* | | | | | 9,378 | | | | 31,885 | |
Clean Harbors, Inc.* | | | | | 7,947 | | | | 506,462 | |
CompX International, Inc. | | | | | 143 | | | | 2,106 | |
Consolidated Graphics, Inc.* | | | | | 1,413 | | | | 68,220 | |
Courier Corp. | | | | | 1,737 | | | | 20,375 | |
Deluxe Corp. | | | | | 8,736 | | | | 198,831 | |
Encore Capital Group, Inc.* | | | | | 2,796 | | | | 59,443 | |
EnergySolutions, Inc.* | | | | | 13,761 | | | | 42,521 | |
Enernoc, Inc.* | | | | | 3,993 | | | | 43,404 | |
Ennis, Inc. | | | | | 4,472 | | | | 59,612 | |
Fuel Tech, Inc.* | | | | | 3,120 | | | | 20,530 | |
G&K Services, Inc. | | | | | 3,205 | | | | 93,298 | |
Geo Group, Inc.* | | | | | 10,946 | | | | 183,346 | |
Healthcare Services Group, Inc. | | | | | 11,221 | | | | 198,499 | |
Heritage-Crystal Clean, Inc.* | | | | | 778 | | | | 12,884 | |
Herman Miller, Inc. | | | | | 9,692 | | | | 178,817 | |
HNI Corp. | | | | | 7,572 | | | | 197,629 | |
See Notes to Financial Statements.
144
SC SM BLACKROCK SMALL CAP INDEX FUND
| | |
PORTFOLIOOF INVESTMENTS (Continued) December 31, 2011 | | Sun Capital Advisers Trust |
| | | | | | | | | | |
| | | Country
Code** | | Shares | | | Value | |
| | | | | | | | | | |
| | | | | | | | | | |
Innerworkings, Inc.* | | | | | 4,355 | | | $ | 40,545 | |
Interface, Inc. | | | | | 8,875 | | | | 102,418 | |
Intersections, Inc. | | | | | 1,565 | | | | 17,356 | |
Kimball International, Inc. | | | | | 5,256 | | | | 26,648 | |
Knoll, Inc. | | | | | 8,083 | | | | 120,033 | |
McGrath Rentcorp. | | | | | 4,102 | | | | 118,917 | |
Metalico, Inc.* | | | | | 6,555 | | | | 21,566 | |
Mine Safety Appliances Co. | | | | | 4,607 | | | | 152,584 | |
Mobile Mini, Inc.* | | | | | 6,187 | | | | 107,963 | |
Multi-Color Corp. | | | | | 1,921 | | | | 49,427 | |
NL Industries, Inc. | | | | | 1,107 | | | | 14,358 | |
Portfolio Recovery Associates, Inc.* | | | | | 2,916 | | | | 196,888 | |
Quad Graphics, Inc. | | | | | 4,345 | | | | 62,307 | |
Rollins, Inc. | | | | | 10,802 | | | | 240,020 | |
Schawk, Inc. | | | | | 1,994 | | | | 22,353 | |
Standard Parking Corp.* | | | | | 2,634 | | | | 47,070 | |
Steelcase, Inc., Class A | | | | | 13,382 | | | | 99,830 | |
Swisher Hygiene, Inc.* | | | | | 14,505 | | | | 54,249 | |
SYKES Enterprises, Inc.* | | | | | 6,685 | | | | 104,687 | |
Team, Inc.* | | | | | 3,268 | | | | 97,223 | |
Tetra Tech, Inc.* | | | | | 10,560 | | | | 227,990 | |
The Brink’s Co. | | | | | 7,908 | | | | 212,567 | |
TMS International Corp., Class A* | | | | | 2,201 | | | | 21,746 | |
TRC Companies, Inc.* | | | | | 3,039 | | | | 18,264 | |
UniFirst Corp. | | | | | 2,387 | | | | 135,438 | |
United Stationers, Inc. | | | | | 7,210 | | | | 234,758 | |
US Ecology, Inc. | | | | | 3,116 | | | | 58,518 | |
Viad Corp. | | | | | 3,497 | | | | 61,128 | |
WCA Waste Corp.* | | | | | 3,034 | | | | 19,751 | |
| | | | | | | | | | |
| | | | | | | | | 4,953,308 | |
| | | | | | | | | | |
COMMUNICATIONS EQUIPMENT – 2.1% | |
ADTRAN, Inc. | | | | | 10,969 | | | | 330,825 | |
Anaren, Inc.* | | | | | 2,587 | | | | 42,996 | |
Arris Group, Inc.* | | | | | 20,952 | | | | 226,701 | |
Aruba Networks, Inc.* | | | | | 14,436 | | | | 267,355 | |
Aviat Networks, Inc.* | | | | | 10,585 | | | | 19,370 | |
| | | | | | | | | | |
| | | Country
Code** | | Shares | | | Value | |
| | | | | | | | | | |
| | | | | | | | | | |
Bel Fuse, Inc., Class B | | | | | 1,768 | | | $ | 33,150 | |
Black Box Corp. | | | | | 3,007 | | | | 84,316 | |
Blue Coat Systems, Inc.* | | | | | 7,342 | | | | 186,854 | |
Calix, Inc.* | | | | | 6,387 | | | | 41,324 | |
Communications Systems, Inc. | | | | | 1,163 | | | | 16,352 | |
Comtech Telecommunications Corp. | | | | | 3,374 | | | | 96,564 | |
Dialogic, Inc.* | | | | | 2,474 | | | | 2,969 | |
Digi International, Inc.* | | | | | 4,349 | | | | 48,535 | |
Emcore Corp.* | | | | | 15,315 | | | | 13,206 | |
Emulex Corp.* | | | | | 14,793 | | | | 101,480 | |
Extreme Networks, Inc.* | | | | | 16,037 | | | | 46,828 | |
Finisar Corp.* | | | | | 15,174 | | | | 254,089 | |
Globecomm Systems, Inc.* | | | | | 3,838 | | | | 52,504 | |
Harmonic, Inc.* | | | | | 19,369 | | | | 97,620 | |
Infinera Corp.* | | | | | 17,614 | | | | 110,616 | |
Interdigital, Inc. | | | | | 7,684 | | | | 334,792 | |
Ixia* | | | | | 6,473 | | | | 68,031 | |
KVH Industries, Inc.* | | | | | 2,472 | | | | 19,232 | |
Loral Space & Communications, Inc.* | | | | | 1,840 | | | | 119,379 | |
Meru Networks, Inc.* | | | | | 1,862 | | | | 7,690 | |
NETGEAR, Inc.* | | | | | 6,192 | | | | 207,865 | |
NumereX Corp.* | | | | | 1,785 | | | | 14,690 | |
Oclaro, Inc.* | | | | | 8,491 | | | | 23,945 | |
Oplink Communications, Inc.* | | | | | 3,362 | | | | 55,372 | |
Opnext, Inc.* | | | | | 7,628 | | | | 6,162 | |
Orbcomm, Inc.* | | | | | 5,631 | | | | 16,837 | |
Plantronics, Inc. | | | | | 7,317 | | | | 260,778 | |
Powerwave Technologies, Inc.* | | | | | 5,639 | | | | 11,729 | |
Procera Networks, Inc.* | | | | | 2,458 | | | | 38,296 | |
Shoretel, Inc.* | | | | | 8,013 | | | | 51,123 | |
Sonus Networks, Inc.* | | | | | 35,418 | | | | 85,003 | |
See Notes to Financial Statements.
145
SC SM BLACKROCK SMALL CAP INDEX FUND
| | |
PORTFOLIOOF INVESTMENTS (Continued) December 31, 2011 | | Sun Capital Advisers Trust |
| | | | | | | | | | | | |
| | | Country
Code** | | | Shares | | | Value | |
| | | | | | | | | | | | |
| | | | | | | | | | | | |
Sycamore Networks, Inc.* | | | | | | | 3,316 | | | $ | 59,356 | |
Symmetricom, Inc.* | | | | | | | 7,271 | | | | 39,191 | |
Tekelec, Inc.* | | | | | | | 10,415 | | | | 113,836 | |
Ubiquiti Networks, Inc.* | | | | | | | 1,359 | | | | 24,774 | |
Viasat, Inc.* | | | | | | | 6,136 | | | | 282,992 | |
Westell Technologies, Inc., Class A* | | | | | | | 9,128 | | | | 20,264 | |
| | | | | | | | | | | | |
| | | | | | | | | | | 3,934,991 | |
| | | | | | | | | | | | |
COMPUTERS & PERIPHERALS – 0.6% | |
3d Systems Corp.* | | | | | | | 7,062 | | | | 101,693 | |
Avid Technology, Inc.* | | | | | | | 5,046 | | | | 43,042 | |
Cray, Inc.* | | | | | | | 6,083 | | | | 39,357 | |
Dot Hill Systems Corp.* | | | | | | | 9,598 | | | | 12,765 | |
Eletronics for Imaging, Inc.* | | | | | | | 7,831 | | | | 111,592 | |
Imation Corp.* | | | | | | | 5,188 | | | | 29,727 | |
Immersion Corp.* | | | | | | | 5,061 | | | | 26,216 | |
Intermec, Inc.* | | | | | | | 9,964 | | | | 68,353 | |
Intevac, Inc.* | | | | | | | 3,831 | | | | 28,349 | |
Novatel Wireless, Inc.* | | | | | | | 5,229 | | | | 16,367 | |
OCZ Technology Group, Inc.* | | | | | | | 8,832 | | | | 58,380 | |
Quantum Corp.* | | | | | | | 38,007 | | | | 91,217 | |
Rimage Corp. | | | | | | | 1,658 | | | | 18,652 | |
Silicon Graphics International Corp.* | | | | | | | 5,328 | | | | 61,059 | |
STEC, Inc.* | | | | | | | 6,123 | | | | 52,597 | |
Stratasys, Inc.* | | | | | | | 3,567 | | | | 108,472 | |
Super Micro Computer, Inc.* | | | | | | | 4,621 | | | | 72,457 | |
Synaptics, Inc.* | | | | | | | 5,438 | | | | 163,956 | |
Xyratex Ltd. | | | BM | | | | 4,884 | | | | 65,055 | |
| | | | | | | | | | | | |
| | | | | | | | | | | 1,169,306 | |
| | | | | | | | | | | | |
CONSTRUCTION & ENGINEERING – 0.8% | |
Aegion Corp.* | | | | | | | 6,663 | | | | 102,210 | |
Argan, Inc. | | | | | | | 1,330 | | | | 20,229 | |
Comfort Systems USA, Inc. | | | | | | | 6,561 | | | | 70,334 | |
Dycom Industries, Inc.* | | | | | | | 5,947 | | | | 124,411 | |
EMCOR Group, Inc. | | | | | | | 11,318 | | | | 303,436 | |
Furmanite Corp.* | | | | | | | 6,244 | | | | 39,400 | |
| | | | | | | | | | |
| | | Country
Code** | | Shares | | | Value | |
| | | | | | | | | | |
| | | | | | | | | | |
Granite Construction, Inc. | | | | | 6,526 | | | $ | 154,797 | |
Great Lakes Dredge & Dock Co. | | | | | 10,194 | | | | 56,679 | |
Layne Christensen Co.* | | | | | 3,284 | | | | 79,473 | |
Mastec, Inc.* | | | | | 9,592 | | | | 166,613 | |
Michael Baker Corp.* | | | | | 1,385 | | | | 27,160 | |
Myr Group, Inc.* | | | | | 3,435 | | | | 65,746 | |
Northwest Pipe Co.* | | | | | 1,619 | | | | 37,010 | |
Orion Marine Group, Inc.* | | | | | 4,514 | | | | 30,018 | |
Pike Electric Corp.* | | | | | 2,676 | | | | 19,240 | |
Primoris Services Corp. | | | | | 4,593 | | | | 68,574 | |
Sterling Construction Co., Inc.* | | | | | 2,737 | | | | 29,477 | |
Tutor Perini Corp.* | | | | | 5,377 | | | | 66,352 | |
UniTek Global Services, Inc.* | | | | | 1,703 | | | | 7,715 | |
| | | | | | | | | | |
| | | | | | | | | 1,468,874 | |
| | | | | | | | | | |
CONSTRUCTION MATERIALS – 0.2% | |
Eagle Materials, Inc. | | | | | 7,534 | | | | 193,323 | |
Headwaters, Inc.* | | | | | 10,452 | | | | 23,203 | |
Texas Industries, Inc. | | | | | 3,832 | | | | 117,949 | |
United States Lime & Minerals, Inc.* | | | | | 426 | | | | 25,607 | |
| | | | | | | | | | |
| | | | | | | | | 360,082 | |
| | | | | | | | | | |
CONSUMER FINANCE – 0.7% | |
Advance America Cash Advance Centers, Inc. | | | | | 9,387 | | | | 84,014 | |
Cash America International, Inc. | | | | | 5,015 | | | | 233,849 | |
Credit Acceptance Corp.* | | | | | 1,144 | | | | 94,128 | |
DFC Global Corp.* | | | | | 7,384 | | | | 133,355 | |
EZCORP, Inc., Class A* | | | | | 7,995 | | | | 210,828 | |
First Cash Financial Services, Inc.* | | | | | 5,337 | | | | 187,275 | |
Imperial Holdings, Inc.* | | | | | 3,095 | | | | 5,819 | |
Nelnet, Inc., Class A | | | | | 4,419 | | | | 108,133 | |
Netspend Holdings, Inc.* | | | | | 4,578 | | | | 37,128 | |
See Notes to Financial Statements.
146
SC SM BLACKROCK SMALL CAP INDEX FUND
| | |
PORTFOLIOOF INVESTMENTS (Continued) December 31, 2011 | | Sun Capital Advisers Trust |
| | | | | | | | | | | | |
| | | Country
Code** | | | Shares | | | Value | |
| | | | | | | | | | | | |
| | | | | | | | | | | | |
Nicholas Financial, Inc. | | | CA | | | | 1,804 | | | $ | 23,127 | |
The First Marblehead Corp.* | | | | | | | 9,399 | | | | 10,997 | |
World Acceptance Corp.* | | | | | | | 2,565 | | | | 188,528 | |
| | | | | | | | | | | | |
| | | | | | | | | | | 1,317,181 | |
| | | | | | | | | | | | |
CONTAINERS & PACKAGING – 0.2% | |
AEP Industries, Inc.* | | | | | | | 659 | | | | 18,551 | |
Boise, Inc. | | | | | | | 15,574 | | | | 110,887 | |
Graphic Packaging Holding Co.* | | | | | | | 27,025 | | | | 115,127 | |
Myers Industries, Inc. | | | | | | | 4,957 | | | | 61,169 | |
| | | | | | | | | | | | |
| | | | | | | | | | | 305,734 | |
| | | | | | | | | | | | |
DISTRIBUTORS – 0.2% | |
Core-Mark Holding Co., Inc. | | | | | | | 1,943 | | | | 76,943 | |
Pool Corp. | | | | | | | 8,150 | | | | 245,315 | |
VOXX International Corp.* | | | | | | | 3,114 | | | | 26,313 | |
Weyco Group, Inc. | | | | | | | 1,204 | | | | 29,558 | |
| | | | | | | | | | | | |
| | | | | | | | | | | 378,129 | |
| | | | | | | | | | | | |
DIVERSIFIED CONSUMER SERVICES – 1.2% | |
American Public Education, Inc.* | | | | | | | 3,001 | | | | 129,883 | |
Archipelago Learning, Inc.* | | | | | | | 2,179 | | | | 21,071 | |
Ascent Capital Group, Inc., Class A* | | | | | | | 2,411 | | | | 122,286 | |
Bridgepoint Education, Inc.* | | | | | | | 3,070 | | | | 70,610 | |
Cambium Learning Group, Inc.* | | | | | | | 2,737 | | | | 8,266 | |
Capella Education Co.* | | | | | | | 2,432 | | | | 87,674 | |
Coinstar, Inc.* | | | | | | | 5,306 | | | | 242,166 | |
Corinthian Colleges, Inc.* | | | | | | | 13,499 | | | | 29,293 | |
Grand Canyon Education, Inc.* | | | | | | | 4,924 | | | | 78,587 | |
Hillenbrand, Inc. | | | | | | | 10,647 | | | | 237,641 | |
K12, Inc.* | | | | | | | 4,350 | | | | 78,039 | |
Lincoln Educational Services Corp. | | | | | | | 3,859 | | | | 30,486 | |
Mac-Gray Corp. | | | | | | | 2,079 | | | | 28,670 | |
| | | | | | | | | | | | |
| | | Country
Code** | | | Shares | | | Value | |
| | | | | | | | | | | | |
| | | | | | | | | | | | |
Matthews International Corp. | | | | | | | 4,998 | | | $ | 157,087 | |
National American University Holdings, Inc. | | | | | | | 1,554 | | | | 11,779 | |
Regis Corp. | | | | | | | 9,748 | | | | 161,329 | |
School Specialty, Inc.* | | | | | | | 2,792 | | | | 6,980 | |
Sotheby’s | | | | | | | 11,459 | | | | 326,925 | |
Steiner Leisure Ltd.* | | | BS | | | | 2,535 | | | | 115,064 | |
Stewart Enterprises, Inc., Class A | | | | | | | 13,587 | | | | 78,261 | |
Strayer Education, Inc. | | | | | | | 2,070 | | | | 201,183 | |
Universal Technical Institute, Inc.* | | | | | | | 3,687 | | | | 47,120 | |
| | | | | | | | | | | | |
| | | | | | | | | | | 2,270,400 | |
| | | | | | | | | | | | |
DIVERSIFIED FINANCIAL SERVICES – 0.3% | |
California First National Bancorp | | | | | | | 397 | | | | 6,383 | |
Compass Diversified Holding | | | | | | | 6,818 | | | | 84,475 | |
Gain Capital Holdings, Inc. | | | | | | | 1,314 | | | | 8,804 | |
Marketaxess Holdings, Inc. | | | | | | | 4,858 | | | | 146,274 | |
Marlin Business Services Corp. | | | | | | | 1,534 | | | | 19,482 | |
Newstar Financial, Inc.* | | | | | | | 4,681 | | | | 47,606 | |
PHH Corp.* | | | | | | | 9,514 | | | | 101,800 | |
Pico Holdings, Inc.* | | | | | | | 3,824 | | | | 78,698 | |
| | | | | | | | | | | | |
| | | | | | | | | | | 493,522 | |
| | | | | | | | | | | | |
DIVERSIFIED TELECOMMUNICATION SERVICES – 0.7% | |
8x8, Inc.* | | | | | | | 10,657 | | | | 33,783 | |
AboveNet, Inc.* | | | | | | | 3,928 | | | | 255,359 | |
Alaska Communications Systems, Inc. | | | | | | | 7,677 | | | | 23,108 | |
Atlantic Tele-network, Inc. | | | | | | | 1,570 | | | | 61,308 | |
Boingo Wireless, Inc.* | | | | | | | 981 | | | | 8,437 | |
Cbeyond, Inc.* | | | | | | | 4,784 | | | | 38,320 | |
Cincinnati Bell, Inc.* | | | | | | | 33,599 | | | | 101,805 | |
Cogent Communications Group, Inc.* | | | | | | | 7,756 | | | | 130,999 | |
See Notes to Financial Statements.
147
SC SM BLACKROCK SMALL CAP INDEX FUND
| | |
PORTFOLIOOF INVESTMENTS (Continued) December 31, 2011 | | Sun Capital Advisers Trust |
| | | | | | | | | | |
| | | Country
Code** | | Shares | | | Value | |
| | | | | | | | | | |
| | | | | | | | | | |
Consolidated Communications Holdings, Inc. | | | | | 4,368 | | | $ | 83,210 | |
FairPoint Communications, Inc.* | | | | | 3,900 | | | | 16,887 | |
General Communication, Inc., Class A* | | | | | 7,132 | | | | 69,822 | |
Globalstar, Inc.* | | | | | 17,284 | | | | 9,333 | |
HickoryTech Corp. | | | | | 2,361 | | | | 26,160 | |
IDT Corp., Class B | | | | | 2,329 | | | | 21,846 | |
inContact, Inc.* | | | | | 5,248 | | | | 23,249 | |
Iridium Communications, Inc.* | | | | | 7,499 | | | | 57,817 | |
Lumos Networks Corp. | | | | | 2,556 | | | | 39,209 | |
Neutral Tandem, Inc.* | | | | | 5,408 | | | | 57,812 | |
Premiere Global Services, Inc.* | | | | | 8,994 | | | | 76,179 | |
SureWest Communications | | | | | 2,366 | | | | 28,463 | |
Towerstream Corp.* | | | | | 7,631 | | | | 16,025 | |
Vonage Holdings Corp.* | | | | | 23,811 | | | | 58,337 | |
| | | | | | | | | | |
| | | | | | | | | 1,237,468 | |
| | | | | | | | | | |
ELECTRIC UTILITIES – 1.6% | |
ALLETE, Inc. | | | | | 5,400 | | | | 226,692 | |
Central Vermont Public Service Corp. | | | | | 2,273 | | | | 79,782 | |
Cleco Corp. | | | | | 10,382 | | | | 395,554 | |
El Paso Electric Co. | | | | | 7,128 | | | | 246,914 | |
IDACORP, Inc. | | | | | 8,415 | | | | 356,880 | |
MGE Energy, Inc. | | | | | 3,911 | | | | 182,918 | |
Otter Tail Corp. | | | | | 6,048 | | | | 133,177 | |
PNM Resources, Inc. | | | | | 13,474 | | | | 245,631 | |
Portland General Electric Co. | | | | | 12,796 | | | | 323,611 | |
The Empire District Electric Co. | | | | | 7,046 | | | | 148,600 | |
UIL Holdings Corp. | | | | | 8,564 | | | | 302,909 | |
Unisource Energy Corp. | | | | | 6,213 | | | | 229,384 | |
Unitil Corp. | | | | | 1,822 | | | | 51,708 | |
| | | | | | | | | | |
| | | | | | | | | 2,923,760 | |
| | | | | | | | | | |
| | | | | | | | | | |
| | | Country
Code** | | Shares | | | Value | |
| | | | | | | | | | |
| | | | | | | | | | |
ELECTRICAL EQUIPMENT – 1.1% | |
A123 Systems, Inc.* | | | | | 14,414 | | | $ | 23,206 | |
Active Power, Inc.* | | | | | 13,697 | | | | 9,040 | |
Acuity Brands, Inc. | | | | | 7,334 | | | | 388,702 | |
American Superconductor Corp.* | | | | | 7,541 | | | | 27,826 | |
AZZ, Inc. | | | | | 2,103 | | | | 95,560 | |
Belden, Inc. | | | | | 8,012 | | | | 266,639 | |
Brady Corp., Class A | | | | | 7,974 | | | | 251,739 | |
Broadwind Energy, Inc.* | | | | | 23,142 | | | | 15,737 | |
Capstone Turbine Corp.* | | | | | 42,218 | | | | 48,973 | |
Coleman Cable, Inc.* | | | | | 1,408 | | | | 12,250 | |
Encore Wire Corp. | | | | | 3,176 | | | | 82,258 | |
EnerSys* | | | | | 8,070 | | | | 209,578 | |
Franklin Electric Co., Inc. | | | | | 3,929 | | | | 171,147 | |
FuelCell Energy, Inc.* | | | | | 19,681 | | | | 17,162 | |
Generac Holdings, Inc.* | | | | | 4,188 | | | | 117,390 | |
Global Power Equipment Group, Inc.* | | | | | 2,681 | | | | 63,674 | |
II-VI, Inc.* | | | | | 8,758 | | | | 160,797 | |
LSI Industries, Inc. | | | | | 3,267 | | | | 19,602 | |
Powell Industries, Inc.* | | | | | 1,504 | | | | 47,045 | |
Powersecure International, Inc.* | | | | | 3,149 | | | | 15,588 | |
Preformed Line Products Co. | | | | | 411 | | | | 24,520 | |
Satcon Technology Corp.* | | | | | 15,129 | | | | 9,079 | |
Thermon Group Holdings, Inc.* | | | | | 1,672 | | | | 29,461 | |
Valence Technology, Inc.* | | | | | 13,432 | | | | 13,163 | |
Vicor Corp. | | | | | 3,427 | | | | 27,279 | |
| | | | | | | | | | |
| | | | | | | | | 2,147,415 | |
| | | | | | | | | | |
ELECTRONIC EQUIPMENT, INSTRUMENTS & COMPONENTS – 2.5% | |
Aeroflex Holding Corp.* | | | | | 3,435 | | | | 35,174 | |
Agilysys, Inc.* | | | | | 3,093 | | | | 24,589 | |
See Notes to Financial Statements.
148
SC SM BLACKROCK SMALL CAP INDEX FUND
| | |
PORTFOLIOOF INVESTMENTS (Continued) December 31, 2011 | | Sun Capital Advisers Trust |
| | | | | | | | | | | | |
| | | Country
Code** | | | Shares | | | Value | |
| | | | | | | | | | | | |
| | | | | | | | | | | | |
Anixter International, Inc.* | | | | | | | 4,915 | | | $ | 293,131 | |
Badger Meter, Inc. | | | | | | | 2,526 | | | | 74,340 | |
Benchmark Electronics, Inc.* | | | | | | | 10,229 | | | | 137,785 | |
Brightpoint, Inc.* | | | | | | | 11,493 | | | | 123,665 | |
Checkpoint Systems, Inc.* | | | | | | | 6,731 | | | | 73,637 | |
Cognex Corp. | | | | | | | 7,024 | | | | 251,389 | |
Coherent, Inc.* | | | | | | | 3,955 | | | | 206,728 | |
CTS Corp. | | | | | | | 5,829 | | | | 53,627 | |
Daktronics, Inc. | | | | | | | 6,011 | | | | 57,525 | |
DDI Corp. | | | | | | | 2,550 | | | | 23,791 | |
DTS, Inc.* | | | | | | | 2,923 | | | | 79,623 | |
Echelon Corp.* | | | | | | | 5,923 | | | | 28,845 | |
Electro Rent Corp. | | | | | | | 3,196 | | | | 54,811 | |
Electro Scientific Industries, Inc.* | | | | | | | 3,847 | | | | 55,705 | |
eMagin Corp.* | | | | | | | 2,987 | | | | 11,052 | |
Fabrinet* | | | KY | | | | 3,477 | | | | 47,565 | |
FARO Technologies, Inc.* | | | | | | | 2,756 | | | | 126,776 | |
FEI Co.* | | | | | | | 6,556 | | | | 267,354 | |
Gerber Scientific, Inc. | | | | | | | 4,364 | | | | 44 | |
GSI Group, Inc.* | | | CA | | | | 4,465 | | | | 45,677 | |
Identive Group, Inc.* | | | | | | | 6,740 | | | | 15,030 | |
Insight Enterprises, Inc.* | | | | | | | 7,415 | | | | 113,375 | |
InvenSense, Inc.* | | | | | | | 1,711 | | | | 17,042 | |
KEMET Corp.* | | | | | | | 7,586 | | | | 53,481 | |
LeCroy Corp.* | | | | | | | 2,834 | | | | 23,834 | |
Littelfuse, Inc. | | | | | | | 3,845 | | | | 165,258 | |
Maxwell Technologies, Inc.* | | | | | | | 4,792 | | | | 77,822 | |
Measurement Specialties, Inc.* | | | | | | | 2,567 | | | | 71,773 | |
Mercury Computer Systems, Inc.* | | | | | | | 5,203 | | | | 69,148 | |
Methode Electronics, Inc. | | | | | | | 6,389 | | | | 52,965 | |
Microvision, Inc.* | | | | | | | 23,294 | | | | 8,388 | |
MTS Systems Corp. | | | | | | | 2,629 | | | | 107,132 | |
Multi Fineline Electronix, Inc.* | | | | | | | 1,507 | | | | 30,969 | |
NeoPhotonics Corp.* | | | | | | | 1,460 | | | | 6,687 | |
Newport Corp.* | | | | | | | 6,297 | | | | 85,702 | |
OSI Systems, Inc.* | | | | | | | 3,221 | | | | 157,120 | |
Park Electrochemical Corp. | | | | | | | 3,496 | | | | 89,568 | |
| | | | | | | | | | |
| | | Country
Code** | | Shares | | | Value | |
| | | | | | | | | | |
| | | | | | | | | | |
PC Connection, Inc. | | | | | 1,601 | | | $ | 17,755 | |
Plexus Corp.* | | | | | 6,005 | | | | 164,417 | |
Power-One, Inc.* | | | | | 11,590 | | | | 45,317 | |
Pulse Electronics Corp. | | | | | 6,943 | | | | 19,440 | |
RadiSys Corp.* | | | | | 3,058 | | | | 15,473 | |
Reald, Inc.* | | | | | 7,075 | | | | 56,175 | |
Richardson Electronics Ltd. | | | | | 2,436 | | | | 29,938 | |
Rofin-Sinar Technologies, Inc.* | | | | | 4,803 | | | | 109,749 | |
Rogers Corp.* | | | | | 2,690 | | | | 99,153 | |
Sanmina-SCI Corp.* | | | | | 13,558 | | | | 126,225 | |
ScanSource, Inc.* | | | | | 4,551 | | | | 163,836 | |
SYNNEX Corp.* | | | | | 4,223 | | | | 128,633 | |
TTM Technologies, Inc.* | | | | | 8,752 | | | | 95,922 | |
Universal Display Corp.* | | | | | 6,508 | | | | 238,779 | |
Viasystems Group, Inc.* | | | | | 458 | | | | 7,749 | |
Vishay Precision Group, Inc.* | | | | | 2,111 | | | | 33,734 | |
X-Rite, Inc.* | | | | | 4,431 | | | | 20,560 | |
Zygo Corp.* | | | | | 2,715 | | | | 47,920 | |
| | | | | | | | | | |
| | | | | | | | | 4,638,902 | |
| | | | | | | | | | |
ENERGY EQUIPMENT & SERVICES – 2.1% | |
Basic Energy Services, Inc.* | | | | | 4,135 | | | | 81,459 | |
Bristow Group, Inc. | | | | | 6,138 | | | | 290,880 | |
C&J Energy Services, Inc.* | | | | | 2,068 | | | | 43,283 | |
Cal Dive International, Inc.* | | | | | 16,372 | | | | 36,837 | |
Complete Production Services, Inc.* | | | | | 13,367 | | | | 448,597 | |
Dawson Geophysical Co.* | | | | | 1,306 | | | | 51,626 | |
Dril-Quip, Inc.* | | | | | 5,817 | | | | 382,875 | |
Exterran Holdings, Inc.* | | | | | 10,623 | | | | 96,669 | |
Geokinetics, Inc.* | | | | | 1,786 | | | | 3,840 | |
Global Geophysical Services, Inc.* | | | | | 3,129 | | | | 21,027 | |
Gulf Island Fabrication, Inc. | | | | | 2,465 | | | | 72,003 | |
Gulfmark Offshore, Inc., Class A* | | | | | 4,001 | | | | 168,082 | |
See Notes to Financial Statements.
149
SC SM BLACKROCK SMALL CAP INDEX FUND
| | |
PORTFOLIOOF INVESTMENTS (Continued) December 31, 2011 | | Sun Capital Advisers Trust |
| | | | | | | | | | | | |
| | | Country
Code** | | | Shares | | | Value | |
| | | | | | | | | | | | |
| | | | | | | | | | | | |
Helix Energy Solutions Group, Inc.* | | | | | | | 17,933 | | | $ | 283,341 | |
Hercules Offshore, Inc.* | | | | | | | 19,735 | | | | 87,623 | |
Hornbeck Offshore Services, Inc.* | | | | | | | 5,130 | | | | 159,133 | |
Ion Geophysical Corp.* | | | | | | | 22,234 | | | | 136,294 | |
Key Energy Services, Inc.* | | | | | | | 21,129 | | | | 326,866 | |
Lufkin Industries, Inc. | | | | | | | 5,155 | | | | 346,983 | |
Matrix Service Co.* | | | | | | | 4,540 | | | | 42,858 | |
Mitcham Industries, Inc.* | | | | | | | 2,011 | | | | 43,920 | |
Natural Gas Services Group, Inc.* | | | | | | | 2,063 | | | | 29,831 | |
Newpark Resources* | | | | | | | 15,274 | | | | 145,103 | |
OYO Geospace Corp.* | | | | | | | 747 | | | | 57,766 | |
Parker Drilling Co.* | | | | | | | 19,691 | | | | 141,184 | |
Phi, Inc.* | | | | | | | 2,193 | | | | 54,496 | |
Pioneer Drilling Co.* | | | | | | | 10,360 | | | | 100,285 | |
RigNet, Inc.* | | | | | | | 964 | | | | 16,137 | |
Tesco Corp.* | | | CA | | | | 5,191 | | | | 65,614 | |
TETRA Technologies, Inc.* | | | | | | | 12,958 | | | | 121,028 | |
Union Drilling, Inc.* | | | | | | | 2,598 | | | | 16,212 | |
Vantage Drilling Co.* | | | KY | | | | 29,988 | | | | 34,786 | |
Willbros Group, Inc.* | | | | | | | 6,493 | | | | 23,829 | |
| | | | | | | | | | | | |
| | | | | | | | | | | 3,930,467 | |
| | | | | | | | | | | | |
FOOD & STAPLES RETAILING – 1.2% | |
Arden Group, Inc., Class A | | | | | | | 206 | | | | 18,542 | |
Casey’s General Stores, Inc. | | | | | | | 6,419 | | | | 330,643 | |
Chefs’ Warehouse Holdings, LLC* | | | | | | | 1,725 | | | | 30,808 | |
Ingles Markets, Inc. | | | | | | | 2,208 | | | | 33,252 | |
Nash Finch Co. | | | | | | | 2,064 | | | | 60,434 | |
PriceSmart, Inc. | | | | | | | 3,013 | | | | 209,675 | |
Rite Aid Corp.* | | | | | | | 99,233 | | | | 125,034 | |
Ruddick Corp. | | | | | | | 8,298 | | | | 353,827 | |
Spartan Stores, Inc. | | | | | | | 3,881 | | | | 71,798 | |
Susser Holdings Corp.* | | | | | | | 1,558 | | | | 35,242 | |
The Andersons, Inc. | | | | | | | 3,130 | | | | 136,656 | |
| | | | | | | | | | | | |
| | | Country
Code** | | | Shares | | | Value | |
| | | | | | | | | | | | |
| | | | | | | | | | | | |
The Fresh Market, Inc.* | | | | | | | 4,777 | | | $ | 190,602 | |
The Pantry, Inc.* | | | | | | | 3,930 | | | | 47,042 | |
United Natural Foods, Inc.* | | | | | | | 8,169 | | | | 326,842 | |
Village Super Market, Inc. | | | | | | | 1,036 | | | | 29,474 | |
Weis Markets, Inc. | | | | | | | 1,850 | | | | 73,889 | |
Winn-Dixie Stores, Inc.* | | | | | | | 9,536 | | | | 89,448 | |
| | | | | | | | | | | | |
| | | | | | | | | | | 2,163,208 | |
| | | | | | | | | | | | |
FOOD PRODUCTS – 1.4% | |
Alico, Inc. | | | | | | | 606 | | | | 11,738 | |
B&G Foods, Inc. | | | | | | | 8,098 | | | | 194,919 | |
Cal-Maine Foods, Inc. | | | | | | | 2,377 | | | | 86,927 | |
Calavo Growers, Inc. | | | | | | | 2,025 | | | | 52,002 | |
Chiquita Brands International, Inc.* | | | | | | | 7,794 | | | | 65,002 | |
Darling International, Inc.* | | | | | | | 19,817 | | | | 263,368 | |
Diamond Foods, Inc. | | | | | | | 3,692 | | | | 119,141 | |
Dole Food Co., Inc.* | | | | | | | 6,122 | | | | 52,955 | |
Farmer Brothers Co. | | | | | | | 1,238 | | | | 9,458 | |
Fresh Del Monte Produce, Inc. | | | KY | | | | 6,160 | | | | 154,062 | |
Griffin Land & Nurseries, Inc. | | | | | | | 414 | | | | 10,955 | |
Hain Celestial Group, Inc.* | | | | | | | 6,055 | | | | 221,976 | |
Imperial Sugar Co. | | | | | | | 2,291 | | | | 8,179 | |
J & J Snack Foods Corp. | | | | | | | 2,411 | | | | 128,458 | |
Lancaster Colony Corp. | | | | | | | 3,182 | | | | 220,640 | |
Lifeway Foods, Inc.* | | | | | | | 802 | | | | 7,731 | |
Limoneira Co. | | | | | | | 1,322 | | | | 22,355 | |
Omega Protein Corp.* | | | | | | | 3,423 | | | | 24,406 | |
Pilgrim’s Pride Corp.* | | | | | | | 8,514 | | | | 49,041 | |
Sanderson Farms, Inc. | | | | | | | 3,734 | | | | 187,185 | |
Seneca Foods Corp.* | | | | | | | 1,554 | | | | 40,124 | |
Smart Balance, Inc.* | | | | | | | 10,092 | | | | 54,093 | |
Snyders-Lance, Inc. | | | | | | | 7,980 | | | | 179,550 | |
See Notes to Financial Statements.
150
SC SM BLACKROCK SMALL CAP INDEX FUND
| | |
PORTFOLIOOF INVESTMENTS (Continued) December 31, 2011 | | Sun Capital Advisers Trust |
| | | | | | | | | | |
| | | Country
Code** | | Shares | | | Value | |
| | | | | | | | | | |
| | | | | | | | | | |
Tootsie Roll Industries, Inc. | | | | | 4,034 | | | $ | 95,485 | |
TreeHouse Foods, Inc.* | | | | | 6,009 | | | | 392,868 | |
| | | | | | | | | | |
| | | | | | | | | 2,652,618 | |
| | | | | | | | | | |
GAS UTILITIES – 1.2% | |
Chesapeake Utilities Corp. | | | | | 1,603 | | | | 69,490 | |
New Jersey Resources Corp. | | | | | 7,015 | | | | 345,138 | |
Northwest Natural Gas Co. | | | | | 4,493 | | | | 215,349 | |
Piedmont Natural Gas Co. | | | | | 12,121 | | | | 411,872 | |
South Jersey Industries, Inc. | | | | | 5,112 | | | | 290,413 | |
Southwest Gas Corp. | | | | | 7,779 | | | | 330,530 | |
The Laclede Group, Inc. | | | | | 3,795 | | | | 153,584 | |
WGL Holdings, Inc. | | | | | 8,648 | | | | 382,414 | |
| | | | | | | | | | |
| | | | | | | | | 2,198,790 | |
| | | | | | | | | | |
HEALTH CARE EQUIPMENT & SUPPLIES – 3.0% | |
Abaxis, Inc.* | | | | | 3,797 | | | | 105,063 | |
ABIOMED, Inc.* | | | | | 5,334 | | | | 98,519 | |
Accuray, Inc.* | | | | | 11,678 | | | | 49,398 | |
Align Technology, Inc.* | | | | | 10,392 | | | | 246,550 | |
Alphatec Holdings, Inc.* | | | | | 9,306 | | | | 16,006 | |
Analogic Corp. | | | | | 2,114 | | | | 121,175 | |
Angiodynamics, Inc.* | | | | | 4,287 | | | | 63,491 | |
Antares Pharma, Inc.* | | | | | 15,074 | | | | 33,163 | |
Arthrocare Corp.* | | | | | 4,608 | | | | 145,981 | |
AtriCure, Inc.* | | | | | 2,389 | | | | 26,518 | |
Atrion Corp. | | | | | 267 | | | | 64,141 | |
Bacterin International Holdings, Inc.* | | | | | 4,415 | | | | 12,627 | |
BioLase Technology, Inc.* | | | | | 5,142 | | | | 13,215 | |
Cantel Medical Corp. | | | | | 2,265 | | | | 63,261 | |
Cardiovascular Systems, Inc.* | | | | | 2,480 | | | | 24,428 | |
Cerus Corp.* | | | | | 8,163 | | | | 22,856 | |
Conceptus, Inc.* | | | | | 5,216 | | | | 65,930 | |
| | | | | | | | | | | | |
| | | Country
Code** | | | Shares | | | Value | |
| | | | | | | | | | | | |
| | | | | | | | | | | | |
Conmed Corp.* | | | | | | | 4,771 | | | $ | 122,472 | |
Cryolife, Inc.* | | | | | | | 4,621 | | | | 22,181 | |
Cyberonics, Inc.* | | | | | | | 4,779 | | | | 160,097 | |
Cynosure, Inc.,
Class A* | | | | | | | 1,571 | | | | 18,475 | |
Delcath Systems, Inc.* | | | | | | | 8,580 | | | | 26,169 | |
Dexcom, Inc.* | | | | | | | 11,276 | | | | 104,980 | |
Dynavox, Inc.,
Class A* | | | | | | | 1,495 | | | | 5,442 | |
Endologix, Inc.* | | | | | | | 8,213 | | | | 94,285 | |
Exactech, Inc.* | | | | | | | 1,457 | | | | 23,997 | |
Greatbatch, Inc.* | | | | | | | 4,000 | | | | 88,400 | |
Haemonetics Corp.* | | | | | | | 4,353 | | | | 266,491 | |
Hansen Medical, Inc.* | | | | | | | 8,088 | | | | 20,867 | |
Heartware International, Inc.* | | | | | | | 2,012 | | | | 138,828 | |
ICU Medical, Inc.* | | | | | | | 2,038 | | | | 91,710 | |
Insulet Corp.* | | | | | | | 7,726 | | | | 145,481 | |
Integra Lifesciences Holdings Corp.* | | | | | | | 3,302 | | | | 101,801 | |
Invacare Corp. | | | | | | | 4,924 | | | | 75,288 | |
Iris International, Inc.* | | | | | | | 3,021 | | | | 28,246 | |
Kensey Nash Corp.* | | | | | | | 1,422 | | | | 27,288 | |
Mako Surgical Corp.* | | | | | | | 5,389 | | | | 135,857 | |
Masimo Corp.* | | | | | | | 8,881 | | | | 165,942 | |
Medical Action Industries, Inc.* | | | | | | | 2,689 | | | | 14,063 | |
Meridian Bioscience, Inc. | | | | | | | 6,927 | | | | 130,505 | |
Merit Medical Systems, Inc.* | | | | | | | 7,059 | | | | 94,449 | |
Natus Med, Inc.* | | | | | | | 4,938 | | | | 46,565 | |
Neogen Corp.* | | | | | | | 3,914 | | | | 119,925 | |
Neoprobe Corp.* | | | | | | | 16,007 | | | | 41,938 | |
NuVasive, Inc.* | | | | | | | 7,149 | | | | 90,006 | |
Nxstage Medical, Inc.* | | | | | | | 7,531 | | | | 133,901 | |
OraSure Technologies, Inc.* | | | | | | | 8,024 | | | | 73,099 | |
Orthofix International NV* | | | AN | | | | 3,030 | | | | 106,747 | |
Palomar Medical Technologies, Inc.* | | | | | | | 3,170 | | | | 29,481 | |
Quidel Corp.* | | | | | | | 4,888 | | | | 73,955 | |
See Notes to Financial Statements.
151
SC SM BLACKROCK SMALL CAP INDEX FUND
| | |
PORTFOLIOOF INVESTMENTS (Continued) December 31, 2011 | | Sun Capital Advisers Trust |
| | | | | | | | | | | | |
| | | Country
Code** | | | Shares | | | Value | |
| | | | | | | | | | | | |
| | | | | | | | | | | | |
Rockwell Medical Technologies, Inc.* | | | | | | | 2,623 | | | $ | 22,217 | |
RTI Biologics, Inc.* | | | | | | | 9,435 | | | | 41,891 | |
Solta Medical, Inc.* | | | | | | | 10,342 | | | | 32,474 | |
Sonosite, Inc.* | | | | | | | 2,351 | | | | 126,625 | |
Spectranetics Corp.* | | | | | | | 5,635 | | | | 40,685 | |
Staar Surgical Co.* | | | | | | | 6,112 | | | | 64,115 | |
Stereotaxis, Inc.* | | | | | | | 7,572 | | | | 6,236 | |
STERIS Corp. | | | | | | | 10,057 | | | | 299,900 | |
Surmodics, Inc.* | | | | | | | 2,602 | | | | 38,145 | |
Symmetry Medical, Inc.* | | | | | | | 6,164 | | | | 49,250 | |
Synergetics USA, Inc.* | | | | | | | 3,723 | | | | 27,476 | |
Synovis Life Technologies, Inc.* | | | | | | | 1,923 | | | | 53,517 | |
Tornier NV* | | | NL | | | | 1,830 | | | | 32,940 | |
Unilife Corp.* | | | | | | | 10,586 | | | | 33,028 | |
Uroplasty, Inc.* | | | | | | | 3,560 | | | | 15,130 | |
Vascular Solutions, Inc.* | | | | | | | 2,822 | | | | 31,409 | |
Volcano Corp.* | | | | | | | 8,800 | | | | 209,352 | |
West Pharmaceutical Services, Inc. | | | | | | | 5,678 | | | | 215,480 | |
Wright Medical Group, Inc.* | | | | | | | 6,560 | | | | 108,240 | |
Young Innovations, Inc. | | | | | | | 957 | | | | 28,356 | |
Zeltiq Aesthetics, Inc.* | | | | | | | 1,126 | | | | 12,791 | |
Zoll Medical Corp.* | | | | | | | 3,706 | | | | 234,145 | |
| | | | | | | | | | | | |
| | | | | | | | | | | 5,714,655 | |
| | | | | | | | | | | | |
HEALTH CARE PROVIDERS & SERVICES – 3.0% | |
Accretive Health, Inc.* | | | | | | | 6,761 | | | | 155,368 | |
Air Methods Corp.* | | | | | | | 1,914 | | | | 161,637 | |
Alliance Healthcare Services, Inc.* | | | | | | | 3,866 | | | | 4,871 | |
Almost Family, Inc.* | | | | | | | 1,446 | | | | 23,975 | |
Amedisys, Inc.* | | | | | | | 5,040 | | | | 54,986 | |
American Dental Partners, Inc.* | | | | | | | 2,631 | | | | 49,542 | |
AMN Healthcare Services, Inc.* | | | | | | | 6,858 | | | | 30,381 | |
AmSurg Corp.* | | | | | | | 5,273 | | | | 137,309 | |
| | | | | | | | | | |
| | | Country
Code** | | Shares | | | Value | |
| | | | | | | | | | |
| | | | | | | | | | |
Assisted Living Concepts, Inc., Class A | | | | | 3,311 | | | $ | 49,301 | |
Bio-Reference Labs, Inc.* | | | | | 4,198 | | | | 68,301 | |
Bioscrip, Inc.* | | | | | 6,728 | | | | 36,735 | |
Capital Senior Living Corp.* | | | | | 4,641 | | | | 36,850 | |
CardioNet, Inc.* | | | | | 4,021 | | | | 9,530 | |
Centene Corp.* | | | | | 8,475 | | | | 335,525 | |
Chemed Corp. | | | | | 3,361 | | | | 172,117 | |
Chindex International, Inc.* | | | | | 1,854 | | | | 15,796 | |
Corvel Corp.* | | | | | 1,102 | | | | 56,984 | |
Cross Country Healthcare, Inc.* | | | | | 4,693 | | | | 26,046 | |
Emeritus Corp.* | | | | | 5,117 | | | | 89,599 | |
ExamWorks Group, Inc.* | | | | | 4,553 | | | | 43,162 | |
Five Star Quality Care, Inc.* | | | | | 7,507 | | | | 22,521 | |
Gentiva Health Services, Inc.* | | | | | 5,189 | | | | 35,026 | |
Hanger Orthopedic Group, Inc.* | | | | | 5,631 | | | | 105,243 | |
HEALTHSOUTH Corp.* | | | | | 16,127 | | | | 284,964 | |
Healthspring, Inc.* | | | | | 11,481 | | | | 626,174 | |
Healthways, Inc.* | | | | | 5,736 | | | | 39,349 | |
HMS Holdings Corp.* | | | | | 14,348 | | | | 458,849 | |
IPC The Hospitalist Co.* | | | | | 2,749 | | | | 125,684 | |
Kindred Healthcare, Inc.* | | | | | 8,749 | | | | 102,976 | |
Landauer, Inc. | | | | | 1,575 | | | | 81,113 | |
LHC Group, Inc.* | | | | | 2,676 | | | | 34,333 | |
Magellan Health Services, Inc.* | | | | | 4,801 | | | | 237,505 | |
MedQuist Holdings, Inc.* | | | | | 5,654 | | | | 54,391 | |
Metropolitan Health Networks, Inc.* | | | | | 7,291 | | | | 54,464 | |
Molina Healthcare, Inc.* | | | | | 4,722 | | | | 105,442 | |
MWI Veterinary Supply, Inc.* | | | | | 2,117 | | | | 140,654 | |
National Healthcare Corp. | | | | | 1,714 | | | | 71,817 | |
See Notes to Financial Statements.
152
SC SM BLACKROCK SMALL CAP INDEX FUND
| | |
PORTFOLIOOF INVESTMENTS (Continued) December 31, 2011 | | Sun Capital Advisers Trust |
| | | | | | | | | | | | |
| | | Country
Code** | | | Shares | | | Value | |
| | | | | | | | | | | | |
| | | | | | | | | | | | |
National Research Corp. | | | | | | | 328 | | | $ | 12,730 | |
Owens & Minor, Inc. | | | | | | | 10,801 | | | | 300,160 | |
Pharmerica Corp.* | | | | | | | 5,021 | | | | 76,219 | |
Providence Service Corp.* | | | | | | | 2,200 | | | | 30,272 | |
PSS World Medical, Inc.* | | | | | | | 9,386 | | | | 227,047 | |
RadNet, Inc.* | | | | | | | 5,201 | | | | 11,078 | |
Select Medical Holdings Corp.* | | | | | | | 7,492 | | | | 63,532 | |
Skilled Healthcare Group, Inc., Class A* | | | | | | | 3,357 | | | | 18,329 | |
Sun Healthcare Group, Inc.* | | | | | | | 4,098 | | | | 15,900 | |
Sunrise Senior Living, Inc.* | | | | | | | 9,807 | | | | 63,549 | |
Team Health Holdings, Inc.* | | | | | | | 4,475 | | | | 98,763 | |
The Ensign Group, Inc. | | | | | | | 2,796 | | | | 68,502 | |
Triple-S Management Corp., Class B* | | | PR | | | | 3,369 | | | | 67,447 | |
U.S. Physical Therapy, Inc. | | | | | | | 1,979 | | | | 38,947 | |
Universal American Corp. | | | | | | | 5,548 | | | | 70,515 | |
Vanguard Health Systems, Inc.* | | | | | | | 5,100 | | | | 52,122 | |
WellCare Health Plans, Inc.* | | | | | | | 7,209 | | | | 378,473 | |
| | | | | | | | | | | | |
| | | | | | | | | | | 5,732,105 | |
| | | | | | | | | | | | |
HEALTH CARE TECHNOLOGY – 0.5% | |
athenahealth, Inc.* | | | | | | | 5,894 | | | | 289,513 | |
Computer Programs and Systems, Inc. | | | | | | | 1,858 | | | | 94,962 | |
ePocrates, Inc.* | | | | | | | 1,095 | | | | 8,541 | |
HealthStream, Inc.* | | | | | | | 2,941 | | | | 54,262 | |
MedAssets, Inc.* | | | | | | | 7,955 | | | | 73,584 | |
Medidata Solutions, Inc.* | | | | | | | 3,606 | | | | 78,431 | |
Merge Healthcare, Inc.* | | | | | | | 9,345 | | | | 45,323 | |
Omnicell, Inc.* | | | | | | | 5,557 | | | | 91,802 | |
| | | | | | | | | | |
| | | Country
Code** | | Shares | | | Value | |
| | | | | | | | | | |
| | | | | | | | | | |
Quality Systems, Inc. | | | | | 6,566 | | | $ | 242,876 | |
Transcend Services, Inc.* | | | | | 1,466 | | | | 34,788 | |
| | | | | | | | | | |
| | | | | | | | | 1,014,082 | |
| | | | | | | | | | |
HOTELS, RESTAURANTS & LEISURE – 2.8% | |
AFC Enterprises, Inc.* | | | | | 4,279 | | | | 62,901 | |
Ambassadors Group, Inc. | | | | | 3,004 | | | | 13,548 | |
Ameristar Casinos, Inc. | | | | | 5,506 | | | | 95,199 | |
Benihana, Inc.* | | | | | 2,376 | | | | 24,306 | |
Biglari Holdings, Inc.* | | | | | 203 | | | | 74,753 | |
BJ’s Restaurants, Inc.* | | | | | 4,070 | | | | 184,452 | |
Bob Evans Farms, Inc. | | | | | 5,119 | | | | 171,691 | |
Boyd Gaming Corp.* | | | | | 9,325 | | | | 69,565 | |
Bravo Brio Restaurant Group, Inc.* | | | | | 3,300 | | | | 56,595 | |
Buffalo Wild Wings, Inc.* | | | | | 3,099 | | | | 209,214 | |
Caribou Coffee Co., Inc.* | | | | | 2,220 | | | | 30,969 | |
Carrols Restaurant Group, Inc.* | | | | | 2,094 | | | | 24,228 | |
CEC Entertainment, Inc. | | | | | 3,348 | | | | 115,339 | |
Churchill Downs, Inc. | | | | | 2,110 | | | | 109,994 | |
Cracker Barrel Old Country Store, Inc. | | | | | 3,874 | | | | 195,288 | |
Dennys Corp.* | | | | | 17,087 | | | | 64,247 | |
DineEquity, Inc.* | | | | | 2,607 | | | | 110,041 | |
Domino’s Pizza, Inc.* | | | | | 9,860 | | | | 334,747 | |
Einstein Noah Restaurant Group, Inc. | | | | | 981 | | | | 15,519 | |
Gaylord Entertainment Co.* | | | | | 6,064 | | | | 146,385 | |
International Speedway Corp., Class A | | | | | 4,971 | | | | 126,015 | |
Interval Leisure Group, Inc.* | | | | | 6,773 | | | | 92,181 | |
See Notes to Financial Statements.
153
SC SM BLACKROCK SMALL CAP INDEX FUND
| | |
PORTFOLIOOF INVESTMENTS (Continued) December 31, 2011 | | Sun Capital Advisers Trust |
| | | | | | | | | | | | |
| | | Country
Code** | | | Shares | | | Value | |
| | | | | | | | | | | | |
| | | | | | | | | | | | |
Isle of Capri Casinos, Inc.* | | | | | | | 3,481 | | | $ | 16,256 | |
Jack In The Box, Inc.* | | | | | | | 7,446 | | | | 155,621 | |
Jamba, Inc.* | | | | | | | 10,638 | | | | 13,936 | |
Krispy Kreme Doughnuts, Inc.* | | | | | | | 10,069 | | | | 65,851 | |
Life Time Fitness, Inc.* | | | | | | | 7,161 | | | | 334,777 | |
Luby’s, Inc.* | | | | | | | 3,182 | | | | 14,351 | |
Marcus Corp. | | | | | | | 3,428 | | | | 43,227 | |
McCormick & Schmicks Seafood Restaurants, Inc.* | | | | | | | 2,247 | | | | 19,639 | |
Monarch Casino & Resort, Inc.* | | | | | | | 1,544 | | | | 15,733 | |
Morgans Hotel Group* | | | | | | | 3,567 | | | | 21,045 | |
Multimedia Games Holding Company, Inc.* | | | | | | | 4,470 | | | | 35,492 | |
O’Charley’s, Inc.* | | | | | | | 3,044 | | | | 16,712 | |
Orient-Express Hotels Ltd.* | | | BM | | | | 16,228 | | | | 121,223 | |
P.F. Chang’s China Bistro, Inc. | | | | | | | 3,609 | | | | 111,554 | |
Papa John’s International, Inc.* | | | | | | | 3,136 | | | | 118,164 | |
Peet’s Coffee & Tea, Inc.* | | | | | | | 2,162 | | | | 135,514 | |
Pinnacle Entertainment, Inc.* | | | | | | | 10,545 | | | | 107,137 | |
Red Lion Hotels Corp.* | | | | | | | 2,528 | | | | 17,519 | |
Red Robin Gourmet Burgers, Inc.* | | | | | | | 2,225 | | | | 61,633 | |
Ruby Tuesday, Inc.* | | | | | | | 10,954 | | | | 75,583 | |
Ruth’s Chris Steak House, Inc.* | | | | | | | 5,877 | | | | 29,209 | |
Scientific Games Corp., Class A* | | | | | | | 9,750 | | | | 94,575 | |
Shuffle Master, Inc.* | | | | | | | 9,110 | | | | 106,769 | |
Six Flags Entertainment Corp. | | | | | | | 7,050 | | | | 290,742 | |
Sonic Corp.* | | | | | | | 10,370 | | | | 69,790 | |
Speedway Motorsports, Inc. | | | | | | | 1,995 | | | | 30,583 | |
Texas Roadhouse, Inc., Class A | | | | | | | 10,645 | | | | 158,611 | |
| | | | | | | | | | | | |
| | | Country
Code** | | | Shares | | | Value | |
| | | | | | | | | | | | |
| | | | | | | | | | | | |
The Cheesecake Factory, Inc.* | | | | | | | 9,801 | | | $ | 287,659 | |
Town Sports International Holdings, Inc.* | | | | | | | 3,513 | | | | 25,821 | |
Vail Resorts, Inc. | | | | | | | 6,099 | | | | 258,354 | |
| | | | | | | | | | | | |
| | | | | | | | | | | 5,180,257 | |
| | | | | | | | | | | | |
HOUSEHOLD DURABLES – 0.8% | |
American Greetings Corp. | | | | | | | 6,823 | | | | 85,356 | |
Beazer Homes USA, Inc.* | | | | | | | 13,306 | | | | 32,999 | |
Blyth, Inc. | | | | | | | 891 | | | | 50,609 | |
Cavco Industries, Inc.* | | | | | | | 1,182 | | | | 47,351 | |
CSS Industries, Inc. | | | | | | | 1,398 | | | | 27,848 | |
Ethan Allen Interiors, Inc. | | | | | | | 4,062 | | | | 96,310 | |
Furniture Brands International, Inc.* | | | | | | | 7,819 | | | | 9,617 | |
Helen of Troy Ltd.* | | | BM | | | | 5,230 | | | | 160,561 | |
Hovnanian Enterprises, Inc., Class A* | | | | | | | 10,213 | | | | 14,809 | |
Irobot Corp.* | | | | | | | 4,004 | | | | 119,519 | |
KB Home | | | | | | | 12,908 | | | | 86,742 | |
La-Z-Boy, Inc.* | | | | | | | 8,722 | | | | 103,792 | |
Libbey, Inc.* | | | | | | | 3,335 | | | | 42,488 | |
Lifetime Brands, Inc. | | | | | | | 1,533 | | | | 18,611 | |
M.D.C. Holdings, Inc. | | | | | | | 6,309 | | | | 111,228 | |
M/I Homes, Inc.* | | | | | | | 3,200 | | | | 30,720 | |
Meritage Homes Corp.* | | | | | | | 4,689 | | | | 108,738 | |
Ryland Group, Inc. | | | | | | | 7,466 | | | | 117,664 | |
Sealy Corp.* | | | | | | | 8,359 | | | | 14,377 | |
Skullcandy, Inc.* | | | | | | | 1,636 | | | | 20,483 | |
Skyline Corp. | | | | | | | 1,211 | | | | 5,268 | |
Standard Pacific Corp.* | | | | | | | 18,324 | | | | 58,270 | |
Universal Electronics, Inc.* | | | | | | | 2,561 | | | | 43,204 | |
Zagg, Inc.* | | | | | | | 3,746 | | | | 26,484 | |
| | | | | | | | | | | | |
| | | | | | | | | | | 1,433,048 | |
| | | | | | | | | | | | |
See Notes to Financial Statements.
154
SC SM BLACKROCK SMALL CAP INDEX FUND
| | |
PORTFOLIOOF INVESTMENTS (Continued) December 31, 2011 | | Sun Capital Advisers Trust |
| | | | | | | | | | | | |
| | | Country
Code** | | | Shares | | | Value | |
| | | | | | | | | | | | |
| | | | | | | | | | | | |
HOUSEHOLD PRODUCTS – 0.1% | |
Central Garden and Pet Co., Class A* | | | | | | | 7,066 | | | $ | 58,789 | |
Harbinger Group, Inc.* | | | | | | | 1,410 | | | | 5,654 | |
Oil-Dri Corp. of America | | | | | | | 795 | | | | 16,091 | |
Spectrum Brands Holdings, Inc.* | | | | | | | 2,787 | | | | 76,364 | |
WD-40 Co. | | | | | | | 2,698 | | | | 109,026 | |
| | | | | | | | | | | | |
| | | | | | | | | | | 265,924 | |
| | | | | | | | | | | | |
INDEPENDENT POWER PRODUCERS & ENERGY TRADERS – 0.2% | |
Atlantic Power Corp. | | | CA | | | | 19,165 | | | | 274,059 | |
Dynegy, Inc.* | | | | | | | 17,481 | | | | 48,422 | |
Genie Energy Ltd., Class B | | | | | | | 2,488 | | | | 19,730 | |
Ormat Technologies, Inc. | | | | | | | 3,118 | | | | 56,218 | |
| | | | | | | | | | | | |
| | | | | | | | | | | 398,429 | |
| | | | | | | | | | | | |
INDUSTRIAL CONGLOMERATES – 0.2% | |
Raven Industries, Inc. | | | | | | | 3,058 | | | | 189,290 | |
Seaboard Corp.* | | | | | | | 53 | | | | 107,908 | |
Standex International Corp. | | | | | | | 2,145 | | | | 73,295 | |
| | | | | | | | | | | | |
| | | | | | | | | | | 370,493 | |
| | | | | | | | | | | | |
INSURANCE – 2.7% | |
Alterra Capital Holdings Ltd. | | | BM | | | | 15,431 | | | | 364,634 | |
American Equity Investment Life Holding Co. | | | | | | | 10,048 | | | | 104,499 | |
American Safety Insurance Holdings Ltd.* | | | BM | | | | 1,829 | | | | 39,781 | |
AMERISAFE, Inc.* | | | | | | | 3,168 | | | | 73,656 | |
Amtrust Financial Services, Inc. | | | | | | | 4,148 | | | | 98,515 | |
Argo Group International Holdings, Inc. | | | BM | | | | 4,746 | | | | 137,444 | |
Baldwin & Lyons, Inc., Class B | | | | | | | 1,557 | | | | 33,943 | |
Citizens, Inc.* | | | | | | | 6,473 | | | | 62,723 | |
| | | | | | | | | | | | |
| | | Country
Code** | | | Shares | | | Value | |
| | | | | | | | | | | | |
| | | | | | | | | | | | |
CNO Financial Group, Inc.* | | | | | | | 37,580 | | | $ | 237,130 | |
Crawford & Co., Class B | | | | | | | 4,423 | | | | 27,246 | |
Delphi Financial Group, Inc. | | | | | | | 8,225 | | | | 364,367 | |
Donegal Group, Inc. | | | | | | | 1,460 | | | | 20,674 | |
eHealth, Inc.* | | | | | | | 3,448 | | | | 50,686 | |
EMC Insurance Group, Inc. | | | | | | | 900 | | | | 18,513 | |
Enstar Group Ltd.* | | | BM | | | | 1,171 | | | | 114,992 | |
FBL Financial Group, Inc. | | | | | | | 2,153 | | | | 73,245 | |
First American Financial Corp. | | | | | | | 17,946 | | | | 227,376 | |
Flagstone Reinsurance Holdings SA | | | LU | | | | 9,225 | | | | 76,475 | |
Fortegra Financial Corp.* | | | | | | | 1,295 | | | | 8,651 | |
Global Indemnity PLC* | | | IE | | | | 2,424 | | | | 48,068 | |
Greenlight Capital Re, Ltd., Class A* | | | KY | | | | 4,800 | | | | 113,616 | |
Hallmark Financial Services, Inc.* | | | | | | | 2,311 | | | | 16,154 | |
Harleysville Group, Inc. | | | | | | | 2,094 | | | | 118,458 | |
Hilltop Holdings, Inc.* | | | | | | | 6,947 | | | | 58,702 | |
Horace Mann Educators Corp. | | | | | | | 6,830 | | | | 93,639 | |
Independence Holding Co. | | | | | | | 1,346 | | | | 10,943 | |
Infinity Property & Casualty Corp. | | | | | | | 2,146 | | | | 121,764 | |
Kansas City Life Insurance Co. | | | | | | | 713 | | | | 23,401 | |
Maiden Holdings Ltd. | | | BM | | | | 8,856 | | | | 77,579 | |
Meadowbrook Insurance Group, Inc. | | | | | | | 9,197 | | | | 98,224 | |
Montpelier Re Holdings Ltd. | | | BM | | | | 10,764 | | | | 191,061 | |
National Financial Partners Corp.* | | | | | | | 6,981 | | | | 94,383 | |
National Interstate Corp. | | | | | | | 1,295 | | | | 31,948 | |
National Western Life Insurance Co. | | | | | | | 363 | | | | 49,426 | |
See Notes to Financial Statements.
155
SC SM BLACKROCK SMALL CAP INDEX FUND
| | |
PORTFOLIOOF INVESTMENTS (Continued) December 31, 2011 | | Sun Capital Advisers Trust |
| | | | | | | | | | | | |
| | | Country
Code** | | | Shares | | | Value | |
| | | | | | | | | | | | |
| | | | | | | | | | | | |
Navigators Group, Inc.* | | | | | | | 2,019 | | | $ | 96,266 | |
OneBeacon Insurance Group Ltd., Class A | | | BM | | | | 3,849 | | | | 59,236 | |
Phoenix Cos., Inc.* | | | | | | | 19,283 | | | | 32,395 | |
Platinum Underwriters Holdings Ltd. | | | BM | | | | 6,414 | | | | 218,782 | |
Presidential Life Corp. | | | | | | | 3,673 | | | | 36,693 | |
Primerica, Inc. | | | | | | | 5,748 | | | | 133,583 | |
ProAssurance Corp. | | | | | | | 5,201 | | | | 415,144 | |
RLI Corp. | | | | | | | 3,134 | | | | 228,343 | |
Safety Insurance Group, Inc. | | | | | | | 2,219 | | | | 89,825 | |
SeaBright Insurance Holdings, Inc. | | | | | | | 3,549 | | | | 27,150 | |
Selective Insurance Group, Inc. | | | | | | | 9,306 | | | | 164,995 | |
State Auto Financial Corp. | | | | | | | 2,568 | | | | 34,899 | |
Stewart Information Services Corp. | | | | | | | 3,130 | | | | 36,151 | |
Symetra Financial Corp. | | | | | | | 11,468 | | | | 104,015 | |
Tower Group, Inc. | | | | | | | 6,376 | | | | 128,604 | |
United Fire & Casualty Co. | | | | | | | 3,699 | | | | 74,646 | |
Universal Insurance Holdings, Inc. | | | | | | | 3,334 | | | | 11,936 | |
| | | | | | | | | | | | |
| | | | | | | | | | | 5,174,579 | |
| | | | | | | | | | | | |
INTERNET & CATALOG RETAIL – 0.3% | |
1-800-Flowers.com, Inc., Class A* | | | | | | | 4,057 | | | | 8,925 | |
Blue Nile, Inc.* | | | | | | | 1,991 | | | | 81,392 | |
Geeknet, Inc.* | | | | | | | 748 | | | | 12,753 | |
HSN, Inc. | | | | | | | 6,761 | | | | 245,154 | |
NutriSystem, Inc. | | | | | | | 4,533 | | | | 58,612 | |
Orbitz Worldwide, Inc.* | | | | | | | 3,552 | | | | 13,355 | |
Overstock.com, Inc.* | | | | | | | 1,896 | | | | 14,865 | |
PetMed Express Common, Inc. | | | | | | | 3,424 | | | | 35,541 | |
Shutterfly, Inc.* | | | | | | | 5,019 | | | | 114,232 | |
| | | | | | | | | | |
| | | Country
Code** | | Shares | | | Value | |
| | | | | | | | | | |
| | | | | | | | | | |
US Auto Parts Network, Inc.* | | | | | 2,453 | | | $ | 10,720 | |
ValueVision Media, Inc., Class A* | | | | | 7,079 | | | | 13,309 | |
| | | | | | | | | | |
| | | | | | | | | 608,858 | |
| | | | | | | | | | |
INTERNET SOFTWARE & SERVICES – 1.8% | |
Active Network, Inc.* | | | | | 2,147 | | | | 29,199 | |
Ancestry.com, Inc.* | | | | | 5,347 | | | | 122,767 | |
Angie’s List, Inc.* | | | | | 1,739 | | | | 27,998 | |
Bankrate, Inc.* | | | | | 3,853 | | | | 82,840 | |
Carbonite, Inc.* | | | | | 1,239 | | | | 13,753 | |
ComScore, Inc.* | | | | | 5,375 | | | | 113,950 | |
Constant Contact, Inc.* | | | | | 4,959 | | | | 115,098 | |
Cornerstone OnDemand, Inc.* | | | | | 1,976 | | | | 36,042 | |
DealerTrack Holdings, Inc.* | | | | | 6,943 | | | | 189,266 | |
Demand Media, Inc.* | | | | | 1,402 | | | | 9,323 | |
Dice Holdings, Inc.* | | | | | 8,352 | | | | 69,238 | |
Digital River, Inc.* | | | | | 6,305 | | | | 94,701 | |
Earthlink, Inc. | | | | | 18,612 | | | | 119,861 | |
Envestnet, Inc.* | | | | | 3,381 | | | | 40,437 | |
FriendFinder Networks, Inc.* | | | | | 807 | | | | 605 | |
InfoSpace, Inc.* | | | | | 6,541 | | | | 71,886 | |
Internap Network Services Corp.* | | | | | 9,004 | | | | 53,484 | |
Intralinks Holdings, Inc.* | | | | | 5,324 | | | | 33,222 | |
j2 Global, Inc. | | | | | 7,729 | | | | 217,494 | |
Keynote Systems, Inc. | | | | | 2,488 | | | | 51,104 | |
Kit Digital, Inc.* | | | | | 6,545 | | | | 55,305 | |
Limelight Networks, Inc.* | | | | | 11,789 | | | | 34,895 | |
Liquidity Services, Inc.* | | | | | 3,196 | | | | 117,932 | |
LivePerson, Inc.* | | | | | 8,878 | | | | 111,419 | |
Logmein, Inc.* | | | | | 3,428 | | | | 132,149 | |
Loopnet, Inc.* | | | | | 2,824 | | | | 51,623 | |
Marchex, Inc., Class B | | | | | 3,692 | | | | 23,075 | |
Move, Inc.* | | | | | 6,786 | | | | 42,888 | |
NIC, Inc. | | | | | 10,808 | | | | 143,855 | |
Opentable, Inc.* | | | | | 3,979 | | | | 155,698 | |
See Notes to Financial Statements.
156
SC SM BLACKROCK SMALL CAP INDEX FUND
| | |
PORTFOLIOOF INVESTMENTS (Continued) December 31, 2011 | | Sun Capital Advisers Trust |
| | | | | | | | | | |
| | | Country
Code** | | Shares | | | Value | |
| | | | | | | | | | |
| | | | | | | | | | |
Openwave Systems, Inc.* | | | | | 14,292 | | | $ | 22,581 | |
Perficient, Inc.* | | | | | 4,180 | | | | 41,842 | |
Quepasa Corp.* | | | | | 1,202 | | | | 3,991 | |
Quinstreet, Inc.* | | | | | 4,707 | | | | 44,058 | |
RealNetworks, Inc. | | | | | 3,641 | | | | 27,308 | |
Responsys, Inc.* | | | | | 1,651 | | | | 14,677 | |
RightNow Technologies, Inc.* | | | | | 4,165 | | | | 177,970 | |
Saba Software, Inc.* | | | | | 4,754 | | | | 37,509 | |
SciQuest, Inc.* | | | | | 2,135 | | | | 30,466 | |
SPS Commerce, Inc.* | | | | | 1,418 | | | | 36,797 | |
Stamps.com, Inc.* | | | | | 1,800 | | | | 47,034 | |
Support.com, Inc.* | | | | | 8,074 | | | | 18,167 | |
TechTarget, Inc.* | | | | | 2,386 | | | | 13,934 | |
Travelzoo, Inc.* | | | | | 929 | | | | 22,835 | |
United Online, Inc. | | | | | 14,938 | | | | 81,263 | |
ValueClick, Inc.* | | | | | 13,329 | | | | 217,129 | |
Vocus, Inc.* | | | | | 3,023 | | | | 66,778 | |
Web.com Group, Inc.* | | | | | 4,987 | | | | 57,101 | |
XO Group, Inc.* | | | | | 4,642 | | | | 38,714 | |
Zillow, Inc.* | | | | | 666 | | | | 14,972 | |
Zix Corp.* | | | | | 11,711 | | | | 33,025 | |
| | | | | | | | | | |
| | | | | | | | | 3,409,258 | |
| | | | | | | | | | |
IT SERVICES – 2.0% | |
Acxiom Corp.* | | | | | 13,729 | | | | 167,631 | |
CACI International, Inc., Class A* | | | | | 4,463 | | | | 249,571 | |
Cardtronics, Inc.* | | | | | 7,270 | | | | 196,726 | |
Cass Information Systems, Inc. | | | | | 1,555 | | | | 56,586 | |
Ciber, Inc.* | | | | | 10,734 | | | | 41,433 | |
Computer Task Group, Inc.* | | | | | 2,596 | | | | 36,552 | |
Convergys Corp.* | | | | | 17,796 | | | | 227,255 | |
CSG Systems International, Inc.* | | | | | 5,815 | | | | 85,539 | |
Dynamics Research Corp.* | | | | | 1,440 | | | | 16,330 | |
Echo Global Logistics, Inc.* | | | | | 1,903 | | | | 30,733 | |
Euronet Worldwide, Inc.* | | | | | 8,635 | | | | 159,575 | |
Exlservice Holdings, Inc.* | | | | | 2,769 | | | | 61,942 | |
Forrester Research, Inc.* | | | | | 2,520 | | | | 85,529 | |
| | | | | | | | | | |
| | | Country
Code** | | Shares | | | Value | |
| | | | | | | | | | |
| | | | | | | | | | |
Heartland Payment Systems, Inc. | | | | | 6,508 | | | $ | 158,535 | |
Higher One Holdings, Inc.* | | | | | 5,142 | | | | 94,818 | |
iGATE Corp.* | | | | | 5,217 | | | | 82,063 | |
Jack Henry & Associates, Inc. | | | | | 14,596 | | | | 490,572 | |
Lionbridge Technologies, Inc.* | | | | | 10,042 | | | | 22,996 | |
Mantech International Corp., Class A | | | | | 3,931 | | | | 122,804 | |
MAXIMUS, Inc. | | | | | 5,878 | | | | 243,055 | |
ModusLink Global Solutions, Inc. | | | | | 7,294 | | | | 39,388 | |
MoneyGram International, Inc.* | | | | | 1,856 | | | | 32,944 | |
NCI, Inc., Class A* | | | | | 1,215 | | | | 14,155 | |
PRGX Global, Inc.* | | | | | 3,289 | | | | 19,569 | |
Sapient Corp. | | | | | 18,521 | | | | 233,365 | |
ServiceSource International, Inc.* | | | | | 1,762 | | | | 27,646 | |
Stream Global Services, Inc.* | | | | | 1,186 | | | | 3,926 | |
Syntel, Inc. | | | | | 2,601 | | | | 121,649 | |
Teletech Holdings, Inc.* | | | | | 4,363 | | | | 70,681 | |
The Hackett Group, Inc.* | | | | | 5,134 | | | | 19,201 | |
TNS, Inc.* | | | | | 4,366 | | | | 77,365 | |
Unisys Corp.* | | | | | 7,293 | | | | 143,745 | |
Virtusa Corp.* | | | | | 2,608 | | | | 37,764 | |
Wright Express Corp.* | | | | | 6,549 | | | | 355,480 | |
| | | | | | | | | | |
| | | | | | | | | 3,827,123 | |
| | | | | | | | | | |
LEISURE EQUIPMENT & PRODUCTS – 0.4% | |
Arctic Cat, Inc.* | | | | | 2,062 | | | | 46,498 | |
Black Diamond, Inc.* | | | | | 2,356 | | | | 17,599 | |
Brunswick Corp. | | | | | 15,065 | | | | 272,074 | |
Callaway Golf Co. | | | | | 11,095 | | | | 61,355 | |
Eastman Kodak Co.* | | | | | 46,318 | | | | 30,084 | |
Jakks Pacific, Inc. | | | | | 4,542 | | | | 64,088 | |
Johnson Outdoors, Inc., Class A* | | | | | 804 | | | | 12,341 | |
Leapfrog Enterprises, Inc.* | | | | | 7,176 | | | | 40,114 | |
Marine Products Corp.* | | | | | 1,819 | | | | 9,022 | |
See Notes to Financial Statements.
157
| | |
SC SM BLACKROCK SMALL CAP INDEX FUND PORTFOLIOOF INVESTMENTS (Continued) |
| December 31, 2011 | | Sun Capital Advisers Trust |
| | | | | | | | | | |
| | | Country
Code** | | Shares | | | Value | |
| | | | | | | | | | |
| | | | | | | | | | |
Smith & Wesson Holding Corp.* | | | | | 9,846 | | | $ | 42,929 | |
Steinway Musical Instruments, Inc.* | | | | | 1,103 | | | | 27,619 | |
Sturm Ruger & Co., Inc. | | | | | 3,176 | | | | 106,269 | |
Summer Infant, Inc.* | | | | | 2,146 | | | | 15,108 | |
| | | | | | | | | | |
| | | | | | | | | 745,100 | |
| | | | | | | | | | |
LIFE SCIENCES TOOLS & SERVICES – 0.4% | |
Affymetrix, Inc.* | | | | | 12,032 | | | | 49,211 | |
Albany Molecular Research, Inc.* | | | | | 3,625 | | | | 10,621 | |
BG Medicine, Inc.* | | | | | 1,343 | | | | 6,339 | |
Cambrex Corp.* | | | | | 4,995 | | | | 35,864 | |
Complete Genomics, Inc.* | | | | | 1,746 | | | | 5,116 | |
Enzo Biochem, Inc.* | | | | | 6,426 | | | | 14,394 | |
eResearchTechnology, Inc.* | | | | | 8,547 | | | | 40,086 | |
Fluidigm Corp.* | | | | | 1,100 | | | | 14,476 | |
Furiex Pharmaceuticals, Inc.* | | | | | 1,714 | | | | 28,641 | |
Harvard Bioscience, Inc.* | | | | | 3,691 | | | | 14,284 | |
Luminex Corp.* | | | | | 6,375 | | | | 135,341 | |
MEDTOX Scientific, Inc.* | | | | | 1,326 | | | | 18,630 | |
Pacific Biosciences of California, Inc.* | | | | | 6,155 | | | | 17,234 | |
Parexel International Corp.* | | | | | 9,960 | | | | 206,570 | |
Sequenom, Inc.* | | | | | 16,986 | | | | 75,588 | |
| | | | | | | | | | |
| | | | | | | | | 672,395 | |
| | | | | | | | | | |
MACHINERY – 3.2% | |
Accuride Corp.* | | | | | 6,885 | | | | 49,021 | |
Actuant Corp., Class A | | | | | 11,628 | | | | 263,839 | |
Alamo Group, Inc. | | | | | 1,139 | | | | 30,673 | |
Albany International Corp. | | | | | 4,650 | | | | 107,508 | |
Altra Holdings, Inc.* | | | | | 4,517 | | | | 85,055 | |
American Railcar Industries, Inc.* | | | | | 1,682 | | | | 40,250 | |
Ampco-Pittsburgh Corp. | | | | | 1,428 | | | | 27,618 | |
Astec Industries, Inc.* | | | | | 3,359 | | | | 108,193 | |
Barnes Group, Inc. | | | | | 9,236 | | | | 222,680 | |
| | | | | | | | | | |
| | | Country
Code** | | Shares | | | Value | |
| | | | | | | | | | |
| | | | | | | | | | |
Blount International, Inc.* | | | | | 8,207 | | | $ | 119,166 | |
Briggs & Stratton Corp. | | | | | 8,514 | | | | 131,882 | |
Cascade Corp. | | | | | 1,535 | | | | 72,406 | |
Chart Industries, Inc.* | | | | | 4,982 | | | | 269,377 | |
CIRCOR International, Inc. | | | | | 2,898 | | | | 102,328 | |
Clarcor, Inc. | | | | | 8,535 | | | | 426,665 | |
Colfax Corp.* | | | | | 4,149 | | | | 118,164 | |
Columbus McKinnon Corp.* | | | | | 3,324 | | | | 42,182 | |
Commercial Vehicle Group, Inc.* | | | | | 4,971 | | | | 44,938 | |
Douglas Dynamics, Inc. | | | | | 3,029 | | | | 44,284 | |
Dynamic Materials Corp. | | | | | 2,317 | | | | 45,830 | |
Energy Recovery, Inc.* | | | | | 7,678 | | | | 19,809 | |
EnPro Industries, Inc.* | | | | | 3,477 | | | | 114,671 | |
Esco Technologies, Inc. | | | | | 4,493 | | | | 129,309 | |
Federal Signal Corp.* | | | | | 10,683 | | | | 44,334 | |
Flow International Corp.* | | | | | 7,938 | | | | 27,783 | |
FreightCar America, Inc.* | | | | | 2,083 | | | | 43,639 | |
Gorman-Rupp Co. | | | | | 2,622 | | | | 71,187 | |
Graham Corp. | | | | | 1,679 | | | | 37,677 | |
Hurco Cos., Inc.* | | | | | 1,095 | | | | 22,995 | |
John Bean Technologies Corp. | | | | | 4,808 | | | | 73,899 | |
Kadant, Inc.* | | | | | 2,120 | | | | 47,933 | |
Kaydon Corp. | | | | | 5,519 | | | | 168,329 | |
LB Foster Co. | | | | | 1,504 | | | | 42,548 | |
Lindsay Corp. | | | | | 2,119 | | | | 116,312 | |
Lydall, Inc.* | | | | | 2,860 | | | | 27,141 | |
Meritor, Inc.* | | | | | 15,936 | �� | | | 84,780 | |
Met-Pro Corp. | | | | | 2,554 | | | | 23,088 | |
Middleby Corp.* | | | | | 3,172 | | | | 298,295 | |
Miller Industries, Inc. | | | | | 1,849 | | | | 29,085 | |
Mueller Industries, Inc. | | | | | 6,410 | | | | 246,272 | |
Mueller Water Products, Inc., Class A | | | | | 26,728 | | | | 65,216 | |
See Notes to Financial Statements.
158
| | |
SC SM BLACKROCK SMALL CAP INDEX FUND PORTFOLIOOF INVESTMENTS (Continued) |
| December 31, 2011 | | Sun Capital Advisers Trust |
| | | | | | | | | | | | |
| | | Country
Code** | | | Shares | | | Value | |
| | | | | | | | | | | | |
| | | | | | | | | | | | |
NACCO Industries, Inc., Class A | | | | | | | 979 | | | $ | 87,346 | |
NN, Inc.* | | | | | | | 2,758 | | | | 16,548 | |
Omega Flex, Inc.* | | | | | | | 437 | | | | 6,175 | |
PMFG, Inc.* | | | | | | | 3,001 | | | | 58,550 | |
RBC Bearings, Inc.* | | | | | | | 3,705 | | | | 154,499 | |
Robbins & Myers, Inc. | | | | | | | 6,686 | | | | 324,605 | |
Sauer-Danfoss, Inc.* | | | | | | | 1,933 | | | | 69,994 | |
Sun Hydraulics, Inc. | | | | | | | 3,368 | | | | 78,912 | |
Tecumseh Products Co., Class A* | | | | | | | 3,305 | | | | 15,534 | |
Tennant Co. | | | | | | | 3,237 | | | | 125,822 | |
The Greenbrier Cos., Inc.* | | | | | | | 3,318 | | | | 80,561 | |
Titan International, Inc. | | | | | | | 7,115 | | | | 138,458 | |
Trimas Corp.* | | | | | | | 4,387 | | | | 78,747 | |
Twin Disc, Inc. | | | | | | | 1,455 | | | | 52,846 | |
Wabash National Corp.* | | | | | | | 11,504 | | | | 90,191 | |
Watts Water Technologies, Inc., Class A | | | | | | | 5,090 | | | | 174,129 | |
Woodward Governor Co. | | | | | | | 10,424 | | | | 426,654 | |
Xerium Technologies, Inc.* | | | | | | | 1,933 | | | | 12,642 | |
| | | | | | | | | | | | |
| | | | | | | | | | | 6,078,574 | |
| | | | | | | | | | | | |
MARINE – 0.1% | |
Baltic Trading Ltd. | | | MH | | | | 2,666 | | | | 12,664 | |
Eagle Bulk Shipping, Inc.* | | | MH | | | | 11,410 | | | | 10,749 | |
Excel Maritime Carriers Ltd.* | | | LR | | | | 7,471 | | | | 10,833 | |
Genco Shipping & Trading Ltd.* | | | MH | | | | 4,980 | | | | 33,665 | |
International Shipholding Corp. | | | | | | | 884 | | | | 16,522 | |
Ultrapetrol Bahamas Ltd.* | | | BS | | | | 3,395 | | | | 10,117 | |
| | | | | | | | | | | | |
| | | | | | | | | | | 94,550 | |
| | | | | | | | | | | | |
MEDIA – 1.3% | |
AH Belo Corp. | | | | | | | 3,091 | | | | 14,682 | |
Arbitron, Inc. | | | | | | | 4,593 | | | | 158,045 | |
Belo Corp., Class A | | | | | | | 15,606 | | | | 98,318 | |
| | | | | | | | | | | | |
| | | Country
Code** | | | Shares | | | Value | |
| | | | | | | | | | | | |
| | | | | | | | | | | | |
Central European Media Enterprises Ltd., Class A* | | | BM | | | | 6,265 | | | $ | 40,848 | |
Cinemark Holdings, Inc. | | | | | | | 15,693 | | | | 290,164 | |
Crown Media Holdings, Inc., Class A* | | | | | | | 5,611 | | | | 6,789 | |
Cumulus Media, Inc., Class A* | | | | | | | 5,852 | | | | 19,546 | |
Dial Global, Inc.* | | | | | | | 687 | | | | 2,192 | |
Digital Domain Media Group, Inc.* | | | | | | | 630 | | | | 3,830 | |
Digital Generation, Inc.* | | | | | | | 4,695 | | | | 55,964 | |
Entercom Communications Corp., Class A* | | | | | | | 4,088 | | | | 25,141 | |
Entravision Communications Corp., Class A | | | | | | | 8,397 | | | | 13,099 | |
Fisher Communications, Inc.* | | | | | | | 1,517 | | | | 43,735 | |
Global Sources Ltd.* | | | BM | | | | 1,885 | | | | 9,142 | |
Gray Television, Inc.* | | | | | | | 8,430 | | | | 13,657 | |
Harte-Hanks, Inc. | | | | | | | 7,456 | | | | 67,775 | |
Journal Communications, Inc., Class A* | | | | | | | 7,426 | | | | 32,674 | |
Knology, Inc.* | | | | | | | 5,155 | | | | 73,201 | |
LIN TV Corp., Class A* | | | | | | | 5,124 | | | | 21,675 | |
Lions Gate Entertainment Corp.* | | | CA | | | | 7,721 | | | | 64,239 | |
Live Nation, Inc.* | | | | | | | 23,741 | | | | 197,288 | |
Martha Stewart Living Omnimedia, Inc., Class A | | | | | | | 4,718 | | | | 20,759 | |
McClatchy Co., Class A* | | | | | | | 9,575 | | | | 22,884 | |
MDC Partners, Inc., Class A | | | CA | | | | 4,304 | | | | 58,190 | |
Meredith Corp. | | | | | | | 6,175 | | | | 201,614 | |
National CineMedia, Inc. | | | | | | | 9,292 | | | | 115,221 | |
Nexstar Broadcasting Group, Inc., Class A* | | | | | | | 1,888 | | | | 14,802 | |
See Notes to Financial Statements.
159
| | |
SC SM BLACKROCK SMALL CAP INDEX FUND PORTFOLIOOF INVESTMENTS (Continued) |
| December 31, 2011 | | Sun Capital Advisers Trust |
| | | | | | | | | | | | |
| | | Country
Code** | | | Shares | | | Value | |
| | | | | | | | | | | | |
| | | | | | | | | | | | |
Outdoor Channel Holdings, Inc. | | | | | | | 2,577 | | | $ | 19,225 | |
ReachLocal, Inc.* | | | | | | | 1,734 | | | | 10,716 | |
Rentrak Corp.* | | | | | | | 1,599 | | | | 22,834 | |
Saga Communications, Inc., Class A* | | | | | | | 603 | | | | 22,540 | |
Scholastic Corp. | | | | | | | 4,476 | | | | 134,146 | |
Sinclair Broadcast Group, Inc. | | | | | | | 8,506 | | | | 96,373 | |
The E.W. Scripps Co., Class A* | | | | | | | 5,169 | | | | 41,404 | |
The New York Times Co., Class A* | | | | | | | 23,203 | | | | 179,359 | |
Valassis Communications, Inc.* | | | | | | | 7,614 | | | | 146,417 | |
Value Line, Inc. | | | | | | | 144 | | | | 1,480 | |
World Wrestling Entertainment, Inc. | | | | | | | 4,607 | | | | 42,937 | |
| | | | | | | | | | | | |
| | | | | | | | | | | 2,402,905 | |
| | | | | | | | | | | | |
METALS & MINING – 1.4% | |
AMCOL International Corp. | | | | | | | 4,109 | | | | 110,327 | |
Castle AM Co.* | | | | | | | 2,797 | | | | 26,460 | |
Century Aluminum Co.* | | | | | | | 8,656 | | | | 73,663 | |
Coeur D’Alene Mines Corp.* | | | | | | | 15,134 | | | | 365,335 | |
General Moly Inc.* | | | | | | | 11,717 | | | | 36,205 | |
Globe Specialty Metals, Inc. | | | | | | | 10,651 | | | | 142,617 | |
Gold Resource Corp. | | | | | | | 4,739 | | | | 100,704 | |
Golden Minerals Co.* | | | | | | | 4,941 | | | | 28,707 | |
Golden Star Resources Ltd.* | | | CA | | | | 44,499 | | | | 73,423 | |
Handy & Harman Ltd.* | | | | | | | 923 | | | | 9,138 | |
Haynes International, Inc. | | | | | | | 2,057 | | | | 112,312 | |
Hecla Mining Co. | | | | | | | 47,198 | | | | 246,846 | |
Horsehead Holding Corp.* | | | | | | | 7,499 | | | | 67,566 | |
Jaguar Mining, Inc.* | | | CA | | | | 14,069 | | | | 89,760 | |
Kaiser Aluminum Corp. | | | | | | | 2,750 | | | | 126,170 | |
Materion Corp.* | | | | | | | 3,430 | | | | 83,280 | |
| | | | | | | | | | | | |
| | | Country
Code** | | | Shares | | | Value | |
| | | | | | | | | | | | |
| | | | | | | | | | | | |
Metals USA Holdings Corp.* | | | | | | | 1,944 | | | $ | 21,870 | |
Midway Gold Corp.* | | | CA | | | | 14,932 | | | | 31,506 | |
Noranda Aluminum Holding Corp. | | | | | | | 3,864 | | | | 31,878 | |
Olympic Steel, Inc. | | | | | | | 1,537 | | | | 35,843 | |
Paramount Gold and Silver Corp.* | | | | | | | 20,082 | | | | 42,975 | |
Redcorp Ventures
Ltd.*(1) | | | CA | | | | 91,400 | | | | — | |
Revett Minerals, Inc.* | | | CA | | | | 4,209 | | | | 19,866 | |
RTI International Metals, Inc.* | | | | | | | 5,091 | | | | 118,162 | |
Stillwater Mining Co.* | | | | | | | 19,570 | | | | 204,702 | |
SunCoke Energy, Inc.* | | | | | | | 2,228 | | | | 24,954 | |
Thompson Creek Metals Co., Inc.* | | | CA | | | | 25,817 | | | | 179,686 | |
Universal Stainless & Alloy* | | | | | | | 1,227 | | | | 45,841 | |
US Energy Corp.* | | | | | | | 4,016 | | | | 11,687 | |
US Gold Corp.* | | | | | | | 17,988 | | | | 60,440 | |
Vista Gold Corp.* | | | CA | | | | 11,938 | | | | 36,650 | |
Worthington Industries, Inc. | | | | | | | 9,740 | | | | 159,541 | |
| | | | | | | | | | | | |
| | | | | | | | | | | 2,718,114 | |
| | | | | | | | | | | | |
MULTI-LINE RETAIL – 0.3% | |
99 Cents Only Stores* | | | | | | | 7,940 | | | | 174,283 | |
Bon-Ton Stores, Inc. | | | | | | | 2,007 | | | | 6,764 | |
Fred’s, Inc. | | | | | | | 6,221 | | | | 90,702 | |
Gordmans Stores, Inc.* | | | | | | | 924 | | | | 11,615 | |
Saks, Inc.* | | | | | | | 19,539 | | | | 190,505 | |
Tuesday Morning Corp.* | | | | | | | 7,652 | | | | 26,399 | |
| | | | | | | | | | | | |
| | | | | | | | | | | 500,268 | |
| | | | | | | | | | | | |
MULTI-UTILITIES – 0.5% | |
Avista Corp. | | | | | | | 9,765 | | | | 251,449 | |
Black Hills Corp. | | | | | | | 6,652 | | | | 223,374 | |
CH Energy Group, Inc. | | | | | | | 2,613 | | | | 152,547 | |
NorthWestern Corp. | | | | | | | 6,159 | | | | 220,430 | |
| | | | | | | | | | | | |
| | | | | | | | | | | 847,800 | |
| | | | | | | | | | | | |
See Notes to Financial Statements.
160
| | |
SC SM BLACKROCK SMALL CAP INDEX FUND PORTFOLIOOF INVESTMENTS (Continued) |
| December 31, 2011 | | Sun Capital Advisers Trust |
| | | | | | | | | | | | |
| | | Country
Code** | | | Shares | | | Value | |
| | | | | | | | | | | | |
| | | | | | | | | | | | |
OIL, GAS & CONSUMABLE FUELS – 4.6% | |
Abraxas Petroleum Corp.* | | | | | | | 14,177 | | | $ | 46,784 | |
Alon USA Energy, Inc. | | | | | | | 1,936 | | | | 16,863 | |
Amyris, Inc.* | | | | | | | 2,964 | | | | 34,205 | |
Apco Oil and Gas International, Inc. | | | KY | | | | 1,532 | | | | 125,195 | |
Approach Resources, Inc.* | | | | | | | 4,360 | | | | 128,228 | |
ATP Oil & Gas Corp.* | | | | | | | 7,621 | | | | 56,091 | |
Berry Petroleum Co. | | | | | | | 8,734 | | | | 367,003 | |
Bill Barrett Corp.* | | | | | | | 7,996 | | | | 272,424 | |
BPZ Resources, Inc.* | | | | | | | 17,473 | | | | 49,623 | |
Callon Petroleum Co.* | | | | | | | 6,844 | | | | 34,015 | |
CAMAC Energy, Inc.* | | | | | | | 9,876 | | | | 9,975 | |
Carrizo Oil & Gas, Inc.* | | | | | | | 6,573 | | | | 173,199 | |
Cheniere Energy, Inc.* | | | | | | | 13,949 | | | | 121,217 | |
Clayton Williams Energy, Inc.* | | | | | | | 989 | | | | 75,045 | |
Clean Energy Fuels Corp.* | | | | | | | 8,320 | | | | 103,667 | |
Cloud Peak Energy, Inc.* | | | | | | | 10,321 | | | | 199,402 | |
Comstock Resources, Inc.* | | | | | | | 8,044 | | | | 123,073 | |
Contango Oil & Gas Co.* | | | | | | | 2,049 | | | | 119,211 | |
Crimson Exploration, Inc.* | | | | | | | 3,348 | | | | 9,575 | |
Crosstex Energy, Inc. | | | | | | | 6,807 | | | | 86,040 | |
CVR Energy, Inc.* | | | | | | | 14,872 | | | | 278,553 | |
Delek US Holdings, Inc. | | | | | | | 2,399 | | | | 27,373 | |
DHT Maritime, Inc. | | | MH | | | | 11,640 | | | | 8,614 | |
Endeavour International Corp.* | | | | | | | 6,286 | | | | 54,625 | |
Energy Partners Ltd.* | | | | | | | 4,980 | | | | 72,708 | |
Energy XXi Bermuda Ltd.* | | | BM | | | | 12,740 | | | | 406,151 | |
Evolution Petroleum Corp.* | | | | | | | 2,675 | | | | 21,534 | |
| | | | | | | | | | | | |
| | | Country
Code** | | | Shares | | | Value | |
| | | | | | | | | | | | |
| | | | | | | | | | | | |
Frontline Ltd. | | | BM | | | | 8,631 | | | $ | 37,027 | |
FX Energy, Inc.* | | | | | | | 8,889 | | | | 42,667 | |
Gastar Exploration Ltd.* | | | CA | | | | 9,636 | | | | 30,642 | |
Georesources, Inc.* | | | | | | | 3,366 | | | | 98,657 | |
Gevo, Inc.* | | | | | | | 967 | | | | 6,082 | |
GMX Resources, Inc.* | | | | | | | 10,470 | | | | 13,087 | |
Golar LNG Ltd. | | | BM | | | | 6,768 | | | | 300,838 | |
Goodrich Petroleum Corp.* | | | | | | | 4,439 | | | | 60,947 | |
Green Plains Renewable Energy, Inc.* | | | | | | | 3,097 | | | | 30,227 | |
Gulfport Energy Corp.* | | | | | | | 7,675 | | | | 226,029 | |
Hallador Energy Co. | | | | | | | 783 | | | | 7,775 | |
Harvest Natural Resources, Inc.* | | | | | | | 5,758 | | | | 42,494 | |
Houston American Energy Corp.* | | | | | | | 2,815 | | | | 34,315 | |
Hyperdynamics Corp.* | | | | | | | 26,660 | | | | 65,317 | |
Isramco, Inc.* | | | | | | | 167 | | | | 14,957 | |
James River Coal Co.* | | | | | | | 6,046 | | | | 41,838 | |
Kior, Inc., Class A* | | | | | | | 1,763 | | | | 17,947 | |
Knightsbridge Tankers Ltd. | | | BM | | | | 3,786 | | | | 51,755 | |
Kodiak Oil & Gas Corp.* | | | CA | | | | 43,552 | | | | 413,744 | |
L&L Energy, Inc.* | | | | | | | 3,575 | | | | 9,259 | |
Magnum Hunter Resources Corp.* | | | | | | | 18,723 | | | | 100,917 | |
McMoRan Exploration Co.* | | | | | | | 16,597 | | | | 241,486 | |
Miller Energy Resources, Inc.* | | | | | | | 5,379 | | | | 15,007 | |
Nordic American Tanker Shipping Ltd. | | | BM | | | | 7,997 | | | | 95,884 | |
Northern Oil and Gas, Inc.* | | | | | | | 10,676 | | | | 256,010 | |
Oasis Petroleum, Inc.* | | | | | | | 10,085 | | | | 293,373 | |
Overseas Shipholding Group, Inc. | | | | | | | 4,536 | | | | 49,578 | |
Panhandle Oil & Gas, Inc., Class A | | | | | | | 1,207 | | | | 39,602 | |
Patriot Coal Corp.* | | | | | | | 15,452 | | | | 130,878 | |
Penn Virginia Corp. | | | | | | | 7,790 | | | | 41,209 | |
See Notes to Financial Statements.
161
| | |
SC SM BLACKROCK SMALL CAP INDEX FUND PORTFOLIOOF INVESTMENTS (Continued) |
| December 31, 2011 | | Sun Capital Advisers Trust |
| | | | | | | | | | | | |
| | | Country
Code** | | | Shares | | | Value | |
| | | | | | | | | | | | |
| | | | | | | | | | | | |
Petroleum Development Corp.* | | | | | | | 3,966 | | | $ | 139,246 | |
PetroQuest Energy, Inc.* | | | | | | | 9,632 | | | | 63,571 | |
Rentech, Inc.* | | | | | | | 37,799 | | | | 49,517 | |
Resolute Energy Corp.* | | | | | | | 7,902 | | | | 85,342 | |
REX American Resources Corp.* | | | | | | | 1,050 | | | | 23,215 | |
Rex Energy Corp.* | | | | | | | 5,981 | | | | 88,280 | |
Rosetta Resources, Inc.* | | | | | | | 8,970 | | | | 390,195 | |
Scorpio Tankers, Inc.* | | | MH | | | | 4,899 | | | | 23,956 | |
SemGroup Corp., Class A* | | | | | | | 6,973 | | | | 181,716 | |
Ship Finance International Ltd. | | | BM | | | | 7,589 | | | | 70,881 | |
Solazyme, Inc.* | | | | | | | 1,880 | | | | 22,372 | |
Stone Energy Corp.* | | | | | | | 8,293 | | | | 218,769 | |
Swift Energy Co.* | | | | | | | 7,179 | | | | 213,360 | |
Syntroleum Corp.* | | | | | | | 14,433 | | | | 13,856 | |
Targa Resources Corp. | | | | | | | 2,745 | | | | 111,694 | |
Teekay Tankers Ltd., Class A | | | MH | | | | 7,135 | | | | 25,115 | |
Triangle Petroleum Corp.* | | | | | | | 7,503 | | | | 44,793 | |
Ur-Energy, Inc.* | | | CA | | | | 18,035 | | | | 15,492 | |
Uranerz Energy Corp.* | | | | | | | 10,386 | | | | 18,903 | |
Uranium Energy Corp.* | | | | | | | 12,621 | | | | 38,620 | |
Uranium Resources, Inc.* | | | | | | | 16,412 | | | | 11,915 | |
USEC, Inc.* | | | | | | | 19,410 | | | | 22,127 | |
Vaalco Energy, Inc.* | | | | | | | 8,700 | | | | 52,548 | |
Venoco, Inc.* | | | | | | | 5,045 | | | | 34,155 | |
Voyager Oil & Gas, Inc.* | | | | | | | 8,096 | | | | 20,807 | |
W&T Offshore, Inc. | | | | | | | 5,891 | | | | 124,948 | |
Warren Resources, Inc.* | | | | | | | 11,885 | | | | 38,745 | |
Western Refining, Inc.* | | | | | | | 8,882 | | | | 118,042 | |
Westmoreland Coal Co.* | | | | | | | 1,693 | | | | 21,586 | |
| | | | | | | | | | |
| | | Country
Code** | | Shares | | | Value | |
| | | | | | | | | | |
| | | | | | | | | | |
World Fuel Services Corp. | | | | | 11,965 | | | $ | 502,291 | |
Zion Oil & Gas, Inc.* | | | | | 4,894 | | | | 10,816 | |
| | | | | | | | | | |
| | | | | | | | | 8,626,814 | |
| | | | | | | | | | |
PAPER & FOREST PRODUCTS – 0.6% | |
Buckeye Technologies, Inc. | | | | | 6,775 | | | | 226,556 | |
Clearwater Paper Corp.* | | | | | 3,886 | | | | 138,380 | |
Deltic Timber Corp. | | | | | 1,815 | | | | 109,608 | |
KapStone Paper and Packaging Corp.* | | | | | 6,580 | | | | 103,569 | |
Louisiana-Pacific Corp.* | | | | | 22,298 | | | | 179,945 | |
Neenah Paper, Inc. | | | | | 2,489 | | | | 55,554 | |
P.H. Glatfelter Co. | | | | | 7,382 | | | | 104,234 | |
Schweitzer-Mauduit International, Inc. | | | | | 2,732 | | | | 181,569 | |
Verso Paper Corp.* | | | | | 2,417 | | | | 2,320 | |
Wausau Paper Corp. | | | | | 8,487 | | | | 70,103 | |
| | | | | | | | | | |
| | | | | | | | | 1,171,838 | |
| | | | | | | | | | |
PERSONAL PRODUCTS – 0.5% | |
Elizabeth Arden, Inc.* | | | | | 4,134 | | | | 153,123 | |
Inter Parfums, Inc. | | | | | 2,798 | | | | 43,537 | |
Medifast, Inc.* | | | | | 2,406 | | | | 33,010 | |
Natures Sunshine Products, Inc.* | | | | | 1,929 | | | | 29,938 | |
Nu Skin Enterprises, Inc. | | | | | 9,267 | | | | 450,098 | |
Nutraceutical International Corp.* | | | | | 1,577 | | | | 17,852 | |
Prestige Brands Holdings, Inc.* | | | | | 8,451 | | | | 95,243 | |
Revlon, Inc., Class A* | | | | | 1,886 | | | | 28,045 | |
Schiff Nutrition International, Inc.* | | | | | 2,019 | | | | 21,603 | |
Synutra International, Inc.* | | | | | 2,938 | | | | 14,866 | |
The Female Health Co. | | | | | 3,257 | | | | 14,689 | |
USANA Health Sciences, Inc.* | | | | | 1,075 | | | | 32,648 | |
| | | | | | | | | | |
| | | | | | | | | 934,652 | |
| | | | | | | | | | |
See Notes to Financial Statements.
162
| | |
SC SM BLACKROCK SMALL CAP INDEX FUND PORTFOLIOOF INVESTMENTS (Continued) |
| December 31, 2011 | | Sun Capital Advisers Trust |
| | | | | | | | | | |
| | | Country
Code** | | Shares | | | Value | |
| | | | | | | | | | |
| | | | | | | | | | |
PHARMACEUTICALS – 1.8% | |
Acura Pharmaceuticals, Inc.* | | | | | 1,789 | | | $ | 6,244 | |
Akorn, Inc.* | | | | | 9,443 | | | | 105,006 | |
Alimera Sciences, Inc.* | | | | | 1,887 | | | | 2,359 | |
Ampio Pharmaceuticals, Inc.* | | | | | 3,339 | | | | 14,257 | |
Auxilium Pharmaceuticals, Inc.* | | | | | 8,049 | | | | 160,416 | |
Avanir Pharmaceuticals, Inc., Class A* | | | | | 21,219 | | | | 43,499 | |
Cadence Pharmaceuticals, Inc.* | | | | | 8,056 | | | | 31,821 | |
Columbia Laboratories, Inc.* | | | | | 12,230 | | | | 30,575 | |
Corcept Therapeutics, Inc.* | | | | | 7,119 | | | | 24,347 | |
Cornerstone Therapeutics, Inc.* | | | | | 1,354 | | | | 7,582 | |
Depomed, Inc.* | | | | | 9,109 | | | | 47,185 | |
Durect Corp.* | | | | | 13,388 | | | | 15,798 | |
Endocyte, Inc.* | | | | | 2,842 | | | | 10,686 | |
Hi-Tech Pharmacal Co., Inc.* | | | | | 1,756 | | | | 68,291 | |
Impax Laboratories, Inc.* | | | | | 11,065 | | | | 223,181 | |
ISTA Pharmaceuticals, Inc.* | | | | | 5,306 | | | | 37,407 | |
Jazz Pharmaceuticals, Inc.* | | | | | 3,727 | | | | 143,974 | |
KV Pharmaceutical Co., Class A* | | | | | 9,108 | | | | 12,751 | |
Lannett Co, Inc.* | | | | | 2,688 | | | | 11,881 | |
Map Pharmaceuticals, Inc.* | | | | | 3,757 | | | | 49,480 | |
Medicis Pharmaceutical Corp., Class A | | | | | 10,478 | | | | 348,393 | |
Nektar Therapeutics* | | | | | 19,086 | | | | 106,786 | |
NeoStem, Inc.* | | | | | 8,958 | | | | 4,542 | |
Obagi Medical Products, Inc.* | | | | | 3,140 | | | | 31,902 | |
Optimer Pharmaceuticals, Inc.* | | | | | 7,782 | | | | 95,252 | |
Pacira Pharmaceuticals, Inc.* | | | | | 1,084 | | | | 9,377 | |
| | | | | | | | | | |
| | | Country
Code** | | Shares | | | Value | |
| | | | | | | | | | |
| | | | | | | | | | |
Pain Therapeutics, Inc.* | | | | | 6,079 | | | $ | 23,100 | |
Par Pharmaceutical Cos., Inc.* | | | | | 6,123 | | | | 200,406 | |
Pernix Therapeutics Holdings, Inc.* | | | | | 718 | | | | 6,649 | |
Pozen, Inc.* | | | | | 4,448 | | | | 17,570 | |
Questcor Pharmaceuticals, Inc.* | | | | | 8,996 | | | | 374,054 | |
Sagent Pharmaceuticals, Inc.* | | | | | 1,173 | | | | 24,633 | |
Salix Pharmaceuticals Ltd.* | | | | | 9,875 | | | | 472,519 | |
Santarus Inc.* | | | | | 8,889 | | | | 29,423 | |
Sucampo Pharmaceuticals, Inc., Class A* | | | | | 2,255 | | | | 9,990 | |
The Medicines Co.* | | | | | 9,107 | | | | 169,754 | |
Transcept Pharmaceuticals, Inc.* | | | | | 838 | | | | 6,561 | |
ViroPharma, Inc.* | | | | | 11,979 | | | | 328,105 | |
Vivus, Inc.* | | | | | 14,982 | | | | 146,074 | |
Xenoport, Inc.* | | | | | 6,218 | | | | 23,691 | |
| | | | | | | | | | |
| | | | | | | | | 3,475,521 | |
| | | | | | | | | | |
PROFESSIONAL SERVICES – 1.5% | |
Acacia Research – Acacia Technologies* | | | | | 7,227 | | | | 263,858 | |
Barrett Business Services, Inc. | | | | | 1,295 | | | | 25,848 | |
CBIZ, Inc.* | | | | | 6,556 | | | | 40,057 | |
CDI Corp. | | | | | 2,173 | | | | 30,009 | |
Costar Group, Inc.* | | | | | 4,276 | | | | 285,338 | |
CRA International, Inc.* | | | | | 1,881 | | | | 37,319 | |
Dolan Co.* | | | | | 5,124 | | | | 43,657 | |
Exponent, Inc.* | | | | | 2,193 | | | | 100,812 | |
Franklin Covey Co.* | | | | | 2,231 | | | | 18,897 | |
FTI Consulting, Inc.* | | | | | 7,114 | | | | 301,776 | |
GP Strategies Corp.* | | | | | 2,501 | | | | 33,713 | |
Heidrick & Struggles International, Inc. | | | | | 3,065 | | | | 66,020 | |
Hill International, Inc.* | | | | | 4,249 | | | | 21,840 | |
Hudson Highland Group, Inc.* | | | | | 5,548 | | | | 26,575 | |
See Notes to Financial Statements.
163
| | |
SC SM BLACKROCK SMALL CAP INDEX FUND PORTFOLIOOF INVESTMENTS (Continued) |
| December 31, 2011 | | Sun Capital Advisers Trust |
| | | | | | | | | | |
| | | Country
Code** | | Shares | | | Value | |
| | | | | | | | | | |
| | | | | | | | | | |
Huron Consulting Group, Inc.* | | | | | 3,742 | | | $ | 144,965 | |
ICF International, Inc.* | | | | | 3,294 | | | | 81,625 | |
Insperity, Inc. | | | | | 3,855 | | | | 97,724 | |
Kelly Services, Inc., Class A | | | | | 4,552 | | | | 62,271 | |
Kforce, Inc.* | | | | | 4,951 | | | | 61,046 | |
Korn / Ferry International* | | | | | 7,942 | | | | 135,491 | |
Mistras Group, Inc.* | | | | | 2,500 | | | | 63,725 | |
Navigant Consulting, Inc.* | | | | | 8,669 | | | | 98,913 | |
Odyssey Marine Exploration, Inc.* | | | | | 12,479 | | | | 34,192 | |
On Assignment, Inc.* | | | | | 6,348 | | | | 70,971 | |
Pendrell Corp.* | | | | | 25,511 | | | | 65,308 | |
Resources Connection, Inc. | | | | | 7,804 | | | | 82,644 | |
RPX Corp.* | | | | | 1,655 | | | | 20,936 | |
The Advisory Board Co.* | | | | | 2,676 | | | | 198,586 | |
The Corporate Executive Board Co. | | | | | 5,847 | | | | 222,771 | |
Trueblue, Inc.* | | | | | 6,725 | | | | 93,343 | |
VSE Corp. | | | | | 729 | | | | 17,700 | |
| | | | | | | | | | |
| | | | | | | | | 2,847,930 | |
| | | | | | | | | | |
REAL ESTATE INVESTMENT TRUSTS – 8.8% | |
Acadia Realty Trust | | | | | 7,113 | | | | 143,256 | |
AG Mortgage Investment Trust, Inc. | | | | | 1,083 | | | | 21,801 | |
Agree Realty Corp. | | | | | 1,684 | | | | 41,056 | |
Alexander’s, Inc. | | | | | 345 | | | | 127,660 | |
American Assets Trust, Inc. | | | | | 5,337 | | | | 109,462 | |
American Campus Communities, Inc. | | | | | 11,512 | | | | 483,044 | |
American Capital Mortgage Investment Corp. | | | | | 1,376 | | | | 25,896 | |
Anworth Mortgage Asset Corp. | | | | | 22,855 | | | | 143,529 | |
Apollo Commercial Real Estate Finance, Inc. | | | | | 3,459 | | | | 45,417 | |
| | | | | | | | | | |
| | | Country
Code** | | Shares | | | Value | |
| | | | | | | | | | |
| | | | | | | | | | |
ARMOUR Residential REIT, Inc. | | | | | 15,621 | | | $ | 110,128 | |
Ashford Hospitality Trust, Inc. | | | | | 8,958 | | | | 71,664 | |
Associated Estates Realty Corp. | | | | | 7,088 | | | | 113,054 | |
BioMed Realty Trust, Inc. | | | | | 26,029 | | | | 470,604 | |
Campus Crest Communities, Inc. | | | | | 5,267 | | | | 52,986 | |
CapLease, Inc. | | | | | 11,682 | | | | 47,195 | |
Capstead Mortgage Corp. | | | | | 14,328 | | | | 178,240 | |
CBL & Associates Properties, Inc. | | | | | 25,141 | | | | 394,714 | |
Cedar Realty Trust, Inc. | | | | | 9,638 | | | | 41,540 | |
Chatham Lodging Trust | | | | | 2,353 | | | | 25,365 | |
Chesapeake Lodging Trust | | | | | 5,285 | | | | 81,706 | |
Cogdell Spencer, Inc. | | | | | 7,808 | | | | 33,184 | |
Colonial Properties Trust | | | | | 14,148 | | | | 295,127 | |
Colony Financial, Inc. | | | | | 5,619 | | | | 88,274 | |
Coresite Realty Corp. | | | | | 3,411 | | | | 60,784 | |
Cousins Properties, Inc. | | | | | 15,258 | | | | 97,804 | |
CreXus Investment Corp. | | | | | 9,780 | | | | 101,516 | |
CubeSmart | | | | | 20,705 | | | | 220,301 | |
CYS Investments, Inc. | | | | | 13,934 | | | | 183,093 | |
DCT Industrial Trust, Inc. | | | | | 41,439 | | | | 212,168 | |
DiamondRock Hospitality Co. | | | | | 28,279 | | | | 272,610 | |
DuPont Fabros Technology, Inc. | | | | | 9,934 | | | | 240,601 | |
Dynex Capital, Inc. | | | | | 6,791 | | | | 62,002 | |
EastGroup Properties, Inc. | | | | | 4,555 | | | | 198,051 | |
Education Realty Trust, Inc. | | | | | 15,435 | | | | 157,900 | |
Entertainment Properties Trust | | | | | 7,870 | | | | 343,998 | |
See Notes to Financial Statements.
164
| | |
SC SM BLACKROCK SMALL CAP INDEX FUND PORTFOLIOOF INVESTMENTS (Continued) |
| December 31, 2011 | | Sun Capital Advisers Trust |
| | | | | | | | | | |
| | | Country
Code** | | Shares | | | Value | |
| | | | | | | | | | |
| | | | | | | | | | |
Equity Lifestyle Properties, Inc. | | | | | 5,220 | | | $ | 348,122 | |
Equity One, Inc. | | | | | 9,122 | | | | 154,892 | |
Excel Trust, Inc. | | | | | 5,231 | | | | 62,772 | |
Extra Space Storage, Inc. | | | | | 15,943 | | | | 386,299 | |
FelCor Lodging Trust, Inc.* | | | | | 21,477 | | | | 65,505 | |
First Industrial Realty Trust, Inc.* | | | | | 14,569 | | | | 149,041 | |
First Potomac Realty Trust | | | | | 8,324 | | | | 108,628 | |
Franklin Street Properties Corp. | | | | | 11,960 | | | | 119,002 | |
Getty Realty Corp. | | | | | 4,475 | | | | 62,426 | |
Gladstone Commercial Corp. | | | | | 1,887 | | | | 33,117 | |
Glimcher Realty Trust | | | | | 18,117 | | | | 166,676 | |
Government Properties Income Trust | | | | | 5,899 | | | | 133,022 | |
Hatteras Financial Corp. | | | | | 12,667 | | | | 334,029 | |
Healthcare Realty Trust, Inc. | | | | | 13,129 | | | | 244,068 | |
Hersha Hospitality Trust | | | | | 23,686 | | | | 115,588 | |
Highwoods Properties, Inc. | | | | | 12,321 | | | | 365,564 | |
Home Properties, Inc. | | | | | 8,149 | | | | 469,138 | |
Hudson Pacific Properties, Inc. | | | | | 3,723 | | | | 52,718 | |
Inland Real Estate Corp. | | | | | 12,893 | | | | 98,116 | |
Invesco Mortgage Capital, Inc. | | | | | 19,742 | | | | 277,375 | |
Investors Real Estate Trust | | | | | 13,240 | | | | 96,586 | |
iStar Financial, Inc.* | | | | | 13,724 | | | | 72,600 | |
Kilroy Realty Corp. | | | | | 9,913 | | | | 377,388 | |
Kite Realty Group Trust | | | | | 8,978 | | | | 40,491 | |
LaSalle Hotel Properties | | | | | 14,426 | | | | 349,253 | |
Lexington Realty Trust | | | | | 20,206 | | | | 151,343 | |
LTC Properties, Inc. | | | | | 5,116 | | | | 157,880 | |
Medical Properties Trust, Inc. | | | | | 19,006 | | | | 187,589 | |
| | | | | | | | | | |
| | | Country
Code** | | Shares | | | Value | |
| | | | | | | | | | |
| | | | | | | | | | |
MFA Financial, Inc. | | | | | 60,588 | | | $ | 407,151 | |
Mid-America Apartment Communities, Inc. | | | | | 6,219 | | | | 388,998 | |
Mission West Properties, Inc. | | | | | 3,093 | | | | 27,899 | |
Monmouth Real Estate Investment Corp., Class A | | | | | 6,560 | | | | 60,024 | |
MPG Office Trust, Inc.* | | | | | 8,474 | | | | 16,863 | |
National Health Investors, Inc. | | | | | 4,126 | | | | 181,461 | |
National Retail Properties, Inc. | | | | | 17,672 | | | | 466,187 | |
Newcastle Investment Corp. | | | | | 17,787 | | | | 82,710 | |
Northstar Realty Finance Corp. | | | | | 16,423 | | | | 78,338 | |
Omega Healthcare Investors, Inc. | | | | | 17,215 | | | | 333,110 | |
One Liberty Properties, Inc. | | | | | 1,875 | | | | 30,938 | |
Parkway Properties, Inc. | | | | | 3,729 | | | | 36,768 | |
Pebblebrook Hotel Trust | | | | | 8,533 | | | | 163,663 | |
Pennsylvania Real Estate Investment | | | | | 9,342 | | | | 97,530 | |
PennyMac Mortgage Investment Trust | | | | | 4,752 | | | | 78,978 | |
Post Properties, Inc. | | | | | 8,437 | | | | 368,866 | |
Potlatch Corp. | | | | | 6,804 | | | | 211,672 | |
PS Business Parks, Inc. | | | | | 3,140 | | | | 174,050 | |
RAIT Financial Trust | | | | | 6,998 | | | | 33,241 | |
Ramco-Gershenson Properties Trust | | | | | 6,650 | | | | 65,369 | |
Redwood Trust, Inc. | | | | | 13,021 | | | | 132,554 | |
Resource Capital Corp. | | | | | 13,167 | | | | 73,867 | |
Retail Opportunity Investments Corp. | | | | | 8,315 | | | | 98,450 | |
RLJ Lodging Trust | | | | | 4,618 | | | | 77,721 | |
Sabra Health Care REIT, Inc. | | | | | 6,350 | | | | 76,771 | |
Saul Centers, Inc. | | | | | 1,266 | | | | 44,842 | |
See Notes to Financial Statements.
165
| | |
SC SM BLACKROCK SMALL CAP INDEX FUND PORTFOLIOOF INVESTMENTS (Continued) |
| December 31, 2011 | | Sun Capital Advisers Trust |
| | | | | | | | | | |
| | | Country
Code** | | Shares | | | Value | |
| | | | | | | | | | |
| | | | | | | | | | |
Sovran Self Storage, Inc. | | | | | 4,672 | | | $ | 199,354 | |
STAG Industrial, Inc. | | | | | 2,702 | | | | 30,992 | |
Starwood Property Trust, Inc. | | | | | 15,754 | | | | 291,607 | |
Strategic Hotels & Resorts, Inc.* | | | | | 29,473 | | | | 158,270 | |
Summit Hotel Properties, Inc. | | | | | 4,637 | | | | 43,773 | |
Sun Communities, Inc. | | | | | 3,541 | | | | 129,353 | |
Sunstone Hotel Investors, Inc.* | | | | | 19,916 | | | | 162,315 | |
Tanger Factory Outlet Centers, Inc. | | | | | 14,584 | | | | 427,603 | |
Terreno Realty Corp. | | | | | 1,592 | | | | 24,103 | |
Two Harbors Investment Corp. | | | | | 23,836 | | | | 220,245 | |
UMH Properties, Inc. | | | | | 1,933 | | | | 17,996 | |
Universal Health Realty Income Trust | | | | | 2,033 | | | | 79,287 | |
Urstadt Biddle Properties, Inc., Class A | | | | | 3,958 | | | | 71,561 | |
Washington Real Estate Investment Trust | | | | | 11,176 | | | | 305,664 | |
Whitestone REIT, Class B | | | | | 1,145 | | | | 13,626 | |
Winthrop Realty Trust | | | | | 5,043 | | | | 51,287 | |
| | | | | | | | | | |
| | | | | | | | | 16,510,015 | |
| | | | | | | | | | |
REAL ESTATE MANAGEMENT & DEVELOPMENT – 0.1% | |
Avatar Holdings, Inc.* | | | | | 1,349 | | | | 9,686 | |
Consolidated-Tomoka Land Co. | | | | | 698 | | | | 18,895 | |
Forestar Group, Inc.* | | | | | 5,946 | | | | 89,963 | |
Kennedy-Wilson Holdings, Inc. | | | | | 4,384 | | | | 46,382 | |
Tejon Ranch Co.* | | | | | 2,437 | | | | 59,658 | |
| | | | | | | | | | |
| | | | | | | | | 224,584 | |
| | | | | | | | | | |
ROAD & RAIL – 1.2% | |
Amerco | | | | | 1,464 | | | | 129,418 | |
Arkansas Best Corp. | | | | | 4,375 | | | | 84,306 | |
| | | | | | | | | | | | |
| | | Country
Code** | | | Shares | | | Value | |
| | | | | | | | | | | | |
| | | | | | | | | | | | |
Avis Budget Group, Inc.* | | | | | | | 17,771 | | | $ | 190,505 | |
Celadon Group, Inc. | | | | | | | 3,368 | | | | 39,776 | |
Covenant Transport Group, Inc., Class A* | | | | | | | 1,175 | | | | 3,490 | |
Dollar Thrifty Automotive Group* | | | | | | | 4,899 | | | | 344,204 | |
Genesee & Wyoming, Inc., Class A* | | | | | | | 6,675 | | | | 404,372 | |
Heartland Express, Inc. | | | | | | | 8,532 | | | | 121,922 | |
Knight Transportation, Inc. | | | | | | | 10,332 | | | | 161,592 | |
Marten Transport Ltd. | | | | | | | 2,624 | | | | 47,206 | |
Old Dominion Freight Line, Inc.* | | | | | | | 8,035 | | | | 325,659 | |
Patriot Transportation Holding, Inc.* | | | | | | | 1,062 | | | | 23,045 | |
Quality Distribution, Inc.* | | | | | | | 2,589 | | | | 29,126 | |
RailAmerica, Inc.* | | | | | | | 3,632 | | | | 54,080 | |
Roadrunner Transportation Systems, Inc.* | | | | | | | 1,536 | | | | 21,704 | |
Saia, Inc.* | | | | | | | 2,757 | | | | 34,407 | |
Swift Transportation Co.* | | | | | | | 13,333 | | | | 109,864 | |
Universal Truckload Services, Inc. | | | | | | | 891 | | | | 16,172 | |
Werner Enterprises, Inc. | | | | | | | 7,437 | | | | 179,232 | |
Zipcar, Inc.* | | | | | | | 1,796 | | | | 24,102 | |
| | | | | | | | | | | | |
| | | | | | | | | | | 2,344,182 | |
| | | | | | | | | | | | |
SEMICONDUCTORS & SEMICONDUCTOR EQUIPMENT – 3.6% | |
Advanced Analogic Technologies, Inc.* | | | | | | | 7,148 | | | | 41,315 | |
Advanced Energy Industries, Inc.* | | | | | | | 7,309 | | | | 78,426 | |
Alpha & Omega Semiconductor Ltd.* | | | BM | | | | 2,452 | | | | 17,924 | |
Amkor Technology, Inc.* | | | | | | | 15,934 | | | | 69,472 | |
See Notes to Financial Statements.
166
| | |
SC SM BLACKROCK SMALL CAP INDEX FUND PORTFOLIOOF INVESTMENTS (Continued) |
| December 31, 2011 | | Sun Capital Advisers Trust |
| | | | | | | | | | |
| | | Country
Code** | | Shares | | | Value | |
| | | | | | | | | | |
| | | | | | | | | | |
Amtech Systems, Inc.* | | | | | 1,667 | | | $ | 14,186 | |
Anadigics, Inc.* | | | | | 11,063 | | | | 24,228 | |
Applied Micro Circuits Corp.* | | | | | 10,626 | | | | 71,407 | |
ATMI, Inc.* | | | | | 5,333 | | | | 106,820 | |
Axcelis Technologies, Inc.* | | | | | 17,653 | | | | 23,479 | |
AXT, Inc.* | | | | | 5,651 | | | | 23,565 | |
Brooks Automation, Inc. | | | | | 11,164 | | | | 114,654 | |
Cabot Microelectronics Corp.* | | | | | 3,979 | | | | 188,008 | |
Cavium, Inc.* | | | | | 8,188 | | | | 232,785 | |
Ceva, Inc.* | | | | | 3,875 | | | | 117,258 | |
Cirrus Logic, Inc.* | | | | | 11,224 | | | | 177,900 | |
Cohu, Inc. | | | | | 4,041 | | | | 45,865 | |
Cymer, Inc.* | | | | | 5,174 | | | | 257,458 | |
Diodes, Inc.* | | | | | 5,968 | | | | 127,118 | |
DSP Group, Inc.* | | | | | 3,875 | | | | 20,189 | |
Entegris, Inc.* | | | | | 22,768 | | | | 198,651 | |
Entropic Communications, Inc.* | | | | | 14,358 | | | | 73,369 | |
Exar Corp.* | | | | | 6,104 | | | | 39,676 | |
FormFactor, Inc.* | | | | | 8,623 | | | | 43,632 | |
FSI International, Inc.* | | | | | 6,681 | | | | 24,452 | |
GSI Technology, Inc.* | | | | | 3,392 | | | | 15,875 | |
GT Advanced Technologies, Inc.* | | | | | 21,352 | | | | 154,589 | |
Hittite Microwave Corp.* | | | | | 5,312 | | | | 262,307 | |
Inphi, Corp.* | | | | | 3,714 | | | | 44,419 | |
Integrated Device Technology, Inc.* | | | | | 25,073 | | | | 136,899 | |
Integrated Silicon Solution, Inc.* | | | | | 4,489 | | | | 41,029 | |
Intermolecular, Inc.* | | | | | 1,651 | | | | 14,166 | |
IXYS Corp.* | | | | | 4,152 | | | | 44,966 | |
Kopin Corp.* | | | | | 11,340 | | | | 43,999 | |
Kulicke & Soffa Industries, Inc.* | | | | | 12,140 | | | | 112,295 | |
Lattice Semiconductor Corp.* | | | | | 19,885 | | | | 118,117 | |
LTX-Credence Corp.* | | | | | 8,526 | | | | 45,614 | |
| | | | | | | | | | |
| | | Country
Code** | | Shares | | | Value | |
| | | | | | | | | | |
| | | | | | | | | | |
MaxLinear, Inc., Class A* | | | | | 2,685 | | | $ | 12,754 | |
Micrel, Inc. | | | | | 8,486 | | | | 85,794 | |
Microsemi Corp.* | | | | | 14,647 | | | | 245,337 | |
Mindspeed Technologies, Inc.* | | | | | 5,844 | | | | 26,766 | |
MIPS Technologies, Inc.* | | | | | 9,033 | | | | 40,287 | |
MKS Instruments, Inc. | | | | | 8,850 | | | | 246,207 | |
Monolithic Power Systems, Inc.* | | | | | 5,014 | | | | 75,561 | |
MoSys, Inc.* | | | | | 5,241 | | | | 22,012 | |
Nanometrics, Inc.* | | | | | 3,458 | | | | 63,696 | |
Netlogic Microsystems, Inc.* | | | | | 11,565 | | | | 573,277 | |
Nve Corp.* | | | | | 793 | | | | 44,035 | |
Omnivision Technologies, Inc.* | | | | | 9,805 | | | | 119,964 | |
PDF Solutions, Inc.* | | | | | 3,946 | | | | 27,504 | |
Pericom Semiconductor Corp.* | | | | | 4,202 | | | | 31,977 | |
Photronics, Inc.* | | | | | 10,100 | | | | 61,408 | |
PLX Technology, Inc.* | | | | | 7,393 | | | | 21,218 | |
Power Integrations, Inc. | | | | | 4,883 | | | | 161,920 | |
Rambus, Inc.* | | | | | 16,577 | | | | 125,156 | |
RF Micro Devices, Inc.* | | | | | 46,804 | | | | 252,742 | |
Rubicon Technology, Inc.* | | | | | 3,042 | | | | 28,564 | |
Rudolph Technologies, Inc.* | | | | | 5,478 | | | | 50,726 | |
Semtech Corp.* | | | | | 11,068 | | | | 274,708 | |
Sigma Designs, Inc.* | | | | | 5,291 | | | | 31,746 | |
Silicon Image, Inc.* | | | | | 13,688 | | | | 64,334 | |
Spansion, Inc., Class A* | | | | | 8,687 | | | | 71,928 | |
Standard Microsystems Corp.* | | | | | 3,867 | | | | 99,653 | |
STR Holdings, Inc.* | | | | | 5,196 | | | | 42,763 | |
Supertex, Inc.* | | | | | 1,576 | | | | 29,755 | |
Tessera Technologies, Inc.* | | | | | 8,642 | | | | 144,754 | |
Triquint Semiconductor, Inc.* | | | | | 27,816 | | | | 135,464 | |
See Notes to Financial Statements.
167
| | |
SC SM BLACKROCK SMALL CAP INDEX FUND PORTFOLIOOF INVESTMENTS (Continued) |
| December 31, 2011 | | Sun Capital Advisers Trust |
| | | | | | | | | | |
| | | Country
Code** | | Shares | | | Value | |
| | | | | | | | | | |
| | | | | | | | | | |
Ultra Clean Holdings* | | | | | 3,893 | | | $ | 23,786 | |
Ultratech, Inc.* | | | | | 4,230 | | | | 103,931 | |
Veeco Instruments, Inc.* | | | | | 6,902 | | | | 143,562 | |
Volterra Semiconductor Corp.* | | | | | 4,130 | | | | 105,769 | |
| | | | | | | | | | |
| | | | | | | | | 6,755,170 | |
| | | | | | | | | | |
SOFTWARE – 4.4% | |
Accelrys, Inc.* | | | | | 9,503 | | | | 63,860 | |
ACI Worldwide, Inc.* | | | | | 5,648 | | | | 161,759 | |
Actuate Corp.* | | | | | 6,371 | | | | 37,334 | |
Advent Software, Inc.* | | | | | 5,550 | | | | 135,198 | |
American Software, Inc., Class A | | | | | 3,798 | | | | 35,891 | |
Aspen Technology, Inc.* | | | | | 14,312 | | | | 248,313 | |
Blackbaud, Inc. | | | | | 7,533 | | | | 208,664 | |
Bottomline Technologies, Inc.* | | | | | 6,041 | | | | 139,970 | |
BroadSoft, Inc.* | | | | | 3,802 | | | | 114,820 | |
Callidus Software, Inc.* | | | | | 5,215 | | | | 33,480 | |
Commvault Systems, Inc.* | | | | | 7,453 | | | | 318,392 | |
Concur Technologies, Inc.* | | | | | 7,558 | | | | 383,871 | |
Convio, Inc.* | | | | | 2,040 | | | | 22,562 | |
Deltek, Inc.* | | | | | 3,760 | | | | 36,923 | |
DemandTec, Inc.* | | | | | 5,555 | | | | 73,159 | |
Digimarc Corp.* | | | | | 1,097 | | | | 26,207 | |
Ebix, Inc. | | | | | 4,854 | | | | 107,273 | |
Ellie Mae, Inc.* | | | | | 1,306 | | | | 7,379 | |
Epiq Systems, Inc. | | | | | 5,371 | | | | 64,559 | |
ePlus, Inc.* | | | | | 668 | | | | 18,891 | |
Fair Issac Corp. | | | | | 6,048 | | | | 216,760 | |
FalconStor Software, Inc.* | | | | | 5,177 | | | | 13,357 | |
Glu Mobile, Inc.* | | | | | 8,193 | | | | 25,726 | |
Guidance Software, Inc.* | | | | | 2,237 | | | | 14,496 | |
Imperva, Inc.* | | | | | 941 | | | | 32,756 | |
Interactive Intelligence Group* | | | | | 2,437 | | | | 55,856 | |
JDA Software Group, Inc.* | | | | | 7,158 | | | | 231,848 | |
| | | | | | | | | | |
| | | Country
Code** | | Shares | | | Value | |
| | | | | | | | | | |
| | | | | | | | | | |
Kenexa Corp.* | | | | | 4,454 | | | $ | 118,922 | |
Magma Design Automation, Inc.* | | | | | 11,199 | | | | 80,409 | |
Manhattan Associates, Inc.* | | | | | 3,454 | | | | 139,818 | |
Mentor Graphics Corp.* | | | | | 16,275 | | | | 220,689 | |
Microstrategy, Inc.* | | | | | 1,351 | | | | 146,340 | |
Monotype Imaging Holdings, Inc.* | | | | | 6,009 | | | | 93,680 | |
Motricity, Inc.* | | | | | 6,454 | | | | 5,809 | |
Netscout Systems, Inc.* | | | | | 6,310 | | | | 111,056 | |
Netsuite, Inc.* | | | | | 4,605 | | | | 186,733 | |
Opnet Technologies, Inc. | | | | | 2,461 | | | | 90,245 | |
Parametric Technology Corp.* | | | | | 20,183 | | | | 368,542 | |
Pegasystems, Inc. | | | | | 2,781 | | | | 81,761 | |
Progress Software Corp.* | | | | | 11,346 | | | | 219,545 | |
PROS Holdings, Inc.* | | | | | 3,696 | | | | 54,997 | |
QAD, Inc., Class A* | | | | | 1,182 | | | | 12,411 | |
Qlik Technologies, Inc.* | | | | | 11,911 | | | | 288,246 | |
Quest Software, Inc.* | | | | | 9,574 | | | | 178,076 | |
Realpage, Inc.* | | | | | 5,120 | | | | 129,382 | |
Rosetta Stone, Inc.* | | | | | 2,000 | | | | 15,260 | |
S1 Corp.* | | | | | 9,452 | | | | 90,456 | |
Seachange International, Inc.* | | | | | 4,386 | | | | 30,834 | |
Smith Micro Software, Inc.* | | | | | 5,997 | | | | 6,777 | |
SolarWinds, Inc.* | | | | | 9,639 | | | | 269,410 | |
Sourcefire, Inc.* | | | | | 4,796 | | | | 155,295 | |
SRS Labs, Inc.* | | | | | 1,950 | | | | 11,213 | |
SS&C Technologies Holdings, Inc.* | | | | | 4,217 | | | | 76,159 | |
SuccessFactors, Inc.* | | | | | 14,111 | | | | 562,606 | |
Synchronoss Technologies, Inc.* | | | | | 4,464 | | | | 134,857 | |
Take-Two Interactive Software, Inc.* | | | | | 12,434 | | | | 168,481 | |
Taleo Corp.* | | | | | 6,939 | | | | 268,470 | |
Tangoe, Inc.* | | | | | 1,660 | | | | 25,564 | |
Telecommunication Systems, Inc.* | | | | | 8,257 | | | | 19,404 | |
TeleNav, Inc.* | | | | | 2,837 | | | | 22,157 | |
THQ, Inc.* | | | | | 11,947 | | | | 9,080 | |
Tivo, Inc.* | | | | | 20,188 | | | | 181,086 | |
Tyler Technologies, Inc.* | | | | | 4,961 | | | | 149,376 | |
See Notes to Financial Statements.
168
| | |
SC SM BLACKROCK SMALL CAP INDEX FUND PORTFOLIOOF INVESTMENTS (Continued) |
| December 31, 2011 | | Sun Capital Advisers Trust |
| | | | | | | | | | |
| | | Country
Code** | | Shares | | | Value | |
| | | | | | | | | | |
| | | | | | | | | | |
Ultimate Software Group, Inc.* | | | | | 4,370 | | | $ | 284,574 | |
Vasco Data Security International* | | | | | 4,673 | | | | 30,468 | |
Verint Systems, Inc.* | | | | | 3,561 | | | | 98,070 | |
Virnetx Holding Corp.* | | | | | 6,883 | | | | 171,869 | |
Wave Systems Corp.* | | | | | 13,773 | | | | 29,887 | |
Websense, Inc.* | | | | | 6,740 | | | | 126,240 | |
| | | | | | | | | | |
| | | | | | | | | 8,293,558 | |
| | | | | | | | | | |
SPECIALTY RETAIL – 3.5% | |
Aeropostale, Inc.* | | | | | 13,666 | | | | 208,406 | |
America’s Car-Mart, Inc.* | | | | | 1,440 | | | | 56,419 | |
Ann, Inc.* | | | | | 8,805 | | | | 218,188 | |
Asbury Automotive Group, Inc.* | | | | | 4,898 | | | | 105,601 | |
Ascena Retail Group, Inc.* | | | | | 10,634 | | | | 316,042 | |
Barnes & Noble, Inc.* | | | | | 4,868 | | | | 70,489 | |
Bebe Stores, Inc. | | | | | 6,597 | | | | 54,953 | |
Big 5 Sporting Goods Corp. | | | | | 3,777 | | | | 39,432 | |
Body Central Corp.* | | | | | 1,954 | | | | 48,772 | |
Brown Shoe Co., Inc. | | | | | 7,115 | | | | 63,323 | |
Build-A-Bear Workshop, Inc.* | | | | | 2,431 | | | | 20,566 | |
Cabela’s, Inc.* | | | | | 7,344 | | | | 186,684 | |
Casual Male Retail Group, Inc.* | | | | | 7,513 | | | | 25,694 | |
Charming Shoppes, Inc.* | | | | | 19,532 | | | | 95,707 | |
Children’s Place Retail Stores, Inc.* | | | | | 4,410 | | | | 234,259 | |
Christopher & Banks Corp. | | | | | 6,494 | | | | 15,196 | |
Citi Trends, Inc.* | | | | | 2,629 | | | | 23,083 | |
Coldwater Creek, Inc.* | | | | | 12,926 | | | | 15,253 | |
Collective Brands, Inc.* | | | | | 10,399 | | | | 149,434 | |
Conn’s, Inc.* | | | | | 2,465 | | | | 27,362 | |
Cost Plus, Inc.* | | | | | 3,183 | | | | 31,034 | |
Destination Maternity Corp. | | | | | 1,793 | | | | 29,979 | |
| | | | | | | | | | |
| | | Country
Code** | | Shares | | | Value | |
| | | | | | | | | | |
| | | | | | | | | | |
Express, Inc.* | | | | | 9,349 | | | $ | 186,419 | |
Finish Line, Inc., Class A | | | | | 8,769 | | | | 169,110 | |
Francesca’s Holdings Corp.* | | | | | 1,713 | | | | 29,635 | |
Genesco, Inc.* | | | | | 4,010 | | | | 247,577 | |
GNC Acquisition Holdings, Inc., Class A* | | | | | 3,851 | | | | 111,486 | |
Group 1 Automotive, Inc. | | | | | 3,854 | | | | 199,637 | |
Haverty Furniture Cos., Inc. | | | | | 3,206 | | | | 35,202 | |
hhgregg, Inc.* | | | | | 2,827 | | | | 40,850 | |
Hibbett Sports, Inc.* | | | | | 4,638 | | | | 209,545 | |
Hot Topic, Inc. | | | | | 6,933 | | | | 45,827 | |
Jos A Bank Clothiers, Inc.* | | | | | 4,674 | | | | 227,904 | |
Kirkland’s, Inc.* | | | | | 2,864 | | | | 38,091 | |
Lithia Motors, Inc. | | | | | 3,694 | | | | 80,751 | |
Lumber Liquidators Holdings, Inc.* | | | | | 3,986 | | | | 70,393 | |
Marinemax, Inc.* | | | | | 3,858 | | | | 25,154 | |
Mattress Firm Holding Corp.* | | | | | 977 | | | | 22,657 | |
Monro Muffler Brake, Inc. | | | | | 5,152 | | | | 199,846 | |
New York & Co., Inc.* | | | | | 4,696 | | | | 12,491 | |
Office Depot, Inc.* | | | | | 46,787 | | | | 100,592 | |
OfficeMax, Inc.* | | | | | 14,833 | | | | 67,342 | |
Pacific Sunwear of California, Inc.* | | | | | 7,834 | | | | 13,396 | |
Penske Automotive Group, Inc. | | | | | 7,547 | | | | 145,280 | |
Pier 1 Imports, Inc.* | | | | | 16,629 | | | | 231,642 | |
Rental-A-Center, Inc. | | | | | 9,928 | | | | 367,336 | |
Rue21, Inc.* | | | | | 2,570 | | | | 55,512 | |
Select Comfort Corp.* | | | | | 9,419 | | | | 204,298 | |
Shoe Carnival, Inc.* | | | | | 1,581 | | | | 40,632 | |
Sonic Automotive, Inc., Class A | | | | | 6,774 | | | | 100,323 | |
Stage Stores, Inc. | | | | | 5,293 | | | | 73,520 | |
Stein Mart, Inc.* | | | | | 4,570 | | | | 31,122 | |
Systemax, Inc.* | | | | | 1,827 | | | | 29,981 | |
Talbots, Inc.* | | | | | 11,723 | | | | 31,183 | |
Teavana Holdings, Inc.* | | | | | 1,238 | | | | 23,250 | |
See Notes to Financial Statements.
169
| | |
SC SM BLACKROCK SMALL CAP INDEX FUND PORTFOLIOOF INVESTMENTS (Continued) |
| December 31, 2011 | | Sun Capital Advisers Trust |
| | | | | | | | | | |
| | | Country
Code** | | Shares | | | Value | |
| | | | | | | | | | |
| | | | | | | | | | |
The Buckle, Inc. | | | | | 4,570 | | | $ | 186,776 | |
The Cato Corp. | | | | | 4,666 | | | | 112,917 | |
The Men’s Wearhouse, Inc. | | | | | 8,717 | | | | 282,518 | |
The Pep Boys – Manny, Moe & Jack | | | | | 8,877 | | | | 97,647 | |
The Wet Seal, Inc., Class A* | | | | | 15,425 | | | | 50,285 | |
Vitamin Shoppe, Inc.* | | | | | 4,195 | | | | 167,297 | |
West Marine, Inc.* | | | | | 2,463 | | | | 28,645 | |
Winmark Corp. | | | | | 367 | | | | 21,055 | |
Zale Corp.* | | | | | 5,304 | | | | 20,208 | |
Zumiez, Inc.* | | | | | 3,581 | | | | 99,409 | |
| | | | | | | | | | |
| | | | | | | | | 6,570,617 | |
| | | | | | | | | | |
TEXTILES, APPAREL & LUXURY GOODS – 1.5% | |
Carter’s, Inc.* | | | | | 8,323 | | | | 331,339 | |
Cherokee, Inc. | | | | | 1,459 | | | | 17,026 | |
Columbia Sportswear Co. | | | | | 2,041 | | | | 95,009 | |
Crocs, Inc.* | | | | | 15,341 | | | | 226,587 | |
Delta Apparel, Inc.* | | | | | 1,146 | | | | 21,877 | |
G-III Apparel Group Ltd.* | | | | | 2,838 | | | | 70,695 | |
Iconix Brand Group, Inc.* | | | | | 12,330 | | | | 200,856 | |
K-Swiss, Inc.,
Class A* | | | | | 4,804 | | | | 14,028 | |
Kenneth Cole Productions, Inc., Class A* | | | | | 1,155 | | | | 12,231 | |
Liz Claiborne, Inc.* | | | | | 15,960 | | | | 137,735 | |
Maidenform Brands, Inc.* | | | | | 4,026 | | | | 73,676 | |
Movado Group, Inc. | | | | | 2,986 | | | | 54,256 | |
Oxford Industries, Inc. | | | | | 2,153 | | | | 97,143 | |
Perry Ellis International, Inc.* | | | | | 1,995 | | | | 28,369 | |
Quiksilver, Inc.* | | | | | 21,750 | | | | 78,517 | |
R.G. Barry Corp. | | | | | 1,456 | | | | 17,588 | |
Skechers U.S.A., Inc., Class A* | | | | | 6,433 | | | | 77,968 | |
Steven Madden Ltd.* | | | | | 6,398 | | | | 220,731 | |
The Jones Group, Inc. | | | | | 13,713 | | | | 144,672 | |
The Warnaco Group, Inc.* | | | | | 6,835 | | | | 342,023 | |
| | | | | | | | | | | | |
| | | Country
Code** | | | Shares | | | Value | |
| | | | | | | | | | | | |
| | | | | | | | | | | | |
True Religion Apparel, Inc.* | | | | | | | 4,354 | | | $ | 150,561 | |
Unifi, Inc.* | | | | | | | 2,246 | | | | 17,070 | |
Vera Bradley, Inc.* | | | | | | | 3,329 | | | | 107,360 | |
Wolverine World Wide, Inc. | | | | | | | 8,406 | | | | 299,590 | |
| | | | | | | | | | | | |
| | | | | | | | | | | 2,836,907 | |
| | | | | | | | | | | | |
THRIFT & MORTGAGE FINANCE – 1.2% | |
Apollo Residential Mortgage, Inc. | | | | | | | 1,771 | | | | 27,025 | |
Astoria Financial Corp. | | | | | | | 14,825 | | | | 125,864 | |
Bank Mutual Corp. | | | | | | | 8,063 | | | | 25,640 | |
BankFinancial Corp. | | | | | | | 3,761 | | | | 20,761 | |
Beneficial Mutual Bancorp, Inc.* | | | | | | | 5,496 | | | | 45,947 | |
Berkshire Hills Bancorp, Inc. | | | | | | | 3,563 | | | | 79,063 | |
BofI Holding, Inc.* | | | | | | | 1,622 | | | | 26,358 | |
Brookline Bancorp, Inc. | | | | | | | 10,065 | | | | 84,949 | |
Cape Bancorp, Inc.* | | | | | | | 1,945 | | | | 15,268 | |
Charter Financial Corp. | | | | | | | 1,253 | | | | 11,603 | |
Clifton Savings Bancorp, Inc. | | | | | | | 1,519 | | | | 14,096 | |
Dime Community Bancshares | | | | | | | 5,226 | | | | 65,848 | |
Doral Financial Corp.* | | | PR | | | | 22,262 | | | | 21,282 | |
ESB Financial Corp. | | | | | | | 2,185 | | | | 30,743 | |
ESSA Bancorp, Inc. | | | | | | | 1,850 | | | | 19,370 | |
Federal Agricultural Mortgage Corp., Class C | | | | | | | 1,729 | | | | 31,157 | |
First Defiance Financial Corp. | | | | | | | 1,681 | | | | 24,526 | |
First Financial Holdings, Inc. | | | | | | | 2,824 | | | | 25,218 | |
First PacTrust Bancorp, Inc. | | | | | | | 1,848 | | | | 18,942 | |
Flagstar Bancorp, Inc.* | | | | | | | 34,578 | | | | 17,462 | |
Flushing Financial Corp. | | | | | | | 5,402 | | | | 68,227 | |
Fox Chase Bancorp. | | | | | | | 2,301 | | | | 29,062 | |
Franklin Financial Corp.* | | | | | | | 2,399 | | | | 28,404 | |
See Notes to Financial Statements.
170
SC SM BLACKROCK SMALL CAP INDEX FUND
| | |
PORTFOLIOOF INVESTMENTS (Continued) December 31, 2011 | | Sun Capital Advisers Trust |
| | | | | | | | | | |
| | | Country
Code** | | Shares | | | Value | |
| | | | | | | | | | |
| | | | | | | | | | |
Home Federal Bancorp, Inc. | | | | | 2,916 | | | $ | 30,326 | |
Kearny Financial Corp. | | | | | 2,289 | | | | 21,746 | |
Meridian Interstate Bancorp, Inc.* | | | | | 1,506 | | | | 18,750 | |
MGIC Investment Corp.* | | | | | 31,669 | | | | 118,125 | |
Northfield Bancorp, Inc. | | | | | 2,942 | | | | 41,659 | |
Northwest Bancshares, Inc. | | | | | 16,444 | | | | 204,563 | |
Oceanfirst Financial Corp. | | | | | 2,494 | | | | 32,597 | |
Ocwen Financial Corp.* | | | | | 16,312 | | | | 236,198 | |
Oritani Financial Corp. | | | | | 7,818 | | | | 99,836 | |
Provident Financial Services | | | | | 10,229 | | | | 136,966 | |
Provident New York Bancorp | | | | | 6,647 | | | | 44,136 | |
Radian Group, Inc. | | | | | 22,968 | | | | 53,745 | |
Rockville Financial, Inc. | | | | | 4,886 | | | | 50,619 | |
Roma Financial Corp. | | | | | 1,395 | | | | 13,727 | |
Territorial Bancorp, Inc. | | | | | 1,890 | | | | 37,327 | |
TrustCo Bank Corp. NY | | | | | 16,080 | | | | 90,209 | |
United Financial Bancorp, Inc. | | | | | 2,737 | | | | 44,038 | |
Viewpoint Financial Group | | | | | 5,807 | | | | 75,549 | |
Walker & Dunlop, Inc.* | | | | | 1,896 | | | | 23,814 | |
Westfield Financial, Inc. | | | | | 4,443 | | | | 32,700 | |
WSFS Financial Corp. | | | | | 1,113 | | | | 40,023 | |
| | | | | | | | | | |
| | | | | | | | | 2,303,468 | |
| | | | | | | | | | |
TOBACCO – 0.2% | |
Alliance One International, Inc.* | | | | | 15,008 | | | | 40,822 | |
Star Scientific, Inc.* | | | | | 18,275 | | | | 39,839 | |
| | | | | | | | | | | | |
| | | Country
Code** | | | Shares | | | Value | |
| | | | | | | | | | | | |
| | | | | | | | | | | | |
Universal Corp. | | | | | | | 3,905 | | | $ | 179,474 | |
Vector Group Ltd. | | | | | | | 8,154 | | | | 144,815 | |
| | | | | | | | | | | | |
| | | | | | | | | | | 404,950 | |
| | | | | | | | | | | | |
TRADING COMPANIES & DISTRIBUTORS – 1.2% | |
Aceto Corp. | | | | | | | 4,565 | | | | 31,499 | |
Aircastle Ltd. | | | BM | | | | 9,260 | | | | 117,787 | |
Applied Industrial Technologies, Inc. | | | | | | | 7,183 | | | | 252,626 | |
Beacon Roofing Supply, Inc.* | | | | | | | 7,771 | | | | 157,207 | |
Cai International, Inc.* | | | | | | | 2,024 | | | | 31,291 | |
DXP Enterprises, Inc.* | | | | | | | 1,461 | | | | 47,044 | |
Essex Rental Corp.* | | | | | | | 3,128 | | | | 9,228 | |
H & E Equipment Services, Inc.* | | | | | | | 4,933 | | | | 66,201 | |
Houston Wire & Cable Co. | | | | | | | 2,939 | | | | 40,617 | |
Interline Brands, Inc.* | | | | | | | 5,602 | | | | 87,223 | |
Kaman Corp. | | | | | | | 4,439 | | | | 121,273 | |
Lawson Products, Inc. | | | | | | | 592 | | | | 9,135 | |
RSC Holdings, Inc.* | | | | | | | 11,455 | | | | 211,918 | |
Rush Enterprises, Inc.* | | | | | | | 5,460 | | | | 114,223 | |
SeaCube Container Leasing Ltd. | | | BM | | | | 1,907 | | | | 28,243 | |
TAL International Group, Inc. | | | | | | | 3,712 | | | | 106,868 | |
Textainer Group Holdings Ltd. | | | BM | | | | 1,894 | | | | 55,153 | |
Titan Machinery, Inc.* | | | | | | | 2,646 | | | | 57,498 | |
United Rentals, Inc.* | | | | | | | 10,579 | | | | 312,609 | |
Watsco, Inc. | | | | | | | 4,744 | | | | 311,491 | |
| | | | | | | | | | | | |
| | | | | | | | | | | 2,169,134 | |
| | | | | | | | | | | | |
TRANSPORTATION INFRASTRUCTURE – 0.0%+ | |
Wesco Aircraft Holdings, Inc.* | | | | | | | 3,488 | | | | 48,797 | |
| | | | | | | | | | | | |
WATER UTILITIES – 0.3% | |
American States Water Co. | | | | | | | 3,166 | | | | 110,493 | |
Artesian Resources Corp. | | | | | | | 1,235 | | | | 23,255 | |
See Notes to Financial Statements.
171
| | |
SC SM BLACKROCK SMALL CAP INDEX FUND PORTFOLIOOF INVESTMENTS (Continued) |
| December 31, 2011 | | Sun Capital Advisers Trust |
| | | | | | | | | | | | |
| | | Country
Code** | | | Shares | | | Value | |
| | | | | | | | | | | | |
| | | | | | | | | | | | |
Cadiz, Inc.* | | | | | | | 2,002 | | | $ | 19,279 | |
California Water Service Group | | | | | | | 7,123 | | | | 130,066 | |
Connecticut Water Service, Inc. | | | | | | | 1,424 | | | | 38,633 | |
Consolidated Water Co., Ltd. | | | KY | | | | 2,582 | | | | 22,154 | |
Middlesex Water Co. | | | | | | | 2,733 | | | | 50,998 | |
Pennichuck Corp. | | | | | | | 727 | | | | 20,959 | |
SJW Corp. | | | | | | | 2,389 | | | | 56,476 | |
York Water Co. | | | | | | | 2,162 | | | | 38,138 | |
| | | | | | | | | | | | |
| | | | | | | | | | | 510,451 | |
| | | | | | | | | | | | |
WIRELESS TELECOMMUNICATION SERVICES – 0.1% | |
Leap Wireless International, Inc.* | | | | | | | 10,475 | | | | 97,313 | |
NTELOS Holdings Corp. | | | | | | | 2,500 | | | | 50,950 | |
Shenandoah Telecommunications Co. | | | | | | | 4,093 | | | | 42,894 | |
USA Mobility, Inc. | | | | | | | 3,861 | | | | 53,552 | |
| | | | | | | | | | | | |
| | | | | | | | | | | 244,709 | |
| | | | | | | | | | | | |
Total Common Stocks
(Cost $189,988,900) | | | | 186,932,404 | |
| | | | | | | | | | | | |
WARRANTS – 0.0% + | | | | | |
OIL, GAS & CONSUMABLE FUELS – 0.0% + | |
Magnum Hunter Resources Corp., expires 10/14/13* (Cost $0) | | | | | | | 1,905 | | | | — | |
| | | | | | | | | | | | |
| | | | | | | | | | |
| | | Country
Code** | | Shares | | | Value | |
| | | | | | | | | | |
| | | | | | | | | | |
SHORT TERM INVESTMENTS – 0.7% | |
MUTUAL FUNDS – 0.7% | |
State Street Institutional Treasury Plus Money Market Fund, 0.00%
(Cost $1,388,718) | | | 1,388,718 | | | $ | 1,388,718 | |
| | | | | | | | | | |
TOTAL INVESTMENTS – 99.8% | | | | | |
(Cost $191,377,618) | | | | | | | 188,321,122 | |
Other assets less liabilities – 0.2% | | | | | | | 376,179 | |
| | | | | | | | | | |
NET ASSETS – 100.0% | | | | | | $ | 188,697,301 | |
| | | | | | | | | | |
| | |
| REIT | | Real Estate Investment Trust |
| |
| AN | | Netherlands Antilles |
| BM | | Bermuda |
| BS | | Bahamas |
| CA | | Canada |
| IE | | Ireland |
| KY | | Cayman Islands |
| LR | | Liberia |
| LU | | Luxembourg |
| MH | | Marshall Islands |
| NL | | Netherlands |
| PA | | Panama |
| PR | | Puerto Rico |
| * | Non-income producing security. |
| ** | Unless otherwise noted the issuer country code for all securities is United States. |
| + | Amount is less than 0.05%. |
| (1) | Eligible for resale under rule 144A of the Securities Act of 1933. This security may be resold in transactions exempt from registration, normally to qualified institutional buyers. At the period end, the value of this security amounted to $0, representing less than 0.05% of net assets. |
See Notes to Financial Statements.
172
| | |
SC SM BLACKROCK SMALL CAP INDEX FUND PORTFOLIOOF INVESTMENTS (Continued) |
| December 31, 2011 | | Sun Capital Advisers Trust |
| (2) | At the period end, cash of $230,000 has been pledged to cover margin requirements for the following open futures contracts: |
| | | | | | | | | | | | |
Type | | Description | | Expiration
Date | | Contracts | | | Unrealized
Appreciation ($) | |
Long | | Russell 2000 Mini Index March Futures | | 3/16/12 | | | 25 | | | | 33,904 | |
| (3) | Fair Value Measurements |
All investments and financial derivative instruments are categorized as Level 1 under the fair value hierarchy. See Note 2b in the Notes to Financial Statements for additional information.
See Notes to Financial Statements.
173
SC SM GOLDMAN SACHS MID CAP VALUE FUND
| | |
PORTFOLIOOF INVESTMENTS December 31, 2011 | | Sun Capital Advisers Trust |
| | | | | | | | | | | | |
| | | Country
Code** | | | Shares | | | Value | |
| | | | | | | | | | | | |
| | | | | | | | | | | | |
| | | | | | | | | | | | |
COMMON STOCKS – 98.2% | |
AEROSPACE & DEFENSE – 1.5% | |
Alliant Techsystems, Inc. | | | | | | | 12,125 | | | $ | 693,065 | |
BE Aerospace, Inc.* | | | | | | | 23,688 | | | | 916,962 | |
Esterline Technologies Corp.* | | | | | | | 4,073 | | | | 227,966 | |
L-3 Communications Holdings, Inc. | | | | | | | 21,195 | | | | 1,413,283 | |
Textron, Inc. | | | | | | | 14,249 | | | | 263,464 | |
| | | | | | | | | | | | |
| | | | | | | | | | | 3,514,740 | |
| | | | | | | | | | | | |
AIR FREIGHT & LOGISTICS – 0.2% | |
UTI Worldwide, Inc. | | | VG | | | | 33,849 | | | | 449,853 | |
| | | | | | | | | | | | |
AIRLINES – 0.1% | |
Alaska Air Group, Inc.* | | | | | | | 2,755 | | | | 206,873 | |
| | | | | | | | | | | | |
AUTO COMPONENTS – 0.2% | |
Autoliv, Inc. | | | | | | | 5,711 | | | | 305,482 | |
Federal-Mogul Corp.* | | | | | | | 10,371 | | | | 152,972 | |
| | | | | | | | | | | | |
| | | | | | | | | | | 458,454 | |
| | | | | | | | | | | | |
AUTOMOBILES – 0.1% | |
Thor Industries, Inc. | | | | | | | 11,322 | | | | 310,562 | |
| | | | | | | | | | | | |
BIOTECHNOLOGY – 0.2% | |
United Therapeutics Corp.* | | | | | | | 8,681 | | | | 410,177 | |
| | | | | | | | | | | | |
BUILDING PRODUCTS – 0.5% | |
Armstrong World Industries, Inc.* | | | | | | | 13,208 | | | | 579,435 | |
Fortune Brands Home & Security, Inc.* | | | | | | | 38,658 | | | | 658,346 | |
| | | | | | | | | | | | |
| | | | | | | | | | | 1,237,781 | |
| | | | | | | | | | | | |
CAPITAL MARKETS – 2.0% | |
American Capital Ltd.* | | | | | | | 21,746 | | | | 146,351 | |
Ameriprise Financial, Inc. | | | | | | | 16,895 | | | | 838,668 | |
Ares Capital Corp. | | | | | | | 27,745 | | | | 428,660 | |
Federated Investors, Inc., Class B | | | | | | | 32,263 | | | | 488,784 | |
Legg Mason, Inc. | | | | | | | 10,995 | | | | 264,430 | |
Raymond James Financial, Inc. | | | | | | | 22,946 | | | | 710,408 | |
SEI Investments Co. | | | | | | | 47,785 | | | | 829,070 | |
T. Rowe Price Group, Inc. | | | | | | | 18,149 | | | | 1,033,585 | |
| | | | | | | | | | | | |
| | | Country
Code** | | | Shares | | | Value | |
| | | | | | | | | | | | |
| | | | | | | | | | | | |
Waddell & Reed Financial, Inc., Class A | | | | | | | 3,061 | | | $ | 75,821 | |
| | | | | | | | | | | | |
| | | | | | | | | | | 4,815,777 | |
| | | | | | | | | | | | |
CHEMICALS – 1.2% | | | | | | | | | | | | |
Airgas, Inc. | | | | | | | 8,673 | | | | 677,188 | |
Ashland, Inc. | | | | | | | 5,441 | | | | 311,008 | |
Cabot Corp. | | | | | | | 21,854 | | | | 702,387 | |
CF Industries Holdings, Inc. | | | | | | | 5,870 | | | | 851,033 | |
Huntsman Corp. | | | | | | | 23,546 | | | | 235,460 | |
| | | | | | | | | | | | |
| | | | | | | | | | | 2,777,076 | |
| | | | | | | | | | | | |
COMMERCIAL BANKS – 4.9% | |
Bank of Hawaii Corp. | | | | | | | 7,055 | | | | 313,877 | |
CIT Group, Inc.* | | | | | | | 9,500 | | | | 331,265 | |
City National Corp. | | | | | | | 12,768 | | | | 564,090 | |
Comerica, Inc. | | | | | | | 34,719 | | | | 895,750 | |
Cullen/Frost Bankers, Inc. | | | | | | | 1,566 | | | | 82,857 | |
East West Bancorp, Inc. | | | | | | | 24,516 | | | | 484,191 | |
Fifth Third Bancorp | | | | | | | 17,780 | | | | 226,162 | |
First Republic Bank* | | | | | | | 8,968 | | | | 274,510 | |
FirstMerit Corp. | | | | | | | 31,740 | | | | 480,226 | |
Fulton Financial Corp. | | | | | | | 130,578 | | | | 1,280,970 | |
KeyCorp | | | | | | | 110,979 | | | | 853,429 | |
M&T Bank Corp. | | | | | | | 29,072 | | | | 2,219,357 | |
Popular, Inc.* | | | PR | | | | 305,621 | | | | 424,813 | |
Prosperity Bancshares, Inc. | | | | | | | 12,221 | | | | 493,117 | |
SunTrust Banks, Inc. | | | | | | | 71,770 | | | | 1,270,329 | |
SVB Financial Group* | | | | | | | 17,074 | | | | 814,259 | |
TCF Financial Corp. | | | | | | | 69,356 | | | | 715,754 | |
| | | | | | | | | | | | |
| | | | | | | | | | | 11,724,956 | |
| | | | | | | | | | | | |
COMMERCIAL SERVICES & SUPPLIES – 0.9% | |
Cintas Corp. | | | | | | | 15,645 | | | | 544,602 | |
Copart, Inc.* | | | | | | | 13,649 | | | | 653,651 | |
R.R. Donnelley & Sons Co. | | | | | | | 58,225 | | | | 840,187 | |
| | | | | | | | | | | | |
| | | | | | | | | | | 2,038,440 | |
| | | | | | | | | | | | |
COMMUNICATIONS EQUIPMENT – 0.7% | |
EchoStar Corp., Class A* | | | | | | | 15,523 | | | | 325,052 | |
Motorola Mobility Holdings, Inc.* | | | | | | | 15,142 | | | | 587,510 | |
See Notes to Financial Statements.
174
SC SM GOLDMAN SACHS MID CAP VALUE FUND
| | |
PORTFOLIOOF INVESTMENTS (Continued) December 31, 2011 | | Sun Capital Advisers Trust |
| | | | | | | | | | | | |
| | | Country
Code** | | | Shares | | | Value | |
| | | | | | | | | | | | |
| | | | | | | | | | | | |
Riverbed Technology, Inc.* | | | | | | | 12,832 | | | $ | 301,552 | |
Tellabs, Inc. | | | | | | | 116,784 | | | | 471,807 | |
| | | | | | | | | | | | |
| | | | | | | | | | | 1,685,921 | |
| | | | | | | | | | | | |
COMPUTERS & PERIPHERALS – 2.0% | |
Diebold, Inc. | | | | | | | 14,118 | | | | 424,528 | |
Lexmark International, Inc., Class A | | | | | | | 19,711 | | | | 651,843 | |
QLogic Corp.* | | | | | | | 24,897 | | | | 373,455 | |
Seagate Technology PLC | | | IE | | | | 9,203 | | | | 150,929 | |
Western Digital Corp.* | | | | | | | 98,390 | | | | 3,045,171 | |
| | | | | | | | | | | | |
| | | | | | | | | | | 4,645,926 | |
| | | | | | | | | | | | |
CONSTRUCTION & ENGINEERING – 0.3% | |
Fluor Corp. | | | | | | | 2,245 | | | | 112,811 | |
URS Corp.* | | | | | | | 18,472 | | | | 648,737 | |
| | | | | | | | | | | | |
| | | | | | | | | | | 761,548 | |
| | | | | | | | | | | | |
CONSUMER FINANCE – 0.5% | |
Discover Financial Services | | | | | | | 45,018 | | | | 1,080,432 | |
Green Dot Corp., Class A* | | | | | | | 3,782 | | | | 118,074 | |
| | | | | | | | | | | | |
| | | | | | | | | | | 1,198,506 | |
| | | | | | | | | | | | |
CONTAINERS & PACKAGING – 0.6% | |
Packaging Corp. of America | | | | | | | 4,790 | | | | 120,899 | |
Rock-Tenn Co., Class A | | | | | | | 8,737 | | | | 504,125 | |
Sealed Air Corp. | | | | | | | 21,508 | | | | 370,153 | |
Sonoco Products Co. | | | | | | | 10,603 | | | | 349,475 | |
| | | | | | | | | | | | |
| | | | | | | | | | | 1,344,652 | |
| | | | | | | | | | | | |
DISTRIBUTORS – 0.2% | |
Genuine Parts Co. | | | | | | | 6,859 | | | | 419,771 | |
| | | | | | | | | | | | |
DIVERSIFIED CONSUMER SERVICES – 0.3% | |
Apollo Group, Inc., Class A* | | | | | | | 1,622 | | | | 87,377 | |
Regis Corp. | | | | | | | 13,283 | | | | 219,834 | |
Weight Watchers International, Inc. | | | | | | | 6,613 | | | | 363,781 | |
| | | | | | | | | | | | |
| | | | | | | | | | | 670,992 | |
| | | | | | | | | | | | |
DIVERSIFIED FINANCIAL SERVICES – 0.4% | |
CBOE Holdings, Inc. | | | | | | | 5,826 | | | | 150,660 | |
| | | | | | | | | | |
| | | Country
Code** | | Shares | | | Value | |
| | | | | | | | | | |
Leucadia National Corp. | | | | | 27,592 | | | $ | 627,442 | |
Moody’s Corp. | | | | | 6,830 | | | | 230,035 | |
| | | | | | | | | | |
| | | | | | | | | 1,008,137 | |
| | | | | | | | | | |
ELECTRIC UTILITIES – 4.3% | |
Cleco Corp. | | | | | 8,167 | | | | 311,163 | |
Entergy Corp. | | | | | 41,219 | | | | 3,011,048 | |
Great Plains Energy, Inc. | | | | | 29,891 | | | | 651,026 | |
ITC Holdings Corp. | | | | | 2,702 | | | | 205,028 | |
Northeast Utilities | | | | | 29,836 | | | | 1,076,184 | |
NV Energy, Inc. | | | | | 5,227 | | | | 85,461 | |
Pepco Holdings, Inc. | | | | | 69,860 | | | | 1,418,158 | |
Pinnacle West Capital Corp. | | | | | 49,376 | | | | 2,378,936 | |
PNM Resources, Inc. | | | | | 35,483 | | | | 646,855 | |
Progress Energy, Inc. | | | | | 2,845 | | | | 159,377 | |
Westar Energy, Inc. | | | | | 5,601 | | | | 161,197 | |
| | | | | | | | | | |
| | | | | | | | | 10,104,433 | |
| | | | | | | | | | |
ELECTRICAL EQUIPMENT – 0.7% | |
General Cable Corp.* | | | | | 14,738 | | | | 368,598 | |
Rockwell Automation, Inc. | | | | | 16,060 | | | | 1,178,322 | |
Thomas & Betts Corp.* | | | | | 4,225 | | | | 230,685 | |
| | | | | | | | | | |
| | | | | | | | | 1,777,605 | |
| | | | | | | | | | |
ELECTRONIC EQUIPMENT, INSTRUMENTS & COMPONENTS – 1.5% | |
Arrow Electronics, Inc.* | | | | | 10,677 | | | | 399,426 | |
Ingram Micro, Inc., Class A* | | | | | 78,835 | | | | 1,434,009 | |
National Instruments Corp. | | | | | 11,790 | | | | 305,950 | |
Vishay Intertechnology, Inc.* | | | | | 169,825 | | | | 1,526,727 | |
| | | | | | | | | | |
| | | | | | | | | 3,666,112 | |
| | | | | | | | | | |
ENERGY EQUIPMENT & SERVICES – 0.8% | |
Exterran Holdings, Inc.* | | | | | 86,621 | | | | 788,251 | |
Helix Energy Solutions Group, Inc.* | | | | | 9,764 | | | | 154,271 | |
See Notes to Financial Statements.
175
SC SM GOLDMAN SACHS MID CAP VALUE FUND
| | |
PORTFOLIOOF INVESTMENTS (Continued) December 31, 2011 | | Sun Capital Advisers Trust |
| | | | | | | | | | | | |
| | | Country
Code** | | | Shares | | | Value | |
| | | | | | | | | | | | |
| | | | | | | | | | | | |
SEACOR Holdings, Inc.* | | | | | | | 10,082 | | | $ | 896,895 | |
| | | | | | | | | | | | |
| | | | | | | | | | | 1,839,417 | |
| | | | | | | | | | | | |
FOOD & STAPLES RETAILING – 0.3% | |
SUPERVALU, Inc. | | | | | | | 78,179 | | | | 634,814 | |
| | | | | | | | | | | | |
FOOD PRODUCTS – 3.8% | |
Bunge Ltd. | | | BM | | | | 5,372 | | | | 307,278 | |
Dean Foods Co.* | | | | | | | 42,283 | | | | 473,570 | |
Flowers Foods, Inc. | | | | | | | 6,018 | | | | 114,222 | |
Hormel Foods Corp. | | | | | | | 84,388 | | | | 2,471,724 | |
Lancaster Colony Corp. | | | | | | | 18,786 | | | | 1,302,621 | |
Smithfield Foods, Inc.* | | | | | | | 28,728 | | | | 697,516 | |
Tyson Foods, Inc., Class A | | | | | | | 181,344 | | | | 3,742,940 | |
| | | | | | | | | | | | |
| | | | | | | | | | | 9,109,871 | |
| | | | | | | | | | | | |
GAS UTILITIES – 0.5% | |
Atmos Energy Corp. | | | | | | | 21,403 | | | | 713,790 | |
UGI Corp. | | | | | | | 11,127 | | | | 327,134 | |
WGL Holdings, Inc. | | | | | | | 1,985 | | | | 87,777 | |
| | | | | | | | | | | | |
| | | | | | | | | | | 1,128,701 | |
| | | | | | | | | | | | |
HEALTH CARE EQUIPMENT & SUPPLIES – 1.1% | |
Boston Scientific Corp.* | | | | | | | 218,085 | | | | 1,164,574 | |
Dentsply International, Inc. | | | | | | | 9,942 | | | | 347,870 | |
Hill-Rom Holdings, Inc. | | | | | | | 33,013 | | | | 1,112,208 | |
| | | | | | | | | | | | |
| | | | | | | | | | | 2,624,652 | |
| | | | | | | | | | | | |
HEALTH CARE PROVIDERS & SERVICES – 4.3% | |
Community Health Systems, Inc.* | | | | | | | 7,956 | | | | 138,832 | |
Coventry Health Care, Inc.* | | | | | | | 76,934 | | | | 2,336,486 | |
Health Net, Inc.* | | | | | | | 53,384 | | | | 1,623,941 | |
Humana, Inc. | | | | | | | 52,210 | | | | 4,574,118 | |
WellCare Health Plans, Inc.* | | | | | | | 27,942 | | | | 1,466,955 | |
| | | | | | | | | | | | |
| | | | | | | | | | | 10,140,332 | |
| | | | | | | | | | | | |
HOTELS, RESTAURANTS & LEISURE – 0.3% | |
Choice Hotels International, Inc. | | | | | | | 4,312 | | | | 164,072 | |
| | | | | | | | | | | | |
| | | Country
Code** | | | Shares | | | Value | |
| | | | | | | | | | | | |
Life Time Fitness, Inc.* | | | | | | | 3,347 | | | $ | 156,472 | |
Marriott Vacations Worldwide Corp.* | | | | | | | 7,231 | | | | 124,084 | |
Royal Caribbean Cruises Ltd. | | | LR | | | | 3,845 | | | | 95,241 | |
The Wendy’s Co. | | | | | | | 26,735 | | | | 143,300 | |
Wynn Resorts Ltd. | | | | | | | 844 | | | | 93,253 | |
| | | | | | | | | | | | |
| | | | | | | | | | | 776,422 | |
| | | | | | | | | | | | |
HOUSEHOLD DURABLES – 2.3% | |
Harman International Industries, Inc. | | | | | | | 20,359 | | | | 774,456 | |
Leggett & Platt, Inc. | | | | | | | 9,936 | | | | 228,926 | |
Mohawk Industries, Inc.* | | | | | | | 48,643 | | | | 2,911,284 | |
Tempur-Pedic International, Inc.* | | | | | | | 31,808 | | | | 1,670,874 | |
| | | | | | | | | | | | |
| | | | | | | | | | | 5,585,540 | |
| | | | | | | | | | | | |
HOUSEHOLD PRODUCTS – 0.2% | |
Clorox Co. | | | | | | | 8,387 | | | | 558,239 | |
| | | | | | | | | | | | |
INDEPENDENT POWER PRODUCERS & ENERGY TRADERS – 0.3% | |
Constellation Energy Group | | | | | | | 4,584 | | | | 181,847 | |
NRG Energy, Inc.* | | | | | | | 32,489 | | | | 588,701 | |
| | | | | | | | | | | | |
| | | | | | | | | | | 770,548 | |
| | | | | | | | | | | | |
INSURANCE – 9.7% | |
Allied World Assurance Co. Holdings Ltd. | | | CH | | | | 33,762 | | | | 2,124,643 | |
American Financial Group, Inc. | | | | | | | 40,821 | | | | 1,505,887 | |
American National Insurance | | | | | | | 2,361 | | | | 172,424 | |
Aspen Insurance Holdings Ltd. | | | BM | | | | 72,408 | | | | 1,918,812 | |
Assurant, Inc. | | | | | | | 18,800 | | | | 771,928 | |
Cincinnati Financial Corp. | | | | | | | 3,212 | | | | 97,838 | |
CNA Financial Corp. | | | | | | | 31,051 | | | | 830,614 | |
Everest Re Group Ltd. | | | BM | | | | 25,924 | | | | 2,179,949 | |
First American Financial Corp. | | | | | | | 10,732 | | | | 135,974 | |
Hanover Insurance Group, Inc. | | | | | | | 5,168 | | | | 180,622 | |
Lincoln National Corp. | | | | | | | 49,545 | | | | 962,164 | |
Mercury General Corp. | | | | | | | 17,092 | | | | 779,737 | |
See Notes to Financial Statements.
176
SC SM GOLDMAN SACHS MID CAP VALUE FUND
| | |
PORTFOLIOOF INVESTMENTS (Continued) December 31, 2011 | | Sun Capital Advisers Trust |
| | | | | | | | | | | | |
| | | Country
Code** | | | Shares | | | Value | |
| | | | | | | | | | | | |
| | | | | | | | | | | | |
PartnerRe Ltd. | | | BM | | | | 11,054 | | | $ | 709,777 | |
Protective Life Corp. | | | | | | | 5,100 | | | | 115,056 | |
Reinsurance Group of America, Inc. | | | | | | | 11,723 | | | | 612,527 | |
StanCorp Financial Group, Inc. | | | | | | | 4,278 | | | | 157,216 | |
The Progressive Corp. (1) | | | | | | | 49,522 | | | | 966,174 | |
Unum Group (1) | | | | | | | 145,731 | | | | 3,070,552 | |
Validus Holdings Ltd. | | | BM | | | | 7,834 | | | | 246,771 | |
W.R. Berkley Corp. | | | | | | | 80,019 | | | | 2,751,853 | |
White Mountains Insurance Group Ltd. | | | BM | | | | 3,915 | | | | 1,775,296 | |
XL Group PLC | | | IE | | | | 44,588 | | | | 881,505 | |
| | | | | | | | | | | | |
| | | | | | | | | | | 22,947,319 | |
| | | | | | | | | | | | |
INTERNET SOFTWARE & SERVICES – 0.0%+ | |
VeriSign, Inc. | | | | | | | 2,540 | | | | 90,729 | |
| | | | | | | | | | | | |
IT SERVICES – 1.5% | | | | | | | | | | | | |
Acxiom Corp.* | | | | | | | 22,281 | | | | 272,051 | |
Amdocs Ltd.* | | | GG | | | | 47,578 | | | | 1,357,401 | |
Computer Sciences Corp. | | | | | | | 24,973 | | | | 591,860 | |
Convergys Corp.* | | | | | | | 16,512 | | | | 210,858 | |
Fidelity National Information Services, Inc. | | | | | | | 26,593 | | | | 707,108 | |
Mantech International Corp., Class A | | | | | | | 5,771 | | | | 180,286 | |
SAIC, Inc.* | | | | | | | 15,825 | | | | 194,489 | |
| | | | | | | | | | | | |
| | | | | | | | | | | 3,514,053 | |
| | | | | | | | | | | | |
LEISURE EQUIPMENT & PRODUCTS – 0.1% | |
Polaris Industries, Inc. | | | | | | | 4,084 | | | | 228,622 | |
| | | | | | | | | | | | |
LIFE SCIENCES TOOLS & SERVICES – 0.0%+ | |
Covance, Inc.* | | | | | | | 2,280 | | | | 104,242 | |
| | | | | | | | | | | | |
MACHINERY – 2.2% | |
AGCO Corp.* | | | | | | | 19,892 | | | | 854,759 | |
Dover Corp. | | | | | | | 6,867 | | | | 398,629 | |
Graco, Inc. | | | | | | | 4,895 | | | | 200,157 | |
Harsco Corp. | | | | | | | 15,485 | | | | 318,681 | |
Ingersoll-Rand PLC | | | IE | | | | 10,278 | | | | 313,171 | |
ITT Corp. | | | | | | | 11,468 | | | | 221,676 | |
Lincoln Electric Holdings, Inc. | | | | | | | 6,334 | | | | 247,786 | |
Parker Hannifin Corp. | | | | | | | 14,623 | | | | 1,115,004 | |
The Timken Co. | | | | | | | 22,763 | | | | 881,156 | |
| | | | | | | | | | |
| | | Country
Code** | | Shares | | | Value | |
| | | | | | | | | | |
Trinity Industries, Inc. | | | | | 16,999 | | | $ | 510,990 | |
Wabtec Corp. | | | | | 1,053 | | | | 73,657 | |
| | | | | | | | | | |
| | | | | | | | | 5,135,666 | |
| | | | | | | | | | |
MEDIA – 1.7% | |
Clear Channel Outdoor Holdings, Inc., Class A* | | | | | 12,827 | | | | 160,979 | |
DISH Network Corp., Class A | | | | | 125,893 | | | | 3,585,432 | |
Regal Entertainment Group, Class A | | | | | 33,502 | | | | 400,014 | |
| | | | | | | | | | |
| | | | | | | | | 4,146,425 | |
| | | | | | | | | | |
METALS & MINING – 0.7% | |
Reliance Steel & Aluminum Co. | | | | | 34,512 | | | | 1,680,389 | |
| | | | | | | | | | |
MULTI-LINE RETAIL – 2.5% | |
99 Cents Only Stores* | | | | | 34,662 | | | | 760,831 | |
Big Lots, Inc.* | | | | | 31,638 | | | | 1,194,651 | |
Dollar Tree, Inc.* | | | | | 17,264 | | | | 1,434,811 | |
Family Dollar Stores, Inc. | | | | | 29,824 | | | | 1,719,652 | |
Saks, Inc.* | | | | | 74,122 | | | | 722,689 | |
| | | | | | | | | | |
| | | | | | | | | 5,832,634 | |
| | | | | | | | | | |
MULTI-UTILITIES – 8.9% | |
Ameren Corp. | | | | | 107,905 | | | | 3,574,893 | |
Consolidated Edison, Inc. | | | | | 9,553 | | | | 592,572 | |
DTE Energy Co. | | | | | 27,308 | | | | 1,486,921 | |
Integrys Energy Group, Inc. | | | | | 77,469 | | | | 4,197,270 | |
MDU Resources Group, Inc. | | | | | 80,631 | | | | 1,730,341 | |
NiSource, Inc. | | | | | 196,457 | | | | 4,677,641 | |
NSTAR | | | | | 1,969 | | | | 92,464 | |
Sempra Energy | | | | | 63,825 | | | | 3,510,375 | |
TECO Energy, Inc. | | | | | 62,976 | | | | 1,205,361 | |
Vectren Corp. | | | | | 2,816 | | | | 85,128 | |
| | | | | | | | | | |
| | | | | | | | | 21,152,966 | |
| | | | | | | | | | |
OIL, GAS & CONSUMABLE FUELS – 6.1% | |
Cimarex Energy Co. | | | | | 21,507 | | | | 1,331,284 | |
Energen Corp. | | | | | 13,642 | | | | 682,100 | |
Forest Oil Corp.* | | | | | 10,380 | | | | 140,649 | |
HollyFrontier Corp. | | | | | 24,630 | | | | 576,342 | |
Murphy Oil Corp. | | | | | 9,888 | | | | 551,157 | |
Newfield Exploration Co.* | | | | | 2,063 | | | | 77,837 | |
See Notes to Financial Statements.
177
SC SM GOLDMAN SACHS MID CAP VALUE FUND
| | |
PORTFOLIOOF INVESTMENTS (Continued) December 31, 2011 | | Sun Capital Advisers Trust |
| | | | | | | | | | | | |
| | | Country
Code** | | | Shares | | | Value | |
| | | | | | | | | | | | |
| | | | | | | | | | | | |
QEP Resources, Inc. | | | | | | | 12,817 | | | $ | 375,538 | |
Tesoro Corp.* | | | | | | | 178,548 | | | | 4,170,881 | |
Ultra Petroleum Corp.* | | | CA | | | | 2,857 | | | | 84,653 | |
Valero Energy Corp. | | | | | | | 311,485 | | | | 6,556,759 | |
| | | | | | | | | | | | |
| | | | | | | | | | | 14,547,200 | |
| | | | | | | | | | | | |
PAPER & FOREST PRODUCTS – 0.9% | |
Domtar Corp. | | | | | | | 15,217 | | | | 1,216,751 | |
International Paper Co. | | | | | | | 2,739 | | | | 81,074 | |
MeadWestvaco Corp. | | | | | | | 31,750 | | | | 950,913 | |
| | | | | | | | | | | | |
| | | | | | | | | | | 2,248,738 | |
| | | | | | | | | | | | |
PHARMACEUTICALS – 0.8% | |
Forest Laboratories, Inc.* | | | | | | | 58,993 | | | | 1,785,128 | |
| | | | | | | | | | | | |
PROFESSIONAL SERVICES – 0.7% | |
Manpower, Inc. | | | | | | | 44,076 | | | | 1,575,717 | |
| | | | | | | | | | | | |
REAL ESTATE INVESTMENT TRUSTS – 11.8% | |
Alexandria Real Estate Equities, Inc. | | | | | | | 1,095 | | | | 75,522 | |
AvalonBay Communities, Inc. | | | | | | | 39,740 | | | | 5,190,044 | |
Boston Properties, Inc. | | | | | | | 7,620 | | | | 758,952 | |
BRE Properties, Inc. | | | | | | | 8,991 | | | | 453,866 | |
Equity Residential | | | | | | | 1,952 | | | | 111,323 | |
Federal Realty Investment Trust | | | | | | | 21,802 | | | | 1,978,532 | |
HCP, Inc. | | | | | | | 24,937 | | | | 1,033,140 | |
Liberty Property Trust | | | | | | | 29,755 | | | | 918,834 | |
Mack-Cali Realty Corp. | | | | | | | 12,607 | | | | 336,481 | |
Piedmont Office Realty Trust, Inc., Class A | | | | | | | 5,808 | | | | 98,968 | |
Plum Creek Timber Co., Inc. | | | | | | | 56,756 | | | | 2,074,999 | |
Potlatch Corp. | | | | | | | 21,028 | | | | 654,181 | |
ProLogis, Inc. | | | | | | | 97,955 | | | | 2,800,533 | |
Rayonier, Inc. | | | | | | | 139,754 | | | | 6,237,221 | |
Realty Income Corp. | | | | | | | 41,368 | | | | 1,446,225 | |
Regency Centers Corp. | | | | | | | 31,088 | | | | 1,169,531 | |
Senior Housing Properties Trust | | | | | | | 63,598 | | | | 1,427,139 | |
Taubman Centers, Inc. | | | | | | | 3,602 | | | | 223,684 | |
UDR, Inc. | | | | | | | 3,150 | | | | 79,065 | |
Vornado Realty Trust | | | | | | | 10,080 | | | | 774,749 | |
Weyerhaeuser Co. | | | | | | | 9,470 | | | | 176,805 | |
| | | | | | | | | | | | |
| | | | | | | | | | | 28,019,794 | |
| | | | | | | | | | | | |
| | | | | | | | | | | | |
| | | Country
Code** | | | Shares | | | Value | |
| | | | | | | | | | | | |
ROAD & RAIL – 0.7% | |
Con-Way, Inc. | | | | | | | 3,083 | | | $ | 89,900 | |
Kansas City Southern* | | | | | | | 1,804 | | | | 122,690 | |
Ryder System, Inc. | | | | | | | 3,813 | | | | 202,623 | |
Werner Enterprises, Inc. | | | | | | | 52,471 | | | | 1,264,551 | |
| | | | | | | | | | | | |
| | | | | | | | | | | 1,679,764 | |
| | | | | | | | | | | | |
SEMICONDUCTORS & SEMICONDUCTOR EQUIPMENT – 0.8% | |
Fairchild Semiconductor International, Inc.* | | | | | | | 22,021 | | | | 265,133 | |
Integrated Device Technology, Inc.* | | | | | | | 146,025 | | | | 797,296 | |
LSI Corp.* | | | | | | | 98,115 | | | | 583,784 | |
Marvell Technology Group Ltd.* | | | BM | | | | 12,870 | | | | 178,250 | |
Micron Technology, Inc.* | | | | | | | 29,227 | | | | 183,838 | |
| | | | | | | | | | | | |
| | | | | | | | | | | 2,008,301 | |
| | | | | | | | | | | | |
SOFTWARE – 1.8% | |
Activision Blizzard, Inc. | | | | | | | 70,296 | | | | 866,047 | |
BMC Software, Inc.* | | | | | | | 2,734 | | | | 89,620 | |
Fortinet, Inc.* | | | | | | | 27,401 | | | | 597,616 | |
Informatica Corp.* | | | | | | | 3,161 | | | | 116,736 | |
Mentor Graphics Corp.* | | | | | | | 39,143 | | | | 530,779 | |
Quest Software, Inc.* | | | | | | | 63,711 | | | | 1,185,025 | |
Synopsys, Inc.* | | | | | | | 34,232 | | | | 931,110 | |
| | | | | | | | | | | | |
| | | | | | | | | | | 4,316,933 | |
| | | | | | | | | | | | |
SPECIALTY RETAIL – 2.3% | |
AutoNation, Inc.* | | | | | | | 20,932 | | | | 771,763 | |
Barnes & Noble, Inc.* | | | | | | | 32,679 | | | | 473,192 | |
Best Buy Co., Inc. | | | | | | | 63,395 | | | | 1,481,541 | |
Dick’s Sporting Goods, Inc. | | | | | | | 27,432 | | | | 1,011,692 | |
Foot Locker, Inc. | | | | | | | 39,169 | | | | 933,789 | |
Limited Brands, Inc. | | | | | | | 5,721 | | | | 230,842 | |
Signet Jewelers Ltd. | | | BM | | | | 5,855 | | | | 257,386 | |
Ulta Salon Cosmetics & Fragrance, Inc.* | | | | | | | 3,141 | | | | 203,914 | |
| | | | | | | | | | | | |
| | | | | | | | | | | 5,364,119 | |
| | | | | | | | | | | | |
TEXTILES, APPAREL & LUXURY GOODS – 0.4% | |
Fossil, Inc.* | | | | | | | 9,622 | | | | 763,602 | |
See Notes to Financial Statements.
178
| | |
SC SM GOLDMAN SACHS MID CAP VALUE FUND PORTFOLIOOF INVESTMENTS (Continued) |
| December 31, 2011 | | Sun Capital Advisers Trust |
| | | | | | | | | | |
| | | Country
Code** | | Shares | | | Value | |
| | | | | | | | | | |
| | | | | | | | | | |
Under Armour, Inc., Class A* | | | | | 1,203 | | | $ | 86,363 | |
| | | | | | | | | | |
| | | | | | | | | 849,965 | |
| | | | | | | | | | |
THRIFT & MORTGAGE FINANCE – 1.0% | |
Hudson City Bancorp, Inc. | | | | | 149,365 | | | | 933,531 | |
New York Community Bancorp, Inc. | | | | | 82,979 | | | | 1,026,450 | |
Washington Federal, Inc. | | | | | 37,218 | | | | 520,680 | |
| | | | | | | | | | |
| | | | | | | | | 2,480,661 | |
| | | | | | | | | | |
TOBACCO – 4.6% | |
Lorillard, Inc. | | | | | 95,606 | | | | 10,899,084 | |
| | | | | | | | | | |
TRADING COMPANIES & DISTRIBUTORS – 1.2% | |
MSC Industrial Direct Co., Inc., Class A | | | | | 7,141 | | | | 510,939 | |
Watsco, Inc. | | | | | 26,296 | | | | 1,726,595 | |
WESCO International, Inc.* | | | | | 12,390 | | | | 656,794 | |
| | | | | | | | | | |
| | | | | | | | | 2,894,328 | |
| | | | | | | | | | |
WIRELESS TELECOMMUNICATION SERVICES – 0.6% | |
Telephone & Data Systems, Inc. | | | | | 21,350 | | | | 552,751 | |
US Cellular Corp.* | | | | | 17,844 | | | | 778,534 | |
| | | | | | | | | | |
| | | | | | | | | 1,331,285 | |
| | | | | | | | | | |
Total Common Stocks
(Cost $200,577,278) | | | | 233,230,890 | |
| | | | | | | | | | |
| | | | | | | | | | |
| | | Country
Code** | | Shares | | | Value | |
SHORT TERM INVESTMENTS – 1.3% | |
MUTUAL FUNDS – 1.3% | |
State Street Institutional Liquid Reserves Fund, 0.17% (Cost $3,145,993) | | | 3,145,993 | | | $ | 3,145,993 | |
| | | | | | | | | | |
TOTAL INVESTMENTS – 99.5% | |
(Cost $203,723,271) | | | | | | | 236,376,883 | |
Other assets less
liabilities – 0.5% | | | | | | | 1,145,200 | |
| | | | | | | | | | |
NET ASSETS – 100.0% | | | | | | $ | 237,522,083 | |
| | | | | | | | | | |
| | |
| BM | | Bermuda |
| CA | | Canada |
| CH | | Switzerland |
| GG | | Guernsey |
| IE | | Ireland |
| LR | | Liberia |
| PR | | Puerto Rico |
| VG | | British Virgin Islands |
| + | Amount is less than 0.05%. |
| * | Non-income producing security. |
| ** | Unless otherwise noted the issuer country code for all securities is United States. |
| (1) | At the period end, securities (or portions thereof) with an aggregate market value of $1,107,593 have been pledged to cover margin requirements for the following open futures contracts: |
| | | | | | | | | | | | | | |
Type | | Description | | Expiration
Date | | | Contracts | | | Unrealized
Appreciation ($) | |
Long | | S&P MidCap 400 E-Mini Index March Futures | | | 3/16/12 | | | | 65 | | | | 42,760 | |
| (2) | Fair Value Measurements |
All investments and financial derivative instruments are categorized as Level 1 under the fair value hierarchy. See Note 2b in the Notes to Financial Statements for additional information.
See Notes to Financial Statements.
179
SC SM COLUMBIA SMALL CAP VALUE FUND
| | |
PORTFOLIOOF INVESTMENTS December 31, 2011 | | Sun Capital Advisers Trust |
| | | | | | | | | | |
| | | Country
Code** | | Shares | | | Value | |
| | | | | | | | | | |
| | | | | | | | | | |
COMMON STOCKS – 99.5% | |
AEROSPACE & DEFENSE – 1.4% | |
AAR Corp. | | | | | 8,840 | | | $ | 169,463 | |
Ceradyne, Inc.* | | | | | 10,490 | | | | 280,922 | |
Curtiss-Wright Corp. | | | | | 9,610 | | | | 339,521 | |
| | | | | | | | | | |
| | | | | | | | | 789,906 | |
| | | | | | | | | | |
BUILDING PRODUCTS – 0.4% | |
Universal Forest Products, Inc. | | | | | 6,370 | | | | 196,642 | |
| | | | | | | | | | |
CAPITAL MARKETS – 2.1% | | | | | |
GFI Group, Inc. | | | | | 47,420 | | | | 195,370 | |
Greenhill & Co., Inc. | | | | | 567 | | | | 20,622 | |
INTL FCStone, Inc.* | | | | | 12,459 | | | | 293,659 | |
Investment Technology Group, Inc.* | | | | | 17,399 | | | | 188,083 | |
Knight Capital Group, Inc.* | | | | | 28,700 | | | | 339,234 | |
Medallion Financial Corp. | | | | | 13,359 | | | | 152,025 | |
| | | | | | | | | | |
| | | | | | | | | 1,188,993 | |
| | | | | | | | | | |
CHEMICALS – 3.4% | | | | | |
Cabot Corp. | | | | | 4,410 | | | | 141,737 | |
Chemtura Corp.* | | | | | 17,350 | | | | 196,749 | |
Cytec Industries, Inc. | | | | | 4,220 | | | | 188,423 | |
Ferro Corp.* | | | | | 36,920 | | | | 180,539 | |
H.B. Fuller Co. | | | | | 16,850 | | | | 389,403 | |
Minerals Technologies, Inc. | | | | | 5,520 | | | | 312,046 | |
OM Group, Inc.* | | | | | 21,062 | | | | 471,578 | |
| | | | | | | | | | |
| | | | | | | | | 1,880,475 | |
| | | | | | | | | | |
COMMERCIAL BANKS – 9.1% | |
Ameris Bancorp* | | | | | 22,323 | | | | 229,480 | |
Bancfirst Corp. | | | | | 5,970 | | | | 224,114 | |
BancTrust Financial Group, Inc.* | | | | | 7,403 | | | | 9,180 | |
BOK Financial Corp. | | | | | 2,520 | | | | 138,424 | |
Bryn Mawr Bank Corp. | | | | | 11,876 | | | | 231,463 | |
Chemical Financial Corp. | | | | | 13,840 | | | | 295,069 | |
Columbia Banking System, Inc. | | | | | 16,480 | | | | 317,570 | |
Community Trust Bancorp, Inc. | | | | | 9,500 | | | | 279,490 | |
First Citizens BancShares, Inc. | | | | | 1,578 | | | | 276,134 | |
| | | | | | | | | | | | |
| | | Country
Code** | | | Shares | | | Value | |
| | | | | | | | | | | | |
| | | | | | | | | | | | |
First Commonwealth Financial Corp. | | | | | | | 59,600 | | | $ | 313,496 | |
First Financial Corp. | | | | | | | 10,592 | | | | 352,502 | |
First National Bank Alaska | | | | | | | 100 | | | | 154,000 | |
FirstMerit Corp. | | | | | | | 27,040 | | | | 409,115 | |
Glacier Bancorp, Inc. | | | | | | | 20,880 | | | | 251,186 | |
Hancock Holding Co. | | | | | | | 13,820 | | | | 441,825 | |
Investors Bancorp, Inc.* | | | | | | | 15,940 | | | | 214,871 | |
Merchants Bancshares, Inc. | | | | | | | 8,644 | | | | 252,405 | |
Northrim Bancorp, Inc. | | | | | | | 10,958 | | | | 191,875 | |
West Coast Bancorp* | | | | | | | 10,960 | | | | 170,976 | |
Wintrust Financial Corp. | | | | | | | 11,549 | | | | 323,949 | |
| | | | | | | | | | | | |
| | | | | | | | | | | 5,077,124 | |
| | | | | | | | | | | | |
COMMERCIAL SERVICES & SUPPLIES – 2.3% | |
ABM Industries, Inc. | | | | | | | 11,090 | | | | 228,676 | |
Consolidated Graphics, Inc.* | | | | | | | 4,519 | | | | 218,177 | |
Ennis, Inc. | | | | | | | 10,430 | | | | 139,032 | |
G&K Services, Inc. | | | | | | | 4,915 | | | | 143,076 | |
UniFirst Corp. | | | | | | | 4,650 | | | | 263,841 | |
United Stationers, Inc. | | | | | | | 8,700 | | | | 283,272 | |
| | | | | | | | | | | | |
| | | | | | | | | | | 1,276,074 | |
| | | | | | | | | | | | |
COMMUNICATIONS EQUIPMENT – 1.3% | |
Anaren, Inc.* | | | | | | | 9,178 | | | | 152,538 | |
Bel Fuse, Inc., Class B | | | | | | | 6,130 | | | | 114,937 | |
Black Box Corp. | | | | | | | 6,100 | | | | 171,044 | |
Symmetricom, Inc.* | | | | | | | 26,440 | | | | 142,512 | |
Tellabs, Inc. | | | | | | | 42,250 | | | | 170,690 | |
| | | | | | | | | | | | |
| | | | | | | | | | | 751,721 | |
| | | | | | | | | | | | |
COMPUTERS & PERIPHERALS – 0.3% | |
QLogic Corp.* | | | | | | | 11,830 | | | | 177,450 | |
| | | | | | | | | | | | |
CONSTRUCTION & ENGINEERING – 2.5% | | | | | |
Comfort Systems USA, Inc. | | | | | | | 14,848 | | | | 159,170 | |
Dycom Industries, Inc.* | | | | | | | 16,350 | | | | 342,042 | |
EMCOR Group, Inc. | | | | | | | 13,260 | | | | 355,501 | |
Great Lakes Dredge & Dock Co. | | | | | | | 2,285 | | | | 12,705 | |
KHD Humboldt Wedag International AG* | | | DE | | | | 12,389 | | | | 80,172 | |
Layne Christensen Co.* | | | | | | | 7,250 | | | | 175,450 | |
See Notes to Financial Statements.
180
SC SM COLUMBIA SMALL CAP VALUE FUND
| | |
PORTFOLIOOF INVESTMENTS (Continued) December 31, 2011 | | Sun Capital Advisers Trust |
| | | | | | | | | | |
| | | Country
Code** | | Shares | | | Value | |
| | | | | | | | | | |
| | | | | | | | | | |
Pike Electric Corp.* | | | | | 18,967 | | | $ | 136,373 | |
Sterling Construction Co., Inc.* | | | | | 11,398 | | | | 122,756 | |
| | | | | | | | | | |
| | | | | | | | | 1,384,169 | |
| | | | | | | | | | |
CONSUMER FINANCE – 0.6% | |
Cash America International, Inc. | | | | | 7,370 | | | | 343,663 | |
| | | | | | | | | | |
CONTAINERS & PACKAGING – 1.5% | |
Greif, Inc., Class A | | | | | 10,427 | | | | 474,950 | |
Greif, Inc., Class B | | | | | 3,368 | | | | 151,728 | |
Packaging Corp. of America | | | | | 7,760 | | | | 195,863 | |
| | | | | | | | | | |
| | | | | | | | | 822,541 | |
| | | | | | | | | | |
DIVERSIFIED CONSUMER SERVICES – 0.6% | |
Lincoln Educational Services Corp. | | | | | 15,561 | | | | 122,932 | |
Regis Corp. | | | | | 14,340 | | | | 237,327 | |
| | | | | | | | | | |
| | | | | | | | | 360,259 | |
| | | | | | | | | | |
DIVERSIFIED FINANCIAL SERVICES – 0.2% | |
Pico Holdings, Inc.* | | | | | 4,684 | | | | 96,397 | |
| | | | | | | | | | |
DIVERSIFIED TELECOMMUNICATION SERVICES – 1.2% | |
Cbeyond, Inc.* | | | | | 23,066 | | | | 184,759 | |
Lumos Networks Corp. | | | | | 7,080 | | | | 108,607 | |
Neutral Tandem, Inc.* | | | | | 17,960 | | | | 191,992 | |
Warwick Valley Telephone Co. | | | | | 11,918 | | | | 157,199 | |
| | | | | | | | | | |
| | | | | | | | | 642,557 | |
| | | | | | | | | | |
ELECTRIC UTILITIES – 2.0% | |
ALLETE, Inc. | | | | | 9,090 | | | | 381,598 | |
IDACORP, Inc. | | | | | 9,280 | | | | 393,565 | |
MGE Energy, Inc. | | | | | 7,130 | | | | 333,470 | |
| | | | | | | | | | |
| | | | | | | | | 1,108,633 | |
| | | | | | | | | | |
ELECTRICAL EQUIPMENT – 1.7% | |
Belden, Inc. | | | | | 7,070 | | | | 235,290 | |
Brady Corp., Class A | | | | | 9,290 | | | | 293,285 | |
GrafTech International Ltd.* | | | | | 18,850 | | | | 257,302 | |
Powell Industries, Inc.* | | | | | 5,195 | | | | 162,500 | |
| | | | | | | | | | |
| | | | | | | | | 948,377 | |
| | | | | | | | | | |
| | | | | | | | | | | | |
| | | Country
Code** | | | Shares | | | Value | |
| | | | | | | | | | | | |
| | | | | | | | | | | | |
ELECTRONIC EQUIPMENT, INSTRUMENTS & COMPONENTS – 2.6% | |
Anixter International, Inc.* | | | | | | | 5,099 | | | $ | 304,105 | |
Benchmark Electronics, Inc.* | | | | | | | 17,450 | | | | 235,052 | |
Electro Scientific Industries, Inc.* | | | | | | | 11,190 | | | | 162,031 | |
Littelfuse, Inc. | | | | | | | 5,750 | | | | 247,135 | |
Methode Electronics, Inc. | | | | | | | 13,180 | | | | 109,262 | |
MTS Systems Corp. | | | | | | | 5,216 | | | | 212,552 | |
Nam Tai Electronics, Inc. | | | VG | | | | 37,817 | | | | 200,808 | |
| | | | | | | | | | | | |
| | | | | | | | | | | 1,470,945 | |
| | | | | | | | | | | | |
ENERGY EQUIPMENT & SERVICES – 2.1% | |
Gulf Island Fabrication, Inc. | | | | | | | 9,180 | | | | 268,148 | |
Matrix Service Co.* | | | | | | | 17,550 | | | | 165,672 | |
RPC, Inc. | | | | | | | 1,690 | | | | 30,843 | |
TETRA Technologies, Inc.* | | | | | | | 16,810 | | | | 157,005 | |
TGC Industries, Inc.* | | | | | | | 23,741 | | | | 169,511 | |
Tidewater, Inc. | | | | | | | 4,800 | | | | 236,640 | |
Union Drilling, Inc.* | | | | | | | 24,613 | | | | 153,585 | |
| | | | | | | | | | | | |
| | | | | | | | | | | 1,181,404 | |
| | | | | | | | | | | | |
FOOD & STAPLES RETAILING – 1.6% | |
Ruddick Corp. | | | | | | | 7,230 | | | | 308,287 | |
Spartan Stores, Inc. | | | | | | | 12,890 | | | | 238,465 | |
The Andersons, Inc. | | | | | | | 7,410 | | | | 323,521 | |
| | | | | | | | | | | | |
| | | | | | | | | | | 870,273 | |
| | | | | | | | | | | | |
FOOD PRODUCTS – 1.0% | | | | | | | | | | | | |
Chiquita Brands International, Inc.* | | | | | | | 24,320 | | | | 202,829 | |
Darling International, Inc.* | | | | | | | 1,720 | | | | 22,859 | |
Fresh Del Monte Produce, Inc. | | | KY | | | | 13,170 | | | | 329,381 | |
| | | | | | | | | | | | |
| | | | | | | | | | | 555,069 | |
| | | | | | | | | | | | |
GAS UTILITIES – 1.2% | | | | | | | | | | | | |
Southwest Gas Corp. | | | | | | | 9,606 | | | | 408,159 | |
The Laclede Group, Inc. | | | | | | | 7,120 | | | | 288,146 | |
| | | | | | | | | | | | |
| | | | | | | | | | | 696,305 | |
| | | | | | | | | | | | |
See Notes to Financial Statements.
181
SC SM COLUMBIA SMALL CAP VALUE FUND
| | |
PORTFOLIOOF INVESTMENTS (Continued) December 31, 2011 | | Sun Capital Advisers Trust |
| | | | | | | | | | | | |
| | | Country
Code** | | | Shares | | | Value | |
| | | | | | | | | | | | |
| | | | | | | | | | | | |
HEALTH CARE EQUIPMENT & SUPPLIES – 2.9% | |
Analogic Corp. | | | | | | | 3,350 | | | $ | 192,022 | |
Angiodynamics, Inc.* | | | | | | | 12,753 | | | | 188,872 | |
Cantel Medical Corp. | | | | | | | 9,566 | | | | 267,178 | |
ICU Medical, Inc.* | | | | | | | 5,275 | | | | 237,375 | |
Kensey Nash Corp.* | | | | | | | 7,020 | | | | 134,714 | |
Medical Action Industries, Inc.* | | | | | | | 20,255 | | | | 105,934 | |
Orthofix International NV* | | | AN | | | | 4,759 | | | | 167,659 | |
Quidel Corp.* | | | | | | | 11,415 | | | | 172,709 | |
Symmetry Medical, Inc.* | | | | | | | 18,343 | | | | 146,561 | |
| | | | | | | | | | | | |
| | | | | | | | | | | 1,613,024 | |
| | | | | | | | | | | | |
HEALTH CARE PROVIDERS & SERVICES – 3.7% | |
AmSurg Corp.* | | | | | | | 11,360 | | | | 295,814 | |
Centene Corp.* | | | | | | | 8,770 | | | | 347,204 | |
Lincare Holdings, Inc. | | | | | | | 7,820 | | | | 201,052 | |
Magellan Health Services, Inc.* | | | | | | | 6,300 | | | | 311,661 | |
Medcath Corp.* | | | | | | | 18,900 | | | | 137,781 | |
Molina Healthcare, Inc.* | | | | | | | 10,250 | | | | 228,883 | |
Owens & Minor, Inc. | | | | | | | 7,910 | | | | 219,819 | |
Triple-S Management Corp., Class B* | | | PR | | | | 8,330 | | | | 166,767 | |
U.S. Physical Therapy, Inc. | | | | | | | 8,062 | | | | 158,660 | |
| | | | | | | | | | | | |
| | | | | | | | | | | 2,067,641 | |
| | | | | | | | | | | | |
HOTELS, RESTAURANTS & LEISURE – 1.5% | |
Benihana, Inc.* | | | | | | | 16,961 | | | | 173,511 | |
Bob Evans Farms, Inc. | | | | | | | 9,340 | | | | 313,264 | |
P.F. Chang’s China Bistro, Inc. | | | | | | | 6,360 | | | | 196,588 | |
Red Robin Gourmet Burgers, Inc.* | | | | | | | 6,049 | | | | 167,557 | |
| | | | | | | | | | | | |
| | | | | | | | | | | 850,920 | |
| | | | | | | | | | | | |
HOUSEHOLD DURABLES – 0.9% | |
American Greetings Corp. | | | | | | | 14,650 | | | | 183,272 | |
Cavco Industries, Inc.* | | | | | | | 4,335 | | | | 173,660 | |
CSS Industries, Inc. | | | | | | | 8,162 | | | | 162,587 | |
| | | | | | | | | | | | |
| | | | | | | | | | | 519,519 | |
| | | | | | | | | | | | |
INSURANCE – 7.9% | | | | | | | | | | | | |
Allied World Assurance Co. Holdings Ltd. | | | CH | | | | 4,080 | | | | 256,754 | |
American Safety Insurance Holdings Ltd.* | | | BM | | | | 12,310 | | | | 267,742 | |
| | | | | | | | | | | | |
| | | Country
Code** | | | Shares | | | Value | |
| | | | | | | | | | | | |
| | | | | | | | | | | | |
Argo Group International Holdings, Inc. | | | BM | | | | 10,750 | | | $ | 311,320 | |
Baldwin & Lyons, Inc., Class B | | | | | | | 9,485 | | | | 206,773 | |
eHealth, Inc.* | | | | | | | 18,658 | | | | 274,273 | |
EMC Insurance Group, Inc. | | | | | | | 10,650 | | | | 219,071 | |
Endurance Specialty Holdings Ltd. | | | BM | | | | 5,960 | | | | 227,970 | |
FBL Financial Group, Inc. | | | | | | | 8,320 | | | | 283,046 | |
Global Indemnity PLC* | | | IE | | | | 16,287 | | | | 322,971 | |
Hanover Insurance Group, Inc. | | | | | | | 7,211 | | | | 252,024 | |
Horace Mann Educators Corp. | | | | | | | 17,750 | | | | 243,353 | |
National Western Life Insurance Co. | | | | | | | 1,086 | | | | 147,870 | |
Navigators Group, Inc.* | | | | | | | 5,930 | | | | 282,742 | |
Old Republic International Corp. | | | | | | | 14,480 | | | | 134,230 | |
Safety Insurance Group, Inc. | | | | | | | 7,350 | | | | 297,528 | |
Stewart Information Services Corp. | | | | | | | 13,192 | | | | 152,368 | |
Symetra Financial Corp. | | | | | | | 22,045 | | | | 199,948 | |
United Fire & Casualty Co. | | | | | | | 17,260 | | | | 348,307 | |
| | | | | | | | | | | | |
| | | | | | | | | | | 4,428,290 | |
| | | | | | | | | | | | |
INTERNET SOFTWARE & SERVICES – 1.4% | |
InfoSpace, Inc.* | | | | | | | 20,271 | | | | 222,778 | |
j2 Global, Inc. | | | | | | | 6,686 | | | | 188,144 | |
United Online, Inc. | | | | | | | 31,090 | | | | 169,130 | |
ValueClick, Inc.* | | | | | | | 11,970 | | | | 194,991 | |
| | | | | | | | | | | | |
| | | | | | | | | | | 775,043 | |
| | | | | | | | | | | | |
IT SERVICES – 3.0% | |
Acxiom Corp.* | | | | | | | 21,130 | | | | 257,997 | |
CACI International, Inc., Class A* | | | | | | | 6,090 | | | | 340,553 | |
Convergys Corp.* | | | | | | | 24,053 | | | | 307,157 | |
CSG Systems International, Inc.* | | | | | | | 11,040 | | | | 162,398 | |
Global Cash Access Holdings, Inc.* | | | | | | | 40,377 | | | | 179,678 | |
See Notes to Financial Statements.
182
SC SM COLUMBIA SMALL CAP VALUE FUND
| | |
PORTFOLIOOF INVESTMENTS (Continued) December 31, 2011 | | Sun Capital Advisers Trust |
| | | | | | | | | | | | |
| | | Country
Code** | | | Shares | | | Value | |
| | | | | | | | | | | | |
| | | | | | | | | | | | |
MoneyGram International, Inc.* | | | | | | | 13,139 | | | $ | 233,217 | |
Teletech Holdings, Inc.* | | | | | | | 10,840 | | | | 175,608 | |
| | | | | | | | | | | | |
| | | | | | | | | | | 1,656,608 | |
| | | | | | | | | | | | |
MACHINERY – 4.5% | |
Astec Industries, Inc.* | | | | | | | 6,750 | | | | 217,417 | |
Briggs & Stratton Corp. | | | | | | | 13,967 | | | | 216,349 | |
CIRCOR International, Inc. | | | | | | | 6,200 | | | | 218,922 | |
EnPro Industries, Inc.* | | | | | | | 7,760 | | | | 255,925 | |
FreightCar America, Inc.* | | | | | | | 6,990 | | | | 146,440 | |
Harsco Corp. | | | | | | | 6,990 | | | | 143,854 | |
ITT Corp. | | | | | | | 2,320 | | | | 44,846 | |
Kadant, Inc.* | | | | | | | 11,032 | | | | 249,434 | |
LB Foster Co. | | | | | | | 7,420 | | | | 209,912 | |
Mueller Industries, Inc. | | | | | | | 9,010 | | | | 346,164 | |
Robbins & Myers, Inc. | | | | | | | 9,065 | | | | 440,106 | |
| | | | | | | | | | | | |
| | | | | | | | | | | 2,489,369 | |
| | | | | | | | | | | | |
MARINE – 0.2% | | | | | |
Diana Shipping, Inc.* | | | MH | | | | 17,690 | | | | 132,321 | |
| | | | | | | | | | | | |
METALS & MINING – 1.3% | |
Olympic Steel, Inc. | | | | | | | 8,895 | | | | 207,431 | |
Thompson Creek Metals Co., Inc.* | | | CA | | | | 35,680 | | | | 248,333 | |
Worthington Industries, Inc. | | | | | | | 16,320 | | | | 267,322 | |
| | | | | | | | | | | | |
| | | | | | | | | | | 723,086 | |
| | | | | | | | | | | | |
MULTI-UTILITIES – 0.4% | |
CH Energy Group, Inc. | | | | | | | 3,520 | | | | 205,498 | |
| | | | | | | | | | | | |
OIL, GAS & CONSUMABLE FUELS – 2.7% | |
Bill Barrett Corp.* | | | | | | | 7,890 | | | | 268,812 | |
Cloud Peak Energy, Inc.* | | | | | | | 13,610 | | | | 262,945 | |
Forest Oil Corp.* | | | | | | | 12,410 | | | | 168,156 | |
James River Coal Co.* | | | | | | | 16,070 | | | | 111,204 | |
Stone Energy Corp.* | | | | | | | 8,025 | | | | 211,700 | |
Swift Energy Co.* | | | | | | | 9,900 | | | | 294,228 | |
VAALCO Energy, Inc.* | | | | | | | 33,825 | | | | 204,303 | |
| | | | | | | | | | | | |
| | | | | | | | | | | 1,521,348 | |
| | | | | | | | | | | | |
| | | | | | | | | | |
| | | Country
Code** | | Shares | | | Value | |
| | | | | | | | | | |
| | | | | | | | | | |
PAPER & FOREST PRODUCTS – 0.4% | |
Wausau Paper Corp. | | | | | 29,113 | | | $ | 240,473 | |
| | | | | | | | | | |
PHARMACEUTICALS – 2.0% | |
Impax Laboratories, Inc.* | | | | | 12,200 | | | | 246,074 | |
Medicis Pharmaceutical Corp., Class A | | | | | 7,110 | | | | 236,408 | |
Par Pharmaceutical Cos., Inc.* | | | | | 7,940 | | | | 259,876 | |
ViroPharma, Inc.* | | | | | 14,490 | | | | 396,881 | |
| | | | | | | | | | |
| | | | | | | | | 1,139,239 | |
| | | | | | | | | | |
PROFESSIONAL SERVICES – 1.0% | |
FTI Consulting, Inc.* | | | | | 7,880 | | | | 334,270 | |
Korn/Ferry International* | | | | | 11,650 | | | | 198,749 | |
| | | | | | | | | | |
| | | | | | | | | 533,019 | |
| | | | | | | | | | |
REAL ESTATE INVESTMENT TRUSTS – 5.9% | |
Chesapeake Lodging Trust | | | | | 21,126 | | | | 326,608 | |
Corporate Office Properties Trust | | | | | 9,408 | | | | 200,014 | |
Cousins Properties, Inc. | | | | | 44,113 | | | | 282,764 | |
DiamondRock Hospitality Co. | | | | | 42,540 | | | | 410,086 | |
Franklin Street Properties Corp. | | | | | 13,349 | | | | 132,823 | |
Getty Realty Corp. | | | | | 6,103 | | | | 85,137 | |
National Health Investors, Inc. | | | | | 5,080 | | | | 223,418 | |
Potlatch Corp. | | | | | 10,670 | | | | 331,944 | |
Starwood Property Trust, Inc. | | | | | 22,793 | | | | 421,898 | |
Sunstone Hotel Investors, Inc.* | | | | | 50,040 | | | | 407,826 | |
Terreno Realty Corp. | | | | | 17,045 | | | | 258,061 | |
Urstadt Biddle Properties, Inc., Class A | | | | | 10,340 | | | | 186,947 | |
| | | | | | | | | | |
| | | | | | | | | 3,267,526 | |
| | | | | | | | | | |
REAL ESTATE MANAGEMENT & DEVELOPMENT – 0.1% | |
Avatar Holdings, Inc.* | | | | | 8,691 | | | | 62,401 | |
| | | | | | | | | | |
See Notes to Financial Statements.
183
SC SM COLUMBIA SMALL CAP VALUE FUND
| | |
PORTFOLIOOF INVESTMENTS (Continued) December 31, 2011 | | Sun Capital Advisers Trust |
| | | | | | | | | | |
| | | Country
Code** | | Shares | | | Value | |
| | | | | | | | | | |
| | | | | | | | | | |
ROAD & RAIL – 1.4% | | | | | | | | | | |
Heartland Express, Inc. | | | | | 11,250 | | | $ | 160,763 | |
Ryder System, Inc. | | | | | 4,600 | | | | 244,444 | |
Werner Enterprises, Inc. | | | | | 16,600 | | | | 400,060 | |
| | | | | | | | | | |
| | | | | | | | | 805,267 | |
| | | | | | | | | | |
SEMICONDUCTORS & SEMICONDUCTOR EQUIPMENT – 4.2% | |
Amkor Technology, Inc.* | | | | | 35,440 | | | | 154,518 | |
ATMI, Inc.* | | | | | 10,680 | | | | 213,920 | |
Cabot Microelectronics Corp.* | | | | | 6,200 | | | | 292,950 | |
Cymer, Inc.* | | | | | 5,480 | | | | 272,685 | |
Entegris, Inc.* | | | | | 36,040 | | | | 314,449 | |
Integrated Device Technology, Inc.* | | | | | 29,560 | | | | 161,398 | |
MKS Instruments, Inc. | | | | | 11,650 | | | | 324,103 | |
Novellus Systems, Inc.* | | | | | 2,751 | | | | 113,589 | |
Teradyne, Inc.* | | | | | 14,520 | | | | 197,908 | |
Tessera Technologies, Inc.* | | | | | 16,264 | | | | 272,422 | |
| | | | | | | | | | |
| | | | | | | | | 2,317,942 | |
| | | | | | | | | | |
SOFTWARE – 1.2% | | | | | | | | | | |
Compuware Corp.* | | | | | 18,930 | | | | 157,498 | |
Monotype Imaging Holdings, Inc.* | | | | | 11,220 | | | | 174,920 | |
Parametric Technology Corp.* | | | | | 8,540 | | | | 155,940 | |
Progress Software Corp.* | | | | | 10,450 | | | | 202,207 | |
| | | | | | | | | | |
| | | | | | | | | 690,565 | |
| | | | | | | | | | |
SPECIALTY RETAIL – 5.8% | |
Aaron’s, Inc. | | | | | 9,940 | | | | 265,199 | |
Children’s Place Retail Stores, Inc.* | | | | | 6,255 | | | | 332,266 | |
Finish Line, Inc., Class A | | | | | 15,640 | | | | 301,617 | |
Foot Locker, Inc. | | | | | 8,920 | | | | 212,653 | |
GameStop Corp., Class A* | | | | | 9,226 | | | | 222,623 | |
hhgregg, Inc.* | | | | | 15,963 | | | | 230,665 | |
OfficeMax, Inc.* | | | | | 31,520 | | | | 143,101 | |
RadioShack Corp. | | | | | 24,510 | | | | 237,992 | |
Rent-A-Center, Inc. | | | | | 16,390 | | | | 606,430 | |
Shoe Carnival, Inc.* | | | | | 6,905 | | | | 177,459 | |
| | | | | | | | | | |
| | | Country
Code** | | Shares | | | Value | |
| | | | | | | | | | |
| | | | | | | | | | |
Stage Stores, Inc. | | | | | 12,752 | | | $ | 177,125 | |
The Men’s Wearhouse, Inc. | | | | | 11,000 | | | | 356,510 | |
| | | | | | | | | | |
| | | | | | | | | 3,263,640 | |
| | | | | | | | | | |
TEXTILES, APPAREL & LUXURY GOODS – 1.4% | |
Movado Group, Inc. | | | | | 12,708 | | | | 230,904 | |
The Jones Group, Inc. | | | | | 29,020 | | | | 306,161 | |
The Warnaco Group, Inc.* | | | | | 4,590 | | | | 229,684 | |
| | | | | | | | | | |
| | | | | | | | | 766,749 | |
| | | | | | | | | | |
THRIFT & MORTGAGE FINANCE – 5.2% | |
Bank Mutual Corp. | | | | | 47,139 | | | | 149,902 | |
BankFinancial Corp. | | | | | 32,948 | | | | 181,873 | |
Beneficial Mutual Bancorp, Inc.* | | | | | 33,520 | | | | 280,227 | |
Brookline Bancorp, Inc. | | | | | 33,223 | | | | 280,402 | |
Clifton Savings Bancorp, Inc. | | | | | 18,895 | | | | 175,345 | |
ESSA Bancorp, Inc. | | | | | 15,059 | | | | 157,668 | |
Home Federal Bancorp, Inc. | | | | | 26,242 | | | | 272,917 | |
MGIC Investment Corp.* | | | | | 65,582 | | | | 244,621 | |
Northfield Bancorp, Inc. | | | | | 11,622 | | | | 164,567 | |
Provident New York Bancorp | | | | | 21,990 | | | | 146,014 | |
TrustCo Bank Corp. NY | | | | | 30,061 | | | | 168,642 | |
United Financial Bancorp, Inc. | | | | | 11,568 | | | | 186,129 | |
Washington Federal, Inc. | | | | | 18,930 | | | | 264,831 | |
Westfield Financial, Inc. | | | | | 31,072 | | | | 228,690 | |
| | | | | | | | | | |
| | | | | | | | | 2,901,828 | |
| | | | | | | | | | |
TRADING COMPANIES & DISTRIBUTORS – 0.9% | |
Applied Industrial Technologies, Inc. | | | | | 7,430 | | | | 261,313 | |
Kaman Corp. | | | | | 8,750 | | | | 239,050 | |
| | | | | | | | | | |
| | | | | | | | | 500,363 | |
| | | | | | | | | | |
See Notes to Financial Statements.
184
SC SM COLUMBIA SMALL CAP VALUE FUND
| | |
PORTFOLIOOF INVESTMENTS (Continued) December 31, 2011 | | Sun Capital Advisers Trust |
| | | | | | | | | | |
| | | Country
Code** | | Shares | | | Value | |
| | | | | | | | | | |
| | | | | | | | | | |
WIRELESS TELECOMMUNICATION SERVICES – 0.5% | | | | | |
NTELOS Holdings Corp. | | | | | 7,080 | | | $ | 144,290 | |
Shenandoah Telecommunications Co. | | | | | 11,101 | | | | 116,339 | |
| | | | | | | | | | |
| | | | | | | | | 260,629 | |
| | | | | | | | | | |
Total Common Stocks
(Cost $56,727,404) | | | | 55,551,285 | |
| | | | | | | | | | |
TOTAL INVESTMENTS – 99.5% | |
(Cost $56,727,404) | | | | | | | 55,551,285 | |
Other assets less
liabilities – 0.5% | | | | | | | 254,207 | |
| | | | | | | | | | |
NET ASSETS – 100.0% | | | | | | $ | 55,805,492 | |
| | | | | | | | | | |
| | |
| AN | | Netherlands Antilles |
| BM | | Bermuda |
| CA | | Canada |
| CH | | Switzerland |
| DE | | Germany |
| IE | | Ireland |
| KY | | Cayman Islands |
| MH | | Marshall Islands |
| PR | | Puerto Rico |
| VG | | British Virgin Islands |
| * | Non-income producing security. |
| ** | Unless otherwise noted the issuer country code for all securities is United States. |
| (1) | Fair Value Measurements † |
The following table summarizes the inputs used to value the Fund’s assets and liabilities, as applicable, measured at fair value at the period end:
| | | | | | | | | | | | | | | | |
Assets | | Quoted Prices
in Active
Markets for
Identical
Assets and
Liabilities
(Level 1) | | | Significant
Other
Observable
Inputs
(Level 2) | | | Significant
Unobservable
Inputs
(Level 3) | | | Total | |
Common Stocks (a) | | $ | 55,471,113 | | | $ | 80,172 | | | $ | — | | | $ | 55,551,285 | |
| | | | | | | | | | | | | | | | |
Total Investments | | $ | 55,471,113 | | | $ | 80,172 | | | $ | — | | | $ | 55,551,285 | |
| | | | | | | | | | | | | | | | |
| † | See Note 2b in the Notes to Financial Statements for additional information. |
| (a) | See Portfolio of Investments for additional detailed categorizations of Level 1 Securities. The Level 2 security is within the Construction & Engineering industry in the Portfolio of Investments. |
See Notes to Financial Statements.
185
SC SM DAVIS VENTURE VALUE FUND
| | |
PORTFOLIOOF INVESTMENTS December 31, 2011 | | Sun Capital Advisers Trust |
| | | | | | | | | | | | |
| | | Country
Code** | | | Shares | | | Value | |
| | | | | | | | | | | | |
| | | | | | | | | | | | |
COMMON STOCKS – 97.0% | |
AEROSPACE & DEFENSE – 0.9% | |
Lockheed Martin Corp. | | | | | | | 43,640 | | | $ | 3,530,476 | |
| | | | | | | | | | | | |
AUTOMOBILES – 0.6% | |
Harley-Davidson, Inc. | | | | | | | 60,986 | | | | 2,370,526 | |
| | | | | | | | | | | | |
BEVERAGES – 4.3% | |
Diageo PLC ADR | | | GB | | | | 79,447 | | | | 6,945,256 | |
Heineken Holding NV | | | NL | | | | 100,159 | | | | 4,098,927 | |
The Coca-Cola Co. | | | | | | | 81,740 | | | | 5,719,348 | |
| | | | | | | | | | | | |
| | | | | | | | | | | 16,763,531 | |
| | | | | | | | | | | | |
CAPITAL MARKETS – 7.5% | |
Ameriprise Financial, Inc. | | | | | | | 45,205 | | | | 2,243,976 | |
Bank of New York Mellon Corp. | | | | | | | 803,520 | | | | 15,998,083 | |
Julius Baer Group Ltd. | | | CH | | | | 204,200 | | | | 7,987,127 | |
The Charles Schwab Corp. | | | | | | | 141,450 | | | | 1,592,727 | |
The Goldman Sachs Group, Inc. | | | | | | | 16,121 | | | | 1,457,822 | |
| | | | | | | | | | | | |
| | | | | | | | | | | 29,279,735 | |
| | | | | | | | | | | | |
CHEMICALS – 3.4% | |
Air Products & Chemicals, Inc. | | | | | | | 24,280 | | | | 2,068,413 | |
Ecolab, Inc. | | | | | | | 32,270 | | | | 1,865,529 | |
Monsanto Co. | | | | | | | 73,220 | | | | 5,130,525 | |
Potash Corp. of Saskatchewan, Inc. | | | CA | | | | 62,925 | | | | 2,597,544 | |
Praxair, Inc. | | | | | | | 14,320 | | | | 1,530,808 | |
| | | | | | | | | | | | |
| | | | | | | | | | | 13,192,819 | |
| | | | | | | | | | | | |
COMMERCIAL BANKS – 5.4% | |
Wells Fargo & Co. | | | | | | | 765,393 | | | | 21,094,231 | |
| | | | | | | | | | | | |
COMMERCIAL SERVICES & SUPPLIES – 2.1% | |
Iron Mountain, Inc. | | | | | | | 260,124 | | | | 8,011,819 | |
| | | | | | | | | | | | |
COMPUTERS & PERIPHERALS – 0.7% | |
Hewlett-Packard Co. | | | | | | | 108,400 | | | | 2,792,384 | |
| | | | | | | | | | | | |
| | | | | | | | | | | | |
| | | Country
Code** | | | Shares | | | Value | |
| | | | | | | | | | | | |
| | | | | | | | | | | | |
CONSTRUCTION MATERIALS – 0.4% | |
Martin Marietta Materials, Inc. | | | | | | | 18,260 | | | $ | 1,376,987 | |
| | | | | | | | | | | | |
CONSUMER FINANCE – 5.2% | |
American Express Co. | | | | | | | 430,175 | | | | 20,291,355 | |
| | | | | | | | | | | | |
CONTAINERS & PACKAGING – 0.5% | |
Sealed Air Corp. | | | | | | | 104,103 | | | | 1,791,613 | |
| | | | | | | | | | | | |
DISTRIBUTORS – 0.3% | |
Li & Fung Ltd. | | | BM | | | | 616,000 | | | | 1,138,949 | |
| | | | | | | | | | | | |
DIVERSIFIED FINANCIAL SERVICES – 0.3% | |
CME Group, Inc. | | | | | | | 2,830 | | | | 689,586 | |
JP Morgan Chase & Co. | | | | | | | 18,736 | | | | 622,972 | |
| | | | | | | | | | | | |
| | | | | | | | | | | 1,312,558 | |
| | | | | | | | | | | | |
ENERGY EQUIPMENT & SERVICES – 0.7% | |
Schlumberger Ltd. | | | AN | | | | 11,600 | | | | 792,396 | |
Transocean Ltd. | | | CH | | | | 48,582 | | | | 1,865,063 | |
| | | | | | | | | | | | |
| | | | | | | | | | | 2,657,459 | |
| | | | | | | | | | | | |
FOOD & STAPLES RETAILING – 10.8% | |
Costco Wholesale Corp. | | | | | | | 255,835 | | | | 21,316,172 | |
CVS Caremark Corp. | | | | | | | 505,412 | | | | 20,610,702 | |
| | | | | | | | | | | | |
| | | | | | | | | | | 41,926,874 | |
| | | | | | | | | | | | |
FOOD PRODUCTS – 1.3% | |
Kraft Foods, Inc., Class A | | | | | | | 89,530 | | | | 3,344,841 | |
Nestle SA | | | CH | | | | 5,750 | | | | 330,565 | |
Unilever NV | | | NL | | | | 40,520 | | | | 1,392,672 | |
| | | | | | | | | | | | |
| | | | | | | | | | | 5,068,078 | |
| | | | | | | | | | | | |
HEALTH CARE EQUIPMENT & SUPPLIES – 0.7% | |
Baxter International, Inc. | | | | | | | 24,280 | | | | 1,201,374 | |
Becton, Dickinson & Co. | | | | | | | 21,240 | | | | 1,587,053 | |
| | | | | | | | | | | | |
| | | | | | | | | | | 2,788,427 | |
| | | | | | | | | | | | |
HEALTH CARE PROVIDERS & SERVICES – 1.9% | |
Express Scripts, Inc.* | | | | | | | 161,761 | | | | 7,229,099 | |
| | | | | | | | | | | | |
See Notes to Financial Statements.
186
SC SM DAVIS VENTURE VALUE FUND
| | |
PORTFOLIOOF INVESTMENTS (Continued) December 31, 2011 | | Sun Capital Advisers Trust |
| | | | | | | | | | | | |
| | | Country
Code** | | | Shares | | | Value | |
| | | | | | | | | | | | |
| | | | | | | | | | | | |
HOUSEHOLD DURABLES – 0.1% | |
Hunter Douglas NV | | | AN | | | | 14,850 | | | $ | 557,753 | |
| | | | | | | | | | | | |
INSURANCE – 11.0% | |
ACE Ltd. | | | CH | | | | 38,620 | | | | 2,708,034 | |
Aon Corp. | | | | | | | 12,980 | | | | 607,464 | |
Berkshire Hathaway, Inc., Class A* | | | | | | | 67 | | | | 7,688,585 | |
Everest Re Group Ltd. | | | BM | | | | 5,950 | | | | 500,335 | |
Fairfax Financial Holdings Ltd. | | | CA | | | | 5,200 | | | | 2,242,240 | |
Fairfax Financial Holdings Ltd. (1) | | | CA | | | | 1,960 | | | | 840,775 | |
Loews Corp. | | | | | | | 316,770 | | | | 11,926,390 | |
Markel Corp.* | | | | | | | 1,353 | | | | 561,049 | |
The Progressive Corp. | | | | | | | 571,319 | | | | 11,146,434 | |
Transatlantic Holdings, Inc. | | | | | | | 85,620 | | | | 4,685,983 | |
| | | | | | | | | | | | |
| | | | | | | | | | | 42,907,289 | |
| | | | | | | | | | | | |
INTERNET & CATALOG RETAIL – 1.4% | |
Expedia, Inc. | | | | | | | 41,230 | | | | 1,196,495 | |
Liberty Interactive Corp., Class A* | | | | | | | 108,062 | | | | 1,752,225 | |
Netflix, Inc.* | | | | | | | 19,710 | | | | 1,365,706 | |
TripAdvisor, Inc.* | | | | | | | 41,230 | | | | 1,039,408 | |
| | | | | | | | | | | | |
| | | | | | | | | | | 5,353,834 | |
| | | | | | | | | | | | |
INTERNET SOFTWARE & SERVICES – 3.2% | |
Google, Inc., Class A* | | | | | | | 19,360 | | | | 12,504,624 | |
| | | | | | | | | | | | |
IT SERVICES – 0.4% | | | | | | | | | | | | |
Visa, Inc., Class A | | | | | | | 17,010 | | | | 1,727,025 | |
| | | | | | | | | | | | |
LIFE SCIENCES TOOLS & SERVICES – 0.3% | |
Agilent Technologies, Inc.* | | | | | | | 34,148 | | | | 1,192,790 | |
| | | | | | | | | | | | |
MACHINERY – 0.3% | |
PACCAR, Inc. | | | | | | | 34,730 | | | | 1,301,333 | |
| | | | | | | | | | | | |
MARINE – 1.1% | |
China Shipping Development Co., Ltd. | | | CN | | | | 1,173,800 | | | | 733,002 | |
Kuehne & Nagel International AG | | | CH | | | | 32,086 | | | | 3,603,825 | |
| | | | | | | | | | | | |
| | | | | | | | | | | 4,336,827 | |
| | | | | | | | | | | | |
| | | | | | | | | | | | |
| | | Country
Code** | | | Shares | | | Value | |
| | | | | | | | | | | | |
| | | | | | | | | | | | |
MEDIA – 1.7% | |
Grupo Televisa SA ADR | | | MX | | | | 42,276 | | | $ | 890,333 | |
The Walt Disney Co. | | | | | | | 148,650 | | | | 5,574,375 | |
| | | | | | | | | | | | |
| | | | | | | | | | | 6,464,708 | |
| | | | | | | | | | | | |
METALS & MINING – 1.2% | |
BHP Billiton PLC | | | GB | | | | 85,600 | | | | 2,495,889 | |
MMX Mineracao e Metalicos SA* | | | BR | | | | 58,500 | | | | 89,385 | |
Rio Tinto PLC | | | GB | | | | 46,472 | | | | 2,255,344 | |
| | | | | | | | | | | | |
| | | | | | | | | | | 4,840,618 | |
| | | | | | | | | | | | |
OIL, GAS & CONSUMABLE FUELS – 11.9% | |
Canadian Natural Resources Ltd. | | | CA | | | | 317,192 | | | | 11,853,465 | |
China Coal Energy Co., Ltd. | | | CN | | | | 1,652,300 | | | | 1,782,797 | |
Devon Energy Corp. | | | | | | | 60,121 | | | | 3,727,502 | |
EOG Resources, Inc. | | | | | | | 169,093 | | | | 16,657,352 | |
Occidental Petroleum Corp. | | | | | | | 109,250 | | | | 10,236,725 | |
OGX Petroleo e Gas Participacoes SA* | | | BR | | | | 321,400 | | | | 2,346,853 | |
| | | | | | | | | | | | |
| | | | | | | | | | | 46,604,694 | |
| | | | | | | | | | | | |
PAPER & FOREST PRODUCTS – 0.0% + | |
Sino-Forest Corp.* | | | CA | | | | 280,530 | | | | 96,783 | |
Sino-Forest Corp.* (1) | | | CA | | | | 6,300 | | | | 2,173 | |
| | | | | | | | | | | | |
| | | | | | | | | | | 98,956 | |
| | | | | | | | | | | | |
PERSONAL PRODUCTS – 0.1% | |
Natura Cosmeticos SA | | | BR | | | | 28,600 | | | | 555,977 | |
| | | | | | | | | | | | |
PHARMACEUTICALS – 6.6% | |
Johnson & Johnson | | | | | | | 152,790 | | | | 10,019,968 | |
Merck & Co., Inc. | | | | | | | 286,833 | | | | 10,813,604 | |
Pfizer, Inc. | | | | | | | 54,740 | | | | 1,184,574 | |
Roche Holding AG | | | CH | | | | 22,400 | | | | 3,796,529 | |
| | | | | | | | | | | | |
| | | | | | | | | | | 25,814,675 | |
| | | | | | | | | | | | |
REAL ESTATE MANAGEMENT &
DEVELOPMENT – 1.8% | |
Brookfield Asset Management, Inc., Class A | | | CA | | | | 117,000 | | | | 3,215,160 | |
Hang Lung Group Ltd. | | | HK | | | | 669,900 | | | | 3,648,542 | |
| | | | | | | | | | | | |
| | | | | | | | | | | 6,863,702 | |
| | | | | | | | | | | | |
See Notes to Financial Statements.
187
SC SM DAVIS VENTURE VALUE FUND
| | |
PORTFOLIOOF INVESTMENTS (Continued) December 31, 2011 | | Sun Capital Advisers Trust |
| | | | | | | | | | | | |
| | |
Country
Code** | | | Shares | | | Value | |
| | | | | | | | | | | | |
| | | | | | | | | | | | |
SEMICONDUCTORS & SEMICONDUCTOR EQUIPMENT – 1.7% | |
Intel Corp. | | | | | | | 44,130 | | | $ | 1,070,153 | |
Texas Instruments, Inc. | | | | | | | 191,055 | | | | 5,561,611 | |
| | | | | | | | | | | | |
| | | | | | | | | | | 6,631,764 | |
| | | | | | | | | | | | |
SOFTWARE – 1.6% | |
Activision Blizzard, Inc. | | | | | | | 189,550 | | | | 2,335,256 | |
Microsoft Corp. | | | | | | | 126,080 | | | | 3,273,037 | |
Oracle Corp. | | | | | | | 30,300 | | | | 777,195 | |
| | | | | | | | | | | | |
| | | | | | | | | | | 6,385,488 | |
| | | | | | | | | | | | |
SPECIALTY RETAIL – 3.1% | |
Bed Bath & Beyond, Inc.* | | | | | | | 173,040 | | | | 10,031,129 | |
CarMax, Inc.* | | | | | | | 62,587 | | | | 1,907,652 | |
| | | | | | | | | | | | |
| | | | | | | | | | | 11,938,781 | |
| | | | | | | | | | | | |
TEXTILES, APPAREL & LUXURY GOODS – 0.1% | |
Compagnie Financiere Richemont SA | | | CH | | | | 9,900 | | | | 500,744 | |
| | | | | | | | | | | | |
TOBACCO – 0.9% | |
Philip Morris International, Inc. | | | | | | | 46,028 | | | | 3,612,277 | |
| | | | | | | | | | | | |
TRANSPORTATION INFRASTRUCTURE – 1.3% | |
China Merchants Holdings International Co., Ltd. | | | HK | | | | 1,687,652 | | | | 4,889,162 | |
LLX Logistica SA* | | | BR | | | | 58,500 | | | | 105,694 | |
| | | | | | | | | | | | |
| | | | | | | | | | | 4,994,856 | |
| | | | | | | | | | | | |
WIRELESS TELECOMMUNICATION SERVICES – 0.2% | |
America Movil SAB de C.V. ADR,
Series L | | | MX | | | | 31,300 | | | | 707,380 | |
| | | | | | | | | | | | |
Total Common Stocks (Cost $333,305,628) | | | | 378,513,015 | |
| | | | | | | | | | | | |
| | | | | | | | | | |
| | | Country
Code** | | Principal
Amount
(000) | | | Value | |
| | | | | | | | | | |
| | | | | | | | | | |
SHORT TERM INVESTMENTS – 2.8% | |
COMMERCIAL PAPER (2) – 2.8% | |
Barclays U.S. Funding LLC 0.09%, 1/3/12
(Amortized cost $11,002,945) | | $ | 11,003 | | | $ | 11,002,945 | |
| | | | | | | | | | |
TOTAL INVESTMENTS – 99.8% | |
(Cost $344,308,573) | | | | | | | 389,515,960 | |
Other assets less
liabilities – 0.2% | | | | | | | 664,186 | |
| | | | | | | | | | |
NET ASSETS – 100.0% | | | | | | $ | 390,180,146 | |
| | | | | | | | | | |
| | |
| ADR | | American Depositary Receipt |
| |
| AN | | Netherlands Antilles |
| BM | | Bermuda |
| BR | | Brazil |
| CA | | Canada |
| CH | | Switzerland |
| CN | | China |
| GB | | Great Britain |
| HK | | Hong Kong |
| MX | | Mexico |
| NL | | Netherlands |
| + | Amount is less than 0.05%. |
| * | Non-income producing security. |
| ** | Unless otherwise noted the issuer country code for all securities is United States. |
| (1) | Eligible for resale under rule 144A of the Securities Act of 1933. These securities may be resold in transactions exempt from registration, normally to qualified institutional buyers. At the period end, the value of these securities amounted to $842,948, representing 0.2% of net assets. |
| (2) | Interest rates represent annualized yield at date of purchase. |
See Notes to Financial Statements.
188
SC SM DAVIS VENTURE VALUE FUND
| | |
PORTFOLIOOF INVESTMENTS (Continued) December 31, 2011 | | Sun Capital Advisers Trust |
| (3) | Fair Value Measurements † |
The following table summarizes the inputs used to value the Fund’s assets and liabilities, as applicable, measured at fair value at the period end:
| | | | | | | | | | | | | | | | |
Assets | | Quoted Prices
in Active
Markets for
Identical
Assets and
Liabilities
(Level 1) | | | Significant
Other
Observable
Inputs
(Level 2) | | | Significant
Unobservable
Inputs
(Level 3) | | | Total | |
Common Stocks | | | | | | | | | | | | | | | | |
Aerospace & Defense | | $ | 3,530,476 | | | $ | — | | | $ | — | | | $ | 3,530,476 | |
Automobiles | | | 2,370,526 | | | | — | | | | — | | | | 2,370,526 | |
Beverages | | | 12,664,604 | | | | 4,098,927 | | | | — | | | | 16,763,531 | |
Capital Markets | | | 21,292,608 | | | | 7,987,127 | | | | — | | | | 29,279,735 | |
Chemicals | | | 13,192,819 | | | | — | | | | — | | | | 13,192,819 | |
Commercial Banks | | | 21,094,231 | | | | — | | | | — | | | | 21,094,231 | |
Commercial Services & Supplies | | | 8,011,819 | | | | — | | | | — | | | | 8,011,819 | |
Computers & Peripherals | | | 2,792,384 | | | | — | | | | — | | | | 2,792,384 | |
Construction Materials | | | 1,376,987 | | | | — | | | | — | | | | 1,376,987 | |
Consumer Finance | | | 20,291,355 | | | | — | | | | — | | | | 20,291,355 | |
Containers & Packaging | | | 1,791,613 | | | | — | | | | — | | | | 1,791,613 | |
Distributors | | | — | | | | 1,138,949 | | | | — | | | | 1,138,949 | |
Diversified Financial Services | | | 1,312,558 | | | | — | | | | — | | | | 1,312,558 | |
Energy Equipment & Services | | | 2,657,459 | | | | — | | | | — | | | | 2,657,459 | |
Food & Staples Retailing | | | 41,926,874 | | | | — | | | | — | | | | 41,926,874 | |
Food Products | | | 4,737,513 | | | | 330,565 | | | | — | | | | 5,068,078 | |
Health Care Equipment & Supplies | | | 2,788,427 | | | | — | | | | — | | | | 2,788,427 | |
Health Care Providers & Services | | | 7,229,099 | | | | — | | | | — | | | | 7,229,099 | |
Household Durables | | | — | | | | 557,753 | | | | — | | | | 557,753 | |
Insurance | | | 42,907,289 | | | | — | | | | — | | | | 42,907,289 | |
Internet & Catalog Retail | | | 5,353,834 | | | | — | | | | — | | | | 5,353,834 | |
Internet Software & Services | | | 12,504,624 | | | | — | | | | — | | | | 12,504,624 | |
IT Services | | | 1,727,025 | | | | — | | | | — | | | | 1,727,025 | |
Life Sciences Tools & Services | | | 1,192,790 | | | | — | | | | — | | | | 1,192,790 | |
Machinery | | | 1,301,333 | | | | — | | | | — | | | | 1,301,333 | |
Marine | | | — | | | | 4,336,827 | | | | — | | | | 4,336,827 | |
Media | | | 6,464,708 | | | | — | | | | — | | | | 6,464,708 | |
Metals & Mining | | | — | | | | 4,840,618 | | | | — | | | | 4,840,618 | |
Oil, Gas & Consumable Fuels | | | 42,475,044 | | | | 4,129,650 | | | | — | | | | 46,604,694 | |
Paper & Forest Products | | | — | | | | 98,956 | | | | — | | | | 98,956 | |
Personal Products | | | — | | | | 555,977 | | | | — | | | | 555,977 | |
Pharmaceuticals | | | 22,018,146 | | | | 3,796,529 | | | | — | | | | 25,814,675 | |
Real Estate Management & Development | | | 3,215,160 | | | | 3,648,542 | | | | — | | | | 6,863,702 | |
Semiconductors & Semiconductor Equipment | | | 6,631,764 | | | | — | | | | — | | | | 6,631,764 | |
Software | | | 6,385,488 | | | | — | | | | — | | | | 6,385,488 | |
Specialty Retail | | | 11,938,781 | | | | — | | | | — | | | | 11,938,781 | |
See Notes to Financial Statements.
189
SC SM DAVIS VENTURE VALUE FUND
| | |
PORTFOLIOOF INVESTMENTS (Continued) December 31, 2011 | | Sun Capital Advisers Trust |
| | | | | | | | | | | | | | | | |
Assets (Continued) | | Quoted Prices
in Active
Markets for
Identical
Assets and
Liabilities
(Level 1) | | | Significant
Other
Observable
Inputs
(Level 2) | | | Significant
Unobservable
Inputs
(Level 3) | | | Total | |
Textiles, Apparel & Luxury Goods | | $ | — | | | $ | 500,744 | | | $ | — | | | $ | 500,744 | |
Tobacco | | | 3,612,277 | | | | — | | | | — | | | | 3,612,277 | |
Transportation Infrastructure | | | — | | | | 4,994,856 | | | | — | | | | 4,994,856 | |
Wireless Telecommunication Services | | | 707,380 | | | | — | | | | — | | | | 707,380 | |
| | | | | | | | | | | | | | | | |
Total Common Stocks | | | 337,496,995 | | | | 41,016,020 | | | | — | | | | 378,513,015 | |
| | | | | | | | | | | | | | | | |
Short Term Investments | | | | | | | | | | | | | | | | |
Commercial Paper | | | — | | | | 11,002,945 | | | | — | | | | 11,002,945 | |
| | | | | | | | | | | | | | | | |
Total Investments | | $ | 337,496,995 | | | $ | 52,018,965 | | | $ | — | | | $ | 389,515,960 | |
| | | | | | | | | | | | | | | | |
| † | See Note 2b in the Notes to Financial Statements for additional information. |
See Notes to Financial Statements.
190
SC SM INVESCO SMALL CAP GROWTH FUND
| | |
PORTFOLIOOF INVESTMENTS December 31, 2011 | | Sun Capital Advisers Trust |
| | | | | | | | | | |
| | | Country
Code** | | Shares | | | Value | |
| | | | | | | | | | |
| | | | | | | | | | |
COMMON STOCKS – 97.9% | |
AEROSPACE & DEFENSE – 2.9% | | | | | |
Hexcel Corp.* | | | | | 16,167 | | | $ | 391,403 | |
TransDigm Group, Inc.* | | | | | 8,701 | | | | 832,512 | |
| | | | | | | | | | |
| | | | | | | | | 1,223,915 | |
| | | | | | | | | | |
AIR FREIGHT & LOGISTICS – 1.5% | | | | | |
Forward Air Corp. | | | | | 9,980 | | | | 319,859 | |
HUB Group, Inc.* | | | | | 9,980 | | | | 323,651 | |
| | | | | | | | | | |
| | | | | | | | | 643,510 | |
| | | | | | | | | | |
AUTO COMPONENTS – 1.1% | | | | | |
Tenneco, Inc.* | | | | | 8,316 | | | | 247,650 | |
TRW Automotive Holdings Corp.* | | | | | 6,885 | | | | 224,451 | |
| | | | | | | | | | |
| | | | | | | | | 472,101 | |
| | | | | | | | | | |
BIOTECHNOLOGY – 3.2% | | | | | | | | |
Acorda Therapeutics, Inc.* | | | | | 7,496 | | | | 178,705 | |
BioMarin Pharmaceutical, Inc.* | | | | | 14,490 | | | | 498,166 | |
Incyte Corp.* | | | | | 21,893 | | | | 328,614 | |
United Therapeutics Corp.* | | | | | 6,987 | | | | 330,136 | |
| | | | | | | | | | |
| | | | | | | | | 1,335,621 | |
| | | | | | | | | | |
CAPITAL MARKETS – 1.8% | | | | | |
Affiliated Managers Group, Inc.* | | | | | 4,362 | | | | 418,534 | |
Greenhill & Co., Inc. | | | | | 3,791 | | | | 137,879 | |
Stifel Financial Corp.* | | | | | 6,027 | | | | 193,165 | |
| | | | | | | | | | |
| | | | | | | | | 749,578 | |
| | | | | | | | | | |
CHEMICALS – 2.7% | | | | | | | | | | |
Intrepid Potash, Inc.* | | | | | 9,245 | | | | 209,214 | |
Olin Corp. | | | | | 16,723 | | | | 328,607 | |
Rockwood Holdings, Inc.* | | | | | 6,294 | | | | 247,795 | |
Solutia, Inc.* | | | | | 20,999 | | | | 362,863 | |
| | | | | | | | | | |
| | | | | | | | | 1,148,479 | |
| | | | | | | | | | |
COMMERCIAL BANKS – 1.4% | | | | | |
Huntington Bancshares, Inc. | | | | | 42,159 | | | | 231,453 | |
SVB Financial Group* | | | | | 7,309 | | | | 348,566 | |
| | | | | | | | | | |
| | | | | | | | | 580,019 | |
| | | | | | | | | | |
| | | | | | | | | | |
| | | Country
Code** | | Shares | | | Value | |
| | | | | | | | | | |
| | | | | | | | | | |
COMMERCIAL SERVICES & SUPPLIES –1.6% | |
Corrections Corporation of America* | | | | | 16,863 | | | $ | 343,500 | |
Tetra Tech, Inc.* | | | | | 15,858 | | | | 342,374 | |
| | | | | | | | | | |
| | | | | | | | | 685,874 | |
| | | | | | | | | | |
COMMUNICATIONS EQUIPMENT – 2.3% | |
Ciena Corp.* | | | | | 13,516 | | | | 163,543 | |
Finisar Corp.* | | | | | 14,016 | | | | 234,698 | |
NETGEAR, Inc.* | | | | | 9,661 | | | | 324,320 | |
Polycom, Inc.* | | | | | 14,953 | | | | 243,734 | |
| | | | | | | | | | |
| | | | | | | | | 966,295 | |
| | | | | | | | | | |
CONTAINERS & PACKAGING – 0.6% | | | | | |
Greif, Inc., Class A | | | | | 5,605 | | | | 255,308 | |
| | | | | | | | | | |
DISTRIBUTORS – 0.7% | | | | | | | | |
Pool Corp. | | | | | 10,433 | | | | 314,033 | |
| | | | | | | | | | |
DIVERSIFIED CONSUMER SERVICES – 0.6% | |
Weight Watchers International, Inc. | | | | | 4,785 | | | | 263,223 | |
| | | | | | | | | | |
ELECTRIC UTILITIES – 0.9% | | | | | |
ITC Holdings Corp. | | | | | 4,997 | | | | 379,172 | |
| | | | | | | | | | |
ELECTRICAL EQUIPMENT – 0.9% | | | | | |
Thomas & Betts Corp.* | | | | | 6,914 | | | | 377,504 | |
| | | | | | | | | | |
ELECTRONIC EQUIPMENT, INSTRUMENTS & COMPONENTS – 0.6% | |
Littelfuse, Inc. | | | | | 6,361 | | | | 273,396 | |
| | | | | | | | | | |
ENERGY EQUIPMENT & SERVICES – 4.7% | |
Atwood Oceanics, Inc.* | | | | | 7,421 | | | | 295,282 | |
Dresser-Rand Group, Inc.* | | | | | 7,373 | | | | 367,986 | |
Dril-Quip, Inc.* | | | | | 5,342 | | | | 351,610 | |
FMC Technologies, Inc.* | | | | | 7,599 | | | | 396,896 | |
Lufkin Industries, Inc. | | | | | 4,588 | | | | 308,818 | |
Patterson-UTI Energy, Inc. | | | | | 12,827 | | | | 256,284 | |
| | | | | | | | | | |
| | | | | | | | | 1,976,876 | |
| | | | | | | | | | |
FOOD & STAPLES RETAILING – 0.7% | | | | | |
Ruddick Corp. | | | | | 7,338 | | | | 312,892 | |
| | | | | | | | | | |
See Notes to Financial Statements.
191
SC SM INVESCO SMALL CAP GROWTH FUND
| | |
PORTFOLIOOF INVESTMENTS (Continued) December 31, 2011 | | Sun Capital Advisers Trust |
| | | | | | | | | | |
| | | Country
Code** | | Shares | | | Value | |
| | | | | | | | | | |
| | | | | | | | | | |
FOOD PRODUCTS – 2.4% | | | | | | | | |
B&G Foods, Inc. | | | | | 17,395 | | | $ | 418,698 | |
Diamond Foods, Inc. | | | | | 5,576 | | | | 179,937 | |
Lancaster Colony Corp. | | | | | 5,845 | | | | 405,292 | |
| | | | | | | | | | |
| | | | | | | | | 1,003,927 | |
| | | | | | | | | | |
HEALTH CARE EQUIPMENT & SUPPLIES – 4.2% | |
Insulet Corp.* | | | | | 12,643 | | | | 238,068 | |
Masimo Corp.* | | | | | 12,818 | | | | 239,504 | |
Meridian Bioscience, Inc. | | | | | 11,238 | | | | 211,724 | |
Sirona Dental Systems, Inc.* | | | | | 7,301 | | | | 321,536 | |
STERIS Corp. | | | | | 10,012 | | | | 298,558 | |
Zoll Medical Corp.* | | | | | 7,498 | | | | 473,723 | |
| | | | | | | | | | |
| | | | | | | | | 1,783,113 | |
| | | | | | | | | | |
HEALTH CARE PROVIDERS & SERVICES – 4.9% | |
Centene Corp.* | | | | | 9,976 | | | | 394,950 | |
Chemed Corp. | | | | | 6,108 | | | | 312,791 | |
Health Management Associates, Inc., Class A* | | | | | 30,441 | | | | 224,350 | |
HMS Holdings Corp.* | | | | | 9,271 | | | | 296,486 | |
MEDNAX, Inc.* | | | | | 4,593 | | | | 330,742 | |
PSS World Medical, Inc.* | | | | | 11,584 | | | | 280,217 | |
VCA Antech, Inc.* | | | | | 11,241 | | | | 222,010 | |
| | | | | | | | | | |
| | | | | | | | | 2,061,546 | |
| | | | | | | | | | |
HEALTH CARE TECHNOLOGY – 1.4% | | | | | |
Allscripts Healthcare Solutions, Inc.* | | | | | 18,924 | | | | 358,421 | |
Quality Systems, Inc. | | | | | 6,550 | | | | 242,284 | |
| | | | | | | | | | |
| | | | | | | | | 600,705 | |
| | | | | | | | | | |
HOTELS, RESTAURANTS & LEISURE – 4.8% | |
Choice Hotels International, Inc. | | | | | 7,728 | | | | 294,050 | |
Darden Restaurants, Inc. | | | | | 6,427 | | | | 292,943 | |
Domino’s Pizza, Inc.* | | | | | 9,632 | | | | 327,006 | |
Jack In The Box, Inc.* | | | | | 12,532 | | | | 261,919 | |
Life Time Fitness, Inc.* | | | | | 8,918 | | | | 416,917 | |
Penn National Gaming, Inc.* | | | | | 10,783 | | | | 410,509 | |
| | | | | | | | | | |
| | | | | | | | | 2,003,344 | |
| | | | | | | | | | |
| | | | | | | | | | | | |
| | | Country
Code** | | | Shares | | | Value | |
| | | | | | | | | | | | |
| | | | | | | | | | | | |
INSURANCE – 1.9% | | | | | | | | | | | | |
Brown & Brown, Inc. | | | | | | | 15,392 | | | $ | 348,321 | |
ProAssurance Corp. | | | | | | | 5,398 | | | | 430,868 | |
| | | | | | | | | | | | |
| | | | | | | | | | | 779,189 | |
| | | | | | | | | | | | |
INTERNET SOFTWARE & SERVICES – 3.5% | |
Ancestry.com, Inc.* | | | | | | | 7,553 | | | | 173,417 | |
Open Text Corp.* | | | CA | | | | 5,723 | | | | 292,674 | |
RightNow Technologies, Inc.* | | | | | | | 9,944 | | | | 424,907 | |
ValueClick, Inc.* | | | | | | | 23,010 | | | | 374,833 | |
WebMD Health Corp., Class A* | | | | | | | 5,444 | | | | 204,422 | |
| | | | | | | | | | | | |
| | | | | | | | | | | 1,470,253 | |
| | | | | | | | | | | | |
IT SERVICES – 1.0% | | | | | | | | | | | | |
Alliance Data Systems Corp.* | | | | | | | 3,927 | | | | 407,780 | |
| | | | | | | | | | | | |
LIFE SCIENCES TOOLS & SERVICES – 2.4% | |
Bruker Corp.* | | | | | | | 16,482 | | | | 204,707 | |
Parexel International Corp.* | | | | | | | 15,320 | | | | 317,737 | |
PerkinElmer, Inc. | | | | | | | 11,864 | | | | 237,280 | |
Techne Corp. | | | | | | | 3,901 | | | | 266,282 | |
| | | | | | | | | | | | |
| | | | | | | | | | | 1,026,006 | |
| | | | | | | | | | | | |
MACHINERY – 4.9% | | | | | | | | | |
Crane Co. | | | | | | | 7,331 | | | | 342,431 | |
Kennametal, Inc. | | | | | | | 8,059 | | | | 294,315 | |
Lincoln Electric Holdings, Inc. | | | | | | | 9,188 | | | | 359,435 | |
Lindsay Corp. | | | | | | | 5,330 | | | | 292,564 | |
WABCO Holdings, Inc.* | | | | | | | 7,528 | | | | 326,715 | |
Wabtec Corp. | | | | | | | 6,630 | | | | 463,768 | |
| | | | | | | | | | | | |
| | | | | | | | | | | 2,079,228 | |
| | | | | | | | | | | | |
METALS & MINING – 1.4% | | | | | | | | | |
Allied Nevada Gold Corp.* | | | | | | | 3,569 | | | | 108,069 | |
Carpenter Technology Corp. | | | | | | | 7,231 | | | | 372,252 | |
Detour Gold Corp.* | | | CA | | | | 4,305 | | | | 106,278 | |
| | | | | | | | | | | | |
| | | | | | | | | | | 586,599 | |
| | | | | | | | | | | | |
See Notes to Financial Statements.
192
SC SM INVESCO SMALL CAP GROWTH FUND
| | |
PORTFOLIOOF INVESTMENTS (Continued) December 31, 2011 | | Sun Capital Advisers Trust |
| | | | | | | | | | |
| | | Country
Code** | | Shares | | | Value | |
| | | | | | | | | | |
| | | | | | | | | | |
OIL, GAS & CONSUMABLE FUELS – 3.2% | |
Bill Barrett Corp.* | | | | | 7,832 | | | $ | 266,836 | |
Energen Corp. | | | | | 6,126 | | | | 306,300 | |
James River Coal Co.* | | | | | 25,227 | | | | 174,571 | |
Resolute Energy Corp.* | | | | | 23,809 | | | | 257,137 | |
SandRidge Energy, Inc.* | | | | | 39,864 | | | | 325,291 | |
| | | | | | | | | | |
| | | | | | | | | 1,330,135 | |
| | | | | | | | | | |
PERSONAL PRODUCTS – 1.2% | | | | | |
Nu Skin Enterprises, Inc. | | | | | 10,110 | | | | 491,043 | |
| | | | | | | | | | |
PHARMACEUTICALS – 1.1% | | | | | | | | |
Salix Pharmaceuticals Ltd.* | | | | | 9,406 | | | | 450,077 | |
| | | | | | | | | | |
PROFESSIONAL SERVICES – 1.2% | | | | | |
Costar Group, Inc.* | | | | | 7,349 | | | | 490,399 | |
| | | | | | | | | | |
REAL ESTATE INVESTMENT TRUSTS – 0.8% | |
Colonial Properties Trust | | | | | 16,300 | | | | 340,018 | |
| | | | | | | | | | |
SEMICONDUCTORS & SEMICONDUCTOR EQUIPMENT – 6.8% | |
Cavium, Inc.* | | | | | 10,995 | | | | 312,588 | |
Cymer, Inc.* | | | | | 6,788 | | | | 337,771 | |
Hittite Microwave Corp.* | | | | | 6,206 | | | | 306,452 | |
Microsemi Corp.* | | | | | 18,784 | | | | 314,632 | |
PMC-Sierra, Inc.* | | | | | 47,010 | | | | 259,025 | |
Power Integrations, Inc. | | | | | 9,810 | | | | 325,300 | |
Semtech Corp.* | | | | | 14,828 | | | | 368,031 | |
Teradyne, Inc.* | | | | | 23,539 | | | | 320,836 | |
Volterra Semiconductor Corp.* | | | | | 11,677 | | | | 299,048 | |
| | | | | | | | | | |
| | | | | | | | | 2,843,683 | |
| | | | | | | | | | |
SOFTWARE – 10.4% | |
ANSYS, Inc.* | | | | | 6,088 | | | | 348,721 | |
Aspen Technology, Inc.* | | | | | 22,118 | | | | 383,747 | |
BroadSoft, Inc.* | | | | | 10,253 | | | | 309,641 | |
Commvault Systems, Inc.* | | | | | 9,956 | | | | 425,320 | |
Fair Issac Corp. | | | | | 9,818 | | | | 351,877 | |
Informatica Corp.* | | | | | 11,287 | | | | 416,829 | |
Interactive Intelligence Group* | | | | | 8,249 | | | | 189,067 | |
| | | | | | | | | | | | |
| | | Country
Code** | | | Shares | | | Value | |
| | | | | | | | | | | | |
| | | | | | | | | | | | |
Manhattan Associates, Inc.* | | | | | | | 10,179 | | | $ | 412,046 | |
MICROS Systems, Inc.* | | | | | | | 8,161 | | | | 380,139 | |
Parametric Technology Corp.* | | | | | | | 12,857 | | | | 234,769 | |
Quest Software, Inc.* | | | | | | | 14,379 | | | | 267,449 | |
Solarwinds, Inc.* | | | | | | | 14,976 | | | | 418,579 | |
Websense, Inc.* | | | | | | | 13,060 | | | | 244,614 | |
| | | | | | | | | | | | |
| | | | | | | | | | | 4,382,798 | |
| | | | | | | | | | | | |
SPECIALTY RETAIL – 6.8% | | | | | | | | | |
Dick’s Sporting Goods, Inc. | | | | | | | 8,604 | | | | 317,315 | |
DSW, Inc., Class A | | | | | | | 6,661 | | | | 294,483 | |
Foot Locker, Inc. | | | | | | | 13,507 | | | | 322,007 | |
GameStop Corp., Class A* | | | | | | | 12,120 | | | | 292,456 | |
Group 1 Automotive, Inc. | | | | | | | 6,492 | | | | 336,286 | |
Monro Muffler Brake, Inc. | | | | | | | 8,380 | | | | 325,060 | |
Tractor Supply Co. | | | | | | | 4,377 | | | | 307,046 | |
Urban Outfitters, Inc.* | | | | | | | 11,629 | | | | 320,495 | |
Vitamin Shoppe, Inc.* | | | | | | | 8,528 | | | | 340,097 | |
| | | | | | | | | | | | |
| | | | | | | | | | | 2,855,245 | |
| | | | | | | | | | | | |
TEXTILES, APPAREL & LUXURY GOODS – 2.9% | |
Maidenform Brands, Inc.* | | | | | | | 12,584 | | | | 230,287 | |
Michael Kors Holdings Ltd.* | | | VG | | | | 9,564 | | | | 260,619 | |
Steven Madden Ltd.* | | | | | | | 11,102 | | | | 383,019 | |
Under Armour, Inc., Class A* | | | | | | | 4,801 | | | | 344,664 | |
| | | | | | | | | | | | |
| | | | | | | | | | | 1,218,589 | |
| | | | | | | | | | | | |
TRADING COMPANIES & DISTRIBUTORS – 1.6% | |
Watsco, Inc. | | | | | | | 5,201 | | | | 341,498 | |
WESCO International, Inc.* | | | | | | | 6,221 | | | | 329,775 | |
| | | | | | | | | | | | |
| | | | | | | | | | | 671,273 | |
| | | | | | | | | | | | |
WIRELESS TELECOMMUNICATION SERVICES – 0.9% | | | | | |
SBA Communications Corp.* | | | | | | | 8,584 | | | | 368,769 | |
| | | | | | | | | | | | |
Total Common Stocks
(Cost $37,811,850) | | | | 41,201,515 | |
| | | | | | | | | | | | |
See Notes to Financial Statements.
193
| | |
SC SM INVESCO SMALL CAP GROWTH FUND PORTFOLIOOF INVESTMENTS (Continued) |
| December 31, 2011 | | Sun Capital Advisers Trust |
| | | | | | | | |
| | | | | | | Value | |
| | | | | | | | |
| | | | | | | | |
TOTAL INVESTMENTS – 97.9% | |
(Cost $37,811,850) | | | | $ | 41,201,515 | |
Other assets less liabilities – 2.1% | | | | | 896,284 | |
| | | | | | | | |
NET ASSETS –100.0% | | | | $ | 42,097,799 | |
| | | | | | | | |
| | |
| CA | | Canada |
| VG | | British Virgin Islands |
| * | Non-income producing security. |
| ** | Unless otherwise noted the issuer country code for all securities is United States. |
| (1) | Fair Value Measurements |
All investments are categorized as Level 1 under the fair value hierarchy. See Note 2b in the Notes to Financial Statements for additional information.
See Notes to Financial Statements.
194
SC SM LORD ABBETT GROWTH & INCOME FUND
| | |
PORTFOLIOOF INVESTMENTS December 31, 2011 | | Sun Capital Advisers Trust |
| | | | | | | | | | | | |
| | | Country
Code** | | | Shares | | | Value | |
| | | | | | | | | | | | |
COMMON STOCKS – 99.5% | |
AEROSPACE & DEFENSE – 3.3% | | | | | |
Rockwell Collins, Inc. | | | | | | | 98,550 | | | $ | 5,456,714 | |
United Technologies Corp. | | | | | | | 128,480 | | | | 9,390,603 | |
| | | | | | | | | | | | |
| | | | | | | | | | | 14,847,317 | |
| | | | | | | | | | | | |
AUTOMOBILES – 1.7% | | | | | |
Ford Motor Co.* | | | | | | | 695,747 | | | | 7,486,238 | |
| | | | | | | | | | | | |
BEVERAGES – 2.3% | | | | | | | | | | | | |
Diageo PLC ADR | | | GB | | | | 49,410 | | | | 4,319,422 | |
The Coca-Cola Co. | | | | | | | 88,560 | | | | 6,196,543 | |
| | | | | | | | | | | | |
| | | | | | | | | | | 10,515,965 | |
| | | | | | | | | | | | |
BIOTECHNOLOGY – 3.0% | | | | | |
Amgen, Inc. | | | | | | | 71,471 | | | | 4,589,153 | |
Celgene Corp.* | | | | | | | 130,897 | | | | 8,848,637 | |
| | | | | | | | | | | | |
| | | | | | | | | | | 13,437,790 | |
| | | | | | | | | | | | |
CAPITAL MARKETS – 2.7% | | | | | |
Lazard Ltd., Class A | | | BM | | | | 66,230 | | | | 1,729,265 | |
State Street Corp. | | | | | | | 260,850 | | | | 10,514,864 | |
| | | | | | | | | | | | |
| | | | | | | | | | | 12,244,129 | |
| | | | | | | | | | | | |
CHEMICALS – 2.3% | | | | | |
Air Products & Chemicals, Inc. | | | | | | | 21,360 | | | | 1,819,659 | |
LyondellBasell Industries NV, Class A | | | NL | | | | 97,670 | | | | 3,173,298 | |
PPG Industries, Inc. | | | | | | | 62,280 | | | | 5,199,757 | |
| | | | | | | | | | | | |
| | | | | | | | | | | 10,192,714 | |
| | | | | | | | | | | | |
COMMERCIAL BANKS – 6.4% | | | | | |
M&T Bank Corp. | | | | | | | 81,940 | | | | 6,255,300 | |
PNC Financial Services Group, Inc. | | | | | | | 202,830 | | | | 11,697,206 | |
U.S. Bancorp | | | | | | | 274,800 | | | | 7,433,340 | |
Wells Fargo & Co. | | | | | | | 135,557 | | | | 3,735,951 | |
| | | | | | | | | | | | |
| | | | | | | | | | | 29,121,797 | |
| | | | | | | | | | | | |
COMMUNICATIONS EQUIPMENT – 0.9% | |
QUALCOMM, Inc. | | | | | | | 77,880 | | | | 4,260,036 | |
| | | | | | | | | | | | |
COMPUTERS & PERIPHERALS – 1.0% | | | | | |
EMC Corp.* | | | | | | | 169,750 | | | | 3,656,415 | |
NetApp, Inc.* | | | | | | | 28,620 | | | | 1,038,047 | |
| | | | | | | | | | | | |
| | | | | | | | | | | 4,694,462 | |
| | | | | | | | | | | | |
CONSTRUCTION & ENGINEERING – 0.7% | |
Jacobs Engineering Group, Inc.* | | | | | | | 75,000 | | | | 3,043,500 | |
| | | | | | | | | | | | |
| | | | | | | | | | | | |
| | | Country
Code** | | | Shares | | | Value | |
| | | | | | | | | | | | |
| | | | | | | | | | | | |
| | | | | | | | | | | | |
DIVERSIFIED FINANCIAL SERVICES – 2.3% | |
JP Morgan Chase & Co. | | | | | | | 311,882 | | | $ | 10,370,077 | |
| | | | | | | | | | | | |
DIVERSIFIED TELECOMMUNICATION
SERVICES – 2.0% | |
AT&T, Inc. | | | | | | | 106,333 | | | | 3,215,510 | |
Verizon Communications, Inc. | | | | | | | 141,030 | | | | 5,658,124 | |
| | | | | | | | | | | | |
| | | | | | | | | | | 8,873,634 | |
| | | | | | | | | | | | |
ELECTRIC UTILITIES – 1.8% | |
NextEra Energy, Inc. | | | | | | | 130,960 | | | | 7,972,845 | |
| | | | | | | | | | | | |
ELECTRICAL EQUIPMENT – 0.3% | |
Rockwell Automation, Inc. | | | | | | | 16,840 | | | | 1,235,551 | |
| | | | | | | | | | | | |
ELECTRONIC EQUIPMENT, INSTRUMENTS & COMPONENTS – 0.6% | |
Arrow Electronics, Inc.* | | | | | | | 77,100 | | | | 2,884,311 | |
| | | | | | | | | | | | |
ENERGY EQUIPMENT & SERVICES – 4.8% | |
Baker Hughes, Inc. | | | | | | | 75,354 | | | | 3,665,218 | |
Halliburton Co. | | | | | | | 266,012 | | | | 9,180,074 | |
Schlumberger Ltd. | | | AN | | | | 132,270 | | | | 9,035,364 | |
| | | | | | | | | | | | |
| | | | | | | | | | | 21,880,656 | |
| | | | | | | | | | | | |
FOOD & STAPLES RETAILING – 1.7% | |
CVS Caremark Corp. | | | | | | | 188,490 | | | | 7,686,622 | |
| | | | | | | | | | | | |
FOOD PRODUCTS – 4.6% | |
Archer-Daniels-Midland Co. | | | | | | | 395,240 | | | | 11,303,864 | |
Bunge Ltd. | | | BM | | | | 166,980 | | | | 9,551,256 | |
| | | | | | | | | | | | |
| | | | | | | | | | | 20,855,120 | |
| | | | | | | | | | | | |
HEALTH CARE EQUIPMENT & SUPPLIES – 1.3% | |
Covidien PLC | | | IE | | | | 66,110 | | | | 2,975,611 | |
St. Jude Medical, Inc. | | | | | | | 78,330 | | | | 2,686,719 | |
| | | | | | | | | | | | |
| | | | | | | | | | | 5,662,330 | |
| | | | | | | | | | | | |
HEALTH CARE PROVIDERS & SERVICES – 8.1% | |
CIGNA Corp. | | | | | | | 137,500 | | | | 5,775,000 | |
DaVita, Inc.* | | | | | | | 77,450 | | | | 5,871,484 | |
Express Scripts, Inc.* | | | | | | | 192,700 | | | | 8,611,763 | |
Humana, Inc. | | | | | | | 23,650 | | | | 2,071,977 | |
McKesson Corp. | | | | | | | 77,860 | | | | 6,066,073 | |
UnitedHealth Group, Inc. | | | | | | | 120,280 | | | | 6,095,790 | |
WellPoint, Inc. | | | | | | | 33,650 | | | | 2,229,312 | |
| | | | | | | | | | | | |
| | | | | | | | | | | 36,721,399 | |
| | | | | | | | | | | | |
See Notes to Financial Statements.
195
SC SM LORD ABBETT GROWTH & INCOME FUND
| | |
PORTFOLIOOF INVESTMENTS (Continued) December 31, 2011 | | Sun Capital Advisers Trust |
| | | | | | | | | | | | |
| | | Country
Code** | | | Shares | | | Value | |
| | | | | | | | | | | | |
HOUSEHOLD PRODUCTS – 0.8% | |
Colgate-Palmolive Co. | | | | | | | 39,600 | | | $ | 3,658,644 | |
| | | | | | | | | | | | |
INSURANCE – 7.6% | |
ACE Ltd. | | | CH | | | | 86,140 | | | | 6,040,137 | |
Berkshire Hathaway, Inc., Class B* | | | | | | | 166,500 | | | | 12,703,950 | |
Marsh & McLennan Cos., Inc. | | | | 298,500 | | | | 9,438,570 | |
Prudential Financial, Inc. | | | | | | | 54,140 | | | | 2,713,497 | |
Travelers Cos., Inc. | | | | | | | 57,910 | | | | 3,426,534 | |
| | | | | | | | | | | | |
| | | | | | | | | | | 34,322,688 | |
| | | | | | | | | | | | |
INTERNET & CATALOG RETAIL – 0.8% | |
HSN, Inc. | | | | | | | 103,850 | | | | 3,765,601 | |
| | | | | | | | | | | | |
LIFE SCIENCES TOOLS & SERVICES – 1.6% | |
Thermo Fisher Scientific, Inc.* | | | | | | | 160,770 | | | | 7,229,827 | |
| | | | | | | | | | | | |
MACHINERY – 4.2% | |
Dover Corp. | | | | | | | 130,770 | | | | 7,591,198 | |
Eaton Corp. | | | | | | | 191,260 | | | | 8,325,548 | |
Parker Hannifin Corp. | | | | | | | 42,790 | | | | 3,262,738 | |
| | | | | | | | | | | | |
| | | | | | | | | | | 19,179,484 | |
| | | | | | | | | | | | |
MEDIA – 5.3% | |
Comcast Corp., Class A | | | | | | | 250,830 | | | | 5,947,179 | |
Omnicom Group, Inc. | | | | | | | 57,010 | | | | 2,541,506 | |
The Walt Disney Co. | | | | | | | 112,190 | | | | 4,207,125 | |
Time Warner, Inc. | | | | | | | 306,670 | | | | 11,083,054 | |
| | | | | | | | | | | | |
| | | | | | | | | | | 23,778,864 | |
| | | | | | | | | | | | |
METALS & MINING – 2.1% | |
Barrick Gold Corp. | | | CA | | | | 89,340 | | | | 4,042,635 | |
Freeport-McMoRan Copper & Gold, Inc. | | | | | | | 143,130 | | | | 5,265,753 | |
| | | | | | | | | | | | |
| | | | | | | | | | | 9,308,388 | |
| | | | | | | | | | | | |
MULTI-LINE RETAIL – 1.7% | |
Target Corp. | | | | | | | 150,310 | | | | 7,698,878 | |
| | | | | | | | | | | | |
OIL, GAS & CONSUMABLE FUELS – 14.7% | |
Anadarko Petroleum Corp. | | | | | | | 154,350 | | | | 11,781,535 | |
Apache Corp. | | | | | | | 52,250 | | | | 4,732,805 | |
Chevron Corp. | | | | | | | 120,388 | | | | 12,809,283 | |
Consol Energy, Inc. | | | | | | | 80,340 | | | | 2,948,478 | |
Devon Energy Corp. | | | | | | | 69,230 | | | | 4,292,260 | |
| | | | | | | | | | | | |
| | | Country
Code** | | | Shares | | | Value | |
| | | | | | | | | | | | |
Exxon Mobil Corp. | | | | | | | 143,740 | | | $ | 12,183,402 | |
Imperial Oil Ltd. | | | CA | | | | 112,570 | | | | 5,007,114 | |
Range Resources Corp. | | | | | | | 69,790 | | | | 4,322,793 | |
Southwestern Energy Co.* | | | | | | | 131,648 | | | | 4,204,837 | |
Suncor Energy, Inc. | | | CA | | | | 151,200 | | | | 4,359,096 | |
| | | | | | | | | | | | |
| | | | | | | | | | | 66,641,603 | |
| | | | | | | | | | | | |
PAPER & FOREST PRODUCTS – 1.3% | |
International Paper Co. | | | | | | | 193,600 | | | | 5,730,560 | |
| | | | | | | | | | | | |
PHARMACEUTICALS – 3.8% | | | | | |
Merck & Co., Inc. | | | | | | | 44,798 | | | | 1,688,884 | |
Teva Pharmaceutical Industries Ltd. ADR | | | IL | | | | 291,950 | | | | 11,783,102 | |
Watson Pharmaceuticals, Inc.* | | | | | | | 58,720 | | | | 3,543,165 | |
| | | | | | | | | | | | |
| | | | | | | | | | | 17,015,151 | |
| | | | | | | | | | | | |
PROFESSIONAL SERVICES – 0.1% | |
The Dun & Bradstreet Corp. | | | | | | | 5,940 | | | | 444,490 | |
| | | | | | | | | | | | |
SEMICONDUCTORS & SEMICONDUCTOR EQUIPMENT – 2.7% | |
Intel Corp. | | | | | | | 130,850 | | | | 3,173,113 | |
Lam Research Corp.* | | | | | | | 33,260 | | | | 1,231,285 | |
Texas Instruments, Inc. | | | | | | | 269,740 | | | | 7,852,131 | |
| | | | | | | | | | | | |
| | | | | | | | | | | 12,256,529 | |
| | | | | | | | | | | | |
SOFTWARE – 0.4% | |
Adobe Systems, Inc.* | | | | | | | 70,000 | | | | 1,978,900 | |
| | | | | | | | | | | | |
SPECIALTY RETAIL – 0.6% | |
The Home Depot, Inc. | | | | | | | 59,430 | | | | 2,498,437 | |
| | | | | | | | | | | | |
Total Common Stocks
(Cost $432,509,423) | | | | 449,494,537 | |
| | | | | | | | | | | | |
SHORT TERM INVESTMENTS – 0.3% | |
MUTUAL FUNDS – 0.3% | | | | | |
State Street Institutional Liquid Reserves Fund, 0.17%
(Cost $1,512,916) | | | | 1,512,916 | | | | 1,512,916 | |
| | | | | | | | | | | | |
See Notes to Financial Statements.
196
SC SM LORD ABBETT GROWTH & INCOME FUND
| | |
PORTFOLIOOF INVESTMENTS (Continued) December 31, 2011 | | Sun Capital Advisers Trust |
| | | | | | | | |
| | | | | | | Value | |
| | | | | | | | |
TOTAL INVESTMENTS – 99.8% | |
(Cost $434,022,339) | | | | $ | 451,007,453 | |
Other assets less liabilities –0.2% | | | | | 799,691 | |
| | | | | | | | |
NET ASSETS – 100.0% | | | | $ | 451,807,144 | |
| | | | | | | | |
| | |
| ADR | | American Depositary Receipt |
| |
| AN | | Netherlands Antilles |
| BM | | Bermuda |
| CA | | Canada |
| CH | | Switzerland |
| GB | | Great Britain |
| IE | | Ireland |
| IL | | Israel |
| NL | | Netherlands |
| * | Non-income producing security. |
| ** | Unless otherwise noted the issuer country code for all securities is United States. |
| (1) | Fair Value Measurements |
All investments are categorized as Level 1 under the fair value hierarchy. See Note 2b in the Notes to Financial Statements for additional information.
See Notes to Financial Statements.
197
SC SM WMC BLUE CHIP MID CAP FUND
| | |
PORTFOLIOOF INVESTMENTS December 31, 2011 | | Sun Capital Advisers Trust |
| | | | | | | | | | | | |
| | | Country
Code** | | | Shares | | | Value | |
| | | | | | | | | | | | |
| | | | | | | | | | | | |
COMMON STOCKS – 99.3% | |
AIR FREIGHT & LOGISTICS – 2.2% | |
C.H. Robinson Worldwide, Inc. | | | | | | | 35,495 | | | $ | 2,476,841 | |
Expeditors International of Washington, Inc. | | | | | | | 40,625 | | | | 1,664,000 | |
| | | | | | | | | | | | |
| | | | | | | | | | | 4,140,841 | |
| | | | | | | | | | | | |
AUTOMOBILES – 1.6% | |
Harley-Davidson, Inc. | | | | | | | 78,125 | | | | 3,036,719 | |
| | | | | | | | | | | | |
BEVERAGES – 1.5% | |
Molson Coors Brewing Co., Class B | | | | | | | 63,940 | | | | 2,783,948 | |
| | | | | | | | | | | | |
BIOTECHNOLOGY – 4.0% | |
Alkermes PLC* | | | IE | | | | 71,755 | | | | 1,245,667 | |
Amylin Pharmaceuticals, Inc.* | | | | | | | 150,805 | | | | 1,716,161 | |
Incyte Corp.* | | | | | | | 104,110 | | | | 1,562,691 | |
Ironwood Pharmaceuticals, Inc.* | | | | | | | 34,700 | | | | 415,359 | |
Regeneron Pharmaceuticals, Inc.* | | | | | | | 19,790 | | | | 1,096,960 | |
Seattle Genetics, Inc.* | | | | | | | 79,205 | | | | 1,323,911 | |
| | | | | | | | | | | | |
| | | | | | | | | | | 7,360,749 | |
| | | | | | | | | | | | |
BUILDING PRODUCTS – 1.5% | |
Lennox International, Inc. | | | | | | | 82,790 | | | | 2,794,162 | |
| | | | | | | | | | | | |
CAPITAL MARKETS – 5.4% | |
CETIP SA | | | BR | | | | 60,210 | | | | 869,942 | |
Greenhill & Co., Inc. | | | | | | | 33,620 | | | | 1,222,760 | |
Invesco Ltd. | | | BM | | | | 131,485 | | | | 2,641,534 | |
LPL Investment Holdings, Inc.* | | | | | | | 24,610 | | | | 751,589 | |
SEI Investments Co. | | | | | | | 150,160 | | | | 2,605,276 | |
T. Rowe Price Group, Inc. | | | | | | | 33,000 | | | | 1,879,350 | |
| | | | | | | | | | | | |
| | | | | | | | | | | 9,970,451 | |
| | | | | | | | | | | | |
CHEMICALS – 2.2% | |
CF Industries Holdings, Inc. | | | | | | | 1,975 | | | | 286,335 | |
FMC Corp. | | | | | | | 25,465 | | | | 2,191,009 | |
The Sherwin-Williams Co. | | | | | | | 18,295 | | | | 1,633,195 | |
| | | | | | | | | | | | |
| | | | | | | | | | | 4,110,539 | |
| | | | | | | | | | | | |
| | | | | | | | | | | | |
| | | Country
Code** | | | Shares | | | Value | |
| | | | | | | | | | | | |
COMMERCIAL BANKS – 6.2% | |
Cullen/Frost Bankers,
Inc. | | | | | | | 20,645 | | | $ | 1,092,327 | |
East West Bancorp, Inc. | | | | | | | 48,300 | | | | 953,925 | |
First Niagara Financial Group, Inc. | | | | | | | 139,580 | | | | 1,204,575 | |
First Republic Bank* | | | | | | | 66,955 | | | | 2,049,493 | |
Huntington Bancshares, Inc. | | | | | | | 309,590 | | | | 1,699,649 | |
M&T Bank Corp. | | | | | | | 45,090 | | | | 3,442,171 | |
Signature Bank* | | | | | | | 15,670 | | | | 940,043 | |
| | | | | | | | | | | | |
| | | | | | | | | | | 11,382,183 | |
| | | | | | | | | | | | |
COMMUNICATIONS EQUIPMENT – 2.4% | |
ADTRAN, Inc. | | | | | | | 74,010 | | | | 2,232,141 | |
F5 Networks, Inc.* | | | | | | | 8,365 | | | | 887,694 | |
Polycom, Inc.* | | | | | | | 75,500 | | | | 1,230,650 | |
| | | | | | | | | | | | |
| | | | | | | | | | | 4,350,485 | |
| | | | | | | | | | | | |
CONSTRUCTION & ENGINEERING – 1.0% | |
Jacobs Engineering Group, Inc.* | | | | | | | 44,045 | | | | 1,787,346 | |
| | | | | | | | | | | | |
CONTAINERS & PACKAGING – 0.7% | |
Silgan Holdings, Inc. | | | | | | | 32,310 | | | | 1,248,458 | |
| | | | | | | | | | | | |
ELECTRIC UTILITIES – 0.5% | |
Northeast Utilities | | | | | | | 27,940 | | | | 1,007,796 | |
| | | | | | | | | | | | |
ELECTRICAL EQUIPMENT – 1.0% | |
Ametek, Inc. | | | | | | | 44,300 | | | | 1,865,030 | |
| | | | | | | | | | | | |
ELECTRONIC EQUIPMENT, INSTRUMENTS & COMPONENTS – 0.8% | |
National Instruments Corp. | | | | | | | 56,640 | | | | 1,469,808 | |
| | | | | | | | | | | | |
ENERGY EQUIPMENT & SERVICES – 3.8% | |
Atwood Oceanics, Inc.* | | | | | | | 63,375 | | | | 2,521,691 | |
ENSCO PLC ADR | | | GB | | | | 64,055 | | | | 3,005,461 | |
McDermott International, Inc.* | | | PA | | | | 122,045 | | | | 1,404,738 | |
| | | | | | | | | | | | |
| | | | | | | | | | | 6,931,890 | |
| | | | | | | | | | | | |
FOOD & STAPLES RETAILING – 0.5% | |
Whole Foods Market, Inc. | | | | | | | 14,010 | | | | 974,816 | |
| | | | | | | | | | | | |
GAS UTILITIES – 1.5% | |
UGI Corp. | | | | | | | 92,845 | | | | 2,729,643 | |
| | | | | | | | | | | | |
See Notes to Financial Statements.
198
SC SM WMC BLUE CHIP MID CAP FUND
| | |
PORTFOLIOOF INVESTMENTS (Continued) December 31, 2011 | | Sun Capital Advisers Trust |
| | | | | | | | | | | | |
| | | Country
Code** | | | Shares | | | Value | |
| | | | | | | | | | | | |
| | | | | | | | | | | | |
HEALTH CARE EQUIPMENT &
SUPPLIES – 1.4% | |
Gen-Probe, Inc.* | | | | | | | 20,855 | | | $ | 1,232,948 | |
ResMed, Inc.* | | | | | | | 51,145 | | | | 1,299,083 | |
| | | | | | | | | | | | |
| | | | | | | | | | | 2,532,031 | |
| | | | | | | | | | | | |
HEALTH CARE PROVIDERS & SERVICES – 6.1% | |
AmerisourceBergen Corp. | | | | | | | 69,260 | | | | 2,575,780 | |
Cardinal Health, Inc. | | | | | | | 48,625 | | | | 1,974,661 | |
Coventry Health Care, Inc.* | | | | | | | 58,660 | | | | 1,781,504 | |
Health Net, Inc.* | | | | | | | 32,615 | | | | 992,148 | |
Lincare Holdings, Inc. | | | | | | | 100,500 | | | | 2,583,855 | |
Patterson Cos., Inc. | | | | | | | 44,140 | | | | 1,303,013 | |
| | | | | | | | | | | | |
| | | | | | | | | | | 11,210,961 | |
| | | | | | | | | | | | |
HEALTH CARE TECHNOLOGY – 0.4% | |
SXC Health Solutions Corp.* | | | CA | | | | 11,580 | | | | 654,038 | |
| | | | | | | | | | | | |
HOUSEHOLD DURABLES – 2.2% | |
NVR, Inc.* | | | | | | | 4,461 | | | | 3,060,246 | |
Tempur-Pedic International, Inc.* | | | | | | | 17,660 | | | | 927,680 | |
| | | | | | | | | | | | |
| | | | | | | | | | | 3,987,926 | |
| | | | | | | | | | | | |
INDEPENDENT POWER PRODUCERS &
ENERGY TRADERS – 0.7% | |
NRG Energy, Inc.* | | | | | | | 72,170 | | | | 1,307,720 | |
| | | | | | | | | | | | |
INDUSTRIAL CONGLOMERATES – 0.9% | |
Carlisle Cos., Inc. | | | | | | | 39,425 | | | | 1,746,528 | |
| | | | | | | | | | | | |
INSURANCE – 1.6% | |
Unum Group | | | | | | | 67,320 | | | | 1,418,432 | |
W.R. Berkley Corp. | | | | | | | 42,056 | | | | 1,446,306 | |
| | | | | | | | | | | | |
| | | | | | | | | | | 2,864,738 | |
| | | | | | | | | | | | |
INTERNET SOFTWARE & SERVICES – 2.2% | |
VeriSign, Inc. | | | | | | | 112,540 | | | | 4,019,929 | |
| | | | | | | | | | | | |
IT SERVICES – 4.4% | | | | | | | | | | | | |
Gartner, Inc.* | | | | | | | 37,100 | | | | 1,289,967 | |
Genpact Ltd.* | | | BM | | | | 244,100 | | | | 3,649,295 | |
The Western Union Co. | | | | | | | 177,595 | | | | 3,242,885 | |
| | | | | | | | | | | | |
| | | | | | | | | | | 8,182,147 | |
| | | | | | | | | | | | |
LEISURE EQUIPMENT & PRODUCTS – 1.3% | |
Hasbro, Inc. | | | | | | | 74,365 | | | | 2,371,500 | |
| | | | | | | | | | | | |
| | | | | | | | | | |
| | | Country
Code** | | Shares | | | Value | |
| | | | | | | | | | |
LIFE SCIENCES TOOLS & SERVICES – 2.5% | |
Life Technologies Corp.* | | | | | 53,040 | | | $ | 2,063,786 | |
Waters Corp.* | | | | | 34,210 | | | | 2,533,251 | |
| | | | | | | | | | |
| | | | | | | | | 4,597,037 | |
| | | | | | | | | | |
MACHINERY – 3.3% | | | | | | | | | | |
IDEX Corp. | | | | | 41,800 | | | | 1,551,198 | |
PACCAR, Inc. | | | | | 80,495 | | | | 3,016,148 | |
Pall Corp. | | | | | 25,150 | | | | 1,437,322 | |
| | | | | | | | | | |
| | | | | | | | | 6,004,668 | |
| | | | | | | | | | |
MEDIA – 1.9% | |
AMC Networks, Inc.,
Class A* | | | | | 12,500 | | | | 469,750 | |
DreamWorks Animation SKG, Inc., Class A* | | | | | 106,330 | | | | 1,764,546 | |
Liberty Global, Inc.,
Class A* | | | | | 28,530 | | | | 1,170,586 | |
| | | | | | | | | | |
| | | | | | | | | 3,404,882 | |
| | | | | | | | | | |
METALS & MINING – 1.5% | |
Carpenter Technology Corp. | | | | | 38,295 | | | | 1,971,426 | |
Walter Energy, Inc. | | | | | 11,985 | | | | 725,812 | |
| | | | | | | | | | |
| | | | | | | | | 2,697,238 | |
| | | | | | | | | | |
MULTI-UTILITIES – 0.9% | |
Wisconsin Energy Corp. | | | | | 48,655 | | | | 1,700,979 | |
| | | | | | | | | | |
OIL, GAS & CONSUMABLE FUELS – 6.2% | |
Alpha Natural Resources, Inc.* | | | | | 35,410 | | | | 723,426 | |
Cobalt International Energy, Inc.* | | | | | 96,370 | | | | 1,495,663 | |
Consol Energy, Inc. | | | | | 49,810 | | | | 1,828,027 | |
Denbury Resources, Inc.* | | | | | 85,440 | | | | 1,290,144 | |
Newfield Exploration Co.* | | | | | 78,695 | | | | 2,969,162 | |
Pioneer Natural Resources Co. | | | | | 34,515 | | | | 3,088,402 | |
| | | | | | | | | | |
| | | | | | | | | 11,394,824 | |
| | | | | | | | | | |
PHARMACEUTICALS – 3.5% | |
Mylan, Inc.* | | | | | 158,955 | | | | 3,411,175 | |
Watson Pharmaceuticals, Inc.* | | | | | 50,345 | | | | 3,037,817 | |
| | | | | | | | | | |
| | | | | | | | | 6,448,992 | |
| | | | | | | | | | |
See Notes to Financial Statements.
199
SC SM WMC BLUE CHIP MID CAP FUND
| | |
PORTFOLIOOF INVESTMENTS (Continued) December 31, 2011 | | Sun Capital Advisers Trust |
| | | | | | | | | | |
| | | Country
Code** | | Shares | | | Value | |
| | | | | | | | | | |
| | | | | | | | | | |
PROFESSIONAL SERVICES – 3.8% | |
Equifax, Inc. | | | | | 29,100 | | | $ | 1,127,334 | |
Manpower, Inc. | | | | | 76,210 | | | | 2,724,507 | |
Robert Half International, Inc. | | | | | 112,815 | | | | 3,210,715 | |
| | | | | | | | | | |
| | | | | | | | | 7,062,556 | |
| | | | | | | | | | |
REAL ESTATE INVESTMENT TRUSTS – 0.7% | |
Alexandria Real Estate Equities, Inc. | | | | | 19,925 | | | | 1,374,227 | |
| | | | | | | | | | |
ROAD & RAIL – 2.1% | |
JB Hunt Transport Services, Inc. | | | | | 54,180 | | | | 2,441,892 | |
Kansas City Southern* | | | | | 20,190 | | | | 1,373,122 | |
| | | | | | | | | | |
| | | | | | | | | 3,815,014 | |
| | | | | | | | | | |
SEMICONDUCTORS & SEMICONDUCTOR EQUIPMENT – 5.7% | |
Analog Devices, Inc. | | | | | 40,610 | | | | 1,453,026 | |
Maxim Integrated Products, Inc. | | | | | 98,955 | | | | 2,576,788 | |
NVIDIA Corp.* | | | | | 166,310 | | | | 2,305,057 | |
Skyworks Solutions, Inc.* | | | | | 170,045 | | | | 2,758,130 | |
Xilinx, Inc. | | | | | 43,140 | | | | 1,383,068 | |
| | | | | | | | | | |
| | | | | | | | | 10,476,069 | |
| | | | | | | | | | |
SOFTWARE – 3.4% | | | | | | | | | | |
Citrix Systems, Inc.* | | | | | 34,345 | | | | 2,085,428 | |
FactSet Research Systems, Inc. | | | | | 19,695 | | | | 1,718,980 | |
| | | | | | | | | | | | |
| | | Country
Code** | | | Shares | | | Value | |
| | | | | | | | | | | | |
Red Hat, Inc.* | | | | | | | 4,550 | | | $ | 187,869 | |
Rovi Corp.* | | | | | | | 93,320 | | | | 2,293,806 | |
| | | | | | | | | | | | |
| | | | | | | | | | | 6,286,083 | |
| | | | | | | | | | | | |
SPECIALTY RETAIL – 2.7% | |
Advanced Auto Parts, Inc. | | | | | | | 33,210 | | | | 2,312,412 | |
CarMax, Inc.* | | | | | | | 58,705 | | | | 1,789,328 | |
Jos A Bank Clothiers, Inc.* | | | | | | | 19,105 | | | | 931,560 | |
| | | | | | | | | | | | |
| | | | | | | | | | | 5,033,300 | |
| | | | | | | | | | | | |
TEXTILES, APPAREL & LUXURY GOODS – 0.3% | |
Michael Kors Holdings Ltd.* | | | VG | | | | 17,870 | | | | 486,958 | |
| | | | | | | | | | | | |
TRADING COMPANIES & DISTRIBUTORS – 1.3% | |
MSC Industrial Direct Co., Inc., Class A | | | | | | | 32,795 | | | | 2,346,482 | |
| | | | | | | | | | | | |
WIRELESS TELECOMMUNICATION SERVICES – 1.5% | |
American Tower Corp., Class A | | | | | | | 45,500 | | | | 2,730,455 | |
| | | | | | | | | | | | |
Total Common Stocks
(Cost $181,432,410) | | | | 182,682,146 | |
| | | | | | | | | | | | |
TOTAL INVESTMENTS – 99.3% | |
(Cost $181,432,410) | | | | | | | | 182,682,146 | |
Other assets less
liabilities – 0.7% | | | | | | | | 1,335,811 | |
| | | | | | | | | | | | |
NET ASSETS – 100.0% | | | | | | | $ | 184,017,957 | |
| | | | | | | | | | | | |
| | |
| ADR | | American Depositary Receipt |
| |
| BM | | Bermuda |
| BR | | Brazil |
| CA | | Canada |
| GB | | Great Britain |
| IE | | Ireland |
| PA | | Panama |
| VG | | British Virgin Islands |
| * | Non-income producing security. |
| ** | Unless otherwise noted the issuer country code for all securities is United States. |
See Notes to Financial Statements.
200
| | |
SC SM WMC BLUE CHIP MID CAP FUND PORTFOLIOOF INVESTMENTS (Continued) |
December 31, 2011 | | Sun Capital Advisers Trust |
| (1) | Fair Value Measurements † |
The following table summarizes the inputs used to value the Fund’s assets and liabilities, as applicable, measured at fair value at the period end:
| | | | | | | | | | | | | | | | | | |
Assets | | Quoted Prices
in Active
Markets for
Identical
Assets and
Liabilities
(Level 1) | | | Significant
Other
Observable
Inputs
(Level 2) | | | Significant
Unobservable
Inputs
(Level 3) | | | Total | |
Common Stocks (a) | | $ | 181,812,204 | | | $ | 869,942 | | | $ | — | | | $ | 182,682,146 | |
| | | | | | | | | | | | | | | | | | |
Total Investments | | $ | 181,812,204 | | | $ | 869,942 | | | $ | — | | | $ | 182,682,146 | |
| | | | | | | | | | | | | | | | | | |
| † | See Note 2b in the Notes to Financial Statements for additional information. |
| (a) | See Portfolio of Investments for additional detailed categorizations of Level 1 Securities. The Level 2 security is within the Capital Markets industry in the Portfolio of Investments. |
See Notes to Financial Statements.
201
SC SM WMC LARGE CAP GROWTH FUND
| | |
PORTFOLIOOF INVESTMENTS December 31, 2011 | | Sun Capital Advisers Trust |
| | | | | | | | | | |
| | | Country
Code** | | Shares | | | Value | |
| | | | | | | | | | |
| | | | | | | | | | |
COMMON STOCKS – 98.6% | |
AEROSPACE & DEFENSE – 2.6% | |
Honeywell International, Inc. | | | | | 46,591 | | | $ | 2,532,221 | |
The Boeing Co. | | | | | 37,497 | | | | 2,750,405 | |
| | | | | | | | | | |
| | | | | | | | | 5,282,626 | |
| | | | | | | | | | |
BEVERAGES – 1.2% | |
The Coca-Cola Co. | | | | | 33,241 | | | | 2,325,873 | |
| | | | | | | | | | |
BIOTECHNOLOGY – 2.1% | |
Amgen, Inc. | | | | | 54,175 | | | | 3,478,577 | |
Gilead Sciences, Inc.* | | | | | 18,725 | | | | 766,414 | |
| | | | | | | | | | |
| | | | | | | | | 4,244,991 | |
| | | | | | | | | | |
CHEMICALS – 1.0% | |
CF Industries Holdings, Inc. | | | | | 5,688 | | | | 824,646 | |
The Sherwin-Williams Co. | | | | | 12,647 | | | | 1,128,998 | |
| | | | | | | | | | |
| | | | | | | | | 1,953,644 | |
| | | | | | | | | | |
COMMUNICATIONS EQUIPMENT – 7.7% | |
Cisco Systems, Inc. | | | | | 529,448 | | | | 9,572,420 | |
Emulex Corp.* | | | | | 127,839 | | | | 876,975 | |
F5 Networks, Inc.* | | | | | 7,881 | | | | 836,332 | |
QUALCOMM, Inc. | | | | | 61,676 | | | | 3,373,677 | |
Riverbed Technology, Inc.* | | | | | 41,024 | | | | 964,064 | |
| | | | | | | | | | |
| | | | | | | | | 15,623,468 | |
| | | | | | | | | | |
COMPUTERS & PERIPHERALS – 12.6% | |
Apple, Inc.* | | | | | 29,716 | | | | 12,034,980 | |
Dell, Inc.* | | | | | 108,109 | | | | 1,581,635 | |
EMC Corp.* | | | | | 265,505 | | | | 5,718,978 | |
NetApp, Inc.* | | | | | 60,332 | | | | 2,188,241 | |
QLogic Corp.* | | | | | 162,014 | | | | 2,430,210 | |
SanDisk Corp.* | | | | | 30,452 | | | | 1,498,543 | |
| | | | | | | | | | |
| | | | | | | | | 25,452,587 | |
| | | | | | | | | | |
CONSUMER FINANCE – 0.9% | |
American Express Co. | | | | | 40,647 | | | | 1,917,319 | |
| | | | | | | | | | |
DIVERSIFIED CONSUMER SERVICES – 2.1% | |
Apollo Group, Inc., Class A* | | | | | 46,799 | | | | 2,521,062 | |
ITT Educational Services, Inc.* | | | | | 31,136 | | | | 1,771,327 | |
| | | | | | | | | | |
| | | | | | | | | 4,292,389 | |
| | | | | | | | | | |
| | | | | | | | | | | | |
| | | Country
Code** | | | Shares | | | Value | |
| | | | | | | | | | | | |
ENERGY EQUIPMENT & SERVICES – 4.5% | |
Baker Hughes, Inc. | | | | | | | 12,803 | | | $ | 622,738 | |
Cameron International Corp.* | | | | | | | 28,040 | | | | 1,379,288 | |
Core Laboratories NV | | | NL | | | | 17,115 | | | | 1,950,254 | |
Diamond Offshore Drilling, Inc. | | | | | | | 40,231 | | | | 2,223,165 | |
National Oilwell Varco, Inc. | | | | | | | 13,753 | | | | 935,067 | |
Oceaneering International, Inc. | | | | | | | 42,157 | | | | 1,944,702 | |
| | | | | | | | | | | | |
| | | | | | | | | | | 9,055,214 | |
| | | | | | | | | | | | |
FOOD & STAPLES RETAILING – 0.8% | |
Costco Wholesale Corp. | | | | | | | 19,444 | | | | 1,620,074 | |
| | | | | | | | | | | | |
HEALTH CARE EQUIPMENT & SUPPLIES – 2.3% | |
Edwards Lifesciences Corp.* | | | | | | | 9,485 | | | | 670,589 | |
Hologic, Inc.* | | | | | | | 83,798 | | | | 1,467,303 | |
Intuitive Surgical, Inc.* | | | | | | | 5,254 | | | | 2,432,655 | |
| | | | | | | | | | | | |
| | | | | | | | | | | 4,570,547 | |
| | | | | | | | | | | | |
HEALTH CARE PROVIDERS & SERVICES – 3.1% | |
AmerisourceBergen Corp. | | | | | | | 28,945 | | | | 1,076,465 | |
Cardinal Health, Inc. | | | | | | | 29,786 | | | | 1,209,609 | |
UnitedHealth Group, Inc. | | | | | | | 78,701 | | | | 3,988,567 | |
| | | | | | | | | | | | |
| | | | | | | | | | | 6,274,641 | |
| | | | | | | | | | | | |
HOTELS, RESTAURANTS & LEISURE – 1.1% | |
Starbucks Corp. | | | | | | | 49,246 | | | | 2,265,808 | |
| | | | | | | | | | | | |
INDUSTRIAL CONGLOMERATES – 2.0% | |
General Electric Co. | | | | | | | 146,010 | | | | 2,615,039 | |
Tyco International Ltd. | | | CH | | | | 30,329 | | | | 1,416,668 | |
| | | | | | | | | | | | |
| | | | | | | | | | | 4,031,707 | |
| | | | | | | | | | | | |
INTERNET & CATALOG RETAIL – 1.3% | |
Amazon.com, Inc.* | | | | | | | 7,965 | | | | 1,378,741 | |
Priceline.com, Inc.* | | | | | | | 2,615 | | | | 1,223,062 | |
| | | | | | | | | | | | |
| | | | | | | | | | | 2,601,803 | |
| | | | | | | | | | | | |
INTERNET SOFTWARE & SERVICES – 4.9% | |
eBay, Inc.* | | | | | | | 92,577 | | | | 2,807,860 | |
Google, Inc., Class A* | | | | | | | 6,854 | | | | 4,426,999 | |
IAC/InterActiveCorp. | | | | | | | 62,819 | | | | 2,676,089 | |
| | | | | | | | | | | | |
| | | | | | | | | | | 9,910,948 | |
| | | | | | | | | | | | |
See Notes to Financial Statements.
202
SC SM WMC LARGE CAP GROWTH FUND
| | |
PORTFOLIOOF INVESTMENTS (Continued) December 31, 2011 | | Sun Capital Advisers Trust |
| | | | | | | | | | | | |
| | | Country
Code** | | | Shares | | | Value | |
| | | | | | | | | | | | |
| | | | | | | | | | | | |
IT SERVICES – 4.8% | |
Cognizant Technology Solutions Corp., Class A* | | | | | | | 10,457 | | | $ | 672,490 | |
International Business Machines Corp. | | | | | | | 48,515 | | | | 8,920,938 | |
| | | | | | | | | | | | |
| | | | | | | | | | | 9,593,428 | |
| | | | | | | | | | | | |
LIFE SCIENCES TOOLS & SERVICES – 2.1% | |
Bruker Corp.* | | | | | | | 59,555 | | | | 739,673 | |
Life Technologies Corp.* | | | | | | | 19,489 | | | | 758,317 | |
Waters Corp.* | | | | | | | 35,807 | | | | 2,651,508 | |
| | | | | | | | | | | | |
| | | | | | | | | | | 4,149,498 | |
| | | | | | | | | | | | |
MACHINERY – 5.1% | |
Caterpillar, Inc. | | | | | | | 44,289 | | | | 4,012,583 | |
Cummins, Inc. | | | | | | | 10,745 | | | | 945,775 | |
Dover Corp. | | | | | | | 19,564 | | | | 1,135,690 | |
Joy Global, Inc. | | | | | | | 22,604 | | | | 1,694,622 | |
Parker Hannifin Corp. | | | | | | | 33,798 | | | | 2,577,098 | |
| | | | | | | | | | | | |
| | | | | | | | | | | 10,365,768 | |
| | | | | | | | | | | | |
MEDIA – 3.3% | |
DIRECTV, Class A* | | | | | | | 27,113 | | | | 1,159,352 | |
News Corp., Class A | | | | | | | 109,792 | | | | 1,958,689 | |
Omnicom Group, Inc. | | | | | | | 62,255 | | | | 2,775,328 | |
Sirius XM Radio, Inc.* | | | | | | | 450,955 | | | | 820,738 | |
| | | | | | | | | | | | |
| | | | | | | | | | | 6,714,107 | |
| | | | | | | | | | | | |
METALS & MINING – 2.9% | |
Cliffs Natural Resources, Inc. | | | | | | | 17,466 | | | | 1,089,005 | |
Freeport-McMoRan Copper & Gold, Inc. | | | | | | | 44,831 | | | | 1,649,333 | |
Rio Tinto PLC ADR | | | GB | | | | 23,647 | | | | 1,156,811 | |
Teck Resources Ltd., Class B | | | CA | | | | 29,553 | | | | 1,039,970 | |
Walter Energy, Inc. | | | | | | | 15,013 | | | | 909,187 | |
| | | | | | | | | | | | |
| | | | | | | | | | | 5,844,306 | |
| | | | | | | | | | | | |
OIL, GAS & CONSUMABLE FUELS – 6.9% | |
Anadarko Petroleum Corp. | | | | | | | 14,687 | | | | 1,121,059 | |
Canadian Natural Resources, Ltd. | | | CA | | | | 30,903 | | | | 1,154,845 | |
Exxon Mobil Corp. | | | | | | | 79,319 | | | | 6,723,078 | |
Occidental Petroleum Corp. | | | | | | | 31,817 | | | | 2,981,253 | |
| | | | | | | | | | | | |
| | | Country
Code** | | | Shares | | | Value | |
| | | | | | | | | | | | |
Valero Energy Corp. | | | | | | | 96,874 | | | $ | 2,039,198 | |
| | | | | | | | | | | | |
| | | | | | | | | | | 14,019,433 | |
| | | | | | | | | | | | |
PHARMACEUTICALS – 1.1% | |
Abbott Laboratories | | | | | | | 38,273 | | | | 2,152,091 | |
| | | | | | | | | | | | |
SEMICONDUCTORS & SEMICONDUCTOR EQUIPMENT – 5.5% | |
Altera Corp. | | | | | | | 150,719 | | | | 5,591,675 | |
Analog Devices, Inc. | | | | | | | 55,640 | | | | 1,990,799 | |
Intersil Corp. | | | | | | | 116,247 | | | | 1,213,619 | |
Xilinx, Inc. | | | | | | | 74,085 | | | | 2,375,165 | |
| | | | | | | | | | | | |
| | | | | | | | | | | 11,171,258 | |
| | | | | | | | | | | | |
SOFTWARE – 9.2% | |
Autodesk, Inc.* | | | | | | | 37,314 | | | | 1,131,734 | |
BMC Software, Inc.* | | | | | | | 23,026 | | | | 754,792 | |
Check Point Software Technologies Ltd.* | | | IL | | | | 34,565 | | | | 1,816,045 | |
Citrix Systems, Inc.* | | | | | | | 18,003 | | | | 1,093,142 | |
Microsoft Corp. | | | | | | | 272,397 | | | | 7,071,426 | |
Oracle Corp. | | | | | | | 204,617 | | | | 5,248,426 | |
Red Hat, Inc.* | | | | | | | 23,775 | | | | 981,670 | |
Symantec Corp.* | | | | | | | 30,057 | | | | 470,392 | |
| | | | | | | | | | | | |
| | | | | | | | | | | 18,567,627 | |
| | | | | | | | | | | | |
SPECIALTY RETAIL – 3.8% | |
Bed Bath & Beyond, Inc.* | | | | | | | 15,728 | | | | 911,752 | |
Lowe’s Cos., Inc. | | | | | | | 29,982 | | | | 760,943 | |
PetSmart, Inc. | | | | | | | 22,809 | | | | 1,169,874 | |
Ross Stores, Inc. | | | | | | | 42,444 | | | | 2,017,363 | |
The Buckle, Inc. | | | | | | | 25,841 | | | | 1,056,122 | |
TJX Cos., Inc. | | | | | | | 27,445 | | | | 1,771,575 | |
| | | | | | | | | | | | |
| | | | | | | | | | | 7,687,629 | |
| | | | | | | | | | | | |
TEXTILES, APPAREL & LUXURY GOODS – 2.1% | |
Coach, Inc. | | | | | | | 31,810 | | | | 1,941,683 | |
Deckers Outdoor Corp.* | | | | | | | 10,247 | | | | 774,366 | |
Lululemon Athletica, Inc.* | | | | | | | 7,349 | | | | 342,904 | |
Ralph Lauren Corp. | | | | | | | 8,380 | | | | 1,157,110 | |
| | | | | | | | | | | | |
| | | | | | | | | | | 4,216,063 | |
| | | | | | | | | | | | |
TOBACCO – 1.6% | |
Philip Morris International, Inc. | | | | | | | 40,207 | | | | 3,155,445 | |
| | | | | | | | | | | | |
Total Common Stocks
(Cost $187,411,696) | | | | 199,060,292 | |
| | | | | | | | | | | | |
See Notes to Financial Statements.
203
SC SM WMC LARGE CAP GROWTH FUND
| | |
PORTFOLIOOF INVESTMENTS (Continued) December 31, 2011 | | Sun Capital Advisers Trust |
| | | | |
| | | Value | |
| | | | |
| | | | |
TOTAL INVESTMENTS – 98.6% | | | | |
(Cost $187,411,696) | | $ | 199,060,292 | |
Other assets less
liabilities – 1.4% | | | 2,843,018 | |
| | | | |
NET ASSETS – 100.0% | | $ | 201,903,310 | |
| | | | |
| | |
| ADR | | American Depositary Receipt |
| |
| CA | | Canada |
| CH | | Switzerland |
| GB | | Great Britain |
| IL | | Israel |
| NL | | Netherlands |
| * | Non-income producing security. |
| ** | Unless otherwise noted the issuer country code for all securities is United States. |
| (1) | Fair Value Measurements |
All investments are categorized as Level 1 under the fair value hierarchy. See Note 2b in the Notes to Financial Statements for additional information.
See Notes to Financial Statements.
204
SUN CAPITAL GLOBAL REAL ESTATE FUND
| | |
PORTFOLIOOF INVESTMENTS December 31, 2011 | | Sun Capital Advisers Trust |
| | | | | | | | | | | | |
| | | Country
Code** | | | Shares | | | Value | |
| | | | | | | | | | | | |
| | | | | | | | | | | | |
COMMON STOCKS – 98.6% | | | | | |
HOUSEHOLD DURABLES – 0.9% | | | | | |
Lennar Corp., Class A | | | | | | | 89,790 | | | $ | 1,764,373 | |
| | | | | | | | | | | | |
REAL ESTATE INVESTMENT TRUSTS – 73.6% | |
DIVERSIFIED – 9.4% | |
British Land Co. PLC | | | GB | | | | 245,410 | | | | 1,762,688 | |
Cousins Properties, Inc. | | | | | | | 266,729 | | | | 1,709,733 | |
Derwent London PLC | | | GB | | | | 61,080 | | | | 1,479,773 | |
Kenedix Realty Investment Corp. | | | JP | | | | 595 | | | | 1,731,584 | |
Land Securities Group PLC | | | GB | | | | 216,502 | | | | 2,136,726 | |
Stockland | | | AU | | | | 1,605,024 | | | | 5,236,764 | |
Vornado Realty Trust | | | | | | | 68,096 | | | | 5,233,859 | |
| | | | | | | | | | | | |
| | | | | | | | | | | 19,291,127 | |
| | | | | | | | | | | | |
INDUSTRIAL – 6.7% | |
DuPont Fabros Technology, Inc. | | | | | | | 137,656 | | | | 3,334,029 | |
EastGroup Properties, Inc. | | | | | | | 59,990 | | | | 2,608,365 | |
Goodman Group | | | AU | | | | 3,740,924 | | | | 2,180,944 | |
ProLogis, Inc. | | | | | | | 153,570 | | | | 4,390,566 | |
Segro PLC | | | GB | | | | 431,852 | | | | 1,398,339 | |
| | | | | | | | | | | | |
| | | | | | | | | | | 13,912,243 | |
| | | | | | | | | | | | |
MORTGAGE – 1.0% | |
Starwood Property Trust, Inc. | | | | | | | 116,521 | | | | 2,156,804 | |
| | | | | | | | | | | | |
OFFICE – 10.8% | | | | | |
Alexandria Real Estate Equities, Inc. | | | | | | | 24,388 | | | | 1,682,040 | |
BioMed Realty Trust, Inc. | | | | | | | 357,054 | | | | 6,455,536 | |
Boston Properties, Inc. | | | | | | | 42,291 | | | | 4,212,184 | |
Digital Realty Trust, Inc. | | | | | | | 38,024 | | | | 2,535,060 | |
Douglas Emmett, Inc. | | | | | | | 89,050 | | | | 1,624,272 | |
Mack-Cali Realty Corp. | | | | | | | 57,660 | | | | 1,538,946 | |
| | | | | | | | | | | | |
| | | Country
Code** | | | Shares | | | Value | |
| | | | | | | | | | | | |
Nippon Building Fund, Inc. | | | JP | | | | 193 | | | $ | 1,579,706 | |
Parkway Properties, Inc. | | | | | | | 258,465 | | | | 2,548,465 | |
| | | | | | | | | | | | |
| | | | | | | | | | | 22,176,209 | |
| | | | | | | | | | | | |
RESIDENTIAL – 7.6% | |
Advance Residence Investment Corp. | | | JP | | | | 989 | | | | 1,908,101 | |
Boardwalk Real Estate Investment Trust | | | CA | | | | 27,175 | | | | 1,345,479 | |
Equity Lifestyle Properties, Inc. | | | | | | | 63,073 | | | | 4,206,338 | |
Essex Property Trust, Inc. | | | | | | | 8,470 | | | | 1,190,120 | |
Home Properties, Inc. | | | | | | | 49,223 | | | | 2,833,768 | |
Mid-America Apartment Communities, Inc. | | | | | | | 66,176 | | | | 4,139,309 | |
| | | | | | | | | | | | |
| | | | | | | | | | | 15,623,115 | |
| | | | | | | | | | | | |
RETAIL – 23.6% | |
CFS Retail Property Trust | | | AU | | | | 1,965,513 | | | | 3,387,401 | |
Corio NV | | | NL | | | | 57,286 | | | | 2,491,556 | |
DDR Corp. | | | | | | | 91,970 | | | | 1,119,275 | |
Federal Realty Investment Trust | | | | | | | 15,947 | | | | 1,447,190 | |
Kimco Realty Corp. | | | | | | | 171,550 | | | | 2,785,972 | |
Primaris Retail Real Estate Investment Trust | | | CA | | | | 83,335 | | | | 1,685,923 | |
Ramco-Gershenson Properties Trust | | | | | | | 189,697 | | | | 1,864,722 | |
Simon Property Group, Inc. | | | | | | | 81,167 | | | | 10,465,673 | |
Tanger Factory Outlet Centers, Inc. | | | | | | | 69,108 | | | | 2,026,247 | |
The Link REIT | | | HK | | | | 1,886,101 | | | | 6,945,445 | |
Unibail-Rodamco | | | FR | | | | 36,991 | | | | 6,649,923 | |
Westfield Group | | | AU | | | | 739,952 | | | | 5,910,788 | |
Westfield Retail Trust | | | AU | | | | 671,295 | | | | 1,709,636 | |
| | | | | | | | | | | | |
| | | | | | | | | | | 48,489,751 | |
| | | | | | | | | | | | |
SPECIALIZED – 14.5% | |
Big Yellow Group PLC | | | GB | | | | 1,045,708 | | | | 3,983,634 | |
Entertainment Properties Trust | | | | | | | 84,228 | | | | 3,681,606 | |
See Notes to Financial Statements.
205
SUN CAPITAL GLOBAL REAL ESTATE FUND
| | |
PORTFOLIOOF INVESTMENTS (Continued) December 31, 2011 | | Sun Capital Advisers Trust |
| | | | | | | | | | | | |
| | | Country
Code** | | | Shares | | | Value | |
| | | | | | | | | | | | |
| | | | | | | | | | | | |
Host Hotels & Resorts, Inc. | | | | | | | 282,051 | | | $ | 4,165,893 | |
Medical Properties Trust, Inc. | | | | | | | 487,329 | | | | 4,809,937 | |
Plum Creek Timber Co., Inc. | | | | | | | 61,002 | | | | 2,230,233 | |
Public Storage | | | | | | | 41,095 | | | | 5,525,634 | |
Ventas, Inc. | | | | | | | 38,180 | | | | 2,104,864 | |
Weyerhaeuser Co. | | | | | | | 182,508 | | | | 3,407,424 | |
| | | | | | | | | | | | |
| | | | | | | | | | | 29,909,225 | |
| | | | | | | | | | | | |
| | | | | | | | | | | 151,558,474 | |
| | | | | | | | | | | | |
REAL ESTATE MANAGEMENT & DEVELOPMENT – 24.1% | |
DIVERSIFIED REAL ESTATE ACTIVITIES – 16.3% | |
Beni Stabili S.p.A | | | IT | | | | 4,088,135 | | | | 1,829,652 | |
Capitaland Ltd. | | | SG | | | | 1,949,367 | | | | 3,321,461 | |
Hang Lung Properties Ltd. | | | HK | | | | 860,944 | | | | 2,449,832 | |
Henderson Land Development
Co., Ltd. | | | HK | | | | 222,251 | | | | 1,104,587 | |
Jones Lang LaSalle, Inc. | | | | | | | 9,120 | | | | 558,691 | |
Mitsubishi Estate
Co., Ltd. | | | JP | | | | 344,069 | | | | 5,140,696 | |
Mitsui Fudosan
Co., Ltd. | | | JP | | | | 397,075 | | | | 5,788,205 | |
Sun Hung Kai
Properties Ltd. | | | HK | | | | 692,254 | | | | 8,677,018 | |
| | | | | | | | | | | | |
| | | Country
Code** | | | Shares | | | Value | |
| | | | | | | | | | | | |
Tokyo Tatemono
Co., Ltd.* | | | JP | | | | 888,571 | | | $ | 2,689,841 | |
Wharf Holdings Ltd. | | | HK | | | | 418,893 | | | | 1,898,519 | |
| | | | | | | | | | | | |
| | | | | | | | | | | 33,458,502 | |
| | | | | | | | | | | | |
REAL ESTATE OPERATING COMPANIES – 7.8% | |
Atrium European Real Estate Ltd. | | | JE | | | | 1,097,714 | | | | 4,946,936 | |
BR Malls Participacoes SA | | | BR | | | | 397,323 | | | | 3,859,800 | |
Global Logistic Properties Ltd.* | | | SG | | | | 2,521,586 | | | | 3,411,883 | |
GSW Immobilien AG* | | | DE | | | | 50,653 | | | | 1,468,492 | |
NTT Urban Development Corp. | | | JP | | | | 3,557 | | | | 2,426,173 | |
| | | | | | | | | | | | |
| | | | | | | | | | | 16,113,284 | |
| | | | | | | | | | | | |
| | | | | | | | | | | 49,571,786 | |
| | | | | | | | | | | | |
Total Common Stocks
(Cost $188,017,251) | | | | 202,894,633 | |
| | | | | | | | | | | | |
SHORT TERM INVESTMENTS – 0.7% | | | | | |
MUTUAL FUNDS – 0.7% | |
State Street Institutional Liquid Reserves Fund, 0.17%
(Cost $1,381,788) | | | | 1,381,788 | | | | 1,381,788 | |
| | | | | | | | | | | | |
TOTAL INVESTMENTS – 99.3% | | | | | |
(Cost $189,399,039) | | | | | | | | 204,276,421 | |
Other assets less
liabilities – 0.7% | | | | | | | | 1,493,695 | |
| | | | | | | | | | | | |
NET ASSETS – 100.0% | | | | | | | $ | 205,770,116 | |
| | | | | | | | | | | | |
| | |
| REIT | | Real Estate Investment Trust |
| |
| AU | | Australia |
| BR | | Brazil |
| CA | | Canada |
| DE | | Germany |
| FR | | France |
| GB | | Great Britain |
| HK | | Hong Kong |
| IT | | Italy |
| JE | | Jersey |
| JP | | Japan |
| NL | | Netherlands |
| SG | | Singapore |
| * | Non-income producing security. |
| ** | Unless otherwise noted the issuer country code for all securities is United States. |
See Notes to Financial Statements.
206
| | |
SUN CAPITAL GLOBAL REAL ESTATE FUND PORTFOLIOOF INVESTMENTS (Continued) |
| December 31, 2011 | | Sun Capital Advisers Trust |
Distribution of investments by country of issuer, as a percentage of net assets, is as follows. Figures may not total to 100% due to the exclusion of the Fund’s other assets and liabilities. (Unaudited)
| | | | |
United States | | | 49.4 | % |
Japan | | | 10.3 | |
Hong Kong | | | 10.2 | |
Australia | | | 9.0 | |
Great Britain | | | 5.2 | |
Singapore | | | 3.3 | |
France | | | 3.2 | |
Jersey | | | 2.4 | |
Other (individually less than 2%) | | | 6.3 | |
| (1) | Fair Value Measurements † |
The following table summarizes the inputs used to value the Fund’s assets and liabilities, as applicable, measured at fair value at the period end:
| | | | | | | | | | | | | | | | |
Assets | | Quoted Prices
in Active
Markets for
Identical
Assets and
Liabilities
(Level 1) | | | Significant
Other
Observable
Inputs
(Level 2) | | | Significant
Unobservable
Inputs
(Level 3) | | | Total | |
Common Stocks | | | | | | | | | | | | | | | | |
Household Durables | | $ | 1,764,373 | | | $ | — | | | $ | — | | | $ | 1,764,373 | |
Real Estate Investment Trusts | | | | | | | | | | | | | | | | |
Diversified | | | 6,943,592 | | | | 12,347,535 | | | | — | | | | 19,291,127 | |
Industrial | | | 10,332,960 | | | | 3,579,283 | | | | — | | | | 13,912,243 | |
Mortgage | | | 2,156,804 | | | | — | | | | — | | | | 2,156,804 | |
Office | | | 20,596,503 | | | | 1,579,706 | | | | — | | | | 22,176,209 | |
Residential | | | 13,715,014 | | | | 1,908,101 | | | | — | | | | 15,623,115 | |
Retail | | | 21,395,002 | | | | 27,094,749 | | | | — | | | | 48,489,751 | |
Specialized | | | 25,925,591 | | | | 3,983,634 | | | | — | | | | 29,909,225 | |
| | | | | | | | | | | | | | | | |
Total Real Estate Investment Trusts | | | 101,065,466 | | | | 50,493,008 | | | | — | | | | 151,558,474 | |
| | | | | | | | | | | | | | | | |
Real Estate Management & Development | | | | | | | | | | | | | | | | |
Diversified Real Estate Activities | | | 558,691 | | | | 32,899,811 | | | | — | | | | 33,458,502 | |
Real Estate Operating Companies | | | — | | | | 16,113,284 | | | | — | | | | 16,113,284 | |
| | | | | | | | | | | | | | | | |
Total Real Estate Management & Development | | | 558,691 | | | | 49,013,095 | | | | — | | | | 49,571,786 | |
| | | | | | | | | | | | | | | | |
Total Common Stocks | | | 103,388,530 | | | | 99,506,103 | | | | — | | | | 202,894,633 | |
| | | | | | | | | | | | | | | | |
Short Term Investments | | | | | | | | | | | | | | | | |
Mutual Funds | | | 1,381,788 | | | | — | | | | — | | | | 1,381,788 | |
| | | | | | | | | | | | | | | | |
Total Investments | | $ | 104,770,318 | | | $ | 99,506,103 | | | $ | — | | | $ | 204,276,421 | |
| | | | | | | | | | | | | | | | |
| † | See Note 2b in the Notes to Financial Statements for additional information. |
See Notes to Financial Statements.
207
| | |
SC SM IBBOTSON TACTICAL OPPORTUNITIES FUND PORTFOLIOOF INVESTMENTS |
| December 31, 2011 | | Sun Capital Advisers Trust |
| | | | | | | | |
| | |
Shares | | | Value | |
| | | | | | | | |
| | | | | | | | |
EXCHANGE TRADED FUNDS – 99.8% | |
iShares Barclays U.S. TIPS Bond Fund | | | 1,096,351 | | | $ | 127,933,198 | |
iShares Russell 1000 Growth Index Fund | | | 549,159 | | | | 31,735,899 | |
iShares Russell 2000 Growth Index Fund | | | 322,347 | | | | 27,151,288 | |
iShares Russell Midcap Growth Index Fund | | | 245,126 | | | | 13,494,186 | |
iShares S&P 500 Index Fund | | | 434,195 | | | | 54,691,201 | |
iShares S&P MidCap 400 Index Fund | | | 101,846 | | | | 8,922,728 | |
Vanguard MSCI EAFE ETF | | | 145,171 | | | | 4,446,588 | |
Vanguard REIT ETF | | | 807,277 | | | | 46,822,066 | |
Vanguard Short-Term Bond ETF | | | 1,355,774 | | | | 109,600,770 | |
Vanguard Total Bond Market ETF | | | 1,750,825 | | | | 146,263,920 | |
| | | | | | | | |
Total Exchange Traded Funds
(Cost $567,818,091) | | | | | | | 571,061,844 | |
| | | | | | | | |
SHORT TERM INVESTMENTS – 0.7% | |
MUTUAL FUNDS – 0.5% | |
State Street Institutional Liquid Reserves Fund, 0.17%
(Cost $3,098,650) | | | 3,098,650 | | | | 3,098,650 | |
| | |
| | | Principal
Amount
(000) | | | | |
| | | | | | | | |
U.S. TREASURY OBLIGATIONS (1) – 0.2% | |
U.S. Treasury Bills
0.01%, 3/8/12
(Amortized cost $1,099,990) | | $ | 1,100 | | | | 1,099,990 | |
| | | | | | | | |
Total Short Term Investments
(Cost $4,198,640) | | | | | | | 4,198,640 | |
| | | | | | | | |
TOTAL INVESTMENTS – 100.5% | | | | | |
(Cost $572,016,731) | | | | | | | 575,260,484 | |
Liabilities in excess of other
assets – (0.5)% | | | | | | | (2,774,014 | ) |
| | | | | | | | |
NET ASSETS – 100.0% | | | | | | $ | 572,486,470 | |
| | | | | | | | |
| | |
ETF REIT TIPS | | Exchange Traded Fund Real Estate Investment Trust Treasury Inflation Protected Securities |
| (1) | Interest rates represent annualized yield at date of purchase. |
See Notes to Financial Statements.
208
| | |
SC SM IBBOTSON TACTICAL OPPORTUNITIES FUND PORTFOLIOOF INVESTMENTS (Continued) |
| December 31, 2011 | | Sun Capital Advisers Trust |
| (2) | Fair Value Measurements † |
The following table summarizes the inputs used to value the Fund’s assets and liabilities, as applicable, measured at fair value at the period end:
| | | | | | | | | | | | | | | | |
Assets | | Quoted Prices
in Active
Markets for
Identical
Assets and
Liabilities
(Level 1) | | | Significant
Other
Observable
Inputs
(Level 2) | | | Significant
Unobservable
Inputs
(Level 3) | | | Total | |
Exchange Traded Funds | | $ | 571,061,844 | | | $ | — | | | $ | — | | | $ | 571,061,844 | |
Short Term Investments | | | | | | | | | | | | | | | | |
Mutual Funds | | | 3,098,650 | | | | — | | | | — | | | | 3,098,650 | |
U.S. Treasury Obligations | | | — | | | | 1,099,990 | | | | — | | | | 1,099,990 | |
| | | | | | | | | | | | | | | | |
Total Short Term Investments | | | 3,098,650 | | | | 1,099,990 | | | | — | | | | 4,198,640 | |
| | | | | | | | | | | | | | | | |
Total Investments | | $ | 574,160,494 | | | $ | 1,099,990 | | | $ | — | | | $ | 575,260,484 | |
| | | | | | | | | | | | | | | | |
| † | See Note 2b in the Notes to Financial Statements for additional information. |
See Notes to Financial Statements.
209
SUN CAPITAL INVESTMENT GRADE BOND FUND®
| | |
PORTFOLIOOF INVESTMENTS December 31, 2011 | | Sun Capital Advisers Trust |
| | | | | | | | | | |
| | | Country
Code* | | Principal
Amount
(000) | | | Value | |
| | | | | | | | | | |
| | | | | | | | | | |
ASSET BACKED SECURITIES – 0.1% | |
Airplanes Pass
Through Trust,
Series D
10.88%, 3/15/19 (1) | | | | $ | 494 | | | $ | — | |
SLM Student
Loan Trust,
Series 2008-5, Class A2
1.52%, 10/25/16 (2) | | | | | 107 | | | | 108,094 | |
SLM Student Loan Trust,
Series 2008-5, Class A4
2.12%, 7/25/23 (2) | | | | | 215 | | | | 220,649 | |
| | | | | | | | | | |
Total Asset Backed Securities
(Cost $587,681) | | | | 328,743 | |
| | | | | | | | | | |
COLLATERALIZED MORTGAGE
OBLIGATIONS – 0.1% | |
Federal National Mortgage Association,
Series 2001-80, Class ZB
6.00%, 1/25/32 | | | | | 478 | | | | 536,280 | |
Federal National Mortgage Association,
Series 2002-53, Class PD
6.00%, 1/25/32 | | | | | 23 | | | | 23,610 | |
| | | | | | | | | | |
Total Collateralized Mortgage Obligations
(Cost $464,849) | | | | 559,890 | |
| | | | | | | | | | |
COMMERCIAL MORTGAGE BACKED
SECURITIES – 5.4% | |
Banc of America Mortgage
Securities, Inc.,
Series 2003-H, Class 2A3
2.79%, 9/25/33 (2) | | | | | 609 | | | | 550,665 | |
Bear Stearns Commercial Mortgage Securities,
Series 2007-T26, Class A4
5.47%, 1/12/45 (2) | | | | | 4,550 | | | | 5,117,112 | |
Bear Stearns Commercial Mortgage Securities,
Series 2007-T28, Class A3
5.79%, 9/11/42 | | | | | 1,000 | | | | 1,060,481 | |
| | | | | | | | | | |
| | | Country
Code* | | Principal
Amount
(000) | | | Value | |
| | | | | | | | | | |
Citigroup/Deutsche Bank Commercial Mortgage Trust,
Series 2005-C1, Class A3
5.23%, 7/15/44 (2) | | | | $ | 750 | | | $ | 781,337 | |
Commercial Mortgage Asset Trust,
Series 1999-C1, Class F
6.25%, 1/17/32 (3) | | | | | 400 | | | | 400,166 | |
GMAC Commercial Mortgage Securities, Inc.,
Series 2003-C1, Class A2
4.08%, 5/10/36 | | | | | 800 | | | | 817,284 | |
JP Morgan Chase Commercial Mortgage Securities Corp.,
Series 2005-LDP5 Mortgage Certificate, Class A3
5.23%, 12/15/44 (2) | | | | | 550 | | | | 578,772 | |
JP Morgan Chase Commercial Mortgage Securities Corp.,
Series 2005-LDP5, Class A4
5.21%, 12/15/44 (2) | | | | | 1,500 | | | | 1,659,300 | |
JP Morgan Chase Commercial Mortgage Securities Corp.,
Series 2006-LDP7 Mortgage Certificate, Class AM
5.87%, 4/15/45 (2) | | | | | 500 | | | | 514,925 | |
LB-UBS Commercial Mortgage Trust,
Series 2006-C1, Class A4
5.16%, 2/15/31 | | | | | 2,000 | | | | 2,206,462 | |
LB-UBS Commercial Mortgage Trust,
Series 2006-C6, Class A4
5.37%, 9/15/39 | | | | | 2,900 | | | | 3,214,546 | |
Morgan Stanley Capital I,
Series 2004-IQ7,
Class A4
5.41%, 6/15/38 (2) | | | | | 1,000 | | | | 1,067,917 | |
See Notes to Financial Statements.
210
SUN CAPITAL INVESTMENT GRADE BOND FUND®
| | |
PORTFOLIOOF INVESTMENTS (Continued) December 31, 2011 | | Sun Capital Advisers Trust |
| | | | | | | | | | | | |
| | | Country
Code* | | | Principal
Amount
(000) | | | Value | |
| | | | | | | | | | | | |
| | | | | | | | | | | | |
Morgan Stanley Capital I,
Series 2004-T15, Class B
5.39%, 6/13/41 (2) | | | | | | $ | 1,500 | | | $ | 1,526,752 | |
Morgan Stanley Capital I,
Series 2007-T27, Class A4
5.64%, 6/11/42 (2) | | | | | | | 6,182 | | | | 7,042,182 | |
| | | | | | | | | | | | |
Total Commercial Mortgage Backed Securities
(Cost $26,053,337) | | | | 26,537,901 | |
| | | | | | | | | | | | |
CORPORATE DEBT OBLIGATIONS – 37.8% | |
AEROSPACE & DEFENSE – 0.3% | |
L-3 Communications Corp.
6.38%, 10/15/15 | | | | | | | 1,487 | | | | 1,524,175 | |
| | | | | | | | | | | | |
AIRLINES – 0.7% | | | | | | | | | | | | |
AMR Corp., Series A
5.25%, 1/31/21 | | | | | | | 3,495 | | | | 3,250,188 | |
| | | | | | | | | | | | |
AUTOMOTIVE – 2.1% | |
Ford Motor Credit Co. LLC
5.63%, 9/15/15 | | | | | | | 6,000 | | | | 6,209,694 | |
Hyundai Capital Services, Inc.
4.38%, 7/27/16 (3) | | | KR | | | | 4,000 | | | | 4,079,436 | |
| | | | | | | | | | | | |
| | | | | | | | | | | 10,289,130 | |
| | | | | | | | | | | | |
BANKS – 4.6% | |
Ally Financial, Inc. 4.50%, 2/11/14 | | | | | | | 5,000 | | | | 4,825,000 | |
Countrywide Financial
Corp. | |
6.25%, 5/15/16 | | | | | | | 325 | | | | 306,194 | |
Huntington Capital | |
6.65%, 5/15/37 (2) | | | | | | | 300 | | | | 284,250 | |
ING Bank NV | |
2.00%, 10/18/13 (3) | | | NL | | | | 2,000 | | | | 1,953,422 | |
2.38%, 6/9/14 (3) | | | NL | | | | 5,000 | | | | 4,874,285 | |
Lloyds TSB Bank PLC | |
6.50%, 9/14/20 (3) | | | GB | | | | 2,025 | | | | 1,694,439 | |
Merrill Lynch & Co., Inc. | |
5.70%, 5/2/17 | | | | | | | 400 | | | | 367,355 | |
6.05%, 5/16/16 | | | | | | | 3,500 | | | | 3,298,956 | |
Nordea Bank AB | |
4.88%, 5/13/21 (3) | | | SE | | | | 3,500 | | | | 2,958,228 | |
| | | | | | | | | | | | |
| | | Country
Code* | | | Principal
Amount
(000) | | | Value | |
| | | | | | | | | | | | |
Royal Bank of Scotland
PLC | |
1.32%, 9/29/15 (2) | | | GB | | | $ | 2,500 | | | $ | 1,790,165 | |
| | | | | | | | | | | | |
| | | | | | | | | | | 22,352,294 | |
| | | | | | | | | | | | |
BUILDING MATERIALS – 0.1% | |
C10 Capital SPV., Ltd. | |
6.72%,12/31/16(2)(3) | | | VG | | | | 500 | | | | 257,500 | |
| | | | | | | | | | | | |
CABLE – 1.2% | |
DIRECTV Holdings LLC | |
7.63%, 5/15/16 | | | | | | | 5,000 | | | | 5,306,250 | |
Time Warner
Entertainment Co. | |
10.15%, 5/1/12 | | | | | | | 500 | | | | 514,469 | |
| | | | | | | | | | | | |
| | | | | | | | | | | 5,820,719 | |
| | | | | | | | | | | | |
CONSUMER PRODUCTS – 0.7% | |
Jarden Corp. | |
6.13%, 11/15/22 | | | | | | | 3,200 | | | | 3,272,000 | |
| | | | | | | | | | | | |
ELECTRIC UTILITIES – 3.4% | |
Allegheny Energy Supply
Co. LLC | |
8.25%, 4/15/12 (3) | | | | | | | 750 | | | | 763,542 | |
Ameren Corp. | |
8.88%, 5/15/14 | | | | | | | 4,000 | | | | 4,482,264 | |
CMS Energy Corp. | |
5.05%, 2/15/18 | | | | | | | 5,000 | | | | 4,987,510 | |
PPL WEM Holdings PLC | |
5.38%, 5/1/21 (3) | | | GB | | | | 4,000 | | | | 4,194,600 | |
Toledo Edison Co. | |
7.25%, 5/1/20 | | | | | | | 1,850 | | | | 2,305,764 | |
| | | | | | | | | | | | |
| | | | | | | | | | | 16,733,680 | |
| | | | | | | | | | | | |
ELECTRONIC EQUIPMENT & INSTRUMENTS – 1.4% | |
Arrow Electronics, Inc. | |
5.13%, 3/1/21 | | | | | | | 3,500 | | | | 3,500,263 | |
Jabil Circuit, Inc. | |
5.63%, 12/15/20 | | | | | | | 3,000 | | | | 3,052,500 | |
| | | | | | | | | | | | |
| | | | | | | | | | | 6,552,763 | |
| | | | | | | | | | | | |
FINANCIALS – 2.9% | |
Caisse centrale Desjardins
du Quebec | |
1.70%, 9/16/13 (3) | | | CA | | | | 5,000 | | | | 5,008,230 | |
Discover Financial
Services | |
6.45%, 6/12/17 | | | | | | | 4,150 | | | | 4,335,360 | |
See Notes to Financial Statements.
211
SUN CAPITAL INVESTMENT GRADE BOND FUND®
| | |
PORTFOLIOOF INVESTMENTS (Continued) December 31, 2011 | | Sun Capital Advisers Trust |
| | | | | | | | | | | | |
| | | Country
Code* | | | Principal
Amount
(000) | | | Value | |
| | | | | | | | | | | | |
| | | | | | | | | | | | |
International Lease
Finance Corp. | |
5.75%, 5/15/16 | | | | | | $ | 4,000 | | | $ | 3,710,168 | |
Lazard Group LLC | |
6.85%, 6/15/17 | | | | | | | 1,050 | | | | 1,101,419 | |
| | | | | | | | | | | | |
| | | | | | | | | | | 14,155,177 | |
| | | | | | | | | | | | |
FOOD, BEVERAGES & RESTAURANTS – 0.7% | |
Anheuser-Busch InBev
Worldwide, Inc. | |
5.38%, 1/15/20 | | | | | | | 3,000 | | | | 3,518,412 | |
| | | | | | | | | | | | |
GAMING – 0.0%+ | |
Mashantucket Western
Pequot Tribe | |
8.50%, 11/15/15 (1)(3) | | | | | | | 1,000 | | | | 45,000 | |
| | | | | | | | | | | | |
GAS & PIPELINE UTILITIES – 0.8% | |
Enterprise Products
Operating LP | |
7.03%, 1/15/68 (2) | | | | | | | 3,000 | | | | 3,120,000 | |
Southern Union Co. | |
3.45%, 11/1/66 (2) | | | | | | | 380 | | | | 354,350 | |
TransCanada PipeLines
Ltd. | |
6.35%, 5/15/67 (2) | | | CA | | | | 600 | | | | 602,019 | |
| | | | | | | | | | | | |
| | | | | | | | | | | 4,076,369 | |
| | | | | | | | | | | | |
HOTELS, RESTAURANTS & LEISURE – 0.9% | |
Wyndham Worldwide
Corp. | |
5.75%, 2/1/18 | | | | | | | 4,000 | | | | 4,234,484 | |
| | | | | | | | | | | | |
INSURANCE – 2.7% | |
Assured Guaranty US
Holdings, Inc. | |
6.40%, 12/15/66 (2) | | | | | | | 600 | | | | 417,000 | |
Kemper Corp. | |
6.00%, 11/30/15 | | | | | | | 4,000 | | | | 4,185,112 | |
Liberty Mutual Group, Inc. | |
6.50%, 3/15/35 (3) | | | | | | | 3,000 | | | | 2,924,661 | |
7.80%, 3/15/37 (3) | | | | | | | 750 | | | | 667,500 | |
Metropolitan Life Global
Funding I | |
3.13%, 1/11/16 (3) | | | | | | | 5,000 | | | | 5,130,750 | |
| | | | | | | | | | | | |
| | | | | | | | | | | 13,325,023 | |
| | | | | | | | | | | | |
MACHINERY – 0.2% | |
Case New Holland, Inc. | |
7.75%, 9/1/13 | | | | | | | 1,000 | | | | 1,062,500 | |
| | | | | | | | | | | | |
| | | | | | | | | | | | |
| | | Country
Code* | | | Principal
Amount
(000) | | | Value | |
| | | | | | | | | | | | |
MANUFACTURING-DIVERSIFIED – 1.4% | |
Bombardier, Inc. | |
7.75%, 3/15/20 (3) | | | CA | | | $ | 3,500 | | | $ | 3,815,000 | |
Textron, Inc. | | | | | | | | | | | | |
7.25%, 10/1/19 | | | | | | | 2,500 | | | | 2,827,522 | |
| | | | | | | | | | | | |
| | | | | | | | | | | 6,642,522 | |
| | | | | | | | | | | | |
METALS & MINING – 2.2% | |
ArcelorMittal | | | | | | | | | | | | |
5.50%, 3/1/21 | | | LU | | | | 3,000 | | | | 2,753,727 | |
Teck Resources, Ltd. | | | | | | | | | | | | |
6.25%, 7/15/41 | | | CA | | | | 3,000 | | | | 3,465,639 | |
10.75%, 5/15/19 | | | CA | | | | 2,500 | | | | 3,050,000 | |
United States
Steel Corp.
6.65%, 6/1/37 | | | | | | | 1,880 | | | | 1,466,400 | |
| | | | | | | | | | | | |
| | | | | | | | | | | 10,735,766 | |
| | | | | | | | | | | | |
OIL & GAS-EXPLORATION & PRODUCTION – 2.4% | |
BG Energy Capital PLC
5.13%, 10/15/41 (3) | | | GB | | | | 3,000 | | | | 3,246,612 | |
EQT Corp.
4.88%, 11/15/21 | | | | | | | 4,000 | | | | 4,037,772 | |
Petrobras International Finance Co.
5.38%, 1/27/21 | | | KY | | | | 4,000 | | | | 4,202,404 | |
| | | | | | | | | | | | |
| | | | | | | | | | | 11,486,788 | |
| | | | | | | | | | | | |
PAPER PRODUCTS –1.5% | |
International Paper Co.
6.00%, 11/15/41 | | | | | | | 6,700 | | | | 7,273,607 | |
| | | | | | | | | | | | |
PHARMACEUTICALS – 1.0% | |
Aristotle Holding, Inc.
4.75%, 11/15/21 (3) | | | | | | | 4,700 | | | | 4,863,424 | |
| | | | | | | | | | | | |
PIPELINES – 0.6% | | | | | | | | | | | | |
Kinder Morgan Finance Co., LLC
6.00%, 1/15/18 (3) | | | | | | | 3,000 | | | | 3,052,500 | |
| | | | | | | | | | | | |
REAL ESTATE INVESTMENT TRUSTS – 4.0% | |
Dexus Property Group
7.13%, 10/15/14 (3) | | | AU | | | | 4,400 | | | | 4,805,103 | |
Digital Realty Trust LP
5.25%, 3/15/21 | | | | | | | 5,000 | | | | 5,009,355 | |
Goodman Funding Property Ltd.
6.38%, 4/15/21 (3) | | | AU | | | | 4,000 | | | | 4,070,092 | |
See Notes to Financial Statements.
212
SUN CAPITAL INVESTMENT GRADE BOND FUND®
| | |
PORTFOLIOOF INVESTMENTS (Continued) December 31, 2011 | | Sun Capital Advisers Trust |
| | | | | | | | | | | | |
| | | Country
Code* | | | Principal
Amount
(000) | | | Value | |
| | | | | | | | | | | | |
| | | | | | | | | | | | |
National Retail Properties, Inc.
6.25%, 6/15/14 | | | | | | $ | 550 | | | $ | 583,569 | |
Reckson Operating Partnership LP
7.75%, 3/15/20 | | | | | | | 4,000 | | | | 4,387,020 | |
Simon Property
Group LP
5.75%, 5/1/12 | | | | | | | 550 | | | | 551,938 | |
| | | | | | | | | | | | |
| | | | | | | | | | | 19,407,077 | |
| | | | | | | | | | | | |
RETAIL – 0.6% | |
Controladora Comercial Mexicana
S.A. de C.V.,
Series AI
7.00%, 6/30/18 | | | MX | | | | 371 | | | | 356,698 | |
QVC, Inc.
7.13%, 4/15/17 (3) | | | | | | | 2,500 | | | | 2,650,000 | |
| | | | | | | | | | | | |
| | | | | | | | | | | 3,006,698 | |
| | | | | | | | | | | | |
TELECOMMUNICATIONS – 1.4% | |
American Tower Corp.
5.05%, 9/1/20 | | | | | | | 4,000 | | | | 4,007,236 | |
Frontier Communications Corp.
8.25%, 4/15/17 | | | | | | | 2,500 | | | | 2,556,250 | |
| | | | | | | | | | | | |
| | | | | | | | | | | 6,563,486 | |
| | | | | | | | | | | | |
Total Corporate Debt Obligations
(Cost $182,929,554) | | | | 183,501,282 | |
| | | | | | | | | | | | |
RESIDENTIAL NON-AGENCY MORTGAGE BACKED SECURITIES – 1.2% | |
JP Morgan Mortgage Trust, Series 2003-A1,
Class 1A1 2.00%,
10/25/33 (2) | | | | | | | 789 | | | | 762,923 | |
JP Morgan Mortgage Trust,
Series 2005-A3,
Class 7CA1
2.67%, 6/25/35 (2) | | | | | | | 32 | | | | 23,596 | |
JP Morgan Mortgage Trust,
Series 2005-A5,
Class TA1
5.41%, 8/25/35 (2) | | | | | | | 434 | | | | 399,680 | |
Master Adjustable Rate Mortgage Trust,
Series 2006-2,
Class 3A1
2.69%, 1/25/36 (2) | | | | | | | 142 | | | | 101,763 | |
| | | | | | | | | | |
| | | Country
Code* | | Principal
Amount
(000) | | | Value | |
| | | | | | | | | | |
MLCC Mortgage Investors, Inc.,
Series 2006-2,
Class 2A
2.15%, 5/25/36 (2) | | | | $ | 1,633 | | | $ | 1,394,245 | |
Residential Accredited Loans, Inc.,
Series 2005-QA7, Class A22
3.23%, 7/25/35 (2) | | | | | 738 | | | | 535,213 | |
Wamu Mortgage Pass Through Certificates,
Series 2003-AR10, Class A7
2.45%, 10/25/33 (2) | | | | | 323 | | | | 304,536 | |
Wamu Mortgage Pass Through Certificates,
Series 2004-AR14, Class A1
2.48%, 1/25/35 (2) | | | | | 1,038 | | | | 939,400 | |
Wamu Mortgage Pass Through Certificates,
Series AR18,
Class 3A2
5.37%, 1/25/36 (2) | | | | | 176 | | | | 54,094 | |
Wells Fargo Mortgage Backed Securities Trust,
Series 2004-AA,
Class A1
2.66%, 12/25/34 (2) | | | | | 518 | | | | 485,891 | |
Wells Fargo Mortgage Backed Securities Trust,
Series 2004-K,
Class 1A2
2.74%, 7/25/34 (2) | | | | | 735 | | | | 732,620 | |
| | | | | | | | | | |
Total Residential Non-Agency Mortgage Backed Securities
(Cost $5,895,278) | | | | 5,733,961 | |
| | | | | | | | | | |
U.S. GOVERNMENT GUARANTEED NOTES – 0.4% | |
FDIC Structured Sale Guaranteed Notes,
Series 2010-S1, Class 1A
0.82%, 2/25/48 (2)(3)
(Cost $2,086,284) | | | | | 2,085 | | | | 2,081,386 | |
| | | | | | | | | | |
See Notes to Financial Statements.
213
SUN CAPITAL INVESTMENT GRADE BOND FUND®
| | |
PORTFOLIOOF INVESTMENTS (Continued) December 31, 2011 | | Sun Capital Advisers Trust |
| | | | | | | | | | |
| | | Country
Code* | | Principal
Amount
(000) | | | Value | |
| | | | | | | | | | |
U.S. GOVERNMENT AGENCY OBLIGATIONS – 31.9% | |
Federal Home Loan
Mortgage Corp. | |
2.35%, 8/1/32 (2) | | | | $ | 34 | | | $ | 34,024 | |
4.50%, 3/1/23 | | | | | 2,356 | | | | 2,499,562 | |
4.50%, TBA (4) | | | | | 7,000 | | | | 7,416,718 | |
5.00%, 9/1/19 | | | | | 104 | | | | 111,569 | |
5.00%, 11/1/19 | | | | | 199 | | | | 214,178 | |
5.00%, 1/1/35 | | | | | 5,939 | | | | 6,389,766 | |
5.00%, 2/1/35 | | | | | 5,416 | | | | 5,826,767 | |
5.00%, 7/1/35 | | | | | 17,200 | | | | 18,507,242 | |
5.50%, 10/1/17 | | | | | 53 | | | | 56,699 | |
5.50%, 11/1/17 | | | | | 107 | | | | 115,381 | |
5.50%, 6/1/33 | | | | | 106 | | | | 115,164 | |
5.50%, 6/1/35 | | | | | 1,215 | | | | 1,324,188 | |
5.50%, 9/1/37 | | | | | 408 | | | | 443,235 | |
5.50%, 5/1/38 | | | | | 79 | | | | 86,071 | |
5.50%, 2/1/39 | | | | | 109 | | | | 118,452 | |
6.00%, 1/1/17 | | | | | 39 | | | | 42,628 | |
6.00%, 2/1/29 | | | | | 6 | | | | 6,867 | |
6.00%, 8/1/37 | | | | | 285 | | | | 313,104 | |
6.50%, 10/1/16 | | | | | 27 | | | | 29,925 | |
6.50%, 11/1/16 | | | | | 3 | | | | 2,894 | |
6.50%, 9/1/34 | | | | | 171 | | | | 193,170 | |
7.00%, 11/1/29 | | | | | 14 | | | | 15,844 | |
7.00%, 1/1/31 | | | | | 4 | | | | 4,868 | |
7.00%, 4/1/31 | | | | | 2 | | | | 2,368 | |
7.50%, 3/1/30 | | | | | 2 | | | | 2,708 | |
7.50%, 12/1/30 | | | | | 16 | | | | 17,188 | |
Federal National Mortgage Association | |
0.80%, 3/12/15 | | | | | 3,300 | | | | 3,306,158 | |
4.50%, 6/1/19 | | | | | 446 | | | | 477,753 | |
4.50%, 5/1/39 | | | | | 5,895 | | | | 6,392,098 | |
4.50%, TBA (4) | | | | | 12,200 | | | | 13,004,437 | |
5.00%, 6/1/18 | | | | | 140 | | | | 150,772 | |
5.00%, 7/1/20 | | | | | 323 | | | | 349,462 | |
5.00%, 10/1/20 | | | | | 147 | | | | 158,880 | |
5.00%, 12/1/20 | | | | | 69 | | | | 74,668 | |
5.00%, 10/1/35 | | | | | 20 | | | | 21,289 | |
5.00%, 3/1/36 | | | | | 12,159 | | | | 13,145,447 | |
5.00%, 5/1/36 | | | | | 974 | | | | 1,043,399 | |
5.00%, 7/1/36 | | | | | 210 | | | | 227,207 | |
5.00%, 5/1/39 | | | | | 6,281 | | | | 6,792,082 | |
5.00%, 9/1/39 | | | | | 8,625 | | | | 9,321,514 | |
5.00%, TBA (4) | | | | | 8,000 | | | | 8,642,500 | |
5.50%, 3/1/22 | | | | | 119 | | | | 129,666 | |
5.50%, 5/1/28 | | | | | 8,688 | | | | 9,473,022 | |
5.50%, 12/1/32 | | | | | 340 | | | | 371,640 | |
5.50%, 5/1/33 | | | | | 25,213 | | | | 27,561,497 | |
| | | | | | | | | | |
| | | Country
Code* | | Principal
Amount
(000) | | | Value | |
| | | | | | | | | | |
5.50%, 6/1/35 | | | | $ | 518 | | | $ | 565,701 | |
5.50%, 8/1/35 | | | | | 308 | | | | 335,962 | |
5.50%, 6/1/37 | | | | | 763 | | | | 830,988 | |
5.50%, 11/1/38 | | | | | 3,903 | | | | 4,253,366 | |
6.00%, 12/1/13 | | | | | 1 | | | | 1,158 | |
6.00%, 11/1/16 | | | | | 8 | | | | 8,970 | |
6.00%, 12/1/36 | | | | | 290 | | | | 319,969 | |
6.00%, 11/1/37 | | | | | 197 | | | | 217,302 | |
6.00%, 10/1/38 | | | | | 134 | | | | 147,415 | |
6.00%, TBA (4) | | | | | 300 | | | | 330,328 | |
8.00%, 8/1/30 | | | | | 2 | | | | 2,670 | |
Government National
Mortgage Association | |
5.50%, 12/15/38 | | | | | 2,785 | | | | 3,129,563 | |
6.00%, 8/15/16 | | | | | 18 | | | | 19,651 | |
6.50%, 9/15/31 | | | | | 34 | | | | 38,934 | |
6.50%, 3/15/32 | | | | | 26 | | | | 30,678 | |
6.50%, 9/15/32 | | | | | 64 | | | | 74,516 | |
6.50%, 10/15/32 | | | | | 115 | | | | 133,482 | |
7.00%, 12/15/14 | | | | | 10 | | | | 11,015 | |
7.00%, 2/15/28 | | | | | 10 | | | | 11,260 | |
7.50%, 3/15/30 | | | | | 3 | | | | 2,830 | |
| | | | | | | | | | |
Total U.S. Government Agency Obligations
(Cost $152,594,534) | | | | 154,999,829 | |
| | | | | | | | | | |
U.S. TREASURY OBLIGATIONS – 19.4% | |
U.S. Treasury Bonds | | | | | | | | | | |
4.25%, 11/15/40 | | | | | 1,000 | | | | 1,275,312 | |
4.38%, 2/15/38 | | | | | 5,410 | | | | 6,994,113 | |
4.38%, 5/15/41 | | | | | 2,300 | | | | 2,996,829 | |
4.75%, 2/15/41 | | | | | 4,850 | | | | 6,683,906 | |
5.38%, 2/15/31 | | | | | 2,630 | | | | 3,748,570 | |
U.S. Treasury Inflation
Indexed Bonds | |
0.50%, 4/15/15 | | | | | 6,269 | | | | 6,559,660 | |
1.88%, 7/15/15 | | | | | 1,164 | | | | 1,283,828 | |
2.00%, 1/15/14 | | | | | 6,434 | | | | 6,813,204 | |
U.S. Treasury Notes | |
0.50%, 10/15/14 | | | | | 5,275 | | | | 5,296,844 | |
1.00%, 8/31/16 | | | | | 3,960 | | | | 4,003,314 | |
1.50%, 6/30/16 | | | | | 3,200 | | | | 3,309,251 | |
2.00%, 11/15/21 | | | | | 1,850 | | | | 1,871,101 | |
2.13%, 8/15/21 | | | | | 13,600 | | | | 13,948,500 | |
2.38%, 3/31/16 | | | | | 5,000 | | | | 5,354,295 | |
2.38%, 5/31/18 | | | | | 12,472 | | | | 13,374,060 | |
3.50%, 5/15/20 | | | | | 4,480 | | | | 5,153,752 | |
4.25%, 11/15/14 | | | | | 5,000 | | | | 5,551,560 | |
| | | | | | | | | | |
Total U.S. Treasury Obligations
(Cost $89,412,015) | | | | 94,218,099 | |
| | | | | | | | | | |
See Notes to Financial Statements.
214
SUN CAPITAL INVESTMENT GRADE BOND FUND®
| | |
PORTFOLIOOF INVESTMENTS (Continued) December 31, 2011 | | Sun Capital Advisers Trust |
| | | | | | | | | | | | |
| | | Country
Code* | | | Principal
Amount
(000) | | | Value | |
| | | | | | | | | | | | |
| | | | | | | | | | | | |
SHORT TERM INVESTMENTS – 11.0% | |
COMMERCIAL PAPER (5) – 7.0% | |
Bank of Montreal
0.10%, 2/6/12 | | | CA | | | $ | 5,000 | | | $ | 4,999,500 | |
BHP Billiton Finance
USA Ltd. | |
0.13%, 1/23/12 (3) | | | AU | | | | 1,000 | | | | 999,920 | |
0.16%, 1/9/12 (3) | | | AU | | | | 3,552 | | | | 3,551,874 | |
Caterpillar Financial
Services Corp. | |
0.05%, 1/25/12 | | | | | | | 100 | | | | 99,997 | |
0.08%, 1/5/12 | | | | | | | 2,700 | | | | 2,699,976 | |
0.08%, 2/27/12 | | | | | | | 2,000 | | | | 1,999,747 | |
Coca-Cola Co.
0.08%, 1/13/12 (3) | | | | | | | 1,000 | | | | 999,973 | |
E.I. du Pont de Nemours & Co.
0.06%, 1/6/12 (3) | | | | | | | 1,150 | | | | 1,149,990 | |
FCAR Owner Trust
0.21%, 1/9/12 | | | | | | | 4,000 | | | | 3,999,813 | |
Pfizer, Inc.
0.03%, 1/26/12 (3) | | | | | | | 3,000 | | | | 2,999,937 | |
Philip Morris International, Inc.
0.07%, 1/19/12 (3) | | | | | | | 4,000 | | | | 3,999,860 | |
Thunder Bay Funding LLC
0.13%, 1/17/12 (3) | | | | | | | 1,200 | | | | 1,199,931 | |
0.22%, 3/5/12 (3) | | | | | | | 2,500 | | | | 2,498,891 | |
UBS Finance Delaware LLC
0.19%, 1/17/12 | | | | | | | 3,000 | | | | 2,999,747 | |
| | | | | | | | | | | | |
Total Commercial Paper
(Cost $34,199,288) | | | | 34,199,156 | |
| | | | | | | | | | | | |
| | | | | | | | | | | | |
| | | Country
Code* | | | Principal
Amount
(000) | | | Value | |
| | | | | | | | | | | | |
FOREIGN GOVERNMENT OBLIGATIONS (5) – 0.7% | |
Province of Ontario | | | | | | | | | | | | |
0.07%, 3/30/12 | | | CA | | | $ | 500 | | | $ | 499,378 | |
0.08%, 3/9/12 | | | CA | | | | 3,000 | | | | 2,997,568 | |
| | | | | | | | | | | | |
Total Foreign Government Obligations | | | | | |
(Cost $3,499,460) | | | | 3,496,946 | |
| | | | | | | | | | | | |
U.S. TREASURY OBLIGATIONS (5) – 1.1% | |
U.S. Treasury Bills
0.01%, 3/29/12
(Cost $5,099,861) | | | | 5,100 | | | | 5,099,755 | |
| | | | | | | | | | | | |
| | | | | | Shares | | | | |
MUTUAL FUNDS – 2.2% | |
Federated Prime Obligation Fund, 0.19% | | | | 4,769,309 | | | | 4,769,309 | |
State Street Institutional Liquid Reserves Fund, 0.17% | | | | 5,864,390 | | | | 5,864,390 | |
| | | | | | | | | | | | |
Total Mutual Funds
(Cost $10,633,699) | | | | | | | | 10,633,699 | |
| | | | | | | | | | | | |
Total Short Term Investments
(Cost $53,432,308) | | | | 53,429,556 | |
| | | | | | | | | | | | |
TOTAL INVESTMENTS – 107.3% | | | | | |
(Cost $513,455,840) | | | | | | | | 521,390,647 | |
Liabilities in excess of other assets – (7.3)% | | | | | | | | (35,675,713 | ) |
| | | | | | | | | | | | |
NET ASSETS – 100.0% | | | | | | | $ | 485,714,934 | |
| | | | | | | | | | | | |
| | |
| FDIC | | Federal Deposit Insurance Corporation |
| TBA | | To Be Announced. Securities are purchased on a forward commitment basis with an approximate principal amount and no definite maturity date. The actual principal and maturity date will be determined upon settlement when the specific mortgage pools are assigned. At the period end, total market value of the TBA securities amounts to $29,393,983 which represents approximately 6.1% of net assets. |
| AU | | Australia |
| CA | | Canada |
| GB | | Great Britain |
| KR | | Korea, Republic of |
| KY | | Cayman Islands |
| LU | | Luxembourg |
| MX | | Mexico |
| NL | | Netherlands |
| SE | | Sweden |
| VG | | British Virgin Islands |
See Notes to Financial Statements.
215
| | |
SUN CAPITAL INVESTMENT GRADE BOND FUND® PORTFOLIOOF INVESTMENTS (Continued) |
| December 31, 2011 | | Sun Capital Advisers Trust |
| + | Amount is less than 0.05%. |
| * | Unless otherwise noted the issuer country code for all securities is United States. |
| (1) | Security is in default and is non-income producing. |
| (2) | Variable rate security. The interest rate shown reflects the rate in effect at the period end. |
| (3) | Eligible for resale under rule 144A or exempt from registration under Section 4(2) of the Securities Act of 1933. These securities may be resold in transactions exempt from registration. At the period end, the value of these securities amounted to $80,936,252, representing 16.7% of net assets. |
| (4) | Security (or a portion thereof) has been purchased on a delayed delivery or when-issued basis. |
| (5) | Interest rates represent annualized yield at date of purchase. |
| (6) | Fair Value Measurements † |
The following table summarizes the inputs used to value the Fund’s assets and liabilities, as applicable, measured at fair value at the period end:
| | | | | | | | | | | | | | | | |
Assets | | Quoted Prices
in Active
Markets for
Identical
Assets and
Liabilities
(Level 1) | | | Significant
Other
Observable
Inputs
(Level 2) | | | Significant
Unobservable
Inputs
(Level 3) | | | Total | |
Asset Backed Securities | | $ | — | | | $ | 328,743 | | | $ | — | | | $ | 328,743 | |
Collateralized Mortgage Obligations | | | — | | | | 559,890 | | | | — | | | | 559,890 | |
Commercial Mortgage Backed Securities | | | — | | | | 26,537,901 | | | | — | | | | 26,537,901 | |
Corporate Debt Obligations (a) | | | — | | | | 183,501,282 | | | | — | | | | 183,501,282 | |
Residential Non-Agency Mortgage Backed Securities | | | — | | | | 5,733,961 | | | | — | | | | 5,733,961 | |
U.S. Government Guaranteed Notes | | | — | | | | 2,081,386 | | | | — | | | | 2,081,386 | |
U.S. Government Agency Obligations | | | — | | | | 154,999,829 | | | | — | | | | 154,999,829 | |
U.S. Treasury Obligations | | | 94,218,099 | | | | — | | | | — | | | | 94,218,099 | |
Short Term Investments | | | | | | | | | | | | | | | | |
Commercial Paper | | | — | | | | 34,199,156 | | | | — | | | | 34,199,156 | |
Foreign Government Obligations | | | — | | | | 3,496,946 | | | | — | | | | 3,496,946 | |
U.S. Treasury Obligations | | | 5,099,755 | | | | — | | | | — | | | | 5,099,755 | |
Mutual Funds | | | 10,633,699 | | | | — | | | | — | | | | 10,633,699 | |
| | | | | | | | | | | | | | | | |
Total Short Term Investments | | | 15,733,454 | | | | 37,696,102 | | | | — | | | | 53,429,556 | |
| | | | | | | | | | | | | | | | |
Total Investments | | $ | 109,951,553 | | | $ | 411,439,094 | | | $ | — | | | $ | 521,390,647 | |
| | | | | | | | | | | | | | | | |
| † | See Note 2b in the Notes to Financial Statements for additional information. |
| (a) | See Portfolio of Investments for additional detailed categorizations. |
See Notes to Financial Statements.
216
SUN CAPITAL MONEY MARKET FUND®
| | |
PORTFOLIOOF INVESTMENTS December 31, 2011 | | Sun Capital Advisers Trust |
| | | | | | | | | | | | |
| | | Country
Code* | | | Principal
Amount
(000) | | | Value | |
| | | | | | | | | | | | |
| | | | | | | | | | | | |
COMMERCIAL PAPER (1) – 55.2% | |
Bank of Montreal | | | | | | | | | |
0.10%, 2/6/12 | | | CA | | | $ | 5,000 | | | $ | 4,999,500 | |
Barclays U.S. Funding
LLC | | | | | | | | | |
0.16%, 1/3/12 | | | | | | | 3,000 | | | | 2,999,973 | |
0.20%, 1/9/12 | | | | | | | 2,000 | | | | 1,999,911 | |
BHP Billiton Finance
USA Ltd. | | | | | | | | | |
0.10%, 1/23/12 (2) | | | AU | | | | 1,400 | | | | 1,399,914 | |
0.12%, 1/17/12 (2) | | | AU | | | | 600 | | | | 599,968 | |
0.16%, 1/23/12 (2) | | | AU | | | | 3,000 | | | | 2,999,707 | |
0.20%, 2/15/12 (2) | | | AU | | | | 2,000 | | | | 1,999,500 | |
Caterpillar Financial
Services Corp. | | | | | | | | | |
0.05%, 1/25/12 | | | | | | | 6,900 | | | | 6,899,770 | |
Chevron Corp. | | | | | | | | | |
0.02%, 1/5/12 | | | | | | | 6,000 | | | | 5,999,987 | |
Cisco Systems, Inc. | | | | | | | | | |
0.07%, 1/10/12 (2) | | | | | | | 5,000 | | | | 4,999,912 | |
Coca-Cola Co. | | | | | | | | | |
0.13%, 1/23/12 (2) | | | | | | | 1,100 | | | | 1,099,913 | |
0.14%, 1/9/12 (2) | | | | | | | 2,500 | | | | 2,499,922 | |
0.14%, 2/13/12 (2) | | | | | | | 1,000 | | | | 999,833 | |
0.15%, 1/5/12 (2) | | | | | | | 1,000 | | | | 999,983 | |
0.18%, 2/1/12 (2) | | | | | | | 1,400 | | | | 1,399,783 | |
E.I. du Pont de Nemours
& Co. | | | | | | | | | |
0.06%, 1/6/12 (2) | | | | | | | 6,100 | | | | 6,099,949 | |
0.14%, 3/20/12 (2) | | | | | | | 900 | | | | 899,723 | |
FCAR Owner Trust | | | | | | | | | |
0.21%, 1/12/12 | | | | | | | 300 | | | | 299,981 | |
0.26%, 1/9/12 | | | | | | | 500 | | | | 499,971 | |
0.26%, 1/10/12 | | | | | | | 2,000 | | | | 1,999,870 | |
0.27%, 1/5/12 | | | | | | | 1,200 | | | | 1,199,964 | |
0.35%, 3/1/12 | | | | | | | 1,000 | | | | 999,417 | |
General Electric Capital
Corp. | | | | | | | | | |
0.03%, 1/13/12 | | | | | | | 3,000 | | | | 2,999,970 | |
International Business Machines Corp. | | | | | | | | | |
0.05%, 1/24/12 (2) | | | | | | | 7,000 | | | | 6,999,776 | |
Nestle Capital Corp. | | | | | | | | | |
0.01%, 1/6/12 (2) | | | | | | | 2,000 | | | | 1,999,997 | |
0.05%, 1/20/12 (2) | | | | | | | 1,250 | | | | 1,249,967 | |
0.10%, 3/30/12 (2) | | | | | | | 450 | | | | 449,889 | |
0.11%, 2/9/12 (2) | | | | | | | 600 | | | | 599,929 | |
0.25%, 5/8/12 (2) | | | | | | | 1,000 | | | | 999,111 | |
| | | | | | | | | | |
| | | Country
Code* | | Principal
Amount
(000) | | | Value | |
| | | | | | | | | | |
| | | | | | | | | | |
PepsiCo, Inc. | | | | | | | | | | |
0.04%, 1/11/12 (2) | | | | $ | 450 | | | $ | 449,995 | |
0.04%, 1/25/12 (2) | | | | | 1,365 | | | | 1,364,964 | |
0.06%, 1/9/12 (2) | | | | | 500 | | | | 499,993 | |
0.06%, 1/23/12 (2) | | | | | 1,335 | | | | 1,334,951 | |
0.06%, 1/24/12 (2) | | | | | 850 | | | | 849,967 | |
0.07%, 1/9/12 (2) | | | | | 1,500 | | | | 1,499,977 | |
0.07%, 1/17/12 (2) | | | | | 1,000 | | | | 999,969 | |
Pfizer, Inc. | | | | | | | | |
0.03%, 1/26/12 (2) | | | | | 3,000 | | | | 2,999,937 | |
0.04%, 1/12/12 (2) | | | | | 4,000 | | | | 3,999,951 | |
Philip Morris
International, Inc. | | | | | | | | |
0.07%, 1/19/12 (2) | | | | | 5,000 | | | | 4,999,825 | |
0.11%, 1/25/12 (2) | | | | | 2,000 | | | | 1,999,853 | |
Procter & Gamble Co. | | | | | | | | |
0.07%, 3/27/12 (2) | | | | | 2,190 | | | | 2,189,634 | |
0.09%, 1/3/12 (2) | | | | | 4,810 | | | | 4,809,976 | |
Rabobank USA
Financial Corp. | | | | | | | | |
0.25%, 1/11/12 | | | | | 1,750 | | | | 1,749,878 | |
0.27%, 1/11/12 | | | | | 450 | | | | 449,966 | |
0.27%, 2/13/12 | | | | | 2,800 | | | | 2,799,097 | |
The Goldman Sachs
Group, Inc. | | | | | | | | |
0.55%, 3/13/12 | | | | | 1,800 | | | | 1,798,020 | |
Thunder Bay Funding
LLC | | | | | | | | |
0.18%, 1/20/12 (2) | | | | | 5,000 | | | | 4,999,525 | |
Toyota Motor Credit
Corp. | | | | | | | | |
0.10%, 2/17/12 | | | | | 5,000 | | | | 4,999,347 | |
UBS Finance Delaware
LLC | | | | | | | | |
0.20%, 1/23/12 | | | | | 3,250 | | | | 3,249,603 | |
0.20%, 1/31/12 | | | | | 1,000 | | | | 999,833 | |
Wal-Mart Stores, Inc. | | | | | | | | |
0.04%, 1/4/12 (2) | | | | | 5,000 | | | | 4,999,983 | |
| | | | | | | | | | |
Total Commercial Paper
(Amortized cost $123,239,334) | | | | 123,239,334 | |
| | | | | | | | | | |
CORPORATE DEBT OBLIGATIONS – 2.6% | |
BANKS – 1.2% | |
Morgan Stanley | | | | | | | | |
0.64%, 1/9/12 (3) | | | | | 2,700 | | | | 2,700,001 | |
See Notes to Financial Statements.
217
SUN CAPITAL MONEY MARKET FUND®
| | |
PORTFOLIOOF INVESTMENTS (Continued) December 31, 2011 | | Sun Capital Advisers Trust |
| | | | | | | | | | | | |
| | | Country
Code* | | | Principal
Amount
(000) | | | Value | |
| | | | | | | | | | | | |
| | | | | | | | | | | | |
FINANCIALS – 1.4% | |
The Goldman Sachs Group, Inc. | | | | | | | | | |
0.61%, 2/6/12 (3) | | | | | | $ | 3,200 | | | $ | 3,200,131 | |
| | | | | | | | | | | | |
Total Corporate Debt Obligations
(Amortized cost $5,900,132) | | | | 5,900,132 | |
| | | | | | | | | | | | |
FOREIGN GOVERNMENT OBLIGATIONS (1) – 16.2% | |
Canadian Wheat Board | | | | | | | | | |
0.01%, 1/10/12 | | | CA | | | | 2,500 | | | | 2,499,994 | |
0.03%, 1/13/12 | | | CA | | | | 2,500 | | | | 2,499,975 | |
Export Development
Canada | | | | | | | | | |
0.03%, 1/17/12 | | | CA | | | | 4,000 | | | | 3,999,947 | |
0.03%, 2/1/12 | | | CA | | | | 1,000 | | | | 999,970 | |
Government of Canada | | | | | | | | | |
0.01%, 1/30/12 | | | CA | | | | 5,000 | | | | 4,999,960 | |
Province of British
Columbia | | | | | | | | | |
0.05%, 4/19/12 | | | CA | | | | 1,000 | | | | 999,849 | |
0.07%, 3/27/12 | | | CA | | | | 1,000 | | | | 999,833 | |
0.08%, 1/4/12 | | | CA | | | | 5,000 | | | | 4,999,967 | |
Province of Ontario | | | | | | | | | |
0.02%, 1/4/12 | | | CA | | | | 1,056 | | | | 1,055,998 | |
0.02%, 1/31/12 | | | CA | | | | 4,500 | | | | 4,499,925 | |
0.03%, 1/31/12 | | | CA | | | | 400 | | | | 399,990 | |
0.06%, 2/15/12 | | | CA | | | | 1,088 | | | | 1,087,918 | |
Province of Quebec | | | | | | | | | |
0.03%, 1/12/12 (2) | | | CA | | | | 1,500 | | | | 1,499,986 | |
0.10%, 2/2/12 (2) | | | CA | | | | 2,000 | | | | 1,999,822 | |
0.10%, 3/19/12 (2) | | | CA | | | | 500 | | | | 499,892 | |
0.11%, 2/14/12 (2) | | | CA | | | | 1,000 | | | | 999,866 | |
0.11%, 3/19/12 (2) | | | CA | | | | 2,000 | | | | 1,999,523 | |
| | | | | | | | | | | | |
Total Foreign Government Obligations (Amortized cost $36,042,415) | | | | 36,042,415 | |
| | | | | | | | | | | | |
FOREIGN GOVERNMENT SPONSORED COMMERCIAL PAPER (1) – 4.5% | |
European Investment
Bank SNAT | | | | | | | | | |
0.05%, 2/17/12 | | | | | | | 5,000 | | | | 4,999,674 | |
Kreditanstalt fuer
Wiederaufbau | | | | | | | | | |
0.19%, 1/20/12 (2) | | | DE | | | | 5,000 | | | | 4,999,499 | |
| | | | | | | | | | | | |
Total Foreign Government Sponsored Commercial Paper
(Amortized cost $9,999,173) | | | | 9,999,173 | |
| | | | | | | | | | | | |
| | | | | | | | | | |
| | | Country
Code* | | Principal
Amount
(000) | | | Value | |
| | | | | | | | | | |
U.S. GOVERNMENT AGENCY OBLIGATIONS (1) – 1.0% | |
Federal Home Loan
Mortgage Corp. Discount Notes | | | | | |
0.01%, 1/24/12 | | | | $ | 109 | | | $ | 108,999 | |
0.02%, 1/17/12 | | | | | 1,000 | | | | 999,993 | |
Federal National
Mortgage Association Discount Notes | | | | | | | | |
0.02%, 1/6/12 | | | | | 700 | | | | 699,998 | |
0.02%, 1/17/12 | | | | | 460 | | | | 459,997 | |
| | | | | | | | | | |
Total U.S. Government Agency Obligations (Amortized cost $2,268,987) | | | | 2,268,987 | |
| | | | | | | | | | |
U.S. TREASURY OBLIGATIONS (1) – 12.6% | |
U.S. Treasury Bills | | | | | | | | |
0.00%, 2/23/12 | | | | | 3,300 | | | | 3,299,995 | |
0.00%, 3/1/12 | | | | | 2,000 | | | | 1,999,992 | |
0.01%, 2/16/12 | | | | | 2,000 | | | | 1,999,967 | |
0.01%, 3/8/12 | | | | | 4,000 | | | | 3,999,963 | |
0.01%, 3/29/12 | | | | | 13,800 | | | | 13,799,640 | |
0.02%, 2/23/12 | | | | | 3,000 | | | | 2,999,932 | |
| | | | | | | | | | |
Total U.S. Treasury Obligations
(Amortized cost $28,099,489) | | | | 28,099,489 | |
| | | | | | | | | | |
| | | | | Shares | | | | |
MUTUAL FUNDS – 8.3% | |
Federated Prime Obligation Fund, 0.19% | | | 9,130,152 | | | | 9,130,152 | |
State Street Institutional Liquid Reserves Fund, 0.17% | | | 9,318,787 | | | | 9,318,787 | |
| | | | | | | | | | |
Total Mutual Funds
(Cost $18,448,939) | | | | 18,448,939 | |
| | | | | | | | | | |
TOTAL INVESTMENTS – 100.4% | | | | | |
(Cost $223,998,469) | | | | | | | 223,998,469 | |
Liabilities in excess of other assets – (0.4)% | | | | | | | (856,042 | ) |
| | | | | | | | | | |
NET ASSETS – 100.0% | | | | | | $ | 223,142,427 | |
| | | | | | | | | | |
| | |
| SNAT | | Supranational |
| |
| AU | | Australia |
| CA | | Canada |
| DE | | Germany |
| * | Unless otherwise noted the issuer country code for all securities is United States. |
| (1) | Interest rates represent annualized yield at date of purchase. |
See Notes to Financial Statements.
218
SUN CAPITAL MONEY MARKET FUND®
| | |
PORTFOLIOOF INVESTMENTS (Continued) December 31, 2011 | | Sun Capital Advisers Trust |
| (2) | Security exempt from registration under Section 4(2) of the Securities Act of 1933. These securities may be resold in transactions exempt from registration. At the period end, the value of these securities amounted to $88,293,864, representing 39.6% of net assets. |
| (3) | Variable rate security. The interest rate shown reflects the rate in effect at the period end. |
| (4) | Fair Value Measurements † |
The following table summarizes the inputs used to value the Fund’s assets and liabilities, as applicable, measured at fair value at the period end:
| | | | | | | | | | | | | | | | |
Assets | | Quoted Prices
in Active
Markets for
Identical
Assets and
Liabilities
(Level 1) | | | Significant
Other
Observable
Inputs
(Level 2) | | | Significant
Unobservable
Inputs
(Level 3) | | | Total | |
Commercial Paper | | $ | — | | | $ | 123,239,334 | | | $ | — | | | $ | 123,239,334 | |
Corporate Debt Obligations (a) | | | — | | | | 5,900,132 | | | | — | | | | 5,900,132 | |
Foreign Government | | | — | | | | 36,042,415 | | | | — | | | | 36,042,415 | |
Foreign Government Sponsored Commercial Paper | | | — | | | | 9,999,173 | | | | — | | | | 9,999,173 | |
U.S. Government Agency Obligations | | | — | | | | 2,268,987 | | | | — | | | | 2,268,987 | |
U.S. Treasury Obligations | | | — | | | | 28,099,489 | | | | — | | | | 28,099,489 | |
Mutual Funds | | | 18,448,939 | | | | — | | | | — | | | | 18,448,939 | |
| | | | | | | | | | | | | | | | |
Total Investments | | $ | 18,448,939 | | | $ | 205,549,530 | | | $ | — | | | $ | 223,998,469 | |
| | | | | | | | | | | | | | | | |
| † | See Note 2b in the Notes to Financial Statements for additional information. |
| (a) | See Portfolio of Investments for additional detailed categorizations. |
See Notes to Financial Statements.
219
SC SM BLACKROCK INFLATION PROTECTED BOND FUND
| | |
PORTFOLIOOF INVESTMENTS December 31, 2011 | | Sun Capital Advisers Trust |
| | | | | | | | | | | | |
| | | Country
Code* | | | Principal
Amount
(000) | | | Value | |
| | | | | | | | | | | | |
| | | | | | | | | | | | |
FOREIGN GOVERNMENT OBLIGATIONS – 16.4% | |
Deutsche Bundesrepublik Inflation Linked Bond 1.50%, 4/15/16 | | | DE | | | $ | 46,821 | | | $ | 51,053,349 | |
France Government Inflation Linked Bond 1.60%, 7/25/15 | | | FR | | | | 35,602 | | | | 37,150,925 | |
Hellenic Republic Government Inflation Linked Bond 2.30%, 7/25/30 | | | GR | | | | 1,004 | | | | 181,683 | |
Italy Buoni Poliennali Del Tesoro Inflation Linked Bond 2.10%, 9/15/21 | | | IT | | | | 1,510 | | | | 1,117,270 | |
| | | | | | | | | | | | |
Total Foreign Government Obligations
(Cost $90,830,310) | | | | 89,503,227 | |
| | | | | | | | | | | | |
U.S. GOVERNMENT AGENCY OBLIGATIONS – 23.6% | |
Federal Home Loan Mortgage Corp.
3.50%, 1/1/42 | | | | | | | 41,975 | | | | 43,134,604 | |
Federal National Mortgage Association
3.50%, 1/1/42 | | | | | | | 40,802 | | | | 41,999,146 | |
Government National Morgage Association
3.50%, 12/20/41 | | | | | | | 41,975 | | | | 43,765,494 | |
| | | | | | | | | | | | |
Total U.S. Government Agency Obligations (Cost $128,065,210) | | | | 128,899,244 | |
| | | | | |
| | | | | | | | | | | | |
U.S. TREASURY OBLIGATIONS – 53.7% | |
U.S. Treasury Inflation Indexed Bonds | | | | | | | | | | | | |
0.13%, 4/15/16 | | | | | | | 23,862 | | | | 24,876,017 | |
0.50%, 4/15/15 | | | | | | | 18,718 | | | | 19,585,506 | |
0.63%, 4/15/13 | | | | | | | 4,178 | | | | 4,248,575 | |
0.63%, 7/15/21 | | | | | | | 2,707 | | | | 2,895,731 | |
1.13%, 1/15/21 | | | | | | | 1,568 | | | | 1,748,917 | |
1.25%, 4/15/14 | | | | | | | 6,436 | | | | 6,743,964 | |
1.25%, 7/15/20 | | | | | | | 1,692 | | | | 1,914,278 | |
1.38%, 7/15/18 | | | | | | | 1,817 | | | | 2,056,757 | |
| | | | | | | | | | |
| | | Country
Code* | | Principal
Amount
(000) | | | Value | |
| | | | | | | | | | |
1.38%, 1/15/20 | | | | $ | 1,772 | | | $ | 2,017,039 | |
1.63%, 1/15/15 | | | | | 7,094 | | | | 7,650,857 | |
1.63%, 1/15/18 | | | | | 508 | | | | 578,490 | |
1.75%, 1/15/28 | | | | | 4,507 | | | | 5,420,243 | |
1.88%, 7/15/13 | | | | | 4,650 | | | | 4,862,962 | |
1.88%, 7/15/15 | | | | | 440 | | | | 485,415 | |
1.88%, 7/15/19 | | | | | 1,329 | | | | 1,565,604 | |
2.00%, 4/15/12 | | | | | 1,686 | | | | 1,693,471 | |
2.00%, 1/15/14 | | | | | 74 | | | | 77,865 | |
2.00%, 7/15/14 | | | | | 13,613 | | | | 14,666,980 | |
2.00%, 1/15/16 | | | | | 7,527 | | | | 8,413,698 | |
2.00%, 1/15/26 | | | | | 7,662 | | | | 9,418,378 | |
2.13%, 1/15/19 | | | | | 2,584 | | | | 3,071,228 | |
2.13%, 2/15/40 | | | | | 14,156 | | | | 18,996,159 | |
2.13%, 2/15/41 | | | | | 9,487 | | | | 12,814,052 | |
2.38%, 1/15/17 | | | | | 12,077 | | | | 14,019,062 | |
2.38%, 1/15/25 (1) | | | | | 39,288 | | | | 49,950,866 | |
2.38%, 1/15/27 | | | | | 15,570 | | | | 20,108,951 | |
2.50%, 7/15/16 | | | | | 5,830 | | | | 6,743,275 | |
2.50%, 1/15/29 | | | | | 1,420 | | | | 1,893,910 | |
2.63%, 7/15/17 | | | | | 3,977 | | | | 4,734,001 | |
3.00%, 7/15/12 | | | | | 2,059 | | | | 2,103,324 | |
3.38%, 1/15/12 | | | | | 612 | | | | 612,301 | |
3.38%, 4/15/32 | | | | | 2,725 | | | | 4,196,976 | |
3.63%, 4/15/28 (1)(2) | | | | | 12,965 | | | | 19,277,929 | |
3.88%, 4/15/29 (1) | | | | | 8,726 | | | | 13,596,613 | |
| | | | | | | | | | |
Total U.S. Treasury Obligations
(Cost $283,222,707) | | | | 293,039,394 | |
| | | | | | | | | | |
| | | | | Notional
Amount
(000) | | | | |
PURCHASED OPTIONS – 0.1% | | | | | |
CALL SWAPTIONS – 0.1% | |
OTC - 10 Year Interest Rate Swap, exercise rate 4.31%,
expires 1/14/13 | | | | | 1,100 | | | | 201,777 | |
| | | | | | | | | | |
PUT SWAPTIONS – 0.0%+ | |
OTC - 10 Year Interest Rate Swap, exercise rate 3.90%,
expires 9/19/13 | | | | | 5,300 | | | | 66,152 | |
See Notes to Financial Statements.
220
SC SM BLACKROCK INFLATION PROTECTED BOND FUND
| | |
PORTFOLIOOF INVESTMENTS (Continued) December 31, 2011 | | Sun Capital Advisers Trust |
| | | | | | | | | | |
| | | | | Notional
Amount
(000) | | | Value | |
| | | | | | | | | | |
OTC - 10 Year Interest Rate Swap, exercise rate 4.31%,
expires 1/14/13 | | | | | 1,100 | | | $ | 3,322 | |
| | | | | | | | | | |
| | | | | | | | | 69,474 | |
| | | | | | | | | | |
Total Purchased Options
(Cost $239,880) | | | | 271,251 | |
| | | | | | | | | | |
| | | | | | | | |
| | |
Shares | | | Value | |
| | | | | | | | |
SHORT TERM INVESTMENTS – 5.4% | |
MUTUAL FUNDS – 5.4% | | | | | | | | |
BlackRock Liquidity Funds TempFund, .10% | | | 14,640,146 | | | $ | 14,640,146 | |
State Street Institutional
U.S. Government Money Market Fund, .00% | | | 14,640,145 | | | | 14,640,145 | |
| | | | | | | | |
Total Short Term Investments (Cost $29,280,291) | | | | | | | 29,280,291 | |
| | | | | | | | |
TOTAL INVESTMENTS – 99.2% | |
(Cost $531,638,398) | | | | | | | 540,993,407 | |
| | | | | | | | |
Other assets less
liabilities – 0.8% | | | | | | | 4,268,993 | |
| | | | | | | | |
NET ASSETS – 100.0% | | | | | | $ | 545,262,400 | |
| | | | | | | | |
| | |
| OTC | | Over the Counter |
| DE | | Germany |
| FR | | France |
| GR | | Greece |
| IT | | Italy |
| * | Unless otherwise noted the issuer country code for all securities is United States. |
| + | Amount is less than 0.05%. |
| (1) | Security (or a portion thereof) has been pledged as collateral for open swap and swaption contracts. At the period end, the value of securities pledged amounted to $3,531,230. |
| (2) | At the period end, securities (or portions thereof) with an aggregate market value of $2,716,521 and cash of $1,416,000 have been pledged to cover margin requirements for the following open futures contracts: |
| | | | | | | | | | | | |
Type | | Description | | Expiration
Date | | Contracts | | | Unrealized
Appreciation /
(Depreciation) ($) | |
Short | | 90-Day Canada Bankers Acceptance March Futures | | 3/19/12 | | | 223 | | | | 76,110 | |
Short | | German Euro-Bobl March Futures | | 3/8/12 | | | 466 | | | | (438,677 | ) |
Short | | German Euro-Bund March Futures | | 3/8/12 | | | 50 | | | | (251,932 | ) |
Short | | German Euro-Schatz March Futures | | 3/8/12 | | | 293 | | | | (99,013 | ) |
Long | | U.S. Treasury 10 Year Note March Futures | | 3/21/12 | | | 383 | | | | 442,058 | |
Short | | U.S. Treasury 2 Year Note March Futures | | 3/30/12 | | | 264 | | | | (38,377 | ) |
Short | | U.S. Treasury 30 Year Bond March Futures | | 3/21/12 | | | 278 | | | | (546,896 | ) |
Short | | U.S. Treasury 5 Year Note March Futures | | 3/30/12 | | | 568 | | | | (324,926 | ) |
Short | | Ultra Long U.S. Treasury Bond March Futures | | 3/21/12 | | | 52 | | | | (190,725 | ) |
| | | | | | | | | | | | |
Net unrealized depreciation | | | | (1,372,378 | ) |
| | | | | | | | | | | | |
See Notes to Financial Statements.
221
| | |
SC SM BLACKROCK INFLATION PROTECTED BOND FUND PORTFOLIOOF INVESTMENTS (Continued) |
| December 31, 2011 | | Sun Capital Advisers Trust |
| (3) | At the period end, open forward foreign currency exchange contracts were as follows: |
| | | | | | | | | | | | | | | | |
Counterparty | | Contracts to Deliver | | | In Exchange
For | | | Settlement
Date | | | Unrealized
Appreciation /
(Depreciation) ($) | |
Citibank NA | | EUR | 68,254,000 | | | USD | 89,172,008 | | | | 1/25/12 | | | | 824,685 | |
Citibank NA | | EUR | 1,235,000 | | | USD | 1,698,125 | | | | 1/25/12 | | | | 99,553 | |
Citibank NA | | EUR | 83,000 | | | USD | 112,434 | | | | 1/25/12 | | | | 4,999 | |
Citibank NA | | USD | 108,797 | | | EUR | 80,000 | | | | 1/25/12 | | | | (5,246 | ) |
Deutsche Bank AG (London) | | EUR | 253,000 | | | USD | 340,734 | | | | 1/25/12 | | | | 13,253 | |
Deutsche Bank AG (London) | | USD | 670,273 | | | EUR | 500,000 | | | | 1/25/12 | | | | (23,078 | ) |
| | | | | | | | | | | | | | | | |
Net unrealized appreciation | | | | | | | | | | | | | | | 914,166 | |
| | | | | | | | | | | | | | | | |
| | | | |
| EUR | | – | | Euro |
| USD | | – | | United States Dollar |
| (4) | At the period end, open written option contracts were as follows: |
Options on Exchange-Traded Futures Contracts
| | | | | | | | | | | | | | | | | | |
Type | | Description | | Expiration
Date | | | Strike
Price ($) | | | Number of
Contracts | | | Value ($) | |
Call | | U.S. Treasury 10 Year Note January Futures | | | 1/27/12 | | | | 132.000 | | | | 71 | | | | 28,844 | |
| | | | | | | | | | | | | | | | | | |
Written option contracts (Premium received, $40,317) | | | | | | | | 71 | | | | 28,844 | |
| | | | | | | | | | | | | | | | | | |
Interest Rate Swaptions
| | | | | | | | | | | | | | | | | | | | | | | | | | |
Type | | Description | | Counterparty | | | Pay/Receive
Floating
Rate | | Floating
Rate | | Exercise
Rate | | | Expiration
Date | | | Notional
Amount
(000) ($) | | | Value ($) | |
Put | | OTC–5 Year Interest Rate
Swap | | | Citibank NA | | | Pay | | 3-Month
USD-LIBOR | | | 2.00 | % | | | 12/13/12 | | | | 16,900 | | | | 131,635 | |
Call | | OTC–10 Year Interest Rate
Swap | | | Citibank NA | | | Receive | | 3-Month
USD-LIBOR | | | 2.15 | % | | | 9/9/13 | | | | 5,300 | | | | 170,978 | |
Call | | OTC–10 Year Interest Rate Swap | | | Citibank NA | | | Receive | | 3-Month
USD-LIBOR | | | 3.91 | % | | | 3/19/12 | | | | 8,000 | | | | 1,335,523 | |
Put | | OTC–10 Year Interest Rate Swap | | | Citibank NA | | | Pay | | 3-Month
USD-LIBOR | | | 3.91 | % | | | 3/19/12 | | | | 8,000 | | | | 87 | |
Call | | OTC–10 Year Interest Rate Swap | |
| Deutsche
Bank AG* |
| | Receive | | 3-Month
USD-LIBOR | | | 4.01 | % | | | 2/2/12 | | | | 6,400 | | | | 1,148,436 | |
Put | | OTC–10 Year Interest Rate Swap | |
| Deutsche
Bank AG* |
| | Pay | | 3-Month
USD-LIBOR | | | 4.01 | % | | | 2/2/12 | | | | 6,400 | | | | 1 | |
| | | | | | | | | | | | | | | | | | | | | | | | | | |
Written swaptions (Premium received, $1,391,616) | | | | | | | | 51,000 | | | | 2,786,660 | |
| | | | | | | | | | | | | | | | | | | | | | | | | | |
| | | | |
| LIBOR | | – | | London Interbank Offered Rate |
| OTC | | – | | Over the Counter |
| USD | | – | | United States Dollar |
See Notes to Financial Statements.
222
| | |
SC SM BLACKROCK INFLATION PROTECTED BOND FUND PORTFOLIOOF INVESTMENTS (Continued) |
| December 31, 2011 | | Sun Capital Advisers Trust |
| (5) | At the period end, open swap contracts were as follows: |
OTC Interest Rate Swap Contracts
| | | | | | | | | | | | | | | | | | | | | | | | |
Counterparty | | Pay/Receive
Floating Rate | | Floating Rate Index | | Fixed
Rate | | | Expiration
Date | | | Notional
Amount
(000) ($) | | | Market
Value ($) | | | Unrealized
Appreciation /
(Depreciation) ($) | |
Barclays Bank PLC** | | Receive | | 3-Month USD-LIBOR | | | 4.13 | % | | | 12/20/21 | | | | 6,200 | | | | (1,197,885 | ) | | | (1,197,885 | ) |
Citibank NA | | Pay | | 3-Month USD-LIBOR | | | 2.71 | % | | | 8/8/21 | | | | 9,500 | | | | 606,890 | | | | 606,890 | |
Deutsche Bank AG* | | Pay | | 6-Month EUR-EURIBOR | | | 1.24 | % | | | 12/13/13 | | | | 41,934 | | | | 38,898 | | | | 38,898 | |
Deutsche Bank AG* | | Pay | | 3-Month USD-LIBOR | | | 1.16 | % | | | 9/23/16 | | | | 500 | | | | (295 | ) | | | (295 | ) |
Deutsche Bank AG* | | Pay | | CPURNSA Index | | | 2.47 | % | | | 10/25/20 | | | | 2,500 | | | | 33,661 | | | | 33,661 | |
Deutsche Bank AG* | | Pay | | CPURNSA Index | | | 2.67 | % | | | 6/23/21 | | | | 4,910 | | | | 219,048 | | | | 219,048 | |
Deutsche Bank AG* | | Pay | | 3-Month USD-LIBOR | | | 2.17 | % | | | 9/13/21 | | | | 7,000 | | | | 105,856 | | | | 105,856 | |
Deutsche Bank AG* | | Pay | | 3-Month USD-LIBOR | | | 2.08 | % | | | 9/28/21 | | | | 1,900 | | | | 12,584 | | | | 12,584 | |
Deutsche Bank AG* | | Pay | | 3-Month USD-LIBOR | | | 2.19 | % | | | 11/30/21 | | | | 3,200 | | | | 47,872 | | | | 47,872 | |
Deutsche Bank AG* | | Receive | | 3-Month USD-LIBOR | | | 4.13 | % | | | 12/20/21 | | | | 2,000 | | | | (386,414 | ) | | | (386,414 | ) |
Deutsche Bank AG* | | Receive | | 3-Month USD-LIBOR | | | 3.99 | % | | | 12/21/21 | | | | 2,000 | | | | (360,670 | ) | | | (360,670 | ) |
Deutsche Bank AG* | | Receive | | CPURNSA Index | | | 1.84 | % | | | 10/25/15 | | | | 4,700 | | | | 61,906 | | | | 61,906 | |
| | | | | | | | | | | | | | | | | | | | | | | | |
Total | | | | | | | | | | | | | | | 86,344 | | | | (818,549 | ) | | | (818,549 | ) |
| | | | | | | | | | | | | | | | | | | | | | | | |
OTC Total Return Swap Contracts
| | | | | | | | | | | | | | | | | | | | | | | | | | | | |
Pay/Receive
Total Return
on Reference Entity | | Counterparty | | Reference
Entity | | Number of
Shares or
Units | | | Floating
Rate | | | Notional
Amount
(000) ($) | | | Maturity
Date | | | Market
Value ($) | | | Unrealized
Depreciation ($) | |
Receive | | Barclays Bank
PLC** | | Barclays Capital US TIPS Index | | | 727,263 | | |
| 1-Month
USD-LIBOR |
| | | 201,590 | | | | 1/20/12 | | | | (1,483,619 | ) | | | (1,483,619 | ) |
| | | | |
| CPURNSA | | – | | Consumer Price All Urban Non-Seasonally Adjusted Index |
| EUR | | – | | Euro |
| EURIBOR | | – | | Euro Interbank Offered Rate |
| LIBOR | | – | | London Interbank Offered Rate |
| USD | | – | | United States Dollar |
| * | At the period end, cash of $700,000 has been pledged as collateral for these open swaps and written swaption contracts. |
| ** | At the period end, cash of $960,000 has been pledged as collateral for these open swap contracts. |
See Notes to Financial Statements.
223
| | |
SC SM BLACKROCK INFLATION PROTECTED BOND FUND PORTFOLIOOF INVESTMENTS (Continued) |
| December 31, 2011 | | Sun Capital Advisers Trust |
| (6) | Fair Value Measurements † |
The following table summarizes the inputs used to value the Fund’s assets and liabilities, as applicable, measured at fair value at the period end:
| | | | | | | | | | | | | | | | |
Assets | | Quoted Prices
in Active
Markets for
Identical
Assets and
Liabilities
(Level 1) | | | Significant
Other
Observable
Inputs
(Level 2) | | | Significant
Unobservable
Inputs
(Level 3) | | | Total | |
Foreign Government Obligations | | $ | — | | | $ | 89,503,227 | | | $ | — | | | $ | 89,503,227 | |
U.S. Government Agency Obligations | | | — | | | | 128,899,244 | | | | — | | | | 128,899,244 | |
U.S. Treasury Obligations | | | 293,039,394 | | | | — | | | | — | | | | 293,039,394 | |
Purchased Options (a) | | | — | | | | 271,251 | | | | — | | | | 271,251 | |
Short Term Investments | | | | | | | | | | | | | | | | |
Mutual Funds | | | 29,280,291 | | | | — | | | | — | | | | 29,280,291 | |
| | | | | | | | | | | | | | | | |
Total Investments | | | 322,319,685 | | | | 218,673,722 | | | | — | | | | 540,993,407 | |
| | | | | | | | | | | | | | | | |
Financial Derivative Instruments | | | | | | | | | | | | | | | | |
Futures Contracts | | | 518,168 | | | | — | | | | — | | | | 518,168 | |
Forward Foreign Currency Exchange Contracts | | | — | | | | 942,490 | | | | — | | | | 942,490 | |
Swap Contracts (a) | | | — | | | | 1,126,715 | | | | — | | | | 1,126,715 | |
| | | | | | | | | | | | | | | | |
Total Financial Derivative Instruments | | $ | 518,168 | | | $ | 2,069,205 | | | $ | — | | | $ | 2,587,373 | |
| | | | | | | | | | | | | | | | |
| | | | |
Liabilities | | | | | | | | | | | | |
Financial Derivative Instruments | | | | | | | | | | | | | | | | |
Futures Contracts | | $ | (1,100,924 | ) | | $ | (789,622 | ) | | $ | — | | | $ | (1,890,546 | ) |
Forward Foreign Currency Exchange Contracts | | | — | | | | (28,324 | ) | | | — | | | | (28,324 | ) |
Written Option Contracts | | | (28,844 | ) | | | — | | | | — | | | | (28,844 | ) |
Written Swaption Contracts | | | — | | | | (2,786,660 | ) | | | — | | | | (2,786,660 | ) |
Swap Contracts (a) | | | — | | | | (3,428,883 | ) | | | — | | | | (3,428,883 | ) |
| | | | | | | | | | | | | | | | |
Total Financial Derivative Instruments | | $ | (1,129,768 | ) | | $ | (7,033,489 | ) | | $ | — | | | $ | (8,163,257 | ) |
| | | | | | | | | | | | | | | | |
| † | See Note 2b in the Notes to Financial Statements for additional information. |
| (a) | See Portfolio of Investments for additional detailed categorizations. |
See Notes to Financial Statements.
224
SC SM GOLDMAN SACHS SHORT DURATION FUND
| | |
PORTFOLIOOF INVESTMENTS December 31, 2011 | | Sun Capital Advisers Trust |
| | | | | | | | | | |
| | | Country
Code** | | Principal
Amount
(000) | | | Value | |
| | | | | | | | | | |
| | | | | | | | | | |
ASSET BACKED SECURITIES – 6.0% | |
Access Group, Inc.,
Series 2003-1, Class A2
0.83%, 12/27/16 (1) | | | | $ | 3,951 | | | $ | 3,887,546 | |
Ally Master Owner Trust, Series 2011-3, Class A2
1.81%, 5/15/16 | | | | | 8,300 | | | | 8,339,310 | |
Bank of America Auto Trust, Series 2009-2A, Class A3
2.13%, 9/15/13 (2) | | | | | 1,476 | | | | 1,479,807 | |
Bank of America Auto Trust, Series 2009-3A, Class A3
1.67%, 12/15/13 (2) | | | | | 3,088 | | | | 3,095,519 | |
Brazos Higher Education Authority,
Series 2004-I, Class A2
0.73%, 6/27/22 (1) | | | | | 3,969 | | | | 3,941,037 | |
Brazos Higher Education Authority,
Series 2005-1, Class 1A2
0.65%, 12/26/18 (1) | | | | | 2,857 | | | | 2,837,564 | |
Brazos Higher Education Authority,
Series 2005-2, Class A10
0.69%, 12/26/19 (1) | | | | | 7,500 | | | | 7,343,569 | |
Brazos Higher Education Authority,
Series 2005-2, Class A9
0.67%, 12/26/17 (1) | | | | | 3,106 | | | | 3,092,164 | |
Brazos Higher Education Authority,
Series 2011-2, Class A2
1.27%, 7/25/29 (1) | | | | | 6,100 | | | | 5,929,310 | |
College Loan Corporation Trust,
Series 2004-1, Class A3
0.58%, 4/25/21 (1) | | | | | 3,269 | | | | 3,262,689 | |
College Loan Corporation Trust,
Series 2005-2, Class A2
0.51%, 10/15/21 (1) | | | | | 1,005 | | | | 1,002,251 | |
Ford Credit Auto Owner Trust,
Series 2009-E, Class A3 1.51%, 1/15/14 | | | | | 3,760 | | | | 3,773,653 | |
Northstar Education
Finance, Inc.,
Series 2004-1, Class A3 0.59%, 4/28/17 (1) | | | | | 485 | | | | 483,197 | |
| | | | | | | | | | |
| | | Country
Code** | | Principal
Amount
(000) | | | Value | |
| | | | | | | | | | |
| | | | | | | | | | |
Northstar Education Finance, Inc.,
Series 2004-2, Class A1
0.54%, 4/28/16 (1) | | | | $ | 2,875 | | | $ | 2,796,508 | |
SLM Student Loan Trust,
Series 2003-11, Class A4
0.74%, 6/15/20 (1) | | | | | 4,013 | | | | 3,999,525 | |
SLM Student Loan Trust, Series 2004-2, Class A4
0.55%, 10/25/19 (1) | | | | | 2,607 | | | | 2,593,952 | |
SLM Student Loan Trust, Series 2007-1, Class A3
0.45%, 7/25/18 (1) | | | | | 4,691 | | | | 4,678,578 | |
SLM Student Loan Trust, Series 2007-7, Class A2
0.62%, 1/25/16 (1) | | | | | 2,194 | | | | 2,186,155 | |
Student Loan
Consolidation Center,
Series 2011-1, Class A
1.51%, 10/25/27 (1)(2) | | | | | 1,862 | | | | 1,807,581 | |
World Financial Network Credit Card Master Trust, Series 2009-B, Class A 3.79%, 5/15/16 | | | | | 4,500 | | | | 4,564,022 | |
| | | | | | | | | | |
Total Asset Backed Securities
(Cost $71,124,188) | | | | 71,093,937 | |
| | | | | | | | | | |
COLLATERALIZED MORTGAGE
OBLIGATIONS – 2.2% | |
Federal National Mortgage Association,
Series 2009-70, Class AL 5.00%, 8/25/19 | | | | | 9,726 | | | | 10,428,428 | |
FHLMC Multifamily Structured Pass
Through Trust,
Series K703, Class A2
2.70%, 5/25/18 | | | | | 15,400 | | | | 15,833,756 | |
| | | | | | | | | | |
Total Collateralized Mortgage Obligations
(Cost $25,826,606) | | | | 26,262,184 | |
| | | | | | | | | | |
CORPORATE DEBT OBLIGATIONS – 45.8% | |
AUTO PARTS – 0.4% | | | | | | | | |
Johnson Controls, Inc. 1.75%, 3/1/14 | | | | | 4,825 | | | | 4,866,712 | |
| | | | | | | | | | |
See Notes to Financial Statements.
225
SC SM GOLDMAN SACHS SHORT DURATION FUND
| | |
PORTFOLIOOF INVESTMENTS (Continued) December 31, 2011 | | Sun Capital Advisers Trust |
| | | | | | | | | | | | |
| | | Country
Code** | | | Principal
Amount
(000) | | | Value | |
| | | | | | | | | | | | |
| | | | | | | | | | | | |
BANKS – 14.0% | | | | | | | | | | | | |
Achmea
Hypotheekbank NV
3.20%, 11/3/14 (2) | | | NL | | | $ | 2,249 | | | $ | 2,360,206 | |
Banco Santander Chile 2.88%, 11/13/12 (2) | | | CL | | | | 6,400 | | | | 6,425,510 | |
Bank of America Corp. 1.85%, 1/30/14 (1) | | | | | | | 725 | | | | 654,546 | |
Canadian Imperial Bank of Commerce | | | | | | | | | | | | |
1.50%, 12/12/14 (2) | | | CA | | | | 11,600 | | | | 11,615,927 | |
2.60%, 7/2/15 (2) | | | CA | | | | 5,200 | | | | 5,378,105 | |
Capital One Financial Corp. | | | | | | | | | | | | |
2.13%, 7/15/14 | | | | | | | 2,800 | | | | 2,764,104 | |
7.38%, 5/23/14 | | | | | | | 3,522 | | | | 3,869,664 | |
Cie de Financement Foncier
2.13%, 4/22/13 (2) | | | FR | | | | 700 | | | | 692,483 | |
Citigroup, Inc. | | | | | | | | | | | | |
5.50%, 10/15/14 | | | | | | | 6,625 | | | | 6,810,811 | |
6.38%, 8/12/14 | | | | | | | 1,875 | | | | 1,967,852 | |
Commonwealth Bank
of Australia
2.40%, 1/12/12 (2) | | | AU | | | | 4,600 | | | | 4,601,881 | |
Credit Suisse New York 1.36%, 1/14/14 (1) | | | CH | | | | 8,100 | | | | 7,839,496 | |
DnB NOR Boligkreditt | | | | | | | | | | | | |
2.10%, 10/14/15 (2) | | | NO | | | | 8,100 | | | | 8,034,366 | |
2.90%, 3/29/16 (2) | | | NO | | | | 7,600 | | | | 7,726,130 | |
ING Bank NV | | | | | | | | | | | | |
1.94%, 6/9/14 (1)(2) | | | NL | | | | 3,525 | | | | 3,376,213 | |
2.50%, 1/14/16 (2) | | | NL | | | | 5,500 | | | | 5,400,879 | |
3.90%, 3/19/14 (2) | | | NL | | | | 2,700 | | | | 2,848,535 | |
Intesa Sanpaolo New York 2.38%, 12/21/12 | | | IT | | | | 4,800 | | | | 4,465,104 | |
JPMorgan Chase & Co. 1.22%, 1/24/14 (1) | | | | | | | 11,825 | | | | 11,646,005 | |
Morgan Stanley | | | | | | | | | | | | |
3.80%, 4/29/16 | | | | | | | 1,950 | | | | 1,796,562 | |
4.10%, 1/26/15 | | | | | | | 3,250 | | | | 3,084,920 | |
Nordea Eiendomskreditt A/S 1.88%, 4/7/14 (2) | | | NO | | | | 500 | | | | 500,452 | |
Royal Bank of Scotland PLC
1.50%, 3/30/12 (2) | | | GB | | | | 9,400 | | | | 9,416,723 | |
2.63%, 5/11/12 (2) | | | GB | | | | 4,800 | | | | 4,831,070 | |
Royal Bank of
Scotland PLC,
Series 2
3.40%, 8/23/13 | | | GB | | | | 2,725 | | | | 2,651,049 | |
| | | | | | | | | | | | |
| | | Country
Code** | | | Principal
Amount
(000) | | | Value | |
| | | | | | | | | | | | |
| | | | | | | | | | | | |
SpareBank 1 Boligkreditt | | | | | | | | | | | | |
1.25%, 10/25/13 (2) | | | NO | | | $ | 8,300 | | | $ | 8,240,937 | |
2.63%, 5/27/16 (2) | | | NO | | | | 9,100 | | | | 9,178,870 | |
Stadshypotek AB
1.45%, 9/30/13 (2) | | | SE | | | | 7,500 | | | | 7,486,830 | |
Standard Chartered PLC 3.85%, 4/27/15 (2) | | | GB | | | | 3,150 | | | | 3,170,359 | |
Swedbank Hypotek AB 1.02%, 3/28/14 (1)(2) | | | SE | | | | 1,600 | | | | 1,572,683 | |
UBS AG 2.25%, 8/12/13 | | | CH | | | | 4,050 | | | | 4,013,894 | |
Wachovia Corp.
5.50%, 5/1/13 | | | | | | | 9,875 | | | | 10,419,103 | |
Wells Fargo & Co.
4.38%, 1/31/13 | | | | | | | 1,000 | | | | 1,033,501 | |
| | | | | | | | | | | | |
| | | | | | | | | | | 165,874,770 | |
| | | | | | | | | | | | |
BIOTECHNOLOGY – 0.2% | | | | | |
Life Technologies Corp. 4.40%, 3/1/15 | | | | | | | 2,275 | | | | 2,364,082 | |
| | | | | | | | | | | | |
CABLE – 0.3% | | | | | | | | | | | | |
Time Warner Cable, Inc.
6.20%, 7/1/13 | | | | | | | 3,350 | | | | 3,594,768 | |
| | | | | | | | | | | | |
COMPUTER & PERIPHERALS – 0.6% | | | | | |
Dell, Inc.
1.40%, 9/10/13 | | | | | | | 3,050 | | | | 3,070,252 | |
Hewlett-Packard Co. 6.13%, 3/1/14 | | | | | | | 3,250 | | | | 3,504,319 | |
| | | | | | | | | | | | |
| | | | | | | | | | | 6,574,571 | |
| | | | | | | | | | | | |
ELECTRIC UTILITIES – 1.9% | | | | | |
Arizona Public Service Co.
6.50%, 3/1/12 | | | | | | | 2,725 | | | | 2,749,539 | |
Commonwealth
Edison Co.
1.63%, 1/15/14 | | | | | | | 4,800 | | | | 4,834,814 | |
Dominion Resources, Inc.
1.80%, 3/15/14 | | | | | | | 3,100 | | | | 3,156,330 | |
DTE Energy Co.
7.63%, 5/15/14 | | | | | | | 3,400 | | | | 3,863,702 | |
Enel Finance
International SA
5.70%, 1/15/13 (2) | | | LU | | | | 1,292 | | | | 1,296,871 | |
Georgia Power Co.
1.30%, 9/15/13 | | | | | | | 1,650 | | | | 1,665,243 | |
See Notes to Financial Statements.
226
SC SM GOLDMAN SACHS SHORT DURATION FUND
| | |
PORTFOLIOOF INVESTMENTS (Continued) December 31, 2011 | | Sun Capital Advisers Trust |
| | | | | | | | | | | | |
| | | Country
Code** | | | Principal
Amount
(000) | | | Value | |
| | | | | | | | | | | | |
| | | | | | | | | | | | |
Wisconsin Electric
Power Co.
6.00%, 4/1/14 | | | | | | $ | 3,875 | | | $ | 4,316,021 | |
| | | | | | | | | | | | |
| | | | | | | | | | | 21,882,520 | |
| | | | | | | | | | | | |
ELECTRONICS – 0.4% | | | | | |
Thermo Fisher
Scientific, Inc.
2.05%, 2/21/14 | | | | | | | 4,875 | | | | 4,992,814 | |
| | | | | | | | | | | | |
ENVIRONMENTAL SERVICES – 0.4% | | | | | |
Waste Management, Inc. | | | | | | | | | | | | |
5.00%, 3/15/14 | | | | | | | 1,825 | | | | 1,955,858 | |
6.38%, 11/15/12 | | | | | | | 2,275 | | | | 2,378,328 | |
| | | | | | | | | | | | |
| | | | | | | | | | | 4,334,186 | |
| | | | | | | | | | | | |
FINANCIALS – 1.6% | | | | | | | | | | | | |
American Express
Credit Corp.
2.75%, 9/15/15 | | | | | | | 5,200 | | | | 5,227,581 | |
Caisse centrale Desjardins du Quebec
2.55%, 3/24/16 (2) | | | CA | | | | 800 | | | | 821,467 | |
General Electric Capital Corp.
6.00%, 6/15/12 | | | | | | | 1,000 | | | | 1,022,480 | |
HSBC Finance Corp.
0.69%, 4/24/12 (1) | | | | | | | 3,400 | | | | 3,360,203 | |
John Deere Capital Corp. 5.25%, 10/1/12 | | | | | | | 525 | | | | 543,274 | |
LeasePlan Corp. NV
3.00%, 5/7/12 (2) | | | NL | | | | 3,900 | | | | 3,929,788 | |
Merrill Lynch & Co., Inc. 5.45%, 7/15/14 | | | | | | | 4,625 | | | | 4,586,021 | |
| | | | | | | | | | | | |
| | | | | | | | | | | 19,490,814 | |
| | | | | | | | | | | | |
FOOD, BEVERAGES & RESTAURANTS – 2.0% | |
Anheuser-Busch InBev NV 4.70%, 4/15/12 | | | | | | | 1,725 | | | | 1,744,280 | |
Anheuser-Busch InBev Worldwide, Inc. | | | | | | | | | | | | |
2.50%, 3/26/13 | | | | | | | 3,075 | | | | 3,131,841 | |
3.00%, 10/15/12 | | | | | | | 1,725 | | | | 1,752,000 | |
5.38%, 11/15/14 | | | | | | | 1,325 | | | | 1,472,245 | |
General Mills, Inc. | | | | | | | | | | | | |
5.25%, 8/15/13 | | | | | | | 2,125 | | | | 2,270,941 | |
6.00%, 2/15/12 | | | | | | | 2,850 | | | | 2,866,530 | |
Kellogg Co. | | | | | | | | | | | | |
4.25%, 3/6/13 | | | | | | | 998 | | | | 1,036,278 | |
5.13%, 12/3/12 | | | | | | | 2,050 | | | | 2,130,538 | |
| | | | | | | | | | | | |
| | | Country
Code** | | | Principal
Amount
(000) | | | Value | |
| | | | | | | | | | | | |
| | | | | | | | | | | | |
Kraft Foods, Inc.
2.63%, 5/8/13 | | | | | | $ | 4,950 | | | $ | 5,057,054 | |
Pepsico, Inc.
4.65%, 2/15/13 | | | | | | | 1,000 | | | | 1,046,253 | |
The Kroger Co.
6.75%, 4/15/12 | | | | | | | 1,200 | | | | 1,219,989 | |
| | | | | | | | | | | | |
| | | | | | | | | | | 23,727,949 | |
| | | | | | | | | | | | |
HEALTH CARE-PRODUCTS – 1.5% | | | | | |
Becton, Dickinson & Co. 1.75%, 11/8/16 | | | | | | | 2,900 | | | | 2,921,802 | |
Covidien International Finance SA
1.88%, 6/15/13 | | | LU | | | | 5,375 | | | | 5,426,036 | |
Dentsply
International, Inc.
1.96%, 8/15/13 (1) | | | | | | | 4,275 | | | | 4,303,942 | |
St. Jude Medical, Inc. 3.75%, 7/15/14 | | | | | | | 4,850 | | | | 5,143,347 | |
| | | | | | | | | | | | |
| | | | | | | | | | | 17,795,127 | |
| | | | | | | | | | | | |
INSURANCE – 1.1% | | | | | | | | | | | | |
Metropolitan Life Global Funding I | | | | | | | | | | | | |
2.50%, 1/11/13 (2) | | | | | | | 3,000 | | | | 3,036,345 | |
5.13%, 4/10/13 (2) | | | | | | | 1,000 | | | | 1,044,633 | |
5.13%, 6/10/14 (2) | | | | | | | 2,750 | | | | 2,961,002 | |
New York Life Global Funding
4.65%, 5/9/13 (2) | | | | | | | 1,000 | | | | 1,048,421 | |
Prudential Financial, Inc. | | | | | | | | | | | | |
2.75%, 1/14/13 | | | | | | | 4,350 | | | | 4,387,480 | |
5.10%, 9/20/14 | | | | | | | 774 | | | | 832,480 | |
| | | | | | | | | | | | |
| | | | | | | | | | | 13,310,361 | |
| | | | | | | | | | | | |
INVESTMENT COMPANIES – 1.1% | | | | | |
FIH Erhvervsbank A/S | | | | | | | | | | | | |
2.00%, 6/12/13 (2) | | | DK | | | | 6,100 | | | | 6,186,900 | |
2.45%, 8/17/12 (2) | | | DK | | | | 7,200 | | | | 7,273,253 | |
| | | | | | | | | | | | |
| | | | | | | | | | | 13,460,153 | |
| | | | | | | | | | | | |
MANUFACTURING DIVERSIFIED – 0.3% | | | | | |
Tyco International
Finance SA
6.00%, 11/15/13 | | | LU | | | | 3,115 | | | | 3,374,582 | |
| | | | | | | | | | | | |
MULTIMEDIA – 1.6% | | | | | | | | | | | | |
Comcast Cable Communications Holdings, Inc.
8.38%, 3/15/13 | | | | | | | 4,300 | | | | 4,676,310 | |
See Notes to Financial Statements.
227
SC SM GOLDMAN SACHS SHORT DURATION FUND
| | |
PORTFOLIOOF INVESTMENTS (Continued) December 31, 2011 | | Sun Capital Advisers Trust |
| | | | | | | | | | | | |
| | | Country
Code** | | | Principal
Amount
(000) | | | Value | |
| | | | | | | | | | | | |
| | | | | | | | | | | | |
NBCUniversal Media LLC 2.10%, 4/1/14 | | | | | | $ | 2,975 | | | $ | 3,024,013 | |
Reed Elsevier Capital, Inc. 4.63%, 6/15/12 | | | | | | | 5,650 | | | | 5,742,350 | |
The Walt Disney Co. 6.38%, 3/1/12 | | | | | | | 2,700 | | | | 2,724,316 | |
Thomson Reuters Corp. 5.95%, 7/15/13 | | | CA | | | | 3,000 | | | | 3,196,470 | |
| | | | | | | | | | | | |
| | | | | | | | | | | 19,363,459 | |
| | | | | | | | | | | | |
OFFICE EQUIPMENT – 0.3% | | | | | |
Xerox Corp.
1.28%, 5/16/14 (1) | | | | | | | 4,025 | | | | 3,965,893 | |
| | | | | | | | | | | | |
OIL & GAS – 1.8% | | | | | | | | | | | | |
Apache Corp.
6.00%, 9/15/13 | | | | | | | 4,000 | | | | 4,357,652 | |
BP Capital Markets PLC 3.13%, 10/1/15 | | | GB | | | | 2,700 | | | | 2,828,042 | |
Gazprom OAO Via Gaz Capital SA
9.25%, 4/23/19 | | | LU | | | | 380 | | | | 451,782 | |
PC Financial Partnership 5.00%, 11/15/14 | | | | | | | 2,650 | | | | 2,863,836 | |
Shell International
Finance BV
1.88%, 3/25/13 | | | NL | | | | 5,700 | | | | 5,806,083 | |
TNK-BP Finance SA | | | | | | | | | | | | |
6.63%, 3/20/17 | | | LU | | | | 516 | | | | 523,740 | |
7.50%, 7/18/16 | | | LU | | | | 346 | | | | 365,030 | |
7.88%, 3/13/18 | | | LU | | | | 270 | | | | 288,563 | |
Total Capital Canada Ltd. 1.63%, 1/28/14 | | | CA | | | | 3,250 | | | | 3,304,701 | |
| | | | | | | | | | | | |
| | | | | | | | | | | 20,789,429 | |
| | | | | | | | | | | | |
PERSONAL PRODUCTS – 0.6% | | | | | |
Colgate-Palmolive Co. 0.60%, 11/15/14 | | | | | | | 3,075 | | | | 3,073,951 | |
The Procter & Gamble Co. 0.70%, 8/15/14 | | | | | | | 4,350 | | | | 4,371,202 | |
| | | | | | | | | | | | |
| | | | | | | | | | | 7,445,153 | |
| | | | | | | | | | | | |
PHARMACEUTICALS – 1.4% | | | | | |
Express Scripts, Inc. | | | | | | | | | | | | |
5.25%, 6/15/12 | | | | | | | 3,075 | | | | 3,133,133 | |
6.25%, 6/15/14 | | | | | | | 900 | | | | 980,943 | |
McKesson Corp.
3.25%, 3/1/16 | | | | | | | 3,075 | | | | 3,254,343 | |
| | | | | | | | | | | | |
| | | Country
Code** | | | Principal
Amount
(000) | | | Value | |
| | | | | | | | | | | | |
| | | | | | | | | | | | |
Medco Health
Solutions, Inc.
2.75%, 9/15/15 | | | | | | $ | 2,700 | | | $ | 2,715,271 | |
Novartis Capital Corp. 1.90%, 4/24/13 | | | | | | | 2,975 | | | | 3,033,396 | |
Teva Pharmaceutical
Finance III LLC
1.50%, 6/15/12 | | | | | | | 3,650 | | | | 3,663,848 | |
| | | | | | | | | | | | |
| | | | | | | | | | | 16,780,934 | |
| | | | | | | | | | | | |
PIPELINES – 0.3% | | | | | | | | | | | | |
Enterprise Products Operating LLC
7.63%, 2/15/12 | | | | | | | 2,475 | | | | 2,490,608 | |
TransCanada PipeLines Ltd. 8.63%, 5/15/12 | | | CA | | | | 1,525 | | | | 1,569,873 | |
| | | | | | | | | | | | |
| | | | | | | | | | | 4,060,481 | |
| | | | | | | | | | | | |
REAL ESTATE INVESTMENT TRUSTS – 0.8% | |
HCP, Inc.
2.70%, 2/1/14 | | | | | | | 1,525 | | | | 1,522,783 | |
Simon Property Group LP 4.20%, 2/1/15 | | | | | | | 3,675 | | | | 3,897,058 | |
WEA Finance LLC / WCI Finance LLC
5.40%, 10/1/12(2) | | | | | | | 4,350 | | | | 4,456,897 | |
| | | | | | | | | | | | |
| | | | | | | | | | | 9,876,738 | |
| | | | | | | | | | | | |
REFINING – 0.6% | | | | | | | | | | | | |
Energy Transfer Partners LP
5.65%, 8/1/12 | | | | | | | 3,325 | | | | 3,397,056 | |
XTO Energy, Inc.
5.75%, 12/15/13 | | | | | | | 3,175 | | | | 3,477,975 | |
| | | | | | | | | | | | |
| | | | | | | | | | | 6,875,031 | |
| | | | | | | | | | | | |
RETAIL – 0.4% | | | | | | | | | | | | |
Wal-Mart Stores, Inc.
3.20%, 5/15/14 | | | | | | | 4,000 | | | | 4,224,380 | |
| | | | | | | | | | | | |
SAVINGS & LOANS – 0.2% | | | | | |
U.S. Central Federal
Credit Union
1.90%, 10/19/12 | | | | | | | 2,400 | | | | 2,433,482 | |
| | | | | | | | | | | | |
SEMICONDUCTORS & SEMICONDUCTOR EQUIPMENT – 0.3% | | | | | |
Intel Corp.
1.95%, 10/1/16 | | | | | | | 3,175 | | | | 3,263,954 | |
| | | | | | | | | | | | |
See Notes to Financial Statements.
228
SC SM GOLDMAN SACHS SHORT DURATION FUND
| | |
PORTFOLIOOF INVESTMENTS (Continued) December 31, 2011 | | Sun Capital Advisers Trust |
| | | | | | | | | | | | |
| | | Country
Code** | | | Principal
Amount
(000) | | | Value | |
| | | | | | | | | | | | |
| | | | | | | | | | | | |
SOFTWARE – 0.8% | | | | | | | | | | | | |
Microsoft Corp.
2.95%, 6/1/14 | | | | | | $ | 5,000 | | | $ | 5,311,360 | |
Oracle Corp.
4.95%, 4/15/13 | | | | | | | 4,100 | | | | 4,329,797 | |
| | | | | | | | | | | | |
| | | | | | | | | | | 9,641,157 | |
| | | | | | | | | | | | |
SPECIAL PURPOSE BANKS – 3.8% | | | | | |
Kreditanstalt fuer Wiederaufbau | | | | | | | | | | | | |
0.29%, 6/17/13 (1) | | | DE | | | | 11,900 | | | | 11,894,371 | |
2.50%, 5/28/13 | | | DE | | | | 5,500 | | | | 5,627,364 | |
Landwirtschaftliche Rentenbank | | | | | | | | | | | | |
1.88%, 9/24/12 | | | DE | | | | 12,300 | | | | 12,402,287 | |
3.25%, 3/15/13 | | | DE | | | | 9,000 | | | | 9,249,570 | |
4.13%, 7/15/13 | | | DE | | | | 5,200 | | | | 5,448,544 | |
| | | | | | | | | | | | |
| | | | | | | | | | | 44,622,136 | |
| | | | | | | | | | | | |
SPECIAL PURPOSE ENTITIES – 0.4% | | | | | |
MassMutual Global
Funding II
1.07%, 9/27/13 (1)(2) | | | | | | | 5,300 | | | | 5,278,339 | |
| | | | | | | | | | | | |
TELECOMMUNICATIONS – 3.8% | | | | | |
AT&T, Inc. | | | | | | | | | | | | |
2.40%, 8/15/16 | | | | | | | 7,950 | | | | 8,111,282 | |
2.95%, 5/15/16 | | | | | | | 2,800 | | | | 2,917,984 | |
France Telecom SA 4.38%, 7/8/14 | | | FR | | | | 6,000 | | | | 6,337,914 | |
Rogers Communications, Inc. | | | | | | | | | | | | |
5.50%, 3/15/14 | | | CA | | | | 625 | | | | 673,710 | |
6.38%, 3/1/14 | | | CA | | | | 4,250 | | | | 4,686,186 | |
Telecom Italia Capital 5.25%, 11/15/13 | | | LU | | | | 4,175 | | | | 4,010,438 | |
Telefonica Emisiones SAU
5.86%, 2/4/13 | | | ES | | | | 3,500 | | | | 3,558,681 | |
Verizon Wireless Capital LLC | | | | | | | | | | | | |
5.25%, 2/1/12 | | | | | | | 4,625 | | | | 4,640,942 | |
7.38%, 11/15/13 | | | | | | | 1,803 | | | | 2,007,532 | |
Vodafone Group PLC | | | | | | | | | | | | |
2.88%, 3/16/16 | | | GB | | | | 4,225 | | | | 4,383,877 | |
5.35%, 2/27/12 | | | GB | | | | 3,225 | | | | 3,246,991 | |
| | | | | | | | | | | | |
| | | | | | | | | | | 44,575,537 | |
| | | | | | | | | | | | |
| | | | | | | | | | | | |
| | | Country
Code** | | | Principal
Amount
(000) | | | Value | |
| | | | | | | | | | | | |
| | | | | | | | | | | | |
TOBACCO – 0.3% | | | | | | | | | | | | |
Philip Morris
International, Inc.
4.88%, 5/16/13 | | | | | | $ | 3,750 | | | $ | 3,957,206 | |
| | | | | | | | | | | | |
TRANSPORTATION – 1.3% | | | | | |
Burlington Northern Santa Fe Corp.
5.90%, 7/1/12 | | | | | | | 4,200 | | | | 4,294,865 | |
CSX Corp.
5.75%, 3/15/13 | | | | | | | 2,450 | | | | 2,579,017 | |
OeBB Infrastruktur AG 4.63%, 11/21/13 | | | AT | | | | 7,700 | | | | 8,089,828 | |
| | | | | | | | | | | | |
| | | | | | | | | | | 14,963,710 | |
| | | | | | | | | | | | |
UTILITIES – 1.3% | | | | | | | | | | | | |
Duke Energy Corp.
6.30%, 2/1/14 | | | | | | | 4,650 | | | | 5,130,270 | |
MidAmerican Energy Holdings Co.
5.00%, 2/15/14 | | | | | | | 3,600 | | | | 3,868,024 | |
Progress Energy, Inc. 6.85%, 4/15/12 | | | | | | | 3,050 | | | | 3,101,630 | |
Public Service Co. of Colorado
7.88%, 10/1/12 | | | | | | | 1,125 | | | | 1,183,275 | |
Southern Co.
4.15%, 5/15/14 | | | | | | | 1,400 | | | | 1,495,549 | |
| | | | | | | | | | | | |
| | | | | | | | | | | 14,778,748 | |
| | | | | | | | | | | | |
Total Corporate Debt Obligations
(Cost $539,128,030) | | | | 542,539,176 | |
| | | | | | | | | | | | |
FOREIGN GOVERNMENT AGENCY OBLIGATIONS – 0.1% | | | | | |
Swedish Housing
Finance Corp.
3.13%, 3/23/12 (2)
(Cost $1,706,557) | | | SE | | | | 1,700 | | | | 1,709,432 | |
| | | | | | | | | | | | |
FOREIGN GOVERNMENT OBLIGATIONS – 1.5% | |
Colombia Government International Bond
4.38%, 7/12/21 | | | CO | | | | 3,140 | | | | 3,375,500 | |
Province of Ontario 1.88%, 11/19/12 | | | CA | | | | 14,300 | | | | 14,474,317 | |
| | | | | | | | | | | | |
Total Foreign Government Obligations
(Cost $17,421,533) | | | | 17,849,817 | |
| | | | | | | | | | | | |
See Notes to Financial Statements.
229
SC SM GOLDMAN SACHS SHORT DURATION FUND
| | |
PORTFOLIOOF INVESTMENTS (Continued) December 31, 2011 | | Sun Capital Advisers Trust |
| | | | | | | | | | |
| | | Country
Code** | | Principal
Amount
(000) | | | Value | |
| | | | | | | | | | |
| | | | | | | | | | |
MUNICIPAL BONDS – 3.4% | |
County of Suffolk NY
1.50%, 9/13/12 | | | | $ | 5,360 | | | $ | 5,378,331 | |
New York City,
Subseries D
5.07%, 12/1/14 | | | | | 5,300 | | | | 5,861,429 | |
New York State Dormitory Authority | | | | | | | | | | |
1.53%, 3/15/13 | | | | | 1,060 | | | | 1,072,148 | |
2.00%, 3/15/14 | | | | | 719 | | | | 737,694 | |
North Texas Tollway Authority
2.44%, 9/1/13 | | | | | 3,975 | | | | 4,072,109 | |
Pennsylvania Higher Education Assistance Agency
1.02%, 4/25/19 (1) | | | | | 2,468 | | | | 2,468,971 | |
San Francisco, California City & County Airports Commission
1.87%, 5/1/12 | | | | | 3,500 | | | | 3,513,685 | |
South Carolina Student Loan Corp., Series A-1
0.63%, 12/3/18 (1) | | | | | 5,675 | | | | 5,592,047 | |
State of California
3.95%, 11/1/15 | | | | | 1,950 | | | | 2,044,419 | |
State of New Jersey
2.02%, 8/15/14 | | | | | 5,300 | | | | 5,480,677 | |
State of Wisconsin
4.80%, 5/1/13 | | | | | 4,300 | | | | 4,512,291 | |
| | | | | | | | | | |
Total Municipal Bonds
(Cost $40,246,251) | | | | 40,733,801 | |
| | | | | | | | | | |
U.S. GOVERNMENT GUARANTEED NOTES – 6.3% | |
FDIC Structured Sale Guaranteed Notes, Series 2010-S1, Class 1A 0.85%, 2/25/48 (1)(2) | | | 1,788 | | | | 1,784,045 | |
NCUA Guaranteed Notes, Series 2010-A1, Class A 0.62%, 12/7/20 (1) | | | | | 2,067 | | | | 2,072,747 | |
NCUA Guaranteed Notes, Series 2010-R1, Class 1A 0.72%, 10/7/20 (1) | | | | | 1,304 | | | | 1,305,236 | |
NCUA Guaranteed Notes, Series 2010-R1, Class 2A 1.84%, 10/7/20 | | | | | 599 | | | | 602,991 | |
| | | | | | | | | | |
| | | Country
Code** | | Principal
Amount
(000) | | | Value | |
| | | | | | | | | | |
| | | | | | | | | | |
NCUA Guaranteed Notes, Series 2010-R2,
Class 1A
0.64%, 11/6/17 (1) | | | | $ | 2,675 | | | $ | 2,674,733 | |
NCUA Guaranteed Notes, Series 2011-R1,
Class 1A
0.72%, 1/8/20 (1) | | | | | 2,413 | | | | 2,417,047 | |
NCUA Guaranteed Notes, Series 2011-R3,
Class 1A
0.68%, 3/11/20 (1) | | | | | 4,270 | | | | 4,275,838 | |
NCUA Guaranteed Notes, Series 2011-R4,
Class 1A
0.65%, 3/6/20 (1) | | | | | 4,439 | | | | 4,439,247 | |
NCUA Guaranteed Notes, Series 2011-R5,
Class 1A
0.65%, 4/6/20 (1) | | | | | 4,427 | | | | 4,427,907 | |
NCUA Guaranteed Notes, Series 2011-R6,
Class 1A
0.65%, 5/7/20 (1) | | | | | 4,329 | | | | 4,329,385 | |
TLGP Ally Financial, Inc. 2.20%, 12/19/12 | | | | | 6,900 | | | | 7,031,583 | |
TLGP Citigroup
Funding, Inc. | | | | | | | | | | |
1.88%, 10/22/12 | | | | | 11,300 | | | | 11,455,488 | |
1.88%, 11/15/12 | | | | | 4,300 | | | | 4,361,903 | |
TLGP Citigroup, Inc.
2.13%, 4/30/12 | | | | | 8,600 | | | | 8,657,336 | |
TLGP General Electric Capital Corp.
2.20%, 6/8/12 | | | | | 15,000 | | | | 15,137,700 | |
| | | | | | | | | | |
Total U.S. Government Guaranteed Notes
(Cost $74,440,221) | | | | 74,973,186 | |
| | | | | | | | | | |
U.S. GOVERNMENT AGENCY
OBLIGATIONS – 12.8% | |
Federal Home Loan Mortgage Corp. | |
0.38%, 10/30/13 | | | | | 22,300 | | | | 22,272,236 | |
0.63%, 12/29/14 | | | | | 9,500 | | | | 9,493,046 | |
1.00%, 8/20/14 | | | | | 5,800 | | | | 5,836,668 | |
4.50%, 1/15/13(3) | | | | | 8,200 | | | | 8,560,046 | |
4.50%, 5/1/23 | | | | | 9 | | | | 9,076 | |
See Notes to Financial Statements.
230
SC SM GOLDMAN SACHS SHORT DURATION FUND
| | |
PORTFOLIOOF INVESTMENTS (Continued) December 31, 2011 | | Sun Capital Advisers Trust |
| | | | | | | | | | |
| | | Country
Code** | | Principal
Amount
(000) | | | Value | |
| | | | | | | | | | |
| | | | | | | | | | |
5.00%, 3/1/16 | | | | $ | 1 | | | $ | 732 | |
5.00%, 5/1/16 | | | | | 2 | | | | 1,893 | |
5.00%, 9/1/16 | | | | | 3 | | | | 3,423 | |
5.00%, 11/1/16 | | | | | 59 | | | | 63,044 | |
5.00%, 3/1/18 | | | | | 1 | | | | 774 | |
5.50%, 1/1/20 | | | | | 695 | | | | 758,961 | |
6.50%, 10/1/37 | | | | | 437 | | | | 495,810 | |
6.50%, 12/1/38 | | | | | 261 | | | | 295,306 | |
Federal National Mortgage
Association | |
0.60%, 11/14/13 | | | | | 12,000 | | | | 12,004,320 | |
0.75%, 12/19/14 | | | | | 3,000 | | | | 3,009,249 | |
1.13%, 7/25/14 | | | | | 10,000 | | | | 10,003,180 | |
2.80%, 3/1/18 | | | | | 3,352 | | | | 3,474,805 | |
3.42%, 10/1/20 | | | | | 1,582 | | | | 1,676,354 | |
3.63%, 12/1/20 | | | | | 1,187 | | | | 1,272,906 | |
3.74%, 6/1/18 | | | | | 29,999 | | | | 32,233,308 | |
3.75%, 3/1/18 | | | | | 4,100 | | | | 4,425,195 | |
3.84%, 5/1/18 | | | | | 2,320 | | | | 2,513,385 | |
4.32%, 7/1/21 | | | | | 19,903 | | | | 21,948,229 | |
5.50%, 5/1/25 | | | | | 9,927 | | | | 10,789,882 | |
6.00%, 3/1/32 | | | | | 0 | * | | | 81 | |
6.00%, 5/1/33 | | | | | 3 | | | | 2,889 | |
6.00%, 12/1/33 | | | | | 1 | | | | 1,651 | |
6.00%, 4/1/35 | | | | | 2 | | | | 1,888 | |
6.00%, 2/1/36 | | | | | 4 | | | | 4,388 | |
6.00%, 3/1/36 | | | | | 3 | | | | 3,248 | |
6.00%, 5/1/36 | | | | | 1 | | | | 1,219 | |
6.00%, 6/1/36 | | | | | 3 | | | | 3,428 | |
| | | | | | | | | | |
Total U.S. Government Agency Obligations
(Cost $149,848,109) | | | | 151,160,620 | |
| | | | | | | | | | |
| | | | | | | | | | |
| | | Country
Code** | | Principal
Amount (000) | | | Value | |
| | | | | | | | | | |
| | | | | | | | | | |
U.S. TREASURY OBLIGATIONS – 20.8% | |
U.S. Treasury Inflation
Indexed Bonds | |
1.88%, 7/15/13 | | | | $ | 7,027 | | | $ | 7,348,590 | |
2.00%, 7/15/14 | | | | | 4,204 | | | | 4,529,962 | |
U.S. Treasury Notes | |
0.25%, 11/30/13 | | | | | 58,900 | | | | 58,906,891 | |
0.25%, 12/15/14 | | | | | 12,100 | | | | 12,060,300 | |
0.38%, 8/31/12 | | | | | 15,000 | | | | 15,026,370 | |
0.38%, 10/31/12 | | | | | 24,500 | | | | 24,548,804 | |
0.38%, 11/15/14 | | | | | 15,900 | | | | 15,909,937 | |
0.63%, 7/31/12 | | | | | 86,600 | | | | 86,867,248 | |
1.38%, 1/15/13 | | | | | 20,400 | | | | 20,653,409 | |
| | | | | | | | | | |
Total U.S. Treasury Obligations
(Cost $245,442,686) | | | | 245,851,511 | |
| | | | | | | | | | |
| | | | | Shares | | | | |
| | | | | | | | | | |
SHORT TERM INVESTMENTS – 0.6% | |
MUTUAL FUNDS – 0.6% | |
State Street Institutional Liquid Reserves Fund, 0.17%
(Cost $6,948,299) | | | 6,948,299 | | | | 6,948,299 | |
| | | | | | | | | | |
TOTAL INVESTMENTS – 99.5% | | | | | |
(Cost $1,172,132,480) | | | | | | | 1,179,121,963 | |
Other assets less
liabilities – 0.5% | | | | | | | 5,895,765 | |
| | | | | | | | | | |
NET ASSETS – 100.0% | | | | | | $ | 1,185,017,728 | |
| | | | | | | | | | |
| | |
| FDIC | | Federal Deposit Insurance Corporation |
| FHLMC | | Federal Home Loan Mortgage Corporation |
| NCUA | | National Credit Union Administration |
| TLGP | | Temporary Liquidity Guarantee Program. Under the Temporary Liquidity Guarantee Program, the Federal Deposit Insurance Corporation guarantees principal and interest in the event of payment default or bankruptcy until the earlier of maturity date of the debt or until June 30, 2012. |
| AT | | Austria |
| AU | | Australia |
| CA | | Canada |
| CH | | Switzerland |
| CL | | Chile |
| CO | | Columbia |
| DE | | Germany |
| DK | | Denmark |
| ES | | Spain |
| FR | | France |
| GB | | Great Britain |
| IT | | Italy |
| LU | | Luxembourg |
See Notes to Financial Statements.
231
| | |
SC SM GOLDMAN SACHS SHORT DURATION FUND PORTFOLIOOF INVESTMENTS (Continued) |
| December 31, 2011 | | Sun Capital Advisers Trust |
| | |
| NL | | Netherlands |
| NO | | Norway |
| SE | | Sweden |
| * | Amount is less than $500. |
| ** | Unless otherwise noted the issuer country code for all securities is United States. |
| (1) | Variable rate security. The interest rate shown reflects the rate in effect at the period end. |
| (2) | Eligible for resale under rule 144A of the Securities Act of 1933. These securities may be resold in transactions exempt from registration, normally to qualified institutional buyers. At the period end, the value of these securities amounted to $150,068,459, representing 12.7% of net assets. |
| (3) | At the period end, securities (or portions thereof) with an aggregate market value of $1,409,276 have been pledged to cover margin requirements for the following open futures contracts: |
| | | | | | | | | | | | |
Type | | Description | | Expiration
Date | | Contracts | | | Unrealized
Appreciation /
(Depreciation) ($) | |
Short | | U.S. Treasury 10 Year Note March Futures | | 3/21/12 | | | 426 | | | | (367,523 | ) |
Long | | U.S. Treasury 2 Year Note March Futures | | 3/30/12 | | | 1,650 | | | | 108,855 | |
Short | | U.S. Treasury 30 Year Bond March Futures | | 3/21/12 | | | 229 | | | | (700,331 | ) |
Short | | U.S. Treasury 5 Year Note March Futures | | 3/30/12 | | | 152 | | | | (17,530 | ) |
Long | | Ultra Long U.S. Treasury Bond March Futures | | 3/21/12 | | | 65 | | | | 164,702 | |
| | | | | | | | | | | | |
Net unrealized depreciation | | | | | | | | | (811,827 | ) |
| | | | | | | | | | | | |
| (4) | Fair Value Measurements † |
The following table summarizes the inputs used to value the Fund’s assets and liabilities, as applicable, measured at fair value at the period end:
| | | | | | | | | | | | | | | | |
Assets | | Quoted Prices
in Active
Markets for
Identical
Assets and
Liabilities
(Level 1) | | | Significant
Other
Observable
Inputs
(Level 2) | | | Significant
Unobservable
Inputs
(Level 3) | | | Total | |
Asset Backed Securities | | $ | — | | | $ | 71,093,937 | | | $ | — | | | $ | 71,093,937 | |
Collateralized Mortgage Obligations | | | — | | | | 26,262,184 | | | | — | | | | 26,262,184 | |
Corporate Debt Obligations (a) | | | — | | | | 542,539,176 | | | | — | | | | 542,539,176 | |
Foreign Government Agency Obligations | | | — | | | | 1,709,432 | | | | — | | | | 1,709,432 | |
Foreign Government Obligations | | | — | | | | 17,849,817 | | | | — | | | | 17,849,817 | |
Municipal Bonds | | | — | | | | 40,733,801 | | | | — | | | | 40,733,801 | |
U.S. Government Guaranteed Notes | | | — | | | | 74,973,186 | | | | — | | | | 74,973,186 | |
U.S. Government Agency Obligations | | | — | | | | 151,160,620 | | | | — | | | | 151,160,620 | |
U.S. Treasury Obligations | | | 245,851,511 | | | | — | | | | — | | | | 245,851,511 | |
Short Term Investments | | | | | | | | | | | | | | | | |
Mutual Funds | | | 6,948,299 | | | | — | | | | — | | | | 6,948,299 | |
| | | | | | | | | | | | | | | | |
Total Investments | | | 252,799,810 | | | | 926,322,153 | | | | — | | | | 1,179,121,963 | |
| | | | | | | | | | | | | | | | |
See Notes to Financial Statements.
232
| | |
SC SM GOLDMAN SACHS SHORT DURATION FUND PORTFOLIOOF INVESTMENTS (Continued) |
| December 31, 2011 | | Sun Capital Advisers Trust |
| | | | | | | | | | | | | | | | |
Assets (Continued) | | Quoted Prices
in Active
Markets for
Identical
Assets and
Liabilities
(Level 1) | | | Significant
Other
Observable
Inputs
(Level 2) | | | Significant
Unobservable
Inputs
(Level 3) | | | Total | |
Financial Derivative Instruments | | | | | | | | | | | | | | | | |
Futures Contracts | | $ | 273,557 | | | $ | — | | | $ | — | | | $ | 273,557 | |
| | | | | | | | | | | | | | | | |
Total Financial Derivative Instruments | | $ | 273,557 | | | $ | — | | | $ | — | | | $ | 273,557 | |
| | | | | | | | | | | | | | | | |
| | | | |
Liabilities | | | | | | | | | | | | |
Financial Derivative Instruments | | | | | | | | | | | | | | | | |
Futures Contracts | | $ | (1,085,384 | ) | | $ | — | | | $ | — | | | $ | (1,085,384 | ) |
| | | | | | | | | | | | | | | | |
Total Financial Derivative Instruments | | $ | (1,085,384 | ) | | $ | — | | | $ | — | | | $ | (1,085,384 | ) |
| | | | | | | | | | | | | | | | |
| † | See Note 2b in the Notes to Financial Statements for additional information. |
| (a) | See Portfolio of Investments for additional detailed categorizations. |
See Notes to Financial Statements.
233
SC SM PIMCO HIGH YIELD FUND
| | |
PORTFOLIOOF INVESTMENTS December 31, 2011 | | Sun Capital Advisers Trust |
| | | | | | | | | | |
| | | Country
Code* | | Principal
Amount
(000) | | | Value | |
| | | | | | | | | | |
| | | | | | | | | | |
ASSET BACKED SECURITIES – 0.2% | |
Credit-Based Asset Servicing and Securitization LLC, Series 2007-CB1, Class AF1A
0.36%, 1/25/37 (1) | | | | $ | 21 | | | $ | 4,298 | |
Credit-Based Asset Servicing and Securitization LLC, Series 2007-CB1, Class AF2
5.72%, 1/25/37 (2) | | | | | 291 | | | | 104,538 | |
Lehman XS Trust, Series 2005-7N, Class 3A1
0.57%, 12/25/35 (1) | | | | | 268 | | | | 118,921 | |
SACO I Trust, Series 2005-2, Class A
0.69% 4/25/35 (1)(3) | | | | | 20 | | | | 7,730 | |
| | | | | | | | | | |
Total Asset Backed Securities (Cost $188,166) | | | | | | | 235,487 | |
| | | | | | | | | | |
COLLATERALIZED MORTGAGE OBLIGATIONS – 1.7% | |
Banc of America Alternative Loan Trust,
Series 2005-4, Class CB6
0.69%, 5/25/35 (1) | | | | | 40 | | | | 25,908 | |
Banc of America Funding Corp., Series 2006-A, Class 3A2
2.79%, 2/20/36 (1) | | | | | 321 | | | | 166,544 | |
Banc of America Funding Corp., Series 2006-B, Class 2A1
2.87%, 3/20/36 (1) | | | | | 120 | | | | 76,292 | |
Countrywide Alternative Loan Trust, Series 2005-43, Class 4A3
5.30%, 10/25/35 (1) | | | | | 46 | | | | 26,712 | |
| | | | | | | | | | |
| | | Country
Code* | | Principal
Amount
(000) | | | Value | |
| | | | | | | | | | |
Countrywide Alternative Loan Trust, Series 2006-0A2, Class A5
0.51%, 5/20/46 (1) | | | | $ | 52 | | | $ | 18,941 | |
Countrywide Home Loan Mortgage Pass Through Trust, Series 2005-2, Class 2A1
0.61%, 3/25/35 (1) | | | | | 71 | | | | 39,931 | |
Countrywide Home Loan Mortgage Pass Through Trust, Series 2005-2, Class A1A
0.61%, 3/25/35 (1) | | | | | 42 | | | | 19,573 | |
Deutsche Alt-A Securities, Inc. Mortgage Loan Trust, Series 2005-6, Class 1A3
5.50%, 12/25/35 | | | | | 29 | | | | 19,899 | |
Downey Savings & Loan Association Mortgage Loan Trust, Series 2005-AR1, Class 2A1A
0.53%, 3/19/45 (1) | | | | | 17 | | | | 10,045 | |
First Horizon Alternative Mortgage Securities Trust, Series 2006-FA2, Class 1A5
6.00%, 5/25/36 | | | | | 34 | | | | 23,639 | |
Harborview Mortgage Loan Trust, Series 2006-1, Class 2A1A
0.52%, 3/19/36 (1) | | | | | 386 | | | | 201,379 | |
IndyMac IMSC Mortgage Loan Trust, Series 2007-F2, Class 1A2
6.00%, 7/25/37 | | | | | 223 | | | | 164,422 | |
IndyMac INDEX Mortgage Loan Trust, Series 2005-AR13, Class 4A1
2.44%, 8/25/35 (1) | | | | | 33 | | | | 21,638 | |
See Notes to Financial Statements.
234
SC SM PIMCO HIGH YIELD FUND
| | |
PORTFOLIOOF INVESTMENTS (Continued) December 31, 2011 | | Sun Capital Advisers Trust |
| | | | | | | | | | |
| | | Country
Code* | | Principal
Amount
(000) | | | Value | |
| | | | | | | | | | |
| | | | | | | | | | |
IndyMac INDEX Mortgage Loan Trust, Series 2005-AR15, Class A1
4.91%, 9/25/35 (1) | | | | $ | 46 | | | $ | 31,958 | |
JP Morgan Mortgage Trust, Series 2007-S3, Class 1A97
6.00%, 8/25/37 | | | | | 56 | | | | 46,516 | |
MortgageIT Trust, Series 2005-1, Class 1A1
0.61%, 2/25/35 (1) | | | | | 253 | | | | 193,375 | |
Residential Accredit Loans, Inc., Series 2006-Q010, Class A1
0.45%, 1/25/37 (1) | | | | | 530 | | | | 281,651 | |
Residential Accredit Loans, Inc., Series 2006-QA2, Class 3A1
5.50%, 2/25/36 (1) | | | | | 254 | | | | 130,576 | |
Residential Asset Securitization Trust, Series 2006-R1, Class A2
0.69%, 1/25/46 (1) | | | | | 1,815 | | | | 755,288 | |
Residential Asset Securitization Trust, Series 2007-A5, Class 2A3
6.00%, 5/25/37 | | | | | 51 | | | | 35,684 | |
Structured Asset Mortgage Investments, Inc., Series 2005-AR6, Class 2A1
0.60%, 9/25/45 (1) | | | | | 27 | | | | 14,584 | |
Wamu Mortgage Pass-Through Certificates, Series 2006-AR12, Class 1A2
5.93%, 10/25/36 (1) | | | | | 398 | | | | 257,614 | |
Wamu Mortgage Pass-Through Certificates, Series 2006-AR12, Class 2A3
5.68%, 10/25/36 (1) | | | | | 79 | | | | 57,556 | |
| | | | | | | | | | |
| | | Country
Code* | | Principal
Amount
(000) | | | Value | |
| | | | | | | | | | |
Wamu Mortgage Pass-Through Certificates, Series 2006-AR16, Class 1A1
2.39%, 12/25/36 (1) | | | | $ | 138 | | | $ | 88,941 | |
| | | | | | | | | | |
Total Collateralized Mortgage Obligations
(Cost $2,277,148) | | | | 2,708,666 | |
| | | | | | | | | | |
CORPORATE DEBT OBLIGATIONS – 87.8% | |
ADVERTISING – 0.6% | |
Affinion Group, Inc. 7.88%, 12/15/18 | | | | | 500 | | | | 422,500 | |
Lamar Media Corp. 7.88%, 4/15/18 | | | | | 250 | | | | 265,000 | |
Visant Corp.
10.00%, 10/1/17 | | | | | 375 | | | | 343,125 | |
| | | | | | | | | | |
| | | | | | | | | 1,030,625 | |
| | | | | | | | | | |
AEROSPACE & DEFENSE – 1.1% | |
Alliant Techsystems, Inc. 6.88%, 9/15/20 | | | | | 250 | | | | 255,000 | |
BE Aerospace, Inc. 6.88%, 10/1/20 | | | | | 250 | | | | 272,500 | |
Esterline Technologies Corp.
7.00%, 8/1/20 | | | | | 375 | | | | 395,625 | |
TransDigm, Inc.
7.75%, 12/15/18 | | | | | 750 | | | | 806,250 | |
| | | | | | | | | | |
| | | | | | | | | 1,729,375 | |
| | | | | | | | | | |
AGRICULTURAL – 0.1% | |
Brickman Group Holdings, Inc.
9.13%, 11/1/18 (3) | | | | | 250 | | | | 222,500 | |
| | | | | | | | | | |
AIRLINES – 0.7% | |
Continental Airlines, Inc. 7.75%, 7/2/14 | | | | | 184 | | | | 185,394 | |
Delta Air Lines, Inc. 9.50%, 9/15/14 (3) | | | | | 397 | | | | 408,910 | |
United Air Lines, Inc. 9.75%, 1/15/17 | | | | | 534 | | | | 576,294 | |
| | | | | | | | | | |
| | | | | | | | | 1,170,598 | |
| | | | | | | | | | |
AUTO PARTS – 0.6% | |
Tomkins LLC
9.00%, 10/1/18 (2) | | | | | 900 | | | | 997,875 | |
| | | | | | | | | | |
See Notes to Financial Statements.
235
| | |
SC SM PIMCO HIGH YIELD FUND PORTFOLIOOF INVESTMENTS (Continued) December 31, 2011 | | Sun Capital Advisers Trust |
| | | | | | | | | | | | |
| | | Country
Code* | | | Principal
Amount
(000) | | | Value | |
| | | | | | | | | | | | |
| | | | | | | | | | | | |
AUTOMOBILES & COMPONENTS – 0.4% | |
Exide Technologies 8.63%, 2/1/18 | | | | | | $ | 500 | | | $ | 385,000 | |
Hyva Global BV
8.63%, 3/24/16 (3) | | | NL | | | | 250 | | | | 206,250 | |
Oshkosh Corp.
8.25%, 3/1/17 | | | | | | | 50 | | | | 52,000 | |
8.50%, 3/1/20 | | | | | | | 50 | | | | 51,500 | |
| | | | | | | | | | | | |
| | | | | | | | | | | 694,750 | |
| | | | | | | | | | | | |
AUTOMOTIVE – 3.7% | |
Allison Transmission, Inc.
7.13%, 5/15/19 (3) | | | | | | | 200 | | | | 196,000 | |
Arvinmeritor, Inc. 8.13%, 9/15/15 | | | | | | | 105 | | | | 93,975 | |
Commercial Vehicle Group, Inc.
7.88%, 4/15/19 (3) | | | | | | | 200 | | | | 192,500 | |
Conti-Gummi Finance BV
7.13%, 10/15/18 | | | NL | | | | 324 | | | | 323,563 | |
7.50%, 9/15/17 | | | NL | | | | 129 | | | | 131,366 | |
8.50%, 7/15/15 | | | NL | | | | 97 | | | | 104,592 | |
Cooper-Standard Automotive, Inc. 8.50%, 5/1/18 | | | | | | | 375 | | | | 392,344 | |
Ford Motor Credit Co. LLC
6.63%, 8/15/17 | | | | | | | 500 | | | | 544,279 | |
7.00%, 10/1/13 | | | | | | | 165 | | | | 174,955 | |
7.50%, 8/1/12 | | | | | | | 125 | | | | 129,015 | |
8.00%, 12/15/16 | | | | | | | 1,000 | | | | 1,134,609 | |
8.13%, 1/15/20 | | | | | | | 225 | | | | 264,840 | |
12.00%, 5/15/15 | | | | | | | 1,000 | | | | 1,224,990 | |
Pittsburgh Glass Works LLC
8.50%, 4/15/16 (3) | | | | | | | 175 | | | | 168,437 | |
The Goodyear Tire & Rubber Co.
8.25%, 8/15/20 | | | | | | | 300 | | | | 327,000 | |
10.50%, 5/15/16 | | | | | | | 65 | | | | 71,663 | |
TRW Automotive, Inc. 7.25%, 3/15/17 (3) | | | | | | | 500 | | | | 535,000 | |
| | | | | | | | | | | | |
| | | | | | | | | | | 6,009,128 | |
| | | | | | | | | | | | |
| | | | | | | | | | | | |
| | | Country
Code* | | | Principal
Amount
(000) | | | Value | |
| | | | | | | | | | | | |
BANKS – 5.7% | |
Ally Financial, Inc. 0.00%, 6/15/15 (4) | | | | | | $ | 500 | | | $ | 370,000 | |
4.50%, 2/11/14 | | | | | | | 1,000 | | | | 965,000 | |
6.25%, 12/1/17 | | | | | | | 250 | | | | 241,150 | |
7.50%, 9/15/20 | | | | | | | 250 | | | | 252,500 | |
8.00%, 11/1/31 | | | | | | | 770 | | | | 727,650 | |
8.30%, 2/12/15 | | | | | | | 250 | | | | 263,750 | |
Bank of America Corp. 6.00%, 9/1/17 | | | | | | | 285 | | | | 278,339 | |
Barclays Bank PLC 14.00%, 6/15/19 (1) | | | GB | | | | 621 | | | | 695,744 | |
Credit Agricole SA
8.38%, 10/13/19 (1)(3) | | | FR | | | | 750 | | | | 562,500 | |
HBOS PLC
6.75%, 5/21/18 (3) | | | GB | | | | 2,100 | | | | 1,683,763 | |
Intesa Sanpaolo SpA 8.05%, 6/20/18 (1) | | | IT | | | | 518 | | | | 332,881 | |
Rabobank Nederland Boerenleenbank BA
11.00%, 6/30/19 (1)(3) | | | NL | | | | 600 | | | | 702,000 | |
RBS Capital Trust 6.47%, 6/30/12 (5) | | | | | | | 65 | | | | 32,292 | |
Regions Bank
7.50%, 5/15/18 | | | | | | | 175 | | | | 173,250 | |
Regions Financial Corp. 7.38%, 12/10/37 | | | | | | | 1,000 | | | | 840,000 | |
Royal Bank of Scotland Group PLC
7.65%, 9/30/31 (1) | | | GB | | | | 375 | | | | 255,469 | |
Societe Generale
5.92%, 4/15/17 (1)(3) | | | FR | | | | 150 | | | | 91,303 | |
Wachovia Capital Trust III
5.57%, 1/17/12 (1) | | | | | | | 1,000 | | | | 837,500 | |
| | | | | | | | | | | | |
| | | | | | | | | | | 9,305,091 | |
| | | | | | | | | | | | |
BIOTECHNOLOGY – 0.2% | |
STHI Holding Corp. 8.00%, 3/15/18 (3) | | | | | | | 350 | | | | 359,625 | |
| | | | | | | | | | | | |
BUILDING & CONSTRUCTION – 0.3% | |
Aguila 3 SA
7.88%, 1/31/18 (3) | | | LU | | | | 450 | | | | 436,500 | |
| | | | | | | | | | | | |
See Notes to Financial Statements.
236
| | |
SC SM PIMCO HIGH YIELD FUND PORTFOLIOOF INVESTMENTS (Continued) December 31, 2011 | | Sun Capital Advisers Trust |
| | | | | | | | | | | | |
| | | Country
Code* | | | Principal
Amount
(000) | | | Value | |
| | | | | | | | | | | | |
| | | | | | | | | | | | |
BUILDING MATERIALS – 1.5% | |
Associated Materials LLC
9.13%, 11/1/17 | | | | | | $ | 500 | | | $ | 436,250 | |
Building Materials Corp. of America
6.75%, 5/1/21 (3) | | | | | | | 250 | | | | 262,500 | |
6.88%, 8/15/18 (3) | | | | | | | 100 | | | | 105,000 | |
7.50%, 3/15/20 (3) | | | | | | | 250 | | | | 270,000 | |
Calcipar SA
6.88%, 5/1/18 (3) | | | LU | | | | 200 | | | | 180,000 | |
Cemex SAB de CV 9.00%, 1/11/18 (3) | | | MX | | | | 500 | | | | 398,750 | |
Grohe Holding Gmbh 5.43%, 9/15/17 (1) | | | DE | | | | 129 | | | | 113,894 | |
Masonite International Corp.
8.25%, 4/15/21 (3) | | | CA | | | | 500 | | | | 490,000 | |
Roofing Supply Group LLC
8.63%, 12/1/17 (3) | | | | | | | 135 | | | | 137,700 | |
Xefin Lux SCA
8.00%, 6/1/18 | | | LU | | | | 129 | | | | 116,483 | |
| | | | | | | | | | | | |
| | | | | | | | | | | 2,510,577 | |
| | | | | | | | | | | | |
CHEMICALS – 4.3% | | | | | | | | | | | | |
Basell Finance Co. BV 8.10%, 3/15/27 (3) | | | NL | | | | 300 | | | | 327,000 | |
Celanese US Holdings LLC
5.88%, 6/15/21 | | | | | | | 250 | | | | 258,125 | |
6.63%, 10/15/18 | | | | | | | 125 | | | | 132,813 | |
CF Industries, Inc. 6.88%, 5/1/18 | | | | | | | 250 | | | | 286,250 | |
7.13%, 5/1/20 | | | | | | | 125 | | | | 147,812 | |
Chemtura Corp.
7.88%, 9/1/18 | | | | | | | 250 | | | | 257,500 | |
Hexion US Finance Corp.
8.88%, 2/1/18 | | | | | | | 750 | | | | 703,125 | |
9.00%, 11/15/20 | | | | | | | 750 | | | | 618,750 | |
Huntsman International LLC
8.63%, 3/15/20 | | | | | | | 400 | | | | 424,000 | |
8.63%, 3/15/21 | | | | | | | 100 | | | | 106,000 | |
Ineos Finance PLC 9.00%, 5/15/15 (3) | | | GB | | | | 500 | | | | 507,500 | |
9.25%, 5/15/15 | | | GB | | | | 162 | | | | 159,355 | |
| | | | | | | | | | | | |
| | | Country
Code* | | | Principal
Amount
(000) | | | Value | |
| | | | | | | | | | | | |
Ineos Group Holdings PLC
7.88%, 2/15/16 | | | GB | | | $ | 971 | | | $ | 718,309 | |
Kinove German Bondco GmbH
9.63%, 6/15/18 (3) | | | DE | | | | 350 | | | | 332,500 | |
Lyondell Chemical Co. 8.00%, 11/1/17 | | | | | | | 203 | | | | 221,777 | |
11.00%, 5/1/18 | | | | | | | 175 | | | | 190,843 | |
Nalco Co.
6.63%, 1/15/19 (3) | | | | | | | 500 | | | | 578,750 | |
Oxea Finance
9.50%, 7/15/17 (3) | | | LU | | | | 237 | | | | 237,000 | |
9.63%, 7/15/17 | | | LU | | | | 307 | | | | 299,700 | |
Rain CII Carbon LLC 8.00%, 12/1/18 (3) | | | | | | | 150 | | | | 150,375 | |
Styrolution GmbH 7.63%, 5/15/16 | | | DE | | | | 324 | | | | 226,494 | |
Vertellus Specialties, Inc. 9.38%, 10/1/15 (3) | | | | | | | 200 | | | | 153,000 | |
| | | | | | | | | | | | |
| | | | | | | | | | | 7,036,978 | |
| | | | | | | | | | | | |
COAL – 1.5% | | | | | | | | | | | | |
Arch Coal, Inc.
7.00%, 6/15/19 (3) | | | | | | | 250 | | | | 255,000 | |
7.25%, 10/1/20 | | | | | | | 100 | | | | 102,250 | |
7.25%, 6/15/21 (3) | | | | | | | 250 | | | | 256,875 | |
CONSOL Energy, Inc. 6.38%, 3/1/21 (3) | | | | | | | 150 | | | | 151,500 | |
8.00%, 4/1/17 | | | | | | | 750 | | | | 821,250 | |
8.25%, 4/1/20 | | | | | | | 250 | | | | 276,250 | |
Peabody Energy Corp. 6.00%, 11/15/18 (3) | | | | | | | 500 | | | | 510,000 | |
6.50%, 9/15/20 | | | | | | | 100 | | | | 105,000 | |
| | | | | | | | | | | | |
| | | | | | | | | | | 2,478,125 | |
| | | | | | | | | | | | |
COMMERCIAL SERVICES – 1.5% | |
Catalent Pharma Solutions, Inc.
9.50%, 4/15/15 (6) | | | | | | | 500 | | | | 513,750 | |
Emergency Medical Services Corp.
8.13%, 6/1/19 | | | | | | | 250 | | | | 249,375 | |
Interactive Data Corp. 10.25%, 8/1/18 | | | | | | | 250 | | | | 273,750 | |
Jaguar Holding Co. 9.50%, 12/1/19 (3) | | | | | | | 250 | | | | 262,500 | |
See Notes to Financial Statements.
237
| | |
SC SM PIMCO HIGH YIELD FUND PORTFOLIOOF INVESTMENTS (Continued) December 31, 2011 | | Sun Capital Advisers Trust |
| | | | | | | | | | |
| | | Country
Code* | | Principal
Amount
(000) | | | Value | |
| | | | | | | | | | |
| | | | | | | | | | |
Live Nation Entertainment, Inc. 8.13%, 5/15/18 (3) | | | | $ | 250 | | | $ | 251,875 | |
PHH Corp.
9.25%, 3/1/16 | | | | | 100 | | | | 95,000 | |
Seminole Indian Tribe of Florida | | | | | | | | | | |
7.75%, 10/1/17 (3) | | | | | 75 | | | | 78,000 | |
The Hertz Corp.
6.75%, 4/15/19 | | | | | 500 | | | | 501,250 | |
7.38%, 1/15/21 | | | | | 250 | | | | 254,062 | |
| | | | | | | | | | |
| | | | | | | | | 2,479,562 | |
| | | | | | | | | | |
COMPUTER & PERIPHERALS – 1.3% | |
Aramark Corp.
3.93%, 2/1/15 (1) | | | | | 525 | | | | 506,625 | |
8.50%, 2/1/15 | | | | | 75 | | | | 76,875 | |
Brocade Communications Systems, Inc.
6.63%, 1/15/18 | | | | | 100 | | | | 104,000 | |
6.88%, 1/15/20 | | | | | 250 | | | | 266,250 | |
SunGard Data Systems, Inc.
7.38%, 11/15/18 | | | | | 325 | | | | 332,719 | |
7.63%, 11/15/20 | | | | | 250 | | | | 256,875 | |
10.63%, 5/15/15 | | | | | 500 | | | | 532,500 | |
| | | | | | | | | | |
| | | | | | | | | 2,075,844 | |
| | | | | | | | | | |
CONSUMER PRODUCTS – 1.2% | |
Armored Autogroup, Inc. 9.25%, 11/1/18 (3) | | | | | 250 | | | | 193,125 | |
Central Garden and Pet Co.
8.25%, 3/1/18 | | | | | 375 | | | | 367,500 | |
Jarden Corp.
7.50%, 5/1/17 | | | | | 500 | | | | 530,000 | |
8.00%, 5/1/16 | | | | | 250 | | | | 270,000 | |
Spectrum Brands Holdings, Inc.
9.50%, 6/15/18 | | | | | 500 | | | | 546,875 | |
The Scotts Miracle-Gro Co. | | | | | | | | | | |
7.25%, 1/15/18 | | | | | 50 | | | | 52,500 | |
| | | | | | | | | | |
| | | | | | | | | 1,960,000 | |
| | | | | | | | | | |
CONSUMER SERVICES – 0.3% | |
WMG Acquisition Corp. | | | | | | | | | | |
9.50%, 6/15/16 | | | | | 500 | | | | 542,500 | |
| | | | | | | | | | |
| | | | | | | | | | | | |
| | | Country
Code* | | | Principal
Amount
(000) | | | Value | |
| | | | | | | | | | | | |
CONTAINERS & GLASS – 1.9% | |
ARD Finance SA 11.13%, 6/1/18 (3)(6) | | | LU | | | $ | 212 | | | $ | 179,344 | |
Ardagh Packaging Finance | | | | | | | | | | | | |
7.38%, 10/15/17 | | | IE | | | | 259 | | | | 253,673 | |
9.25%, 10/15/20 | | | IE | | | | 129 | | | | 116,806 | |
Berry Plastics Corp. | | | | | | | | | | | | |
5.15%, 2/15/15 (1) | | | | | | | 445 | | | | 439,438 | |
9.50%, 5/15/18 | | | | | | | 500 | | | | 502,500 | |
Crown Americas LLC | | | | | | | | | | | | |
7.63%, 5/15/17 | | | | | | | 150 | | | | 163,688 | |
Crown European Holdings SA | | | | | | | | | | | | |
7.13%, 8/15/18 | | | FR | | | | 65 | | | | 65,521 | |
Graphic Packaging International, Inc. | | | | | | | | | | | | |
7.88%, 10/1/18 | | | | | | | 500 | | | | 532,500 | |
OI European Group B.V. | | | | | | | | | | | | |
6.88%, 3/31/17 | | | NL | | | | 65 | | | | 65,036 | |
Owens-Brockway Glass Container, Inc. | | | | | | | | | | | | |
7.38%, 5/15/16 | | | | | | | 25 | | | | 27,375 | |
Packaging Dynamics Corp. | | | | | | | | | | | | |
8.75%, 2/1/16 (3) | | | | | | | 150 | | | | 150,000 | |
Sealed Air Corp. | | | | | | | | | | | | |
8.13%, 9/15/19 (3) | | | | | | | 250 | | | | 273,750 | |
8.38%, 9/15/21 (3) | | | | | | | 250 | | | | 276,250 | |
| | | | | | | | | | | | |
| | | | | | | | | | | 3,045,881 | |
| | | | | | | | | | | | |
ELECTRIC UTILITIES – 0.1% | |
CMS Energy Corp. | | | | | | | | | | | | |
8.75%, 6/15/19 | | | | | | | 150 | | | | 177,712 | |
| | | | | | | | | | | | |
ELECTRONICS – 0.1% | | | | | | | | | | | | |
NXP BV | | | | | | | | | | | | |
3.15%, 10/15/13 (1) | | | NL | | | | 75 | | | | 75,000 | |
| | | | | | | | | | | | |
ENERGY – 0.3% | | | | | | | | | | | | |
Covanta Holding Corp. | | | | | | | | | | | | |
7.25%, 12/1/20 | | | | | | | 100 | | | | 105,116 | |
Headwaters, Inc. | | | | | | | | | | | | |
7.63%, 4/1/19 | | | | | | | 350 | | | | 309,750 | |
| | | | | | | | | | | | |
| | | | | | | | | | | 414,866 | |
| | | | | | | | | | | | |
See Notes to Financial Statements.
238
| | |
SC SM PIMCO HIGH YIELD FUND PORTFOLIOOF INVESTMENTS (Continued) December 31, 2011 | | Sun Capital Advisers Trust |
| | | | | | | | | | | | |
| | | Country
Code* | | | Principal
Amount
(000) | | | Value | |
| | | | | | | | | | | | |
| | | | | | | | | | | | |
FINANCIALS – 4.6% | | | | | | | | | | | | |
CIT Group, Inc. | | | | | | | | | | | | |
7.00%, 5/1/15 | | | | | | $ | 661 | | | $ | 661,824 | |
7.00%, 5/1/16 | | | | | | | 1,500 | | | | 1,499,839 | |
7.00%, 5/1/17 | | | | | | | 641 | | | | 641,179 | |
E*Trade Financial Corp. | | | | | | | | | | | | |
6.75%, 6/1/16 | | | | | | | 100 | | | | 97,000 | |
FCE Bank PLC | | | | | | | | | | | | |
7.13%, 1/15/13 | | | GB | | | | 647 | | | | 661,686 | |
International Lease Finance Corp. | | | | | | | | | | | | |
6.25%, 5/15/19 | | | | | | | 200 | | | | 184,758 | |
6.63%, 11/15/13 | | | | | | | 100 | | | | 99,500 | |
7.13%, 9/1/18 (3) | | | | | | | 500 | | | | 517,500 | |
8.25%, 12/15/20 | | | | | | | 400 | | | | 404,000 | |
8.63%, 9/15/15 | | | | | | | 750 | | | | 768,750 | |
8.75%, 3/15/17 | | | | | | | 475 | | | | 489,250 | |
Pinnacle Foods Finance LLC | | | | | | | | | | | | |
8.25%, 9/1/17 | | | | | | | 500 | | | | 520,000 | |
SLM Corp., Series A | | | | | | | | | | | | |
8.00%, 3/25/20 | | | | | | | 150 | | | | 151,500 | |
8.45%, 6/15/18 | | | | | | | 360 | | | | 370,800 | |
Springleaf Finance Corp. | | | | | | | | | | | | |
6.90%, 12/15/17 | | | | | | | 250 | | | | 180,000 | |
UPCB Finance Ltd. | | | | | | | | | | | | |
7.63%, 1/15/20 | | | KY | | | | 324 | | | | 319,518 | |
| | | | | | | | | | | | |
| | | | | | | | | | | 7,567,104 | |
| | | | | | | | | | | | |
FOOD, BEVERAGES & RESTAURANTS – 2.4% | |
Bumble Bee Acquisition Corp. | | | | | | | | | | | | |
9.00%, 12/15/17 (3) | | | | | | | 238 | | | | 241,570 | |
Bumble Bee Holding Co. SCA
9.63%, 3/15/18 (3)(6) | | | LU | | | | 250 | | | | 222,500 | |
Constellation Brands, Inc. | | | | | | | | | | | | |
7.25%, 5/15/17 | | | | | | | 150 | | | | 165,000 | |
Cott Beverages, Inc. | | | | | | | | | | | | |
8.13%, 9/1/18 | | | | | | | 250 | | | | 270,000 | |
Del Monte Corp. | | | | | | | | | | | | |
7.63%, 2/15/19 | | | | | | | 500 | | | | 480,000 | |
Michael Foods, Inc. | | | | | | | | | | | | |
9.75%, 7/15/18 | | | | | | | 500 | | | | 526,250 | |
Pilgrim’s Pride Corp. | | | | | | | | | | | | |
7.88%, 12/15/18 | | | | | | | 500 | | | | 470,000 | |
| | | | | | | | | | | | |
| | | Country
Code* | | | Principal
Amount
(000) | | | Value | |
| | | | | | | | | | | | |
Refresco Group BV | | | | | | | | | | | | |
7.38%, 5/15/18 | | | NL | | | $ | 129 | | | $ | 121,660 | |
Simmons Foods, Inc. | | | | | | | | | | | | |
10.50%, 11/1/17 (3) | | | | | | | 125 | | | | 104,062 | |
Smithfield Foods, Inc. | | | | | | | | | | | | |
7.75%, 7/1/17 | | | | | | | 500 | | | | 547,500 | |
TreeHouse Foods, Inc. | | | | | | | | | | | | |
7.75%, 3/1/18 | | | | | | | 250 | | | | 270,625 | |
U.S. Foodservice | | | | | | | | | | | | |
8.50%, 6/30/19 (3) | | | | | | | 500 | | | | 483,750 | |
| | | | | | | | | | | | |
| | | | | | | | | | | 3,902,917 | |
| | | | | | | | | | | | |
GAMING – 2.4% | | | | | | | | | | | | |
Ameristar Casinos, Inc. | | | | | | | | | | | | |
7.50%, 4/15/21 | | | | | | | 500 | | | | 515,000 | |
MGM Resorts International | | | | | | | | | | | | |
7.63%, 1/15/17 | | | | | | | 1,250 | | | | 1,190,625 | |
9.00%, 3/15/20 | | | | | | | 250 | | | | 276,875 | |
10.38%, 5/15/14 | | | | | | | 750 | | | | 856,875 | |
11.13%, 11/15/17 | | | | | | | 175 | | | | 199,500 | |
Seneca Gaming Corp. | | | | | | | | | | | | |
8.25%, 12/1/18 (3) | | | | | | | 125 | | | | 122,187 | |
Wynn Las Vegas Capital Corp. | | | | | | | | | | | | |
7.75%, 8/15/20 | | | | | | | 250 | | | | 277,500 | |
7.88%, 11/1/17 | | | | | | | 500 | | | | 548,750 | |
| | | | | | | | | | | | |
| | | | | | | | | | | 3,987,312 | |
| | | | | | | | | | | | |
GAS & PIPELINE UTILITIES – 0.5% | |
Enterprise Products Operating LP | | | | | | | | | | | | |
8.38%, 8/1/66 (1) | | | | | | | 750 | | | | 802,500 | |
| | | | | | | | | | | | |
HEALTH CARE – 3.9% | | | | | | | | | | | | |
American Renal Holdings | | | | | | | | | | | | |
8.38%, 5/15/18 | | | | | | | 100 | | | | 105,000 | |
Capella Healthcare, Inc. | | | | | | | | | | | | |
9.25%, 7/1/17 | | | | | | | 250 | | | | 253,750 | |
Community Health Systems, Inc. | | | | | | | | | | | | |
8.88%, 7/15/15 | | | | | | | 500 | | | | 516,250 | |
DaVita, Inc. | | | | | | | | | | | | |
6.38%, 11/1/18 | | | | | | | 175 | | | | 179,156 | |
6.63%, 11/1/20 | | | | | | | 250 | | | | 256,875 | |
DJO Finance LLC | | | | | | | | | | | | |
7.75%, 4/15/18 | | | | | | | 500 | | | | 383,750 | |
9.75%, 10/15/17 | | | | | | | 500 | | | | 388,750 | |
See Notes to Financial Statements.
239
| | |
SC SM PIMCO HIGH YIELD FUND PORTFOLIOOF INVESTMENTS (Continued) December 31, 2011 | | Sun Capital Advisers Trust |
| | | | | | | | | | |
| | | Country
Code* | | Principal
Amount
(000) | | | Value | |
| | | | | | | | | | |
| | | | | | | | | | |
HCA Holdings, Inc. | | | | | | | | | | |
7.75%, 5/15/21 | | | | $ | 250 | | | $ | 254,375 | |
HCA, Inc. | | | | | | | | | | |
6.50%, 2/15/20 | | | | | 900 | | | | 933,750 | |
7.25%, 9/15/20 | | | | | 400 | | | | 422,000 | |
7.50%, 2/15/22 | | | | | 875 | | | | 894,687 | |
8.50%, 4/15/19 | | | | | 150 | | | | 164,250 | |
9.88%, 2/15/17 | | | | | 81 | | | | 88,493 | |
IASIS Healthcare LLC | | | | | | | | | | |
8.38%, 5/15/19 | | | | | 400 | | | | 349,000 | |
Tenet Healthcare Corp. | | | | | | | | | | |
8.00%, 8/1/20 | | | | | 500 | | | | 500,625 | |
Vanguard Health Holding Co. II LLC | | | | | | | | | | |
8.00%, 2/1/18 | | | | | 700 | | | | 694,750 | |
| | | | | | | | | | |
| | | | | | | | | 6,385,461 | |
| | | | | | | | | | |
HEALTH CARE - FACILITIES – 1.4% | |
Alere, Inc. | | | | | | | | | | |
8.63%, 10/1/18 | | | | | 275 | | | | 270,875 | |
Biomet, Inc. | | | | | | | | | | |
10.00%, 10/15/17 | | | | | 350 | | | | 378,000 | |
10.38%, 10/15/17 (6) | | | | | 1,250 | | | | 1,353,125 | |
11.63%, 10/15/17 | | | | | 320 | | | | 347,200 | |
| | | | | | | | | | |
| | | | | | | | | 2,349,200 | |
| | | | | | | | | | |
HOLDING COMPANIES – 1.6% | |
Reynolds Group Issuer, Inc. | | | | | | | | | | |
6.88%, 2/15/21 (3) | | | | | 100 | | | | 99,500 | |
7.13%, 4/15/19 (3) | | | | | 350 | | | | 356,125 | |
7.88%, 8/15/19 (3) | | | | | 250 | | | | 261,250 | |
8.25%, 2/15/21 (3) | | | | | 500 | | | | 442,500 | |
8.75%, 10/15/16 (3) | | | | | 500 | | | | 526,250 | |
9.00%, 4/15/19 (3) | | | | | 500 | | | | 475,000 | |
9.25%, 5/15/18 (3) | | | | | 250 | | | | 239,375 | |
9.88%, 8/15/19 (3) | | | | | 250 | | | | 242,500 | |
| | | | | | | | | | |
| | | | | | | | | 2,642,500 | |
| | | | | | | | | | |
HOTELS, RESTAURANTS & LEISURE – 0.6% | |
CityCenter Holdings LLC | | | | | | | | | | |
7.63%, 1/15/16 (3) | | | | | 100 | | | | 102,500 | |
10.75%, 1/15/17 (3)(6) | | | | | 264 | | | | 259,061 | |
Eldorado Resorts LLC | | | | | | | | | | |
8.63%, 6/15/19 (3) | | | | | 250 | | | | 223,125 | |
| | | | | | | | | | | | |
| | | Country
Code* | | | Principal
Amount
(000) | | | Value | |
| | | | | | | | | | | | |
Marina District Finance Co., Inc. | | | | | | | | | | | | |
9.50%, 10/15/15 | | | | | | $ | 50 | | | $ | 46,750 | |
9.88%, 8/15/18 | | | | | | | 200 | | | | 182,500 | |
Scientific Games Corp. | | | | | | | | | | | | |
8.13%, 9/15/18 | | | | | | | 100 | | | | 102,500 | |
| | | | | | | | | | | | |
| | | | | | | | | | | 916,436 | |
| | | | | | | | | | | | |
INSURANCE – 0.2% | | | | | | | | | | | | |
American International Group, Inc. | | | | | | | | | | | | |
0.65%, 3/20/12 (1) | | | | | | | 40 | | | | 39,649 | |
8.18%, 5/15/58 (1) | | | | | | | 250 | | | | 222,500 | |
Towergate Finance PLC | | | | | | | | | | | | |
8.50%, 2/15/18 | | | GB | | | | 155 | | | | 136,664 | |
| | | | | | | | | | | | |
| | | | | | | | | | | 398,813 | |
| | | | | | | | | | | | |
LEISURE & ENTERTAINMENT – 0.9% | |
Caesars Entertainment Operating Co., Inc. | | | | | | | | | | | | |
10.00%, 12/15/18 | | | | | | | 500 | | | | 342,500 | |
11.25%, 6/1/17 | | | | | | | 500 | | | | 530,625 | |
Cinemark USA, Inc. | | | | | | | | | | | | |
7.38%, 6/15/21 | | | | | | | 250 | | | | 255,625 | |
Production Resource Group, Inc. | | | | | | | | | | | | |
8.88%, 5/1/19 (3) | | | | | | | 125 | | | | 114,375 | |
Travelport LLC | | | | | | | | | | | | |
9.88%, 9/1/14 | | | | | | | 100 | | | | 59,500 | |
11.88%, 9/1/16 | | | | | | | 350 | | | | 101,500 | |
| | | | | | | | | | | | |
| | | | | | | | | | | 1,404,125 | |
| | | | | | | | | | | | |
MACHINERY – 0.6% | |
Case New Holland, Inc. | | | | | | | | | | | | |
7.88%, 12/1/17 | | | | | | | 350 | | | | 395,500 | |
The Manitowoc Co., Inc. | | | | | | | | | | | | |
8.50%, 11/1/20 | | | | | | | 500 | | | | 526,875 | |
| | | | | | | | | | | | |
| | | | | | | | | | | 922,375 | |
| | | | | | | | | | | | |
MANUFACTURING DIVERSIFIED – 1.7% | |
Actuant Corp. | | | | | | | | | | | | |
6.88%, 6/15/17 | | | | | | | 15 | | | | 15,450 | |
Amsted Industries, Inc. | | | | | | | | | | | | |
8.13%, 3/15/18 (3) | | | | | | | 250 | | | | 265,000 | |
Bombardier, Inc. | | | | | | | | | | | | |
7.50%, 3/15/18 (3) | | | CA | | | | 275 | | | | 294,250 | |
Griffon Corp. | | | | | | | | | | | | |
7.13%, 4/1/18 | | | | | | | 200 | | | | 198,000 | |
See Notes to Financial Statements.
240
| | |
SC SM PIMCO HIGH YIELD FUND PORTFOLIOOF INVESTMENTS (Continued) December 31, 2011 | | Sun Capital Advisers Trust |
| | | | | | | | | | | | |
| | | Country
Code* | | | Principal
Amount
(000) | | | Value | |
| | | | | | | | | | | | |
| | | | | | | | | | | | |
Polymer Group, Inc. | | | | | | | | | | | | |
7.75%, 2/1/19 (3) | | | | | | $ | 250 | | | $ | 258,750 | |
Polypore International, Inc. | | | | | | | | | | | | |
7.50%, 11/15/17 | | | | | | | 150 | | | | 155,250 | |
RBS Global, Inc. | | | | | | | | | | | | |
8.50%, 5/1/18 | | | | | | | 1,000 | | | | 1,060,000 | |
11.75%, 8/1/16 | | | | | | | 250 | | | | 262,500 | |
SPX Corp. | | | | | | | | | | | | |
6.88%, 9/1/17 | | | | | | | 200 | | | | 216,000 | |
| | | | | | | | | | | | |
| | | | | | | | | | | 2,725,200 | |
| | | | | | | | | | | | |
METALS & MINING – 1.7% | |
Aleris International, Inc. | | | | | | | | | | | | |
7.63%, 2/15/18 | | | | | | | 750 | | | | 731,250 | |
FMG Resources (August 2006) Property Ltd. | | | | | | | | | | | | |
7.00%, 11/1/15 (3) | | | AU | | | | 125 | | | | 126,250 | |
Novelis, Inc. | | | | | | | | | | | | |
8.38%, 12/15/17 | | | CA | | | | 500 | | | | 531,250 | |
8.75%, 12/15/20 | | | CA | | | | 1,000 | | | | 1,072,500 | |
Steel Dynamics, Inc. | | | | | | | | | | | | |
7.63%, 3/15/20 | | | | | | | 25 | | | | 26,375 | |
7.75%, 4/15/16 | | | | | | | 50 | | | | 52,125 | |
Teck Resources, Ltd. | | | | | | | | | | | | |
9.75%, 5/15/14 | | | CA | | | | 121 | | | | 142,195 | |
10.25%, 5/15/16 | | | CA | | | | 129 | | | | 148,350 | |
| | | | | | | | | | | | |
| | | | | | | | | | | 2,830,295 | |
| | | | | | | | | | | | |
MULTIMEDIA – 6.8% | |
AMC Networks, Inc. | | | | | | | | | | | | |
7.75%, 7/15/21 (3) | | | | | | | 200 | | | | 217,500 | |
Cablevision Systems Corp. | | | | | | | | | | | | |
7.75%, 4/15/18 | | | | | | | 250 | | | | 265,000 | |
CCO Holdings LLC | | | | | | | | | | | | |
6.50%, 4/30/21 | | | | | | | 500 | | | | 506,250 | |
7.38%, 6/1/20 | | | | | | | 250 | | | | 263,750 | |
7.88%, 4/30/18 | | | | | | | 250 | | | | 266,562 | |
8.13%, 4/30/20 | | | | | | | 200 | | | | 219,000 | |
Cequel Communications Holdings I LLC | | | | | | | | | | | | |
8.63%, 11/15/17 (3) | | | | | | | 500 | | | | 530,000 | |
Clear Channel Worldwide Holdings, Inc. Series B | | | | | | | | | | | | |
9.25%, 12/15/17 | | | | | | | 750 | | | | 810,000 | |
| | | | | | | | | | | | |
| | | Country
Code* | | | Principal
Amount
(000) | | | Value | |
| | | | | | | | | | | | |
CSC Holdings LLC | | | | | | | | | | | | |
7.63%, 7/15/18 | | | | | | $ | 210 | | | $ | 231,000 | |
7.88%, 2/15/18 | | | | | | | 865 | | | | 957,987 | |
DISH DBS Corp. | | | | | | | | | | | | |
6.75%, 6/1/21 | | | | | | | 250 | | | | 269,375 | |
7.13%, 2/1/16 | | | | | | | 935 | | | | 1,007,462 | |
7.75%, 5/31/15 | | | | | | | 75 | | | | 82,500 | |
7.88%, 9/1/19 | | | | | | | 100 | | | | 113,000 | |
Insight Communications Co., Inc. | | | | | | | | | | | | |
9.38%, 7/15/18 (3) | | | | | | | 300 | | | | 342,750 | |
Kabel BW Erste Beteiligungs GmbH | | | | | | | | | | | | |
7.50%, 3/15/19 (3) | | | DE | | | | 474 | | | | 484,298 | |
LIN Television Corp. 8.38%, 4/15/18 | | | | | | | 250 | | | | 243,438 | |
LIN Television Corp., Series B | | | | | | | | | | | | |
6.50%, 5/15/13 | | | | | | | 151 | | | | 151,189 | |
Musketeer GmbH | | | | | | | | | | | | |
9.50%, 3/15/21 | | | DE | | | | 324 | | | | 323,563 | |
Nara Cable Funding Ltd. | | | | | | | | | | | | |
8.88%, 12/1/18 | | | IE | | | | 129 | | | | 113,894 | |
Nielsen Finance LLC | | | | | | | | | | | | |
7.75%, 10/15/18 | | | | | | | 400 | | | | 432,000 | |
11.50%, 5/1/16 | | | | | | | 162 | | | | 185,490 | |
The McClatchy Co. | | | | | | | | | | | | |
11.50%, 2/15/17 | | | | | | | 250 | | | | 241,875 | |
Univision Communications, Inc. | | | | | | | | | | | | |
6.88%, 5/15/19 (3) | | | | | | | 500 | | | | 482,500 | |
7.88%, 11/1/20 (3) | | | | | | | 325 | | | | 329,875 | |
8.50%, 5/15/21 (3) | | | | | | | 250 | | | | 227,500 | |
UPC Holding BV | | | | | | | | | | | | |
8.00%, 11/1/16 | | | NL | | | | 324 | | | | 321,945 | |
8.38%, 8/15/20 | | | NL | | | | 647 | | | | 609,916 | |
9.75%, 4/15/18 | | | NL | | | | 129 | | | | 131,690 | |
Videotron Ltee | | | | | | | | | | | | |
9.13%, 4/15/18 | | | CA | | | | 600 | | | | 660,750 | |
| | | | | | | | | | | | |
| | | | | | | | | | | 11,022,059 | |
| | | | | | | | | | | | |
OIL & GAS – EXPLORATION & PRODUCTION – 4.3% | |
Calumet Specialty Products Partners LP | | | | | | | | | | | | |
9.38%, 5/1/19 (3) | | | | | | | 150 | | | | 145,500 | |
Coffeyville Resources LLC | | | | | | | | | | | | |
9.00%, 4/1/15 (3) | | | | | | | 45 | | | | 47,700 | |
See Notes to Financial Statements.
241
| | |
SC SM PIMCO HIGH YIELD FUND PORTFOLIOOF INVESTMENTS (Continued) December 31, 2011 | | Sun Capital Advisers Trust |
| | | | | | | | | | | | |
| | | Country
Code* | | | Principal
Amount
(000) | | | Value | |
| | | | | | | | | | | | |
| | | | | | | | | | | | |
Concho Resources, Inc. | | | | | | | | | | | | |
6.50%, 1/15/22 | | | | | | $ | 400 | | | $ | 418,000 | |
7.00%, 1/15/21 | | | | | | | 200 | | | | 214,750 | |
Continental Resources, Inc. | | | | | | | | | | | | |
7.13%, 4/1/21 | | | | | | | 75 | | | | 81,375 | |
7.38%, 10/1/20 | | | | | | | 50 | | | | 54,500 | |
8.25%, 10/1/19 | | | | | | | 50 | | | | 55,000 | |
Denbury Resources, Inc. | | | | | | | | | | | | |
8.25%, 2/15/20 | | | | | | | 149 | | | | 166,508 | |
9.75%, 3/1/16 | | | | | | | 250 | | | | 275,625 | |
Forest Oil Corp. | | | | | | | | | | | | |
7.25%, 6/15/19 | | | | | | | 125 | | | | 127,500 | |
8.50%, 2/15/14 | | | | | | | 250 | | | | 272,500 | |
Linn Energy LLC | | | | | | | | | | | | |
8.63%, 4/15/20 | | | | | | | 425 | | | | 461,125 | |
Newfield Exploration Co. | | | | | | | | | | | | |
6.88%, 2/1/20 | | | | | | | 250 | | | | 267,500 | |
7.13%, 5/15/18 | | | | | | | 330 | | | | 352,275 | |
NFR Energy LLC | | | | | | | | | | | | |
9.75%, 2/15/17 (3) | | | | | | | 250 | | | | 225,000 | |
Oasis Petroleum, Inc. | | | | | | | | | | | | |
6.50%, 11/1/21 | | | | | | | 250 | | | | 248,125 | |
OGX Petroleo e Gas Participacoes SA | | | | | | | | | | | | |
8.50%, 6/1/18 (3) | | | BR | | | | 500 | | | | 490,000 | |
Petrohawk Energy Corp. | | | | | | | | | | | | |
6.25%, 6/1/19 | | | | | | | 250 | | | | 275,000 | |
7.25%, 8/15/18 | | | | | | | 550 | | | | 618,750 | |
10.50%, 8/1/14 | | | | | | | 250 | | | | 278,125 | |
Plains Exploration & Production Co. | | | | | | | | | | | | |
6.63%, 5/1/21 | | | | | | | 500 | | | | 525,000 | |
7.63%, 4/1/20 | | | | | | | 325 | | | | 351,812 | |
SandRidge Energy, Inc. | | | | | | | | | | | | |
7.50%, 3/15/21 | | | | | | | 1,000 | | | | 992,500 | |
| | | | | | | | | | | | |
| | | | | | | | | | | 6,944,170 | |
| | | | | | | | | | | | |
OIL & GAS EQUIPMENT & SERVICES – 0.6% | |
Cie Generale De Geophysique-Veritas | | | | | | | | | | | | |
6.50%, 6/1/21 | | | FR | | | | 250 | | | | 242,500 | |
7.75%, 5/15/17 | | | FR | | | | 175 | | | | 177,188 | |
Dresser-Rand Group, Inc. | | | | | | | | | | | | |
6.50%, 5/1/21 (3) | | | | | | | 200 | | | | 204,500 | |
Expro Finance Luxembourg SCA | | | | | | | | | | | | |
8.50%, 12/15/16 (3) | | | LU | | | | 250 | | | | 220,000 | |
| | | | | | | | | | | | |
| | | Country
Code* | | | Principal
Amount
(000) | | | Value | |
| | | | | | | | | | | | |
Thermon Industries, Inc. | | | | | | | | | | | | |
9.50%, 5/1/17 | | | | | | $ | 171 | | | $ | 184,252 | |
| | | | | | | | | | | | |
| | | | | | | | | | | 1,028,440 | |
| | | | | | | | | | | | |
PAPER PRODUCTS – 1.0% | |
Georgia-Pacific LLC | | | | | | | | | | | | |
7.25%, 6/1/28 | | | | | | | 10 | | | | 12,065 | |
7.70%, 6/15/15 | | | | | | | 815 | | | | 946,900 | |
8.00%, 1/15/24 | | | | | | | 115 | | | | 147,442 | |
8.25%, 5/1/16 (3) | | | | | | | 50 | | | | 55,548 | |
8.88%, 5/15/31 | | | | | | | 200 | | | | 274,913 | |
Sappi Papier Holding GmbH | | | | | | | | | | | | |
6.63%, 4/15/21 (3) | | | AT | | | | 200 | | | | 171,500 | |
| | | | | | | | | | | | |
| | | | | | | | | | | 1,608,368 | |
| | | | | | | | | | | | |
PHARMACEUTICALS – 2.9% | |
ConvaTec Healthcare | | | | | | | | | | | | |
10.50%, 12/15/18 (3) | | | LU | | | | 250 | | | | 223,125 | |
Endo Pharmaceuticals Holdings, Inc. | | | | | | | | | | | | |
7.00%, 7/15/19 | | | | | | | 150 | | | | 159,750 | |
Grifols, Inc. | | | | | | | | | | | | |
8.25%, 2/1/18 | | | | | | | 250 | | | | 262,500 | |
Mylan, Inc. | | | | | | | | | | | | |
7.63%, 7/15/17 (3) | | | | | | | 200 | | | | 218,250 | |
7.88%, 7/15/20 (3) | | | | | | | 500 | | | | 551,875 | |
NBTY, Inc. | | | | | | | | | | | | |
9.00%, 10/1/18 | | | | | | | 500 | | | | 550,000 | |
Novasep Holding SAS | | | | | | | | | | | | |
9.75%, 12/15/16 (3)(5) | | | FR | | | | 200 | | | | 95,000 | |
Valeant Pharmaceuticals International | | | | | | | | | | | | |
6.50%, 7/15/16 (3) | | | | | | | 500 | | | | 499,375 | |
6.75%, 10/1/17 (3) | | | | | | | 100 | | | | 99,875 | |
7.00%, 10/1/20 (3) | | | | | | | 500 | | | | 493,750 | |
7.25%, 7/15/22 (3) | | | | | | | 250 | | | | 242,500 | |
Warner Chilcott Co., LLC | | | | | | | | | | | | |
7.75%, 9/15/18 | | | PR | | | | 1,250 | | | | 1,276,562 | |
| | | | | | | | | | | | |
| | | | | | | | | | | 4,672,562 | |
| | | | | | | | | | | | |
PIPELINES – 1.3% | |
El Paso Corp. | | | | | | | | | | | | |
7.80%, 8/1/31 | | | | | | | 200 | | | | 230,500 | |
8.05%, 10/15/30 | | | | | | | 1,010 | | | | 1,176,650 | |
Energy Transfer Equity | | | | | | | | | | | | |
7.50%, 10/15/20 | | | | | | | 350 | | | | 382,375 | |
See Notes to Financial Statements.
242
| | |
SC SM PIMCO HIGH YIELD FUND PORTFOLIOOF INVESTMENTS (Continued) December 31, 2011 | | Sun Capital Advisers Trust |
| | | | | | | | | | |
| | | Country
Code* | | Principal
Amount
(000) | | | Value | |
| | | | | | | | | | |
| | | | | | | | | | |
MarkWest Energy Partners LP | | | | | | | | | | |
6.75%, 11/1/20 | | | | $ | 100 | | | $ | 104,750 | |
Regency Energy Partners LP | | | | | | | | | | |
6.88%, 12/1/18 | | | | | 275 | | | | 292,188 | |
| | | | | | | | | | |
| | | | | | | | | 2,186,463 | |
| | | | | | | | | | |
REAL ESTATE INVESTMENT TRUSTS – 0.3% | |
Host Hotels & Resorts, Inc. | | | | | | | | | | |
6.00%, 11/1/20 | | | | | 500 | | | | 511,250 | |
| | | | | | | | | | |
REFINING – 1.5% | |
Chesapeake Energy Corp. | | | | | | | | | | |
7.25%, 12/15/18 | | | | | 150 | | | | 165,750 | |
7.63%, 7/15/13 | | | | | 25 | | | | 26,438 | |
9.50%, 2/15/15 | | | | | 1,500 | | | | 1,717,500 | |
Range Resources Corp. | | | | | | | | | | |
5.75%, 6/1/21 | | | | | 250 | | | | 270,625 | |
6.75%, 8/1/20 | | | | | 150 | | | | 166,500 | |
7.25%, 5/1/18 | | | | | 25 | | | | 26,750 | |
7.50%, 10/1/17 | | | | | 125 | | | | 132,812 | |
| | | | | | | | | | |
| | | | | | | | | 2,506,375 | |
| | | | | | | | | | |
RETAIL – 2.0% | |
Inergy LP | | | | | | | | | | |
6.88%, 8/1/21 | | | | | 73 | | | | 73,365 | |
7.00%, 10/1/18 | | | | | 150 | | | | 152,250 | |
Limited Brands, Inc. | | | | | | | | | | |
6.63%, 4/1/21 | | | | | 175 | | | | 185,500 | |
7.00%, 5/1/20 | | | | | 75 | | | | 81,187 | |
Michaels Stores, Inc. 7.75%, 11/1/18 | | | | | 500 | | | | 505,000 | |
New Albertsons, Inc. | | | | | | | | | | |
7.45%, 8/1/29 | | | | | 375 | | | | 292,500 | |
8.70%, 5/1/30 | | | | | 250 | | | | 218,125 | |
PETCO Animal Supplies, Inc. | | | | | | | | | | |
9.25%, 12/1/18 (3) | | | | | 250 | | | | 268,125 | |
Phillips-Van Heusen Corp. | | | | | | | | | | |
7.38%, 5/15/20 | | | | | 500 | | | | 542,500 | |
QVC, Inc. | | | | | | | | | | |
7.13%, 4/15/17 (3) | | | | | 150 | | | | 159,000 | |
7.38%, 10/15/20 (3) | | | | | 50 | | | | 53,375 | |
7.50%, 10/1/19 (3) | | | | | 250 | | | | 268,125 | |
| | | | | | | | | | | | |
| | | Country
Code* | | | Principal
Amount
(000) | | | Value | |
| | | | | | | | | | | | |
Roadhouse Financing, Inc. | | | | | | | | | | | | |
10.75%, 10/15/17 | | | | | | $ | 250 | | | $ | 243,125 | |
Sally Beauty Holdings, Inc. | | | | | | | | | | | | |
6.88%, 11/15/19 (3) | | | | | | | 125 | | | | 130,625 | |
Suburban Propane Partners LP | | | | | | | | | | | | |
7.38%, 3/15/20 | | | | | | | 50 | | | | 52,000 | |
| | | | | | | | | | | | |
| | | | | | | | | | | 3,224,802 | |
| | | | | | | | | | | | |
SEMICONDUCTORS & SEMICONDUCTOR
EQUIPMENT – 0.2% | |
Sensata Technologies BV | | | | | | | | | | | | |
6.50%, 5/15/19 (3) | | | NL | | | | 250 | | | | 246,875 | |
| | | | | | | | | | | | |
SHIPBUILDING – 0.1% | |
Huntington Ingalls Industries, Inc. | | | | | | | | | | | | |
6.88%, 3/15/18 (3) | | | | | | | 175 | | | | 171,500 | |
| | | | | | | | | | | | |
SOFTWARE – 0.8% | |
Audatex North America, Inc. | | | | | | | | | | | | |
6.75%, 6/15/18 (3) | | | | | | | 250 | | | | 252,500 | |
Fidelity National Information Services, Inc. | | | | | | | | | | | | |
7.63%, 7/15/17 | | | | | | | 250 | | | | 270,625 | |
First Data Corp. | | | | | | | | | | | | |
8.25%, 1/15/21 (3) | | | | | | | 500 | | | | 447,500 | |
9.88%, 9/24/15 | | | | | | | 13 | | | | 12,220 | |
12.63%, 1/15/21 | | | | | | | 100 | | | | 87,000 | |
ManTech International Corp. | | | | | | | | | | | | |
7.25%, 4/15/18 | | | | | | | 175 | | | | 178,281 | |
| | | | | | | | | | | | |
| | | | | | | | | | | 1,248,126 | |
| | | | | | | | | | | | |
SPECIAL PURPOSE ENTITIES – 0.7% | |
NSG Holdings LLC | | | | | | | | | | | | |
7.75%, 12/15/25 (3) | | | | | | | 365 | | | | 374,125 | |
QBE Capital Funding III Ltd. | | | | | | | | | | | | |
7.25%, 5/24/41 (1)(3) | | | JE | | | | 200 | | | | 176,108 | |
Ziggo Bond Co. BV | | | | | | | | | | | | |
8.00%, 5/15/18 | | | NL | | | | 324 | | | | 326,798 | |
Ziggo Finance BV | | | | | | | | | | | | |
6.13%, 11/15/17 | | | NL | | | | 226 | | | | 228,759 | |
| | | | | | | | | | | | |
| | | | | | | | | | | 1,105,790 | |
| | | | | | | | | | | | |
See Notes to Financial Statements.
243
| | |
SC SM PIMCO HIGH YIELD FUND PORTFOLIOOF INVESTMENTS (Continued) December 31, 2011 | | Sun Capital Advisers Trust |
| | | | | | | | | | | | |
| | | Country
Code* | | | Principal
Amount
(000) | | | Value | |
| | | | | | | | | | | | |
| | | | | | | | | | | | |
TELECOMMUNICATIONS – 8.5% | |
Avaya, Inc. | | | | | | | | | | | | |
7.00%, 4/1/19 (3) | | | | | | $ | 500 | | | $ | 485,000 | |
Commscope, Inc. | | | | | | | | | | | | |
8.25%, 1/15/19 (3) | | | | | | | 750 | | | | 750,000 | |
Crown Castle International Corp. | | | | | | | | | | | | |
7.13%, 11/1/19 | | | | | | | 375 | | | | 405,000 | |
Digicel Ltd. | | | | | | | | | | | | |
8.25%, 9/1/17 (3) | | | BM | | | | 1,000 | | | | 1,005,000 | |
EH Holding Corp. | | | | | | | | | | | | |
6.50%, 6/15/19 (3) | | | | | | | 125 | | | | 130,313 | |
7.63%, 6/15/21 (3) | | | | | | | 200 | | | | 210,000 | |
Frontier Communications Corp. | | | | | | | | | | | | |
6.63%, 3/15/15 | | | | | | | 25 | | | | 24,750 | |
7.13%, 3/15/19 | | | | | | | 550 | | | | 536,250 | |
7.88%, 4/15/15 | | | | | | | 125 | | | | 126,719 | |
8.25%, 4/15/17 | | | | | | | 200 | | | | 204,500 | |
8.50%, 4/15/20 | | | | | | | 250 | | | | 255,937 | |
Intelsat Jackson Holdings SA | | | | | | | | | | | | |
7.25%, 4/1/19 (3) | | | LU | | | | 350 | �� | | | 355,250 | |
7.25%, 10/15/20 | | | LU | | | | 500 | | | | 507,500 | |
7.50%, 4/1/21 (3) | | | LU | | | | 500 | | | | 505,625 | |
8.50%, 11/1/19 | | | LU | | | | 825 | | | | 874,500 | |
Intelsat Luxembourg SA | | | | | | | | | | | | |
11.25%, 2/4/17 | | | LU | | | | 500 | | | | 483,750 | |
11.50%, 2/4/17 (6) | | | LU | | | | 237 | | | | 228,339 | |
11.50%, 2/4/17 (3)(6) | | | LU | | | | 500 | | | | 482,500 | |
MetroPCS Wireless, Inc. | | | | | | | | | | | | |
6.63%, 11/15/20 | | | | | | | 250 | | | | 233,125 | |
Qwest Communications International, Inc. | | | | | | | | | | | | |
7.13%, 4/1/18 | | | | | | | 250 | | | | 260,000 | |
Sprint Capital Corp. | | | | | | | | | | | | |
6.90%, 5/1/19 | | | | | | | 1,750 | | | | 1,439,375 | |
8.75%, 3/15/32 | | | | | | | 500 | | | | 404,375 | |
Sprint Nextel Corp. | | | | | | | | | | | | |
6.00%, 12/1/16 | | | | | | | 145 | | | | 120,350 | |
8.38%, 8/15/17 | | | | | | | 500 | | | | 448,125 | |
Syniverse Holdings, Inc. | | | | | | | | | | | | |
9.13%, 1/15/19 | | | | | | | 250 | | | | 263,750 | |
Telesat Canada LLC | | | | | | | | | | | | |
11.00%, 11/1/15 | | | CA | | | | 575 | | | | 617,406 | |
TW Telecom Holdings, Inc. | | | | | | | | | | | | |
8.00%, 3/1/18 | | | | | | | 100 | | | | 106,500 | |
| | | | | | | | | | | | |
| | | Country
Code* | | | Principal
Amount
(000) | | | Value | |
| | | | | | | | | | | | |
Vimpel-Communications | | | | | | | | | | | | |
7.75%, 2/2/21 (3) | | | IE | | | $ | 300 | | | $ | 256,875 | |
VimpelCom Holdings BV | | | | | | | | | | | | |
7.50%, 3/1/22 (3) | | | NL | | | | 250 | | | | 210,000 | |
Virgin Media Finance PLC | | | | | | | | | | | | |
9.50%, 8/15/16 | | | GB | | | | 175 | | | | 196,438 | |
Wind Acquisition Finance SA | | | | | | | | | | | | |
7.25%, 2/15/18 (3) | | | LU | | | | 300 | | | | 273,000 | |
11.75%, 7/15/17 (3) | | | LU | | | | 750 | | | | 671,250 | |
Windstream Corp. | | | | | | | | | | | | |
7.75%, 10/1/21 | | | | | | | 500 | | | | 512,500 | |
7.88%, 11/1/17 | | | | | | | 200 | | | | 216,500 | |
| | | | | | | | | | | | |
| | | | | | | | | | | 13,800,502 | |
| | | | | | | | | | | | |
TEXTILES & APPAREL – 0.1% | |
Levi Strauss & Co. | | | | | | | | | | | | |
7.63%, 5/15/20 | | | | | | | 225 | | | | 229,781 | |
| | | | | | | | | | | | |
TRANSPORTATION – 0.4% | |
AMGH Merger Sub, Inc. | | | | | | | | | | | | |
9.25%, 11/1/18 (3) | | | | | | | 500 | | | | 515,000 | |
CMA CGM SA | | | | | | | | | | | | |
8.50%, 4/15/17 (3) | | | FR | | | | 400 | | | | 177,000 | |
| | | | | | | | | | | | |
| | | | | | | | | | | 692,000 | |
| | | | | | | | | | | | |
UTILITIES – 6.0% | | | | | | | | | | | | |
AES Red Oak LLC, Series A | | | | | | | | | | | | |
8.54%, 11/30/19 | | | | | | | 715 | | | | 736,192 | |
Calpine Corp. | | | | | | | | | | | | |
7.50%, 2/15/21 (3) | | | | | | | 750 | | | | 802,500 | |
7.88%, 7/31/20 (3) | | | | | | | 500 | | | | 538,750 | |
7.88%, 1/15/23 (3) | | | | | | | 250 | | | | 268,750 | |
Energy Future Holdings Corp. | | | | | | | | | | | | |
9.75%, 10/15/19 | | | | | | | 39 | | | | 39,000 | |
10.00%, 1/15/20 | | | | | | | 750 | | | | 787,500 | |
Energy Future Intermediate Holding Co. LLC | | | | | | | | | | | | |
9.75%, 10/15/19 | | | | | | | 47 | | | | 47,000 | |
GenOn Energy, Inc. | | | | | | | | | | | | |
7.63%, 6/15/14 | | | | | | | 500 | | | | 500,000 | |
See Notes to Financial Statements.
244
| | |
SC SM PIMCO HIGH YIELD FUND PORTFOLIOOF INVESTMENTS (Continued) December 31, 2011 | | Sun Capital Advisers Trust |
| | | | | | | | | | | | |
| | | Country
Code* | | | Principal
Amount
(000) | | | Value | |
| | | | | | | | | | | | |
| | | | | | | | | | | | |
GenOn REMA LLC, Series C | | | | | | | | | | | | |
9.68%, 7/2/26 | | | | | | $ | 100 | | | $ | 99,250 | |
Intergen NV | | | | | | | | | | | | |
9.00%, 6/30/17 (3) | | | NL | | | | 1,000 | | | | 1,052,500 | |
Midwest Generation LLC, Series B | | | | | | | | | | | | |
8.56%, 1/2/16 | | | | | | | 395 | | | | 399,379 | |
NRG Energy, Inc. | | | | | | | | | | | | |
7.38%, 1/15/17 | | | | | | | 500 | | | | 518,750 | |
7.63%, 1/15/18 | | | | | | | 250 | | | | 250,000 | |
7.88%, 5/15/21 (3) | | | | | | | 150 | | | | 146,250 | |
8.50%, 6/15/19 | | | | | | | 1,050 | | | | 1,065,750 | |
Quicksilver Resources, Inc. | | | | | | | | | | | | |
9.13%, 8/15/19 | | | | | | | 300 | | | | 318,000 | |
11.75%, 1/1/16 | | | | | | | 300 | | | | 340,500 | |
Tenaska Alabama Partners LP | | | | | | | | | | | | |
7.00%, 6/30/21 (3) | | | | | | | 299 | | | | 313,667 | |
The AES Corp. | | | | | | | | | | | | |
7.38%, 7/1/21 (3) | | | | | | | 300 | | | | 323,250 | |
7.75%, 10/15/15 | | | | | | | 175 | | | | 190,312 | |
8.00%, 10/15/17 | | | | | | | 245 | | | | 269,500 | |
8.00%, 6/1/20 | | | | | | | 500 | | | | 550,000 | |
9.75%, 4/15/16 | | | | | | | 175 | | | | 200,375 | |
| | | | | | | | | | | | |
| | | | | | | | | | | 9,757,175 | |
| | | | | | | | | | | | |
WHOLESALE – 0.4% | | | | | | | | | | | | |
American Tire Distributors Holdings, Inc. | | | | | | | | | | | | |
9.75%, 6/1/17 | | | | | | | 200 | | | | 206,000 | |
VWR Funding, Inc. | | | | | | | | | | | | |
10.25%, 7/15/15 (6) | | | | | | | 500 | | | | 516,250 | |
| | | | | | | | | | | | |
| | | | | | | | | | | 722,250 | |
| | | | | | | | | | | | |
Total Corporate Debt Obligations
(Cost $140,624,877) | | | | 143,265,838 | |
| | | | | | | | | | | | |
FOREIGN GOVERNMENT OBLIGATIONS – 1.1% | |
Brazil Notas do Tesouro Nacional, Series F | | | | | | | | | | | | |
10.00%, 1/1/12 | | | BR | | | | 95 | | | | 94,893 | |
10.00%, 1/1/17 | | | BR | | | | 1,823 | | | | 1,751,941 | |
| | | | | | | | | | | | |
Total Foreign Government Obligations (Cost $1,679,640) | | | | 1,846,834 | |
| | | | | | | | | | | | |
| | | | | | | | | | |
| | | Country
Code* | | Principal
Amount
(000) | | | Value | |
| | | | | | | | | | |
BANK LOAN OBLIGATIONS – 1.8% | |
SENIOR LOANS – 1.8% | | | | | | | | | | |
First Data Corp. | | | | | | | | | | |
3.04%, 9/24/14 (1) | | | | $ | 443 | | | $ | 401,034 | |
Newsday LLC | | | | | | | | | | |
10.50%, 8/1/13 | | | | | 200 | | | | 206,000 | |
Quintiles Transnational Corp. | | | | | | | | | | |
5.00%, 6/8/18 (1) | | | | | 498 | | | | 486,804 | |
Springleaf Finance Funding | | | | | | | | | | |
5.50%, 5/10/17 (1) | | | | | 500 | | | | 434,270 | |
Texas Competitive Electric Holdings Co. LLC | | | | | | | | | | |
4.78%, 10/10/17 (1) | | | | | 1,384 | | | | 873,297 | |
Vodafone Americas Finance | | | | | | | | | | |
6.87%, 8/11/15 (6) | | | | | 535 | | | | 533,825 | |
| | | | | | | | | | |
Total Bank Loan Obligations
(Cost $2,955,989) | | | | 2,935,230 | |
| | | | | | | | | | |
| | | | | Shares | | | | |
COMMON STOCKS – 0.0% + | |
MULTIMEDIA – 0.0% + | |
Dex One Corp.**
(Cost $305,690) | | | 9,862 | | | | 16,371 | |
| | | | | | | | | | |
| | | | | Principal
Amount
(000) | | | | |
SHORT TERM INVESTMENTS – 5.2% | |
U.S. TREASURY OBLIGATIONS (7) – 4.8% | |
U.S. Treasury Bills | | | | | | | | | | |
0.01%, 4/5/12 (8) | | | | $ | 1,200 | | | | 1,199,938 | |
0.01%, 4/12/12 | | | | | 300 | | | | 299,985 | |
0.01%, 4/26/12 | | | | | 100 | | | | 99,993 | |
0.01%, 6/14/12 | | | | | 300 | | | | 299,932 | |
0.03%, 3/22/12 | | | | | 400 | | | | 399,985 | |
0.04%, 4/12/12 | | | | | 100 | | | | 99,995 | |
0.04%, 5/17/12 | | | | | 200 | | | | 199,974 | |
0.04%, 6/21/12 | | | | | 300 | | | | 299,923 | |
0.05%, 3/15/12 (8) | | | | | 1,600 | | | | 1,599,936 | |
0.05%, 5/10/12 | | | | | 500 | | | | 499,946 | |
0.05%, 6/14/12 | | | | | 400 | | | | 399,910 | |
0.06%, 5/24/12 | | | | | 700 | | | | 699,896 | |
0.09%, 8/23/12 | | | | | 300 | | | | 299,864 | |
0.11%, 10/18/12 | | | | | 200 | | | | 199,864 | |
See Notes to Financial Statements.
245
| | |
SC SM PIMCO HIGH YIELD FUND PORTFOLIOOF INVESTMENTS (Continued) December 31, 2011 | | Sun Capital Advisers Trust |
| | | | | | | | | | |
| | | Country
Code* | | Principal
Amount
(000) | | | Value | |
| | | | | | | | | | |
| | | | | | | | | | |
0.14%, 5/3/12 | | | | $ | 200 | | | $ | 199,983 | |
0.18%, 6/28/12 | | | | | 1,000 | | | | 999,705 | |
0.23%, 4/5/12 | | | | | 80 | | | | 79,996 | |
| | | | | | | | | | |
Total U.S. Treasury Obligations
(Cost $7,878,737) | | | | 7,878,825 | |
| | | | | | | | | | |
| | | | | Shares | | | | |
MUTUAL FUNDS – 0.4% | |
State Street Institutional U.S. Government Money Market Fund
(Cost $624,741) | | | 624,741 | | | | 624,741 | |
| | | | | | | | | | |
Total Short Term Investments
(Cost $8,503,478) | | | | 8,503,566 | |
| | | | | | | | | | |
TOTAL INVESTMENTS – 97.8% | |
(Cost $156,534,988) | | | | | | | 159,511,992 | |
Other assets less
liabilities – 2.2% | | | | | | | 3,615,277 | |
| | | | | | | | | | |
NET ASSETS – 100.0% | | | | | | $ | 163,127,269 | |
| | | | | | | | | | |
| | |
| AT | | Austria |
| AU | | Australia |
| BM | | Bermuda |
| BR | | Brazil |
| CA | | Canada |
| DE | | Germany |
| FR | | France |
| GB | | Great Britain |
| IE | | Ireland |
| IT | | Italy |
| JE | | Jersey |
| KY | | Cayman Islands |
| LU | | Luxembourg |
| MX | | Mexico |
| NL | | Netherlands |
| PR | | Puerto Rico |
| * | Unless otherwise noted the issuer country code for all securities is United States. |
| ** | Non-income producing security. |
| + | Amount is less than 0.05%. |
| (1) | Variable rate security. The interest rate shown reflects the rate in effect at the period end. |
| (2) | Security is a “Step-up” bond where the coupon increases on a predetermined future date. |
| (3) | Eligible for resale under rule 144A of the Securities Act of 1933. These securities may be resold in transactions exempt from registration, normally to qualified institutional buyers. At the period end, the value of these securities amounted to $37,336,951, representing 22.9% of net assets. |
See Notes to Financial Statements.
246
| | |
SC SM PIMCO HIGH YIELD FUND PORTFOLIOOF INVESTMENTS (Continued) |
| December 31, 2011 | | Sun Capital Advisers Trust |
| (5) | Security is in default and is non-income producing. |
| (6) | Payment in-kind bond which may pay interest in the form of additional bonds. |
| (7) | Interest rates represent annualized yield at date of purchase. |
| (8) | Security (or a portion thereof) has been pledged as collateral for open swap contracts. At the period end, the value of securities pledged amounted to $425,983. |
| (9) | At the period end, open forward foreign currency exchange contracts were as follows: |
| | | | | | | | | | | | | | | | | | | | | | | | |
Counterparty | | Contracts to Deliver | | | | | In Exchange For | | | | | Settlement
Date | | | | Unrealized
Appreciation/
(Depreciation) ($) | |
| Barclays Bank PLC | | BRL | | | 2,740,969 | | | | | USD | | | 1,428,928 | | | | | 1/4/12 | | | | | (40,564 | ) |
| Barclays Bank PLC | | USD | | | 1,461,227 | | | | | BRL | | | 2,740,969 | | | | | 1/4/12 | | | | | 8,265 | |
| Citibank NA | | USD | | | 35,124 | | | | | CNY | | | 223,597 | | | | | 6/1/12 | | | | | 338 | |
| Deutsche Bank AG (London) | | USD | | | 26,335 | | | | | CNY | | | 170,584 | | | | | 2/13/12 | | | | | 747 | |
| Deutsche Bank AG (London) | | USD | | | 1,010,766 | | | | | EUR | | | 729,000 | | | | | 1/17/12 | | | | | (67,194 | ) |
| Deutsche Bank AG (London) | | USD | | | 211,766 | | | | | EUR | | | 162,000 | | | | | 2/2/12 | | | | | (2,067 | ) |
| JPMorgan Securities* | | EUR | | | 5,687,000 | | | | | USD | | | 7,732,472 | | | | | 1/17/12 | | | | | 371,577 | |
| JPMorgan Securities* | | EUR | | | 246,000 | | | | | USD | | | 342,639 | | | | | 1/17/12 | | | | | 24,232 | |
| JPMorgan Securities* | | GBP | | | 544,000 | | | | | USD | | | 853,169 | | | | | 3/12/12 | | | | | 8,900 | |
| UBS AG | | BRL | | | 2,740,969 | | | | | USD | | | 1,461,227 | | | | | 1/4/12 | | | | | (8,265 | ) |
| UBS AG | | BRL | | | 2,740,969 | | | | | USD | | | 1,512,843 | | | | | 3/2/12 | | | | | 60,998 | |
| UBS AG | | EUR | | | 242,000 | | | | | USD | | | 333,798 | | | | | 1/17/12 | | | | | 20,568 | |
| UBS AG | | USD | | | 1,530,413 | | | | | BRL | | | 2,740,969 | | | | | 1/4/12 | | | | | (60,921 | ) |
| | | | | | | | | | | | | | | | | | | | | | | | |
Net unrealized appreciation | | | | | 316,614 | |
| | | | | | | | | | | | | | | | | | | | | | | | |
| * | At the period end, the broker pledged securities with a fair value of $319,782 to the Fund as collateral for these open forward foreign currency exchange contracts. |
| | | | |
| BRL | | – | | Brazilian Real |
| CNY | | – | | Yuan Renminbi |
| EUR | | – | | Euro |
| GBP | | – | | Great British Pound |
| USD | | – | | United States Dollar |
See Notes to Financial Statements.
247
SC SM PIMCO HIGH YIELD FUND
| | |
PORTFOLIOOF INVESTMENTS (Continued) December 31, 2011 | | Sun Capital Advisers Trust |
| (10) | At the period end, open swap contracts were as follows: |
OTC Credit Default Swap Contracts on Corporate Issues – Sell Protection (a)
| | | | | | | | | | | | | | | | | | | | | | | | | | | | |
Counterparty | | Reference
Entity | | (Pay)/
Receive
Fixed
Rate | | Expiration
Date | | | Implied
Credit
Spread
(b) | | | Notional
Amount (c)
(000) ($) | | | Market
Value ($) | | | Upfront
Premiums
Paid/
(Received)
($) | | | Unrealized
Appreciation
($) | |
Deutsche Bank AG | | Ally Financial, Inc. | | 5.00% | | | 3/20/12 | | | | 4.46% | | | | 60 | | | | 71 | | | | (9,300 | ) | | | 9,371 | |
Deutsche Bank AG | | SLM Corp. | | 5.00% | | | 6/20/12 | | | | 3.15% | | | | 100 | | | | 877 | | | | (13,000 | ) | | | 13,877 | |
Deutsche Bank AG | | RRI Energy, Inc. | | 5.00% | | | 9/20/14 | | | | 6.48% | | | | 300 | | | | (10,605 | ) | | | (43,500 | ) | | | 32,895 | |
Goldman Sachs International | | El Paso Corp. | | 5.00% | | | 9/20/14 | | | | 1.91% | | | | 500 | | | | 40,915 | | | | (47,500 | ) | | | 88,415 | |
| | | | | | | | | | | | | | | | | | | | | | | | | | | | |
Total | | | | | | 960 | | | | 31,258 | | | | (113,300 | ) | | | 144,558 | |
| | | | | | | | | | | | | | | | | | | | | | | | | | | | |
Centrally Cleared Credit Default Swap Contracts on Credit Indices – Sell Protection (a)
| | | | | | | | | | | | | | | | |
Reference Entity | | (Pay)/
Receive
Fixed
Rate | | Expiration
Date | | Notional
Amount (c)
(000) ($) | | | Market
Value (d) ($) | | | Unrealized
Appreciation ($) | |
CDX.HY-16 5 Year Index | | 5.00% | | 6/20/16 | | | 4,655 | | | | (209,277 | ) | | | 70,023 | |
OTC Credit Default Swap Contracts on Credit Indices – Sell Protection (a)
| | | | | | | | | | | | | | | | | | | | | | | | |
Counterparty | | Reference
Entity | | (Pay)/
Receive
Fixed
Rate | | Expiration
Date | | | Notional
Amount (c)
(000) ($) | | | Market
Value (d) ($) | | | Upfront
Premiums
Paid/
(Received) ($) | | | Unrealized
Depreciation ($) | |
Morgan Stanley Capital Services, Inc. | | CDX.HY-16 5
Year Index | | 5.00% | | | 6/20/16 | | | | 245 | | | | (11,222 | ) | | | 1,225 | | | | (12,447 | ) |
CDX.HY - Credit Derivatives Index – High Yield
| (a) | If the Fund is a seller of protection and a credit event occurs, as defined under the terms of that particular swap agreement, the Fund will either (i) pay to the buyer of protection an amount equal to the notional amount of the swap and take delivery of the referenced obligation or underlying securities comprising the referenced index or (ii) pay a net settlement amount in the form of cash or securities equal to the notional amount of the swap less the recovery value of the referenced obligation or underlying securities comprising the referenced index. |
See Notes to Financial Statements.
248
SC SM PIMCO HIGH YIELD FUND
| | |
PORTFOLIOOF INVESTMENTS (Continued) December 31, 2011 | | Sun Capital Advisers Trust |
| (b) | Implied credit spreads, represented in absolute terms, utilized in determining the market value of credit default swap agreements on corporate issues as of period end serve as an indicator of the current status of the payment/performance risk and represent the likelihood or risk of default for the credit derivative. The implied credit spread of a particular referenced entity reflects the cost of buying/selling protection and may include upfront payments required to be made to enter into the agreement. Wider credit spreads represent a deterioration of the referenced entity’s credit soundness and a greater likelihood or risk of default or other credit event occurring as defined under the terms of that particular agreement. |
| (c) | The maximum potential amount the Fund could be required to pay as a seller of credit protection or receive as a buyer of credit protection if a credit event occurs as defined under the terms of that particular swap agreement. |
| (d) | The quoted market prices and resulting values for credit default swap contracts on credit indices serve as an indicator of the current status of the payment/performance risk and represent the likelihood of an expected liability (or profit) for the credit derivative had the notional amount of the swap agreement been closed/sold as of the period end. Increasing market values, in absolute terms when compared to the notional amount of the swap, represent a deterioration of the referenced entity’s credit soundness and a greater likelihood or risk of default or other credit event occurring as defined under the terms of the agreement. |
See Notes to Financial Statements.
249
SC SM PIMCO HIGH YIELD FUND
| | |
PORTFOLIOOF INVESTMENTS (Continued) December 31, 2011 | | Sun Capital Advisers Trust |
| (11) | Fair Value Measurements † |
The following table summarizes the inputs used to value the Fund’s assets and liabilities, as applicable, measured at fair value at the period end:
| | | | | | | | | | | | | | | | |
Assets | | Quoted Prices
in Active
Markets for
Identical
Assets and
Liabilities
(Level 1) | | | Significant
Other
Observable
Inputs
(Level 2) | | | Significant
Unobservable
Inputs
(Level 3) | | | Total | |
Asset Backed Securities | | $ | — | | | $ | 235,487 | | | $ | — | | | $ | 235,487 | |
Collateralized Mortgage Obligations | | | — | | | | 2,708,666 | | | | — | | | | 2,708,666 | |
Corporate Debt Obligations (a) | | | — | | | | 143,265,838 | | | | — | | | | 143,265,838 | |
Foreign Government Obligations | | | — | | | | 1,846,834 | | | | — | | | | 1,846,834 | |
Bank Loan Obligations (a) | | | — | | | | 2,935,230 | | | | — | | | | 2,935,230 | |
Common Stocks (a) | | | 16,371 | | | | — | | | | — | | | | 16,371 | |
Short Term Investments | | | | | | | | | | | | | | | | |
U.S. Treasury Obligations | | | 7,878,825 | | | | — | | | | — | | | | 7,878,825 | |
Mutual Funds | | | 624,741 | | | | — | | | | — | | | | 624,741 | |
| | | | | | | | | | | | | | | | |
Total Short Term Investments | | | 8,503,566 | | | | — | | | | — | | | | 8,503,566 | |
| | | | | | | | | | | | | | | | |
Total Investments | | | 8,519,937 | | | | 150,992,055 | | | | — | | | | 159,511,992 | |
| | | | | | | | | | | | | | | | |
Financial Derivative Instruments | | | | | | | | | | | | | | | | |
Forward Foreign Currency Exchange Contracts | | | — | | | | 495,625 | | | | — | | | | 495,625 | |
Swap Contracts (a) | | | — | | | | 41,863 | | | | — | | | | 41,863 | |
| | | | | | | | | | | | | | | | |
Total Financial Derivative Instruments | | $ | — | | | $ | 537,488 | | | $ | — | | | $ | 537,488 | |
| | | | | | | | | | | | | | | | |
| | | | |
Liabilities | | | | | | | | | | | | |
Financial Derivative Instruments | | | | | | | | | | | | | | | | |
Forward Foreign Currency Exchange Contracts | | $ | — | | | $ | (179,011 | ) | | $ | — | | | $ | (179,011 | ) |
Swap Contracts (a) | | | — | | | | (231,104 | ) | | | — | | | | (231,104 | ) |
| | | | | | | | | | | | | | | | |
Total Financial Derivative Instruments | | $ | — | | | $ | (410,115 | ) | | $ | — | | | $ | (410,115 | ) |
| | | | | | | | | | | | | | | | |
| † | See Note 2b in the Notes to Financial Statements for additional information. |
| (a) | See Portfolio of Investments for additional detailed categorizations. |
See Notes to Financial Statements.
250
SC SM PIMCO TOTAL RETURN FUND
| | |
PORTFOLIOOF INVESTMENTS December 31, 2011 | | Sun Capital Advisers Trust |
| | | | | | | | | | | | |
| | | Country
Code* | | | Principal
Amount
(000) | | | Value | |
| | | | | | | | | | | | |
| | | | | | | | | | | | |
ASSET BACKED SECURITIES – 2.2% | |
Bear Stearns Asset Backed Securities Trust,
Series 2006-SD3
5.50%, 8/25/36 | | | | | | $ | 1,574 | | | $ | 942,267 | |
Citibank Omni Master Trust,
Series 2009-A14A, Class A14
3.03%, 8/15/18 (1)(2) | | | | | | | 2,700 | | | | 2,832,317 | |
Citibank Omni Master Trust,
Series 2009-A8, Class A8
2.38%, 5/16/16 (1)(2) | | | | | | | 1,800 | | | | 1,811,055 | |
Countrywide Asset-Backed Certificates,
Series 2006-2,
Class 2A2
0.48%, 6/25/36 (1) | | | | | | | 176 | | | | 136,790 | |
Duane Street CLO,
Series 2005-1A, Class A
0.69%, 11/8/17 (1)(2) | | | KY | | | | 8,151 | | | | 7,884,383 | |
Galaxy CLO Ltd.,
Series 2005-4A,
Class A1VB
0.68%, 4/17/17 (1)(2) | | | KY | | | | 927 | | | | 900,209 | |
Halcyon Structured Asset Management Long/Short CLO Ltd.,
Series 2007-1A, Class A1
0.66%, 8/7/21 (1)(2) | | | | | | | 2,000 | | | | 1,924,306 | |
Hillmark Funding,
Series 2006-1A,
Class A1
0.73%, 5/21/21 (1)(2) | | | KY | | | | 2,400 | | | | 2,220,451 | |
Marathon Financing BV,
Series 2006-1A,
Class A1
0.75%, 10/5/26 (1)(2) | | | NL | | | | 509 | | | | 498,371 | |
Pacifica CDO Ltd.,
Series 2005-5A,
Class A1
0.68%, 1/26/20 (1)(2) | | | KY | | | | 4,017 | | | | 3,729,694 | |
Structured Asset Securities Corp.,
Series 2007-WF1,
Class A2
0.38%, 2/25/37 (1) | | | | | | | 451 | | | | 447,156 | |
| | | | | | | | | | | | |
Total Asset Backed Securities
(Cost $22,956,267) | | | | 23,326,999 | |
| | | | | | | | | | | | |
| | | | | | | | | | | | |
| | | Country
Code* | | | Principal
Amount
(000) | | | Value | |
| | | | | | | | | | | | |
| | | | | | | | | | | | |
COLLATERALIZED MORTGAGE
OBLIGATIONS – 2.2% | |
Arran Residential Mortgages Funding PLC,
Series 2010-1A,
Class A2B
2.86%, 5/16/47 (1)(2) | | | GB | | | $ | 1,294 | | | $ | 1,286,498 | |
BCAP LLC,
Series 2011-RR5,
Class 12A1
5.64%, 3/26/37 (1)(2) | | | | | | | 100 | | | | 73,800 | |
BCAP LLC,
Series 2011-RR5,
Class 9A1
5.25%, 5/26/37 (2) | | | | | | | 3,437 | | | | 2,792,458 | |
Bear Stearns Alt-A Trust,
Series 2005-4
2.59%, 5/25/35 (1) | | | | | | | 154 | | | | 111,804 | |
Bear Stearns Alt-A Trust,
Series 2006-1
2.66%, 2/25/36 (1) | | | | | | | 161 | | | | 58,336 | |
Citigroup Mortgage Loan Trust, Inc.,
Series 2005-4, Class A
5.31%, 8/25/35 (1) | | | | | | | 2,257 | | | | 1,980,922 | |
Countrywide Home Loan Mortgage Pass Through Trust,
Series 2005-29,
Class A1
5.75%, 12/25/35 | | | | | | | 1,838 | | | | 1,531,982 | |
Federal National Mortgage Association,
Series 2005-75,
Class FL
0.74%, 9/25/35 (1) | | | | | | | 697 | | | | 692,845 | |
Federal National Mortgage Association,
Series 2007-30,
Class AF
0.60%, 4/25/37 (1) | | | | | | | 349 | | | | 347,016 | |
First Horizon Asset Securities, Inc.,
Series 2005-AR4,
Class 2A1
2.64%, 10/25/35 (1) | | | | | | | 637 | | | | 459,221 | |
See Notes to Financial Statements.
251
SC SM PIMCO TOTAL RETURN FUND
| | |
PORTFOLIOOF INVESTMENTS (Continued) December 31, 2011 | | Sun Capital Advisers Trust |
| | | | | | | | | | | | |
| | | Country
Code* | | | Principal
Amount
(000) | | | Value | |
| | | | | | | | | | | | |
| | | | | | | | | | | | |
First Horizon Asset Securities, Inc.,
Series 2005-AR6,
Class 4A1
5.55%, 2/25/36 (1) | | | | | | $ | 547 | | | $ | 460,499 | |
Granite Master Issuer PLC,
Series 2006-3, Class A5
1.25%, 12/20/54 (1) | | | GB | | | | 2,798 | | | | 2,672,043 | |
Granite Master Issuer PLC,
Series 2006-4, Class A7
1.36%, 12/20/54 (1) | | | GB | | | | 2,045 | | | | 1,952,647 | |
Granite Mortgages PLC,
Series 2003-3, Class 2A
1.96%, 1/20/44 (1) | | | GB | | | | 120 | | | | 114,875 | |
Granite Mortgages PLC,
Series 2003-3, Class 3A
1.35%, 1/20/44 (1) | | | GB | | | | 125 | | | | 119,562 | |
Granite Mortgages PLC,
Series 2004-3,
Class 3A2
1.45%, 9/20/44 (1) | | | GB | | | | 721 | | | | 689,516 | |
GSR Mortgage Loan Trust,
Series 2005-AR6,
Class 1A1
2.72%, 9/25/35 (1) | | | | | | | 3,406 | | | | 3,092,160 | |
Harborview Mortgage Loan Trust,
Series 2005-4
2.75%, 7/19/35 (1) | | | | | | | 357 | | | | 264,205 | |
JP Morgan Mortgage Trust,
Series 2005-S3,
Class 1A2
5.75%, 1/25/36 | | | | | | | 73 | | | | 67,230 | |
JP Morgan Mortgage Trust,
Series 2007-A1
2.80%, 7/25/35 (1) | | | | | | | 494 | | | | 346,912 | |
Master Adjustable Rate Mortgage Trust,
Series 2005-6,
Class 5A2
2.39%, 7/25/35 (1) | | | | | | | 1,173 | | | | 835,993 | |
MLCC Mortgage Investors, Inc.,
Series 2005-1, Class 2A5
2.06%, 4/25/35 (1) | | | | | | | 1,200 | | | | 1,024,902 | |
| | | | | | | | | | | | |
| | | Country
Code* | | | Principal
Amount
(000) | | | Value | |
| | | | | | | | | | | | |
| | | | | | | | | | | | |
Nomura Asset Acceptance Corp.,
Series 2005-AP2,
Class A5
4.98%, 5/25/35 (3) | | | | | | $ | 324 | | | $ | 270,226 | |
Wachovia Mortgage Loan Trust LLC,
Series 2005-B,
Class 2A4
2.68%, 10/20/35 (1) | | | | | | | 2,800 | | | | 2,034,410 | |
| | | | | | | | | | | | |
Total Collateralized Mortgage Obligations
(Cost $24,452,352) | | | | 23,280,062 | |
| | | | | | | | | | | | |
COMMERCIAL MORTGAGE BACKED
SECURITIES – 1.6% | |
Citigroup/Deutsche Bank Commercial Mortgage Trust,
Series 2007-CD5,
Class A4
5.89%, 11/15/44 (1) | | | | | | | 5,000 | | | | 5,541,710 | |
JP Morgan Chase Commercial Mortgage Securities Corp.,
Series 2003-CB7,
Class A4
4.88%, 1/12/38 (1) | | | | | | | 2,682 | | | | 2,812,963 | |
JP Morgan Chase Commercial Mortgage Securities Corp.,
Series 2010-C2,
Class A3
4.07%, 11/15/43 (2) | | | | | | | 1,000 | | | | 1,049,396 | |
Morgan Stanley Capital I,
Series 2004-IQ8,
Class A5
5.11%, 6/15/40 (1) | | | | | | | 600 | | | | 640,900 | |
Opera Finance PLC,
Series CSC3, Class A
1.21%, 4/25/17 (1) | | | GB | | | | 4,174 | | | | 3,631,380 | |
Silenus European Loan Conduit,
Series 25X, Class A
1.61%, 5/15/19 (1) | | | IE | | | | 70 | | | | 57,452 | |
Titan Europe PLC,
Series 2007-3X,
Class A1
1.26%, 10/23/16 (1) | | | IE | | | | 4,354 | | | | 3,831,926 | |
| | | | | | | | | | | | |
Total Commercial Mortgage Backed Securities
(Cost $16,337,595) | | | | 17,565,727 | |
| | | | | | | | | | | | |
See Notes to Financial Statements.
252
SC SM PIMCO TOTAL RETURN FUND
| | |
PORTFOLIOOF INVESTMENTS (Continued) December 31, 2011 | | Sun Capital Advisers Trust |
| | | | | | | | | | | | |
| | | Country
Code* | | | Principal
Amount
(000) | | | Value | |
| | | | | | | | | | | | |
| | | | | | | | | | | | |
CORPORATE DEBT OBLIGATIONS – 29.9% | |
AGRICULTURAL – 0.1% | |
Altria Group, Inc.
4.13%, 9/11/15 | | | | | | $ | 500 | | | $ | 542,798 | |
BAT International Finance PLC
9.50%, 11/15/18 (2) | | | GB | | | | 160 | | | | 217,261 | |
| | | | | | | | | | | | |
| | | | | | | | | | | 760,059 | |
| | | | | | | | | | | | |
AUTOMOTIVE – 0.5% | |
Ford Motor Credit Co. LLC | | | | | | | | | | | | |
5.63%, 9/15/15 | | | | | | | 1,300 | | | | 1,345,434 | |
5.88%, 8/2/21 | | | | | | | 300 | | | | 312,662 | |
7.00%, 4/15/15 | | | | | | | 1,900 | | | | 2,042,500 | |
8.70%, 10/1/14 | | | | | | | 400 | | | | 446,642 | |
12.00%, 5/15/15 | | | | | | | 1,400 | | | | 1,714,986 | |
| | | | | | | | | | | | |
| | | | | | | | | | | 5,862,224 | |
| | | | | | | | | | | | |
BANKS – 13.6% | |
Ally Financial, Inc. | | | | | | | | | | | | |
0.00%, 6/15/15 (4) | | | | | | | 3,500 | | | | 2,590,000 | |
7.50%, 9/15/20 | | | | | | | 300 | | | | 303,000 | |
8.30%, 2/12/15 | | | | | | | 2,400 | | | | 2,532,000 | |
American Express Bank, FSB
5.50%, 4/16/13 | | | | | | | 400 | | | | 418,101 | |
Australia & New Zealand Banking Group Ltd. | | | | | | | | | | | | |
1.29%, 5/8/13 (1) | | | AU | | | | 1,200 | | | | 1,200,312 | |
2.13%, 1/10/14 (2) | | | AU | | | | 1,500 | | | | 1,498,584 | |
Banco Santander Brazil SA
2.66%, 3/18/14 (1)(2) | | | BR | | | | 1,000 | | | | 952,680 | |
Banco Santander Chile
1.66%, 4/20/12 (1)(2) | | | CL | | | | 900 | | | | 900,287 | |
Bank of America Corp. | | | | | | | | | | | | |
5.65%, 5/1/18 | | | | | | | 1,900 | | | | 1,810,231 | |
5.75%, 12/1/17 | | | | | | | 300 | | | | 283,356 | |
6.00%, 9/1/17 | | | | | | | 1,100 | | | | 1,074,291 | |
Bank of China Hong Kong Ltd.
5.55%, 2/11/20 (2) | | | HK | | | | 100 | | | | 103,804 | |
Bank of India
6.25%, 2/16/21 | | | IN | | | | 1,900 | | | | 1,814,812 | |
Bank of Montreal
2.85%, 6/9/15 (2) | | | CA | | | | 300 | | | | 310,967 | |
Bank of Nova Scotia 1.65%, 10/29/15 (2) | | | CA | | | | 500 | | | | 499,393 | |
Barclays Bank PLC | | | | | | | | | | | | |
0.74%, 9/11/17 (1) | | | GB | | | | 13,400 | | | | 11,658,938 | |
| | | | | | | | | | | | |
| | | Country
Code* | | | Principal
Amount
(000) | | | Value | |
| | | | | | | | | | | | |
| | | | | | | | | | | | |
2.38%, 1/13/14 | | | GB | | | $ | 1,900 | | | $ | 1,859,673 | |
5.00%, 9/22/16 | | | GB | | | | 1,500 | | | | 1,553,496 | |
6.05%, 12/4/17 (2) | | | GB | | | | 500 | | | | 452,129 | |
Barnett Capital Trust III
1.05%, 2/1/27 (1) | | | | | | | 200 | | | | 144,449 | |
BBVA Bancomer SA Texas | | | | | | | | | | | | |
4.50%, 3/10/16 (2) | | | MX | | | | 300 | | | | 294,000 | |
6.50%, 3/10/21 (2) | | | MX | | | | 600 | | | | 578,250 | |
7.25%, 4/22/20 (2) | | | MX | | | | 1,100 | | | | 1,100,000 | |
Bear Stearns Cos. LLC
5.30%, 10/30/15 | | | | | | | 100 | | | | 107,539 | |
BNP Paribas | | | | | | | | | | | | |
1.29%, 1/10/14 (1) | | | FR | | | | 2,100 | | | | 1,936,752 | |
7.20%, 6/25/37 (1)(2) | | | FR | | | | 100 | | | | 69,750 | |
7.78%, 7/2/18 (1) | | | FR | | | | 129 | | | | 104,510 | |
BPCE SA
2.38%, 10/4/13 (2) | | | FR | | | | 200 | | | | 193,710 | |
Citigroup Capital XXI 8.30%, 12/21/57 (1) | | | | | | | 1,600 | | | | 1,598,000 | |
Citigroup, Inc. | | | | | | | | | | | | |
3.63%, 11/30/17 (1) | | | | | | | 1,035 | | | | 824,602 | |
4.88%, 5/7/15 | | | | | | | 1,000 | | | | 987,732 | |
5.50%, 4/11/13 | | | | | | | 700 | | | | 714,646 | |
5.50%, 10/15/14 | | | | | | | 400 | | | | 411,219 | |
5.63%, 8/27/12 | | | | | | | 5,300 | | | | 5,380,046 | |
6.13%, 11/21/17 | | | | | | | 200 | | | | 213,446 | |
8.50%, 5/22/19 | | | | | | | 200 | | | | 235,417 | |
Commonwealth Bank of Australia
0.81%, 7/12/13 (1)(2) | | | AU | | | | 1,600 | | | | 1,599,250 | |
Cooperatieve Centrale Raiffeisen-Boerenleenbank BA 6.88%, 3/19/20 | | | NL | | | | 4,659 | | | | 3,962,736 | |
Credit Agricole SA
8.38%, 10/31/19 (1)(2) | | | FR | | | | 2,300 | | | | 1,725,000 | |
Credit Suisse New York
2.20%, 1/14/14 | | | CH | | | | 400 | | | | 395,595 | |
Danske Bank A/S
2.50%, 5/10/12 (2) | | | DK | | | | 300 | | | | 301,887 | |
Deutsche Bank AG
6.00%, 9/1/17 | | | DE | | | | 300 | | | | 335,037 | |
Dexia Credit Local
0.91%, 4/29/14 (1)(2) | | | FR | | | | 1,700 | | | | 1,542,243 | |
0.93%, 3/5/13 (1)(2) | | | FR | | | | 3,300 | | | | 3,123,760 | |
Fifth Third Bancorp
0.98%, 12/20/16 (1) | | | | | | | 600 | | | | 528,820 | |
See Notes to Financial Statements.
253
SC SM PIMCO TOTAL RETURN FUND
| | |
PORTFOLIOOF INVESTMENTS (Continued) December 31, 2011 | | Sun Capital Advisers Trust |
| | | | | | | | | | | | |
| | | Country
Code* | | | Principal
Amount
(000) | | | Value | |
| | | | | | | | | | | | |
| | | | | | | | | | | | |
Fortis Bank Nederland Holding NV
3.00%, 4/17/12 | | | NL | | | $ | 259 | | | $ | 260,400 | |
HBOS PLC
0.73%, 9/6/17 (1) | | | GB | | | | 17,800 | | | | 12,425,610 | |
6.75%, 5/21/18 (2) | | | GB | | | | 3,200 | | | | 2,565,734 | |
HSBC Bank PLC
2.00%, 1/19/14 (2) | | | GB | | | | 500 | | | | 492,484 | |
ICICI Bank Ltd.
5.50%, 3/25/15 | | | IN | | | | 1,400 | | | | 1,400,361 | |
5.75%, 11/16/20 | | | IN | | | | 1,500 | | | | 1,380,042 | |
ICICI Bank Ltd./Dubai
4.75%, 11/25/16 (2) | | | IN | | | | 3,700 | | | | 3,515,522 | |
ING Bank NV
1.38%, 3/30/12 (1)(2) | | | NL | | | | 4,200 | | | | 4,189,840 | |
2.63%, 2/9/12 (2) | | | NL | | | | 1,400 | | | | 1,402,547 | |
Intesa Sanpaolo New York
2.38%, 12/21/12 | | | IT | | | | 2,400 | | | | 2,232,552 | |
Intesa Sanpaolo SpA 2.91%, 2/24/14 (1)(2) | | | IT | | | | 1,100 | | | | 968,491 | |
Itau Unibanco Holding SA
6.20%, 4/15/20 (2) | | | BR | | | | 1,800 | | | | 1,867,819 | |
JP Morgan Chase & Co.,
Series I
7.90%, 4/30/18 (1) | | | | | | | 300 | | | | 319,407 | |
JP Morgan Chase Bank NA
0.87%, 6/13/16 (1) | | | | | | | 300 | | | | 268,490 | |
JP Morgan Chase Capital XXI,
Series U
1.38%, 2/2/37 (1) | | | | | | | 1,000 | | | | 708,343 | |
LBG Capital No.1 PLC
6.44%, 5/23/20 | | | GB | | | | 1,035 | | | | 700,810 | |
7.87%, 12/17/19 | | | GB | | | | 777 | | | | 574,610 | |
LBG Capital No.2 PLC
8.88%, 2/7/20 | | | GB | | | | 388 | | | | 298,972 | |
9.13%, 7/15/20 | | | GB | | | | 2,640 | | | | 2,006,476 | |
15.00%, 12/21/19 | | | GB | | | | 466 | | | | 486,866 | |
Lloyds TSB Bank PLC
2.80%, 4/2/12 (2) | | | GB | | | | 4,300 | | | | 4,319,083 | |
4.88%, 1/21/16 | | | GB | | | | 1,500 | | | | 1,461,876 | |
Macquarie Bank Ltd.
4.10%, 12/17/13 (2) | | | AU | | | | 300 | | | | 318,053 | |
Merrill Lynch & Co., Inc.
1.78%, 5/30/14 (1) | | | | | | | 129 | | | | 111,812 | |
6.88%, 4/25/18 | | | | | | | 200 | | | | 197,188 | |
Morgan Stanley
0.69%, 1/9/14 (1) | | | | | | | 500 | | | | 452,380 | |
0.88%, 10/15/15 (1) | | | | | | | 2,000 | | | | 1,681,340 | |
| | | | | | | | | | | | |
| | | Country
Code* | | | Principal
Amount
(000) | | | Value | |
| | | | | | | | | | | | |
| | | | | | | | | | | | |
1.81%, 3/1/13 (1) | | | | | | $ | 6,407 | | | $ | 6,075,155 | |
5.95%, 12/28/17 | | | | | | | 400 | | | | 381,094 | |
National Australia Bank Ltd.
1.11%, 4/11/14 (1)(2) | | | AU | | | | 4,500 | | | | 4,454,784 | |
1.37%, 7/25/14 (1)(2) | | | AU | | | | 600 | | | | 596,129 | |
Nordea Bank AB
2.13%, 1/14/14 (2) | | | SE | | | | 200 | | | | 196,149 | |
4.88%, 1/27/20 (2) | | | SE | | | | 1,800 | | | | 1,848,483 | |
Nordea Eiendomskreditt
A/S
0.80%, 4/7/14 (1)(2) | | | NO | | | | 2,000 | | | | 1,938,252 | |
Northern Rock Asset Management PLC 5.63%, 6/22/17 (2) | | | GB | | | | 1,300 | | | | 1,366,950 | |
Royal Bank of Scotland Group PLC
2.63%, 5/11/12 (2) | | | GB | | | | 200 | | | | 201,295 | |
4.38%, 3/16/16 | | | GB | | | | 2,300 | | | | 2,194,184 | |
5.00%, 10/1/14 | | | GB | | | | 100 | | | | 82,546 | |
6.99%, 10/5/17 (2)(5) | | | GB | | | | 200 | | | | 125,250 | |
Santander UK PLC
1.81%, 10/10/17 (1) | | | GB | | | | 3,624 | | | | 2,722,151 | |
Santander US Debt SA Unipersonal
1.38%, 3/30/12 (1)(2) | | | ES | | | | 3,100 | | | | 3,094,460 | |
2.99%, 10/7/13 (2) | | | ES | | | | 1,800 | | | | 1,720,823 | |
7.30%, 7/27/19 (1) | | | ES | | | | 1,398 | | | | 1,167,127 | |
Scotland International Finance No. 2 BV 4.25%, 5/23/13 (2) | | | NL | | | | 1,200 | | | | 1,068,000 | |
Societe Generale
5.92%, 4/5/17 (1)(2) | | | FR | | | | 400 | | | | 243,475 | |
State Bank of India/London
4.50%, 7/27/15 (2) | | | IN | | | | 1,000 | | | | 989,090 | |
State Street Capital Trust IV
1.55%, 6/15/37 (1) | | | | | | | 200 | | | | 131,653 | |
Sumitomo Mitsui Banking Corp.
1.95%, 1/14/14 (2) | | | JP | | | | 2,200 | | | | 2,225,782 | |
Swedbank AB
2.80%, 2/10/12 (2) | | | SE | | | | 1,000 | | | | 1,002,356 | |
Turkiye Garanti Bankasi AS
2.91%, 4/20/16 (1)(2) | | | TR | | | | 300 | | | | 270,000 | |
UBS AG/Stamford CT
1.60%, 2/23/12 (1) | | | CH | | | | 800 | | | | 800,982 | |
See Notes to Financial Statements.
254
SC SM PIMCO TOTAL RETURN FUND
| | |
PORTFOLIOOF INVESTMENTS (Continued) December 31, 2011 | | Sun Capital Advisers Trust |
| | | | | | | | | | | | |
| | | Country
Code* | | | Principal
Amount
(000) | | | Value | |
| | | | | | | | | | | | |
| | | | | | | | | | | | |
USB Capital IX
3.50%, 2/6/12 (1) | | | | | | $ | 1,000 | | | $ | 697,290 | |
Wachovia Bank NA 0.88%, 3/15/16 (1) | | | | | | | 400 | | | | 358,074 | |
Westpac Banking Corp.
1.31%, 3/31/14 (1)(2) | | | AU | | | | 2,200 | | | | 2,206,310 | |
3.59%, 8/14/14 (2) | | | AU | | | | 300 | | | | 319,839 | |
| | | | | | | | | | | | |
| | | | | | | | | | | 145,309,241 | |
| | | | | | | | | | | | |
CHEMICALS – 0.3% | | | | | | | | | | | | |
Braskem SA
5.75%, 4/15/21 (2) | | | KY | | | | 2,200 | | | | 2,183,500 | |
The Dow Chemical Co.
4.85%, 8/15/12 | | | | | | | 900 | | | | 920,768 | |
6.00%, 10/1/12 | | | | | | | 100 | | | | 103,852 | |
| | | | | | | | | | | | |
| | | | | | | | | | | 3,208,120 | |
| | | | | | | | | | | | |
DIVERSIFIED – 0.2% | | | | | | | | | |
Noble Group Ltd.
4.88%, 8/5/15 (2) | | | BM | | | | 1,000 | | | | 915,000 | |
6.75%, 1/29/20 | | | BM | | | | 1,000 | | | | 860,000 | |
| | | | | | | | | | | | |
| | | | | | | | | | | 1,775,000 | |
| | | | | | | | | | | | |
ELECTRIC UTILITIES – 0.7% | | | | | |
CMS Energy Corp.
5.05%, 2/15/18 | | | | | | | 1,000 | | | | 997,502 | |
Comision Federal de Electricidad
4.88%, 5/26/21 (2) | | | MX | | | | 5,100 | | | | 5,253,000 | |
Electricite de France
6.50%, 1/26/19 (2) | | | FR | | | | 400 | | | | 452,491 | |
Entergy Corp.
3.63%, 9/15/15 | | | | | | | 1,000 | | | | 1,015,093 | |
| | | | | | | | | | | | |
| | | | | | | | | | | 7,718,086 | |
| | | | | | | | | | | | |
FINANCIALS – 5.4% | | | | | | | | | | | | |
American Express Co. 4.88%, 7/15/13 | | | | | | | 500 | | | | 522,865 | |
7.00%, 3/19/18 | | | | | | | 700 | | | | 845,891 | |
American Express Credit Corp.
5.13%, 8/25/14 | | | | | | | 4,200 | | | | 4,512,140 | |
Banque PSA Finance
2.27%, 4/4/14 (1)(2) | | | FR | | | | 1,200 | | | | 1,111,234 | |
Countrywide Financial Corp.
5.80%, 6/7/12 | | | | | | | 2,100 | | | | 2,104,418 | |
| | | | | | | | | | | | |
| | | Country
Code* | | | Principal
Amount
(000) | | | Value | |
| | | | | | | | | | | | |
| | | | | | | | | | | | |
General Electric Capital Corp.,
Series A
6.15%, 8/7/37 | | | | | | $ | 100 | | | $ | 109,389 | |
6.88%, 1/10/39 | | | | | | | 4,000 | | | | 4,792,128 | |
International Lease Finance Corp.
5.40%, 2/15/12 | | | | | | | 3,700 | | | | 3,700,000 | |
5.75%, 5/15/16 | | | | | | | 200 | | | | 185,508 | |
6.38%, 3/25/13 | | | | | | | 2,000 | | | | 1,990,000 | |
6.75%, 9/1/16 (2) | | | | | | | 400 | | | | 410,000 | |
LeasePlan Corp. NV
3.00%, 5/7/12 (2) | | | NL | | | | 1,000 | | | | 1,007,638 | |
3.13%, 2/10/12 | | | NL | | | | 259 | | | | 259,498 | |
Nomura Holdings, Inc.
6.70%, 3/4/20 | | | JP | | | | 2,300 | | | | 2,421,753 | |
SLM Corp.
6.25%, 1/25/16 | | | | | | | 200 | | | | 194,496 | |
SLM Corp.,
Series A
0.72%, 1/27/14 (1) | | | | | | | 500 | | | | 451,993 | |
5.00%, 10/1/13 | | | | | | | 5,700 | | | | 5,700,000 | |
5.38%, 1/15/13 | | | | | | | 130 | | | | 130,897 | |
8.00%, 3/25/20 | | | | | | | 1,100 | | | | 1,111,000 | |
8.45%, 6/15/18 | | | | | | | 2,300 | | | | 2,369,000 | |
Springleaf Finance Corp.
3.25%, 1/16/13 | | | | | | | 11,131 | | | | 9,603,130 | |
4.88%, 7/15/12 | | | | | | | 4,500 | | | | 4,320,000 | |
Sydney Airport Finance Co., Pty Ltd.
5.13%, 2/22/21 (2) | | | AU | | | | 100 | | | | 101,465 | |
The Goldman Sachs Group, Inc.
1.02%, 3/22/16 (1) | | | | | | | 600 | | | | 517,895 | |
1.43%, 7/29/13 (1) | | | | | | | 200 | | | | 193,876 | |
5.95%, 1/18/18 | | | | | | | 6,800 | | | | 6,964,703 | |
6.15%, 4/1/18 | | | | | | | 1,100 | | | | 1,135,298 | |
6.25%, 9/1/17 | | | | | | | 700 | | | | 731,806 | |
| | | | | | | | | | | | |
| | | | | | | | | | | 57,498,021 | |
| | | | | | | | | | | | |
FOOD, BEVERAGES & RESTAURANTS – 0.5% | |
Anheuser-Busch InBev Worldwide, Inc.
4.13%, 1/15/15 | | | | | | | 1,200 | | | | 1,293,794 | |
5.38%, 1/15/20 | | | | | | | 1,200 | | | | 1,407,365 | |
Pernod-Ricard SA
5.75%, 4/7/21 (2) | | | FR | | | | 1,500 | | | | 1,692,302 | |
See Notes to Financial Statements.
255
SC SM PIMCO TOTAL RETURN FUND
| | |
PORTFOLIOOF INVESTMENTS (Continued) December 31, 2011 | | Sun Capital Advisers Trust |
| | | | | | | | | | | | |
| | | Country
Code* | | | Principal
Amount
(000) | | | Value | |
| | | | | | | | | | | | |
| | | | | | | | | | | | |
Tate & Lyle International Finance PLC
6.63%, 6/15/16 (2) | | | GB | | | $ | 500 | | | $ | 569,607 | |
| | | | | | | | | | | | |
| | | | | | | | | | | 4,963,068 | |
| | | | | | | | | | | | |
HEALTH CARE – 0.5% | | | | | |
HCA, Inc.
7.88%, 2/15/20 | | | | | | | 4,000 | | | | 4,320,000 | |
Roche Holdings, Inc.
6.00%, 3/1/19 (2) | | | | | | | 600 | | | | 729,248 | |
| | | | | | | | | | | | |
| | | | | | | | | | | 5,049,248 | |
| | | | | | | | | | | | |
INSURANCE – 1.8% | | | | | | | | | | | | |
American International Group, Inc.
1.75%, 7/19/13 (1) | | | | | | | 10,354 | | | | 9,603,638 | |
5.05%, 10/1/15 | | | | | | | 100 | | | | 96,823 | |
5.45%, 5/18/17 | | | | | | | 100 | | | | 95,564 | |
5.85%, 1/16/18 | | | | | | | 200 | | | | 195,603 | |
8.25%, 8/15/18 | | | | | | | 1,000 | | | | 1,058,501 | |
MetLife Institutional Funding II
1.27%, 4/4/14 (1)(2) | | | | | | | 800 | | | | 798,229 | |
Ohio National Financial Services, Inc.
6.38%, 4/30/20 (2) | | | | | | | 5,100 | | | | 5,546,184 | |
Pacific LifeCorp.
6.00%, 2/10/20 (2) | | | | | | | 1,300 | | | | 1,383,595 | |
The Dai-ichi Life Insurance Co., Ltd.
7.25%, 7/25/21 (1)(2) | | | JP | | | | 600 | | | | 603,982 | |
The Hartford Financial Services Group, Inc.
8.13%, 6/15/38 (1) | | | | | | | 300 | | | | 297,000 | |
| | | | | | | | | | | | |
| | | | | | | | | | | 19,679,119 | |
| | | | | | | | | | | | |
INVESTMENT COMPANIES – 0.6% | | | | | |
FIH Erhvervsbank
A/S
0.91%, 6/13/13 (1)(2) | | | DK | | | | 6,500 | | | | 6,493,766 | |
Temasek Financial I Ltd.
4.30%, 10/25/19 (2) | | | SG | | | | 300 | | | | 322,136 | |
| | | | | | | | | | | | |
| | | | | | | | | | | 6,815,902 | |
| | | | | | | | | | | | |
METALS & MINING – 0.8% | | | | | |
Alcoa, Inc.
6.15%, 8/15/20 | | | | | | | 600 | | | | 623,386 | |
CSN Resources SA
6.50%, 7/21/20 (2) | | | LU | | | | 1,400 | | | | 1,463,000 | |
| | | | | | | | | | | | |
| | | Country
Code* | | | Principal
Amount
(000) | | | Value | |
| | | | | | | | | | | | |
| | | | | | | | | | | | |
Gerdau Holdings, Inc.
7.00%, 1/20/20 (2) | | | BR | | | $ | 1,700 | | | $ | 1,793,500 | |
Gerdau Trade, Inc.
5.75%, 1/30/21 (2) | | | VG | | | | 2,700 | | | | 2,679,750 | |
GTL Trade Finance, Inc.
7.25%, 10/20/17 (2) | | | VG | | | | 1,400 | | | | 1,505,000 | |
Vale Overseas Ltd.
6.88%, 11/10/39 | | | KY | | | | 300 | | | | 343,620 | |
| | | | | | | | | | | | |
| | | | | | | | | | | 8,408,256 | |
| | | | | | | | | | | | |
OIL & GAS – 0.6% | | | | | | | | | | | | |
Petroleos Mexicanos
6.50%, 6/2/41 | | | MX | | | | 2,900 | | | | 3,262,500 | |
Ras Laffan Liquefied Natural Gas Co. Ltd. III
6.75%, 9/30/19 | | | QA | | | | 1,200 | | | | 1,420,800 | |
Reliance Holdings USA
4.50%, 10/19/20 | | | | | | | 1,900 | | | | 1,726,346 | |
Total Capital SA
4.45%, 6/24/20 | | | FR | | | | 200 | | | | 222,771 | |
| | | | | | | | | | | | |
| | | | | | | | | | | 6,632,417 | |
| | | | | | | | | | | | |
OIL & GAS—EXPLORATION & PRODUCTION – 0.3% | |
Gazprom OAO
9.63%, 3/1/13 | | | DE | | | | 2,400 | | | | 2,556,000 | |
Novatek Finance Ltd.
5.33%, 2/3/16 (2) | | | IE | | | | 200 | | | | 201,500 | |
Transocean, Inc.
4.95%, 11/15/15 | | | KY | | | | 100 | | | | 102,115 | |
| | | | | | | | | | | | |
| | | | | | | | | | | 2,859,615 | |
| | | | | | | | | | | | |
PIPELINES – 0.0%+ | | | | | | | | | | | | |
El Paso Corp.
7.88%, 6/15/12 | | | | | | | 400 | | | | 409,035 | |
| | | | | | | | | | | | |
REFINING – 0.3% | | | | | | | | | | | | |
Petrobras International Finance Co.
7.88%, 3/15/19 | | | KY | | | | 2,900 | | | | 3,461,721 | |
| | | | | | | | | | | | |
RETAIL – 0.0%+ | | | | | | | | | | | | |
CVS Pass-through Trust
6.94%, 1/10/30 | | | | | | | 91 | | | | 101,243 | |
| | | | | | | | | | | | |
SAVINGS & LOANS – 0.1% | | | | | |
Nationwide Building Society
6.25%, 2/25/20 (2) | | | GB | | | | 600 | | | | 595,309 | |
| | | | | | | | | | | | |
See Notes to Financial Statements.
256
SC SM PIMCO TOTAL RETURN FUND
| | |
PORTFOLIOOF INVESTMENTS (Continued) December 31, 2011 | | Sun Capital Advisers Trust |
| | | | | | | | | | | | |
| | | Country
Code* | | | Principal
Amount
(000) | | | Value | |
| | | | | | | | | | | | |
| | | | | | | | | | | | |
SPECIAL PURPOSE BANKS – 0.5% | | | | | |
European Investment Bank SNAT
3.63%, 1/15/21 | | | | | | $ | 129 | | | $ | 136,031 | |
Kreditanstalt fuer Wiederaufbau
2.00%, 9/7/16 | | | DE | | | | 1,812 | | | | 1,844,515 | |
The Export-Import Bank of Korea
1.05%, 3/3/12 (2) | | | KR | | | | 1,156 | | | | 1,156,165 | |
5.13%, 6/29/20 | | | KR | | | | 300 | | | | 314,116 | |
5.88%, 1/14/15 | | | KR | | | | 900 | | | | 965,226 | |
8.13%, 1/21/14 | | | KR | | | | 400 | | | | 442,076 | |
| | | | | | | | | | | | |
| | | | | | | | | | | 4,858,129 | |
| | | | | | | | | | | | |
SPECIAL PURPOSE ENTITIES – 0.5% | | | | | |
IPIC GMTN Ltd.
5.00%, 11/15/20 | | | KY | | | | 1,200 | | | | 1,207,500 | |
MUFG Capital Finance 5 Ltd.
6.30%, 1/25/17 (1) | | | KY | | | | 2,019 | | | | 1,891,467 | |
Odebrecht Drilling VIII/IX Ltd.
6.35%, 6/30/21 (2) | | | KY | | | | 2,300 | | | | 2,369,000 | |
Vnesheconombank Veb Finance Ltd.
5.45%, 11/22/17 (2) | | | IE | | | | 200 | | | | 198,000 | |
| | | | | | | | | | | | |
| | | | | | | | | | | 5,665,967 | |
| | | | | | | | | | | | |
TELECOMMUNICATIONS – 1.3% | | | | | |
BellSouth Corp.
4.46%, 4/26/12 (2) | | | | | | | 10,500 | | | | 10,616,309 | |
Deutsche Telekom International Finance BV
6.50%, 4/8/22 | | | NL | | | | 2,951 | | | | 3,463,030 | |
| | | | | | | | | | | | |
| | | | | | | | | | | 14,079,339 | |
| | | | | | | | | | | | |
TRANSPORTATION – 0.7% | | | | | |
Asciano Finance Ltd.
5.00%, 4/7/18 (2) | | | AU | | | | 5,100 | | | | 5,114,009 | |
DP World Ltd.
6.25%, 7/2/17 (2) | | | KY | | | | 1,900 | | | | 1,923,750 | |
Ryder System, Inc.
6.00%, 3/1/13 | | | | | | | 400 | | | | 420,579 | |
| | | | | | | | | | | | |
| | | | | | | | | | | 7,458,338 | |
| | | | | | | | | | | | |
| | | | | | | | | | | | |
| | | Country
Code* | | | Principal
Amount
(000) | | | Value | |
| | | | | | | | | | | | |
| | | | | | | | | | | | |
UTILITIES – 0.6% | | | | | | | | | | | | |
Centrais Eletricas Brasileiras SA
6.88%, 7/30/19 (2) | | | BR | | | $ | 1,600 | | | $ | 1,808,000 | |
MidAmerican Energy Holdings Co.
6.13%, 4/1/36 | | | | | | | 300 | | | | 358,305 | |
Nakilat, Inc.
6.07%, 12/31/33 | | | MH | | | | 2,800 | | | | 2,982,000 | |
NRG Energy, Inc.
8.25%, 9/1/20 | | | | | | | 700 | | | | 703,500 | |
The AES Corp.
7.38%, 7/1/21 (2) | | | | | | | 200 | | | | 215,500 | |
| | | | | | | | | | | | |
| | | | | | | | | | | 6,067,305 | |
| | | | | | | | | | | | |
Total Corporate Debt Obligations
(Cost $329,976,667) | | | | 319,234,762 | |
| | | | | | | | | | | | |
FOREIGN GOVERNMENT AGENCY
OBLIGATIONS – 1.1% | |
Banco Nacional de Desenvolvimento Economico e Social
4.13%, 9/15/17 (2) | | | BR | | | | 259 | | | | 253,803 | |
Canada Housing Trust No. 1
3.35%, 12/15/20 (2) | | | CA | | | | 1,767 | | | | 1,910,023 | |
3.75%, 3/15/20 (2) | | | CA | | | | 196 | | | | 218,538 | |
3.80%, 6/15/21 (2) | | | CA | | | | 687 | | | | 767,990 | |
Instituto de Credito Oficial
3.15%, 3/25/14 (1) | | | ES | | | | 1,683 | | | | 1,572,536 | |
Korea Housing Finance Corp.
4.13%, 12/15/15 (2) | | | KR | | | | 3,500 | | | | 3,614,114 | |
Societe Financement de l’Economie Francaise
0.60%, 7/16/12 (1)(2) | | | FR | | | | 1,000 | | | | 1,001,060 | |
3.38%, 5/5/14 (2) | | | FR | | | | 2,100 | | | | 2,149,081 | |
| | | | | | | | | | | | |
Total Foreign Government Agency Obligations
(Cost $11,461,427) | | | | 11,487,145 | |
| | | | | | | | | | | | |
FOREIGN GOVERNMENT OBLIGATIONS – 5.9% | |
Canadian Government Bond
2.75%, 9/1/16 | | | CA | | | | 1,472 | | | | 1,570,307 | |
3.25%, 6/1/21 | | | CA | | | | 98 | | | | 109,134 | |
3.75%, 6/1/19 | | | CA | | | | 589 | | | | 673,920 | |
4.25%, 6/1/18 | | | CA | | | | 98 | | | | 114,547 | |
See Notes to Financial Statements.
257
SC SM PIMCO TOTAL RETURN FUND
| | |
PORTFOLIOOF INVESTMENTS (Continued) December 31, 2011 | | Sun Capital Advisers Trust |
| | | | | | | | | | | | |
| | | Country
Code* | | | Principal
Amount
(000) | | | Value | |
| | | | | | | | | | | | |
| | | | | | | | | | | | |
Italy Buoni Poliennali Del Tesoro Inflation Linked Bond
2.10%, 9/15/16 | | | IT | | | $ | 402 | | | $ | 349,121 | |
2.10%, 9/15/21 | | | IT | | | | 4,477 | | | | 3,312,659 | |
Province of Ontario Canada
1.38%, 1/27/14 | | | CA | | | | 900 | | | | 909,423 | |
1.60%, 9/21/16 | | | CA | | | | 21,300 | | | | 21,234,417 | |
3.00%, 7/16/18 | | | CA | | | | 200 | | | | 210,347 | |
3.15%, 6/2/22 | | | CA | | | | 393 | | | | 400,561 | |
4.00%, 6/2/21 | | | CA | | | | 687 | | | | 754,612 | |
4.20%, 6/2/20 | | | CA | | | | 13,448 | | | | 15,020,714 | |
4.30%, 3/8/17 | | | CA | | | | 393 | | | | 439,495 | |
4.60%, 6/2/39 | | | CA | | | | 294 | | | | 355,492 | |
4.70%, 6/2/37 | | | CA | | | | 1,276 | | | | 1,546,474 | |
Province of Quebec Canada
3.50%, 12/1/22 | | | CA | | | | 98 | | | | 102,105 | |
4.25%, 12/1/21 | | | CA | | | | 785 | | | | 872,779 | |
4.50%, 12/1/17 | | | CA | | | | 491 | | | | 556,677 | |
4.50%, 12/1/18 | | | CA | | | | 589 | | | | 669,797 | |
Republic of Turkey
7.00%, 9/26/16 | | | TR | | | | 6,100 | | | | 6,687,125 | |
Russian Foreign Bond 3.63%, 4/29/15 | | | RU | | | | 100 | | | | 100,500 | |
7.50%, 3/31/30 (3) | | | RU | | | | 2,839 | | | | 3,296,789 | |
Spain Government Bond
4.65%, 7/30/25 | | | ES | | | | 3,883 | | | | 3,508,842 | |
United Kingdom Gilt
4.25%, 12/7/40 | | | GB | | | | 311 | | | | 382,349 | |
United Mexican States,
Series A
6.05%, 1/11/40 | | | MX | | | | 200 | | | | 244,500 | |
| | | | | | | | | | | | |
Total Foreign Government Obligations
(Cost $64,504,369) | | | | 63,422,686 | |
| | | | | | | | | | | | |
MUNICIPAL BONDS – 3.8% | | | | | |
Acalanes Union High School District,
Series 2008-B
0.00%, 8/1/46 (4) | | | | | | | 4,600 | | | | 409,584 | |
California Infrastructure & Economic Development Bank
6.49%, 5/15/49 | | | | | | | 1,000 | | | | 1,168,800 | |
California State University
6.43%, 11/1/30 | | | | | | | 200 | | | | 227,522 | |
City of New York, NY
5.00%, 8/1/35 | | | | | | | 4,700 | | | | 5,121,355 | |
6.25%, 6/1/35 | | | | | | | 3,800 | | | | 4,233,580 | |
| | | | | | | | | | |
| | | Country
Code* | | Principal
Amount
(000) | | | Value | |
| | | | | | | | | | |
| | | | | | | | | | |
City of Newport Beach, California Certificates of Participation
7.17%, 7/1/40 | | | | $ | 2,300 | | | $ | 2,602,864 | |
Contra Costa, California Community College District
6.50%, 8/1/34 | | | | | 1,600 | | | | 1,887,136 | |
County of Clark, NV
6.82%, 7/1/45 | | | | | 300 | | | | 377,268 | |
County of Fresno CA,
Series A
0.00%, 8/15/28 (4) | | | | | 2,200 | | | | 672,870 | |
Irvine Ranch Water District, California
6.62%, 5/1/40 | | | | | 3,700 | | | | 4,962,995 | |
Long Beach Unified School District,
Series 2008-B
0.00%, 8/1/34 (4) | | | | | 2,400 | | | | 616,896 | |
Los Angeles Unified School District, California
6.76%, 7/1/34 | | | | | 200 | | | | 248,208 | |
Metropolitan Government of Nashville & Davidson County, Tennessee, Water and Sewer Revenue
6.57%, 7/1/37 | | | | | 3,700 | | | | 4,631,660 | |
Metropolitan Transportation Authority
7.34%, 11/15/39 | | | | | 1,100 | | | | 1,540,726 | |
New Jersey Economic Development Authority
1.55%, 6/15/13 (1) | | | | | 1,300 | | | | 1,300,013 | |
New York State Thruway Authority
5.88%, 4/1/30 | | | | | 1,000 | | | | 1,227,510 | |
Pasadena, California Public Financing Authority
7.15%, 3/1/43 | | | | | 1,400 | | | | 1,836,366 | |
Philadelphia Authority for Industrial Development
0.00%, 4/15/23 (4) | | | | | 3,000 | | | | 1,320,420 | |
State of California
7.60%, 11/1/40 | | | | | 500 | | | | 617,355 | |
7.63%, 3/1/40 | | | | | 1,000 | | | | 1,230,350 | |
7.95%, 3/1/36 | | | | | 400 | | | | 452,312 | |
See Notes to Financial Statements.
258
SC SM PIMCO TOTAL RETURN FUND
| | |
PORTFOLIOOF INVESTMENTS (Continued) December 31, 2011 | | Sun Capital Advisers Trust |
| | | | | | | | | | |
| | | Country
Code* | | Principal
Amount
(000) | | | Value | |
| | | | | | | | | | |
| | | | | | | | | | |
State of Illinois
4.07%, 1/1/14 | | | | $ | 400 | | | $ | 410,704 | |
State of Louisiana
3.00%, 5/1/43 (1) | | | | | 400 | | | | 404,664 | |
State of Washington
5.00%, 6/1/41 | | | | | 2,500 | | | | 2,708,550 | |
| | | | | | | | | | |
Total Municipal Bonds
(Cost $34,873,681) | | | | 40,209,708 | |
| | | | | | | | | | |
U.S. GOVERNMENT AGENCY OBLIGATIONS – 44.9% | |
Federal Home Loan Mortgage Corp.
2.00%, 8/25/16 | | | | | 100 | | | | 103,987 | |
2.50%, 5/27/16 | | | | | 100 | | | | 105,907 | |
4.50%, 2/1/39 | | | | | 95 | | | | 100,943 | |
4.50%, 4/1/39 | | | | | 610 | | | | 647,420 | |
4.50%, 1/1/40 | | | | | 680 | | | | 721,704 | |
4.50%, 2/1/41 | | | | | 225 | | | | 239,149 | |
4.88%, 6/13/18 | | | | | 200 | | | | 240,984 | |
5.50%, 3/1/37 | | | | | 805 | | | | 875,516 | |
5.50%, 4/1/37 | | | | | 96 | | | | 104,455 | |
5.50%, 7/1/37 | | | | | 304 | | | | 330,725 | |
5.50%, 8/1/37 | | | | | 150 | | | | 162,856 | |
5.50%, 7/1/38 | | | | | 477 | | | | 518,669 | |
5.50%, 8/1/38 | | | | | 385 | | | | 418,504 | |
5.50%, 1/1/40 | | | | | 96 | | | | 104,319 | |
Federal National Mortgage
Association | | | | | |
3.00%, TBA (6) | | | | | 42,000 | | | | 43,240,310 | |
3.33%, 11/1/21 | | | | | 399 | | | | 423,672 | |
3.50%, 8/1/25 | | | | | 125 | | | | 130,498 | |
3.50%, 10/1/25 | | | | | 675 | | | | 706,504 | |
3.50%, 1/1/26 | | | | | 7,971 | | | | 8,343,250 | |
3.50%, 2/1/26 | | | | | 5,912 | | | | 6,187,962 | |
3.50%, 9/1/26 | | | | | 317 | | | | 331,871 | |
3.50%, TBA (6) | | | | | 36,500 | | | | 38,167,724 | |
4.00%, 8/1/39 | | | | | 165 | | | | 173,791 | |
4.00%, 12/1/40 | | | | | 6,377 | | | | 6,704,411 | |
4.00%, 1/1/41 | | | | | 993 | | | | 1,044,330 | |
4.00%, 2/1/41 | | | | | 7,737 | | | | 8,135,429 | |
4.00%, 3/1/41 | | | | | 198 | | | | 208,476 | |
4.00%, 4/1/41 | | | | | 507 | | | | 532,851 | |
4.00%, 7/1/41 | | | | | 387 | | | | 406,647 | |
4.00%, 8/1/41 | | | | | 3,152 | | | | 3,316,052 | |
4.00%, TBA (6) | | | | | 57,000 | | | | 59,888,909 | |
4.50%, 6/1/38 | | | | | 114 | | | | 121,290 | |
4.50%, 1/1/39 | | | | | 356 | | | | 379,641 | |
4.50%, 3/1/39 | | | | | 692 | | | | 737,707 | |
4.50%, 4/1/39 | | | | | 59 | | | | 63,282 | |
| | | | | | | | | | |
| | | Country
Code* | | Principal
Amount
(000) | | | Value | |
| | | | | | | | | | |
| | | | | | | | | | |
4.50%, 5/1/39 | | | | $ | 1,021 | | | $ | 1,087,451 | |
4.50%, 6/1/39 | | | | | 43 | | | | 45,991 | |
4.50%, 8/1/39 | | | | | 599 | | | | 638,019 | |
4.50%, 11/1/39 | | | | | 10,328 | | | | 10,999,994 | |
4.50%, 1/1/40 | | | | | 608 | | | | 647,779 | |
4.50%, 7/1/40 | | | | | 901 | | | | 959,989 | |
4.50%, 8/1/40 | | | | | 134,601 | | | | 143,249,808 | |
4.50%, 9/1/40 | | | | | 528 | | | | 562,521 | |
4.50%, 10/1/40 | | | | | 2,400 | | | | 2,556,594 | |
4.50%, 11/1/40 | | | | | 930 | | | | 990,324 | |
4.50%, 5/1/41 | | | | | 41,858 | | | | 44,578,299 | |
4.50%, TBA (6) | | | | | 16,000 | | | | 17,025,000 | |
5.00%, 4/1/38 | | | | | 67 | | | | 71,985 | |
5.00%, 6/1/38 | | | | | 92 | | | | 99,845 | |
5.00%, 7/1/38 | | | | | 21 | | | | 22,394 | |
5.00%, 8/1/38 | | | | | 160 | | | | 172,954 | |
5.00%, 1/1/39 | | | | | 509 | | | | 550,225 | |
5.00%, 4/1/39 | | | | | 1,777 | | | | 1,921,487 | |
5.00%, 7/1/40 | | | | | 8,000 | | | | 8,652,069 | |
5.00%, 6/1/41 | | | | | 953 | | | | 1,030,918 | |
5.00%, TBA (6) | | | | | 2,000 | | | | 2,160,625 | |
5.50%, 8/1/33 | | | | | 31 | | | | 34,497 | |
5.50%, 2/1/34 | | | | | 9 | | | | 10,060 | |
5.50%, 4/1/34 | | | | | 94 | | | | 103,144 | |
5.50%, 4/1/35 | | | | | 18 | | | | 19,312 | |
5.50%, 3/1/36 | | | | | 344 | | | | 375,741 | |
5.50%, 4/1/36 | | | | | 17 | | | | 18,772 | |
5.50%, 8/1/36 | | | | | 11 | | | | 11,588 | |
5.50%, 11/1/36 | | | | | 735 | | | | 802,327 | |
5.50%, 12/1/36 | | | | | 7 | | | | 8,088 | |
5.50%, 5/1/37 | | | | | 16 | | | | 17,524 | |
5.50%, 11/1/37 | | | | | 1,788 | | | | 1,948,275 | |
5.50%, 1/1/38 | | | | | 1,115 | | | | 1,215,003 | |
5.50%, 2/1/38 | | | | | 1,471 | | | | 1,602,973 | |
5.50%, 4/1/38 | | | | | 951 | | | | 1,036,265 | |
5.50%, 5/1/38 | | | | | 995 | | | | 1,084,491 | |
5.50%, TBA (6) | | | | | 6,000 | | | | 6,533,437 | |
6.00%, 8/1/36 | | | | | 288 | | | | 318,184 | |
6.00%, 9/1/36 | | | | | 45 | | | | 49,838 | |
6.00%, 10/1/36 | | | | | 10 | | | | 10,987 | |
6.00%, 12/1/36 | | | | | 126 | | | | 139,452 | |
6.00%, 1/1/37 | | | | | 116 | | | | 127,684 | |
6.00%, 4/1/37 | | | | | 196 | | | | 215,879 | |
6.00%, 5/1/37 | | | | | 39 | | | | 42,570 | |
6.00%, 8/1/37 | | | | | 589 | | | | 649,466 | |
6.00%, 9/1/37 | | | | | 1,662 | | | | 1,832,503 | |
6.00%, 10/1/37 | | | | | 744 | | | | 820,595 | |
6.00%, 11/1/37 | | | | | 1,045 | | | | 1,153,168 | |
6.00%, 12/1/37 | | | | | 4,078 | | | | 4,495,196 | |
See Notes to Financial Statements.
259
SC SM PIMCO TOTAL RETURN FUND
| | |
PORTFOLIOOF INVESTMENTS (Continued) December 31, 2011 | | Sun Capital Advisers Trust |
| | | | | | | | | | |
| | | Country
Code* | | Principal
Amount
(000) | | | Value | |
| | | | | | | | | | |
| | | | | | | | | | |
6.00%, 1/1/38 | | | | $ | 1,117 | | | $ | 1,230,495 | |
6.00%, 3/1/38 | | | | | 350 | | | | 385,504 | |
6.00%, 4/1/38 | | | | | 140 | | | | 154,240 | |
6.00%, 5/1/38 | | | | | 38 | | | | 41,495 | |
6.00%, 6/1/38 | | | | | 366 | | | | 403,287 | |
6.00%, 8/1/38 | | | | | 816 | | | | 900,037 | |
6.00%, 9/1/38 | | | | | 1,639 | | | | 1,806,569 | |
6.00%, 10/1/38 | | | | | 189 | | | | 208,056 | |
6.00%, 11/1/38 | | | | | 366 | | | | 403,358 | |
6.00%, 12/1/38 | | | | | 651 | | | | 719,160 | |
6.00%, 1/1/39 | | | | | 22 | | | | 24,411 | |
6.00%, 3/1/39 | | | | | 35 | | | | 38,879 | |
6.00%, 7/1/39 | | | | | 62 | | | | 68,856 | |
6.00%, 9/1/39 | | | | | 163 | | | | 179,778 | |
6.00%, 4/1/40 | | | | | 264 | | | | 291,519 | |
6.00%, TBA (6) | | | | | 21,400 | | | | 23,563,407 | |
6.50%, 9/1/37 | | | | | 1,586 | | | | 1,774,996 | |
| | | | | | | | | | |
Total U.S. Government Agency Obligations
(Cost $472,210,817) | | | | 478,815,082 | |
| | | | | | | | | | |
U.S. TREASURY OBLIGATIONS – 26.3% | |
U.S. Treasury Inflation Indexed Bonds
0.63%, 7/15/21 | | | | | 8,138 | | | | 8,705,571 | |
1.13%, 1/15/21 (7) | | | | | 10,248 | | | | 11,428,570 | |
1.25%, 7/15/20 | | | | | 3,115 | | | | 3,523,211 | |
1.38%, 1/15/20 | | | | | 8,901 | | | | 10,134,079 | |
1.75%, 1/15/28 (9) | | | | | 3,675 | | | | 4,419,383 | |
2.00%, 1/15/26 | | | | | 9,697 | | | | 11,920,222 | |
2.38%, 1/15/25 | | | | | 1,682 | | | | 2,138,223 | |
2.38%, 1/15/27 (7) | | | | | 6,176 | | | | 7,975,714 | |
2.50%, 1/15/29 (9) | | | | | 4,746 | | | | 6,331,793 | |
U.S. Treasury Notes
0.25%, 12/15/14 | | | | | 17,600 | | | | 17,542,254 | |
0.88%, 12/31/16 (6) | | | | | 8,900 | | | | 8,915,993 | |
1.38%, 12/31/18 (6) | | | | | 28,100 | | | | 28,152,687 | |
1.38%, 11/30/18 | | | | | 2,400 | | | | 2,408,251 | |
1.50%, 8/31/18 (7) | | | | | 10,000 | | | | 10,146,090 | |
2.00%, 11/15/21 | | | | | 300 | | | | 303,422 | |
2.63%, 8/15/20 | | | | | 16,500 | | | | 17,795,514 | |
2.63%, 11/15/20 (7) | | | | | 23,400 | | | | 25,191,551 | |
3.00%, 2/28/17 (6)(7)(9) | | | | | 52,200 | | | | 57,729,964 | |
3.38%, 11/15/19 | | | | | 1,800 | | | | 2,051,860 | |
3.50%, 5/15/20 | | | | | 7,500 | | | | 8,627,932 | |
3.63%, 2/15/20 | | | | | 8,300 | | | | 9,626,058 | |
3.63%, 2/15/21 (6)(7)(9) | | | | | 22,100 | | | | 25,658,454 | |
| | | | | | | | | | |
Total U.S. Treasury Obligations
(Cost $274,694,022) | | | | 280,726,796 | |
| | | | | | | | | | |
| | | | | | | | | | | | |
| | | Country
Code* | | | Shares | | | Value | |
| | | | | | | | | | | | |
| | | | | | | | | | | | |
CONVERTIBLE PREFERRED STOCKS – 0.0% + | |
BANKS – 0.0% + | | | | | | | | | | | | |
Wells Fargo & Co.,
Series L
7.50%, 12/31/49
(Cost $129,360) | | | | | | | 200 | | | $ | 212,900 | |
| | | | | | | | | | | | |
PREFERRED STOCKS – 0.3% | |
BANKS – 0.3% | | | | | | | | | | | | |
Citigroup, Inc.,
Series 1
6.15%, 12/15/12
(Cost $2,963,790) | | | | | | | 405,000 | | | | 2,890,080 | |
| | | | | | | | | | | | |
| | | | | | Notional
Amount
(000) | | | | |
PURCHASED OPTIONS – 0.0% + | |
CALL SWAPTIONS – 0.0% + | | | | | |
OTC -1 Year Interest Rate Swap, exercise rate 1.25%, expires 4/30/12
(Cost $172,998) | | | | | | | 45,600 | | | | 246,755 | |
| | | | | | | | | | | | |
| | | | | | Principal
Amount
(000) | | | | |
SHORT TERM INVESTMENTS – 6.8% | |
CERTIFICATES OF DEPOSIT – 1.1% | |
BANKS – 1.1% | | | | | | | | | | | | |
Abbey National Treasury Services PLC
1.89%, 6/10/13 (1) | | | GB | | | $ | 2,500 | | | | 2,495,665 | |
Banco do Brasil SA
0.00%, 2/15/12 (4) | | | BR | | | | 3,800 | | | | 3,792,613 | |
Itau Unibanco SA New York
1.00%, 2/6/12 | | | BR | | | | 5,800 | | | | 5,790,586 | |
| | | | | | | | | | | | |
Total Certificates of Deposit
(Cost $12,083,199) | | | | 12,078,864 | |
| | | | | | | | | | | | |
COMMERCIAL PAPER (8) – 3.4% | |
Kells Funding LLC
0.47%, 1/27/12 (2) (Amortized cost $36,087,746) | | | | | | | 36,100 | | | | 36,087,746 | |
| | | | | | | | | | | | |
See Notes to Financial Statements.
260
SC SM PIMCO TOTAL RETURN FUND
| | |
PORTFOLIOOF INVESTMENTS (Continued) December 31, 2011 | | Sun Capital Advisers Trust |
| | | | | | | | | | |
| | | Country
Code* | | Principal
Amount (000) | | | Value | |
| | | | | | | | | | |
| | | | | | | | | | |
U.S. TREASURY OBLIGATIONS (8) – 2.0% | |
U.S. Treasury Bills
0.01%, 1/5/12 (7) | | | | $ | 260 | | | $ | 260,000 | |
0.01%, 4/5/12 (7) | | | | | 550 | | | | 549,972 | |
0.04%, 6/21/12 | | | | | 11,100 | | | | 11,097,147 | |
0.10%, 11/15/12 | | | | | 900 | | | | 899,307 | |
0.10%, 12/13/12 | | | | | 3,300 | | | | 3,296,604 | |
0.18%, 6/28/12 | | | | | 5,000 | | | | 4,998,525 | |
| | | | | | | | | | |
Total U.S. Treasury Obligations
(Cost $21,102,844) | | | | 21,101,555 | |
| | | | | | | | | | |
| | | | | | | | | | |
| | | Country
Code* | | Shares | | | Value | |
| | | | | | | | | | |
| | | | | | | | | | |
MUTUAL FUNDS – 0.3% | | | | | |
State Street Institutional U.S. Government Money Market Fund
(Cost $2,779,528) | | | | | 2,779,528 | | | $ | 2,779,528 | |
| | | | | | | | | | |
Total Short Term Investments
(Cost $72,053,317) | | | | 72,047,693 | |
| | | | | | | | | | |
TOTAL INVESTMENTS – 125.0% | |
(Cost $1,326,786,662) | | | | | | | 1,333,466,395 | |
Liabilities in excess of other assets – (25.0)% | | | | | | | (266,856,395 | ) |
| | | | | | | | | | |
NET ASSETS – 100.0% | | | $ | 1,066,610,000 | |
| | | | | | | | | | |
| | |
| OTC | | Over the Counter |
| SNAT | | Supranational |
| TBA | | To Be Announced. Securities are purchased on a forward commitment basis with an approximate principal amount and no definite maturity date. The actual principal and maturity date will be determined upon settlement when the specific mortgage pools are assigned. At the period end, total market value of the TBA securities amounts to $190,579,412 which represents approximately 17.9% of net assets. At period end, the broker delivered cash of $1,340,000 to the Fund as collateral. |
| AU | | Australia |
| BM | | Bermuda |
| BR | | Brazil |
| CA | | Canada |
| CH | | Switzerland |
| CL | | Chile |
| DE | | Germany |
| DK | | Denmark |
| ES | | Spain |
| FR | | France |
| GB | | Great Britain |
| HK | | Hong Kong |
| IE | | Ireland |
| IN | | India |
| IT | | Italy |
| JP | | Japan |
| KR | | Korea, Republic of |
| KY | | Cayman Islands |
| LU | | Luxembourg |
| MH | | Marshall Islands |
| MX | | Mexico |
| NL | | Netherlands |
| NO | | Norway |
| QA | | Qatar |
| RU | | Russia |
See Notes to Financial Statements.
261
SC SM PIMCO TOTAL RETURN FUND
| | |
PORTFOLIOOF INVESTMENTS (Continued) December 31, 2011 | | Sun Capital Advisers Trust |
| | |
| SE | | Sweden |
| SG | | Singapore |
| TR | | Turkey |
| VG | | British Virgin Islands |
| * | Unless otherwise noted the issuer country code for all securities is United States. |
| + | Amount is less than 0.05%. |
| (1) | Variable rate security. The interest rate shown reflects the rate in effect at the period end. |
| (2) | Eligible for resale under rule 144A or exempt from registration under Section 4(2) of the Securities Act of 1933. These securities may be resold in transactions exempt from registration. At the period end, the value of these securities amounted to $193,187,417, representing 18.1% of net assets. |
| (3) | Security is a “Step-up” bond where the coupon increases on a predetermined future date. |
| (5) | Security is in default and is non-income producing. |
| (6) | Security (or a portion thereof) has been purchased on a delayed delivery or when-issued basis. |
| (7) | At the period end, securities (or portions thereof) with an aggregate market value of $4,814,991 and cash of $37,000 have been pledged as collateral for open swap and swaption contracts. |
| (8) | Interest rates represent annualized yield at date of purchase. |
| (9) | At the period end, securities (or portions thereof) with an aggregate market value of $1,672,973 have been pledged to cover margin requirements for the following open futures contracts: |
| | | | | | | | | | |
Type | | Description | | Expiration
Date | | Contracts | | Unrealized
Appreciation ($) | |
Long | | 90-Day Eurodollar December Futures | | 12/16/13 | | 115 | | | 35,831 | |
Long | | 90-Day Eurodollar June Futures | | 6/17/13 | | 140 | | | 79,637 | |
Long | | 90-Day Eurodollar March Futures | | 3/17/14 | | 180 | | | 230,599 | |
Long | | 90-Day Eurodollar September Futures | | 9/16/13 | | 237 | | | 276,654 | |
Long | | U.S. Treasury 10 Year Note March Futures | | 3/21/12 | | 385 | | | 377,742 | |
Long | | U.S. Treasury 5 Year Note March Futures | | 3/30/12 | | 514 | | | 237,683 | |
| | | | | | | | | | |
Net unrealized appreciation | | | | | | | 1,238,146 | |
| | | | | | | | | | |
| (10) | At the period end, open forward foreign currency exchange contracts were as follows: |
| | | | | | | | | | | | | | | | | | | | | | | | | | |
Counterparty | | | | Contracts to Deliver | | | | | In Exchange For | | | | | Settlement
Date | | | | Unrealized
Appreciation/
(Depreciation) ($) | |
| Bank of America NA | | | | USD | | | 537,450 | | | | | IDR | | | 4,873,600,000 | | | | | 1/31/12 | | | | | (1,325 | ) |
| Barclays Bank PLC* | | | | CAD | | | 355,000 | | | | | USD | | | 344,433 | | | | | 2/9/12 | | | | | (3,761 | ) |
| Barclays Bank PLC* | | | | CAD | | | 300,000 | | | | | USD | | | 289,687 | | | | | 2/9/12 | | | | | (4,561 | ) |
| Barclays Bank PLC* | | | | CAD | | | 512,000 | | | | | USD | | | 501,971 | | | | | 2/9/12 | | | | | (213 | ) |
| Barclays Bank PLC* | | | | CAD | | | 12,622,000 | | | | | USD | | | 12,328,881 | | | | | 2/9/12 | | | | | (51,114 | ) |
| Barclays Bank PLC* | | | | CAD | | | 203,000 | | | | | USD | | | 200,725 | | | | | 2/9/12 | | | | | 1,617 | |
| Barclays Bank PLC* | | | | EUR | | | 659,000 | | | | | USD | | | 856,891 | | | | | 1/17/12 | | | | | 3,923 | |
| Barclays Bank PLC* | | | | EUR | | | 595,000 | | | | | USD | | | 774,387 | | | | | 1/17/12 | | | | | 4,256 | |
| Barclays Bank PLC* | | | | EUR | | | 80,000 | | | | | USD | | | 104,119 | | | | | 1/17/12 | | | | | 572 | |
| Barclays Bank PLC* | | | | EUR | | | 1,522,000 | | | | | USD | | | 2,042,838 | | | | | 1/17/12 | | | | | 72,856 | |
| Barclays Bank PLC* | | | | EUR | | | 1,225,000 | | | | | USD | | | 1,644,202 | | | | | 1/17/12 | | | | | 58,639 | |
| Barclays Bank PLC* | | | | EUR | | | 465,000 | | | | | USD | | | 633,249 | | | | | 1/17/12 | | | | | 31,382 | |
See Notes to Financial Statements.
262
SC SM PIMCO TOTAL RETURN FUND
| | |
PORTFOLIOOF INVESTMENTS (Continued) December 31, 2011 | | Sun Capital Advisers Trust |
| | | | | | | | | | | | | | | | | | | | | | | | | | |
Counterparty | | | | Contracts to Deliver | | | | | In Exchange For | | | | | Settlement
Date | | | | Unrealized
Appreciation/
(Depreciation) ($) | |
| Barclays Bank PLC* | | | | GBP | | | 247,000 | | | | | USD | | | 379,826 | | | | | 3/12/12 | | | | | (3,509 | ) |
| Barclays Bank PLC* | | | | IDR | | | 4,994,000,000 | | | | | USD | | | 556,125 | | | | | 1/31/12 | | | | | 6,755 | |
| Barclays Bank PLC* | | | | IDR | | | 1,640,000,000 | | | | | USD | | | 175,871 | | | | | 7/2/12 | | | | | (2,095 | ) |
| Barclays Bank PLC* | | | | INR | | | 74,280,000 | | | | | USD | | | 1,439,814 | | | | | 7/12/12 | | | | | 84,406 | |
| Barclays Bank PLC* | | | | PHP | | | 70,297,000 | | | | | USD | | | 1,644,567 | | | | | 3/15/12 | | | | | 45,805 | |
| Barclays Bank PLC* | | | | PHP | | | 5,100,000 | | | | | USD | | | 118,605 | | | | | 3/15/12 | | | | | 2,616 | |
| Barclays Bank PLC* | | | | PHP | | | 3,875,500 | | | | | USD | | | 90,212 | | | | | 3/15/12 | | | | | 2,072 | |
| Barclays Bank PLC* | | | | PHP | | | 3,000,000 | | | | | USD | | | 69,930 | | | | | 3/15/12 | | | | | 1,701 | |
| Barclays Bank PLC* | | | | TWD | | | 5,379,780 | | | | | USD | | | 175,724 | | | | | 1/11/12 | | | | | (1,981 | ) |
| Barclays Bank PLC* | | | | USD | | | 200,000 | | | | | CNY | | | 1,278,000 | | | | | 6/1/12 | | | | | 2,684 | |
| Barclays Bank PLC* | | | | USD | | | 1,300,000 | | | | | CNY | | �� | 8,320,390 | | | | | 6/1/12 | | | | | 19,569 | |
| Barclays Bank PLC* | | | | USD | | | 1,974,963 | | | | | EUR | | | 1,437,000 | | | | | 1/17/12 | | | | | (115,000 | ) |
| Barclays Bank PLC* | | | | USD | | | 1,090,119 | | | | | EUR | | | 800,000 | | | | | 1/17/12 | | | | | (54,650 | ) |
| Barclays Bank PLC* | | | | USD | | | 4,075,425 | | | | | EUR | | | 3,014,000 | | | | | 1/17/12 | | | | | (174,293 | ) |
| Barclays Bank PLC* | | | | USD | | | 32,200 | | | | | MXN | | | 449,721 | | | | | 3/15/12 | | | | | (151 | ) |
| Barclays Bank PLC* | | | | USD | | | 7,134,107 | | | | | MXN | | | 99,000,000 | | | | | 3/15/12 | | | | | (79,056 | ) |
| Barclays Bank PLC* | | | | USD | | | 29,079 | | | | | MXN | | | 408,822 | | | | | 3/15/12 | | | | | 55 | |
| Barclays Bank PLC* | | | | USD | | | 294,200 | | | | | TWD | | | 8,431,780 | | | | | 1/11/12 | | | | | (15,682 | ) |
| Barclays Bank PLC* | | | | ZAR | | | 220,050 | | | | | USD | | | 27,229 | | | | | 1/26/12 | | | | | 66 | |
| Citibank NA | | | | AUD | | | 100,000 | | | | | USD | | | 100,802 | | | | | 2/23/12 | | | | | (899 | ) |
| Citibank NA | | | | AUD | | | 299,000 | | | | | USD | | | 298,843 | | | | | 2/23/12 | | | | | (5,242 | ) |
| Citibank NA | | | | AUD | | | 100,000 | | | | | USD | | | 100,802 | | | | | 2/23/12 | | | | | (899 | ) |
| Citibank NA | | | | CAD | | | 625,000 | | | | | USD | | | 604,406 | | | | | 2/9/12 | | | | | (8,611 | ) |
| Citibank NA | | | | CAD | | | 12,000 | | | | | USD | | | 11,571 | | | | | 2/9/12 | | | | | (199 | ) |
| Citibank NA | | | | CAD | | | 310,000 | | | | | USD | | | 298,910 | | | | | 2/9/12 | | | | | (5,147 | ) |
| Citibank NA | | | | CAD | | | 3,000 | | | | | USD | | | 2,917 | | | | | 2/9/12 | | | | | (26 | ) |
| Citibank NA | | | | CAD | | | 300,000 | | | | | USD | | | 293,492 | | | | | 2/9/12 | | | | | (756 | ) |
| Citibank NA | | | | CAD | | | 500,000 | | | | | USD | | | 489,153 | | | | | 2/9/12 | | | | | (1,260 | ) |
| Citibank NA | | | | EUR | | | 860,000 | | | | | USD | | | 1,127,023 | | | | | 1/17/12 | | | | | 13,893 | |
| Citibank NA | | | | EUR | | | 599,000 | | | | | USD | | | 782,471 | | | | | 1/17/12 | | | | | 7,163 | |
| Citibank NA | | | | EUR | | | 2,210,000 | | | | | USD | | | 2,882,695 | | | | | 1/17/12 | | | | | 22,210 | |
| Citibank NA | | | | EUR | | | 191,000 | | | | | USD | | | 264,050 | | | | | 1/17/12 | | | | | 16,832 | |
| Citibank NA | | | | EUR | | | 1,005,000 | | | | | USD | | | 1,343,369 | | | | | 1/17/12 | | | | | 42,561 | |
| Citibank NA | | | | EUR | | | 1,263,000 | | | | | USD | | | 1,693,410 | | | | | 1/17/12 | | | | | 58,663 | |
| Citibank NA | | | | EUR | | | 606,000 | | | | | USD | | | 813,226 | | | | | 1/17/12 | | | | | 28,858 | |
| Citibank NA | | | | EUR | | | 600,000 | | | | | USD | | | 829,477 | | | | | 1/17/12 | | | | | 52,875 | |
| Citibank NA | | | | EUR | | | 300,000 | | | | | USD | | | 404,358 | | | | | 1/17/12 | | | | | 16,057 | |
| Citibank NA | | | | MYR | | | 2,292,718 | | | | | USD | | | 740,781 | | | | | 4/23/12 | | | | | 20,744 | |
| Citibank NA | | | | PHP | | | 3,000,000 | | | | | USD | | | 67,492 | | | | | 3/15/12 | | | | | (737 | ) |
| Citibank NA | | | | PHP | | | 1,000,000 | | | | | USD | | | 22,538 | | | | | 3/15/12 | | | | | (205 | ) |
| Citibank NA | | | | SGD | | | 1,512,335 | | | | | USD | | | 1,183,647 | | | | | 2/10/12 | | | | | 17,715 | |
| Citibank NA | | | | USD | | | 400,000 | | | | | CNY | | | 2,556,080 | | | | | 6/1/12 | | | | | 5,381 | |
| Citibank NA | | | | USD | | | 500,000 | | | | | CNY | | | 3,202,250 | | | | | 6/1/12 | | | | | 7,860 | |
| Citibank NA | | | | USD | | | 100,000 | | | | | CNY | | | 630,650 | | | | | 6/1/12 | | | | | 18 | |
| Citibank NA | | | | USD | | | 100,000 | | | | | CNY | | | 630,450 | | | | | 6/1/12 | | | | | (14 | ) |
| Citibank NA | | | | USD | | | 1,000,000 | | | | | CNY | | | 6,313,000 | | | | | 2/1/13 | | | | | 58 | |
| Citibank NA | | | | USD | | | 592,292 | | | | | EUR | | | 425,000 | | | | | 1/17/12 | | | | | (42,199 | ) |
| Citibank NA | | | | USD | | | 568,368 | | | | | GBP | | | 366,000 | | | | | 1/4/12 | | | | | 30 | |
| Citibank NA | | | | USD | | | 765,004 | | | | | MYR | | | 2,292,718 | | | | | 4/23/12 | | | | | (44,967 | ) |
See Notes to Financial Statements.
263
SC SM PIMCO TOTAL RETURN FUND
| | |
PORTFOLIOOF INVESTMENTS (Continued) December 31, 2011 | | Sun Capital Advisers Trust |
| | | | | | | | | | | | | | | | | | | | | | | | | | |
Counterparty | | | | Contracts to Deliver | | | | | In Exchange For | | | | | Settlement
Date | | | | Unrealized
Appreciation/
(Depreciation) ($) | |
| Citibank NA | | | | USD | | | 2,487,649 | | | | | PHP | | | 108,461,500 | | | | | 3/15/12 | | | | | (20,914 | ) |
| Credit Suisse | | | | CNY | | | 1,277,400 | | | | | USD | | | 200,000 | | | | | 6/1/12 | | | | | (2,589 | ) |
| Credit Suisse | | | | USD | | | 873,372 | | | | | EUR | | | 630,000 | | | | | 1/17/12 | | | | | (57,939 | ) |
| Deutsche Bank AG (London) | | | | EUR | | | 316,000 | | | | | USD | | | 421,373 | | | | | 1/17/12 | | | | | 12,363 | |
| Deutsche Bank AG (London) | | | | INR | | | 25,460,000 | | | | | USD | | | 500,000 | �� | | | | 7/12/12 | | | | | 35,424 | |
| Deutsche Bank AG (London) | | | | USD | | | 404,213 | | | | | CNY | | | 2,552,000 | | | | | 6/1/12 | | | | | 520 | |
| Deutsche Bank AG (London) | | | | USD | | | 4,044,312 | | | | | CNY | | | 25,628,807 | | | | | 2/1/13 | | | | | 15,610 | |
| Deutsche Bank AG (London) | | | | USD | | | 4,278,007 | | | | | EUR | | | 3,273,000 | | | | | 1/17/12 | | | | | (41,642 | ) |
| Deutsche Bank AG (London) | | | | USD | | | 135,727 | | | | | GBP | | | 87,000 | | | | | 3/12/12 | | | | | (706 | ) |
| Deutsche Bank AG (London) | | | | USD | | | 230,947 | | | | | IDR | | | 2,000,000,000 | | | | | 1/31/12 | | | | | (10,935 | ) |
| Goldman Sachs International | | | | CAD | | | 206,000 | | | | | USD | | | 199,893 | | | | | 2/9/12 | | | | | (2,157 | ) |
| Goldman Sachs International | | | | EUR | | | 551,000 | | | | | USD | | | 720,793 | | | | | 1/17/12 | | | | | 7,614 | |
| Goldman Sachs International | | | | IDR | | | 3,466,000,000 | | | | | USD | | | 383,619 | | | | | 1/31/12 | | | | | 2,338 | |
| Goldman Sachs International | | | | IDR | | | 150,760,000 | | | | | USD | | | 16,202 | | | | | 7/2/12 | | | | | (158 | ) |
| Goldman Sachs International | | | | PHP | | | 8,570,000 | | | | | USD | | | 200,000 | | | | | 3/15/12 | | | | | 5,093 | |
| Goldman Sachs International | | | | USD | | | 500,000 | | | | | CNY | | | 3,155,000 | | | | | 2/1/13 | | | | | (209 | ) |
| HSBC Bank PLC | | | | BRL | | | 743,000 | | | | | USD | | | 400,000 | | | | | 1/4/12 | | | | | 1,662 | |
| HSBC Bank PLC | | | | BRL | | | 241,540 | | | | | USD | | | 130,000 | | | | | 1/4/12 | | | | | 505 | |
| HSBC Bank PLC | | | | BRL | | | 999,000 | | | | | USD | | | 540,000 | | | | | 1/4/12 | | | | | 4,415 | |
| HSBC Bank PLC | | | | IDR | | | 3,397,000,000 | | | | | USD | | | 367,243 | | | | | 7/2/12 | | | | | (1,385 | ) |
| HSBC Bank PLC | | | | IDR | | | 7,084,000,000 | | | | | USD | | | 758,499 | | | | | 7/2/12 | | | | | (10,227 | ) |
| HSBC Bank PLC | | | | MXN | | | 5,318,800 | | | | | USD | | | 400,000 | | | | | 3/15/12 | | | | | 20,966 | |
| HSBC Bank PLC | | | | MXN | | | 1,329,550 | | | | | USD | | | 100,000 | | | | | 3/15/12 | | | | | 5,252 | |
| HSBC Bank PLC | | | | MXN | | | 61,970,137 | | | | | USD | | | 4,567,812 | | | | | 3/15/12 | | | | | 151,626 | |
| HSBC Bank PLC | | | | MXN | | | 5,317,400 | | | | | USD | | | 400,000 | | | | | 3/15/12 | | | | | 21,065 | |
| HSBC Bank PLC | | | | MXN | | | 1,329,050 | | | | | USD | | | 100,000 | | | | | 3/15/12 | | | | | 5,288 | |
| HSBC Bank PLC | | | | USD | | | 1,057,437 | | | | | BRL | | | 1,983,540 | | | | | 1/4/12 | | | | | 5,981 | |
| HSBC Bank PLC | | | | USD | | | 200,000 | | | | | CNY | | | 1,278,300 | | | | | 6/1/12 | | | | | 2,731 | |
| HSBC Bank PLC | | | | USD | | | 300,000 | | | | | CNY | | | 1,913,250 | | | | | 6/1/12 | | | | | 3,431 | |
| HSBC Bank PLC | | | | USD | | | 600,000 | | | | | CNY | | | 3,828,000 | | | | | 6/1/12 | | | | | 7,100 | |
| HSBC Bank PLC | | | | USD | | | 100,000 | | | | | CNY | | | 638,350 | | | | | 6/1/12 | | | | | 1,239 | |
| HSBC Bank PLC | | | | USD | | | 200,000 | | | | | CNY | | | 1,278,100 | | | | | 6/1/12 | | | | | 2,700 | |
| HSBC Bank PLC | | | | USD | | | 100,000 | | | | | CNY | | | 639,800 | | | | | 6/1/12 | | | | | 1,469 | |
| HSBC Bank PLC | | | | USD | | | 100,000 | | | | | CNY | | | 639,450 | | | | | 6/1/12 | | | | | 1,413 | |
| HSBC Bank PLC | | | | USD | | | 200,000 | | | | | CNY | | | 1,278,600 | | | | | 6/1/12 | | | | | 2,779 | |
| HSBC Bank PLC | | | | USD | | | 200,000 | | | | | CNY | | | 1,278,500 | | | | | 6/1/12 | | | | | 2,763 | |
| HSBC Bank PLC | | | | USD | | | 234,211 | | | | | IDR | | | 2,047,000,000 | | | | | 1/31/12 | | | | | (9,028 | ) |
| HSBC Bank PLC | | | | USD | | | 1,929,442 | | | | | IDR | | | 17,432,510,000 | | | | | 7/2/12 | | | | | (37,740 | ) |
| HSBC Bank PLC | | | | USD | | | 288,359 | | | | | MXN | | | 4,054,473 | | | | | 3/15/12 | | | | | 575 | |
| JPMorgan Securities** | | | | AUD | | | 193,000 | | | | | USD | | | 190,739 | | | | | 2/23/12 | | | | | (5,543 | ) |
| JPMorgan Securities** | | | | BRL | | | 21,018,254 | | | | | USD | | | 11,254,754 | | | | | 1/4/12 | | | | | (13,576 | ) |
| JPMorgan Securities** | | | | CAD | | | 609,000 | | | | | USD | | | 594,561 | | | | | 2/9/12 | | | | | (2,762 | ) |
| JPMorgan Securities** | | | | CAD | | | 512,000 | | | | | USD | | | 497,764 | | | | | 2/9/12 | | | | | (4,419 | ) |
| JPMorgan Securities** | | | | CAD | | | 5,000 | | | | | USD | | | 4,809 | | | | | 2/9/12 | | | | | (95 | ) |
| JPMorgan Securities** | | | | CAD | | | 728,000 | | | | | USD | | | 699,973 | | | | | 2/9/12 | | | | | (14,069 | ) |
| JPMorgan Securities** | | | | CAD | | | 617,000 | | | | | USD | | | 600,890 | | | | | 2/9/12 | | | | | (4,280 | ) |
| JPMorgan Securities** | | | | CAD | | | 298,000 | | | | | USD | | | 286,168 | | | | | 2/9/12 | | | | | (6,119 | ) |
| JPMorgan Securities** | | | | CAD | | | 1,549,000 | | | | | USD | | | 1,499,995 | | | | | 2/9/12 | | | | | (19,305 | ) |
| JPMorgan Securities** | | | | CAD | | | 310,000 | | | | | USD | | | 304,860 | | | | | 2/9/12 | | | | | 804 | |
See Notes to Financial Statements.
264
SC SM PIMCO TOTAL RETURN FUND
| | |
PORTFOLIOOF INVESTMENTS (Continued) December 31, 2011 | | Sun Capital Advisers Trust |
| | | | | | | | | | | | | | | | | | | | | | | | | | |
Counterparty | | | | Contracts to Deliver | | | | | In Exchange For | | | | | Settlement
Date | | | | Unrealized
Appreciation/
(Depreciation) ($) | |
| JPMorgan Securities** | | | | CAD | | | 177,000 | | | | | USD | | | 173,394 | | | | | 2/9/12 | | | | | (212 | ) |
| JPMorgan Securities** | | | | CAD | | | 339,000 | | | | | USD | | | 334,194 | | | | | 2/9/12 | | | | | 1,694 | |
| JPMorgan Securities** | | | | EUR | | | 1,320,000 | | | | | USD | | | 1,718,534 | | | | | 1/17/12 | | | | | 10,009 | |
| JPMorgan Securities** | | | | EUR | | | 482,000 | | | | | USD | | | 627,525 | | | | | 1/17/12 | | | | | 3,655 | |
| JPMorgan Securities** | | | | EUR | | | 1,647,000 | | | | | USD | | | 2,224,140 | | | | | 1/17/12 | | | | | 92,367 | |
| JPMorgan Securities** | | | | EUR | | | 1,300,000 | | | | | USD | | | 1,755,545 | | | | | 1/17/12 | | | | | 72,907 | |
| JPMorgan Securities** | | | | EUR | | | 61,733,000 | | | | | USD | | | 83,936,817 | | | | | 1/17/12 | | | | | 4,033,506 | |
| JPMorgan Securities** | | | | GBP | | | 126,000 | | | | | USD | | | 196,855 | | | | | 3/12/12 | | | | | 1,307 | |
| JPMorgan Securities** | | | | GBP | | | 14,628,000 | | | | | USD | | | 22,941,458 | | | | | 3/12/12 | | | | | 239,305 | |
| JPMorgan Securities** | | | | INR | | | 20,356,000 | | | | | USD | | | 400,000 | | | | | 7/12/12 | | | | | 28,558 | |
| JPMorgan Securities** | | | | INR | | | 15,400,000 | | | | | USD | | | 302,875 | | | | | 7/12/12 | | | | | 21,867 | |
| JPMorgan Securities** | | | | INR | | | 20,445,000 | | | | | USD | | | 401,670 | | | | | 7/12/12 | | | | | 28,604 | |
| JPMorgan Securities** | | | | PHP | | | 13,272,000 | | | | | USD | | | 300,000 | | | | | 3/15/12 | | | | | (1,844 | ) |
| JPMorgan Securities** | | | | PHP | | | 4,314,500 | | | | | USD | | | 100,000 | | | | | 3/15/12 | | | | | 1,876 | |
| JPMorgan Securities** | | | | PHP | | | 17,688,000 | | | | | USD | | | 400,000 | | | | | 3/15/12 | | | | | (2,277 | ) |
| JPMorgan Securities** | | | | USD | | | 11,204,954 | | | | | BRL | | | 21,018,254 | | | | | 1/4/12 | | | | | 63,376 | |
| JPMorgan Securities** | | | | USD | | | 11,117,828 | | | | | BRL | | | 21,018,254 | | | | | 3/2/12 | | | | | 15,185 | |
| JPMorgan Securities** | | | | USD | | | 400,000 | | | | | CNY | | | 2,552,000 | | | | | 6/1/12 | | | | | 4,733 | |
| JPMorgan Securities** | | | | USD | | | 300,000 | | | | | CNY | | | 1,913,700 | | | | | 6/1/12 | | | | | 3,503 | |
| JPMorgan Securities** | | | | USD | | | 200,000 | | | | | CNY | | | 1,279,600 | | | | | 6/1/12 | | | | | 2,938 | |
| JPMorgan Securities** | | | | USD | | | 1,400,000 | | | | | CNY | | | 8,967,000 | | | | | 6/1/12 | | | | | 22,118 | |
| JPMorgan Securities** | | | | USD | | | 200,000 | | | | | CNY | | | 1,283,400 | | | | | 6/1/12 | | | | | 3,540 | |
| JPMorgan Securities** | | | | USD | | | 400,000 | | | | | CNY | | | 2,566,800 | | | | | 6/1/12 | | | | | 7,081 | |
| JPMorgan Securities** | | | | USD | | | 100,000 | | | | | CNY | | | 641,700 | | | | | 6/1/12 | | | | | 1,770 | |
| JPMorgan Securities** | | | | USD | | | 300,000 | | | | | CNY | | | 1,887,450 | | | | | 6/1/12 | | | | | (661 | ) |
| JPMorgan Securities** | | | | USD | | | 100,000 | | | | | CNY | | | 630,500 | | | | | 6/1/12 | | | | | (6 | ) |
| JPMorgan Securities** | | | | USD | | | 100,000 | | | | | CNY | | | 630,200 | | | | | 6/1/12 | | | | | (54 | ) |
| JPMorgan Securities** | | | | USD | | | 3,355,013 | | | | | INR | | | 155,941,000 | | | | | 7/12/12 | | | | | (509,514 | ) |
| JPMorgan Securities** | | | | USD | | | 208,412 | | | | | ZAR | | | 1,520,050 | | | | | 1/26/12 | | | | | (20,779 | ) |
| JPMorgan Securities** | | | | ZAR | | | 700,000 | | | | | USD | | | 87,058 | | | | | 1/26/12 | | | | | 651 | |
| JPMorgan Securities** | | | | ZAR | | | 600,000 | | | | | USD | | | 74,667 | | | | | 1/26/12 | | | | | 604 | |
| Morgan Stanley & Co., Inc.*** | | | | BRL | | | 371,400 | | | | | USD | | | 200,000 | | | | | 1/4/12 | | | | | 885 | |
| Morgan Stanley & Co., Inc.*** | | | | BRL | | | 1,016,675 | | | | | USD | | | 550,000 | | | | | 1/4/12 | | | | | 4,939 | |
| Morgan Stanley & Co., Inc.*** | | | | BRL | | | 1,017,363 | | | | | USD | | | 539,000 | | | | | 1/4/12 | | | | | (6,430 | ) |
| Morgan Stanley & Co., Inc.*** | | | | BRL | | | 25,407,231 | | | | | USD | | | 13,544,744 | | | | | 1/4/12 | | | | | (76,610 | ) |
| Morgan Stanley & Co., Inc.*** | | | | CAD | | | 200,000 | | | | | USD | | | 193,993 | | | | | 2/9/12 | | | | | (2,172 | ) |
| Morgan Stanley & Co., Inc.*** | | | | EUR | | | 638,000 | | | | | USD | | | 835,008 | | | | | 1/17/12 | | | | | 9,221 | |
| Morgan Stanley & Co., Inc.*** | | | | IDR | | | 5,621,350,000 | | | | | USD | | | 622,382 | | | | | 1/31/12 | | | | | 3,999 | |
| Morgan Stanley & Co., Inc.*** | | | | MXN | | | 21,393,600 | | | | | USD | | | 1,600,000 | | | | | 3/15/12 | | | | | 75,425 | |
| Morgan Stanley & Co., Inc.*** | | | | TWD | | | 3,052,000 | | | | | USD | | | 100,000 | | | | | 1/11/12 | | | | | (814 | ) |
| Morgan Stanley & Co., Inc.*** | | | | USD | | | 1,282,353 | | | | | BRL | | | 2,405,438 | | | | | 1/4/12 | | | | | 7,253 | |
| Morgan Stanley & Co., Inc.*** | | | | USD | | | 14,290,585 | | | | | BRL | | | 25,407,231 | | | | | 1/4/12 | | | | | (669,231 | ) |
| Morgan Stanley & Co., Inc.*** | | | | USD | | | 500,000 | | | | | CNY | | | 3,184,750 | | | | | 6/1/12 | | | | | 5,084 | |
| Morgan Stanley & Co., Inc.*** | | | | USD | | | 100,000 | | | | | CNY | | | 638,750 | | | | | 6/1/12 | | | | | 1,301 | |
| Morgan Stanley & Co., Inc.*** | | | | USD | | | 497,313 | | | | | PHP | | | 21,655,500 | | | | | 3/15/12 | | | | | (4,803 | ) |
| Royal Bank of Canada | | | | CAD | | | 305,000 | | | | | USD | | | 296,759 | | | | | 2/9/12 | | | | | (2,393 | ) |
| Royal Bank of Canada | | | | CAD | | | 518,000 | | | | | USD | | | 500,402 | | | | | 2/9/12 | | | | | (7,666 | ) |
| Royal Bank of Canada | | | | CAD | | | 415,000 | | | | | USD | | | 401,842 | | | | | 2/9/12 | | | | | (5,201 | ) |
| Royal Bank of Canada | | | | CAD | | | 3,681,000 | | | | | USD | | | 3,612,844 | | | | | 2/9/12 | | | | | 2,420 | |
See Notes to Financial Statements.
265
SC SM PIMCO TOTAL RETURN FUND
| | |
PORTFOLIOOF INVESTMENTS (Continued) December 31, 2011 | | Sun Capital Advisers Trust |
| | | | | | | | | | | | | | | | | | | | | | | | | | |
Counterparty | | | | Contracts to Deliver | | | | | In Exchange For | | | | | Settlement
Date | | | | Unrealized
Appreciation/
(Depreciation) ($) | |
| Royal Bank of Canada | | | | EUR | | | 968,000 | | | | | USD | | | 1,278,980 | | | | | 1/17/12 | | | | | 26,061 | |
| Royal Bank of Canada | | | | EUR | | | 787,000 | | | | | USD | | | 1,064,249 | | | | | 1/17/12 | | | | | 45,605 | |
| Royal Bank of Canada | | | | EUR | | | 300,000 | | | | | USD | | | 405,686 | | | | | 1/17/12 | | | | | 17,385 | |
| Royal Bank of Canada | | | | GBP | | | 366,000 | | | | | USD | | | 573,156 | | | | | 1/4/12 | | | | | 4,758 | |
| Royal Bank of Canada | | | | USD | | | 573,011 | | | | | GBP | | | 366,000 | | | | | 2/2/12 | | | | | (4,755 | ) |
| Royal Bank of Scotland PLC | | | | USD | | | 500,000 | | | | | CNY | | | 3,205,500 | | | | | 6/1/12 | | | | | 8,375 | |
| | | | | | | | | | | | | | | | | | | | | | | | | | |
Net unrealized appreciation | | | | | | | | | | | | | | | | | | | | | | | | | 3,646,712 | |
| | | | | | | | | | | | | | | | | | | | | | | | | | |
| * | At the period end, cash of $25,000 has been received as collateral for these open forward foreign currency exchange contracts. |
| ** | At the period end, the broker pledged securities with a fair value of $4,018,763 to the Fund as collateral for these open forward foreign currency exchange contracts. |
| *** | At the period end, cash of $285,000 has been received as collateral for these open forward foreign currency exchange contracts. |
| | | | |
| AUD | | – | | Australian Dollar |
| BRL | | – | | Brazilian Real |
| CAD | | – | | Canadian Dollar |
| CNY | | – | | Yuan Renminbi |
| EUR | | – | | Euro |
| GBP | | – | | Great British Pound |
| IDR | | – | | Indonesian Rupiah |
| INR | | – | | Indian Rupee |
| MXN | | – | | Mexican Peso |
| MYR | | – | | Malaysian Ringgit |
| PHP | | – | | Philippine Peso |
| SGD | | – | | Singapore Dollar |
| TWD | | – | | New Taiwan Dollar |
| USD | | – | | United States Dollar |
| ZAR | | – | | South African Rand |
| (11) | At the period end, open written option contracts were as follows: |
Options on Exchange-Traded Futures Contracts
| | | | | | | | | | | | | | | | |
Type | | Description | | Expiration
Date | | Strike
Price ($) | | | Number of
Contracts | | | Value ($) | |
Put | | 90-Day Eurodollar March Futures | | 3/19/12 | | | 99.000 | | | | 81 | | | | 6,581 | |
| | | | | | | | | | | | | | | | |
Written option contracts (Premium received, $66,210) | | | | | | | | | 81 | | | | 6,581 | |
| | | | | | | | | | | |
See Notes to Financial Statements.
266
SC SM PIMCO TOTAL RETURN FUND
| | |
PORTFOLIOOF INVESTMENTS (Continued) December 31, 2011 | | Sun Capital Advisers Trust |
Inflation Floor Options
| | | | | | | | | | | | | | | | | | |
Description | | Counterparty | | Strike
Index | | Exercise
Index | | Expiration
Date | | | Notional
Amount
(000) ($) | | | Value ($) | |
Floor - OTC CPURNSA Index | | Citibank NA | | 216.687 | | Maximum of [1-(Index Final/Index Initial)] or $0 | | | 4/7/20 | | | | 2,100 | | | | 8,331 | |
Floor - OTC CPURNSA Index | | Citibank NA | | 217.965 | | Maximum of [1-(Index Final/Index Initial)] or $0 | | | 9/29/20 | | | | 1,300 | | | | 5,475 | |
Floor - OTC CPURNSA Index | | Deutsche Bank AG | | 215.949 | | Maximum of [1-(Index Final/Index Initial)] or $0 | | | 3/10/20 | | | | 1,000 | | | | 4,506 | |
| | | | | | | | | | | | | | | | | | |
Written inflation floor options (Premium received, $42,970) | | | | | | | 4,400 | | | | 18,312 | |
| | | | | | | | | |
Interest Rate Swaptions
| | | | | | | | | | | | | | | | | | | | | | |
Type | | Description | | Counterparty | | Pay/Receive
Floating
Rate | | Floating
Rate | | Exercise
Rate | | | Expiration
Date | | Notional
Amount
(000) ($) | | | Value ($) | |
Put | | OTC - 5 Year Interest Rate Swap | | Bank of America
NA | | Pay | | 3-Month
USD-LIBOR | | | 1.70% | | | 8/13/12 | | | 4,600 | | | | 30,330 | |
Put | | OTC - 1 Year Interest Rate Swap | | Bank of America
NA | | Pay | | 3-Month
USD-LIBOR | | | 2.25% | | | 5/28/13 | | | 13,700 | | | | 11,068 | |
Put | | OTC - 2 Year Interest Rate Swap | | Bank of America
NA | | Pay | | 3-Month
USD-LIBOR | | | 2.25% | | | 9/24/12 | | | 7,100 | | | | 2,873 | |
Put | | OTC - 3 Year Interest Rate Swap | | Bank of America
NA | | Pay | | 3-Month
USD-LIBOR | | | 3.00% | | | 6/18/12 | | | 11,000 | | | | 375 | |
Put | | OTC - 3 Year Interest Rate Swap | | Barclays Bank PLC* | | Pay | | 3-Month
USD-LIBOR | | | 3.00% | | | 6/18/12 | | | 8,900 | | | | 303 | |
Put | | OTC - 2 Year Interest Rate Swap | | Citibank NA | | Pay | | 3-Month
USD-LIBOR | | | 0.92% | | | 11/14/12 | | | 3,900 | | | | 13,939 | |
Put | | OTC - 5 Year Interest Rate Swap | | Citibank NA | | Pay | | 3-Month
USD-LIBOR | | | 1.70% | | | 8/13/12 | | | 24,600 | | | | 162,199 | |
Put | | OTC - 2 Year Interest Rate Swap | | Citibank NA | | Pay | | 3-Month
USD-LIBOR | | | 2.25% | | | 9/24/12 | | | 800 | | | | 324 | |
Put | | OTC - 3 Year Interest Rate Swap | | Citibank NA | | Pay | | 3-Month
USD-LIBOR | | | 3.00% | | | 6/18/12 | | | 7,800 | | | | 266 | |
Put | | OTC - 5 Year Interest Rate Swap | | Citibank NA | | Pay | | 3-Month
USD-LIBOR | | | 3.25% | | | 7/16/12 | | | 5,000 | | | | 800 | |
Put | | OTC - 3 Year Interest Rate Swap | | Deutsche Bank AG | | Pay | | 3-Month
USD-LIBOR | | | 1.00% | | | 8/13/12 | | | 4,000 | | | | 20,544 | |
Put | | OTC - 2 Year Interest Rate Swap | | Deutsche Bank AG | | Pay | | 3-Month
USD-LIBOR | | | 1.20% | | | 7/11/13 | | | 10,500 | | | | 59,998 | |
Put | | OTC - 5 Year Interest Rate Swap | | Deutsche Bank AG | | Pay | | 3-Month
USD-LIBOR | | | 1.70% | | | 8/13/12 | | | 20,000 | | | | 131,869 | |
Put | | OTC - 1 Year Interest Rate Swap | | Deutsche Bank AG | | Pay | | 3-Month
USD-LIBOR | | | 1.75% | | | 7/11/13 | | | 68,700 | | | | 94,050 | |
Put | | OTC - 3 Year Interest Rate Swap | | Deutsche Bank AG | | Pay | | 3-Month
USD-LIBOR | | | 2.75% | | | 6/18/12 | | | 6,300 | | | | 408 | |
See Notes to Financial Statements.
267
SC SM PIMCO TOTAL RETURN FUND
| | |
PORTFOLIOOF INVESTMENTS (Continued) December 31, 2011 | | Sun Capital Advisers Trust |
| | | | | | | | | | | | | | | | | | | | | | |
Type | | Description | | Counterparty | | Pay/Receive
Floating
Rate | | Floating
Rate | | Exercise
Rate | | | Expiration
Date | | Notional
Amount
(000) ($) | | | Value ($) | |
Put | | OTC - 3 Year Interest Rate Swap | | Deutsche Bank AG | | Pay | | 3-Month
USD-LIBOR | | | 3.00% | | | 6/18/12 | | | 5,300 | | | | 181 | |
Put | | OTC - 1 Year Interest Rate Swap | | Goldman Sachs Bank** | | Pay | | 3-Month
USD-LIBOR | | | 1.00% | | | 11/19/12 | | | 10,700 | | | | 14,535 | |
Put | | OTC - 5 Year Interest Rate Swap | | Goldman Sachs Bank** | | Pay | | 3-Month
USD-LIBOR | | | 1.70% | | | 8/13/12 | | | 2,200 | | | | 14,505 | |
Put | | OTC - 1 Year Interest Rate Swap | | Goldman Sachs Bank** | | Pay | | 3-Month
USD-LIBOR | | | 2.00% | | | 4/30/12 | | | 66,600 | | | | 3,696 | |
Put | | OTC - 2 Year Interest Rate Swap | | Goldman Sachs Bank** | | Pay | | 3-Month
USD-LIBOR | | | 2.25% | | | 9/24/12 | | | 6,700 | | | | 2,711 | |
Put | | OTC - 2 Year Interest Rate Swap | | Morgan Stanley Capital Services, Inc.*** | | Pay | | 3-Month
USD-LIBOR | | | 0.92% | | | 11/14/12 | | | 27,100 | | | | 96,859 | |
Put | | OTC - 2 Year Interest Rate Swap | | Morgan Stanley Capital Services, Inc.*** | | Pay | | 3-Month
USD-LIBOR | | | 2.25% | | | 9/24/12 | | | 3,500 | | | | 1,416 | |
Put | | OTC - 10 Year Interest Rate Swap | | Morgan Stanley Capital Services, Inc.*** | | Pay | | 3-Month
USD-LIBOR | | | 10.00% | | | 7/10/12 | | | 2,000 | | | | — | |
Put | | OTC - 5 Year Interest Rate Swap | | Royal Bank of Scotland PLC | | Pay | | 3-Month
USD-LIBOR | | | 1.70% | | | 8/13/12 | | | 18,000 | | | | 118,683 | |
Put | | OTC - 1 Year Interest Rate Swap | | Royal Bank of Scotland PLC | | Pay | | 3-Month
USD-LIBOR | | | 1.75% | | | 11/19/12 | | | 12,200 | | | | 6,739 | |
Put | | OTC - 1 Year Interest Rate Swap | | Royal Bank of Scotland PLC | | Pay | | 3-Month
USD-LIBOR | | | 2.00% | | | 4/30/12 | | | 24,600 | | | | 1,365 | |
Put | | OTC - 2 Year Interest Rate Swap | | Royal Bank of Scotland PLC | | Pay | | 3-Month
USD-LIBOR | | | 2.25% | | | 9/24/12 | | | 30,700 | | | | 12,424 | |
Put | | OTC - 3 Year Interest Rate Swap | | Royal Bank of Scotland PLC | | Pay | | 3-Month
USD-LIBOR | | | 2.75% | | | 6/18/12 | | | 5,900 | | | | 382 | |
Put | | OTC - 3 Year Interest Rate Swap | | Royal Bank of Scotland PLC | | Pay | | 3-Month
USD-LIBOR | | | 3.00% | | | 6/18/12 | | | 14,900 | | | | 508 | |
Put | | OTC - 5 Year Interest Rate Swap | | Royal Bank of Scotland PLC | | Pay | | 3-Month
USD-LIBOR | | | 3.25% | | | 7/16/12 | | | 1,700 | | | | 272 | |
| | | | | | | | | | | | | | | | | | | | | | |
Written swaptions (Premium received, $3,016,754) | | | | | | | | | | | 429,000 | | | | 803,622 | |
| | | | | | | | | | | | | | | | |
| | | | |
| CPURNSA | | – | | Consumer Price All Urban Non-Seasonally Adjusted Index |
| LIBOR | | – | | London Interbank Offered Rate |
| OTC | | – | | Over the Counter |
| USD | | – | | United States Dollar |
See Notes to Financial Statements.
268
SC SM PIMCO TOTAL RETURN FUND
| | |
PORTFOLIOOF INVESTMENTS (Continued) December 31, 2011 | | Sun Capital Advisers Trust |
| (12) | At the period end, open swap contracts were as follows: |
Centrally Cleared Interest Rate Swap Contracts
| | | | | | | | | | | | | | | | | | |
Pay/Receive
Floating Rate | | Floating Rate
Index | | Fixed
Rate | | Expiration
Date | | Notional
Amount
(000) ($) | | | Market
Value ($) | | | Unrealized
Appreciation ($) | |
| Pay | | 6-Month EUR-EURIBOR | | 3.65% | | 9/21/21 | | | 1,294 | | | | 151,752 | | | | 27,529 | |
| Pay | | 6-Month EUR-EURIBOR | | 2.50% | | 3/21/22 | | | 13,719 | | | | 117,622 | | | | 462,084 | |
| Pay | | 6-Month EUR-EURIBOR | | 2.75% | | 3/21/22 | | | 19,155 | | | | 605,011 | | | | 427,256 | |
| Pay | | 6-Month EUR-EURIBOR | | 3.00% | | 3/21/22 | | | 12,813 | | | | 699,552 | | | | 186,551 | |
| | | | | | | | | | | | | | | | | | |
Total | | | | | | | | | 46,981 | | | | 1,573,937 | | | | 1,103,420 | |
| | | | | | | | | | | | | | | | | | |
OTC Interest Rate Swap Contracts
| | | | | | | | | | | | | | | | | | | | | | | | |
Counterparty | | Pay/
Receive
Floating
Rate | | Floating Rate Index | | Fixed
Rate | | Expiration
Date | | | Notional
Amount
(000) ($) | | | Market
Value ($) | | Upfront
Premiums
Paid/
(Received) ($) | | | Unrealized
Appreciation/
(Depreciation) ($) | |
| Barclays Bank PLC* | | Pay | | BRL- BZDIOVRA | | 12.455% | | | 1/2/13 | | | | 965 | | | 22,472 | | | 881 | | | | 21,591 | |
| Barclays Bank PLC* | | Pay | | MXN-TIIE- Banxico | | 5.60% | | | 9/6/16 | | | | 150 | | | (1,285) | | | 1,056 | | | | (2,341 | ) |
| Barclays Bank PLC* | | Pay | | 6-Month AUD-BBR BBSW | | 4.25% | | | 6/15/17 | | | | 307 | | | (1,004) | | | (294 | ) | | | (710 | ) |
| Barclays Bank PLC* | | Pay | | 6-Month EUR-EURIBOR | | 2.50% | | | 9/21/18 | | | | 1,035 | | | 31,661 | | | (13,452 | ) | | | 45,113 | |
| Barclays Bank PLC* | | Pay | | 6-Month EUR-EURIBOR | | 3.50% | | | 9/21/21 | | | | 6,083 | | | 617,086 | | | 25,155 | | | | 591,931 | |
| Barclays Bank PLC* | | Pay | | 6-Month EUR-EURIBOR | | 3.00% | | | 9/21/21 | | | | 3,106 | | | 177,882 | | | 22,804 | | | | 155,078 | |
| Barclays Bank PLC* | | Pay | | 6-Month GBP-LIBOR | | 3.00% | | | 3/21/22 | | | | 932 | | | 56,458 | | | 10,692 | | | | 45,766 | |
| Barclays Bank PLC* | | Pay | | 6-Month EUR-EURIBOR | | 2.50% | | | 3/21/22 | | | | 2,330 | | | 19,001 | | | (57,509 | ) | | | 76,510 | |
| Deutsche Bank AG | | Pay | | 6-Month AUD-BBR BBSW | | 4.25% | | | 6/15/17 | | | | 511 | | | (1,674) | | | (274 | ) | | | (1,400 | ) |
| Goldman Sachs Bank** | | Pay | | BRL- BZDIOVRA | | 12.65% | | | 1/2/14 | | | | 536 | | | 31,390 | | | 6,547 | | | | 24,843 | |
| Goldman Sachs Bank** | | Pay | | U.S. Federal Fund Rate | | 0.50% | | | 9/19/14 | | | | 2,700 | | | 11,965 | | | (11,529 | ) | | | 23,494 | |
| HSBC Bank USA, NA**** | | Pay | | MXN-TIIE- Banxico | | 5.60% | | | 9/6/16 | | | | 279 | | | (2,386) | | | 1,530 | | | | (3,916 | ) |
| HSBC Bank USA, NA**** | | Pay | | 6-Month GBP-LIBOR | | 3.00% | | | 3/21/22 | | | | 8,231 | | | 498,712 | | | 232,447 | | | | 266,265 | |
| Morgan Stanley Capital Services, Inc.*** | | Pay | | BRL- BZDIOVRA | | 12.59% | | | 1/2/13 | | | | 107 | | | 4,254 | | | 273 | | | | 3,981 | |
| Morgan Stanley Capital Services, Inc.*** | | Pay | | BRL- BZDIOVRA | | 12.50% | | | 1/2/13 | | | | 2,091 | | | 49,988 | | | 2,964 | | | | 47,024 | |
See Notes to Financial Statements.
269
SC SM PIMCO TOTAL RETURN FUND
| | |
PORTFOLIOOF INVESTMENTS (Continued) December 31, 2011 | | Sun Capital Advisers Trust |
| | | | | | | | | | | | | | | | | | | | | | | | | | |
Counterparty | | Pay/
Receive
Floating
Rate | | Floating
Rate Index | | Fixed
Rate | | Expiration
Date | | | Notional
Amount
(000) ($) | | | Market
Value ($) | | | Upfront
Premiums
Paid/
(Received) ($) | | | Unrealized
Appreciation/
(Depreciation) ($) | |
| Morgan Stanley Capital Services, Inc.*** | | Pay | | U.S. Federal Fund Rate | | 0.50% | | | 9/19/13 | | | | 13,300 | | | | 44,461 | | | | (17,290 | ) | | | 61,751 | |
| Morgan Stanley Capital Services, Inc.*** | | Pay | | BRL- BZDIOVRA | | 12.51% | | | 1/2/14 | | | | 536 | | | | 29,331 | | | | 4,601 | | | | 24,730 | |
| Morgan Stanley Capital Services, Inc.*** | | Pay | | BRL- BZDIOVRA | | 12.54% | | | 1/2/14 | | | | 1,716 | | | | 59,530 | | | | (2,173 | ) | | | 61,703 | |
| Morgan Stanley Capital Services, Inc.*** | | Pay | | MXN-TIIE- Banxico | | 5.60% | | | 9/6/16 | | | | 215 | | | | (1,835) | | | | 600 | | | | (2,435 | ) |
| Morgan Stanley Capital Services, Inc.*** | | Pay | | MXN-TIIE- Banxico | | 6.35% | | | 6/2/21 | | | | 222 | | | | (6,030) | | | | 734 | | | | (6,764 | ) |
| Royal Bank of Scotland PLC | | Pay | | 3-Month CAD-CDOR | | 5.70% | | | 12/18/24 | | | | 3,141 | | | | 246,068 | | | | (2,193 | ) | | | 248,261 | |
| | | | | | | | | | | | | | | | | | | | | | | | | | |
Total | | | | | | | | | | | | | 48,493 | | | | 1,886,045 | | | | 205,570 | | | | 1,680,475 | |
| | | | | | | | | | | | | | | | | | | | | | | | | | |
| | | | |
| AUD | | – | | Australian Dollar |
| BBR BBSW | | – | | Bank Bill Swap Reference Rate |
| BRL | | – | | Brazilian Real |
| BZDIOVRA | | – | | Brazilian Interbank Deposit Rate Over |
| CAD | | – | | Canadian Dollar |
| CDOR | | – | | Canadian Deposit Offered Rate |
| EUR | | – | | Euro |
| EURIBOR | | – | | Euro Interbank Offered Rate |
| GBP | | – | | Great British Pound |
| LIBOR | | – | | London Interbank Offered Rate |
| MXN | | – | | Mexican Peso |
| TIIE | | – | | Tasa de Interes Interbancaria de Equilibrio (Interbank Equilibrium Interest Rate) |
OTC Credit Default Swap Contracts on Corporate Issues – Buy Protection (a)
| | | | | | | | | | | | | | | | | | | | |
Counterparty | | Reference
Entity | | (Pay)/
Receive
Fixed
Rate | | Expiration
Date | | Implied
Credit
Spread (b) | | | Notional
Amount (c)
(000) ($) | | | Market
Value ($) | | Unrealized
Depreciation ($) | |
| Barclays Bank PLC* | | Tate & Lyle International Finance PLC | | (1.15%) | | 6/20/16 | | | 0.83% | | | | 500 | | | (7,011) | | | (7,011 | ) |
See Notes to Financial Statements.
270
SC SM PIMCO TOTAL RETURN FUND
| | |
PORTFOLIOOF INVESTMENTS (Continued) December 31, 2011 | | Sun Capital Advisers Trust |
OTC Credit Default Swap Contracts on Corporate and Sovereign Issues – Sell Protection (a)
| | | | | | | | | | | | | | | | | | | | | | | | |
Counterparty | | Reference Entity | | (Pay)/
Receive
Fixed
Rate | | Expiration
Date | | Implied
Credit
Spread (b) | | | Notional
Amount (c)
(000) ($) | | | Market
Value ($) | | Upfront
Premiums
Paid/
(Received) ($) | | | Unrealized
Appreciation/
(Depreciation) ($) | |
| Bank of America NA | | Berkshire Hathaway Finance | | 1.00% | | 3/20/21 | | | 2.02% | | | | 2,500 | | | (194,696) | | | (81,066 | ) | | | (113,630 | ) |
| Bank of America NA | | Credit Agricole SA | | 1.00% | | 6/20/16 | | | 5.57% | | | | 906 | | | (156,585) | | | (74,323 | ) | | | (82,262 | ) |
| Bank of America NA | | General Electric Capital Corp. | | 1.00% | | 12/20/15 | | | 2.36% | | | | 500 | | | (25,125) | | | (10,025 | ) | | | (15,100 | ) |
| Bank of America NA | | General Electric Capital Corp. | | 1.00% | | 12/20/15 | | | 2.36% | | | | 500 | | | (25,125) | | | (9,796 | ) | | | (15,329 | ) |
| Bank of America NA | | General Electric Capital Corp. | | 1.00% | | 3/20/16 | | | 2.40% | | | | 10,400 | | | (569,873) | | | (115,798 | ) | | | (454,075 | ) |
| Bank of America NA | | Indonesian Government Bond | | 1.00% | | 9/20/16 | | | 1.97% | | | | 1,300 | | | (55,646) | | | (19,903 | ) | | | (35,743 | ) |
| Bank of America NA | | Japan Government Bond | | 1.00% | | 3/20/16 | | | 1.30% | | | | 100 | | | (1,213) | | | 1,440 | | | | (2,653 | ) |
| Bank of America NA | | Japan Government Bond | | 1.00% | | 3/20/16 | | | 1.30% | | | | 200 | | | (2,426) | | | 2,676 | | | | (5,102 | ) |
| Bank of America NA | | Metlife, Inc. | | 1.00% | | 12/20/15 | | | 3.08% | | | | 600 | | | (45,376) | | | (21,812 | ) | | | (23,564 | ) |
| Bank of America NA | | Metlife, Inc. | | 1.00% | | 12/20/15 | | | 3.08% | | | | 900 | | | (68,063) | | | (50,283 | ) | | | (17,780 | ) |
| Bank of America NA | | Prudential Financial, Inc. | | 1.00% | | 12/20/15 | | | 2.52% | | | | 700 | | | (39,357) | | | (20,428 | ) | | | (18,929 | ) |
| Bank of America NA | | Spain Government Bond | | 1.00% | | 3/20/16 | | | 3.76% | | | | 100 | | | (10,241) | | | (6,562 | ) | | | (3,679 | ) |
| Bank of America NA | | Spain Government Bond | | 1.00% | | 3/20/16 | | | 3.76% | | | | 4,900 | | | (501,820) | | | (323,602 | ) | | | (178,218 | ) |
| Barclays Bank PLC* | | Brazilian Government Bond | | 1.00% | | 6/20/15 | | | 1.29% | | | | 500 | | | (4,945) | | | (7,190 | ) | | | 2,245 | |
| Barclays Bank PLC* | | Brazilian Government Bond | | 1.00% | | 12/20/16 | | | 1.57% | | | | 3,600 | | | (96,664) | | | (90,671 | ) | | | (5,993 | ) |
| Barclays Bank PLC* | | China Government Bond | | 1.00% | | 3/20/16 | | | 1.27% | | | | 1,000 | | | (11,027) | | | 11,950 | | | | (22,977 | ) |
| Barclays Bank PLC* | | France Government Bond | | 0.25% | | 9/20/16 | | | 2.10% | | �� | | 100 | | | (8,071) | | | (6,115 | ) | | | (1,956 | ) |
| Barclays Bank PLC* | | Italy Republic Bond | | 1.00% | | 3/20/16 | | | 4.89% | | | | 800 | | | (110,282) | | | (31,136 | ) | | | (79,146 | ) |
| Barclays Bank PLC* | | Italy Republic Bond | | 1.00% | | 3/20/16 | | | 4.89% | | | | 3,900 | | | (537,626) | | | (138,949 | ) | | | (398,677 | ) |
| Barclays Bank PLC* | | United Mexican States, Series A | | 1.00% | | 3/20/15 | | | 1.16% | | | | 400 | | | (2,022) | | | (8,999 | ) | | | 6,977 | |
| Barclays Bank PLC* | | United Mexican States, Series A | | 1.00% | | 9/20/15 | | | 1.27% | | | | 3,300 | | | (32,138) | | | (44,617 | ) | | | 12,479 | |
| Citibank NA | | Brazilian Government Bond | | 1.00% | | 9/20/15 | | | 1.34% | | | | 1,000 | | | (12,192) | | | (15,694 | ) | | | 3,502 | |
| Citibank NA | | Brazilian Government Bond | | 1.00% | | 3/20/16 | | | 1.41% | | | | 1,400 | | | (23,341) | | | (26,562 | ) | | | 3,221 | |
See Notes to Financial Statements.
271
SC SM PIMCO TOTAL RETURN FUND
| | |
PORTFOLIOOF INVESTMENTS (Continued) December 31, 2011 | | Sun Capital Advisers Trust |
| | | | | | | | | | | | | | | | | | | | | | | | |
Counterparty | | Reference Entity | | (Pay)/
Receive
Fixed
Rate | | Expiration
Date | | Implied
Credit
Spread (b) | | | Notional
Amount (c)
(000) ($) | | | Market
Value ($) | | Upfront
Premiums
Paid/
(Received) ($) | | | Unrealized
Appreciation/
(Depreciation) ($) | |
| Citibank NA | | China Government Bond | | 1.00% | | 6/20/16 | | | 1.33% | | | | 1,400 | | | (19,817) | | | 15,095 | | | | (34,912 | ) |
| Citibank NA | | France Government Bond | | 0.25% | | 9/20/16 | | | 2.10% | | | | 3,100 | | | (250,194) | | | (209,892 | ) | | | (40,302 | ) |
| Citibank NA | | Italy Republic Bond | | 1.00% | | 3/20/16 | | | 4.89% | | | | 3,300 | | | (454,914) | | | (426,720 | ) | | | (28,194 | ) |
| Citibank NA | | Kazakhstan Government Bond | | 1.00% | | 3/20/16 | | | 2.87% | | | | 300 | | | (22,083) | | | (8,658 | ) | | | (13,425 | ) |
| Citibank NA | | Metlife, Inc. | | 1.00% | | 12/20/15 | | | 3.08% | | | | 800 | | | (60,501) | | | (29,083 | ) | | | (31,418 | ) |
| Citibank NA | | United Mexican States, Series A | | 1.00% | | 3/20/15 | | | 1.16% | | | | 400 | | | (2,023) | | | (9,184 | ) | | | 7,161 | |
| Deutsche Bank AG | | Ally Financial Inc. | | 5.00% | | 12/20/16 | | | 6.35% | | | | 600 | | | (29,981) | | | (8,547 | ) | | | (21,434 | ) |
| Deutsche Bank AG | | Ally Financial Inc. | | 5.00% | | 12/20/16 | | | 6.35% | | | | 1,200 | | | (59,962) | | | (42,000 | ) | | | (17,962 | ) |
| Deutsche Bank AG | | Brazilian Government Bond | | 1.00% | | 6/20/15 | | | 1.29% | | | | 500 | | | (4,945) | | | (4,780 | ) | | | (165 | ) |
| Deutsche Bank AG | | Brazilian Government Bond | | 1.00% | | 12/20/15 | | | 1.38% | | | | 6,200 | | | (89,550) | | | (35,105 | ) | | | (54,445 | ) |
| Deutsche Bank AG | | China Government Bond | | 1.00% | | 9/20/16 | | | 1.38% | | | | 400 | | | (6,894) | | | 2,210 | | | | (9,104 | ) |
| Deutsche Bank AG | | China Government Bond | | 1.00% | | 6/20/16 | | | 1.33% | | | | 800 | | | (11,324) | | | 8,612 | | | | (19,936 | ) |
| Deutsche Bank AG | | Japan Government Bond | | 1.00% | | 3/20/15 | | | 1.11% | | | | 700 | | | (2,377) | | | 8,131 | | | | (10,508 | ) |
| Deutsche Bank AG | | Kazakhstan Government Bond | | 1.00% | | 3/20/16 | | | 2.87% | | | | 300 | | | (22,083) | | | (9,075 | ) | | | (13,008 | ) |
| Deutsche Bank AG | | Merrill Lynch & Co., Inc. | | 1.00% | | 3/20/16 | | | 4.69% | | | | 1,500 | | | (196,506) | | | (31,933 | ) | | | (164,573 | ) |
| Deutsche Bank AG | | Metlife, Inc. | | 1.00% | | 3/20/18 | | | 3.36% | | | | 2,600 | | | (320,852) | | | (147,690 | ) | | | (173,162 | ) |
| Deutsche Bank AG | | United Mexican States, Series A | | 1.00% | | 3/20/15 | | | 1.16% | | | | 200 | | | (1,011) | | | (4,592 | ) | | | 3,581 | |
| Deutsche Bank AG | | United Mexican States, Series A | | 1.00% | | 9/20/15 | | | 1.27% | | | | 3,000 | | | (29,216) | | | (40,561 | ) | | | 11,345 | |
| Goldman Sachs International** | | Brazilian Government Bond | | 1.00% | | 9/20/16 | | | 1.52% | | | | 400 | | | (9,412) | | | (2,435 | ) | | | (6,977 | ) |
| Goldman Sachs International** | | Brazilian Government Bond | | 1.00% | | 6/20/15 | | | 1.29% | | | | 500 | | | (4,946) | | | (6,716 | ) | | | 1,770 | |
| Goldman Sachs International** | | France Government Bond | | 0.25% | | 9/20/16 | | | 2.10% | | | | 300 | | | (24,212) | | | (15,221 | ) | | | (8,991 | ) |
| Goldman Sachs International** | | France Government Bond | | 0.25% | | 12/20/16 | | | 2.14% | | | | 4,500 | | | (388,159) | | | (336,397 | ) | | | (51,762 | ) |
| Goldman Sachs International** | | Italy Republic Bond | | 1.00% | | 3/20/16 | | | 4.89% | | | | 200 | | | (27,570) | | | (7,694 | ) | | | (19,876 | ) |
| Goldman Sachs International** | | Italy Republic Bond | | 1.00% | | 3/20/16 | | | 4.89% | | | | 1,600 | | | (220,564) | | | (57,984 | ) | | | (162,580 | ) |
See Notes to Financial Statements.
272
SC SM PIMCO TOTAL RETURN FUND
| | |
PORTFOLIOOF INVESTMENTS (Continued) December 31, 2011 | | Sun Capital Advisers Trust |
| | | | | | | | | | | | | | | | | | | | | | | | |
Counterparty | | Reference Entity | | (Pay)/
Receive
Fixed
Rate | | Expiration
Date | | Implied
Credit
Spread (b) | | | Notional
Amount (c)
(000) ($) | | | Market
Value ($) | | Upfront
Premiums
Paid/
(Received) ($) | | | Unrealized
Appreciation/
(Depreciation) ($) | |
| Goldman Sachs International** | | Metlife, Inc. | | 1.00% | | 9/20/15 | | | 3.02% | | | | 1,000 | | | (69,530) | | | (64,375 | ) | | | (5,155 | ) |
| Goldman Sachs International** | | Spain Government Bond | | 1.00% | | 3/20/16 | | | 3.76% | | | | 100 | | | (10,241) | | | (6,645 | ) | | | (3,596 | ) |
| Goldman Sachs International** | | Spain Government Bond | | 1.00% | | 6/20/16 | | | 3.77% | | | | 1,000 | | | (107,757) | | | (60,347 | ) | | | (47,410 | ) |
| Goldman Sachs International** | | United Kingdom Gilt | | 1.00% | | 12/20/15 | | | 0.79% | | | | 500 | | | 4,054 | | | 11,508 | | | | (7,454 | ) |
| Goldman Sachs International** | | United Kingdom Gilt | | 1.00% | | 6/20/15 | | | 0.71% | | | | 900 | | | 8,948 | | | 9,063 | | | | (115 | ) |
| Goldman Sachs International** | | United Kingdom Gilt | | 1.00% | | 12/20/15 | | | 0.79% | | | | 1,000 | | | 8,108 | | | 23,194 | | | | (15,086 | ) |
| Goldman Sachs International** | | United Kingdom Gilt | | 1.00% | | 6/20/15 | | | 0.71% | | | | 2,200 | | | 21,873 | | | 20,327 | | | | 1,546 | |
| HSBC Bank USA, NA**** | | Brazilian Government Bond | | 1.00% | | 9/20/15 | | | 1.34% | | | | 1,200 | | | (14,630) | | | (11,923 | ) | | | (2,707 | ) |
| HSBC Bank USA, NA**** | | Brazilian Government Bond | | 1.00% | | 3/20/16 | | | 1.41% | | | | 2,800 | | | (46,681) | | | (13,144 | ) | | | (33,537 | ) |
| HSBC Bank USA, NA**** | | China Government Bond | | 1.00% | | 6/20/16 | | | 1.33% | | | | 1,500 | | | (21,233) | | | (29,606 | ) | | | 8,373 | |
| HSBC Bank USA, NA**** | | France Government Bond | | 0.25% | | 9/20/16 | | | 2.10% | | | | 200 | | | (16,141) | | | (12,139 | ) | | | (4,002 | ) |
| HSBC Bank USA, NA**** | | Kazakhstan Government Bond | | 1.00% | | 3/20/16 | | | 2.87% | | | | 400 | | | (29,443) | | | (11,729 | ) | | | (17,714 | ) |
| Morgan Stanley Capital Services, Inc.*** | | Brazilian Government Bond | | 1.00% | | 6/20/15 | | | 1.29% | | | | 500 | | | (4,945) | | | (4,839 | ) | | | (106 | ) |
| Morgan Stanley Capital Services, Inc.*** | | Brazilian Government Bond | | 1.00% | | 9/20/15 | | | 1.34% | | | | 4,900 | | | (59,740) | | | (68,592 | ) | | | 8,852 | |
| Morgan Stanley Capital Services, Inc.*** | | California State General Obligation | | 2.25% | | 3/20/21 | | | 2.68% | | | | 2,400 | | | (55,347) | | | — | | | | (55,347 | ) |
| Morgan Stanley Capital Services, Inc.*** | | China Government Bond | | 1.00% | | 9/20/16 | | | 1.38% | | | | 900 | | | (15,511) | | | 4,574 | | | | (20,085 | ) |
| Morgan Stanley Capital Services, Inc.*** | | France Government Bond | | 0.25% | | 3/20/16 | | | 2.00% | | | | 500 | | | (34,588) | | | (17,026 | ) | | | (17,562 | ) |
| Morgan Stanley Capital Services, Inc.*** | | General Electric Capital Corp. | | 1.00% | | 6/20/16 | | | 2.45% | | | | 100 | | | (5,946) | | | (383 | ) | | | (5,563 | ) |
| Morgan Stanley Capital Services, Inc.*** | | United Mexican States, Series A | | 1.00% | | 3/20/16 | | | 1.35% | | | | 2,700 | | | (38,534) | | | (16,616 | ) | | | (21,918 | ) |
| Royal Bank of Scotland PLC | | China Government Bond | | 1.00% | | 6/20/16 | | | 1.33% | | | | 800 | | | (11,324) | | | 8,419 | | | | (19,743 | ) |
See Notes to Financial Statements.
273
SC SM PIMCO TOTAL RETURN FUND
| | |
PORTFOLIOOF INVESTMENTS (Continued) December 31, 2011 | | Sun Capital Advisers Trust |
| | | | | | | | | | | | | | | | | | | | | | | | | | |
Counterparty | | Reference Entity | | (Pay)/
Receive
Fixed
Rate | | Expiration
Date | | Implied
Credit
Spread (b) | | | Notional
Amount (c)
(000) ($) | | | Market
Value ($) | | | Upfront
Premiums
Paid/
(Received) ($) | | | Unrealized
Appreciation/
(Depreciation) ($) | |
| Royal Bank of Scotland PLC | | France Government Bond | | 0.25% | | 3/20/16 | | | 2.00% | | | | 500 | | | | (34,588) | | | | (16,794 | ) | | | (17,794 | ) |
| Royal Bank of Scotland PLC | | France Government Bond | | 0.25% | | 12/20/15 | | | 1.97% | | | | 700 | | | | (45,022) | | | | (13,898 | ) | | | (31,124 | ) |
| Royal Bank of Scotland PLC | | France Government Bond | | 0.25% | | 3/20/16 | | | 2.00% | | | | 6,200 | | | | (428,893) | | | | (190,853 | ) | | | (238,040 | ) |
| Royal Bank of Scotland PLC | | Indonesian Government Bond | | 1.00% | | 9/20/16 | | | 1.97% | | | | 100 | | | | (4,280) | | | | (1,578 | ) | | | (2,702 | ) |
| Royal Bank of Scotland PLC | | Italy Republic
Bond | | 1.00% | | 3/20/16 | | | 4.89% | | | | 3,900 | | | | (537,626) | | | | (140,673 | ) | | | (396,953 | ) |
| | | | | | | | | | | | | | | | | | | | | | | | | | |
Total | | | | | | | | | | | | | 111,406 | | | | (6,341,967 | ) | | | (3,091,759 | ) | | | (3,250,208 | ) |
| | | | | | | | | | | | | | | | | | | | | | | | | | |
OTC Credit Default Swap Contracts on Credit Indices – Sell Protection (a)
| | | | | | | | | | | | | | | | | | | | | | |
Counterparty | | Reference Entity | | (Pay)/
Receive
Fixed
Rate | | Expiration
Date | | Notional
Amount (c)
(000) ($) | | | Market
Value(d) ($) | | | Upfront
Premiums
Paid/
(Received) ($) | | | Unrealized
Depreciation ($) | |
| Bank of America NA | | CDX.EM-14 Index | | 5.00% | | 12/20/15 | | | 5,000 | | | | 395,547 | | | | 685,000 | | | | (289,453 | ) |
| Barclays Bank PLC* | | CDX.EM-13 Index | | 5.00% | | 6/20/15 | | | 6,000 | | | | 445,814 | | | | 769,300 | | | | (323,486 | ) |
| Barclays Bank PLC* | | CDX.EM-14 Index | | 5.00% | | 12/20/15 | | | 900 | | | | 71,199 | | | | 120,900 | | | | (49,701 | ) |
| Barclays Bank PLC* | | CDX.EM-15 Index | | 5.00% | | 6/20/16 | | | 700 | | | | 58,800 | | | | 74,200 | | | | (15,400 | ) |
| Citibank NA | | CDX.EM-14 Index | | 5.00% | | 12/20/15 | | | 3,100 | | | | 245,239 | | | | 418,100 | | | | (172,861 | ) |
| Deutsche Bank AG | | CDX.EM-13 Index | | 5.00% | | 6/20/15 | | | 2,000 | | | | 148,605 | | | | 246,500 | | | | (97,895 | ) |
| Deutsche Bank AG | | CDX.EM-14 Index | | 5.00% | | 12/20/15 | | | 1,000 | | | | 79,109 | | | | 123,600 | | | | (44,491 | ) |
| Deutsche Bank AG | | CDX.EM-15 Index | | 5.00% | | 6/20/16 | | | 300 | | | | 25,200 | | | | 40,650 | | | | (15,450 | ) |
| HSBC Bank USA, NA**** | | CDX.EM-13 Index | | 5.00% | | 6/20/15 | | | 4,100 | | | | 304,639 | | | | 437,590 | | | | (132,951 | ) |
| HSBC Bank USA, NA**** | | CDX.EM-14 Index | | 5.00% | | 12/20/15 | | | 400 | | | | 31,644 | | | | 52,200 | | | | (20,556 | ) |
| Morgan Stanley Capital Services, Inc.*** | | CDX.EM-13 Index | | 5.00% | | 6/20/15 | | | 1,900 | | | | 141,174 | | | | 214,250 | | | | (73,076 | ) |
| Morgan Stanley Capital Services, Inc.*** | | CDX.EM-14 Index | | 5.00% | | 12/20/15 | | | 900 | | | | 71,199 | | | | 117,000 | | | | (45,801 | ) |
| | | | | | | | | | | | | | | | | | | | | | |
Total | | | | | | | | | 26,300 | | | | 2,018,169 | | | | 3,299,290 | | | | (1,281,121 | ) |
| | | | | | | | | | | | | | | | | | | | | | |
| | | | | | | | | | | | | | | | | | |
| CDX.EM | | – | | Credit Derivatives Index – Emerging Markets |
| * | At the period end, cash of $590,000 has been received as collateral for these open swap and written swaption contracts. |
| ** | At the period end, cash of $220,000 has been received as collateral for these open swap and written swaption contracts. |
| *** | At the period end, cash of $170,000 has been received as collateral for these open swap and written swaption contracts. |
| **** | At the period end, cash of $590,000 has been received as collateral for these open swap contracts. |
See Notes to Financial Statements.
274
SC SM PIMCO TOTAL RETURN FUND
| | |
PORTFOLIOOF INVESTMENTS (Continued) December 31, 2011 | | Sun Capital Advisers Trust |
| (a) | If the Fund is a seller of protection and a credit event occurs, as defined under the terms of that particular swap agreement, the Fund will either (i) pay to the buyer of protection an amount equal to the notional amount of the swap and take delivery of the referenced obligation or underlying securities comprising the referenced index or (ii) pay a net settlement amount in the form of cash or securities equal to the notional amount of the swap less the recovery value of the referenced obligation or underlying securities comprising the referenced index. |
| (b) | Implied credit spreads, represented in absolute terms, utilized in determining the market value of credit default swap agreements on corporate and sovereign issues as of period end serve as an indicator of the current status of the payment/performance risk and represent the likelihood or risk of default for the credit derivative. The implied credit spread of a particular referenced entity reflects the cost of buying/selling protection and may include upfront payments required to be made to enter into the agreement. Wider credit spreads represent a deterioration of the referenced entity’s credit soundness and a greater likelihood or risk of default or other credit event occurring as defined under the terms of that particular agreement. |
| (c) | The maximum potential amount the Fund could be required to pay as a seller of credit protection or receive as a buyer of credit protection if a credit event occurs as defined under the terms of that particular swap agreement. |
| (d) | The quoted market prices and resulting values for credit default swap contracts on credit indices serve as an indicator of the current status of the payment/performance risk and represent the likelihood of an expected liability (or profit) for the credit derivative had the notional amount of the swap agreement been closed/sold as of the period end. Increasing market values, in absolute terms when compared to the notional amount of the swap, represent a deterioration of the referenced entity’s credit soundness and a greater likelihood or risk of default or other credit event occurring as defined under the terms of the agreement. |
See Notes to Financial Statements.
275
SC SM PIMCO TOTAL RETURN FUND
| | |
PORTFOLIOOF INVESTMENTS (Continued) December 31, 2011 | | Sun Capital Advisers Trust |
| (13) | Fair Value Measurements † |
The following table summarizes the inputs used to value the Fund’s assets and liabilities, as applicable, measured at fair value at the period end:
| | | | | | | | | | | | | | | | |
Assets | | Quoted
Prices in
Active
Markets for
Identical
Assets and
Liabilities
(Level 1) | | | Significant
Other
Observable
Inputs
(Level 2) | | | Significant
Unobservable
Inputs
(Level 3) | | | Total | |
Asset Backed Securities | | $ | — | | | $ | 23,326,999 | | | $ | — | | | $ | 23,326,999 | |
Collateralized Mortgage Obligations | | | — | | | | 23,280,062 | | | | — | | | | 23,280,062 | |
Commercial Mortgage Backed Securities | | | — | | | | 17,565,727 | | | | — | | | | 17,565,727 | |
Corporate Debt Obligations (a) | | | — | | | | 319,234,762 | | | | — | | | | 319,234,762 | |
Foreign Government Agency Obligations | | | — | | | | 11,487,145 | | | | — | | | | 11,487,145 | |
Foreign Government Obligations | | | — | | | | 63,422,686 | | | | — | | | | 63,422,686 | |
Municipal Bonds | | | — | | | | 40,209,708 | | | | — | | | | 40,209,708 | |
U.S. Government Agency Obligations | | | — | | | | 478,815,082 | | | | — | | | | 478,815,082 | |
U.S. Treasury Obligations | | | 280,726,796 | | | | — | | | | — | | | | 280,726,796 | |
Convertible Preferred Stocks (a) | | | 212,900 | | | | — | | | | — | | | | 212,900 | |
Preferred Stocks (a) | | | — | | | | 2,890,080 | | | | — | | | | 2,890,080 | |
Purchased Options (a) | | | — | | | | 246,755 | | | | — | | | | 246,755 | |
Short Term Investments | | | | | | | | | | | — | | | | | |
Certificates of Deposit (a) | | | — | | | | 12,078,864 | | | | — | | | | 12,078,864 | |
Commercial Paper | | | — | | | | 36,087,746 | | | | — | | | | 36,087,746 | |
U.S. Treasury Obligations | | | 20,841,555 | | | | 260,000 | | | | — | | | | 21,101,555 | |
Mutual Funds | | | 2,779,528 | | | | — | | | | — | | | | 2,779,528 | |
| | | | | | | | | | | | | | | | |
Total Short Term Investments | | | 23,621,083 | | | | 48,426,610 | | | | — | | | | 72,047,693 | |
| | | | | | | | | | | | | | | | |
Total Investments | | | 304,560,779 | | | | 1,028,905,616 | | | | — | | | | 1,333,466,395 | |
| | | | | | | | | | | | | | | | |
Financial Derivative Instruments | | | | | | | | | | | | | | | | |
Futures Contracts | | | 1,238,146 | | | | — | | | | — | | | | 1,238,146 | |
Forward Foreign Currency Exchange Contracts | | | — | | | | 5,846,483 | | | | — | | | | 5,846,483 | |
Swap Contracts (a) | | | — | | | | 5,535,348 | | | | — | | | | 5,535,348 | |
| | | | | | | | | | | | | | | | |
Total Financial Derivative Instruments | | $ | 1,238,146 | | | $ | 11,381,831 | | | $ | — | | | $ | 12,619,977 | |
| | | | | | | | | | | | | | | | |
| | | | |
Liabilities | | | | | | | | | | | | |
Financial Derivative Instruments | | | | | | | | | | | | | | | | |
Forward Foreign Currency Exchange Contracts | | $ | — | | | $ | (2,199,771 | ) | | $ | — | | | $ | (2,199,771 | ) |
Written Option Contracts (a) | | | (6,581 | ) | | | (18,312 | ) | | | — | | | | (24,893 | ) |
Written Swaption Contracts | | | — | | | | (803,622 | ) | | | — | | | | (803,622 | ) |
Swap Contracts (a) | | | — | | | | (6,406,175 | ) | | | — | | | | (6,406,175 | ) |
| | | | | | | | | | | | | | | | |
Total Financial Derivative Instruments | | $ | (6,581 | ) | | $ | (9,427,880 | ) | | $ | — | | | $ | (9,434,461 | ) |
| | | | | | | | | | | | | | | | |
| † | See Note 2b in the Notes to Financial Statements for additional information. |
| (a) | See Portfolio of Investments for additional detailed categorizations. |
See Notes to Financial Statements.
276
SC SM IBBOTSON BALANCED FUND
| | |
PORTFOLIOOF INVESTMENTS December 31, 2011 | | Sun Capital Advisers Trust |
| | | | | | | | |
| | |
Shares (2) | | | Value | |
| | | | | | | | |
| | | | | | | | |
MUTUAL FUNDS (1) – 99.9% | |
MFS Emerging Markets Equity Portfolio | | | 2,647,633 | | | $ | 36,643,241 | |
MFS International Growth Portfolio | | | 5,859,791 | | | | 64,926,479 | |
MFS Value Portfolio | | | 8,132,007 | | | | 102,788,564 | |
SCSM AllianceBernstein International Value Fund | | | 4,879,360 | | | | 37,717,455 | |
SCSM BlackRock Inflation Protected Bond Fund | | | 11,284,426 | | | | 127,965,388 | |
SCSM BlackRock International Index Fund | | | 4,081,698 | | | | 37,061,818 | |
SCSM BlackRock Large Cap Index Fund | | | 8,505,212 | | | | 70,253,054 | |
SCSM BlackRock Small Cap Index Fund | | | 1,514,876 | | | | 18,814,755 | |
SCSM Columbia Small Cap Value Fund | | | 2,847,627 | | | | 23,720,729 | |
SCSM Davis Venture Value Fund | | | 6,081,272 | | | | 66,772,368 | |
SCSM Goldman Sachs Mid Cap Value Fund | | | 6,742,659 | | | | 58,391,430 | |
SCSM Goldman Sachs Short Duration Fund | | | 21,596,581 | | | | 219,853,190 | |
SCSM Ibbotson Tactical Opportunities Fund | | | 37,444,626 | | | | 368,080,672 | |
SCSM Invesco Small Cap Growth Fund | | | 1,748,526 | | | | 18,499,408 | |
SCSM Lord Abbett Growth & Income Fund | | | 5,723,770 | | | | 36,975,551 | |
SCSM PIMCO High Yield Fund | | | 6,013,800 | | | | 55,687,787 | |
SCSM PIMCO Total Return Fund | | | 16,202,915 | | | | 184,551,205 | |
SCSM WMC Blue Chip Mid Cap Fund | | | 4,081,950 | | | | 56,126,819 | |
SCSM WMC Large Cap Growth Fund | | | 8,967,565 | | | | 82,860,303 | |
Sun Capital Global Real Estate Fund | | | 3,791,157 | | | | 36,963,779 | |
Sun Capital Investment Grade Bond Fund® | | | 15,452,076 | | | | 147,412,808 | |
| | | | | | | | |
Total Mutual Funds
(Cost $1,879,548,410) | | | | | | | 1,852,066,803 | |
| | | | | | | | |
| | | | | | |
| | | | | Value | |
| | | | | | |
TOTAL INVESTMENTS – 99.9% | | | | |
(Cost $1,879,548,410) | | | | $ | 1,852,066,803 | |
Other assets less
liabilities – 0.1% | | | | | 1,183,793 | |
| | | | | | |
NET ASSETS – 100.0% | | | | $ | 1,853,250,596 | |
| | | | | | |
| (1) | Sun Capital Advisers LLC® or its affiliate, Massachusetts Financial Services Company (“MFS”), serves as investment adviser to these underlying funds. These are affiliated securities. |
| (2) | Each investment is in the Initial Class Shares. |
| (3) | Fair Value Measurements |
All investments are categorized as Level 1 under the fair value hierarchy. See Note 2b in the Notes to Financial Statements for additional information.
See Notes to Financial Statements.
277
SC SM IBBOTSON CONSERVATIVE FUND
| | |
PORTFOLIOOF INVESTMENTS December 31, 2011 | | Sun Capital Advisers Trust |
| | | | | | | | |
| | |
Shares (2) | | | Value | |
| | | | | | | | |
| | | | | | | | |
MUTUAL FUNDS (1) – 99.9% | |
MFS International Growth Portfolio | | | 2,365,375 | | | $ | 26,208,358 | |
MFS Value Portfolio | | | 3,620,876 | | | | 45,767,867 | |
SCSM AllianceBernstein International Value Fund | | | 2,470,766 | | | | 19,099,021 | |
SCSM BlackRock Inflation Protected Bond Fund | | | 9,922,005 | | | | 112,515,541 | |
SCSM BlackRock International Index Fund | | | 1,577,907 | | | | 14,327,398 | |
SCSM BlackRock Large Cap Index Fund | | | 3,798,288 | | | | 31,373,861 | |
SCSM BlackRock Small Cap Index Fund | | | 778,044 | | | | 9,663,301 | |
SCSM Columbia Small Cap Value Fund | | | 1,174,382 | | | | 9,782,603 | |
SCSM Davis Venture Value Fund | | | 1,991,423 | | | | 21,865,823 | |
SCSM Goldman Sachs Mid Cap Value Fund | | | 2,843,091 | | | | 24,621,168 | |
SCSM Goldman Sachs Short Duration Fund | | | 18,009,704 | | | | 183,338,791 | |
SCSM Ibbotson Tactical Opportunities Fund | | | 9,613,253 | | | | 94,498,281 | |
SCSM Lord Abbett Growth & Income Fund | | | 2,972,056 | | | | 19,199,482 | |
SCSM PIMCO High Yield Fund | | | 4,114,513 | | | | 38,100,390 | |
SCSM PIMCO Total Return Fund | | | 10,601,971 | | | | 120,756,448 | |
SCSM WMC Blue Chip Mid Cap Fund | | | 2,104,650 | | | | 28,938,932 | |
SCSM WMC Large Cap Growth Fund | | | 4,100,610 | | | | 37,889,635 | |
Sun Capital Investment Grade Bond Fund® | | | 11,646,101 | | | | 111,103,802 | |
| | | | | | | | |
Total Mutual Funds
(Cost $939,498,637) | | | | | | | 949,050,702 | |
| | | | | | | | |
| | | | | | |
| | | | | Value | |
| | | | | | |
| | | | | | |
TOTAL INVESTMENTS – 99.9% | |
(Cost $939,498,637) | | | | $ | 949,050,702 | |
Other assets less
liabilities – 0.1% | | | | | 846,011 | |
| | | | | | |
NET ASSETS – 100.0% | | | | $ | 949,896,713 | |
| | | | | | |
| (1) | Sun Capital Advisers LLC® or its affiliate, MFS, serves as investment adviser to these underlying funds. These are affiliated securities. |
| (2) | Each investment is in the Initial Class Shares. |
| (3) | Fair Value Measurements |
All investments are categorized as Level 1 under the fair value hierarchy. See Note 2b in the Notes to Financial Statements for additional information.
See Notes to Financial Statements.
278
SC SM IBBOTSON GROWTH FUND
| | |
PORTFOLIOOF INVESTMENTS December 31, 2011 | | Sun Capital Advisers Trust |
| | | | | | | | |
| | |
Shares (2) | | | Value | |
| | | | | | | | |
| | | | | | | | |
MUTUAL FUNDS (1) – 100.1% | |
MFS Emerging Markets Equity Portfolio | | | 757,033 | | | $ | 10,477,332 | |
MFS International Growth Portfolio | | | 2,709,571 | | | | 30,022,045 | |
MFS Value Portfolio | | | 2,889,179 | | | | 36,519,220 | |
SCSM AllianceBernstein International Value Fund | | | 1,447,719 | | | | 11,190,868 | |
SCSM BlackRock Inflation Protected Bond Fund | | | 1,906,510 | | | | 21,619,818 | |
SCSM BlackRock International Index Fund | | | 1,731,682 | | | | 15,723,676 | |
SCSM BlackRock Large Cap Index Fund | | | 3,728,699 | | | | 30,799,054 | |
SCSM BlackRock Small Cap Index Fund | | | 1,036,235 | | | | 12,870,044 | |
SCSM Columbia Small Cap Value Fund | | | 1,207,147 | | | | 10,055,533 | |
SCSM Davis Venture Value Fund | | | 3,842,045 | | | | 42,185,653 | |
SCSM Goldman Sachs Mid Cap Value Fund | | | 2,953,360 | | | | 25,576,101 | |
SCSM Goldman Sachs Short Duration Fund | | | 1,984,334 | | | | 20,200,519 | |
SCSM Ibbotson Tactical Opportunities Fund | | | 11,201,121 | | | | 110,107,021 | |
SCSM Invesco Small Cap Growth Fund | | | 933,033 | | | | 9,871,494 | |
SCSM Lord Abbett Growth & Income Fund | | | 1,732,901 | | | | 11,194,542 | |
SCSM PIMCO Total Return Fund | | | 4,005,097 | | | | 45,618,060 | |
SCSM WMC Blue Chip Mid Cap Fund | | | 2,019,863 | | | | 27,773,121 | |
SCSM WMC Large Cap Growth Fund | | | 4,303,139 | | | | 39,761,004 | |
Sun Capital Global Real Estate Fund | | | 1,370,074 | | | | 13,358,220 | |
Sun Capital Investment Grade Bond Fund® | | | 2,508,106 | | | | 23,927,334 | |
| | | | | | | | |
Total Mutual Funds
(Cost $548,296,543) | | | | | | | 548,850,659 | |
| | | | | | | | |
| | | | | | |
| | | | | Value | |
| | | | | | |
TOTAL INVESTMENTS – 100.1% | | | | |
(Cost $548,296,543) | | | | $ | 548,850,659 | |
Liabilities in excess of
other assets – (0.1)% | | | | | (688,246 | ) |
| | | | | | |
NET ASSETS – 100.0% | | | | $ | 548,162,413 | |
| | | | | | |
| (1) | Sun Capital Advisers LLC® or its affiliate, MFS, serves as investment adviser to these underlying funds. These are affiliated securities. |
| (2) | Each investment is in the Initial Class shares |
| (3) | Fair Value Measurements |
All investments are categorized as Level 1 under the fair value hierarchy. See Note 2b in the Notes to Financial Statements for additional information.
See Notes to Financial Statements.
279
| | |
| STATEMENTSOF ASSETSAND LIABILITIES | | |
December 31, 2011 | | Sun Capital Advisers Trust |
| | | | | | | | | | | | | | | | | | | | |
| | | SC AllianceBernstein
International
Value Fund | | | SC BlackRock
International
Index Fund | | | SC BlackRock
Large Cap
Index Fund | | | SC BlackRock
Small Cap
Index Fund | | | SC Goldman
Sachs Mid Cap
Value Fund | |
ASSETS | | | | | | | | | | | | | | | | | | | | |
Investments, at value
Securities | | $ | 72,444,103 | | | $ | 70,697,537 | | | $ | 161,258,391 | | | $ | 188,321,122 | | | $ | 236,376,883 | |
| | | | | | | | | | | | | | | | | | | | |
Total Investments | | | 72,444,103 | | | | 70,697,537 | | | | 161,258,391 | | | | 188,321,122 | | | | 236,376,883 | |
Foreign currency, at value | | | 183,260 | | | | 1,097,784 | | | | — | | | | — | | | | — | |
Margin deposits with broker | | | 19,934 | | | | 202,000 | | | | 264,000 | | | | 230,000 | | | | — | |
Interest and dividends receivable | | | 197,239 | | | | 148,141 | | | | 235,937 | | | | 266,633 | | | | 252,329 | |
Receivable for Fund shares sold | | | — | | | | 52,993 | | | | 60,516 | | | | 39 | | | | — | |
Receivable for investments sold | | | — | | | | 1,844 | | | | 25,667 | | | | 31,776 | | | | 5,563,335 | |
Variation margin receivable | | | 3,495 | | | | 13,766 | | | | — | | | | — | | | | — | |
Unrealized appreciation on forward foreign currency exchange contracts | | | 13,700 | | | | — | | | | — | | | | — | | | | — | |
Receivable due from Adviser | | | — | | | | 13,241 | | | | — | | | | 16,104 | | | | — | |
Other assets | | | 1,227 | | | | 1,189 | | | | 2,718 | | | | 3,185 | | | | 1,960 | |
| | | | | | | | | | | | | | | | | | | | |
Total Assets | | | 72,862,958 | | | | 72,228,495 | | | | 161,847,229 | | | | 188,868,859 | | | | 242,194,507 | |
| | | | | | | | | | | | | | | | | | | | |
LIABILITIES | | | | | | | | | | | | | | | | | | | | |
Due to Custodian | | | — | | | | — | | | | — | | | | 25 | | | | — | |
Payable for investments purchased - regular delivery | | | — | | | | 390 | | | | — | | | | — | | | | 2,348,698 | |
Payable for Fund shares redeemed | | | 417 | | | | 17 | | | | 599 | | | | 39,705 | | | | 2,085,606 | |
Investment advisory fee payable | | | 40,242 | | | | — | | | | 58,428 | | | | — | | | | 212,435 | |
Distribution fee (Service Class) payable | | | 401 | | | | 506 | | | | 3,024 | | | | 12,758 | | | | 3,460 | |
Variation margin payable | | | — | | | | — | | | | 13,832 | | | | 6,997 | | | | 22,100 | |
Unrealized depreciation on forward foreign currency exchange contracts | | | 5,393 | | | | — | | | | — | | | | — | | | | — | |
Accrued expenses and other liabilities | | | 56,496 | | | | 96,864 | | | | 58,365 | | | | 112,073 | | | | 125 | |
| | | | | | | | | | | | | | | | | | | | |
Total Liabilities | | | 102,949 | | | | 97,777 | | | | 134,248 | | | | 171,558 | | | | 4,672,424 | |
| | | | | | | | | | | | | | | | | | | | |
NET ASSETS | | $ | 72,760,009 | | | $ | 72,130,718 | | | $ | 161,712,981 | | | $ | 188,697,301 | | | $ | 237,522,083 | |
| | | | | | | | | | | | | | | | | | | | |
COMPOSITION OF NET ASSETS | | | | | | | | | | | | | | | | | | | | |
Paid-in Capital | | $ | 80,487,596 | | | $ | 78,980,865 | | | $ | 154,301,451 | | | $ | 184,416,842 | | | $ | 172,176,292 | |
Accumulated undistributed net investment income (loss) | | | 1,909,690 | | | | 1,735,605 | | | | 2,033,903 | | | | 1,156,617 | | | | 3,216,457 | |
Accumulated net realized gain (loss) on investments and foreign currency related transactions | | | (2,679,646 | ) | | | (130,662 | ) | | | (769,658 | ) | | | 6,146,427 | | | | 29,432,962 | |
Net unrealized appreciation (depreciation) on investments and assets and liabilities in
foreign currencies | | | (6,957,631 | ) | | | (8,455,090 | ) | | | 6,147,285 | | | | (3,022,585 | ) | | | 32,696,372 | |
| | | | | | | | | | | | | | | | | | | | |
| | $ | 72,760,009 | | | $ | 72,130,718 | | | $ | 161,712,981 | | | $ | 188,697,301 | | | $ | 237,522,083 | |
| | | | | | | | | | | | | | | | | | | | |
Initial Class | | | | | | | | | | | | | | | | | | | | |
Net Assets | | $ | 69,019,316 | | | $ | 67,269,513 | | | $ | 133,605,658 | | | $ | 71,404,731 | | | $ | 207,482,810 | |
Shares of beneficial interest | | | 8,931,018 | | | | 7,411,574 | | | | 16,181,720 | | | | 5,747,909 | | | | 23,949,270 | |
Net asset value per share | | $ | 7.73 | | | $ | 9.08 | | | $ | 8.26 | | | $ | 12.42 | | | $ | 8.66 | |
| | | | | | | | | | | | | | | | | | | | |
Service Class | | | | | | | | | | | | | | | | | | | | |
Net Assets | | $ | 3,740,693 | | | $ | 4,861,205 | | | $ | 28,107,323 | | | $ | 117,292,570 | | | $ | 30,039,273 | |
Shares of beneficial interest | | | 485,466 | | | | 536,966 | | | | 3,317,531 | | | | 9,565,883 | | | | 3,481,098 | |
Net asset value per share | | $ | 7.71 | | | $ | 9.05 | | | $ | 8.47 | | | $ | 12.26 | | | $ | 8.63 | |
| | | | | | | | | | | | | | | | | | | | |
Investments, at cost | | $ | 79,408,093 | | | $ | 79,178,949 | | | $ | 155,107,916 | | | $ | 191,377,618 | | | $ | 203,723,271 | |
| | | | | | | | | | | | | | | | | | | | |
Foreign currency, at cost | | $ | 185,712 | | | $ | 1,097,589 | | | $ | — | | | $ | — | | | $ | — | |
| | | | | | | | | | | | | | | | | | | | |
See Notes to Financial Statements.
280
| | |
| STATEMENTSOF ASSETSAND LIABILITIES (Continued) | | |
| December 31, 2011 | | Sun Capital Advisers Trust |
| | | | | | | | | | | | | | | | | | | | |
| | | SC Columbia
Small Cap
Value Fund | | | SC Davis
Venture
Value Fund | | | SC Invesco
Small Cap
Growth Fund | | | SC Lord Abbett
Growth &
Income Fund | | | SC WMC Blue
Chip Mid Cap
Fund | |
ASSETS | | | | | | | | | | | | | | | | | | | | |
Investments, at value
Securities | | $ | 55,551,285 | | | $ | 389,515,960 | | | $ | 41,201,515 | | | $ | 451,007,453 | | | $ | 182,682,146 | |
| | | | | | | | | | | | | | | | | | | | |
Total Investments | | | 55,551,285 | | | | 389,515,960 | | | | 41,201,515 | | | | 451,007,453 | | | | 182,682,146 | |
Cash | | | 219,714 | | | | 358 | | | | 934,920 | | | | — | | | | 1,350,185 | |
Interest and dividends receivable | | | 73,504 | | | | 576,470 | | | | 15,320 | | | | 328,618 | | | | 170,593 | |
Receivable for Fund shares sold | | | 35,222 | | | | — | | | | 1,195 | | | | 288 | | | | 34 | |
Receivable for investments sold | | | 83,657 | | | | 511,752 | | | | 75,498 | | | | 4,030,855 | | | | 24,337 | |
Other assets | | | 950 | | | | 6,616 | | | | 707 | | | | 3,731 | | | | 3,076 | |
| | | | | | | | | | | | | | | | | | | | |
Total Assets | | | 55,964,332 | | | | 390,611,156 | | | | 42,229,155 | | | | 455,370,945 | | | | 184,230,371 | |
| | | | | | | | | | | | | | | | | | | | |
LIABILITIES | | | | | | | | | | | | | | | | | | | | |
Payable for investments purchased - regular delivery | | | 64,565 | | | | 386 | | | | 56,873 | | | | 2,872,028 | | | | — | |
Payable for Fund shares redeemed | | | 63 | | | | 65,249 | | | | 1,494 | | | | 353,440 | | | | 21,266 | |
Investment advisory fee payable | | | 55,692 | | | | 248,365 | | | | 36,971 | | | | 336,462 | | | | 124,335 | |
Distribution fee (Service Class) payable | | | 1,295 | | | | 26,001 | | | | 1,442 | | | | 1,630 | | | | 3,819 | |
Accrued expenses and other liabilities | | | 37,225 | | | | 91,009 | | | | 34,576 | | | | 241 | | | | 62,994 | |
| | | | | | | | | | | | | | | | | | | | |
Total Liabilities | | | 158,840 | | | | 431,010 | | | | 131,356 | | | | 3,563,801 | | | | 212,414 | |
| | | | | | | | | | | | | | | | | | | | |
NET ASSETS | | $ | 55,805,492 | | | $ | 390,180,146 | | | $ | 42,097,799 | | | $ | 451,807,144 | | | $ | 184,017,957 | |
| | | | | | | | | | | | | | | | | | | | |
COMPOSITION OF NET ASSETS | | | | | | | | | | | | | | | | | | | | |
Paid-in Capital | | $ | 56,380,620 | | | $ | 327,530,005 | | | $ | 37,298,737 | | | $ | 350,776,341 | | | $ | 170,873,171 | |
Accumulated undistributed net investment income (loss) | | | 102,823 | | | | 1,752,236 | | | | — | | | | 3,737,451 | | | | 325,477 | |
Accumulated net realized gain (loss) on investments and foreign currency related transactions | | | 498,168 | | | | 15,691,918 | | | | 1,409,397 | | | | 80,308,239 | | | | 11,569,600 | |
Net unrealized appreciation (depreciation) on investments and assets and liabilities in
foreign currencies | | | (1,176,119 | ) | | | 45,205,987 | | | | 3,389,665 | | | | 16,985,113 | | | | 1,249,709 | |
| | | | | | | | | | | | | | | | | | | | |
| | $ | 55,805,492 | | | $ | 390,180,146 | | | $ | 42,097,799 | | | $ | 451,807,144 | | | $ | 184,017,957 | |
| | | | | | | | | | | | | | | | | | | | |
Initial Class | | | | | | | | | | | | | | | | | | | | |
Net Assets | | $ | 43,958,075 | | | $ | 150,771,819 | | | $ | 28,829,814 | | | $ | 436,816,009 | | | $ | 148,863,313 | |
Shares of beneficial interest | | | 5,274,872 | | | | 13,737,132 | | | | 2,725,825 | | | | 67,652,122 | | | | 10,826,391 | |
Net asset value per share | | $ | 8.33 | | | $ | 10.98 | | | $ | 10.58 | | | $ | 6.46 | | | $ | 13.75 | |
| | | | | | | | | | | | | | | | | | | | |
Service Class | | | | | | | | | | | | | | | | | | | | |
Net Assets | | $ | 11,847,417 | | | $ | 239,408,327 | | | $ | 13,267,985 | | | $ | 14,991,135 | | | $ | 35,154,644 | |
Shares of beneficial interest | | | 1,426,773 | | | | 21,871,586 | | | | 1,266,218 | | | | 2,332,581 | | | | 2,578,730 | |
Net asset value per share | | $ | 8.30 | | | $ | 10.95 | | | $ | 10.48 | | | $ | 6.43 | | | $ | 13.63 | |
| | | | | | | | | | | | | | | | | | | | |
Investments, at cost | | $ | 56,727,404 | | | $ | 344,308,573 | | | $ | 37,811,850 | | | $ | 434,022,339 | | | $ | 181,432,410 | |
| | | | | | | | | | | | | | | | | | | | |
See Notes to Financial Statements.
281
| | |
| STATEMENTSOF ASSETSAND LIABILITIES (Continued) | | |
| December 31, 2011 | | Sun Capital Advisers Trust |
| | | | | | | | | | | | | | | | | | | | |
| | | SC WMC
Large Cap
Growth Fund | | | Sun Capital
Global Real
Estate Fund | | | SC Ibbotson
Tactical
Opportunities
Fund | | | Sun Capital
Investment
Grade Bond
Fund | | | Sun Capital
Money Market
Fund | |
ASSETS | | | | | | | | | | | | | | | | | | | | |
Investments, at value
Securities | | $ | 199,060,292 | | | $ | 204,276,421 | | | $ | 575,260,484 | | | $ | 521,390,647 | | | $ | 223,998,469 | |
| | | | | | | | | | | | | | | | | | | | |
Total Investments | | | 199,060,292 | | | | 204,276,421 | | | | 575,260,484 | | | | 521,390,647 | | | | 223,998,469 | |
Cash | | | 2,336,530 | | | | — | | | | — | | | | 16,805 | | | | — | |
Foreign currency, at value | | | — | | | | 477,389 | | | | — | | | | — | | | | — | |
Interest and dividends receivable | | | 129,973 | | | | 1,317,604 | | | | 1,886 | | | | 3,663,580 | | | | 9,760 | |
Receivable for Fund shares sold | | | 3,367 | | | | 19 | | | | 295,442 | | | | 496,005 | | | | 145,864 | |
Receivable for investments sold | | | 2,881,014 | | | | — | | | | — | | | | 1,010,583 | | | | — | |
Receivable due from Adviser | | | — | | | | — | | | | — | | | | — | | | | 51,243 | |
Other assets | | | 3,462 | | | | 3,435 | | | | 9,743 | | | | 8,317 | | | | 3,906 | |
| | | | | | | | | | | | | | | | | | | | |
Total Assets | | | 204,414,638 | | | | 206,074,868 | | | | 575,567,555 | | | | 526,585,937 | | | | 224,209,242 | |
| | | | | | | | | | | | | | | | | | | | |
LIABILITIES | | | | | | | | | | | | | | | | | | | | |
Payable for investments purchased - regular delivery | | | 2,247,878 | | | | — | | | | 2,813,273 | | | | 11,218,800 | | | | — | |
Payable for investments purchased - delayed delivery | | | — | | | | — | | | | — | | | | 29,283,782 | | | | — | |
Payable for Fund shares redeemed | | | 51,856 | | | | 126,267 | | | | — | | | | 949 | | | | 992,589 | |
Investment advisory fee payable | | | 151,765 | | | | 54,028 | | | | 175,389 | | | | 244,208 | | | | — | |
Distribution fee (Service Class) payable | | | 1,794 | | | | 12,810 | | | | — | | | | 19,299 | | | | 17,640 | |
Accrued expenses and other liabilities | | | 58,035 | | | | 111,647 | | | | 92,423 | | | | 103,965 | | | | 56,586 | |
| | | | | | | | | | | | | | | | | | | | |
Total Liabilities | | | 2,511,328 | | | | 304,752 | | | | 3,081,085 | | | | 40,871,003 | | | | 1,066,815 | |
| | | | | | | | | | | | | | | | | | | | |
NET ASSETS | | $ | 201,903,310 | | | $ | 205,770,116 | | | $ | 572,486,470 | | | $ | 485,714,934 | | | $ | 223,142,427 | |
| | | | | | | | | | | | | | | | | | | | |
COMPOSITION OF NET ASSETS | | | | | | | | | | | | | | | | | | | | |
Paid-in Capital | | $ | 176,173,952 | | | $ | 269,042,973 | | | $ | 588,785,900 | | | $ | 467,498,956 | | | $ | 223,141,969 | |
Accumulated undistributed net investment income (loss) | | | 461,699 | | | | (5,401,900 | ) | | | 5,583,870 | | | | (175,667 | ) | | | 424 | |
Accumulated net realized gain (loss) on investments, capital gains distributions from underlying funds and foreign currency related transactions | | | 13,618,954 | | | | (72,765,265 | ) | | | (25,127,053 | ) | | | 10,456,838 | | | | 34 | |
Net unrealized appreciation (depreciation) on investments and assets and liabilities in
foreign currencies | | | 11,648,705 | | | | 14,894,308 | | | | 3,243,753 | | | | 7,934,807 | | | | — | |
| | | | | | | | | | | | | | | | | | | | |
| | $ | 201,903,310 | | | $ | 205,770,116 | | | $ | 572,486,470 | | | $ | 485,714,934 | | | $ | 223,142,427 | |
| | | | | | | | | | | | | | | | | | | | |
Initial Class | | | | | | | | | | | | | | | | | | | | |
Net Assets | | $ | 185,489,331 | | | $ | 87,924,387 | | | $ | 572,486,470 | | | $ | 307,974,871 | | | $ | 64,198,236 | |
Shares of beneficial interest | | | 20,068,908 | | | | 9,013,832 | | | | 58,259,000 | | | | 32,288,526 | | | | 64,175,111 | |
Net asset value per share | | $ | 9.24 | | | $ | 9.75 | | | $ | 9.83 | | | $ | 9.54 | | | $ | 1.00 | |
| | | | | | | | | | | | | | | | | | | | |
Service Class | | | | | | | | | | | | | | | | | | | | |
Net Assets | | $ | 16,413,979 | | | $ | 117,845,729 | | | $ | — | | | $ | 177,740,063 | | | $ | 158,944,191 | |
Shares of beneficial interest | | | 1,788,108 | | | | 10,874,746 | | | | — | | | | 18,499,059 | | | | 158,968,038 | |
Net asset value per share | | $ | 9.18 | | | $ | 10.84 | | | $ | — | | | $ | 9.61 | | | $ | 1.00 | |
| | | | | | | | | | | | | | | | | | | | |
Investments, at cost | | $ | 187,411,696 | | | $ | 189,399,039 | | | $ | 572,016,731 | | | $ | 513,455,840 | | | $ | 223,998,469 | |
| | | | | | | | | | | | | | | | | | | | |
Foreign currency, at cost | | $ | — | | | $ | 459,053 | | | $ | — | | | $ | — | | | $ | — | |
| | | | | | | | | | | | | | | | | | | | |
See Notes to Financial Statements.
282
| | |
| STATEMENTSOF ASSETSAND LIABILITIES (Continued) | | |
| December 31, 2011 | | Sun Capital Advisers Trust |
| | | | | | | | | | | | | | | | |
| | | SC BlackRock
Inflation Protected
Bond Fund | | | SC Goldman
Sachs Short
Duration Fund | | | SC PIMCO
High Yield
Fund | | | SC PIMCO
Total Return
Fund | |
ASSETS | | | | | | | | | | | | | | | | |
Investments, at value
Securities | | $ | 540,993,407 | | | $ | 1,179,121,963 | | | $ | 159,511,992 | | | $ | 1,333,466,395 | |
| | | | | | | | | | | | | | | | |
Total Investments | | | 540,993,407 | | | | 1,179,121,963 | | | | 159,511,992 | | | | 1,333,466,395 | |
Cash | | | — | | | | — | | | | 7,554 | | | | 6,109 | |
Foreign currency, at value | | | 1,194 | | | | — | | | | 157,413 | | | | 1,379,735 | |
Margin deposits with broker | | | 1,416,000 | | | | — | | | | — | | | | — | |
Cash collateral pledged to broker | | | 1,660,000 | | | | — | | | | — | | | | 37,000 | |
Interest and dividends receivable | | | 2,970,436 | | | | 6,332,853 | | | | 3,100,257 | | | | 8,680,398 | |
Receivable for Fund shares sold | | | 3,581,849 | | | | 635,108 | | | | 68,329 | | | | 1,342,101 | |
Receivable for investments sold | | | — | | | | 23,475,313 | | | | 72,486 | | | | 80,488,708 | |
Variation margin receivable | | | — | | | | — | | | | — | | | | 471,951 | |
Unrealized appreciation on forward foreign currency exchange contracts | | | 942,490 | | | | — | | | | 495,625 | | | | 5,846,483 | |
Swaps, at value | | | 1,126,715 | | | | — | | | | 41,863 | | | | 3,961,411 | |
Other assets | | | 172,011 | | | | 9,915 | | | | 4,012 | | | | 189,690 | |
| | | | | | | | | | | | | | | | |
Total Assets | | | 552,864,102 | | | | 1,209,575,152 | | | | 163,459,531 | | | | 1,435,869,981 | |
| | | | | | | | | | | | | | | | |
LIABILITIES | | | | | | | | | | | | | | | | |
Due to Custodian | | | 730,000 | | | | — | | | | — | | | | — | |
Payable for investments purchased - regular delivery | | | — | | | | — | | | | — | | | | 10,001,728 | |
Payable for investments purchased - delayed delivery | | | — | | | | 23,448,750 | | | | — | | | | 345,892,035 | |
Cash collateral received from broker | | | — | | | | — | | | | — | | | | 3,220,000 | |
Payable for Fund shares redeemed | | | — | | | | 395,648 | | | | 23,440 | | | | — | |
Investment advisory fee payable | | | 298,440 | | | | 638,579 | | | | 101,586 | | | | 577,349 | |
Distribution fee (Service Class) payable | | | 30,441 | | | | 20,838 | | | | 3,311 | | | | 76,045 | |
Variation margin payable | | | 214,258 | | | | 53,021 | | | | 2,997 | | | | — | |
Options written (Premium $1,431,933; $0; $0 and $3,125,934, respectively) | | | 2,815,504 | | | | — | | | | — | | | | 828,515 | |
Unrealized depreciation on forward foreign currency exchange contracts | | | 28,324 | | | | — | | | | 179,011 | | | | 2,199,771 | |
Accrued expenses and other liabilities | | | 55,852 | | | | 588 | | | | 90 | | | | 58,363 | |
Swaps, at value | | | 3,428,883 | | | | — | | | | 21,827 | | | | 6,406,175 | |
| | | | | | | | | | | | | | | | |
Total Liabilities | | | 7,601,702 | | | | 24,557,424 | | | | 332,262 | | | | 369,259,981 | |
| | | | | | | | | | | | | | | | |
NET ASSETS | | $ | 545,262,400 | | | $ | 1,185,017,728 | | | $ | 163,127,269 | | | $ | 1,066,610,000 | |
| | | | | | | | | | | | | | | | |
COMPOSITION OF NET ASSETS | | | | | | | | | | | | | | | | |
Paid-in Capital | | $ | 504,991,287 | | | $ | 1,182,093,242 | | | $ | 154,392,566 | | | $ | 1,052,848,669 | |
Accumulated undistributed investment income (loss) | | | (360,478 | ) | | | — | | | | 394,189 | | | | 1,766,410 | |
Accumulated net realized gain (loss) on investments and foreign currency related transactions | | | 35,427,828 | | | | (3,253,170 | ) | | | 4,876,653 | | | | (29,287 | ) |
Net unrealized appreciation (depreciation) on investments and assets and liabilities in
foreign currencies | | | 5,203,763 | | | | 6,177,656 | | | | 3,463,861 | | | | 12,024,208 | |
| | | | | | | | | | | | | | | | |
| | $ | 545,262,400 | | | $ | 1,185,017,728 | | | $ | 163,127,269 | | | $ | 1,066,610,000 | |
| | | | | | | | | | | | | | | | |
Initial Class | | | | | | | | | | | | | | | | |
Net Assets | | $ | 264,474,074 | | | $ | 993,705,118 | | | $ | 132,252,878 | | | $ | 361,694,247 | |
Shares of beneficial interest | | | 23,317,392 | | | | 97,608,498 | | | | 14,284,143 | | | | 31,765,750 | |
Net asset value per share | | $ | 11.34 | | | $ | 10.18 | | | $ | 9.26 | | | $ | 11.39 | |
| | | | | | | | | | | | | | | | |
Service Class | | | | | | | | | | | | | | | | |
Net Assets | | $ | 280,788,326 | | | $ | 191,312,610 | | | $ | 30,874,391 | | | $ | 704,915,753 | |
Shares of beneficial interest | | | 24,821,337 | | | | 18,802,326 | | | | 3,334,350 | | | | 61,917,358 | |
Net asset value per share | | $ | 11.31 | | | $ | 10.17 | | | $ | 9.26 | | | $ | 11.38 | |
| | | | | | | | | | | | | | | | |
Investments, at cost | | $ | 531,638,398 | | | $ | 1,172,132,480 | | | $ | 156,534,988 | | | $ | 1,326,786,662 | |
| | | | | | | | | | | | | | | | |
Foreign currency, at cost | | $ | 1,194 | | | $ | — | | | $ | 167,794 | | | $ | 1,382,273 | |
| | | | | | | | | | | | | | | | |
Net premium paid/(received) on swaps | | $ | — | | | $ | — | | | $ | (112,075 | ) | | $ | 413,101 | |
| | | | | | | | | | | | | | | | |
See Notes to Financial Statements.
283
| | |
| STATEMENTSOF ASSETSAND LIABILITIES (Continued) | | |
December 31, 2011 | | Sun Capital Advisers Trust |
| | | | | | | | | | | | |
| | | SC Ibbotson
Balanced Fund | | | SC Ibbotson
Conservative Fund | | | SC Ibbotson
Growth Fund | |
ASSETS | | | | | | | | | | | | |
Investments, at value
Affiliated securities | | $ | 1,852,066,803 | | | $ | 949,050,702 | | | $ | 548,850,659 | |
| | | | | | | | | | | | |
Total Investments | | | 1,852,066,803 | | | | 949,050,702 | | | | 548,850,659 | |
Cash | | | 1,324,590 | | | | 518,397 | | | | 1,261 | |
Interest and dividends receivable | | | 1,365,053 | | | | 982,430 | | | | 196,578 | |
Receivable for Fund shares sold | | | 1,684,215 | | | | 1,173,807 | | | | — | |
Receivable for investments sold | | | — | | | | — | | | | 28,739 | |
Other assets | | | 31,345 | | | | 16,151 | | | | 9,347 | |
| | | | | | | | | | | | |
Total Assets | | | 1,856,472,006 | | | | 951,741,487 | | | | 549,086,584 | |
| | | | | | | | | | | | |
LIABILITIES | | | | | | | | | | | | |
Notes payable | | | — | | | | — | | | | 30,000 | |
Payable for investments purchased - regular delivery | | | 2,689,643 | | | | 1,500,827 | | | | 196,578 | |
Payable for Fund shares redeemed | | | 13 | | | | 22 | | | | 456,689 | |
Investment advisory fee payable | | | 194,038 | | | | 149,951 | | | | 113,281 | |
Distribution fee (Service Class) payable | | | 200,318 | | | | 102,518 | | | | 59,473 | |
Accrued expenses and other liabilities | | | 137,398 | | | | 91,456 | | | | 68,150 | |
| | | | | | | | | | | | |
Total Liabilities | | | 3,221,410 | | | | 1,844,774 | | | | 924,171 | |
| | | | | | | | | | | | |
NET ASSETS | | $ | 1,853,250,596 | | | $ | 949,896,713 | | | $ | 548,162,413 | |
| | | | | | | | | | | | |
COMPOSITION OF NET ASSETS | | | | | | | | | | | | |
Paid-in Capital | | $ | 1,787,242,628 | | | $ | 887,992,715 | | | $ | 508,285,158 | |
Accumulated undistributed net investment income (loss) | | | 45,833,983 | | | | 25,597,929 | | | | 13,155,787 | |
Accumulated net realized gain (loss) on investments and capital gains from affiliated underlying funds | | | 47,655,592 | | | | 26,754,004 | | | | 26,167,352 | |
Net unrealized appreciation (depreciation) on investments and assets and liabilities in
foreign currencies | | | (27,481,607 | ) | | | 9,552,065 | | | | 554,116 | |
| | | | | | | | | | | | |
| | $ | 1,853,250,596 | | | $ | 949,896,713 | | | $ | 548,162,413 | |
| | | | | | | | | | | | |
Initial Class | | | | | | | | | | | | |
Net Assets | | $ | 3,149,702 | | | $ | 5,504,748 | | | $ | 2,143,152 | |
Shares of beneficial interest | | | 271,545 | | | | 480,101 | | | | 200,283 | |
Net asset value per share | | $ | 11.60 | | | $ | 11.47 | | | $ | 10.70 | |
| | | | | | | | | | | | |
Service Class | | | | | | | | | | | | |
Net Assets | | $ | 1,850,100,894 | | | $ | 944,391,965 | | | $ | 546,019,261 | |
Shares of beneficial interest | | | 159,704,843 | | | | 82,389,947 | | | | 51,044,017 | |
Net asset value per share | | $ | 11.58 | | | $ | 11.46 | | | $ | 10.70 | |
| | | | | | | | | | | | |
Investments, at cost | | $ | 1,879,548,410 | | | $ | 939,498,637 | | | $ | 548,296,543 | |
| | | | | | | | | | | | |
See Notes to Financial Statements.
284
| | |
| STATEMENTSOF OPERATIONS | | |
| For the Year Ended December 31, 2011 | | Sun Capital Advisers Trust |
| | | | | | | | | | | | | | | | | | | | |
| | | SC AllianceBernstein
International Value
Fund | | | SC BlackRock
International
Index Fund | | | SC BlackRock
Large Cap
Index Fund | | | SC BlackRock
Small Cap
Index Fund | | | SC Goldman
Sachs Mid Cap
Value Fund | |
INVESTMENT INCOME | | | | | | | | | | | | | | | | | | | | |
Interest | | $ | 1,277 | | | $ | 691 | | | $ | 1,714 | | | $ | 12,406 | | | $ | 10,931 | |
Dividends (net of foreign withholding taxes of $246,508; $183,183; $0; $1,752 and $1,899, respectively) | | | 2,629,037 | | | | 2,163,567 | | | | 2,756,790 | | | | 2,637,627 | | | | 6,118,958 | |
| | | | | | | | | | | | | | | | | | | | |
Total investment income | | | 2,630,314 | | | | 2,164,258 | | | | 2,758,504 | | | | 2,650,033 | | | | 6,129,889 | |
| | | | | | | | | | | | | | | | | | | | |
EXPENSES | | | | | | | | | | | | | | | | | | | | |
Investment advisory fee | | | 495,766 | | | | 262,149 | | | | 464,833 | | | | 719,592 | | | | — | |
Unified management fee | | | — | | | | — | | | | — | | | | — | | | | 2,812,092 | |
Distribution fee (Service Class) | | | 9,940 | | | | 4,794 | | | | 52,788 | | | | 324,408 | | | | 81,658 | |
Custody | | | 112,445 | | | | 369,405 | | | | 81,862 | | | | 239,473 | | | | — | |
Accounting | | | 39,261 | | | | 38,863 | | | | 44,500 | | | | 46,917 | | | | — | |
Audit | | | 47,721 | | | | 39,897 | | | | 35,863 | | | | 36,219 | | | | — | |
Legal | | | 5,251 | | | | 15,478 | | | | 16,704 | | | | 61,858 | | | | 4,951 | |
Printing | | | 1,856 | | | | 1,035 | | | | 9,472 | | | | 118,911 | | | | — | |
Administration | | | 44,018 | | | | 39,409 | | | | 56,625 | | | | 79,493 | | | | — | |
Transfer agent | | | 7,090 | | | | 6,030 | | | | 8,656 | | | | 10,276 | | | | — | |
Trustees fees | | | 3,676 | | | | 2,991 | | | | 5,893 | | | | 9,019 | | | | 12,563 | |
Insurance | | | 1,581 | | | | 1,222 | | | | 2,417 | | | | 4,084 | | | | 1,593 | |
Registration fees | | | 2,346 | | | | 2,313 | | | | 6,668 | | | | 4,127 | | | | — | |
Miscellaneous fees | | | 9,947 | | | | 42,261 | | | | 3,405 | | | | 6,303 | | | | 561 | |
| | | | | | | | | | | | | | | | | | | | |
Total expenses | | | 780,898 | | | | 825,847 | | | | 789,686 | | | | 1,660,680 | | | | 2,913,418 | |
| | | | | | | | | | | | | | | | | | | | |
Less: Reduction of investment advisory fees or unified management fees | | | (177,024 | ) | | | (262,149 | ) | | | (66,395 | ) | | | (175,243 | ) | | | — | |
Reimbursement of operating expenses | | | — | | | | (162,553 | ) | | | — | | | | — | | | | — | |
| | | | | | | | | | | | | | | | | | | | |
Net expenses | | | 603,874 | | | | 401,145 | | | | 723,291 | | | | 1,485,437 | | | | 2,913,418 | |
| | | | | | | | | | | | | | | | | | | | |
Net investment income | | | 2,026,440 | | | | 1,763,113 | | | | 2,035,213 | | | | 1,164,596 | | | | 3,216,471 | |
| | | | | | | | | | | | | | | | | | | | |
REALIZED AND UNREALIZED GAIN (LOSS) | | | | | | | | | | | | | | | | | | | | |
Net realized gain (loss) from: | | | | | | | | | | | | | | | | | | | | |
Investments | | | (1,858,460 | ) | | | (174,630 | ) | | | 50,775 | | | | 9,307,903 | | | | 30,673,920 | |
Futures | | | (62,921 | ) | | | 91,709 | | | | (434,634 | ) | | | 218,268 | | | | (906,369 | ) |
Foreign currency related transactions | | | (2,328 | ) | | | 21,726 | | | | — | | | | (52 | ) | | | — | |
| | | | | | | | | | | | | | | | | | | | |
Net realized gain (loss) | | | (1,923,709 | ) | | | (61,195 | ) | | | (383,859 | ) | | | 9,526,119 | | | | 29,767,551 | |
| | | | | | | | | | | | | | | | | | | | |
Change in unrealized appreciation (depreciation) on: | | | | | | | | | | | | | | | | | | | | |
Investments | | | (14,381,874 | ) | | | (10,459,804 | ) | | | 25,305 | | | | (21,047,279 | ) | | | (26,313,561 | ) |
Futures | | | 9,875 | | | | 13,350 | | | | (57,956 | ) | | | (15,314 | ) | | | 48,682 | |
Assets and liabilities in foreign currencies | | | (2,091 | ) | | | (9,981 | ) | | | — | | | | 7 | | | | — | |
| | | | | | | | | | | | | | | | | | | | |
Change in unrealized appreciation (depreciation) | | | (14,374,090 | ) | | | (10,456,435 | ) | | | (32,651 | ) | | | (21,062,586 | ) | | | (26,264,879 | ) |
| | | | | | | | | | | | | | | | | | | | |
Net realized and unrealized gain (loss) | | | (16,297,799 | ) | | | (10,517,630 | ) | | | (416,510 | ) | | | (11,536,467 | ) | | | 3,502,672 | |
| | | | | | | | | | | | | | | | | | | | |
Net increase (decrease) in net assets from operations | | $ | (14,271,359 | ) | | $ | (8,754,517 | ) | | $ | 1,618,703 | | | $ | (10,371,871 | ) | | $ | 6,719,143 | |
| | | | | | | | | | | | | | | | | | | | |
See Notes to Financial Statements.
285
| | |
| STATEMENTSOF OPERATIONS (Continued) | | |
| For the Year Ended December 31, 2011 | | Sun Capital Advisers Trust |
| | | | | | | | | | | | | | | | | | | | |
| | | SC Columbia
Small Cap
Value Fund | | | SC Davis
Venture Value
Fund | | | SC Invesco
Small Cap
Growth Fund | | | SC Lord Abbett
Growth &
Income Fund | | | SC WMC Blue
Chip Mid Cap
Fund | |
INVESTMENT INCOME | | | | | | | | | | | | | | | | | | | | |
Interest | | $ | — | | | $ | 32,346 | | | $ | — | | | $ | 13,443 | | | $ | 21,364 | |
Dividends (net of foreign withholding taxes of $745; $127,407; $0; $131,106 and $1,783, respectively) | | | 943,188 | | | | 7,258,730 | | | | 245,210 | | | | 8,214,170 | | | | 2,202,781 | |
| | | | | | | | | | | | | | | | | | | | |
Total investment income | | | 943,188 | | | | 7,291,076 | | | | 245,210 | | | | 8,227,613 | | | | 2,224,145 | |
| | | | | | | | | | | | | | | | | | | | |
EXPENSES | | | | | | | | | | | | | | | | | | | | |
Investment advisory fee | | | 560,773 | | | | 3,098,132 | | | | 377,976 | | | | — | | | | 1,461,926 | |
Unified management fee | | | — | | | | — | | | | — | | | | 4,427,460 | | | | — | |
Distribution fee (Service Class) | | | 31,221 | | | | 641,121 | | | | 34,589 | | | | 36,961 | | | | 97,353 | |
Custody | | | 71,570 | | | | 75,700 | | | | 35,446 | | | | — | | | | 52,496 | |
Accounting | | | 36,967 | | | | 59,171 | | | | 36,065 | | | | — | | | | 45,350 | |
Audit | | | 34,745 | | | | 36,485 | | | | 34,603 | | | | — | | | | 35,262 | |
Legal | | | 4,134 | | | | 27,266 | | | | 2,596 | | | | 9,325 | | | | 12,244 | |
Printing | | | 5,803 | | | | 59,944 | | | | 6,322 | | | | — | | | | 39,729 | |
Administration | | | 40,000 | | | | 161,587 | | | | 32,641 | | | | — | | | | 76,031 | |
Transfer agent | | | 7,802 | | | | 11,569 | | | | 6,863 | | | | — | | | | 11,153 | |
Trustees fees | | | 2,936 | | | | 19,434 | | | | 1,822 | | | | 24,254 | | | | 8,487 | |
Insurance | | | 1,280 | | | | 9,733 | | | | 723 | | | | 3,325 | | | | 3,377 | |
Registration fees | | | 1,470 | | | | 901 | | | | 1,042 | | | | — | | | | 6,500 | |
Miscellaneous fees | | | 2,524 | | | | 9,421 | | | | 1,838 | | | | 1,018 | | | | 4,241 | |
| | | | | | | | | | | | | | | | | | | | |
Total expenses | | | 801,225 | | | | 4,210,464 | | | | 572,526 | | | | 4,502,343 | | | | 1,854,149 | |
| | | | | | | | | | | | | | | | | | | | |
Less: Reduction of investment advisory fees or unified management fees | | | (50,472 | ) | | | — | | | | (78,373 | ) | | | (14,104 | ) | | | — | |
| | | | | | | | | | | | | | | | | | | | |
Net expenses | | | 750,753 | | | | 4,210,464 | | | | 494,153 | | | | 4,488,239 | | | | 1,854,149 | |
| | | | | | | | | | | | | | | | | | | | |
Net investment income (loss) | | | 192,435 | | | | 3,080,612 | | | | (248,943 | ) | | | 3,739,374 | | | | 369,996 | |
| | | | | | | | | | | | | | | | | | | | |
REALIZED AND UNREALIZED GAIN (LOSS) | | | | | | | | | | | | | | | | | | | | |
Net realized gain (loss) from: | | | | | | | | | | | | | | | | | | | | |
Investments | | | 1,252,078 | | | | 17,048,097 | | | | 1,636,367 | | | | 81,889,029 | | | | 15,220,517 | |
Foreign currency related transactions | | | — | | | | 15,792 | | | | (39 | ) | | | (1,781 | ) | | | (23,151 | ) |
| | | | | | | | | | | | | | | | | | | | |
Net realized gain (loss) | | | 1,252,078 | | | | 17,063,889 | | | | 1,636,328 | | | | 81,887,248 | | | | 15,197,366 | |
| | | | | | | | | | | | | | | | | | | | |
Change in unrealized appreciation (depreciation) on: | | | | | | | | | | | | | | | | | | | | |
Investments | | | (6,135,475 | ) | | | (37,039,837 | ) | | | (3,012,085 | ) | | | (114,410,703 | ) | | | (30,278,702 | ) |
Assets and liabilities in foreign currencies | | | — | | | | (6,484 | ) | | | — | | | | (1 | ) | | | (27 | ) |
| | | | | | | | | | | | | | | | | | | | |
Change in unrealized appreciation (depreciation) | | | (6,135,475 | ) | | | (37,046,321 | ) | | | (3,012,085 | ) | | | (114,410,704 | ) | | | (30,278,729 | ) |
| | | | | | | | | | | | | | | | | | | | |
Net realized and unrealized gain (loss) | | | (4,883,397 | ) | | | (19,982,432 | ) | | | (1,375,757 | ) | | | (32,523,456 | ) | | | (15,081,363 | ) |
| | | | | | | | | | | | | | | | | | | | |
Net increase (decrease) in net assets from operations | | $ | (4,690,962 | ) | | $ | (16,901,820 | ) | | $ | (1,624,700 | ) | | $ | (28,784,082 | ) | | $ | (14,711,367 | ) |
| | | | | | | | | | | | | | | | | | | | |
See Notes to Financial Statements.
286
| | |
| STATEMENTSOF OPERATIONS (Continued) | | |
| For the Year Ended December 31, 2011 | | Sun Capital Advisers Trust |
| | | | | | | | | | | | | | | | | | | | |
| | | SC WMC
Large Cap
Growth Fund | | | Sun Capital
Global Real
Estate Fund | | | SC Ibbotson
Tactical
Opportunities
Fund | | | Sun Capital
Investment
Grade Bond
Fund | | | Sun Capital
Money Market
Fund | |
INVESTMENT INCOME | | | | | | | | | | | | | | | | | | | | |
Interest | | $ | — | | | $ | 6,281 | | | $ | 2,836 | | | $ | 15,538,891 | | | $ | 295,215 | |
Dividends (net of foreign withholding taxes of $6,253; $269,790; $0; $0 and $0,
respectively) | | | 2,244,080 | | | | 6,935,335 | | | | 7,649,286 | | | | — | | | | — | |
| | | | | | | | | | | | | | | | | | | | |
Total investment income | | | 2,244,080 | | | | 6,941,616 | | | | 7,652,122 | | | | 15,538,891 | | | | 295,215 | |
| | | | | | | | | | | | | | | | | | | | |
EXPENSES | | | | | | | | | | | | | | | | | | | | |
Investment advisory fee | | | 1,488,628 | | | | 2,223,032 | | | | 1,966,977 | | | | 2,564,327 | | | | 1,007,486 | |
Distribution fee (Service Class) | | | 45,207 | | | | 325,067 | | | | — | | | | 388,916 | | | | 332,493 | |
Custody | | | 77,510 | | | | 98,686 | | | | 57,181 | | | | 78,329 | | | | 36,515 | |
Accounting | | | 46,082 | | | | 46,708 | | | | 46,847 | | | | 64,190 | | | | 48,360 | |
Audit | | | 35,369 | | | | 37,855 | | | | 33,658 | | | | 36,216 | | | | 32,228 | |
Legal | | | 13,268 | | | | 17,867 | | | | 35,720 | | | | 29,282 | | | | 20,440 | |
Printing | | | 18,431 | | | | 146,643 | | | | 6,035 | | | | 43,707 | | | | 26,861 | |
Administration | | | 82,257 | | | | 95,996 | | | | 198,649 | | | | 164,501 | | | | 103,773 | |
Transfer agent | | | 11,695 | | | | 12,315 | | | | 2,639 | | | | 10,689 | | | | 9,344 | |
Trustees fees | | | 9,149 | | | | 11,263 | | | | 24,780 | | | | 19,515 | | | | 9,398 | |
Insurance | | | 4,370 | | | | 5,551 | | | | 9,671 | | | | 8,576 | | | | 4,194 | |
Registration fees | | | 2,958 | | | | 235 | | | | 22,079 | | | | 5,298 | | | | — | |
Miscellaneous fees | | | 4,527 | | | | 6,379 | | | | 9,626 | | | | 8,194 | | | | 3,406 | |
| | | | | | | | | | | | | | | | | | | | |
Total expenses | | | 1,839,451 | | | | 3,027,597 | | | | 2,413,862 | | | | 3,421,740 | | | | 1,634,498 | |
| | | | | | | | | | | | | | | | | | | | |
Less: Reduction of investment advisory fees or unified management fees | | | (56,766 | ) | | | (134,073 | ) | | | — | | | | — | | | | (1,007,486 | ) |
Reimbursement of operating expenses | | | — | | | | — | | | | — | | | | — | | | | (432,207 | ) |
| | | | | | | | | | | | | | | | | | | | |
Net expenses | | | 1,782,685 | | | | 2,893,524 | | | | 2,413,862 | | | | 3,421,740 | | | | 194,805 | |
| | | | | | | | | | | | | | | | | | | | |
Net investment income | | | 461,395 | | | | 4,048,092 | | | | 5,238,260 | | | | 12,117,151 | | | | 100,410 | |
| | | | | | | | | | | | | | | | | | | | |
REALIZED AND UNREALIZED GAIN (LOSS) | | | | | | | | | | | | | | | | | | | | |
Net realized gain (loss) from: | | | | | | | | | | | | | | | | | | | | |
Investments | | | 15,549,407 | | | | 17,717,063 | | | | (25,692,874 | ) | | | 13,279,551 | | | | 189 | |
Capital gain distributions from underlying funds | | | — | | | | — | | | | 1,172,858 | | | | — | | | | — | |
Foreign currency related transactions | | | 315 | | | | (37,309 | ) | | | — | | | | (4,837 | ) | | | — | |
| | | | | | | | | | | | | | | | | | | | |
Net realized gain (loss) | | | 15,549,722 | | | | 17,679,754 | | | | (24,520,016 | ) | | | 13,274,714 | | | | 189 | |
| | | | | | | | | | | | | | | | | | | | |
Change in unrealized appreciation (depreciation) on: | | | | | | | | | | | | | | | | | | | | |
Investments | | | (24,678,170 | ) | | | (36,240,076 | ) | | | (13,441,503 | ) | | | 2,742,198 | | | | — | |
Assets and liabilities in foreign currencies | | | (39 | ) | | | 13,379 | | | | — | | | | — | | | | — | |
| | | | | | | | | | | | | | | | | | | | |
Change in unrealized appreciation (depreciation) | | | (24,678,209 | ) | | | (36,226,697 | ) | | | (13,441,503 | ) | | | 2,742,198 | | | | — | |
| | | | | | | | | | | | | | | | | | | | |
Net realized and unrealized gain (loss) | | | (9,128,487 | ) | | | (18,546,943 | ) | | | (37,961,519 | ) | | | 16,016,912 | | | | 189 | |
| | | | | | | | | | | | | | | | | | | | |
Net increase (decrease) in net assets from operations | | $ | (8,667,092 | ) | | $ | (14,498,851 | ) | | $ | (32,723,259 | ) | | $ | 28,134,063 | | | $ | 100,599 | |
| | | | | | | | | | | | | | | | | | | | |
See Notes to Financial Statements.
287
| | |
| STATEMENTSOF OPERATIONS (Continued) | | |
| For the Year Ended December 31, 2011 | | Sun Capital Advisers Trust |
| | | | | | | | | | | | | | | | |
| | | SC BlackRock
Inflation
Protected Bond
Fund | | | SC Goldman
Sachs Short
Duration Fund | | | SC PIMCO
High Yield
Fund | | | SC PIMCO
Total Return
Fund | |
INVESTMENT INCOME | | | | | | | | | | | | | | | | |
Interest | | $ | 13,414,254 | | | $ | 21,068,239 | | | $ | 13,831,620 | | | $ | 26,945,776 | |
Dividends | | | — | | | | — | | | | 23,438 | | | | 301,335 | |
| | | | | | | | | | | | | | | | |
Total investment income | | | 13,414,254 | | | | 21,068,239 | | | | 13,855,058 | | | | 27,247,111 | |
| | | | | | | | | | | | | | | | |
EXPENSES | | | | | | | | | | | | | | | | |
Unified management fee | | | 3,128,009 | | | | 7,562,100 | | | | 1,315,627 | | | | 5,923,060 | |
Distribution fee (Service Class) | | | 572,343 | | | | 436,218 | | | | 80,359 | | | | 1,491,700 | |
Legal | | | 8,645 | | | | 21,273 | | | | 3,222 | | | | 16,316 | |
Trustees fees | | | 21,638 | | | | 55,350 | | | | 8,299 | | | | 41,243 | |
Insurance | | | 2,275 | | | | 6,972 | | | | 1,027 | | | | 4,631 | |
Miscellaneous fees | | | 836 | | | | 2,176 | | | | 346 | | | | 1,571 | |
| | | | | | | | | | | | | | | | |
Total expenses | | | 3,733,746 | | | | 8,084,089 | | | | 1,408,880 | | | | 7,478,521 | |
| | | | | | | | | | | | | | | | |
Less: Reduction of investment advisory fees or unified management fees | | | (10,675 | ) | | | — | | | | — | | | | (21,566 | ) |
| | | | | | | | | | | | | | | | |
Net expenses | | | 3,723,071 | | | | 8,084,089 | | | | 1,408,880 | | | | 7,456,955 | |
| | | | | | | | | | | | | | | | |
Net investment income | | | 9,691,183 | | | | 12,984,150 | | | | 12,446,178 | | | | 19,790,156 | |
| | | | | | | | | | | | | | | | |
REALIZED AND UNREALIZED GAIN (LOSS) | | | | | | | | | | | | | | | | |
Net realized gain (loss) from: | | | | | | | | | | | | | | | | |
Investments | | | 33,967,357 | | | | 7,500,536 | | | | 5,433,786 | | | | (5,789,645 | ) |
Futures | | | (4,498,018 | ) | | | (10,168,402 | ) | | | 245,470 | | | | 11,919,424 | |
Written options | | | 1,958,147 | | | | — | | | | — | | | | (3,292,806 | ) |
Swaps | | | 3,891,676 | | | | — | | | | (150,662 | ) | | | (604,106 | ) |
Foreign currency related transactions | | | 512,246 | | | | — | | | | 246,651 | | | | 5,406,736 | |
| | | | | | | | | | | | | | | | |
Net realized gain (loss) | | | 35,831,408 | | | | (2,667,866 | ) | | | 5,775,245 | | | | 7,639,603 | |
| | | | | | | | | | | | | | | | |
Change in unrealized appreciation (depreciation) on: | | | | | | | | | | | | | | | | |
Investments | | | 10,915,470 | | | | (3,673,243 | ) | | | (11,610,115 | ) | | | (961,142 | ) |
Futures | | | (936,169 | ) | | | (869,201 | ) | | | (242,475 | ) | | | 1,918,902 | |
Written options | | | (1,394,478 | ) | | | — | | | | — | | | | 3,234,191 | |
Swaps | | | (1,716,970 | ) | | | — | | | | (75,950 | ) | | | (2,896,459 | ) |
Assets and liabilities in foreign currencies | | | 1,540,014 | | | | — | | | | 82,023 | | | | 2,484,718 | |
| | | | | | | | | | | | | | | | |
Change in unrealized appreciation (depreciation) | | | 8,407,867 | | | | (4,542,444 | ) | | | (11,846,517 | ) | | | 3,780,210 | |
| | | | | | | | | | | | | | | | |
Net realized and unrealized gain (loss) | | | 44,239,275 | | | | (7,210,310 | ) | | | (6,071,272 | ) | | | 11,419,813 | |
| | | | | | | | | | | | | | | | |
Net increase (decrease) in net assets from operations | | $ | 53,930,458 | | | $ | 5,773,840 | | | $ | 6,374,906 | | | $ | 31,209,969 | |
| | | | | | | | | | | | | | | | |
See Notes to Financial Statements.
288
| | |
| STATEMENTSOF OPERATIONS (Continued) | | |
| For the Year Ended December 31, 2011 | | Sun Capital Advisers Trust |
| | | | | | | | | | | | |
| | | SC Ibbotson
Balanced Fund | | | SC Ibbotson
Conservative
Fund | | | SC Ibbotson
Growth Fund | |
INVESTMENT INCOME | | | | | | | | | | | | |
Dividends from affiliated underlying funds | | | 30,120,475 | | | | 16,794,340 | | | | 7,678,194 | |
| | | | | | | | | | | | |
Total investment income | | | 30,120,475 | | | | 16,794,340 | | | | 7,678,194 | |
| | | | | | | | | | | | |
EXPENSES | | | | | | | | | | | | |
Investment advisory fee | | | 2,136,588 | | | | 1,065,192 | | | | 731,974 | |
Distribution fee (Service Class) | | | 4,266,703 | | | | 2,116,868 | | | | 1,459,026 | |
Custody | | | 133,056 | | | | 78,987 | | | | 62,102 | |
Accounting | | | 62,209 | | | | 44,936 | | | | 35,721 | |
Audit | | | 37,749 | | | | 34,467 | | | | 33,646 | |
Legal | | | 112,401 | | | | 55,956 | | | | 38,593 | |
Printing | | | 113,774 | | | | 64,599 | | | | 39,826 | |
Administration | | | 512,436 | | | | 282,505 | | | | 226,083 | |
Transfer agent | | | 6,870 | | | | 6,194 | | | | 6,982 | |
Trustees fees | | | 78,130 | | | | 39,081 | | | | 27,585 | |
Insurance | | | 32,045 | | | | 17,064 | | | | 13,251 | |
Miscellaneous fees | | | 31,332 | | | | 17,720 | | | | 13,740 | |
| | | | | | | | | | | | |
Total expenses | | | 7,523,293 | | | | 3,823,569 | | | | 2,688,529 | |
| | | | | | | | | | | | |
Less: Reduction of investment advisory fees or unified management fees | | | — | | | | — | | | | (30,539 | ) |
| | | | | | | | | | | | |
Net expenses | | | 7,523,293 | | | | 3,823,569 | | | | 2,657,990 | |
| | | | | | | | | | | | |
Net investment income | | | 22,597,182 | | | | 12,970,771 | | | | 5,020,204 | |
| | | | | | | | | | | | |
REALIZED AND UNREALIZED GAIN (LOSS) | | | | | | | | | | | | |
Net realized gain (loss) from: | | | | | | | | | | | | |
Affiliated investments | | | 14,231,134 | | | | 12,016,855 | | | | 12,462,243 | |
Capital gain distributions from affiliated underlying funds | | | 56,678,139 | | | | 27,372,000 | | | | 21,842,345 | |
| | | | | | | | | | | | |
Net realized gain (loss) | | | 70,909,273 | | | | 39,388,855 | | | | 34,304,588 | |
| | | | | | | | | | | | |
Change in unrealized appreciation (depreciation) on: | | | | | | | | | | | | |
Affiliated investments | | | (134,384,440 | ) | | | (47,602,597 | ) | | | (62,543,315 | ) |
| | | | | | | | | | | | |
Change in unrealized appreciation (depreciation) | | | (134,384,440 | ) | | | (47,602,597 | ) | | | (62,543,315 | ) |
| | | | | | | | | | | | |
Net realized and unrealized gain (loss) | | | (63,475,167 | ) | | | (8,213,742 | ) | | | (28,238,727 | ) |
| | | | | | | | | | | | |
Net increase (decrease) in net assets from operations | | $ | (40,877,985 | ) | | $ | 4,757,029 | | | $ | (23,218,523 | ) |
| | | | | | | | | | | | |
See Notes to Financial Statements.
289
| | |
| STATEMENTSOF CHANGESIN NET ASSETS | | |
| | | Sun Capital Advisers Trust |
| | | | | | | | | | | | | | | | | | | | | | | | |
| | | SC AllianceBernstein
International Value Fund | | | SC BlackRock
International Index Fund | | | SC BlackRock Large Cap
Index Fund | |
| | | Year Ended December 31, | | | Year Ended December 31, | | | Year Ended December 31, | |
| | | 2011 | | | 2010 | | | 2011 | | | 2010* | | | 2011 | | | 2010 | |
INCREASE (DECREASE) IN NET ASSETS FROM OPERATIONS | | | | | | | | | | | | | | | | | | | | | | | | |
Net investment income (loss) | | $ | 2,026,440 | | | $ | 1,433,993 | | | $ | 1,763,113 | | | $ | 11,836 | | | $ | 2,035,213 | | | $ | 1,350,737 | |
Net realized gain (loss) | | | (1,923,709 | ) | | | 4,761,611 | | | | (61,195 | ) | | | (67,035 | ) | | | (383,859 | ) | | | 17,406,046 | |
Change in unrealized appreciation (depreciation) | | | (14,374,090 | ) | | | (614,010 | ) | | | (10,456,435 | ) | | | 2,001,345 | | | | (32,651 | ) | | | (222,758 | ) |
| | | | | | | | | | | | | | | | | | | | | | | | |
Net increase (decrease) in net assets resulting from operations | | | (14,271,359 | ) | | | 5,581,594 | | | | (8,754,517 | ) | | | 1,946,146 | | | | 1,618,703 | | | | 18,534,025 | |
| | | | | | | | | | | | | | | | | | | | | | | | |
DISTRIBUTIONS TO SHAREHOLDERS FROM | | | | | | | | | | | | | | | | | | | | | | | | |
Net investment income: | | | | | | | | | | | | | | | | | | | | | | | | |
Initial Class | | | (2,131,553 | ) | | | (5,066 | ) | | | (27,188 | ) | | | — | | | | (1,188,116 | ) | | | — | |
Service Class | | | (92,452 | ) | | | (170 | ) | | | (366 | ) | | | — | | | | (153,956 | ) | | | — | |
Net realized gain on investments: | | | | | | | | | | | | | | | | | | | | | | | | |
Initial Class | | | (4,184,882 | ) | | | (1,243,366 | ) | | | (13,792 | ) | | | — | | | | (15,053,193 | ) | | | (216,837 | ) |
Service Class | | | (198,077 | ) | | | (41,814 | ) | | | (605 | ) | | | — | | | | (2,622,329 | ) | | | (24,908 | ) |
| | | | | | | | | | | | | | | | | | | | | | | | |
Net decrease in net assets from distributions | | | (6,606,964 | ) | | | (1,290,416 | ) | | | (41,951 | ) | | | — | | | | (19,017,594 | ) | | | (241,745 | ) |
| | | | | | | | | | | | | | | | | | | | | | | | |
SHARE TRANSACTIONS | | | | | | | | | | | | | | | | | | | | | | | | |
Net proceeds from sales | | | 24,761,780 | | | | 34,934,924 | | | | 27,957,708 | | | | 53,063,106 | | | | 59,067,590 | | | | 53,409,421 | |
Net proceeds from reinvestment of distributions | | | 6,606,964 | | | | 1,290,416 | | | | 41,951 | | | | — | | | | 19,017,594 | | | | 241,745 | |
Cost of shares redeemed | | | (11,982,247 | ) | | | (23,677,066 | ) | | | (1,962,277 | ) | | | (119,468 | ) | | | (5,549,730 | ) | | | (47,738,756 | ) |
| | | | | | | | | | | | | | | | | | | | | | | | |
Net increase (decrease) in net assets from share transactions | | | 19,386,497 | | | | 12,548,274 | | | | 26,037,382 | | | | 52,943,638 | | | | 72,535,454 | | | | 5,912,410 | |
| | | | | | | | | | | | | | | | | | | | | | | | |
Total increase (decrease) in net assets | | | (1,491,826 | ) | | | 16,839,452 | | | | 17,240,914 | | | | 54,889,784 | | | | 55,136,563 | | | | 24,204,690 | |
NET ASSETS | | | | | | | | | | | | | | | | | | | | | | | | |
Beginning of period | | | 74,251,835 | | | | 57,412,383 | | | | 54,889,804 | | | | 20 | ** | | | 106,576,418 | | | | 82,371,728 | |
| | | | | | | | | | | | | | | | | | | | | | | | |
End of period† | | $ | 72,760,009 | | | $ | 74,251,835 | | | $ | 72,130,718 | | | $ | 54,889,804 | | | $ | 161,712,981 | | | $ | 106,576,418 | |
| | | | | | | | | | | | | | | | | | | | | | | | |
† Accumulated undistributed net investment income (loss) | | $ | 1,909,690 | | | $ | 1,643,157 | | | $ | 1,735,605 | | | $ | (26,586 | ) | | $ | 2,033,903 | | | $ | 1,345,539 | |
| | | | | | | | | | | | | | | | | | | | | | | | |
| * | For the period November 15, 2010 (commencement of operations) to December 31, 2010. |
| ** | Amount represents initial seed investment. |
See Notes to Financial Statements.
290
| | |
| STATEMENTSOF CHANGESIN NET ASSETS (Continued) | | |
| | | Sun Capital Advisers Trust |
| | | | | | | | | | | | | | | | | | | | | | | | |
| | | SC BlackRock Small Cap
Index Fund | | | SC Goldman Sachs Mid
Cap Value Fund | | | SC Columbia Small Cap
Value Fund | |
| | | Year Ended December 31, | | | Year Ended December 31, | | | Year Ended December 31, | |
| | | 2011 | | | 2010 | | | 2011 | | | 2010 | | | 2011 | | | 2010 | |
INCREASE (DECREASE) IN NET ASSETS FROM OPERATIONS | | | | | | | | | | | | | | | | | | | | | | | | |
Net investment income (loss) | | $ | 1,164,596 | | | $ | 719,170 | | | $ | 3,216,471 | | | $ | 3,355,421 | | | $ | 192,435 | | | $ | 306,272 | |
Net realized gain (loss) | | | 9,526,119 | | | | 46,763,334 | | | | 29,767,551 | | | | 23,083,327 | | | | 1,252,078 | | | | 10,133,361 | |
Change in unrealized appreciation (depreciation) | | | (21,062,586 | ) | | | (7,590,100 | ) | | | (26,264,879 | ) | | | 23,569,954 | | | | (6,135,475 | ) | | | (518,490 | ) |
| | | | | | | | | | | | | | | | | | | | | | | | |
Net increase (decrease) in net assets resulting from operations | | | (10,371,871 | ) | | | 39,892,404 | | | | 6,719,143 | | | | 50,008,702 | | | | (4,690,962 | ) | | | 9,921,143 | |
| �� | | | | | | | | | | | | | | | | | | | | | | | |
DISTRIBUTIONS TO SHAREHOLDERS FROM | | | | | | | | | | | | | | | | | | | | | | | | |
Net investment income: | | | | | | | | | | | | | | | | | | | | | | | | |
Initial Class | | | (336,194 | ) | | | (155,615 | ) | | | (2,530,062 | ) | | | — | | | | (315,572 | ) | | | — | |
Service Class | | | (298,646 | ) | | | (155,938 | ) | | | (279,038 | ) | | | — | | | | (54,992 | ) | | | — | |
Net realized gain on investments: | | | | | | | | | | | | | | | | | | | | | | | | |
Initial Class | | | — | | | | — | | | | (20,477,095 | ) | | | (5,643,760 | ) | | | (8,341,941 | ) | | | (3,503,453 | ) |
Service Class | | | — | | | | — | | | | (2,866,709 | ) | | | (540,908 | ) | | | (2,165,393 | ) | | | (809,308 | ) |
| | | | | | | | | | | | | | | | | | | | | | | | |
Net decrease in net assets from distributions | | | (634,840 | ) | | | (311,553 | ) | | | (26,152,904 | ) | | | (6,184,668 | ) | | | (10,877,898 | ) | | | (4,312,761 | ) |
| | | | | | | | | | | | | | | | | | | | | | | | |
SHARE TRANSACTIONS | | | | | | | | | | | | | | | | | | | | | | | | |
Net proceeds from sales | | | 73,065,958 | | | | 13,269,153 | | | | 41,490,219 | | | | 74,814,561 | | | | 15,347,441 | | | | 22,139,445 | |
Net proceeds from reinvestment of distributions | | | 634,840 | | | | 311,553 | | | | 26,152,904 | | | | 6,184,668 | | | | 10,877,898 | | | | 4,312,761 | |
Cost of shares redeemed | | | (54,674,961 | ) | | | (56,251,939 | ) | | | (82,486,214 | ) | | | (62,184,412 | ) | | | (15,925,425 | ) | | | (11,469,850 | ) |
| | | | | | | | | | | | | | | | | | | | | | | | |
Net increase (decrease) in net assets from share transactions | | | 19,025,837 | | | | (42,671,233 | ) | | | (14,843,091 | ) | | | 18,814,817 | | | | 10,299,914 | | | | 14,982,356 | |
| | | | | | | | | | | | | | | | | | | | | | | | |
Total increase (decrease) in net assets | | | 8,019,126 | | | | (3,090,382 | ) | | | (34,276,852 | ) | | | 62,638,851 | | | | (5,268,946 | ) | | | 20,590,738 | |
NET ASSETS | | | | | | | | | | | | | | | | | | | | | | | | |
Beginning of period | | | 180,678,175 | | | | 183,768,557 | | | | 271,798,935 | | | | 209,160,084 | | | | 61,074,438 | | | | 40,483,700 | |
| | | | | | | | | | | | | | | | | | | | | | | | |
End of period† | | $ | 188,697,301 | | | $ | 180,678,175 | | | $ | 237,522,083 | | | $ | 271,798,935 | | | $ | 55,805,492 | | | $ | 61,074,438 | |
| | | | | | | | | | | | | | | | | | | | | | | | |
† Accumulated undistributed net investment income (loss) | | $ | 1,156,617 | | | $ | 791,322 | | | $ | 3,216,457 | | | $ | 3,346,874 | | | $ | 102,823 | | | $ | 310,060 | |
| | | | | | | | | | | | | | | | | | | | | | | | |
See Notes to Financial Statements.
291
| | |
| STATEMENTSOF CHANGESIN NET ASSETS (Continued) | | |
| | | Sun Capital Advisers Trust |
| | | | | | | | | | | | | | | | | | | | | | | | |
| | | SC Davis Venture
Value Fund | | | SC Invesco Small Cap
Growth Fund | | | SC Lord Abbett Growth
& Income Fund | |
| | | Year Ended December 31, | | | Year Ended December 31, | | | Year Ended December 31, | |
| | | 2011 | | | 2010 | | | 2011 | | | 2010 | | | 2011 | | | 2010 | |
INCREASE (DECREASE) IN NET ASSETS FROM OPERATIONS | | | | | | | | | | | | | | | | | | | | | | | | |
Net investment income (loss) | | $ | 3,080,612 | | | $ | 2,547,809 | | | $ | (248,943 | ) | | $ | (148,181 | ) | | $ | 3,739,374 | | | $ | 3,182,186 | |
Net realized gain (loss) | | | 17,063,889 | | | | 31,572,627 | | | | 1,636,328 | | | | 1,661,528 | | | | 81,887,248 | | | | 81,513,204 | |
Change in unrealized appreciation (depreciation) | | | (37,046,321 | ) | | | 18,973,697 | | | | (3,012,085 | ) | | | 4,731,050 | | | | (114,410,704 | ) | | | 6,557,057 | |
| | | | | | | | | | | | | | | | | | | | | | | | |
Net increase (decrease) in net assets resulting from operations | | | (16,901,820 | ) | | | 53,094,133 | | | | (1,624,700 | ) | | | 6,244,397 | | | | (28,784,082 | ) | | | 91,252,447 | |
| | | | | | | | | | | | | | | | | | | | | | | | |
DISTRIBUTIONS TO SHAREHOLDERS FROM | | | | | | | | | | | | | | | | | | | | | | | | |
Net investment income: | | | | | | | | | | | | | | | | | | | | | | | | |
Initial Class | | | (1,458,153 | ) | | | (1,027,110 | ) | | | — | | | | — | | | | (3,111,235 | ) | | | — | |
Service Class | | | (1,681,850 | ) | | | (583,899 | ) | | | — | | | | — | | | | (62,483 | ) | | | — | |
Net realized gain on investments: | | | | | | | | | | | | | | | | | | | | | | | | |
Initial Class | | | (7,052,000 | ) | | | — | | | | (940,924 | ) | | | (1,478,663 | ) | | | (79,188,726 | ) | | | (22,281,747 | ) |
Service Class | | | (10,983,085 | ) | | | — | | | | (452,649 | ) | | | (722,220 | ) | | | (2,464,036 | ) | | | (518,969 | ) |
| | | | | | | | | | | | | | | | | | | | | | | | |
Net decrease in net assets from distributions | | | (21,175,088 | ) | | | (1,611,009 | ) | | | (1,393,573 | ) | | | (2,200,883 | ) | | | (84,826,480 | ) | | | (22,800,716 | ) |
| | | | | | | | | | | | | | | | | | | | | | | | |
SHARE TRANSACTIONS | | | | | | | | | | | | | | | | | | | | | | | | |
Net proceeds from sales | | | 35,005,009 | | | | 101,561,755 | | | | 19,428,355 | | | | 9,254,259 | | | | 40,666,490 | | | | 87,295,175 | |
Net proceeds from reinvestment of distributions | | | 21,175,088 | | | | 1,611,009 | | | | 1,393,573 | | | | 2,200,883 | | | | 84,826,480 | | | | 22,800,716 | |
Cost of shares redeemed | | | (51,687,437 | ) | | | (113,481,100 | ) | | | (7,054,019 | ) | | | (3,746,705 | ) | | | (118,535,361 | ) | | | (128,148,494 | ) |
| | | | | | | | | | | | | | | | | | | | | | | | |
Net increase (decrease) in net assets from share transactions | | | 4,492,660 | | | | (10,308,336 | ) | | | 13,767,909 | | | | 7,708,437 | | | | 6,957,609 | | | | (18,052,603 | ) |
| | | | | | | | | | | | | | | | | | | | | | | | |
Total increase (decrease) in net assets | | | (33,584,248 | ) | | | 41,174,788 | | | | 10,749,636 | | | | 11,751,951 | | | | (106,652,953 | ) | | | 50,399,128 | |
NET ASSETS | | | | | | | | | | | | | | | | | | | | | | | | |
Beginning of period | | | 423,764,394 | | | | 382,589,606 | | | | 31,348,163 | | | | 19,596,212 | | | | 558,460,097 | | | | 508,060,969 | |
| | | | | | | | | | | | | | | | | | | | | | | | |
End of period† | | $ | 390,180,146 | | | $ | 423,764,394 | | | $ | 42,097,799 | | | $ | 31,348,163 | | | $ | 451,807,144 | | | $ | 558,460,097 | |
| | | | | | | | | | | | | | | | | | | | | | | | |
† Accumulated undistributed net investment income (loss) | | $ | 1,752,236 | | | $ | 1,811,049 | | | $ | — | | | $ | — | | | $ | 3,737,451 | | | $ | 3,182,309 | |
| | | | | | | | | | | | | | | | | | | | | | | | |
See Notes to Financial Statements.
292
| | |
| STATEMENTSOF CHANGESIN NET ASSETS (Continued) | | |
| | | Sun Capital Advisers Trust |
| | | | | | | | | | | | | | | | | | | | | | | | |
| | | SC WMC Blue Chip Mid
Cap Fund | | | SC WMC Large Cap
Growth Fund | | | Sun Capital Global Real
Estate Fund | |
| | | Year Ended December 31, | | | Year Ended December 31, | | | Year Ended December 31, | |
| | | 2011 | | | 2010 | | | 2011 | | | 2010 | | | 2011 | | | 2010 | |
INCREASE (DECREASE) IN NET ASSETS FROM OPERATIONS | | | | | | | | | | | | | | | | | | | | | | | | |
Net investment income (loss) | | $ | 369,996 | | | $ | 108,582 | | | $ | 461,395 | | | $ | 607,276 | | | $ | 4,048,092 | | | $ | 6,818,385 | |
Net realized gain (loss) | | | 15,197,366 | | | | 15,478,147 | | | | 15,549,722 | | | | 22,548,882 | | | | 17,679,754 | | | | 21,437,170 | |
Change in unrealized appreciation (depreciation) | | | (30,278,729 | ) | | | 14,767,047 | | | | (24,678,209 | ) | | | 13,271,194 | | | | (36,226,697 | ) | | | 6,098,216 | |
| | | | | | | | | | | | | | | | | | | | | | | | |
Net increase (decrease) in net assets resulting from operations | | | (14,711,367 | ) | | | 30,353,776 | | | | (8,667,092 | ) | | | 36,427,352 | | | | (14,498,851 | ) | | | 34,353,771 | |
| | | | | | | | | | | | | | | | | | | | | | | | |
DISTRIBUTIONS TO SHAREHOLDERS FROM | | | | | | | | | | | | | | | | | | | | | | | | |
Net investment income: | | | | | | | | | | | | | | | | | | | | | | | | |
Initial Class | | | (87,870 | ) | | | (60,133 | ) | | | (579,237 | ) | | | (545,213 | ) | | | (6,609,071 | ) | | | (12,598,073 | ) |
Service Class | | | — | | | | — | | | | (12,731 | ) | | | (9,148 | ) | | | (7,956,792 | ) | | | (13,918,369 | ) |
| | | | | | | | | | | | | | | | | | | | | | | | |
Net decrease in net assets from distributions | | | (87,870 | ) | | | (60,133 | ) | | | (591,968 | ) | | | (554,361 | ) | | | (14,565,863 | ) | | | (26,516,442 | ) |
| | | | | | | | | | | | | | | | | | | | | | | | |
SHARE TRANSACTIONS | | | | | | | | | | | | | | | | | | | | | | | | |
Net proceeds from sales | | | 47,484,537 | | | | 65,448,862 | | | | 35,457,471 | | | | 54,836,305 | | | | 25,509,428 | | | | 40,263,351 | |
Net proceeds from reinvestment of distributions | | | 87,870 | | | | 60,133 | | | | 591,968 | | | | 554,361 | | | | 14,565,863 | | | | 26,516,442 | |
Cost of shares redeemed | | | (17,498,041 | ) | | | (43,053,482 | ) | | | (16,007,222 | ) | | | (67,647,634 | ) | | | (59,721,367 | ) | | | (44,052,501 | ) |
| | | | | | | | | | | | | | | | | | | | | | | | |
Net increase (decrease) in net assets from share transactions | | | 30,074,366 | | | | 22,455,513 | | | | 20,042,217 | | | | (12,256,968 | ) | | | (19,646,076 | ) | | | 22,727,292 | |
| | | | | | | | | | | | | | | | | | | | | | | | |
Total increase (decrease) in net assets | | | 15,275,129 | | | | 52,749,156 | | | | 10,783,157 | | | | 23,616,023 | | | | (48,710,790 | ) | | | 30,564,621 | |
NET ASSETS | | | | | | | | | | | | | | | | | | | | | | | | |
Beginning of period | | | 168,742,828 | | | | 115,993,672 | | | | 191,120,153 | | | | 167,504,130 | | | | 254,480,906 | | | | 223,916,285 | |
| | | | | | | | | | | | | | | | | | | | | | | | |
End of period† | | $ | 184,017,957 | | | $ | 168,742,828 | | | $ | 201,903,310 | | | $ | 191,120,153 | | | $ | 205,770,116 | | | $ | 254,480,906 | |
| | | | | | | | | | | | | | | | | | | | | | | | |
† Accumulated undistributed net investment income (loss) | | $ | 325,477 | | | $ | 105,271 | | | $ | 461,699 | | | $ | 591,957 | | | $ | (5,401,900 | ) | | $ | (870,323 | ) |
| | | | | | | | | | | | | | | | | | | | | | | | |
See Notes to Financial Statements.
293
| | |
| STATEMENTSOF CHANGESIN NET ASSETS (Continued) | | |
| | | Sun Capital Advisers Trust |
| | | | | | | | | | | | | | | | | | | | | | | | |
| | | SC Ibbotson Tactical
Opportunities Fund | | | Sun Capital Investment
Grade Bond Fund | | | Sun Capital Money
Market Fund | |
| | | Year Ended December 31, | | | Year Ended December 31, | | | Year Ended December 31, | |
| | | 2011 | | | 2010* | | | 2011 | | | 2010 | | | 2011 | | | 2010 | |
INCREASE (DECREASE) IN NET ASSETS FROM OPERATIONS | | | | | | | | | | | | | | | | | | | | | | | | |
Net investment income (loss) | | $ | 5,238,260 | | | $ | 3,857,285 | | | $ | 12,117,151 | | | $ | 10,282,898 | | | $ | 100,410 | | | $ | 153,247 | |
Net realized gain (loss) | | | (24,520,016 | ) | | | 537,564 | | | | 13,274,714 | | | | 7,159,689 | | | | 189 | | | | 529 | |
Change in unrealized appreciation (depreciation) | | | (13,441,503 | ) | | | 16,685,256 | | | | 2,742,198 | | | | 3,226,405 | | | | — | | | | — | |
| | | | | | | | | | | | | | | | | | | | | | | | |
Net increase (decrease) in net assets resulting from operations | | | (32,723,259 | ) | | | 21,080,105 | | | | 28,134,063 | | | | 20,668,992 | | | | 100,599 | | | | 153,776 | |
| | | | | | | | | | | | | | | | | | | | | | | | |
DISTRIBUTIONS TO SHAREHOLDERS FROM | | | | | | | | | | | | | | | | | | | | | | | | |
Net investment income: | | | | | | | | | | | | | | | | | | | | | | | | |
Initial Class | | | (3,891,717 | ) | | | — | | | | (8,410,817 | ) | | | (7,412,008 | ) | | | (100,408 | ) | | | (153,247 | ) |
Service Class | | | — | | | | — | | | | (4,422,591 | ) | | | (3,029,790 | ) | | | — | | | | — | |
Net realized gain on investments: | | | | | | | | | | | | | | | | | | | | | | | | |
Initial Class | | | (764,559 | ) | | | — | | | | (5,933,714 | ) | | | (681,253 | ) | | | (423 | ) | | | — | |
Service Class | | | — | | | | — | | | | (3,518,517 | ) | | | (313,903 | ) | | | (908 | ) | | | — | |
| | | | | | | | | | | | | | | | | | | | | | | | |
Net decrease in net assets from distributions | | | (4,656,276 | ) | | | — | | | | (22,285,639 | ) | | | (11,436,954 | ) | | | (101,739 | ) | | | (153,247 | ) |
| | | | | | | | | | | | | | | | | | | | | | | | |
SHARE TRANSACTIONS | | | | | | | | | | | | | | | | | | | | | | | | |
Net proceeds from sales | | | 155,432,816 | | | | 434,362,406 | | | | 115,018,973 | | | | 200,395,252 | | | | 168,938,206 | | | | 151,481,767 | |
Net proceeds from reinvestment of distributions | | | 4,656,276 | | | | — | | | | 22,285,639 | | | | 11,436,954 | | | | 101,739 | | | | 153,247 | |
Cost of shares redeemed | | | (5,645,958 | ) | | | (19,650 | ) | | | (30,552,460 | ) | | | (48,989,541 | ) | | | (132,382,403 | ) | | | (169,444,454 | ) |
| | | | | | | | | | | | | | | | | | | | | | | | |
Net increase (decrease) in net assets from share transactions | | | 154,443,134 | | | | 434,342,756 | | | | 106,752,152 | | | | 162,842,665 | | | | 36,657,542 | | | | (17,809,440 | ) |
| | | | | | | | | | | | | | | | | | | | | | | | |
Total increase (decrease) in net assets | | | 117,063,599 | | | | 455,422,861 | | | | 112,600,576 | | | | 172,074,703 | | | | 36,656,402 | | | | (17,808,911 | ) |
NET ASSETS | | | | | | | | | | | | | | | | | | | | | | | | |
Beginning of period | | | 455,422,871 | | | | 10 | ** | | | 373,114,358 | | | | 201,039,655 | | | | 186,486,025 | | | | 204,294,936 | |
| | | | | | | | | | | | | | | | | | | | | | | | |
End of period† | | $ | 572,486,470 | | | $ | 455,422,871 | | | $ | 485,714,934 | | | $ | 373,114,358 | | | $ | 223,142,427 | | | $ | 186,486,025 | |
| | | | | | | | | | | | | | | | | | | | | | | | |
† Accumulated undistributed net investment income (loss) | | $ | 5,583,870 | | | $ | 3,891,690 | | | $ | (175,667 | ) | | $ | 9,304 | | | $ | 424 | | | $ | 422 | |
| | | | | | | | | | | | | | | | | | | | | | | | |
| * | For the period November 15, 2010 (commencement of operations) to December 31, 2010. |
| ** | Amount represents initial seed investment. |
See Notes to Financial Statements.
294
| | |
| STATEMENTSOF CHANGESIN NET ASSETS (Continued) | | |
| | | Sun Capital Advisers Trust |
| | | | | | | | | | | | | | | | |
| | | SC BlackRock Inflation
Protected Bond Fund | | | SC Goldman Sachs Short
Duration Fund | |
| | | Year Ended December 31, | | | Year Ended December 31, | |
| | | 2011 | | | 2010 | | | 2011 | | | 2010 | |
INCREASE (DECREASE) IN NET ASSETS FROM OPERATIONS | | | | | | | | | | | | | | | | |
Net investment income (loss) | | $ | 9,691,183 | | | $ | 3,508,503 | | | $ | 12,984,150 | | | $ | 13,496,544 | |
Net realized gain (loss) | | | 35,831,408 | | | | 13,896,047 | | | | (2,667,866 | ) | | | 9,186,082 | |
Change in unrealized appreciation (depreciation) | | | 8,407,867 | | | | (4,717,883 | ) | | | (4,542,444 | ) | | | 998,471 | |
| | | | | | | | | | | | | | | | |
Net increase (decrease) in net assets resulting from operations | | | 53,930,458 | | | | 12,686,667 | | | | 5,773,840 | | | | 23,681,097 | |
| | | | | | | | | | | | | | | | |
DISTRIBUTIONS TO SHAREHOLDERS FROM | | | | | | | | | | | | | | | | |
Net investment income: | | | | | | | | | | | | | | | | |
Initial Class | | | (5,975,908 | ) | | | (2,042,941 | ) | | | (11,423,943 | ) | | | (13,719,331 | ) |
Service Class | | | (4,587,618 | ) | | | (1,190,584 | ) | | | (1,560,207 | ) | | | (1,542,346 | ) |
Net realized gain on investments: | | | | | | | | | | | | | | | | |
Initial Class | | | (6,570,230 | ) | | | (1,815,579 | ) | | | (5,924,191 | ) | | | (972,991 | ) |
Service Class | | | (6,765,513 | ) | | | (1,330,938 | ) | | | (1,139,506 | ) | | | (138,662 | ) |
Return of capital: | | | | | | | | | | | | | | | | |
Initial Class | | | — | | | | — | | | | (444,745 | ) | | | — | |
Service Class | | | — | | | | — | | | | (60,740 | ) | | | — | |
| | | | | | | | | | | | | | | | |
Net decrease in net assets from distributions | | | (23,899,269 | ) | | | (6,380,042 | ) | | | (20,553,332 | ) | | | (16,373,330 | ) |
| | | | | | | | | | | | | | | | |
SHARE TRANSACTIONS | | | | | | | | | | | | | | | | |
Net proceeds from sales | | | 175,920,152 | | | | 193,206,634 | | | | 224,077,321 | | | | 300,846,678 | |
Net proceeds from reinvestment of distributions | | | 23,899,269 | | | | 6,380,042 | | | | 20,553,332 | | | | 16,373,330 | |
Cost of shares redeemed | | | (63,538,400 | ) | | | (12,046,006 | ) | | | (199,049,052 | ) | | | (147,289,854 | ) |
| | | | | | | | | | | | | | | | |
Net increase (decrease) in net assets from share transactions | | | 136,281,021 | | | | 187,540,670 | | | | 45,581,601 | | | | 169,930,154 | |
| | | | | | | | | | | | | | | | |
Total increase (decrease) in net assets | | | 166,312,210 | | | | 193,847,295 | | | | 30,802,109 | | | | 177,237,921 | |
NET ASSETS | | | | | | | | | | | | | | | | |
Beginning of period | | | 378,950,190 | | | | 185,102,895 | | | | 1,154,215,619 | | | | 976,977,698 | |
| | | | | | | | | | | | | | | | |
End of period† | | $ | 545,262,400 | | | $ | 378,950,190 | | | $ | 1,185,017,728 | | | $ | 1,154,215,619 | |
| | | | | | | | | | | | | | | | |
† Accumulated undistributed net investment income (loss) | | $ | (360,478 | ) | | $ | 638,947 | | | $ | — | | | $ | — | |
| | | | | | | | | | | | | | | | |
See Notes to Financial Statements.
295
| | |
| STATEMENTSOF CHANGESIN NET ASSETS (Continued) | | |
| | | Sun Capital Advisers Trust |
| | | | | | | | | | | | | | | | |
| | | SC PIMCO High Yield
Fund | | | SC PIMCO Total Return
Fund | |
| | | Year Ended December 31, | | | Year Ended December 31, | |
| | | 2011 | | | 2010 | | | 2011 | | | 2010 | |
INCREASE (DECREASE) IN NET ASSETS FROM OPERATIONS | | | | | | | | | | | | | | | | |
Net investment income (loss) | | $ | 12,446,178 | | | $ | 10,503,313 | | | $ | 19,790,156 | | | $ | 10,423,575 | |
Net realized gain (loss) | | | 5,775,245 | | | | 4,663,008 | | | | 7,639,603 | | | | 24,324,457 | |
Change in unrealized appreciation (depreciation) | | | (11,846,517 | ) | | | 1,547,809 | | | | 3,780,210 | | | | 2,026,730 | |
| | | | | | | | | | | | | | | | |
Net increase (decrease) in net assets resulting from operations | | | 6,374,906 | | | | 16,714,130 | | | | 31,209,969 | | | | 36,774,762 | |
| | | | | | | | | | | | | | | | |
DISTRIBUTIONS TO SHAREHOLDERS FROM | | | | | | | | | | | | | | | | |
Net investment income: | | | | | | | | | | | | | | | | |
Initial Class | | | (10,762,395 | ) | | | (8,491,359 | ) | | | (8,526,376 | ) | | | (5,163,456 | ) |
Service Class | | | (2,302,772 | ) | | | (1,965,640 | ) | | | (14,698,114 | ) | | | (7,131,257 | ) |
Net realized gain on investments: | | | | | | | | | | | | | | | | |
Initial Class | | | (3,540,485 | ) | | | (857,562 | ) | | | (8,344,147 | ) | | | (893,320 | ) |
Service Class | | | (831,503 | ) | | | (202,216 | ) | | | (16,650,181 | ) | | | (1,377,736 | ) |
| | | | | | | | | | | | | | | | |
Net decrease in net assets from distributions | | | (17,437,155 | ) | | | (11,516,777 | ) | | | (48,218,818 | ) | | | (14,565,769 | ) |
| | | | | | | | | | | | | | | | |
SHARE TRANSACTIONS | | | | | | | | | | | | | | | | |
Net proceeds from sales | | | 33,647,337 | | | | 63,731,516 | | | | 325,105,197 | | | | 379,028,421 | |
Net proceeds from reinvestment of distributions | | | 17,437,155 | | | | 11,516,777 | | | | 48,218,818 | | | | 14,565,769 | |
Cost of shares redeemed | | | (49,447,118 | ) | | | (24,995,144 | ) | | | (46,112,654 | ) | | | (47,950,269 | ) |
| | | | | | | | | | | | | | | | |
Net increase (decrease) in net assets from share transactions | | | 1,637,374 | | | | 50,253,149 | | | | 327,211,361 | | | | 345,643,921 | |
| | | | | | | | | | | | | | | | |
Total increase (decrease) in net assets | | | (9,424,875 | ) | | | 55,450,502 | | | | 310,202,512 | | | | 367,852,914 | |
NET ASSETS | | | | | | | | | | | | | | | | |
Beginning of period | | | 172,552,144 | | | | 117,101,642 | | | | 756,407,488 | | | | 388,554,574 | |
| | | | | | | | | | | | | | | | |
End of period† | | $ | 163,127,269 | | | $ | 172,552,144 | | | $ | 1,066,610,000 | | | $ | 756,407,488 | |
| | | | | | | | | | | | | | | | |
† Accumulated undistributed net investment income (loss) | | $ | 394,189 | | | $ | 366,223 | | | $ | 1,766,410 | | | $ | (586,403 | ) |
| | | | | | | | | | | | | | | | |
See Notes to Financial Statements.
296
| | |
| STATEMENTSOF CHANGESIN NET ASSETS (Continued) | | |
| | | Sun Capital Advisers Trust |
| | | | | | | | | | | | | | | | | | | | | | | | |
| | | SC Ibbotson Balanced Fund | | | SC Ibbotson
Conservative Fund | | | SC Ibbotson Growth Fund | |
| | | Year Ended December 31, | | | Year Ended December 31, | | | Year Ended December 31, | |
| | | 2011 | | | 2010 | | | 2011 | | | 2010 | | | 2011 | | | 2010 | |
INCREASE (DECREASE) IN NET ASSETS FROM OPERATIONS | | | | | | | | | | | | | | | | | | | | | | | | |
Net investment income (loss) | | $ | 22,597,182 | | | $ | 12,819,808 | | | $ | 12,970,771 | | | $ | 6,715,912 | | | $ | 5,020,204 | | | $ | 5,451,060 | |
Net realized gain (loss) | | | 70,909,273 | | | | 65,356,107 | | | | 39,388,855 | | | | 23,520,441 | | | | 34,304,588 | | | | 52,815,917 | |
Change in unrealized appreciation (depreciation) | | | (134,384,440 | ) | | | 51,959,160 | | | | (47,602,597 | ) | | | 27,625,126 | | | | (62,543,315 | ) | | | 11,687,524 | |
| | | | | | | | | | | | | | | | | | | | | | | | |
Net increase (decrease) in net assets resulting from operations | | | (40,877,985 | ) | | | 130,135,075 | | | | 4,757,029 | | | | 57,861,479 | | | | (23,218,523 | ) | | | 69,954,501 | |
| | | | | | | | | | | | | | | | | | | | | | | | |
DISTRIBUTIONS TO SHAREHOLDERS FROM | | | | | | | | | | | | | | | | | | | | | | | | |
Net investment income: | | | | | | | | | | | | | | | | | | | | | | | | |
Initial Class | | | (37,770 | ) | | | (16,154 | ) | | | (77,271 | ) | | | (34,581 | ) | | | (37,431 | ) | | | (17,891 | ) |
Service Class | | | (20,418,196 | ) | | | (9,758,906 | ) | | | (10,742,754 | ) | | | (7,460,635 | ) | | | (9,219,001 | ) | | | (7,020,584 | ) |
Net realized gain on investments: | | | | | | | | | | | | | | | | | | | | | | | | |
Initial Class | | | (88,078 | ) | | | (7,998 | ) | | | (115,262 | ) | | | (14,251 | ) | | | (173,024 | ) | | | (12,008 | ) |
Service Class | | | (57,633,808 | ) | | | (6,259,087 | ) | | | (19,296,974 | ) | | | (3,749,369 | ) | | | (48,814,290 | ) | | | (5,614,337 | ) |
| | | | | | | | | | | | | | | | | | | | | | | | |
Net decrease in net assets from distributions | | | (78,177,852 | ) | | | (16,042,145 | ) | | | (30,232,261 | ) | | | (11,258,836 | ) | | | (58,243,746 | ) | | | (12,664,820 | ) |
| | | | | | | | | | | | | | | | | | | | | | | | |
SHARE TRANSACTIONS | | | | | | | | | | | | | | | | | | | | | | | | |
Net proceeds from sales | | | 471,059,800 | | | | 754,316,052 | | | | 219,153,249 | | | | 351,389,899 | | | | 35,985,469 | | | | 106,923,986 | |
Net proceeds from reinvestment of distributions | | | 78,177,852 | | | | 16,042,145 | | | | 30,232,261 | | | | 11,258,836 | | | | 58,243,746 | | | | 12,664,820 | |
Cost of shares redeemed | | | (22,858,558 | ) | | | (5,242,404 | ) | | | (35,755,822 | ) | | | (14,007,370 | ) | | | (55,143,740 | ) | | | (35,071,730 | ) |
| | | | | | | | | | | | | | | | | | | | | | | | |
Net increase (decrease) in net assets from share transactions | | | 526,379,094 | | | | 765,115,793 | | | | 213,629,688 | | | | 348,641,365 | | | | 39,085,475 | | | | 84,517,076 | |
| | | | | | | | | | | | | | | | | | | | | | | | |
Total increase (decrease) in net assets | | | 407,323,257 | | | | 879,208,723 | | | | 188,154,456 | | | | 395,244,008 | | | | (42,376,794 | ) | | | 141,806,757 | |
NET ASSETS | | | | | | | | | | | | | | | | | | | | | | | | |
Beginning of period | | | 1,445,927,339 | | | | 566,718,616 | | | | 761,742,257 | | | | 366,498,249 | | | | 590,539,207 | | | | 448,732,450 | |
| | | | | | | | | | | | | | | | | | | | | | | | |
End of period† | | $ | 1,853,250,596 | | | $ | 1,445,927,339 | | | $ | 949,896,713 | | | $ | 761,742,257 | | | $ | 548,162,413 | | | $ | 590,539,207 | |
| | | | | | | | | | | | | | | | | | | | | | | | |
† Accumulated undistributed net investment income (loss) | | $ | 45,833,983 | | | $ | 20,455,821 | | | $ | 25,597,929 | | | $ | 10,819,968 | | | $ | 13,155,787 | | | $ | 9,256,393 | |
| | | | | | | | | | | | | | | | | | | | | | | | |
See Notes to Financial Statements.
297
| | |
| FINANCIAL HIGHLIGHTS | | |
| | | Sun Capital Advisers Trust |
Selected data for a share outstanding throughout each period:
| | | | | | | | | | | | | | | | | | | | | | | | | | | | | | | | |
| | | SC AllianceBernstein
International Value Fund
Initial Class Shares | | | SC AllianceBernstein
International Value Fund
Service Class Shares | |
| | | Years Ended December 31, | | | Years Ended December 31, | |
| | | 2011 | | | 2010 | | | 2009 | | | 2008* | | | 2011 | | | 2010 | | | 2009 | | | 2008* | |
Net Asset Value, Beginning of Period | | $ | 10.11 | | | $ | 9.82 | | | $ | 7.92 | | | $ | 10.00 | | | $ | 10.09 | | | $ | 9.81 | | | $ | 7.92 | | | $ | 10.00 | |
| | | | | | | | | | | | | | | | | | | | | | | | | | | | | | | | |
Income (Loss) from Investment Operations: | | | | | | | | | | | | | | | | | | | | | | | | | | | | | | | | |
Net investment income (loss) (d) | | | 0.24 | † | | | 0.19 | † | | | 0.22 | † | | | 0.01 | | | | 0.22 | † | | | 0.16 | † | | | 0.21 | † | | | 0.02 | |
Net realized and unrealized gain (loss) on investments | | | (1.89 | ) | | | 0.25 | | | | 2.13 | | | | (2.07 | ) | | | (1.88 | ) | | | 0.27 | | | | 2.11 | | | | (2.09 | ) |
| | | | | | | | | | | | | | | | | | | | | | | | | | | | | | | | |
Total from Investment Operations | | | (1.65 | ) | | | 0.44 | | | | 2.35 | | | | (2.06 | ) | | | (1.66 | ) | | | 0.43 | | | | 2.32 | | | | (2.07 | ) |
| | | | | | | | | | | | | | | | | | | | | | | | | | | | | | | | |
Less Distributions from: | | | | | | | | | | | | | | | | | | | | | | | | | | | | | | | | |
Net investment income | | | (0.24 | ) | | | (0.00 | )(e) | | | (0.22 | ) | | | (0.02 | ) | | | (0.23 | ) | | | (0.00 | )(e) | | | (0.20 | ) | | | (0.01 | ) |
Net realized gain on investments | | | (0.49 | ) | | | (0.15 | ) | | | (0.23 | ) | | | — | | | | (0.49 | ) | | | (0.15 | ) | | | (0.23 | ) | | | — | |
| | | | | | | | | | | | | | | | | | | | | | | | | | | | | | | | |
Total distributions | | | (0.73 | ) | | | (0.15 | ) | | | (0.45 | ) | | | (0.02 | ) | | | (0.72 | ) | | | (0.15 | ) | | | (0.43 | ) | | | (0.01 | ) |
| | | | | | | | | | | | | | | | | | | | | | | | | | | | | | | | |
Net Asset Value, End of Period | | $ | 7.73 | | | $ | 10.11 | | | $ | 9.82 | | | $ | 7.92 | | | $ | 7.71 | | | $ | 10.09 | | | $ | 9.81 | | | $ | 7.92 | |
| | | | | | | | | | | | | | | | | | | | | | | | | | | | | | | | |
Total Return (b) | | | (16.21 | )% | | | 4.62 | % | | | 29.71 | % | | | (20.64 | )% | | | (16.46 | )% | | | 4.52 | % | | | 29.26 | % | | | (20.69 | )% |
| | | | | | | | | | | | | | | | | | | | | | | | | | | | | | | | |
Ratios and Supplemental Data: | | | | | | | | | | | | | | | | | | | | | | | | | | | | | | | | |
Net Assets, End of Period (000’s) | | $ | 69,019 | | | $ | 71,186 | | | $ | 55,746 | | | $ | 9,763 | | | $ | 3,741 | | | $ | 3,065 | | | $ | 1,666 | | | $ | 2,051 | |
Ratio to average net assets: | | | | | | | | | | | | | | | | | | | | | | | | | | | | | | | | |
Net expenses (a)(c)(d) | | | 0.75 | % | | | 0.75 | % | | | 0.75 | % | | | 0.75 | % | | | 1.00 | % | | | 1.00 | % | | | 1.00 | % | | | 1.00 | % |
Gross expenses (a)(d) | | | 0.98 | % | | | 1.06 | % | | | 1.38 | % | | | 6.64 | % | | | 1.23 | % | | | 1.31 | % | | | 1.69 | % | | | 4.64 | % |
Net investment income (loss) (a)(c)(d) | | | 2.58 | % | | | 2.01 | % | | | 2.47 | % | | | 1.18 | % | | | 2.40 | % | | | 1.65 | % | | | 2.35 | % | | | 1.07 | % |
Portfolio turnover rate | | | 47 | % | | | 60 | % | | | 49 | % | | | 7 | % | | | 47 | % | | | 60 | % | | | 49 | % | | | 7 | % |
| * | For the period October 1, 2008 (commencement of operations) to December 31, 2008. |
| † | Based on average shares outstanding during the period. |
| (a) | Annualized for periods of less than one year. |
| (b) | Total returns are historical and assume changes in share price, reinvestments of all dividends and distributions, and no sales charge. Had certain expenses not been reduced during the periods shown, total returns would have been lower. Total returns for periods of less than one year are not annualized. |
| (c) | Such percentages are after advisory fee or unified management fee waivers and expense reimbursements, as applicable. |
| (d) | Does not include any insurance charges imposed in connection with your variable insurance contract. |
| (e) | Amount is less than $0.005 per share. |
298
| | |
| FINANCIAL HIGHLIGHTS (Continued) | | |
| | | Sun Capital Advisers Trust |
Selected data for a share outstanding throughout each period:
| | | | | | | | | | | | | | | | |
| | | SC BlackRock
International Index Fund
Initial Class Shares | | | SC BlackRock
International Index Fund
Service Class Shares | |
| | | Years Ended December 31, | | | Years Ended December 31, | |
| | | 2011 | | | 2010* | | | 2011 | | | 2010* | |
Net Asset Value, Beginning of Period | | $ | 10.38 | | | $ | 10.00 | | | $ | 10.37 | | | $ | 10.00 | |
| | | | | | | | | | | | | | | | |
Income (Loss) from Investment Operations: | | | | | | | | | | | | | | | | |
Net investment income (loss) (d) | | | 0.27 | † | | | 0.00 | †(e) | | | 0.19 | † | | | (0.00 | )†(e) |
Net realized and unrealized gain (loss) on investments | | | (1.56 | ) | | | 0.38 | | | | (1.51 | ) | | | 0.37 | |
| | | | | | | | | | | | | | | | |
Total from Investment Operations | | | (1.29 | ) | | | 0.38 | | | | (1.32 | ) | | | 0.37 | |
| | | | | | | | | | | | | | | | |
Less Distributions from: | | | | | | | | | | | | | | | | |
Net investment income | | | (0.01 | ) | | | — | | | | (0.00 | )(e) | | | — | |
Net realized gain on investments | | | (0.00 | )(e) | | | — | | | | (0.00 | )(e) | | | — | |
| | | | | | | | | | | | | | | | |
Total distributions | | | (0.01 | ) | | | — | | | | (0.00 | )(e) | | | — | |
| | | | | | | | | | | | | | | | |
Net Asset Value, End of Period | | $ | 9.08 | | | $ | 10.38 | | | $ | 9.05 | | | $ | 10.37 | |
| | | | | | | | | | | | | | | | |
Total Return (b) | | | (12.46 | )% | | | 3.80 | % | | | (12.70 | )% | | | 3.70 | % |
| | | | | | | | | | | | | | | | |
Ratios and Supplemental Data: | | | | | | | | | | | | | | | | |
Net Assets, End of Period (000’s) | | $ | 67,270 | | | $ | 54,635 | | | $ | 4,861 | | | $ | 255 | |
Ratio to average net assets: | | | | | | | | | | | | | | | | |
Net expenses (a)(c)(d) | | | 0.60 | % | | | 0.60 | % | | | 0.86 | % | | | 0.85 | % |
Gross expenses (a)(d) | | | 1.25 | % | | | 2.27 | % | | | 1.60 | % | | | 5.60 | % |
Net investment income (loss) (a)(c)(d) | | | 2.71 | % | | | 0.18 | % | | | 2.02 | % | | | (0.07 | )% |
Portfolio turnover rate | | | 3 | % | | | 1 | % | | | 3 | % | | | 1 | % |
| * | For the period November 15, 2010 (commencement of operations) to December 31, 2010. |
| † | Based on average shares outstanding during the period. |
| (a) | Annualized for periods of less than one year. |
| (b) | Total returns are historical and assume changes in share price, reinvestments of all dividends and distributions, and no sales charge. Had certain expenses not been reduced during the periods shown, total returns would have been lower. Total returns for periods of less than one year are not annualized. |
| (c) | Such percentages are after advisory fee or unified management fee waivers and expense reimbursements, as applicable. |
| (d) | Does not include any insurance charges imposed in connection with your variable insurance contract. |
| (e) | Amount is less than $0.005 per share. |
299
| | |
| FINANCIAL HIGHLIGHTS (Continued) | | |
| | | Sun Capital Advisers Trust |
Selected data for a share outstanding throughout each period:
| | | | | | | | | | | | | | | | | | | | | | | | | | | | | | | | | | | | | | | | |
| | | SC BlackRock Large Cap Index Fund
Initial Class Shares | | | SC BlackRock Large Cap Index Fund
Service Class Shares | |
| | | Years Ended December 31, | | | Years Ended December 31, | |
| | | 2011 | | | 2010 | | | 2009 | | | 2008 | | | 2007 | | | 2011 | | | 2010 | | | 2009 | | | 2008 | | | 2007 | |
Net Asset Value, Beginning of Period | | $ | 9.37 | | | $ | 8.04 | | | $ | 6.70 | | | $ | 10.77 | | | $ | 12.37 | | | $ | 9.59 | | | $ | 8.25 | | | $ | 6.87 | | | $ | 11.03 | | | $ | 12.65 | |
| | | | | | | | | | | | | | | | | | | | | | | | | | | | | | | | | | | | | | | | |
Income (Loss) from Investment Operations: | | | | | | | | | | | | | | | | | | | | | | | | | | | | | | | | | | | | | | | | |
Net investment income (loss) (c) | | | 0.14 | † | | | 0.10 | † | | | 0.11 | † | | | 0.04 | | | | 0.12 | | | | 0.12 | † | | | 0.09 | † | | | 0.10 | † | | | 0.10 | | | | 0.08 | |
Net realized and unrealized gain (loss) on
investments | | | (0.07 | ) | | | 1.25 | | | | 1.30 | | | | (4.03 | ) | | | (0.84 | ) | | | (0.08 | ) | | | 1.27 | | | | 1.33 | | | | (4.19 | ) | | | (0.84 | ) |
| | | | | | | | | | | | | | | | | | | | | | | | | | | | | | | | | | | | | | | | |
Total from Investment Operations | | | 0.07 | | | | 1.35 | | | | 1.41 | | | | (3.99 | ) | | | (0.72 | ) | | | 0.04 | | | | 1.36 | | | | 1.43 | | | | (4.09 | ) | | | (0.76 | ) |
| | | | | | | | | | | | | | | | | | | | | | | | | | | | | | | | | | | | | | | | |
Less Distributions from: | | | | | | | | | | | | | | | | | | | | | | | | | | | | | | | | | | | | | | | | |
Net investment income | | | (0.08 | ) | | | — | | | | (0.07 | ) | | | (0.05 | ) | | | (0.10 | ) | | | (0.06 | ) | | | — | | | | (0.05 | ) | | | (0.04 | ) | | | (0.08 | ) |
Net realized gain on investments | | | (1.10 | ) | | | (0.02 | ) | | | — | | | | (0.03 | ) | | | (0.78 | ) | | | (1.10 | ) | | | (0.02 | ) | | | — | | | | (0.03 | ) | | | (0.78 | ) |
| | | | | | | | | | | | | | | | | | | | | | | | | | | | | | | | | | | | | | | | |
Total distributions | | | (1.18 | ) | | | (0.02 | ) | | | (0.07 | ) | | | (0.08 | ) | | | (0.88 | ) | | | (1.16 | ) | | | (0.02 | ) | | | (0.05 | ) | | | (0.07 | ) | | | (0.86 | ) |
| | | | | | | | | | | | | | | | | | | | | | | | | | | | | | | | | | | | | | | | |
Net Asset Value, End of Period | | $ | 8.26 | | | $ | 9.37 | | | $ | 8.04 | | | $ | 6.70 | | | $ | 10.77 | | | $ | 8.47 | | | $ | 9.59 | | | $ | 8.25 | | | $ | 6.87 | | | $ | 11.03 | |
| | | | | | | | | | | | | | | | | | | | | | | | | | | | | | | | | | | | | | | | |
Total Return (a) | | | 1.58 | % | | | 16.76 | % | | | 21.09 | % | | | (37.06 | )% | | | (5.81 | )% | | | 1.17 | % | | | 16.45 | % | | | 20.85 | % | | | (37.15 | )% | | | (6.07 | )% |
| | | | | | | | | | | | | | | | | | | | | | | | | | | | | | | | | | | | | | | | |
Ratios and Supplemental Data: | | | | | | | | | | | | | | | | | | | | | | | | | | | | | | | | | | | | | | | | |
Net Assets, End of Period (000’s) | | $ | 133,606 | | | $ | 90,267 | | | $ | 70,638 | | | $ | 8,366 | | | $ | 5,544 | | | $ | 28,107 | | | $ | 16,309 | | | $ | 11,734 | | | $ | 4,974 | | | $ | 7,808 | |
Ratios to average net assets: | | | | | | | | | | | | | | | | | | | | | | | | | | | | | | | | | | | | | | | | |
Net expenses (b)(c) | | | 0.50 | % | | | 0.85 | % | | | 0.90 | % | | | 0.90 | % | | | 0.90 | % | | | 0.75 | % | | | 1.09 | % | | | 1.15 | % | | | 1.15 | % | | | 1.15 | % |
Gross expenses (c) | | | 0.56 | % | | | 0.86 | % | | | 1.13 | % | | | 2.08 | % | | | 1.81 | % | | | 0.80 | % | | | 1.10 | % | | | 1.44 | % | | | 2.34 | % | | | 2.05 | % |
Net investment income (loss) (b)(c) | | | 1.57 | % | | | 1.23 | % | | | 1.55 | % | | | 1.39 | % | | | 0.89 | % | | | 1.33 | % | | | 1.02 | % | | | 1.37 | % | | | 1.05 | % | | | 0.63 | % |
Portfolio turnover rate | | | 2 | % | | | 235 | % | | | 109 | % | | | 189 | % | | | 63 | % | | | 2 | % | | | 235 | % | | | 109 | % | | | 189 | % | | | 63 | % |
| † | Based on average shares outstanding during the period. |
| (a) | Total returns are historical and assume changes in share price, reinvestments of all dividends and distributions, and no sales charge. Had certain expenses not been reduced during the periods shown, total returns would have been lower. |
| (b) | Such percentages are after advisory fee or unified management fee waivers and expense reimbursements, as applicable. |
| (c) | Does not include any insurance charges imposed in connection with your variable insurance contract. |
300
| | |
| FINANCIAL HIGHLIGHTS (Continued) | | |
| | | Sun Capital Advisers Trust |
Selected data for a share outstanding throughout each period:
| | | | | | | | | | | | | | | | | | | | | | | | | | | | | | | | | | | | | | | | |
| | | SC BlackRock Small Cap Index Fund
Initial Class Shares | | | SC BlackRock Small Cap Index Fund
Service Class Shares | |
| | | Years Ended December 31, | | | Years Ended December 31, | |
| | | 2011 | | | 2010 | | | 2009 | | | 2008 | | | 2007 | | | 2011 | | | 2010 | | | 2009 | | | 2008 | | | 2007 | |
Net Asset Value, Beginning of Period | | $ | 13.12 | | | $ | 10.58 | | | $ | 7.74 | | | $ | 12.98 | | | $ | 15.02 | | | $ | 12.95 | | | $ | 10.45 | | | $ | 7.66 | | | $ | 12.85 | | | $ | 14.99 | |
| | | | | | | | | | | | | | | | | | | | | | | | | | | | | | | | | | | | | | | | |
Income (Loss) from Investment Operations: | | | | | | | | | | | | | | | | | | | | | | | | | | | | | | | | | | | | | | | | |
Net investment income (loss) (c) | | | 0.11 | † | | | 0.06 | † | | | 0.04 | † | | | 0.03 | | | | 0.05 | | | | 0.06 | † | | | 0.04 | † | | | 0.02 | † | | | (0.00 | )(d) | | | 0.01 | |
Net realized and unrealized gain (loss) on investments | | | (0.75 | ) | | | 2.52 | | | | 2.81 | | | | (4.82 | ) | | | (0.23 | ) | | | (0.72 | ) | | | 2.47 | | | | 2.78 | | | | (4.77 | ) | | | (0.29 | ) |
| | | | | | | | | | | | | | | | | | | | | | | | | | | | | | | | | | | | | | | | |
Total from Investment Operations | | | (0.64 | ) | | | 2.58 | | | | 2.85 | | | | (4.79 | ) | | | (0.18 | ) | | | (0.66 | ) | | | 2.51 | | | | 2.80 | | | | (4.77 | ) | | | (0.28 | ) |
| | | | | | | | | | | | | | | | | | | | | | | | | | | | | | | | | | | | | | | | |
Less Distributions from: | | | | | | | | | | | | | | | | | | | | | | | | | | | | | | | | | | | | | | | | |
Net investment income | | | (0.06 | ) | | | (0.04 | ) | | | (0.01 | ) | | | (0.03 | ) | | | — | | | | (0.03 | ) | | | (0.01 | ) | | | (0.01 | ) | | | (0.00 | )(d) | | | — | |
Net realized gain on investments | | | — | | | | — | | | | — | | | | (0.42 | ) | | | (1.86 | ) | | | — | | | | — | | | | — | | | | (0.42 | ) | | | (1.86 | ) |
| | | | | | | | | | | | | | | | | | | | | | | | | | | | | | | | | | | | | | | | |
Total distributions | | | (0.06 | ) | | | (0.04 | ) | | | (0.01 | ) | | | (0.45 | ) | | | (1.86 | ) | | | (0.03 | ) | | | (0.01 | ) | | | (0.01 | ) | | | (0.42 | ) | | | (1.86 | ) |
| | | | | | | | | | | | | | | | | | | | | | | | | | | | | | | | | | | | | | | | |
Net Asset Value, End of Period | | $ | 12.42 | | | $ | 13.12 | | | $ | 10.58 | | | $ | 7.74 | | | $ | 12.98 | | | $ | 12.26 | | | $ | 12.95 | | | $ | 10.45 | | | $ | 7.66 | | | $ | 12.85 | |
| | | | | | | | | | | | | | | | | | | | | | | | | | | | | | | | | | | | | | | | |
Total Return (a) | | | (4.87 | )% | | | 24.46 | % | | | 36.77 | % | | | (37.99 | )% | | | (1.44 | )% | | | (5.09 | )% | | | 24.07 | % | | | 36.50 | % | | | (38.14 | )% | | | (2.11 | )% |
| | | | | | | | | | | | | | | | | | | | | | | | | | | | | | | | | | | | | | | | |
Ratios and Supplemental Data: | | | | | | | | | | | | | | | | | | | | | | | | | | | | | | | | | | | | | | | | |
Net Assets, End of Period (000’s) | | $ | 71,405 | | | $ | 45,720 | | | $ | 48,950 | | | $ | 38,435 | | | $ | 72,741 | | | $ | 117,293 | | | $ | 134,958 | | | $ | 134,819 | | | $ | 115,098 | | | $ | 105,377 | |
Ratios to average net assets: | | | | | | | | | | | | | | | | | | | | | | | | | | | | | | | | | | | | | | | | |
Net expenses (b)(c) | | | 0.61 | % | | | 0.95 | % | | | 1.00 | % | | | 1.00 | % | | | 1.00 | % | | | 0.85 | % | | | 1.20 | % | | | 1.25 | % | | | 1.25 | % | | | 1.25 | % |
Gross expenses (c) | | | 0.70 | % | | | 0.99 | % | | | 1.21 | % | | | 1.29 | % | | | 1.38 | % | | | 0.94 | % | | | 1.23 | % | | | 1.46 | % | | | 1.55 | % | | | 1.61 | % |
Net investment income (loss) (b)(c) | | | 0.83 | % | | | 0.57 | % | | | 0.45 | % | | | 0.21 | % | | | 0.31 | % | | | 0.50 | % | | | 0.34 | % | | | 0.20 | % | | | 0.04 | % | | | (0.06 | )% |
Portfolio turnover rate | | | 37 | % | | | 131 | % | | | 132 | % | | | 126 | % | | | 126 | % | | | 37 | % | | | 131 | % | | | 132 | % | | | 126 | % | | | 126 | % |
| † | Based on average shares outstanding during the period. |
| (a) | Total returns are historical and assume changes in share price, reinvestments of all dividends and distributions, and no sales charge. Had certain expenses not been reduced during the periods shown, total returns would have been lower. |
| (b) | Such percentages are after advisory fee or unified management fee waivers and expenses reimbursements, as applicable. |
| (c) | Does not include any insurance charges imposed in connection with your variable insurance contract. |
| (d) | Amount is less than $0.005 per share. |
301
| | |
| FINANCIAL HIGHLIGHTS (Continued) | | |
| | | Sun Capital Advisers Trust |
Selected data for a share outstanding throughout each period:
| | | | | | | | | | | | | | | | | | | | | | | | | | | | | | | | |
| | | SC Goldman Sachs
Mid Cap Value Fund
Initial Class Shares | | | SC Goldman Sachs
Mid Cap Value Fund
Service Class Shares | |
| | | Years Ended December 31, | | | Years Ended December 31, | |
| | | 2011 | | | 2010 | | | 2009 | | | 2008* | | | 2011 | | | 2010 | | | 2009 | | | 2008* | |
Net Asset Value, Beginning of Period | | $ | 9.45 | | | $ | 7.93 | | | $ | 6.93 | | | $ | 10.00 | | | $ | 9.41 | | | $ | 7.93 | | | $ | 6.93 | | | $ | 10.00 | |
| | | | | | | | | | | | | | | | | | | | | | | | | | | | | | | | |
Income (Loss) from Investment Operations: | | | | | | | | | | | | | | | | | | | | | | | | | | | | | | | | |
Net investment income (loss) (d) | | | 0.12 | † | | | 0.12 | † | | | 0.11 | † | | | 0.05 | | | | 0.10 | † | | | 0.10 | † | | | 0.09 | † | | | 0.07 | |
Net realized and unrealized gain (loss) on investments | | | 0.06 | | | | 1.61 | | | | 1.68 | | | | (3.06 | ) | | | 0.07 | | | | 1.59 | | | | 1.68 | | | | (3.09 | ) |
| | | | | | | | | | | | | | | | | | | | | | | | | | | | | | | | |
Total from Investment Operations | | | 0.18 | | | | 1.73 | | | | 1.79 | | | | (3.01 | ) | | | 0.17 | | | | 1.69 | | | | 1.77 | | | | (3.02 | ) |
| | | | | | | | | | | | | | | | | | | | | | | | | | | | | | | | |
Less Distributions from: | | | | | | | | | | | | | | | | | | | | | | | | | | | | | | | | |
Net investment income | | | (0.10 | ) | | | — | | | | (0.08 | ) | | | (0.06 | ) | | | (0.08 | ) | | | — | | | | (0.06 | ) | | | (0.05 | ) |
Net realized gain on investments | | | (0.87 | ) | | | (0.21 | ) | | | (0.71 | ) | | | — | | | | (0.87 | ) | | | (0.21 | ) | | | (0.71 | ) | | | — | |
| | | | | | | | | | | | | | | | | | | | | | | | | | | | | | | | |
Total distributions | | | (0.97 | ) | | | (0.21 | ) | | | (0.79 | ) | | | (0.06 | ) | | | (0.95 | ) | | | (0.21 | ) | | | (0.77 | ) | | | (0.05 | ) |
| | | | | | | | | | | | | | | | | | | | | | | | | | | | | | | | |
Net Asset Value, End of Period | | $ | 8.66 | | | $ | 9.45 | | | $ | 7.93 | | | $ | 6.93 | | | $ | 8.63 | | | $ | 9.41 | | | $ | 7.93 | | | $ | 6.93 | |
| | | | | | | | | | | | | | | | | | | | | | | | | | | | | | | | |
Total Return (b) | | | 2.47 | % | | | 22.13 | % | | | 25.68 | % | | | (30.07 | )% | | | 2.34 | % | | | 21.62 | % | | | 25.38 | % | | | (30.21 | )% |
| | | | | | | | | | | | | | | | | | | | | | | | | | | | | | | | |
Ratios and Supplemental Data: | | | | | | | | | | | | | | | | | | | | | | | | | | | | | | | | |
Net Assets, End of Period (000’s) | | $ | 207,483 | | | $ | 245,161 | | | $ | 190,461 | | | $ | 6,496 | | | $ | 30,039 | | | $ | 26,638 | | | $ | 18,699 | | | $ | 4,452 | |
Ratio to average net assets: | | | | | | | | | | | | | | | | | | | | | | | | | | | | | | | | |
Net expenses (a)(c)(d) | | | 1.06 | % | | | 1.06 | % | | | 1.06 | % | | | 1.07 | % | | | 1.31 | % | | | 1.31 | % | | | 1.31 | % | | | 1.32 | % |
Gross expenses (a)(d) | | | 1.06 | % | | | 1.06 | % | | | 1.06 | % | | | 1.08 | % | | | 1.31 | % | | | 1.31 | % | | | 1.31 | % | | | 1.32 | % |
Net investment income (loss) (a)(c)(d) | | | 1.23 | % | | | 1.41 | % | | | 1.45 | % | | | 2.10 | % | | | 1.02 | % | | | 1.18 | % | | | 1.15 | % | | | 1.65 | % |
Portfolio turnover rate | | | 50 | % | | | 65 | % | | | 159 | % | | | 90 | % | | | 50 | % | | | 65 | % | | | 159 | % | | | 90 | % |
| * | For the period March 7, 2008 (commencement of operations) to December 31, 2008. |
| † | Based on average shares outstanding during the period. |
| (a) | Annualized for periods of less than one year. |
| (b) | Total returns are historical and assume changes in share price, reinvestments of all dividends and distributions, and no sales charge. Had certain expenses not been reduced during the periods shown, total returns would have been lower. Total returns for periods of less than one year are not annualized. |
| (c) | Such percentages are after advisory fee or unified management fee waivers and expense reimbursements, as applicable. |
| (d) | Does not include any insurance charges imposed in connection with your variable insurance contract. |
302
| | |
| FINANCIAL HIGHLIGHTS (Continued) | | |
| | | Sun Capital Advisers Trust |
Selected data for a share outstanding throughout each period:
| | | | | | | | | | | | | | | | | | | | | | | | | | | | | | | | |
| | | SC Columbia
Small Cap Value Fund
Initial Class Shares | | | SC Columbia
Small Cap Value Fund
Service Class Shares | |
| | | Years Ended December 31, | | | Years Ended December 31, | |
| | | 2011 | | | 2010 | | | 2009 | | | 2008* | | | 2011 | | | 2010 | | | 2009 | | | 2008* | |
Net Asset Value, Beginning of Period | | $ | 11.18 | | | $ | 10.08 | | | $ | 7.97 | | | $ | 10.00 | | | $ | 11.14 | | | $ | 10.07 | | | $ | 7.97 | | | $ | 10.00 | |
| | | | | | | | | | | | | | | | | | | | | | | | | | | | | | | | |
Income (Loss) from Investment Operations: | | | | | | | | | | | | | | | | | | | | | | | | | | | | | | | | |
Net investment income (loss) (d) | | | 0.04 | † | | | 0.07 | † | | | 0.06 | † | | | 0.01 | | | | 0.01 | † | | | 0.05 | † | | | 0.04 | † | | | 0.01 | |
Net realized and unrealized gain (loss) on investments | | | (0.88 | ) | | | 1.93 | | | | 2.38 | | | | (2.03 | ) | | | (0.86 | ) | | | 1.92 | | | | 2.36 | | | | (2.03 | ) |
| | | | | | | | | | | | | | | | | | | | | | | | | | | | | | | | |
Total from Investment Operations | | | (0.84 | ) | | | 2.00 | | | | 2.44 | | | | (2.02 | ) | | | (0.85 | ) | | | 1.97 | | | | 2.40 | | | | (2.02 | ) |
| | | | | | | | | | | | | | | | | | | | | | | | | | | | | | | | |
Less Distributions from: | | | | | | | | | | | | | | | | | | | | | | | | | | | | | | | | |
Net investment income | | | (0.07 | ) | | | — | | | | (0.05 | ) | | | (0.01 | ) | | | (0.05 | ) | | | — | | | | (0.02 | ) | | | (0.01 | ) |
Net realized gain on investments | | | (1.94 | ) | | | (0.90 | ) | | | (0.28 | ) | | | — | | | | (1.94 | ) | | | (0.90 | ) | | | (0.28 | ) | | | — | |
| | | | | | | | | | | | | | | | | | | | | | | | | | | | | | | | |
Total distributions | | | (2.01 | ) | | | (0.90 | ) | | | (0.33 | ) | | | (0.01 | ) | | | (1.99 | ) | | | (0.90 | ) | | | (0.30 | ) | | | (0.01 | ) |
| | | | | | | | | | | | | | | | | | | | | | | | | | | | | | | | |
Net Asset Value, End of Period | | $ | 8.33 | | | $ | 11.18 | | | $ | 10.08 | | | $ | 7.97 | | | $ | 8.30 | | | $ | 11.14 | | | $ | 10.07 | | | $ | 7.97 | |
| | | | | | | | | | | | | | | | | | | | | | | | | | | | | | | | |
Total Return (b) | | | (6.32 | )% | | | 21.62 | % | | | 30.52 | % | | | (20.15 | )% | | | (6.50 | )% | | | 21.33 | % | | | 30.07 | % | | | (20.20 | )% |
| | | | | | | | | | | | | | | | | | | | | | | | | | | | | | | | |
Ratios and Supplemental Data: | | | | | | | | | | | | | | | | | | | | | | | | | | | | | | | | |
Net Assets, End of Period (000’s) | | $ | 43,958 | | | $ | 48,782 | | | $ | 33,674 | | | $ | 4,316 | | | $ | 11,847 | | | $ | 12,293 | | | $ | 6,809 | | | $ | 1,424 | |
Ratio to average net assets: | | | | | | | | | | | | | | | | | | | | | | | | | | | | | | | | |
Net expenses (a)(c)(d) | | | 1.15 | % | | | 1.15 | % | | | 1.15 | % | | | 1.15 | % | | | 1.40 | % | | | 1.40 | % | | | 1.40 | % | | | 1.40 | % |
Gross expenses (a)(d) | | | 1.24 | % | | | 1.41 | % | | | 1.54 | % | | | 8.84 | % | | | 1.48 | % | | | 1.67 | % | | | 1.87 | % | | | 6.68 | % |
Net investment income (loss) (a)(c)(d) | | | 0.36 | % | | | 0.68 | % | | | 0.65 | % | | | 1.18 | % | | | 0.12 | % | | | 0.47 | % | | | 0.44 | % | | | 0.72 | % |
Portfolio turnover rate | | | 50 | % | | | 139 | % | | | 110 | % | | | 28 | % | | | 50 | % | | | 139 | % | | | 110 | % | | | 28 | % |
| * | For the period October 1, 2008 (commencement of operations) to December 31, 2008. |
| † | Based on average shares outstanding during the period. |
| (a) | Annualized for periods of less than one year. |
| (b) | Total returns are historical and assume changes in share price, reinvestments of all dividends and distributions, and no sales charge. Had certain expenses not been reduced during the periods shown, total returns would have been lower. Total returns for periods of less than one year are not annualized. |
| (c) | Such percentages are after advisory fee or unified management fee waivers and expense reimbursements, as applicable. |
| (d) | Does not include any insurance charges imposed in connection with your variable insurance contract. |
303
| | |
| FINANCIAL HIGHLIGHTS (Continued) | | |
| | | Sun Capital Advisers Trust |
Selected data for a share outstanding throughout each period:
| | | | | | | | | | | | | | | | | | | | | | | | | | | | | | | | | | | | | | | | |
| | | SC Davis Venture Value Fund
Initial Class Shares | | | SC Davis Venture Value Fund
Service Class Shares | |
| | | Years Ended December 31, | | | Years Ended December 31, | |
| | | 2011 | | | 2010 | | | 2009 | | | 2008 | | | 2007 | | | 2011 | | | 2010 | | | 2009 | | | 2008 | | | 2007 | |
Net Asset Value, Beginning of Period | | $ | 12.08 | | | $ | 10.75 | | | $ | 8.34 | | | $ | 13.65 | | | $ | 13.17 | | | $ | 12.05 | | | $ | 10.72 | | | $ | 8.32 | | | $ | 13.61 | | | $ | 13.15 | |
| | | | | | | | | | | | | | | | | | | | | | | | | | | | | | | | | | | | | | | | |
Income (Loss) from Investment Operations: | | | | | | | | | | | | | | | | | | | | | | | | | | | | | | | | | | | | | | | | |
Net investment income (loss) (c) | | | 0.11 | † | | | 0.08 | † | | | 0.06 | † | | | 0.10 | | | | 0.17 | | | | 0.08 | † | | | 0.05 | † | | | 0.04 | † | | | 0.06 | | | | 0.12 | |
Net realized and unrealized gain (loss) on
investments | | | (0.59 | ) | | | 1.30 | | | | 2.39 | | | | (5.21 | ) | | | 0.39 | | | | (0.59 | ) | | | 1.31 | | | | 2.37 | | | | (5.17 | ) | | | 0.39 | |
| | | | | | | | | | | | | | | | | | | | | | | | | | | | | | | | | | | | | | | | |
Total from Investment Operations | | | (0.48 | ) | | | 1.38 | | | | 2.45 | | | | (5.11 | ) | | | 0.56 | | | | (0.51 | ) | | | 1.36 | | | | 2.41 | | | | (5.11 | ) | | | 0.51 | |
| | | | | | | | | | | | | | | | | | | | | | | | | | | | | | | | | | | | | | | | |
Less Distributions from: | | | | | | | | | | | | | | | | | | | | | | | | | | | | | | | | | | | | | | | | |
Net investment income | | | (0.11 | ) | | | (0.05 | ) | | | (0.04 | ) | | | (0.09 | ) | | | (0.08 | ) | | | (0.08 | ) | | | (0.03 | ) | | | (0.01 | ) | | | (0.07 | ) | | | (0.05 | ) |
Net realized gain on investments | | | (0.51 | ) | | | — | | | | — | | | | (0.11 | ) | | | — | | | | (0.51 | ) | | | — | | | | — | | | | (0.11 | ) | | | — | |
| | | | | | | | | | | | | | | | | | | | | | | | | | | | | | | | | | | | | | | | |
Total distributions | | | (0.62 | ) | | | (0.05 | ) | | | (0.04 | ) | | | (0.20 | ) | | | (0.08 | ) | | | (0.59 | ) | | | (0.03 | ) | | | (0.01 | ) | | | (0.18 | ) | | | (0.05 | ) |
| | | | | | | | | | | | | | | | | | | | | | | | | | | | | | | | | | | | | | | | |
Net Asset Value, End of Period | | $ | 10.98 | | | $ | 12.08 | | | $ | 10.75 | | | $ | 8.34 | | | $ | 13.65 | | | $ | 10.95 | | | $ | 12.05 | | | $ | 10.72 | | | $ | 8.32 | | | $ | 13.61 | |
| | | | | | | | | | | | | | | | | | | | | | | | | | | | | | | | | | | | | | | | |
Total Return (a) | | | (3.77 | )% | | | 12.92 | % | | | 29.39 | % | | | (37.81 | )% | | | 4.23 | % | | | (4.02 | )% | | | 12.68 | % | | | 29.02 | % | | | (37.93 | )% | | | 3.91 | % |
| | | | | | | | | | | | | | | | | | | | | | | | | | | | | | | | | | | | | | | | |
Ratios and Supplemental Data: | | | | | | | | | | | | | | | | | | | | | | | | | | | | | | | | | | | | | | | | |
Net Assets, End of Period (000’s) | | $ | 150,772 | | | $ | 157,652 | | | $ | 147,350 | | | $ | 31,868 | | | $ | 52,861 | | | $ | 239,408 | | | $ | 266,112 | | | $ | 235,240 | | | $ | 82,041 | | | $ | 27,764 | |
Ratios to average net assets: | | | | | | | | | | | | | | | | | | | | | | | | | | | | | | | | | | | | | | | | |
Net expenses (b)(c) | | | 0.86 | % | | | 0.87 | % | | | 0.90 | % | | | 0.90 | % | | | 0.90 | % | | | 1.11 | % | | | 1.12 | % | | | 1.15 | % | | | 1.15 | % | | | 1.15 | % |
Gross expenses (c) | | | 0.86 | % | | | 0.87 | % | | | 0.93 | % | | | 1.11 | % | | | 1.11 | % | | | 1.11 | % | | | 1.12 | % | | | 1.18 | % | | | 1.35 | % | | | 1.35 | % |
Net investment income (loss) (b)(c) | | | 0.90 | % | | | 0.73 | % | | | 0.62 | % | | | 0.86 | % | | | 1.06 | % | | | 0.65 | % | | | 0.49 | % | | | 0.41 | % | | | 0.65 | % | | | 0.68 | % |
Portfolio turnover rate | | | 16 | % | | | 39 | % | | | 17 | % | | | 19 | % | | | 10 | % | | | 16 | % | | | 39 | % | | | 17 | % | | | 19 | % | | | 10 | % |
| † | Based on average shares outstanding during the period. |
| (a) | Total returns are historical and assume changes in share price, reinvestments of all dividends and distributions, and no sales charge. Had certain expenses not been reduced during the periods shown, total returns would have been lower. |
| (b) | Such percentages are after advisory fee or unified management fee waivers and expense reimbursements, as applicable. |
| (c) | Does not include any insurance charges imposed in connection with your variable insurance contract. |
304
| | |
| FINANCIAL HIGHLIGHTS (Continued) | | |
| | | Sun Capital Advisers Trust |
Selected data for a share outstanding throughout each period:
| | | | | | | | | | | | | | | | | | | | | | | | | | | | | | | | |
| | | SC Invesco Small
Cap Growth Fund
Initial Class Shares | | | SC Invesco Small
Cap Growth Fund
Service Class Shares | |
| | | Years Ended December 31, | | | Years Ended December 31, | |
| | | 2011 | | | 2010 | | | 2009 | | | 2008* | | | 2011 | | | 2010 | | | 2009 | | | 2008* | |
Net Asset Value, Beginning of Period | | $ | 11.06 | | | $ | 9.59 | | | $ | 7.51 | | | $ | 10.00 | | | $ | 10.99 | | | $ | 9.55 | | | $ | 7.50 | | | $ | 10.00 | |
| | | | | | | | | | | | | | | | | | | | | | | | | | | | | | | | |
Income (Loss) from Investment Operations: | | | | | | | | | | | | | | | | | | | | | | | | | | | | | | | | |
Net investment income (loss) (d) | | | (0.06 | )† | | | (0.05 | )† | | | (0.02 | )† | | | (0.00 | )(e) | | | (0.09 | )† | | | (0.08 | )† | | | (0.04 | )† | | | (0.01 | ) |
Net realized and unrealized gain (loss) on investments | | | (0.05 | ) | | | 2.39 | | | | 2.41 | | | | (2.49 | ) | | | (0.05 | ) | | | 2.39 | | | | 2.40 | | | | (2.49 | ) |
| | | | | | | | | | | | | | | | | | | | | | | | | | | | | | | | |
Total from Investment Operations | | | (0.11 | ) | | | 2.34 | | | | 2.39 | | | | (2.49 | ) | | | (0.14 | ) | | | 2.31 | | | | 2.36 | | | | (2.50 | ) |
| | | | | | | | | | | | | | | | | | | | | | | | | | | | | | | | |
Less Distributions from: | | | | | | | | | | | | | | | | | | | | | | | | | | | | | | | | |
Net investment income | | | — | | | | — | | | | — | | | | — | | | | — | | | | — | | | | — | | | | — | |
Net realized gain on investments | | | (0.37 | ) | | | (0.87 | ) | | | (0.31 | ) | | | — | | | | (0.37 | ) | | | (0.87 | ) | | | (0.31 | ) | | | — | |
| | | | | | | | | | | | | | | | | | | | | | | | | | | | | | | | |
Total distributions | | | (0.37 | ) | | | (0.87 | ) | | | (0.31 | ) | | | — | | | | (0.37 | ) | | | (0.87 | ) | | | (0.31 | ) | | | — | |
| | | | | | | | | | | | | | | | | | | | | | | | | | | | | | | | |
Net Asset Value, End of Period | | $ | 10.58 | | | $ | 11.06 | | | $ | 9.59 | | | $ | 7.51 | | | $ | 10.48 | | | $ | 10.99 | | | $ | 9.55 | | | $ | 7.50 | |
| | | | | | | | | | | | | | | | | | | | | | | | | | | | | | | | |
Total Return (b) | | | (0.92 | )% | | | 26.08 | % | | | 31.75 | % | | | (24.90 | )% | | | (1.20 | )% | | | 25.86 | % | | | 31.39 | % | | | (25.00 | )% |
| | | | | | | | | | | | | | | | | | | | | | | | | | | | | | | | |
Ratios and Supplemental Data: | | | | | | | | | | | | | | | | | | | | | | | | | | | | | | | | |
Net Assets, End of Period (000’s) | | $ | 28,830 | | | $ | 20,587 | | | $ | 13,109 | | | $ | 2,530 | | | $ | 13,268 | | | $ | 10,761 | | | $ | 6,488 | | | $ | 1,544 | |
Ratio to average net assets: | | | | | | | | | | | | | | | | | | | | | | | | | | | | | | | | |
Net expenses (a)(c)(d) | | | 1.16 | % | | | 1.15 | % | | | 1.15 | % | | | 1.15 | % | | | 1.40 | % | | | 1.40 | % | | | 1.40 | % | | | 1.40 | % |
Gross expenses (a)(d) | | | 1.35 | % | | | 1.63 | % | | | 2.17 | % | | | 11.09 | % | | | 1.61 | % | | | 1.88 | % | | | 2.48 | % | | | 9.42 | % |
Net investment income (loss) (a)(c)(d) | | | (0.53 | )% | | | (0.53 | )% | | | (0.25 | )% | | | (0.40 | )% | | | (0.80 | )% | | | (0.78 | )% | | | (0.51 | )% | | | (0.72 | )% |
Portfolio turnover rate | | | 33 | % | | | 42 | % | | | 114 | % | | | 4 | % | | | 33 | % | | | 42 | % | | | 114 | % | | | 4 | % |
| * | For the period October 1, 2008 (commencement of operations) to December 31, 2008. |
| † | Based on average shares outstanding during the period. |
| (a) | Annualized for periods of less than one year. |
| (b) | Total returns are historical and assume changes in share price, reinvestments of all dividends and distributions, and no sales charge. Had certain expenses not been reduced during the periods shown, total returns would have been lower. Total returns for periods of less than one year are not annualized. |
| (c) | Such percentages are after advisory fee or unified management fee waivers and expense reimbursements, as applicable. |
| (d) | Does not include any insurance charges imposed in connection with your variable insurance contract. |
| (e) | Amount is less than $0.005 per share. |
305
| | |
| FINANCIAL HIGHLIGHTS (Continued) | | |
| | | Sun Capital Advisers Trust |
Selected data for a share outstanding throughout each period:
| | | | | | | | | | | | | | | | | | | | | | | | | | | | | | | | |
| | | SC Lord Abbett
Growth & Income Fund
Initial Class Shares | | | SC Lord Abbett
Growth & Income Fund
Service Class Shares | |
| | | Years Ended December 31, | | | Years Ended December 31, | |
| | | 2011 | | | 2010 | | | 2009 | | | 2008* | | | 2011 | | | 2010 | | | 2009 | | | 2008* | |
Net Asset Value, Beginning of Period | | $ | 8.44 | | | $ | 7.52 | | | $ | 7.08 | | | $ | 10.00 | | | $ | 8.41 | | | $ | 7.51 | | | $ | 7.08 | | | $ | 10.00 | |
| | | | | | | | | | | | | | | | | | | | | | | | | | | | | | | | |
Income (Loss) from Investment Operations: | | | | | | | | | | | | | | | | | | | | | | | | | | | | | | | | |
Net investment income (loss) (d) | | | 0.06 | † | | | 0.05 | † | | | 0.05 | † | | | 0.06 | | | | 0.04 | † | | | 0.03 | † | | | 0.04 | † | | | 0.06 | |
Net realized and unrealized gain (loss) on investments | | | (0.64 | ) | | | 1.20 | | | | 1.22 | | | | (2.92 | ) | | | (0.63 | ) | | | 1.20 | | | | 1.19 | | | | (2.93 | ) |
| | | | | | | | | | | | | | | | | | | | | | | | | | | | | | | | |
Total from Investment Operations | | | (0.58 | ) | | | 1.25 | | | | 1.27 | | | | (2.86 | ) | | | (0.59 | ) | | | 1.23 | | | | 1.23 | | | | (2.87 | ) |
| | | | | | | | | | | | | | | | | | | | | | | | | | | | | | | | |
Less Distributions from: | | | | | | | | | | | | | | | | | | | | | | | | | | | | | | | | |
Net investment income | | | (0.05 | ) | | | — | | | | (0.05 | ) | | | (0.06 | ) | | | (0.04 | ) | | | — | | | | (0.02 | ) | | | (0.05 | ) |
Net realized gain on investments | | | (1.35 | ) | | | (0.33 | ) | | | (0.78 | ) | | | — | | | | (1.35 | ) | | | (0.33 | ) | | | (0.78 | ) | | | — | |
| | | | | | | | | | | | | | | | | | | | | | | | | | | | | | | | |
Total distributions | | | (1.40 | ) | | | (0.33 | ) | | | (0.83 | ) | | | (0.06 | ) | | | (1.39 | ) | | | (0.33 | ) | | | (0.80 | ) | | | (0.05 | ) |
| | | | | | | | | | | | | | | | | | | | | | | | | | | | | | | | |
Net Asset Value, End of Period | | $ | 6.46 | | | $ | 8.44 | | | $ | 7.52 | | | $ | 7.08 | | | $ | 6.43 | | | $ | 8.41 | | | $ | 7.51 | | | $ | 7.08 | |
| | | | | | | | | | | | | | | | | | | | | | | | | | | | | | | | |
Total Return (b) | | | (6.15 | )% | | | 17.19 | % | | | 17.85 | % | | | (28.54 | )% | | | (6.40 | )% | | | 16.94 | % | | | 17.41 | % | | | (28.68 | )% |
| | | | | | | | | | | | | | | | | | | | | | | | | | | | | | | | |
Ratios and Supplemental Data: | | | | | | | | | | | | | | | | | | | | | | | | | | | | | | | | |
Net Assets, End of Period (000’s) | | $ | 436,816 | | | $ | 544,716 | | | $ | 498,639 | | | $ | 2,229 | | | $ | 14,991 | | | $ | 13,744 | | | $ | 9,422 | | | $ | 2,620 | |
Ratio to average net assets: | | | | | | | | | | | | | | | | | | | | | | | | | | | | | | | | |
Net expenses (a)(c)(d) | | | 0.87 | % | | | 0.87 | % | | | 0.87 | % | | | 0.87 | % | | | 1.12 | % | | | 1.12 | % | | | 1.12 | % | | | 1.12 | % |
Gross expenses (a)(d) | | | 0.88 | % | | | 0.88 | % | | | 0.88 | % | | | 0.90 | % | | | 1.13 | % | | | 1.13 | % | | | 1.13 | % | | | 1.14 | % |
Net investment income (loss) (a)(c)(d) | | | 0.74 | % | | | 0.62 | % | | | 0.68 | % | | | 1.71 | % | | | 0.51 | % | | | 0.36 | % | | | 0.49 | % | | | 1.48 | % |
Portfolio turnover rate | | | 68 | % | | | 63 | % | | | 83 | % | | | 73 | % | | | 68 | % | | | 63 | % | | | 83 | % | | | 73 | % |
| * | For the period March 7, 2008 (commencement of operations) to December 31, 2008. |
| † | Based on average shares outstanding during the period. |
| (a) | Annualized for periods of less than one year. |
| (b) | Total returns are historical and assume changes in share price, reinvestments of all dividends and distributions, and no sales charge. Had certain expenses not been reduced during the periods shown, total returns would have been lower. Total returns for periods of less than one year are not annualized. |
| (c) | Such percentages are after advisory fee or unified management fee waivers and expense reimbursements, as applicable. |
| (d) | Does not include any insurance charges imposed in connection with your variable insurance contract. |
306
| | |
| FINANCIAL HIGHLIGHTS (Continued) | | |
| | | Sun Capital Advisers Trust |
Selected data for a share outstanding throughout each period:
| | | | | | | | | | | | | | | | | | | | | | | | | | | | | | | | | | | | |
| | | SC WMC Blue Chip Mid Cap Fund
Initial Class Shares | | | SC WMC Blue Chip Mid Cap Fund
Service Class Shares | |
| | | Years Ended December 31, | | | Years Ended December 31, | |
| | | 2011 | | | 2010 | | | 2009 | | | 2008 | | | 2007 | | | 2011 | | | 2010 | | | 2009 | | | 2008* | |
Net Asset Value, Beginning of Period | | $ | 14.92 | | | $ | 12.12 | | | $ | 9.32 | | | $ | 17.95 | | | $ | 19.04 | | | $ | 14.82 | | | $ | 12.07 | | | $ | 9.30 | | | $ | 15.70 | |
| | | | | | | | | | | | | | | | | | | | | | | | | | | | | | | | | | | | |
Income (Loss) from Investment Operations: | | | | | | | | | | | | | | | | | | | | | | | | | | | | | | | | | | | | |
Net investment income (loss) (d) | | | 0.04 | † | | | 0.02 | † | | | 0.02 | † | | | 0.01 | | | | (0.00 | )(e) | | | (0.00 | )†(e) | | | (0.01 | )† | | | (0.01 | )† | | | 0.02 | |
Net realized and unrealized gain (loss) on investments | | | (1.20 | ) | | | 2.79 | | | | 2.78 | | | | (5.41 | ) | | | 2.87 | | | | (1.19 | ) | | | 2.76 | | | | 2.78 | | | | (3.19 | ) |
| | | | | | | | | | | | | | | | | | | | | | | | | | | | | | | | | | | | |
Total from Investment Operations | | | (1.16 | ) | | | 2.81 | | | | 2.80 | | | | (5.40 | ) | | | 2.87 | | | | (1.19 | ) | | | 2.75 | | | | 2.77 | | | | (3.17 | ) |
| | | | | | | | | | | | | | | | | | | | | | | | | | | | | | | | | | | | |
Less Distributions from: | | | | | | | | | | | | | | | | | | | | | | | | | | | | | | | | | | | | |
Net investment income | | | (0.01 | ) | | | (0.01 | ) | | | (0.00 | )(e) | | | (0.03 | ) | | | (0.25 | ) | | | — | | | | — | | | | (0.00 | )(e) | | | (0.03 | ) |
Net realized gain on investments | | | — | | | | — | | | | — | | | | (3.20 | ) | | | (3.71 | ) | | | — | | | | — | | | | — | | | | (3.20 | ) |
| | | | | | | | | | | | | | | | | | | | | | | | | | | | | | | | | | | | |
Total distributions | | | (0.01 | ) | | | (0.01 | ) | | | (0.00 | )(e) | | | (3.23 | ) | | | (3.96 | ) | | | — | | | | — | | | | (0.00 | )(e) | | | (3.23 | ) |
| | | | | | | | | | | | | | | | | | | | | | | | | | | | | | | | | | | | |
Net Asset Value, End of Period | | $ | 13.75 | | | $ | 14.92 | | | $ | 12.12 | | | $ | 9.32 | | | $ | 17.95 | | | $ | 13.63 | | | $ | 14.82 | | | $ | 12.07 | | | $ | 9.30 | |
| | | | | | | | | | | | | | | | | | | | | | | | | | | | | | | | | | | | |
Total Return (b) | | | (7.78 | )% | | | 23.17 | % | | | 30.07 | % | | | (35.14 | )% | | | 15.41 | % | | | (8.03 | )% | | | 22.78 | % | | | 29.96 | % | | | (26.06 | )% |
| | | | | | | | | | | | | | | | | | | | | | | | | | | | | | | | | | | | |
Ratios and Supplemental Data: | | | | | | | | | | | | | | | | | | | | | | | | | | | | | | | | | | | | |
Net Assets, End of Period (000’s) | | $ | 148,863 | | | $ | 128,115 | | | $ | 75,745 | | | $ | 45,842 | | | $ | 85,438 | | | $ | 35,155 | | | $ | 40,627 | | | $ | 40,249 | | | $ | 31,137 | |
Ratio to average net assets: | | | | | | | | | | | | | | | | | | | | | | | | | | | | | | | | | | | | |
Net expenses (a)(c)(d) | | | 0.96 | % | | | 0.99 | % | | | 1.00 | % | | | 1.00 | % | | | 1.00 | % | | | 1.21 | % | | | 1.24 | % | | | 1.25 | % | | | 1.25 | % |
Gross expenses (a)(d) | | | 0.96 | % | | | 0.99 | % | | | 1.10 | % | | | 1.21 | % | | | 1.14 | % | | | 1.21 | % | | | 1.24 | % | | | 1.35 | % | | | 1.47 | % |
Net investment income (loss) (a)(c)(d) | | | 0.26 | % | | | 0.17 | % | | | 0.17 | % | | | 0.05 | % | | | (0.17 | )% | | | (0.00 | )% | | | (0.11 | )% | | | (0.09 | )% | | | 0.02 | % |
Portfolio turnover rate | | | 68 | % | | | 69 | % | | | 82 | % | | | 104 | % | | | 75 | % | | | 68 | % | | | 69 | % | | | 82 | % | | | 104 | % |
| * | For the period March 7, 2008 (commencement of operations – Service Class Shares) through December 31, 2008. |
| † | Based on average shares outstanding during the period. |
| (a) | Annualized for periods of less than one year. |
| (b) | Total returns are historical and assume changes in share price, reinvestments of all dividends and distributions, and no sales charge. Had certain expenses not been reduced during the periods shown, total returns would have been lower. Total returns for periods of less than one year are not annualized. |
| (c) | Such percentages are after advisory fee or unified management fee waivers and expense reimbursements, as applicable. |
| (d) | Does not include any insurance charges imposed in connection with your variable insurance contract. |
| (e) | Amount is less than $0.005 per share. |
307
| | |
| FINANCIAL HIGHLIGHTS (Continued) | | |
| | | Sun Capital Advisers Trust |
Selected data for a share outstanding throughout the period:
| | | | | | | | | | | | | | | | | | | | | | | | | | | | | | | | | | | | | | | | |
| | | SC WMC Large Cap Growth Fund
Initial Class Shares | | | SC WMC Large Cap Growth Fund
Service Class Shares | |
| | | Years Ended December 31, | | | Years Ended December 31, | |
| | | 2011 | | | 2010 | | | 2009 | | | 2008 | | | 2007* | | | 2011 | | | 2010 | | | 2009 | | | 2008 | | | 2007 | |
Net Asset Value, Beginning of Period | | $ | 9.71 | | | $ | 8.15 | | | $ | 5.95 | | | $ | 10.65 | | | $ | 9.99 | | | $ | 9.65 | | | $ | 8.10 | | | $ | 5.92 | | | $ | 10.63 | | | $ | 9.98 | |
| | | | | | | | | | | | | | | | | | | | | | | | | | | | | | | | | | | | | | | | |
Income (Loss) from Investment Operations: | | | | | | | | | | | | | | | | | | | | | | | | | | | | | | | | | | | | | | | | |
Net investment income (loss) (d) | | | 0.02 | † | | | 0.03 | † | | | 0.04 | † | | | 0.04 | | | | (0.00 | )(e) | | | 0.00 | †(e) | | | 0.01 | † | | | 0.03 | † | | | 0.02 | | | | (0.02 | ) |
Net realized and unrealized gain (loss) on investments | | | (0.46 | ) | | | 1.55 | | | | 2.17 | | | | (4.74 | ) | | | 0.69 | | | | (0.46 | ) | | | 1.54 | | | | 2.16 | | | | (4.73 | ) | | | 0.70 | |
| | | | | | | | | | | | | | | | | | | | | | | | | | | | | | | | | | | | | | | | |
Total from Investment Operations | | | (0.44 | ) | | | 1.58 | | | | 2.21 | | | | (4.70 | ) | | | 0.69 | | | | (0.46 | ) | | | 1.55 | | | | 2.19 | | | | (4.71 | ) | | | 0.68 | |
| | | | | | | | | | | | | | | | | | | | | | | | | | | | | | | | | | | | | | | | |
Less Distributions from: | | | | | | | | | | | | | | | | | | | | | | | | | | | | | | | | | | | | | | | | |
Net investment income | | | (0.03 | ) | | | (0.02 | ) | | | (0.01 | ) | | | — | | | | — | | | | (0.01 | ) | | | (0.00 | )(e) | | | (0.01 | ) | | | — | | | | — | |
Net realized gain on investments | | | — | | | | — | | | | — | | | | (0.00 | )(e) | | | (0.03 | ) | | | — | | | | — | | | | — | | | | (0.00 | )(e) | | | (0.03 | ) |
| | | | | | | | | | | | | | | | | | | | | | | | | | | | | | | | | | | | | | | | |
Total distributions | | | (0.03 | ) | | | (0.02 | ) | | | (0.01 | ) | | | (0.00 | )(e) | | | (0.03 | ) | | | (0.01 | ) | | | (0.00 | )(e) | | | (0.01 | ) | | | (0.00 | )(e) | | | (0.03 | ) |
| | | | | | | | | | | | | | | | | | | | | | | | | | | | | | | | | | | | | | | | |
Net Asset Value, End of Period | | $ | 9.24 | | | $ | 9.71 | | | $ | 8.15 | | | $ | 5.95 | | | $ | 10.65 | | | $ | 9.18 | | | $ | 9.65 | | | $ | 8.10 | | | $ | 5.92 | | | $ | 10.63 | |
| | | | | | | | | | | | | | | | | | | | | | | | | | | | | | | | | | | | | | | | |
Total Return (b) | | | (4.53 | )% | | | 19.50 | % | | | 37.23 | % | | | (44.12 | )% | | | 6.88 | % | | | (4.80 | )% | | | 19.19 | % | | | 37.08 | % | | | (44.30 | )% | | | 6.78 | % |
| | | | | | | | | | | | | | | | | | | | | | | | | | | | | | | | | | | | | | | | |
Ratios and Supplemental Data: | | | | | | | | | | | | | | | | | | | | | | | | | | | | | | | | | | | | | | | | |
Net Assets, End of Period (000’s) | | $ | 185,489 | | | $ | 172,338 | | | $ | 149,621 | | | $ | 34,599 | | | $ | 62,680 | | | $ | 16,414 | | | $ | 18,782 | | | $ | 17,883 | | | $ | 15,518 | | | $ | 33,064 | |
Ratios to average net assets: | | | | | | | | | | | | | | | | | | | | | | | | | | | | | | | | | | | | | | | | |
Net expenses (a)(c)(d) | | | 0.88 | % | | | 0.81 | % | | | 0.81 | % | | | 0.81 | % | | | 0.81 | % | | | 1.12 | % | | | 1.06 | % | | | 1.06 | % | | | 1.06 | % | | | 1.06 | % |
Gross expenses (a)(d) | | | 0.90 | % | | | 0.92 | % | | | 1.05 | % | | | 1.17 | % | | | 1.06 | % | | | 1.16 | % | | | 1.17 | % | | | 1.33 | % | | | 1.43 | % | | | 1.46 | % |
Net investment income (loss) (a)(c)(d) | | | 0.26 | % | | | 0.34 | % | | | 0.60 | % | | | 0.43 | % | | | 0.01 | % | | | 0.00 | % | | | 0.09 | % | | | 0.46 | % | | | 0.17 | % | | | (0.25 | )% |
Portfolio turnover rate | | | 58 | % | | | 77 | % | | | 72 | % | | | 265 | % | | | 307 | % | | | 58 | % | | | 77 | % | | | 72 | % | | | 265 | % | | | 307 | % |
| * | For the period April 2, 2007 (commencement of operations – Initial Class Shares) through December 31, 2007. |
| † | Based on average shares outstanding during the period. |
| (a) | Annualized for periods of less than one year. |
| (b) | Total returns are historical and assume changes in share price, reinvestments of all dividends and distributions, and no sales charge. Had certain expenses not been reduced during the periods shown, total returns would have been lower. Total returns for periods of less than one year are not annualized. |
| (c) | Such percentages are after advisory fee or unified management fee waivers and expense reimbursements, as applicable. |
| (d) | Does not include any insurance charges imposed in connection with your variable insurance contract. |
| (e) | Amount is less than $0.005 per share. |
308
| | |
| FINANCIAL HIGHLIGHTS (Continued) | | |
| | | Sun Capital Advisers Trust |
Selected data for a share outstanding throughout each period:
| | | | | | | | | | | | | | | | | | | | | | | | | | | | | | | | | | | | | | | | |
| | | Sun Capital
Global Real Estate Fund
Initial Class Shares | | | Sun Capital
Global Real Estate Fund
Service Class Shares | |
| | | Years Ended December 31, | | | Years Ended December 31, | |
| | | 2011 | | | 2010 | | | 2009 | | | 2008 | | | 2007 | | | 2011 | | | 2010 | | | 2009 | | | 2008 | | | 2007 | |
Net Asset Value, Beginning of Period | | $ | 11.44 | | | $ | 11.23 | | | $ | 8.99 | | | $ | 18.24 | | | $ | 24.60 | | | $ | 12.61 | | | $ | 12.25 | | | $ | 9.77 | | | $ | 19.66 | | | $ | 26.23 | |
| | | | | | | | | | | | | | | | | | | | | | | | | | | | | | | | | | | | | | | | |
Income (Loss) from Investment Operations: | | | | | | | | | | | | | | | | | | | | | | | | | | | | | | | | | | | | | | | | |
Net investment income (loss) (c) | | | 0.21 | † | | | 0.34 | † | | | 0.32 | † | | | 0.18 | | | | 0.66 | | | | 0.20 | † | | | 0.34 | † | | | 0.32 | † | | | 0.18 | | | | 0.40 | |
Net realized and unrealized gain (loss) on investments | | | (1.08 | ) | | | 1.28 | | | | 2.35 | | | | (7.53 | ) | | | (3.70 | ) | | | (1.17 | ) | | | 1.40 | | | | 2.56 | | | | (8.22 | ) | | | (3.71 | ) |
| | | | | | | | | | | | | | | | | | | | | | | | | | | | | | | | | | | | | | | | |
Total from Investment Operations | | | (0.87 | ) | | | 1.62 | | | | 2.67 | | | | (7.35 | ) | | | (3.04 | ) | | | (0.97 | ) | | | 1.74 | | | | 2.88 | | | | (8.04 | ) | | | (3.31 | ) |
| | | | | | | | | | | | | | | | | | | | | | | | | | | | | | | | | | | | | | | | |
Less Distributions from: | | | | | | | | | | | | | | | | | | | | | | | | | | | | | | | | | | | | | | | | |
Net investment income | | | (0.82 | ) | | | (1.41 | ) | | | (0.36 | ) | | | (0.39 | ) | | | (0.36 | ) | | | (0.80 | ) | | | (1.38 | ) | | | (0.33 | ) | | | (0.34 | ) | | | (0.30 | ) |
Net realized gain on investments | | | — | | | | — | | | | (0.07 | ) | | | (1.51 | ) | | | (2.96 | ) | | | — | | | | — | | | | (0.07 | ) | | | (1.51 | ) | | | (2.96 | ) |
| | | | | | | | | | | | | | | | | | | | | | | | | | | | | | | | | | | | | | | | |
Total distributions | | | (0.82 | ) | | | (1.41 | ) | | | (0.43 | ) | | | (1.90 | ) | | | (3.32 | ) | | | (0.80 | ) | | | (1.38 | ) | | | (0.40 | ) | | | (1.85 | ) | | | (3.26 | ) |
| | | | | | | | | | | | | | | | | | | | | | | | | | | | | | | | | | | | | | | | |
Net Asset Value, End of Period | | $ | 9.75 | | | $ | 11.44 | | | $ | 11.23 | | | $ | 8.99 | | | $ | 18.24 | | | $ | 10.84 | | | $ | 12.61 | | | $ | 12.25 | | | $ | 9.77 | | | $ | 19.66 | |
| | | | | | | | | | | | | | | | | | | | | | | | | | | | | | | | | | | | | | | | |
Total Return (a) | | | (7.59 | )% | | | 15.28 | % | | | 30.09 | % | | | (44.73 | )% | | | (13.13 | )% | | | (7.74 | )% | | | 14.94 | % | | | 29.83 | % | | | (44.89 | )% | | | (13.34 | )% |
| | | | | | | | | | | | | | | | | | | | | | | | | | | | | | | | | | | | | | | | |
Ratios and Supplemental Data: | | | | | | | | | | | | | | | | | | | | | | | | | | | | | | | | | | | | | | | | |
Net Assets, End of Period (000’s) | | $ | 87,924 | | | $ | 111,981 | | | $ | 84,988 | | | $ | 45,841 | | | $ | 87,441 | | | $ | 117,846 | | | $ | 142,500 | | | $ | 138,929 | | | $ | 126,838 | | | $ | 173,065 | |
Ratios to average net assets: | | | | | | | | | | | | | | | | | | | | | | | | | | | | | | | | | | | | | | | | |
Net expenses (b)(c) | | | 1.10 | % | | | 1.10 | % | | | 1.10 | % | | | 1.10 | % | | | 1.10 | % | | | 1.35 | % | | | 1.35 | % | | | 1.35 | % | | | 1.35 | % | | | 1.35 | % |
Gross expenses (c) | | | 1.15 | % | | | 1.11 | % | | | 1.17 | % | | | 1.23 | % | | | 1.18 | % | | | 1.41 | % | | | 1.37 | % | | | 1.43 | % | | | 1.48 | % | | | 1.43 | % |
Net investment income (loss) (b)(c) | | | 1.89 | % | | | 3.07 | % | | | 3.52 | % | | | 1.28 | % | | | 2.65 | % | | | 1.60 | % | | | 2.80 | % | | | 3.33 | % | | | 1.15 | % | | | 2.82 | % |
Portfolio turnover rate | | | 27 | % | | | 40 | % | | | 110 | % | | | 76 | % | | | 25 | % | | | 27 | % | | | 40 | % | | | 110 | % | | | 76 | % | | | 25 | % |
| † | Based on average shares outstanding during the period. |
| (a) | Total returns are historical and assume changes in share price, reinvestments of all dividends and distributions, and no sales charge. Had certain expenses not been reduced during the periods shown, total returns would have been lower. |
| (b) | Such percentages are after advisory fee or unified management fee waivers and expense reimbursements, as applicable. |
| (c) | Does not include any insurance charges imposed in connection with your variable insurance contract. |
309
| | |
| FINANCIAL HIGHLIGHTS (Continued) | | |
| | | Sun Capital Advisers Trust |
Selected data for a share outstanding throughout each period:
| | | | | | | | |
| | | SC Ibbotson Tactical
Opportunities Fund
Initial Class Shares
| |
| | | Years Ended December 31, | |
| | | 2011 | | | 2010* | |
Net Asset Value, Beginning of Period | | $ | 10.52 | | | $ | 10.00 | |
| | | | | | | | |
Income (Loss) from Investment Operations: | | | | | | | | |
Net investment income (loss) (d) | | | 0.10 | † | | | 0.09 | † |
Net realized and unrealized gain (loss) on investments | | | (0.71 | ) | | | 0.43 | |
| | | | | | | | |
Total from Investment Operations | | | (0.61 | ) | | | 0.52 | |
| | | | | | | | |
Less Distributions from: | | | | | | | | |
Net investment income | | | (0.07 | ) | | | — | |
Net realized gain on investments | | | (0.01 | ) | | | — | |
| | | | | | | | |
Total distributions | | | (0.08 | ) | | | — | |
| | | | | | | | |
Net Asset Value, End of Period | | $ | 9.83 | | | $ | 10.52 | |
| | | | | | | | |
Total Return (b) | | | (5.75 | )% | | | 5.20 | % |
| | | | | | | | |
Ratios and Supplemental Data: | | | | | | | | |
Net Assets, End of Period (000’s) | | $ | 572,486 | | | $ | 455,423 | |
Ratios to average net assets: | | | | | | | | |
Net expenses (a)(c)(d)(e) | | | 0.45 | % | | | 0.50 | % |
Gross expenses (a)(d)(e) | | | 0.45 | % | | | 0.60 | % |
Net investment income (loss) (a)(c)(d)(e) | | | 0.97 | % | | | 7.56 | % |
Portfolio turnover rate (f) | | | 156 | % | | | 17 | % |
| * | For the period November 15, 2010 (commencement of operations) to December 31, 2010. |
| † | Based on average shares outstanding during the period. |
| (a) | Annualized for periods of less than one year. |
| (b) | Total returns are historical and assume changes in share price, reinvestments of all dividends and distributions, and no sales charge. Had certain expenses not been reduced during the periods shown, total returns would have been lower. Total returns for periods of less than one year are not annualized. |
| (c) | Such percentages are after advisory fee or unified management fee waivers and expense reimbursements, as applicable. |
| (d) | Does not include any insurance charges imposed in connection with your variable insurance contract. |
| (e) | Does not include expenses of the underlying funds in which the Fund invests. |
| (f) | Does not include the portfolio turnover activity of the underlying funds in which the Fund invests. |
310
| | |
| FINANCIAL HIGHLIGHTS (Continued) | | |
| | | Sun Capital Advisers Trust |
Selected data for a share outstanding throughout each period:
| | | | | | | | | | | | | | | | | | | | | | | | | | | | | | | | | | | | | | | | |
| | | Sun Capital
Investment Grade Bond Fund
Initial Class Shares | | | Sun Capital
Investment Grade Bond Fund
Service Class Shares | |
| | | Years Ended December 31, | | | Years Ended December 31, | |
| | | 2011 | | | 2010 | | | 2009 | | | 2008 | | | 2007 | | | 2011 | | | 2010 | | | 2009 | | | 2008 | | | 2007 | |
Net Asset Value, Beginning of Period | | $ | 9.39 | | | $ | 9.06 | | | $ | 7.84 | | | $ | 9.48 | | | $ | 9.62 | | | $ | 9.46 | | | $ | 9.12 | | | $ | 7.90 | | | $ | 9.55 | | | $ | 9.69 | |
| | | | | | | | | | | | | | | | | | | | | | | | | | | | | | | | | | | | | | | | |
Income (Loss) from Investment Operations: | | | | | | | | | | | | | | | | | | | | | | | | | | | | | | | | | | | | | | | | |
Net investment income (loss) (c) | | | 0.28 | † | | | 0.32 | † | | | 0.39 | † | | | 0.51 | | | | 0.49 | | | | 0.26 | † | | | 0.30 | † | | | 0.37 | † | | | 0.49 | | | | 0.47 | |
Net realized and unrealized gain (loss) on investments | | | 0.37 | | | | 0.37 | | | | 1.23 | | | | (1.65 | ) | | | (0.14 | ) | | | 0.37 | | | | 0.38 | | | | 1.23 | | | | (1.66 | ) | | | (0.14 | ) |
| | | | | | | | | | | | | | | | | | | | | | | | | | | | | | | | | | | | | | | | |
Total from Investment Operations | | | 0.65 | | | | 0.69 | | | | 1.62 | | | | (1.14 | ) | | | 0.35 | | | | 0.63 | | | | 0.68 | | | | 1.60 | | | | (1.17 | ) | | | 0.33 | |
| | | | | | | | | | | | | | | | | | | | | | | | | | | | | | | | | | | | | | | | |
Less Distributions from: | | | | | | | | | | | | | | | | | | | | | | | | | | | | | | | | | | | | | | | | |
Net investment income | | | (0.30 | ) | | | (0.33 | ) | | | (0.39 | ) | | | (0.50 | ) | | | (0.49 | ) | | | (0.28 | ) | | | (0.31 | ) | | | (0.37 | ) | | | (0.48 | ) | | | (0.47 | ) |
Net realized gain on investments | | | (0.20 | ) | | | (0.03 | ) | | | (0.01 | ) | | | — | | | | — | | | | (0.20 | ) | | | (0.03 | ) | | | (0.01 | ) | | | — | | | | — | |
| | | | | | | | | | | | | | | | | | | | | | | | | | | | | | | | | | | | | | | | |
Total distributions | | | (0.50 | ) | | | (0.36 | ) | | | (0.40 | ) | | | (0.50 | ) | | | (0.49 | ) | | | (0.48 | ) | | | (0.34 | ) | | | (0.38 | ) | | | (0.48 | ) | | | (0.47 | ) |
| | | | | | | | | | | | | | | | | | | | | | | | | | | | | | | | | | | | | | | | |
Net Asset Value, End of Period | | $ | 9.54 | | | $ | 9.39 | | | $ | 9.06 | | | $ | 7.84 | | | $ | 9.48 | | | $ | 9.61 | | | $ | 9.46 | | | $ | 9.12 | | | $ | 7.90 | | | $ | 9.55 | |
| | | | | | | | | | | | | | | | | | | | | | | | | | | | | | | | | | | | | | | | |
Total Return (a) | | | 7.06 | % | | | 7.67 | % | | | 21.00 | % | | | (12.47 | )% | | | 3.75 | % | | | 6.77 | % | | | 7.49 | % | | | 20.58 | % | | | (12.67 | )% | | | 3.51 | % |
| | | | | | | | | | | | | | | | | | | | | | | | | | | | | | | | | | | | | | | | |
Ratios and Supplemental Data: | | | | | | | | | | | | | | | | | | | | | | | | | | | | | | | | | | | | | | | | |
Net Assets, End of Period (000’s) | | $ | 307,975 | | | $ | 245,190 | | | $ | 136,827 | | | $ | 35,941 | | | $ | 40,696 | | | $ | 177,740 | | | $ | 127,925 | | | $ | 64,213 | | | $ | 21,189 | | | $ | 25,460 | |
Ratios to average net assets: | | | | | | | | | | | | | | | | | | | | | | | | | | | | | | | | | | | | | | | | |
Net expenses (b)(c) | | | 0.71 | % | | | 0.73 | % | | | 0.75 | % | | | 0.75 | % | | | 0.75 | % | | | 0.96 | % | | | 0.98 | % | | | 1.00 | % | | | 1.00 | % | | | 1.00 | % |
Gross expenses (c) | | | 0.71 | % | | | 0.73 | % | | | 0.84 | % | | | 1.06 | % | | | 1.00 | % | | | 0.96 | % | | | 0.98 | % | | | 1.10 | % | | | 1.31 | % | | | 1.24 | % |
Net investment income (loss) (b)(c) | | | 2.93 | % | | | 3.47 | % | | | 4.49 | % | | | 5.70 | % | | | 5.10 | % | | | 2.67 | % | | | 3.22 | % | | | 4.25 | % | | | 5.45 | % | | | 4.89 | % |
Portfolio turnover rate (d) | | | 96 | % | | | 90 | % | | | 99 | % | | | 30 | % | | | 46 | % | | | 96 | % | | | 90 | % | | | 99 | % | | | 30 | % | | | 46 | % |
| † | Based on average shares outstanding during the period. |
| (a) | Total returns are historical and assume changes in share price, reinvestments of all dividends and distributions, and no sales charge. Had certain expenses not been reduced during the periods shown, total returns would have been lower. |
| (b) | Such percentages are after advisory fee or unified management fee waivers and expense reimbursements, as applicable. |
| (c) | Does not include any insurance charges imposed in connection with your variable insurance contract. |
| (d) | Excludes mortgage dollar roll transactions. |
311
| | |
| FINANCIAL HIGHLIGHTS (Continued) | | |
| | | Sun Capital Advisers Trust |
Selected data for a share outstanding throughout each period:
| | | | | | | | | | | | | | | | | | | | | | | | | | | | | | | | | | | | | | | | |
| | | Sun Capital
Money Market Fund
Initial Class Shares | | | Sun Capital
Money Market Fund
Service Class Shares | |
| | | Years Ended December 31, | | | Years Ended December 31, | |
| | | 2011 | | | 2010 | | | 2009 | | | 2008 | | | 2007 | | | 2011 | | | 2010 | | | 2009 | | | 2008 | | | 2007 | |
Net Asset Value, Beginning of Period | | $ | 1.00 | | | $ | 1.00 | | | $ | 1.00 | | | $ | 1.00 | | | $ | 1.00 | | | $ | 1.00 | | | $ | 1.00 | | | $ | 1.00 | | | $ | 1.00 | | | $ | 1.00 | |
| | | | | | | | | | | | | | | | | | | | | | | | | | | | | | | | | | | | | | | | |
Income (Loss) from Investment Operations: | | | | | | | | | | | | | | | | | | | | | | | | | | | | | | | | | | | | | | | | |
Net investment income (loss) (c) | | | 0.00 | (d)† | | | 0.00 | (d)† | | | 0.00 | (d)† | | | 0.02 | | | | 0.05 | | | | 0.00 | (d)† | | | 0.00 | (d)† | | | 0.00 | (d)† | | | 0.02 | | | | 0.05 | |
Net realized and unrealized gain (loss) on investments | | | 0.00 | (d) | | | 0.00 | (d) | | | 0.00 | (d) | | | 0.00 | (d) | | | 0.00 | (d) | | | 0.00 | (d) | | | 0.00 | (d) | | | 0.00 | (d) | | | 0.00 | (d) | | | — | |
| | | | | | | | | | | | | | | | | | | | | | | | | | | | | | | | | | | | | | | | |
Total from Investment Operations | | | 0.00 | (d) | | | 0.00 | (d) | | | 0.00 | (d) | | | 0.02 | | | | 0.05 | | | | 0.00 | (d) | | | 0.00 | (d) | | | 0.00 | (d) | | | 0.02 | | | | 0.05 | |
| | | | | | | | | | | | | | | | | | | | | | | | | | | | | | | | | | | | | | | | |
Less Distributions from: | | | | | | | | | | | | | | | | | | | | | | | | | | | | | | | | | | | | | | | | |
Net investment income | | | (0.00 | )(d) | | | (0.00 | )(d) | | | (0.00 | )(d) | | | (0.02 | ) | | | (0.05 | ) | | | — | | | | — | | | | (0.00 | )(d) | | | (0.02 | ) | | | (0.05 | ) |
Net realized gain on investments | | | (0.00 | )(d) | | | — | | | | — | | | | — | | | | — | | | | (0.00 | )(d) | | | — | | | | — | | | | — | | | | — | |
| | | | | | | | | | | | | | | | | | | | | | | | | | | | | | | | | | | | | | | | |
Total distributions | | | (0.00 | )(d) | | | (0.00 | )(d) | | | (0.00 | )(d) | | | (0.02 | ) | | | (0.05 | ) | | | (0.00 | )(d) | | | — | | | | (0.00 | )(d) | | | (0.02 | ) | | | (0.05 | ) |
| | | | | | | | | | | | | | | | | | | | | | | | | | | | | | | | | | | | | | | | |
Net Asset Value, End of Period | | $ | 1.00 | | | $ | 1.00 | | | $ | 1.00 | | | $ | 1.00 | | | $ | 1.00 | | | $ | 1.00 | | | $ | 1.00 | | | $ | 1.00 | | | $ | 1.00 | | | $ | 1.00 | |
| | | | | | | | | | | | | | | | | | | | | | | | | | | | | | | | | | | | | | | | |
Total Return (a) | | | 0.15 | % | | | 0.19 | % | | | 0.25 | % | | | 2.25 | % | | | 4.87 | % | | | 0.00 | % | | | 0.00 | % | | | 0.02 | % | | | 2.00 | % | | | 4.61 | % |
| | | | | | | | | | | | | | | | | | | | | | | | | | | | | | | | | | | | | | | | |
Ratios and Supplemental Data: | | | | | | | | | | | | | | | | | | | | | | | | | | | | | | | | | | | | | | | | |
Net Assets, End of Period (000’s) | | $ | 64,198 | | | $ | 67,785 | | | $ | 88,013 | | | $ | 150,416 | | | $ | 129,112 | | | $ | 158,944 | | | $ | 118,701 | | | $ | 116,282 | | | $ | 54,108 | | | $ | 1,740 | |
Ratios to average net assets: | | | | | | | | | | | | | | | | | | | | | | | | | | | | | | | | | | | | | | | | |
Net expenses (b)(c) | | | 0.00 | % | | | 0.03 | % | | | 0.20 | % | | | 0.50 | % | | | 0.50 | % | | | 0.14 | % | | | 0.22 | % | | | 0.38 | % | | | 0.75 | % | | | 0.75 | % |
Gross expenses (c) | | | 0.65 | % | | | 0.66 | % | | | 0.72 | % | | | 0.81 | % | | | 0.76 | % | | | 0.90 | % | | | 0.91 | % | | | 0.94 | % | | | 1.10 | % | | | 1.00 | % |
Net investment income (loss) (b)(c) | | | 0.15 | % | | | 0.19 | % | | | 0.25 | % | | | 2.19 | % | | | 4.76 | % | | | 0.00 | % | | | 0.00 | % | | | 0.01 | % | | | 1.34 | % | | | 4.50 | % |
Portfolio turnover rate | | | N/A | | | | N/A | | | | N/A | | | | N/A | | | | N/A | | | | N/A | | | | N/A | | | | N/A | | | | N/A | | | | N/A | |
| † | Based on average shares outstanding during the period. |
| (a) | Total returns are historical and assume changes in share price, reinvestments of all dividends and distributions, and no sales charge. Had certain expenses not been reduced during the periods shown, total returns would have been lower. |
| (b) | Such percentages are after advisory fee or unified management fee waivers and expense reimbursements, as applicable. |
| (c) | Does not include any insurance charges imposed in connection with your variable insurance contract. |
| (d) | Amount is less than $0.005 per share. |
312
| | |
| FINANCIAL HIGHLIGHTS (Continued) | | |
| | | Sun Capital Advisers Trust |
Selected data for a share outstanding throughout each period:
| | | | | | | | | | | | | | | | | | | | | | | | | | | | | | | | |
| | | SC BlackRock Inflation
Protected Bond Fund
Initial Class Shares | | | SC BlackRock Inflation
Protected Bond Fund
Service Class Shares | |
| | | Years Ended December 31, | | | Years Ended December 31, | |
| | | 2011 | | | 2010 | | | 2009 | | | 2008* | | | 2011 | | | 2010 | | | 2009 | | | 2008* | |
Net Asset Value, Beginning of Period | | $ | 10.64 | | | $ | 10.34 | | | $ | 9.87 | | | $ | 10.00 | | | $ | 10.61 | | | $ | 10.32 | | | $ | 9.87 | | | $ | 10.00 | |
| | | | | | | | | | | | | | | | | | | | | | | | | | | | | | | | |
Income (Loss) from Investment Operations: | | | | | | | | | | | | | | | | | | | | | | | | | | | | | | | | |
Net investment income (loss) (e) | | | 0.25 | † | | | 0.14 | † | | | 0.24 | † | | | (0.05 | ) | | | 0.20 | † | | | 0.12 | † | | | 0.21 | † | | | (0.06 | ) |
Net realized and unrealized gain (loss) on investments | | | 1.00 | | | | 0.40 | | | | 0.61 | | | | (0.05 | )(c) | | | 1.03 | | | | 0.38 | | | | 0.60 | | | | (0.04 | )(c) |
| | | | | | | | | | | | | | | | | | | | | | | | | | | | | | | | |
Total from Investment Operations | | | 1.25 | | | | 0.54 | | | | 0.85 | | | | (0.10 | ) | | | 1.23 | | | | 0.50 | | | | 0.81 | | | | (0.10 | ) |
| | | | | | | | | | | | | | | | | | | | | | | | | | | | | | | | |
Less Distributions from: | | | | | | | | | | | | | | | | | | | | | | | | | | | | | | | | |
Net investment income | | | (0.26 | ) | | | (0.14 | ) | | | (0.22 | ) | | | (0.03 | ) | | | (0.24 | ) | | | (0.11 | ) | | | (0.20 | ) | | | (0.03 | ) |
Net realized gain on investments | | | (0.29 | ) | | | (0.10 | ) | | | (0.16 | ) | | | — | | | | (0.29 | ) | | | (0.10 | ) | | | (0.16 | ) | | | — | |
| | | | | | | | | | | | | | | | | | | | | | | | | | | | | | | | |
Total distributions | | | (0.55 | ) | | | (0.24 | ) | | | (0.38 | ) | | | (0.03 | ) | | | (0.53 | ) | | | (0.21 | ) | | | (0.36 | ) | | | (0.03 | ) |
| | | | | | | | | | | | | | | | | | | | | | | | | | | | | | | | |
Net Asset Value, End of Period | | $ | 11.34 | | | $ | 10.64 | | | $ | 10.34 | | | $ | 9.87 | | | $ | 11.31 | | | $ | 10.61 | | | $ | 10.32 | | | $ | 9.87 | |
| | | | | | | | | | | | | | | | | | | | | | | | | | | | | | | | |
Total Return (b) | | | 11.90 | % | | | 5.24 | % | | | 8.72 | % | | | (0.95 | )% | | | 11.70 | % | | | 4.91 | % | | | 8.34 | % | | | (0.96 | )% |
| | | | | | | | | | | | | | | | | | | | | | | | | | | | | | | | |
Ratios and Supplemental Data: | | | | | | | | | | | | | | | | | | | | | | | | | | | | | | | | |
Net Assets, End of Period (000’s) | | $ | 264,474 | | | $ | 217,591 | | | $ | 106,264 | | | $ | 8,311 | | | $ | 280,788 | | | $ | 161,359 | | | $ | 78,839 | | | $ | 4,276 | |
Ratio to average net assets: | | | | | | | | | | | | | | | | | | | | | | | | | | | | | | | | |
Net expenses (a)(d)(e) | | | 0.65 | % | | | 0.65 | % | | | 0.65 | % | | | 0.65 | % | | | 0.90 | % | | | 0.90 | % | | | 0.90 | % | | | 0.90 | % |
Gross expenses (a)(e) | | | 0.66 | % | | | 0.66 | % | | | 0.66 | % | | | 0.68 | % | | | 0.91 | % | | | 0.91 | % | | | 0.91 | % | | | 0.93 | % |
Net investment income (loss) (a)(d)(e) | | | 2.23 | % | | | 1.34 | % | | | 2.33 | % | | | (4.63 | )% | | | 1.78 | % | | | 1.09 | % | | | 2.07 | % | | | (4.60 | )% |
Portfolio turnover rate | | | 430 | % | | | 388 | % | | | 278 | % | | | 85 | % | | | 430 | % | | | 388 | % | | | 278 | % | | | 85 | % |
| * | For the period October 1, 2008 (commencement of operations) to December 31, 2008. |
| † | Based on average shares outstanding during the period. |
| (a) | Annualized for periods of less than one year. |
| (b) | Total returns are historical and assume changes in share price, reinvestments of all dividends and distributions, and no sales charge. Had certain expenses not been reduced during the periods shown, total returns would have been lower. Total returns for periods of less than one year are not annualized. |
| (c) | The amount shown for a share outstanding does not correspond with the net realized and unrealized gain (loss) on investments for the period due to timing of sales and repurchases of Fund shares in relation to fluctuating market values of the investments of the fund. |
| (d) | Such percentages are after advisory fee or unified management fee waivers and expense reimbursements, as applicable. |
| (e) | Does not include any insurance charges imposed in connection with your variable insurance contract. |
313
| | |
| FINANCIAL HIGHLIGHTS (Continued) | | |
| | | Sun Capital Advisers Trust |
Selected data for a share outstanding throughout each period:
| | | | | | | | | | | | | | | | | | | | | | | | | | | | | | | | |
| | | SC Goldman Sachs
Short Duration Fund
Initial Class Shares | | | SC Goldman Sachs
Short Duration Fund
Service Class Shares | |
| | | Years Ended December 31, | | | Years Ended December 31, | |
| | | 2011 | | | 2010 | | | 2009 | | | 2008* | | | 2011 | | | 2010 | | | 2009 | | | 2008* | |
Net Asset Value, Beginning of Period | | $ | 10.31 | | | $ | 10.23 | | | $ | 10.13 | | | $ | 10.00 | | | $ | 10.31 | | | $ | 10.23 | | | $ | 10.13 | | | $ | 10.00 | |
| | | | | | | | | | | | | | | | | | | | | | | | | | | | | | | | |
Income (Loss) from Investment Operations: | | | | | | | | | | | | | | | | | | | | | | | | | | | | | | | | |
Net investment income (loss) (d) | | | 0.12 | † | | | 0.14 | † | | | 0.19 | † | | | 0.16 | | | | 0.09 | † | | | 0.11 | † | | | 0.17 | † | | | 0.14 | |
Net realized and unrealized gain (loss) on investments | | | (0.07 | ) | | | 0.11 | | | | 0.19 | | | | 0.16 | | | | (0.07 | ) | | | 0.11 | | | | 0.18 | | | | 0.16 | |
| | | | | | | | | | | | | | | | | | | | | | | | | | | | | | | | |
Total from Investment Operations | | | 0.05 | | | | 0.25 | | | | 0.38 | | | | 0.32 | | | | 0.02 | | | | 0.22 | | | | 0.35 | | | | 0.30 | |
| | | | | | | | | | | | | | | | | | | | | | | | | | | | | | | | |
Less Distributions from: | | | | | | | | | | | | | | | | | | | | | | | | | | | | | | | | |
Net investment income | | | (0.12 | ) | | | (0.16 | ) | | | (0.21 | ) | | | (0.16 | ) | | | (0.10 | ) | | | (0.13 | ) | | | (0.18 | ) | | | (0.14 | ) |
Net realized gain on investments | | | (0.06 | ) | | | (0.01 | ) | | | (0.07 | ) | | | (0.03 | ) | | | (0.06 | ) | | | (0.01 | ) | | | (0.07 | ) | | | (0.03 | ) |
Capital | | | (0.00 | )(e) | | | — | | | | — | | | | — | | | | (0.00 | )(e) | | | — | | | | — | | | | — | |
| | | | | | | | | | | | | | | | | | | | | | | | | | | | | | | | |
Total distributions | | | (0.18 | ) | | | (0.17 | ) | | | (0.28 | ) | | | (0.19 | ) | | | (0.16 | ) | | | (0.14 | ) | | | (0.25 | ) | | | (0.17 | ) |
| | | | | | | | | | | | | | | | | | | | | | | | | | | | | | | | |
Net Asset Value, End of Period | | $ | 10.18 | | | $ | 10.31 | | | $ | 10.23 | | | $ | 10.13 | | | $ | 10.17 | | | $ | 10.31 | | | $ | 10.23 | | | $ | 10.13 | |
| | | | | | | | | | | | | | | | | | | | | | | | | | | | | | | | |
Total Return (b) | | | 0.53 | % | | | 2.41 | % | | | 3.78 | % | | | 3.22 | % | | | 0.17 | % | | | 2.16 | % | | | 3.52 | % | | | 3.00 | % |
| | | | | | | | | | | | | | | | | | | | | | | | | | | | | | | | |
Ratios and Supplemental Data: | | | | | | | | | | | | | | | | | | | | | | | | | | | | | | | | |
Net Assets, End of Period (000’s) | | $ | 993,705 | | | $ | 1,004,464 | | | $ | 869,648 | | | $ | 54,602 | | | $ | 191,313 | | | $ | 149,752 | | | $ | 107,329 | | | $ | 63,422 | |
Ratio to average net assets: | | | | | | | | | | | | | | | | | | | | | | | | | | | | | | | | |
Net expenses (a)(c)(d) | | | 0.65 | % | | | 0.65 | % | | | 0.65 | % | | | 0.65 | % | | | 0.90 | % | | | 0.90 | % | | | 0.90 | % | | | 0.90 | % |
Gross expenses (a)(d) | | | 0.65 | % | | | 0.65 | % | | | 0.65 | % | | | 0.68 | % | | | 0.90 | % | | | 0.90 | % | | | 0.90 | % | | | 0.92 | % |
Net investment income (loss) (a)(c)(d) | | | 1.14 | % | | | 1.32 | % | | | 1.82 | % | | | 2.34 | % | | | 0.89 | % | | | 1.05 | % | | | 1.66 | % | | | 1.95 | % |
Portfolio turnover rate | | | 154 | % | | | 122 | % | | | 231 | % | | | 333 | % | | | 154 | % | | | 122 | % | | | 231 | % | | | 333 | % |
| * | For the period March 7, 2008 (commencement of operations) to December 31, 2008. |
| † | Based on average shares outstanding during the period. |
| (a) | Annualized for periods of less than one year. |
| (b) | Total returns are historical and assume changes in share price, reinvestments of all dividends and distributions, and no sales charge. Had certain expenses not been reduced during the periods shown, total returns would have been lower. Total returns for periods of less than one year are not annualized. |
| (c) | Such percentages are after advisory fee or unified management fee waivers and expense reimbursements, as applicable. |
| (d) | Does not include any insurance charges imposed in connection with your variable insurance contract. |
| (e) | Amount is less than $0.005 per share. |
314
| | |
| FINANCIAL HIGHLIGHTS (Continued) | | |
| | | Sun Capital Advisers Trust |
Selected data for a share outstanding throughout each period:
| | | | | | | | | | | | | | | | | | | | | | | | | | | | | | | | |
| | | SC PIMCO
High Yield Fund
Initial Class Shares | | | SC PIMCO
High Yield Fund
Service Class Shares | |
| | | Years Ended December 31, | | | Years Ended December 31, | |
| | | 2011 | | | 2010 | | | 2009 | | | 2008* | | | 2011 | | | 2010 | | | 2009 | | | 2008* | |
Net Asset Value, Beginning of Period | | $ | 9.83 | | | $ | 9.46 | | | $ | 8.07 | | | $ | 10.00 | | | $ | 9.83 | | | $ | 9.46 | | | $ | 8.07 | | | $ | 10.00 | |
| | | | | | | | | | | | | | | | | | | | | | | | | | | | | | | | |
Income (Loss) from Investment Operations: | | | | | | | | | | | | | | | | | | | | | | | | | | | | | | | | |
Net investment income (loss) (d) | | | 0.68 | † | | | 0.72 | † | | | 0.75 | † | | | 0.53 | | | | 0.66 | † | | | 0.70 | † | | | 0.72 | † | | | 0.51 | |
Net realized and unrealized gain (loss) on investments | | | (0.28 | ) | | | 0.44 | | | | 1.62 | | | | (1.85 | ) | | | (0.29 | ) | | | 0.43 | | | | 1.62 | | | | (1.85 | ) |
| | | | | | | | | | | | | | | | | | | | | | | | | | | | | | | | |
Total from Investment Operations | | | 0.40 | | | | 1.16 | | | | 2.37 | | | | (1.32 | ) | | | 0.37 | | | | 1.13 | | | | 2.34 | | | | (1.34 | ) |
| | | | | | | | | | | | | | | | | | | | | | | | | | | | | | | | |
Less Distributions from: | | | | | | | | | | | | | | | | | | | | | | | | | | | | | | | | |
Net investment income | | | (0.72 | ) | | | (0.72 | ) | | | (0.74 | ) | | | (0.55 | ) | | | (0.69 | ) | | | (0.69 | ) | | | (0.71 | ) | | | (0.53 | ) |
Net realized gain on investments | | | (0.25 | ) | | | (0.07 | ) | | | (0.24 | ) | | | (0.06 | ) | | | (0.25 | ) | | | (0.07 | ) | | | (0.24 | ) | | | (0.06 | ) |
| | | | | | | | | | | | | | | | | | | | | | | | | | | | | | | | |
Total distributions | | | (0.97 | ) | | | (0.79 | ) | | | (0.98 | ) | | | (0.61 | ) | | | (0.94 | ) | | | (0.76 | ) | | | (0.95 | ) | | | (0.59 | ) |
| | | | | | | | | | | | | | | | | | | | | | | | | | | | | | | | |
Net Asset Value, End of Period | | $ | 9.26 | | | $ | 9.83 | | | $ | 9.46 | | | $ | 8.07 | | | $ | 9.26 | | | $ | 9.83 | | | $ | 9.46 | | | $ | 8.07 | |
| | | | | | | | | | | | | | | | | | | | | | | | | | | | | | | | |
Total Return (b) | | | 4.26 | % | | | 12.68 | % | | | 30.67 | % | | | (13.74 | )% | | | 4.01 | % | | | 12.40 | % | | | 30.34 | % | | | (13.92 | )% |
| | | | | | | | | | | | | | | | | | | | | | | | | | | | | | | | |
Ratios and Supplemental Data: | | | | | | | | | | | | | | | | | | | | | | | | | | | | | | | | |
Net Assets, End of Period (000’s) | | $ | 132,253 | | | $ | 140,327 | | | $ | 92,422 | | | $ | 3,134 | | | $ | 30,874 | | | $ | 32,225 | | | $ | 24,680 | | | $ | 12,300 | |
Ratio to average net assets: | | | | | | | | | | | | | | | | | | | | | | | | | | | | | | | | |
Net expenses (a)(c)(d) | | | 0.75 | % | | | 0.75 | % | | | 0.75 | % | | | 0.75 | % | | | 1.00 | % | | | 1.00 | % | | | 1.00 | % | | | 1.00 | % |
Gross expenses (a)(d) | | | 0.75 | % | | | 0.75 | % | | | 0.75 | % | | | 0.77 | % | | | 1.00 | % | | | 1.00 | % | | | 1.00 | % | | | 1.03 | % |
Net investment income (loss) (a)(c)(d) | | | 7.05 | % | | | 7.42 | % | | | 8.45 | % | | | 6.74 | % | | | 6.80 | % | | | 7.19 | % | | | 8.19 | % | | | 7.18 | % |
Portfolio turnover rate | | | 35 | % | | | 28 | % | | | 190 | % | | | 75 | % | | | 35 | % | | | 28 | % | | | 190 | % | | | 75 | % |
| * | For the period March 7, 2008 (commencement of operations) to December 31, 2008. |
| † | Based on average shares outstanding during the period. |
| (a) | Annualized for periods of less than one year. |
| (b) | Total returns are historical and assume changes in share price, reinvestments of all dividends and distributions, and no sales charge. Had certain expenses not been reduced during the periods shown, total returns would have been lower. Total returns for periods of less than one year are not annualized. |
| (c) | Such percentages are after advisory fee or unified management fee waivers and expense reimbursements, as applicable. |
| (d) | Does not include any insurance charges imposed in connection with your variable insurance contract. |
315
| | |
| FINANCIAL HIGHLIGHTS (Continued) | | |
| | | Sun Capital Advisers Trust |
Selected data for a share outstanding throughout each period:
| | | | | | | | | | | | | | | | | | | | | | | | | | | | | | | | |
| | | SC PIMCO
Total Return Fund
Initial Class Shares | | | SC PIMCO
Total Return Fund
Service Class Shares | |
| | | Years Ended December 31, | | | Years Ended December 31, | |
| | | 2011 | | | 2010 | | | 2009 | | | 2008* | | | 2011 | | | 2010 | | | 2009 | | | 2008* | |
Net Asset Value, Beginning of Period | | $ | 11.58 | | | $ | 11.04 | | | $ | 10.55 | | | $ | 10.00 | | | $ | 11.58 | | | $ | 11.04 | | | $ | 10.55 | | | $ | 10.00 | |
| | | | | | | | | | | | | | | | | | | | | | | | | | | | | | | | |
Income (Loss) from Investment Operations: | | | | | | | | | | | | | | | | | | | | | | | | | | | | | | | | |
Net investment income (loss) (d) | | | 0.27 | † | | | 0.22 | † | | | 0.27 | † | | | 0.03 | | | | 0.24 | † | | | 0.19 | † | | | 0.24 | † | | | 0.02 | |
Net realized and unrealized gain (loss) on investments | | | 0.15 | | | | 0.61 | | | | 0.65 | | | | 0.55 | | | | 0.14 | | | | 0.61 | | | | 0.65 | | | | 0.55 | |
| | | | | | | | | | | | | | | | | | | | | | | | | | | | | | | | |
Total from Investment Operations | | | 0.42 | | | | 0.83 | | | | 0.92 | | | | 0.58 | | | | 0.38 | | | | 0.80 | | | | 0.89 | | | | 0.57 | |
| | | | | | | | | | | | | | | | | | | | | | | | | | | | | | | | |
Less Distributions from: | | | | | | | | | | | | | | | | | | | | | | | | | | | | | | | | |
Net investment income | | | (0.31 | ) | | | (0.25 | ) | | | (0.29 | ) | | | (0.03 | ) | | | (0.28 | ) | | | (0.22 | ) | | | (0.26 | ) | | | (0.02 | ) |
Net realized gain on investments | | | (0.30 | ) | | | (0.04 | ) | | | (0.14 | ) | | | (0.00 | )(e) | | | (0.30 | ) | | | (0.04 | ) | | | (0.14 | ) | | | (0.00 | )(e) |
| | | | | | | | | | | | | | | | | | | | | | | | | | | | | | | | |
Total distributions | | | (0.61 | ) | | | (0.29 | ) | | | (0.43 | ) | | | (0.03 | ) | | | (0.58 | ) | | | (0.26 | ) | | | (0.40 | ) | | | (0.02 | ) |
| | | | | | | | | | | | | | | | | | | | | | | | | | | | | | | | |
Net Asset Value, End of Period | | $ | 11.39 | | | $ | 11.58 | | | $ | 11.04 | | | $ | 10.55 | | | $ | 11.38 | | | $ | 11.58 | | | $ | 11.04 | | | $ | 10.55 | |
| | | | | | | | | | | | | | | | | | | | | | | | | | | | | | | | |
Total Return (b) | | | 3.70 | % | | | 7.53 | % | | | 8.89 | % | | | 5.82 | % | | | 3.35 | % | | | 7.27 | % | | | 8.62 | % | | | 5.76 | % |
| | | | | | | | | | | | | | | | | | | | | | | | | | | | | | | | |
Ratios and Supplemental Data: | | | | | | | | | | | | | | | | | | | | | | | | | | | | | | | | |
Net Assets, End of Period (000’s) | | $ | 361,694 | | | $ | 273,150 | | | $ | 144,812 | | | $ | 13,823 | | | $ | 704,916 | | | $ | 483,257 | | | $ | 243,743 | | | $ | 18,397 | |
Ratio to average net assets: | | | | | | | | | | | | | | | | | | | | | | | | | | | | | | | | |
Net expenses (a)(c)(d) | | | 0.65 | % | | | 0.65 | % | | | 0.65 | % | | | 0.65 | % | | | 0.90 | % | | | 0.90 | % | | | 0.90 | % | | | 0.90 | % |
Gross expenses (a)(d) | | | 0.66 | % | | | 0.66 | % | | | 0.66 | % | | | 0.68 | % | | | 0.91 | % | | | 0.91 | % | | | 0.91 | % | | | 0.93 | % |
Net investment income (loss) (a)(c)(d) | | | 2.33 | % | | | 1.93 | % | | | 2.44 | % | | | 1.19 | % | | | 2.09 | % | | | 1.67 | % | | | 2.15 | % | | | 0.97 | % |
Portfolio turnover rate | | | 551 | % | | | 493 | % | | | 496 | % | | | 181 | % | | | 551 | % | | | 493 | % | | | 496 | % | | | 181 | % |
| * | For the period October 1, 2008 (commencement of operations) to December 31, 2008. |
| † | Based on average shares outstanding during the period. |
| (a) | Annualized for periods of less than one year. |
| (b) | Total returns are historical and assume changes in share price, reinvestments of all dividends and distributions, and no sales charge. Had certain expenses not been reduced during the periods shown, total returns would have been lower. Total returns for periods of less than one year are not annualized. |
| (c) | Such percentages are after advisory fee or unified management fee waivers and expense reimbursements, as applicable. |
| (d) | Does not include any insurance charges imposed in connection with your variable insurance contract. |
| (e) | Amount is less than $0.005 per share. |
316
| | |
| FINANCIAL HIGHLIGHTS (Continued) | | |
| | | Sun Capital Advisers Trust |
Selected data for a share outstanding throughout each period:
| | | | | | | | | | | | | | | | | | | | | | | | | | | | | | | | |
| | | SC Ibbotson Balanced Fund
Initial Class Shares | | | SC Ibbotson Balanced Fund
Service Class Shares | |
| | | Years Ended December 31, | | | Years Ended December 31, | |
| | | 2011 | | | 2010 | | | 2009 | | | 2008* | | | 2011 | | | 2010 | | | 2009 | | | 2008* | |
Net Asset Value, Beginning of Period | | $ | 12.37 | | | $ | 11.21 | | | $ | 9.07 | | | $ | 10.00 | | | $ | 12.35 | | | $ | 11.20 | | | $ | 9.06 | | | $ | 10.00 | |
| | | | | | | | | | | | | | | | | | | | | | | | | | | | | | | | |
Income (Loss) from Investment Operations: | | | | | | | | | | | | | | | | | | | | | | | | | | | | | | | | |
Net investment income (loss) (e) | | | 0.20 | † | | | 0.20 | † | | | 0.20 | † | | | 0.02 | | | | 0.16 | † | | | 0.15 | † | | | 0.17 | † | | | 0.01 | |
Net realized and unrealized gain (loss) on investments | | | (0.40 | ) | | | 1.15 | | | | 1.97 | | | | (0.95 | )(c) | | | (0.39 | ) | | | 1.16 | | | | 1.97 | | | | (0.95 | )(c) |
| | | | | | | | | | | | | | | | | | | | | | | | | | | | | | | | |
Total from Investment Operations | | | (0.20 | ) | | | 1.35 | | | | 2.17 | | | | (0.93 | ) | | | (0.23 | ) | | | 1.31 | | | | 2.14 | | | | (0.94 | ) |
| | | | | | | | | | | | | | | | | | | | | | | | | | | | | | | | |
Less Distributions from: | | | | | | | | | | | | | | | | | | | | | | | | | | | | | | | | |
Net investment income | | | (0.17 | ) | | | (0.13 | ) | | | (0.03 | ) | | | — | | | | (0.14 | ) | | | (0.10 | ) | | | (0.00 | )(h) | | | — | |
Net realized gain on investments | | | (0.40 | ) | | | (0.06 | ) | | | (0.00 | )(h) | | | — | | | | (0.40 | ) | | | (0.06 | ) | | | (0.00 | )(h) | | | — | |
| | | | | | | | | | | | | | | | | | | | | | | | | | | | | | | | |
Total distributions | | | (0.57 | ) | | | (0.19 | ) | | | (0.03 | ) | | | — | | | | (0.54 | ) | | | (0.16 | ) | | | (0.00 | )(h) | | | — | |
| | | | | | | | | | | | | | | | | | | | | | | | | | | | | | | | |
Net Asset Value, End of Period | | $ | 11.60 | | | $ | 12.37 | | | $ | 11.21 | | | $ | 9.07 | | | $ | 11.58 | | | $ | 12.35 | | | $ | 11.20 | | | $ | 9.06 | |
| | | | | | | | | | | | | | | | | | | | | | | | | | | | | | | | |
Total Return (b) | | | (1.56 | )% | | | 12.18 | % | | | 23.91 | % | | | (9.30 | )% | | | (1.81 | )% | | | 11.82 | % | | | 23.65 | % | | | (9.40 | )% |
| | | | | | | | | | | | | | | | | | | | | | | | | | | | | | | | |
Ratios and Supplemental Data: | | | | | | | | | | | | | | | | | | | | | | | | | | | | | | | | |
Net Assets, End of Period (000’s) | | $ | 3,150 | | | $ | 1,687 | | | $ | 442 | | | $ | 56 | | | $ | 1,850,101 | | | $ | 1,444,241 | | | $ | 566,276 | | | $ | 38,747 | |
Ratio to average net assets: | | | | | | | | | | | | | | | | | | | | | | | | | | | | | | | | |
Net expenses (a)(d)(e)(f) | | | 0.19 | % | | | 0.20 | % | | | 0.20 | % | | | 0.20 | % | | | 0.44 | % | | | 0.45 | % | | | 0.45 | % | | | 0.45 | % |
Gross expenses (a)(e)(f) | | | 0.19 | % | | | 0.21 | % | | | 0.28 | % | | | 16.72 | % | | | 0.44 | % | | | 0.46 | % | | | 0.52 | % | | | 2.11 | % |
Net investment income (loss) (a)(d)(e)(f) | | | 1.61 | % | | | 1.75 | % | | | 1.95 | % | | | 0.88 | % | | | 1.32 | % | | | 1.30 | % | | | 1.69 | % | | | 1.82 | % |
Portfolio turnover rate (g) | | | 7 | % | | | 27 | % | | | 14 | % | | | 0 | % | | | 7 | % | | | 27 | % | | | 14 | % | | | 0 | % |
| * | For the period October 1, 2008 (commencement of operations) to December 31, 2008. |
| † | Based on average shares outstanding during the period. |
| (a) | Annualized for periods of less than one year. |
| (b) | Total returns are historical and assume changes in share price, reinvestments of all dividends and distributions, and no sales charge. Had certain expenses not been reduced during the periods shown, total returns would have been lower. Total returns for periods of less than one year are not annualized. |
| (c) | The amount shown for a share outstanding does not correspond with the net realized and unrealized gain (loss) on investments for the period due to timing of sales and repurchases of Fund shares in relation to fluctuating market values of the investments of the fund. |
| (d) | Such percentages are after advisory fee or unified management fee waivers and expense reimbursements, as applicable. |
| (e) | Does not include any insurance charges imposed in connection with your variable insurance contract. |
| (f) | Does not include expenses of the underlying funds in which the Fund invests. |
| (g) | Does not include the portfolio turnover activity of the underlying funds in which the Fund invests. |
| (h) | Amount is less than $0.005. |
317
| | |
| FINANCIAL HIGHLIGHTS (Continued) | | |
| | | Sun Capital Advisers Trust |
Selected data for a share outstanding throughout each period:
| | | | | | | | | | | | | | | | | | | | | | | | | | | | | | | | |
| | | SC Ibbotson Conservative Fund
Initial Class Shares | | | SC Ibbotson Conservative Fund
Service Class Shares | |
| | | Years Ended December 31, | | | Years Ended December 31, | |
| | | 2011 | | | 2010 | | | 2009 | | | 2008* | | | 2011 | | | 2010 | | | 2009 | | | 2008* | |
Net Asset Value, Beginning of Period | | $ | 11.79 | | | $ | 10.94 | | | $ | 9.19 | | | $ | 10.00 | | | $ | 11.79 | | | $ | 10.94 | | | $ | 9.18 | | | $ | 10.00 | |
| | | | | | | | | | | | | | | | | | | | | | | | | | | | | | | | |
Income (Loss) from Investment Operations: | | | | | | | | | | | | | | | | | | | | | | | | | | | | | | | | |
Net investment income (loss) (e) | | | 0.19 | † | | | 0.14 | † | | | 0.33 | † | | | 0.03 | | | | 0.18 | † | | | 0.13 | † | | | 0.20 | † | | | 0.02 | |
Net realized and unrealized gain (loss) on investments | | | (0.08 | ) | | | 0.94 | | | | 1.45 | | | | (0.84 | )(c) | | | (0.11 | ) | | | 0.92 | | | | 1.56 | | | | (0.84 | )(c) |
| | | | | | | | | | | | | | | | | | | | | | | | | | | | | | | | |
Total from Investment Operations | | | 0.11 | | | | 1.08 | | | | 1.78 | | | | (0.81 | ) | | | 0.07 | | | | 1.05 | | | | 1.76 | | | | (0.82 | ) |
| | | | | | | | | | | | | | | | | | | | | | | | | | | | | | | | |
Less Distributions from: | | | | | | | | | | | | | | | | | | | | | | | | | | | | | | | | |
Net investment income | | | (0.17 | ) | | | (0.16 | ) | | | (0.03 | ) | | | — | | | | (0.14 | ) | | | (0.13 | ) | | | (0.00 | )(h) | | | — | |
Net realized gain on investments | | | (0.26 | ) | | | (0.07 | ) | | | (0.00 | )(h) | | | — | | | | (0.26 | ) | | | (0.07 | ) | | | (0.00 | )(h) | | | — | |
| | | | | | | | | | | | | | | | | | | | | | | | | | | | | | | | |
Total distributions | | | (0.43 | ) | | | (0.23 | ) | | | (0.03 | ) | | | — | | | | (0.40 | ) | | | (0.20 | ) | | | (0.00 | )(h) | | | — | |
| | | | | | | | | | | | | | | | | | | | | | | | | | | | | | | | |
Net Asset Value, End of Period | | $ | 11.47 | | | $ | 11.79 | | | $ | 10.94 | | | $ | 9.19 | | | $ | 11.46 | | | $ | 11.79 | | | $ | 10.94 | | | $ | 9.18 | |
| | | | | | | | | | | | | | | | | | | | | | | | | | | | | | | | |
Total Return (b) | | | 0.97 | % | | | 9.92 | % | | | 19.37 | % | | | (8.10 | )% | | | 0.63 | % | | | 9.64 | % | | | 19.22 | % | | | (8.20 | )% |
| | | | | | | | | | | | | | | | | | | | | | | | | | | | | | | | |
Ratios and Supplemental Data: | | | | | | | | | | | | | | | | | | | | | | | | | | | | | | | | |
Net Assets, End of Period (000’s) | | $ | 5,505 | | | $ | 5,053 | | | $ | 1,708 | | | $ | 46 | | | $ | 944,392 | | | $ | 756,690 | | | $ | 364,790 | | | $ | 33,974 | |
Ratio to average net assets: | | | | | | | | | | | | | | | | | | | | | | | | | | | | | | | | |
Net expenses (a)(d)(e)(f) | | | 0.20 | % | | | 0.20 | % | | | 0.20 | % | | | 0.20 | % | | | 0.45 | % | | | 0.45 | % | | | 0.45 | % | | | 0.45 | % |
Gross expenses (a)(e)(f) | | | 0.20 | % | | | 0.21 | % | | | 0.26 | % | | | 17.09 | % | | | 0.45 | % | | | 0.47 | % | | | 0.53 | % | | | 2.12 | % |
Net investment income (loss) (a)(d)(e)(f) | | | 1.57 | % | | | 1.27 | % | | | 3.15 | % | | | 1.15 | % | | | 1.52 | % | | | 1.18 | % | | | 2.01 | % | | | 2.22 | % |
Portfolio turnover rate (g) | | | 7 | % | | | 16 | % | | | 12 | % | | | 1 | % | | | 7 | % | | | 16 | % | | | 12 | % | | | 1 | % |
| * | For the period October 1, 2008 (commencement of operations) to December 31, 2008. |
| † | Based on average shares outstanding during the period. |
| (a) | Annualized for periods of less than one year. |
| (b) | Total returns are historical and assume changes in share price, reinvestments of all dividends and distributions, and no sales charge. Had certain expenses not been reduced during the periods shown, total returns would have been lower. Total returns for periods of less than one year are not annualized. |
| (c) | The amount shown for a share outstanding does not correspond with the net realized and unrealized gain (loss) on investments for the period due to timing of sales and repurchases of Fund shares in relation to fluctuating market values of the investments of the fund. |
| (d) | Such percentages are after advisory fee or unified management fee waivers and expense reimbursements, as applicable. |
| (e) | Does not include any insurance charges imposed in connection with your variable insurance contract. |
| (f) | Does not include expenses of the underlying funds in which the Fund invests. |
| (g) | Does not include the portfolio turnover activity of the underlying funds in which the Fund invests. |
| (h) | Amount is less than $0.005. |
318
| | |
| FINANCIAL HIGHLIGHTS (Continued) | | |
| | | Sun Capital Advisers Trust |
Selected data for a share outstanding throughout each period:
| | | | | | | | | | | | | | | | | | | | | | | | | | | | | | | | |
| | | SC Ibbotson Growth Fund
Initial Class Shares | | | SC Ibbotson Growth Fund
Service Class Shares | |
| | | Years Ended December 31, | | | Years Ended December 31, | |
| | | 2011 | | | 2010 | | | 2009 | | | 2008* | | | 2011 | | | 2010 | | | 2009 | | | 2008* | |
Net Asset Value, Beginning of Period | | $ | 12.47 | | | $ | 11.25 | | | $ | 8.87 | | | $ | 10.00 | | | $ | 12.47 | | | $ | 11.24 | | | $ | 8.87 | | | $ | 10.00 | |
| | | | | | | | | | | | | | | | | | | | | | | | | | | | | | | | |
Income (Loss) from Investment Operations: | | | | | | | | | | | | | | | | | | | | | | | | | | | | | | | | |
Net investment income (loss) (e) | | | 0.16 | † | | | 0.18 | † | | | 0.06 | † | | | 0.02 | | | | 0.10 | † | | | 0.12 | † | | | 0.12 | † | | | 0.01 | |
Net realized and unrealized gain (loss) on investments | | | (0.64 | ) | | | 1.34 | | | | 2.35 | | | | (1.15 | )(c) | | | (0.61 | ) | | | 1.38 | | | | 2.25 | | | | (1.14 | )(c) |
| | | | | | | | | | | | | | | | | | | | | | | | | | | | | | | | |
Total from Investment Operations | | | (0.48 | ) | | | 1.52 | | | | 2.41 | | | | (1.13 | ) | | | (0.51 | ) | | | 1.50 | | | | 2.37 | | | | (1.13 | ) |
| | | | | | | | | | | | | | | | | | | | | | | | | | | | | | | | |
Less Distributions from: | | | | | | | | | | | | | | | | | | | | | | | | | | | | | | | | |
Net investment income | | | (0.23 | ) | | | (0.18 | ) | | | (0.03 | ) | | | — | | | | (0.20 | ) | | | (0.15 | ) | | | (0.00 | )(h) | | | — | |
Net realized gain on investments | | | (1.06 | ) | | | (0.12 | ) | | | (0.00 | )(h) | | | — | | | | (1.06 | ) | | | (0.12 | ) | | | (0.00 | )(h) | | | — | |
| | | | | | | | | | | | | | | | | | | | | | | | | | | | | | | | |
Total distributions | | | (1.29 | ) | | | (0.30 | ) | | | (0.03 | ) | | | — | | | | (1.26 | ) | | | (0.27 | ) | | | (0.00 | )(h) | | | — | |
| | | | | | | | | | | | | | | | | | | | | | | | | | | | | | | | |
Net Asset Value, End of Period | | $ | 10.70 | | | $ | 12.47 | | | $ | 11.25 | | | $ | 8.87 | | | $ | 10.70 | | | $ | 12.47 | | | $ | 11.24 | | | $ | 8.87 | |
| | | | | | | | | | | | | | | | | | | | | | | | | | | | | | | | |
Total Return (b) | | | (3.66 | )% | | | 13.80 | % | | | 27.17 | % | | | (11.30 | )% | | | (3.90 | )% | | | 13.61 | % | | | 26.75 | % | | | (11.30 | )% |
| | | | | | | | | | | | | | | | | | | | | | | | | | | | | | | | |
Ratios and Supplemental Data: | | | | | | | | | | | | | | | | | | | | | | | | | | | | | | | | |
Net Assets, End of Period (000’s) | | $ | 2,143 | | | $ | 1,616 | | | $ | 292 | | | $ | 92 | | | $ | 546,019 | | | $ | 588,923 | | | $ | 448,441 | | | $ | 33,191 | |
Ratio to average net assets: | | | | | | | | | | | | | | | | | | | | | | | | | | | | | | | | |
Net expenses (a)(d)(e)(f) | | | 0.21 | % | | | 0.20 | % | | | 0.20 | % | | | 0.20 | % | | | 0.45 | % | | | 0.45 | % | | | 0.45 | % | | | 0.45 | % |
Gross expenses (a)(e)(f) | | | 0.21 | % | | | 0.22 | % | | | 0.30 | % | | | 14.32 | % | | | 0.46 | % | | | 0.47 | % | | | 0.53 | % | | | 2.08 | % |
Net investment income (loss) (a)(d)(e)(f) | | | 1.34 | % | | | 1.54 | % | | | 0.61 | % | | | 1.20 | % | | | 0.86 | % | | | 1.03 | % | | | 1.18 | % | | | 1.53 | % |
Portfolio turnover rate (g) | | | 16 | % | | | 38 | % | | | 16 | % | | | 7 | % | | | 16 | % | | | 38 | % | | | 16 | % | | | 7 | % |
| * | For the period October 1, 2008 (commencement of operations) to December 31, 2008. |
| † | Based on average shares outstanding during the period. |
| (a) | Annualized for periods of less than one year. |
| (b) | Total returns are historical and assume changes in share price, reinvestments of all dividends and distributions, and no sales charge. Had certain expenses not been reduced during the periods shown, total returns would have been lower. Total returns for periods of less than one year are not annualized. |
| (c) | The amount shown for a share outstanding does not correspond with the net realized and unrealized gain (loss) on investments for the period due to timing of sales and repurchases of Fund shares in relation to fluctuating market values of the investments of the fund. |
| (d) | Such percentages are after advisory fee or unified management fee waivers and expense reimbursements, as applicable. |
| (e) | Does not include any insurance charges imposed in connection with your variable insurance contract. |
| (f) | Does not include expenses of the underlying funds in which the Fund invests. |
| (g) | Does not include the portfolio turnover activity of the underlying funds in which the Fund invests. |
| (h) | Amount is less than $0.005. |
319
| | |
| NOTESTO FINANCIAL STATEMENTS | | Sun Capital Advisers Trust |
1. ORGANIZATION
Sun Capital Advisers Trust (the “Trust”) is registered under the Investment Company Act of 1940, as amended (the “1940 Act”), as an open-end management investment company. The Trust was established as a Delaware statutory trust under the laws of Delaware by an Agreement and Declaration of Trust dated July 13, 1998. It currently consists of twenty two funds (each referred to as a “Fund” and, collectively, as “the Funds”). Three of the Funds, SC Ibbotson Balanced Fund, SC Ibbotson Conservative Fund and SC Ibbotson Growth Fund, are affiliated “Fund-of-Funds”, which invest in other Funds of the Trust and in other mutual funds managed by MFS, an affiliate of the investment adviser to each Fund of the Trust, Sun Capital Advisers LLC (“Sun Capital”). The three Fund-of-Funds and each of the other Funds other than SC Ibbotson Tactical Opportunities Fund (the “Ibbotson Tactical Opportunities Fund”) are offered to variable annuity and variable life insurance separate accounts established by affiliated insurance companies to fund variable annuity contracts and variable life insurance policies. The Ibbotson Tactical Opportunities Fund, a Fund-of-exchange traded funds, is not available for investment by contract holders but serves exclusively as an investment option designed to implement a tactical strategy for the three Fund-of-Funds. Effective December 30, 2011, the affiliated insurance companies that invest in the Funds discontinued selling new variable annuities and variable life insurance policies. These companies, Sun Life Assurance Company of Canada (U.S.) (“Sun Life (U.S.)”) and Sun Life Insurance and Annuity Company of New York (“Sun Life (N.Y.)”), are indirect wholly owned subsidiaries of Sun Life Financial Inc. (“Sun Life Financial”), a publicly traded holding company. Sun Life Financial has stated that the decision to discontinue new sales of variable annuity and individual life products in the U.S. will not impact existing customers, and that Sun Life Financial will continue to provide service to its policyholders.
Each of the Funds is an open-end mutual fund under the 1940 Act. Each is classified as a diversified mutual fund except for Sun Capital Global Real Estate Fund and SC BlackRock Inflation Protected Bond Fund, which are classified as non-diversified mutual funds. Each Fund, except for the Ibbotson Tactical Opportunities Fund, offers Initial Class Shares and Service Class Shares. The Ibbotson Tactical Opportunities Fund offers only Initial Class Shares. The Funds are:
SC AllianceBernstein International Value Fund (“AllianceBernstein International Value Fund”)
SC BlackRock International Index Fund (“BlackRock International Index Fund”)
SC BlackRock Large Cap Index Fund (“BlackRock Large Cap Index Fund”)
SC BlackRock Small Cap Index Fund (“BlackRock Small Cap Index Fund”)
SC Goldman Sachs Mid Cap Value Fund (“Goldman Sachs Mid Cap Value Fund”)
SC Columbia Small Cap Value Fund (“Columbia Small Cap Value Fund”)
SC Davis Venture Value Fund (“Davis Venture Value Fund”)
SC Invesco Small Cap Growth Fund (“Invesco Small Cap Growth Fund”)
SC Lord Abbett Growth & Income Fund (“Lord Abbett Growth & Income Fund”)
SC WMC Blue Chip Mid Cap Fund (“WMC Blue Chip Mid Cap Fund”)
SC WMC Large Cap Growth Fund (“WMC Large Cap Growth Fund”)
Sun Capital Global Real Estate Fund (“Global Real Estate Fund”)
SC Ibbotson Tactical Opportunities Fund (“Ibbotson Tactical Opportunities Fund”)
Sun Capital Investment Grade Bond Fund (“Investment Grade Bond Fund”)
Sun Capital Money Market Fund (“Money Market Fund”)
SC BlackRock Inflation Protected Bond Fund (“BlackRock Inflation Protected Bond Fund”)
SC Goldman Sachs Short Duration Fund (“Goldman Sachs Short Duration Fund”)
SC PIMCO High Yield Fund (“PIMCO High Yield Fund”)
SC PIMCO Total Return Fund (“PIMCO Total Return Fund”)
SC Ibbotson Balanced Fund (“Ibbotson Balanced Fund”)
SC Ibbotson Conservative Fund (“Ibbotson Conservative Fund”)
SC Ibbotson Growth Fund (“Ibbotson Growth Fund”)
320
| | |
| NOTESTO FINANCIAL STATEMENTS (continued) | | Sun Capital Advisers Trust |
Each Fund-of-Funds seeks to achieve its objective by investing in a portfolio of underlying affiliated funds (“underlying funds”) which, in turn, may invest in a variety of U.S. and foreign equity, fixed income, money market and derivative instruments. The Fund-of-Funds do not invest in the underlying funds for the purpose of exercising management or control; however, investments by the Fund-of-Funds, within their principal investment strategies, may represent a significant portion of the underlying funds’ net assets. Each Fund-of-Funds’ “Portfolio of Investments” lists the underlying funds held as an investment of the Fund-of-Funds as of period end, but does not include the holdings of the underlying funds. A complete list of the holdings of each underlying fund, as well as the financial statements of each underlying fund, each as of December 31, 2011, are available at the SEC’s website at www.sec.gov if not already provided in this report under the name of the underlying fund.
2. SIGNIFICANT ACCOUNTING POLICIES
The preparation of financial statements in conformity with accounting principles generally accepted in the United States of America (“U.S. GAAP”) requires management to make estimates and assumptions that affect the reported amounts of assets and liabilities and disclosure of contingent assets and liabilities at the date of the financial statements and the reported amounts of increases and decreases in net assets from operations during the reporting period. Actual results could differ from those estimates.
The following is a summary of significant accounting policies followed by the Trust in the preparation of its financial statements:
a) Determination of Net Asset Value
The net asset value per share (“NAV”) of each Fund is determined as of the close of regular trading on the New York Stock Exchange (normally 4:00 p.m. Eastern standard time) on each day the New York Stock Exchange is open for business (a “valuation day”). If the New York Stock Exchange closes early for any reason, each Fund will accelerate the determination of its NAV to that earlier time.
b) Valuation of Investments
U.S. GAAP defines the fair value of a financial instrument as the price that a Fund would receive to sell an asset or pay to transfer a liability in an orderly transaction between market participants at the measurement date.
Valuation techniques of the Funds’ major categories of assets and liabilities are as follows:
Investments in securities and option contracts listed on the National Association of Securities Dealers Automation Quotation System (“NASDAQ”) are valued at the NASDAQ Official Closing Price on the day of valuation. Securities and option contracts listed on any other U.S. or foreign exchanges are valued at the last sale price on the exchange or system in which they are principally traded on the valuation date, or if no sales occurred on that day, at the mean between the closing bid and asked prices. Over-the-counter (OTC) equity securities not quoted on the NASDAQ are valued at the last sale price on the valuation day, or, if no sale occurs, at the mean between the last bid and asked prices. If both bid and asked prices are not available on the valuation day, the last bid price is used to value securities and purchased option contracts and the last asked price is used to value written option contracts.
Debt securities are valued by a dealer or by a pricing service based upon a computerized matrix system, which considers market transactions and dealer supplied valuations. The fair value of corporate bonds is estimated using various techniques, which may consider recently executed transactions in securities of the issuer or comparable issuers, market price quotations (where observable), bond spreads, fundamental data relating to the issuer, and adjusted credit default swap spreads. The fair value of asset backed and mortgage backed securities is estimated using models that consider the future cash flows of each tranche of the entity, establish a benchmark yield, and develop an estimated tranche specific spread to the benchmark yield based on the unique attributes of the tranche. The fair value of U.S. Government and agency securities are normally estimated using a model that incorporates market observable data, such as reported sales of similar securities, broker quotes, yields, bids, offers and reference data.
321
| | |
| NOTESTO FINANCIAL STATEMENTS (continued) | | Sun Capital Advisers Trust |
Short-term securities maturing in 60 days or less are valued at amortized cost, which approximates market value. Investments in open end mutual funds and underlying funds are valued at their daily closing NAV as reported by the investment company. Securities for which current market quotations are not readily available or are considered unreliable are stated at fair value as determined in good faith by an Internal Pricing Committee under the oversight of the Trust’s Board of Trustees.
The close of foreign exchanges before the determination of each Fund’s NAV gives rise to the possibility that significant events, including broad market moves, may have occurred after these foreign exchanges close but before the Funds determine their NAVs. In consideration of this, the Board of Trustees has approved an independent pricing vendor to facilitate the fair value process of equity securities traded on particular foreign exchanges. The independent pricing service considers the correlation of the trading patterns of the foreign security to the intraday trading in the U.S. markets for investments such as American Depositary Receipts, futures, exchange-traded funds (“ETFs”), and the movements of certain indexes of securities based on a statistical analysis of the historical relationship. The frequency with which this fair value process is used cannot be predicted and may be utilized to a significant extent. The value of securities used for NAV calculation under this fair value process may differ from published prices for the same securities.
Exchange traded futures and exchange traded options on futures contracts are valued at the settlement price determined by the relevant exchange. OTC swap contracts, OTC options and swaptions are valued daily based upon quotations from an independent pricing vendor. Depending on the product and the terms of the transaction, the fair value of the OTC derivatives can be modeled taking into account the counterparties’ creditworthiness and using a series of techniques, including simulation models. Many pricing models do not entail material subjectivity because the methodologies used do not necessitate significant judgments and the pricing inputs are observed from actively quoted markets. Swaps that are executed on trade facility platforms, such as a registered exchange (“centrally cleared swap”), are valued at settlement price as determined by that exchange. For centrally cleared credit default swaps, the clearing facility requires its members to provide actionable levels across complete term structures. These levels along with external third party prices are used to produce daily settlement prices. Centrally cleared interest rate swaps are valued using a pricing model that references the underlying rates including the overnight index swap rate and LIBOR forward rate.
The U.S. dollar value of forward foreign currency contracts is determined using forward currency exchange rates supplied by a quotation service.
In accordance with Rule 2a-7 under the 1940 Act, the Money Market Fund values its securities initially at cost, and thereafter, securities are assumed to have a constant amortization to maturity of any discount or premium. Amortized cost approximates fair value.
In accordance with U.S. GAAP, the Funds have categorized their financial instruments, based on priority of the inputs to the valuation technique, into a three-level hierarchy. The fair value hierarchy gives the highest priority to quoted prices in active markets for identical assets or liabilities (Level 1) and the lowest priority to significant unobservable inputs (Level 3). The Funds utilize valuation techniques that maximize the use of observable inputs and minimize the use of unobservable inputs. If the inputs used to measure fair value for a security fall within different levels of the hierarchy, the category level is based on the lowest priority level input that is significant to the fair value measurement of the instrument. The inputs or methodology used for valuing securities are not necessarily an indication of the risk associated with investing in those securities. Changes in valuation techniques may result in transfers into or out of an investment’s assigned level within the hierarchy.
The three-tier hierarchy of fair value measurements is summarized in the three broad levels listed below:
Level 1 – quoted prices in active markets for identical assets or liabilities
The types of assets and liabilities utilizing Level 1 valuations generally include exchange traded domestic and certain foreign equities, listed derivatives (such as futures, options), investments in open end mutual funds, including ETFs, with quoted market prices and certain OTC actively traded U.S. Treasury securities.
322
| | |
| NOTESTO FINANCIAL STATEMENTS (continued) | | Sun Capital Advisers Trust |
Level 2 – significant other observable inputs, including:
| | a) | Quoted prices for identical or similar assets or liabilities in active and non-active markets, |
| | b) | Inputs other than quoted market prices that are observable, and |
| | c) | Inputs that are derived principally from or corroborated by observable market data through correlation or other means |
The types of assets and liabilities utilizing Level 2 valuations generally include debt securities such as U.S. Government agency obligations, U.S. Government guaranteed notes, foreign government obligations, municipal bonds, mortgage backed securities, asset backed securities, collateralized mortgage obligations, corporate debt obligations, bank loan obligations, certificates of deposit and those securities valued at amortized cost; OTC derivatives such as swaps, options, swaptions, foreign forward currency exchange contracts, centrally cleared swaps and equity-linked securities; and certain foreign equity securities and derivatives traded on particular foreign exchanges that close before the Funds determine their NAVs.
Level 3 – significant unobservable inputs (including the Funds’ own assumptions in determining the fair value of assets or liabilities)
Generally, the types of assets and liabilities utilizing Level 3 valuations include securities whose trading has been suspended or which has been de-listed from its primary trading exchange; securities in default or bankruptcy proceedings for which there is no current market quotation; or securities and certain derivatives valued by broker quotes which may include brokers’ assumptions about the assumptions a market participant would use.
The tables summarizing the inputs used to value the Fund’s assets and liabilities measured at fair value as of December 31, 2011 and transfers among levels, if any, are incorporated within each Fund’s Portfolio of Investments. During the year ended December 31, 2011, there were no significant changes to valuation techniques described above and the related inputs.
c) Investment Transactions and Income
Investment security transactions are accounted for as of trade date. Dividend income from securities and dividend and capital gain distributions from affiliated underlying funds are recorded on the ex-dividend date (net of foreign withholding taxes, as applicable). Non-cash dividends included in income, if any, are recorded at fair market value of securities received. Interest income is recorded on the accrual basis (net of foreign withholding taxes, as applicable). Discounts and premiums on debt securities are amortized using the interest method.
Upon notification from issuers some dividend income received from a real estate investment trust (“REIT”) may be redesignated as a reduction of cost of investment and/or realized gain. Realized gains and losses from security transactions are determined on the basis of identified cost for both financial statement and federal income tax purposes. Investment income, realized and unrealized gains and losses are allocated pro rata on the basis of relative net assets to both classes of shares.
d) Expenses
Expenses directly attributable to a Fund are charged to that Fund. Expenses not directly attributable to a particular Fund are allocated among the affected Funds on the basis of relative net assets. Expenses directly attributable to a particular share class of a Fund are charged directly to such class. All other expenses are borne pro rata on the basis of relative net assets by all classes of shares.
e) Foreign Currency Translation and Foreign Investments
The accounting records of the Funds are maintained in U.S. dollars. Portfolio securities and other assets and liabilities denominated in a foreign currency are translated to U.S. dollars at the prevailing rates of exchange at
323
| | |
| NOTESTO FINANCIAL STATEMENTS (continued) | | Sun Capital Advisers Trust |
period end. Purchases and sales of securities, income receipts and expense payments are translated into U.S. dollars at the prevailing exchange rate on the respective dates of transactions. The Funds do not isolate that portion of the results of operations resulting from changes in foreign exchange rates on investments from the fluctuations arising from changes in market prices of securities held. The effects of changes in foreign currency exchange rates on portfolio investments are included in the net realized and unrealized gains and losses on investments and assets and liabilities in foreign currencies. Net realized gains and losses on foreign currency transactions include disposition of foreign currencies, net gains or losses from assets or liabilities denominated in foreign currencies, and currency gains and losses between the accrual and receipt dates of portfolio investment income and between the trade and settlement dates of portfolio investment transactions.
f) New Accounting Pronouncements
In April 2011, the Financial Accounting Standards Board (“FASB”) issued Accounting Standards Update (“ASU”) No. 2011-03, Reconsideration of Effective Control for Repurchase Agreements, related to the accounting for repurchase agreements and similar agreements that both entitle and obligate a transferor to repurchase or redeem financial assets before their maturity. The ASU modifies the criteria for determining effective control of transferred assets and as a result certain agreements may now be accounted for as secured borrowings. The ASU is effective prospectively for new transfers and existing transactions that are modified in the first interim or annual period beginning on or after December 15, 2011. At this time, management is evaluating the implications of this change and its impact on the Funds’ financial statements has not been determined.
In May 2011, the FASB issued ASU No. 2011-04, Fair Value Measurement (Topic 820) – Amendments to Achieve Common Fair Value Measurement and Disclosure Requirements in U.S. GAAP and IFRSs. The update changes the wording used to describe the requirements in GAAP for measuring fair value and for disclosing information about fair value measurements. The update is effective during interim and annual periods beginning after December 15, 2011. Management is currently evaluating the impact of the ASU’s adoption on the Funds’ financial statement disclosures.
In December 2011, the FASB issued ASU No. 2011-11, Balance Sheet (Topic 210) – Disclosures about Offsetting Assets and Liabilities. The update creates new disclosure requirements requiring entities to disclose both gross and net information for derivatives and other financial instruments that are either offset in the Statement of Assets and Liabilities or subject to an enforceable master netting arrangement or similar agreement. The disclosure requirements are effective for interim and annual reporting periods beginning on or after January 1, 2013. Management is currently evaluating the impact of the ASU’s adoption on the Funds’ financial statement disclosures.
3. SECURITIES AND OTHER INVESTMENTS
a) Mortgage Dollar Roll Transactions
Certain funds may enter into mortgage dollar roll (“MDR”) transactions to take advantage of opportunities in the mortgage market. A dollar roll transaction involves a sale by the Fund of mortgage-backed securities that it holds with an agreement by the Fund to repurchase similar securities at an agreed upon price on a specified future date. The Fund treats mortgage dollar rolls as two separate transactions: one involving the purchase of a security and a separate transaction involving a sale, and realizes gains and losses on these transactions. The Fund receives compensation as a “drop”. The “drop” represents the difference between the selling price and the repurchase price for the mortgage-backed securities and is reflected in the unrealized gain/loss of the security repurchased. During the period between the sale and repurchase, the Fund will not be entitled to receive interest and principal payments on the securities sold. A Fund will only enter into “covered” rolls. A “covered” roll is a specific type of dollar roll for which there is an offsetting cash position or liquid security position.
324
| | |
| NOTESTO FINANCIAL STATEMENTS (continued) | | Sun Capital Advisers Trust |
Dollar roll transactions involve the risk that the market value of the securities sold by the Fund may decline below the repurchase price of those similar securities which the Fund is obligated to purchase or that the return earned by the Fund with the proceeds of a dollar roll “drop” may not exceed interest foregone. As of December 31, 2011, only Investment Grade Bond Fund had open MDR transactions that were made through “To Be Announced” securities.
b) Real Estate Investment Trusts
Certain Funds may invest in REITs. REITs are pooled investment vehicles that invest primarily in income producing real estate or real estate related loans or interests. REITs are generally classified as equity REITs, mortgage REITs or a combination of equity and mortgage REITs. Equity REITs invest most of their assets directly in real property and derive income primarily from the collection of rents. Equity REITs can also realize capital gains by selling properties that have appreciated in value. Mortgage REITs invest most of their assets in real estate mortgages and derive income from interest payments. Each Fund will indirectly bear its proportionate share of any expenses (such as operating expenses and advisory fees) paid by REITs in which it invests in addition to the expenses paid by the Fund.
Certain risks may arise when investing in REITs. Although Global Real Estate Fund does not invest directly in real estate, it does invest primarily in real estate equity securities and does concentrate its investments in the real estate industry, and, therefore, an investment in the Fund may be subject to certain risks associated with the direct ownership of real estate and with the real estate industry in general. Each of the other Funds that may invest in REITs may, to a lesser degree, be subject to these risks. Risks associated with the real estate industry may include risks resulting from future economic, political and environmental conditions.
c) Repurchase Agreements
The Funds may invest in repurchase agreements. In a repurchase agreement, a Fund takes possession of an underlying debt obligation (“collateral”) for a relatively short period (usually not more than 7 days) subject to the obligation to sell the security back to the repurchase agreement counterparty at a fixed time and price plus accrued interest. Securities serving as collateral for each repurchase agreement must be delivered to the Fund’s custodian. The value of the collateral must at least equal 102% of the principal and interest amount of the repurchase transaction, until the agreement matures. The value of the collateral is marked to market on a daily basis to ensure the adequacy of the collateral. In the event of default, the Funds have the right to liquidate the collateral and apply the proceeds in satisfaction of the obligation. There is the risk that the collateral may be insufficient to meet the obligation in the event of default. As of December 31, 2011, no Fund was party to any open repurchase agreements.
d) When Issued Securities and Forward Commitments
The Funds may purchase or sell securities on a when issued or forward commitment basis. These transactions are arrangements in which the Funds purchase and sell securities with payment and delivery scheduled for a future time. Settlement dates may be a month or more after entering into these transactions and such transactions may involve a risk of loss if the value of the underlying security declines prior to the settlement date. The price of the underlying securities and the date when these securities will be delivered and paid for are fixed at the time the transaction is negotiated. If the counterparty to the purchase transaction fails to deliver the securities, the Fund is at risk to subsequently invest at less advantageous prices and yields. In connection with such purchases the Funds maintain cash or liquid assets in an amount equal to purchase commitments for such underlying securities until settlement date, and for sales commitments the Funds maintain equivalent deliverable securities as “cover” for the transactions. Unsettled sales commitments are valued at the current market value of the underlying security and marked to market daily on the Fund’s Statement of Assets and Liabilities. As of December 31, 2011, there were no outstanding forward sales contracts.
325
| | |
| NOTESTO FINANCIAL STATEMENTS (continued) | | Sun Capital Advisers Trust |
e) Treasury Inflation-Protected Securities
Certain Funds may invest in Treasury Inflation-Protected Securities (“TIPS”), specially structured bonds in which the principal amount is adjusted daily to reflect changes in inflation, as measured by the U.S. Consumer Pricing Index for Urban Consumers. The adjustments to principal due to inflation are reflected as increases or decreases to interest income. Such adjustments may have a significant impact on the Fund’s distributions. The repayment of the original bond principal upon maturity is guaranteed by the full faith and credit of the U.S. Government. At December 31, 2011, Investment Grade Bond Fund, BlackRock Inflation Protected Bond Fund, Goldman Sachs Short Duration Fund and PIMCO Total Return Fund held TIPS as listed on each Fund’s Portfolio of Investments.
f) Equity Linked Securities
Certain Funds may invest in equity-linked securities which are privately issued securities with investment results that are designed to correspond generally to the performance of a specified stock index or “basket” of stocks, or a single stock. These securities may be used by a Fund to gain exposure to countries that place restrictions on direct investments by foreigners. To the extent that the Funds invest in equity-linked securities having returns that correspond to the performance of a foreign securities index or one or more foreign stocks, investing in equity-linked securities will involve risks similar to the risks of investing in foreign securities. In addition, the Funds bear the risk that the issuer of an equity-linked security may default on its obligation under the terms of the arrangement with the counterparty. At December 31, 2011, only AllianceBernstein International Value Fund held equity-linked securities as listed on the Fund’s Portfolio of Investments.
g) Bank Loan Obligations
Certain Funds may invest in senior loans in the form of participations (“Participations”) or assignments of all or a portion of loans from third parties (“Assignments”). Loan participations typically represent direct participation in a loan owed by a corporate borrower, and generally are offered by banks, other financial institutions or lending syndicates. The Fund may participate in such syndications, or can buy part of a loan, becoming a co-lender. When purchasing loan participations, the Fund assumes the credit risk associated with the corporate borrower and may assume the credit risk associated with a financial intermediary.
Assignments typically result in the Fund having a direct contractual relationship with the borrower, and the Fund may enforce compliance by the borrower with terms of the loan agreement. All senior loans involve interest rate risk, liquidity risk and credit risk, including the potential default or insolvency of the borrower. As of December 31, 2011, only PIMCO High Yield Fund had open bank loan obligations as listed on the Fund’s Portfolio of Investments.
h) Exchange Traded Funds
The Ibbotson Tactical Opportunities Fund invests substantially all of its assets in ETFs. ETFs are investment companies, the shares of which are listed and traded on U.S. stock exchanges or otherwise traded in the OTC market and may be purchased and sold at market price throughout the trading day. The market price of an underlying ETF may be different from the NAV of such underlying ETF (i.e., an underlying ETF may trade at a discount or premium to its NAV). The Fund’s assets may be invested in a variety of equity and fixed income ETFs. Because the Fund’s investments are focused in these underlying ETFs, the Fund’s NAV and investment performance are directly related to the performance and risk of the underlying ETFs and the equity and bond markets in which those ETFs invest. Underlying ETFs also may change their investment objectives or policies without the approval of the Fund, causing the Fund to withdraw its investment from the underlying ETF at a time and price that is unfavorable to the Fund.
326
| | |
| NOTESTO FINANCIAL STATEMENTS (continued) | | Sun Capital Advisers Trust |
As a result of the Fund’s investment in underlying ETFs, it will indirectly bear fees and expenses charged by the underlying ETFs, in addition to the Fund’s direct fees and expenses. Therefore, the cost of investing in the Ibbotson Tactical Opportunities Fund may be higher than the cost of investing in mutual funds that invest directly in individual stocks and bonds.
4. PRINCIPAL INVESTMENT RISKS
In the normal course of pursuing their investment objectives, the Funds may trade financial instruments and enter into financial transactions where risk of potential loss exists due to changes in the market (market or equity risk), failure of the other party to a transaction to perform or a decline in credit quality of the issuer (counterparty and credit risk), fluctuations in the value of foreign currencies (foreign currency exchange risk) and unfavorable changes in interest rates (interest rate risk). The potential loss due to any of these risks could exceed the value of the financial assets recorded in the Fund’s financial statements. Financial assets which potentially expose the Funds to credit risk consist principally of cash due from counterparties and investments. In addition, investing in foreign markets may also involve special risks and considerations not typically associated with investing in the U.S. such as high rates of inflation, repatriation restrictions on income and capital, and adverse political and economic developments. Moreover, securities issued in these markets may be less liquid, be subject to government ownership controls, have delayed settlements, and their prices may be more volatile than those of comparable securities in the U.S.
Counterparty risk, the type of credit risk associated with a default by an institution or other entity with which the Funds have unsettled or open transactions, is managed through evaluation of each counterparty prior to entering into transactions with them. Transactions in listed securities are generally settled/paid for upon delivery using approved counterparties. The risk of loss would generally be considered low as the trades will fail if either party fails to meet its obligation.
The Funds may be subject to various Master Agreements, which govern the terms of certain transactions with select counterparties. These Master Agreements reduce the counterparty risk associated with relevant transactions by specifying credit protection mechanisms and providing standardization that improves legal certainty. Since different types of forward and OTC derivative transactions have different mechanics and are sometimes traded out of different legal entities of a particular counterparty organization, each type of transaction may be covered by a different Master Agreement and result in the need for multiple agreements with a single counterparty. Therefore, exposure cannot be netted and collateralized across all types of transactions. Exposures can only be netted across transactions governed under the same Master Agreement with the same legal entity.
Master Securities Forward Transaction Agreements (“Master Forward Agreements”) govern the considerations and factors surrounding the settlement of certain purchases and sales made on a delayed delivery basis by and between the Fund and select counterparties. The Master Forward Agreements maintain provisions for, among other things, initiation and confirmation, payment and transfer, events of default, termination, and maintenance of collateral.
International Swaps and Derivatives Association, Inc. Master Agreements (“ISDA Master Agreements”) govern OTC financial derivative transactions entered into by the Funds and their counterparties. The ISDA Master Agreements maintain provisions for general obligations, representations, agreements, collateral and events of default or termination. Events of termination include conditions that may entitle counterparties to elect to terminate early and cause settlement of all outstanding transactions under the applicable ISDA Master Agreement. Any election to early terminate could be material to the Funds’ financial statements.
5. FINANCIAL DERIVATIVE INSTRUMENTS
The following disclosures contain information on the Funds’ objectives and strategies for using derivative instruments, the credit-risk-related contingent features in certain derivative instruments, and how derivative
327
| | |
| NOTESTO FINANCIAL STATEMENTS (continued) | | Sun Capital Advisers Trust |
instruments affect the Funds’ financial position, results of operations, and cash flows. The derivative instruments outstanding as of December 31, 2011, as disclosed in the notes to each applicable Fund’s Portfolio of Investments, and the amount of realized and unrealized gains and losses on derivative instruments during the year ended December 31, 2011, as disclosed in each Fund’s Statement of Operations, serve as indicators of the volume of derivative activity for the Funds.
The following is a summary of the fair valuations of the Funds’ financial derivative instruments (not accounted for as hedging instruments under U.S. GAAP) categorized by risk exposure:
Fair Values of Derivative Instruments on the Statement of Assets and Liabilities as of December 31, 2011:
| | | | | | | | | | | | | | | | | | | | | | |
| | | Asset Derivatives | |
Fund | | Derivative Type | | Interest Rate | | | Foreign
Exchange | | | Credit | | | Equity | | | Total | |
AllianceBernstein International Value Fund | | Forward Foreign Currency Exchange Contracts(a) | | $ | — | | | $ | 13,700 | | | $ | — | | | $ | — | | | $ | 13,700 | |
| | Futures Contracts(b) | | | — | | | | — | | | | — | | | | 3,275 | | | | 3,275 | |
| | | | | | | | | | | | | | | | | | | | | | |
| | Total Value | | $ | — | | | $ | 13,700 | | | $ | — | | | $ | 3,275 | | | $ | 16,975 | |
| | | | | | | | | | | | | | | | | | | | | | |
| | | | | | |
BlackRock International Index Fund | | Futures Contracts(b) | | $ | — | | | $ | — | | | $ | — | | | $ | 33,833 | | | $ | 33,833 | |
| | | | | | | | | | | | | | | | | | | | | | |
| | Total Value | | $ | — | | | $ | — | | | $ | — | | | $ | 33,833 | | | $ | 33,833 | |
| | | | | | | | | | | | | | | | | | | | | | |
| | | | | | |
BlackRock Small Cap Index Fund | | Futures Contracts(b) | | $ | — | | | $ | — | | | $ | — | | | $ | 33,904 | | | $ | 33,904 | |
| | | | | | | | | | | | | | | | | | | | | | |
| | Total Value | | $ | — | | | $ | — | | | $ | — | | | $ | 33,904 | | | $ | 33,904 | |
| | | | | | | | | | | | | | | | | | | | | | |
| | | | | | |
Goldman Sachs Mid Cap Value Fund | | Futures Contracts(b) | | $ | — | | | $ | — | | | $ | — | | | $ | 42,760 | | | $ | 42,760 | |
| | | | | | | | | | | | | | | | | | | | | | |
| | Total Value | | $ | — | | | $ | — | | | $ | — | | | $ | 42,760 | | | $ | 42,760 | |
| | | | | | | | | | | | | | | | | | | | | | |
BlackRock Inflation Protected Bond Fund | | Forward Foreign Currency Exchange Contracts(a) | | $ | — | | | $ | 942,490 | | | $ | — | | | $ | — | | | $ | 942,490 | |
| | Futures Contracts(b) | | | 518,168 | | | | — | | | | — | | | | — | | | | 518,168 | |
| | Purchased Options(c) | | | 271,251 | | | | — | | | | — | | | | — | | | | 271,251 | |
| | Swap Contracts(d) | | | 1,126,715 | | | | — | | | | — | | | | — | | | | 1,126,715 | |
| | | | | | | | | | | | | | | | | | | | | | |
| | Total Value | | $ | 1,916,134 | | | $ | 942,490 | | | $ | — | | | $ | — | | | $ | 2,858,624 | |
| | | | | | | | | | | | | | | | | | | | | | |
| | | | | | |
Goldman Sachs Short Duration Fund | | Futures Contracts(b) | | $ | 273,557 | | | $ | — | | | $ | — | | | $ | — | | | $ | 273,557 | |
| | | | | | | | | | | | | | | | | | | | | | |
| | Total Value | | $ | 273,557 | | | $ | — | | | $ | — | | | $ | — | | | $ | 273,557 | |
| | | | | | | | | | | | | | | | | | | | | | |
| | | | | | |
PIMCO High Yield Fund | | Forward Foreign Currency Exchange Contracts(a) | | $ | — | | | $ | 495,625 | | | $ | — | | | $ | — | | | $ | 495,625 | |
| | Swap Contracts(d) | | | — | | | | — | | | | 41,863 | | | | — | | | | 41,863 | |
| | | | | | | | | | | | | | | | | | | | | | |
| | Total Value | | $ | — | | | $ | 495,625 | | | $ | 41,863 | | | $ | — | | | $ | 537,488 | |
| | | | | | | | | | | | | | | | | | | | | | |
328
| | |
| NOTESTO FINANCIAL STATEMENTS (continued) | | Sun Capital Advisers Trust |
| | | | | | | | | | | | | | | | | | | | | | |
| | | Asset Derivatives | |
Fund | | Derivative Type | | Interest Rate | | | Foreign
Exchange | | | Credit | | | Equity | | | Total | |
| | | | | | |
PIMCO Total Return Fund | | Forward Foreign Currency Exchange Contracts(a) | | $ | — | | | $ | 5,846,483 | | | $ | — | | | $ | — | | | $ | 5,846,483 | |
| | Futures Contracts(b) | | | 1,238,146 | | | | — | | | | — | | | | — | | | | 1,238,146 | |
| | Purchased Options(c) | | | 246,755 | | | | — | | | | — | | | | — | | | | 246,755 | |
| | OTC Swap Contracts(d) | | | 1,900,259 | | | | — | | | | 2,061,152 | | | | — | | | | 3,961,411 | |
| | Centrally Cleared Swap Contracts(e) | |
| 1,573,937
|
| | | — | | | | — | | | | — | | | | 1,573,937 | |
| | | | | | | | | | | | | | | | | | | | | | |
| | Total Value | | $ | 4,959,097 | | | $ | 5,846,483 | | | $ | 2,061,152 | | | $ | — | | | $ | 12,866,732 | |
| | | | | | | | | | | | | | | | | | | | | | |
| (a) | Statement of Assets and Liabilities location: Unrealized appreciation on forward foreign currency exchange contracts. |
| (b) | Statement of Assets and Liabilities location: Variation margin receivable or payable, as applicable. Only current day’s variation margin is reported within the Statement of Assets and Liabilities. Amount presented is cumulative appreciation (depreciation) on futures as presented in each Fund’s Portfolio of Investments. |
| (c) | Statement of Assets and Liabilities location: Investments, at value. |
| (d) | Statement of Assets and Liabilities location: Swaps, at value. |
| (e) | Statement of Assets and Liabilities location: Variation margin receivable or payable, as applicable. Only current day’s variation margin is reported within the Statement of Assets and Liabilities. Amount presented is market value on centrally cleared swap contracts as presented in each Fund’s Portfolio of Investments. |
329
| | |
| NOTESTO FINANCIAL STATEMENTS (continued) | | Sun Capital Advisers Trust |
| | | | | | | | | | | | | | | | | | | | | | |
| | | Liability Derivatives | |
Fund | | Derivative Type | | Interest Rate | | | Foreign
Exchange | | | Credit | | | Equity | | | Total | |
AllianceBernstein International Value Fund | | Forward Foreign Currency Exchange Contracts(a) | | $ | — | | | $ | (5,393 | ) | | $ | — | | | $ | — | | | $ | (5,393 | ) |
| | | | | | | | | | | | | | | | | | | | | | |
| | Total Value | | $ | — | | | $ | (5,393 | ) | | $ | — | | | $ | — | | | $ | (5,393 | ) |
| | | | | | | | | | | | | | | | | | | | | | |
| | | | | | |
BlackRock International Index Fund | | Futures Contracts(b) | | $ | — | | | $ | — | | | $ | — | | | $ | (4,607 | ) | | $ | (4,607 | ) |
| | | | | | | | | | | | | | | | | | | | | | |
| | Total Value | | $ | — | | | $ | — | | | $ | — | | | $ | (4,607 | ) | | $ | (4,607 | ) |
| | | | | | | | | | | | | | | | | | | | | | |
| | | | | | |
BlackRock Large Cap Index Fund | | Futures Contracts(b) | | $ | — | | | $ | — | | | $ | — | | | $ | (3,190 | ) | | $ | (3,190 | ) |
| | | | | | | | | | | | | | | | | | | | | | |
| | Total Value | | $ | — | | | $ | — | | | $ | — | | | $ | (3,190 | ) | | $ | (3,190 | ) |
| | | | | | | | | | | | | | | | | | | | | | |
| | | | | | |
BlackRock Inflation Protected Bond Fund | | Forward Foreign Currency Exchange Contracts(a) | | $ | — | | | $ | (28,324 | ) | | $ | — | | | $ | — | | | $ | (28,324 | ) |
| | Futures Contracts(b) | | | (1,890,546 | ) | | | — | | | | — | | | | — | | | | (1,890,546 | ) |
| | Swap Contracts(c) | | | (3,428,883 | ) | | | — | | | | — | | | | — | | | | (3,428,883 | ) |
| | Written Option Contracts(d) | | | (2,815,504 | ) | | | — | | | | — | | | | — | | | | (2,815,504 | ) |
| | | | | | | | | | | | | | | | | | | | | | |
| | Total Value | | $ | (8,134,933 | ) | | $ | (28,324 | ) | | $ | — | | | $ | — | | | $ | (8,163,257 | ) |
| | | | | | | | | | | | | | | | | | | | | | |
| | | | | | |
Goldman Sachs Short Duration Fund | | Futures Contracts(b) | | $ | (1,085,384 | ) | | $ | — | | | $ | — | | | $ | — | | | $ | (1,085,384 | ) |
| | | | | | | | | | | | | | | | | | | | | | |
| | Total Value | | $ | (1,085,384 | ) | | $ | — | | | $ | — | | | $ | — | | | $ | (1,085,384 | ) |
| | | | | | | | | | | | | | | | | | | | | | |
| | | | | | |
PIMCO High Yield Fund | | Forward Foreign Currency Exchange Contracts(a) | | $ | — | | | $ | (179,011 | ) | | $ | — | | | $ | — | | | $ | (179,011 | ) |
| | OTC Swap Contracts(c) | | | — | | | | — | | | | (21,827 | ) | | | — | | | | (21,827 | ) |
| | Centrally Cleared Swap Contracts(e) | | | — | | | | — | | | | (209,277 | ) | | | — | | | | (209,277 | ) |
| | | | | | | | | | | | | | | | | | | | | | |
| | Total Value | | $ | — | | | $ | (179,011 | ) | | $ | (231,104 | ) | | $ | — | | | $ | (410,115 | ) |
| | | | | | | | | | | | | | | | | | | | | | |
| | | | | | |
PIMCO Total Return Fund | | Forward Foreign Currency Exchange Contracts(a) | | $ | — | | | $ | (2,199,771 | ) | | $ | — | | | $ | — | | | $ | (2,199,771 | ) |
| | Swap Contracts(c) | | | (14,214 | ) | | | — | | | | (6,391,961 | ) | | | — | | | | (6,406,175 | ) |
| | Written Option Contracts(d) | | | (828,515 | ) | | | — | | | | — | | | | — | | | | (828,515 | ) |
| | | | | | | | | | | | | | | | | | | | | | |
| | Total Value | | $ | (842,729 | ) | | $ | (2,199,771 | ) | | $ | (6,391,961 | ) | | $ | — | | | $ | (9,434,461 | ) |
| | | | | | | | | | | | | | | | | | | | | | |
| (a) | Statement of Assets and Liabilities location: Unrealized depreciation on forward foreign currency exchange contracts. |
| (b) | Statement of Assets and Liabilities location: Variation margin receivable or payable, as applicable. Only current day’s variation margin is reported within the Statement of Assets and Liabilities. Amount presented is cumulative appreciation (depreciation) on futures, as applicable, as presented in each Fund’s Portfolio of Investments. |
330
| | |
| NOTESTO FINANCIAL STATEMENTS (continued) | | Sun Capital Advisers Trust |
| (c) | Statement of Assets and Liabilities location. Swap, at value. |
| (d) | Statement of Assets and Liabilities location: Options written. |
| (e) | Statement of Assets and Liabilities location: Variation margin receivable or payable, as applicable. Only current day’s variation margin is reported within the Statement of Assets and Liabilities. Amount presented is market value on centrally cleared swap contracts as presented in each Fund’s Portfolio of Investments. |
Effect of Derivative Instruments on the Statement of Operations for the Year Ended December 31, 2011:
| | | | | | | | | | | | | | | | | | | | | | |
| | | Realized Gain (Loss) | |
Fund | | Derivative Type | | Interest Rate | | | Foreign
Exchange | | | Credit | | | Equity | | | Total | |
AllianceBernstein International Value Fund | | Forward Foreign Currency Exchange Contracts(a) | | $ | — | | | $ | 35,600 | | | $ | — | | | $ | — | | | $ | 35,600 | |
| | Futures Contracts(b) | | | — | | | | — | | | | — | | | | (62,921 | ) | | | (62,921 | ) |
| | | | | | | | | | | | | | | | | | | | | | |
| | Total Value | | $ | — | | | $ | 35,600 | | | $ | — | | | $ | (62,921 | ) | | $ | (27,321 | ) |
| | | | | | | | | | | | | | | | | | | | | | |
| | | | | | |
BlackRock International Index Fund | | Futures Contracts(b) | | $ | — | | | $ | — | | | $ | — | | | $ | 91,709 | | | $ | 91,709 | |
| | | | | | | | | | | | | | | | | | | | | | |
| | Total Value | | $ | — | | | $ | — | | | $ | — | | | $ | 91,709 | | | $ | 91,709 | |
| | | | | | | | | | | | | | | | | | | | | | |
| | | | | | |
BlackRock Large Cap Index Fund | | Futures Contracts(b) | | $ | — | | | $ | — | | | $ | — | | | $ | (434,634 | ) | | $ | (434,634 | ) |
| | | | | | | | | | | | | | | | | | | | | | |
| | Total Value | | $ | — | | | $ | — | | | $ | — | | | $ | (434,634 | ) | | $ | (434,634 | ) |
| | | | | | | | | | | | | | | | | | | | | | |
| | | | | | |
BlackRock Small Cap Index Fund | | Futures Contracts(b) | | $ | — | | | $ | — | | | $ | — | | | $ | 218,268 | | | $ | 218,268 | |
| | | | | | | | | | | | | | | | | | | | | | |
| | Total Value | | $ | — | | | $ | — | | | $ | — | | | $ | 218,268 | | | $ | 218,268 | |
| | | | | | | | | | | | | | | | | | | | | | |
| | | | | | |
Goldman Sachs Mid Cap Value Fund | | Futures Contracts(b) | | $ | — | | | $ | — | | | $ | — | | | $ | (906,369 | ) | | $ | (906,369 | ) |
| | | | | | | | | | | | | | | | | | | | | | |
| | Total Value | | $ | — | | | $ | — | | | $ | — | | | $ | (906,369 | ) | | $ | (906,369 | ) |
| | | | | | | | | | | | | | | | | | | | | | |
| | | | | | |
BlackRock Inflation Protected Bond Fund | | Forward Foreign Currency Exchange Contracts(a) | | $ | — | | | $ | (884,623 | ) | | $ | — | | | $ | — | | | $ | (884,623 | ) |
| | Futures Contracts(b) | | | (4,498,018 | ) | | | — | | | | — | | | | — | | | | (4,498,018 | ) |
| | Purchased Option Contracts(c) | | | 402,832 | | | | — | | | | — | | | | — | | | | 402,832 | |
| | Swap Contracts(d) | | | 3,891,676 | | | | — | | | | — | | | | — | | | | 3,891,676 | |
| | Written Option Contracts(e) | | | 1,958,147 | | | | — | | | | — | | | | — | | | | 1,958,147 | |
| | | | | | | | | | | | | | | | | | | | | | |
| | Total Value | | $ | 1,754,637 | | | $ | (884,623 | ) | | $ | — | | | $ | — | | | $ | 870,014 | |
| | | | | | | | | | | | | | | | | | | | | | |
| | | | | | |
Goldman Sachs Short Duration Fund | | Futures Contracts(b) | | $ | (10,168,402 | ) | | $ | — | | | $ | — | | | $ | — | | | $ | (10,168,402 | ) |
| | | | | | | | | | | | | | | | | | | | | | |
| | Total Value | | $ | (10,168,402 | ) | | $ | — | | | $ | — | | | $ | — | | | $ | (10,168,402 | ) |
| | | | | | | | | | | | | | | | | | | | | | |
331
| | |
| NOTESTO FINANCIAL STATEMENTS (continued) | | Sun Capital Advisers Trust |
| | | | | | | | | | | | | | | | | | | | | | |
| | | Realized Gain (Loss) | |
Fund | | Derivative Type | | Interest Rate | | | Foreign
Exchange | | | Credit | | | Equity | | | Total | |
PIMCO High Yield Fund | | Forward Foreign Currency Exchange Contracts(a) | | $ | — | | | $ | 279,760 | | | $ | — | | | $ | — | | | $ | 279,760 | |
| | Futures Contracts(b) | | | 245,470 | | | | — | | | | — | | | | — | | | | 245,470 | |
| | Swap Contracts(d) | | | — | | | | — | | | | (150,662 | ) | | | — | | | | (150,662 | ) |
| | | | | | | | | | | | | | | | | | | | | | |
| | Total Value | | $ | 245,470 | | | $ | 279,760 | | | $ | (150,662 | ) | | $ | — | | | $ | 374,568 | |
| | | | | | | | | | | | | | | | | | | | | | |
| | | | | | |
PIMCO Total Return Fund | | Forward Foreign Currency Exchange Contracts(a) | | $ | — | | | $ | 5,805,367 | | | $ | — | | | $ | — | | | $ | 5,805,367 | |
| | Futures Contracts(b) | | | 11,919,424 | | | | — | | | | — | | | | — | | | | 11,919,424 | |
| | Swap Contracts(d) | | | (3,728,594 | ) | | | — | | | | 3,124,488 | | | | — | | | | (604,106 | ) |
| | Written Option Contracts(e) | | | (3,344,021 | ) | | | — | | | | 51,215 | | | | — | | | | (3,292,806 | ) |
| | | | | | | | | | | | | | | | | | | | | | |
| | Total Value | | $ | 4,846,809 | | | $ | 5,805,367 | | | $ | 3,175,703 | | | $ | — | | | $ | 13,827,879 | |
| | | | | | | | | | | | | | | | | | | | | | |
| (a) | Statement of Operations location: Net realized gain (loss) from: Foreign currency related transactions (Statement of Operations includes both forward foreign currency exchange contracts and foreign currency transactions). |
| (b) | Statement of Operations location: Net realized gain (loss) from: Futures. |
| (c) | Statement of Operations location: Net realized gain (loss) from: Investments. |
| (d) | Statement of Operations location: Net realized gain (loss) from: Swaps. |
| (e) | Statement of Operations location: Net realized gain (loss) from: Written options. |
| | | | | | | | | | | | | | | | | | | | | | |
| | | Change in Unrealized Appreciation (Depreciation) | |
Fund | | Derivative Type | | Interest Rate | | | Foreign
Exchange | | | Credit | | | Equity | | | Total | |
AllianceBernstein International Value Fund | | Forward Foreign Currency Exchange Contracts(a) | | $ | — | | | $ | 8,307 | | | $ | — | | | $ | — | | | $ | 8,307 | |
| | Futures Contracts(b) | | | — | | | | — | | | | — | | | | 9,875 | | | | 9,875 | |
| | | | | | | | | | | | | | | | | | | | | | |
| | Total Value | | $ | — | | | $ | 8,307 | | | $ | — | | | $ | 9,875 | | | $ | 18,182 | |
| | | | | | | | | | | | | | | | | | | | | | |
| | | | | | |
BlackRock International Index Fund | | Futures Contracts(b) | | $ | — | | | $ | — | | | $ | — | | | $ | 13,350 | | | $ | 13,350 | |
| | | | | | | | | | | | | | | | | | | | | | |
| | Total Value | | $ | — | | | $ | — | | | $ | — | | | $ | 13,350 | | | $ | 13,350 | |
| | | | | | | | | | | | | | | | | | | | | | |
| | | | | | |
BlackRock Large Cap Index Fund | | Futures Contracts(b) | | $ | — | | | $ | — | | | $ | — | | | $ | (57,956 | ) | | $ | (57,956 | ) |
| | | | | | | | | | | | | | | | | | | | | | |
| | Total Value | | $ | — | | | $ | — | | | $ | — | | | $ | (57,956 | ) | | $ | (57,956 | ) |
| | | | | | | | | | | | | | | | | | | | | | |
| | | | | | |
BlackRock Small Cap Index Fund | | Futures Contracts(b) | | $ | — | | | $ | — | | | $ | — | | | $ | (15,314 | ) | | $ | (15,314 | ) |
| | | | | | | | | | | | | | | | | | | | | | |
| | Total Value | | $ | — | | | $ | — | | | $ | — | | | $ | (15,314 | ) | | $ | (15,314 | ) |
| | | | | | | | | | | | | | | | | | | | | | |
| | | | | | |
Goldman Sachs Mid Cap Value Fund | | Futures Contracts(b) | | $ | — | | | $ | — | | | $ | — | | | $ | 48,682 | | | $ | 48,682 | |
| | | | | | | | | | | | | | | | | | | | | | |
| | Total Value | | $ | — | | | $ | — | | | $ | — | | | $ | 48,682 | | | $ | 48,682 | |
| | | | | | | | | | | | | | | | | | | | | | |
332
| | |
| NOTESTO FINANCIAL STATEMENTS (continued) | | Sun Capital Advisers Trust |
| | | | | | | | | | | | | | | | | | | | | | |
| | | Change in Unrealized Appreciation (Depreciation) | |
Fund | | Derivative Type | | Interest Rate | | | Foreign
Exchange | | | Credit | | | Equity | | | Total | |
BlackRock Inflation Protected Bond Fund | | Forward Foreign Currency Exchange Contracts(a) | | $ | — | | | $ | 1,553,113 | | | $ | — | | | $ | — | | | $ | 1,553,113 | |
| | Futures Contracts(b) | | | (936,169 | ) | | | — | | | | — | | | | — | | | | (936,169 | ) |
| | Purchased Option Contracts(c) | | | 31,371 | | | | — | | | | — | | | | — | | | | 31,371 | |
| | Swap Contracts(d) | | | (1,716,970 | ) | | | — | | | | — | | | | — | | | | (1,716,970 | ) |
| | Written Option Contracts(e) | | | (1,394,478 | ) | | | — | | | | — | | | | — | | | | (1,394,478 | ) |
| | | | | | | | | | | | | | | | | | | | | | |
| | Total Value | | $ | (4,016,246 | ) | | $ | 1,553,113 | | | $ | — | | | $ | — | | | $ | (2,463,133 | ) |
| | | | | | | | | | | | | | | | | | | | | | |
| | | | | | |
Goldman Sachs Short Duration Fund | | Futures Contracts(b) | | $ | (869,201 | ) | | $ | — | | | $ | — | | | $ | — | | | $ | (869,201 | ) |
| | | | | | | | | | | | | | | | | | | | | | |
| | Total Value | | $ | (869,201 | ) | | $ | — | | | $ | — | | | $ | — | | | $ | (869,201 | ) |
| | | | | | | | | | | | | | | | | | | | | | |
| | | | | | |
PIMCO High Yield Fund | | Forward Foreign Currency Exchange Contracts(a) | | $ | — | | | $ | 119,465 | | | $ | — | | | $ | — | | | $ | 119,465 | |
| | Futures Contracts(b) | | | (242,475 | ) | | | — | | | | — | | | | — | | | | (242,475 | ) |
| | Swap Contracts(d) | | | — | | | | — | | | | (75,950 | ) | | | — | | | | (75,950 | ) |
| | | | | | | | | | | | | | | | | | | | | | |
| | Total Value | | $ | (242,475 | ) | | $ | 119,465 | | | $ | (75,950 | ) | | $ | — | | | $ | (198,960 | ) |
| | | | | | | | | | | | | | | | | | | | | | |
| | | | | | |
PIMCO Total Return Fund | | Forward Foreign Currency Exchange Contracts(a) | | $ | — | | | $ | 2,575,331 | | | $ | — | | | $ | — | | | $ | 2,575,331 | |
| | Futures Contracts(b) | | | 1,918,902 | | | | — | | | | — | | | | — | | | | 1,918,902 | |
| | Purchased Option Contracts(c) | | | 73,757 | | | | — | | | | — | | | | — | | | | 73,757 | |
| | Swap Contracts(d) | | | 2,833,115 | | | | — | | | | (5,729,574 | ) | | | — | | | | (2,896,459 | ) |
| | Written Option Contracts(e) | | | 3,234,191 | | | | — | | | | — | | | | — | | | | 3,234,191 | |
| | | | | | | | | | | | | | | | | | | | | | |
| | Total Value | | $ | 8,059,965 | | | $ | 2,575,331 | | | $ | (5,729,574 | ) | | $ | — | | | $ | 4,905,722 | |
| | | | | | | | | | | | | | | | | | | | | | |
| (a) | Statement of Operations location: Change in unrealized appreciation (depreciation) on: Assets and liabilities in foreign currencies (Statement of Operations includes both forward foreign currency exchange contracts and foreign currency transactions). |
| (b) | Statement of Operations location: Change in unrealized appreciation (depreciation) on: Futures. |
| (c) | Statement of Operations location: Change in unrealized appreciation (depreciation) on: Investments. |
| (d) | Statement of Operations location: Change in unrealized appreciation (depreciation) on: Swaps. |
| (e) | Statement of Operations location: Change in unrealized appreciation (depreciation) on: Written options. |
a) Swap Agreements
Certain Funds may invest in swap agreements. Swap agreements are bilaterally negotiated contracts between a Fund and a counterparty to exchange or swap investment cash flows, assets, foreign currencies or market-linked
333
| | |
| NOTESTO FINANCIAL STATEMENTS (continued) | | Sun Capital Advisers Trust |
returns at specified, future intervals. Swap agreements are privately negotiated in the OTC market and may be executed in a multilateral or other trade facility platform, such as a registered commodities exchange (“centrally cleared swaps”). A Fund may enter into credit default, cross-currency, interest rate, total return and other forms of swap agreements to manage its exposure to credit, currency and interest rate risks. In connection with these agreements, securities or cash may be identified as collateral or margin in accordance with the terms of the respective swap agreements to provide assets of value and recourse in the event of default or bankruptcy/insolvency. The amount of collateral posted or received by a Fund, as noted on each applicable Fund’s Portfolio of Investments, is generally subject to certain minimum requirements as determined between the Fund and each counterparty. Cash posted or received is recorded as cash collateral pledged or received from broker on the Statement of Assets and Liabilities.
The value of the OTC swap is adjusted daily based upon quotations from an independent pricing vendor and is recorded as swaps, at value, on the Fund’s Statement of Assets and Liabilities. Daily changes in valuation of centrally cleared swaps, if any, are recorded within variation margin receivable or payable on the Statement of Assets and Liabilities. Changes in market value of swap agreements are recorded as a change in unrealized appreciation or depreciation on the Statement of Operations. Upfront swap premium payments paid or received by the Fund, if any, are disclosed as such on the Fund’s Statement of Assets and Liabilities and represent payments paid or received upon entering into the OTC swap contracts to compensate for differences between stated terms of the swap contract and prevailing market conditions (credit spreads, currency exchange rates, interest rates and other relevant factors). These upfront payments are recorded as realized gain or loss on the Fund’s Statement of Operations upon termination or maturity of the swap contract. Under the terms of the OTC swap contracts, the Fund receives or makes net periodic payments which are included as part of realized gains or losses on the Fund’s Statement of Operations. Liquidation payments received or made upon termination of the swap contract are recorded as realized gain or loss in the Fund’s Statement of Operations.
Entering into swap agreements involves, to varying degrees, elements of credit, market and documentation risk in excess of the amounts recognized on the Fund’s Statement of Operations. Bilaterally negotiated swap agreements are also subject to risks related to the counterparty’s ability to perform, and may decline in value if the counterparty’s creditworthiness deteriorates. A Fund may also suffer losses if it is unable to terminate outstanding swap agreements or reduce its exposure through offsetting transactions. Bilaterally negotiated swap agreements also bear the risk that the Fund will not be able to meet its obligations to the counterparty.
The Funds may enter into certain interest rate, total return and credit default swap contracts that may contain provisions whereby the counterparty may terminate the contract under certain conditions, including but not limited to a decline in a Fund’s net assets below a certain level, which may result in a payment by the Funds for those swaps in a net liability position.
(i) Credit Default Swap Agreements
Certain Funds may enter into credit default swap agreements. A Fund may buy or sell credit default swap contracts to seek to increase the Fund’s income, to provide comparable exposure to fixed income securities that might not be available in primary markets, to add leverage to the portfolio, or to hedge the risk of default on other securities held by the Fund. A credit default swap is a contract between a buyer and a seller of protection against a predefined credit event. As a seller in the credit default swap contract, the Fund would be required to pay the par (or other agreed-upon) value of certain third party debt obligations to the counterparty in the event of a credit event (generally including the occurrence of a bankruptcy, failure to make payments in respect of debt obligations, or debt restructurings) in respect of such third party, such as a U.S. or foreign corporate issuer. Such a payment would likely result in a loss to the Fund. In return, the Fund would receive from the counterparty a periodic stream of payments over the term of the contract provided that no credit event has occurred. If no credit event occurs, the Fund would keep the stream of payments and would have no payment obligations. The Fund may also buy credit default swap contracts in order to hedge against the risk of default of debt securities or to
334
| | |
| NOTESTO FINANCIAL STATEMENTS (continued) | | Sun Capital Advisers Trust |
take a view as to the likelihood of default of debt securities. This would involve the risk that the contract may expire worthless if a credit event does not occur during the term of the transaction. It would also involve credit risk that the seller may fail to satisfy its payment obligations to the Fund in the event of a credit event.
Credit default swap agreements on corporate and sovereign issues involve one party making a stream of payments to another party in exchange for the right to receive a specified return in the event of a credit event. If a credit event occurs and cash settlement is not elected, a variety of other deliverable obligations may be delivered in lieu of the specific referenced obligation. The ability to deliver other obligations may result in a cheapest-to-deliver option (the buyer of protection’s right to choose the deliverable obligation with the lowest value following a credit event). A Fund may use credit default swaps on corporate and sovereign issues to provide a measure of protection against credit events in respect of the issuers (i.e., to reduce risk where a Fund owns or has exposure to the referenced obligation) or to take an active long or short position with respect to the likelihood of the occurrence of a credit event in respect of a particular issuer.
Credit default swap agreements on credit indices involve one party making a stream of payments to another party in exchange for the right to receive a specified return in the event of certain credit events in respect of or default of all or part of the referenced entities comprising the credit index. A credit index is a list or a basket of credit instruments or exposures designed to be representative of some part of the credit market as a whole. Index credit default swaps that reference asset-backed or mortgage-backed instruments may require payments in the event of a write-down, principal or interest shortfall in respect of the underlying instruments. Index credit default swaps that reference corporate entities or instruments generally include the same credit events that would be contained in a single-name credit default swap on the relevant corporate entity or instruments. An index credit default swap references all the entities in the index, and if there is a credit event, the credit event is settled based on that entity’s weight in the index. A Fund may use credit default swaps on credit indices to hedge a portfolio of credit default swaps or bonds which is less expensive than it would be to buy many individual credit default swaps to achieve a similar effect.
The maximum potential amount of future payments (undiscounted) that a Fund as a seller of protection could be required to make under a credit default swap agreement would be an amount equal to the notional amount of the agreement which is disclosed in each Fund’s Portfolio of Investments. These potential amounts would be partially offset by any recovery values of the respective referenced obligations, upfront payments received upon entering into the agreement, or net amounts received from the settlement of buy protection credit default swap agreements entered into by the Fund for the same referenced entity or entities. At December 31, 2011, PIMCO High Yield Fund and PIMCO Total Return Fund had open credit default swap contracts and were the sellers of protection.
(ii) Interest Rate Swap Agreements
Certain Funds may enter into interest rate swap agreements to manage the interest rate risk inherent in the Fund’s underlying investments such as fixed rate bonds. The value of these bonds may decrease if interest rates rise. In an interest rate swap, the Fund would agree to pay the other party to the interest rate swap (the “counterparty”) a fixed rate payment in exchange for the counterparty agreeing to pay to the Fund a variable rate payment, or the Fund would agree to receive from the counterparty a fixed rate payment in exchange for the counterparty agreeing to receive from the Fund a variable rate payment. The payment obligations would be based on the notional amount of the swap.
As of December 31, 2011, BlackRock Inflation Protected Bond Fund and PIMCO Total Return Fund had open interest rate swap agreements as listed on each Fund’s Portfolio of Investments.
(iii) Total Return Swap Agreements
Certain Funds may enter into total return swap agreements to obtain exposure to a security or market without owning or taking physical custody of such security or investing directly in such market. Total return swap
335
| | |
| NOTESTO FINANCIAL STATEMENTS (continued) | | Sun Capital Advisers Trust |
agreements are contracts in which one party agrees to make periodic payments to another party based on the change in market value of the assets underlying the contract, which may include a specified security, basket of securities or securities indices during the specific period, in return for periodic payments based on a fixed or variable interest rate or the total return from other underlying assets. To the extent the total return of the security or index underlying the transaction exceeds or falls short of the offsetting interest rate obligation, a Fund will receive a payment from or make a payment to the counterparty.
As of December 31, 2011, only BlackRock Inflation Protected Bond Fund had outstanding total return swap agreements as listed on the Fund’s Portfolio of Investments.
b) Forward Foreign Currency Exchange and Spot Contracts
Certain Funds may engage in forward foreign currency exchange and spot contracts in an effort to enhance total return, to facilitate transactions in foreign securities and to reduce exposure to foreign currency exchange rates. Forward foreign currency exchange contracts are agreements to purchase or sell a specified currency on a specified future date at a price set at the time of the contract. The use of forward foreign currency exchange and spot contracts does not eliminate fluctuations in the underlying prices of the Fund’s securities, but it does establish a rate of exchange on a particular date. When a contract is used to hedge against movements in exchange rates, it will limit the risk of loss due to a decline in the value of the hedged currency during the relevant period, but will also limit any potential gain that might result should the value of the currency increase during that period. In addition, the Fund could be exposed to risks if the counterparties to the contracts are unable to meet the terms of their contracts. The Funds may segregate liquid assets to cover their obligations under these contracts.
The value of forward foreign currency exchange contracts is translated into U.S. dollars. The change in market values of forward foreign currency exchange contracts is recorded as unrealized appreciation (depreciation) on forward foreign currency exchange contracts on the Fund’s Statement of Assets and Liabilities. When the contract is closed, the Fund records a realized gain or loss equal to the difference between the value of the contract at the time it was opened and the value at the time it was closed which is included in realized gain/(loss) on foreign currency related transactions on the Fund’s Statement of Operations.
As of December 31, 2011, AllianceBernstein International Value Fund, BlackRock Inflation Protected Bond Fund, PIMCO High Yield Fund and PIMCO Total Return Fund had open forward foreign currency exchange contracts as listed on each Fund’s Portfolio of Investments.
c) Futures
Certain Funds may enter into futures contracts. A Fund may enter into futures contracts as a hedge against changes in interest rates or securities prices, for duration management, and return enhancement purposes. A futures contract is an agreement between a buyer or seller and an established futures exchange or its clearinghouse, regulated and approved by the Commodity Futures Trading Commission, in which the buyer or seller agrees to take or make a delivery of a specific amount of a financial instrument at a specified price on a specific date (the “settlement date”). Certain risks may arise upon entering into futures contracts, including the risk that an illiquid commodity market will limit the Fund’s ability to close out a futures contract prior to the settlement date and that a change in the value of a futures contract may not correlate exactly with the changes in the value of the securities. The Funds segregate liquid assets or engage in other appropriate measures to cover their obligations under these contracts, as noted on each applicable Fund’s Portfolio of Investments.
Upon entering into a futures contract, the Fund is required to deposit with a financial intermediary an amount (“initial margin”) equal to a certain percentage of the face value indicated in the futures contract. Subsequent payments (“variation margin”) made or received by the Fund are dependent upon the daily fluctuations in the
336
| | |
| NOTESTO FINANCIAL STATEMENTS (continued) | | Sun Capital Advisers Trust |
value of the underlying contract and are recorded as changes in unrealized gains or losses in the Fund’s Statement of Operations. The value of futures contracts are based upon their quoted settlement prices. Futures contracts involve, to a varying degree, risk of loss in excess of the variation margin disclosed on the Statement of Assets and Liabilities.
As of December 31, 2011, AllianceBernstein International Value Fund, BlackRock International Index Fund, BlackRock Large Cap Index Fund, BlackRock Small Cap Index Fund, Goldman Sachs Mid Cap Value Fund, BlackRock Inflation Protected Bond Fund, Goldman Sachs Short Duration Fund and PIMCO Total Return Fund had open futures contracts as listed on each Fund’s Portfolio of Investments.
d) Options
Certain Funds may enter into call and put option contracts on 1) securities, futures, commodities, currencies or swaps (“swaptions”) it owns or in which it may invest, 2) inflation floors and 3) forward volatility agreements. The Fund may enter into option contracts in order to hedge against potential adverse price movements in the value of portfolio investments; as a temporary substitute for purchasing or selling selected investments; to lock in the purchase price of a security or currency which it expects to purchase in the near future; or to enhance total return. An option contract is a contract in which the writer of the option grants the buyer of the option the right to purchase from (a “call option”), or sell to (a “put option”) the writer a designated instrument at a specified price within a specified period of time. Writing put options tends to increase a Fund’s exposure to the underlying instrument. Writing call options tends to decrease a Fund’s exposure to the underlying instruments. Swaptions are similar to options on securities except that instead of selling or purchasing the right to buy or sell a security, the writer or purchaser of the swap option is granting or buying the right to enter into a previously agreed upon swap agreement at any time before or upon the expiration of the option. Certain options will require cash settlement by the Fund if the option is exercised. An inflation floor option can be used to give downside protection to investments in inflation-linked products. A forward volatility agreement option hedges against the amount of volatility of an underlying instrument’s value, rate, or movement of a related index.
Certain risks may arise upon entering into option contracts including the risk that an illiquid secondary market will limit the Fund’s ability to close out an option contract prior to the expiration date and that a change in the value of the option contract may not correlate exactly with changes in the value of the securities or currencies hedged. The Fund’s maximum exposure to purchased options is limited to the premium initially paid. If a Fund writes a put option, it accepts the risk of a decline in the value of the underlying security below the exercise price. OTC purchased options have the risk of the potential inability of counterparties to meet the terms of their contracts. The Funds may segregate liquid assets to cover their obligations under written option contracts.
The Fund pays a premium as cost for a purchased put or call option, which is disclosed in the Fund’s Portfolio of Investments and subsequently marked to market to reflect the current value of the option. When a Fund writes an inflation cap and a call or put option, an amount equal to the premium received is recorded as a liability on the Statement of Assets and Liabilities and subsequently marked to market to reflect the current value of the option written. Certain forward volatility agreements may be written with premiums on the underlying instruments to be determined on a future date, based upon implied volatility parameters at specified terms. Realized gain or loss is recognized on the Fund’s Statement of Operations when the option contract expires or is closed.
As of December 31, 2011, BlackRock Inflation Protected Bond Fund and PIMCO Total Return Fund had open purchased option, written options and swaptions, and the PIMCO Total Return Fund had open inflation floor contracts as listed on each Fund’s Portfolio of Investments.
337
| | |
| NOTESTO FINANCIAL STATEMENTS (continued) | | Sun Capital Advisers Trust |
Transactions in all types of options written during the year ended December 31, 2011, as applicable, were as follows:
| | | | | | | | | | | | |
BlackRock Inflation Protected Bond Fund | | Number of
Contracts | | | Notional Par | | | Premium
Amount | |
Beginning of period | | | — | | | $ | 31,400,000 | | | $ | 1,282,390 | |
Written | | | 1,523 | | | | 224,000,000 | | | | 3,110,401 | |
Bought back | | | (641 | ) | | | (9,000,000 | ) | | | (800,986 | ) |
Expired | | | (552 | ) | | | (179,700,000 | ) | | | (1,345,098 | ) |
Exercised | | | (259 | ) | | | (15,700,000 | ) | | | (814,774 | ) |
| | | | | | | | | | | | |
End of period | | | 71 | | | $ | 51,000,000 | | | $ | 1,431,933 | |
| | | | | | | | | | | | |
| | | | | | | | | | | | |
PIMCO Total Return Fund | | Number of
Contracts | | | Notional Par | | | Premium
Amount | |
Beginning of period | | | 368 | | | $ | 190,700,000 | | | $ | 1,879,431 | |
Written | | | 635 | | | | 577,600,000 | | | | 3,124,469 | |
Bought back | | | (642 | ) | | | (119,700,000 | ) | | | (621,542 | ) |
Expired | | | (280 | ) | | | (173,100,000 | ) | | | (885,513 | ) |
Exercised | | | — | | | | (42,100,000 | ) | | | (370,911 | ) |
| | | | | | | | | | | | |
End of period | | | 81 | | | $ | 433,400,000 | | | $ | 3,125,934 | |
| | | | | | | | | | | | |
6. INVESTMENT ADVISORY AND OTHER RELATED PARTY AGREEMENTS
a) Investment Advisory Agreement
Sun Capital (the “Adviser”) is the investment adviser to each of the Funds under separate investment advisory or investment advisory and management agreements with the Trust. Sun Life Financial, a publicly traded holding company, is the ultimate parent of the Adviser. The Adviser, at its own cost, has retained AllianceBernstein L.P., as subadviser for the AllianceBernstein International Value Fund; BlackRock Investment Management, LLC, as subadviser for the BlackRock International Index Fund, BlackRock Large Cap Index Fund and BlackRock Small Cap Index Fund; BlackRock Financial Management, Inc., as subadviser for the BlackRock Inflation Protected Bond Fund; Goldman Sachs Asset Management, L.P., as subadviser for the Goldman Sachs Mid Cap Value Fund and Goldman Sachs Short Duration Fund; Columbia Management Investment Advisers, LLC, as subadviser for the Columbia Small Cap Value Fund; Davis Selected Advisers, L.P., as subadviser for the Davis Venture Value Fund; Invesco Advisers, Inc., as subadviser for the Invesco Small Cap Growth Fund; Lord, Abbett & Co. LLC, as subadviser for the Lord Abbett Growth & Income Fund; Wellington Management Company, LLP, as subadviser for the WMC Blue Chip Mid Cap Fund and WMC Large Cap Growth Fund; Ibbotson Associates, Inc., as subadviser for the Ibbotson Tactical Opportunities Fund, Ibbotson Balanced Fund, Ibbotson Conservative Fund, and Ibbotson Growth Fund; and Pacific Investment Management Company LLC, as subadviser for the PIMCO High Yield Fund and PIMCO Total Return Fund. Effective May 1, 2011, MFS was appointed as subadviser for the Global Real Estate Fund. There was no change to the Fund’s name, investment goal or investment strategy as a result of this change.
338
| | |
| NOTESTO FINANCIAL STATEMENTS (continued) | | Sun Capital Advisers Trust |
As compensation for all services rendered, facilities provided and expenses paid or assumed by the Adviser under the investment advisory agreements, each of the following sixteen Funds pays an advisory fee monthly to the Adviser at the following annual rates based on the average daily net assets of the Fund.
| | | | | | |
| Fund | | Asset Level | | Fee | |
AllianceBernstein International Value Fund | | All | | | 0.63% | |
| | | |
BlackRock International Index Fund | | $0-$500 million over $500 million | |
| 0.40%
0.375% |
|
| | | |
BlackRock Large Cap Index Fund | | $0-$500 million over $500 million | |
| 0.35%
0.325% |
|
| | | |
BlackRock Small Cap Index Fund | | $0-$500 million over $500 million | |
| 0.375%
0.35% |
|
| | | |
Columbia Small Cap Value Fund | | $0-$250 million over $250 million | |
| 0.90%
0.85% |
|
| | | |
Davis Venture Value Fund | | $0-$500 million over $500 million | |
| 0.75%
0.70% |
|
| | | |
Invesco Small Cap Growth Fund | | $0-$250 million over $250 million | |
| 0.95%
0.90% |
|
| | | |
WMC Blue Chip Mid Cap Fund | | $0-$300 million over $300 million | |
| 0.80%
0.75% |
|
| | | |
WMC Large Cap Growth Fund | | $0-$750 million over $750 million | |
| 0.75%
0.70% |
|
| | | |
Global Real Estate Fund | | All | | | 0.95% | |
| | | |
Ibbotson Tactical Opportunities Fund | | $0-$250 million $250 million-$500 million $500 million-$750 million $750 million-$1billion over $1 billion | |
| 0.375%
0.36% 0.34% 0.32% 0.30% |
|
| | | |
Investment Grade Bond Fund | | All | | | 0.60% | |
| | | |
Money Market Fund | | All | | | 0.50% | |
| | | |
Ibbotson Balanced Fund | | All | | | 0.125% | |
| | | |
Ibbotson Conservative Fund | | All | | | 0.125% | |
| | | |
Ibbotson Growth Fund | | All | | | 0.125% | |
339
| | |
| NOTESTO FINANCIAL STATEMENTS (continued) | | Sun Capital Advisers Trust |
Under the investment advisory and management agreements, each of the following six Funds pays a unified management fee to the Adviser on a monthly basis for its advisory and management services. Out of each Fund’s unified management fee, the Adviser pays for all of the ordinary expenses of managing and operating the Fund. Each fee is calculated based on the annual stated percentage of average daily net assets for the Fund, as follows:
| | | | | | |
| Fund | | Asset Level | | Fee | |
Goldman Sachs Mid Cap Value Fund | | All | | | 1.05% | |
| | | |
Lord Abbett Growth & Income Fund | | All | | | 0.87% | |
| | | |
BlackRock Inflation Protected Bond Fund | | All | | | 0.65% | |
| | | |
Goldman Sachs Short Duration Fund | | All | | | 0.64% | |
| | | |
PIMCO High Yield Fund | | All | | | 0.74% | |
| | | |
PIMCO Total Return Fund | | All | | | 0.65% | |
b) Contractual Expense Limitations
i) Funds with investment advisory agreements
For the sixteen Funds that have investment advisory agreements, the Adviser has contractually agreed (until at least April 30, 2013) not to impose all or a portion of its advisory fee and to reimburse other operating expenses to reduce each Fund’s total annual operating expenses as a percentage of average daily net assets to:
| | | | | | | | |
| | | Contractual Expense Limitations | |
Fund | | Initial Class | | | Service Class | |
AllianceBernstein International Value Fund | | | 0.75 | % | | | 1.00 | % |
BlackRock International Index Fund | | | 0.60 | % | | | 0.85 | % |
BlackRock Large Cap Index Fund | | | 0.50 | % | | | 0.75 | % |
BlackRock Small Cap Index Fund | | | 0.60 | % | | | 0.85 | % |
Columbia Small Cap Value Fund | | | 1.15 | % | | | 1.40 | % |
Davis Venture Value Fund | | | 0.90 | % | | | 1.15 | % |
Invesco Small Cap Growth Fund | | | 1.15 | % | | | 1.40 | % |
WMC Blue Chip Mid Cap Fund | | | 1.00 | % | | | 1.25 | % |
WMC Large Cap Growth Fund* | | | 0.90 | % | | | 1.15 | % |
Global Real Estate Fund** | | | 1.05 | % | | | 1.30 | % |
Ibbotson Tactical Opportunities Fund | | | 0.50 | % | | | N/A | |
Investment Grade Bond Fund | | | 0.75 | % | | | 1.00 | % |
Money Market Fund | | | 0.50 | % | | | 0.75 | % |
Ibbotson Balanced Fund | | | 0.20 | % | | | 0.45 | % |
Ibbotson Conservative Fund | | | 0.20 | % | | | 0.45 | % |
Ibbotson Growth Fund | | | 0.20 | % | | | 0.45 | % |
| * | Prior to May 1, 2011 the expense limitations for the WMC Large Cap Growth Fund were 0.81% and 1.06% for Initial Class and Service Class, respectively. |
| ** | The current expense limitations for Global Real Estate Fund went into effect on November 1, 2011. Prior to that, the expense limitations for the Global Real Estate Fund were 1.10% and 1.35% for Initial Class and Service Class, respectively. |
340
| | |
| NOTESTO FINANCIAL STATEMENTS (continued) | | Sun Capital Advisers Trust |
Effective May 1, 2011, the expense limits do not apply to the following categories of expenses: (i) compensation of the Trust’s independent trustees and expenses incurred in the performance of their duties; (ii) legal fees and expenses of counsel to the independent trustees; (iii) premiums for liability insurance dedicated to the independent trustees; (iv) expenses related to the electronic preparation, delivery or use of materials for meetings of the board of trustees; (v) expenses associated with obtaining data from third parties for the independent trustees’ use; and (vi) such other expenses as are determined to be extraordinary expenses by the independent trustees. Prior to May 1, 2011, these categories of expenses were covered by the expense limitations applicable to these Funds.
To the extent that one of these Fund’s total expense ratio falls below the expense limit stated above in future years, the Adviser reserves the right to be reimbursed for advisory fees waived and fund expenses paid on behalf of the Fund during the prior two fiscal years.
For each of the periods below, the Adviser waived all or part of its advisory fee and reimbursed certain operating expenses in the following amounts:
| | | | | | | | | | | | | | | | |
| | | Year Ended
December 31, 2011 | | | Two-year period ended
December 31, 2011 | |
Fund | | Advisory
Fees Waived | | | Expenses
Reimbursed | | | Advisory
Fees Waived | | | Expenses
Reimbursed | |
AllianceBernstein International Value Fund | | $ | 177,024 | | | $ | — | | | $ | 402,207 | | | $ | — | |
BlackRock International Index Fund | | | 262,149 | | | | 162,553 | | | | 288,539 | * | | | 247,176 | * |
BlackRock Large Cap Index Fund | | | 66,395 | | | | — | | | | 78,457 | | | | — | |
BlackRock Small Cap Index Fund | | | 175,243 | | | | — | | | | 242,406 | | | | — | |
Columbia Small Cap Value Fund | | | 50,472 | | | | — | | | | 177,269 | | | | — | |
Davis Venture Value Fund | | | — | | | | — | | | | — | | | | — | |
Invesco Small Cap Growth Fund | | | 78,373 | | | | — | | | | 194,909 | | | | — | |
WMC Blue Chip Mid Cap Fund | | | — | | | | — | | | | — | | | | — | |
WMC Large Cap Growth Fund | | | 56,766 | | | | — | | | | 266,928 | | | | — | |
Global Real Estate Fund | | | 134,073 | | | | — | | | | 169,289 | | | | — | |
Ibbotson Tactical Opportunities Fund | | | — | | | | — | | | | 52,556 | * | | | — | * |
Investment Grade Bond Fund | | | — | | | | — | | | | — | | | | — | |
Money Market Fund** | | | 1,007,486 | | | | 432,207 | | | | 1,992,753 | | | | 756,084 | |
Ibbotson Balanced Fund | | | — | | | | — | | | | 81,277 | | | | — | |
Ibbotson Conservative Fund | | | — | | | | — | | | | 101,185 | | | | — | |
Ibbotson Growth Fund | | | 30,539 | | | | — | | | | 136,249 | | | | — | |
| * | For the period November 15, 2010 (commencement of operations) to December 31, 2011. |
| ** | In addition to the contractual expense limitations described above, the Adviser has provided additional support to the Money Market Fund in order to avoid a negative yield by voluntarily increasing the amount of advisory fees waived and expenses reimbursed by the Adviser for the Fund. Of the total amounts of advisory fees waived by the Adviser, as shown in the table above, $722,912 were voluntarily waived for the year ended 2011 and $1,390,308 were voluntarily waived for the two years ended December 31, 2011. Of the amounts of expenses reimbursed by the Adviser, as shown in the table above, $432,207 were voluntarily reimbursed for the year ended December 31, 2011 and $756,084 were voluntarily reimbursed for the two years December 31, 2011. |
341
| | |
| NOTESTO FINANCIAL STATEMENTS (continued) | | Sun Capital Advisers Trust |
ii) Funds with investment advisory and management agreements
For the six Funds that have investment advisory and management agreements, the Adviser contractually agreed until April 30, 2011 not to impose all or a portion of its unified fee and to reimburse other operating expenses to reduce each Fund’s total annual operating expenses to:
| | | | | | | | |
| | | Contractual Expense Limitations | |
Fund | | Initial Class | | | Service Class | |
Goldman Sachs Mid Cap Value Fund | | | 1.07 | % | | | 1.32 | % |
Lord Abbett Growth & Income Fund | | | 0.87 | % | | | 1.12 | % |
BlackRock Inflation Protected Bond Fund | | | 0.65 | % | | | 0.90 | % |
Goldman Sachs Short Duration Fund | | | 0.65 | % | | | 0.90 | % |
PIMCO High Yield Fund | | | 0.75 | % | | | 1.00 | % |
PIMCO Total Return Fund | | | 0.65 | % | | | 0.90 | % |
Effective May 1, 2011, there were no expense limits applicable to these six Funds. However, to the extent that, during either of the two succeeding years, one of these Fund’s total expense ratio falls below the expense limit previously in place, the Adviser reserves the right to be reimbursed for unified fees waived and fund expenses paid on behalf of the Fund under the previous expense limitation.
For each of the periods below, the Adviser waived all or part of its unified fee and reimbursed certain operating expenses in the following amounts:
| | | | | | | | | | | | | | | | |
| | | Year Ended
December 31, 2011 | | | Two-year period ended
December 31, 2011 | |
Fund | | Advisory
Fees Waived | | | Expenses
Reimbursed | | | Advisory
Fees Waived | | | Expenses
Reimbursed | |
Goldman Sachs Mid Cap Value Fund | | $ | — | | | $ | — | | | $ | — | | | $ | — | |
Lord Abbett Growth & Income Fund | | | 14,104 | | | | — | | | | 50,510 | | | | — | |
BlackRock Inflation Protected Bond Fund | | | 10,675 | | | | — | | | | 29,694 | | | | — | |
Goldman Sachs Short Duration Fund | | | — | | | | — | | | | — | | | | — | |
PIMCO High Yield Fund | | | — | | | | — | | | | — | | | | — | |
PIMCO Total Return Fund | | | 21,566 | | | | — | | | | 60,735 | | | | — | |
c) Distribution and Service Plan
The Trust has adopted a plan of distribution and service pursuant to Rule 12b-1 under the 1940 Act with respect to its Service Class Shares (the “Plan”), pursuant to which distribution and service fees are paid to the Trust’s underwriter, Clarendon Insurance Agency, Inc. (“Clarendon”), which is a wholly-owned subsidiary of Sun Life (U.S.). The fees payable by the Trust to Clarendon under the Plan are accrued daily at a rate with respect to each Fund which may not exceed 0.25% of the Fund’s average daily net assets attributable to Service Class Shares regardless of the level of expenses actually incurred by Clarendon and others. Clarendon uses the service and distribution fees to compensate Sun Life (U.S.) and Sun Life (N.Y.) for services rendered in connection with maintenance and distribution of the variable contracts issued by Sun Life (U.S.) and Sun Life (N.Y.).
d) Trustees’ Compensation
Each independent trustee of the Trust is compensated by the Funds. The aggregate remuneration accrued by the Funds to the independent trustees for the year ended December 31, 2011 was $436,506, including out of pocket expenses. The Trust pays no compensation directly to those of its Trustees or officers who are affiliated with the
342
| | |
| NOTESTO FINANCIAL STATEMENTS (continued) | | Sun Capital Advisers Trust |
Adviser, or its affiliates, all of whom receive remuneration for their services to the Trust from the Adviser, or its affiliates. Certain officers and Trustees of the Trust are also officers and directors of the Adviser, and/or other companies affiliated with the Adviser.
7. INVESTMENT TRANSACTIONS
Cost of purchases and proceeds from sales and maturities of investments, excluding short-term securities, for the year ended December 31, 2011, were as follows:
| | | | | | | | | | | | | | | | |
Fund | | Non-
Government
Purchases | | | Government
Purchases | | | Non-
Government
Sales | | | Government
Sales | |
AllianceBernstein International Value Fund | | $ | 51,412,337 | | | $ | — | | | $ | 36,915,345 | | | $ | — | |
BlackRock International Index Fund | | | 29,143,650 | | | | — | | | | 1,760,886 | | | | — | |
BlackRock Large Cap Index Fund | | | 56,422,798 | | | | — | | | | 2,246,086 | | | | — | |
BlackRock Small Cap Index Fund | | | 91,962,305 | | | | — | | | | 68,875,050 | | | | — | |
Goldman Sachs Mid Cap Value Fund | | | 130,743,935 | | | | — | | | | 166,953,227 | | | | — | |
Columbia Small Cap Value Fund | | | 31,003,526 | | | | — | | | | 31,379,695 | | | | — | |
Davis Venture Value Fund | | | 63,888,323 | | | | — | | | | 76,244,499 | | | | — | |
Invesco Small Cap Growth Fund | | | 24,271,141 | | | | — | | | | 12,715,981 | | | | — | |
Lord Abbett Growth & Income Fund | | | 343,819,830 | | | | — | | | | 413,867,234 | | | | — | |
WMC Blue Chip Mid Cap Fund | | | 153,777,545 | | | | — | | | | 122,800,449 | | | | — | |
WMC Large Cap Growth Fund | | | 128,580,258 | | | | — | | | | 111,721,824 | | | | — | |
Global Real Estate Fund | | | 63,085,013 | | | | — | | | | 86,560,541 | | | | — | |
Ibbotson Tactical Opportunities Fund | | | 1,001,227,490 | | | | — | | | | 843,824,392 | | | | — | |
Investment Grade Bond Fund** | | | 262,892,270 | | | | 222,198,757 | | | | 288,720,770 | | | | 117,638,266 | |
BlackRock Inflation Protected Bond Fund | | | 261,854,397 | | | | 1,701,811,861 | | | | 210,281,033 | | | | 1,616,799,060 | |
Goldman Sachs Short Duration Fund | | | 417,082,575 | | | | 1,444,879,591 | | | | 258,686,161 | | | | 1,496,095,672 | |
PIMCO High Yield Fund | | | 59,184,001 | | | | — | | | | 64,917,308 | | | | — | |
PIMCO Total Return Fund | | | 372,742,829 | | | | 4,886,562,076 | | | | 111,646,399 | | | | 4,766,185,945 | |
Ibbotson Balanced Fund | | | 644,801,829 | * | | | — | | | | 115,643,526 | * | | | — | |
Ibbotson Conservative Fund | | | 284,636,517 | * | | | — | | | | 61,154,669 | * | | | — | |
Ibbotson Growth Fund | | | 101,499,146 | * | | | — | | | | 93,176,335 | * | | | — | |
| * | Affiliated investment transactions. |
| ** | Amounts exclude mortgage dollar roll transactions. |
Purchases and sales, including maturities, of short-term securities by the Money Market Fund for the year ended December 31, 2011 were $2,300,586,341 and $2,263,743,229, respectively.
8. AFFILIATED COMPANY SECURITIES
The term “affiliated securities” includes securities issued by any company that is under common control with the Fund. At December 31, 2011, the Adviser or its affiliate, MFS, served as investment adviser to the underlying funds of Ibbotson Balanced Fund, Ibbotson Conservative Fund and Ibbotson Growth Fund. Purchases and proceeds from sales of affiliated investments are disclosed in Note 7 – Investment Transactions. Dividend and capital gains distributions from affiliated underlying funds are presented in each Fund’s Statement of Operations. Underlying funds managed by MFS seek to achieve capital appreciation by investing primarily in U.S. and foreign equity securities, including those in emerging markets.
343
| | |
| NOTESTO FINANCIAL STATEMENTS (continued) | | Sun Capital Advisers Trust |
9. LINE OF CREDIT
The Trust has entered into a $20 million committed unsecured revolving line of credit (the “Agreement”) primarily for temporary or emergency purposes. The Money Market Fund is not a party to this Agreement. Interest is charged to each Fund based on its borrowings at a rate equal to a variable lending rate. In addition, a commitment fee on the daily unused portion of the $20 million committed line is allocated among the participating Funds based on net assets at the end of each calendar quarter. During the year ended December 31, 2011, the following Funds had borrowings and incurred commitment fees under this Agreement as follows:
| | | | | | | | | | | | | | | | |
Fund | | Maximum Loan | | | Average Daily
Amount of Loan | | | Weighted Average
Interest Rate | | | Commitment
Fee | |
AllianceBernstein International Value Fund | | $ | 948,000 | | | $ | 15,132 | | | | 1.42 | % | | $ | 225 | |
BlackRock International Index Fund | | | — | | | | — | | | | — | | | | 233 | |
BlackRock Large Cap Index Fund | | | 75,000 | | | | 205 | | | | 1.48 | | | | 381 | |
BlackRock Small Cap Index Fund | | | 290,000 | | | | 795 | | | | 1.15 | | | | 582 | |
Goldman Sachs Mid Cap Value Fund | | | — | | | | — | | | | — | | | | 866 | |
Columbia Small Cap Value Fund | | | 541,000 | | | | 1,482 | | | | 1.39 | | | | 190 | |
Davis Venture Value Fund | | | — | | | | — | | | | — | | | | 1,182 | |
Invesco Small Cap Growth Fund | | | 175,000 | | | | 2,573 | | | | 1.40 | | | | 126 | |
Lord Abbett Growth & Income Fund | | | 5,030,000 | | | | 33,074 | | | | 1.44 | | | | 1,681 | |
WMC Blue Chip Mid Cap Fund | | | — | | | | — | | | | — | | | | 563 | |
WMC Large Cap Growth Fund | | | 158,000 | | | | 663 | | | | 1.50 | | | | 568 | |
Global Real Estate Fund | | | 1,851,000 | | | | 14,852 | | | | 1.44 | | | | 685 | |
Ibbotson Tactical Opportunities Fund | | | 802,000 | | | | 2,389 | | | | 1.40 | | | | 1,975 | |
Investment Grade Bond Fund | | | 3,295,000 | | | | 9,027 | | | | 1.39 | | | | 1,346 | |
BlackRock Inflation Protected Bond Fund | | | — | | | | — | | | | — | | | | 1,476 | |
Goldman Sachs Short Duration Fund | | | — | | | | — | | | | — | | | | 3,816 | |
PIMCO High Yield Fund | | | — | | | | — | | | | — | | | | 571 | |
PIMCO Total Return Fund | | | 5,879,000 | | | | 51,005 | | | | 1.38 | | | | 2,822 | |
Ibbotson Balanced Fund | | | 10,855,000 | | | | 81,915 | | | | 1.39 | | | | 5,496 | |
Ibbotson Conservative Fund | | | 12,581,000 | | | | 169,537 | | | | 1.46 | | | | 2,708 | |
Ibbotson Growth Fund | | | 2,906,000 | | | | 186,027 | | | | 1.40 | | | | 1,763 | |
As of December 31, 2011, Ibbotson Growth Fund had an open borrowing under this agreement of $30,000 as noted on the Fund’s Statement of Assets and Liabilities.
344
| | |
| NOTESTO FINANCIAL STATEMENTS (continued) | | Sun Capital Advisers Trust |
10. SHARE TRANSACTIONS
Each of the Funds is authorized to issue an unlimited number of shares without par value. Transactions in classes of each Fund were as follows:
| | | | | | | | | | | | | | | | |
| | | Initial Class Shares | | | Service Class Shares | |
| | | Year Ended
December 31,
2011 | | | Year Ended
December 31,
2010 | | | Year Ended
December 31,
2011 | | | Year Ended
December 31,
2010 | |
AllianceBernstein International Value Fund (shares) | | | | | | | | | | | | | | | | |
Shares sold | | | 2,433,734 | | | | 3,567,009 | | | | 222,733 | | | | 174,698 | |
Shares issued as reinvestment of distributions | | | 825,678 | | | | 133,237 | | | | 38,027 | | | | 4,490 | |
Shares redeemed | | | (1,366,252 | ) | | | (2,340,618 | ) | | | (79,238 | ) | | | (45,024 | ) |
| | | | | | | | | | | | | | | | |
Net increase (decrease) in shares outstanding | | | 1,893,160 | | | | 1,359,628 | | | | 181,522 | | | | 134,164 | |
Beginning of period | | | 7,037,858 | | | | 5,678,230 | | | | 303,944 | | | | 169,780 | |
| | | | | | | | | | | | | | | | |
End of period | | | 8,931,018 | | | | 7,037,858 | | | | 485,466 | | | | 303,944 | |
| | | | | | | | | | | | | | | | |
AllianceBernstein International Value Fund ($) | | | | | | | | | | | | | |
Net proceeds from sales | | $ | 22,612,526 | | | $ | 33,291,819 | | | $ | 2,149,254 | | | $ | 1,643,105 | |
Net proceeds on reinvestment of distributions | | | 6,316,435 | | | | 1,248,432 | | | | 290,529 | | | | 41,984 | |
Shares redeemed | | | (11,245,051 | ) | | | (23,253,856 | ) | | | (737,196 | ) | | | (423,210 | ) |
| | | | | | | | | | | | | | | | |
Net increase (decrease) in net assets | | $ | 17,683,910 | | | $ | 11,286,395 | | | $ | 1,702,587 | | | $ | 1,261,879 | |
| | | | | | | | | | | | | | | | |
BlackRock International Index Fund (shares)(a) | | | | | | | | | | | | | | | | |
Shares sold | | | 2,292,818 | | | | 5,277,325 | | | | 552,244 | | | | 24,602 | |
Shares issued as reinvestment of distributions | | | 4,558 | | | | — | | | | 108 | | | | — | |
Shares redeemed | | | (151,353 | ) | | | (11,775 | ) | | | (39,989 | ) | | | — | |
| | | | | | | | | | | | | | | | |
Net increase (decrease) in shares outstanding | | | 2,146,023 | | | | 5,265,550 | | | | 512,363 | | | | 24,602 | |
Beginning of period | | | 5,265,551 | | | | 1 | | | | 24,603 | | | | 1 | |
| | | | | | | | | | | | | | | | |
End of period | | | 7,411,574 | | | | 5,265,551 | | | | 536,966 | | | | 24,603 | |
| | | | | | | | | | | | | | | | |
BlackRock International Index Fund ($)(a) | | | | | | | | | | | | | | | | |
Net proceeds from sales | | $ | 22,596,525 | | | $ | 52,817,033 | | | $ | 5,361,183 | | | $ | 246,073 | |
Net proceeds on reinvestment of distributions | | | 40,980 | | | | — | | | | 971 | | | | — | |
Shares redeemed | | | (1,554,527 | ) | | | (119,468 | ) | | | (407,750 | ) | | | — | |
| | | | | | | | | | | | | | | | |
Net increase (decrease) in net assets | | $ | 21,082,978 | | | $ | 52,697,565 | | | $ | 4,954,404 | | | $ | 246,073 | |
| | | | | | | | | | | | | | | | |
BlackRock Large Cap Index Fund (shares) | | | | | | | | | | | | | | | | |
Shares sold | | | 4,708,128 | | | | 5,938,764 | | | | 1,624,483 | | | | 528,690 | |
Shares issued as reinvestment of distributions | | | 2,092,952 | | | | 26,219 | | | | 348,342 | | | | 2,941 | |
Shares redeemed | | | (249,436 | ) | | | (5,116,303 | ) | | | (356,764 | ) | | | (253,110 | ) |
| | | | | | | | | | | | | | | | |
Net increase (decrease) in shares outstanding | | | 6,551,644 | | | | 848,680 | | | | 1,616,061 | | | | 278,521 | |
Beginning of period | | | 9,630,076 | | | | 8,781,396 | | | | 1,701,470 | | | | 1,422,949 | |
| | | | | | | | | | | | | | | | |
End of period | | | 16,181,720 | | | | 9,630,076 | | | | 3,317,531 | | | | 1,701,470 | |
| | | | | | | | | | | | | | | | |
345
| | |
| NOTESTO FINANCIAL STATEMENTS (continued) | | Sun Capital Advisers Trust |
| | | | | | | | | | | | | | | | |
| | | Initial Class Shares | | | Service Class Shares | |
| | | Year Ended
December 31,
2011 | | | Year Ended
December 31,
2010 | | | Year Ended
December 31,
2011 | | | Year Ended
December 31,
2010 | |
BlackRock Large Cap Index Fund ($) | | | | | | | | | | | | | | | | |
Net proceeds from sales | | $ | 44,275,010 | | | $ | 48,839,087 | | | $ | 14,792,580 | | | $ | 4,570,334 | |
Net proceeds on reinvestment of distributions | | | 16,241,309 | | | | 216,837 | | | | 2,776,285 | | | | 24,908 | |
Shares redeemed | | | (2,288,402 | ) | | | (45,548,229 | ) | | | (3,261,328 | ) | | | (2,190,527 | ) |
| | | | | | | | | | | | | | | | |
Net increase (decrease) in net assets | | $ | 58,227,917 | | | $ | 3,507,695 | | | $ | 14,307,537 | | | $ | 2,404,715 | |
| | | | | | | | | | | | | | | | |
BlackRock Small Cap Index Fund (shares) | | | | | | | | | | | | | | | | |
Shares sold | | | 4,528,871 | | | | 491,327 | | | | 1,037,265 | | | | 694,478 | |
Shares issued as reinvestment of distributions | | | 28,564 | | | | 14,108 | | | | 25,701 | | | | 14,319 | |
Shares redeemed | | | (2,295,481 | ) | | | (1,644,466 | ) | | | (1,921,719 | ) | | | (3,188,604 | ) |
| | | | | | | | | | | | | | | | |
Net increase (decrease) in shares outstanding | | | 2,261,954 | | | | (1,139,031 | ) | | | (858,753 | ) | | | (2,479,807 | ) |
Beginning of period | | | 3,485,955 | | | | 4,624,986 | | | | 10,424,636 | | | | 12,904,443 | |
| | | | | | | | | | | | | | | | |
End of period | | | 5,747,909 | | | | 3,485,955 | | | | 9,565,883 | | | | 10,424,636 | |
| | | | | | | | | | | | | | | | |
BlackRock Small Cap Index Fund ($) | | | | | | | | | | | | | | | | |
Net proceeds from sales | | $ | 60,773,741 | | | $ | 5,730,919 | | | $ | 12,292,217 | | | $ | 7,538,234 | |
Net proceeds on reinvestment of distributions | | | 336,194 | | | | 155,615 | | | | 298,646 | | | | 155,938 | |
Shares redeemed | | | (30,503,469 | ) | | | (18,747,647 | ) | | | (24,171,492 | ) | | | (37,504,292 | ) |
| | | | | | | | | | | | | | | | |
Net increase (decrease) in net assets | | $ | 30,606,466 | | | $ | (12,861,113 | ) | | $ | (11,580,629 | ) | | $ | (29,810,120 | ) |
| | | | | | | | | | | | | | | | |
Goldman Sachs Mid Cap Value Fund (shares) | | | | | | | | | | | | | | | | |
Shares sold | | | 3,026,010 | | | | 7,670,260 | | | | 1,309,707 | | | | 1,195,388 | |
Shares issued as reinvestment of distributions | | | 2,795,523 | | | | 677,522 | | | | 383,628 | | | | 65,091 | |
Shares redeemed | | | (7,824,114 | ) | | | (6,401,931 | ) | | | (1,041,972 | ) | | | (789,814 | ) |
| | | | | | | | | | | | | | | | |
Net increase (decrease) in shares outstanding | | | (2,002,581 | ) | | | 1,945,851 | | | | 651,363 | | | | 470,665 | |
Beginning of period | | | 25,951,851 | | | | 24,006,000 | | | | 2,829,735 | | | | 2,359,070 | |
| | | | | | | | | | | | | | | | |
End of period | | | 23,949,270 | | | | 25,951,851 | | | | 3,481,098 | | | | 2,829,735 | |
| | | | | | | | | | | | | | | | |
Goldman Sachs Mid Cap Value Fund ($) | | | | | | | | | | | | | | | | |
Net proceeds from sales | | $ | 28,898,092 | | | $ | 64,672,510 | | | $ | 12,592,127 | | | $ | 10,142,051 | |
Net proceeds on reinvestment of distributions | | | 23,007,157 | | | | 5,643,760 | | | | 3,145,747 | | | | 540,908 | |
Shares redeemed | | | (73,195,153 | ) | | | (55,491,591 | ) | | | (9,291,061 | ) | | | (6,692,821 | ) |
| | | | | | | | | | | | | | | | |
Net increase (decrease) in net assets | | $ | (21,289,904 | ) | | $ | 14,824,679 | | | $ | 6,446,813 | | | $ | 3,990,138 | |
| | | | | | | | | | | | | | | | |
Columbia Small Cap Value Fund (shares) | | | | | | | | | | | | | | | | |
Shares sold | | | 1,070,411 | | | | 1,544,629 | | | | 370,217 | | | | 569,073 | |
Shares issued as reinvestment of distributions | | | 1,108,516 | | | | 377,528 | | | | 285,030 | | | | 87,398 | |
Shares redeemed | | | (1,268,260 | ) | | | (900,177 | ) | | | (331,516 | ) | | | (229,432 | ) |
| | | | | | | | | | | | | | | | |
Net increase (decrease) in shares outstanding | | | 910,667 | | | | 1,021,980 | | | | 323,731 | | | | 427,039 | |
Beginning of period | | | 4,364,205 | | | | 3,342,225 | | | | 1,103,042 | | | | 676,003 | |
| | | | | | | | | | | | | | | | |
End of period | | | 5,274,872 | | | | 4,364,205 | | | | 1,426,773 | | | | 1,103,042 | |
| | | | | | | | | | | | | | | | |
346
| | |
| NOTESTO FINANCIAL STATEMENTS (continued) | | Sun Capital Advisers Trust |
| | | | | | | | | | | | | | | | |
| | | Initial Class Shares | | | Service Class Shares | |
| | | Year Ended
December 31,
2011 | | | Year Ended
December 31,
2010 | | | Year Ended
December 31,
2011 | | | Year Ended
December 31,
2010 | |
Columbia Small Cap Value Fund ($) | | | | | | | | | | | | | | | | |
Net proceeds from sales | | $ | 11,602,071 | | | $ | 16,293,217 | | | $ | 3,745,370 | | | $ | 5,846,228 | |
Net proceeds on reinvestment of distributions | | | 8,657,513 | | | | 3,503,453 | | | | 2,220,385 | | | | 809,308 | |
Shares redeemed | | | (12,572,714 | ) | | | (9,044,675 | ) | | | (3,352,711 | ) | | | (2,425,175 | ) |
| | | | | | | | | | | | | | | | |
Net increase (decrease) in net assets | | $ | 7,686,870 | | | $ | 10,751,995 | | | $ | 2,613,044 | | | $ | 4,230,361 | |
| | | | | | | | | | | | | | | | |
Davis Venture Value Fund (shares) | | | | | | | | | | | | | | | | |
Shares sold | | | 1,586,257 | | | | 7,288,612 | | | | 1,432,124 | | | | 2,157,750 | |
Shares issued as reinvestment of distributions | | | 811,263 | | | | 96,261 | | | | 1,209,640 | | | | 54,826 | |
Shares redeemed | | | (1,715,501 | ) | | | (8,039,035 | ) | | | (2,862,667 | ) | | | (2,060,829 | ) |
| | | | | | | | | | | | | | | | |
Net increase (decrease) in shares outstanding | | | 682,019 | | | | (654,162 | ) | | | (220,903 | ) | | | 151,747 | |
Beginning of period | | | 13,055,113 | | | | 13,709,275 | | | | 22,092,489 | | | | 21,940,742 | |
| | | | | | | | | | | | | | | | |
End of period | | | 13,737,132 | | | | 13,055,113 | | | | 21,871,586 | | | | 22,092,489 | |
| | | | | | | | | | | | | | | | |
Davis Venture Value Fund ($) | | | | | | | | | | | | | | | | |
Net proceeds from sales | | $ | 18,862,490 | | | $ | 78,342,507 | | | $ | 16,142,519 | | | $ | 23,219,248 | |
Net proceeds on reinvestment of distributions | | | 8,510,153 | | | | 1,027,110 | | | | 12,664,935 | | | | 583,899 | |
Shares redeemed | | | (19,028,388 | ) | | | (90,371,562 | ) | | | (32,659,049 | ) | | | (23,109,538 | ) |
| | | | | | | | | | | | | | | | |
Net increase (decrease) in net assets | | $ | 8,344,255 | | | $ | (11,001,945 | ) | | $ | (3,851,595 | ) | | $ | 693,609 | |
| | | | | | | | | | | | | | | | |
Invesco Small Cap Growth Fund (shares) | | | | | | | | | | | | | | | | |
Shares sold | | | 956,223 | | | | 495,380 | | | | 726,028 | | | | 438,169 | |
Shares issued as reinvestment of distributions | | | 91,708 | | | | 157,640 | | | | 44,464 | | | | 77,408 | |
Shares redeemed | | | (184,169 | ) | | | (158,170 | ) | | | (483,901 | ) | | | (214,999 | ) |
| | | | | | | | | | | | | | | | |
Net increase (decrease) in shares outstanding | | | 863,762 | | | | 494,850 | | | | 286,591 | | | | 300,578 | |
Beginning of period | | | 1,862,063 | | | | 1,367,213 | | | | 979,627 | | | | 679,049 | |
| | | | | | | | | | | | | | | | |
End of period | | | 2,725,825 | | | | 1,862,063 | | | | 1,266,218 | | | | 979,627 | |
| | | | | | | | | | | | | | | | |
Invesco Small Cap Growth Fund ($) | | | | | | | | | | | | | | | | |
Net proceeds from sales | | $ | 11,170,544 | | | $ | 4,927,667 | | | $ | 8,257,811 | | | $ | 4,326,592 | |
Net proceeds on reinvestment of distributions | | | 940,924 | | | | 1,478,663 | | | | 452,649 | | | | 722,220 | |
Shares redeemed | | | (2,059,866 | ) | | | (1,570,015 | ) | | | (4,994,153 | ) | | | (2,176,690 | ) |
| | | | | | | | | | | | | | | | |
Net increase (decrease) in net assets | | $ | 10,051,602 | | | $ | 4,836,315 | | | $ | 3,716,307 | | | $ | 2,872,122 | |
| | | | | | | | | | | | | | | | |
Lord Abbett Growth & Income Fund (shares) | | | | | | | | | | | | | | | | |
Shares sold | | | 4,720,773 | | | | 11,085,638 | | | | 542,432 | | | | 760,127 | |
Shares issued as reinvestment of distributions | | | 13,252,812 | | | | 2,990,839 | | | | 408,822 | | | | 69,848 | |
Shares redeemed | | | (14,883,223 | ) | | | (15,813,249 | ) | | | (253,743 | ) | | | (449,032 | ) |
| | | | | | | | | | | | | | | | |
Net increase (decrease) in shares outstanding | | | 3,090,362 | | | | (1,736,772 | ) | | | 697,511 | | | | 380,943 | |
Beginning of period | | | 64,561,760 | | | | 66,298,532 | | | | 1,635,070 | | | | 1,254,127 | |
| | | | | | | | | | | | | | | | |
End of period | | | 67,652,122 | | | | 64,561,760 | | | | 2,332,581 | | | | 1,635,070 | |
| | | | | | | | | | | | | | | | |
347
| | |
| NOTESTO FINANCIAL STATEMENTS (continued) | | Sun Capital Advisers Trust |
| | | | | | | | | | | | | | | | |
| | | Initial Class Shares | | | Service Class Shares | |
| | | Year Ended
December 31,
2011 | | | Year Ended
December 31,
2010 | | | Year Ended
December 31,
2011 | | | Year Ended
December 31,
2010 | |
Lord Abbett Growth & Income Fund ($) | | | | | | | | | | | | | | | | |
Net proceeds from sales | | $ | 36,518,513 | | | $ | 81,259,922 | | | $ | 4,147,977 | | | $ | 6,035,253 | |
Net proceeds on reinvestment of distributions | | | 82,299,961 | | | | 22,281,747 | | | | 2,526,519 | | | | 518,969 | |
Shares redeemed | | | (116,619,910 | ) | | | (124,677,960 | ) | | | (1,915,451 | ) | | | (3,470,534 | ) |
| | | | | | | | | | | | | | | | |
Net increase (decrease) in net assets | | $ | 2,198,564 | | | $ | (21,136,291 | ) | | $ | 4,759,045 | | | $ | 3,083,688 | |
| | | | | | | | | | | | | | | | |
WMC Blue Chip Mid Cap Fund (shares) | | | | | | | | | | | | | | | | |
Shares sold | | | 2,967,702 | | | | 4,678,564 | | | | 306,365 | | | | 263,704 | |
Shares issued as reinvestment of distributions | | | 6,504 | | | | 4,691 | | | | — | | | | — | |
Shares redeemed | | | (732,953 | ) | | | (2,346,045 | ) | | | (468,393 | ) | | | (858,621 | ) |
| | | | | | | | | | | | | | | | |
Net increase (decrease) in shares outstanding | | | 2,241,253 | | | | 2,337,210 | | | | (162,028 | ) | | | (594,917 | ) |
Beginning of period | | | 8,585,138 | | | | 6,247,928 | | | | 2,740,758 | | | | 3,335,675 | |
| | | | | | | | | | | | | | | | |
End of period | | | 10,826,391 | | | | 8,585,138 | | | | 2,578,730 | | | | 2,740,758 | |
| | | | | | | | | | | | | | | | |
WMC Blue Chip Mid Cap Fund ($) | | | | | | | | | | | | | | | | |
Net proceeds from sales | | $ | 43,288,339 | | | $ | 62,074,414 | | | $ | 4,196,198 | | | $ | 3,374,448 | |
Net proceeds on reinvestment of distributions | | | 87,870 | | | | 60,133 | | | | — | | | | — | |
Shares redeemed | | | (10,738,809 | ) | | | (31,559,949 | ) | | | (6,759,232 | ) | | | (11,493,533 | ) |
| | | | | | | | | | | | | | | | |
Net increase (decrease) in net assets | | $ | 32,637,400 | | | $ | 30,574,598 | | | $ | (2,563,034 | ) | | $ | (8,119,085 | ) |
| | | | | | | | | | | | | | | | |
WMC Large Cap Growth Fund (shares) | | | | | | | | | | | | | | | | |
Shares sold | | | 3,408,644 | | | | 6,364,356 | | | | 327,990 | | | | 415,338 | |
Shares issued as reinvestment of distributions | | | 63,583 | | | | 65,688 | | | | 1,406 | | | | 1,109 | |
Shares redeemed | | | (1,143,489 | ) | | | (7,040,501 | ) | | | (487,917 | ) | | | (678,065 | ) |
| | | | | | | | | | | | | | | | |
Net increase (decrease) in shares outstanding | | | 2,328,738 | | | | (610,457 | ) | | | (158,521 | ) | | | (261,618 | ) |
Beginning of period | | | 17,740,170 | | | | 18,350,627 | | | | 1,946,629 | | | | 2,208,247 | |
| | | | | | | | | | | | | | | | |
End of period | | | 20,068,908 | | | | 17,740,170 | | | | 1,788,108 | | | | 1,946,629 | |
| | | | | | | | | | | | | | | | |
WMC Large Cap Growth Fund ($) | | | | | | | | | | | | | | | | |
Net proceeds from sales | | $ | 32,275,994 | | | $ | 51,480,956 | | | $ | 3,181,477 | | | $ | 3,355,349 | |
Net proceeds on reinvestment of distributions | | | 579,237 | | | | 545,213 | | | | 12,731 | | | | 9,148 | |
Shares redeemed | | | (11,265,680 | ) | | | (61,907,003 | ) | | | (4,741,542 | ) | | | (5,740,631 | ) |
| | | | | | | | | | | | | | | | |
Net increase (decrease) in net assets | | $ | 21,589,551 | | | $ | (9,880,834 | ) | | $ | (1,547,334 | ) | | $ | (2,376,134 | ) |
| | | | | | | | | | | | | | | | |
Global Real Estate Fund (shares) | | | | | | | | | | | | | | | | |
Shares sold | | | 1,513,230 | | | | 2,802,255 | | | | 820,994 | | | | 755,136 | |
Shares issued as reinvestment of distributions | | | 675,084 | | | | 1,175,193 | | | | 731,323 | | | | 1,176,532 | |
Shares redeemed | | | (2,966,337 | ) | | | (1,750,396 | ) | | | (1,979,421 | ) | | | (1,968,579 | ) |
| | | | | | | | | | | | | | | | |
Net increase (decrease) in shares outstanding | | | (778,023 | ) | | | 2,227,052 | | | | (427,104 | ) | | | (36,911 | ) |
Beginning of period | | | 9,791,855 | | | | 7,564,803 | | | | 11,301,850 | | | | 11,338,761 | |
| | | | | | | | | | | | | | | | |
End of period | | | 9,013,832 | | | | 9,791,855 | | | | 10,874,746 | | | | 11,301,850 | |
| | | | | | | | | | | | | | | | |
348
| | |
| NOTESTO FINANCIAL STATEMENTS (continued) | | Sun Capital Advisers Trust |
| | | | | | | | | | | | | | | | |
| | | Initial Class Shares | | | Service Class Shares | |
| | | Year Ended
December 31,
2011 | | | Year Ended
December 31,
2010 | | | Year Ended
December 31,
2011 | | | Year Ended
December 31,
2010 | |
Global Real Estate Fund ($) | | | | | | | | | | | | | | | | |
Net proceeds from sales | | $ | 16,347,434 | | | $ | 31,073,659 | | | $ | 9,161,994 | | | $ | 9,189,692 | |
Net proceeds on reinvestment of distributions | | | 6,609,071 | | | | 12,598,073 | | | | 7,956,792 | | | | 13,918,369 | |
Shares redeemed | | | (35,237,113 | ) | | | (19,588,315 | ) | | | (24,484,254 | ) | | | (24,464,186 | ) |
| | | | | | | | | | | | | | | | |
Net increase (decrease) in net assets | | $ | (12,280,608 | ) | | $ | 24,083,417 | | | $ | (7,365,468 | ) | | $ | (1,356,125 | ) |
| | | | | | | | | | | | | | | | |
Ibbotson Tactical Opportunities Fund (shares)(a) | | | | | | | | | | | | | | | | |
Shares sold | | | 15,006,242 | | | | 43,300,126 | | | | | | | | | |
Shares issued as reinvestment of distributions | | | 478,548 | | | | — | | | | | | | | | |
Shares redeemed | | | (524,047 | ) | | | (1,870 | ) | | | | | | | | |
| | | | | | | | | | | | | | | | |
Net increase (decrease) in shares outstanding | | | 14,960,743 | | | | 43,298,256 | | | | | | | | | |
Beginning of period | | | 43,298,257 | | | | 1 | | | | | | | | | |
| | | | | | | | | | | | | | | | |
End of period | | | 58,259,000 | | | | 43,298,257 | | | | | | | | | |
| | | | | | | | | | | | | | | | |
Ibbotson Tactical Opportunities Fund ($)(a) | | | | | | | | | | | | | | | | |
Net proceeds from sales | | $ | 155,432,816 | | | $ | 434,362,406 | | | | | | | | | |
Net proceeds on reinvestment of distributions | | | 4,656,276 | | | | — | | | | | | | | | |
Shares redeemed | | | (5,645,958 | ) | | | (19,650 | ) | | | | | | | | |
| | | | | | | | | | | | | | | | |
Net increase (decrease) in net assets | | $ | 154,443,134 | | | $ | 434,342,756 | | | | | | | | | |
| | | | | | | | | | | | | | | | |
Investment Grade Bond Fund (shares) | | | | | | | | | | | | | | | | |
Shares sold | | | 6,335,639 | | | | 14,965,112 | | | | 5,689,947 | | | | 6,497,983 | |
Shares issued as reinvestment of distributions | | | 1,503,554 | | | | 862,977 | | | | 826,557 | | | | 353,970 | |
Shares redeemed | | | (1,651,800 | ) | | | (4,833,373 | ) | | | (1,538,420 | ) | | | (370,097 | ) |
| | | | | | | | | | | | | | | | |
Net increase (decrease) in shares outstanding | | | 6,187,393 | | | | 10,994,716 | | | | 4,978,084 | | | | 6,481,856 | |
Beginning of period | | | 26,101,133 | | | | 15,106,417 | | | | 13,520,975 | | | | 7,039,119 | |
| | | | | | | | | | | | | | | | |
End of period | | | 32,288,526 | | | | 26,101,133 | | | | 18,499,059 | | | | 13,520,975 | |
| | | | | | | | | | | | | | | | |
Investment Grade Bond Fund ($) | | | | | | | | | | | | | | | | |
Net proceeds from sales | | $ | 60,335,114 | | | $ | 139,297,497 | | | $ | 54,683,859 | | | $ | 61,097,755 | |
Net proceeds on reinvestment of distributions | | | 14,344,531 | | | | 8,093,261 | | | | 7,941,108 | | | | 3,343,693 | |
Shares redeemed | | | (15,818,010 | ) | | | (45,521,961 | ) | | | (14,734,450 | ) | | | (3,467,580 | ) |
| | | | | | | | | | | | | | | | |
Net increase (decrease) in net assets | | $ | 58,861,635 | | | $ | 101,868,797 | | | $ | 47,890,517 | | | $ | 60,973,868 | |
| | | | | | | | | | | | | | | | |
Money Market Fund (shares) | | | | | | | | | | | | | | | | |
Shares sold | | | 46,780,506 | | | | 59,695,332 | | | | 122,157,700 | | | | 91,786,435 | |
Shares issued as reinvestment of distributions | | | 100,831 | | | | 153,247 | | | | 908 | | | | — | |
Shares redeemed | | | (50,467,531 | ) | | | (80,077,232 | ) | | | (81,914,872 | ) | | | (89,367,222 | ) |
| | | | | | | | | | | | | | | | |
Net increase (decrease) in shares outstanding | | | (3,586,194 | ) | | | (20,228,653 | ) | | | 40,243,736 | | | | 2,419,213 | |
Beginning of period | | | 67,761,305 | | | | 87,989,958 | | | | 118,724,302 | | | | 116,305,089 | |
| | | | | | | | | | | | | | | | |
End of period | | | 64,175,111 | | | | 67,761,305 | | | | 158,968,038 | | | | 118,724,302 | |
| | | | | | | | | | | | | | | | |
349
| | |
| NOTESTO FINANCIAL STATEMENTS (continued) | | Sun Capital Advisers Trust |
| | | | | | | | | | | | | | | | |
| | | Initial Class Shares | | | Service Class Shares | |
| | | Year Ended
December 31,
2011 | | | Year Ended
December 31,
2010 | | | Year Ended
December 31,
2011 | | | Year Ended
December 31,
2010 | |
Money Market Fund ($) | | | | | | | | | | | | | | | | |
Net proceeds from sales | | $ | 46,780,506 | | | $ | 59,695,332 | | | $ | 122,157,700 | | | $ | 91,786,435 | |
Net proceeds on reinvestment of distributions | | | 100,831 | | | | 153,247 | | | | 908 | | | | — | |
Shares redeemed | | | (50,467,531 | ) | | | (80,077,232 | ) | | | (81,914,872 | ) | | | (89,367,222 | ) |
| | | | | | | | | | | | | | | | |
Net increase (decrease) in net assets | | $ | (3,586,194 | ) | | $ | (20,228,653 | ) | | $ | 40,243,736 | | | $ | 2,419,213 | |
| | | | | | | | | | | | | | | | |
BlackRock Inflation Protected Bond Fund (shares) | | | | | | | | | | | | | | | | |
Shares sold | | | 4,680,351 | | | | 10,086,435 | | | | 11,325,372 | | | | 8,182,656 | |
Shares issued as reinvestment of distributions | | | 1,131,969 | | | | 362,109 | | | | 1,025,365 | | | | 237,149 | |
Shares redeemed | | | (2,951,023 | ) | | | (272,165 | ) | | | (2,731,100 | ) | | | (860,104 | ) |
| | | | | | | | | | | | | | | | |
Net increase (decrease) in shares outstanding | | | 2,861,297 | | | | 10,176,379 | | | | 9,619,637 | | | | 7,559,701 | |
Beginning of period | | | 20,456,095 | | | | 10,279,716 | | | | 15,201,700 | | | | 7,641,999 | |
| | | | | | | | | | | | | | | | |
End of period | | | 23,317,392 | | | | 20,456,095 | | | | 24,821,337 | | | | 15,201,700 | |
| | | | | | | | | | | | | | | | |
BlackRock Inflation Protected Bond Fund ($) | | | | | | | | | | | | | | | | |
Net proceeds from sales | | $ | 50,902,272 | | | $ | 106,668,556 | | | $ | 125,017,880 | | | $ | 86,538,078 | |
Net proceeds on reinvestment of distributions | | | 12,546,138 | | | | 3,858,520 | | | | 11,353,131 | | | | 2,521,522 | |
Shares redeemed | | | (33,047,091 | ) | | | (2,890,510 | ) | | | (30,491,309 | ) | | | (9,155,496 | ) |
| | | | | | | | | | | | | | | | |
Net increase (decrease) in net assets | | $ | 30,401,319 | | | $ | 107,636,566 | | | $ | 105,879,702 | | | $ | 79,904,104 | |
| | | | | | | | | | | | | | | | |
Goldman Sachs Short Duration Fund (shares) | | | | | | | | | | | | | | | | |
Shares sold | | | 15,908,758 | | | | 24,391,949 | | | | 5,888,081 | | | | 4,779,074 | |
Shares issued as reinvestment of distributions | | | 1,731,925 | | | | 1,423,197 | | | | 269,033 | | | | 162,967 | |
Shares redeemed | | | (17,444,173 | ) | | | (13,380,910 | ) | | | (1,885,476 | ) | | | (905,179 | ) |
| | | | | | | | | | | | | | | | |
Net increase (decrease) in shares outstanding | | | 196,510 | | | | 12,434,236 | | | | 4,271,638 | | | | 4,036,862 | |
Beginning of period | | | 97,411,988 | | | | 84,977,752 | | | | 14,530,688 | | | | 10,493,826 | |
| | | | | | | | | | | | | | | | |
End of period | | | 97,608,498 | | | | 97,411,988 | | | | 18,802,326 | | | | 14,530,688 | |
| | | | | | | | | | | | | | | | |
Goldman Sachs Short Duration Fund ($) | | | | | | | | | | | | | | | | |
Net proceeds from sales | | $ | 163,435,943 | | | $ | 251,573,909 | | | $ | 60,641,378 | | | $ | 49,272,769 | |
Net proceeds on reinvestment of distributions | | | 17,792,879 | | | | 14,692,322 | | | | 2,760,453 | | | | 1,681,008 | |
Shares redeemed | | | (179,650,509 | ) | | | (137,964,965 | ) | | | (19,398,543 | ) | | | (9,324,889 | ) |
| | | | | | | | | | | | | | | | |
Net increase (decrease) in net assets | | $ | 1,578,313 | | | $ | 128,301,266 | | | $ | 44,003,288 | | | $ | 41,628,888 | |
| | | | | | | | | | | | | | | | |
PIMCO High Yield Fund (shares) | | | | | | | | | | | | | | | | |
Shares sold | | | 2,594,656 | | | | 5,534,887 | | | | 829,386 | | | | 1,052,578 | |
Shares issued as reinvestment of distributions | | | 1,505,437 | | | | 965,971 | | | | 330,542 | | | | 224,053 | |
Shares redeemed | | | (4,092,272 | ) | | | (1,992,484 | ) | | | (1,103,732 | ) | | | (606,972 | ) |
| | | | | | | | | | | | | | | | |
Net increase (decrease) in shares outstanding | | | 7,821 | | | | 4,508,374 | | | | 56,196 | | | | 669,659 | |
Beginning of period | | | 14,276,322 | | | | 9,767,948 | | | | 3,278,154 | | | | 2,608,495 | |
| | | | | | | | | | | | | | | | |
End of period | | | 14,284,143 | | | | 14,276,322 | | | | 3,334,350 | | | | 3,278,154 | |
| | | | | | | | | | | | | | | | |
350
| | |
| NOTESTO FINANCIAL STATEMENTS (continued) | | Sun Capital Advisers Trust |
| | | | | | | | | | | | | | | | |
| | | Initial Class Shares | | | Service Class Shares | |
| | | Year Ended
December 31,
2011 | | | Year Ended
December 31,
2010 | | | Year Ended
December 31,
2011 | | | Year Ended
December 31,
2010 | |
PIMCO High Yield Fund ($) | | | | | | | | | | | | | | | | |
Net proceeds from sales | | $ | 25,669,951 | | | $ | 53,529,410 | | | $ | 7,977,386 | | | $ | 10,202,106 | |
Net proceeds on reinvestment of distributions | | | 14,302,880 | | | | 9,348,921 | | | | 3,134,275 | | | | 2,167,856 | |
Shares redeemed | | | (38,937,056 | ) | | | (19,168,429 | ) | | | (10,510,062 | ) | | | (5,826,715 | ) |
| | | | | | | | | | | | | | | | |
Net increase (decrease) in net assets | | $ | 1,035,775 | | | $ | 43,709,902 | | | $ | 601,599 | | | $ | 6,543,247 | |
| | | | | | | | | | | | | | | | |
PIMCO Total Return Fund (shares) | | | | | | | | | | | | | | | | |
Shares sold | | | 7,850,320 | | | | 12,666,177 | | | | 20,285,661 | | | | 20,371,783 | |
Shares issued as reinvestment of distributions | | | 1,470,355 | | | | 521,269 | | | | 2,734,042 | | | | 732,251 | |
Shares redeemed | | | (1,147,012 | ) | | | (2,711,374 | ) | | | (2,846,857 | ) | | | (1,439,317 | ) |
| | | | | | | | | | | | | | | | |
Net increase (decrease) in shares outstanding | | | 8,173,663 | | | | 10,476,072 | | | | 20,172,846 | | | | 19,664,717 | |
Beginning of period | | | 23,592,087 | | | | 13,116,015 | | | | 41,744,512 | | | | 22,079,795 | |
| | | | | | | | | | | | | | | | |
End of period | | | 31,765,750 | | | | 23,592,087 | | | | 61,917,358 | | | | 41,744,512 | |
| | | | | | | | | | | | | | | | |
PIMCO Total Return Fund ($) | | | | | | | | | | | | | | | | |
Net proceeds from sales | | $ | 90,554,042 | | | $ | 145,027,137 | | | $ | 234,551,155 | | | $ | 234,001,284 | |
Net proceeds on reinvestment of distributions | | | 16,870,523 | | | | 6,056,776 | | | | 31,348,295 | | | | 8,508,993 | |
Shares redeemed | | | (13,441,861 | ) | | | (31,454,819 | ) | | | (32,670,793 | ) | | | (16,495,450 | ) |
| | | | | | | | | | | | | | | | |
Net increase (decrease) in net assets | | $ | 93,982,704 | | | $ | 119,629,094 | | | $ | 233,228,657 | | | $ | 226,014,827 | |
| | | | | | | | | | | | | | | | |
Ibbotson Balanced Fund (shares) | | | | | | | | | | | | | | | | |
Shares sold | | | 154,218 | | | | 137,449 | | | | 37,829,990 | | | | 65,391,657 | |
Shares issued as reinvestment of distributions | | | 11,049 | | | | 2,104 | | | | 6,858,700 | | | | 1,396,512 | |
Shares redeemed | | | (30,117 | ) | | | (42,608 | ) | | | (1,905,774 | ) | | | (421,503 | ) |
| | | | | | | | | | | | | | | | |
Net increase (decrease) in shares outstanding | | | 135,150 | | | | 96,945 | | | | 42,782,916 | | | | 66,366,666 | |
Beginning of period | | | 136,395 | | | | 39,450 | | | | 116,921,927 | | | | 50,555,261 | |
| | | | | | | | | | | | | | | | |
End of period | | | 271,545 | | | | 136,395 | | | | 159,704,843 | | | | 116,921,927 | |
| | | | | | | | | | | | | | | | |
Ibbotson Balanced Fund ($) | | | | | | | | | | | | | | | | |
Net proceeds from sales | | $ | 1,894,501 | | | $ | 1,590,393 | | | $ | 469,165,299 | | | $ | 752,725,659 | |
Net proceeds on reinvestment of distributions | | | 125,848 | | | | 24,152 | | | | 78,052,004 | | | | 16,017,993 | |
Shares redeemed | | | (372,552 | ) | | | (495,419 | ) | | | (22,486,006 | ) | | | (4,746,985 | ) |
| | | | | | | | | | | | | | | | |
Net increase (decrease) in net assets | | $ | 1,647,797 | | | $ | 1,119,126 | | | $ | 524,731,297 | | | $ | 763,996,667 | |
| | | | | | | | | | | | | | | | |
Ibbotson Conservative Fund (shares) | | | | | | | | | | | | | | | | |
Shares sold | | | 72,367 | | | | 301,852 | | | | 18,518,405 | | | | 31,046,199 | |
Shares issued as reinvestment of distributions | | | 17,084 | | | | 4,356 | | | | 2,665,459 | | | | 999,109 | |
Shares redeemed | | | (37,926 | ) | | | (33,787 | ) | | | (2,994,860 | ) | | | (1,194,488 | ) |
| | | | | | | | | | | | | | | | |
Net increase (decrease) in shares outstanding | | | 51,525 | | | | 272,421 | | | | 18,189,004 | | | | 30,850,820 | |
Beginning of period | | | 428,576 | | | | 156,155 | | | | 64,200,943 | | | | 33,350,123 | |
| | | | | | | | | | | | | | | | |
End of period | | | 480,101 | | | | 428,576 | | | | 82,389,947 | | | | 64,200,943 | |
| | | | | | | | | | | | | | | | |
351
| | |
| NOTESTO FINANCIAL STATEMENTS (continued) | | Sun Capital Advisers Trust |
| | | | | | | | | | | | | | | | |
| | | Initial Class Shares | | | Service Class Shares | |
| | | Year Ended
December 31,
2011 | | | Year Ended
December 31,
2010 | | | Year Ended
December 31,
2011 | | | Year Ended
December 31,
2010 | |
Ibbotson Conservative Fund ($) | | | | | | | | | | | | | | | | |
Net proceeds from sales | | $ | 852,853 | | | $ | 3,469,227 | | | $ | 218,300,396 | | | $ | 347,920,672 | |
Net proceeds on reinvestment of distributions | | | 192,533 | | | | 48,832 | | | | 30,039,728 | | | | 11,210,004 | |
Shares redeemed | | | (454,244 | ) | | | (384,667 | ) | | | (35,301,578 | ) | | | (13,622,703 | ) |
| | | | | | | | | | | | | | | | |
Net increase (decrease) in net assets | | $ | 591,142 | | | $ | 3,133,392 | | | $ | 213,038,546 | | | $ | 345,507,973 | |
| | | | | | | | | | | | | | | | |
Ibbotson Growth Fund (shares) | | | | | | | | | | | | | | | | |
Shares sold | | | 69,640 | | | | 129,754 | | | | 2,819,137 | | | | 9,249,698 | |
Shares issued as reinvestment of distributions | | | 20,101 | | | | 2,641 | | | | 5,542,817 | | | | 1,115,174 | |
Shares redeemed | | | (19,050 | ) | | | (28,749 | ) | | | (4,545,696 | ) | | | (3,020,369 | ) |
| | | | | | | | | | | | | | | | |
Net increase (decrease) in shares outstanding | | | 70,691 | | | | 103,646 | | | | 3,816,258 | | | | 7,344,503 | |
Beginning of period | | | 129,592 | | | | 25,946 | | | | 47,227,759 | | | | 39,883,256 | |
| | | | | | | | | | | | | | | | |
End of period | | | 200,283 | | | | 129,592 | | | | 51,044,017 | | | | 47,227,759 | |
| | | | | | | | | | | | | | | | |
Ibbotson Growth Fund ($) | | | | | | | | | | | | | | | | |
Net proceeds from sales | | $ | 833,315 | | | $ | 1,499,274 | | | $ | 35,152,154 | | | $ | 105,424,712 | |
Net proceeds on reinvestment of distributions | | | 210,455 | | | | 29,899 | | | | 58,033,291 | | | | 12,634,921 | |
Shares redeemed | | | (222,662 | ) | | | (334,194 | ) | | | (54,921,078 | ) | | | (34,737,536 | ) |
| | | | | | | | | | | | | | | | |
Net increase (decrease) in net assets | | $ | 821,108 | | | $ | 1,194,979 | | | $ | 38,264,367 | | | $ | 83,322,097 | |
| | | | | | | | | | | | | | | | |
| (a) | The BlackRock International Index Fund and the Ibbotson Tactical Opportunities Fund commenced operations on November 15, 2010 and share activity presented for the year ended December 31, 2010 is for the period November 15, 2010 to December 31, 2010. |
11. FEDERAL INCOME TAX INFORMATION
Each Fund is treated as a separate entity for Federal tax purposes. Each Fund intends to elect or has elected to be treated and intends to qualify each year as a regulated investment company under Subchapter M of the Internal Revenue Code, as amended (“the Code”). By so qualifying, the Funds will not be subject to Federal income taxes to the extent that they distribute all of their taxable income, including realized capital gains, for the fiscal year. In addition, by distributing during each calendar year substantially all of their net investment income, capital gains and certain other amounts, if any, the Funds will not be subject to a Federal excise tax. As a result, no provision for income taxes is required.
There are no unrecognized tax benefits in the accompanying financial statements in connection with the tax positions taken by each Fund. Each of the Fund’s federal tax returns for the prior three fiscal years remains subject to examination by the Internal Revenue Service. The statute of limitations on the Funds’ state and local tax returns may remain open for an additional year depending upon the jurisdiction.
Capital accounts within the financial statements are adjusted for permanent book-tax differences. These adjustments have no impact on net assets or results of operations. Temporary book-tax differences will reverse in a subsequent period.
Book-tax differences are primarily due to treatment of derivatives, distributions received from REIT securities, currency gain (loss), Passive Foreign Investment Companies, capital loss carryforwards, and losses deferred due to wash sales.
352
| | |
| NOTESTO FINANCIAL STATEMENTS (continued) | | Sun Capital Advisers Trust |
As of December 31, 2011, the components of distributable earnings on a tax basis were as follows:
| | | | | | | | | | | | |
Fund | | Undistributed
Ordinary
Income | | | Undistributed
Long-Term
Capital Gains | | | Net Unrealized
Appreciation/
(Depreciation) | |
AllianceBernstein International Value Fund | | $ | 1,963,758 | | | $ | — | | | $ | (7,293,364 | ) |
BlackRock International Index Fund | | | 1,770,389 | | | | — | | | | (8,556,846 | ) |
BlackRock Large Cap Index Fund | | | 2,033,903 | | | | — | | | | 5,776,014 | |
BlackRock Small Cap Index Fund | | | 6,457,764 | | | | 3,087,484 | | | | (5,264,789 | ) |
Goldman Sachs Mid Cap Value Fund | | | 7,472,438 | | | | 25,357,634 | | | | 32,515,719 | |
Columbia Small Cap Value Fund… | | | 1,133,499 | | | | 906,628 | | | | (2,615,255 | ) |
Davis Venture Value Fund | | | 2,159,744 | | | | 16,698,960 | | | | 43,791,437 | |
Invesco Small Cap Growth Fund | | | — | | | | 1,556,677 | | | | 3,242,385 | |
Lord Abbett Growth & Income Fund | | | 5,698,891 | | | | 79,210,202 | | | | 16,121,710 | |
WMC Blue Chip Mid Cap Fund | | | 325,477 | | | | 12,535,986 | | | | 283,323 | |
WMC Large Cap Growth Fund | | | 1,283,612 | | | | 14,793,175 | | | | 9,652,571 | |
Global Real Estate Fund | | | 1,802,860 | | | | — | | | | 5,025,017 | |
Ibbotson Tactical Opportunities Fund | | | 5,583,870 | | | | — | | | | 1,349,139 | |
Investment Grade Bond Fund | | | 4,576,747 | | | | 5,880,091 | | | | 7,759,140 | |
Money Market Fund | | | 458 | | | | — | | | | — | |
BlackRock Inflation Protected Bond Fund | | | 32,172,999 | | | | 3,989,854 | | | | 4,108,260 | |
Goldman Sachs Short Duration Fund | | | — | | | | — | | | | 6,983,551 | |
PIMCO High Yield Fund | | | 1,012,579 | | | | 4,793,674 | | | | 2,928,450 | |
PIMCO Total Return Fund | | | 5,304,114 | | | | 2,002,751 | | | | 6,454,466 | |
Ibbotson Balanced Fund | | | 45,907,971 | | | | 48,386,010 | | | | (28,286,013 | ) |
Ibbotson Conservative Fund | | | 25,983,853 | | | | 26,699,430 | | | | 9,220,715 | |
Ibbotson Growth Fund | | | 13,609,555 | | | | 26,100,926 | | | | 166,774 | |
Net capital loss carryforwards may be applied against any net realized taxable gains in succeeding years, subject to the carryforward period limitations, where applicable. Effective for taxable years beginning after December 22, 2010, the Regulated Investment Company Modernization Act of 2010 (the “Modernization Act”) changed the capital loss carryforward rules. Capital losses generated in tax years beginning after the date of enactment may now be carried forward indefinitely, and retain the character of the original loss. Under pre-enactment law, capital losses could be carried forward for up to eight tax years as short-term capital losses. The provisions affecting the utilization of capital loss carryforwards under the Modernization Act also require the utilization of post-enactment losses prior to the utilization of pre-enactment losses.
At December 31, 2011, the following Funds had post-enactment accumulated capital loss carryovers which can be used to offset certain future realized capital gains.
| | | | | | | | |
Fund | | Short-Term
Capital Gains | | | Long-Term
Capital Gains | |
AllianceBernstein International Value Fund | | $ | 1,533,751 | | | $ | 864,230 | |
BlackRock International Index Fund | | | — | | | | 63,690 | |
BlackRock Large Cap Index Fund | | | 102,763 | | | | 295,624 | |
Ibbotson Tactical Opportunities Fund | | | 23,232,439 | | | | — | |
Goldman Sachs Short Duration Fund | | | 346,726 | | | | 3,712,339 | |
353
| | |
| NOTESTO FINANCIAL STATEMENTS (continued) | | Sun Capital Advisers Trust |
At December 31, 2011, the following Fund had pre-enactment accumulated capital loss carryover, subject to the eight-year carryforward period and possible expiration:
| | | | |
Fund | | Expires
December 31, 2017 | |
Global Real Estate Fund | | $ | 70,100,734 | |
The following Funds utilized capital loss carryforwards during the year ended December 31, 2011, as follows:
| | | | |
Fund | | Amount | |
BlackRock Small Cap Index Fund | | $ | 2,474,009 | |
WMC Blue Chip Mid Cap Fund | | | 3,075,950 | |
WMC Large Cap Growth Fund | | | 559,254 | |
Global Real Estate Fund | | | 10,702,060 | |
The Investment Grade Bond Fund, Money Market Fund, BlackRock Inflation Protected Bond Fund, Goldman Sachs Short Duration Fund, PIMCO High Yield Fund and PIMCO Total Return Fund declare dividends from net investment income, if any, daily and pay dividends monthly. Each of the remaining Funds in the Trust declare and pay dividends from net investment income, if any, at least annually. Each Fund distributes its net realized capital gains, if any, at least annually. Income and capital gain distributions are determined in accordance with income tax regulations which may differ from U.S. GAAP.
The tax character of distributions paid during the year ended December 31, 2011, was as follows:
| | | | | | | | | | | | |
Fund | | Ordinary
Income | | | Long-Term
Capital Gains | | | Return of
Capital | |
AllianceBernstein International Value Fund | | $ | 3,470,196 | | | $ | 3,136,768 | | | $ | — | |
BlackRock International Index Fund | | | 28,615 | | | | 13,336 | | | | — | |
BlackRock Large Cap Index Fund | | | 12,866,759 | | | | 6,150,835 | | | | — | |
BlackRock Small Cap Index Fund | | | 634,840 | | | | — | | | | — | |
Goldman Sachs Mid Cap Value Fund | | | 11,204,440 | | | | 14,948,464 | | | | — | |
Columbia Small Cap Value Fund | | | 10,421,497 | | | | 456,401 | | | | — | |
Davis Venture Value Fund | | | 3,350,947 | | | | 17,824,141 | | | | — | |
Invesco Small Cap Growth Fund | | | 528,359 | | | | 865,214 | | | | — | |
Lord Abbett Growth & Income Fund | | | 21,087,094 | | | | 63,739,386 | | | | — | |
WMC Blue Chip Mid Cap Fund | | | 87,870 | | | | — | | | | — | |
WMC Large Cap Growth Fund | | | 591,968 | | | | — | | | | — | |
Global Real Estate Fund | | | 14,565,863 | | | | — | | | | — | |
Ibbotson Tactical Opportunities Fund | | | 4,589,457 | | | | 66,819 | | | | — | |
Investment Grade Bond Fund | | | 20,176,761 | | | | 2,108,878 | | | | — | |
Money Market Fund | | | 101,739 | | | | — | | | | — | |
BlackRock Inflation Protected Bond Fund | | | 21,033,430 | | | | 2,865,839 | | | | — | |
Goldman Sachs Short Duration Fund | | | 15,665,677 | | | | 4,382,170 | | | | 505,485 | |
PIMCO High Yield Fund | | | 15,379,355 | | | | 2,057,800 | | | | — | |
PIMCO Total Return Fund | | | 40,194,165 | | | | 8,024,653 | | | | — | |
Ibbotson Balanced Fund | | | 24,163,850 | | | | 54,014,002 | | | | — | |
Ibbotson Conservative Fund | | | 11,965,785 | | | | 18,266,476 | | | | — | |
Ibbotson Growth Fund | | | 10,493,541 | | | | 47,750,205 | | | | — | |
354
| | |
| NOTESTO FINANCIAL STATEMENTS (continued) | | Sun Capital Advisers Trust |
The tax character of distributions paid during the year ended December 31, 2010, was as follows:
| | | | | | | | |
Fund | | Ordinary
Income | | | Long-Term
Capital Gains | |
AllianceBernstein International Value Fund | | $ | 1,251,307 | | | $ | 39,109 | |
BlackRock Large Cap Index Fund | | | 241,745 | | | | — | |
BlackRock Small Cap Index Fund | | | 311,553 | | | | — | |
Goldman Sachs Mid Cap Value Fund | | | 5,547,330 | | | | 637,338 | |
Columbia Small Cap Value Fund | | | 3,987,622 | | | | 325,139 | |
Davis Venture Value Fund | | | 1,611,009 | | | | — | |
Invesco Small Cap Growth Fund | | | 1,862,909 | | | | 337,974 | |
Lord Abbett Growth & Income Fund | | | 22,800,716 | | | | — | |
WMC Blue Chip Mid Cap Fund | | | 60,133 | | | | — | |
WMC Large Cap Growth Fund | | | 554,361 | | | | — | |
Global Real Estate Fund | | | 26,516,442 | | | | — | |
Investment Grade Bond Fund | | | 11,436,954 | | | | — | |
Money Market Fund | | | 153,247 | | | | — | |
BlackRock Inflation Protected Bond Fund | | | 6,035,581 | | | | 344,461 | |
Goldman Sachs Short Duration Fund | | | 16,012,555 | | | | 360,775 | |
PIMCO High Yield Fund | | | 11,470,465 | | | | 46,312 | |
PIMCO Total Return Fund | | | 14,472,398 | | | | 93,371 | |
Ibbotson Balanced Fund | | | 15,191,811 | | | | 850,334 | |
Ibbotson Conservative Fund | | | 10,796,952 | | | | 461,884 | |
Ibbotson Growth Fund | | | 11,613,647 | | | | 1,051,173 | |
355
| | |
| NOTESTO FINANCIAL STATEMENTS (continued) | | Sun Capital Advisers Trust |
The identified cost of investments and their respective gross unrealized appreciation and depreciation for federal income tax purposes at December 31, 2011 were as follows:
| | | | | | | | | | | | | | | | |
| | | Identified
Cost | | | Gross Unrealized | | | Net
Appreciation/
(Depreciation) | |
Fund | | | Appreciation | | | (Depreciation) | | |
AllianceBernstein International Value Fund | | $ | 79,735,519 | | | $ | 3,496,147 | | | $ | (10,787,563 | ) | | $ | (7,291,416 | ) |
BlackRock International Index Fund | | | 79,265,067 | | | | 2,105,812 | | | | (10,673,342 | ) | | | (8,567,530 | ) |
BlackRock Large Cap Index Fund | | | 155,482,378 | | | | 14,403,181 | | | | (8,627,168 | ) | | | 5,776,013 | |
BlackRock Small Cap Index Fund | | | 193,585,918 | | | | 20,474,053 | | | | (25,738,849 | ) | | | (5,264,796 | ) |
Goldman Sachs Mid Cap Value Fund | | | 203,861,163 | | | | 40,573,381 | | | | (8,057,661 | ) | | | 32,515,720 | |
Columbia Small Cap Value Fund | | | 58,166,540 | | | | 4,047,830 | | | | (6,663,085 | ) | | | (2,615,255 | ) |
Davis Venture Value Fund | | | 345,723,509 | | | | 60,486,122 | | | | (16,693,671 | ) | | | 43,792,451 | |
Invesco Small Cap Growth Fund | | | 37,959,130 | | | | 5,432,372 | | | | (2,189,987 | ) | | | 3,242,385 | |
Lord Abbett Growth & Income Fund | | | 434,885,742 | | | | 35,961,743 | | | | (19,840,032 | ) | | | 16,121,711 | |
WMC Blue Chip Mid Cap Fund | | | 182,398,796 | | | | 12,825,879 | | | | (12,542,529 | ) | | | 283,350 | |
WMC Large Cap Growth Fund | | | 189,407,830 | | | | 19,165,120 | | | | (9,512,658 | ) | | | 9,652,462 | |
Global Real Estate Fund | | | 199,268,330 | | | | 21,256,357 | | | | (16,248,266 | ) | | | 5,008,091 | |
Ibbotson Tactical Opportunities Fund | | | 573,911,345 | | | | 4,271,371 | | | | (2,922,232 | ) | | | 1,349,139 | |
Investment Grade Bond Fund | | | 513,455,840 | | | | 12,668,783 | | | | (4,733,976 | ) | | | 7,934,807 | |
Money Market Fund | | | 223,998,469 | | | | — | | | | — | | | | — | |
BlackRock Inflation Protected Bond Fund | | | 532,391,018 | | | | 10,216,046 | | | | (1,613,657 | ) | | | 8,602,389 | |
Goldman Sachs Short Duration Fund | | | 1,172,138,412 | | | | 10,847,729 | | | | (3,864,178 | ) | | | 6,983,551 | |
PIMCO High Yield Fund | | | 156,537,920 | | | | 8,685,627 | | | | (5,711,555 | ) | | | 2,974,072 | |
PIMCO Total Return Fund | | | 1,327,493,077 | | | | 28,998,308 | | | | (23,024,990 | ) | | | 5,973,318 | |
Ibbotson Balanced Fund | | | 1,880,352,816 | | | | 24,163,588 | | | | (52,449,601 | ) | | | (28,286,013 | ) |
Ibbotson Conservative Fund | | | 939,829,987 | | | | 24,470,426 | | | | (15,249,711 | ) | | | 9,220,715 | |
Ibbotson Growth Fund | | | 548,683,885 | | | | 13,031,082 | | | | (12,864,308 | ) | | | 166,774 | |
12. INDEMNIFICATION
Under the Trust’s organizational documents, its officers and Trustees may be indemnified against certain liabilities and expenses arising out of the performance of their duties to the Trust. Additionally, in the normal course of business, the Trust enters into agreements with service providers that may contain indemnification clauses. The Trust’s maximum exposure under these agreements is unknown as this would involve future claims that may be made against the Trust that have not yet occurred.
13. EVALUATION OF SUBSEQUENT EVENTS
Management has determined that there are no material events through the issuance date of the financial statements that would require additional disclosure in the Funds’ financial statements.
356
REPORTOF INDEPENDENT REGISTERED PUBLIC ACCOUNTING FIRM
To the Trustees and the Shareholders of Sun Capital Advisers Trust:
We have audited the accompanying statements of assets and liabilities, including the portfolios of investments of SC AllianceBernstein International Value Fund, SC BlackRock International Index Fund, SC BlackRock Large Cap Index Fund, SC BlackRock Small Cap Index Fund, SC Goldman Sachs Mid Cap Value Fund, SC Columbia Small Cap Value Fund, SC Davis Venture Value Fund, SC Invesco Small Cap Growth Fund, SC Lord Abbett Growth & Income Fund, SC WMC Blue Chip Mid Cap Fund, SC WMC Large Cap Growth Fund, Sun Capital Global Real Estate Fund, SC Ibbotson Tactical Opportunities Fund, Sun Capital Investment Grade Bond Fund, Sun Capital Money Market Fund, SC BlackRock Inflation Protected Bond Fund, SC Goldman Sachs Short Duration Fund, SC PIMCO High Yield Fund, SC PIMCO Total Return Fund, SC Ibbotson Balanced Fund, SC Ibbotson Conservative Fund, and SC Ibbotson Growth Fund (collectively the “Funds”) (each a Fund of Sun Capital Advisers Trust, the “Trust”) as of December 31, 2011, the related statements of operations for the year then ended, and the statements of changes in net assets and the financial highlights for each of the periods presented. These financial statements and financial highlights are the responsibility of the Trust’s management. Our responsibility is to express an opinion on these financial statements and financial highlights based on our audits.
We conducted our audits in accordance with the standards of the Public Company Accounting Oversight Board (United States). Those standards require that we plan and perform the audit to obtain reasonable assurance about whether the financial statements and financial highlights are free of material misstatement. The Trust is not required to have, nor were we engaged to perform, an audit of its internal control over financial reporting. Our audits included consideration of internal control over financial reporting as a basis for designing audit procedures that are appropriate in the circumstances, but not for the purpose of expressing an opinion on the effectiveness of the Trust’s internal control over financial reporting. Accordingly, we express no such opinion. An audit also includes examining, on a test basis, evidence supporting the amounts and disclosures in the financial statements, assessing the accounting principles used and significant estimates made by management, as well as evaluating the overall financial statement presentation. Our procedures included confirmation of securities owned as of December 31, 2011, by correspondence with the custodians and brokers; where replies were not received from brokers, we performed other auditing procedures. We believe that our audits provide a reasonable basis for our opinion.
In our opinion, such financial statements and financial highlights referred to above present fairly, in all material respects, the financial position of each of the Funds constituting Sun Capital Advisers Trust as of December 31, 2011, the results of their operations for the year then ended, and the changes in their net assets and the financial highlights for each of the periods presented, in conformity with accounting principles generally accepted in the United States of America.
DELOITTE & TOUCHE LLP
Boston, Massachusetts
February 24, 2012
357
OTHER INFORMATION (Unaudited)
PROXY VOTING POLICIES AND PROCEDURES AND VOTING RECORDS
A description of the policies and procedures that the Funds use to determine how to vote proxies relating to portfolio securities and information regarding how the Funds voted proxies relating to portfolio securities during the most recent 12-month period ended June 30 are available (i) without charge, upon request, by calling (800) 432-1102 x 3330 and (ii) on the U.S. Securities and Exchange Commission’s website at www.sec.gov.
QUARTERLY FILING OF PORTFOLIO HOLDINGS
The Funds file their complete schedule of investments with the U.S. Securities and Exchange Commission (“SEC”) for the first and third quarters of each fiscal year on Form N-Q. The Funds’ Form N-Q filings are available (i) on the SEC’s website at www.sec.gov; and (ii) for review and copying at the SEC’s Public Reference Room in Washington, D.C. Information about the operations of the Public Reference Room may be obtained by calling (800) SEC-0330.
TAX INFORMATION
For the year ended December 31, 2011, the following Funds paid distributions which were designated as long-term capital gains dividends:
| | | | |
Fund | | Amount | |
AllianceBernstein International Value Fund | | $ | 3,136,768 | |
BlackRock International Index Fund | | | 13,336 | |
BlackRock Large Cap Index Fund | | | 6,150,835 | |
Goldman Sachs Mid Cap Value Fund | | | 14,948,464 | |
Columbia Small Cap Value Fund | | | 456,401 | |
Davis Venture Value Fund | | | 17,824,141 | |
Invesco Small Cap Growth Fund | | | 865,214 | |
Lord Abbett Growth & Income Fund | | | 63,739,386 | |
Ibbotson Tactical Opportunities Fund | | | 66,819 | |
Investment Grade Bond Fund | | | 2,108,878 | |
BlackRock Inflation Protected Bond Fund | | | 2,865,839 | |
Goldman Sachs Short Duration Fund | | | 4,382,170 | |
PIMCO High Yield Fund | | | 2,057,800 | |
PIMCO Total Return Fund | | | 8,024,653 | |
Ibbotson Balanced Fund | | | 54,014,002 | |
Ibbotson Conservative Fund | | | 18,266,476 | |
Ibbotson Growth Fund | | | 47,750,205 | |
358
OTHER INFORMATION (Unaudited) (Continued)
For federal tax purposes, the following information is furnished with respect to the distributions of the Trust for its fiscal year ended December 31, 2011:
Percentage of distributions which qualify for the corporate dividends received deduction:
| | | | |
Fund | | Percentage | |
BlackRock Large Cap Index Fund | | | 100.00 | % |
BlackRock Small Cap Index Fund | | | 100.00 | % |
Goldman Sachs Mid Cap Value Fund | | | 9.47 | % |
Columbia Small Cap Value Fund | | | 8.12 | % |
Davis Venture Value Fund | | | 100.00 | % |
Invesco Small Cap Growth Fund | | | 5.45 | % |
Lord Abbett Growth & Income Fund | | | 7.91 | % |
WMC Blue Chip Mid Cap Fund | | | 100.00 | % |
WMC Large Cap Growth Fund | | | 100.00 | % |
Global Real Estate Fund | | | 0.83 | % |
PIMCO High Yield Fund | | | 0.21 | % |
PIMCO Total Return Fund | | | 1.03 | % |
Ibbotson Balanced Fund | | | 6.45 | % |
Ibbotson Conservative Fund | | | 4.88 | % |
Ibbotson Growth Fund | | | 8.49 | % |
The following Funds designate as income received from foreign sources and taxes paid to foreign countries the following amounts:
| | | | | | | | |
| | | Foreign Source | | | Foreign Taxes | |
Fund | | Income | | | Paid | |
AllianceBernstein International Value Fund | | $ | 2,875,714 | | | $ | 187,392 | |
BlackRock International Index Fund | | | 2,346,150 | | | | 142,024 | |
Global Real Estate Fund | | | 4,684,350 | | | | 139,072 | |
359
OTHER INFORMATION (Unaudited) (Continued)
Funds Having Investment Advisory and/or Subadvisory Agreements Renewed in November 2011:
Sun Capital Global Real Estate Fund
Sun Capital Investment Grade Bond Fund®
Sun Capital Money Market Fund®
SC AllianceBernstein International Value Fund
SC BlackRock Inflation Protected Bond Fund
SC BlackRock Large Cap Index Fund
SC BlackRock Small Cap Index Fund
SC Columbia Small Cap Value Fund
SC Davis Venture Value Fund
SC Goldman Sachs Mid Cap Value Fund
SC Goldman Sachs Short Duration Fund
SC Ibbotson Balanced Fund
SC Ibbotson Growth Fund
SC Ibbotson Conservative Fund
SC Invesco Small Cap Growth Fund
SC Lord Abbett Growth & Income Fund
SC PIMCO High Yield Fund
SC PIMCO Total Return Fund
SC WMC Blue Chip Mid Cap Fund
SC WMC Large Cap Growth Fund
Factors Considered by the Board of Trustees (the “Board”) in Approving the Continuation of each Investment Advisory Agreement.
The Trust’s Board approved the continuation of each above-referenced Fund’s current investment advisory agreement (including, in the case of all Funds other than Sun Capital Investment Grade Bond Fund, Sun Capital Money Market Fund, SC BlackRock Large Cap Index Fund and BlackRock Small Cap Index Fund1, each Fund’s subadvisory agreement) for an additional twelve-month period at an in-person meeting held in November 2011. In terms of the process that the Trustees followed prior to approving the continuation of each investment advisory and subadvisory agreement (together, the “investment advisory agreements”), Variable Contract Owners2 should know that:
| * | At present, five of the Trust’s seven Trustees, including the Board’s chairman, are independent of Sun Capital Advisers LLC (“Sun Capital”), which serves as investment adviser to each of the Funds, each subadviser, and their respective affiliates (“Independent Trustees”). |
| * | In connection with the Board’s 2011 contract review, the Independent Trustees met on multiple occasions to discuss and consider contract review matters, and were advised by, and held private meetings with, their independent legal counsel. These meetings included a special in-person meeting with their independent legal counsel dedicated exclusively to contract review matters. |
| 1 | The Trust’s Board approved new subadvisory agreements with an initial two year term for SC BlackRock Large Cap Index Fund and BlackRock Small Cap Index Fund in November 2010. Sun Capital Investment Grade Bond Fund and Sun Capital Money Market Fund do not have subadvisers. The Trust’s Board approved new investment advisory and subadvisory agreements, each with an initial two year terms, for SC BlackRock International Index Fund and SC Ibbotson Tactical Opportunity Fund in November 2010. |
| 2 | Shares of the Funds will principally be owned by Sun Life (U.S.) and Sun Life (N.Y.) for the benefit of the owners of variable annuities and variable life insurance policies (“Variable Contract Owners”) issued by Sun Life (U.S.) or Sun Life (N.Y.). |
360
OTHER INFORMATION (Unaudited) (Continued)
| * | The Board engaged in a thorough review of each Fund’s investment advisory agreement(s). In this connection, the Board reviewed a wide range of materials furnished at the Board’s request by Sun Capital and, as applicable, each subadviser, prior to reaching these decisions. |
| * | The Board has also put into place a process of identifying funds underperforming, over specified periods, their benchmarks or peer universes compiled by an independent fund data service, and receiving more detailed reporting and information from Sun Capital regarding any such funds. The Board believes this process is an effective manner of identifying and addressing underperforming funds. |
In determining to approve the continuation of each Fund’s investment advisory agreement(s), the Board considered all factors that it believed relevant to the interests of the Fund and Variable Contract Owners, including but not limited to:
| • | | Fees and expenses. The investment advisory and, as applicable, investment subadvisory fee schedules for each Fund, including (i) comparative information provided by Lipper regarding investment advisory fee rates paid to other advisers by similar funds; and (ii) fee rates paid to Sun Capital by each Fund, and to each subadviser by Sun Capital, in each case, relative to those paid by similar funds and institutional accounts advised by such firms. The Board considered that Sun Capital currently does not manage any institutional accounts in a manner similar to a Fund. The Board also received and considered information regarding the differences in the type and level of services required for the Funds and institutional accounts more generally. In the case of each subadvised Fund, the Board noted that the investment subadvisory fees paid to each subadviser are paid by Sun Capital out of its fee, not by the Fund. The Board also considered that, with respect to each of the SC Lord Abbett Growth & Income Fund, SC Goldman Sachs Mid Cap Value Fund, SC Goldman Sachs Short Duration Fund, SC PIMCO High Yield Fund, SC PIMCO Total Return Fund and SC BlackRock Inflation Protected Bond Fund (collectively, the “Unified Fee Funds”), because Sun Capital provides a broader range of services and bears additional categories of expenses in return for the “unified” investment management fee it receives than would be the case under a typical investment advisory agreement, it was most appropriate to examine and compare each such Fund’s total operating expense ratio relative to the total operating expense ratios of other similar funds. With respect to each of the Sun Capital Global Real Estate Fund and the SC Goldman Sachs Short Duration Fund, in addition to comparative information provided by Lipper, the Board also considered comparative information regarding the advisory and administration fees and total expense ratios of peer funds considered by Sun Capital to be the Funds’ primary competitors. The Board also considered Sun Capital’s agreement to reduce the expense caps applicable to the Sun Capital Global Real Estate Fund in connection with the 2011 contract review. With respect to the SC BlackRock Large Cap Index Fund and SC BlackRock Small Cap Index Fund, the Board also considered that the investment advisory agreements with Sun Capital had been amended in August 2010 to reduce the fee rate payable to Sun Capital in conjunction with changes to such Funds’ investment programs, and that Sun Capital had represented that there would be no reduction in the quality or quantity of services that Sun Capital provides to each fund as a result of, or otherwise in connection with, such fee reductions. Finally, the Board considered the impact of the expense limitation agreement between each Fund (other than the Unified Fee Funds) and Sun Capital on such Funds’ expense ratios. Taking into account the foregoing, the Board concluded that the fee schedules in effect for each Fund represent reasonable compensation in light of the nature, extent and quality of the investment services being provided to such Fund. |
| • | | Economies of scale. The extent to which economies of scale would be realized as each Fund grows. In this regard, the Board observed that the advisory fees charged to the SC BlackRock Small Cap Index Fund, SC BlackRock Large Cap Index Fund, SC Columbia Small Cap Value Fund, SC Davis Venture Value Fund, SC WMC Large Cap Growth Fund, SC WMC Blue Chip Mid Cap Fund and SC Invesco Small Cap Growth Fund contain breakpoints. The Board also noted that certain funds without breakpoints (for example, the SC Goldman Sachs Short Duration Fund) received substantial assets as the result of substitution transactions, and |
361
OTHER INFORMATION (Unaudited) (Continued)
| | that any economies of scale associated with their current asset levels were effectively taken into account when establishing such funds’ advisory fee rates at the time of such substitution transactions. In addition, the Board considered Sun Capital’s commitment to consider initial and/or additional breakpoints for each Fund to the extent the Fund’s assets under management increase to more substantial, scalable levels in the future. The Board concluded that, to the extent economies of scale exist in the management of a Fund at its current asset level, each Fund’s fee schedule represents an appropriate sharing of such economies of scale between the Fund and its investment adviser(s). |
| • | | Profitability; Other benefits to Sun Capital. The costs of the services to be provided, and profits realized, by Sun Capital and its affiliates from their relationship with each Fund. In this regard, the Board observed that Sun Capital reported that it was operating several Funds at a net loss (suggesting that Sun Capital had assumed considerable economic risk in contracting with the Funds), and had committed to total operating expense caps applicable to each Fund (other than the Unified Fee Funds) through at least April 30, 2013. In analyzing Sun Capital’s costs and profits and its affiliates’ costs, the Board also reviewed the fees paid to and services provided by Sun Capital and its affiliates to each Fund for non-advisory services, such as distribution (including fees paid pursuant to Rule 12b-1 plans). The Board also considered other potential benefits to Sun Capital and its affiliates from their relationships with the Funds, including the roles of the Funds in supporting the variable contracts issued by Sun Life (U.S.) and Sun Life (N.Y.), both of which are affiliates of Sun Capital. Finally, the Board considered that Sun Capital had retained industry consultants with expertise in mutual fund profitability methodologies, and that the profitability information presented by Sun Capital reflected input from these consultants. The Board concluded that each Fund’s investment advisory fee schedule represented reasonable compensation in light of, among other factors, the costs incurred by the adviser and its affiliates in providing services to each Fund. |
| • | | Investment performance. The investment performance of each Fund, both absolute and relative to various benchmarks and industry peer groups, including comparative information provided by Lipper regarding each Fund’s performance relative to other similar Funds. With respect to the Sun Capital Global Real Estate Fund, the Board also considered the Fund’s performance since its transition to a global real estate fund relative to peer global real estate funds managed by the Fund’s primary competitors, and that the Fund’s subadvisory agreement with Massachusetts Financial Services Company (“MFS”) had only been in effect since May 1, 2011. With respect to the SC AllianceBernstein International Value Fund, the Board noted while the Fund has underperformed since inception, the Fund’s subadviser has a strong long-term record managing assets in this strategy. |
| • | | Nature, quality and extent of services. The nature, scope and quality of the services that Sun Capital and each subadviser provide to the Funds. In this regard, the Board considered, among other things, Sun Capital’s and each subadviser’s personnel (including particularly those personnel with responsibilities for providing services to the Funds), resources, policies and investment processes. In addition to meeting with representatives of Sun Capital and each subadviser, the Board also considered, among other things, Sun Capital’s representation that it was satisfied with the resources, compliance program and level of commitment put forth by each subadviser and its recommendation that each subadvisory agreement be continued. The Board also noted Sun Capital’s record in recommending the termination and replacement of underperforming subadvisers. The Board considered that the types of services to be provided under the investment advisory agreements were comparable to (or, in the case of the Unified Fee Funds, broader than) those typically found in agreements of such type. In this regard, the Board concluded that the quality and range of services provided by Sun Capital and, as applicable, each subadviser, have benefited and should continue to benefit each Fund and its Variable Contract Owners. |
| • | | Brokerage practices. The practices of Sun Capital and each subadviser regarding the selection and compensation of brokers and dealers executing portfolio transactions for the Funds, including the brokers’ and dealers’ provision of brokerage and research services to Sun Capital and each subadviser. |
362
OTHER INFORMATION (Unaudited) (Continued)
| • | | Compliance. Sun Capital’s and each subadviser’s commitment to and record of compliance, including its written compliance policies and procedures. In this regard, the Board considered Sun Capital’s continued commitment of attention and resources to compliance functions relevant to the Funds’ operations, including the oversight of subadvisers. The Board also considered the Sun Life organization’s commitment of resources to its U.S. business more generally. |
After due consideration of these and other factors that it considered relevant, the Board determined to approve the continuation of each Fund’s investment advisory agreement and, as applicable, investment subadvisory agreement, and concluded that the continuation of such agreements was in the best interest of the Fund and the Variable Contract Owners.
In reaching this conclusion, the Board did not give particular weight to any single factor noted above. The Board considered these and other factors over the course of multiple meetings, certain of which were held in executive session with only the Independent Trustees and their counsel present. It is possible that individual Trustees may have weighed these factors differently in reaching their individual decisions to approve the continuation of the investment advisory agreements.
363
| | |
| OTHER INFORMATION (Unaudited) (Continued) | | Sun Capital Advisers Trust |
Each Fund’s business is managed by the Trustees. Several of the Funds’ Trustees and Officers are also Directors and Officers of Sun Life Assurance Company of Canada or the Adviser. The table below provides more information about the Funds’ Trustees and certain Officers.
| | | | | | | | | | |
| Name, address and age | | Position with the
Trust | | Length of Time Served | | Principal occupation
past 5 years | | Number of Funds
Within Fund Complex
Overseen by Trustee | | Other Directorships Held
Outside of the Fund
Complex by Trustee |
Michael P. Castellano c/o Sun Capital Advisers Trust One Sun Life Executive Park Wellesley Hills, MA 02481 Year of birth: 1941 | | Trustee | | Since
February 2005 | | Retired | | 22 | | None |
Dawn-Marie Driscoll c/o Sun Capital Advisers Trust One Sun Life Executive Park Wellesley Hills, MA 02481 Year of birth: 1946 | | Trustee | | Since June 2007 | | President, Driscoll Associates (consulting firm); Executive Fellow, Center for Business Ethics, Bentley University; Directorships: Advisory Board, Center for Business Ethics, Bentley University; Trustee, Southwest Florida Community Foundation (charitable organization), Director, ICI Mutual; Former Directorships: Investment Company Institute; Former Memberships: Executive Committee of the Independent Directors Council of the Investment Company Institute. | | 22 | | Trustee, DWS Funds Board (113 mutual funds) since 1987. |
Keith R. Fox c/o Sun Capital Advisers Trust; One Sun Life Executive Park Wellesley Hills, MA 02481 Born: 1954 | | Trustee | | Since
April, 2011 | | Managing General Partner, Exeter Capital Partners (a series of private investment funds). | | 22 | | Directorships: Progressive International Corporation (kitchen goods importer and distributor) since 2000; Box Top Media Inc. (advertising) since 2006; The Kennel Shop (retailer) since 2007. Trustee, DWS Funds Board (113 mutual funds) since 1996. |
Carol A. Kosel c/o Sun Capital Advisers Trust; One Sun Life Executive Park Wellesley Hills, MA 02481 Born: 1963 | | Trustee | | Since
April, 2011 | | Former Trustee to the Evergreen Funds; Former Consultant to the Evergreen Boards of Trustees; Former Senior Vice President and Head of Fund Administration, Evergreen | | 22 | | None. |
364
| | |
| OTHER INFORMATION (Unaudited) (Continued) | | Sun Capital Advisers Trust |
| | | | | | | | | | |
| Name, address and age | | Position with the
Trust | | Length of Time Served | | Principal occupation
past 5 years | | Number of Funds
Within Fund Complex
Overseen by Trustee | | Other Directorships Held
Outside of the Fund
Complex by Trustee |
| | | | | | | Investments, Inc.; Former Treasurer, Evergreen Funds; Former Treasurer, Vestaur Securities Fund; Former Senior Manager, KPMG, LLC. | | | | |
William N. Searcy, Jr. c/o Sun Capital Advisers Trust One Sun Life Executive Park Wellesley Hills, MA 02481 Year of birth: 1946 | | Chairman and Trustee | | Chairman since 2005 Trustee since October 1998 | | Private investor. Pension and Savings Trust Officer, Sprint Corp. (wireless and wireline communications services)
1989-2003. | | 22 | | Trustee, DWS Funds Board (113 mutual funds) since 1993. |
Scott M. Davis* One Sun Life Executive Park Wellesley Hills, MA 02481 Born: 1963 | | Trustee | | Since
April, 2011 | | Senior Vice President and General Counsel for Sun Life Financial’s U.S. Operations since 2007. Vice President and General Counsel for Sun Life Financial’s U.S. Operations, 1999-2004. Associated with Sun Life Financial since 1995. | | 22 | | Director, Clarendon Insurance Agency, Inc. since 2006. Director, Sun Life Assurance Company of Canada (U.S.) since 2004. Director, Sun Life Insurance and Annuity Company of New York since 2004. Director of numerous other Sun Life Financial affiliated entities since 2004. |
John T. Donnelly* One Sun Life Executive Park Wellesley Hills, MA 02481 Year of birth: 1958 | | President, Chief Executive Officer and Trustee | | Since
May 2009 | | President and Manager, Sun Capital Advisers LLC since 2009. Senior Managing Director, Investment Operations for Sun Life Assurance Company of Canada (U.S.) since 2005. Associated with Sun Life Financial since 1981. | | 22 | | Director, Sun Life Insurance and Annuity Company of New York since 2008. Director, Crosspointe Shops I & II since 2009. Director of numerous other Sun Life Financial affiliated entities since 2005. |
Lena Metelitsa* One Sun Life Executive Park Wellesley Hills, MA 02481 Year of birth: 1967 | | Chief Financial Officer and Treasurer | | Since May 2010; Serves at the discretion of the Trustees. | | Managing Director and Chief Financial Officer, Sun Capital Advisers LLC since 2010. Senior Director, Sun Capital Advisers LLC, 2008-2010. Associated with Sun Life Financial since 2005. | | N/A | | N/A |
365
| | |
| OTHER INFORMATION (Unaudited) (Continued) | | Sun Capital Advisers Trust |
| | | | | | | | | | |
| Name, address and age | | Position with the
Trust | | Length of Time Served | | Principal occupation
past 5 years | | Number of Funds
Within Fund Complex
Overseen by Trustee | | Other Directorships Held
Outside of the Fund
Complex by Trustee |
Maura A. Murphy, Esq.* One Sun Life Executive Park Wellesley Hills, MA 02481 Year of birth: 1960 | | Secretary and Chief Legal Officer | | Since October 1998; Serves at the discretion of the Trustees. | | Managing Director and General Counsel since 2000, and Secretary since 1998, Sun Capital Advisers LLC. Assistant Vice President and Senior Counsel, Sun Life Financial. Associated with Sun Life Financial since 1998. | | N/A | | N/A |
Andrew S. Harris* One Sun Life Executive Park Wellesley Hills, MA 02481 Born: 1974 | | Chief Compliance Officer | | Since August 2010; Serves at the discretion of the Trustees. | | Chief Compliance Officer, Sun Capital Advisers LLC since 2010. Fund Compliance Officer, SEI Investments 2008-2010. Director of Corporate Compliance, Nationwide Funds Group 2004-2008. | | N/A | | N/A |
| * | An interested person of the Funds for purposes of Section 2(a)(19) of the 1940 Act. |
The Statement of Additional Information (SAI) includes additional information about the Funds’ Trustees and is available, without charge, upon request by calling 1-800-432-1102 x3330.
366
Sun Capital Advisers Trust
TRUSTEES AND OFFICERS
Michael P. Castellano, Trustee
Dawn-Marie Driscoll, Trustee
Keith R. Fox, Trustee
Carol A. Kosel, Trustee
William N. Searcy, Jr., Chairman, Trustee
Scott M. Davis, Trustee
John T. Donnelly, President, Chief Executive Officer and Trustee
Lena Metelitsa, Chief Financial Officer and Treasurer
Maura A. Murphy, Secretary and Chief Legal Officer
Andrew S. Harris, Chief Compliance Officer
INVESTMENT ADVISER
Sun Capital Advisers LLC
One Sun Life Executive Park
Wellesley Hills, MA 02481
INDEPENDENT REGISTERED PUBLIC ACCOUNTING FIRM
Deloitte & Touche LLP
200 Berkeley Street
Boston, MA 02116
ADMINISTRATOR, CUSTODIAN, TRANSFER AGENT
State Street Bank & Trust Company
One Lincoln Street
Boston, MA 02111
LEGAL COUNSEL
Dechert LLP
200 Clarendon Street
Boston, MA 02116
This report must be preceded or accompanied by a prospectus for Sun Capital Advisers Trust which includes more information about charges and expenses. Please read the prospectus carefully before you invest or send money.
Registrant has adopted a code of ethics that applies to registrant’s principal executive officer and principal financial officer. This code of ethics is available without charge, upon request, by calling 1-800-432-1102 x3330. A copy of this code of ethics is filed as an exhibit to this Form N-CSR. No substantive amendments were approved or waivers granted to this code of ethics during the period covered by this report.
| Item 3. | Audit Committee Financial Expert. |
The registrant’s Board of Trustees has determined that the registrant has at least one financial expert, Michael P. Castellano, serving on its Audit Committee. Mr. Castellano is considered “independent” for purposes of Item 3(a)(2) of Form N-CSR.
| Item 4. | Principal Accountant Fees and Services. |
Aggregate fees billed for professional services rendered to the registrant for the last two fiscal years by the registrant’s principal accountant were as follows:
(a) Audit Fees: Includes amounts related to the audit of the registrant’s annual financial statements and services normally provided by the accountant in connection with statutory and regulatory filings.
| | | | |
FY 2011 | | FY 2010 | |
$875,640 | | $ | 765,705 | |
(b) Audit-related Fees: Includes amounts related to assurance and related services that are reasonably related to the performance of the audit of the registrant’s financial statements and are not reported under paragraph (a) of this Item.
| | | | |
FY 2011 | | FY 2010 | |
None | | | None | |
(c) Tax Fees: Includes amounts related to tax compliance, tax planning and tax advice.
| | | | |
FY 2011 | | FY 2010 | |
$69,920 | | $ | 69,920 | |
(d) All Other Fees: Includes amounts related to products and services provided to the registrant by the registrant’s principal accountant, other than the services reported in paragraphs (a) through (c) of this Item.
| | | | |
FY 2011 | | FY 2010 | |
None | | | None | |
(e)(1) The registrant’s Audit Committee has adopted a policy whereby audit and non-audit services performed by the registrant’s principal accountant for the registrant require pre-approval. In addition, non-audit services performed by the registrant’s principal accountant for the registrant’s investment adviser and any entity controlling, controlled by or under common control with the investment adviser that provides ongoing services to the registrant also require pre-approval if the services provided to those entities are related directly to the operations and financial reporting of the registrant.
The policy includes a list of specified services that are deemed to be pre-approved, subject to stated dollar limits, by the Audit Committee. The Audit Committee must provide specific advance approval for any service that is not included in the list of pre-approved services, or for any pre-approved service that exceeds the dollar limit set forth in the policy. In determining whether to approve services, the Audit Committee considers whether the services are consistent with maintaining the principal accountant’s independence.
(e)(2) No services included in this Item 4 (b) through (d) were approved pursuant to the “de minimis exception” set forth in paragraph (c)(7)(i)(C) of Rule 2-01 of Regulation S-X.
(f) Not applicable
(g) During the registrant’s fiscal years ended December 31, 2011 and December 31, 2010, the aggregate fees billed by the registrant’s principal accountant for non-audit services rendered to the registrant, the registrant’s investment adviser, or to any entity controlling, controlled by, or under common control with the adviser that provides ongoing services to the registrant were $94,920 and $225,920 respectively.
(h) Not applicable
| Item 5. | Audit Committee of Listed Registrants. |
Not applicable
| Item 6. | Schedule of Investments. |
Included in stockholder report filed under Item 1.
| Item 7. | Disclosure of Proxy Voting Policies and Procedures for Closed-End Management Investment Companies. |
Not applicable
| Item 8. | Portfolio Managers of Closed-End Management Investment Companies. |
Not Applicable
| Item 9. | Purchases of Equity Securities by Closed-End Management Investment Company and Affiliated Purchasers. |
Not Applicable
| Item 10. | Submission of Matters to a Vote of Security Holders. |
No material changes to the procedures by which shareholders may recommend nominees to the registrant’s Board of Trustees have been implemented since the registrant’s most recent disclosure to this Item.
| Item 11. | Controls and Procedures. |
| (a) | Based upon their evaluation of the registrant’s disclosure controls and procedures as conducted within 90 days of the filing date of this Form N-CSR, the registrant’s principal financial officer and principal executive officer have concluded that those disclosure controls and procedures provide reasonable assurance that the material information required to be disclosed by the registrant on this report is recorded, processed, summarized and reported within the time periods specified in the Securities and Exchange Commission’s rules and forms. |
| (b) | There have been no significant changes in the registrant’s internal control over financial reporting during the registrant’s second fiscal quarter of the period covered by this report that has materially affected, or is reasonably likely to materially affect, the registrant’s internal control over financial reporting. |
| (a) (1) | The code of ethics as required by Form N-CSR Item 2 is filed herewith. |
| (a) (2) | A separate certification for each principal executive officer and principal financial officer of the registrant as required by Rule 30a-2(a) under the Investment Company Act of 1940, as amended, are filed herewith. |
| (a) (3) | A combined certification by the principal executive and principal financial officers of the registrant as required by Rule 30a-2(b), under the Investment Company Act of 1940, as amended, is filed herewith. |
SIGNATURES
Pursuant to the requirements of the Securities Exchange Act of 1934 and the Investment Company Act of 1940, the registrant has duly caused this report to be signed on its behalf by the undersigned, thereunto duly authorized.
| | | | | | | | |
| (Registrant) | | | | SUN CAPITAL ADVISERS TRUST |
| | |
| By (Signature and Title)* | | | | /s/ JOHN T. DONNELLY |
| | | | | | John T. Donnelly, President |
Date: February 24, 2012
Pursuant to the requirements of the Securities Exchange Act of 1934 and the Investment Company Act of 1940, this report has been signed below by the following persons on behalf of the registrant and in the capacities and on the dates indicated.
| | | | | | | | |
| | |
| By (Signature and Title)* | | | | /s/ JOHN T. DONNELLY |
| | | | | | John T. Donnelly, President |
| | | | | | (Chief Executive Officer) |
Date: February 24, 2012
| | | | | | | | |
| | | | |
| | |
| By (Signature and Title)* | | | | /s/ LENA METELITSA |
| | | | | | Lena Metelitsa, Treasurer |
| | | | | | (Chief Financial Officer) |
Date: February 24, 2012
| * | Print name and title of each signing officer under his or her signature. |