UNITED STATES
SECURITIES AND EXCHANGE COMMISSION
Washington, D.C. 20549
FORM N-CSR
CERTIFIED SHAREHOLDER REPORT OF
REGISTERED MANAGEMENT INVESTMENT COMPANIES
Investment Company Act file number 811-08879
SUN CAPITAL ADVISERS TRUST
(Exact name of registrant as specified in charter)
One Sun Life Executive Park, Wellesley Hills, Massachusetts 02481
(Address of principal executive offices) (Zip code)
James M.A. Anderson
Sun Capital Advisers Trust
One Sun Life Executive Park
Wellesley Hills, Massachusetts 02481
(Name and address of agent for service)
Registrant’s telephone number, including area code: (800) 432-1102 x 3330
Date of fiscal year end: December 31
Date of reporting period: December 31, 2008
| Item 1. | Reports to Stockholders. |
The following is a copy of the report transmitted to stockholders pursuant to Rule 30e-1 under the Investment Company Act of 1940, as amended:
SUN CAPITAL ADVISERS TRUST®
Annual Report December 31, 2008
Sun Capital Investment Grade Bond Fund®
Sun Capital Money Market Fund®
Sun Capital Global Real Estate Fund®
SCSM Davis Venture Value Fund
SCSM Oppenheimer Main Street Small Cap Fund
SCSM Oppenheimer Large Cap Core Fund
SCSM WMC Large Cap Growth Fund
SCSM WMC Blue Chip Mid Cap Fund
SCSM Lord Abbett Growth & Income Fund
SCSM Goldman Sachs Mid Cap Value Fund
SCSM Goldman Sachs Short Duration Fund
SCSM Dreman Small Cap Value Fund
SCSM PIMCO High Yield Fund
SCSM PIMCO Total Return Fund
SCSM AIM Small Cap Growth Fund
SCSM AllianceBernstein International Value Fund
SCSM BlackRock Inflation Protected Bond Fund
SCSM Ibbotson Moderate Fund
SCSM Ibbotson Balanced Fund
SCSM Ibbotson Growth Fund
| | |
 | | Sun Capital Advisers Trust is a mutual fund registered with the Securities and Exchange Commission under the Investment Company Act of 1940. Its investment adviser is Sun Capital Advisers LLC®, a member of the Sun Life Financial group of companies. |
TABLE OF CONTENTS
Please Note:
This report and the financial statements contained herein are submitted for the general information of the shareholders of the Funds. This report is not authorized for distribution to prospective investors in the Funds unless preceded or accompanied by an effective prospectus.
The views and opinions expressed in each Fund’s “Management’s Discussion and Analysis” are those of the portfolio manager(s) of the Fund. The views and opinions expressed, and the portfolio holdings described, are as of December 31, 2008, and are subject to change at any time without notice due to market or other conditions. These should not be construed as investment advice or as a recommendation to buy or sell any security. Any forecasts or other forward looking views may not come to pass. Past performance is no guarantee of future results. Performance may have changed materially since December 31, 2008.
Industry classifications included within each Fund’s Portfolio of Investments are unaudited.
MANAGEMENT’S DISCUSSION & ANALYSIS
INVESTMENT GRADE BOND FUND
The Fund’s performance for the year ended December 31, 2008 was a direct reflection of the Fund’s overweight to the spread sectors of the Barclays Capital U.S. Aggregate Bond Index (the “Index”), which continued to reach historically wide levels, and subsequent underweight to U.S. Treasuries. In 2008 U.S. Treasuries recorded their best returns since 1995. The Barclays Capital U.S. Treasury Index generated a return of almost 14% for 2008. Negative excess (vs. duration neutral U.S. Treasuries), and in some cases absolute returns for 2008, were historical by any measure. Negative excess returns were multiples of those previously experienced in most sectors. September, October and November were among the worst months ever for the Index as well as most of its sectors. All sectors reached their historically wide levels in late 2008, despite significant governmental policy response. In late December, historically wide spreads and attractive yields began to stimulate investors whose risk appetite was slowly returning. The deleveraging phenomena, which affected all asset classes over the last 18 months has slowed, thus removing the technical overhang of sellers far outnumbering buyers.
With historically wide spreads, the Fund continues to focus on taking advantage of market dislocations, as opportunities exist across all spread sectors. According to Credit Suisse, current spread levels for investment grade corporate securities imply a default rate of approximately 9%. Moody’s 5-year cumulative investment grade corporate default rate from the depression era of 1931-1935 was 3.88%. Commercial mortgage-backed securities that benefit from significant credit enhancement are extremely attractive with yields north of 10%. During the last real estate collapse in the early 1990s, commercial loans experienced about a 10% default rate while these AAA rated securities benefit from 15-50% of credit enhancement. We will continue to search to enhance the portfolio while also remaining cognizant of the overall level of risk. Given the existing market dislocation, prudent portfolio construction is key. We continue to seek value from an irrational marketplace.
The Fund’s allocation to the spread sectors of the Index declined modestly during the 4th quarter of 2008. Cash was allowed to increase to almost 10% during the 4th quarter in anticipation of attractive opportunities in the marketplace. At December 31, 2008, approximately, 6% of the Fund’s holdings retained a credit rating below investment grade.
1
INVESTMENT GRADE BOND FUND
| | |
TOP TEN BOND ISSUERS At December 31, 2008 | | PORTFOLIO COMPOSITION At December 31, 2008 |
| | | |
| | | % of Net Assets | |
Federal National Mortgage Association | | 25.3 | % |
Federal Home Loan Mortgage Corp. | | 9.4 | |
U.S. Treasury | | 3.5 | |
Rogers Communications, Inc. | | 2.6 | |
Government National Mortgage Association | | 1.7 | |
GMAC Commercial Mortgage Securities, Inc. | | 1.4 | |
Residential Accredited Loans, Inc. | | 1.4 | |
Allegheny Energy Supply Co. LLC | | 1.3 | |
Wachovia Corp. | | 1.2 | |
Bear Stearns Commercial Mortgage Securities | | 1.2 | |
| | | |
| | | % of Net Assets | |
U.S. Treasury and U.S. Government Agency Obligations | | 39.9 | % |
Corporate Debt Obligations | | 36.8 | |
Short Term Investments | | 11.3 | |
Commercial Mortgage Backed Securities | | 7.0 | |
Residential Mortgage Backed Securities | | 3.3 | |
Asset Backed Securities | | 0.4 | |
Other assets less liabilities | | 1.3 | |
| | | |
TOTAL | | 100.0 | % |
| | | |
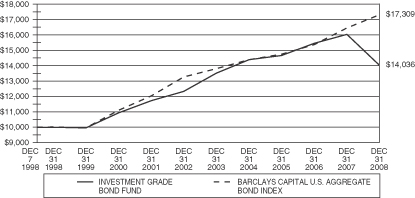
Comparison of Change in Value of a $10,000 Investment in the Investment Grade Bond Fund – Initial Class and the Barclays Capital U.S. Aggregate Bond Index
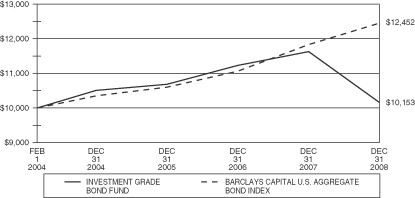
Comparison of Change in Value of a $10,000 Investment in the Investment Grade Bond Fund – Service Class and the Barclays Capital U.S. Aggregate Bond Index
2
INVESTMENT GRADE BOND FUND
Total Returns for Periods Ended December 31, 2008**
| | | | | | | | | | | | | | | |
Initial Class Shares | | One Year | | | Three Years | | | Five Years | | | Ten Years | | | Life of
Fund*** | |
Investment Grade Bond Fund | | (12.47 | )% | | (1.45 | )% | | 0.76 | % | | 3.44 | % | | 3.42 | % |
Barclays Capital U.S. Aggregate Bond Index* | | 5.24 | % | | 5.51 | % | | 4.65 | % | | 5.63 | % | | 5.60 | % |
Service Class Shares | | | | | | | | | | | | | | | |
Investment Grade Bond Fund | | (12.67 | )% | | (1.68 | )% | | N/A | | | N/A | | | 0.31 | % |
Barclays Capital U.S. Aggregate Bond Index* | | 5.24 | % | | 5.51 | % | | N/A | | | N/A | | | 4.56 | % |
*The performance data of the index has been prepared from sources and data that the investment adviser believes to be reliable, but no representation is made as to their accuracy. The index is unmanaged and has no fees or costs. The Barclays Capital U.S. Aggregate Bond Index (formerly Lehman Brothers U.S. Aggregate Bond Index) is composed of U.S. securities in the Treasury, Government-Related, Corporate, and Securitized sectors. The Barclays Capital U.S. Aggregate Bond Index has been taken from published sources.
**Performance data is historical and includes changes in share price and reinvestment of income dividends and capital gains distributions. Past performance does not indicate future results. Performance numbers are net of all operating expenses, but do not include any insurance charges imposed in connection with your variable insurance contract. In addition, the investment adviser reduced its management fee and/or reimbursed certain other expenses during these periods. If this performance information included the effect of the insurance charges and the fees and expenses assumed by the investment adviser, performance numbers would be lower. The value of an investment in the Investment Grade Bond Fund and the return on the investment will fluctuate and redemption proceeds may be higher or lower than an investor’s original cost. Returns greater than one year are annualized.
***Initial Class Shares for the period from December 7, 1998 (commencement of operations) to December 31, 2008. Service Class Shares for the period from February 1, 2004 (commencement of operations) to December 31, 2008.
3
MANAGEMENT’S DISCUSSION & ANALYSIS
MONEY MARKET FUND
The Federal Reserve’s monetary policy committee (FOMC) began 2008 deliberating the impact of the deterioration in financial markets, weak labor markets, as well as the ongoing correction in the housing market. As a result, the FOMC voted in an emergency meeting to reduce their benchmark lending rate by 75 basis points on January 22nd from 4.25% to 3.50%. Fed Chairman Bernanke, along with other officials, were proactive in efforts to alleviate the credit crunch by utilizing a host of liquidity programs, including expanding the Term Auction Facility (TAF) auctions, lengthening the maturity of open market repurchase agreements, and making changes to acceptable collateral for those loans to include mortgage-linked bonds. The central bank arranged for an emergency loan to Bear Stearns Co. to prevent the institution from filing for bankruptcy and disrupting the capital markets. At each of the next three regular meetings, the FOMC lowered the lending rate. By the end of April, the rate had been reduced to 2%.
The FOMC kept rates unchanged through the end of the third quarter, content that growth and inflation risks were essentially balanced. In September, market conditions took a serious turn for the worse, as confidence and liquidity appeared to vanish. Federal National Mortgage Association and Federal Home Loan Mortgage Corporation were suddenly forced into conservatorship. Lehman Brothers abruptly filed for Chapter 11 bankruptcy and in the same weekend, Merrill Lynch was acquired by the Bank of America. Shortly thereafter, American International Group (AIG) received emergency loans from the U.S. government in return for equity interest to avert bankruptcy. The safety of money market mutual funds suddenly came into question. In response, the Federal Reserve, the Bank of Canada, the Bank of England, the ECB and the Bank of Japan poured billions into the banking system on a daily basis through a variety of liquidity and lending programs. In October, the Commercial Paper Funding Facility (CPFF) was launched to provide a liquidity backstop for U.S. issuers of commercial paper. In addition the Federal Reserve of New York was tapped to finance the purchase of unsecured and asset-backed commercial paper and agency discount notes from eligible issues through its primary dealers. The Treasury also established a temporary guaranty program for the U.S. money market mutual fund industry to stem the tide of redemptions and repair the confidence lost. In October, Congress authorized and President Bush signed the Troubled Assets Relief Program (TARP) which would provide up to $700 billion to the U.S. Treasury to purchase troubled assets. Later, bank holding companies were given the ability to issue bonds and commercial paper, unconditionally guaranteed by the U.S. government though the Term Lending Guarantee Program (TLGP).
In addition to the programs mentioned above, the FOMC continued to lower rates in the fourth quarter. By year end, the Fed Funds target interest rate was at a record low and is now quoted in a range of 0.00% to 0.25%. The Discount Rate ended the year at 0.50%. The liquidity programs, along with the safety of U.S. Treasury bills provided tremendous demand for safe, short term investments. The persistent flight to quality has brought interest rates on U.S. Treasury bills near and even below zero. Rates on agency discount paper, industrial and TLGP commercial paper also declined sharply given their safety and liquidity.
Three-month Treasury bills started the year at the high of 3.33%. However, as the Fed started to lower interest rates in January, for a total of ten reductions by year end, U.S. Treasury bills plummeted to a low of (0.02%) early in December before ending the year at 0.08%.
Economic data continues to indicate weak consumer, housing, and manufacturing data as well as falling commodity prices. With the Fed Funds target interest rate now in a range of 0.00% to 0.25%, the Fed has ensured the market it will use whatever tools necessary to maintain stability in the financial markets and promote economic development. Our strategy remains to invest in a high quality, liquid portfolio.
4
MONEY MARKET FUND
| | |
TOP TEN ISSUERS At December 31, 2008 | | PORTFOLIO COMPOSITION At December 31, 2008 |
| | | |
| | | % of Net Assets | |
Federal Home Loan Mortgage | | 20.4 | % |
Federal National Mortgage Association | | 19.1 | |
U.S. Treasury | | 3.9 | |
Government of Canada | | 3.4 | |
Coca Cola Co. | | 3.0 | |
AT&T, Inc. | | 2.9 | |
Hewlett Packard Co. | | 2.9 | |
The Procter & Gamble Co. | | 2.9 | |
Pfizer, Inc. | | 2.9 | |
Wal-Mart Stores, Inc. | | 2.9 | |
| | | |
| | | % of Net Assets | |
Commercial Paper | | 43.8 | % |
U.S. Treasury and U.S. Government Agency Obligations | | 43.4 | |
Mutual Funds | | 4.7 | |
Foreign Government Obligations | | 4.0 | |
U.S. Government Guaranteed Commercial Paper | | 3.9 | |
Other assets less liabilities | | 0.2 | |
| | | |
TOTAL | | 100.0 | % |
| | | |
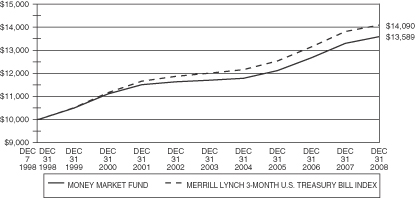
Comparison of Change in Value of a $10,000 Investment in the Money Market Fund –Initial Class and the Merrill Lynch 3-Month U.S. Treasury Bill Index
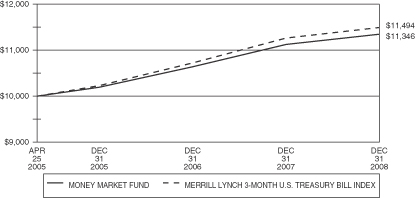
Comparison of Change in Value of a $10,000 Investment in the Money Market Fund –Service Class and the Merrill Lynch 3-Month U.S. Treasury Bill Index
5
MONEY MARKET FUND
Total Returns for Periods Ended December 31, 2008**
| | | | | | | | | | | | | | | |
Initial Class Shares | | One Year | | | Three Years | | | Five Years | | | Ten Years | | | Life of
Fund*** | |
Money Market Fund | | 2.25 | % | | 3.90 | % | | 3.03 | % | | 3.08 | % | | 3.09 | % |
Merrill Lynch 3-month U.S. Treasury Bill Index* | | 2.06 | % | | 3.96 | % | | 3.25 | % | | 3.45 | % | | 3.46 | % |
Service Class Shares | | | | | | | | | | | | | | | |
Money Market Fund | | 2.00 | % | | 3.64 | % | | N/A | | | N/A | | | 3.49 | % |
Merrill Lynch 3-month U.S. Treasury Bill Index* | | 2.06 | % | | 3.96 | % | | N/A | | | N/A | | | 3.85 | % |
*The performance data of the index has been prepared from sources and data that the investment adviser believes to be reliable, but no representation is made as to their accuracy. The index is unmanaged and has no fees or costs. The Merrill Lynch 3-month U.S. Treasury Bill Index is a one-security index which at the beginning of every month selects for inclusion the U.S. Treasury Bill maturing closest to, but not beyond 91 days from that date. That issue is then held for one month, sold and rolled into the new U.S. Treasury Bill. The Merrill Lynch 3-month U.S. Treasury Bill Index has been taken from published sources.
**Performance data is historical and includes changes in share price and reinvestment of income dividends and capital gains distributions. Past performance does not indicate future results. Performance numbers are net of all operating expenses, but do not include any insurance charges imposed in connection with your variable insurance contract. In addition, the investment adviser reduced its management fee and/or reimbursed certain other expenses during these periods. If this performance information included the effect of the insurance charges and the fees and expenses assumed by the investment adviser, performance numbers would be lower. The value of an investment in the Money Market Fund and the return on the investment will fluctuate and redemption proceeds may be higher or lower than an investor’s original cost. Returns greater than one year are annualized.
***Initial Class Shares for the period from December 7, 1998 (commencement of operations) to December 31, 2008. Service Class Shares for the period from April 25, 2005 (commencement of operations) to December 31, 2008.
6
MANAGEMENT’S DISCUSSION & ANALYSIS
GLOBAL REAL ESTATE FUND
Effective May 1, 2008, Global Real Estate Fund amended its investment strategy to a global real estate mandate, with the Fund now benchmarked to the FTSE/EPRA NAREIT Global Real Estate Index rather than the MSCI US REIT Index. In the first four months of 2008, the Fund outperformed its then benchmark, the MSCI US REIT Index. For the period May 1, 2008 to December 31, 2008, the Fund underperformed its benchmark, the FTSE/EPRA NAREIT Global Real Estate Index, due to a combination of poor stock selection, sector allocation and country allocation.
Despite the strategic rationale for global mandate, the tactical timing of the switch was not ideal, as the transition occurred in the midst of a worsening global recession. Global diversification was not a benefit in 2008, and the only business model, and/or property type that did well was one that featured virtually no debt. The last eight months of 2008, the period in which the Fund was fully global, saw the MSCI U.S. REIT Index tumble -42.73%, and the FTSE EPRA/NAREIT Global Real Estate Index fall - -47.86%, and the Fund underperformed on a relative basis.
We have always believed that diversification takes on a special meaning in managing a U.S. real estate portfolio because the different property types and business models typically behave very differently at different stages of the economic cycle. With a global portfolio, the opportunities to diversify are even greater. Furthermore, we believe real estate as an asset class will remain less correlated globally than bonds and stocks due to the local economic drivers that have a large influence on the users and owners of real estate.
The 3rd and 4th quarters of 2008 were extremely volatile in both the global and U.S. real estate equity markets, with the global markets fairing slightly worse than the U.S. market. For the year, global real estate equities also underperformed U.S. real estate equities. Globally, the performance trends by property type were the same for the last 6 months and for all of 2008, mostly because the terrible performance in the 4th quarter overwhelmed the performance in the other three quarters. Due to their above industry average leverage levels and economic cyclicality, the industrial, regional mall, and hotel property types were the worst performers. The best performing property types were the self-storage, health care, and apartment sectors.
No review of 2008 would be complete without at least recognizing the on-going global recession. As one of the more leveraged asset classes, anything real estate-related has, and will continue to suffer until more realistic values are reached. The damage has not spared any property type.
7
GLOBAL REAL ESTATE FUND
| | |
TOP TEN EQUITY HOLDINGS At December 31, 2008 | | INDUSTRY WEIGHTINGS At December 31, 2008 |
| | | |
| | | % of Net Assets | |
Unibail-Rodamco | | 4.7 | % |
Simon Property Group, Inc. | | 4.4 | |
Vornado Realty Trust | | 4.3 | |
Alexandria Real Estate Equities, Inc. | | 4.2 | |
Ventas, Inc. | | 4.2 | |
Mitsubishi Estate Co. Ltd. | | 4.0 | |
Kimco Realty Corp. | | 4.0 | |
Capitaland Ltd. | | 3.9 | |
The Link REIT | | 3.8 | |
Plum Creek Timber Co., Inc. | | 3.8 | |
| | | |
| | | % of Net Assets | |
Diversified | | 23.9 | % |
Shopping Centers | | 18.9 | |
Regional Malls | | 13.1 | |
Office | | 9.1 | |
Health Care Equipment & Services | | 7.8 | |
Short Term Investments | | 7.5 | |
Timber & Forest Products | | 6.8 | |
Warehouse & Industrial | | 6.6 | |
Apartments | | 4.9 | |
Storage | | 0.6 | |
Other assets less liabilities | | 0.8 | |
| | | |
TOTAL | | 100.0 | % |
| | | |
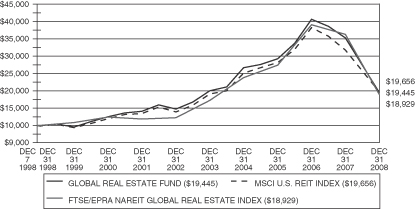
Comparison of Change in Value of a $10,000 Investment in the Global Real Estate Fund – Initial Class, MSCI U.S. REIT Index and the FTSE/EPRA NAREIT Global Real Estate Index
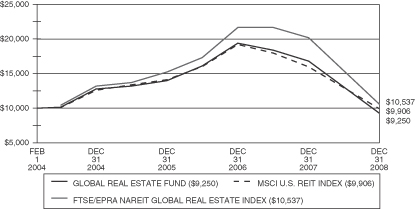
Comparison of Change in Value of a $10,000 Investment in the Global Real Estate Fund – Service Class, MSCI U.S. REIT Index and the FTSE/EPRA NAREIT Global Real Estate Index
8
GLOBAL REAL ESTATE FUND
Total Returns for Periods Ended December 31, 2008**
| | | | | | | | | | | | | | | |
Initial Class Shares | | One Year | | | Three Years | | | Five Years | | | Ten Years | | | Life of
Fund*** | |
Global Real Estate Fund | | (44.73 | )% | | (12.62 | )% | | (0.49 | )% | | 6.95 | % | | 6.83 | % |
MSCI U.S. REIT Index* | | (37.97 | )% | | (11.15 | )% | | 0.67 | % | | 7.19 | % | | 6.94 | % |
FTSE/EPRA NAREIT Global Real Estate Index* | | (47.72 | )% | | (11.53 | )% | | 1.96 | % | | 6.63 | % | | 6.54 | % |
Service Class Shares | | | | | | | | | | | | | | | |
Global Real Estate Fund | | (44.89 | )% | | (12.84 | )% | | N/A | | | N/A | | | (1.57 | )% |
MSCI U.S. REIT Index* | | (37.97 | )% | | (11.15 | )% | | N/A | | | N/A | | | (0.19 | )% |
FTSE/EPRA NAREIT Global Real Estate Index* | | (47.72 | )% | | (11.53 | )% | | N/A | | | N/A | | | 1.07 | % |
*The performance data of the indices has been prepared from sources and data that the investment adviser believes to be reliable, but no representation is made as to their accuracy. The indices are unmanaged and have no fees. The MSCI U.S. REIT Index is a total-return index composed of the most actively traded real estate investment trusts and is designed to be a measure of real estate equity performance. The FTSE EPRA/NAREIT Global Real Estate Index is a total-return comprising eight index families covering the world’s largest investment markets in various currencies, and is designed to track the performance of listed real estate companies and REITs worldwide. The MSCI U.S. REIT Index and the FTSE EPRA/NAREIT Global Real Estate Index have been taken from published sources.
**Performance data is historical and includes changes in share price and reinvestment of income dividends and capital gains distributions. Past performance does not indicate future results. Performance numbers are net of all operating expenses, but do not include any insurance charges imposed in connection with your variable insurance contract. In addition, the investment adviser reduced its management fee and/or reimbursed certain other expenses during these periods. If this performance information included the effect of the insurance charges and the fees and expenses assumed by the investment adviser, performance numbers would be lower. The value of an investment in the Global Real Estate Fund and the return on the investment will fluctuate and redemption proceeds may be higher or lower than an investor’s original cost. Returns greater than one year are annualized. Effective May 1, 2008, Global Real Estate Fund amended its investment strategy to a global real estate mandate, with the Fund now benchmarked to the FTSE/EPRA NAREIT Global Real Estate Index rather than the MSCI U.S. REIT Index.
***Initial Class Shares for the period from December 7, 1998 (commencement of operations) to December 31, 2008. Service Class Shares for the period from February 1, 2004 (commencement of operations) to December 31, 2008.
9
MANAGEMENT’S DISCUSSION & ANALYSIS
DAVIS VENTURE VALUE FUND (subadvised by Davis Selected Advisers, L.P.)
The sectors within the S&P 500 Index that turned in the weakest performance over the year were financials, materials, and information technology. The sectors that turned in the strongest (but still negative) performance over the year were consumer staples and health care.
The Fund’s financial companies out-performed the corresponding sector within the Index (down 49% versus down 55% for the Index), but were still the largest detractors from performance. A higher relative average weighting in this sector (30% versus 16% for the Index) detracted from both absolute and relative performance. American International Group, American Express, Merrill Lynch, Berkshire Hathaway, Loews, Wachovia, and JPMorgan Chase were among the top detractors from performance. Wells Fargo and Hartford Financial Services were among the top contributors to the Fund’s performance.
The second largest detractor from performance were energy companies. The Fund’s energy companies performed roughly in-line with the corresponding sector within the Index (both down 35%) but had a higher relative average weighting in this sector (17% versus 14% for the Index). ConocoPhillips was among the top detractors from performance.
The Fund’s relative performance was helped by having a higher relative average weighting in consumer staple companies (15% versus 11% for the Index). Unfortunately, the Fund’s consumer staple companies under-performed the corresponding sector within the Index (down 25% vs down 16% for the Index). Wal-Mart Stores was among the most important contributors to performance while Costco was among the most important detractors. The Fund no longer owns Wal-Mart Stores.
The Fund’s relative performance was harmed by having a lower relative average weighting in health care companies (4% versus 13% for the Index). The Fund’s healthcare companies under-performed the corresponding sector within the Index (down 29% vs down 23% for the Index). Schering Plough, was among the most important contributors to performance.
H&R Block, a consumer discretionary company, was the single most important contributor to performance over the year.
The Fund held approximately 9% of assets in foreign companies (including American Depositary Receipts) at December 31, 2008. As a whole these companies under-performed the domestic companies held by the Fund.
10
DAVIS VENTURE VALUE FUND
| | |
TOP TEN EQUITY HOLDINGS At December 31, 2008 | | INDUSTRY WEIGHTINGS (Continued) At December 31, 2008 |
| | | |
| | | % of Net Assets | |
Costco Wholesale Corp. | | 5.1 | % |
Wells Fargo & Co. | | 4.5 | |
JPMorgan Chase & Co. | | 4.3 | |
ConocoPhillips | | 4.3 | |
Occidental Petroleum Corp. | | 4.1 | |
Berkshire Hathaway, Inc., Class A | | 4.0 | |
Devon Energy Corp. | | 3.3 | |
Philip Morris International, Inc. | | 3.3 | |
EOG Resources, Inc. | | 2.9 | |
Comcast Corp., Class A Special | | 2.4 | |
INDUSTRY WEIGHTINGS
At December 31, 2008
| | | |
| | | % of Net Assets | |
Oil & Gas-Exploration & Production | | 16.4 | % |
Short Term Investments | | 13.5 | |
Insurance | | 10.1 | |
Food & Staples Retailing | | 7.2 | |
Diversified Financial Services | | 5.2 | |
Media | | 4.9 | |
Commercial Banks | | 4.7 | |
Tobacco | | 3.3 | |
Capital Markets | | 3.2 | |
Commercial Services & Supplies | | 2.6 | |
Health Care Providers & Services | | 2.6 | |
Consumer Finance | | 2.5 | |
Beverages | | 2.2 | |
Software | | 2.0 | |
Pharmaceuticals | | 1.8 | |
Household Products | | 1.7 | |
Diversified Consumer Services | | 1.6 | |
Specialty Retail | | 1.5 | |
Containers & Packaging | | 1.4 | |
Computers & Peripherals | | 1.4 | |
Semiconductors & Semiconductor Equipment | | 1.3 | |
Construction Materials | | 1.3 | |
Electronic Equipment & Instruments | | 1.2 | |
Industrial Conglomerates | | 0.9 | |
Internet Software & Services | | 0.9 | |
| | | |
| | | % of Net Assets | |
Real Estate Management & Development | | 0.7 | % |
Automobiles | | 0.7 | |
Communications Equipment | | 0.6 | |
Energy Equipment & Services | | 0.5 | |
Internet & Catalog Retail | | 0.5 | |
Air Freight & Logistics | | 0.5 | |
Marine | | 0.5 | |
Chemicals | | 0.5 | |
Transportation | | 0.5 | |
Metals & Mining | | 0.4 | |
Paper & Forest Products | | 0.4 | |
Machinery | | 0.3 | |
Personal Products | | 0.3 | |
Food Products | | 0.2 | |
Independent Power Producers & Energy Traders | | 0.2 | |
Wireless Telecommunication Services | | 0.2 | |
Electrical Equipment | | 0.1 | |
Household Durables | | 0.1 | |
Multi-Line Retail | | 0.1 | |
Liabilities in excess of other assets | | (2.7 | ) |
| | | |
TOTAL | | 100.0 | % |
| | | |
11
DAVIS VENTURE VALUE FUND
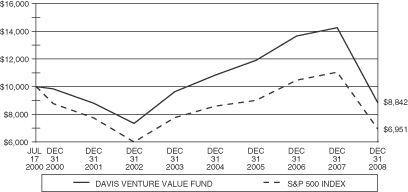
Comparison of Change in Value of a $10,000 Investment in the Davis Venture Value Fund – Initial Class and the S&P 500 Index
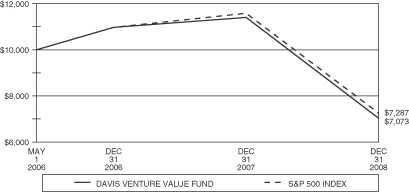
Comparison of Change in Value of a $10,000 Investment in the Davis Venture Value Fund – Service Class and the S&P 500 Index
12
DAVIS VENTURE VALUE FUND
Total Returns for Periods Ended December 31, 2008**
| | | | | | | | | | | | |
Initial Class Shares | | One Year | | | Three Years | | | Five Years | | | Life of
Fund*** | |
Davis Venture Value Fund | | (37.81 | )% | | (9.39 | )% | | (1.70 | )% | | (1.44 | )% |
S&P 500 Index* | | (37.00 | )% | | (8.34 | )% | | (2.19 | )% | | (4.21 | )% |
Service Class Shares | | | | | | | | | | | | |
Davis Venture Value Fund | | (37.93 | )% | | N/A | | | N/A | | | (12.16 | )% |
S&P 500 Index* | | (37.00 | )% | | N/A | | | N/A | | | (11.19 | )% |
*The performance data of the index has been prepared from sources and data that the investment adviser believes to be reliable, but no representation is made as to their accuracy. The index is unmanaged and has no fees or costs. The S&P’s 500 Index is a market-value weighted index of 500 blue chip stocks and is considered to be a benchmark of the overall stock market. The S&P 500 Index has been taken from published sources.
**Performance data is historical and includes changes in share price and reinvestment of income dividends and capital gains distributions. Past performance does not indicate future results. Performance numbers are net of all operating expenses, but do not include any insurance charges imposed in connection with your variable insurance contract. In addition, the investment adviser reduced its management fee and/or reimbursed certain other expenses during these periods. If this performance information included the effect of the insurance charges and the fees and expenses assumed by the investment adviser, performance numbers would be lower. The value of an investment in the Davis Venture Value Fund and the return on the investment will fluctuate and redemption proceeds may be higher or lower than an investor’s original cost. Returns greater than one year are annualized.
***Initial Class Shares for the period from July 17, 2000 (commencement of operations) to December 31, 2008. Service Class Shares for the period from May 1, 2006 (commencement of operations) to December 31, 2008.
13
MANAGEMENT’S DISCUSSION & ANALYSIS
OPPENHEIMER MAIN STREET SMALL CAP FUND (subadvised by OppenheimerFunds, Inc.)
Like most other asset classes, U.S. stocks declined sharply when a credit crunch that began in 2007 developed into a full-blown global financial crisis over the summer of 2008. Turmoil spread from the sub-prime mortgage sector of the U.S. bond market to other financial markets, including stocks, as investors became increasingly risk-averse. Declining asset prices compelled major financial institutions to write down or write off a significant portion of their investments’ value, contributing to massive losses that led to the insolvency of several major commercial banks, investment banks, mortgage agencies and insurers.
Meanwhile, a U.S. economic slowdown that began in late 2007 was exacerbated by the financial crisis, leading to a surge in job losses and additional pressure on slumping home prices. Cash-strapped consumers and anxious businesses curtailed spending, adding fuel to the downturn. The U.S. recession quickly spread to overseas markets, reducing previously robust demand for energy and building materials. Consequently, commodity prices that had reached record highs over the first half of the year plummeted over the second half.
Investors worried about these developments engaged in a “flight to quality,” selling riskier assets, such as small-cap stocks, in favor of U.S. Treasury securities. Selling pressure appeared to be indiscriminate as investors rushed for the exits, punishing stocks of fundamentally sound companies along with less healthy ones. Although the financial institutions at the epicenter of the crisis were mainly very large companies, the flight to quality was also damaging for smaller businesses, which historically have been more volatile than their larger counterparts. The bear market was especially severe for traditionally economically-sensitive sectors, such as the consumer discretionary and information technology sectors, while sectors whose fortunes rise and fall with commodity prices, such as energy and basic materials producers, also were hard hit. Conversely, the historically defensive consumer staples and utilities sectors held up relatively well.
As always, we invested the Fund’s assets in accordance with the signals generated by our multi-factor quantitative models, including a newly developed model designed to consider unusually volatile market conditions. Our process worked relatively well over the first half of 2008, when the Fund generally produced higher returns than the Russell 2000 Index. Our market capitalization model indicated that companies toward the larger end of the small-cap range, including a number of mid-cap companies, were likely to fare better than micro-cap and other smaller stocks. In addition, our stock selection model found a number of opportunities in the materials sector, leading to an overweight position that benefited relative performance as commodity prices soared to record highs. Conversely, we identified relatively few highly ranked stocks in the financial sector, which was hurt by the credit crisis, and the health care sector, where managed care companies struggled with rising costs. On the other hand, an underweight position in the energy sector, a relatively small component of the index, detracted from relative performance over the first half of the year.
The positions that benefited the Fund’s results during the first half of the year were detractors over the second half of the year, when extreme volatility roiled equity markets. Midcap stocks, many of which had been removed from the Russell 2000 Index when it rebalanced at mid-year, fell sharply in the wake of the banking crisis, adversely affecting the Fund to a greater extent than the index. Although we reduced the Fund’s exposure to mid-cap stocks over the second half of 2008, it was not enough to offset the capitalization range’s poor performance. In addition, the Fund’s overweight positions in the materials, consumer discretionary and information technology sectors fared poorly in the deepening recession that dominated the final six months of 2008.
As of year-end, our models have indicated that smaller-cap stocks generally are better positioned in the current market environment, which was reflected in a modestly underweighted position in mid-cap stocks and mildly overweight exposure to small and micro-cap stocks relative to the benchmark. In addition, the Fund ended the reporting period with an emphasis on the information technology, industrials and energy sector, where a number
14
MANAGEMENT’S DISCUSSION & ANALYSIS (Continued)
of companies appear to have been punished too severely during the downturn and may be poised to rebound strongly in an eventual recovery. Likewise, we are also keeping an eye on the materials sector in 2009 and as of period end maintained an overweight position relative to the benchmark. Conversely, we ended the reporting period underweight the benchmark in financials.
15
OPPENHEIMER MAIN STREET SMALL CAP FUND
| | |
TOP TEN EQUITY HOLDINGS At December 31, 2008 | | INDUSTRY WEIGHTINGS (Continued) At December 31, 2008 |
| | | |
| | | % of Net Assets | |
EMCOR Group, Inc. | | 0.4 | % |
QLogic Corp. | | 0.4 | |
AMERIGROUP Corp. | | 0.3 | |
First Horizon National Corp. | | 0.3 | |
Tractor Supply Co. | | 0.3 | |
Gardner Denver, Inc. | | 0.3 | |
GrafTech International Ltd. | | 0.3 | |
Acuity Brands, Inc. | | 0.3 | |
Perini Corp. | | 0.3 | |
Deluxe Corp. | | 0.3 | |
INDUSTRY WEIGHTINGS
At December 31, 2008
| | | |
| | | % of Net Assets | |
Semiconductors & Semiconductor Equipment | | 5.7 | % |
Commercial Services & Supplies | | 5.4 | |
Machinery | | 5.3 | |
Specialty Retail | | 5.2 | |
Insurance | | 5.0 | |
Commercial Banks | | 4.3 | |
Oil & Gas-Exploration & Production | | 3.6 | |
Health Care Providers & Services | | 3.2 | |
Software | | 3.2 | |
Communications Equipment | | 3.1 | |
Electronic Equipment & Instruments | | 3.1 | |
Energy Equipment & Services | | 2.9 | |
Chemicals | | 2.8 | |
Real Estate Investment Trusts | | 2.7 | |
Hotels, Restaurants & Leisure | | 2.5 | |
IT Services | | 2.3 | |
Metals & Mining | | 2.1 | |
Internet Software & Services | | 2.1 | |
Electrical Equipment | | 2.0 | |
Computers & Peripherals | | 1.9 | |
Textiles, Apparel & Luxury Goods | | 1.7 | |
Household Durables | | 1.7 | |
Health Care Equipment & Supplies | | 1.5 | |
Construction & Engineering | | 1.4 | |
Diversified Telecommunication Services | | 1.4 | |
Aerospace & Defense | | 1.4 | |
Biotechnology | | 1.4 | |
| | | |
| | | % of Net Assets | |
Capital Markets | | 1.3 | % |
Trading Companies & Distributors | | 1.2 | |
Building Products | | 1.2 | |
Media | | 1.1 | |
Auto Components | | 1.1 | |
Thrift & Mortgage Finance | | 1.1 | |
Internet & Catalog Retail | | 1.0 | |
Airlines | | 0.9 | |
Consumer Finance | | 0.8 | |
Short Term Investments | | 0.8 | |
Personal Products | | 0.8 | |
Road & Rail | | 0.8 | |
Leisure Equipment & Products | | 0.8 | |
Pharmaceuticals | | 0.8 | |
Diversified Consumer Services | | 0.7 | |
Life Sciences Tools & Services | | 0.6 | |
Wireless Telecommunication Services | | 0.6 | |
Paper & Forest Products | | 0.6 | |
Multi-Line Retail | | 0.5 | |
Food Products | | 0.5 | |
Food & Staples Retailing | | 0.5 | |
Diversified Financial Services | | 0.5 | |
Containers & Packaging | | 0.5 | |
Marine | | 0.4 | |
Air Freight & Logistics | | 0.3 | |
Industrial Conglomerates | | 0.3 | |
Multi-Utilities | | 0.2 | |
Gas Utilities | | 0.2 | |
Office Electronics | | 0.2 | |
Automobiles | | 0.2 | |
Tobacco | | 0.2 | |
Health Care Technology | | 0.1 | |
Household Products | | 0.1 | |
Real Estate Management & Development | | 0.1 | |
Water Utilities | | 0.1 | |
Independent Power Producers & Energy Traders | | 0.0 | * |
Beverages | | 0.0 | * |
Distributors | | 0.0 | * |
Other assets less liabilities | | 0.0 | * |
| | | |
TOTAL | | 100.0 | % |
| | | |
| * | Amount is less than 0.05%. |
16
OPPENHEIMER MAIN STREET SMALL CAP FUND
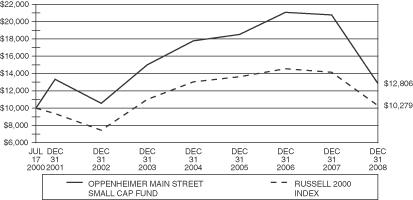
Comparison of Change in Value of a $10,000 Investment in the Oppenheimer Main Street Small Cap Fund – Initial Class and the Russell 2000 Index
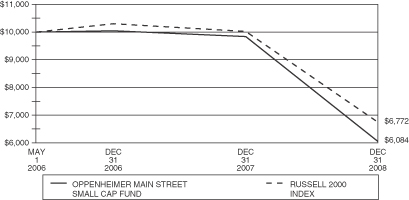
Comparison of Change in Value of a $10,000 Investment in the Oppenheimer Main Street Small Cap Fund – Service Class and the Russell 2000 Index
17
OPPENHEIMER MAIN STREET SMALL CAP FUND
Total Returns for Periods Ended December 31, 2008**
| | | | | | | | | | | | |
Initial Class Shares | | One Year | | | Three Years | | | Five Years | | | Life of
Fund*** | |
Oppenheimer Main Street Small Cap Fund | | (37.99 | )% | | (11.45 | )% | | (3.02 | )% | | 2.97 | % |
Russell 2000 Index* | | (33.79 | )% | | (8.28 | )% | | (0.93 | )% | | 0.33 | % |
Service Class Shares | | | | | | | | | | | | |
Oppenheimer Main Street Small Cap Fund | | (38.14 | )% | | N/A | | | N/A | | | (16.98 | )% |
Russell 2000 Index* | | (33.79 | )% | | N/A | | | N/A | | | (13.60 | )% |
*The performance data for the index has been prepared from sources and data that the investment adviser believes to be reliable, but no representation is made as to their accuracy. The Russell 2000 Index includes the 2000 companies with the smallest market capitalizations from the Russell 3000 Index. The Russell 2000 Index has been taken from published sources.
**Performance data is historical and includes changes in share price and reinvestment of income dividends and capital gains distributions. Past performance does not indicate future results. Performance numbers are net of all operating expenses, but do not include any insurance charges imposed in connection with your variable insurance contract. In addition, the investment adviser reduced its management fee and/or reimbursed certain other expenses during these periods. If this performance information included the effect of the insurance charges and the fees and expenses assumed by the investment adviser, performance numbers would be lower. The value of an investment in the Oppenheimer Main Street Small Cap Fund and the return on the investment will fluctuate and redemption proceeds may be higher or lower than an investor’s original cost. Returns greater than one year are annualized.
***Initial Class Shares for the period from July 17, 2000 (commencement of operations) to December 31, 2008. Service Class Shares for the period from May 1, 2006 (commencement of operations) to December 31, 2008.
18
MANAGEMENT’S DISCUSSION & ANALYSIS
OPPENHEIMER LARGE CAP CORE FUND (subadvised by OppenheimerFunds, Inc.)
Effective May 1, 2008 Oppenheimer Funds, Inc. replaced Sun Capital Advisers LLC as subadviser to the Sun Capital All Cap Fund. Also effective May 1, 2008 the name of the Fund was changed to SC Oppenheimer Large Cap Core Fund. OFI Institutional Asset Management, Inc., an affiliate of OppenheimerFunds, Inc., serves as sub-subadviser to SC Oppenheimer Large Cap Core Fund.
The pervasive lack of credit in 2008 fueled a massive scaling back among U.S. corporations, increasing unemployment, and decreasing consumer spending. And while third quarter GDP was only slightly negative, economists anticipate the fourth quarter will be among the worst on record. Equity markets have been sent reeling, turning in the weakest calendar year performance in the post World-War II era. In response, the Federal Reserve cut interest rates to their lowest level in history; Congress approved a roughly $170 billion stimulus plan early in 2008 and a $700 billion TARP in the opening days of the fourth quarter. Deals were brokered to save the likes of Bear Stearns, Fannie Mae, and Freddie Mac and Congress is arranging for billions of dollars in loans for a struggling automotive industry.
The fourth quarter brought unprecedented volatility to the markets. Once unheard of, daily price movements of ±5% were not uncommon and moves of ±3% were commonplace, particularly early in the quarter. Though volatility eased in the closing weeks of the fourth quarter the average daily price movement of the S&P 500 was ±3.3%.
While we would hesitate to call November 20 the ultimately low in the bear market ravaging equities over the preceding 14 months, the subsequent rally has been significant. From the intra-quarter low through December 31, the S&P 500 gained 20.5%. In an absolute sense, this rally surpasses the technical definition of a bull market; however, its brevity precludes this designation, as we typically look for a sustained rally over at least three months.
Financials added the most value versus the S&P 500 since inception. Earlier in 2008, in response to ongoing uncertainty surrounding the integrity of data coming out of the sector, our quantitative team took steps to either limit the allowable position size in our client portfolios or to avoid specific stocks altogether – a strategy that worked well. The portfolio did not hold Fannie Mae, Freddie Mac, Goldman Sachs, Merrill Lynch, Lehman Brothers, or Wachovia; further, we elected to remove AIG from the portfolio well ahead of its collapsing share price.
Stock selectivity in Consumer Staples proved costly to the portfolio. Proctor & Gamble was the most costly holding in the sector; added to the portfolio in November, the stock is underweight in comparison to the benchmark making it costly in relative terms. The decision to avoid Anheuser-Busch also proved costly as the stock had strong gains.
We see parallels between today’s housing and credit turmoil and the technology bubble of the late ‘90s. Markets have seen prices rise on little or no substance; valuation tools are not working in line with their historical norms, and quantitative techniques have been out of favor. A decade ago, the tech bubble burst and stocks fell into a long and costly bear market. After some initial choppiness, markets experienced indiscriminate selling as fear of a protracted bear market grew. Following the tumult, valuation and risk measures swung back into favor and our process led to market outperformance for the next several years. The position we are now in is strikingly similar: we are seeing choppiness (with unprecedented volatility) and indiscriminate selling, which has altered the complacency and extreme risk-seeking behavior of earlier this year, moving the markets back towards a historically normal risk-averse stance.
19
OPPENHEIMER LARGE CAP CORE FUND
| | |
TOP TEN EQUITY HOLDINGS At December 31, 2008 | | INDUSTRY WEIGHTINGS (Continued) At December 31, 2008 |
| | | |
| | | % of Net Assets | |
Wal-Mart Stores, Inc. | | 4.0 | % |
Exxon Mobil Corp. | | 3.8 | |
International Business Machines Corp. | | 2.9 | |
Hewlett-Packard Co. | | 2.8 | |
Johnson & Johnson | | 2.5 | |
Amgen, Inc. | | 2.2 | |
Microsoft Corp. | | 2.1 | |
Northrop Grumman Corp. | | 2.1 | |
Pfizer, Inc. | | 2.0 | |
Verizon Communications, Inc. | | 2.0 | |
INDUSTRY WEIGHTINGS
At December 31, 2008
| | | |
| | | % of Net Assets | |
Oil & Gas-Exploration & Production | | 13.1 | % |
Pharmaceuticals | | 7.8 | |
Computers & Peripherals | | 6.9 | |
Aerospace & Defense | | 6.1 | |
Short Term Investments | | 5.6 | |
Food Products | | 5.6 | |
Health Care Providers & Services | | 5.5 | |
Food & Staples Retailing | | 4.9 | |
Software | | 4.0 | |
Road & Rail | | 3.4 | |
Insurance | | 2.9 | |
Diversified Telecommunication Services | | 2.8 | |
Specialty Retail | | 2.6 | |
Capital Markets | | 2.6 | |
Real Estate Investment Trusts | | 2.4 | |
Biotechnology | | 2.2 | |
Tobacco | | 2.2 | |
Energy Equipment & Services | | 2.2 | |
Diversified Financial Services | | 2.1 | |
Household Products | | 2.0 | |
Electric Utilities | | 1.9 | |
Media | | 1.4 | |
Multi-Utilities | | 1.4 | |
Chemicals | | 1.4 | |
Communications Equipment | | 1.1 | |
| | | |
| | | % of Net Assets | |
Health Care Equipment & Supplies | | 1.1 | % |
Construction & Engineering | | 1.1 | |
Machinery | | 1.1 | |
Beverages | | 0.9 | |
Commercial Services & Supplies | | 0.7 | |
Commercial Banks | | 0.6 | |
Office Electronics | | 0.6 | |
Semiconductors & Semiconductor Equipment | | 0.5 | |
IT Services | | 0.5 | |
Thrift & Mortgage Finance | | 0.4 | |
Metals & Mining | | 0.4 | |
Air Freight & Logistics | | 0.3 | |
Leisure Equipment & Products | | 0.3 | |
Wireless Telecommunication Services | | 0.2 | |
Textiles, Apparel & Luxury Goods | | 0.2 | |
Industrial Conglomerates | | 0.1 | |
Liabilities in excess of other assets | | (3.1 | ) |
| | | |
TOTAL | | 100.0 | % |
| | | |
20
OPPENHEIMER LARGE CAP CORE FUND
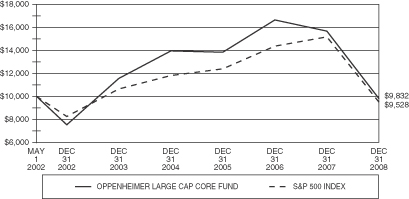
Comparison of Change in Value of a $10,000 Investment in the Oppenheimer Large Cap Core Fund – Initial Class and the S&P 500 Index
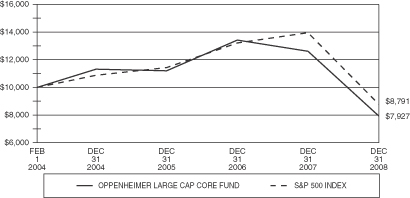
Comparison of Change in Value of a $10,000 Investment in the Oppenheimer Large Cap Core Fund – Service Class and the S&P 500 Index
21
OPPENHEIMER LARGE CAP CORE FUND
Total Returns for Periods Ended December 31, 2008**
| | | | | | | | | | | | |
Initial Class Shares | | One Year | | | Three Years | | | Five Years | | | Life of
Fund*** | |
Oppenheimer Large Cap Core Fund | | (37.06 | )% | | (10.71 | )% | | (3.18 | )% | | (0.25 | )% |
S&P 500 Index* | | (37.00 | )% | | (8.34 | )% | | (2.19 | )% | | (0.72 | )% |
Service Class Shares | | | | | | | | | | | | |
Oppenheimer Large Cap Core Fund | | (37.15 | )% | | (10.91 | )% | | N/A | | | (4.62 | )% |
S&P 500 Index* | | (37.00 | )% | | (8.34 | )% | | N/A | | | (2.59 | )% |
*The performance data of the index has been prepared from sources and data that the investment adviser believes to be reliable, but no representation is made as to their accuracy. The index is unmanaged and has no fees or costs. The S&P 500 Index is a market-value weighted index of 500 blue chip stocks and is considered to be a benchmark of the overall stock market. The S&P 500 Index has been taken from published sources.
**Performance data is historical and includes changes in share price and reinvestment of income dividends and capital gains distributions. Past performance does not indicate future results. Performance numbers are net of all operating expenses, but do not include any insurance charges imposed in connection with your variable insurance contract. In addition, the investment adviser reduced its management fee and reimbursed certain other expenses during these periods. If this performance information included the effect of the insurance charges and the fees and expenses assumed by the investment adviser, performance numbers would be lower. The value of an investment in the Oppenheimer Large Cap Core Fund and the return on the investment will fluctuate and redemption proceeds may be higher or lower than an investor’s original cost. Returns greater than one year are annualized. Effective May 1, 2008 Oppenheimer Funds, Inc. replaced Sun Capital Advisers LLC as subadviser to the Sun Capital All Cap Fund. Also effective May 1, 2008 the name of the Fund was changed to SC Oppenheimer Large Cap Core Fund. OFI Institutional Asset Management, Inc., an affiliate of OppenheimerFunds, Inc., serves as sub-subadviser to SC Oppenheimer Large Cap Core Fund.
***Initial Class Shares for the period from May 1, 2002 (commencement of operations) to December 31, 2008. Service Class Shares for the period from February 1, 2004 (commencement of operations) to December 31, 2008.
22
MANAGEMENT’S DISCUSSION & ANALYSIS
WMC LARGE CAP GROWTH FUND (subadvised by Wellington Management Co., LLP)
Effective August 1, 2008, Wellington Management Company, LLP replaced Pyramis Global Advisors, LLC as subadviser to FI Large Cap Growth Fund. Also effective August 1, 2008, the name of the Fund changed to WMC Large Cap Growth Fund.
The one-year period ended December 31, 2008 was an extraordinarily challenging year in financial markets as nearly every asset class recorded significant price declines. After a positive start to the year, global equity markets stumbled as a widespread contraction in credit led to major changes in the financial landscape. These included the near collapse of large investment bank Bear Stearns, government takeovers of Fannie Mae and Freddie Mac, the collapse of Lehman Brothers, the fall of insurance firm AIG, and the seizure of banking firm Washington Mutual. The global economy also weakened, sending energy and commodities prices lower. Equity investors sought to shed risk in response to increasing concerns about the financial system and a US recession, punishing stock prices broadly.
Small cap, mid cap, and large cap stocks declined in unison during the period, as measured by the Russell 2000, S&P MidCap 400, and S&P 500 indices, respectively. Value and Growth stocks performed similarly during the period, as measured by the Russell 1000 Value and Russell 1000 Growth indices. There were no safe havens as all ten sectors within the Russell 1000 Growth Index posted negative double digit returns. Energy, Materials, and Telecommunication Services were the biggest laggards. Consumer Staples, Health Care, and Consumer Discretionary declined the least.
For the period from early August to year-end, overall Fund performance was hurt by weaker stock selection within the Materials, Financials, and Health Care sectors. This was partially offset by the positive impact to relative performance from stock selection within the Information Technology, Consumer Discretionary, and Energy sectors. The Fund’s underweight position to the relatively outperforming Consumer Staples sector negatively impacted relative performance. An underweight position to Materials and an overweight position to Information Technology also detracted from relative performance.
Among the largest detractors from relative performance during the period were Smith International, Potash, and Mosaic. Not owning integrated oil and gas company Exxon Mobil detracted from relative performance, as the market viewed its shares as a safe haven within the Energy sector. Shares of oil and gas exploration and production supplier Smith International declined because of lower revenues due to lower natural gas and oil prices. Shares of Canadian-based fertilizer and feed products company Potash and major fertilizer producer Mosaic fell as falling grain prices led to weakness in fertilizer demand. Information technology companies Cisco Systems, Microsoft, and IBM also detracted from the Fund’s absolute returns.
Top contributors to relative performance included AutoZone, Apollo Group, and Eli Lilly. Not owning oilfield service company Schlumberger also contributed to relative performance. Specialty auto parts retailer AutoZone’s shares rose over the period due to better than expected earnings and expectations that replacement part sales will increase as car owners try to extend the life of existing vehicles. Shares of for-profit education company Apollo Group rose as the company experienced very strong sales growth and high incremental margins in the most recent quarter. Shares of pharmaceutical company Eli Lilly performed well due to the possibility of sustainable growth with several new drugs. Department store giant Wal-Mart was also among other top absolute contributors.
Sector exposure is predominantly a fall-out of stock selection. At the end of 2008 our largest overweights relative to the Russell 1000 Growth Index were to the Information Technology and Health Care sectors, while the largest underweights were to Consumer Staples and Utilities.
23
WMC LARGE CAP GROWTH FUND
| | |
TOP TEN EQUITY HOLDINGS At December 31, 2008 | | INDUSTRY WEIGHTINGS At December 31, 2008 |
| | | |
| | | % of Net Assets | |
Cisco Systems, Inc. | | 4.4 | % |
Microsoft Corp. | | 4.3 | |
Oracle Corp. | | 4.0 | |
Occidental Petroleum Corp. | | 3.1 | |
Philip Morris International, Inc. | | 3.0 | |
International Business Machines Corp. | | 3.0 | |
Abbott Laboratories | | 2.7 | |
Wal-Mart Stores, Inc. | | 2.7 | |
Eli Lilly & Co. | | 2.4 | |
Altera Corp. | | 2.2 | |
| | | |
| | | % of Net Assets | |
Software | | 11.6 | % |
Pharmaceuticals | | 10.1 | |
Oil, Gas & Consumable Fuels | | 7.3 | |
Communications Equipment | | 6.4 | |
Short Term Investments | | 5.3 | |
Specialty Retail | | 5.2 | |
Semiconductors & Semiconductor Equipment | | 5.0 | |
Computers & Peripherals | | 5.0 | |
Machinery | | 4.9 | |
Biotechnology | | 3.6 | |
Aerospace & Defense | | 3.1 | |
Tobacco | | 3.0 | |
Household Products | | 3.0 | |
Food Products | | 2.9 | |
Food & Staples Retailing | | 2.7 | |
Health Care Equipment & Supplies | | 2.5 | |
Electrical Equipment | | 2.4 | |
Chemicals | | 2.2 | |
IT Services | | 2.0 | |
Construction & Engineering | | 1.8 | |
Energy Equipment & Services | | 1.5 | |
Capital Markets | | 1.4 | |
Diversified Consumer Services | | 1.3 | |
Commercial Banks | | 1.1 | |
Textiles, Apparel & Luxury Goods | | 0.9 | |
Diversified Financial Services | | 0.8 | |
Insurance | | 0.8 | |
Commercial Services & Supplies | | 0.7 | |
Household Durables | | 0.6 | |
Road & Rail | | 0.6 | |
Life Sciences Tools & Services | | 0.5 | |
Diversified Telecommunication Services | | 0.4 | |
Personal Products | | 0.4 | |
Media | | 0.4 | |
Auto Components | | 0.3 | |
Hotels, Restaurants & Leisure | | 0.1 | |
Liabilities in excess of other assets | | (1.8 | ) |
| | | |
TOTAL | | 100.0 | % |
| | | |
24
WMC LARGE CAP GROWTH FUND
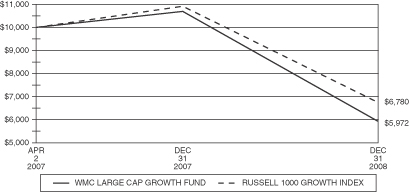
Comparison of Change in Value of a $10,000 Investment in the WMC Large Cap Growth Fund – Initial Class and the Russell 1000 Growth Index
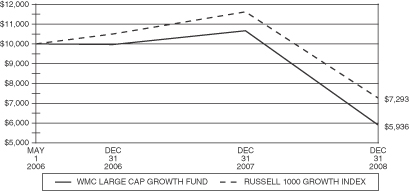
Comparison of Change in Value of a $10,000 Investment in the WMC Large Cap Growth Fund – Service Class and the Russell 1000 Growth Index
25
WMC LARGE CAP GROWTH FUND
Total Returns for Periods Ended December 31, 2008**
| | | | | | |
Initial Class Shares | | One Year | | | Life of
Fund*** | |
WMC Large Cap Growth Fund | | (44.12 | )% | | (25.53 | )% |
Russell 1000 Growth Index* | | (38.44 | )% | | (19.94 | )% |
Service Class Shares | | | | | | |
WMC Large Cap Growth Fund | | (44.30 | )% | | (17.75 | )% |
Russell 1000 Growth Index* | | (38.44 | )% | | (11.16 | )% |
*The performance data of the index has been prepared from sources and data that the investment adviser believes to be reliable, but no representation is made as to their accuracy. The Russell 1000 Growth Index is an unmanaged index that measures the performance of those Russell 1000 Index securities with higher price-to-book ratios and higher forecasted growth values, representative of U.S. securities exhibiting growth characteristics. The Russell 1000 Growth Index includes the largest 1000 securities in the Russell 3000 Index, based on market cap. The Russell 3000 Index consists of the 3000 largest and most liquid stocks based and traded in the U.S. The Russell 1000 Growth Index has been taken from published sources.
**Performance data is historical and includes changes in share price and reinvestment of income dividends and capital gains distributions. Past performance does not indicate future results. Performance numbers are net of all operating expenses, but do not include any insurance charges imposed in connection with your variable insurance contract. In addition, the investment adviser reduced its management fee and/or reimbursed certain other expenses during these periods. If this performance information included the effect of the insurance charges and the fees and expenses assumed by the investment adviser, performance numbers would be lower. The value of an investment in the WMC Large Cap Growth Fund and the return on the investment will fluctuate and redemption proceeds may be higher or lower than an investor’s original cost. Returns greater than one year are annualized. Effective August 1, 2008, Wellington Management Company, LLP replaced Pyramis Global Advisors, LLC as subadviser to FI Large Cap Growth Fund. Also effective August 1, 2008, the name of the Fund changed to WMC Large Cap Growth Fund.
***Initial Class Shares for the period from April 2, 2007 (commencement of operations) to December 31, 2008. Service Class Shares for the period from May 1, 2006 (commencement of operations) to December 31, 2008.
26
MANAGEMENT’S DISCUSSION & ANALYSIS
WMC BLUE CHIP MID CAP FUND (subadvised by Wellington Management Co., LLP)
The one-year period ended December 31, 2008 was an extraordinarily challenging year in financial markets as nearly every asset class recorded significant price declines. After a positive start to the year, global equity markets stumbled as a widespread contraction in credit led to major changes in the financial landscape. These included the near collapse of large investment bank Bear Stearns, government takeovers of Fannie Mae and Freddie Mac, the collapse of Lehman Brothers, the fall of insurance firm AIG, and the seizure of banking firm Washington Mutual. The global economy also weakened, sending energy and commodities prices lower. Equity investors sought to shed risk in response to increasing concerns about the financial system and a US recession, punishing stock prices broadly.
Small cap, mid cap, and large cap stocks declined in unison during the period, as measured by the Russell 2000, S&P MidCap 400, and S&P 500 indices, respectively. There were no safe havens as all ten sectors within the S&P MidCap 400 Index posted negative returns. Energy, Telecommunication Services, and Materials were the biggest laggards. Utilities and Consumer Staples declined the least.
Security selection in Consumer Discretionary, Materials, and Health Care contributed to positive relative performance for the Fund, and more than offset weaker stock selection in the Financials, Information Technology, and Energy sectors. Sector positioning, driven by security selection, also contributed positively to benchmark-relative returns during the period, primarily due to underweight positions in Energy and Consumer Discretionary. The Fund benefited from a modest cash position, which helped relative performance in a downward-trending market.
Top contributors to returns on a relative basis included Barr Pharmaceuticals, ITT Educational Services, and Allied Waste. Shares of specialty pharmaceutical company Barr Pharmaceuticals rose after the company received a stock and cash takeover offer from generic drug firm Teva Pharmaceutical. Shares of ITT Educational Services, a technology-oriented postsecondary degree programs provider, benefited from strong industry fundamentals as the softer economy aided enrollment growth and increases in federal loan limits enhanced pricing power. Waste management company Allied Waste was acquired by Republic Services in early December. Other top contributors to absolute performance included drug developer Millennium Pharmaceuticals, who was purchased by Takeda Pharmaceutical, and specialty automotive aftermarket parts and accessories retailer O’Reilly Automotive.
Top detractors from relative performance included Electronic Arts, CGG Veritas, and Chicago Bridge & Iron. Video game software company Electronic Arts saw its shares drift lower on disappointing bottom-line results due to high development costs and acquisition charges. Shares of CGG Veritas, a geophysical equipment and services provider, fell on concerns that demand for its seismic services would decline as energy companies cut back their exploration and production expenditures. Shares of global engineering and construction company Chicago Bridge & Iron declined due to project cost overruns and poor bidding on projects. US hospital operator Community Health Systems and oil and gas exploration and production company Forest Oil were also among the top detractors from absolute performance.
Sector exposure is predominantly a fall-out of stock selection. At the end of 2008 our largest overweights relative to the S&P MidCap 400 Index were to the Information Technology and Health Care sectors, while the largest underweights were to Financials and Materials.
27
WMC BLUE CHIP MID CAP FUND
| | |
TOP TEN EQUITY HOLDINGS At December 31, 2008 | | INDUSTRY WEIGHTINGS (Continued) At December 31, 2008 |
| | | |
| | | % of Net Assets | |
Republic Services, Inc. | | 2.7 | % |
The Western Union Co. | | 2.2 | |
Beckman Coulter, Inc. | | 1.9 | |
Equifax, Inc. | | 1.9 | |
Northeast Utilities | | 1.8 | |
UGI Corp. | | 1.8 | |
O’Reilly Automotive, Inc. | | 1.8 | |
DPL, Inc. | | 1.8 | |
Dreamworks Animation Skg, Inc., Class A | | 1.7 | |
Clorox Co. | | 1.7 | |
INDUSTRY WEIGHTINGS
At December 31, 2008
| | | |
| | | % of Net Assets | |
Insurance | | 8.6 | % |
Specialty Retail | | 8.1 | |
Health Care Providers & Services | | 5.5 | |
Short Term Investments | | 5.4 | |
Software | | 4.9 | |
Computers & Peripherals | | 4.3 | |
Professional Services | | 4.3 | |
Health Care Equipment & Supplies | | 3.9 | |
Diversified Consumer Services | | 3.7 | |
Electric Utilities | | 3.6 | |
IT Services | | 3.6 | |
Oil & Gas-Exploration & Production | | 3.1 | |
Biotechnology | | 2.9 | |
Commercial Services & Supplies | | 2.7 | |
Semiconductors & Semiconductor Equipment | | 2.6 | |
Machinery | | 2.3 | |
Media | | 2.3 | |
Containers & Packaging | | 2.2 | |
Road & Rail | | 2.2 | |
Aerospace & Defense | | 2.1 | |
Life Sciences Tools & Services | | 2.0 | |
Gas Utilities | | 1.8 | |
Food & Staples Retailing | | 1.7 | |
Household Products | | 1.7 | |
Building Products | | 1.4 | |
| | | |
| | | % of Net Assets | |
Capital Markets | | 1.4 | % |
Commercial Banks | | 1.2 | |
Wireless Telecommunication Services | | 1.1 | |
Electrical Equipment | | 1.0 | |
Electronic Equipment & Instruments | | 1.0 | |
Household Durables | | 0.9 | |
Pharmaceuticals | | 0.9 | |
Chemicals | | 0.8 | |
Energy Equipment & Services | | 0.8 | |
Hotels, Restaurants & Leisure | | 0.8 | |
Metals & Mining | | 0.8 | |
Internet Software & Services | | 0.7 | |
Leisure Equipment & Products | | 0.7 | |
Real Estate Investment Trusts | | 0.6 | |
Health Care Technology | | 0.4 | |
Airlines | | 0.3 | |
Auto Components | | 0.2 | |
Consumer Finance | | 0.2 | |
Food Products | | 0.0 | * |
Liabilities in excess of other assets | | (0.7 | ) |
| | | |
TOTAL | | 100.0 | % |
| | | |
| * | Amount is less than 0.05%. |
28
WMC BLUE CHIP MID CAP FUND
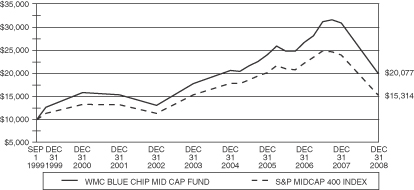
Comparison of Change in Value of a $10,000 Investment in the WMC Blue Chip Mid Cap Fund – Initial Class and the S&P MidCap 400 Index
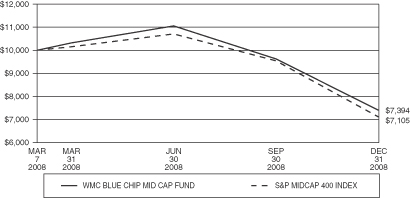
Comparison of Change in Value of a $10,000 Investment in the WMC Blue Chip Mid Cap Fund – Service Class and the S&P MidCap 400 Index
29
WMC BLUE CHIP MID CAP FUND
Total Returns for Periods Ended December 31, 2008**
| | | | | | | | | | | | |
Initial Class Shares | | One Year | | | Three Years | | | Five Years | | | Life of
Fund*** | |
Blue Chip Mid Cap Fund | | (35.14 | )% | | (5.91 | )% | | 2.44 | % | | 7.75 | % |
S&P MidCap 400 Index* | | (36.23 | )% | | (8.74 | )% | | (0.08 | )% | | 4.67 | % |
Service Class Shares | | | | | | | | | | | | |
Blue Chip Mid Cap Fund | | NA | | | NA | | | NA | | | (26.06 | )% |
S&P MidCap 400 Index* | | NA | | | NA | | | NA | | | (28.95 | )% |
*The performance data of the index has been prepared from sources and data that the investment adviser believes to be reliable, but no representation is made as to their accuracy. The index is unmanaged and has no fees or costs. The S&P MidCap 400 Index is a capitalization-weighted index that measures the mid-range sector of the U.S. stock market. The S&P MidCap 400 Index has been taken from published sources.
**Performance data is historical and includes changes in share price and reinvestment of income dividends and capital gains distributions. Past performance does not indicate future results. Performance numbers are net of all operating expenses, but do not include any insurance charges imposed in connection with your variable insurance contract. In addition, the investment adviser reduced its management fee and/or reimbursed certain other expenses during these periods. If this performance information included the effect of the insurance charges and the fees and expenses assumed by the investment adviser, performance numbers would be lower. The value of an investment in the WMC Blue Chip Mid Cap Fund and the return on the investment will fluctuate and redemption proceeds may be higher or lower than an investor’s original cost. Returns greater than one year are annualized.
***Initial Class Shares for the period from September 1, 1999 (commencement of operations) to December 31, 2008. Service Class Shares for the period from March 7, 2008 (commencement of operations) to December 31, 2008.
30
MANAGEMENT’S DISCUSSION & ANALYSIS
LORD ABBETT GROWTH & INCOME FUND (subadvised by Lord, Abbett & Co. LLC)
Stock selection within the financial services sector was the largest contributor to relative performance during the period since inception until December 31, 2008. A key contributor was Wells Fargo & Company, a bank holding company with a sizable residential mortgage business. The company was one of the few financial firms that showed a positive return during a tumultuous year for the financial industry, far outperforming its peers. In the past three quarters it reported better than expected earnings and it raised its dividend. The Fund’s overweight position in the overall financial sector reduced somewhat the benefit of good stock selection.
Also contributing to relative performance was stock selection within the materials & processing sector. Agricultural processor Archer-Daniels-Midland Company rose sharply due to fourth quarter earnings results that far surpassed analysts’ expectations. Fears of a margin squeeze evaporated as corn prices fell dramatically in the second half of the year.
Within the auto & transportation sector, shares of Delta Air Lines rose significantly during the fourth quarter. Investors liked the solid growth in the airline’s Revenue per Available Seat Mile accompanied by a strategic reduction in capacity and declining fuel costs. Also, during the fourth quarter the airline completed its merger with Northwest Airlines which should result in operational synergies and geographical diversification.
The Fund’s sizeable underweights within the utilities and the integrated oils sectors were the largest detractors from relative performance. Electric utilities performed well in a poor market, and international oil holdings held up even in the face of dramatically lower crude oil prices in the second half of the year.
With the U.S. economy softening and credit fears deepening throughout 2008, just about every asset class, except Treasuries, suffered. The average ‘BAA’ U.S. corporate bond fell approximately 15 percent, oil plummeted nearly 60 percent, and the S&P 500® Index declined roughly 40 percent. But as weak as the economic fundamentals remained by year-end, it became increasingly apparent that financial markets had discounted altogether too much pessimism. The ensuing reassessment, helped, no doubt, by the relief measures undertaken by the Federal Reserve Board (the Fed) and the Treasury, has begun to improve financial conditions, as is evidenced by the uptrend that developed in equity markets.
Despite the marked sell-off suffered by equities during 2008, the year began with only modest losses – the S&P 500 was down just 11.4 percent (on a total return basis) in the eight months ended August, 2008. However, the bankruptcy of U.S. investment bank Lehman Brothers in September sent the credit markets into a tailspin and intensified the selling of equities. In the credit markets, the spread between the three-month London Interbank Offering Rate (LIBOR) and three-month overnight indexed swap rates (OIS) measured 78 basis points (bps) in early September but Lehman’s failure on September 15 helped send the LIBOR/OIS spread to a record high of 364 bps by the end of September. From the end of August 2008 to the market’s low on November 20, 2008, the S&P 500 sharply dropped 41.0 percent (on a total return basis).
Fortunately, the actions taken by the Fed and the Treasury, including a reduction in the fed funds rate to a record low of 0.25 percent and the establishment of several special funding facilities, helped restore some semblance of confidence to the financial system, as stocks, bond prices, and most credit spreads began to recover towards the end of 2008. The S&P 500 Index, for instance, finished the year approximately 19 percent above its November lows, and the LIBOR-OIS spread narrowed to 126 bps.
For the period, the losses in the equity market were broad as every major equity investment style plummeted during 2008. At the margin, smaller capitalization companies outperformed their larger peers; small caps finished the year down about 33.1 percent, versus a loss of roughly 36.1 percent for large caps (on a total return basis). Small and mid cap value outperformed their “growthier” peers, while large cap growth eked out slightly better performance than the large cap value style of investing. As for sector performance, consumer staples, health care,
31
MANAGEMENT’S DISCUSSION & ANALYSIS (Continued)
and utilities (three sectors largely considered defensive) outperformed the others, on a relative basis, with losses of 16.1 percent, 23.4 percent, and 30.2 percent, respectively (on a total return basis). It was the financial sector that paced the sell-off in equities with a total return meltdown of 56.6 percent.
The financial services sector remains the largest overweight within the Fund, after having moved above a market weight in late June. Throughout the fourth quarter, we cautiously and opportunistically added to existing positions in high-quality diversified financial firms, an investment management company and a mortgage Real Estate Investment Trust. We increased the consumer discretionary sector from a meaningful to a significant overweight by adding to positions within the retail industry. We believe this will position the portfolio well as the economy begins to bottom and consumer spending starts to increase at some point in 2009.
The utilities sector remains the Fund’s largest underweight sector. We believe investors have crowded into this expensive, “safe haven” area because of the poor stock market environment and will be unpleasantly surprised by the lack of upside when the overall market turns more positive. The integrated oils sector also remains a significant underweight. This sector held up well during the quarter, even though crude oil and other energy prices declined sharply. We have difficulty finding attractively valued companies here, as we believe most are over-earning their long term potential by a substantial margin because of the “mini bubble” in energy prices over the past year.
We considerably reduced exposure to the technology sector such that it moved from being a large overweight to a moderate overweight, and to the consumer staples sector, such that it moved from being overweight to being underweight. Most of the stocks we sold in these areas have held up better than the overall market and we are finding better risk-reward opportunities elsewhere in the market.
32
LORD ABBETT GROWTH & INCOME FUND
| | |
TOP TEN EQUITY HOLDINGS At December 31, 2008 | | INDUSTRY WEIGHTINGS At December 31, 2008 |
| | | |
| | | % of Net Assets | |
Wells Fargo & Co. | | 4.8 | % |
Bank of New York Mellon Corp. | | 4.8 | |
JPMorgan Chase & Co. | | 4.6 | |
Delta Air Lines, Inc. | | 3.5 | |
Merrill Lynch & Co., Inc. | | 3.5 | |
General Electric Co. | | 3.1 | |
Archer-Daniels-Midland Co. | | 2.7 | |
Exxon Mobil Corp. | | 2.6 | |
The Goldman Sachs Group, Inc. | | 2.5 | |
The Home Depot, Inc. | | 2.5 | |
| | | |
| | | % of Net Assets | |
Capital Markets | | 15.5 | % |
Commercial Banks | | 9.9 | |
Short Term Investments | | 8.7 | |
Multi-Line Retail | | 7.4 | |
Oil & Gas-Exploration & Production | | 5.1 | |
Diversified Financial Services | | 4.6 | |
Pharmaceuticals | | 4.4 | |
Specialty Retail | | 4.3 | |
Airlines | | 3.5 | |
Food & Staples Retailing | | 3.1 | |
Industrial Conglomerates | | 3.1 | |
Insurance | | 2.8 | |
Health Care Equipment & Supplies | | 2.8 | |
Software | | 2.7 | |
Energy Equipment & Services | | 2.3 | |
Beverages | | 2.3 | |
Biotechnology | | 2.1 | |
Food Products | | 1.9 | |
Consumer Finance | | 1.6 | |
Internet & Catalog Retail | | 1.6 | |
Machinery | | 1.5 | |
Diversified Telecommunication Services | | 1.5 | |
Real Estate Investment Trusts | | 1.4 | |
Road & Rail | | 1.2 | |
Hotels, Restaurants & Leisure | | 1.1 | |
Media | | 1.0 | |
Commercial Services & Supplies | | 0.9 | |
Computers & Peripherals | | 0.8 | |
IT Services | | 0.7 | |
Chemicals | | 0.6 | |
Metals & Mining | | 0.6 | |
Building Products | | 0.4 | |
Semiconductors & Semiconductor Equipment | | 0.3 | |
Health Care Providers & Services | | 0.2 | |
Air Freight & Logistics | | 0.1 | |
Household Products | | 0.1 | |
Liabilities in excess of other assets | | (2.1 | ) |
| | | |
TOTAL | | 100.0 | % |
| | | |
33
LORD ABBETT GROWTH & INCOME FUND
Comparison of Change in Value of a $10,000 Investment in the Lord Abbett Growth & Income Fund – Initial Class and the Russell 1000 Value Index
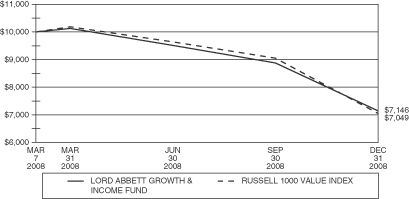
Comparison of Change in Value of a $10,000 Investment in the Lord Abbett Growth & Income Fund – Service Class and the Russell 1000 Value Index
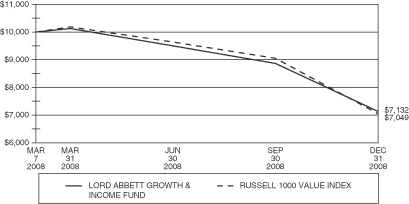
34
LORD ABBETT GROWTH & INCOME FUND
Total Returns for Period Ended December 31, 2008**
| | | |
Initial Class Shares | | Life of
Fund*** | |
Lord Abbett Growth & Income Fund | | (28.54 | )% |
Russell 1000 Value Index* | | (29.51 | )% |
Service Class Shares | | | |
Lord Abbett Growth & Income Fund | | (28.68 | )% |
Russell 1000 Value Index* | | (29.51 | )% |
*The performance data of the index has been prepared from sources and data that the investment adviser believes to be reliable, but no representation is made as to their accuracy. The Russell 1000 Index measures the performance of the 1,000 largest companies in the Russell 3000 Index, which measures the performance of the 3,000 largest U.S. companies based on total market capitalization. The Russell 1000 Value Index measures the performance of those Russell 1000 companies with lower price-to-book ratio and lower forecasted growth values. The Russell 1000 Value Index has been taken from published sources.
**Performance data is historical and includes changes in share price and reinvestment of income dividends and capital gains distributions. Past performance does not indicate future results. Performance numbers are net of all operating expenses, but do not include any insurance charges imposed in connection with your variable insurance contract. In addition, the investment adviser reduced its management fee and certain other expenses during this period. If this performance information included the effect of the insurance charges and the fees and expenses assumed by the investment adviser, performance numbers would be lower. The value of an investment in the Lord Abbett Growth & Income Fund and the return on the investment will fluctuate and redemption proceeds may be higher or lower than an investor’s original cost.
***For the period from March 7, 2008 (commencement of operations) to December 31, 2008.
35
MANAGEMENT’S DISCUSSION & ANALYSIS
GOLDMAN SACHS MID CAP VALUE FUND
(subadvised by Goldman Sachs Asset Management, L.P.)
Goldman Sachs Mid Cap Value Fund outperformed its benchmark, the Russell Mid Cap Value Index, for the time period since inception, March 7, 2008, to December 31, 2008.
During the period, stock selection among sectors was a positive contributor to the Fund’s performance. The Fund’s holdings in the Financials sector were the most successful relative to their peers in the benchmark. On the downside, stock selection in the Materials sector was the least successful. All ten sectors in the Index posted negative results, particularly the Energy (-50.6%) and Consumer Discretionary (-44.9%) sectors. The Financials (-35.9%) sector was the largest detractor (weight times performance) from Index returns.
In individual holdings, underweights in Washington Mutual and Reliant Energy, Inc. as well an overweight in Hudson City Bancorp were among the most successful selections. Meanwhile, underweights in United States Steel and AON Corp., as well as an overweight in CBS Corp. were the biggest detractors from excess returns for the period.
Returns to the investment themes were positive overall. Profitability contributed most positively to excess returns, followed by Momentum, Sentiment and Quality. Conversely, Valuation and Management detracted from relative performance. Valuation and Profitability summarize results from the balance sheet and income statement, whereas Quality and Management measure the operating, investing, and financing activities from a company’s statement of cash flows. Momentum measures information about a wide variety of investment-relevant events that are sufficiently complex, in many cases, that it takes time for the market to fully appreciate their implications for security values. The sixth theme, Sentiment, is based on the detailed research of stock analysts, research that includes the evaluation of financial statements, discussions with management, and the study of industry trends. Sentiment allows us to incorporate a wide range of qualitative information on companies and their industries into our quantitative evaluation of stocks.
Extraordinary moves in global financial markets during the fourth quarter of 2008 created an unprecedented period of market distress as credit spreads, both implied and realized volatilities, and investor risk aversion remained at persistently elevated levels.
After five years of strong performance in most major equity indices, 2008 was one of the most challenging years in the history of equity markets. The S&P 500 and the Russell 2000 Indices were down approximately 37.0% and 33.8%, respectively, and the MSCI EAFE and MSCI World Indices fell 43.4% and 40.7%. In contrast to 2007, value outperformed growth and large cap stocks lagged small cap stocks in the US.
36
GOLDMAN SACHS MID CAP VALUE FUND
| | |
TOP TEN EQUITY HOLDINGS At December 31, 2008 | | INDUSTRY WEIGHTINGS (Continued) At December 31, 2008 |
| | | |
| | | % of Net Assets | |
Edison International | | 1.2 | % |
The Progressive Corp. | | 1.0 | |
Safeway, Inc. | | 0.9 | |
American Electric Power Co., Inc. | | 0.9 | |
PG&E Corp. | | 0.9 | |
Lorillard, Inc. | | 0.9 | |
Bunge, Ltd. | | 0.8 | |
Fortune Brands, Inc. | | 0.8 | |
Equity Residential Properties Trust | | 0.7 | |
UST, Inc. | | 0.7 | |
INDUSTRY WEIGHTINGS
At December 31, 2008
| | | |
| | | % of Net Assets | |
Short Term Investments | | 15.4 | % |
Insurance | | 10.6 | |
Real Estate Investment Trusts | | 8.8 | |
Multi-Utilities | | 6.7 | |
Commercial Banks | | 5.3 | |
Oil & Gas-Exploration & Production | | 4.4 | |
Electric Utilities | | 4.3 | |
Food Products | | 3.8 | |
Household Durables | | 3.2 | |
Media | | 2.7 | |
Capital Markets | | 2.4 | |
Containers & Packaging | | 2.0 | |
Health Care Providers & Services | | 1.7 | |
Machinery | | 1.7 | |
Pharmaceuticals | | 1.7 | |
Chemicals | | 1.6 | |
Food & Staples Retailing | | 1.6 | |
Tobacco | | 1.6 | |
Beverages | | 1.5 | |
Diversified Financial Services | | 1.5 | |
Hotels, Restaurants & Leisure | | 1.5 | |
Thrift & Mortgage Finance | | 1.5 | |
Commercial Services & Supplies | | 1.4 | |
Diversified Telecommunication Services | | 1.3 | |
Energy Equipment & Services | | 1.2 | |
Computers & Peripherals | | 1.1 | |
Gas Utilities | | 1.1 | |
IT Services | | 1.1 | |
Electronic Equipment & Instruments | | 1.0 | |
| | | |
| | | % of Net Assets | |
Multi-Line Retail | | 1.0 | % |
Paper & Forest Products | | 1.0 | |
Specialty Retail | | 1.0 | |
Airlines | | 0.9 | |
Independent Power Producers & Energy Traders | | 0.9 | |
Electrical Equipment | | 0.7 | |
Consumer Finance | | 0.6 | |
Distributors | | 0.6 | |
Health Care Equipment & Supplies | | 0.6 | |
Health Care Technology | | 0.6 | |
Road & Rail | | 0.6 | |
Wireless Telecommunication Services | | 0.6 | |
Auto Components | | 0.5 | |
Building Products | | 0.5 | |
Personal Products | | 0.5 | |
Software | | 0.5 | |
Air Freight & Logistics | | 0.4 | |
Exchange Traded Fund | | 0.4 | |
Automobiles | | 0.3 | |
Construction Materials | | 0.3 | |
Semiconductors & Semiconductor Equipment | | 0.3 | |
Communications Equipment | | 0.2 | |
Internet & Catalog Retail | | 0.2 | |
Internet Software & Services | | 0.2 | |
Marine | | 0.2 | |
Metals & Mining | | 0.2 | |
Textiles, Apparel & Luxury Goods | | 0.2 | |
Water Utilities | | 0.2 | |
Aerospace & Defense | | 0.1 | |
Construction & Engineering | | 0.1 | |
Diversified Consumer Services | | 0.1 | |
Household Products | | 0.1 | |
Industrial Conglomerates | | 0.1 | |
Office Electronics | | 0.1 | |
Real Estate Management & Development | | 0.1 | |
Trading Companies & Distributors | | 0.1 | |
Biotechnology | | 0.0 | * |
Leisure Equipment & Products | | 0.0 | * |
Life Sciences Tools & Services | | 0.0 | * |
Liabilities in excess of other assets | | (8.7 | ) |
| | | |
TOTAL | | 100.0 | % |
| | | |
| * | Amount is less than 0.05%. |
37
GOLDMAN SACHS MID CAP VALUE FUND
Comparison of Change in Value of a $10,000 Investment in the Goldman Sachs Mid Cap Value Fund – Initial Class and the Russell Midcap Value Index
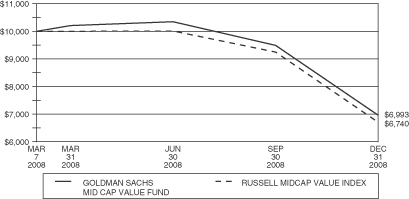
Comparison of Change in Value of a $10,000 Investment in the Goldman Sachs Mid Cap Value Fund – Service Class and the Russell Midcap Value Index

38
GOLDMAN SACHS MID CAP VALUE FUND
Total Returns for Period Ended December 31, 2008**
| | | |
Initial Class Shares | | Life of
Fund*** | |
Goldman Sachs Mid Cap Value Fund | | (30.07 | )% |
Russell MidCap Value Index* | | (32.60 | )% |
Service Class Shares | | | |
Goldman Sachs Mid Cap Value Fund | | (30.21 | )% |
Russell MidCap Value Index* | | (32.60 | )% |
*The performance data of the index has been prepared from sources and data that the investment adviser believes to be reliable, but no representation is made as to their accuracy. The Russell Midcap Value Index measures the performance of the mid-cap value segment of the U.S. equity universe. It includes those Russell Midcap Value Index companies with lower price-to-book ratios and lower forecasted growth values. The Russell Midcap Value Index has been taken from published sources.
**Performance data is historical and includes changes in share price and reinvestment of income dividends and capital gains distributions. Past performance does not indicate future results. Performance numbers are net of all operating expenses, but do not include any insurance charges imposed in connection with your variable insurance contract. In addition, the investment adviser reduced its management fee and/or reimbursed certain other expenses during these periods. If this performance information included the effect of the insurance charges, performance numbers would be lower. The value of an investment in the Goldman Sachs Mid Cap Value Fund and the return on the investment will fluctuate and redemption proceeds may be higher or lower than an investor’s original cost.
***For the period from March 7, 2008 (commencement of operations) to December 31, 2008.
39
MANAGEMENT’S DISCUSSION & ANALYSIS
GOLDMAN SACHS SHORT DURATION FUND
(subadvised by Goldman Sachs Asset Management, L.P.)
A combination of top-down and bottom-up strategies impacted relative performance during the year. Top-down strategies included our duration strategy and cross-sector exposures. Cross-sector positioning detracted from relative performance over the period. Specifically, the portfolio’s overweight exposure to the corporate and mortgage-backed securities sectors detracted from performance as all spread sectors underperformed treasuries over the period. This was partially offset by positive returns of the Fund’s U.S. Swap position, as swaps outperformed treasuries during the year. Security selection of corporate securities within the financial subsector detracted from returns during the period. 2008 was marked by significant pressure on financial names as asset quality began to deteriorate causing an overall weak economic conditions. Selection of various government specific bonds were the largest contributors to performance during the period. Specifically U.S. Treasury holdings in the front end of the yield curve helped performance as short term rates fell over 300 basis points during 2008.
The Barclays Capital U.S. Investment Grade Corporate Bond Index underperformed swaps and duration-adjusted Treasuries by 879 bps and 563 bps, respectively. Despite showing some tentative signs of stabilization in the final weeks of the year, corporate spreads pushed wider, ending the quarter 98 bps wider at 555 bps over Treasuries. Spreads on synthetic corporate indices widened to a much lesser extent, ending the quarter 39 bps wider at 205 bps. On the supply front, the revision to the FDIC’s Temporary Liquidity Guarantee Program resolved some of the key uncertainties hindering widespread participation in this program, leading to a surge in FDIC-guaranteed issuance, with more than $70 billion of issuance since the program’s inception in November. At the same time that the government’s efforts to stem the crisis are being stepped up, company specific news continued to deteriorate. Sectors within the Barclays Capital U.S. Investment Grade Corporate Bond Index that are more sensitive to the economy, such as Lodging (-23.6%), REITs (-21.6%) and Building Materials (-17.0%) were the worst-performing industries. On the other hand, financials recouped some of their sharp third quarter losses as Brokerage (16.2%) and Banking (10.6%) were some of the top-performing sectors.
Yields on U.S. government bonds fell significantly during the fourth quarter as the negative feedback loop between the real economy and the financial system became more entrenched. Governments and central banks across the globe continued their swift and extraordinary efforts to strengthen financial systems and improve credit conditions. The Federal Open Market Committee decided to establish a target range for the federal Funds rate of 0-0.25%, marking the end of conventional easing. The Federal Reserve Board (the “Fed”) will now pursue unconventional approaches in hopes of stimulating aggregate demand.
40
GOLDMAN SACHS SHORT DURATION FUND
| | |
TOP TEN BOND ISSUERS At December 31, 2008 | | PORTFOLIO COMPOSITION At December 31, 2008 |
| | | |
| | | % of Net Assets | |
Federal National Mortgage Association | | 42.6 | % |
Federal Home Loan Bank | | 16.0 | |
Federal Home Loan Mortgage Corp. | | 14.6 | |
American Express Bank | | 3.2 | |
General Electric Capital Corp. | | 2.4 | |
John Deere Capital Corp. | | 2.0 | |
HSBC USA, Inc. | | 1.7 | |
Regions Bank | | 1.6 | |
JP Morgan Chase & Co. | | 1.4 | |
Federal Farm Credit Bank | | 1.3 | |
| | | |
| | | % of Net Assets | |
U.S. Government Agency Obligations | | 73.5 | % |
Short Term Investments | | 24.7 | |
Corporate Debt Obligations | | 17.5 | |
Collateralized Mortgage Obligations | | 1.0 | |
Liabilities in excess of other assets | | (16.7 | ) |
| | | |
TOTAL | | 100.0 | % |
| | | |
Comparison of Change in Value of a $10,000 Investment in the Goldman Sachs Short Duration Fund – Initial Class and the Merrill Lynch 1-3 Year Treasury Index
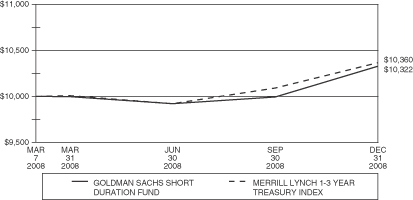
Comparison of Change in Value of a $10,000 Investment in the Goldman Sachs Short Duration Fund – Service Class and the Merrill Lynch 1-3 Year Treasury Index
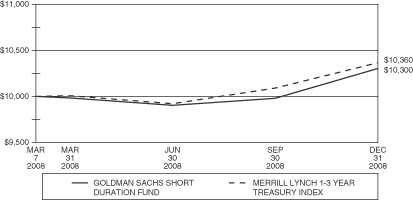
41
GOLDMAN SACHS SHORT DURATION FUND
Total Returns for Period Ended December 31, 2008**
| | | |
Initial Class Shares | | Life of
Fund*** | |
Goldman Sachs Short Duration Fund | | 3.22 | % |
Merrill Lynch 1-3 Year Treasury Index* | | 3.60 | % |
Service Class Shares | | | |
Goldman Sachs Short Duration Fund | | 3.00 | % |
Merrill Lynch 1-3 Year Treasury Index* | | 3.60 | % |
*The performance data of the index has been prepared from sources and data that the investment adviser believes to be reliable, but no representation is made as to their accuracy. The Merrill Lynch 1-3 Year Treasury Index tracks the performance of the direct Sovereign debt of the U.S. Government. It includes all U.S. dollar-denominated U.S. Treasury Notes and Bonds having at least one year remaining to maturity. U.S. Treasury Bills and Inflation-Linked securities do not qualify for the index and zero coupon bonds are excluded. The benchmark represents securities with a 1-3 year maturity range. The Merrill Lynch 1-3 Year Treasury Index has been taken from published sources.
**Performance data is historical and includes changes in share price and reinvestment of income dividends and capital gains distributions. Past performance does not indicate future results. Performance numbers are net of all operating expenses, but do not include any insurance charges imposed in connection with your variable insurance contract. In addition, the investment adviser reduced its management fee and certain other expenses during this period. If this performance information included the effect of the insurance charges and the fees and expenses assumed by the investment adviser, performance numbers would be lower. The value of an investment in the Goldman Sachs Short Duration Fund and the return on the investment will fluctuate and redemption proceeds may be higher or lower than an investor’s original cost.
***For the period from March 7, 2008 (commencement of operations) to December 31, 2008.
42
MANAGEMENT’S DISCUSSION & ANALYSIS
DREMAN SMALL CAP VALUE FUND (subadvised by Dreman Value Management, L.L.C.)
The fourth quarter of 2008 unfortunately retained the negative theme of the prior quarters of 2008, as the unwinding of the global credit bubble continued to take its toll on the equity markets. This leverage unwind has caused massive redemptions and the negative feedback loop from the financial crisis, putting major pressure on earnings as the economies around the world have slowed substantially leaving most in a recession. The economic deterioration accelerated over the past few months as General Motors reported that U.S. auto sales in October 2008 had fallen to levels not seen in more than 25 years, and adjusting for population growth was the lowest since World War II. Meanwhile, Japan’s industrial production collapsed in November by 8.1% month-over-month and by 16.2% year-over-year, which is the sharpest decline ever recorded, reflecting November’s sharp decline in the value of exports, which are strongly correlated with production trends. Even China slowed dramatically as November’s exports fell by 2%, a sharp drop compared to its prior growth rates of 20%.
For the quarter, large cap stocks outperformed small cap stocks, primarily as a result of the small cap energy stocks being decimated during the quarter. This sector was down 48.7%, compared to the large cap energy stocks which were down 22.6%.
For the period since inception to December 31, 2008, the Fund outperformed its benchmark through stock selection and sector allocation. From an attribution standpoint the Fund’s best performing sectors, on a relative basis, included Consumer Discretionary, Consumer Staples, Financials, Industrials, Information Technology, Telecommunication Services and Utilities. The Fund’s worst performing sectors were Energy, Materials, and Health Care.
In the Consumer Discretionary sector our stock selection and underweight position helped performance. We avoided many of the laggards in this sector as our research uncovered weakening demand for many of the retailers, consumer durables and media companies. In addition, most of the stocks we own outperformed the index on a relative basis. A rising unemployment rate coupled with a negative wealth effect from a bear market in stocks and housing should continue to pressure discretionary spending. We remain underweight this sector versus the benchmark.
In the Consumer Staples sector, our overweight combined with stock selection helped performance, on a relative basis. One of our strongest performers, Nash Finch, a food distribution company, was up for the quarter. Offsetting this gain were declines in Ralcorp Holdings, a manufacturer of private label food products, and Central European Distribution, a beverage distributor. We remain overweight this sector as the markets continue to be extremely volatile. This relative safe harbor should serve us well in the near future; however, as new opportunities arise we could use these stocks as sources of cash.
Surprisingly, in the small cap space the financial sector was a relative outperformer. Our underweight in this space for the quarter hurt the Fund; however, stock selection helped to offset this negative performance. Our bank holdings faired poorly during the quarter as charge-offs continued to rise and negatively impact earnings.
In the Insurance space we faired much better; Safety Insurance, a property and casualty insurer in Massachusetts, United Fire & Casualty, Odyssey Re Holdings, and Allied World Assurance all posted positive returns for the quarter. We continue to significantly underweight this sector.
Energy was our worst performing sector, where both our overweight and stock selection detracted from performance. With such a quick and fierce decline we believe that the stocks are selling near all time lows in terms of valuation. Energy assets, like oil and natural gas, in our opinion, will become more valuable as demand increases and supply decreases. While the pullbacks can be vicious, such as the one in the second half of the year, we believe that remaining overweight will prove to be a winning strategy in the coming quarters and years.
43
MANAGEMENT’S DISCUSSION & ANALYSIS (Continued)
The Industrial Sector was a relative outperformer for the fourth quarter. Our stock selection and overweight added to performance. Our holdings in the electrical equipment industry were particularly weak. General Cable, a provider of copper, aluminum, and fiber optic wire and cable products, sold off with the decline in copper prices. Several other stocks also hurt performance during the year including Kennametal, a manufacturer of metal cutting and tungsten carbide tools used for drilling, boring, grooving, and threading. As the industrial stocks sold off we added Genesee & Wyoming, a short line rail company, to the Fund as we believe it has an attractive valuation and strong fundamentals. We remain slightly overweight the Industrial Sector.
44
DREMAN SMALL CAP VALUE FUND
| | |
TOP TEN EQUITY HOLDINGS At December 31, 2008 | | INDUSTRY WEIGHTINGS At December 31, 2008 |
| | | |
| | | % of Net Assets | |
IAMGOLD Corp. | | 1.4 | % |
Sybase, Inc. | | 1.3 | |
Pan American Silver Corp. | | 1.3 | |
EMCOR Group, Inc. | | 1.2 | |
United Fire & Casualty Co. | | 1.2 | |
Endurance Specialty Holdings, Ltd. | | 1.2 | |
StanCorp Financial Group, Inc | | 1.2 | |
LifePoint Hospitals, Inc. | | 1.2 | |
Park Electrochemical Corp. | | 1.1 | |
Regal-Beloit Corp. | | 1.1 | |
| | | |
| | | % of Net Assets | |
Short Term Investments | | 17.2 | % |
Insurance | | 12.5 | |
Oil & Gas-Exploration & Production | | 5.7 | |
Metals & Mining | | 4.8 | |
Health Care Providers & Services | | 4.7 | |
Commercial Banks | | 4.4 | |
Machinery | | 4.4 | |
Food Products | | 3.8 | |
Food & Staples Retailing | | 3.6 | |
Electronic Equipment & Instruments | | 2.9 | |
Multi-Utilities | | 2.5 | |
Electric Utilities | | 2.4 | |
Electrical Equipment | | 2.3 | |
Software | | 2.2 | |
Construction & Engineering | | 2.1 | |
Specialty Retail | | 2.1 | |
Aerospace & Defense | | 1.9 | |
IT Services | | 1.8 | |
Textiles, Apparel & Luxury Goods | | 1.8 | |
Energy Equipment & Services | | 1.7 | |
Commercial Services & Supplies | | 1.6 | |
Diversified Telecommunication Services | | 1.6 | |
Communications Equipment | | 1.5 | |
Road & Rail | | 1.5 | |
Tobacco | | 1.4 | |
Hotels, Restaurants & Leisure | | 1.1 | |
Diversified Financial Services | | 1.0 | |
Trading Companies & Distributors | | 1.0 | |
Household Durables | | 0.9 | |
Media | | 0.9 | |
Capital Markets | | 0.7 | |
Diversified Consumer Services | | 0.7 | |
Life Sciences Tools & Services | | 0.7 | |
Other assets less liabilities | | 0.6 | |
| | | |
TOTAL | | 100.0 | % |
| | | |
45
DREMAN SMALL CAP VALUE FUND
Comparison of Change in Value of a $10,000 Investment in the Dreman Small Cap Value Fund – Initial Class and the Russell 2000 Value Index

Comparison of Change in Value of a $10,000 Investment in the Dreman Small Cap Value Fund – Service Class and the Russell 2000 Value Index
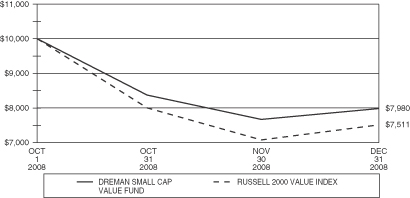
46
DREMAN SMALL CAP VALUE FUND
Total Returns for Period Ended December 31, 2008**
| | | |
Initial Class Shares | | Life of
Fund*** | |
Dreman Small Cap Value Fund | | (20.15 | )% |
Russell 2000 Value Index* | | (24.89 | )% |
Service Class Shares | | | |
Dreman Small Cap Value Fund | | (20.20 | )% |
Russell 2000 Value Index* | | (24.89 | )% |
*The performance data of the index has been prepared from sources and data that the investment adviser believes to be reliable, but no representation is made as to their accuracy. The Russell 2000 Value Index tracks the performance of the small value segment of the U.S. equity universe. It includes those Russell 2000 companies with lower price-to-book ratios and lower forecasted growth values. The Russell 2000 Value Index has been taken from published sources.
**Performance data is historical and includes changes in share price and reinvestment of income dividends and capital gains distributions. Past performance does not indicate future results. Performance numbers are net of all operating expenses, but do not include any insurance charges imposed in connection with your variable insurance contract. In addition, the investment adviser reduced its management fee and certain other expenses during this period. If this performance information included the effect of the insurance charges and the fees and expenses assumed by the investment adviser, performance numbers would be lower. The value of an investment in the Dreman Small Cap Value Fund and the return on the investment will fluctuate and redemption proceeds may be higher or lower than an investor’s original cost.
***For the period from October 1, 2008 (commencement of operations) to December 31, 2008.
47
MANAGEMENT’S DISCUSSION & ANALYSIS
PIMCO HIGH YIELD FUND (subadvised by Pacific Investment Management Company LLC)
Over the period from inception until December 31, 2008, interest rates fell worldwide and yield curves in the U.S., Europe, and the United Kingdom steepened as investors fled to the safety of government bonds, especially shorter maturities. To forestall a recession and unfreeze credit markets during the early part of the year, the Federal Reserve continued to ease and reduce Federal Funds rate by 200 basis points, or 2 percentage points, and took several unconventional steps: it made several hundred billion dollars of liquidity facilities available to the financial system against an expanded range of collateral, opened its discount window to investment banks, and arranged the rescue of Bear Stearns. During the year, speculative grade spreads continued to widen, reaching a five-year high, as technicals continued to weigh on the market. However, negative technicals in the high yield market subsided modestly during the middle of the year spurring a low quality rally even as defaults grew.
What helped performance during the period
| | • | | An above-benchmark average quality, as the flight to safety benefited higher rated bonds relative to low quality |
| | • | | A strong emphasis on high grade financials in the fourth quarter, as this segment of the market benefited significantly from government capital injections and debt guarantees |
| | • | | Within the utility sector, a focus on upper quality tier electric generation companies, which outpaced the broader sector |
| | • | | An underweight to metals and mining, which fell alongside the decline in commodities |
| | • | | Security selection in the consumer cyclical sector, where auto loans and auto parts/equipment led the broader industry category |
What hurt performance during the period
| | • | | An underweight to the aerospace and defense sector, which was among the top performing industry categories |
| | • | | Security selection in the telecom sector detracted from returns as integrated service and fixed-line providers underperformed wireless |
| | • | | An underweight to consumer non-cyclicals detracted from returns, which bested the overall market on the backs of strong tobacco, pharmaceuticals, and beverage sector returns |
While still below their long-term average, defaults have jumped more than four-fold since the start of the year, reflecting a clear deterioration in fundamentals that is likely to continue. Although the momentum has been nothing short of rapid, it began from a peak in fundamentals and from a 26-year low in defaults. Nevertheless, the prolonged freezing of credit markets and ailing economy have the potential to exacerbate the pace of this deterioration. Valuations have taken the back seat to the fundamentals and technicals for the better part of the last two years. Whether it was when the record low spreads failed to mitigate the bid for high yield in the early-to-mid 2007 period given relatively strong fundamentals or the extreme wide spreads that couldn’t lure investors over the course of the last several months amid negative technicals, valuations have become a secondary consideration. Today, valuations appear very attractive as spreads have reached all-time wides and appear to discount default rates materially higher than today’s current levels or even the most pessimist forecasts for defaults. While we believe there are significant opportunities at today’s level of spreads, the overriding volatility in the market and potential for continued deleveraging calls for a defensive posture and makes prudent security selection a top priority.
48
PIMCO HIGH YIELD FUND
| | |
TOP TEN BOND ISSUERS At December 31, 2008 | | PORTFOLIO COMPOSITION At December 31, 2008 |
| | | |
| | | % of Net Assets | |
HCA, Inc. | | 2.6 | % |
Biomet, Inc. | | 2.1 | |
Bank of America Corp. | | 2.1 | |
American International Group, Inc. | | 1.8 | |
Energy Future Holdings Corp. | | 1.8 | |
Morgan Stanley | | 1.7 | |
Sprint Capital Corp. | | 1.6 | |
Alltel Communication, Inc. | | 1.6 | |
NRG Energy, Inc. | | 1.6 | |
Georgia-Pacific LLC | | 1.5 | |
| | | |
| | | % of Net Assets | |
Corporate Debt Obligations | | 65.3 | % |
Short Term Investments | | 29.1 | |
Preferred Stock | | 2.5 | |
Commercial Mortgage Backed Securities | | 1.6 | |
Convertible Bonds | | 0.6 | |
Asset Backed Securities | | 0.2 | |
Other assets less liabilities | | 0.7 | |
| | | |
TOTAL | | 100.0 | % |
| | | |
Comparison of Change in Value of a $10,000 Investment in the PIMCO High Yield Fund – Initial Class and the Merrill Lynch US High Yield BB-B Rated Constrained Index
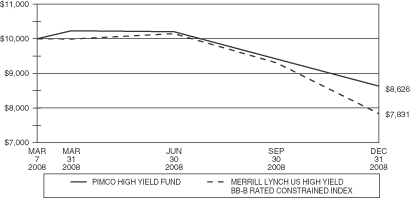
Comparison of Change in Value of a $10,000 Investment in the PIMCO High Yield Fund – Service Class and the Merrill Lynch US High Yield BB-B Rated Constrained Index
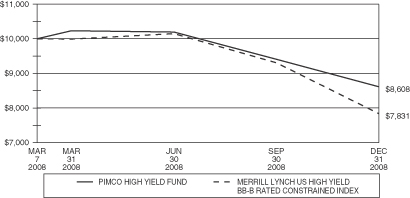
49
PIMCO HIGH YIELD FUND
Total Returns for Periods Ended December 31, 2008**
| | | |
Initial Class Shares | | Life of
Fund*** | |
PIMCO High Yield Fund | | (13.74 | )% |
Merrill Lynch US High Yield BB-B Rated Constrained Index* | | (21.69 | )% |
Service Class Shares | | | |
PIMCO High Yield Fund | | (13.92 | )% |
Merrill Lynch US High Yield BB-B Rated Constrained Index* | | (21.69 | )% |
*The performance data of the index has been prepared from sources and data that the investment adviser believes to be reliable, but no representation is made as to their accuracy. The Merrill Lynch US High Yield BB-B Rated Constrained Index contains all securities in the Merrill Lynch US High Yield Index rated BB1 through B3, based on an average of Moody’s, S&P and Fitch, but caps issuer exposure at 2%. Index constituents are capitalization-weighted, based on their current amount outstanding, provided the total allocation to an individual issuer does not exceed 2%. Issuers that exceed the limit are reduced to 2% and the face value of each of their bonds is adjusted on a pro-rata basis. Similarly, the face values of bonds of all other issuers that fall below the 2% cap are increased on a pro-rata basis. In the event there are fewer than 50 issuers in the index, each is equally weighted and the face values of their respective bonds are increased or decreased on a pro-rata basis. The Merrill Lynch US High Yield BB-B Rated Constrained Index has been taken from published sources.
**Performance data is historical and includes changes in share price and reinvestment of income dividends and capital gains distributions. Past performance does not indicate future results. Performance numbers are net of all operating expenses, but do not include any insurance charges imposed in connection with your variable insurance contract. In addition, the investment adviser reduced its management fee and certain other expenses during this period. If this performance information included the effect of the insurance charges and the fees and expenses assumed by the investment adviser, performance numbers would be lower. The value of an investment in the PIMCO High Yield Fund and the return on the investment will fluctuate and redemption proceeds may be higher or lower than an investor’s original cost.
***For the period March 7, 2008 (commencement of operations) to December 31, 2008.
50
MANAGEMENT’S DISCUSSION & ANALYSIS
PIMCO TOTAL RETURN FUND (subadvised by Pacific Investment Management Company LLC)
Over the period since inception until December 31, 2008, interest rates fell worldwide and yield curves in the U.S., Europe, and the United Kingdom steepened as investors fled to the safety of government bonds, especially shorter maturities. To forestall a recession and unfreeze credit markets during the early part of the year, the Federal Reserve continued to ease and reduce Federal Funds rate by 200 basis points, or 2 percentage points, and took several unconventional steps: it made several hundred billion dollars of liquidity facilities available to the financial system against an expanded range of collateral, opened its discount window to investment banks, and arranged the rescue of Bear Stearns.
During the middle part of the fiscal year, the central bank paused to reassess a U.S. economy buffeted by conflicting pressures of weakening economic indicators on one side and the threat of inflation on the other. However, the crisis, which was originally thought to be contained within the housing market, gradually spread to the corporate sector. The month of September featured a succession of shocking events. These included the Treasury’s bailout of mortgage agencies Fannie Mae and Freddie Mac and insurer AIG, as well as the realignment of the biggest U.S. investment banks via bankruptcy, merger, recapitalization, or transformation into bank holding companies.
In early October the U.S. Congress approved the $700 billion Troubled Asset Relief Program proposed by the Treasury and the Fed to help unclog the flow of credit. As economic data continued to show a weakening economy in the midst of a deep recession, forceful action was taken by the Federal Open Market Committee (FOMC). In addition to the previously announced government programs and continued Federal Fund rate cuts aimed to get the economy growing again, the FOMC stated it would target the fed funds rate between 0 and 0.25 percent.
What helped performance during the period
| | • | | Non-U.S. duration. The portfolio was positioned on the front end of yield curves in certain developed countries outside the U.S., such as the U.K., where we felt that the market had not fully priced in a slowdown. This paid off as markets began to price in rate cuts by global central banks. |
| | • | | Underweight to corporates. Though we added to the portfolio’s corporate positioning, we stayed underweight. As spreads ballooned, this was a source of outperformance. |
| | • | | Overweight to financials. An overweight to bonds of financial companies, which benefited from government policy support in the fourth quarter. |
What hurt performance during the period
| | • | | Overweight to agency mortgage-backed securities. As the financial system de-levered, large institutions sold their most liquid assets to raise cash; in many cases, their most liquid assets were agency mortgage-backed securities. Spreads on agency mortgages widened to well over 200 basis points over Treasuries. |
| | • | | Curve steepening biases. In the U.S., the U.K., Australia, and the Eurozone, the portfolio was positioned for yield curve steepening. While curves steepened over the full year, the U.S. curve flattened during the fourth quarter, following funding of the portfolio. |
51
PIMCO TOTAL RETURN FUND
| | |
TOP TEN BOND ISSUERS At December 31, 2008 | | PORTFOLIO COMPOSITION At December 31, 2008 |
| | | |
| | | % of Net Assets | |
Government National Mortgage Association | | 19.8 | % |
Federal Home Loan Mortgage Corp. | | 15.9 | |
Federal National Mortgage Association | | 12.7 | |
Shell International Finance | | 3.5 | |
American International Group, Inc. | | 2.9 | |
Wachovia Corp. | | 1.7 | |
The Goldman Sachs Group, Inc. | | 1.5 | |
Bank of America Corp. | | 1.3 | |
Morgan Stanley | | 1.3 | |
Merrill Lynch & Co., Inc. | | 1.0 | |
| | | |
| | | % of Net Assets | |
Short Term Investments | | 71.4 | % |
U.S. Treasury and U.S. Government Agency Obligations | | 49.4 | |
Corporate Debt Obligations | | 21.7 | |
Preferred Stock | | 0.8 | |
Liabilities in excess of other assets | | (43.3 | ) |
| | | �� |
TOTAL | | 100.0 | % |
| | | |
Comparison of Change in Value of a $10,000 Investment in the PIMCO Total Return Fund – Initial Class and the Barclays Capital U.S. Aggregate Bond Index

Comparison of Change in Value of a $10,000 Investment in the PIMCO Total Return Fund – Service Class and the Barclays Capital U.S. Aggregate Bond Index
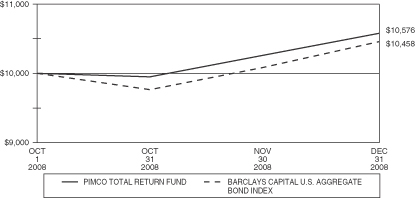
52
PIMCO TOTAL RETURN FUND
Total Returns for Period Ended December 31, 2008**
| | | |
Initial Class Shares | | Life of
Fund*** | |
PIMCO Total Return Fund | | 5.82 | % |
Barclays Capital U.S. Aggregate Bond Index* | | 4.58 | % |
Service Class Shares | | | |
PIMCO Total Return Fund | | 5.76 | % |
Barclays Capital U.S. Aggregate Bond Index* | | 4.58 | % |
*The performance data of the index has been prepared from sources and data that the investment adviser believes to be reliable, but no representation is made as to their accuracy. The Barclays Capital U.S. Aggregate Bond Index (formerly Lehman Brothers U.S. Aggregate Bond Index) is composed of U.S. securities in Treasury, Government-Related, Corporate, and Securitized sectors. The Barclays Capital U.S. Aggregate Bond Index has been taken from published sources. The Barclays Capital U.S. Aggregate Bond Index has been taken from published sources.
**Performance data is historical and includes changes in share price and reinvestment of income dividends and capital gains distributions. Past performance does not indicate future results. Performance numbers are net of all operating expenses, but do not include any insurance charges imposed in connection with your variable insurance contract. In addition, the investment adviser reduced its management fee and certain other expenses during this period. If this performance information included the effect of the insurance charges and the fees and expenses assumed by the investment adviser, performance numbers would be lower. The value of an investment in the PIMCO Total Return Fund and the return on the investment will fluctuate and redemption proceeds may be higher or lower than an investor’s original cost.
***For the period from October 1, 2008 (commencement of operations) to December 31, 2008.
53
MANAGEMENT’S DISCUSSION & ANALYSIS
AIM SMALL CAP GROWTH FUND | (subadvised by Invesco Aim Advisors, Inc.) |
For the period since inception to December 31, 2008, the Fund outperformed by the widest margin in the Consumer Discretionary sector, driven largely by stock selection in the consumer services industry group. In this sector, for profit education services provider DeVry Inc. was one of the Fund’s top contributors to performance. Teen retailer Hot Topic Inc. also made a significant contribution. The Fund also outperformed in the Information Technology sector, driven by stock selection in the software/services and the technology hardware/equipment industry groups. One of the leading contributors to performance was Cogent Inc., a company that provides automated fingerprint identification systems. Outperformance in the Energy sector was also driven by stock selection.
Underperformance in the Health Care sector was driven primarily by stock selection in two industry groups: pharmaceuticals/biotechnology/life sciences and health care equipment/services. One of the leading detractors to Fund performance was Parexel Intl Corp., a company that provides research services to pharmaceutical, biotech and medical device firms. Some of this weak performance was offset by strong performance from cosmetic surgery products maker Mentor Corp. Underperformance in the Telecom sector was due to stock selection and an underweight position. Underperformance in the Financials sector was largely due to stock selection in the bank and real estate industry groups. Two of the leading detractors to overall fund performance were SVB Financial Group, the holding company for Silicon Valley Bank, and Biomed Realty Trust.
Many factors contributed to the negative performance of most major market indexes for the fiscal year ended December 31, 2008. The chief catalyst was the ongoing subprime loan crisis and its far-reaching effects on overall credit availability. Additionally, record high crude oil prices, falling home values and the weak U.S. dollar placed significant pressure on the purchasing power of consumers. Later in the fiscal year, consumer confidence fell and market volatility increased dramatically due to growing fears of a global recession.
In the volatile market environment, the portfolio has a slightly more defensive posture. Additionally, we have slightly more exposure to the U.S., given valuation levels and the slowdown in many foreign economies.
At December 31, 2008, the largest overweight positions were in the semiconductor/semiconductor equipment, diversified financials, consumer services and transportation industry groups. The largest underweight positions were in the pharmaceuticals/life sciences/biotechnology, capital goods and consumer durables/apparel industry groups.
54
AIM SMALL CAP GROWTH FUND
| | |
TOP TEN EQUITY HOLDINGS At December 31, 2008 | | INDUSTRY WEIGHTINGS (Continued) At December 31, 2008 |
| | | |
| | | % of Net Assets | |
Tetra Tech, Inc. | | 1.9 | % |
Myriad Group, Inc. | | 1.8 | |
Greenhill & Co., Inc. | | 1.5 | |
Cogent, Inc. | | 1.4 | |
Knight Transportation, Inc. | | 1.4 | |
TransDigm Group, Inc. | | 1.4 | |
Strayer Education, Inc. | | 1.4 | |
Hot Topic, Inc. | | 1.4 | |
Ralcorp Holdings, Inc. | | 1.3 | |
Marvel Entertainment, Inc. | | 1.3 | |
INDUSTRY WEIGHTINGS
At December 31, 2008
| | | |
| | | % of Net Assets | |
Short Term Investments | | 8.0 | % |
Biotechnology | | 6.9 | |
Software | | 6.0 | |
Health Care Equipment & Supplies | | 5.9 | |
Semiconductors & Semiconductor Equipment | | 5.8 | |
Commercial Services & Supplies | | 5.7 | |
Health Care Providers & Services | | 5.0 | |
Oil & Gas-Exploration & Production | | 4.0 | |
Capital Markets | | 4.0 | |
Hotels, Restaurants & Leisure | | 3.9 | |
Machinery | | 3.7 | |
Communications Equipment | | 3.5 | |
IT Services | | 3.4 | |
Specialty Retail | | 2.7 | |
Electronic Equipment & Instruments | | 2.7 | |
Diversified Consumer Services | | 2.6 | |
Life Sciences Tools & Services | | 2.5 | |
Energy Equipment & Services | | 2.4 | |
Internet Software & Services | | 2.2 | |
Air Freight & Logistics | | 2.1 | |
Media | | 1.9 | |
Aerospace & Defense | | 1.9 | |
Electrical Equipment | | 1.7 | |
Commercial Banks | | 1.5 | |
Pharmaceuticals | | 1.5 | |
Road & Rail | | 1.4 | |
| | | |
| | | % of Net Assets | |
Food Products | | 1.3 | % |
Insurance | | 1.2 | |
Household Products | | 1.2 | |
Health Care Technology | | 1.2 | |
Electric Utilities | | 1.0 | |
Containers & Packaging | | 0.9 | |
Chemicals | | 0.9 | |
Textiles, Apparel & Luxury Goods | | 0.8 | |
Wireless Telecommunication Services | | 0.7 | |
Real Estate Investment Trusts | | 0.7 | |
Construction & Engineering | | 0.6 | |
Metals & Mining | | 0.6 | |
Multi-Line Retail | | 0.5 | |
Trading Companies & Distributors | | 0.5 | |
Liabilities in excess of other assets | | (5.0 | ) |
| | | |
TOTAL | | 100.0 | % |
| | | |
55
AIM SMALL CAP GROWTH FUND
Comparison of Change in Value of a $10,000 Investment in the AIM Small Cap Growth Fund – Initial Class and the Russell 2000 Growth Index
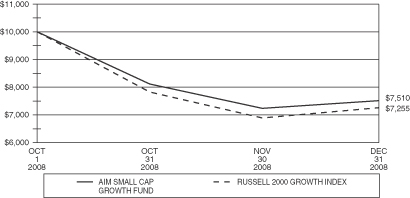
Comparison of Change in Value of a $10,000 Investment in the AIM Small Cap Growth Fund – Service Class and the Russell 2000 Growth Index
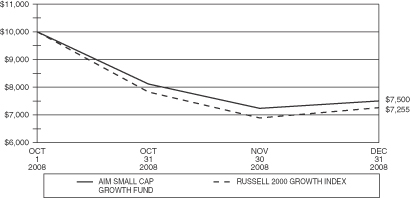
56
AIM SMALL CAP GROWTH FUND
Total Returns for Period Ended December 31, 2008**
| | | |
Initial Class Shares | | Life of
Fund*** | |
AIM Small Cap Growth Fund | | (24.90 | )% |
Russell 2000 Growth Index* | | (27.45 | )% |
Service Class Shares | | | |
AIM Small Cap Growth Fund | | (25.00 | )% |
Russell 2000 Growth Index* | | (27.45 | )% |
*The performance data of the index has been prepared from sources and data that the investment adviser believes to be reliable, but no representation is made as to their accuracy. The Russell 2000 Growth Index measures the performance of those Russell 2000 companies with higher price-to-book ratios and higher forecasted growth values. The Russell 2000 Growth Index has been taken from published sources.
**Performance data is historical and includes changes in share price and reinvestment of income dividends and capital gains distributions. Past performance does not indicate future results. Performance numbers are net of all operating expenses, but do not include any insurance charges imposed in connection with your variable insurance contract. In addition, the investment adviser reduced its management fee and certain other expenses during this period. If this performance information included the effect of the insurance charges and the fees and expenses assumed by the investment adviser, performance numbers would be lower. The value of an investment in the AIM Small Cap Growth Fund and the return on the investment will fluctuate and redemption proceeds may be higher or lower than an investor’s original cost.
***For the period from October 1, 2008 (commencement of operations) to December 31, 2008.
57
MANAGEMENT’S DISCUSSION & ANALYSIS
ALLIANCEBERNSTEIN INTERNATIONAL VALUE FUND
(subadvised by AllianceBernstein L.P.)
Equity markets around the world collapsed in 2008, recording one of their worst ever years, as turmoil in the financial system threatened to plunge the global economy into a deep and prolonged recession. The MSCI EAFE Index fell -43%, including a decline of -20% in the fourth quarter. All sectors of the market were down over the quarter and the year, led by financials and consumer cyclicals. In this environment, defensive sectors, such as consumer staples, and health care, held up relatively better. The US dollar gained strongly relative to sterling, was up slightly against the euro, but lost ground to the yen.
The wholesale flight to safety intensified in the fourth quarter, as evidence mounted that the global economy was entering a severe slowdown. The yield on Treasury bills remained stuck near zero, showing that investors were willing to forego a return on their investment in exchange for a safe place to park their cash. Government bond yields also hit or neared record lows. But yield spreads on investment grade corporate bonds shot to peaks unseen since the Great Depression. Economic conditions are certainly grim. Global industrial production is plummeting, unemployment is rising quickly, and credit markets remain nearly frozen. The US led much of the developed world into recession, and emerging-market economies that have powered global growth in recent years, such as China, have also slowed sharply.
For the period since inception to December 31,2008, security selection was beneficial to Fund performance in the telecommunications sector, including Nippon Telegraph & Telephone (+0.13%) and Telecom Italia (+0.11%). Despite recent underperformance by the sector, several of our financial positions contributed to performance, including Allianz (+0.33%) and Prudential (0.20%). Detracting from performance were several of our financial holdings, including BNP Paribas (-0.43%), Credit Suisse (-0.35%), ORIX (-0.27%) and Credit Agricole (-0.24%). On a country basis, an underweight in Switzerland benefitted returns (+0.27%), while an overweight in Russia detracted (-0.22%).
Our research and experience as value managers have taught us to keep portfolio risk proportionate with the value opportunity we identify. After a lengthy period of compression, valuation spreads have widened. We continue to take advantage of investor overreaction to economic and industrial stresses, using our deep research capabilities to look for investment opportunities arising from current market volatility.
We have positioned the Fund to withstand the near-term risks associated with the new restrictive credit environment and depressed economic conditions while retaining the potential to benefit significantly from the inevitable market rebound.
In the economically sensitive commodity sector, we have reviewed balance sheets to make sure that the companies that we own can survive an extended period of lower commodity prices. This has led us to reduce our overweight in chemicals, nonferrous metals and steel stocks but increase our weight in energy companies.
And we have increased our exposure to the cyclically sensitive technology sector, where we have found several new opportunities that have excellent franchises and good balance sheets. We’re also maintaining significant exposure to a very attractive group of financial companies, though we have diversified our holdings within the sector to reduce single-stock risk.
58
ALLIANCEBERNSTEIN INTERNATIONAL VALUE FUND
| | |
TOP TEN EQUITY HOLDINGS At December 31, 2008 | | INDUSTRY WEIGHTINGS (Continued) At December 31, 2008 |
| | | |
| | | % of Net Assets | |
Royal Dutch Shell PLC | | 2.7 | % |
BP PLC | | 2.3 | |
Vodafone Group PLC | | 2.1 | |
Total SA | | 2.0 | |
Novartis AG | | 2.0 | |
GlaxoSmithKline PLC | | 1.8 | |
Telefonica SA | | 1.8 | |
HSBC Holdings PLC | | 1.6 | |
E.ON AG | | 1.5 | |
Eni SpA | | 1.4 | |
INDUSTRY WEIGHTINGS
At December 31, 2008
| | | |
| | | % of Net Assets | |
Commercial Banks | | 13.3 | % |
Oil, & Gas Consumable Fuels | | 11.9 | |
Short Term Investments | | 9.2 | |
Pharmaceuticals | | 8.2 | |
Diversified Telecommunication Services | | 6.6 | |
Insurance | | 4.2 | |
Automobiles | | 4.1 | |
Metals & Mining | | 3.6 | |
Capital Markets | | 3.5 | |
Electric Utilities | | 3.3 | |
Wireless Telecommunication Services | | 3.0 | |
Food & Staples Retailing | | 2.4 | |
Chemicals | | 2.3 | |
Food Products | | 2.3 | |
Communications Equipment | | 2.2 | |
Multi-Utilities | | 2.2 | |
Household Durables | | 1.9 | |
Road & Rail | | 1.7 | |
Computers & Peripherals | | 1.7 | |
Electronic Equipment & Instruments | | 1.6 | |
Trading Companies & Distributors | | 1.6 | |
Hotels, Restaurants & Leisure | | 1.6 | |
Aerospace & Defense | | 1.1 | |
Auto Components | | 1.1 | |
Industrial Conglomerates | | 0.9 | |
| | | |
| | | % of Net Assets | |
Machinery | | 0.8 | % |
Diversified Financial Services | | 0.8 | |
Real Estate Management & Development | | 0.7 | |
Office Electronics | | 0.5 | |
Tobacco | | 0.5 | |
Semiconductors & Semiconductor Equipment | | 0.5 | |
Independent Power Producers & Energy Traders | | 0.5 | |
Transportation Infrastructure | | 0.5 | |
Airlines | | 0.4 | |
Exchange Traded Fund | | 0.4 | |
Specialty Retail | | 0.3 | |
Marine | | 0.3 | |
Commercial Services & Supplies | | 0.3 | |
Containers & Packaging | | 0.3 | |
Health Care Providers & Services | | 0.3 | |
Electrical Equipment | | 0.3 | |
Leisure Equipment & Products | | 0.2 | |
Textiles, Apparel & Luxury Goods | | 0.2 | |
Electrical Components | | 0.2 | |
Paper & Forest Products | | 0.2 | |
Gas Utilities | | 0.1 | |
Construction & Engineering | | 0.1 | |
Personal Products | | 0.1 | |
Air Freight & Logistics | | 0.1 | |
Liabilities in excess of other assets | | (4.1 | ) |
| | | |
TOTAL | | 100 | % |
| | | |
59
ALLIANCEBERNSTEIN INTERNATIONAL VALUE FUND
Comparison of Change in Value of a $10,000 Investment in the AllianceBernstein International Value Fund – Initial Class and the MSCI-EAFE Index
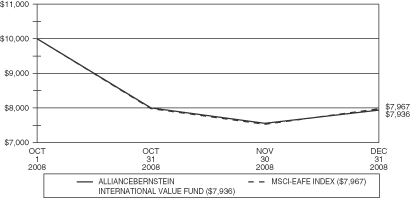
Comparison of Change in Value of a $10,000 Investment in the AllianceBernstein International Value Fund – Service Class and the MSCI-EAFE Index

60
ALLIANCEBERNSTEIN INTERNATIONAL VALUE FUND
Total Returns for Period Ended December 31, 2008**
| | | |
Initial Class Shares | | Life of
Fund*** | |
AllianceBernstein International Value Fund | | (20.64 | )% |
MSCI-EAFE Index* | | (20.33 | )% |
Service Class Shares | | | |
AllianceBernstein International Value Fund | | (20.69 | )% |
MSCI-EAFE Index* | | (20.33 | )% |
*The performance data of the index has been prepared from sources and data that the investment adviser believes to be reliable, but no representation is made as to their accuracy. The MSCI-EAFE Index (Europe, Australasia, Far East) tracks performance of large cap international equity securities and is widely regarded as the standard for measuring large cap international stock market performance. The MSCI-EAFE Index has been taken from published sources.
**Performance data is historical and includes changes in share price and reinvestment of income dividends and capital gains distributions. Past performance does not indicate future results. Performance numbers are net of all operating expenses, but do not include any insurance charges imposed in connection with your variable insurance contract. In addition, the investment adviser reduced its management fee and certain other expenses during this period. If this performance information included the effect of the insurance charges and the fees and expenses assumed by the investment adviser, performance numbers would be lower. The value of an investment in the AllianceBernstein International Value Fund and the return on the investment will fluctuate and redemption proceeds may be higher or lower than an investor’s original cost.
***For the period from October 1, 2008 (commencement of operations) to December 31, 2008.
61
MANAGEMENT’S DISCUSSION & ANALYSIS
BLACKROCK INFLATION PROTECTED BOND FUND
(subadvised by Blackrock Financial Management, Inc.)
For the period since inception to December 31, 2008, global inflation-linked bond markets continued the underperformance that has been a hallmark of 2008, as recession fears and deleveraging put pressure on breakeven inflation. The increased chance of global recession has been the biggest driver of these moves. Combined with the fall in energy prices, investors simply are not looking to buy inflation protection in this environment. However, the global inflation-linked bond markets appear attractive, as Treasury Inflation Protected Securities (TIPS) prices have dropped alongside a dramatic decline in inflation expectations. While TIPS will underperform in a deflationary environment, we believe this is a relatively short-term view. Longer term, after this bout of forced selling subsides and the government programs begin to stabilize the markets, we would expect inflation to pick up and TIPS to outperform. In fact, in December, global inflation-linked bonds staged a small comeback. The rally was driven by breakeven inflation in TIPS with maturities of 5 years or less, which outperformed nominal Treasuries by 50 to 100 basis points across the globe. Commodity markets stabilized somewhat, but the real driver of performance was an apparent break from deleveraging in shorter-maturity inflation-linked bonds.
On the longer end, real yields rallied in line with nominal Treasuries as central banks continued to ease and economies continued to weaken. Many investors are looking for inflation-linked bonds to bounce back in 2009 from what appears to be depressed levels. However, our view is that inflation has only begun to fall, meaning that there will be strong headwinds against the product for the early part of 2009. We would use a significant sell-off in real yields to add to positions, but believe the markets are fairly priced at the moment.
The main positive driver of performance, was our move to much cheaper “off-the-run’ TIPS vs. their “on-the-run” counterparts. This allowed us to pick up incremental yield available in the slightly less liquid non-current TIPS issues. Off-the-run issues are older dated bonds while on-the-run are recently issued. In the case of TIPS, the older dated bonds have lower inflation floors based on CPI at issuance. As a result, the principal amount on those bonds can continue to drop back to earlier levels, leading to greater volatility in the bonds.
Detracting from performance was our curve flattening strategy. We anticipated for some time that the steepening of the yield curve which occurred as the Fed pushed down front end rates would reverse and that long term yields would rally on deflation fears. We moved to a flattening bias, overweighting the 10 year sector of the curve. Throughout the period the TIPS curve remained steep. Also detracting to a lesser extent was our cash position, as TIPS rallied throughout the period.
62
BLACKROCK INFLATION PROTECTED BOND FUND
| | |
TOP BOND ISSUERS At December 31, 2008 | | PORTFOLIO COMPOSITION At December 31, 2008 |
| | | |
| | | % of Net Assets | |
U.S. Treasury | | 50.4 | % |
Government of France | | 5.0 | |
Government National Mortgage Association | | 4.9 | |
Morgan Stanley | | 4.5 | |
Federal Home Loan Bank | | 4.5 | |
JP Morgan Chase & Co. | | 4.5 | |
Federal Farm Credit Bank | | 4.5 | |
Federal National Mortgage Association | | 3.9 | |
Federal Home Loan Mortgage Corp. | | 3.2 | |
| | | |
| | | % of Net Assets | |
U.S. Treasury and U.S. Government Agency Obligations | | 71.3 | % |
Short Term Investments | | 17.7 | |
Corporate Debt Obligations | | 8.9 | |
Foreign Government Obligations | | 5.0 | |
Liabilities in excess of other assets | | (2.9 | ) |
| | | |
TOTAL | | 100.0 | % |
| | | |
Comparison of Change in Value of a $10,000 Investment in the BlackRock Inflation Protected Bond Fund – Initial Class and the Barclays Capital Global Real Index: U.S. TIPS
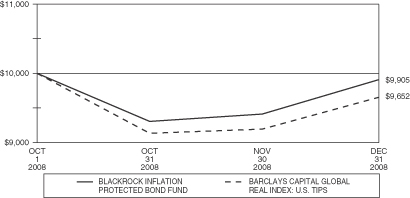
Comparison of Change in Value of a $10,000 Investment in the BlackRock Inflation Protected Bond Fund – Service Class and the Barclays Capital Global Real Index: U.S. TIPS

63
BLACKROCK INFLATION PROTECTED BOND FUND
Total Returns for Period Ended December 31, 2008**
| | | |
Initial Class Shares | | Life of
Fund*** | |
BlackRock Inflation Protected Bond Fund | | (0.95 | )% |
Barclays Capital Global Real Index: U.S. TIPS* | | (3.48 | )% |
Service Class Shares | | | |
BlackRock Inflation Protected Bond Fund | | (0.96 | )% |
Barclays Capital Global Real Index: U.S. TIPS* | | (3.48 | )% |
*The performance data of the index has been prepared from sources and data that the investment adviser believes to be reliable, but no representation is made as to their accuracy. Barclays Capital Global Real Index: U.S. TIPS (formerly the Lehman Brothers Global Real: U.S. TIPS Index) is an unmanaged market index comprised of all U.S. Treasury Inflation Protected Securities rated investment grade (Baa3 or better) that have at least one year to final maturity and at least $250 million par amount outstanding. The Barclays Capital Global Real Index: U.S. TIPS has been taken from published sources.
**Performance data is historical and includes changes in share price and reinvestment of income dividends and capital gains distributions. Past performance does not indicate future results. Performance numbers are net of all operating expenses, but do not include any insurance charges imposed in connection with your variable insurance contract. In addition, the investment adviser reduced its management fee and certain other expenses during this period. If this performance information included the effect of the insurance charges and the fees and expenses assumed by the investment adviser, performance numbers would be lower. The value of an investment in the BlackRock Inflation Protected Bond Fund and the return on the investment will fluctuate and redemption proceeds may be higher or lower than an investor’s original cost.
***For the period from October 1, 2008 (commencement of operations) to December 31, 2008.
64
MANAGEMENT’S DISCUSSION & ANALYSIS
IBBOTSON MODERATE, BALANCEDAND GROWTH FUNDS
(subadvised by Ibbotson Associates, Inc.)
Ibbotson Moderate Fund
Ibbotson Moderate Fund currently has a neutral weighting relative to its strategic asset class targets. From an asset class level, the Fund was negatively impacted the most by its exposure to large cap value and international equities, particularly in October 2008. Core bonds and short-term bonds helped temper the negative downturn. At the Fund portfolio level, SC Davis Venture Value Fund, MFS Value Portfolio and SC AllianceBernstein International Value Fund were the largest detractors of performance, while SC PIMCO Total Return Fund and SC Goldman Sachs Short Duration Fund were positive contributors to performance.
Ibbotson Balanced and Growth Funds
Each of the Ibbotson Balanced Fund and Ibbotson Growth Fund currently has an underweight in REITs relative to their strategic asset class targets. This underweight benefited the portfolios in the period since inception to December 31, 2008 since global REITS underperformed most other markets. The Funds were negatively impacted the most by their exposure to large cap value, large cap growth and international equities, particularly in October 2008. Core bonds and short-term bonds helped temper the negative downturn. At the Ibbotson Balanced Fund portfolio level, SC Davis Venture Value Fund, MFS Value Portfolio and SC AllianceBernstein International Value Fund were the largest detractors of performance, while SC PIMCO Total Return Fund and SC Goldman Sachs Short Duration Fund were positive contributors to performance. At the Ibbotson Growth Fund portfolio level, SC WMC Large Cap Growth Fund, Sun Capital Global Real Estate Fund, and SC Davis Venture Value Fund were the largest detractors of performance, while SC PIMCO Total Return Fund and SC Goldman Sachs Short Duration Fund were positive contributors to performance.
U.S. Bond Market
The newly named Barclay’s U.S. Aggregate returned 4.58% in the 4th quarter and 5.24% for the calendar year. This annual return is only slightly lower than average; however, it masks the destruction that occurred in certain U.S. bond segments, as well as certain U.S. core bond funds designed to track the performance of the aggregate U.S. bond market. For many years the dispersion of intermediate-term U.S. bond funds has been rather tight. However, in 2007 and 2008, there are incredible amounts of dispersion, with some funds losing nearly 90% of their value.
Fears of a lengthy recession and lack of inflation have hurt Treasury inflation-protected securities, which lost 2.35% for the year and 3.48% for the quarter. At one point during the quarter, implied annualized deflation exceeded 2%. We believe policy makers will do whatever they can to avoid deflation. Policy makers have both a growing incentive and need to systematically devalue the U.S. dollar to help pay for the growing U.S. federal debt; thus, we believe realized inflation will exceed the currently implied near zero over the next five years. While the traditional CPI measure of inflation has dropped dramatically, the Personal Consumption Expenditures Index, or core PCE has not.
Finally, high-yield bonds, a category of assets that grew out of the corporate takeover and leveraged buyout activities of the infamous Michael Milken, dropped 17.9% in the 4th quarter and 26.2% during 2008. Yields are at all-time highs; yet, it is important to remember that high-yield bonds are a relatively new asset class and that this is the most significant recessionary period during their existence.
U.S. Stock Market
Of the 83 years since 1926, 2008’s negative 37.0% return of the S&P 500 Index was the second worst year on record. Only the 43.3% loss of 1931 was worse. Of the 332 quarters since 1926, the -22.0% return of the S&P 500 Index in Q4 2008 was the sixth worst quarter on record. During the 4th quarter, small-cap stocks
65
MANAGEMENT’S DISCUSSION & ANALYSIS (Continued)
underperformed large-cap stocks by almost 4%, while value stocks narrowly beat out growth stocks. For 2008, small-cap stocks outperformed large-cap stocks by nearly 6%, while value stocks outperformed growth stocks by around 2%.
U.S. REITs
U.S. REITs experienced an extremely volatile period in 2008. In contrast with most other asset classes, REITs had a positive year-to-date return heading into the third quarter. However, in the fourth quarter U.S. REITs lost -38% ending the year with a loss of -37.7%. While 2008 was a difficult year for U.S. REITs, they just barely underperformed the S&P 500, which lost -37%.
Global Equity Markets
The MSCI EAFE returned -19.9% for the quarter and -43.1% for the year. A portion of this year’s negative return can be attributed to the U.S. dollar, which appreciated relative to most currencies. It was also the worst year ever for emerging markets as measured by the relatively short-lived MSCI Emerging Markets Index, which had an annual return of -54.5%.
66
IBBOTSON MODERATE FUND
| | |
TOP TEN INVESTMENT COMPANIES At December 31, 2008 | | PORTFOLIO COMPOSITION At December 31, 2008 |
| | | |
| | | % of Net Assets | |
SC Goldman Sachs Short Duration Fund | | 20.8 | % |
SC PIMCO Total Return Fund | | 14.7 | |
Sun Capital Investment Grade Bond Fund | | 10.8 | |
SC BlackRock Inflation Protected Bond Fund | | 9.7 | |
MFS Value Portfolio | | 6.9 | |
SC Davis Venture Value Fund | | 5.9 | |
SC AllianceBernstein International Value Fund | | 5.9 | |
SC WMC Large Cap Growth Fund | | 4.9 | |
MFS International Growth Portfolio | | 4.8 | |
SC Dreman Small Cap Value Fund | | 3.0 | |
| | | |
| | | % of Net Assets | |
Investment Companies | | 98.3 | % |
Short Term Investments | | 2.0 | |
Liabilities in excess of other assets | | (0.3 | ) |
| | | |
TOTAL | | 100.0 | % |
| | | |
Comparison of Change in Value of a $10,000 Investment in the Ibbotson Moderate Fund – Initial Class and the Dow Jones Moderately Conservative U.S. Relative Risk Portfolio Index
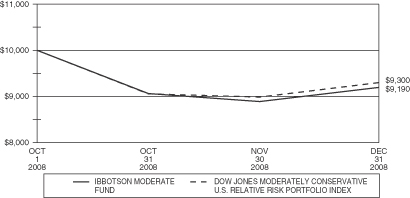
Comparison of Change in Value of a $10,000 Investment in the Ibbotson Moderate Fund – Service Class and the Dow Jones Moderately Conservative U.S. Relative Risk Portfolio Index
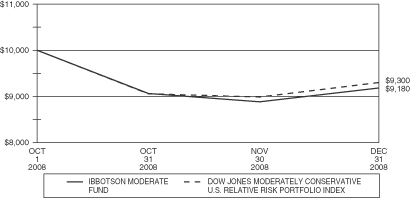
67
IBBOTSON MODERATE FUND
Total Returns for Period Ended December 31, 2008**
| | |
Initial Class Shares | | Life of
Fund*** |
Ibbotson Moderate Fund | | (8.10)% |
Dow Jones Moderately Conservative U.S. Relative Risk Portfolio Index* | | (7.00)% |
Service Class Shares | | |
Ibbotson Moderate Fund | | (8.20)% |
Dow Jones Moderately Conservative U.S. Relative Risk Portfolio Index* | | (7.00)% |
*The performance data of the index has been prepared from sources and data that the investment adviser believes to be reliable, but no representation is made as to their accuracy. The Dow Jones Relative Risk Indexes measure the performance of conservative, moderate and aggressive portfolios based on incremental levels of potential risk. The indexes are designed to systematically measure various levels of risk relative to the risk of a U.S. all-stock index. The Dow Jones Moderately Conservative U.S. Relative Risk Portfolio Index consists of 40% equities and 60% fixed income. The Dow Jones Moderately Conservative U.S. Relative Risk Portfolio Index has been taken from published sources.
**Performance data is historical and includes changes in share price and reinvestment of income dividends and capital gains distributions. Past performance does not indicate future results. Performance numbers are net of all operating expenses, but do not include any insurance charges imposed in connection with your variable insurance contract. In addition, the investment adviser reduced its management fee and certain other expenses during this period. If this performance information included the effect of the insurance charges and the fees and expenses assumed by the investment adviser, performance numbers would be lower. The value of an investment in the Ibbotson Moderate Fund and the return on the investment will fluctuate and redemption proceeds may be higher or lower than an investor’s original cost.
***For the period from October 1, 2008 (commencement of operations) to December 31, 2008.
68
IBBOTSON BALANCED FUND
| | |
TOP TEN INVESTMENT COMPANIES At December 31, 2008 | | PORTFOLIO COMPOSITION At December 31, 2008 |
| | | |
| | | % of Net Assets | |
SC Goldman Sachs Short Duration Fund | | 12.6 | % |
SC PIMCO Total Return Fund | | 11.4 | |
MFS Value Portfolio | | 9.6 | |
SC Davis Venture Value Fund | | 7.6 | |
SC AllianceBernstein International Value Fund | | 7.5 | |
SC WMC Large Cap Growth Fund | | 6.7 | |
Sun Capital Investment Grade Bond Fund | | 6.7 | |
MFS International Growth Portfolio | | 6.6 | |
SC BlackRock Inflation Protected Bond Fund | | 5.7 | |
SC Oppenheimer Large Cap Core Fund | | 4.8 | |
| | | |
| | | % of Net Assets | |
Investment Companies | | 95.8 | % |
Short Term Investments | | 2.1 | |
Other assets less liabilities | | 2.1 | |
| | | |
TOTAL | | 100.0 | % |
| | | |
Comparison of Change in Value of a $10,000 Investment in the Ibbotson Balanced Fund – Initial Class and the Dow Jones Moderate U.S. Relative Risk Portfolio Index
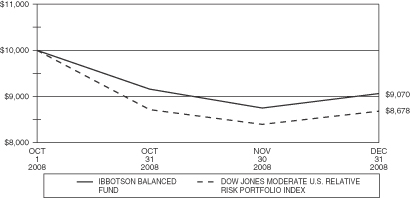
Comparison of Change in Value of a $10,000 Investment in the Ibbotson Balanced Fund – Service Class and the Dow Jones Moderate U.S. Relative Risk Portfolio Index
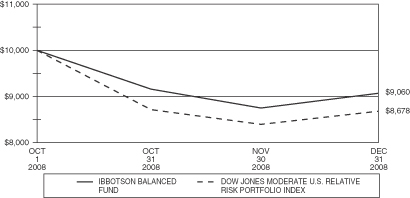
69
IBBOTSON BALANCED FUND
Total Returns for Period Ended December 31, 2008**
| | | |
Initial Class Shares | | Life of
Fund*** | |
Ibbotson Balanced Fund | | (9.30 | )% |
Dow Jones Moderate U.S. Relative Risk Portfolio Index* | | (13.22 | )% |
Service Class Shares | | | |
Ibbotson Balanced Fund | | (9.40 | )% |
Dow Jones Moderate U.S. Relative Risk Portfolio Index* | | (13.22 | )% |
*The performance data of the index has been prepared from sources and data that the investment adviser believes to be reliable, but no representation is made as to their accuracy. The Dow Jones Relative Risk Indexes measure the performance of conservative, moderate and aggressive portfolios based on incremental levels of potential risk. The indexes are designed to systematically measure various levels of risk relative to the risk of a U.S. all-stock index. The Dow Jones Moderate U.S. Relative Risk Portfolio Index consists of 60% equities and 40% income. The Dow Jones Moderate U.S. Relative Risk Portfolio Index has been taken from published sources.
**Performance data is historical and includes changes in share price and reinvestment of income dividends and capital gains distributions. Past performance does not indicate future results. Performance numbers are net of all operating expenses, but do not include any insurance charges imposed in connection with your variable insurance contract. In addition, the investment adviser reduced its management fee and certain other expenses during this period. If this performance information included the effect of the insurance charges and the fees and expenses assumed by the investment adviser, performance numbers would be lower. The value of an investment in the Ibbotson Balanced Fund and the return on the investment will fluctuate and redemption proceeds may be higher or lower than an investor’s original cost.
***For the period from October 1, 2008 (commencement of operations) to December 31, 2008.
70
IBBOTSON GROWTH FUND
| | |
TOP TEN INVESTMENT COMPANIES At December 31, 2008 | | PORTFOLIO COMPOSITION At December 31, 2008 |
| | | |
| | | % of Net Assets | |
SC WMC Large Cap Growth Fund | | 11.7 | % |
MFS Value Portfolio | | 9.7 | |
MFS International Growth Portfolio | | 9.6 | |
SC AllianceBernstein International Value Fund | | 8.6 | |
SC PIMCO Total Return Fund | | 7.8 | |
SC Davis Venture Value Fund | | 7.7 | |
SC Oppenheimer Large Cap Core Fund | | 6.9 | |
Sun Capital Global Real Estate Fund | | 5.0 | |
SC Goldman Sachs Mid Cap Value Fund | | 4.0 | |
SC Goldman Sachs Short Duration Fund | | 3.9 | |
| | | |
| | | % of Net Assets | |
Investment Companies | | 97.4 | % |
Short Term Investments | | 1.3 | |
Other assets less liabilities | | 1.3 | |
| | | |
TOTAL | | 100.0 | % |
| | | |
Comparison of Change in Value of a $10,000 Investment in the Ibbotson Growth Fund – Initial Class and the Dow Jones Moderately Aggressive U.S. Relative Risk Portfolio Index
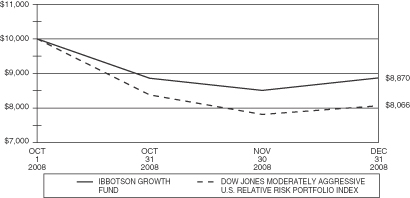
Comparison of Change in Value of a $10,000 Investment in the Ibbotson Growth Fund – Service Class and the Dow Jones Moderately Aggressive U.S. Relative Risk Portfolio Index

71
IBBOTSON GROWTH FUND
Total Returns for Period Ended December 31, 2008**
| | | |
Initial Class Shares | | Life of
Fund*** | |
Ibbotson Growth Fund | | (11.30 | )% |
Dow Jones Moderately Aggressive U.S. Relative Risk Portfolio Index* | | (19.34 | )% |
Service Class Shares | | | |
Ibbotson Growth Fund | | (11.30 | )% |
Dow Jones Moderately Aggressive U.S. Relative Risk Portfolio Index* | | (19.34 | )% |
*The performance data of the index has been prepared from sources and data that the investment adviser believes to be reliable, but no representation is made as to their accuracy. The Dow Jones Relative Risk Indexes measure the performance of conservative, moderate and aggressive portfolios based on incremental levels of potential risk. The indexes are designed to systematically measure various levels of risk relative to the risk of a U.S. all-stock index. The Dow Jones Moderately Aggressive U.S. Relative Risk Portfolio Index consists of 80% equities and 20% fixed income. The Dow Jones Moderately Aggressive U.S. Relative Risk Portfolio Index has been taken from published sources.
**Performance data is historical and includes changes in share price and reinvestment of income dividends and capital gains distributions. Past performance does not indicate future results. Performance numbers are net of all operating expenses, but do not include any insurance charges imposed in connection with your variable insurance contract. In addition, the investment adviser reduced its management fee and certain other expenses during this period. If this performance information included the effect of the insurance charges and the fees and expenses assumed by the investment adviser, performance numbers would be lower. The value of an investment in the Ibbotson Growth Fund and the return on the investment will fluctuate and redemption proceeds may be higher or lower than an investor’s original cost.
***For the period from October 1, 2008 (commencement of operations) to December 31, 2008.
72
EXPENSE INFORMATION
December 31, 2008 (Unaudited)
Information About Your Fund’s Expenses
All mutual funds incur ongoing operating expenses, including management fees and administrative services, among others. The following tables are intended to increase your understanding of the ongoing costs of investing in each Fund. The following examples are based on the investment of $1,000 at the beginning of the period and held for the entire period, July 1, 2008 to December 31, 2008. Expense information does not include any insurance charges imposed in connection with your variable insurance contract.
Actual Expenses: The first section of each table provides information about actual account values and actual expenses. You may use the information in this section, together with the amount you invested, to estimate the expenses you paid over the period. To do so, simply divide your account value by $1,000 (for example, an $8,600 account value divided by $1,000 = 8.6), then multiply the result by the number given for your Fund under the heading “Expenses Paid During the Period”. In addition, Ibbotson Moderate Fund, Ibbotson Balanced Fund and Ibbotson Growth Fund, as shareholders in underlying funds, indirectly bear a pro rata share of the fees and expenses incurred by the underlying funds. These fees and expenses are not included in the annualized expense ratios used to calculate the “Expenses Paid During the Period” for the Funds.
Hypothetical (5% annual return before expenses): The second section of each table provides information about hypothetical account values and hypothetical expenses based on each Fund’s actual expense ratio and an assumed rate of return of 5% per year before expenses, which is not the actual return of the Fund. The hypothetical account values and expenses may not be used to estimate the actual ending account balance or expenses you paid for the period. However, you may use this information to compare the ongoing costs of investing in the Funds with the hypothetical examples that appear in the shareholder reports of other mutual funds. In addition, Ibbotson Moderate Fund, Ibbotson Balanced Fund and Ibbotson Growth Fund, as shareholders in underlying funds, indirectly bear a pro rata share of the fees and expenses incurred by the underlying funds. These fees and expenses are not included in the annualized expense ratios used to calculate the “Expense Paid During the Period” for the Funds.
Expense Information
| | | | | | | | | |
| | | Beginning
Account
Value
7/1/2008 | | Ending
Account
Value
12/31/2008 | | Expenses
Paid During
the Period* |
Investment Grade Bond Fund |
Actual | | | | | | |
Initial Class | | $ | 1,000.00 | | $ | 876.60 | | $ | 3.54 |
Service Class | | $ | 1,000.00 | | $ | 876.40 | | $ | 4.72 |
Hypothetical (5% annual return before expenses) |
Initial Class | | $ | 1,000.00 | | $ | 1,021.37 | | $ | 3.81 |
Service Class | | $ | 1,000.00 | | $ | 1,020.11 | | $ | 5.08 |
|
Global Real Estate Fund |
Actual | | | | | | |
Initial Class | | $ | 1,000.00 | | $ | 563.20 | | $ | 4.32 |
Service Class | | $ | 1,000.00 | | $ | 562.50 | | $ | 5.30 |
Hypothetical (5% annual return before expenses) |
Initial Class | | $ | 1,000.00 | | $ | 1,019.61 | | $ | 5.58 |
Service Class | | $ | 1,000.00 | | $ | 1,018.35 | | $ | 6.85 |
|
Oppenheimer Main Street Small Cap Fund |
Actual | | | | | | |
Initial Class | | $ | 1,000.00 | | $ | 685.60 | | $ | 4.24 |
Service Class | | $ | 1,000.00 | | $ | 684.70 | | $ | 5.29 |
Hypothetical (5% annual return before expenses) |
Initial Class | | $ | 1,000.00 | | $ | 1,020.11 | | $ | 5.08 |
Service Class | | $ | 1,000.00 | | $ | 1,018.85 | | $ | 6.34 |
| | | | | | | | | |
| | | Beginning
Account
Value
7/1/2008 | | Ending
Account
Value
12/31/2008 | | Expenses
Paid During
the Period* |
|
Money Market Fund |
Actual | | | | | | |
Initial Class | | $ | 1,000.00 | | $ | 1,008.50 | | $ | 2.52 |
Service Class | | $ | 1,000.00 | | $ | 1,007.30 | | $ | 3.78 |
Hypothetical (5% annual return before expenses) |
Initial Class | | $ | 1,000.00 | | $ | 1,022.62 | | $ | 2.54 |
Service Class | | $ | 1,000.00 | | $ | 1,021.37 | | $ | 3.81 |
Davis Venture Value Fund |
Actual | | | | | | |
Initial Class | | $ | 1,000.00 | | $ | 696.40 | | $ | 3.84 |
Service Class | | $ | 1,000.00 | | $ | 695.90 | | $ | 4.90 |
Hypothetical (5% annual return before expenses) |
Initial Class | | $ | 1,000.00 | | $ | 1,020.61 | | $ | 4.57 |
Service Class | | $ | 1,000.00 | | $ | 1,019.36 | | $ | 5.84 |
|
Oppenheimer Large Cap Core Fund |
Actual | | | | | | |
Initial Class | | $ | 1,000.00 | | $ | 730.50 | | $ | 3.91 |
Service Class | | $ | 1,000.00 | | $ | 729.70 | | $ | 5.00 |
Hypothetical (5% annual return before expenses) |
Initial Class | | $ | 1,000.00 | | $ | 1,020.61 | | $ | 4.57 |
Service Class | | $ | 1,000.00 | | $ | 1,019.36 | | $ | 5.84 |
73
EXPENSE INFORMATION (Continued)
December 31, 2008 (Unaudited)
| | | | | | | | | |
| | | Beginning
Account
Value
7/1/2008 | | Ending
Account
Value
12/31/2008 | | Expenses
Paid During
the Period*, ** |
WMC Large Cap Growth Fund |
Actual | | | | | | |
Initial Class | | $ | 1,000.00 | | $ | 650.40 | | $ | 3.36 |
Service Class | | $ | 1,000.00 | | $ | 649.20 | | $ | 4.39 |
Hypothetical (5% annual return before expenses) |
Initial Class | | $ | 1,000.00 | | $ | 1,021.06 | | $ | 4.12 |
Service Class | | $ | 1,000.00 | | $ | 1,019.81 | | $ | 5.38 |
|
Lord Abbett Growth & Income Fund |
Actual | | | | | | |
Initial Class | | $ | 1,000.00 | | $ | 751.40 | | $ | 3.83 |
Service Class | | $ | 1,000.00 | | $ | 750.70 | | $ | 4.93 |
Hypothetical (5% annual return before expenses) |
Initial Class | | $ | 1,000.00 | | $ | 1,020.76 | | $ | 4.42 |
Service Class | | $ | 1,000.00 | | $ | 1,019.51 | | $ | 5.69 |
|
Goldman Sachs Short Duration Fund |
Actual | | | | | | |
Initial Class | | $ | 1,000.00 | | $ | 1,040.50 | | $ | 3.33 |
Service Class | | $ | 1,000.00 | | $ | 1,040.30 | | $ | 4.62 |
Hypothetical (5% annual return before expenses) |
Initial Class | | $ | 1,000.00 | | $ | 1,021.87 | | $ | 3.30 |
Service Class | | $ | 1,000.00 | | $ | 1,020.61 | | $ | 4.57 |
| | |
PIMCO High Yield Fund | | | | |
Actual | | | | | | |
Initial Class | | $ | 1,000.00 | | $ | 845.80 | | $ | 3.48 |
Service Class | | $ | 1,000.00 | | $ | 844.70 | | $ | 4.64 |
Hypothetical (5% annual return before expenses) |
Initial Class | | $ | 1,000.00 | | $ | 1,021.37 | | $ | 3.81 |
Service Class | | $ | 1,000.00 | | $ | 1,020.11 | | $ | 5.08 |
|
AIM Small Cap Growth Fund |
Actual | | | | | | |
Initial Class | | $ | 1,000.00 | | $ | 751.00 | | $ | 2.53 |
Service Class | | $ | 1,000.00 | | $ | 750.00 | | $ | 3.08 |
Hypothetical (5% annual return before expenses) |
Initial Class | | $ | 1,000.00 | | $ | 1,009.68 | | $ | 2.90 |
Service Class | | $ | 1,000.00 | | $ | 1,009.05 | | $ | 3.54 |
| | | | | | | | | |
| | | Beginning
Account
Value
7/1/2008 | | Ending
Account
Value
12/31/2008 | | Expenses
Paid During
the Period*, ** |
|
WMC Blue Chip Mid Cap Fund |
Actual | | | | | | |
Initial Class | | $ | 1,000.00 | | $ | 670.30 | | $ | 4.20 |
Service Class | | $ | 1,000.00 | | $ | 668.70 | | $ | 5.24 |
Hypothetical (5% annual return before expenses) |
Initial Class | | $ | 1,000.00 | | $ | 1,020.11 | | $ | 5.08 |
Service Class | | $ | 1,000.00 | | $ | 1,018.85 | | $ | 6.34 |
|
Goldman Sachs Mid Cap Value Fund |
Actual | | | | | | |
Initial Class | | $ | 1,000.00 | | $ | 676.30 | | $ | 4.51 |
Service Class | | $ | 1,000.00 | | $ | 675.60 | | $ | 5.56 |
Hypothetical (5% annual return before expenses) |
Initial Class | | $ | 1,000.00 | | $ | 1,019.76 | | $ | 5.43 |
Service Class | | $ | 1,000.00 | | $ | 1,018.50 | | $ | 6.70 |
Dreman Small Cap Value Fund |
Actual | | | | | | |
Initial Class | | $ | 1,000.00 | | $ | 798.50 | | $ | 2.60 |
Service Class | | $ | 1,000.00 | | $ | 798.00 | | $ | 3.16 |
Hypothetical (5% annual return before expenses) |
Initial Class | | $ | 1,000.00 | | $ | 1,009.68 | | $ | 2.90 |
Service Class | | $ | 1,000.00 | | $ | 1,009.05 | | $ | 3.54 |
|
PIMCO Total Return Fund |
Actual | | | | | | |
Initial Class | | $ | 1,000.00 | | $ | 1,058.20 | | $ | 1.68 |
Service Class | | $ | 1,000.00 | | $ | 1,057.60 | | $ | 2.33 |
Hypothetical (5% annual return before expenses) |
Initial Class | | $ | 1,000.00 | | $ | 1,010.93 | | $ | 1.64 |
Service Class | | $ | 1,000.00 | | $ | 1,010.31 | | $ | 2.27 |
|
AllianceBernstein International Value Fund |
Actual | | | | | | |
Initial Class | | $ | 1,000.00 | | $ | 793.60 | | $ | 1.69 |
Service Class | | $ | 1,000.00 | | $ | 793.10 | | $ | 2.25 |
Hypothetical (5% annual return before expenses) |
Initial Class | | $ | 1,000.00 | | $ | 1,010.68 | | $ | 1.90 |
Service Class | | $ | 1,000.00 | | $ | 1,010.05 | | $ | 2.53 |
74
EXPENSE INFORMATION (Continued)
December 31, 2008 (Unaudited)
| | | | | | | | | |
| | | Beginning
Account
Value
7/1/2008 | | Ending
Account
Value
12/31/2008 | | Expenses
Paid During
the Period** |
BlackRock Inflation Protected Bond Fund |
Actual | | | | | | |
Initial Class | | $ | 1,000.00 | | $ | 990.50 | | $ | 1.63 |
Service Class | | $ | 1,000.00 | | $ | 990.40 | | $ | 2.25 |
Hypothetical (5% annual return before expenses) |
Initial Class | | $ | 1,000.00 | | $ | 1,010.93 | | $ | 1.64 |
Service Class | | $ | 1,000.00 | | $ | 1,010.31 | | $ | 2.27 |
Ibbotson Balanced Fund |
Actual | | | | | | |
Initial Class | | $ | 1,000.00 | | $ | 907.00 | | $ | 0.48 |
Service Class | | $ | 1,000.00 | | $ | 906.00 | | $ | 1.08 |
Hypothetical (5% annual return before expenses) |
Initial Class | | $ | 1,000.00 | | $ | 1,012.07 | | $ | 0.51 |
Service Class | | $ | 1,000.00 | | $ | 1,011.44 | | $ | 1.14 |
| | | | | | | | | |
| | | Beginning
Account
Value
7/1/2008 | | Ending
Account
Value
12/31/2008 | | Expenses
Paid During
the Period** |
|
Ibbotson Moderate Fund |
Actual | | | | | | |
Initial Class | | $ | 1,000.00 | | $ | 919.00 | | $ | 0.48 |
Service Class | | $ | 1,000.00 | | $ | 918.00 | | $ | 1.08 |
Hypothetical (5% annual return before expenses) |
Initial Class | | $ | 1,000.00 | | $ | 1,012.07 | | $ | 0.51 |
Service Class | | $ | 1,000.00 | | $ | 1,011.44 | | $ | 1.14 |
|
Ibbotson Growth Fund |
Actual | | | | | | |
Initial Class | | $ | 1,000.00 | | $ | 887.00 | | $ | 0.47 |
Service Class | | $ | 1,000.00 | | $ | 887.00 | | $ | 1.07 |
Hypothetical (5% annual return before expenses) |
Initial Class | | $ | 1,000.00 | | $ | 1,012.07 | | $ | 0.51 |
Service Class | | $ | 1,000.00 | | $ | 1,011.44 | | $ | 1.14 |
| * | For each class of the Fund, expenses are equal to the six-month annualized expense ratio for the class, multiplied by the average account value over the period, multiplied by the number of days in the most recent six-month period divided by the number of days in the year. The six-month annualized expense ratio was 0.75%, 1.00%, 0.50%, 0.75%, 1.10%, 1.35%, 0.90%, 1.15%, 1.00%, 1.25%, 0.90%, 1.15%, 0.81%, 1.06%, 1.00%, 1.25%, 0.87%, 1.12%, 1.07%, 1.32%, 0.65%, 0.90%, 0.75% and 1.00% for the Investment Grade Bond Fund – Initial Class, Investment Grade Bond Fund – Service Class, Money Market Fund – Initial Class, Money Market Fund – Service Class, Global Real Estate Fund – Initial Class, Global Real Estate Fund – Service Class, Davis Venture Value Fund – Initial Class, Davis Venture Value Fund – Service Class, Oppenheimer Main Street Small Cap Fund – Initial Class, Oppenheimer Main Street Small Cap Fund – Service Class, Oppenheimer Large Cap Core Fund – Initial Class, Oppenheimer Large Cap Core Fund – Service Class, WMC Large Cap Growth Fund – Initial Class, WMC Large Cap Growth Fund – Service Class, WMC Blue Chip Mid Cap Fund – Initial Class, WMC Blue Chip Mid Cap Fund – Service Class, Lord Abbett Growth & Income Fund – Initial Class, Lord Abbett Growth & Income Fund – Service Class, Goldman Sachs Mid Cap Value Fund – Initial Class, Goldman Sachs Mid Cap Value Fund – Service Class, Goldman Sachs Short Duration Fund – Initial Class, Goldman Sachs Short Duration Fund – Service Class, PIMCO High Yield Fund – Initial Class, and PIMCO High Yield Fund – Service Class, respectively. |
| ** | The Dreman Small Cap Value Fund, PIMCO Total Return Fund, AIM Small Cap Growth Fund, AllianceBernstein International Value Fund, BlackRock Inflation Protected Bond Fund, Ibbotson Moderate Fund, Ibbotson Balanced Fund and Ibbotson Growth Fund commenced operations on October 1, 2008. For each class of the Dreman Small Cap Value Fund, PIMCO Total Return Fund, AIM Small Cap Growth Fund, AllianceBernstein International Value Fund, BlackRock Inflation Protected Bond Fund, Ibbotson Moderate Fund, Ibbotson Balanced Fund and Ibbotson Growth Fund, actual expenses are equal to the actual expenses incurred by each class from commencement of operations through December 31, 2008. In addition, Ibbotson Moderate Fund, Ibbotson Balanced Fund and Ibbotson Growth Fund, as shareholders in underlying funds, indirectly bear their pro rata share of the fees and expenses incurred by the underlying funds, which fees and expenses are not included in the annualized expense ratios of these Funds. Hypothetical expenses for each class are equal to the three-month annualized expense ratio for the class, multiplied by the average account value over the period, multiplied by the number of days in the most recent six month period divided by the number of days in the year. The three-month annualized expense ratio was 1.15%, 1.40%, 0.65%, 0.90%, 1.15% 1.40%, 0.75%, 1.00%, 0.65%, 0.90%, 0.20%, 0.45%, 0.20%, 0.45%, 0.20% and 0.45% for Dreman Small Cap Value Fund – Initial Class, Dreman Small Cap Value Fund – Service Class, PIMCO Total Return Fund – Initial Class, PIMCO Total Return Fund – Service Class, AIM Small Cap Growth Fund – Initial Class, AIM Small Cap Growth Fund – Service Class, AllianceBernstein International Value Fund – Initial Class, AllianceBernstein International Value Fund – Service Class, BlackRock Inflation Protected Bond Fund – Initial Class, BlackRock Inflation Protected Bond Fund – Service Class, Ibbotson Moderate Fund – Initial Class, Ibbotson Moderate Fund – Service Class, Ibbotson Balanced Fund – Initial Class, Ibbotson Balanced Fund – Service Class, Ibbotson Growth Fund – Initial Class, and Ibbotson Growth Fund – Service Class, respectively. |
75
INVESTMENT GRADE BOND FUND
| | |
PORTFOLIO OF INVESTMENTS December 31, 2008 | | Sun Capital Advisers Trust |
| | | | | | |
| | | Principal
Amount
(000) | | Value |
| | | | | | |
| | | | | | |
ASSET BACKED SECURITIES – 0.4% |
Airplanes Pass Through Trust,
Series D (1)
10.88%, 3/15/12 | | $ | 494 | | $ | 0 |
SLM Student Loan Trust,
Series 2008-5, Class A2 (2)
4.64%, 10/25/16 | | | 160 | | | 152,139 |
SLM Student Loan Trust,
Series 2008-5, Class A4 (2)
5.24%, 7/25/23 | | | 120 | | | 103,740 |
| | | | | | |
Total Asset Backed Securities
(cost $540,825) | | | | | | 255,879 |
| | | | | | |
CORPORATE DEBT OBLIGATIONS – 36.8% |
AUTO – 0.6% | | | | | | |
Ford Motor Credit Co.
8.00%, 12/15/16 | | | 500 | | | 325,684 |
| | | | | | |
BANKS – 4.4% | | | | | | |
Capital One Capital III
7.69%, 8/15/36 | | | 700 | | | 319,676 |
Countrywide Financial Corp.
6.25%, 5/15/16 | | | 325 | | | 308,590 |
HBOS PLC (2)(3)
5.92%, 9/29/49 | | | 500 | | | 189,306 |
Huntington Capital (2)
6.65%, 5/15/37 | | | 300 | | | 122,637 |
Icici Bank, Ltd. (2)(3)
6.38%, 4/30/22 | | | 300 | | | 157,534 |
Merrill Lynch & Co., Inc.
5.70%, 5/2/17 | | | 400 | | | 354,382 |
Morgan Stanley
4.75%, 4/1/14 | | | 500 | | | 380,944 |
Wachovia Corp.
5.75%, 2/1/18 | | | 700 | | | 701,393 |
| | | | | | |
| | | | | | 2,534,462 |
| | | | | | |
BROKERAGE – 0.6% | | | | | | |
Jefferies Group, Inc.
6.25%, 1/15/36 | | | 500 | | | 296,850 |
Lehman Brothers Holdings, Inc. (1)
5.75%, 5/17/13 | | | 500 | | | 47,500 |
| | | | | | |
| | | | | | 344,350 |
| | | | | | |
BUILDING MATERIALS – 1.2% | | | | | | |
C10 Capital Spv., Ltd. (2)(3)
6.72%, 12/1/49 | | | 650 | | | 309,290 |
| | | | | | |
| | | Principal
Amount
(000) | | Value |
| | | | | | |
| | | | | | |
Owens Corning, Inc.
6.50%, 12/1/16 | | $ | 500 | | $ | 362,103 |
| | | | | | |
| | | | | | 671,393 |
| | | | | | |
CABLE – 0.9% | | | | | | |
Time Warner Entertainment Co.
10.15%, 5/1/12 | | | 500 | | | 515,385 |
| | | | | | |
ELECTRIC UTILITIES – 3.4% | | | | | | |
Allegheny Energy Supply Co. LLC (3)
8.25%, 4/15/12 | | | 750 | | | 738,750 |
Centerpoint Energy, Inc.
6.50%, 5/1/18 | | | 750 | | | 612,754 |
Nisource Finance Corp.
6.40%, 3/15/18 | | | 650 | | | 405,650 |
PSEG Energy Holdings, Inc.
8.50%, 6/15/11 | | | 200 | | | 188,523 |
| | | | | | |
| | | | | | 1,945,677 |
| | | | | | |
FINANCIALS – 3.3% | | | | | | |
Allied Capital Corp.
6.00%, 4/1/12 | | | 500 | | | 346,096 |
American Capital Strategies, Ltd.
6.85%, 8/1/12 | | | 650 | | | 272,106 |
CIT Group Funding Co.
4.65%, 7/1/10 | | | 350 | | | 307,255 |
Discover Financial Services
6.45%, 6/12/17 | | | 650 | | | 456,093 |
General Motors Acceptance Corp.
7.00%, 2/1/12 | | | 300 | | | 237,066 |
Noble Group, Ltd. (3)
6.63%, 3/17/15 | | | 500 | | | 285,000 |
| | | | | | |
| | | | | | 1,903,616 |
| | | | | | |
GAMING – 0.7% | | | | | | |
Mashantucket Western Pequot Tribe (3)
8.50%, 11/15/15 | | | 1,000 | | | 392,500 |
| | | | | | |
GAS & PIPELINE UTILITIES – 2.2% | | | |
Enterprise Products Operating LP (2)
7.03%, 1/15/68 | | | 1,000 | | | 470,000 |
Southern Natural Gas Co. (3)
5.90%, 4/1/17 | | | 500 | | | 396,229 |
Southern Union Co. (2)
7.20%, 11/1/66 | | | 380 | | | 131,100 |
Transcanada Pipelines, Ltd. (2)
6.35%, 5/15/67 | | | 600 | | | 268,196 |
| | | | | | |
| | | | | | 1,265,525 |
| | | | | | |
See Notes to Financial Statements.
76
INVESTMENT GRADE BOND FUND
| | |
PORTFOLIO OF INVESTMENTS (Continued) December 31, 2008 | | Sun Capital Advisers Trust |
| | | | | | |
| | | Principal
Amount
(000) | | Value |
| | | | | | |
| | | | | | |
HEALTH SERVICES – 1.8% | | | | | | |
Humana, Inc.
6.45%, 6/1/16 | | $ | 500 | | $ | 395,323 |
Medco Health Solutions, Inc.
7.13%, 3/15/18 | | | 700 | | | 646,866 |
| | | | | | |
| | | | | | 1,042,189 |
| | | | | | |
HOME CONSTRUCTION – 0.9% | | | | | | |
KB Home & Broad Home Corp.
6.38%, 8/15/11 | | | 650 | | | 500,500 |
| | | | | | |
INSURANCE – 1.6% | | | | | | |
American International Group, Inc. (3)
8.25%, 8/15/18 | | | 650 | | | 475,747 |
Assured Guaranty US Holdings, Inc. (2)
6.40%, 12/15/66 | | | 600 | | | 89,916 |
Liberty Mutual Group, Inc. (3)
7.80%, 3/15/37 | | | 750 | | | 336,564 |
| | | | | | |
| | | | | | 902,227 |
| | | | | | |
METALS – 1.6% | | | | | | |
Rio Tinto Fin USA, Ltd.
6.50%, 7/15/18 | | | 650 | | | 476,561 |
United States Steel Corp.
6.05%, 6/1/17 | | | 700 | | | 457,673 |
| | | | | | |
| | | | | | 934,234 |
| | | | | | |
MULTIMEDIA – 0.7% | | | | | | |
Grupo Televisa S.A.
6.00%, 5/15/18 | | | 500 | | | 420,450 |
| | | | | | |
OIL – 0.5% | | | | | | |
Pemex Finance, Ltd.
9.03%, 2/15/11 | | | 270 | | | 276,870 |
| | | | | | |
REAL ESTATE INVESTMENT TRUSTS – 3.6% |
Commercial Net Lease Realty
6.25%, 6/15/14 | | | 550 | | | 427,692 |
Prologis
6.63%, 5/15/18 | | | 750 | | | 358,742 |
Realty Income Corp.
6.75%, 8/15/19 | | | 500 | | | 289,357 |
Reckson Operating Partnership
5.15%, 1/15/11 | | | 700 | | | 519,316 |
Simon Property Group LP
5.75%, 5/1/12 | | | 550 | | | 439,665 |
| | | | | | |
| | | | | | 2,034,772 |
| | | | | | |
| | | | | | |
| | | Principal
Amount
(000) | | Value |
| | | | | | |
| | | | | | |
RETAIL – 1.6% | | | | | | |
Controladora Commercial Mexicana S.A. de C.V. (1)
6.63%, 6/1/15 | | $ | 600 | | $ | 294,220 |
Home Depot, Inc.
5.88%, 12/16/36 | | | 450 | | | 352,846 |
JC Penney Corp., Inc.
5.75%, 2/15/18 | | | 425 | | | 282,116 |
| | | | | | |
| | | | | | 929,182 |
| | | | | | |
SOFTWARE – 1.1% | | | | | | |
Fiserv, Inc.
6.80%, 11/20/17 | | | 700 | | | 620,027 |
| | | | | | |
SUPERMARKETS – 1.0% | | | | | | |
Delhaize Group
6.50%, 6/15/17 | | | 600 | | | 544,796 |
| | | | | | |
TELECOMMUNICATIONS – 4.2% | | | |
Intelsat
6.50%, 11/1/13 | | | 260 | | | 145,600 |
Rogers Communications, Inc.
6.80%, 8/15/18 | | | 750 | | | 757,823 |
Rogers Wireless, Inc.
8.00%, 12/15/12 | | | 800 | | | 766,000 |
Sprint Capital Corp.
6.90%, 5/1/19 | | | 400 | | | 284,000 |
Telecom Italia Capital
4.95%, 9/30/14 | | | 600 | | | 456,750 |
| | | | | | |
| | | | | | 2,410,173 |
| | | | | | |
TOBACCO – 0.9% | | | | | | |
Philip Morris International, Inc.
5.65%, 5/16/18 | | | 500 | | | 495,666 |
| | | | | | |
Total Corporate Debt Obligations
(cost $30,683,748) | | | | | | 21,009,678 |
| | | | | | |
RESIDENTIAL NON-AGENCY
MORTGAGE BACKED SECURITIES – 3.3% |
JP Morgan Mortgage Trust,
Series 2005-A3, Class 7CA1 (2)
5.11%, 6/25/35 | | | 50 | | | 43,244 |
Master Adjustable Rate
Mortgage Trust,
Series 2006-2, Class 3A1 (2)
4.84%, 1/25/36 | | | 299 | | | 238,558 |
See Notes to Financial Statements.
77
INVESTMENT GRADE BOND FUND
| | |
PORTFOLIO OF INVESTMENTS (Continued) December 31, 2008 | | Sun Capital Advisers Trust |
| | | | | | |
| | | Principal
Amount
(000) | | Value |
| | | | | | |
| | | | | | |
Residential Accredited Loans, Inc., (2)
Series 2005-QA7, Class A22
4.82%, 7/25/35 | | $ | 969 | | $ | 576,516 |
Series 2003-QS17, Class CB3 | | | | | | |
5.50%, 9/25/33 | | | 222 | | | 221,439 |
Wamu Mortgage Pass Through Certificates, (2)
Series 2003-AR10, Class A7
4.67%, 10/25/33 | | | 562 | | | 463,314 |
Series 2005-AR18, Class 3A2 | | | | | | |
5.62%, 1/25/36 | | | 282 | | | 132,860 |
Wells Fargo Mortgage Backed Securities Trust,
Series 2005-AR 16 (2)
4.99%, 10/25/35 | | | 500 | | | 215,939 |
| | | | | | |
Total Residential Non-Agency
Mortgage Backed Securities
(cost $2,461,307) | | | | | | 1,891,870 |
| | | | | | |
COMMERCIAL MORTGAGE BACKED SECURITIES – 7.0% |
Banc of America Mortgage Securities, Inc.,
Series 2005-E, Class 2A7 (2)
4.61%, 6/25/35 | | | 640 | | | 256,306 |
Bear Stearns Commercial Mortgage Securities
Series 2007-T28, Class A3
5.79%, 9/11/42 | | | 1,000 | | | 674,240 |
Citigroup/Deutsche Bank Commercial Mortgage Trust,
Series 2005-C1, Class A3 (2)
5.23%, 7/15/44 | | | 750 | | | 605,979 |
Commercial Mortgage Asset Trust,
Series 1999-C1, Class F (3)
6.25%, 1/17/32 | | | 400 | | | 178,829 |
CS First Boston Mortgage Securities Corp.,
Series 2000-C1, Class A2
7.55%, 4/15/62 | | | 306 | | | 305,943 |
GMAC Commercial Mortgage Securities, Inc.,
Series 2003-C1, Class A2
4.08%, 5/10/36 | | | 800 | | | 694,738 |
GMAC Commercial Mortgage Securities, Inc.,
Series 2003-C1, Class A2
4.22%, 4/10/40 | | | 111 | | | 106,977 |
| | | | | | |
| | | Principal
Amount
(000) | | Value |
| | | | | | |
| | | | | | |
Greenwich Capital Commercial Funding Corp.,
Series 2005-GG3, Class A4 (2)
4.80%, 8/10/42 | | $ | 200 | | $ | 170,300 |
GS Mortgage Securities Corp.,
Series 2005-GG4, Class AJ
4.78%, 7/10/39 | | | 700 | | | 313,173 |
JP Morgan Chase Commercial Mortgage Securities Corp.,
Series 2006-LDP7 Mortgage Certificate, Class AM (2)
5.88%, 4/15/45 | | | 500 | | | 257,145 |
JP Morgan Chase Commercial Mortgage,
Series 2005 LDP5 Mortgage Certificate, Class A3 (2)
5.21%, 12/15/44 | | | 550 | | | 434,322 |
| | | | | | |
Total Commercial Mortgage Backed Securities
(cost $5,902,033) | | | | | | 3,997,952 |
| | | | | | |
U.S. TREASURY AND U.S. GOVERNMENT AGENCY OBLIGATIONS – 39.9% |
Federal Home Loan Mortgage
4.73%, 8/1/32 (2) | | | 37 | | | 36,548 |
5.00%, 9/1/19 | | | 270 | | | 278,512 |
5.00%, 11/1/19 | | | 520 | | | 535,120 |
5.50%, 10/1/17 | | | 141 | | | 146,111 |
5.50%, 11/1/17 | | | 276 | | | 284,860 |
5.50%, 6/1/33 | | | 304 | | | 311,691 |
5.50%, 3/1/36 | | | 427 | | | 428,856 |
5.50%, 9/1/37 | | | 1,671 | | | 1,711,997 |
5.50%, 5/1/38 | | | 174 | | | 177,854 |
6.00%, 1/1/17 | | | 75 | | | 77,889 |
6.00%, 2/1/29 | | | 18 | | | 18,480 |
6.00%, 8/1/37 | | | 777 | | | 801,227 |
6.50%, 10/1/16 | | | 40 | | | 41,965 |
6.50%, 11/1/16 | | | 5 | | | 5,066 |
6.50%, 9/1/34 | | | 276 | | | 287,619 |
7.00%, 11/1/29 | | | 23 | | | 23,804 |
7.00%, 1/1/31 | | | 11 | | | 11,308 |
7.00%, 4/1/31 | | | 4 | | | 3,861 |
7.00%, 8/1/31 | | | 156 | | | 163,513 |
7.50%, 3/1/30 | | | 5 | | | 5,661 |
7.50%, 12/1/30 | | | 17 | | | 17,665 |
Federal National Mortgage Assn. | | | | | | |
4.50%, 6/1/19 | | | 1,036 | | | 1,062,673 |
5.00%, 6/1/18 | | | 331 | | | 342,187 |
5.00%, 7/1/20 | | | 801 | | | 824,822 |
See Notes to Financial Statements.
78
INVESTMENT GRADE BOND FUND
| | |
PORTFOLIO OF INVESTMENTS (Continued) December 31, 2008 | | Sun Capital Advisers Trust |
| | | | | | |
| | | Principal
Amount
(000) | | Value |
| | | | | | |
| | | | | | |
5.00%, 10/1/20 | | $ | 307 | | $ | 316,191 |
5.00%, 12/1/20 | | | 199 | | | 204,748 |
5.00%, 10/1/35 | | | 49 | | | 50,069 |
5.00%, 5/1/36 | | | 1,942 | | | 1,931,906 |
5.00%, 7/1/36 | | | 569 | | | 581,894 |
5.50%, 3/1/22 | | | 391 | | | 403,282 |
5.50%, 12/1/32 | | | 1,025 | | | 1,054,829 |
5.50%, 6/1/35 | | | 1,099 | | | 1,127,753 |
5.50%, 8/1/35 | | | 733 | | | 752,130 |
5.50%, 6/1/37 | | | 2,172 | | | 2,229,185 |
6.00%, 12/1/13 | | | 2 | | | 2,541 |
6.00%, 11/1/16 | | | 14 | | | 14,827 |
6.00%, 1/25/32 | | | 1,467 | | | 1,513,515 |
6.00%, 8/1/34 | | | 360 | | | 371,789 |
6.00%, 12/1/36 | | | 784 | | | 808,082 |
6.00%, 11/1/37 | | | 847 | | | 872,597 |
8.00%, 8/1/30 | | | 4 | | | 3,751 |
Government National Mortgage Assn. |
6.00%, 8/15/16 | | | 42 | | | 44,322 |
6.00%, 9/20/38 | | | 446 | | | 460,041 |
6.50%, 9/15/31 | | | 84 | | | 88,525 |
6.50%, 3/15/32 | | | 70 | | | 73,835 |
6.50%, 9/15/32 | | | 105 | | | 109,892 |
6.50%, 10/15/32 | | | 122 | | | 128,303 |
7.00%, 12/15/14 | | | 26 | | | 27,148 |
7.00%, 2/15/28 | | | 19 | | | 19,836 |
7.50%, 3/15/30 | | | 3 | | | 3,403 |
7.50%, 9/15/30 | | | 35 | | | 37,602 |
United States Treasury Notes
4.25%, 11/15/17 | | | 500 | | | 582,461 |
United States Treasury Inflation Indexed Bonds | | | | | | |
1.88%, 7/15/13 | | | 1,180 | | | 1,111,271 |
2.00%, 1/15/14 | | | 293 | | | 277,914 |
| | | | | | |
Total U.S. Treasury and U.S. Government Agency Obligations
(cost $22,097,526) | | | | | | 22,802,931 |
| | | | | | |
| | | | | | |
| | | Principal
Amount
(000) | | Value |
| | | | | | |
| | | | | | |
SHORT TERM INVESTMENTS – 11.3% |
COMMERCIAL PAPER – 4.1% | | | | | | |
Citigroup Funding, Inc.,
0.15%, 2/17/09 | | $ | 1,000 | | $ | 999,804 |
Hewlett Packard Co.,
0.55%, 3/2/09 | | | 500 | | | 499,542 |
Philip Morris Intl, Inc.,
0.75%, 2/6/09 | | | 850 | | | 849,362 |
| | | | | | |
Total Commercial Paper | | | | | | 2,348,708 |
| | | | | | |
| | | Shares | | |
MUTUAL FUNDS – 5.4% | | | | | | |
Federated Prime Obligation Fund | | | 1,778,936 | | | 1,778,936 |
SSgA Money Market Fund | | | 1,318,066 | | | 1,318,066 |
| | | | | | |
Total Mutual Funds | | | | | | 3,097,002 |
| | | | | | |
| | | | | | |
| | | Principal
Amount
(000) | | |
| | | | | | |
U.S. GOVERNMENT AGENCY OBLIGATIONS – 1.8% |
Federal Home Loan Mortgage Discount Notes
0.40%, 1/30/09 | | $ | 1,000 | | | 999,678 |
| | | | | | |
Total Short Term Investments
(cost $6,445,388) | | | | | | 6,445,388 |
| | | | | | |
TOTAL INVESTMENTS – 98.7%
| | | |
(cost $68,130,827) | | | | | | 56,403,698 |
Other assets less liabilities – 1.3% | | | | | | 726,935 |
| | | | | | |
NET ASSETS – 100.0% | | | | | $ | 57,130,633 |
| | | | | | |
| (1) | Security is in default and is non-income producing. |
| (2) | Variable rate security. The interest rate shown reflects the rate in effect as of December 31, 2008. |
| (3) | Eligible for resale under rule 144A of the Securities Act of 1933. These securities may be resold in transactions exempt from registration, normally to qualified institutional buyers. At December 31, 2008 these securities amounted to $3,459,749 representing 6.1% of net assets. |
See Notes to Financial Statements.
79
MONEY MARKET FUND
| | |
PORTFOLIO OF INVESTMENTS December 31, 2008 | | Sun Capital Advisers Trust |
| | | | | | |
| | | Principal
Amount
(000) | | Value |
| | | | | | |
| | | | | | |
| | | | | | |
COMMERCIAL PAPER – 43.8% | | | |
American General Finance Corp. (1)(2)(3) | | | | | | |
2.97%, 8/24/09 | | $ | 4,700 | | $ | 4,331,943 |
Capital Support Agreement (2) | | | — | | | 368,057 |
AT&T, Inc. (1) | | | | | | |
0.90%, 1/21/09 | | | 2,000 | | | 1,999,000 |
1.15%, 1/12/09 | | | 1,000 | | | 999,649 |
1.15%, 1/20/09 | | | 3,000 | | | 2,998,179 |
Coca Cola Co. (1) | | | | | | |
1.20%, 1/5/09 | | | 2,600 | | | 2,599,653 |
1.20%, 2/3/09 | | | 2,000 | | | 1,997,800 |
2.25%, 1/15/09 | | | 1,440 | | | 1,438,740 |
Dupont (E.I.) De NeMours & Co. (1) 0.20%, 1/7/09 | | | 750 | | | 749,975 |
European Investment Bank
0.57%, 6/10/09 | | | 2,000 | | | 1,994,933 |
Export Development Corp. | | | | | | |
0.97%, 5/8/09 | | | 1,000 | | | 996,578 |
1.50%, 4/13/09 | | | 1,100 | | | 1,095,325 |
2.45%, 3/10/09 | | | 3,900 | | | 3,881,952 |
Hewlett Packard Co. (1)
0.60%, 3/3/09 | | | 3,500 | | | 3,496,442 |
0.80%, 1/2/09 | | | 2,500 | | | 2,499,944 |
International Business Machine Corp. (1)
3.00%, 1/7/09 | | | 3,000 | | | 2,998,500 |
J.P. Morgan Chase
2.80%, 1/6/09 | | | 1,650 | | | 1,649,358 |
KFW International Finance, Inc. (1) 0.68%, 1/13/09 | | | 3,500 | | | 3,499,207 |
0.84%, 1/6/09 | | | 2,000 | | | 1,999,767 |
Merrill Lynch & Co., Inc.
3.31%, 1/5/09 | | | 1,375 | | | 1,374,494 |
Microsoft Corp. (1)
0.50%, 1/16/09 | | | 3,000 | | | 2,999,375 |
Nestle Capital Corp. (1)
0.65%, 2/2/09 | | | 1,000 | | | 999,422 |
0.95%, 2/17/09 | | | 2,500 | | | 2,496,899 |
Nestle Finance, Inc.
1.00%, 2/2/09 | | | 1,000 | | | 999,111 |
1.02%, 2/2/09 | | | 2,500 | | | 2,497,733 |
Pfizer, Inc. (1)
0.50%, 5/18/09 | | | 2,000 | | | 1,996,194 |
1.20%, 3/17/09 | | | 1,000 | | | 997,500 |
1.25%, 3/10/09 | | | 3,000 | | | 2,992,917 |
Philip Morris International (1)
0.95%, 3/12/09 | | | 3,000 | | | 2,994,458 |
1.25%, 2/4/09 | | | 1,000 | | | 998,819 |
1.25%, 2/5/09 | | | 1,650 | | | 1,647,995 |
| | | | | | |
| | | Principal
Amount
(000) | | Value |
| | | | | | |
| | | | | | |
Pitney Bowes, Inc. (1)
2.20%, 1/5/09 | | $ | 3,000 | | $ | 2,999,267 |
The Procter & Gamble Co. (1) | | | | | | |
1.10%, 1/16/09 | | | 1,000 | | | 999,542 |
1.15%, 2/11/09 | | | 2,000 | | | 1,997,381 |
1.85%, 2/3/09 | | | 3,000 | | | 2,994,913 |
Toyota Credit de Puerto Rico
2.20%, 1/6/09 | | | 3,000 | | | 2,999,083 |
2.58%, 1/14/09 | | | 1,785 | | | 1,783,337 |
United Parcel Service (1)
0.40%, 1/13/09 | | | 1,000 | | | 999,867 |
0.50%, 2/6/09 | | | 2,705 | | | 2,703,648 |
0.50%, 3/2/09 | | | 1,500 | | | 1,498,750 |
Wal-Mart Stores, Inc. (1)
0.55%, 6/15/09 | | | 3,500 | | | 3,491,177 |
0.75%, 9/8/09 | | | 2,500 | | | 2,486,979 |
| | | | | | |
Total Commercial Paper
(amortized cost $89,543,863) | | | | | | 89,543,863 |
| | | | | | |
FOREIGN GOVERNMENT OBLIGATIONS – 4.0% |
Government of Canada Bills | | | | | | |
0.40%, 2/23/09 | | | 1,500 | | | 1,499,117 |
0.50%, 2/18/09 | | | 1,500 | | | 1,499,000 |
0.50%, 6/10/09 | | | 2,000 | | | 1,995,555 |
1.20%, 1/30/09 | | | 2,000 | | | 1,998,067 |
Quebec Government
1.00%, 3/5/09 | | | 1,200 | | | 1,197,900 |
| | | | | | |
Total Foreign Government Obligations (cost $8,189,639) | | | | | | 8,189,639 |
| | | | | | |
U.S. TREASURY AND U.S. GOVERNMENT AGENCY OBLIGATIONS – 43.4% |
Federal Home Loan Mortgage Discount Notes
0.40%, 1/30/09 | | | 3,500 | | | 3,498,872 |
0.40%, 5/12/09 | | | 2,000 | | | 1,997,089 |
0.50%, 1/20/09 | | | 3,500 | | | 3,499,076 |
0.80%, 1/26/09 | | | 4,195 | | | 4,192,670 |
1.00%, 1/27/09 | | | 1,925 | | | 1,923,610 |
1.05%, 2/9/09 | | | 4,000 | | | 3,995,450 |
1.50%, 1/9/09 | | | 2,655 | | | 2,654,115 |
2.00%, 1/26/09 | | | 6,785 | | | 6,775,576 |
2.05%, 1/30/09 | | | 7,000 | | | 6,988,440 |
2.65%, 1/12/09 | | | 6,140 | | | 6,135,028 |
Federal National Mortgage Association Discount Notes
0.55%, 3/4/09 | | | 4,385 | | | 4,380,847 |
0.60%, 3/2/09 | | | 3,700 | | | 3,696,300 |
0.70%, 10/16/09 | | | 2,000 | | | 1,988,800 |
See Notes to Financial Statements.
80
MONEY MARKET FUND
| | |
PORTFOLIO OF INVESTMENTS (Continued) December 31, 2008 | | Sun Capital Advisers Trust |
| | | | | | |
| | | Principal
Amount
(000) | | Value |
| | | | | | |
| | | | | | |
0.75%, 2/4/09 | | $ | 5,500 | | $ | 5,496,104 |
0.83%, 1/20/09 | | | 5,000 | | | 4,997,810 |
0.90%, 2/17/09 | | | 2,000 | | | 1,997,650 |
0.91%, 2/2/09 | | | 2,100 | | | 2,098,301 |
1.05%, 1/26/09 | | | 6,000 | | | 5,995,625 |
1.05%, 2/9/09 | | | 1,945 | | | 1,942,788 |
1.65%, 1/2/09 | | | 5,000 | | | 4,999,771 |
2.05%, 1/8/09 | | | 1,565 | | | 1,564,376 |
United States Treasury Bills
0.43%, 1/2/09 | | | 4,000 | | | 3,999,952 |
0.64%, 1/8/09 | | | 2,100 | | | 2,099,739 |
0.70%, 1/2/09 | | | 1,900 | | | 1,899,963 |
| | | | | | |
Total U.S. Treasury and U.S. Government Agency Obligations (amortized cost $88,817,952) | | | | | | 88,817,952 |
| | | | | | |
U.S. GOVERNMENT GUARANTEED COMMERCIAL PAPER – 3.9% |
TLGP Citigroup Funding, Inc. 0.40%, 5/11/09 | | | 2,000 | | | 1,997,111 |
TLGP Citigroup Funding, Inc. 0.60%, 5/15/09 | | | 2,000 | | | 1,995,533 |
TLGP GE Capital
0.45%, 6/15/09 | | | 4,000 | | | 3,991,750 |
| | | | | | |
Total U.S. Government Guaranteed Commercial Paper
(amortized cost $7,984,394) | | | | | | 7,984,394 |
| | | | | | |
| | | | | |
| | |
Shares | | Value |
| | | | | |
| | | | | |
MUTUAL FUNDS – 4.7% | | | | | |
Federated Prime Obligation Fund | | 4,864,657 | | $ | 4,864,657 |
SSgA Money Market Fund | | 4,628,331 | | | 4,628,331 |
| | | | | |
Total Mutual Funds
(cost $9,492,988) | | | | | 9,492,988 |
| | | | | |
TOTAL INVESTMENTS – 99.8% | | | |
(cost $204,028,836) | | | | | 204,028,836 |
Other assets less liabilities – 0.2% | | | | | 495,223 |
| | | | | |
NET ASSETS – 100.0% | | | | $ | 204,524,059 |
| | | | | |
| (1) | Security exempt from registration under Section 4(2) of the Securities Act of 1933. These securities may be resold in transactions exempt from registration, normally to qualified institutional buyers. At December 31, 2008, these securities amounted to $70,271,959, representing 34.4% of net assets. |
| (2) | Subject to a Capital Support Agreement (Note 9). |
| (3) | Variable rate security. The interest rate shown reflects the rate in effect at December 31, 2008. |
| | | | |
| TLGP | | | | Temporary Liquidity Guarantee Program |
See Notes to Financial Statements.
81
GLOBAL REAL ESTATE FUND
| | |
PORTFOLIO OF INVESTMENTS December 31, 2008 | | Sun Capital Advisers Trust |
| | | | | | | |
| | | Country
Code** | | Shares | | Value |
| | | | | | | |
| | | | | | | |
REAL ESTATE INVESTMENT TRUSTS – 91.7% |
APARTMENTS – 4.9% |
AvalonBay Communities, Inc. | | | | 54,789 | | $ | 3,319,118 |
Equity Residential Properties Trust | | | | 173,142 | | | 5,163,094 |
| | | | | | | |
| | | | | | | 8,482,212 |
| | | | | | | |
DIVERSIFIED – 23.9% |
British Land Co. PLC | | GB | | 673,955 | | | 5,399,892 |
Capitaland Ltd. | | SG | | 3,098,039 | | | 6,759,703 |
Derwent London PLC | | GB | | 268,249 | | | 2,821,824 |
Lexington Corporate Properties Trust | | | | 987,523 | | | 4,937,615 |
Mitsubishi Estate Co. Ltd. | | JP | | 414,618 | | | 6,849,026 |
Stockland | | AU | | 1,044,881 | | | 2,972,363 |
Vornado Realty Trust | | | | 124,439 | | | 7,509,894 |
Wereldhave NV | | NL | | 44,996 | | | 3,968,873 |
| | | | | | | |
| | | | | | | 41,219,190 |
| | | | | | | |
HEALTH CARE EQUIPMENT & SERVICES – 7.8% |
Medical Properties Trust, Inc. | | | | 1,007,554 | | | 6,357,666 |
Ventas, Inc. | | | | 214,031 | | | 7,185,020 |
| | | | | | | |
| | | | | | | 13,542,686 |
| | | | | | | |
OFFICE – 9.1% |
Alexandria Real Estate Equities, Inc. | | | | 119,223 | | | 7,193,916 |
Beni Stabili S.p.A | | IT | | 5,199,003 | | | 3,653,971 |
Highwoods Properties, Inc. | | | | 102,023 | | | 2,791,349 |
SL Green Realty Corp. | | | | 82,927 | | | 2,147,809 |
| | | | | | | |
| | | | | | | 15,787,045 |
| | | | | | | |
REGIONAL MALLS – 13.1% |
Pennsylvania Real Estate Investment | | | | 461,216 | | | 3,436,059 |
Simon Property Group, Inc. | | | | 142,712 | | | 7,582,289 |
The Macerich Co. | | | | 188,554 | | | 3,424,141 |
Unibail-Rodamco | | FR | | 54,166 | | | 8,092,111 |
| | | | | | | |
| | | | | | | 22,534,600 |
| | | | | | | |
| | | | | | | |
| | | Country
Code** | | Shares | | Value |
| | | | | | | |
SHOPPING CENTERS – 18.9% |
Atrium European Real Estate, Ltd.* | | AT | | 767,929 | | $ | 2,817,778 |
Hammerson PLC | | GB | | 584,862 | | | 4,530,647 |
Japan Retail Fund Investment Corp. | | JP | | 1,158 | | | 5,001,809 |
Kimco Realty Corp. | | | | 374,122 | | | 6,838,950 |
Klepierre | | FR | | 155,486 | | | 3,823,725 |
Regency Centers Corp. | | | | 65,950 | | | 3,079,865 |
The Link REIT | | HK | | 3,956,077 | | | 6,580,965 |
| | | | | | | |
| | | | | | | 32,673,739 |
| | | | | | | |
STORAGE – 0.6% |
Big Yellow Group PLC | | GB | | 298,986 | | | 1,039,383 |
| | | | | | | |
TIMBER & FOREST PRODUCTS – 6.8% |
Plum Creek Timber Co., Inc. | | | | 187,765 | | | 6,522,956 |
Weyerhaeuser Co. | | | | 170,184 | | | 5,209,332 |
| | | | | | | |
| | | | | | | 11,732,288 |
| | | | | | | |
WAREHOUSE & INDUSTRIAL – 6.6% |
Brixton PLC | | GB | | 1,850,170 | | | 3,576,231 |
EastGroup Properties, Inc. | | | | 67,824 | | | 2,413,178 |
Goodman Group | | AU | | 4,520,149 | | | 2,327,621 |
ProLogis Trust | | | | 225,467 | | | 3,131,737 |
| | | | | | | |
| | | | | | | 11,448,767 |
| | | | | | | |
Total Real Estate Investment Trusts
(cost $269,018,014) | | | 158,459,910 |
| | | | | | | |
SHORT TERM INVESTMENTS – 7.5% |
MUTUAL FUNDS – 7.5% |
Federated Prime Obligation Fund | | 6,712,201 | | | 6,712,201 |
SSgA Money Market Fund | | 6,168,293 | | | 6,168,293 |
| | | | | | | |
Total Short Term Investments (cost $12,880,494) | | | | | 12,880,494 |
| | | | | | | |
TOTAL INVESTMENTS – 99.2% | | | |
(cost $281,898,508) | | | | | 171,340,404 |
Other assets less liabilities – 0.8% | | | | | 1,338,308 |
| | | | | | | |
NET ASSETS – 100.0% | | | | $ | 172,678,712 |
| | | | | | | |
See Notes to Financial Statements.
82
GLOBAL REAL ESTATE FUND
| | |
PORTFOLIO OF INVESTMENTS (Continued) December 31, 2008 | | Sun Capital Advisers Trust |
| * | Non-income producing security |
| ** | Unless otherwise noted the country code for all securities is United States. |
| | | | |
| AT | | | | Austria |
| AU | | | | Australia |
| FR | | | | France |
| GB | | | | Great Britain |
| HK | | | | Hong Kong |
| IT | | | | Italy |
| JP | | | | Japan |
| NL | | | | Netherlands |
| SG | | | | Singapore |
See Notes to Financial Statements.
83
DAVIS VENTURE VALUE FUND
| | |
PORTFOLIO OF INVESTMENTS December 31, 2008 | | Sun Capital Advisers Trust |
| | | | | | | |
| | | Country
Code** | | Shares | | Value |
| | | | | | | |
| | | | | | | |
| | | | | | | |
COMMON STOCKS – 89.2% |
AIR FREIGHT & LOGISTICS – 0.5% | | | |
United Parcel Services, Inc., Class B | | | | 10,560 | | $ | 582,490 |
| | | | | | | |
AUTOMOBILES – 0.7% | | | |
Harley-Davidson, Inc. | | | | 47,330 | | | 803,190 |
| | | | | | | |
BEVERAGES – 2.2% | | | |
Diageo PLC ADR | | | | 29,960 | | | 1,699,930 |
Heineken Holding NV | | NL | | 26,325 | | | 751,964 |
| | | | | | | |
| | | | | | | 2,451,894 |
| | | | | | | |
CAPITAL MARKETS – 3.2% | | | |
Ameriprise Financial, Inc. | | | | 23,675 | | | 553,048 |
Bank of New York Mellon Corp. | | | | 74,670 | | | 2,115,401 |
E*Trade Financial Corp.* | | | | 7,400 | | | 8,510 |
Merrill Lynch & Co., Inc. | | | | 31,977 | | | 372,212 |
Morgan Stanley | | | | 5,380 | | | 86,295 |
State Street Corp. | | | | 3,815 | | | 150,044 |
The Goldman Sachs Group, Inc. | | | | 4,530 | | | 382,287 |
| | | | | | | |
| | | | | | | 3,667,797 |
| | | | | | | |
CHEMICALS – 0.5% | | | |
Monsanto Co. | | | | 7,900 | | | 555,765 |
| | | | | | | |
COMMERCIAL BANKS – 4.7% | | | |
Wachovia Corp. | | | | 33,420 | | | 185,147 |
Wells Fargo & Co. | | | | 175,370 | | | 5,169,907 |
| | | | | | | |
| | | | | | | 5,355,054 |
| | | | | | | |
COMMERCIAL SERVICES & SUPPLIES – 2.6% |
Dun & Bradstreet Corp. | | | | 9,300 | | | 717,960 |
Iron Mountain, Inc.* | | | | 83,663 | | | 2,068,986 |
Visa, Inc., Class A | | | | 4,420 | | | 231,829 |
| | | | | | | |
| | | | | | | 3,018,775 |
| | | | | | | |
COMMUNICATIONS EQUIPMENT – 0.6% | | | |
Cisco Systems, Inc.* | | | | 38,970 | | | 635,211 |
| | | | | | | |
COMPUTERS & PERIPHERALS – 1.4% | | | |
Dell, Inc.* | | | | 36,150 | | | 370,176 |
Hewlett-Packard Co. | | | | 32,250 | | | 1,170,353 |
| | | | | | | |
| | | | | | | 1,540,529 |
| | | | | | | |
| | | | | | | |
| | | Country
Code** | | Shares | | Value |
| | | | | | | |
| | | | | | | |
CONSTRUCTION MATERIALS – 1.3% | | | |
Martin Marietta Materials, Inc. | | | | 4,800 | | $ | 465,984 |
Vulcan Materials Co. | | | | 14,614 | | | 1,016,842 |
| | | | | | | |
| | | | | | | 1,482,826 |
| | | | | | | |
CONSUMER FINANCE – 2.5% | | | |
American Express Co. | | | | 148,235 | | | 2,749,759 |
Discover Financial Services | | | | 7,165 | | | 68,283 |
| | | | | | | |
| | | | | | | 2,818,042 |
| | | | | | | |
CONTAINERS & PACKAGING – 1.4% | | | |
Sealed Air Corp. | | | | 108,768 | | | 1,624,994 |
| | | | | | | |
DIVERSIFIED CONSUMER SERVICES – 1.6% |
H&R Block, Inc. | | | | 81,324 | | | 1,847,681 |
| | | | | | | |
DIVERSIFIED FINANCIAL SERVICES – 5.2% |
Citigroup, Inc. | | | | 36,723 | | | 246,411 |
JPMorgan Chase & Co. | | | | 156,696 | | | 4,940,625 |
Moody’s Corp. | | | | 34,600 | | | 695,114 |
| | | | | | | |
| | | | | | | 5,882,150 |
| | | | | | | |
ELECTRICAL EQUIPMENT – 0.1% | | | |
ABB, Ltd. ADR | | | | 10,090 | | | 151,451 |
| | | | | | | |
ELECTRONIC EQUIPMENT & INSTRUMENTS – 1.2% |
Agilent Technologies, Inc.* | | | | 53,105 | | | 830,031 |
Garmin, Ltd. | | | | 6,580 | | | 126,139 |
Tyco Electronics, Ltd. | | | | 27,842 | | | 451,319 |
| | | | | | | |
| | | | | | | 1,407,489 |
| | | | | | | |
ENERGY EQUIPMENT & SERVICES – 0.5% |
Transocean, Ltd.* | | | | 12,872 | | | 608,202 |
| | | | | | | |
FOOD & STAPLES RETAILING – 7.2% | | | |
Costco Wholesale Corp. | | | | 109,970 | | | 5,773,425 |
CVS Caremark Corp. | | | | 82,385 | | | 2,367,745 |
Whole Foods Market, Inc. | | | | 9,815 | | | 92,653 |
| | | | | | | |
| | | | | | | 8,233,823 |
| | | | | | | |
FOOD PRODUCTS – 0.2% | | | |
The Hershey Co. | | | | 8,160 | | | 283,478 |
| | | | | | | |
HEALTH CARE PROVIDERS & SERVICES – 2.6% |
Cardinal Health, Inc. | | | | 22,970 | | | 791,776 |
Express Scripts, Inc.* | | | | 19,265 | | | 1,059,190 |
See Notes to Financial Statements.
84
DAVIS VENTURE VALUE FUND
| | |
PORTFOLIO OF INVESTMENTS (Continued) December 31, 2008 | | Sun Capital Advisers Trust |
| | | | | | | |
| | | Country
Code** | | Shares | | Value |
| | | | | | | |
| | | | | | | |
UnitedHealth Group, Inc. | | | | 40,690 | | $ | 1,082,354 |
| | | | | | | |
| | | | | | | 2,933,320 |
| | | | | | | |
HOUSEHOLD DURABLES – 0.1% | | | |
Hunter Douglas NV | | NL | | 3,933 | | | 129,478 |
| | | | | | | |
HOUSEHOLD PRODUCTS – 1.7% | | | |
The Procter & Gamble Co. | | | | 31,025 | | | 1,917,965 |
| | | | | | | |
INDEPENDENT POWER PRODUCERS & ENERGY TRADERS – 0.2% |
AES Corp.* | | | | 27,060 | | | 222,974 |
| | | | | | | |
INDUSTRIAL CONGLOMERATES – 0.9% | | | |
Siemens AG | | DE | | 5,300 | | | 399,002 |
Tyco International, Ltd. | | | | 27,882 | | | 602,251 |
| | | | | | | |
| | | | | | | 1,001,253 |
| | | | | | | |
INSURANCE – 10.1% | | | |
American International Group, Inc. | | | | 87,700 | | | 137,689 |
Berkshire Hathaway, Inc., Class A* | | | | 47 | | | 4,540,200 |
Loews Corp. | | | | 89,655 | | | 2,532,754 |
Markel Corp.* | | | | 329 | | | 98,371 |
MBIA, Inc.* | | | | 7,400 | | | 30,118 |
Nipponkoa Insurance Co., Ltd. | | JP | | 53,050 | | | 412,718 |
The Hartford Financial Services Group, Inc. | | | | 21,800 | | | 357,956 |
The Principal Financial Group, Inc. | | | | 9,400 | | | 212,158 |
The Progressive Corp. | | | | 158,950 | | | 2,354,050 |
Transatlantic Holdings, Inc. | | | | 21,081 | | | 844,505 |
| | | | | | | |
| | | | | | | 11,520,519 |
| | | | | | | |
INTERNET & CATALOG RETAIL – 0.5% |
Amazon.com, Inc.* | | | | 10,330 | | | 529,722 |
Liberty Media Corp. –Interactive, Series A* | | | | 20,597 | | | 64,263 |
| | | | | | | |
| | | | | | | 593,985 |
| | | | | | | |
| | | | | | | |
| | | Country
Code** | | Shares | | Value |
| | | | | | | |
| | | | | | | |
INTERNET SOFTWARE & SERVICES – 0.9% |
eBay, Inc.* | | | | 15,830 | | $ | 220,987 |
Google, Inc., Class A* | | | | 2,500 | | | 769,125 |
| | | | | | | |
| | | | | | | 990,112 |
| | | | | | | |
MACHINERY – 0.3% | | | |
PACCAR, Inc. | | | | 11,490 | | | 328,614 |
| | | | | | | |
MARINE – 0.5% | | | |
China Shipping Development Co., Ltd. | | HK | | 168,000 | | | 169,296 |
Kuehne & Nagel International AG | | CH | | 6,186 | | | 400,657 |
| | | | | | | |
| | | | | | | 569,953 |
| | | | | | | |
MEDIA – 4.9% | | | |
Comcast Corp., Class A Special | | | | 171,016 | | | 2,761,908 |
Grupo Televisa SA ADR | | | | 80,250 | | | 1,198,935 |
Liberty Media Corp. –Entertainment, Series A* | | | | 20,140 | | | 352,047 |
News Corp., Class A | | | | 142,930 | | | 1,299,234 |
WPP Group PLC ADR | | | | 700 | | | 20,713 |
| | | | | | | |
| | | | | | | 5,632,837 |
| | | | | | | |
METALS & MINING – 0.4% | | | |
BHP Billiton PLC | | GB | | 15,900 | | | 308,390 |
Rio Tinto PLC | | GB | | 5,500 | | | 122,246 |
| | | | | | | |
| | | | | | | 430,636 |
| | | | | | | |
MULTI-LINE RETAIL – 0.1% | | | |
Sears Holdings Corp.* | | | | 1,590 | | | 61,803 |
| | | | | | | |
OIL & GAS-EXPLORATION & PRODUCTION – 16.4% |
Canadian Natural Resources, Ltd. | | | | 43,235 | | | 1,728,535 |
China Coal Energy Co. | | HK | | 314,100 | | | 253,841 |
ConocoPhillips | | | | 93,480 | | | 4,842,264 |
Devon Energy Corp. | | | | 57,700 | | | 3,791,467 |
EOG Resources, Inc. | | | | 49,443 | | | 3,291,915 |
Occidental Petroleum Corp. | | | | 77,500 | | | 4,649,225 |
OGX Petroleo e Gas Participacoes SA* | | BR | | 300 | | | 67,669 |
| | | | | | | |
| | | | | | | 18,624,916 |
| | | | | | | |
See Notes to Financial Statements.
85
DAVIS VENTURE VALUE FUND
| | |
PORTFOLIO OF INVESTMENTS (Continued) December 31, 2008 | | Sun Capital Advisers Trust |
| | | | | | | |
| | | Country
Code** | | Shares | | Value |
| | | | | | | |
| | | | | | | |
PAPER & FOREST PRODUCTS – 0.4% | | | |
Sino-Forest Corp.* | | CA | | 55,300 | | $ | 442,131 |
| | | | | | | |
PERSONAL PRODUCTS – 0.3% | | | |
Avon Products, Inc. | | | | 13,130 | | | 315,514 |
| | | | | | | |
PHARMACEUTICALS – 1.8% | | | |
Johnson & Johnson | | | | 10,400 | | | 622,232 |
Schering-Plough Corp. | | | | 81,100 | | | 1,381,133 |
| | | | | | | |
| | | | | | | 2,003,365 |
| | | | | | | |
REAL ESTATE MANAGEMENT & DEVELOPMENT – 0.7% |
Brookfield Asset Management, Inc. | | | | 37,580 | | | 573,847 |
Hang Lung Group, Ltd. | | HK | | 90,000 | | | 274,936 |
| | | | | | | |
| | | | | | | 848,783 |
| | | | | | | |
SEMICONDUCTORS & SEMICONDUCTOR EQUIPMENT – 1.3% |
Texas Instruments, Inc. | | | | 98,930 | | | 1,535,394 |
| | | | | | | |
SOFTWARE – 2.0% | | | |
Microsoft Corp. | | | | 116,215 | | | 2,259,220 |
| | | | | | | |
SPECIALTY RETAIL – 1.5% | | | |
Bed Bath & Beyond, Inc.* | | | | 37,610 | | | 956,046 |
CarMax, Inc.* | | | | 23,700 | | | 186,756 |
Lowe’s Cos., Inc. | | | | 26,850 | | | 577,812 |
| | | | | | | |
| | | | | | | 1,720,614 |
| | | | | | | |
TOBACCO – 3.3% | | | |
Altria Group, Inc. | | | | 4,020 | | | 60,541 |
Philip Morris International, Inc. | | | | 85,748 | | | 3,730,896 |
| | | | | | | |
| | | | | | | 3,791,437 |
| | | | | | | |
| | | | | | | | | |
| | | Country
Code** | | Shares | | Value | |
| | | | | | | | | |
| | | | | | | | | |
TRANSPORTATION – 0.5% | | | | |
China Merchants Holdings International Co., Ltd. | | HK | | | 223,705 | | $ | 436,880 | |
Cosco Pacific Ltd. | | HK | | | 105,300 | | | 108,266 | |
| | | | | | | | | |
| | | | | | | | 545,146 | |
| | | | | | | | | |
WIRELESS TELECOMMUNICATION SERVICES – 0.2% | |
Sprint Nextel Corp.* | | | | | 97,500 | | | 178,425 | |
| | | | | | | | | |
Total Common Stocks
(cost $125,662,597) | | | 101,549,235 | |
| | | | | | | | | |
| | | | | Principal
Amount
(000) | | | |
SHORT TERM INVESTMENTS – 13.5% | | | | |
REPURCHASE AGREEMENT – 13.5% | | | | |
State Street Bank and Trust Company, 0.01%, 1/2/09 (collateralized by $14,780,000 FHLB, 4.375%, 9/17/10, with a value of $15,736,266 total to be received $15,425,013)
(cost $15,425,000) | | $ | 15,425 | | | 15,425,000 | |
| | | | | | | | | |
TOTAL INVESTMENTS – 102.7% | | | | |
(cost $141,087,597) | | | | | | 116,974,235 | |
Liabilities in excess of other assets – (2.7)% | | | | | | (3,065,383 | ) |
| | | | | | | | | |
NET ASSETS – 100.0% | | | | | $ | 113,908,852 | |
| | | | | | | | | |
| * | Non-income producing security |
| ** | Unless otherwise noted the country code for all securities is United States. |
| | | | |
| ADR | | | | American Depositary Receipt |
| FHLB | | | | Federal Home Loan Bank |
| | |
| BR | | | | Brazil |
| CA | | | | Canada |
| CH | | | | Switzerland |
| DE | | | | Germany |
| GB | | | | Great Britain |
| HK | | | | Hong Kong |
| JP | | | | Japan |
| NL | | | | Netherlands |
See Notes to Financial Statements.
86
OPPENHEIMER MAIN STREET SMALL CAP FUND
| | |
PORTFOLIO OF INVESTMENTS December 31, 2008 | | Sun Capital Advisers Trust |
| | | | | | | |
| | | Country
Code** | | Shares | | Value |
| | | | | | | |
| | | | | | | |
COMMON STOCKS – 99.2% | | | |
AEROSPACE & DEFENSE – 1.4% |
Aerovironment, Inc.* | | | | 2,300 | | $ | 84,663 |
Applied Signal Technology, Inc. | | | | 200 | | | 3,588 |
Argon ST, Inc.* | | | | 3,200 | | | 60,352 |
BE Aerospace, Inc.* | | | | 25,000 | | | 192,250 |
Ceradyne, Inc.* | | | | 14,500 | | | 294,495 |
Cubic Corp. | | | | 10,400 | | | 282,880 |
Ducommun, Inc. | | | | 7,700 | | | 128,590 |
DynCorp International, Inc.* | | | | 12,200 | | | 185,074 |
Esterline Technologies Corp.* | | | | 11,500 | | | 435,735 |
Gencorp, Inc.* | | | | 14,100 | | | 51,888 |
Goodrich Corp. | | | | 1,400 | | | 51,828 |
Herley Industries, Inc.* | | | | 700 | | | 8,596 |
Ladish Co., Inc.* | | | | 1,700 | | | 23,545 |
Precision Castparts Corp. | | | | 1,200 | | | 71,376 |
Triumph Group, Inc. | | | | 5,900 | | | 250,514 |
| | | | | | | |
| | | | | | | 2,125,374 |
| | | | | | | |
AIR FREIGHT & LOGISTICS – 0.3% |
Air Transport Services Group, Inc.* | | | | 2,400 | | | 432 |
Atlas Air Worldwide Holdings, Inc.* | | | | 7,600 | | | 143,640 |
HUB Group, Inc.* | | | | 3,500 | | | 92,855 |
Pacer International, Inc. | | | | 21,800 | | | 227,374 |
| | | | | | | |
| | | | | | | 464,301 |
| | | | | | | |
AIRLINES – 0.9% |
Continental Airlines, Inc., Class B* | | | | 10,100 | | | 182,406 |
Hawaiian Holdings, Inc.* | | | | 22,000 | | | 140,360 |
Republic Airways Holdings, Inc.* | | | | 17,900 | | | 190,993 |
SkyWest, Inc. | | | | 20,900 | | | 388,740 |
UAL Corp. | | | | 18,500 | | | 203,870 |
US Airways Group, Inc.* | | | | 40,200 | | | 310,746 |
| | | | | | | |
| | | | | | | 1,417,115 |
| | | | | | | |
AUTO COMPONENTS – 1.1% |
American Axle & Manufacturing Holdings, Inc. | | | | 29,000 | | | 83,810 |
Amerigon, Inc.* | | | | 600 | | | 1,956 |
| | | | | | | |
| | | Country
Code** | | Shares | | Value |
| | | | | | | |
| | | | | | | |
ArvinMeritor, Inc. | | | | 35,400 | | $ | 100,890 |
ATAC, Technology Corp.* | | | | 6,500 | | | 95,095 |
Autoliv, Inc. | | | | 14,600 | | | 313,316 |
Cooper Tire & Rubber Co. | | | | 29,400 | | | 181,104 |
Drew Industries, Inc.* | | | | 8,800 | | | 105,600 |
Exide Technologies* | | | | 10,700 | | | 56,603 |
Fuel Systems Solutions, Inc.* | | | | 100 | | | 3,276 |
GenTek, Inc.* | | | | 600 | | | 9,030 |
Hayes Lemmerz International, Inc.* | | | | 1,600 | | | 720 |
Lear Corp.* | | | | 37,040 | | | 52,226 |
Modine Manufacturing Co. | | | | 6,200 | | | 30,194 |
Sauer-Danfoss, Inc. | | | | 4,900 | | | 42,875 |
Shiloh Industries, Inc. | | | | 500 | | | 1,500 |
Stoneridge, Inc.* | | | | 9,800 | | | 44,688 |
Superior Industries International, Inc. | | | | 8,100 | | | 85,212 |
Tenneco Automotive, Inc.* | | | | 32,400 | | | 95,580 |
The Goodyear Tire & Rubber Co.* | | | | 6,500 | | | 38,805 |
TRW Automotive Holdings Corp.* | | | | 42,600 | | | 153,360 |
Visteon Corp.* | | | | 3,400 | | | 1,190 |
Wabco Holdings, Inc. | | | | 10,800 | | | 170,532 |
| | | | | | | |
| | | | | | | 1,667,562 |
| | | | | | | |
AUTOMOBILES – 0.2% |
Thor Industries, Inc. | | | | 16,700 | | | 220,106 |
Winnebago Industries, Inc. | | | | 8,000 | | | 48,240 |
| | | | | | | |
| | | | | | | 268,346 |
| | | | | | | |
BEVERAGES – 0.0% + |
Boston Beer Co., Inc.* | | | | 1,600 | | | 45,440 |
Coca-Cola Bottling Co. Consolidated | | | | 100 | | | 4,596 |
| | | | | | | |
| | | | | | | 50,036 |
| | | | | | | |
BIOTECHNOLOGY – 1.4% |
Acorda Therapeutics, Inc.* | | | | 2,700 | | | 55,377 |
Alexion Pharmaceuticals, Inc.* | | | | 2,800 | | | 101,332 |
Allos Therapeutics, Inc.* | | | | 8,600 | | | 52,632 |
See Notes to Financial Statements.
87
OPPENHEIMER MAIN STREET SMALL CAP FUND
| | |
PORTFOLIO OF INVESTMENTS (Continued) December 31, 2008 | | Sun Capital Advisers Trust |
| | | | | | | |
| | | Country
Code** | | Shares | | Value |
| | | | | | | |
| | | | | | | |
Alnylam Pharmaceuticals, Inc.* | | | | 1,100 | | $ | 27,203 |
Array Biopharma, Inc.* | | | | 1,300 | | | 5,265 |
Celldex Therapeutics, Inc.* | | | | 2,000 | | | 15,840 |
Cepheid, Inc.* | | | | 2,000 | | | 20,760 |
Cubist Pharmaceuticals, Inc.* | | | | 11,800 | | | 285,088 |
CV Therapeutics, Inc.* | | | | 11,800 | | | 108,678 |
Dendreon Corp.* | | | | 12,300 | | | 56,334 |
Emergent Biosolutions, Inc.* | | | | 8,100 | | | 211,491 |
Enzon Pharmaceuticals, Inc.* | | | | 18,300 | | | 106,689 |
Facet Biotech Corp.* | | | | 5,880 | | | 56,389 |
Geron Corp.* | | | | 4,300 | | | 20,081 |
GTX, Inc.* | | | | 2,900 | | | 48,836 |
Halozyme Therapeutics, Inc.* | | | | 1,100 | | | 6,160 |
Human Genome Sciences, Inc.* | | | | 12,700 | | | 26,924 |
Incyte Corp.* | | | | 6,800 | | | 25,772 |
Isis Pharmaceuticals, Inc.* | | | | 1,200 | | | 17,016 |
Ligand Pharmaceuticals, Inc.* | | | | 2,100 | | | 5,754 |
Mannkind Corp.* | | | | 7,500 | | | 25,725 |
Martek Biosciences Corp. | | | | 5,800 | | | 175,798 |
Momenta Pharmaceuticals, Inc.* | | | | 11,000 | | | 127,600 |
Myriad Group, Inc.* | | | | 1,800 | | | 119,268 |
Nabi Biopharmaceuticals* | | | | 2,000 | | | 6,700 |
NPS Pharmaceuticals, Inc.* | | | | 2,300 | | | 14,283 |
OSI Pharmaceuticals, Inc.* | | | | 600 | | | 23,430 |
Osiris Therapeutics, Inc.* | | | | 1,500 | | | 28,740 |
PDL BioPharma, Inc. | | | | 29,400 | | | 181,692 |
Progenics Pharmaceuticals, Inc.* | | | | 6,000 | | | 61,860 |
Rigel Pharmaceuticals, Inc.* | | | | 2,700 | | | 21,600 |
Rxi Pharmaceuticals Corp.* | | | | 828 | | | 4,761 |
Savient Pharmaceuticals, Inc.* | | | | 12,700 | | | 73,533 |
| | | | | | | |
| | | Country
Code** | | Shares | | Value |
| | | | | | | |
| | | | | | | |
Zymogenetics, Inc.* | | | | 1,800 | | $ | 5,400 |
| | | | | | | |
| | | | | | | 2,124,011 |
| | | | | | | |
BUILDING PRODUCTS – 1.2% |
Aaon, Inc. | | | | 7,450 | | | 155,556 |
American Woodmark Corp. | | | | 2,700 | | | 49,221 |
Ameron International Corp. | | | | 4,200 | | | 264,264 |
Apogee Enterprises, Inc. | | | | 11,300 | | | 117,068 |
Armstrong World Industries, Inc. | | | | 7,000 | | | 151,340 |
Griffon Corp.* | | | | 12,954 | | | 120,859 |
Insteel Industries, Inc. | | | | 13,500 | | | 152,415 |
Lennox International, Inc. | | | | 2,200 | | | 71,038 |
NCI Building Systems, Inc.* | | | | 12,600 | | | 205,380 |
Quanex Building Products Corp. | | | | 18,600 | | | 174,282 |
Trex Co., Inc.* | | | | 8,000 | | | 131,680 |
Universal Forest Products, Inc. | | | | 8,100 | | | 217,971 |
| | | | | | | |
| | | | | | | 1,811,074 |
| | | | | | | |
CAPITAL MARKETS – 1.3% |
Affiliated Managers Group, Inc.* | | | | 1,200 | | | 50,304 |
Ameriprise Financial, Inc. | | | | 2,800 | | | 65,408 |
BGC Partners, Inc. | | | | 1,800 | | | 4,968 |
Cohen & Steers, Inc. | | | | 1,600 | | | 17,584 |
E*Trade Financial Corp.* | | | | 116,800 | | | 134,320 |
GAMCO Investors, Inc. | | | | 2,000 | | | 54,640 |
GFI Group, Inc. | | | | 2,200 | | | 7,788 |
Investment Technology Group, Inc.* | | | | 3,300 | | | 74,976 |
Janus Capital Group, Inc. | | | | 13,700 | | | 110,011 |
KBW, Inc.* | | | | 3,400 | | | 78,200 |
Knight Capital Group, Inc.* | | | | 14,300 | | | 230,945 |
LaBranche & Co., Inc.* | | | | 31,600 | | | 151,364 |
Legg Mason, Inc. | | | | 1,900 | | | 41,629 |
NGP Capital Resources Co. | | | | 1,200 | | | 10,044 |
See Notes to Financial Statements.
88
OPPENHEIMER MAIN STREET SMALL CAP FUND
| | |
PORTFOLIO OF INVESTMENTS (Continued) December 31, 2008 | | Sun Capital Advisers Trust |
| | | | | | | |
| | | Country
Code** | | Shares | | Value |
| | | | | | | |
| | | | | | | |
Penson Worldwide, Inc.* | | | | 5,800 | | $ | 44,196 |
Piper Jaffray Cos., Inc.* | | | | 5,300 | | | 210,728 |
Sanders Morris Harris Group, Inc. | | | | 1,200 | | | 7,188 |
SEI Investments Co. | | | | 600 | | | 9,426 |
Stifel Financial Corp.* | | | | 6,100 | | | 279,685 |
SWS Group, Inc. | | | | 14,350 | | | 271,932 |
Thomas Weisel Partners Group, Inc.* | | | | 1,100 | | | 5,192 |
Tradestation Group, Inc.* | | | | 3,700 | | | 23,865 |
US Global Investors, Inc. | | | | 300 | | | 1,467 |
Waddell & Reed Financial, Inc., Class A | | | | 5,200 | | | 80,392 |
| | | | | | | |
| | | | | | | 1,966,252 |
| | | | | | | |
CHEMICALS – 2.8% |
American Vanguard Corp. | | | | 1,700 | | | 19,890 |
Arch Chemicals, Inc. | | | | 800 | | | 20,856 |
Ashland, Inc. | | | | 29,062 | | | 305,442 |
Balchem Corp. | | | | 2,700 | | | 67,257 |
Cabot Corp. | | | | 2,100 | | | 32,130 |
Calgon Carbon Corp.* | | | | 7,400 | | | 113,664 |
Celanese Corp., Series A | | | | 900 | | | 11,187 |
CF Industries Holdings, Inc. | | | | 1,600 | | | 78,656 |
Chemtura Corp. | | | | 106,300 | | | 148,820 |
Cytec Industries, Inc. | | | | 3,900 | | | 82,758 |
Eastman Chemical Co. | | | | 900 | | | 28,539 |
Ferro Corp. | | | | 19,300 | | | 136,065 |
Fuller H B Co. | | | | 20,100 | | | 323,811 |
Ico, Inc.* | | | | 7,000 | | | 22,120 |
Innophos Holdings, Inc. | | | | 9,100 | | | 180,271 |
Innospec, Inc. | | | | 8,300 | | | 48,887 |
Koppers Holdings, Inc. | | | | 12,300 | | | 265,926 |
Landec Corp.* | | | | 5,400 | | | 35,532 |
LSB Industries, Inc.* | | | | 4,720 | | | 39,270 |
Minerals Technologies, Inc. | | | | 5,200 | | | 212,680 |
Nalco Holding Co. | | | | 2,900 | | | 33,466 |
NewMarket Corp. | | | | 4,500 | | | 157,095 |
Nova Chemicals Corp. | | | | 24,600 | | | 117,342 |
Olin Corp. | | | | 17,800 | | | 321,824 |
| | | | | | | |
| | | Country
Code** | | Shares | | Value |
| | | | | | | |
| | | | | | | |
OM Group, Inc.* | | | | 8,900 | | $ | 187,879 |
Penford Corp. | | | | 300 | | | 3,036 |
PolyOne Corp.* | | | | 37,200 | | | 117,180 |
Quaker Chemical Corp. | | | | 3,200 | | | 52,640 |
Rockwood Holdings, Inc.* | | | | 8,700 | | | 93,960 |
Schulman A, Inc. | | | | 10,000 | | | 170,000 |
ShengdaTech, Inc.* | | | | 1,500 | | | 5,280 |
Spartech Corp. | | | | 10,100 | | | 63,226 |
Stepan Chemical Co. | | | | 2,600 | | | 122,174 |
Terra Industries, Inc. | | | | 8,100 | | | 135,027 |
Valhi, Inc. | | | | 200 | | | 2,140 |
Valspar Corp. | | | | 11,800 | | | 213,462 |
W.R. Grace & Co.* | | | | 2,200 | | | 13,134 |
Westlake Chemical Corp. | | | | 800 | | | 13,032 |
Zep, Inc. | | | | 9,930 | | | 191,748 |
Zoltek Cos., Inc,* | | | | 5,900 | | | 53,041 |
| | | | | | | |
| | | | | | | 4,240,447 |
| | | | | | | |
COMMERCIAL BANKS – 4.3% |
1st Source Corp. | | | | 700 | | | 16,541 |
AMCORE Financial, Inc. | | | | 1,400 | | | 5,068 |
Bancfirst Corp. | | | | 900 | | | 47,628 |
Banco Latinoamericano De Exportaciones SA, Class E | | | | 3,300 | | | 47,388 |
BankFinancial Corp. | | | | 700 | | | 7,133 |
Boston Private Financial Holdings, Inc. | | | | 10,000 | | | 68,400 |
Capitol Bancorp, Ltd. | | | | 600 | | | 4,680 |
Cascade Bancorp | | | | 1,500 | | | 10,125 |
Cathay General Bancorp | | | | 6,600 | | | 156,750 |
Central Pacific Financial Corp. | | | | 13,400 | | | 134,536 |
Chemical Financial Corp. | | | | 2,700 | | | 75,276 |
Citizens Republic Bancorp, Inc. | | | | 11,000 | | | 32,780 |
City Holding Co. | | | | 5,300 | | | 184,334 |
Cobiz Financial, Inc. | | | | 2,400 | | | 23,376 |
Columbia Banking System, Inc. | | | | 2,000 | | | 23,860 |
Community Banking Systems, Inc. | | | | 8,800 | | | 214,632 |
Community Trust Bancorp, Inc. | | | | 3,500 | | | 128,625 |
East West Bancorp, Inc. | | | | 19,500 | | | 311,415 |
See Notes to Financial Statements.
89
OPPENHEIMER MAIN STREET SMALL CAP FUND
| | |
PORTFOLIO OF INVESTMENTS (Continued) December 31, 2008 | | Sun Capital Advisers Trust |
| | | | | | | |
| | | Country
Code** | | Shares | | Value |
| | | | | | | |
| | | | | | | |
F.N.B. Corp. | | | | 900 | | $ | 11,880 |
First Community Bancshares, Inc. | | | | 1,500 | | | 52,305 |
First Financial Bancorp | | | | 4,000 | | | 49,560 |
First Horizon National Corp. | | | | 47,309 | | | 500,054 |
First Merchants Corp. | | | | 4,600 | | | 102,166 |
First Midwest Bancorp, Inc. | | | | 7,600 | | | 151,772 |
First Security Group, Inc. | | | | 2,000 | | | 9,240 |
Frontier Financial Corp. | | | | 11,400 | | | 49,704 |
Glacier Bancorp, Inc. | | | | 600 | | | 11,412 |
Greene Bancshares, Inc. | | | | 1,911 | | | 25,876 |
Guaranty Bancorp* | | | | 2,500 | | | 5,000 |
Hancock Holding Co. | | | | 400 | | | 18,184 |
Hanmi Financial Corp. | | | | 3,400 | | | 7,004 |
Huntington Bancshares, Inc. | | | | 10,100 | | | 77,366 |
Iberiabank Corp. | | | | 1,300 | | | 62,400 |
Independent Bank Corp. Massachusetts | | | | 1,200 | | | 31,392 |
International Bancshares Corp. | | | | 3,400 | | | 74,222 |
MainSource Financial Group, Inc. | | | | 2,200 | | | 34,100 |
MB Financial, Inc. | | | | 900 | | | 25,155 |
National Penn Bancshares, Inc. | | | | 20,300 | | | 294,553 |
NBT Bancorp, Inc. | | | | 4,300 | | | 120,228 |
Old National Bancorp | | | | 8,100 | | | 147,096 |
Old Second Bancorp, Inc. | | | | 200 | | | 2,320 |
Oriental Financial Group | | | | 6,500 | | | 39,325 |
Pacific Capital Bancorp | | | | 22,900 | | | 386,552 |
PacWest Bancorp | | | | 8,100 | | | 217,890 |
Park National Corp. | | | | 700 | | | 50,225 |
Popular, Inc. | | | | 39,400 | | | 203,304 |
Porter Bancorp, Inc. | | | | 315 | | | 4,835 |
Prosperity Bancshares, Inc. | | | | 1,500 | | | 44,385 |
Provident Bankshares Corp. | | | | 19,300 | | | 186,438 |
Regions Financial Corp. | | | | 9,600 | | | 76,416 |
Renasant Corp. | | | | 1,500 | | | 25,545 |
Republic Bancorp, Inc. | | | | 1,200 | | | 32,640 |
Sandy Spring Bancorp, Inc. | | | | 1,800 | | | 39,294 |
Santander Bancorp | | | | 2,200 | | | 27,478 |
| | | | | | | |
| | | Country
Code** | | Shares | | Value |
| | | | | | | |
| | | | | | | |
Signature Bank* | | | | 500 | | $ | 14,345 |
Simmons First National Corp., Class A | | | | 2,400 | | | 70,728 |
Southside Bancshares, Inc. | | | | 2,100 | | | 49,350 |
Southwest Bancorp, Inc. | | | | 100 | | | 1,296 |
Sterling Bancorp | | | | 8,700 | | | 122,061 |
Sterling Financial Corp. | | | | 8,300 | | | 73,040 |
Susquehanna Bancshares, Inc. | | | | 27,000 | | | 429,570 |
The Colonial BancGroup, Inc. | | | | 39,900 | | | 82,593 |
The South Financial Group, Inc. | | | | 19,100 | | | 82,512 |
Tompkins Financial Corp. | | | | 2,200 | | | 127,490 |
TowneBank | | | | 200 | | | 4,958 |
Trustmark Corp. | | | | 1,100 | | | 23,749 |
UCBH Holdings, Inc. | | | | 21,400 | | | 147,232 |
UMB Financial Corp. | | | | 900 | | | 44,226 |
Umpqua Holdings Corp. | | | | 6,300 | | | 91,161 |
United Bankshares, Inc. | | | | 300 | | | 9,966 |
United Community Banks, Inc. | | | | 8,642 | | | 117,363 |
WesBanco, Inc. | | | | 4,700 | | | 127,887 |
West Coast Bancorp | | | | 900 | | | 5,931 |
Westamerica Bancorporation | | | | 400 | | | 20,460 |
Western Alliance Bancorp* | | | | 4,000 | | | 40,360 |
Whitney Holding Corp. | | | | 9,600 | | | 153,504 |
Wintrust Financial Corp. | | | | 6,200 | | | 127,534 |
| | | | | | | |
| | | | | | | 6,657,179 |
| | | | | | | |
COMMERCIAL SERVICES & SUPPLIES – 5.4% |
Acco Brands Corp.* | | | | 8,300 | | | 28,635 |
Administaff, Inc. | | | | 14,100 | | | 305,688 |
American Ecology Corp. | | | | 7,800 | | | 157,794 |
American Reprographics Co.* | | | | 12,700 | | | 87,630 |
Amrep Corp.* | | | | 400 | | | 12,512 |
Bowne & Co., Inc. | | | | 8,800 | | | 51,744 |
Casella Waste Systems, Inc., Class A* | | | | 2,100 | | | 8,568 |
CBIZ, Inc.* | | | | 22,900 | | | 198,085 |
CDI Corp. | | | | 12,200 | | | 157,868 |
Cenveo, Inc.* | | | | 10,200 | | | 45,390 |
See Notes to Financial Statements.
90
OPPENHEIMER MAIN STREET SMALL CAP FUND
| | |
PORTFOLIO OF INVESTMENTS (Continued) December 31, 2008 | | Sun Capital Advisers Trust |
| | | | | | | |
| | | Country
Code** | | Shares | | Value |
| | | | | | | |
| | | | | | | |
Clean Harbors, Inc.* | | | | 900 | | $ | 57,096 |
Comfort Systems USA, Inc. | | | | 21,900 | | | 233,454 |
COMSYS IT Partners, Inc.* | | | | 2,000 | | | 4,480 |
Consolidated Graphics, Inc.* | | | | 7,300 | | | 165,272 |
Copart, Inc.* | | | | 400 | | | 10,876 |
Cornell Cos., Inc.* | | | | 6,600 | | | 122,694 |
Costar Group, Inc.* | | | | 4,300 | | | 141,642 |
Courier Corp. | | | | 1,100 | | | 19,690 |
CRA International, Inc.* | | | | 5,400 | | | 145,422 |
Deluxe Corp. | | | | 31,400 | | | 469,744 |
EnergySolutions, Inc. | | | | 10,100 | | | 57,065 |
Ennis, Inc. | | | | 4,900 | | | 59,339 |
Equifax, Inc. | | | | 1,500 | | | 39,780 |
Exponent, Inc.* | | | | 8,300 | | | 249,664 |
First Advantage Corp., Class A* | | | | 3,300 | | | 46,695 |
G&K Services, Inc. | | | | 5,800 | | | 117,276 |
Heidrick & Struggles International, Inc. | | | | 6,700 | | | 144,318 |
Hewitt Associates, Inc., Class A* | | | | 2,200 | | | 62,436 |
Hill International, Inc.* | | | | 10,400 | | | 73,216 |
HNI Corp. | | | | 18,600 | | | 294,624 |
Hudson Highland Group, Inc.* | | | | 6,000 | | | 20,100 |
ICF International, Inc.* | | | | 4,500 | | | 110,565 |
Interface, Inc. | | | | 32,500 | | | 150,800 |
Kelly Services, Inc., Class A | | | | 9,500 | | | 123,595 |
Kenexa Corp.* | | | | 5,000 | | | 39,900 |
Kforce, Inc.* | | | | 5,600 | | | 43,008 |
Knoll, Inc. | | | | 15,500 | | | 139,810 |
Korn / Ferry International* | | | | 25,900 | | | 295,778 |
Layne Christensen Co.* | | | | 1,000 | | | 24,010 |
M&F Worldwide Corp.* | | | | 900 | | | 13,905 |
Manpower, Inc. | | | | 2,500 | | | 84,975 |
McGrath Rentcorp. | | | | 3,200 | | | 68,352 |
Metalico, Inc.* | | | | 8,000 | | | 12,400 |
Miller Herman, Inc. | | | | 25,600 | | | 333,568 |
Monster Worldwide, Inc.* | | | | 31,300 | | | 378,417 |
On Assignment, Inc.* | | | | 8,900 | | | 50,463 |
PHH Corp.* | | | | 22,400 | | | 285,152 |
Pike Electric Corp.* | | | | 8,800 | | | 108,240 |
| | | | | | | |
| | | Country
Code** | | Shares | | Value |
| | | | | | | |
| | | | | | | |
PRG-Schultz International, Inc.* | | | | 300 | | $ | 1,224 |
Resources Global Professionals* | | | | 20,200 | | | 330,876 |
Robert Half International, Inc. | | | | 1,900 | | | 39,558 |
RR Donnelley & Sons Co. | | | | 7,800 | | | 105,924 |
RSC Holdings, Inc.* | | | | 3,000 | | | 25,560 |
Schawk, Inc. | | | | 6,900 | | | 79,074 |
School Specialty, Inc.* | | | | 5,700 | | | 108,984 |
Spherion Corp.* | | | | 11,700 | | | 25,857 |
Standard Parking Corp.* | | | | 1,600 | | | 30,944 |
Steelcase, Inc., Class A | | | | 46,800 | | | 263,016 |
Taleo Corp.* | | | | 7,300 | | | 57,159 |
Team, Inc.* | | | | 4,800 | | | 132,960 |
Teletech Holdings, Inc.* | | | | 20,900 | | | 174,515 |
The Advisory Board Co.* | | | | 500 | | | 11,150 |
The Brink’s Co. | | | | 2,500 | | | 67,200 |
The Corporate Executive Board Co. | | | | 6,000 | | | 132,360 |
The Standard Register Co. | | | | 11,140 | | | 99,480 |
Ticketmaster* | | | | 5,080 | | | 32,614 |
Trueblue, Inc.* | | | | 26,800 | | | 256,476 |
United Stationers, Inc.* | | | | 6,800 | | | 227,732 |
Viad Corp. | | | | 10,900 | | | 269,666 |
Waste Services, Inc.* | | | | 3,400 | | | 22,372 |
Watson Wyatt Worldwide, Inc. | | | | 100 | | | 4,782 |
| | | | | | | |
| | | | | | | 8,351,218 |
| | | | | | | |
COMMUNICATIONS EQUIPMENT – 3.1% |
3Com Corp.* | | | | 82,300 | | | 187,644 |
Acme Packet, Inc.* | | | | 6,700 | | | 35,242 |
Adtran, Inc. | | | | 15,200 | | | 226,176 |
Avocent Corp.* | | | | 24,800 | | | 444,168 |
Bel Fuse, Inc. | | | | 700 | | | 12,628 |
Bigband Networks* | | | | 5,000 | | | 27,600 |
Black Box Corp. | | | | 4,160 | | | 108,659 |
Ciena Corp.* | | | | 30,200 | | | 202,340 |
CommScope, Inc.* | | | | 14,300 | | | 222,222 |
Comtech Telecommunications* | | | | 2,400 | | | 109,968 |
Digi International, Inc.* | | | | 3,800 | | | 30,818 |
Dycom Industries, Inc.* | | | | 26,200 | | | 215,364 |
See Notes to Financial Statements.
91
OPPENHEIMER MAIN STREET SMALL CAP FUND
| | |
PORTFOLIO OF INVESTMENTS (Continued) December 31, 2008 | | Sun Capital Advisers Trust |
| | | | | | | |
| | | Country
Code** | | Shares | | Value |
| | | | | | | |
| | | | | | | |
Echostar Corp., Class A* | | | | 1,900 | | $ | 28,253 |
EMS Technologies, Inc.* | | | | 5,600 | | | 144,872 |
Extreme Networks, Inc.* | | | | 5,475 | | | 12,812 |
F5 Networks, Inc.* | | | | 5,000 | | | 114,300 |
Finisar Corp.* | | | | 25,400 | | | 9,652 |
Harris Stratex Networks, Inc.* | | | | 2,400 | | | 12,384 |
Hughes Communications, Inc.* | | | | 1,100 | | | 17,534 |
Interdigital, Inc.* | | | | 11,700 | | | 321,750 |
Ixia* | | | | 15,900 | | | 91,902 |
JDS Uniphase Corp.* | | | | 90,700 | | | 331,055 |
Loral Space & Communications, Inc.* | | | | 100 | | | 1,453 |
Mastec, Inc.* | | | | 23,300 | | | 269,814 |
NETGEAR, Inc.* | | | | 3,700 | | | 42,217 |
Oplink Communications, Inc.* | | | | 1,400 | | | 12,040 |
Parkervision, Inc.* | | | | 3,472 | | | 8,576 |
Performance Technologies, Inc.* | | | | 600 | | | 2,004 |
Plantronics, Inc. | | | | 29,800 | | | 393,360 |
Polycom, Inc.* | | | | 8,300 | | | 112,133 |
Powerwave Technologies, Inc.* | | | | 50,800 | | | 25,400 |
Seachange International, Inc.* | | | | 8,600 | | | 62,006 |
Shoretel, Inc.* | | | | 2,900 | | | 13,021 |
Sonus Networks, Inc.* | | | | 8,400 | | | 13,272 |
Starent Networks Corp.* | | | | 2,000 | | | 23,860 |
Symmetricom, Inc.* | | | | 1,200 | | | 4,740 |
Tekelec, Inc.* | | | | 20,700 | | | 276,138 |
Tellabs, Inc.* | | | | 109,700 | | | 451,964 |
UTStarcom, Inc.* | | | | 31,100 | | | 57,535 |
Viasat, Inc.* | | | | 6,200 | | | 149,296 |
| | | | | | | |
| | | | | | | 4,826,172 |
| | | | | | | |
COMPUTERS & PERIPHERALS – 1.9% |
3par, Inc.* | | | | 6,900 | | | 52,923 |
Adaptec, Inc.* | | | | 31,600 | | | 104,280 |
Avid Technology, Inc.* | | | | 11,600 | | | 126,556 |
Brocade Communications Systems, Inc.* | | | | 90,100 | | | 252,280 |
Compellent Technologies, Inc.* | | | | 900 | | | 8,757 |
| | | | | | | |
| | | Country
Code** | | Shares | | Value |
| | | | | | | |
| | | | | | | |
Eletronics for Imaging, Inc.* | | | | 18,500 | | $ | 176,860 |
Emulex Corp.* | | | | 48,100 | | | 335,738 |
Hutchinson Technology, Inc.* | | | | 3,200 | | | 11,136 |
Hypercom Corp.* | | | | 400 | | | 432 |
Imation Corp. | | | | 11,200 | | | 151,984 |
Intermec, Inc.* | | | | 3,200 | | | 42,496 |
Lexmark International, Inc., Class A* | | | | 2,800 | | | 75,320 |
NCR Corp.* | | | | 5,100 | | | 72,114 |
NetApp, Inc.* | | | | 1,000 | | | 13,970 |
Netezza Corp.* | | | | 12,400 | | | 82,336 |
Palm, Inc.* | | | | 14,400 | | | 44,208 |
PROS Holdings, Inc.* | | | | 700 | | | 4,025 |
QLogic Corp.* | | | | 43,200 | | | 580,608 |
Rackable Systems, Inc.* | | | | 2,300 | | | 9,062 |
Seagate Technology | | | | 21,200 | | | 93,916 |
Stec, Inc.* | | | | 23,000 | | | 97,980 |
Stratasys, Inc.* | | | | 1,100 | | | 11,825 |
Sun Microsystems, Inc.* | | | | 13,800 | | | 52,716 |
Synaptics, Inc.* | | | | 20,100 | | | 332,856 |
Teradata Corp.* | | | | 2,000 | | | 29,660 |
Western Digital Corp.* | | | | 16,500 | | | 188,925 |
Xyratex, Ltd.* | | | | 3,000 | | | 8,850 |
| | | | | | | |
| | | | | | | 2,961,813 |
| | | | | | | |
CONSTRUCTION & ENGINEERING – 1.4% |
Chicago Bridge & Iron Co., NV | | | | 20,300 | | | 204,015 |
EMCOR Group, Inc.* | | | | 29,100 | | | 652,713 |
Fluor Corp. | | | | 1,900 | | | 85,253 |
Furmanite Corp.* | | | | 2,000 | | | 10,780 |
Granite Construction, Inc. | | | | 7,200 | | | 316,296 |
Insituform Technologies, Inc., Class A* | | | | 9,800 | | | 192,962 |
Integrated Electrical Services, Inc.* | | | | 3,600 | | | 31,536 |
KBR, Inc. | | | | 300 | | | 4,560 |
Michael Baker Corp.* | | | | 3,700 | | | 136,567 |
Orion Marine Group, Inc.* | | | | 300 | | | 2,898 |
Perini Corp.* | | | | 20,200 | | | 472,276 |
The Shaw Group, Inc.* | | | | 3,700 | | | 75,739 |
| | | | | | | |
| | | | | | | 2,185,595 |
| | | | | | | |
See Notes to Financial Statements.
92
OPPENHEIMER MAIN STREET SMALL CAP FUND
| | |
PORTFOLIO OF INVESTMENTS (Continued) December 31, 2008 | | Sun Capital Advisers Trust |
| | | | | | | |
| | | Country
Code** | | Shares | | Value |
| | | | | | | |
| | | | | | | |
CONSUMER FINANCE – 0.8% | | | | | |
Advance America Cash Advance Centers, Inc. | | | | 800 | | $ | 1,512 |
Advanta Corp. | | | | 8,000 | | | 16,720 |
AmeriCredit Corp.* | | | | 33,200 | | | 253,648 |
Cash America International, Inc. | | | | 12,300 | | | 336,405 |
Discover Financial Services | | | | 9,100 | | | 86,723 |
Dollar Financial Corp.* | | | | 800 | | | 8,240 |
EZCORP, Inc., Class A* | | | | 8,300 | | | 126,243 |
First Cash Financial Services, Inc.* | | | | 9,500 | | | 181,070 |
Nelnet, Inc., Class A | | | | 4,900 | | | 70,217 |
The First Marblehead Corp.* | | | | 9,100 | | | 11,739 |
The Student Loan Corp. | | | | 200 | | | 8,200 |
World Acceptance Corp.* | | | | 7,700 | | | 152,152 |
| | | | | | | |
| | | | | | | 1,252,869 |
| | | | | | | |
CONTAINERS & PACKAGING – 0.5% |
Myers Industries, Inc. | | | | 10,700 | | | 85,600 |
Packaging Corp of America | | | | 300 | | | 4,038 |
Rock-Tenn Co. | | | | 6,700 | | | 229,006 |
Sealed Air Corp. | | | | 1,700 | | | 25,398 |
Smurfit-Stone Container Corp.* | | | | 54,800 | | | 13,974 |
Sonoco Products Co. | | | | 2,100 | | | 48,636 |
Temple-Inland, Inc. | | | | 58,500 | | | 280,800 |
| | | | | | | |
| | | | | | | 687,452 |
| | | | | | | |
DISTRIBUTORS – 0.0% + | | | | | |
Core-mark Holding Co., Inc.* | | | | 1,200 | | | 25,824 |
| | | | | | | |
DIVERSIFIED CONSUMER SERVICES – 0.7% |
Career Education Corp.* | | | | 13,200 | | | 236,808 |
Coinstar, Inc.* | | | | 800 | | | 15,608 |
Noah Education Holdings Ltd. ADR | | | | 4,120 | | | 12,978 |
Pre-Paid Legal Services, Inc.* | | | | 1,800 | | | 67,122 |
Regis Corp. | | | | 16,900 | | | 245,557 |
Service Corp. International | | | | 10,100 | | | 50,197 |
| | | | | | | |
| | | Country
Code** | | Shares | | Value |
| | | | | | | |
| | | | | | | |
Steiner Leisure, Ltd.* | | | | 6,000 | | $ | 177,120 |
Stewart Enterprises, Inc., Class A | | | | 25,400 | | | 76,454 |
Thinkorswim Group, Inc.* | | | | 5,900 | | | 33,158 |
Universal Technical Institute, Inc.* | | | | 4,800 | | | 82,416 |
| | | | | | | |
| | | | | | | 997,418 |
| | | | | | | |
DIVERSIFIED FINANCIAL SERVICES – 0.5% |
Asset Acceptance Capital Corp.* | | | | 4,800 | | | 24,528 |
CIT Group, Inc. | | | | 36,500 | | | 165,710 |
Encore Capital Group, Inc.* | | | | 1,200 | | | 8,640 |
Financial Federal Corp. | | | | 9,600 | | | 223,392 |
Interactive Brokers Group, Inc., Class A* | | | | 9,800 | | | 175,322 |
Marketaxess Holdings, Inc.* | | | | 4,300 | | | 35,088 |
Newstar Financial, Inc.* | | | | 800 | | | 3,192 |
NYSE Euronext | | | | 2,400 | | | 65,712 |
Pico Holdings, Inc.* | | | | 1,100 | | | 29,238 |
| | | | | | | |
| | | | | | | 730,822 |
| | | | | | | |
DIVERSIFIED TELECOMMUNICATION SERVICES – 1.4% |
Alaska Communications Systems, Inc. | | | | 7,900 | | | 74,102 |
Atlantic Tele-network, Inc. | | | | 4,200 | | | 111,510 |
Cbeyond, Inc.* | | | | 5,400 | | | 86,292 |
Cincinnati Bell, Inc.* | | | | 109,700 | | | 211,721 |
Cogent Communications Group, Inc.* | | | | 9,700 | | | 63,341 |
Embarq Corp. | | | | 4,700 | | | 169,012 |
General Communication, Inc. Class A* | | | | 4,100 | | | 33,169 |
Global Crossing Ltd* | | | | 5,300 | | | 42,082 |
Iowa Telecommunication Services, Inc. | | | | 12,200 | | | 174,216 |
NTELOS Holdings Corp. | | | | 16,000 | | | 394,560 |
PAETEC Holding Corp.* | | | | 2,600 | | | 3,744 |
Premiere Global Services, Inc.* | | | | 40,600 | | | 349,566 |
See Notes to Financial Statements.
93
OPPENHEIMER MAIN STREET SMALL CAP FUND
| | |
PORTFOLIO OF INVESTMENTS (Continued) December 31, 2008 | | Sun Capital Advisers Trust |
| | | | | | | |
| | | Country
Code** | | Shares | | Value |
| | | | | | | |
| | | | | | | |
Qwest Communications International, Inc. | | | | 21,500 | | $ | 78,260 |
Tw Telecom, Inc.* | | | | 38,900 | | | 329,483 |
Windstream Corp. | | | | 1,000 | | | 9,200 |
| | | | | | | |
| | | | | | | 2,130,258 |
| | | | | | | |
ELECTRICAL EQUIPMENT – 2.0% |
Acuity Brands, Inc. | | | | 13,800 | | | 481,758 |
Advanced Battery Technologies, Inc.* | | | | 1,500 | | | 3,990 |
AZZ, Inc.* | | | | 5,900 | | | 148,090 |
Baldor Electric Co. | | | | 20,700 | | | 369,495 |
Belden CDT, Inc. | | | | 21,459 | | | 448,064 |
Brady Corp. | | | | 3,300 | | | 79,035 |
C&D Technologies, Inc.* | | | | 4,100 | | | 12,833 |
Encore Wire Corp. | | | | 11,200 | | | 212,352 |
EnerSys* | | | | 3,100 | | | 34,100 |
FuelCell Energy, Inc.* | | | | 1,800 | | | 6,984 |
Fushi Copperweld, Inc.* | | | | 500 | | | 2,635 |
GrafTech International Ltd.* | | | | 58,300 | | | 485,056 |
Hubbell, Inc., Class B | | | | 800 | | | 26,144 |
II-VI, Inc.* | | | | 2,000 | | | 38,180 |
LSI Industries, Inc. | | | | 3,300 | | | 22,671 |
Plug Power, Inc.* | | | | 800 | | | 816 |
Polypore International, Inc.* | | | | 1,400 | | | 10,584 |
Powell Industries, Inc.* | | | | 4,800 | | | 139,296 |
Regal-Beloit Corp. | | | | 1,600 | | | 60,784 |
Rockwell Automation, Inc. | | | | 1,600 | | | 51,584 |
Smith A O Corp. | | | | 10,700 | | | 315,864 |
Valence Technology, Inc.* | | | | 10,500 | | | 19,110 |
Vicor Corp. | | | | 3,800 | | | 25,118 |
Woodward Governor Co. | | | | 5,100 | | | 117,402 |
| | | | | | | |
| | | | | | | 3,111,945 |
| | | | | | | |
ELECTRONIC EQUIPMENT & INSTRUMENTS – 3.1% |
Acacia Research – Acacia Technologies* | | | | 3,500 | | | 10,640 |
Agilent Technologies, Inc.* | | | | 5,500 | | | 85,965 |
Agilysys, Inc. | | | | 1,000 | | | 4,290 |
Amphenol Corp., Class A | | | | 3,600 | | | 86,328 |
Anixter International, Inc.* | | | | 4,100 | | | 123,492 |
| | | | | | | |
| | | Country
Code** | | Shares | | Value |
| | | | | | | |
| | | | | | | |
Arrow Electronics, Inc.* | | | | 11,900 | | $ | 224,196 |
Avnet, Inc.* | | | | 3,100 | | | 56,451 |
Benchmark Electronics, Inc.* | | | | 35,000 | | | 446,950 |
Brightpoint, Inc.* | | | | 14,500 | | | 63,075 |
Cogent, Inc.* | | | | 9,100 | | | 123,487 |
Cognex Corp. | | | | 10,070 | | | 149,036 |
Coherent, Inc.* | | | | 6,900 | | | 148,074 |
CTS Corp. | | | | 17,400 | | | 95,874 |
Daktronics, Inc. | | | | 4,600 | | | 43,056 |
DTS, Inc.* | | | | 7,700 | | | 141,295 |
Electro Rent Corp. | | | | 100 | | | 1,116 |
Electro Scientific Industries, Inc.* | | | | 6,800 | | | 46,172 |
Gerber Scientific, Inc.* | | | | 2,100 | | | 10,731 |
Ingram Micro, Inc., Class A* | | | | 5,400 | | | 72,306 |
Insight Enterprises, Inc.* | | | | 13,400 | | | 92,460 |
Itron, Inc.* | | | | 500 | | | 31,870 |
L-1 Identity Solutions, Inc.* | | | | 800 | | | 5,392 |
Littelfuse, Inc.* | | | | 7,900 | | | 131,140 |
Measurement Specialties, Inc.* | | | | 100 | | | 695 |
Methode Electronics, Inc. | | | | 19,260 | | | 129,812 |
Molex, Inc. | | | | 4,500 | | | 65,205 |
MTS Technologies, Inc. | | | | 5,000 | | | 133,200 |
Multi Fineline Electronix, Inc.* | | | | 10,700 | | | 125,083 |
Nam Tai Electronics, Inc. | | | | 4,100 | | | 22,550 |
National Instruction Corp. | | | | 2,200 | | | 53,592 |
Newport Corp.* | | | | 7,100 | | | 48,138 |
OSI Systems, Inc.* | | | | 4,500 | | | 62,325 |
Park Electrochemical Corp. | | | | 6,100 | | | 115,656 |
PC Connection, Inc.* | | | | 1,500 | | | 7,680 |
Plexus Corp.* | | | | 16,700 | | | 283,065 |
RadiSys Corp.* | | | | 200 | | | 1,106 |
Rofin-Sinar Technologies, Inc.* | | | | 14,200 | | | 292,236 |
Rogers Corp.* | | | | 4,800 | | | 133,296 |
Sanmina-SCI Corp.* | | | | 93,600 | | | 43,992 |
ScanSource, Inc.* | | | | 6,600 | | | 127,182 |
SYNNEX Corp.* | | | | 15,100 | | | 171,083 |
Tech Data Corp.* | | | | 14,200 | | | 253,328 |
See Notes to Financial Statements.
94
OPPENHEIMER MAIN STREET SMALL CAP FUND
| | |
PORTFOLIO OF INVESTMENTS (Continued) December 31, 2008 | | Sun Capital Advisers Trust |
| | | | | | | |
| | | Country
Code** | | Shares | | Value |
| | | | | | | |
| | | | | | | |
Technitrol, Inc. | | | | 12,500 | | $ | 43,500 |
Trimble Navigation Ltd.* | | | | 4,100 | | | 88,601 |
TTM Technologies, Inc.* | | | | 23,400 | | | 121,914 |
Universal Display Corp.* | | | | 700 | | | 6,615 |
Vishay Intertechnology, Inc.* | | | | 79,500 | | | 271,890 |
Zygo Corp.* | | | | 300 | | | 2,073 |
| | | | | | | |
| | | | | | | 4,797,213 |
| | | | | | | |
ENERGY EQUIPMENT & SERVICES – 2.9% |
Allis-Chalmers Energy, Inc.* | | | | 13,000 | | | 71,500 |
Basic Energy Services, Inc.* | | | | 13,400 | | | 174,736 |
BJ Services Co. | | | | 5,300 | | | 61,851 |
Bronco Drilling Co., Inc.* | | | | 2,000 | | | 12,920 |
Complete Production Services, Inc.* | | | | 27,300 | | | 222,495 |
Dawson Geophysical Co.* | | | | 2,800 | | | 49,868 |
Dresser-Rand Group, Inc.* | | | | 6,200 | | | 106,950 |
Dril-Quip, Inc.* | | | | 3,700 | | | 75,887 |
Englobal Corp.* | | | | 8,100 | | | 26,325 |
ENSCO International, Inc. | | | | 5,331 | | | 151,347 |
Exterran Holdings, Inc.* | | | | 7,200 | | | 153,360 |
Forbes Energy Services Ltd.* (1) | | CA | | 25,700 | | | 32,060 |
Global Industries, Ltd.* | | | | 9,200 | | | 32,108 |
Gulf Island Fabrication, Inc. | | | | 9,100 | | | 131,131 |
Gulfmark Offshore, Inc.* | | | | 6,700 | | | 159,393 |
Headwaters, Inc.* | | | | 23,800 | | | 160,650 |
Helmerich & Payne, Inc. | | | | 800 | | | 18,200 |
Hercules Offshore, Inc.* | | | | 14,000 | | | 66,500 |
Hornbeck Offshore Services, Inc.* | | | | 5,600 | | | 91,504 |
Ion Geophysical Corp.* | | | | 13,600 | | | 46,648 |
Key Energy Services, Inc.* | | | | 47,400 | | | 209,034 |
Lufkin Industries, Inc. | | | | 500 | | | 17,250 |
| | | | | | | |
| | | Country
Code** | | Shares | | Value |
| | | | | | | |
| | | | | | | |
Matrix Service Co.* | | | | 3,900 | | $ | 29,913 |
Nabors Industries, Ltd.* | | | | 7,800 | | | 93,366 |
NATCO Group, Inc.* | | | | 2,600 | | | 39,468 |
Natural Gas Services Group, Inc.* | | | | 3,700 | | | 37,481 |
Newpark Resources* | | | | 29,700 | | | 109,890 |
North American Energy Partners, Inc.* | | | | 4,200 | | | 14,028 |
Oceaneering International, Inc.* | | | | 2,300 | | | 67,022 |
Oil States International, Inc.* | | | | 22,600 | | | 422,394 |
Parker Drilling Co.* | | | | 51,200 | | | 148,480 |
Patterson-UTI Energy, Inc. | | | | 14,100 | | | 162,291 |
FPioneer Drilling Co.* | | | | 14,900 | | | 82,993 |
Precision Drilling Trust | | | | 14,844 | | | 124,545 |
Pride International, Inc.* | | | | 3,400 | | | 54,332 |
SEACOR Holdings, Inc.* | | | | 5,500 | | | 366,575 |
Superior Energy Services, Inc.* | | | | 5,500 | | | 87,615 |
T-3 Energy Services, Inc.* | | | | 200 | | | 1,888 |
Technicoil Corp.* | | CA | | 16,600 | | | 5,413 |
TETRA Technologies, Inc.* | | | | 19,300 | | | 93,798 |
Tidewater, Inc. | | | | 1,000 | | | 40,270 |
Union Drilling, Inc.* | | | | 6,500 | | | 33,735 |
Unit Corp.* | | | | 8,600 | | | 229,792 |
Weatherford International Ltd.* | | | | 6,000 | | | 64,920 |
Willbros Group, Inc.* | | | | 7,800 | | | 66,066 |
| | | | | | | |
| | | | | | | 4,447,992 |
| | | | | | | |
FOOD & STAPLES RETAILING – 0.5% |
Arden Group, Inc. | | | | 200 | | | 25,200 |
Casey’s General Stores, Inc. | | | | 2,100 | | | 47,817 |
Ingles Markets, Inc. | | | | 2,000 | | | 35,180 |
Nash Finch Co. | | | | 5,000 | | | 224,450 |
Spartan Stores, Inc. | | | | 4,800 | | | 111,600 |
SUPERVALU, Inc. | | | | 2,400 | | | 35,040 |
The Andersons, Inc. | | | | 400 | | | 6,592 |
The Pantry, Inc.* | | | | 11,800 | | | 253,110 |
Winn-Dixie Stores, Inc.* | | | | 300 | | | 4,830 |
| | | | | | | |
| | | | | | | 743,819 |
| | | | | | | |
See Notes to Financial Statements.
95
OPPENHEIMER MAIN STREET SMALL CAP FUND
| | |
PORTFOLIO OF INVESTMENTS (Continued) December 31, 2008 | | Sun Capital Advisers Trust |
| | | | | | | |
| | | Country
Code** | | Shares | | Value |
| | | | | | | |
| | | | | | | |
FOOD PRODUCTS – 0.5% | | | | | |
Agria Corp. ADR* | | | | 200 | | $ | 298 |
B&G Foods, Inc., Class A | | | | 1,000 | | | 5,400 |
Bunge, Ltd. | | | | 500 | | | 25,885 |
Chiquita Brands Inernational, Inc.* | | | | 12,000 | | | 177,360 |
Darling International, Inc.* | | | | 42,200 | | | 231,678 |
Del Monte Foods Co. | | | | 12,800 | | | 91,392 |
Diamond Foods, Inc. | | | | 5,900 | | | 118,885 |
J & J Snack Foods Corp. | | | | 500 | | | 17,940 |
Omega Protein Corp.* | | | | 7,900 | | | 31,679 |
Ralcorp Holdings, Inc.* | | | | 1,100 | | | 64,240 |
Reddy Ice Holdings, Inc. | | | | 1,200 | | | 1,728 |
| | | | | | | |
| | | | | | | 766,485 |
| | | | | | | |
GAS UTILITIES – 0.2% | | | | | | | |
Northwest Natural Gas Co. | | | | 1,100 | | | 48,653 |
The Laclede Group, Inc. | | | | 2,000 | | | 93,680 |
WGL Holdings, Inc. | | | | 5,900 | | | 192,871 |
| | | | | | | |
| | | | | | | 335,204 |
| | | | | | | |
HEALTH CARE EQUIPMENT & SUPPLIES – 1.5% |
Abaxis, Inc.* | | | | 2,000 | | | 32,060 |
Advanced Medical Optics, Inc.* | | | | 8,200 | | | 54,202 |
Align Technology, Inc.* | | | | 8,900 | | | 77,875 |
American Medical Systems Holdings, Inc.* | | | | 2,000 | | | 17,980 |
Analogic Corp. | | | | 7,800 | | | 212,784 |
Angiodynamics, Inc.* | | | | 3,100 | | | 42,439 |
Cardiac Science Corp* | | | | 300 | | | 2,250 |
Conmed Corp.* | | | | 6,000 | | | 143,640 |
Cyberonics, Inc.* | | | | 10,700 | | | 177,299 |
Datascope Corp. | | | | 3,700 | | | 193,288 |
Exactech, Inc.* | | | | 2,800 | | | 47,152 |
Invacare Corp. | | | | 1,300 | | | 20,176 |
Inverness Medical Innovations, Inc.* | | | | 1,600 | | | 30,256 |
Iris International, Inc.* | | | | 2,200 | | | 30,668 |
Kensey Nash Corp.* | | | | 6,800 | | | 131,988 |
Merit Medical Systems, Inc.* | | | | 9,800 | | | 175,714 |
| | | | | | | |
| | | Country
Code** | | Shares | | Value |
| | | | | | | |
| | | | | | | |
Natus Med, Inc.* | | | | 6,800 | | $ | 88,060 |
Neogen Corp.* | | | | 500 | | | 12,490 |
Orthofix International* | | | | 2,000 | | | 30,660 |
Palomar Medical Technologies, Inc.* | | | | 2,800 | | | 32,284 |
Quidel Corp.* | | | | 10,700 | | | 139,849 |
Sirona Dental Systems, Inc.* | | | | 1,800 | | | 18,900 |
Somanetics Corp.* | | | | 6,100 | | | 100,711 |
Sonosite, Inc.* | | | | 3,700 | | | 70,596 |
Spectranetics Corp.* | | | | 400 | | | 1,044 |
Stereotaxis, Inc.* | | | | 1,200 | | | 5,280 |
STERIS Corp. | | | | 5,000 | | | 119,450 |
Symmetry Medical, Inc.* | | | | 3,500 | | | 27,895 |
Synovis Life Technologies, Inc.* | | | | 3,900 | | | 73,086 |
Vnus Medical Technologies, Inc.* | | | | 3,900 | | | 63,258 |
Volcano Corp.* | | | | 1,300 | | | 19,500 |
Zoll Medical Corp.* | | | | 8,000 | | | 151,120 |
| | | | | | | |
| | | | | | | 2,343,954 |
| | | | | | | |
HEALTH CARE PROVIDERS & SERVICES – 3.2% |
Air Methods Corp.* | | | | 500 | | | 7,995 |
Alliance Imaging, Inc.* | | | | 10,900 | | | 86,873 |
Almost Family, Inc.* | | | | 1,100 | | | 49,478 |
AMERIGROUP Corp.* | | | | 17,800 | | | 525,456 |
AMN Healthcare Services, Inc.* | | | | 9,200 | | | 77,832 |
Assisted Living Concepts, Inc.* | | | | 2,900 | | | 12,035 |
athenahealth, Inc.* | | | | 500 | | | 18,810 |
Brookdale Senior Living, Inc. | | | | 11,300 | | | 63,054 |
Centene Corp.* | | | | 22,000 | | | 433,620 |
Chemed Corp. | | | | 7,200 | | | 286,344 |
Chindex International, Inc.* | | | | 1,050 | | | 8,347 |
CIGNA Corp. | | | | 4,100 | | | 69,085 |
Community Health Systems, Inc.* | | | | 2,000 | | | 29,160 |
Corvel Corp.* | | | | 1,500 | | | 32,970 |
Coventry Health Care, Inc.* | | | | 1,700 | | | 25,296 |
Cross Country Healthcare, Inc.* | | | | 6,500 | | | 57,135 |
Cryolife, Inc.* | | | | 10,800 | | | 104,868 |
Ensign Group Inc. | | | | 600 | | | 10,044 |
Gentiva Health Services, Inc.* | | | | 2,400 | | | 70,224 |
See Notes to Financial Statements.
96
OPPENHEIMER MAIN STREET SMALL CAP FUND
| | |
PORTFOLIO OF INVESTMENTS (Continued) December 31, 2008 | | Sun Capital Advisers Trust |
| | | | | | | |
| | | Country
Code** | | Shares | | Value |
| | | | | | | |
| | | | | | | |
Hanger Orthopedic Group, Inc.* | | | | 11,600 | | $ | 168,316 |
Health Management Associates, Inc., Class A* | | | | 8,000 | | | 14,320 |
Health Net, Inc.* | | | | 11,000 | | | 119,790 |
Healthextras, Inc.* | | | | 6,400 | | | 155,840 |
HEALTHSOUTH Corp.* | | | | 900 | | | 9,864 |
Healthspring, Inc.* | | | | 19,700 | | | 393,409 |
Healthways, Inc.* | | | | 6,100 | | | 70,028 |
Kindred Healthcare, Inc.* | | | | 14,900 | | | 193,998 |
Landauer, Inc. | | | | 3,400 | | | 249,220 |
LifePoint Hospitals, Inc.* | | | | 19,500 | | | 445,380 |
Lincare Holdings, Inc.* | | | | 7,500 | | | 201,975 |
Medcath Corp.* | | | | 2,400 | | | 25,056 |
MEDNAX, Inc.* | | | | 2,400 | | | 76,080 |
Molina Healthcare, Inc.* | | | | 9,800 | | | 172,578 |
Odyssey Healthcare, Inc.* | | | | 4,700 | | | 43,475 |
Owens & Minor, Inc. | | | | 1,700 | | | 64,005 |
Pharmerica Corp.* | | | | 10,900 | | | 170,803 |
Providence Service Corp.* | | | | 900 | | | 1,305 |
Rehabcare Group, Inc.* | | | | 9,500 | | | 144,020 |
Res-Care, Inc.* | | | | 5,900 | | | 88,618 |
Skilled Healthcare Group, Inc.* | | | | 1,800 | | | 15,192 |
Sun Healthcare Group, Inc.* | | | | 2,000 | | | 17,700 |
WellCare Health Plan, Inc.* | | | | 12,300 | | | 158,178 |
| | | | | | | |
| | | | | | | 4,967,776 |
| | | | | | | |
HEALTH CARE TECHNOLOGY – 0.1% |
Allscripts-Misys Heathcare Solutions, Inc. | | | | 6,600 | | | 65,472 |
Computer Programs and Systems, Inc. | | | | 1,800 | | | 48,240 |
IMS Health, Inc. | | | | 1,000 | | | 15,160 |
Omnicell, Inc.* | | | | 5,900 | | | 72,039 |
| | | | | | | |
| | | | | | | 200,911 |
| | | | | | | |
HOTELS, RESTAURANTS & LEISURE – 2.5% |
AFC Enterprises* | | | | 1,100 | | | 5,159 |
Ameristar Casinos, Inc. | | | | 5,000 | | | 43,200 |
Bally Technologies, Inc.* | | | | 3,900 | | | 93,717 |
| | | | | | | |
| | | Country
Code** | | Shares | | Value |
| | | | | | | |
| | | | | | | |
BJ’s Restaurants, Inc.* | | | | 2,300 | | $ | 24,771 |
Bob Evans Farms, Inc. | | | | 17,500 | | | 357,525 |
Boyd Gaming Corp. | | | | 29,200 | | | 138,116 |
Brinker International, Inc. | | | | 28,000 | | | 295,120 |
California Pizza Kitchen, Inc.* | | | | 9,900 | | | 106,128 |
CEC Entertainment, Inc.* | | | | 13,400 | | | 324,950 |
Churchill Downs, Inc. | | | | 1,000 | | | 40,420 |
CKE Restaurants, Inc. | | | | 18,700 | | | 162,316 |
Cracker Barrel Old Country Store, Inc. | | | | 10,496 | | | 216,113 |
Dennys Corp.* | | | | 41,400 | | | 82,386 |
DineEquity, Inc. | | | | 3,400 | | | 39,304 |
Domino’s Pizza, Inc.* | | | | 1,600 | | | 7,536 |
Dover Downs Gaming & Entertainment, Inc. | | | | 400 | | | 1,272 |
International Speedway Corp., Class A | | | | 6,100 | | | 175,253 |
Interval Leisure Group, Inc.* | | | | 3,680 | | | 19,835 |
Isle of Capri Casinos, Inc.* | | | | 3,600 | | | 11,520 |
Jack In The Box, Inc.* | | | | 11,700 | | | 258,453 |
Krispy Kreme Doughnuts, Inc.* | | | | 14,600 | | | 24,528 |
LIFE TIME FITNESS, Inc.* | | | | 4,300 | | | 55,685 |
Marcus Corp. | | | | 4,900 | | | 79,527 |
Morgans Hotel Group* | | | | 800 | | | 3,728 |
O’Charley’s, Inc. | | | | 1,200 | | | 2,400 |
Orient-Express Hotels, Ltd. | | | | 6,600 | | | 50,556 |
Panera Bread Co., Class A* | | | | 3,700 | | | 193,288 |
Peet’s Coffee & Tea, Inc.* | | | | 1,000 | | | 23,250 |
Pinnacle Entertainment, Inc.* | | | | 9,100 | | | 69,888 |
Red Robin Gourmet Burgers, Inc.* | | | | 4,200 | | | 70,686 |
Riviera Holdings Corp.* | | | | 100 | | | 300 |
Ruby Tuesday, Inc.* | | | | 11,200 | | | 17,472 |
Shuffle Master, Inc.* | | | | 5,100 | | | 25,296 |
Sonic Corp.* | | | | 3,500 | | | 42,595 |
Speedway Motorsports, Inc. | | | | 6,700 | | | 107,937 |
The Cheesecake Factory, Inc.* | | | | 9,400 | | | 94,940 |
See Notes to Financial Statements.
97
OPPENHEIMER MAIN STREET SMALL CAP FUND
| | |
PORTFOLIO OF INVESTMENTS (Continued) December 31, 2008 | | Sun Capital Advisers Trust |
| | | | | | | |
| | | Country
Code** | | Shares | | Value |
| | | | | | | |
| | | | | | | |
The Steak N Shake Co.* | | | | 4,500 | | $ | 26,775 |
Town Sports International Holdings, Inc.* | | | | 1,900 | | | 6,061 |
Vail Resorts, Inc.* | | | | 4,900 | | | 130,340 |
WMS Industries, Inc.* | | | | 12,500 | | | 336,250 |
Wyndham Worldwide Corp. | | | | 18,500 | | | 121,175 |
| | | | | | | |
| | | | | | | 3,885,771 |
| | | | | | | |
HOUSEHOLD DURABLES – 1.7% |
American Greetings Corp. | | | | 25,700 | | | 194,549 |
Avatar Holdings, Inc.* | | | | 600 | | | 15,912 |
Beazer Homes USA, Inc.* | | | | 16,900 | | | 26,702 |
Blyth, Inc. | | | | 16,700 | | | 130,928 |
Brookfield Homes Corp. | | | | 700 | | | 3,024 |
Cavco Industries, Inc.* | | | | 1,000 | | | 26,890 |
Centex Corp. | | | | 10,900 | | | 115,976 |
Champion Enterprises, Inc.* | | | | 28,700 | | | 16,072 |
CSS Industries, Inc. | | | | 3,100 | | | 54,994 |
Ethan Allen Interiors, Inc. | | | | 6,800 | | | 97,716 |
Furniture Brands International, Inc. | | | | 17,100 | | | 37,791 |
Harman International Industries, Inc. | | | | 11,800 | | | 197,414 |
Helen of Troy, Ltd.* | | | | 11,300 | | | 196,168 |
Hooker Furniture Corp. | | | | 4,300 | | | 32,938 |
Hovnanian Enterprises, Inc., Class A* | | | | 41,700 | | | 71,724 |
Jarden Corp.* | | | | 2,600 | | | 29,900 |
KB Home | | | | 7,900 | | | 107,598 |
Kimball International, Inc. | | | | 5,700 | | | 49,077 |
La-Z- Boy, Inc. | | | | 25,000 | | | 54,250 |
Lennar Corp., Class A | | | | 31,400 | | | 272,238 |
M.D.C. Holdings, Inc. | | | | 900 | | | 27,270 |
M/I Homes, Inc. | | | | 6,600 | | | 69,564 |
Meritage Homes Corp.* | | | | 11,200 | | | 136,304 |
National Presto Industries, Inc. | | | | 2,100 | | | 161,700 |
Palm Harbor Homes, Inc.* | | | | 1,500 | | | 7,470 |
Ryland Group, Inc. | | | | 12,600 | | | 222,642 |
Sealy Corp. | | | | 15,000 | | | 37,650 |
Standard Pacific Corp.* | | | | 7,100 | | | 12,638 |
| | | | | | | |
| | | Country
Code** | | Shares | | Value |
| | | | | | | |
| | | | | | | |
Tempur-Pedic International, Inc. | | | | 19,100 | | $ | 135,419 |
Universal Electronics, Inc.* | | | | 100 | | | 1,622 |
| | | | | | | |
| | | | | | | 2,544,140 |
| | | | | | | |
HOUSEHOLD PRODUCTS – 0.1% |
Central Garden And Pet Co., Class A* | | | | 10,000 | | | 59,000 |
WD-40 Co. | | | | 4,300 | | | 121,647 |
| | | | | | | |
| | | | | | | 180,647 |
| | | | | | | |
INDEPENDENT POWER PRODUCERS & ENERGY TRADERS – 0.0% + |
Canadian Hydro Developers, Inc.* | | CA | | 7,800 | | | 18,829 |
Mirant Corp.* | | | | 2,300 | | | 43,401 |
| | | | | | | |
| | | | | | | 62,230 |
| | | | | | | |
INDUSTRIAL CONGLOMERATES – 0.3% |
McDermott International, Inc.* | | | | 1,500 | | | 14,820 |
Raven Industries, Inc. | | | | 5,100 | | | 122,910 |
Standex International Corp. | | | | 2,700 | | | 53,568 |
Tredegar Corp. | | | | 11,100 | | | 201,798 |
Walter Industries, Inc. | | | | 3,000 | | | 52,530 |
| | | | | | | |
| | | | | | | 445,626 |
| | | | | | | |
INSURANCE – 5.0% |
Allied World Assurance Holdings, Ltd. | | | | 6,100 | | | 247,660 |
American Equity Investment Life Holding Co. | | | | 16,400 | | | 114,800 |
American Financial Group, Inc. | | | | 2,600 | | | 59,488 |
American Physicians Capital, Inc. | | | | 5,350 | | | 257,335 |
Amerisafe, Inc.* | | | | 10,880 | | | 223,366 |
Amtrust Financial Services, Inc. | | | | 14,600 | | | 169,360 |
Aspen Insurance Holdings, Ltd. | | | | 18,400 | | | 446,200 |
Assured Guaranty, Ltd. | | | | 1,600 | | | 18,240 |
Axis Capital Holdings, Ltd. | | | | 1,600 | | | 46,592 |
Citizens, Inc.* | | | | 1,300 | | | 12,610 |
CNA Financial Corp. | | | | 6,200 | | | 101,928 |
CNA Surety Corp.* | | | | 7,800 | | | 149,760 |
See Notes to Financial Statements.
98
OPPENHEIMER MAIN STREET SMALL CAP FUND
| | |
PORTFOLIO OF INVESTMENTS (Continued) December 31, 2008 | | Sun Capital Advisers Trust |
| | | | | | | |
| | | Country
Code** | | Shares | | Value |
| | | | | | | |
| | | | | | | |
Conseco, Inc.* | | | | 55,300 | | $ | 286,454 |
Delphi Financial Group, Inc. | | | | 12,450 | | | 229,578 |
Donegal Group, Inc. | | | | 233 | | | 3,907 |
eHealth, Inc.* | | | | 600 | | | 7,968 |
EMC Insurance Group, Inc. | | | | 300 | | | 7,695 |
Employers Holdings, Inc. | | | | 12,100 | | | 199,650 |
Endurance Specialty Holdings, Ltd. | | | | 4,500 | | | 137,385 |
FBL Financial Group, Inc. | | | | 7,000 | | | 108,150 |
First Mercury Financial Corp.* | | | | 800 | | | 11,408 |
FPIC Insurance Group, Inc.* | | | | 4,300 | | | 188,254 |
Genworth Financial, Inc., Class A | | | | 21,700 | | | 61,411 |
Hallmark Financial Services, Inc.* | | | | 1,600 | | | 14,032 |
Harleysville Group, Inc. | | | | 5,100 | | | 177,123 |
Horace Mann Educators Corp. | | | | 11,500 | | | 105,685 |
Infinity Property & Casualty Corp. | | | | 4,100 | | | 191,593 |
IPC Holdings, Ltd. | | | | 13,700 | | | 409,630 |
Life Partners Holdings, Inc. | | | | 400 | | | 17,456 |
Lincoln National Corp. | | | | 2,000 | | | 37,680 |
Maiden Holdings Ltd. | | | | 600 | | | 1,878 |
Max Re Capital Ltd. | | | | 26,200 | | | 463,740 |
Meadowbrook Insurance Group, Inc. | | | | 9,967 | | | 64,188 |
National Financial Partners Corp. | | | | 5,600 | | | 17,024 |
National Interstate Corp. | | | | 2,100 | | | 37,527 |
National Western Life Insurance Co. | | | | 100 | | | 16,917 |
Nationwide Financial Services | | | | 3,400 | | | 177,514 |
Navigators Group, Inc.* | | | | 3,400 | | | 186,694 |
NYMAGIC, Inc. | | | | 100 | | | 1,905 |
Old Republic International Corp. | | | | 900 | | | 10,728 |
OneBeacon Insurance Group, Ltd. | | | | 4,800 | | | 50,112 |
Phoenix Cos., Inc. | | | | 22,000 | | | 71,940 |
Platinum Underwriters Holdings, Ltd. | | | | 11,400 | | | 411,312 |
| | | | | | | |
| | | Country
Code** | | Shares | | Value |
| | | | | | | |
| | | | | | | |
PMA Capital Corp.* | | | | 2,700 | | $ | 19,116 |
Presidential Life Corp. | | | | 1,600 | | | 15,824 |
ProAssurance Corp.* | | | | 6,900 | | | 364,182 |
Protective Life Corp. | | | | 17,500 | | | 251,125 |
RLI Corp. | | | | 4,000 | | | 244,640 |
Safety Insurance Group, Inc. | | | | 4,100 | | | 156,046 |
SeaBright Insurance Holdings, Inc.* | | | | 5,300 | | | 62,222 |
Selective Insurance Group, Inc. | | | | 11,000 | | | 252,230 |
StanCorp Financial Group, Inc. | | | | 1,600 | | | 66,832 |
State Auto Financial Corp. | | | | 700 | | | 21,042 |
Stewart Information Services Corp. | | | | 1,900 | | | 44,631 |
Transatlantic Holdings, Inc. | | | | 700 | | | 28,042 |
United America Indemnity Ltd.* | | | | 8,000 | | | 102,480 |
United Fire & Casualty Co. | | | | 1,700 | | | 52,819 |
Unitrin, Inc. | | | | 11,200 | | | 178,528 |
Universal American Financial Corp.* | | | | 6,700 | | | 59,094 |
Unum Group | | | | 4,600 | | | 85,560 |
Zenith National Insurance Corp. | | | | 2,300 | | | 72,611 |
| | | | | | | |
| | | | | | | 7,630,901 |
| | | | | | | |
INTERNET & CATALOG RETAIL – 1.0% |
1-800-flowers.com, Inc.* | | | | 15,200 | | | 58,064 |
Blue Nile, Inc.* | | | | 2,600 | | | 63,674 |
Coldwater Creek, Inc.* | | | | 20,500 | | | 58,425 |
Expedia, Inc.* | | | | 10,900 | | | 89,816 |
Gaiam, Inc.* | | | | 1,800 | | | 8,316 |
HSN, Inc.* | | | | 3,380 | | | 24,573 |
Liberty Media Corp. – Interactive, Series A* | | | | 15,400 | | | 48,048 |
Netflix, Inc.* | | | | 14,600 | | | 436,394 |
NutriSystem, Inc. | | | | 12,910 | | | 188,357 |
Orbitz Worldwide, Inc.* | | | | 8,200 | | | 31,816 |
Overstock.com, Inc.* | | | | 6,500 | | | 70,070 |
PetMed Express Common, Inc.* | | | | 8,300 | | | 146,329 |
Priceline.com, Inc.* | | | | 600 | | | 44,190 |
Shutterfly, Inc.* | | | | 2,400 | | | 16,776 |
See Notes to Financial Statements.
99
OPPENHEIMER MAIN STREET SMALL CAP FUND
| | |
PORTFOLIO OF INVESTMENTS (Continued) December 31, 2008 | | Sun Capital Advisers Trust |
| | | | | | | |
| | | Country
Code** | | Shares | | Value |
| | | | | | | |
| | | | | | | |
Stamps.com, Inc.* | | | | 9,100 | | $ | 89,453 |
Systemax, Inc. | | | | 8,600 | | | 92,622 |
| | | | | | | |
| | | | | | | 1,466,923 |
| | | | | | | |
INTERNET SOFTWARE & SERVICES – 2.1% |
Akamai Technologies, Inc.* | | | | 1,600 | | | 24,144 |
Art Technology Group, Inc.* | | | | 13,700 | | | 26,441 |
Asiainfo Holdings, Inc.* | | | | 14,900 | | | 176,416 |
Bidz.com, Inc.* | | | | 900 | | | 4,140 |
Digital River, Inc.* | | | | 16,000 | | | 396,800 |
Earthlink, Inc.* | | | | 31,900 | | | 215,644 |
Imergent, Inc. | | | | 2,700 | | | 11,205 |
Interwoven, Inc.* | | | | 8,000 | | | 100,800 |
j2 Global Communications, Inc.* | | | | 21,800 | | | 436,872 |
Limelight Networks, Inc.* | | | | 300 | | | 735 |
Loopnet, Inc.* | | | | 8,700 | | | 59,334 |
Marchex, Inc., Class B | | | | 9,300 | | | 54,219 |
Moduslink Global Solutions, Inc.* | | | | 8,180 | | | 23,640 |
Navisite, Inc.* | | | | 2,500 | | | 1,000 |
NIC, Inc. | | | | 10,100 | | | 46,460 |
Open Text Corp.* | | | | 13,300 | | | 400,729 |
Perficient, Inc.* | | | | 1,500 | | | 7,170 |
RealNetworks, Inc.* | | | | 11,100 | | | 39,183 |
S1 Corp.* | | | | 28,800 | | | 227,232 |
Sohu.com, Inc.* | | | | 1,100 | | | 52,074 |
SonicWall, Inc.* | | | | 16,600 | | | 66,068 |
Soundbite Communications, Inc.* | | | | 3,000 | | | 3,870 |
Switch & Data Facilities Co.* | | | | 2,500 | | | 18,475 |
The Knot, Inc.* | | | | 3,300 | | | 27,456 |
TheStreet.com, Inc. | | | | 3,500 | | | 10,150 |
United Online, Inc. | | | | 27,299 | | | 165,705 |
Valueclick, Inc.* | | | | 36,800 | | | 251,712 |
VeriSign, Inc.* | | | | 2,300 | | | 43,884 |
Vignette Corp.* | | | | 13,700 | | | 128,917 |
VistaPrint Ltd.* | | | | 3,200 | | | 59,552 |
Vocus, Inc.* | | | | 4,300 | | | 78,303 |
Zix Corp.* | | | | 2,700 | | | 3,213 |
| | | | | | | |
| | | | | | | 3,161,543 |
| | | | | | | |
IT SERVICES – 2.3% | | | | | | | |
Acxiom Corp. | | | | 39,600 | | | 321,156 |
| | | | | | | |
| | | Country
Code** | | Shares | | Value |
| | | | | | | |
| | | | | | | |
Broadridge Financial Solutions, Inc. | | | | 500 | | $ | 6,270 |
Ciber, Inc.* | | | | 35,020 | | | 168,446 |
Computer Sciences Corp.* | | | | 2,100 | | | 73,794 |
Convergys Corp.* | | | | 57,600 | | | 369,216 |
CSG Systems International, Inc.* | | | | 18,200 | | | 317,954 |
DST Systems, Inc.* | | | | 700 | | | 26,586 |
Euronet Worldwide, Inc.* | | | | 2,700 | | | 31,347 |
Exlservice Holdings, Inc.* | | | | 3,300 | | | 28,281 |
Forrester Research, Inc.* | | | | 4,800 | | | 135,408 |
Gartner, Inc.* | | | | 6,400 | | | 114,112 |
Global Cash Access Holdings, Inc.* | | | | 14,300 | | | 31,746 |
Heartland Payment Systems, Inc. | | | | 3,400 | | | 59,500 |
iGATE Corp.* | | | | 8,000 | | | 52,080 |
info USA, Inc. | | | | 3,600 | | | 17,064 |
Integral Systems, Inc.* | | | | 9,208 | | | 110,957 |
Mantech International Corp.* | | | | 700 | | | 37,933 |
Mastech Holdings, Inc.* | | | | 106 | | | 252 |
MAXIMUS, Inc. | | | | 2,200 | | | 77,242 |
MPS Group, Inc.* | | | | 51,700 | | | 389,301 |
NCI, Inc.* | | | | 1,800 | | | 54,234 |
Ness Technologies, Inc.* | | | | 4,900 | | | 20,972 |
Neustar, Inc., Class A* | | | | 10,700 | | | 204,691 |
Online Resources Corp.* | | | | 200 | | | 948 |
Perot Systems Corp., Class A* | | | | 22,700 | | | 310,309 |
Rightnow Technologies, Inc.* | | | | 11,500 | | | 88,895 |
Sapient Corp.* | | | | 44,700 | | | 198,468 |
SYKES Enterprises, Inc.* | | | | 5,800 | | | 110,896 |
Syntel, Inc. | | | | 1,400 | | | 32,368 |
The Hackett Group, Inc.* | | | | 800 | | | 2,336 |
TNS, Inc.* | | | | 100 | | | 939 |
Total System Services, Inc. | | | | 2,300 | | | 32,200 |
Unisys Corp.* | | | | 64,000 | | | 54,400 |
See Notes to Financial Statements.
100
OPPENHEIMER MAIN STREET SMALL CAP FUND
| | |
PORTFOLIO OF INVESTMENTS (Continued) December 31, 2008 | | Sun Capital Advisers Trust |
| | | | | | | |
| | | Country
Code** | | Shares | | Value |
| | | | | | | |
| | | | | | | |
Wright Express Corp.* | | | | 2,400 | | $ | 30,240 |
| | | | | | | |
| | | | | | | 3,510,541 |
| | | | | | | |
LEISURE EQUIPMENT & PRODUCTS – 0.8% |
Brunswick Corp. | | | | 58,300 | | | 245,443 |
Callaway Golf Co. | | | | 41,800 | | | 388,322 |
Jakks Pacific, Inc.* | | | | 10,100 | | | 208,363 |
Leapfrog Enterprises, Inc.* | | | | 17,900 | | | 62,650 |
Polaris Industries, Inc. | | | | 6,500 | | | 186,225 |
Pool Corp. | | | | 2,200 | | | 39,534 |
RC2 Corp.* | | | | 3,500 | | | 37,345 |
Steinway Musical Instruments, Inc.* | | | | 2,200 | | | 38,522 |
| | | | | | | |
| | | | | | | 1,206,404 |
| | | | | | | |
LIFE SCIENCES TOOLS & SERVICES – 0.6% |
Albany Molecular Research, Inc.* | | | | 9,800 | | | 95,452 |
Bio-Rad Laboratories, Inc.* | | | | 900 | | | 67,779 |
Bruker Corp.* | | | | 1,500 | | | 6,060 |
Dionex Corp.* | | | | 200 | | | 8,970 |
Enzo Biochem, Inc.* | | | | 600 | | | 2,934 |
EResearch Technology, Inc.* | | | | 16,700 | | | 110,721 |
inVentiv Health, Inc.* | | | | 5,200 | | | 60,008 |
Kendle International, Inc.* | | | | 900 | | | 23,148 |
Life Sciences Research, Inc.* | | | | 1,400 | | | 13,160 |
Luminex Corp.* | | | | 7,100 | | | 151,656 |
Medivation, Inc.* | | | | 5,100 | | | 74,307 |
Nektar Therapeutics* | | | | 9,100 | | | 50,596 |
Parexel International Corp.* | | | | 13,300 | | | 129,143 |
Sequenom, Inc.* | | | | 2,200 | | | 43,648 |
Varian, Inc.* | | | | 2,700 | | | 90,477 |
| | | | | | | |
| | | | | | | 928,059 |
| | | | | | | |
MACHINERY – 5.3% | | | | | | | |
3d Systems Corp.* | | | | 100 | | | 794 |
Actuant Corp., Class A | | | | 16,500 | | | 313,830 |
AGCO Corp.* | | | | 400 | | | 9,436 |
Albany International Corp. | | | | 500 | | | 6,420 |
Altra Holdings, Inc.* | | | | 8,100 | | | 64,071 |
American Railcar Industries, Inc. | | | | 800 | | | 8,424 |
American Science & Engineering, Inc. | | | | 800 | | | 59,168 |
| | | | | | | |
| | | Country
Code** | | Shares | | Value |
| | | | | | | |
| | | | | | | |
Ampco-Pittsburgh Corp. | | | | 6,600 | | $ | 143,220 |
Astec Industries, Inc.* | | | | 1,600 | | | 50,128 |
Axsys Technologies, Inc.* | | | | 1,500 | | | 82,290 |
Badger Meter, Inc. | | | | 6,800 | | | 197,336 |
Barnes Group, Inc. | | | | 19,700 | | | 285,650 |
Blount International, Inc.* | | | | 17,700 | | | 167,796 |
Briggs & Stratton Corp. | | | | 8,400 | | | 147,756 |
Bucyrus International, Inc. | | | | 4,500 | | | 83,340 |
Cascade Bancorp | | | | 1,300 | | | 38,818 |
Chart Industries, Inc.* | | | | 15,600 | | | 165,828 |
CIRCOR International, Inc. | | | | 9,000 | | | 247,500 |
Colfax Corp.* | | | | 2,800 | | | 29,092 |
Columbus Mckinnon Corp.* | | | | 10,800 | | | 147,420 |
Commercial Vehicle Group, Inc.* | | | | 800 | | | 744 |
Crane Co. | | | | 9,400 | | | 162,056 |
Cummins, Inc. | | | | 4,000 | | | 106,920 |
Dover Corp. | | | | 3,000 | | | 98,760 |
DXP Enterprises, Inc.* | | | | 1,600 | | | 23,376 |
Dynamic Materials Corp. | | | | 1,400 | | | 27,034 |
EnPro Industries, Inc.* | | | | 13,500 | | | 290,790 |
Federal Signal Corp. | | | | 21,800 | | | 178,978 |
Flowserve Corp. | | | | 200 | | | 10,300 |
Gardner Denver, Inc.* | | | | 21,300 | | | 497,142 |
Gorman-rupp Co. | | | | 7,525 | | | 234,178 |
Graco, Inc. | | | | 7,200 | | | 170,856 |
Graham Corp. | | | | 2,600 | | | 28,132 |
Harsco Corp. | | | | 2,700 | | | 74,736 |
Hurco Cos., Inc.* | | | | 1,100 | | | 13,200 |
IDEX Corp. | | | | 1,500 | | | 36,225 |
Ingersoll-Rand Co., Ltd., Class A | | | | 10,400 | | | 180,440 |
John Bean Technologies Corp. | | | | 3,923 | | | 32,051 |
Joy Global, Inc. | | | | 1,300 | | | 29,757 |
K-tron International, Inc.* | | | | 300 | | | 23,970 |
Kadant, Inc.* | | | | 8,000 | | | 107,840 |
Kennametal, Inc. | | | | 12,000 | | | 266,280 |
LB Foster Co.* | | | | 2,900 | | | 90,712 |
Lincoln Electric Holdings, Inc. | | | | 900 | | | 45,837 |
Lydall, Inc.* | | | | 3,400 | | | 19,550 |
See Notes to Financial Statements.
101
OPPENHEIMER MAIN STREET SMALL CAP FUND
| | |
PORTFOLIO OF INVESTMENTS (Continued) December 31, 2008 | | Sun Capital Advisers Trust |
| | | | | | | |
| | | Country
Code** | | Shares | | Value |
| | | | | | | |
| | | | | | | |
McCoy Corp. (1) | | CA | | 6,200 | | $ | 6,780 |
Met-Pro Corp. | | | | 500 | | | 6,660 |
Mueller Industries, Inc. | | | | 14,500 | | | 363,660 |
Mueller Water Products, Inc., Class A | | | | 23,800 | | | 199,920 |
NACCO Industries, Inc., Class A | | | | 800 | | | 29,928 |
Navistar International Corp., Inc.* | | | | 2,100 | | | 44,898 |
NN, Inc. | | | | 2,400 | | | 5,496 |
Nordson Corp. | | | | 700 | | | 22,603 |
Oshkosh Truck Corp. | | | | 36,300 | | | 322,707 |
Parker Hannifin Corp. | | | | 1,000 | | | 42,540 |
RBC Bearings, Inc.* | | | | 1,100 | | | 22,308 |
Robbins & Myers, Inc. | | | | 11,800 | | | 190,806 |
Sun Hydraulics, Inc. | | | | 8,250 | | | 155,430 |
Tecumseh Products Co.* | | | | 10,200 | | | 97,716 |
Tennant Co. | | | | 2,800 | | | 43,120 |
Terex Corp.* | | | | 5,100 | | | 88,332 |
The Greenbrier Cos., Inc | | | | 1,300 | | | 8,931 |
The Manitowoc Co., Inc. | | | | 24,600 | | | 213,036 |
The Timken Co. | | | | 19,200 | | | 376,896 |
Thermadyne Holdings Corp.* | | | | 1,200 | | | 8,244 |
Titan International, Inc. | | | | 22,900 | | | 188,925 |
Toro Co. | | | | 14,100 | | | 465,300 |
Trimas Corp.* | | | | 100 | | | 138 |
Trinity Industries, Inc. | | | | 8,000 | | | 126,080 |
Twin Disc, Inc. | | | | 900 | | | 6,201 |
Wabash National Corp. | | | | 8,900 | | | 40,050 |
Watts Water Technologies, Inc., Class A | | | | 400 | | | 9,988 |
| | | | | | | |
| | | | | | | 8,084,874 |
| | | | | | | |
MARINE – 0.4% | | | | | | | |
Alexander & Baldwin, Inc. | | | | 1,900 | | | 47,614 |
American Commercial Lines, Inc.* | | | | 18,100 | | | 88,690 |
Excel Maritime Carriers Ltd. | | | | 4,600 | | | 32,384 |
Genco Shipping & Trading Ltd. | | | | 12,600 | | | 186,480 |
Horizon Lines, Inc. | | | | 2,600 | | | 9,074 |
Kirby Corp.* | | | | 2,300 | | | 62,928 |
Safe Bulkers, Inc. | | | | 11,400 | | | 76,152 |
Star Bulk Carriers Corp. | | | | 11,952 | | | 30,717 |
| | | | | | | |
| | | Country
Code** | | Shares | | Value |
| | | | | | | |
| | | | | | | |
TBS International Ltd.* | | | | 11,300 | | $ | 113,339 |
Ultrapetrol Bahamas Ltd.* | | | | 500 | | | 1,595 |
| | | | | | | |
| | | | | | | 648,973 |
| | | | | | | |
MEDIA – 1.1% | | | | | | | |
Arbitron, Inc. | | | | 2,000 | | | 26,560 |
Ascent Media Corp., Class A* | | | | 500 | | | 10,920 |
Belo Corp., Class A | | | | 34,925 | | | 54,483 |
Cablevision Systems Corp., Class A | | | | 2,000 | | | 33,680 |
CBS Corp., Class B | | | | 4,700 | | | 38,493 |
Central European Media Enterprises, Ltd., Class A* | | | | 1,100 | | | 23,892 |
Charter Communications, Inc.* | | | | 79,500 | | | 6,503 |
Clear Channel Outdoor Holdings, Inc., Class A* | | | | 2,600 | | | 15,990 |
Cox Radio, Inc., Class A* | | | | 12,800 | | | 76,928 |
CTC Media, Inc.* | | | | 1,000 | | | 4,800 |
Cumulus Media, Inc.* | | | | 3,600 | | | 8,964 |
DG Fastchannel, Inc.* | | | | 300 | | | 3,744 |
DISH Network Corp., Class A* | | | | 5,300 | | | 58,777 |
E.W. Scripps Co., Class A | | | | 12,800 | | | 28,288 |
Entercom Communications Corp., Class A | | | | 2,200 | | | 2,706 |
Entravision Communications Corp.* | | | | 28,800 | | | 44,928 |
Fisher Communications, Inc. | | | | 200 | | | 4,128 |
Gannett Co., Inc. | | | | 2,800 | | | 22,400 |
Global Sources Ltd.* | | | | 11,762 | | | 64,103 |
Harte-Hanks, Inc. | | | | 8,700 | | | 54,288 |
Hearst-Argyle Television, Inc. | | | | 900 | | | 5,454 |
Journal Communications, Inc. | | | | 4,800 | | | 11,760 |
Knology, Inc.* | | | | 4,200 | | | 21,672 |
Lamar Advertising Co. Class A* | | | | 9,800 | | | 123,088 |
Liberty Media Corp. – Capital, Series A* | | | | 2,200 | | | 10,362 |
Lin TV Corp.* | | | | 5,900 | | | 6,431 |
See Notes to Financial Statements.
102
OPPENHEIMER MAIN STREET SMALL CAP FUND
| | |
PORTFOLIO OF INVESTMENTS (Continued) December 31, 2008 | | Sun Capital Advisers Trust |
| | | | | | | |
| | | Country
Code** | | Shares | | Value |
| | | | | | | |
| | | | | | | |
McClatchy Co., Class A | | | | 18,100 | | $ | 14,480 |
Media General, Inc. | | | | 4,800 | | | 8,400 |
Mediacom Communications Corp., Class A* | | | | 15,200 | | | 65,360 |
Meredith Corp. | | | | 21,100 | | | 361,232 |
National CineMedia, Inc. | | | | 9,000 | | | 91,260 |
RCN Corp.* | | | | 800 | | | 4,720 |
Scholastic Corp. | | | | 17,100 | | | 232,218 |
Sinclair Broadcast Group, Inc. | | | | 28,100 | | | 87,110 |
The McGraw-Hill Cos., Inc. | | | | 2,700 | | | 62,613 |
Valassis Communications, Inc.* | | | | 2,000 | | | 2,640 |
Warner Music Group Corp. | | | | 19,100 | | | 57,682 |
| | | | | | | |
| | | | | | | 1,751,057 |
| | | | | | | |
METALS & MINING – 2.1% | | | | | |
AK Steel Holding Corp. | | | | 28,500 | | | 265,620 |
Allegheny Technologies, Inc. | | | | 1,800 | | | 45,954 |
Amerigo Resources Ltd. | | CA | | 20,800 | | | 6,403 |
Brush Engineered Materials, Inc.* | | | | 7,500 | | | 95,400 |
Carpenter Technology Corp. | | | | 19,200 | | | 394,368 |
Castle AM Co. | | | | 8,600 | | | 93,138 |
Century Aluminum Co.* | | | | 25,500 | | | 255,000 |
Commercial Metals Co. | | | | 100 | | | 1,187 |
Farallon Resources Ltd.* | | CA | | 20,100 | | | 2,442 |
General Steel Holdings, Inc.* | | | | 3,100 | | | 12,214 |
Gibraltar Industries, Inc. | | | | 15,500 | | | 185,070 |
Haynes International, Inc.* | | | | 4,800 | | | 118,176 |
Hecla Mining Co.* | | | | 33,900 | | | 94,920 |
Kaiser Aluminum Corp. | | | | 2,900 | | | 65,308 |
Northwest Pipe Co.* | | | | 3,700 | | | 157,657 |
Olympic Steel, Inc. | | | | 6,600 | | | 134,442 |
Redcorp Ventures Ltd.* (1) | | CA | | 91,400 | | | 2,961 |
Reliance Steel & Aluminum Co. | | | | 7,800 | | | 155,532 |
| | | | | | | |
| | | Country
Code** | | Shares | | Value |
| | | | | | | |
| | | | | | | |
RTI International Metals, Inc.* | | | | 15,560 | | $ | 222,664 |
Schnitzer Steel Industries, Inc., Class A | | | | 12,100 | | | 455,565 |
Sims Group Ltd. ADR | | | | 15,805 | | | 196,298 |
Stillwater Mining Co.* | | | | 6,600 | | | 32,604 |
Sutor Technology Group Ltd.* | | | | 300 | | | 693 |
United States Steel Corp. | | | | 1,300 | | | 48,360 |
Universal Stainless & Alloy* | | | | 1,000 | | | 14,490 |
Worthington Industries, Inc. | | | | 16,800 | | | 185,136 |
| | | | | | | |
| | | | | | | 3,241,602 |
| | | | | | | |
MULTI-LINE RETAIL – 0.5% | | | |
Big Lots, Inc.* | | | | 20,700 | | | 299,943 |
Conn’s, Inc.* | | | | 3,900 | | | 33,072 |
Dillard’s, Inc. | | | | 44,200 | | | 175,474 |
Fred’s, Inc. | | | | 21,500 | | | 231,340 |
Macy’s, Inc. | | | | 4,200 | | | 43,470 |
Nordstrom, Inc. | | | | 2,200 | | | 29,282 |
Retail Ventures, Inc.* | | | | 500 | | | 1,735 |
| | | | | | | |
| | | | | | | 814,316 |
| | | | | | | |
MULTI-UTILITIES – 0.2% | | | | | |
Avista Corp. | | | | 12,000 | | | 232,560 |
CH Energy Group, Inc. | | | | 2,500 | | | 128,475 |
| | | | | | | |
| | | | | | | 361,035 |
| | | | | | | |
OFFICE ELECTRONICS – 0.2% |
Xerox Corp. | | | | 9,500 | | | 75,715 |
Zebra Technologies Corp., Class A* | | | | 12,000 | | | 243,120 |
| | | | | | | |
| | | | | | | 318,835 |
| | | | | | | |
OIL & GAS-EXPLORATION & PRODUCTION – 3.6% |
Abraxas Petroleum Corp.* | | | | 3,100 | | | 2,232 |
Alon USA Energy, Inc. | | | | 800 | | | 7,320 |
Alpha Natural Resources, Inc.* | | | | 1,700 | | | 27,523 |
Arena Resources, Inc.* | | | | 1,200 | | | 33,708 |
ATP Oil & Gas Corp.* | | | | 16,700 | | | 97,695 |
Berry Petroleum Co. | | | | 27,100 | | | 204,876 |
Bill Barrett Corp.* | | | | 11,400 | | | 240,882 |
BPZ Resources, Inc.* | | | | 3,700 | | | 23,680 |
Brigham Exploration Co.* | | | | 19,200 | | | 61,440 |
See Notes to Financial Statements.
103
OPPENHEIMER MAIN STREET SMALL CAP FUND
| | |
PORTFOLIO OF INVESTMENTS (Continued) December 31, 2008 | | Sun Capital Advisers Trust |
| | | | | | | |
| | | Country
Code** | | Shares | | Value |
| | | | | | | |
| | | | | | | |
Callon Petroleum Co.* | | | | 10,600 | | $ | 27,560 |
Cano Petroleum, Inc.* | | | | 1,400 | | | 616 |
Carrizo Oil & Gas, Inc.* | | | | 1,900 | | | 30,590 |
Celtic Exploration Ltd.* | | CA | | 500 | | | 5,107 |
Cimarex Energy Co. | | | | 7,400 | | | 198,172 |
Clayton Williams Energy, Inc.* | | | | 600 | | | 27,264 |
Contango Oil & Gas Co.* | | | | 300 | | | 16,890 |
Crosstex Energy, Inc. | | | | 2,500 | | | 9,750 |
CVR Energy, Inc.* | | | | 17,200 | | | 68,800 |
Delek US Holdings, Inc. | | | | 10,200 | | | 53,958 |
Denbury Resources, Inc.* | | | | 7,800 | | | 85,176 |
DHT Maritime, Inc. | | | | 500 | | | 2,770 |
Enbridge Energy Management LLC* | | | | 104 | | | 2,543 |
Encore Aquisition Co.* | | | | 2,500 | | | 63,800 |
Energy Partners Ltd.* | | | | 14,000 | | | 18,900 |
Foundation Coal Holdings, Inc. | | | | 23,700 | | | 332,274 |
Frontier Oil Corp. | | | | 20,100 | | | 253,863 |
Frontline Ltd. | | | | 800 | | | 23,688 |
Galleon Energy, Inc.* | | CA | | 3,150 | | | 13,013 |
Gasco Energy, Inc.* | | | | 19,100 | | | 7,449 |
General Maritime Corp. | | | | 10,406 | | | 112,385 |
Georesources, Inc.* | | | | 1,800 | | | 15,642 |
Gulfport Energy Corp.* | | | | 2,200 | | | 8,690 |
Helix Energy Solutions Group, Inc.* | | | | 9,200 | | | 66,608 |
Holly Corp. | | | | 6,000 | | | 109,380 |
Houston American Energy Corp. | | | | 300 | | | 1,014 |
International Coal Group, Inc.* | | | | 6,600 | | | 15,180 |
Jabil Circuit, Inc. | | | | 4,900 | | | 33,075 |
Jura Energy Corp.* | | CA | | 13,900 | | | 1,070 |
Knightsbridge Tankers Ltd. | | | | 7,400 | | | 108,410 |
Mariner Energy, Inc.* | | | | 33,100 | | | 337,620 |
Massey Energy Co. | | | | 8,300 | | | 114,457 |
McMoRan Exploration Co.* | | | | 7,300 | | | 71,540 |
Meridian Resource Corp.* | | | | 9,400 | | | 5,358 |
Midnight Oil Exploration Ltd.* | | CA | | 15,100 | | | 9,174 |
Noble Corp. | | | | 2,500 | | | 55,225 |
| | | | | | | |
| | | Country
Code** | | Shares | | Value |
| | | | | | | |
| | | | | | | |
Overseas Shipholding Group, Inc. | | | | 4,700 | | $ | 197,917 |
Paramount Resources Ltd.* | | CA | | 900 | | | 5,009 |
PetroQuest Energy, Inc.* | | | | 18,600 | | | 125,736 |
Pioneer Natural Resources Co. | | | | 1,800 | | | 29,124 |
Plains Exploration & Production Co.* | | | | 7,600 | | | 176,624 |
Quicksilver Resources, Inc.* | | | | 14,300 | | | 79,651 |
Rentech, Inc.* | | | | 2,500 | | | 1,700 |
Rosetta Resources, Inc.* | | | | 26,600 | | | 188,328 |
Smith International, Inc. | | | | 600 | | | 13,734 |
St. Mary Land & Exploration Co. | | | | 1,500 | | | 30,465 |
Stone Energy Corp.* | | | | 23,916 | | | 263,554 |
Sunoco, Inc. | | | | 1,400 | | | 60,844 |
Swift Energy Co.* | | | | 15,400 | | | 258,874 |
Teekay Tankers Ltd., Class A | | | | 6,500 | | | 82,550 |
Tesoro Corp. | | | | 19,800 | | | 260,766 |
Tristar Oil & Gas Ltd.* | | CA | | 1,300 | | | 11,952 |
TUSK Energy Corp.* | | CA | | 18,607 | | | 13,867 |
Vaalco Energy, Inc.* | | | | 32,200 | | | 239,568 |
Venoco, Inc.* | | | | 1,900 | | | 5,149 |
Vero Energy, Inc.* | | CA | | 4,400 | | | 19,389 |
W&T Offshore, Inc. | | | | 20,000 | | | 286,400 |
Warren Resources, Inc.* | | | | 6,500 | | | 12,935 |
Western Refining, Inc. | | | | 13,800 | | | 107,088 |
Westmoreland Coal Co.* | | | | 800 | | | 8,880 |
World Fuel Services Corp. | | | | 900 | | | 33,300 |
| | | | | | | |
| | | | | | | 5,519,771 |
| | | | | | | |
PAPER & FOREST PRODUCTS – 0.6% |
Buckeye Technologies, Inc.* | | | | 11,900 | | | 43,316 |
Clearwater Paper Corp.* | | | | 1,011 | | | 8,482 |
Deltic Timber Corp. | | | | 1,100 | | | 50,325 |
Domtar Corp.* | | | | 52,800 | | | 88,176 |
Glatfelter | | | | 13,400 | | | 124,620 |
International Paper Co. | | | | 6,200 | | | 73,160 |
Louisiana-Pacific Corp. | | | | 21,000 | | | 32,760 |
See Notes to Financial Statements.
104
OPPENHEIMER MAIN STREET SMALL CAP FUND
| | |
PORTFOLIO OF INVESTMENTS (Continued) December 31, 2008 | | Sun Capital Advisers Trust |
| | | | | | | |
| | | Country
Code** | | Shares | | Value |
| | | | | | | |
| | | | | | | |
MeadWestvaco Corp. | | | | 1,900 | | $ | 21,261 |
Mercer International, Inc.* | | | | 2,600 | | | 4,992 |
Neenah Paper, Inc. | | | | 2,600 | | | 22,984 |
Potlatch Corp. | | | | 3,540 | | | 92,076 |
Schweitzer-Mauduit International, Inc. | | | | 3,200 | | | 64,064 |
Verso Paper Corp. | | | | 800 | | | 824 |
Wausau Paper Corp. | | | | 18,500 | | | 211,640 |
| | | | | | | |
| | | | | | | 838,680 |
| | | | | | | |
PERSONAL PRODUCTS – 0.8% |
American Oriental Bioengineering, Inc.* | | | | 28,800 | | | 195,552 |
Bare Escentuals, Inc.* | | | | 8,800 | | | 46,024 |
Chattem, Inc.* | | | | 300 | | | 21,459 |
Elizabeth Arden, Inc.* | | | | 6,400 | | | 80,704 |
Herbalife, Ltd. | | | | 12,900 | | | 279,672 |
Inter Parfums, Inc. | | | | 7,000 | | | 53,760 |
NBTY, Inc.* | | | | 19,600 | | | 306,740 |
Nu Skin Enterprises, Inc. | | | | 6,200 | | | 64,666 |
Prestige Brands Holdings, Inc.* | | | | 18,100 | | | 190,955 |
Revlon, Inc., Class A* | | | | 500 | | | 3,335 |
| | | | | | | |
| | | | | | | 1,242,867 |
| | | | | | | |
PHARMACEUTICALS – 0.8% |
Adolor Corp.* | | | | 10,100 | | | 16,766 |
Auxilium Pharmaceuticals, Inc.* | | | | 3,600 | | | 102,384 |
BioMimetic Therapeutics, Inc.* | | | | 1,200 | | | 11,064 |
Cypress Bioscience, Inc.* | | | | 2,500 | | | 17,100 |
Durect Corp.* | | | | 1,100 | | | 3,729 |
Endo Pharmaceuticals Holding, Inc.* | | | | 1,100 | | | 28,468 |
Forest Laboratories, Inc.* | | | | 2,970 | | | 75,646 |
King Pharmaceuticals, Inc.* | | | | 11,231 | | | 119,273 |
KV Pharmaceutical Co., Class A* | | | | 1,800 | | | 5,184 |
Medicis Pharmaceutical Corp., Class A | | | | 26,900 | | | 373,910 |
Middlebrook Pharmaceuticals, Inc.* | | | | 4,300 | | | 6,450 |
| | | | | | | |
| | | Country
Code** | | Shares | | Value |
| | | | | | | |
| | | | | | | |
Noven Pharmaceuticals, Inc.* | | | | 8,300 | | $ | 91,300 |
Optimer Pharmaceuticals, Inc.* | | | | 600 | | | 7,266 |
Pain Therapeutics, Inc.* | | | | 7,600 | | | 44,992 |
Par Pharmaceutical Cos., Inc.* | | | | 5,500 | | | 73,755 |
Pozen, Inc.* | | | | 4,300 | | | 21,672 |
Questcor Pharmaceuticals, Inc.* | | | | 1,200 | | | 11,172 |
Salix Pharmaceuticals Ltd.* | | | | 5,200 | | | 45,916 |
Valeant Pharmaceuticals International* | | | | 900 | | | 20,610 |
Viropharma, Inc.* | | | | 1,400 | | | 18,228 |
Vivus, Inc.* | | | | 10,900 | | | 57,988 |
| | | | | | | |
| | | | | | | 1,152,873 |
| | | | | | | |
REAL ESTATE INVESTMENT TRUSTS – 2.7% |
Acadia Realty Trust | | | | 600 | | | 8,562 |
Agree Realty Corp. | | | | 1,930 | | | 34,991 |
Alexander’s, Inc. | | | | 100 | | | 25,490 |
Alexandria Real Estate Equities, Inc. | | | | 2,300 | | | 138,782 |
Arbor Realty Trust, Inc. | | | | 800 | | | 2,360 |
Ashford Hospitality Trust, Inc. | | | | 12,400 | | | 14,260 |
Associated Estates Realty Corp. | | | | 1,500 | | | 13,695 |
BioMed Realty Trust, Inc. | | | | 12,510 | | | 146,617 |
Brandywine Reality Trust | | | | 4,900 | | | 37,779 |
Caplease, Inc. | | | | 3,600 | | | 6,228 |
CBL & Associates Properties, Inc. | | | | 2,800 | | | 18,200 |
Cedar Shopping Centers, Inc. | | | | 2,700 | | | 19,116 |
Colonial Properties Trust | | | | 2,500 | | | 20,825 |
Commercial Net Lease Realty | | | | 12,900 | | | 221,751 |
Corporate Office Properties Trust | | | | 3,320 | | | 101,924 |
Dct Industrial Trust, Inc. | | | | 2,900 | | | 14,674 |
DiamondRock Hospitality Co. | | | | 22,200 | | | 112,554 |
Digital Realty Trust, Inc. | | | | 3,900 | | | 128,115 |
See Notes to Financial Statements.
105
OPPENHEIMER MAIN STREET SMALL CAP FUND
| | |
PORTFOLIO OF INVESTMENTS (Continued) December 31, 2008 | | Sun Capital Advisers Trust |
| | | | | | | |
| | | Country
Code** | | Shares | | Value |
| | | | | | | |
| | | | | | | |
EastGroup Properties, Inc. | | | | 3,400 | | $ | 120,972 |
Entertainment Properties Trust | | | | 5,430 | | | 161,814 |
Equity Lifestyle Properties, Inc. | | | | 1,100 | | | 42,196 |
Equity One, Inc. | | | | 900 | | | 15,930 |
Extra Space Storage, Inc. | | | | 6,900 | | | 71,208 |
FelCor Lodging Trust, Inc. | | | | 18,400 | | | 33,856 |
First Industrial Realty Trust, Inc. | | | | 11,100 | | | 83,805 |
First Potomac Realty Trust | | | | 1,200 | | | 11,160 |
Forestar Real Estate Group, Inc.* | | | | 600 | | | 5,712 |
Glimcher Realty Trust | | | | 1,200 | | | 3,372 |
Gramercy Capital Corp. | | | | 1,500 | | | 1,920 |
Healthcare Realty Trust, Inc. | | | | 4,100 | | | 96,268 |
Hersha Hospitality Trust | | | | 2,600 | | | 7,800 |
Highwoods Properties, Inc. | | | | 8,200 | | | 224,352 |
Home Properties, Inc. | | | | 4,000 | | | 162,400 |
Inland Real Estate Corp. | | | | 10,000 | | | 129,800 |
Investors Real Estate Trust | | | | 500 | | | 5,355 |
Kite Realty Group Trust | | | | 5,600 | | | 31,136 |
LaSalle Hotel Properties | | | | 5,100 | | | 56,355 |
Lexington Corporate Properties Trust | | | | 8,200 | | | 41,000 |
LTC Properties, Inc. | | | | 3,700 | | | 75,036 |
Medical Properties Trust, Inc. | | | | 7,800 | | | 49,218 |
Mid America Apartment Communities, Inc. | | | | 4,200 | | | 156,072 |
National Health Investors, Inc. | | | | 2,100 | | | 57,603 |
Nationwide Health Properties, Inc. | | | | 6,400 | | | 183,808 |
Omega Healthcare Investors, Inc. | | | | 12,680 | | | 202,499 |
Parkway Properties, Inc. | | | | 3,100 | | | 55,800 |
Pennsylvania Real Estate Investment | | | | 6,000 | | | 44,700 |
| | | | | | | |
| | | Country
Code** | | Shares | | Value |
| | | | | | | |
| | | | | | | |
Post Properties, Inc. | | | | 1,300 | | $ | 21,450 |
PS Business Parks, Inc. | | | | 1,700 | | | 75,922 |
Ramco Gershenson Properties Trust | | | | 1,900 | | | 11,742 |
Realty Income Corp. | | | | 6,100 | | | 141,215 |
Saul Centers, Inc. | | | | 800 | | | 31,600 |
Senior Housing Properties Trust | | | | 16,400 | | | 293,888 |
SL Green Realty Corp. | | | | 2,900 | | | 75,110 |
Sovran Self Storage, Inc. | | | | 1,200 | | | 43,200 |
Strategic Hotels & Resorts, Inc. | | | | 10,400 | | | 17,472 |
Sunstone Hotel Investors, Inc. | | | | 9,104 | | | 56,354 |
Tanger Factory Outlet Centers, Inc. | | | | 2,490 | | | 93,674 |
Taubman Centers, Inc. | | | | 1,600 | | | 40,736 |
Universal Health Realty Income Trust | | | | 100 | | | 3,291 |
Urstadt Biddle Properties, Inc., Class A | | | | 300 | | | 4,779 |
Washington Real Estate Investment Trust | | | | 3,600 | | | 101,880 |
| | | | | | | |
| | | | | | | 4,209,383 |
| | | | | | | |
REAL ESTATE MANAGEMENT &
DEVELOPMENT – 0.1% |
American Campus Communities, Inc. | | | | 1,100 | | | 22,528 |
CB Richard Ellis Group, Inc., Class A* | | | | 10,300 | | | 44,496 |
Consolidated-Tomoka Land Co. | | | | 100 | | | 3,819 |
Forest City Enterprises, Inc. | | | | 5,600 | | | 37,520 |
Jones Lang LaSalle, Inc. | | | | 2,400 | | | 66,480 |
Move, Inc.* | | | | 3,000 | | | 4,800 |
| | | | | | | |
| | | | | | | 179,643 |
| | | | | | | |
ROAD & RAIL – 0.8% |
Amerco* | | | | 1,100 | | | 37,983 |
Arkansas Best Corp. | | | | 13,000 | | | 391,430 |
Avis Budget Group, Inc.* | | | | 47,600 | | | 33,320 |
Cai International, Inc.* | | | | 7,100 | | | 22,507 |
Celadon Group, Inc.* | | | | 3,600 | | | 30,708 |
Hertz Global Holdings, Inc.* | | | | 17,800 | | | 90,246 |
See Notes to Financial Statements.
106
OPPENHEIMER MAIN STREET SMALL CAP FUND
| | |
PORTFOLIO OF INVESTMENTS (Continued) December 31, 2008 | | Sun Capital Advisers Trust |
| | | | | | | |
| | | Country
Code** | | Shares | | Value |
| | | | | | | |
| | | | | | | |
Marten Transport Ltd.* | | | | 8,900 | | $ | 168,744 |
Werner Enterprises, Inc. | | | | 20,200 | | | 350,268 |
YRC Worldwide, Inc.* | | | | 32,600 | | | 93,562 |
| | | | | | | |
| | | 1,218,768 |
| | | | | | | |
SEMICONDUCTORS & SEMICONDUCTOR EQUIPMENT – 5.7% |
Actel Corp.* | | | | 12,000 | | | 140,640 |
Advanced Analogic Technologies, Inc.* | | | | 500 | | | 1,510 |
Advanced Energy Industries, Inc.* | | | | 17,600 | | | 175,120 |
Advanced Micro Devices, Inc.* | | | | 6,300 | | | 13,608 |
Altera Corp. | | | | 4,000 | | | 66,840 |
Amkor Technology, Inc.* | | | | 92,800 | | | 202,304 |
Analog Devices, Inc. | | | | 5,400 | | | 102,708 |
Applied Micro Circuits Corp.* | | | | 21,100 | | | 82,923 |
Atheros Communications* | | | | 8,400 | | | 120,204 |
Atmel Corp.* | | | | 145,800 | | | 456,354 |
ATMI, Inc.* | | | | 12,900 | | | 199,047 |
Broadcom Corp., Class A* | | | | 5,400 | | | 91,638 |
Brooks Automation, Inc.* | | | | 24,600 | | | 142,926 |
Cabot Microelectronics Corp.* | | | | 9,800 | | | 255,486 |
Cirrus Logic, Inc.* | | | | 26,900 | | | 72,092 |
Cohu, Inc. | | | | 4,900 | | | 59,535 |
Conexant Systems, Inc.* | | | | 3,800 | | | 2,603 |
Cymer, Inc.* | | | | 9,800 | | | 214,718 |
Day4 Energy, Inc.* | | CA | | 14,900 | | | 10,500 |
DSP Group, Inc.* | | | | 4,500 | | | 36,090 |
Entegris, Inc.* | | | | 62,000 | | | 135,780 |
Exar Corp.* | | | | 9,600 | | | 64,032 |
Fairchild Semiconductor International, Inc.* | | | | 65,500 | | | 320,295 |
FEI Co.* | | | | 4,700 | | | 88,642 |
Integrated Device Technology, Inc.* | | | | 76,400 | | | 428,604 |
Intellon Corp.* | | | | 3,300 | | | 8,283 |
International Rectifier Corp.* | | | | 8,800 | | | 118,800 |
Intersil Holding Corp. | | | | 19,300 | | | 177,367 |
| | | | | | | |
| | | Country
Code** | | Shares | | Value |
| | | | | | | |
| | | | | | | |
IXYS Corp. | | | | 5,000 | | $ | 41,300 |
Kla-Tencor Corp. | | | | 4,400 | | | 95,876 |
Kulicke & Soffa Industries, Inc.* | | | | 4,200 | | | 7,140 |
Lattice Semiconductor Corp.* | | | | 50,300 | | | 75,953 |
LSI Corp.* | | | | 44,600 | | | 146,734 |
Marvell Technology Group Ltd.* | | | | 13,800 | | | 92,046 |
Mattson Technology, Inc.* | | | | 2,400 | | | 3,384 |
MEMC Electronic Materials, Inc.* | | | | 3,300 | | | 47,124 |
Micrel, Inc. | | | | 30,400 | | | 222,224 |
Microtune, Inc.* | | | | 3,300 | | | 6,732 |
MKS Instruments, Inc.* | | | | 23,800 | | | 352,002 |
Monolithic Power Systems, Inc.* | | | | 15,000 | | | 189,150 |
National Semiconductor Corp. | | | | 2,800 | | | 28,196 |
Netlogic Microsystems, Inc.* | | | | 7,800 | | | 171,678 |
Novellus Systems, Inc.* | | | | 16,800 | | | 207,312 |
NVIDIA Corp.* | | | | 6,400 | | | 51,648 |
Omnivision Technologies, Inc.* | | | | 17,400 | | | 91,350 |
ON Semiconductor Corp.* | | | | 16,900 | | | 57,460 |
Pericom Semiconductor Corp.* | | | | 14,500 | | | 79,460 |
PMC-Sierra, Inc.* | | | | 67,800 | | | 329,508 |
RF Micro Devices, Inc.* | | | | 69,300 | | | 54,054 |
Rudolph Technologies, Inc.* | | | | 1,100 | | | 3,883 |
Semtech Corp.* | | | | 31,500 | | | 355,005 |
Silicon Image, Inc.* | | | | 43,900 | | | 184,380 |
Silicon Laboratories, Inc.* | | | | 14,300 | | | 354,354 |
Silicon Storage Technology, Inc.* | | | | 15,400 | | | 35,266 |
Skyworks Solutions, Inc.* | | | | 57,000 | | | 315,780 |
Spansion, Inc., Class A* | | | | 1,900 | | | 360 |
Standard Microsystems Corp.* | | | | 6,700 | | | 109,478 |
Supertex, Inc.* | | | | 5,000 | | | 120,050 |
Techwell, Inc.* | | | | 1,300 | | | 8,450 |
Teradyne, Inc.* | | | | 77,400 | | | 326,628 |
See Notes to Financial Statements.
107
OPPENHEIMER MAIN STREET SMALL CAP FUND
| | |
PORTFOLIO OF INVESTMENTS (Continued) December 31, 2008 | | Sun Capital Advisers Trust |
| | | | | | | |
| | | Country
Code** | | Shares | | Value |
| | | | | | | |
| | | | | | | |
Tessera Technologies, Inc.* | | | | 1,100 | | $ | 13,068 |
Triquint Semiconductor, Inc.* | | | | 18,800 | | | 64,672 |
Ultra Clean Holdings* | | | | 900 | | | 1,809 |
Ultratech, Inc.* | | | | 11,500 | | | 137,540 |
Varian Semiconductor Equipment Associates, Inc.* | | | | 9,400 | | | 170,328 |
Veeco Instruments, Inc.* | | | | 18,000 | | | 114,120 |
Verigy Ltd.* | | | | 12,400 | | | 119,288 |
Volterra Semiconductor Corp.* | | | | 15,100 | | | 107,965 |
Xilinx, Inc. | | | | 3,100 | | | 55,242 |
Zoran Corp.* | | | | 9,500 | | | 64,885 |
| | | | | | | |
| | | | | | | 8,801,531 |
| | | | | | | |
SOFTWARE – 3.2% |
Actuate Corp.* | | | | 596 | | | 1,764 |
Advent Software, Inc.* | | | | 1,700 | | | 33,949 |
Amdocs, Ltd.* | | | | 300 | | | 5,487 |
ANSYS, Inc.* | | | | 266 | | | 7,419 |
Arcsight, Inc.* | | | | 300 | | | 2,403 |
Aspen Technology, Inc.* | | | | 19,800 | | | 146,916 |
Autodesk, Inc.* | | | | 4,100 | | | 80,565 |
Blackbaud, Inc. | | | | 1,800 | | | 24,300 |
Bottomline Technologies, Inc.* | | | | 2,400 | | | 17,040 |
Cadence Design Systems, Inc.* | | | | 68,300 | | | 249,978 |
Commvault Systems, Inc.* | | | | 1,600 | | | 21,456 |
Compuware Corp.* | | | | 14,800 | | | 99,900 |
DemandTec, Inc.* | | | | 600 | | | 4,842 |
Double-take Software, Inc.* | | | | 1,500 | | | 13,455 |
Epiq Systems, Inc.* | | | | 7,850 | | | 131,173 |
FactSet Research Systems, Inc. | | | | 700 | | | 30,968 |
Fair Issac Corp. | | | | 25,600 | | | 431,616 |
FalconStor Software, Inc.* | | | | 2,700 | | | 7,506 |
i2 Technologies, Inc.* | | | | 1,500 | | | 9,585 |
Interactive Intelligence, Inc.* | | | | 2,600 | | | 16,666 |
Jack Henry & Associates, Inc. | | | | 1,800 | | | 34,938 |
JDA Software Group, Inc.* | | | | 14,000 | | | 183,820 |
| | | | | | | |
| | | Country
Code** | | Shares | | Value |
| | | | | | | |
| | | | | | | |
Lawson Software, Inc.* | | | | 7,800 | | $ | 36,972 |
Manhattan Associates, Inc.* | | | | 11,800 | | | 186,558 |
Mentor Graphics Corp.* | | | | 22,400 | | | 115,808 |
MICROS Systems, Inc.* | | | | 4,300 | | | 70,176 |
Microstrategy, Inc.* | | | | 4,159 | | | 154,424 |
MSC.Software Corp.* | | | | 2,800 | | | 18,704 |
Net 1 UEPS Technologies, Inc.* | | | | 19,600 | | | 268,520 |
Netscout Systems, Inc.* | | | | 7,000 | | | 60,340 |
Nuance Communications, Inc.* | | | | 900 | | | 9,324 |
Parametric Technology Corp.* | | | | 29,700 | | | 375,705 |
Pegasystems, Inc. | | | | 2,200 | | | 27,192 |
Phoenix Technologies Ltd.* | | | | 900 | | | 3,150 |
Progress Software Corp.* | | | | 7,400 | | | 142,524 |
Quest Software, Inc.* | | | | 27,700 | | | 348,743 |
Radiant Systems, Inc.* | | | | 7,900 | | | 26,623 |
Renaissance Learning, Inc. | | | | 100 | | | 899 |
Smith Micro Software, Inc.* | | | | 3,400 | | | 18,904 |
Solera Holdings, Inc.* | | | | 700 | | | 16,870 |
SPSS, Inc.* | | | | 5,500 | | | 148,280 |
Sybase, Inc.* | | | | 3,000 | | | 74,310 |
Symyx Technologies, Inc.* | | | | 1,500 | | | 8,910 |
Synchronoss Technologies, Inc.* | | | | 5,700 | | | 60,762 |
Synopsys, Inc.* | | | | 1,900 | | | 35,188 |
Take-Two Interactive Software, Inc. | | | | 18,000 | | | 136,080 |
The9 Ltd.* | | | | 700 | | | 9,324 |
Tibco Software, Inc.* | | | | 88,900 | | | 461,391 |
Tyler Technologies, Inc.* | | | | 10,500 | | | 125,790 |
Ultimate Software Group, Inc.* | | | | 1,900 | | | 27,740 |
Wind River Systems, Inc.* | | | | 35,500 | | | 320,565 |
| | | | | | | |
| | | | | | | 4,845,522 |
| | | | | | | |
SPECIALTY RETAIL – 5.2% |
Abercrombie & Fitch Co. Class A | | | | 3,600 | | | 83,052 |
See Notes to Financial Statements.
108
OPPENHEIMER MAIN STREET SMALL CAP FUND
| | |
PORTFOLIO OF INVESTMENTS (Continued) December 31, 2008 | | Sun Capital Advisers Trust |
| | | | | | | |
| | | Country
Code** | | Shares | | Value |
| | | | | | | |
| | | | | | | |
Aeropostale, Inc.* | | | | 25,600 | | $ | 412,160 |
America’s Car-mart, Inc.* | | | | 4,100 | | | 56,621 |
American Eagle Outfitters, Inc. | | | | 2,800 | | | 26,208 |
AnnTaylor Stores Corp.* | | | | 41,700 | | | 240,609 |
Asbury Automotive Group, Inc. | | | | 15,600 | | | 71,292 |
Autonation, Inc.* | | | | 34,000 | | | 335,920 |
Barnes & Noble, Inc. | | | | 15,800 | | | 237,000 |
Bebe Stores, Inc. | | | | 15,500 | | | 115,785 |
Big 5 Sporting Goods Corp. | | | | 600 | | | 3,126 |
Blockbuster, Inc.* | | | | 45,720 | | | 57,607 |
Books-A-Million, Inc. | | | | 700 | | | 1,785 |
Borders Group, Inc., Class A* | | | | 15,500 | | | 6,200 |
Brown Shoe, Inc. | | | | 27,520 | | | 233,094 |
Buckle, Inc. | | | | 15,525 | | | 338,756 |
Cato Corp. | | | | 9,200 | | | 138,920 |
Charlotte Russe Holding, Inc.* | | | | 6,200 | | | 40,238 |
Charming Shoppes, Inc.* | | | | 26,300 | | | 64,172 |
Chico’s FAS, Inc.* | | | | 13,400 | | | 56,012 |
Childrens Place Retail Stores, Inc.* | | | | 15,700 | | | 340,376 |
Christopher & Banks Corp. | | | | 9,000 | | | 50,400 |
Citi Trends, Inc.* | | | | 9,500 | | | 139,840 |
Dress Barn, Inc.* | | | | 31,600 | | | 339,384 |
Finish Line, Inc., Class A | | | | 30,900 | | | 173,040 |
Foot Locker, Inc. | | | | 11,800 | | | 86,612 |
Genesco, Inc.* | | | | 9,500 | | | 160,740 |
Group 1 Automotive, Inc. | | | | 10,800 | | | 116,316 |
Guess?, Inc. | | | | 2,000 | | | 30,700 |
Gymboree Corp.* | | | | 3,300 | | | 86,097 |
Haverty Furniture Cos., Inc. | | | | 13,263 | | | 123,744 |
hhgregg, Inc.* | | | | 600 | | | 5,208 |
Hibbett Sports, Inc.* | | | | 7,100 | | | 111,541 |
Hot Topic, Inc.* | | | | 22,600 | | | 209,502 |
J. Crew Group, Inc.* | | | | 1,100 | | | 13,420 |
Jo-ann Stores, Inc.* | | | | 15,000 | | | 232,350 |
Limited Brands, Inc. | | | | 4,600 | | | 46,184 |
Lumber Liquidators, Inc.* | | | | 3,600 | | | 38,016 |
| | | | | | | |
| | | Country
Code** | | Shares | | Value |
| | | | | | | |
| | | | | | | |
Monro Muffler, Inc. | | | | 1,300 | | $ | 33,150 |
New York & Co., Inc.* | | | | 14,900 | | | 34,568 |
Office Depot, Inc.* | | | | 66,800 | | | 199,064 |
OfficeMax, Inc. | | | | 29,800 | | | 227,672 |
Pacific Sunwear of California, Inc.* | | | | 26,600 | | | 42,294 |
Penske Auto Group, Inc. | | | | 22,700 | | | 174,336 |
Pier 1 Imports, Inc.* | | | | 3,400 | | | 1,258 |
RadioShack Corp. | | | | 18,900 | | | 225,666 |
Rental-A-Center, Inc.* | | | | 26,000 | | | 458,900 |
Sally Beauty Holdings, Inc.* | | | | 31,000 | | | 176,390 |
Sonic Automotive, Inc., Class A | | | | 12,300 | | | 48,954 |
Stage Stores, Inc. | | | | 18,100 | | | 149,325 |
Talbots, Inc. | | | | 19,200 | | | 45,888 |
Taser International, Inc.* | | | | 5,500 | | | 29,040 |
The Men’s Wearhouse, Inc. | | | | 16,500 | | | 223,410 |
The Pep Boys – Manny, Moe & Jack | | | | 18,200 | | | 75,166 |
The Wet Seal, Inc., Class A* | | | | 41,700 | | | 123,849 |
Tractor Supply Co.* | | | | 13,800 | | | 498,732 |
Tween Brands, Inc.* | | | | 10,100 | | | 43,632 |
Williams-Sonoma, Inc. | | | | 35,500 | | | 279,030 |
Zale Corp.* | | | | 18,800 | | | 62,604 |
Zumiez, Inc.* | | | | 4,400 | | | 32,780 |
| | | | | | | |
| | | | | | | 8,007,735 |
| | | | | | | |
TEXTILES, APPAREL & LUXURY GOODS – 1.7% |
American Apparel, Inc.* | | | | 2,900 | | | 5,771 |
Coach, Inc.* | | | | 3,600 | | | 74,772 |
Crocs, Inc.* | | | | 7,800 | | | 9,672 |
FGX International Holdings, Ltd.* | | | | 700 | | | 9,618 |
Jones Apparel Group, Inc. | | | | 42,800 | | | 250,808 |
K-Swiss, Inc., Class a | | | | 1,800 | | | 20,520 |
Kenneth Cole Productions, Inc. Class A | | | | 2,400 | | | 16,992 |
Liz Claiborne, Inc. | | | | 78,200 | | | 203,320 |
Madden Steven Ltd.* | | | | 8,800 | | | 187,616 |
Maidenform Brands, Inc.* | | | | 6,700 | | | 68,005 |
Movado Group, Inc. | | | | 2,300 | | | 21,597 |
Oxford Industries, Inc. | | | | 5,500 | | | 48,235 |
See Notes to Financial Statements.
109
OPPENHEIMER MAIN STREET SMALL CAP FUND
| | |
PORTFOLIO OF INVESTMENTS (Continued) December 31, 2008 | | Sun Capital Advisers Trust |
| | | | | | | |
| | | Country
Code** | | Shares | | Value |
| | | | | | | |
| | | | | | | |
Perry Ellis International, Inc.* | | | | 7,600 | | $ | 48,184 |
Phillips-Van Heusen Corp. | | | | 12,400 | | | 249,612 |
Polo Ralph Lauren Corp | | | | 700 | | | 31,787 |
Quiksilver, Inc.* | | | | 63,100 | | | 116,104 |
Timberland Co., Class A* | | | | 18,000 | | | 207,900 |
True Religion Apparel, Inc.* | | | | 7,800 | | | 97,032 |
Unifi, Inc.* | | | | 14,700 | | | 41,454 |
UniFirst Corp. | | | | 3,900 | | | 115,791 |
Volcom, Inc.* | | | | 700 | | | 7,630 |
Warnaco Group, Inc.* | | | | 18,400 | | | 361,192 |
Wolverine World Wide, Inc. | | | | 16,500 | | | 347,160 |
Xerium Technologies, Inc.* | | | | 7,400 | | | 4,884 |
| | | | | | | |
| | | | | | | 2,545,656 |
| | | | | | | |
THRIFT & MORTGAGE FINANCE – 1.1% |
Anchor Bancorp Wisconsin, Inc. | | | | 2,200 | | | 6,072 |
Bank Mutual Corp. | | | | 8,400 | | | 96,936 |
City Bank | | | | 900 | | | 4,680 |
Corus Bankshares, Inc. | | | | 900 | | | 999 |
Dime Community Bancshares | | | | 12,500 | | | 166,250 |
Doral Financial Corp.* | | | | 200 | | | 1,500 |
Encore Bancshares, Inc.* | | | | 1,200 | | | 13,200 |
First Niagara Financial Group, Inc. | | | | 1,000 | | | 16,170 |
First Place Financial Corp. | | | | 1,000 | | | 3,830 |
Flagstar Bancorp, Inc.* | | | | 3,500 | | | 2,485 |
Flushing Financial Corp. | | | | 6,800 | | | 81,328 |
MGIC Investment Corp. | | | | 57,600 | | | 200,448 |
NewAlliance Bancshares, Inc. | | | | 2,800 | | | 36,876 |
Oceanfirst Financial Corp. | | | | 1,200 | | | 19,920 |
Ocwen Financial Corp.* | | | | 13,700 | | | 125,766 |
Provident Financial Services | | | | 10,000 | | | 153,000 |
Provident New York Bancorp | | | | 8,600 | | | 106,640 |
| | | | | | | |
| | | Country
Code** | | Shares | | Value |
| | | | | | | |
| | | | | | | |
Radian Group, Inc. | | | | 39,800 | | $ | 146,464 |
The PMI Group, Inc. | | | | 35,500 | | | 69,225 |
TierOne Corp. | | | | 1,700 | | | 6,375 |
Tree.com, Inc.* | | | | 296 | | | 770 |
TrustCo Bank Corp NY | | | | 800 | | | 7,608 |
Webster Financial Corp. | | | | 22,000 | | | 303,160 |
WSFS Financial Corp. | | | | 1,000 | | | 47,990 |
| | | | | | | |
| | | | | | | 1,617,692 |
| | | | | | | |
TOBACCO – 0.2% |
Universal Corp. | | | | 8,100 | | | 241,947 |
| | | | | | | |
TRADING COMPANIES & DISTRIBUTORS – 1.2% |
Applied Industrial Technologies, Inc. | | | | 17,250 | | | 326,370 |
Beacon Roofing Supply, Inc.* | | | | 9,500 | | | 131,860 |
BlueLinx Holdings, Inc.* | | | | 800 | | | 1,512 |
GATX Corp. | | | | 5,200 | | | 161,044 |
H & E Equipment Services, Inc.* | | | | 6,600 | | | 50,886 |
Houston Wire & Cable Co. | | | | 8,700 | | | 80,997 |
Interline Brands, Inc.* | | | | 2,500 | | | 26,575 |
MSC Industrial Direct Co., Inc., Class A | | | | 1,300 | | | 47,879 |
Rush Enterprises, Inc.* | | | | 13,700 | | | 117,409 |
Tal International Group, Inc. | | | | 2,400 | | | 33,840 |
Textainer Group Holdings Ltd. | | | | 3,200 | | | 33,920 |
United Rentals, Inc.* | | | | 37,867 | | | 345,347 |
Watsco, Inc. | | | | 800 | | | 30,720 |
WESCO International, Inc.* | | | | 22,700 | | | 436,521 |
| | | | | | | |
| | | | | | | 1,824,880 |
| | | | | | | |
WATER UTILITIES – 0.1% |
Cascal | | | | 10,000 | | | 40,200 |
SJW Corp. | | | | 3,700 | | | 110,778 |
| | | | | | | |
| | | | | | | 150,978 |
| | | | | | | |
WIRELESS TELECOMMUNICATION SERVICES – 0.6% |
Centennial Communication Corp.* | | | | 47,700 | | | 384,462 |
ICO Global Communications (Holdings), Ltd.* | | | | 1,800 | | | 2,034 |
See Notes to Financial Statements.
110
OPPENHEIMER MAIN STREET SMALL CAP FUND
| | |
PORTFOLIO OF INVESTMENTS (Continued) December 31, 2008 | | Sun Capital Advisers Trust |
| | | | | | | |
| | | Country
Code** | | Shares | | Value |
| | | | | | | |
| | | | | | | |
IPCS, Inc.* | | | | 3,900 | | $ | 26,754 |
NII Holdings, Inc.* | | | | 1,800 | | | 32,724 |
Syniverse Holdings, Inc.* | | | | 17,300 | | | 206,562 |
Telephone & Data Systems, Inc. | | | | 3,000 | | | 95,250 |
US Cellular Corp.* | | | | 1,500 | | | 64,860 |
USA Mobility, Inc.* | | | | 8,400 | | | 97,187 |
| | | | | | | |
| | | | | | | 909,833 |
| | | | | | | |
Total Common Stocks
(cost $210,422,584) | | | 152,207,673 |
| | | | | | | |
WARRANT – 0.0% + |
METALS & MINING – 0.0% |
Redcorp Ventures Ltd.,* Expires 7/10/09
(cost $0) | | CA | | 45,700 | | | 185 |
| | | | | | | |
| | | | | | | | |
| | | | | Principal
Amount
(000) | | Value |
| | | | | | | | |
SHORT TERM INVESTMENTS – 0.8% |
REPURCHASE AGREEMENT – 0.8% |
State Street Bank and Trust Company, 0.01%, 1/2/09 (collateralized by $1,200,000 FHLB, 4.375%, 9/17/10, with a value of $1,277,640 total to be received $1,251,474) (cost $1,251,474) | | | | $ | 1,251 | | $ | 1,251,474 |
| | | | | | | | |
TOTAL INVESTMENTS – 100.0% |
(cost $211,674,058) | | | | | | | | 153,459,332 |
Other assets less liabilities – 0.0% + | | | | | | | | 73,595 |
| | | | | | | | |
NET ASSETS – 100.0% | | | | | | | $ | 153,532,927 |
| | | | | | | | |
| (1) | Eligible for resale under rule 144A of the Securities Act of 1933. These securities may be resold in transactions exempt from registration, normally to qualified institutional buyers. At December 31, 2008, these securities amounted to $41,801 representing 0.03% of net assets. |
| * | Non-income producing security |
| ** | Unless otherwise noted the country code for all securities is United States. |
| + | Amount is less than 0.05%. |
| | | | |
| ADR | | | | American Depositary Receipt |
| CA | | | | Canada |
| FHLB | | | | Federal Home Loan Bank |
See Notes to Financial Statements.
111
OPPENHEIMER LARGE CAP CORE FUND
| | |
PORTFOLIO OF INVESTMENTS December 31, 2008 | | Sun Capital Advisers Trust |
| | | | | |
| | | Shares | | Value |
| | | | | |
| | | | | |
COMMON STOCKS – 97.5% | | | | | |
AEROSPACE & DEFENSE – 6.1% | | | | | |
Honeywell International Inc. | | 7,100 | | $ | 233,093 |
Lockheed Martin Corp. | | 1,100 | | | 92,488 |
Northrop Grumman Corp. | | 6,100 | | | 274,744 |
Raytheon Co. | | 4,200 | | | 214,368 |
| | | | | |
| | | | | 814,693 |
| | | | | |
AIR FREIGHT & LOGISTICS – 0.3% | | | | | |
United Parcel Services, Inc., Class B | | 800 | | | 44,128 |
| | | | | |
BEVERAGES – 0.9% | | | | | |
Coca-Cola Co. | | 2,600 | | | 117,702 |
| | | | | |
BIOTECHNOLOGY – 2.2% | | | | | |
Amgen, Inc.* | | 5,100 | | | 294,525 |
| | | | | |
CAPITAL MARKETS – 2.6% | | | | | |
Ameriprise Financial, Inc. | | 2,900 | | | 67,744 |
Bank of New York Mellon Corp. | | 6,300 | | | 178,479 |
Northern Trust Corp. | | 2,000 | | | 104,280 |
| | | | | |
| | | | | 350,503 |
| | | | | |
CHEMICALS – 1.4% | | | | | |
Monsanto Co. | | 500 | | | 35,175 |
Sigma-Aldrich Corp. | | 1,300 | | | 54,912 |
The Dow Chemical Co. | | 6,200 | | | 93,558 |
| | | | | |
| | | | | 183,645 |
| | | | | |
COMMERCIAL BANKS – 0.6% | | | | | |
Wells Fargo & Co. | | 2,800 | | | 82,544 |
| | | | | |
COMMERCIAL SERVICES & SUPPLIES – 0.7% |
Pitney Bowes, Inc. | | 1,700 | | | 43,316 |
RR Donnelley & Sons Co. | | 3,800 | | | 51,604 |
| | | | | |
| | | | | 94,920 |
| | | | | |
COMMUNICATIONS EQUIPMENT – 1.1% |
Cisco Systems, Inc.* | | 5,800 | | | 94,540 |
QUALCOMM, Inc. | | 1,500 | | | 53,745 |
| | | | | |
| | | | | 148,285 |
| | | | | |
COMPUTERS & PERIPHERALS – 6.9% |
Dell, Inc.* | | 15,000 | | | 153,600 |
Hewlett-Packard Co. | | 10,400 | | | 377,416 |
International Business Machines Corp. | | 4,600 | | | 387,136 |
| | | | | |
| | | | | 918,152 |
| | | | | |
CONSTRUCTION & ENGINEERING – 1.1% |
Fluor Corp. | | 3,200 | | | 143,584 |
| | | | | |
| | | | | |
| | | Shares | | Value |
| | | | | |
DIVERSIFIED FINANCIAL SERVICES – 2.1% |
Bank of America Corp. | | 3,400 | | $ | 47,872 |
JPMorgan Chase & Co. | | 7,500 | | | 236,475 |
| | | | | |
| | | | | 284,347 |
| | | | | |
DIVERSIFIED TELECOMMUNICATION SERVICES – 2.8% |
AT&T, Inc. | | 2,400 | | | 68,400 |
Verizon Communications, Inc. | | 8,000 | | | 271,200 |
Windstream Corp. | | 3,800 | | | 34,960 |
| | | | | |
| | | | | 374,560 |
| | | | | |
ELECTRIC UTILITIES – 1.9% | | | | | |
Firstenergy Corp. | | 5,100 | | | 247,758 |
| | | | | |
ENERGY EQUIPMENT & SERVICES – 2.2% |
ENSCO International, Inc. | | 1,300 | | | 36,907 |
Halliburton Co. | | 9,400 | | | 170,892 |
Schlumberger, Ltd. | | 1,200 | | | 50,796 |
Weatherford International Ltd.* | | 3,200 | | | 34,624 |
| | | | | |
| | | | | 293,219 |
| | | | | |
FOOD & STAPLES RETAILING – 4.9% |
Kroger Co. | | 2,000 | | | 52,820 |
Safeway, Inc. | | 1,200 | | | 28,524 |
Sysco Corp. | | 1,500 | | | 34,410 |
Wal-Mart Stores, Inc. | | 9,600 | | | 538,176 |
| | | | | |
| | | | | 653,930 |
| | | | | |
FOOD PRODUCTS – 5.6% | | | | | |
Archer-Daniels-Midland Co. | | 6,800 | | | 196,044 |
Campbell Soup Co. | | 600 | | | 18,006 |
ConAgra Foods, Inc. | | 14,700 | | | 242,550 |
H.J. Heinz Co. | | 5,800 | | | 218,080 |
Sara Lee Corp. | | 4,600 | | | 45,034 |
Tyson Foods, Inc., Class A | | 2,500 | | | 21,900 |
| | | | | |
| | | | | 741,614 |
| | | | | |
HEALTH CARE EQUIPMENT & SUPPLIES – 1.1% |
Baxter International Inc. | | 600 | | | 32,154 |
Medtronic, Inc. | | 2,200 | | | 69,124 |
Stryker Corp. | | 1,100 | | | 43,945 |
| | | | | |
| | | | | 145,223 |
| | | | | |
HEALTH CARE PROVIDERS & SERVICES – 5.5% |
Aetna, Inc. | | 1,800 | | | 51,300 |
AmerisourceBergen Corp. | | 3,300 | | | 117,678 |
Cardinal Health, Inc. | | 2,300 | | | 79,281 |
CIGNA Corp. | | 3,300 | | | 55,605 |
Humana, Inc.* | | 4,500 | | | 167,760 |
McKesson Corp. | | 5,000 | | | 193,650 |
See Notes to Financial Statements.
112
OPPENHEIMER LARGE CAP CORE FUND
| | |
PORTFOLIO OF INVESTMENTS (Continued) December 31, 2008 | | Sun Capital Advisers Trust |
| | | | | |
| | | Shares | | Value |
| | | | | |
| | | | | |
UnitedHealth Group Inc. | | 2,400 | | $ | 63,840 |
| | | | | |
| | | | | 729,114 |
| | | | | |
HOUSEHOLD PRODUCTS – 2.0% | | | | | |
Colgate-Palmolive Co. | | 1,000 | | | 68,540 |
The Procter & Gamble Co. | | 3,300 | | | 204,006 |
| | | | | |
| | | | | 272,546 |
| | | | | |
INDUSTRIAL CONGLOMERATES – 0.1% |
Textron, Inc. | | 800 | | | 11,096 |
| | | | | |
INSURANCE – 2.9% | | | | | |
Aflac, Inc. | | 600 | | | 27,504 |
Assurant, Inc. | | 1,300 | | | 39,000 |
Prudential Financial, Inc. | | 3,500 | | | 105,910 |
The Chubb Corp. | | 900 | | | 45,900 |
The Principal Financial Group, Inc. | | 2,300 | | | 51,911 |
Torchmark Corp. | | 2,500 | | | 111,750 |
| | | | | |
| | | | | 381,975 |
| | | | | |
IT SERVICES – 0.5% | | | | | |
Automatic Data Processing, Inc. | | 1,800 | | | 70,812 |
| | | | | |
LEISURE EQUIPMENT & PRODUCTS – 0.3% |
Hasbro, Inc. | | 1,500 | | | 43,755 |
| | | | | |
MACHINERY – 1.1% | | | | | |
Dover Corp. | | 4,300 | | | 141,556 |
| | | | | |
MEDIA – 1.4% | | | | | |
Comcast Corp., Class A | | 11,300 | | | 190,744 |
| | | | | |
METALS & MINING – 0.4% | | | | | |
Alcoa, Inc. | | 4,300 | | | 48,418 |
| | | | | |
MULTI-UTILITIES – 1.4% | | | | | |
Dominion Resources, Inc. | | 2,800 | | | 100,352 |
Integrys Energy Group, Inc. | | 2,100 | | | 90,258 |
| | | | | |
| | | | | 190,610 |
| | | | | |
OFFICE ELECTRONICS – 0.6% | | | | | |
Xerox Corp. | | 10,300 | | | 82,091 |
| | | | | |
OIL & GAS-EXPLORATION & PRODUCTION – 13.1% |
Apache Corp. | | 400 | | | 29,812 |
Chesapeake Energy Corp. | | 13,800 | | | 223,146 |
ChevronTexaco Corp. | | 1,900 | | | 140,543 |
ConocoPhillips | | 5,100 | | | 264,180 |
Devon Energy Corp. | | 1,600 | | | 105,136 |
Exxon Mobil Corp. | | 6,400 | | | 510,912 |
Marathon Oil Corp. | | 2,500 | | | 68,400 |
Noble Corp. | | 2,900 | | | 64,061 |
The Williams Cos., Inc. | | 12,800 | | �� | 185,344 |
| | | | | |
| | | Shares | | Value |
| | | | | |
| | | | | |
Valero Energy Corp. | | 7,000 | | $ | 151,480 |
| | | | | |
| | | | | 1,743,014 |
| | | | | |
PHARMACEUTICALS – 7.8% | | | | | |
Abbott Laboratories | | 3,200 | | | 170,784 |
Eli Lilly & Co. | | 2,900 | | | 116,783 |
Express Scripts, Inc.* | | 1,500 | | | 82,470 |
Gilead Sciences, Inc.* | | 700 | | | 35,798 |
Johnson & Johnson | | 5,600 | | | 335,048 |
Pfizer, Inc. | | 15,400 | | | 272,734 |
Wyeth | | 800 | | | 30,008 |
| | | | | |
| | | | | 1,043,625 |
| | | | | |
REAL ESTATE INVESTMENT TRUSTS – 2.4% |
Kimco Realty Corp. | | 8,900 | | | 162,692 |
Simon Property Group, Inc. | | 2,900 | | | 154,077 |
| | | | | |
| | | | | 316,769 |
| | | | | |
ROAD & RAIL – 3.4% | | | | | |
Burlington Northern Santa Fe Corp. | | 500 | | | 37,855 |
CSX Corp. | | 2,600 | | | 84,422 |
Norfolk Southern Corp. | | 3,900 | | | 183,495 |
Union Pacific Corp. | | 3,200 | | | 152,960 |
| | | | | |
| | | | | 458,732 |
| | | | | |
SEMICONDUCTORS & SEMICONDUCTOR EQUIPMENT – 0.5% |
Intel Corp. | | 4,900 | | | 71,834 |
| | | | | |
SOFTWARE – 4.0% | | | | | |
Microsoft Corp. | | 14,500 | | | 281,880 |
Oracle Corp.* | | 2,800 | | | 49,644 |
Salesforce.com, Inc.* | | 1,000 | | | 32,010 |
Symantec Corp.* | | 12,200 | | | 164,944 |
| | | | | |
| | | | | 528,478 |
| | | | | |
SPECIALTY RETAIL – 2.6% | | | | | |
Limited Brands, Inc. | | 16,100 | | | 161,644 |
Staples, Inc. | | 2,500 | | | 44,800 |
The Sherwin-Williams Co. | | 800 | | | 47,800 |
TJX Cos., Inc. | | 4,700 | | | 96,679 |
| | | | | |
| | | | | 350,923 |
| | | | | |
TEXTILES, APPAREL & LUXURY GOODS – 0.2% |
Nike, Inc., Class B | | 400 | | | 20,400 |
| | | | | |
THRIFT & MORTGAGE FINANCE – 0.4% |
Hudson City Bancorp, Inc. | | 3,700 | | | 59,052 |
| | | | | |
TOBACCO – 2.2% | | | | | |
Philip Morris International, Inc. | | 6,000 | | | 261,060 |
See Notes to Financial Statements.
113
OPPENHEIMER LARGE CAP CORE FUND
| | |
PORTFOLIO OF INVESTMENTS (Continued) December 31, 2008 | | Sun Capital Advisers Trust |
| | | | | | |
| | | Shares | | Value | |
| | | | | | |
| | | | | | |
Reynolds American, Inc. | | 800 | | $ | 32,248 | |
| | | | | | |
| | | | | 293,308 | |
| | | | | | |
WIRELESS TELECOMMUNICATION SERVICES – 0.2% | |
Sprint Nextel Corp.* | | 12,300 | | | 22,509 | |
| | | | | | |
Total Common Stocks
(cost $14,459,707) | | | | | 13,004,693 | |
| | | | | | |
SHORT TERM INVESTMENTS – 5.6% | |
MUTUAL FUNDS – 5.6% | | | | | | |
SSgA Treasury Fund
(cost $749,448) | | 749,448 | | | 749,448 | |
| | | | | | |
TOTAL INVESTMENTS – 103.1% | | | | | | |
(cost $15,209,155) | | | | | 13,754,141 | |
Liabilities in excess of other assets – (3.1)% | | | | | (413,504 | ) |
| | | | | | |
NET ASSETS – 100.0% | | | | $ | 13,340,637 | |
| | | | | | |
| * | Non-income producing security |
See Notes to Financial Statements.
114
WMC LARGE CAP GROWTH FUND
| | |
PORTFOLIO OF INVESTMENTS December 31, 2008 | | Sun Capital Advisers Trust |
| | | | | |
| | | Shares | | Value |
| | | | | |
| | | | | |
COMMON STOCKS – 96.5% |
AEROSPACE & DEFENSE – 3.1% |
General Dynamics Corp. | | 7,800 | | $ | 449,202 |
Raytheon Co. | | 19,300 | | | 985,072 |
United Technologies Corp. | | 2,500 | | | 134,000 |
| | | | | |
| | | | | 1,568,274 |
| | | | | |
AUTO COMPONENTS – 0.3% |
Gentex Corp. | | 15,600 | | | 137,748 |
| | | | | |
BIOTECHNOLOGY – 3.6% |
Amgen, Inc.* | | 6,800 | | | 392,700 |
Amylin Pharmaceuticals, Inc.* | | 7,115 | | | 77,198 |
Genentech, Inc.* | | 6,450 | | | 534,769 |
Gilead Sciences, Inc.* | | 9,150 | | | 467,931 |
Life Technologies Corp.* | | 15,000 | | | 349,650 |
| | | | | |
| | | | | 1,822,248 |
| | | | | |
CAPITAL MARKETS – 1.4% |
Invesco, Ltd. | | 14,400 | | | 207,936 |
Morgan Stanley | | 25,200 | | | 404,208 |
The Goldman Sachs Group, Inc. | | 880 | | | 74,263 |
| | | | | |
| | | | | 686,407 |
| | | | | |
CHEMICALS – 2.2% |
FMC Corp. | | 6,550 | | | 292,982 |
Monsanto Co. | | 5,700 | | | 400,995 |
Potash Corp. | | 1,660 | | | 121,545 |
The Mosaic Co. | | 8,800 | | | 304,480 |
| | | | | |
| | | | | 1,120,002 |
| | | | | |
COMMERCIAL BANKS – 1.1% |
Banco Itau Holding Financeira S.A. ADR | | 17,000 | | | 197,200 |
M&T Bank Corp. | | 5,825 | | | 334,413 |
| | | | | |
| | | | | 531,613 |
| | | | | |
COMMERCIAL SERVICES & SUPPLIES – 0.7% |
Visa, Inc., Class A | | 6,900 | | | 361,905 |
| | | | | |
COMMUNICATIONS EQUIPMENT – 6.4% |
Cisco Systems, Inc.* | | 134,700 | | | 2,195,610 |
Emulex Corp.* | | 54,634 | | | 381,345 |
QUALCOMM, Inc. | | 17,500 | | | 627,025 |
| | | | | |
| | | | | 3,203,980 |
| | | | | |
COMPUTERS & PERIPHERALS – 5.0% |
Apple Computer, Inc.* | | 2,450 | | | 209,108 |
International Business Machines Corp. | | 18,000 | | | 1,514,880 |
NetApp, Inc.* | | 55,500 | | | 775,335 |
| | | | | |
| | | | | 2,499,323 |
| | | | | |
| | | | | |
| | | Shares | | Value |
| | | | | |
| | | | | |
CONSTRUCTION & ENGINEERING – 1.8% |
Fluor Corp. | | 13,000 | | $ | 583,310 |
Jacobs Engineering Group, Inc.* | | 6,900 | | | 331,890 |
| | | | | |
| | | | | 915,200 |
| | | | | |
DIVERSIFIED CONSUMER SERVICES – 1.3% |
Apollo Group Inc., Class A* | | 4,800 | | | 367,776 |
ITT Educational Services, Inc.* | | 3,200 | | | 303,936 |
| | | | | |
| | | | | 671,712 |
| | | | | |
DIVERSIFIED FINANCIAL SERVICES – 0.8% |
JPMorgan Chase & Co. | | 4,900 | | | 154,497 |
U.S. Bancorp | | 10,100 | | | 252,601 |
| | | | | |
| | | | | 407,098 |
| | | | | |
DIVERSIFIED TELECOMMUNICATION SERVICES – 0.4% |
Brasil Telecom S.A. ADR | | 10,900 | | | 195,328 |
| | | | | |
ELECTRICAL EQUIPMENT – 2.4% |
ABB Ltd. ADR | | 15,000 | | | 225,150 |
Emerson Electric Co. | | 26,700 | | | 977,487 |
| | | | | |
| | | | | 1,202,637 |
| | | | | |
ENERGY EQUIPMENT & SERVICES – 1.5% |
Diamond Offshore Drilling, Inc. | | 6,041 | | | 356,057 |
Smith International, Inc. | | 16,500 | | | 377,685 |
| | | | | |
| | | | | 733,742 |
| | | | | |
FOOD & STAPLES RETAILING – 2.7% |
Wal-Mart Stores, Inc. | | 24,000 | | | 1,345,440 |
| | | | | |
FOOD PRODUCTS – 2.9% |
Campbell Soup Co. | | 5,450 | | | 163,555 |
Kellogg Co. | | 16,800 | | | 736,680 |
Nestle S.A. ADR | | 13,800 | | | 547,860 |
| | | | | |
| | | | | 1,448,095 |
| | | | | |
HEALTH CARE EQUIPMENT & SUPPLIES – 2.5% |
Intuitive Surgical, Inc.* | | 2,000 | | | 253,980 |
Medtronic, Inc. | | 19,200 | | | 603,264 |
Varian Medical Systems, Inc.* | | 11,200 | | | 392,448 |
| | | | | |
| | | 1,249,692 |
| | | | | |
HOTELS, RESTAURANTS & LEISURE – 0.1% |
Ctrip.com International, Ltd. ADR | | 2,500 | | | 59,500 |
| | | | | |
HOUSEHOLD DURABLES – 0.6% |
NVR, Inc.* | | 615 | | | 280,594 |
| | | | | |
HOUSEHOLD PRODUCTS – 3.0% |
Colgate-Palmolive Co. | | 12,900 | | | 884,166 |
See Notes to Financial Statements.
115
WMC LARGE CAP GROWTH FUND
| | |
PORTFOLIO OF INVESTMENTS (Continued) December 31, 2008 | | Sun Capital Advisers Trust |
| | | | | |
| | | Shares | | Value |
| | | | | |
| | | | | |
Kimberly-Clark Corp. | | 11,900 | | $ | 627,606 |
| | | | | |
| | | | | 1,511,772 |
| | | | | |
INSURANCE – 0.8% |
The Chubb Corp. | | 7,900 | | | 402,900 |
| | | | | |
IT SERVICES – 2.0% |
Accenture, Ltd., Class A | | 15,700 | | | 514,803 |
The Western Union Co. | | 34,600 | | | 496,164 |
| | | | | |
| | | | | 1,010,967 |
| | | | | |
LIFE SCIENCES TOOLS & SERVICES – 0.5% |
PerkinElmer, Inc. | | 18,900 | | | 262,899 |
| | | | | |
MACHINERY – 4.9% |
Caterpillar, Inc. | | 19,900 | | | 888,933 |
Cummins, Inc. | | 17,100 | | | 457,083 |
Dover Corp. | | 18,400 | | | 605,728 |
Joy Global, Inc. | | 21,300 | | | 487,557 |
| | | | | |
| | | | | 2,439,301 |
| | | | | |
MEDIA – 0.4% |
Scripps Networks Interactive, Inc., Class A | | 8,250 | | | 181,500 |
| | | | | |
OIL, GAS & CONSUMABLE FUELS – 7.3% |
Apache Corp. | | 4,100 | | | 305,573 |
Hess Corp. | | 11,430 | | | 613,105 |
Noble Energy, Inc. | | 9,700 | | | 477,434 |
Occidental Petroleum Corp. | | 25,900 | | | 1,553,741 |
Transocean Ltd.* | | 5,700 | | | 269,325 |
XTO Energy, Inc. | | 12,200 | | | 430,294 |
| | | | | |
| | | | | 3,649,472 |
| | | | | |
PERSONAL PRODUCTS – 0.4% |
Herbalife, Ltd. | | 8,400 | | | 182,112 |
| | | | | |
PHARMACEUTICALS – 10.1% | | | | | |
Abbott Laboratories | | 25,600 | | | 1,366,272 |
Astrazeneca PLC ADR | | 12,400 | | | 508,772 |
Eli Lilly & Co. | | 30,400 | | | 1,224,208 |
Johnson & Johnson | | 13,200 | | | 789,756 |
Merck & Co., Inc. | | 28,500 | | | 866,400 |
Wyeth | | 8,400 | | | 315,084 |
| | | | | |
| | | | | 5,070,492 |
| | | | | |
ROAD & RAIL – 0.6% |
Norfolk Southern Corp. | | 5,800 | | | 272,890 |
| | | | | |
SEMICONDUCTORS & SEMICONDUCTOR EQUIPMENT – 5.0% |
Altera Corp. | | 65,800 | | | 1,099,518 |
Analog Devices, Inc. | | 16,500 | | | 313,830 |
QLogic Corp.* | | 44,100 | | | 592,704 |
| | | | | | | |
| | | Shares | | Value | |
| | | | | | | |
Xilinx, Inc. | | | 28,910 | | $ | 515,176 | |
| | | | | | | |
| | | | | | 2,521,228 | |
| | | | | | | |
SOFTWARE – 11.6% | |
Adobe Systems, Inc.* | | | 11,000 | | | 234,190 | |
BMC Software, Inc.* | | | 32,100 | | | 863,811 | |
Giant Interactive Group, Inc. ADR* | | | 39,004 | | | 253,136 | |
Microsoft Corp. | | | 111,300 | | | 2,163,672 | |
Oracle Corp.* | | | 113,400 | | | 2,010,582 | |
Shanda Interactive Entertainment Ltd. ADR* | | | 9,100 | | | 294,476 | |
| | | | | | | |
| | | | | | 5,819,867 | |
| | | | | | | |
SPECIALTY RETAIL – 5.2% | |
Advanced Auto Parts, Inc. | | | 11,400 | | | 383,610 | |
AutoZone, Inc.* | | | 6,400 | | | 892,608 | |
The Gap, Inc. | | | 24,300 | | | 325,377 | |
TJX Cos., Inc. | | | 32,644 | | | 671,487 | |
Urban Outfitters, Inc.* | | | 22,800 | | | 341,544 | |
| | | | | | | |
| | | | | | 2,614,626 | |
| | | | | | | |
TEXTILES, APPAREL & LUXURY GOODS – 0.9% | |
Nike, Inc., Class B | | | 9,100 | | | 464,100 | |
| | | | | | | |
TOBACCO – 3.0% | |
Philip Morris International, Inc. | | | 34,900 | | | 1,518,498 | |
| | | | | | | |
Total Common Stocks
(cost $62,789,311) | | | | | | 48,363,162 | |
| | | | | | | |
| | |
| | | Principal
Amount
(000) | | | |
SHORT TERM INVESTMENTS – 5.3% | |
REPURCHASE AGREEMENT – 5.3% | |
State Street Bank and Trust Company, 0.01%, 1/02/09 (collateralized by $2,530,000 FHLB, 4.375%, 9/17/10, with a value of $2,693,691 total to be received $2,640,405) (cost $2,640,403) | | $ | 2,640 | | | 2,640,403 | |
| | | | | | | |
TOTAL INVESTMENTS – 101.8% | |
(cost $65,429,714) | | | | | | 51,003,565 | |
Liabilities in excess of other assets – (1.8)% | | | | | | (886,685 | ) |
| | | | | | | |
NET ASSETS – 100.0% | | | | | $ | 50,116,880 | |
| | | | | | | |
| * | Non-income producing security |
| | | | |
| ADR | | | | American Depositary Receipt |
| FHLB | | | | Federal Home Loan Bank |
See Notes to Financial Statements.
116
WMC BLUE CHIP MID CAP FUND
| | |
PORTFOLIO OF INVESTMENTS December 31, 2008 | | Sun Capital Advisers Trust |
| | | | | |
| | | Shares | | Value |
| | | | | |
| | | | | |
COMMON STOCKS – 95.3% | | | | | |
AEROSPACE & DEFENSE – 2.1% | | | | | |
Alliant Techsystems, Inc.* | | 12,200 | | $ | 1,046,272 |
Precision Castparts Corp. | | 9,000 | | | 535,320 |
| | | | | |
| | | | | 1,581,592 |
| | | | | |
AIRLINES – 0.3% | | | | | |
Continental Airlines, Inc., Class B* | | 11,600 | | | 209,496 |
| | | | | |
AUTO COMPONENTS – 0.2% | | | | | |
BorgWarner, Inc. | | 7,700 | | | 167,629 |
| | | | | |
BIOTECHNOLOGY – 2.9% | | | | | |
Amylin Pharmaceuticals, Inc.* | | 51,400 | | | 557,690 |
Cephalon, Inc.* | | 4,000 | | | 308,160 |
Onyx Pharmaceuticals, Inc.* | | 10,900 | | | 372,344 |
Regeneron Pharmaceuticals, Inc.* | | 20,000 | | | 367,200 |
Vertex Pharmaceuticals, Inc.* | | 20,900 | | | 634,942 |
| | | | | |
| | | | | 2,240,336 |
| | | | | |
BUILDING PRODUCTS – 1.4% | | | | | |
Lennox International, Inc. | | 33,800 | | | 1,091,402 |
| | | | | |
CAPITAL MARKETS – 1.4% | | | | | |
Blackrock, Inc. | | 2,700 | | | 362,205 |
State Street Corp. | | 18,400 | | | 723,672 |
| | | | | |
| | | | | 1,085,877 |
| | | | | |
CHEMICALS – 0.8% | | | | | |
FMC Corp. | | 13,500 | | | 603,855 |
| | | | | |
COMMERCIAL BANKS – 1.2% | | | | | |
M&T Bank Corp. | | 16,300 | | | 935,783 |
| | | | | |
COMMERCIAL SERVICES & SUPPLIES – 2.7% |
Republic Services, Inc. | | 84,885 | | | 2,104,299 |
| | | | | |
COMPUTERS & PERIPHERALS – 4.3% |
Diebold, Inc. | | 32,500 | | | 912,925 |
NCR Corp.* | | 62,100 | | | 878,094 |
NetApp, Inc.* | | 73,900 | | | 1,032,383 |
Teradata Corp.* | | 32,300 | | | 479,009 |
| | | | | |
| | | | | 3,302,411 |
| | | | | |
CONSUMER FINANCE – 0.2% | | | | | |
SLM Corp.* | | 21,800 | | | 194,020 |
| | | | | |
CONTAINERS & PACKAGING – 2.2% |
Ball Corp. | | 29,200 | | | 1,214,428 |
Sealed Air Corp. | | 32,000 | | | 478,080 |
| | | | | |
| | | | | 1,692,508 |
| | | | | |
DIVERSIFIED CONSUMER SERVICES – 3.7% |
Apollo Group Inc., Class A* | | 6,100 | | | 467,382 |
| | | | | |
| | | Shares | | Value |
| | | | | |
DeVry, Inc. | | 18,200 | | $ | 1,044,862 |
ITT Educational Services, Inc.* | | 11,000 | | | 1,044,780 |
Strayer Education, Inc. | | 1,500 | | | 321,615 |
| | | | | |
| | | | | 2,878,639 |
| | | | | |
ELECTRIC UTILITIES – 3.6% | | | | | |
DPL, Inc. | | 59,000 | | | 1,347,560 |
Northeast Utilities | | 59,000 | | | 1,419,540 |
| | | | | |
| | | | | 2,767,100 |
| | | | | |
ELECTRICAL EQUIPMENT – 1.0% |
Ametek, Inc. | | 26,400 | | | 797,544 |
| | | | | |
ELECTRONIC EQUIPMENT & INSTRUMENTS – 1.0% |
Flir Systems, Inc.* | | 11,400 | | | 349,752 |
Itron, Inc.* | | 6,100 | | | 388,814 |
| | | | | |
| | | | | 738,566 |
| | | | | |
ENERGY EQUIPMENT & SERVICES – 0.8% |
Smith International, Inc. | | 28,100 | | | 643,209 |
| | | | | |
FOOD & STAPLES RETAILING – 1.7% |
BJ’s Wholesale Club, Inc.* | | 9,400 | | | 322,044 |
Kroger Co. | | 7,000 | | | 184,870 |
SUPERVALU, Inc. | | 54,400 | | | 794,240 |
| | | | | |
| | | | | 1,301,154 |
| | | | | |
FOOD PRODUCTS – 0.0% + | | | | | |
Hormel Foods Corp. | | 600 | | | 18,648 |
| | | | | |
GAS UTILITIES – 1.8% | | | | | |
UGI Corp. | | 57,300 | | | 1,399,266 |
| | | | | |
HEALTH CARE EQUIPMENT & SUPPLIES – 3.9% |
Beckman Coulter, Inc. | | 34,100 | | | 1,498,354 |
St. Jude Medical, Inc.* | | 29,300 | | | 965,728 |
Varian Medical Systems, Inc.* | | 14,800 | | | 518,592 |
| | | | | |
| | | | | 2,982,674 |
| | | | | |
HEALTH CARE PROVIDERS & SERVICES – 5.5% |
Community Health Systems, Inc.* | | 63,100 | | | 919,998 |
Humana, Inc.* | | 28,400 | | | 1,058,752 |
Omnicare, Inc. | | 22,800 | | | 632,928 |
Patterson Cos., Inc.* | | 51,800 | | | 971,250 |
Universal Health Services, Inc., Class B | | 18,300 | | | 687,531 |
| | | | | |
| | | | | 4,270,459 |
| | | | | |
HEALTH CARE TECHNOLOGY – 0.4% |
Cerner Corp.* | | 7,900 | | | 303,755 |
| | | | | |
HOTELS, RESTAURANTS & LEISURE – 0.8% |
Scientific Games Corp., Class A* | | 35,200 | | | 617,408 |
| | | | | |
See Notes to Financial Statements.
117
WMC BLUE CHIP MID CAP FUND
| | |
PORTFOLIO OF INVESTMENTS (Continued) December 31, 2008 | | Sun Capital Advisers Trust |
| | | | | |
| | | Shares | | Value |
| | | | | |
| | | | | |
HOUSEHOLD DURABLES – 0.9% | | | | | |
NVR, Inc.* | | 1,500 | | $ | 684,375 |
| | | | | |
HOUSEHOLD PRODUCTS – 1.7% | | | | | |
Clorox Co. | | 23,200 | | | 1,288,992 |
| | | | | |
INSURANCE – 8.6% | | | | | |
Aon Corp. | | 18,300 | | | 835,944 |
Arch Capital Group, Ltd.* | | 5,900 | | | 413,590 |
Axis Capital Holdings, Ltd. | | 9,800 | | | 285,376 |
Everest Re Group, Ltd. | | 12,900 | | | 982,206 |
Fidelity National Financial, Inc., Class A | | 17,800 | | | 315,950 |
First American Corp. | | 6,400 | | | 184,896 |
Marsh & McLennan Cos., Inc. | | 39,500 | | | 958,665 |
PartnerRe, Ltd. | | 2,800 | | | 199,556 |
Unum Group | | 49,100 | | | 913,260 |
W.R. Berkley Corp. | | 37,071 | | | 1,149,201 |
White Mountains Insurance Group Ltd. | | 1,500 | | | 400,665 |
| | | | | |
| | | | | 6,639,309 |
| | | | | |
INTERNET SOFTWARE & SERVICES – 0.7% |
VeriSign, Inc.* | | 28,100 | | | 536,148 |
| | | | | |
IT SERVICES – 3.6% | | | | | |
Global Payments, Inc. | | 34,200 | | | 1,121,418 |
The Western Union Co. | | 116,100 | | | 1,664,874 |
| | | | | |
| | | | | 2,786,292 |
| | | | | |
LEISURE EQUIPMENT & PRODUCTS – 0.7% |
Mattel, Inc. | | 31,700 | | | 507,200 |
| | | | | |
LIFE SCIENCES TOOLS & SERVICES – 2.0% |
Life Technologies Corp.* | | 46,600 | | | 1,086,246 |
Pharmaceutical Product Development, Inc. | | 16,300 | | | 472,863 |
| | | | | |
| | | | | 1,559,109 |
| | | | | |
MACHINERY – 2.3% | | | | | |
Kennametal, Inc. | | 30,500 | | | 676,795 |
PACCAR, Inc. | | 37,300 | | | 1,066,780 |
| | | | | |
| | | | | 1,743,575 |
| | | | | |
MEDIA – 2.3% | | | | | |
Dreamworks Animation Skg, Inc., Class A* | | 52,800 | | | 1,333,728 |
Scripps Networks Interactive, Inc., Class A | | 20,300 | | | 446,600 |
| | | | | |
| | | | | 1,780,328 |
| | | | | |
METALS & MINING – 0.8% | | | | | |
Nucor Corp. | | 13,400 | | | 619,080 |
| | | | | |
| | | | | |
| | | Shares | | Value |
| | | | | |
| | | | | |
OIL, GAS & CONSUMABLE FUELS – 3.1% |
Forest Oil Corp.* | | 28,800 | | $ | 474,912 |
Noble Energy, Inc. | | 19,800 | | | 974,556 |
St. Mary Land & Exploration Co. | | 17,900 | | | 363,549 |
Ultra Petroleum Corp.* | | 16,700 | | | 576,317 |
| | | | | |
| | | | | 2,389,334 |
| | | | | |
PHARMACEUTICALS – 0.9% | | | | | |
Perrigo Co. | | 20,800 | | | 672,048 |
| | | | | |
PROFESSIONAL SERVICES – 4.3% |
Dun & Bradstreet Corp. | | 11,400 | | | 880,080 |
Equifax, Inc. | | 56,100 | | | 1,487,772 |
Manpower, Inc. | | 17,900 | | | 608,421 |
Robert Half International, Inc. | | 17,054 | | | 355,064 |
| | | | | |
| | | | | 3,331,337 |
| | | | | |
REAL ESTATE INVESTMENT TRUSTS – 0.6% |
Kimco Realty Corp. | | 26,300 | | | 480,764 |
| | | | | |
ROAD & RAIL – 2.2% | | | | | |
JB Hunt Transport Services, Inc. | | 28,900 | | | 759,203 |
Kansas City Southern* | | 20,200 | | | 384,810 |
Landstar Systems, Inc. | | 13,800 | | | 530,334 |
| | | | | |
| | | | | 1,674,347 |
| | | | | |
SEMICONDUCTORS & SEMICONDUCTOR EQUIPMENT – 2.6% |
Altera Corp. | | 54,700 | | | 914,037 |
Lam Research Corp.* | | 49,400 | | | 1,051,232 |
| | | | | |
| | | | | 1,965,269 |
| | | | | |
SOFTWARE – 4.9% | | | | | |
BMC Software, Inc.* | | 17,600 | | | 473,616 |
Electronic Arts, Inc.* | | 47,300 | | | 758,692 |
FactSet Research Systems, Inc. | | 17,500 | | | 774,200 |
McAfee, Inc.* | | 14,200 | | | 490,894 |
MICROS Systems, Inc.* | | 27,300 | | | 445,536 |
Red Hat, Inc.* | | 60,400 | | | 798,488 |
| | | | | |
| | | | | 3,741,426 |
| | | | | |
SPECIALTY RETAIL – 8.1% | | | | | |
Advanced Auto Parts, Inc. | | 23,600 | | | 794,140 |
AutoZone, Inc.* | | 6,300 | | | 878,661 |
Best Buy Co., Inc. | | 39,900 | | | 1,121,589 |
Dick’s Sporting Goods, Inc.* | | 21,900 | | | 309,009 |
O’Reilly Automotive, Inc.* | | 44,000 | | | 1,352,560 |
Staples, Inc. | | 34,800 | | | 623,616 |
The Sherwin-Williams Co. | | 12,500 | | | 746,875 |
Tiffany & Co. | | 17,700 | | | 418,251 |
| | | | | |
| | | | | 6,244,701 |
| | | | | |
See Notes to Financial Statements.
118
WMC BLUE CHIP MID CAP FUND
| | |
PORTFOLIO OF INVESTMENTS (Continued) December 31, 2008 | | Sun Capital Advisers Trust |
| | | | | | | |
| | | Shares | | Value | |
| | | | | | | |
| | | | | | | |
WIRELESS TELECOMMUNICATION
SERVICES – 1.1% | |
American Tower Corp. Class A* | | | 27,700 | | $ | 812,165 | |
| | | | | | | |
Total Common Stocks
(cost $90,606,967) | | | | | | 73,383,429 | |
| | | | | | | |
| | | Principal
Amount
(000) | | | |
SHORT TERM INVESTMENTS – 5.4% | |
REPURCHASE AGREEMENT – 5.4% | |
State Street Bank and Trust Company, 0.01%, 1/02/09 (collateralized by $3,985,000 FHLB, 4.375%, 09/17/10, with a value of $4,242,830 total to be received $4,159,049)
(cost $4,159,046) | | $ | 4,159 | | | 4,159,046 | |
| | | | | | | |
TOTAL INVESTMENTS – 100.7% | |
(cost $94,766,013) | | | | | | 77,542,475 | |
Liabilities in excess of other assets – (0.7)% | | | | | | (563,337 | ) |
| | | | | | | |
NET ASSETS – 100.0% | | | | | $ | 76,979,138 | |
| | | | | | | |
| * | Non-income producing security |
| + | Amount is less than 0.05%. |
| FHLB | Federal Home Loan Bank |
See Notes to Financial Statements.
119
LORD ABBETT GROWTH & INCOME FUND
| | |
PORTFOLIO OF INVESTMENTS December 31, 2008 | | Sun Capital Advisers Trust |
| | | | | |
| | | Shares | | Value |
| | | | | |
| | | | | |
COMMON STOCKS – 93.4% | | | | | |
AIR FREIGHT & LOGISTICS – 0.1% |
FedEx Corp. | | 60 | | $ | 3,849 |
| | | | | |
AIRLINES – 3.5% | | | | | |
Delta Air Lines, Inc.* | | 14,980 | | | 171,671 |
| | | | | |
BEVERAGES – 2.3% | | | | | |
Coca-Cola Enterprises, Inc. | | 9,190 | | | 110,556 |
| | | | | |
BIOTECHNOLOGY – 2.1% | | | | | |
Amgen, Inc.* | | 1,470 | | | 84,892 |
Genzyme Corp.* | | 280 | | | 18,584 |
| | | | | |
| | | | | 103,476 |
| | | | | |
BUILDING PRODUCTS – 0.4% |
Masco Corp. | | 1,830 | | | 20,368 |
| | | | | |
CAPITAL MARKETS – 15.5% |
Bank of New York Mellon Corp. | | 8,180 | | | 231,740 |
Franklin Resources, Inc. | | 1,330 | | | 84,827 |
Legg Mason, Inc. | | 500 | | | 10,955 |
Merrill Lynch & Co., Inc. | | 14,490 | | | 168,664 |
T Rowe Price Group, Inc. | | 2,630 | | | 93,207 |
The Charles Schwab Corp. | | 2,280 | | | 36,868 |
The Goldman Sachs Group, Inc. | | 1,460 | | | 123,209 |
| | | | | |
| | | | | 749,470 |
| | | | | |
CHEMICALS – 0.6% |
PPG Industries, Inc. | | 700 | | | 29,701 |
| | | | | |
COMMERCIAL BANKS – 9.9% |
BB&T Corp. | | 1,470 | | | 40,366 |
Fifth Third Bancorp | | 4,170 | | | 34,444 |
M&T Bank Corp. | | 1,050 | | | 60,281 |
Marshall & Ilsley Corp. | | 840 | | | 11,458 |
PNC Financial Services Group, Inc. | | 1,640 | | | 80,360 |
Suntrust Banks, Inc. | | 670 | | | 19,792 |
Wells Fargo & Co. | | 7,880 | | | 232,302 |
| | | | | |
| | | | | 479,003 |
| | | | | |
COMMERCIAL SERVICES & SUPPLIES – 0.9% |
Ticketmaster* | | 724 | | | 4,648 |
Waste Management, Inc. | | 1,180 | | | 39,105 |
| | | | | |
| | | | | 43,753 |
| | | | | |
COMPUTERS & PERIPHERALS – 0.8% |
Hewlett-Packard Co. | | 1,040 | | | 37,742 |
| | | | | |
CONSUMER FINANCE – 1.6% |
Capital One Financial Corp. | | 2,480 | | | 79,087 |
| | | | | |
DIVERSIFIED FINANCIAL SERVICES – 4.6% |
JPMorgan Chase & Co. | | 7,150 | | | 225,439 |
| | | | | |
| | | | | |
| | | Shares | | Value |
| | | | | |
DIVERSIFIED TELECOMMUNICATION SERVICES – 1.5% |
AT&T, Inc. | | 2,470 | | $ | 70,395 |
| | | | | |
ENERGY EQUIPMENT & SERVICES – 2.3% |
Halliburton Co. | | 1,770 | | | 32,179 |
Schlumberger, Ltd. | | 1,920 | | | 81,273 |
| | | | | |
| | | | | 113,452 |
| | | | | |
FOOD & STAPLES RETAILING – 3.1% |
Kroger Co. | | 2,330 | | | 61,535 |
Wal-Mart Stores, Inc. | | 1,570 | | | 88,014 |
| | | | | |
| | | | | 149,549 |
| | | | | |
FOOD PRODUCTS – 1.9% | | | | | |
General Mills, Inc. | | 150 | | | 9,113 |
Kraft Foods, Inc., Class A | | 3,090 | | | 82,966 |
| | | | | |
| | | | | 92,079 |
| | | | | |
HEALTH CARE EQUIPMENT & SUPPLIES – 2.8% |
Boston Scientific Corp.* | | 13,150 | | | 101,781 |
Covidien, Ltd. | | 940 | | | 34,066 |
| | | | | |
| | | | | 135,847 |
| | | | | |
HEALTH CARE PROVIDERS & SERVICES – 0.2% |
Humana, Inc.* | | 160 | | | 5,965 |
UnitedHealth Group Inc. | | 120 | | | 3,192 |
| | | | | |
| | | | | 9,157 |
| | | | | |
HOTELS, RESTAURANTS & LEISURE – 1.1% |
Carnival Corp. | | 2,050 | | | 49,856 |
Marriott International, Inc., Class A | | 60 | | | 1,167 |
| | | | | |
| | | | | 51,023 |
| | | | | |
HOUSEHOLD PRODUCTS – 0.1% |
Colgate-Palmolive Co. | | 40 | | | 2,742 |
| | | | | |
INDUSTRIAL CONGLOMERATES – 3.1% |
General Electric Co. | | 9,170 | | | 148,554 |
| | | | | |
INSURANCE – 2.8% | | | | | |
ACE, Ltd. | | 490 | | | 25,931 |
Aon Corp. | | 1,840 | | | 84,051 |
MetLife, Inc. | | 750 | | | 26,145 |
| | | | | |
| | | | | 136,127 |
| | | | | |
INTERNET & CATALOG RETAIL – 1.6% |
HSN, Inc.* | | 1,854 | | | 13,479 |
IAC/InterActiveCorp.* | | 4,110 | | | 64,650 |
| | | | | |
| | | | | 78,129 |
| | | | | |
IT SERVICES – 0.7% | | | | | |
The Western Union Co. | | 2,460 | | | 35,276 |
| | | | | |
See Notes to Financial Statements.
120
LORD ABBETT GROWTH & INCOME FUND
| | |
PORTFOLIO OF INVESTMENTS (Continued) December 31, 2008 | | Sun Capital Advisers Trust |
| | | | | |
| | | Shares | | Value |
| | | | | |
| | | | | |
MACHINERY – 1.5% | | | | | |
Eaton Corp. | | 1,440 | | $ | 71,582 |
| | | | | |
MEDIA – 1.0% | | | | | |
Comcast Corp., Class A | | 1,380 | | | 23,294 |
Time Warner, Inc. | | 2,380 | | | 23,943 |
| | | | | |
| | | | | 47,237 |
| | | | | |
METALS & MINING – 0.6% | | | | | |
Freeport-McMoRan Copper & Gold, Inc. | | 1,190 | | | 29,084 |
| | | | | |
MULTI-LINE RETAIL – 7.4% | | | | | |
Archer-Daniels-Midland Co. | | 4,560 | | | 131,465 |
JC Penney Co., Inc. | | 930 | | | 18,321 |
Kohl’s Corp.* | | 2,790 | | | 100,998 |
Target Corp. | | 3,170 | | | 109,460 |
| | | | | |
| | | | | 360,244 |
| | | | | |
OIL & GAS-EXPLORATION & PRODUCTION – 5.1% |
Chevron Corp. | | 940 | | | 69,532 |
El Paso Corp. | | 1,510 | | | 11,823 |
Exxon Mobil Corp. | | 1,580 | | | 126,131 |
Occidental Petroleum Corp. | | 430 | | | 25,796 |
XTO Energy, Inc. | | 450 | | | 15,872 |
| | | | | |
| | | | | 249,154 |
| | | | | |
PHARMACEUTICALS – 4.4% | | | | | |
Abbott Laboratories | | 1,630 | | | 86,993 |
Pfizer, Inc. | | 2,410 | | | 42,681 |
Teva Pharmaceutical Industries, Ltd. ADR | | 1,980 | | | 84,289 |
| | | | | |
| | | | | 213,963 |
| | | | | |
| | | | | | |
| | | Shares | | Value | |
| | | | | | |
REAL ESTATE INVESTMENT TRUSTS – 1.4% | |
Annaly Capital Management, Inc. | | 4,300 | | $ | 68,241 | |
| | | | | | |
ROAD & RAIL – 1.2% | | | | | | |
Hertz Global Holdings, Inc.* | | 11,820 | | | 59,927 | |
| | | | | | |
SEMICONDUCTORS & SEMICONDUCTOR EQUIPMENT – 0.3% | |
Intel Corp. | | 1,000 | | | 14,660 | |
| | | | | | |
SOFTWARE – 2.7% | | | | | | |
Adobe Systems, Inc.* | | 850 | | | 18,096 | |
Microsoft Corp. | | 1,930 | | | 37,519 | |
Oracle Corp.* | | 4,220 | | | 74,821 | |
| | | | | | |
| | | | | 130,436 | |
| | | | | | |
SPECIALTY RETAIL – 4.3% | | | | | | |
Best Buy Co., Inc. | | 2,360 | | | 66,340 | |
J. Crew Group, Inc.* | | 1,500 | | | 18,300 | |
The Home Depot, Inc. | | 5,280 | | | 121,545 | |
| | | | | | |
| | | | | 206,185 | |
| | | | | | |
Total Common Stocks
(cost $5,173,375) | | | | | 4,527,158 | |
| | | | | | |
SHORT TERM INVESTMENTS – 8.7% | |
MUTUAL FUNDS – 8.7% | | | | | | |
SSgA Money Market Fund
(cost $423,394) | | 423,394 | | | 423,394 | |
| | | | | | |
TOTAL INVESTMENTS – 102.1% | | | | | | |
(cost $5,596,769) | | | | | 4,950,552 | |
Liabilities in excess of other assets – (2.1)% | | | | | (101,032 | ) |
| | | | | | |
NET ASSETS – 100.0% | | | | $ | 4,849,520 | |
| | | | | | |
| * | Non-income producing security |
| ADR | American Depositary Receipt |
See Notes to Financial Statements.
121
GOLDMAN SACHS MID CAP VALUE FUND
| | |
PORTFOLIO OF INVESTMENTS December 31, 2008 | | Sun Capital Advisers Trust |
| | | | | |
| | | Shares | | Value |
| | | | | |
| | | | | |
COMMON STOCKS – 93.3% |
AEROSPACE & DEFENSE – 0.1% |
BE Aerospace, Inc.* | | 1,110 | | $ | 8,536 |
| | | | | |
AIR FREIGHT & LOGISTICS – 0.4% |
Expeditors International of Washington, Inc. | | 684 | | | 22,756 |
UTI Worldwide, Inc. | | 1,152 | | | 16,520 |
| | | | | |
| | | | | 39,276 |
| | | | | |
AIRLINES – 0.9% |
AMR Corp.* | | 839 | | | 8,952 |
Continental Airlines, Inc., Class B* | | 476 | | | 8,596 |
Delta Air Lines, Inc.* | | 2,071 | | | 23,734 |
Southwest Airlines Co. | | 6,187 | | | 53,332 |
| | | | | |
| | | | | 94,614 |
| | | | | |
AUTO COMPONENTS – 0.5% |
Autoliv, Inc. | | 914 | | | 19,614 |
BorgWarner, Inc. | | 379 | | | 8,251 |
Johnson Controls, Inc. | | 1,385 | | | 25,152 |
The Goodyear Tire & Rubber Co.* | | 688 | | | 4,107 |
| | | | | |
| | | | | 57,124 |
| | | | | |
AUTOMOBILES – 0.3% |
Ford Motor Co.* | | 12,096 | | | 27,700 |
Thor Industries, Inc. | | 625 | | | 8,237 |
| | | | | |
| | | | | 35,937 |
| | | | | |
BEVERAGES – 1.5% |
Brown-Forman Corp., Class B | | 124 | | | 6,385 |
Coca-Cola Enterprises, Inc. | | 3,468 | | | 41,720 |
Constellation Brands, Inc., Class A* | | 846 | | | 13,341 |
Dr Pepper Snapple Group, Inc.* | | 2,801 | | | 45,516 |
Hansen Natural Corp.* | | 312 | | | 10,461 |
Molson Coors Brewing Co., Class B | | 254 | | | 12,426 |
Pepsi Bottling Group, Inc. | | 772 | | | 17,378 |
PepsiAmericas, Inc. | | 667 | | | 13,580 |
| | | | | |
| | | | | 160,807 |
| | | | | |
BIOTECHNOLOGY – 0.0% + |
Facet Biotech Corp.* | | 183 | | | 1,757 |
| | | | | |
BUILDING PRODUCTS – 0.5% |
Armstrong World Industries, Inc. | | 1,008 | | | 21,793 |
Masco Corp. | | 1,318 | | | 14,669 |
NVR, Inc.* | | 32 | | | 14,600 |
Owens Corning, Inc.* | | 502 | | | 8,685 |
| | | | | |
| | | | | 59,747 |
| | | | | |
| | | | | |
| | | Shares | | Value |
| | | | | |
| | | | | |
CAPITAL MARKETS – 2.4% |
American Capital, Ltd. | | 1,158 | | $ | 3,752 |
Ameriprise Financial, Inc. | | 2,344 | | | 54,756 |
Bank of New York Mellon Corp. | | 426 | | | 12,068 |
Blackrock, Inc. | | 35 | | | 4,695 |
Eaton Vance Corp. | | 562 | | | 11,808 |
Federated Investors, Inc., Class B | | 549 | | | 9,311 |
Invesco, Ltd. | | 1,815 | | | 26,209 |
Investment Technology Group, Inc.* | | 458 | | | 10,406 |
Janus Capital Group, Inc. | | 795 | | | 6,384 |
Northern Trust Corp. | | 453 | | | 23,619 |
Raymond James Financial, Inc. | | 1,258 | | | 21,549 |
SEI Investments Co. | | 2,949 | | | 46,329 |
T Rowe Price Group, Inc. | | 632 | | | 22,398 |
The Charles Schwab Corp. | | 270 | | | 4,366 |
| | | | | |
| | | | | 257,650 |
| | | | | |
CHEMICALS – 1.6% |
Airgas, Inc. | | 129 | | | 5,030 |
Cytec Industries, Inc. | | 1,178 | | | 24,997 |
Eastman Chemical Co. | | 341 | | | 10,813 |
FMC Corp. | | 660 | | | 29,522 |
Huntsman Corp. | | 2,475 | | | 8,514 |
Lubrizol Corp. | | 628 | | | 22,853 |
Monsanto Co. | | 389 | | | 27,366 |
PPG Industries, Inc. | | 285 | | | 12,093 |
Rohm & Haas Co. | | 139 | | | 8,589 |
RPM International, Inc. | | 1,021 | | | 13,569 |
Valspar Corp. | | 470 | | | 8,502 |
| | | | | |
| | | | | 171,848 |
| | | | | |
COMMERCIAL BANKS – 5.3% |
Associated Banc-Corp. | | 545 | | | 11,407 |
BancorpSouth, Inc. | | 1,684 | | | 39,338 |
Bank Hawaii Corp. | | 593 | | | 26,786 |
BOK Financial Corp. | | 223 | | | 9,009 |
City National Corp. | | 179 | | | 8,717 |
Comerica, Inc. | | 1,380 | | | 27,393 |
Commerce Bancshares, Inc. | | 254 | | | 11,163 |
Cullen/Frost Bankers, Inc. | | 454 | | | 23,009 |
Fifth Third Bancorp | | 4,686 | | | 38,706 |
First Horizon National Corp. | | 500 | | | 5,285 |
Fulton Financial Corp. | | 1,244 | | | 11,967 |
Huntington Bancshares, Inc. | | 4,145 | | | 31,751 |
Keycorp | | 1,538 | | | 13,104 |
M&T Bank Corp. | | 473 | | | 27,155 |
Marshall & Ilsley Corp. | | 3,362 | | | 45,858 |
National City Corp. | | 6,481 | | | 11,731 |
Regions Financial Corp. | | 8,863 | | | 70,549 |
Suntrust Banks, Inc. | | 274 | | | 8,094 |
See Notes to Financial Statements.
122
GOLDMAN SACHS MID CAP VALUE FUND
| | |
PORTFOLIO OF INVESTMENTS (Continued) December 31, 2008 | | Sun Capital Advisers Trust |
| | | | | |
| | | Shares | | Value |
| | | | | |
| | | | | |
Synovus Financial Corp. | | 7,206 | | $ | 59,810 |
Whitney Holding Corp. | | 1,736 | | | 27,759 |
Wilmington Trust Corp. | | 1,552 | | | 34,516 |
Zions Bancorporation | | 1,460 | | | 35,785 |
| | | | | |
| | | | | 578,892 |
| | | | | |
COMMERCIAL SERVICES & SUPPLIES – 1.4% |
Cintas Corp. | | 665 | | | 15,448 |
Convergys Corp.* | | 1,821 | | | 11,673 |
Manpower, Inc. | | 1,660 | | | 56,423 |
Republic Services, Inc. | | 688 | | | 17,055 |
Robert Half International, Inc. | | 509 | | | 10,597 |
RR Donnelley & Sons Co. | | 2,232 | | | 30,311 |
Steelcase, Inc., Class A | | 2,437 | | | 13,696 |
| | | | | |
| | | | | 155,203 |
| | | | | |
COMMUNICATIONS EQUIPMENT – 0.2% |
Tellabs, Inc.* | | 4,542 | | | 18,713 |
| | | | | |
COMPUTERS & PERIPHERALS – 1.1% |
Brocade Communications Systems, Inc.* | | 3,642 | | | 10,198 |
Lexmark International, Inc., Class A* | | 631 | | | 16,974 |
NetApp, Inc.* | | 559 | | | 7,809 |
QLogic Corp.* | | 626 | | | 8,413 |
SanDisk Corp.* | | 1,143 | | | 10,973 |
Seagate Technology | | 4,232 | | | 18,748 |
Sun Microsystems, Inc.* | | 7,446 | | | 28,444 |
Teradata Corp.* | | 1,081 | | | 16,031 |
| | | | | |
| | | | | 117,590 |
| | | | | |
CONSTRUCTION & ENGINEERING – 0.1% |
Foster Wheeler, Ltd.* | | 248 | | | 5,798 |
URS Corp.* | | 239 | | | 9,744 |
| | | | | |
| | | | | 15,542 |
| | | | | |
CONSTRUCTION MATERIALS – 0.3% |
Vulcan Materials Co. | | 493 | | | 34,303 |
| | | | | |
CONSUMER FINANCE – 0.6% |
AmeriCredit Corp.* | | 1,272 | | | 9,718 |
Capital One Financial Corp. | | 406 | | | 12,947 |
Discover Financial Services | | 4,824 | | | 45,973 |
| | | | | |
| | | | | 68,638 |
| | | | | |
CONTAINERS & PACKAGING – 2.0% |
AptarGroup, Inc. | | 1,150 | | | 40,526 |
Ball Corp. | | 704 | | | 29,279 |
Bemis Co. | | 1,126 | | | 26,664 |
Owens- Ilinois, Inc.* | | 686 | | | 18,748 |
Pactiv Corp.* | | 832 | | | 20,700 |
| | | | | |
| | | Shares | | Value |
| | | | | |
| | | | | |
Sealed Air Corp. | | 1,684 | | $ | 25,159 |
Sonoco Products Co. | | 2,271 | | | 52,596 |
Temple-Inland, Inc. | | 2,138 | | | 10,263 |
| | | | | |
| | | | | 223,935 |
| | | | | |
DISTRIBUTORS – 0.6% |
Genuine Parts Co. | | 1,672 | | | 63,302 |
| | | | | |
DIVERSIFIED CONSUMER SERVICES – 0.1% |
Career Education Corp.* | | 827 | | | 14,836 |
| | | | | |
DIVERSIFIED FINANCIAL SERVICES – 1.5% |
Bank of America Corp. | | 353 | | | 4,970 |
CME Group, Inc. | | 169 | | | 35,170 |
Lender Processing Services, Inc. | | 411 | | | 12,104 |
Leucadia National Corp. | | 1,305 | | | 25,839 |
Moody’s Corp. | | 3,122 | | | 62,721 |
Nasdaq Stock Market, Inc.* | | 301 | | | 7,438 |
NYSE Euronext | | 389 | | | 10,651 |
| | | | | |
| | | | | 158,893 |
| | | | | |
DIVERSIFIED TELECOMMUNICATION
SERVICES – 1.3% |
AT&T, Inc. | | 210 | | | 5,985 |
CenturyTel, Inc. | | 1,475 | | | 40,312 |
Embarq Corp. | | 700 | | | 25,172 |
Frontier Communications Corp. | | 2,579 | | | 22,541 |
Qwest Communications International, Inc. | | 6,560 | | | 23,878 |
Windstream Corp. | | 2,312 | | | 21,270 |
| | | | | |
| | | | | 139,158 |
| | | | | |
ELECTRIC UTILITIES – 4.3% |
American Electric Power Co., Inc. | | 3,047 | | | 101,404 |
DPL, Inc. | | 979 | | | 22,361 |
Edison International | | 3,968 | | | 127,452 |
Exelon Corp. | | 77 | | | 4,282 |
Hawaiian Electric Industries, Inc. | | 793 | | | 17,557 |
Northeast Utilities | | 1,134 | | | 27,284 |
NV Energy, Inc. | | 2,438 | | | 24,112 |
Pepco Holdings, Inc. | | 949 | | | 16,854 |
Pinnacle West Capital Corp. | | 1,515 | | | 48,677 |
Progress Energy, Inc. | | 1,413 | | | 56,308 |
Reliant Energy, Inc.* | | 3,951 | | | 22,837 |
| | | | | |
| | | | | 469,128 |
| | | | | |
ELECTRICAL EQUIPMENT – 0.7% |
Cooper Industries, Ltd., Class A | | 969 | | | 28,324 |
Emerson Electric Co. | | 748 | | | 27,384 |
LSI Corp.* | | 2,789 | | | 9,176 |
Thomas & Betts Corp.* | | 295 | | | 7,086 |
| | | | | |
| | | | | 71,970 |
| | | | | |
See Notes to Financial Statements.
123
GOLDMAN SACHS MID CAP VALUE FUND
| | |
PORTFOLIO OF INVESTMENTS (Continued) December 31, 2008 | | Sun Capital Advisers Trust |
| | | | | |
| | | Shares | | Value |
| | | | | |
| | | | | |
ELECTRONIC EQUIPMENT
& INSTRUMENTS – 1.0% |
Arrow Electronics, Inc.* | | 645 | | $ | 12,152 |
Ingram Micro, Inc., Class A* | | 3,831 | | | 51,297 |
Jabil Circuit, Inc. | | 489 | | | 3,301 |
Tech Data Corp.* | | 1,836 | | | 32,754 |
Vishay Intertechnology, Inc.* | | 2,955 | | | 10,106 |
| | | | | |
| | | | | 109,610 |
| | | | | |
ENERGY EQUIPMENT & SERVICES – 1.2% |
BJ Services Co. | | 1,546 | | | 18,042 |
Exterran Holdings, Inc.* | | 1,237 | | | 26,348 |
Halliburton Co. | | 261 | | | 4,745 |
Helmerich & Payne, Inc. | | 418 | | | 9,509 |
Nabors Industries, Ltd.* | | 1,504 | | | 18,003 |
Oil States International, Inc.* | | 262 | | | 4,897 |
SEACOR Holdings, Inc. (1)* | | 414 | | | 27,593 |
Tidewater, Inc. | | 222 | | | 8,940 |
Transocean Ltd.* | | 178 | | | 8,411 |
| | | | | |
| | | 126,488 |
| | | | | |
EXCHANGE TRADED FUNDS – 0.4% |
Ishares Russell 2000 Index Fund | | 565 | | | 27,838 |
S&P 500 SPDR Trust Series 1 | | 118 | | | 10,648 |
| | | | | |
| | | | | 38,486 |
| | | | | |
FOOD & STAPLES RETAILING – 1.6% |
BJ’s Wholesale Club, Inc.* | | 1,107 | | | 37,926 |
Safeway, Inc. | | 4,276 | | | 101,640 |
SUPERVALU, Inc. | | 2,536 | | | 37,026 |
| | | | | |
| | | | | 176,592 |
| | | | | |
FOOD PRODUCTS – 3.8% |
Bunge, Ltd. | | 1,786 | | | 92,461 |
Campbell Soup Co. | | 1,431 | | | 42,944 |
ConAgra Foods, Inc. | | 1,921 | | | 31,696 |
Corn Products International, Inc. | | 1,244 | | | 35,889 |
Dean Foods Co.* | | 382 | | | 6,865 |
Del Monte Foods Co. | | 3,985 | | | 28,453 |
H.J. Heinz Co. | | 701 | | | 26,358 |
Hormel Foods Corp. | | 1,008 | | | 31,329 |
Sara Lee Corp. | | 1,106 | | | 10,828 |
Smithfield Foods, Inc.* | | 1,452 | | | 20,430 |
The Hershey Co. | | 1,007 | | | 34,983 |
The J. M. Smucker Co. | | 479 | | | 20,769 |
Tyson Foods, Inc., Class A | | 3,353 | | | 29,372 |
| | | | | |
| | | | | 412,377 |
| | | | | |
GAS UTILITIES – 1.1% | | | | | |
Atmos Energy Corp. | | 1,274 | | | 30,194 |
Energen Corp. | | 1,401 | | | 41,091 |
Oneok, Inc. | | 347 | | | 10,105 |
| | | | | |
| | | Shares | | Value |
| | | | | |
| | | | | |
Questar Corp. | | 481 | | $ | 15,724 |
UGI Corp. | | 1,000 | | | 24,420 |
| | | | | |
| | | | | 121,534 |
| | | | | |
HEALTH CARE EQUIPMENT & SUPPLIES – 0.6% |
Advanced Medical Optics, Inc.* | | 867 | | | 5,731 |
Beckman Coulter, Inc. | | 82 | | | 3,603 |
Hill-Rom Holdings, Inc. | | 835 | | | 13,744 |
Hologic, Inc.* | | 1,808 | | | 23,631 |
Hospira, Inc.* | | 450 | | | 12,069 |
The Cooper Cos., Inc. | | 353 | | | 5,789 |
| | | | | |
| | | | | 64,567 |
| | | | | |
HEALTH CARE PROVIDERS & SERVICES – 1.7% |
AmerisourceBergen Corp. | | 742 | | | 26,460 |
Brookdale Senior Living, Inc. | | 1,212 | | | 6,763 |
CIGNA Corp. | | 1,159 | | | 19,529 |
Community Health Systems, Inc.* | | 995 | | | 14,507 |
Coventry Health Care, Inc.* | | 780 | | | 11,606 |
Health Net, Inc.* | | 1,812 | | | 19,733 |
Humana, Inc.* | | 380 | | | 14,166 |
LifePoint Hospitals, Inc.* | | 456 | | | 10,415 |
McKesson Corp. | | 87 | | | 3,370 |
Medco Health Solutions, Inc.* | | 205 | | | 8,592 |
Omnicare, Inc. | | 599 | | | 16,628 |
Universal Health Services, Inc., Class B | | 885 | | | 33,249 |
| | | | | |
| | | | | 185,018 |
| | | | | |
HEALTH CARE TECHNOLOGY – 0.6% |
Hlth Corp.* | | 5,986 | | | 62,614 |
| | | | | |
HOTELS, RESTAURANTS & LEISURE – 1.5% |
Chipotle Mexican Grill, Inc., Class A* | | 109 | | | 6,756 |
Interval Leisure Group, Inc.* | | 1,286 | | | 6,932 |
McDonald’s Corp. (1) | | 858 | | | 53,359 |
Panera Bread Co., Class A* | | 536 | | | 28,001 |
Royal Caribbean Cruises, Ltd. | | 1,270 | | | 17,462 |
Wyndham Worldwide Corp. | | 915 | | | 5,993 |
Yum! Brands, Inc. | | 1,561 | | | 49,171 |
| | | | | |
| | | | | 167,674 |
| | | | | |
HOUSEHOLD DURABLES – 3.2% |
Black & Decker Corp. | | 477 | | | 19,943 |
Centex Corp. | | 2,488 | | | 26,472 |
D.R.Horton, Inc. | | 1,377 | | | 9,735 |
Fortune Brands, Inc. | | 2,219 | | | 91,600 |
Harman International Industries, Inc. | | 1,398 | | | 23,389 |
Jarden Corp.* | | 1,256 | | | 14,444 |
Leggett & Platt, Inc. | | 2,278 | | | 34,603 |
See Notes to Financial Statements.
124
GOLDMAN SACHS MID CAP VALUE FUND
| | |
PORTFOLIO OF INVESTMENTS (Continued) December 31, 2008 | | Sun Capital Advisers Trust |
| | | | | |
| | | Shares | | Value |
| | | | | |
| | | | | |
Mohawk Industries, Inc.* | | 516 | | $ | 22,173 |
Newell Rubbermaid, Inc. | | 726 | | | 7,100 |
Pulte Homes, Inc. | | 799 | | | 8,733 |
Snap-On, Inc. | | 187 | | | 7,364 |
The Stanley Works, Inc. | | 405 | | | 13,811 |
Toll Brothers, Inc.* | | 1,831 | | | 39,238 |
Whirlpool Corp. (1) | | 890 | | | 36,802 |
| | | | | |
| | | | | 355,407 |
| | | | | |
HOUSEHOLD PRODUCTS – 0.1% |
Clorox Co. | | 185 | | | 10,279 |
| | | | | |
INDEPENDENT POWER PRODUCERS & ENERGY TRADERS – 0.9% |
Dynegy, Inc., Class A* | | 9,399 | | | 18,798 |
Mirant Corp.* | | 1,269 | | | 23,946 |
NRG Energy, Inc.* | | 2,475 | | | 57,742 |
| | | | | |
| | | | | 100,486 |
| | | | | |
INDUSTRIAL CONGLOMERATES – 0.1% |
Teleflex, Inc. | | 213 | | | 10,671 |
| | | | | |
INSURANCE – 10.6% | | | | | |
Aflac, Inc. | | 1,043 | | | 47,811 |
Alleghany Corp.* | | 74 | | | 20,868 |
American Financial Group, Inc. | | 695 | | | 15,902 |
Aon Corp. | | 1,335 | | | 60,983 |
Arch Capital Group, Ltd. (1)* | | 968 | | | 67,857 |
Assurant, Inc. | | 396 | | | 11,880 |
Axis Capital Holdings, Ltd. | | 1,100 | | | 32,032 |
Brown & Brown, Inc. | | 1,968 | | | 41,131 |
Cincinnati Financial Corp. | | 1,613 | | | 46,890 |
CNA Financial Corp. | | 1,013 | | | 16,654 |
Conseco, Inc.* | | 1,463 | | | 7,578 |
Endurance Specialty Holdings, Ltd. | | 1,061 | | | 32,392 |
Everest Re Group, Ltd. | | 269 | | | 20,482 |
Fidelity National Financial, Inc., Class A | | 1,708 | | | 30,317 |
First American Corp. | | 1,097 | | | 31,692 |
Genworth Financial, Inc., Class A | | 1,863 | | | 5,272 |
HCC Insurance Holdings, Inc. | | 1,308 | | | 34,989 |
Lincoln National Corp. | | 2,447 | | | 46,102 |
Markel Corp.* | | 31 | | | 9,269 |
Marsh & McLennan Cos., Inc. | | 891 | | | 21,625 |
MBIA, Inc.* | | 2,003 | | | 8,152 |
Mercury General Corp. | | 813 | | | 37,390 |
Nationwide Financial Services | | 582 | | | 30,386 |
Old Republic International Corp. | | 4,226 | | | 50,374 |
OneBeacon Insurance Group, Ltd. | | 1,083 | | | 11,307 |
PartnerRe, Ltd. | | 471 | | | 33,568 |
Protective Life Corp. | | 943 | | | 13,532 |
Prudential Financial, Inc. | | 285 | | | 8,624 |
| | | | | |
| | | Shares | | Value |
| | | | | |
| | | | | |
Reinsurance Group of America, Inc. | | 609 | | $ | 26,077 |
RenaissanceRe Holdings, Ltd. | | 152 | | | 7,837 |
StanCorp Financial Group, Inc. | | 290 | | | 12,113 |
The Hanover Insurance Group, Inc. | | 732 | | | 31,454 |
The Principal Financial Group, Inc. | | 1,714 | | | 38,685 |
The Progressive Corp. (1) | | 7,241 | | | 107,239 |
Unitrin, Inc. | | 1,455 | | | 23,193 |
Unum Group (1) | | 4,092 | | | 76,111 |
W.R. Berkley Corp. | | 1,311 | | | 40,641 |
Xl Capital, Ltd., Class A | | 1,707 | | | 6,316 |
| | | | | |
| | | | | 1,164,725 |
| | | | | |
INTERNET & CATALOG RETAIL – 0.2% |
Expedia, Inc.* | | 1,444 | | | 11,899 |
HSN, Inc.* | | 983 | | | 7,146 |
| | | | | |
| | | | | 19,045 |
| | | | | |
INTERNET SOFTWARE & SERVICES – 0.2% |
Sohu.com, Inc.* | | 269 | | | 12,734 |
VeriSign, Inc.* | | 425 | | | 8,109 |
| | | | | |
| | | | | 20,843 |
| | | | | |
IT SERVICES – 1.1% | | | | | |
Accenture, Ltd., Class A | | 1,331 | | | 43,644 |
Affiliated Computer Services, Inc., Class A* | | 100 | | | 4,595 |
Computer Sciences Corp.* | | 1,122 | | | 39,427 |
Fidelity National Information Services, Inc. | | 1,864 | | | 30,327 |
Genpact, Ltd.* | | 611 | | | 5,022 |
| | | | | |
| | | | | 123,015 |
| | | | | |
LEISURE EQUIPMENT & PRODUCTS – 0.0% + |
Eastman Kodak Co. | | 830 | | | 5,461 |
| | | | | |
LIFE SCIENCES TOOLS & SERVICES – 0.0% + |
Life Technologies Corp.* | | 163 | | | 3,800 |
| | | | | |
MACHINERY – 1.7% | | | | | |
AGCO Corp.* | | 1,183 | | | 27,907 |
Dover Corp. | | 567 | | | 18,666 |
Flowserve Corp. | | 263 | | | 13,544 |
Gardner Denver, Inc.* | | 223 | | | 5,205 |
Graco, Inc. | | 195 | | | 4,627 |
IDEX Corp. | | 500 | | | 12,075 |
Kennametal, Inc. | | 500 | | | 11,095 |
Lincoln Electric Holdings, Inc. | | 289 | | | 14,719 |
Oshkosh Truck Corp. | | 611 | | | 5,432 |
Pentair, Inc. | | 172 | | | 4,071 |
Terex Corp.* | | 399 | | | 6,911 |
The Timken Co. | | 1,095 | | | 21,495 |
See Notes to Financial Statements.
125
GOLDMAN SACHS MID CAP VALUE FUND
| | |
PORTFOLIO OF INVESTMENTS (Continued) December 31, 2008 | | Sun Capital Advisers Trust |
| | | | | |
| | | Shares | | Value |
| | | | | |
| | | | | |
Toro Co. | | 921 | | $ | 30,393 |
Trinity Industries, Inc. | | 736 | | | 11,599 |
| | | | | |
| | | | | 187,739 |
| | | | | |
MARINE – 0.2% | | | | | |
Alexander & Baldwin, Inc. | | 898 | | | 22,504 |
| | | | | |
MEDIA – 2.7% | | | | | |
Ascent Media Corp., Class A* | | 967 | | | 21,119 |
Cablevision Systems Corp., Class A | | 1,700 | | | 28,628 |
CBS Corp., Class B (1) | | 6,047 | | | 49,525 |
Clear Channel Outdoor Holdings, Inc., Class A* | | 1,240 | | | 7,626 |
Comcast Corp., Class A | | 574 | | | 9,689 |
Discovery Communications, Inc., Class A* | | 509 | | | 7,207 |
Discovery Communications, Inc., Class C* | | 1,257 | | | 16,831 |
DISH Network Corp., Class A* | | 644 | | | 7,142 |
Dreamworks Animation Skg, Inc.* | | 148 | | | 3,739 |
Gannett Co., Inc. | | 2,040 | | | 16,320 |
Hearst-Argyle Television, Inc. | | 1,647 | | | 9,981 |
Liberty Global, Inc., Class A* | | 708 | | | 11,271 |
Meredith Corp. | | 507 | | | 8,680 |
Scripps Networks Interactive, Inc., Class A | | 405 | | | 8,910 |
The DIRECTV Group, Inc.* | | 424 | | | 9,714 |
The McGraw-Hill Cos., Inc. | | 1,816 | | | 42,113 |
Time Warner, Inc. | | 1,097 | | | 11,036 |
Virgin Media, Inc. | | 6,319 | | | 31,532 |
| | | | | |
| | | | | 301,063 |
| | | | | |
METALS & MINING – 0.2% | | | | | |
Commercial Metals Co. | | 503 | | | 5,970 |
Reliance Steel & Aluminum Co. | | 523 | | | 10,429 |
Southern Copper Corp. | | 470 | | | 7,548 |
| | | | | |
| | | | | 23,947 |
| | | | | |
MULTI-LINE RETAIL – 1.0% | | | | | |
Dollar Tree, Inc.* | | 196 | | | 8,193 |
Family Dollar Stores, Inc., Class A | | 1,839 | | | 47,943 |
Macy’s, Inc. | | 2,510 | | | 25,978 |
Sears Holdings Corp.* | | 661 | | | 25,693 |
| | | | | |
| | | | | 107,807 |
| | | | | |
MULTI-UTILITIES – 6.7% | | | | | |
Alliant Energy Corp. | | 1,371 | | | 40,006 |
Consolidated Edison, Inc. | | 1,699 | | | 66,142 |
Integrys Energy Group, Inc. | | 1,837 | | | 78,954 |
MDU Resources Group, Inc. | | 2,594 | | | 55,978 |
NiSource, Inc. | | 5,824 | | | 63,889 |
| | | | | |
| | | Shares | | Value |
| | | | | |
| | | | | |
Nstar | | 500 | | $ | 18,245 |
OGE Energy Corp. | | 1,946 | | | 50,168 |
PG&E Corp. | | 2,532 | | | 98,014 |
Puget Energy, Inc. | | 1,368 | | | 37,305 |
SCANA Corp. | | 1,297 | | | 46,173 |
Sempra Energy | | 1,779 | | | 75,839 |
TECO Energy, Inc. | | 958 | | | 11,831 |
Vectren Corp. | | 2,592 | | | 64,826 |
Wisconsin Energy Corp. | | 218 | | | 9,152 |
Xcel Energy, Inc. | | 765 | | | 14,191 |
| | | | | |
| | | | | 730,713 |
| | | | | |
OFFICE ELECTRONICS – 0.1% | | | | | |
Xerox Corp. | | 774 | | | 6,169 |
| | | | | |
OIL & GAS-EXPLORATION & PRODUCTION – 4.4% |
Alpha Natural Resources, Inc.* | | 353 | | | 5,715 |
Apache Corp. | | 308 | | | 22,955 |
Cabot Oil & Gas Corp. | | 337 | | | 8,762 |
Cimarex Energy Co. | | 994 | | | 26,619 |
El Paso Corp. | | 933 | | | 7,306 |
Encore Aquisition Co.* | | 714 | | | 18,221 |
EOG Resources, Inc. | | 81 | | | 5,393 |
Forest Oil Corp.* | | 472 | | | 7,783 |
Helix Energy Solutions Group, Inc.* | | 492 | | | 3,562 |
Hess Corp. | | 109 | | | 5,847 |
Murphy Oil Corp. | | 779 | | | 34,549 |
Newfield Exploration Co.* | | 300 | | | 5,925 |
Noble Energy, Inc. | | 959 | | | 47,202 |
Overseas Shipholding Group, Inc. | | 231 | | | 9,728 |
Patterson-UTI Energy, Inc. | | 880 | | | 10,129 |
Pioneer Natural Resources Co. | | 1,657 | | | 26,810 |
Plains Exploration & Production Co.* | | 925 | | | 21,497 |
Southwestern Energy Co.* | | 657 | | | 19,033 |
Spectra Energy Corp. | | 1,851 | | | 29,135 |
St. Mary Land & Exploration Co. | | 723 | | | 14,684 |
Sunoco, Inc. | | 1,073 | | | 46,633 |
Teekay Shipping Corp. | | 291 | | | 5,718 |
Tesoro Corp. | | 3,708 | | | 48,834 |
Ultra Petroleum Corp.* | | 159 | | | 5,487 |
Valero Energy Corp. | | 2,022 | | | 43,756 |
| | | | | |
| | | | | 481,283 |
| | | | | |
PAPER & FOREST PRODUCTS – 1.0% | | | |
Domtar Corp.* | | 6,824 | | | 11,396 |
International Paper Co. | | 3,559 | | | 41,996 |
MeadWestvaco Corp. | | 855 | | | 9,568 |
Plum Creek Timber Co., Inc. | | 1,014 | | | 35,226 |
Rayonier, Inc. | | 534 | | | 16,741 |
| | | | | |
| | | | | 114,927 |
| | | | | |
See Notes to Financial Statements.
126
GOLDMAN SACHS MID CAP VALUE FUND
| | |
PORTFOLIO OF INVESTMENTS (Continued) December 31, 2008 | | Sun Capital Advisers Trust |
| | | | | |
| | | Shares | | Value |
| | | | | |
| | | | | |
PERSONAL PRODUCTS – 0.5% | | | | | |
Alberto – Culver Co. | | 1,865 | | $ | 45,711 |
Herbalife, Ltd. | | 441 | | | 9,561 |
| | | | | |
| | | | | 55,272 |
| | | | | |
PHARMACEUTICALS – 1.7% | | | | | |
Forest Laboratories, Inc.* | | 2,240 | | | 57,053 |
Gilead Sciences, Inc.* | | 668 | | | 34,162 |
King Pharmaceuticals, Inc.* | | 4,197 | | | 44,572 |
Mylan Labs, Inc.* | | 2,452 | | | 24,250 |
Schering-Plough Corp. | | 266 | | | 4,530 |
Teva Pharmaceutical Industries, Ltd. ADR | | 362 | | | 15,406 |
Watson Pharmaceuticals, Inc.* | | 342 | | | 9,087 |
| | | | | |
| | | | | 189,060 |
| | | | | |
REAL ESTATE INVESTMENT TRUSTS – 8.8% |
AMB Property Corp. (1) | | 1,365 | | | 31,968 |
Annaly Capital Management, Inc. | | 3,293 | | | 52,260 |
Apartment Investment & Management Co. | | 2,008 | | | 23,192 |
AvalonBay Communities, Inc. (1) | | 781 | | | 47,313 |
Boston Properties, Inc. | | 1,041 | | | 57,255 |
Brandywine Reality Trust | | 952 | | | 7,340 |
BRE Properties, Inc. | | 998 | | | 27,924 |
Camden Property Trust | | 165 | | | 5,171 |
Developers Diversified Realty Corp. | | 3,072 | | | 14,991 |
Duke Realty Corp. | | 2,094 | | | 22,950 |
Equity Residential Properties Trust | | 2,741 | | | 81,737 |
Essex Property Trust, Inc. | | 287 | | | 22,027 |
Federal Realty Investment Trust | | 511 | | | 31,723 |
HCP, Inc. | | 727 | | | 20,189 |
Health Care REIT, Inc. | | 742 | | | 31,312 |
Host Hotels & Resorts, Inc. | | 2,127 | | | 16,101 |
Kilroy Realty Corp. | | 777 | | | 25,998 |
Kimco Realty Corp. | | 2,841 | | | 51,934 |
Liberty Property Trust | | 2,015 | | | 46,003 |
Mack-Cali Realty Corp. | | 809 | | | 19,821 |
Nationwide Health Properties, Inc. | | 2,191 | | | 62,926 |
ProLogis Trust | | 2,087 | | | 28,988 |
Public Storage | | 635 | | | 50,483 |
Regency Centers Corp. | | 968 | | | 45,206 |
Simon Property Group, Inc. | | 203 | | | 10,785 |
SL Green Realty Corp. | | 1,303 | | | 33,748 |
The Macerich Co. | | 484 | | | 8,789 |
Ventas, Inc. | | 501 | | | 16,819 |
Vornado Realty Trust | | 667 | | | 40,253 |
Weyerhaeuser Co. | | 924 | | | 28,284 |
| | | | | |
| | | | | 963,490 |
| | | | | |
| | | | | |
| | | Shares | | Value |
| | | | | |
| | | | | |
REAL ESTATE MANAGEMENT & DEVELOPMENT – 0.1% |
Jones Lang LaSalle, Inc. | | 504 | | $ | 13,961 |
| | | | | |
ROAD & RAIL – 0.6% | | | | | |
Con-Way, Inc. | | 598 | | | 15,907 |
Hertz Global Holdings, Inc.* | | 4,169 | | | 21,137 |
JB Hunt Transport Services, Inc. | | 284 | | | 7,460 |
Ryder System, Inc. | | 350 | | | 13,573 |
Werner Enterprises, Inc. | | 258 | | | 4,474 |
| | | | | |
| | | | | 62,551 |
| | | | | |
SEMICONDUCTORS & SEMICONDUCTOR EQUIPMENT – 0.3% |
Advanced Micro Devices, Inc.* | | 7,499 | | | 16,198 |
Broadcom Corp., Class A* | | 834 | | | 14,153 |
Integrated Device Technology, Inc.* | | 925 | | | 5,189 |
| | | | | |
| | | | | 35,540 |
| | | | | |
SOFTWARE – 0.5% | | | | | |
Adobe Systems, Inc.* | | 528 | | | 11,241 |
Amdocs, Ltd.* | | 742 | | | 13,571 |
Autodesk, Inc.* | | 185 | | | 3,635 |
Cadence Design Systems, Inc.* | | 972 | | | 3,558 |
Synopsys, Inc.* | | 709 | | | 13,131 |
VMware, Inc., Class A* | | 234 | | | 5,543 |
| | | | | |
| | | | | 50,679 |
| | | | | |
SPECIALTY RETAIL – 1.0% | | | | | |
Aeropostale, Inc.* | | 274 | | | 4,411 |
Bed Bath & Beyond, Inc.* | | 495 | | | 12,583 |
Foot Locker, Inc. | | 2,400 | | | 17,616 |
Liz Claiborne, Inc. | | 1,783 | | | 4,636 |
OfficeMax, Inc. | | 933 | | | 7,128 |
PetSmart, Inc. | | 1,113 | | | 20,535 |
RadioShack Corp. | | 2,022 | | | 24,143 |
Ross Stores, Inc. | | 536 | | | 15,935 |
Urban Outfitters, Inc.* | | 303 | | | 4,539 |
| | | | | |
| | | | | 111,526 |
| | | | | |
TEXTILES, APPAREL & LUXURY GOODS – 0.2% |
Coach, Inc.* | | 195 | | | 4,050 |
Jones Apparel Group, Inc. | | 1,412 | | | 8,275 |
VF Corp. | | 195 | | | 10,680 |
| | | | | |
| | | | | 23,005 |
| | | | | |
THRIFT & MORTGAGE FINANCE – 1.5% |
Astoria Financial Corp. | | 371 | | | 6,114 |
Hudson City Bancorp, Inc. | | 4,485 | | | 71,580 |
New York Community Bancorp, Inc. | | 458 | | | 5,478 |
See Notes to Financial Statements.
127
GOLDMAN SACHS MID CAP VALUE FUND
| | |
PORTFOLIO OF INVESTMENTS (Continued) December 31, 2008 | | Sun Capital Advisers Trust |
| | | | | |
| | | Shares | | Value |
| | | | | |
| | | | | |
People’s United Financial, Inc. | | 1,070 | | $ | 19,078 |
TFS Financial Corp. | | 2,153 | | | 27,774 |
Washington Federal, Inc. | | 1,425 | | | 21,318 |
Webster Financial Corp. | | 890 | | | 12,264 |
| | | | | |
| | | | | 163,606 |
| | | | | |
TOBACCO – 1.6% | | | | | |
Lorillard, Inc. | | 1,715 | | | 96,640 |
UST, Inc. | | 1,147 | | | 79,579 |
| | | | | |
| | | | | 176,219 |
| | | | | |
TRADING COMPANIES & DISTRIBUTORS – 0.1% |
United Rentals, Inc.* | | 805 | | | 7,342 |
| | | | | |
WATER UTILITIES – 0.2% | | | | | |
American Water Works Co., Inc. | | 698 | | | 14,574 |
Aqua America, Inc. | | 418 | | | 8,607 |
| | | | | |
| | | | | 23,181 |
| | | | | |
| | | | | | |
| | | Shares | | Value | |
| | | | | | |
| | | | | | |
WIRELESS TELECOMMUNICATION
SERVICES – 0.6% | |
Crown Castle International Corp.* | | 1,290 | | $ | 22,678 | |
Leap Wireless International, Inc.* | | 166 | | | 4,464 | |
Sprint Nextel Corp.* | | 8,956 | | | 16,390 | |
Telephone & Data Systems, Inc. | | 396 | | | 12,573 | |
US Cellular Corp.* | | 142 | | | 6,140 | |
| | | | | | |
| | | | | 62,245 | |
| | | | | | |
Total Common Stocks
(cost $11,830,250) | | | | | 10,209,920 | |
| | | | | | |
SHORT TERM INVESTMENTS – 15.4% | |
MUTUAL FUNDS – 15.4% | | | | | | |
SSgA Prime Money Market Fund (cost $1,687,024) | | 1,687,024 | | | 1,687,024 | |
| | | | | | |
TOTAL INVESTMENTS – 108.7% | | | | |
(cost $13,517,274) | | | | | 11,896,944 | |
Liabilities in excess of other assets – (8.7)% | | | | | (949,365 | ) |
| | | | | | |
NET ASSETS – 100.0% | | | | $ | 10,947,579 | |
| | | | | | |
| * | Non-income producing security |
| (1) | Security or a portion of the security has been designated as collateral for futures contracts. |
| + | Amount is less than 0.05%. |
| | | | |
| ADR | | | | American Depositary Receipt |
See Notes to Financial Statements.
128
GOLDMAN SACHS MID CAP VALUE FUND
| | |
| PORTFOLIO OF OTHER FINANCIAL INSTRUMENTS |
| December 31, 2008 | | Sun Capital Advisers Trust |
At December 31, 2008, open futures contracts purchased were as follows:
| | | | | | | | | | |
Futures | | Expiration
Date | | Contracts | | Aggregated
Face
Value ($) | | Notional
Value ($) | | Unrealized
Appreciation ($) |
S&P 500 Mini Index Futures | | 3/20/09 | | 3 | | 129,894 | | 135,015 | | 5,121 |
Russell Mini 2000 Index Futures | | 3/20/09 | | 8 | | 376,444 | | 398,320 | | 21,876 |
| | | | | | | | | | |
Net unrealized appreciation | | | | | | | | | | 26,997 |
| | | | | | | | | | |
See Notes to Financial Statements.
129
GOLDMAN SACHS SHORT DURATION FUND
| | |
PORTFOLIO OF INVESTMENTS December 31, 2008 | | Sun Capital Advisers Trust |
| | | | | | |
| | | Principal
Amount
(000) | | Value |
| | | | | | |
| | | | | | |
CORPORATE DEBT OBLIGATIONS – 17.5% |
BANKS – 8.4% | | | | | | |
American Express Bank
2.49%, 12/10/10 (1) | | $ | 1,900 | | $ | 1,898,362 |
3.15%, 12/9/11 | | | 1,900 | | | 1,915,126 |
HSBC USA, Inc.
3.13%, 12/16/11 | | | 1,900 | | | 1,973,162 |
PNC Funding Corp.
1.88%, 6/22/11 | | | 1,200 | | | 1,201,786 |
Regions Bank
2.75%, 12/10/10 | | | 1,900 | | | 1,940,405 |
Wells Fargo & Co.
4.38%, 1/31/13 | | | 1,000 | | | 979,216 |
| | | | | | |
| | | | | | 9,908,057 |
| | | | | | |
BROKERAGE – 5.8% | | | | | | |
General Electric Capital Corp. 3.00%, 12/9/11 | | | 1,800 | | | 1,860,930 |
6.00%, 6/15/12 | | | 1,000 | | | 1,026,048 |
John Deere Capital Corp.
2.74%, 8/19/10 (1) | | | 1,000 | | | 939,503 |
2.88%, 6/19/12 | | | 1,350 | | | 1,388,463 |
JP Morgan Chase & Co.
2.63%, 12/1/10 | | | 1,600 | | | 1,632,123 |
| | | | | | |
| | | | | | 6,847,067 |
| | | | | | |
FOOD, BEVERAGES & RESTAURANTS – 0.9% |
Pepsico, Inc.
4.65%, 2/15/13 | | | 1,000 | | | 1,028,180 |
| | | | | | |
INSURANCE – 1.6% | | | | | | |
Metropolitan Life Global Funding I
5.13%, 4/10/13 (2) | | | 1,000 | | | 931,759 |
New York Life Global Funding
4.65%, 5/9/13 (2) | | | 1,000 | | | 966,307 |
| | | | | | |
| | | | | | 1,898,066 |
| | | | | | |
SPECIAL PURPOSE BANK – 0.8% |
Kreditanstalt Fur Wiederaufbau
3.75%, 6/27/11 | | | 900 | | | 936,423 |
| | | | | | |
Total Corporate Debt Obligations (cost $20,507,052) | | | | | | 20,617,793 |
| | | | | | |
COLLATERALIZED MORTGAGE OBLIGATION – 1.0% |
Federal National Mortgage Association,
Series 2005-91, Class FJ
0.97%, 10/25/35 (1)
(cost $1,139,230) | | | 1,199 | | | 1,165,711 |
| | | | | | |
| | | | | | |
| | | Principal
Amount
(000) | | Value |
| | | | | | |
| | | | | | |
U.S. GOVERNMENT AGENCY OBLIGATIONS – 73.5% |
Federal Farm Credit Bank (3)
3.90%, 6/20/11 | | $ | 1,500 | | $ | 1,591,278 |
Federal Home Loan Bank (3)
3.00%, 12/10/10 | | | 1,900 | | | 1,964,361 |
3.05%, 4/28/10 | | | 2,600 | | | 2,604,667 |
3.13%, 6/10/11 | | | 1,155 | | | 1,198,153 |
3.25%, 3/11/11 | | | 1,000 | | | 1,042,483 |
3.50%, 10/22/09 | | | 1,000 | | | 1,001,185 |
3.75%, 1/8/10 | | | 1,600 | | | 1,649,210 |
3.88%, 12/10/10 | | | 3,500 | | | 3,673,607 |
4.25%, 6/10/11 | | | 1,500 | | | 1,606,344 |
4.50%, 10/9/09 | | | 4,000 | | | 4,120,388 |
Federal Home Loan Mortgage Corp. (3) | | | | | | |
2.88%, 6/28/10 | | | 5,100 | | | 5,234,813 |
4.50%, 12/1/18 | | | 1,434 | | | 1,481,531 |
4.50%, 5/1/23 | | | 1,000 | | | 1,023,986 |
5.13%, 4/18/11 | | | 1,600 | | | 1,728,120 |
5.45%, 7/9/10 | | | 1,300 | | | 1,301,167 |
5.50%, 9/25/13 | | | 5,000 | | | 5,152,150 |
6.50%, 10/1/37 | | | 812 | | | 848,319 |
6.50%, 12/1/38 | | | 400 | | | 415,533 |
Federal National Mortgage Association (3) | | | | | | |
3.38%, 5/19/11 | | | 1,500 | | | 1,576,228 |
3.63%, 8/15/11 | | | 2,200 | | | 2,331,773 |
4.50%, 10/1/18 | | | 226 | | | 233,321 |
4.50%, 11/1/18 | | | 50 | | | 51,139 |
4.50%, 12/1/18 | | | 84 | | | 86,119 |
4.50%, 5/1/19 | | | 330 | | | 337,464 |
4.50%, 6/1/19 | | | 164 | | | 167,878 |
4.50%, 8/1/19 | | | 113 | | | 116,448 |
4.50%, 5/1/23 | | | 5,986 | | | 6,126,449 |
4.50%, 6/1/23 | | | 2,995 | | | 3,065,546 |
4.50%, TBA | | | 12,000 | | | 12,262,500 |
4.68%, 6/15/11 | | | 1,900 | | | 2,055,141 |
4.69%, 4/1/37 | | | 3,184 | | | 3,206,996 |
5.00%, 8/1/20 | | | 927 | | | 955,053 |
5.00%, 9/1/38 | | | 1,995 | | | 2,038,884 |
5.13%, 4/15/11 | | | 1,200 | | | 1,298,018 |
5.50%, 7/1/37 | | | 557 | | | 571,663 |
5.50%, 2/1/38 | | | 427 | | | 437,934 |
6.00%, 10/1/36 | | | 35 | | | 36,299 |
6.00%, 7/1/38 | | | 899 | | | 926,440 |
6.00%, 8/1/38 | | | 555 | | | 570,848 |
6.00%, 10/1/38 | | | 43 | | | 44,048 |
6.00%, 11/1/38 | | | 364 | | | 375,498 |
See Notes to Financial Statements.
130
GOLDMAN SACHS SHORT DURATION FUND
| | |
PORTFOLIO OF INVESTMENTS (Continued) December 31, 2008 | | Sun Capital Advisers Trust |
| | | | | | |
| | | Principal
Amount
(000) | | Value |
| | | | | | |
| | | | | | |
6.50%, 9/1/37 | | $ | 2,893 | | $ | 3,008,316 |
6.50%, TBA | | | 7,000 | | | 7,269,065 |
| | | | | | |
Total U.S. Government Agency Obligations (cost $84,896,789) | | | | | | 86,786,363 |
| | | | | | |
| | | Shares | | |
SHORT TERM INVESTMENTS – 24.7% |
MUTUAL FUNDS – 9.6% | | | | | | |
SSgA Prime Money
Market Fund
(cost $11,347,225) | | | 11,347,225 | | | 11,347,225 |
| | | | | | |
| | | | | | | |
| | | Principal
Amount
(000) | | Value | |
| | | | | | | |
| | | | | | | |
U.S. GOVERNMENT AGENCY OBLIGATIONS – 15.1% | |
Federal Home Loan Mortgage Discount Notes
2.90%, 10/23/09 (3) | | $ | 8,500 | | $ | 8,458,350 | |
Federal National Mortgage Association Discount Notes
1.70%, 4/1/09 (3) | | | 1,000 | | | 999,630 | |
2.90%, 10/16/09 (3) | | | 8,400 | | | 8,359,848 | |
| | | | | | | |
Total U.S. Government Agency Obligations
(cost $17,498,878) | | | | | | 17,817,828 | |
| | | | | | | |
Total Short Term Investments
(cost $28,846,103) | | | | | | 29,165,053 | |
| | | | | | | |
TOTAL INVESTMENTS – 116.7% | | | | |
(cost $135,389,174) | | | | | | 137,734,920 | |
Liabilities in excess of other assets – (16.7)% | | | | | | (19,710,511 | ) |
| | | | | | | |
NET ASSETS – 100.0% | | | | | $ | 118,024,409 | |
| | | | | | | |
| (1) | Variable rate security. The interest rate shown reflects the rate in effect at December 31, 2008. |
| (2) | Eligible for resale under rule 144A of the Securities Act of 1933. These securities may be resold in transactions exempt from registration, normally to qualified institutional buyers. At December 31, 2008 these securities amounted to $1,898,066, representing 1.6% of net assets. |
| (3) | Security or a portion of the security has been designated as collateral for futures and TBA securities. |
| TBA | To Be Announced. Securities are purchased on a forward commitment basis with an approximate principal amount and no defined maturity date. The actual principal and maturity date will be determined upon settlement when the specific mortgage pools are assigned. Total market value of TBA securities (excluding forward sales contracts, if any) amounts to $19,531,565 which represents approximately 16.5% of net assets as of December 31, 2008. |
See Notes to Financial Statements.
131
GOLDMAN SACHS SHORT DURATION FUND
| | |
| PORTFOLIO OF OTHER FINANCIAL INSTRUMENTS |
| December 31, 2008 | | Sun Capital Advisers Trust |
At December 31, 2008, open futures contracts purchased were as follows:
| | | | | | | | | | | |
Futures | | Expiration
Date | | Contracts
| | Aggregated
Face
Value ($) | | Notional
Value ($) | | Unrealized
Appreciation/
(Depreciation) ($) | |
90 Day Eurodollar Futures | | 3/16/09 | | 3 | | 740,587 | | 742,050 | | 1,463 | |
90 Day Eurodollar Futures | | 12/14/09 | | 9 | | 2,216,498 | | 2,218,163 | | 1,665 | |
90 Day Eurodollar Futures | | 9/14/09 | | 17 | | 4,186,968 | | 4,196,663 | | 9,695 | |
90 Day Eurodollar Futures | | 6/15/09 | | 40 | | 9,829,275 | | 9,887,000 | | 57,725 | |
2 Year U.S. Treasury Notes Futures | | 3/31/09 | | 113 | | 24,459,369 | | 24,641,063 | | 181,694 | |
30 Year U.S. Treasury Bond Futures | | 3/20/09 | | 5 | | 691,540 | | 690,234 | | (1,306 | ) |
| | | | | | | | | | | |
Net unrealized appreciation | | | | | | | | | | 250,936 | |
| | | | | | | | | | | |
At December 31, 2008, open futures contracts sold were as follows:
| | | | | | | | | | | |
Futures | | Expiration
Date | | Contracts | | Aggregated
Face
Value ($) | | Notional
Value ($) | | Unrealized
Appreciation/
(Depreciation) ($) | |
5 Year U.S. Treasury Notes Futures | | 3/31/09 | | 5 | | 596,601 | | 595,273 | | 1,328 | |
10 Year U.S. Treasury Notes Futures | | 3/20/09 | | 56 | | 6,903,774 | | 7,042,000 | | (138,226 | ) |
| | | | | | | | | | | |
Net unrealized depreciation | | | | | | | | | | (136,898 | ) |
| | | | | | | | | | | |
At December 31, 2008, the Fund had the following forward sales contracts:
| | | | | | | | | | | |
Description | | Interest
Rate | | | Maturity
Date | | Settlement
Date | | Principal
Amount ($) | | Value ($) |
Federal National Mortgage Association | | 5.00 | % | | TBA-30 Yr | | 1/13/09 | | 1,000,000 | | 1,020,938 |
Federal Home Loan Mortgage Corporation | | 4.50 | % | | TBA-15 Yr | | 1/20/09 | | 1,000,000 | | 1,022,188 |
Federal National Mortgage Association | | 4.50 | % | | TBA-15 Yr | | 1/20/09 | | 10,000,000 | | 10,218,750 |
| | | | | | | | | | | |
(Proceeds receivable $12,168,320) | | | | | | | | | | | 12,261,876 |
| | | | | | | | | | | |
See Notes to Financial Statements.
132
DREMAN SMALL CAP VALUE FUND
| | |
PORTFOLIO OF INVESTMENTS December 31, 2008 | | Sun Capital Advisers Trust |
| | | | | |
| | | Shares | | Value |
| | | | | |
| | | | | |
COMMON STOCKS – 82.2% |
AEROSPACE & DEFENSE – 1.9% |
Curtiss-Wright Corp. | | 1,600 | | $ | 53,424 |
Esterline Technologies Corp.* | | 1,500 | | | 56,835 |
| | | | | |
| | | | | 110,259 |
| | | | | |
CAPITAL MARKETS – 0.7% |
Waddell & Reed Financial, Inc., Class A | | 2,500 | | | 38,650 |
| | | | | |
COMMERCIAL BANKS – 4.4% |
Associated Banc-Corp. | | 2,600 | | | 54,418 |
FirstMerit Corp. | | 2,300 | | | 47,357 |
MB Financial, Inc. | | 1,900 | | | 53,105 |
Prosperity Bancshares, Inc. | | 1,559 | | | 46,131 |
TCF Financial Corp. | | 3,600 | | | 49,176 |
| | | | | |
| | | | | 250,187 |
| | | | | |
COMMERCIAL SERVICES & SUPPLIES – 1.6% |
Kelly Services, Inc., Class A | | 2,500 | | | 32,525 |
The Brink’s Co. | | 2,200 | | | 59,136 |
| | | | | |
| | | | | 91,661 |
| | | | | |
COMMUNICATIONS EQUIPMENT – 1.5% |
CommScope, Inc.* | | 2,500 | | | 38,850 |
Plantronics, Inc. | | 3,500 | | | 46,200 |
| | | | | |
| | | | | 85,050 |
| | | | | |
CONSTRUCTION & ENGINEERING – 2.1% |
EMCOR Group, Inc.* | | 3,100 | | | 69,533 |
URS Corp.* | | 1,200 | | | 48,924 |
| | | | | |
| | | | | 118,457 |
| | | | | |
DIVERSIFIED CONSUMER SERVICES – 0.7% |
Regis Corp. | | 2,600 | | | 37,778 |
| | | | | |
DIVERSIFIED FINANCIAL SERVICES – 1.0% |
Financial Federal Corp. | | 2,600 | | | 60,502 |
| | | | | |
DIVERSIFIED TELECOMMUNICATION SERVICES –1.6% |
Alaska Communications Systems, Inc. | | 4,900 | | | 45,962 |
Iowa Telecommunication Services, Inc. | | 3,100 | | | 44,268 |
| | | | | |
| | | | | 90,230 |
| | | | | |
ELECTRIC UTILITIES – 2.4% |
ALLETE, Inc. | | 1,400 | | | 45,178 |
IDACORP, Inc. | | 1,600 | | | 47,120 |
NV Energy, Inc. | | 4,400 | | | 43,516 |
| | | | | |
| | | | | 135,814 |
| | | | | |
| | | | | |
| | | Shares | | Value |
| | | | | |
| | | | | |
ELECTRICAL EQUIPMENT – 2.3% |
Baldor Electric Co. | | 2,500 | | $ | 44,625 |
General Cable Corp.* | | 1,200 | | | 21,228 |
Regal-Beloit Corp. | | 1,700 | | | 64,583 |
| | | | | |
| | | | | 130,436 |
| | | | | |
ELECTRONIC EQUIPMENT & INSTRUMENTS – 2.9% |
Anixter International, Inc.* | | 2,000 | | | 60,240 |
Mettler-Toledo International, Inc.* | | 600 | | | 40,440 |
Park Electrochemical Corp. | | 3,409 | | | 64,635 |
| | | | | |
| | | | | 165,315 |
| | | | | |
ENERGY EQUIPMENT & SERVICES – 1.7% |
Bristow Group, Inc.* | | 1,800 | | | 48,222 |
Oil States International, Inc.* | | 2,600 | | | 48,594 |
| | | | | |
| | | | | 96,816 |
| | | | | |
FOOD & STAPLES RETAILING – 3.6% |
Central European Distribution Corp.* | | 2,400 | | | 47,280 |
Nash Finch Co. | | 1,200 | | | 53,868 |
Ruddick Corp. | | 2,200 | | | 60,830 |
Weis Markets, Inc. | | 1,400 | | | 47,082 |
| | | | | |
| | | | | 209,060 |
| | | | | |
FOOD PRODUCTS – 3.8% |
Corn Products International, Inc. | | 1,700 | | | 49,045 |
Del Monte Foods Co. | | 8,400 | | | 59,976 |
Ralcorp Holdings, Inc.* | | 800 | | | 46,720 |
The J. M. Smucker Co. | | 1,400 | | | 60,704 |
| | | | | |
| | | | | 216,445 |
| | | | | |
HEALTH CARE PROVIDERS & SERVICES – 4.7% |
Amedisys, Inc.* | | 1,000 | | | 41,340 |
AmSurg Corp.* | | 2,152 | | | 50,228 |
Healthspring, Inc.* | | 2,900 | | | 57,913 |
LifePoint Hospitals, Inc.* | | 2,900 | | | 66,236 |
MEDNAX, Inc.* | | 1,800 | | | 57,060 |
| | | | | |
| | | | | 272,777 |
| | | | | |
HOTELS, RESTAURANTS & LEISURE – 1.1% |
International Speedway Corp., Class A | | 2,200 | | | 63,206 |
| | | | | |
HOUSEHOLD DURABLES – 0.9% |
Helen of Troy, Ltd.* | | 3,000 | | | 52,080 |
| | | | | |
INSURANCE – 12.5% | | | | | |
Allied World Assurance Holdings, Ltd. | | 1,400 | | | 56,840 |
Argo Group International Holdings, Inc.* | | 1,500 | | | 50,880 |
See Notes to Financial Statements.
133
DREMAN SMALL CAP VALUE FUND
| | |
PORTFOLIO OF INVESTMENTS (Continued) December 31, 2008 | | Sun Capital Advisers Trust |
| | | | | |
| | | Shares | | Value |
| | | | | |
| | | | | |
Aspen Insurance Holdings, Ltd. | | 2,400 | | $ | 58,200 |
Endurance Specialty Holdings, Ltd. | | 2,200 | | | 67,166 |
IPC Holdings, Ltd. | | 1,800 | | | 53,820 |
Odyssey Re Holdings Corp. | | 1,100 | | | 56,991 |
Platinum Underwriters Holdings, Ltd. | | 1,600 | | | 57,728 |
Safety Insurance Group, Inc. | | 1,400 | | | 53,284 |
Selective Insurance Group, Inc. | | 2,200 | | | 50,446 |
StanCorp Financial Group, Inc. | | 1,600 | | | 66,832 |
The Hanover Insurance Group, Inc. | | 1,300 | | | 55,861 |
United Fire & Casualty Co. | | 2,200 | | | 68,354 |
Willis Group Holdings, Ltd. | | 800 | | | 19,904 |
| | | | | |
| | | | | 716,306 |
| | | | | |
IT SERVICES – 1.8% |
CACI International, Inc., Class A* | | 1,100 | | | 49,599 |
DST Systems, Inc.* | | 1,400 | | | 53,172 |
| | | | | |
| | | | | 102,771 |
| | | | | |
LIFE SCIENCES TOOLS & SERVICES – 0.7% |
PerkinElmer, Inc. | | 2,900 | | | 40,339 |
| | | | | |
MACHINERY – 4.4% |
Barnes Group, Inc. | | 3,900 | | | 56,550 |
Gardner Denver, Inc.* | | 2,200 | | | 51,348 |
Joy Global, Inc. | | 2,100 | | | 48,069 |
Kennametal, Inc. | | 2,800 | | | 62,132 |
Mueller Water Products, Inc., Class A | | 4,400 | | | 36,960 |
| | | | | |
| | | | | 255,059 |
| | | | | |
MEDIA – 0.9% |
Dreamworks Animation Skg, Inc., Class A* | | 2,000 | | | 50,520 |
| | | | | |
METALS & MINING – 4.8% |
Century Aluminum Co.* | | 2,400 | | | 24,000 |
IAMGOLD Corp. | | 13,200 | | | 80,652 |
Pan American Silver Corp.* | | 4,300 | | | 73,401 |
Reliance Steel & Aluminum Co. | | 2,500 | | | 49,850 |
Worthington Industries, Inc. | | 4,300 | | | 47,386 |
| | | | | |
| | | | | 275,289 |
| | | | | |
MULTI-UTILITIES – 2.5% |
Integrys Energy Group, Inc. | | 1,100 | | | 47,278 |
TECO Energy, Inc. | | 4,100 | | | 50,635 |
Vectren Corp. | | 1,800 | | | 45,018 |
| | | | | |
| | | | | 142,931 |
| | | | | |
OIL & GAS-EXPLORATION & PRODUCTION – 5.7% |
Arch Coal, Inc. | | 2,600 | | | 42,354 |
Atwood Oceanics, Inc.* | | 1,800 | | | 27,504 |
Jabil Circuit, Inc. | | 8,300 | | | 56,025 |
Parallel Petroleum Corp.* | | 3,800 | | | 7,638 |
PetroQuest Energy, Inc.* | | 4,700 | | | 31,772 |
| | | | | |
| | | Shares | | Value |
| | | | | |
| | | | | |
St. Mary Land & Exploration Co. | | 2,500 | | $ | 50,775 |
Stone Energy Corp.* | | 1,300 | | | 14,326 |
Superior Energy Services, Inc.* | | 2,900 | | | 46,197 |
Whiting Petroleum Corp.* | | 1,600 | | | 53,536 |
| | | | | |
| | | | | 330,127 |
| | | | | |
ROAD & RAIL – 1.5% |
Genesee & Wyoming, Inc., Class A* | | 1,700 | | | 51,850 |
Ryder System, Inc. | | 903 | | | 35,018 |
| | | | | |
| | | | | 86,868 |
| | | | | |
SOFTWARE – 2.2% |
Jack Henry & Associates, Inc. | | 2,698 | | | 52,368 |
Sybase, Inc.* | | 3,100 | | | 76,787 |
| | | | | |
| | | | | 129,155 |
| | | | | |
SPECIALTY RETAIL – 2.1% |
Aaron Rents, Inc. | | 2,100 | | | 55,902 |
Penske Auto Group, Inc. | | 5,600 | | | 43,008 |
The Men’s Wearhouse, Inc. | | 1,800 | | | 24,372 |
| | | | | |
| | | | | 123,282 |
| | | | | |
TEXTILES, APPAREL & LUXURY GOODS – 1.8% |
Hanesbrands, Inc.* | | 4,000 | | | 51,000 |
Wolverine World Wide, Inc. | | 2,600 | | | 54,704 |
| | | | | |
| | | | | 105,704 |
| | | | | |
TOBACCO – 1.4% |
Universal Corp. | | 1,400 | | | 41,818 |
Vector Group, Ltd. | | 2,700 | | | 36,774 |
| | | | | |
| | | | | 78,592 |
| | | | | |
TRADING COMPANIES & DISTRIBUTORS – 1.0% |
GATX Corp. | | 1,800 | | | 55,747 |
| | | | | |
Total Common Stocks
(cost $4,855,039) | | | | | 4,717,413 |
| | | | | |
SHORT TERM INVESTMENTS – 17.2% |
MUTUAL FUNDS – 17.2% |
SSgA Government Money Market Fund | | 27,923 | | | 27,923 |
SSgA Treasury Fund | | 961,099 | | | 961,099 |
| | | | | |
Total Short Term Investments
(cost $989,022) | | | | | 989,022 |
| | | | | |
TOTAL INVESTMENTS – 99.4% | | | | | |
(cost $5,844,061) | | | | | 5,706,435 |
Other assets less liabilities – 0.6% | | | | | 33,691 |
| | | | | |
NET ASSETS – 100.0% | | | | $ | 5,740,126 |
| | | | | |
| * | Non-income producing security |
See Notes to Financial Statements.
134
PIMCO HIGH YIELD FUND
| | |
PORTFOLIO OF INVESTMENTS December 31, 2008 | | Sun Capital Advisers Trust |
| | | | | | | | |
| | | Country
Code* | | Principal
Amount
(000) | | Value |
| | | | | | | | |
| | | | | | | | |
ASSET BACKED SECURITY – 0.2% |
Midwest Generation LLC, Series B
8.56%, 1/2/16 (1)
(cost $39,215) | | | | $ | 38 | | $ | 35,875 |
| | | | | | | | |
CONVERTIBLE BONDS – 0.6% |
Chesapeake Energy Corp.
2.25%, 12/15/38 (1) | | | | | 50 | | | 22,438 |
Prudential Financial, Inc.
0.37%, 12/15/37 (1)(3) | | | | | 25 | | | 23,662 |
Rayonier TRS Holdings, Inc.
3.75%, 10/15/12 (1) | | | | | 50 | | | 44,625 |
| | | | | | | | |
Total Convertible Bonds
(cost $83,636) | | | | | | | | 90,725 |
| | | | | | | | |
CORPORATE DEBT OBLIGATIONS – 65.3% |
AUTOMOBILES & COMPONENTS – 0.4% |
The Hertz Corp.
8.88%, 1/1/14 (1) | | | | | 100 | | | 61,500 |
| | | | | | | | |
AUTOMOTIVE – 2.9% |
Allison Transmission
11.00%, 11/1/15 (1)(2) | | | | | 50 | | | 24,500 |
Arvinmeritor, Inc.
8.13%, 9/15/15 (1) | | | | | 105 | | | 47,250 |
Cooper-Standard Automotive, Inc.
7.00%, 12/15/12 (1) | | | | | 15 | | | 4,500 |
Ford Motor Credit Co. | | | | | | | | |
5.70%, 1/15/10 (1) | | | | | 15 | | | 12,747 |
7.00%, 10/1/13 (1) | | | | | 40 | | | 27,637 |
7.38%, 10/28/09 (1) | | | | | 35 | | | 30,738 |
8.00%, 12/15/16 (1) | | | | | 225 | | | 146,558 |
General Motors Corp.
8.25%, 7/15/23 (1) | | | | | 110 | | | 18,150 |
Tenneco, Inc.
8.13%, 11/15/15 (1) | | | | | 25 | | | 11,500 |
The Goodyear Tire & Rubber Co. | | | | | | | | |
7.86%, 8/15/11 (1) | | | | | 50 | | | 41,500 |
9.00%, 7/1/15 (1) | | | | | 20 | | | 16,100 |
TRW Automotive, Inc. | | | | | | | | |
7.00%, 3/15/14 (1)(2) | | | | | 25 | | | 13,250 |
7.25%, 3/15/17 (1)(2) | | | | | 50 | | | 25,500 |
United Rentals North America, Inc.
6.50%, 2/15/12 (1) | | | | | 40 | | | 31,600 |
| | | | | | | | |
| | | | | | | | 451,530 |
| | | | | | | | |
| | | | | | | | |
| | | Country
Code* | | Principal
Amount
(000) | | Value |
| | | | | | | | |
| | | | | | | | |
BANKS – 1.9% |
Bank of America Corp.
8.00%, 12/29/49 (1)(3) | | | | $ | 100 | | $ | 71,929 |
Barclays Bank PLC
7.70%, 12/31/49 (1)(2)(3) | | | | | 50 | | | 33,063 |
Credito Italia
1.80%, 5/15/09 (1)(3) | | | | | 50 | | | 49,971 |
RBS Capital Trust
6.47%, 12/29/49 (1)(3) | | | | | 50 | | | 31,971 |
Wells Fargo Capital
9.75%, 12/29/49 (1)(3) | | | | | 100 | | | 101,000 |
| | | | | | | | |
| | | | | | | | 287,934 |
| | | | | | | | |
BROKERAGE – 5.5% |
CIT Group, Inc. | | | | | | | | |
5.60%, 4/27/11 (1) | | | | | 10 | | | 8,443 |
5.80%, 7/28/11 (1) | | | | | 150 | | | 125,694 |
Citigroup, Inc. | | | | | | | | |
1.97%, 3/17/09 (1)(3) | | | | | 25 | | | 24,875 |
4.31%, 10/22/09 (1)(3) | | | | | 25 | | | 24,225 |
5.50%, 4/11/13 (1) | | | | | 25 | | | 24,342 |
8.40%, 4/29/49 (1)(3) | | | | | 50 | | | 33,014 |
Countrywide Home Loans, Inc.
4.13%, 9/15/09 (1) | | | | | 40 | | | 39,531 |
GMAC LLC
8.00%, 11/1/31 (1) | | | | | 345 | | | 201,859 |
Lehman Brothers Holdings, Inc. | | | | | | | | |
6.63%, 1/18/12 (4) | | | | | 25 | | | 2,375 |
6.88%, 5/2/18 (4) | | | | | 25 | | | 2,375 |
Merrill Lynch & Co., Inc. | | | | | | | | |
4.49%, 5/12/10 (1)(3) | | | | | 25 | | | 24,089 |
6.88%, 4/25/18 (1) | | | | | 25 | | | 26,151 |
Nuveen Investments, Inc.
10.50%, 11/15/15 (1)(2) | | | | | 15 | | | 3,319 |
SLM Corp.,
Series A
5.00%, 10/1/13 (1) | | | | | 50 | | | 35,776 |
5.38%, 1/15/13 (1) | | | | | 50 | | | 36,656 |
8.45%, 6/15/18 (1) | | | | | 35 | | | 27,672 |
The Bear Stearns Cos., Inc
6.40%, 10/2/17 (1) | | | | | 70 | | | 72,742 |
The Goldman Sachs Group, Inc. | | | | | | | | |
5.95%, 1/18/18 (1) | | | | | 110 | | | 104,299 |
6.75%, 10/1/37 (1) | | | | | 40 | | | 32,475 |
| | | | | | | | |
| | | | | | | | 849,912 |
| | | | | | | | |
See Notes to Financial Statements.
135
PIMCO HIGH YIELD FUND
| | |
PORTFOLIO OF INVESTMENTS (Continued) December 31, 2008 | | Sun Capital Advisers Trust |
| | | | | | | | |
| | | Country
Code* | | Principal
Amount
(000) | | Value |
| | | | | | | | |
| | | | | | | | |
CHEMICALS – 0.2% |
Ineos Group Holdings
8.50%, 2/15/16 (1)(2) | | | | $ | 50 | | $ | 4,500 |
Nalco Co.
8.88%, 11/15/13 (1) | | | | | 25 | | | 21,125 |
| | | | | | | | |
| | | | | | | | 25,625 |
| | | | | | | | |
COMMERCIAL SERVICES & SUPPLIES – 0.2% |
Lender Processing Services, Inc.
8.13%, 7/1/16(1) | | | | | 30 | | | 26,738 |
| | | | | | | | |
COMPUTER & PERIPHERALS – 1.8% |
Aramark Corp. | | | | | | | | |
6.69%, 2/1/15 (1)(3) | | | | | 50 | | | 37,750 |
8.50%, 2/1/15 (1) | | | | | 50 | | | 45,250 |
Seagate Technology Hdd Holdings | | | | | | | | |
2.28%, 10/1/09 (1)(3) | | | | | 25 | | | 22,875 |
6.38%, 10/1/11 (1) | | | | | 60 | | | 41,400 |
Sungard Data Systems, Inc.
9.13%, 8/15/13(1) | | | | | 160 | | | 138,400 |
| | | | | | | | |
| | | | | | | | 285,675 |
| | | | | | | | |
CONSUMER PRODUCTS – 0.3% |
Mattel, Inc.
2.40%, 6/15/09 (1)(3) | | | | | 50 | | | 50,026 |
| | | | | | | | |
CONSUMER SERVICES – 0.1% |
Service Corp. International
7.63%, 10/1/18 (1) | | | | | 20 | | | 14,800 |
| | | | | | | | |
CONTAINERS & GLASS – 0.8% |
Berry Plastics Corp.
9.50%, 2/15/15 (1)(3) | | | | | 45 | | | 31,050 |
Crown Americas LLC | | | | | | | | |
7.63%, 11/15/13 (1) | | | | | 15 | | | 14,850 |
7.75%, 11/15/15 (1) | | | | | 25 | | | 24,875 |
OI European Group B.V.
6.88%, 3/31/17 (1) | | NL | | | 50 | | | 50,737 |
| | | | | | | | |
| | | | | | | | 121,512 |
| | | | | | | | |
ELECTRONICS – 0.7% |
Celestica, Inc. | | | | | | | | |
7.63%, 7/1/13 (1) | | | | | 25 | | | 20,500 |
7.88%, 7/1/11 (1) | | | | | 80 | | | 72,800 |
| | | | | | | | |
| | | Country
Code* | | Principal
Amount
(000) | | Value |
| | | | | | | | |
| | | | | | | | |
Sanmina-Sci Corp.
8.13%, 3/1/16 (1) | | | | $ | 25 | | $ | 9,750 |
| | | | | | | | |
| | | | | | | | 103,050 |
| | | | | | | | |
ENVIRONMENTAL SERVICES – 0.9% |
Allied Waste North America, Inc.,
Series B
7.13%, 5/15/16 (1) | | | | | 25 | | | 22,750 |
7.25%, 3/15/15 (1) | | | | | 105 | | | 97,650 |
Waste Management, Inc.
6.88%, 5/15/09 (1) | | | | | 25 | | | 24,884 |
| | | | | | | | |
| | | | | | | | 145,284 |
| | | | | | | | |
FINANCIAL SERVICES – 2.8% |
JP Morgan Chase & Co. | | | | | | | | |
4.72%, 1/17/11 (1)(3) | | | | | 50 | | | 46,783 |
7.90%, 4/29/49 (1)(3) | | | | | 100 | | | 83,183 |
Morgan Stanley | | | | | | | | |
4.62%, 1/9/14 (1)(3) | | | | | 200 | | | 138,489 |
5.95%, 12/28/17 (1) | | | | | 140 | | | 116,197 |
Wachovia Corp. | | | | | | | | |
2.35%, 6/1/10 (1)(3) | | | | | 25 | | | 23,587 |
5.75%, 2/1/18 (1) | | | | | 25 | | | 25,050 |
| | | | | | | | |
| | | | | | | | 433,289 |
| | | | | | | | |
FOOD, BEVERAGES & RESTAURANTS – 0.4% |
Supervalu, Inc.
7.50%, 11/15/14 (1) | | | | | 70 | | | 57,400 |
| | | | | | | | |
GAS & PIPELINE UTILITIES – 0.2% |
Enterprise Products Operating LP
8.38%, 8/1/66 (1)(3) | | | | | 50 | | | 27,500 |
| | | | | | | | |
HEALTH CARE – 5.1% |
Community Health Systems, Inc.
8.88%, 7/15/15 (1) | | | | | 230 | | | 211,600 |
Davita, Inc. | | | | | | | | |
6.63%, 3/15/13 (1) | | | | | 50 | | | 47,500 |
7.25%, 3/15/15 (1) | | | | | 140 | | | 133,000 |
HCA, Inc. | | | | | | | | |
9.13%, 11/15/14 (1) | | | | | 125 | | | 115,937 |
9.25%, 11/15/16 (1) | | | | | 300 | | | 275,250 |
9.63%, 11/15/16 (1) | | | | | 15 | | | 11,700 |
| | | | | | | | |
| | | | | | | | 794,987 |
| | | | | | | | |
See Notes to Financial Statements.
136
PIMCO HIGH YIELD FUND
| | |
PORTFOLIO OF INVESTMENTS (Continued) December 31, 2008 | | Sun Capital Advisers Trust |
| | | | | | | | |
| | | Country
Code* | | Principal
Amount
(000) | | Value |
| | | | | | | | |
| | | | | | | | |
HEALTH CARE - FACILITIES – 2.3% |
Biomet, Inc. | | | | | | | | |
10.00%, 10/15/17 (1) | | | | $ | 150 | | $ | 144,000 |
10.38%, 10/15/17 (1) | | | | | 100 | | | 79,000 |
11.63%, 10/15/17 (1) | | | | | 120 | | | 102,600 |
Fresenius Medical Care Capital Trust IV
7.88%, 6/15/11 (1) | | | | | 25 | | | 23,750 |
| | | | | | | | |
| | | | | | | | 349,350 |
| | | | | | | | |
INSURANCE – 2.4% |
AIG SunAmerica
3.69%, 7/26/10 (1)(3) | | | | | 50 | | | 47,100 |
American International Group, Inc. | | | | | | | | |
1.63%, 3/20/12 (1)(3) | | | | | 40 | | | 25,069 |
5.85%, 1/16/18 (1) | | | | | 150 | | | 100,543 |
8.18%, 5/15/58 (1)(2)(3) | | | | | 25 | | | 9,725 |
8.25%, 8/15/18 (1)(2) | | | | | 200 | | | 146,384 |
Metropolitan Life Global Funding
2.22%, 6/25/10 (1)(2)(3) | | | | | 50 | | | 44,915 |
| | | | | | | | |
| | | | | | | | 373,736 |
| | | | | | | | |
LEISURE & ENTERTAINMENT – 0.6% |
Harrah’s Operating Co., Inc.
10.75%, 2/1/16 (1)(2) | | | | | 100 | | | 28,500 |
Royal Caribbean Cruises, Ltd.
8.75%, 2/2/11 (1) | | | | | 50 | | | 38,500 |
Wynn Las Vegas Capital Corp.
6.63%, 12/1/14 (1) | | | | | 45 | | | 33,975 |
| | | | | | | | |
| | | | | | | | 100,975 |
| | | | | | | | |
MANUFACTURING DIVERSIFIED – 0.5% |
Actuant Corp.
6.88%, 6/15/17 (1) | | | | | 15 | | | 11,287 |
Bombardier, Inc.
8.00%, 11/15/14 (1)(2) | | | | | 75 | | | 66,000 |
| | | | | | | | |
| | | | | | | | 77,287 |
| | | | | | | | |
METALS – 0.7% |
Freeport-McMoRan Copper & Gold, Inc. (1) | | | | | | | | |
7.08%, 4/1/15 (1)(3) | | | | | 110 | | | 72,600 |
8.38%, 4/1/17 (1) | | | | | 50 | | | 41,000 |
| | | | | | | | |
| | | | | | | | 113,600 |
| | | | | | | | |
| | | | | | | | |
| | | Country
Code* | | Principal
Amount
(000) | | Value |
| | | | | | | | |
| | | | | | | | |
MULTIMEDIA – 5.0% | | | | | | | | |
Charter Communications Operating Capital LLC
8.38%, 4/30/14 (1)(2) | | | | $ | 90 | | $ | 68,850 |
CSC Holdings, Inc.
7.88%, 2/15/18 (1) | | | | | 90 | | | 70,650 |
CSC Holdings, Inc.
7.63%, 7/15/18 (1) | | | | | 110 | | | 85,800 |
CSC Holdings, Inc.,
Series B
7.63%, 4/1/11 (1) | | | | | 50 | | | 47,125 |
Dex Media West LLC,
Series B
8.50%, 8/15/10 (1) | | | | | 20 | | | 12,100 |
Dex Media, Inc.
8.00%, 11/15/13 (1) | | | | | 50 | | | 9,250 |
DirecTV Holdings LLC
8.38%, 3/15/13 (1) | | | | | 140 | | | 139,300 |
Echostar DBS Corp. | | | | | | | | |
6.38%, 10/1/11 (1) | | | | | 55 | | | 51,150 |
7.00%, 10/1/13 (1) | | | | | 50 | | | 43,375 |
7.13%, 2/1/16 (1) | | | | | 80 | | | 66,800 |
7.75%, 5/31/15 (1) | | | | | 25 | | | 21,250 |
Quebecor Media, Inc.
7.75%, 3/15/16 (1) | | | | | 55 | | | 37,125 |
RH Donnelley Corp. | | | | | | | | |
8.88%, 10/15/17 (1) | | | | | 65 | | | 9,750 |
11.75%, 5/15/15 (1)(2) | | | | | 50 | | | 12,250 |
Shaw Communications, Inc.
8.25%, 4/11/10 (1) | | | | | 50 | | | 49,250 |
Videotron Ltee
9.13%, 4/15/18 (1)(2) | | | | | 50 | | | 46,500 |
| | | | | | | | |
| | | | | | | | 770,525 |
| | | | | | | | |
OIL & GAS EQUIPMENT & SERVICES – 1.0% |
Amerigas Partners LP | | | | | | | | |
7.13%, 5/20/16 (1) | | | | | 45 | | | 36,000 |
7.25%, 5/20/15 (1) | | | | | 25 | | | 20,375 |
Cie Generale De Geophysique-Veritas | | | | | | | | |
7.50%, 5/15/15 (1) | | | | | 10 | | | 6,200 |
7.75%, 5/15/17 (1) | | | | | 30 | | | 17,400 |
Ferrellgas Partners LP
8.75%, 6/15/12 (1) | | | | | 25 | | | 17,500 |
Suburban Propane Partners LP
6.88%, 12/15/13 (1) | | | | | 70 | | | 57,400 |
| | | | | | | | |
| | | | | | | | 154,875 |
| | | | | | | | |
See Notes to Financial Statements.
137
PIMCO HIGH YIELD FUND
| | |
PORTFOLIO OF INVESTMENTS (Continued) December 31, 2008 | | Sun Capital Advisers Trust |
| | | | | | | | |
| | | Country
Code* | | Principal
Amount
(000) | | Value |
| | | | | | | | |
| | | | | | | | |
PAPER PRODUCTS – 1.9% | | | | | | |
Cascades, Inc.
7.25%, 2/15/13 (1) | | | | $ | 20 | | $ | 10,200 |
Georgia-Pacific LLC | | | | | | | | |
7.13%, 1/15/17 (1)(2) | | | | | 125 | | | 105,000 |
7.25%, 6/1/28 (1) | | | | | 10 | | | 6,100 |
7.70%, 6/15/15 (1) | | | | | 65 | | | 49,400 |
8.00%, 1/15/24 (1) | | | | | 115 | | | 77,625 |
Verso Paper Holdings LLC, Series B | | | | | | | | |
6.94%, 8/1/14 (1)(3) | | | | | 15 | | | 4,350 |
9.13%, 8/1/14 (1) | | | | | 30 | | | 11,850 |
Weyerhaeuser Co.
2.47%, 9/24/09 (1)(3) | | | | | 25 | | | 24,007 |
| | | | | | | | |
| | | | | | | | 288,532 |
| | | | | | | | |
PIPELINES – 2.8% | | | | | | | | |
Colorado Interstate Gas Co.
5.95%, 3/15/15 (1) | | | | | 20 | | | 16,648 |
Dynegy Holdings, Inc. | | | | | | | | |
6.88%, 4/1/11 (1) | | | | | 20 | | | 17,500 |
7.50%, 6/1/15 (1) | | | | | 20 | | | 14,000 |
8.38%, 5/1/16 (1) | | | | | 100 | | | 71,000 |
El Paso Corp. | | | | | | | | |
7.25%, 6/1/18 (1) | | | | | 50 | | | 39,683 |
7.00%, 6/15/17 (1) | | | | | 100 | | | 78,260 |
Kinder Morgan Finance Co.
5.70%, 1/5/16 (1) | | | | | 170 | | | 126,650 |
NGPL Pipeco LLC
7.12%, 12/15/17 (1)(2) | | | | | 50 | | | 45,010 |
SemGroup LP
8.75%, 11/15/15 (1)(2)(4) | | | | | 30 | | | 1,050 |
Williams Cos., Inc.
7.63%, 7/15/19 (1) | | | | | 30 | | | 23,437 |
Williams Partners LP
7.25%, 2/1/17 (1) | | | | | 100 | | | 79,000 |
| | | | | | | | |
| | | | | | | | 512,238 |
| | | | | | | | |
REAL ESTATE INVESTMENT TRUSTS – 0.2% |
Ventas Realty LP/Ventas Capital Corp. | | | | | | | | |
6.63%, 10/15/14 (1) | | | | | 10 | | | 7,600 |
6.75%, 6/1/10 (1) | | | | | 20 | | | 18,925 |
6.75%, 4/1/17 (1) | | | | | 10 | | | 7,600 |
| | | | | | | | |
| | | | | | | | 34,125 |
| | | | | | | | |
REFINING – 2.8% | | | | | | | | |
Chesapeake Energy Corp. | | | | | | | | |
6.88%, 1/15/16 (1) | | | | | 60 | | | 48,000 |
| | | | | | | | |
| | | Country
Code* | | Principal
Amount
(000) | | Value |
| | | | | | | | |
| | | | | | | | |
7.00%, 8/15/14 (1) | | | | $ | 75 | | $ | 62,250 |
7.63%, 7/15/13 (1) | | | | | 25 | | | 21,500 |
Mariner Energy, Inc.
8.00%, 5/15/17 (1) | | | | | 15 | | | 7,800 |
Newfield Exploration Co.
7.13%, 5/15/18 (1) | | | | | 100 | | | 79,000 |
Opti Canada, Inc.
8.25%, 12/15/14 (1) | | | | | 90 | | | 48,600 |
Petrohawk Energy Corp.
7.88%, 6/1/15 (2) | | | | | 25 | | | 18,500 |
Sandridge Energy, Inc. | | | | | | | | |
8.00%, 6/1/18 (1)(2) | | | | | 30 | | | 16,650 |
8.63%, 4/1/15 (1) | | | | | 95 | | | 49,875 |
| | | | | | | | |
| | | | | | | | 352,175 |
| | | | | | | | |
RESTAURANTS – 0.1% | | | | | | | | |
NPC International, Inc.
9.50%, 5/1/14 (1) | | | | | 15 | | | 10,875 |
| | | | | | | | |
RETAIL – 0.2% |
New Albertsons, Inc.
7.75%, 6/15/26 (1) | | | | | 40 | | | 24,400 |
| | | | | | | | |
SEMICONDUCTORS & SEMICONDUCTOR EQUIPMENT – 0.7% |
Freescale Semiconductor, Inc.
8.88%, 12/15/14 (1) | | | | | 185 | | | 81,400 |
Sensata Technologies BV
8.00%, 5/1/14 (1) | | | | | 50 | | | 22,500 |
| | | | | | | | |
| | | | | | | | 103,900 |
| | | | | | | | |
SOFTWARE – 0.9% |
First Data Corp.
9.88%, 9/24/15 (1) | | | | | 230 | | | 139,150 |
| | | | | | | | |
SPECIAL PURPOSE ENTITY – 1.8% |
El Paso Performance-Linked Trust
7.75%, 7/15/11 (1)(2) | | | | | 200 | | | 173,150 |
NSG Holdings LLC
7.75%, 12/15/25 (2) | | | | | 30 | | | 23,400 |
Santander Perpetual SA Unipersonal
6.67%, 10/29/49 (1)(2)(3) | | | | | 100 | | | 63,604 |
Universal City Development Partners
11.75%, 4/1/10 (1) | | | | | 20 | | | 12,900 |
Universal City Florida Holding Co.
7.94%, 5/1/10 (1)(3) | | | | | 10 | | | 4,300 |
| | | | | | | | |
| | | | | | | | 277,354 |
| | | | | | | | |
See Notes to Financial Statements.
138
PIMCO HIGH YIELD FUND
| | |
PORTFOLIO OF INVESTMENTS (Continued) December 31, 2008 | | Sun Capital Advisers Trust |
| | | | | | | | |
| | | Country
Code* | | Principal
Amount
(000) | | Value |
| | | | | | | | |
| | | | | | | | |
TELECOMMUNICATIONS – 9.9% |
Alltel Communication, Inc.
4.37%, 5/15/15 (1)(5) | | | | $ | 249 | | $ | 244,636 |
Cincinnati Bell, Inc.
7.00%, 2/15/15 (1) | | | | | 20 | | | 15,300 |
Citizens Communications Co.
6.63%, 3/15/15 (1) | | | | | 65 | | | 47,450 |
9.00%, 8/15/31 (1) | | | | | 25 | | | 15,750 |
Cricket Communications, Inc.
9.38%, 11/1/14 (1) | | | | | 50 | | | 45,000 |
Frontier Communications Corp.
9.25%, 5/15/11 (1) | | | | | 50 | | | 47,500 |
Metropcs Wireless, Inc.
9.25%, 11/1/14 (1) | | | | | 40 | | | 35,800 |
Nordic Telephone Co. Holdings
8.88%, 5/1/16 (2) | | | | | 150 | | | 105,000 |
Nortel Networks, Ltd.
9.00%, 7/15/11 (1)(3) | | | | | 50 | | | 12,500 |
10.13%, 7/15/13 (1) | | | | | 145 | | | 38,425 |
Qwest Capital Funding, Inc.
7.25%, 2/15/11 (1) | | | | | 115 | | | 96,600 |
7.90%, 8/15/10 (1) | | | | | 25 | | | 22,750 |
8.88%, 3/15/12 (1) | | | | | 40 | | | 37,000 |
Qwest Communications International, Inc.
7.25%, 2/15/11 (1) | | | | | 150 | | | 130,500 |
7.50%, 2/15/14 (1) | | | | | 25 | | | 17,875 |
Sprint Capital Corp.
6.90%, 5/1/19 (1) | | | | | 280 | | | 198,800 |
8.75%, 3/15/32 (1) | | | | | 75 | | | 50,625 |
Sprint Nextel Corp.
6.00%, 12/1/16 (1) | | | | | 145 | | | 102,225 |
Telesat Canada LLC
11.00%, 11/1/15 (2) | | | | | 100 | | | 71,500 |
Time Warner Telecom Holdings, Inc.
9.25%, 2/15/14 (1) | | | | | 20 | | | 16,400 |
West Corp.
9.50%, 10/15/14 (1) | | | | | 110 | | | 60,500 |
Windstream Corp.
8.63%, 8/1/16 (1) | | | | | 125 | | | 110,625 |
| | | | | | | | |
| | | | | | | | 1,522,761 |
| | | | | | | | |
TOBACCO – 0.1% |
Reynolds American, Inc. 7.75%, 6/1/18 (1) | | | | | 20 | | | 16,409 |
| | | | | | | | |
| | | | | | | | |
| | | Country
Code* | | Principal
Amount
(000) | | Value |
| | | | | | | | |
| | | | | | | | |
UTILITIES – 7.2% |
Edison Mission Energy
7.00%, 5/15/17 (1) | | | | $ | 20 | | $ | 17,400 |
7.20%, 5/15/19 (1) | | | | | 80 | | | 65,600 |
Energy Future Holdings Corp.
10.88%, 11/1/17 (1)(2) | | | | | 345 | | | 244,950 |
11.25%, 11/1/17 (1)(2) | | | | | 75 | | | 36,375 |
Intergen
9.00%, 6/30/17 (2) | | | | | 75 | | | 61,500 |
Ipalco Enterprises, Inc.
7.25%, 4/1/16 (1)(2) | | | | | 40 | | | 32,800 |
NRG Energy, Inc.
7.38%, 2/1/16 (1) | | | | | 50 | | | 46,500 |
7.38%, 1/15/17 (1) | | | | | 215 | | | 197,800 |
Reliant Energy, Inc.
6.75%, 12/15/14 (1) | | | | | 105 | | | 94,500 |
Sierra Pacific Resources
7.80%, 6/15/12 (1) | | | | | 25 | | | 23,399 |
Texas Competitive Electric Holdings Co. LLC
10.50%, 11/1/15 (1)(2) | | | | | 80 | | | 56,800 |
10.50%, 11/1/16 (1)(2) | | | | | 25 | | | 12,500 |
The AES Corp.
7.75%, 3/1/14 (1) | | | | | 80 | | | 70,400 |
7.75%, 10/15/15 (1) | | | | | 25 | | | 21,000 |
8.00%, 10/15/17 (1) | | | | | 45 | | | 36,900 |
8.00%, 6/1/20 (1)(2) | | | | | 95 | | | 73,625 |
8.88%, 2/15/11 (1) | | | | | 20 | | | 18,700 |
| | | | | | | | |
| | | | | | | | 1,110,749 |
| | | | | | | | |
Total Corporate Debt Obligations
(cost $11,487,846) | | | | | | | | 10,069,778 |
| | | | | | | | |
COMMERCIAL MORTGAGE BACKED SECURITIES – 1.6% |
Countrywide Alternative Loan Trust, Series 2006-43 CB, Class A
0.84%, 2/25/37 (1)(3) | | | | | 67 | | | 23,173 |
Goldman Sachs Mortgage Securities Corp. II,
Series 2006-GG8,
Class A4
5.56%, 11/10/39 (1) | | | | | 100 | | | 79,320 |
See Notes to Financial Statements.
139
PIMCO HIGH YIELD FUND
| | |
PORTFOLIO OF INVESTMENTS (Continued) December 31, 2008 | | Sun Capital Advisers Trust |
| | | | | | | | |
| | | Country
Code* | | Principal
Amount
(000) | | Value |
| | | | | | | | |
| | | | | | | | |
Greenwich Capital Commercial Funding Corp.,
Series 2007-GG9,
Class A4
5.44%, 3/10/39 (1) | | | | $ | 100 | | $ | 76,113 |
Merrill Lynch/Countrywide Commercial Mortgage Trust,
Series 2007-6, Class A4
5.49%, 3/12/51 (1)(3) | | | | | 100 | | | 68,848 |
| | | | | | | | |
Total Commercial Mortgage Backed Securities
(cost $263,540) | | | | | | | | 247,454 |
| | | | | | | | |
| | | | | Shares | | |
PREFERRED STOCK – 2.5% |
AUTOMOTIVE – 0.0% + | | | | | | | | |
General Motors Corp.,
Series B
5.25%, 3/6/32 (1) | | | | | 1,200 | | | 4,128 |
| | | | | | | | |
BANKS – 2.5% | | | | | | | | |
Bank of America Corp.,
Series L
7.25%, 12/31/49 (1) | | | | | 380 | | | 247,000 |
Wachovia Corp.,
Series L
7.50%, 12/31/49 (1) | | | | | 175 | | | 131,250 |
| | | | | | | | |
| | | | | | | | 378,250 |
| | | | | | | | |
INSURANCE – 0.0% + | | | | | | | | |
American International Group, Inc.
8.50%, 8/1/11 (1) | | | | | 100 | | | 850 |
| | | | | | | | |
Total Preferred Stock
(cost $375,748) | | | | | | | | 383,228 |
| | | | | | | | |
| | | | | Principal
Amount
(000) | | |
SHORT TERM INVESTMENTS – 29.1% |
COMMERCIAL PAPER – 0.3% | | | | | | |
UBS AG Stamford
2.12%, 3/17/09 (1)(3) | | | | $ | 50 | | | 50,004 |
| | | | | | | | |
| | | | | | | | |
| | | Country
Code* | |
Shares | | Value |
| | | | | | | | |
| | | | | | | | |
MUTUAL FUNDS – 4.8% | | | | | | | | |
SSgA Treasury Fund | | | | | 741,161 | | $ | 741,161 |
| | | | | | | | |
| | | | | Principal
Amount
(000) | | |
| | | | | | | | |
REPURCHASE AGREEMENT – 0.7% |
State Street Bank and Trust Company, 0.01%, 1/2/09 (collateralized by $100,000 FHLB, 4.375%, 09/17/10, with a value of $106,420 total to be received $100,000)
(cost $100,000) | | $ | 100 | | | 100,000 |
| | | | | | | | |
U.S. GOVERNMENT AGENCY OBLIGATIONS – 23.3% |
Federal Home Loan Bank Discount Notes | | | | | | |
0.03%, 1/5/09 (1) | | | 200 | | | 199,999 |
0.05%, 1/2/09 (1) | | | 1,700 | | | 1,699,997 |
0.08%, 1/21/09 (1) | | | 400 | | | 399,978 |
0.08%, 1/22/09 (1) | | | 1,000 | | | 999,954 |
Federal Home Loan Mortgage Discount Notes
0.04%, 2/3/09 (1) | | | 100 | | | 99,996 |
Federal National Mortgage Association Discount Notes 1.10%, 2/3/09 (1) | | | 200 | | | 199,798 |
| | | | | | | | |
| | | | | | | | 3,599,722 |
| | | | | | | | |
Total Short Term Investments
(cost $4,490,750) | | | | | | 4,490,887 |
| | | | | | | | |
TOTAL INVESTMENTS – 99.3%
(cost $16,740,735) | | | 15,317,947 |
Other assets less liabilities –0.7% | | | | | | 116,246 |
| | | | | | | | |
NET ASSETS – 100.0% | | | | | $ | 15,434,193 |
| | | | | | | | |
| * | Unless otherwise noted the country code for all securities is United States |
| (1) | Security or a portion of the security has been designated as collateral for futures, credit default swaps and interest rate swaps. |
| (2) | Eligible for resale under rule 144A of the Securities Act of 1933. These securities may be resold in transactions exempt from registration, normally to qualified institutional buyers. At December 31, 2008 these securities amounted to $1,668,670, representing 10.8% of net assets. |
See Notes to Financial Statements.
140
PIMCO HIGH YIELD FUND
| | |
PORTFOLIO OF INVESTMENTS (Continued) December 31, 2008 | | Sun Capital Advisers Trust |
See Notes to Financial Statements.
| (3) | Variable rate security. The interest rate shown reflects the rate at December 31, 2008. |
| (4) | Security is in default and is non-income producing. |
| + | Amount is less than 0.05%. |
| | |
| FHLB | | Federal Home Loan Bank |
| NL | | Netherlands |
141
PIMCO HIGH YIELD FUND
| | |
| PORTFOLIO OF OTHER FINANCIAL INSTRUMENTS |
| December 31, 2008 | | Sun Capital Advisers Trust |
At December 31, 2008, cash of $31,200 has been pledged for open futures contracts purchased as follows:
| | | | | | | | | | |
Futures | | Expiration
Date | | Contracts | | Aggregated
Face
Value ($) | | Notional
Value ($) | | Unrealized
Appreciation ($) |
3 Month Pound Sterling Futures | | 9/16/09 | | 2 | | 343,802 | | 353,165 | | 9,363 |
90 Day Eurodollar Futures | | 3/16/09 | | 10 | | 2,425,300 | | 2,473,500 | | 48,200 |
90 Day Eurodollar Futures | | 12/13/10 | | 3 | | 720,412 | | 734,100 | | 13,688 |
90 Day Eurodollar Futures | | 6/15/09 | | 1 | | 240,650 | | 247,175 | | 6,525 |
90 Day Eurodollar Futures | | 6/14/10 | | 2 | | 484,350 | | 491,300 | | 6,950 |
| | | | | | | | | | |
Net unrealized appreciation | | | | | | | | | | 84,726 |
| | | | | | | | | | |
At December 31, 2008, open forward foreign currency exchange contracts were as follows:
| | | | | | | | | | | | | | | | | |
Contracts to Deliver | | In Exchange For | | | | Settlement Date | | | | Unrealized
Appreciation/
(Depreciation) ($) | |
| EUR | | 73,000 | | | | USD | | 92,202 | | | | 1/13/2009 | | | | (9,234 | ) |
| USD | | 4,447 | | | | GBP | | 3,000 | | | | 1/13/2009 | | | | (135 | ) |
| USD | | 10,697 | | | | GBP | | 7,000 | | | | 1/13/2009 | | | | (635 | ) |
| USD | | 10,812 | | | | GBP | | 7,000 | | | | 1/13/2009 | | | | (750 | ) |
| GBP | | 19,954 | | | | USD | | 30,000 | | | | 1/13/2009 | | | | 1,318 | |
| USD | | 2,045 | | | | BRL | | 4,940 | | | | 2/3/2009 | | | | 52 | |
| BRL | | 4,940 | | | | USD | | 2,000 | | | | 2/3/2009 | | | | (97 | ) |
| USD | | 15,517 | | | | PHP | | 711,000 | | | | 2/6/2009 | | | | (614 | ) |
| USD | | 11,363 | | | | PHP | | 547,700 | | | | 2/6/2009 | | | | 117 | |
| PHP | | 759,750 | | | | USD | | 15,000 | | | | 2/6/2009 | | | | (925 | ) |
| PHP | | 498,950 | | | | USD | | 9,919 | | | | 2/6/2009 | | | | (538 | ) |
| USD | | 8,600 | | | | MYR | | 30,000 | | | | 2/12/2009 | | | | 61 | |
| USD | | 10,000 | | | | MYR | | 35,918 | | | | 2/12/2009 | | | | 369 | |
| USD | | 6,952 | | | | MYR | | 24,610 | | | | 2/12/2009 | | | | 153 | |
| USD | | 1,908 | | | | MYR | | 6,641 | | | | 2/12/2009 | | | | 9 | |
| MYR | | 56,600 | | | | USD | | 16,000 | | | | 2/12/2009 | | | | (340 | ) |
| MYR | | 40,568 | | | | USD | | 11,000 | | | | 2/12/2009 | | | | (712 | ) |
| USD | | 10,000 | | | | MYR | | 35,160 | | | | 4/14/2009 | | | | 147 | |
| USD | | 10,000 | | | | MYR | | 36,045 | | | | 4/14/2009 | | | | 403 | |
| MYR | | 64,565 | | | | USD | | 18,668 | | | | 4/14/2009 | | | | 35 | |
| MYR | | 6,641 | | | | USD | | 1,902 | | | | 4/14/2009 | | | | (15 | ) |
| USD | | 10,000 | | | | SGD | | 14,793 | | | | 4/14/2009 | | | | 255 | |
| USD | | 10,000 | | | | SGD | | 14,828 | | | | 4/14/2009 | | | | 279 | |
| USD | | 10,000 | | | | SGD | | 14,638 | | | | 4/14/2009 | | | | 147 | |
| SGD | | 8,079 | | | | USD | | 5,326 | | | | 4/14/2009 | | | | (274 | ) |
| SGD | | 6,083 | | | | USD | | 4,000 | | | | 4/14/2009 | | | | (217 | ) |
| SGD | | 30,098 | | | | USD | | 20,965 | | | | 4/14/2009 | | | | 101 | |
| USD | | 10,000 | | | | PHP | | 487,400 | | | | 5/06/2009 | | | | 161 | |
| USD | | 10,000 | | | | PHP | | 479,700 | | | | 5/06/2009 | | | | 1 | |
| PHP | | 967,100 | | | | USD | | 18,746 | | | | 5/06/2009 | | | | (1,417 | ) |
| USD | | 25,000 | | | | RUB | | 606,875 | | | | 5/06/2009 | | | | (7,339 | ) |
| USD | | 24,000 | | | | RUB | | 564,360 | | | | 5/06/2009 | | | | (7,576 | ) |
See Notes to Financial Statements.
142
PIMCO HIGH YIELD FUND
| | |
| PORTFOLIO OF OTHER FINANCIAL INSTRUMENTS (Continued) |
| December 31, 2008 | | Sun Capital Advisers Trust |
| | | | | | | | | | | | | | | | | |
Contracts to Deliver | | In Exchange For | | | | Settlement Date | | | | Unrealized
Appreciation/
(Depreciation) ($) | |
| RUB | | 158,000 | | | | USD | | 5,000 | | | | 5/06/2009 | | | | 402 | |
| RUB | | 883,960 | | | | USD | | 28,000 | | | | 5/06/2009 | | | | 2,275 | |
| RUB | | 129,275 | | | | USD | | 3,888 | | | | 5/06/2009 | | | | 126 | |
| USD | | 42,558 | | | | BRL | | 80,967 | | | | 6/2/2009 | | | | (9,442 | ) |
| BRL | | 80,967 | | | | USD | | 32,413 | | | | 6/2/2009 | | | | (703 | ) |
| USD | | 10,000 | | | | CNY | | 64,425 | | | | 7/15/2009 | | | | (709 | ) |
| USD | | 10,000 | | | | CNY | | 64,475 | | | | 7/15/2009 | | | | (702 | ) |
| USD | | 20,000 | | | | CNY | | 129,180 | | | | 7/15/2009 | | | | (1,371 | ) |
| USD | | 2,000 | | | | CNY | | 12,896 | | | | 7/15/2009 | | | | (140 | ) |
| USD | | 20,000 | | | | CNY | | 130,584 | | | | 7/15/2009 | | | | (1,168 | ) |
| USD | | 10,000 | | | | SGD | | 14,464 | | | | 7/30/2009 | | | | 27 | |
| SGD | | 14,464 | | | | USD | | 10,087 | | | | 7/30/2009 | | | | 60 | |
| | | | | | | | | | | | | | | | | |
Net unrealized depreciation | | | | | | (38,555 | ) |
| | | | | | | | | | | | | | | | | |
| | | | |
| BRL | | — | | Brazilian Real |
| CNY | | — | | Yuan Renminbi |
| EUR | | — | | Euro Dollar |
| GBP | | — | | Great British Pound |
| MYR | | — | | Malaysian Ringgit |
| PHP | | — | | Philippine Peso |
| RUB | | — | | New Russian Ruble |
| SGD | | — | | Singapore Dollar |
| USD | | — | | United States Dollar |
At December 31, 2008, outstanding interest rate swap contracts were as follows:
| | | | | | | | | | | | | |
Counterparty | | Pay/Receive
Floating Rate | | Floating Rate Index | | Fixed
Rate | | Expiration
Date | | Notional
Amount
(000) | | Unrealized
Appreciation/
(Depreciation) ($) | |
Bank of America NA | | Receive | | 3-Month USD-LIBOR | | 5.00% | | 12/17/2028 | | 300 | | (102,665 | ) |
Barclays Capital, Inc. | | Receive | | 3-Month USD-LIBOR | | 5.00% | | 12/17/2038 | | 600 | | (283,818 | ) |
Merrill Lynch, Inc. | | Pay | | 3-Month USD-LIBOR | | 5.00% | | 12/17/2018 | | 100 | | 18,999 | |
Bank of America NA | | Receive | | 3-Month USD-LIBOR | | 5.00% | | 12/17/2038 | | 100 | | (49,285 | ) |
Goldman Sachs LP | | Pay | | 3-Month USD-LIBOR | | 4.00% | | 12/17/2013 | | 700 | | 65,913 | |
Barclays Capital, Inc. | | Pay | | 6-Month USD-LIBOR | | 4.00% | | 6/17/2014 | | 900 | | 11,236 | |
Citibank NA | | Pay | | 3-Month USD-LIBOR | | 4.00% | | 6/17/2014 | | 1,900 | | 28,792 | |
Bank of America NA | | Pay | | 3-Month USD-LIBOR | | 4.00% | | 6/17/2016 | | 100 | | 2,255 | |
| | | | | | | | | | | | | |
Net unrealized depreciation | | | | | | | | | | | | (308,573 | ) |
| | | | | | | | | | | | | |
| | | | |
| LIBOR | | — | | Represents the London InterBank Offered Rate |
| USD | | — | | United States Dollar |
See Notes to Financial Statements.
143
PIMCO HIGH YIELD FUND
| | |
| PORTFOLIO OF OTHER FINANCIAL INSTRUMENTS (Continued) |
| December 31, 2008 | | Sun Capital Advisers Trust |
At December 31, 2008, outstanding credit default swaps contracts-sell protection (1) were as follows:
| | | | | | | | | | | | | | | | | | | | |
Counterparty | | Reference
Obligation | | (Pay)/Receive
Fixed Rate | | Expiration
Date | | Implied
Credit
Spread | | | Notional
Amount (3)
(000) ($) | | Market
Value
(000) ($) | | | Upfront
Premiums
Paid/
(Received) ($) | | | Unrealized
Appreciation/
(Depreciation) ($) | |
Deutsche Bank AG | | GMAC LLC | | 5.00% | | 3/20/2012 | | 8.27% | (2) | | 60 | | 55 | | | (9,300 | ) | | 4,139 | |
UBS AG | | CDX High Yield 10 Year Index | | 5.00% | | 6/20/2013 | | 9.90% | | | 800 | | 673 | (4) | | (71,000 | ) | | (54,331 | ) |
Deutsche Bank AG | | CDX – High Yield 5 Year Index | | 1.50% | | 12/20/2013 | | 1.95% | | | 500 | | 490 | (4) | | (4,231 | ) | | (5,546 | ) |
Barclays Capital, Inc. | | SLM Corp. | | 5.00% | | 12/20/2013 | | 8.26% | (2) | | 50 | | 45 | | | (5,500 | ) | | 80 | |
| | | | | | | | | | | | | | | | | | | | |
Net unrealized depreciation | | | | | | | | | | | | | | | | | (55,658 | ) |
| | | | | | | | | | | | | | | | | | | | |
| (1) | If the Fund is a seller of protection and a credit event occurs, as defined under the terms of that particular swap agreement, the Fund will pay to the buyer of the protection an amount up to the notional amount of the swap and in certain instances, take delivery of the security. |
| (2) | Implied credit spreads, represented in absolute terms, utilized in determining the market value of credit default swap agreements on corporate issues as of period end serve as an indicator of the current status of the payment/performance risk and represent the likelihood or risk of default for the credit derivative. The implied credit spread of a particular referenced entity reflects the cost of selling protection and may include upfront payments required to be made to enter into the agreement. Wider credit spreads represent a deterioration of the referenced entity’s credit soundness and a greater likelihood or risk of default or other credit event occurring as defined under the terms of the agreement. |
| (3) | The maximum potential amount the Fund could be required to pay as a seller of credit protection if a credit event occurs as defined under the terms of that particular swap agreement. |
| (4) | The quoted market prices and resulting values for credit default swap contracts on credit indices serve as an indicator of the current status of the payment/performance risk and represent the likelihood of an expected liability (or profit) for the credit derivative had the notional amount of the swap agreement been closed/sold as of the period end. Increasing market values, in absolute terms when compared to the notional amount of the swap, represent a deterioration of the referenced entity’s credit soundness and a greater likelihood or risk of default or other credit event occurring as defined under the terms of the agreement. |
See Notes to Financial Statements.
144
PIMCO TOTAL RETURN FUND
| | |
PORTFOLIO OF INVESTMENTS December 31, 2008 | | Sun Capital Advisers Trust |
| | | | | | | | |
| | | Country
Code* | | Principal
Amount
(000) | | Value |
| | | | | | | | |
| | | | | | | | |
CORPORATE DEBT OBLIGATIONS – 21.7% |
BANKS – 5.7% |
Bank of America Corp. 5.75%, 12/1/17 (2) | | | | $ | 300 | | $ | 299,532 |
Bear Stearns Co., Inc. 5.30%, 10/30/15 (2) | | | | | 100 | | | 96,210 |
BNP Paribas 7.20%, 12/31/49 (1)(2) | | FR | | | 100 | | | 63,572 |
7.78%, 12/31/49 (2) | | FR | | | 100 | | | 106,642 |
Macquarie Bank Ltd. 4.10%, 12/17/13 (1) | | | | | 300 | | | 304,724 |
New York Community Bank 3.00%, 12/16/11 (2) | | | | | 200 | | | 205,362 |
PNC Funding Corp. 2.30%, 6/22/12 (2) | | | | | 200 | | | 201,998 |
Royal Bank of Scotland Group PLC
5.00%, 10/1/14 (2) | | | | | 100 | | | 85,718 |
6.99%, 10/29/49 (1)(2) | | | | | 200 | | | 93,507 |
SLM Corp. XU 4.75%, 3/17/14 (2) | | | | | 100 | | | 80,623 |
Sovereign Bancorp, Inc. 2.50%, 6/15/12 (2) | | | | | 200 | | | 202,962 |
State Street Capital Trust IV
3.00%, 6/15/37 (2) | | | | | 200 | | | 87,836 |
| | | | | | | | |
| | | | | | | | 1,828,686 |
| | | | | | | | |
BROKERAGE – 10.1% |
CIT Group, Inc. 4.75%, 12/15/10 (2) | | | | | 100 | | | 88,027 |
Citigroup Capital XXI 8.30%, 12/21/57 (2) | | | | | 400 | | | 308,495 |
Citigroup, Inc. 6.13%, 11/21/17 (2) | | | | | 200 | | | 202,108 |
8.40%, 4/29/49 (2) | | | | | 100 | | | 66,029 |
General Electric Capital Corp. 4.49%, 1/8/16 (2) | | | | | 100 | | | 73,638 |
6.15%, 8/7/37
Series A (2) | | | | | 100 | | | 100,262 |
JP Morgan Chase & Co. 7.90%, 4/29/49 (2) | | | | | 300 | | | 249,549 |
JP Morgan Chase Bank NA 2.33%, 6/13/16 (2) | | | | | 300 | | | 225,476 |
| | | | | | | | |
| | | Country
Code* | | Principal
Amount
(000) | | Value |
| | | | | | | | |
Merrill Lynch & Co., Inc. | | | | | | | | |
4.20%, 5/30/14 (2) | | GB | | $ | 100 | | $ | 109,633 |
6.88%, 4/25/18 (2) | | GB | | | 200 | | | 209,205 |
Shell International Finance B.V.
6.38%, 12/15/38 (2) | | | | | 1,000 | | | 1,124,989 |
The Goldman Sachs Group, Inc. | | | | | | | | |
5.95%, 1/18/18 (2) | | | | | 200 | | | 189,634 |
6.15%, 4/1/18 (2) | | | | | 100 | | | 96,096 |
6.25%, 9/1/17 (2) | | | | | 200 | | | 193,927 |
| | | | | | | | |
| | | | | | | | 3,237,068 |
| | | | | | | | |
FINANCIAL SERVICES – 2.8% |
Barnett Capital III
3.82%, 2/1/27 (2) | | | | | 200 | | | 90,003 |
Morgan Stanley
4.62%, 1/9/14 (2) | | | | | 500 | | | 346,222 |
5.95%, 12/28/17 (2) | | | | | 100 | | | 82,998 |
Wachovia Bank NA 2.33%, 3/15/16 (2) | | | | | 400 | | | 289,252 |
Wachovia Corp.
5.30%, 10/15/11 (2) | | | | | 100 | | | 96,443 |
| | | | | | | | |
| | | | | | | | 904,918 |
| | | | | | | | |
INSURANCE – 3.1% |
American General Finance Corp.
5.38%, 9/1/09 (2) | | | | | 100 | | | 71,517 |
American International Group, Inc.
5.05%, 10/1/15 (2) | | | | | 100 | | | 67,057 |
5.07%, 4/26/11 (2) | | | | | 100 | | | 75,308 |
5.45%, 5/18/17 (2) | | | | | 100 | | | 66,088 |
8.25%, 8/15/18 (1)(2) | | | | | 1,000 | | | 731,919 |
| | | | | | | | |
| | | | | | | | 1,011,889 |
| | | | | | | | |
Total Corporate Debt Obligations (cost $6,763,547) | | | | | | 6,982,561 |
| | | | | | | | |
U.S. TREASURY AND U.S. GOVERNMENT AGENCY OBLIGATIONS – 49.4% |
Federal Home Loan Mortgage Corp. 5.50%, TBA | | | | | 5,000 | | | 5,117,190 |
Federal National Mortgage Association
5.00%, TBA | | | | | 2,000 | | | 2,041,876 |
5.50%, TBA | | | | | 2,000 | | | 2,050,000 |
See Notes to Financial Statements.
145
PIMCO TOTAL RETURN FUND
| | |
PORTFOLIO OF INVESTMENTS (Continued) December 31, 2008 | | Sun Capital Advisers Trust |
| | | | | | | | |
| | | Country
Code* | | Principal
Amount
(000) | | Value |
| | | | | | | | |
| | | | | | | | |
Government National Mortgage Association | | | | | | | | |
5.50%, TBA | | | | $ | 2,000 | | $ | 2,059,376 |
6.00%, 2/15/38 (2) | | | | | 662 | | | 683,888 |
6.00%, 8/15/38 (2) | | | | | 26 | | | 27,066 |
6.00%, TBA | | | | | 2,500 | | | 2,578,905 |
6.50%, TBA | | | | | 1,000 | | | 1,039,688 |
United States Treasury Inflation Indexed Bonds | | | | | | | | |
2.00%, 1/15/26 (2) | | | | | 109 | | | 102,817 |
2.63%, 7/15/17 (2) | | | | | 209 | | | 214,237 |
| | | | | | | | |
Total U.S. Treasury and U.S. Government Agency Obligations (cost $15,753,507) | | | | | | 15,915,043 |
| | | | | | | | |
| | | | | Shares | | |
PREFERRED STOCKS – 0.8% |
BANKS – 0.8% |
Bank of America Corp.,
Series L
7.25%, 12/31/49 (2) | | | | | 200 | | | 130,000 |
Wachovia Corp., Series L 7.50%, 12/31/49 | | | | | 200 | | | 150,000 |
| | | | | | | | |
Total Preferred Stocks (cost $269,461) | | | | | | 280,000 |
| | | | | | | | |
| | | | | Principal
Amount
(000) | | |
SHORT TERM INVESTMENTS – 71.4% |
MUNICIPAL – 1.2% |
State Of Illinois
4.50%, 6/24/09 (2) (cost $400,988) | | | | $ | 401 | | | 400,988 |
| | | | | | | | |
REPURCHASE AGREEMENT – 2.2% |
State Street Bank and Trust Company, 0.01%, 1/2/09 (collateralized by $675,000 FHLB, 4.375%, 09/17/10, with a value of $718,335 total to be received $700,000 (cost $700,000) | | | | | 700 | | | 700,000 |
| | | | | | | | |
| | | | | | | | | |
| | | Country
Code* | | Principal
Amount
(000) | | Value | |
| | | | | | | | | |
U.S. GOVERNMENT AGENCY OBLIGATIONS – 63.9% | |
Federal Home Loan Bank Discount Notes
0.03%, 1/5/09 (2) | | | | $ | 300 | | $ | 299,999 | |
0.05%, 1/2/09 (2) | | | | | 4,800 | | | 4,799,991 | |
0.08%, 1/21/09 (2) | | | | | 5,200 | | | 5,199,711 | |
0.08%, 1/22/09 (2) | | | | | 5,600 | | | 5,599,739 | |
0.17%, 2/4/09 (2) | | | | | 300 | | | 299,952 | |
Federal Home Loan Mortgage Discount Notes
0.04%, 2/3/09 (2) | | | | | 700 | | | 699,974 | |
0.10%, 3/4/09 (2) | | | | | 500 | | | 499,940 | |
0.12%, 1/27/09 (2) | | | | | 1,300 | | | 1,299,887 | |
Federal National Mortgage Association Discount Notes | | | | | | | | | |
0.15%, 2/23/09 (2) | | | | | 1,000 | | | 999,706 | |
1.10%, 2/3/09 (2) | | | | | 900 | | | 899,092 | |
| | | | | | | | | |
Total U.S. Government Agency Obligations (cost $20,597,964) | | | | | | | | 20,597,991 | |
| | | | | | | | | |
| | | | | Shares | | | |
MUTUAL FUNDS – 4.1% | |
SSgA Treasury Fund (cost $1,307,900) | | | 1,307,900 | | | 1,307,900 | |
| | | | | | | | | |
Total Short Term Investments (cost $23,006,852) | | | | | | 23,006,879 | |
| | | | | | | | | |
TOTAL INVESTMENTS – 143.3% | | | | |
(cost $45,793,367) | | | | | | 46,184,483 | |
Liabilities in excess of other assets – (43.3)% | | | | | | (13,964,618 | ) |
| | | | | | | | | |
NET ASSETS – 100.0% | | | | | $ | 32,219,865 | |
| | | | | | | | | |
See Notes to Financial Statements.
146
PIMCO TOTAL RETURN FUND
| | |
PORTFOLIO OF INVESTMENTS (Continued) December 31, 2008 | | Sun Capital Advisers Trust |
| * | Unless otherwise noted the country code for all securities is United States. |
| (1) | Eligible for resale under rule 144A of the Securities Act of 1933. These securities may be resold in transactions exempt from registration, normally to qualified institutional buyers. At December 31, 2008, these securities amounted to $1,193,722 representing 3.7% of net assets. |
| (2) | Security or a portion of the security has been designated as collateral for futures and TBA securities. |
| TBA | To Be Announced. Securities are purchased on a forward commitment basis with an approximate principal amount and no defined maturity date. The actual principal and maturity date will be determined upon settlement when the specific mortgage pools are assigned. Total market value of TBA securities (excluding forward sales contracts, if any) amounts to $14,887,035 which represents approximately 46.2% of net assets as of December 31, 2008. |
| | | | |
| FR | | | | France |
| GB | | | | Great Britain |
| FHLB | | | | Federal Home Loan Bank |
See Notes to Financial Statements.
147
PIMCO TOTAL RETURN FUND
| | |
| PORTFOLIO OF OTHER FINANCIAL INSTRUMENTS |
| December 31, 2008 | | Sun Capital Advisers Trust |
At December 31, 2008, open futures contracts purchased were as follows:
| | | | | | | | | | |
Futures | | Expiration
Date | | Contracts | | Aggregated
Face
Value ($) | | Notional
Value ($) | | Unrealized
Appreciation ($) |
German Euro-Bobl Futures | | 3/6/09 | | 2 | | 320,462 | | 323,075 | | 2,613 |
3 Month Sterling Interest Rate Futures | | 3/18/09 | | 6 | | 1,049,335 | | 1,059,281 | | 9,946 |
90 Day Eurodollar Futures | | 6/15/09 | | 30 | | 7,345,125 | | 7,415,250 | | 70,125 |
5 Year U.S. Treasury Note Futures | | 3/31/09 | | 27 | | 3,182,953 | | 3,214,477 | | 31,524 |
10 Year U.S. Treasury Note Futures | | 3/20/09 | | 15 | | 1,850,453 | | 1,886,250 | | 35,797 |
| | | | | | | | | | |
Net unrealized appreciation | | | | | | | | | | 150,005 |
| | | | | | | | | | |
At December 31, 2008, open forward foreign currency exchange contracts were as follows:
| | | | | | | | | | | | | | | | | |
Contracts to Deliver | | In Exchange For | | | | Settlement Date | | | | Unrealized
Appreciation/
(Depreciation) ($) | |
| EUR | | 155,000 | | | | USD | | 194,355 | | | | 1/13/2009 | | | | (21,022 | ) |
| EUR | | 77,000 | | | | USD | | 97,254 | | | | 1/13/2009 | | | | (9,740 | ) |
| EUR | | 64,000 | | | | USD | | 81,331 | | | | 1/13/2009 | | | | (7,599 | ) |
| GBP | | 7,000 | | | | USD | | 10,477 | | | | 1/13/2009 | | | | 415 | |
| GBP | | 1,000 | | | | USD | | 1,532 | | | | 1/13/2009 | | | | 95 | |
| | | | | | | | | | | | | | | | | |
Net unrealized depreciation | | | | (37,851 | ) |
| | | | | | | | | | | | | | | | | |
| | | | |
| EUR | | — | | Euro |
| GBP | | — | | Great British Pound |
| USD | | — | | United States Dollar |
See Notes to Financial Statements.
148
AIM SMALL CAP GROWTH FUND
| | |
PORTFOLIO OF INVESTMENTS December 31, 2008 | | Sun Capital Advisers Trust |
| | | | | |
| | | Shares | | Value |
| | | | | |
| | | | | |
COMMON STOCKS – 97.0% | | | | | |
AEROSPACE & DEFENSE – 1.9% | | | | | |
Hexcel Corp.* | | 2,596 | | $ | 19,185 |
TransDigm Group, Inc.* | | 1,681 | | | 56,431 |
| | | | | |
| | | | | 75,616 |
| | | | | |
AIR FREIGHT & LOGISTICS – 2.1% | | | | | |
Forward Air Corp. | | 1,681 | | | 40,798 |
HUB Group, Inc.* | | 1,681 | | | 44,597 |
| | | | | |
| | | | | 85,395 |
| | | | | |
BIOTECHNOLOGY – 6.9% | | | | | |
Acorda Therapeutics, Inc.* | | 1,448 | | | 29,698 |
BioMarin Pharmaceutical, Inc.* | | 2,406 | | | 42,827 |
Cepheid, Inc.* | | 2,222 | | | 23,064 |
Human Genome Sciences, Inc.* | | 2,972 | | | 6,301 |
Martek Biosciences Corp. | | 1,306 | | | 39,585 |
Myriad Group, Inc.* | | 1,118 | | | 74,079 |
OSI Pharmaceuticals, Inc.* | | 746 | | | 29,131 |
United Therapeutics Corp.* | | 554 | | | 34,653 |
| | | | | |
| | | | | 279,338 |
| | | | | |
CAPITAL MARKETS – 4.0% | | | | | |
Affiliated Managers Group, Inc.* | | 742 | | | 31,105 |
Greenhill & Co., Inc. | | 880 | | | 61,398 |
optionsXpress Holdings, Inc. | | 2,034 | | | 27,174 |
Stifel Financial Corp.* | | 931 | | | 42,686 |
| | | | | |
| | | | | 162,363 |
| | | | | |
CHEMICALS – 0.9% | | | | | |
Calgon Carbon Corp.* | | 2,406 | | | 36,956 |
| | | | | |
COMMERCIAL BANKS – 1.5% | | | | | |
City National Corp. | | 742 | | | 36,136 |
SVB Financial Group* | | 1,005 | | | 26,361 |
| | | | | |
| | | | | 62,497 |
| | | | | |
COMMERCIAL SERVICES & SUPPLIES – 5.7% |
Costar Group, Inc.* | | 1,493 | | | 49,179 |
EnergySolutions, Inc. | | 2,596 | | | 14,667 |
Fuel Tech, Inc.* | | 2,596 | | | 27,492 |
Interface, Inc. | | 3,718 | | | 17,252 |
Pike Electric Corp.* | | 3,718 | | | 45,731 |
Tetra Tech, Inc.* | | 3,178 | | | 76,749 |
| | | | | |
| | | | | 231,070 |
| | | | | |
COMMUNICATIONS EQUIPMENT – 3.5% |
Harmonic, Inc.* | | 5,950 | | | 33,380 |
Nice Systems, Ltd.* | | 1,866 | | | 41,929 |
Polycom, Inc.* | | 2,430 | | | 32,829 |
Starent Networks Corp.* | | 2,970 | | | 35,432 |
| | | | | |
| | | | | 143,570 |
| | | | | |
| | | | | |
| | | Shares | | Value |
| | | | | |
CONSTRUCTION & ENGINEERING – 0.6% |
Quanta Services, Inc.* | | 1,306 | | $ | 25,859 |
| | | | | |
CONTAINERS & PACKAGING – 0.9% |
Greif, Inc., Class A | | 1,118 | | | 37,375 |
| | | | | |
DIVERSIFIED CONSUMER SERVICES – 2.6% |
DeVry, Inc. | | 891 | | | 51,152 |
Strayer Education, Inc. | | 262 | | | 56,176 |
| | | | | |
| | | | | 107,328 |
| | | | | |
ELECTRIC UTILITIES – 1.0% | | | | | |
ITC Holdings Corp. | | 931 | | | 40,666 |
| | | | | |
ELECTRICAL EQUIPMENT – 1.7% | | | | | |
General Cable Corp.* | | 1,471 | | | 26,022 |
Regal-Beloit Corp. | | 1,118 | | | 42,473 |
| | | | | |
| | | | | 68,495 |
| | | | | |
ELECTRONIC EQUIPMENT & INSTRUMENTS – 2.7% |
Cogent, Inc.* | | 4,284 | | | 58,134 |
Coherent, Inc.* | | 931 | | | 19,979 |
Tech Data Corp.* | | 1,681 | | | 29,989 |
| | | | | |
| | | | | 108,102 |
| | | | | |
ENERGY EQUIPMENT & SERVICES – 2.4% |
Dril-Quip, Inc.* | | 1,306 | | | 26,786 |
FMC Technologies, Inc.* | | 931 | | | 22,186 |
Ion Geophysical Corp.* | | 3,502 | | | 12,012 |
Unit Corp.* | | 1,306 | | | 34,896 |
| | | | | |
| | | | | 95,880 |
| | | | | |
FOOD PRODUCTS – 1.3% | | | | | |
Ralcorp Holdings, Inc.* | | 931 | | | 54,370 |
| | | | | |
HEALTH CARE EQUIPMENT & SUPPLIES – 5.9% |
Gen-probe, Inc.* | | 767 | | | 32,858 |
Insulet Corp.* | | 2,222 | | | 17,154 |
Mentor Corp. | | 1,248 | | | 38,601 |
Meridian Bioscience, Inc. | | 1,866 | | | 47,527 |
NuVasive, Inc.* | | 1,424 | | | 49,341 |
Wright Medical Group, Inc.* | | 1,548 | | | 31,626 |
Zoll Medical Corp.* | | 1,306 | | | 24,670 |
| | | | | |
| | | | | 241,777 |
| | | | | |
HEALTH CARE PROVIDERS & SERVICES – 5.0% |
Chemed Corp. | | 1,118 | | | 44,463 |
nventive Health, Inc.* | | 2,034 | | | 23,472 |
LifePoint Hospitals, Inc.* | | 1,681 | | | 38,394 |
MEDNAX, Inc.* | | 931 | | | 29,513 |
PSS World Medical, Inc.* | | 1,550 | | | 29,171 |
VCA Antech, Inc.* | | 1,867 | | | 37,116 |
| | | | | |
| | | | | 202,129 |
| | | | | |
See Notes to Financial Statements.
149
AIM SMALL CAP GROWTH FUND
| | |
PORTFOLIO OF INVESTMENTS (Continued) December 31, 2008 | | Sun Capital Advisers Trust |
| | | | | |
| | | Shares | | Value |
| | | | | |
| | | | | |
HEALTH CARE TECHNOLOGY – 1.2% |
Eclipsys Corp.* | | 3,345 | | $ | 47,466 |
| | | | | |
HOTELS, RESTAURANTS & LEISURE – 3.9% |
Buffalo Wild Wings, Inc.* | | 1,306 | | | 33,499 |
Choice Hotels, Inc. | | 1,306 | | | 39,258 |
Jack In The Box, Inc.* | | 2,406 | | | 53,149 |
P.F. Chang’s China Bistro, Inc.* | | 1,493 | | | 31,263 |
| | | | | |
| | | | | 157,169 |
| | | | | |
HOUSEHOLD PRODUCTS – 1.2% | | | | | |
Church & Dwight Co., Inc. | | 859 | | | 48,207 |
| | | | | |
INSURANCE – 1.2% | | | | | |
ProAssurance Corp.* | | 931 | | | 49,138 |
| | | | | |
INTERNET SOFTWARE & SERVICES – 2.2% |
Bankrate, Inc.* | | 1,118 | | | 42,484 |
Omniture, Inc.* | | 1,284 | | | 13,662 |
Websense, Inc.* | | 2,241 | | | 33,548 |
| | | | | |
| | | | | 89,694 |
| | | | | |
IT SERVICES – 3.4% | | | | | |
Global Payments, Inc. | | 931 | | | 30,527 |
Neustar, Inc., Class A* | | 1,962 | | | 37,533 |
SRA International, Inc.* | | 2,027 | | | 34,966 |
Syntel, Inc. | | 1,493 | | | 34,518 |
| | | | | |
| | | | | 137,544 |
| | | | | |
LIFE SCIENCES TOOLS & SERVICES – 2.5% |
AMAG Pharmaceuticals, Inc.* | | 893 | | | 32,014 |
Parexel International Corp.* | | 2,222 | | | 21,576 |
Techne Corp. | | 80 | | | 5,161 |
Varian, Inc.* | | 1,306 | | | 43,764 |
| | | | | |
| | | | | 102,515 |
| | | | | |
MACHINERY – 3.7% | | | | | |
Barnes Group, Inc. | | 2,222 | | | 32,219 |
Bucyrus International, Inc. | | 931 | | | 17,242 |
Dynamic Materials Corp. | | 1,660 | | | 32,055 |
Lindsay Manufacturing Co. | | 742 | | | 23,588 |
Wabtec Corp. | | 1,118 | | | 44,440 |
| | | | | |
| | | | | 149,544 |
| | | | | |
MEDIA – 1.9% | | | | | |
Live Nation, Inc.* | | 2,596 | | | 14,901 |
Marvel Entertainment, Inc.* | | 1,736 | | | 53,382 |
National CineMedia, Inc. | | 1,049 | | | 10,637 |
| | | | | |
| | | | | 78,920 |
| | | | | |
METALS & MINING – 0.6% | | | | | |
Carpenter Technology Corp. | | 1,118 | | | 22,964 |
| | | | | |
| | | | | |
| | | Shares | | Value |
| | | | | |
MULTI-LINE RETAIL – 0.5% | | | | | |
Big Lots, Inc.* | | 1,493 | | $ | 21,634 |
| | | | | |
OIL & GAS-EXPLORATION & PRODUCTION – 4.0% |
Arena Resources, Inc.* | | 1,681 | | | 47,219 |
Bill Barrett Corp.* | | 1,866 | | | 39,429 |
Carrizo Oil & Gas, Inc.* | | 1,493 | | | 24,037 |
Goodrich Petroleum Corp.* | | 1,118 | | | 33,484 |
Whiting Petroleum Corp.* | | 554 | | | 18,537 |
| | | | | |
| | | | | 162,706 |
| | | | | |
PHARMACEUTICALS – 1.5% | | | | | |
Medicine Co.* | | 2,406 | | | 35,440 |
Perrigo Co. | | 768 | | | 24,814 |
| | | | | |
| | | | | 60,254 |
| | | | | |
REAL ESTATE INVESTMENT TRUSTS – 0.7% |
BioMed Realty Trust, Inc. | | 2,542 | | | 29,792 |
| | | | | |
ROAD & RAIL – 1.4% | | | | | |
Knight Transportation, Inc. | | 3,531 | | | 56,920 |
| | | | | |
SEMICONDUCTORS & SEMICONDUCTOR EQUIPMENT – 5.8% |
Advanced Energy Industries, Inc.* | | 3,345 | | | 33,283 |
Hittite Microwave Corp.* | | 1,118 | | | 32,936 |
Microsemi Corp.* | | 2,053 | | | 25,950 |
Monolithic Power Systems, Inc.* | | 2,131 | | | 26,872 |
Power Integrations, Inc. | | 1,681 | | | 33,418 |
Silicon Laboratories, Inc.* | | 1,866 | | | 46,240 |
Varian Semiconductor Equipment Associates, Inc.* | | 2,053 | | | 37,200 |
| | | | | |
| | | | | 235,899 |
| | | | | |
SOFTWARE – 6.0% | | | | | |
ANSYS, Inc.* | | 1,404 | | | 39,157 |
Aspen Technology, Inc.* | | 3,718 | | | 27,588 |
Blackboard, Inc.* | | 1,430 | | | 37,509 |
Informatica Corp.* | | 3,345 | | | 45,927 |
Lawson Software, Inc.* | | 3,619 | | | 17,154 |
Manhattan Associates, Inc.* | | 1,612 | | | 25,486 |
Quality Systems, Inc. | | 1,223 | | | 53,347 |
| | | | | |
| | | | | 246,168 |
| | | | | |
SPECIALTY RETAIL – 2.7% | | | | | |
AnnTaylor Stores Corp.* | | 2,222 | | | 12,821 |
Hot Topic, Inc.* | | 5,950 | | | 55,157 |
Tractor Supply Co.* | | 645 | | | 23,310 |
Zumiez, Inc.* | | 2,785 | | | 20,748 |
| | | | | |
| | | | | 112,036 |
| | | | | |
See Notes to Financial Statements.
150
AIM SMALL CAP GROWTH FUND
| | |
PORTFOLIO OF INVESTMENTS (Continued) December 31, 2008 | | Sun Capital Advisers Trust |
| | | | | |
| | | Shares | | Value |
| | | | | |
| | | | | |
TEXTILES, APPAREL & LUXURY GOODS – 0.8% |
Warnaco Group, Inc.* | | 1,682 | | $ | 33,018 |
| | | | | |
TRADING COMPANIES & DISTRIBUTORS – 0.5% |
WESCO International, Inc.* | | 1,119 | | | 21,518 |
| | | | | |
WIRELESS TELECOMMUNICATION SERVICES – 0.7% |
SBA Communications Corp.* | | 1,867 | | | 30,468 |
| | | | | |
Total Common Stocks
(cost $4,532,406) | | | | | 3,952,360 |
| | | | | |
| | | | | | | |
| | | Principal
Amount
(000) | | Value | |
| | | | | | | |
SHORT TERM INVESTMENTS – 8.0% | |
REPURCHASE AGREEMENT – 8.0% | |
State Street Bank and Trust Company, 0.01%, 1/02/09 (collateralized by $315,000 FHLB, 4.375%, 9/17/2010, with a value of $335,381 total to be received $323,845) (cost $323,845) | | $ | 324 | | $ | 323,845 | |
| | | | | | | |
TOTAL INVESTMENTS – 105.0% | | | | |
(cost $4,856,251) | | | | | | 4,276,205 | |
Liabilities in excess of other assets – (5.0)% | | | | | | (201,944 | ) |
| | | | | | | |
NET ASSETS – 100.0% | | | | | $ | 4,074,261 | |
| | | | | | | |
| * | Non-income producing security |
| FHLB | Federal Home Loan Bank |
See Notes to Financial Statements.
151
ALLIANCEBERNSTEIN INTERNATIONAL VALUE FUND
| | |
PORTFOLIO OF INVESTMENTS December 31, 2008 | | Sun Capital Advisers Trust |
| | | | | | | |
| | | Country
Code** | | Shares | | Value |
| | | | | | | |
| | | | | | | |
COMMON STOCKS – 94.6% |
AEROSPACE & DEFENSE – 1.1% |
Bombardier, Inc. | | CA | | 10,600 | | $ | 38,210 |
European Aeronautic Defence And Space Co., NV | | FR | | 5,190 | | | 87,894 |
| | | | | | | |
| | | | | | | 126,104 |
| | | | | | | |
AIR FREIGHT & LOGISTICS – 0.1% |
Deutsche Post AG | | DE | | 480 | | | 8,119 |
| | | | | | | |
AIRLINES – 0.4% |
Qantas Airways, Ltd. | | AU | | 25,200 | | | 46,426 |
| | | | | | | |
AUTO COMPONENTS – 1.1% |
Bridgestone Corp. | | JP | | 300 | | | 4,500 |
Compagnie Generale Des Etablissements Michelin | | FR | | 1,700 | | | 89,817 |
Magna International, Inc. | | CA | | 1,000 | | | 29,769 |
| | | | | | | |
| | | | | | | 124,086 |
| | | | | | | |
AUTOMOBILES – 4.1% |
Daimler AG | | DE | | 500 | | | 19,051 |
Honda Motor Co., Ltd. | | JP | | 5,300 | | | 112,883 |
Isuzu Motors, Ltd. | | JP | | 19,000 | | | 24,551 |
Nissan Motor Co., Ltd. | | JP | | 23,800 | | | 85,624 |
Renault SA | | FR | | 3,200 | | | 83,507 |
Toyota Motor Corp. | | JP | | 4,800 | | | 158,680 |
| | | | | | | |
| | | | | | | 484,296 |
| | | | | | | |
CAPITAL MARKETS – 3.5% |
Credit Suisse Group AG | | CH | | 4,300 | | | 120,505 |
Deutsche Bank AG | | DE | | 3,500 | | | 138,412 |
Macquarie International Infrastructure Fund, Ltd. | | SG | | 108,000 | | | 22,182 |
UBS AG* | | CH | | 8,954 | | | 130,275 |
| | | | | | | |
| | | | | | | 411,374 |
| | | | | | | |
CHEMICALS – 2.3% |
Arkema SA | | FR | | 300 | | | 5,170 |
Basf SE | | DE | | 3,300 | | | 128,217 |
Lanxess AG | | DE | | 500 | | | 9,750 |
Methanex Corp. | | CA | | 1,800 | | | 19,976 |
Mitsubishi Chemical Holdings Corp. | | JP | | 13,500 | | | 59,820 |
| | | | | | | |
| | | Country
Code** | | Shares | | Value |
| | | | | | | |
Solvay SA | | BE | | 700 | | $ | 51,979 |
| | | | | | | |
| | | | | | | 274,912 |
| | | | | | | |
COMMERCIAL BANKS – 13.2% |
Australia & New Zealand Banking Group, Ltd. | | AU | | 4,500 | | | 48,583 |
Banco Santander SA | | ES | | 9,825 | | | 94,916 |
Barclays PLC | | GB | | 58,800 | | | 133,646 |
BNP Paribas | | FR | | 3,200 | | | 138,126 |
Commonwealth Bank of Australia | | AU | | 2,200 | | | 45,266 |
Credit Agricole SA | | FR | | 9,040 | | | 101,538 |
HBOS PLC* | | GB | | 87,770 | | | 90,857 |
HSBC Holdings PLC | | GB | | 19,400 | | | 189,871 |
Intesa Sanpaolo SpA | | IT | | 18,800 | | | 68,295 |
KB Financial Group, Inc.* | | | | 800 | | | 20,960 |
Lloyds TSB Group PLC | | GB | | 22,600 | | | 42,775 |
Mizuho Financial Group, Inc. | | JP | | 14 | | | 39,799 |
National Australia Bank, Ltd. | | AU | | 6,400 | | | 94,091 |
National Bank of Canada | | CA | | 300 | | | 7,606 |
National Bank of Greece S.A. | | GR | | 300 | | | 5,571 |
Nordea Bank AB | | SE | | 10,000 | | | 71,277 |
Royal Bank of Scotland Group PLC | | GB | | 153,100 | | | 112,701 |
Societe Generale | | FR | | 2,300 | | | 116,686 |
Sumitomo Mitsui Financial Group, Inc. | | JP | | 25 | | | 103,696 |
UniCredit SpA | | IT | | 13,800 | | | 35,087 |
| | | | | | | |
| | | | | | | 1,561,347 |
| | | | | | | |
COMMERCIAL SERVICES & SUPPLIES – 0.3% |
G4S PLC | | GB | | 13,100 | | | 38,611 |
| | | | | | | |
COMMUNICATIONS EQUIPMENT – 2.2% |
Nokia Oyj | | FI | | 10,100 | | | 158,493 |
Telefonaktiebolaget LM Ericsson | | SE | | 13,400 | | | 104,465 |
| | | | | | | |
| | | | | | | 262,958 |
| | | | | | | |
COMPUTERS & PERIPHERALS – 1.7% |
Fujitsu, Ltd. | | JP | | 20,000 | | | 97,240 |
Toshiba Corp. | | JP | | 25,000 | | | 102,870 |
| | | | | | | |
| | | | | | | 200,110 |
| | | | | | | |
See Notes to Financial Statements.
152
ALLIANCEBERNSTEIN INTERNATIONAL VALUE FUND
| | |
PORTFOLIO OF INVESTMENTS (Continued) December 31, 2008 | | Sun Capital Advisers Trust |
| | | | | | | |
| | | Country
Code** | | Shares | | Value |
| | | | | | | |
| | | | | | | |
CONSTRUCTION & ENGINEERING – 0.1% |
Bilfinger Berger AG | | DE | | 200 | | $ | 10,705 |
| | | | | | | |
CONTAINERS & PACKAGING – 0.3% |
Amcor, Ltd. | | AU | | 9,100 | | | 36,981 |
| | | | | | | |
DIVERSIFIED FINANCIAL SERVICES – 0.8% |
ING Groep NV | | NL | | 8,300 | | | 91,349 |
| | | | | | | |
DIVERSIFIED TELECOMMUNICATION
SERVICES – 6.6% |
BCE, Inc. | | CA | | 3,800 | | | 77,354 |
Deutsche Telekom AG | | DE | | 6,600 | | | 99,788 |
France Telecom SA | | FR | | 4,600 | | | 128,215 |
Nippon Telegraph & Telephone Corp. | | JP | | 20 | | | 103,254 |
Telecom Corp of New Zealand, Ltd. | | AU | | 14,000 | | | 18,734 |
Telecom Italia SpA | | IT | | 48,600 | | | 79,955 |
Telecom Italia SpA | | IT | | 21,100 | | | 24,024 |
Telefonica SA | | ES | | 9,600 | | | 216,688 |
Telstra Corp., Ltd. | | AU | | 11,400 | | | 30,441 |
| | | | | | | |
| | | | | | | 778,453 |
| | | | | | | |
ELECTRIC UTILITIES – 3.3% |
Chubu Electric Power Co., Inc. | | JP | | 800 | | | 24,366 |
E.ON AG | | DE | | 4,500 | | | 176,702 |
Enel SpA | | IT | | 5,600 | | | 36,073 |
The Kansai Electric Power Co., Inc. | | JP | | 900 | | | 26,069 |
The Tokyo Electric Power Co., Inc. | | JP | | 3,300 | | | 110,160 |
Tohoku Electric Power Co., Inc. | | JP | | 500 | | | 13,526 |
| | | | | | | |
| | | | | | | 386,896 |
| | | | | | | |
ELECTRICAL EQUIPMENT – 0.3% |
Furukawa Electric Co., Ltd. | | JP | | 5,000 | | | 24,401 |
Schneider Electric SA | | FR | | 100 | | | 7,445 |
| | | | | | | |
| | | | | | | 31,846 |
| | | | | | | |
ELECTRONIC EQUIPMENT & INSTRUMENTS – 1.6% |
FUJIFILM Holdings Corp. | | JP | | 700 | | | 15,627 |
Hitachi High-Technologies Corp. | | JP | | 1,100 | | | 17,615 |
Hitachi, Ltd. | | JP | | 20,000 | | | 77,618 |
KYOCERA Corp. | | JP | | 700 | | | 50,679 |
| | | | | | | |
| | | Country
Code** | | Shares | | Value |
| | | | | | | |
Premier Farnell PLC | | GB | | 15,900 | | $ | 32,393 |
| | | | | | | |
| | | | | | | 193,932 |
| | | | | | | |
EXCHANGE TRADED FUND – 0.4% |
Ishares MSCI Eafe Index Fund | | | | 1,000 | | | 44,870 |
| | | | | | | |
FOOD & STAPLES RETAILING – 2.4% |
Aeon Co., Ltd | | JP | | 7,300 | | | 73,516 |
Awb, Ltd. | | AU | | 11,400 | | | 20,320 |
Carrefour SA | | FR | | 800 | | | 30,923 |
Delhaize Group | | BE | | 900 | | | 55,635 |
J Sainsbury PLC | | GB | | 13,700 | | | 65,377 |
Seven & I Holdings Co., Ltd. | | JP | | 1,000 | | | 34,372 |
| | | | | | | |
| | | | | | | 280,143 |
| | | | | | | |
FOOD PRODUCTS – 2.3% |
Associated British Foods PLC | | GB | | 8,100 | | | 85,271 |
Groupe Danone | | FR | | 600 | | | 36,252 |
Nestle SA | | CH | | 2,327 | | | 92,145 |
Suedzucker AG | | DE | | 1,900 | | | 28,784 |
Tate & Lyle PLC | | GB | | 5,100 | | | 29,716 |
| | | | | | | |
| | | | | | | 272,168 |
| | | | | | | |
GAS UTILITIES – 0.1% |
Tokyo Gas Co., Ltd. | | JP | | 3,000 | | | 15,207 |
| | | | | | | |
HEALTH CARE PROVIDERS & SERVICES – 0.3% |
Celesio AG | | DE | | 1,200 | | | 32,469 |
| | | | | | | |
HOTELS, RESTAURANTS & LEISURE – 1.6% |
Tabcorp Holdings, Ltd. | | AU | | 11,700 | | | 57,243 |
Thomas Cook Group PLC | | GB | | 18,900 | | | 48,331 |
Tui AG | | DE | | 4,000 | | | 47,519 |
Tui Travel PLC | | GB | | 11,300 | | | 38,302 |
| | | | | | | |
| | | | | | | 191,395 |
| | | | | | | |
HOUSEHOLD DURABLES – 1.9% |
Panosonic Corp. | | JP | | 3,000 | | | 36,877 |
Sharp Corp. | | JP | | 13,000 | | | 93,710 |
Sony Corp. | | JP | | 4,000 | | | 87,488 |
| | | | | | | |
| | | | | | | 218,075 |
| | | | | | | |
INDEPENDENT POWER PRODUCERS & ENERGY TRADERS – 0.5% |
Drax Group PLC | | GB | | 7,200 | | | 58,448 |
| | | | | | | |
See Notes to Financial Statements.
153
ALLIANCEBERNSTEIN INTERNATIONAL VALUE FUND
| | |
PORTFOLIO OF INVESTMENTS (Continued) December 31, 2008 | | Sun Capital Advisers Trust |
| | | | | | | |
| | | Country
Code** | | Shares | | Value |
| | | | | | | |
| | | | | | | |
INDUSTRIAL CONGLOMERATES – 0.9% |
Koninklijke Philips Electronics NV | | NL | | 4,850 | | $ | 96,159 |
Siemens AG | | DE | | 200 | | | 15,057 |
| | | | | | | |
| | | | | | | 111,216 |
| | | | | | | |
INSURANCE – 4.2% |
Allianz SE | | DE | | 1,400 | | | 148,961 |
Amlin PLC | | GB | | 5,300 | | | 27,549 |
Assicurazioni Generali SpA | | IT | | 600 | | | 16,566 |
Catlin Group, Ltd. | | GB | | 5,700 | | | 35,879 |
Fairfax Financial Holdings, Ltd. | | CA | | 150 | | | 47,388 |
Industrial Alliance Insurance and Financial Services, Inc. | | CA | | 700 | | | 13,217 |
Muenchener Rueckversicherungs AG | | DE | | 850 | | | 131,960 |
Prudential PLC | | GB | | 11,500 | | | 69,807 |
Swiss Reinsurance | | CH | | 185 | | | 9,059 |
| | | | | | | |
| | | | | | | 500,386 |
| | | | | | | |
LEISURE EQUIPMENT & PRODUCTS – 0.2% |
Namco Bandai Holdings, Inc. | | JP | | 2,500 | | | 27,401 |
| | | | | | | |
MACHINERY – 0.8% |
Vallourec SA* | | FR | | 500 | | | 56,850 |
Volvo AB | | SE | | 6,800 | | | 38,697 |
| | | | | | | |
| | | | | | | 95,547 |
| | | | | | | |
MARINE – 0.3% |
Mitsui Osk Lines, Ltd. | | JP | | 5,000 | | | 30,901 |
Neptune Orient Lines, Ltd. | | SG | | 10,000 | | | 7,859 |
| | | | | | | |
| | | | | | | 38,760 |
| | | | | | | |
METALS & MINING – 3.6% |
Anglo American PLC | | GB | | 300 | | | 7,001 |
Arcelormittal | | FR | | 4,200 | | | 101,805 |
Barrick Gold Corp. | | CA | | 300 | | | 10,865 |
BHP Billiton, Ltd. | | AU | | 5,000 | | | 106,221 |
First Quantum Minerals, Ltd. | | CA | | 400 | | | 5,706 |
JFE Holdings, Inc. | | JP | | 2,400 | | | 63,782 |
MMC Norilsk Nickel | | | | 1,528 | | | 9,794 |
Nippon Steel Corp. | | JP | | 7,000 | | | 23,004 |
| | | | | | | |
| | | Country
Code** | | Shares | | Value |
| | | | | | | |
| | | | | | | |
Sumitomo Metal Mining Co., Ltd. | | JP | | 7,000 | | $ | 74,883 |
Yamato Kogyo Co., Ltd. | | JP | | 600 | | | 16,239 |
| | | | | | | |
| | | | | | | 419,300 |
| | | | | | | |
MULTI-UTILITIES – 2.2% |
A2a SpA | | IT | | 26,500 | | | 47,642 |
Centrica PLC | | GB | | 23,400 | | | 90,086 |
GDF Suez | | FR | | 1,600 | | | 79,419 |
RWE AG | | DE | | 420 | | | 37,303 |
| | | | | | | |
| | | | | | | 254,450 |
| | | | | | | |
OFFICE ELECTRONICS – 0.5% |
Canon, Inc. | | JP | | 2,000 | | | 63,369 |
| | | | | | | |
OIL & GAS CONSUMABLE FUELS – 11.9% |
Addax Petroleum Corp. | | CA | | 1,900 | | | 32,459 |
BP PLC | | GB | | 34,900 | | | 269,408 |
China Petroleum & Chemical Corp. | | HK | | 104,000 | | | 63,925 |
Eni SpA | | IT | | 7,100 | | | 170,852 |
Lukoil | | | | 1,500 | | | 48,555 |
Petro | | CA | | 4,100 | | | 88,742 |
Repsol YPF SA | | ES | | 800 | | | 17,080 |
Royal Dutch Shell PLC | | NL | | 12,200 | | | 322,563 |
Statoilhydro ASA | | NO | | 9,300 | | | 155,540 |
Total SA | | FR | | 4,400 | | | 241,909 |
| | | | | | | |
| | | | | | | 1,411,033 |
| | | | | | | |
PAPER & FOREST PRODUCTS – 0.2% |
Mondi PLC | | GB | | 7,500 | | | 22,325 |
| | | | | | | |
PERSONAL PRODUCTS – 0.1% |
L’oreal SA | | FR | | 100 | | | 8,727 |
| | | | | | | |
PHARMACEUTICALS – 8.2% |
Astellas Pharma, Inc. | | JP | | 600 | | | 24,559 |
AstraZeneca PLC | | GB | | 1,900 | | | 77,730 |
Bayer AG | | DE | | 2,500 | | | 145,671 |
Daiichi Sankyo Co., Ltd. | | JP | | 1,100 | | | 26,013 |
GlaxoSmithKline PLC | | GB | | 11,700 | | | 217,593 |
Novartis AG | | CH | | 4,680 | | | 234,381 |
Novo Nordisk AS | | DK | | 450 | | | 23,213 |
Roche Holding AG* | | CH | | 200 | | | 30,964 |
Sanofi-Aventis SA | | FR | | 2,600 | | | 166,304 |
Takeda Pharmaceutical Co., Ltd. | | JP | | 400 | | | 20,849 |
| | | | | | | |
| | | | | | | 967,277 |
| | | | | | | |
See Notes to Financial Statements.
154
ALLIANCEBERNSTEIN INTERNATIONAL VALUE FUND
| | |
PORTFOLIO OF INVESTMENTS (Continued) December 31, 2008 | | Sun Capital Advisers Trust |
| | | | | | | |
| | | Country
Code** | | Shares | | Value |
| | | | | | | |
| | | | | | | |
REAL ESTATE MANAGEMENT & DEVELOPMENT – 0.7% |
Lend Lease Corp., Ltd. | | AU | | 5,200 | | $ | 26,203 |
Mitsui Fudosan Co., Ltd. | | JP | | 1,000 | | | 16,672 |
New World Development, Ltd. | | HK | | 35,000 | | | 35,837 |
| | | | | | | |
| | | | | | | 78,712 |
| | | | | | | |
ROAD & RAIL – 1.7% |
Arriva PLC | | GB | | 5,200 | | | 45,280 |
Central Japan Railway Co. | | JP | | 3 | | | 26,018 |
East Japan Railway Co. | | JP | | 12 | | | 91,208 |
FirstGroup PLC | | GB | | 6,700 | | | 42,371 |
| | | | | | | |
| | | | | | | 204,877 |
| | | | | | | |
SEMICONDUCTORS & SEMICONDUCTOR EQUIPMENT – 0.5% |
Elpida Memory, Inc.* | | JP | | 4,000 | | | 24,743 |
Samsung Electronics Co., Ltd. (1) | | HK | | 200 | | | 35,229 |
| | | | | | | |
| | | | | | | 59,972 |
| | | | | | | |
SPECIALTY RETAIL – 0.3% |
Kesa Electricals PLC | | GB | | 31,650 | | | 40,700 |
| | | | | | | |
TEXTILES, APPAREL & LUXURY GOODS – 0.2% |
Yue Yuen Industrial Holdings, Ltd. | | HK | | 12,500 | | | 24,818 |
| | | | | | | |
TOBACCO – 0.5% |
British American Tobacco PLC | | GB | | 2,300 | | | 60,000 |
| | | | | | | |
TRADING COMPANIES & DISTRIBUTORS – 1.6% |
Mitsubishi Corp. | | JP | | 8,500 | | | 120,394 |
Mitsui & Co., Ltd. | | JP | | 7,000 | | | 71,963 |
| | | | | | | |
| | | | | | | 192,357 |
| | | | | | | |
TRANSPORTATION INFRASTRUCTURE – 0.5% |
Macquarie Infrastructure Group | | AU | | 47,300 | | | 56,699 |
| | | | | | | |
WIRELESS TELECOMMUNICATION SERVICES – 3.0% |
KDDI Corp. | | JP | | 10 | | | 71,403 |
NTT DoCoMo, Inc. | | JP | | 21 | | | 41,334 |
Vodafone Group PLC | | GB | | 120,100 | | | 245,922 |
| | | | | | | |
| | | | | | | 358,659 |
| | | | | | | |
Total Common Stocks
(cost $11,615,959) | | | 11,177,865 |
| | | | | | | |
| | | | | | | | |
| | | Country
Code** | | Shares | | Value | |
| | | | | | | | |
RIGHTS – 0.0% | |
COMMERCIAL BANKS – 0.0% | |
HBOS PLC, expires 1/9/09* | | GB | | 49,529 | | | — | |
Lloyds TSB Group PLC, expires 1/12/09* | | GB | | 7,650 | | | — | |
| | | | | | | | |
Total Rights
(cost $0) | | | — | |
| | | | | | | | |
EQUITY LINKED SECURITIES – 0.3% | |
ELECTRICAL COMPONENTS – 0.3% | |
AU Optronics Corp. (Citigroup Global Markets Holdings Inc.), expires 1/17/12* (1) | | | | 31,600 | | | 23,700 | |
AU Optronics Corp. (Credit Suisse First Boston), expires 3/5/09* | | | | 19,400 | | | 14,550 | |
| | | | | | | | |
Total Equity Linked Securities
(cost $40,300) | | | 38,250 | |
| | | | | | | | |
SHORT TERM INVESTMENTS – 9.2% | |
MUTUAL FUNDS – 9.2% | |
SSgA Prime Money Market Fund
(cost $1,086,641) | | 1,086,641 | | | 1,086,641 | |
| | | | | | | | |
TOTAL INVESTMENTS – 104.1% | |
(cost $12,742,900) | | | | | 12,302,756 | |
Liabilities in excess of other assets – (4.1)% | | | | | (488,397 | ) |
| | | | | | | | |
NET ASSETS – 100.0% | | | | $ | 11,814,359 | |
| | | | | | | | |
See Notes to Financial Statements.
155
ALLIANCEBERNSTEIN INTERNATIONAL VALUE FUND
| | |
PORTFOLIO OF INVESTMENTS (Continued) December 31, 2008 | | Sun Capital Advisers Trust |
| (1) | Eligible for resale under rule 144A of the Securities Act of 1933. These securities may be resold in transactions exempt from registration, normally to qualified institutional buyers. At December 31, 2008 these securities amounted to $58,929 representing 0.5% of net assets. |
| * | Non-income producing security |
| ** | Unless otherwise noted the country code for all securities is United States |
| | | | |
| AU | | | | Australia |
| BE | | | | Belgium |
| CA | | | | Canada |
| CH | | | | Switzerland |
| DE | | | | Germany |
| DK | | | | Denmark |
| ES | | | | Spain |
| FI | | | | Finland |
| FR | | | | France |
| GB | | | | Great Britain |
| GR | | | | Greece |
| HK | | | | Hong Kong |
| IT | | | | Italy |
| JP | | | | Japan |
| NL | | | | Netherlands |
| NO | | | | Norway |
| SE | | | | Sweden |
| SG | | | | Singapore |
See Notes to Financial Statements.
156
ALLIANCEBERNSTEIN INTERNATIONAL VALUE FUND
| | |
| PORTFOLIO OF OTHER FINANCIAL INSTRUMENTS |
| December 31, 2008 | | Sun Capital Advisers Trust |
At December 31, 2008 cash of $30,938 has been pledged for open futures contracts purchased as follows:
| | | | | | | | | | |
Futures | | Expiration
Date | | Contracts | | Aggregated
Face
Value ($) | | Notional
Value ($) | | Unrealized
Appreciation ($) |
TOPIX Index Futures | | 3/13/09 | | 3 | | 278,365 | | 285,273 | | 6,908 |
| | | | | | | | | | |
Net unrealized appreciation | | | | | | | | | | 6,908 |
| | | | | | | | | | |
At December 31, 2008, open forward foreign currency exchange contracts were as follows:
| | | | | | | | | | | | | | | | | |
Contracts to Deliver | | In Exchange For | | | | Settlement Date | | | | Unrealized
Appreciation/
(Depreciation) ($) | |
| CAD | | 108,000 | | | | USD | | 85,923 | | | | 3/16/2009 | | | | (1,601 | ) |
| CAD | | 120,000 | | | | USD | | 95,181 | | | | 3/16/2009 | | | | (2,068 | ) |
| CAD | | 111,000 | | | | USD | | 90,649 | | | | 3/16/2009 | | | | 694 | |
| | | | | | | | | | | | | | | | | |
Net unrealized depreciation | | | | (2,975 | ) |
| | | | | | | | | | | | | | | | | |
| | | | |
| CAD | | — | | Canadian Dollar |
| USD | | — | | United States Dollar |
See Notes to Financial Statements.
157
BLACKROCK INFLATION PROTECTED BOND FUND
| | |
PORTFOLIO OF INVESTMENTS December 31, 2008 | | Sun Capital Advisers Trust |
| | | | | | | |
| | | Principal
Amount
(000) | | | Value |
| | | | | | | |
| | | | | | | |
CORPORATE DEBT OBLIGATIONS – 8.9% |
DIVERSIFIED FINANCIAL SERVICES – 8.9% |
JPMorgan Chase & Co.
2.63%, 12/1/10 | | $ | 550 | | | $ | 561,042 |
Morgan Stanley
2.90%, 12/1/10 | | | 550 | | | | 564,388 |
| | | | | | | |
Total Corporate Debt Obligations (cost $1,125,417) | | | | | | | 1,125,430 |
| | | | | | | |
FOREIGN GOVERNMENT OBLIGATIONS – 5.0% |
France Government Bond
3.00%, 7/25/12
(cost $36,051) | | | 437 | | | | 633,050 |
| | | | | | | |
U.S. TREASURY AND U.S. GOVERNMENT AGENCY OBLIGATIONS – 71.3% |
Federal Farm Credit Bank
2.25%, 7/1/10 | | | 550 | | | | 561,025 |
Federal Home Loan Bank
2.38%, 4/30/10 | | | 550 | | | | 561,186 |
Federal Home Loan Mortgage
6.00%, 8/1/37 | | | 388 | | | | 400,614 |
Federal National Mortgage Association
5.00%, 2/1/38 | | | 481 | | | | 492,028 |
Government National Mortgage Association
5.50%, 12/15/38 | | | 600 | | | | 619,357 |
United States Treasury Inflation Indexed Bonds (1) | | | | | | | |
0.63%, 4/15/13 | | | 195 | | | | 186,194 |
0.88%, 4/15/10 | | | 34 | | | | 32,243 |
1.38%, 7/15/18 | | | 176 | | | | 164,429 |
1.63%, 1/15/15 | | | 289 | | | | 268,299 |
1.63%, 1/15/18 | | | 0 | * | | | 139 |
1.75%, 1/15/28 | | | 437 | | | | 404,147 |
1.88%, 7/15/13 | | | 201 | | | | 188,793 |
1.88%, 7/15/15 | | | 334 | | | | 315,632 |
2.00%, 4/15/12 | | | 598 | | | | 583,019 |
2.00%, 1/15/14 | | | 569 | | | | 538,798 |
2.00%, 7/15/14 | | | 580 | | | | 548,897 |
2.00%, 1/15/16 | | | 344 | | | | 329,273 |
2.00%, 1/15/26 | | | 344 | | | | 323,873 |
2.38%, 4/15/11 | | | 213 | | | | 207,867 |
2.38%, 1/15/17 | | | 285 | | | | 282,438 |
2.38%, 1/15/25 | | | 431 | | | | 423,591 |
2.38%, 1/15/27 | | | 376 | | | | 377,731 |
2.50%, 7/15/16 | | | 64 | | | | 63,857 |
| | | | | | | | |
| | | Principal
Amount
(000) | | | Value | |
| | | | | | | | |
| | | | | | | | |
2.63%, 7/15/17 | | $ | 115 | | | $ | 117,831 | |
3.00%, 7/15/12 | | | 0 | * | | | 206 | |
3.38%, 1/15/12 | | | 232 | | | | 229,318 | |
3.50%, 1/15/11 | | | 124 | | | | 122,171 | |
3.63%, 4/15/28 | | | 221 | | | | 263,296 | |
3.88%, 4/15/29 | | | 297 | | | | 366,219 | |
| | | | | | | | |
Total U.S. Treasury and U.S. Government Agency Obligations (cost $9,386,336) | | | | | | | 8,972,471 | |
| | | | | | | | |
| | | Shares | | | | |
SHORT TERM INVESTMENTS – 17.7% | |
MUTUAL FUNDS – 17.7% | |
BlackRock Liquidity Funds TempFund Portfolio | | | 1,113,566 | | | | 1,113,566 | |
SSgA Money Market Fund | | | 1,113,684 | | | | 1,113,684 | |
| | | | | | | | |
Total Short Term Investments
(cost $2,227,250) | | | | | | | 2,227,250 | |
| | | | | | | | |
TOTAL INVESTMENTS – 102.9%
(cost $12,775,054) | | | | 12,958,201 | |
Liabilities in excess of other assets – (2.9)% | | | | | | | (370,919 | ) |
| | | | | | | | |
NET ASSETS – 100.0% | | | | | | $ | 12,587,282 | |
| | | | | | | | |
| * | Amount is less than $500. |
| (1) | Security or a portion of the security has been designated as collateral for futures. |
See Notes to Financial Statements.
158
BLACKROCK INFLATION PROTECTED BOND FUND
| | |
| PORTFOLIO OF OTHER FINANCIAL INSTRUMENTS |
| December 31, 2008 | | Sun Capital Advisers Trust |
At December 31, 2008, open futures contracts purchased were as follows:
| | | | | | | | | | | |
Futures | | Expiration
Date | | Contracts | | Aggregated
Face
Value ($) | | Notional
Value ($) | | Unrealized
Depreciation ($) | |
10 Year U.S. Treasury Note Futures | | 3/20/09 | | 2 | | 255,754 | | 251,500 | | (4,254 | ) |
30 Year U.S. Treasury Bond Futures | | 3/20/09 | | 16 | | 2,250,561 | | 2,208,750 | | (41,811 | ) |
| | | | | | | | | | | |
Net unrealized depreciation | | | | | | | | | | (46,065 | ) |
| | | | | | | | | | | |
At December 31, 2008, open futures contracts sold were as follows:
| | | | | | | | | | | |
Futures | | Expiration
Date | | Contracts | | Aggregated
Face
Value ($) | | Notional
Value ($) | | Unrealized
Appreciation/
(Depreciation) ($) | |
5 Year U.S. Treasury Note Futures | | 3/31/09 | | 7 | | 835,181 | | 833,383 | | 1,798 | |
2 Year U.S. Treasury Note Futures | | 3/31/09 | | 2 | | 435,559 | | 436,125 | | (566 | ) |
| | | | | | | | | | | |
Net unrealized appreciation | | | | | | | | | | 1,232 | |
| | | | | | | | | | | |
At December 31, 2008, outstanding total return swap agreements were as follows:
| | | | | | | | | | | | | | | |
Pay/Receive Total Return on Reference Entity | | Reference Entity | | Number of
Shares
or Units | | Floating
Rate | | Notional
Amount
(000) | | Maturity
Date | | Counterparty | | Unrealized
Appreciation/
(Depreciation) ($) | |
Pay | | Barclays Bank PLC Inflation Linked Index | | 7,833 | | 3-Month
USD-LIBOR | | 1,650 | | 3/23/2009 | | Barclays Capital, Inc. | | (9,407 | ) |
Pay | | USD IG Inflation Linked Sovereign Index | | 5,408 | | 3-Month
USD-LIBOR | | 1,100 | | 3/31/2009 | | Deutsche Bank AG | | (0 | ) |
| | | | | | | | | | | | | | | |
Net unrealized depreciation | | (9,407 | ) |
| | | | | | | | | | | | | | | |
| | | | |
| LIBOR | | — | | Represents the London InterBank Offered Rate |
| USD | | — | | United States Dollar |
See Notes to Financial Statements.
159
IBBOTSON MODERATE FUND
| | |
PORTFOLIO OF INVESTMENTS December 31, 2008 | | Sun Capital Advisers Trust |
| | | | | |
| | |
Shares | | Value |
| | | | | |
| | | | | |
INVESTMENT COMPANIES (1)(2) – 98.3% |
MFS International Growth Portfolio | | 184,769 | | $ | 1,644,446 |
MFS Value Portfolio | | 219,293 | | | 2,346,438 |
SC AllianceBernstein International Value Fund | | 251,543 | | | 1,992,219 |
SC BlackRock Inflation Protected Bond Fund | | 333,316 | | | 3,289,826 |
SC Davis Venture Value Fund | | 240,441 | | | 2,005,276 |
SC Dreman Small Cap Value Fund | | 129,083 | | | 1,028,795 |
SC Goldman Sachs Mid Cap Value Fund | | 147,262 | | | 1,020,527 |
SC Goldman Sachs Short Duration Fund | | 698,930 | | | 7,080,157 |
SC Oppenheimer Large Cap Core Fund | | 150,220 | | | 1,006,473 |
SC PIMCO High Yield Fund | | 125,752 | | | 1,014,817 |
SC PIMCO Total Return Fund | | 473,566 | | | 4,996,123 |
SC WMC Blue Chip Mid Cap Fund | | 72,466 | | | 675,381 |
SC WMC Large Cap Growth Fund | | 280,082 | | | 1,666,485 |
Sun Capital Investment Grade Bond Fund | | 468,944 | | | 3,676,521 |
| | | | | |
Total Investment Companies (cost $32,502,591) | | | | | 33,443,484 |
| | | | | |
| | | | | | | |
| | | Principal
Amount
(000) | | Value | |
| | | | | | | |
| | | | | | | |
| | | | | | | |
SHORT TERM INVESTMENTS – 2.0% | |
REPURCHASE AGREEMENT – 2.0% | |
State Street Bank and Trust Company, 0.01%, 1/02/09 (collateralized by $645,000 FHLB, 4.375%, 9/17/2010, with a value of $686,409 total to be received $671,042) (cost $671,042) | | $ | 671 | | $ | 671,042 | |
| | | | | | | |
TOTAL INVESTMENTS – 100.3% | |
(cost $33,173,633) | | | | | | 34,114,526 | |
Liabilities in excess of other assets – (0.3)% | | | | | | (93,798 | ) |
| | | | | | | |
NET ASSETS – 100.0% | | | | | $ | 34,020,728 | |
| | | | | | | |
| (1) | Sun Capital Advisers LLC or its affiliate, Massachusetts Financial Services Company (“MFS”), serves as investment adviser to these underlying funds. |
| (2) | Affiliated securities. |
| | | | |
| | |
| FHLB | | | | Federal Home Loan Bank |
See Notes to Financial Statements.
160
IBBOTSON BALANCED FUND
| | |
PORTFOLIO OF INVESTMENTS December 31, 2008 | | Sun Capital Advisers Trust |
| | | | | |
| | |
Shares | | Value |
| | | | | |
| | | | | |
INVESTMENT COMPANIES (1)(2) – 95.8% |
MFS Emerging Markets Equity Portfolio | | 81,906 | | $ | 727,327 |
MFS International Growth Portfolio | | 288,303 | | | 2,565,898 |
MFS Value Portfolio | | 347,814 | | | 3,721,607 |
SC AIM Small Cap Growth Fund | | 99,156 | | | 744,663 |
SC AllianceBernstein International Value Fund | | 368,365 | | | 2,917,449 |
SC BlackRock Inflation Protected Bond Fund | | 224,458 | | | 2,215,396 |
SC Davis Venture Value Fund | | 355,899 | | | 2,968,198 |
SC Dreman Small Cap Value Fund | | 140,066 | | | 1,116,327 |
SC Goldman Sachs Mid Cap Value Fund | | 161,386 | | | 1,118,402 |
SC Goldman Sachs Short Duration Fund | | 482,774 | | | 4,890,503 |
SC Oppenheimer Large Cap Core Fund | | 280,107 | | | 1,876,718 |
SC PIMCO High Yield Fund | | 94,207 | | | 760,251 |
SC PIMCO Total Return Fund | | 421,092 | | | 4,442,516 |
SC WMC Blue Chip Mid Cap Fund | | 80,582 | | | 751,025 |
SC WMC Large Cap Growth Fund | | 436,912 | | | 2,599,625 |
Sun Capital Global Real Estate Fund | | 128,262 | | | 1,153,073 |
Sun Capital Investment Grade Bond Fund | | 331,275 | | | 2,597,194 |
| | | | | |
Total Investment Companies
(cost $35,876,106) | | | | | 37,166,172 |
| | | | | |
| | | | | | |
| | | Principal
Amount
(000) | | Value |
| | | | | | |
| | | | | | |
SHORT TERM INVESTMENTS – 2.1% |
REPURCHASE AGREEMENT – 2.1% |
State Street Bank and Trust Company, 0.01%, 1/02/09 (collateralized by $795,000 FHLB, 4.375%, 9/17/2010, with a value of $846,039 total to be received $824,585)
(cost $824,585) | | $ | 825 | | $ | 824,585 |
| | | | | | |
TOTAL INVESTMENTS – 97.9%
(cost $36,700,691) | | | | | | 37,990,757 |
Other assets less liabilities – 2.1% | | | | | | 812,041 |
| | | | | | |
NET ASSETS – 100.0% | | | | | $ | 38,802,798 |
| | | | | | |
| (1) | Sun Capital Advisers LLC or its affiliate, MFS, serves as investment adviser to these underlying funds. |
| (2) | Affiliated securities. |
| | |
| |
| FHLB | | Federal Home Loan Bank |
See Notes to Financial Statements.
161
IBBOTSON GROWTH FUND
| | |
PORTFOLIO OF INVESTMENTS December 31, 2008 | | Sun Capital Advisers Trust |
| | | | | |
| | |
Shares | | Value |
| | | | | |
| | | | | |
INVESTMENT COMPANIES (1)(2) – 97.4% |
MFS Emerging Markets Equity Portfolio | | 107,981 | | $ | 958,871 |
MFS International Growth Portfolio | | 358,701 | | | 3,192,436 |
MFS Value Portfolio | | 300,726 | | | 3,217,766 |
SC AIM Small Cap Growth Fund | | 87,943 | | | 660,455 |
SC AllianceBernstein International Value Fund | | 362,358 | | | 2,869,872 |
SC BlackRock Inflation Protected Bond Fund | | 131,378 | | | 1,296,702 |
SC Davis Venture Value Fund | | 308,696 | | | 2,574,527 |
SC Dreman Small Cap Value Fund | | 122,004 | | | 972,374 |
SC Goldman Sachs Mid Cap Value Fund | | 190,539 | | | 1,320,435 |
SC Goldman Sachs Short Duration Fund | | 129,427 | | | 1,311,094 |
SC Lord Abbett Growth and Income Fund | | 139,271 | | | 986,036 |
SC Oppenheimer Large Cap Core Fund | | 340,546 | | | 2,281,659 |
SC Oppenheimer Main Street Small Cap Fund | | 85,646 | | | 662,902 |
SC PIMCO Total Return Fund | | 245,747 | | | 2,592,633 |
SC WMC Blue Chip Mid Cap Fund | | 70,019 | | | 652,576 |
SC WMC Large Cap Growth Fund | | 652,038 | | | 3,879,628 |
Sun Capital Global Real Estate Fund | | 186,851 | | | 1,679,790 |
Sun Capital Investment Grade Bond Fund | | 166,276 | | | 1,303,601 |
| | | | | |
Total Investment Companies (cost $30,770,618) | | | | | 32,413,357 |
| | | | | |
| | | | | | |
| | | Principal
Amount
(000) | | Value |
| | | | | | |
| | | | | | |
SHORT TERM INVESTMENTS – 1.3% |
REPURCHASE AGREEMENT – 1.3% |
State Street Bank and Trust Company, 0.01%, 1/02/09 (collateralized by $430,000 FHLB, 4.375%, 9/17/2010, with a value of $457,606 total to be received $445,861) (cost $445,861) | | $ | 446 | | $ | 445,861 |
| | | | | | |
TOTAL INVESTMENTS – 98.7% |
(cost $31,216,479) | | | | | | 32,859,218 |
Other assets less liabilities – 1.3% | | | | | | 424,218 |
| | | | | | |
NET ASSETS – 100.0% | | | | | $ | 33,283,436 |
| | | | | | |
| (1) | Sun Capital Advisers LLC or its affiliate, MFS, serves as investment adviser to these underlying funds. |
| (2) | Affiliated securities. |
| | | | |
| FHLB | | | | Federal Home Loan Bank |
See Notes to Financial Statements.
162
| | |
| STATEMENTSOF ASSETS AND LIABILITIES | | |
| December 31, 2008 | | Sun Capital Advisers Trust |
| | | | | | | | | | | | | | | | | | | | | | | |
| | | Investment
Grade
Bond Fund | | | Money
Market
Fund | | Global
Real
Estate Fund | | | Davis
Venture
Value Fund | | | Oppenheimer
Main Street
Small Cap Fund | | | Oppenheimer
Large Cap
Core Fund | |
ASSETS | | | | | | | | | | | | | | | | | | | | | | | |
Investments, at value | | | | | | | | | | | | | | | | | | | | | | | |
Securities | | $ | 56,403,698 | | | $ | 204,028,836 | | $ | 171,340,404 | | | $ | 101,549,235 | | | $ | 152,207,858 | | | $ | 13,754,141 | |
Repurchase Agreements | | | — | | | | — | | | — | | | | 15,425,000 | | | | 1,251,474 | | | | — | |
| | | | | | | | | | | | | | | | | | | | | | | |
Total Investments | | | 56,403,698 | | | | 204,028,836 | | | 171,340,404 | | | | 116,974,235 | | | | 153,459,332 | | | | 13,754,141 | |
Cash | | | — | | | | — | | | — | | | | 1,102 | | | | 2,245 | | | | — | |
Foreign currency, at value | | | — | | | | — | | | 93,731 | | | | — | | | | — | | | | — | |
Interest and dividends receivable | | | 592,598 | | | | 10,325 | | | 1,423,692 | | | | 105,584 | | | | 148,587 | | | | 22,764 | |
Receivable for Fund shares sold | | | 241,323 | | | | 1,550,157 | | | 120,700 | | | | 517,062 | | | | 11,923 | | | | 109,638 | |
Receivable for investments sold | | | — | | | | — | | | — | | | | 126,859 | | | | 137,600 | | | | — | |
Receivable due from Adviser | | | — | | | | 10,543 | | | — | | | | — | | | | — | | | | 1,740 | |
Other assets | | | 7,094 | | | | 45,183 | | | 15,582 | | | | 12,693 | | | | 15,741 | | | | 1,399 | |
| | | | | | | | | | | | | | | | | | | | | | | |
Total Assets | | | 57,244,713 | | | | 205,645,044 | | | 172,994,109 | | | | 117,737,535 | | | | 153,775,428 | | | | 13,889,682 | |
| | | | | | | | | | | | | | | | | | | | | | | |
LIABILITIES | | | | | | | | | | | | | | | | | | | | | | | |
Payable for investments purchased - regular delivery | | | — | | | | — | | | — | | | | 3,689,294 | | | | 10,314 | | | | 497,306 | |
Payable for Fund shares redeemed | | | 20,275 | | | | 1,031,031 | | | 57,600 | | | | 1,107 | | | | 15,490 | | | | 686 | |
Investment advisory fee payable | | | 18,772 | | | | — | | | 148,305 | | | | 59,047 | | | | 89,348 | | | | — | |
Accrued expenses and other liabilities | | | 75,033 | | | | 89,954 | | | 109,492 | | | | 79,235 | | | | 127,349 | | | | 51,053 | |
| | | | | | | | | | | | | | | | | | | | | | | |
Total Liabilities | | | 114,080 | | | | 1,120,985 | | | 315,397 | | | | 3,828,683 | | | | 242,501 | | | | 549,045 | |
| | | | | | | | | | | | | | | | | | | | | | | |
NET ASSETS | | $ | 57,130,633 | | | $ | 204,524,059 | | $ | 172,678,712 | | | $ | 113,908,852 | | | $ | 153,532,927 | | | $ | 13,340,637 | |
| | | | | | | | | | | | | | | | | | | | | | | |
COMPOSITION OF NET ASSETS | | | | | | | | | | | | | | | | | | | | | | | |
Paid-in Capital | | $ | 69,446,667 | | | $ | 204,523,832 | | $ | 276,917,923 | | | $ | 141,281,534 | | | $ | 236,897,591 | | | $ | 18,490,007 | |
Accumulated undistributed net investment income | | | 59,049 | | | | 227 | | | 5,263,622 | | | | 665,810 | | | | 174,353 | | | | 44,504 | |
Accumulated net realized gain (loss) on investments and foreign currency related transactions | | | (647,954 | ) | | | — | | | 1,052,653 | | | | (3,925,496 | ) | | | (25,324,274 | ) | | | (3,738,860 | ) |
Net unrealized depreciation on investments and assets and liabilities in foreign currencies | | | (11,727,129 | ) | | | — | | | (110,555,486 | ) | | | (24,112,996 | ) | | | (58,214,743 | ) | | | (1,455,014 | ) |
| | | | | | | | | | | | | | | | | | | | | | | |
| | $ | 57,130,633 | | | $ | 204,524,059 | | $ | 172,678,712 | | | $ | 113,908,852 | | | $ | 153,532,927 | | | $ | 13,340,637 | |
| | | | | | | | | | | | | | | | | | | | | | | |
Initial Class | | | | | | | | | | | | | | | | | | | | | | | |
Net Assets | | $ | 35,941,392 | | | $ | 150,415,937 | | $ | 45,840,898 | | | $ | 31,867,607 | | | $ | 38,434,575 | | | $ | 8,366,416 | |
Shares of Beneficial Interest | | | 4,581,657 | | | | 150,390,750 | | | 5,098,914 | | | | 3,820,234 | | | | 4,968,188 | | | | 1,248,385 | |
Net asset value per share | | $ | 7.84 | | | $ | 1.00 | | $ | 8.99 | | | $ | 8.34 | | | $ | 7.74 | | | $ | 6.70 | |
| | | | | | | | | | | | | | | | | | | | | | | |
Service Class | | | | | | | | | | | | | | | | | | | | | | | |
Net Assets | | $ | 21,189,241 | | | $ | 54,108,122 | | $ | 126,837,814 | | | $ | 82,041,245 | | | $ | 115,098,352 | | | $ | 4,974,221 | |
Shares of Beneficial Interest | | | 2,681,836 | | | | 54,134,262 | | | 12,977,804 | | | | 9,859,116 | | | | 15,034,865 | | | | 724,107 | |
Net asset value per share | | $ | 7.90 | | | $ | 1.00 | | $ | 9.77 | | | $ | 8.32 | | | $ | 7.66 | | | $ | 6.87 | |
| | | | | | | | | | | | | | | | | | | | | | | |
Investment in securities, at cost | | $ | 68,130,827 | | | $ | 204,028,836 | | $ | 281,898,508 | | | $ | 141,087,597 | | | $ | 211,674,058 | | | $ | 15,209,155 | |
| | | | | | | | | | | | | | | | | | | | | | | |
Foreign currency, at cost | | $ | — | | | $ | — | | $ | 94,597 | | | $ | — | | | $ | — | | | $ | — | |
| | | | | | | | | | | | | | | | | | | | | | | |
See Notes to Financial Statements.
163
| | |
| STATEMENTSOF ASSETS AND LIABILITIES (Continued) | | |
| December 31, 2008 | | Sun Capital Advisers Trust |
| | | | | | | | | | | | | | | | | | | | | | | |
| | | WMC Large
Cap Growth
Fund | | | WMC Blue
Chip Mid Cap
Fund | | | Lord Abbett
Growth &
Income Fund | | | Goldman Sachs
Mid Cap Value
Fund | | | Goldman Sachs
Short Duration
Fund | | Dreman Small
Cap Value
Fund | |
ASSETS | | | | | | | | | | | | | | | | | | | | | | | |
Investments, at value | | | | | | | | | | | | | | | | | | | | | | | |
Securities | | $ | 48,363,162 | | | $ | 73,383,429 | | | $ | 4,950,552 | | | $ | 11,896,944 | | | $ | 137,734,920 | | $ | 5,706,435 | |
Repurchase Agreements | | | 2,640,403 | | | | 4,159,046 | | | | — | | | | — | | | | — | | | — | |
| | | | | | | | | | | | | | | | | | | | | | | |
Total Investments | | | 51,003,565 | | | | 77,542,475 | | | | 4,950,552 | | | | 11,896,944 | | | | 137,734,920 | | | 5,706,435 | |
Cash | | | — | | | | 36,404 | | | | — | | | | — | | | | 273 | | | — | |
Interest and dividends receivable | | | 85,856 | | | | 71,903 | | | | 10,049 | | | | 28,626 | | | | 493,836 | | | 5,881 | |
Receivable for Fund shares sold | | | 340,624 | | | | 55,123 | | | | 30,360 | | | | 67,961 | | | | 663,916 | | | 29,780 | |
Receivable for investments sold and forward sales contracts | | | 108,338 | | | | 354,015 | | | | 45,682 | | | | 110,197 | | | | 13,202,383 | | | — | |
Futures variation margin receivable | | | — | | | | — | | | | — | | | | 11,643 | | | | 62,513 | | | — | |
Receivable due from Adviser | | | — | | | | — | | | | 13,294 | | | | 6,696 | | | | — | | | 46,255 | |
Other assets | | | 5,869 | | | | 8,775 | | | | 95 | | | | 203 | | | | 2,964 | | | 560 | |
| | | | | | | | | | | | | | | | | | | | | | | |
Total Assets | | | 51,544,252 | | | | 78,068,695 | | | | 5,050,032 | | | | 12,122,270 | | | | 152,160,805 | | | 5,788,911 | |
| | | | | | | | | | | | | | | | | | | | | | | |
LIABILITIES | | | | | | | | | | | | | | | | | | | | | | | |
Forward sales contracts, at value (proceeds receivable $0; $0; $0; $0; $12,168,320 and $0, respectively) | | | — | | | | — | | | | — | | | | — | | | | 12,261,876 | | | — | |
Payable for investments purchased - regular delivery | | | 1,320,378 | | | | 945,287 | | | | 199,799 | | | | 1,173,749 | | | | — | | | 254 | |
Payable for investments purchased - delayed delivery | | | — | | | | — | | | | — | | | | — | | | | 21,740,688 | | | — | |
Payable for Fund shares redeemed | | | 15,598 | | | | 30,178 | | | | 37 | | | | 88 | | | | 122 | | | 11 | |
Investment advisory fee payable | | | 32,407 | | | | 43,513 | | | | — | | | | — | | | | 119,511 | | | — | |
Accrued expenses and other liabilities | | | 58,989 | | | | 70,579 | | | | 676 | | | | 854 | | | | 14,199 | | | 48,520 | |
| | | | | | | | | | | | | | | | | | | | | | | |
Total Liabilities | | | 1,427,372 | | | | 1,089,557 | | | | 200,512 | | | | 1,174,691 | | | | 34,136,396 | | | 48,785 | |
| | | | | | | | | | | | | | | | | | | | | | | |
NET ASSETS | | $ | 50,116,880 | | | $ | 76,979,138 | | | $ | 4,849,520 | | | $ | 10,947,579 | | | $ | 118,024,409 | | $ | 5,740,126 | |
| | | | | | | | | | | | | | | | | | | | | | | |
COMPOSITION OF NET ASSETS | | | | | | | | | | | | | | | | | | | | | | | |
Paid-in Capital | | $ | 84,822,706 | | | $ | 105,104,201 | | | $ | 5,916,251 | | | $ | 13,202,255 | | | $ | 115,525,795 | | $ | 6,161,971 | |
Accumulated undistributed net investment income | | | 231,270 | | | | 31,048 | | | | 2,811 | | | | 1,126 | | | | — | | | 76 | |
Accumulated net realized gain (loss) on investments and foreign currency related transactions | | | (20,510,947 | ) | | | (10,932,573 | ) | | | (423,325 | ) | | | (662,469 | ) | | | 132,386 | | | (284,288 | ) |
Net unrealized appreciation (depreciation) on investments and assets and liabilities in foreign currencies | | | (14,426,149 | ) | | | (17,223,538 | ) | | | (646,217 | ) | | | (1,593,333 | ) | | | 2,366,228 | | | (137,633 | ) |
| | | | | | | | | | | | | | | | | | | | | | | |
| | $ | 50,116,880 | | | $ | 76,979,138 | | | $ | 4,849,520 | | | $ | 10,947,579 | | | $ | 118,024,409 | | $ | 5,740,126 | |
| | | | | | | | | | | | | | | | | | | | | | | |
Initial Class | | | | | | | | | | | | | | | | | | | | | | | |
Net Assets | | $ | 34,599,374 | | | $ | 45,842,261 | | | $ | 2,229,477 | | | $ | 6,495,617 | | | $ | 54,602,403 | | $ | 4,316,228 | |
Shares of Beneficial Interest | | | 5,819,503 | | | | 4,920,869 | | | | 314,718 | | | | 937,302 | | | | 5,389,716 | | | 541,439 | |
Net asset value per share | | $ | 5.95 | | | $ | 9.32 | | | $ | 7.08 | | | $ | 6.93 | | | $ | 10.13 | | $ | 7.97 | |
| | | | | | | | | | | | | | | | | | | | | | | |
Service Class | | | | | | | | | | | | | | | | | | | | | | | |
Net Assets | | $ | 15,517,506 | | | $ | 31,136,877 | | | $ | 2,620,043 | | | $ | 4,451,962 | | | $ | 63,422,006 | | $ | 1,423,898 | |
Shares of Beneficial Interest | | | 2,620,986 | | | | 3,349,772 | | | | 369,897 | | | | 642,495 | | | | 6,261,807 | | | 178,632 | |
Net asset value per share | | $ | 5.92 | | | $ | 9.30 | | | $ | 7.08 | | | $ | 6.93 | | | $ | 10.13 | | $ | 7.97 | |
| | | | | | | | | | | | | | | | | | | | | | | |
Investment in securities, at cost | | $ | 65,429,714 | | | $ | 94,766,013 | | | $ | 5,596,769 | | | $ | 13,517,274 | | | $ | 135,389,174 | | $ | 5,844,061 | |
| | | | | | | | | | | | | | | | | | | | | | | |
See Notes to Financial Statements.
164
| | |
| STATEMENTSOF ASSETS AND LIABILITIES (Continued) | | |
| December 31, 2008 | | Sun Capital Advisers Trust |
| | | | | | | | | | | | | | | | | | | |
| | | PIMCO High
Yield Fund | | | PIMCO Total
Return Fund | | AIM Small
Cap Growth
Fund | | | AllianceBernstein
International
Value Fund | | | BlackRock
Inflation
Protected Bond
Fund | |
ASSETS | | | | | | | | | | | | | | | | | | | |
Investments, at value | | | | | | | | | | | | | | | | | | | |
Securities | | $ | 15,217,947 | | | $ | 45,484,483 | | $ | 3,952,360 | | | $ | 12,302,756 | | | $ | 12,958,201 | |
Repurchase Agreements | | | 100,000 | | | | 700,000 | | | 323,845 | | | | — | | | | — | |
| | | | | | | | | | | | | | | | | | | |
Total Investments | | | 15,317,947 | | | | 46,184,483 | | | 4,276,205 | | | | 12,302,756 | | | | 12,958,201 | |
Cash | | | 631 | | | | 199,372 | | | — | | | | 7,072 | | | | — | |
Foreign currency, at value | | | 16,133 | | | | 30,612 | | | — | | | | 143,754 | | | | — | |
Margin deposits with broker | | | 31,200 | | | | — | | | — | | | | 30,938 | | | | — | |
Interest and dividends receivable | | | 270,373 | | | | 103,109 | | | 2,131 | | | | 19,029 | | | | 83,783 | |
Receivable for Fund shares sold | | | 65,360 | | | | 573,563 | | | 13,245 | | | | 56,866 | | | | 261,291 | |
Receivable for investments sold | | | 2,046,094 | | | | 8,127,383 | | | 3,338 | | | | 121,153 | | | | — | |
Futures variation margin receivable | | | — | | | | — | | | — | | | | 36 | | | | — | |
Unrealized appreciation on foreign currency contracts | | | 6,498 | | | | 510 | | | — | | | | 694 | | | | — | |
Unrealized appreciation on swaps | | | 131,414 | | | | — | | | — | | | | — | | | | — | |
Swap premiums paid | | | 208,594 | | | | — | | | — | | | | — | | | | — | |
Receivable due from Adviser | | | 10,820 | | | | — | | | 52,804 | | | | 68,372 | | | | 1,587 | |
Other assets | | | 286 | | | | 538 | | | 438 | | | | 1,153 | | | | 224 | |
| | | | | | | | | | | | | | | | | | | |
Total Assets | | | 18,105,350 | | | | 55,219,570 | | | 4,348,161 | | | | 12,751,823 | | | | 13,305,086 | |
| | | | | | | | | | | | | | | | | | | |
LIABILITIES | | | | | | | | | | | | | | | | | | | |
Payable for investments purchased - regular delivery | | | — | | | | — | | | 222,363 | | | | 866,028 | | | | 641,289 | |
Payable for investments purchased - delayed delivery | | | 2,010,555 | | | | 22,911,364 | | | — | | | | — | | | | — | |
Payable for Fund shares redeemed | | | 3 | | | | 3 | | | 20 | | | | — | | | | — | |
Investment advisory fee payable | | | — | | | | 6,659 | | | — | | | | — | | | | — | |
Futures variation margin payable | | | 1,070 | | | | 40,137 | | | — | | | | — | | | | 66,300 | |
Unrealized depreciation of foreign currency contracts | | | 45,053 | | | | 38,361 | | | — | | | | 3,669 | | | | — | |
Accrued expenses and other liabilities | | | 24,110 | | | | 3,181 | | | 51,517 | | | | 67,767 | | | | 808 | |
Swap premiums received | | | 94,721 | | | | — | | | — | | | | — | | | | — | |
Unrealized depreciation on swaps | | | 495,645 | | | | — | | | — | | | | — | | | | 9,407 | |
| | | | | | | | | | | | | | | | | | | |
Total Liabilities | | | 2,671,157 | | | | 22,999,705 | | | 273,900 | | | | 937,464 | | | | 717,804 | |
| | | | | | | | | | | | | | | | | | | |
NET ASSETS | | $ | 15,434,193 | | | $ | 32,219,865 | | $ | 4,074,261 | | | $ | 11,814,359 | | | $ | 12,587,282 | |
| | | | | | | | | | | | | | | | | | | |
COMPOSITION OF NET ASSETS | | | | | | | | | | | | | | | | | | | |
Paid-in Capital | | $ | 16,998,182 | | | $ | 31,295,748 | | $ | 4,716,119 | | | $ | 12,412,928 | | | $ | 12,407,922 | |
Accumulated undistributed (distributions in excess of) net investment income | | | (43,005 | ) | | | 1,678 | | | — | | | | 6,997 | | | | (60,868 | ) |
Accumulated net realized gain (loss) on investments and foreign currency related transactions | | | 220,193 | | | | 418,957 | | | (61,812 | ) | | | (169,349 | ) | | | 111,321 | |
Net unrealized appreciation (depreciation) on investments and assets and liabilities in foreign currencies | | | (1,741,177 | ) | | | 503,482 | | | (580,046 | ) | | | (436,217 | ) | | | 128,907 | |
| | | | | | | | | | | | | | | | | | | |
| | $ | 15,434,193 | | | $ | 32,219,865 | | $ | 4,074,261 | | | $ | 11,814,359 | | | $ | 12,587,282 | |
| | | | | | | | | | | | | | | | | | | |
Initial Class | | | | | | | | | | | | | | | | | | | |
Net Assets | | $ | 3,133,732 | | | $ | 13,822,651 | | $ | 2,530,378 | | | $ | 9,763,070 | | | $ | 8,310,881 | |
Shares of Beneficial Interest | | | 388,262 | | | | 1,310,682 | | | 337,100 | | | | 1,233,140 | | | | 841,936 | |
Net asset value per share | | $ | 8.07 | | | $ | 10.55 | | $ | 7.51 | | | $ | 7.92 | | | $ | 9.87 | |
| | | | | | | | | | | | | | | | | | | |
Service Class | | | | | | | | | | | | | | | | | | | |
Net Assets | | $ | 12,300,461 | | | $ | 18,397,214 | | $ | 1,543,883 | | | $ | 2,051,289 | | | $ | 4,276,401 | |
Shares of Beneficial Interest | | | 1,524,061 | | | | 1,744,403 | | | 205,814 | | | | 259,132 | | | | 433,384 | |
Net asset value per share | | $ | 8.07 | | | $ | 10.55 | | $ | 7.50 | | | $ | 7.92 | | | $ | 9.87 | |
| | | | | | | | | | | | | | | | | | | |
Investment in securities, at cost | | $ | 16,740,735 | | | $ | 45,793,367 | | $ | 4,856,251 | | | $ | 12,742,900 | | | $ | 12,775,054 | |
| | | | | | | | | | | | | | | | | | | |
Foreign currency, at cost | | $ | 16,483 | | | $ | 31,392 | | $ | — | | | $ | 143,915 | | | $ | — | |
| | | | | | | | | | | | | | | | | | | |
See Notes to Financial Statements.
165
| | |
| STATEMENTSOF ASSETS AND LIABILITIES (Continued) | | |
| December 31, 2008 | | Sun Capital Advisers Trust |
| | | | | | | | | |
| | | Ibbotson
Moderate Fund | | Ibbotson
Balanced Fund | | Ibbotson
Growth Fund |
ASSETS | | | | | | | | | |
Investments, at value | | | | | | | | | |
Affiliated securities | | $ | 33,443,484 | | $ | 37,166,172 | | $ | 32,413,357 |
Repurchase Agreements | | | 671,042 | | | 824,585 | | | 445,861 |
| | | | | | | | | |
Total Investments | | | 34,114,526 | | | 37,990,757 | | | 32,859,218 |
Interest and dividends receivable | | | 42,911 | | | 29,174 | | | 12,231 |
Receivable for Fund shares sold | | | 582,133 | | | 1,640,252 | | | 872,754 |
Receivable due from Adviser | | | 38,170 | | | 38,396 | | | 39,966 |
Other assets | | | 2,923 | | | 3,248 | | | 2,831 |
| | | | | | | | | |
Total Assets | | | 34,780,663 | | | 39,701,827 | | | 33,787,000 |
| | | | | | | | | |
LIABILITIES | | | | | | | | | |
Payable for investments purchased - regular delivery | | | 715,045 | | | 853,759 | | | 458,092 |
Payable for Fund shares redeemed | | | 40 | | | — | | | 76 |
Accrued expenses and other liabilities | | | 44,850 | | | 45,270 | | | 45,396 |
| | | | | | | | | |
Total Liabilities | | | 759,935 | | | 899,029 | | | 503,564 |
| | | | | | | | | |
NET ASSETS | | $ | 34,020,728 | | $ | 38,802,798 | | $ | 33,283,436 |
| | | | | | | | | |
COMPOSITION OF NET ASSETS | | | | | | | | | |
Paid-in Capital | | $ | 32,991,652 | | $ | 37,433,644 | | $ | 31,576,843 |
Accumulated undistributed net investment income | | | 86,547 | | | 71,014 | | | 57,004 |
Accumulated net realized gain on investments and capital gain distributions from affiliated underlying funds | | | 1,636 | | | 8,074 | | | 6,850 |
Net unrealized appreciation (depreciation) on investments and assets and liabilities in foreign currencies | | | 940,893 | | | 1,290,066 | | | 1,642,739 |
| | | | | | | | | |
| | $ | 34,020,728 | | $ | 38,802,798 | | $ | 33,283,436 |
| | | | | | | | | |
Initial Class | | | | | | | | | |
Net Assets | | $ | 46,397 | | $ | 55,745 | | $ | 92,037 |
Shares of Beneficial Interest | | | 5,050 | | | 6,146 | | | 10,373 |
Net asset value per share | | $ | 9.19 | | $ | 9.07 | | $ | 8.87 |
| | | | | | | | | |
Service Class | | | | | | | | | |
Net Assets | | $ | 33,974,331 | | $ | 38,747,053 | | $ | 33,191,399 |
Shares of Beneficial Interest | | | 3,699,605 | | | 4,275,965 | | | 3,742,036 |
Net asset value per share | | $ | 9.18 | | $ | 9.06 | | $ | 8.87 |
| | | | | | | | | |
Investment in securities, at cost | | $ | 33,173,633 | | $ | 36,700,691 | | $ | 31,216,479 |
| | | | | | | | | |
See Notes to Financial Statements.
166
| | |
| STATEMENTSOF OPERATIONS | | |
| For the Year Ended December 31, 2008 | | Sun Capital Advisers Trust |
| | | | | | | | | | | | | | | | | | | | | | | | |
| | | Investment
Grade
Bond Fund | | | Money
Market
Fund | | | Global
Real
Estate Fund | | | Davis
Venture
Value Fund | | | Oppenheimer
Main Street
Small Cap Fund | | | Oppenheimer
Large Cap
Core Fund | |
INVESTMENT INCOME | | | | | | | | | | | | | | | | | | | | | | | | |
Interest | | $ | 4,006,612 | | | $ | 4,023,154 | | | $ | 228,394 | | | $ | 71,750 | | | $ | 18,324 | | | $ | 5,428 | |
Dividends (net of foreign withholding taxes of $0; $0; $299,990; $13,599; $2,937 and $0, respectively) | | | — | | | | — | | | | 5,236,576 | | | | 1,552,709 | | | | 2,187,383 | | | | 248,976 | |
| | | | | | | | | | | | | | | | | | | | | | | | |
Total investment income | | | 4,006,612 | | | | 4,023,154 | | | | 5,464,970 | | | | 1,624,459 | | | | 2,205,707 | | | | 254,404 | |
| | | | | | | | | | | | | | | | | | | | | | | | |
EXPENSES | | | | | | | | | | | | | | | | | | | | | | | | |
Investment advisory fee | | | 372,841 | | | | 764,346 | | | | 2,111,410 | | | | 683,937 | | | | 1,392,137 | | | | 79,514 | |
Distribution fee (Service Class) | | | 64,670 | | | | 40,987 | | | | 384,470 | | | | 127,783 | | | | 295,462 | | | | 16,555 | |
Custody and fund accounting | | | 87,407 | | | | 81,115 | | | | 115,491 | | | | 101,654 | | | | 467,904 | | | | 68,502 | |
Audit | | | 54,937 | | | | 34,719 | | | | 48,818 | | | | 38,114 | | | | 48,635 | | | | 43,193 | |
Legal | | | 41,505 | | | | 156,142 | | | | 139,122 | | | | 56,995 | | | | 112,588 | | | | 6,858 | |
Printing | | | 8,266 | | | | 12,038 | | | | 49,581 | | | | 6,990 | | | | 27,146 | | | | 929 | |
Administration | | | 61,669 | | | | 132,275 | | | | 188,270 | | | | 81,987 | | | | 149,108 | | | | 22,250 | |
Transfer agency | | | 12,065 | | | | 12,044 | | | | 16,092 | | | | 12,709 | | | | 12,085 | | | | 10,961 | |
Trustees fees | | | 8,527 | | | | 21,500 | | | | 30,259 | | | | 12,906 | | | | 24,138 | | | | 1,534 | |
Insurance | | | 8,082 | | | | 35,644 | | | | 30,856 | | | | 9,969 | | | | 20,653 | | | | 1,657 | |
Miscellaneous fees | | | 2,735 | | | | 1,494 | | | | 7,894 | | | | 3,502 | | | | 8,047 | | | | 1,361 | |
| | | | | | | | | | | | | | | | | | | | | | | | |
Total expenses | | | 722,704 | | | | 1,292,304 | | | | 3,122,263 | | | | 1,136,546 | | | | 2,557,903 | | | | 253,314 | |
| | | | | | | | | | | | | | | | | | | | | | | | |
Less: Reduction of investment advisory fees or unified management fees | | | (191,983 | ) | | | (482,700 | ) | | | (293,003 | ) | | | (188,039 | ) | | | (522,271 | ) | | | (79,514 | ) |
Reimbursement of operating expenses | | | — | | | | — | | | | — | | | | — | | | | — | | | | (55,013 | ) |
| | | | | | | | | | | | | | | | | | | | | | | | |
Net expenses | | | 530,721 | | | | 809,604 | | | | 2,829,260 | | | | 948,507 | | | | 2,035,632 | | | | 118,787 | |
| | | | | | | | | | | | | | | | | | | | | | | | |
Net investment income | | | 3,475,891 | | | | 3,213,550 | | | | 2,635,710 | | | | 675,952 | | | | 170,075 | | | | 135,617 | |
| | | | | | | | | | | | | | | | | | | | | | | | |
REALIZED AND UNREALIZED GAIN (LOSS) | | | | | | | | | | | | | | | | | | | | | | | | |
Net realized gain (loss) from: | | | | | | | | | | | | | | | | | | | | | | | | |
Investments | | | (593,956 | ) | | | 407 | | | | 3,894,191 | | | | (3,467,964 | ) | | | (23,595,475 | ) | | | (3,695,987 | ) |
Foreign currency related transactions | | | — | | | | — | | | | 40,017 | | | | (9,826 | ) | | | (1,348 | ) | | | — | |
| | | | | | | | | | | | | | | | | | | | | | | | |
Net realized gain (loss) | | | (593,956 | ) | | | 407 | | | | 3,934,208 | | | | (3,477,790 | ) | | | (23,596,823 | ) | | | (3,695,987 | ) |
| | | | | | | | | | | | | | | | | | | | | | | | |
Change in unrealized appreciation/(depreciation) on: | | | | | | | | | | | | | | | | | | | | | | | | |
Investments | | | (10,576,615 | ) | | | (368,057 | ) | | | (110,831,132 | ) | | | (42,463,555 | ) | | | (53,294,085 | ) | | | (1,076,518 | ) |
Capital Support Agreement | | | — | | | | 368,057 | | | | — | | | | — | | | | — | | | | — | |
Assets and liabilities in foreign currencies | | | — | | | | — | | | | 2,618 | | | | 264 | | | | 21 | | | | — | |
| | | | | | | | | | | | | | | | | | | | | | | | |
Change in unrealized appreciation (depreciation) | | | (10,576,615 | ) | | | — | | | | (110,828,514 | ) | | | (42,463,291 | ) | | | (53,294,064 | ) | | | (1,076,518 | ) |
| | | | | | | | | | | | | | | | | | | | | | | | |
Net realized and unrealized gain (loss) | | | (11,170,571 | ) | | | 407 | | | | (106,894,306 | ) | | | (45,941,081 | ) | | | (76,890,887 | ) | | | (4,772,505 | ) |
| | | | | | | | | | | | | | | | | | | | | | | | |
Increase (Decrease) in Net Assets From Operations | | $ | (7,694,680 | ) | | $ | 3,213,957 | | | $ | (104,258,596 | ) | | $ | (45,265,129 | ) | | $ | (76,720,812 | ) | | $ | (4,636,888 | ) |
| | | | | | | | | | | | | | | | | | | | | | | | |
See Notes to Financial Statements.
167
| | |
| STATEMENTSOF OPERATIONS (Continued) | | |
| For the Year Ended December 31, 2008 | | Sun Capital Advisers Trust |
| | | | | | | | | | | | | | | | | | | | | | | | |
| | | WMC Large
Cap Growth
Fund | | | WMC Blue
Chip Mid Cap
Fund | | | Lord Abbett
Growth &
Income Fund* | | | Goldman Sachs
Mid Cap Value
Fund* | | | Goldman Sachs
Short Duration
Fund* | | | Dreman Small
Cap Value
Fund** | |
INVESTMENT INCOME | | | | | | | | | | | | | | | | | | | | | | | | |
Interest | | $ | 5,031 | | | $ | 50,682 | | | $ | 3,339 | | | $ | 7,036 | | | $ | 1,455,343 | | | $ | 168 | |
Dividends (net of foreign withholding taxes of $125; $1,960; $137; $4; $0 and $97, respectively) | | | 840,454 | | | | 847,928 | | | | 62,534 | | | | 136,159 | | | | — | | | | 19,745 | |
| | | | | | | | | | | | | | | | | | | | | | | | |
Total investment income | | | 845,485 | | | | 898,610 | | | | 65,873 | | | | 143,195 | | | | 1,455,343 | | | | 19,913 | |
| | | | | | | | | | | | | | | | | | | | | | | | |
EXPENSES | | | | | | | | | | | | | | | | | | | | | | | | |
Investment advisory fee | | | 513,309 | | | | 656,698 | | | | — | | | | — | | | | — | | | | 7,945 | |
Unified management fee | | | — | | | | — | | | | 22,146 | | | | 49,104 | | | | 326,561 | | | | — | |
Distribution fee (Service Class) | | | 59,837 | | | | 38,321 | | | | 3,673 | | | | 6,366 | | | | 83,681 | | | | 815 | |
Custody and fund accounting | | | 88,287 | | | | 125,260 | | | | — | | | | — | | | | — | | | | 16,837 | |
Audit | | | 37,535 | | | | 41,205 | | | | — | | | | — | | | | — | | | | 39,011 | |
Legal | | | 42,233 | | | | 50,407 | | | | 290 | | | | 530 | | | | 5,740 | | | | 468 | |
Printing | | | 5,275 | | | | 9,103 | | | | — | | | | — | | | | — | | | | 360 | |
Administration | | | 66,102 | | | | 75,611 | | | | — | | | | — | | | | — | | | | 3,550 | |
Transfer agency | | | 24,236 | | | | 11,173 | | | | — | | | | — | | | | — | | | | 1,377 | |
Trustees fees | | | 9,449 | | | | 11,422 | | | | 348 | | | | 644 | | | | 7,431 | | | | 127 | |
Insurance | | | 12,861 | | | | 10,536 | | | | 2 | | | | 5 | | | | 77 | | | | 25 | |
Miscellaneous fees | | | 3,208 | | | | 3,458 | | | | — | | | | — | | | | — | | | | 500 | |
| | | | | | | | | | | | | | | | | | | | | | | | |
Total expenses | | | 862,332 | | | | 1,033,194 | | | | 26,459 | | | | 56,649 | | | | 423,490 | | | | 71,015 | |
| | | | | | | | | | | | | | | | | | | | | | | | |
Less: Reduction of investment advisory fees or unified management fees | | | (248,119 | ) | | | (174,001 | ) | | | (640 | ) | | | (249 | ) | | | (13,248 | ) | | | (7,945 | ) |
Reimbursement of operating expenses | | | — | | | | — | | | | — | | | | — | | | | — | | | | (52,104 | ) |
| | | | | | | | | | | | | | | | | | | | | | | | |
Net expenses | | | 614,213 | | | | 859,193 | | | | 25,819 | | | | 56,400 | | | | 410,242 | | | | 10,966 | |
| | | | | | | | | | | | | | | | | | | | | | | | |
Net investment income | | | 231,272 | | | | 39,417 | | | | 40,054 | | | | 86,795 | | | | 1,045,101 | | | | 8,947 | |
| | | | | | | | | | | | | | | | | | | | | | | | |
REALIZED AND UNREALIZED GAIN (LOSS) | | | | | | | | | | | | | | | | | | | | | | | | |
Net realized gain (loss) from: | | | | | | | | | | | | | | | | | | | | | | | | |
Investments | | | (18,232,383 | ) | | | (10,890,390 | ) | | | (423,325 | ) | | | (574,895 | ) | | | 243,769 | | | | (284,288 | ) |
Futures | | | — | | | | — | | | | — | | | | (87,574 | ) | | | 222,687 | | | | — | |
Foreign currency related transactions | | | 3 | | | | (5,367 | ) | | | — | | | | — | | | | — | | | | — | |
| | | | | | | | | | | | | | | | | | | | | | | | |
Net realized gain (loss) | | | (18,232,380 | ) | | | (10,895,757 | ) | | | (423,325 | ) | | | (662,469 | ) | | | 466,456 | | | | (284,288 | ) |
| | | | | | | | | | | | | | | | | | | | | | | | |
Change in unrealized appreciation/(depreciation) on: | | | | | | | | | | | | | | | | | | | | | | | | |
Investments | | | (19,060,002 | ) | | | (25,509,203 | ) | | | (646,217 | ) | | | (1,620,330 | ) | | | 2,345,746 | | | | (137,626 | ) |
Forward sales contracts | | | — | | | | — | | | | — | | | | — | | | | (93,556 | ) | | | — | |
Futures | | | — | | | | — | | | | — | | | | 26,997 | | | | 114,038 | | | | — | |
Assets and liabilities in foreign currencies | | | — | | | | 321 | | | | — | | | | — | | | | — | | | | (7 | ) |
| | | | | | | | | | | | | | | | | | | | | | | | |
Change in unrealized appreciation (depreciation) | | | (19,060,002 | ) | | | (25,508,882 | ) | | | (646,217 | ) | | | (1,593,333 | ) | | | 2,366,228 | | | | (137,633 | ) |
| | | | | | | | | | | | | | | | | | | | | | | | |
Net realized and unrealized gain (loss) | | | (37,292,382 | ) | | | (36,404,639 | ) | | | (1,069,542 | ) | | | (2,255,802 | ) | | | 2,832,684 | | | | (421,921 | ) |
| | | | | | | | | | | | | | | | | | | | | | | | |
Increase (Decrease) in Net Assets From Operations | | $ | (37,061,110 | ) | | $ | (36,365,222 | ) | | $ | (1,029,488 | ) | | $ | (2,169,007 | ) | | $ | 3,877,785 | | | $ | (412,974 | ) |
| | | | | | | | | | | | | | | | | | | | | | | | |
| * | For the period March 7, 2008 (commencement of operations) to December 31, 2008. |
| ** | For the period October 1, 2008 (commencement of operations) to December 31, 2008. |
See Notes to Financial Statements.
168
| | |
| STATEMENTSOF OPERATIONS (Continued) | | |
| For the Year Ended December 31, 2008 | | Sun Capital Advisers Trust |
| | | | | | | | | | | | | | | | | | | | |
| | | PIMCO High
Yield Fund* | | | PIMCO Total
Return Fund** | | | AIM Small
Cap Growth
Fund** | | | AllianceBernstein
International
Value Fund** | | | BlackRock
Inflation
Protected Bond
Fund** | |
INVESTMENT INCOME | | | | | | | | | | | | | | | | | | | | |
Interest | | $ | 461,458 | | | $ | 55,768 | | | $ | 25 | | | $ | 4,012 | | | $ | (59,798 | )*** |
Dividends (net of foreign withholding taxes of $0; $0; $0; $2,832 and $0, respectively) | | | 9,917 | | | | 5,500 | | | | 5,230 | | | | 28,557 | | | | — | |
| | | | | | | | | | | | | | | | | | | | |
Total investment income | | | 471,375 | | | | 61,268 | | | | 5,255 | | | | 32,569 | | | | (59,798 | ) |
| | | | | | | | | | | | | | | | | | | | |
EXPENSES | | | | | | | | | | | | | | | | | | | | |
Investment advisory fee | | | — | | | | — | | | | 6,942 | | | | 10,404 | | | | — | |
Unified management fee | | | 44,079 | | | | 21,418 | | | | — | | | | — | | | | 10,041 | |
Distribution fee (Service Class) | | | 11,363 | | | | 4,659 | | | | 829 | | | | 1,241 | | | | 1,517 | |
Custody and fund accounting | | | — | | | | — | | | | 19,493 | | | | 25,155 | | | | — | |
Audit | | | — | | | | — | | | | 39,011 | | | | 43,686 | | | | — | |
Legal | | | 738 | | | | 329 | | | | 389 | | | | 857 | | | | 152 | |
Printing | | | — | | | | — | | | | 360 | | | | 360 | | | | — | |
Administration | | | — | | | | — | | | | 6,624 | | | | 15,821 | | | | — | |
Transfer agency | | | — | | | | — | | | | 1,259 | | | | 1,412 | | | | — | |
Trustees fees | | | 822 | | | | 545 | | | | 104 | | | | 238 | | | | 247 | |
Insurance | | | 7 | | | | 14 | | | | 11 | | | | 30 | | | | 6 | |
Miscellaneous fees | | | — | | | | 60 | | | | 500 | | | | 500 | | | | — | |
| | | | | | | | | | | | | | | | | | | | |
Total expenses | | | 57,009 | | | | 27,025 | | | | 75,522 | | | | 99,704 | | | | 11,963 | |
| | | | | | | | | | | | | | | | | | | | |
Less: Reduction of investment advisory fees or unified management fees | | | (1,567 | ) | | | (947 | ) | | | (6,942 | ) | | | (10,404 | ) | | | (405 | ) |
Reimbursement of operating expenses | | | — | | | | — | | | | (59,348 | ) | | | (75,673 | ) | | | — | |
| | | | | | | | | | | | | | | | | | | | |
Net expenses | | | 55,442 | | | | 26,078 | | | | 9,232 | | | | 13,627 | | | | 11,558 | |
| | | | | | | | | | | | | | | | | | | | |
Net investment income (loss) | | | 415,933 | | | | 35,190 | | | | (3,977 | ) | | | 18,942 | | | | (71,356 | ) |
| | | | | | | | | | | | | | | | | | | | |
REALIZED AND UNREALIZED GAIN (LOSS) | | | | | | | | | | | | | | | | | | | | |
Net realized gain (loss) from: | | | | | | | | | | | | | | | | | | | | |
Investments | | | (54,963 | ) | | | 347,029 | | | | (61,812 | ) | | | (166,783 | ) | | | 163,613 | |
Written options | | | 11,306 | | | | — | | | | — | | | | — | | | | — | |
Futures | | | 9,347 | | | | 76,907 | | | | — | | | | (1,627 | ) | | | (7,917 | ) |
Swaps | | | 341,038 | | | | — | | | | — | | | | — | | | | — | |
Foreign currency related transactions | | | 7,423 | | | | 1,768 | | | | — | | | | 8,111 | | | | — | |
| | | | | | | | | | | | | | | | | | | | |
Net realized gain (loss) | | | 314,151 | | | | 425,704 | | | | (61,812 | ) | | | (160,299 | ) | | | 155,696 | |
| | | | | | | | | | | | | | | | | | | | |
Change in unrealized appreciation/(depreciation) on: | | | | | | | | | | | | | | | | | | | | |
Investments | | | (1,422,788 | ) | | | 391,116 | | | | (580,046 | ) | | | (440,144 | ) | | | 183,147 | |
Futures | | | 84,726 | | | | 150,005 | | | | — | | | | 6,908 | | | | (44,833 | ) |
Swaps | | | (364,231 | ) | | | — | | | | — | | | | — | | | | (9,407 | ) |
Assets and liabilities in foreign currencies | | | (38,884 | ) | | | (37,639 | ) | | | — | | | | (2,981 | ) | | | — | |
| | | | | | | | | | | | | | | | | | | | |
Change in unrealized appreciation (depreciation) | | | (1,741,177 | ) | | | 503,482 | | | | (580,046 | ) | | | (436,217 | ) | | | 128,907 | |
| | | | | | | | | | | | | | | | | | | | |
Net realized and unrealized gain (loss) | | | (1,427,026 | ) | | | 929,186 | | | | (641,858 | ) | | | (596,516 | ) | | | 284,603 | |
| | | | | | | | | | | | | | | | | | | | |
Increase (Decrease) in Net Assets From Operations | | $ | (1,011,093 | ) | | $ | 964,376 | | | $ | (645,835 | ) | | $ | (577,574 | ) | | $ | 213,247 | |
| | | | | | | | | | | | | | | | | | | | |
| * | For the period March 7, 2008 (commencement of operations) to December 31, 2008. |
| ** | For the period October 1, 2008 (commencement of operations) to December 31, 2008. |
| *** | Includes $(100,430) deflation adjustment related to U.S. Treasury Inflation Protected securities at December 31, 2008. |
See Notes to Financial Statements.
169
| | |
| STATEMENTSOF OPERATIONS (Continued) | | |
| For the Year Ended December 31, 2008 | | Sun Capital Advisers Trust |
| | | | | | | | | | | | |
| | | Ibbotson
Moderate Fund* | | | Ibbotson
Balanced Fund* | | | Ibbotson
Growth Fund* | |
INVESTMENT INCOME | | | | | | | | | | | | |
Dividends from affiliated underlying funds | | $ | 78,618 | | | $ | 67,565 | | | $ | 61,673 | |
| | | | | | | | | | | | |
Total investment income | | | 78,618 | | | | 67,565 | | | | 61,673 | |
| | | | | | | | | | | | |
EXPENSES | | | | | | | | | | | | |
Investment advisory fee | | | 3,691 | | | | 3,726 | | | | 3,891 | |
Distribution fee (Service Class) | | | 7,354 | | | | 7,423 | | | | 7,748 | |
Custody and fund accounting | | | 13,912 | | | | 14,858 | | | | 15,074 | |
Audit | | | 30,349 | | | | 30,349 | | | | 30,349 | |
Legal | | | 1,665 | | | | 1,471 | | | | 1,899 | |
Printing | | | 360 | | | | 360 | | | | 360 | |
Administration | | | 4,636 | | | | 4,373 | | | | 4,828 | |
Transfer agency | | | 1,152 | | | | 1,152 | | | | 1,156 | |
Trustees fees | | | 536 | | | | 474 | | | | 582 | |
Insurance | | | 76 | | | | 84 | | | | 73 | |
Miscellaneous fees | | | 500 | | | | 500 | | | | 500 | |
| | | | | | | | | | | | |
Total expenses | | | 64,231 | | | | 64,770 | | | | 66,460 | |
| | | | | | | | | | | | |
Less: Reduction of investment advisory fees | | | (3,691 | ) | | | (3,726 | ) | | | (3,891 | ) |
Reimbursement of operating expenses | | | (47,279 | ) | | | (47,659 | ) | | | (48,596 | ) |
| | | | | | | | | | | | |
Net expenses | | | 13,261 | | | | 13,385 | | | | 13,973 | |
| | | | | | | | | | | | |
Net investment income | | | 65,357 | | | | 54,180 | | | | 47,700 | |
| | | | | | | | | | | | |
REALIZED AND UNREALIZED GAIN (LOSS) | | | | | | | | | | | | |
Net realized gain (loss) from: | | | | | | | | | | | | |
Affiliated investments | | | (10,301 | ) | | | — | | | | 5,042 | |
Capital gain distributions from affiliated underlying funds | | | 26,220 | | | | 17,979 | | | | 3,792 | |
| | | | | | | | | | | | |
Net realized gain | | | 15,919 | | | | 17,979 | | | | 8,834 | |
| | | | | | | | | | | | |
Change in unrealized appreciation/(depreciation) on: | | | | | | | | | | | | |
Affiliated investments | | | 940,893 | | | | 1,290,066 | | | | 1,642,739 | |
| | | | | | | | | | | | |
Change in unrealized appreciation (depreciation) | | | 940,893 | | | | 1,290,066 | | | | 1,642,739 | |
| | | | | | | | | | | | |
Net realized and unrealized gain | | | 956,812 | | | | 1,308,045 | | | | 1,651,573 | |
| | | | | | | | | | | | |
Net Increase in Net Assets From Operations | | $ | 1,022,169 | | | $ | 1,362,225 | | | $ | 1,699,273 | |
| | | | | | | | | | | | |
| * | For the period October 1, 2008 (commencement of operations) to December 31, 2008. |
See Notes to Financial Statements.
170
| | |
| STATEMENTSOF CHANGESIN NET ASSETS | | |
| December 31, 2008 | | Sun Capital Advisers Trust |
| | | | | | | | | | | | | | | | | | | | | | | | |
| | | Investment Grade
Bond Fund | | | Money Market Fund | | | Global Real Estate Fund | |
| | | Year Ended December 31, | | | Year Ended December 31, | | | Year Ended December 31, | |
| | | 2008 | | | 2007 | | | 2008 | | | 2007 | | | 2008 | | | 2007 | |
INCREASE (DECREASE) IN NET ASSETS FROM OPERATIONS | | | | | | | | | | | | | | | | | | | | | | | | |
Net investment income | | $ | 3,475,891 | | | $ | 3,103,552 | | | $ | 3,213,550 | | | $ | 6,151,415 | | | $ | 2,635,710 | | | $ | 6,876,030 | |
Net realized gain (loss) | | | (593,956 | ) | | | 2,464 | | | | 407 | | | | (3 | ) | | | 3,934,208 | | | | 15,613,636 | |
Change in unrealized depreciation | | | (10,576,615 | ) | | | (847,401 | ) | | | — | | | | — | | | | (110,828,514 | ) | | | (59,117,636 | ) |
| | | | | | | | | | | | | | | | | | | | | | | | |
Net increase (decrease) in net assets resulting from operations | | | (7,694,680 | ) | | | 2,258,615 | | | | 3,213,957 | | | | 6,151,412 | | | | (104,258,596 | ) | | | (36,627,970 | ) |
| | | | | | | | | | | | | | | | | | | | | | | | |
DISTRIBUTIONS TO SHAREHOLDERS FROM | | | | | | | | | | | | | | | | | | | | | | | | |
Net investment income: | | | | | | | | | | | | | | | | | | | | | | | | |
Initial Class | | | (2,041,988 | ) | | | (2,262,262 | ) | | | (2,994,363 | ) | | | (6,083,138 | ) | | | (1,555,089 | ) | | | (1,516,434 | ) |
Service Class | | | (1,393,099 | ) | | | (876,489 | ) | | | (219,187 | ) | | | (68,277 | ) | | | (3,039,439 | ) | | | (1,811,254 | ) |
Net realized gain on investments: | | | | | | | | | | | | | | | | | | | | | | | | |
Initial Class | | | — | | | | — | | | | — | | | | — | | | | (6,037,186 | ) | | | (12,628,394 | ) |
Service Class | | | — | | | | — | | | | — | | | | — | | | | (13,357,483 | ) | | | (18,059,353 | ) |
| | | | | | | | | | | | | | | | | | | | | | | | |
Net decrease in net assets from distributions | | | (3,435,087 | ) | | | (3,138,751 | ) | | | (3,213,550 | ) | | | (6,151,415 | ) | | | (23,989,197 | ) | | | (34,015,435 | ) |
| | | | | | | | | | | | | | | | | | | | | | | | |
SHARE TRANSACTIONS | | | | | | | | | | | | | | | | | | | | | | | | |
Net proceeds from sales | | | 18,885,287 | | | | 24,231,512 | | | | 143,659,397 | | | | 69,745,250 | | | | 60,765,414 | | | | 107,443,210 | |
Net proceeds from reinvestment of distributions | | | 3,435,087 | | | | 3,138,703 | | | | 3,213,416 | | | | 6,151,347 | | | | 23,989,197 | | | | 34,015,435 | |
Cost of shares redeemed | | | (20,215,334 | ) | | | (14,913,723 | ) | | | (73,200,633 | ) | | | (66,483,696 | ) | | | (44,334,619 | ) | | | (38,459,918 | ) |
| | | | | | | | | | | | | | | | | | | | | | | | |
Net increase in net assets from share transactions | | | 2,105,040 | | | | 12,456,492 | | | | 73,672,180 | | | | 9,412,901 | | | | 40,419,992 | | | | 102,998,727 | |
| | | | | | | | | | | | | | | | | | | | | | | | |
Total increase (decrease) in net assets | | | (9,024,727 | ) | | | 11,576,356 | | | | 73,672,587 | | | | 9,412,898 | | | | (87,827,801 | ) | | | 32,355,322 | |
NET ASSETS | | | | | | | | | | | | | | | | | | | | | | | | |
Beginning of period | | | 66,155,360 | | | | 54,579,004 | | | | 130,851,472 | | | | 121,438,574 | | | | 260,506,513 | | | | 228,151,191 | |
| | | | | | | | | | | | | | | | | | | | | | | | |
End of period† | | $ | 57,130,633 | | | $ | 66,155,360 | | | $ | 204,524,059 | | | $ | 130,851,472 | | | $ | 172,678,712 | | | $ | 260,506,513 | |
| | | | | | | | | | | | | | | | | | | | | | | | |
† Accumulated undistributed net investment income | | $ | 59,049 | | | $ | 16,611 | | | $ | 227 | | | $ | — | | | $ | 5,263,622 | | | $ | 7,851,799 | |
| | | | | | | | | | | | | | | | | | | | | | | | |
See Notes to Financial Statements.
171
| | |
| STATEMENTSOF CHANGESIN NET ASSETS (Continued) | | |
| December 31, 2008 | | Sun Capital Advisers Trust |
| | | | | | | | | | | | | | | | | | | | | | | | |
| | | Davis Venture Value Fund | | | Oppenheimer Main Street
Small Cap Fund | | | Oppenheimer Large Cap
Core Fund | |
| | | Year Ended December 31, | | | Year Ended December 31, | | | Year Ended December 31, | |
| | | 2008 | | | 2007 | | | 2008 | | | 2007 | | | 2008 | | | 2007 | |
INCREASE (DECREASE) IN NET ASSETS FROM OPERATIONS | | | | | | | | | | | | | | | | | | | | | | | | |
Net investment income | | $ | 675,952 | | | $ | 712,087 | | | $ | 170,075 | | | $ | 231,068 | | | $ | 135,617 | | | $ | 101,795 | |
Net realized gain (loss) | | | (3,477,790 | ) | | | 2,336,914 | | | | (23,596,823 | ) | | | 5,711,348 | | | | (3,695,987 | ) | | | 867,392 | |
Change in unrealized depreciation | | | (42,463,291 | ) | | | (783,487 | ) | | | (53,294,064 | ) | | | (12,600,394 | ) | | | (1,076,518 | ) | | | (1,832,135 | ) |
| | | | | | | | | | | | | | | | | | | | | | | | |
Net increase (decrease) in net assets resulting from operations | | | (45,265,129 | ) | | | 2,265,514 | | | | (76,720,812 | ) | | | (6,657,978 | ) | | | (4,636,888 | ) | | | (862,948 | ) |
| | | | | | | | | | | | | | | | | | | | | | | | |
DISTRIBUTIONS TO SHAREHOLDERS FROM | | | | | | | | | | | | | | | | | | | | | | | | |
Net investment income: | | | | | | | | | | | | | | | | | | | | | | | | |
Initial Class | | | (302,170 | ) | | | (323,114 | ) | | | (149,427 | ) | | | — | | | | (64,446 | ) | | | (49,720 | ) |
Service Class | | | (406,816 | ) | | | (72,502 | ) | | | (21,647 | ) | | | — | | | | (26,667 | ) | | | (48,698 | ) |
Net realized gain on investments: | | | | | | | | | | | | | | | | | | | | | | | | |
Initial Class | | | (349,234 | ) | | | — | | | | (2,072,831 | ) | | | (9,223,990 | ) | | | (15,750 | ) | | | (368,681 | ) |
Service Class | | | (673,944 | ) | | | — | | | | (5,137,272 | ) | | | (7,562,789 | ) | | | (23,323 | ) | | | (500,968 | ) |
| | | | | | | | | | | | | | | | | | | | | | | | |
Net decrease in net assets from distributions | | | (1,732,164 | ) | | | (395,616 | ) | | | (7,381,177 | ) | | | (16,786,779 | ) | | | (130,186 | ) | | | (968,067 | ) |
| | | | | | | | | | | | | | | | | | | | | | | | |
SHARE TRANSACTIONS | | | | | | | | | | | | | | | | | | | | | | | | |
Net proceeds from sales | | | 92,985,530 | | | | 33,199,463 | | | | 81,260,289 | | | | 118,435,652 | | | | 7,260,977 | | | | 5,510,262 | |
Net proceeds from reinvestment of distributions | | | 1,732,164 | | | | 395,616 | | | | 7,381,177 | | | | 16,786,779 | | | | 130,186 | | | | 968,067 | |
Cost of shares redeemed | | | (14,436,392 | ) | | | (16,305,872 | ) | | | (29,124,543 | ) | | | (20,899,911 | ) | | | (2,635,432 | ) | | | (2,740,114 | ) |
| | | | | | | | | | | | | | | | | | | | | | | | |
Net increase in net assets from share transactions | | | 80,281,302 | | | | 17,289,207 | | | | 59,516,923 | | | | 114,322,520 | | | | 4,755,731 | | | | 3,738,215 | |
| | | | | | | | | | | | | | | | | | | | | | | | |
Total increase (decrease) in net assets | | | 33,284,009 | | | | 19,159,105 | | | | (24,585,066 | ) | | | 90,877,763 | | | | (11,343 | ) | | | 1,907,200 | |
NET ASSETS | | | | | | | | | | | | | | | | | | | | | | | | |
Beginning of period | | | 80,624,843 | | | | 61,465,738 | | | | 178,117,993 | | | | 87,240,230 | | | | 13,351,980 | | | | 11,444,780 | |
| | | | | | | | | | | | | | | | | | | | | | | | |
End of period† | | $ | 113,908,852 | | | $ | 80,624,843 | | | $ | 153,532,927 | | | $ | 178,117,993 | | | $ | 13,340,637 | | | $ | 13,351,980 | |
| | | | | | | | | | | | | | | | | | | | | | | | |
† Accumulated undistributed net investment income | | $ | 665,810 | | | $ | 708,986 | | | $ | 174,353 | | | $ | 182,225 | | | $ | 44,504 | | | $ | — | |
| | | | | | | | | | | | | | | | | | | | | | | | |
See Notes to Financial Statements.
172
| | |
| STATEMENTSOF CHANGESIN NET ASSETS (Continued) | | |
| December 31, 2008 | | Sun Capital Advisers Trust |
| | | | | | | | | | | | | | | | | | | | | | | | |
| | | WMC Large Cap
Growth Fund | | | WMC Blue Chip
Mid Cap Fund | | | Lord Abbett
Growth &
Income Fund | | | Goldman Sachs
Mid Cap Value
Fund | |
| | | Year Ended December 31, | | | Year Ended December 31, | | | Year Ended
December 31,
2008* | | | Year Ended
December 31,
2008* | |
| | | 2008 | | | 2007 | | | 2008 | | | 2007 | | | |
INCREASE (DECREASE) IN NET ASSETS FROM OPERATIONS | | | | | | | | | | | | | | | | | | | | | | | | |
Net investment income (loss) | | $ | 231,272 | | | $ | (63,576 | ) | | $ | 39,417 | | | $ | (162,986 | ) | | $ | 40,054 | | | $ | 86,795 | |
Net realized gain (loss) | | | (18,232,380 | ) | | | (1,854,436 | ) | | | (10,895,757 | ) | | | 18,951,633 | | | | (423,325 | ) | | | (662,469 | ) |
Change in unrealized appreciation (depreciation) | | | (19,060,002 | ) | | | 4,484,369 | | | | (25,508,882 | ) | | | (4,881,922 | ) | | | (646,217 | ) | | | (1,593,333 | ) |
| | | | | | | | | | | | | | | | | | | | | | | | |
Net increase (decrease) in net assets resulting from operations | | | (37,061,110 | ) | | | 2,566,357 | | | | (36,365,222 | ) | | | 13,906,725 | | | | (1,029,488 | ) | | | (2,169,007 | ) |
| | | | | | | | | | | | | | | | | | | | | | | | |
DISTRIBUTIONS TO SHAREHOLDERS FROM | | | | | | | | | | | | | | | | | | | | | | | | |
Net investment income: | | | | | | | | | | | | | | | | | | | | | | | | |
Initial Class | | | — | | | | — | | | | (109,299 | ) | | | (1,028,183 | ) | | | (19,768 | ) | | | (56,352 | ) |
Service Class | | | — | | | | — | | | | (46,740 | ) | | | — | | | | (18,267 | ) | | | (30,641 | ) |
Net realized gain on investments: | | | | | | | | | | | | | | | | | | | | | | | | |
Initial Class | | | (6,208 | ) | | | (157,990 | ) | | | (12,915,287 | ) | | | (15,554,509 | ) | | | — | | | | — | |
Service Class | | | (3,443 | ) | | | (83,653 | ) | | | (5,523,070 | ) | | | — | | | | — | | | | — | |
| | | | | | | | | | | | | | | | | | | | | | | | |
Net decrease in net assets from distributions | | | (9,651 | ) | | | (241,643 | ) | | | (18,594,396 | ) | | | (16,582,692 | ) | | | (38,035 | ) | | | (86,993 | ) |
| | | | | | | | | | | | | | | | | | | | | | | | |
SHARE TRANSACTIONS | | | | | | | | | | | | | | | | | | | | | | | | |
Net proceeds from sales | | | 11,778,180 | | | | 4,731,411 | | | | 49,336,829 | | | | 4,709,517 | | | | 4,077,770 | | | | 11,822,729 | |
Subscriptions in-kind | | | — | | | | 115,803,403 | | | | — | | | | — | | | | — | | | | — | |
Net proceeds from reinvestment of distributions | | | 9,651 | | | | 241,643 | | | | 18,594,396 | | | | 16,582,692 | | | | 38,035 | | | | 86,993 | |
Cost of shares redeemed | | | (20,344,224 | ) | | | (31,166,663 | ) | | | (21,430,385 | ) | | | (27,810,794 | ) | | | (198,762 | ) | | | (1,706,143 | ) |
| | | | | | | | | | | | | | | | | | | | | | | | |
Net increase (decrease) in net assets from share transactions | | | (8,556,393 | ) | | | 89,609,794 | | | | 46,500,840 | | | | (6,518,585 | ) | | | 3,917,043 | | | | 10,203,579 | |
| | | | | | | | | | | | | | | | | | | | | | | | |
Total increase (decrease) in net assets | | | (45,627,154 | ) | | | 91,934,508 | | | | (8,458,778 | ) | | | (9,194,552 | ) | | | 2,849,520 | | | | 7,947,579 | |
NET ASSETS | | | | | | | | | | | | | | | | | | | | | | | | |
Beginning of period | | | 95,744,034 | | | | 3,809,526 | | | | 85,437,916 | | | | 94,632,468 | | | | 2,000,000 | ** | | | 3,000,000 | ** |
| | | | | | | | | | | | | | | | | | | | | | | | |
End of period† | | $ | 50,116,880 | | | $ | 95,744,034 | | | $ | 76,979,138 | | | $ | 85,437,916 | | | $ | 4,849,520 | | | $ | 10,947,579 | |
| | | | | | | | | | | | | | | | | | | | | | | | |
† Accumulated undistributed net investment income | | $ | 231,270 | | | $ | — | | | $ | 31,048 | | | $ | 154,488 | | | $ | 2,811 | | | $ | 1,126 | |
| | | | | | | | | | | | | | | | | | | | | | | | |
| * | For the period March 7, 2008 (commencement of operations) to December 31, 2008. |
| ** | Amount represents initial seed investment. |
See Notes to Financial Statements.
173
| | |
| STATEMENTSOF CHANGESIN NET ASSETS (Continued) | | |
| December 31, 2008 | | Sun Capital Advisers Trust |
| | | | | | | | | | | | | | | | | | | | | | | | | | | | |
| | | Goldman
Sachs Short
Duration Fund | | | Dreman Small
Cap Value
Fund | | | PIMCO High
Yield Fund | | | PIMCO Total
Return Fund | | | AIM Small
Cap Growth
Fund | | | AllianceBernstein
International
Value Fund | | | BlackRock
Inflation
Protected Bond
Fund | |
| | | Year Ended
December 31,
2008* | | | Year Ended
December 31,
2008** | | | Year Ended
December 31,
2008* | | | Year Ended
December 31,
2008** | | | Year Ended
December 31,
2008** | | | Year Ended
December 31,
2008** | | | Year Ended
December 31,
2008** | |
INCREASE (DECREASE) IN NET ASSETS FROM OPERATIONS | | | | | | | | | | | | | | | | | | | | | | | | | | | | |
Net investment income (loss) | | $ | 1,045,101 | | | $ | 8,947 | | | $ | 415,933 | | | $ | 35,190 | | | $ | (3,977 | ) | | $ | 18,942 | | | $ | (71,356 | ) |
Net realized gain (loss) | | | 466,456 | | | | (284,288 | ) | | | 314,151 | | | | 425,704 | | | | (61,812 | ) | | | (160,299 | ) | | | 155,696 | |
Change in unrealized appreciation (depreciation) | | | 2,366,228 | | | | (137,633 | ) | | | (1,741,177 | ) | | | 503,482 | | | | (580,046 | ) | | | (436,217 | ) | | | 128,907 | |
| | | | | | | | | | | | | | | | | | | | | | | | | | | | |
Net increase (decrease) in net assets resulting from operations | | | 3,877,785 | | | | (412,974 | ) | | | (1,011,093 | ) | | | 964,376 | | | | (645,835 | ) | | | (577,574 | ) | | | 213,247 | |
| | | | | | | | | | | | | | | | | | | | | | | | | | | | |
DISTRIBUTIONS TO SHAREHOLDERS FROM | | | | | | | | | | | | | | | | | | | | | | | | | | | | |
Net investment income: | | | | | | | | | | | | | | | | | | | | | | | | | | | | |
Initial Class | | | (399,794 | ) | | | (7,879 | ) | | | (98,649 | ) | | | (18,954 | ) | | | — | | | | (19,366 | ) | | | (23,211 | ) |
Service Class | | | (663,066 | ) | | | (1,788 | ) | | | (350,940 | ) | | | (20,739 | ) | | | — | | | | (2,842 | ) | | | (12,136 | ) |
Net realized gain on investments: | | | | | | | | | | | | | | | | | | | | | | | | | | | | |
Initial Class | | | (149,333 | ) | | | — | | | | (20,890 | ) | | | (2,111 | ) | | | — | | | | — | | | | — | |
Service Class | | | (176,210 | ) | | | — | | | | (83,930 | ) | | | (2,868 | ) | | | — | | | | — | | | | — | |
| | | | | | | | | | | | | | | | | | | | | | | | | | | | |
Net decrease in net assets from distributions | | | (1,388,403 | ) | | | (9,667 | ) | | | (554,409 | ) | | | (44,672 | ) | | | — | | | | (22,208 | ) | | | (35,347 | ) |
| | | | | | | | | | | | | | | | | | | | | | | | | | | | |
SHARE TRANSACTIONS | | | | | | | | | | | | | | | | | | | | | | | | | | | | |
Net proceeds from sales | | | 136,659,740 | | | | 3,198,466 | | | | 13,754,894 | | | | 28,521,919 | | | | 1,757,485 | | | | 7,515,829 | | | | 9,430,225 | |
Net proceeds from reinvestment of distributions | | | 1,388,373 | | | | 9,667 | | | | 554,389 | | | | 44,653 | | | | — | | | | 22,208 | | | | 35,332 | |
Cost of shares redeemed | | | (26,513,086 | ) | | | (45,366 | ) | | | (309,588 | ) | | | (266,411 | ) | | | (37,389 | ) | | | (123,896 | ) | | | (56,175 | ) |
| | | | | | | | | | | | | | | | | | | | | | | | | | | | |
Net increase in net assets from share transactions | | | 111,535,027 | | | | 3,162,767 | | | | 13,999,695 | | | | 28,300,161 | | | | 1,720,096 | | | | 7,414,141 | | | | 9,409,382 | |
| | | | | | | | | | | | | | | | | | | | | | | | | | | | |
Total increase in net assets | | | 114,024,409 | | | | 2,740,126 | | | | 12,434,193 | | | | 29,219,865 | | | | 1,074,261 | | | | 6,814,359 | | | | 9,587,282 | |
NET ASSETS | | | | | | | | | | | | | | | | | | | | | | | | | | | | |
Beginning of period*** | | | 4,000,000 | | | | 3,000,000 | | | | 3,000,000 | | | | 3,000,000 | | | | 3,000,000 | | | | 5,000,000 | | | | 3,000,000 | |
| | | | | | | | | | | | | | | | | | | | | | | | | | | | |
End of period† | | $ | 118,024,409 | | | $ | 5,740,126 | | | $ | 15,434,193 | | | $ | 32,219,865 | | | $ | 4,074,261 | | | $ | 11,814,359 | | | $ | 12,587,282 | |
| | | | | | | | | | | | | | | | | | | | | | | | | | | | |
† Accumulated undistributed (distributions in excess of) net investment income | | $ | — | | | $ | 76 | | | $ | (43,005 | ) | | $ | 1,678 | | | $ | — | | | $ | 6,997 | | | $ | (60,868 | ) |
| | | | | | | | | | | | | | | | | | | | | | | | | | | | |
| * | For the period March 7, 2008 (commencement of operations) to December 31, 2008. |
| ** | For the period October 1, 2008 (commencement of operations) to December 31, 2008. |
| *** | Amount represents initial seed investment. |
See Notes to Financial Statements.
174
| | |
| STATEMENTSOF CHANGESIN NET ASSETS (Continued) | | |
| December 31, 2008 | | Sun Capital Advisers Trust |
| | | | | | | | | | | | |
| | | Ibbotson
Moderate Fund | | | Ibbotson
Balanced Fund | | | Ibbotson
Growth Fund | |
| | | Year Ended
December 31,
2008* | | | Year Ended
December 31,
2008* | | | Year Ended
December 31,
2008* | |
INCREASE (DECREASE) IN NET ASSETS FROM OPERATIONS | | | | | | | | | | | | |
Net investment income | | $ | 65,357 | | | $ | 54,180 | | | $ | 47,700 | |
Net realized gain | | | 15,919 | | | | 17,979 | | | | 8,834 | |
Change in unrealized appreciation | | | 940,893 | | | | 1,290,066 | | | | 1,642,739 | |
| | | | | | | | | | | | |
Net increase in net assets resulting from operations | | | 1,022,169 | | | | 1,362,225 | | | | 1,699,273 | |
| | | | | | | | | | | | |
SHARE TRANSACTIONS | | | | | | | | | | | | |
Net proceeds from sales | | | 32,979,255 | | | | 37,341,768 | | | | 32,548,692 | |
Net proceeds from reinvestment of distributions | | | — | | | | — | | | | — | |
Cost of shares redeemed | | | (80,696 | ) | | | (1,195 | ) | | | (1,064,529 | ) |
| | | | | | | | | | | | |
Net increase in net assets from share transactions | | | 32,898,559 | | | | 37,340,573 | | | | 31,484,163 | |
| | | | | | | | | | | | |
Total increase in net assets | | | 33,920,728 | | | | 38,702,798 | | | | 33,183,436 | |
NET ASSETS | | | | | | | | | | | | |
Beginning of period** | | | 100,000 | | | | 100,000 | | | | 100,000 | |
| | | | | | | | | | | | |
End of period† | | $ | 34,020,728 | | | $ | 38,802,798 | | | $ | 33,283,436 | |
| | | | | | | | | | | | |
† Accumulated undistributed net investment income | | $ | 86,547 | | | $ | 71,014 | | | $ | 57,004 | |
| | | | | | | | | | | | |
| * | For the period October 1, 2008 (commencement of operations) to December 31, 2008. |
| ** | Amount represents initial seed investment. |
See Notes to Financial Statements.
175
| | |
| FINANCIAL HIGHLIGHTS | | |
| | | Sun Capital Advisers Trust |
Selected data for a share outstanding throughout each period:
| | | | | | | | | | | | | | | | | | | | | | | | | | | | | | | | | | | | | | | | |
| | | Investment Grade Bond Fund
Initial Class Shares | | | Investment Grade Bond Fund
Service Class Shares | |
| | | Years Ended December 31, | | | Years Ended December 31, | |
| | | 2008 | | | 2007 | | | 2006 | | | 2005 | | | 2004 | | | 2008 | | | 2007 | | | 2006 | | | 2005 | | | 2004* | |
Net Asset Value, Beginning of Period | | $ | 9.48 | | | $ | 9.62 | | | $ | 9.72 | | | $ | 10.09 | | | $ | 10.02 | | | $ | 9.55 | | | $ | 9.69 | | | $ | 9.79 | | | $ | 10.16 | | | $ | 10.09 | |
| | | | | | | | | | | | | | | | | | | | | | | | | | | | | | | | | | | | | | | | |
Income (Loss) from Investment Operations: | | | | | | | | | | | | | | | | | | | | | | | | | | | | | | | | | | | | | | | | |
Net investment income (d) | | | 0.51 | | | | 0.49 | | | | 0.50 | | | | 0.46 | | | | 0.48 | | | | 0.49 | | | | 0.47 | | | | 0.47 | | | | 0.44 | | | | 0.42 | |
Net realized and unrealized gain (loss) on investments | | | (1.65 | ) | | | (0.14 | ) | | | 0.00 | (e) | | | (0.27 | ) | | | 0.14 | | | | (1.66 | ) | | | (0.14 | ) | | | 0.01 | | | | (0.27 | ) | | | 0.07 | |
| | | | | | | | | | | | | | | | | | | | | | | | | | | | | | | | | | | | | | | | |
Total from Investment Operations | | | (1.14 | ) | | | 0.35 | | | | 0.50 | | | | 0.19 | | | | 0.62 | | | | (1.17 | ) | | | 0.33 | | | | 0.48 | | | | 0.17 | | | | 0.49 | |
| | | | | | | | | | | | | | | | | | | | | | | | | | | | | | | | | | | | | | | | |
Less Distributions from: | | | | | | | | | | | | | | | | | | | | | | | | | | | | | | | | | | | | | | | | |
Net investment income | | | (0.50 | ) | | | (0.49 | ) | | | (0.47 | ) | | | (0.47 | ) | | | (0.48 | ) | | | (0.48 | ) | | | (0.47 | ) | | | (0.45 | ) | | | (0.44 | ) | | | (0.42 | ) |
In excess of net investment income | | | — | | | | — | | | | — | | | | — | | | | — | | | | — | | | | — | | | | — | | | | — | | | | — | |
Net realized gain on investments | | | — | | | | — | | | | (0.11 | ) | | | (0.09 | ) | | | (0.07 | ) | | | — | | | | — | | | | (0.11 | ) | | | (0.10 | ) | | | — | |
In excess of net realized gain on investments | | | — | | | | — | | | | — | | | | — | | | | — | | | | — | | | | — | | | | — | | | | — | | | | — | |
Capital | | | — | | | | — | | | | (0.02 | ) | | | — | | | | — | | | | — | | | | — | | | | (0.02 | ) | | | — | | | | — | |
| | | | | | | | | | | | | | | | | | | | | | | | | | | | | | | | | | | | | | | | |
Total distributions | | | (0.50 | ) | | | (0.49 | ) | | | (0.60 | ) | | | (0.56 | ) | | | (0.55 | ) | | | (0.48 | ) | | | (0.47 | ) | | | (0.58 | ) | | | (0.54 | ) | | | (0.42 | ) |
| | | | | | | | | | | | | | | | | | | | | | | | | | | | | | | | | | | | | | | | |
Net Asset Value, End of Period | | $ | 7.84 | | | $ | 9.48 | | | $ | 9.62 | | | $ | 9.72 | | | $ | 10.09 | | | $ | 7.90 | | | $ | 9.55 | | | $ | 9.69 | | | $ | 9.79 | | | $ | 10.16 | |
| | | | | | | | | | | | | | | | | | | | | | | | | | | | | | | | | | | | | | | | |
Total Return (b) | | | (12.47 | )% | | | 3.75 | % | | | 5.39 | % | | | 1.96 | % | | | 6.42 | % | | | (12.67 | )% | | | 3.51 | % | | | 5.13 | % | | | 1.73 | % | | | 5.03 | % |
| | | | | | | | | | | | | | | | | | | | | | | | | | | | | | | | | | | | | | | | |
Ratios and Supplemental Data: | | | | | | | | | | | | | | | | | | | | | | | | | | | | | | | | | | | | | | | | |
Net Assets, End of Period (000’s) | | $ | 35,941 | | | $ | 40,696 | | | $ | 45,186 | | | $ | 53,630 | | | $ | 57,619 | | | $ | 21,189 | | | $ | 25,460 | | | $ | 9,393 | | | $ | 3,612 | | | $ | 704 | |
Ratios to average net assets: | | | | | | | | | | | | | | | | | | | | | | | | | | | | | | | | | | | | | | | | |
Net expenses (a)(c)(d) | | | 0.75 | % | | | 0.75 | % | | | 0.75 | % | | | 0.75 | % | | | 0.75 | % | | | 1.00 | % | | | 1.00 | % | | | 1.00 | % | | | 1.00 | % | | | 1.00 | % |
Gross expenses (a)(d) | | | 1.06 | % | | | 1.00 | % | | | 1.06 | % | | | 1.03 | % | | | 0.98 | % | | | 1.31 | % | | | 1.24 | % | | | 1.31 | % | | | 1.28 | % | | | 1.26 | % |
Net investment income (a)(c)(d) | | | 5.70 | % | | | 5.10 | % | | | 5.14 | % | | | 4.72 | % | | | 4.81 | % | | | 5.45 | % | | | 4.89 | % | | | 5.06 | % | | | 4.48 | % | | | 4.58 | % |
Portfolio turnover rate | | | 30 | % | | | 46 | % | | | 55 | % | | | 55 | % | | | 66 | % | | | 30 | % | | | 46 | % | | | 55 | % | | | 55 | % | | | 66 | % |
| * | For the period from February 1, 2004 (Commencement of Operations – Service Class Shares) through December 31, 2004. |
| (a) | Annualized for periods of less than one year. |
| (b) | Total returns are historical and assume changes in share price, reinvestments of all dividends and distributions, and no sales charge. Had certain expenses not been reduced during the periods shown, total returns would have been lower. Total returns for periods of less than one year are not annualized. |
| (c) | Such percentages are after advisory fee or unified management fee waivers and expense reimbursements, as applicable. |
| (d) | Does not include any insurance charges imposed in connection with your variable insurance contract. |
| (e) | Amount is less than $0.005 per share. |
176
| | |
| FINANCIAL HIGHLIGHTS (Continued) | | |
| | | Sun Capital Advisers Trust |
Selected data for a share outstanding throughout each period:
| | | | | | | | | | | | | | | | | | | | | | | | | | | | | | | | | | | | |
| | | Money Market Fund
Initial Class Shares | | | Money Market Fund
Service Class Shares | |
| | | Years Ended December 31, | | | Years Ended December 31, | |
| | | 2008 | | | 2007 | | | 2006 | | | 2005 | | | 2004 | | | 2008 | | | 2007 | | | 2006 | | | 2005* | |
Net Asset Value, Beginning of Period | | $ | 1.00 | | | $ | 1.00 | | | $ | 1.00 | | | $ | 1.00 | | | $ | 1.00 | | | $ | 1.00 | | | $ | 1.00 | | | $ | 1.00 | | | $ | 1.00 | |
| | | | | | | | | | | | | | | | | | | | | | | | | | | | | | | | | | | | |
Income (Loss) from Investment Operations: | | | | | | | | | | | | | | | | | | | | | | | | | | | | | | | | | | | | |
Net investment income (d) | | | 0.02 | | | | 0.05 | | | | 0.05 | | | | 0.03 | | | | 0.01 | | | | 0.02 | | | | 0.05 | | | | 0.04 | | | | 0.02 | |
Net realized and unrealized gain (loss) on investments | | | 0.00 | (e) | | | 0.00 | (e) | | | — | | | | — | | | | — | | | | 0.00 | (e) | | | — | | | | — | | | | — | |
| | | | | | | | | | | | | | | | | | | | | | | | | | | | | | | | | | | | |
Total from Investment Operations | | | 0.02 | | | | 0.05 | | | | 0.05 | | | | 0.03 | | | | 0.01 | | | | 0.02 | | | | 0.05 | | | | 0.04 | | | | 0.02 | |
| | | | | | | | | | | | | | | | | | | | | | | | | | | | | | | | | | | | |
Less Distributions from: | | | | | | | | | | | | | | | | | | | | | | | | | | | | | | | | | | | | |
Net investment income | | | (0.02 | ) | | | (0.05 | ) | | | (0.05 | ) | | | (0.03 | ) | | | (0.01 | ) | | | (0.02 | ) | | | (0.05 | ) | | | (0.04 | ) | | | (0.02 | ) |
In excess of net investment income | | | — | | | | — | | | | — | | | | — | | | | — | | | | — | | | | — | | | | — | | | | — | |
Net realized gain on investments | | | — | | | | — | | | | — | | | | — | | | | — | | | | — | | | | — | | | | — | | | | — | |
In excess of net realized gain on investments | | | — | | | | — | | | | — | | | | — | | | | — | | | | — | | | | — | | | | — | | | | — | |
Capital | | | — | | | | — | | | | — | | | | — | | | | — | | | | — | | | | — | | | | — | | | | — | |
| | | | | | | | | | | | | | | | | | | | | | | | | | | | | | | | | | | | |
Total distributions | | | (0.02 | ) | | | (0.05 | ) | | | (0.05 | ) | | | (0.03 | ) | | | (0.01 | ) | | | (0.02 | ) | | | (0.05 | ) | | | (0.04 | ) | | | (0.02 | ) |
| | | | | | | | | | | | | | | | | | | | | | | | | | | | | | | | | | | | |
Net Asset Value, End of Period | | $ | 1.00 | | | $ | 1.00 | | | $ | 1.00 | | | $ | 1.00 | | | $ | 1.00 | | | $ | 1.00 | | | $ | 1.00 | | | $ | 1.00 | | | $ | 1.00 | |
| | | | | | | | | | | | | | | | | | | | | | | | | | | | | | | | | | | | |
Total Return (b) | | | 2.25 | % | | | 4.87 | % | | | 4.59 | % | | | 2.75 | % | | | 0.74 | % | | | 2.00 | % | | | 4.61 | % | | | 4.33 | % | | | 1.93 | % |
| | | | | | | | | | | | | | | | | | | | | | | | | | | | | | | | | | | | |
Ratios and Supplemental Data: | | | | | | | | | | | | | | | | | | | | | | | | | | | | | | | | | | | | |
Net Assets, End of Period (000’s) | | $ | 150,416 | | | $ | 129,112 | | | $ | 120,164 | | | $ | 110,430 | | | $ | 121,399 | | | $ | 54,108 | | | $ | 1,740 | | | $ | 1,274 | | | $ | 509 | |
Ratios to average net assets: | | | | | | | | | | | | | | | | | | | | | | | | | | | | | | | | | | | | |
Net expenses (a)(c)(d) | | | 0.50 | % | | | 0.50 | % | | | 0.50 | % | | | 0.50 | % | | | 0.65 | % | | | 0.75 | % | | | 0.75 | % | | | 0.75 | % | | | 0.75 | % |
Gross expenses (a)(d) | | | 0.81 | % | | | 0.76 | % | | | 0.77 | % | | | 0.77 | % | | | 0.71 | % | | | 1.10 | % | | | 1.00 | % | | | 1.02 | % | | | 1.02 | % |
Net investment income (a)(c)(d) | | | 2.19 | % | | | 4.76 | % | | | 4.51 | % | | | 2.69 | % | | | 0.77 | % | | | 1.34 | % | | | 4.50 | % | | | 4.31 | % | | | 2.99 | % |
Portfolio turnover rate | | | N/A | | | | N/A | | | | N/A | | | | N/A | | | | N/A | | | | N/A | | | | N/A | | | | N/A | | | | N/A | |
| * | For the period from April 25, 2005 (Commencement of Operations – Service Class Shares) through December 31, 2005. |
| (a) | Annualized for periods of less than one year. |
| (b) | Total returns are historical and assume changes in share price, reinvestments of all dividends and distributions, and no sales charge. Had certain expenses not been reduced during the periods shown, total returns would have been lower. Total returns for periods of less than one year are not annualized. |
| (c) | Such percentages are after advisory fee or unified management fee waivers and expense reimbursements, as applicable. |
| (d) | Does not include any insurance charges imposed in connection with your variable insurance contract. |
| (e) | Amount is less than $0.005 per share. |
177
| | |
| FINANCIAL HIGHLIGHTS (Continued) | | |
| | | Sun Capital Advisers Trust |
Selected data for a share outstanding throughout each period:
| | | | | | | | | | | | | | | | | | | | | | | | | | | | | | | | | | | | | | | | |
| | | Global Real Estate Fund
Initial Class Shares | | | Global Real Estate Fund
Service Class Shares | |
| | | Years Ended December 31, | | | Years Ended December 31, | |
| | | 2008 | | | 2007 | | | 2006 | | | 2005 | | | 2004 | | | 2008 | | | 2007 | | | 2006 | | | 2005 | | | 2004* | |
Net Asset Value, Beginning of Period | | $ | 18.24 | | | $ | 24.60 | | | $ | 18.80 | | | $ | 19.01 | | | $ | 15.09 | | | $ | 19.66 | | | $ | 26.23 | | | $ | 19.97 | | | $ | 20.08 | | | $ | 15.72 | |
| | | | | | | | | | | | | | | | | | | | | | | | | | | | | | | | | | | | | | | | |
Income (Loss) from Investment Operations: | | | | | | | | | | | | | | | | | | | | | | | | | | | | | | | | | | | | | | | | |
Net investment income (d) | | | 0.18 | | | | 0.66 | | | | 0.81 | | | | 0.23 | | | | 0.58 | | | | 0.18 | | | | 0.40 | | | | 0.64 | | | | 0.21 | | | | 0.30 | |
Net realized and unrealized gain (loss) on investments | | | (7.53 | ) | | | (3.70 | ) | | | 6.37 | | | | 1.59 | | | | 4.24 | | | | (8.22 | ) | | | (3.71 | ) | | | 6.94 | | | | 1.65 | | | | 4.06 | |
| | | | | | | | | | | | | | | | | | | | | | | | | | | | | | | | | | | | | | | | |
Total from Investment Operations | | | (7.35 | ) | | | (3.04 | ) | | | 7.18 | | | | 1.82 | | | | 4.82 | | | | (8.04 | ) | | | (3.31 | ) | | | 7.58 | | | | 1.86 | | | | 4.36 | |
| | | | | | | | | | | | | | | | | | | | | | | | | | | | | | | | | | | | | | | | |
Less Distributions from: | | | | | | | | | | | | | | | | | | | | | | | | | | | | | | | | | | | | | | | | |
Net investment income | | | (0.39 | ) | | | (0.36 | ) | | | (0.37 | ) | | | (0.32 | ) | | | (0.27 | ) | | | (0.34 | ) | | | (0.30 | ) | | | (0.31 | ) | | | (0.26 | ) | | | — | |
In excess of net investment income | | | — | | | | — | | | | — | | | | — | | | | — | | | | — | | | | — | | | | — | | | | — | | | | — | |
Net realized gain on investments | | | (1.51 | ) | | | (2.96 | ) | | | (1.01 | ) | | | (1.71 | ) | | | (0.63 | ) | | | (1.51 | ) | | | (2.96 | ) | | | (1.01 | ) | | | (1.71 | ) | | | — | |
In excess of net realized gain on investments | | | — | | | | — | | | | — | | | | — | | | | — | | | | — | | | | — | | | | — | | | | — | | | | — | |
Capital | | | — | | | | — | | | | — | | | | — | | | | — | | | | — | | | | — | | | | — | | | | — | | | | — | |
| | | | | | | | | | | | | | | | | | | | | | | | | | | | | | | | | | | | | | | | |
Total distributions | | | (1.90 | ) | | | (3.32 | ) | | | (1.38 | ) | | | (2.03 | ) | | | (0.90 | ) | | | (1.85 | ) | | | (3.26 | ) | | | (1.32 | ) | | | (1.97 | ) | | | — | |
| | | | | | | | | | | | | | | | | | | | | | | | | | | | | | | | | | | | | | | | |
Net Asset Value, End of Period | | $ | 8.99 | | | $ | 18.24 | | | $ | 24.60 | | | $ | 18.80 | | | $ | 19.01 | | | $ | 9.77 | | | $ | 19.66 | | | $ | 26.23 | | | $ | 19.97 | | | $ | 20.08 | |
| | | | | | | | | | | | | | | | | | | | | | | | | | | | | | | | | | | | | | | | |
Total Return (b) | | | (44.73 | )% | | | (13.13 | )% | | | 38.96 | % | | | 9.67 | % | | | 33.32 | % | | | (44.89 | )% | | | (13.34 | )% | | | 38.64 | % | | | 9.37 | % | | | 27.74 | % |
| | | | | | | | | | | | | | | | | | | | | | | | | | | | | | | | | | | | | | | | |
Ratios and Supplemental Data: | | | | | | | | | | | | | | | | | | | | | | | | | | | | | | | | | | | | | | | | |
Net Assets, End of Period (000’s) | | $ | 45,841 | | | $ | 87,441 | | | $ | 121,197 | | | $ | 105,368 | | | $ | 102,300 | | | $ | 126,838 | | | $ | 173,065 | | | $ | 106,954 | | | $ | 50,778 | | | $ | 21,890 | |
Ratios to average net assets: | | | | | | | | | | | | | | | | | | | | | | | | | | | | | | | | | | | | | | | | |
Net expenses (a)(c)(d) | | | 1.10 | % | | | 1.10 | % | | | 1.10 | % | | | 1.10 | % | | | 1.23 | % | | | 1.35 | % | | | 1.35 | % | | | 1.35 | % | | | 1.35 | % | | | 1.50 | % |
Gross expenses (a)(d) | | | 1.23 | % | | | 1.18 | % | | | 1.19 | % | | | 1.22 | % | | | 1.23 | % | | | 1.48 | % | | | 1.43 | % | | | 1.44 | % | | | 1.47 | % | | | 1.51 | % |
Net investment income (a)(c)(d) | | | 1.28 | % | | | 2.65 | % | | | 3.08 | % | | | 3.55 | % | | | 3.62 | % | | | 1.15 | % | | | 2.82 | % | | | 2.95 | % | | | 3.56 | % | | | 3.79 | % |
Portfolio turnover rate | | | 76 | % | | | 25 | % | | | 44 | % | | | 32 | % | | | 67 | % | | | 76 | % | | | 25 | % | | | 44 | % | | | 32 | % | | | 67 | % |
| * | For the period from February 1, 2004 (Commencement of Operations – Service Class Shares) through December 31, 2004. |
| (a) | Annualized for periods of less than one year. |
| (b) | Total returns are historical and assume changes in share price, reinvestments of all dividends and distributions, and no sales charge. Had certain expenses not been reduced during the periods shown, total returns would have been lower. Total returns for periods of less than one year are not annualized. |
| (c) | Such percentages are after advisory fee or unified management fee waivers and expense reimbursements, as applicable. |
| (d) | Does not include any insurance charges imposed in connection with your variable insurance contract. |
178
| | |
| FINANCIAL HIGHLIGHTS (Continued) | | |
| | | Sun Capital Advisers Trust |
Selected data for a share outstanding throughout each period:
| | | | | | | | | | | | | | | | | | | | | | | | | | | | | | | | |
| | | Davis Venture Value Fund
Initial Class Shares | | | Davis Venture Value Fund
Service Class Shares | |
| | | Years Ended December 31, | | | Years Ended December 31, | |
| | | 2008 | | | 2007 | | | 2006 | | | 2005 | | | 2004 | | | 2008 | | | 2007 | | | 2006* | |
Net Asset Value, Beginning of Period | | $ | 13.65 | | | $ | 13.17 | | | $ | 11.56 | | | $ | 10.61 | | | $ | 9.50 | | | $ | 13.61 | | | $ | 13.15 | | | $ | 12.08 | |
| | | | | | | | | | | | | | | | | | | | | | | | | | | | | | | | |
Income (Loss) from Investment Operations: | | | | | | | | | | | | | | | | | | | | | | | | | | | | | | | | |
Net investment income (d) | | | 0.10 | | | | 0.17 | | | | 0.09 | | | | 0.09 | | | | 0.08 | | | | 0.06 | | | | 0.12 | | | | 0.04 | |
Net realized and unrealized gain on investments | | | (5.21 | ) | | | 0.39 | | | | 1.61 | | | | 0.94 | | | | 1.10 | | | | (5.17 | ) | | | 0.39 | | | | 1.12 | |
| | | | | | | | | | | | | | | | | | | | | | | | | | | | | | | | |
Total from Investment Operations | | | (5.11 | ) | | | 0.56 | | | | 1.70 | | | | 1.03 | | | | 1.18 | | | | (5.11 | ) | | | 0.51 | | | | 1.16 | |
| | | | | | | | | | | | | | | | | | | | | | | | | | | | | | | | |
Less Distributions from: | | | | | | | | | | | | | | | | | | | | | | | | | | | | | | | | |
Net investment income | | | (0.09 | ) | | | (0.08 | ) | | | (0.09 | ) | | | (0.08 | ) | | | (0.07 | ) | | | (0.07 | ) | | | (0.05 | ) | | | (0.09 | ) |
In excess of net investment income | | | — | | | | — | | | | — | | | | — | | | | — | | | | — | | | | — | | | | — | |
Net realized gain on investments | | | (0.11 | ) | | | — | | | | — | | | | — | | | | — | | | | (0.11 | ) | | | — | | | | — | |
In excess of net realized gain on investments | | | — | | | | — | | | | — | | | | — | | | | — | | | | — | | | | — | | | | — | |
Capital | | | — | | | | — | | | | — | | | | — | | | | — | | | | — | | | | — | | | | — | |
| | | | | | | | | | | | | | | | | | | | | | | | | | | | | | | | |
Total distributions | | | (0.20 | ) | | | (0.08 | ) | | | (0.09 | ) | | | (0.08 | ) | | | (0.07 | ) | | | (0.18 | ) | | | (0.05 | ) | | | (0.09 | ) |
| | | | | | | | | | | | | | | | | | | | | | | | | | | | | | | | |
Net Asset Value, End of Period | | $ | 8.34 | | | $ | 13.65 | | | $ | 13.17 | | | $ | 11.56 | | | $ | 10.61 | | | $ | 8.32 | | | $ | 13.61 | | | $ | 13.15 | |
| | | | | | | | | | | | | | | | | | | | | | | | | | | | | | | | |
Total Return (b) | | | (37.81 | )% | | | 4.23 | % | | | 14.77 | % | | | 9.73 | % | | | 12.45 | % | | | (37.93 | )% | | | 3.91 | % | | | 9.66 | % |
| | | | | | | | | | | | | | | | | | | | | | | | | | | | | | | | |
Ratios and Supplemental Data: | | | | | | | | | | | | | | | | | | | | | | | | | | | | | | | | |
Net Assets, End of Period (000’s) | | $ | 31,868 | | | $ | 52,861 | | | $ | 61,438 | | | $ | 54,216 | | | $ | 51,362 | | | $ | 82,041 | | | $ | 27,764 | | | $ | 27 | |
Ratios to average net assets: | | | | | | | | | | | | | | | | | | | | | | | | | | | | | | | | |
Net expenses (a)(c)(d) | | | 0.90 | % | | | 0.90 | % | | | 0.90 | % | | | 0.90 | % | | | 0.90 | % | | | 1.15 | % | | | 1.15 | % | | | 1.15 | % |
Gross expenses (a)(d) | | | 1.11 | % | | | 1.11 | % | | | 1.16 | % | | | 1.13 | % | | | 1.16 | % | | | 1.35 | % | | | 1.35 | % | | | 1.43 | % |
Net investment income (a)(c)(d) | | | 0.86 | % | | | 1.06 | % | | | 0.74 | % | | | 0.81 | % | | | 0.83 | % | | | 0.65 | % | | | 0.68 | % | | | 0.48 | % |
Portfolio turnover rate | | | 19 | % | | | 10 | % | | | 16 | % | | | 15 | % | | | 11 | % | | | 19 | % | | | 10 | % | | | 16 | % |
| * | For the period from May 1, 2006 (Commencement of Operations – Service Class Shares) through December 31, 2006. |
| (a) | Annualized for periods of less than one year. |
| (b) | Total returns are historical and assume changes in share price, reinvestments of all dividends and distributions, and no sales charge. Had certain expenses not been reduced during the periods shown, total returns would have been lower. Total returns for periods of less than one year are not annualized. |
| (c) | Such percentages are after advisory fee or unified management fee waivers and expense reimbursements, as applicable. |
| (d) | Does not include any insurance charges imposed in connection with your variable insurance contract. |
179
| | |
| FINANCIAL HIGHLIGHTS (Continued) | | |
| | | Sun Capital Advisers Trust |
Selected data for a share outstanding throughout each period:
| | | | | | | | | | | | | | | | | | | | | | | | | | | | | | | | |
| | | Oppenheimer Main Street
Small Cap Fund
Initial Class Shares | | | Oppenheimer Main Street
Small Cap Fund
Service Class Shares | |
| | | Years Ended December 31, | | | Years Ended December 31, | |
| | | 2008 | | | 2007 | | | 2006 | | | 2005 | | | 2004 | | | 2008 | | | 2007 | | | 2006* | |
Net Asset Value, Beginning of Period | | $ | 12.98 | | | $ | 15.02 | | | $ | 13.79 | | | $ | 15.21 | | | $ | 14.07 | | | $ | 12.85 | | | $ | 14.99 | | | $ | 15.56 | |
| | | | | | | | | | | | | | | | | | | | | | | | | | | | | | | | |
Income (Loss) from Investment Operations: | | | | | | | | | | | | | | | | | | | | | | | | | | | | | | | | |
Net investment income (loss) (d) | | | 0.03 | | | | 0.05 | | | | 0.01 | | | | 0.01 | | | | 1.23 | | | | (0.00 | )(e) | | | 0.01 | | | | (0.01 | ) |
Net realized and unrealized gain (loss) on investments | | | (4.82 | ) | | | (0.23 | ) | | | 1.82 | | | | 0.57 | | | | 1.14 | | | | (4.77 | ) | | | (0.29 | ) | | | 0.04 | |
| | | | | | | | | | | | | | | | | | | | | | | | | | | | | | | | |
Total from Investment Operations | | | (4.79 | ) | | | (0.18 | ) | | | 1.83 | | | | 0.58 | | | | 2.37 | | | | (4.77 | ) | | | (0.28 | ) | | | 0.03 | |
| | | | | | | | | | | | | | | | | | | | | | | | | | | | | | | | |
Less Distributions from: | | | | | | | | | | | | | | | | | | | | | | | | | | | | | | | | |
Net investment income | | | (0.03 | ) | | | — | | | | — | | | | — | | | | — | | | | (0.00 | )(e) | | | — | | | | — | |
In excess of net investment income | | | — | | | | — | | | | — | | | | — | | | | — | | | | — | | | | — | | | | — | |
Net realized gain on investments | | | (0.42 | ) | | | (1.86 | ) | | | (0.60 | ) | | | (2.00 | ) | | | (1.23 | ) | | | (0.42 | ) | | | (1.86 | ) | | | (0.60 | ) |
In excess of net realized gain on investments | | | — | | | | — | | | | — | | | | — | | | | — | | | | — | | | | — | | | | — | |
Capital | | | — | | | | — | | | | — | | | | — | | | | — | | | | — | | | | — | | | | — | |
| | | | | | | | | | | | | | | | | | | | | | | | | | | | | | | | |
Total distributions | | | (0.45 | ) | | | (1.86 | ) | | | (0.60 | ) | | | (2.00 | ) | | | (1.23 | ) | | | (0.42 | ) | | | (1.86 | ) | | | (0.60 | ) |
| | | | | | | | | | | | | | | | | | | | | | | | | | | | | | | | |
Net Asset Value, End of Period | | $ | 7.74 | | | $ | 12.98 | | | $ | 15.02 | | | $ | 13.79 | | | $ | 15.21 | | | $ | 7.66 | | | $ | 12.85 | | | $ | 14.99 | |
| | | | | | | | | | | | | | | | | | | | | | | | | | | | | | | | |
Total Return (b) | | | (37.99 | )% | | | (1.44 | )% | | | 13.60 | % | | | 4.33 | % | | | 18.43 | % | | | (38.14 | )% | | | (2.11 | )% | | | 0.48 | % |
| | | | | | | | | | | | | | | | | | | | | | | | | | | | | | | | |
Ratios and Supplemental Data: | | | | | | | | | | | | | | | | | | | | | | | | | | | | | | | | |
Net Assets, End of Period (000’s) | | $ | 38,435 | | | $ | 72,741 | | | $ | 87,215 | | | $ | 86,949 | | | $ | 89,031 | | | $ | 115,098 | | | $ | 105,377 | | | $ | 25 | |
Ratios to average net assets: | | | | | | | | | | | | | | | | | | | | | | | | | | | | | | | | |
Net expenses (a)(c)(d) | | | 1.00 | % | | | 1.00 | % | | | 1.00 | % | | | 1.00 | % | | | 1.00 | % | | | 1.25 | % | | | 1.25 | % | | | 1.25 | % |
Gross expenses (a)(d) | | | 1.29 | % | | | 1.38 | % | | | 1.42 | % | | | 1.10 | % | | | 1.09 | % | | | 1.55 | % | | | 1.61 | % | | | 1.82 | % |
Net investment income (loss) (a)(c)(d) | | | 0.21 | % | | | 0.31 | % | | | 0.02 | % | | | 0.03 | % | | | (0.10 | )% | | | 0.04 | % | | | (0.06 | )% | | | (0.09 | )% |
Portfolio turnover rate | | | 126 | % | | | 126 | % | | | 206 | % | | | 58 | % | | | 106 | % | | | 126 | % | | | 126 | % | | | 206 | % |
| * | For the period from May 1, 2006 (Commencement of Operations – Service Class Shares) through December 31, 2006. |
| (a) | Annualized for periods of less than one year. |
| (b) | Total returns are historical and assume changes in share price, reinvestments of all dividends and distributions, and no sales charge. Had certain expenses not been reduced during the periods shown, total returns would have been lower. Total returns for periods of less than one year are not annualized. |
| (c) | Such percentages are after advisory fee or unified management fee waivers and expense reimbursements, as applicable. |
| (d) | Does not include any insurance charges imposed in connection with your variable insurance contract. |
| (e) | Amount is less than $0.005 per share. |
180
| | |
| FINANCIAL HIGHLIGHTS (Continued) | | |
| | | Sun Capital Advisers Trust |
Selected data for a share outstanding throughout each period:
| | | | | | | | | | | | | | | | | | | | | | | | | | | | | | | | | | | | | | | | |
| | | Oppenheimer Large Cap Core Fund
Initial Class Shares | | | Oppenheimer Large Cap Core Fund
Service Class Shares | |
| | | Years Ended December 31, | | | Years Ended December 31, | |
| | | 2008 | | | 2007 | | | 2006 | | | 2005 | | | 2004 | | | 2008 | | | 2007 | | | 2006 | | | 2005 | | | 2004* | |
Net Asset Value, Beginning of Period | | $ | 10.77 | | | $ | 12.37 | | | $ | 10.47 | | | $ | 12.47 | | | $ | 11.45 | | | $ | 11.03 | | | $ | 12.65 | | | $ | 10.70 | | | $ | 12.72 | | | $ | 12.14 | |
| | | | | | | | | | | | | | | | | | | | | | | | | | | | | | | | | | | | | | | | |
Income (Loss) from Investment Operations: | | | | | | | | | | | | | | | | | | | | | | | | | | | | | | | | | | | | | | | | |
Net investment income (loss) (d) | | | 0.04 | | | | 0.12 | | | | 0.17 | | | | 0.02 | | | | 0.03 | | | | 0.10 | | | | 0.08 | | | | 0.12 | | | | (0.00 | )(e) | | | 0.00 | (e) |
Net realized and unrealized gain (loss) on investments | | | (4.03 | ) | | | (0.84 | ) | | | 1.93 | | | | (0.09 | ) | | | 2.25 | | | | (4.19 | ) | | | (0.84 | ) | | | 2.00 | | | | (0.11 | ) | | | 1.58 | |
| | | | | | | | | | | | | | | | | | | | | | | | | | | | | | | | | | | | | | | | |
Total from Investment Operations | | | (3.99 | ) | | | (0.72 | ) | | | 2.10 | | | | (0.07 | ) | | | 2.28 | | | | (4.09 | ) | | | (0.76 | ) | | | 2.12 | | | | (0.11 | ) | | | 1.58 | |
| | | | | | | | | | | | | | | | | | | | | | | | | | | | | | | | | | | | | | | | |
Less Distributions from: | | | | | | | | | | | | | | | | | | | | | | | | | | | | | | | | | | | | | | | | |
Net investment income | | | (0.05 | ) | | | (0.10 | ) | | | (0.16 | ) | | | (0.02 | ) | | | (0.03 | ) | | | (0.04 | ) | | | (0.08 | ) | | | (0.13 | ) | | | — | | | | (0.00 | )(e) |
In excess of net investment income | | | — | | | | — | | | | — | | | | — | | | | — | | | | — | | | | — | | | | — | | | | — | | | | — | |
Net realized gain on investments | | | (0.03 | ) | | | (0.78 | ) | | | (0.04 | ) | | | (1.91 | ) | | | (1.23 | ) | | | (0.03 | ) | | | (0.78 | ) | | | (0.04 | ) | | | (1.91 | ) | | | (1.00 | ) |
In excess of net realized gain on investments | | | — | | | | — | | | | — | | | | — | | | | — | | | | — | | | | — | | | | — | | | | — | | | | — | |
Capital | | | — | | | | — | | | �� | — | | | | — | | | | — | | | | — | | | | — | | | | — | | | | — | | | | — | |
| | | | | | | | | | | | | | | | | | | | | | | | | | | | | | | | | | | | | | | | |
Total distributions | | | (0.08 | ) | | | (0.88 | ) | | | (0.20 | ) | | | (1.93 | ) | | | (1.26 | ) | | | (0.07 | ) | | | (0.86 | ) | | | (0.17 | ) | | | (1.91 | ) | | | (1.00 | ) |
| | | | | | | | | | | | | | | | | | | | | | | | | | | | | | | | | | | | | | | | |
Net Asset Value, End of Period | | $ | 6.70 | | | $ | 10.77 | | | $ | 12.37 | | | $ | 10.47 | | | $ | 12.47 | | | $ | 6.87 | | | $ | 11.03 | | | $ | 12.65 | | | $ | 10.70 | | | $ | 12.72 | |
| | | | | | | | | | | | | | | | | | | | | | | | | | | | | | | | | | | | | | | | |
Total Return (b) | | | (37.06 | )% | | | (5.81 | )% | | | 20.07 | % | | | (0.72 | )% | | | 20.39 | % | | | (37.15 | )% | | | (6.07 | )% | | | 19.78 | % | | | (0.98 | )% | | | 13.20 | % |
| | | | | | | | | | | | | | | | | | | | | | | | | | | | | | | | | | | | | | | | |
Ratios and Supplemental Data: | | | | | | | | | | | | | | | | | | | | | | | | | | | | | | | | | | | | | | | | |
Net Assets, End of Period (000’s) | | $ | 8,366 | | | $ | 5,544 | | | $ | 6,183 | | | $ | 5,505 | | | $ | 7,049 | | | $ | 4,974 | | | $ | 7,808 | | | $ | 5,262 | | | $ | 1,594 | | | $ | 1,111 | |
Ratios to average net assets: | | | | | | | | | | | | | | | | | | | | | | | | | | | | | | | | | | | | | | | | |
Net expenses (a)(c)(d) | | | 0.90 | % | | | 0.90 | % | | | 0.90 | % | | | 0.90 | % | | | 0.90 | % | | | 1.15 | % | | | 1.15 | % | | | 1.15 | % | | | 1.15 | % | | | 1.15 | % |
Gross expenses (a)(d) | | | 2.08 | % | | | 1.81 | % | | | 2.47 | % | | | 2.74 | % | | | 3.42 | % | | | 2.34 | % | | | 2.05 | % | | | 2.62 | % | | | 3.04 | % | | | 4.04 | % |
Net investment income (loss) (a)(c)(d) | | | 1.39 | % | | | 0.89 | % | | | 1.47 | % | | | 0.15 | % | | | 0.27 | % | | | 1.05 | % | | | 0.63 | % | | | 1.44 | % | | | (0.05 | )% | | | 0.21 | % |
Portfolio turnover rate | | | 189 | % | | | 63 | % | | | 135 | % | | | 114 | % | | | 137 | % | | | 189 | % | | | 63 | % | | | 135 | % | | | 114 | % | | | 137 | % |
| * | For the period from February 1, 2004 (Commencement of Operations – Service Class Shares) through December 31, 2004. |
| (a) | Annualized for periods of less than one year. |
| (b) | Total returns are historical and assume changes in share price, reinvestments of all dividends and distributions, and no sales charge. Had certain expenses not been reduced during the periods shown, total returns would have been lower. Total returns for periods of less than one year are not annualized. |
| (c) | Such percentages are after advisory fee or unified management fee waivers and expense reimbursements, as applicable. |
| (d) | Does not include any insurance charges imposed in connection with your variable insurance contract. |
| (e) | Amount is less than $0.005 per share. |
181
| | |
| FINANCIAL HIGHLIGHTS (Continued) | | |
| | | Sun Capital Advisers Trust |
Selected data for a share outstanding throughout the period:
| | | | | | | | | | | | | | | | | | | | |
| | | WMC Large Cap Growth Fund
Initial Class Shares | | | WMC Large Cap Growth Fund
Service Class Shares | |
| | | Years Ended December 31, | | | Years Ended December 31, | |
| | | 2008 | | | 2007** | | | 2008 | | | 2007 | | | 2006* | |
Net Asset Value, Beginning of Period | | $ | 10.65 | | | $ | 9.99 | | | $ | 10.63 | | | $ | 9.98 | | | $ | 10.00 | |
| | | | | | | | | | | | | | | | | | | | |
Income (Loss) from Investment Operations: | | | | | | | | | | | | | | | | | | | | |
Net investment income (loss) (d) | | | 0.04 | | | | (0.00 | )(e) | | | 0.02 | | | | (0.02 | ) | | | (0.01 | ) |
Net realized and unrealized gain (loss) on investments | | | (4.74 | ) | | | 0.69 | | | | (4.73 | ) | | | 0.70 | | | | (0.01 | ) |
| | | | | | | | | | | | | | | | | | | | |
Total from Investment Operations | | | (4.70 | ) | | | 0.69 | | | | (4.71 | ) | | | 0.68 | | | | (0.02 | ) |
| | | | | | | | | | | | | | | | | | | | |
Less Distributions from: | | | | | | | | | | | | | | | | | | | | |
Net investment income | | | — | | | | — | | | | — | | | | — | | | | — | |
In excess of net investment income | | | — | | | | — | | | | — | | | | — | | | | — | |
Net realized gain on investments | | | (0.00 | )(e) | | | (0.03 | ) | | | (0.00 | )(e) | | | (0.03 | ) | | | — | |
In excess of net realized gain on investments | | | — | | | | — | | | | — | | | | — | | | | — | |
Capital | | | — | | | | — | | | | — | | | | — | | | | — | |
| | | | | | | | | | | | | | | | | | | | |
Total distributions | | | (0.00 | ) | | | (0.03 | ) | | | (0.00 | ) | | | (0.03 | ) | | | — | |
| | | | | | | | | | | | | | | | | | | | |
Net Asset Value, End of Period | | $ | 5.95 | | | $ | 10.65 | | | $ | 5.92 | | | $ | 10.63 | | | $ | 9.98 | |
| | | | | | | | | | | | | | | | | | | | |
Total Return (b) | | | (44.12 | )% | | | 6.88 | % | | | (44.30 | )% | | | 6.78 | % | | | (0.20 | )% |
| | | | | | | | | | | | | | | | | | | | |
Ratios and Supplemental Data: | | | | | | | | | | | | | | | | | | | | |
Net Assets, End of Period (000’s) | | $ | 34,599 | | | $ | 62,680 | | | $ | 15,518 | | | $ | 33,064 | | | $ | 3,810 | |
Ratios to average net assets: | | | | | | | | | | | | | | | | | | | | |
Net expenses (a)(c)(d) | | | 0.81 | % | | | 0.81 | % | | | 1.06 | % | | | 1.06 | % | | | 1.06 | % |
Gross expenses (a)(d) | | | 1.17 | % | | | 1.06 | % | | | 1.43 | % | | | 1.46 | % | | | 5.26 | % |
Net investment income (loss) (a)(c)(d) | | | 0.43 | % | | | 0.01 | % | | | 0.17 | % | | | (0.25 | )% | �� | | (0.10 | )% |
Portfolio turnover rate | | | 265 | % | | | 307 | % | | | 265 | % | | | 307 | % | | | 110 | % |
| * | For the period from May 1, 2006 (Commencement of Operations – Service Class Shares) through December 31, 2006. |
| ** | For the period from April 2, 2007 (Commencement of Operations – Initial Class Shares) through December 31, 2007. |
| (a) | Annualized for periods of less than one year. |
| (b) | Total returns are historical and assume changes in share price, reinvestments of all dividends and distributions, and no sales charge. Had certain expenses not been reduced during the periods shown, total returns would have been lower. Total returns for periods of less than one year are not annualized. |
| (c) | Such percentage are after advisory fee or unified management fee waivers and expense reimbursements, as applicable. |
| (d) | Does not include any insurance charges imposed in connection with your variable insurance contract. |
| (e) | Amount is less than $0.005 per share. |
182
| | |
| FINANCIAL HIGHLIGHTS (Continued) | | |
| | | Sun Capital Advisers Trust |
Selected data for a share outstanding throughout each period:
| | | | | | | | | | | | | | | | | | | | | | | | |
| | | WMC Blue Chip Mid Cap Fund
Initial Class Shares | | | WMC Blue Chip Mid Cap Fund
Service Class Shares | |
| | | Years Ended December 31, | | | Year Ended December 31, | |
| | | 2008 | | | 2007 | | | 2006 | | | 2005 | | | 2004 | | | 2008* | |
Net Asset Value, Beginning of Period | | $ | 17.95 | | | $ | 19.04 | | | $ | 20.60 | | | $ | 18.13 | | | $ | 15.61 | | | $ | 15.70 | |
| | | | | | | | | | | | | | | | | | | | | | | | |
Income (Loss) from Investment Operations: | | | | | | | | | | | | | | | | | | | | | | | | |
Net investment income (loss) (d) | | | 0.01 | | | | (0.00 | )(e) | | | 0.18 | | | | (0.00 | )(e) | | | 0.02 | | | | 0.02 | |
Net realized and unrealized gain (loss) on investments | | | (5.41 | ) | | | 2.87 | | | | 1.87 | | | | 2.98 | | | | 2.50 | | | | (3.19 | ) |
| | | | | | | | | | | | | | | | | | | | | | | | |
Total from Investment Operations | | | (5.40 | ) | | | 2.87 | | | | 2.05 | | | | 2.98 | | | | 2.52 | | | | (3.17 | ) |
| | | | | | | | | | | | | | | | | | | | | | | | |
Less Distributions from: | | | | | | | | | | | | | | | | | | | | | | | | |
Net investment income | | | (0.03 | ) | | | (0.25 | ) | | | — | | | | (0.02 | ) | | | — | | | | (0.03 | ) |
In excess of net investment income | | | — | | | | — | | | | — | | | | — | | | | — | | | | — | |
Net realized gain on investments | | | (3.20 | ) | | | (3.71 | ) | | | (3.61 | ) | | | (0.49 | ) | | | — | | | | (3.20 | ) |
In excess of net realized gain on investments | | | — | | | | — | | | | — | | | | — | | | | — | | | | — | |
Capital | | | — | | | | — | | | | — | | | | — | | | | — | | | | — | |
| | | | | | | | | | | | | | | | | | | | | | | | |
Total distributions | | | (3.23 | ) | | | (3.96 | ) | | | (3.61 | ) | | | (0.51 | ) | | | — | | | | (3.23 | ) |
| | | | | | | | | | | | | | | | | | | | | | | | |
Net Asset Value, End of Period | | $ | 9.32 | | | $ | 17.95 | | | $ | 19.04 | | | $ | 20.60 | | | $ | 18.13 | | | $ | 9.30 | |
| | | | | | | | | | | | | | | | | | | | | | | | |
Total Return (b) | | | (35.14 | )% | | | 15.41 | % | | | 11.30 | % | | | 16.61 | % | | | 16.14 | % | | | (26.06 | )% |
| | | | | | | | | | | | | | | | | | | | | | | | |
Ratios and Supplemental Data: | | | | | | | | | | | | | | | | | | | | | | | | |
Net Assets, End of Period (000’s) | | $ | 45,842 | | | $ | 85,438 | | | $ | 94,632 | | | $ | 94,928 | | | $ | 89,609 | | | $ | 31,137 | |
Ratio to average net assets: | | | | | | | | | | | | | | | | | | | | | | | | |
Net expenses (a)(c)(d) | | | 1.00 | % | | | 1.00 | % | | | 1.00 | % | | | 1.00 | % | | | 1.00 | % | | | 1.25 | % |
Gross expenses (a)(d) | | | 1.21 | % | | | 1.14 | % | | | 1.14 | % | | | 1.15 | % | | | 1.12 | % | | | 1.47 | % |
Net investment income (loss) (a)(c)(d) | | | 0.05 | % | | | (0.17 | )% | | | 0.92 | % | | | (0.03 | )% | | | 0.13 | % | | | 0.02 | % |
Portfolio turnover rate | | | 104 | % | | | 75 | % | | | 83 | % | | | 67 | % | | | 60 | % | | | 104 | % |
| * | For the period from March 7, 2008 (Commencement of Operations – Service Class Shares) through December 31, 2008. |
| (a) | Annualized for periods of less than one year. |
| (b) | Total returns are historical and assume changes in share price, reinvestments of all dividends and distributions, and no sales charge. Had certain expenses not been reduced during the periods shown, total returns would have been lower. Total returns for periods of less than one year are not annualized. |
| (c) | Such percentages are after advisory fee or unified management fee waivers and expense reimbursements, as applicable. |
| (d) | Does not include any insurance charges imposed in connection with your variable insurance contract. |
| (e) | Amount is less than $0.005 per share. |
183
| | |
| FINANCIAL HIGHLIGHTS (Continued) | | |
| | | Sun Capital Advisers Trust |
Selected data for a share outstanding throughout each period:
| | | | | | | | | | | | | | | | |
| | | Lord Abbett
Growth & Income Fund
Initial Class Shares | | | Lord Abbett
Growth & Income Fund
Service Class Shares | | | Goldman Sachs
Mid Cap Value Fund
Initial Class Shares | | | Goldman Sachs
Mid Cap Value Fund
Service Class Shares | |
| | | Year Ended December 31, | | | Year Ended December 31, | | | Year Ended December 31, | | | Year Ended December 31, | |
| | | 2008* | | | 2008* | | | 2008* | | | 2008* | |
Net Asset Value, Beginning of Period | | $ | 10.00 | | | $ | 10.00 | | | $ | 10.00 | | | $ | 10.00 | |
| | | | | | | | | | | | | | | | |
Income (Loss) from Investment Operations: | | | | | | | | | | | | | | | | |
Net investment income (d) | | | 0.06 | | | | 0.06 | | | | 0.05 | | | | 0.07 | |
Net realized and unrealized loss on investments | | | (2.92 | ) | | | (2.93 | ) | | | (3.06 | ) | | | (3.09 | ) |
| | | | | | | | | | | | | | | | |
Total from Investment Operations | | | (2.86 | ) | | | (2.87 | ) | | | (3.01 | ) | | | (3.02 | ) |
| | | | | | | | | | | | | | | | |
Less Distributions from: | | | | | | | | | | | | | | | | |
Net investment income | | | (0.06 | ) | | | (0.05 | ) | | | (0.06 | ) | | | (0.05 | ) |
In excess of net investment income | | | — | | | | — | | | | — | | | | — | |
Net realized gain on investments | | | — | | | | — | | | | — | | | | — | |
In excess of net realized gain on investments | | | — | | | | — | | | | — | | | | — | |
Capital | | | — | | | | — | | | | — | | | | — | |
| | | | | | | | | | | | | | | | |
Total distributions | | | (0.06 | ) | | | (0.05 | ) | | | (0.06 | ) | | | (0.05 | ) |
| | | | | | | | | | | | | | | | |
Net Asset Value, End of Period | | $ | 7.08 | | | $ | 7.08 | | | $ | 6.93 | | | $ | 6.93 | |
| | | | | | | | | | | | | | | | |
Total Return (b) | | | (28.54 | )% | | | (28.68 | )% | | | (30.07 | )% | | | (30.21 | )% |
| | | | | | | | | | | | | | | | |
Ratios and Supplemental Data: | | | | | | | | | | | | | | | | |
Net Assets, End of Period (000’s) | | $ | 2,229 | | | $ | 2,620 | | | $ | 6,496 | | | $ | 4,452 | |
Ratio to average net assets: | | | | | | | | | | | | | | | | |
Net expenses (a)(c)(d) | | | 0.87 | % | | | 1.12 | % | | | 1.07 | % | | | 1.32 | % |
Gross expenses (a)(d) | | | 0.90 | % | | | 1.14 | % | | | 1.08 | % | | | 1.32 | % |
Net investment income (a)(c)(d) | | | 1.71 | % | | | 1.48 | % | | | 2.10 | % | | | 1.65 | % |
Portfolio turnover rate | | | 73 | % | | | 73 | % | | | 90 | % | | | 90 | % |
| * | For the period March 7, 2008 (Commencement of Operations) to December 31, 2008. |
| (a) | Annualized for periods of less than one year. |
| (b) | Total returns are historical and assume changes in share price, reinvestments of all dividends and distributions, and no sales charge. Had certain expenses not been reduced during the periods shown, total returns would have been lower. Total returns for periods of less than one year are not annualized. |
| (c) | Such percentages are after advisory fee or unified management fee waivers and expense reimbursements, as applicable. |
| (d) | Does not include any insurance charges imposed in connection with your variable insurance contract. |
184
| | |
| FINANCIAL HIGHLIGHTS (Continued) | | |
| | | Sun Capital Advisers Trust |
Selected data for a share outstanding throughout each period:
| | | | | | | | | | | | | | | | |
| | | Goldman Sachs
Short Duration Fund
Initial Class Shares | | | Goldman Sachs
Short Duration Fund
Service Class Shares | | | Dreman
Small Cap Value Fund
Initial Class Shares | | | Dreman
Small Cap Value Fund
Service Class Shares | |
| | | Year Ended December 31, | | | Year Ended December 31, | | | Year Ended December 31, | | | Year Ended December 31, | |
| | | 2008* | | | 2008* | | | 2008** | | | 2008** | |
Net Asset Value, Beginning of Period | | $ | 10.00 | | | $ | 10.00 | | | $ | 10.00 | | | $ | 10.00 | |
| | | | | | | | | | | | | | | | |
Income (Loss) from Investment Operations: | | | | | | | | | | | | | | | | |
Net investment income (d) | | | 0.16 | | | | 0.14 | | | | 0.01 | | | | 0.01 | |
Net realized and unrealized income (loss) on investments | | | 0.16 | | | | 0.16 | | | | (2.03 | ) | | | (2.03 | ) |
| | | | | | | | | | | | | | | | |
Total from Investment Operations | | | 0.32 | | | | 0.30 | | | | (2.02 | ) | | | (2.02 | ) |
| | | | | | | | | | | | | | | | |
Less Distributions from: | | | | | | | | | | | | | | | | |
Net investment income | | | (0.16 | ) | | | (0.14 | ) | | | (0.01 | ) | | | (0.01 | ) |
In excess of net investment income | | | — | | | | — | | | | — | | | | — | |
Net realized gain on investments | | | (0.03 | ) | | | (0.03 | ) | | | — | | | | — | |
In excess of net realized gain on investments | | | — | | | | — | | | | — | | | | — | |
Capital | | | — | | | | — | | | | — | | | | — | |
| | | | | | | | | | | | | | | | |
Total distributions | | | (0.19 | ) | | | (0.17 | ) | | | (0.01 | ) | | | (0.01 | ) |
| | | | | | | | | | | | | | | | |
Net Asset Value, End of Period | | $ | 10.13 | | | $ | 10.13 | | | $ | 7.97 | | | $ | 7.97 | |
| | | | | | | | | | | | | | | | |
Total Return (b) | | | 3.22 | % | | | 3.00 | % | | | (20.15 | )% | | | (20.20 | )% |
| | | | | | | | | | | | | | | | |
Ratios and Supplemental Data: | | | | | | | | | | | | | | | | |
Net Assets, End of Period (000’s) | | $ | 54,602 | | | $ | 63,422 | | | $ | 4,316 | | | $ | 1,424 | |
Ratio to average net assets: | | | | | | | | | | | | | | | | |
Net expenses (a)(c)(d) | | | 0.65 | % | | | 0.90 | % | | | 1.15 | % | | | 1.40 | % |
Gross expenses (a)(d) | | | 0.68 | % | | | 0.92 | % | | | 8.84 | % | | | 6.68 | % |
Net investment income (a)(c)(d) | | | 2.34 | % | | | 1.95 | % | | | 1.18 | % | | | 0.72 | % |
Portfolio turnover rate | | | 333 | % | | | 333 | % | | | 28 | % | | | 28 | % |
| * | For the period March 7, 2008 (Commencement of Operations) to December 31, 2008. |
| ** | For the period October 1, 2008 (Commencement of Operations) to December 31, 2008. |
| (a) | Annualized for periods of less than one year. |
| (b) | Total returns are historical and assume changes in share price, reinvestments of all dividends and distributions, and no sales charge. Had certain expenses not been reduced during the periods shown, total returns would have been lower. Total returns for periods of less than one year are not annualized. |
| (c) | Such percentages are after advisory fee or unified management fee waivers and expense reimbursements, as applicable. |
| (d) | Does not include any insurance charges imposed in connection with your variable insurance contract. |
185
| | |
| FINANCIAL HIGHLIGHTS (Continued) | | |
| | | Sun Capital Advisers Trust |
Selected data for a share outstanding throughout each period:
| | | | | | | | | | | | | | | | |
| | | PIMCO High Yield Fund
Initial Class Shares | | | PIMCO High Yield Fund
Service Class Shares | | | PIMCO Total Return Fund
Initial Class Shares | | | PIMCO Total Return Fund
Service Class Shares | |
| | | Year Ended December 31, | | | Year Ended December 31, | | | Year Ended December 31, | | | Year Ended December 31, | |
| | | 2008* | | | 2008* | | | 2008** | | | 2008** | |
Net Asset Value, Beginning of Period | | $ | 10.00 | | | $ | 10.00 | | | $ | 10.00 | | | $ | 10.00 | |
| | | | | | | | | | | | | | | | |
Income (Loss) from Investment Operations: | | | | | | | | | | | | | | | | |
Net investment income (d) | | | 0.53 | | | | 0.51 | | | | 0.03 | | | | 0.02 | |
Net realized and unrealized gain (loss) on investments | | | (1.85 | ) | | | (1.85 | ) | | | 0.55 | | | | 0.55 | |
| | | | | | | | | | | | | | | | |
Total from Investment Operations | | | (1.32 | ) | | | (1.34 | ) | | | 0.58 | | | | 0.57 | |
| | | | | | | | | | | | | | | | |
Less Distributions from: | | | | | | | | | | | | | | | | |
Net investment income | | | (0.55 | ) | | | (0.53 | ) | | | (0.03 | ) | | | (0.02 | ) |
In excess of net investment income | | | — | | | | — | | | | — | | | | — | |
Net realized gain on investments | | | (0.06 | ) | | | (0.06 | ) | | | (0.00 | )(e) | | | (0.00 | )(e) |
In excess of net realized gain on investments | | | — | | | | — | | | | — | | | | — | |
Capital | | | — | | | | — | | | | — | | | | — | |
| | | | | | | | | | | | | | | | |
Total distributions | | | (0.61 | ) | | | (0.59 | ) | | | (0.03 | ) | | | (0.02 | ) |
| | | | | | | | | | | | | | | | |
Net Asset Value, End of Period | | $ | 8.07 | | | $ | 8.07 | | | $ | 10.55 | | | $ | 10.55 | |
| | | | | | | | | | | | | | | | |
Total Return (b) | | | (13.74 | )% | | | (13.92 | )% | | | 5.82 | % | | | 5.76 | % |
| | | | | | | | | | | | | | | | |
Ratios and Supplemental Data: | | | | | | | | | | | | | | | | |
Net Assets, End of Period (000’s) | | $ | 3,134 | | | $ | 12,300 | | | $ | 13,823 | | | $ | 18,397 | |
Ratio to average net assets: | | | | | | | | | | | | | | | | |
Net expenses (a)(c)(d) | | | 0.75 | % | | | 1.00 | % | | | 0.65 | % | | | 0.90 | % |
Gross expenses (a)(d) | | | 0.77 | % | | | 1.03 | % | | | 0.68 | % | | | 0.93 | % |
Net investment income (a)(c)(d) | | | 6.74 | % | | | 7.18 | % | | | 1.19 | % | | | 0.97 | % |
Portfolio turnover rate | | | 75 | % | | | 75 | % | | | 181 | % | | | 181 | % |
| * | For the period March 7, 2008 (Commencement of Operations) to December 31, 2008. |
| ** | For the period October 1, 2008 (Commencement of Operations) to December 31, 2008. |
| (a) | Annualized for periods of less than one year. |
| (b) | Total returns are historical and assume changes in share price, reinvestments of all dividends and distributions, and no sales charge. Had certain expenses not been reduced during the periods shown, total returns would have been lower. Total returns for periods of less than one year are not annualized. |
| (c) | Such percentages are after advisory fee or unified management fee waivers and expense reimbursements, as applicable. |
| (d) | Does not include any insurance charges imposed in connection with your variable insurance contract. |
| (e) | Amount is less than $0.005 per share. |
186
| | |
| FINANCIAL HIGHLIGHTS (Continued) | | |
| | | Sun Capital Advisers Trust |
Selected data for a share outstanding throughout each period:
| | | | | | | | | | | | | | | | |
| | | AIM Small
Cap Growth Fund
Initial Class Shares | | | AIM Small
Cap Growth Fund
Service Class Shares | | | AllianceBernstein
International Value Fund
Initial Class Shares | | | AllianceBernstein
International Value Fund
Service Class Shares | |
| | | Year Ended December 31, | | | Year Ended December 31, | | | Year Ended December 31, | | | Year Ended December 31, | |
| | | 2008* | | | 2008* | | | 2008* | | | 2008* | |
Net Asset Value, Beginning of Period | | $ | 10.00 | | | $ | 10.00 | | | $ | 10.00 | | | $ | 10.00 | |
| | | | | | | | | | | | | | | | |
Income (Loss) from Investment Operations: | | | | | | | | | | | | | | | | |
Net investment income (loss) (d) | | | (0.00 | )(e) | | | (0.01 | ) | | | 0.01 | | | | 0.02 | |
Net realized and unrealized loss on investments | | | (2.49 | ) | | | (2.49 | ) | | | (2.07 | ) | | | (2.09 | ) |
| | | | | | | | | | | | | | | | |
Total from Investment Operations | | | (2.49 | ) | | | (2.50 | ) | | | (2.06 | ) | | | (2.07 | ) |
| | | | | | | | | | | | | | | | |
Less Distributions from: | | | | | | | | | | | | | | | | |
Net investment income | | | — | | | | — | | | | (0.02 | ) | | | (0.01 | ) |
In excess of net investment income | | | — | | | | — | | | | — | | | | — | |
Net realized gain on investments | | | — | | | | — | | | | — | | | | — | |
In excess of net realized gain on investments | | | — | | | | — | | | | — | | | | — | |
Capital | | | — | | | | — | | | | — | | | | — | |
| | | | | | | | | | | | | | | | |
Total distributions | | | — | | | | — | | | | (0.02 | ) | | | (0.01 | ) |
| | | | | | | | | | | | | | | | |
Net Asset Value, End of Period | | $ | 7.51 | | | $ | 7.50 | | | $ | 7.92 | | | $ | 7.92 | |
| | | | | | | | | | | | | | | | |
Total Return (b) | | | (24.90 | )% | | | (25.00 | )% | | | (20.64 | )% | | | (20.69 | )% |
| | | | | | | | | | | | | | | | |
Ratios and Supplemental Data: | | | | | | | | | | | | | | | | |
Net Assets, End of Period (000’s) | | $ | 2,530 | | | $ | 1,544 | | | $ | 9,763 | | | $ | 2,051 | |
Ratio to average net assets: | | | | | | | | | | | | | | | | |
Net expenses (a)(c)(d) | | | 1.15 | % | | | 1.40 | % | | | 0.75 | % | | | 1.00 | % |
Gross expenses (a)(d) | | | 11.09 | % | | | 9.42 | % | | | 6.64 | % | | | 4.64 | % |
Net investment income (loss) (a)(c)(d) | | | (0.40 | )% | | | (0.72 | )% | | | 1.18 | % | | | 1.07 | % |
Portfolio turnover rate | | | 4 | % | | | 4 | % | | | 7 | % | | | 7 | % |
| * | For the period October 1, 2008 (Commencement of Operations) to December 31, 2008. |
| (a) | Annualized for periods of less than one year. |
| (b) | Total returns are historical and assume changes in share price, reinvestments of all dividends and distributions, and no sales charge. Had certain expenses not been reduced during the periods shown, total returns would have been lower. Total returns for periods of less than one year are not annualized. |
| (c) | Such percentages are after advisory fee or unified management fee waivers and expense reimbursements, as applicable. |
| (d) | Does not include any insurance charges imposed in connection with your variable insurance contract. |
| (e) | Amount is less than $0.005 per share. |
187
| | |
| FINANCIAL HIGHLIGHTS (Continued) | | |
| | | Sun Capital Advisers Trust |
Selected data for a share outstanding throughout each period:
| | | | | | | | | | | | | | | | |
| | | BlackRock Inflation
Protected Bond Fund
Initial Class Shares | | | BlackRock Inflation
Protected Bond Fund
Service Class Shares | | | Ibbotson Moderate Fund
Initial Class Shares | | | Ibbotson Moderate Fund
Service Class Shares | |
| | | Year Ended December 31, | | | Year Ended December 31, | | | Year Ended December 31, | | | Year Ended December 31, | |
| | | 2008* | | | 2008* | | | 2008* | | | 2008* | |
Net Asset Value, Beginning of Period | | $ | 10.00 | | | $ | 10.00 | | | $ | 10.00 | | | $ | 10.00 | |
| | | | | | | | | | | | | | | | |
Income (Loss) from Investment Operations: | | | | | | | | | | | | | | | | |
Net investment income (loss) (e) | | | (0.05 | ) | | | (0.06 | ) | | | 0.03 | | | | 0.02 | |
Net realized and unrealized loss on investments | | | (0.05 | )(c) | | | (0.04 | )(c) | | | (0.84 | )(c) | | | (0.84 | )(c) |
| | | | | | | | | | | | | | | | |
Total from Investment Operations | | | (0.10 | ) | | | (0.10 | ) | | | (0.81 | ) | | | (0.82 | ) |
| | | | | | | | | | | | | | | | |
Less Distributions from: | | | | | | | | | | | | | | | | |
Net investment income | | | (0.03 | ) | | | (0.03 | ) | | | — | | | | — | |
In excess of net investment income | | | — | | | | — | | | | — | | | | — | |
Net realized gain on investments | | | — | | | | — | | | | — | | | | — | |
In excess of net realized gain on investments | | | — | | | | — | | | | — | | | | — | |
Capital | | | — | | | | — | | | | — | | | | — | |
| | | | | | | | | | | | | | | | |
Total distributions | | | (0.03 | ) | | | (0.03 | ) | | | — | | | | — | |
| | | | | | | | | | | | | | | | |
Net Asset Value, End of Period | | $ | 9.87 | | | $ | 9.87 | | | $ | 9.19 | | | $ | 9.18 | |
| | | | | | | | | | | | | | | | |
Total Return (b) | | | (0.95 | )% | | | (0.96 | )% | | | (8.10 | )% | | | (8.20 | )% |
| | | | | | | | | | | | | | | | |
Ratios and Supplemental Data: | | | | | | | | | | | | | | | | |
Net Assets, End of Period (000’s) | | $ | 8,311 | | | $ | 4,276 | | | $ | 46 | | | $ | 33,974 | |
Ratio to average net assets: | | | | | | | | | | | | | | | | |
Net expenses (a)(d)(e) | | | 0.65 | % | | | 0.90 | % | | | 0.20 | %(f) | | | 0.45 | %(f) |
Gross expenses (a)(e) | | | 0.68 | % | | | 0.93 | % | | | 17.09 | %(f) | | | 2.12 | %(f) |
Net investment income (a)(d)(e) | | | (4.63 | )% | | | (4.60 | )% | | | 1.15 | % | | | 2.22 | % |
Portfolio turnover rate | | | 85 | % | | | 85 | % | | | 1 | %(g) | | | 1 | %(g) |
| * | For the period October 1, 2008 (Commencement of Operations) to December 31, 2008. |
| (a) | Annualized for periods of less than one year. |
| (b) | Total returns are historical and assume changes in share price, reinvestments of all dividends and distributions, and no sales charge. Had certain expenses not been reduced during the periods shown, total returns would have been lower. Total returns for periods of less than one year are not annualized. |
| (c) | The amount shown for a share outstanding does not correspond with the net realized and unrealized gain (loss) on investments for the period due to timing of sales and repurchases of Fund shares in relation to fluctuating market values of the investments of the fund. |
| (d) | Such percentages are after advisory fee or unified management fee waivers and expense reimbursements, as applicable. |
| (e) | Does not include any insurance charges imposed in connection with your variable insurance contract. |
| (f) | Does not include expenses of the underlying funds in which the Fund invests. |
| (g) | Does not include the portfolio turnover activity of the underlying funds in which the Fund invests. |
188
| | |
| FINANCIAL HIGHLIGHTS (Continued) | | |
| | | Sun Capital Advisers Trust |
Selected data for a share outstanding throughout each period:
| | | | | | | | | | | | | | | | |
| | | Ibbotson Balanced Fund
Initial Class Shares | | | Ibbotson Balanced Fund
Service Class Shares | | | Ibbotson Growth Fund
Initial Class Shares | | | Ibbotson Growth Fund
Service Class Shares | |
| | | Year Ended December 31, | | | Year Ended December 31, | | | Year Ended December 31, | | | Year Ended December 31, | |
| | | 2008* | | | 2008* | | | 2008* | | | 2008* | |
Net Asset Value, Beginning of Period | | $ | 10.00 | | | $ | 10.00 | | | $ | 10.00 | | | $ | 10.00 | |
| | | | | | | | | | | | | | | | |
Income (Loss) from Investment Operations: | | | | | | | | | | | | | | | | |
Net investment income (e) | | | 0.02 | | | | 0.01 | | | | 0.02 | | | | 0.01 | |
Net realized and unrealized loss on investments | | | (0.95 | )(c) | | | (0.95 | )(c) | | | (1.15 | )(c) | | | (1.14 | )(c) |
| | | | | | | | | | | | | | | | |
Total from Investment Operations | | | (0.93 | ) | | | (0.94 | ) | | | (1.13 | ) | | | (1.13 | ) |
| | | | | | | | | | | | | | | | |
Net Asset Value, End of Period | | $ | 9.07 | | | $ | 9.06 | | | $ | 8.87 | | | $ | 8.87 | |
| | | | | | | | | | | | | | | | |
Total Return (b) | | | (9.30 | )% | | | (9.40 | )% | | | (11.30 | )% | | | (11.30 | )% |
| | | | | | | | | | | | | | | | |
Ratios and Supplemental Data: | | | | | | | | | | | | | | | | |
Net Assets, End of Period (000’s) | | $ | 56 | | | $ | 38,747 | | | $ | 92 | | | $ | 33,191 | |
Ratio to average net assets: | | | | | | | | | | | | | | | | |
Net expenses (a)(d)(e)(f) | | | 0.20 | % | | | 0.45 | % | | | 0.20 | % | | | 0.45 | % |
Gross expenses (a)(e)(f) | | | 16.72 | % | | | 2.11 | % | | | 14.32 | % | | | 2.08 | % |
Net investment income (a)(d)(e) | | | 0.88 | % | | | 1.82 | % | | | 1.20 | % | | | 1.53 | % |
Portfolio turnover rate (g) | | | 0 | % | | | 0 | % | | | 7 | % | | | 7 | % |
| * | For the period October 1, 2008 (Commencement of Operations) to December 31, 2008. |
| (a) | Annualized for periods of less than one year. |
| (b) | Total returns are historical and assume changes in share price, reinvestments of all dividends and distributions, and no sales charge. Had certain expenses not been reduced during the periods shown, total returns would have been lower. Total returns for periods of less than one year are not annualized. |
| (c) | The amount shown for a share outstanding does not correspond with the net realized and unrealized gain (loss) on investments for the period due to timing of sales and repurchases of Fund shares in relation to fluctuating market values of the investments of the fund. |
| (d) | Such percentages are after advisory fee or unified management fee waivers and expense reimbursements, as applicable. |
| (e) | Does not include any insurance charges imposed in connection with your variable insurance contract. |
| (f) | Does not include expenses of the underlying funds in which the Fund invests. |
| (g) | Does not include the portfolio turnover activity of the underlying funds in which the Fund invests. |
189
| | |
| NOTESTO FINANCIAL STATEMENTS | | Sun Capital Advisers Trust |
NOTE 1 — ORGANIZATION
Sun Capital Advisers Trust (the “Trust”) is registered under the Investment Company Act of 1940, as amended (the “1940 Act”) as an open-end management investment company. The Trust was established as a Delaware statutory trust under the laws of Delaware by an Agreement and Declaration of Trust dated July 13, 1998. It currently consists of twenty funds (each referred to as a “Fund” and, collectively, as “the Funds”), which are offered only to qualified pension and retirement plans and variable annuity and variable life insurance separate accounts established by affiliated insurance companies to fund variable annuity contracts and variable life insurance policies. As of December 31, 2008, 100% of the outstanding voting securities of the Funds were owned by separate accounts of Sun Life Assurance Company of Canada (U.S.), (“Sun Life (U.S.)”), Sun Life Insurance and Annuity Company of New York (“Sun Life (N.Y.)”), and the general fund of Sun Life Assurance Company of Canada (“Sun Life of Canada”).
All of the Funds are open-end mutual funds under the 1940 Act. Each is classified as diversified mutual fund except for the Global Real Estate Fund and BlackRock Inflation Protected Bond Fund. Each Fund offers Initial Class Shares and Service Class Shares. The Funds are:
|
Sun Capital Investment Grade Bond Fund (“Investment Grade Bond Fund”) Sun Capital Money Market Fund (“Money Market Fund”) Sun Capital Global Real Estate Fund (“Global Real Estate Fund”),
formerly known as the Sun Capital Real Estate Fund SC Davis Venture Value Fund (“Davis Venture Value Fund”) SC Oppenheimer Main Street Small Cap Fund (“Oppenheimer Main Street Small Cap Fund”) SC Oppenheimer Large Cap Core Fund (“Oppenheimer Large Cap Core Fund”),
formerly known as the Sun Capital All Cap Fund SC WMC Large Cap Growth Fund (“Large Cap Growth Fund”),
formerly known as the SC FI Large Cap Growth Fund SC WMC Blue Chip Mid Cap Fund (“Blue Chip Mid Cap Fund”),
formerly known as SC Blue Chip Mid Cap Fund SC Lord Abbett Growth & Income Fund (“Lord Abbett Growth & Income Fund”) SC Goldman Sachs Mid Cap Value Fund (“Goldman Sachs Mid Cap Value Fund”) SC Goldman Sachs Short Duration Fund (“Goldman Sachs Short Duration Fund”) SC Dreman Small Cap Value Fund “(Dreman Small Cap Value Fund”) SC PIMCO High Yield Fund (“PIMCO High Yield Fund”) SC PIMCO Total Return Fund (“PIMCO Total Return Fund”) SC AIM Small Cap Growth Fund (“AIM Small Cap Growth Fund”) SC AllianceBernstein International Value Fund (“AllianceBernstein International Value Fund”) SC BlackRock Inflation Protected Bond Fund (“BlackRock Inflation Protected Bond Fund”) SC Ibbotson Moderate Fund (“Ibbotson Moderate Fund”) SC Ibbotson Balanced Fund (“Ibbotson Balanced Fund”) SC Ibbotson Growth Fund (“Ibbotson Growth Fund”) |
Service Class Shares for the Blue Chip Mid Cap Fund and both Initial and Service Class Shares for the Lord Abbett Growth & Income Fund, Goldman Sachs Mid Cap Value Fund, Goldman Sachs Short Duration Fund and PIMCO High Yield Fund commenced operations on March 7, 2008. Both Initial and Service Class shares for the Dreman Small Cap Value Fund, PIMCO Total Return Fund, AIM Small Cap Growth Fund, AllianceBernstein International Value Fund, BlackRock Inflation Protected Bond Fund, Ibbotson Moderate Fund, Ibbotson Balanced Fund and Ibbotson Growth Fund commenced operations on October 1, 2008.
190
| | |
| NOTESTO FINANCIAL STATEMENTS (Continued) | | Sun Capital Advisers Trust |
Ibbotson Moderate Fund, Ibbotson Balanced Fund and Ibbotson Growth Fund are affiliated fund of funds. Each fund seeks to achieve its objectives by investing in portfolios of underlying affiliated funds (“underlying funds”) which, in turn, may invest in a variety of U.S. and foreign equity, fixed income, money market and derivative instruments. The Funds do not invest in the underlying funds for the purpose of exercising management or control, however investments by the Funds within their principal investment strategies may represent a significant portion of the underlying funds net assets. Each Fund’s “Portfolio of Investments” lists the underlying funds held as of period end as an investment of the Fund, but does not include the holdings of the underlying funds. A complete list of the holdings of each underlying fund, as well as the financial statements of each underlying fund, as of December 31, 2008 are available at the SEC’s website at www.sec.gov if not already provided in this report under the name of the underlying fund.
NOTE 2 — SIGNIFICANT ACCOUNTING POLICIES
The preparation of financial statements in conformity with accounting principles generally accepted in the United States of America requires management to make estimates and assumptions that affect the reported amounts of assets and liabilities and disclosure of contingent assets and liabilities at the date of the financial statements and the reported amounts of revenues and expenses during the reporting period. Actual results could differ from those estimates.
The following is a summary of significant accounting policies followed by the Trust in the preparation of its financial statements:
a) Valuation of Investments
The net asset value per share (“NAV”) of each Fund is determined as of the close of regular trading on the New York Stock Exchange (normally 4:00 p.m. New York time) on each day the New York Stock Exchange is open for business (a valuation day). If the New York Stock Exchange closes early as a result of holiday observance, emergency, the triggering of trading “circuit breakers” or other reason, each Fund will accelerate the determination of its NAV to that earlier time.
Investments in securities listed on the National Association of Securities Dealers Automation Quotation System (“NASDAQ”) are valued at the NASDAQ Official Closing Price on the day of valuation. Securities listed on any other U.S. or foreign exchanges are valued at the last sale price on the exchange or system in which they are principally traded on the valuation date, or if no sales occurred on that day, at the mean between the closing bid and asked prices. Certain fixed income securities are valued by a dealer or by a pricing service based upon a computerized matrix system, which considers market transactions and dealer supplied valuations. Short-term securities maturing in 60 days or less are valued at cost plus earned discount to maturity (amortized cost), which approximates market value. Over-the-counter equity securities not quoted on the NASDAQ are valued at the last sale price on the valuation day, or, if no sale occurs, at the mean between the last bid and asked prices. If both bid and asked prices are not available for that day, the last bid price is used. Investments in open end mutual funds and underlying funds are valued at their daily closing net asset value per share as reported by the investment company. Securities for which current market quotations are not readily available or are considered unreliable are stated at fair value as determined in good faith by an Internal Pricing Committee under the oversight of the Board of Trustees.
The close of foreign exchanges before the determination of each Fund’s NAV gives rise to the possibility that significant events, including broad market moves, may have occurred after these foreign exchanges close but before the Funds determine their NAV. To account for this, the Board of Trustees has approved an independent pricing vendor to facilitate the fair value process of equity securities traded on certain foreign exchanges. The frequency with which this fair value process is used cannot be predicted and may be utilized to a significant extent. The value of securities used for net asset value calculation under this fair value process may differ from published prices for the same securities.
191
| | |
| NOTESTO FINANCIAL STATEMENTS (Continued) | | Sun Capital Advisers Trust |
In accordance with Rule 2a-7 of the 1940 Act, the Money Market Fund values its securities initially at cost, and thereafter, securities are assumed to have a constant amortization to maturity of any discount or premium. Amortized cost approximates fair value.
b) Fair Value Measurements
On January 1, 2008, the Trust adopted Financial Accounting Standards Board (“FASB”) Statement of Financial Accounting Standards No. 157, “Fair Value Measurements” (“FAS 157”). FAS 157 defines fair value, establishes a three-tier hierarchy as a framework for measuring fair value and requires additional disclosures about the use of fair value measurements. FAS 157 defines fair value as the price that would be received to sell an asset or paid to transfer a liability in an orderly transaction between market participants at the measurement date. The Funds utilize valuation techniques that maximize the use of observable inputs and minimize the use of unobservable inputs. In compliance with FAS 157, the Funds have categorized their financial instruments, based on priority of the inputs to the valuation technique, into a three level hierarchy. The fair value hierarchy gives the highest priority to quoted prices in active markets for identical assets or liabilities (level 1) and the lowest priority to unobservable inputs (level 3). If the inputs used to measure fair value fall within different levels of the hierarchy, the category level is based on the lowest priority level input that is significant to the fair value measurement of the instrument.
The three-tier hierarchy of fair value measurements pursuant to FAS 157 is summarized in the three broad levels listed below:
Level 1 – unadjusted quoted prices in active markets for identical investments
Level 2 – prices determined using other significant observable inputs (including quoted prices for similar investments, interest rates, prepayment speeds, credit risk, etc.)
Level 3 – prices determined using significant unobservable inputs (including the Funds’ own assumptions in determining the fair value of investments)
The following is a summary of the inputs used as of December 31, 2008 in valuing each Fund’s investments carried at value:
| | | | | | | |
| | | Investments
in Securities | | | Other Financial
Instruments* |
Investment Grade Bond Fund | | | | | | | |
Valuation Inputs | | | | | | | |
Level 1 – Unadjusted Quoted Prices | | $ | 5,068,647 | | | $ | — |
Level 2 – Significant Observable Inputs | | | 51,335,051 | | | | — |
Level 3 – Significant Unobservable Inputs | | | — | ** | | | — |
| | | | | | | |
Total | | $ | 56,403,698 | | | $ | — |
| | | | | | | |
Money Market Fund | | | | | | | |
Valuation Inputs | | | | | | | |
Level 1 – Unadjusted Quoted Prices | | $ | 9,492,988 | | | $ | — |
Level 2 – Significant Observable Inputs | | | 194,535,848 | | | | — |
Level 3 – Significant Unobservable Inputs | | | — | | | | — |
| | | | | | | |
Total | | $ | 204,028,836 | | | $ | — |
| | | | | | | |
Global Real Estate Fund | | | | | | | |
Valuation Inputs | | | | | | | |
Level 1 – Unadjusted Quoted Prices | | $ | 101,124,482 | | | $ | — |
Level 2 – Significant Observable Inputs | | | 70,215,922 | | | | — |
Level 3 – Significant Unobservable Inputs | | | — | | | | — |
| | | | | | | |
Total | | $ | 171,340,404 | | | $ | — |
| | | | | | | |
192
| | |
| NOTESTO FINANCIAL STATEMENTS (Continued) | | Sun Capital Advisers Trust |
| | | | | | |
| | | Investments
in Securities | | Other Financial
Instruments* |
Davis Venture Value Fund | | | | | | |
Valuation Inputs | | | | | | |
Level 1 – Unadjusted Quoted Prices | | $ | 97,781,561 | | $ | — |
Level 2 – Significant Observable Inputs | | | 19,192,674 | | | — |
Level 3 – Significant Unobservable Inputs | | | — | | | — |
| | | | | | |
Total | | $ | 116,974,235 | | $ | — |
| | | | | | |
Oppenheimer Main Street Small Cap Fund | | | | | | |
Valuation Inputs | | | | | | |
Level 1 – Unadjusted Quoted Prices | | $ | 152,207,858 | | $ | — |
Level 2 – Significant Observable Inputs | | | 1,251,474 | | | — |
Level 3 – Significant Unobservable Inputs | | | — | | | — |
| | | | | | |
Total | | $ | 153,459,332 | | $ | — |
| | | | | | |
Oppenheimer Large Cap Core Fund | | | | | | |
Valuation Inputs | | | | | | |
Level 1 – Unadjusted Quoted Prices | | $ | 13,754,141 | | $ | — |
Level 2 – Significant Observable Inputs | | | — | | | — |
Level 3 – Significant Unobservable Inputs | | | — | | | — |
| | | | | | |
Total | | $ | 13,754,141 | | $ | — |
| | | | | | |
WMC Large Cap Growth Fund | | | | | | |
Valuation Inputs | | | | | | |
Level 1 – Unadjusted Quoted Prices | | $ | 48,363,162 | | $ | — |
Level 2 – Significant Observable Inputs | | | 2,640,403 | | | — |
Level 3 – Significant Unobservable Inputs | | | — | | | — |
| | | | | | |
Total | | $ | 51,003,565 | | $ | — |
| | | | | | |
WMC Blue Chip Mid Cap Fund | | | | | | |
Valuation Inputs | | | | | | |
Level 1 – Unadjusted Quoted Prices | | $ | 73,383,429 | | $ | — |
Level 2 – Significant Observable Inputs | | | 4,159,046 | | | — |
Level 3 – Significant Unobservable Inputs | | | — | | | — |
| | | | | | |
Total | | $ | 77,542,475 | | $ | — |
| | | | | | |
Lord Abbett Growth & Income Fund | | | | | | |
Valuation Inputs | | | | | | |
Level 1 – Unadjusted Quoted Prices | | $ | 4,950,552 | | $ | — |
Level 2 – Significant Observable Inputs | | | — | | | — |
Level 3 – Significant Unobservable Inputs | | | — | | | — |
| | | | | | |
Total | | $ | 4,950,552 | | $ | — |
| | | | | | |
Goldman Sachs Mid Cap Value Fund | | | | | | |
Valuation Inputs | | | | | | |
Level 1 – Unadjusted Quoted Prices | | $ | 11,896,944 | | $ | 26,997 |
Level 2 – Significant Observable Inputs | | | — | | | — |
Level 3 – Significant Unobservable Inputs | | | — | | | — |
| | | | | | |
Total | | $ | 11,896,944 | | $ | 26,997 |
| | | | | | |
193
| | |
| NOTESTO FINANCIAL STATEMENTS (Continued) | | Sun Capital Advisers Trust |
| | | | | | | |
| | | Investments
in Securities | | Other Financial
Instruments* | |
Goldman Sachs Short Duration Fund | | | | | | | |
Valuation Inputs | | | | | | | |
Level 1 – Unadjusted Quoted Prices | | $ | 11,347,225 | | $ | 114,038 | |
Level 2 – Significant Observable Inputs | | | 126,387,695 | | | (93,556 | ) |
Level 3 – Significant Unobservable Inputs | | | — | | | — | |
| | | | | | | |
Total | | $ | 137,734,920 | | $ | 20,482 | |
| | | | | | | |
Dreman Small Cap Value Fund | | | | | | | |
Valuation Inputs | | | | | | | |
Level 1 – Unadjusted Quoted Prices | | $ | 5,706,435 | | $ | — | |
Level 2 – Significant Observable Inputs | | | — | | | — | |
Level 3 – Significant Unobservable Inputs | | | — | | | — | |
| | | | | | | |
Total | | $ | 5,706,435 | | $ | — | |
| | | | | | | |
PIMCO High Yield Fund | | | | | | | |
Valuation Inputs | | | | | | | |
Level 1 – Unadjusted Quoted Prices | | $ | 1,124,389 | | $ | 84,726 | |
Level 2 – Significant Observable Inputs | | | 14,193,558 | | | (402,786 | ) |
Level 3 – Significant Unobservable Inputs | | | — | | | — | |
| | | | | | | |
Total | | $ | 15,317,947 | | $ | (318,060 | ) |
| | | | | | | |
PIMCO Total Return Fund | | | | | | | |
Valuation Inputs | | | | | | | |
Level 1 – Unadjusted Quoted Prices | | $ | 1,904,954 | | $ | 150,005 | |
Level 2 – Significant Observable Inputs | | | 44,279,529 | | | (37,851 | ) |
Level 3 – Significant Unobservable Inputs | | | — | | | — | |
| | | | | | | |
Total | | $ | 46,184,483 | | $ | 112,154 | |
| | | | | | | |
AIM Small Cap Growth Fund | | | | | | | |
Valuation Inputs | | | | | | | |
Level 1 – Unadjusted Quoted Prices | | $ | 3,952,360 | | $ | — | |
Level 2 – Significant Observable Inputs | | | 323,845 | | | — | |
Level 3 – Significant Unobservable Inputs | | | — | | | — | |
| | | | | | | |
Total | | $ | 4,276,205 | | $ | — | |
| | | | | | | |
AllianceBernstein International Value Fund | | | | | | | |
Valuation Inputs | | | | | | | |
Level 1 – Unadjusted Quoted Prices | | $ | 1,523,763 | | $ | 6,908 | |
Level 2 – Significant Observable Inputs | | | 10,778,993 | | | (2,975 | ) |
Level 3 – Significant Unobservable Inputs | | | — | | | — | |
| | | | | | | |
Total | | $ | 12,302,756 | | $ | 3,933 | |
| | | | | | | |
BlackRock Inflation Protected Bond Fund | | | | | | | |
Valuation Inputs | | | | | | | |
Level 1 – Unadjusted Quoted Prices | | $ | 9,198,561 | | $ | (44,833 | ) |
Level 2 – Significant Observable Inputs | | | 3,759,640 | | | (9,407 | ) |
Level 3 – Significant Unobservable Inputs | | | — | | | — | |
| | | | | | | |
Total | | $ | 12,958,201 | | $ | (54,240 | ) |
| | | | | | | |
194
| | |
| NOTESTO FINANCIAL STATEMENTS (Continued) | | Sun Capital Advisers Trust |
| | | | | | |
| | | Investments
in Securities | | Other Financial
Instruments* |
Ibbotson Moderate Fund | | | | | | |
Valuation Inputs | | | | | | |
Level 1 – Unadjusted Quoted Prices | | $ | 33,443,484 | | $ | — |
Level 2 – Significant Observable Inputs | | | 671,042 | | | — |
Level 3 – Significant Unobservable Inputs | | | — | | | — |
| | | | | | |
Total | | $ | 34,114,526 | | $ | — |
| | | | | | |
Ibbotson Balanced Fund | | | | | | |
Valuation Inputs | | | | | | |
Level 1 – Unadjusted Quoted Prices | | $ | 37,166,172 | | $ | — |
Level 2 – Significant Observable Inputs | | | 824,585 | | | — |
Level 3 – Significant Unobservable Inputs | | | — | | | — |
| | | | | | |
Total | | $ | 37,990,757 | | $ | — |
| | | | | | |
Ibbotson Growth Fund | | | | | | |
Valuation Inputs | | | | | | |
Level 1 – Unadjusted Quoted Prices | | $ | 32,413,357 | | $ | — |
Level 2 – Significant Observable Inputs | | | 445,861 | | | — |
Level 3 – Significant Unobservable Inputs | | | — | | | — |
| | | | | | |
Total | | $ | 32,859,218 | | $ | — |
| | | | | | |
| * | Other financial instruments are reflected in each Fund’s Portfolio of Other Financial Instruments and include investments such as futures, swaps, forward foreign currency exchange contracts and forward sales contracts. |
| ** | The only investment held by the Investment Grade Bond Fund whose fair value was determined using Level 3 inputs had a value of $0 and $0 at December 31, 2007 and 2008. |
c) Investment Transactions and Income
Investment security transactions are accounted for as of trade date. Dividend income from securities and dividend and capital gain distributions from affiliated underlying funds are recorded on the ex-dividend date (net of foreign withholding taxes, as applicable). Non-cash dividends included in income, if any, are recorded at fair market value of securities received. Interest income is recorded on the accrual basis (net of foreign withholding taxes). Discounts and premiums on debt securities are amortized using the interest method. Upon notification from issuers some dividend income received from a real estate investment trust (“REIT”) may be redesignated as a reduction of cost of investment and/or realized gain. Realized gains and losses from security transactions are determined on the basis of identified cost for both financial statement and federal income tax purposes. Net investment income, realized and unrealized gains and losses are borne pro rata on the basis of relative net assets by all classes of shares.
d) Foreign Currency Translation and Foreign Investments
The accounting records of the Funds are maintained in U.S. dollars. Portfolio securities and other assets and liabilities denominated in a foreign currency are translated to U.S. dollars at the prevailing rates of exchange at period end. Purchases and sales of securities, income receipts and expense payments are translated into U.S. dollars at the prevailing exchange rate on the respective dates of transactions. The Funds do not isolate that portion of the results of operations resulting from changes in foreign exchange rates on investments from the fluctuations arising from changes in market prices of securities held. The effects of changes in foreign currency
195
| | |
| NOTESTO FINANCIAL STATEMENTS (Continued) | | Sun Capital Advisers Trust |
exchange rates on portfolio investments are included in the net realized and unrealized gains and losses on investments and assets and liabilities in foreign currencies. Net realized gains and losses on foreign currency transactions include disposition of foreign currencies, net gains or losses from assets or liabilities denominated in foreign currencies, and currency gains and losses between the accrual and receipt dates of portfolio investment income and between the trade and settlement dates of portfolio investment transactions.
e) Federal Income Taxes
Each Fund is treated as a separate entity for Federal tax purposes. Each Fund intends to elect or has elected to be treated and intends to qualify each year as a regulated investment company under Subchapter M of the Internal Revenue Code, as amended (“the Code”). By so qualifying, the Funds will not be subject to Federal income taxes to the extent that they distribute all of their taxable income, including realized capital gains, for the fiscal year. In addition, by distributing during each calendar year substantially all of their net investment income, capital gains and certain other amounts, if any, the Funds will not be subject to a Federal excise tax.
The Funds are subject to the provisions of FASB Interpretation No. 48, Accounting for Uncertainties in Income Taxes – an interpretation of FASB statement 109 (“FIN 48”). FIN 48 sets forth a minimum threshold for financial statement recognition, measurement and disclosure of the benefit of a tax position taken or expected to be taken on a tax return. The implementation of FIN 48 did not result in any unrecognized tax benefits in the accompanying financial statements. Each of the Fund’s federal tax returns for the prior three fiscal years remains subject to examination by the Internal Revenue Service. Foreign taxes are provided based on the Funds’ understanding of the tax rules and rates that exist in the foreign markets in which they invest.
A portion of the dividend income recorded by certain funds is from distributions by publicly traded REITs, and such distributions for tax purposes may also consist of capital gains and return of capital. The actual return of capital and capital gains portions of such distributions will be determined by formal notifications from the REITs subsequent to the calendar year-end. Distributions received from the REITs that are determined to be a return of capital may be recorded by the Fund as a reduction to the cost basis of the securities held.
At December 31, 2008, the following Funds have available for federal income tax purposes capital loss carryovers which can be used to offset certain future realized capital gains.
| | | |
Fund | | Expires
December 31, 2016 |
Davis Venture Value | | $ | 1,763,796 |
Oppenheimer Main Street Small Cap | | | 17,652,366 |
Oppenheimer Large Cap Core | | | 2,287,986 |
WMC Large Cap Growth | | | 17,593,194 |
WMC Blue Chip Mid Cap | | | 5,608,009 |
Lord Abbett Growth & Income | | | 218,915 |
Goldman Sachs Mid Cap Value | | | 161,747 |
AIM Small Cap Growth | | | 5,033 |
AllianceBernstein International Value | | | 19,725 |
Investment Grade Bond Fund and Money Market Fund fully utilized their capital loss carryforwards of $42,836 and $180, respectively, as of December 31, 2008.
196
| | |
| NOTESTO FINANCIAL STATEMENTS (Continued) | | Sun Capital Advisers Trust |
Under current tax law, certain capital or currency losses realized after October 31 within a taxable year may be deferred and treated as occurring on the first day of the following tax year. For the tax period ended December 31, 2008, the following Funds elected to defer net losses arising between November 1, 2008 and December 31, 2008.
| | | |
Fund | | Amount |
Investment Grade Bond | | $ | 741,388 |
Global Real Estate | | | 535,881 |
Davis Venture Value | | | 971,223 |
Oppenheimer Main Street Small Cap | | | 3,777,029 |
Oppenheimer Large Cap Core | | | 1,450,873 |
WMC Large Cap Growth | | | 2,087,755 |
WMC Blue Chip Mid Cap | | | 4,336,795 |
Lord Abbett Growth & Income | | | 81,241 |
Goldman Sachs Mid Cap Value | | | 284,117 |
Dreman Small Cap Value | | | 156,320 |
PIMCO High Yield | | | 73,583 |
PIMCO Total Return | | | 33,953 |
AIM Small Cap Growth | | | 47,277 |
AllianceBernstein International Value | | | 142,006 |
BlackRock Inflation Protected Bond | | | 31,650 |
The tax character of distributions paid during the year ended December 31, 2008, was as follows:
| | | | | | |
Fund | | Ordinary
Income | | Long-Term
Capital Gain |
Investment Grade Bond | | $ | 3,435,087 | | $ | — |
Money Market | | | 3,213,550 | | | — |
Global Real Estate | | | 9,984,130 | | | 14,005,067 |
Davis Venture Value | | | 708,988 | | | 1,023,176 |
Oppenheimer Main Street Small Cap | | | 3,066,891 | | | 4,314,286 |
Oppenheimer Large Cap Core | | | 91,113 | | | 39,073 |
WMC Large Cap Growth | | | 9,651 | | | — |
WMC Blue Chip Mid Cap | | | 6,107,397 | | | 12,486,999 |
Lord Abbett Growth & Income* | | | 38,035 | | | — |
Goldman Sachs Mid Cap Value* | | | 86,993 | | | — |
Goldman Sachs Short Duration* | | | 1,215,306 | | | 173,097 |
Dreman Small Cap Value** | | | 9,667 | | | — |
PIMCO High Yield* | | | 523,341 | | | 31,068 |
PIMCO Total Return** | | | 44,672 | | | — |
AllianceBernstein International Value** | | | 22,208 | | | — |
BlackRock Inflation Protected Bond** | | | 35,347 | | | — |
| * | For the period March 7, 2008 (Commencement of Operations) to December 31, 2008. |
| ** | For the period October 1, 2008 (Commencement of Operations) to December 31, 2008. |
197
| | |
| NOTESTO FINANCIAL STATEMENTS (Continued) | | Sun Capital Advisers Trust |
The tax character of distributions paid during the year ended December 31, 2007, was as follows:
| | | | | | |
Fund | | Ordinary
Income | | Long-Term
Capital Gain |
Oppenheimer Large Cap Core | | $ | 566,912 | | $ | 401,155 |
Investment Grade Bond | | | 3,138,751 | | | — |
Money Market | | | 6,151,415 | | | — |
Global Real Estate | | | 5,214,804 | | | 28,800,631 |
Davis Venture Value | | | 395,616 | | | — |
Oppenheimer Main Street Small Cap | | | 3,893,207 | | | 12,893,572 |
WMC Large Cap Growth | | | 241,643 | | | — |
WMC Blue Chip Mid Cap | | | 1,959,434 | | | 14,623,258 |
As of December 31, 2008 the components of distributable earnings on a tax basis were as follows:
| | | | | | | | | | |
Fund | | Undistributed
Ordinary
Income | | Undistributed
Long-Term
Capital Gain | | Net Unrealized
Appreciation
(Depreciation) | |
Investment Grade Bond | | $ | 125,961 | | $ | 26,571 | | $ | (11,727,129 | ) |
Money Market | | | 430 | | | — | | | — | |
Global Real Estate | | | 5,848,864 | | | 1,741,522 | | | (111,293,713 | ) |
Davis Venture Value | | | 665,810 | | | — | | | (25,303,473 | ) |
Oppenheimer Main Street Small Cap | | | 168,680 | | | — | | | (62,103,949 | ) |
Oppenheimer Large Cap Core | | | 44,504 | | | — | | | (1,455,014 | ) |
WMC Large Cap Growth | | | 231,270 | | | — | | | (15,256,147 | ) |
WMC Blue Chip Mid Cap | | | 31,048 | | | — | | | (18,211,306 | ) |
Lord Abbett Growth & Income | | | 2,811 | | | — | | | (769,386 | ) |
Goldman Sachs Mid Cap Value | | | 1,126 | | | — | | | (1,809,938 | ) |
Goldman Sachs Short Duration | | | 221,710 | | | 28,938 | | | 2,247,966 | |
Dreman Small Cap Value | | | 76 | | | — | | | (265,601 | ) |
PIMCO High Yield | | | 290,680 | | | 32,038 | | | (1,813,124 | ) |
PIMCO Total Return | | | 430,596 | | | 136,147 | | | 391,328 | |
AIM Small Cap Growth | | | — | | | — | | | (589,548 | ) |
AllianceBernstein International Value | | | 12,918 | | | — | | | (449,756 | ) |
BlackRock Inflation Protected Bond | | | 57,339 | | | — | | | 153,672 | |
Ibbotson Moderate | | | 86,700 | | | 11,937 | | | 930,439 | |
Ibbotson Balanced | | | 71,014 | | | 8,074 | | | 1,290,066 | |
Ibbotson Growth | | | 79,156 | | | 1,808 | | | 1,625,629 | |
f) Credit Default Swaps
Certain Funds may enter into credit default swap contracts. A credit default swap is a contract between a buyer and a seller of protection against a pre-defined credit event. A Fund may buy or sell credit default swap contracts to seek to increase the Fund’s income, to add leverage to the portfolio, or to hedge the risk of default on Fund securities. As a seller in the credit default swap contract, the Fund would be required to pay the par (or other agreed-upon) value of certain third party debt obligations to the counterparty in the event of a credit event (generally including the occurrence of a bankruptcy, failure to make payments in respect of debt obligations, or debt restructurings) in respect of such third party, such as a US or foreign corporate issuer. Such a payment would likely result in a loss to the Fund. In return, the Fund would receive from the counterparty a periodic stream of payments over the term of the contract provided that no credit event has occurred. If no credit event occurs, the Fund would keep the stream of payments and would have no payment obligations. The Fund may also buy credit default swap contracts in order to hedge against the risk of default of debt securities or to
198
| | |
| NOTESTO FINANCIAL STATEMENTS (Continued) | | Sun Capital Advisers Trust |
take a view as to the likelihood of default of debt securities. This would involve the risk that the contract may expire worthless if a credit event does not occur during the term of the transaction. It would also involve credit risk that the seller may fail to satisfy its payment obligations to the Fund in the event of a credit event. In connection with credit default swaps in which the Fund is the buyer, the Fund will segregate cash or liquid assets or enter into certain offsetting positions, with a value at least equal to the Fund’s exposure (any accrued but unpaid net amounts owed by the Fund to any counterparty), on a marked to market basis. In connection with credit default swaps in which the Fund is the seller, the Fund will segregate cash or liquid assets or enter into certain offsetting positions, with a value at least equal to the full notional amount of the swap (minus any amounts owed to the Fund).
Credit default swap agreements on corporate issues involve one party making a stream of payments to another party in exchange for the right to receive a specified return in the event of a credit event. If a credit event occurs and cash settlement is not elected, a variety of other deliverable obligations may be delivered in lieu of the specific referenced obligation. The ability to deliver other obligations may result in a cheapest-to-deliver option (the buyer of protection’s right to choose to deliver the deliverable obligation with the lowest value following a credit event). A Fund may use credit default swaps on corporate issues to provide a measure of protection against credit events in respect of the issuers (i.e., to reduce risk where a Fund owns or has exposure to the referenced obligation) or to take an active long or short position with respect to the likelihood of the occurrence of a credit event in respect of a particular issuer.
Credit default swap agreements on credit indices involve one party making a stream of payments to another party in exchange for the right to receive a specified return in the event of a write-down, principal shortfall, interest shortfall or default of all or part of the referenced entities comprising the credit index. A credit index is a list or basket of credit instruments or exposures designed to be representative of some part of the credit market as a whole. An index credit default swap references all the entities in the index, and if there is a credit event, the credit event is settled based on that entity’s weight in the index. A Fund may use credit default swaps on credit indices to hedge a portfolio of credit default swaps or bonds with a credit default swap on indices which is less expensive than it would be to buy many individual credit default swaps to achieve a similar effect.
The maximum potential amount of future payments (undiscounted) that a Fund as a seller of protection could be required to make under a credit default swap agreement would be an amount equal to the notional amount of the agreement. Notional amounts of all credit default swap agreements outstanding as of December 31, 2008 for which a Fund is the seller of protection are disclosed in each Fund’s Portfolio of Other Financial Instruments. These potential amounts would be partially offset by any recovery values of the respective referenced obligations, upfront payments received upon entering into the agreement, or net amounts received from the settlement of buy protection credit default swap agreements entered into by a Fund for the same referenced entity or entities.
Credit default swap contracts are marked to market daily based upon quotations from the independent pricing vendor and the change in value, if any, is recorded daily as unrealized gain or loss. An upfront payment made by the Fund, if any, is recorded as an asset on the Statement of Assets and Liabilities. An upfront payment received by the Fund, if any, is recorded as a liability on the Statement of Assets and Liabilities. Under the terms of the credit default swap contracts, the Fund receives or makes payments quarterly based on a specified interest rate on a fixed notional amount. These payments are recorded as a realized gain or loss on the Statement of Operations. Payments received or made as a result of a credit event or termination of the contract are recognized, net of a proportional amount of the upfront payment, as realized gains or losses. As of December 31, 2008, only PIMCO High Yield Fund had open credit default swap agreements as listed on the Fund’s Portfolio of Other Financial Instruments.
g) Forward Foreign Currency Exchange and Spot Contracts
Certain Funds may engage in forward foreign currency exchange and spot contracts in an effort to facilitate transactions in foreign securities and to reduce exposure to foreign currency exchange rates. The value of such
199
| | |
| NOTESTO FINANCIAL STATEMENTS (Continued) | | Sun Capital Advisers Trust |
contracts is translated into U.S. dollars. Forward foreign currency exchange and spot contracts are marked to market daily. The change in market value is recorded as unrealized appreciation/(depreciation) on assets and liabilities in foreign currencies. When the contract is closed, the Fund records a realized gain or loss from foreign currency-related transactions equal to the difference between the value of the contract at the time it was opened and the value at the time it was closed.
The use of forward foreign currency exchange and spot contracts does not eliminate fluctuations in the underlying prices of the Fund’s securities, but it does establish a rate of exchange on a particular date. When a contract is used to hedge against movements in exchange rates, it will limit the risk of loss due to a decline in the value of the hedged currency during the relevant period, but will also limit any potential gain that might result should the value of the currency increase during that period. In addition, the Fund could be exposed to risks if the counterparties to the contracts are unable to meet the terms of their contracts. As of December 31, 2008, PIMCO High Yield Fund, PIMCO Total Return Fund and AllianceBernstein International Value Fund had open forward contracts as listed on the Portfolio of Other Financial Instruments.
h) Futures
Certain Funds may enter into futures contracts. A futures contract is an agreement between a buyer or seller and an established futures exchange or its clearinghouse in which the buyer or seller agrees to take or make a delivery of a specific amount of a financial instrument at a specified price on a specific date (the “settlement date”). A Fund may enter into futures contracts as a hedge against anticipated interest rate changes and for duration management, risk management and return enhancement purposes.
Upon entering into a futures contract, the Fund is required to deposit with a financial intermediary an amount (“initial margin”) equal to a certain percentage of the face value indicated in the futures contract. Subsequent payments (“variation margin”) are made or received by the Fund dependent upon the daily fluctuations in the value of the underlying security and are recorded as unrealized gains or losses in the Fund’s Statement of Operations. Futures contracts are valued at the most recent settlement price. The value of futures contracts will be the sum of the initial margin plus or minus the difference between the value of the futures contract on each day the Fund’s net asset value is calculated and the value on the date the futures contract is originated. Certain risks may arise upon entering into futures contracts, including the risk that an illiquid secondary market will limit the Fund’s ability to close out a futures contract prior to the settlement date and that a change in the value of a futures contract may not correlate exactly with the changes in the value of the securities. As of December 31, 2008, Goldman Sachs Short Duration Fund, Goldman Sachs Mid Cap Value Fund, PIMCO High Yield Fund, PIMCO Total Return Fund, AllianceBernstein International Value Fund and BlackRock Inflation Protected Bond Fund had open futures contracts as listed on each Fund’s Portfolio of Other Financial Instruments.
i) Interest Rate Swaps
Certain Funds may enter into interest rate swap contracts. A Fund may enter into interest rate swap transactions to manage the interest rate risk inherent in the Fund’s underlying investments. In an interest rate swap, the Fund would agree to pay the other party to the interest rate swap (the “counterparty”) a fixed rate payment in exchange for the counterparty agreeing to pay to the Fund a variable rate payment, or the Fund would agree to receive from the counterparty a fixed rate payment in exchange for the counterparty agreeing to receive from the Fund a variable rate payment. The payment obligations would be based on the notional amount of the swap.
Certain risks may arise when entering into swap transactions including counterparty default, illiquidity or unfavorable changes in interest rates. Payments received or made at the end of the measurement period are recorded as realized gain or loss in the Fund’s Statement of Operations. The value of the swap is adjusted daily based upon quotations from an independent pricing vendor and the change in value is recorded as unrealized appreciation or depreciation. As of December 31, 2008, only PIMCO High Yield Fund had open interest rate swaps agreements as listed on the Fund’s Portfolio of Other Financial Instruments.
200
| | |
| NOTESTO FINANCIAL STATEMENTS (Continued) | | Sun Capital Advisers Trust |
j) Loan Participations and Assignments
Certain Funds may invest in senior loans in the form of participations (“Participations”) or assignments of all or a portion of loans from third parties (“Assignments”). Loan participations typically represent direct participation in a loan owed by a corporate borrower, and generally are offered by banks, other financial institutions or lending syndicates. The Fund may participate in such syndications, or can buy part of a loan, becoming a co-lender. When purchasing loan participations, the Fund assumes the credit risk associated with the corporate borrower and may assume the credit risk associated with an interposed bank or other financial intermediary.
Assignments typically result in the Fund having a direct contractual relationship with the borrower, and the Fund may enforce compliance by the borrower with terms of the loan agreement. All senior loans involve interest rate risk, liquidity risk and credit risk, including the potential default or insolvency of the borrower. As of December 31, 2008, only PIMCO High Yield Fund had open senior loans as listed on the Fund’s Portfolio of Investments.
k) Mortgage Dollar Roll Transactions
Certain funds may enter into mortgage dollar roll (“MDR”) transactions with selected financial institutions to take advantage of opportunities in the mortgage market. A Fund will only enter into “covered” rolls. A “covered” roll is a specific type of dollar roll for which there is an offsetting cash position or liquid security position. A dollar roll transaction involves a sale by the Fund of mortgage-back securities that it holds with an agreement by the Fund to repurchase substantially similar securities at an agreed upon price on a specified future date. The securities repurchased will be substantially similar as to type, coupon and maturity as those sold. The Fund is paid a fee for entering into a dollar roll transaction, that is accrued as income over the life of the dollar roll contract. During the period between the sale and repurchase, the Fund will not be entitled to receive interest and principal payments on the securities sold.
The proceeds of the sale will generally be invested in additional instruments for the Fund, and the income from these investments, together with any additional fee income received on the dollar roll transaction, will generally exceed the interest income that would have been earned on the securities sold. Dollar roll transactions involve the risk that the market value of the securities sold by the Fund may decline below the repurchase price of those similar securities which the Fund is obligated to purchase or that the return earned by the Fund with the proceeds of a dollar roll may not exceed transaction costs. As of December 31, 2008 there were no open MDR transactions.
l) Options
Certain Funds may enter into option contracts. An option contract is a contract in which the writer of the option grants the buyer of the option the right to purchase from (a “call option”), or sell to (a “put option”) the writer a designated instrument at a specified price within a specified period of time. Certain options, including options on indices, will require cash settlement by the Fund if the option is exercised. The Fund may enter into option contracts in order to hedge against potential adverse price movements in the value of portfolio assets; as a temporary substitute for selling selected investments; to lock in the purchase price of a security or currency which it expects to purchase in the near future; as a temporary substitute for purchasing selected investments; or to enhance potential gain.
When a Fund writes a call or put option, an amount equal to the premium received is recorded as a liability and subsequently marked to market to reflect the current value of the option written. The Fund pays a premium as a cost for a purchased put and call option, which is disclosed in the Fund’s Portfolio of Investments and subsequently marked to market to reflect the current value of the option. The liability representing the Fund’s obligation under an exchange traded written option or investment in a purchased option is valued at the last sale price or, in the absence of a sale, the mean between the closing bid and asked prices or at the most recent asked price (bid price for purchased options) if no bid and asked price are available. Over-the-counter written or purchased options are valued using dealer supplied quotations. Gain or loss is recognized when the option contract expires or is closed.
201
| | |
| NOTESTO FINANCIAL STATEMENTS (Continued) | | Sun Capital Advisers Trust |
If a Fund writes a put option, it accepts the risk of a decline in the value of the underlying security below the exercise price. Over-the-counter options have the risk of the potential inability of counterparties to meet the terms of their contracts. The Fund’s maximum exposure to purchased options is limited to the premium initially paid. In addition, certain risks may arise upon entering into option contracts including the risk that an illiquid secondary market will limit the Fund’s ability to close out an option contract prior to the expiration date and that a change in the value of the option contract may not correlate exactly with changes in the value of the securities or currencies hedged. There were no open option contracts as of December 31, 2008.
m) Real Estate Investment Trusts (“REITs”)
Certain Funds may invest in REITs. REITs are pooled investment vehicles that invest primarily in income producing real estate or real estate related loans or interests. REITs are generally classified as equity REITs, mortgage REITs or a combination of equity and mortgage REITs. Equity REITs invest most of their assets directly in real property and derive income primarily from the collection of rents. Equity REITs can also realize capital gains by selling properties that have appreciated in value. Mortgage REITs invest most of their assets in real estate mortgages and derive income from interest payments. Each Fund will indirectly bear its proportionate share of any expenses (such as operating expenses and advisory fees) paid by REITs in which it invests in addition to the expenses paid by the Fund.
Certain risks may arise when investing in REITs. Although Global Real Estate Fund does not invest directly in real estate, it does invest primarily in real estate equity securities and does concentrate its investments in the real estate industry, and, therefore, an investment in the Fund may be subject to certain risks associated with the direct ownership of real estate and with the real estate industry in general. Each of the other funds that may invest in REITs may, to a lesser degree, be subject to these risks. Risks associated with the real estate industry may include risks resulting from future economic, political and environmental conditions.
n) Repurchase Agreements
The Funds may invest in repurchase agreements. In a repurchase agreement, a Fund buys a security (“collateral”) for a relatively short period (usually not more than 7 days) subject to the obligation to sell the security back to the repurchase agreement counterparty at a fixed time and price plus accrued interest. Securities serving as collateral for each repurchase agreement must be delivered to the Trust’s custodian. The value of the collateral must at least equal 102% of the principal amount of the repurchase transaction, until the agreement matures. The value of the collateral is marked to market on a daily basis to ensure the adequacy of the collateral. In the event of default, the Funds have the right to liquidate the collateral and apply the proceeds in satisfaction of the obligation. There is the risk that the collateral may be insufficient to meet the obligation in the event of default. As of December 31, 2008, Davis Venture Value Fund, Oppenheimer Main Street Small Cap Fund, WMC Large Cap Growth Fund, WMC Blue Chip Mid Cap Fund, PIMCO High Yield Fund, PIMCO Total Return Fund, AIM Small Cap Growth Fund, Ibbotson Moderate Fund, Ibbotson Balanced Fund and Ibbotson Growth Fund had open repurchase agreements as listed on each Fund’s Portfolio of Investments.
o) Total Return Swap Agreements
Certain Funds may enter into total return swap agreements. Total return swap agreements are contracts in which one party agrees to make periodic payments to another party based on the change in market value of the assets underlying the contract, which may include a specified security, basket of securities or securities indices during the specific period, in return for periodic payments based on a fixed or variable interest rate or the total return from other underlying assets. Total return swap agreements are subject to the risk that a counterparty will default on its payment obligations to the fund under contract. Total return swap agreements also bear the risk that the Fund will not be able to meet its obligations to the counterparty. Total return swap agreements on indices involve
202
| | |
| NOTESTO FINANCIAL STATEMENTS (Continued) | | Sun Capital Advisers Trust |
commitments to pay interest in exchange for a market-linked return. To the extent the total return of the security or index underlying the transaction exceeds or falls short of the offsetting interest rate obligation, a Fund will receive a payment from or make a payment to the counterparty.
Total return swap contracts are marked to market daily based upon quotations from an independent pricing vendor and the change in value, if any, is recorded daily as unrealized gain or loss. As of December 31, 2008, only BlackRock Inflation Protected Bond Fund had outstanding total return swap contracts as listed on the Fund’s Portfolio of Other Financial Instruments.
p) When Issued Securities and Forward Commitments
The Funds may purchase or sell securities on a when issued or forward commitment basis. These transactions are arrangements in which the Funds purchase and sell securities with payment and delivery scheduled for a future time. Settlement dates may be a month or more after entering into these transactions and such transactions may involve a risk of loss if the value of the underlying security declines prior to the settlement date. The price of the underlying securities and the date when these securities will be delivered and paid for are fixed at the time the transaction is negotiated. If the other party involved in the transaction fails to deliver the securities, the Fund is at risk to subsequently invest at less advantageous prices and yields. In connection with such purchases the Funds maintain cash or liquid assets in an amount equal to purchase commitments for such underlying securities until settlement date, and for sales commitments the Funds maintain equivalent deliverable securities as “cover” for the transaction. Unsettled commitments are valued at current market value of the underlying security. Daily fluctuations in the value of such contracts are recorded as unrealized gains or losses. As of December 31, 2008, only Goldman Sachs Short Duration Fund had outstanding forward sales contracts as listed on the Fund’s Portfolio of Other Financial Instruments.
q) Treasury Inflation-Protected Securities
Certain Funds may invest in Treasury Inflation-Protected Securities (“TIPS”), specially structured bonds in which the principal amount is adjusted daily to reflect inflation, as measured by the U.S. Consumer Pricing Index for Urban Consumers (“CPIU”). The adjustments to principal due to inflation are reflected as increases or decreases to interest income. Such adjustments may have a significant impact on the Fund’s distributions. The repayment of the original bond principal upon maturity is guaranteed by the full faith and credit of the U.S. Government.
r) Equity Linked Securities
Certain Funds may invest in equity-linked securities which are privately issued securities whose investment results are designed to correspond generally to the performance of a specified stock index or “basket” of stocks, or a single stock. These securities may be used by a Fund to gain exposure to countries that place restrictions on investments by foreigners. To the extent that the Funds invest in equity-linked securities whose return corresponds to the performance of a foreign securities index or one or more foreign stocks, investing in equity-linked securities will involve risks similar to the risks of investing in foreign securities. In addition, the Funds bear the risk that the issuer of an equity-linked security may default on its obligation under the terms of the arrangement with the counterparty. At December 31, 2008, the AllianceBernstein International Value Fund held equity-linked securities as listed on the Fund’s Portfolio of Investments.
s) Expenses
Expenses directly attributable to a Fund are charged to that Fund. Expenses not directly attributable to a particular Fund are allocated evenly among the affected Funds, allocated on the basis of relative net assets, or otherwise allocated among the Funds as the Trustees may direct or approve. Expenses directly attributable to a particular class of a Fund are charged directly to such class. In calculating the net asset value per share of each
203
| | |
| NOTESTO FINANCIAL STATEMENTS (Continued) | | Sun Capital Advisers Trust |
class, investment income, realized and unrealized gains and losses and expenses other than class specific expenses are allocated daily to each class of shares based upon the proportion of net assets of each class at the beginning of each day plus current day fund share activity.
t) Dividends and Distributions
The Investment Grade Bond Fund, Money Market Fund, Goldman Sachs Short Duration Fund, PIMCO High Yield Fund, PIMCO Total Return Fund and BlackRock Inflation Protected Bond Fund declare dividends from net investment income daily, if any, and pay dividends monthly. Each of the remaining Funds in the Trust declare and pay dividends from net investment income, if any, at least annually. Each Fund distributes its net realized capital gains, if any, at least annually. Income and capital gain distributions are determined in accordance with income tax regulations which may differ from generally accepted accounting principles. These differences, which may result in distribution reclassifications, are primarily due to differing treatments for distributions from REIT securities, currency gain (loss), Passive Foreign Investment Companies (PFIC’s), non-deductible 12b-1 fees, derivative transactions, TIPS adjustments and reclasses of short-term capital gains from underlying funds. Permanent book and tax basis differences relating to shareholder distributions will result in reclassifications to paid in capital and may affect the per share allocation between net investment income and realized and unrealized gain (loss). Undistributed net investment income and accumulated undistributed net realized gain (loss) on investments may include temporary book and tax differences which will reverse in a subsequent period. Any taxable income or gain remaining at fiscal year end is distributed in the following year.
u) Recently Issued Accounting Pronouncements
In March 2008, FASB issued Statement of Financial Accounting Standards No. 161, Disclosures about Derivative Instruments and Hedging Activities (“SFAS 161”), an amendment of FASB Statement No. 133, Accounting for Derivative Instruments and Hedging Activities (“SFAS 133”), effective for fiscal years beginning after November 15, 2008. SFAS 161 requires enhanced disclosures to provide information about the reasons the Funds invest in derivative instruments, the accounting treatment and the effect derivatives have on financial performance. Management is currently evaluating the impact the adoption of SFAS 161 will have on the Funds’ financial statement disclosures.
In September 2008, FASB issued Staff Position No. FAS 133-1 and FIN 45-4, Disclosures about Credit Derivatives and Certain Guarantees: An Amendment of FASB Statement No. 133 and FASB Interpretation No. 45” (the “Position”). The Position amends SFAS 133, and also amends FASB Interpretation No. 45 (“FIN 45”), Guarantor’s Accounting and Disclosure Requirements for Guarantees, Including Indirect Guarantees of Indebtedness of Others. The amendments to SFAS 133 include required disclosure for (i) the nature and terms of the credit derivative, reasons for entering into the credit derivative, the events or circumstances that would require the seller to perform under the credit derivative, and the current status of the payment/performance risk of the credit derivative, (ii) the maximum potential amount of future payments (undiscounted) the seller could be required to make under the credit derivative, (iii) the fair value of the credit derivative, and (iv) the nature of any recourse provisions and assets held either as collateral or by third parties. The amendments to FIN 45 require additional disclosures about the current status of the payment/performance risk of a guarantee. The Trust adopted the Position on December 31, 2008.
NOTE 3 — INVESTMENT ADVISORY AND OTHER RELATED PARTY AGREEMENTS
a) Investment Advisory Agreement
Sun Capital Advisers LLC (the “Adviser”) is the investment adviser to each of the Funds under separate investment advisory agreements with the Trust. The Adviser is a direct wholly-owned subsidiary of Sun Life Assurance Company of Canada – U.S. Operations Holdings, Inc. (“Sun Life – U.S. Ops Holdco”), a holding company. Sun Life Financial, Inc. (“Sun Life Financial”), a publicly traded holding company, is the ultimate
204
| | |
| NOTESTO FINANCIAL STATEMENTS (Continued) | | Sun Capital Advisers Trust |
parent of Sun Life – US Ops Holdco and the Adviser. The Adviser, at its own cost, has retained Davis Selected Advisers, L.P., as subadviser for the Davis Venture Value Fund; Oppenheimer Funds, Inc., as subadviser for the Oppenheimer Main Street Small Cap Fund and the Oppenheimer Large Cap Core Fund and OFI Institutional Asset Management, Inc., an affiliate of OppenheimerFunds, Inc., as sub-subadviser to the Oppenheimer Large Cap Core Fund; Wellington Management Company, LLP, as subadviser for the WMC Blue Chip Mid Cap Fund and WMC Large Cap Growth Fund; Lord, Abbett & Co. LLC, as subadviser for the Lord Abbett Growth & Income Fund; Goldman Sachs Asset Management, L.P., as subadviser for the Goldman Sachs Mid Cap Value Fund and the Goldman Sachs Short Duration Fund; Dreman Value Management, LLC, as sub-adviser for the Dreman Small Cap Value Fund; Pacific Investment Management Company LLC, as subadviser for PIMCO High Yield Fund and PIMCO Total Return Fund; Invesco AIM Advisors, Inc., as subadviser for AIM Small Cap Growth Fund; AllianceBernstein L.P., as subadviser for the AllianceBernstein International Value Fund; BlackRock Financial Management, Inc., as subadviser for the BlackRock Inflation Protected Bond Fund; and Ibbotson Associates, Inc., as subadviser for the Ibbotson Moderate Fund, Ibbotson Balanced Fund and Ibbotson Growth Fund.
As compensation for all services rendered, facilities provided and expenses paid or assumed by the Adviser under the advisory agreements, the following fourteen Funds pay compensation monthly to the Adviser at the following annual rates based on the average daily net assets of each Fund taken separately:
| | | | |
| Fund | | Asset Level | | Fee |
Investment Grade Bond | | All | | 0.60% |
| | | |
Money Market | | All | | 0.50% |
| | | |
Global Real Estate | | All | | 0.95% |
| | | |
Davis Venture Value | | $0-$500 million over $500 million | | 0.75%
0.70% |
| | | |
Oppenheimer Main Street Small Cap | | $0-$400 million $400 million-$800 million over $800 million | | 0.80%
0.75% 0.70% |
| | | |
Oppenheimer Large Cap Core | | All | | 0.70% |
| | | |
WMC Large Cap Growth | | $0-$750 million over $750 million | | 0.75%
0.70% |
| | | |
WMC Blue Chip Mid Cap | | $0-$300 million over $300 million | | 0.80%
0.75% |
| | | |
Dreman Small Cap Value | | $0-$250 million over $250 million | | 0.90%
0.85% |
| | | |
AIM Small Cap Growth | | $0-$250 million over $250 million | | 0.95%
0.90% |
| | | |
AllianceBernstein International Value | | All | | 0.63% |
| | | |
Ibbotson Moderate | | All | | 0.125% |
| | | |
Ibbotson Balanced | | All | | 0.125% |
| | | |
Ibbotson Growth | | All | | 0.125% |
205
| | |
| NOTESTO FINANCIAL STATEMENTS (Continued) | | Sun Capital Advisers Trust |
Under the investment advisory and management agreements, the following six Funds pay a unified management fee to the Adviser on a monthly basis for its advisory and management services. Each fee is calculated based on a stated percentage of the Fund’s average daily net assets, as follows:
| | | | |
| Fund | | Asset Level | | Fee |
Lord Abbett Growth & Income | | All | | 0.87% |
| | | |
Goldman Sachs Mid Cap Value | | All | | 1.05% |
| | | |
Goldman Sachs Short Duration | | All | | 0.65% |
| | | |
PIMCO High Yield | | All | | 0.75% |
| | | |
PIMCO Total Return | | All | | 0.65% |
| | | |
BlackRock Inflation Protected Bond | | All | | 0.65% |
b) Limitations
The Adviser has contractually agreed (until at least April 30, 2010) to reduce its advisory fee and to reimburse each Fund’s other operating expenses to reduce each Fund’s total annual operating expenses to:
| | | | | | |
| | | Contractual Expense Limitations | |
Fund | | Initial Class | | | Service Class | |
Investment Grade Bond | | 0.75 | % | | 1.00 | % |
Money Market | | 0.50 | % | | 0.75 | % |
Global Real Estate | | 1.10 | % | | 1.35 | % |
Davis Venture Value | | 0.90 | % | | 1.15 | % |
Oppenheimer Main Street Small Cap | | 1.00 | % | | 1.25 | % |
Oppenheimer Large Cap Core | | 0.90 | % | | 1.15 | % |
WMC Large Cap Growth | | 0.81 | % | | 1.06 | % |
WMC Blue Chip Mid Cap | | 1.00 | % | | 1.25 | % |
Lord Abbett Growth & Income | | 0.87 | % | | 1.12 | % |
Goldman Sachs Mid Cap Value | | 1.07 | % | | 1.32 | % |
Goldman Sachs Short Duration | | 0.65 | % | | 0.90 | % |
Dreman Small Cap Value | | 1.15 | % | | 1.40 | % |
PIMCO High Yield | | 0.75 | % | | 1.00 | % |
PIMCO Total Return | | 0.65 | % | | 0.90 | % |
AIM Small Cap Growth Fund | | 1.15 | % | | 1.40 | % |
AllianceBernstein International Value | | 0.75 | % | | 1.00 | % |
BlackRock Inflation Protected Bond | | 0.65 | % | | 0.90 | % |
Ibbotson Moderate | | 0.20 | % | | 0.45 | % |
Ibbotson Balanced | | 0.20 | % | | 0.45 | % |
Ibbotson Growth | | 0.20 | % | | 0.45 | % |
206
| | |
| NOTESTO FINANCIAL STATEMENTS (Continued) | | Sun Capital Advisers Trust |
To the extent that a Fund’s total expense ratio falls below the expense limit stated above in future years, the Adviser reserves the right to be reimbursed for advisory fees waived and fund expenses paid on behalf of each fund during the prior two fiscal years. For each of the periods below, the Adviser waived all or part of its investment advisory fee and reimbursed certain operating expenses in the following amounts:
| | | | | | | | | | | | |
| | | Year Ended
December 31, 2008 | | Two-year period ended
December 31, 2008 |
Fund | | Advisory
Fees Waived | | Expenses
Reimbursed | | Advisory
Fees Waived | | Expenses
Reimbursed |
Investment Grade Bond | | $ | 191,983 | | $ | — | | $ | 344,956 | | $ | — |
Money Market | | | 482,700 | | | — | | | 812,479 | | | — |
Global Real Estate | | | 293,003 | | | — | | | 504,793 | | | — |
Davis Venture Value | | | 188,039 | | | — | | | 335,790 | | | — |
Oppenheimer Main Street Small Cap | | | 522,271 | | | — | | | 984,376 | | | — |
Oppenheimer Large Cap Core | | | 79,514 | | | 55,013 | | | 174,208 | | | 82,576 |
WMC Large Cap Growth | | | 248,119 | | | — | | | 474,248 | | | — |
WMC Blue Chip Mid Cap | | | 174,001 | | | — | | | 303,820 | | | — |
Lord Abbett Growth & Income* | | | 640 | | | — | | | 640 | | | — |
Goldman Sachs Mid Cap Value* | | | 249 | | | — | | | 249 | | | — |
Goldman Sachs Short Duration* | | | 13,248 | | | — | | | 13,248 | | | — |
Dreman Small Cap Value** | | | 7,945 | | | 52,104 | | | 7,945 | | | 52,104 |
PIMCO High Yield* | | | 1,567 | | | — | | | 1,567 | | | — |
PIMCO Total Return** | | | 947 | | | — | | | 947 | | | — |
AIM Small Cap Growth** | | | 6,942 | | | 59,348 | | | 6,942 | | | 59,348 |
AllianceBernstein International Value** | | | 10,404 | | | 75,673 | | | 10,404 | | | 75,673 |
BlackRock Inflation Protected Bond** | | | 405 | | | — | | | 405 | | | — |
Ibbotson Moderate** | | | 3,691 | | | 47,279 | | | 3,691 | | | 47,279 |
Ibbotson Balanced** | | | 3,726 | | | 47,659 | | | 3,726 | | | 47,659 |
Ibbotson Growth** | | | 3,891 | | | 48,596 | | | 3,891 | | | 48,596 |
| * | For the period March 7, 2008 (Commencement of Operations) to December 31, 2008. |
| ** | For the period October 1, 2008 (Commencement of Operations) to December 31, 2008. |
c) Distribution and Service Plan
The Trust has adopted a plan of distribution and service pursuant to Rule 12b-1 under the 1940 Act with respect to its Service Class Shares (the “Plan”), pursuant to which distribution and service fees are paid to Clarendon Insurance Agency, Inc. (“Clarendon”), which is a wholly-owned subsidiary of Sun Life (U.S.). The fees of the Trust payable to Clarendon pursuant of the Plan are accrued daily at a rate with respect to each Fund which may not exceed 0.25% of the Fund’s average daily net assets attributable to Service Class Shares regardless of the level of expenses actually incurred by Clarendon and others. Clarendon uses the service and distribution fees to compensate Sun Life (U.S.) and Sun Life (N.Y.) for services rendered in connection with maintenance and distribution of the variable contracts issued by Sun Life (U.S.) and Sun Life (N.Y.).
d) Trustees’ Compensation
Trustees’ fees are paid by the Trust to each independent trustee of the Trust. The aggregate remuneration paid by the Funds to the independent trustees for the year ended December 31, 2008 was $144,272, including out of pocket expenses. The Trust pays no compensation directly to its Trustees or officers who are affiliated with the
207
| | |
| NOTESTO FINANCIAL STATEMENTS (Continued) | | Sun Capital Advisers Trust |
Adviser, or its affiliates, all of whom receive remuneration for their services to the Trust from the Adviser, or its affiliates. Certain officers and Trustees of the Trust are officers and directors of the Adviser, Sun Life – US Ops Holdco or Sun Life Financial.
NOTE 4 — INVESTMENT TRANSACTIONS
Cost of purchases and proceeds from sales and maturities of investments, excluding short-term securities, for the year ended December 31, 2008, were as follows:
| | | | | | | | | | | | | | |
Fund | | Non-
Government
Purchases | | | Government
Purchases | | Non-
Government
Sales | | | Government
Sales |
Investment Grade Bond | | $ | 12,301,452 | | | $ | 6,431,001 | | $ | 14,940,867 | | | $ | 8,936,082 |
Global Real Estate | | | 185,549,744 | | | | — | | | 164,805,917 | | | | — |
Davis Venture Value | | | 86,621,461 | | | | — | | | 16,908,442 | | | | — |
Oppenheimer Main Street Small Cap | | | 270,616,851 | | | | — | | | 219,056,679 | | | | — |
Oppenheimer Large Cap Core | | | 26,318,063 | | | | — | | | 21,274,253 | | | | — |
WMC Large Cap Growth | | | 181,782,635 | | | | — | | | 191,033,487 | | | | — |
WMC Blue Chip Mid Cap | | | 107,918,426 | | | | — | | | 83,578,753 | | | | — |
Lord Abbett Growth & Income* | | | 7,656,903 | | | | 113,589 | | | 2,163,160 | | | | 10,632 |
Goldman Sachs Mid Cap Value* | | | 17,428,093 | | | | — | | | 5,025,764 | | | | — |
Goldman Sachs Short Duration* | | | 25,585,206 | | | | 193,311,621 | | | 5,431,857 | | | | 118,987,630 |
Dreman Small Cap Value** | | | 6,062,134 | | | | — | | | 922,807 | | | | — |
PIMCO High Yield* | | | 13,220,845 | | | | 4,037,478 | | | 717,754 | | | | 4,019,142 |
PIMCO Total Return** | | | 7,021,435 | | | | 35,046,510 | | | 359,416 | | | | 19,277,622 |
AIM Small Cap Growth** | | | 4,710,987 | | | | — | | | 116,769 | | | | — |
AllianceBernstein International Value** | | | 12,282,396 | | | | — | | | 459,354 | | | | — |
BlackRock Inflation Protected Bond** | | | 633,050 | | | | 14,906,008 | | | 163,613 | | | | 4,900,200 |
Ibbotson Moderate** | | | 32,592,603 | *** | | | — | | | 79,711 | *** | | | — |
Ibbotson Balanced** | | | 35,876,106 | *** | | | — | | | — | | | | — |
Ibbotson Growth** | | | 31,709,367 | *** | | | — | | | 943,791 | *** | | | — |
| * | For the period March 7, 2008 (Commencement of Operations) to December 31, 2008. |
| ** | For the period October 1, 2008 (Commencement of Operations) to December 31, 2008. |
| *** | Affiliated investment transactions. |
Purchases and sales, including maturities, of short-term securities by the Money Market Fund for the year ended December 31, 2008 were $1,022,525,124 and $953,241,747, respectively.
For the period March 7, 2008 (Commencement of Operations) to December 31, 2008, PIMCO High Yield Fund had the following written covered option contracts:
| | | | | | | |
| | | Number of Contracts | | | Premium Amount | |
Beginning of period | | — | | | $ | — | |
Written during the period | | 12 | | | | 11,306 | |
Bought back during the period | | (10 | ) | | | (10,217 | ) |
Expired during the period | | (2 | ) | | | (1,089 | ) |
| | | | | | | |
Balance at end of period | | — | | | $ | — | |
| | | | | | | |
208
| | |
| NOTESTO FINANCIAL STATEMENTS (Continued) | | Sun Capital Advisers Trust |
The identified cost for federal income tax purposes of investments owned by each Fund and their respective gross unrealized appreciation and depreciation at December 31, 2008 were as follows:
| | | | | | | | | | | | | | |
Fund | | Identified
Cost | | Gross Unrealized | | | Net
Unrealized
Appreciation/
(Depreciation) | |
| | | Appreciation | | (Depreciation) | | |
Investment Grade Bond | | $ | 68,130,827 | | $ | 952,858 | | $ | (12,679,987 | ) | | $ | (11,727,129 | ) |
Money Market | | | 204,028,836 | | | — | | | — | | | | — | |
Global Real Estate | | | 282,636,735 | | | — | | | (111,296,331 | ) | | | (111,296,331 | ) |
Davis Venture Value | | | 142,278,074 | | | 2,985,456 | | | (28,289,295 | ) | | | (25,303,839 | ) |
Oppenheimer Main Street Small Cap | | | 215,563,264 | | | 4,067,330 | | | (66,171,262 | ) | | | (62,103,932 | ) |
Oppenheimer Large Cap Core | | | 15,209,155 | | | 415,006 | | | (1,870,020 | ) | | | (1,455,014 | ) |
WMC Large Cap Growth | | | 66,259,713 | | | 551,543 | | | (15,807,691 | ) | | | (15,256,148 | ) |
WMC Blue Chip Mid Cap | | | 96,753,781 | | | 1,915,978 | | | (20,127,284 | ) | | | (18,211,306 | ) |
Lord Abbett Growth & Income | | | 5,719,938 | | | 91,755 | | | (861,141 | ) | | | (769,386 | ) |
Goldman Mid Cap Value | | | 13,706,882 | | | 326,256 | | | (2,136,194 | ) | | | (1,809,938 | ) |
Goldman Short Duration | | | 135,393,398 | | | 2,557,288 | | | (215,766 | ) | | | 2,341,522 | |
Dreman Small Cap Value | | | 5,972,029 | | | 213,992 | | | (479,586 | ) | | | (265,594 | ) |
PIMCO High Yield | | | 16,759,694 | | | 454,997 | | | (1,896,744 | ) | | | (1,441,747 | ) |
PIMCO Total Return | | | 45,793,367 | | | 464,745 | | | (73,629 | ) | | | 391,116 | |
AIM Small Cap Growth | | | 4,865,753 | | | 97,729 | | | (687,277 | ) | | | (589,548 | ) |
AllianceBernstein International Value | | | 12,759,998 | | | 318,730 | | | (775,972 | ) | | | (457,242 | ) |
BlackRock Inflation Protected Bond | | | 12,795,122 | | | 207,452 | | | (44,373 | ) | | | 163,079 | |
Ibbotson Moderate | | | 33,184,087 | | | 930,439 | | | — | | | | 930,439 | |
Ibbotson Balanced | | | 36,700,691 | | | 1,290,066 | | | — | | | | 1,290,066 | |
Ibbotson Growth | | | 31,233,589 | | | 1,625,629 | | | — | | | | 1,625,629 | |
The differences between the book basis and federal income tax basis cost of investments is primarily due to the deferral of realized capital losses on wash sales.
NOTE 5 — AFFILIATED COMPANY SECURITIES
The term “affiliated securities” includes securities issued by any company that is under common control with the Fund. At December 31, 2008, the Adviser or its affiliate, MFS, served as investment adviser to the underlying funds of Ibbotson Moderate Fund, Ibbotson Balanced Fund and Ibbotson Growth Fund. Purchases and proceeds from sales of affiliated investments are disclosed in Note 4 – Investment Transactions. Dividend and capital gains distributions from affiliated underlying funds are presented in each Fund’s Statement of Operations.
209
| | |
| NOTESTO FINANCIAL STATEMENTS (Continued) | | Sun Capital Advisers Trust |
NOTE 6 — LINE OF CREDIT
The Trust has entered into a $20 million committed unsecured revolving line of credit (the “Agreement”) primarily for temporary or emergency purposes. The Money Market Fund is not a party to this Agreement.
Interest is charged to each Fund based on its borrowings at a rate equal to a variable lending rate. In addition, a commitment fee on the daily unused portion of the $20 million committed line is allocated among the participating Funds at the end of each calendar quarter. During the year ended December 31, 2008, the following Funds had borrowings and commitment fees paid under this Agreement as follows:
| | | | | | | | | | | | |
Fund | | Maximum Loan | | Average Daily
Amount of Loan | | Weighted Average
Interest Rate | | | Commitment
Fees Paid |
Investment Grade Bond | | $ | — | | $ | — | | — | % | | $ | 1,183 |
Global Real Estate | | | 779,000 | | | 10,055 | | 2.77 | | | | 4,493 |
Davis Venture Value. | | | — | | | — | | — | | | | 1,754 |
Oppenheimer Main Street Small Cap | | | 4,424,000 | | | 58,320 | | 3.48 | | | | 3,463 |
Oppenheimer Large Cap Core | | | 119,000 | | | 2,787 | | 2.76 | | | | 214 |
WMC Large Cap Growth | | | 1,696,000 | | | 11,243 | | 3.91 | | | | 1,309 |
WMC Blue Chip Mid Cap | | | 154,000 | | | 1,683 | | 4.81 | | | | 1,612 |
Lord Abbett Growth & Income* | | | — | | | — | | — | | | | 53 |
Goldman Sachs Mid Cap Value* | | | — | | | — | | — | | | | 97 |
Goldman Sachs Short Duration* | | | — | | | — | | — | | | | 849 |
Dreman Small Cap Value** | | | 663,000 | | | 5,434 | | 0.75 | | | | — |
PIMCO High Yield* | | | 242,000 | | | 661 | | 1.50 | | | | 109 |
PIMCO Total Return** | | | 1,147,000 | | | 9,402 | | 0.75 | | | | — |
As of December 31, 2008, there were no outstanding borrowings under this Agreement.
| * | The Lord Abbett Growth & Income Fund, Goldman Sachs Mid Cap Value Fund, Goldman Sachs Short Duration Fund and PIMCO High Yield Fund commenced operations on March 7, 2008 and activity presented is for the period March 7, 2008 (Commencement of Operations) to December 31, 2008. |
| ** | The Dreman Small Cap Value Fund and PIMCO Total Return Fund commenced operations on October 1, 2008 and activity presented is for the period October 1, 2008 (Commencement of Operations) to December 31, 2008. |
NOTE 7 — SHARE TRANSACTIONS
Each of the Funds is authorized to issue an unlimited number of shares without par value. Transactions in classes of each Fund were as follows:
| | | | | | | | | | | | |
| | | Initial Class Shares | | | Service Class Shares | |
| | | Year Ended
December 31,
2008 | | | Year Ended
December 31,
2007 | | | Year Ended
December 31,
2008 | | | Year Ended
December 31,
2007 | |
INVESTMENT GRADE BOND FUND (shares) | | | | | | | | | | | | |
Shares sold | | 1,374,910 | | | 674,859 | | | 840,979 | | | 1,850,733 | |
Shares issued as reinvestment of distributions | | 230,549 | | | 237,130 | | | 155,938 | | | 91,424 | |
Shares redeemed | | (1,314,407 | ) | | (1,318,890 | ) | | (980,280 | ) | | (246,506 | ) |
| | | | | | | | | | | | |
Net increase (decrease) in shares outstanding | | 291,052 | | | (406,901 | ) | | 16,637 | | | 1,695,651 | |
Beginning of period | | 4,290,605 | | | 4,697,506 | | | 2,665,199 | | | 969,548 | |
| | | | | | | | | | | | |
End of period | | 4,581,657 | | | 4,290,605 | | | 2,681,836 | | | 2,665,199 | |
| | | | | | | | | | | | |
210
| | |
| NOTESTO FINANCIAL STATEMENTS (Continued) | | Sun Capital Advisers Trust |
| | | | | | | | | | | | | | | | |
| | | Initial Class Shares | | | Service Class Shares | |
| | | Year Ended
December 31,
2008 | | | Year Ended
December 31,
2007 | | | Year Ended
December 31,
2008 | | | Year Ended
December 31,
2007 | |
INVESTMENT GRADE BOND FUND ($) | | | | | | | | | | | | | | | | |
Net proceeds from sales | | $ | 11,129,730 | | | $ | 6,459,516 | | | $ | 7,755,557 | | | $ | 17,771,996 | |
Net proceeds on reinvestment of distributions | | | 2,041,988 | | | | 2,262,235 | | | | 1,393,099 | | | | 876,468 | |
Shares redeemed | | | (11,545,254 | ) | | | (12,555,013 | ) | | | (8,670,080 | ) | | | (2,358,710 | ) |
| | | | | | | | | | | | | | | | |
Net increase (decrease) in net assets | | $ | 1,626,464 | | | $ | (3,833,262 | ) | | $ | 478,576 | | | $ | 16,289,754 | |
| | | | | | | | | | | | | | | | |
MONEY MARKET FUND (shares) | | | | | | | | | | | | | | | | |
Shares sold | | | 78,659,262 | | | | 69,244,541 | | | | 65,000,135 | | | | 500,709 | |
Shares issued as reinvestment of distributions | | | 2,994,238 | | | | 6,083,067 | | | | 219,178 | | | | 68,280 | |
Shares redeemed | | | (60,375,891 | ) | | | (66,380,014 | ) | | | (12,824,742 | ) | | | (103,682 | ) |
| | | | | | | | | | | | | | | | |
Net increase (decrease) in shares outstanding | | | 21,277,609 | | | | 8,947,594 | | | | 52,394,571 | | | | 465,307 | |
Beginning of period | | | 129,113,141 | | | | 120,165,547 | | | | 1,739,691 | | | | 1,274,384 | |
| | | | | | | | | | | | | | | | |
End of period | | | 150,390,750 | | | | 129,113,141 | | | | 54,134,262 | | | | 1,739,691 | |
| | | | | | | | | | | | | | | | |
MONEY MARKET FUND ($) | | | | | | | | | | | | | | | | |
Net proceeds from sales | | $ | 78,659,262 | | | $ | 69,244,541 | | | $ | 65,000,135 | | | $ | 500,709 | |
Net proceeds on reinvestment of distributions | | | 2,994,238 | | | | 6,083,067 | | | | 219,178 | | | | 68,280 | |
Shares redeemed | | | (60,375,891 | ) | | | (66,380,014 | ) | | | (12,824,742 | ) | | | (103,682 | ) |
| | | | | | | | | | | | | | | | |
Net increase (decrease) in net assets | | $ | 21,277,609 | | | $ | 8,947,594 | | | $ | 52,394,571 | | | $ | 465,307 | |
| | | | | | | | | | | | | | | | |
GLOBAL REAL ESTATE FUND (shares) | | | | | | | | | | | | | | | | |
Shares sold | | | 1,375,371 | | | | 684,637 | | | | 4,448,663 | | | | 3,895,525 | |
Shares issued as reinvestment of distributions | | | 485,129 | | | | 731,377 | | | | 962,826 | | | | 952,570 | |
Shares redeemed | | | (1,555,179 | ) | | | (1,548,876 | ) | | | (1,236,005 | ) | | | (122,564 | ) |
| | | | | | | | | | | | | | | | |
Net increase (decrease) in shares outstanding | | | 305,321 | | | | (132,862 | ) | | | 4,175,484 | | | | 4,725,531 | |
Beginning of period | | | 4,793,593 | | | | 4,926,455 | | | | 8,802,320 | | | | 4,076,789 | |
| | | | | | | | | | | | | | | | |
End of period | | | 5,098,914 | | | | 4,793,593 | | | | 12,977,804 | | | | 8,802,320 | |
| | | | | | | | | | | | | | | | |
GLOBAL REAL ESTATE FUND ($) | | | | | | | | | | | | | | | | |
Net proceeds from sales | | $ | 13,087,917 | | | $ | 15,105,931 | | | $ | 47,677,497 | | | $ | 92,337,279 | |
Net proceeds on reinvestment of distributions | | | 7,592,275 | | | | 14,144,828 | | | | 16,396,922 | | | | 19,870,607 | |
Shares redeemed | | | (23,692,885 | ) | | | (35,262,977 | ) | | | (20,641,734 | ) | | | (3,196,941 | ) |
| | | | | | | | | | | | | | | | |
Net increase (decrease) in net assets | | $ | (3,012,693 | ) | | $ | (6,012,218 | ) | | $ | 43,432,685 | | | $ | 109,010,945 | |
| | | | | | | | | | | | | | | | |
211
| | |
| NOTESTO FINANCIAL STATEMENTS (Continued) | | Sun Capital Advisers Trust |
| | | | | | | | | | | | | | | | |
| | | Initial Class Shares | | | Service Class Shares | |
| | | Year Ended
December 31,
2008 | | | Year Ended
December 31,
2007 | | | Year Ended
December 31,
2008 | | | Year Ended
December 31,
2007 | |
DAVIS VENTURE VALUE FUND (shares) | | | | | | | | | | | | | | | | |
Shares sold | | | 1,066,633 | | | | 352,493 | | | | 7,819,284 | | | | 2,055,246 | |
Shares issued as reinvestment of distributions | | | 57,241 | | | | 23,987 | | | | 95,137 | | | | 5,391 | |
Shares redeemed | | | (1,177,492 | ) | | | (1,168,496 | ) | | | (94,660 | ) | | | (23,367 | ) |
| | | | | | | | | | | | | | | | |
Net increase (decrease) in shares outstanding | | | (53,618 | ) | | | (792,016 | ) | | | 7,819,761 | | | | 2,037,270 | |
Beginning of period | | | 3,873,852 | | | | 4,665,868 | | | | 2,039,355 | | | | 2,085 | |
| | | | | | | | | | | | | | | | |
End of period | | | 3,820,234 | | | | 3,873,852 | | | | 9,859,116 | | | | 2,039,355 | |
| | | | | | | | | | | | | | | | |
DAVIS VENTURE VALUE FUND ($) | | | | | | | | | | | | | | | | |
Net proceeds from sales | | $ | 9,184,868 | | | $ | 4,846,001 | | | $ | 83,800,662 | | | $ | 28,353,462 | |
Net proceeds on reinvestment of distributions | | | 651,404 | | | | 323,114 | | | | 1,080,760 | | | | 72,502 | |
Shares redeemed | | | (13,464,808 | ) | | | (15,976,603 | ) | | | (971,584 | ) | | | (329,269 | ) |
| | | | | | | | | | | | | | | | |
Net increase (decrease) in net assets | | $ | (3,628,536 | ) | | $ | (10,807,488 | ) | | $ | 83,909,838 | | | $ | 28,096,695 | |
| | | | | | | | | | | | | | | | |
OPPENHEIMER MAIN STREET SMALL CAP FUND (shares) | | | | | | | | | | | | | | | | |
Shares sold | | | 916,325 | | | | 480,543 | | | | 7,386,771 | | | | 7,627,770 | |
Shares issued as reinvestment of distributions | | | 195,621 | | | | 695,101 | | | | 458,571 | | | | 575,555 | |
Shares redeemed | | | (1,746,969 | ) | | | (1,380,644 | ) | | | (1,010,665 | ) | | | (4,813 | ) |
| | | | | | | | | | | | | | | | |
Net increase (decrease) in shares outstanding | | | (635,023 | ) | | | (205,000 | ) | | | 6,834,677 | | | | 8,198,512 | |
Beginning of period | | | 5,603,211 | | | | 5,808,211 | | | | 8,200,188 | | | | 1,676 | |
| | | | | | | | | | | | | | | | |
End of period | | | 4,968,188 | | | | 5,603,211 | | | | 15,034,865 | | | | 8,200,188 | |
| | | | | | | | | | | | | | | | |
OPPENHEIMER MAIN STREET SMALL CAP FUND ($) | | | | | | | | | | | | | | | | |
Net proceeds from sales | | $ | 7,717,527 | | | $ | 6,505,454 | | | $ | 73,542,762 | | | $ | 111,930,198 | |
Net proceeds on reinvestment of distributions | | | 2,222,258 | | | | 9,223,990 | | | | 5,158,919 | | | | 7,562,789 | |
Shares redeemed | | | (18,320,015 | ) | | | (20,829,036 | ) | | | (10,804,528 | ) | | | (70,875 | ) |
| | | | | | | | | | | | | | | | |
Net increase (decrease) in net assets | | $ | (8,380,230 | ) | | $ | (5,099,592 | ) | | $ | 67,897,153 | | | $ | 119,422,112 | |
| | | | | | | | | | | | | | | | |
OPPENHEIMER LARGE CAP CORE FUND (shares) | | | | | | | | | | | | | | | | |
Shares sold | | | 815,994 | | | | 116,389 | | | | 230,404 | | | | 320,611 | |
Shares issued as reinvestment of distributions | | | 11,499 | | | | 38,812 | | | | 6,488 | | | | 49,789 | |
Shares redeemed | | | (94,101 | ) | | | (140,137 | ) | | | (220,692 | ) | | | (78,528 | ) |
| | | | | | | | | | | | | | | | |
Net increase (decrease) in shares outstanding | | | 733,392 | | | | 15,064 | | | | 16,200 | | | | 291,872 | |
Beginning of period | | | 514,993 | | | | 499,929 | | | | 707,907 | | | | 416,035 | |
| | | | | | | | | | | | | | | | |
End of period | | | 1,248,385 | | | | 514,993 | | | | 724,107 | | | | 707,907 | |
| | | | | | | | | | | | | | | | |
212
| | |
| NOTESTO FINANCIAL STATEMENTS (Continued) | | Sun Capital Advisers Trust |
| | | | | | | | | | | | | | | | |
| | | Initial Class Shares | | | Service Class Shares | |
| | | Year Ended
December 31,
2008 | | | Year Ended
December 31,
2007 | | | Year Ended
December 31,
2008 | | | Year Ended
December 31,
2007 | |
OPPENHEIMER LARGE CAP CORE FUND ($) | | | | | | | | | | | | | | | | |
Net proceeds from sales | | $ | 5,312,407 | | | $ | 1,443,134 | | | $ | 1,948,570 | | | $ | 4,067,128 | |
Net proceeds on reinvestment of distributions | | | 80,196 | | | | 418,401 | | | | 49,990 | | | | 549,666 | |
Shares redeemed | | | (802,060 | ) | | | (1,740,225 | ) | | | (1,833,372 | ) | | | (999,889 | ) |
| | | | | | | | | | | | | | | | |
Net increase (decrease) in net assets | | $ | 4,590,543 | | | $ | 121,310 | | | $ | 165,188 | | | $ | 3,616,905 | |
| | | | | | | | | | | | | | | | |
WMC LARGE CAP GROWTH FUND (shares)(a) | | | | | | | | | | | | | | | | |
Shares sold | | | 1,451,769 | | | | 230,312 | | | | 426,481 | | | | 224,059 | |
Subscriptions in-kind(b) | | | — | | | | 7,504,352 | | | | — | | | | 3,598,563 | |
Shares issued as reinvestment of distributions | | | 758 | | | | 14,919 | | | | 421 | | | | 7,914 | |
Shares redeemed | | | (1,517,999 | ) | | | (1,864,608 | ) | | | (915,536 | ) | | | (1,102,785 | ) |
| | | | | | | | | | | | | | | | |
Net increase (decrease) in shares outstanding | | | (65,472 | ) | | | 5,884,975 | | | | (488,634 | ) | | | 2,727,751 | |
Beginning of period | | | 5,884,975 | | | | — | | | | 3,109,620 | | | | 381,869 | |
| | | | | | | | | | | | | | | | |
End of period | | | 5,819,503 | | | | 5,884,975 | | | | 2,620,986 | | | | 3,109,620 | |
| | | | | | | | | | | | | | | | |
WMC LARGE CAP GROWTH FUND ($)(a) | | | | | | | | | | | | | | | | |
Net proceeds from sales | | $ | 8,466,611 | | | $ | 2,407,392 | | | $ | 3,311,569 | | | $ | 2,324,019 | |
Subscription in Kind(b) | | | — | | | | 78,270,388 | | | | — | | | | 37,533,015 | |
Net proceeds on reinvestment of distributions | | | 6,208 | | | | 157,990 | | | | 3,443 | | | | 83,653 | |
Shares redeemed | | | (12,637,314 | ) | | | (19,517,679 | ) | | | (7,706,910 | ) | | | (11,648,984 | ) |
| | | | | | | | | | | | | | | | |
Net increase (decrease) in net assets | | $ | (4,164,495 | ) | | $ | 61,318,091 | | | $ | (4,391,898 | ) | | $ | 28,291,703 | |
| | | | | | | | | | | | | | | | |
WMC BLUE CHIP MID CAP FUND (shares)(c) | | | | | | | | | | | | | | | | |
Shares sold | | | 644,278 | | | | 229,932 | | | | 2,968,949 | | | | | |
Shares issued as reinvestment of distributions | | | 1,007,315 | | | | 940,595 | | | | 431,434 | | | | | |
Shares redeemed | | | (1,491,561 | ) | | | (1,380,043 | ) | | | (50,611 | ) | | | | |
| | | | | | | | | | | | | | | | |
Net increase (decrease) in shares outstanding | | | 160,032 | | | | (209,516 | ) | | | 3,349,772 | | | | | |
Beginning of period | | | 4,760,837 | | | | 4,970,353 | | | | — | | | | | |
| | | | | | | | | | | | | | | | |
End of period | | | 4,920,869 | | | | 4,760,837 | | | | 3,349,772 | | | | | |
| | | | | | | | | | | | | | | | |
WMC BLUE CHIP MID CAP FUND ($)(c) | | | | | | | | | | | | | | | | |
Net proceeds from sales | | $ | 7,248,451 | | | $ | 4,709,517 | | | $ | 42,088,378 | | | | | |
Net proceeds on reinvestment of distributions | | | 13,024,586 | | | | 16,582,692 | | | | 5,569,810 | | | | | |
Shares redeemed | | | (20,911,785 | ) | | | (27,810,794 | ) | | | (518,600 | ) | | | | |
| | | | | | | | | | | | | | | | |
Net increase (decrease) in net assets | | $ | (638,748 | ) | | $ | (6,518,585 | ) | | $ | 47,139,588 | | | | | |
| | | | | | | | | | | | | | | | |
213
| | |
| NOTESTO FINANCIAL STATEMENTS (Continued) | | Sun Capital Advisers Trust |
| | | | | | | | |
| | | Initial Class Shares | | | Service Class Shares | |
| | | Year Ended
December 31,
2008 | | | Year Ended
December 31,
2008 | |
LORD ABBETT GROWTH & INCOME FUND (shares)(c) | | | | | | | | |
Shares sold | | | 222,457 | | | | 279,032 | |
Shares issued as reinvestment of distributions | | | 2,852 | | | | 2,636 | |
Shares redeemed | | | (10,591 | ) | | | (11,771 | ) |
| | | | | | | | |
Net increase (decrease) in shares outstanding | | | 214,718 | | | | 269,897 | |
Beginning of period | | | 100,000 | | | | 100,000 | |
| | | | | | | | |
End of period | | | 314,718 | | | | 369,897 | |
| | | | | | | | |
LORD ABBETT GROWTH & INCOME FUND ($)(c) | | | | | | | | |
Net proceeds from sales | | $ | 1,690,197 | | | $ | 2,387,573 | |
Net proceeds on reinvestment of distributions | | | 19,768 | | | | 18,267 | |
Shares redeemed | | | (87,749 | ) | | | (111,013 | ) |
| | | | | | | | |
Net increase (decrease) in net assets | | $ | 1,622,216 | | | $ | 2,294,827 | |
| | | | | | | | |
GOLDMAN SACHS MID CAP VALUE FUND (shares)(c) | | | | | | | | |
Shares sold | | | 858,895 | | | | 614,069 | |
Shares issued as reinvestment of distributions | | | 8,336 | | | | 4,533 | |
Shares redeemed | | | (79,929 | ) | | | (126,107 | ) |
| | | | | | | | |
Net increase (decrease) in shares outstanding | | | 787,302 | | | | 492,495 | |
Beginning of period | | | 150,000 | | | | 150,000 | |
| | | | | | | | |
End of period | | | 937,302 | | | | 642,495 | |
| | | | | | | | |
GOLDMAN SACHS MID CAP VALUE FUND ($)(c) | | | | | | | | |
Net proceeds from sales | | $ | 6,385,274 | | | $ | 5,437,455 | |
Net proceeds on reinvestment of distributions | | | 56,352 | | | | 30,641 | |
Shares redeemed | | | (655,799 | ) | | | (1,050,344 | ) |
| | | | | | | | |
Net increase (decrease) in net assets | | $ | 5,785,827 | | | $ | 4,417,752 | |
| | | | | | | | |
GOLDMAN SACHS SHORT DURATION FUND (shares)(c) | | | | | | | | |
Shares sold | | | 5,768,762 | | | | 7,992,460 | |
Shares issued as reinvestment of distributions | | | 54,759 | | | | 83,955 | |
Shares redeemed | | | (633,805 | ) | | | (2,014,608 | ) |
| | | | | | | | |
Net increase (decrease) in shares outstanding | | | 5,189,716 | | | | 6,061,807 | |
Beginning of period | | | 200,000 | | | | 200,000 | |
| | | | | | | | |
End of period | | | 5,389,716 | | | | 6,261,807 | |
| | | | | | | | |
GOLDMAN SACHS SHORT DURATION FUND ($)(c) | | | | | | | | |
Net proceeds from sales | | $ | 57,374,714 | | | $ | 79,285,026 | |
Net proceeds on reinvestment of distributions | | | 549,121 | | | | 839,252 | |
Shares redeemed | | | (6,376,505 | ) | | | (20,136,581 | ) |
| | | | | | | | |
Net increase (decrease) in net assets | | $ | 51,547,330 | | | $ | 59,987,697 | |
| | | | | | | | |
214
| | |
| NOTESTO FINANCIAL STATEMENTS (Continued) | | Sun Capital Advisers Trust |
| | | | | | | | |
| | | Initial Class Shares | | | Service Class Shares | |
| | | Year Ended
December 31,
2008 | | | Year Ended
December 31,
2008 | |
DREMAN SMALL CAP VALUE FUND (shares)(d) | | | | | | | | |
Shares sold | | | 395,205 | | | | 29,118 | |
Shares issued as reinvestment of distributions | | | 1,013 | | | | 230 | |
Shares redeemed | | | (4,779 | ) | | | (716 | ) |
| | | | | | | | |
Net increase (decrease) in shares outstanding | | | 391,439 | | | | 28,632 | |
Beginning of period | | | 150,000 | | | | 150,000 | |
| | | | | | | | |
End of period | | | 541,439 | | | | 178,632 | |
| | | | | | | | |
DREMAN SMALL CAP VALUE FUND ($)(d) | | | | | | | | |
Net proceeds from sales | | $ | 2,974,536 | | | $ | 223,930 | |
Net proceeds on reinvestment of distributions | | | 7,879 | | | | 1,788 | |
Shares redeemed | | | (40,303 | ) | | | (5,063 | ) |
| | | | | | | | |
Net increase (decrease) in net assets | | $ | 2,942,112 | | | $ | 220,655 | |
| | | | | | | | |
PIMCO HIGH YIELD FUND (shares)(c) | | | | | | | | |
Shares sold | | | 225,014 | | | | 1,357,957 | |
Shares issued as reinvestment of distributions | | | 13,632 | | | | 51,316 | |
Shares redeemed | | | (384 | ) | | | (35,212 | ) |
| | | | | | | | |
Net increase (decrease) in shares outstanding | | | 238,262 | | | | 1,374,061 | |
Beginning of period | | | 150,000 | | | | 150,000 | |
| | | | | | | | |
End of period | | | 388,262 | | | | 1,524,061 | |
| | | | | | | | |
PIMCO HIGH YIELD FUND ($)(c) | | | | | | | | |
Net proceeds from sales | | $ | 1,739,109 | | | $ | 12,015,785 | |
Net proceeds on reinvestment of distributions | | | 119,537 | | | | 434,852 | |
Shares redeemed | | | (3,069 | ) | | | (306,519 | ) |
| | | | | | | | |
Net increase (decrease) in net assets | | $ | 1,855,577 | | | $ | 12,144,118 | |
| | | | | | | | |
PIMCO TOTAL RETURN FUND (shares)(d) | | | | | | | | |
Shares sold | | | 1,169,446 | | | | 1,607,235 | |
Shares issued as reinvestment of distributions | | | 2,014 | | | | 2,254 | |
Shares redeemed | | | (10,778 | ) | | | (15,086 | ) |
| | | | | | | | |
Net increase (decrease) in shares outstanding | | | 1,160,682 | | | | 1,594,403 | |
Beginning of period | | | 150,000 | | | | 150,000 | |
| | | | | | | | |
End of period | | | 1,310,682 | | | | 1,744,403 | |
| | | | | | | | |
PIMCO TOTAL RETURN FUND ($)(d) | | | | | | | | |
Net proceeds from sales | | $ | 12,027,546 | | | $ | 16,494,373 | |
Net proceeds on reinvestment of distributions | | | 21,046 | | | | 23,607 | |
Shares redeemed | | | (109,515 | ) | | | (156,896 | ) |
| | | | | | | | |
Net increase (decrease) in net assets | | $ | 11,939,077 | | | $ | 16,361,084 | |
| | | | | | | | |
215
| | |
| NOTESTO FINANCIAL STATEMENTS (Continued) | | Sun Capital Advisers Trust |
| | | | | | | | |
| | | Initial Class Shares | | | Service Class Shares | |
| | | Year Ended
December 31,
2008 | | | Year Ended
December 31,
2008 | |
AIM SMALL CAP GROWTH FUND (shares)(d) | | | | | | | | |
Shares sold | | | 190,788 | | | | 56,833 | |
Shares redeemed | | | (3,688 | ) | | | (1,019 | ) |
| | | | | | | | |
Net increase (decrease) in shares outstanding | | | 187,100 | | | | 55,814 | |
Beginning of period | | | 150,000 | | | | 150,000 | |
| | | | | | | | |
End of period | | | 337,100 | | | | 205,814 | |
| | | | | | | | |
AIM SMALL CAP GROWTH FUND ($)(d) | | | | | | | | |
Net proceeds from sales | | $ | 1,353,803 | | | $ | 403,682 | |
Shares redeemed | | | (30,260 | ) | | | (7,129 | ) |
| | | | | | | | |
Net increase (decrease) in net assets | | $ | 1,323,543 | | | $ | 396,553 | |
| | | | | | | | |
ALLIANCEBERNSTEIN INTERNATIONAL VALUE FUND (shares)(d) | | | | | | | | |
Shares sold | | | 993,912 | | | | 10,748 | |
Shares issued as reinvestment of distributions | | | 2,464 | | | | 361 | |
Shares redeemed | | | (13,236 | ) | | | (1,977 | ) |
| | | | | | | | |
Net increase (decrease) in shares outstanding | | | 983,140 | | | | 9,132 | |
Beginning of period | | | 250,000 | | | | 250,000 | |
| | | | | | | | |
End of period | | | 1,233,140 | | | | 259,132 | |
| | | | | | | | |
ALLIANCEBERNSTEIN INTERNATIONAL VALUE FUND ($)(d) | | | | | | | | |
Net proceeds from sales | | $ | 7,432,505 | | | $ | 83,324 | |
Net proceeds on reinvestment of distributions | | | 19,366 | | | | 2,842 | |
Shares redeemed | | | (109,007 | ) | | | (14,889 | ) |
| | | | | | | | |
Net increase (decrease) in net assets | | $ | 7,342,864 | | | $ | 71,277 | |
| | | | | | | | |
BLACKROCK INFLATION PROTECTED BOND FUND (shares)(d) | | | | | | | | |
Shares sold | | | 694,093 | | | | 283,469 | |
Shares issued as reinvestment of distributions | | | 2,366 | | | | 1,238 | |
Shares redeemed | | | (4,523 | ) | | | (1,323 | ) |
| | | | | | | | |
Net increase (decrease) in shares outstanding | | | 691,936 | | | | 283,384 | |
Beginning of period | | | 150,000 | | | | 150,000 | |
| | | | | | | | |
End of period | | | 841,936 | | | | 433,384 | |
| | | | | | | | |
BLACKROCK INFLATION PROTECTED BOND FUND ($)(d) | | | | | | | | |
Net proceeds from sales | | $ | 6,709,684 | | | $ | 2,720,541 | |
Net proceeds on reinvestment of distributions | | | 23,196 | | | | 12,136 | |
Shares redeemed | | | (42,980 | ) | | | (13,195 | ) |
| | | | | | | | |
Net increase (decrease) in net assets | | $ | 6,689,900 | | | $ | 2,719,482 | |
| | | | | | | | |
216
| | |
| NOTESTO FINANCIAL STATEMENTS (Continued) | | Sun Capital Advisers Trust |
| | | | | | | | |
| | | Initial Class Shares | | | Service Class Shares | |
| | | Year Ended
December 31,
2008 | | | Year Ended
December 31,
2008 | |
IBBOTSON MODERATE FUND (shares)(d) | | | | | | | | |
Shares sold | | | 50 | | | | 3,703,343 | |
Shares redeemed | | | — | | | | (8,738 | ) |
| | | | | | | | |
Net increase (decrease) in shares outstanding | | | 50 | | | | 3,694,605 | |
Beginning of period | | | 5,000 | | | | 5,000 | |
| | | | | | | | |
End of period | | | 5,050 | | | | 3,699,605 | |
| | | | | | | | |
IBBOTSON MODERATE FUND ($)(d) | | | | | | | | |
Net proceeds from sales | | $ | 451 | | | $ | 32,978,804 | |
Shares redeemed | | | — | | | | (80,696 | ) |
| | | | | | | | |
Net increase (decrease) in net assets | | $ | 451 | | | $ | 32,898,108 | |
| | | | | | | | |
IBBOTSON BALANCED FUND (shares)(d) | | | | | | | | |
Shares sold | | | 1,155 | | | | 4,271,092 | |
Shares redeemed | | | (9 | ) | | | (127 | ) |
| | | | | | | | |
Net increase (decrease) in shares outstanding | | | 1,146 | | | | 4,270,965 | |
Beginning of period | | | 5,000 | | | | 5,000 | |
| | | | | | | | |
End of period | | | 6,146 | | | | 4,275,965 | |
| | | | | | | | |
IBBOTSON BALANCED FUND ($)(d) | | | | | | | | |
Net proceeds from sales | | $ | 10,063 | | | $ | 37,331,705 | |
Shares redeemed | | | (81 | ) | | | (1,114 | ) |
| | | | | | | | |
Net increase (decrease) in net assets | | $ | 9,982 | | | $ | 37,330,591 | |
| | | | | | | | |
IBBOTSON GROWTH FUND (shares)(d) | | | | | | | | |
Shares sold | | | 5,400 | | | | 3,857,782 | |
Shares redeemed | | | (27 | ) | | | (120,746 | ) |
| | | | | | | | |
Net increase (decrease) in shares outstanding | | | 5,373 | | | | 3,737,036 | |
Beginning of period | | | 5,000 | | | | 5,000 | |
| | | | | | | | |
End of period | | | 10,373 | | | | 3,742,036 | |
| | | | | | | | |
IBBOTSON GROWTH FUND ($)(d) | | | | | | | | |
Net proceeds from sales | | $ | 46,493 | | | $ | 32,502,199 | |
Shares redeemed | | | (230 | ) | | | (1,064,299 | ) |
| | | | | | | | |
Net increase (decrease) in net assets | | $ | 46,263 | | | $ | 31,437,900 | |
| | | | | | | | |
| (a) | Initial Class Shares for the WMC Large Cap Growth Fund commenced on April 7, 2007 and share activity presented is for the period April 2, 2007 to December 31, 2007. |
| (b) | During the year ended December 31, 2007, WMC Large Cap Growth Fund received securities with a value of $115,803,403 in exchange for 11,102,915 fund shares. |
| (c) | The Lord Abbett Growth & Income Fund, Goldman Sachs Mid Cap Value Fund, Goldman Sachs Short Duration Fund, PIMCO High Yield Fund and the Service Class for the WMC Blue Chip Mid Cap Fund commenced operations on March 7, 2008 and share activity presented is for the period March 7, 2008 to December 31, 2008. |
217
| | |
| NOTESTO FINANCIAL STATEMENTS (Continued) | | Sun Capital Advisers Trust |
| (d) | The Dreman Small Cap Value Fund, PIMCO Total Return Fund, AIM Small Cap Growth Fund, AllianceBernstein International Value Fund, BlackRock Inflation Protected Bond Fund, Ibbotson Moderate Fund, Ibbotson Balanced Fund, and the Ibbotson Growth Fund commenced operations on October 1, 2008 and share activity presented is for the period October 1, 2008 to December 31, 2008. |
NOTE 8 — INDEMNIFICATION
Under the Trust’s organizational documents, its officers and Trustees may be indemnified against certain liabilities and expenses arising out of the performance of their duties to the Trust. Additionally, in the normal course of business, the Trust enters into agreements with service providers that may contain indemnification clauses. The Trust’s maximum exposure under these agreements is unknown as this would involve future claims that may be made against the Trust that have not yet occurred.
NOTE 9 — CAPITAL SUPPORT AGREEMENT
On September 16, 2008, the Trust, on behalf of the Money Market Fund (the “Fund”), entered into a Capital Support Agreement, as subsequently amended (the “Agreement”), with Sun Life (U.S.), an affiliate of the Fund’s investment adviser, Sun Capital Advisers LLC, in order to prevent any losses that might be realized upon the ultimate disposition of the Fund’s investment in commercial paper issued by American General Finance Corporation (or any instrument received in exchange for such paper in an exchange offer, debt restructuring, reorganization or similar transaction, excepting only those qualifying as “Eligible Securities” as defined in paragraph (a)(10) of Rule 2a-7 of the 1940 Act, together referred to as “AGFC Commercial Paper”) from adversely affecting the Fund’s market-based net asset value. The Agreement was entered into at no cost to the Fund, and Sun Life (U.S.) is not entitled to obtain any shares or other property from the Fund in exchange for its participation in the Agreement or contributions of capital to the Fund pursuant to the Agreement.
The Agreement requires Sun Life (U.S.) to make capital contributions in cash to the Fund in amounts equal to the excess of the amortized cost value plus any accrued and unpaid interest on the AGFC Commercial Paper over the amount received by the Fund for such AGFC Commercial Paper, subject to an aggregate limit of $4.7 million plus the amount of any interest accrued in the period from October 27, 2008 to August 24, 2009, upon the occurrence of any of the following circumstances: a) sale of the AGFC Commercial Paper by the Fund for an amount less than amortized cost value; b) receipt of final payment on the AGFC Commercial Paper in an amount less than amortized cost value plus any accrued and unpaid interest; c) receipt of court-established proceeds in an amount less than amortized cost value or a court order discharging liability for payment on the AGFC Commercial Paper; and d) receipt of new securities that qualify as “Eligible Securities” in exchange for the AGFC Commercial Paper if the amortized cost of such new securities is less than the amortized cost value of the AGFC Commercial Paper. The Board of Trustees of the Trust has determined that Sun Life (U.S.)’s commitment under the Agreement is of comparable quality to a “First Tier Security” as defined in Rule 2a-7 of the 1940 Act.
The Fund treats amounts potentially contributable under the Agreement as an asset of the Fund in calculating its market-based net asset value (“NAV”). Until the disposition of the AGFC Commercial Paper in one of the above circumstances, such potential contributions may increase, decrease or be eliminated on any day the Fund calculates its market-based NAV per share due to changes in the market value of the AGFC Commercial Paper or other factors occurring prior to actual payment of the amount from Sun Life (U.S.) to the Fund. As of December 31, 2008, the amortized cost value of the AGFC Commercial Paper was $4,700,000, of which $4,331,943 derived from the fair value of the AGFC Commercial Paper and $368,057 derived from potential contributions under the Agreement. There were no other potentially contributable amounts under the Agreement because no accrued interest on the AGFC Commercial Paper was overdue as of December 31, 2008. The Agreement requires the Fund to sell any remaining investment in the AGFC Commercial Paper on the day preceding the Agreement’s expiration date, which will be no later than August 24, 2009.
218
| | |
| NOTESTO FINANCIAL STATEMENTS (Continued) | | Sun Capital Advisers Trust |
NOTE 10 — TEMPORARY GUARANTEE PROGRAM
In October 2008, the Money Market Fund (the “Fund”) enrolled in the U.S. Department of the Treasury’s (“U.S. Treasury”) Temporary Guarantee Program for Money Market Funds (the “Program”) for an initial term extending from September 19, 2008 to December 18, 2008. In December 2008, the Fund elected to participate in the extended term of the Program expiring April 30, 2009. Under the Program, the U.S. Treasury guarantees the $1.00 per share value of Fund shares outstanding as of September 19, 2008, subject to certain terms and limitations. The Program covers only the number of shares a shareholder (“Covered Shareholder”) held in the Fund as of the close of business on September 19, 2008 or the number of shares a shareholder holds if and when a guarantee event occurs, whichever is less. A guarantee event would occur if the Fund’s market-based net asset value per share falls below $0.995 and is not promptly cured. Upon the occurrence of a guarantee event, the Fund is required to liquidate and Covered Shareholders become entitled to receive $1.00 per “covered” share, subject to certain adjustments and to an overall limit (currently set at $50 billion) on payments available to all money market funds participating in the Program.
To participate in the Program during the initial period from September 19, 2008 to December 18, 2008, the Fund paid a fee to the U.S. Treasury equal to 0.01% of the net asset value of the Fund as of September 19, 2008. To participate in the Program during the extended period from December 19, 2008 to April 30, 2009, the Fund paid a fee to the U.S. Treasury equal to 0.015% of the net asset value of the Fund as of September 19, 2008. The Fund’s investment adviser, Sun Capital Advisers LLC, agreed to cover the cost of the fee for the initial period of participation to the extent that the Fund’s gross expenses exceeded the Fund’s contractual expense limitation, and the Fund agreed to cover the cost of the fee for the extended period of participation without application of the Fund’s contractual expense limitation.
If the U.S. Treasury extends the Program beyond April 30, 2009 to a date no later than September 18, 2009, the Board of Trustees of the Fund would again consider whether to apply to participate in the extended period. Participation in any extension of the Program would require payment of an additional fee. There can be no assurance that the Fund will elect to participate, or be eligible to participate, in any further extension of the Program.
NOTE 11 — SUBSEQUENT EVENT
In January 2009, the Securities and Exchange Commission granted a substitution order (the “Substitution Order”) that enables Sun Life (U.S.) and Sun Life (N.Y.) (together, the “Sun Life Insurance Companies”) to transfer assets into the Lord Abbett Growth & Income Fund, Goldman Sachs Mid Cap Value Fund, Goldman Sachs Short Duration Fund and PIMCO High Yield Fund from other third-party funds that currently serve as investment options for certain variable annuity and variable life insurance products issued by the Sun Life Insurance Companies. As of December 31, 2008, the aggregate assets to be transferred amounted to approximately $1.3 billion. In connection with the Substitution Order, the Board of Trustees of the Trust approved amendments to the Investment Advisory and Management Agreements between each of Goldman Sachs Short Duration Fund and PIMCO High Yield Fund (together, the “Funds”) and the Adviser resulting in a reduction in the Unified Management Fee of each of these Funds from 0.65% and 0.75% to 0.64% and 0.74%, respectively. The fee reductions will take effect upon the transfer of assets into the Funds on or about February 20, 2009.
219
REPORTOF INDEPENDENT REGISTERED PUBLIC ACCOUNTING FIRM
To the Trustees and the Shareholders of Sun Capital Advisers Trust:
We have audited the accompanying statements of assets and liabilities, including the portfolios of investments and the portfolios of other financial instruments, of Sun Capital Investment Grade Bond Fund, Sun Capital Money Market Fund, Sun Capital Global Real Estate Fund (formerly known as Sun Capital Real Estate Fund), SC Davis Venture Value Fund, SC Oppenheimer Main Street Small Cap Fund, SC Oppenheimer Large Cap Core Fund (formerly known as Sun Capital All Cap Fund), SC WMC Large Cap Growth Fund (formerly known as SC FI Large Cap Growth Fund), SC WMC Blue Chip Mid Cap Fund (formerly known as SC Blue Chip Mid Cap Fund), SC Lord Abbett Growth & Income Fund, SC Goldman Sachs Mid Cap Value Fund, SC Goldman Sachs Short Duration Fund, SC Dreman Small Cap Value Fund, SC PIMCO High Yield Fund, SC PIMCO Total Return Fund, SC AIM Small Cap Growth Fund, SC AllianceBernstein International Value Fund, SC BlackRock Inflation Protected Bond Fund, SC Ibbotson Moderate Fund, SC Ibbotson Balanced Fund, and SC Ibbotson Growth Fund (each a portfolio of Sun Capital Advisers Trust, the “Trust”) as of December 31, 2008, and the related statements of operations, the statements of changes in net assets, and the financial highlights for the periods presented. These financial statements and financial highlights are the responsibility of the Trust’s management. Our responsibility is to express an opinion on these financial statements and financial highlights based on our audits.
We conducted our audits in accordance with the standards of the Public Company Accounting Oversight Board (United States). Those standards require that we plan and perform the audit to obtain reasonable assurance about whether the financial statements and financial highlights are free of material misstatement. The Trust is not required to have, nor were we engaged to perform, an audit of its internal control over financial reporting. Our audits included consideration of internal control over financial reporting as a basis for designing audit procedures that are appropriate in the circumstances, but not for the purpose of expressing an opinion on the effectiveness of the Trust’s internal control over financial reporting. Accordingly, we express no such opinion. An audit also includes examining, on a test basis, evidence supporting the amounts and disclosures in the financial statements, assessing the accounting principles used and significant estimates made by management, as well as evaluating the overall financial statement presentation. Our procedures included confirmation of securities owned as of December 31, 2008, by correspondence with the custodian and brokers; where replies were not received from brokers, we performed other auditing procedures. We believe that our audits provide a reasonable basis for our opinion.
In our opinion, such financial statements and financial highlights referred to above present fairly, in all material respects, the financial positions of Sun Capital Investment Grade Bond Fund, Sun Capital Money Market Fund, Sun Capital Global Real Estate Fund (formerly known as Sun Capital Real Estate Fund), SC Davis Venture Value Fund, SC Oppenheimer Main Street Small Cap Fund, SC Oppenheimer Large Cap Core Fund (formerly known as Sun Capital All Cap Fund), SC WMC Large Cap Growth Fund (formerly known as SC FI Large Cap Growth Fund), SC WMC Blue Chip Mid Cap Fund (formerly known as SC Blue Chip Mid Cap Fund), SC Lord Abbett Growth & Income Fund, SC Goldman Sachs Mid Cap Value Fund, SC Goldman Sachs Short Duration Fund, SC Dreman Small Cap Value Fund, SC PIMCO High Yield Fund, SC PIMCO Total Return Fund, SC AIM Small Cap Growth Fund, SC AllianceBernstein International Value Fund, SC BlackRock Inflation Protected Bond Fund, SC Ibbotson Moderate Fund, SC Ibbotson Balanced Fund, and SC Ibbotson Growth Fund as of December 31, 2008, the results of their operations, the changes in their net assets, and their financial highlights for each of the periods presented, in conformity with accounting principles generally accepted in the United States of America.
DELOITTE & TOUCHE LLP
Boston, Massachusetts
February 25, 2009
220
OTHER INFORMATION (Unaudited)
PROXY VOTING POLICIES AND PROCEDURES AND VOTING RECORDS
A description of the policies and procedures that the Funds use to determine how to vote proxies relating to portfolio securities and information regarding how the Funds voted proxies relating to portfolio securities during the most recent 12-month period ended June 30 are available (i) without charge, upon request, by calling (800) 432-1102 x 3330 and (ii) on the U.S. Securities and Exchange Commission’s website at www.sec.gov.
QUARTERLY FILING OF PORTFOLIO HOLDINGS
The Funds file their complete schedule of investments with the U.S. Securities and Exchange Commission (“SEC”) for the first and third quarters of each fiscal year on Form N-Q. The Funds’ Form N-Q are (i) available on the SEC’s website at www.sec.gov; and (ii) available for review and copying at the SEC’s Public Reference Room in Washington, D.C. Information about the operations of the Public Reference Room may be obtained by calling (800) SEC-0330.
TAX INFORMATION
For the year ended December 31, 2008, the following Funds paid distributions which were designated as long-term capital gains dividends:
| | | |
Fund | | Amount |
Global Real Estate | | $ | 14,005,067 |
Davis Venture Value | | | 1,023,176 |
Oppenheimer Main Street Small Cap | | | 4,314,286 |
Oppenheimer Large Cap Core | | | 39,073 |
WMC Blue Chip Mid Cap | | | 12,486,999 |
Goldman Sachs Short Duration* | | | 173,097 |
PIMCO High Yield* | | | 31,068 |
| * | For the period March 7, 2008 (Commencement of Operations) to December 31, 2008. |
For federal tax purposes, the following information is furnished with respect to the distributions of the Trust for its fiscal year ended December 31, 2008:
Percentage of distributions which qualify for the corporate dividends received deduction:
| | | |
Fund | | Percentage | |
Global Real Estate | | 2.33 | % |
Davis Venture Value | | 100.00 | % |
Oppenheimer Main Street Small Cap | | 38.39 | % |
Oppenheimer Large Cap Core | | 100.00 | % |
WMC Large Cap Growth | | 100.00 | % |
WMC Blue Chip Mid Cap | | 9.33 | % |
Lord Abbett Growth & Income* | | 100.00 | % |
Goldman Sachs Mid Cap Value* | | 99.25 | % |
Dreman Small Cap Value** | | 100.00 | % |
PIMCO High Yield* | | 0.27 | % |
PIMCO Total Return** | | 1.15 | % |
| * | For the period March 7, 2008 (Commencement of Operations) to December 31, 2008. |
| ** | For the period October 1, 2008 (Commencement of Operations) to December 31, 2008. |
221
OTHER INFORMATION (Unaudited) (Continued)
ADVISORY CONTRACT RENEWALS & APPROVALS
Funds Having Investment Advisory and/or Subadvisory Agreements Renewed in 2008:
Sun Capital Investment Grade Bond Fund
Sun Capital Money Market Fund
Sun Capital Global Real Estate Fund
SC Davis Venture Value Fund
SC Oppenheimer Main Street Small Cap Fund
SC Oppenheimer Large Cap Core Fund
SC WMC Large Cap Growth Fund
SC WMC Blue Chip Mid Cap Fund
Factors Considered by the Board of Trustees (the “Board”) in Renewing the Investment Advisory and Subadvisory Agreements.
The Funds’ Board approved the continuation of each above-referenced Fund’s current investment advisory agreement (including, in the case of the SC Davis Venture Value Fund, SC Oppenheimer Main Street Small Cap Fund and SC WMC Blue Chip Mid Cap Fund, each such Fund’s subadvisory agreement) for an additional twelve-month period at an in-person meeting held in November 2008. The subadvisory agreements for SC Oppenheimer Large Cap Core Fund and SC WMC Large Cap Growth Fund were approved separately at earlier in-person meetings of the Board in February and May of 2008, respectively. For information regarding the approval process for those subadvisory agreements, please see the Funds’ semi-annual report dated June 30, 2008.
In terms of the process that the Trustees followed prior to approving the continuation of each investment advisory and subadvisory agreement (together, the “investment advisory agreements”), Variable Contract Owners* should know that:
| * | At present, all but one of the Funds’ Trustees, including the Board’s chairman, are independent of Sun Capital Advisers LLC (“Sun Capital”), which serves as the investment adviser to each of the Funds, each subadviser, and their respective affiliates (“Independent Trustees”). |
| * | In connection with the Board’s 2008 contract review, the Independent Trustees met on multiple occasions to discuss and consider contract review matters, and were advised by, and held private meetings with, their independent legal counsel. |
| * | The Board engaged in a thorough review of each Fund’s investment advisory agreement(s). In this connection, the Board reviewed a wide range of materials furnished by the Sun Capital and, as applicable, each subadviser, prior to reaching these decisions. |
| * | In connection with reviewing the Funds’ investment advisory agreements, the Board also reviewed the terms of the Funds’ Rule 12b-1 plan, distribution agreement, and servicing agreements. |
In determining to approve the continuation of each investment advisory agreement, the Board considered all factors that it believed relevant to the interests of Variable Contract Owners, including but not limited to:
| • | | Fees and expenses. The investment advisory and, as applicable, investment subadvisory fee schedules for each Fund, including (i) comparative information provided by Lipper regarding investment advisory fee rates paid to other advisers by similar funds; and (ii) fee rates paid to Sun Capital and each subadviser by each Fund |
| * | Shares of the Funds are owned by Sun Life (U.S.) and Sun Life (N.Y.) for the benefit of the owners of variable annuities and variable life insurance policies (“Variable Contract Owners”) issued by Sun Life (U.S.) or Sun Life (N.Y.). |
222
OTHER INFORMATION (Unaudited) (Continued)
| | relative to those paid by similar funds and institutional accounts advised by such firms. The Board gave a lesser weight to fees paid by similar institutional accounts advised by such firms, in light of the material differences in the scope of services typically provided to mutual funds relative to institutional accounts. In the case of each sub-advised Fund, the Board noted that the investment subadvisory fees paid to each subadviser are paid by Sun Capital out of its fee, not by the Fund. Taking into account the foregoing, the Board concluded that the fee schedules in effect for each Fund represent reasonable compensation in light of the nature, extent and quality of the investment services being provided to such Fund. |
| • | | Economies of scale. The extent to which economies of scale would be realized as each Fund grows. In this regard, the Board observed that the advisory fees charged to the SC Davis Venture Value Fund, SC Oppenheimer Main Street Small Cap Fund, SC WMC Large Cap Growth Fund and SC Blue Chip Mid Cap Fund contain breakpoints and, accordingly, reflect the potential to share economies of scale. In addition, with respect to the SC Oppenheimer Large Cap Core Fund, Sun Capital Investment Grade Bond Fund, Sun Capital Money Market Fund and Sun Capital Global Real Estate Fund, the Board considered Sun Capital’s commitment to consider breakpoints on each such Fund to the extent any such Fund’s assets under management increase to more substantial, scaleable levels in the future. The Board concluded that each Fund’s fee schedule represents an appropriate sharing between the Variable Contract Owners and the investment advisers of such economies of scale as may exist in the management of each Fund at current asset levels. |
| • | | Profitability; Other benefits to Sun Capital. The costs of the services to be provided, and profits realized, by Sun Capital and its affiliates from their relationship with each Fund. In this regard, the Board observed that Sun Capital reported that it was operating several Funds at a net loss (suggesting that the adviser had assumed considerable economic risk in contracting with the Funds), and had committed to extend previously existing total operating expense caps applicable to each Fund through at least April 30, 2010. In analyzing Sun Capital’s costs and profits and its affiliates’ costs, the Board also reviewed the fees paid to and services provided by Sun Capital and its affiliates to each Fund for non-advisory services, such as distribution (including fees paid pursuant to Rule 12b-1 plans). The Board also considered other potential benefits to Sun Capital and its affiliates from their relationships with the Funds, including the role of the Funds in supporting the variable contracts issued by Sun Life (U.S.) and Sun Life (N.Y.) both of which are affiliates of Sun Capital. The Board concluded that each Fund’s investment advisory fee schedule represented reasonable compensation in light of, among other factors, the costs incurred by Sun Capital and its affiliates in providing services to each Fund. |
| • | | Investment performance. The investment performance of each Fund, both absolute and relative to various benchmarks and industry peer groups, including comparative information provided by Lipper regarding each Fund’s performance relative to other similar Funds. The Board observed that the SC WMC Large Cap Growth Fund had underperformed its benchmark and peer group averages over its initial period of operation, and that during 2008 the Board approved the termination of the Fund’s initial subadviser and the retention of a new subadviser (Wellington Management Company, LLP). |
| • | | Nature, quality and extent of services. The nature, scope and quality of the services that Sun Capital and each subadviser provide to the Funds. In this regard, the Board considered, among other things, Sun Capital’s and each subadviser’s personnel (including particularly those personnel with responsibilities for providing services to the Funds), resources, policies and investment processes. In addition to meeting with representatives of Sun Capital and each subadviser, the Board also considered, among other things, Sun Capital’s representation that it was satisfied with the resources, compliance program and level of commitment put forth by each subadviser and its recommendation that each subadvisory agreement be continued. The Board considered that the types of services to be provided under the investment advisory agreements were comparable to those typically found in agreements of such type. In this regard, the Board concluded that the quality and range of services provided by Sun Capital and, as applicable, each subadviser, have benefited and should continue to benefit each Fund and the Variable Contract Owners. |
223
OTHER INFORMATION (Unaudited) (Continued)
| • | | Brokerage practices. The practices of Sun Capital and each subadviser regarding the selection and compensation of brokers and dealers executing portfolio transactions for the Funds, including the brokers’ and dealers’ provision of brokerage and research services to Sun Capital and each subadviser. The Board indicated that it would continue to monitor the allocation of each Fund’s brokerage to ensure that the principle of “best price and execution” remains paramount in the portfolio trading process. |
| • | | Compliance. Sun Capital’s and each subadviser’s commitment to and record of compliance, including its written compliance policies and procedures. In this regard, the Board considered the adviser’s continued commitment of attention and resources to compliance functions relevant to the Funds’ operations, including the oversight of subadvisers. |
After due consideration of these and other factors that it considered relevant, the Board determined to approve the continuation of each Fund’s investment advisory agreement and, as applicable, investment subadvisory agreement, and concluded that the continuation of such agreements was in the best interest of the Fund and the Variable Contract Owners.
In reaching this conclusion, the Board did not give particular weight to any single factor noted above. The Board considered these factors over the course of multiple meetings, certain of which were held in executive session with only the Independent Trustees and their counsel present. It is possible that individual Trustees may have weighed these factors differently in reaching their individual decisions to approve the continuation of the investment advisory agreements.
Funds Having Investment Advisory and/or Subadvisory Agreements Initially Approved in 2008:
SC Ibbotson Moderate Fund
SC Ibbotson Balanced Fund
SC Ibbotson Growth Fund
SC Dreman Small Cap Value Fund
SC AIM Small Cap Growth Fund
SC AllianceBernstein International Value Fund
SC PIMCO Total Return Fund
SC BlackRock Inflation Protected Bond Fund
Factors Considered by the Board of Trustees (the “Board”) in Initially Approving each Fund’s Investment Advisory Agreements.
The Funds’ Board approved the initial investment advisory agreement (or investment advisory and management agreement in the cases of SC PIMCO Total Return Fund and SC BlackRock Inflation Protected Bond Fund) and sub-advisory agreement for each Fund listed above (together, the “investment advisory agreements”) at an in-person meeting held in May 2008. In terms of the process that the Trustees followed prior to approving each of the investment advisory agreements, Variable Contract Owners* should know that:
| * | At present, all but one of the Funds’ Trustees, including the Board’s chairman, are independent of Sun Capital, each subadviser, and their respective affiliates (“Independent Trustees”). |
| * | In connection with reviewing the Funds’ investment advisory agreements, the Independent Trustees met on multiple occasions to discuss and consider the proposed arrangements, and were advised by, and met privately with, their independent legal counsel. |
| * | Shares of the Funds are owned by Sun Life (U.S.) and Sun Life (N.Y.) for the benefit of the owners of variable annuities and variable life insurance policies (“Variable Contract Owners”) issued by Sun Life (U.S.) or Sun Life (N.Y.). |
224
OTHER INFORMATION (Unaudited) (Continued)
| * | The Board engaged in a thorough review of each Fund’s investment advisory agreements. In this connection, the Board reviewed a wide range of materials furnished by Sun Capital and each subadviser prior to reaching these decisions. |
| * | In connection with reviewing the Funds’ investment advisory agreements, the Board also reviewed the terms of the Funds’ Rule 12b-1 plan, distribution agreement, and servicing agreements. |
In determining to approve each Fund’s investment advisory agreements, the Board considered all factors that it believed relevant to the interests of the Fund and the Variable Contract Owners, including but not limited to:
| • | | Fees and expenses. The investment advisory and investment subadvisory fee schedules for each Fund, including (i) comparative information provided by Lipper regarding investment advisory and sub-advisory fee rates paid to other advisers by similar funds; and (ii) as applicable, fee rates paid to Sun Capital and each subadviser by each Fund relative to those paid by similar funds and institutional accounts advised by such firms. The Board gave a lesser weight to fees paid by similar institutional accounts advised by such firms, in light of the material differences in the scope of services typically provided to mutual funds relative to institutional accounts. The Board also determined that, with respect only to SC PIMCO Total Return Fund and SC BlackRock Inflation Protected Bond Fund, because Sun Capital is obligated to provide a broader range of services and to bear additional categories of expenses in return for the “unitary” investment management fee it will receive than would be the case under a typical investment advisory agreement, it was most appropriate to examine and compare each Fund’s total operating expense ratio relative to the total operating expense ratios of other similar funds. The Board noted that the investment subadvisory fees paid to each Fund’s subadviser will be paid by Sun Capital out of its fee, not by the Fund. Taking into account the foregoing, the Board concluded that the fee schedules for each Fund represent reasonable compensation in light of the nature, extent and quality of the investment services expected to be provided to each such Fund. |
| • | | Economies of scale. Given the uncertainty regarding each Fund’s size and related operating costs, the Board deferred its evaluation of economies of scale to a future date. |
| • | | Profitability; Other benefits to Sun Capital. Because the Funds had not yet commenced operations, no information regarding Sun Capital’s costs and profits from providing investment advisory services to the Funds could be considered by the Board. The Board did review and consider the fees to be paid to and services to be provided by Sun Capital and its affiliates to each Fund for non-advisory services, such as distribution (including fees paid pursuant to Rule 12b-1 plans). The Board also considered other potential benefits to Sun Capital and its affiliates from their relationships with the Funds, including the role of the Funds in supporting the variable contracts issued by Sun Life (U.S.) and Sun Life (N.Y.), both of which are affiliates of Sun Capital. The Board also considered the entrepreneurial risk associated with launching new funds. |
| • | | Investment performance. Because the Funds had not yet commenced operations, no information relating to the Funds’ past performance could be considered by the Board. The Board did consider Sun Capital’s experience with overseeing the management of other funds, and each subadviser’s experience with, and performance record in, managing other similar funds and/or accounts. |
| • | | Nature, quality and extent of services. The Board considered, among other things, Sun Capital’s and each subadviser’s personnel (including in particular those personnel with responsibilities for providing services to the Funds), resources, policies and investment processes. The Board also considered Sun Capital’s representation that it was satisfied with the resources, compliance program and level of commitment expected to be put forth by each subadviser and its recommendation that each subadvisory agreement be approved. The Board also considered the terms of the investment advisory agreements, including the broader scope of services and expenses to be provided and assumed under the investment advisory agreements for SC PIMCO Total Return Fund and SC BlackRock Inflation Protected Bond Fund, as compared to typical investment advisory agreements. The Board concluded that the quality and range of services expected to be provided by Sun Capital and each subadviser should benefit each Fund and its Variable Contract Owners. |
225
OTHER INFORMATION (Unaudited) (Continued)
| • | | Brokerage practices. The Board considered the practices of Sun Capital and each subadviser regarding the selection and compensation of brokers and dealers executing portfolio transactions for the Funds, including the brokers’ and dealers’ provision of brokerage and research services to Sun Capital and each subadviser. The Board indicated that it would monitor the allocation of each Fund’s brokerage to ensure that the principle of “best price and execution” remains paramount in the portfolio trading process. |
| • | | Compliance. The Board considered Sun Capital’s and each subadviser’s commitment to and record of compliance, including its written compliance policies and procedures. In this regard, the Board considered Sun Capital’s continued commitment of attention and resources to compliance functions relevant to the Funds’ operations. |
After due consideration of these and other factors that it considered relevant, the Board determined to approve each Fund’s investment advisory agreements, and concluded that the approval of such agreements was in the best interest of each Fund and its Variable Contract Owners.
In reaching this conclusion, the Board did not give particular weight to any single factor noted above. The Board considered these factors over the course of multiple meetings, certain of which were held in executive session with only the Independent Trustees and their counsel present. It is possible that individual Trustees may have weighed these factors differently in reaching their individual decisions to approve the investment advisory agreements.
226
| | |
| OTHER INFORMATION (Unaudited) (Continued) | | |
| | | Sun Capital Advisers Trust |
Each fund’s business is managed by the trustees. Several of the funds’ trustees and officers are also directors and officers of Sun Life Assurance Company of Canada or the adviser. The table below provides more information about the funds’ trustees and officers.
| | | | | | | | | | |
| Name, address and age | | Position with the
Trust | | Length of Time Served | | Principal occupation
past 5 years | | Number of Funds
Within Fund Complex
Overseen by Trustee | | Other Directorships Held
Outside of the Fund
Complex by Trustee |
Michael P. Castellano c/o Sun Capital Advisers Trust One Sun Life Executive Park Wellesley Hills, MA 02481 Year of birth: 1941 | | Trustee | | Since
February 2005 | | Retired | | 20 | | None |
Dawn-Marie Driscoll c/o Sun Capital Advisers Trust One Sun Life Executive Park Wellesley Hills, MA 02481 Year of birth: 1946 | | Trustee | | Since June 2007 | | President, Driscoll Associates (consulting firm); Executive Fellow, Center for Business Ethics, Bentley College; Directorships: Advisory Board, Center for Business Ethics, Bentley College; Trustee, Southwest Florida Community Foundation (charitable organization); Former Directorships: Investment Company Institute; Former Memberships: Executive Committee of the Independent Directors Council of the Investment Company Institute. | | 20 | | Trustee, DWS Scudder Funds (New York) Board (134 mutual funds) since 1987. |
William N. Searcy, Jr. c/o Sun Capital Advisers Trust One Sun Life Executive Park Wellesley Hills, MA 02481 Year of birth: 1946 | | Chairman and Trustee | | Chairman since 2005 Trustee since October 1998 | | Private investor. Pension and savings trust officer, Sprint Corp. (wireless and wireline communications services) 1989-2003. | | 20 | | Trustee, DWS Scudder Funds (New York) Board (134 mutual funds) since 1993. |
James M.A. Anderson* 150 King Street Toronto, Ontario M5H IJ9 Year of birth: 1949 | | President, Chief Executive Officer and Trustee | | Trustee since October 1998 | | Executive Vice President and Chief Investment Officer, Sun Life Assurance Company of Canada since 2005. President, Chief Investment Officer and Manager, Sun Capital Advisers LLC, since 1998. Associated with Sun Life Financial since 1970. | | 20 | | Director, Sun Life of Canada (U.S.) SPE 97-I, Inc. since 2003, Director, Crosspointe Shops I LLC (real estate holding company) since 2004; Director, Crosspointe Shops II LLC (real estate holding company) since 2004. |
227
| | |
| OTHER INFORMATION (Unaudited) (Continued) | | |
| | | Sun Capital Advisers Trust |
| | | | | | | | | | |
| Name, address and age | | Position with the
Trust | | Length of Time Served | | Principal occupation
past 5 years | | Number of Funds
Within Fund Complex
Overseen by Trustee | | Other Directorships Held
Outside of the Fund
Complex by Trustee |
James F. Alban* One Sun Life Executive Park Wellesley Hills, MA 02481 Year of birth: 1962 | | Chief Financial Officer and Treasurer | | Since October 1998; Serves at the discretion of the Trustees. | | Managing Director and Chief Financial Officer, Sun Capital Advisers LLC, since 2000. Associated with Sun Life Financial since 1998. | | N/A | | N/A |
Joseph L. Ciardi* One Sun Life Executive Park Wellesley Hills, MA 02481 Year of birth: 1967 | | Chief Compliance Officer | | Since May 2006; Serves at the discretion of the Trustees. | | Chief Compliance Officer, Sun Capital Advisers LLC, since 2006. Deputy Chief Compliance Officer and Senior Vice President, Canaccord Adams Inc. (an independent financial services firm), 1996 - 2006 | | N/A | | N/A |
Maura A. Murphy, Esq.* One Sun Life Executive Park Wellesley Hills, MA 02481 Year of birth: 1960 | | Secretary | | Since October 1998; Serves at the discretion of the Trustees. | | Managing Director and General Counsel since 2000, and Secretary since 1998, Sun Capital Advisers LLC. Assistant Vice President and Senior Counsel, Sun Life Assurance Company of Canada (U.S.). Associated with Sun Life Financial since 1998. | | N/A | | N/A |
| * | An interested person of the Funds for purposes of Section 2(a)(19) of the 1940 Act. |
The Statement of Additional Information (SAI) includes additional information about the Funds’ trustees and is available, without charge, upon request by calling 1-800-432-1102 x3330.
228
Sun Capital Advisers Trust
TRUSTEES AND OFFICERS
Michael P. Castellano, Trustee
Dawn-Marie Driscoll, Trustee
William N. Searcy, Jr., Chairman, Trustee
James M.A. Anderson, President, CEO and Trustee
James F. Alban, Treasurer and CFO
Joseph L. Ciardi, Chief Compliance Officer
Maura A. Murphy, Secretary
INVESTMENT ADVISER
Sun Capital Advisers LLC
One Sun Life Executive Park
Wellesley Hills, MA 02481
INDEPENDENT REGISTERED PUBLIC ACCOUNTING FIRM
Deloitte & Touche LLP
200 Berkeley Street
Boston, MA 02116
ADMINISTRATOR, CUSTODIAN, TRANSFER AGENT
State Street Bank & Trust Company
1 Lincoln Street
Boston, MA 02111
LEGAL COUNSEL
Wilmer Cutler Pickering Hale and Dorr LLP
60 State Street
Boston, MA 02109
This report must be preceded or accompanied by a prospectus for Sun Capital Advisers Trust which includes more information about charges and expenses. Please read the prospectus carefully before you invest or send money.
Registrant has adopted a code of ethics that applies to registrant’s principal executive officer and principal financial officer. This code of ethics is available without charge, upon request, by calling 1-800-432-1102 x1562. A copy of this code of ethics is filed as an exhibit to this Form N-CSR. No substantive amendments were approved or waivers granted to this code of ethics during the period covered by this report.
| Item 3. | Audit Committee Financial Expert. |
The registrant’s Board of Trustees has determined that the registrant has at least one financial expert, Michael P. Castellano, serving on its Audit Committee. Mr. Castellano is considered “independent” for purposes of Item 3(a)(2) of Form N-CSR.
| Item 4. | Principal Accountant Fees and Services. |
Aggregate fees billed for professional services rendered to the registrant for the last two fiscal years by the registrant’s principal accountant were as follows:
(a) Audit Fees: Includes amounts related to the audit of the registrant’s annual financial statements and services normally provided by the accountant in connection with statutory and regulatory filings.
| | | |
FY 2008 | | FY 2007 |
$630,875 | | $ | 246,840 |
(b) Audit-related Fees:
| | | |
FY 2008 | | FY 2007 |
$21,775 | | $ | 21,000 |
(c) Tax Fees: Includes amounts related to tax compliance, tax planning and tax advice.
| | | |
FY 2008 | | FY 2007 |
$77,850 | | $ | 27,325 |
(d) All Other Fees: Includes amounts related to non-audit services provided to the registrant by the registrant’s principal accountant.
(e)(1) The registrant’s Audit Committee has adopted a policy whereby audit and non-audit services performed by the registrant’s principal accountant for the registrant, its investment adviser and any entity controlling, controlled by or under common control with the investment adviser that provides ongoing services to the registrant require pre-approval.
The policy includes a list of specified services that are deemed to be pre-approved, subject to stated dollar limits, by the Audit Committee. The Audit Committee must provide specific advance approval for any service that is not included in the list of pre-approved services, or for any pre-approved service that exceeds the dollar limit set forth in the policy. In determining whether to approve services, the Audit Committee considers whether the services are consistent with maintaining the principal accountant’s independence.
(e)(2) No services included in this Item 4 (b) through (d) were approved pursuant to paragraph (c)(7)(i)(C) of Rule 2-01 of Regulation S-X.
(f) Not applicable
(g) During the registrant’s fiscal years ended December 31, 2008 and December 31, 2007, there were no fees billed by the registrant’s principal accountant for non-audit services rendered to the registrant, the registrant’s investment adviser, or to any entity controlling, controlled by, or under common control with the adviser that provides ongoing services to the registrant.
(h) Not applicable
| Item 5. | Audit Committee of Listed Registrants. |
Not applicable
| Item 6. | Schedule of Investments. |
Included in stockholder report filed under Item 1.
| Item 7. | Disclosure of Proxy Voting Policies and Procedures for Closed-End Management Investment Companies. |
Not applicable
| Item 8. | Portfolio Managers of Closed-End Management Investment Companies. |
Not Applicable
| Item 9. | Purchases of Equity Securities by Closed-End Management Investment Company and Affiliated Purchasers. |
Not Applicable
| Item 10. | Submission of Matters to a Vote of Security Holders. |
No material changes to the procedures by which shareholders may recommend nominees to the registrant’s Board of Trustees have been implemented since the registrant’s most recent disclosure to this Item.
| Item 11. | Controls and Procedures. |
| (a) | Based upon their evaluation of the registrant’s disclosure controls and procedures as conducted within 90 days of the filing date of this Form N-CSR, the registrant’s principal financial officer and principal executive officer have concluded that those disclosure controls and procedures provide reasonable assurance that the material information required to be disclosed by the registrant on this report is recorded, processed, summarized and reported within the time periods specified in the Securities and Exchange Commission’s rules and forms. |
| (b) | There have been no significant changes in the registrant’s internal control over financial reporting during the registrant’s second fiscal quarter of the period covered by this report that has materially affected, or is reasonably likely to materially affect, the registrant’s internal control over financial reporting. |
| (a) (1) | The code of ethics as required by Form N-CSR Item 2 is filed herewith. |
| (a) (2) | A separate certification for each principal executive officer and principal financial officer of the registrant as required by Rule 30a-2(a) under the Investment Company Act of 1940, as amended, are filed herewith. |
| (a) (3) | A combined certification by the principal executive and principal financial officers of the registrant as required by Rule 30a-2(b), under the Investment Company Act of 1940, as amended, is filed herewith. |
SIGNATURES
Pursuant to the requirements of the Securities Exchange Act of 1934 and the Investment Company Act of 1940, the registrant has duly caused this report to be signed on its behalf by the undersigned, thereunto duly authorized.
| | | | | | | | |
| (Registrant) | | | | SUN CAPITAL ADVISERS TRUST |
| | |
| By (Signature and Title)* | | | | /s/ JAMES M.A. ANDERSON |
| | | | | | James M.A. Anderson, President |
Date: February 24, 2009
Pursuant to the requirements of the Securities Exchange Act of 1934 and the Investment Company Act of 1940, this report has been signed below by the following persons on behalf of the registrant and in the capacities and on the dates indicated.
| | | | | | | | |
| | |
| By (Signature and Title)* | | | | /s/ JAMES M.A. ANDERSON |
| | | | | | James M.A. Anderson, President |
| | | | | | (Chief Executive Officer) |
Date: February 24, 2009
| | | | | | | | |
| | | | |
| | |
| By (Signature and Title)* | | | | /s/ JAMES F. ALBAN |
| | | | | | James F. Alban, Treasurer |
| | | | | | (Chief Financial Officer) |
Date: February 24, 2009
| * | Print name and title of each signing officer under his or her signature. |