UNITED STATES
SECURITIES AND EXCHANGE COMMISSION
Washington, D.C. 20549
FORM N-CSR
CERTIFIED SHAREHOLDER REPORT OF REGISTERED
MANAGEMENT INVESTMENT COMPANIES
Investment Company Act file number 811-08879
SUN CAPITAL ADVISERS TRUST
(Exact name of registrant as specified in charter)
| | |
One Sun Life Executive Park, Wellesley Hills, Massachusetts 02481 |
| (Address of principal executive offices) (Zip code) |
James M.A. Anderson
Sun Capital Advisers Trust
One Sun Life Executive Park
Wellesley Hills, Massachusetts 02481
(Name and address of agent for service)
Registrant’s telephone number, including area code: (781) 237-6030
Date of fiscal year end: December 31
Date of reporting period: December 31, 2006
Item 1. Reports to Stockholders.
The following is a copy of the report transmitted to stockholders pursuant to Rule 30e-1 under the Investment Company Act of 1940, as amended:
SUN CAPITAL ADVISERS TRUST®
Annual Report December 31, 2006
Sun Capital® All Cap Fund
Sun Capital Investment Grade Bond Fund®
Sun Capital Money Market Fund®
Sun Capital Real Estate Fund®
SCSM Davis Venture Value Fund
SCSM Oppenheimer Main Street Small Cap Fund
SCSM FI Large Cap Growth Fund
SCSM Blue Chip Mid Cap Fund
| | |
 | | Sun Capital Advisers Trust is a mutual fund registered with the Securities and Exchange Commission under the Investment Company Act of 1940. Its investment adviser is Sun Capital Advisers LLC®, a member of the Sun Life Financial group of companies. |
MANAGEMENT’S DISCUSSION & ANALYSIS
ALL CAP FUND
Throughout 2006, the Fund continued to be weighted towards economically sensitive stocks, a strategy we have kept in place since 2003. We have maintained a bias towards large capitalization stocks, ending the quarter with a roughly 76% weighting in large caps, 14% in mid caps, and 10% in small caps. During the fourth quarter the large cap weighting decreased approximately 700 basis points while the mid cap and small cap weightings increased by 600 basis points and 100 basis points, respectively. The weighting changes between large, mid, and small cap holdings was due to better valuation opportunities found in the mid cap and small cap sectors.
During the fourth quarter, we continued to manage the portfolio to take advantage of opportunities in various sectors. Weightings increased in Industrials and Technology, and decreased in Consumer Staples, Healthcare, and Telecommunications. The Fund ended the year with an overweight in Technology, Industrials, Materials, and Health Care and an underweight in Consumer Discretion, Consumer Staples, Energy, Financials, Telecommunications and Utilities.
Overall, the All Cap Fund has maintained a diversified portfolio roughly aligned with S&P 500 Index sector weightings. Specifically, valuation metrics as of December 31 show the portfolio trading at 1.63 times sales vs. 2.00 times for the S&P 500 index, a price to book of 1.8 vs. 2.8, and a price to cash flow of 12.3 vs. 11.3, respectively. The portfolio’s dividend yield was 1.7% versus 1.7% for the S&P 500 Index, and debt to capitalization ratio was 35% vs. 32% for the S&P 500 Index.
1
ALL CAP FUND
| | |
TOP TEN EQUITY HOLDINGS At December 31, 2006 | | INDUSTRY WEIGHTINGS At December 31, 2006 |
| | | |
| | | % of Net Assets | |
General Electric Co. | | 4.2 | % |
MRV Communications, Inc. | | 3.7 | |
Ciena Corp. | | 3.2 | |
Verizon Communications, Inc. | | 3.0 | |
Exxon Mobil Corp. | | 2.9 | |
Redback Networks, Inc. | | 2.7 | |
Finisar Corp. | | 2.6 | |
Omnicare, Inc. | | 2.4 | |
Citigroup, Inc. | | 2.3 | |
JPMorgan Chase & Co. | | 2.1 | |
| | | |
| | | % of Net Assets | |
Communications Equipment | | 13.5 | % |
Oil, Gas & Consumable Fuels | | 7.3 | |
Diversified Financial Services | | 6.4 | |
Pharmaceuticals | | 6.1 | |
Industrial Conglomerates | | 5.8 | |
Software | | 4.2 | |
Health Care Provider & Services | | 4.1 | |
Media | | 4.1 | |
Insurance | | 3.8 | |
Aerospace & Defense | | 3.7 | |
Computer & Peripherals | | 3.7 | |
Commercial Banks | | 3.2 | |
Diversified Telecommunication Services | | 3.0 | |
Beverages | | 2.7 | |
Capital Markets | | 2.6 | |
Leisure Equipment & Products | | 2.2 | |
Electric Utilities | | 1.7 | |
Hotels Restaurants & Leisure | | 1.5 | |
Consumer Finance | | 1.3 | |
Food & Staples Retailing | | 1.3 | |
Tobacco | | 1.2 | |
Short Term Investments | | 1.1 | |
Chemicals | | 1.0 | |
Health Care Equipment & Supplies | | 1.0 | |
Health Care Technology | | 1.0 | |
Household Products | | 1.0 | |
Biotechnology | | 0.9 | |
Electrical Equipment | | 0.9 | |
Internet Software & Services | | 0.9 | |
Metals & Mining | | 0.9 | |
Multiline Retail | | 0.9 | |
REITS | | 0.9 | |
Semiconductors & Semiconductor Equipment | | 0.9 | |
Specialty Retail | | 0.9 | |
Thrift & Mortgage Finance | | 0.9 | |
Air Freight & Logistics | | 0.8 | |
Multi-Utilities | | 0.8 | |
Paper & Forest Products | | 0.8 | |
Machinery | | 0.5 | |
Personal Products | | 0.4 | |
Other assets less liabilities | | 0.1 | |
| | | |
| | 100.0 | % |
| | | |
2
ALL CAP FUND
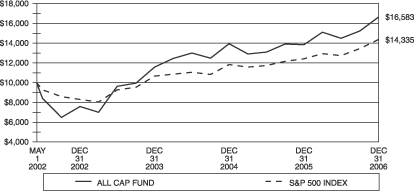
Comparison of Change in Value of a $10,000 Investment in the All Cap Fund – Initial Class and the S&P 500 Index
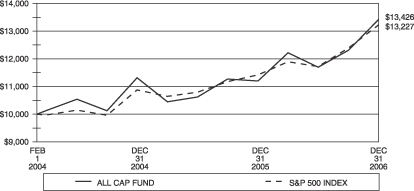
Comparison of Change in Value of a $10,000 Investment in the All Cap Fund – Service Class and the S&P 500 Index
3
ALL CAP FUND
Total Returns for Periods Ended December 31, 2006**
| | | | | | | | | | | |
Initial Class Shares | | One Year | | | Three Years | | | Five Years | | Life of
Fund*** | |
All Cap Fund | | 20.07 | % | | 12.80 | % | | N/A | | 11.44 | % |
S&P 500 Index* | | 15.79 | % | | 10.45 | % | | N/A | | 8.02 | % |
Service Class Shares | | | | | | | | | | | |
All Cap Fund | | 19.78 | % | | N/A | | | N/A | | 10.64 | % |
S&P 500 Index* | | 15.79 | % | | N/A | | | N/A | | 10.06 | % |
*The performance data of the index has been prepared from sources and data that the investment adviser believes to be reliable, but no representation is made as to their accuracy. The index is unmanaged and has no fees or costs. The Standard & Poor’s 500 Index is a market-value weighted index of 500 blue chip stocks and is considered to be a benchmark of the overall stock market.
**Performance data is historical and includes changes in share price and reinvestment of income dividends and capital gains distributions. Past performance does not indicate future results. Performance numbers are net of all operating expenses, but do not include any insurance charges imposed in connection with your variable insurance contract. In addition, the investment adviser reduced its management fee and certain other expenses during this period. If this performance information included the effect of the insurance charges and the fees and expenses assumed by the investment adviser, performance numbers would be lower. The value of an investment in the All Cap Fund and the return on the investment will fluctuate and redemption proceeds may be higher or lower than an investor’s original cost. Returns greater than one year are annualized.
***Initial Class Shares for the period from May 1, 2002 (commencement of operations) to December 31, 2006. Service Class Shares for the period from February 1, 2004 (commencement of operations) to December 31, 2006.
4
MANAGEMENT’S DISCUSSION & ANALYSIS
INVESTMENT GRADE BOND FUND
Performance for 2006 was positively impacted by an overweight to the credit sector, particularly below investment grade and BBB rated securities as market participants embraced higher yielding instruments. The Fund’s duration, which was generally short that of the Index, positively affected results.
Mortgage-backed securities (MBS) comprised 33.9% of the portfolio at December 31, 2006, while 41.3% of fund assets were allocated to the credit sector. The portfolio retained 8.4% commercial mortgages-backed securities (CMBS), 6.2% US Treasuries, almost 4.4% US Agencies and 1.3% asset-backed securities (ABS).
After 17 straight 25 basis point (bp) increases which raised the overnight lending rate from 1%, the Federal Reserve left the overnight lending rate unchanged at the last four meetings of the Federal Open Market Committee (FOMC) in 2006. During 2006, the Fed Funds rate increased from 4.50%, to its current 5.25%. During 2006, the 10-year US Treasury increased by 34bp to 4.70%, while the 2-year jumped by 48bp to 4.81%. A Treasury curve inversion persisted at year-end 2006 as the Federal Funds rate was 55bp higher than the 10-year US Treasury.
With 3rd quarter GDP being reported as 2%, the economy has slowed from its Q1 2006 and Q2 2006 growth rates of 5.6% and 2.6%, respectively. The slowdown in the housing sector, and to a lesser extent manufacturing, especially autos, were the primary drivers behind the anemic Q3 2006 growth figure. Despite the housing slowdown, to date, other sectors of the economy have not been as affected as once feared, specifically the consumer. With the employment picture remaining solid and energy prices having receded from their highs, data related to consumer spending has remained acceptable, dispelling the notion that declining home prices would remove a feeling of wealth and subsequently the penchant to spend. In addition, recent consumer confidence readings have also surprised on the upside, perhaps as a result of the recent strong performance of the equity markets.
While inflation levels remain elevated according to the Fed, expectations are for a “moderation over time”. The housing market is, according to a Fed release, undergoing a “substantial cooling”. However, spillover affects from housing have not been felt in other areas of the economy as the consumer remains vibrant according to recent measures. The manufacturing sector has also slowed from a relatively vibrant pace but appears to be on solid footing. In addition, manufacturing is continuing to become less relevant to the services-led economy on the United States. The Fed believes that the economy is “likely to expand at a moderate pace”.
Spread sectors continue to offer upside opportunity when compared to US Treasuries. The credit sector benefits from very strong supply/demand technicals, including heavy foreign buying. At the end of 1995, insurance companies held approximately 34% of the outstanding corporate securities while foreign buyers owned about 16%. Currently, insurance companies own about 25%, while foreign entities report owning 28%. Notwithstanding a weaker US Dollar, it is not expected that foreign buyers curtail their buying of US corporate credit. While shareholding enhancing activities remain a concern, especially LBOs, many new corporate bonds contain provisions that allow the bondholder the right to sell or “put” the bond back to the issuer at par or higher should an LBO occur. Away from LBOs, company credit fundamentals appear very solid after years of repair. Some minor deterioration is to be expected. Defaults, which may move up from historically low levels should continue to remain well below long term norms. MBS and CMBS securities retain attractive risk adjusted valuations and will continue to be a focus. Portfolio duration, given our interest rate outlook, will remain matched to slightly long the benchmark duration.
5
INVESTMENT GRADE BOND FUND
| | |
TOP TEN BOND ISSUERS At December 31, 2006 | | PORTFOLIO COMPOSITION At December 31, 2006 |
| | | |
| | | % of Net Assets | |
Federal National Mortgage Association | | 25.6 | % |
Federal Home Loan Mortgage | | 11.2 | |
U.S. Treasury Notes | | 6.4 | |
Government National Mortgage Association | | 2.2 | |
Commercial Net Lease Realty | | 2.1 | |
Ford Motor Credit Co. | | 1.8 | |
GMAC Commercial Mortgage Securities, Inc. | | 1.8 | |
Allegheny Energy Supply Co. LLC | | 1.5 | |
Capital One Capital III | | 1.5 | |
Peco Energy Transition Trust | | 1.4 | |
| | | |
| | | % of Net Assets | |
U.S. Government Agency Obligations | | 45.7 | % |
Corporate Debt Obligations | | 42.5 | |
Commercial Mortgage Backed Securities | | 8.7 | |
Short Term Investments | | 4.5 | |
Asset Backed Securities | | 1.4 | |
Liabilities in excess of other assets | | (2.8 | ) |
| | | |
| | 100.0 | % |
| | | |
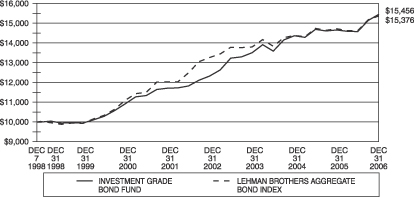
Comparison of Change in Value of a $10,000 Investment in the Investment Grade Bond Fund – Initial Class and the Lehman Brothers Aggregate Bond Index
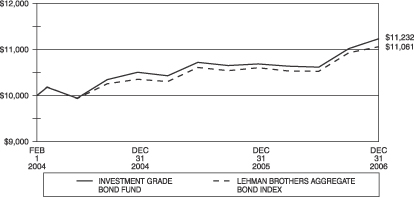
Comparison of Change in Value of a $10,000 Investment in the Investment Grade Bond Fund – Service Class and the Lehman Brothers Aggregate Bond Index
6
INVESTMENT GRADE BOND FUND
Total Returns for Periods Ended December 31, 2006**
| | | | | | | | | | | | |
Initial Class Shares | | One Year | | | Three Years | | | Five Years | | | Life of Fund*** | |
Investment Grade Bond Fund | | 5.39 | % | | 4.57 | % | | 5.70 | % | | 5.54 | % |
Lehman Brothers Aggregate Bond Index* | | 4.33 | % | | 3.70 | % | | 5.06 | % | | 5.47 | % |
Service Class Shares | | | | | | | | | | | | |
Investment Grade Bond Fund | | 5.13 | % | | N/A | | | N/A | | | 4.07 | % |
Lehman Brothers Aggregate Bond Index* | | 4.33 | % | | N/A | | | N/A | | | 3.52 | % |
*The performance data of the index has been prepared from sources and data that the investment adviser believes to be reliable, but no representation is made as to their accuracy. The index is unmanaged and has no fees or costs. The Lehman Brothers Aggregate Bond Index is composed of securities from the Lehman Brothers Government/Credit Index, the Mortgage-Backed Securities Index and the Asset-Backed Securities Index.
**Performance data is historical and includes changes in share price and reinvestment of income dividends and capital gains distributions. Past performance does not indicate future results. Performance numbers are net of all operating expenses, but do not include any insurance charges imposed in connection with your variable insurance contract. In addition, the investment adviser reduced its management fee during this period. If this performance information included the effect of the insurance charges and the fees and expenses assumed by the investment adviser, performance numbers would be lower. The value of an investment in the Investment Grade Bond Fund and the return on the investment will fluctuate and redemption proceeds may be higher or lower than an investor’s original cost. Returns greater than one year are annualized.
***Initial Class Shares for the period from December 7, 1998 (commencement of operations) to December 31, 2006. Service Class Shares for the period from February 1, 2004 (commencement of operations) to December 31, 2006.
7
MANAGEMENT’S DISCUSSION & ANALYSIS
MONEY MARKET FUND
At December 31, 2006, the Fund had net assets of $121.4 million, compared to $110.9 million a year earlier. The Fund had a seven-day yield of 4.75% and an average maturity of 40 days. The portfolio was primarily invested in highly rated commercial paper.
The Federal Open Market Committee (FOMC) of the Federal Reserve Board started the year with the Federal Funds rate at 4.25%. The Fed increased rates at its first four meetings by 25 basis points at each meeting before pausing in June at 5.25%, where it ended the year.
The minutes of the FOMC December 12th meeting were released on January 3rd of 2007. The minutes indicated that the Governors believe the biggest risk to the economy continues to be the current elevated level of inflation. However, the lower energy costs, effects of prior interest rate increases and a cooling housing market will continue to impede further inflationary pressures. Policy change will be dependent on the strength of economic growth versus inflation in the upcoming months.
Three-month Treasury bills started the year at the low of 4.08%. Rates began to increase with the four consecutive rate hikes and Treasury bills reached their high on July 25, 2006 at 5.13% and ended the year at 5.01%. The spread on 90-day commercial paper over Treasury bills fluctuated between 16 and 57 basis points during the year.
With the FOMC most likely on hold for at least the first quarter of 2007, it is our current strategy to maintain an average maturity that reflects a neutral Fed. We will continue to invest in a diversified portfolio of high quality instruments.
| | |
TOP TEN ISSUERS At December 31, 2006 | | PORTFOLIO COMPOSITION At December 31, 2006 |
| | | |
| | | % of Net Assets | |
FCAR Owner Trust | | 4.2 | % |
Canada (Govt of) | | 4.1 | |
Merrill Lynch & Co., Inc. | | 4.1 | |
Societe Generale North America | | 4.1 | |
International Business Machines Corp. (IBM) | | 4.1 | |
Province of British Columbia | | 4.1 | |
AT&T, Inc. | | 4.0 | |
Barclays U.S. Funding | | 4.0 | |
Harley Davidson | | 4.0 | |
Morgan Stanley Dean Witter | | 4.0 | |
| | | |
| | | % of Net Assets | |
Commercial Paper | | 97.6 | % |
Mutual Funds | | 2.3 | |
Other assets less liabilities | | 0.1 | |
| | | |
| | 100.0 | % |
| | | |
8
MONEY MARKET FUND
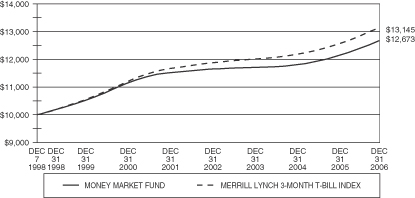
Comparison of Change in Value of a $10,000 Investment in the Money Market Fund –Initial Class and the Merrill Lynch 3-Month U.S. Treasury Bill Index
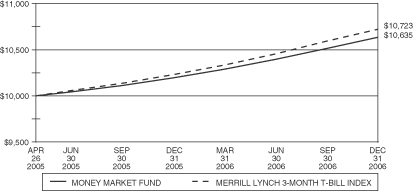
Comparison of Change in Value of a $10,000 Investment in the Money Market Fund –Service Class and the Merrill Lynch 3-Month U.S. Treasury Bill Index
9
MONEY MARKET FUND
Total Returns for Periods Ended December 31, 2006**
| | | | | | | | | | | | |
Initial Class Shares | | One Year | | | Three Years | | | Five Years | | | Life of
Fund*** | |
Money Market Fund | | 4.59 | % | | 2.68 | % | | 1.94 | % | | 2.98 | % |
Merrill Lynch 3-month U.S. Treasury Bill Index* | | 4.82 | % | | 3.06 | % | | 2.42 | % | | 3.44 | % |
Service Class Shares | | | | | | | | | | | | |
Money Market Fund | | 4.33 | % | | N/A | | | N/A | | | 3.71 | % |
Merrill Lynch 3-month U.S. Treasury Bill Index* | | 4.82 | % | | N/A | | | N/A | | | 4.23 | % |
*The performance data of the index has been prepared from sources and data that the investment adviser believes to be reliable, but no representation is made as to their accuracy. The index is unmanaged and has no fees or costs. The Merrill Lynch three-month U.S. Treasury Bill Index is a one-security index which at the beginning of every month selects for inclusion the U.S. Treasury Bill maturing closest to, but not beyond 91 days from that date. That issue is then held for one month, sold and rolled into the new U.S. Treasury Bill.
**Performance data is historical and includes changes in share price and reinvestment of income dividends and capital gains distributions. Past performance does not indicate future results. Performance numbers are net of all operating expenses, but do not include any insurance charges imposed in connection with your variable insurance contract. In addition, the investment adviser reduced its management fee during this period. If this performance information included the effect of the insurance charges and the fees and expenses assumed by the investment adviser, performance numbers would be lower. The value of an investment in the Money Market Fund and the return on the investment will fluctuate and redemption proceeds may be higher or lower than an investor’s original cost. Returns greater than one year are annualized.
***Initial Class Shares for the period from December 7, 1998 (commencement of operations) to December 31, 2006. Service Class Shares for the period from April 25, 2005 (commencement of operations) to December 31, 2006.
10
MANAGEMENT’S DISCUSSION & ANALYSIS
REAL ESTATE FUND
The best performing stocks in the portfolio during the last twelve months were SL Green Reality Corp., Medical Properties Trust, Inc., Equity Office Properties Trust, AvalonBay Communities, Inc., and Vornado Realty Trust. The worst performing stocks during the last twelve months were Pennsylvania Real Estate Investment, New York Community Bancorp, Inc., Alexandria Real Estate Equities, Inc., CapitalSource, Inc. and Eastgroup Properties, Inc.
For the last twelve months, the MSCI US REIT Index was up 35.92%, outperforming the Dow Jones Industrial Average, the S&P 500 Index, and the NASDAQ Composite Index which were up 19.03%, 15.79%, and 10.38%, respectively.
Real estate fundamentals are very good at the moment, and there is no indication that fundamentals will take a turn for the worse. Therefore, with earnings at or near their peak for many of the REIT property types, it seems odd that valuation multiples are also at peak levels. In other words, after outperforming every major market index each year for the past seven years, and with fundamentals as good as they have ever been, investors are expecting the good times continue. If that were not the case, valuation multiples would be below average, indicating that earnings were decelerating, or even going down.
The nature of real estate ownership dictates that fundamentals rarely break down overnight due to the presence of leases. Therefore, dedicated real estate investors have the luxury (or burden) of being able to monitor trends like job growth, interest rates, and development starts, that often can signal a reversal of fortunes. For the time being all indications are that nothing is changing, other than some scattered reports of new developments appearing on the drawing board. The large amount of acquisitions and go-private transactions in the REIT universe in 2006 eliminated a number of viable investment alternatives in the lodging, apartment, retail, and office sectors, but also created opportunities for some not widely held U.S. REITs and international REITs to expand their equity market capitalizations. If the strong performance in fourth quarter of 2006 was any indication, health care REITs could be one of the property types that is gaining investor acceptance. The Fund is currently meaningfully underweight residential, and has built a large weighting in health care REITs, which are within the specialty property type of the benchmark.
The average dividend yield for the MSCI U.S. REIT Index was 3.6% at the end of the 4th quarter 2006. The Fund finished the quarter with an average dividend yield of 3.9%. The average equity market capitalization for the Fund was $8.34 billion, compared to $3.65 billion for the MSCI U.S.REIT Index.
| | |
TOP TEN REIT HOLDINGS At December 31, 2006 | | SECTOR WEIGHTINGS At December 31, 2006 |
| | | |
| | | % of Net Assets | |
Simon Property Group, Inc. | | 4.6 | % |
Ventas, Inc. | | 4.6 | |
SL Green Reality Corp. | | 4.4 | |
Macerich Co. | | 4.2 | |
Medical Properties Trust, Inc. | | 4.0 | |
Equity Office Properties Trust | | 4.0 | |
Archstone-Smith Trust | | 4.0 | |
BRE Properties, Inc. | | 3.8 | |
Highwoods Properties, Inc. | | 3.5 | |
Alexandria Real Estate Equities, Inc. | | 3.5 | |
| | | |
| | | % of Net Assets | |
Office | | 15.5 | % |
Regional Malls | | 14.0 | |
Apartments | | 13.2 | |
Health Care Equipment & Services | | 10.6 | |
Diversified | | 10.2 | |
Shopping Centers | | 9.3 | |
Hotel & Restaurants | | 6.8 | |
Warehouse & Industrial | | 5.8 | |
Banks | | 3.2 | |
Financial Services | | 3.0 | |
Storage | | 2.8 | |
Short-Term Investments | | 2.7 | |
Mortgage | | 2.7 | |
Other assets less liabilities | | 0.2 | |
| | | |
| | 100.0 | % |
| | | |
11
REAL ESTATE FUND
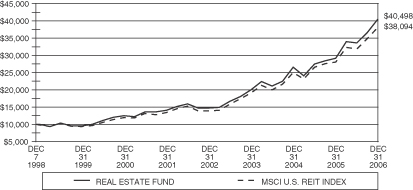
Comparison of Change in Value of a $10,000 Investment in the Real Estate Fund – Initial Class and the MSCI U. S. REIT Index
Comparison of Change in Value of a $10,000 Investment in the Real Estate Fund –Service Class and the MSCI U. S. REIT Index

12
REAL ESTATE FUND
Total Returns for Periods Ended December 31, 2006**
| | | | | | | | | | | | |
Initial Class Shares | | One Year | | | Three Years | | | Five Years | | | Life of
Fund*** | |
Real Estate Fund | | 38.96 | % | | 26.66 | % | | 23.51 | % | | 18.93 | % |
MSCI US REIT Index* | | 35.92 | % | | 26.08 | % | | 23.22 | % | | 18.01 | % |
Service Class Shares | | | | | | | | | | | | |
Real Estate Fund | | 38.64 | % | | N/A | | | N/A | | | 25.45 | % |
MSCI US REIT Index* | | 35.92 | % | | N/A | | | N/A | | | 25.06 | % |
*The performance data of the index has been prepared from sources and data that the investment adviser believes to be reliable, but no representation is made as to their accuracy. The index is unmanaged and has no fees. The MSCI U.S. REIT Index is a total-return index composed of the most actively traded real estate investment trusts and is designed to be a measure of real estate equity performance.
**Performance data is historical and includes changes in share price and reinvestment of income dividends and capital gains distributions. Past performance does not indicate future results. Performance numbers are net of all operating expenses, but do not include any insurance charges imposed in connection with your variable insurance contract. In addition, the investment adviser reduced its management fee during this period. If this performance information included the effect of the insurance charges and the fees and expenses assumed by the investment adviser, performance numbers would be lower. The value of an investment in the Real Estate Fund and the return on the investment will fluctuate and redemption proceeds may be higher or lower than an investor’s original cost. Returns greater than one year are annualized.
***Initial Class Shares for the period from December 7, 1998 (commencement of operations) to December 31, 2006. Service Class Shares for the period from February 1, 2004 (commencement of operations) to December 31, 2006.
13
MANAGEMENT’S DISCUSSION & ANALYSIS
DAVIS VENTURE VALUE FUND (subadvised by Davis Advisors)
During the twelve-month period ended December 31, 2006, the stock market, as measured by the Standard & Poor’s 500 Index, increased by 15.79%. U.S. economic activity, as measured by the gross domestic product (“GDP”), increased by 1.8% in the last calendar quarter of 2005 and between 2.2% and 5.6% over each of the first three calendar quarters of 2006. Interest rates, as measured by the 10-year Treasury bond, began 2006 a little above 4.4%, peaked in June at about 5.1%, and ended the year just below 4.6%.
Consumer discretionary companies were the most important contributors to the Fund’s performance over the twelve-month period. The Fund benefited from careful stock selection in this sector as the Fund’s consumer discretionary companies out-performed consumer discretionary companies included in the Index. Comcast and Harley-Davidson were among the top contributors to performance. Apollo Group (purchased in March 2006) and H&R Block were among the top detractors from performance.
Diversified financial and consumer staple companies also made important contributions to performance. Two diversified financial companies, JPMorgan Chase and American Express, and one consumer staples company, Altria, were among the top contributors to performance. One consumer staples company, Hershey Foods, was among the top detractors from performance.
The Fund’s largest investment was in insurance companies. While insurance companies made a positive contribution to performance, they under-performed the Index. Berkshire Hathaway and Loews were among the top contributors to performance. Progressive and Transatlantic Holdings were among the top detractors from performance.
The Fund’s investments in telecommunication service and energy companies also contributed to the Fund under-performing the Index over the twelve-month period. Telecommunication service companies were the strongest performing sector of the Index, but the telecommunication service companies owned by the Fund did not perform as well. While energy companies made positive contributions to the Fund’s performance, they also under-performed the Index. One energy company, ConocoPhillips, was among the top contributors to performance. One telecommunications company, Sprint Nextel (purchased in March 2006), and one energy company, EOG Resources, were among the top detractors from performance.
The Fund had approximately 6% of its assets invested in foreign companies at December 31, 2006. As a group, the foreign companies owned by the Fund out-performed the S&P 500 Index over the twelve-month period. Consistent with our low-turnover strategy, only two companies dropped out of the Fund’s top 13 holdings, Progressive and Golden West Financial. Progressive remains among the Fund’s top 20 holdings at year-end and Golden West Financial was acquired by Wachovia. Two new additions to the Fund’s top 13 holdings at year-end were Wachovia (which the Fund received when Wachovia acquired Golden West Financial) and Citigroup (which had already been a top 20 holding).
14
DAVIS VENTURE VALUE FUND
| | |
TOP TEN EQUITY HOLDINGS At December 31, 2006 | | INDUSTRY WEIGHTINGS At December 31, 2006 |
| | | |
| | | % of Net Assets | |
ConocoPhillips | | 4.6 | % |
American Express Co | | 4.6 | |
American International Group, Inc. | | 4.5 | |
Altria Group, Inc | | 4.5 | |
Tyco International, Ltd. | | 4.3 | |
JPMorgan Chase & Co | | 4.2 | |
Costco Wholesale Corp. | | 3.6 | |
Comcast Corp. Class A Special | | 3.5 | |
Berkshire Hathaway, Inc. Class A | | 3.4 | |
HSBC Holdings PLC | | 2.7 | |
| | | |
| | | % of Net Assets | |
Insurance | | 14.4 | % |
Oil, Gas & Consumable Fuels | | 11.3 | |
Commercial Banks | | 8.2 | |
Diversified Financial Services | | 7.8 | |
Media | | 7.2 | |
Food & Staples Retailing | | 5.5 | |
Consumer Finance | | 4.6 | |
Tobacco | | 4.5 | |
Industrial Conglomerates | | 4.3 | |
Health Care Providers & Services | | 3.7 | |
Capital Markets | | 2.5 | |
Containers & Packaging | | 2.2 | |
Software | | 2.2 | |
Beverages | | 2.0 | |
Automobiles | | 1.9 | |
Wireless Telecommunication Services | | 1.6 | |
Construction Materials | | 1.5 | |
Commercial Services & Supplies | | 1.3 | |
Computers & Peripherals | | 1.3 | |
Diversified Consumer Services | | 1.3 | |
IT Services | | 1.3 | |
Internet & Catalog Retail | | 1.3 | |
Specialty Retail | | 1.3 | |
Household Products | | 1.1 | |
Short Term Investments | | 1.1 | |
Transportation Infrastructure | | 1.0 | |
Energy Equipment & Services | | 0.8 | |
Food Products | | 0.6 | |
Air Freight & Logistics | | 0.5 | |
Marine | | 0.4 | |
Metals & Mining | | 0.4 | |
Personal Products | | 0.4 | |
Communications Equipment | | 0.2 | |
Household Durables | | 0.2 | |
Multiline Retail | | 0.2 | |
Liabilities in excess of other assets | | (0.1 | ) |
| | | |
| | 100.0 | % |
| | | |
15
DAVIS VENTURE VALUE FUND
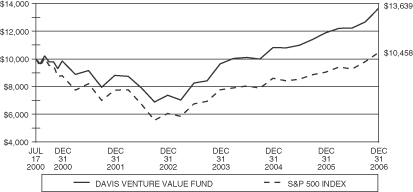
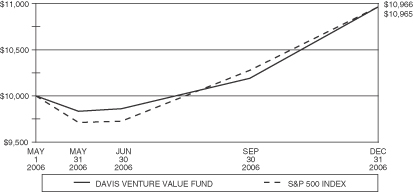
Comparison of Change in Value of a $10,000 Investment in the Davis Venture Value Fund – Initial Class and the S&P 500 Index
Comparison of Change in Value of a $10,000 Investment in the Davis Venture Value Fund – Service Class and the S&P 500 Index
16
DAVIS VENTURE VALUE FUND
Total Returns for Periods Ended December 31, 2006**
| | | | | | | | | | | | |
Initial Class Shares | | One Year | | | Three Years | | | Five Years | | | Life of
Fund*** | |
Davis Venture Value Fund | | 14.77 | % | | 12.30 | % | | 9.13 | % | | 4.92 | % |
S&P 500 Index* | | 15.79 | % | | 10.45 | % | | 6.19 | % | | 0.69 | % |
Service Class Shares | | | | | | | | | | | | |
Davis Venture Value Fund | | N/A | | | N/A | | | N/A | | | 9.66 | % |
S&P 500 Index* | | N/A | | | N/A | | | N/A | | | 9.65 | % |
*The performance data of the index has been prepared from sources and data that the investment adviser believes to be reliable, but no representation is made as to their accuracy. The index is unmanaged and has no fees or costs. The Standard & Poor’s 500 Index is a market-value weighted index of 500 blue chip stocks and is considered to be a benchmark of the overall stock market.
**Performance data is historical and includes changes in share price and reinvestment of income dividends and capital gains distributions. Past performance does not indicate future results. Performance numbers are net of all operating expenses, but do not include any insurance charges imposed in connection with your variable insurance contract. In addition, the investment adviser reduced its management fee and certain other expenses during this period. If this performance information included the effect of the insurance charges and the fees and expenses assumed by the investment adviser, performance numbers would be lower. The value of an investment in the Davis Venture Value Fund and the return on the investment will fluctuate and redemption proceeds may be higher or lower than an investor’s original cost. Returns greater than one year are annualized.
***Initial Class Shares for the period from July 17, 2000 (commencement of operations) to December 31, 2006. Service Class Shares for the period from May 1, 2006 (commencement of operations) to December 31, 2006.
17
MANAGEMENT’S DISCUSSION & ANALYSIS
OPPENHEIMER MAIN STREET SMALL CAP FUND (subadvised by OppenheimerFunds, Inc.)
OppenheimerFunds began subadvising the Fund on January 9, 2006, since which time through December 31, 2006 the Fund produced lower returns than its benchmark, the Russell 2000 Index. We attribute the Fund’s performance primarily to its underweighted position in real estate investment trusts, which fared relatively well during the reporting period, and its comparatively heavy exposure to mid-cap stocks, which generally lagged other capitalization ranges in 2006.
Although our investment approach relies on the results of our multi-factor quantitative models, and not our subjective view of economic events, it is worth noting that economic conditions changed significantly during 2006. While the first half of the year was characterized by rising interest rates and robust economic growth, the July through December period saw stable short-term interest rates and the onset of an economic slowdown. In fact, after more than two years of steady increases that drove the overnight federal funds rate from 1% to 5.25% by the end of June 2006, the Federal Reserve Board refrained from further rate hikes during the remainder of the reporting period. The pause in the Fed’s tightening campaign apparently was a response to cooling housing markets, less robust employment gains and other signs that the U.S. economy is moving to a slower, more mature phase of its cycle. Yet, the rate of inflation has remained above the Fed’s stated “comfort zone,” despite a sharp decline in energy prices in the final four months of the year.
With their economic and inflation outlooks more uncertain, investors began to turn away from smaller, economically sensitive companies and toward larger, well-established businesses with track records of consistent earnings under a variety of economic conditions. From 2000 through 2005, micro-, small- and mid-cap stocks produced substantially higher returns, on average, than larger capitalization ranges as investors remained comfortable with the risks that smaller companies typically entail. In contrast, the largest U.S. companies, which comprise the “mega-cap” category, underperformed other capitalization ranges. This situation began to change in 2006, as mega-cap stocks pulled ahead of mid- and large-cap stocks, but continued to trail small- and micro-cap stocks for the year overall.
Within the small-cap market, value-oriented stocks produced returns that were significantly higher than those of growth-oriented shares. This was largely due to high mergers & acquisitions (M&A) and leverage buyout (LBO) activity, which caused a rise in prices for inexpensively valued companies across the board. Additionally, the cyclical nature of value companies benefited from the strong global economy.
The momentum factors considered by our quantitative stock selection models became less predictive of performance as market conditions evolved, and stocks that had done well over the first half of the year fared relatively poorly over the second half. For example, a number of industrial and energy companies had strong momentum characteristics after gaining value over the first half of 2006, but many of those companies lagged the averages during the second half as the U.S. economy slowed and commodity prices fell. Conversely, real estate investment trusts that had relatively weak momentum characteristics rallied strongly during the final six months of 2006. Our stock selection models also proved to be relatively ineffective in the consumer staples, technology and health care sectors. In addition, the Fund’s relative performance was hindered by its relatively heavy exposure to mid-cap stocks during a year in which mid-cap stocks produced below-average results.
These disappointments were offset to a significant degree by better performance in other areas, where valuation factors contributed to high rankings for a number of individual companies. For example, both valuation and momentum factors supported high rankings for stocks in the basic materials sector, leading to an overweighted position in one of the small-cap market’s better performing areas. Finally, seasonal factors considered by our “turn of the year” model helped the Fund participate more fully in a year-end rally among lower-quality stocks.
As of the end of the reporting period, our models prefer larger stocks within the small-cap market and as a result we have reduced the Fund’s exposure to micro-cap stocks. Our stock selection models have assigned relatively high rankings to companies in the basic materials and technology sectors, and generally lower rankings to stocks in the more fully valued utilities, heath care, energy and consumer staples areas.
18
OPPENHEIMER MAIN STREET SMALL CAP FUND
| | |
TOP TEN EQUITY HOLDINGS At December 31, 2006 | | INDUSTRY WEIGHTINGS (Continued) At December 31, 2006 |
| | | |
| | | % of Net Assets | |
Payless Shoesource, Inc. | | 0.4 | % |
Greif, Inc. | | 0.4 | |
Cleveland-Cliffs, Inc. | | 0.4 | |
AK Steel Holding Corp. | | 0.4 | |
AMERIGROUP Corp. | | 0.4 | |
Oregon Steel Mills, Inc. | | 0.4 | |
Hercules, Inc. | | 0.4 | |
WR Grace & Co. | | 0.4 | |
Chaparral Steel Co. | | 0.4 | |
Interdigital Communications Corp. | | 0.4 | |
INDUSTRY WEIGHTINGS
At December 31, 2006
| | | |
| | | % of Net Assets | |
Specialty Retail | | 5.8 | % |
Commercial Services & Supplies | | 5.1 | |
Semiconductors & Semiconductor Equipment | | 4.9 | |
Software | | 4.8 | |
Chemicals | | 4.0 | |
Insurance | | 3.9 | |
Machinery | | 3.7 | |
REITS | | 3.6 | |
Electronic Equipment & Instruments | | 3.5 | |
Health Care Provider & Services | | 3.1 | |
Metals & Mining | | 3.1 | |
Communications Equipment | | 3.0 | |
Internet Software & Services | | 3.0 | |
IT Services | | 2.9 | |
Oil, Gas & Consumable Fuels | | 2.8 | |
Energy Equipment & Services | | 2.3 | |
Hotels Restaurants & Leisure | | 2.3 | |
Textiles, Apparel & Luxury Goods | | 1.9 | |
Computers & Peripherals | | 1.8 | |
Electrical Equipment | | 1.8 | |
Thrift & Mortgage Finance | | 1.8 | |
Diversified Consumer Services | | 1.7 | |
Health Care Equipment & Supplies | | 1.7 | |
Pharmaceuticals | | 1.6 | |
Household Durables | | 1.5 | |
| | | |
| | | % of Net Assets | |
Auto Components | | 1.4 | % |
Media | | 1.4 | |
Consumer Finance | | 1.2 | |
Diversified Telecommunication Services | | 1.2 | |
Aerospace & Defense | | 1.1 | |
Life Sciences Tools & Services | | 1.1 | |
Capital Markets | | 1.0 | |
Commercial Banks | | 0.9 | |
Construction & Engineering | | 0.9 | |
Containers & Packaging | | 0.9 | |
Air Freight & Logistics | | 0.8 | |
Airlines | | 0.8 | |
Food & Staples Retailing | | 0.8 | |
Multiline Retail | | 0.8 | |
Trading Companies & Distributors | | 0.8 | |
Food Products | | 0.7 | |
Leisure Equipment & Products | | 0.7 | |
Personal Products | | 0.7 | |
Road & Rail | | 0.7 | |
Construction Materials | | 0.6 | |
Internet & Catalog Retail | | 0.6 | |
Building Products | | 0.5 | |
Electric Utilities | | 0.5 | |
Gas Utilities | | 0.5 | |
Multi-Utilities | | 0.5 | |
Health Care Technology | | 0.3 | |
Marine | | 0.3 | |
Paper & Forest Products | | 0.3 | |
Wireless Telecommunication Services | | 0.3 | |
Beverages | | 0.2 | |
Biotechnology | | 0.2 | |
Diversified Financial Services | | 0.2 | |
Tobacco | | 0.2 | |
Automobiles | | 0.1 | |
Distributors | | 0.1 | |
Household Products | | 0.1 | |
Independent Power Producers & Energy Traders | | 0.1 | |
Industrial Conglomerates | | 0.1 | |
Real Estate Management & Development | | 0.1 | |
Other asset less liabilities | | 0.7 | |
| | | |
| | 100.0 | % |
| | | |
19
OPPENHEIMER MAIN STREET SMALL CAP FUND
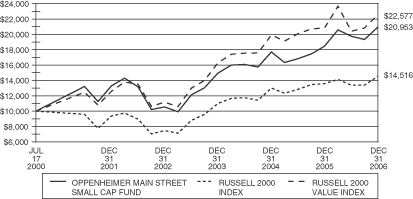
Comparison of Change in Value of a $10,000 Investment in the Oppenheimer Main Street Small Cap Fund – Initial Class, Russell 2000 Index and the Russell 2000 Value Index
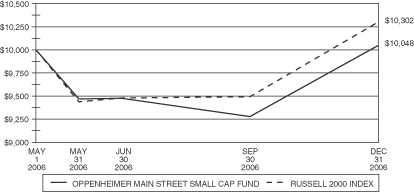
Comparison of Change in Value of a $10,000 Investment in the Oppenheimer Main Street Small Cap Fund – Service Class and the Russell 2000 Index
20
OPPENHEIMER MAIN STREET SMALL CAP FUND
Total Returns for Periods Ended December 31, 2006**
| | | | | | | | | | | | |
Initial Class Shares | | One Year | | | Three Years | | | Five Years | | | Life of
Fund*** | |
Oppenheimer Main Street Small Cap Fund | | 13.60 | % | | 11.96 | % | | 9.55 | % | | 12.13 | % |
Russell 2000 Index* | | 18.37 | % | | 13.56 | % | | 11.39 | % | | 5.93 | % |
Russell 2000 Value Index* | | 23.48 | % | | 16.48 | % | | 15.37 | % | | 13.43 | % |
Service Class Shares | | | | | | | | | | | | |
Oppenheimer Main Street Small Cap Fund | | N/A | | | N/A | | | N/A | | | 0.48 | % |
Russell 2000 Index* | | N/A | | | N/A | | | N/A | | | 3.02 | % |
*Effective with the change in subadviser to OppenheimerFunds, Inc. on January 9, 2006, the benchmark index was changed from the Russell 2000 Value Index to the Russell 2000 Index. The performance data of each index has been prepared from sources and data that the investment adviser believes to be reliable, but no representation is made as to their accuracy. The Russell 2000 Value Index is an unmanaged, marketweighted total return index that measures the performance of companies within the Russell 2000 Index having lower price-to-book ratios and lower forecasted growth values. The Russell 2000 Index includes the 2000 companies with the smallest market capitalizations from the Russell 3000 Index.
**Performance data is historical and includes changes in share price and reinvestment of income dividends and capital gains distributions. Past performance does not indicate future results. Performance numbers are net of all operating expenses, but do not include any insurance charges imposed in connection with your variable insurance contract. In addition, the investment adviser reduced its management fee during this period. If this performance information included the effect of the insurance charges and the fees and expenses assumed by the investment adviser, performance numbers would be lower. The value of an investment in the Oppenheimer Main Street Small Cap Fund and the return on the investment will fluctuate and redemption proceeds may be higher or lower than an investor’s original cost. Returns greater than one year are annualized.
***Initial Class Shares for the period from July 17, 2000 (commencement of operations) to December 31, 2006. Service Class Shares for the period from May 1, 2006 (commencement of operations) to December 31, 2006.
21
MANAGEMENT’S DISCUSSION & ANALYSIS
FI LARGE CAP GROWTH FUND (subadvised by Pyramis Global Advisors, LLC)
The Materials, Industrials, and Telecommunication Services sectors finished as the Fund’s largest contributors. Outperformance within Materials was due in large part to holdings within the Metals & Mining industry. Share prices of Allegheny Technologies, a specialty metals producer, appreciated from record stainless steel profits driven by the company’s purchase of cheap nickel. The Industrial sector’s positive return was largely attributed to the Machinery industry, where holdings of Manitowoc, a manufacturer of cranes and construction related equipment, accounted for much of the outperformance. Manitowoc shares appreciated after the company announced positive earnings results stemming from continued demand within non-residential construction markets.
The Consumer Discretionary and Information Technology sectors proved to be the two largest detractors from performance. The former’s underperformance was due to stock selection within the Specialty Retail and Household Durable industries. Share prices of two Specialty Retail holdings, Circuit City and Ann Taylor declined over the period as investors worried that a projected U.S. economic slowdown would slow consumer spending. A number of semiconductor holdings in the Information Technology sector dragged down returns as their performance did not meet expectations.
The Portfolio is positioned to gain from active stock selection through a combination of quantitative and fundamental research platforms that seek companies with faster, more consistent growth prospects at attractive valuations. We continue to favor the Machinery industry, with positions in heavy machinery manufacturers. We believe these businesses will benefit from a continued global boom in non-residential construction and steady demand for mining-related equipment. Additionally, we are overweight the Biotechnology industry, focusing on companies with strong franchises and solid product pipelines. Within the Information Technology sector, we are bullish on the Computer & Peripherals industry, maintaining our positions in Hard Disk Drive producers and Personal Computer manufacturers. We believe these businesses will benefit from market share gains and better than expected PC and flash data storage demand. Finally of note, we are overweight the Metals & Mining industry, focusing on specialty metals producers that should grow earnings from demand within the Aerospace industry and increased production capacity.
22
FI LARGE CAP GROWTH FUND
| | |
TOP TEN EQUITY HOLDINGS At December 31, 2006 | | INDUSTRY WEIGHTINGS At December 31, 2006 |
| | | |
| | | % of Net Assets | |
Google, Inc. | | 3.6 | % |
Allegheny Technologies, Inc. | | 3.1 | |
Manitowoc, Inc. | | 3.0 | |
Joy Global, Inc. | | 2.9 | |
Hewlett-Packard Co. | | 2.9 | |
Terex Corp. | | 2.8 | |
Merrill Lynch & Co., Inc. | | 2.7 | |
Cisco Systems, Inc. | | 2.7 | |
Cymer, Inc. | | 2.7 | |
Western Digital Corp. | | 2.7 | |
| | | |
| | | % of Net Assets | |
Machinery | | 10.4 | % |
Computers & Peripherals | | 10.3 | |
Biotechnology | | 8.5 | |
Semiconductors & Semiconductor Equipment | | 7.3 | |
Short Term Investments | | 6.3 | |
Capital Markets | | 5.7 | |
Health Care Providers & Services | | 4.6 | |
Communications Equipment | | 4.3 | |
Specialty Retail | | 4.3 | |
Metals & Mining | | 3.9 | |
Oil, Gas & Consumable Fuels | | 3.8 | |
Internet Software & Services | | 3.6 | |
Food & Staples Retailing | | 3.1 | |
Multiline Retail | | 2.9 | |
Pharmaceuticals | | 2.9 | |
Household Durables | | 2.5 | |
Tobacco | | 2.5 | |
Insurance | | 2.1 | |
Beverages | | 2.0 | |
Road & Rail | | 1.7 | |
Software | | 1.6 | |
Life Sciences Tools & Services | | 1.5 | |
Automobiles | | 1.3 | |
Distributors | | 1.0 | |
Food Products | | 0.9 | |
Hotels Restaurants & Leisure | | 0.9 | |
Diversified Telecommunication Services | | 0.8 | |
Electrical Equipment | | 0.8 | |
Independent Power Producers & Energy Traders | | 0.8 | |
Health Care Equipment & Supplies | | 0.7 | |
Industrial Conglomerates | | 0.5 | |
Textiles, Apparel & Luxury Goods | | 0.5 | |
Thrift & Mortgage Finance | | 0.4 | |
Commercial Banks | | 0.3 | |
Liabilities in excess of other assets | | (4.7 | ) |
| | | |
| | 100.0 | % |
| | | |
23
FI LARGE CAP GROWTH FUND
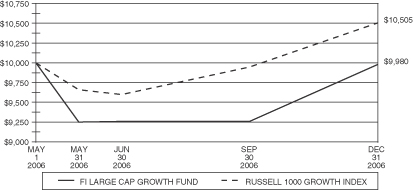
Comparison of Change in Value of a $10,000 Investment in the FI Large Cap Growth Fund – Service Class and the Russell 1000 Growth Index
Total Returns for Period Ended December 31, 2006**
| | | | | | | | | |
Service Class Shares | | One Year | | Three Years | | Five Years | | Life of
Fund*** | |
FI Large Cap Growth Fund | | N/A | | N/A | | N/A | | (0.20 | )% |
Russell 1000 Growth Index* | | N/A | | N/A | | N/A | | 5.05 | % |
*The performance data of the index has been prepared from sources and data that the investment adviser believes to be reliable, but no representation is made as to their accuracy. The Russell 1000 Growth Index is an unmanaged index that measures the performance of those Russell 1000 Index securities with higher price-to-book ratios and higher forecasted growth values, representative of U.S. securities exhibiting growth characteristics. The Russell 1000 Index includes the largest 1000 securities in the Russell 3000 Index, based on market cap. The Russell 3000 Index consists of the 3000 largest and most liquid stocks based and traded in the U.S.
**Performance data is historical and includes changes in share price and reinvestment of income dividends and capital gains distributions. Past performance does not indicate future results. Performance numbers are net of all operating expenses, but do not include any insurance charges imposed in connection with your variable insurance contract. In addition, the investment adviser reduced its management fee and certain other expenses during this period. If this performance information included the effect of the insurance charges and the fees and expenses assumed by the investment adviser, performance numbers would be lower. The value of an investment in the FI Large Cap Growth Fund and the return on the investment will fluctuate and redemption proceeds may be higher or lower than an investor’s original cost.
***Service Class Shares for the period from May 1, 2006 (commencement of operations) to December 31, 2006.
24
MANAGEMENT’S DISCUSSION & ANALYSIS
BLUE CHIP MID CAP FUND (subadvised by Wellington Management Co., LLP)
Equity markets got off to a slow start early in the year as investor concerns about excessive monetary tightening by the Federal Reserve Bank took center stage. Falling energy prices and the long awaited pause in the Fed’s rate hikes provided some relief during the second half of the year. US equities continued to rally through the end of the year on record merger and acquisition activity and a surprisingly resilient consumer in the face of a slowing economy. Employment held up well, while housing continued to weaken.
During the twelve-month period ended December 31, 2006, investor preferences shifted to small (+18.4) and large cap shares (+15.8) versus mid cap stocks (+10.4) when measured by the Russell 2000 Indexes, S&P 500 Index and S&P MidCap 400 Index respectively. Value (+22.2) comfortably outperformed growth (+9.1) for the year. In a reversal from last year within the S&P MidCap 400 Index, Telecommunication Services was the best-performing sector, while Health Care was the only sector to post a negative return.
The Fund’s outperformance was driven primarily by positive security selection in seven out of the ten broad-based sectors, but was partially offset by negative sector allocation decisions. The Fund benefited from strong stock selection within the Consumer Discretionary and Industrials sectors. Negative stock selection was, for the most part, confined to the Information Technology sector. The Fund’s overweight allocation to the top-performing Telecommunications sector also positively contributed to performance. However, our underweight position to the strong performing Utilities sector detracted from performance.
The best-performing stock for the year on an absolute and relative basis was American Tower. Shares of the communications tower operator rose as the company benefited from a high, predictable growth rate, operating leverage, and strong free cash flow. The Telecommunications industry continues to experience growth as cell phone companies increase spending to support both new subscribers and the move to new technology. A number of the top contributors to performance also came from the Industrials sector, including employment services company Manpower, aerospace and defense company Rockwell Collins, and machinery manufacturer PACCAR. Shares of aviation and electronics supplier Rockwell Collins advanced after the company announced strong results and increased its earnings forecast. The company also continued to benefit from Boeing’s new 787 product cycle. Among other contributors was IT services provider Cognizant Technology Solutions.
Two of the top three detractors, on a relative and absolute basis, were Consumer Discretionary names, Sirius Satellite and D R Horton. Shares of Sirius suffered from a deceleration in demand, particularly in retail sales, and an up-tick in churn. We eliminated the stock due to concerns about the long-term sustainability of customer growth at current monthly pricing levels. Homebuilder DR Horton declined as the market reacted to increasing evidence of slower new home demand within the US, and we exited our position. We also eliminated our position in blue chip electronics manufacturing company Jabil Circuit, which was among other top detractors and declined on options backdating concerns and disappointing guidance.
The largest increase in relative weight during the year was in Industrials, with exposure to staffing and employment companies such as Manpower and Monster Worldwide. Within this sector we also like select engineering & construction stocks. We reduced our overweight to Consumer Discretionary by eliminating consumer services stock Harrah’s Entertainment after a takeover offer and reduced our Media exposure. We recently added to Energy holdings via a new purchase of Murphy Oil. These exploration & production purchases provide greater leverage to energy prices following a period of price weakness.
At year-end our largest overweights relative to the S&P MidCap 400 Index were to the Industrials and Health Care sectors, while the largest underweights were to Financials and Utilities.
25
BLUE CHIP MID CAP FUND
| | |
TOP TEN EQUITY HOLDINGS At December 31, 2006 | | INDUSTRY WEIGHTINGS At December 31, 2006 |
| | | |
| | | % of Net Assets | |
SUPERVALU, Inc. | | 2.0 | % |
Equifax, Inc. | | 1.9 | |
Manpower, Inc | | 1.8 | |
GlobalSantaFe Corp. | | 1.7 | |
American Standard Cos., Inc. | | 1.7 | |
Cameco Corp | | 1.7 | |
Network Appliance, Inc. | | 1.7 | |
Abercrombie & Fitch Co. Class A | | 1.6 | |
Republic Services, Inc. | | 1.5 | |
Altera Corp. | | 1.5 | |
| | | |
| | | % of Net Assets | |
Commercial Services & Supplies | | 8.9 | % |
Special Retail | | 6.2 | |
Oil, Gas & Consumable Fuels | | 5.5 | |
Semiconductors & Semiconductor Equipment | | 5.5 | |
Capital Markets | | 5.0 | |
Insurance | | 4.2 | |
IT Services | | 4.0 | |
Health Care Providers & Services | | 3.8 | |
Software | | 3.8 | |
Pharmaceuticals | | 3.7 | |
Energy Equipment & Services | | 3.1 | |
Aerospace & Defense | | 2.9 | |
Health Care Equipment & Supplies | | 2.9 | |
Construction & Engineering | | 2.7 | |
Biotechnology | | 2.6 | |
Media | | 2.5 | |
Metals & Mining | | 2.1 | |
Food & Staples Retailing | | 2.0 | |
Short Term Investment | | 2.0 | |
Building Products | | 1.7 | |
Computers & Peripherals | | 1.7 | |
Electric Utilities | | 1.5 | |
Machinery | | 1.5 | |
Auto Components | | 1.4 | |
Road & Rail | | 1.4 | |
Wireless Telecommunication Services | | 1.4 | |
Electrical Equipment | | 1.3 | |
Household Products | | 1.3 | |
Independent Power Producers & Energy Traders | | 1.3 | |
REITS | | 1.3 | |
Air Freight & Logistics | | 1.1 | |
Household Durables | | 1.0 | |
Life Sciences Tools & Services | | 1.0 | |
Hotels Restaurants & Leisure | | 0.9 | |
Thrigt & Mortgage Finance | | 0.9 | |
Commercial Banks | | 0.8 | |
Diversified Financial Services | | 0.8 | |
Diversified Commercial Services | | 0.7 | |
Food Products | | 0.7 | |
Multi-Utilities | | 0.6 | |
Multiline Retail | | 0.6 | |
Textiles, Apparel & Luxury Goods | | 0.6 | |
Consumer Finance | | 0.5 | |
Personal Products | | 0.4 | |
Trading Companies & Distributors | | 0.3 | |
Liabilities in excess of other assets | | (0.1 | ) |
| | | |
| | 100.0 | % |
| | | |
26
BLUE CHIP MID CAP FUND
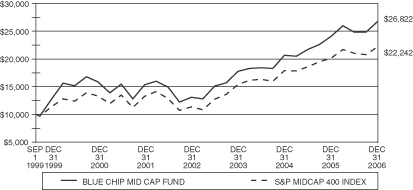
Comparison of Change in Value of a $10,000 Investment in the Blue Chip Mid Cap Fund – Initial Class and the S&P MidCap 400 Index
Total Returns for Periods Ended December 31, 2006**
| | | | | | | | | | | | |
Initial Class Shares | | One Year | | | Three Years | | | Five Years | | | Life of
Fund*** | |
Blue Chip Mid Cap Fund | | 11.30 | % | | 14.66 | % | | 11.79 | % | | 14.40 | % |
S&P MidCap 400 Index* | | 10.32 | % | | 13.10 | % | | 10.90 | % | | 11.52 | % |
*The performance data of the index has been prepared from sources and data that the investment adviser believes to be reliable, but no representation is made as to their accuracy. The index is unmanaged and has no fees or costs. The Standard & Poor’s MidCap 400 Index is a capitalization-weighted index that measures the mid-range sector of the U.S. stock market.
**Performance data is historical and includes changes in share price and reinvestment of income dividends and capital gains distributions. Past performance does not indicate future results. Performance numbers are net of all operating expenses, but do not include any insurance charges imposed in connection with your variable insurance contract. In addition, the investment adviser reduced its management fee during this period. If this performance information included the effect of the insurance charges and the fees and expenses assumed by the investment adviser, performance numbers would be lower. The value of an investment in the Blue Chip Mid Cap Fund and the return on the investment will fluctuate and redemption proceeds may be higher or lower than an investor’s original cost. Returns greater than one year are annualized.
***Initial Class Shares for the period from September 1, 1999 (commencement of operations) to December 31, 2006.
27
EXPENSE INFORMATION
December 31, 2006 (Unaudited)
Information About Your Fund’s Expenses
All mutual funds incur ongoing operating expenses, including management fees and administrative services, among others. The following tables are intended to increase your understanding of the ongoing costs of investing in each Fund. The following examples are based on the investment of $1,000 at the beginning of the period and held for the entire period, July 1, 2006 to December 31, 2006. Expense information does not include any insurance charges imposed in connection with your variable insurance contract.
Actual Expenses: The first section of each table provides information about actual account values and actual expenses. You may use the information in this section, together with the amount you invested, to estimate the expenses you paid over the period. To do so, simply divide your account value by $1,000 (for example, an $8,600 account value divided by $1,000 = 8.6), then multiply the result by the number given for your fund under the heading “Expenses Paid During the Period”.
Hypothetical (5% annual return before expenses): The second section of each table provides information about hypothetical account values and hypothetical expenses based on each Fund’s actual expense ratio and an assumed rate of return of 5% per year before expenses, which is not the actual return of the Fund. The hypothetical account values and expenses may not be used to estimate the actual ending account balance or expenses you paid for the period. However, you may use this information to compare the ongoing costs of investing in the Funds with the hypothetical examples that appear in the shareholder reports of other mutual funds.
Expense Information
| | | | | | | | | |
All Cap Fund |
Actual | | Beginning
Account
Value
7/1/2006 | | Ending
Account
Value
12/31/2006 | | Expenses
Paid During
the Period* |
Initial Class | | $ | 1,000.00 | | $ | 1,148.10 | | $ | 4.87 |
Service Class | | $ | 1,000.00 | | $ | 1,147.37 | | $ | 6.22 |
|
Hypothetical (5% annual return before expenses) |
Initial Class | | $ | 1,000.00 | | $ | 1,020.67 | | $ | 4.58 |
Service Class | | $ | 1,000.00 | | $ | 1,019.41 | | $ | 5.85 |
| | | | | | | | | |
|
Money Market Fund |
Actual | | Beginning
Account
Value
7/1/2006 | | Ending
Account
Value
12/31/2006 | | Expenses
Paid During
the Period* |
Initial Class | | $ | 1,000.00 | | $ | 1,024.35 | | $ | 2.55 |
Service Class | | $ | 1,000.00 | | $ | 1,023.07 | | $ | 3.82 |
|
Hypothetical (5% annual return before expenses) |
Initial Class | | $ | 1,000.00 | | $ | 1,022.68 | | $ | 2.55 |
Service Class | | $ | 1,000.00 | | $ | 1,021.42 | | $ | 3.82 |
| | | | | | | | | |
Investment Grade Bond Fund |
Actual | | Beginning
Account
Value
7/1/2006 | | Ending
Account
Value
12/31/2006 | | Expenses
Paid During
the Period* |
Initial Class | | $ | 1,000.00 | | $ | 1,059.59 | | $ | 3.89 |
Service Class | | $ | 1,000.00 | | $ | 1,058.03 | | $ | 5.19 |
|
Hypothetical (5% annual return before expenses) |
Initial Class | | $ | 1,000.00 | | $ | 1,021.42 | | $ | 3.82 |
Service Class | | $ | 1,000.00 | | $ | 1,020.16 | | $ | 5.09 |
| | | | | | | | | |
|
Real Estate Fund |
Actual | | Beginning
Account
Value
7/1/2006 | | Ending
Account
Value
12/31/2006 | | Expenses
Paid During
the Period* |
Initial Class | | $ | 1,000.00 | | $ | 1,205.59 | | $ | 6.12 |
Service Class | | $ | 1,000.00 | | $ | 1,203.78 | | $ | 7.50 |
|
Hypothetical (5% annual return before expenses) |
Initial Class | | $ | 1,000.00 | | $ | 1,019.66 | | $ | 5.60 |
Service Class | | $ | 1,000.00 | | $ | 1,018.40 | | $ | 6.87 |
28
EXPENSE INFORMATION (Continued)
December 31, 2006 (Unaudited)
| | | | | | | | | |
Davis Venture Value Fund |
Actual | | Beginning
Account
Value
7/1/2006 | | Ending
Account
Value
12/31/2006 | | Expenses
Paid During
the Period* |
Initial Class | | $ | 1,000.00 | | $ | 1,113.94 | | $ | 4.80 |
Service Class | | $ | 1,000.00 | | $ | 1,112.25 | | $ | 6.12 |
|
Hypothetical (5% annual return before expenses) |
Initial Class | | $ | 1,000.00 | | $ | 1,020.67 | | $ | 4.58 |
Service Class | | $ | 1,000.00 | | $ | 1,019.41 | | $ | 5.85 |
|
FI Large Cap Growth Fund |
Actual | | Beginning
Account
Value
7/1/2006 | | Ending
Account
Value
12/31/2006 | | Expenses
Paid During
the Period* |
Service Class | | $ | 1,000.00 | | $ | 1,077.75 | | $ | 5.55 |
|
Hypothetical (5% annual return before expenses) |
Service Class | | $ | 1,000.00 | | $ | 1,019.86 | | $ | 5.40 |
| | | | | | | | | |
Oppenheimer Main Street Small Cap Fund |
Actual | | Beginning
Account
Value
7/1/2006 | | Ending
Account
Value
12/31/2006 | | Expenses
Paid During
the Period* |
Initial Class | | $ | 1,000.00 | | $ | 1,062.04 | | $ | 5.20 |
Service Class | | $ | 1,000.00 | | $ | 1,060.67 | | $ | 6.49 |
|
Hypothetical (5% annual return before expenses) |
Initial Class | | $ | 1,000.00 | | $ | 1,020.16 | | $ | 5.09 |
Service Class | | $ | 1,000.00 | | $ | 1,018.90 | | $ | 6.36 |
|
Blue Chip Mid Cap Fund |
Actual | | Beginning
Account
Value
7/1/2006 | | Ending
Account
Value
12/31/2006 | | Expenses
Paid During
the Period* |
Initial Class | | $ | 1,000.00 | | $ | 1,079.94 | | $ | 5.24 |
|
Hypothetical (5% annual return before expenses) |
Initial Class | | $ | 1,000.00 | | $ | 1,020.16 | | $ | 5.09 |
| * | For each class of the Fund, expenses are equal to the six-month annualized expense ratio for the class, multiplied by the average account value over the period, multiplied by the number of days in the most recent six-month period divided by the number of days in the year. The six-month annualized expense ratio was 0.90%, 1.15%, 0.75%, 1.00%, 0.50%, 0.75%, 1.10%, 1.35%, 0.90%, 1.15%, 1.00%, 1.25%, 1.06% and 1.00% for the All Cap Fund –Initial Class, All Cap Fund – Service Class, Investment Grade Bond Fund – Initial Class, Investment Grade Bond Fund – Service Class, Money Market Fund – Initial Class, Money Market Fund – Service Class, Real Estate Fund – Initial Class, Real Estate Fund – Service Class, Davis Venture Value Fund – Initial Class, Davis Venture Value Fund – Service Class, Oppenheimer Main Street Small Cap Fund – Initial Class, Oppenheimer Main Street Small Cap Fund – Service Class, FI Large Cap Growth Fund – Service Class and Blue Chip Mid Cap Fund – Initial Class, respectively. |
29
ALL CAP FUND
| | |
PORTFOLIO OF INVESTMENTS December 31, 2006 | | Sun Capital Advisers Trust |
| | | | | |
| | | Shares | | Value |
| | | | | |
COMMON STOCKS – 98.8% | | | | | |
AEROSPACE & DEFENSE – 3.7% | | | |
Honeywell International, Inc. | | 2,178 | | $ | 98,533 |
Raytheon Co. | | 2,139 | | | 112,939 |
The Boeing Co. | | 1,311 | | | 116,469 |
United Technologies Corp. | | 1,603 | | | 100,220 |
| | | | | |
| | | | | 428,161 |
| | | | | |
AIR FREIGHT & LOGISTICS – 0.8% | | | |
United Parcel Services, Inc.
Class B | | 1,257 | | | 94,250 |
| | | | | |
BEVERAGES – 2.7% | | | |
Anheuser-Busch Cos., Inc. | | 2,233 | | | 109,863 |
Coca-Cola Co | | 2,072 | | | 99,974 |
PepsiCo, Inc. | | 1,572 | | | 98,329 |
| | | | | |
| | | | | 308,166 |
| | | | | |
BIOTECHNOLOGY – 0.9% | | | |
Biogen Idec, Inc.* | | 2,000 | | | 98,380 |
| | | | | |
CAPITAL MARKETS – 2.6% | | | |
Merrill Lynch & Co., Inc. | | 1,474 | | | 137,229 |
The Goldman Sachs Group, Inc. | | 797 | | | 158,882 |
| | | | | |
| | | | | 296,111 |
| | | | | |
CHEMICALS – 1.0% | | | |
E.I. du Pont de Nemours & Co. | | 2,293 | | | 111,692 |
| | | | | |
COMMERCIAL BANKS – 3.2% | | | |
Wachovia Corp. | | 2,570 | | | 146,362 |
Wells Fargo & Co. | | 6,272 | | | 223,032 |
| | | | | |
| | | | | 369,394 |
| | | | | |
COMMUNICATIONS EQUIPMENT – 13.5% |
Ciena Corp.* | | 13,074 | | | 362,280 |
Cisco Systems, Inc.* | | 5,417 | | | 148,047 |
Finisar Corp.* | | 93,600 | | | 302,328 |
MRV Communications, Inc.* | | 120,598 | | | 426,917 |
Redback Networks, Inc.* | | 12,387 | | | 308,932 |
| | | | | |
| | | | | 1,548,504 |
| | | | | |
COMPUTERS & PERIPHERALS – 3.7% | | | |
Apple Computer, Inc.* | | 1,661 | | | 140,919 |
Hewlett-Packard Co. | | 3,603 | | | 148,408 |
International Business Machines Corp. | | 1,362 | | | 132,318 |
| | | | | |
| | | | | 421,645 |
| | | | | |
CONSUMER FINANCE – 1.3% | | | |
American Express Co. | | 2,528 | | | 153,374 |
| | | | | |
| | | | | |
| | | Shares | | Value |
| | | | | |
DIVERSIFIED FINANCIAL SERVICES – 6.4% |
Bank of America Corp. | | 4,358 | | $ | 232,674 |
Citigroup, Inc. | | 4,671 | | | 260,175 |
JPMorgan Chase & Co. | | 4,975 | | | 240,292 |
| | | | | |
| | | | | 733,141 |
| | | | | |
DIVERSIFIED TELECOMMUNICATION SERVICES – 3.0% | | | |
Verizon Communications, Inc. | | 9,291 | | | 345,997 |
| | | | | |
ELECTRIC UTILITIES – 1.7% | | | |
Duke Energy Corp. | | 3,066 | | | 101,822 |
Exelon Corp. | | 1,555 | | | 96,239 |
| | | | | |
| | | | | 198,061 |
| | | | | |
ELECTRICAL EQUIPMENT – 0.9% | | | |
Emerson Electric Co. | | 2,192 | | | 96,645 |
| | | | | |
FOOD & STAPLES RETAILING – 1.3% | | | |
CVS Corp. | | 1,877 | | | 58,018 |
Wal-Mart Stores, Inc. | | 1,977 | | | 91,298 |
| | | | | |
| | | | | 149,316 |
| | | | | |
HEALTH CARE EQUIPMENT & SUPPLIES – 1.0% |
Baxter International, Inc. | | 2,435 | | | 112,960 |
| | | | | |
HEALTH CARE PROVIDERS & SERVICES – 4.1% |
Omnicare, Inc. | | 6,977 | | | 269,522 |
Tenet Healthcare Corp.* | | 14,696 | | | 102,431 |
WellPoint, Inc.* | | 1,258 | | | 98,992 |
| | | | | |
| | | | | 470,945 |
| | | | | |
HEALTH CARE TECHNOLOGY – 1.0% | | | |
Merge Technologies, Inc.* | | 17,077 | | | 112,025 |
| | | | | |
HOTELS RESTAURANTS & LEISURE – 1.5% |
Cosi, Inc.* | | 34,418 | | | 175,188 |
| | | | | |
HOUSEHOLD PRODUCTS – 1.0% | | | |
Kimberly-Clark Corp. | | 1,587 | | | 107,837 |
| | | | | |
INDUSTRIAL CONGLOMERATES – 5.8% | | | |
General Electric Co. | | 12,947 | | | 481,758 |
Tyco International, Ltd. | | 3,629 | | | 110,321 |
Walter Industries, Inc. | | 2,472 | | | 66,868 |
| | | | | |
| | | | | 658,947 |
| | | | | |
INSURANCE – 3.8% | | | |
Metlife, Inc. | | 1,778 | | | 104,920 |
Prudential Financial, Inc. | | 2,480 | | | 212,933 |
The Allstate Corp. | | 1,700 | | | 110,687 |
| | | | | |
| | | | | 428,540 |
| | | | | |
See Notes to Financial Statements.
30
ALL CAP FUND
| | |
PORTFOLIO OF INVESTMENTS (Continued) December 31, 2006 | | Sun Capital Advisers Trust |
| | | | | |
| | | Shares | | Value |
| | | | | |
INTERNET SOFTWARE & SERVICES – 0.9% |
Google, Inc.* | | 229 | | $ | 105,450 |
| | | | | |
LEISURE EQUIPMENT & PRODUCTS – 2.2% |
Eastman Kodak Co. | | 3,227 | | | 83,257 |
Nautilus, Inc. | | 11,715 | | | 164,010 |
| | | | | |
| | | | | 247,267 |
| | | | | |
MACHINERY – 0.5% | | | |
Mueller Water Products Inc* | | 4,084 | | | 60,852 |
| | | | | |
MEDIA – 4.1% | | | |
Comcast Corp. Class A* | | 3,193 | | | 135,160 |
Idearc, Inc.* | | 464 | | | 13,293 |
The Walt Disney Co. | | 2,637 | | | 90,370 |
Time Warner, Inc. | | 6,119 | | | 133,272 |
Viacom, Inc.* | | 2,421 | | | 99,334 |
| | | | | |
| | | | | 471,429 |
| | | | | |
METALS & MINING – 0.9% | | | |
Newmont Mining Corp. | | 2,357 | | | 106,418 |
| | | | | |
MULTI-UTILITIES – 0.8% | | | |
Dominion Resources, Inc. | | 1,139 | | | 95,494 |
| | | | | |
MULTILINE RETAIL – 0.9% | | | |
Federated Department Stores, Inc. | | 2,565 | | | 97,803 |
| | | | | |
OIL, GAS & CONSUMABLE FUELS – 7.3% |
ChevronTexaco Corp. | | 2,671 | | | 196,399 |
ConocoPhillips | | 1,249 | | | 89,865 |
Exxon Mobil Corp. | | 4,265 | | | 326,827 |
Massey Energy Co. | | 9,488 | | | 220,406 |
| | | | | |
| | | | | 833,497 |
| | | | | |
PAPER & FOREST PRODUCTS – 0.8% |
International Paper Co. | | 2,695 | | | 91,899 |
| | | | | |
PERSONAL PRODUCTS – 0.4% | | | |
Alberto Culver Co.* | | 1,981 | | | 42,492 |
| | | | | |
PHARMACEUTICALS – 6.1% | | | |
Abbott Laboratories | | 2,076 | | | 101,122 |
Eli Lilly & Co. | | 1,748 | | | 91,071 |
Johnson & Johnson | | 2,576 | | | 170,067 |
Merck & Co., Inc. | | 2,663 | | | 116,107 |
Schering-Plough Corp. | | 4,990 | | | 117,963 |
Wyeth | | 2,042 | | | 103,979 |
| | | | | |
| | | | | 700,309 |
| | | | | |
| * | Non-income producing security |
| | | | | |
| | | Shares | | Value |
| | | | | |
REITS – 0.9% | | | | | |
CapitalSource, Inc. | | 3,702 | | $ | 101,102 |
| | | | | |
SEMICONDUCTORS & SEMICONDUCTOR EQUIPMENT – 0.9% |
Intel Corp. | | 4,949 | | | 100,217 |
| | | | | |
SOFTWARE – 4.2% | | | | | |
Microsoft Corp. | | 7,601 | | | 226,966 |
Oracle Corp.* | | 7,507 | | | 128,670 |
Symantec Corp.* | | 5,959 | | | 124,245 |
| | | | | |
| | | | | 479,881 |
| | | | | |
SPECIALTY RETAIL – 0.9% | | | |
Lowe’s Cos., Inc. | | 2,904 | | | 90,459 |
Sally Beauty Holdings, Inc.* | | 1,981 | | | 15,452 |
| | | | | |
| | | | | 105,911 |
| | | | | |
THRIFT & MORTGAGE FINANCE – 0.9% |
Freddie Mac | | 1,577 | | | 107,078 |
| | | | | |
TOBACCO – 1.2% | | | | | |
Altria Group, Inc. | | 1,611 | | | 138,256 |
| | | | | |
Total Common Stocks (cost $9,850,996) | | | | | 11,304,634 |
| | | | | |
SHORT TERM INVESTMENT – 1.1% | | | |
MUTUAL FUNDS – 1.1% | | | | | |
Federated Prime Obligation Fund (amortized cost $133,001) | | 133,001 | | | 133,001 |
| | | | | |
TOTAL INVESTMENTS – 99.9% (cost $9,983,997) | | | | | 11,437,635 |
Other assets less liabilities – 0.1% | | | | | 7,145 |
| | | | | |
NET ASSETS – 100.0% | | | | $ | 11,444,780 |
| | | | | |
See Notes to Financial Statements.
31
INVESTMENT GRADE BOND FUND
| | |
PORTFOLIO OF INVESTMENTS December 31, 2006 | | Sun Capital Advisers Trust |
| | | | | | |
| | | Principal
Amount
(000) | | Value |
| | | | | | |
ASSET BACKED SECURITIES – 1.4% | | | |
Airplanes Pass Through Trust Series D (1)
10.88%, 3/15/19 | | $ | 494 | | $ | 0 |
Peco Energy Transition Trust 6.13%, 3/1/09 | | | 750 | | | 756,302 |
| | | | | | |
Total Asset Backed Securities
(cost $1,094,905) | | | | | | 756,302 |
| | | | | | |
CORPORATE DEBT OBLIGATIONS – 42.5% |
AEROSPACE & DEFENSE – 0.9% | | | |
Embraer Overseas, Ltd. (2)
6.38%, 1/24/17 | | | 500 | | | 500,000 |
| | | | | | |
AUTOMOTIVE – 1.8% | | | | | | |
Ford Motor Credit Co.
8.00%, 12/15/16 | | | 1,000 | | | 988,150 |
| | | | | | |
BANKS – 2.8% | | | | | | |
Financial Security Assurance Holdings, Ltd. (2)
6.40%, 12/15/66 | | | 300 | | | 301,382 |
HBOS PLC (2)
5.92%, 9/29/49 | | | 500 | | | 490,477 |
Washington Mutual Preferred Funding Trust (2)
6.53%, 3/29/49 | | | 750 | | | 741,375 |
| | | | | | |
| | | | | | 1,533,234 |
| | | | | | |
BROADCASTING/MEDIA – 1.1% | | | |
Time Warner Entertainment Co. 10.15%, 5/1/12 | | | 500 | | | 592,071 |
| | | | | | |
BROKERAGE – 2.7% | | | | | | |
Jefferies Group, Inc.
6.25%, 1/15/36 | | | 500 | | | 485,025 |
Lehman Brothers Holdings, Inc. 5.75%, 5/17/13 | | | 500 | | | 507,890 |
Morgan Stanley
4.75%, 4/1/14 | | | 500 | | | 478,064 |
| | | | | | |
| | | | | | 1,470,979 |
| | | | | | |
BUILDING MATERIALS – 3.0% | | | |
C10 Capital Spv., Ltd (2)
6.72%, 12/1/49 | | | 650 | | | 648,405 |
CRH America, Inc.
6.00%, 9/30/16 | | | 500 | | | 504,698 |
Owens Corning, Inc. (2)
6.50%, 12/1/16 | | | 500 | | | 507,919 |
| | | | | | |
| | | | | | 1,661,022 |
| | | | | | |
| | | | | | |
| | | Principal
Amount
(000) | | Value |
| | | | | | |
CONSUMER SERVICES – 0.6% | | | |
Realogy Corp. (2)
6.50%, 10/15/16 | | $ | 300 | | $ | 307,158 |
| | | | | | |
DISTRIBUTORS – 0.7% | | | | | | |
Southern Union Co.
7.20%, 11/1/66 | | | 380 | | | 374,589 |
| | | | | | |
ELECTRIC UTILITIES – 1.9% | | | |
Allegheny Energy Supply Co. LLC (2)
8.25%, 4/15/12 | | | 750 | | | 823,125 |
PSEG Energy Holdings, Inc. 8.50%, 6/15/11 | | | 200 | | | 215,000 |
| | | | | | |
| | | | | | 1,038,125 |
| | | | | | |
FINANCIAL SERVICES – 4.7% | | | |
Allied Capital Corp.
6.00%, 4/1/12 | | | 500 | | | 492,812 |
Capital One Capital III
7.69%, 8/15/36 | | | 700 | | | 792,791 |
General Motors Acceptance Corp.
7.00%, 2/1/12 | | | 300 | | | 309,504 |
iStar Financial, Inc. (2)
5.95%, 10/15/13 | | | 500 | | | 502,518 |
Noble Group, Ltd. (2)
6.63%, 3/17/15 | | | 500 | | | 454,181 |
| | | | | | |
| | | | | | 2,551,806 |
| | | | | | |
GAMING – 1.7% | | | | | | |
Buffalo Thunder Development Authority (2)
9.38%, 12/15/14 | | | 100 | | | 101,500 |
Caesars Entertainment, Inc. 7.00%, 4/15/13 | | | 200 | | | 204,589 |
MGM Mirage, Inc.
6.75%, 9/1/12 | | | 600 | | | 591,000 |
| | | | | | |
| | | | | | 897,089 |
| | | | | | |
GAS & PIPELINE UTILITIES – 1.2% | | | |
Dynegy Holdings, Inc.
6.88%, 4/1/11 | | | 115 | | | 115,000 |
Enterprise Products Operating LP
8.38%, 8/1/66 | | | 500 | | | 541,603 |
| | | | | | |
| | | | | | 656,603 |
| | | | | | |
HEALTH SERVICES – 0.9% | | | |
Humana, Inc.
6.45%, 6/1/16 | | | 500 | | | 513,792 |
| | | | | | |
See Notes to Financial Statements.
32
INVESTMENT GRADE BOND FUND
| | |
PORTFOLIO OF INVESTMENTS (Continued) December 31, 2006 | | Sun Capital Advisers Trust |
| | | | | | |
| | | Principal
Amount
(000) | | Value |
| | | | | | |
HOME CONSTRUCTION – 1.2% | | | |
KB Home & Broad Home Corp. 6.38%, 8/15/11 | | $ | 650 | | $ | 639,563 |
| | | | | | |
INSURANCE – 2.8% | | | | | | |
Assured Guaranty Us Holdings, Inc. 6.40%, 12/15/66 | | | 600 | | | 600,494 |
Liberty Mutual Group, Inc. (2) 7.00%, 3/15/34 | | | 500 | | | 514,772 |
Marsh & McLennan Cos., Inc. 5.75%, 9/15/15 | | | 400 | | | 393,525 |
| | | | | | |
| | | | | | 1,508,791 |
| | | | | | |
METALS – 1.2% | | | | | | |
Vale Overseas, Ltd.
6.88%, 11/21/36 | | | 650 | | | 666,670 |
| | | | | | |
OIL – 1.5% | | | |
Amerada Hess Corp.
7.88%, 10/1/29 | | | 250 | | | 291,823 |
Pemex Finance, Ltd.
9.03%, 2/15/11 | | | 510 | | | 543,165 |
| | | | | | |
| | | | | | 834,988 |
| | | | | | |
PAPER – 1.1% | | | |
Abitibi-Consolidated, Inc.
5.25%, 6/20/08 | | | 650 | | | 624,000 |
| | | | | | |
REITS – 4.4% | | | |
Commercial Net Lease Realty | | | | | | |
6.25%, 6/15/14 | | | 550 | | | 560,401 |
7.13%, 3/15/08 | | | 600 | | | 608,352 |
Reckson Operating Partnership
5.15%, 1/15/11 | | | 700 | | | 684,289 |
Simon Property Group LP
5.75%, 5/1/12 | | | 550 | | | 555,638 |
| | | | | | |
| | | | | | 2,408,680 |
| | | | | | |
RETAIL – 2.3% | | | |
Controladora Commercial Mexicana S.A. de C.V.
6.63%, 6/1/15 | | | 600 | | | 617,335 |
Home Depot, Inc.
5.88%, 12/16/36 | | | 650 | | | 637,860 |
| | | | | | |
| | | | | | 1,255,195 |
| | | | | | |
| | | | | | |
| | | Principal
Amount
(000) | | Value |
| | | | | | |
SUPERMARKETS – 1.0% | | | |
Delhaize America, Inc.
8.13%, 4/15/11 | | $ | 500 | | $ | 539,378 |
| | | | | | |
TELECOMMUNICATIONS – 3.0% | | | |
Intelsat
6.50%, 11/1/13 | | | 260 | | | 221,000 |
Sprint Capital Corp.
6.90%, 5/1/19 | | | 400 | | | 412,414 |
Telecom Italia Capital
5.25%, 11/15/13 | | | 500 | | | 476,745 |
Telefonica Emisiones
6.42%, 6/20/16 | | | 500 | | | 515,809 |
| | | | | | |
| | | | | | 1,625,968 |
| | | | | | |
Total Corporate Debt Obligations (cost $22,934,338) | | | | | | 23,187,851 |
| | | | | | |
COMMERCIAL MORTGAGE BACKED SECURITIES – 8.7% | | | |
Citigroup/Deutsche Bank Commercial Mortgage Trust Series 2005-C1
Class A3
5.23%, 7/15/44 | | | 750 | | | 748,639 |
Commercial Mortgage Asset Trust Series 1999-C1 Class F (2)
6.25%, 1/17/32 | | | 400 | | | 417,332 |
CS First Boston Mortgage Securities Corp. Series 2000-C1 Class A2
7.55%, 4/15/62 | | | 400 | | | 422,714 |
GMAC Commercial Mortgage Securities, Inc. Series 2003-C1 Class A2 | | | | | | |
4.08%, 5/10/36 | | | 800 | | | 750,126 |
4.22%, 4/10/40 | | | 220 | | | 214,659 |
Greenwich Capital Commercial Funding Corp. Series 2005-GG3 Class A4
4.80%, 8/10/42 | | | 200 | | | 193,367 |
GS Mortgage Securities Corp. Series 2005-GG4 Class AJ
4.78%, 7/10/39 | | | 700 | | | 671,327 |
See Notes to Financial Statements.
33
INVESTMENT GRADE BOND FUND
| | |
PORTFOLIO OF INVESTMENTS (Continued) December 31, 2006 | | Sun Capital Advisers Trust |
| | | | | | |
| | | Principal
Amount
(000) | | Value |
| | | | | | |
JP Morgan Chase Commercial Mortgage Series 2005 LDP5 Mortgage Certificate Class A3
5.21%, 12/15/44 | | $ | 550 | | $ | 549,228 |
JP Morgan Chase Commercial Mortgage Securities Corp.
5.88%, 4/15/45 | | | 500 | | | 520,529 |
LB-UBS Commercial Mortgage Trust Series 2002-C2 Class A1
3.83%, 6/15/26 | | | 6 | | | 6,360 |
Wachovia Bank Comercial Mortgage Trust Series 2003-C9 Class A2
3.96%, 12/15/35 | | | 235 | | | 229,237 |
| | | | | | |
Total Commercial Mortgage Backed Securities
(cost $4,697,999) | | | | | | 4,723,518 |
| | | | | | |
U.S. GOVERNMENT AGENCY OBLIGATIONS – 45.7% | | | |
Federal Home Loan Mortgage | | | | | | |
4.75%, 8/1/32 | | | 311 | | | 313,930 |
5.00%, 9/1/19 | | | 377 | | | 371,201 |
5.00%, 11/1/19 | | | 772 | | | 759,636 |
5.50%, 10/1/17 | | | 210 | | | 210,005 |
5.50%, 11/1/17 | | | 410 | | | 410,369 |
5.50%, 9/15/28 | | | 600 | | | 603,640 |
5.50%, 6/1/33 | | | 381 | | | 376,935 |
5.50%, TBA | | | 500 | | | 494,375 |
5.75%, 4/15/08 | | | 1,250 | | | 1,259,239 |
6.00%, 1/1/17 | | | 150 | | | 152,310 |
6.00%, 2/1/29 | | | 20 | | | 20,607 |
6.50%, 10/1/16 | | | 73 | | | 75,055 |
6.50%, 11/1/16 | | | 7 | | | 6,797 |
6.50%, 9/1/34 | | | 403 | | | 410,676 |
6.50%, 4/1/35 | | | 372 | | | 379,012 |
7.00%, 11/1/29 | | | 33 | | | 34,482 |
7.00%, 1/1/31 | | | 16 | | | 16,241 |
7.00%, 4/1/31 | | | 5 | | | 5,103 |
7.00%, 8/1/31 | | | 161 | | | 165,161 |
7.50%, 3/1/30 | | | 9 | | | 8,970 |
7.50%, 12/1/30 | | | 17 | | | 17,857 |
| | | | | | |
| | | Principal
Amount
(000) | | Value |
| | | | | | |
Federal National Mortgage Assn. | | | |
4.50%, 6/1/19 | | $ | 1,378 | | $ | 1,330,655 |
5.00%, 6/1/18 | | | 478 | | | 470,982 |
5.00%, 7/1/20 | | | 1,168 | | | 1,148,575 |
5.00%, 10/1/20 | | | 436 | | | 428,930 |
5.00%, 12/1/20 | | | 272 | | | 267,764 |
5.00%, 9/1/35 | | | 1,118 | | | 1,079,220 |
5.00%, 10/1/35 | | | 505 | | | 487,906 |
5.00%, 1/1/36 | | | 735 | | | 710,104 |
5.00%, 7/1/36 | | | 643 | | | 621,416 |
5.05%, 4/28/15 | | | 1,000 | | | 979,439 |
5.50%, 12/1/32 | | | 1,346 | | | 1,332,369 |
5.50%, 6/1/35 | | | 1,354 | | | 1,339,159 |
5.50%, 8/1/35 | | | 880 | | | 870,345 |
6.00%, 12/1/13 | | | 3 | | | 3,256 |
6.00%, 11/1/16 | | | 24 | | | 24,784 |
6.00%, 1/25/32 | | | 1,349 | | | 1,364,133 |
6.00%, 8/1/34 | | | 490 | | | 493,721 |
6.00%, TBA | | | 1,000 | | | 1,006,562 |
8.00%, 8/1/30 | | | 5 | | | 4,982 |
Government National Mortgage Assn. | | | |
6.00%, 8/15/16 | | | 65 | | | 66,030 |
6.00%, TBA | | | 450 | | | 455,063 |
6.50%, 9/15/31 | | | 94 | | | 96,563 |
6.50%, 3/15/32 | | | 118 | | | 121,425 |
6.50%, 9/15/32 | | | 144 | | | 147,644 |
6.50%, 10/15/32 | | | 211 | | | 216,706 |
7.00%, 12/15/14 | | | 32 | | | 33,286 |
7.00%, 2/15/28 | | | 25 | | | 25,907 |
7.50%, 3/15/30 | | | 3 | | | 3,631 |
7.50%, 9/15/30 | | | 48 | | | 50,425 |
Tennessee Valley Authority Series A
5.63%, 1/18/11 | | | 200 | | | 204,630 |
U.S. Treasury Notes (3) | | | | | | |
1.88%, 7/15/13 | | | 1,100 | | | 1,062,607 |
2.00%, 1/15/14 | | | 711 | | | 690,325 |
3.50%, 11/15/09 | | | 1,800 | | | 1,741,009 |
| | | | | | |
Total U.S. Government Agency Obligations
(cost $25,214,696) | | | | | | 24,971,154 |
| | | | | | |
See Notes to Financial Statements.
34
INVESTMENT GRADE BOND FUND
| | |
PORTFOLIO OF INVESTMENTS (Continued) December 31, 2006 | | Sun Capital Advisers Trust |
| | | | | | | |
| | | Principal
Amount
(000) | | Value | |
| | | | | | | |
SHORT TERM INVESTMENTS – 4.5% | |
COMMERCIAL PAPER – 1.5% | |
Barclays U.S Funding
5.24%, 1/12/07 | | $ | 650 | | $ | 648,959 | |
UBS Finance, Inc.
5.22%, 2/16/07 | | | 205 | | | 203,633 | |
| | | | | | | |
| | | | | | 852,592 | |
| | | | | | | |
| | | Shares | | | |
MUTUAL FUNDS – 3.0% | | | | | | | |
Federated Prime Obligation Fund | | | 1,617,040 | | | 1,617,040 | |
SSGA Money Market Fund | | | 7 | | | 7 | |
| | | | | | | |
| | | | | | 1,617,047 | |
| | | | | | | |
Total Short Term Investments (amortized cost $2,469,639) | | | | | | 2,469,639 | |
| | | | | | | |
TOTAL INVESTMENTS – 102.8% | | | | |
(cost $56,411,577) | | | | | | 56,108,464 | |
Liabilities in excess of other assets – (2.8)% | | | | | | (1,529,460 | ) |
| | | | | | | |
NET ASSETS – 100.0% | | | | | $ | 54,579,004 | |
| | | | | | | |
| (1) | Security is in default. |
| (2) | Eligible for resale under rule 144A of the Securities Act of 1933. These securities may be resold in transactions exempt from registration, normally to qualified institutional buyers. At December 31, 2006 these securities amounted to $6,310,144, representing 11.56% of net assets. |
| (3) | Security or a portion of the security has been designated as collateral for TBA securities. |
TBA = to be announced
See Notes to Financial Statements.
35
MONEY MARKET FUND
| | |
PORTFOLIO OF INVESTMENTS December 31, 2006 | | Sun Capital Advisers Trust |
| | | | | | |
| | | Principal
Amount
(000) | | Value |
| | | | | | |
COMMERCIAL PAPER – 97.6% | | | |
American Express Credit Corp. | | | | | | |
5.22%, 2/23/07 | | $ | 4,687 | | $ | 4,687,000 |
American General Finance Corp. (1) | | | | | | |
5.28%, 1/19/07 | | | 4,800 | | | 4,787,328 |
AT&T, Inc. (1) | | | | | | |
5.24%, 1/10/07 | | | 1,000 | | | 998,690 |
5.25%, 1/2/07 | | | 1,885 | | | 1,884,725 |
5.25%, 1/10/07 | | | 2,000 | | | 1,997,375 |
Barclays U.S. Funding | | | | | | |
5.24%, 1/12/07 | | | 1,590 | | | 1,587,454 |
5.30%, 1/29/07 | | | 3,300 | | | 3,286,397 |
BellSouth Corp. (1) | | | | | | |
5.22%, 1/12/07 | | | 2,195 | | | 2,191,499 |
5.22%, 2/2/07 | | | 2,035 | | | 2,025,558 |
Canada (Govt of) | | | | | | |
5.00%, 4/9/07 | | | 5,100 | | | 5,030,583 |
Citigroup Funding, Inc. | | | | | | |
5.20%, 1/4/07 | | | 2,235 | | | 2,235,000 |
5.24%, 2/12/07 | | | 2,662 | | | 2,662,000 |
Coca-Cola Co. (1) | | | | | | |
5.17%, 2/20/07 | | | 4,865 | | | 4,830,067 |
Export Development Corp. | | | | | | |
5.10%, 2/1/07 | | | 1,000 | | | 995,608 |
5.11%, 1/16/07 | | | 1,000 | | | 997,871 |
5.13%, 1/16/07 | | | 1,600 | | | 1,596,580 |
FCAR Owner Trust | | | | | | |
5.19%, 3/2/07 | | | 1,240 | | | 1,229,274 |
5.25%, 1/25/07 | | | 3,920 | | | 3,906,280 |
General Electric Capital Corp. | | | | | | |
5.21%, 1/31/07 | | | 1,843 | | | 1,843,000 |
5.24%, 2/16/07 | | | 2,113 | | | 2,113,000 |
Goldman Sachs Group | | | | | | |
5.21%, 2/1/07 | | | 1,560 | | | 1,553,001 |
5.23%, 1/19/07 | | | 2,000 | | | 1,994,770 |
5.23%, 2/1/07 | | | 1,155 | | | 1,149,798 |
Harley Davidson (1) | | | | | | |
5.23%, 2/12/07 | | | 4,900 | | | 4,870,102 |
International Business Machines Corp. (IBM) (1) | | | | | | |
5.17%, 1/5/07 | | | 4,950 | | | 4,947,156 |
KFW International Finance, Inc. (1) | | | |
5.14%, 4/26/07 | | | 3,600 | | | 3,540,890 |
5.18%, 2/21/07 | | | 1,300 | | | 1,290,460 |
| | | | | | |
| | | Principal
Amount
(000) | | Value |
| | | | | | |
Merrill Lynch & Co., Inc. | | | | | | |
5.21%, 2/20/07 | | $ | 5,000 | | $ | 4,963,819 |
Morgan Stanley Dean Witter | | | | | | |
5.24%, 3/6/07 | | | 3,300 | | | 3,269,259 |
5.24%, 3/7/07 | | | 1,600 | | | 1,584,862 |
Province of British Columbia | | | | | | |
5.25%, 1/22/07 | | | 4,950 | | | 4,934,841 |
Prudential Funding LLC | | | | | | |
5.19%, 2/21/07 | | | 4,000 | | | 3,970,590 |
Rabobank USA Financial Corp. | | | | | | |
5.24%, 1/10/07 | | | 1,630 | | | 1,627,865 |
5.26%, 1/19/07 | | | 2,950 | | | 2,942,242 |
Societe Generale North America | | | | | | |
5.21%, 3/12/07 | | | 5,000 | | | 4,949,396 |
The Procter & Gamble Co. (1) | | | | | | |
5.21%, 2/20/07 | | | 4,290 | | | 4,258,957 |
Thunder Bay Funding, Inc. (1) | | | | | | |
5.24%, 1/5/07 | | | 4,015 | | | 4,012,662 |
Toyota Credit de Puerto Rico | | | | | | |
5.23%, 1/18/07 | | | 3,400 | | | 3,391,603 |
5.23%, 2/15/07 | | | 1,442 | | | 1,432,573 |
UBS Finance, Inc. | | | | | | |
5.22%, 2/16/07 | | | 3,760 | | | 3,734,921 |
United Parcel Service, Inc. | | | | | | |
5.06%, 1/3/07 | | | 3,240 | | | 3,239,089 |
| | | | | | |
Total Commercial Paper (amortized cost $118,544,145) | | | | | | 118,544,145 |
| | | | | | |
| | | Shares | | |
MUTUAL FUNDS – 2.3% | | | | | | |
Federated Prime Obligation Fund | | | 2,824,507 | | | 2,824,507 |
SSGA Money Market Fund | | | 1,435 | | | 1,435 |
| | | | | | |
TOTAL MUTUAL FUNDS (amortized cost $2,825,942) | | | | | | 2,825,942 |
| | | | | | |
TOTAL INVESTMENTS – 99.9% | | | |
(cost $121,370,087) | | | | | | 121,370,087 |
Other assets less
liabilities – 0.1% | | | | | | 68,487 |
| | | | | | |
NET ASSETS – 100.0% | | | | | $ | 121,438,574 |
| | | | | | |
| (1) | Security exempt from registration under Section 4(2) of the Securities Act of 1933. These securities may be resold in transactions exempt from registration, normally to qualified institutional buyers. At December 31, 2006 these securities amounted to $41,635,469, representing 34.29% of net assets. |
See Notes to Financial Statements.
36
REAL ESTATE FUND
| | |
PORTFOLIO OF INVESTMENTS December 31, 2006 | | Sun Capital Advisers Trust |
| | | | | |
| | | Shares | | Value |
| | | | | |
REAL ESTATE INVESTMENT TRUSTS – 97.1% |
APARTMENTS – 13.2% | | | | | |
Archstone-Smith Trust | | 155,376 | | $ | 9,044,437 |
AvalonBay Communities, Inc. | | 50,325 | | | 6,544,766 |
BRE Properties, Inc. | | 133,731 | | | 8,695,190 |
Equity Residential Properties Trust | | 116,938 | | | 5,934,603 |
| | | | | |
| | | | | 30,218,996 |
| | | | | |
BANKS – 3.2% | | | | | |
New York Community
Bancorp, Inc. | | 449,023 | | | 7,229,270 |
| | | | | |
DIVERSIFIED – 10.2% | | | | | |
iStar Financial, Inc. | | 159,175 | | | 7,611,749 |
Lexington Corporate Properties Trust | | 355,479 | | | 7,969,839 |
Vornado Realty Trust | | 62,658 | | | 7,612,947 |
| | | | | |
| | | | | 23,194,535 |
| | | | | |
FINANCIAL SERVICES – 3.0% | | | | | |
CapitalSource, Inc. | | 251,938 | | | 6,880,427 |
| | | | | |
HEALTH CARE EQUIPMENT & SERVICES – 10.6% |
Medical Properties Trust, Inc. | | 598,412 | | | 9,155,704 |
Nationwide Health Properties, Inc. | | 148,058 | | | 4,474,313 |
Ventas, Inc. | | 248,992 | | | 10,537,341 |
| | | | | |
| | | | | 24,167,358 |
| | | | | |
HOTELS & RESTAURANTS – 6.8% | | | |
Hilton Hotels Corp. | | 146,367 | | | 5,108,208 |
Host Marriott Corp. | | 260,885 | | | 6,404,727 |
Innkeepers USA Trust | | 253,163 | | | 3,924,027 |
| | | | | |
| | | | | 15,436,962 |
| | | | | |
MORTGAGE – 2.7% | | | | | |
Douglas Emmett, Inc. | | 56,848 | | | 1,511,588 |
Health Care Property Investors, Inc. | | 123,383 | | | 4,542,962 |
| | | | | |
| | | | | 6,054,550 |
| | | | | |
OFFICE – 15.5% | | | | | |
Alexandria Real Estate Equities, Inc. | | 79,715 | | | 8,003,386 |
Equity Office Properties Trust | | 189,599 | | | 9,132,984 |
Highwoods Properties, Inc. | | 197,162 | | | 8,036,323 |
SL Green Reality Corp. | | 76,461 | | | 10,152,492 |
| | | | | |
| | | | | 35,325,185 |
| | | | | |
| | | | | |
| | | Shares | | Value |
| | | | | |
REGIONAL MALLS – 14.0% | | | |
General Growth Properties, Inc. | | 124,412 | | $ | 6,498,039 |
Macerich Co. | | 109,711 | | | 9,497,681 |
Pennsylvania Real Estate Investment | | 137,882 | | | 5,429,793 |
Simon Property Group, Inc. | | 104,732 | | | 10,608,304 |
| | | | | |
| | | | | 32,033,817 |
| | | | | |
SHOPPING CENTERS – 9.3% | | | |
Developers Diversified Realty Corp. | | 117,518 | | | 7,397,758 |
Kimco Realty Corp. | | 174,203 | | | 7,830,425 |
Regency Centers Corp. | | 78,179 | | | 6,111,252 |
| | | | | |
| | | | | 21,339,435 |
| | | | | |
STORAGE – 2.8% | | | | | |
Public Storage, Inc. | | 65,045 | | | 6,341,888 |
| | | | | |
WAREHOUSE & INDUSTRIAL – 5.8% | | | |
Eastgroup Properties, Inc. | | 122,165 | | | 6,543,157 |
ProLogis Trust | | 111,774 | | | 6,792,506 |
| | | | | |
| | | | | 13,335,663 |
| | | | | |
Total Real Estate Investment Trusts
(cost $162,167,422) | | | | | 221,558,086 |
| | | | | |
SHORT TERM INVESTMENT – 2.7% |
MUTUAL FUNDS – 2.7% | | | | | |
Federated Prime Obligation Fund (amortized cost $6,112,461) | | 6,112,461 | | | 6,112,461 |
| | | | | |
TOTAL INVESTMENTS – 99.8% | | | |
(cost $168,279,883) | | | | | 227,670,547 |
Other assets less
liabilities – 0.2% | | | | | 480,644 |
| | | | | |
NET ASSETS – 100.0% | | | | $ | 228,151,191 |
| | | | | |
See Notes to Financial Statements.
37
DAVIS VENTURE VALUE FUND
| | |
PORTFOLIO OF INVESTMENTS December 31, 2006 | | Sun Capital Advisers Trust |
| | | | | | | |
| | | Country
Code | | Shares | | Value |
| | | | | | | |
COMMON STOCKS – 99.0% | | | | | |
AIR FREIGHT & LOGISTICS – 0.5% |
United Parcel Services, Inc. Class B | | | | 4,000 | | $ | 299,920 |
| | | | | | | |
AUTOMOBILES – 1.9% | | | | | |
Harley-Davidson, Inc. | | | | 16,900 | | | 1,190,943 |
| | | | | | | |
BEVERAGES – 2.0% | | | | | | | |
Diageo PLC ADR | | | | 9,600 | | | 761,376 |
Heineken Holding NV | | NL | | 11,425 | | | 464,354 |
| | | | | | | |
| | | | | | | 1,225,730 |
| | | | | | | |
CAPITAL MARKETS – 2.5% | | | |
Ameriprise Financial, Inc. | | | | 13,080 | | | 712,860 |
Mellon Financial Corp | | | | 6,600 | | | 278,190 |
Morgan Stanley | | | | 5,600 | | | 456,008 |
State Street Corp. | | | | 1,700 | | | 114,648 |
| | | | | | | |
| | | | | | | 1,561,706 |
| | | | | | | |
COMMERCIAL BANKS – 8.2% | | | |
Commerce Bancorp, Inc. | | | | 10,000 | | | 352,700 |
HSBC Holdings PLC | | GB | | 89,881 | | | 1,638,982 |
Wachovia Corp. | | | | 26,420 | | | 1,504,619 |
Wells Fargo & Co. | | | | 44,100 | | | 1,568,196 |
| | | | | | | |
| | | | | | | 5,064,497 |
| | | | | | | |
COMMERCIAL SERVICES & SUPPLIES – 1.3% |
D & B Corp.* | | | | 9,300 | | | 769,947 |
| | | | | | | |
COMMUNICATIONS EQUIPMENT – 0.2% |
Nokia Corp. ADR | | | | 6,800 | | | 138,176 |
| | | | | | | |
COMPUTERS & PERIPHERALS – 1.3% |
Dell, Inc.* | | | | 15,400 | | | 386,386 |
Hewlett-Packard Co. | | | | 9,500 | | | 391,305 |
| | | | | | | |
| | | | | | | 777,691 |
| | | | | | | |
CONSTRUCTION MATERIALS – 1.5% |
Martin Marietta Materials, Inc. | | | | 4,800 | | | 498,768 |
Vulcan Materials Co. | | | | 4,900 | | | 440,363 |
| | | | | | | |
| | | | | | | 939,131 |
| | | | | | | |
CONSUMER FINANCE – 4.6% | | | |
American Express Co. | | | | 46,100 | | | 2,796,887 |
| | | | | | | |
| | | | | | | |
| | | Country
Code | | Shares | | Value |
| | | | | | | |
CONTAINERS & PACKAGING – 2.2% |
Sealed Air Corp. | | | | 20,800 | | $ | 1,350,336 |
| | | | | | | |
DIVERSIFIED CONSUMER SERVICES – 1.3% |
Apollo Group, Inc. Class A* | | | | 3,900 | | | 151,983 |
H&R Block, Inc. | | | | 27,500 | | | 633,600 |
| | | | | | | |
| | | | | | | 785,583 |
| | | | | | | |
DIVERSIFIED FINANCIAL SERVICES – 7.8% |
Citigroup, Inc. | | | | 24,633 | | | 1,372,058 |
JPMorgan Chase & Co. | | | | 53,796 | | | 2,598,347 |
Moody’s Corp. | | | | 12,000 | | | 828,720 |
| | | | | | | |
| | | | | | | 4,799,125 |
| | | | | | | |
ENERGY EQUIPMENT & SERVICES – 0.8% |
Transocean, Inc.* | | | | 6,300 | | | 509,607 |
| | | | | | | |
FOOD & STAPLES RETAILING – 5.5% |
Costco Wholesale Corp. | | | | 42,400 | | | 2,241,688 |
Wal-Mart Stores, Inc. | | | | 24,600 | | | 1,136,028 |
| | | | | | | |
| | | | | | | 3,377,716 |
| | | | | | | |
FOOD PRODUCTS – 0.6% | | | | | |
The Hershey Co. | | | | 7,000 | | | 348,600 |
| | | | | | | |
HEALTH CARE PROVIDERS & SERVICES – 3.7% |
Cardinal Health, Inc. | | | | 8,500 | | | 547,655 |
Caremark Rx, Inc. | | | | 14,100 | | | 805,251 |
Express Scripts Inc* | | | | 3,700 | | | 264,920 |
UnitedHealth Group, Inc. | | | | 12,300 | | | 660,879 |
| | | | | | | |
| | | | | | | 2,278,705 |
| | | | | | | |
HOUSEHOLD DURABLES – 0.2% |
Hunter Douglas NV | | NL | | 1,760 | | | 141,440 |
| | | | | | | |
HOUSEHOLD PRODUCTS – 1.1% |
The Procter & Gamble Co. | | | | 10,500 | | | 674,835 |
| | | | | | | |
INDUSTRIAL CONGLOMERATES – 4.3% |
Tyco International, Ltd. | | | | 87,130 | | | 2,648,752 |
| | | | | | | |
INSURANCE – 14.4% | | | |
Ambac Financial Group, Inc. | | | | 310 | | | 27,612 |
See Notes to Financial Statements.
38
DAVIS VENTURE VALUE FUND
| | |
PORTFOLIO OF INVESTMENTS (Continued) December 31, 2006 | | Sun Capital Advisers Trust |
| | | | | | | |
| | | Country
Code | | Shares | | Value |
| | | | | | | |
American International Group, Inc. | | | | 39,000 | | $ | 2,794,740 |
Aon Corp. | | | | 11,100 | | | 392,274 |
Berkshire Hathaway, Inc. Class A* | | | | 19 | | | 2,089,810 |
Loews Corp. | | | | 31,000 | | | 1,285,570 |
Markel Corp.* | | | | 110 | | | 52,811 |
The Chubb Corp. | | | | 3,000 | | | 158,730 |
The Principal Financial Group, Inc. | | | | 3,400 | | | 199,580 |
The Progressive Corp. | | | | 54,900 | | | 1,329,678 |
Transatlantic Holdings, Inc. | | | | 8,787 | | | 545,673 |
| | | | | | | |
| | | | | | | 8,876,478 |
| | | | | | | |
INTERNET & CATALOG RETAIL – 1.3% |
Amazon.com, Inc.* | | | | 9,800 | | | 386,708 |
Expedia, Inc.* | | | | 3,900 | | | 81,822 |
IAC/InterActiveCorp* | | | | 3,800 | | | 141,208 |
Liberty Media
Corp – Interactive Series A* | | | | 9,100 | | | 196,287 |
| | | | | | | |
| | | | | | | 806,025 |
| | | | | | | |
IT SERVICES – 1.3% | | | |
Iron Mountain, Inc.* | | | | 18,900 | | | 781,326 |
| | | | | | | |
MARINE – 0.4% | | | | | | | |
Kuehne & Nagel International AG | | CH | | 3,000 | | | 218,054 |
| | | | | | | |
MEDIA – 7.2% | | | | | | | |
Comcast Corp. Class A Special* | | | | 50,700 | | | 2,123,316 |
Gannett Co., Inc. | | | | 2,600 | | | 157,196 |
Lagardere S.C.A. | | FR | | 6,500 | | | 523,222 |
Liberty Media
Corp – Capital Series A* | | | | 1,840 | | | 180,283 |
News Corp., Class A | | | | 47,200 | | | 1,013,856 |
NTL, Inc. | | | | 11,452 | | | 289,048 |
WPP Group PLC ADR | | | | 2,300 | | | 155,802 |
| | | | | | | |
| | | | | | | 4,442,723 |
| | | | | | | |
METALS & MINING – 0.4% |
BHP Billiton PLC | | GB | | 6,800 | | | 124,465 |
Rio Tinto PLC | | GB | | 2,500 | | | 133,090 |
| | | | | | | |
| | | | | | | 257,555 |
| | | | | | | |
| | | | | | | |
| | | Country
Code | | Shares | | Value |
| | | | | | | |
MULTILINE RETAIL – 0.2% |
Sears Holdings Corp* | | | | 840 | | $ | 141,061 |
| | | | | | | |
OIL, GAS & CONSUMABLE FUELS – 11.3% |
Canadian Natural Resources Ltd | | | | 4,600 | | | 244,858 |
China Coal Energy Co* | | HK | | 213,100 | | | 138,914 |
ConocoPhillips | | | | 39,328 | | | 2,829,650 |
Devon Energy Corp. | | | | 20,000 | | | 1,341,600 |
EOG Resources, Inc. | | | | 17,200 | | | 1,074,140 |
Occidental Petroleum Corp. | | | | 26,800 | | | 1,308,644 |
| | | | | | | |
| | | | | | | 6,937,806 |
| | | | | | | |
PERSONAL PRODUCTS – 0.4% |
Avon Products, Inc. | | | | 7,200 | | | 237,888 |
| | | | | | | |
SOFTWARE – 2.2% | | | | | | | |
Microsoft Corp. | | | | 45,600 | | | 1,361,616 |
| | | | | | | |
SPECIALTY RETAIL – 1.3% |
Bed Bath & Beyond, Inc.* | | | | 8,300 | | | 316,230 |
CarMax, Inc.* | | | | 3,200 | | | 171,616 |
Lowe’s Cos., Inc. | | | | 9,700 | | | 302,155 |
| | | | | | | |
| | | | | | | 790,001 |
| | | | | | | |
TOBACCO – 4.5% |
Altria Group, Inc. | | | | 31,900 | | | 2,737,658 |
| | | | | | | |
TRANSPORTATION INFRASTRUCTURE – 1.0% |
China Merchants Holdings International Co., Ltd. | | HK | | 97,989 | | | 401,904 |
Cosco Pacific, Ltd. | | HK | | 83,300 | | | 194,712 |
| | | | | | | |
| | | | | | | 596,616 |
| | | | | | | |
WIRELESS TELECOMMUNICATION SERVICES – 1.6% |
SK Telecom Co., Ltd. ADR | | | | 12,200 | | | 323,056 |
Sprint Nextel Corp. | | | | 35,300 | | | 666,817 |
| | | | | | | |
| | | | | | | 989,873 |
| | | | | | | |
Total Common Stocks
(cost $41,720,209) | | | | | | | 60,854,007 |
| | | | | | | |
See Notes to Financial Statements.
39
DAVIS VENTURE VALUE FUND
| | |
PORTFOLIO OF INVESTMENTS (Continued) December 31, 2006 | | Sun Capital Advisers Trust |
| | | | | | | |
| | | Principal
Amount
(000) | | Value | |
| | | | | | | |
SHORT TERM INVESTMENT – 1.1% | |
REPURCHASE AGREEMENT – 1.1% | | | | |
State Street Bank and Trust Company 4.680, %, 1/2/07 (collateralized by $675,000 Federal Home Loan Bank, 4.375%, 09/17/10, with a value of $670,205 total to be received $653,340)
(amortized cost $653,000) | | $ | 653 | | $ | 653,000 | |
| | | | | | | |
TOTAL INVESTMENTS – 100.1% | | | | |
(cost $42,373,209) | | | | | | 61,507,007 | |
Liabilities in excess of other assets – (0.1)% | | | | | | (41,269 | ) |
| | | | | | | |
NET ASSETS – 100.0% | | | | | $ | 61,465,738 | |
| | | | | | | |
| * | Non-income producing security |
ADR = American Depositary Receipt
CH = Switzerland
FR = France
GB = Great Britain
HK = Hong Kong
NL = Netherlands
See Notes to Financial Statements.
40
OPPENHEIMER MAIN STREET SMALL CAP FUND
| | |
PORTFOLIO OF INVESTMENTS December 31, 2006 | | Sun Capital Advisers Trust |
| | | | | | | |
| | | Country
Code | | Shares | | Value |
| | | | | | | |
COMMON STOCKS – 99.3% |
AEROSPACE & DEFENSE – 1.1% |
AerCap Holdings NV* | | | | 4,600 | | $ | 106,628 |
Armor Holdings, Inc.* | | | | 2,300 | | | 126,155 |
Ceradyne, Inc.* | | | | 2,400 | | | 135,600 |
Cubic Corp. | | | | 200 | | | 4,340 |
Curtiss-Wright Corp. | | | | 300 | | | 11,124 |
DynCorp International, Inc.* | | | | 1,400 | | | 22,218 |
K&F Industries Holdings, Inc.* | | | | 1,300 | | | 29,523 |
L-3 Communications Holdings Inc | | | | 400 | | | 32,712 |
Orbital Sciences Corp.* | | | | 12,300 | | | 226,812 |
Spirit Aerosystems Holdings, Inc.* | | | | 2,670 | | | 89,365 |
Teledyne Technologies, Inc.* | | | | 3,000 | | | 120,390 |
Triumph Group, Inc. | | | | 100 | | | 5,243 |
United Industrial Corp. | | | | 1,000 | | | 50,750 |
| | | | | | | |
| | | | | | | 960,860 |
| | | | | | | |
AIR FREIGHT & LOGISTICS – 0.8% |
ABX Air, Inc.* | | | | 1,400 | | | 9,702 |
Atlas Air Worldwide Holdings, Inc.* | | | | 1,600 | | | 71,200 |
EGL, Inc.* | | | | 3,451 | | | 102,771 |
HUB Group, Inc.* | | | | 9,300 | | | 256,215 |
Pacer International, Inc. | | | | 7,900 | | | 235,183 |
| | | | | | | |
| | | | | | | 675,071 |
| | | | | | | |
AIRLINES – 0.8% |
Alaska Air Group, Inc.* | | | | 5,400 | | | 213,300 |
Allegiant Travel Co* | | | | 260 | | | 7,296 |
AMR Corp.* | | | | 5,970 | | | 180,473 |
Continental Airlines, Inc.* | | | | 4,174 | | | 172,177 |
ExpressJet Holdings, Inc.* | | | | 4,100 | | | 33,210 |
Frontier Airlines Holdings, Inc.* | | | | 2,300 | | | 17,020 |
Mesa Air Group, Inc.* | | | | 100 | | | 857 |
SkyWest, Inc. | | | | 1,500 | | | 38,265 |
US Airways Group, Inc.* | | | | 200 | | | 10,770 |
| | | | | | | |
| | | | | | | 673,368 |
| | | | | | | |
| | | | | | | |
| | | Country
Code | | Shares | | Value |
| | | | | | | |
AUTO COMPONENTS – 1.4% |
Aftermarket Technology Corp.* | | | | 1,700 | | $ | 36,176 |
ArvinMeritor, Inc. | | | | 14,200 | | | 258,866 |
Autoliv, Inc. | | | | 1,500 | | | 90,450 |
Fuel Systems Solutions, Inc.* | | | | 500 | | | 11,040 |
GenTek, Inc.* | | | | 600 | | | 20,754 |
Lear Corp. | | | | 7,240 | | | 213,797 |
Modine Manufacturing Co. | | | | 3,400 | | | 85,102 |
Sauer- Danfoss, Inc. | | | | 2,800 | | | 90,300 |
Shiloh Industries, Inc.* | | | | 600 | | | 11,370 |
Standard Motor Products, Inc. | | | | 100 | | | 1,498 |
Tenneco Automotive, Inc.* | | | | 10,500 | | | 259,560 |
The Goodyear Tire & Rubber Co.* | | | | 5,700 | | | 119,643 |
| | | | | | | |
| | | | | | | 1,198,556 |
| | | | | | | |
AUTOMOBILES – 0.1% |
Winnebago Indiana, Inc. | | | | 3,600 | | | 118,476 |
| | | | | | | |
BEVERAGES – 0.2% |
Boston Beer Co., Inc.* | | | | 600 | | | 21,588 |
Cott Corp* | | | | 700 | | | 10,017 |
Jones Soda Co.* | | | | 600 | | | 7,380 |
MGP Ingredients, Inc. | | | | 1,400 | | | 31,654 |
Molson Coors Brewing Co | | | | 1,100 | | | 84,084 |
National Beverage Corp. | | | | 1,700 | | | 23,851 |
| | | | | | | |
| | | | | | | 178,574 |
| | | | | | | |
BIOTECHNOLOGY – 0.2% |
Alexion Pharmaceuticals, Inc.* | | | | 300 | | | 12,117 |
Alnylam Pharmaceuticals, Inc.* | | | | 200 | | | 4,280 |
Array Biopharma, Inc.* | | | | 200 | | | 2,584 |
Digene Corp.* | | | | 500 | | | 23,960 |
Enzon Pharmaceuticals, Inc.* | | | | 1,700 | | | 14,467 |
Indevus Pharmaceuticals, Inc.* | | | | 500 | | | 3,550 |
See Notes to Financial Statements.
41
OPPENHEIMER MAIN STREET SMALL CAP FUND
| | |
PORTFOLIO OF INVESTMENTS (Continued) December 31, 2006 | | Sun Capital Advisers Trust |
| | | | | | | |
| | | Country
Code | | Shares | | Value |
| | | | | | | |
Isis Pharmaceuticals, Inc.* | | | | 3,200 | | $ | 35,584 |
Omrix Biopharmaceuticals, Inc.* | | | | 500 | | | 15,130 |
OSI Pharmaceuticals, Inc.* | | | | 300 | | | 10,494 |
QLT, Inc.* | | | | 2,100 | | | 17,766 |
Regeneron Pharmaceuticals, Inc.* | | | | 1,000 | | | 20,070 |
Savient Pharmaceuticals, Inc.* | | | | 3,100 | | | 34,751 |
United Therapeutics Corp.* | | | | 400 | | | 21,748 |
| | | | | | | |
| | | | | | | 216,501 |
| | | | | | | |
BUILDING PRODUCTS – 0.5% |
American Woodmark Corp. | | | | 1,400 | | | 58,590 |
Ameron International Corp. | | | | 800 | | | 61,096 |
Builders FirstSource, Inc.* | | | | 3,200 | | | 57,056 |
Goodman Global, Inc.* | | | | 1,500 | | | 25,800 |
Insteel Industries, Inc. | | | | 2,200 | | | 39,138 |
Jacuzzi Brands, Inc.* | | | | 400 | | | 4,972 |
PW Eagle, Inc. | | | | 1,500 | | | 51,750 |
Universal Forest Products, Inc. | | | | 3,800 | | | 177,156 |
| | | | | | | |
| | | | | | | 475,558 |
| | | | | | | |
CAPITAL MARKETS – 1.0% |
Cohen & Steers, Inc. | | | | 2,300 | | | 92,391 |
Janus Capital Group, Inc. | | | | 4,100 | | | 88,519 |
KBW, Inc.* | | | | 300 | | | 8,817 |
Knight Capital Group, Inc.* | | | | 15,529 | | | 297,691 |
Lazard, Ltd. | | | | 500 | | | 23,670 |
Piper Jaffray Cos., Inc.* | | | | 3,900 | | | 254,085 |
Stifel Financial Corp.* | | | | 400 | | | 15,692 |
SWS Group, Inc. | | | | 1,500 | | | 53,550 |
| | | | | | | |
| | | | | | | 834,415 |
| | | | | | | |
CHEMICALS – 4.0% |
Albemarle Corp. | | | | 1,500 | | | 107,700 |
Arch Chemicals, Inc. | | | | 1,600 | | | 53,296 |
Ashland, Inc. | | | | 1,600 | | | 110,688 |
Cabot Corp | | | | 200 | | | 8,714 |
CF Industries Holdings, Inc. | | | | 8,000 | | | 205,120 |
| | | | | | | |
| | | Country
Code | | Shares | | Value |
| | | | | | | |
Eastman Chemical Co. | | | | 200 | | $ | 11,862 |
FMC Corp. | | | | 900 | | | 68,895 |
Fuller H B Co. | | | | 11,300 | | | 291,766 |
Georgia Gulf Corp. | | | | 2,800 | | | 54,068 |
Hercules, Inc.* | | | | 16,900 | | | 326,339 |
Innophos Holdings, Inc.* | | | | 2,700 | | | 39,636 |
Innospec, Inc. | | | | 100 | | | 4,655 |
Koppers Holdings, Inc. | | | | 500 | | | 13,035 |
Landec Corp.* | | | | 200 | | | 2,152 |
Lubrizol Corp. | | | | 1,600 | | | 80,208 |
Lyondell Chemical Co. | | | | 4,400 | | | 112,508 |
MacDermid, Inc. | | | | 1,900 | | | 64,790 |
NewMarket Corp. | | | | 4,400 | | | 259,820 |
Olin Corp. | | | | 4,600 | | | 75,992 |
OM Group, Inc.* | | | | 6,100 | | | 276,208 |
Pioneer Cos., Inc.* | | | | 1,600 | | | 45,856 |
PolyOne Corp.* | | | | 20,600 | | | 154,500 |
Rockwood Holdings, Inc.* | | | | 1,300 | | | 32,838 |
Rohm & Haas Co. | | | | 300 | | | 15,336 |
Schulman A, Inc. | | | | 2,000 | | | 44,500 |
Sensient Technologies Corp. | | | | 7,600 | | | 186,960 |
Spartech Corp. | | | | 9,000 | | | 235,980 |
Stepan Chemical Co. | | | | 500 | | | 15,835 |
Terra Industries, Inc.* | | | | 13,300 | | | 159,334 |
Tronox, Inc. | | | | 3,500 | | | 55,965 |
Valspar Corp. | | | | 2,600 | | | 71,864 |
WR Grace & Co.* | | | | 16,400 | | | 324,720 |
| | | | | | | |
| | | | | | | 3,511,140 |
| | | | | | | |
COMMERCIAL BANKS – 0.9% |
Bancorpsouth, Inc. | | | | 800 | | | 21,456 |
Banner Corp. | | | | 300 | | | 13,302 |
City Holding Co. | | | | 900 | | | 36,801 |
Columbia Banking Systems, Inc. | | | | 600 | | | 21,072 |
Community Trust Bancorp, Inc. | | | | 200 | | | 8,306 |
Financial Institutions, Inc. | | | | 100 | | | 2,305 |
First Citizens BancShares, Inc. | | | | 200 | | | 40,528 |
First Security Group, Inc. | | | | 2,200 | | | 25,366 |
See Notes to Financial Statements.
42
OPPENHEIMER MAIN STREET SMALL CAP FUND
| | |
PORTFOLIO OF INVESTMENTS (Continued) December 31, 2006 | | Sun Capital Advisers Trust |
| | | | | | | |
| | | Country
Code | | Shares | | Value |
| | | | | | | |
First South Bancorp, Inc. | | | | 100 | | $ | 3,189 |
Frontier Financial Corp. | | | | 850 | | | 24,845 |
Greater Bay Bancorp | | | | 4,400 | | | 115,852 |
Greene County Bancshares, Inc. | | | | 200 | | | 7,946 |
Hancock Holding Co. | | | | 2,000 | | | 105,680 |
Hanmi Financial Corp. | | | | 2,500 | | | 56,325 |
Independent Bank Corp. | | | | 685 | | | 17,324 |
Intervest Bancshares Corp.* | | | | 1,000 | | | 34,410 |
National Penn Bancshares, Inc. | | | | 136 | | | 2,754 |
Porter Bancorp, Inc. | | | | 400 | | | 8,876 |
Preferred Bank | | | | 400 | | | 24,036 |
PrivateBancorp, Inc. | | | | 700 | | | 29,141 |
Provident Bankshares Corp. | | | | 1,400 | | | 49,840 |
Republic Bancorp, Inc. | | | | 300 | | | 7,527 |
Southwest Bancorp, Inc. | | | | 300 | | | 8,358 |
Sterling Bancshares, Inc. | | | | 900 | | | 11,718 |
Sterling Financial Corp. | | | | 3,200 | | | 108,192 |
Taylor Cap Group, Inc. | | | | 100 | | | 3,661 |
Union Bankshares Corp. | | | | 50 | | | 1,530 |
United Community Banks, Inc. | | | | 200 | | | 6,464 |
| | | | | | | |
| | | | | | | 796,804 |
| | | | | | | |
COMMERCIAL SERVICES & SUPPLIES – 5.1% |
Administaff, Inc. | | | | 6,200 | | | 265,174 |
Allied Waste Industries, Inc.* | | | | 3,400 | | | 41,786 |
American Ecology Corp. | | | | 300 | | | 5,553 |
American Reprographics Co.* | | | | 1,700 | | | 56,627 |
Amrep Corp. | | | | 300 | | | 36,750 |
Avery Dennison Corp | | | | 500 | | | 33,965 |
Banta Corp. | | | | 3,500 | | | 127,400 |
Bowne & Co., Inc. | | | | 700 | | | 11,158 |
CBIZ, Inc.* | | | | 5,000 | | | 34,850 |
Cdi Corp | | | | 100 | | | 2,490 |
| | | | | | | |
| | | Country
Code | | Shares | | Value |
| | | | | | | |
Central Parking Corp. | | | | 1,500 | | $ | 27,000 |
Cenveo, Inc.* | | | | 7,800 | | | 165,360 |
Clean Harbors, Inc.* | | | | 2,300 | | | 111,343 |
COMSYS IT Partners, Inc.* | | | | 1,700 | | | 34,357 |
Consolidated Graphics, Inc.* | | | | 2,000 | | | 118,140 |
Cornell Cos., Inc.* | | | | 500 | | | 9,165 |
Corrections Corp of America* | | | | 1,250 | | | 56,537 |
Covanta Holding Corp* | | | | 4,300 | | | 94,772 |
CRA International, Inc.* | | | | 600 | | | 31,440 |
Deluxe Corp. | | | | 6,500 | | | 163,800 |
Diamond Management & Technology Consultants, Inc. | | | | 600 | | | 7,464 |
Ennis, Inc. | | | | 2,200 | | | 53,812 |
Exponent, Inc.* | | | | 1,900 | | | 35,454 |
First Consulting Group, Inc.* | | | | 700 | | | 9,632 |
Geo Group, Inc.* | | | | 750 | | | 28,140 |
Healthcare Services Group, Inc. | | | | 900 | | | 26,064 |
Heidrick & Struggles International, Inc.* | | | | 1,500 | | | 63,540 |
ICT Group, Inc.* | | | | 1,200 | | | 37,908 |
IHS, Inc.* | | | | 1,900 | | | 75,012 |
IKON Office Solutions, Inc. | | | | 16,100 | | | 263,557 |
John H Harland Co. | | | | 5,900 | | | 296,180 |
Kelly Services, Inc. | | | | 100 | | | 2,894 |
Kenexa Corp* | | | | 300 | | | 9,978 |
Kforce, Inc.* | | | | 2,200 | | | 26,774 |
Knoll, Inc. | | | | 5,800 | | | 127,600 |
Korn / Ferry International* | | | | 11,500 | | | 264,040 |
Labor Ready, Inc.* | | | | 13,600 | | | 249,288 |
Manpower, Inc. | | | | 1,600 | | | 119,888 |
Miller Herman, Inc. | | | | 1,100 | | | 39,996 |
On Assignment, Inc.* | | | | 1,800 | | | 21,150 |
PeopleSupport, Inc.* | | | | 1,600 | | | 33,680 |
PHH Corp.* | | | | 3,800 | | | 109,706 |
Pike Electric Corp* | | | | 1,400 | | | 22,862 |
Resources Global Professionals* | | | | 200 | | | 6,368 |
See Notes to Financial Statements.
43
OPPENHEIMER MAIN STREET SMALL CAP FUND
| | |
PORTFOLIO OF INVESTMENTS (Continued) December 31, 2006 | | Sun Capital Advisers Trust |
| | | | | | | |
| | | Country
Code | | Shares | | Value |
| | | | | | | |
Robert Half International, Inc. | | | | 1,000 | | $ | 37,120 |
RR Donnelley & Sons Co. | | | | 1,700 | | | 60,418 |
SAIC, Inc.* | | | | 600 | | | 10,674 |
School Specialty, Inc.* | | | | 200 | | | 7,498 |
Sitel Corp.* | | | | 2,400 | | | 10,128 |
Spherion Corp.* | | | | 5,600 | | | 41,608 |
Standard Register Co. / The | | | | 600 | | | 7,200 |
Steelcase, Inc. | | | | 4,700 | | | 85,352 |
Team, Inc.* | | | | 800 | | | 27,864 |
Teletech Holdings, Inc.* | | | | 1,100 | | | 26,268 |
Tetra Tech, Inc.* | | | | 10,600 | | | 191,754 |
United Stationers, Inc.* | | | | 1,300 | | | 60,697 |
Viad Corp. | | | | 4,900 | | | 198,940 |
Volt Information Sciences, Inc.* | | | | 1,700 | | | 85,357 |
Waste Industries USA, Inc. | | | | 500 | | | 15,260 |
Watson Wyatt Worldwide, Inc. | | | | 5,900 | | | 266,385 |
| | | | | | | |
| | | | | | | 4,491,177 |
| | | | | | | |
COMMUNICATIONS EQUIPMENT – 3.0% |
Adtran, Inc. | | | | 8,000 | | | 181,600 |
Anaren, Inc.* | | | | 2,400 | | | 42,624 |
Andrew Corp.* | | | | 700 | | | 7,161 |
Arris Group, Inc.* | | | | 22,800 | | | 285,228 |
Avanex Corp* | | | | 3,700 | | | 6,993 |
Avaya, Inc.* | | | | 9,000 | | | 125,820 |
Avocent Corp.* | | | | 1,300 | | | 44,005 |
Bel Fuse, Inc. | | | | 700 | | | 21,119 |
Black Box Corp. | | | | 500 | | | 20,995 |
C-Cor.net Corp.* | | | | 2,900 | | | 32,306 |
Carrier Access Corp.* | | | | 1,200 | | | 7,872 |
CommScope, Inc.* | | | | 10,200 | | | 310,896 |
Comtech Telecommunications* | | | | 2,000 | | | 76,140 |
Digi International, Inc.* | | | | 1,800 | | | 24,822 |
Ditech Networks, Inc.* | | | | 2,600 | | | 17,992 |
Dycom Industries, Inc.* | | | | 100 | | | 2,112 |
EMS Technologies, Inc.* | | | | 1,500 | | | 30,045 |
Extreme Networks, Inc.* | | | | 6,700 | | | 28,073 |
| | | | | | | |
| | | Country
Code | | Shares | | Value |
| | | | | | | |
Foundry Networks, Inc.* | | | | 5,800 | | $ | 86,884 |
Harmonic, Inc.* | | | | 4,500 | | | 32,715 |
Inter-Tel, Inc. | | | | 200 | | | 4,432 |
Interdigital Communications Corp.* | | | | 9,400 | | | 315,370 |
Oplink Communications, Inc.* | | | | 1,500 | | | 30,840 |
Packeteer, Inc.* | | | | 300 | | | 4,080 |
Performance Technologies, Inc.* | | | | 1,000 | | | 5,990 |
Polycom, Inc.* | | | | 9,300 | | | 287,463 |
Redback Networks, Inc.* | | | | 900 | | | 22,446 |
SafeNet, Inc.* | | | | 800 | | | 19,152 |
Sonus Networks, Inc.* | | | | 15,300 | | | 100,827 |
Stratex Networks, Inc.* | | | | 1,500 | | | 7,245 |
Symmetricom, Inc.* | | | | 700 | | | 6,244 |
Tekelec, Inc.* | | | | 5,900 | | | 87,497 |
Tellabs, Inc.* | | | | 5,700 | | | 58,482 |
Utstarcom, Inc.* | | | | 25,300 | | | 221,375 |
Viasat, Inc.* | | | | 2,400 | | | 71,544 |
| | | | | | | |
| | | | | | | 2,628,389 |
| | | | | | | |
COMPUTERS & PERIPHERALS – 1.8% |
Adaptec, Inc.* | | | | 2,600 | | | 12,116 |
Brocade Communications Systems, Inc.* | | | | 36,800 | | | 302,128 |
Cray, Inc.* | | | | 1,800 | | | 21,384 |
Diebold, Inc. | | | | 2,200 | | | 102,520 |
Eletronics for Imaging, Inc.* | | | | 4,500 | | | 119,610 |
Emulex Corp.* | | | | 15,400 | | | 300,454 |
Hypercom Corp.* | | | | 4,500 | | | 28,575 |
Imation Corp. | | | | 3,100 | | | 143,933 |
Komag, Inc.* | | | | 5,190 | | | 196,597 |
Lexmark International, Inc. Class A* | | | | 2,000 | | | 146,400 |
NCR Corp.* | | | | 3,000 | | | 128,280 |
QLogic Corp.* | | | | 3,700 | | | 81,104 |
Seagate Technology | | | | 611 | | | 16,192 |
| | | | | | | |
| | | | | | | 1,599,293 |
| | | | | | | |
See Notes to Financial Statements.
44
OPPENHEIMER MAIN STREET SMALL CAP FUND
| | |
PORTFOLIO OF INVESTMENTS (Continued) December 31, 2006 | | Sun Capital Advisers Trust |
| | | | | | | |
| | | Country
Code | | Shares | | Value |
| | | | | | | |
CONSTRUCTION & ENGINEERING – 0.9% |
Chicago Bridge & Iron Co. | | | | 2,400 | | $ | 65,616 |
Comfort Systems USA, Inc. | | | | 3,900 | | | 49,296 |
EMCOR Group, Inc.* | | | | 5,400 | | | 306,990 |
Granite Construction, Inc. | | | | 1,700 | | | 85,544 |
Infrasource Services, Inc.* | | | | 7,600 | | | 165,452 |
Insituform Technologies, Inc.* | | | | 300 | | | 7,758 |
Michael Baker Corp.* | | | | 300 | | | 6,795 |
Perini Corp.* | | | | 600 | | | 18,468 |
Quanta Services, Inc.* | | | | 3,600 | | | 70,812 |
Sterling Construction Co., Inc.* | | | | 300 | | | 6,528 |
| | | | | | | |
| | | | | | | 783,259 |
| | | | | | | |
CONSTRUCTION MATERIALS – 0.6% |
Eagle Materials, Inc. | | | | 6,000 | | | 259,380 |
Headwaters, Inc.* | | | | 8,600 | | | 206,056 |
US Concrete, Inc.* | | | | 3,800 | | | 27,056 |
| | | | | | | |
| | | | | | | 492,492 |
| | | | | | | |
CONSUMER FINANCE – 1.2% |
Advanta Corp. | | | | 4,600 | | | 200,698 |
AmeriCredit Corp.* | | | | 3,800 | | | 95,646 |
Asta Funding, Inc. | | | | 1,600 | | | 48,704 |
Cash America International, Inc. | | | | 4,900 | | | 229,810 |
Credit Acceptance Corp.* | | | | 366 | | | 12,199 |
Dollar Financial Corp.* | | | | 1,000 | | | 27,860 |
Ezcorp, Inc.* | | | | 4,200 | | | 68,250 |
First Cash Financial Services, Inc.* | | | | 800 | | | 20,696 |
First Marblehead Corp. / The | | | | 1,950 | | | 106,567 |
World Acceptance Corp.* | | | | 4,300 | | | 201,885 |
| | | | | | | |
| | | | | | | 1,012,315 |
| | | | | | | |
| | | | | | | |
| | | Country
Code | | Shares | | Value |
| | | | | | | |
CONTAINERS & PACKAGING – 0.9% |
AEP Industries, Inc.* | | | | 500 | | $ | 26,655 |
Caraustar Industries, Inc.* | | | | 600 | | | 4,854 |
Chesapeake Corp. | | | | 500 | | | 8,510 |
Graphic Packaging Corp.* | | | | 1,000 | | | 4,330 |
Greif, Inc. | | | | 2,900 | | | 343,360 |
Myers Industries, Inc. | | | | 2,200 | | | 34,452 |
Packaging Corp of America | | | | 1,700 | | | 37,570 |
Pactiv Corp.* | | | | 4,100 | | | 146,329 |
Rock-Tenn Co. | | | | 3,100 | | | 84,041 |
Silgan Holdings, Inc. | | | | 2,400 | | | 105,408 |
Sonoco Products Co. | | | | 400 | | | 15,224 |
| | | | | | | |
| | | | | | | 810,733 |
| | | | | | | |
DISTRIBUTORS – 0.1% |
Building Materials Holding Corp. | | | | 2,300 | | | 56,787 |
| | | | | | | |
DIVERSIFIED CONSUMER SERVICES – 1.7% |
Apollo Group, Inc. Class A* | | | | 1,700 | | | 66,249 |
Bright Horizons Family Solutions, Inc.* | | | | 900 | | | 34,794 |
Career Education Corp.* | | | | 3,600 | | | 89,208 |
Coinstar, Inc.* | | | | 3,000 | | | 91,710 |
Corinthian Colleges, Inc.* | | | | 8,100 | | | 110,403 |
CPI Corp. | | | | 400 | | | 18,596 |
DeVry, Inc. | | | | 9,400 | | | 263,200 |
INVESTools, Inc.* | | | | 4,500 | | | 62,055 |
ITT Educational Services, Inc.* | | | | 1,300 | | | 86,281 |
Jackson Hewitt Tax Service, Inc. | | | | 5,100 | | | 173,247 |
Regis Corp. | | | | 2,400 | | | 94,896 |
Service Corp International | | | | 3,800 | | | 38,950 |
Sotheby’s Holdings | | | | 1,600 | | | 49,632 |
Steiner Leisure, Ltd.* | | | | 2,200 | | | 100,100 |
Stewart Enterprises, Inc. | | | | 5,300 | | | 33,125 |
Strayer Education, Inc. | | | | 1,000 | | | 106,050 |
Vertrue, Inc.* | | | | 600 | | | 23,046 |
| | | | | | | |
| | | | | | | 1,441,542 |
| | | | | | | |
See Notes to Financial Statements.
45
OPPENHEIMER MAIN STREET SMALL CAP FUND
| | |
PORTFOLIO OF INVESTMENTS (Continued) December 31, 2006 | | Sun Capital Advisers Trust |
| | | | | | | |
| | | Country
Code | | Shares | | Value |
| | | | | | | |
DIVERSIFIED FINANCIAL SERVICES – 0.2% |
IntercontinentalExchange, Inc.* | | | | 400 | | $ | 43,160 |
International Securities Exchange, Inc. | | | | 2,600 | | | 121,654 |
Medallion Financial Corp. | | | | 300 | | | 3,711 |
Resource America, Inc. | | | | 200 | | | 5,280 |
| | | | | | | |
| | | | | | | 173,805 |
| | | | | | | |
DIVERSIFIED TELECOMMUNICATION
SERVICES – 1.2% |
Alaska Communications Systems, Inc. | | | | 3,600 | | | 54,684 |
Broadwing Corp.* | | | | 500 | | | 7,810 |
Cbeyond, Inc.* | | | | 4,000 | | | 122,360 |
CenturyTel, Inc. | | | | 3,000 | | | 130,980 |
Cincinnati Bell, Inc.* | | | | 43,900 | | | 200,623 |
Citizens Communications Co. | | | | 5,800 | | | 83,346 |
Cogent Communications Group, Inc.* | | | | 1,900 | | | 30,818 |
Commonwealth Telephone Enterprises, Inc. | | | | 100 | | | 4,186 |
Consolidated Communications Holdings, Inc. | | | | 1,700 | | | 35,530 |
CT Communications, Inc. | | | | 1,400 | | | 32,088 |
Embarq Corp. | | | | 2,100 | | | 110,376 |
Fairpoint Communications, Inc. | | | | 2,800 | | | 53,060 |
General Communication, Inc.* | | | | 3,500 | | | 55,055 |
Golden Telecom Inc | | | | 600 | | | 28,104 |
Iowa Telecommunication Services, Inc. | | | | 1,900 | | | 37,449 |
North Pittsburgh Systems, Inc. | | | | 800 | | | 19,312 |
| | | | | | | |
| | | | | | | 1,005,781 |
| | | | | | | |
ELECTRIC UTILITIES – 0.5% |
Central Vermont Public Service Corp. | | | | 200 | | | 4,710 |
Cleco Corp. | | | | 2,900 | | | 73,167 |
El Paso Electric Co.* | | | | 1,100 | | | 26,807 |
Idacorp, Inc. | | | | 3,500 | | | 135,275 |
| | | | | | | |
| | | Country
Code | | Shares | | Value |
| | | | | | | |
Otter Tail Corp. | | | | 300 | | $ | 9,348 |
Reliant Energy, Inc.* | | | | 1,700 | | | 24,157 |
UIL Holdings Corp. | | | | 2,399 | | | 101,214 |
Unisource Energy Corp | | | | 2,600 | | | 94,978 |
| | | | | | | |
| | | | | | | 469,656 |
| | | | | | | |
ELECTRICAL EQUIPMENT – 1.8% |
Acuity Brands, Inc. | | | | 5,400 | | | 281,016 |
Baldor Electric Co. | | | | 3,900 | | | 130,338 |
Belden CDT, Inc. | | | | 7,859 | | | 307,208 |
Cooper Industries, Ltd. | | | | 500 | | | 45,215 |
EnerSys* | | | | 2,500 | | | 40,000 |
First Solar Inc* | | | | 300 | | | 8,940 |
Franklin Electric Co., Inc. | | | | 100 | | | 5,139 |
Generale Cable Corp.* | | | | 2,400 | | | 104,904 |
Genlyte Group, Inc.* | | | | 800 | | | 62,488 |
GrafTech International Ltd.* | | | | 4,700 | | | 32,524 |
II-VI, Inc.* | | | | 800 | | | 22,352 |
LSI Industries, Inc. | | | | 900 | | | 17,865 |
Regal-Beloit Corp. | | | | 3,500 | | | 183,785 |
Smith A O Corp. | | | | 500 | | | 18,780 |
Superior Essex, Inc.* | | | | 2,500 | | | 83,125 |
The Lamson & Sessions Co.* | | | | 1,100 | | | 26,686 |
Thomas & Betts Corp.* | | | | 700 | | | 33,096 |
Vicor Corp. | | | | 2,300 | | | 25,553 |
Woodward Governor Co. | | | | 4,100 | | | 162,811 |
| | | | | | | |
| | | | | | | 1,591,825 |
| | | | | | | |
ELECTRONIC EQUIPMENT & INSTRUMENTS – 3.5% |
Acacia Research – Acacia Technologies* | | | | 2,300 | | | 30,774 |
Aeroflex, Inc.* | | | | 1,900 | | | 22,268 |
Agilysys, Inc. | | | | 600 | | | 10,044 |
Avnet, Inc.* | | | | 2,000 | | | 51,060 |
AVX Corp. | | | | 5,000 | | | 73,950 |
Benchmark Electronics, Inc.* | | | | 2,400 | | | 58,464 |
CDW Corp. | | | | 1,100 | | | 77,352 |
Checkpoint Systems, Inc.* | | | | 1,400 | | | 28,280 |
Cogent, Inc.* | | | | 900 | | | 9,909 |
Cognex Corp. | | | | 2,300 | | | 54,786 |
CPI International, Inc.* | | | | 900 | | | 13,500 |
See Notes to Financial Statements.
46
OPPENHEIMER MAIN STREET SMALL CAP FUND
| | |
PORTFOLIO OF INVESTMENTS (Continued) December 31, 2006 | | Sun Capital Advisers Trust |
| | | | | | | |
| | | Country
Code | | Shares | | Value |
| | | | | | | |
CTS Corp. | | | | 2,600 | | $ | 40,820 |
Daktronics, Inc. | | | | 3,800 | | | 140,030 |
Dolby Laboratories, Inc.* | | | | 2,300 | | | 71,346 |
DTS, Inc.* | | | | 300 | | | 7,257 |
Excel Technology, Inc.* | | | | 600 | | | 15,354 |
Flir Systems, Inc.* | | | | 1,300 | | | 41,379 |
Gerber Scientific, Inc.* | | | | 1,900 | | | 23,864 |
Global Imaging Systems, Inc.* | | | | 7,300 | | | 160,235 |
Ingram Micro, Inc.* | | | | 2,200 | | | 44,902 |
Insight Enterprises, Inc.* | | | | 4,200 | | | 79,254 |
Ipg Photonics Corp.* | | | | 1,540 | | | 36,960 |
Itron, Inc.* | | | | 4,500 | | | 233,280 |
Kemet Corp.* | | | | 2,800 | | | 20,440 |
Littelfuse, Inc.* | | | | 2,800 | | | 89,264 |
Methode Electronics, Inc. | | | | 1,400 | | | 15,162 |
Mettler Toledo International, Inc.* | | | | 1,000 | | | 78,850 |
MTS Technologies, Inc. | | | | 2,400 | | | 92,688 |
Newport Corp.* | | | | 3,400 | | | 71,230 |
OYO Geospace Corp.* | | | | 200 | | | 11,618 |
Park Electrochemical Corp. | | | | 2,200 | | | 56,430 |
Paxar Corp.* | | | | 900 | | | 20,754 |
Pc Connection, Inc.* | | | | 700 | | | 10,381 |
Planar Systems, Inc.* | | | | 800 | | | 7,736 |
Plexus Corp.* | | | | 8,700 | | | 207,756 |
RadiSys Corp.* | | | | 2,121 | | | 35,357 |
Rofin-Sinar Technologies, Inc.* | | | | 4,300 | | | 259,978 |
Rogers Corp.* | | | | 3,300 | | | 195,195 |
Sanmina-SCI Corp.* | | | | 5,300 | | | 18,285 |
ScanSource, Inc.* | | | | 700 | | | 21,280 |
Solectron Corp.* | | | | 9,612 | | | 30,951 |
Staktek Holdings, Inc.* | | | | 200 | | | 1,030 |
SYNNEX Corp.* | | | | 1,500 | | | 32,910 |
Tech Data Corp.* | | | | 3,542 | | | 134,135 |
Technitrol, Inc. | | | | 3,900 | | | 93,171 |
Tektronix, Inc. | | | | 2,000 | | | 58,340 |
TTM Technologies, Inc.* | | | | 4,500 | | | 50,985 |
Vishay Intertechnology, Inc.* | | | | 6,500 | | | 88,010 |
Zygo Corp.* | | | | 2,000 | | | 32,900 |
| | | | | | | |
| | | | | | | 3,059,904 |
| | | | | | | |
| | | | | | | |
| | | Country
Code | | Shares | | Value |
| | | | | | | |
ENERGY EQUIPMENT & SERVICES – 2.3% |
Basic Energy Services, Inc.* | | | | 900 | | $ | 22,185 |
Dril-Quip, Inc.* | | | | 2,000 | | | 78,320 |
Ensign Energy Services, Inc. | | CA | | 4,600 | | | 72,588 |
Global Industries, Inc.* | | | | 2,300 | | | 29,992 |
Grey Wolf, Inc.* | | | | 31,900 | | | 218,834 |
Gulfmark Offshore, Inc.* | | | | 1,200 | | | 44,892 |
Hornbeck Offshore Services, Inc.* | | | | 1,800 | | | 64,260 |
Hydril* | | | | 1,400 | | | 105,266 |
Input/Output, Inc.* | | | | 7,600 | | | 103,588 |
Leader Energy Services, Ltd. (1)* | | CA | | 12,600 | | | 17,839 |
Lone Star Technologies, Inc.* | | | | 5,900 | | | 285,619 |
Lufkin Industries, Inc. | | | | 100 | | | 5,808 |
Matrix Service Co.* | | | | 1,800 | | | 28,980 |
NATCO Group, Inc.* | | | | 1,400 | | | 44,632 |
North American Energy Partners, Inc.* | | | | 4,500 | | | 73,260 |
Parker Drilling Co.* | | | | 19,700 | | | 160,949 |
Pason Systems, Inc. | | CA | | 1,600 | | | 18,205 |
Patterson-UTI Energy, Inc. | | | | 600 | | | 13,938 |
Savanna Energy Services Corp.* | | CA | | 896 | | | 14,562 |
SEACOR Holdings, Inc.* | | | | 1,000 | | | 99,140 |
Technicoil Corp.* | | CA | | 16,600 | | | 14,956 |
Tidewater, Inc. | | | | 2,100 | | | 101,556 |
Trican Well Service, Ltd. | | CA | | 2,500 | | | 43,590 |
Trico Marine Services, Inc.* | | | | 1,300 | | | 49,803 |
Universal Compression Holdings, Inc.* | | | | 1,500 | | | 93,165 |
Veritas DGC, Inc.* | | | | 1,900 | | | 162,697 |
W-H Energy Services, Inc.* | | | | 700 | | | 34,083 |
| | | | | | | |
| | | | | | | 2,002,707 |
| | | | | | | |
See Notes to Financial Statements.
47
OPPENHEIMER MAIN STREET SMALL CAP FUND
| | |
PORTFOLIO OF INVESTMENTS (Continued) December 31, 2006 | | Sun Capital Advisers Trust |
| | | | | | | |
| | | Country
Code | | Shares | | Value |
| | | | | | | |
FOOD & STAPLES RETAILING – 0.8% |
Andersons, Inc. | | | | 200 | | $ | 8,478 |
Arden Group, Inc. | | | | 200 | | | 24,762 |
Casey’s General Stores, Inc. | | | | 3,100 | | | 73,005 |
Ingles Markets, Inc. | | | | 900 | | | 26,811 |
Longs Drug Stores Corp. | | | | 3,163 | | | 134,048 |
Nash Finch Co. | | | | 700 | | | 19,110 |
Pantry, Inc.* | | | | 5,100 | | | 238,884 |
Performance Food Group Co.* | | | | 1,700 | | | 46,988 |
Rite Aid Corp* | | | | 4,900 | | | 26,656 |
Smart & Final, Inc.* | | | | 900 | | | 17,010 |
Spartan Stores, Inc. | | | | 1,800 | | | 37,674 |
Weis Markets, Inc. | | | | 500 | | | 20,055 |
Wild Oats Markets, Inc.* | | | | 1,100 | | | 15,818 |
| | | | | | | |
| | | | | | | 689,299 |
| | | | | | | |
FOOD PRODUCTS – 0.7% |
Chiquita Brands Inernational, Inc. | | | | 1,800 | | | 28,746 |
Corn Products International, Inc. | | | | 1,200 | | | 41,448 |
Dean Foods Co.* | | | | 2,200 | | | 93,016 |
Delta and Pine Land Co. | | | | 3,900 | | | 157,755 |
Flowers Foods, Inc. | | | | 2,100 | | | 56,679 |
Gold Kist, Inc.* | | | | 200 | | | 4,204 |
J & J Snack Foods Corp. | | | | 800 | | | 33,120 |
Premium Standard Farms, Inc. | | | | 1,700 | | | 31,569 |
Reddy Ice Holdings, Inc. | | | | 800 | | | 20,656 |
Seaboard Corp. | | | | 100 | | | 176,500 |
| | | | | | | |
| | | | | | | 643,693 |
| | | | | | | |
GAS UTILITIES – 0.5% |
Cascade Natural Gas Corp. | | | | 100 | | | 2,592 |
New Jersey Resources Corp. | | | | 2,800 | | | 136,024 |
Oneok, Inc. | | | | 2,100 | | | 90,552 |
Peoples Energy Corp. | | | | 1,000 | | | 44,570 |
Southwest Gas Corp. | | | | 2,500 | | | 95,925 |
The Laclede Group, Inc. | | | | 1,600 | | | 56,048 |
UGI Corp. | | | | 959 | | | 26,162 |
| | | | | | | |
| | | | | | | 451,873 |
| | | | | | | |
| | | | | | | |
| | | Country
Code | | Shares | | Value |
| | | | | | | |
HEALTH CARE EQUIPMENT & SUPPLIES – 1.7% |
Abaxis, Inc.* | | | | 600 | | $ | 11,550 |
Advanced Medical Optics, Inc.* | | | | 900 | | | 31,680 |
Biosite, Inc.* | | | | 1,800 | | | 87,930 |
Candela Corp.* | | | | 1,900 | | | 23,503 |
Cholestech Corp* | | | | 300 | | | 5,526 |
Dade Behring Holdings, Inc. | | | | 1,200 | | | 47,772 |
Datascope Corp. | | | | 100 | | | 3,644 |
DJ Orthopedics, Inc.* | | | | 1,100 | | | 47,102 |
Edwards Lifesciences Corp.* | | | | 2,200 | | | 103,488 |
Greatbatch, Inc.* | | | | 1,400 | | | 37,688 |
Hillenbrand Industries, Inc. | | | | 400 | | | 22,772 |
ICU Medical, Inc.* | | | | 400 | | | 16,272 |
Idexx Laboratories, Inc.* | | | | 400 | | | 31,720 |
Immucor, Inc.* | | | | 9,450 | | | 276,223 |
Integra Lifesciences Holdings Corp.* | | | | 1,300 | | | 55,367 |
Invacare Corp. | | | | 300 | | | 7,365 |
Kinetic Concepts, Inc.* | | | | 1,500 | | | 59,325 |
Mentor Corp. | | | | 1,700 | | | 83,079 |
Meridian Bioscience, Inc. | | | | 500 | | | 12,265 |
Palomar Medical Technologies, Inc.* | | | | 3,900 | | | 197,613 |
Quidel Corp.* | | | | 2,200 | | | 29,964 |
West Pharmaceutical Services, Inc. | | | | 4,600 | | | 235,658 |
Zoll Medical Corp.* | | | | 1,300 | | | 75,712 |
| | | | | | | |
| | | | | | | 1,503,218 |
| | | | | | | |
HEALTH CARE PROVIDERS & SERVICES – 3.1% |
Air Methods Corp.* | | | | 900 | | | 25,128 |
AMERIGROUP Corp.* | | | | 9,300 | | | 333,777 |
AmerisourceBergen Corp. | | | | 2,800 | | | 125,888 |
Apria Healthcare Group, Inc.* | | | | 5,600 | | | 149,240 |
Bio-Reference Labs, Inc.* | | | | 400 | | | 8,996 |
Centene Corp* | | | | 6,300 | | | 154,791 |
Chemed Corp. | | | | 5,100 | | | 188,598 |
Corvel Corp* | | | | 500 | | | 23,785 |
See Notes to Financial Statements.
48
OPPENHEIMER MAIN STREET SMALL CAP FUND
| | |
PORTFOLIO OF INVESTMENTS (Continued) December 31, 2006 | | Sun Capital Advisers Trust |
| | | | | | | |
| | | Country
Code | | Shares | | Value |
| | | | | | | |
Coventry Health Care, Inc.* | | | | 2,200 | | $ | 110,110 |
Cross Country Healthcare, Inc.* | | | | 1,900 | | | 41,458 |
Emergency Medical Services LP* | | | | 200 | | | 4,196 |
Express Scripts, Inc.* | | | | 500 | | | 35,800 |
Genesis HealthCare Corp.* | | | | 1,200 | | | 56,676 |
Healthspring, Inc.* | | | | 5,000 | | | 101,750 |
Healthways, Inc.* | | | | 3,900 | | | 186,069 |
HMS Holdings Corp* | | | | 600 | | | 9,090 |
Humana, Inc.* | | | | 2,700 | | | 149,337 |
inVentiv Health, Inc.* | | | | 800 | | | 28,280 |
Kindred Healthcare, Inc.* | | | | 6,400 | | | 161,600 |
Laboratory Corp of America Holdings* | | | | 1,900 | | | 139,593 |
LCA- Vision, Inc. | | | | 700 | | | 24,052 |
Lincare Holdings, Inc.* | | | | 800 | | | 31,872 |
Magellan Health Services, Inc.* | | | | 4,500 | | | 194,490 |
Medcath Corp.* | | | | 900 | | | 24,624 |
Molina Healthcare, Inc.* | | | | 5,100 | | | 165,801 |
National Healthcare Corp. | | | | 300 | | | 16,560 |
Odyssey Healthcare, Inc.* | | | | 1,700 | | | 22,542 |
Pediatrix Medical Group* | | | | 100 | | | 4,890 |
PSS World Medical, Inc.* | | | | 3,800 | | | 74,214 |
Res-Care, Inc.* | | | | 800 | | | 14,520 |
Visicu, Inc.* | | | | 200 | | | 2,240 |
WellCare Health Plan, Inc.* | | | | 1,100 | | | 75,790 |
| | | | | | | |
| | | | | | | 2,685,757 |
| | | | | | | |
HEALTH CARE TECHNOLOGY – 0.3% |
Computer Programs & Systems, Inc. | | | | 600 | | | 20,394 |
Dendrite International, Inc.* | | | | 2,100 | | | 22,491 |
Emdeon Corp.* | | | | 8,000 | | | 99,120 |
IMS Health, Inc. | | | | 900 | | | 24,732 |
Omnicell, Inc.* | | | | 2,500 | | | 46,575 |
| | | | | | | |
| | | Country
Code | | Shares | | Value |
| | | | | | | |
Per-Se Technologies, Inc.* | | | | 1,128 | | $ | 31,336 |
Phase Forward, Inc.* | | | | 2,400 | | | 35,952 |
Trizetto Group, Inc* | | | | 300 | | | 5,511 |
Vital Images, Inc.* | | | | 400 | | | 13,920 |
| | | | | | | |
| | | | | | | 300,031 |
| | | | | | | |
HOTELS RESTAURANTS & LEISURE – 2.3% |
AFC Enterprises* | | | | 1,400 | | | 24,738 |
Ambassadors Group, Inc. | | | | 1,600 | | | 48,560 |
Aztar Corp.* | | | | 2,600 | | | 141,492 |
Bally Technologies, Inc.* | | | | 1,500 | | | 28,020 |
Bob Evans Farms, Inc. | | | | 5,200 | | | 177,944 |
Brinker International, Inc. | | | | 2,300 | | | 69,368 |
Buffalo Wild Wings, Inc.* | | | | 800 | | | 42,560 |
CBRL Group, Inc. | | | | 1,900 | | | 85,044 |
CEC Entertainment, Inc.* | | | | 300 | | | 12,075 |
Chipotle Mexican Grill, Inc.* | | | | 500 | | | 28,500 |
Ctrip.com International, Ltd. | | | | 800 | | | 49,984 |
Dennys Corp.* | | | | 6,600 | | | 31,086 |
Domino’s Pizza, Inc. | | | | 7,600 | | | 212,800 |
Dover Downs Gaming & Entertainment, Inc. | | | | 3,050 | | | 40,778 |
Ihop Corp. | | | | 2,900 | | | 152,830 |
Jack In The Box, Inc.* | | | | 4,700 | | | 286,888 |
Krispy Kreme Doughnuts, Inc.* | | | | 3,400 | | | 37,740 |
Luby’s Cafeterias, Inc.* | | | | 2,400 | | | 26,136 |
Marcus Corp. | | | | 200 | | | 5,116 |
McCormick & Schmicks Seafood* | | | | 1,400 | | | 33,656 |
Monarch Casino & Resort, Inc.* | | | | 1,600 | | | 38,208 |
MTR Gaming Group, Inc.* | | | | 700 | | | 8,554 |
Multimedia Games, Inc.* | | | | 2,000 | | | 19,200 |
O’Charley’s, Inc.* | | | | 1,400 | | | 29,792 |
Papa Johns International, Inc.* | | | | 3,300 | | | 95,733 |
Ruby Tuesday, Inc. | | | | 300 | | | 8,232 |
See Notes to Financial Statements.
49
OPPENHEIMER MAIN STREET SMALL CAP FUND
| | |
PORTFOLIO OF INVESTMENTS (Continued) December 31, 2006 | | Sun Capital Advisers Trust |
| | | | | | | |
| | | Country
Code | | Shares | | Value |
| | | | | | | |
Vail Resorts, Inc.* | | | | 1,800 | | $ | 80,676 |
Wendy’s International, Inc. | | | | 2,800 | | | 92,652 |
WMS Industries, Inc.* | | | | 2,900 | | | 101,094 |
| | | | | | | |
| | | | | | | 2,009,456 |
| | | | | | | |
HOUSEHOLD DURABLES – 1.5% |
American Greetings Corp. | | | | 5,300 | | | 126,511 |
Black & Decker Corp | | | | 400 | | | 31,988 |
Blyth, Inc. | | | | 4,400 | | | 91,300 |
CSS Industries, Inc. | | | | 100 | | | 3,537 |
Ethan Allen Interiors, Inc. | | | | 4,200 | | | 151,662 |
Furniture Brands International, Inc. | | | | 600 | | | 9,738 |
Interface, Inc.* | | | | 7,700 | | | 109,494 |
Jarden Corp* | | | | 1,800 | | | 62,622 |
Kimball Internationall, Inc. | | | | 4,500 | | | 109,350 |
La Z Boy, Inc. | | | | 3,600 | | | 42,732 |
Leggett & Platt, Inc. | | | | 1,100 | | | 26,290 |
Meritage Homes Corp* | | | | 2,200 | | | 104,984 |
Skyline Corp. | | | | 100 | | | 4,022 |
Snap-On, Inc. | | | | 2,500 | | | 119,100 |
Stanley Furniture Co., Inc. | | | | 1,600 | | | 34,320 |
Stanley Works, Inc. | | | | 600 | | | 30,174 |
Tempur-Pedic International, Inc.* | | | | 13,100 | | | 268,026 |
| | | | | | | |
| | | | | | | 1,325,850 |
| | | | | | | |
HOUSEHOLD PRODUCTS – 0.1% |
Energizer Holdings, Inc.* | | | | 1,400 | | | 99,386 |
Spectrum Brands, Inc.* | | | | 400 | | | 4,360 |
WD-40 Co. | | | | 300 | | | 10,461 |
| | | | | | | |
| | | | | | | 114,207 |
| | | | | | | |
INDEPENDENT POWER PRODUCERS & ENERGY TRADERS – 0.1% |
Canadian Hydro Developers, Inc.* | | CA | | 10,800 | | | 55,140 |
| | | | | | | |
INDUSTRIAL CONGLOMERATES – 0.1% |
Sequa Corp.* | | | | 700 | | | 80,542 |
Teleflex, Inc. | | | | 300 | | | 19,368 |
Tredegar Corp | | | | 900 | | | 20,349 |
| | | | | | | |
| | | | | | | 120,259 |
| | | | | | | |
| | | | | | | |
| | | Country
Code | | Shares | | Value |
| | | | | | | |
INSURANCE – 3.9% |
Affirmative Insurance Holdings, Inc. | | | | 500 | | $ | 8,135 |
Ambac Financial Group, Inc. | | | | 1,400 | | | 124,698 |
American Financial Group, Inc./OH | | | | 300 | | | 10,773 |
American Physicians Capital, Inc.* | | | | 1,350 | | | 54,054 |
Argonaut Group, Inc.* | | | | 3,700 | | | 128,982 |
Assurant, Inc. | | | | 2,300 | | | 127,075 |
Bristol West Holdings, Inc. | | | | 1,900 | | | 30,077 |
CNA Financial Corp* | | | | 1,400 | | | 56,448 |
CNA Surety Corp.* | | | | 2,300 | | | 49,450 |
Commerce Group, Inc. | | | | 1,400 | | | 41,650 |
Darwin Professional Underwriters, Inc.* | | | | 800 | | | 18,760 |
Delphi Financial Group, Inc. | | | | 4,750 | | | 192,185 |
Direct General Corp. | | | | 2,100 | | | 43,344 |
Donegal Group, Inc. | | | | 1,133 | | | 22,195 |
EMC Insurance Group, Inc. | | | | 700 | | | 23,884 |
FBL Financial Group, Inc. | | | | 400 | | | 15,632 |
First Mercury Financial Corp* | | | | 500 | | | 11,760 |
FPIC Insurance Group, Inc.* | | | | 900 | | | 35,073 |
Great American Financial Resources, Inc. | | | | 200 | | | 4,610 |
Harleysville Group, Inc. | | | | 2,900 | | | 100,978 |
Horace Mann Educators Corp. | | | | 3,200 | | | 64,640 |
Infinity Property & Casualty Corp. | | | | 3,200 | | | 154,848 |
IPC Holdings, Ltd. | | | | 100 | | | 3,145 |
LandAmerica Financial Group, Inc. | | | | 100 | | | 6,311 |
Markel Corp.* | | | | 100 | | | 48,010 |
MBIA, Inc. | | | | 1,800 | | | 131,508 |
Meadowbrook Insurance Group, Inc.* | | | | 2,500 | | | 24,725 |
National Western Life Insurance Co. | | | | 100 | | | 23,014 |
Nationwide Financial Services | | | | 1,400 | | | 75,880 |
See Notes to Financial Statements.
50
OPPENHEIMER MAIN STREET SMALL CAP FUND
| | |
PORTFOLIO OF INVESTMENTS (Continued) December 31, 2006 | | Sun Capital Advisers Trust |
| | | | | | | |
| | | Country
Code | | Shares | | Value |
| | | | | | | |
Odyssey Re Holdings Corp. | | | | 800 | | $ | 29,840 |
Ohio Casualty Corp. | | | | 7,400 | | | 220,594 |
Old Republic International Corp. | | | | 2,200 | | | 51,216 |
OneBeacon Insurance Group, Ltd.* | | | | 2,200 | | | 61,600 |
PartnerRe, Ltd. | | | | 1,000 | | | 71,030 |
Phoenix Cos., Inc. | | | | 9,900 | | | 157,311 |
Presidential Life Corp. | | | | 1,000 | | | 21,950 |
Procentury Corp. | | | | 1,900 | | | 35,150 |
Reinsurance Group of America, Inc. | | | | 400 | | | 22,280 |
RenaissanceRe Holdings, Ltd. | | | | 600 | | | 36,000 |
RLI Corp. | | | | 1,300 | | | 73,346 |
Safeco Corp. | | | | 1,800 | | | 112,590 |
Safety Insurance Group, Inc. | | | | 2,100 | | | 106,491 |
SeaBright Insurance Holdings, I1nc.* | | | | 700 | | | 12,607 |
Selective Insurance Group, Inc. | | | | 2,700 | | | 154,683 |
State Auto Financial Corp. | | | | 1,600 | | | 55,568 |
The Hanover Insurance Group, Inc. | | | | 1,800 | | | 87,840 |
The Midland Co. | | | | 200 | | | 8,390 |
Torchmark Corp. | | | | 700 | | | 44,632 |
Tower Group, Inc. | | | | 1,400 | | | 43,498 |
Transatlantic Holdings, Inc. | | | | 100 | | | 6,210 |
United America Indemnity, Ltd.* | | | | 1,200 | | | 30,396 |
Universal American Financial Corp.* | | | | 800 | | | 14,912 |
USI Holdings Corp.* | | | | 700 | | | 10,752 |
Zenith National Insurance Corp. | | | | 5,500 | | | 258,005 |
| | | | | | | |
| | | | | | | 3,358,735 |
| | | | | | | |
INTERNET & CATALOG RETAIL – 0.6% |
Blue Nile, Inc.* | | | | 900 | | | 33,201 |
Expedia, Inc.* | | | | 1,500 | | | 31,470 |
FTD Group, Inc.* | | | | 2,200 | | | 39,358 |
GSI Commerce, Inc.* | | | | 400 | | | 7,500 |
IAC/InterActive Corp.* | | | | 2,600 | | | 96,616 |
| | | | | | | |
| | | Country
Code | | Shares | | Value |
| | | | | | | |
Netflix, Inc.* | | | | 5,200 | | $ | 134,472 |
Nutri/System, Inc.* | | | | 500 | | | 31,695 |
Priceline.com, Inc.* | | | | 2,900 | | | 126,469 |
Stamps.com, Inc.* | | | | 600 | | | 9,450 |
Systemax, Inc.* | | | | 800 | | | 13,960 |
| | | | | | | |
| | | | | | | 524,191 |
| | | | | | | |
INTERNET SOFTWARE & SERVICES – 3.0% |
24 / 7 Real Media, Inc.* | | | | 3,100 | | | 28,055 |
Aquantive, Inc.* | | | | 1,500 | | | 36,990 |
Art Technology Group, Inc.* | | | | 5,800 | | | 13,514 |
CMGI, Inc.* | | | | 14,200 | | | 19,028 |
Cybersource Corp.* | | | | 300 | | | 3,306 |
Digital Insight Corp.* | | | | 5,600 | | | 215,544 |
Digital River, Inc.* | | | | 2,200 | | | 122,738 |
Digitas, Inc.* | | | | 8,200 | | | 109,962 |
Earthlink, Inc.* | | | | 22,900 | | | 162,590 |
eCollege.com, Inc.* | | | | 900 | | | 14,085 |
Infospace, Inc.* | | | | 2,600 | | | 53,326 |
Internap Network Services Corp* | | | | 2,500 | | | 49,675 |
Interwoven, Inc.* | | | | 3,700 | | | 54,279 |
j2 Global Communications, Inc.* | | | | 8,100 | | | 220,725 |
Liquidity Services, Inc.* | | | | 300 | | | 5,163 |
NIC, Inc.* | | | | 600 | | | 2,982 |
Open Text Corp.* | | | | 4,400 | | | 89,320 |
RealNetworks, Inc.* | | | | 14,213 | | | 155,490 |
SAVVIS, Inc.* | | | | 3,040 | | | 108,559 |
Sohu.com, Inc.* | | | | 5,100 | | | 122,400 |
SonicWall, Inc.* | | | | 6,400 | | | 53,888 |
TheStreet.com, Inc. | | | | 3,200 | | | 28,480 |
Travelzoo, Inc.* | | | | 1,200 | | | 35,940 |
United Online, Inc. | | | | 17,400 | | | 231,072 |
Valueclick, Inc.* | | | | 3,800 | | | 89,794 |
VeriSign, Inc.* | | | | 4,100 | | | 98,605 |
Vignette Corp.* | | | | 1,900 | | | 32,433 |
WebEx Communications, Inc.* | | | | 6,700 | | | 233,763 |
webMethods, Inc.* | | | | 6,400 | | | 47,104 |
Websense, Inc.* | | | | 6,600 | | | 150,678 |
| | | | | | | |
| | | | | | | 2,589,488 |
| | | | | | | |
See Notes to Financial Statements.
51
OPPENHEIMER MAIN STREET SMALL CAP FUND
| | |
PORTFOLIO OF INVESTMENTS (Continued) December 31, 2006 | | Sun Capital Advisers Trust |
| | | | | | | |
| | | Country
Code | | Shares | | Value |
| | | | | | | |
IT SERVICES – 2.9% |
Acxiom Corp. | | | | 3,500 | | $ | 89,775 |
Affiliated Computer Services, Inc.* | | | | 900 | | | 43,956 |
BearingPoint, Inc.* | | | | 1,000 | | | 7,870 |
CACI International, Inc.* | | | | 200 | | | 11,300 |
Ceridian Corp.* | | | | 3,157 | | | 88,333 |
Ciber, Inc.* | | | | 2,700 | | | 18,306 |
Computer Sciences Corp.* | | | | 2,200 | | | 117,414 |
Convergys Corp.* | | | | 4,200 | | | 99,876 |
Covansys Corp.* | | | | 2,800 | | | 64,260 |
CSG Systems International, Inc.* | | | | 10,200 | | | 272,646 |
DST Systems, Inc.* | | | | 1,500 | | | 93,945 |
Fiserv, Inc.* | | | | 2,400 | | | 125,808 |
Forrester Research, Inc.* | | | | 2,100 | | | 56,931 |
Gartner, Inc.* | | | | 6,000 | | | 118,740 |
Gevity HR, Inc. | | | | 800 | | | 18,952 |
Hewitt Associates, Inc.* | | | | 200 | | | 5,150 |
Infocrossing, Inc.* | | | | 300 | | | 4,890 |
infoUSA, Inc. | | | | 3,900 | | | 46,449 |
Integral Systems, Inc. | | | | 300 | | | 6,951 |
Isilon Systems, Inc.* | | | | 500 | | | 13,800 |
Keane, Inc.* | | | | 2,900 | | | 34,539 |
Lightbridge, Inc.* | | | | 3,100 | | | 41,974 |
Mantech International Corp.* | | | | 900 | | | 33,147 |
MAXIMUS, Inc. | | | | 1,000 | | | 30,780 |
MPS Group, Inc.* | | | | 19,200 | | | 272,256 |
NCI, Inc.* | | | | 1,700 | | | 25,993 |
Ness Technologies, Inc.* | | | | 400 | | | 5,704 |
Perot Systems Corp.* | | | | 6,700 | | | 109,813 |
Sabre Holdings Corp. | | | | 3,800 | | | 121,182 |
SRA International, Inc.* | | | | 2,800 | | | 74,872 |
Startek, Inc. | | | | 500 | | | 6,770 |
SYKES Enterprises, Inc.* | | | | 7,100 | | | 125,244 |
The BISYS Group, Inc.* | | | | 18,000 | | | 232,380 |
TNS, Inc.* | | | | 100 | | | 1,925 |
Total System Services, Inc. | | | | 1,300 | | | 34,307 |
| | | | | | | |
| | | Country
Code | | Shares | | Value |
| | | | | | | |
Tyler Technologies, Inc.* | | | | 4,100 | | $ | 57,646 |
Unisys Corp.* | | | | 4,300 | | | 33,712 |
VeriFone Holdings, Inc.* | | | | 600 | | | 21,240 |
| | | | | | | |
| | | | | | | 2,568,836 |
| | | | | | | |
LEISURE EQUIPMENT & PRODUCTS – 0.7% |
Brunswick Corp | | | | 700 | | | 22,330 |
Eastman Kodak Co. | | | | 4,300 | | | 110,940 |
Hasbro, Inc. | | | | 4,100 | | | 111,725 |
K2, Inc.* | | | | 2,900 | | | 38,251 |
Marvel Entertainment, Inc.* | | | | 4,600 | | | 123,786 |
Mattel, Inc. | | | | 5,900 | | | 133,694 |
RC2 Corp.* | | | | 1,100 | | | 48,400 |
Steinway Musical Instruments, Inc.* | | | | 700 | | | 21,735 |
Sturm Ruger & Co., Inc.* | | | | 300 | | | 2,880 |
| | | | | | | |
| | | | | | | 613,741 |
| | | | | | | |
LIFE SCIENCES TOOLS & SERVICES – 1.1% |
Albany Molecular Research, Inc.* | | | | 100 | | | 1,056 |
Applera Corporation-Applied Biosystems Group | | | | 3,932 | | | 144,265 |
Bio-Rad Laboratories, Inc.* | | | | 900 | | | 74,268 |
Bruker BioSciences Corp* | | | | 2,700 | | | 20,277 |
Charles River Laboratories International, Inc.* | | | | 200 | | | 8,650 |
Dionex Corp.* | | | | 1,200 | | | 68,052 |
Diversa Corp.* | | | | 200 | | | 2,176 |
Illumina, Inc.* | | | | 1,400 | | | 55,034 |
Invitrogen Corp* | | | | 600 | | | 33,954 |
Kendle International, Inc.* | | | | 1,300 | | | 40,885 |
Luminex Corp.* | | | | 1,200 | | | 15,240 |
Molecular Devices Corp.* | | | | 1,300 | | | 27,391 |
Parexel International Corp.* | | | | 2,900 | | | 84,013 |
PharmaNet Development Group, Inc.* | | | | 1,400 | | | 30,898 |
See Notes to Financial Statements.
52
OPPENHEIMER MAIN STREET SMALL CAP FUND
| | |
PORTFOLIO OF INVESTMENTS (Continued) December 31, 2006 | | Sun Capital Advisers Trust |
| | | | | | | |
| | | Country
Code | | Shares | | Value |
| | | | | | | |
Thermo Fisher Scientific, Inc.* | | | | 2,800 | | $ | 126,812 |
Varian, Inc.* | | | | 3,700 | | | 165,723 |
Waters Corp.* | | | | 1,100 | | | 53,867 |
| | | | | | | |
| | | | | | | 952,561 |
| | | | | | | |
MACHINERY – 3.7% |
Actuant Corp. Class A | | | | 1,500 | | | 71,475 |
AGCO Corp.* | | | | 3,600 | | | 111,384 |
Albany International Corp. | | | | 1,500 | | | 49,365 |
American Railcar Industries, Inc. | | | | 600 | | | 20,424 |
American Science & Engineering, Inc.* | | | | 200 | | | 11,902 |
Ampco-Pittsburgh Corp. | | | | 1,400 | | | 46,872 |
Astec Industries, Inc.* | | | | 1,000 | | | 35,100 |
Briggs & Stratton Corp. | | | | 1,500 | | | 40,425 |
Bucyrus International, Inc. | | | | 2,000 | | | 103,520 |
Cascade Bancorp | | | | 500 | | | 26,450 |
Commercial Vehicle Group, Inc.* | | | | 100 | | | 2,180 |
Cummins, Inc. | | | | 900 | | | 106,362 |
Dynamic Materials Corp. | | | | 1,000 | | | 28,100 |
Eaton Corp. | | | | 1,100 | | | 82,654 |
Federal Signal Corp | | | | 1,600 | | | 25,664 |
Flow International Corp.* | | | | 3,000 | | | 33,060 |
Freightcar America, Inc. | | | | 1,100 | | | 60,995 |
Gardner Denver, Inc.* | | | | 6,100 | | | 227,591 |
Gorman-rupp Co | | | | 100 | | | 3,697 |
Kadant, Inc.* | | | | 1,000 | | | 24,380 |
Kaydon Corp. | | | | 5,600 | | | 222,544 |
Lindsay Manufacturing Co. | | | | 1,000 | | | 32,650 |
Manitowoc, Inc. | | | | 1,400 | | | 83,202 |
Middleby Corp.* | | | | 200 | | | 20,934 |
Miller Industries, Inc.* | | | | 800 | | | 19,200 |
Mueller Industries, Inc. | | | | 6,100 | | | 193,370 |
NACCO Industries, Inc. | | | | 1,300 | | | 177,580 |
Navistar International Corp., Inc.* | | | | 500 | | | 16,715 |
Nordson Corp. | | | | 4,800 | | | 239,184 |
| | | | | | | |
| | | Country
Code | | Shares | | Value |
| | | | | | | |
RBC Bearings, Inc.* | | | | 1,000 | | $ | 28,660 |
Robbins & Myers, Inc. | | | | 1,200 | | | 55,104 |
SPX Corp. | | | | 1,900 | | | 116,204 |
Sun Hydraulics, Inc. | | | | 300 | | | 6,153 |
Tennant Co. | | | | 1,300 | | | 37,700 |
Terex Corp.* | | | | 400 | | | 25,832 |
Titan International, Inc. | | | | 1,800 | | | 36,270 |
Toro Co. | | | | 5,900 | | | 275,117 |
Valmont Industries, Inc. | | | | 4,600 | | | 255,254 |
Wabtec Corp. | | | | 7,800 | | | 236,964 |
| | | | | | | |
| | | | | | | 3,190,237 |
| | | | | | | |
MARINE – 0.3% |
American Commercial Lines, Inc.* | | | | 2,000 | | | 131,020 |
Horizon Lines, Inc. | | | | 4,700 | | | 126,712 |
| | | | | | | |
| | | | | | | 257,732 |
| | | | | | | |
MEDIA – 1.4% |
Arbitron, Inc. | | | | 300 | | | 13,032 |
Catalina Marketing Corp. | | | | 500 | | | 13,750 |
Charter Communications, Inc.* | | | | 29,700 | | | 90,882 |
Citadel Broadcasting Corp. | | | | 4,200 | | | 41,832 |
Cox Radio, Inc.* | | | | 9,600 | | | 156,480 |
Cumulus Media, Inc.* | | | | 4,200 | | | 43,638 |
Emmis Communications Corp. | | | | 900 | | | 7,416 |
GateHouse Media, Inc. | | | | 1,200 | | | 22,272 |
Harris Interactive, Inc.* | | | | 1,000 | | | 5,040 |
Journal Register Co. | | | | 3,300 | | | 24,090 |
Knology, Inc.* | | | | 1,700 | | | 18,088 |
Lee Enterprises, Inc. | | | | 2,500 | | | 77,650 |
Lin TV Corp.* | | | | 1,300 | | | 12,935 |
Live Nation, Inc.* | | | | 3,900 | | | 87,360 |
Lodgenet Entertainment Corp.* | | | | 1,600 | | | 40,048 |
Mediacom Communications Corp.* | | | | 6,300 | | | 50,652 |
ProQuest Co.* | | | | 300 | | | 3,135 |
Radio One, Inc.* | | | | 3,700 | | | 24,938 |
RCN Corp* | | | | 200 | | | 6,030 |
See Notes to Financial Statements.
53
OPPENHEIMER MAIN STREET SMALL CAP FUND
| | |
PORTFOLIO OF INVESTMENTS (Continued) December 31, 2006 | | Sun Capital Advisers Trust |
| | | | | | | |
| | | Country
Code | | Shares | | Value |
| | | | | | | |
Reader’s Digest Association, Inc. | | | | 3,800 | | $ | 63,460 |
Regal Entertainment Group | | | | 2,000 | | | 42,640 |
Scholastic Corp.* | | | | 2,900 | | | 103,936 |
Sinclair Broadcast Group, Inc. | | | | 7,400 | | | 77,700 |
Warner Music Group Corp. | | | | 2,200 | | | 50,490 |
Westwood One, Inc. | | | | 4,800 | | | 33,888 |
World Wrestling Entertainment, Inc. | | | | 5,400 | | | 88,020 |
| | | | | | | |
| | | | | | | 1,199,402 |
| | | | | | | |
METALS & MINING – 3.1% |
AK Steel Holding Corp.* | | | | 19,900 | | | 336,310 |
Amerigo Resources, Ltd. | | CA | | 20,800 | | | 38,730 |
Brush Engineered Materials, Inc.* | | | | 1,100 | | | 37,147 |
Carpenter Technology Corp. | | | | 1,000 | | | 102,520 |
Castle AM Co. | | | | 1,300 | | | 33,085 |
Century Aluminum Co.* | | | | 4,470 | | | 199,586 |
Chaparral Steel Co. | | | | 7,200 | | | 318,744 |
Cleveland-Cliffs, Inc. | | | | 7,000 | | | 339,080 |
Commercial Metals Co. | | | | 400 | | | 10,320 |
Compass Minerals International, Inc . | | | | 2,500 | | | 78,900 |
Dynatec Corp.* | | CA | | 4,300 | | | 7,859 |
Gibraltar Industries, Inc. | | | | 1,900 | | | 44,669 |
Inmet Mining Corp. | | CA | | 1,000 | | | 53,552 |
LionOre Mining International, Ltd.* | | CA | | 4,800 | | | 54,574 |
Metal Management, Inc. | | | | 2,100 | | | 79,485 |
Olympic Steel, Inc. | | | | 900 | | | 20,007 |
Oregon Steel Mills, Inc.* | | | | 5,300 | | | 330,773 |
Quanex Corp. | | | | 7,800 | | | 269,802 |
RTI International Metals, Inc.* | | | | 500 | | | 39,110 |
Ryerson, Inc. | | | | 200 | | | 5,018 |
Schnitzer Steel Industries, Inc. | | | | 1,100 | | | 43,670 |
| | | | | | | |
| | | Country
Code | | Shares | | Value |
| | | | | | | |
Steel Dynamics, Inc. | | | | 2,680 | | $ | 86,966 |
Steel Technologies, Inc. | | | | 500 | | | 8,775 |
United States Steel Corp. | | | | 1,700 | | | 124,338 |
| | | | | | | |
| | | | | | | 2,663,020 |
| | | | | | | |
MULTI-UTILITIES – 0.5% |
Avista Corp. | | | | 10,100 | | | 255,631 |
Centerpoint Energy, Inc. | | | | 5,600 | | | 92,848 |
CH Energy Group, Inc. | | | | 1,000 | | | 52,800 |
CMS Energy Corp* | | | | 2,100 | | | 35,070 |
| | | | | | | |
| | | | | | | 436,349 |
| | | | | | | |
MULTILINE RETAIL – 0.8% |
Big Lots, Inc.* | | | | 12,400 | | | 284,208 |
Dillard’s, Inc. | | | | 2,835 | | | 99,140 |
Dollar Tree Stores, Inc.* | | | | 4,100 | | | 123,410 |
Family Dollar Stores, Inc. | | | | 3,600 | | | 105,588 |
Nordstrom, Inc. | | | | 700 | | | 34,538 |
Retail Ventures, Inc.* | | | | 2,700 | | | 51,408 |
| | | | | | | |
| | | | | | | 698,292 |
| | | | | | | |
OIL, GAS & CONSUMABLE FUELS – 2.8% |
Alon USA Energy, Inc. | | | | 4,500 | | | 118,395 |
Atlas Energy, Ltd.* | | CA | | 23,300 | | | 81,972 |
Birchcliff Energy, Ltd.* | | CA | | 1,100 | | | 3,860 |
Capitol Energy Resources, Ltd.* | | CA | | 7,400 | | | 27,113 |
Celtic Exploration, Ltd.* | | CA | | 2,600 | | | 31,033 |
Comstock Resources, Inc.* | | | | 700 | | | 21,742 |
Cyries Energy, Inc.* | | CA | | 4,000 | | | 43,453 |
Delek US Holdings, Inc. | | | | 500 | | | 8,195 |
Delphi Energy Corp.* | | CA | | 8,500 | | | 18,088 |
Duvernay Oil Corp.* | | CA | | 300 | | | 8,889 |
Edge Petroleum Corp.* | | | | 200 | | | 3,648 |
Ember Resources, Inc.* | | CA | | 900 | | | 1,985 |
Foundation Coal Holdings, Inc. | | | | 7,100 | | | 225,496 |
Frontier Oil Corp. | | | | 3,200 | | | 91,968 |
Galleon Energy, Inc.* | | CA | | 4,350 | | | 67,486 |
See Notes to Financial Statements.
54
OPPENHEIMER MAIN STREET SMALL CAP FUND
| | |
PORTFOLIO OF INVESTMENTS (Continued) December 31, 2006 | | Sun Capital Advisers Trust |
| | | | | | | |
| | | Country
Code | | Shares | | Value |
| | | | | | | |
General Maritime Corp. | | | | 3,900 | | $ | 137,241 |
Giant Industries, Inc.* | | | | 100 | | | 7,495 |
Harvest Natural Resources, Inc.* | | | | 300 | | | 3,189 |
Holly Corp. | | | | 2,000 | | | 102,800 |
Kereco Energy Ltd* | | CA | | 6,120 | | | 38,965 |
Mahalo Energy, Ltd.* | | CA | | 6,000 | | | 18,123 |
Midnight Oil Exploration, Ltd.* | | CA | | 15,100 | | | 30,708 |
Mission Oil & Gas, Inc.* | | CA | | 2,300 | | | 24,966 |
Newfield Exploration Co* | | | | 300 | | | 13,785 |
Omi Corp. | | | | 7,600 | | | 160,892 |
Overseas Shipholding Group, Inc. | | | | 1,600 | | | 90,080 |
Paramount Resources, Ltd.* | | CA | | 4,600 | | | 94,731 |
Pogo Producing Co. | | | | 600 | | | 29,064 |
ProEx Energy, Ltd.* | | CA | | 1,200 | | | 13,231 |
ProspEx Resources, Ltd.* | | CA | | 9,800 | | | 37,337 |
Real Resources, Inc.* | | CA | | 1,300 | | | 18,629 |
Sound Energy Trust | | CA | | 2,300 | | | 10,085 |
St. Mary Land & Exploration Co. | | | | 500 | | | 18,420 |
Sunoco, Inc. | | | | 2,100 | | | 130,956 |
Sure Energy, Inc.* | | CA | | 1,867 | | | 1,506 |
Swift Energy Co.* | | | | 1,400 | | | 62,734 |
Teekay Shipping Corp. | | | | 200 | | | 8,724 |
Tesoro Corp. | | | | 1,400 | | | 92,078 |
TUSK Energy Corp.* | | CA | | 14,900 | | | 40,274 |
USEC, Inc.* | | | | 20,600 | | | 262,032 |
Vaalco Energy, Inc.* | | | | 6,100 | | | 41,175 |
Western Refining, Inc. | | | | 6,500 | | | 165,490 |
Zenas Energy Corp.* | | CA | | 6,300 | | | 16,866 |
| | | | | | | |
| | | | | | | 2,424,899 |
| | | | | | | |
PAPER & FOREST PRODUCTS – 0.3% |
Bowater, Inc. | | | | 7,100 | | | 159,750 |
Buckeye Technologies, Inc.* | | | | 1,500 | | | 17,970 |
Louisiana-Pacific Corp. | | | | 3,100 | | | 66,743 |
Neenah Paper, Inc. | | | | 1,000 | | | 35,320 |
Schweitzer-Mauduit International, Inc. | | | | 600 | | | 15,630 |
| | | | | | | |
| | | | | | | 295,413 |
| | | | | | | |
| | | | | | | |
| | | Country
Code | | Shares | | Value |
| | | | | | | |
PERSONAL PRODUCTS – 0.7% |
Chattem, Inc.* | | | | 2,100 | | $ | 105,168 |
Estee Lauder Cos., Inc./The | | | | 900 | | | 36,738 |
Mannatech, Inc. | | | | 1,600 | | | 23,568 |
NBTY, Inc.* | | | | 6,300 | | | 261,891 |
Physicians Formula Holdings, Inc.* | | | | 3,600 | | | 67,284 |
Playtex Products, Inc.* | | | | 1,300 | | | 18,707 |
USANA Health Sciences, Inc.* | | | | 2,000 | | | 103,320 |
| | | | | | | |
| | | | | | | 616,676 |
| | | | | | | |
PHARMACEUTICALS – 1.6% |
Alpharma, Inc. | | | | 6,900 | | | 166,290 |
BioMimetic Therapeutics, Inc.* | | | | 2,200 | | | 29,018 |
Bradley Pharmaceuticals, Inc.* | | | | 1,900 | | | 39,102 |
Depomed, Inc.* | | | | 500 | | | 1,725 |
Endo Pharmaceuticals Holding, Inc.* | | | | 3,500 | | | 96,530 |
King Pharmaceuticals, Inc.* | | | | 4,731 | | | 75,318 |
Medicines Co* | | | | 2,000 | | | 63,440 |
Medicis Pharmaceutical Corp. | | | | 5,700 | | | 200,241 |
Mylan Labs, Inc. | | | | 3,900 | | | 77,844 |
New River Pharmaceuticals, Inc.* | | | | 600 | | | 32,826 |
Noven Pharmaceuticals, Inc.* | | | | 2,000 | | | 50,900 |
Pain Therapeutics, Inc.* | | | | 4,500 | | | 40,050 |
Perrigo Co. | | | | 5,200 | | | 89,960 |
Pozen, Inc.* | | | | 1,300 | | | 22,087 |
Sciele Pharma, Inc.* | | | | 6,900 | | | 165,600 |
Viropharma, Inc.* | | | | 9,900 | | | 144,936 |
Watson Pharmaceuticals, Inc.* | | | | 2,500 | | | 65,075 |
| | | | | | | |
| | | | | | | 1,360,942 |
| | | | | | | |
REAL ESTATE MANAGEMENT &
DEVELOPMENT – 0.1% |
CB Richard Ellis Group, Inc.* | | | | 2,200 | | | 73,040 |
| | | | | | | |
See Notes to Financial Statements.
55
OPPENHEIMER MAIN STREET SMALL CAP FUND
| | |
PORTFOLIO OF INVESTMENTS (Continued) December 31, 2006 | | Sun Capital Advisers Trust |
| | | | | | | |
| | | Country
Code | | Shares | | Value |
| | | | | | | |
REITS – 3.6% |
Acadia Realty Trust | | | | 700 | | $ | 17,514 |
Agree Realty Corp. | | | | 1,500 | | | 51,555 |
Alexandria Real Estate Equities, Inc. | | | | 800 | | | 80,320 |
AMB Property Corp. | | | | 500 | | | 29,305 |
American Home Mortgage Investment Corp. | | | | 400 | | | 14,048 |
Ashford Hospitality Trust, Inc. | | | | 1,200 | | | 14,940 |
Associated Estates Realty Corp. | | | | 700 | | | 9,618 |
BioMed Realty Trust, Inc. | | | | 1,800 | | | 51,480 |
Brandywine Reality Trust | | | | 2,200 | | | 73,150 |
BRE Properties, Inc. | | | | 200 | | | 13,004 |
Camden Property Trust | | | | 400 | | | 29,540 |
Capital Trust, Inc. | | | | 200 | | | 9,988 |
CapitalSource, Inc. | | | | 2,300 | | | 62,813 |
CBL & Associates Properties, Inc. | | | | 1,500 | | | 65,025 |
Cedar Shopping Centers Inc | | | | 500 | | | 7,955 |
Colonial Properties Trust | | | | 1,300 | | | 60,944 |
Commercial Net Lease Realty | | | | 2,500 | | | 57,375 |
Corporate Office Properties Trust | | | | 1,200 | | | 60,564 |
Crescent Real Estate Co. | | | | 1,100 | | | 21,725 |
Dct Industrial Trust, Inc. | | | | 3,500 | | | 41,300 |
DiamondRock Hospitality Co. | | | | 3,700 | | | 66,637 |
Digital Realty Trust, Inc. | | | | 1,800 | | | 61,614 |
Duke Realty Corp. | | | | 400 | | | 16,360 |
Eastgroup Properties, Inc. | | | | 800 | | | 42,848 |
Entertainment Properties Trust | | | | 600 | | | 35,064 |
Equity Inns, Inc. | | | | 3,000 | | | 47,880 |
Equity Lifestyle Properties, Inc. | | | | 200 | | | 10,886 |
Equity One, Inc. | | | | 2,000 | | | 53,320 |
| | | | | | | |
| | | Country
Code | | Shares | | Value |
| | | | | | | |
Federal Realty Investment Trust | | | | 500 | | $ | 42,500 |
FelCor Lodging Trust, Inc. | | | | 1,300 | | | 28,392 |
First Industrial Reality Trust, Inc. | | | | 1,600 | | | 75,024 |
First Potomac Realty Trust | | | | 100 | | | 2,911 |
Franklin Street Properties Corp. | | | | 100 | | | 2,105 |
Friedman Billings Ramsey Group, Inc. | | | | 400 | | | 3,200 |
Glimcher Realty Trust | | | | 900 | | | 24,039 |
Gramercy Capital Corp. | | | | 700 | | | 21,623 |
Health Care Realty Trust, Inc. | | | | 1,000 | | | 39,540 |
Health Care REIT, Inc. | | | | 1,000 | | | 43,020 |
Highland Hospitality Corp. | | | | 1,600 | | | 22,800 |
Highwoods Properties, Inc. | | | | 1,500 | | | 61,140 |
Home Properties, Inc. | | | | 1,300 | | | 77,051 |
Hospitality Properties Trust | | | | 1,100 | | | 52,283 |
Hrpt Properties Trust | | | | 1,300 | | | 16,055 |
Inland Real Estate Corp. | | | | 1,200 | | | 22,464 |
Innkeepers USA Trust | | | | 1,200 | | | 18,600 |
iStar Financial, Inc. | | | | 100 | | | 4,782 |
Kilroy Realty Corp. | | | | 700 | | | 54,600 |
Kimco Realty Corp. | | | | 90 | | | 4,045 |
Kite Realty Group Trust | | | | 100 | | | 1,862 |
KKR Financial Corp. | | | | 900 | | | 24,111 |
LaSalle Hotel Properties | | | | 700 | | | 32,095 |
Lexington Realty Trust | | | | 2,200 | | | 49,324 |
Liberty Property Trust | | | | 1,200 | | | 58,968 |
Longview Fibre Co. | | | | 2,224 | | | 48,817 |
LTC Properties, Inc. | | | | 1,000 | | | 27,310 |
Macerich Co. | | | | 100 | | | 8,657 |
Mack California Reality Corp. | | | | 800 | | | 40,800 |
Maguire Properties, Inc. | | | | 1,500 | | | 60,000 |
Mid America Apartment Communities, Inc. | | | | 1,100 | | | 62,964 |
See Notes to Financial Statements.
56
OPPENHEIMER MAIN STREET SMALL CAP FUND
| | |
PORTFOLIO OF INVESTMENTS (Continued) December 31, 2006 | | Sun Capital Advisers Trust |
| | | | | | | |
| | | Country
Code | | Shares | | Value |
| | | | | | | |
Nationwide Health Properties, Inc. | | | | 1,700 | | $ | 51,374 |
Newcastle Investment Corp. | | | | 300 | | | 9,396 |
Omega Healthcare Investors, Inc. | | | | 700 | | | 12,404 |
Parkway Properties, Inc. | | | | 500 | | | 25,505 |
Pennsylvania Real Estate Investment | | | | 1,000 | | | 39,380 |
Post Properties, Inc. | | | | 1,000 | | | 45,700 |
PS Business Parks, Inc. | | | | 700 | | | 49,497 |
RAIT Investment Trust | | | | 100 | | | 3,448 |
Ramco Gershenson Properties Trust | | | | 700 | | | 26,698 |
Realty Income Corp. | | | | 1,200 | | | 33,240 |
Reckson Associates Realty Corp. | | | | 200 | | | 9,120 |
Redwood Trust, Inc. | | | | 200 | | | 11,616 |
Regency Centers Corp. | | | | 400 | | | 31,268 |
Senior Housing Properties Trust | | | | 2,700 | | | 66,096 |
SL Green Reality Corp. | | | | 300 | | | 39,834 |
Sovran Self Storage, Inc. | | | | 900 | | | 51,552 |
Spirit Finance Corp. | | | | 4,000 | | | 49,880 |
Strategic Hotels & Resorts, Inc. | | | | 3,800 | | | 82,802 |
Sunstone Hotel Investors, Inc. | | | | 2,000 | | | 53,460 |
Tanger Factory Outlet Centers, Inc. | | | | 1,800 | | | 70,344 |
U-Store-It Trust | | | | 900 | | | 18,495 |
United Dominion Realty Trust, Inc. | | | | 1,400 | | | 44,506 |
Ventas, Inc. | | | | 1,400 | | | 59,248 |
Washington Real Estate Investment Trust | | | | 1,200 | | | 48,000 |
Weingarten Reality Investment | | | | 800 | | | 36,888 |
Winston Hotels, Inc. | | | | 600 | | | 7,950 |
| | | | | | | |
| | | | | | | 3,115,555 |
| | | | | | | |
| | | | | | | |
| | | Country
Code | | Shares | | Value |
| | | | | | | |
ROAD & RAIL – 0.7% |
Arkansas Best Corp. | | | | 1,400 | | $ | 50,400 |
Dollar Thrifty Automotive Group* | | | | 700 | | | 31,927 |
Genesee & Wyoming, Inc.* | | | | 700 | | | 18,368 |
Heartland Express, Inc. | | | | 966 | | | 14,510 |
Kansas City Southern* | | | | 2,000 | | | 57,960 |
Laidlaw International, Inc. | | | | 3,740 | | | 113,808 |
PAM Transportation Services* | | | | 500 | | | 11,010 |
Ryder System, Inc. | | | | 600 | | | 30,636 |
Saia, Inc.* | | | | 1,700 | | | 39,457 |
Swift Transportation Co., Inc.* | | | | 8,934 | | | 234,696 |
Universal Truckload Services, Inc.* | | | | 100 | | | 2,375 |
Werner Enterprises, Inc. | | | | 200 | | | 3,496 |
| | | | | | | |
| | | | | | | 608,643 |
| | | | | | | |
SEMICONDUCTORS & SEMICONDUCTOR EQUIPMENT – 4.9% |
Actel Corp* | | | | 1,300 | | | 23,608 |
Advanced Energy Industries, Inc.* | | | | 6,300 | | | 118,881 |
Agere Systems, Inc.* | | | | 7,000 | | | 134,190 |
Altera Corp.* | | | | 6,800 | | | 133,824 |
AMIS Holdings, Inc.* | | | | 1,900 | | | 20,083 |
Amkor Technology, Inc.* | | | | 32,100 | | | 299,814 |
Applied Micro Circuits Corp.* | | | | 28,700 | | | 102,172 |
Asyst Technologies, Inc.* | | | | 6,300 | | | 46,053 |
Atheros Communications, Inc.* | | | | 6,700 | | | 142,844 |
Atmel Corp.* | | | | 11,800 | | | 71,390 |
ATMI, Inc.* | | | | 3,400 | | | 103,802 |
Cirrus Logic, Inc.* | | | | 5,100 | | | 35,088 |
Cohu, Inc. | | | | 1,600 | | | 32,256 |
Credence Systems Corp* | | | | 3,100 | | | 16,120 |
Cree, Inc.* | | | | 1,200 | | | 20,784 |
Cymer, Inc.* | | | | 6,500 | | | 285,675 |
Diodes, Inc.* | | | | 2,000 | | | 70,960 |
DSP Group, Inc.* | | | | 500 | | | 10,850 |
See Notes to Financial Statements.
57
OPPENHEIMER MAIN STREET SMALL CAP FUND
| | |
PORTFOLIO OF INVESTMENTS (Continued) December 31, 2006 | | Sun Capital Advisers Trust |
| | | | | | | |
| | | Country
Code | | Shares | | Value |
| | | | | | | |
Fairchild Semiconductor International, Inc.* | | | | 3,000 | | $ | 50,430 |
Formfactor, Inc.* | | | | 800 | | | 29,800 |
Hittite Microwave Corp.* | | | | 4,100 | | | 132,512 |
Integrated Device Technology, Inc.* | | | | 5,800 | | | 89,784 |
Intersil Holding Corp. | | | | 4,000 | | | 95,680 |
Intevac, Inc.* | | | | 2,500 | | | 64,875 |
Kulicke & Soffa Industries, Inc.* | | | | 5,984 | | | 50,266 |
Linear Technology Corp. | | | | 1,100 | | | 33,352 |
LSI Logic Corp.* | | | | 11,700 | | | 105,300 |
LTX Corp.* | | | | 9,329 | | | 52,242 |
Mattson Technology, Inc.* | | | | 3,000 | | | 27,960 |
Micrel, Inc.* | | | | 21,200 | | | 228,536 |
Microtune, Inc.* | | | | 2,200 | | | 10,340 |
MKS Instruments, Inc.* | | | | 6,100 | | | 137,738 |
National Semiconductor Corp. | | | | 5,600 | | | 127,120 |
Novellus Systems, Inc.* | | | | 3,600 | | | 123,912 |
Omnivision Technologies, Inc.* | | | | 14,988 | | | 204,586 |
Portalplayer, Inc.* | | | | 1,900 | | | 25,555 |
Power Integrations, Inc.* | | | | 100 | | | 2,345 |
RF Micro Devices, Inc.* | | | | 3,400 | | | 23,086 |
Semtech Corp* | | | | 4,000 | | | 52,280 |
Silicon Image, Inc.* | | | | 16,200 | | | 206,064 |
Silicon Storage Technology, Inc.* | | | | 4,000 | | | 18,040 |
Sirf Technology Holdings, Inc.* | | | | 600 | | | 15,312 |
Supertex, Inc.* | | | | 1,200 | | | 47,100 |
Techwell, Inc.* | | | | 100 | | | 1,606 |
Teradyne, Inc.* | | | | 6,700 | | | 100,232 |
Tessera Technologies, Inc.* | | | | 3,400 | | | 137,156 |
Transmeta Corp.* | | | | 4,100 | | | 4,551 |
Trident Microsystems, Inc.* | | | | 400 | | | 7,272 |
Triquint Semiconductor, Inc.* | | | | 4,300 | | | 19,350 |
| | | | | | | |
| | | Country
Code | | Shares | | Value |
| | | | | | | |
Varian Semiconductor Equipment, Inc.* | | | | 2,200 | | $ | 100,144 |
Veeco Instruments, Inc.* | | | | 2,200 | | | 41,206 |
Xilinx, Inc. | | | | 4,800 | | | 114,288 |
Zoran Corp.* | | | | 8,100 | | | 118,098 |
| | | | | | | |
| | | | | | | 4,266,512 |
| | | | | | | |
SOFTWARE – 4.8% |
Actuate Corp.* | | | | 5,300 | | | 31,482 |
Advent Software, Inc.* | | | | 3,800 | | | 134,102 |
Altiris, Inc.* | | | | 2,000 | | | 50,760 |
Amdocs Ltd.* | | | | 1,900 | | | 73,625 |
Ansoft Corp.* | | | | 3,100 | | | 86,180 |
Aspen Technology, Inc.* | | | | 5,100 | | | 56,202 |
Autodesk, Inc.* | | | | 1,900 | | | 76,874 |
BEA Systems, Inc.* | | | | 8,800 | | | 110,704 |
Blackbaud, Inc. | | | | 9,300 | | | 241,800 |
BMC Software, Inc.* | | | | 4,735 | | | 152,467 |
Cadence Design Systems, Inc.* | | | | 6,200 | | | 111,042 |
Check Point Software Technologies* | | | | 1,800 | | | 39,456 |
Cognos, Inc.* | | | | 1,700 | | | 72,182 |
Compuware Corp.* | | | | 12,200 | | | 101,626 |
Double-take Software, Inc.* | | | | 1,400 | | | 18,032 |
Fair Issac Corp. | | | | 3,600 | | | 146,340 |
Hyperion Solutions Corp.* | | | | 2,600 | | | 93,444 |
i2 Technologies, Inc.* | | | | 1,100 | | | 25,102 |
Interactive Intelligence, Inc.* | | | | 2,000 | | | 44,840 |
Intuit, Inc.* | | | | 1,500 | | | 45,765 |
JDA Software Group, Inc.* | | | | 1,600 | | | 22,032 |
Kronos, Inc.* | | | | 2,200 | | | 80,828 |
Lawson Software, Inc.* | | | | 12,300 | | | 90,897 |
Magma Design Automation, Inc.* | | | | 900 | | | 8,037 |
Manhattan Associates, Inc.* | | | | 4,800 | | | 144,384 |
Mapinfo Corp.* | | | | 1,200 | | | 15,660 |
McAfee, Inc.* | | | | 3,900 | | | 110,682 |
Mentor Graphics Corp.* | | | | 16,600 | | | 299,298 |
Micros Systems, Inc.* | | | | 3,200 | | | 168,640 |
See Notes to Financial Statements.
58
OPPENHEIMER MAIN STREET SMALL CAP FUND
| | |
PORTFOLIO OF INVESTMENTS (Continued) December 31, 2006 | | Sun Capital Advisers Trust |
| | | | | | | |
| | | Country
Code | | Shares | | Value |
| | | | | | | |
Microstrategy, Inc.* | | | | 2,459 | | $ | 280,351 |
Net 1 UEPS Technologies, Inc.* | | | | 900 | | | 26,604 |
Novell, Inc.* | | | | 8,900 | | | 55,180 |
Open Solutions, Inc.* | | | | 1,100 | | | 41,404 |
Opnet Technologies, Inc.* | | | | 500 | | | 7,225 |
Parametric Technology Corp.* | | | | 1,000 | | | 18,020 |
Progress Software Corp.* | | | | 400 | | | 11,172 |
Quality Systems, Inc. | | | | 2,300 | | | 85,721 |
Quest Software, Inc.* | | | | 9,700 | | | 142,105 |
Sonic Solutions* | | | | 1,200 | | | 19,560 |
SPSS, Inc.* | | | | 1,800 | | | 54,126 |
Sybase, Inc.* | | | | 4,500 | | | 111,150 |
Synchronoss Technologies, Inc.* | | | | 200 | | | 2,744 |
Synopsys, Inc.* | | | | 4,870 | | | 130,175 |
The9 Ltd* | | | | 300 | | | 9,666 |
Tibco Software, Inc.* | | | | 23,800 | | | 224,672 |
Transaction Systems Architects, Inc.* | | | | 3,800 | | | 123,766 |
Ultimate Software Group, Inc.* | | | | 700 | | | 16,282 |
VA Software Corp.* | | | | 7,500 | | | 37,725 |
Vasco Data Security International* | | | | 1,800 | | | 21,330 |
Verint Systems, Inc.* | | | | 900 | | | 30,852 |
Wind River Systems, Inc.* | | | | 6,500 | | | 66,625 |
| | | | | | | |
| | | | | | | 4,168,938 |
| | | | | | | |
SPECIALTY RETAIL – 5.8% |
Abercrombie & Fitch Co. Class A | | | | 1,700 | | | 118,371 |
Aeropostale, Inc.* | | | | 9,600 | | | 296,352 |
American Eagle Outfitters, Inc. | | | | 3,750 | | | 117,037 |
AnnTaylor Stores Corp.* | | | | 2,900 | | | 95,236 |
Asbury Automotive Group, Inc. | | | | 3,700 | | | 87,172 |
Autonation, Inc.* | | | | 3,213 | | | 68,501 |
Autozone, Inc.* | | | | 1,000 | | | 115,560 |
Barnes & Noble, Inc. | | | | 3,101 | | | 123,141 |
Bebe Stores, Inc. | | | | 2,500 | | | 49,475 |
Blockbuster, Inc.* | | | | 13,200 | | | 69,828 |
Books-A-Million, Inc. | | | | 1,300 | | | 29,484 |
| | | | | | | |
| | | Country
Code | | Shares | | Value |
| | | | | | | |
Buckle, Inc. | | | | 2,900 | | $ | 147,465 |
Cache, Inc.* | | | | 1,200 | | | 30,288 |
Casual Male Retail Group, Inc.* | | | | 4,300 | | | 56,115 |
Cato Corp. | | | | 4,000 | | | 91,640 |
Charlotte Russe Holding, Inc.* | | | | 2,010 | | | 61,807 |
Charming Shoppes, Inc.* | | | | 18,200 | | | 246,246 |
Christopher & Banks Corp. | | | | 6,401 | | | 119,443 |
Circuit City Stores, Inc. | | | | 2,866 | | | 54,397 |
CSK Auto Corp.* | | | | 2,400 | | | 41,160 |
Dick’s Sporting Goods, Inc.* | | | | 1,600 | | | 78,384 |
Dress Barn, Inc.* | | | | 11,900 | | | 277,627 |
DSW, Inc.* | | | | 5,700 | | | 219,849 |
Genesco, Inc.* | | | | 2,900 | | | 108,170 |
Group 1 Automotive, Inc. | | | | 5,000 | | | 258,600 |
Gymboree Corp.* | | | | 7,229 | | | 275,859 |
Haverty Furniture Cos., Inc. | | | | 1,700 | | | 25,160 |
Mens Wearhouse, Inc. | | | | 4,100 | | | 156,866 |
Midas, Inc.* | | | | 800 | | | 18,400 |
Mothers Work, Inc.* | | | | 300 | | | 11,817 |
OfficeMax, Inc. | | | | 2,400 | | | 119,160 |
Pacific Sunwear of California, Inc.* | | | | 400 | | | 7,832 |
Payless Shoesource, Inc.* | | | | 10,783 | | | 353,898 |
PETsMART, Inc. | | | | 700 | | | 20,202 |
RadioShack Corp. | | | | 4,300 | | | 72,154 |
Rental-A-Center, Inc.* | | | | 9,800 | | | 289,198 |
Ross Stores, Inc. | | | | 3,500 | | | 102,550 |
Select Comfort Corp.* | | | | 7,943 | | | 138,129 |
Sherwin-Williams Co / The | | | | 1,600 | | | 101,728 |
Shoe Carnival, Inc.* | | | | 1,700 | | | 53,720 |
Sonic Automotive, Inc. | | | | 3,000 | | | 87,120 |
Stage Stores, Inc. | | | | 1,800 | | | 54,702 |
Syms Corp.* | | | | 100 | | | 1,991 |
The Wet Seal, Inc.* | | | | 7,000 | | | 46,690 |
Tween Brands, Inc.* | | | | 4,442 | | | 177,369 |
United Retail Group, Inc.* | | | | 600 | | | 8,412 |
West Marine, Inc.* | | | | 500 | | | 8,635 |
| | | | | | | |
| | | | | | | 5,092,940 |
| | | | | | | |
See Notes to Financial Statements.
59
OPPENHEIMER MAIN STREET SMALL CAP FUND
| | |
PORTFOLIO OF INVESTMENTS (Continued) December 31, 2006 | | Sun Capital Advisers Trust |
| | | | | | | |
| | | Country
Code | | Shares | | Value |
| | | | | | | |
TEXTILES, APPAREL & LUXURY GOODS – 1.9% |
Brown Shoe, Inc.* | | | | 6,550 | | $ | 312,697 |
Cherokee, Inc. | | | | 500 | | | 21,455 |
Deckers Outdoor Corp.* | | | | 1,000 | | | 59,950 |
Jones Apparel Group, Inc. | | | | 2,400 | | | 80,232 |
K Swiss, Inc. | | | | 500 | | | 15,370 |
Kellwood Co. | | | | 6,200 | | | 201,624 |
Liz Claiborne, Inc. | | | | 400 | | | 17,384 |
Madden Steven, Ltd. | | | | 5,600 | | | 196,504 |
Maidenform Brands, Inc.* | | | | 1,400 | | | 25,368 |
Perry Ellis International, Inc.* | | | | 800 | | | 32,800 |
Phillips-Van Heusen Corp. | | | | 600 | | | 30,102 |
Polo Ralph Lauren Corp | | | | 1,300 | | | 100,958 |
Skechers U.S.A,. Inc.* | | | | 6,500 | | | 216,515 |
True Religion Apparel, Inc.* | | | | 1,200 | | | 18,372 |
VF Corp. | | | | 500 | | | 41,040 |
Wolverine World Wide, Inc. | | | | 9,600 | | | 273,792 |
| | | | | | | |
| | | | | | | 1,644,163 |
| | | | | | | |
THRIFT & MORTGAGE FINANCE – 1.8% |
Bank Mutual Corp. | | | | 2,000 | | | 24,220 |
Bankunited Financial Corp. | | | | 800 | | | 22,368 |
Citizens First Bancorp, Inc. | | | | 200 | | | 6,148 |
Corus Bankshares, Inc. | | | | 8,500 | | | 196,095 |
Federal Agricultural Mortgage Corp. | | | | 900 | | | 24,417 |
First Federal Financial Corp.* | | | | 3,200 | | | 214,304 |
First Financial Holdings, Inc. | | | | 300 | | | 11,754 |
First Niagara Financial Group, Inc. | | | | 7,500 | | | 111,450 |
First Public Financial Corp. | | | | 300 | | | 7,047 |
Fremont General Corp. | | | | 9,000 | | | 145,890 |
ITLA Capital Corp. | | | | 100 | | | 5,791 |
KNBT Bancorp, Inc. | | | | 100 | | | 1,673 |
| | | | | | | |
| | | Country
Code | | Shares | | Value |
| | | | | | | |
MAF Bancorp, Inc. | | | | 2,000 | | $ | 89,380 |
MGIC Investment Corp | | | | 1,500 | | | 93,810 |
NexCen Brands, Inc.* | | | | 700 | | | 5,061 |
Ocwen Financial Corp.* | | | | 10,900 | | | 172,874 |
PFF Bancorp, Inc. | | | | 2,200 | | | 75,922 |
PMI Group, Inc. | | | | 2,000 | | | 94,340 |
Provident Finacial Services | | | | 3,600 | | | 65,268 |
Radian Group, Inc. | | | | 1,600 | | | 86,256 |
TierOne Corp. | | | | 1,200 | | | 37,932 |
Triad Guaranty, Inc.* | | | | 1,700 | | | 93,279 |
WSFS Financial Corp. | | | | 400 | | | 26,772 |
| | | | | | | |
| | | | | | | 1,612,051 |
| | | | | | | |
TOBACCO – 0.2% |
Loews Corp. | | | | 900 | | | 58,248 |
UST, Inc. | | | | 2,200 | | | 128,040 |
| | | | | | | |
| | | | | | | 186,288 |
| | | | | | | |
TRADING COMPANIES & DISTRIBUTORS – 0.8% |
Applied Industrial Technologies, Inc. | | | | 7,950 | | | 209,165 |
BlueLinx Holdings, Inc. | | | | 2,400 | | | 24,960 |
Houston Wire & Cable Co* | | | | 1,100 | | | 22,990 |
Interline Brands, Inc.* | | | | 3,000 | | | 67,410 |
Kaman Corp. | | | | 600 | | | 13,434 |
Rush Enterprises, Inc.* | | | | 1,100 | | | 18,612 |
UAP Holding Corp. | | | | 6,000 | | | 151,080 |
United Rentals, Inc.* | | | | 3,489 | | | 88,725 |
WW Grainger, Inc. | | | | 900 | | | 62,946 |
| | | | | | | |
| | | | | | | 659,322 |
| | | | | | | |
See Notes to Financial Statements.
60
OPPENHEIMER MAIN STREET SMALL CAP FUND
| | |
PORTFOLIO OF INVESTMENTS (Continued) December 31, 2006 | | Sun Capital Advisers Trust |
| | | | | | | |
| | | Country
Code | | Shares | | Value |
| | | | | | | |
WIRELESS TELECOMMUNICATION
SERVICES – 0.3% |
Dobson Communications Corp.* | | | | 15,900 | | $ | 138,489 |
FiberTower Corp* | | | | 1,100 | | | 6,468 |
Telephone & Data Systems Inc | | | | 2,000 | | | 108,660 |
USA Mobility, Inc. | | | | 1,200 | | | 26,843 |
| | | | | | | |
| | | | | | | 280,460 |
| | | | | | | |
Total Common Stocks
(cost $78,936,185) | | | | | | | 86,616,197 |
| | | | | | | |
TOTAL INVESTMENTS – 99.3% | | | |
(cost $78,936,185) | | | | | | | 86,616,197 |
Other assets less
liabilities – 0.7% | | | | | | | 624,033 |
| | | | | | | |
NET ASSETS – 100.0% | | | | | | $ | 87,240,230 |
| | | | | | | |
| * | Non-income producing security |
| (1) | Eligible for resale under rule 144A of the Securities Act of 1933. These securities may be resold in transactions exempt from registration, normally to qualified institutional buyers. At December 31, 2006 these securities amounted to $17,839, representing 0.02% of net assets |
CA = Canada
See Notes to Financial Statements.
61
FI LARGE CAP GROWTH FUND
| | |
PORTFOLIO OF INVESTMENTS December 31, 2006 | | Sun Capital Advisers Trust |
| | | | | |
| | | Shares | | Value |
| | | | | |
COMMON STOCKS – 98.4% | | | | | |
AUTOMOBILES – 1.3% |
Thor Industries, Inc. | | 1,140 | | $ | 50,149 |
| | | | | |
BEVERAGES – 2.0% | | | | | |
Hansen Natural Corp.* | | 2,250 | | | 75,780 |
| | | | | |
BIOTECHNOLOGY – 8.5% | | | | | |
Amgen, Inc.* | | 1,050 | | | 71,725 |
Amylin Pharmaceuticals, Inc.* | | 1,200 | | | 43,284 |
Biogen Idec, Inc.* | | 1,430 | | | 70,342 |
Genentech, Inc.* | | 1,030 | | | 83,564 |
Gilead Sciences, Inc.* | | 850 | | | 55,191 |
| | | | | |
| | | | | 324,106 |
| | | | | |
CAPITAL MARKETS – 5.7% | | | | | |
Knight Capital Group, Inc.* | | 1,670 | | | 32,014 |
Merrill Lynch & Co., Inc. | | 1,120 | | | 104,272 |
The Goldman Sachs Group, Inc. | | 410 | | | 81,733 |
| | | | | |
| | | | | 218,019 |
| | | | | |
COMMERCIAL BANKS – 0.3% | | | | | |
Wells Fargo & Co. | | 310 | | | 11,024 |
| | | | | |
COMMUNICATIONS EQUIPMENT – 4.3% |
Cisco Systems, Inc.* | | 3,760 | | | 102,761 |
Motorola, Inc. | | 1,340 | | | 27,550 |
Redback Networks, Inc.* | | 1,300 | | �� | 32,422 |
| | | | | |
| | | | | 162,733 |
| | | | | |
COMPUTERS & PERIPHERALS – 10.3% |
Apple Computer, Inc.* | | 940 | | | 79,750 |
Brocade Communications Systems,Inc.* | | 2,330 | | | 19,129 |
Hewlett-Packard Co. | | 2,650 | | | 109,153 |
Network Appliance, Inc.* | | 220 | | | 8,642 |
Seagate Technology | | 2,790 | | | 73,935 |
Western Digital Corp.* | | 4,980 | | | 101,891 |
| | | | | |
| | | | | 392,500 |
| | | | | |
DISTRIBUTORS – 1.0% | | | | | |
Building Materials Holding Corp. | | 1,550 | | | 38,270 |
| | | | | |
DIVERSIFIED TELECOMMUNICATION SERVICES – 0.8% |
AT&T, Inc. | | 880 | | | 31,460 |
| | | | | |
ELECTRICAL EQUIPMENT – 0.8% | | | | | |
Energy Conversion Devices, Inc.* | | 870 | | | 29,563 |
| | | | | |
| | | | | |
| | | Shares | | Value |
| | | | | |
FOOD & STAPLES RETAILING – 3.1% |
CVS Corp. | | 2,800 | | $ | 86,548 |
Wal-Mart Stores, Inc. | | 710 | | | 32,788 |
| | | | | |
| | | | | 119,336 |
| | | | | |
FOOD PRODUCTS – 0.9% | | | | | |
Archer-Daniels-Midland Co | | 560 | | | 17,898 |
Corn Products International, Inc. | | 530 | | | 18,306 |
| | | | | |
| | | | | 36,204 |
| | | | | |
HEALTH CARE EQUIPMENT & SUPPLIES – 0.7% |
Baxter International, Inc. | | 560 | | | 25,978 |
| | | | | |
HEALTH CARE PROVIDERS & SERVICES – 4.6% |
Sierra Health Services, Inc.* | | 2,080 | | | 74,963 |
UnitedHealth Group, Inc. | | 1,860 | | | 99,938 |
| | | | | |
| | | | | 174,901 |
| | | | | |
HOTELS RESTAURANTS & LEISURE – 0.9% |
McDonald’s Corp. | | 440 | | | 19,505 |
Penn National Gaming, Inc.* | | 140 | | | 5,827 |
Pinnacle Entertainment, Inc.* | | 300 | | | 9,942 |
| | | | | |
| | | | | 35,274 |
| | | | | |
HOUSEHOLD DURABLES – 2.5% | | | | | |
D.R.Horton, Inc. | | 1,920 | | | 50,861 |
Ryland Group, Inc. | | 790 | | | 43,150 |
| | | | | |
| | | | | 94,011 |
| | | | | |
INDEPENDENT POWER PRODUCERS & ENERGY TRADERS – 0.8% |
AES Corp.* | | 380 | | | 8,375 |
Constellation Energy Group, Inc. | | 300 | | | 20,661 |
| | | | | |
| | | | | 29,036 |
| | | | | |
INDUSTRIAL CONGLOMERATES – 0.5% |
General Electric Co. | | 490 | | | 18,233 |
| | | | | |
INSURANCE – 2.1% | | | | | |
ACE, Ltd. | | 960 | | | 58,147 |
The Chubb Corp. | | 430 | | | 22,751 |
| | | | | |
| | | | | 80,898 |
| | | | | |
INTERNET SOFTWARE & SERVICES – 3.6% |
Google, Inc.* | | 300 | | | 138,144 |
| | | | | |
LIFE SCIENCES TOOLS & SERVICES – 1.5% |
Pharmaceutical Product Development Inc | | 1,790 | | | 57,674 |
| | | | | |
See Notes to Financial Statements.
62
FI LARGE CAP GROWTH FUND
| | |
PORTFOLIO OF INVESTMENTS (Continued) December 31, 2006 | | Sun Capital Advisers Trust |
| | | | | |
| | | Shares | | Value |
| | | | | |
MACHINERY – 10.4% |
Bucyrus International, Inc. | | 1,270 | | $ | 65,735 |
Caterpillar, Inc. | | 20 | | | 1,227 |
Joy Global, Inc. | | 2,310 | | | 111,665 |
Manitowoc, Inc. | | 1,900 | | | 112,917 |
Terex Corp.* | | 1,650 | | | 106,557 |
| | | | | |
| | | | | 398,101 |
| | | | | |
METALS & MINING – 3.9% | | | | | |
Allegheny Technologies, Inc. | | 1,322 | | | 119,879 |
Titanium Metals Corp.* | | 950 | | | 28,034 |
| | | | | |
| | | | | 147,913 |
| | | | | |
MULTILINE RETAIL – 2.9% | | | | | |
JC Penney Co., Inc. | | 1,290 | | | 99,794 |
Kohl’s Corp.* | | 130 | | | 8,896 |
| | | | | |
| | | | | 108,690 |
| | | | | |
OIL, GAS & CONSUMABLE FUELS – 3.8% |
Exxon Mobil Corp. | | 350 | | | 26,820 |
Sunoco, Inc. | | 710 | | | 44,276 |
Tesoro Corp. | | 1,120 | | | 73,662 |
| | | | | |
| | | | | 144,758 |
| | | | | |
PHARMACEUTICALS – 2.9% |
Endo Pharmaceuticals Holding, Inc.* | | 740 | | | 20,409 |
Johnson & Johnson | | 460 | | | 30,369 |
Merck & Co., Inc. | | 860 | | | 37,496 |
Sepracor, Inc.* | | 330 | | | 20,322 |
| | | | | |
| | | | | 108,596 |
| | | | | |
ROAD & RAIL – 1.7% |
CSX Corp. | | 1,420 | | | 48,891 |
Norfolk Southern Corp. | | 300 | | | 15,087 |
| | | | | |
| | | | | 63,978 |
| | | | | |
SEMICONDUCTORS & SEMICONDUCTOR EQUIPMENT – 7.3% |
Cymer, Inc.* | | 2,320 | | | 101,964 |
Intersil Holding Corp. | | 500 | | | 11,960 |
Lam Research Corp.* | | 1,780 | | | 90,103 |
Marvell Technology Group, Ltd.* | | 2,430 | | | 46,632 |
MEMC Electronic Materials, Inc.* | | 720 | | | 28,181 |
| | | | | |
| | | | | 278,840 |
| | | | | |
| | | | | | | |
| | | Shares | | Value | |
| | | | | | | |
SOFTWARE – 1.6% | |
Microsoft Corp. | | | 1,550 | | $ | 46,283 | |
Oracle Corp.* | | | 870 | | | 14,912 | |
| | | | | | | |
| | | | | | 61,195 | |
| | | | | | | |
SPECIALTY RETAIL – 4.3% | |
AnnTaylor Stores Corp.* | | | 1,170 | | | 38,423 | |
Best Buy Co., Inc. | | | 800 | | | 39,352 | |
Circuit City Stores, Inc. | | | 1,470 | | | 27,901 | |
Mens Wearhouse, Inc. | | | 760 | | | 29,077 | |
TJX Cos., Inc. | | | 960 | | | 27,379 | |
| | | | | | | |
| | | | | | 162,132 | |
| | | | | | | |
TEXTILES, APPAREL & LUXURY GOODS – 0.5% | |
Wolverine World Wide, Inc. | | | 660 | | | 18,823 | |
| | | | | | | |
THRIFT & MORTGAGE FINANCE – 0.4% | |
Radian Group, Inc. | | | 270 | | | 14,556 | |
| | | | | | | |
TOBACCO – 2.5% | |
Altria Group, Inc. | | | 1,010 | | | 86,678 | |
Loews Corp. | | | 160 | | | 10,354 | |
| | | | | | | |
| | | | | | 97,032 | |
| | | | | | | |
Total Common Stocks
(cost $3,598,423) | | | | | | 3,747,907 | |
| | | | | | | |
| | | Principal
Amount
(000) | | | |
SHORT TERM INVESTMENT – 6.3% | | | | |
REPURCHASE AGREEMENT – 6.3% | |
State Street Bank and Trust Company, 2.500%, 1/2/07 (collateralized by $250,000 Federal Home Loan Bank, 4.375%, 09/17/10, with a value of $248,224 total to be received $242,067)
(amortized cost $242,000) | | $ | 242 | | | 242,000 | |
| | | | | | | |
TOTAL INVESTMENTS – 104.7% | | | | |
(cost $3,840,423) | | | | | | 3,989,907 | |
Liabilities in excess
of other assets – (4.7)% | | | | | | (180,381 | ) |
| | | | | | | |
NET ASSETS – 100.0% | | | | | $ | 3,809,526 | |
| | | | | | | |
| * | Non-income producing security |
See Notes to Financial Statements.
63
BLUE CHIP MID CAP FUND
| | |
PORTFOLIO OF INVESTMENTS December 31, 2006 | | Sun Capital Advisers Trust |
| | | | | | | |
| | | Country
Code | | Shares | | Value |
| | | | | | | |
COMMON STOCKS – 98.1% |
AEROSPACE & DEFENSE – 2.9% |
Precision Castparts Corp. | | | | 13,800 | | $ | 1,080,264 |
Rockwell Collins, Inc. | | | | 21,600 | | | 1,367,064 |
Spirit Aerosystems Holdings, Inc.* | | | | 10,000 | | | 334,700 |
| | | | | | | |
| | | | | | | 2,782,028 |
| | | | | | | |
AIR FREIGHT & LOGISTICS – 1.1% |
CH Robinson Worldwide, Inc. | | | | 17,300 | | | 707,397 |
Expeditors International of Washington, Inc. | | | | 9,000 | | | 364,500 |
| | | | | | | |
| | | | | | | 1,071,897 |
| | | | | | | |
AUTO COMPONENTS – 1.4% |
BorgWarner, Inc. | | | | 10,500 | | | 619,710 |
TRW Automotive Holdings Corp.* | | | | 25,900 | | | 670,033 |
| | | | | | | |
| | | | | | | 1,289,743 |
| | | | | | | |
BIOTECHNOLOGY – 2.6% |
Amylin Pharmaceuticals, Inc.* | | | | 13,800 | | | 497,766 |
Cephalon, Inc.* | | | | 13,500 | | | 950,535 |
Millennium Pharmaceuticals, Inc.* | | | | 45,500 | | | 495,950 |
Vertex Pharmaceuticals, Inc.* | | | | 14,200 | | | 531,364 |
| | | | | | | |
| | | | | | | 2,475,615 |
| | | | | | | |
BUILDING PRODUCTS – 1.7% |
American Standard Cos., Inc. | | | | 35,600 | | | 1,632,260 |
| | | | | | | |
CAPITAL MARKETS – 5.0% |
Aberdeen Asset Management PLC | | GB | | 174,747 | | | 650,309 |
Blackrock, Inc. | | | | 4,000 | | | 607,600 |
E*Trade Financial Corp.* | | | | 38,300 | | | 858,686 |
State Street Corp. | | | | 19,800 | | | 1,335,312 |
T Rowe Price Group, Inc. | | | | 29,700 | | | 1,299,969 |
| | | | | | | |
| | | | | | | 4,751,876 |
| | | | | | | |
| | | | | | | |
| | | Country
Code | | Shares | | Value |
| | | | | | | |
COMMERCIAL BANKS – 0.8% |
UCBH Holdings, Inc. | | | | 44,000 | | $ | 772,640 |
| | | | | | | |
COMMERCIAL SERVICES & SUPPLIES – 8.9% |
Allied Waste Industries, Inc.* | | | | 61,100 | | | 750,919 |
American Reprographics Co.* | | | | 9,900 | | | 329,769 |
Corporate Executive Board Co. | | | | 2,600 | | | 228,020 |
Equifax, Inc. | | | | 44,600 | | | 1,810,760 |
Manpower, Inc. | | | | 22,400 | | | 1,678,432 |
Monster Worldwide, Inc.* | | | | 30,300 | | | 1,413,192 |
Republic Services, Inc. | | | | 35,800 | | | 1,455,986 |
Robert Half International, Inc. | | | | 20,700 | | | 768,384 |
| | | | | | | |
| | | | | | | 8,435,462 |
| | | | | | | |
COMPUTERS & PERIPHERALS – 1.7% |
Network Appliance, Inc.* | | | | 40,400 | | $ | 1,586,912 |
| | | | | | | |
CONSTRUCTION & ENGINEERING – 2.7% |
Fluor Corp. | | | | 14,500 | | | 1,183,925 |
Foster Wheeler, Ltd.* | | | | 24,600 | | | 1,356,444 |
| | | | | | | |
| | | | | | | 2,540,369 |
| | | | | | | |
CONSUMER FINANCE – 0.5% |
AmeriCredit Corp.* | | | | 19,900 | | | 500,883 |
| | | | | | | |
DIVERSIFIED CONSUMER SERVICES – 0.7% |
Weight Watchers International, Inc. | | | | 12,600 | | | 661,878 |
| | | | | | | |
DIVERSIFIED FINANCIAL SERVICES – 0.8% |
Hong Kong Exchanges and Clearing, Ltd. | | HK | | 65,000 | | | 715,388 |
| | | | | | | |
ELECTRIC UTILITIES – 1.5% |
Northeast Utilities | | | | 49,300 | | | 1,388,288 |
| | | | | | | |
ELECTRICAL EQUIPMENT – 1.3% |
Roper Industries, Inc. | | | | 15,200 | | | 763,648 |
Suntech Power Holdings Co., Ltd.* | | | | 14,300 | | | 486,343 |
| | | | | | | |
| | | | | | | 1,249,991 |
| | | | | | | |
See Notes to Financial Statements.
64
BLUE CHIP MID CAP FUND
| | |
PORTFOLIO OF INVESTMENTS (Continued) December 31, 2006 | | Sun Capital Advisers Trust |
| | | | | | | |
| | | Country
Code | | Shares | | Value |
| | | | | | | |
ENERGY EQUIPMENT & SERVICES – 3.1% |
GlobalSantaFe Corp. | | | | 27,900 | | $ | 1,639,962 |
Noble Corp. | | | | 17,200 | | | 1,309,780 |
| | | | | | | |
| | | | | | | 2,949,742 |
| | | | | | | |
FOOD & STAPLES RETAILING – 2.0% |
SUPERVALU, Inc. | | | | 53,600 | | | 1,916,200 |
| | | | | | | |
FOOD PRODUCTS – 0.7% |
Tyson Foods, Inc. | | | | 40,000 | | | 658,000 |
| | | | | | | |
HEALTH CARE EQUIPMENT & SUPPLIES – 2.9% |
Beckman Coulter, Inc. | | | | 21,200 | | | 1,267,760 |
Cytyc Corp* | | | | 26,900 | | | 761,270 |
Dade Behring Holdings, Inc. | | | | 17,900 | | | 712,599 |
| | | | | | | |
| | | | | | | 2,741,629 |
| | | | | | | |
HEALTH CARE PROVIDERS & SERVICES – 3.8% |
DaVita, Inc.* | | | | 16,600 | | | 944,208 |
Manor Care, Inc. | | | | 25,400 | | | 1,191,768 |
Patterson Cos., Inc.* | | | | 17,200 | | | 610,772 |
Universal Health Services, Inc. | | | | 15,800 | | | 875,794 |
| | | | | | | |
| | | | | | | 3,622,542 |
| | | | | | | |
HOTELS RESTAURANTS & LEISURE – 0.9% |
OSI Restaurant Partners, Inc. | | | | 21,900 | | | 858,480 |
| | | | | | | |
HOUSEHOLD DURABLES – 1.0% |
Newell Rubbermaid, Inc. | | | | 33,800 | | | 978,510 |
| | | | | | | |
HOUSEHOLD PRODUCTS – 1.3% |
Clorox Co | | | | 18,900 | | | 1,212,435 |
| | | | | | | |
INDEPENDENT POWER PRODUCERS & ENERGY TRADERS – 1.3% |
NRG Energy, Inc.* | | | | 21,600 | | | 1,209,816 |
| | | | | | | |
INSURANCE – 4.2% |
Ambac Financial Group, Inc. | | | | 14,900 | | | 1,327,143 |
Assurant, Inc. | | | | 19,200 | | | 1,060,800 |
Everest Re Group, Ltd. | | | | 6,700 | | | 657,337 |
UnumProvident Corp. | | | | 42,400 | | | 881,072 |
| | | | | | | |
| | | | | | | 3,926,352 |
| | | | | | | |
| | | | | | | |
| | | Country
Code | | Shares | | Value |
| | | | | | | |
IT SERVICES – 4.0% |
Alliance Data Systems Corp.* | | | | 16,700 | | $ | 1,043,249 |
Cognizant Technology Solutions Corp., Class A* | | | | 10,800 | | | 833,328 |
Moneygram International, Inc. | | | | 39,000 | | | 1,223,040 |
The BISYS Group, Inc.* | | | | 50,500 | | | 651,955 |
| | | | | | | |
| | | | | | | 3,751,572 |
| | | | | | | |
LIFE SCIENCES TOOLS & SERVICES – 1.0% |
Charles River Laboratories International, Inc.* | | | | 21,800 | | | 942,850 |
| | | | | | | |
MACHINERY – 1.5% |
Oshkosh Truck Corp. | | | | 10,800 | | | 522,936 |
Paccar, Inc. | | | | 14,075 | | | 913,467 |
| | | | | | | |
| | | | | | | 1,436,403 |
| | | | | | | |
MEDIA – 2.5% |
Cablevision Systems Corp., Class A | | | | 40,800 | | | 1,161,984 |
EchoStar Communications Corp., Class A* | | | | 16,600 | | | 631,298 |
Focus Media Holding, Ltd.* | | | | 8,182 | | | 543,203 |
| | | | | | | |
| | | | | | | 2,336,485 |
| | | | | | | |
METALS & MINING – 2.1% |
Phelps Dodge Corp. | | | | 5,100 | | | 610,572 |
Teck Cominco, Ltd. | | | | 18,400 | | | 1,386,440 |
| | | | | | | |
| | | | | | | 1,997,012 |
MULTI-UTILITIES – 0.6% |
PNM Resources, Inc. | | | | 19,100 | | | 594,010 |
| | | | | | | |
MULTILINE RETAIL – 0.6% |
Saks, Inc. | | | | 30,900 | | | 550,638 |
| | | | | | | |
See Notes to Financial Statements.
65
BLUE CHIP MID CAP FUND
| | |
PORTFOLIO OF INVESTMENTS (Continued) December 31, 2006 | | Sun Capital Advisers Trust |
| | | | | | | |
| | | Country
Code | | Shares | | Value |
| | | | | | | |
OIL, GAS & CONSUMABLE FUELS – 5.5% |
Cameco Corp. | | | | 39,500 | | $ | 1,597,775 |
Murphy Oil Corp | | | | 13,500 | | | 686,475 |
Noble Energy, Inc. | | | | 14,600 | | | 716,422 |
Peabody Energy Corp. | | | | 15,800 | | | 638,478 |
Southwestern Energy Co.* | | | | 12,300 | | | 431,115 |
Western Oil Sands, Inc.* | | CA | | 40,800 | | | 1,145,159 |
| | | | | | | |
| | | | | | | 5,215,424 |
| | | | | | | |
PERSONAL PRODUCTS – 0.4% |
Alberto Culver Co.*. | | | | 18,100 | | | 388,245 |
| | | | | | | |
PHARMACEUTICALS – 3.7% |
Barr Pharmaceuticals, Inc.* | | | | 21,600 | | | 1,082,592 |
Eisai Co., Ltd. | | JP | | 15,100 | | | 829,691 |
Mylan Labs, Inc. | | | | 30,200 | | | 602,792 |
Shionogi & Co. | | JP | | 51,000 | | | 1,002,647 |
| | | | | | | |
| | | | | | | 3,517,722 |
| | | | | | | |
REITS – 1.3% |
Host Marriott Corp. | | | | 35,561 | | | 873,023 |
Ventas, Inc. | | | | 8,100 | | | 342,792 |
| | | | | | | |
| | | | | | | 1,215,815 |
| | | | | | | |
ROAD & RAIL – 1.4% |
JB Hunt Transport Services, Inc. | | | | 31,900 | | | 662,563 |
Landstar Systems, Inc. | | | | 17,300 | | | 660,514 |
| | | | | | | |
| | | | | | | 1,323,077 |
| | | | | | | |
SEMICONDUCTORS & SEMICONDUCTOR EQUIPMENT – 5.5% |
Altera Corp.* | | | | 73,800 | | | 1,452,384 |
Kla-Tencor Corp. | | | | 22,900 | | | 1,139,275 |
Lam Research Corp.* | | | | 14,800 | | | 749,176 |
Linear Technology Corp. | | | | 33,800 | | | 1,024,816 |
MEMC Electronic Materials, Inc.* | | | | 20,800 | | | 814,112 |
| | | | | | | |
| | | | | | | 5,179,763 |
| | | | | | | |
| | | | | | | |
| | | Country
Code | | Shares | | Value |
| | | | | | | |
SOFTWARE – 3.8% |
Activision, Inc.* | | | | 65,500 | | $ | 1,129,220 |
Autodesk, Inc.* | | | | 29,900 | | | 1,209,754 |
Cadence Design Systems, Inc.* | | | | 70,000 | | | 1,253,700 |
| | | | | | | |
| | | | | | | 3,592,674 |
| | | | | | | |
SPECIALTY RETAIL – 6.2% |
Abercrombie & Fitch Co. Class A | | | | 21,100 | | | 1,469,193 |
American Eagle Outfitters, Inc. | | | | 10,200 | | | 318,342 |
CarMax, Inc.* | | | | 20,500 | | | 1,099,415 |
O’Reilly Automotive, Inc.* | | | | 14,000 | | | 448,840 |
PETsMART, Inc. | | | | 40,600 | | | 1,171,716 |
Sally Beauty Holdings, Inc.* | | | | 7,100 | | | 55,380 |
Tiffany & Co. | | | | 33,000 | | | 1,294,920 |
| | | | | | | |
| | | | | | | 5,857,806 |
| | | | | | | |
TEXTILES, APPAREL & LUXURY GOODS – 0.6% |
Gildan Activewear, Inc.* | | | | 11,200 | | | 522,256 |
| | | | | | | |
THRIFT & MORTGAGE FINANCE – 0.9% |
Webster Financial Corp. | | | | 17,000 | | | 828,240 |
| | | | | | | |
TRADING COMPANIES & DISTRIBUTORS – 0.3% |
Fastenal Co. | | | | 8,000 | | | 287,040 |
| | | | | | | |
WIRELESS TELECOMMUNICATION
SERVICES – 1.4% |
American Tower Corp. Class A* | | | | 36,100 | | | 1,345,808 |
| | | | | | | |
Total Common Stocks
(cost $79,644,373) | | | | | | | 92,811,776 |
| | | | | | | |
See Notes to Financial Statements.
66
BLUE CHIP MID CAP FUND
| | |
PORTFOLIO OF INVESTMENTS (Continued) December 31, 2006 | | Sun Capital Advisers Trust |
| | | | | | | | | |
| | | | | Principal
Amount
(000) | | Value | |
| | | | | | | | | |
SHORT TERM INVESTMENT – 2.0% | |
REPURCHASE AGREEMENT – 2.0% | |
State Street Bank and Trust Company, 4.850%, 1/2/07 (collateralized by $1,960,000 Federal Home Loan Bank, 4.375%, 09/17/10, with a value of $1,946,076 total to be received $1,905,026) (amortized cost $1,904,000) | | $ | 1,904 | | $ | 1,904,000 | |
| | | | | | | | | |
TOTAL INVESTMENTS – 100.1% | | | | |
(cost $81,548,373) | | | | | | 94,715,776 | |
Liabilities in excess
of other assets – (0.1)% | | | | | | (83,308 | ) |
| | | | | | | | | |
NET ASSETS – 100.0% | | | | | $ | 94,632,468 | |
| | | | | | | | | |
| * | Non-income producing security |
CA = Canada
GB = Great Britain
HK = Hong Kong
JP = Japan
See Notes to Financial Statements.
67
| | |
STATEMENTSOF ASSETSAND LIABILITIES December 31, 2006 | | Sun Capital Advisers Trust |
| | | | | | | | | | | | | | | | | | | | | | | | | | | | | |
| | | All Cap
Fund | | | Investment Grade
Bond Fund | | | Money Market
Fund | | | Real Estate
Fund | | Davis Venture
Value Fund | | | Oppenheimer
Main Street
Small Cap Fund | | FI Large
Cap Growth
Fund | | | Blue Chip
Mid Cap
Fund |
ASSETS | | | | | | | | | | | | | | | | | | | | | | | | | | | | | |
Investment in securities, at value | | $ | 11,437,635 | | | $ | 56,108,464 | | | $ | 121,370,087 | | | $ | 227,670,547 | | $ | 61,507,007 | | | $ | 86,616,197 | | $ | 3,989,907 | | | $ | 94,715,776 |
Cash | | | — | | | | 1,578 | | | | 89 | | | | — | | | 1,162 | | | | 44,730 | | | 30 | | | | 237 |
Foreign currency, at value | | | — | | | | — | | | | — | | | | — | | | — | | | | 285 | | | — | | | | — |
Interest and dividends receivable | | | 13,147 | | | | 466,548 | | | | 57,399 | | | | 983,871 | | | 72,512 | | | | 73,053 | | | 2,741 | | | | 102,670 |
Receivable for Fund shares sold | | | 22,467 | | | | 55,398 | | | | 100,783 | | | | 137,556 | | | — | | | | 32 | | | 377 | | | | 561 |
Receivable for investments sold | | | 812 | | | | 402 | | | | — | | | | — | | | — | | | | 1,456,490 | | | 37,499 | | | | 207,142 |
Receivable due from Adviser | | | 16,203 | | | | — | | | | — | | | | — | | | — | | | | — | | | 31,078 | | | | — |
Other assets | | | 1,892 | | | | 9,197 | | | | 20,019 | | | | 37,865 | | | 9,930 | | | | 14,790 | | | 589 | | | | 15,722 |
| | | | | | | | | | | | | | | | | | | | | | | | | | | | | |
Total Assets | | | 11,492,156 | | | | 56,641,587 | | | | 121,548,377 | | | | 228,829,839 | | | 61,590,611 | | | | 88,205,577 | | | 4,062,221 | | | | 95,042,108 |
| | | | | | | | | | | | | | | | | | | | | | | | | | | | | |
LIABILITIES | | | | | | | | | | | | | | | | | | | | | | | | | | | | | |
Payable for investments purchased | | | — | | | | 1,969,260 | | | | — | | | | — | | | 4,249 | | | | 152,842 | | | 213,709 | | | | 127,118 |
Payable for Fund shares redeemed | | | 179 | | | | 49 | | | | 281 | | | | 63,016 | | | 2,404 | | | | 56,920 | | | 1 | | | | 76,342 |
Adviser fee payable | | | — | | | | 28,821 | | | | 53,002 | | | | 475,556 | | | 61,810 | | | | 23,440 | | | — | | | | 145,144 |
Trustees fees payable | | | 3,900 | | | | 3,900 | | | | 3,900 | | | | 3,900 | | | 3,900 | | | | 3,900 | | | 3,900 | | | | 3,900 |
Accrued expenses and other liabilities | | | 43,297 | | | | 60,553 | | | | 52,620 | | | | 136,176 | | | 52,510 | | | | 728,245 | | | 35,085 | | | | 57,136 |
| | | | | | | | | | | | | | | | | | | | | | | | | | | | | |
Total Liabilities | | | 47,376 | | | | 2,062,583 | | | | 109,803 | | | | 678,648 | | | 124,873 | | | | 965,347 | | | 252,695 | | | | 409,640 |
| | | | | | | | | | | | | | | | | | | | | | | | | | | | | |
NET ASSETS | | $ | 11,444,780 | | | $ | 54,579,004 | | | $ | 121,438,574 | | | $ | 228,151,191 | | $ | 61,465,738 | | | $ | 87,240,230 | | $ | 3,809,526 | | | $ | 94,632,468 |
| | | | | | | | | | | | | | | | | | | | | | | | | | | | | |
COMPOSITION OF NET ASSETS | | | | | | | | | | | | | | | | | | | | | | | | | | | | | |
Paid-in Capital | | | 9,997,883 | | | | 54,885,135 | | | | 121,439,931 | | | | 133,499,204 | | | 43,711,025 | | | | 63,058,148 | | | 3,769,305 | | | | 65,121,946 |
Accumulated undistributed (distributions in excess of) net investment income | | | — | | | | — | | | | — | | | | 4,863,265 | | | 401,361 | | | | 12,559 | | | — | | | | 863,339 |
Accumulated net realized gain (loss) on investments and foreign currency transactions | | | (6,741 | ) | | | (3,018 | ) | | | (1,357 | ) | | | 30,398,058 | | | (1,780,430 | ) | | | 16,489,808 | | | (109,263 | ) | | | 15,479,917 |
Net unrealized appreciation (depreciation) of investments and foreign currency transactions | | | 1,453,638 | | | | (303,113 | ) | | | — | | | | 59,390,664 | | | 19,133,782 | | | | 7,679,715 | | | 149,484 | | | | 13,167,266 |
| | | | | | | | | | | | | | | | | | | | | | | | | | | | | |
| | $ | 11,444,780 | | | $ | 54,579,004 | | | $ | 121,438,574 | | | $ | 228,151,191 | | $ | 61,465,738 | | | $ | 87,240,230 | | $ | 3,809,526 | | | $ | 94,632,468 |
| | | | | | | | | | | | | | | | | | | | | | | | | | | | | |
Initial Class | | | | | | | | | | | | | | | | | | | | | | | | | | | | | |
Net Assets | | | 6,182,712 | | | | 45,186,049 | | | | 120,164,190 | | | | 121,196,695 | | | 61,438,322 | | | | 87,215,110 | | | — | | | | 94,632,468 |
Share of Beneficial Interest | | | 499,929 | | | | 4,697,506 | | | | 120,165,547 | | | | 4,926,455 | | | 4,665,868 | | | | 5,808,211 | | | — | | | | 4,970,353 |
Net asset value per share | | $ | 12.37 | | | $ | 9.62 | | | $ | 1.00 | | | $ | 24.60 | | $ | 13.17 | | | $ | 15.02 | | $ | — | | | $ | 19.04 |
| | | | | | | | | | | | | | | | | | | | | | | | | | | | | |
Service Class | | | | | | | | | | | | | | | | | | | | | | | | | | | | | |
Net Assets | | | 5,262,068 | | | | 9,392,955 | | | | 1,274,384 | | | | 106,954,496 | | | 27,416 | | | | 25,120 | | | 3,809,526 | | | | — |
Share of Beneficial Interest | | | 416,035 | | | | 969,548 | | | | 1,274,384 | | | | 4,076,789 | | | 2,085 | | | | 1,676 | | | 381,869 | | | | — |
Net asset value per share | | $ | 12.65 | | | $ | 9.69 | | | $ | 1.00 | | | $ | 26.23 | | $ | 13.15 | | | $ | 14.99 | | $ | 9.98 | | | $ | — |
| | | | | | | | | | | | | | | | | | | | | | | | | | | | | |
Investments in securities, at cost | | $ | 9,983,997 | | | $ | 56,411,577 | | | $ | 121,370,087 | | | $ | 168,279,883 | | $ | 42,373,209 | | | $ | 78,936,185 | | $ | 3,840,423 | | | $ | 81,548,373 |
| | | | | | | | | | | | | | | | | | | | | | | | | | | | | |
Foreign currency, at cost | | $ | — | | | $ | — | | | $ | — | | | $ | — | | $ | — | | | $ | 285 | | $ | — | | | $ | — |
| | | | | | | | | | | | | | | | | | | | | | | | | | | | | |
See Notes to Financial Statements.
68
| | |
STATEMENTSOF OPERATIONS For the Year Ended December 31, 2006 | | Sun Capital Advisers Trust |
| | | | | | | | | | | | | | | | | | | | | | | | | | | | | | | | |
| | | All Cap
Fund | | | Investment
Grade
Bond
Fund | | | Money
Market
Fund | | | Real Estate
Fund | | | Davis
Venture
Value
Fund | | | Oppenheimer
Main Street
Small Cap
Fund | | | FI Large
Cap
Growth
Fund* | | | Blue Chip
Mid Cap
Fund | |
INVESTMENT INCOME | | | | | | | | | | | | | | | | | | | | | | | | | | | | | | | | |
Interest | | $ | 12,684 | | | $ | 3,186,879 | | | $ | 5,937,538 | | | $ | 233,143 | | | $ | 68,186 | | | $ | 15,244 | | | $ | 1,428 | | | $ | 151,759 | |
Dividends (net of foreign withholding taxes of $0; $0; $0; $0; $3,924; $1,158; $0 and $5,944 respectively) | | | 211,399 | | | | — | | | | — | | | | 7,819,761 | | | | 853,814 | | | | 882,991 | | | | 18,332 | | | | 1,686,949 | |
| | | | | | | | | | | | | | | | | | | | | | | | | | | | | | | | |
Total investment income | | | 224,083 | | | | 3,186,879 | | | | 5,937,538 | | | | 8,052,904 | | | | 922,000 | | | | 898,235 | | | | 19,760 | | | | 1,838,708 | |
| | | | | | | | | | | | | | | | | | | | | | | | | | | | | | | | |
EXPENSES | | | | | | | | | | | | | | | | | | | | | | | | | | | | | | | | |
Investment advisory fee | | | 63,998 | | | | 323,455 | | | | 592,258 | | | | 1,810,086 | | | | 420,467 | | | | 702,737 | | | | 15,469 | | | | 767,309 | |
Distribution fee (Service Class) | | | 8,405 | | | | 16,431 | | | | 2,265 | | | | 191,660 | | | | 43 | | | | 40 | | | | 5,157 | | | | — | |
Custody and fund accounting | | | 63,470 | | | | 82,736 | | | | 78,090 | | | | 87,429 | | | | 76,069 | | | | 345,934 | | | | 38,932 | | | | 123,045 | |
Audit | | | 35,345 | | | | 39,805 | | | | 30,730 | | | | 38,455 | | | | 33,370 | | | | 33,370 | | | | 26,500 | | | | 33,370 | |
Legal | | | 3,417 | | | | 18,288 | | | | 39,943 | | | | 66,705 | | | | 19,485 | | | | 31,068 | | | | 752 | | | | 33,528 | |
Printing | | | 619 | | | | 3,522 | | | | 7,161 | | | | 20,691 | | | | 2,784 | | | | 5,290 | | | | 530 | | | | 5,215 | |
Administration | | | 20,536 | | | | 55,607 | | | | 106,128 | | | | 161,921 | | | | 53,701 | | | | 78,730 | | | | 3,621 | | | | 78,382 | |
Transfer agency | | | 13,218 | | | | 13,652 | | | | 13,579 | | | | 18,153 | | | | 10,182 | | | | 10,249 | | | | 2,931 | | | | 8,965 | |
Trustees fees | | | 19,030 | | | | 19,030 | | | | 19,030 | | | | 19,029 | | | | 19,030 | | | | 19,029 | | | | 13,586 | | | | 19,030 | |
Insurance | | | 1,537 | | | | 12,288 | | | | 23,621 | | | | 32,892 | | | | 11,915 | | | | 19,128 | | | | 27 | | | | 20,708 | |
Miscellaneous fees | | | 1,101 | | | | 2,681 | | | | 1,410 | | | | 11,270 | | | | 3,227 | | | | 7,112 | | | | 574 | | | | 4,119 | |
| | | | | | | | | | | | | | | | | | | | | | | | | | | | | | | | |
Total expenses | | | 230,676 | | | | 587,495 | | | | 914,215 | | | | 2,458,291 | | | | 650,273 | | | | 1,252,687 | | | | 108,079 | | | | 1,093,671 | |
| | | | | | | | | | | | | | | | | | | | | | | | | | | | | | | | |
Less: Reduction of advisory fees | | | (63,998 | ) | | | (166,746 | ) | | | (319,692 | ) | | | (170,744 | ) | | | (145,668 | ) | | | (374,226 | ) | | | (15,469 | ) | | | (134,534 | ) |
Reimbursement of operating expenses | | | (75,988 | ) | | | — | | | | — | | | | — | | | | — | | | | — | | | | (70,747 | ) | | | — | |
| | | | | | | | | | | | | | | | | | | | | | | | | | | | | | | | |
Net expenses | | | 90,690 | | | | 420,749 | | | | 594,523 | | | | 2,287,547 | | | | 504,605 | | | | 878,461 | | | | 21,863 | | | | 959,137 | |
| | | | | | | | | | | | | | | | | | | | | | | | | | | | | | | | |
Net investment income (loss) | | | 133,393 | | | | 2,766,130 | | | | 5,343,015 | | | | 5,765,357 | | | | 417,395 | | | | 19,774 | | | | (2,103 | ) | | | 879,571 | |
| | | | | | | | | | | | | | | | | | | | | | | | | | | | | | | | |
REALIZED AND UNREALIZED GAIN (LOSS) FROM INVESTMENTS AND FOREIGN CURRENCY | | | | | | | | | | | | | | | | | | | | | | | | | | | | | | | | |
Net realized gain (loss) from investments and foreign currency transactions | | | 226,517 | | | | (25,436 | ) | | | — | | | | 29,434,780 | | | | 1,921,923 | | | | 16,547,916 | | | | (109,263 | ) | | | 15,597,796 | |
Net increase (decrease) in unrealized appreciation (depreciation) on investments and translation of assets and liabilities in foreign currencies | | | 1,322,327 | | | | 44,189 | | | | — | | | | 27,468,821 | | | | 5,479,918 | | | | (5,153,854 | ) | | | 149,484 | | | | (6,369,825 | ) |
| | | | | | | | | | | | | | | | | | | | | | | | | | | | | | | | |
Net realized and unrealized gain on investments and foreign currency | | | 1,548,844 | | | | 18,753 | | | | — | | | | 56,903,601 | | | | 7,401,841 | | | | 11,394,062 | | | | 40,221 | | | | 9,227,971 | |
| | | | | | | | | | | | | | | | | | | | | | | | | | | | | | | | |
Net increase in net assets from operations | | $ | 1,682,237 | | | $ | 2,784,883 | | | $ | 5,343,015 | | | $ | 62,668,958 | | | $ | 7,819,236 | | | $ | 11,413,836 | | | $ | 38,118 | | | $ | 10,107,542 | |
| | | | | | | | | | | | | | | | | | | | | | | | | | | | | | | | |
| * | For the period May 1, 2006 (commencement of operations) to December 31, 2006. |
See Notes to Financial Statements.
69
| | |
| STATEMENTSOF CHANGESIN NET ASSETS | | |
| | | Sun Capital Advisers Trust |
| | | | | | | | | | | | | | | | | | | | | | | | |
| | | All Cap Fund | | | Investment Grade
Bond Fund | | | Money Market Fund | |
| | | Year Ended December 31, | | | Year Ended December 31, | | | Year Ended December 31, | |
| | | 2006 | | | 2005 | | | 2006 | | | 2005 | | | 2006 | | | 2005 | |
INCREASE (DECREASE) IN NET ASSETS FROM OPERATIONS | | | | | | | | | | | | | | | | | | | | | | | | |
Net investment income | | $ | 133,393 | | | $ | 8,657 | | | $ | 2,766,130 | | | $ | 2,719,397 | | | $ | 5,343,015 | | | $ | 3,181,996 | |
Net realized gain (loss) from investments and foreign currency transactions | | | 226,517 | | | | 780,624 | | | | (25,436 | ) | | | 545,935 | | | | — | | | | — | |
Net increase (decrease) in unrealized appreciation (depreciation) on investments and translation of assets and liabilities in foreign currencies | | | 1,322,327 | | | | (910,945 | ) | | | 44,189 | | | | (2,127,925 | ) | | | — | | | | — | |
| | | | | | | | | | | | | | | | | | | | | | | | |
Net increase (decrease) in net assets resulting from operations | | | 1,682,237 | | | | (121,664 | ) | | | 2,784,883 | | | | 1,137,407 | | | | 5,343,015 | | | | 3,181,996 | |
| | | | | | | | | | | | | | | | | | | | | | | | |
DISTRIBUTIONS TO SHAREHOLDERS FROM | | | | | | | | | | | | | | | | | | | | | | | | |
Net investment income | | | | | | | | | | | | | | | | | | | | | | | | |
Initial Class | | | (81,806 | ) | | | (6,945 | ) | | | (2,349,146 | ) | | | (2,621,561 | ) | | | (5,303,933 | ) | | | (3,175,767 | ) |
Service Class | | | (53,365 | ) | | | — | | | | (315,428 | ) | | | (95,679 | ) | | | (39,082 | ) | | | (6,229 | ) |
Net realized gain on investments | | | | | | | | | | | | | | | | | | | | | | | | |
Initial Class | | | (17,589 | ) | | | (870,808 | ) | | | (526,431 | ) | | | (539,326 | ) | | | — | | | | — | |
Service Class | | | (14,555 | ) | | | (230,967 | ) | | | (83,387 | ) | | | (26,024 | ) | | | — | | | | — | |
Return of Capital | | | | | | | | | | | | | | | | | | | | | | | | |
Initial Class | | | — | | | | — | | | | (84,142 | ) | | | — | | | | — | | | | — | |
Service Class | | | — | | | | — | | | | (17,414 | ) | | | — | | | | — | | | | — | |
| | | | | | | | | | | | | | | | | | | | | | | | |
Net decrease in net assets from distributions | | | (167,315 | ) | | | (1,108,720 | ) | | | (3,375,948 | ) | | | (3,282,590 | ) | | | (5,343,015 | ) | | | (3,181,996 | ) |
| | | | | | | | | | | | | | | | | | | | | | | | |
SHARE TRANSACTIONS | | | | | | | | | | | | | | | | | | | | | | | | |
Net proceeds from sales | | | 4,731,848 | | | | 1,613,789 | | | | 9,505,246 | | | | 9,108,090 | | | | 72,804,005 | | | | 46,046,388 | |
Net proceeds from reinvestment of distributions | | | 167,315 | | | | 1,108,720 | | | | 3,375,948 | | | | 3,282,590 | | | | 5,343,015 | | | | 3,181,996 | |
Shares redeemed | | | (2,068,212 | ) | | | (2,552,857 | ) | | | (14,953,135 | ) | | | (11,326,637 | ) | | | (67,647,556 | ) | | | (59,688,037 | ) |
| | | | | | | | | | | | | | | | | | | | | | | | |
Net increase (decrease) in net assets from share transactions | | | 2,830,951 | | | | 169,652 | | | | (2,071,941 | ) | | | 1,064,043 | | | | 10,499,464 | | | | (10,459,653 | ) |
| | | | | | | | | | | | | | | | | | | | | | | | |
Total increase (decrease) in net assets | | | 4,345,873 | | | | (1,060,732 | ) | | | (2,663,006 | ) | | | (1,081,140 | ) | | | 10,499,464 | | | | (10,459,653 | ) |
NET ASSETS | | | | | | | | | | | | | | | | | | | | | | | | |
Beginning of period | | | 7,098,907 | | | | 8,159,639 | | | | 57,242,010 | | | | 58,323,150 | | | | 110,939,110 | | | | 121,398,763 | |
| | | | | | | | | | | | | | | | | | | | | | | | |
End of period† | | $ | 11,444,780 | | | $ | 7,098,907 | | | $ | 54,579,004 | | | $ | 57,242,010 | | | $ | 121,438,574 | | | $ | 110,939,110 | |
| | | | | | | | | | | | | | | | | | | | | | | | |
SHARES OF BENEFICIAL INTEREST | | | | | | | | | | | | | | | | | | | | | | | | |
Shares sold | | | 409,327 | | | | 134,011 | | | | 985,014 | | | | 915,508 | | | | 72,804,005 | | | | 46,046,388 | |
Shares issued to shareholders from reinvestment of distributions | | | 13,350 | | | | 102,718 | | | | 352,010 | | | | 330,946 | | | | 5,343,015 | | | | 3,181,996 | |
Shares redeemed | | | (181,277 | ) | | | (214,689 | ) | | | (1,555,314 | ) | | | (1,140,853 | ) | | | (67,647,556 | ) | | | (59,688,037 | ) |
| | | | | | | | | | | | | | | | | | | | | | | | |
Net increase (decrease) | | | 241,400 | | | | 22,040 | | | | (218,290 | ) | | | 105,601 | | | | 10,499,464 | | | | (10,459,653 | ) |
| | | | | | | | | | | | | | | | | | | | | | | | |
† Includes undistributed net investment income (loss) | | $ | — | | | $ | 1,712 | | | $ | — | | | $ | 10,116 | | | $ | — | | | $ | — | |
| | | | | | | | | | | | | | | | | | | | | | | | |
See Notes to Financial Statements.
70
| | |
| STATEMENTSOF CHANGESIN NET ASSETS | | |
| | | Sun Capital Advisers Trust |
| | | | | | | | | | | | | | | | | | | | | | | | |
| | | Real Estate Fund | | | Davis Venture Value
Fund | | | Oppenheimer Main Street
Small Cap Fund | |
| | | Year Ended December 31, | | | Year Ended December 31, | | | Year Ended December 31, | |
| | | 2006 | | | 2005 | | | 2006 | | | 2005 | | | 2006 | | | 2005 | |
INCREASE (DECREASE) IN NET ASSETS FROM OPERATIONS | | | | | | | | | | | | | | | | | | | | | | | | |
Net investment income | | $ | 5,765,357 | | | $ | 4,817,451 | | | $ | 417,395 | | | $ | 427,907 | | | $ | 19,774 | | | $ | 25,508 | |
Net realized gain from investments and foreign currency transactions | | | 29,434,780 | | | | 6,023,698 | | | | 1,921,923 | | | | 1,639,967 | | | | 16,547,916 | | | | 3,645,851 | |
Net increase (decrease) in unrealized appreciation (depreciation) on investments and translation of assets and liabilities in foreign currencies | | | 27,468,821 | | | | 3,155,872 | | | | 5,479,918 | | | | 2,904,816 | | | | (5,153,854 | ) | | | (241,717 | ) |
| | | | | | | | | | | | | | | | | | | | | | | | |
Net increase in net assets resulting from operations | | | 62,668,958 | | | | 13,997,021 | | | | 7,819,236 | | | | 4,972,690 | | | | 11,413,836 | | | | 3,429,642 | |
| | | | | | | | | | | | | | | | | | | | | | | | |
DISTRIBUTIONS TO SHAREHOLDERS FROM | | | | | | | | | | | | | | | | | | | | | | | | |
Net investment income | | | | | | | | | | | | | | | | | | | | | | | | |
Initial Class | | | (1,835,207 | ) | | | (1,649,860 | ) | | | (404,193 | ) | | | (375,813 | ) | | | — | | | | — | |
Service Class | | | (1,070,294 | ) | | | (474,100 | ) | | | (184 | ) | | | — | | | | — | | | | — | |
Net realized gain on investments | | | | | | | | | | | | | | | | | | | | | | | | |
Initial Class | | | (4,968,324 | ) | | | (8,876,631 | ) | | | — | | | | — | | | | (3,408,768 | ) | | | (11,416,531 | ) |
Service Class | | | (3,456,525 | ) | | | (3,083,227 | ) | | | — | | | | — | | | | (959 | ) | | | — | |
| | | | | | | | | | | | | | | | | | | | | | | | |
Net decrease in net assets from share transactions | | | (11,330,350 | ) | | | (14,083,818 | ) | | | (404,377 | ) | | | (375,813 | ) | | | (3,409,727 | ) | | | (11,416,531 | ) |
| | | | | | | | | | | | | | | | | | | | | | | | |
SHARE TRANSACTIONS | | | | | | | | | | | | | | | | | | | | | | | | |
Net proceeds from sales | | | 53,438,966 | | | | 38,013,393 | | | | 8,823,372 | | | | 5,492,029 | | | | 7,967,521 | | | | 6,420,151 | |
Net proceeds from reinvestment of distributions | | | 11,330,350 | | | | 14,083,818 | | | | 404,377 | | | | 375,813 | | | | 3,409,727 | | | | 11,416,531 | |
Shares redeemed | | | (44,102,686 | ) | | | (20,055,112 | ) | | | (9,392,552 | ) | | | (7,610,726 | ) | | | (19,090,076 | ) | | | (11,931,548 | ) |
| | | | | | | | | | | | | | | | | | | | | | | | |
Net increase (decrease) in net assets from share transactions | | | 20,666,630 | | | | 32,042,099 | | | | (164,803 | ) | | | (1,742,884 | ) | | | (7,712,828 | ) | | | 5,905,134 | |
| | | | | | | | | | | | | | | | | | | | | | | | |
Total increase (decrease) in net assets | | | 72,005,238 | | | | 31,955,302 | | | | 7,250,056 | | | | 2,853,993 | | | | 291,281 | | | | (2,081,755 | ) |
NET ASSETS | | | | | | | | | | | | | | | | | | | | | | | | |
Beginning of period | | | 156,145,953 | | | | 124,190,651 | | | | 54,215,682 | | | | 51,361,689 | | | | 86,948,949 | | | | 89,030,704 | |
| | | | | | | | | | | | | | | | | | | | | | | | |
End of period† | | $ | 228,151,191 | | | $ | 156,145,953 | | | $ | 61,465,738 | | | $ | 54,215,682 | | | $ | 87,240,230 | | | $ | 86,948,949 | |
| | | | | | | | | | | | | | | | | | | | | | | | |
SHARES OF BENEFICIAL INTEREST | | | | | | | | | | | | | | | | | | | | | | | | |
Shares sold | | | 2,325,382 | | | | 1,990,343 | | | | 725,226 | | | | 513,729 | | | | 559,301 | | | | 456,798 | |
Shares issued to shareholders from reinvestment of distributions | | | 496,597 | | | | 746,181 | | | | 33,475 | | | | 34,010 | | | | 245,305 | | | | 859,679 | |
Shares redeemed | | | (1,966,405 | ) | | | (1,059,612 | ) | | | (779,404 | ) | | | (698,669 | ) | | | (1,300,786 | ) | | | (862,382 | ) |
| | | | | | | | | | | | | | | | | | | | | | | | |
Net increase (decrease) | | | 855,574 | | | | 1,676,912 | | | | (20,703 | ) | | | (150,930 | ) | | | (496,180 | ) | | | 454,095 | |
| | | | | | | | | | | | | | | | | | | | | | | | |
† Includes undistributed net investment income | | $ | 4,863,265 | | | $ | 3,855,530 | | | $ | 401,361 | | | $ | 434,924 | | | $ | 12,559 | | | $ | 87,050 | |
| | | | | | | | | | | | | | | | | | | | | | | | |
See Notes to Financial Statements.
71
| | |
| STATEMENTSOF CHANGESIN NET ASSETS (Continued) | | |
| | | Sun Capital Advisers Trust |
| | | | | | | | | | | | |
| | | FI Large Cap Growth Fund | | | Blue Chip Mid Cap Fund | |
| | | Year Ended December 31, 2006* | | | Year Ended December 31, | |
| | | | 2006 | | | 2005 | |
INCREASE (DECREASE) IN NET ASSETS FROM OPERATIONS | | | | | | | | | | | | |
Net investment income (loss) | | $ | (2,103 | ) | | $ | 879,571 | | | $ | 26,196 | |
Net realized gain (loss) from investments and foreign currency transactions | | | (109,263 | ) | | | 15,597,796 | | | | 15,622,443 | |
Net increase (decrease) in unrealized appreciation (depreciation) on investments and translation of assets and liabilities in foreign currencies | | | 149,484 | | | | (6,369,825 | ) | | | (1,693,758 | ) |
| | | | | | | | | | | | |
Net increase in net assets resulting from operations | | | 38,118 | | | | 10,107,542 | | | | 13,954,881 | |
| | | | | | | | | | | | |
DISTRIBUTIONS TO SHAREHOLDERS FROM | | | | | | | | | | | | |
Net investment income | | | | | | | | | | | | |
Initial Class | | | — | | | | — | | | | (81,022 | ) |
Service Class | | | — | | | | — | | | | — | |
Net realized gain on investments | | | | | | | | | | | | |
Initial Class | | | — | | | | (15,575,148 | ) | | | (2,267,288 | ) |
Service Class | | | — | | | | — | | | | — | |
| | | | | | | | | | | | |
Net decrease in net assets from distributions | | | — | | | | (15,575,148 | ) | | | (2,348,310 | ) |
| | | | | | | | | | | | |
SHARE TRANSACTIONS | | | | | | | | | | | | |
Net proceeds from sales | | | 3,814,139 | | | | 8,457,476 | | | | 5,212,236 | |
Net proceeds from reinvestment of distributions | | | — | | | | 15,575,148 | | | | 2,348,310 | |
Shares redeemed | | | (42,731 | ) | | | (18,860,690 | ) | | | (13,847,670 | ) |
| | | | | | | | | | | | |
Net increase (decrease) in net assets from share transactions | | | 3,771,408 | | | | 5,171,934 | | | | (6,287,124 | ) |
| | | | | | | | | | | | |
Total increase (decrease) in net assets | | | 3,809,526 | | | | (295,672 | ) | | | 5,319,447 | |
NET ASSETS | | | | | | | | | | | | |
Beginning of period | | | — | | | | 94,928,140 | | | | 89,608,693 | |
| | | | | | | | | | | | |
End of period† | | $ | 3,809,526 | | | $ | 94,632,468 | | | $ | 94,928,140 | |
| | | | | | | | | | | | |
SHARES OF BENEFICIAL INTEREST | | | | | | | | | | | | |
Shares sold | | | 386,310 | | | | 413,951 | | | | 280,289 | |
Shares issued to shareholders from reinvestment of distributions | | | — | | | | 879,952 | | | | 121,800 | |
Shares redeemed | | | (4,441 | ) | | | (930,785 | ) | | | (737,379 | ) |
| | | | | | | | | | | | |
Net increase (decrease) | | | 381,869 | | | | 363,118 | | | | (335,290 | ) |
| | | | | | | | | | | | |
† Includes undistributed net investment income | | | — | | | $ | 863,339 | | | $ | 5,706 | |
| | | | | | | | | | | | |
* For the period May 1, 2006 (commencement of operations) to December 31, 2006. | | | | | | | | | | | | |
See Notes to Financial Statements.
72
| | |
| FINANCIAL HIGHLIGHTS | | |
| | | Sun Capital Advisers Trust |
Selected data for a share outstanding throughout each period:
| | | | | | | | | | | | | | | | | | | | | | | | | | | | | | | | |
| | | All Cap Fund Initial Class Shares | | | All Cap Fund Service Class Shares | |
| | | Year Ended December 31, | | | For the Period
5/1/2002* to
12/31/2002 | | | Year Ended
December 31, | | | For the Period
2/1/2004* to
12/31/2004 | |
| | | 2006 | | | 2005 | | | 2004 | | | 2003 | | | | 2006 | | | 2005 | | |
Net Asset Value, Beginning of Period | | $ | 10.470 | | | $ | 12.470 | | | $ | 11.450 | | | $ | 7.540 | | | $ | 10.000 | | | $ | 10.700 | | | $ | 12.720 | | | $ | 12.140 | |
| | | | | | | | | | | | | | | | | | | | | | | | | | | | | | | | |
Income (Loss) from Investment Operations: | | | | | | | | | | | | | | | | | | | | | | | | | | | | | | | | |
Net investment income (loss) (d) | | | 0.173 | | | | 0.019 | | | | 0.031 | | | | 0.040 | | | | 0.020 | | | | 0.121 | | | | (0.002 | ) | | | 0.004 | |
Net realized and unrealized gain (loss) on investments | | | 1.929 | | | | (0.091 | ) | | | 2.249 | | | | 3.943 | | | | (2.462 | ) | | | 1.996 | | | | (0.105 | ) | | | 1.583 | |
| | | | | | | | | | | | | | | | | | | | | | | | | | | | | | | | |
Total from Investment Operations | | | 2.102 | | | | (0.072 | ) | | | 2.280 | | | | 3.983 | | | | (2.442 | ) | | | 2.117 | | | | (0.107 | ) | | | 1.587 | |
| | | | | | | | | | | | | | | | | | | | | | | | | | | | | | | | |
Less Distributions from: | | | | | | | | | | | | | | | | | | | | | | | | | | | | | | | | |
Net investment income | | | (0.166 | ) | | | (0.015 | ) | | | (0.035 | ) | | | (0.036 | ) | | | (0.018 | ) | | | (0.131 | ) | | | — | | | | (0.004 | ) |
In excess of net investment income | | | — | | | | — | | | | — | | | | — | | | | — | | | | — | | | | — | | | | — | |
Net realized gain on investments | | | (0.036 | ) | | | (1.913 | ) | | | (1.225 | ) | | | (0.037 | ) | | | — | | | | (0.036 | ) | | | (1.913 | ) | | | (1.003 | ) |
In excess of net realized gain on investments | | | — | | | | — | | | | — | | | | — | | | | — | | | | — | | | | — | | | | — | |
Capital | | | — | | | | — | | | | — | | | | — | | | | — | | | | — | | | | — | | | | — | |
| | | | | | | | | | | | | | | | | | | | | | | | | | | | | | | | |
Total distributions | | | (0.202 | ) | | | (1.928 | ) | | | (1.260 | ) | | | (0.073 | ) | | | (0.018 | ) | | | (0.167 | ) | | | (1.913 | ) | | | (1.007 | ) |
| | | | | | | | | | | | | | | | | | | | | | | | | | | | | | | | |
Net Asset Value, End of Period | | $ | 12.370 | | | $ | 10.470 | | | $ | 12.470 | | | $ | 11.450 | | | $ | 7.540 | | | $ | 12.650 | | | $ | 10.700 | | | $ | 12.720 | |
| | | | | | | | | | | | | | | | | | | | | | | | | | | | | | | | |
Total Return (b) | | | 20.07 | % | | | (0.72 | )% | | | 20.39 | % | | | 52.89 | % | | | (24.43 | )% | | | 19.78 | % | | | (0.98 | )% | | | 13.20 | % |
| | | | | | | | | | | | | | | | | | | | | | | | | | | | | | | | |
Ratios and Supplemental Data: | | | | | | | | | | | | | | | | | | | | | | | | | | | | | | | | |
Net Assets, End of Period (000’s) | | $ | 6,183 | | | $ | 5,505 | | | $ | 7,049 | | | $ | 5,082 | | | $ | 1,780 | | | $ | 5,262 | | | $ | 1,594 | | | $ | 1,111 | |
Ratios to average net assets: | | | | | | | | | | | | | | | | | | | | | | | | | | | | | | | | |
Net expenses (a)(c)(d) | | | 0.90 | % | | | 0.90 | % | | | 0.90 | % | | | 0.90 | % | | | 0.90 | % | | | 1.15 | % | | | 1.15 | % | | | 1.15 | % |
Gross expenses (a)(d) | | | 2.47 | % | | | 2.74 | % | | | 3.42 | % | | | 5.47 | % | | | 5.73 | % | | | 2.62 | % | | | 3.04 | % | | | 4.04 | % |
Net investment income (loss) (a)(c)(d) | | | 1.47 | % | | | 0.15 | % | | | 0.27 | % | | | 0.70 | % | | | 0.41 | % | | | 1.44 | % | | | (0.05 | )% | | | 0.21 | % |
Portfolio turnover rate | | | 135 | % | | | 114 | % | | | 137 | % | | | 150 | % | | | 67 | % | | | 135 | % | | | 114 | % | | | 137 | % |
| * | Commencement of operations |
| (a) | Annualized for periods of less than one year. |
| (b) | Total returns are historical and assume changes in share price, reinvestments of all dividends and distributions, and no sales charge. Had certain expenses not been reduced during the periods shown, total returns would have been lower. Total returns for periods of less than one year are not annualized. |
| (c) | Such percentages are after advisory fee waivers and expenses reimbursements. |
| (d) | Does not include any insurance charges imposed in connection with your variable insurance contract. |
73
| | |
| FINANCIAL HIGHLIGHTS (Continued) | | |
| | | Sun Capital Advisers Trust |
Selected data for a share outstanding throughout each period:
| | | | | | | | | | | | | | | | | | | | | | | | | | | | | | | | |
| | | Investment Grade Bond Fund
Initial Class Shares | | | Investment Grade Bond Fund
Service Class Shares | |
| | | Year Ended December 31, | | | Year Ended
December 31, | | | For the Period
2/1/2004* to
12/31/2004 | |
| | | 2006 | | | 2005 | | | 2004 | | | 2003 | | | 2002 | | | 2006 | | | 2005 | | |
Net Asset Value, Beginning of Period | | $ | 9.720 | | | $ | 10.090 | | | $ | 10.020 | | | $ | 9.630 | | | $ | 9.680 | | | $ | 9.790 | | | $ | 10.160 | | | $ | 10.090 | |
| | | | | | | | | | | | | | | | | | | | | | | | | | | | | | | | |
Income (Loss) from Investment Operations: | | | | | | | | | | | | | | | | | | | | | | | | | | | | | | | | |
Net investment income (d) | | | 0.496 | | | | 0.468 | | | | 0.485 | | | | 0.514 | | | | 0.538 | | | | 0.473 | | | | 0.447 | | | | 0.424 | |
Net realized and unrealized gain (loss) on investments | | | 0.008 | | | | (0.274 | ) | | | 0.139 | | | | 0.393 | | | | (0.050 | ) | | | 0.010 | | | | (0.274 | ) | | | 0.070 | |
| | | | | | | | | | | | | | | | | | | | | | | | | | | | | | | | |
Total from Investment Operations | | | 0.504 | | | | 0.194 | | | | 0.624 | | | | 0.907 | | | | 0.488 | | | | 0.483 | | | | 0.173 | | | | 0.494 | |
| | | | | | | | | | | | | | | | | | | | | | | | | | | | | | | | |
Less Distributions from: | | | | | | | | | | | | | | | | | | | | | | | | | | | | | | | | |
Net investment income | | | (0.477 | ) | | | (0.468 | ) | | | (0.485 | ) | | | (0.517 | ) | | | (0.538 | ) | | | (0.456 | ) | | | (0.447 | ) | | | (0.424 | ) |
In excess of net investment income | | | — | | | | — | | | | — | | | | — | | | | — | | | | — | | | | — | | | | — | |
Net realized gain on investments | | | (0.109 | ) | | | (0.096 | ) | | | (0.069 | ) | | | — | | | | — | | | | (0.109 | ) | | | (0.096 | ) | | | — | |
In excess of net realized gain on investments | | | — | | | | — | | | | — | | | | — | | | | — | | | | — | | | | — | | | | — | |
Capital | | | (0.018 | ) | | | — | | | | — | | | | — | | | | — | | | | (0.018 | ) | | | — | | | | — | |
| | | | | | | | | | | | | | | | | | | | | | | | | | | | | | | | |
Total distributions | | | (0.604 | ) | | | (0.564 | ) | | | (0.554 | ) | | | (0.517 | ) | | | (0.538 | ) | | | (0.583 | ) | | | (0.543 | ) | | | (0.424 | ) |
| | | | | | | | | | | | | | | | | | | | | | | | | | | | | | | | |
Net Asset Value, End of Period | | $ | 9.620 | | | $ | 9.720 | | | $ | 10.090 | | | $ | 10.020 | | | $ | 9.630 | | | $ | 9.690 | | | $ | 9.790 | | | $ | 10.160 | |
| | | | | | | | | | | | | | | | | | | | | | | | | | | | | | | | |
Total Return (b) | | | 5.39 | % | | | 1.96 | % | | | 6.42 | % | | | 9.63 | % | | | 5.23 | % | | | 5.13 | % | | | 1.73 | % | | | 5.03 | % |
| | | | | | | | | | | | | | | | | | | | | | | | | | | | | | | | |
Ratios and Supplemental Data: | | | | | | | | | | | | | | | | | | | | | | | | | | | | | | | | |
Net Assets, End of Period (000’s) | | $ | 45,186 | | | $ | 53,630 | | | $ | 57,619 | | | $ | 66,335 | | | $ | 67,679 | | | $ | 9,393 | | | $ | 3,612 | | | $ | 704 | |
Ratios to average net assets: | | | | | | | | | | | | | | | | | | | | | | | | | | | | | | | | |
Net expenses (a)(c)(d) | | | 0.75 | % | | | 0.75 | % | | | 0.75 | % | | | 0.75 | % | | | 0.75 | % | | | 1.00 | % | | | 1.00 | % | | | 1.00 | % |
Gross expenses (a)(d) | | | 1.06 | % | | | 1.03 | % | | | 0.98 | % | | | 0.88 | % | | | 0.81 | % | | | 1.31 | % | | | 1.28 | % | | | 1.26 | % |
Net investment income (a)(c)(d) | | | 5.14 | % | | | 4.72 | % | | | 4.81 | % | | | 5.22 | % | | | 5.60 | % | | | 5.06 | % | | | 4.48 | % | | | 4.58 | % |
Portfolio turnover rate | | | 55 | % | | | 55 | % | | | 66 | % | | | 57 | % | | | 144 | % | | | 55 | % | | | 55 | % | | | 66 | % |
| * | Commencement of operations |
| (a) | Annualized for periods of less than one year. |
| (b) | Total returns are historical and assume changes in share price, reinvestments of all dividends and distributions, and no sales charge. Had certain expenses not been reduced during the periods shown, total returns would have been lower. Total returns for periods of less than one year are not annualized. |
| (c) | Such percentages are after advisory fee waivers and expenses reimbursements. |
| (d) | Does not include any insurance charges imposed in connection with your variable insurance contract. |
74
| | |
| FINANCIAL HIGHLIGHTS (Continued) | | |
| | | Sun Capital Advisers Trust |
Selected data for a share outstanding throughout each period:
| | | | | | | | | | | | | | | | | | | | | | | | | | | | |
| | | Money Market Fund
Initial Class Shares | | | Money Market Fund
Service Class Shares | |
| | | Year Ended December 31, | | | Year Ended
December 31, 2006 | | | For the Period
4/25/2005* to
12/31/2005 | |
| | | 2006 | | | 2005 | | | 2004 | | | 2003 | | | 2002 | | | |
Net Asset Value, Beginning of Period | | $ | 1.000 | | | $ | 1.000 | | | $ | 1.000 | | | $ | 1.000 | | | $ | 1.000 | | | $ | 1.000 | | | $ | 1.000 | |
| | | | | | | | | | | | | | | | | | | | | | | | | | | | |
Income (Loss) from Investment Operations: | | | | | | | | | | | | | | | | | | | | | | | | | | | | |
Net investment income (d) | | | 0.045 | | | | 0.027 | | | | 0.007 | | | | 0.005 | | | | 0.011 | | | | 0.042 | | | | 0.019 | |
Net realized and unrealized gain (loss) on investments | | | — | | | | — | | | | — | | | | — | | | | — | | | | — | | | | — | |
| | | | | | | | | | | | | | | | | | | | | | | | | | | | |
Total from Investment Operations | | | 0.045 | | | | 0.027 | | | | 0.007 | | | | 0.005 | | | | 0.011 | | | | 0.042 | | | | 0.019 | |
| | | | | | | | | | | | | | | | | | | | | | | | | | | | |
Less Distributions from: | | | | | | | | | | | | | | | | | | | | | | | | | | | | |
Net investment income | | | (0.045 | ) | | | (0.027 | ) | | | (0.007 | ) | | | (0.005 | ) | | | (0.011 | ) | | | (0.042 | ) | | | (0.019 | ) |
In excess of net investment income | | | — | | | | — | | | | — | | | | — | | | | — | | | | — | | | | — | |
Net realized gain on investments | | | — | | | | — | | | | — | | | | — | | | | — | | | | — | | | | — | |
In excess of net realized gain on investments | | | — | | | | — | | | | — | | | | — | | | | — | | | | — | | | | — | |
Capital | | | — | | | | — | | | | — | | | | — | | | | — | | | | — | | | | — | |
| | | | | | | | | | | | | | | | | | | | | | | | | | | | |
Total distributions | | | (0.045 | ) | | | (0.027 | ) | | | (0.007 | ) | | | (0.005 | ) | | | (0.011 | ) | | | (0.042 | ) | | | (0.019 | ) |
| | | | | | | | | | | | | | | | | | | | | | | | | | | | |
Net Asset Value, End of Period | | $ | 1.000 | | | $ | 1.000 | | | $ | 1.000 | | | $ | 1.000 | | | $ | 1.000 | | | $ | 1.000 | | | $ | 1.000 | |
| | | | | | | | | | | | | | | | | | | | | | | | | | | | |
Total Return (b) | | | 4.59 | % | | | 2.75 | % | | | 0.74 | % | | | 0.55 | % | | | 1.12 | % | | | 4.33 | % | | | 1.93 | % |
| | | | | | | | | | | | | | | | | | | | | | | | | | | | |
Ratios and Supplemental Data: | | | | | | | | | | | | | | | | | | | | | | | | | | | | |
Net Assets, End of Period (000’s) | | $ | 120,164 | | | $ | 110,430 | | | $ | 121,399 | | | $ | 113,004 | | | $ | 149,363 | | | $ | 1,274 | | | $ | 509 | |
Ratios to average net assets: | | | | | | | | | | | | | | | | | | | | | | | | | | | | |
Net expenses (a)(c)(d) | | | 0.50 | % | | | 0.50 | % | | | 0.65 | % | | | 0.65 | % | | | 0.65 | % | | | 0.75 | % | | | 0.75 | % |
Gross expenses (a)(d) | | | 0.77 | % | | | 0.77 | % | | | 0.71 | % | | | 0.65 | % | | | 0.65 | % | | | 1.02 | % | | | 1.02 | % |
Net investment income (a)(c)(d) | | | 4.51 | % | | | 2.69 | % | | | 0.77 | % | | | 0.56 | % | | | 1.11 | % | | | 4.31 | % | | | 2.99 | % |
Portfolio turnover rate | | | N/A | | | | N/A | | | | N/A | | | | N/A | | | | N/A | | | | N/A | | | | N/A | |
| * | Commencement of operations |
| (a) | Annualized for periods of less than one year. |
| (b) | Total returns are historical and assume changes in share price, reinvestments of all dividends and distributions, and no sales charge. Had certain expenses not been reduced during the periods shown, total returns would have been lower. Total returns for periods of less than one year are not annualized. |
| (c) | Such percentages are after advisory fee waivers and expenses reimbursements. |
| (d) | Does not include any insurance charges imposed in connection with your variable insurance contract. |
75
| | |
| FINANCIAL HIGHLIGHTS (Continued) | | |
| | | Sun Capital Advisers Trust |
Selected data for a share outstanding throughout each period:
| | | | | | | | | | | | | | | | | | | | | | | | | | | | | | | | |
| | | Real Estate Fund
Initial Class Shares | | | Real Estate Fund
Service Class Shares | |
| | | Year Ended December 31, | | | Year Ended
December 31, | | | For the Period
2/1/2004* to
12/31/2004 | |
| | | 2006 | | | 2005 | | | 2004 | | | 2003 | | | 2002 | | | 2006 | | | 2005 | | |
Net Asset Value, Beginning of Period | | $ | 18.800 | | | $ | 19.010 | | | $ | 15.090 | | | $ | 11.100 | | | $ | 11.850 | | | $ | 19.970 | | | $ | 20.080 | | | $ | 15.720 | |
| | | | | | | | | | | | | | | | | | | | | | | | | | | | | | | | |
Income (Loss) from Investment Operations: | | | | | | | | | | | | | | | | | | | | | | | | | | | | | | | | |
Net investment income (d) | | | 0.811 | | | | 0.224 | | | | 0.581 | | | | 0.277 | | | | 0.496 | | | | 0.638 | | | | 0.206 | | | | 0.302 | |
Net realized and unrealized gain (loss) on investments | | | 6.368 | | | | 1.591 | | | | 4.241 | | | | 3.713 | | | | (0.036 | ) | | | 6.941 | | | | 1.655 | | | | 4.058 | |
| | | | | | | | | | | | | | | | | | | | | | | | | | | | | | | | |
Total from Investment Operations | | | 7.179 | | | | 1.815 | | | | 4.822 | | | | 3.990 | | | | 0.460 | | | | 7.579 | | | | 1.861 | | | | 4.360 | |
| | | | | | | | | | | | | | | | | | | | | | | | | | | | | | | | |
Less Distributions from: | | | | | | | | | | | | | | | | | | | | | | | | | | | | | | | | |
Net investment income | | | (0.372 | ) | | | (0.317 | ) | | | (0.274 | ) | | | — | | | | (0.463 | ) | | | (0.312 | ) | | | (0.263 | ) | | | — | |
In excess of net investment income | | | — | | | | — | | | | — | | | | — | | | | — | | | | — | | | | — | | | | — | |
Net realized gain on investments | | | (1.007 | ) | | | (1.708 | ) | | | (0.628 | ) | | | — | | | | (0.583 | ) | | | (1.007 | ) | | | (1.708 | ) | | | — | |
In excess of net realized gain on investments | | | — | | | | — | | | | — | | | | — | | | | (0.070 | ) | | | — | | | | — | | | | — | |
Capital | | | — | | | | — | | | | — | | | | — | | | | (0.094 | ) | | | — | | | | — | | | | — | |
| | | | | | | | | | | | | | | | | | | | | | | | | | | | | | | | |
Total distributions | | | (1.379 | ) | | | (2.025 | ) | | | (0.902 | ) | | | — | | | | (1.210 | ) | | | (1.319 | ) | | | (1.971 | ) | | | — | |
| | | | | | | | | | | | | | | | | | | | | | | | | | | | | | | | |
Net Asset Value, End of Period | | $ | 24.600 | | | $ | 18.800 | | | $ | 19.010 | | | $ | 15.090 | | | $ | 11.100 | | | $ | 26.230 | | | $ | 19.970 | | | $ | 20.080 | |
| | | | | | | | | | | | | | | | | | | | | | | | | | | | | | | | |
Total Return (b) | | | 38.96 | % | | | 9.67 | % | | | 33.32 | % | | | 35.95 | % | | | 4.04 | % | | | 38.64 | % | | | 9.37 | % | | | 27.74 | % |
| | | | | | | | | | | | | | | | | | | | | | | | | | | | | | | | |
Ratios and Supplemental Data: | | | | | | | | | | | | | | | | | | | | | | | | | | | | | | | | |
Net Assets, End of Period (000’s) | | $ | 121,197 | | | $ | 105,368 | | | $ | 102,300 | | | $ | 78,695 | | | $ | 44,310 | | | $ | 106,954 | | | $ | 50,778 | | | $ | 21,890 | |
Ratios to average net assets: | | | | | | | | | | | | | | | | | | | | | | | | | | | | | | | | |
Net expenses (a)(c)(d) | | | 1.10 | % | | | 1.10 | % | | | 1.23 | % | | | 1.25 | % | | | 1.25 | % | | | 1.35 | % | | | 1.35 | % | | | 1.50 | % |
Gross expenses (a)(d) | | | 1.19 | % | | | 1.22 | % | | | 1.23 | % | | | 1.26 | % | | | 1.41 | % | | | 1.44 | % | | | 1.47 | % | | | 1.51 | % |
Net investment income (a)(c)(d) | | | 3.08 | % | | | 3.55 | % | | | 3.62 | % | | | 4.54 | % | | | 5.51 | % | | | 2.95 | % | | | 3.56 | % | | | 3.79 | % |
Portfolio turnover rate | | | 44 | % | | | 32 | % | | | 67 | % | | | 42 | % | | | 49 | % | | | 44 | % | | | 32 | % | | | 67 | % |
| * | Commencement of operations |
| (a) | Annualized for periods of less than one year. |
| (b) | Total returns are historical and assume changes in share price, reinvestments of all dividends and distributions, and no sales charge. Had certain expenses not been reduced during the periods shown, total returns would have been lower. Total returns for periods of less than one year are not annualized. |
| (c) | Such percentages are after advisory fee waivers and expenses reimbursements. |
| (d) | Does not include any insurance charges imposed in connection with your variable insurance contract. |
76
| | |
| FINANCIAL HIGHLIGHTS (Continued) | | |
| | | Sun Capital Advisers Trust |
Selected data for a share outstanding throughout each period:
| | | | | | | | | | | | | | | | | | | | | | | | |
| | | Davis Venture Value Fund
Initial Class Shares | | | Davis Venture Value Fund
Service Class Shares | |
| | | Year Ended December 31, | | | For the Period
5/1/2006* to
12/31/2006 | |
| | | 2006 | | | 2005 | | | 2004 | | | 2003 | | | 2002 | | |
Net Asset Value, Beginning of Period | | $ | 11.560 | | | $ | 10.610 | | | $ | 9.500 | | | $ | 7.320 | | | $ | 8.740 | | | $ | 12.080 | |
| | | | | | | | | | | | | | | | | | | | | | | | |
Income (Loss) from Investment Operations: | | | | | | | | | | | | | | | | | | | | | | | | |
Net investment income (loss) (d) | | | 0.092 | | | | 0.087 | | | | 0.079 | | | | 0.065 | | | | 0.054 | | | | (0.040 | ) |
Net realized and unrealized gain (loss) on investments | | | 1.607 | | | | 0.941 | | | | 1.097 | | | | 2.161 | | | | (1.474 | ) | | | 1.119 | |
| | | | | | | | | | | | | | | | | | | | | | | | |
Total from Investment Operations | | | 1.699 | | | | 1.028 | | | | 1.176 | | | | 2.226 | | | | (1.420 | ) | | | 1.159 | |
| | | | | | | | | | | | | | | | | | | | | | | | |
Less Distributions from: | | | | | | | | | | | | | | | | | | | | | | | | |
Net investment income | | | (0.089 | ) | | | (0.078 | ) | | | (0.066 | ) | | | (0.046 | ) | | | — | (e) | | | (0.089 | ) |
In excess of net investment income | | | — | | | | — | | | | — | | | | — | | | | — | | | | — | |
Net realized gain on investments | | | — | | | | — | | | | — | | | | — | | | | — | | | | — | |
In excess of net realized gain on investments | | | — | | | | — | | | | — | | | | — | | | | — | | | | — | |
Capital | | | — | | | | — | | | | — | | | | — | | | | — | | | | — | |
| | | | | | | | | | | | | | | | | | | | | | | | |
Total distributions | | | (0.089 | ) | | | (0.078 | ) | | | (0.066 | ) | | | (0.046 | ) | | | — | | | | (0.089 | ) |
| | | | | | | | | | | | | | | | | | | | | | | | |
Net Asset Value, End of Period | | $ | 13.170 | | | $ | 11.560 | | | $ | 10.610 | | | $ | 9.500 | | | $ | 7.320 | | | $ | 13.150 | |
| | | | | | | | | | | | | | | | | | | | | | | | |
Total Return (b) | | | 14.77 | % | | | 9.73 | % | | | 12.45 | % | | | 30.50 | % | | | (16.24 | )% | | | 9.66 | % |
| | | | | | | | | | | | | | | | | | | | | | | | |
Ratios and Supplemental Data: | | | | | | | | | | | | | | | | | | | | | | | | |
Net Assets, End of Period (000’s) | | $ | 61,438 | | | $ | 54,216 | | | $ | 51,362 | | | $ | 44,215 | | | $ | 32,194 | | | $ | 27 | |
Ratios to average net assets: | | | | | | | | | | | | | | | | | | | | | | | | |
Net expenses (a)(c)(d) | | | 0.90 | % | | | 0.90 | % | | | 0.90 | % | | | 0.90 | % | | | 0.90 | % | | | 1.15 | % |
Gross expenses (a)(d) | | | 1.16 | % | | | 1.13 | % | | | 1.16 | % | | | 1.19 | % | | | 1.21 | % | | | 1.43 | % |
Net investment income (a)(c)(d) | | | 0.74 | % | | | 0.81 | % | | | 0.83 | % | | | 0.86 | % | | | 0.71 | % | | | 0.48 | % |
Portfolio turnover rate | | | 16 | % | | | 15 | % | | | 11 | % | | | 7 | % | | | 26 | % | | | 16 | % |
| * | Commencement of operations |
| (a) | Annualized for periods of less than one year. |
| (b) | Total returns are historical and assume changes in share price, reinvestments of all dividends and distributions, and no sales charge. Had certain expenses not been reduced during the periods shown, total returns would have been lower. Total returns for periods of less than one year are not annualized. |
| (c) | Such percentages are after advisory fee waivers and expenses reimbursements. |
| (d) | Does not include any insurance charges imposed in connection with your variable insurance contract. |
| (e) | Amount is less than .001 per share. |
77
| | |
| FINANCIAL HIGHLIGHTS (Continued) | | |
| | | Sun Capital Advisers Trust |
Selected data for a share outstanding throughout each period:
| | | | | | | | | | | | | | | | | | | | | | | | |
| | | Oppenheimer Main Street Small Cap Fund
Initial Class Shares | | | Oppenheimer
Main Street
Small Cap Fund
Services Class Shares | |
| | | Year Ended December 31, | | | For the Period
5/1/2006* to
12/31/2006 | |
| | | 2006 | | | 2005 | | | 2004 | | | 2003 | | | 2002 | | |
Net Asset Value, Beginning of Period | | $ | 13.790 | | | $ | 15.210 | | | $ | 14.070 | | | $ | 9.940 | | | $ | 12.820 | | | $ | 15.560 | |
| | | | | | | | | | | | | | | | | | | | | | | | |
Income (Loss) from Investment Operations: | | | | | | | | | | | | | | | | | | | | | | | | |
Net investment income (loss) (d) | | | 0.005 | | | | 0.014 | | | | 1.229 | | | | (0.003 | ) | | | 0.012 | | | | (0.008 | ) |
Net realized and unrealized gain (loss) on investments | | | 1.822 | | | | 0.568 | | | | 1.142 | | | | 4.139 | | | | (2.640 | ) | | | 0.035 | |
| | | | | | | | | | | | | | | | | | | | | | | | |
Total from Investment Operations | | | 1.827 | | | | 0.582 | | | | 2.371 | | | | 4.136 | | | | (2.628 | ) | | | 0.027 | |
| | | | | | | | | | | | | | | | | | | | | | | | |
Less Distributions from: | | | | | | | | | | | | | | | | | | | | | | | | |
Net investment income | | | — | | | | — | | | | — | | | | (0.006 | ) | | | — | | | | — | |
In excess of net investment income | | | — | | | | — | | | | — | | | | — | | | | — | | | | — | |
Net realized gain on investments | | | (0.597 | ) | | | (2.002 | ) | | | (1.231 | ) | | | — | | | | (0.220 | ) | | | (0.597 | ) |
In excess of net realized gain on investments | | | — | | | | — | | | | — | | | | — | | | | (0.032 | ) | | | — | |
Capital | | | — | | | | — | | | | — | | | | — | | | | — | | | | — | |
| | | | | | | | | | | | | | | | | | | | | | | | |
Total distributions | | | (0.597 | ) | | | (2.002 | ) | | | (1.231 | ) | | | (0.006 | ) | | | (0.252 | ) | | | (0.597 | ) |
| | | | | | | | | | | | | | | | | | | | | | | | |
Net Asset Value, End of Period | | $ | 15.020 | | | $ | 13.790 | | | $ | 15.210 | | | $ | 14.070 | | | $ | 9.940 | | | $ | 14.990 | |
| | | | | | | | | | | | | | | | | | | | | | | | |
Total Return (b) | | | 13.60 | % | | | 4.33 | % | | | 18.43 | % | | | 41.62 | % | | | (20.61 | )% | | | 0.48 | % |
| | | | | | | | | | | | | | | | | | | | | | | | |
Ratios and Supplemental Data: | | | | | | | | | | | | | | | | | | | | | | | | |
Net Assets, End of Period (000’s) | | $ | 87,215 | | | $ | 86,949 | | | $ | 89,031 | | | $ | 71,827 | | | $ | 44,282 | | | $ | 25 | |
Ratios to average net assets: | | | | | | | | | | | | | | | | | | | | | | | | |
Net expenses (a)(c)(d) | | | 1.00 | % | | | 1.00 | % | | | 1.00 | % | | | 1.00 | % | | | 1.00 | % | | | 1.25 | % |
Gross expenses (a)(d) | | | 1.42 | % | | | 1.10 | % | | | 1.09 | % | | | 1.12 | % | | | 1.34 | % | | | 1.82 | % |
Net investment income (loss) (a)(c)(d) | | | 0.02 | % | | | 0.03 | % | | | (0.10 | )% | | | 0.13 | % | | | 0.18 | % | | | (0.09 | )% |
Portfolio turnover rate | | | 206 | % | | | 58 | % | | | 106 | % | | | 144 | % | | | 136 | % | | | 206 | % |
| * | Commencement of operations |
| (a) | Annualized for periods of less than one year. |
| (b) | Total returns are historical and assume changes in share price, reinvestments of all dividends and distributions, and no sales charge. Had certain expenses not been reduced during the periods shown, total returns would have been lower. Total returns for periods of less than one year are not annualized. |
| (c) | Such percentages are after advisory fee waivers and expenses reimbursements. |
| (d) | Does not include any insurance charges imposed in connection with your variable insurance contract. |
78
| | |
| FINANCIAL HIGHLIGHTS (Continued) | | |
| | | Sun Capital Advisers Trust |
Selected data for a share outstanding throughout the period:
| | | | |
| | | FI Large Cap Growth Fund
Service Class Shares | |
| | | For the Period
5/1/2006* to
12/31/2006 | |
Net Asset Value, Beginning of Period | | $ | 10.000 | |
| | | | |
Income (Loss) from Investment Operations: | | | | |
Net investment loss (d) | | | (0.006 | ) |
Net realized and unrealized loss on investments | | | (0.014 | ) |
| | | | |
Total from Investment Operations | | | (0.020 | ) |
| | | | |
Less Distributions from: | | | | |
Net investment income | | | — | |
In excess of net investment income | | | — | |
Net realized gain on investments | | | — | |
In excess of net realized gain on investments | | | — | |
Capital | | | — | |
| | | | |
Total distributions | | | — | |
| | | | |
Net Asset Value, End of Period | | $ | 9.980 | |
| | | | |
Total Return (b) | | | (0.20 | )% |
| | | | |
Ratios and Supplemental Data: | | | | |
Net Assets, End of Period (000’s) | | $ | 3,810 | |
Ratios to average net assets: | | | | |
Net expenses (a)(c)(d) | | | 1.06 | % |
Gross expenses (a)(d) | | | 5.26 | % |
Net investment loss (a)(c)(d) | | | (0.10 | )% |
Portfolio turnover rate | | | 110 | % |
| * | Commencement of operations |
| (a) | Annualized for periods of less than one year. |
| (b) | Total returns are historical and assume changes in share price, reinvestments of all dividends and distributions, and no sales charge. Had certain expenses not been reduced during the periods shown, total returns would have been lower. Total returns for periods of less than one year are not annualized. |
| (c) | Such percentages are after advisory fee waivers and expenses reimbursements. |
| (d) | Does not include any insurance charges imposed in connection with your variable insurance contract. |
79
| | |
| FINANCIAL HIGHLIGHTS (Continued) | | |
| | | Sun Capital Advisers Trust |
Selected data for a share outstanding throughout each period:
| | | | | | | | | | | | | | | | | | | | |
| | | Blue Chip Mid Cap Fund
Initial Class Shares | |
| | | Year Ended December 31, | |
| | | 2006 | | | 2005 | | | 2004 | | | 2003 | | | 2002 | |
Net Asset Value, Beginning of Period | | $ | 20.600 | | | $ | 18.130 | | | $ | 15.610 | | | $ | 11.470 | | | $ | 13.480 | |
| | | | | | | | | | | | | | | | | | | | |
Income (Loss) from Investment Operations: | | | | | | | | | | | | | | | | | | | | |
Net investment income (loss) (d) | | | 0.177 | | | | (0.003 | ) | | | 0.022 | | | | (0.011 | ) | | | (0.024 | ) |
Net realized and unrealized gain (loss) on investments | | | 1.877 | | | | 2.979 | | | | 2.498 | | | | 4.151 | | | | (1.986 | ) |
| | | | | | | | | | | | | | | | | | | | |
Total from Investment Operations | | | 2.054 | | | | 2.976 | | | | 2.520 | | | | 4.140 | | | | (2.010 | ) |
| | | | | | | | | | | | | | | | | | | | |
Less Distributions from: | | | | | | | | | | | | | | | | | | | | |
Net investment income | | | — | | | | (0.017 | ) | | | — | | | | — | | | | — | |
In excess of net investment income | | | — | | | | — | | | | — | | | | — | | | | — | |
Net realized gain on investments | | | (3.614 | ) | | | (0.489 | ) | | | — | | | | — | | | | — | |
In excess of net realized gain on investments | | | — | | | | — | | | | — | | | | — | | | | — | |
Capital | | | — | | | | — | | | | — | | | | — | | | | — | |
| | | | | | | | | | | | | | | | | | | | |
Total distributions | | | (3.614 | ) | | | (0.506 | ) | | | — | | | | — | | | | — | |
| | | | | | | | | | | | | | | | | | | | |
Net Asset Value, End of Period | | $ | 19.040 | | | $ | 20.600 | | | $ | 18.130 | | | $ | 15.610 | | | $ | 11.470 | |
| | | | | | | | | | | | | | | | | | | | |
Total Return (b) | | | 11.30 | % | | | 16.61 | % | | | 16.14 | % | | | 36.09 | % | | | (14.91 | )% |
| | | | | | | | | | | | | | | | | | | | |
Ratios and Supplemental Data: | | | | | | | | | | | | | | | | | | | | |
Net Assets, End of Period (000’s) | | $ | 94,632 | | | $ | 94,928 | | | $ | 89,609 | | | $ | 75,669 | | | $ | 53,506 | |
Ratios to average net assets: | | | | | | | | | | | | | | | | | | | | |
Net expenses (a)(c)(d) | | | 1.00 | % | | | 1.00 | % | | | 1.00 | % | | | 1.00 | % | | | 1.00 | % |
Gross expenses (a)(d) | | | 1.14 | % | | | 1.15 | % | | | 1.12 | % | | | 1.14 | % | | | 1.17 | % |
Net investment income (loss) (a)(c)(d) | | | 0.92 | % | | | 0.03 | % | | | 0.13 | % | | | (0.09 | )% | | | (0.21 | )% |
Portfolio turnover rate | | | 83 | % | | | 67 | % | | | 60 | % | | | 76 | % | | | 90 | % |
| (a) | Annualized for periods of less than one year. |
| (b) | Total returns are historical and assume changes in share price, reinvestments of all dividends and distributions, and no sales charge. Had certain expenses not been reduced during the periods shown, total returns would have been lower. Total returns for periods of less than one year are not annualized. |
| (c) | Such percentages are after advisory fee waivers and expenses reimbursements. |
| (d) | Does not include any insurance charges imposed in connection with your variable insurance contract. |
80
| | |
| NOTESTO FINANCIAL STATEMENTS | | Sun Capital Advisers Trust |
NOTE A — ORGANIZATION
Sun Capital Advisers Trust (the “Trust”) is registered under the Investment Company Act of 1940 as amended (the “1940 Act”) as an open-end management investment company. The Trust was established as a Delaware statutory trust under the laws of Delaware by an Agreement and Declaration of Trust dated July 13, 1998. It currently consists of eight funds (each referred to as a “Fund” collectively as “the Funds”), which are offered only to qualified pension and retirement plans and variable annuity and variable life insurance separate accounts established by insurance companies to fund variable annuity contracts and variable life insurance policies. The Funds are the Sun Capital All Cap Fund (“All Cap Fund”), Sun Capital Investment Grade Bond Fund (“Investment Grade Bond Fund”), Sun Capital Money Market Fund (“Money Market Fund”), Sun Capital Real Estate Fund (“Real Estate Fund”), SC Davis Venture Value Fund (“Davis Venture Value Fund”), SC Oppenheimer Main Street Small Cap Fund (“Oppenheimer Main Street Small Cap Fund”) (formerly Value Small Cap Fund), SC FI Large Cap Growth Fund (“FI Large Cap Growth Fund”) and the SC Blue Chip Mid Cap Fund (“Blue Chip Mid Cap Fund”). Each of the Funds, other than the Real Estate Fund, is classified as a diversified fund under the 1940 Act. Each Fund offers Initial Class Shares except the FI Large Cap Growth Fund. Each Fund offers Service Class Shares except the Blue Chip Mid Cap Fund. Service Class Shares for Davis Venture Value Fund, Oppenheimer Main Street Small Cap Fund and FI Large Cap Growth Fund commenced operations on May 1, 2006.
NOTE B — SIGNIFICANT ACCOUNTING POLICIES
The preparation of financial statements in conformity with accounting principles generally accepted in the United States of America requires management to make estimates and assumptions that affect the reported amounts of assets and liabilities and disclosure of contingent assets and liabilities at the date of the financial statements and the reported amounts of revenues and expenses during the reporting period. Actual results could differ from those estimates.
The following is a summary of significant accounting policies followed by the Trust in the preparation of its financial statements.
Valuation of Investments
Securities for which exchange quotations are readily available are valued at the last sales price, or, if no sales occurred on that day, at the mean between the closing bid and asked prices. Certain fixed income securities are valued by a dealer or by a pricing service based upon a computerized matrix system, which considers market transactions and dealer supplied valuations. Short-term securities maturing in 60 days or less are valued at cost plus earned discount to maturity (amortized cost), which approximates market value. Securities for which current market quotations are not readily available are stated at fair value as determined in good faith under the direction of the Board of Trustees.
In accordance with Rule 2a-7 of the 1940 Act, the Money Market Fund values its securities initially at cost, and thereafter, securities are assumed to have a constant amortization to maturity of any discount or premium. Amortized cost approximates fair value.
Investments in open end mutual funds are valued at their closing net asset value per share as reported by the investment company.
In September 2006, the Financial Accounting Standards Board (FASB) issued Statement of Financial Accounting Standards No. 157, Fair Value Measurement (“SFAS 157”). SFAS 157, which is effective for fiscal years beginning after November 15, 2007, defines fair value, establishes a framework for measuring fair value and expands disclosures about fair value measurements. Management is currently evaluating the impact, if any, the adoption of SFAS 157 will have on the disclosures in the Fund’s financial statements.
81
| | |
| NOTESTO FINANCIAL STATEMENTS (Continued) | | Sun Capital Advisers Trust |
Investment Transactions and Income
Investment security transactions are accounted for as of trade date. Dividend income is recorded on the ex-dividend date. Interest income is recorded on the accrual basis. Discounts and premiums on debt securities are amortized using the interest method. Upon notification from issuers some dividend income received from a REIT may be redesignated as a reduction of cost of investment and/or realized gain. Realized gains and losses from security transactions are determined on the basis of identified cost for both financial statement and federal income tax purposes.
The Real Estate Fund may have elements of risk due to concentrated investments in specific industries. Such concentrations may subject the Fund to additional risks resulting from future political or economic conditions.
Foreign Currency Translation and Foreign Investments
The accounting records of the Funds are maintained in U.S. dollars. Portfolio securities and other assets and liabilities denominated in a foreign currency are translated to U.S. dollars at the prevailing rates of exchange at period end. Purchases and sales of securities, income receipts and expense payments are translated into U.S. dollars at the prevailing exchange rate on the respective dates of transactions. The effects of changes in foreign currency exchange rates on portfolio investments are included in the net realized and unrealized gains and losses on investments. Net gains and losses on foreign currency transactions include disposition of foreign currencies, and currency gains and losses between the accrual and receipt dates of portfolio investment income and between the trade and settlement dates of portfolio investment transactions.
Federal Income Taxes
Each Fund is treated as a separate entity for Federal tax purposes. Each Fund intends to elect or has elected to be treated and intends to qualify each year as a regulated investment company under Subchapter M of the Internal Revenue Code, as amended (“the Code”). By so qualifying, the Funds will not be subject to Federal income taxes to the extent that they distribute all of their taxable income, including realized capital gains, for the fiscal year. In addition, by distributing during each calendar year substantially all of their net investment income, capital gains and certain other amounts, if any, the Funds will not be subject to a Federal excise tax.
In June 2006, Financial Accounting Standards Board Interpretation No. 48, Accounting for Uncertainty in Income Taxes — an interpretation of FASB Statement 109 (“FIN 48”) was issued and is effective on the last business day of the semiannual reporting period for fiscal years beginning after December 15, 2006. FIN 48 provides guidance for how uncertain tax positions should be recognized, measured, presented and disclosed in the financial statements based on an evaluation as to whether the tax positions are “more likely than not” to be sustained by the Internal Revenue Service. At December 31, 2006, Trust management has evaluated the tax positions taken by the All Cap Fund, Investment Grade Bond Fund and Real Estate Fund (“the Funds”) regarding the appropriateness of distributions made during each Funds’ fiscal year ended December 31, 2004 and each Funds’ related Subchapter M status under the Code. Trust management has concluded that the tax positions originally taken meet the “more likely than not” standard and therefore there will be no impact to the Fund’s financial statements. Trust management is currently evaluating all other uncertain tax positions taken by the Trust and the impact, if any, on the Fund’s financial statements.
A portion of the dividend income recorded by Real Estate Fund is from distributions by publicly traded REITs, and such distributions for tax purposes may also consist of capital gains and return of capital. The actual return of capital and capital gains portions of such distributions will be determined by formal notifications from the REITs subsequent to the calendar year-end. Distributions received from the REITs that are determined to be a return of capital are recorded by the Fund as a reduction to the cost basis of the securities held.
82
| | |
| NOTESTO FINANCIAL STATEMENTS (Continued) | | Sun Capital Advisers Trust |
At December 31, 2006, the following Funds have available for federal income tax purposes capital loss carryovers which can be used to offset certain future realized capital gains.
| | | | | | | | | | | | | | | | | | | | | |
| | | Expires December 31, |
| | | 2007 | | 2008 | | 2009 | | 2010 | | 2011 | | 2012 | | 2014 |
Money Market Fund | | $ | 1,180 | | $ | 156 | | $ | — | | $ | — | | $ | — | | $ | 21 | | $ | — |
Davis Venture Value Fund | | | — | | | — | | | — | | | 709,437 | | | 347,308 | | | 135,278 | | | — |
FI Large Cap Growth Fund | | | — | | | — | | | — | | | — | | | — | | | — | | | 70,556 |
Under current tax law, certain capital losses realized after October 31 within a taxable year may be deferred and treated as occurring on the first day of the following tax year. For the tax period ended December 31, 2006, the following Funds elected to defer net losses arising between November 1, 2006 and December 31, 2006.
| | | |
| | | Amount |
Oppenheimer Main Street Small Cap Fund | | $ | 166 |
The tax character of distributions paid during the year ended December 31, 2006, was as follows:
| | | | | | | | |
| | | Ordinary Income | | Long-Term
Capital Gain | | Return of
Capital |
All Cap Fund | | $ | 165,405 | | $ | 1,910 | | — |
Investment Grade Bond Fund | | | 2,818,736 | | | 455,656 | | 101,556 |
Money Market Fund | | | 5,343,015 | | | — | | — |
Real Estate Fund | | | 4,952,767 | | | 6,377,583 | | — |
Davis Venture Value Fund | | | 404,377 | | | — | | — |
Oppenheimer Main Street Small Cap Fund | | | 601,289 | | | 2,808,438 | | — |
Blue Chip Mid Cap Fund | | | 2,566,459 | | | 13,008,689 | | — |
The tax character of distributions paid during the year ended December 31, 2005, was as follows:
| | | | | | |
| | | Ordinary Income | | Long-Term
Capital Gain |
All Cap Fund | | $ | 400,157 | | $ | 708,563 |
Investment Grade Bond Fund | | | 2,826,016 | | | 456,574 |
Money Market Fund | | | 3,181,996 | | | — |
Real Estate Fund | | | 5,212,470 | | | 8,871,348 |
Davis Venture Value Fund | | | 375,813 | | | — |
Oppenheimer Main Street Small Cap Fund | | | 5,255,164 | | | 6,161,367 |
Blue Chip Mid Cap Fund | | | 255,455 | | | 2,092,855 |
83
| | |
| NOTESTO FINANCIAL STATEMENTS (Continued) | | Sun Capital Advisers Trust |
As of December 31, 2006 the components of distributable earnings on a tax basis were as follows:
| | | | | | | | | | |
| | | Undistributed
Ordinary
Income | | Undistributed
Long-Term
Capital Gain | | Net Unrealized
Appreciation
(Depreciation) | |
All Cap Fund | | $ | — | | $ | — | | $ | 1,446,896 | |
Investment Grade Bond Fund | | | — | | | — | | | (306,131 | ) |
Money Market Fund | | | — | | | — | | | — | |
Real Estate Fund | | | 5,756,340 | | | 28,539,826 | | | 60,355,822 | |
Davis Venture Value Fund | | | 401,361 | | | — | | | 18,545,375 | |
Oppenheimer Main Street Small Cap Fund | | | 3,910,531 | | | 12,887,529 | | | 7,384,188 | |
FI Large Cap Growth Fund | | | — | | | — | | | 110,777 | |
Blue Chip Mid Cap Fund | | | 1,959,423 | | | 14,623,258 | | | 12,927,841 | |
Dollar Roll Transactions
The Investment Grade Bond Fund may enter into dollar roll transactions with financial institutions to take advantage of opportunities in the mortgage market. The Fund will only enter into “covered” rolls. A “covered” roll is a specific type of dollar roll for which there is an offsetting cash position or liquid security position. A dollar roll transaction involves a sale by the Fund of securities that it holds with an agreement by the Fund to repurchase similar securities at an agreed upon price and date. The securities repurchased will be substantially similar as to type, coupon and maturity as those sold. The Fund is paid a fee for entering into a dollar roll transaction, that is accrued as income over the life of the dollar roll contract. During the period between the sale and repurchase, the Fund will not be entitled to receive interest and principal payments on the securities sold.
The proceeds of the sale will generally be invested in additional instruments for the Fund, and the income from these investments, together with any additional fee income received on the dollar roll transaction, will generally exceed the interest income that would have been earned on the securities sold. Dollar roll transactions involve the risk that the market value of the securities sold by the Fund may decline below the repurchase price of those similar securities which the Fund is obligated to purchase or that the return earned by the Fund with the proceeds of a dollar roll may not exceed transaction costs.
Repurchase Agreements
In connection with transactions in repurchase agreements, the Trust’s custodian takes possession of the underlying collateral securities, the value of which at least equals 102% of the principal amount of the repurchase transaction. The value of the collateral is marked-to-market on a daily basis to ensure the adequacy of the collateral. In the event of default, the Funds have the right to liquidate the collateral and apply the proceeds in satisfaction of the obligation. There is the risk that the collateral may be insufficient to meet the obligation in the event of default.
When Issued Securities and Forward Commitments
The Funds may purchase or sell securities on a when issued or forward commitment basis. These transactions are arrangements in which the Funds purchase and sell securities with payment and delivery scheduled for a future time. Settlement dates may be a month or more after entering into these transactions and such transactions may involve a risk of loss if the value of the underlying security declines prior to the settlement date. The price of the underlying securities and the date when these securities will be delivered and paid for are fixed at the time the transaction is negotiated. This may increase the risk if the other party involved in the transaction fails to deliver and causes the Funds to subsequently invest at less advantageous prices and yields. In connection with such purchases the Funds maintain cash or liquid assets in an amount equal to purchase commitments for such
84
| | |
| NOTESTO FINANCIAL STATEMENTS (Continued) | | Sun Capital Advisers Trust |
underlying securities until settlement date and for sales commitments the Funds maintain equivalent deliverable securities as “cover” for the transaction. Unsettled commitments are valued at current market value of the underlying security. Daily fluctuations in the value of such contracts are recorded as unrealized gains or losses. The Funds will not enter into such agreements for the purpose of investment leverage.
Expenses
Expenses directly attributable to a Fund are charged to that Fund. Expenses not directly attributable to a particular Fund are allocated evenly among the affected Funds, allocated on the basis of relative net assets, or otherwise allocated among the Funds as the Trustees may direct or approve. Expenses directly attributable to a particular class of a Fund are charged directly to such class. In calculating the net asset value per share of each class, investment income, realized and unrealized gains and losses and expenses other than class specific expenses are allocated daily to each class of shares based upon the proportion of net assets of each class at the beginning of each day plus current day fund share activity.
Dividends and Distributions
The Investment Grade Bond Fund and Money Market Fund declare dividends daily from net investment income, if any. Each of the remaining Funds in the Trust distributes net investment income, if any, annually. Each Fund distributes its net realized capital gains, if any, at least annually. Income and capital gain distributions are determined in accordance with income tax regulations which may differ from generally accepted accounting principles. These differences, which may result in distribution reclassifications, are primarily due to differing treatments for non-taxable dividends, capital loss carryforwards and losses deferred due to wash sales. Permanent book and tax basis differences relating to shareholder distributions will result in reclassifications to paid in capital and may affect the per share allocation between net investment income and realized and unrealized gain (loss). Undistributed net investment income and accumulated undistributed net realized gain (loss) on investments may include temporary book and tax differences which will reverse in a subsequent period. Any taxable income or gain remaining at fiscal year end is distributed in the following year.
NOTE C — INVESTMENT ADVISORY AND OTHER RELATED PARTY AGREEMENTS
Investment Advisory Agreement
Sun Capital Advisers, LLC (the “Adviser”) is the investment adviser to each of the Funds under separate investment advisory agreements with the Trust. The Adviser, at its own cost, has retained Davis Advisors, as subadviser for the Davis Venture Value Fund; OppenheimerFunds, Inc., as subadviser for the Oppenheimer Main Street Small Cap Fund; Pyramis Global Advisors, LLC, as subadviser for the FI Large Cap Growth Fund; and Wellington Management Company, LLP, as subadviser for the Blue Chip Mid Cap Fund. The Adviser is a direct wholly-owned subsidiary of Sun Life Assurance Company of Canada — U.S. Operations Holdings, Inc. (“Sun Life — US Ops Holdco”), a holding company. Sun Life Financial, Inc. (“Sun Life Financial”), a publicly traded holding company, is the ultimate parent of Sun Life — US Ops Holdco and the Adviser.
85
| | |
| NOTESTO FINANCIAL STATEMENTS (Continued) | | Sun Capital Advisers Trust |
As compensation for all services rendered, facilities provided and expenses paid or assumed by the Adviser under the advisory agreement, the Trust pays compensation quarterly to the Adviser at the following annual rates based on the average daily net assets of each Fund taken separately:
| | | | |
| | | Daily Net Assets | | Advisory Fee |
All Cap Fund | | All | | 0.70% |
| | | |
Investment Grade Bond Fund | | All | | 0.60% |
| | | |
Money Market Fund | | All | | 0.50% |
| | | |
Real Estate Fund | | All | | 0.95% |
| | | |
Davis Venture Value Fund | | $0-$500 million over $500 million | | 0.75%
0.70% |
| | | |
Oppenheimer Main Street Small Cap Fund | | $0-$400 million $400 million-$800 million over $800 million | | 0.80%
0.75%
0.70% |
| | | |
FI Large Cap Growth Fund | | $0-$750 million over $750 million | | 0.75%
0.70% |
| | | |
Blue Chip Mid Cap Fund | | $0-$300 million over $300 million | | 0.80%
0.75% |
Limitations
Through April 30, 2008, the Adviser has contractually agreed to reduce its advisory fee and to reimburse each Fund’s other expenses to reduce each Fund’s total annual operating expenses to:
| | | | | | |
| | | Total Operating Expense | |
| | | Initial Class | | | Service Class | |
All Cap Fund | | 0.90 | % | | 1.15 | % |
Investment Grade Bond Fund | | 0.75 | % | | 1.00 | % |
Money Market Fund | | 0.50 | % | | 0.75 | % |
Real Estate Fund | | 1.10 | % | | 1.35 | % |
Davis Venture Value Fund | | 0.90 | % | | 1.15 | % |
Oppenheimer Main Street Small Cap Fund | | 1.00 | % | | 1.25 | % |
FI Large Cap Growth Fund | | — | | | 1.06 | % |
Blue Chip Mid Cap Fund | | 1.00 | % | | — | |
86
| | |
| NOTESTO FINANCIAL STATEMENTS (Continued) | | Sun Capital Advisers Trust |
For the year ended December 31, 2006, the Adviser waived all or part of its advisory fee and reimbursed certain operating expenses in the following amounts:
| | | | | | |
| | | Advisory
Fees Waived | | Expenses
Reimbursed |
All Cap Fund | | $ | 63,998 | | $ | 75,988 |
Investment Grade Bond Fund | | $ | 166,746 | | $ | — |
Money Market Fund | | $ | 319,692 | | $ | — |
Real Estate Fund | | $ | 170,744 | | $ | — |
Davis Venture Value Fund | | $ | 145,668 | | $ | — |
Oppenheimer Main Street Small Cap Fund | | $ | 374,226 | | $ | — |
FI Large Cap Growth Fund | | $ | 15,469 | | $ | 70,747 |
Blue Chip Mid Cap Fund | | $ | 134,534 | | $ | — |
To the extent that a Fund’s gross expenses fall below the expense limit stated above in future years, the Adviser reserves the right to be reimbursed for advisory fees waived and fund expenses paid by it during the prior two fiscal years. For the two year period ended December 31, 2006 the aggregate amount of expenses waived or reimbursed for the Trust is $2,664,205.
Distribution and Service Plan
The Trust has adopted a plan of distribution and service pursuant to Rule 12b-1 under the 1940 Act with respect to its Service Class Shares (the “Plan”), pursuant to which distribution and service fees are paid to Clarendon Insurance Agency, Inc. (“Clarendon”), which is a wholly-owned subsidiary of Sun Life Assurance Company of Canada (U.S.). The fees of the Trust payable to Clarendon pursuant of the Plan are accrued daily at a rate with respect to each fund which may not exceed 0.25% of the fund’s average daily net assets attributable to Service Class shares regardless of the level of expenses actually incurred by Clarendon and others.
Trustees’ Compensation
Trustees’ fees are paid by the Trust to each independent trustee of the Trust. The aggregate remuneration paid by the Funds to the independent trustees for the year ended December 31, 2006 was $116,250. The Trust pays no compensation directly to its Trustees or officers who are affiliated with the Adviser, Sun Life-US Ops Holdco or Sun Life Financial, all of whom receive remuneration for their services to the Trust from the Adviser, Sun Life- US Ops Holdco or Sun Life Financial. Certain officers and Trustees of the Trust are officers and directors of the Adviser, Sun Life -US Ops Holdco or Sun Life Financial.
87
| | |
| NOTESTO FINANCIAL STATEMENTS (Continued) | | Sun Capital Advisers Trust |
NOTE D — INVESTMENT TRANSACTIONS
Purchases and proceeds from sales and maturities of investments, excluding short-term securities, for the year ended December 31, 2006 were as follows:
| | | | | | | | | | | | |
| | | Non-
Government
Purchases | | Government
Purchases | | Non-
Government
Sales | | Government
Sales |
All Cap Fund | | $ | 14,902,478 | | $ | 85,757 | | $ | 11,884,416 | | $ | 62,751 |
Investment Grade Bond Fund | | $ | 27,455,052 | | $ | 2,191,777 | | $ | 27,959,234 | | $ | 2,053,145 |
Real Estate Fund | | $ | 95,666,814 | | $ | — | | $ | 79,476,824 | | $ | — |
Davis Venture Value Fund | | $ | 9,925,402 | | $ | — | | $ | 8,678,787 | | $ | — |
Oppenheimer Main Street Small | | | | | | | | | | | | |
Cap Fund | | $ | 179,293,803 | | $ | 1,007,458 | | $ | 177,950,780 | | $ | 476,508 |
FI Large Cap Growth Fund | | $ | 7,053,497 | | $ | — | | $ | 3,389,991 | | $ | — |
Blue Chip Mid Cap Fund | | $ | 77,197,983 | | $ | — | | $ | 85,036,212 | | $ | — |
Purchases and sales, including maturities, of short-term securities, by the Money Market Fund for the year ended December 31, 2006 were $1,024,883,097 and $1,015,960,101, respectively.
The identified cost for federal income tax purposes of investments owned by each Fund and their respective gross unrealized appreciation and depreciation at December 31, 2006 were as follows:
| | | | | | | | | | | | | | |
| | | Identified
Cost | | Gross Unrealized | | | Net
Unrealized
Appreciation/
(Depreciation) | |
| | | | Appreciation | | (Depreciation) | | |
All Cap Fund | | $ | 9,990,739 | | $ | 1,489,631 | | $ | (42,735 | ) | | $ | 1,446,896 | |
Investment Grade Bond Fund | | $ | 56,414,595 | | $ | 804,172 | | $ | (1,110,303 | ) | | $ | (306,131 | ) |
Money Market Fund | | $ | 121,370,087 | | $ | — | | $ | — | | | $ | — | |
Real Estate Fund | | $ | 167,314,725 | | $ | 61,593,738 | | $ | (1,237,916 | ) | | $ | 60,355,822 | |
Davis Venture Value Fund | | $ | 42,961,616 | | $ | 18,951,227 | | $ | (405,836 | ) | | $ | 18,545,391 | |
Oppenheimer Main Street Small Cap Fund | | $ | 79,232,009 | | $ | 9,794,349 | | $ | (2,410,161 | ) | | $ | 7,384,188 | |
FI Large Cap Growth Fund | | $ | 3,879,130 | | $ | 208,157 | | $ | (97,380 | ) | | $ | 110,777 | |
Blue Chip Mid Cap Fund | | $ | 81,787,935 | | $ | 14,509,229 | | $ | (1,581,388 | ) | | $ | 12,927,841 | |
88
| | |
| NOTESTO FINANCIAL STATEMENTS (Continued) | | Sun Capital Advisers Trust |
NOTE E — SHARE TRANSACTIONS
Each of the Funds is authorized to issue an unlimited number of shares without par value. Transactions in classes of each Fund were as follows:
| | | | | | | | | | | | | | | | |
| | | Initial Class | | | Service Class | |
| | | Year Ended December 31, | | | Year Ended December 31, | |
| | | 2006 | | | 2005 | | | 2006* | | | 2005 | |
ALL CAP FUND (shares) | | | | | | | | | | | | | | | | |
Shares sold | | | 118,106 | | | | 49,211 | | | | 291,221 | | | | 84,800 | |
Shares issued as reinvestment of distributions | | | 8,010 | | | | 81,630 | | | | 5,340 | | | | 21,088 | |
Shares redeemed | | | (151,864 | ) | | | (170,355 | ) | | | (29,413 | ) | | | (44,334 | ) |
| | | | | | | | | | | | | | | | |
Net increase (decrease) in shares outstanding | | | (25,748 | ) | | | (39,514 | ) | | | 267,148 | | | | 61,554 | |
Beginning of period | | | 525,677 | | | | 565,191 | | | | 148,887 | | | | 87,333 | |
| | | | | | | | | | | | | | | | |
End of period | | | 499,929 | | | | 525,677 | | | | 416,035 | | | | 148,887 | |
| | | | | | | | | | | | | | | | |
ALL CAP FUND ($) | | | | | | | | | | | | | | | | |
Net proceeds from sales | | $ | 1,362,456 | | | $ | 586,192 | | | $ | 3,369,392 | | | $ | 1,027,597 | |
Net proceeds on reinvestment of distributions | | | 99,395 | | | | 877,754 | | | | 67,920 | | | | 230,966 | |
Shares redeemed | | | (1,731,074 | ) | | | (2,016,273 | ) | | | (337,138 | ) | | | (536,584 | ) |
| | | | | | | | | | | | | | | | |
Net increase (decrease) in net assets | | $ | (269,223 | ) | | $ | (552,327 | ) | | $ | 3,100,174 | | | $ | 721,979 | |
| | | | | | | | | | | | | | | | |
INVESTMENT GRADE BOND FUND (shares) | | | | | | | | | | | | | | | | |
Shares sold | | | 312,524 | | | | 558,468 | | | | 672,490 | | | | 357,040 | |
Shares issued as reinvestment of distributions | | | 308,883 | | | | 318,714 | | | | 43,127 | | | | 12,232 | |
Shares redeemed | | | (1,440,306 | ) | | | (1,071,233 | ) | | | (115,008 | ) | | | (69,620 | ) |
| | | | | | | | | | | | | | | | |
Net increase (decrease) in shares outstanding | | | (818,899 | ) | | | (194,051 | ) | | | 600,609 | | | | 299,652 | |
Beginning of period | | | 5,516,405 | | | | 5,710,456 | | | | 368,939 | | | | 69,287 | |
| | | | | | | | | | | | | | | | |
End of period | | | 4,697,506 | | | | 5,516,405 | | | | 969,548 | | | | 368,939 | |
| | | | | | | | | | | | | | | | |
INVESTMENT GRADE BOND FUND ($) | | | | | | | | | | | | | | | | |
Net proceeds from sales | | $ | 2,997,840 | | | $ | 5,546,130 | | | $ | 6,507,406 | | | $ | 3,561,960 | |
Net proceeds on reinvestment of distributions | | | 2,959,719 | | | | 3,160,886 | | | | 416,229 | | | | 121,704 | |
Shares redeemed | | | (13,834,855 | ) | | | (10,638,528 | ) | | | (1,118,280 | ) | | | (688,109 | ) |
| | | | | | | | | | | | | | | | |
Net increase (decrease) in net assets | | $ | (7,877,296 | ) | | $ | (1,931,512 | ) | | $ | 5,805,355 | | | $ | 2,995,555 | |
| | | | | | | | | | | | | | | | |
MONEY MARKET FUND (shares) | | | | | | | | | | | | | | | | |
Shares sold | | | 72,037,441 | | | | 45,515,313 | | | | 766,564 | | | | 531,075 | |
Shares issued as reinvestment of distributions | | | 5,303,933 | | | | 3,175,767 | | | | 39,082 | | | | 6,229 | |
Shares redeemed | | | (67,607,254 | ) | | | (59,659,773 | ) | | | (40,302 | ) | | | (28,264 | ) |
| | | | | | | | | | | | | | | | |
Net increase (decrease) in shares outstanding | | | 9,734,120 | | | | (10,968,693 | ) | | | 765,344 | | | | 509,040 | |
Beginning of period | | | 110,431,427 | | | | 121,400,120 | | | | 509,040 | | | | — | |
| | | | | | | | | | | | | | | | |
End of period | | | 120,165,547 | | | | 110,431,427 | | | | 1,274,384 | | | | 509,040 | |
| | | | | | | | | | | | | | | | |
89
| | |
| NOTESTO FINANCIAL STATEMENTS (Continued) | | Sun Capital Advisers Trust |
| | | | | | | | | | | | | | | | |
| | | Initial Class | | | Service Class | |
| | | Year Ended December 31, | | | Year Ended December 31, | |
| | | 2006 | | | 2005 | | | 2006* | | | 2005 | |
MONEY MARKET FUND ($) | | | | | | | | | | | | | | | | |
Net proceeds from sales | | $ | 72,037,441 | | | $ | 45,515,313 | | | $ | 766,564 | | | $ | 531,075 | |
Net proceeds on reinvestment of distributions | | | 5,303,933 | | | | 3,175,767 | | | | 39,082 | | | | 6,229 | |
Shares redeemed | | | (67,607,254 | ) | | | (59,659,773 | ) | | | (40,302 | ) | | | (28,264 | ) |
| | | | | | | | | | | | | | | | |
Net increase (decrease) in net assets | | $ | 9,734,120 | | | $ | (10,968,693 | ) | | $ | 765,344 | | | $ | 509,040 | |
| | | | | | | | | | | | | | | | |
REAL ESTATE FUND (shares) | | | | | | | | | | | | | | | | |
Shares sold | | | 457,882 | | | | 593,691 | | | | 1,867,500 | | | | 1,396,652 | |
Shares issued as reinvestment of distributions | | | 305,914 | | | | 566,245 | | | | 190,683 | | | | 179,936 | |
Shares redeemed | | | (1,442,794 | ) | | | (935,247 | ) | | | (523,611 | ) | | | (124,365 | ) |
| | | | | | | | | | | | | | | | |
Net increase (decrease) in shares outstanding | | | (678,998 | ) | | | 224,689 | | | | 1,534,572 | | | | 1,452,223 | |
Beginning of period | | | 5,605,453 | | | | 5,380,764 | | | | 2,542,217 | | | | 1,089,994 | |
| | | | | | | | | | | | | | | | |
End of period | | | 4,926,455 | | | | 5,605,453 | | | | 4,076,789 | | | | 2,542,217 | |
| | | | | | | | | | | | | | | | |
REAL ESTATE FUND ($) | | | | | | | | | | | | | | | | |
Net proceeds from sales | | $ | 9,826,458 | | | $ | 10,760,213 | | | $ | 43,612,508 | | | $ | 27,253,180 | |
Net proceeds on reinvestment of distributions | | | 6,803,531 | | | | 10,526,491 | | | | 4,526,819 | | | | 3,557,327 | |
Shares redeemed | | | (31,613,485 | ) | | | (17,472,633 | ) | | | (12,489,201 | ) | | | (2,582,479 | ) |
| | | | | | | | | | | | | | | | |
Net increase (decrease) in net assets | | $ | (14,983,496 | ) | | $ | 3,814,071 | | | $ | 35,650,126 | | | $ | 28,228,028 | |
| | | | | | | | | | | | | | | | |
DAVIS VENTURE VALUE FUND (shares) | | | | | | | | | | | | | | | | |
Shares sold | | | 723,156 | | | | 513,729 | | | | 2,070 | | | | — | |
Shares issued as reinvestment of distributions | | | 33,460 | | | | 34,010 | | | | 15 | | | | — | |
Shares redeemed | | | (779,404 | ) | | | (698,669 | ) | | | — | | | | — | |
| | | | | | | | | | | | | | | | |
Net increase (decrease) in shares outstanding | | | (22,788 | ) | | | (150,930 | ) | | | 2,085 | | | | — | |
Beginning of period | | | 4,688,656 | | | | 4,839,586 | | | | — | | | | — | |
| | | | | | | | | | | | | | | | |
End of period | | | 4,665,868 | | | | 4,688,656 | | | | 2,085 | | | | | |
| | | | | | | | | | | | | | | | |
DAVIS VENTURE VALUE FUND ($) | | | | | | | | | | | | | | | | |
Net proceeds from sales | | $ | 8,798,372 | | | $ | 5,492,029 | | | $ | 25,000 | | | $ | — | |
Net proceeds on reinvestment of distributions | | | 404,193 | | | | 375,813 | | | | 184 | | | | — | |
Shares redeemed | | | (9,392,552 | ) | | | (7,610,726 | ) | | | — | | | | — | |
| | | | | | | | | | | | | | | | |
Net increase (decrease) in net assets | | $ | (189,987 | ) | | $ | (1,742,884 | ) | | $ | 25,184 | | | $ | | |
| | | | | | | | | | | | | | | | |
90
| | |
| NOTESTO FINANCIAL STATEMENTS (Continued) | | Sun Capital Advisers Trust |
| | | | | | | | | | | | |
| | | Initial Class | | | Service Class | |
| | | Year Ended December 31, | | | Year Ended
December 31,
2006* | |
| | | 2006 | | | 2005 | | |
OPPENHEIMER MAIN STREET SMALL CAP FUND (shares) | | | | | | | | | | | | |
Shares sold | | | 557,694 | | | | 456,798 | | | | 1,607 | |
Shares issued as reinvestment of distributions | | | 245,236 | | | | 859,679 | | | | 69 | |
Shares redeemed | | | (1,300,786 | ) | | | (862,382 | ) | | | — | |
| | | | | | | | | | | | |
Net increase (decrease) in shares outstanding | | | (497,856 | ) | | | 454,095 | | | | 1,676 | |
Beginning of period | | | 6,306,067 | | | | 5,851,972 | | | | — | |
| | | | | | | | | | | | |
End of period | | | 5,808,211 | | | | 6,306,067 | | | | 1,676 | |
| | | | | | | | | | | | |
OPPENHEIMER MAIN STREET SMALL CAP FUND ($) | | | | | | | | | | | | |
Net proceeds from sales | | $ | 7,942,521 | | | $ | 6,420,151 | | | $ | 25,000 | |
Net proceeds on reinvestment of distributions | | | 3,408,768 | | | | 11,416,531 | | | | 959 | |
Shares redeemed | | | (19,090,076 | ) | | | (11,931,548 | ) | | | — | |
| | | | | | | | | | | | |
Net increase (decrease) in net assets | | $ | (7,738,787 | ) | | $ | 5,905,134 | | | $ | 25,959 | |
| | | | | | | | | | | | |
FI LARGE CAP GROWTH FUND (shares) | | | | | | | | | | | | |
Shares sold | | | — | | | | — | | | | 386,310 | |
Shares issued as reinvestment of distributions | | | — | | | | — | | | | — | |
Shares redeemed | | | — | | | | — | | | | (4,441 | ) |
| | | | | | | | | | | | |
Net increase in shares outstanding | | | — | | | | — | | | | 381,869 | |
Beginning of period | | | — | | | | — | | | | — | |
| | | | | | | | | | | | |
End of period | | | — | | | | — | | | | 381,869 | |
| | | | | | | | | | | | |
FI LARGE CAP GROWTH FUND ($) | | | | | | | | | | | | |
Net proceeds from sales | | $ | — | | | $ | — | | | $ | 3,814,139 | |
Net proceeds on reinvestment of distributions | | | — | | | | — | | | | — | |
Shares redeemed | | | — | | | | — | | | | (42,731 | ) |
| | | | | | | | | | | | |
Net increase in net assets | | $ | — | | | $ | — | | | $ | 3,771,408 | |
| | | | | | | | | | | | |
BLUE CHIP MID CAP FUND (shares) | | | | | | | | | | | | |
Shares sold | | | 413,951 | | | | 280,289 | | | | | |
Shares issued as reinvestment of distributions | | | 879,952 | | | | 121,800 | | | | | |
Shares redeemed | | | (930,785 | ) | | | (737,379 | ) | | | | |
| | | | | | | | | | | | |
Net increase (decrease) in shares outstanding | | | 363,118 | | | | (335,290 | ) | | | | |
Beginning of period | | | 4,607,235 | | | | 4,942,525 | | | | | |
| | | | | | | | | | | | |
End of period | | | 4,970,353 | | | | 4,607,235 | | | | | |
| | | | | | | | | | | | |
BLUE CHIP MID CAP FUND ($) | | | | | | | | | | | | |
Net proceeds from sales | | $ | 8,457,476 | | | $ | 5,212,236 | | | | | |
Net proceeds on reinvestment of distributions | | | 15,575,148 | | | | 2,348,310 | | | | | |
Shares redeemed | | | (18,860,690 | ) | | | (13,847,670 | ) | | | | |
| | | | | | | | | | | | |
Net increase (decrease) in net assets | | $ | 5,171,934 | | | $ | (6,287,124 | ) | | | | |
| | | | | | | | | | | | |
| * | Service Class Shares for the Davis Venture Value Fund, Oppenheimer Main Street Small Cap Fund and FI Large Cap Growth Fund commenced on May 1, 2006 and share activity presented is for the period May 1, 2006 to December 31, 2006. |
91
| | |
| NOTESTO FINANCIAL STATEMENTS (Continued) | | Sun Capital Advisers Trust |
NOTE F — LINE OF CREDIT
The Trust has entered into a $15 million committed unsecured revolving line of credit (the “Agreement”) primarily for temporary or emergency purposes. The Money Market Fund is not a party to this agreement.
Interest is charged to each Fund based on its borrowings at a rate equal to the overnight federal funds rate plus 0.50% per annum. In addition, a commitment fee on the daily unused portion of the $15 million committed line is allocated among the participating funds at the end of each calendar quarter. During the year ended December 31, 2006 the following Funds had borrowings and commitment fees under this Agreement as follows:
| | | | | | | | | | | | |
| | | Maximum
Loan | | Average
Daily
Amount
of Loan | | Weighted
Average
Interest
Rate | | | Commitment
Fees Paid |
All Cap Fund | | $ | — | | $ | — | | — | % | | $ | 267 |
Investment Grade Bond Fund | | | — | | | — | | — | | | | 1,698 |
Real Estate Fund | | | 1,986,000 | | | 72,343 | | 5.214 | | | | 5,626 |
Davis Venture Value Fund | | | 265,000 | | | 3,206 | | 5.800 | | | | 1,718 |
Oppenheimer Main Street Small Cap Fund | | | 1,396,000 | | | 54,236 | | 5.416 | | | | 2,738 |
FI Large Cap Growth Fund | | | — | | | — | | — | | | | 45 |
Blue Chip Mid Cap Fund | | | 507,000 | | | 6,297 | | 4.753 | | | | 2,989 |
NOTE G — INDEMNIFICATION
Under the Trust’s organizational documents, its officers and trustees may be indemnified against certain liabilities and expenses arising out of the performance of their duties to the Trust. Additionally, in the normal course of business, the Trust enters into agreements with service providers that may contain indemnification clauses. The Trust’s maximum exposure under these agreements is unknown as this would involve future claims that may be made against the Trust that have not yet occurred.
92
REPORTOF INDEPENDENT REGISTERED PUBLIC ACCOUNTING FIRM
To the Board of Trustees and the Shareholders of Sun Capital Advisers Trust:
We have audited the accompanying statements of assets and liabilities, including the portfolios of investments, of Sun Capital All Cap Fund, Sun Capital Investment Grade Bond Fund, Sun Capital Money Market Fund, Sun Capital Real Estate Fund, SC Davis Venture Value Fund, SC Oppenheimer Main Street Small Cap Fund (formerly Value Small Cap Fund), SC Blue Chip Mid Cap Fund and SC FI Large Cap Growth Fund (each a portfolio of Sun Capital Advisers Trust, the “Trust”) as of December 31, 2006, and the related statements of operations for the year then ended, the statements of changes in net assets for each of the two years in the period then ended and the financial highlights for each of the five years in the period then ended. These financial statements and financial highlights are the responsibility of the Trust’s management. Our responsibility is to express an opinion on these financial statements and financial highlights based on our audits.
We conducted our audits in accordance with the standards of the Public Company Accounting Oversight Board (United States). Those standards require that we plan and perform the audit to obtain reasonable assurance about whether the financial statements and financial highlights are free of material misstatement. The Trust is not required to have, nor were we engaged to perform, an audit of its internal control over financial reporting. Our audits included consideration of internal control over financial reporting as a basis for designing audit procedures that are appropriate in the circumstances, but not for the purpose of expressing an opinion on the effectiveness of the Trust’s internal control over financial reporting. Accordingly, we express no such opinion. An audit also includes examining, on a test basis, evidence supporting the amounts and disclosures in the financial statements, assessing the accounting principles used and significant estimates made by management, as well as evaluating the overall financial statement presentation. Our procedures included confirmation of securities owned as of December 31, 2006, by correspondence with the custodian and brokers; where replies were not received from brokers, we performed other auditing procedures. We believe that our audits provide a reasonable basis for our opinion.
In our opinion, such financial statements and financial highlights present fairly, in all material respects, the financial positions of Sun Capital All Cap Fund, Sun Capital Investment Grade Bond Fund, Sun Capital Money Market Fund, Sun Capital Real Estate Fund, SC Davis Venture Value Fund, SC Oppenheimer Main Street Small Cap Fund (formerly Value Small Cap Fund), SC Blue Chip Mid Cap Fund and SC FI Large Cap Growth Fund as of December 31, 2006, the results of their operations for the year then ended, the changes in their net assets for each of the two years in the period then ended and their financial highlights for each of the five years in the period then ended, in conformity with accounting principles generally accepted in the United States of America.
DELOITTE & TOUCHE LLP
Boston, Massachusetts
February 16, 2007
93
OTHER INFORMATION (Unaudited)
PROXY VOTING
A description of the policies and procedures that the Funds use to determine how to vote proxies relating to portfolio securities and information regarding how the Funds voted proxies relating to portfolio securities during the most recent 12-month period ended June 30 are available (i) without charge, upon request, by calling 1-800-432-1102 x 1687 and (ii) on the U.S. Securities and Exchange Commission’s website at www.sec.gov.
QUARTERLY FILING OF PORTFOLIO HOLDINGS
The Funds file their complete schedule of investments with the U.S. Securities and Exchange Commission (“SEC”) for the first and third quarters of each fiscal year on Form N-Q. The Funds’ Form N-Q will be available (i) on the SEC’s website at www.sec.gov; and (ii) available for review and copying at the SEC’s Public Reference Room in Washington, D.C. Information about the operations of the Public Reference Room may be obtained by calling 800-SEC-0330.
TAX INFORMATION
For the year ended December 31, 2006, the following Funds paid distributions which were designated as long-term capital gains dividends:
| | | |
| | | Amount |
All Cap Fund | | $ | 1,910 |
Investment Grade Bond Fund | | | 455,656 |
Real Estate Fund | | | 6,377,583 |
Oppenheimer Main Street Small Cap Fund | | | 2,808,438 |
Blue Chip Mid Cap Fund | | | 13,008,689 |
For federal tax purposes, the following information is furnished with respect to the distributions of the Trust for its fiscal year ended December 31, 2006:
Percentage of distributions which qualify for the corporate dividends received deduction:
| | | |
| | | Percentage | |
All Cap Fund | | 99.24 | % |
Investment Grade Bond Fund | | — | |
Money Market Fund | | — | |
Real Estate Fund | | 15.44 | % |
Davis Venture Value Fund | | 100.00 | % |
Oppenheimer Main Street Small Cap Fund | | 52.92 | % |
FI Large Cap Growth Fund | | — | |
Blue Chip Mid Cap Fund | | 25.68 | % |
ADVISORY CONTRACT RENEWAL
Factors Considered by the Independent Trustees in Approving the Investment Advisory Agreement.
The 1940 Act requires that each fund's investment advisory agreement and, as applicable, subadvisory agreement, be approved annually both by the board of trustees and also by a majority of the independent trustees voting separately. In November 2006, the Board, all but one member of which is independent of the adviser and each subadviser, unanimously approved the continuation of each of the investment advisory and subadvisory agreements listed below (each an “investment advisory agreement” and collectively the “investment advisory agreements”).
94
OTHER INFORMATION (Unaudited) (Continued)
The independent trustees engaged in a thorough review of the investment advisory agreements, after which they determined to approve the continuation of each investment advisory agreement for an additional twelve month period. The trustees reviewed a wide range of materials furnished by the adviser and, as applicable, each subadviser, prior to reaching these decisions. The independent trustees were advised by, and held private meetings with, their independent legal counsel in connection with the review of the investment advisory agreements, and requested and received additional information regarding the adviser and each subadviser. In deciding to approve the continuation of each investment advisory agreement, the trustees considered information about the following, among other things:
| • | | the adviser’s and each subadviser’s personnel (including particularly those personnel with responsibilities for providing services to the funds), resources, policies and investment processes — in this regard, in addition to meeting with representatives of the adviser and each subadviser, the independent trustees also considered, among other things, the adviser’s representation that it was satisfied with the resources committed to the funds by each subadviser and its recommendation that each subadvisory agreement be continued; |
| • | | the nature, scope and quality of the services that the adviser and each subadviser could provide to the funds — in this regard, the independent trustees considered, among other things, that the types of services to be provided under the investment advisory agreements were comparable to those typically found in agreements of such type; |
| • | | the investment performance of each fund and its investment adviser, both absolute and relative to various benchmarks and industry peer groups — in this regard, the independent trustees noted the disappointing investment performance of the SC Value Small Cap Fund in past years, and observed that the Board had approved a change in subadviser to that Fund effective in early 2006 (this Fund was renamed the Oppenheimer Main Street Small Cap Fund at that time in conjunction with the appointment of OppenheimerFunds, Inc. as the Fund's new subadviser); |
| • | | the costs of the services to, and profits realized by, the adviser and its affiliates from their relationship with each fund — in this regard, the independent trustees observed that the adviser was operating several funds at a net loss (suggesting that the adviser had assumed considerable economic risk in contracting with the funds), and had committed to extend previously existing total operating expense caps applicable to each fund through at least April 30, 2008, including the reduced total operating expense caps applicable to the Sun Capital Money Market Fund and the Sun Capital Real Estate Fund that first took effect in 2005; in analyzing the adviser’s and its affiliates’ costs and profits, the trustees also reviewed the fees paid to and services provided by the adviser and its affiliates to the fund for non-advisory services, including distribution (including fees paid pursuant to Rule 12b-1 plans); the board concluded that each fund's investment advisory fee schedule represented reasonable compensation in light of, among other factors, the costs incurred by the adviser and its affiliates in providing services to the funds; |
| • | | the extent to which economies of scale would be realized as the funds grow — in this regard, the independent trustees observed that the advisory fees charged to the SC Davis Venture Value Fund, the SC Blue Chip Mid Cap Fund and the Oppenheimer Main Street Small Cap Fund contain breakpoints and, accordingly, reflect the potential to share economies of scale, and that the adviser committed to revisit with the Board the possibility of adding breakpoints for each other fund to the extent any such fund’s assets under management increase to more substantial, scaleable levels in the future; based on these factors, among others, the Board concluded that each fund's fee schedule represents an appropriate sharing between fund shareholders and the adviser of such economies of scale as may exist in the management of each fund at current asset levels; |
| • | | the advisory and subadvisory fee rates paid to the adviser and each subadviser for the funds relative to those payable for similar funds advised by such firms and other firms, and relative to those payable by institutional accounts advised or subadvised by such firms; in this regard, the board gave a lesser weight to fees paid by |
95
OTHER INFORMATION (Unaudited) (Continued)
| | similar institutional accounts advised or subadvised by such firms in light of material differences in the scope of services provided to mutual funds as opposed to institutional accounts; taking into account the foregoing, the Board concluded that the fee schedule in effect for each fund represented reasonable compensation in light of the nature, extent and quality of the investment services being provided to each fund; |
| • | | the practices of the adviser and each subadviser regarding the selection and compensation of brokers and dealers executing portfolio transactions for the funds, and the brokers’ and dealers’ provision of brokerage and research services to the adviser and each subadviser; and |
| • | | the adviser’s and each subadviser’s commitment to and record of compliance, including its written compliance policies and procedures; in this regard, the independent trustees considered the significant attention and resources dedicated by the adviser to documenting and enhancing its compliance processes in recent years. |
In conducting their review, the independent trustees received and considered information prepared by Lipper Inc. relating to each fund’s performance, advisory fees and total expenses relative to appropriate peer groups and universes.
In addition to considering all of the foregoing in connection with the independent trustees’ annual contract review, the independent trustees also receive and consider information bearing on the investment advisory agreements throughout the year in connection with their regular quarterly meetings. This includes information relating to the investment performance of each fund and its investment adviser, brokerage reports and reports regarding any compliance-related developments.
After due consideration of these and other factors that they considered relevant, the trustees, including the independent trustees, unanimously determined to approve the continuation of each investment advisory agreement, and concluded that the continuation of such agreements was in the best interests of each fund's shareholders.
In reaching this conclusion, the board did not give particular weight to any single factor noted above. The board considered these factors over the course of several meetings, each of which included an executive session with only the independent trustees and their counsel present. It is possible that individual trustees may have weighted these factors differently in reaching their individual decisions to approve the continuation of the investment advisory agreements.
Investment Advisory Agreements Approved in November 2006
Investment advisory agreements:
Sun Capital Investment Grade Bond Fund
Sun Capital Money Market Fund
Sun Capital Real Estate Fund
Sun Capital All Cap Fund
SC Oppenheimer Main Street Small Cap Fund
SC Davis Venture Value Fund
SC Blue Chip Mid Cap Fund
Sub-advisory agreements:
SC Davis Venture Value Fund
SC Blue Chip Mid Cap Fund
96
| | |
| OTHER INFORMATION (Unaudited) (Continued) | | Sun Capital Advisers Trust |
Each fund’s business is managed by the trustees. Several of the funds’ trustees and officers are also directors and officers of Sun Life Assurance Company of Canada or the adviser. The table below provides more information about the funds’ trustees and officers.
| | | | | | | | | | |
Name, address and age | | Position with the Trust | | Length of
Time Served | | Principal occupation
past 5 years | | Number of Funds
Within Fund Complex
Overseen by Trustee | | Other Directorships Held Outside of
the Fund Complex by Trustee |
Michael P. Castellano 16 Sheldrake Lane Palm Beach Gardens, FL 33418 Year of birth: 1941 | | Trustee | | Since February 2005 | | Retired | | 8 | | Director, Globe Tel Communications Corp. since 2006. |
| | | | | |
Anthony C. Paddock 350 Fifth Avenue, Suite 5513 New York, NY 10118 Year of birth: 1935 | | Trustee | | Since October 1998 | | Managing Director, Empire Valuation Consultants, Inc., since 1996. President, AC Paddock & Associates (consulting), since 1996. | | 8 | | |
| | | | | |
William N. Searcy, Jr. 4411 133rd St. Ct. NW Gig Harbor, WA 98332 Year of birth: 1946 | | Chairman and Trustee | | Since October 1998 | | Private investor since 2003. Pension and savings trust officer, Sprint Corp., 1989-2003. | | 8 | | Trustee, Scudder Funds (New York) Board (88 mutual funds) since 1993 |
| | | | | |
James M.A. Anderson* One Sun Life Executive Park Wellesley Hills, MA 02481 Year of birth: 1949 | | President, Chief Executive Officer and Trustee | | Trustee since October 1998 | | Executive Vice President and Chief Investment Officer, Sun Life Financial, since 2005, previously chief investment officer, Sun Capital Advisers LLC, 2000-2005 and vice president, Sun Life Financial, 1995 - 2005. | | 8 | | Director, Sun Capital Advisers LLC since 1998, Director, Sun Life of Canada (U.S.) SPE 97-I, Inc. since 2003, Director, Crosspointe Shops I LLC since 2004, Director, Crosspointe Shops II LLC, since 2004 |
| | | | | |
James F. Alban* One Sun Life Executive Park Wellesley Hills, MA 02481 Year of birth: 1962 | | Chief Financial Officer and Treasurer | | Since October 1998 | | Senior vice president and Chief Financial Officer, Sun Capital Advisers LLC, since 2000. Assistant vice president, Sun Life Financial since 1998. | | N/A | | N/A |
97
| | |
| OTHER INFORMATION (Unaudited) (Continued) | | Sun Capital Advisers Trust |
| | | | | | | | | | |
Name, address and age | | Position with the Trust | | Length of
Time Served | | Principal occupation
past 5 years | | Number of Funds
Within Fund Complex
Overseen by Trustee | | Other Directorships Held Outside of
the Fund Complex by Trustee |
Joseph L. Ciardi* One Sun Life Executive Park Wellesley Hills, MA 02481 Year of birth: 1967 | | Chief Compliance Officer | | Since May 2006 | | Chief Compliance Officer, Sun Capital Advisers LLC, since 2006. Assistant vice president, Sun Life Financial, since 2006. Deputy Chief Compliance Officer, Canaccord Adams Inc., 1996-2006 | | N/A | | N/A |
| | | | | |
Maura A. Murphy, Esq.* One Sun Life Executive Park Wellesley Hills, MA 02481 Year of birth: 1960 | | Secretary | | Since October 1998 | | Senior vice president and chief counsel, Sun Capital Advisers LLC, since 2000 and secretary since 1998. Senior counsel at Sun Life Financial since 1998. | | N/A | | N/A |
98
Sun Capital Advisers Trust
TRUSTEES AND OFFICERS
Michael P. Castellano, Trustee
Anthony C. Paddock, Trustee
William N. Searcy, Jr., Chairman, Trustee
James M.A. Anderson, President, CEO and Trustee
James F. Alban, Treasurer and CFO
Joseph L. Ciardi, Chief Compliance Officer
Maura A. Murphy, Secretary
INVESTMENT ADVISER
Sun Capital Advisers LLC
One Sun Life Executive Park
Wellesley Hills, MA 02481
INDEPENDENT REGISTERED PUBLIC ACCOUNTING FIRM
Deloitte & Touche LLP
200 Berkeley Street
Boston, MA 02116
ADMINISTRATOR, CUSTODIAN, TRANSFER AGENT
State Street Bank & Trust Company
1 Lincoln Street
Boston, MA 02111
LEGAL COUNSEL
Wilmer Cutler Pickering Hale and Dorr LLP
60 State Street
Boston, MA 02109
This report must be preceded or accompanied by a prospectus for Sun Capital Advisers Trust which includes more information about charges and expenses. Please read the prospectus carefully before you invest or send money.
Item 2. Code of Ethics.
Registrant has adopted a code of ethics that applies to registrant’s principal executive officer and principal financial officer. This code of ethics is available without charge, upon request, by calling 1-800-432-1102 x1687. A copy of this code of ethics is filed as an exhibit to this Form N-CSR. No substantive amendments were approved or waivers granted to this code of ethics during the period covered by this report.
Item 3. Audit Committee Financial Expert.
The registrant’s Board of Trustees has determined that the registrant has at least one financial expert, Michael P. Castellano, serving on its Audit Committee. Mr. Castellano is considered “independent” for purposes of Item 3(a)(2) of Form N-CSR.
Item 4. Principal Accountant Fees and Services.
Aggregate fees billed for professional services rendered to the registrant for the last two fiscal years by the registrant’s principal accountant were as follows:
(a) Audit Fees: Includes amounts related to the audit of the registrant’s annual financial statements and services normally provided by the accountant in connection with statutory and regulatory filings.
| | | |
| FY 2006 | | FY 2005 |
| $230,085 | | $ | 192,000 |
(b) Audit-related Fees:
(c) Tax Fees: Includes amounts related to tax compliance, tax planning and tax advice.
| | |
| FY 2006 | | FY 2005 |
| $25,250 | | $22,585 |
(d) All Other Fees: Includes amounts related to non-audit services provided to the registrant by the registrant’s principal accountant.
| | |
| FY 2006 | | FY 2005 |
| $98,250 | | None |
(e)(1) The registrant’s Audit Committee has adopted a policy whereby audit and non-audit services performed by the registrant’s principal accountant for the registrant, its investment adviser and any entity controlling, controlled by or under common control with the investment adviser that provides ongoing services to the registrant require pre-approval.
The policy includes a list of specified services that are deemed to be pre-approved, subject to stated dollar limits, by the Audit Committee. The Audit Committee must provide specific advance approval for any service that is not included in the list of pre-approved services, or for any pre-approved service that exceeds the dollar limit set forth in the policy. In determining whether to approve services, the Audit Committee considers whether the services are consistent with maintaining the principal accountant’s independence.
(e)(2) No services included in this Item 4 (b) through (d) were approved pursuant to paragraph (c)(7)(i)(C) of Rule 2-01 of Regulation S-X.
(f) Not applicable
(g) During the registrant’s fiscal years ended December 31, 2006 and December 31, 2005, the aggregate fees billed by the registrant’s principal accountant for non-audit services rendered to the registrant, the registrant’s investment adviser, or to any entity controlling, controlled by, or under common control with the adviser that provides ongoing services to the registrant were $98,250 and $0, respectively, and were less than the aggregate fees billed for those same periods by the registrant’s principal accountant for audit services rendered to the registrant.
(h) Not applicable
Item 5. Audit Committee of Listed Registrants.
Not applicable
Item 6. Schedule of Investments.
Included in stockholder report filed under Item 1.
Item 7. Disclosure of Proxy Voting Policies and Procedures for Closed-End Management Investment Companies.
Not applicable
Item 8. Portfolio Managers of Closed-End Management Investment Companies.
Not Applicable
Item 9. Purchases of Equity Securities by Closed-End Management Investment Company and Affiliated Purchasers.
Not Applicable
Item 10. Submission of Matters to a Vote of Security Holders.
No material changes to the procedures by which shareholders may recommend nominees to the registrant’s Board of Trustees have been implemented since the registrant’s most recent disclosure to this Item.
Item 11. Controls and Procedures.
| (a) | Based upon their evaluation of the registrant’s disclosure controls and procedures as conducted within 90 days of the filing date of this Form N-CSR, the registrant’s principal financial officer and principal executive officer have concluded that those disclosure controls and procedures provide reasonable assurance that the material information required to be disclosed by the registrant on this report is recorded, processed, summarized and reported within the time periods specified in the Securities and Exchange Commission’s rules and forms. |
| (b) | There have been no significant changes in the registrant’s internal control over financial reporting during the registrant’s second fiscal quarter of the period covered by this report that has materially affected, or is reasonably likely to materially affect, the registrant’s internal control over financial reporting. |
Item 12. Exhibits.
| | |
| (a)(1) | | The code of ethics as required by Form N-CSR Item 2 is filed herewith. |
| |
| (a)(2) | | A separate certification for each principal executive officer and principal financial officer of the registrant as required by Rule 30a-2 under the Investment Company Act of 1940, as amended, are filed herewith. |
SIGNATURES
Pursuant to the requirements of the Securities Exchange Act of 1934 and the Investment Company Act of 1940, the registrant has duly caused this report to be signed on its behalf by the undersigned, thereunto duly authorized.
| | | | |
| (Registrant) | | SUN CAPITAL ADVISERS TRUST | | |
| | |
| By (Signature and Title)* | | /s/ JAMES M.A. ANDERSON | | |
| | James M.A. Anderson, President | | |
Date: February 15, 2007
Pursuant to the requirements of the Securities Exchange Act of 1934 and the Investment Company Act of 1940, this report has been signed below by the following persons on behalf of the registrant and in the capacities and on the dates indicated.
| | | | |
| By (Signature and Title)* | | /s/ JAMES M.A. ANDERSON | | |
| | James M.A. Anderson, President | | |
| | (Chief Executive Officer) | | |
Date: February 15, 2007
| | | | |
| By (Signature and Title)* | | /s/ JAMES F. ALBAN | | |
| | James F. Alban, Treasurer | | |
| | (Chief Financial Officer) | | |
Date: February 15, 2007
| * | Print name and title of each signing officer under his or her signature. |