UNITED STATES
SECURITIES AND EXCHANGE COMMISSION
Washington, D.C. 20549
FORM N-CSR
CERTIFIED SHAREHOLDER REPORT OF
REGISTERED MANAGEMENT INVESTMENT COMPANIES
Investment Company Act file number 811-08879
SUN CAPITAL ADVISERS TRUST
(Exact name of registrant as specified in charter)
One Sun Life Executive Park, Wellesley Hills, Massachusetts 02481
(Address of principal executive offices) (Zip code)
John T. Donnelly
Sun Capital Advisers Trust
One Sun Life Executive Park
Wellesley Hills, Massachusetts 02481
(Name and address of agent for service)
Registrant’s telephone number, including area code: (800) 432-1102 x 3330
Date of fiscal year end: December 31
Date of reporting period: December 31, 2009
| Item 1. | Reports to Stockholders. |
The following is a copy of the report transmitted to stockholders pursuant to Rule 30e-1 under the Investment Company Act of 1940, as amended:
SUN CAPITAL ADVISERS TRUST®
Annual Report December 31, 2009
Sun Capital Investment Grade Bond Fund®
Sun Capital Money Market Fund®
Sun Capital Global Real Estate Fund
SCSM Davis Venture Value Fund
SCSM Oppenheimer Main Street Small Cap Fund
SCSM Oppenheimer Large Cap Core Fund
SCSM WMC Large Cap Growth Fund
SCSM WMC Blue Chip Mid Cap Fund
SCSM Lord Abbett Growth & Income Fund
SCSM Goldman Sachs Mid Cap Value Fund
SCSM Goldman Sachs Short Duration Fund
SCSM Dreman Small Cap Value Fund
SCSM PIMCO High Yield Fund
SCSM PIMCO Total Return Fund
SCSM AIM Small Cap Growth Fund
SCSM AllianceBernstein International Value Fund
SCSM BlackRock Inflation Protected Bond Fund
SCSM Ibbotson Moderate Fund
SCSM Ibbotson Balanced Fund
SCSM Ibbotson Growth Fund
| | |
 | | Sun Capital Advisers Trust is registered under the Investment Company Act of 1940 as an open-end management investment company. Its investment adviser is Sun Capital Advisers LLC®, a member of the Sun Life Financial group of companies. |
TABLE OF CONTENTS
Important Information about this Report:
This report and the financial statements contained herein are submitted for the general information of the shareholders of the Funds. This report is not authorized for distribution to prospective investors in the Funds unless preceded or accompanied by an effective prospectus. Investors should consider the investment objectives, risks, charges and expenses of a Fund before investing. This and other information is contained in a Fund’s prospectus. Please read the prospectus carefully before you invest.
The views and opinions expressed in each Fund’s “Management’s Discussion and Analysis” are those of the portfolio manager(s) of the Fund. The views and opinions expressed, and the portfolio holdings described, are as of December 31, 2009, and are subject to change at any time without notice due to market or other conditions. These should not be construed as investment advice or as a recommendation to buy or sell any security. Any forecasts or other forward looking views may not come to pass. Past performance is no guarantee of future results. Performance may have changed materially since December 31, 2009.
An investment in a Fund is not a bank deposit and is not insured by the Federal Deposit Insurance Corporation. It is possible to lose money on an investment in any of the Funds.
Country codes included within each Fund’s Portfolio of Investments are unaudited.
INVESTMENT GRADE BOND FUND
MANAGEMENT’S DISCUSSION & ANALYSIS
How did the Fund perform during the year ended December 31, 2009?
Investment Grade Bond Fund (the “Fund”) outperformed its benchmark, the Barclays Capital U.S. Aggregate Bond Index (the “Index”), for the year ended December 31, 2009.
What economic and market factors most influenced the fixed income markets as a whole during the year ended December 31, 2009?
Following a pattern that began in earnest during the second quarter of 2009, risky assets were very much in demand during the fourth quarter of 2009 and generated strong one-year returns. In retrospect, during the fourth quarter of 2008, the Federal Reserve was, among other things, slashing interest rates to zero while the U.S. Government was injecting capital directly into financial institutions as part of the $700 billion TARP program, as the Credit Crisis of 2008 continued in an unrelenting manner. Most of the Federal Reserve’s special liquidity facilities that were enacted to support the financial markets in late 2008, will expire in early 2010 given the improvement in market stability and investor confidence. After a significant down year in 2008, all fixed income spread sectors generated strong returns in 2009. The high yield and investment grade corporate sectors produced strong positive returns in 2009, up 58.2% and 18.5%, respectively. Beleaguered structured sectors, Commercial Mortgage Backed Securities (CMBS) and Asset Backed Securities (ABS), returned 28.5% and 24.7%, respectively. Corporate securities with CCC credit ratings, considered highly speculative, returned 90.6% in 2009. While U.S. Treasuries benefited during 2008 as investors sought their safety, the trend for 2009 has been about capturing valuations. In general, the lower the credit quality of securities, the higher the return they generated for 2009. As market participants began to gain confidence that the credit crisis was abating, and spreads were deemed to offer adequate compensation for market risks, beginning during the first quarter of 2009, demand for spread product began to increase. While traditional fixed income participants were present, equity players were also enticed by the historically attractive return potential (equity-like) while being able to improve their position in the capital structure.
What key factors were most responsible for the Fund’s performance during the year ended December 31, 2009?
The primary driver of performance for 2009 was the Fund’s overweight position in the spread sectors of the Index, particularly the Credit sector. The Credit portion of the Fund returned 40.4% for 2009 while the Index allocation returned 18.7%. The Fund’s 9.8% allocation to the U.S. Treasury sector generated a return of 6.4% as a result of an allocation to U.S. Treasury Inflation Protected Securities (TIPS) while the 24% Index allocation returned a negative 3.6%. The Fund’s weighting to CMBS produced a return of 37.0% while the Index return was 28.5%. The Fund’s duration position had a modest positive affect on Fund performance while yield curve positioning detracted slightly.
What changes did you make to the Fund’s sector allocations during the year ended December 31, 2009 and how did these affect performance during the reporting period?
In general, sector allocations positively affected the relative performance of the Fund during 2009 given the overweight allocations to Credit, MBS and CMBS, while the Fund’s allocation to short term investments negatively affected performance. The allocation to the MBS and CMBS sectors, while still greater than the Index, declined, while the allocation to the U.S. Treasury sector increased for the year ended December 31, 2009. The allocation to the Credit sector remained relatively unchanged during the reporting period.
1
INVESTMENT GRADE BOND FUND (Continued)
Did the Fund experience major changes to its top ten issuers during the year ended December 31, 2009?
Top ten issuers were altered during the year to maximize total return. Allocations to Federal National Mortgage Association and Federal Home Loan Mortgage Corp. were reduced in favor of U.S. Treasuries while holdings of corporate and non-agency Mortgage-Backed Securities were purchased or sold to generate enhanced returns.
How was the Fund positioned relative to its benchmark index at the end of December 31, 2009?
The Fund remained overweight the Credit sector of the Index while being underweight U.S. Treasuries, Agencies and to a lesser extent, MBS and CMBS.
PORTFOLIO COMPOSITION AT DECEMBER 31, 2009*
Percentage of Net Assets
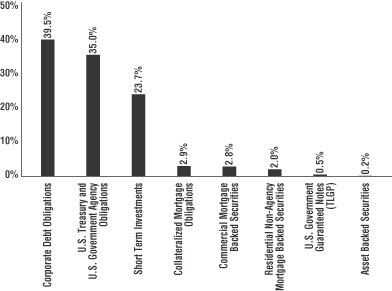
| * | The percentages shown for each investment category reflect the value of investments in that category as a percentage of net assets. Figures in the above graph may not total to 100% due to the exclusion of the Fund’s other assets and liabilities. |
TOP TEN ISSUERS AT DECEMBER 31, 2009
| | | | | |
| | | % of Net Assets | | | Category |
Federal National Mortgage Association | | 16.4 | % | | U.S. Government Agency |
U.S. Treasury | | 9.2 | | | U.S. Treasury |
Federal Home Loan Mortgage Corp. | | 9.0 | | | U.S. Government Agency |
Philip Morris International, Inc. | | 3.3 | | | Short Term – Commercial Paper |
HSBC Finance Corp. | | 3.0 | | | Short Term – Commercial Paper |
KFW International Finance, Inc. | | 3.0 | | | Short Term – Commercial Paper |
JPMorgan Chase & Co. | | 2.1 | | | Corporate Debt – Financials |
Coca-Cola Co. | | 1.8 | | | Short Term – Commercial Paper |
Barclays Bank PLC | | 1.5 | | | Corporate Debt – Financials |
Morgan Stanley | | 1.4 | | | Corporate Debt – Financials |
2
INVESTMENT GRADE BOND FUND (Continued)
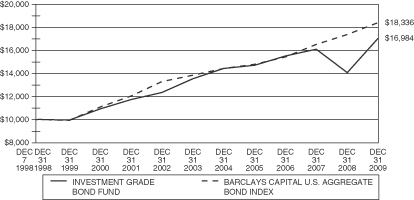
Comparison of Change in Value of a $10,000 Investment in the Investment Grade Bond Fund – Initial Class and the Barclays Capital U.S. Aggregate Bond Index
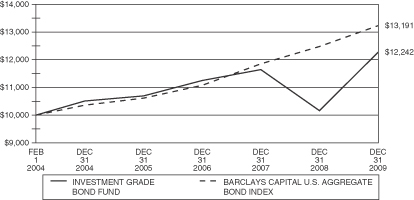
Comparison of Change in Value of a $10,000 Investment in the Investment Grade Bond Fund – Service Class and the Barclays Capital U.S. Aggregate Bond Index
3
INVESTMENT GRADE BOND FUND (Continued)
Average Annual Total Returns for Periods Ended December 31, 2009**
| | | | | | | | | | | | | | | |
Initial Class Shares | | One Year | | | Three Years | | | Five Years | | | Ten Years | | | Life of
Fund*** | |
Investment Grade Bond Fund | | 21.00 | % | | 3.19 | % | | 3.38 | % | | 5.49 | % | | 4.90 | % |
Barclays Capital U.S. Aggregate Bond Index* | | 5.93 | % | | 6.04 | % | | 4.97 | % | | 6.33 | % | | 5.63 | % |
Service Class Shares | | | | | | | | | | | | | | | |
Investment Grade Bond Fund | | 20.58 | % | | 2.91 | % | | 3.11 | % | | — | | | 3.48 | % |
Barclays Capital U.S. Aggregate Bond Index* | | 5.93 | % | | 6.04 | % | | 4.97 | % | | — | | | 4.79 | % |
*The performance data of the index has been prepared from sources and data that the investment adviser believes to be reliable, but no representation is made as to their accuracy. The index is unmanaged and cannot be invested in directly. The Barclays Capital U.S. Aggregate Bond Index is composed of U.S. securities in the Treasury, Government-Related, Corporate, and Securitized sectors.
**Performance data is historical and includes changes in share price and reinvestment of income dividends and capital gains distributions. Past performance does not indicate future results. All Fund returns are net of fees and expenses, but do not include any insurance charges imposed in connection with your variable insurance contract. If this performance information included the effect of the insurance charges and the fees and expenses assumed by the investment adviser, performance numbers would be lower. The value of an investment in the Investment Grade Bond Fund and the return on the investment will fluctuate and redemption proceeds may be higher or lower than an investor’s original cost.
***Initial Class Shares for the period from December 7, 1998 (commencement of operations) to December 31, 2009. Service Class Shares for the period from February 1, 2004 (commencement of operations) to December 31, 2009.
4
MONEY MARKET FUND
MANAGEMENT’S DISCUSSION & ANALYSIS
How did the Fund perform during the year ended December 31, 2009?
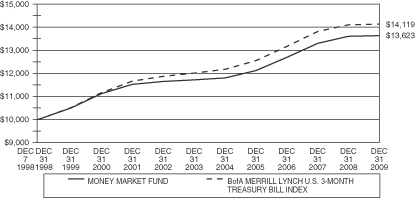
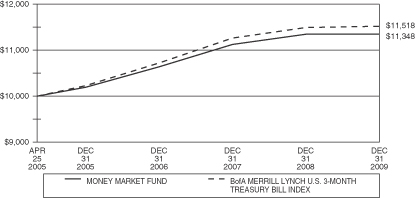
Money Market Fund (the “Fund”) performed approximately in line with its benchmark, the BofA Merrill Lynch U.S. 3-Month Treasury Bill Index (the “Index”), for the year ended December 31, 2009.
What economic and market factors most influenced the money markets as a whole during the year ended December 31, 2009?
Several signs of economic rebound appeared throughout the year. The pace of job loss has slowed, the housing sector showed some signs of improvement, and household spending expanded moderately. This data would typically lead to higher short term rates. However, the zero interest rate policy of the Federal Reserve and the market’s persistent demand for quality completely overwhelmed the economic data, leaving short term rates at historically low levels. The Federal Open Market Committee (FOMC) elected to keep rates unchanged during 2009 at the 0.00% to 0.25% range that was implemented in December of 2008. Three-month Treasury bills traded in a very tight range, starting the year at 0.08% and closing the year at 0.06%.
Commercial paper issuance remained subdued, as many companies continued to reduce their reliance on short term funding in favor of longer term issuance. Since the peak of August 8, 2007, commercial paper issuance is down 47%. For the year ended December 31, 2009, issuance was down 28%. The Temporary Liquidity Guarantee Program (TLGP), used by financial institutions to accomplish a large portion of their funding earlier in the year, expired at the beginning of the fourth quarter, leaving investors with fewer choices and increasing demand on an already thin supply of short-term investment options.
What key factors were responsible for the Fund’s performance during the year ended December 31, 2009?
The Federal Reserve’s zero interest rate policy and the market’s insatiable demand for quality were the most influential factors on the performance of the Fund. Market conditions have forced the Fund’s gross portfolio yield below the Fund’s operating expense caps causing the adviser to further subsidize the Fund to maintain a minimum yield of 0.00%.
How did you manage the Fund’s weighted average maturity during the year ended December 31, 2009?
On December 31, 2009, the Fund had an average maturity of 51 days, slightly longer than the average taxable money market fund maturity of 47 days as reported in the Money Fund Report, published by iMoneyNet Inc. The Fund’s average maturity ranged from 35-56 days during the year. Though the money market yield curve has been stubbornly flat, the Fund has extended the average days to maturity when appropriate longer term opportunities were present.
How was the Fund invested during the year ended December 31, 2009?
The Fund is invested in a diversified portfolio of top tier, short term investments. Fund holdings in Federal Home Loan Mortgage (FHLMC), Federal National Mortgage Association (FNMA) and U.S. Treasury Bills were lower in 2009 than 2008, in favor of TLGP investments issued by Goldman Sachs Group, Inc. and GE Capital Corp. The TLGP securities offered slightly more yield than the FNMA and FHLMC offerings and carried a full U.S. Government guarantee. Yields were compressed on all money market instruments, and this minor change in asset mix had minimal impact on performance.
5
MONEY MARKET FUND (Continued)
PORTFOLIO COMPOSITION AT DECEMBER 31, 2009*
Percentage of Net Assets
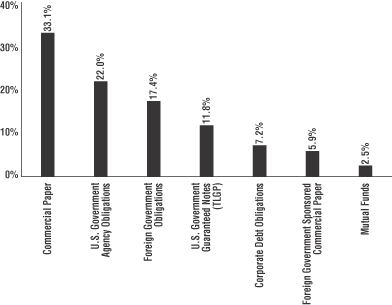
| * | The percentages shown for each investment category reflect the value of investments in that category as a percentage of net assets. Figures in the above graph may not total to 100% due to the exclusion of the Fund’s other assets and liabilities. |
TOP TEN ISSUERS AT DECEMBER 31, 2009
| | | | | |
| | | % of Net Assets | | | Category |
Federal National Mortgage Association | | 12.5 | % | | U.S. Government Agency |
Federal Home Loan Mortgage Corp. | | 9.5 | | | U.S. Government Agency |
Goldman Sachs Group, Inc. | | 8.6 | | | Commercial Paper & TLGP |
Province of British Columbia | | 3.9 | | | Foreign Government |
GE Capital Corp. | | 3.4 | | | Commercial Paper & TLGP |
Philip Morris International, Inc. | | 3.4 | | | Commercial Paper |
Procter & Gamble International Funding SCA | | 3.4 | | | Corporate Debt & Commercial Paper |
Province of Quebec | | 3.4 | | | Foreign Government |
KFW International Finance, Inc. | | 3.4 | | | Commercial Paper |
Province of Ontario | | 3.4 | | | Foreign Government |
6
MONEY MARKET FUND (Continued)
Comparison of Change in Value of a $10,000 Investment in the Money Market Fund – Initial Class and the BofA Merrill Lynch U.S. 3-Month Treasury Bill Index
Comparison of Change in Value of a $10,000 Investment in the Money Market Fund – Service Class and the BofA Merrill Lynch U.S. 3-Month Treasury Bill Index
7
MONEY MARKET FUND (Continued)
Average Annual Total Returns for Periods Ended December 31, 2009**
| | | | | | | | | | | | | | | |
Initial Class Shares | | One Year | | | Three Years | | | Five Years | | | Ten Years | | | Life of
Fund*** | |
Money Market Fund | | 0.25 | % | | 2.44 | % | | 2.93 | % | | 2.64 | % | | 2.83 | % |
BofA Merrill Lynch U.S. 3-Month Treasury Bill Index* | | 0.21 | % | | 2.40 | % | | 3.02 | % | | 2.99 | % | | 3.16 | % |
Service Class Shares | | | | | | | | | | | | | | | |
Money Market Fund | | 0.02 | % | | 2.19 | % | | — | | | — | | | 2.73 | % |
BofA Merrill Lynch U.S. 3-Month Treasury Bill Index* | | 0.21 | % | | 2.40 | % | | — | | | — | | | 3.06 | % |
*The performance data of the index has been prepared from sources and data that the investment adviser believes to be reliable, but no representation is made as to their accuracy. The index is unmanaged and cannot be invested in directly. The BofA Merrill Lynch U.S. 3-Month Treasury Bill Index is a single security index which at the beginning of every month selects for inclusion the U.S. Treasury Bill maturing closest to, but not beyond, three months from that date. That issue is then held for one month, sold and rolled into the newly selected U.S. Treasury Bill.
**Performance data is historical and includes changes in share price and reinvestment of income dividends and capital gains distributions. Past performance does not indicate future results. All Fund returns are net of fees and expenses, but do not include any insurance charges imposed in connection with your variable insurance contract. If this performance information included the effect of the insurance charges and the fees and expenses assumed by the investment adviser, performance numbers would be lower. Although the Fund seeks to maintain a stable net asset value of $1 per share there can be no assurance that it will do so. The value of an investment in the Money Market Fund and the return on the investment may fluctuate and redemption proceeds may be higher or lower than an investor’s original cost.
***Initial Class Shares for the period from December 7, 1998 (commencement of operations) to December 31, 2009. Service Class Shares for the period from April 25, 2005 (commencement of operations) to December 31, 2009.
8
GLOBAL REAL ESTATE FUND
MANAGEMENT’S DISCUSSION & ANALYSIS
How did the Fund perform during the year ended December 31, 2009?
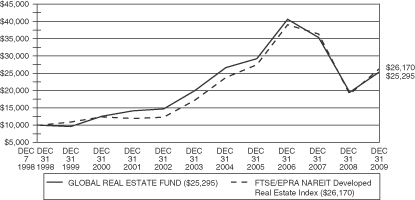
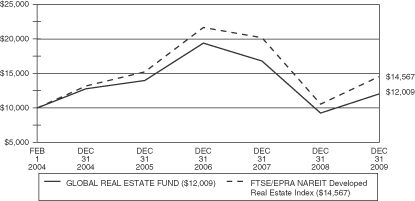
Global Real Estate Fund (the “Fund”) underperformed its benchmark, the FTSE/EPRA NAREIT Developed Real Estate Index (the “Index”), for the year ended December 31, 2009.
What economic and market factors most influenced the global real estate equity markets as a whole during the year ended December 31, 2009?
Real estate companies were most impacted by the turmoil in the debt capital markets in 2009. Many real estate companies, which were suffering from the effects of worsening fundamentals and high leverage, were forced to issue equity to calm equity owners, lenders, and other stakeholders. The equity markets, which were one of the only capital markets accessible during the height of the capital markets crisis, responded positively to the re-equitization, despite resulting in heavy shareholder dilution. As 2009 progressed, the debt capital markets stabilized, though borrowers are likely to be paying higher rates and be subject to stricter underwriting standards in the future.
How did the Fund’s country allocations affect relative performance during the year ended December 31, 2009?
The allocation to the U.S. contributed to the underperformance in the 1st quarter of 2009. For the remainder of 2009, the Fund’s country weightings were mostly in-line with the benchmark, so the relative impact on performance from country allocations was minimized. However, in terms of absolute performance, Japan was the worst performer in 2009 due to the poor performance of the Japanese economy. Hong Kong’s return was the best in 2009. It outperformed on the strength of the Chinese economy.
Which stocks contributed most to the Fund’s returns during the year ended December 31, 2009?
Capitaland Ltd., Simon Property Group, Inc., Atrium European Real Estate Ltd., The Link REIT, and Klepierre were the top five contributors to the Fund’s returns in 2009.
Which stocks detracted from the Fund’s results during the year ended December 31, 2009?
Mitsubishi Estate Co. Ltd., Brixton, Nippon Building Fund, Inc., British Land Co. PLC, and Sun Hung Kai Properties, Ltd. were the top five detractors to the Fund’s returns in 2009. The Fund no longer holds Brixton.
Did the Fund experience major changes to its top ten holdings during the year ended December 31, 2009?
The top ten holdings at the end of 2009 included nine non-U.S. based companies, compared to only four in 2008. In May 2009 the Fund composition changed dramatically to more closely align the Fund’s country weights to the country weights of the Index. As a result, at the end of 2009 the Fund had a U.S. weight of only 39.0% compared to the U.S. weighting at the end of 2008 of 57.3%.
How was the Fund positioned relative to its benchmark index at the end of December 31, 2009?
The Fund finished 2009 closely aligned to the country weights in the Index, with a few exceptions. The Fund was overweight in the U.S., Australia, the U.K., France, and Brazil. The Fund was underweight in Singapore, China, and Hong Kong.
9
GLOBAL REAL ESTATE FUND (Continued)
COUNTRY ALLOCATIONS AT DECEMBER 31, 2009*
Percentage of Net Assets

| * | The percentages shown for each country reflect the value of investments in that country as a percentage of net assets. Figures in the above graph may not total to 100% due to the exclusion of the Fund’s other assets and liabilities. |
| ** | Includes 4 countries with an allocation of less than 2% individually. |
TOP TEN EQUITY HOLDINGS AT DECEMBER 31, 2009
| | | | | |
| | | % of Net Assets | | | Industry |
Westfield Group | | 5.6 | % | | Retail |
Simon Property Group, Inc. | | 5.1 | | | Retail |
Unibail-Rodamco | | 4.4 | | | Retail |
Sun Hung Kai Properties, Ltd. | | 4.2 | | | Diversified Real Estate Activities |
Mitsubishi Estate Co. Ltd. | | 4.2 | | | Diversified Real Estate Activities |
The Link REIT | | 3.9 | | | Retail |
Capitaland Ltd. | | 3.6 | | | Diversified Real Estate Activities |
Segro PLC | | 3.4 | | | Industrial |
Atrium European Real Estate Ltd. | | 3.3 | | | Real Estate Operating Companies |
Mitsui Fudosan Co., Ltd. | | 3.2 | | | Diversified Real Estate Activities |
10
GLOBAL REAL ESTATE FUND (Continued)
Comparison of Change in Value of a $10,000 Investment in the Global Real Estate Fund – Initial Class and the FTSE/EPRA NAREIT Developed Real Estate Index
Comparison of Change in Value of a $10,000 Investment in the Global Real Estate Fund – Service Class and the FTSE/EPRA NAREIT Developed Real Estate Index
11
GLOBAL REAL ESTATE FUND (Continued)
Average Annual Total Returns for Periods Ended December 31, 2009**
| | | | | | | | | | | | | | | |
Initial Class Shares | | One Year | | | Three Years | | | Five Years | | | Ten Years | | | Life of
Fund*** | |
Global Real Estate Fund | | 30.09 | % | | (14.52 | )% | | (0.98 | )% | | 10.25 | % | | 8.75 | % |
FTSE EPRA/NAREIT Developed Real Estate Index* | | 38.26 | % | | (12.39 | )% | | 2.00 | % | | 9.21 | % | | 9.07 | % |
Service Class Shares | | | | | | | | | | | | | | | |
Global Real Estate Fund | | 29.83 | % | | (14.73 | )% | | (1.23 | )% | | — | | | 3.14 | % |
FTSE EPRA/NAREIT Developed Real Estate Index* | | 38.26 | % | | (12.39 | )% | | 2.00 | % | | — | | | 6.56 | % |
*The performance data of the index has been prepared from sources and data that the investment adviser believes to be reliable, but no representation is made as to their accuracy. The index is unmanaged and cannot be invested in directly. The FTSE EPRA/NAREIT Developed Real Estate Index (formerly FTSE EPRA/NAREIT Global Real Estate Index) is a total-return index comprising eight index families covering the world’s largest investment markets in various currencies, and is designed to track the performance of listed real estate companies and REITs worldwide.
**Performance data is historical and includes changes in share price and reinvestment of income dividends and capital gains distributions. Past performance does not indicate future results. All Fund returns are net of fees and expenses, but do not include any insurance charges imposed in connection with your variable insurance contract. If this performance information included the effect of the insurance charges and the fees and expenses assumed by the investment adviser, performance numbers would be lower. The value of an investment in the Global Real Estate Fund and the return on the investment will fluctuate and redemption proceeds may be higher or lower than an investor’s original cost.
***Initial Class Shares for the period from December 7, 1998 (commencement of operations) to December 31, 2009. Service Class Shares for the period from February 1, 2004 (commencement of operations) to December 31, 2009.
12
DAVIS VENTURE VALUE FUND
(subadvised by Davis Selected Advisers, L.P.)
MANAGEMENT’S DISCUSSION & ANALYSIS
How did the Fund perform during the year ended December 31, 2009?
Davis Venture Value Fund (the “Fund”) outperformed its benchmark, the S&P 500® Index (the “Index”), for the year ended December 31, 2009.
What economic and market factors most influenced the equity markets as a whole during the year ended December 31, 2009?
During 2009 the financial markets evidenced some improvement as the market benefited from credit extended through the Federal Reserve’s liquidity programs. Real Gross Domestic Product reversed a year and a half downward trend and turned up during the last part of 2009 while unemployment remained high. For the year ended December 2009, the consumer price index for all urban consumers rose 2.7%, compared to 0.1% for 2008.
Were there any significant sector over/under weights that materially impacted Fund performance relative to the benchmark during the year ended December 31, 2009?
The sectors within the Index that turned in the strongest performance over the year were Information Technology, Materials, and Consumer Discretionary. The sectors that turned in the weakest performance (although the performance was still positive) were Utilities, Telecommunication Services, and Energy. The lowest returning sector of the Index, Telecommunication Services, returned 9% for the year ended December 31, 2009.
The Fund, as compared to the Index, was underweight in both the Information Technology (9% versus 18% for the Index) and Telecommunication Services (less than 1% versus 3% for the Index) sectors. Being underweight in the strongly performing Information Technology sector was the largest detractor from Fund performance relative to the Index. Being underweight in the weakly performing Telecommunication Services sector was a contributor to the Fund’s performance relative to the Index.
Which stocks contributed most to the Fund’s returns during the year ended December 31, 2009?
American Express Co. and GAM Holding, Ltd, two financial companies, were among the largest contributors to the Fund’s performance. The Fund also benefited from the stock selection of a number of Energy securities. Where the Index’s Energy companies only gained 14%, the Fund’s Energy companies gained 37%. Occidental Petroleum Corp., EOG Resources, Inc., and Canadian Natural Resources, Ltd. were among the Fund’s strongest contributors to performance. Other securities contributing strongly to performance were three information technology companies, Google, Inc., Microsoft Corp., and Texas Instruments, Inc.
The Fund held approximately 14% of its assets in foreign companies (including American Depositary Receipts) at December 31, 2009. As a whole these companies out-performed the domestic companies held by the Fund.
Which stocks detracted from the Fund’s results during the year ended December 31, 2009?
ConocoPhillips, an energy company, and Philip Morris International, Inc., a consumer staples company, were the largest detractors from performance. Two financial companies, Bank of America and Citigroup, along with Iron Mountain, Inc., an industrial company, and Vulcan Materials Co., a material company, were also among the largest detractors from performance. The Fund no longer holds Bank of America or Citigroup.
13
DAVIS VENTURE VALUE FUND (Continued)
Did the Fund experience major changes to its top ten holdings during the year ended December 31, 2009?
As of December 31, 2009, only three companies had dropped out of the Fund’s top 10 holdings from the end of 2008. This is consistent with our low-turnover strategy. The Fund continues to own all three companies that dropped out of the top ten, Comcast Corp., Philip Morris International, Inc., and ConocoPhillips, but in reduced amounts. The three new holdings in the top 10 were American Express Co. and Loews Corp., both of which were in the top 20 at the end of 2008, and Merck & Co., Inc., which is a new addition to the Fund.
How was the Fund positioned relative to its benchmark index at the end of December 31, 2009?
The Fund’s portfolio is positioned using a bottom up stock selection process rather than a top down sector biased process. As a result, all weighting differentials relative to the Index reflect stock selection rather than sector bets. As of the year end the Fund continued to hold a larger percentage of securities in energy and financial companies when compared to the Index (16% versus 12% and 29% versus 14%, respectively). The Fund also remains underweight as compared to the Index in Industrial and Information Technology companies (6% versus 10% and 9% versus 20%, respectively).
SECTOR ALLOCATIONS AT DECEMBER 31, 2009*
Percentage of Net Assets
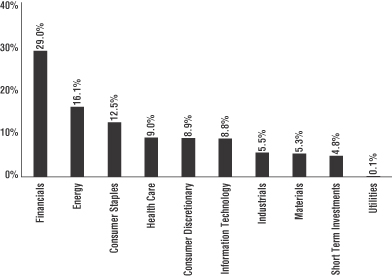
| * | The above graph categorizes investments using Global Industry Classification Standards (“GICS”). The percentages shown for each sector reflect the value of investments in that sector as a percentage of net assets. Figures in the above graph may not total to 100% due to the exclusion of the Fund’s other assets and liabilities. |
14
DAVIS VENTURE VALUE FUND (Continued)
TOP TEN EQUITY HOLDINGS AT DECEMBER 31, 2009
| | | | | |
| | | % of Net Assets | | | Industry |
Occidental Petroleum Corp. | | 4.5 | % | | Oil, Gas & Consumable Fuels |
Berkshire Hathaway, Inc., Class A | | 4.5 | | | Insurance |
Costco Wholesale Corp. | | 4.3 | | | Food & Staples Retailing |
Wells Fargo & Co. | | 4.3 | | | Commercial Banks |
American Express Co. | | 4.0 | | | Consumer Finance |
EOG Resources, Inc. | | 3.5 | | | Oil, Gas & Consumable Fuels |
Devon Energy Corp. | | 3.3 | | | Oil, Gas & Consumable Fuels |
Loews Corp. | | 2.6 | | | Insurance |
JP Morgan Chase & Co. | | 2.5 | | | Diversified Financial Services |
Merck & Co., Inc. | | 2.4 | | | Pharmaceuticals |
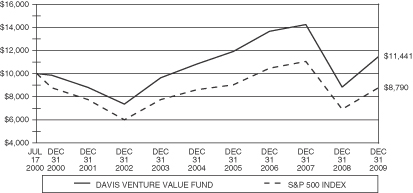
Comparison of Change in Value of a $10,000 Investment in the Davis Venture Value Fund – Initial Class and the S&P 500 Index
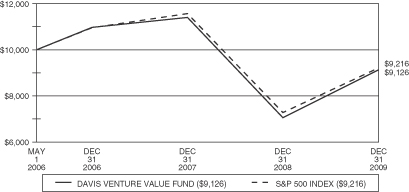
Comparison of Change in Value of a $10,000 Investment in the Davis Venture Value Fund – Service Class and the S&P 500 Index
15
DAVIS VENTURE VALUE FUND (Continued)
Average Annual Total Returns for Periods Ended December 31, 2009**
| | | | | | | | | | | | |
Initial Class Shares | | One Year | | | Three Years | | | Five Years | | | Life of
Fund*** | |
Davis Venture Value Fund | | 29.39 | % | | (5.69 | )% | | 1.10 | % | | 1.43 | % |
S&P 500 Index* | | 26.46 | % | | (5.61 | )% | | 0.42 | % | | (1.35 | )% |
Service Class Shares | | | | | | | | | | | | |
Davis Venture Value Fund | | 29.02 | % | | (5.94 | )% | | — | | | (2.46 | )% |
S&P 500 Index* | | 26.46 | % | | (5.61 | )% | | — | | | (2.20 | )% |
*The performance data of the index has been prepared from sources and data that the investment adviser believes to be reliable, but no representation is made as to their accuracy. The index is unmanaged and cannot be invested in directly. The S&P 500 Index is a market-value weighted index of 500 blue chip stocks and is considered to be a benchmark of the overall stock market.
**Performance data is historical and includes changes in share price and reinvestment of income dividends and capital gains distributions. Past performance does not indicate future results. All Fund returns are net of fees and expenses, but do not include any insurance charges imposed in connection with your variable insurance contract. If this performance information included the effect of the insurance charges and the fees and expenses assumed by the investment adviser, performance numbers would be lower. The value of an investment in the Davis Venture Value Fund and the return on the investment will fluctuate and redemption proceeds may be higher or lower than an investor’s original cost.
***Initial Class Shares for the period from July 17, 2000 (commencement of operations) to December 31, 2009. Service Class Shares for the period from May 1, 2006 (commencement of operations) to December 31, 2009.
16
OPPENHEIMER MAIN STREET SMALL CAP FUND
(subadvised by OppenheimerFunds, Inc.)
MANAGEMENT’S DISCUSSION & ANALYSIS
How did the Fund perform during the year ended December 31, 2009?
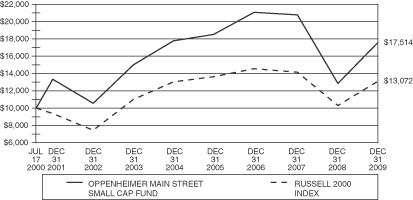
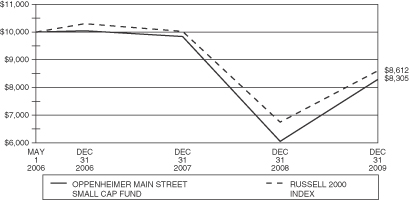
Oppenheimer Main Street Small Cap Fund (the “Fund”) outperformed its benchmark, the Russell 2000 Index (the “Index”), for the year ended December 31, 2009.
What economic and market factors most influenced the equity markets as a whole during the year ended December 31, 2009?
Pronounced signs of economic weakness persisted through the first half of 2009. After declining in the fourth quarter of 2008, Gross Domestic Product (“GDP”) continued to decline in the first and second quarters of 2009, falling by 6.4% and 0.7%, respectively. In February and March, the U.S. economy lost more than 600,000 jobs in each month and consumer confidence dropped sharply. In early March, the U.S. stock market hit a multi-year low.
Investor sentiment soon began to improve as evidence appeared that global credit markets were thawing in response to massive remedial efforts by U.S. Government and monetary authorities. The U.S. Government enacted the $787 billion American Recovery and Reinvestment Act of 2009, which was designed to retain and create jobs, provide budget relief to states and localities, maintain social programs and offer tax relief to businesses and individuals.
As it became clearer that these remedial measures had helped to avert a collapse of the U.S. banking system and with historically low valuations, equities began an impressive rally that began in March 2009 and continued through the end of the year. While volatility persisted, most global equity markets ended the reporting period with substantial gains.
For the first time since the second quarter of 2008, the rate of GDP was once again positive in the third quarter of 2009, increasing at a modest rate. Some of the lagging indicators, such as unemployment figures, continued to be troubling and hovered at around 10% in the U.S. The housing market continued to slump through the end of the year and consumer confidence remained shaky.
Were there any significant sector over/under weights that materially impacted Fund performance relative to the benchmark during the year ended December 31, 2009?
The Fund outperformed the Index in nine out of ten sectors during the reporting period, led by gains in Consumer Discretionary, Information Technology, Financials and Industrials, in that order. In Consumer Discretionary, both a relative overweight position and stock selection helped Fund performance, as Consumer Discretionary vied with the Materials sector as the top performing sector, in terms of total return. In Information Technology, both a relative overweight position and stock selection helped Fund performance here as well, as Information Technology finished as the third top performing sector in terms of total return. An underweight to Financials, the worst performing sector of the Index, and better relative stock selection both helped Fund performance during the reporting period. Financials was the only sector in the Index to post negative returns for the period. Within Industrials, strong relative stock selection led outperformance.
Which stocks contributed most to the Fund’s returns during the year ended December 31, 2009?
Among the top contributors in the Consumer Discretionary sector were TRW Automative Holdings Corp. and Philips-Van Heusen Corp.
17
OPPENHEIMER MAIN STREET SMALL CAP FUND (Continued)
In Information Technology, Skyworks Solutions, Inc. was the top contributor to performance and the second largest contributor to overall Fund performance. Skyworks Solutions is a manufacturer of semiconductor chips for communications technologies. Other top contributors included Western Digital Corp. (which the Fund sold by period end), STEC, Inc., Brocade Communications Systems, Inc. (which the Fund sold) and Blue Coat Systems, Inc.
In Industrials, Gardner Denver, Inc., a manufacturer based in Quincy, Illinois of various compressors, pumps and blowers as well as fluid transfer equipment for the petroleum, chemical and food industries, was the top performer and the third largest contributor to overall Fund performance. BE Aerospace, Inc. also outperformed within the sector and was the fifth largest driver of performance for the Fund.
Which stocks detracted from the Fund’s results during the year ended December 31, 2009?
The securities which detracted most from Fund performance included a few financial stocks, including Pacific Capital Bancorp, East West Bancorp, Inc., Susquehanna Bancshares, Inc., all of which the Fund sold by period end. Insurance stock Conseco, Inc. also detracted but remained in the Fund at period end. Within Industrials, logistics company Pacer International, Inc. detracted from performance as did airline company U.S. Airways Group, Inc. NCI Building Systems also detracted.
Did the Fund experience major changes during the year ended December 31, 2009?
Effective May 19, 2009, Matthew P. Ziehl and Raman Vardharaj assumed co-management of the Fund, bringing their time-tested investment approach, which combines fundamental security analysis with robust quantitative tools. Accordingly, during the year, the number of securities in the portfolio was reduced significantly. The Fund’s investment process will continue to be driven by in-depth fundamental research, supported by quantitative screening and implemented by an experienced team of portfolio managers and sector managers. The resulting portfolio will be comprised of stocks that they believe are attractively priced relative to a company’s underlying prospects. The investment process has four elements which combine fundamental and quantitative research: idea generation, fundamental research, quantitative process and portfolio construction.
How was the Fund positioned relative to its benchmark index at the end of December 31, 2009?
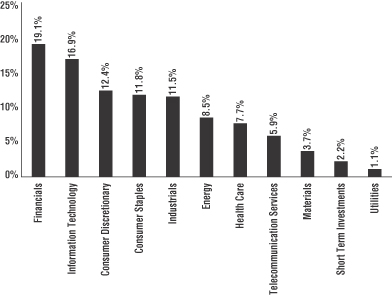
The Fund was overweight Information Technology, Health Care and Materials, and underweight all other sectors.
18
OPPENHEIMER MAIN STREET SMALL CAP FUND (Continued)
SECTOR ALLOCATIONS AT DECEMBER 31, 2009*
Percentage of Net Assets
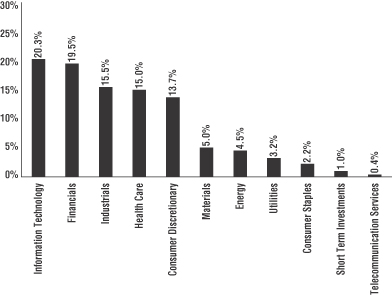
| * | The above graph categorizes investments using GICS. The percentages shown for each sector reflect the value of investments in that sector as a percentage of net assets. Figures in the above graph may not total to 100% due to the exclusion of the Fund’s other assets and liabilities. |
TOP TEN EQUITY HOLDINGS AT DECEMBER 31, 2009
| | | | | |
| | | % of Net Assets | | | Industry |
Blue Coat Systems, Inc. | | 1.2 | % | | Communications Equipment |
Health Management Associates, Inc., Class A | | 1.0 | | | Health Care Providers & Services |
BE Aerospace, Inc. | | 0.8 | | | Aerospace & Defense |
Tractor Supply Co. | | 0.8 | | | Specialty Retail |
Gardner Denver, Inc. | | 0.8 | | | Machinery |
Mid-America Apartment Communities, Inc. | | 0.8 | | | Real Estate Investment Trusts |
Hanover Insurance Group, Inc. | | 0.8 | | | Insurance |
Capella Education Co. | | 0.7 | | | Diversified Consumer Services |
Stifel Financial Corp. | | 0.7 | | | Capital Markets |
Old Dominion Freight Line | | 0.7 | | | Road & Rail |
19
OPPENHEIMER MAIN STREET SMALL CAP FUND (Continued)
Comparison of Change in Value of a $10,000 Investment in the Oppenheimer Main Street Small Cap Fund – Initial Class and the Russell 2000 Index
Comparison of Change in Value of a $10,000 Investment in the Oppenheimer Main Street Small Cap Fund – Service Class and the Russell 2000 Index
20
OPPENHEIMER MAIN STREET SMALL CAP FUND (Continued)
Average Annual Total Returns for Periods Ended December 31, 2009**
| | | | | | | | | | | | |
Initial Class Shares | | One Year | | | Three Years | | | Five Years | | | Life of
Fund*** | |
Oppenheimer Main Street Small Cap Fund | | 36.77 | % | | (5.80 | )% | | (0.19 | )% | | 6.10 | % |
Russell 2000 Index* | | 27.17 | % | | (6.07 | )% | | 0.51 | % | | 2.87 | % |
Service Class Shares | | | | | | | | | | | | |
Oppenheimer Main Street Small Cap Fund | | 36.50 | % | | (6.15 | )% | | — | | | (4.93 | )% |
Russell 2000 Index* | | 27.17 | % | | (6.07 | )% | | — | | | (3.99 | )% |
*The performance data of the index has been prepared from sources and data that the investment adviser believes to be reliable, but no representation is made as to their accuracy. The index is unmanaged and cannot be invested in directly. The Russell 2000 Index is comprised of the 2,000 companies with the smallest market capitalizations from the Russell 3000 Index.
**Performance data is historical and includes changes in share price and reinvestment of income dividends and capital gains distributions. Past performance does not indicate future results. All Fund returns are net of fees and expenses, but do not include any insurance charges imposed in connection with your variable insurance contract. If this performance information included the effect of the insurance charges and the fees and expenses assumed by the investment adviser, performance numbers would be lower. The value of an investment in the Oppenheimer Main Street Small Cap Fund and the return on the investment will fluctuate and redemption proceeds may be higher or lower than an investor’s original cost.
***Initial Class Shares for the period from July 17, 2000 (commencement of operations) to December 31, 2009. Service Class Shares for the period from May 1, 2006 (commencement of operations) to December 31, 2009.
21
OPPENHEIMER LARGE CAP CORE FUND
(subadvised by OppenheimerFunds, Inc.)
MANAGEMENT’S DISCUSSION & ANALYSIS
How did the Fund perform during the year ended December 31, 2009?
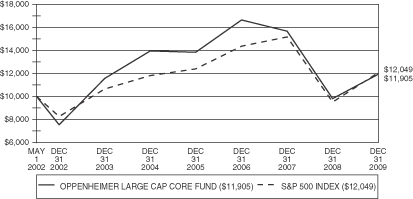
Oppenheimer Large Cap Core Fund (the “Fund”) underperformed its benchmark, the S&P 500 Index (the “Index”), for the year ended December 31, 2009.
What economic and market factors most influenced the equity markets as a whole during the year ended December 31, 2009?
A year ago, the economic picture was, at best, grim. Already ensnared in a brutal bear market, a pervasive lack of credit forced a massive scaling back among U.S. corporations, increasing unemployment and decreasing consumer spending; fourth-quarter 2008’s GDP figure was among the worst on record.
March 9, 2009 represented the low point of the most recent bear market. The ensuing rally has been nothing short of spectacular – the price-only S&P® gained 65.6% from the market bottom through the year’s end. Much of the rally was driven by stocks that had been battered early in the year. As is typical at the beginning of a cyclical recovery, the market rally demonstrated a “worst to first” move: higher-risk, lower-quality assets – those that are typically ranked poorly by our investment process – outperforming higher-quality assets.
Were there any significant sector over/under weights that materially impacted Fund performance relative to the benchmark during the year ended December 31, 2009?
Quantitative models identifying high-quality, low-risk securities form the heart of our investment process. While a sound investment strategy, and one we continue to believe in, this approach underperformed in a year dominated by a contrary philosophy, (i.e., the higher the risk or lower the quality of the underlying firm, the better the stock performed). While the third quarter marked the emergence of a return to quality, it did not take hold to the extent that we had hoped, and we are still experiencing a disconnect between improving fundamentals and stock performance.
While Energy and Health Care were among the Fund’s top performing sectors for the full year, largely due to strong stock selection, their positive impact was not enough to compensate for the negative drag of stock selection in the Information Technology and Consumer Discretionary sectors. To a lesser extent, Materials and Telecommunication Services contributed positively to performance, where sector allocation was the driving benefit, while Utilities and Financials detracted from returns. An overweight to Financials, a sector that underperformed the broader market, proved costly.
Which stocks contributed most to the Fund’s returns during the year ended December 31, 2009?
The Dow Chemical Co., a materials manufacturer of chemicals, plastics and other specialized products, was the top contributor to Fund performance for the year, followed by financials holding company Wells Fargo & Co. and industrials conglomerate General Electric Co. Given our strong selection in Energy, it is unsurprising that three of the top ten performing stocks were Energy positions, as Exxon Mobil Corp., Chesapeake Energy Corp., and the Williams Cos., Inc. all made notable contribution to relative returns.
Which stocks detracted from the Fund’s results during the year ended December 31, 2009?
An underweight to a technology holding Google, Inc. was the leading detractor for the year, as our models underweighted this strong performing stock. An overweight to the Wal-Mart Stores, Inc., a stock whose price had a difficult year, was a close second. A number of financial holdings also negatively impacted relative performance, including the Goldman Sachs Group, Inc., Bank of America Corp., and JP Morgan Chase & Co.
22
OPPENHEIMER LARGE CAP CORE FUND (Continued)
Did the Fund experience major changes to its top ten holdings during the year ended December 31, 2009?
As compared with year-end 2008, concentration in top ten names decreased as of December 31, 2009. Four 2008 top ten names remained in the top ten at year end 2009, including Wal-Mart Stores, Inc., Hewlett-Packard Co., Exxon Mobil Corp., and International Business Machines Corp. Of the six 2008 names that fell out of the top ten this year, four are still held (Johnson & Johnson, Microsoft Corp., Northrop Grumman Corp. and Verizon Communications, Inc.), and two were sold completely (Amgen and Pfizer).
How was the Fund positioned relative to its benchmark index at the end of December 31, 2009?
Although stock selection remains the primary source of risk and return for our strategy, earlier this year we incorporated a sector-tilt strategy as a potential source of alpha. At December 31, 2009, the largest overweight position relative to the Fund’s benchmark was in Financials, followed by Consumer Discretionary, Telecommunication Services and Industrials. The largest underweight position relative to the benchmark was Health Care, followed by Energy, Information Technology and Utilities. In each case, sector weights were within our target limit of 5% deviation from the benchmark.
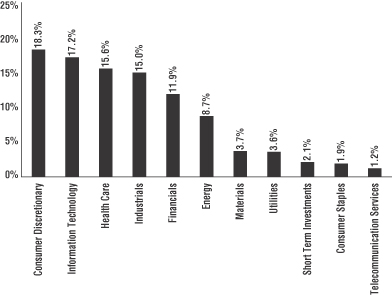
SECTOR ALLOCATIONS AT DECEMBER 31, 2009*
Percentage of Net Assets
| * | The above graph categorizes investments using GICS. The percentages shown for each sector reflect the value of investments in that sector as a percentage of net assets. Figures in the above graph may not total to 100% due to the exclusion of the Fund’s other assets and liabilities. |
23
OPPENHEIMER LARGE CAP CORE FUND (Continued)
TOP TEN EQUITY HOLDINGS AT DECEMBER 31, 2009
| | | | | |
| | | % of Net Assets | | | Industry |
AT&T, Inc. | | 3.8 | % | | Diversified Telecommunication Services |
Wal-Mart Stores, Inc. | | 3.1 | | | Food & Staples Retailing |
Hewlett-Packard Co. | | 2.7 | | | Computers & Peripherals |
Apple, Inc. | | 2.6 | | | Computers & Peripherals |
Exxon Mobil Corp. | | 2.4 | | | Oil, Gas & Consumable Fuels |
American Express Co. | | 2.3 | | | Consumer Finance |
JP Morgan Chase & Co. | | 2.2 | | | Diversified Financial Services |
McDonald’s Corp. | | 2.1 | | | Hotels, Restaurants & Leisure |
International Business Machines Corp. | | 2.1 | | | Computers & Peripherals |
The Goldman Sachs Group, Inc. | | 2.0 | | | Capital Markets |
Comparison of Change in Value of a $10,000 Investment in the Oppenheimer Large Cap Core Fund – Initial Class and the S&P 500 Index
Comparison of Change in Value of a $10,000 Investment in the Oppenheimer Large Cap Core Fund – Service Class and the S&P 500 Index

24
OPPENHEIMER LARGE CAP CORE FUND (Continued)
Average Annual Total Returns for Periods Ended December 31, 2009**
| | | | | | | | | | | | |
Initial Class Shares | | One Year | | | Three Years | | | Five Years | | | Life of
Fund*** | |
Oppenheimer Large Cap Core Fund | | 21.09 | % | | (10.46 | )% | | (3.07 | )% | | 2.30 | % |
S&P 500 Index* | | 26.46 | % | | (5.61 | )% | | 0.42 | % | | 2.46 | % |
Service Class Shares | | | | | | | | | | | | |
Oppenheimer Large Cap Core Fund | | 20.85 | % | | (10.64 | )% | | (3.28 | )% | | (0.72 | )% |
S&P 500 Index* | | 26.46 | % | | (5.61 | )% | | 0.42 | % | | 1.81 | % |
*The performance data of the index has been prepared from sources and data that the investment adviser believes to be reliable, but no representation is made as to their accuracy. The index is unmanaged and cannot be invested in directly. The S&P 500 Index is a market-value weighted index of 500 blue chip stocks and is considered to be a benchmark of the overall stock market.
**Performance data is historical and includes changes in share price and reinvestment of income dividends and capital gains distributions. Past performance does not indicate future results. All Fund returns are net of fees and expenses, but do not include any insurance charges imposed in connection with your variable insurance contract. If this performance information included the effect of the insurance charges and the fees and expenses assumed by the investment adviser, performance numbers would be lower. The value of an investment in the Oppenheimer Large Cap Core Fund and the return on the investment will fluctuate and redemption proceeds may be higher or lower than an investor’s original cost.
***Initial Class Shares for the period from May 1, 2002 (commencement of operations) to December 31, 2009. Service Class Shares for the period from February 1, 2004 (commencement of operations) to December 31, 2009.
25
WMC LARGE CAP GROWTH FUND
(subadvised by Wellington Management Co., LLP)
MANAGEMENT’S DISCUSSION & ANALYSIS
How did the Fund perform during the year ended December 31, 2009?
WMC Large Cap Growth Fund (the “Fund”) performed approximately in line with its benchmark, the Russell 1000 Growth Index (the “Index”), for the year ended December 31, 2009.
What economic and market factors most influenced the equity markets as a whole during the year ended December 31, 2009?
After a tumultuous start, U.S. equities finished 2009 near their highs for the year. Throughout the year, extraordinary government and central bank measures helped to stabilize global economies and markets, and as the year progressed, low interest rates, better-than-expected corporate earnings, and improving economic data provided a favorable backdrop for equities.
Small cap, mid cap, and large cap stocks rose in unison during the period, as measured by the Russell 2000, S&P Midcap 400, and S&P 500 indices, respectively. Growth stocks outperformed value stocks during the period, as measured by the Russell 1000 Growth and Russell 1000 Value indices. All ten sectors within the Russell 1000 Growth Index posted positive double digit returns. Information Technology, Materials, and Consumer Discretionary rose the most, and Utilities, Consumer Staples, and Health Care rose the least.
Were there any significant sector over/under weights that materially impacted Fund performance relative to the benchmark during the year ended December 31, 2009?
Sector positioning, driven by bottom-up security selection, contributed positively to benchmark-relative returns during the period. The Fund’s overweight position to the strong performing Information Technology sector and underweight positions in the Consumer Staples and Health Care sectors aided returns. An overweight position to Energy detracted from relative performance. Fund performance was aided by strong security selection within the Financials and Consumer Discretionary sectors. This was partially offset by poor stock selection within the Information Technology, Health Care, and Materials sectors.
Which stocks contributed most to the Fund’s returns during the year ended December 31, 2009?
Top contributors to relative performance included NetApp Inc., Joy Global, Inc., and Coach, Inc. Also, not owning diversified energy company Exxon Mobil and consumer products giant Procter & Gamble contributed positively to Fund performance relative to the Index. Shares of network storage equipment manufacturer NetApp Inc. rose as the company gained market share during the period due to its low cost hardware combined with unified storage software. Shares of mining equipment manufacturer Joy Global, Inc. moved higher along with commodity prices as the company gained market share in the underground coal mining market. Shares of New York-based accessories maker Coach, Inc. rose as the company completed an acquisition in China early in the year and weathered the U.S. recession through new pricing strategies and promotional activities. Telecommunications equipment supplier Cisco Systems, Inc. and global technology giant Microsoft Corp. were also among the top absolute contributors.
Which stocks detracted from the Fund’s results during the year ended December 31, 2009?
Among the largest detractors from relative performance during the period were Eli Lilly & Co., Apple, Inc., and Raytheon Co. Shares of major U.S. pharmaceutical company Eli Lilly & Co. came under pressure on concerns about the impact of future patent expirations on the company’s long-term growth, as well as near-term pressures
26
WMC LARGE CAP GROWTH FUND (Continued)
due to a slower ramp-up of anti-clotting agent, Effient. Our underweight position in consumer electronics company Apple, Inc. hurt relative returns during part of the year. Apple, Inc. shares rose due to strong sales of iPhones and MacBooks and expectations for the launch of its new tablet device. Shares of Massachusetts-based defense contractor Raytheon Co. underperformed as investors feared that President Obama’s budget proposal would negatively impact defense spending and would include sharp cuts to defense contractors. Health Care company Abbott Laboratories also detracted from the Fund’s absolute returns.
How was the Fund positioned relative to its benchmark index at the end of December 31, 2009?
Our largest overweights relative to the Russell 1000 Growth Index were to the Information Technology, Energy, and Industrials, while the largest underweights were to Consumer Staples and Health Care.
SECTOR ALLOCATIONS AT DECEMBER 31, 2009*
Percentage of Net Assets
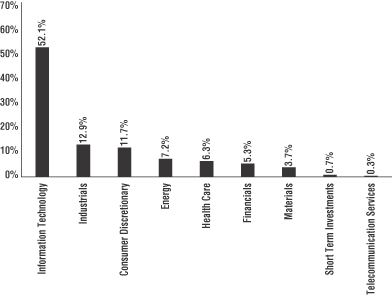
| * | The above graph categorizes investments using GICS. The percentages shown for each sector reflect the value of investments in that sector as a percentage of net assets. Figures in the above graph may not total to 100% due to the exclusion of the Fund’s other assets and liabilities. |
27
WMC LARGE CAP GROWTH FUND (Continued)
TOP TEN EQUITY HOLDINGS AT DECEMBER 31, 2009
| | | | | |
| | | % of Net Assets | | | Industry |
Cisco Systems, Inc. | | 5.1 | % | | Communications Equipment |
Microsoft Corp. | | 4.8 | | | Software |
Apple, Inc. | | 3.9 | | | Computers & Peripherals |
Google, Inc., Class A | | 3.4 | | | Internet Software & Services |
International Business Machines Corp. | | 3.3 | | | Computers & Peripherals |
Oracle Corp. | | 2.6 | | | Software |
NetApp, Inc. | | 2.3 | | | Computers & Peripherals |
Caterpillar, Inc. | | 2.3 | | | Machinery |
QLogic Corp. | | 2.1 | | | Computers & Peripherals |
EMC Corp. | | 1.8 | | | Computers & Peripherals |
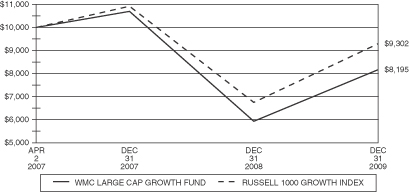
Comparison of Change in Value of a $10,000 Investment in the WMC Large Cap Growth Fund – Initial Class and the Russell 1000 Growth Index
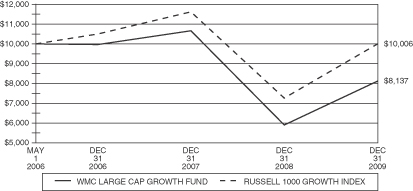
Comparison of Change in Value of a $10,000 Investment in the WMC Large Cap Growth Fund – Service Class and the Russell 1000 Growth Index
28
WMC LARGE CAP GROWTH FUND (Continued)
Average Annual Total Returns for Periods Ended December 31, 2009**
| | | | | | | | | |
Initial Class Shares | | One Year | | | Three Years | | | Life of
Fund*** | |
WMC Large Cap Growth Fund | | 37.23 | % | | — | | | (6.98 | )% |
Russell 1000 Growth Index* | | 37.21 | % | | — | | | (2.60 | )% |
Service Class Shares | | | | | | | | | |
WMC Large Cap Growth Fund | | 37.08 | % | | (6.58 | )% | | (5.46 | )% |
Russell 1000 Growth Index* | | 37.21 | % | | (1.89 | )% | | 0.02 | % |
*The performance data of the index has been prepared from sources and data that the investment adviser believes to be reliable, but no representation is made as to their accuracy. The index is unmanaged and cannot be invested in directly. The Russell 1000 Growth Index measures the performance of those Russell 1000 Index securities with higher price-to-book ratios and higher forecasted growth values, representative of U.S. securities exhibiting growth characteristics. The Russell 1000 Growth Index includes the largest 1,000 securities in the Russell 3000 Index, based on market cap. The Russell 3000 Index consists of the 3,000 largest and most liquid stocks based and traded in the U.S.
**Performance data is historical and includes changes in share price and reinvestment of income dividends and capital gains distributions. Past performance does not indicate future results. All Fund returns are net of fees and expenses, but do not include any insurance charges imposed in connection with your variable insurance contract. If this performance information included the effect of the insurance charges and the fees and expenses assumed by the investment adviser, performance numbers would be lower. The value of an investment in the WMC Large Cap Growth Fund and the return on the investment will fluctuate and redemption proceeds may be higher or lower than an investor’s original cost.
***Initial Class Shares for the period from April 2, 2007 (commencement of operations) to December 31, 2009. Service Class Shares for the period from May 1, 2006 (commencement of operations) to December 31, 2009.
29
WMC BLUE CHIP MID CAP FUND
(subadvised by Wellington Management Co., LLP)
MANAGEMENT’S DISCUSSION & ANALYSIS
How did the Fund perform during the year ended December 31, 2009?
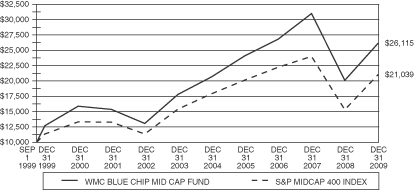
Blue Chip Mid Cap Fund (the “Fund”) underperformed its benchmark, the S&P Midcap 400 Index (the “Index”), for the year ended December 31, 2009.
What economic and market factors most influenced the equity markets as a whole during the year ended December 31, 2009?
After a tumultuous start, U.S. equities finished 2009 near their highs for the year. Throughout the year, extraordinary government and central bank measures helped to stabilize global economies and markets, and as the year progressed, low interest rates, better-than-expected corporate earnings, and improving economic data provided a favorable backdrop for equities.
Small cap, mid cap, and large cap stocks rose in unison during the period, as measured by the Russell 2000, S&P Midcap 400, and S&P 500 indices, respectively. All ten sectors within the S&P Midcap 400 Index rose during the year led by Energy, Information Technology, and Consumer Discretionary. Financials and Telecommunication Services increased the least.
Were there any significant sector over/under weights that materially impacted Fund performance relative to the benchmark during the year ended December 31, 2009?
Sector positioning, driven by security selection, contributed positively to benchmark-relative returns during the period, primarily due to an underweight to Financials and overweight positions in Information Technology and Health Care. An underweight to the strong performing Materials sector detracted from relative returns. Security selection in Consumer Discretionary, Energy, and Materials detracted most from relative performance for the Fund, and more than offset stronger stock selection in the Information Technology and Financials sectors.
Which stocks contributed most to the Fund’s returns during the year ended December 31, 2009?
Top contributors to returns on a relative basis included NetApp, Inc., Life Technologies Corp., and Red Hat, Inc. Shares of data storage equipment maker NetApp, Inc. rose as the company’s earnings exceeded expectations and management raised guidance citing manufacturing cost improvements and signs of improving business sentiment. Life Technologies Corp., created through the merger of Invitrogen and Applied Biosystems, is a provider of tools and cultures used in genetic research and drug development. The company’s shares benefited during the period from strong synergies after the merger and the impact of government agency stimulus funds. Open-source enterprise software and services company Red Hat, Inc. benefited from growing revenue and higher margins as Information Technology organizations moved ahead with purchases of the firm’s high value software solutions.
Which stocks detracted from the Fund’s results during the year ended December 31, 2009?
Top detractors from relative performance included Huntington Bancshares, Inc., W.R. Berkley Corp., and Apollo Group Inc. Ohio-based diversified banking and financials services company Huntington Bancshares, Inc. reported a larger-than-expected earnings loss due to an increase in provision for credit loss expense. W.R. Berkley Corp. shares underperformed as the insurance sector came under pressure on concerns about the pricing cycle. Shares of for-profit educational services provider Apollo Group Inc. fell after the firm announced that the SEC had launched an informal investigation into its revenue recognition practices. Health and supplemental benefit plans provider Humana, Inc. and waste management company Republic Services, Inc. were also among the top detractors from absolute performance.
30
WMC BLUE CHIP MID CAP FUND (Continued)
How was the Fund positioned relative to its benchmark index at the end of December 31, 2009?
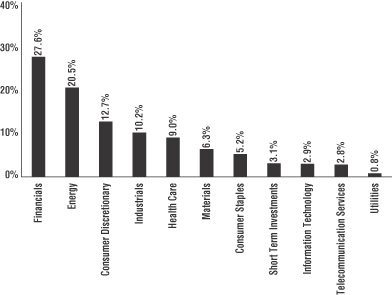
Sector exposure is predominantly a fall-out of stock selection. Our largest overweights relative to the Index were to the Consumer Discretionary and Health Care sectors, while the largest underweights were to Financials and Utilities.
SECTOR ALLOCATIONS AT DECEMBER 31, 2009*
Percentage of Net Assets
| * | The above graph categorizes investments using GICS. The percentages shown for each sector reflect the value of investments in that sector as a percentage of net assets. Figures in the above graph may not total to 100% due to the exclusion of the Fund’s other assets and liabilities. |
TOP TEN EQUITY HOLDINGS AT DECEMBER 31, 2009
| | | | | |
| | | % of Net Assets | | | Industry |
Dreamworks Animation Skg, Inc., Class A | | 2.0 | % | | Media |
Beckman Coulter, Inc. | | 1.9 | | | Health Care Equipment & Supplies |
Lam Research Corp. | | 1.7 | | | Semiconductors & Semiconductor Equipment |
PACCAR, Inc. | | 1.6 | | | Machinery |
Massey Energy Co. | | 1.6 | | | Oil, Gas & Consumable Fuels |
Unum Group | | 1.6 | | | Insurance |
Watson Pharmaceuticals, Inc. | | 1.5 | | | Pharmaceuticals |
The Western Union Co. | | 1.5 | | | IT Services |
Rockwell Collins, Inc. | | 1.5 | | | Aerospace & Defense |
Southwest Airlines Co. | | 1.5 | | | Airlines |
31
WMC BLUE CHIP MID CAP FUND (Continued)
Comparison of Change in Value of a $10,000 Investment in the WMC Blue Chip Mid Cap Fund – Initial Class and the S&P Midcap 400 Index
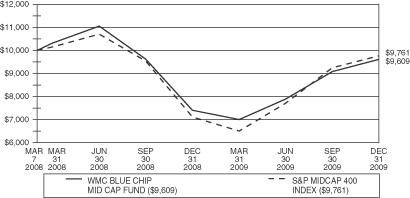
Comparison of Change in Value of a $10,000 Investment in the WMC Blue Chip Mid Cap Fund – Service Class and the S&P Midcap 400 Index
32
WMC BLUE CHIP MID CAP FUND (Continued)
Average Annual Total Returns for Periods Ended December 31, 2009**
| | | | | | | | | | | | | | | |
Initial Class Shares | | One Year | | | Three Years | | | Five Years | | | Ten Years | | | Life of
Fund*** | |
WMC Blue Chip Mid Cap Fund | | 30.07 | % | | (0.89 | )% | | 4.79 | % | | 7.47 | % | | 9.73 | % |
S&P Midcap 400 Index* | | 37.38 | % | | (1.83 | )% | | 3.27 | % | | 6.36 | % | | 7.46 | % |
Service Class Shares | | | | | | | | | | | | | | | |
WMC Blue Chip Mid Cap Fund | | 29.96 | % | | — | | | — | | | — | | | (2.16 | )% |
S&P Midcap 400 Index* | | 37.38 | % | | — | | | — | | | — | | | (1.33 | )% |
*The performance data of the index has been prepared from sources and data that the investment adviser believes to be reliable, but no representation is made as to their accuracy. The index is unmanaged and cannot be invested in directly. The S&P Midcap 400 Index is a capitalization-weighted index that measures the mid-range sector of the U.S. stock market.
**Performance data is historical and includes changes in share price and reinvestment of income dividends and capital gains distributions. Past performance does not indicate future results. All Fund returns are net of fees and expenses, but do not include any insurance charges imposed in connection with your variable insurance contract. If this performance information included the effect of the insurance charges and the fees and expenses assumed by the investment adviser, performance numbers would be lower. The value of an investment in the WMC Blue Chip Mid Cap Fund and the return on the investment will fluctuate and redemption proceeds may be higher or lower than an investor’s original cost.
***Initial Class Shares for the period from September 1, 1999 (commencement of operations) to December 31, 2009. Service Class Shares for the period from March 7, 2008 (commencement of operations) to December 31, 2009.
33
LORD ABBETT GROWTH & INCOME FUND
(subadvised by Lord, Abbett & Co. LLC)
MANAGEMENT’S DISCUSSION & ANALYSIS
How did the Fund perform during the year ended December 31, 2009?
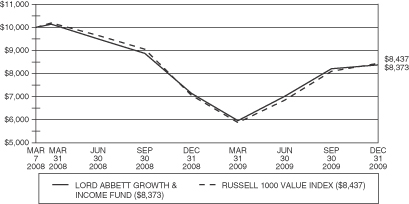
Lord Abbett Growth & Income Fund (the “Fund”) underperformed its benchmark, the Russell 1000 Value Index (the “Index”), for the year ended December 31, 2009.
What economic and market factors most influenced the equity markets as a whole during the year ended December 31, 2009?
After a difficult start to the year, the equity markets (as represented by the S&P 500 Index) recovered during the balance of the period, ending the year up 26.46%. This improvement enabled some investors to recover a portion of their previous losses.
Overall, all equity asset classes and investing styles trended higher throughout the period. Mid cap stocks (as defined by the Russell MidCap Index) generally outperformed large cap stocks (as measured by the Russell 1000 Index) and small cap stocks (as measured by the Russell 2000 Index). Growth stocks (as represented by the Russell 3000 Growth Index) generally outperformed value stocks (as represented by the Russell 3000 Value Index) for the year.
On the international side, foreign equity markets (as measured by the MSCI EAFE Index with Gross Dividends) outperformed domestic equity markets (as represented by the S&P 500 Index) for the 12-month period.
Were there any significant sector over/under weights that materially impacted Fund performance relative to the benchmark during the year ended December 31, 2009?
An overweight within the underperforming Financials sector was the largest detractor from relative performance for the year. Financial stocks suffered relatively in the first quarter of the year but strengthened in the last three quarters.
A beneficial overweight and favorable stock selection within the robust Consumer Discretionary sector contributed relatively for the year. Also, strong stock selection and an overweight position within the diversified retail area of the sector aided relative performance for the year.
Among individual holdings, which stocks contributed most to the Fund’s returns during the year ended December 31, 2009?
Hertz Global Holdings, Inc. was one of the Fund’s strongest performers for the period, as shares of the car and equipment rental provider rose after investors began detecting early signs of a bottoming process in the overall economy. Hertz also benefited from reducing its fleet, which resulted in lower-than-expected expenses. Strong stock selection also was evident within the Energy sector. Oilfield services company Schlumberger, Ltd. rebounded sharply from its price swoon in fourth quarter 2008, as reported earnings for the first two quarters of 2009 exceeded consensus expectations. Also within the Energy sector, the Fund benefited from an underweight of Exxon Mobil Corp., which underperformed both the sector and the Index. J. Crew Group, Inc. and HSN, Inc. were notable contributors within the Consumer Discretionary sector.
Which stocks detracted from the Fund’s results during the year ended December 31, 2009?
Unfavorable stock selection within the producer durables sector also detracted from relative performance. Shares of General Electric Co. declined in sympathy with the financial services sector during the tumultuous first quarter. The company reported quarterly earnings that were below consensus expectations, it reduced its quarterly dividend and it suffered from a credit rating downgrade. We eliminated the position during this time.
The Fund’s underweight position in Bank of America Corp. for the last three quarters of the year detracted from relative performance as the stock more than doubled during that recovery period.
34
LORD ABBETT GROWTH & INCOME FUND (Continued)
How was the Fund positioned relative to its benchmark index at the end of December 31, 2009?
The Fund continues to be positioned for a cyclical recovery in the economy. Consumer Discretionary was the Fund’s largest overweight sector relative to the Index, with a continuing concentration primarily in the diversified retail area. The Fund sold select Diversified Retail and Specialty Retail holdings throughout the period, however, so the overweight is somewhat reduced from a year ago. Financials is now the second largest overweight sector. Over the past year, however, the sector represented the Fund’s largest decline in active weight versus the benchmark index. As in the previous two quarters, the Fund continued to reduce exposure here during the fourth quarter. Specifically, the Fund trimmed or eliminated positions within the asset management & custodian, financial data & systems, and multi-line insurance industries.
The Utilities sector remains the Fund’s largest underweight sector, as we believe individual stock valuations are relatively expensive and better opportunities exist elsewhere in the market. The Producer Durables sector is now moderately underweight, and we made relatively few changes during the most recent quarter.
The largest increase in active weight over the course of the year occurred within the Energy sector. The Fund increased exposure to existing holdings as well as initiated new positions within the integrated oils industry. The Fund also added to an existing position in a coal company. As a result, the Energy sector moved from a significant underweight to a moderate overweight during the period.
SECTOR ALLOCATIONS AT DECEMBER 31, 2009*
Percentage of Net Assets
| * | The above graph categorizes investments using GICS. The percentages shown for each sector reflect the value of investments in that sector as a percentage of net assets. Figures in the above graph may not total to 100% due to the exclusion of the Fund’s other assets and liabilities. |
35
LORD ABBETT GROWTH & INCOME FUND (Continued)
TOP TEN EQUITY HOLDINGS AT DECEMBER 31, 2009
| | | | | |
| | | % of Net Assets | | | Industry |
Wells Fargo & Co. | | 4.4 | % | | Commercial Banks |
JP Morgan Chase & Co. | | 4.2 | | | Diversified Financial Services |
Exxon Mobil Corp. | | 3.9 | | | Oil, Gas & Consumable Fuels |
Delta Air Lines, Inc. | | 3.1 | | | Airlines |
Schlumberger, Ltd. | | 2.7 | | | Energy Equipment & Services |
Chevron Corp. | | 2.7 | | | Oil, Gas & Consumable Fuels |
The Goldman Sachs Group, Inc. | | 2.5 | | | Capital Markets |
Hertz Global Holdings, Inc. | | 2.2 | | | Road & Rail |
Kroger Co. | | 2.2 | | | Food & Staples Retailing |
Bank of New York Mellon Corp. | | 2.1 | | | Capital Markets |
Comparison of Change in Value of a $10,000 Investment in the Lord Abbett Growth & Income Fund – Initial Class and the Russell 1000 Value Index
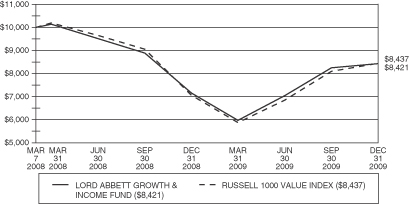
Comparison of Change in Value of a $10,000 Investment in the Lord Abbett Growth & Income Fund – Service Class and the Russell 1000 Value Index
36
LORD ABBETT GROWTH & INCOME FUND (Continued)
Average Annual Total Returns for Periods Ended December 31, 2009**
| | | | | | |
| | | One Year | | | Life of
Fund*** | |
Lord Abbett Growth & Income Fund-Initial Class Shares | | 17.85 | % | | (9.00 | )% |
Lord Abbett Growth & Income Fund-Service Class Shares | | 17.41 | % | | (9.28 | )% |
Russell 1000 Value Index* | | 19.69 | % | | (8.92 | )% |
*The performance data of the index has been prepared from sources and data that the investment adviser believes to be reliable, but no representation is made as to their accuracy. The index is unmanaged and cannot be invested in directly. The Russell 1000 Index measures the performance of the 1,000 largest companies in the Russell 3000 Index, which measures the performance of the 3,000 largest U.S. companies based on total market capitalization. The Russell 1000 Value Index measures the performance of those Russell 1000 companies with lower price-to-book ratio and lower forecasted growth values.
**Performance data is historical and includes changes in share price and reinvestment of income dividends and capital gains distributions. Past performance does not indicate future results. All Fund returns are net of fees and expenses, but do not include any insurance charges imposed in connection with your variable insurance contract. If this performance information included the effect of the insurance charges and the fees and expenses assumed by the investment adviser, performance numbers would be lower. The value of an investment in the Lord Abbett Growth & Income Fund and the return on the investment will fluctuate and redemption proceeds may be higher or lower than an investor’s original cost.
***For the period from March 7, 2008 (commencement of operations) to December 31, 2009.
37
GOLDMAN SACHS MID CAP VALUE FUND
(subadvised by Goldman Sachs Asset Management, L.P.)
MANAGEMENT’S DISCUSSION & ANALYSIS
How did the Fund perform during the year ended December 31, 2009?
Goldman Sachs Mid Cap Value Fund (the “Fund”) underperformed its benchmark, the Russell Midcap Value Index (the “Index”), for the year ended December 31, 2009.
Returns to the investment themes were negative overall. Momentum was the worst performing theme, followed at a distance by Management, Sentiment, Quality and Profitability. Conversely, Valuation contributed positively to excess returns. Valuation and Profitability summarize results from the balance sheet and income statement, whereas Quality and Management measure the operating, investing, and financing activities from a company’s statement of cash flows. Momentum measures information about a wide variety of investment-relevant events that are sufficiently complex, in many cases, that it takes time for the market to fully appreciate their implications for security values. The sixth theme, Sentiment, is based on the detailed research of stock analysts, research that includes the evaluation of financial statements, discussions with management, and the study of industry trends. Sentiment allows us to incorporate a wide range of qualitative information on companies and their industries into our quantitative evaluation of stocks.
What economic and market factors most influenced the equity markets as a whole during the year ended December 31, 2009?
The dramatic rally in global equity markets that began in late March may provide evidence that an economic recovery has begun. However, while the stock market may be a leading indicator of economic conditions, it is not perfect. Other economic indicators – such as persistently weak employment, soft consumer spending and excess industrial capacity – can suggest continued uncertainty surrounding a sustainable global economic recovery. During the fourth quarter, perceived risk continued to fall as global equity markets rallied for the third quarter in a row, with the exception of Japan. The market reversal from declines of 2008 impacted our price momentum signal and we took steps to address this in our research models and investment process.
Were there any significant sector over/under weights that materially impacted Fund performance relative to the benchmark during the year ended December 31, 2009?
Among sectors, stock selection was negative overall for the period. Overweight positions in the Financials and Consumer Discretionary sectors underperformed their peers in the benchmark. On the upside, an overweight position in Telecommunication Services and an underweight position in Utilities sectors outpaced their peers in the benchmark most.
Which stocks contributed most to the Fund’s returns during the year ended December 31, 2009?
Overweight positions in Harman International Industries, Inc., Seagate Technology and Cimarex Energy Co. were the largest contributors to relative returns for the year.
Which stocks detracted from the Fund’s results during the year ended December 31, 2009?
An underweight position in Ford Motor Co., as well as overweight positions in Family Dollar Stores and Valero Energy Corp., were the largest detractors from the Fund’s relative performance for the year.
How was the Fund positioned relative to its benchmark index at the end of December 31, 2009?
The Fund was overweight in the Information Technology, Health Care, Consumer Discretionary, Materials and Industrials sectors relative to the Index. Meanwhile, the Fund was underweight in the Utilities, Consumer Staples, Telecommunication Services, Financials and Energy sectors.
38
GOLDMAN SACHS MID CAP VALUE FUND (Continued)
SECTOR ALLOCATIONS AT DECEMBER 31, 2009*
Percentage of Net Assets
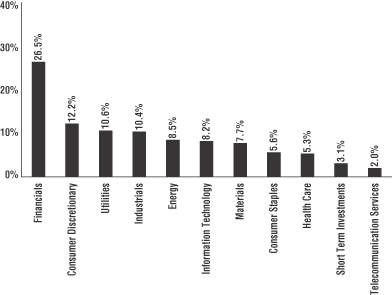
| * | The above graph categorizes investments using GICS. The percentages shown for each sector reflect the value of investments in that sector as a percentage of net assets. Figures in the above graph may not total to 100% due to the exclusion of the Fund’s other assets and liabilities. |
TOP TEN EQUITY HOLDINGS AT DECEMBER 31, 2009
| | | | | |
| | | % of Net Assets | | | Industry |
AvalonBay Communities, Inc. | | 1.9 | % | | Real Estate Investment Trusts |
Lorillard, Inc. | | 1.8 | | | Tobacco |
International Paper Co. | | 1.7 | | | Paper & Forest Products |
Unum Group | | 1.6 | | | Insurance |
Seagate Technology | | 1.5 | | | Computers & Peripherals |
Ameren Corp. | | 1.4 | | | Multi-Utilities |
Cimarex Energy Co. | | 1.4 | | | Oil, Gas & Consumable Fuels |
Integrys Energy Group, Inc. | | 1.3 | | | Multi-Utilities |
Liberty Property Trust | | 1.3 | | | Real Estate Investment Trusts |
Forest Laboratories, Inc. | | 1.2 | | | Pharmaceuticals |
39
GOLDMAN SACHS MID CAP VALUE FUND (Continued)
Comparison of Change in Value of a $10,000 Investment in the Goldman Sachs Mid Cap Value Fund – Initial Class and the Russell Midcap Value Index

Comparison of Change in Value of a $10,000 Investment in the Goldman Sachs Mid Cap Value Fund – Service Class and the Russell Midcap Value Index
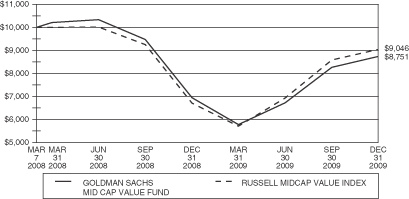
40
GOLDMAN SACHS MID CAP VALUE FUND (Continued)
Average Annual Total Returns for Periods Ended December 31, 2009**
| | | | | | |
| | | One Year | | | Life of
Fund*** | |
Goldman Sachs Mid Cap Value Fund-Initial Class Shares | | 25.68 | % | | (6.84 | )% |
Goldman Sachs Mid Cap Value Fund-Service Class Shares | | 25.38 | % | | (7.06 | )% |
Russell Midcap Value Index* | | 34.21 | % | | (5.36 | )% |
*The performance data of the index has been prepared from sources and data that the investment adviser believes to be reliable, but no representation is made as to their accuracy. The index is unmanaged and cannot be invested in directly. The Russell Midcap Value Index measures the performance of the mid-cap value segment of the U.S. equity universe. It includes those Russell Midcap Value Index companies with lower price-to-book ratios and lower forecasted growth values.
**Performance data is historical and includes changes in share price and reinvestment of income dividends and capital gains distributions. Past performance does not indicate future results. All Fund returns are net of fees and expenses, but do not include any insurance charges imposed in connection with your variable insurance contract. If this performance information included the effect of the insurance charges, performance numbers would be lower. The value of an investment in the Goldman Sachs Mid Cap Value Fund and the return on the investment will fluctuate and redemption proceeds may be higher or lower than an investor’s original cost.
***For the period from March 7, 2008 (commencement of operations) to December 31, 2009.
41
GOLDMAN SACHS SHORT DURATION FUND
(subadvised by Goldman Sachs Asset Management, L.P.)
MANAGEMENT’S DISCUSSION & ANALYSIS
How did the Fund perform during the year ended December 31, 2009?
Goldman Sachs Short Duration Fund (the “Fund”) outperformed its benchmark, the BofA Merrill Lynch 1-3 year U.S. Treasury Index (the “Index”), for the year ended December 31, 2009.
What economic and market factors most influenced the fixed income markets as a whole during the year ended December 31, 2009?
Overall, spreads have rallied across all risk markets as governments have worked to remove systemic risk from the market. In addition, the macroeconomic environment has also shown signs of improvement. The 2009 rally is best characterized as a return to rational levels. Early in the year, spreads were pricing in unprecedented economic weakness and record defaults. The outsized liquidity premium in fixed income markets has largely disappeared, but certain sectors remain dislocated.
What key factors were most responsible for the Fund’s performance during the year ended December 31, 2009?
A combination of top-down and bottom-up strategies benefited the Fund’s performance during the year. The Fund’s position of government and agency securities, though decreased in size, contributed to performance. Specifically, the Fund’s government selection positioning, agency selection and TIPS selection added to performance the most. The Fund’s government cross-sector positioning also added to performance. A cross-sector strategy is one in which Fund assets are invested across a variety of fixed income sectors, including some that may not be included in the Fund’s benchmark.
While less risky assets were the Fund’s top contributor, investment grade corporate credit and mortgage-backed securities (“MBS”) also benefitted performance. Investment grade corporate credit rallied heavily in 2009 and the Fund’s increased exposure meaningfully added to performance. The Fund’s Financial exposure remained roughly the same; however, its exposure to Industrials increased considerably and was the largest contributor to individual corporate selection. Our short and medium term maturity U.S. corporate exposure within the investment grade corporate sector added to performance as well. The Fund’s position in MBS benefited the most from a rally in the overall mortgage market that saw agency adjustable-rate mortgages (ARMs) perform well for the Fund. Security selection for those positions added again to performance. Finally, tactical management of the Fund’s duration and term structure detracted from returns during the year.
What changes did you make to the Fund’s sector allocations during the year ended December 31, 2009 and how did these affect performance during the reporting period?
As discussed above, the Fund’s allocation to quasi-government securities decreased during the reporting period. In contrast, the Fund’s exposure to investment grade corporate credit, in particular in the Industrials sector, increased during the period.
Did the Fund experience major changes to its top ten issuers during the year ended December 31, 2009?
Changes in the top ten issuers were significant over the year as we took advantage of opportunities in fixed income markets due to major market dislocation. The changes made in response to this opportunity positively impacted the Fund’s performance in 2009. At December 31, 2009, the top issuers remain conservative; however, we have taken on more credit risk over the year. Agency MBS remain a large Fund position; however, the allocation decreased year over year as we saw attractive opportunities in other sectors.
42
GOLDMAN SACHS SHORT DURATION FUND (Continued)
How was the Fund positioned relative to its benchmark index at the end of December 31, 2009?
At the end of the period, less than 7% of the Fund’s assets were in the U.S. Treasuries, versus 100% for the Index. Though the sector allocations differ, the Index continues to have a short duration (+1.92), with the Fund just a bit shorter (+1.86). The Fund has outperformed the benchmark for the year primarily due to the performance of these allocations.
PORTFOLIO COMPOSITION AT DECEMBER 31, 2009*
Percentage of Net Assets
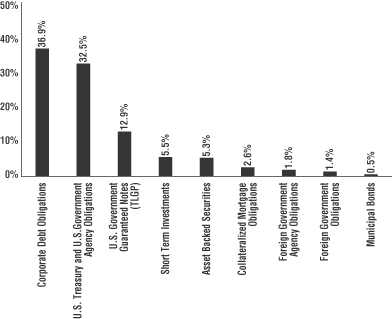
| * | The percentages shown for each investment category reflect the value of investments in that category as a percentage of net assets. Figures in the above graph may not total to 100% due to the exclusion of the Fund’s other assets and liabilities. |
43
GOLDMAN SACHS SHORT DURATION FUND (Continued)
TOP TEN ISSUERS AT DECEMBER 31, 2009
| | | | | |
| | | % of Net Assets | | | Category |
Federal Home Loan Mortgage Corp. | | 18.4 | % | | U.S. Government Agency |
Federal National Mortgage Association | | 12.0 | | | U.S. Government Agency |
U.S. Treasury | | 6.7 | | | U.S. Treasury |
Bank of America Corp. | | 5.4 | | | Asset Backed Securities & TLGP |
General Electric Capital Corp. | | 4.1 | | | Corporate Debt – Financials |
Citigroup, Inc. | | 3.9 | | | TLGP |
Federal Home Loan Bank | | 2.9 | | | U.S. Government Agency |
Kreditanstalt Fur Wiederaufbau | | 2.8 | | | Special Purpose Banks |
The Royal Bank of Scotland PLC | | 2.1 | | | Corporate Debt – Financials |
Societe Financement de l’Economie Francaise | | 1.8 | | | Foreign Government Agency |
Comparison of Change in Value of a $10,000 Investment in the Goldman Sachs Short Duration Fund – Initial Class and the BofA Merrill Lynch 1-3 Year U.S. Treasury Index
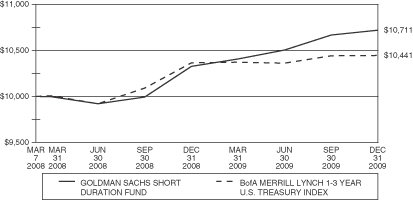
Comparison of Change in Value of a $10,000 Investment in the Goldman Sachs Short Duration Fund – Service Class and the BofA Merrill Lynch 1-3 Year U.S. Treasury Index
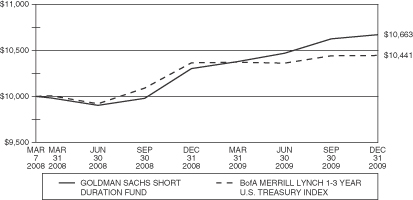
44
GOLDMAN SACHS SHORT DURATION FUND (Continued)
Average Annual Total Returns for Periods Ended December 31, 2009**
| | | | | | |
| | | One Year | | | Life of
Fund*** | |
Goldman Sachs Short Duration Fund-Initial Class Shares | | 3.78 | % | | 3.84 | % |
Goldman Sachs Short Duration Fund-Service Class Shares | | 3.52 | % | | 3.59 | % |
BofA Merrill Lynch 1-3 Year U.S. Treasury Index* | | 0.78 | % | | 2.40 | % |
*The performance data of the index has been prepared from sources and data that the investment adviser believes to be reliable, but no representation is made as to their accuracy. The index is unmanaged and cannot be invested in directly. The BofA Merrill Lynch 1-3 Year U.S. Treasury Index is a subset of the BofA Merrill Lynch U.S. Treasury Index including all securities with a remaining term to final maturity of less than 3 years. The BofA Merrill Lynch U.S. Treasury Index tracks the performance of U.S. dollar denominated sovereign debt publicly issued by the U.S. government in its domestic market. Qualifying securities must have at least one year remaining term to final maturity, a fixed coupon schedule and a minimum amount outstanding of $1 billion.
**Performance data is historical and includes changes in share price and reinvestment of income dividends and capital gains distributions. Past performance does not indicate future results. All Fund returns are net of fees and expenses, but do not include any insurance charges imposed in connection with your variable insurance contract. If this performance information included the effect of the insurance charges and the fees and expenses assumed by the investment adviser, performance numbers would be lower. The value of an investment in the Goldman Sachs Short Duration Fund and the return on the investment will fluctuate and redemption proceeds may be higher or lower than an investor’s original cost.
***For the period from March 7, 2008 (commencement of operations) to December 31, 2009.
45
DREMAN SMALL CAP VALUE FUND
(subadvised by Dreman Value Management, L.L.C.)
MANAGEMENT’S DISCUSSION & ANALYSIS
How did the Fund perform during the year ended December 31, 2009?
Dreman Small Cap Value Fund (the “Fund”) outperformed its benchmark, the Russell 2000 Value Index (the “Index”), for the year ended December 31, 2009.
What economic and market factors most influenced the equity markets as a whole during the year ended December 31, 2009?
2009 was a tale of two markets: one of panic and the other of recovery. In the panic phase of the market the indices hit lows not seen in a decade. Valuations were depressed and the economic picture looked dismal. During this time we found several attractive investment opportunities. Our low price/earnings process uncovered many sound companies trading at historically low valuation levels. We viewed this precipitous fall in stock prices during the panic phase as a classic market over-reaction and positioned the Fund for a rally. The recovery phase of the 2009 market started after the March 9th lows. We saw many of our investments grow 60%, 70% or even 100% in as little as just 6 months. During this positive run, however, the economic picture remained bleak. Unemployment hovered around 10% and many market pundits thought the consumer was dead. It is interesting to note that the Consumer Discretionary sector in the Index was the 2nd best performing sector (behind Materials), rising 145% from the March 9th low. While the Fund participated during the initial stages of this rally, we began to take profits as valuations appeared excessive given the meteoric rise in stock prices. This conservative approach weighed upon returns in the third quarter, causing us to relinquish some of our outperformance from earlier in the year. The positive momentum lasted through the end of the year but with much less volatility than the first three quarters.
Were there any significant sector over/under weights that materially impacted performance relative to the benchmark during the year ended December 31, 2009?
The Fund’s outperformance was generated through both stock selection and sector allocation. Our best performing sectors on a relative basis were Financials, Industrials, Energy, Materials, and Consumer Staples. Sectors that detracted from performance were Consumer Discretionary, Information Technology, and Telecommunication Services.
The Auto Components Industry posted a significant positive return for the year in the Index. The Fund held no companies in the space as the fundamental analysis suggested these companies were too levered to the U.S. auto industry, which in our opinion remains in peril.
Which stocks contributed most to the Fund’s returns during the year ended December 31, 2009?
In the Consumer Finance industry, Cash America International, Inc., a pawn shop operator, was a significant contributor to Fund performance. Another big winner in the Fund was Legg Mason, an asset management company. We unfortunately had to sell Legg Mason following a significant rise in the stock price that resulted in a market capitalization of the company above our maximum of $4 billion for the Fund. Other contributors included Joy Global, Inc., a leading coal mining equipment manufacturer, Gardner Denver, Inc., a manufacturer of compressors and vacuums for the fluid transfer, General Cable Corp., a leading manufacturer of aluminum and copper wires used for the transmission and distribution of power, Dick’s Sporting Goods, Inc., a sporting goods retailer, RadioShack Corp., a specialty electronics retailer and Dreamworks Animation Skg, Inc., a producer of computer animated films.
46
DREMAN SMALL CAP VALUE FUND (Continued)
Which stocks detracted from the Fund’s results during the year ended December 31, 2009?
One of the Fund’s detractors for the year was Associated Banc-Corp., which was sold during the year. PetroQuest Energy, Inc., an oil and gas exploration company, fell due to liquidity concerns. United Fire & Casualty Co. struggled during the year as a series of missed earnings estimates weighed on the stock price. Other detractors include Odyssey Re Holdings Corp., a reinsurance company, and Mueller Water Products, Inc., a manufacturer of water infrastructure and flow control products. The Fund no longer holds these companies.
Did the Fund experience major changes to its top ten holdings during the year ended December 31, 2009?
None of the top ten holdings of the Fund at December 31, 2008 were top ten positions at December 31, 2009, though five holdings remain in the Fund. The shift in top ten holdings was due to valuation levels as the Fund moved away from expensive stocks and back in to lower valuation stocks.
How was the Fund positioned relative to its benchmark index at the end of December 31, 2009?
The Fund remains underweight Financials, Consumer Discretionary, Information Technology, Materials, Industrials, and Utilities. The Fund remains overweight Consumer Staples, Energy, Health Care, and Telecommunication Services. The Fund’s over/underweight positions are based on the relative valuations of the market and the sectors.
47
DREMAN SMALL CAP VALUE FUND (Continued)
SECTOR ALLOCATIONS AT DECEMBER 31, 2009*
Percentage of Net Assets

| * | The above graph categorizes investments using GICS. The percentages shown for each sector reflect the value of investments in that sector as a percentage of net assets. Figures in the above graph may not total to 100% due to the exclusion of the Fund’s other assets and liabilities. |
TOP TEN EQUITY HOLDINGS AT DECEMBER 31, 2009
| | | | | |
| | | % of Net Assets | | | Industry |
Tesoro Corp. | | 1.4 | % | | Oil, Gas & Consumable Fuels |
Iowa Telecommunication Services, Inc. | | 1.3 | | | Diversified Telecommunication Services |
Amedisys, Inc. | | 1.2 | | | Health Care Providers & Services |
Hospitality Properties Trust | | 1.2 | | | Real Estate Investment Trusts |
Whiting Petroleum Corp. | | 1.2 | | | Oil, Gas & Consumable Fuels |
Jabil Circuit, Inc. | | 1.2 | | | Electronic Equipment & Instruments |
Synaptics, Inc. | | 1.1 | | | Computers & Peripherals |
Microsemi Corp. | | 1.1 | | | Semiconductors & Semiconductor Equipment |
Gammon Gold, Inc. | | 1.1 | | | Metals & Mining |
Helen of Troy, Ltd. | | 1.1 | | | Household Durables |
48
DREMAN SMALL CAP VALUE FUND (Continued)
Comparison of Change in Value of a $10,000 Investment in the Dreman Small Cap Value Fund – Initial Class and the Russell 2000 Value Index

Comparison of Change in Value of a $10,000 Investment in the Dreman Small Cap Value Fund – Service Class and the Russell 2000 Value Index
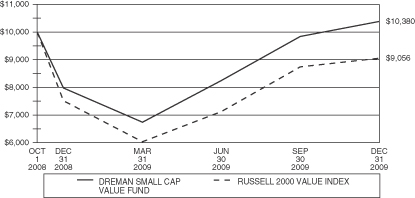
49
DREMAN SMALL CAP VALUE FUND (Continued)
Average Annual Total Returns for Periods Ended December 31, 2009**
| | | | | | |
| | | One Year | | | Life of
Fund*** | |
Dreman Small Cap Value Fund-Initial Class Shares | | 30.52 | % | | 3.35 | % |
Dreman Small Cap Value Fund-Service Class Shares | | 30.07 | % | | 3.02 | % |
Russell 2000 Value Index* | | 20.58 | % | | (7.62 | )% |
*The performance data of the index has been prepared from sources and data that the investment adviser believes to be reliable, but no representation is made as to their accuracy. The index is unmanaged and cannot be invested in directly. The Russell 2000 Value Index tracks the performance of the small value segment of the U.S. equity universe. It includes those Russell 2000 companies with lower price-to-book ratios and lower forecasted growth values.
**Performance data is historical and includes changes in share price and reinvestment of income dividends and capital gains distributions. Past performance does not indicate future results. All Fund returns are net of fees and expenses, but do not include any insurance charges imposed in connection with your variable insurance contract. If this performance information included the effect of the insurance charges and the fees and expenses assumed by the investment adviser, performance numbers would be lower. The value of an investment in the Dreman Small Cap Value Fund and the return on the investment will fluctuate and redemption proceeds may be higher or lower than an investor’s original cost.
***For the period from October 1, 2008 (commencement of operations) to December 31, 2009.
50
PIMCO HIGH YIELD FUND
(subadvised by Pacific Investment Management Company LLC)
MANAGEMENT’S DISCUSSION & ANALYSIS
How did the Fund perform during the year ended December 31, 2009?
PIMCO High Yield (the “Fund”) underperformed its benchmark, the BofA Merrill Lynch BB-B U.S. High Yield Constrained Index (the “Index”), for the year ended December 31, 2009.
What economic and market factors most influenced the fixed income markets as a whole during the year ended December 31, 2009?
Few asset classes saw the positive impact from the improved liquidity, associated with policy responses, as did the high yield bond market, as risk appetites grew and the stretch for yield dominated most of 2009. Despite the strong run up in performance in the second and third quarter, inflows into high yield mutual funds remained healthy throughout the fourth quarter.
The high yield market, led by a yield thirsty investor base, continued its strong momentum and finished the year off on a high note, posting its tenth month of positive performance. Also for the tenth consecutive month, lower rated bonds and cyclical industries led the way, reflecting an unrelenting willingness on the part of investors to reach for yield despite the elevated risk. The lowest quality tiers of the high yield market, CCC and lower rated issues, posted the strongest returns, outpacing BB and B-rated issues.
Spreads continued to compress in the fourth quarter. Once again, the top performing industry categories over the quarter, such as broadcasting, insurance, and publishing/printing, were the areas of the market where prices were most severely depressed, reflecting the persistent willingness of investors to reach for yield. Although none of the broad industry categories were in negative territory, the biggest laggards for the quarter were entertainment/film, gaming, and cable/pay TV.
What key strategies were most responsible for the Fund’s performance during the year ended December 31, 2009?
The following strategies contributed to performance for the year:
| | • | | An emphasis on the Finance sector, where insurance and bank companies had considerable price appreciation for the year. The Fund reduced its exposure to those names that had appreciated above their fair value and increased positions in names with more attractive risk/reward benefits |
| | • | | Security selection in the Consumer Cyclical sector, as auto-related holdings outperformed the broader category and are no longer priced at distressed levels |
| | • | | An underweight to Consumer Non-Cyclicals, which lagged the market on lower returns from beverage and tobacco |
The following strategies detracted from performance for the year:
| | • | | Tactical exposure to higher quality bonds, such as investment grade, which significantly underperformed the high yield market over the period |
| | • | | An overweight to Utilities and Pipelines sector, which underperformed along with most other defensive areas of the market for 2009 |
| | • | | Security selection in the Transportation sector where higher quality securitized bonds underperformed other subordinated issues in the industry category |
| | • | | Outside of traditional high yield, exposure to emerging markets, where returns fell well-short of high yield bonds, and detracted from performance |
51
PIMCO HIGH YIELD FUND (Continued)
How was the Fund positioned relative to its benchmark index at the end of December 31, 2009?
The Fund is overweight when compared to the Index in Financials, Utilities, and Airlines sectors. The Fund is underweight when compared to the Index in Retailers, Metals & Mining, and Paper.
PORTFOLIO COMPOSITION AT DECEMBER 31, 2009*
Percentage of Net Assets
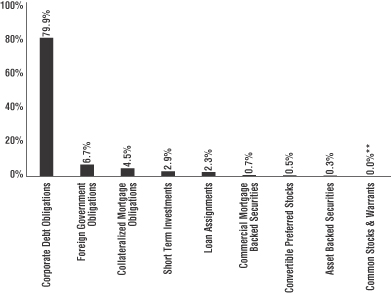
| * | The percentages shown for each investment category reflect the value of investments in that category as a percentage of net assets. Figures in the above graph may not total to 100% due to the exclusion of the Fund’s other assets and liabilities. |
| ** | Amount is less than 0.05%. |
TOP TEN ISSUERS AT DECEMBER 31, 2009
| | | | | |
| | | % of Net Assets | | | Category |
Brazil Notas do Tesouro Nacional | | 6.7 | % | | Foreign Government |
HCA, Inc. | | 3.4 | | | Corporate Debt – Health Care |
American International Group, Inc. | | 2.8 | | | Corporate Debt – Financials |
Ford Motor Credit Co. LLC | | 2.8 | | | Corporate Debt – Automotive |
Biomet, Inc. | | 2.6 | | | Corporate Debt – Health Care – Facilities |
Chesapeake Energy Corp. | | 2.5 | | | Corporate Debt – Refining |
Wells Fargo & Co. | | 2.3 | | | Corporate Debt – Financials |
Qwest Communications International, Inc. | | 2.1 | | | Corporate Debt – Telecommunications |
Barclays Bank PLC | | 2.1 | | | Corporate Debt – Financials |
GMAC LLC | | 2.0 | | | Corporate Debt – Financials |
52
PIMCO HIGH YIELD FUND (Continued)
Comparison of Change in Value of a $10,000 Investment in the PIMCO High Yield Fund – Initial Class and the BofA Merrill Lynch BB-B U.S. High Yield Constrained Index
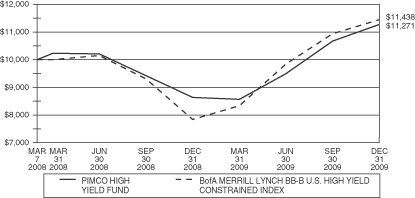
Comparison of Change in Value of a $10,000 Investment in the PIMCO High Yield Fund – Service Class and the BofA Merrill Lynch BB-B U.S. High Yield Constrained Index

53
PIMCO HIGH YIELD FUND (Continued)
Average Annual Total Returns for Periods Ended December 31, 2009**
| | | | | | |
| | | One Year | | | Life of
Fund*** | |
PIMCO High Yield Fund-Initial Class Shares | | 30.67 | % | | 6.79 | % |
PIMCO High Yield Fund-Service Class Shares | | 30.34 | % | | 6.52 | % |
BofA Merrill Lynch BB-B U.S. High Yield Constrained Index* | | 46.06 | % | | 7.67 | % |
*The performance data of the index has been prepared from sources and data that the investment adviser believes to be reliable, but no representation is made as to their accuracy. The index is unmanaged and cannot be invested in directly. The BofA Merrill Lynch BB-B U.S. High Yield Constrained Index contains all securities in the BofA Merrill Lynch U.S. High Yield Index rated BB1 through B3, based on an average of Moody’s, S&P and Fitch, but caps issuer exposure at 2%. Index constituents are capitalization-weighted, based on their current amount outstanding, provided the total allocation to an individual issuer does not exceed 2%.
**Performance data is historical and includes changes in share price and reinvestment of income dividends and capital gains distributions. Past performance does not indicate future results. All Fund returns are net of fees and expenses, but do not include any insurance charges imposed in connection with your variable insurance contract. If this performance information included the effect of the insurance charges and the fees and expenses assumed by the investment adviser, performance numbers would be lower. The value of an investment in the PIMCO High Yield Fund and the return on the investment will fluctuate and redemption proceeds may be higher or lower than an investor’s original cost.
***For the period from March 7, 2008 (commencement of operations) to December 31, 2009.
54
PIMCO TOTAL RETURN FUND
(subadvised by Pacific Investment Management Company LLC)
MANAGEMENT’S DISCUSSION & ANALYSIS
How did the Fund perform during the year ended December 31, 2009?
PIMCO Total Return Fund (the “Fund”) outperformed its benchmark, the Barclays Capital U.S. Aggregate Bond Index (the “Index”), for the year ended December 31, 2009.
What economic and market factors most influenced the fixed income markets as a whole during the year ended December 31, 2009?
Policy responses to the financial crisis and economic downturn that began in the second half of 2008 helped to stabilize the global economy in 2009. Interest rates generally rose in the fourth quarter of 2009 and for the full year as investors’ risk appetites revived, crimping demand for Treasuries and other sovereign bonds. The Index, a widely used index of U.S. high-grade bonds, returned 0.20% during the fourth quarter and 5.93% for all of 2009.
Initiatives such as the Federal Reserve’s (“Fed”) purchase of mortgage and Treasury securities, the Fed’s commitment to hold short term rates near zero and government support for consumer finance markets were major factors behind enhanced stability. The U.S. economy expanded in the third quarter and was expected to do so again in the final quarter amid a modest recovery in consumer spending and a slower rate of inventory drawdown by businesses.
A striking feature of the U.S. economy as the year drew to a close was the record steepness in the Treasury yield curve. This steepening also occurred in government yield curves of other major developed economies. The yield curve has steepened in the past as the economy pulls out of recession. The widening gap between the two and 10-year Treasury yields, and corresponding steepening elsewhere in the world, reflected optimism among investors about a global economic recovery. It also reflected an assumption in fixed income markets that the Fed and other major central banks will keep short rates low for an extended period of time.
Better-than-expected economic data near year-end put upward pressure on intermediate and longer maturity Treasury yields. Perhaps the most important data were signs of higher consumer spending and incomes, indicating that the biggest part of the U.S. economy might be poised to recover.
What key strategies were most responsible for the Fund’s performance during the year ended December 31, 2009?
The following strategies contributed to performance:
| • | | An overweight to Agency mortgage pass-through securities for the first half of the year and into the 3rd quarter; valuations of these bonds benefitted from government policy responses |
| • | | An emphasis on bonds of financial companies for the year, as these bonds benefited from government guarantees and a flight to higher yielding assets. Within the Financial industry, we reduced our exposure to those names who had appreciated above their fair value; and increased positions in names with more attractive risk/reward benefits |
| • | | Tactical duration positioning also contributed to performance, as we had an overweight in duration early in the year when investors invested in safe assets and a neutral stance later in the year as rates rose |
The following strategies detracted from performance:
| • | | Underweight to emerging markets for the first half of the year as risky assets outperformed Treasuries for the year |
55
PIMCO TOTAL RETURN FUND (Continued)
How was the Fund positioned relative to its benchmark index at the end of December 31, 2009?
The Fund is underweight when compared to the Index in mortgage backed and asset backed securities, investment grade credit and emerging markets. However, within the investment grade credit allocation, the Fund is overweight in Financials. In addition, the Fund had some allocations to municipal securities, emerging market currencies and German interest rates, which are not in the Index sectors.
PORTFOLIO COMPOSITION AT DECEMBER 31, 2009*
Percentage of Net Assets
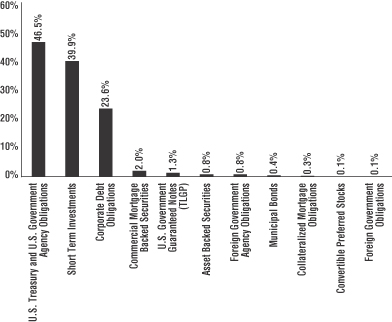
| * | The percentages shown for each investment category reflect the value of investments in that category as a percentage of net assets. Figures in the above graph may not total to 100% due to the exclusion of the Fund’s other assets and liabilities. |
TOP TEN ISSUERS AT DECEMBER 31, 2009
| | | | | |
| | | % of Net Assets | | | Category |
Federal National Mortgage Association | | 33.8 | % | | U.S. Government Agency |
U.S. Treasury | | 25.5 | | | U.S. Treasury |
Federal Home Loan Mortgage Corp. | | 12.0 | | | U.S. Government Agency |
Federal Home Loan Bank | | 9.3 | | | U.S. Government Agency |
Government National Mortgage Association | | 5.2 | | | U.S. Government Agency |
Citigroup, Inc. | | 3.0 | | | Corporate Debt – Financials |
Royal Bank of Scotland Group PLC | | 2.1 | | | Corporate Debt – Financials |
JP Morgan Chase & Co. | | 1.7 | | | Corporate Debt – Financials |
Lloyds TSB Bank PLC | | 1.6 | | | Corporate Debt – Financials |
Merrill Lynch & Co., Inc. | | 1.3 | | | Corporate Debt – Financials |
56
PIMCO TOTAL RETURN FUND (Continued)
Comparison of Change in Value of a $10,000 Investment in the PIMCO Total Return Fund – Initial Class and the Barclays Capital U.S. Aggregate Bond Index
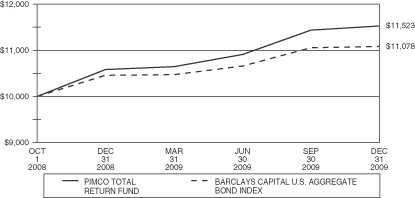
Comparison of Change in Value of a $10,000 Investment in the PIMCO Total Return Fund – Service Class and the Barclays Capital U.S. Aggregate Bond Index

57
PIMCO TOTAL RETURN FUND (Continued)
Average Annual Total Returns for Periods Ended December 31, 2009**
| | | | | | |
| | | One Year | | | Life of
Fund*** | |
PIMCO Total Return Fund-Initial Class Shares | | 8.89 | % | | 11.96 | % |
PIMCO Total Return Fund-Service Class Shares | | 8.62 | % | | 11.69 | % |
Barclays Capital U.S. Aggregate Bond Index* | | 5.93 | % | | 8.54 | % |
*The performance data of the index has been prepared from sources and data that the investment adviser believes to be reliable, but no representation is made as to their accuracy. The index is unmanaged and cannot be invested in directly. The Barclays Capital U.S. Aggregate Bond Index is composed of U.S. securities in Treasury, Government-Related, Corporate, and Securitized sectors.
**Performance data is historical and includes changes in share price and reinvestment of income dividends and capital gains distributions. Past performance does not indicate future results. All Fund returns are net of fees and expenses, but do not include any insurance charges imposed in connection with your variable insurance contract. If this performance information included the effect of the insurance charges and the fees and expenses assumed by the investment adviser, performance numbers would be lower. The value of an investment in the PIMCO Total Return Fund and the return on the investment will fluctuate and redemption proceeds may be higher or lower than an investor’s original cost.
***For the period from October 1, 2008 (commencement of operations) to December 31, 2009.
58
AIM SMALL CAP GROWTH FUND
(subadvised by Invesco Advisers, Inc.)
MANAGEMENT’S DISCUSSION & ANALYSIS
How did the Fund perform during the year ended December 31, 2009?
AIM Small Cap Growth Fund (the “Fund”) underperformed its benchmark, the Russell 2000 Growth Index (the “Index”), for the year ended December 31, 2009.
What economic and market factors most influenced the equity markets as a whole during the year ended December 31, 2009?
2009 was a tale of two markets. During the first two months of the year, equity markets experienced steep declines as severe problems in the credit markets, a rapidly deteriorating housing market, rising energy and food prices and a deteriorating outlook for corporate earnings led to a global economic recession. However, the U.S. economy began to show signs that the economic contraction was moderating, and equity markets rapidly reversed direction beginning on March 9, 2009, and rallied strongly for most of the remaining months in the year.
Where there any significant sector over/under weights that materially impacted Fund performance relative to the benchmark during the year ended December 31, 2009?
While there was no significant sector over/under weights in the Fund, overweight positions in the Energy and Information Technology sectors and an underweight position in the Health Care sector contributed to Fund performance versus the Index. On the other hand, an overweight position in the Financials sector detracted from performance versus the Index.
During the year, the most significant positioning changes included additions in more economically sensitive sectors including Information Technology, Consumer Discretionary and Energy. Purchases in these sectors were largely funded by reducing exposure to the more defensive Health Care sector.
Which stocks contributed most to the Fund’s returns during the year ended December 31, 2009?
The Fund’s top five contributors to absolute performance included Starent Networks Corp., Dril-Quip, Inc., Tech Data Corp., SBA Communications Corp. and Warnaco Group, Inc.
The Fund outperformed the Index by the widest margin in the Industrials sector, driven by stock selection. Many Industrials holdings had strong performance following the March 9th market inflection point, including capital goods holdings Bucyrus International, Inc., TransDigm Group, Inc. and General Cable Corp. All three holdings benefited from accelerating demand for their products and services as the global economy showed signs of dramatic improvement. Outperformance in the Energy sector was driven by stock selection and an overweight position. Energy holding Dril-Quip, Inc. made a solid contribution to performance. The Fund also outperformed in the Telecommunication Services sector, due to stock selection. Telecom holding SBA Communications Corp. also made a strong contribution to Fund performance.
Which stocks detracted from the Fund’s results during the year ended December 31, 2009?
The Fund’s top five detractors to absolute performance included the Medicines Co., Martek Biosciences Corp., Wright Medical Group, Inc., Bankrate, Inc. and DeVry, Inc. The Fund underperformed by the widest margin in the Consumer Discretionary sector. Within this sector, the leading detractor to performance was for-profit education services provider DeVry, Inc. This more defensive holding had weak performance due to a heightened regulatory environment, and was also negatively impacted as investors rotated into more economically sensitive holdings during the market rebound. Much of the remaining underperformance in the Consumer Discretionary
59
AIM SMALL CAP GROWTH FUND (Continued)
sector was because the Fund did not own many of the more highly leveraged and/or cyclical companies that had the highest performance following the market inflection point. The Fund also underperformed in Consumer Staples, Materials, Information Technology and Health Care. Underperformance in each of these sectors was driven by stock selection. Three of the Fund’s top five detractors to performance were Health Care holdings: The Medecines Co., Martek Biosciences Corp. and Wright Medical Group, Inc.
How was the Fund positioned relative to its benchmark index at the end of December 31, 2009?
The Fund’s largest overweight positions included the Energy and Financials sectors. The Fund’s largest underweight positions included the Health Care, Consumer Staples and Consumer Discretionary.
SECTOR ALLOCATIONS AT DECEMBER 31, 2009*
Percentage of Net Assets
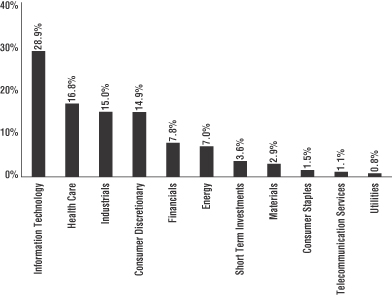
| * | The above graph categorizes investments using GICS. The percentages shown for each sector reflect the value of investments in that sector as a percentage of net assets. Figures in the above graph may not total to 100% due to the exclusion of the Fund’s other assets and liabilities. |
60
AIM SMALL CAP GROWTH FUND (Continued)
TOP TEN EQUITY HOLDINGS AT DECEMBER 31, 2009
| | | | | |
| | | % of Net Assets | | | Industry |
Informatica Corp. | | 1.5 | % | | Software |
TransDigm Group, Inc. | | 1.4 | | | Aerospace & Defense |
Quality Systems, Inc. | | 1.4 | | | Software |
Dril-Quip, Inc. | | 1.3 | | | Energy Equipment & Services |
Knight Transportation, Inc. | | 1.2 | | | Road & Rail |
Sybase, Inc. | | 1.1 | | | Software |
SBA Communications Corp. | | 1.1 | | | Wireless Telecommunication Services |
Costar Group, Inc. | | 1.1 | | | Commercial Services & Supplies |
Polycom, Inc. | | 1.1 | | | Communications Equipment |
Greif, Inc., Class A | | 1.1 | | | Containers & Packaging |
Comparison of Change in Value of a $10,000 Investment in the AIM Small Cap Growth Fund – Initial Class and the Russell 2000 Growth Index
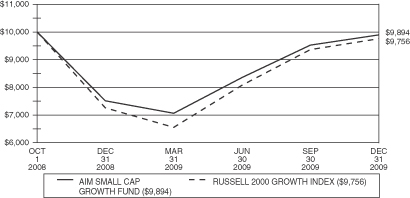
Comparison of Change in Value of a $10,000 Investment in the AIM Small Cap Growth Fund – Service Class and the Russell 2000 Growth Index

61
AIM SMALL CAP GROWTH FUND (Continued)
Average Annual Total Returns for Periods Ended December 31, 2009**
| | | | |
| | | One Year | | Life of
Fund*** |
AIM Small Cap Growth Fund-Initial Class Shares | | 31.75% | | (0.84)% |
AIM Small Cap Growth Fund-Service Class Shares | | 31.39% | | (1.16)% |
Russell 2000 Growth Index* | | 34.47% | | (1.95)% |
*The performance data of the index has been prepared from sources and data that the investment adviser believes to be reliable, but no representation is made as to their accuracy. The index is unmanaged and cannot be invested in directly. The Russell 2000 Growth Index measures the performance of those Russell 2000 companies with higher price-to-book ratios and higher forecasted growth values.
**Performance data is historical and includes changes in share price and reinvestment of income dividends and capital gains distributions. Past performance does not indicate future results. All Fund returns are net of fees and expenses, but do not include any insurance charges imposed in connection with your variable insurance contract. If this performance information included the effect of the insurance charges and the fees and expenses assumed by the investment adviser, performance numbers would be lower. The value of an investment in the AIM Small Cap Growth Fund and the return on the investment will fluctuate and redemption proceeds may be higher or lower than an investor’s original cost.
***For the period from October 1, 2008 (commencement of operations) to December 31, 2009.
62
ALLIANCEBERNSTEIN INTERNATIONAL VALUE FUND
(subadvised by AllianceBernstein L.P.)
MANAGEMENT’S DISCUSSION & ANALYSIS
How did the Fund perform during the year ended December 31, 2009?
AllianceBernstein International Value Fund (the “Fund”) underperformed its benchmark, the MSCI-EAFE Index (the “Index”), for the year ended December 31, 2009.
What economic and market factors most influenced the international equity markets as a whole during the year ended December 31, 2009?
Equity markets around the world delivered strong returns in 2009, led by dramatic rebounds in emerging markets and cyclically-sensitive stocks. The Index finished the year 31.78% higher in U.S. dollars, including a fourth-quarter gain of 2.18%. Fourth quarter performance was led by Industrial Commodities and Consumer Staples stocks, while Finance and Transportation stocks lagged.
Stock market returns in 2009 were driven largely by improving sentiment, as investors re-rated riskier stocks that had sold off excessively in 2008. The year began in a challenging way, as asset prices in many markets continued to fall as policymakers scrambled to combat the severe global economic slowdown. Global equity markets remained highly volatile, plunging to fresh lows before recovering in March as investors took heart from renewed government efforts to stabilize the banking system. During the second quarter, capital markets rebounded on growing evidence that aggressive policy action on a global scale had been successful at staving off a depression.
The global economic recovery broadened in late 2009 as evidence emerged that the U.S. and Europe had returned to positive growth, and much of Asia – including China, India, South Korea and Taiwan – posted near double-digit gains in the third quarter. A resurgence of domestic demand in these countries has added momentum to the economic recoveries of other nations, such as Japan and Australia, by boosting their exports. Global trade flows and consumer and business confidence have also rebounded.
How did the country allocations affect relative Fund performance during the year ended December 31, 2009?
The Fund’s country allocations are primarily a result of our bottom-up stock selection process. Security selection within countries was generally positive during the year, contributing to returns in Japan, France and Germany, while detracting in the United Kingdom. Country selection also contributed to overall performance. The Fund benefited from our underweight to Japan, and an overweight to the United Kingdom. Country selection detracted in Hong Kong and Singapore. Currency selection in the Fund was negative, however, as an underweight to the Australian dollar and overweight to the British Pound Sterling and the U.S. Dollar detracted from returns.
Which stocks contributed most to the Fund’s returns during the year ended December 31, 2009?
Top contributors were Nissan Motor Co., Ltd., Credit Suisse Group AG, Renault SA, Deutsche Bank AG and BNP Paribas. The depreciating yen helped automaker Nissan Motor Co., Ltd., which advanced further as a result of encouraging news about improved business performance in China.
Which stocks detracted from the Fund’s results during the year ended December 31, 2009?
Top detractors were overweight positions in Barclays PLC, Lloyds Banking Group PLC, and Nippon Telegraph & Telephone Corp. Also detracting was underweight positions in Royal Bank of Scotland Group PLC and Rio Tinto PLC.
63
ALLIANCEBERNSTEIN INTERNATIONAL VALUE FUND (Continued)
Did the Fund experience major changes to its top ten holdings during the year ended December 31, 2009?
Each of the top ten holdings in the Fund as of December 31, 2008 remains in the Fund as of December 31, 2009, though not necessarily in the top ten. There were four new top ten portfolio holdings as of December 31, 2009, including Rio Tinto PLC, which was added to the Fund in late 2009. Rio Tinto PLC is a UK-based diversified mining and exploration company. Our research indicates that Rio Tinto PLC is positioned to benefit from strong Chinese demand for iron ore.
How was the Fund positioned relative to its benchmark index at the end of December 31, 2009?
The Fund was overweight in United Kingdom, Germany, Canada and Korea and underweight in Japan, Switzerland, Australia and Sweden when compared to the Index. The Fund is overweight in Telecommunications and Financials and underweight in Consumer Discretionary and Health Care when compared to the Index.
Our sector and country overweights reflect the results of our bottom-up stock selection decisions, as we believe that undervalued companies may be found in all sectors and countries at different times. Our investment horizon is long-term and, as a result, the sector and country overweights in the Fund are likely to change relatively slowly.
COUNTRY ALLOCATIONS AT DECEMBER 31, 2009*
Percentage of Net Assets
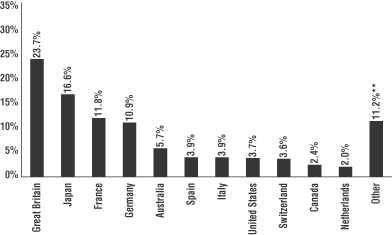
| * | The percentages shown for each country reflect the value of investments in that country as a percentage of net assets. Figures in the above graph may not total to 100% due to the exclusion of the Fund’s other assets and liabilities. |
| ** | Includes 16 countries with an allocation of less than 2% individually. |
64
ALLIANCEBERNSTEIN INTERNATIONAL VALUE FUND (Continued)
TOP TEN EQUITY HOLDINGS AT DECEMBER 31, 2009
| | | | | |
| | | % of Net Assets | | | Industry |
Royal Dutch Shell PLC | | 2.4 | % | | Oil, Gas & Consumable Fuels |
Vodafone Group PLC | | 2.1 | | | Wireless Telecommunication Services |
Banco Santander SA | | 2.0 | | | Commercial Banks |
BP PLC | | 1.9 | | | Oil, Gas & Consumable Fuels |
GlaxoSmithKline PLC | | 1.5 | | | Pharmaceuticals |
Rio Tinto PLC | | 1.4 | | | Metals & Mining |
Novartis AG | | 1.4 | | | Pharmaceuticals |
Allianz SE | | 1.4 | | | Insurance |
Telefonica SA | | 1.4 | | | Diversified Telecommunication Services |
Sanofi-Aventis SA | | 1.4 | | | Pharmaceuticals |
Comparison of Change in Value of a $10,000 Investment in the AllianceBernstein International Value Fund – Initial Class and the MSCI-EAFE Index
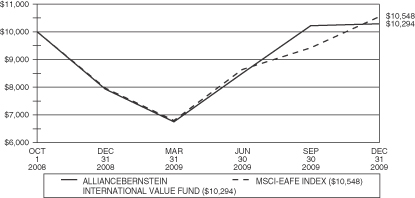
Comparison of Change in Value of a $10,000 Investment in the AllianceBernstein International Value Fund – Service Class and the MSCI-EAFE Index

65
ALLIANCEBERNSTEIN INTERNATIONAL VALUE FUND (Continued)
Average Annual Total Returns for Periods Ended December 31, 2009**
| | | | | | |
| | | One Year | | | Life of
Fund*** | |
AllianceBernstein International Value Fund-Initial Class Shares | | 29.71 | % | | 2.33 | % |
AllianceBernstein International Value Fund-Service Class Shares | | 29.26 | % | | 2.00 | % |
MSCI-EAFE Index* | | 31.78 | % | | 4.36 | % |
*The performance data of the index has been prepared from sources and data that the investment adviser believes to be reliable, but no representation is made as to their accuracy. The index is unmanaged and cannot be invested in directly. The MSCI-EAFE Index (Europe, Australasia, Far East) tracks performance of large cap international equity securities and is widely regarded as the standard for measuring large cap international stock market performance.
**Performance data is historical and includes changes in share price and reinvestment of income dividends and capital gains distributions. Past performance does not indicate future results. All Fund returns are net of fees and expenses, but do not include any insurance charges imposed in connection with your variable insurance contract. If this performance information included the effect of the insurance charges and the fees and expenses assumed by the investment adviser, performance numbers would be lower. The value of an investment in the AllianceBernstein International Value Fund and the return on the investment will fluctuate and redemption proceeds may be higher or lower than an investor’s original cost.
***For the period from October 1, 2008 (commencement of operations) to December 31, 2009.
66
BLACKROCK INFLATION PROTECTED BOND FUND
(subadvised by BlackRock Financial Management, Inc.)
MANAGEMENT’S DISCUSSION & ANALYSIS
How did the Fund perform during the year ended December 31, 2009?
BlackRock Inflation Protected Bond Fund (the “Fund”) underperformed its benchmark, the Barclays Capital Global Real Index: U.S. TIPS (the “Index”), for the year ended December 31, 2009.
What economic and market factors most influenced the fixed income markets as a whole during the year ended December 31, 2009?
U.S. Treasury Inflation Protected Securities (“TIPS”) outperformed nominal U.S. Treasuries during 2009 as aggressive government quantitative easing programs raised market inflation expectations. The markets became increasingly uncomfortable with the excess liquidity being provided by the Central Bank, and began looking toward inflation-linked bonds as a means of protecting portfolios from future inflation risk. In the short term, inflation risk continues to be on the downside as the Fed begins to reverse some of the stimulus measures put in place such as their asset purchase program and zero interest rate policy. In addition, the U.S. Treasury announced plans to increase TIPS as a percentage of issuance during 2010 reflecting both increased funding needs and a growing demand base from investors.
What key factors were most responsible for the Fund’s performance during the year ended December 31, 2009?
Fund performance for the year was positively affected by duration and yield curve management, as real yields rallied throughout the period driving breakeven levels (the difference in yields between TIPS and non-inflation bonds of similar maturities) wider and the yield curve steeper. In addition, the Fund benefited from its allocation to Agency Mortgage Backed Securities (“MBS”) which rallied throughout the year as the Fed provided support through its Agency MBS purchase program. Fund performance was negatively affected by our underweight exposure to TIPS with maturities of less than five years.
What changes did you make to the Fund’s sector allocations during the year ended December 31, 2009?
We reduced our exposure to TIPS with maturities less than five years starting in the latter half of the year due to low real yield levels, high breakeven levels and an increasing level of supply in the TIPS space. Although we continue to view the short end as expensive, shorter dated TIPS have continued to rally through the end of 2009.
How was the Fund positioned relative to its benchmark index at the end of December 31, 2009?
Inflation expectations remain high given that the Federal Reserve Board, in their latest meeting, reiterated their intention to keep interest rates “exceptionally low” for “an extended period” and said the economy is strengthening. Officials kept their benchmark overnight lending rate in a range of zero to 0.25%, where it has been for a year, re-stating that low interest rates are contingent on “low rates of resource utilization, subdued inflation trends, and stable inflation expectations.” The Fed also reaffirmed its plan to continue purchases of Agency MBS totaling $1.25 trillion and about $175 billion of agency debt through the first quarter of next year. We believe that the short end of the curve is trading rich, pricing in a high level of inflation expectations in the near term as a consequence of the Fed’s aggressive stimulus program. Overall, the Fund is neutral on breakevens which are pricing in fairly valued inflation expectations. In addition, the Fund’s duration is positioned slightly shorter than the benchmark given the low absolute level of real yields and expected supply of TIPS.
67
BLACKROCK INFLATION PROTECTED BOND FUND (Continued)
PORTFOLIO COMPOSITION AT DECEMBER 31, 2009*
Percentage of Net Assets
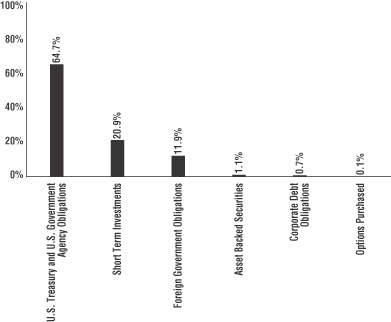
| * | The percentages shown for each investment category reflect the value of investments in that category as a percentage of net assets. Figures in the above graph may not total to 100% due to the exclusion of the Fund’s other assets and liabilities. |
TOP TEN ISSUERS AT DECEMBER 31, 2009
| | | | | |
| | | % of Net Assets | | | Category |
U.S. Treasury | | 51.1 | % | | U.S. Treasury |
Government of France | | 4.7 | | | Foreign Government |
Government National Mortgage Association | | 4.6 | | | U.S. Government Agency |
Federal National Mortgage Association | | 4.5 | | | U.S. Government Agency |
Federal Home Loan Mortgage Corp. | | 4.5 | | | U.S. Government Agency |
Bundesrepublik Deutschland | | 4.1 | | | Foreign Government |
Buoni Poliennali Del Tesoro | | 3.1 | | | Foreign Government |
Bank of America Credit Card Trust | | 0.5 | | | Asset Backed Securities |
Ford Credit Auto Owner Trust | | 0.5 | | | Asset Backed Securities |
Suncorp-Metway, Ltd. | | 0.4 | | | Corporate Debt – Financials |
68
BLACKROCK INFLATION PROTECTED BOND FUND (Continued)
Comparison of Change in Value of a $10,000 Investment in the BlackRock Inflation Protected Bond Fund – Initial Class and the Barclays Capital Global Real Index: U.S. TIPS
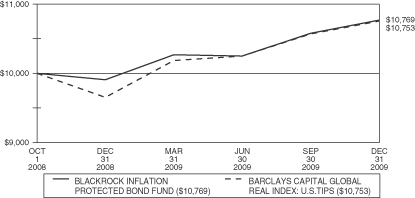
Comparison of Change in Value of a $10,000 Investment in the BlackRock Inflation Protected Bond Fund – Service Class and the Barclays Capital Global Real Index: U.S. TIPS
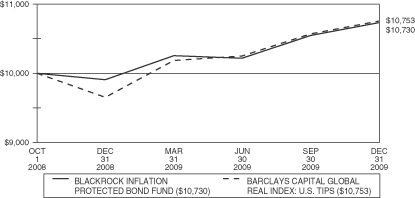
69
BLACKROCK INFLATION PROTECTED BOND FUND (Continued)
Average Annual Total Returns for Periods Ended December 31, 2009**
| | | | | | |
| | | One Year | | | Life of
Fund*** | |
BlackRock Inflation Protected Bond Fund-Initial Class Shares | | 8.72 | % | | 6.08 | % |
BlackRock Inflation Protected Bond Fund-Service Class Shares | | 8.34 | % | | 5.77 | % |
Barclays Capital Global Real Index: U.S. TIPS* | | 11.41 | % | | 5.98 | % |
*The performance data of the index has been prepared from sources and data that the investment adviser believes to be reliable, but no representation is made as to their accuracy. The index is unmanaged and cannot be invested in directly. Barclays Capital Global Real Index: U.S. TIPS is a market index comprised of all U.S. Treasury Inflation Protected Securities rated investment grade (Baa3 or better) that have at least one year to final maturity and at least $250 million par amount outstanding.
**Performance data is historical and includes changes in share price and reinvestment of income dividends and capital gains distributions. Past performance does not indicate future results. All Fund returns are net of fees and expenses, but do not include any insurance charges imposed in connection with your variable insurance contract. If this performance information included the effect of the insurance charges and the fees and expenses assumed by the investment adviser, performance numbers would be lower. The value of an investment in the BlackRock Inflation Protected Bond Fund and the return on the investment will fluctuate and redemption proceeds may be higher or lower than an investor’s original cost.
***For the period from October 1, 2008 (commencement of operations) to December 31, 2009.
70
IBBOTSON MODERATE, BALANCEDAND GROWTH FUNDS
(subadvised by Ibbotson Associates, Inc.)
MANAGEMENT’S DISCUSSION & ANALYSIS
What key economic and market factors most influenced management’s tactical asset allocation strategy for the Ibbotson Moderate, Balanced and Growth Funds (the “Funds”) during the year ended December 31, 2009?
The market disequilibrium and subsequent strong market rally that began in March served as the main drivers of Ibbotson’s dynamic asset allocation strategy in 2009. In June, we decided to reduce several dynamic overweights due to the significant increase in valuations for riskier assets that began in March. The overweight to high yield bonds and Treasury Inflation-Protected Securities (“TIPS”) at the expense of short-term bonds initiated in January, and the overweight held since inception to U.S. equities at the expense of Real Estate Investment Trusts (“REIT”) were moved back to neutral target allocations. The outlook for REITs improved as valuations improved. High yield bond yield spreads relative to government bonds narrowed considerably, but with the possibility of defaults still looming, we decided to move back to neutral and take some profit. Finally, we expected deflationary forces to keep inflation low in the near-term, so the TIPS overweight initiated in January was removed in June. In November, the Funds began to move to an overweight position in U.S. large cap equities at the expense of small cap equities as a way to reduce risks of a market retracement as large-cap equities should be less affected by short-term volatility.
What changes did you make to the Funds’ allocations during the reporting period and how did it affect performance during the year ended December 31, 2009?
In January, the Funds moved to an underweight in short-term bonds and an overweight in U.S. corporate bonds and TIPS relative to strategic asset class targets. In May, the Funds moved to an overweight in U.S. high yield bonds and back to a neutral weight in TIPS relative to their strategic asset class targets. This was sourced from the overweight previously held in core bonds. In June, the Ibbotson Balanced and Growth Funds removed their underweights in REITs that had existed since the Funds’ inceptions. In November, the Ibbotson Balanced and Growth Funds reduced their small-cap exposure and moved to an overweight in large-cap equities. The dynamic over- and underweights implemented in the Moderate and Balanced Funds over the year also contributed positively compared to these Funds’ strategic (long-term) targets. In the Growth Fund, during the month of December, the dynamic underweight to small-cap equities reduced the prior positive contributions to performance delivered by our dynamic shifts.
How did the Funds perform during the year ended December 31, 2009?
For the year ended December 31, 2009, the Ibbotson Moderate Fund (the “Moderate Fund”) outperformed its benchmark, the Dow Jones Moderately Conservative U.S. Relative Risk Portfolio Index; the Ibbotson Balanced Fund (the “Balanced Fund”) outperformed its benchmark, the Dow Jones Moderate U.S. Relative Risk Portfolio Index; and the Ibbotson Growth Fund (the “Growth Fund”) underperformed its benchmark, the Dow Jones Moderately Aggressive U.S. Relative Risk Portfolio Index.
What key factors were responsible for the Fund’s performance during the year ended December 31, 2009?
In the Moderate Fund, asset class diversification, dynamic shifts to the portfolio, and underlying fund performance all contributed positively to 2009 results. Compared to a basic, blended benchmark of the S&P 500 and Barclays Capital U.S. Aggregate Bond indices, the Fund’s exposure to high yield bonds and smaller-cap equities benefited performance. Fund selection was positive, as the Fund performed better than the Fund’s dynamic asset allocation targets constructed using a weighted-average of indices representing the targeted asset classes. Finally, dynamic over- and underweights implemented in the Fund over the year also contributed positively compared to the Fund’s strategic (long-term) targets.
71
IBBOTSON MODERATE, BALANCEDAND GROWTH FUNDS (Continued)
In the Balanced Fund, asset class diversification and our dynamic shifts to the portfolio contributed positively to 2009 performance. Compared to a basic, blended benchmark of the S&P 500 and Barclays Capital U.S. Aggregate Bond indices, the Fund’s exposure to emerging market equities and smaller-cap equities benefited performance. Manager-level performance detracted from overall performance, as the Fund slightly underperformed the Fund’s dynamic asset allocation targets constructed using a weighted-average of indices representing the targeted asset classes. However, dynamic over- and underweights implemented in the Fund over the year contributed positively compared to the Fund’s strategic or long-term targets.
Asset class diversification contributed positively to 2009 performance in the Growth Fund. Compared to a basic, blended benchmark of the S&P 500 and Barclays Capital U.S. Aggregate Bond indices, the Fund’s exposure to emerging market equities, high yield bonds and smaller-cap equities benefited performance. Fund-level performance was slightly negative, as the Fund slightly underperformed the Fund’s dynamic asset allocation targets constructed using a weighted-average of indices representing the targeted asset classes. Unfortunately, the dynamic underweight to small-cap equities initiated in November mitigated the prior positive contributions to performance delivered by our dynamic shifts in the Fund.
Which underlying funds were the most significant contributors/detractors to the Funds’ performance for the year ended December 31, 2009?
Moderate Fund
The Sun Capital Investment Grade Bond, SC Davis Venture Value, SC WMC Large Cap Growth, SC PIMCO High Yield and SC BlackRock Inflation Protected Bond funds were the most positive contributors to performance. There were no detractors from absolute performance; however, the SC PIMCO High Yield, SC WMC Blue Chip Mid Cap and SC Oppenheimer Large Cap Core funds experienced the largest underperformance relative to our asset class benchmarks.
Balanced Fund
The SC WMC Large Cap Growth, SC Davis Venture Value, MFS International Growth and MFS Value funds were the largest contributors to performance. There were no detractors from absolute performance; however, the SC PIMCO High Yield, SC WMC Blue Chip Mid Cap and SC Oppenheimer Large Cap Core funds experienced the largest underperformance relative to our asset class benchmarks.
Growth Fund
The SC WMC Large Cap Growth, MFS International Growth, SC Davis Venture Value, and MFS Value funds were the largest contributors to the Fund’s performance. There were no detractors from absolute performance; however, the SC PIMCO High Yield, SC WMC Blue Chip Mid Cap and SC Lord Abbett Growth & Income funds experienced the largest underperformance relative to our asset class benchmarks.
72
IBBOTSON MODERATE FUND
PORTFOLIO COMPOSITION AT DECEMBER 31, 2009*
Percentage of Net Assets
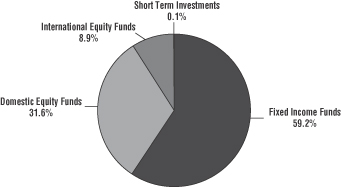
| * | The percentages shown for each investment category reflect the value of investments in that category as a percentage of net assets. Figures in the above graph may not total to 100% due to the exclusion of the Fund’s other assets and liabilities. |
TOP TEN INVESTMENT COMPANIES AT DECEMBER 31, 2009
| | | | | |
| | | % of Net Assets | | | Category |
SC Goldman Sachs Short Duration Fund | | 17.8 | % | | Fixed Income |
SC BlackRock Inflation Protected Bond Fund | | 12.9 | | | Fixed Income |
SC PIMCO Total Return Fund | | 12.9 | | | Fixed Income |
Sun Capital Investment Grade Bond Fund | | 10.9 | | | Fixed Income |
SC Davis Venture Value Fund | | 6.9 | | | Domestic Equity |
MFS Value Portfolio | | 6.9 | | | Domestic Equity |
SC WMC Large Cap Growth Fund | | 5.4 | | | Domestic Equity |
SC Goldman Sachs Mid Cap Value Fund | | 4.9 | | | Domestic Equity |
SC PIMCO High Yield Fund | | 4.6 | | | Fixed Income |
MFS International Growth Portfolio | | 4.0 | | | International Equity |
73
IBBOTSON MODERATE FUND (Continued)
Comparison of Change in Value of a $10,000 Investment in the Ibbotson Moderate Fund – Initial Class and the Dow Jones Moderately Conservative U.S. Relative Risk Portfolio Index
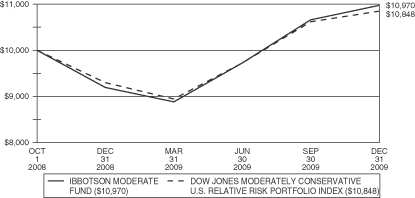
Comparison of Change in Value of a $10,000 Investment in the Ibbotson Moderate Fund – Service Class and the Dow Jones Moderately Conservative U.S. Relative Risk Portfolio Index

74
IBBOTSON MODERATE FUND (Continued)
Average Annual Total Returns for Periods Ended December 31, 2009**
| | | | | | |
| | | One Year | | | Life of
Fund*** | |
Ibbotson Moderate Fund-Initial Class Shares | | 19.37 | % | | 7.66 | % |
Ibbotson Moderate Fund-Service Class Shares | | 19.22 | % | | 7.45 | % |
Dow Jones Moderately Conservative U.S. Relative Risk Portfolio Index* | | 16.65 | % | | 6.73 | % |
*The performance data of the index has been prepared from sources and data that the investment adviser believes to be reliable, but no representation is made as to their accuracy. The index is unmanaged and cannot be invested in directly. The Dow Jones Relative Risk Indices measure the performance of conservative, moderate and aggressive portfolios based on incremental levels of potential risk. The indices are designed to systematically measure various levels of risk relative to the risk of a U.S. all-stock index. The Dow Jones Moderately Conservative U.S. Relative Risk Portfolio Index consists of 40% equities and 60% fixed income securities.
**Performance data is historical and includes changes in share price and reinvestment of income dividends and capital gains distributions. Past performance does not indicate future results. All Fund returns are net of fees and expenses, but do not include any insurance charges imposed in connection with your variable insurance contract. If this performance information included the effect of the insurance charges and the fees and expenses assumed by the investment adviser, performance numbers would be lower. The value of an investment in the Ibbotson Moderate Fund and the return on the investment will fluctuate and redemption proceeds may be higher or lower than an investor’s original cost.
***For the period from October 1, 2008 (commencement of operations) to December 31, 2009.
75
IBBOTSON BALANCED FUND
PORTFOLIO COMPOSITION AT DECEMBER 31, 2009*
Percentage of Net Assets
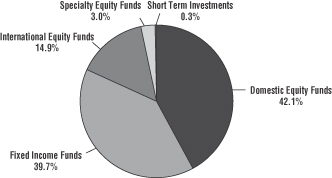
| * | The percentages shown for each investment category reflect the value of investments in that category as a percentage of net assets. Figures in the above graph may not total to 100% due to the exclusion of the Fund’s other assets and liabilities. |
TOP TEN INVESTMENT COMPANIES AT DECEMBER 31, 2009
| | | | | |
| | | % of Net Assets | | | Category |
SC Goldman Sachs Short Duration Fund | | 10.9 | % | | Fixed Income |
SC PIMCO Total Return Fund | | 9.9 | | | Fixed Income |
MFS Value Portfolio | | 9.8 | | | Domestic Equity |
SC Davis Venture Value Fund | | 8.9 | | | Domestic Equity |
Sun Capital Investment Grade Bond Fund | | 7.9 | | | Fixed Income |
SC WMC Large Cap Growth Fund | | 7.9 | | | Domestic Equity |
SC BlackRock Inflation Protected Bond Fund | | 7.0 | | | Fixed Income |
MFS International Growth Portfolio | | 5.9 | | | International Equity |
SC Goldman Sachs Mid Cap Value Fund | | 5.0 | | | Domestic Equity |
SC Oppenheimer Large Cap Core Fund | | 4.9 | | | Domestic Equity |
76
IBBOTSON BALANCED FUND (Continued)
Comparison of Change in Value of a $10,000 Investment in the Ibbotson Balanced Fund – Initial Class and the Dow Jones Moderate U.S. Relative Risk Portfolio Index

Comparison of Change in Value of a $10,000 Investment in the Ibbotson Balanced Fund – Service Class and the Dow Jones Moderate U.S. Relative Risk Portfolio Index
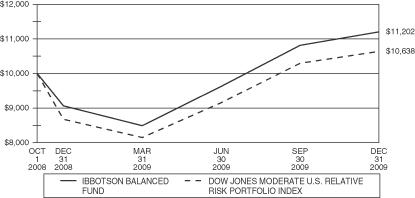
77
IBBOTSON BALANCED FUND (Continued)
Average Annual Total Returns for Periods Ended December 31, 2009**
| | | | | | |
| | | One Year | | | Life of
Fund*** | |
Ibbotson Balanced Fund-Initial Class Shares | | 23.91 | % | | 9.75 | % |
Ibbotson Balanced Fund-Service Class Shares | | 23.65 | % | | 9.47 | % |
Dow Jones Moderate U.S. Relative Risk Portfolio Index* | | 22.59 | % | | 5.07 | % |
*The performance data of the index has been prepared from sources and data that the investment adviser believes to be reliable, but no representation is made as to their accuracy. The index is unmanaged and cannot be invested in directly. The Dow Jones Relative Risk Indices measure the performance of conservative, moderate and aggressive portfolios based on incremental levels of potential risk. The indices are designed to systematically measure various levels of risk relative to the risk of a U.S. all-stock index. The Dow Jones Moderate U.S. Relative Risk Portfolio Index consists of 60% equities and 40% fixed income securities.
**Performance data is historical and includes changes in share price and reinvestment of income dividends and capital gains distributions. Past performance does not indicate future results. All Fund returns are net of fees and expenses, but do not include any insurance charges imposed in connection with your variable insurance contract. If this performance information included the effect of the insurance charges and the fees and expenses assumed by the investment adviser, performance numbers would be lower. The value of an investment in the Ibbotson Balanced Fund and the return on the investment will fluctuate and redemption proceeds may be higher or lower than an investor’s original cost.
***For the period from October 1, 2008 (commencement of operations) to December 31, 2009.
78
IBBOTSON GROWTH FUND
PORTFOLIO COMPOSITION AT DECEMBER 31, 2009*
Percentage of Net Assets
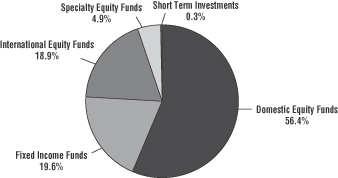
| * | The percentages shown for each investment category reflect the value of investments in that category as a percentage of net assets. Figures in the above graph may not total to 100% due to the exclusion of the Fund’s other assets and liabilities. |
TOP TEN INVESTMENT COMPANIES AT DECEMBER 31, 2009
| | | | | |
| | | % of Net Assets | | | Category |
SC WMC Large Cap Growth Fund | | 12.3 | % | | Domestic Equity |
MFS Value Portfolio | | 10.7 | | | Domestic Equity |
SC Davis Venture Value Fund | | 10.3 | | | Domestic Equity |
SC PIMCO Total Return Fund | | 8.8 | | | Fixed Income |
MFS International Growth Portfolio | | 7.9 | | | International Equity |
SC Oppenheimer Large Cap Core Fund | | 6.8 | | | Domestic Equity |
Sun Capital Global Real Estate Fund | | 4.9 | | | Specialty Equity |
SC AllianceBernstein International Value Fund | | 4.9 | | | International Equity |
SC Goldman Sachs Mid Cap Value Fund | | 4.9 | | | Domestic Equity |
Sun Capital Investment Grade Bond Fund | | 4.9 | | | Fixed Income |
79
IBBOTSON GROWTH FUND (Continued)
Comparison of Change in Value of a $10,000 Investment in the Ibbotson Growth Fund – Initial Class and the Dow Jones Moderately Aggressive U.S. Relative Risk Portfolio Index
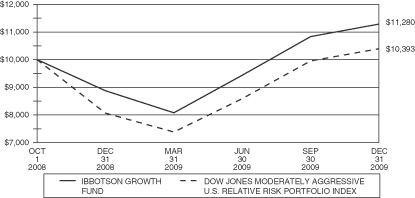
Comparison of Change in Value of a $10,000 Investment in the Ibbotson Growth Fund – Service Class and the Dow Jones Moderately Aggressive U.S. Relative Risk Portfolio Index
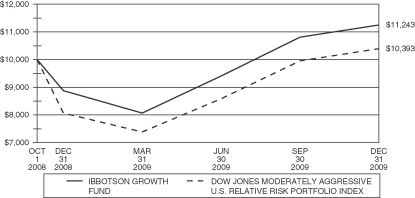
80
IBBOTSON GROWTH FUND (Continued)
Average Annual Total Returns for Periods Ended December 31, 2009**
| | | | | | |
| | | One Year | | | Life of
Fund*** | |
Ibbotson Growth Fund-Initial Class Shares | | 27.17 | % | | 10.07 | % |
Ibbotson Growth Fund-Service Class Shares | | 26.75 | % | | 9.79 | % |
Dow Jones Moderately Aggressive U.S. Relative Risk Portfolio Index* | | 28.84 | % | | 3.13 | % |
*The performance data of the index has been prepared from sources and data that the investment adviser believes to be reliable, but no representation is made as to their accuracy. The index is unmanaged and cannot be invested in directly. The Dow Jones Relative Risk Indices measure the performance of conservative, moderate and aggressive portfolios based on incremental levels of potential risk. The indices are designed to systematically measure various levels of risk relative to the risk of a U.S. all-stock index. The Dow Jones Moderately Aggressive U.S. Relative Risk Portfolio Index consists of 80% equities and 20% fixed income securities.
**Performance data is historical and includes changes in share price and reinvestment of income dividends and capital gains distributions. Past performance does not indicate future results. All Fund returns are net of fees and expenses, but do not include any insurance charges imposed in connection with your variable insurance contract. If this performance information included the effect of the insurance charges and the fees and expenses assumed by the investment adviser, performance numbers would be lower. The value of an investment in the Ibbotson Growth Fund and the return on the investment will fluctuate and redemption proceeds may be higher or lower than an investor’s original cost.
***For the period from October 1, 2008 (commencement of operations) to December 31, 2009.
81
EXPENSE INFORMATION
December 31, 2009 (Unaudited)
Information About Your Fund’s Expenses
All mutual funds incur ongoing operating expenses, including management fees and administrative services, among others. The following table is intended to increase your understanding of the ongoing costs of investing in each Fund. The following example is based on the investment of $1,000 on July 1, 2009 and held for the six month period ended December 31, 2009. Expense information does not include any insurance charges imposed in connection with your variable insurance contract.
Actual Expenses: The table below provides information about actual account values and actual expenses. You may use the actual account values and actual expense information below, together with the amount you invested, to estimate the expenses you paid over the period. To do so, simply divide your account value by $1,000 (for example, an $8,600 account value divided by $1,000 = 8.6), then multiply the result by the number given for your Fund under the heading “Actual Expenses Paid During Period”. In addition, Ibbotson Moderate Fund, Ibbotson Balanced Fund and Ibbotson Growth Fund, as shareholders in underlying funds, indirectly bear a pro rata share of the fees and expenses incurred by the underlying funds. These fees and expenses are not included in the annualized expense ratios used to calculate the “Net Expense Ratio During Period” for the Ibbotson Funds.
Hypothetical (5% annual return before expenses): The table below also provides information about hypothetical account values and hypothetical expenses for comparison purposes. The hypothetical account values and hypothetical expenses are based on each Fund’s actual expense ratio and an assumed rate of return of 5% per year before expenses, which is not the actual return of the Fund. The hypothetical account values and expenses may not be used to estimate the actual ending account balance or expenses you paid for the period. However, you may use this information to compare the ongoing costs of investing in the Funds with the hypothetical examples that appear in the shareholder reports of other mutual funds. In addition, Ibbotson Moderate Fund, Ibbotson Balanced Fund and Ibbotson Growth Fund, as shareholders in underlying funds, indirectly bear a pro rata share of the fees and expenses incurred by the underlying funds. These fees and expenses are not included in the annualized expense ratios used to calculate the “Net Expense Ratio During Period” for the Ibbotson Funds.
Expense Information
| | | | | | | | | | | | | | | | | | |
| | | Beginning
Account
Value
7/1/09 | | Actual
Ending
Account
Value
12/31/09 | | Hypothetical
Ending
Account
Value | | Actual
Expenses
Paid
During
Period* | | Hypothetical
Expenses
Paid During
Period* | | Net
Expense
Ratio
During
Period | |
Investment Grade Bond | | | | | | | | | | | | | | | | | | |
Initial Class | | $ | 1,000.00 | | $ | 1,082.40 | | $ | 1,021.42 | | $ | 3.94 | | $ | 3.82 | | 0.75 | % |
Service Class | | | 1,000.00 | | | 1,080.60 | | | 1,020.16 | | | 5.24 | | | 5.09 | | 1.00 | |
Money Market | | | | | | | | | | | | | | | | | | |
Initial Class | | | 1,000.00 | | | 1,001.20 | | | 1,025.00 | | | 0.20 | | | 0.20 | | 0.04 | |
Service Class | | | 1,000.00 | | | 1,000.00 | | | 1,023.89 | | | 1.31 | | | 1.33 | | 0.26 | |
Global Real Estate | | | | | | | | | | | | | | | | | | |
Initial Class | | | 1,000.00 | | | 1,336.50 | | | 1,019.66 | | | 6.48 | | | 5.60 | | 1.10 | |
Service Class | | | 1,000.00 | | | 1,335.20 | | | 1,018.40 | | | 7.95 | | | 6.87 | | 1.35 | |
Davis Venture Value | | | | | | | | | | | | | | | | | | |
Initial Class | | | 1,000.00 | | | 1,239.00 | | | 1,020.67 | | | 5.08 | | | 4.58 | | 0.90 | |
Service Class | | | 1,000.00 | | | 1,236.70 | | | 1,019.41 | | | 6.48 | | | 5.85 | | 1.15 | |
Oppenheimer Main Street Small Cap | | | | | | | | | | | | | | | | | | |
Initial Class | | | 1,000.00 | | | 1,212.60 | | | 1,020.16 | | | 5.58 | | | 5.09 | | 1.00 | |
Service Class | | | 1,000.00 | | | 1,213.00 | | | 1,018.90 | | | 6.97 | | | 6.36 | | 1.25 | |
82
EXPENSE INFORMATION (Continued)
December 31, 2009 (Unaudited)
| | | | | | | | | | | | | | | | | | |
| | | Beginning
Account
Value
7/1/09 | | Actual
Ending
Account
Value
12/31/09 | | Hypothetical
Ending
Account
Value | | Actual
Expenses
Paid
During
Period* | | Hypothetical
Expenses
Paid During
Period* | | Net
Expense
Ratio
During
Period | |
Oppenheimer Large Cap Core | | | | | | | | | | | | | | | | | | |
Initial Class | | $ | 1,000.00 | | $ | 1,214.50 | | $ | 1,020.67 | | $ | 5.02 | | $ | 4.58 | | 0.90 | % |
Service Class | | | 1,000.00 | | | 1,213.80 | | | 1,019.41 | | | 6.42 | | | 5.85 | | 1.15 | |
WMC Large Cap Growth | | | | | | | | | | | | | | | | | | |
Initial Class | | | 1,000.00 | | | 1,233.40 | | | 1,021.12 | | | 4.56 | | | 4.13 | | 0.81 | |
Service Class | | | 1,000.00 | | | 1,233.30 | | | 1,019.86 | | | 5.97 | | | 5.40 | | 1.06 | |
WMC Blue Chip Mid Cap | | | | | | | | | | | | | | | | | | |
Initial Class | | | 1,000.00 | | | 1,219.60 | | | 1,020.16 | | | 5.59 | | | 5.09 | | 1.00 | |
Service Class | | | 1,000.00 | | | 1,219.50 | | | 1,018.90 | | | 6.99 | | | 6.36 | | 1.25 | |
Lord Abbett Growth & Income | | | | | | | | | | | | | | | | | | |
Initial Class | | | 1,000.00 | | | 1,195.40 | | | 1,020.82 | | | 4.81 | | | 4.43 | | 0.87 | |
Service Class | | | 1,000.00 | | | 1,194.30 | | | 1,019.56 | | | 6.19 | | | 5.70 | | 1.12 | |
Goldman Sachs Mid Cap Value | | | | | | | | | | | | | | | | | | |
Initial Class | | | 1,000.00 | | | 1,294.20 | | | 1,019.86 | | | 6.13 | | | 5.40 | | 1.06 | |
Service Class | | | 1,000.00 | | | 1,294.90 | | | 1,018.60 | | | 7.58 | | | 6.67 | | 1.31 | |
Goldman Sachs Short Duration | | | | | | | | | | | | | | | | | | |
Initial Class | | | 1,000.00 | | | 1,020.30 | | | 1,021.93 | | | 3.31 | | | 3.31 | | 0.65 | |
Service Class | | | 1,000.00 | | | 1,019.00 | | | 1,020.67 | | | 4.58 | | | 4.58 | | 0.90 | |
Dreman Small Cap Value | | | | | | | | | | | | | | | | | | |
Initial Class | | | 1,000.00 | | | 1,262.50 | | | 1,019.41 | | | 6.56 | | | 5.85 | | 1.15 | |
Service Class | | | 1,000.00 | | | 1,259.60 | | | 1,018.15 | | | 7.97 | | | 7.12 | | 1.40 | |
PIMCO High Yield | | | | | | | | | | | | | | | | | | |
Initial Class | | | 1,000.00 | | | 1,187.90 | | | 1,021.42 | | | 4.14 | | | 3.82 | | 0.75 | |
Service Class | | | 1,000.00 | | | 1,186.50 | | | 1,020.16 | | | 5.51 | | | 5.09 | | 1.00 | |
PIMCO Total Return | | | | | | | | | | | | | | | | | | |
Initial Class | | | 1,000.00 | | | 1,056.30 | | | 1,021.93 | | | 3.37 | | | 3.31 | | 0.65 | |
Service Class | | | 1,000.00 | | | 1,054.90 | | | 1,020.67 | | | 4.66 | | | 4.58 | | 0.90 | |
AIM Small Cap Growth | | | | | | | | | | | | | | | | | | |
Initial Class | | | 1,000.00 | | | 1,183.50 | | | 1,019.41 | | | 6.33 | | | 5.85 | | 1.15 | |
Service Class | | | 1,000.00 | | | 1,181.50 | | | 1,018.15 | | | 7.70 | | | 7.12 | | 1.40 | |
AllianceBernstein International Value | | | | | | | | | | | | | | | | | | |
Initial Class | | | 1,000.00 | | | 1,211.40 | | | 1,021.42 | | | 4.18 | | | 3.82 | | 0.75 | |
Service Class | | | 1,000.00 | | | 1,208.60 | | | 1,020.16 | | | 5.57 | | | 5.09 | | 1.00 | |
BlackRock Inflation Protected Bond | | | | | | | | | | | | | | | | | | |
Initial Class | | | 1,000.00 | | | 1,050.80 | | | 1,021.93 | | | 3.36 | | | 3.31 | | 0.65 | |
Service Class | | | 1,000.00 | | | 1,050.00 | | | 1,020.67 | | | 4.65 | | | 4.58 | | 0.90 | |
Ibbotson Moderate Fund | | | | | | | | | | | | | | | | | | |
Initial Class | | | 1,000.00 | | | 1,128.60 | | | 1,024.20 | | | 1.07 | | | 1.02 | | 0.20 | |
Service Class | | | 1,000.00 | | | 1,127.10 | | | 1,022.94 | | | 2.41 | | | 2.29 | | 0.45 | |
Ibbotson Balanced Fund | | | | | | | | | | | | | | | | | | |
Initial Class | | | 1,000.00 | | | 1,164.60 | | | 1,024.20 | | | 1.09 | | | 1.02 | | 0.20 | |
Service Class | | | 1,000.00 | | | 1,163.30 | | | 1,022.94 | | | 2.45 | | | 2.29 | | 0.45 | |
Ibbotson Growth Fund | | | | | | | | | | | | | | | | | | |
Initial Class | | | 1,000.00 | | | 1,196.10 | | | 1,024.20 | | | 1.11 | | | 1.02 | | 0.20 | |
Service Class | | | 1,000.00 | | | 1,194.80 | | | 1,022.94 | | | 2.49 | | | 2.29 | | 0.45 | |
| * | For each class of the Fund, expenses are equal to the six-month annualized expense ratio for the class, multiplied by the average account value over the period, multiplied by the number of days in the most recent six-month period divided by the number of days in the year. |
83
INVESTMENT GRADE BOND FUND
| | |
PORTFOLIO OF INVESTMENTS December 31, 2009 | | Sun Capital Advisers Trust |
| | | | | | | | | |
| | | Country
Code* | | Principal
Amount
(000) | | Value | |
| | | | | | | | | |
| | | | | | | | | |
ASSET BACKED SECURITIES – 0.2% | | | | |
Airplanes Pass Through Trust, Series D (1) 10.88%, 3/15/12 | | | | $ | 494 | | $ | — | ** |
SLM Student Loan Trust, Series 2008-5, Class A2 (2)
1.38%, 10/25/16 | | | | | 160 | | | 162,450 | |
SLM Student Loan Trust, Series 2008-5, Class A4 (2)
1.98%, 7/25/23 | | | | | 215 | | | 224,694 | |
| | | | | | | | | |
Total Asset Backed Securities
(Cost $636,775) | | | 387,144 | |
| | | | | | | | | |
COLLATERALIZED MORTGAGE
OBLIGATIONS – 2.9% | |
JP Morgan Mortgage Trust,
Series 2003-A1,
Class 1A1 (2)
4.31%, 10/25/33 | | | | | 1,431 | | | 1,357,000 | |
JP Morgan Mortgage Trust,
Series 2005-A5,
Class TA1 (2)
5.43%, 8/25/35 | | | | | 1,014 | | | 925,510 | |
MLCC Mortgage Investors, Inc.,
Series 2006-2,
Class 2A (2)
5.36%, 5/25/36 | | | | | 2,461 | | | 2,130,692 | |
Wamu Mortgage Pass Through Certificates,
Series 2004-AR14,
Class A1 (2)
2.87%, 1/25/35 | | | | | 1,424 | | | 1,329,821 | |
| | | | | | | | | |
Total Collateralized Mortgage Obligations
(Cost $5,810,423) | | | 5,743,023 | |
| | | | | | | | | |
COMMERCIAL MORTGAGE BACKED
SECURITIES – 2.8% | |
Banc of America Mortgage Securities, Inc., Series 2003-H, Class 2A3 (2)
3.83%, 9/25/33 | | | | | 860 | | | 797,755 | |
| | | | | | | | |
| | | Country
Code* | | Principal
Amount
(000) | | Value |
| | | | | | | | |
Banc of America Mortgage Securities, Inc., Series 2005-E, Class 2A7 (2)
4.60%, 6/25/35 | | | | $ | 640 | | $ | 430,399 |
Bear Stearns Commercial Mortgage Securities Series 2007-T28, Class A3
5.79%, 9/11/42 | | | | | 1,000 | | | 1,002,276 |
Citigroup/Deutsche Bank Commercial Mortgage Trust, Series 2005-C1,
Class A3 (2)
5.22%, 7/15/44 | | | | | 750 | | | 754,613 |
Commercial Mortgage Asset Trust,
Series 1999-C1,
Class F (3)
6.25%, 1/17/32 | | | | | 400 | | | 262,664 |
CS First Boston Mortgage Securities Corp.,
Series 2000-C1,
Class A2
7.55%, 4/15/62 | | | | | 100 | | | 100,375 |
GMAC Commercial Mortgage Securities, Inc.,
Series 2003-C1,
Class A2
4.08%, 5/10/36 | | | | | 800 | | | 797,696 |
GMAC Commercial Mortgage Securities, Inc.,
Series 2003-C3,
Class A2
4.22%, 4/10/40 | | | | | 75 | | | 75,763 |
GS Mortgage Securities Corp.,
Series 2005-GG4, Class AJ
4.78%, 7/10/39 | | | | | 700 | | | 532,855 |
See Notes to Financial Statements.
84
INVESTMENT GRADE BOND FUND
| | |
PORTFOLIO OF INVESTMENTS (Continued) December 31, 2009 | | Sun Capital Advisers Trust |
| | | | | | | | |
| | | Country
Code* | | Principal
Amount
(000) | | Value |
| | | | | | | | |
| | | | | | | | |
JP Morgan Chase Commercial Mortgage Securities Corp.,
Series 2005-LDP5 Mortgage Certificate,
Class A3 (2)
5.21%, 12/15/44 | | | | $ | 550 | | $ | 550,034 |
JP Morgan Chase Commercial Mortgage Securities Corp.,
Series 2006-LDP7 Mortgage Certificate,
Class AM (2)
5.87%, 4/15/45 | | | | | 500 | | | 399,762 |
| | | | | | | | |
Total Commercial Mortgage
Backed Securities
(Cost $6,251,874) | | | 5,704,192 |
| | | | | | | | |
CORPORATE DEBT OBLIGATIONS – 39.5% |
AUTOMOTIVE – 0.9% | | | | | | |
Ford Motor Credit Co. LLC (2)
3.03%, 1/13/12 | | | | | 2,000 | | | 1,860,000 |
| | | | | | | | |
BANKS – 7.3% | | | | | | | | |
ANZ National (International) Ltd. (3)
2.38%, 12/21/12 | | NZ | | | 2,500 | | | 2,481,790 |
Barclays Bank PLC
2.50%, 1/23/13 | | GB | | | 3,000 | | | 2,996,547 |
Capital One Capital III
7.69%, 8/15/36 | | | | | 700 | | | 644,000 |
Citigroup, Inc.
6.13%, 5/15/18 | | | | | 1,000 | | | 1,005,408 |
Commonwealth Bank of Australia (3)
5.00%, 10/15/19 | | AU | | | 2,000 | | | 1,985,662 |
Countrywide Financial Corp.
6.25%, 5/15/16 | | | | | 325 | | | 330,579 |
GMAC LLC
7.00%, 2/1/12 | | | | | 300 | | | 295,500 |
Huntington Capital (2)
6.65%, 5/15/37 | | | | | 300 | | | 185,802 |
ICICI Bank, Ltd. (2)(3)
6.38%, 4/30/22 | | IN | | | 300 | | | 269,314 |
| | | | | | | | |
| | | Country
Code* | | Principal
Amount
(000) | | Value |
| | | | | | | | |
JPMorgan Chase & Co. (2)
0.78%, 1/22/10 | | | | $ | 1,000 | | $ | 1,000,308 |
Lloyds Banking Group PLC (2)(3)
5.92%, Perpetual | | GB | | | 500 | | | 300,000 |
Merrill Lynch & Co., Inc.
5.70%, 5/2/17 | | | | | 400 | | | 392,069 |
Morgan Stanley
4.00%, 1/15/10 | | | | | 750 | | | 750,545 |
4.20%, 11/20/14 | | | | | 2,000 | | | 2,001,396 |
| | | | | | | | |
| | | | | | | | 14,638,920 |
| | | | | | | | |
BROKERAGE – 0.2% | | | | | | | | |
Jefferies Group, Inc.
6.25%, 1/15/36 | | | | | 500 | | | 398,447 |
| | | | | | | | |
BUILDING MATERIALS – 0.2% | | | |
C10 Capital SPV., Ltd. (2)(3)
6.72%, Perpetual | | VG | | | 650 | | | 458,146 |
| | | | | | | | |
CABLE – 0.3% | | | | | | | | |
Time Warner Entertainment Co.
10.15%, 5/1/12 | | | | | 500 | | | 575,404 |
| | | | | | | | |
CONSUMER PRODUCTS – 0.5% | | | |
Procter & Gamble International Funding SCA (2)
0.29%, 5/7/10 | | LU | | | 1,000 | | | 999,547 |
| | | | | | | | |
DIVERSIFIED – 0.8% | | | | | | |
Hutchison Whampoa International Ltd. (3)
4.63%, 9/11/15 | | KY | | | 1,480 | | | 1,493,305 |
| | | | | | | | |
ELECTRIC UTILITIES – 6.1% | | | |
Allegheny Energy Supply Co. LLC (3)
5.75%, 10/15/19 | | | | | 1,500 | | | 1,456,993 |
8.25%, 4/15/12 | | | | | 750 | | | 820,554 |
Ameren Corp.
8.88%, 5/15/14 | | | | | 2,000 | | | 2,246,446 |
Centerpoint Energy, Inc.
6.50%, 5/1/18 | | | | | 750 | | | 772,071 |
See Notes to Financial Statements.
85
INVESTMENT GRADE BOND FUND
| | |
PORTFOLIO OF INVESTMENTS (Continued) December 31, 2009 | | Sun Capital Advisers Trust |
| | | | | | | | |
| | | Country
Code* | | Principal
Amount
(000) | | Value |
| | | | | | | | |
| | | | | | | | |
Enel Finance International SA (3) 5.13%, 10/7/19 | | LU | | $ | 2,000 | | $ | 2,012,352 |
Kansas Gas & Electric Co. (3)
6.70%, 6/15/19 | | | | | 750 | | | 833,482 |
Nisource Finance Corp.
6.40%, 3/15/18 | | | | | 1,650 | | | 1,714,951 |
PSEG Energy Holdings, Inc. 8.50%, 6/15/11 | | | | | 200 | | | 209,250 |
Toledo Edison Co. 7.25%, 5/1/20 | | | | | 1,850 | | | 2,111,098 |
| | | | | | | | |
| | | | | | | | 12,177,197 |
| | | | | | | | |
ELECTRONIC EQUIPMENT & INSTRUMENTS – 0.5% |
Jabil Circuit, Inc.
7.75%, 7/15/16 | | | | | 1,000 | | | 1,050,000 |
| | | | | | | | |
FINANCIALS – 1.9% | | | | | | | | |
Allied Capital Corp. 6.00%, 4/1/12 | | | | | 500 | | | 448,878 |
American Capital Strategies, Ltd.
8.85%, 8/1/12 | | | | | 650 | | | 614,250 |
Discover Financial Services
6.45%, 6/12/17 | | | | | 650 | | | 608,358 |
Hyundai Capital Services (3)
6.00%, 5/5/15 | | KR | | | 2,000 | | | 2,088,328 |
| | | | | | | | |
| | | | | | | | 3,759,814 |
| | | | | | | | |
GAMING – 0.7% | | | | | | | | |
Mashantucket Western Pequot Tribe (1)(3) 8.50%, 11/15/15 | | | | | 1,000 | | | 245,000 |
MGM MIRAGE, Inc. (3)
11.13%, 11/15/17 | | | | | 1,000 | | | 1,107,500 |
| | | | | | | | |
| | | | | | | | 1,352,500 |
| | | | | | | | |
GAS & PIPELINE UTILITIES – 1.5% | | | |
Enterprise Products Operating LP (2) 7.03%, 1/15/68 | | | | | 1,000 | | | 917,500 |
Florida Gas Transmission Co. LLC (3)
7.90%, 5/15/19 | | | | | 1,000 | | | 1,170,435 |
| | | | | | | | |
| | | Country
Code* | | Principal
Amount
(000) | | Value |
| | | | | | | | |
Southern Union Co. (2)
7.20%, 11/1/66 | | | | $ | 380 | | $ | 324,900 |
TransCanada PipeLines, Ltd. (2)
6.35%, 5/15/67 | | CA | | | 600 | | | 562,960 |
| | | | | | | | |
| | | | | | | | 2,975,795 |
| | | | | | | | |
HOME CONSTRUCTION – 0.3% | | | |
KB Home & Broad Home Corp.
6.38%, 8/15/11 | | | | | 650 | | | 650,000 |
| | | | | | | | |
INSURANCE – 3.1% | | | | | | |
American International Group, Inc.
8.25%, 8/15/18 | | | | | 650 | | | 610,252 |
Assured Guaranty US Holdings, Inc. (2) 6.40%, 12/15/66 | | | | | 600 | | | 432,000 |
Humana, Inc.
6.45%, 6/1/16 | | | | | 500 | | | 505,404 |
Liberty Mutual Group, Inc. (3)
7.80%, 3/15/37 | | | | | 750 | | | 618,750 |
New York Life Global Funding (3)
2.25%, 12/14/12 | | | | | 2,000 | | | 1,988,544 |
Prudential Financial, Inc.
3.63%, 9/17/12 | | | | | 2,000 | | | 2,029,586 |
| | | | | | | | |
| | | | | | | | 6,184,536 |
| | | | | | | | |
MACHINERY – 0.5% | | | | | | | | |
Case New Holland, Inc. (3)
7.75%, 9/1/13 | | | | | 1,000 | | | 1,022,500 |
| | | | | | | | |
MANUFACTURING – DIVERSIFIED – 2.3% |
Ingersoll Rand Global Holding Co., Ltd. 9.50%, 4/15/14 | | BM | | | 1,750 | | | 2,091,140 |
Textron, Inc.
7.25%, 10/1/19 | | | | | 2,500 | | | 2,587,675 |
| | | | | | | | |
| | | | | | | | 4,678,815 |
| | | | | | | | |
METALS & MINING – 2.7% | | | | | | |
Anglo American Capital PLC (3)
9.38%, 4/8/14 | | GB | | | 1,800 | | | 2,159,888 |
See Notes to Financial Statements.
86
INVESTMENT GRADE BOND FUND
| | |
PORTFOLIO OF INVESTMENTS (Continued) December 31, 2009 | | Sun Capital Advisers Trust |
| | | | | | | | |
| | | Country
Code* | | Principal
Amount
(000) | | Value |
| | | | | | | | |
| | | | | | | | |
ArcelorMittal
9.85%, 6/1/19 | | LU | | $ | 1,137 | | $ | 1,470,598 |
Teck Resources, Ltd. 9.75%, 5/15/14 | | CA | | | 1,000 | | | 1,153,750 |
United States Steel Corp.
6.05%, 6/1/17 | | | | | 700 | | | 668,267 |
| | | | | | | | |
| | | | | | | | 5,452,503 |
| | | | | | | | |
OIL FIELD SERVICES – 0.6% | | | |
Pride International, Inc.
8.50%, 6/15/19 | | | | | 1,000 | | | 1,155,000 |
| | | | | | | | |
PAPER PRODUCTS – 0.6% | | | | | | |
International Paper Co. 9.38%, 5/15/19 | | | | | 1,000 | | | 1,229,171 |
| | | | | | | | |
REAL ESTATE INVESTMENT TRUSTS – 4.0% |
Commercial Net Lease Realty
6.25%, 6/15/14 | | | | | 550 | | | 558,901 |
Dexus Finance Property, Ltd. (3)
7.13%, 10/15/14 | | AU | | | 2,000 | | | 2,055,028 |
Prologis
6.63%, 5/15/18 | | | | | 750 | | | 711,280 |
Realty Income Corp. 6.75%, 8/15/19 | | | | | 500 | | | 489,607 |
Reckson Operating Partnership
5.15%, 1/15/11 | | | | | 700 | | | 697,527 |
Simon Property
Group LP
5.75%, 5/1/12 | | | | | 550 | | | 577,773 |
10.35%, 4/1/19 | | | | | 750 | | | 942,050 |
Westfield Capital Corp. MULT (3)
5.13%, 11/15/14 | | | | | 2,000 | | | 2,063,312 |
| | | | | | | | |
| | | | | | | | 8,095,478 |
| | | | | | | | |
RETAIL – 1.1% | | | | | | | | |
Controladora Comercial Mexicana S.A. de C.V. (1) 6.63%, 6/1/15 | | MX | | | 600 | | | 323,163 |
J.C. Penney Co., Inc.
5.75%, 2/15/18 | | | | | 425 | | | 419,156 |
QVC, Inc. (3)
7.50%, 10/1/19 | | | | | 1,500 | | | 1,530,000 |
| | | | | | | | |
| | | | | | | | 2,272,319 |
| | | | | | | | |
| | | | | | | | |
| | | Country
Code* | | Principal
Amount
(000) | | Value |
| | | | | | | | |
SOFTWARE – 0.4% | | | | | | | | |
Fiserv, Inc.
6.80%, 11/20/17 | | | | $ | 700 | | $ | 772,413 |
| | | | | | | | |
TELECOMMUNICATIONS – 1.5% | | | |
American Tower Corp. (3)
4.63%, 4/1/15 | | | | | 2,000 | | | 2,022,910 |
Sprint Capital Corp. 6.90%, 5/1/19 | | | | | 400 | | | 368,000 |
Telecom Italia Capital SpA
5.25%, 10/1/15 | | LU | | | 600 | | | 627,328 |
| | | | | | | | |
| | | | | | | | 3,018,238 |
| | | | | | | | |
TRANSPORTATION – 0.5% | | | |
CSX Corp.
6.25%, 3/15/18 | | | | | 1,000 | | | 1,076,823 |
| | | | | | | | |
UTILITIES – 1.0% | | | | | | | | |
Massachusetts Electric Co. (3)
5.90%, 11/15/39 | | | | | 2,000 | | | 2,030,628 |
| | | | | | | | |
Total Corporate Debt Obligations
(Cost $77,856,464) | | | 79,377,499 |
| | | | | | | | |
RESIDENTIAL NON-AGENCY MORTGAGE BACKED SECURITIES – 2.0% |
JP Morgan Mortgage Trust,
Series 2005-A3,
Class 7CA1 (2)
5.01%, 6/25/35 | | | | | 42 | | | 33,705 |
Master Adjustable Rate Mortgage Trust,
Series 2006-2,
Class 3A1 (2)
4.84%, 1/25/36 | | | | | 211 | | | 170,275 |
Residential Accredited Loans, Inc.,
4.81%, 7/25/35 (2) | | | | | 838 | | | 551,916 |
5.50%, 9/25/33 | | | | | 67 | | | 65,549 |
Wamu Mortgage Pass Through Certificates, (2)
2.82%, 10/25/33 | | | | | 435 | | | 387,400 |
5.61%, 1/25/36 | | | | | 250 | | | 95,677 |
See Notes to Financial Statements.
87
INVESTMENT GRADE BOND FUND
| | |
PORTFOLIO OF INVESTMENTS (Continued) December 31, 2009 | | Sun Capital Advisers Trust |
| | | | | | | | |
| | | Country
Code* | | Principal
Amount
(000) | | Value |
| | | | | | | | |
| | | | | | | | |
Wells Fargo Mortgage Backed Securities Trust, Series 2004-AA,
Class A1 (2)
4.98%, 12/25/34 | | $ | 934 | | $ | 902,908 |
Wells Fargo Mortgage Backed Securities Trust, Series 2004-K,
Class 1A2 (2)
4.46%, 7/25/34 | | | 1,414 | | | 1,353,676 |
Wells Fargo Mortgage Backed Securities Trust,
Series 2005-AR 16 (2)
5.00%, 10/25/35 | | | 500 | | | 415,560 |
| | | | | | | | |
Total Residential Non-Agency
Mortgage Backed Securities
(Cost $4,177,767) | | | 3,976,666 |
| | | | | | | | |
U.S. GOVERNMENT GUARANTEED NOTES – 0.5% |
TLGP GE Capital Corp. (2)
0.34%, 3/11/11
(Cost $1,000,000) | | | | | 1,000 | | | 1,002,291 |
| | | | | | | | |
U.S. TREASURY AND U.S. GOVERNMENT AGENCY OBLIGATIONS – 35.0% |
Federal Home Loan Mortgage Corp.
2.73%, 8/1/32 (2) | | | | | 36 | | | 36,710 |
5.00%, 9/1/19 | | | | | 206 | | | 216,362 |
5.00%, 11/1/19 | | | | | 419 | | | 440,552 |
5.00%, TBA | | | | | 13,900 | | | 14,251,837 |
5.50%, 10/1/17 | | | | | 103 | | | 109,903 |
5.50%, 11/1/17 | | | | | 207 | | | 220,740 |
5.50%, 6/1/33 | | | | | 219 | | | 230,488 |
5.50%, 9/1/37 | | | | | 970 | | | 1,016,805 |
5.50%, 5/1/38 | | | | | 142 | | | 148,891 |
5.50%, 2/1/39 | | | | | 309 | | | 324,128 |
6.00%, 1/1/17 | | | | | 66 | | | 71,181 |
6.00%, 2/1/29 | | | | | 14 | | | 14,826 |
6.00%, 8/1/37 | | | | | 538 | | | 571,530 |
6.50%, 10/1/16 | | | | | 36 | | | 39,229 |
6.50%, 11/1/16 | | | | | 4 | | | 4,585 |
6.50%, 9/1/34 | | | | | 248 | | | 267,340 |
7.00%, 11/1/29 | | | | | 20 | | | 22,028 |
| | | | | | | | |
| | | Country
Code* | | Principal
Amount
(000) | | Value |
| | | | | | | | |
7.00%, 1/1/31 | | | | $ | 7 | | $ | 7,933 |
7.00%, 4/1/31 | | | | | 4 | | | 3,957 |
7.00%, 8/1/31 | | | | | 153 | | | 168,324 |
7.50%, 3/1/30 | | | | | 5 | | | 5,890 |
7.50%, 12/1/30 | | | | | 16 | | | 18,379 |
Federal National Mortgage Association
| | | |
4.50%, 6/1/19 | | | | | 838 | | | 871,180 |
5.00%, 6/1/18 | | | | | 258 | | | 272,104 |
5.00%, 7/1/20 | | | | | 595 | | | 625,906 |
5.00%, 10/1/20 | | | | | 238 | | | 249,699 |
5.00%, 12/1/20 | | | | | 139 | | | 145,687 |
5.00%, 10/1/35 | | | | | 41 | | | 42,132 |
5.00%, 5/1/36 | | | | | 1,681 | | | 1,718,283 |
5.00%, 7/1/36 | | | | | 445 | | | 457,897 |
5.00%, 9/1/39 | | | | | 12,739 | | | 13,086,414 |
5.50%, 3/1/22 | | | | | 249 | | | 264,256 |
5.50%, 12/1/32 | | | | | 786 | | | 827,357 |
5.50%, 6/1/35 | | | | | 857 | | | 900,026 |
5.50%, 8/1/35 | | | | | 542 | | | 569,651 |
5.50%, 6/1/37 | | | | | 1,664 | | | 1,743,652 |
5.50%, 11/1/38 | | | | | 8,177 | | | 8,568,913 |
6.00%, 12/1/13 | | | | | 2 | | | 2,159 |
6.00%, 11/1/16 | | | | | 13 | | | 13,495 |
6.00%, 1/25/32 | | | | | 1,047 | | | 1,116,153 |
6.00%, 12/1/36 | | | | | 626 | | | 665,117 |
6.00%, 11/1/37 | | | | | 567 | | | 601,965 |
6.00%, 10/1/38 | | | | | 284 | | | 300,640 |
8.00%, 8/1/30 | | | | | 3 | | | 3,419 |
Government National Mortgage Association
| | | |
6.00%, 8/15/16 | | | 27 | | | 28,474 |
6.00%, TBA | | | | | 300 | | | 316,969 |
6.50%, 9/15/31 | | | | | 64 | | | 69,390 |
6.50%, 3/15/32 | | | | | 43 | | | 45,932 |
6.50%, 9/15/32 | | | | | 80 | | | 86,472 |
6.50%, 10/15/32 | | | | | 120 | | | 129,168 |
7.00%, 12/15/14 | | | | | 22 | | | 23,799 |
7.00%, 2/15/28 | | | | | 16 | | | 17,429 |
7.50%, 3/15/30 | | | | | 3 | | | 3,457 |
7.50%, 9/15/30 | | | | | 35 | | | 39,258 |
U.S. Treasury Inflation Indexed Bonds
1.88%, 7/15/13 | | | | | 1,177 | | | 1,239,599 |
2.00%, 1/15/14 | | | | | 6,142 | | | 6,495,250 |
See Notes to Financial Statements.
88
INVESTMENT GRADE BOND FUND
| | |
PORTFOLIO OF INVESTMENTS (Continued) December 31, 2009 | | Sun Capital Advisers Trust |
| | | | | | | | |
| | | Country
Code* | | Principal
Amount
(000) | | Value |
| | | | | | | | |
| | | | | | | | |
U.S. Treasury Notes 2.38%, 3/31/16 | | | | $ | 5,000 | | $ | 4,783,595 |
4.25%, 11/15/14 | | | | | 5,000 | | | 5,385,940 |
4.25%, 11/15/17 | | | | | 500 | | | 524,063 |
| | | | | | | | |
Total U.S. Treasury and U.S. Government Agency Obligations
(Cost $68,917,826) | | | 70,426,518 |
| | | | | | | | |
SHORT TERM INVESTMENTS – 23.7% | | | |
COMMERCIAL PAPER (4) – 10.7% | | | |
Coca-Cola Co. (3)
0.10%, 1/21/10 | | | | | 1,648 | | | 1,647,909 |
0.14%, 1/14/10 | | | | | 1,875 | | | 1,874,905 |
HSBC Finance Corp. 0.17%, 1/15/10 | | | | | 6,000 | | | 5,999,603 |
Microsoft Corp. (3) 0.10%, 1/12/10 | | | | | 921 | | | 920,972 |
0.15%, 5/10/10 | | | | | 1,200 | | | 1,199,355 |
Nestle Finance International Ltd. 0.10%, 2/22/10 | | LU | | | 2,436 | | | 2,435,648 |
Philip Morris International, Inc. (3) 0.09%, 1/15/10 | | | | | 6,545 | | | 6,544,771 |
Procter & Gamble International Funding SCA (3)
0.10%, 1/19/10 | | LU | | | 1,000 | | | 999,950 |
| | | | | | | | |
Total Commercial Paper
(Cost $21,623,113) | | | 21,623,113 |
| | | | | | | | |
FOREIGN GOVERNMENT OBLIGATIONS (4) – 1.5% |
Province of British Columbia
0.09%, 3/18/10 | | CA | | | 1,595 | | | 1,594,697 |
Province of Quebec (3) 0.10%, 1/15/10 | | CA | | | 1,500 | | | 1,499,942 |
| | | | | | | | |
Total Foreign Government Obligations
(Cost $3,094,639) | | | 3,094,639 |
| | | | | | | | |
| | | | | | | | | |
| | | Country
Code* | | Principal
Amount
(000) | | Value | |
| | | | | | | | | |
FOREIGN GOVERNMENT SPONSORED COMMERCIAL PAPER (4) – 4.0% | | | | |
European Investment Bank SNAT
0.08%, 1/21/10 | | | | $ | 2,000 | | $ | 1,999,911 | |
KFW International Finance, Inc. (3) 0.14%, 3/29/10 | | DE | | | 4,240 | | | 4,238,565 | |
0.20%, 1/13/10 | | DE | | | 1,725 | | | 1,724,885 | |
| | | | | | | | | |
Total Foreign Government Sponsored Commercial Paper
(Cost $7,963,361) | | | 7,963,361 | |
| | | | | | | | | |
| | | | | Shares | | | |
MUTUAL FUNDS – 7.5% | | | | |
Federated Prime Obligation Fund | | | 7,271,118 | | | 7,271,118 | |
State Street Institutional Liquid Reserves Fund | | | 7,797,699 | | | 7,797,699 | |
| | | | | | | | | |
Total Mutual Funds
(Cost $15,068,817) | | | | | | 15,068,817 | |
| | | | | | | | | |
Total Short Term Investments
(Cost $47,749,930) | | | | | | 47,749,930 | |
| | | | | | | | | |
TOTAL INVESTMENTS – 106.6% | | | | |
(Cost $212,401,059) | | | | | | 214,367,263 | |
Liabilities in excess of other assets – (6.6)% | | | | | | (13,327,608 | ) |
| | | | | | | | | |
NET ASSETS – 100.0% | | | | | $ | 201,039,655 | |
| | | | | | | | | |
| * | Unless otherwise noted the issuer country code for all securities is United States. |
| ** | Security is fair valued by management. |
| (1) | Security is in default and is non-income producing. |
| (2) | Variable rate security. The interest rate shown reflects the rate in effect at the period end. |
| (3) | Eligible for resale under rule 144A or exempt from registration under Section 4(2) of the Securities Act of 1933. These securities may be resold in transactions exempt from registration. At the period end, the value of these securities amounted to $53,128,339, representing 26.4% of net assets. |
| (4) | Interest rates represent annualized yield at date of purchase. |
See Notes to Financial Statements.
89
INVESTMENT GRADE BOND FUND
| | |
PORTFOLIO OF INVESTMENTS (Continued) December 31, 2009 | | Sun Capital Advisers Trust |
| | |
| MULT | | Multinational |
| SNAT | | Supranational |
| TBA | | To Be Announced. Securities are purchased on a forward commitment basis with an approximate principal amount and no definite maturity date. The actual principal and maturity date will be determined upon settlement when the specific mortgage pools are assigned. At the period end, total market value of the TBA securities amounts to $14,568,806 which represents approximately 7.2% of net assets. |
| TLGP | | Temporary Liquidity Guarantee Program. Under the Temporary Liquidity Guarantee Program, the Federal Deposit Insurance Corporation guarantees principal and interest in the event of payment default or bankruptcy until the earlier of maturity date of the debt or until June 30, 2012. |
| |
| AU | | Australia |
| BM | | Bermuda |
| CA | | Canada |
| DE | | Germany |
| GB | | Great Britain |
| IN | | India |
| KR | | Korea, Republic Of |
| KY | | Cayman Islands |
| LU | | Luxembourg |
| MX | | Mexico |
| NZ | | New Zealand |
| VG | | British Virgin Islands |
| (5) | Fair Value Measurements † |
The following table summarizes the inputs used to value the Fund’s assets and liabilities, as applicable, measured at fair value at the period end:
| | | | | | | | | | | | | |
Assets | | Quoted Prices
in Active
Markets for
Identical
Assets and
Liabilities
(Level 1) | | Significant
Other
Observable
Inputs
(Level 2) | | Significant
Unobservable
Inputs
(Level 3) | | | Total |
Asset Backed Securities | | $ | — | | $ | 387,144 | | $ | — | * | | $ | 387,144 |
Collateralized Mortgage Obligations | | | — | | | 5,743,023 | | | — | | | | 5,743,023 |
Commercial Mortgage Backed Securities | | | — | | | 5,704,192 | | | — | | | | 5,704,192 |
Corporate Debt Obligations (a) | | | — | | | 79,377,499 | | | — | | | | 79,377,499 |
Residential Non-Agency Mortgage Backed Securities | | | — | | | 3,976,666 | | | — | | | | 3,976,666 |
U.S. Government Guaranteed Notes | | | — | | | 1,002,291 | | | — | | | | 1,002,291 |
U.S. Treasury and U.S. Government Agency Obligations | | | 18,428,447 | | | 51,998,071 | | | — | | | | 70,426,518 |
Short Term Investments | | | | | | | | | | | | | |
Commercial Paper | | | — | | | 21,623,113 | | | — | | | | 21,623,113 |
Foreign Government Obligations | | | — | | | 3,094,639 | | | — | | | | 3,094,639 |
Foreign Government Sponsored Commercial Paper | | | — | | | 7,963,361 | | | — | | | | 7,963,361 |
Mutual Funds | | | 15,068,817 | | | — | | | — | | | | 15,068,817 |
| | | | | | | | | | | | | |
Total Short Term Investments | | | 15,068,817 | | | 32,681,113 | | | — | | | | 47,749,930 |
| | | | | | | | | | | | | |
Total Investments | | | 33,497,264 | | | 180,869,999 | | | — | * | | | 214,367,263 |
| | | | | | | | | | | | | |
Total | | $ | 33,497,264 | | $ | 180,869,999 | | $ | — | * | | $ | 214,367,263 |
| | | | | | | | | | | | | |
| † | See Note 2b in the Notes to Financial Statements for additional information. |
| * | The only investment held by the Fund whose fair value was determined using Level 3 inputs had a value of $0 and $0 at December 31, 2008, and December 31, 2009. |
| (a) | See Portfolio of Investments for additional detailed categorizations. |
See Notes to Financial Statements.
90
MONEY MARKET FUND
| | |
PORTFOLIO OF INVESTMENTS December 31, 2009 | | Sun Capital Advisers Trust |
| | | | | | | | |
| | | Country
Code* | | Principal
Amount
(000) | | Value |
| | | | | | | | |
| | | | | | | | |
COMMERCIAL PAPER (1) – 33.1% | | | |
Bank of Montreal
0.12%, 1/29/10 | | CA | | $ | 5,600 | | $ | 5,599,477 |
Coca-Cola Co. (2)
0.10%, 1/21/10 | | | | | 550 | | | 549,969 |
0.14%, 1/14/10 | | | | | 3,450 | | | 3,449,826 |
0.17%, 3/15/10 | | | | | 3,000 | | | 2,998,966 |
Goldman Sachs Group, Inc.
0.10%, 1/22/10 | | | | | 5,600 | | | 5,599,673 |
HSBC Finance Corp.
0.17%, 1/15/10 | | | | | 5,700 | | | 5,699,623 |
Microsoft Corp. (2)
0.15%, 4/14/10 | | | | | 1,650 | | | 1,649,292 |
0.15%, 5/10/10 | | | | | 800 | | | 799,570 |
0.17%, 6/8/10 | | | | | 4,035 | | | 4,031,990 |
Nestle Capital Corp. (2)
0.23%, 2/12/10 | | LU | | | 3,000 | | | 2,999,195 |
0.30%, 2/8/10 | | LU | | | 1,000 | | | 999,683 |
Nestle Finance International Ltd.
0.09%, 2/10/10 | | LU | | | 2,000 | | | 1,999,800 |
0.10%, 2/22/10 | | LU | | | 1,000 | | | 999,856 |
Philip Morris International, Inc. (2)
0.18%, 1/19/10 | | | | | 2,463 | | | 2,462,778 |
0.27%, 3/25/10 | | | | | 3,540 | | | 3,537,796 |
0.30%, 3/25/10 | | | | | 1,000 | | | 999,308 |
Procter & Gamble International Funding SCA (2)
0.10%, 1/19/10 | | LU | | | 3,000 | | | 2,999,850 |
Rabobank USA Financial Corp.
0.09%, 1/6/10 | | | | | 2,558 | | | 2,557,968 |
0.10%, 1/4/10 | | | | | 1,833 | | | 1,832,985 |
Societe Generale North America
0.15%, 1/7/10 | | | | | 500 | | | 499,988 |
0.20%, 1/15/10 | | | | | 3,000 | | | 2,999,767 |
0.22%, 1/8/10 | | | | | 1,922 | | | 1,921,918 |
State Street Corp.
0.19%, 1/5/10 | | | | | 5,500 | | | 5,499,884 |
| | | | | | | | |
| | | Country
Code* | | Principal
Amount
(000) | | Value |
| | | | | | | | |
Toyota Credit de Puerto Rico
0.16%, 3/1/10 | | PR | | $ | 4,895 | | $ | 4,893,716 |
| | | | | | | | |
Total Commercial Paper
(Amortized cost $67,582,878) | | | 67,582,878 |
| | | | | | | | |
CORPORATE DEBT OBLIGATIONS – 7.2% |
BANKS – 4.1% | | | | | | | | |
JPMorgan Chase & Co. (3)
0.78%, 1/22/10 | | | | | 3,401 | | | 3,402,031 |
Morgan Stanley
0.56%, 1/15/10 (3) | | | | | 500 | | | 499,993 |
4.00%, 1/15/10 | | | | | 4,500 | | | 4,505,889 |
| | | | | | | | |
| | | | | | | | 8,407,913 |
| | | | | | | | |
CHEMICALS – 1.1% | | | | | | | | |
E.I. du Pont de Nemours and Co.
4.13%, 4/30/10 | | | | | 2,299 | | | 2,327,321 |
| | | | | | | | |
CONSUMER PRODUCTS – 2.0% | | | |
Procter & Gamble International Funding SCA (3) 0.29%, 5/7/10 | | LU | | | 4,000 | | | 4,000,000 |
| | | | | | | | |
Total Corporate Debt Obligations
(Amortized cost $14,735,234) | | | 14,735,234 |
| | | | | | | | |
FOREIGN GOVERNMENT
OBLIGATIONS (1) – 17.4% |
Export Development Canada
0.17%, 5/20/10 | | CA | | | 7,000 | | | 6,995,405 |
Government of Canada Bills
0.08%, 3/11/10 | | CA | | | 4,000 | | | 3,999,387 |
0.15%, 5/17/10 | | CA | | | 1,250 | | | 1,249,292 |
0.30%, 1/12/10 | | CA | | | 1,345 | | | 1,344,877 |
Province of British Columbia
0.15%, 2/8/10 | | CA | | | 1,000 | | | 999,842 |
0.17%, 1/13/10 | | CA | | | 7,000 | | | 6,999,603 |
Province of Ontario
0.13%, 2/4/10 | | CA | | | 7,000 | | | 6,999,140 |
Province of Quebec (2)
0.10%, 1/7/10 | | CA | | | 1,500 | | | 1,499,975 |
0.10%, 1/15/10 | | CA | | | 3,500 | | | 3,499,864 |
0.17%, 1/11/10 | | CA | | | 2,000 | | | 1,999,905 |
| | | | | | | | |
Total Foreign Government
Obligations
(Amortized cost $35,587,290) | | | 35,587,290 |
| | | | | | | | |
See Notes to Financial Statements.
91
MONEY MARKET FUND
| | |
PORTFOLIO OF INVESTMENTS (Continued) December 31, 2009 | | Sun Capital Advisers Trust |
| | | | | | | | |
| | | Country
Code* | | Principal
Amount
(000) | | Value |
| | | | | | | | |
| | | | | | | | |
FOREIGN GOVERNMENT SPONSORED COMMERCIAL PAPER (1) – 5.9% |
European Investment Bank SNAT
0.08%, 1/21/10 | | | | $ | 5,060 | | $ | 5,059,775 |
KFW International Finance, Inc. (2)
0.15%, 2/2/10 | | DE | | | 2,000 | | | 1,999,733 |
0.16%, 1/20/10 | | DE | | | 1,000 | | | 999,916 |
0.19%, 1/20/10 | | DE | | | 4,000 | | | 3,999,599 |
| | | | | | | | |
Total Foreign Government
Sponsored Commercial Paper
(Amortized cost $12,059,023) | | | 12,059,023 |
| | | | | | | | |
U.S. GOVERNMENT GUARANTEED NOTES – 11.8% |
TLGP Bank of America NA (3)
0.33%, 7/29/10 | | | | | 5,000 | | | 5,000,000 |
TLGP GE Capital Corp. (3)
0.34%, 3/11/11 | | | | | 7,000 | | | 7,000,000 |
TLGP Goldman Sachs Group, Inc. (3)
0.33%, 3/15/11 | | | | | 12,000 | | | 12,000,000 |
| | | | | | | | |
Total U.S. Government
Guaranteed Notes
(Amortized cost $24,000,000) | | | 24,000,000 |
| | | | | | | | |
U.S. GOVERNMENT AGENCY OBLIGATIONS (1) – 22.0% |
Federal Home Loan Mortgage Corp. Discount Notes |
0.03%, 2/2/10 | | | | | 614 | | | 613,984 |
0.07%, 3/12/10 | | | | | 1,356 | | | 1,355,815 |
0.10%, 1/28/10 | | | | | 3,682 | | | 3,681,724 |
| | | | | | | | |
| | | Country
Code* | | Principal
Amount
(000) | | Value |
| | | | | | | | |
0.10%, 3/11/10 | | | | $ | 4,475 | | $ | 4,474,142 |
0.12%, 1/25/10 | | | | | 509 | | | 508,961 |
0.13%, 3/1/10 | | | | | 3,585 | | | 3,584,236 |
0.13%, 3/15/10 | | | | | 1,204 | | | 1,203,683 |
0.14%, 4/26/10 | | | | | 670 | | | 669,711 |
0.28%, 1/11/10 | | | | | 2,385 | | | 2,384,815 |
0.28%, 2/8/10 | | | | | 1,000 | | | 999,704 |
Federal National Mortgage Association Discount Notes |
0.03%, 2/4/10 | | | | | 4,220 | | | 4,219,880 |
0.07%, 2/23/10 | | | | | 5,500 | | | 5,499,433 |
0.08%, 3/1/10 | | | | | 1,373 | | | 1,372,820 |
0.11%, 4/19/10 | | | | | 4,240 | | | 4,238,601 |
0.18%, 3/17/10 | | | | | 5,685 | | | 5,682,868 |
0.23%, 7/1/10 | | | | | 4,515 | | | 4,509,779 |
| | | | | | | | |
Total U.S. Government
Agency Obligations
(Amortized cost $45,000,156) | | | 45,000,156 |
| | | | | | | | |
| | | | | Shares | | |
MUTUAL FUNDS – 2.5% |
Federated Prime Obligation Fund | | | 2,056,442 | | | 2,056,442 |
State Street Institutional Liquid Reserves Fund | | | 2,973,712 | | | 2,973,712 |
| | | | | | | | |
Total Mutual Funds
(Cost $5,030,154) | | | | | | 5,030,154 |
| | | | | | | | |
TOTAL INVESTMENTS – 99.9% | | | |
(Cost $203,994,735) | | | | | | 203,994,735 |
Other assets less
liabilities – 0.1% | | | | | | 300,201 |
| | | | | | | | |
NET ASSETS – 100.0% | | | | | $ | 204,294,936 |
| | | | | | | | |
| * | Unless otherwise noted the issuer country code for all securities is United States. |
| (1) | Interest rates represent annualized yield at date of purchase. |
| (2) | Security exempt from registration under Section 4(2) of the Securities Act of 1933. These securities may be resold in transactions exempt from registration. At the period end, the value of these securities amounted to $41,477,215, representing 20.3% of net assets. |
| (3) | Variable rate security. The interest rate shown reflects the rate in effect at the period end. |
| | |
| SNAT | | Supranational |
| TLGP | | Temporary Liquidity Guarantee Program. Under the Temporary Liquidity Guarantee Program, the Federal Deposit Insurance Corporation guarantees principal and interest in the event of payment default or bankruptcy until the earlier of maturity date of the debt or until June 30, 2012. |
See Notes to Financial Statements.
92
MONEY MARKET FUND
| | |
PORTFOLIO OF INVESTMENTS (Continued) December 31, 2009 | | Sun Capital Advisers Trust |
| | |
| CA | | Canada |
| DE | | Germany |
| LU | | Luxembourg |
| PR | | PuertoRico |
| (4) | Fair Value Measurements † |
The following table summarizes the inputs used to value the Fund’s assets and liabilities, as applicable, measured at fair value at the period end:
| | | | | | | | | | | | |
Assets | | Quoted Prices
in Active
Markets for
Identical
Assets and
Liabilities
(Level 1) | | Significant
Other
Observable
Inputs
(Level 2) | | Significant
Unobservable
Inputs
(Level 3) | | Total |
Commercial Paper | | $ | — | | $ | 67,582,878 | | $ | — | | $ | 67,582,878 |
Corporate Debt Obligations (a) | | | — | | | 14,735,234 | | | — | | | 14,735,234 |
Foreign Government Obligations | | | — | | | 35,587,290 | | | — | | | 35,587,290 |
Foreign Government Sponsored Commercial Paper | | | — | | | 12,059,023 | | | — | | | 12,059,023 |
U.S. Government Guaranteed Notes | | | — | | | 24,000,000 | | | — | | | 24,000,000 |
U.S. Government Agency Obligations | | | — | | | 45,000,156 | | | — | | | 45,000,156 |
Mutual Funds | | | 5,030,154 | | | — | | | — | | | 5,030,154 |
| | | | | | | | | | | | |
Total Investments | | | 5,030,154 | | | 198,964,581 | | | — | | | 203,994,735 |
| | | | | | | | | | | | |
Total | | $ | 5,030,154 | | $ | 198,964,581 | | $ | — | | $ | 203,994,735 |
| | | | | | | | | | | | |
| † | See Note 2b in the Notes to Financial Statements for additional information. |
| (a) | See Portfolio of Investments for additional detailed categorizations. |
See Notes to Financial Statements.
93
GLOBAL REAL ESTATE FUND
| | |
PORTFOLIO OF INVESTMENTS December 31, 2009 | | Sun Capital Advisers Trust |
| | | | | | | |
| | | Country
Code** | | Shares | | Value |
| | | | | | | |
| | | | | | | |
COMMON STOCKS – 97.4% | | | | | |
PAPER & FOREST PRODUCTS – 1.7% | | | |
Weyerhaeuser Co. | | | | 87,908 | | $ | 3,792,351 |
| | | | | | | |
REAL ESTATE INVESTMENT TRUSTS – 67.2% |
DIVERSIFIED – 8.1% | | | |
British Land Co. PLC | | GB | | 285,723 | | | 2,200,177 |
Land Securities Group PLC | | GB | | 301,018 | | | 3,313,183 |
Stockland | | AU | | 1,690,453 | | | 5,955,834 |
Vornado Realty Trust | | | | 95,121 | | | 6,652,763 |
| | | | | | | |
| | | | | | | 18,121,957 |
| | | | | | | |
INDUSTRIAL – 5.3% | | | |
Goodman Group | | AU | | 7,669,222 | | | 4,338,822 |
Segro PLC | | GB | | 1,372,560 | | | 7,613,287 |
| | | | | | | |
| | | | | | | 11,952,109 |
| | | | | | | |
MORTGAGE – 1.3% | | | |
Starwood Property Trust, Inc. | | | | 161,447 | | | 3,049,734 |
| | | | | | | |
OFFICE – 11.6% | | | |
Alexandria Real Estate Equities, Inc. | | | | 34,690 | | | 2,230,220 |
BioMed Realty Trust, Inc. | | | | 329,546 | | | 5,200,236 |
Boston Properties, Inc. | | | | 54,190 | | | 3,634,523 |
Digital Realty Trust, Inc. | | | | 111,131 | | | 5,587,667 |
Douglas Emmett, Inc. | | | | 95,430 | | | 1,359,877 |
Lexington Corporate Properties Trust | | | | 499,822 | | | 3,038,918 |
Nippon Building Fund, Inc. | | JP | | 651 | | | 4,947,692 |
| | | | | | | |
| | | | | | | 25,999,133 |
| | | | | | | |
RESIDENTIAL – 3.9% | | | |
AvalonBay Communities, Inc. | | | | 27,345 | | | 2,245,298 |
Equity Lifestyle Properties, Inc. | | | | 21,826 | | | 1,101,558 |
Equity Residential Properties Trust | | | | 88,915 | | | 3,003,549 |
| | | | | | | |
| | | Country
Code** | | Shares | | Value |
| | | | | | | |
Home Properties, Inc. | | | | 24,226 | | $ | 1,155,822 |
Mid-America Apartment Communities, Inc. | | | | 23,652 | | | 1,141,919 |
| | | | | | | |
| | | | | | | 8,648,146 |
| | | | | | | |
RETAIL – 28.2% | | | |
CFS Retail Property Trust | | AU | | 2,055,940 | | | 3,500,782 |
Corio NV | | NL | | 48,479 | | | 3,302,867 |
Federal Realty Investment Trust | | | | 24,164 | | | 1,636,386 |
Hammerson PLC | | GB | | 694,126 | | | 4,724,529 |
Kimco Realty Corp. | | | | 182,750 | | | 2,472,607 |
Klepierre | | FR | | 32,992 | | | 1,336,679 |
Mercialys | | FR | | 103,026 | | | 3,626,612 |
Simon Property Group, Inc. | | | | 142,708 | | | 11,388,098 |
The Link REIT | | HK | | 3,410,151 | | | 8,666,626 |
Unibail-Rodamco | | FR | | 45,216 | | | 9,933,052 |
Westfield Group | | AU | | 1,115,891 | | | 12,488,948 |
| | | | | | | |
| | | | | | | 63,077,186 |
| | | | | | | |
SPECIALIZED – 8.8% | | | |
HCP, Inc. | | | | 90,093 | | | 2,751,440 |
Medical Properties Trust, Inc. | | | | 373,192 | | | 3,731,920 |
Plum Creek Timber Co., Inc. | | | | 85,671 | | | 3,234,937 |
Public Storage | | | | 65,092 | | | 5,301,743 |
Ventas, Inc. | | | | 107,698 | | | 4,710,711 |
| | | | | | | |
| | | | | | | 19,730,751 |
| | | | | | | |
| | | | | | | 150,579,016 |
| | | | | | | |
REAL ESTATE MANAGEMENT & DEVELOPMENT – 26.7% |
DIVERSIFIED REAL ESTATE ACTIVITIES – 21.2% | | | |
Beni Stabili S.p.A | | IT | | 1,287,339 | | | 1,053,216 |
Capitaland Ltd. | | SG | | 2,727,003 | | | 8,089,816 |
Hang Lung Properties, Ltd. | | HK | | 1,781,598 | | | 6,984,490 |
Mitsubishi Estate Co. Ltd. | | JP | | 582,382 | | | 9,298,229 |
Mitsui Fudosan Co., Ltd. | | JP | | 429,613 | | | 7,263,991 |
See Notes to Financial Statements.
94
GLOBAL REAL ESTATE FUND
| | |
PORTFOLIO OF INVESTMENTS (Continued) December 31, 2009 | | Sun Capital Advisers Trust |
| | | | | | | |
| | | Country
Code** | | Shares | | Value |
| | | | | | | |
| | | | | | | |
Sun Hung Kai Properties, Ltd. | | HK | | 636,018 | | $ | 9,457,026 |
Wharf Holdings, Ltd. | | HK | | 941,583 | | | 5,403,750 |
| | | | | | | |
| | | | | | | 47,550,518 |
| | | | | | | |
REAL ESTATE OPERATING COMPANIES – 5.5% |
Atrium European Real Estate Ltd. | | JE | | 1,096,801 | | | 7,381,947 |
BR Malls Participacoes SA* | | BR | | 216,273 | | | 2,670,804 |
PSP Swiss Property AG* | | CH | | 39,080 | | | 2,207,151 |
| | | | | | | |
| | | | | | | 12,259,902 |
| | | | | | | |
| | | | | | | 59,810,420 |
| | | | | | | |
THRIFT & MORTGAGE FINANCE – 1.8% | | | |
New York Community Bancorp, Inc. | | | | 277,365 | | | 4,024,566 |
| | | | | | | |
Total Common Stocks
(Cost $173,183,658) | | | 218,206,353 |
| | | | | | | |
| | | | | | | |
| | | | |
Shares | | Value |
| | | | | | | |
SHORT TERM INVESTMENTS – 2.2% | | | |
MUTUAL FUNDS – 2.2% | | | | | |
Federated Prime Obligation Fund | | 793,454 | | $ | 793,454 |
State Street Institutional Liquid Reserves Fund | | 4,099,637 | | | 4,099,637 |
| | | | | | | |
Total Short Term Investments
(Cost $4,893,091) | | | | | 4,893,091 |
| | | | | | | |
TOTAL INVESTMENTS – 99.6% | | | |
(Cost $178,076,749) | | | | | 223,099,444 |
Other assets less liabilities – 0.4% | | | | | 816,841 |
| | | | | | | |
NET ASSETS – 100.0% | | | | $ | 223,916,285 |
| | | | | | | |
| * | Non-income producing security. |
| ** | Unless otherwise noted the issuer country code for all securities is United States. |
| | |
| REIT | | Real Estate Investment Trust |
| |
| AU | | Australia |
| BR | | Brazil |
| CH | | Switzerland |
| FR | | France |
| GB | | Great Britain |
| HK | | Hong Kong |
| IT | | Italy |
| JE | | Jersey |
| JP | | Japan |
| NL | | Netherlands |
| SG | | Singapore |
Distribution of investments by country of issuer, as a percentage of net assets, is as follows. Figures may not total to 100% due to the exclusion of the Fund’s other assets and liabilities. (Unaudited)
| | | |
United States | | 39.0 | % |
Hong Kong | | 13.6 | |
Australia | | 11.7 | |
Japan | | 9.6 | |
Great Britain | | 8.0 | |
France | | 6.6 | |
Singapore | | 3.6 | |
Jersey | | 3.3 | |
Others (individually less than 2%) | | 4.2 | |
See Notes to Financial Statements.
95
| | |
GLOBAL REAL ESTATE FUND PORTFOLIO OF INVESTMENTS (Continued) |
| December 31, 2009 | | Sun Capital Advisers Trust |
| (1) | Fair Value Measurements † |
The following table summarizes the inputs used to value the Fund’s assets and liabilities, as applicable, measured at fair value at the period end:
| | | | | | | | | | | | |
Assets | | Quoted Prices
in Active
Markets for
Identical
Assets and
Liabilities
(Level 1) | | Significant
Other
Observable
Inputs
(Level 2) | | Significant
Unobservable
Inputs
(Level 3) | | Total |
Common Stocks | | | | | | | | | | | | |
Paper & Forest Products | | $ | 3,792,351 | | $ | — | | $ | — | | $ | 3,792,351 |
Real Estate Investment Trusts | | | | | | | | | | | | |
Diversified | | | 6,652,763 | | | 11,469,194 | | | — | | | 18,121,957 |
Industrial | | | — | | | 11,952,109 | | | — | | | 11,952,109 |
Mortgage | | | 3,049,734 | | | — | | | — | | | 3,049,734 |
Office | | | 21,051,441 | | | 4,947,692 | | | — | | | 25,999,133 |
Residential | | | 8,648,146 | | | — | | | — | | | 8,648,146 |
Retail | | | 15,497,091 | | | 47,580,095 | | | — | | | 63,077,186 |
Specialized | | | 19,730,751 | | | — | | | — | | | 19,730,751 |
| | | | | | | | | | | | |
Total Real Estate Investment Trusts | | | 74,629,926 | | | 75,949,090 | | | — | | | 150,579,016 |
| | | | | | | | | | | | |
Real Estate Management & Development | | | | | | | | | | | | |
Diversified Real Estate Activities | | | — | | | 47,550,518 | | | — | | | 47,550,518 |
Real Estate Operating Companies | | | 2,670,804 | | | 9,589,098 | | | — | | | 12,259,902 |
| | | | | | | | | | | | |
Total Real Estate Management & Development | | | 2,670,804 | | | 57,139,616 | | | — | | | 59,810,420 |
| | | | | | | | | | | | |
Thrift & Mortgage Finance | | | 4,024,566 | | | — | | | — | | | 4,024,566 |
| | | | | | | | | | | | |
Total Common Stocks | | | 85,117,647 | | | 133,088,706 | | | — | | | 218,206,353 |
| | | | | | | | | | | | |
Short Term Investments | | | | | | | | | | | | |
Mutual Funds | | | 4,893,091 | | | — | | | — | | | 4,893,091 |
| | | | | | | | | | | | |
Total Investments | | | 90,010,738 | | | 133,088,706 | | | — | | | 223,099,444 |
| | | | | | | | | | | | |
Total | | $ | 90,010,738 | | $ | 133,088,706 | | $ | — | | $ | 223,099,444 |
| | | | | | | | | | | | |
| † | See Note 2b in the Notes to Financial Statements for additional information. |
See Notes to Financial Statements.
96
DAVIS VENTURE VALUE FUND
| | |
PORTFOLIO OF INVESTMENTS December 31, 2009 | | Sun Capital Advisers Trust |
| | | | | | | |
| | | Country
Code** | | Shares | | Value |
| | | | | | | |
| | | | | | | |
COMMON STOCKS – 94.9% | | | |
AIR FREIGHT & LOGISTICS – 0.5% | | | |
United Parcel Services, Inc., Class B | | | | 34,540 | | $ | 1,981,560 |
| | | | | | | |
AUTOMOBILES – 1.1% | | | | | | | |
Harley-Davidson, Inc. | | | | 160,366 | | | 4,041,223 |
| | | | | | | |
BEVERAGES – 2.9% | | | | | | | |
Diageo PLC ADR | | GB | | 69,487 | | | 4,823,093 |
Heineken Holding NV | | NL | | 98,659 | | | 4,126,227 |
The Coca-Cola Co. | | | | 36,800 | | | 2,097,600 |
| | | | | | | |
| | | | | | | 11,046,920 |
| | | | | | | |
CAPITAL MARKETS – 4.7% | | | |
Ameriprise Financial, Inc. | | | | 77,565 | | | 3,011,073 |
Bank of New York Mellon Corp. | | | | 269,600 | | | 7,540,712 |
Julius Baer Group, Ltd. | | CH | | 152,600 | | | 5,366,705 |
The Goldman Sachs Group, Inc. | | | | 13,291 | | | 2,244,053 |
| | | | | | | |
| | | | | | | 18,162,543 |
| | | | | | | |
CHEMICALS – 0.7% | | | |
Monsanto Co. | | | | 23,840 | | | 1,948,920 |
Potash Corp. of Saskatchewan, Inc. | | CA | | 8,345 | | | 905,432 |
| | | | | | | |
| | | | | | | 2,854,352 |
| | | | | | | |
COMMERCIAL BANKS – 4.7% | | | |
GAM Holding, Ltd. | | CH | | 149,000 | | | 1,804,250 |
Wells Fargo & Co. | | | | 602,913 | | | 16,272,622 |
| | | | | | | |
| | | | | | | 18,076,872 |
| | | | | | | |
COMMERCIAL SERVICES & SUPPLIES – 1.8% |
Iron Mountain, Inc.* | | | | 250,074 | | | 5,691,684 |
Visa, Inc., Class A | | | | 13,500 | | | 1,180,710 |
| | | | | | | |
| | | | | | | 6,872,394 |
| | | | | | | |
COMPUTERS & PERIPHERALS – 1.6% |
Hewlett-Packard Co. | | | | 118,070 | | | 6,081,786 |
| | | | | | | |
CONSTRUCTION MATERIALS – 0.7% |
Martin Marietta Materials, Inc. | | | | 4,800 | | | 429,168 |
Vulcan Materials Co. | | | | 41,319 | | | 2,176,272 |
| | | | | | | |
| | | | | | | 2,605,440 |
| | | | | | | |
| | | | | | | |
| | | Country
Code** | | Shares | | Value |
| | | | | | | |
CONSUMER FINANCE – 4.0% |
American Express Co. | | | | 380,525 | | $ | 15,418,873 |
| | | | | | | |
CONTAINERS & PACKAGING – 2.1% |
Sealed Air Corp. | | | | 367,623 | | | 8,036,239 |
| | | | | | | |
DIVERSIFIED CONSUMER SERVICES – 0.6% |
H&R Block, Inc. | | | | 96,111 | | | 2,174,031 |
| | | | | | | |
DIVERSIFIED FINANCIAL SERVICES – 3.2% |
JP Morgan Chase & Co. | | | | 227,736 | | | 9,489,759 |
Moody’s Corp. | | | | 105,686 | | | 2,832,385 |
| | | | | | | |
| | | | | | | 12,322,144 |
| | | | | | | |
ELECTRICAL EQUIPMENT – 0.4% |
ABB Ltd. ADR* | | CH | | 83,690 | | | 1,598,479 |
| | | | | | | |
ELECTRONIC EQUIPMENT & INSTRUMENTS – 1.2% |
Agilent Technologies, Inc.* | | | | 149,208 | | | 4,635,892 |
Garmin, Ltd. | | KY | | 280 | | | 8,596 |
| | | | | | | |
| | | | | | | 4,644,488 |
| | | | | | | |
ENERGY EQUIPMENT & SERVICES – 0.8% |
Transocean, Ltd.* | | CH | | 38,282 | | | 3,169,750 |
| | | | | | | |
FOOD & STAPLES RETAILING – 6.7% |
Costco Wholesale Corp. | | | | 277,020 | | | 16,391,273 |
CVS Caremark Corp. | | | | 284,122 | | | 9,151,570 |
| | | | | | | |
| | | | | | | 25,542,843 |
| | | | | | | |
FOOD PRODUCTS – 0.2% |
The Hershey Co. | | | | 24,120 | | | 863,255 |
| | | | | | | |
HEALTH CARE EQUIPMENT & SUPPLIES – 1.2% |
Becton, Dickinson and Co. | | | | 44,800 | | | 3,532,928 |
CareFusion Corp.* | | | | 37,108 | | | 928,071 |
| | | | | | | |
| | | | | | | 4,460,999 |
| | | | | | | |
HEALTH CARE PROVIDERS & SERVICES – 2.4% |
Cardinal Health, Inc. | | | | 75,056 | | | 2,419,805 |
Express Scripts, Inc.* | | | | 57,335 | | | 4,956,611 |
Laboratory Corp. of America Holdings* | | | | 20,720 | | | 1,550,685 |
UnitedHealth Group, Inc. | | | | 9,870 | | | 300,838 |
| | | | | | | |
| | | | | | | 9,227,939 |
| | | | | | | |
See Notes to Financial Statements.
97
DAVIS VENTURE VALUE FUND
| | |
PORTFOLIO OF INVESTMENTS (Continued) December 31, 2009 | | Sun Capital Advisers Trust |
| | | | | | | |
| | | Country
Code** | | Shares | | Value |
| | | | | | | |
| | | | | | | |
HOUSEHOLD DURABLES – 0.2% |
Hunter Douglas NV | | AN | | 13,603 | | $ | 665,004 |
| | | | | | | |
HOUSEHOLD PRODUCTS – 1.4% |
The Procter & Gamble Co. | | | | 91,475 | | | 5,546,129 |
| | | | | | | |
INDEPENDENT POWER PRODUCERS & ENERGY TRADERS – 0.1% |
AES Corp.* | | | | 33,960 | | | 452,008 |
| | | | | | | |
INDUSTRIAL CONGLOMERATES – 0.8% |
Tyco International Ltd. | | CH | | 82,382 | | | 2,939,390 |
| | | | | | | |
INSURANCE – 11.4% | | | | | | | |
Berkshire Hathaway, Inc., Class A* | | | | 175 | | | 17,360,000 |
Fairfax Financial Holdings Ltd. | | CA | | 3,670 | | | 1,431,153 |
Loews Corp. | | | | 273,905 | | | 9,956,447 |
Markel Corp.* | | | | 1,000 | | | 340,000 |
The Hartford Financial Services Group, Inc. | | | | 70,359 | | | 1,636,550 |
The Principal Financial Group, Inc. | | | | 30,700 | | | 738,028 |
The Progressive Corp.* | | | | 455,854 | | | 8,200,813 |
Transatlantic Holdings, Inc. | | | | 73,660 | | | 3,838,423 |
| | | | | | | |
| | | | | | | 43,501,414 |
| | | | | | | |
INTERNET & CATALOG RETAIL – 0.7% |
Amazon.com, Inc.* | | | | 12,160 | | | 1,635,763 |
Liberty Media Corp. – Interactive, Series A* | | | | 79,597 | | | 862,832 |
| | | | | | | |
| | | | | | | 2,498,595 |
| | | | | | | |
INTERNET SOFTWARE & SERVICES – 1.7% |
Google, Inc., Class A* | | | | 10,468 | | | 6,489,951 |
| | | | | | | |
MACHINERY – 0.2% | | | |
PACCAR, Inc. | | | | 23,670 | | | 858,511 |
| | | | | | | |
MARINE – 0.8% | | | |
China Shipping Development Co., Ltd. | | CN | | 694,800 | | | 1,036,869 |
Kuehne & Nagel International AG | | CH | | 21,386 | | | 2,079,342 |
| | | | | | | |
| | | | | | | 3,116,211 |
| | | | | | | |
MEDIA – 4.0% | | | |
Comcast Corp., Class A Special | | | | 141,888 | | | 2,271,627 |
| | | | | | | |
| | | Country
Code** | | Shares | | Value |
| | | | | | | |
DIRECTV, Class A* | | | | 64,579 | | $ | 2,153,710 |
Grupo Televisa SA ADR | | MX | | 83,356 | | | 1,730,471 |
Liberty Media-Starz,
Series A* | | | | 5,877 | | | 271,223 |
News Corp., Class A | | | | 396,805 | | | 5,432,260 |
The Walt Disney Co. | | | | 101,240 | | | 3,264,990 |
| | | | | | | |
| | | | | | | 15,124,281 |
| | | | | | | |
METALS & MINING – 0.9% | | | |
BHP Billiton PLC | | GB | | 55,600 | | | 1,772,529 |
Rio Tinto PLC | | GB | | 30,172 | | | 1,629,193 |
| | | | | | | |
| | | | | | | 3,401,722 |
| | | | | | | |
OIL, GAS & CONSUMABLE FUELS – 15.3% |
Canadian Natural Resources, Ltd. | | CA | | 127,461 | | | 9,170,819 |
China Coal Energy Co. | | CN | | 1,605,300 | | | 2,904,751 |
ConocoPhillips | | | | 26,800 | | | 1,368,676 |
Devon Energy Corp. | | | | 169,404 | | | 12,451,194 |
EOG Resources, Inc. | | | | 138,433 | | | 13,469,531 |
Occidental Petroleum Corp. | | | | 213,660 | | | 17,381,241 |
OGX Petroleo e Gas Participacoes SA | | BR | | 180,000 | | | 1,767,949 |
| | | | | | | |
| | | | | | | 58,514,161 |
| | | | | | | |
PAPER & FOREST PRODUCTS – 0.9% | | | |
Sino-Forest
Corp.* (1) | | CA | | 6,300 | | | 116,862 |
Sino-Forest Corp.* | | CA | | 169,130 | | | 3,134,043 |
| | | | | | | |
| | | | | | | 3,250,905 |
| | | | | | | |
PERSONAL PRODUCTS – 0.4% | | | |
Mead Johnson Nutrition Co., Class A | | | | 28,320 | | | 1,237,584 |
Natura Cosmeticos SA | | BR | | 20,200 | | | 421,288 |
| | | | | | | |
| | | | | | | 1,658,872 |
| | | | | | | |
PHARMACEUTICALS – 5.4% | | | |
Johnson & Johnson | | | | 124,600 | | | 8,025,486 |
Merck & Co., Inc. | | | | 255,165 | | | 9,323,729 |
Pfizer, Inc. | | | | 185,660 | | | 3,377,155 |
| | | | | | | |
| | | | | | | 20,726,370 |
| | | | | | | |
PROFESSIONAL SERVICES – 0.2% | | | |
The Dun & Bradstreet Corp. | | | | 9,300 | | | 784,641 |
| | | | | | | |
See Notes to Financial Statements.
98
DAVIS VENTURE VALUE FUND
| | |
PORTFOLIO OF INVESTMENTS (Continued) December 31, 2009 | | Sun Capital Advisers Trust |
| | | | | | | |
| | | Country
Code** | | Shares | | Value |
| | | | | | | |
| | | | | | | |
REAL ESTATE MANAGEMENT &
DEVELOPMENT – 1.0% |
Brookfield Asset Management, Inc. | | CA | | 81,900 | | $ | 1,816,542 |
Hang Lung Group, Ltd. | | HK | | 391,900 | | | 1,935,641 |
| | | | | | | |
| | | | | | | 3,752,183 |
| | | | | | | |
SEMICONDUCTORS & SEMICONDUCTOR EQUIPMENT – 1.5% |
Texas Instruments, Inc. | | | | 224,565 | | | 5,852,164 |
| | | | | | | |
SOFTWARE – 2.5% |
Activision Blizzard, Inc.* | | | | 156,600 | | | 1,739,826 |
Microsoft Corp. | | | | 253,800 | | | 7,738,362 |
| | | | | | | |
| | | | | | | 9,478,188 |
| | | | | | | |
SPECIALTY RETAIL – 2.0% | | | |
Bed Bath & Beyond, Inc.* | | | | 122,690 | | | 4,739,515 |
CarMax, Inc.* | | | | 124,717 | | | 3,024,387 |
| | | | | | | |
| | | | | | | 7,763,902 |
| | | | | | | |
TOBACCO – 0.9% | | | |
Philip Morris International, Inc. | | | | 68,748 | | | 3,312,966 |
| | | | | | | |
TRANSPORTATION – 1.0% | | | |
China Merchants Holdings International Co., Ltd. | | HK | | 993,591 | | | 3,205,260 |
Cosco Pacific Ltd. | | BM | | 547,916 | | | 696,757 |
| | | | | | | |
| | | | | | | 3,902,017 |
| | | | | | | |
| | | | | | | | |
| | | Country
Code** | | Shares | | Value |
| | | | | | | | |
TRANSPORTATION INFRASTRUCTURE – 0.1% |
LLX Logistica SA* | | BR | | | 41,700 | | $ | 242,152 |
| | | | | | | | |
Total Common Stocks
(Cost $299,960,562) | | | 363,013,867 |
| | | | | | | | |
| | | | | Principal
Amount
(000) | | |
CORPORATE DEBT OBLIGATIONS – 0.3% |
AUTOMOBILES – 0.3% |
Harley-Davidson, Inc. 15.00%, 2/1/14
(Cost $1,000,000) | | $ | 1,000 | | | 1,224,015 |
| | | | | | | | |
SHORT TERM INVESTMENTS – 4.8% |
COMMERCIAL PAPER (2) – 4.8% |
San Paolo IMI U.S.
Financial Co.
0.13%, 1/4/10 | | | 7,000 | | | 6,999,924 |
Three Pillars
Funding (1)
0.30%, 1/4/10 | | | 11,164 | | | 11,163,721 |
| | | | | | | | |
Total Short Term Investments
(Amortized
cost $18,163,645) | | | | | | 18,163,645 |
| | | | | | | | |
TOTAL INVESTMENTS – 100.0% |
(Cost $319,124,207) | | | | | | 382,401,527 |
Other assets less liabilities – 0.0% + | | | | | | 188,079 |
| | | | | | | | |
NET ASSETS – 100.0% | | | | | $ | 382,589,606 |
| | | | | | | | |
| * | Non-income producing security. |
| ** | Unless otherwise noted the issuer country code for all securities is United States. |
| + | Amount is less than 0.05%. |
| (1) | Eligible for resale under rule 144A or exempt from registration under Section 4(2) of the Securities Act of 1933. These securities may be resold in transactions exempt from registration. At the period end, the value of these securities amounted to $11,280,583, representing 2.9% of net assets. |
| (2) | Interest rates represent annualized yield at date of purchase. |
| | |
| ADR | | American Depositary Receipt |
| |
| AN | | Netherlands Antilles |
| BM | | Bermuda |
| BR | | Brazil |
| CA | | Canada |
| CH | | Switzerland |
See Notes to Financial Statements.
99
DAVIS VENTURE VALUE FUND
| | |
PORTFOLIO OF INVESTMENTS (Continued) December 31, 2009 | | Sun Capital Advisers Trust |
| | |
| CN | | China |
| GB | | Great Britain |
| HK | | Hong Kong |
| KY | | Cayman Islands |
| MX | | Mexico |
| NL | | Netherlands |
| (3) | Fair Value Measurements † |
The following table summarizes the inputs used to value the Fund’s assets and liabilities, as applicable, measured at fair value at the period end:
| | | | | | | | | | | | |
Assets | | Quoted Prices
in Active
Markets for
Identical
Assets and
Liabilities
(Level 1) | | Significant
Other
Observable
Inputs
(Level 2) | | Significant
Unobservable
Inputs
(Level 3) | | Total |
Common Stocks | | | | | | | | | | | | |
Air Freight & Logistics | | $ | 1,981,560 | | $ | — | | $ | — | | $ | 1,981,560 |
Automobiles | | | 4,041,223 | | | — | | | — | | | 4,041,223 |
Beverages | | | 6,920,693 | | | 4,126,227 | | | — | | | 11,046,920 |
Capital Markets | | | 18,162,543 | | | — | | | — | | | 18,162,543 |
Chemicals | | | 2,854,352 | | | — | | | — | | | 2,854,352 |
Commercial Banks | | | 16,272,622 | | | 1,804,250 | | | — | | | 18,076,872 |
Commercial Services & Supplies | | | 6,872,394 | | | — | | | — | | | 6,872,394 |
Computers & Peripherals | | | 6,081,786 | | | — | | | — | | | 6,081,786 |
Construction Materials | | | 2,605,440 | | | — | | | — | | | 2,605,440 |
Consumer Finance | | | 15,418,873 | | | — | | | — | | | 15,418,873 |
Containers & Packaging | | | 8,036,239 | | | — | | | — | | | 8,036,239 |
Diversified Consumer Services | | | 2,174,031 | | | — | | | — | | | 2,174,031 |
Diversified Financial Services | | | 12,322,144 | | | — | | | — | | | 12,322,144 |
Electrical Equipment | | | 1,598,479 | | | — | | | — | | | 1,598,479 |
Electronic Equipment & Instruments | | | 4,644,488 | | | — | | | — | | | 4,644,488 |
Energy Equipment & Services | | | 3,169,750 | | | — | | | — | | | 3,169,750 |
Food & Staples Retailing | | | 25,542,843 | | | — | | | — | | | 25,542,843 |
Food Products | | | 863,255 | | | — | | | — | | | 863,255 |
Health Care Equipment & Supplies | | | 4,460,999 | | | — | | | — | | | 4,460,999 |
Health Care Providers & Services | | | 9,227,939 | | | — | | | — | | | 9,227,939 |
Household Durables | | | — | | | 665,004 | | | — | | | 665,004 |
Household Products | | | 5,546,129 | | | — | | | — | | | 5,546,129 |
Independent Power Producers & Energy Traders | | | 452,008 | | | — | | | — | | | 452,008 |
Industrial Conglomerates | | | 2,939,390 | | | — | | | — | | | 2,939,390 |
Insurance | | | 43,501,414 | | | — | | | — | | | 43,501,414 |
Internet & Catalog Retail | | | 2,498,595 | | | — | | | — | | | 2,498,595 |
Internet Software & Services | | | 6,489,951 | | | — | | | — | | | 6,489,951 |
Machinery | | | 858,511 | | | — | | | — | | | 858,511 |
Marine | | | — | | | 3,116,211 | | | — | | | 3,116,211 |
Media | | | 15,124,281 | | | — | | | — | | | 15,124,281 |
Metals & Mining | | | — | | | 3,401,722 | | | — | | | 3,401,722 |
See Notes to Financial Statements.
100
DAVIS VENTURE VALUE FUND
| | |
PORTFOLIO OF INVESTMENTS (Continued) December 31, 2009 | | Sun Capital Advisers Trust |
| | | | | | | | | | | | |
Assets (Continued) | | Quoted Prices
in Active
Markets for
Identical
Assets and
Liabilities
(Level 1) | | Significant
Other
Observable
Inputs
(Level 2) | | Significant
Unobservable
Inputs
(Level 3) | | Total |
Oil, Gas & Consumable Fuels | | $ | 55,609,410 | | $ | 2,904,751 | | $ | — | | $ | 58,514,161 |
Paper & Forest Products | | | 3,134,043 | | | 116,862 | | | — | | | 3,250,905 |
Personal Products | | | 1,658,872 | | | — | | | — | | | 1,658,872 |
Pharmaceuticals | | | 20,726,370 | | | — | | | — | | | 20,726,370 |
Professional Services | | | 784,641 | | | — | | | — | | | 784,641 |
Real Estate Management & Development | | | 1,816,542 | | | 1,935,641 | | | — | | | 3,752,183 |
Semiconductors & Semiconductor Equipment | | | 5,852,164 | | | — | | | — | | | 5,852,164 |
Software | | | 9,478,188 | | | — | | | — | | | 9,478,188 |
Specialty Retail | | | 7,763,902 | | | — | | | — | | | 7,763,902 |
Tobacco | | | 3,312,966 | | | — | | | — | | | 3,312,966 |
Transportation | | | — | | | 3,902,017 | | | — | | | 3,902,017 |
Transportation Infrastructure | | | 242,152 | | | — | | | — | | | 242,152 |
| | | | | | | | | | | | |
Total Common Stocks | | | 341,041,182 | | | 21,972,685 | | | — | | | 363,013,867 |
| | | | | | | | | | | | |
Corporate Debt Obligations | | | | | | | | | | | | |
Automobiles | | | — | | | 1,224,015 | | | — | | | 1,224,015 |
Short Term Investments | | | | | | | | | | | | |
Commercial Paper | | | — | | | 18,163,645 | | | — | | | 18,163,645 |
| | | | | | | | | | | | |
Total Investments | | | 341,041,182 | | | 41,360,345 | | | — | | | 382,401,527 |
| | | | | | | | | | | | |
Total | | $ | 341,041,182 | | $ | 41,360,345 | | $ | — | | $ | 382,401,527 |
| | | | | | | | | | | | |
| † | See Note 2b in the Notes to Financial Statements for additional information. |
See Notes to Financial Statements.
101
OPPENHEIMER MAIN STREET SMALL CAP FUND
| | |
PORTFOLIO OF INVESTMENTS December 31, 2009 | | Sun Capital Advisers Trust |
| | | | | | | |
| | | Country
Code** | | Shares | | Value |
| | | | | | | |
| | | | | | | |
COMMON STOCKS – 99.3% |
AEROSPACE & DEFENSE – 1.6% |
BE Aerospace, Inc.* | | | | 65,325 | | $ | 1,535,137 |
Ceradyne, Inc.* | | | | 19,562 | | | 375,786 |
Cubic Corp. | | | | 4,644 | | | 173,221 |
DynCorp International, Inc.* | | | | 20,494 | | | 294,089 |
Gencorp, Inc.* | | | | 23,154 | | | 162,078 |
Triumph Group, Inc. | | | | 8,219 | | | 396,567 |
| | | | | | | |
| | | | | | | 2,936,878 |
| | | | | | | |
AIR FREIGHT & LOGISTICS – 0.8% |
Atlas Air Worldwide Holdings, Inc.* | | | | 3,822 | | | 142,370 |
HUB Group, Inc.* | | | | 48,803 | | | 1,309,384 |
| | | | | | | |
| | | | | | | 1,451,754 |
| | | | | | | |
AIRLINES – 0.6% |
Allegiant Travel Co.* | | | | 5,240 | | | 247,171 |
Hawaiian Holdings, Inc.* | | | | 33,458 | | | 234,206 |
Pinnacle Airlines Corp.* | | | | 7,240 | | | 49,811 |
Republic Airways Holdings, Inc.* | | | | 24,433 | | | 180,560 |
SkyWest, Inc. | | | | 19,163 | | | 324,238 |
| | | | | | | |
| | | | | | | 1,035,986 |
| | | | | | | |
AUTO COMPONENTS – 0.4% |
ATAC, Technology Corp.* | | | | 13,238 | | | 315,726 |
Cooper Tire & Rubber Co. | | | | 10,654 | | | 213,613 |
Spartan Motors, Inc. | | | | 5,493 | | | 30,926 |
Standard Motor Products, Inc.* | | | | 7,126 | | | 60,713 |
Superior Industries International, Inc. | | | | 4,436 | | | 67,871 |
| | | | | | | |
| | | | | | | 688,849 |
| | | | | | | |
BEVERAGES – 0.1% | | | | | | | |
Cott Corp.* | | CA | | 22,834 | | | 187,239 |
| | | | | | | |
BIOTECHNOLOGY – 1.4% |
Acorda Therapeutics, Inc.* | | | | 24,565 | | | 619,529 |
Cubist Pharmaceuticals, Inc.* | | | | 2,410 | | | 45,718 |
Martek Biosciences Corp.* | | | | 16,829 | | | 318,741 |
| | | | | | | |
| | | Country
Code** | | Shares | | Value |
| | | | | | | |
| | | | | | | |
PDL BioPharma, Inc. | | | | 43,603 | | $ | 299,116 |
Savient Pharmaceuticals, Inc.* | | | | 75,298 | | | 1,024,806 |
Sinovac Biotech, Ltd.* | | AG | | 27,026 | | | 171,075 |
| | | | | | | |
| | | | | | | 2,478,985 |
| | | | | | | |
BUILDING PRODUCTS – 0.5% |
Aaon, Inc. | | | | 6,923 | | | 134,929 |
Ameron International Corp. | | | | 4,993 | | | 316,856 |
Apogee Enterprises, Inc. | | | | 20,791 | | | 291,074 |
NCI Building Systems, Inc.* | | | | 19,012 | | | 34,412 |
Universal Forest Products, Inc. | | | | 2,580 | | | 94,970 |
| | | | | | | |
| | | | | | | 872,241 |
| | | | | | | |
CAPITAL MARKETS – 3.8% |
Apollo Investment Corp. | | | | 20,614 | | | 196,451 |
Ares Capital Corp. | | | | 9,927 | | | 123,591 |
BGC Partners, Inc. | | | | 19,536 | | | 90,256 |
BlackRock Kelso Capital Corp. | | | | 6,926 | | | 59,010 |
Fifth Street Finance Corp. | | | | 17,660 | | | 189,668 |
Gladstone Capital Corp. | | | | 15,650 | | | 120,505 |
Gladstone Investment Corp. | | | | 10,644 | | | 48,537 |
Hercules Technology Growth Capital, Inc. | | | | 27,400 | | | 284,686 |
Investment Technology Group, Inc.* | | | | 4,810 | | | 94,757 |
Knight Capital Group, Inc.* | | | | 85,753 | | | 1,320,596 |
MCG Capital Corp.* | | | | 24,761 | | | 106,968 |
MF Global, Ltd.* | | BM | | 117,014 | | | 813,247 |
NGP Capital Resources Co. | | | | 7,126 | | | 57,934 |
Oppenheimer Holdings, Inc., Class A | | | | 3,822 | | | 126,967 |
optionsXpress Holdings, Inc. | | | | 43,720 | | | 675,474 |
PennantPark Investment Corp. | | | | 15,769 | | | 140,659 |
Penson Worldwide, Inc.* | | | | 13,842 | | | 125,409 |
Prospect Capital Corp. | | | | 27,061 | | | 319,590 |
See Notes to Financial Statements.
102
OPPENHEIMER MAIN STREET SMALL CAP FUND
| | |
PORTFOLIO OF INVESTMENTS (Continued) December 31, 2009 | | Sun Capital Advisers Trust |
| | | | | | | |
| | | Country
Code** | | Shares | | Value |
| | | | | | | |
| | | | | | | |
Rodman & Renshaw Capital Group, Inc.* | | | | 26,976 | | $ | 110,602 |
Stifel Financial Corp.* | | | | 23,004 | | | 1,362,757 |
TICC Capital Corp. | | | | 12,430 | | | 75,202 |
Tradestation Group, Inc.* | | | | 16,361 | | | 129,088 |
Triangle Capital Corp. | | | | 4,236 | | | 51,213 |
W.P. Carey & Co., LLC | | | | 5,170 | | | 142,951 |
Waddell & Reed Financial, Inc., Class A | | | | 6,469 | | | 197,563 |
| | | | | | | |
| | | | | | | 6,963,681 |
| | | | | | | |
CHEMICALS – 1.9% | | | | | | | |
Ashland, Inc. | | | | 8,043 | | | 318,664 |
Cabot Corp. | | | | 2,280 | | | 59,804 |
Cytec Industries, Inc. | | | | 17,764 | | | 646,965 |
Hawkins, Inc. | | | | 6,381 | | | 139,297 |
Innophos Holdings, Inc. | | | | 18,755 | | | 431,177 |
Innospec, Inc. | | | | 3,618 | | | 36,506 |
KMG Chemicals, Inc. | | | | 4,132 | | | 61,773 |
Koppers Holdings, Inc. | | | | 1,040 | | | 31,657 |
LSB Industries, Inc.* | | | | 10,411 | | | 146,795 |
Minerals Technologies, Inc. | | | | 6,923 | | | 377,096 |
NewMarket Corp. | | | | 2,786 | | | 319,749 |
Omnova Solutions, Inc.* | | | | 15,604 | | | 95,652 |
PolyOne Corp.* | | | | 24,072 | | | 179,818 |
Schulman A, Inc. | | | | 13,043 | | | 263,208 |
Spartech Corp. | | | | 10,864 | | | 111,465 |
Stepan Chemical Co. | | | | 1,991 | | | 129,037 |
W.R. Grace & Co.* | | | | 8,822 | | | 223,638 |
| | | | | | | |
| | | | | | | 3,572,301 |
| | | | | | | |
COMMERCIAL BANKS – 2.6% |
Alliance Financial Corp. | | | | 1,991 | | | 54,056 |
Banco Latinoamericano de Comercio Exterior SA, Class E | | PA | | 16,121 | | | 224,082 |
Banco Macro SA ADR | | AR | | 7,717 | | | 229,658 |
Bancolombia SA ADR | | CO | | 5,474 | | | 249,122 |
Bank Of Marin Bancorp | | | | 1,991 | | | 64,827 |
BBVA Banco Frances SA ADR | | AR | | 7,854 | | | 49,402 |
Cass Information Systems, Inc. | | | | 551 | | | 16,750 |
Century Bancorp, Inc., Class A | | | | 2,280 | | | 50,228 |
Hancock Holding Co. | | | | 22,728 | | | 995,259 |
| | | | | | | |
| | | Country
Code** | | Shares | | Value |
| | | | | | | |
| | | | | | | |
IBERIABANK Corp. | | | | 14,718 | | $ | 791,976 |
International Bancshares Corp. | | | | 20,259 | | | 383,503 |
National Bankshares, Inc. | | | | 1,756 | | | 49,677 |
Northrim Bancorp, Inc. | | | | 3,318 | | | 56,008 |
Oriental Financial Group | | PR | | 29,099 | | | 314,269 |
Santander Bancorp* | | PR | | 6,358 | | | 78,076 |
Sterling Bancshares, Inc. | | | | 114,997 | | | 589,935 |
The First of Long Island Corp. | | | | 2,309 | | | 58,302 |
Westamerica Bancorporation | | | | 9,454 | | | 523,468 |
| | | | | | | |
| | | | | | | 4,778,598 |
| | | | | | | |
COMMERCIAL SERVICES & SUPPLIES – 3.0% |
American Reprographics Co.* | | | | 30,269 | | | 212,186 |
Comfort Systems USA, Inc. | | | | 24,647 | | | 304,144 |
Consolidated Graphics, Inc.* | | | | 3,254 | | | 113,955 |
Courier Corp. | | | | 768 | | | 10,944 |
Deluxe Corp. | | | | 22,072 | | | 326,445 |
EnergySolutions, Inc. | | | | 63,632 | | | 540,236 |
Ennis, Inc. | | | | 6,842 | | | 114,877 |
G&K Services, Inc. | | | | 6,484 | | | 162,943 |
Herman Miller, Inc. | | | | 15,664 | | | 250,311 |
M&F Worldwide Corp.* | | | | 3,254 | | | 128,533 |
North American Galvanizing & Coatings, Inc.* | | | | 11,138 | | | 54,019 |
Pike Electric Corp.* | | | | 8,678 | | | 80,532 |
R.R. Donnelley & Sons Co. | | | | 19,226 | | | 428,163 |
Resources Global Professionals* | | | | 18,693 | | | 396,665 |
School Specialty, Inc.* | | | | 18,432 | | | 431,125 |
Spherion Corp.* | | | | 14,847 | | | 83,440 |
Team, Inc.* | | | | 6,512 | | | 122,491 |
Teletech Holdings, Inc.* | | | | 23,208 | | | 464,856 |
The Brink’s Co. | | | | 6,028 | | | 146,722 |
VSE Corp. | | | | 2,480 | | | 111,798 |
Waste Connections, Inc.* | | | | 25,606 | | | 853,704 |
See Notes to Financial Statements.
103
OPPENHEIMER MAIN STREET SMALL CAP FUND
| | |
PORTFOLIO OF INVESTMENTS (Continued) December 31, 2009 | | Sun Capital Advisers Trust |
| | | | | | | |
| | | Country
Code** | | Shares | | Value |
| | | | | | | |
| | | | | | | |
Watson Wyatt Worldwide, Inc. | | | | 4,539 | | $ | 215,693 |
| | | | | | | |
| | | | | | | 5,553,782 |
| | | | | | | |
COMMUNICATIONS EQUIPMENT – 3.7% |
Adtran, Inc. | | | | 9,581 | | | 216,052 |
Arris Group, Inc.* | | | | 113,027 | | | 1,291,899 |
Black Box Corp. | | | | 6,974 | | | 197,643 |
Blue Coat Systems, Inc.* | | | | 75,224 | | | 2,146,893 |
Comtech Telecommunications Corp.* | | | | 31,194 | | | 1,093,350 |
Dycom Industries, Inc.* | | | | 28,118 | | | 225,787 |
Interdigital, Inc.* | | | | 6,512 | | | 172,828 |
Ituran Location and Control Ltd. | | IL | | 3,932 | | | 50,487 |
NETGEAR, Inc.* | | | | 8,337 | | | 180,829 |
Oplink Communications, Inc.* | | | | 4,320 | | | 70,805 |
Plantronics, Inc. | | | | 11,900 | | | 309,162 |
Polycom, Inc.* | | | | 27,709 | | | 691,894 |
Sierra Wireless, Inc.* | | CA | | 19,980 | | | 211,788 |
| | | | | | | |
| | | | | | | 6,859,417 |
| | | | | | | |
COMPUTERS & PERIPHERALS – 1.3% |
China Digital TV Holding Co., Ltd. ADR | | KY | | 8,475 | | | 51,613 |
Diebold, Inc. | | | | 3,318 | | | 94,397 |
NCR Corp.* | | | | 12,598 | | | 140,216 |
QLogic Corp.* | | | | 22,213 | | | 419,159 |
Rimage Corp* | | | | 2,994 | | | 51,916 |
Stec, Inc.* | | | | 14,970 | | | 244,610 |
Synaptics, Inc.* | | | | 42,904 | | | 1,315,007 |
| | | | | | | |
| | | | | | | 2,316,918 |
| | | | | | | |
CONSTRUCTION & ENGINEERING – 1.0% |
EMCOR Group, Inc.* | | | | 16,570 | | | 445,733 |
Michael Baker Corp.* | | | | 5,713 | | | 236,518 |
Primoris Services Corp. | | | | 6,926 | | | 55,200 |
Sterling Construction Co., Inc.* | | | | 5,898 | | | 113,124 |
Tutor Perini Corp.* | | | | 54,591 | | | 987,005 |
| | | | | | | |
| | | | | | | 1,837,580 |
| | | | | | | |
CONSTRUCTION MATERIALS – 0.5% |
Eagle Materials, Inc. | | | | 34,241 | | | 891,978 |
| | | | | | | |
| | | | | | | |
| | | Country
Code** | | Shares | | Value |
| | | | | | | |
| | | | | | | |
CONSUMER FINANCE – 1.3% | | | | | |
Advance America Cash Advance Centers, Inc. | | | | 37,875 | | $ | 210,585 |
Cash America International, Inc. | | | | 12,645 | | | 442,069 |
EZCORP, Inc., Class A* | | | | 21,831 | | | 375,712 |
First Cash Financial Services, Inc.* | | | | 17,350 | | | 384,996 |
Nelnet, Inc., Class A | | | | 16,891 | | | 291,032 |
The Student Loan Corp. | | | | 2,180 | | | 101,523 |
World Acceptance Corp.* | | | | 15,464 | | | 554,075 |
| | | | | | | |
| | | | | | | 2,359,992 |
| | | | | | | |
CONTAINERS & PACKAGING – 1.1% |
AEP Industries, Inc.* | | | | 4,460 | | | 170,729 |
Boise, Inc.* | | | | 21,178 | | | 112,455 |
Bway Holding Co.* | | | | 9,323 | | | 179,188 |
Myers Industries, Inc. | | | | 13,089 | | | 119,110 |
Packaging Corp of America | | | | 51,474 | | | 1,184,417 |
Rock-Tenn Co. | | | | 6,231 | | | 314,104 |
| | | | | | | |
| | | | | | | 2,080,003 |
| | | | | | | |
DISTRIBUTORS – 0.1% | | | | | | | |
Core-mark Holding Co., Inc.* | | | | 6,310 | | | 207,978 |
| | | | | | | |
DIVERSIFIED CONSUMER SERVICES – 1.3% |
Capella Education Co.* | | | | 18,205 | | | 1,370,836 |
Career Education Corp.* | | | | 5,998 | | | 139,813 |
Corinthian Colleges, Inc.* | | | | 13,518 | | | 186,143 |
Hillenbrand, Inc. | | | | 2,248 | | | 42,352 |
Jackson Hewitt Tax Service, Inc.* | | | | 20,254 | | | 89,118 |
Lincoln Educational Services Corp.* | | | | 4,980 | | | 107,917 |
Pre-Paid Legal Services, Inc.* | | | | 3,792 | | | 155,775 |
Steiner Leisure, Ltd.* | | BS | | 6,952 | | | 276,412 |
| | | | | | | |
| | | | | | | 2,368,366 |
| | | | | | | |
DIVERSIFIED FINANCIAL SERVICES – 1.4% |
Encore Capital Group, Inc.* | | | | 6,612 | | | 115,049 |
See Notes to Financial Statements.
104
OPPENHEIMER MAIN STREET SMALL CAP FUND
| | |
PORTFOLIO OF INVESTMENTS (Continued) December 31, 2009 | | Sun Capital Advisers Trust |
| | | | | | | |
| | | Country
Code** | | Shares | | Value |
| | | | | | | |
| | | | | | | |
Lender Processing Services, Inc. | | | | 18,543 | | $ | 753,958 |
MSCI, Inc., Class A* | | | | 38,976 | | | 1,239,437 |
Portfolio Recovery Associates, Inc.* | | | | 8,398 | | | 376,902 |
| | | | | | | |
| | | | | | | 2,485,346 |
| | | | | | | |
DIVERSIFIED TELECOMMUNICATION SERVICES – 0.3% |
Atlantic Tele-network, Inc. | | | | 1,051 | | | 57,816 |
Cincinnati Bell, Inc.* | | | | 120,601 | | | 416,073 |
HickoryTech Corp. | | | | 5,998 | | | 52,962 |
Nortel Inversora SA ADR* | | AR | | 3,418 | | | 51,270 |
| | | | | | | |
| | | | | | | 578,121 |
| | | | | | | |
ELECTRIC UTILITIES – 1.0% |
Cleco Corp. | | | | 15,657 | | | 427,906 |
Companhia Paranaense de Energia-Copel ADR | | BR | | 21,786 | | | 467,310 |
El Paso Electric Co.* | | | | 11,043 | | | 223,952 |
Empresa Distribuidora y Comercializadora Norte SA ADR* | | AR | | 6,926 | | | 54,715 |
Westar Energy, Inc. | | | | 29,592 | | | 642,738 |
| | | | | | | |
| | | | | | | 1,816,621 |
| | | | | | | |
ELECTRICAL EQUIPMENT – 2.0% |
AZZ, Inc.* | | | | 7,494 | | | 245,054 |
Encore Wire Corp. | | | | 11,481 | | | 241,905 |
EnerSys* | | | | 16,036 | | | 350,707 |
GT Solar International, Inc.* | | | | 33,127 | | | 184,186 |
Harbin Electric, Inc.* | | | | 22,320 | | | 458,453 |
Hubbell, Inc., Class B | | | | 9,096 | | | 430,241 |
Powell Industries, Inc.* | | | | 9,751 | | | 307,449 |
Regal-Beloit Corp. | | | | 15,992 | | | 830,624 |
Smith A O Corp. | | | | 4,820 | | | 209,140 |
Thomas & Betts Corp.* | | | | 11,008 | | | 393,976 |
| | | | | | | |
| | | | | | | 3,651,735 |
| | | | | | | |
ELECTRONIC EQUIPMENT & INSTRUMENTS – 1.6% |
Anixter International, Inc.* | | | | 4,506 | | | 212,233 |
Benchmark Electronics, Inc.* | | | | 22,997 | | | 434,873 |
Cogent, Inc.* | | | | 10,948 | | | 113,750 |
| | | | | | | |
| | | Country
Code** | | Shares | | Value |
| | | | | | | |
| | | | | | | |
Insight Enterprises, Inc.* | | | | 20,113 | | $ | 229,690 |
Multi Fineline Electronix, Inc.* | | | | 13,665 | | | 387,676 |
PC Connection, Inc.* | | | | 1,288 | | | 8,694 |
PC Mall, Inc.* | | | | 7,440 | | | 38,837 |
ScanSource, Inc.* | | | | 10,779 | | | 287,799 |
Spectrum Control, Inc.* | | | | 6,412 | | | 60,722 |
SYNNEX Corp.* | | | | 12,295 | | | 376,965 |
Tech Data Corp.* | | | | 10,019 | | | 467,487 |
Technitrol, Inc. | | | | 11,572 | | | 50,685 |
TTM Technologies, Inc.* | | | | 22,338 | | | 257,557 |
| | | | | | | |
| | | | | | | 2,926,968 |
| | | | | | | |
ENERGY EQUIPMENT & SERVICES – 2.0% |
Acergy SA ADR | | LU | | 29,098 | | | 454,220 |
Basic Energy Services, Inc.* | | | | 12,200 | | | 108,580 |
Bolt Technology Corp* | | | | 4,767 | | | 52,532 |
Cal Dive International, Inc.* | | | | 26,157 | | | 197,747 |
Compagnie Generale De Geophysique-Veritas ADR* | | FR | | 9,526 | | | 202,427 |
Complete Production Services, Inc.* | | | | 14,980 | | | 194,740 |
Dawson Geophysical Co.* | | | | 4,455 | | | 102,955 |
Geokinetics, Inc.* | | | | 5,574 | | | 53,622 |
Gulfmark Offshore, Inc.* | | | | 10,593 | | | 299,888 |
Matrix Service Co.* | | | | 11,668 | | | 124,264 |
Oil States International, Inc.* | | | | 11,265 | | | 442,602 |
Pioneer Drilling Co.* | | | | 13,124 | | | 103,680 |
Rowan Cos., Inc.* | | | | 6,242 | | | 141,319 |
SEACOR Holdings, Inc.* | | | | 4,452 | | | 339,465 |
T-3 Energy Services, Inc.* | | | | 7,219 | | | 184,084 |
TGC Industries, Inc.* | | | | 11,048 | | | 43,198 |
Tidewater, Inc. | | | | 6,246 | | | 299,496 |
Willbros Group, Inc.* | | | | 21,535 | | | 363,295 |
| | | | | | | |
| | | | | | | 3,708,114 |
| | | | | | | |
EXCHANGE TRADED FUNDS – 0.0% + |
ASA Ltd. | | BM | | 149 | | | 11,540 |
| | | | | | | |
See Notes to Financial Statements.
105
OPPENHEIMER MAIN STREET SMALL CAP FUND
| | |
PORTFOLIO OF INVESTMENTS (Continued) December 31, 2009 | | Sun Capital Advisers Trust |
| | | | | | | |
| | | Country
Code** | | Shares | | Value |
| | | | | | | |
| | | | | | | |
FOOD & STAPLES RETAILING – 0.2% |
Nash Finch Co. | | | | 2,491 | | $ | 92,391 |
The Pantry, Inc.* | | | | 9,648 | | | 131,117 |
Weis Markets, Inc. | | | | 3,767 | | | 136,968 |
| | | | | | | |
| | | | | | | 360,476 |
| | | | | | | |
FOOD PRODUCTS – 1.1% | | | | | |
Agria Corp. ADR* | | KY | | 17,460 | | | 54,650 |
American Italian Pasta Co.* | | | | 6,125 | | | 213,089 |
Cal-Maine Foods, Inc. | | | | 4,810 | | | 163,925 |
Darling International, Inc.* | | | | 34,950 | | | 292,881 |
Fresh Del Monte Produce, Inc.* | | KY | | 4,436 | | | 98,036 |
J & J Snack Foods Corp. | | | | 1,541 | | | 61,578 |
Lancaster Colony Corp. | | | | 3,713 | | | 184,536 |
Overhill Farms, Inc.* | | | | 8,368 | | | 40,668 |
TreeHouse Foods, Inc.* | | | | 23,044 | | | 895,490 |
| | | | | | | |
| | | | | | | 2,004,853 |
| | | | | | | |
GAS UTILITIES – 1.0% | | | | | | | |
AGL Resources, Inc. | | | | 11,089 | | | 404,416 |
Atmos Energy Corp. | | | | 13,816 | | | 406,190 |
Chesapeake Utilities Corp. | | | | 1,051 | | | 33,684 |
New Jersey Resources Corp. | | | | 9,414 | | | 352,084 |
Nicor, Inc. | | | | 4,920 | | | 207,132 |
Southwest Gas Corp. | | | | 11,466 | | | 327,125 |
The Laclede Group, Inc. | | | | 3,044 | | | 102,796 |
| | | | | | | |
| | | | | | | 1,833,427 |
| | | | | | | |
HEALTH CARE EQUIPMENT & SUPPLIES – 4.2% |
American Medical Systems Holdings, Inc.* | | | | 15,171 | | | 292,649 |
Atrion Corp. | | | | 945 | | | 147,155 |
Dexcom, Inc.* | | | | 5,300 | | | 42,824 |
Greatbatch, Inc.* | | | | 26,758 | | | 514,556 |
Hill-Rom Holdings, Inc. | | | | 14,857 | | | 356,419 |
Integra Lifesciences Holdings Corp.* | | | | 18,952 | | | 697,055 |
Invacare Corp. | | | | 13,122 | | | 327,263 |
Kensey Nash Corp.* | | | | 7,599 | | | 193,774 |
Kinetic Concepts, Inc.* | | | | 8,766 | | | 330,040 |
Masimo Corp.* | | | | 13,778 | | | 419,127 |
| | | | | | | |
| | | Country
Code** | | Shares | | Value |
| | | | | | | |
| | | | | | | |
Merit Medical Systems, Inc.* | | | | 22,094 | | $ | 426,193 |
Natus Med, Inc.* | | | | 24,308 | | | 359,515 |
NuVasive, Inc.* | | | | 35,960 | | | 1,150,001 |
Orthofix International* | | AN | | 16,441 | | | 509,178 |
Quidel Corp.* | | | | 11,272 | | | 155,328 |
Sirona Dental Systems, Inc.* | | | | 2,248 | | | 71,351 |
STERIS Corp. | | | | 12,538 | | | 350,688 |
Surmodics, Inc.* | | | | 4,013 | | | 90,935 |
Symmetry Medical, Inc.* | | | | 20,109 | | | 162,079 |
Thoratec Corp.* | | | | 13,500 | | | 363,420 |
Utah Medical Products, Inc. | | | | 1,856 | | | 54,418 |
Volcano Corp.* | | | | 38,076 | | | 661,761 |
Young Innovations, Inc. | | | | 1,966 | | | 48,717 |
| | | | | | | |
| | | | | | | 7,724,446 |
| | | | | | | |
HEALTH CARE PROVIDERS & SERVICES – 7.4% |
Alliance Imaging, Inc.* | | | | 6,095 | | | 34,802 |
Allied Healthcare International, Inc.* | | | | 17,784 | | | 51,751 |
Amedisys, Inc.* | | | | 7,166 | | | 347,981 |
America Service Group, Inc. | | | | 7,707 | | | 122,310 |
American Dental Partners, Inc.* | | | | 3,718 | | | 47,962 |
AMN Healthcare Services, Inc.* | | | | 16,320 | | | 147,859 |
AmSurg Corp.* | | | | 18,622 | | | 410,056 |
Centene Corp.* | | | | 19,792 | | | 418,997 |
Chemed Corp. | | | | 6,653 | | | 319,144 |
Community Health Systems, Inc.* | | | | 4,919 | | | 175,116 |
Continucare Corp.* | | | | 17,046 | | | 74,491 |
Corvel Corp.* | | | | 1,288 | | | 43,200 |
Emergency Medical Services Corp., Class A* | | | | 6,024 | | | 326,200 |
Genoptix, Inc.* | | | | 21,176 | | | 752,383 |
Gentiva Health Services, Inc.* | | | | 15,779 | | | 426,191 |
Health Management Associates, Inc., Class A* | | | | 240,676 | | | 1,749,715 |
HEALTHSOUTH Corp.* | | | | 16,980 | | | 318,715 |
See Notes to Financial Statements.
106
OPPENHEIMER MAIN STREET SMALL CAP FUND
| | |
PORTFOLIO OF INVESTMENTS (Continued) December 31, 2009 | | Sun Capital Advisers Trust |
| | | | | | | |
| | | Country
Code** | | Shares | | Value |
| | | | | | | |
| | | | | | | |
Healthspring, Inc.* | | | | 30,991 | | $ | 545,752 |
Healthways, Inc.* | | | | 7,996 | | | 146,647 |
HMS Holdings Corp.* | | | | 14,258 | | | 694,222 |
inVentiv Health, Inc.* | | | | 14,195 | | | 229,533 |
Kindred Healthcare, Inc.* | | | | 5,452 | | | 100,644 |
LHC Group, Inc.* | | | | 12,027 | | | 404,228 |
LifePoint Hospitals, Inc.* | | | | 8,138 | | | 264,566 |
Lincare Holdings, Inc.* | | | | 12,573 | | | 466,710 |
Magellan Health Services, Inc.* | | | | 9,232 | | | 376,019 |
MEDNAX, Inc.* | | | | 19,367 | | | 1,164,150 |
Metropolitan Health Networks, Inc.* | | | | 24,276 | | | 48,309 |
Molina Healthcare, Inc.* | | | | 14,270 | | | 326,355 |
Nighthawk Radiology Holdings, Inc.* | | | | 18,228 | | | 82,573 |
NovaMed, Inc.* | | | | 11,886 | | | 46,118 |
Odyssey Healthcare, Inc.* | | | | 21,584 | | | 336,279 |
Pharmerica Corp.* | | | | 19,399 | | | 308,056 |
PSS World Medical, Inc.* | | | | 348 | | | 7,854 |
Rehabcare Group, Inc.* | | | | 14,138 | | | 430,219 |
Res-Care, Inc.* | | | | 9,066 | | | 101,539 |
Sun Healthcare Group, Inc.* | | | | 83,305 | | | 763,907 |
The Ensign Group, Inc. | | | | 3,032 | | | 46,602 |
Triple-S Management Corp., Class B* | | PR | | 16,726 | | | 294,378 |
U.S. Physical Therapy, Inc.* | | | | 7,398 | | | 125,248 |
Universal Health Services, Inc., Class B | | | | 5,794 | | | 176,717 |
VCA Antech, Inc.* | | | | 4,295 | | | 107,031 |
Virtual Radiologic Corp.* | | | | 3,932 | | | 50,172 |
WellCare Health Plan, Inc.* | | | | 5,634 | | | 207,106 |
| | | | | | | |
| | | | | | | 13,617,807 |
| | | | | | | |
HEALTH CARE TECHNOLOGY – 0.3% |
MedAssets, Inc.* | | | | 28,158 | | | 597,231 |
| | | | | | | |
HOTELS, RESTAURANTS & LEISURE – 2.9% |
AFC Enterprises* | | | | 7,519 | | | 61,355 |
Ambassadors Group, Inc. | | | | 7,187 | | | 95,515 |
| | | | | | | |
| | | Country
Code** | | Shares | | Value |
| | | | | | | |
| | | | | | | |
Ameristar Casinos, Inc. | | | | 66,515 | | $ | 1,013,023 |
Bally Technologies, Inc.* | | | | 27,015 | | | 1,115,449 |
Carrols Restaurant Group, Inc.* | | | | 7,026 | | | 49,674 |
CEC Entertainment, Inc.* | | | | 11,319 | | | 361,303 |
Chipotle Mexican Grill, Inc., Class A* | | | | 6,580 | | | 580,093 |
International Speedway Corp., Class A | | | | 1,966 | | | 55,933 |
Jack In The Box, Inc.* | | | | 53,969 | | | 1,061,570 |
P.F. Chang’s China Bistro, Inc.* | | | | 10,536 | | | 399,420 |
Papa John’s International, Inc.* | | | | 13,359 | | | 312,066 |
Speedway Motorsports, Inc. | | | | 8,424 | | | 148,431 |
The Cheesecake Factory, Inc.* | | | | 5,374 | | | 116,025 |
| | | | | | | |
| | | | | | | 5,369,857 |
| | | | | | | |
HOUSEHOLD DURABLES – 0.6% |
American Greetings Corp. | | | | 7,026 | | | 153,097 |
Blyth, Inc. | | | | 6,502 | | | 219,247 |
CSS Industries, Inc. | | | | 2,580 | | | 50,155 |
Helen of Troy, Ltd.* | | BM | | 4,436 | | | 108,505 |
Kid Brands, Inc.* | | | | 8,992 | | | 39,385 |
La-Z-Boy, Inc.* | | | | 11,572 | | | 110,281 |
National Presto Industries, Inc. | | | | 3,236 | | | 353,468 |
Tempur-Pedic International, Inc.* | | | | 6,482 | | | 153,170 |
| | | | | | | |
| | | | | | | 1,187,308 |
| | | | | | | |
HOUSEHOLD PRODUCTS – 0.1% |
Central Garden And Pet Co., Class A* | | | | 26,745 | | | 265,845 |
| | | | | | | |
INDEPENDENT POWER PRODUCERS & ENERGY TRADERS – 0.2% |
Calpine Corp.* | | | | 2,200 | | | 24,200 |
Mirant Corp.* | | | | 21,134 | | | 322,716 |
| | | | | | | |
| | | | | | | 346,916 |
| | | | | | | |
INDUSTRIAL CONGLOMERATES – 0.3% |
Carlisle Cos., Inc. | | | | 10,516 | | | 360,278 |
Tredegar Corp. | | | | 16,768 | | | 265,270 |
| | | | | | | |
| | | | | | | 625,548 |
| | | | | | | |
See Notes to Financial Statements.
107
OPPENHEIMER MAIN STREET SMALL CAP FUND
| | |
PORTFOLIO OF INVESTMENTS (Continued) December 31, 2009 | | Sun Capital Advisers Trust |
| | | | | | | |
| | | Country
Code** | | Shares | | Value |
| | | | | | | |
| | | | | | | |
INSURANCE – 5.0% |
Allied World Assurance Holdings, Ltd. | | BM | | 5,972 | | $ | 275,130 |
American Physicians Capital, Inc. | | | | 6,923 | | | 209,905 |
American Physicians Service Group, Inc. | | | | 1,856 | | | 42,818 |
American Safety Insurance Holdings, Ltd.* | | BM | | 3,418 | | | 49,390 |
Amerisafe, Inc.* | | | | 16,753 | | | 301,051 |
Amtrust Financial Services, Inc. | | | | 19,325 | | | 228,422 |
Argo Group International Holdings, Inc.* | | BM | | 7,731 | | | 225,281 |
Aspen Insurance Holdings, Ltd. | | BM | | 14,079 | | | 358,311 |
CNA Surety Corp.* | | | | 11,045 | | | 164,460 |
Conseco, Inc.* | | | | 62,072 | | | 310,360 |
EMC Insurance Group, Inc. | | | | 2,380 | | | 51,194 |
Employers Holdings, Inc. | | | | 12,434 | | | 190,738 |
Endurance Specialty Holdings, Ltd. | | BM | | 10,293 | | | 383,208 |
Enstar Group, Ltd.* | | BM | | 3,011 | | | 219,863 |
FBL Financial Group, Inc. | | | | 8,164 | | | 151,197 |
First Mercury Financial Corp. | | | | 10,931 | | | 149,864 |
Flagstone Reinsurance Holdings Ltd. | | BM | | 18,184 | | | 198,933 |
FPIC Insurance Group, Inc.* | | | | 4,212 | | | 162,668 |
Greenlight Capital Re, Ltd., Class A* | | KY | | 9,306 | | | 219,342 |
Hanover Insurance Group, Inc. | | | | 31,079 | | | 1,380,840 |
Harleysville Group, Inc. | | | | 4,420 | | | 140,512 |
Infinity Property & Casualty Corp. | | | | 7,147 | | | 290,454 |
Life Partners Holdings, Inc. | | | | 10,469 | | | 221,838 |
MBIA, Inc.* | | | | 26,816 | | | 106,728 |
Mercer Insurance Group, Inc. | | | | 2,894 | | | 52,584 |
Mercury General Corp. | | | | 4,132 | | | 162,222 |
Montpelier Re Holdings Ltd. | | BM | | 17,670 | | | 306,044 |
National Interstate Corp. | | | | 1,799 | | | 30,511 |
| | | | | | | |
| | | Country
Code** | | Shares | | Value |
| | | | | | | |
| | | | | | | |
National Western Life Insurance Co. | | | | 615 | | $ | 106,776 |
OneBeacon Insurance Group, Ltd. | | BM | | 8,054 | | | 110,984 |
Platinum Underwriters Holdings, Ltd. | | BM | | 10,834 | | | 414,834 |
PMA Capital Corp.* | | | | 11,712 | | | 73,786 |
ProAssurance Corp.* | | | | 7,524 | | | 404,114 |
Safety Insurance Group, Inc. | | | | 8,728 | | | 316,216 |
SeaBright Insurance Holdings, Inc.* | | | | 4,336 | | | 49,821 |
StanCorp Financial Group, Inc. | | | | 10,111 | | | 404,642 |
Unitrin, Inc. | | | | 14,102 | | | 310,949 |
Universal Insurance Holdings, Inc. | | | | 18,698 | | | 109,757 |
Validus Holdings Ltd. | | BM | | 13,603 | | | 366,465 |
| | | | | | | |
| | | | | | | 9,252,212 |
| | | | | | | |
INTERNET & CATALOG RETAIL – 0.4% |
HSN, Inc.* | | | | 7,932 | | | 160,147 |
NutriSystem, Inc. | | | | 5,698 | | | 177,607 |
Ticketmaster Entertainment, Inc.* | | | | 37,921 | | | 463,394 |
| | | | | | | |
| | | | | | | 801,148 |
| | | | | | | |
INTERNET SOFTWARE & SERVICES – 2.2% |
Divx, Inc.* | | | | 4,492 | | | 25,335 |
Earthlink, Inc. | | | | 39,529 | | | 328,486 |
GigaMedia Ltd.* | | SG | | 62,520 | | | 204,440 |
j2 Global Communications, Inc.* | | | | 49,894 | | | 1,015,343 |
Perficient, Inc.* | | | | 5,983 | | | 50,437 |
S1 Corp.* | | | | 31,150 | | | 203,098 |
Saba Software, Inc.* | | | | 12,924 | | | 53,505 |
SkillSoft PLC ADR* | | IE | | 15,387 | | | 161,256 |
Sohu.com, Inc.* | | | | 2,720 | | | 155,802 |
SonicWall, Inc.* | | | | 21,584 | | | 164,254 |
United Online, Inc. | | | | 29,668 | | | 213,313 |
Valueclick, Inc.* | | | | 30,897 | | | 312,678 |
VistaPrint NV* | | NL | | 16,420 | | | 930,357 |
Web.com Group, Inc.* | | | | 4,114 | | | 26,864 |
Websense, Inc.* | | | | 9,435 | | | 164,735 |
| | | | | | | |
| | | | | | | 4,009,903 |
| | | | | | | |
IT SERVICES – 4.0% |
Acxiom Corp.* | | | | 41,443 | | | 556,165 |
Broadridge Financial Solutions, Inc. | | | | 19,002 | | | 428,685 |
See Notes to Financial Statements.
108
OPPENHEIMER MAIN STREET SMALL CAP FUND
| | |
PORTFOLIO OF INVESTMENTS (Continued) December 31, 2009 | | Sun Capital Advisers Trust |
| | | | | | | |
| | | Country
Code** | | Shares | | Value |
| | | | | | | |
| | | | | | | |
CACI International, Inc., Class A* | | | | 24,514 | | $ | 1,197,509 |
Convergys Corp.* | | | | 26,684 | | | 286,853 |
CSG Systems International, Inc.* | | | | 17,375 | | | 331,689 |
DST Systems, Inc.* | | | | 7,597 | | | 330,849 |
Forrester Research, Inc.* | | | | 3,962 | | | 102,814 |
Gartner, Inc.* | | | | 19,306 | | | 348,280 |
Global Cash Access Holdings, Inc.* | | | | 29,161 | | | 218,416 |
iGATE Corp. | | | | 8,015 | | | 80,150 |
Ness Technologies, Inc.* | | | | 18,288 | | | 89,611 |
NeuStar, Inc., Class A* | | | | 53,985 | | | 1,243,814 |
Patni Computer Systems Ltd. ADR | | IN | | 11,728 | | | 239,838 |
Satyam Computer Services, Ltd. ADR* | | IN | | 39,775 | | | 183,363 |
SYKES Enterprises, Inc.* | | | | 7,401 | | | 188,504 |
Syntel, Inc. | | | | 3,772 | | | 143,449 |
Telvent GIT SA | | ES | | 5,170 | | | 201,527 |
TNS, Inc.* | | | | 10,557 | | | 271,209 |
Unisys Corp.* | | | | 7,764 | | | 299,380 |
Virtusa Corp.* | | | | 18,712 | | | 169,531 |
Wright Express Corp.* | | | | 11,997 | | | 382,224 |
| | | | | | | |
| | | | | | | 7,293,860 |
| | | | | | | |
LEISURE EQUIPMENT & PRODUCTS – 0.7% |
Polaris Industries, Inc. | | | | 4,288 | | | 187,086 |
Pool Corp. | | | | 38,965 | | | 743,452 |
Smith & Wesson Holding Corp.* | | | | 9,026 | | | 36,916 |
Sport Supply Group, Inc. | | | | 5,274 | | | 66,400 |
Sturm Ruger & Co., Inc. | | | | 28,629 | | | 277,701 |
| | | | | | | |
| | | | | | | 1,311,555 |
| | | | | | | |
LIFE SCIENCES TOOLS & SERVICES – 0.5% |
Bruker Corp.* | | | | 7,240 | | | 87,315 |
Cambrex Corp.* | | | | 18,912 | | | 105,529 |
EResearch Technology, Inc.* | | | | 31,025 | | | 186,460 |
Harvard Bioscience, Inc.* | | | | 13,852 | | | 49,452 |
Icon PLC ADR* | | IE | | 8,992 | | | 195,396 |
Kendle International, Inc.* | | | | 14,756 | | | 270,182 |
| | | | | | | |
| | | | | | | 894,334 |
| | | | | | | |
| | | | | | | |
| | | Country
Code** | | Shares | | Value |
| | | | | | | |
| | | | | | | |
MACHINERY – 3.8% | | | | | | | |
Altra Holdings, Inc.* | | | | 7,518 | | $ | 92,847 |
American Railcar Industries, Inc. | | | | 4,760 | | | 52,455 |
Ampco-Pittsburgh Corp. | | | | 5,821 | | | 183,536 |
Chart Industries, Inc.* | | | | 17,959 | | | 297,221 |
Colfax Corp.* | | | | 23,176 | | | 279,039 |
DXP Enterprises, Inc.* | | | | 3,972 | | | 51,914 |
EnPro Industries, Inc.* | | | | 20,029 | | | 528,966 |
Force Protection, Inc.* | | | | 22,644 | | | 117,975 |
FreightCar America, Inc. | | | | 15,137 | | | 300,167 |
Gardner Denver, Inc. | | | | 36,013 | | | 1,532,353 |
Graco, Inc. | | | | 34,370 | | | 981,951 |
Harsco Corp. | | | | 3,694 | | | 119,058 |
K-tron International, Inc.* | | | | 547 | | | 59,481 |
Lincoln Electric Holdings, Inc. | | | | 4,101 | | | 219,239 |
Mueller Industries, Inc. | | | | 15,949 | | | 396,173 |
Oshkosh Corp. | | | | 1,756 | | | 65,025 |
Portec Rail Products, Inc. | | | | 5,474 | | | 58,627 |
The Timken Co. | | | | 8,124 | | | 192,620 |
Toro Co. | | | | 7,725 | | | 322,982 |
Wabtec Corp. | | | | 22,933 | | | 936,584 |
Watts Water Technologies, Inc., Class A | | | | 4,810 | | | 148,725 |
| | | | | | | |
| | | | | | | 6,936,938 |
| | | | | | | |
MARINE – 0.2% |
Kirby Corp.* | | | | 3,492 | | | 121,626 |
Safe Bulkers, Inc. | | MH | | 18,919 | | | 165,731 |
| | | | | | | |
| | | | | | | 287,357 |
| | | | | | | |
MEDIA – 0.8% | | | | | | | |
Belo Corp., Class A | | | | 7,804 | | | 42,454 |
CTC Media, Inc.* | | | | 6,842 | | | 101,946 |
Entercom Communications Corp., Class A* | | | | 5,998 | | | 42,406 |
Gannett Co., Inc. | | | | 6,198 | | | 92,040 |
Harte-Hanks, Inc. | | | | 13,608 | | | 146,694 |
Jon Wiley & Sons, Inc. | | | | 5,434 | | | 227,576 |
Journal Communications, Inc. | | | | 11,786 | | | 45,848 |
Lee Enterprises, Inc.* | | | | 30,898 | | | 107,216 |
Mediacom Communications Corp., Class A* | | | | 8,934 | | | 39,935 |
See Notes to Financial Statements.
109
OPPENHEIMER MAIN STREET SMALL CAP FUND
| | |
PORTFOLIO OF INVESTMENTS (Continued) December 31, 2009 | | Sun Capital Advisers Trust |
| | | | | | | |
| | | Country
Code** | | Shares | | Value |
| | | | | | | |
| | | | | | | |
National CineMedia, Inc. | | | | 4,840 | | $ | 80,199 |
Scholastic Corp. | | | | 9,107 | | | 271,662 |
Sinclair Broadcast Group, Inc.* | | | | 32,218 | | | 129,838 |
Valassis Communications, Inc.* | | | | 3,982 | | | 72,711 |
Value Line, Inc. | | | | 1,652 | | | 41,482 |
| | | | | | | |
| | | | | | | 1,442,007 |
| | | | | | | |
METALS & MINING – 1.2% | | | | | |
Century Aluminum Co.* | | | | 29,083 | | | 470,854 |
Compass Minerals International, Inc. | | | | 17,813 | | | 1,196,855 |
Gibraltar Industries, Inc.* | | | | 7,340 | | | 115,458 |
Mesabi Trust | | | | 3,492 | | | 44,698 |
Redcorp Ventures Ltd.* (1) | | CA | | 91,400 | | | 437 |
Thompson Creek Metals Co., Inc.* | | CA | | 27,698 | | | 324,621 |
| | | | | | | |
| | | | | | | 2,152,923 |
| | | | | | | |
MULTI-LINE RETAIL – 0.6% | | | | | |
Big Lots, Inc.* | | | | 10,835 | | | 313,998 |
Saks, Inc.* | | | | 130,526 | | | 856,251 |
| | | | | | | |
| | | | | | | 1,170,249 |
| | | | | | | |
MULTI-UTILITIES – 0.6% | | | | | |
Avista Corp. | | | | 10,049 | | | 216,958 |
NorthWestern Corp. | | | | 31,304 | | | 814,530 |
| | | | | | | |
| | | | | | | 1,031,488 |
| | | | | | | |
OIL, GAS & CONSUMABLE FUELS – 2.5% |
China Integrated Energy, Inc.* | | | | 7,026 | | | 49,463 |
CVR Energy, Inc.* | | | | 25,596 | | | 175,589 |
Dominion Resources Black Warrior Trust | | | | 3,518 | | | 50,483 |
Encore Aquisition Co.* | | | | 1,301 | | | 62,474 |
Gulfport Energy Corp.* | | | | 12,814 | | | 146,720 |
Holly Corp. | | | | 44,733 | | | 1,146,507 |
Inergy LP | | | | 20,794 | | | 741,930 |
MarkWest Energy Partners LP | | | | 45,309 | | | 1,326,195 |
| | | | | | | |
| | | Country
Code** | | Shares | | Value |
| | | | | | | |
| | | | | | | |
Pengrowth Energy Trust | | CA | | 8,697 | | $ | 83,752 |
PrimeEnergy Corp.* | | | | 1,242 | | | 45,196 |
Provident Energy Trust | | CA | | 9,092 | | | 61,098 |
Ship Finance International Ltd. | | BM | | 3,822 | | | 52,094 |
Stone Energy Corp.* | | | | 3,318 | | | 59,890 |
Teekay Tankers Ltd., Class A | | MH | | 16,077 | | | 137,137 |
World Fuel Services Corp. | | | | 14,100 | | | 377,739 |
| | | | | | | |
| | | | | | | 4,516,267 |
| | | | | | | |
PAPER & FOREST PRODUCTS – 0.3% |
Buckeye Technologies, Inc.* | | | | 20,564 | | | 200,705 |
Clearwater Paper Corp.* | | | | 3,488 | | | 191,735 |
Domtar Corp.* | | | | 1,726 | | | 95,638 |
KapStone Paper and Packaging Corp.* | | | | 12,924 | | | 127,301 |
| | | | | | | |
| | | | | | | 615,379 |
| | | | | | | |
PERSONAL PRODUCTS – 0.4% | | | | | |
American Oriental Bioengineering, Inc.* | | | | 28,800 | | | 133,920 |
Herbalife, Ltd. | | KY | | 11,304 | | | 458,603 |
Prestige Brands Holdings, Inc.* | | | | 26,466 | | | 208,023 |
| | | | | | | |
| | | | | | | 800,546 |
| | | | | | | |
PHARMACEUTICALS – 1.2% | | | | | |
Biovail Corp. | | CA | | 13,942 | | | 194,630 |
Cornerstone Therapeutics, Inc.* | | | | 8,992 | | | 54,851 |
Endo Pharmaceuticals Holding, Inc.* | | | | 8,022 | | | 164,531 |
Impax Laboratories, Inc.* | | | | 10,848 | | | 147,533 |
Indevus Pharmaceuticals, Inc. | | | | 600 | | | — |
King Pharmaceuticals, Inc.* | | | | 19,911 | | | 244,308 |
KV Pharmaceutical Co., Class A* | | | | 24,276 | | | 89,093 |
Medicis Pharmaceutical Corp., Class A | | | | 6,706 | | | 181,397 |
Par Pharmaceutical Cos., Inc.* | | | | 4,162 | | | 112,624 |
Perrigo Co. | | | | 11,094 | | | 441,985 |
See Notes to Financial Statements.
110
OPPENHEIMER MAIN STREET SMALL CAP FUND
| | |
PORTFOLIO OF INVESTMENTS (Continued) December 31, 2009 | | Sun Capital Advisers Trust |
| | | | | | | |
| | | Country
Code** | | Shares | | Value |
| | | | | | | |
| | | | | | | |
Questcor Pharmaceuticals, Inc.* | | | | 60,806 | | $ | 288,829 |
Valeant Pharmaceuticals International* | | | | 10,374 | | | 329,789 |
| | | | | | | |
| | | | | | | 2,249,570 |
| | | | | | | |
PROFESSIONAL SERVICES – 0.0% + |
GP Strategies Corp.* | | | | 6,926 | | | 52,153 |
| | | | | | | |
REAL ESTATE INVESTMENT TRUSTS – 5.1% |
Agree Realty Corp. | | | | 4,371 | | | 101,801 |
Associated Estates Realty Corp. | | | | 5,474 | | | 61,692 |
CapitalSource, Inc. | | | | 78,254 | | | 310,668 |
CBL & Associates Properties, Inc. | | | | 15,344 | | | 148,376 |
Chimera Investment Corp. | | | | 171,568 | | | 665,684 |
DiamondRock Hospitality Co. | | | | 15,817 | | | 133,970 |
Digital Realty Trust, Inc. | | | | 25,800 | | | 1,297,224 |
Equity Lifestyle Properties, Inc. | | | | 4,202 | | | 212,075 |
Forestar Real Estate Group, Inc.* | | | | 16,367 | | | 359,747 |
Hatteras Financial Corp. | | | | 30,694 | | | 858,204 |
Home Properties, Inc. | | | | 9,531 | | | 454,724 |
Hospitality Properties Trust | | | | 5,060 | | | 119,973 |
HRPT Properties Trust | | | | 7,650 | | | 49,496 |
Kilroy Realty Corp. | | | | 3,518 | | | 107,897 |
LaSalle Hotel Properties | | | | 8,268 | | | 175,530 |
Liberty Property Trust | | | | 1,552 | | | 49,680 |
LTC Properties, Inc. | | | | 17,770 | | | 475,347 |
Mack-Cali Realty Corp. | | | | 6,252 | | | 216,132 |
Mid America Apartment Communities, Inc. | | | | 31,598 | | | 1,525,551 |
Monmouth Real Estate Investment Corp., Class A | | | | 7,240 | | | 53,866 |
National Health Investors, Inc. | | | | 7,360 | | | 272,246 |
Nationwide Health Properties, Inc. | | | | 1,652 | | | 58,117 |
Newcastle Investment Corp.* | | | | 14,880 | | | 31,099 |
| | | | | | | |
| | | Country
Code** | | Shares | | Value |
| | | | | | | |
| | | | | | | |
Realty Income Corp. | | | | 392 | | $ | 10,157 |
Starwood Property Trust, Inc. | | | | 29,742 | | | 561,826 |
Tanger Factory Outlet Centers, Inc. | | | | 20,266 | | | 790,171 |
Walter Investment Management Corp. | | | | 20,778 | | | 297,749 |
| | | | | | | |
| | | | | | | 9,399,002 |
| | | | | | | |
REAL ESTATE MANAGEMENT & DEVELOPMENT – 0.1% |
E-House China Holdings Ltd. ADS* | | KY | | 10,577 | | | 191,655 |
FirstService Corp.* | | CA | | 2,380 | | | 45,506 |
| | | | | | | |
| | | | | | | 237,161 |
| | | | | | | |
ROAD & RAIL – 1.2% | | | | | | | |
Avis Budget Group, Inc.* | | | | 37,749 | | | 495,267 |
Dollar Thrifty Automotive Group* | | | | 12,769 | | | 327,014 |
Old Dominion Freight Line* | | | | 43,531 | | | 1,336,402 |
| | | | | | | |
| | | | | | | 2,158,683 |
| | | | | | | |
SEMICONDUCTORS & SEMICONDUCTOR EQUIPMENT – 3.2% |
Amkor Technology, Inc.* | | | | 7,440 | | | 53,270 |
Atheros Communications* | | | | 30,945 | | | 1,059,557 |
Himax Technologies, Inc. ADR | | KY | | 44,364 | | | 122,888 |
Mellanox Technologies Ltd.* | | IL | | 4,310 | | | 81,287 |
Micrel, Inc. | | | | 30,617 | | | 251,059 |
Netlogic Microsystems, Inc.* | | | | 21,578 | | | 998,198 |
Semtech Corp.* | | | | 58,849 | | | 1,001,022 |
Sigma Designs, Inc.* | | | | 12,345 | | | 132,092 |
Silicon Motion Technology Corp. ADR* | | KY | | 8,242 | | | 28,105 |
Skyworks Solutions, Inc.* | | | | 64,724 | | | 918,434 |
Tessera Technologies, Inc.* | | | | 8,620 | | | 200,587 |
Varian Semiconductor Equipment Associates, Inc.* | | | | 26,650 | | | 956,202 |
See Notes to Financial Statements.
111
OPPENHEIMER MAIN STREET SMALL CAP FUND
| | |
PORTFOLIO OF INVESTMENTS (Continued) December 31, 2009 | | Sun Capital Advisers Trust |
| | | | | | | |
| | | Country
Code** | | Shares | | Value |
| | | | | | | |
| | | | | | | |
Volterra Semiconductor Corp.* | | | | 7,240 | | $ | 138,429 |
| | | | | | | |
| | | | | | | 5,941,130 |
| | | | | | | |
SOFTWARE – 4.0% | | | | | | | |
Actuate Corp.* | | | | 27,392 | | | 117,238 |
Blackboard, Inc.* | | | | 9,470 | | | 429,843 |
Changyou.com Ltd. ADR* | | KY | | 1,552 | | | 51,542 |
Compuware Corp.* | | | | 38,553 | | | 278,738 |
Concur Technologies, Inc.* | | | | 14,131 | | | 604,100 |
Double-take Software, Inc.* | | | | 7,024 | | | 70,170 |
FactSet Research Systems, Inc. | | | | 18,549 | | | 1,221,823 |
Fair Issac Corp. | | | | 18,683 | | | 398,135 |
Fortinet, Inc.* | | | | 3,518 | | | 61,811 |
Giant Interactive Group, Inc. ADR | | KY | | 16,601 | | | 116,539 |
i2 Technologies, Inc.* | | | | 10,831 | | | 207,089 |
Informatica Corp.* | | | | 12,690 | | | 328,164 |
Jack Henry & Associates, Inc. | | | | 6,411 | | | 148,222 |
JDA Software Group, Inc.* | | | | 6,182 | | | 157,456 |
Manhattan Associates, Inc.* | | | | 13,743 | | | 330,244 |
MICROS Systems, Inc.* | | | | 3,478 | | | 107,922 |
Microstrategy, Inc.* | | | | 4,696 | | | 441,518 |
Monotype Imaging Holdings, Inc.* | | | | 6,412 | | | 57,900 |
Net 1 UEPS Technologies, Inc.* | | | | 22,045 | | | 428,114 |
Novell, Inc.* | | | | 6,462 | | | 26,817 |
Perfect World Co. Ltd. ADR* | | KY | | 6,585 | | | 259,712 |
Pervasive Software, Inc.* | | | | 9,406 | | | 45,337 |
Quest Software, Inc.* | | | | 20,891 | | | 384,395 |
Sybase, Inc.* | | | | 5,481 | | | 237,875 |
Tibco Software, Inc.* | | | | 87,147 | | | 839,226 |
| | | | | | | |
| | | | | | | 7,349,930 |
| | | | | | | |
SPECIALTY RETAIL – 3.9% | | | | | |
Aeropostale, Inc.* | | | | 9,688 | | | 329,876 |
Barnes & Noble, Inc. | | | | 15,225 | | | 290,341 |
Big 5 Sporting Goods Corp. | | | | 2,449 | | | 42,074 |
| | | | | | | |
| | | Country
Code** | | Shares | | Value |
| | | | | | | |
| | | | | | | |
Books-A-Million, Inc. | | | | 5,274 | | $ | 35,441 |
Borders Group, Inc., Class A* | | | | 10,844 | | | 12,796 |
Cabela’s, Inc.* | | | | 20,842 | | | 297,207 |
Cato Corp. | | | | 19,348 | | | 388,121 |
Childrens Place Retail Stores, Inc.* | | | | 28,079 | | | 926,888 |
Destination Maternity Corp.* | | | | 2,794 | | | 53,086 |
Dress Barn, Inc.* | | | | 14,694 | | | 339,431 |
Finish Line, Inc., Class A | | | | 20,204 | | | 253,560 |
Group 1 Automotive, Inc.* | | | | 7,056 | | | 200,038 |
Gymboree Corp.* | | | | 8,295 | | | 360,750 |
Jo-Ann Stores, Inc.* | | | | 1,966 | | | 71,248 |
JOS A Bank Clothiers, Inc.* | | | | 3,729 | | | 157,326 |
Kirkland’s, Inc.* | | | | 26,657 | | | 463,032 |
RadioShack Corp. | | | | 17,218 | | | 335,751 |
Rental-A-Center, Inc.* | | | | 18,399 | | | 326,030 |
Signet Jewelers, Ltd.* | | BM | | 5,791 | | | 154,736 |
Stage Stores, Inc. | | | | 27,865 | | | 344,411 |
The Men’s Wearhouse, Inc. | | | | 7,295 | | | 153,633 |
Tractor Supply Co.* | | | | 28,958 | | | 1,533,616 |
| | | | | | | |
| | | | | | | 7,069,392 |
| | | | | | | |
TEXTILES, APPAREL & LUXURY GOODS – 2.0% |
Carter’s, Inc.* | | | | 12,571 | | | 329,989 |
Deckers Outdoor Corp.* | | | | 2,036 | | | 207,102 |
Fossil, Inc.* | | | | 30,988 | | | 1,039,957 |
Madden Steven Ltd.* | | | | 5,609 | | | 231,315 |
Perry Ellis International, Inc.* | | | | 7,616 | | | 114,697 |
Phillips-Van Heusen Corp. | | | | 27,289 | | | 1,110,117 |
Timberland Co., Class A* | | | | 25,565 | | | 458,380 |
UniFirst Corp. | | | | 4,202 | | | 202,158 |
| | | | | | | |
| | | | | | | 3,693,715 |
| | | | | | | |
THRIFT & MORTGAGE FINANCE – 0.6% | | | |
First Defiance Financial Corp. | | | | 6,463 | | | 72,967 |
First Niagara Financial Group, Inc. | | | | 34,692 | | | 482,566 |
NASB Financial, Inc. | | | | 839 | | | 19,540 |
Northwest Bancshares, Inc. | | | | 17,620 | | | 199,459 |
See Notes to Financial Statements.
112
OPPENHEIMER MAIN STREET SMALL CAP FUND
| | |
PORTFOLIO OF INVESTMENTS (Continued) December 31, 2009 | | Sun Capital Advisers Trust |
| | | | | | | |
| | | Country
Code** | | Shares | | Value |
| | | | | | | |
| | | | | | | |
Oceanfirst Financial Corp. | | | | 12,533 | | $ | 141,623 |
United Financial Bancorp, Inc. | | | | 8,163 | | | 107,017 |
| | | | | | | |
| | | | | | | 1,023,172 |
| | | | | | | |
TOBACCO – 0.3% | | | | | | | |
Alliance One International, Inc.* | | | | 21,178 | | | 103,349 |
Universal Corp. | | | | 9,119 | | | 415,917 |
| | | | | | | |
| | | | | | | 519,266 |
| | | | | | | |
TRADING COMPANIES & DISTRIBUTORS – 0.3% |
Aircastle Ltd. | | BM | | 5,838 | | | 57,504 |
Genesis Lease Ltd. ADS | | BM | | 2,001 | | | 17,869 |
Houston Wire & Cable Co. | | | | 9,406 | | | 111,931 |
Interline Brands, Inc.* | | | | 3,674 | | | 63,450 |
WESCO International, Inc.* | | | | 14,286 | | | 385,865 |
| | | | | | | |
| | | | | | | 636,619 |
| | | | | | | |
TRANSPORTATION – 0.1% | | | | | |
Diana Shipping, Inc.* | | MH | | 12,186 | | | 176,453 |
| | | | | | | |
| | | | | | | | |
| | | | |
Shares | | Value | |
| | | | | | | | |
| | | | | | | | |
WATER UTILITIES – 0.4% | | | | | | |
Aqua America, Inc. | | | | 41,496 | | $ | 726,595 | |
| | | | | | | | |
WIRELESS TELECOMMUNICATION SERVICES – 0.1% | | | | |
USA Mobility, Inc. | | | | 19,509 | | | 214,794 | |
| | | | | | | | |
Total Common Stocks
(Cost $156,888,391) | | | 182,518,486 | |
| | | | | | | | |
SHORT TERM INVESTMENTS – 1.0% | | | | |
MUTUAL FUNDS – 1.0% | | | | | | |
State Street Institutional Treasury Plus Money Market Fund
(Cost $1,730,277) | | 1,730,277 | | | 1,730,277 | |
| | | | | | | | |
TOTAL INVESTMENTS – 100.3% | | | | |
(Cost $158,618,668) | | | | | 184,248,763 | |
Liabilities in excess of other assets – (0.3)% | | | | | (480,206 | ) |
| | | | | | | | |
NET ASSETS – 100.0% | | | | $ | 183,768,557 | |
| | | | | | | | |
| * | Non-income producing security. |
| ** | Unless otherwise noted the issuer country code for all securities is United States. |
| + | Amount is less than 0.05%. |
| (1) | Eligible for resale under rule 144A of the Securities Act of 1933. This security may be resold in transactions exempt from registration, normally to qualified institutional buyers. At the period end, the value of this security amounted to $437, representing less than 0.05% of net assets. |
| | |
| ADR | | American Depositary Receipt |
| ADS | | American Depositary Shares |
| | |
| AG | | Antigua |
| AN | | Netherlands Antilles |
| AR | | Argentina |
| BM | | Bermuda |
| BR | | Brazil |
| BS | | Bahamas |
| CA | | Canada |
| CO | | Columbia |
| ES | | Spain |
| FR | | France |
| IE | | Ireland |
| IL | | Israel |
| IN | | India |
See Notes to Financial Statements.
113
OPPENHEIMER MAIN STREET SMALL CAP FUND
| | |
PORTFOLIO OF INVESTMENTS (Continued) December 31, 2009 | | Sun Capital Advisers Trust |
| | |
| KY | | Cayman Islands |
| LU | | Luxembourg |
| MH | | Marshall Islands |
| NL | | Netherlands |
| PA | | Panama |
| PR | | Puerto Rico |
| SG | | Singapore |
| (2) | Fair Value Measurements † |
The following table summarizes the inputs used to value the Fund’s assets and liabilities, as applicable, measured at fair value at the period end:
| | | | | | | | | | | | |
Assets | | Quoted Prices
in Active
Markets for
Identical
Assets and
Liabilities
(Level 1) | | Significant
Other
Observable
Inputs
(Level 2) | | Significant
Unobservable
Inputs
(Level 3) | | Total |
Total Common Stocks (a) | | $ | 182,518,486 | | $ | — | | $ | — | | $ | 182,518,486 |
Short Term Investments | | | | | | | | | | | | |
Mutual Funds | | | 1,730,277 | | | — | | | — | | | 1,730,277 |
| | | | | | | | | | | | |
Total Investments | | | 184,248,763 | | | — | | | — | | | 184,248,763 |
| | | | | | | | | | | | |
Total | | $ | 184,248,763 | | $ | — | | $ | — | | $ | 184,248,763 |
| | | | | | | | | | | | |
| † | See Note 2b in the Notes to Financial Statements for additional information. |
| (a) | See Portfolio of Investments for additional detailed categorizations. |
See Notes to Financial Statements.
114
OPPENHEIMER LARGE CAP CORE FUND
| | |
PORTFOLIOOF INVESTMENTS December 31, 2009 | | Sun Capital Advisers Trust |
| | | | | | | |
| | | Country
Code** | | Shares | | Value |
| | | | | | | |
| | | | | | | |
COMMON STOCKS – 98.6% | | | | | |
AEROSPACE & DEFENSE – 5.0% | | | |
Honeywell International, Inc. | | | | 9,400 | | $ | 368,480 |
Lockheed Martin Corp. | | | | 6,200 | | | 467,170 |
Northrop Grumman Corp. | | | | 26,800 | | | 1,496,780 |
Raytheon Co. | | | | 18,500 | | | 953,120 |
United Technologies Corp. | | | | 12,400 | | | 860,684 |
| | | | | | | |
| | | | | | | 4,146,234 |
| | | | | | | |
AIR FREIGHT & LOGISTICS – 1.4% | | | |
FedEx Corp. | | | | 14,300 | | | 1,193,335 |
| | | | | | | |
AUTO COMPONENTS – 1.3% | | | |
Johnson Controls, Inc. | | | | 29,400 | | | 800,856 |
The Goodyear Tire & Rubber Co.* | | | | 17,400 | | | 245,340 |
| | | | | | | |
| | | | | | | 1,046,196 |
| | | | | | | |
AUTOMOBILES – 0.3% | | | |
Ford Motor Co.* | | | | 21,900 | | | 219,000 |
| | | | | | | |
BEVERAGES – 1.5% | | | |
Coca-Cola Enterprises, Inc. | | | | 29,800 | | | 631,760 |
The Coca-Cola Co. | | | | 11,100 | | | 632,700 |
| | | | | | | |
| | | | | | | 1,264,460 |
| | | | | | | |
BUILDING PRODUCTS – 0.8% | | | |
Masco Corp. | | | | 46,900 | | | 647,689 |
| | | | | | | |
CAPITAL MARKETS – 3.9% | | | |
Ameriprise Financial, Inc. | | | | 7,300 | | | 283,386 |
Northern Trust Corp. | | | | 17,400 | | | 911,760 |
State Street Corp. | | | | 7,500 | | | 326,550 |
The Goldman Sachs Group, Inc. | | | | 9,900 | | | 1,671,516 |
| | | | | | | |
| | | | | | | 3,193,212 |
| | | | | | | |
CHEMICALS – 1.1% | | | |
E.I. du Pont de Nemours & Co. | | | | 13,700 | | | 461,279 |
Ecolab, Inc. | | | | 4,800 | | | 213,984 |
Monsanto Co. | | | | 3,200 | | | 261,600 |
| | | | | | | |
| | | | | | | 936,863 |
| | | | | | | |
COMMERCIAL BANKS – 0.4% | | | |
Wells Fargo & Co. | | | | 11,300 | | | 304,987 |
| | | | | | | |
| | | | | | | |
| | | Country
Code** | | Shares | | Value |
| | | | | | | |
COMMERCIAL SERVICES & SUPPLIES – 1.1% |
R.R. Donnelley & Sons Co. | | | | 41,400 | | $ | 921,978 |
| | | | | | | |
COMMUNICATIONS EQUIPMENT – 2.7% | | | |
Cisco Systems, Inc.* | | | | 30,200 | | | 722,988 |
Motorola, Inc.* | | | | 173,700 | | | 1,347,912 |
QUALCOMM, Inc. | | | | 4,100 | | | 189,666 |
| | | | | | | |
| | | | | | | 2,260,566 |
| | | | | | | |
COMPUTERS & PERIPHERALS – 9.7% | | | |
Apple, Inc.* | | | | 10,300 | | | 2,171,858 |
Dell, Inc.* | | | | 54,000 | | | 775,440 |
Hewlett-Packard Co. | | | | 43,300 | | | 2,230,383 |
International Business Machines Corp. | | | | 13,400 | | | 1,754,060 |
SanDisk Corp.* | | | | 35,400 | | | 1,026,246 |
| | | | | | | |
| | | | | | | 7,957,987 |
| | | | | | | |
CONSTRUCTION & ENGINEERING – 0.5% |
Fluor Corp. | | | | 9,000 | | | 405,360 |
| | | | | | | |
CONSUMER FINANCE – 2.3% |
American Express Co. | | | | 46,500 | | | 1,884,180 |
| | | | | | | |
DIVERSIFIED FINANCIAL SERVICES – 4.0% |
Bank of America Corp. | | | | 47,500 | | | 715,350 |
Citigroup, Inc. | | | | 94,500 | | | 312,795 |
JP Morgan Chase & Co. | | | | 43,500 | | | 1,812,645 |
NYSE Euronext | | | | 17,700 | | | 447,810 |
| | | | | | | |
| | | | | | | 3,288,600 |
| | | | | | | |
DIVERSIFIED TELECOMMUNICATION SERVICES – 5.6% |
AT&T, Inc. | | | | 112,300 | | | 3,147,769 |
Qwest Communications International, Inc. | | | | 63,800 | | | 268,598 |
Verizon Communications, Inc. | | | | 35,500 | | | 1,176,115 |
| | | | | | | |
| | | | | | | 4,592,482 |
| | | | | | | |
ENERGY EQUIPMENT & SERVICES – 0.3% |
Schlumberger, Ltd. | | AN | | 3,500 | | | 227,815 |
| | | | | | | |
FOOD & STAPLES RETAILING – 3.4% |
Wal-Mart Stores, Inc. | | | | 47,100 | | | 2,517,495 |
Walgreen Co. | | | | 8,400 | | | 308,448 |
| | | | | | | |
| | | | | | | 2,825,943 |
| | | | | | | |
FOOD PRODUCTS – 4.7% |
Archer-Daniels-Midland Co. | | | | 40,000 | | | 1,252,400 |
ConAgra Foods, Inc. | | | | 27,500 | | | 633,875 |
See Notes to Financial Statements.
115
OPPENHEIMER LARGE CAP CORE FUND
| | |
PORTFOLIOOF INVESTMENTS (Continued) December 31, 2009 | | Sun Capital Advisers Trust |
| | | | | | | |
| | | Country
Code** | | Shares | | Value |
| | | | | | | |
| | | | | | | |
Dean Foods Co.* | | | | 34,500 | | $ | 622,380 |
H.J. Heinz Co. | | | | 5,800 | | | 248,008 |
Kraft Foods, Inc., Class A | | | | 10,200 | | | 277,236 |
The Hershey Co. | | | | 5,600 | | | 200,424 |
Tyson Foods, Inc., Class A | | | | 53,300 | | | 653,991 |
| | | | | | | |
| | | | | | | 3,888,314 |
| | | | | | | |
HEALTH CARE PROVIDERS & SERVICES – 4.3% |
AmerisourceBergen Corp. | | | | 15,000 | | | 391,050 |
Humana, Inc.* | | | | 23,600 | | | 1,035,804 |
McKesson Corp. | | | | 17,400 | | | 1,087,500 |
UnitedHealth Group, Inc. | | | | 33,200 | | | 1,011,936 |
| | | | | | | |
| | | | | | | 3,526,290 |
| | | | | | | |
HOTELS, RESTAURANTS & LEISURE – 3.5% |
McDonald’s Corp. | | | | 28,300 | | | 1,767,052 |
Yum! Brands, Inc. | | | | 31,700 | | | 1,108,549 |
| | | | | | | |
| | | | | | | 2,875,601 |
| | | | | | | |
HOUSEHOLD PRODUCTS – 1.6% |
Clorox Co. | | | | 21,800 | | | 1,329,800 |
| | | | | | | |
INDEPENDENT POWER PRODUCERS & ENERGY TRADERS – 0.3% |
AES Corp.* | | | | 21,300 | | | 283,503 |
| | | | | | | |
INSURANCE – 7.1% |
Cincinnati Financial Corp. | | | | 14,300 | | | 375,232 |
Genworth Financial Inc., Class A* | | | | 47,200 | | | 535,720 |
Lincoln National Corp. | | | | 17,100 | | | 425,448 |
MetLife, Inc. | | | | 34,400 | | | 1,216,040 |
Prudential Financial, Inc. | | | | 29,700 | | | 1,477,872 |
The Chubb Corp. | | | | 17,900 | | | 880,322 |
The Principal Financial Group, Inc. | | | | 37,300 | | | 896,692 |
| | | | | | | |
| | | | | | | 5,807,326 |
| | | | | | | |
INTERNET SOFTWARE & SERVICES – 0.5% |
AOL, Inc.* | | | | 1,481 | | | 34,478 |
Google, Inc., Class A* | | | | 600 | | | 371,988 |
| | | | | | | |
| | | | | | | 406,466 |
| | | | | | | |
IT SERVICES – 0.9% |
Computer Sciences Corp.* | | | | 13,000 | | | 747,890 |
| | | | | | | |
| | | | | | | |
| | | Country
Code** | | Shares | | Value |
| | | | | | | |
MACHINERY – 1.7% |
Dover Corp. | | | | 14,800 | | $ | 615,828 |
Eaton Corp. | | | | 8,100 | | | 515,322 |
ITT Corp. | | | | 4,800 | | | 238,752 |
| | | | | | | |
| | | | | | | 1,369,902 |
| | | | | | | |
MEDIA – 2.9% |
Comcast Corp., Class A | | | | 58,200 | | | 981,252 |
News Corp., Class A | | | | 24,200 | | | 331,298 |
The Interpublic Group of Cos., Inc.* | | | | 37,200 | | | 274,536 |
The Walt Disney Co. | | | | 9,300 | | | 299,925 |
Time Warner, Inc. | | | | 16,300 | | | 474,982 |
| | | | | | | |
| | | | | | | 2,361,993 |
| | | | | | | |
METALS & MINING – 1.6% |
Newmont Mining Corp. | | | | 27,100 | | | 1,282,101 |
| | | | | | | |
MULTI-LINE RETAIL – 0.6% |
J.C. Penney Co., Inc. | | | | 18,900 | | | 502,929 |
| | | | | | | |
MULTI-UTILITIES – 0.8% |
NiSource, Inc. | | | | 44,900 | | | 690,562 |
| | | | | | | |
OIL, GAS & CONSUMABLE FUELS – 8.2% |
Chevron Corp. | | | | 10,000 | | | 769,900 |
ConocoPhillips | | | | 21,900 | | | 1,118,433 |
Exxon Mobil Corp. | | | | 29,400 | | | 2,004,786 |
Marathon Oil Corp. | | | | 35,600 | | | 1,111,432 |
The Williams Cos., Inc. | | | | 65,800 | | | 1,387,064 |
Valero Energy Corp. | | | | 23,000 | | | 385,250 |
| | | | | | | |
| | | | | | | 6,776,865 |
| | | | | | | |
PAPER & FOREST PRODUCTS – 1.0% |
MeadWestvaco Corp. | | | | 28,200 | | | 807,366 |
| | | | | | | |
PHARMACEUTICALS – 3.4% |
Bristol-Myers Squibb Co. | | | | 55,200 | | | 1,393,800 |
Johnson & Johnson | | | | 14,500 | | | 933,945 |
Merck & Co., Inc. | | | | 13,700 | | | 500,598 |
| | | | | | | |
| | | | | | | 2,828,343 |
| | | | | | | |
ROAD & RAIL – 1.0% |
Norfolk Southern Corp. | | | | 7,200 | | | 377,424 |
Union Pacific Corp. | | | | 7,000 | | | 447,300 |
| | | | | | | |
| | | | | | | 824,724 |
| | | | | | | |
SEMICONDUCTORS & SEMICONDUCTOR EQUIPMENT – 0.9% |
Intel Corp. | | | | 24,900 | | | 507,960 |
See Notes to Financial Statements.
116
OPPENHEIMER LARGE CAP CORE FUND
| | |
PORTFOLIOOF INVESTMENTS (Continued) December 31, 2009 | | Sun Capital Advisers Trust |
| | | | | | | |
| | | Country
Code** | | Shares | | Value |
| | | | | | | |
| | | | | | | |
Xilinx, Inc. | | | | 8,500 | | $ | 213,010 |
| | | | | | | |
| | | | | | | 720,970 |
| | | | | | | |
SOFTWARE – 2.2% |
Microsoft Corp. | | | | 47,900 | | | 1,460,471 |
Oracle Corp. | | | | 15,200 | | | 373,008 |
| | | | | | | |
| | | | | | | 1,833,479 |
| | | | | | | |
SPECIALTY RETAIL – 3.8% |
Autonation, Inc.* | | | | 15,900 | | | 304,485 |
AutoZone, Inc.* | | | | 5,700 | | | 900,999 |
Best Buy Co., Inc. | | | | 6,600 | | | 260,436 |
Limited Brands, Inc. | | | | 17,300 | | | 332,852 |
Ross Stores, Inc. | | | | 6,800 | | | 290,428 |
The Gap, Inc. | | | | 18,700 | | | 391,765 |
TJX Cos., Inc. | | | | 18,400 | | | 672,520 |
| | | | | | | |
| | | | | | | 3,153,485 |
| | | | | | | |
THRIFT & MORTGAGE FINANCE – 1.4% |
Hudson City Bancorp, Inc. | | | | 84,600 | | | 1,161,558 |
| | | | | | | |
| | | | | | | | |
| | | Country
Code** | | Shares | | Value | |
| | | | | | | | |
TOBACCO – 0.6% | |
Philip Morris International, Inc. | | | | 9,700 | | $ | 467,443 | |
| | | | | | | | |
WIRELESS TELECOMMUNICATION SERVICES – 0.3% | |
Sprint Nextel Corp.* | | | | 67,300 | | | 246,318 | |
| | | | | | | | |
Total Common Stocks
(Cost $74,807,421) | | | 81,210,115 | |
| | | | | | | | |
SHORT TERM INVESTMENTS – 2.2% | |
MUTUAL FUNDS – 2.2% | |
State Street Institutional Treasury Plus Money Market Fund
(Cost $1,811,393) | | 1,811,393 | | | 1,811,393 | |
| | | | | | | | |
TOTAL INVESTMENTS – 100.8% | | | | |
(Cost $76,618,814) | | | | | 83,021,508 | |
Liabilities in excess of other assets – (0.8)% | | | | | (649,780 | ) |
| | | | | | | | |
NET ASSETS – 100.0% | | | | $ | 82,371,728 | |
| | | | | | | | |
| * | Non-income producing security. |
| ** | Unless otherwise noted the issuer country code for all securities is United States. |
| (1) | Fair Value Measurements † |
The following table summarizes the inputs used to value the Fund’s assets and liabilities, as applicable, measured at fair value at the period end:
| | | | | | | | | | | | |
Assets | | Quoted Prices
in Active
Markets for
Identical
Assets and
Liabilities
(Level 1) | | Significant
Other
Observable
Inputs
(Level 2) | | Significant
Unobservable
Inputs
(Level 3) | | Total |
Common Stocks (a) | | $ | 81,210,115 | | $ | — | | $ | — | | $ | 81,210,115 |
Short Term Investments | | | | | | | | | | | | |
Mutual Funds | | | 1,811,393 | | | — | | | — | | | 1,811,393 |
| | | | | | | | | | | | |
Total Investments | | | 83,021,508 | | | — | | | — | | | 83,021,508 |
| | | | | | | | | | | | |
Total | | $ | 83,021,508 | | $ | — | | $ | — | | $ | 83,021,508 |
| | | | | | | | | | | | |
| † | See Note 2b in the Notes to Financial Statements for additional information. |
| (a) | See Portfolio of Investments for additional detailed categorizations. |
See Notes to Financial Statements.
117
WMC LARGE CAP GROWTH FUND
| | |
PORTFOLIO OF INVESTMENTS December 31, 2009 | | Sun Capital Advisers Trust |
| | | | | | | |
| | | Country
Code** | | Shares | | Value |
| | | | | | | |
| | | | | | | |
COMMON STOCKS – 99.5% |
AEROSPACE & DEFENSE – 1.7% |
Raytheon Co. | | | | 22,178 | | $ | 1,142,611 |
The Boeing Co. | | | | 32,301 | | | 1,748,453 |
| | | | | | | |
| | | | | | | 2,891,064 |
| | | | | | | |
BIOTECHNOLOGY – 0.1% |
Amylin Pharmaceuticals, Inc.* | | | | 7,646 | | | 108,497 |
| | | | | | | |
CAPITAL MARKETS – 2.5% |
Morgan Stanley | | | | 25,981 | | | 769,038 |
State Street Corp. | | | | 16,206 | | | 705,609 |
The Goldman Sachs Group, Inc. | | | | 16,268 | | | 2,746,689 |
| | | | | | | |
| | | | | | | 4,221,336 |
| | | | | | | |
CHEMICALS – 0.7% |
FMC Corp. | | | | 7,170 | | | 399,799 |
The Mosaic Co. | | | | 13,457 | | | 803,787 |
| | | | | | | |
| | | | | | | 1,203,586 |
| | | | | | | |
COMMERCIAL BANKS – 1.4% |
Itau Unibanco Banco Multiplo SA ADR | | BR | | 63,271 | | | 1,445,110 |
Wells Fargo & Co. | | | | 35,641 | | | 961,950 |
| | | | | | | |
| | | | | | | 2,407,060 |
| | | | | | | |
COMMERCIAL SERVICES & SUPPLIES – 0.8% |
Visa, Inc., Class A | | | | 15,874 | | | 1,388,340 |
| | | | | | | |
COMMUNICATIONS EQUIPMENT – 9.7% |
Cisco Systems, Inc.* | | | | 353,776 | | | 8,469,397 |
Emulex Corp.* | | | | 171,786 | | | 1,872,467 |
Juniper Networks, Inc.* | | | | 96,767 | | | 2,580,776 |
Motorola, Inc.* | | | | 95,297 | | | 739,505 |
QUALCOMM, Inc. | | | | 56,612 | | | 2,618,871 |
| | | | | | | |
| | | | | | | 16,281,016 |
| | | | | | | |
COMPUTERS & PERIPHERALS – 16.4% |
Apple, Inc.* | | | | 30,606 | | | 6,453,581 |
Dell, Inc.* | | | | 57,416 | | | 824,494 |
EMC Corp.* | | | | 176,900 | | | 3,090,443 |
International Business Machines Corp. | | | | 42,346 | | | 5,543,091 |
NetApp, Inc.* | | | | 111,857 | | | 3,846,762 |
QLogic Corp.* | | | | 183,217 | | | 3,457,305 |
Riverbed Technology, Inc.* | | | | 53,851 | | | 1,236,957 |
SanDisk Corp.* | | | | 77,718 | | | 2,253,045 |
Teradata Corp.* | | | | 23,850 | | | 749,606 |
| | | | | | | |
| | | | | | | 27,455,284 |
| | | | | | | |
| | | | | | | |
| | | Country
Code** | | Shares | | Value |
| | | | | | | |
DIVERSIFIED CONSUMER SERVICES – 1.1% |
Apollo Group Inc., Class A* | | | | 21,575 | | $ | 1,307,013 |
ITT Educational Services, Inc.* | | | | 5,362 | | | 514,538 |
| | | | | | | |
| | | | | | | 1,821,551 |
| | | | | | | |
DIVERSIFIED TELECOMMUNICATION SERVICES – 0.3% |
Brasil Telecom SA ADR* | | BR | | 15,585 | | | 453,991 |
| | | | | | | |
ELECTRICAL EQUIPMENT – 1.3% |
ABB Ltd. ADR* | | CH | | 12,174 | | | 232,524 |
Emerson Electric Co. | | | | 45,152 | | | 1,923,475 |
| | | | | | | |
| | | | | | | 2,155,999 |
| | | | | | | |
ENERGY EQUIPMENT & SERVICES – 4.5% |
Baker Hughes, Inc. | | | | 47,237 | | | 1,912,154 |
Diamond Offshore Drilling, Inc. | | | | 12,155 | | | 1,196,295 |
Oceaneering International, Inc.* | | | | 34,705 | | | 2,030,936 |
Smith International, Inc. | | | | 48,371 | | | 1,314,240 |
Transocean, Ltd.* | | CH | | 13,276 | | | 1,099,253 |
| | | | | | | |
| | | | | | | 7,552,878 |
| | | | | | | |
HEALTH CARE EQUIPMENT & SUPPLIES – 3.4% |
Bard (C.R.), Inc. | | | | 12,612 | | | 982,475 |
Hospira, Inc.* | | | | 17,291 | | | 881,841 |
Intuitive Surgical, Inc.* | | | | 2,783 | | | 844,139 |
Medtronic, Inc. | | | | 66,349 | | | 2,918,029 |
| | | | | | | |
| | | | | | | 5,626,484 |
| | | | | | | |
HOTELS, RESTAURANTS & LEISURE – 2.6% |
Bally Technologies, Inc.* | | | | 29,872 | | | 1,233,415 |
Las Vegas Sands Corp.* | | | | 108,255 | | | 1,617,330 |
Starbucks Corp.* | | | | 62,074 | | | 1,431,426 |
| | | | | | | |
| | | | | | | 4,282,171 |
| | | | | | | |
INDUSTRIAL CONGLOMERATES – 1.1% |
General Electric Co. | | | | 125,193 | | | 1,894,170 |
| | | | | | | |
INSURANCE – 1.4% |
Lincoln National Corp. | | | | 93,968 | | | 2,337,924 |
| | | | | | | |
See Notes to Financial Statements.
118
WMC LARGE CAP GROWTH FUND
| | |
PORTFOLIO OF INVESTMENTS (Continued) December 31, 2009 | | Sun Capital Advisers Trust |
| | | | | | | |
| | | Country
Code** | | Shares | | Value |
| | | | | | | |
| | | | | | | |
INTERNET & CATALOG RETAIL – 1.8% |
Amazon.com, Inc.* | | | | 15,027 | | $ | 2,021,432 |
Expedia, Inc.* | | | | 38,200 | | | 982,122 |
| | | | | | | |
| | | | | | | 3,003,554 |
| | | | | | | |
INTERNET SOFTWARE & SERVICES – 5.7% |
eBay, Inc.* | | | | 82,000 | | | 1,930,280 |
Google, Inc., Class A* | | | | 9,282 | | | 5,754,654 |
NetEase.com, Inc. ADR* | | KY | | 24,668 | | | 927,764 |
Sohu.com, Inc.* | | | | 15,308 | | | 876,842 |
| | | | | | | |
| | | | | | | 9,489,540 |
| | | | | | | |
IT SERVICES – 0.8% |
The Western Union Co. | | | | 73,853 | | | 1,392,129 |
| | | | | | | |
LIFE SCIENCES TOOLS & SERVICES – 1.2% |
Life Technologies Corp.* | | | | 18,038 | | | 942,125 |
Waters Corp.* | | | | 17,050 | | | 1,056,418 |
| | | | | | | |
| | | | | | | 1,998,543 |
| | | | | | | |
MACHINERY – 8.8% |
Caterpillar, Inc. | | | | 67,052 | | | 3,821,293 |
Cummins, Inc. | | | | 30,703 | | | 1,408,040 |
Dover Corp. | | | | 52,155 | | | 2,170,170 |
Illinois Tool Works, Inc. | | | | 40,749 | | | 1,955,545 |
Ingersoll-Rand PLC | | IE | | 51,958 | | | 1,856,979 |
Joy Global, Inc. | | | | 25,936 | | | 1,338,038 |
Parker Hannifin Corp. | | | | 40,064 | | | 2,158,648 |
| | | | | | | |
| | | | | | | 14,708,713 |
| | | | | | | |
MEDIA – 0.7% |
Scripps Networks Interactive, Inc., Class A | | | | 28,446 | | | 1,180,509 |
| | | | | | | |
METALS & MINING – 3.0% |
Barrick Gold Corp. | | CA | | 32,624 | | | 1,284,733 |
Nucor Corp. | | | | 47,055 | | | 2,195,116 |
Southern Copper Corp. | | | | 45,039 | | | 1,482,233 |
| | | | | | | |
| | | | | | | 4,962,082 |
| | | | | | | |
OIL, GAS & CONSUMABLE FUELS – 2.7% |
Noble Energy, Inc. | | | | 25,206 | | | 1,795,171 |
Occidental Petroleum Corp. | | | | 32,523 | | | 2,645,746 |
| | | | | | | |
| | | | | | | 4,440,917 |
| | | | | | | |
| | | | | | | |
| | | Country
Code** | | Shares | | Value |
| | | | | | | |
PHARMACEUTICALS – 1.6% |
Eli Lilly & Co. | | | | 77,380 | | $ | 2,763,240 |
| | | | | | | |
SEMICONDUCTORS & SEMICONDUCTOR EQUIPMENT – 7.9% |
Altera Corp. | | | | 116,064 | | | 2,626,528 |
Analog Devices, Inc. | | | | 52,593 | | | 1,660,887 |
Intel Corp. | | | | 106,774 | | | 2,178,190 |
Intersil Holding Corp. | | | | 147,618 | | | 2,264,460 |
Texas Instruments, Inc. | | | | 54,889 | | | 1,430,407 |
Xilinx, Inc. | | | | 120,692 | | | 3,024,542 |
| | | | | | | |
| | | | | | | 13,185,014 |
| | | | | | | |
SOFTWARE – 10.8% |
BMC Software, Inc.* | | | | 41,945 | | | 1,681,995 |
Check Point Software Technologies Ltd.* | | IL | | 44,004 | | | 1,490,856 |
Longtop Financial Technologies, Ltd. ADR* | | KY | | 37,765 | | | 1,398,060 |
Microsoft Corp. | | | | 261,456 | | | 7,971,793 |
Oracle Corp. | | | | 178,971 | | | 4,391,948 |
Shanda Interactive Entertainment, Ltd. ADR* | | KY | | 22,401 | | | 1,178,517 |
| | | | | | | |
| | | | | | | 18,113,169 |
| | | | | | | |
SPECIALTY RETAIL – 4.5% |
Abercrombie & Fitch Co., Class A | | | | 40,606 | | | 1,415,119 |
Advanced Auto Parts, Inc. | | | | 38,777 | | | 1,569,693 |
Best Buy Co., Inc. | | | | 15,518 | | | 612,340 |
Guess?, Inc. | | | | 21,118 | | | 893,291 |
The Buckle, Inc. | | | | 30,234 | | | 885,252 |
TJX Cos., Inc. | | | | 27,530 | | | 1,006,222 |
Urban Outfitters, Inc.* | | | | 34,890 | | | 1,220,801 |
| | | | | | | |
| | | | | | | 7,602,718 |
| | | | | | | |
TEXTILES, APPAREL & LUXURY GOODS – 1.0% |
Coach, Inc. | | | | 48,127 | | | 1,758,079 |
| | | | | | | |
Total Common Stocks
(Cost $143,623,838) | | | 166,679,558 |
| | | | | | | |
See Notes to Financial Statements.
119
WMC LARGE CAP GROWTH FUND
| | |
PORTFOLIO OF INVESTMENTS (Continued) December 31, 2009 | | Sun Capital Advisers Trust |
| | | | | | |
| | | Principal
Amount
(000) | | Value |
| | | | | | |
| | | | | | |
SHORT TERM INVESTMENTS – 0.7% |
REPURCHASE AGREEMENTS – 0.7% |
State Street Bank and Trust Company, 0.01%, dated 12/31/09, due 1/4/10 (collateralized by $1,090,000 FHLB, 4.375%, 9/17/10, with a value of $1,133,927, total to be received $1,111,001)
(Amortized cost $1,111,000) | | $ | 1,111 | | $ | 1,111,000 |
| | | | | | |
| | | | | | |
| | | | | Value | |
| | | | | | |
| | | | | | |
TOTAL INVESTMENTS – 100.2% | |
(Cost $144,734,838) | | | | $ | 167,790,558 | |
Liabilities in excess of other assets – (0.2)% | | | | | (286,428 | ) |
| | | | | | |
NET ASSETS – 100.0% | | | | $ | 167,504,130 | |
| | | | | | |
| * | Non-income producing security. |
| ** | Unless otherwise noted the issuer country code for all securities is United States. |
| | |
| ADR | | American Depositary Receipt |
| FHLB | | Federal Home Loan Bank |
| |
| BR | | Brazil |
| CA | | Canada |
| CH | | Switzerland |
| IE | | Ireland |
| IL | | Israel |
| KY | | Cayman Islands |
| (1) | Fair Value Measurements † |
The following table summarizes the inputs used to value the Fund’s assets and liabilities, as applicable, measured at fair value at the period end:
| | | | | | | | | | | | |
Assets | | Quoted Prices
in Active
Markets for
Identical
Assets and
Liabilities
(Level 1) | | Significant
Other
Observable
Inputs
(Level 2) | | Significant
Unobservable
Inputs
(Level 3) | | Total |
Common Stocks (a) | | $ | 166,679,558 | | $ | — | | $ | — | | $ | 166,679,558 |
Short Term Investments | | | | | | | | | | | | |
Repurchase Agreements | | | — | | | 1,111,000 | | | — | | | 1,111,000 |
| | | | | | | | | | | | |
Total Investments | | | 166,679,558 | | | 1,111,000 | | | — | | | 167,790,558 |
| | | | | | | | | | | | |
Total | | $ | 166,679,558 | | $ | 1,111,000 | | $ | — | | $ | 167,790,558 |
| | | | | | | | | | | | |
| † | See Note 2b in the Notes to Financial Statements for additional information. |
| (a) | See Portfolio of Investments for additional detailed categorizations. |
See Notes to Financial Statements.
120
WMC BLUE CHIP MID CAP FUND
| | |
PORTFOLIO OF INVESTMENTS December 31, 2009 | | Sun Capital Advisers Trust |
| | | | | | | |
| | | Country
Code** | | Shares | | Value |
| | | | | | | |
| | | | | | | |
COMMON STOCKS – 97.1% |
AEROSPACE & DEFENSE – 2.6% |
BE Aerospace, Inc.* | | | | 48,600 | | $ | 1,142,100 |
Precision Castparts Corp. | | | | 1,300 | | | 143,455 |
Rockwell Collins, Inc. | | | | 31,490 | | | 1,743,286 |
| | | | | | | |
| | | | | | | 3,028,841 |
| | | | | | | |
AIRLINES – 1.5% |
Southwest Airlines Co. | | | | 151,500 | | | 1,731,645 |
| | | | | | | |
AUTOMOBILES – 0.4% |
Harley-Davidson, Inc. | | | | 18,600 | | | 468,720 |
| | | | | | | |
BIOTECHNOLOGY – 1.4% |
Amylin Pharmaceuticals, Inc.* | | | | 70,620 | | | 1,002,098 |
Vertex Pharmaceuticals, Inc.* | | | | 14,300 | | | 612,755 |
| | | | | | | |
| | | | | | | 1,614,853 |
| | | | | | | |
BUILDING PRODUCTS – 2.0% |
Lennox International, Inc. | | | | 43,200 | | | 1,686,528 |
Masco Corp. | | | | 43,400 | | | 599,354 |
| | | | | | | |
| | | | | | | 2,285,882 |
| | | | | | | |
CAPITAL MARKETS – 1.2% |
Waddell & Reed Financial, Inc., Class A | | | | 45,700 | | | 1,395,678 |
| | | | | | | |
CHEMICALS – 1.3% |
FMC Corp. | | | | 11,200 | | | 624,512 |
Scotts Miracle-Gro Co., Class A | | | | 22,100 | | | 868,751 |
| | | | | | | |
| | | | | | | 1,493,263 |
| | | | | | | |
COMMERCIAL BANKS – 4.2% |
Huntington Bancshares, Inc. | | | | 369,600 | | | 1,349,040 |
M&T Bank Corp. | | | | 22,000 | | | 1,471,580 |
PNC Financial Services Group, Inc. | | | | 22,050 | | | 1,164,019 |
Suntrust Banks, Inc. | | | | 21,900 | | | 444,351 |
TCF Financial Corp. | | | | 28,600 | | | 389,532 |
| | | | | | | |
| | | | | | | 4,818,522 |
| | | | | | | |
COMMERCIAL SERVICES & SUPPLIES – 1.8% |
Herman Miller, Inc. | | | | 35,600 | | | 568,888 |
HNI Corp. | | | | 19,900 | | | 549,837 |
| | | | | | | |
| | | Country
Code** | | Shares | | Value |
| | | | | | | |
Republic Services, Inc. | | | | 35,985 | | $ | 1,018,735 |
| | | | | | | |
| | | | | | | 2,137,460 |
| | | | | | | |
COMMUNICATIONS EQUIPMENT – 0.8% |
Juniper Networks, Inc.* | | | | 19,800 | | | 528,066 |
Polycom, Inc.* | | | | 15,200 | | | 379,544 |
| | | | | | | |
| | | | | | | 907,610 |
| | | | | | | |
COMPUTERS & PERIPHERALS – 3.7% |
NetApp, Inc.* | | | | 45,700 | | | 1,571,623 |
SanDisk Corp.* | | | | 20,000 | | | 579,800 |
Seagate Technology | | KY | | 61,400 | | | 1,116,866 |
Teradata Corp.* | | | | 32,800 | | | 1,030,904 |
| | | | | | | |
| | | | | | | 4,299,193 |
| | | | | | | |
CONSTRUCTION MATERIALS – 0.5% |
Martin Marietta Materials, Inc. | | | | 7,100 | | | 634,811 |
| | | | | | | |
DIVERSIFIED CONSUMER SERVICES – 3.3% |
Apollo Group Inc., Class A* | | | | 18,800 | | | 1,138,904 |
DeVry, Inc. | | | | 12,300 | | | 697,779 |
ITT Educational Services, Inc.* | | | | 11,900 | | | 1,141,924 |
Strayer Education, Inc. | | | | 4,100 | | | 871,209 |
| | | | | | | |
| | | | | | | 3,849,816 |
| | | | | | | |
ELECTRIC UTILITIES – 1.2% |
Northeast Utilities | | | | 56,300 | | | 1,451,977 |
| | | | | | | |
ELECTRICAL EQUIPMENT – 1.1% |
Ametek, Inc. | | | | 33,800 | | | 1,292,512 |
| | | | | | | |
ELECTRONIC EQUIPMENT & INSTRUMENTS – 0.3% |
National Instruments Corp. | | | | 12,000 | | | 353,400 |
| | | | | | | |
ENERGY EQUIPMENT & SERVICES – 1.1% |
Nabors Industries, Ltd.* | | BM | | 56,000 | | | 1,225,840 |
| | | | | | | |
FOOD PRODUCTS – 1.4% |
Flowers Foods, Inc. | | | | 41,100 | | | 976,536 |
Smithfield Foods, Inc.* | | | | 41,200 | | | 625,828 |
| | | | | | | |
| | | | | | | 1,602,364 |
| | | | | | | |
GAS UTILITIES – 1.1% |
UGI Corp. | | | | 50,700 | | | 1,226,433 |
| | | | | | | |
HEALTH CARE EQUIPMENT & SUPPLIES – 4.4% |
Beckman Coulter, Inc. | | | | 34,300 | | | 2,244,592 |
Edwards Lifesciences Corp.* | | | | 9,000 | | | 781,650 |
See Notes to Financial Statements.
121
WMC BLUE CHIP MID CAP FUND
| | |
PORTFOLIO OF INVESTMENTS (Continued) December 31, 2009 | | Sun Capital Advisers Trust |
| | | | | | | |
| | | Country
Code** | | Shares | | Value |
| | | | | | | |
| | | | | | | |
St. Jude Medical, Inc.* | | | | 32,400 | | $ | 1,191,672 |
Zimmer Holdings, Inc.* | | | | 14,400 | | | 851,184 |
| | | | | | | |
| | | | | | | 5,069,098 |
| | | | | | | |
HEALTH CARE PROVIDERS & SERVICES – 4.0% |
Coventry Health Care, Inc.* | | | | 58,400 | | | 1,418,536 |
Humana, Inc.* | | | | 16,200 | | | 711,018 |
Omnicare, Inc. | | | | 27,100 | | | 655,278 |
Patterson Cos., Inc.* | | | | 45,400 | | | 1,270,292 |
Universal Health Services, Inc., Class B | | | | 19,200 | | | 585,600 |
| | | | | | | |
| | | | | | | 4,640,724 |
| | | | | | | |
HEALTH CARE TECHNOLOGY – 0.7% |
Cerner Corp.* | | | | 10,100 | | | 832,644 |
| | | | | | | |
HOTELS, RESTAURANTS & LEISURE – 0.7% |
International Game Technology | | | | 44,400 | | | 833,388 |
| | | | | | | |
HOUSEHOLD DURABLES – 1.2% |
NVR, Inc.* | | | | 1,300 | | | 923,923 |
Pulte Homes, Inc.* | | | | 18,200 | | | 182,000 |
The Stanley Works | | | | 6,200 | | | 319,362 |
| | | | | | | |
| | | | | | | 1,425,285 |
| | | | | | | |
INDUSTRIAL CONGLOMERATES – 0.8% |
Carlisle Cos., Inc. | | | | 25,700 | | | 880,482 |
| | | | | | | |
INSURANCE – 4.1% |
Everest Re Group, Ltd. | | BM | | 9,900 | | | 848,232 |
Fidelity National Financial, Inc., Class A | | | | 41,700 | | | 561,282 |
Unum Group | | | | 92,520 | | | 1,805,990 |
W.R. Berkley Corp. | | | | 61,971 | | | 1,526,966 |
| | | | | | | |
| | | | | | | 4,742,470 |
| | | | | | | |
INTERNET SOFTWARE & SERVICES – 2.0% |
Equinix, Inc.* | | | | 11,800 | | | 1,252,570 |
VeriSign, Inc.* | | | | 45,900 | | | 1,112,616 |
| | | | | | | |
| | | | | | | 2,365,186 |
| | | | | | | |
IT SERVICES – 2.3% |
Global Payments, Inc. | | | | 17,300 | | | 931,778 |
The Western Union Co. | | | | 93,100 | | | 1,754,935 |
| | | | | | | |
| | | | | | | 2,686,713 |
| | | | | | | |
LEISURE EQUIPMENT & PRODUCTS – 2.0% |
Hasbro, Inc. | | | | 39,900 | | | 1,279,194 |
Mattel, Inc. | | | | 49,800 | | | 995,004 |
| | | | | | | |
| | | | | | | 2,274,198 |
| | | | | | | |
| | | | | | | |
| | | Country
Code** | | Shares | | Value |
| | | | | | | |
LIFE SCIENCES TOOLS & SERVICES – 1.6% |
Life Technologies Corp.* | | | | 16,300 | | $ | 851,349 |
Qiagen NV* | | NL | | 42,810 | | | 955,519 |
| | | | | | | |
| | | | | | | 1,806,868 |
| | | | | | | |
MACHINERY – 3.3% |
IDEX Corp. | | | | 38,800 | | | 1,208,620 |
PACCAR, Inc. | | | | 52,500 | | | 1,904,175 |
Parker Hannifin Corp. | | | | 13,900 | | | 748,932 |
| | | | | | | |
| | | | | | | 3,861,727 |
| | | | | | | |
MEDIA – 3.9% |
Discovery Communications, Inc., Class A* | | | | 37,550 | | | 1,151,659 |
Dreamworks Animation Skg, Inc., Class A* | | | | 58,500 | | | 2,337,075 |
Scripps Networks Interactive, Inc., Class A | | | | 25,900 | | | 1,074,850 |
| | | | | | | |
| | | | | | | 4,563,584 |
| | | | | | | |
METALS & MINING – 1.9% |
Cliffs Natural Resources, Inc. | | | | 14,400 | | | 663,696 |
Steel Dynamics, Inc. | | | | 64,000 | | | 1,134,080 |
Teck Resources, Ltd., Class B* | | CA | | 11,000 | | | 384,670 |
| | | | | | | |
| | | | | | | 2,182,446 |
| | | | | | | |
MULTI-UTILITIES – 1.0% |
Wisconsin Energy Corp. | | | | 22,400 | | | 1,116,192 |
| | | | | | | |
OIL, GAS & CONSUMABLE FUELS – 7.6% |
Cameco Corp. | | CA | | 39,200 | | | 1,261,064 |
Denbury Resources, Inc.* | | | | 35,600 | | | 526,880 |
Forest Oil Corp.* | | | | 14,500 | | | 322,625 |
Massey Energy Co. | | | | 43,600 | | | 1,831,636 |
Noble Energy, Inc. | | | | 12,000 | | | 854,640 |
Overseas Shipholding Group, Inc. | | | | 23,500 | | | 1,032,825 |
Peabody Energy Corp. | | | | 34,400 | | | 1,555,224 |
St. Mary Land & Exploration Co. | | | | 17,400 | | | 595,776 |
Ultra Petroleum Corp.* | | CA | | 17,500 | | | 872,550 |
| | | | | | | |
| | | | | | | 8,853,220 |
| | | | | | | |
See Notes to Financial Statements.
122
WMC BLUE CHIP MID CAP FUND
| | |
PORTFOLIO OF INVESTMENTS (Continued) December 31, 2009 | | Sun Capital Advisers Trust |
| | | | | | | |
| | | Country
Code** | | Shares | | Value |
| | | | | | | |
| | | | | | | |
PERSONAL PRODUCTS – 0.5% |
The Estee Lauder Cos., Inc. Class A | | | | 11,300 | | $ | 546,468 |
| | | | | | | |
PHARMACEUTICALS – 3.5% |
King Pharmaceuticals, Inc.* | | | | 100,700 | | | 1,235,589 |
Mylan Labs, Inc.* | | | | 56,200 | | | 1,035,766 |
Watson Pharmaceuticals, Inc.* | | | | 45,200 | | | 1,790,372 |
| | | | | | | |
| | | | | | | 4,061,727 |
| | | | | | | |
REAL ESTATE INVESTMENT TRUSTS – 2.4% |
Host Hotels & Resorts, Inc.* | | | | 36,529 | | | 426,294 |
Liberty Property Trust | | | | 17,100 | | | 547,371 |
Public Storage | | | | 10,700 | | | 871,515 |
Simon Property Group, Inc. | | | | 12,148 | | | 969,410 |
| | | | | | | |
| | | | | | | 2,814,590 |
| | | | | | | |
ROAD & RAIL – 1.9% |
Con-Way, Inc. | | | | 23,250 | | | 811,658 |
JB Hunt Transport Services, Inc. | | | | 27,700 | | | 893,879 |
Kansas City Southern* | | | | 16,300 | | | 542,627 |
| | | | | | | |
| | | | | | | 2,248,164 |
| | | | | | | |
SEMICONDUCTORS & SEMICONDUCTOR EQUIPMENT – 4.2% |
Altera Corp. | | | | 30,000 | | | 678,900 |
Analog Devices, Inc. | | | | 17,500 | | | 552,650 |
Intersil Holding Corp. | | | | 19,500 | | | 299,130 |
Lam Research Corp.* | | | | 49,300 | | | 1,933,053 |
Maxim Integrated Products, Inc. | | | | 41,000 | | | 832,300 |
Xilinx, Inc. | | | | 25,200 | | | 631,512 |
| | | | | | | |
| | | | | | | 4,927,545 |
| | | | | | | |
SOFTWARE – 3.9% |
Check Point Software Technologies Ltd.* | | IL | | 38,600 | | | 1,307,768 |
FactSet Research Systems, Inc. | | | | 11,600 | | | 764,092 |
MICROS Systems, Inc.* | | | | 29,800 | | | 924,694 |
Red Hat, Inc.* | | | | 49,600 | | | 1,532,640 |
| | | | | | | |
| | | | | | | 4,529,194 |
| | | | | | | |
| | | | | | | |
| | | Country
Code** | | Shares | | Value |
| | | | | | | |
SPECIALTY RETAIL – 6.8% |
Advanced Auto Parts, Inc. | | | | 39,700 | | $ | 1,607,056 |
AutoZone, Inc.* | | | | 4,600 | | | 727,122 |
CarMax, Inc.* | | | | 20,300 | | | 492,275 |
O’Reilly Automotive, Inc.* | | | | 32,100 | | | 1,223,652 |
Office Depot, Inc.* | | | | 94,000 | | | 606,300 |
Penske Automotive Group, Inc.* | | | | 51,480 | | | 781,466 |
Staples, Inc. | | | | 58,100 | | | 1,428,679 |
The Sherwin-Williams Co. | | | | 17,300 | | | 1,066,545 |
| | | | | | | |
| | | | | | | 7,933,095 |
| | | | | | | |
WATER UTILITIES – 0.3% |
Aqua America, Inc. | | | | 17,200 | | | 301,172 |
| | | | | | | |
WIRELESS TELECOMMUNICATION SERVICES – 1.2% |
American Tower Corp. Class A* | | | | 31,000 | | | 1,339,510 |
| | | | | | | |
Total Common Stocks
(Cost $95,893,111) | | | 112,654,510 |
| | | | | | | |
| | | | | Principal
Amount
(000) | | |
SHORT TERM INVESTMENTS – 2.1% |
| REPURCHASE AGREEMENTS – 2.1% |
State Street Bank and Trust Company, 0.00%, dated 12/31/09, due 1/4/10 (collateralized by $2,410,000 FHLB, 4.375%, 9/17/10, with a value of $2,507,123, total to be received $2,456,000) (Amortized cost $2,456,000) | | $2,456 | | | 2,456,000 |
| | | | | | | |
TOTAL INVESTMENTS – 99.2% |
(Cost $98,349,111) | | | | | 115,110,510 |
Other assets less liabilities – 0.8% | | | | | 883,162 |
| | | | | | | |
NET ASSETS – 100.0% | | | | $ | 115,993,672 |
| | | | | | | |
See Notes to Financial Statements.
123
WMC BLUE CHIP MID CAP FUND
| | |
PORTFOLIO OF INVESTMENTS (Continued) December 31, 2009 | | Sun Capital Advisers Trust |
| * | Non-income producing security. |
| ** | Unless otherwise noted the issuer country code for all securities is United States. |
| | |
| FHLB | | Federal Home Loan Bank |
| |
| BM | | Bermuda |
| CA | | Canada |
| IL | | Israel |
| KY | | Cayman Islands |
| NL | | Netherlands |
| (1) | Fair Value Measurements † |
The following table summarizes the inputs used to value the Fund’s assets and liabilities, as applicable, measured at fair value at the period end:
| | | | | | | | | | | | |
Assets | | Quoted Prices
in Active
Markets for
Identical
Assets and
Liabilities
(Level 1) | | Significant
Other
Observable
Inputs
(Level 2) | | Significant
Unobservable
Inputs
(Level 3) | | Total |
Common Stocks (a) | | $ | 112,654,510 | | $ | — | | $ | — | | $ | 112,654,510 |
Short Term Investments | | | | | | | | | | | | |
Repurchase Agreements | | | — | | | 2,456,000 | | | — | | | 2,456,000 |
| | | | | | | | | | | | |
Total Investments | | | 112,654,510 | | | 2,456,000 | | | — | | | 115,110,510 |
| | | | | | | | | | | | |
Total | | $ | 112,654,510 | | $ | 2,456,000 | | $ | — | | $ | 115,110,510 |
| | | | | | | | | | | | |
| † | See Note 2b in the Notes to Financial Statements for additional information. |
| (a) | See Portfolio of Investments for additional detailed categorizations. |
See Notes to Financial Statements.
124
LORD ABBETT GROWTH & INCOME FUND
| | |
PORTFOLIO OF INVESTMENTS December 31, 2009 | | Sun Capital Advisers Trust |
| | | | | | | |
| | | Country
Code** | | Shares | | Value |
| | | | | | | |
| | | | | | | |
COMMON STOCKS – 97.8% | | | | | |
AEROSPACE & DEFENSE – 0.7% | | | |
Honeywell International, Inc. | | | | 55,670 | | $ | 2,182,264 |
Raytheon Co. | | | | 26,720 | | | 1,376,614 |
| | | | | | | |
| | | | | | | 3,558,878 |
| | | | | | | |
AIR FREIGHT & LOGISTICS – 0.3% | | | |
FedEx Corp. | | | | 15,150 | | | 1,264,267 |
| | | | | | | |
AIRLINES – 3.1% | | | |
Delta Air Lines, Inc.* | | | | 1,369,090 | | | 15,580,244 |
| | | | | | | |
AUTOMOBILES – 1.6% | | | |
Ford Motor Co.* | | | | 803,370 | | | 8,033,700 |
| | | | | | | |
BIOTECHNOLOGY – 1.1% | | | |
Amgen, Inc.* | | | | 102,560 | | | 5,801,819 |
| | | | | | | |
BUILDING PRODUCTS – 0.1% | | | |
Masco Corp. | | | | 22,970 | | | 317,216 |
| | | | | | | |
CAPITAL MARKETS – 8.4% | | | |
Bank of New York Mellon Corp. | | | | 384,980 | | | 10,767,891 |
Franklin Resources, Inc. | | | | 51,480 | | | 5,423,418 |
Legg Mason, Inc. | | | | 20,350 | | | 613,756 |
Morgan Stanley | | | | 283,930 | | | 8,404,328 |
State Street Corp. | | | | 60,730 | | | 2,644,184 |
The Charles Schwab Corp. | | | | 109,360 | | | 2,058,155 |
The Goldman Sachs Group, Inc. | | | | 76,050 | | | 12,840,282 |
| | | | | | | |
| | | | | | | 42,752,014 |
| | | | | | | |
CHEMICALS – 2.3% | | | |
Potash Corp. of Saskatchewan, Inc. | | CA | | 10,280 | | | 1,115,380 |
The Dow Chemical Co. | | | | 189,070 | | | 5,224,004 |
The Mosaic Co. | | | | 85,790 | | | 5,124,237 |
| | | | | | | |
| | | | | | | 11,463,621 |
| | | | | | | |
COMMERCIAL BANKS – 10.8% | | | |
BB&T Corp. | | | | 90,620 | | | 2,299,029 |
Keycorp | | | | 432,150 | | | 2,398,433 |
M&T Bank Corp. | | | | 53,780 | | | 3,597,344 |
PNC Financial Services Group, Inc. | | | | 181,400 | | | 9,576,106 |
| | | | | | | |
| | | Country
Code** | | Shares | | Value |
| | | | | | | |
Regions Financial Corp. | | | | 248,070 | | $ | 1,312,290 |
Suntrust Banks, Inc. | | | | 448,909 | | | 9,108,364 |
Wells Fargo & Co. | | | | 836,640 | | | 22,580,914 |
Zions Bancorporation | | | | 319,240 | | | 4,095,849 |
| | | | | | | |
| | | | | | | 54,968,329 |
| | | | | | | |
COMMUNICATIONS EQUIPMENT – 0.5% | | | |
Cisco Systems, Inc.* | | | | 109,620 | | | 2,624,303 |
| | | | | | | |
COMPUTERS & PERIPHERALS – 1.4% | | | |
EMC Corp.* | | | | 122,700 | | | 2,143,569 |
Hewlett-Packard Co. | | | | 96,210 | | | 4,955,777 |
| | | | | | | |
| | | | | | | 7,099,346 |
| | | | | | | |
CONSUMER FINANCE – 0.1% | | | |
Capital One Financial Corp. | | | | 12,140 | | | 465,448 |
| | | | | | | |
DIVERSIFIED FINANCIAL SERVICES – 7.1% |
Bank of America Corp. | | | | 645,614 | | | 9,722,947 |
Citigroup, Inc. | | | | 1,413,470 | | | 4,678,586 |
JP Morgan Chase & Co. | | | | 516,207 | | | 21,510,345 |
| | | | | | | |
| | | | | | | 35,911,878 |
| | | | | | | |
DIVERSIFIED TELECOMMUNICATION SERVICES – 2.8% |
AT&T, Inc. | | | | 339,070 | | | 9,504,132 |
Verizon Communications, Inc. | | | | 148,150 | | | 4,908,210 |
| | | | | | | |
| | | | | | | 14,412,342 |
| | | | | | | |
ELECTRIC UTILITIES – 0.2% | | | |
Southern Co. | | | | 29,340 | | | 977,609 |
| | | | | | | |
ELECTRICAL EQUIPMENT – 0.6% | | | |
Emerson Electric Co. | | | | 69,370 | | | 2,955,162 |
| | | | | | | |
ENERGY EQUIPMENT & SERVICES – 4.7% |
Halliburton Co. | | | | 246,832 | | | 7,427,175 |
Schlumberger, Ltd. | | AN | | 212,150 | | | 13,808,844 |
Smith International, Inc. | | | | 105,120 | | | 2,856,110 |
| | | | | | | |
| | | | | | | 24,092,129 |
| | | | | | | |
FOOD & STAPLES RETAILING – 2.5% | | | |
Kroger Co. | | | | 552,320 | | | 11,339,130 |
See Notes to Financial Statements.
125
LORD ABBETT GROWTH & INCOME FUND
| | |
PORTFOLIO OF INVESTMENTS (Continued) December 31, 2009 | | Sun Capital Advisers Trust |
| | | | | | | |
| | | Country
Code** | | Shares | | Value |
| | | | | | | |
| | | | | | | |
Wal-Mart Stores, Inc. | | | | 26,160 | | $ | 1,398,252 |
| | | | | | | |
| | | | | | | 12,737,382 |
| | | | | | | |
FOOD PRODUCTS – 2.4% | | | |
Archer-Daniels-Midland Co. | | | | 270,030 | | | 8,454,639 |
Kraft Foods, Inc., Class A | | | | 131,210 | | | 3,566,288 |
| | | | | | | |
| | | | | | | 12,020,927 |
| | | | | | | |
HEALTH CARE EQUIPMENT & SUPPLIES –2.0% |
Boston Scientific Corp.* | | | | 519,170 | | | 4,672,530 |
Covidien PLC | | IE | | 114,770 | | | 5,496,335 |
| | | | | | | |
| | | | | | | 10,168,865 |
| | | | | | | |
HEALTH CARE PROVIDERS & SERVICES –1.6% |
UnitedHealth Group, Inc. | | | | 262,660 | | | 8,005,877 |
| | | | | | | |
HOTELS, RESTAURANTS & LEISURE – 2.7% |
Carnival Corp.* | | PA | | 111,640 | | | 3,537,872 |
Hyatt Hotels Corp., Class A* | | | | 122,540 | | | 3,652,917 |
Marriott International, Inc., Class A | | | | 186,942 | | | 5,094,169 |
Starwood Hotels & Resorts Worldwide, Inc. | | | | 38,240 | | | 1,398,437 |
| | | | | | | |
| | | | | | | 13,683,395 |
| | | | | | | |
HOUSEHOLD DURABLES – 0.5% | | | |
Pulte Homes, Inc.* | | | | 275,510 | | | 2,755,100 |
| | | | | | | |
HOUSEHOLD PRODUCTS – 0.3% | | | |
Colgate-Palmolive Co. | | | | 16,970 | | | 1,394,085 |
| | | | | | | |
INSURANCE – 0.9% | | | |
MetLife, Inc. | | | | 103,670 | | | 3,664,735 |
The Principal Financial Group, Inc. | | | | 43,480 | | | 1,045,259 |
| | | | | | | |
| | | | | | | 4,709,994 |
| | | | | | | |
INTERNET & CATALOG RETAIL – 1.0% |
HSN, Inc.* | | | | 255,104 | | | 5,150,550 |
| | | | | | | |
MACHINERY – 3.6% |
Caterpillar, Inc. | | | | 96,640 | | | 5,507,513 |
Eaton Corp. | | | | 156,000 | | | 9,924,720 |
Joy Global, Inc. | | | | 13,540 | | | 698,529 |
Praxair, Inc. | | | | 23,500 | | | 1,887,285 |
| | | | | | | |
| | | | | | | 18,018,047 |
| | | | | | | |
| | | | | | | |
| | | Country
Code** | | Shares | | Value |
| | | | | | | |
MEDIA – 2.4% |
Comcast Corp., Class A | | | | 237,750 | | $ | 4,008,465 |
Omnicom Group, Inc. | | | | 49,610 | | | 1,942,232 |
Time Warner Cable, Inc. | | | | 55,296 | | | 2,288,701 |
Time Warner, Inc. | | | | 75,350 | | | 2,195,699 |
Viacom, Inc.* | | | | 59,230 | | | 1,760,908 |
| | | | | | | |
| | | | | | | 12,196,005 |
| | | | | | | |
METALS & MINING – 3.6% |
Agnico-Eagle Mines Ltd. | | CA | | 27,850 | | | 1,503,900 |
Barrick Gold Corp. | | CA | | 190,190 | | | 7,489,682 |
Cliffs Natural Resources, Inc. | | | | 72,760 | | | 3,353,508 |
Newmont Mining Corp. | | | | 66,900 | | | 3,165,039 |
United States Steel Corp. | | | | 51,830 | | | 2,856,870 |
| | | | | | | |
| | | | | | | 18,368,999 |
| | | | | | | |
MULTI-LINE RETAIL – 3.2% |
J.C. Penney Co., Inc. | | | | 95,110 | | | 2,530,877 |
Kohl’s Corp.* | | | | 70,930 | | | 3,825,255 |
Target Corp. | | | | 207,210 | | | 10,022,748 |
| | | | | | | |
| | | | | | | 16,378,880 |
| | | | | | | |
MULTI-UTILITIES – 0.6% |
PG&E Corp. | | | | 70,240 | | | 3,136,216 |
| | | | | | | |
OIL, GAS & CONSUMABLE FUELS – 15.8% |
Apache Corp. | | | | 10,530 | | | 1,086,380 |
Arch Coal, Inc. | | | | 104,400 | | | 2,322,900 |
Chevron Corp. | | | | 176,390 | | | 13,580,266 |
ConocoPhillips | | | | 59,620 | | | 3,044,793 |
Devon Energy Corp. | | | | 46,820 | | | 3,441,270 |
El Paso Corp. | | | | 453,970 | | | 4,462,525 |
EOG Resources, Inc. | | | | 34,770 | | | 3,383,121 |
Exxon Mobil Corp. | | | | 290,160 | | | 19,786,010 |
Hess Corp. | | | | 51,240 | | | 3,100,020 |
Marathon Oil Corp. | | | | 169,620 | | | 5,295,536 |
Murphy Oil Corp. | | | | 32,890 | | | 1,782,638 |
Occidental Petroleum Corp. | | | | 59,050 | | | 4,803,718 |
Petroleo Brasileiro SA ADR | | BR | | 79,470 | | | 3,789,130 |
Southwestern Energy Co.* | | | | 11,820 | | | 569,724 |
Suncor Energy, Inc. | | CA | | 122,910 | | | 4,339,952 |
XTO Energy, Inc. | | | | 116,290 | | | 5,410,974 |
| | | | | | | |
| | | | | | | 80,198,957 |
| | | | | | | |
See Notes to Financial Statements.
126
LORD ABBETT GROWTH & INCOME FUND
| | |
PORTFOLIO OF INVESTMENTS (Continued) December 31, 2009 | | Sun Capital Advisers Trust |
| | | | | | | |
| | | Country
Code** | | Shares | | Value |
| | | | | | | |
| | | | | | | |
PHARMACEUTICALS – 4.3% |
Abbott Laboratories | | | | 126,930 | | $ | 6,852,951 |
Johnson & Johnson | | | | 57,590 | | | 3,709,372 |
Merck & Co., Inc. | | | | 108,658 | | | 3,970,363 |
Teva Pharmaceutical Industries, Ltd. ADR | | IL | | 130,170 | | | 7,312,951 |
| | | | | | | |
| | | | | | | 21,845,637 |
| | | | | | | |
REAL ESTATE INVESTMENT TRUSTS – 0.1% |
Annaly Capital Management, Inc. | | | | 35,200 | | | 610,720 |
| | | | | | | |
ROAD & RAIL – 2.2% |
Hertz Global Holdings, Inc.* | | | | 954,060 | | | 11,372,395 |
| | | | | | | |
SEMICONDUCTORS & SEMICONDUCTOR EQUIPMENT – 0.6% |
Intel Corp. | | | | 144,150 | | | 2,940,660 |
| | | | | | | |
SOFTWARE – 0.4% |
Adobe Systems, Inc.* | | | | 59,400 | | | 2,184,732 |
| | | | | | | |
SPECIALTY RETAIL – 1.2% |
Best Buy Co., Inc. | | | | 36,780 | | | 1,451,339 |
J. Crew Group, Inc.* | | | | 74,790 | | | 3,346,104 |
| | | | | | | | |
| | | Country
Code** | | Shares | | Value | |
The Home Depot, Inc. | | | | 52,570 | | $ | 1,520,850 | |
| | | | | | | | |
| | | | | | | 6,318,293 | |
| | | | | | | | |
TEXTILES, APPAREL & LUXURY GOODS – 0.1% | |
Nike, Inc., Class B | | | | 4,410 | | | 291,369 | |
| | | | | | | | |
Total Common Stocks
(Cost $371,920,129) | | | 496,765,390 | |
| | | | | | | | |
CONVERTIBLE PREFERRED STOCKS – 0.2% | |
DIVERSIFIED FINANCIAL SERVICES – 0.2% | |
Bank of America Corp. 10.00%, Perpetual (Cost $1,218,900) | | 81,260 | | | 1,212,399 | |
| | | | | | | | |
SHORT TERM INVESTMENTS – 3.1% | |
MUTUAL FUNDS – 3.1% | |
State Street Institutional Liquid Reserves Fund (Cost $15,839,881) | | 15,839,881 | | | 15,839,881 | |
| | | | | | | | |
TOTAL INVESTMENTS – 101.1% | |
(Cost $388,978,910) | | | | | | | 513,817,670 | |
Liabilities in excess of other assets – (1.1)% | | | | | (5,756,701 | ) |
| | | | | | | | |
NET ASSETS – 100.0% | | | | $ | 508,060,969 | |
| | | | | | | | |
| * | Non-income producing security. |
| ** | Unless otherwise noted the issuer country code for all securities is United States. |
| | |
| ADR | | American Depositary Receipt |
| |
| AN | | Netherlands Antilles |
| BR | | Brazil |
| CA | | Canada |
| IE | | Ireland |
| IL | | Israel |
| PA | | Panama |
See Notes to Financial Statements.
127
| | |
LORD ABBETT GROWTH & INCOME FUND PORTFOLIO OF INVESTMENTS (Continued) |
| December 31, 2009 | | Sun Capital Advisers Trust |
| (1) | Fair Value Measurements † |
The following table summarizes the inputs used to value the Fund’s assets and liabilities, as applicable, measured at fair value at the period end:
| | | | | | | | | | | | |
Assets | | Quoted Prices
in Active
Markets for
Identical
Assets and
Liabilities
(Level 1) | | Significant
Other
Observable
Inputs
(Level 2) | | Significant
Unobservable
Inputs
(Level 3) | | Total |
Common Stocks (a) | | $ | 496,765,390 | | $ | — | | $ | — | | $ | 496,765,390 |
Convertible Preferred Stocks (a) | | | 1,212,399 | | | — | | | — | | | 1,212,399 |
Short Term Investments | | | | | | | | | | | | |
Mutual Funds | | | 15,839,881 | | | — | | | — | | | 15,839,881 |
| | | | | | | | | | | | |
Total Investments | | | 513,817,670 | | | — | | | — | | | 513,817,670 |
| | | | | | | | | | | | |
Total | | $ | 513,817,670 | | $ | — | | $ | — | | $ | 513,817,670 |
| | | | | | | | | | | | |
| † | See Note 2b in the Notes to Financial Statements for additional information. |
| (a) | See Portfolio of Investments for additional detailed categorizations. |
See Notes to Financial Statements.
128
GOLDMAN SACHS MID CAP VALUE FUND
| | |
PORTFOLIO OF INVESTMENTS December 31, 2009 | | Sun Capital Advisers Trust |
| | | | | | | |
| | | Country
Code** | | Shares | | Value |
| | | | | | | |
| | | | | | | |
COMMON STOCKS – 97.0% |
AEROSPACE & DEFENSE – 0.5% |
L-3 Communications Holdings, Inc. | | | | 8,108 | | $ | 704,990 |
Northrop Grumman Corp. | | | | 5,928 | | | 331,079 |
| | | | | | | |
| | | | | | | 1,036,069 |
| | | | | | | |
AIR FREIGHT & LOGISTICS – 0.6% |
United Parcel Services, Inc., Class B | | | | 6,413 | | | 367,914 |
UTI Worldwide, Inc. | | VG | | 68,632 | | | 982,810 |
| | | | | | | |
| | | | | | | 1,350,724 |
| | | | | | | |
AIRLINES – 0.9% |
Southwest Airlines Co. | | | | 156,968 | | | 1,794,144 |
| | | | | | | |
AUTO COMPONENTS – 0.7% |
Autoliv, Inc. | | | | 26,487 | | | 1,148,476 |
BorgWarner, Inc. | | | | 9,322 | | | 309,677 |
| | | | | | | |
| | | | | | | 1,458,153 |
| | | | | | | |
AUTOMOBILES – 0.4% |
Harley-Davidson, Inc. | | | | 9,667 | | | 243,608 |
Thor Industries, Inc. | | | | 18,461 | | | 579,676 |
| | | | | | | |
| | | | | | | 823,284 |
| | | | | | | |
BIOTECHNOLOGY – 0.6% |
Amgen, Inc.* | | | | 8,093 | | | 457,821 |
Genzyme Corp.* | | | | 3,297 | | | 161,586 |
Gilead Sciences, Inc.* | | | | 13,829 | | | 598,519 |
| | | | | | | |
| | | | | | | 1,217,926 |
| | | | | | | |
BUILDING PRODUCTS – 0.6% |
Armstrong World Industries, Inc.* | | | | 20,628 | | | 803,048 |
Masco Corp. | | | | 37,972 | | | 524,393 |
| | | | | | | |
| | | | | | | 1,327,441 |
| | | | | | | |
CAPITAL MARKETS – 1.0% |
Allied Capital Corp.* | | | | 42,263 | | | 152,570 |
Ameriprise Financial, Inc. | | | | 23,483 | | | 911,610 |
Federated Investors, Inc., Class B | | | | 36,144 | | | 993,960 |
| | | | | | | |
| | | | | | | 2,058,140 |
| | | | | | | |
CHEMICALS – 2.3% |
CF Industries Holdings, Inc. | | | | 6,597 | | | 598,876 |
Cytec Industries, Inc. | | | | 18,585 | | | 676,866 |
| | | | | | | |
| | | Country
Code** | | Shares | | Value |
| | | | | | | |
| | | | | | | |
E.I. du Pont de Nemours & Co. | | | | 4,221 | | $ | 142,121 |
Eastman Chemical Co. | | | | 23,773 | | | 1,432,085 |
Huntsman Corp. | | | | 110,515 | | | 1,247,714 |
PPG Industries, Inc. | | | | 8,060 | | | 471,832 |
The Dow Chemical Co. | | | | 12,104 | | | 334,434 |
| | | | | | | |
| | | | | | | 4,903,928 |
| | | | | | | |
COMMERCIAL BANKS – 3.5% |
Associated Banc-Corp. | | | | 82,616 | | | 909,602 |
BB&T Corp. | | | | 18,752 | | | 475,738 |
Comerica, Inc. | | | | 34,478 | | | 1,019,515 |
Fifth Third Bancorp | | | | 188,152 | | | 1,834,482 |
Keycorp | | | | 68,367 | | | 379,437 |
Marshall & Ilsley Corp. | | | | 78,283 | | | 426,642 |
Popular, Inc. | | PR | | 305,621 | | | 690,703 |
Suntrust Banks, Inc. | | | | 39,806 | | | 807,664 |
Synovus Financial Corp. | | | | 57,554 | | | 117,986 |
Wells Fargo & Co. | | | | 22,866 | | | 617,153 |
| | | | | | | |
| | | | | | | 7,278,922 |
| | | | | | | |
COMMERCIAL SERVICES & SUPPLIES – 2.0% |
Avery Dennison Corp. | | | | 2,124 | | | 77,505 |
Manpower, Inc. | | | | 42,102 | | | 2,297,927 |
R.R. Donnelley & Sons Co. | | | | 81,552 | | | 1,816,163 |
| | | | | | | |
| | | | | | | 4,191,595 |
| | | | | | | |
COMMUNICATIONS EQUIPMENT – 0.7% |
EchoStar Corp., Class A* | | | | 12,497 | | | 251,689 |
JDS Uniphase Corp.* | | | | 56,523 | | | 466,315 |
Tellabs, Inc.* | | | | 116,784 | | | 663,333 |
| | | | | | | |
| | | | | | | 1,381,337 |
| | | | | | | |
COMPUTERS & PERIPHERALS – 2.1% |
Lexmark International, Inc., Class A* | | | | 6,177 | | | 160,478 |
SanDisk Corp.* | | | | 8,329 | | | 241,458 |
Seagate Technology | | KY | | 169,100 | | | 3,075,929 |
Sun Microsystems, Inc.* | | | | 86,084 | | | 806,607 |
| | | | | | | |
| | | | | | | 4,284,472 |
| | | | | | | |
CONSTRUCTION & ENGINEERING – 0.2% |
URS Corp.* | | | | 9,050 | | | 402,906 |
| | | | | | | |
CONSUMER FINANCE – 1.3% |
AmeriCredit Corp.* | | | | 44,030 | | | 838,331 |
See Notes to Financial Statements.
129
GOLDMAN SACHS MID CAP VALUE FUND
| | |
PORTFOLIO OF INVESTMENTS (Continued) December 31, 2009 | | Sun Capital Advisers Trust |
| | | | | | | |
| | | Country
Code** | | Shares | | Value |
| | | | | | | |
| | | | | | | |
Discover Financial Services | | | | 113,066 | | $ | 1,663,201 |
The Student Loan Corp. | | | | 5,216 | | | 242,909 |
| | | | | | | |
| | | | | | | 2,744,441 |
| | | | | | | |
CONTAINERS & PACKAGING – 1.1% |
Bemis Co. | | | | 7,788 | | | 230,914 |
Packaging Corp of America | | | | 45,368 | | | 1,043,918 |
Sealed Air Corp. | | | | 7,807 | | | 170,661 |
Sonoco Products Co. | | | | 17,684 | | | 517,257 |
Temple-Inland, Inc. | | | | 14,695 | | | 310,211 |
| | | | | | | |
| | | | | | | 2,272,961 |
| | | | | | | |
DIVERSIFIED FINANCIAL SERVICES – 0.5% |
Citigroup, Inc. | | | | 56,393 | | | 186,661 |
U.S. Bancorp | | | | 36,616 | | | 824,226 |
| | | | | | | |
| | | | | | | 1,010,887 |
| | | | | | | |
DIVERSIFIED TELECOMMUNICATION
SERVICES – 1.1% |
CenturyTel, Inc. | | | | 40,801 | | | 1,477,404 |
Qwest Communications International, Inc. | | | | 192,262 | | | 809,423 |
| | | | | | | |
| | | | | | | 2,286,827 |
| | | | | | | |
ELECTRIC UTILITIES – 2.7% |
Duke Energy Corp. | | | | 18,796 | | | 323,479 |
Edison International (1) | | | | 64,865 | | | 2,256,005 |
Exelon Corp. | | | | 14,119 | | | 689,995 |
Pepco Holdings, Inc. | | | | 37,521 | | | 632,229 |
Pinnacle West Capital Corp. | | | | 49,376 | | | 1,806,174 |
| | | | | | | |
| | | | | | | 5,707,882 |
| | | | | | | |
ELECTRICAL EQUIPMENT – 1.0% |
General Cable Corp.* | | | | 5,266 | | | 154,926 |
Rockwell Automation, Inc. | | | | 31,287 | | | 1,469,863 |
Thomas & Betts Corp.* | | | | 12,870 | | | 460,617 |
| | | | | | | |
| | | | | | | 2,085,406 |
| | | | | | | |
ELECTRONIC EQUIPMENT & INSTRUMENTS – 1.9% |
Arrow Electronics, Inc.* | | | | 27,996 | | | 828,962 |
Avnet, Inc.* | | | | 27,543 | | | 830,697 |
Ingram Micro, Inc., Class A* | | | | 80,963 | | | 1,412,804 |
Jabil Circuit, Inc. | | | | 13,396 | | | 232,688 |
Tech Data Corp.* | | | | 4,747 | | | 221,495 |
| | | | | | | |
| | | Country
Code** | | Shares | | Value |
| | | | | | | |
| | | | | | | |
Vishay Intertechnology, Inc.* | | | | 47,205 | | $ | 394,162 |
| | | | | | | |
| | | | | | | 3,920,808 |
| | | | | | | |
ENERGY EQUIPMENT & SERVICES – 2.4% |
ENSCO International PLC ADR | | GB | | 13,873 | | | 554,088 |
Exterran Holdings, Inc.* | | | | 43,099 | | | 924,473 |
Oil States International, Inc.* | | | | 19,447 | | | 764,073 |
Patterson-UTI Energy, Inc. | | | | 83,608 | | | 1,283,383 |
SEACOR Holdings, Inc.* | | | | 953 | | | 72,666 |
Smith International, Inc. | | | | 7,144 | | | 194,102 |
Unit Corp.* | | | | 27,722 | | | 1,178,185 |
| | | | | | | |
| | | | | | | 4,970,970 |
| | | | | | | |
FOOD & STAPLES RETAILING – 0.6% |
Safeway, Inc. | | | | 5,243 | | | 111,623 |
SUPERVALU, Inc. | | | | 89,794 | | | 1,141,282 |
| | | | | | | |
| | | | | | | 1,252,905 |
| | | | | | | |
FOOD PRODUCTS – 3.2% |
Archer-Daniels-Midland Co. | | 12,370 | | | 387,305 |
Bunge, Ltd. | | BM | | 17,632 | | | 1,125,451 |
Campbell Soup Co. | | | | 19,232 | | | 650,042 |
Hormel Foods Corp. | | | | 46,484 | | | 1,787,310 |
Smithfield Foods, Inc.* | | | | 27,744 | | | 421,431 |
The Hershey Co. | | | | 4,947 | | | 177,053 |
Tyson Foods, Inc., Class A | | | | 182,490 | | | 2,239,152 |
| | | | | | | |
| | | | | | | 6,787,744 |
| | | | | | | |
GAS UTILITIES – 1.1% |
Atmos Energy Corp. | | | | 11,981 | | | 352,241 |
Energen Corp. | | | | 14,982 | | | 701,158 |
National Fuel Gas Co. | | | | 1,296 | | | 64,800 |
Questar Corp. | | | | 27,326 | | | 1,135,942 |
| | | | | | | |
| | | | | | | 2,254,141 |
| | | | | | | |
HEALTH CARE EQUIPMENT & SUPPLIES – 0.4% |
Hill-Rom Holdings, Inc. | | | | 36,133 | | | 866,831 |
| | | | | | | |
HEALTH CARE PROVIDERS & SERVICES – 2.5% |
AmerisourceBergen Corp. | | | | 6,807 | | | 177,458 |
Cardinal Health, Inc. | | | | 14,813 | | | 477,571 |
See Notes to Financial Statements.
130
GOLDMAN SACHS MID CAP VALUE FUND
| | |
PORTFOLIO OF INVESTMENTS (Continued) December 31, 2009 | | Sun Capital Advisers Trust |
| | | | | | | |
| | | Country
Code** | | Shares | | Value |
| | | | | | | |
| | | | | | | |
CIGNA Corp. | | | | 23,700 | | $ | 835,899 |
Coventry Health Care, Inc.* | | | | 75,611 | | | 1,836,591 |
Health Net, Inc.* | | | | 10,181 | | | 237,116 |
Humana, Inc.* | | | | 37,404 | | | 1,641,662 |
| | | | | | | |
| | | | | | | 5,206,297 |
| | | | | | | |
HOTELS, RESTAURANTS & LEISURE – 0.9% |
Choice Hotels, Inc. | | | | 13,916 | | | 440,581 |
Marriott International, Inc., Class A | | | | 27,630 | | | 752,917 |
Royal Caribbean Cruises, Ltd.* | | LR | | 3,367 | | | 85,118 |
Wyndham Worldwide Corp. | | | | 24,799 | | | 500,196 |
| | | | | | | |
| | | | | | | 1,778,812 |
| | | | | | | |
HOUSEHOLD DURABLES – 2.8% |
Black & Decker Corp. | | | | 7,597 | | | 492,514 |
Fortune Brands, Inc. | | | | 5,657 | | | 244,382 |
Harman International Industries, Inc. | | | | 31,051 | | | 1,095,479 |
Leggett & Platt, Inc. | | | | 58,738 | | | 1,198,255 |
Mohawk Industries, Inc.* | | | | 26,969 | | | 1,283,725 |
Newell Rubbermaid, Inc. | | | | 5,449 | | | 81,790 |
Whirlpool Corp. (1) | | | | 19,046 | | | 1,536,250 |
| | | | | | | |
| | | | | | | 5,932,395 |
| | | | | | | |
INDEPENDENT POWER PRODUCERS & ENERGY TRADERS – 0.7% |
Constellation Energy Group | | | | 11,135 | | | 391,618 |
Mirant Corp.* | | | | 71,951 | | | 1,098,692 |
| | | | | | | |
| | | | | | | 1,490,310 |
| | | | | | | |
INDUSTRIAL CONGLOMERATES – 0.2% |
Carlisle Cos., Inc. | | | | 4,941 | | | 169,279 |
Textron, Inc. | | | | 18,142 | | | 341,251 |
| | | | | | | |
| | | | | | | 510,530 |
| | | | | | | |
INSURANCE – 7.3% |
Aspen Insurance Holdings, Ltd. | | BM | | 24,164 | | | 614,974 |
Assurant, Inc. | | | | 12,821 | | | 377,963 |
Axis Capital Holdings, Ltd. | | BM | | 10,362 | | | 294,384 |
CNA Financial Corp.* | | | | 34,724 | | | 833,376 |
Endurance Specialty Holdings, Ltd. | | BM | | 22,872 | | | 851,525 |
| | | | | | | |
| | | Country
Code** | | Shares | | Value |
| | | | | | | |
| | | | | | | |
First American Corp. | | | | 17,019 | | $ | 563,499 |
Genworth Financial Inc., Class A* | | | | 11,623 | | | 131,921 |
Lincoln National Corp. | | | | 33,365 | | | 830,121 |
Marsh & McLennan Cos., Inc. | | | | 60,204 | | | 1,329,304 |
MBIA, Inc.* | | | | 84,452 | | | 336,119 |
Old Republic International Corp. | | | | 37,729 | | | 378,799 |
Protective Life Corp. | | | | 41,199 | | | 681,843 |
The Hartford Financial Services Group, Inc. | | | | 20,951 | | | 487,320 |
The Progressive Corp.* (1) | | | | 80,053 | | | 1,440,154 |
Transatlantic Holdings, Inc. | | | | 14,536 | | | 757,471 |
Travelers Cos., Inc. | | | | 2,011 | | | 100,269 |
Unitrin, Inc. | | | | 8,409 | | | 185,418 |
Unum Group (1) | | | | 166,551 | | | 3,251,076 |
W.R. Berkley Corp. | | | | 41,290 | | | 1,017,386 |
XL Capital Ltd., Class A | | KY | | 39,525 | | | 724,493 |
| | | | | | | |
| | | | | | | 15,187,415 |
| | | | | | | |
INTERNET & CATALOG RETAIL – 1.1% |
Expedia, Inc.* | | | | 42,840 | | | 1,101,416 |
Liberty Media Corp. – Interactive, Series A* | | | | 107,066 | | | 1,160,596 |
| | | | | | | |
| | | | | | | 2,262,012 |
| | | | | | | |
INTERNET SOFTWARE & SERVICES – 0.0% + |
AOL, Inc.* | | | | 2,818 | | | 65,603 |
| | | | | | | |
IT SERVICES – 0.3% |
Accenture PLC, Class A | | IE | | 10,143 | | | 420,934 |
Computer Sciences Corp.* | | | | 2,136 | | | 122,884 |
Convergys Corp.* | | | | 8,565 | | | 92,074 |
| | | | | | | |
| | | | | | | 635,892 |
| | | | | | | |
LEISURE EQUIPMENT & PRODUCTS – 0.1% |
Eastman Kodak Co.* | | | | 37,316 | | | 157,474 |
| | | | | | | |
MACHINERY – 4.1% |
AGCO Corp.* | | | | 24,128 | | | 780,300 |
Cummins, Inc. | | | | 24,590 | | | 1,127,697 |
Eaton Corp. | | | | 34,844 | | | 2,216,775 |
Graco, Inc. | | | | 2,459 | | | 70,254 |
See Notes to Financial Statements.
131
GOLDMAN SACHS MID CAP VALUE FUND
| | |
PORTFOLIO OF INVESTMENTS (Continued) December 31, 2009 | | Sun Capital Advisers Trust |
| | | | | | | |
| | | Country
Code** | | Shares | | Value |
| | | | | | | |
| | | | | | | |
Lincoln Electric Holdings, Inc. | | | | 7,963 | | $ | 425,702 |
Navistar International Corp., Inc.* | | | | 2,916 | | | 112,703 |
Oshkosh Corp. | | | | 19,303 | | | 714,790 |
Parker Hannifin Corp. | | | | 8,524 | | | 459,273 |
The Manitowoc Co., Inc. | | | | 7,312 | | | 72,901 |
The Timken Co. | | | | 59,470 | | | 1,410,034 |
Trinity Industries, Inc. | | | | 69,391 | | | 1,210,179 |
| | | | | | | |
| | | | | | | 8,600,608 |
| | | | | | | |
MEDIA – 3.4% |
CBS Corp., Class B (1) | | | | 104,447 | | | 1,467,480 |
Clear Channel Outdoor Holdings, Inc., Class A* | | | | 12,827 | | | 133,273 |
DISH Network Corp., Class A | | | | 93,591 | | | 1,943,885 |
Gannett Co., Inc. | | | | 44,174 | | | 655,984 |
Meredith Corp. | | | | 3,615 | | | 111,523 |
Scripps Networks Interactive, Inc., Class A | | | | 31,888 | | | 1,323,352 |
The Washington Post Co., Class B | | | | 1,050 | | | 461,580 |
Time Warner, Inc. | | | | 33,110 | | | 964,825 |
| | | | | | | |
| | | | | | | 7,061,902 |
| | | | | | | |
METALS & MINING – 1.8% |
Commercial Metals Co. | | | | 69,561 | | | 1,088,630 |
Freeport-McMoRan Copper & Gold, Inc.* | | | | 3,401 | | | 273,066 |
Reliance Steel & Aluminum Co. | | | | 39,499 | | | 1,707,147 |
Schnitzer Steel Industries, Inc., Class A | | | | 16,260 | | | 775,602 |
| | | | | | | |
| | | | | | | 3,844,445 |
| | | | | | | |
MULTI-LINE RETAIL – 1.2% |
Big Lots, Inc.* | | | | 11,822 | | | 342,601 |
J.C. Penney Co., Inc. | | | | 38,649 | | | 1,028,450 |
Macy’s, Inc. | | | | 58,757 | | | 984,767 |
Sears Holdings Corp.* | | | | 1,308 | | | 109,153 |
| | | | | | | |
| | | | | | | 2,464,971 |
| | | | | | | |
MULTI-UTILITIES – 6.1% |
Alliant Energy Corp. | | | | 5,134 | | | 155,355 |
Ameren Corp. | | | | 106,173 | | | 2,967,535 |
| | | | | | | |
| | | Country
Code** | | Shares | | Value |
| | | | | | | |
| | | | | | | |
Consolidated Edison, Inc. | | | | 3,671 | | $ | 166,774 |
DTE Energy Co. | | | | 28,189 | | | 1,228,759 |
Integrys Energy Group, Inc. | | | | 66,848 | | | 2,806,948 |
MDU Resources Group, Inc. | | | | 80,341 | | | 1,896,048 |
NiSource, Inc. | | | | 165,090 | | | 2,539,084 |
Sempra Energy | | | | 12,228 | | | 684,523 |
TECO Energy, Inc. | | | | 9,297 | | | 150,797 |
Xcel Energy, Inc. | | | | 3,138 | | | 66,588 |
| | | | | | | |
| | | | | | | 12,662,411 |
| | | | | | | |
OFFICE ELECTRONICS – 0.4% |
Xerox Corp. | | | | 109,096 | | | 922,952 |
| | | | | | | |
OIL, GAS & CONSUMABLE FUELS – 6.1% |
Arch Coal, Inc. | | | | 56,822 | | | 1,264,289 |
Cimarex Energy Co. | | | | 54,481 | | | 2,885,859 |
Devon Energy Corp. | | | | 8,230 | | | 604,905 |
Forest Oil Corp.* | | | | 7,547 | | | 167,921 |
Helix Energy Solutions Group, Inc.* | | | | 46,982 | | | 552,039 |
Hess Corp. | | | | 1,876 | | | 113,498 |
Mariner Energy, Inc.* | | | | 43,787 | | | 508,367 |
Murphy Oil Corp. | | | | 22,191 | | | 1,202,752 |
Overseas Shipholding Group, Inc. | | | | 11,202 | | | 492,328 |
Pioneer Natural Resources Co. | | | | 5,298 | | | 255,205 |
Quicksilver Resources, Inc.* | | | | 7,579 | | | 113,761 |
St. Mary Land & Exploration Co. | | | | 42,012 | | | 1,438,491 |
Teekay Shipping Corp. | | MH | | 27,421 | | | 636,441 |
Tesoro Corp. | | | | 116,497 | | | 1,578,534 |
Valero Energy Corp. | | | | 58,450 | | | 979,037 |
| | | | | | | |
| | | | | | | 12,793,427 |
| | | | | | | |
PAPER & FOREST PRODUCTS – 3.5% |
International Paper Co. | | | | 135,081 | | | 3,617,469 |
MeadWestvaco Corp. | | | | 48,071 | | | 1,376,273 |
Rayonier, Inc. | | | | 55,552 | | | 2,342,072 |
| | | | | | | |
| | | | | | | 7,335,814 |
| | | | | | | |
PHARMACEUTICALS – 1.8% |
Eli Lilly & Co. | | | | 3,755 | | | 134,091 |
Forest Laboratories, Inc.* | | | | 81,335 | | | 2,611,667 |
See Notes to Financial Statements.
132
GOLDMAN SACHS MID CAP VALUE FUND
| | |
PORTFOLIO OF INVESTMENTS (Continued) December 31, 2009 | | Sun Capital Advisers Trust |
| | | | | | | |
| | | Country
Code** | | Shares | | Value |
| | | | | | | |
| | | | | | | |
King Pharmaceuticals, Inc.* | | | | 69,969 | | $ | 858,520 |
Watson Pharmaceuticals, Inc.* | | | | 5,214 | | | 206,526 |
| | | | | | | |
| | | | | | | 3,810,804 |
| | | | | | | |
REAL ESTATE INVESTMENT TRUSTS – 10.4% |
AvalonBay Communities, Inc. | | | | 47,334 | | | 3,886,595 |
Boston Properties, Inc. | | | | 9,655 | | | 647,561 |
BRE Properties, Inc. | | | | 73,597 | | | 2,434,589 |
Duke Realty Corp. | | | | 20,093 | | | 244,532 |
Equity Residential Properties Trust | | | | 76,046 | | | 2,568,834 |
Federal Realty Investment Trust | | | | 20,156 | | | 1,364,964 |
Health Care REIT, Inc. | | | | 8,850 | | | 392,232 |
Liberty Property Trust | | | | 83,004 | | | 2,656,958 |
Nationwide Health Properties, Inc. | | | | 34,037 | | | 1,197,422 |
Plum Creek Timber Co., Inc. | | | | 45,983 | | | 1,736,318 |
Realty Income Corp. | | | | 26,975 | | | 698,922 |
Regency Centers Corp. | | | | 38,352 | | | 1,344,621 |
Senior Housing Properties Trust | | | | 11,082 | | | 242,363 |
Simon Property Group, Inc. | | | | 26,944 | | | 2,150,131 |
The Macerich Co. | | | | 406 | | | 14,596 |
Weyerhaeuser Co. | | | | 3,728 | | | 160,826 |
| | | | | | | |
| | | | | | | 21,741,464 |
| | | | | | | |
ROAD & RAIL – 0.3% |
Hertz Global Holdings, Inc.* | | | | 15,186 | | | 181,017 |
Ryder System, Inc. | | | | 12,004 | | | 494,205 |
| | | | | | | |
| | | | | | | 675,222 |
| | | | | | | |
SEMICONDUCTORS & SEMICONDUCTOR EQUIPMENT – 2.0% |
Advanced Micro Devices, Inc.* | | | | 37,213 | | | 360,222 |
Fairchild Semiconductor International, Inc.* | | | | 54,335 | | | 542,807 |
Integrated Device Technology, Inc.* | | | | 152,657 | | | 987,691 |
Intel Corp. | | | | 3,657 | | | 74,603 |
Intersil Holding Corp. | | | | 35,542 | | | 545,214 |
LSI Corp.* | | | | 272,914 | | | 1,640,213 |
| | | | | | | |
| | | | | | | 4,150,750 |
| | | | | | | |
| | | | | | | | |
| | | Country
Code** | | Shares | | Value | |
| | | | | | | | |
| | | | | | | | |
SOFTWARE – 0.8% | |
CA, Inc. | | | | 5,575 | | $ | 125,215 | |
Microsoft Corp. | | | | 24,939 | | | 760,390 | |
Symantec Corp.* | | | | 10,047 | | | 179,741 | |
Synopsys, Inc.* | | | | 26,333 | | | 586,699 | |
| | | | | | | | |
| | | | | | | 1,652,045 | |
| | | | | | | | |
SPECIALTY RETAIL – 1.6% | |
Autonation, Inc.* | | | | 40,258 | | | 770,941 | |
Barnes & Noble, Inc. | | | | 21,687 | | | 413,571 | |
CarMax, Inc.* | | | | 25,374 | | | 615,319 | |
Limited Brands, Inc. | | | | 17,311 | | | 333,064 | |
Office Depot, Inc.* | | | | 55,094 | | | 355,356 | |
Williams-Sonoma, Inc. | | | | 44,614 | | | 927,079 | |
| | | | | | | | |
| | | | | | | 3,415,330 | |
| | | | | | | | |
THRIFT & MORTGAGE FINANCE – 1.5% | |
Hudson City Bancorp, Inc. | | | | 149,365 | | | 2,050,782 | |
New York Community Bancorp, Inc. | | | | 5,638 | | | 81,807 | |
Washington Federal, Inc. | | | | 55,335 | | | 1,070,179 | |
| | | | | | | | |
| | | | | | | 3,202,768 | |
| | | | | | | | |
TOBACCO – 1.8% | |
Lorillard, Inc. | | | | 47,788 | | | 3,834,031 | |
| | | | | | | | |
WIRELESS TELECOMMUNICATION SERVICES – 0.9% | |
NII Holdings, Inc.* | | | | 9,490 | | | 318,674 | |
Sprint Nextel Corp.* | | | | 224,901 | | | 823,138 | |
US Cellular Corp.* | | | | 17,844 | | | 756,764 | |
| | | | | | | | |
| | | | | | | 1,898,576 | |
| | | | | | | | |
Total Common Stocks
(Cost $167,659,991) | | | 202,965,104 | |
| | | | | | | | |
SHORT TERM INVESTMENTS – 3.1% | |
MUTUAL FUNDS – 3.1% | | | | | | |
State Street Institutional
Liquid Reserves Fund
(Cost $6,361,452) | | 6,361,452 | | | 6,361,452 | |
| | | | | | | | |
TOTAL INVESTMENTS – 100.1%
| | | | |
(Cost $174,021,443) | | | | | 209,326,556 | |
Liabilities in excess of other
assets – (0.1)% | | | | | (166,472 | ) |
| | | | | | | | |
NET ASSETS – 100.0% | | | | $ | 209,160,084 | |
| | | | | | | | |
See Notes to Financial Statements.
133
GOLDMAN SACHS MID CAP VALUE FUND
| | |
PORTFOLIO OF INVESTMENTS (Continued) December 31, 2009 | | Sun Capital Advisers Trust |
| * | Non-income producing security. |
| ** | Unless otherwise noted the issuer country code for all securities is United States. |
| + | Amount is less than 0.05%. |
| | |
| ADR | | American Depositary Receipt |
| REIT | | Real Estate Investment Trust |
| |
| BM | | Bermuda |
| GB | | Great Britain |
| IE | | Ireland |
| KY | | Cayman Islands |
| LR | | Liberia |
| MH | | Marshall Islands |
| PR | | Puerto Rico |
| VG | | British Virgin Islands |
| (1) | At the period end, securities (or portions thereof) with an aggregate market value of $1,828,683 have been pledged to cover margin requirements for the following open futures contracts: |
| | | | | | | | | | | | |
Type | | Description | | Expiration
Date | | Contracts | | Aggregate
Face
Value ($) | | Aggregate
Notional
Value ($) | | Unrealized
Appreciation ($) |
Long | | S&P MidCap 400 E-Mini March Futures | | 3/19/10 | | 63 | | 4,480,686 | | 4,566,870 | | 86,184 |
| (2) | Fair Value Measurements † |
The following table summarizes the inputs used to value the Fund’s assets and liabilities, as applicable, measured at fair value at the period end:
| | | | | | | | | | | | |
Assets | | Quoted Prices
in Active
Markets for
Identical
Assets and
Liabilities
(Level 1) | | Significant
Other
Observable
Inputs
(Level 2) | | Significant
Unobservable
Inputs
(Level 3) | | Total |
Common Stocks (a) | | $ | 202,965,104 | | $ | — | | $ | — | | $ | 202,965,104 |
Short Term Investments | | | | | | | | | | | | |
Mutual Funds | | | 6,361,452 | | | — | | | — | | | 6,361,452 |
| | | | | | | | | | | | |
Total Investments | | | 209,326,556 | | | — | | | — | | | 209,326,556 |
| | | | | | | | | | | | |
Futures Contracts | | | 86,184 | | | — | | | — | | | 86,184 |
| | | | | | | | | | | | |
Total | | $ | 209,412,740 | | $ | — | | $ | — | | $ | 209,412,740 |
| | | | | | | | | | | | |
| † | See Note 2b in the Notes to Financial Statements for additional information. |
| (a) | See Portfolio of Investments for additional detailed categorizations. |
See Notes to Financial Statements.
134
GOLDMAN SACHS SHORT DURATION FUND
| | |
PORTFOLIO OF INVESTMENTS December 31, 2009 | | Sun Capital Advisers Trust |
| | | | | | | | |
| | | Country
Code** | | Principal
Amount
(000) | | Value |
| | | | | | | | |
| | | | | | | | |
ASSET BACKED SECURITIES – 5.3% |
Bank of America Auto Trust, Series 2009-1A, Class A2 (1) 1.70%, 12/15/11 | | | | $ | 11,500 | | $ | 11,558,958 |
Bank of America Auto Trust, Series 2009-2A, Class A3 (1) 2.13%, 9/15/13 | | | | | 7,000 | | | 7,066,994 |
Bank of America Auto Trust, Series 2009-3A, Class A3 (1) 1.67%, 12/15/13 | | | | | 9,500 | | | 9,478,384 |
Chase Issuance Trust, Series 2009-A5, Class A5 (2) 1.03%, 6/15/12 | | | | | 16,000 | | | 16,044,229 |
Ford Credit Auto Owner
Trust, Series 2009-E,
Class A3
1.51%, 1/15/14 | | | | | 7,500 | | | 7,459,627 |
| | | | | | | | |
Total Asset Backed
Securities
(Cost $51,496,987) | | | 51,608,192 |
| | | | | | | | |
COLLATERALIZED MORTGAGE OBLIGATIONS – 2.6% |
Federal Home Loan Mortgage Corp., Series 3450, Class AJ 4.50%, 7/15/22 | | | | | 13,177 | | | 13,717,456 |
Federal National Mortgage Association, Series 2005-83, Class TG 5.00%, 2/25/25 | | | | | 4,774 | | | 4,816,558 |
Federal National Mortgage Association, Series 2005-87, Class PB 5.00%, 3/25/21 | | | | | 6,914 | | | 7,007,906 |
| | | | | | | | |
Total Collateralized Mortgage Obligations
(Cost $25,777,653) | | | 25,541,920 |
| | | | | | | | |
| | | | | | | | |
| | | Country
Code** | | Principal
Amount
(000) | | Value |
| | | | | | | | |
CORPORATE DEBT OBLIGATIONS – 36.9% |
BANKS – 8.4% |
ANZ National (International) Ltd. (1) 3.25%, 4/2/12 | | NZ | | $ | 7,900 | | $ | 8,137,514 |
Banco Santander Chile (1) 2.88%, 11/13/12 | | CL | | | 6,400 | | | 6,447,091 |
Dexia Credit Local (1) 2.38%, 9/23/11 | | FR | | | 9,200 | | | 9,388,894 |
Intesa Sanpaolo New York 2.38%, 12/21/12 | | IT | | | 4,800 | | | 4,757,707 |
Merrill Lynch & Co., Inc. 6.05%, 8/15/12 | | | | | 1,625 | | | 1,740,752 |
Morgan Stanley 6.00%, 5/13/14 | | | | | 3,400 | | | 3,655,687 |
Suncorp-Metway Ltd. (1)(2) 1.53%, 4/15/11 | | AU | | | 13,400 | | | 13,597,355 |
The Royal Bank of Scotland PLC (1) | | | | | | | | |
1.50%, 3/30/12 | | GB | | | 9,400 | | | 9,308,923 |
2.63%, 5/11/12 | | GB | | | 10,600 | | | 10,751,760 |
Wachovia Corp. 5.50%, 5/1/13 | | | | | 4,050 | | | 4,302,449 |
Wells Fargo & Co. 4.38%, 1/31/13 | | | | | 1,000 | | | 1,038,680 |
Westpac Banking Corp. (1) 3.25%, 12/16/11 | | AU | | | 8,700 | | | 8,982,141 |
| | | | | | | | |
| | | | | | | | 82,108,953 |
| | | | | | | | |
BROKERAGE – 1.7% |
The Bear Stearns Cos., LLC. | | | | | | | | |
0.51%, 1/31/11 (2) | | | | | 8,000 | | | 8,012,336 |
6.95%, 8/10/12 | | | | | 7,875 | | | 8,798,548 |
| | | | | | | | |
| | | | | | | | 16,810,884 |
| | | | | | | | |
CABLE – 0.4% |
Time Warner Cable Inc. 6.20%, 7/1/13 | | | | | 3,350 | | | 3,679,828 |
| | | | | | | | |
See Notes to Financial Statements.
135
GOLDMAN SACHS SHORT DURATION FUND
| | |
PORTFOLIO OF INVESTMENTS (Continued) December 31, 2009 | | Sun Capital Advisers Trust |
| | | | | | | | |
| | | Country
Code** | | Principal
Amount
(000) | | Value |
| | | | | | | | |
| | | | | | | | |
COMPUTER & PERIPHERALS – 0.5% |
Hewlett-Packard Co. | | | | | | | | |
2.25%, 5/27/11 | | | | $ | 1,500 | | $ | 1,521,303 |
4.25%, 2/24/12 | | | | | 3,125 | | | 3,277,925 |
| | | | | | | | |
| | | | | | | | 4,799,228 |
| | | | | | | | |
ENVIRONMENTAL SERVICES – 0.2% |
Allied Waste North America, Inc. 6.38%, 4/15/11 | | | | | 1,675 | | | 1,748,603 |
| | | | | | | | |
FINANCIALS – 0.9% |
General Electric Capital Corp. 6.00%, 6/15/12 | | | | | 1,000 | | | 1,077,907 |
John Deere Capital Corp. | | | | | | | | |
0.77%, 8/19/10 (2) | | | | | 1,000 | | | 1,002,574 |
1.01%, 6/10/11 (2) | | | | | 2,475 | | | 2,498,161 |
5.25%, 10/1/12 | | | | | 525 | | | 566,967 |
LeasePlan Corp. NV (1) 3.00%, 5/7/12 | | NL | | | 3,900 | | | 3,993,284 |
| | | | | | | | |
| | | | | | | | 9,138,893 |
| | | | | | | | |
FOOD, BEVERAGES & RESTAURANTS – 1.1% |
Anheuser-Busch InBev NV 4.70%, 4/15/12 | | | | | 1,725 | | | 1,799,002 |
General Mills, Inc. | | | | | | | | |
5.25%, 8/15/13 | | | | | 1,200 | | | 1,294,608 |
6.00%, 2/15/12 | | | | | 2,850 | | | 3,077,077 |
Kellogg Co. 5.13%, 12/3/12 | | | | | 2,050 | | | 2,224,789 |
Pepsico, Inc. 4.65%, 2/15/13 | | | | | 1,000 | | | 1,068,166 |
The Kroger Co. 6.75%, 4/15/12 | | | | | 1,200 | | | 1,310,645 |
| | | | | | | | |
| | | | | | | | 10,774,287 |
| | | | | | | | |
HEALTH CARE – 0.4% |
Roche Holdings, Inc. (1) | | | | | | | | |
4.50%, 3/1/12 | | | | | 800 | | | 840,254 |
5.00%, 3/1/14 | | | | | 3,175 | | | 3,396,732 |
| | | | | | | | |
| | | | | | | | 4,236,986 |
| | | | | | | | |
INSURANCE – 0.8% |
Metropolitan Life Global Funding I (1) | | | | | | | | |
5.13%, 11/9/11 | | | | | 3,150 | | | 3,297,921 |
5.13%, 4/10/13 | | | | | 1,000 | | | 1,059,390 |
| | | | | | | | |
| | | Country
Code** | | Principal
Amount
(000) | | Value |
| | | | | | | | |
New York Life Global Funding (1)
4.65%, 5/9/13 | | | | $ | 1,000 | | $ | 1,050,369 |
The Chubb Corp. 6.00%, 11/15/11 | | | | | 2,050 | | | 2,202,370 |
| | | | | | | | |
| | | | | | | | 7,610,050 |
| | | | | | | | |
MULTIMEDIA – 1.4% |
Comcast Corp. 5.45%, 11/15/10 | | | | | 3,675 | | | 3,798,039 |
Reed Elsevier Capital, Inc. | | | | | | | | |
4.63%, 6/15/12 | | | | | 5,650 | | | 5,873,034 |
6.75%, 8/1/11 | | | | | 950 | | | 1,018,272 |
The Walt Disney Co. 6.38%, 3/1/12 | | | | | 2,700 | | | 2,949,231 |
| | | | | | | | |
| | | | | | | | 13,638,576 |
| | | | | | | | |
PHARMACEUTICALS – 0.9% |
Express Scripts, Inc. 5.25%, 6/15/12 | | | | | 3,075 | | | 3,267,498 |
Merck & Co., Inc. 1.88%, 6/30/11 | | | | | 1,700 | | | 1,716,017 |
Pfizer, Inc. 4.45%, 3/15/12 | | | | | 3,325 | | | 3,516,683 |
| | | | | | | | |
| | | | | | | | 8,500,198 |
| | | | | | | | |
PIPELINES – 0.9% |
Enterprise Products Operating LLC | | | | | | | | |
4.95%, 6/1/10 | | | | | 2,575 | | | 2,610,076 |
7.63%, 2/15/12 | | | | | 2,475 | | | 2,735,729 |
The Williams Cos, Inc. (1) 6.38%, 10/1/10 | | | | | 1,400 | | | 1,425,340 |
TransCanada PipeLines Ltd. 8.63%, 5/15/12 | | CA | | | 1,525 | | | 1,730,584 |
| | | | | | | | |
| | | | | | | | 8,501,729 |
| | | | | | | | |
REAL ESTATE INVESTMENT TRUSTS – 0.1% |
WEA Finance LLC / WCI Finance LLC (1) 5.40%, 10/1/12 | | | | | 1,100 | | | 1,166,865 |
| | | | | | | | |
REFINING – 2.5% |
ConocoPhillips 9.38%, 2/15/11 | | | | | 5,800 | | | 6,276,255 |
Devon Energy Corp. 6.88%, 9/30/11 | | CA | | | 1,800 | | | 1,955,367 |
See Notes to Financial Statements.
136
GOLDMAN SACHS SHORT DURATION FUND
| | |
PORTFOLIO OF INVESTMENTS (Continued) December 31, 2009 | | Sun Capital Advisers Trust |
| | | | | | | | |
| | | Country
Code** | | Principal
Amount
(000) | | Value |
| | | | | | | | |
| | | | | | | | |
EnCana Corp. | | | | | | | | |
4.75%, 10/15/13 | | CA | | $ | 1,700 | | $ | 1,785,937 |
6.30%, 11/1/11 | | CA | | | 775 | | | 833,545 |
Energy Transfer Equity LP
5.65%, 8/1/12 | | | | | 3,325 | | | 3,533,979 |
Shell International Finance BV
1.30%, 9/22/11 | | NL | | | 6,800 | | | 6,817,551 |
XTO Energy, Inc.
5.75%, 12/15/13 | | | | | 3,175 | | | 3,532,010 |
| | | | | | | | |
| | | | | | | | 24,734,644 |
| | | | | | | | |
RETAIL – 0.7% |
CVS Caremark Corp.
5.75%, 8/15/11 | | | | | 2,900 | | | 3,088,137 |
Wal-Mart Stores Inc.
3.20%, 5/15/14 | | | | | 4,000 | | | 4,073,404 |
| | | | | | | | |
| | | | | | | | 7,161,541 |
| | | | | | | | |
SAVINGS & LOANS – 0.6% |
U.S. Central Federal Credit Union | | | | | | | | |
1.25%, 10/19/11 | | | | | 3,200 | | | 3,199,127 |
1.90%, 10/19/12 | | | | | 2,400 | | | 2,398,123 |
| | | | | | | | |
| | | | | | | | 5,597,250 |
| | | | | | | | |
SOFTWARE – 1.0% |
Microsoft Corp.
2.95%, 6/1/14 | | | | | 5,000 | | | 5,053,560 |
Oracle Corp.
4.95%, 4/15/13 | | | | | 4,100 | | | 4,399,550 |
| | | | | | | | |
| | | | | | | | 9,453,110 |
| | | | | | | | |
SPECIAL PURPOSE BANKS – 7.3% |
African Development Bank SNAT
1.75%, 10/1/12 | | | | | 9,400 | | | 9,338,872 |
International Bank for Reconstruction and Development SNAT
1.65%, 5/18/11 | | | | | 10,000 | | | 10,023,615 |
Kreditanstalt Fur Wiederaufbau | | | | | | | | |
2.50%, 5/28/13 | | DE | | | 11,000 | | | 11,079,156 |
3.75%, 6/27/11 | | DE | | | 900 | | | 934,569 |
4.75%, 5/15/12 | | DE | | | 14,000 | | | 15,000,552 |
L-Bank BW Foerderbank
3.25%, 10/29/10 | | DE | | | 4,000 | | | 4,075,664 |
| | | | | | | | |
| | | Country
Code** | | Principal
Amount
(000) | | Value |
| | | | | | | | |
Landwirtschaftliche Rentenbank | | | | | | | | |
1.88%, 9/24/12 | | DE | | $ | 8,700 | | $ | 8,674,709 |
4.13%, 7/15/13 | | DE | | | 5,200 | | | 5,482,490 |
NRW.BANK 5.38%, 7/19/10 | | DE | | | 7,000 | | | 7,176,372 |
| | | | | | | | |
| | | | | | | | 71,785,999 |
| | | | | | | | |
TELECOMMUNICATIONS – 4.5% |
BellSouth Corp. (1) 4.95%, 4/26/10 | | | | | 10,000 | | | 10,125,970 |
France Telecom SA | | | | | | | | |
4.38%, 7/8/14 | | FR | | | 6,000 | | | 6,269,772 |
7.75%, 3/1/11 | | FR | | | 2,500 | | | 2,679,425 |
Rogers Communications, Inc. | | | | | | | | |
5.50%, 3/15/14 | | CA | | | 625 | | | 669,704 |
6.25%, 6/15/13 | | CA | | | 625 | | | 684,655 |
6.38%, 3/1/14 | | CA | | | 1,675 | | | 1,854,550 |
7.88%, 5/1/12 | | CA | | | 250 | | | 280,175 |
Telefonica Emisiones SAU
5.86%, 2/4/13 | | ES | | | 3,500 | | | 3,781,631 |
Telefonica Europe BV
7.75%, 9/15/10 | | NL | | | 3,050 | | | 3,190,629 |
Verizon Wireless Capital LLC
3.75%, 5/20/11 | | | | | 5,475 | | | 5,645,634 |
5.25%, 2/1/12 | | | | | 4,625 | | | 4,905,391 |
Vodafone Group PLC
5.35%, 2/27/12 | | GB | | | 3,225 | | | 3,440,840 |
| | | | | | | | |
| | | | | | | | 43,528,376 |
| | | | | | | | |
TOBACCO – 0.4% |
Philip Morris International, Inc.
4.88%, 5/16/13 | | | | | 3,750 | | | 3,958,710 |
| | | | | | | | |
TRANSPORTATION – 0.5% |
Burlington Northern Santa Fe Corp.
5.90%, 7/1/12 | | | | | 4,200 | | | 4,553,779 |
| | | | | | | | |
UTILITIES – 1.7% |
Duke Energy Corp. 6.30%, 2/1/14 | | | | | 3,100 | | | 3,408,819 |
MidAmerican Energy Holdings Co.
5.00%, 2/15/14 | | | | | 3,600 | | | 3,777,700 |
See Notes to Financial Statements.
137
GOLDMAN SACHS SHORT DURATION FUND
| | |
PORTFOLIO OF INVESTMENTS (Continued) December 31, 2009 | | Sun Capital Advisers Trust |
| | | | | | | | |
| | | Country
Code** | | Principal
Amount
(000) | | Value |
| | | | | | | | |
| | | | | | | | |
Progress Energy, Inc.
6.85%, 4/15/12 | | | | $ | 3,050 | | $ | 3,310,748 |
7.10%, 3/1/11 | | | | | 1,525 | | | 1,614,097 |
Public Service Co. of Colorado
7.88%, 10/1/12 | | | | | 1,125 | | | 1,290,819 |
Southern Co.
0.68%, 10/21/11 (2) | | | | | 2,100 | | | 2,105,653 |
4.15%, 5/15/14 | | | | | 1,400 | | | 1,439,691 |
| | | | | | | | |
| | | | | | | | 16,947,527 |
| | | | | | | | |
Total Corporate Debt Obligations
(Cost $353,873,917) | | | 360,436,016 |
| | | | | | | | |
FOREIGN GOVERNMENT AGENCY
OBLIGATIONS – 1.8% |
Societe Financement de l’Economie Francaise (1)
1.50%, 10/29/10 | | FR | | | 10,000 | | | 10,046,800 |
2.00%, 2/25/11 | | FR | | | 7,600 | | | 7,694,514 |
| | | | | | | | |
Total Foreign Government
Agency Obligations
(Cost $17,694,117) | | | 17,741,314 |
| | | | | | | | |
FOREIGN GOVERNMENT OBLIGATIONS – 1.4% |
Province of Ontario
1.88%, 11/19/12
(Cost $14,274,842) | | CA | | | 14,300 | | | 14,157,543 |
| | | | | | | | |
MUNICIPAL BONDS – 0.5% |
Pennsylvania Higher Education Assistance Agency (2)
0.89%, 4/25/19
(Cost $4,900,000) | | | | | 4,900 | | | 4,898,579 |
| | | | | | | | |
U.S. GOVERNMENT GUARANTEED NOTES – 12.9% |
TLGP American Express Bank
3.15%, 12/9/11 | | | | | 1,900 | | | 1,963,589 |
TLGP BancWest Corp.
2.15%, 3/27/12 | | | | | 10,100 | | | 10,231,229 |
TLGP Bank of America Corp.
2.10%, 4/30/12 | | | | | 24,800 | | | 25,028,929 |
TLGP Citibank NA
1.88%, 5/7/12 | | | | | 6,900 | | | 6,936,715 |
TLGP Citigroup Funding, Inc.
1.88%, 10/22/12 | | | | | 11,300 | | | 11,257,308 |
1.88%, 11/15/12 | | | | | 4,300 | | | 4,288,914 |
| | | | | | | | |
| | | Country
Code** | | Principal
Amount
(000) | | Value |
| | | | | | | | |
TLGP Citigroup, Inc.
2.13%, 4/30/12 | | | | $ | 15,500 | | $ | 15,665,974 |
TLGP General Electric Capital Corp.
2.00%, 9/28/12 | | | | | 4,700 | | | 4,706,082 |
2.20%, 6/8/12 | | | | | 15,000 | | | 15,210,375 |
2.63%, 12/28/12 | | | | | 16,800 | | | 17,109,338 |
3.00%, 12/9/11 | | | | | 1,800 | | | 1,855,480 |
TLGP GMAC LLC
2.20%, 12/19/12 | | | | | 6,900 | | | 6,942,311 |
TLGP HSBC USA, Inc.
3.13%, 12/16/11 | | | | | 1,900 | | | 1,966,219 |
TLGP John Deere Capital Corp.
2.88%, 6/19/12 | | | | | 1,350 | | | 1,391,143 |
TLGP PNC Funding Corp.
1.88%, 6/22/11 | | | | | 1,200 | | | 1,212,214 |
| | | | | | | | |
Total U.S. Government
Guaranteed Notes
(Cost $124,746,516) | | | 125,765,820 |
| | | | | | | | |
U.S. TREASURY AND U.S. GOVERNMENT AGENCY OBLIGATIONS – 32.5% |
Federal Home Loan Bank
3.13%, 6/10/11 | | | | | 1,155 | | | 1,186,901 |
3.25%, 3/11/11 | | | | | 1,000 | | | 1,029,805 |
4.25%, 6/10/11 | | | | | 1,500 | | | 1,567,316 |
Federal Home Loan Mortgage Corp. |
0.48%, 5/15/37 (2) | | | | | 3,047 | | | 3,009,070 |
2.00%, 2/25/11 | | | | | 19,400 | | | 19,436,724 |
2.00%, 3/16/11 | | | | | 34,400 | | | 34,485,725 |
2.05%, 3/9/11 | | | | | 22,500 | | | 22,558,882 |
4.50%, 5/1/23 | | | | | 19 | | | 19,640 |
5.00%, 12/1/13 | | | | | 2 | | | 2,222 |
5.00%, 4/1/14 | | | | | 7 | | | 7,481 |
5.00%, 3/1/16 | | | | | 1 | | | 1,160 |
5.00%, 5/1/16 | | | | | 3 | | | 3,288 |
5.00%, 9/1/16 | | | | | 7 | | | 7,242 |
5.00%, 11/1/16 | | | | | 100 | | | 105,946 |
5.00%, 12/1/16 | | | | | 25 | | | 26,062 |
5.00%, 1/1/17 | | | | | 284 | | | 298,617 |
5.00%, 2/1/17 | | | | | 493 | | | 516,825 |
5.00%, 3/1/17 | | | | | 387 | | | 407,992 |
5.00%, 4/1/17 | | | | | 631 | | | 665,145 |
5.00%, 5/1/17 | | | | | 26 | | | 27,745 |
5.00%, 6/1/17 | | | | | 11 | | | 11,238 |
See Notes to Financial Statements.
138
GOLDMAN SACHS SHORT DURATION FUND
| | |
PORTFOLIO OF INVESTMENTS (Continued) December 31, 2009 | | Sun Capital Advisers Trust |
| | | | | | | | |
| | | Country
Code** | | Principal
Amount
(000) | | Value |
| | | | | | | | |
| | | | | | | | |
5.00%, 7/1/17 | | | | $ | 3 | | $ | 3,462 |
5.00%, 8/1/17 | | | | | 27 | | | 29,300 |
5.00%, 9/1/17 | | | | | 1,596 | | | 1,680,399 |
5.00%, 10/1/17 | | | | | 3,893 | | | 4,105,801 |
5.00%, 11/1/17 | | | | | 3,429 | | | 3,615,527 |
5.00%, 12/1/17 | | | | | 1,226 | | | 1,292,402 |
5.00%, 1/1/18 | | | | | 5,345 | | | 5,636,051 |
5.00%, 2/1/18 | | | | | 5,712 | | | 6,022,578 |
5.00%, 3/1/18 | | | | | 12,485 | | | 13,159,116 |
5.00%, 4/1/18 | | | | | 2,728 | | | 2,874,669 |
5.00%, 5/1/18 | | | | | 1,895 | | | 1,997,300 |
5.00%, 6/1/18 | | | | | 409 | | | 431,522 |
5.00%, 7/1/18 | | | | | 393 | | | 413,556 |
5.00%, 8/1/18 | | | | | 236 | | | 248,883 |
5.00%, 9/1/18 | | | | | 155 | | | 163,261 |
5.00%, 10/1/18 | | | | | 590 | | | 623,198 |
5.00%, 11/1/18 | | | | | 675 | | | 710,770 |
5.00%, 12/1/18 | | | | | 477 | | | 502,243 |
5.00%, 1/1/19 | | | | | 334 | | | 352,975 |
5.00%, 2/1/19 | | | | | 122 | | | 128,320 |
5.00%, 3/1/19 | | | | | 98 | | | 103,367 |
5.00%, 10/15/21 | | | | | 6,278 | | | 6,597,751 |
5.00%, 4/1/38 | | | | | 84 | | | 86,743 |
5.00%, 3/1/39 | | | | | 286 | | | 293,551 |
5.00%, 4/1/39 | | | | | 654 | | | 671,672 |
5.00%, 5/1/39 | | | | | 96 | | | 98,912 |
5.00%, 6/1/39 | | | | | 290 | | | 297,314 |
5.00%, 10/1/39 | | | | | 499 | | | 511,967 |
5.43%, 9/1/38 (2) | | | | | 13,965 | | | 14,664,609 |
5.50%, 1/1/20 | | | | | 2,080 | | | 2,217,359 |
5.50%, 5/1/20 | | | | | 904 | | | 963,104 |
5.50%, 7/1/20 | | | | | 808 | | | 861,134 |
5.93%, 8/1/37 (2) | | | | | 11,639 | | | 12,361,098 |
6.50%, 10/1/37 | | | | | 673 | | | 727,739 |
6.50%, 12/1/38 | | | | | 366 | | | 392,562 |
Federal National Mortgage Association
|
0.68%, 2/25/37 (2) | | | | | 6,414 | | | 6,281,114 |
2.00%, 3/2/11 (4) | | | | | 22,000 | | | 22,061,732 |
3.93%, 4/1/37 (2) | | | | | 2,358 | | | 2,441,586 |
4.50%, 10/1/18 | | | | | 186 | | | 192,928 |
4.50%, 11/1/18 | | | | | 42 | | | 43,627 |
4.50%, 12/1/18 | | | | | 70 | | | 73,376 |
4.50%, 5/1/19 | | | | | 156 | | | 162,610 |
4.50%, 4/1/23 | | | | | 597 | | | 615,862 |
4.62%, 6/1/35 (2) | | | | | 9,823 | | | 10,231,231 |
4.68%, 6/15/11 | | | | | 1,900 | | | 2,000,577 |
5.00%, 7/1/19 | | | | | 637 | | | 671,362 |
5.00%, 8/1/19 | | | | | 882 | | | 927,790 |
| | | | | | | | | |
| | | Country
Code** | | Principal
Amount
(000) | | | Value |
| | | | | | | | | |
5.00%, 8/25/19 | | | | $ | 19,239 | | | $ | 20,354,508 |
5.00%, 9/1/19 | | | | | 2,373 | | | | 2,495,556 |
5.00%, 10/1/19 | | | | | 2,772 | | | | 2,917,224 |
5.00%, 11/1/19 | | | | | 2,507 | | | | 2,640,657 |
5.00%, 12/1/19 | | | | | 3,641 | | | | 3,833,379 |
5.00%, 1/1/20 | | | | | 1,197 | | | | 1,259,528 |
5.00%, 2/1/20 | | | | | 617 | | | | 649,689 |
5.00%, 7/1/20 | | | | | 53 | | | | 55,450 |
5.00%, 11/25/21 | | | | | 8,715 | | | | 9,150,945 |
5.00%, 5/1/39 | | | | | 27 | | | | 28,130 |
5.00%, 6/1/39 | | | | | 39 | | | | 40,263 |
5.00%, 7/1/39 | | | | | 30 | | | | 30,836 |
5.00%, 10/1/39 | | | | | 299 | | | | 306,683 |
5.01%, 4/1/35 (2) | | | | | 3,954 | | | | 4,127,684 |
5.50%, 3/1/18 | | | | | 9,800 | | | | 10,435,542 |
5.50%, 7/1/37 | | | | | 423 | | | | 443,574 |
6.00%, 3/1/32 | | | | | 0 | * | | | 84 |
6.00%, 5/1/33 | | | | | 8 | | | | 8,072 |
6.00%, 12/1/33 | | | | | 3 | | | | 3,522 |
6.00%, 2/1/35 | | | | | 15 | | | | 15,997 |
6.00%, 4/1/35 | | | | | 5 | | | | 4,887 |
6.00%, 7/1/35 | | | | | 30 | | | | 31,512 |
6.00%, 11/1/35 | | | | | 79 | | | | 85,142 |
6.00%, 1/1/36 | | | | | 86 | | | | 91,142 |
6.00%, 2/1/36 | | | | | 7 | | | | 7,954 |
6.00%, 3/1/36 | | | | | 6 | | | | 6,815 |
6.00%, 5/1/36 | | | | | 3 | | | | 2,700 |
6.00%, 6/1/36 | | | | | 5 | | | | 5,809 |
6.00%, 10/1/36 | | | | | 27 | | | | 28,487 |
6.00%, 8/1/38 | | | | | 405 | | | | 429,396 |
6.00%, 11/1/38 | | | | | 64 | | | | 67,849 |
U.S. Treasury Inflation Indexed Bonds
|
0.88%, 4/15/10 | | | | | 18,257 | | | | 18,318,446 |
1.88%, 7/15/13 | | | | | 6,003 | | | | 6,321,954 |
2.38%, 4/15/11 | | | | | 1,851 | | | | 1,906,128 |
3.50%, 1/15/11 | | | | | 8,943 | | | | 9,275,946 |
4.25%, 1/15/10 | | | | | 6,039 | | | | 6,045,872 |
| | | | | | | | | |
Total U.S. Treasury and U.S. Government Agency Obligations (Cost $315,974,637) | | | | 317,346,398 |
| | | | | | | | | |
SHORT TERM INVESTMENTS – 5.5% |
MUNICIPAL BONDS – 0.5% |
State Of Illinois
4.00%, 5/20/10
(Cost $5,043,228) | | | 5,000 | | | | 5,065,350 |
| | | | | | | | | |
See Notes to Financial Statements.
139
GOLDMAN SACHS SHORT DURATION FUND
| | |
PORTFOLIO OF INVESTMENTS (Continued) December 31, 2009 | | Sun Capital Advisers Trust |
| | | | | | | | |
| | | | | Principal
Amount
(000) | | Value |
| | | | | | | | |
| | | | | | | | |
U.S. TREASURY AND U.S. GOVERNMENT AGENCY OBLIGATIONS (3) – 5.0% |
Federal Home Loan Bank Discount Note
0.01%, 1/4/10 | | | | $ | 25,000 | | $ | 24,999,998 |
U.S. Treasury Bill
0.00%, 1/14/10 | | | | | 23,200 | | | 23,200,000 |
| | | | | | | | |
Total U.S. Treasury and U.S. Government Agency Obligations
|
(Amortized cost $48,199,998) | | | | | | | | 48,199,998 |
| | | | | | | | |
| | | | | | | |
| | | | |
Shares | | Value |
| | | | | | | |
MUTUAL FUNDS – 0.0% + |
State Street Institutional Liquid Reserves Fund
(Cost $90,963) | | | | 90,963 | | $ | 90,963 |
| | | | | | | |
Total Short Term Investments
(Cost $53,334,189) | | | | | 53,356,311 |
| | | | | | | |
TOTAL INVESTMENTS – 99.4% |
(Cost $962,072,858) | | | | | 970,852,093 |
Other assets less liabilities – 0.6% | | | | | 6,125,605 |
| | | | | | | |
NET ASSETS – 100.0% | | | | $ | 976,977,698 |
| | | | | | | |
| + | Amount is less than 0.05%. |
| * | Amount is less than $500. |
| ** | Unless otherwise noted the issuer country code for all securities is United States. |
| (1) | Eligible for resale under rule 144A of the Securities Act of 1933. These securities may be resold in transactions exempt from registration, normally to qualified institutional buyers. At the period end, the value of these securities amounted to $138,815,453, representing 14.2% of net assets. |
| (2) | Variable rate security. The interest rate shown reflects the rate in effect at the period end. |
| (3) | Interest rates represent annualized yield at date of purchase. |
| | |
| SNAT | | Supranational |
| TLGP | | Temporary Liquidity Guarantee Program. Under the Temporary Liquidity Guarantee Program, the Federal Deposit Insurance Corporation guarantees principal and interest in the event of payment default or bankruptcy until the earlier of maturity date of the debt or until June 30, 2012. |
| |
| AU | | Australia |
| CA | | Canada |
| CL | | Chile |
| DE | | Germany |
| ES | | Spain |
| FR | | France |
| GB | | Great Britain |
| IT | | Italy |
| NL | | Netherlands |
| NZ | | New Zealand |
See Notes to Financial Statements.
140
| | |
GOLDMAN SACHS SHORT DURATION FUND PORTFOLIO OF INVESTMENTS (Continued) |
| December 31, 2009 | | Sun Capital Advisers Trust |
| (4) | At the period end, securities (or portions thereof) with an aggregate market value of $2,105,893 have been pledged to cover margin requirements for the following open futures contracts: |
| | | | | | | | | | | | | |
Type | | Description | | Expiration
Date | | Contracts | | Aggregate
Face
Value ($) | | Aggregate
Notional
Value ($) | | Unrealized
Appreciation/
(Depreciation) ($) | |
Long | | 90-Day Eurodollar December Futures | | 12/13/10 | | 21 | | 5,142,945 | | 5,169,675 | | 26,730 | |
Long | | 90-Day Eurodollar December Futures | | 12/19/11 | | 21 | | 5,058,042 | | 5,093,550 | | 35,508 | |
Long | | 90-Day Eurodollar June Futures | | 6/14/10 | | 290 | | 71,902,623 | | 72,007,000 | | 104,377 | |
Long | | 90-Day Eurodollar June Futures | | 6/13/11 | | 21 | | 5,087,277 | | 5,128,463 | | 41,186 | |
Long | | 90-Day Eurodollar March Futures | | 3/15/10 | | 25 | | 6,213,188 | | 6,227,812 | | 14,624 | |
Long | | 90-Day Eurodollar March Futures | | 3/14/11 | | 21 | | 5,104,339 | | 5,148,675 | | 44,336 | |
Long | | 90-Day Eurodollar September Futures | | 9/13/10 | | 13 | | 3,185,800 | | 3,214,250 | | 28,450 | |
Long | | 90-Day Eurodollar September Futures | | 9/19/11 | | 21 | | 5,072,361 | | 5,110,350 | | 37,989 | |
Short | | U.S. Treasury 10 Year Note March Futures | | 3/22/10 | | 329 | | 39,307,066 | | 37,984,078 | | 1,322,988 | |
Long | | U.S. Treasury 2 Year Note March Futures | | 3/31/10 | | 1,334 | | 289,770,193 | | 288,498,345 | | (1,271,848 | ) |
Long | | U.S. Treasury 30 Year Bond March Futures | | 3/22/10 | | 40 | | 4,880,141 | | 4,615,000 | | (265,141 | ) |
Short | | U.S. Treasury 5 Year Note March Futures | | 3/31/10 | | 439 | | 51,037,250 | | 50,214,055 | | 823,195 | |
| | | | | | | | | | | | | |
Net unrealized appreciation | | | | | | 942,394 | |
| | | | | | | | | | | | | |
| (5) | Fair Value Measurements † |
The following table summarizes the inputs used to value the Fund’s assets and liabilities, as applicable, measured at fair value at the period end:
| | | | | | | | | | | | |
Assets | | Quoted Prices
in Active
Markets for
Identical
Assets and
Liabilities
(Level 1) | | Significant
Other
Observable
Inputs
(Level 2) | | Significant
Unobservable
Inputs
(Level 3) | | Total |
Asset Backed Securities | | $ | — | | $ | 51,608,192 | | $ | — | | $ | 51,608,192 |
Collateralized Mortgage Obligations | | | — | | | 25,541,920 | | | — | | | 25,541,920 |
Corporate Debt Obligations (a) | | | — | | | 360,436,016 | | | — | | | 360,436,016 |
Foreign Government Agency Obligations | | | — | | | 17,741,314 | | | — | | | 17,741,314 |
Foreign Government Obligations | | | — | | | 14,157,543 | | | — | | | 14,157,543 |
Municipal Bonds | | | — | | | 4,898,579 | | | — | | | 4,898,579 |
U.S. Government Guaranteed Notes | | | — | | | 125,765,820 | | | — | | | 125,765,820 |
U.S. Treasury and U.S. Government Agency Obligations | | | 41,868,346 | | | 275,478,052 | | | — | | | 317,346,398 |
Short Term Investments | | | | | | | | | | | | |
Municipal Bonds | | | — | | | 5,065,350 | | | — | | | 5,065,350 |
U.S. Treasury and U.S. Government Agency Obligations | | | — | | | 48,199,998 | | | — | | | 48,199,998 |
Mutual Funds | | | 90,963 | | | — | | | — | | | 90,963 |
| | | | | | | | | | | | |
Total Short Term Investments | | | 90,963 | | | 53,265,348 | | | — | | | 53,356,311 |
| | | | | | | | | | | | |
Total Investments | | | 41,959,309 | | | 928,892,784 | | | — | | | 970,852,093 |
| | | | | | | | | | | | |
Futures Contracts | | | 2,479,383 | | | — | | | — | | | 2,479,383 |
| | | | | | | | | | | | |
Total | | $ | 44,438,692 | | $ | 928,892,784 | | $ | — | | $ | 973,331,476 |
| | | | | | | | | | | | |
See Notes to Financial Statements.
141
| | |
GOLDMAN SACHS SHORT DURATION FUND PORTFOLIO OF INVESTMENTS (Continued) |
| December 31, 2009 | | Sun Capital Advisers Trust |
| | | | | | | | | | | | | | |
Liabilities | | Quoted Prices
in Active
Markets for
Identical
Assets and
Liabilities
(Level 1) | | | Significant
Other
Observable
Inputs
(Level 2) | | Significant
Unobservable
Inputs
(Level 3) | | Total | |
Futures Contracts | | $ | (1,536,989 | ) | | $ | — | | $ | — | | $ | (1,536,989 | ) |
| | | | | | | | | | | | | | |
Total | | $ | (1,536,989 | ) | | $ | — | | $ | — | | $ | (1,536,989 | ) |
| | | | | | | | | | | | | | |
| † | See Note 2b in the Notes to Financial Statements for additional information. |
| (a) | See Portfolio of Investments for additional detailed categorizations. |
See Notes to Financial Statements.
142
DREMAN SMALL CAP VALUE FUND
| | |
PORTFOLIO OF INVESTMENTS December 31, 2009 | | Sun Capital Advisers Trust |
| | | | | | | |
| | | Country
Code** | | Shares | | Value |
| | | | | | | |
| | | | | | | |
COMMON STOCKS – 99.1% |
AEROSPACE & DEFENSE – 2.0% |
Curtiss-Wright Corp. | | | | 13,150 | | $ | 411,858 |
Esterline Technologies Corp.* | | | | 9,850 | | | 401,584 |
| | | | | | | |
| | | | | | | 813,442 |
| | | | | | | |
CAPITAL MARKETS – 3.0% |
Investment Technology Group, Inc.* | | | | 20,525 | | | 404,342 |
Raymond James Financial, Inc. | | | | 16,950 | | | 402,902 |
Waddell & Reed Financial, Inc., Class A | | | | 13,350 | | | 407,709 |
| | | | | | | |
| | | | | | | 1,214,953 |
| | | | | | | |
CHEMICALS – 3.1% |
OM Group, Inc.* | | | | 13,725 | | | 430,828 |
RPM International, Inc. | | | | 20,150 | | | 409,649 |
Scotts Miracle-Gro Co., Class A | | | | 10,425 | | | 409,807 |
| | | | | | | |
| | | | | | | 1,250,284 |
| | | | | | | |
COMMERCIAL BANKS – 2.0% |
Bank Hawaii Corp. | | | | 8,550 | | | 402,363 |
FirstMerit Corp. | | | | 20,261 | | | 408,057 |
| | | | | | | |
| | | | | | | 810,420 |
| | | | | | | |
COMMERCIAL SERVICES & SUPPLIES – 3.0% |
Kelly Services, Inc., Class A* | | | | 35,800 | | | 427,094 |
Rino International Corp.* | | | | 14,330 | | | 396,224 |
The Brink’s Co. | | | | 16,275 | | | 396,134 |
| | | | | | | |
| | | | | | | 1,219,452 |
| | | | | | | |
COMMUNICATIONS EQUIPMENT – 2.0% |
CommScope, Inc.* | | | | 15,150 | | | 401,929 |
Plantronics, Inc. | | | | 15,800 | | | 410,484 |
| | | | | | | |
| | | | | | | 812,413 |
| | | | | | | |
COMPUTERS & PERIPHERALS – 2.1% |
Lexmark International, Inc., Class A* | | | | 15,750 | | | 409,185 |
Synaptics, Inc.* | | | | 15,125 | | | 463,581 |
| | | | | | | |
| | | | | | | 872,766 |
| | | | | | | |
CONSTRUCTION & ENGINEERING – 1.9% |
EMCOR Group, Inc.* | | | | 15,050 | | | 404,845 |
| | | | | | | |
| | | Country
Code** | | Shares | | Value |
| | | | | | | |
Tutor Perini Corp.* | | | | 19,734 | | $ | 356,791 |
| | | | | | | |
| | | | | | | 761,636 |
| | | | | | | |
CONSUMER FINANCE – 1.0% |
Cash America International, Inc. | | | | 11,756 | | | 410,990 |
| | | | | | | |
DIVERSIFIED CONSUMER SERVICES – 1.0% |
Regis Corp. | | | | 25,525 | | | 397,424 |
| | | | | | | |
DIVERSIFIED TELECOMMUNICATION SERVICES – 1.3% |
Iowa Telecommunication Services, Inc. | | | | 31,075 | | | 520,817 |
| | | | | | | |
ELECTRIC UTILITIES – 3.0% |
ALLETE, Inc. | | | | 12,175 | | | 397,879 |
IDACORP, Inc. | | | | 13,075 | | | 417,746 |
NV Energy, Inc. | | | | 32,475 | | | 402,041 |
| | | | | | | |
| | | | | | | 1,217,666 |
| | | | | | | |
ELECTRICAL EQUIPMENT – 1.9% |
General Cable Corp.* | | | | 13,225 | | | 389,080 |
Regal-Beloit Corp. | | | | 7,750 | | | 402,535 |
| | | | | | | |
| | | | | | | 791,615 |
| | | | | | | |
ELECTRONIC EQUIPMENT & INSTRUMENTS – 4.3% |
Anixter International, Inc.* | | | | 8,650 | | | 407,415 |
Jabil Circuit, Inc. | | | | 26,875 | | | 466,819 |
Mettler-Toledo International, Inc.* | | | | 3,950 | | | 414,710 |
Park Electrochemical Corp. | | | | 16,159 | | | 446,635 |
| | | | | | | |
| | | | | | | 1,735,579 |
| | | | | | | |
ENERGY EQUIPMENT & SERVICES – 3.0% |
Cal Dive International, Inc.* | | | | 54,025 | | | 408,429 |
Oil States International, Inc.* | | | | 10,525 | | | 413,527 |
Superior Energy Services, Inc.* | | | | 16,525 | | | 401,392 |
| | | | | | | |
| | | | | | | 1,223,348 |
| | | | | | | |
FOOD & STAPLES RETAILING – 3.1% |
Central European Distribution Corp.* | | | | 14,475 | | | 411,235 |
Nash Finch Co. | | | | 11,625 | | | 431,171 |
Ruddick Corp. | | | | 15,525 | | | 399,458 |
| | | | | | | |
| | | | | | | 1,241,864 |
| | | | | | | |
See Notes to Financial Statements.
143
DREMAN SMALL CAP VALUE FUND
| | |
PORTFOLIO OF INVESTMENTS (Continued) December 31, 2009 | | Sun Capital Advisers Trust |
| | | | | | | |
| | | Country
Code** | | Shares | | Value |
| | | | | | | |
| | | | | | | |
FOOD PRODUCTS – 3.1% |
Corn Products International, Inc. | | | | 13,800 | | $ | 403,374 |
Del Monte Foods Co. | | | | 36,475 | | | 413,626 |
Ralcorp Holdings, Inc.* | | | | 7,125 | | | 425,434 |
| | | | | | | |
| | | | | | | 1,242,434 |
| | | | | | | |
HEALTH CARE EQUIPMENT & SUPPLIES – 1.0% |
Inverness Medical Innovations, Inc.* | | | | 9,325 | | | 387,081 |
| | | | | | | |
HEALTH CARE PROVIDERS & SERVICES – 6.3% |
Amedisys, Inc.* | | | | 9,850 | | | 478,316 |
AmSurg Corp.* | | | | 18,185 | | | 400,434 |
Healthspring, Inc.* | | | | 23,500 | | | 413,835 |
LifePoint Hospitals, Inc.* | | | | 12,650 | | | 411,251 |
MEDNAX, Inc.* | | | | 6,875 | | | 413,256 |
Owens & Minor, Inc. | | | | 9,700 | | | 416,421 |
| | | | | | | |
| | | | | | | 2,533,513 |
| | | | | | | |
HOTELS, RESTAURANTS & LEISURE – 3.0% |
Brinker International, Inc. | | | | 28,125 | | | 419,625 |
International Speedway Corp., Class A | | | | 14,175 | | | 403,279 |
LIFE TIME FITNESS, Inc.* | | | | 15,800 | | | 393,894 |
| | | | | | | |
| | | | | | | 1,216,798 |
| | | | | | | |
HOUSEHOLD DURABLES – 2.1% |
Helen of Troy, Ltd.* | | BM | | 18,275 | | | 447,007 |
Jarden Corp. | | | | 13,475 | | | 416,512 |
| | | | | | | |
| | | | | | | 863,519 |
| | | | | | | |
INDUSTRIAL CONGLOMERATES – 1.0% |
Teleflex, Inc. | | | | 7,450 | | | 401,481 |
| | | | | | | |
INSURANCE – 7.0% |
Allied World Assurance Holdings, Ltd. | | BM | | 8,900 | | | 410,023 |
Argo Group International Holdings, Inc.* | | BM | | 13,750 | | | 400,675 |
Aspen Insurance Holdings, Ltd. | | BM | | 15,750 | | | 400,838 |
Endurance Specialty Holdings, Ltd. | | BM | | 11,075 | | | 412,322 |
Hanover Insurance Group, Inc. | | | | 9,175 | | | 407,645 |
Platinum Underwriters Holdings, Ltd. | | BM | | 10,700 | | | 409,703 |
| | | | | | | |
| | | Country
Code** | | Shares | | Value |
| | | | | | | |
Protective Life Corp. | | | | 23,588 | | $ | 390,381 |
| | | | | | | |
| | | | | | | 2,831,587 |
| | | | | | | |
IT SERVICES – 2.0% |
CACI International, Inc., Class A* | | | | 8,325 | | | 406,676 |
DST Systems, Inc.* | | | | 9,400 | | | 409,370 |
| | | | | | | |
| | | | | | | 816,046 |
| | | | | | | |
LEISURE EQUIPMENT & PRODUCTS – 1.0% |
Jakks Pacific, Inc.* | | | | 32,425 | | | 392,991 |
| | | | | | | |
LIFE SCIENCES TOOLS & SERVICES – 1.0% |
PerkinElmer, Inc. | | | | 19,900 | | | 409,741 |
| | | | | | | |
MACHINERY – 2.1% |
Barnes Group, Inc. | | | | 25,025 | | | 422,922 |
Gardner Denver, Inc. | | | | 9,650 | | | 410,608 |
| | | | | | | |
| | | | | | | 833,530 |
| | | | | | | |
METALS & MINING – 4.2% |
Gammon Gold, Inc.* | | CA | | 41,875 | | | 461,044 |
Pan American Silver Corp.* | | CA | | 17,275 | | | 411,318 |
Reliance Steel & Aluminum Co. | | | | 9,425 | | | 407,348 |
Thompson Creek Metals Co., Inc.* | | CA | | 36,297 | | | 425,401 |
| | | | | | | |
| | | | | | | 1,705,111 |
| | | | | | | |
MULTI-UTILITIES – 3.1% |
Integrys Energy Group, Inc. | | | | 10,000 | | | 419,900 |
TECO Energy, Inc. | | | | 26,150 | | | 424,153 |
Vectren Corp. | | | | 16,475 | | | 406,603 |
| | | | | | | |
| | | | | | | 1,250,656 |
| | | | | | | |
OIL, GAS & CONSUMABLE FUELS – 7.5% |
Atwood Oceanics, Inc.* | | | | 11,150 | | | 399,727 |
Contango Oil & Gas Co.* | | | | 8,500 | | | 399,585 |
Forest Oil Corp.* | | | | 19,100 | | | 424,975 |
St. Mary Land & Exploration Co. | | | | 11,350 | | | 388,624 |
Tesoro Corp. | | | | 42,745 | | | 579,195 |
W&T Offshore, Inc. | | | | 33,611 | | | 393,249 |
Whiting Petroleum Corp.* | | | | 6,550 | | | 467,997 |
| | | | | | | |
| | | | | | | 3,053,352 |
| | | | | | | |
See Notes to Financial Statements.
144
DREMAN SMALL CAP VALUE FUND
| | |
PORTFOLIO OF INVESTMENTS (Continued) December 31, 2009 | | Sun Capital Advisers Trust |
| | | | | | | |
| | | Country
Code** | | Shares | | Value |
| | | | | | | |
| | | | | | | |
REAL ESTATE INVESTMENT TRUSTS – 3.1% |
Alexandria Real Estate Equities, Inc. | | | | 6,375 | | $ | 409,849 |
Anworth Mortgage Asset Corp. | | | | 55,725 | | | 390,075 |
Hospitality Properties Trust | | | | 20,100 | | | 476,571 |
| | | | | | | |
| | | | | | | 1,276,495 |
| | | | | | | |
ROAD & RAIL – 1.9% |
Genesee & Wyoming, Inc., Class A* | | | | 12,125 | | | 395,760 |
Ryder System, Inc. | | | | 9,163 | | | 377,241 |
| | | | | | | |
| | | | | | | 773,001 |
| | | | | | | |
SEMICONDUCTORS & SEMICONDUCTOR EQUIPMENT – 1.1% |
Microsemi Corp.* | | | | 26,075 | | | 462,831 |
| | | | | | | |
SOFTWARE – 3.0% |
Jack Henry & Associates, Inc. | | | | 17,423 | | | 402,820 |
Net 1 UEPS Technologies, Inc.* | | | | 20,592 | | | 399,896 |
Sybase, Inc.* | | | | 9,475 | | | 411,215 |
| | | | | | | |
| | | | | | | 1,213,931 |
| | | | | | | |
SPECIALTY RETAIL – 1.0% |
RadioShack Corp. | | | | 20,026 | | | 390,507 |
| | | | | | | |
TEXTILES, APPAREL & LUXURY GOODS – 1.9% |
Hanesbrands, Inc.* | | | | 15,950 | | | 384,555 |
Wolverine World Wide, Inc. | | | | 14,825 | | | 403,536 |
| | | | | | | |
| | | | | | | 788,091 |
| | | | | | | |
| | | | | | | | |
| | | Country
Code** | | Shares | | Value | |
| | | | | | | | |
THRIFT & MORTGAGE FINANCE – 1.0% | |
Washington Federal, Inc. | | | | 20,475 | | $ | 395,987 | |
| | | | | | | | |
TOBACCO – 2.0% | |
Universal Corp. | | | | 8,800 | | | 401,368 | |
Vector Group, Ltd. | | | | 29,101 | | | 407,414 | |
| | | | | | | | |
| | | | | | | 808,782 | |
| | | | | | | | |
TRADING COMPANIES & DISTRIBUTORS – 1.0% | |
GATX Corp. | | | | 13,625 | | | 391,719 | |
| | | | | | | | |
TRANSPORTATION – 1.0% | |
Diana Shipping, Inc.* | | MH | | 27,275 | | | 394,942 | |
| | | | | | | | |
Total Common Stocks
(Cost $34,650,949) | | | 40,128,795 | |
| | | | | | | | |
SHORT TERM INVESTMENTS – 1.0% | |
MUTUAL FUNDS – 1.0% | |
State Street Institutional U.S. Government
Money Market Fund
(Cost $406,075) | | | | 406,075 | | | 406,075 | |
| | | | | | | | |
TOTAL INVESTMENTS – 100.1% | |
(Cost $35,057,024) | | | | | | | 40,534,870 | |
Liabilities in excess of other assets – (0.1)% | | | | | | | (51,170 | ) |
| | | | | | | | |
NET ASSETS – 100.0% | | | | | | $ | 40,483,700 | |
| | | | | | | | |
| * | Non-income producing security. |
| ** | Unless otherwise noted the issuer country code for all securities is United States. |
| | |
| BM | | Bermuda |
| CA | | Canada |
| MH | | Marshall Islands |
See Notes to Financial Statements.
145
| | |
DREMAN SMALL CAP VALUE FUND PORTFOLIO OF INVESTMENTS (Continued) |
| December 31, 2009 | | Sun Capital Advisers Trust |
| (1) | Fair Value Measurements † |
The following table summarizes the inputs used to value the Fund’s assets and liabilities, as applicable, measured at fair value at the period end:
| | | | | | | | | | | | |
Assets | | Quoted Prices
in Active
Markets for
Identical
Assets and
Liabilities
(Level 1) | | Significant
Other
Observable
Inputs
(Level 2) | | Significant
Unobservable
Inputs
(Level 3) | | Total |
Common Stocks (a) | | $ | 40,128,795 | | $ | — | | $ | — | | $ | 40,128,795 |
Short Term Investments | | | | | | | | | | | | |
Mutual Funds | | | 406,075 | | | — | | | — | | | 406,075 |
| | | | | | | | | | | | |
Total Investments | | | 40,534,870 | | | — | | | — | | | 40,534,870 |
| | | | | | | | | | | | |
Total | | $ | 40,534,870 | | $ | — | | $ | — | | $ | 40,534,870 |
| | | | | | | | | | | | |
| † | See Note 2b in the Notes to Financial Statements for additional information. |
| (a) | See Portfolio of Investments for additional detailed categorizations. |
See Notes to Financial Statements.
146
PIMCO HIGH YIELD FUND
| | |
PORTFOLIO OF INVESTMENTS December 31, 2009 | | Sun Capital Advisers Trust |
| | | | | | | | |
| | | Country
Code* | | Principal
Amount
(000) | | Value |
| | | | | | | | |
| | | | | | | | |
ASSET BACKED SECURITIES – 0.3% |
Credit-Based Asset Servicing and Securitization LLC, Series 2007-CB1, Class AF1A
0.30%, 1/25/37 (1) | | | | $ | 31 | | $ | 14,453 |
Credit-Based Asset Servicing and Securitization LLC, Series 2007-CB1, Class AF2
5.72%, 1/25/37 (2) | | | | | 300 | | | 135,008 |
Lehman XS Trust, Series 2005-7N, Class 3A1
0.51%, 12/25/35 (1) | | | | | 349 | | | 186,615 |
SACO I Trust, Series 2005-2, Class A
0.43%, 4/25/35 (1)(3) | | | | | 20 | | | 8,088 |
| | | | | | | | |
Total Asset Backed Securities (Cost $218,268) | | | | | | 344,164 |
| | | | | | | | |
COLLATERALIZED MORTGAGE OBLIGATIONS – 4.5% |
Adjustable Rate Mortgage Trust, Series 2005-7, Class 1A1
3.73%, 10/25/35 (1) | | | | | 68 | | | 34,811 |
Banc of America Alternative Loan Trust, Series 2005-4, Class CB6
0.63%, 5/25/35 (1) | | | | | 51 | | | 35,876 |
Banc of America Funding Corp., Series 2006-A, Class 3A2
5.79%, 2/20/36 (1) | | | | | 416 | | | 236,694 |
Banc of America Funding Corp., Series 2006-B, Class 2A1
5.52%, 3/20/36 (1) | | | | | 164 | | | 111,810 |
Countrywide Alternative Loan Trust,
Series 2005-43,
Class 4A3
5.64%, 10/25/35 (1) | | | | | 55 | | | 23,486 |
| | | | | | | | |
| | | Country
Code* | | Principal
Amount
(000) | | Value |
| | | | | | | | |
Countrywide Alternative Loan Trust, Series 2005-62, Class 2A1
1.54%, 12/25/35 (1) | | | | $ | 76 | | $ | 40,419 |
Countrywide Alternative Loan Trust,
Series 2006-0A2, Class A5
0.46%, 5/20/46 (1) | | | | | 59 | | | 28,213 |
Countrywide Alternative Loan Trust,
Series 2006-43 CB, Class A
0.60%, 2/25/37 (1) | | | | | 62 | | | 22,247 |
Countrywide Home Loan Mortgage Pass Through Trust,
Series 2005-2,
Class 2A1
0.55%, 3/25/35 (1) | | | | | 85 | | | 51,394 |
Countrywide Home Loan Mortgage Pass Through Trust,
Series 2005-2,
Class A1A
0.55%, 3/25/35 (1) | | | | | 50 | | | 24,491 |
Deutsche Alt-A Securities, Inc. Mortgage Loan Trust, Series 2005-6,
Class 1A3
5.50%, 12/25/35 | | | | | 46 | | | 34,654 |
Downey Savings & Loan Association Mortgage Loan Trust,
Series 2005-AR1, Class 2A1A
0.48%, 3/19/45 (1) | | | | | 21 | | | 11,792 |
First Horizon Alternative Mortgage Securities Trust,
Series 2006-FA2, Class 1A5
6.00%, 5/25/36 | | | | | 53 | | | 38,878 |
Harborview Mortgage Loan Trust,
Series 2006-1,
Class 2A1A
0.47%, 3/19/36 (1) | | | | | 460 | | | 249,154 |
See Notes to Financial Statements.
147
PIMCO HIGH YIELD FUND
| | |
PORTFOLIO OF INVESTMENTS (Continued) December 31, 2009 | | Sun Capital Advisers Trust |
| | | | | | | | |
| | | Country
Code* | | Principal
Amount
(000) | | Value |
| | | | | | | | |
| | | | | | | | |
IndyMac IMSC Mortgage Loan Trust,
Series 2007-F2,
Class 1A2
6.00%, 7/25/37 | | | | $ | 300 | | $ | 121,710 |
IndyMac INDEX Mortgage Loan Trust, Series 2005-AR13, Class 4A1
5.15%, 8/25/35 (1) | | | | | 41 | | | 27,620 |
IndyMac INDEX Mortgage Loan Trust, Series 2005-AR15, Class A1
5.26%, 9/25/35 (1) | | | | | 57 | | | 41,976 |
JP Morgan Mortgage Trust, Series 2007-S3, Class 1A97
6.00%, 8/25/37 | | | | | 80 | | | 59,738 |
MortgageIT Trust,
Series 2005-1,
Class 1A1
0.55%, 2/25/35 (1) | | | | | 303 | | | 212,071 |
Residential Accredit Loans, Inc.,
Series 2006-Q010, Class A1
0.39%, 1/25/37 (1) | | | | | 676 | | | 350,621 |
Residential Accredit Loans, Inc.,
Series 2006-QA2, Class 3A1
5.50%, 2/25/36 (1) | | | | | 324 | | | 209,342 |
Residential Asset Securitization Trust, Series 2006-R1, Class A2
0.63%, 1/25/46 (1) | | | | | 2,319 | | | 1,074,713 |
Residential Asset Securitization Trust, Series 2007-A5,
Class 2A3
6.00%, 5/25/37 | | | | | 67 | | | 49,308 |
Structured Asset Mortgage Investments, Inc., Series 2005-AR6, Class 2A1
0.54%, 9/25/45 (1) | | | | | 33 | | | 18,282 |
| | | | | | | | |
| | | Country
Code* | | Principal
Amount
(000) | | Value |
| | | | | | | | |
Thornburg Mortgage Securities Trust,
Series 2006-5,
Class A1
0.35%, 10/25/46 (1) | | | | $ | 107 | | $ | 104,789 |
Wamu Mortgage Pass-Through Certificates, Series 2006-AR12, Class 1A2
5.79%, 10/25/36 (1) | | | | | 398 | | | 290,954 |
Wamu Mortgage Pass-Through Certificates, Series 2006-AR12, Class 2A3
5.72%, 10/25/36 (1) | | | | | 105 | | | 79,328 |
Wamu Mortgage Pass-Through Certificates, Series 2006-AR16, Class 1A1
5.56%, 12/25/36 (1) | | | | | 185 | | | 131,119 |
Wamu Mortgage Pass-Through Certificates, Series 2007-HY2, Class 1A1
5.57%, 12/25/36 (1) | | | | | 2,397 | | | 1,601,230 |
| | | | | | | | |
Total Collateralized Mortgage Obligations (Cost $4,626,830) | | | | | | 5,316,720 |
| | | | | | | | |
COMMERCIAL MORTGAGE BACKED SECURITIES –0.7% |
Goldman Sachs Mortgage Securities Corp. II, Series 2006-GG8, Class A4
5.56%, 11/10/39 | | | | | 100 | | | 87,554 |
Greenwich Capital Commercial Funding Corp.,
Series 2007-GG9, Class A4
5.44%, 3/10/39 | | | | | 100 | | | 88,355 |
Merrill Lynch/Countrywide Commercial Mortgage Trust,
Series 2007-6,
Class A4
5.49%, 3/12/51 (1) | | | | | 100 | | | 81,348 |
See Notes to Financial Statements.
148
PIMCO HIGH YIELD FUND
| | |
PORTFOLIO OF INVESTMENTS (Continued) December 31, 2009 | | Sun Capital Advisers Trust |
| | | | | | | | |
| | | Country
Code* | | Principal
Amount
(000) | | Value |
| | | | | | | | |
| | | | | | | | |
RBSCF Trust, Series 2009-RR1, Class JPA
6.07%, 9/17/39 (1)(3) | | | | $ | 600 | | $ | 518,002 |
| | | | | | | | |
Total Commercial Mortgage Backed Securities
(Cost $725,801) | | | 775,259 |
| | | |
CORPORATE DEBT OBLIGATIONS – 79.9% |
AIRLINES – 4.2% |
American Airlines Pass Through Trust, Series 2001-02
6.98%, 4/1/11 | | | | | 14 | | | 13,652 |
American Airlines, Inc.
10.50%, 10/15/12 (3) | | | | | 1,500 | | | 1,567,500 |
Continental Airlines, Inc.
7.75%, 7/2/14 | | | | | 361 | | | 352,050 |
Delta Air Lines, Inc.
7.11%, 9/18/11 | | | | | 700 | | | 706,125 |
9.50%, 9/15/14 (3) | | | | | 600 | | | 623,250 |
United Air Lines, Inc.
9.75%, 1/15/17 | | | | | 600 | | | 612,000 |
10.40%, 11/1/16 | | | | | 1,000 | | | 1,053,750 |
| | | | | | | | |
| | | | | | | | 4,928,327 |
| | | | | | | | |
AUTOMOTIVE – 3.3% |
Allison Transmission
11.00%, 11/1/15 (3) | | | | | 50 | | | 52,500 |
Arvinmeritor, Inc.
8.13%, 9/15/15 | | | | | 105 | | | 100,275 |
Cooper-Standard Automotive, Inc.
7.00%, 12/15/12 (4) | | | | | 15 | | | 14,212 |
Ford Motor Credit Co. LLC
3.03%, 1/13/12 (1) | | | | | 500 | | | 465,000 |
5.70%, 1/15/10 | | | | | 1,065 | | | 1,065,038 |
7.00%, 10/1/13 | | | | | 165 | | | 164,752 |
7.88%, 6/15/10 | | | | | 100 | | | 101,511 |
8.00%, 6/1/14 | | | | | 75 | | | 77,009 |
8.00%, 12/15/16 | | | | | 550 | | | 550,731 |
12.00%, 5/15/15 | | | | | 700 | | | 811,740 |
The Goodyear Tire & Rubber Co.
9.00%, 7/1/15 | | | | | 265 | | | 275,600 |
10.50%, 5/15/16 | | | | | 100 | | | 110,500 |
TRW Automotive, Inc.
7.00%, 3/15/14 (3) | | | | | 25 | | | 24,500 |
7.25%, 3/15/17 (3) | | | | | 50 | | | 48,500 |
| | | | | | | | |
| | | | | | | | 3,861,868 |
| | | | | | | | |
| | | | | | | | |
| | | Country
Code* | | Principal
Amount
(000) | | Value |
| | | | | | | | |
BANKS – 14.9% |
AgriBank FCB
9.13%, 7/15/19 | | | | $ | 1,000 | | $ | 1,098,952 |
BAC Capital Trust VI
5.63%, 3/8/35 | | | | | 100 | | | 79,994 |
Bank of America Corp.
8.13%,
Perpetual (1) | | | | | 100 | | | 96,274 |
Bank of America Corp. Capital Trust VII
5.25%, 8/10/35 | | | | | 650 | | | 703,420 |
Barclays Bank PLC
14.00%,
Perpetual (1) | | GB | | | 1,200 | | | 2,471,257 |
Capital One Capital V
10.25%, 8/15/39 | | | | | 600 | | | 697,500 |
Citigroup Capital XXI
8.30%, 12/21/57 (1) | | | | | 400 | | | 385,000 |
Discover Bank
8.70%, 11/18/19 | | | | | 850 | | | 910,651 |
GMAC LLC
6.63%, 5/15/12 | | | | | 1,275 | | | 1,247,938 |
6.88%, 8/28/12 | | | | | 400 | | | 391,424 |
8.00%, 11/1/31 | | | | | 770 | | | 692,787 |
HBOS PLC
6.75%, 5/21/18 (3) | | GB | | | 2,100 | | | 1,948,602 |
Intesa Sanpaolo SpA
8.05%,
Perpetual (1) | | IT | | | 700 | | | 998,467 |
JP Morgan Chase & Co., Series I, GDR
7.90%,
Perpetual (1) | | | | | 100 | | | 103,146 |
NB Capital Trust IV
8.25%, 4/15/27 | | | | | 100 | | | 99,000 |
Rabobank Nederland Boerenleenbank BA
11.00%,
Perpetual (1)(3) | | NL | | | 600 | | | 731,552 |
RBS Capital Trust
6.47%,
Perpetual (1) | | | | | 50 | | | 32,972 |
Regions Bank
7.50%, 5/15/18 | | | | | 925 | | | 845,576 |
Regions Financial Corp.
0.42%, 6/26/12 (1) | | | | | 200 | | | 179,686 |
7.38%, 12/10/37 | | | | | 1,000 | | | 818,559 |
Societe Generale
5.92%,
Perpetual (1)(3) | | FR | | | 150 | | | 116,843 |
See Notes to Financial Statements.
149
PIMCO HIGH YIELD FUND
| | |
PORTFOLIO OF INVESTMENTS (Continued) December 31, 2009 | | Sun Capital Advisers Trust |
| | | | | | | | |
| | | Country
Code* | | Principal
Amount
(000) | | Value |
| | | | | | | | |
| | | | | | | | |
Wachovia Capital Trust III
5.80%,
Perpetual (1) | | | | $ | 1,000 | | $ | 765,000 |
Wells Fargo & Co. GDR
7.98%, Perpetual (1) | | | | | 300 | | | 300,750 |
Wells Fargo Capital XIII
7.70%,
Perpetual (1) | | | | | 1,850 | | | 1,794,500 |
| | | | | | | | |
| | | | | | | | 17,509,850 |
| | | | | | | | |
BROKERAGE – 0.0% + |
Lehman Brothers Holdings, Inc.
6.63%, 1/18/12 (4) | | | | | 25 | | | 4,875 |
6.88%, 5/2/18 (4) | | | | | 25 | | | 5,188 |
| | | | | | | | |
| | | | | | | | 10,063 |
| | | | | | | | |
COAL – 0.4% |
Drummond Co., Inc.
9.00%, 10/15/14 (3) | | | | | 500 | | | 524,375 |
| | | | | | | | |
COMMERCIAL SERVICES – 0.2% |
Lender Processing Services, Inc.
8.13%, 7/1/16 | | | | | 155 | | | 164,881 |
Quintiles Transnational Corp.
9.50%, 12/30/14 (3)(5) | | | | | 100 | | | 100,500 |
| | | | | | | | |
| | | | | | | | 265,381 |
| | | | | | | | |
COMPUTER & PERIPHERALS – 1.5% |
Aramark Corp.
3.78%, 2/1/15 (1) | | | | | 525 | | | 480,375 |
8.50%, 2/1/15 | | | | | 75 | | | 77,250 |
SunGard Data Systems, Inc.
9.13%, 8/15/13 | | | | | 200 | | | 205,000 |
10.63%, 5/15/15 | | | | | 950 | | | 1,046,187 |
| | | | | | | | |
| | | | | | | | 1,808,812 |
| | | | | | | | |
CONSUMER SERVICES – 0.5% |
WMG Acquisition Corp.
9.50%, 6/15/16 (3) | | | | | 500 | | | 535,625 |
| | | | | | | | |
CONTAINERS & GLASS – 0.7% |
Berry Plastics Corp.
5.03%, 2/15/15 (1) | | | | | 445 | | | 406,619 |
| | | | | | | | |
| | | Country
Code* | | Principal
Amount
(000) | | Value |
| | | | | | | | |
Crown Americas LLC
7.63%, 5/15/17 (3) | | | | $ | 150 | | $ | 155,625 |
7.75%, 11/15/15 | | | | | 25 | | | 25,875 |
OI European Group B.V.
6.88%, 3/31/17 | | NL | | | 50 | | | 68,810 |
Owens-Brockway Glass Container, Inc.
6.75%, 12/1/14 | | | | | 100 | | | 139,771 |
7.38%, 5/15/16 | | | | | 25 | | | 25,813 |
| | | | | | | | |
| | | | | | | | 822,513 |
| | | | | | | | |
ELECTRIC UTILITIES – 0.1% |
CMS Energy Corp.
8.75%, 6/15/19 | | | | | 150 | | | 164,181 |
| | | | | | | | |
FINANCIALS – 3.0% |
CIT Group, Inc.
7.00%, 5/1/13 | | | | | 40 | | | 37,612 |
7.00%, 5/1/14 | | | | | 61 | | | 56,192 |
7.00%, 5/1/15 | | | | | 161 | | | 143,650 |
7.00%, 5/1/16 | | | | | 101 | | | 88,738 |
7.00%, 5/1/17 | | | | | 141 | | | 122,473 |
HSBC Finance Capital Trust IX
5.91%, 11/30/35 (1) | | | | | 100 | | | 82,000 |
International Lease Finance Corp.
0.48%, 5/24/10 (1) | | | | | 50 | | | 48,612 |
4.88%, 9/1/10 | | | | | 600 | | | 576,322 |
5.00%, 4/15/10 | | | | | 75 | | | 73,874 |
5.63%, 9/15/10 | | | | | 400 | | | 395,676 |
6.63%, 11/15/13 | | | | | 100 | | | 80,499 |
SLM Corp., Series A
0.44%, 7/26/10 (1) | | | | | 525 | | | 513,808 |
0.51%, 10/25/11 (1) | | | | | 175 | | | 163,820 |
0.76%, 10/1/10 (1) | | | | | 350 | | | 347,064 |
4.50%, 7/26/10 | | | | | 100 | | | 99,642 |
5.00%, 10/1/13 | | | | | 100 | | | 91,994 |
5.13%, 8/27/12 | | | | | 100 | | | 93,747 |
5.38%, 1/15/13 | | | | | 75 | | | 70,750 |
5.40%, 10/25/11 | | | | | 25 | | | 24,978 |
8.45%, 6/15/18 | | | | | 360 | | | 355,231 |
| | | | | | | | |
| | | | | | | | 3,466,682 |
| | | | | | | | |
FOOD, BEVERAGES & RESTAURANTS – 0.1% |
American Stores Co.
7.90%, 5/1/17 | | | | | 100 | | | 94,250 |
8.00%, 6/1/26 | | | | | 50 | | | 45,625 |
| | | | | | | | |
| | | | | | | | 139,875 |
| | | | | | | | |
See Notes to Financial Statements.
150
PIMCO HIGH YIELD FUND
| | |
PORTFOLIO OF INVESTMENTS (Continued) December 31, 2009 | | Sun Capital Advisers Trust |
| | | | | | | | |
| | | Country
Code* | | Principal
Amount
(000) | | Value |
| | | | | | | | |
| | | | | | | | |
GAMING – 0.3% |
MGM MIRAGE, Inc.
10.38%, 5/15/14 (3) | | | | $ | 100 | | $ | 108,500 |
11.13%, 11/15/17 (3) | | | | | 175 | | | 193,812 |
| | | | | | | | |
| | | | | | | | 302,312 |
| | | | | | | | |
GAS & PIPELINE UTILITIES – 1.1% |
Enterprise Products Operating LP
8.38%, 8/1/66 (1) | | | | | 1,050 | | | 1,023,750 |
Southern Natural Gas Co.
5.90%, 4/1/17 (3) | | | | | 25 | | | 25,673 |
TransCanada PipeLines, Ltd.
6.35%, 5/15/67 (1) | | CA | | | 325 | | | 304,937 |
| | | | | | | | |
| | | | | | | | 1,354,360 |
| | | | | | | | |
HEALTH CARE – 4.1% |
Community Health Systems, Inc.
8.88%, 7/15/15 | | | | | 230 | | | 238,050 |
HCA, Inc.
8.50%, 4/15/19 (3) | | | | | 150 | | | 161,625 |
9.13%, 11/15/14 | | | | | 175 | | | 184,625 |
9.25%, 11/15/16 | | | | | 2,125 | | | 2,281,719 |
9.63%, 11/15/16 (5) | | | | | 1,140 | | | 1,234,050 |
9.88%, 2/15/17 (3) | | | | | 125 | | | 138,125 |
United Surgical Partners International, Inc.
8.88%, 5/1/17 | | | | | 575 | | | 592,250 |
| | | | | | | | |
| | | | | | | | 4,830,444 |
| | | | | | | | |
HEALTH CARE - FACILITIES – 2.6% |
Biomet, Inc.
10.00%, 10/15/17 | | | | | 650 | | | 706,062 |
10.38%, 10/15/17 (5) | | | | | 1,825 | | | 1,980,125 |
11.63%, 10/15/17 | | | | | 320 | | | 353,600 |
| | | | | | | | |
| | | | | | | | 3,039,787 |
| | | | | | | | |
INSURANCE – 2.9% |
AIG SunAmerica
0.43%, 7/26/10 (1) | | KY | | | 50 | | | 47,932 |
American International Group, Inc.
0.35%, 3/20/12 (1) | | | | | 40 | | | 34,694 |
4.00%, 9/20/11 | | | | | 500 | | | 667,027 |
5.45%, 5/18/17 | | | | | 425 | | | 343,955 |
5.85%, 1/16/18 | | | | | 150 | | | 123,079 |
5.95%, 10/4/10 | | | | | 150 | | | 233,836 |
| | | | | | | | |
| | | Country
Code* | | Principal
Amount
(000) | | Value |
| | | | | | | | |
6.25%, 5/1/36 | | | | $ | 2,300 | | $ | 1,707,787 |
8.18%, 5/15/58 (1) | | | | | 25 | | | 16,500 |
8.25%, 8/15/18 | | | | | 200 | | | 187,770 |
| | | | | | | | |
| | | | | | | | 3,362,580 |
| | | | | | | | |
LEISURE & ENTERTAINMENT – 0.9% |
Harrah’s Operating Co., Inc.
10.00%, 12/15/18 (3) | | | | | 70 | | | 56,175 |
Royal Caribbean Cruises, Ltd.
8.75%, 2/2/11 | | LR | | | 25 | | | 26,156 |
Starwood Hotels & Resorts Worldwide, Inc.
6.75%, 5/15/18 | | | | | 200 | | | 200,500 |
Wynn Las Vegas Capital Corp.
6.63%, 12/1/14 | | | | | 270 | | | 260,888 |
7.88%, 11/1/17 (3) | | | | | 500 | | | 506,250 |
| | | | | | | | |
| | | | | | | | 1,049,969 |
| | | | | | | | |
MANUFACTURING DIVERSIFIED – 0.0% + |
Actuant Corp.
6.88%, 6/15/17 | | | | | 15 | | | 14,269 |
| | | | | | | | |
METALS & MINING – 1.3% |
Freeport-McMoRan Copper & Gold, Inc.
8.38%, 4/1/17 | | | | | 775 | | | 848,625 |
Teck Resources, Ltd.
9.75%, 5/15/14 | | CA | | | 325 | | | 374,969 |
10.25%, 5/15/16 | | CA | | | 225 | | | 262,125 |
| | | | | | | | |
| | | | | | | | 1,485,719 |
| | | | | | | | |
MULTIMEDIA – 4.7% |
Charter Communications Operating Capital LLC
8.38%, 4/30/14 (3) | | | | | 90 | | | 92,475 |
Clear Channel Worldwide Holdings, Inc.
9.25%, 12/15/17 (3) | | | | | 250 | | | 257,500 |
CSC Holdings, Inc.
7.63%, 7/15/18 | | | | | 210 | | | 216,300 |
7.88%, 2/15/18 | | | | | 865 | | | 895,275 |
8.50%, 6/15/15 (3) | | | | | 475 | | | 505,875 |
8.63%, 2/15/19 (3) | | | | | 325 | | | 349,781 |
Dex Media West LLC, Series B
9.88%, 8/15/13 (4) | | | | | 200 | | | 63,000 |
See Notes to Financial Statements.
151
PIMCO HIGH YIELD FUND
| | |
PORTFOLIO OF INVESTMENTS (Continued) December 31, 2009 | | Sun Capital Advisers Trust |
| | | | | | | | |
| | | Country
Code* | | Principal
Amount
(000) | | Value |
| | | | | | | | |
| | | | | | | | |
DISH DBS Corp.
6.63%, 10/1/14 | | | | $ | 25 | | $ | 25,219 |
7.88%, 9/1/19 | | | | | 100 | | | 104,875 |
Echostar DBS Corp.
7.00%, 10/1/13 | | | | | 200 | | | 205,750 |
7.13%, 2/1/16 | | | | | 935 | | | 954,869 |
7.75%, 5/31/15 | | | | | 75 | | | 78,563 |
Quebecor Media, Inc.
7.75%, 3/15/16 | | CA | | | 55 | | | 54,863 |
RH Donnelley Corp.
11.75%, 5/15/15 (3)(4) | | | | | 250 | | | 206,250 |
UnityMedia GmbH
10.38%, 2/15/15 (3) | | DE | | | 100 | | | 105,125 |
UnityMedia Hessen GmbH & Co. KG
3.60%, 4/15/13 (1) | | DE | | | 100 | | | 141,921 |
UPC Holding BV
8.63%, 1/15/14 | | NL | | | 275 | | | 394,226 |
9.75%, 4/15/18 (3) | | NL | | | 100 | | | 147,297 |
Videotron Ltee
9.13%, 4/15/18 (3) | | CA | | | 550 | | | 605,000 |
9.13%, 4/15/18 | | CA | | | 50 | | | 55,000 |
| | | | | | | | |
| | | | | | | | 5,459,164 |
| | | | | | | | |
OIL & GAS - EXPLORATION & PRODUCTION – 1.2% |
Encore Acquisition Co.
6.00%, 7/15/15 | | | | | 700 | | | 700,000 |
Penn Virginia Corp.
10.38%, 6/15/16 | | | | | 250 | | | 272,500 |
Petroleum Co. of Trinidad & Tobago Ltd.
9.75%, 8/14/19(3) | | TT | | | 350 | | | 391,562 |
| | | | | | | | |
| | | | | | | | 1,364,062 |
| | | | | | | | |
OIL & GAS EQUIPMENT & SERVICES – 1.3% |
Amerigas Partners LP
7.13%, 5/20/16 | | | | | 460 | | | 460,000 |
7.25%, 5/20/15 | | | | | 50 | | | 50,000 |
Cie Generale De Geophysique-Veritas
7.50%, 5/15/15 | | FR | | | 735 | | | 729,487 |
7.75%, 5/15/17 | | FR | | | 175 | | | 173,688 |
Suburban Propane Partners LP
6.88%, 12/15/13 | | | | | 63 | | | 63,000 |
| | | | | | | | |
| | | | | | | | 1,476,175 |
| | | | | | | | |
| | | | | | | | |
| | | Country
Code* | | Principal
Amount
(000) | | Value |
| | | | | | | | |
PAPER PRODUCTS – 1.2% |
Cascades, Inc.
7.25%, 2/15/13 | | CA | | $ | 20 | | $ | 20,200 |
Georgia-Pacific LLC
7.13%, 1/15/17 (3) | | | | | 150 | | | 151,875 |
7.25%, 6/1/28 | | | | | 10 | | | 9,300 |
7.70%, 6/15/15 | | | | | 815 | | | 855,750 |
8.00%, 1/15/24 | | | | | 115 | | | 117,300 |
8.25%, 5/1/16 (3) | | | | | 50 | | | 53,000 |
8.88%, 5/15/31 | | | | | 200 | | | 212,000 |
Verso Paper Holdings LLC, Series B
9.13%, 8/1/14 | | | | | 30 | | | 28,650 |
| | | | | | | | |
| | | | | | | | 1,448,075 |
| | | | | | | | |
PHARMACEUTICALS – 0.2% |
Novasep Holding SAS
9.75%, 12/15/16 (3) | | FR | | | 200 | | | 195,000 |
| | | | | | | | |
PIPELINES – 2.9% |
Colorado Interstate Gas Co.
5.95%, 3/15/15 | | | | | 20 | | | 21,004 |
Dynegy Holdings Pass Through Trust, Series A
7.27%, 11/8/10 | | | | | 26 | | | 25,542 |
Dynegy Holdings Pass Through Trust, Series B
7.67%, 11/8/16 | | | | | 450 | | | 434,250 |
El Paso Corp.
7.80%, 8/1/31 | | | | | 200 | | | 188,287 |
8.05%, 10/15/30 | | | | | 1,010 | | | 952,623 |
8.25%, 2/15/16 | | | | | 300 | | | 320,250 |
Kinder Morgan Finance Co.
5.70%, 1/5/16 | | CA | | | 320 | | | 307,200 |
Knight, Inc.
5.15%, 3/1/15 | | | | | 850 | | | 816,000 |
Williams Cos., Inc.
7.88%, 9/1/21 | | | | | 150 | | | 172,053 |
8.75%, 1/15/20 | | | | | 75 | | | 89,473 |
Williams Partners LP
7.25%, 2/1/17 | | | | | 100 | | | 101,019 |
| | | | | | | | |
| | | | | | | | 3,427,701 |
| | | | | | | | |
See Notes to Financial Statements.
152
PIMCO HIGH YIELD FUND
| | |
PORTFOLIO OF INVESTMENTS (Continued) December 31, 2009 | | Sun Capital Advisers Trust |
| | | | | | | | |
| | | Country
Code* | | Principal
Amount
(000) | | Value |
| | | | | | | | |
| | | | | | | | |
REAL ESTATE INVESTMENT TRUSTS – 0.4% |
Ventas Realty LP
6.50%, 6/1/16 | | | | $ | 375 | | $ | 361,875 |
6.75%, 4/1/17 | | | | | 60 | | | 58,050 |
| | | | | | | | |
| | | | | | | | 419,925 |
| | | | | | | | |
REFINING – 4.6% |
Berry Petroleum Co.
10.25%, 6/1/14 | | | | | 325 | | | 353,437 |
Chesapeake Energy Corp.
6.88%, 1/15/16 | | | | | 150 | | | 150,000 |
7.00%, 8/15/14 | | | | | 75 | | | 75,938 |
7.25%, 12/15/18 | | | | | 150 | | | 151,125 |
7.63%, 7/15/13 | | | | | 25 | | | 26,188 |
9.50%, 2/15/15 | | | | | 2,325 | | | 2,551,687 |
Continental Resources, Inc.
8.25%, 10/1/19 (3) | | | | | 50 | | | 52,500 |
Newfield Exploration Co.
7.13%, 5/15/18 | | | | | 330 | | | 333,300 |
Opti Canada, Inc.
7.88%, 12/15/14 | | CA | | | 125 | | | 102,500 |
8.25%, 12/15/14 | | CA | | | 290 | | | 238,887 |
Range Resources Corp.
7.25%, 5/1/18 | | | | | 25 | | | 25,500 |
7.50%, 10/1/17 | | | | | 125 | | | 128,750 |
Sandridge Energy, Inc.
8.63%, 4/1/15(5) | | | | | 1,150 | | | 1,150,000 |
| | | | | | | | |
| | | | | | | | 5,339,812 |
| | | | | | | | |
RESTAURANTS – 0.1% |
NPC International, Inc.
9.50%, 5/1/14 | | | | | 165 | | | 163,350 |
| | | | | | | | |
RETAIL – 2.2% |
Ferrellgas Partners LP
6.75%, 5/1/14 | | | | | 100 | | | 98,500 |
J.C. Penney Co., Inc.
7.13%, 11/15/23 | | | | | 50 | | | 49,563 |
7.95%, 4/1/17 | | | | | 225 | | | 245,813 |
New Albertsons, Inc.
7.45%, 8/1/29 | | | | | 375 | | | 321,562 |
7.75%, 6/15/26 | | | | | 190 | | | 170,050 |
8.00%, 5/1/31 | | | | | 725 | | | 657,937 |
8.70%, 5/1/30 | | | | | 525 | | | 509,250 |
SUPERVALU, Inc.
7.50%, 11/15/14 | | | | | 520 | | | 526,500 |
8.00%, 5/1/16 | | | | | 50 | | | 50,750 |
| | | | | | | | |
| | | | | | | | 2,629,925 |
| | | | | | | | |
| | | | | | | | |
| | | Country
Code* | | Principal
Amount
(000) | | Value |
| | | | | | | | |
SEMICONDUCTORS & SEMICONDUCTOR EQUIPMENT – 0.6% |
Sensata Technologies BV
8.00%, 5/1/14 | | NL | | $ | 700 | | $ | 686,000 |
| | | | | | | | |
SOFTWARE – 0.3% |
First Data Corp.
9.88%, 9/24/15 | | | | | 380 | | | 354,350 |
| | | | | | | | |
SPECIAL PURPOSE ENTITIES – 0.8% |
El Paso Performance-Linked Trust
7.75%, 7/15/11 (3) | | | | | 250 | | | 256,290 |
NSG Holdings LLC
7.75%, 12/15/25 (3) | | | | | 490 | | | 438,550 |
Santander Perpetual SA Unipersonal
6.67%,
Perpetual (1)(3) | | ES | | | 100 | | | 89,882 |
Sumitomo Mitsui Financial Group Preferred Capital, Ltd.
6.08%,
Perpetual (1)(3) | | KY | | | 200 | | | 171,826 |
| | | | | | | | |
| | | | | | | | 956,548 |
| | | | | | | | |
TELECOMMUNICATIONS – 9.8% |
Cincinnati Bell, Inc.
7.00%, 2/15/15 | | | | | 20 | | �� | 19,750 |
Citizens Communications Co.
6.63%, 3/15/15 | | | | | 25 | | | 24,313 |
9.00%, 8/15/31 | | | | | 90 | | | 88,425 |
Cricket Communications, Inc.
9.38%, 11/1/14 | | | | | 200 | | | 201,000 |
10.00%, 7/15/15 | | | | | 175 | | | 177,406 |
Crown Castle International Corp. 7.75%, 5/1/17 (3) | | | | | 175 | | | 186,375 |
Frontier Communications Corp.
7.13%, 3/15/19 | | | | | 550 | | | 519,750 |
7.45%, 7/1/35 | | | | | 100 | | | 81,250 |
8.25%, 5/1/14 | | | | | 125 | | | 130,313 |
Intelsat Corp.
9.25%, 8/15/14 | | | | | 225 | | | 231,187 |
9.25%, 6/15/16 | | | | | 150 | | | 154,875 |
See Notes to Financial Statements.
153
PIMCO HIGH YIELD FUND
| | |
PORTFOLIO OF INVESTMENTS (Continued) December 31, 2009 | | Sun Capital Advisers Trust |
| | | | | | | | |
| | | Country
Code* | | Principal
Amount
(000) | | Value |
| | | | | | | | |
| | | | | | | | |
Intelsat Jackson Holdings Ltd.
8.50%, 11/1/19 (3) | | BM | | $ | 700 | | $ | 721,000 |
9.50%, 6/15/16 | | BM | | | 25 | | | 26,750 |
Intelsat Subsidiary Holding Co., Ltd. 8.88%, 1/15/15 | | BM | | | 50 | | | 51,750 |
MetroPCS Wireless, Inc.
9.25%, 11/1/14 | | | | | 395 | | | 399,938 |
Motorola, Inc.
6.00%, 11/15/17 | | | | | 125 | | | 120,943 |
Nordic Telephone Co. Holdings
8.88%, 5/1/16 (3) | | DK | | | 625 | | | 660,937 |
Qwest Capital Funding, Inc.
7.25%, 2/15/11 | | | | | 115 | | | 116,725 |
8.88%, 3/15/12 | | | | | 150 | | | 161,250 |
Qwest Communications International, Inc.
7.25%, 2/15/11 | | | | | 100 | | | 100,500 |
7.50%, 2/15/14 | | | | | 1,525 | | | 1,530,719 |
8.00%, 10/1/15 (3) | | | | | 100 | | | 102,750 |
Qwest Corp.
7.50%, 6/15/23 | | | | | 250 | | | 236,250 |
8.38%, 5/1/16 | | | | | 250 | | | 268,125 |
Sprint Capital Corp.
7.63%, 1/30/11 | | | | | 75 | | | 76,781 |
8.38%, 3/15/12 | | | | | 75 | | | 77,625 |
8.75%, 3/15/32 | | | | | 400 | | | 377,000 |
Sprint Nextel Corp.
6.00%, 12/1/16 | | | | | 145 | | | 132,313 |
8.38%, 8/15/17 | | | | | 700 | | | 714,000 |
Telesat Canada LLC
11.00%, 11/1/15 | | CA | | | 575 | | | 623,875 |
Time Warner Telecom Holdings, Inc.
9.25%, 2/15/14 | | | | | 170 | | | 175,313 |
Virgin Media Finance PLC
9.50%, 8/15/16 | | GB | | | 175 | | | 187,906 |
West Corp.
9.50%, 10/15/14 | | | | | 110 | | | 111,650 |
Wind Acquisition Finance SA
11.00%, 12/1/15 | | LU | | | 50 | | | 77,053 |
11.75%, 7/15/17 (3) | | LU | | | 1,000 | | | 1,092,500 |
12.00%, 12/1/15 (3) | | LU | | | 300 | | | 321,000 |
| | | | | | | | |
| | | Country
Code* | | Principal
Amount
(000) | | Value |
| | | | | | | | |
Windstream Corp.
7.88%, 11/1/17 (3) | | | | $ | 200 | | $ | 197,500 |
8.63%, 8/1/16 | | | | | 995 | | | 1,012,412 |
| | | | | | | | |
| | | | | | | | 11,489,209 |
| | | | | | | | |
TRANSPORTATION – 0.1% | | | |
Kansas City Southern
8.00%, 6/1/15 | | | | | 75 | | | 77,719 |
| | | | | | | | |
UTILITIES – 7.4% | | | | | | | | |
AES Red Oak LLC,
Series A
8.54%, 11/30/19 | | | | | 841 | | | 838,671 |
Dominion Resources, Inc.
6.30%, 9/30/66 (1) | | | | | 250 | | | 220,000 |
7.50%, 6/30/66 (1) | | | | | 50 | | | 48,500 |
Energy Future Holdings Corp.
9.75%, 10/15/19 | | | | | 39 | | | 38,885 |
11.25%, 11/1/17 (5) | | | | | 5 | | | 3,729 |
Energy Future Intermediate Holding Co. LLC
9.75%, 10/15/19 | | | | | 47 | | | 46,861 |
FPL Group Capital, Inc., Series B
6.35%, 10/1/66 (1) | | | | | 50 | | | 46,250 |
Intergen
9.00%, 6/30/17 (3) | | NL | | | 1,225 | | | 1,277,062 |
Ipalco Enterprises, Inc.
7.25%, 4/1/16 (3) | | | | | 40 | | | 40,100 |
Midwest Generation LLC, Series B
8.56%, 1/2/16 | | | | | 584 | | | 590,204 |
NRG Energy, Inc.
7.38%, 2/1/16 | | | | | 275 | | | 275,344 |
7.38%, 1/15/17 | | | | | 315 | | | 315,788 |
8.50%, 6/15/19 | | | | | 1,050 | | | 1,076,250 |
Quicksilver Resources, Inc.
9.13%, 8/15/19 | | | | | 575 | | | 600,875 |
11.75%, 1/1/16 | | | | | 300 | | | 340,500 |
Reliant Energy Mid-Atlantic Power Holdings LLC, Series C
9.68%, 7/2/26 | | | | | 100 | | | 102,750 |
RRI Energy, Inc.
7.63%, 6/15/14 | | | | | 500 | | | 495,000 |
7.88%, 6/15/17 | | | | | 150 | | | 147,375 |
See Notes to Financial Statements.
154
PIMCO HIGH YIELD FUND
| | |
PORTFOLIO OF INVESTMENTS (Continued) December 31, 2009 | | Sun Capital Advisers Trust |
| | | | | | | | |
| | | Country
Code* | | Principal
Amount
(000) | | Value |
| | | | | | | | |
| | | | | | | | |
Sierra Pacific Resources
7.80%, 6/15/12 | | | | $ | 25 | | $ | 25,388 |
Sithe Independence Funding Corp., Series A
9.00%, 12/30/13 | | | | | 70 | | | 72,234 |
Tenaska Alabama Partners LP
7.00%, 6/30/21 (3) | | | | | 337 | | | 310,107 |
The AES Corp.
7.75%, 10/15/15 | | | | | 175 | | | 177,625 |
8.00%, 10/15/17 | | | | | 245 | | | 251,431 |
8.00%, 6/1/20 | | | | | 1,095 | | | 1,114,162 |
9.75%, 4/15/16 (3) | | | | | 175 | | | 191,625 |
| | | | | | | | |
| | | | | | | | 8,646,716 |
| | | | | | | | |
Total Corporate Debt Obligations
(Cost $83,306,466) | | | 93,610,723 |
| | | | | | | | |
FOREIGN GOVERNMENT OBLIGATIONS – 6.7% |
Brazil Notas do Tesouro Nacional, Series F
10.00%, 1/1/12 | | BR | | | 11,140 | | | 6,187,614 |
10.00%, 1/1/17 | | BR | | | 3,400 | | | 1,677,602 |
| | | | | | | | |
Total Foreign Government Obligations
(Cost $7,538,931) | | | 7,865,216 |
| | | | | | | | |
LOAN ASSIGNMENTS – 2.3% |
SENIOR LOANS – 2.3% | | | | | | | | |
Energy Future Competitive Holdings Co.
3.73%, 10/10/14 (1) | | | | | 1,975 | | | 1,592,187 |
3.78%, 10/10/14 (1) | | | | | 5 | | | 4,083 |
First Data Corp.
3.00%, 9/24/14 (1) | | | | | 470 | | | 416,840 |
3.03%, 9/24/14 (1) | | | | | 25 | | | 21,921 |
Newsday LLC
9.75%, 8/1/13 | | | | | 200 | | | 212,760 |
Texas Competitive Electric Holdings Co. LLC
3.73%, 10/10/14 (1) | | | | | 499 | | | 397,953 |
| | | | | | | | |
Total Loan Assignments
(Cost $2,190,455) | | | 2,645,744 |
| | | | | | | | |
| | | | | Shares | | |
COMMON STOCKS – 0.0% + |
FINANCIALS – 0.0% + | | | | | | | | |
CIT Group, Inc.** | | | | | 1,205 | | | 33,270 |
| | | | | | | | |
| | | | | | | | |
| | | Country
Code* | | Shares | | Value |
| | | | | | | | |
PIPELINES – 0.0% + | | | | | | | | |
SemGroup Corp., Class A** | | | | | 77 | | $ | 1,983 |
| | | | | | | | |
Total Common Stocks
(Cost $15,073) | | | | | | | | 35,253 |
| | | | | | | | |
CONVERTIBLE PREFERRED STOCKS – 0.5% |
BANKS – 0.5% | | | | | | | | |
Wells Fargo & Co., Series L 7.50%, Perpetual
(Cost $384,735) | | | | | 625 | | | 573,750 |
| | | | | | | | |
WARRANTS – 0.0% + |
PIPELINES – 0.0% + | | | | | | | | |
SemGroup Corp., expires 11/30/14**
(Cost $81) | | | | | 81 | | | 61 |
| | | | | | | | |
| | | | | Principal
Amount
(000) | | |
SHORT TERM INVESTMENTS – 2.9% |
U.S. TREASURY AND U.S. GOVERNMENT AGENCY OBLIGATIONS (6) – 1.9% |
Federal Home Loan Mortgage Corp. Discount Note
|
0.09%, 1/25/10 | | $ | 1,900 | | | 1,899,962 |
U.S. Treasury Bill
0.01%, 4/1/10 (7) | | | 346 | | | 345,951 |
| | | | | | | | |
Total U.S. Treasury and U.S. Government Agency Obligations
(Cost $2,245,793) | | | | | | 2,245,913 |
| | | | | | | | |
| | | | | Shares | | |
MUTUAL FUNDS – 1.0% |
State Street Institutional U.S. Government Money Market Fund
(Cost $1,162,062) | | | 1,162,062 | | | 1,162,062 |
| | | | | | | | |
Total Short Term Investments
(Cost $3,407,855) | | | | | | 3,407,975 |
| | | | | | | | |
TOTAL INVESTMENTS – 97.8% |
(Cost $102,414,495) | | | | | | 114,574,865 |
Other assets less liabilities – 2.2% | | | | | | 2,526,777 |
| | | | | | | | |
NET ASSETS – 100.0% | | | | | $ | 117,101,642 |
| | | | | | | | |
See Notes to Financial Statements.
155
PIMCO HIGH YIELD FUND
| | |
PORTFOLIO OF INVESTMENTS (Continued) December 31, 2009 | | Sun Capital Advisers Trust |
| * | Unless otherwise noted the issuer country code for all securities is United States. |
| ** | Non-income producing security. |
| + | Amount is less than 0.05%. |
| (1) | Variable rate security. The interest rate shown reflects the rate in effect at the period end. |
| (2) | Security is a “Step-up” bond where the coupon increases on a predetermined future date. |
| (3) | Eligible for resale under rule 144A of the Securities Act of 1933. These securities may be resold in transactions exempt from registration, normally to qualified institutional buyers. At the period end, the value of these securities amounted to $17,316,366, representing 14.8% of net assets. |
| (4) | Security is in default and is non-income producing. |
| (5) | Payment in-kind bond security. |
| (6) | Interest rates represent annualized yield at date of purchase. |
| | |
| GDR | | Global Depositary Receipt |
| |
| BM | | Bermuda |
| BR | | Brazil |
| CA | | Canada |
| DE | | Germany |
| DK | | Denmark |
| ES | | Spain |
| FR | | France |
| GB | | Great Britain |
| IT | | Italy |
| KY | | Cayman Islands |
| LR | | Liberia |
| LU | | Luxembourg |
| NL | | Netherlands |
| TT | | Trinidad and Tobago |
| (7) | At the period end, securities (or portions thereof) with an aggregate market value of $345,951 have been pledged to cover margin requirements for the following open futures contracts: |
| | | | | | | | | | | | |
Type | | Description | | Expiration
Date | | Contracts | | Aggregate
Face
Value ($) | | Aggregate
Notional
Value ($) | | Unrealized
Appreciation ($) |
Long | | 90-Day Eurodollar December
Futures | | 12/13/10 | | 53 | | 12,980,900 | | 13,047,275 | | 66,375 |
Long | | 90-Day Eurodollar June Futures | | 6/14/10 | | 6 | | 1,479,250 | | 1,489,800 | | 10,550 |
Long | | 90-Day Eurodollar March Futures | | 3/15/10 | | 7 | | 1,743,350 | | 1,743,788 | | 438 |
Long | | 90-Day Eurodollar March Futures | | 3/14/11 | | 66 | | 16,137,825 | | 16,181,550 | | 43,725 |
Long | | United Kingdom 90-Day LIBOR Sterling Interest Rate December Futures | | 12/15/10 | | 156 | | 30,592,803 | | 30,860,191 | | 267,388 |
| | | | | | | | | | | | |
Net unrealized appreciation | | | | | | | | | | 388,476 |
| | | | | | | | | | | | |
See Notes to Financial Statements.
156
| | |
PIMCO HIGH YIELD FUND PORTFOLIO OF INVESTMENTS (Continued) |
| December 31, 2009 | | Sun Capital Advisers Trust |
| (8) | At the period end, open forward foreign currency exchange contracts were as follows: |
| | | | | | | | | | | | | | | | | |
Contracts to Deliver | | | | In Exchange For | | | | Settlement
Date | | | | Unrealized
Appreciation/
(Depreciation) ($) | |
| CNY | | 20,358 | | | | USD | | 3,000 | | | | 3/29/10 | | | | 15 | |
| CNY | | 40,734 | | | | USD | | 6,000 | | | | 3/29/10 | | | | 28 | |
| CNY | | 20,352 | | | | USD | | 3,000 | | | | 3/29/10 | | | | 16 | |
| CNY | | 40,716 | | | | USD | | 6,000 | | | | 3/29/10 | | | | 31 | |
| CNY | | 24,775 | | | | USD | | 3,651 | | | | 3/29/10 | | | | 19 | |
| CNY | | 13,567 | | | | USD | | 2,000 | | | | 3/29/10 | | | | 11 | |
| CNY | | 13,574 | | | | USD | | 2,000 | | | | 3/29/10 | | | | 10 | |
| CNY | | 13,574 | | | | USD | | 2,000 | | | | 3/29/10 | | | | 10 | |
| CNY | | 40,713 | | | | USD | | 6,000 | | | | 3/29/10 | | | | 31 | |
| EUR | | 2,141,000 | | | | USD | | 3,109,920 | | | | 3/17/10 | | | | 41,105 | |
| GBP | | 2,365,000 | | | | USD | | 3,933,544 | | | | 1/13/10 | | | | 113,770 | |
| USD | | 17,800 | | | | CNY | | 120,043 | | | | 3/29/10 | | | | (200 | ) |
| USD | | 4,113 | | | | CNY | | 27,827 | | | | 3/29/10 | | | | (34 | ) |
| USD | | 11,888 | | | | CNY | | 80,493 | | | | 3/29/10 | | | | (87 | ) |
| USD | | 4,000 | | | | CNY | | 27,125 | | | | 6/7/10 | | | | (18 | ) |
| USD | | 21,346 | | | | CNY | | 144,618 | | | | 6/7/10 | | | | (113 | ) |
| USD | | 6,000 | | | | CNY | | 39,801 | | | | 11/17/10 | | | | (123 | ) |
| USD | | 6,000 | | | | CNY | | 39,798 | | | | 11/17/10 | | | | (124 | ) |
| USD | | 3,000 | | | | CNY | | 19,848 | | | | 11/17/10 | | | | (69 | ) |
| USD | | 3,000 | | | | CNY | | 19,854 | | | | 11/17/10 | | | | (68 | ) |
| USD | | 6,000 | | | | CNY | | 39,708 | | | | 11/17/10 | | | | (137 | ) |
| USD | | 3,744 | | | | CNY | | 24,775 | | | | 11/17/10 | | | | (85 | ) |
| USD | | 2,000 | | | | CNY | | 13,276 | | | | 11/17/10 | | | | (40 | ) |
| USD | | 2,000 | | | | CNY | | 13,259 | | | | 11/23/10 | | | | (42 | ) |
| USD | | 2,000 | | | | CNY | | 13,278 | | | | 11/23/10 | | | | (39 | ) |
| | | | | | | | | | | | | | | | | |
Net unrealized appreciation | | | | | | | | | | | | 153,867 | |
| | | | | | | | | | | | | | | | | |
| | | | |
| CNY | | – | | Yuan Renminbi |
| EUR | | – | | Euro |
| GBP | | – | | Great British Pound |
| USD | | – | | United States Dollar |
| (9) | At the period end, open written option contracts were as follows: |
| | | | | | | | | | | | |
Type | | Description | | Counterparty | | Expiration
Date | | Strike
Price ($) | | Number of
Contracts | | Value ($) |
Call | | U.S. Treasury 10 Year Note March Futures | | Citigroup Global Markets, Inc. | | 2/19/10 | | 120 | | 4 | | 188 |
Put | | U.S. Treasury 10 Year Note March Futures | | Citigroup Global Markets, Inc. | | 2/19/10 | | 115 | | 4 | | 3,875 |
| | | | | | | | | | | | |
(Written Option Premium $3,113) | | | | | | | | 8 | | 4,063 |
| | | | | | | | | | | | |
See Notes to Financial Statements.
157
| | |
PIMCO HIGH YIELD FUND PORTFOLIO OF INVESTMENTS (Continued) |
| December 31, 2009 | | Sun Capital Advisers Trust |
| (10) | At the period end, open written interest rate swaption contracts were as follows: |
| | | | | | | | | | | | | | | | |
Type | | Description | | Counterparty | | Pay/Receive
Floating
Rate | | Floating
Rate | | Exercise
Rate | | Expiration
Date | | Notional
Amount
(000) ($) | | Value ($) |
| Call | | OTC -10 Year
Interest Rate Swap | | Bank of America NA | | Receive | | 3-Month
USD-LIBOR | | 3.25% | | 4/19/10 | | 1,500 | | 2,733 |
| Put | | OTC -10 Year
Interest Rate Swap | | Bank of America NA | | Pay | | 3-Month
USD-LIBOR | | 4.25% | | 4/19/10 | | 2,700 | | 51,191 |
| Call | | OTC -10 Year
Interest Rate Swap | | Barclays Bank PLC* | | Receive | | 3-Month
USD-LIBOR | | 3.25% | | 4/19/10 | | 1,000 | | 1,822 |
| Put | | OTC -10 Year
Interest Rate Swap | | Barclays Bank PLC* | | Pay | | 3-Month
USD-LIBOR | | 4.25% | | 4/19/10 | | 1,000 | | 18,959 |
| Put | | OTC -5 Year
Interest Rate Swap | | Barclays Bank PLC* | | Pay | | 3-Month
USD-LIBOR | | 5.00% | | 6/15/10 | | 2,000 | | 3,660 |
| Call | | OTC -10 Year
Interest Rate Swap | | Deutsche Bank AG | | Receive | | 3-Month
USD-LIBOR | | 3.25% | | 4/19/10 | | 700 | | 1,275 |
| Call | | OTC -7 Year
Interest Rate Swap | | Deutsche Bank AG | | Receive | | 3-Month
USD-LIBOR | | 2.75% | | 4/19/10 | | 2,300 | | 2,325 |
| Put | | OTC -10 Year
Interest Rate Swap | | Deutsche Bank AG | | Pay | | 3-Month
USD-LIBOR | | 4.25% | | 4/19/10 | | 500 | | 9,480 |
| Put | | OTC -10 Year
Interest Rate Swap | | Deutsche Bank AG | | Pay | | 3-Month
USD-LIBOR | | 5.00% | | 4/19/10 | | 200 | | 958 |
| Put | | OTC -7 Year
Interest Rate Swap | | Deutsche Bank AG | | Pay | | 3-Month
USD-LIBOR | | 4.00% | | 4/19/10 | | 2,300 | | 25,260 |
| Put | | OTC -5 Year
Interest Rate Swap | | Deutsche Bank AG | | Pay | | 3-Month
USD-LIBOR | | 5.00% | | 6/15/10 | | 3,000 | | 5,490 |
| Put | | OTC -10 Year
Interest Rate Swap | | Goldman Sachs Bank | | Pay | | 3-Month
USD-LIBOR | | 4.25% | | 4/19/10 | | 600 | | 11,376 |
| Put | | OTC -5 Year
Interest Rate Swap | | Goldman Sachs Bank | | Pay | | 3-Month
USD-LIBOR | | 5.00% | | 6/15/10 | | 1,000 | | 1,830 |
| Put | | OTC -5 Year
Interest Rate Swap | | Merrill Lynch Capital Services, Inc. | | Pay | | 3-Month
USD-LIBOR | | 5.80% | | 6/28/10 | | 4,000 | | 3,005 |
| Call | | OTC -7 Year
Interest Rate Swap | | Morgan Stanley Capital Services Inc. | | Receive | | 3-Month
USD-LIBOR | | 2.75% | | 4/19/10 | | 1,300 | | 1,314 |
| Call | | OTC -10 Year
Interest Rate Swap | | Morgan Stanley Capital Services Inc. | | Receive | | 3-Month
USD-LIBOR | | 3.25% | | 4/19/10 | | 700 | | 1,275 |
| Put | | OTC -7 Year
Interest Rate Swap | | Morgan Stanley Capital Services Inc. | | Pay | | 3-Month
USD-LIBOR | | 4.00% | | 4/19/10 | | 1,300 | | 14,277 |
| | | | | | | | | | | | | | | | |
(Written Swaption Premium $233,579) | | | | | | | | | | 26,100 | | 156,230 |
| | | | | | | | | | | | | | | | |
| | | | |
| LIBOR | | – | | London InterBank Offered Rate |
| USD | | – | | United States Dollar |
See Notes to Financial Statements.
158
| | |
PIMCO HIGH YIELD FUND PORTFOLIO OF INVESTMENTS (Continued) |
| December 31, 2009 | | Sun Capital Advisers Trust |
At the period end, outstanding credit default swap contracts on corporate issues – Sell Protection (a) were as follows:
| | | | | | | | | | | | | | | | | | | |
Counterparty | | Reference Entity | | (Pay)/Receive
Fixed Rate | | Expiration
Date | | Implied
Credit
Spread (b) | | Notional
Amount (c)
(000) ($) | | Market
Value ($) | | | Upfront
Premiums
Paid/
(Received) ($) | | | Unrealized
Appreciation/
(Depreciation) ($) | |
Bank of America NA | | American International Group, Inc. | | 5.00% | | 9/20/10 | | 5.25% | | 400 | | (722 | ) | | (58,000 | ) | | 57,278 | |
Bank of America NA | | American International Group, Inc. | | 5.00% | | 9/20/11 | | 5.49% | | 200 | | (1,587 | ) | | (46,000 | ) | | 44,413 | |
Bank of America NA | | American International Group, Inc. | | 5.00% | | 9/20/11 | | 5.49% | | 200 | | (1,587 | ) | | (48,000 | ) | | 46,413 | |
Bank of America NA | | Berkshire Hathaway, Inc. | | 1.00% | | 9/20/14 | | 1.43% | | 200 | | (3,704 | ) | | (11,771 | ) | | 8,067 | |
Bank of America NA | | General Electric Capital Corp. | | 5.00% | | 6/20/14 | | 1.59% | | 500 | | 70,047 | | | 14,226 | | | 55,821 | |
Bank of America NA | | General Electric Capital Corp. | | 5.00% | | 6/20/14 | | 1.59% | | 600 | | 84,056 | | | 18,269 | | | 65,787 | |
Bank of America NA | | General Electric Capital Corp. | | 5.00% | | 6/20/14 | | 1.59% | | 200 | | 28,019 | | | 6,214 | | | 21,805 | |
Bank of America NA | | SLM Corp. | | 5.00% | | 12/20/10 | | 4.90% | | 100 | | 95 | | | (8,250 | ) | | 8,345 | |
Bank of America NA | | SLM Corp. | | 5.00% | | 12/20/10 | | 4.90% | | 200 | | 190 | | | (20,500 | ) | | 20,690 | |
Bank of America NA | | SLM Corp. | | 5.00% | | 12/20/11 | | 4.94% | | 500 | | 585 | | | (40,000 | ) | | 40,585 | |
Barclays Bank PLC* | | General Electric Capital Corp. | | 5.00% | | 6/20/14 | | 1.59% | | 200 | | 28,019 | | | 6,929 | | | 21,090 | |
Barclays Bank PLC* | | RRI Energy, Inc. | | 5.00% | | 9/20/14 | | 5.92% | | 1,200 | | (42,102 | ) | | (189,000 | ) | | 146,898 | |
Barclays Bank PLC* | | SLM Corp. | | 5.00% | | 12/20/13 | | 5.29% | | 50 | | (472 | ) | | (5,500 | ) | | 5,028 | |
Citibank NA | | Dynegy Holdings, Inc. | | 5.00% | | 9/20/14 | | 6.85% | | 100 | | (6,963 | ) | | (14,000 | ) | | 7,037 | |
Citibank NA | | General Electric Capital Corp. | | 3.25% | | 3/20/14 | | 1.58% | | 100 | | 6,526 | | | — | | | 6,526 | |
Citibank NA | | RRI Energy, Inc. | | 5.00% | | 9/20/14 | | 5.92% | | 500 | | (17,542 | ) | | (55,000 | ) | | 37,458 | |
Deutsche Bank AG | | Berkshire Hathaway, Inc. | | 1.00% | | 9/20/14 | | 1.43% | | 100 | | (1,852 | ) | | (5,872 | ) | | 4,020 | |
Deutsche Bank AG | | Berkshire Hathaway, Inc. | | 1.00% | | 12/20/14 | | 1.45% | | 200 | | (4,069 | ) | | (2,795 | ) | | (1,274 | ) |
Deutsche Bank AG | | General Electric Capital Corp. | | 5.00% | | 6/20/14 | | 1.59% | | 400 | | 56,037 | | | 16,493 | | | 39,544 | |
Deutsche Bank AG | | GMAC LLC | | 5.00% | | 3/20/12 | | 3.39% | | 60 | | 2,020 | | | (9,300 | ) | | 11,320 | |
Deutsche Bank AG | | Prudential Financial, Inc. | | 5.00% | | 9/20/14 | | 1.41% | | 100 | | 15,634 | | | (1,596 | ) | | 17,230 | |
Deutsche Bank AG | | RRI Energy, Inc. | | 5.00% | | 9/20/14 | | 5.92% | | 300 | | (10,525 | ) | | (43,500 | ) | | 32,975 | |
Deutsche Bank AG | | RRI Energy, Inc. | | 5.00% | | 9/20/14 | | 5.92% | | 300 | | (10,525 | ) | | (43,500 | ) | | 32,975 | |
See Notes to Financial Statements.
159
| | |
PIMCO HIGH YIELD FUND PORTFOLIO OF INVESTMENTS (Continued) |
| December 31, 2009 | | Sun Capital Advisers Trust |
| | | | | | | | | | | | | | | | | | |
Counterparty | | Reference
Entity | | (Pay)/Receive
Fixed Rate | | Expiration
Date | | Implied
Credit
Spread (b) | | Notional
Amount (c)
(000) ($) | | Market
Value ($) | | | Upfront
Premiums
Paid/
(Received) ($) | | | Unrealized
Appreciation/
(Depreciation) ($) |
Deutsche Bank AG | | SLM Corp. | | 5.00% | | 6/20/10 | | 4.89% | | 100 | | 52 | | | (5,750 | ) | | 5,802 |
Deutsche Bank AG | | SLM Corp. | | 5.00% | | 6/20/12 | | 5.06% | | 100 | | (123 | ) | | (13,000 | ) | | 12,877 |
Goldman Sachs International | | American International Group, Inc. | | 5.00% | | 9/20/11 | | 5.49% | | 100 | | (794 | ) | | (23,000 | ) | | 22,206 |
Goldman Sachs International | | Berkshire Hathaway, Inc. | | 1.00% | | 6/20/14 | | 1.40% | | 300 | | (4,980 | ) | | (16,911 | ) | | 11,931 |
Goldman Sachs International | | Berkshire Hathaway, Inc. | | 1.00% | | 6/20/14 | | 1.40% | | 100 | | (1,660 | ) | | (5,213 | ) | | 3,553 |
Goldman Sachs International | | Dynegy Holdings, Inc. | | 5.00% | | 9/20/14 | | 6.85% | | 100 | | (6,963 | ) | | (22,000 | ) | | 15,037 |
Goldman Sachs International | | El Paso Corp. | | 5.00% | | 9/20/14 | | 3.72% | | 900 | | 47,926 | | | (85,500 | ) | | 133,426 |
Goldman Sachs International | | Prudential Financial, Inc. | | 5.00% | | 9/20/14 | | 1.41% | | 400 | | 62,534 | | | (1,602 | ) | | 64,136 |
Goldman Sachs International | | RRI Energy, Inc. | | 5.00% | | 9/20/14 | | 5.92% | | 100 | | (3,508 | ) | | (17,000 | ) | | 13,492 |
Goldman Sachs International | | RRI Energy, Inc. | | 5.00% | | 9/20/14 | | 5.92% | | 500 | | (17,542 | ) | | (80,000 | ) | | 62,458 |
Morgan Stanley Capital Services, Inc. | | General Electric Capital Corp. | | 1.00% | | 12/20/14 | | 1.60% | | 300 | | (8,083 | ) | | (16,407 | ) | | 8,324 |
UBS AG | | American International Group, Inc. | | 5.00% | | 9/20/14 | | 5.87% | | 100 | | (3,314 | ) | | (14,000 | ) | | 10,686 |
UBS AG | | Indonesia NS | | 1.93% | | 9/20/14 | | 1.85% | | 1,000 | | 3,227 | | | — | | | 3,227 |
UBS AG | | SLM Corp. | | 5.00% | | 3/20/10 | | 4.88% | | 100 | | 27 | | | (4,000 | ) | | 4,027 |
| | | | | | | | | | | | | | | | | | |
Total | | | | | | | | | | 10,910 | | 256,377 | | | (844,836 | ) | | 1,101,213 |
| | | | | | | | | | | | | | | | | | |
At the period end, outstanding credit default swap contracts on credit indices – Buy Protection (a) were as follows:
| | | | | | | | | | | | | | | | | |
Counterparty | | Reference
Entity | | (Pay)/Receive
Fixed Rate | | | Expiration
Date | | Notional
Amount (c)
(000) ($) | | Market
Value(d) ($) | | | Upfront
Premiums
Paid/
(Received) ($) | | Unrealized
Depreciation ($) | |
Bank of America NA | | CDX High Yield 12 5-Year Index | | (5.00 | )% | | 6/20/14 | | 188 | | (1,495 | ) | | 10,340 | | (11,835 | ) |
Deutsche Bank AG | | CDX High Yield 12 5-Year Index | | (5.00 | )% | | 6/20/14 | | 94 | | (747 | ) | | 11,868 | | (12,615 | ) |
Deutsche Bank AG | | CDX High Yield 13 5-Year Index | | (5.00 | )% | | 12/20/14 | | 297 | | 1,869 | | | 21,718 | | (19,849 | ) |
UBS AG | | CDX High Yield 12 5-Year Index | | (5.00 | )% | | 6/20/14 | | 1,128 | | (8,967 | ) | | 58,515 | | (67,482 | ) |
| | | | | | | | | | | | | | | | | |
Total | | | | | | | | | 1,707 | | (9,340 | ) | | 102,441 | | (111,781 | ) |
| | | | | | | | | | | | | | | | | |
| * | At the period end, cash of $420,000 has been received as collateral for these open swap and swaption contracts. |
| (a) | If the Fund is a seller of protection and a credit event occurs, as defined under the terms of that particular swap agreement, the Fund will pay to the buyer of the protection an amount up to the notional amount of the swap and in certain instances, take delivery of the security. As a buyer of protection, the Fund will generally receive from the seller of protection an amount up to the notional amount of the swap if a credit event occurs. |
See Notes to Financial Statements.
160
| | |
PIMCO HIGH YIELD FUND PORTFOLIO OF INVESTMENTS (Continued) |
| December 31, 2009 | | Sun Capital Advisers Trust |
| (b) | Implied credit spreads, represented in absolute terms, utilized in determining the market value of credit default swap agreements on corporate issues as of period end serve as an indicator of the current status of the payment/performance risk and represent the likelihood or risk of default for the credit derivative. The implied credit spread of a particular referenced entity reflects the cost of buying/selling protection and may include upfront payments required to be made to enter into the agreement. Wider credit spreads represent a deterioration of the referenced entity’s credit soundness and a greater likelihood or risk of default or other credit event occurring as defined under the terms of that particular agreement. |
| (c) | The maximum potential amount the Fund could be required to pay as a seller of credit protection or receive as a buyer of credit protection if a credit event occurs as defined under the terms of that particular swap agreement. |
| (d) | The quoted market prices and resulting values for credit default swap contracts on credit indices serve as an indicator of the current status of the payment/performance risk and represent the likelihood of an expected liability (or profit) for the credit derivative had the notional amount of the swap agreement been closed/sold as of the period end. Increasing market values, in absolute terms when compared to the notional amount of the swap, represent a deterioration of the referenced entity’s credit soundness and a greater likelihood of risk of default or other credit event occurring as defined under the terms of the agreement. |
| (12) | Fair Value Measurements † |
The following table summarizes the inputs used to value the Fund’s assets and liabilities, as applicable, measured at fair value at the period end:
| | | | | | | | | | | | |
Assets | | Quoted Prices
in Active
Markets for
Identical
Assets and
Liabilities
(Level 1) | | Significant
Other
Observable
Inputs
(Level 2) | | Significant
Unobservable
Inputs
(Level 3) | | Total |
Asset Backed Securities | | $ | — | | $ | 344,164 | | $ | — | | $ | 344,164 |
Collateralized Mortgage Obligations | | | — | | | 5,316,720 | | | — | | | 5,316,720 |
Commercial Mortgage Backed Securities | | | — | | | 775,259 | | | — | | | 775,259 |
Corporate Debt Obligations (a) | | | — | | | 93,610,723 | | | — | | | 93,610,723 |
Foreign Government Obligations | | | — | | | 7,865,216 | | | — | | | 7,865,216 |
Loan Assignments | | | — | | | 2,645,744 | | | — | | | 2,645,744 |
Common Stocks | | | | | | | | | | | | |
Financials | | | 33,270 | | | — | | | — | | | 33,270 |
Pipelines | | | — | | | 1,983 | | | — | | | 1,983 |
| | | | | | | | | | | | |
Total Common Stocks | | | 33,270 | | | 1,983 | | | — | | | 35,253 |
| | | | | | | | | | | | |
Convertible Preferred Stocks (a) | | | 573,750 | | | — | | | — | | | 573,750 |
Warrants (a) | | | — | | | 61 | | | — | | | 61 |
Short Term Investments | | | | | | | | | | | | |
U.S. Treasury and U.S. Government Agency Obligations | | | 345,951 | | | 1,899,962 | | | — | | | 2,245,913 |
Mutual Funds | | | 1,162,062 | | | — | | | — | | | 1,162,062 |
| | | | | | | | | | | | |
Total Short Term Investments | | | 1,508,013 | | | 1,899,962 | | | — | | | 3,407,975 |
| | | | | | | | | | | | |
Total Investments | | | 2,115,033 | | | 112,459,832 | | | — | | | 114,574,865 |
| | | | | | | | | | | | |
Futures Contracts | | | 388,476 | | | — | | | — | | | 388,476 |
Forward Foreign Currency Exchange Contracts | | | — | | | 155,046 | | | — | | | 155,046 |
Swap Contracts | | | — | | | 1,102,487 | | | — | | | 1,102,487 |
| | | | | | | | | | | | |
Total | | $ | 2,503,509 | | $ | 113,717,365 | | $ | — | | $ | 116,220,874 |
| | | | | | | | | | | | |
See Notes to Financial Statements.
161
| | |
PIMCO HIGH YIELD FUND PORTFOLIO OF INVESTMENTS (Continued) |
| December 31, 2009 | | Sun Capital Advisers Trust |
| | | | | | | | | | | | | | | |
Liabilities | | Quoted Prices
in Active
Markets for
Identical
Assets and
Liabilities
(Level 1) | | | Significant
Other
Observable
Inputs
(Level 2) | | | Significant
Unobservable
Inputs
(Level 3) | | Total | |
Forward Foreign Currency Exchange Contracts | | $ | — | | | $ | (1,179 | ) | | $ | — | | $ | (1,179 | ) |
| | | | | | | | | | | | | | | |
Swap Contracts | | | — | | | | (113,055 | ) | | | — | | | (113,055 | ) |
| | | | | | | | | | | | | | | |
Written Option Contracts | | | (4,063 | ) | | | — | | | | — | | | (4,063 | ) |
| | | | | | | | | | | | | | | |
Written Swaption Contracts | | | — | | | | (156,230 | ) | | | — | | | (156,230 | ) |
| | | | | | | | | | | | | | | |
Total | | $ | (4,063 | ) | | $ | (270,464 | ) | | $ | — | | $ | (274,527 | ) |
| | | | | | | | | | | | | | | |
| † | See Note 2b in the Notes to Financial Statements for additional information. |
| (a) | See Portfolio of Investments for additional detailed categorizations. |
See Notes to Financial Statements.
162
PIMCO TOTAL RETURN FUND
| | |
PORTFOLIO OF INVESTMENTS December 31, 2009 | | Sun Capital Advisers Trust |
| | | | | | | | |
| | | Country
Code* | | Principal
Amount
(000) | | Value |
| | | | | | | | |
| | | | | | | | |
ASSET BACKED SECURITIES – 0.8% |
Bear Stearns Asset Backed Securities Trust,
Series 2006-SD3 5.50%, 8/25/36 | | | | $ | 2,363 | | $ | 1,446,740 |
Countrywide Asset-Backed Certificates, Series 2006-2,
Class 2A2
0.42%, 6/25/36 (1) | | | | | 269 | | | 222,383 |
Ford Credit Auto Owner Trust, Series 2008-C, Class A2B
1.13%, 1/15/11 (1) | | | | | 15 | | | 14,974 |
Ford Credit Auto Owner Trust, Series 2008-C, Class A3
1.65%, 6/15/12 (1) | | | | | 1,000 | | | 1,006,674 |
Ford Credit Auto Owner Trust, Series 2009-D, Class A2
1.21%, 1/15/12 | | | | | 300 | | | 300,828 |
| | | | | | | | |
Total Asset Backed Securities
(Cost $2,307,801) | | | 2,991,599 |
| | | | | | | | |
COLLATERALIZED MORTGAGE
OBLIGATIONS – 0.3% |
Bear Stearns Alt-A Trust, Series 2005-4
5.31%, 5/25/35 (1) | | | | | 183 | | | 126,559 |
Bear Stearns Alt-A Trust, Series 2006-1
5.68%, 2/25/36 (1) | | | | | 196 | | | 105,776 |
Harborview Mortgage Loan Trust,
Series 2005-4
5.15%, 7/19/35 (1) | | | | | 538 | | | 408,403 |
JP Morgan Mortgage Trust,
Series 2005-S3,
Class 1A2
5.75%, 1/25/36 | | | | | 118 | | | 98,292 |
JP Morgan Mortgage Trust,
Series 2007-A1 3.97%, 7/25/35 (1) | | | | | 724 | | | 334,641 |
| | | | | | | | |
| | | Country
Code* | | Principal
Amount
(000) | | Value |
| | | | | | | | |
Nomura Asset Acceptance Corp., Series 2005-AP2, Class A5
4.98%, 5/25/35 (2) | | | | $ | 370 | | $ | 243,058 |
| | | | | | | | |
Total Collateralized Mortgage Obligations (Cost $1,207,892) | | | 1,316,729 |
| | | | | | | | |
COMMERCIAL MORTGAGE BACKED
SECURITIES – 2.0% |
Citigroup/Deutsche Bank Commercial Mortgage Trust,
Series 2007-CD5,
Class A4
5.89%, 11/15/44 (1) | | | | | 5,000 | | | 4,476,157 |
JP Morgan Chase Commercial Mortgage Securities Corp., Series 2003-CB7, Class A4 4.88%, 1/12/38 (1) | | | | | 2,800 | | | 2,811,866 |
Morgan Stanley Capital I, Series 2004-IQ8,
Class A5
5.11%, 6/15/40 (1) | | | | | 600 | | | 585,010 |
| | | | | | | | |
Total Commercial Mortgage Backed Securities
(Cost $7,151,578) | | | 7,873,033 |
| | | | | | | | |
CORPORATE DEBT OBLIGATIONS – 23.6% |
AGRICULTURAL – 0.1% |
BAT International Finance PLC
9.50%, 11/15/18 (3) | | GB | | | 160 | | | 203,182 |
| | | | | | | | |
AUTOMOTIVE – 0.3% |
Ford Motor Credit Co. LLC
7.38%, 2/1/11 | | | | | 1,000 | | | 1,020,386 |
7.88%, 6/15/10 | | | | | 200 | | | 203,021 |
| | | | | | | | |
| | | | | | | | 1,223,407 |
| | | | | | | | |
BANKS – 13.5% |
American Express Bank, FSB
5.50%, 4/16/13 | | | | | 400 | | | 426,372 |
Bank of America Corp.
0.39%, 2/12/10 (1) | | | | | 195 | | | 194,970 |
See Notes to Financial Statements.
163
PIMCO TOTAL RETURN FUND
| | |
PORTFOLIO OF INVESTMENTS (Continued) December 31, 2009 | | Sun Capital Advisers Trust |
| | | | | | | | |
| | | Country
Code* | | Principal
Amount
(000) | | Value |
| | | | | | | | |
| | | | | | | | |
5.75%, 12/1/17 | | | | $ | 300 | | $ | 307,205 |
6.00%, 9/1/17 | | | | | 1,100 | | | 1,141,716 |
Barclays Bank PLC
5.00%, 9/22/16 | | GB | | | 1,500 | | | 1,532,718 |
6.05%, 12/4/17 (3) | | GB | | | 500 | | | 508,851 |
Barnett Capital III
0.91%, 2/1/27 (1) | | | | | 200 | | | 135,455 |
Bear Stearns Co., Inc. 5.30%, 10/30/15 | | | | | 100 | | | 105,766 |
BNP Paribas
7.20%,
Perpetual (1)(3) | | FR | | | 100 | | | 92,000 |
7.78%, Perpetual (1) | | FR | | | 100 | | | 148,516 |
Citigroup Capital XXI 8.30%, 12/21/57 (1) | | | | | 1,600 | | | 1,540,000 |
Citigroup, Inc.
3.63%, 11/30/17 (1) | | | | | 800 | | | 986,602 |
5.50%, 4/11/13 | | | | | 700 | | | 725,735 |
5.50%, 10/15/14 | | | | | 400 | | | 405,012 |
6.13%, 11/21/17 | | | | | 200 | | | 201,595 |
8.50%, 5/22/19 | | | | | 200 | | | 230,951 |
Commonwealth Bank of Australia
0.70%, 7/12/13
(1)(3) | | AU | | | 1,600 | | | 1,594,530 |
Credit Agricole SA
8.38%,
Perpetual (1)(3) | | FR | | | 2,300 | | | 2,438,000 |
Danske Bank A/S
2.50%, 5/10/12 (3) | | DK | | | 300 | | | 305,033 |
Deutsche Bank AG
6.00%, 9/1/17 | | DE | | | 300 | | | 327,067 |
Dexia Credit Local
0.90%, 9/23/11
(1)(3) | | FR | | | 400 | | | 403,381 |
Fortis Bank Nederland Holding NV
3.00%, 4/17/12 | | NL | | | 200 | | | 292,993 |
ING Bank NV
2.63%, 2/9/12 (3) | | NL | | | 1,400 | | | 1,430,666 |
Intesa Sanpaolo New York 2.38%, 12/21/12 | | IT | | | 2,400 | | | 2,378,854 |
JP Morgan Chase & Co., Series C
0.38%, 12/21/11 (1) | | | | | 2,000 | | | 1,991,380 |
JP Morgan Chase & Co., Series I, GDR
7.90%, Perpetual (1) | | | | | 300 | | | 309,438 |
| | | | | | | | |
| | | Country
Code* | | Principal
Amount
(000) | | Value |
| | | | | | | | |
JP Morgan Chase Bank NA
0.58%, 6/13/16 (1) | | | | $ | 300 | | $ | 273,490 |
JP Morgan Chase Capital XXI
1.23%, 2/2/37 (1) | | | | | 1,000 | | | 683,200 |
Lloyds TSB Bank
PLC
2.30%, 4/1/11 (3) | | GB | | | 1,800 | | | 1,824,719 |
2.80%, 4/2/12 (3) | | GB | | | 4,300 | | | 4,386,739 |
Macquarie Bank Ltd. 4.10%, 12/17/13 (3) | | AU | | | 300 | | | 315,243 |
Merrill Lynch & Co., Inc.
0.47%, 2/15/11 (1) | | | | | 1,500 | | | 1,465,713 |
1.02%, 5/30/14 (1) | | | | | 100 | | | 131,357 |
6.88%, 4/25/18 | | | | | 200 | | | 215,488 |
Merrill Lynch & Co., Inc., Series C
0.35%, 3/23/10 (1) | | | | | 400 | | | 400,074 |
0.50%, 2/5/10 (1) | | | | | 2,776 | | | 2,776,902 |
Morgan Stanley
0.58%, 1/9/14 (1) | | | | | 500 | | | 477,375 |
0.76%, 10/15/15 (1) | | | | | 2,000 | | | 1,875,554 |
5.95%, 12/28/17 | | | | | 400 | | | 412,576 |
National Australia Bank Ltd.
2.55%, 1/13/12 (3) | | AU | | | 1,000 | | | 1,014,866 |
Northern Rock PLC 5.63%, 6/22/17 (3) | | GB | | | 1,300 | | | 1,221,051 |
Royal Bank of Scotland Group PLC
0.67%, 4/8/11 (1)(3) | | GB | | | 5,000 | | | 5,010,450 |
3.00%, 12/9/11 (3) | | GB | | | 2,800 | | | 2,868,250 |
5.00%, 10/1/14 | | GB | | | 100 | | | 88,376 |
6.99%,
Perpetual (1)(3) | | GB | | | 200 | | | 111,000 |
Societe Generale
5.92%,
Perpetual (1)(3) | | FR | | | 400 | | | 311,580 |
State Street Capital
Trust IV
1.25%, 6/15/37 (1) | | | | | 200 | | | 134,848 |
Swedbank AB
2.80%, 2/10/12 (3) | | SE | | | 1,000 | | | 1,021,554 |
Union Planters Corp. 7.75%, 3/1/11 | | | | | 300 | | | 298,274 |
Wachovia Bank NA 0.58%, 3/15/16 (1) | | | | | 400 | | | 358,897 |
See Notes to Financial Statements.
164
PIMCO TOTAL RETURN FUND
| | |
PORTFOLIO OF INVESTMENTS (Continued) December 31, 2009 | | Sun Capital Advisers Trust |
| | | | | | | | |
| | | Country
Code* | | Principal
Amount
(000) | | Value |
| | | | | | | | |
| | | | | | | | |
Wachovia Corp.
0.41%, 10/15/11 (1) | | | | $ | 3,900 | | $ | 3,856,367 |
5.30%, 10/15/11 | | | | | 650 | | | 689,988 |
| | | | | | | | |
| | | | | | | | 52,378,737 |
| | | | | | | | |
CHEMICALS – 0.3% |
The Dow Chemical Co. 4.85%, 8/15/12 | | | | | 1,000 | | | 1,050,961 |
| | | | | | | | |
ELECTRIC UTILITIES – 0.1% |
Electricite de France 6.50%, 1/26/19 (3) | | FR | | | 400 | | | 449,047 |
| | | | | | | | |
FINANCIALS – 4.8% |
American Express Co. 7.00%, 3/19/18 | | | | | 700 | | | 770,890 |
American Express Credit Corp.
1.63%, 5/27/10 (1) | | | | | 1,100 | | | 1,104,430 |
Citigroup Funding, Inc., Series D
1.33%, 5/7/10 (1) | | | | | 4,000 | | | 4,009,136 |
Countrywide Financial Corp. 5.80%, 6/7/12 | | | | | 2,100 | | | 2,229,173 |
General Electric Capital Corp., Series A
0.48%, 1/8/16 (1) | | | | | 100 | | | 90,659 |
6.15%, 8/7/37 | | | | | 100 | | | 94,432 |
6.88%, 1/10/39 | | | | | 800 | | | 826,148 |
International Lease Finance Corp.
5.40%, 2/15/12 | | | | | 3,700 | | | 3,217,346 |
LeasePlan Corp. NV
3.00%, 5/7/12 (3) | | NL | | | 1,000 | | | 1,023,919 |
3.13%, 2/10/12 | | NL | | | 200 | | | 293,241 |
SLM Corp.
4.75%, 3/17/14 | | | | | 100 | | | 122,569 |
SLM Corp., Series A
0.45%, 3/15/11 (1) | | | | | 1,800 | | | 1,694,765 |
0.58%, 1/27/14 (1) | | | | | 500 | | | 385,702 |
The Goldman Sachs Group, Inc.
0.46%, 2/6/12 (1) | | | | | 200 | | | 198,508 |
0.70%, 3/22/16 (1) | | | | | 600 | | | 552,565 |
6.15%, 4/1/18 | | | | | 1,100 | | | 1,177,549 |
6.25%, 9/1/17 | | | | | 700 | | | 750,690 |
| | | | | | | | |
| | | | | | | | 18,541,722 |
| | | | | | | | |
| | | | | | | | |
| | | Country
Code* | | Principal
Amount
(000) | | Value |
| | | | | | | | |
FOOD, BEVERAGES & RESTAURANTS – 0.7% |
Anheuser-Busch InBev Worldwide, Inc.
4.13%, 1/15/15 (3) | | | | $ | 1,200 | | $ | 1,218,421 |
5.38%, 1/15/20 (3) | | | | | 1,200 | | | 1,224,311 |
Tate & Lyle International Finance PLC
6.63%, 6/15/16 (3) | | GB | | | 500 | | | 518,007 |
| | | | | | | | |
| | | | | | | | 2,960,739 |
| | | | | | | | |
HEALTH CARE – 0.1% |
Roche Holdings, Inc. 6.00%, 3/1/19 (3) | | | | | 600 | | | 659,311 |
| | | | | | | | |
INSURANCE – 1.2% |
American General Finance Corp.
4.88%, 5/15/10 | | | | | 700 | | | 690,318 |
American International Group, Inc. | | | | | | | | |
0.88%, 4/26/11 (1) | | | | | 100 | | | 130,961 |
5.05%, 10/1/15 | | | | | 100 | | | 83,425 |
5.45%, 5/18/17 | | | | | 100 | | | 80,931 |
8.25%, 8/15/18 | | | | | 1,000 | | | 938,850 |
Metropolitan Life Global Funding I
0.85%, 9/17/10 (1)(3) | | | | | 2,800 | | | 2,802,231 |
| | | | | | | | |
| | | | | | | | 4,726,716 |
| | | | | | | | |
INVESTMENT COMPANIES – 0.1% | | | |
Temasek Financial I Ltd.
4.30%, 10/25/19 (3) | | SG | | | 300 | | | 293,570 |
| | | | | | | | |
METALS & MINERALS – 0.1% |
Gerdau Holdings, Inc.
7.00%, 1/20/20 (3) | | BR | | | 200 | | | 205,500 |
| | | | | | | | |
OIL & GAS – 0.3% | | | |
Shell International Finance B.V.
6.38%, 12/15/38 | | NL | | | 1,000 | | | 1,127,378 |
| | | | | | | | |
PIPELINES – 0.1% | | | |
El Paso Corp.
7.88%, 6/15/12 | | | | | 400 | | | 414,422 |
| | | | | | | | |
REFINING – 0.4% | | | |
Petrobras International Finance Co.
7.88%, 3/15/19 | | KY | | | 1,300 | | | 1,498,656 |
| | | | | | | | |
See Notes to Financial Statements.
165
PIMCO TOTAL RETURN FUND
| | |
PORTFOLIO OF INVESTMENTS (Continued) December 31, 2009 | | Sun Capital Advisers Trust |
| | | | | | | | |
| | | Country
Code* | | Principal
Amount
(000) | | Value |
| | | | | | | | |
| | | | | | | | |
SPECIAL PURPOSE BANKS – 0.3% | | | |
The Export-Import Bank of Korea | | | | | | | | |
5.88%, 1/14/15 | | KR | | $ | 900 | | $ | 965,801 |
8.13%, 1/21/14 | | KR | | | 400 | | | 464,355 |
| | | | | | | | |
| | | | | | | | 1,430,156 |
| | | | | | | | |
TELECOMMUNICATIONS – 0.6% | | | |
BellSouth Corp.
4.95%, 4/26/10 (3) | | | | | 1,200 | | | 1,215,116 |
Verizon Wireless Capital LLC
2.87%, 5/20/11 (1) | | | | | 1,000 | | | 1,033,936 |
| | | | | | | | |
| | | | | | | | 2,249,052 |
| | | | | | | | |
TRANSPORTATION – 0.1% | | | |
Ryder System, Inc.
6.00%, 3/1/13 | | | | | 400 | | | 420,496 |
| | | | | | | | |
UTILITIES – 0.5% | | | |
Centrais Eletricas Brasileiras SA
6.88%, 7/30/19 (3) | | BR | | | 1,600 | | | 1,734,000 |
MidAmerican Energy Holdings Co.
6.13%, 4/1/36 | | | | | 300 | | | 307,258 |
| | | | | | | | |
| | | | | | | | 2,041,258 |
| | | | | | | | |
Total Corporate Debt Obligations
(Cost $86,614,467) | | | 91,874,310 |
| | | | | | | | |
FOREIGN GOVERNMENT AGENCY OBLIGATIONS – 0.8% | | | |
Societe Financement de l’Economie Francaise | | | | | | | | |
0.48%, 7/16/12 (1)(3) | | FR | | | 1,000 | | | 1,005,000 |
3.38%, 5/5/14 (3) | | FR | | | 2,100 | | | 2,140,866 |
| | | | | | | | |
Total Foreign Government Agency Obligations
(Cost $3,092,865) | | | 3,145,866 |
| | | | | | | | |
FOREIGN GOVERNMENT OBLIGATIONS – 0.1% |
United Mexican States, Series A
6.05%, 1/11/40
(Cost $200,199) | | MX | | | 200 | | | 192,260 |
| | | | | | | | |
MUNICIPAL BONDS – 0.4% | | | |
Metropolitan Transportation Authority
7.34%, 11/15/39 | | | | | 1,100 | | | 1,225,675 |
| | | | | | | | |
| | | Country
Code* | | Principal
Amount
(000) | | Value |
| | | | | | | | |
State Of Louisiana
3.00%, 5/1/43 (1) | | | | $ | 400 | | $ | 396,544 |
| | | | | | | | |
Total Municipal Bonds
(Cost $1,500,000) | | | 1,622,219 |
| | | | | | | | |
U.S. GOVERNMENT GUARANTEED NOTES – 1.3% |
TLGP Citibank NA | | | | | | | | |
1.88%, 5/7/12 | | | | | 2,100 | | | 2,111,174 |
1.88%, 6/4/12 | | | | | 100 | | | 100,573 |
TLGP Citigroup Funding, Inc.
2.25%, 12/10/12 | | | | | 300 | | | 302,355 |
TLGP Citigroup, Inc.
2.13%, 4/30/12 | | | | | 1,200 | | | 1,212,850 |
TLGP General Electric Capital Corp. | | | | | | | | |
2.00%, 9/28/12 | | | | | 600 | | | 600,776 |
3.00%, 12/9/11 | | | | | 500 | | | 515,411 |
TLGP Morgan Stanley
3.25%, 12/1/11 | | | | | 300 | | | 311,198 |
| | | | | | | | |
Total U.S. Government Guaranteed Notes
(Cost $5,155,600) | | | 5,154,337 |
| | | | | | | | |
U.S. TREASURY AND U.S. GOVERNMENT AGENCY OBLIGATIONS – 46.5% |
Federal Home Loan Bank
1.00%, 12/28/11 | | | | | 100 | | | 99,580 |
Federal Home Loan Mortgage Corp. |
1.13%, 6/1/11 | | | | | 1,600 | | | 1,605,491 |
1.13%, 12/15/11 | | | | | 200 | | | 199,379 |
5.00%, 4/18/17 | | | | | 1,300 | | | 1,411,615 |
5.50%, 4/1/37 | | | | | 184 | | | 192,544 |
5.50%, 7/1/37 | | | | | 579 | | | 607,487 |
5.50%, 8/1/37 | | | | | 312 | | | 326,946 |
5.50%, 8/1/38 | | | | | 755 | | | 792,185 |
5.50%, TBA | | | | | 2,000 | | | 2,095,000 |
Federal National Mortgage Association |
5.00%, TBA | | | | | 1,000 | | | 1,026,094 |
5.50%, 2/1/34 | | | | | 17 | | | 17,501 |
5.50%, 3/1/36 | | | | | 556 | | | 582,622 |
5.50%, 8/1/36 | | | | | 22 | | | 23,133 |
5.50%, 12/1/36 | | | | | 14 | | | 14,431 |
5.50%, 8/1/37 | | | | | 16 | | | 16,275 |
5.50%, 6/1/38 | | | | | 588 | | | 616,184 |
5.50%, TBA | | | | | 11,000 | | | 11,513,909 |
6.00%, 9/1/34 | | | | | 25 | | | 27,068 |
6.00%, 8/1/36 | | | | | 485 | | | 514,990 |
6.00%, 10/1/36 | | | | | 19 | | | 20,545 |
See Notes to Financial Statements.
166
PIMCO TOTAL RETURN FUND
| | |
PORTFOLIO OF INVESTMENTS (Continued) December 31, 2009 | | Sun Capital Advisers Trust |
| | | | | | | | |
| | | Country
Code* | | Principal
Amount
(000) | | Value |
| | | | | | | | |
| | | | | | | | |
6.00%, 12/1/36 | | | | $ | 655 | | $ | 696,078 |
6.00%, 1/1/37 | | | | | 186 | | | 197,117 |
6.00%, 8/1/37 | | | | | 680 | | | 721,485 |
6.00%, 9/1/37 | | | | | 360 | | | 381,500 |
6.00%, 8/1/38 (6) | | | | | 1,611 | | | 1,710,952 |
6.00%, TBA | | | | | 34,000 | | | 36,008,108 |
6.50%, TBA | | | | | 2,000 | | | 2,141,876 |
Government National Mortgage Association |
5.50%, 2/15/37 | | | | | 842 | | | 883,404 |
6.00%, 6/15/36 | | | | | 327 | | | 345,990 |
6.00%, 2/15/38 | | | | | 455 | | | 480,760 |
6.00%, 8/15/38 | | | | | 583 | | | 616,903 |
6.00%, 10/15/38 | | | | | 4,472 | | | 4,729,311 |
6.00%, TBA | | | | | 11,000 | | | 11,622,182 |
6.50%, 12/15/37 | | | | | 639 | | | 679,720 |
6.50%, 8/15/38 | | | | | 681 | | | 724,151 |
U.S. Treasury Bonds | | | | | | | | |
3.50%, 2/15/39 | | | | | 1,000 | | | 819,062 |
4.25%, 5/15/39 | | | | | 2,100 | | | 1,970,062 |
4.38%, 2/15/38 | | | | | 1,400 | | | 1,344,000 |
4.38%, 11/15/39 (6) | | | | | 4,500 | | | 4,307,346 |
4.50%, 5/15/38 | | | | | 400 | | | 391,688 |
4.50%, 8/15/39 (6) | | | | | 4,300 | | | 4,202,579 |
4.75%, 2/15/37 | | | | | 200 | | | 204,375 |
U.S. Treasury Notes | | | | | | | | |
1.00%, 7/31/11 | | | | | 12,200 | | | 12,218,581 |
1.00%, 8/31/11 | | | | | 57,700 | | | 57,729,312 |
1.00%, 9/30/11 | | | | | 7,600 | | | 7,597,925 |
1.00%, 10/31/11 (6) | | | | | 2,300 | | | 2,297,930 |
2.63%, 12/31/14 | | | | | 2,300 | | | 2,293,441 |
2.75%, 11/30/16 | | | | | 1,800 | | | 1,732,921 |
| | | | | | | | |
Total U.S. Treasury and U.S. Government Agency Obligations
(Cost $181,387,471) | | | 180,751,738 |
| | | | | | | | |
| | | | | Shares | | |
CONVERTIBLE PREFERRED STOCKS – 0.1% |
BANKS – 0.1% | | | | | | | | |
Wells Fargo & Co., Series L
7.50%, Perpetual
(Cost $129,360) | | | | | 200 | | | 183,600 |
| | | | | | | | |
| | | | | | | | |
| | | Country
Code* | | Principal
Amount
(000) | | Value |
| | | | | | | | |
SHORT TERM INVESTMENTS – 39.9% |
U.S. TREASURY AND U.S. GOVERNMENT AGENCY OBLIGATIONS (4) – 39.3% |
Federal Home Loan Bank Discount Notes |
0.05%, 1/22/10 | | | | $ | 17,600 | | $ | 17,599,487 |
0.07%, 2/3/10 | | | | | 1,500 | | | 1,499,931 |
0.08%, 1/8/10 | | | | | 6,300 | | | 6,299,951 |
0.08%, 1/6/10 | | | | | 1,400 | | | 1,399,988 |
0.09%, 1/15/10 | | | | | 1,900 | | | 1,899,978 |
0.09%, 1/27/10 | | | | | 900 | | | 899,944 |
0.09%, 2/19/10 | | | | | 2,700 | | | 2,699,761 |
0.10%, 1/8/10 | | | | | 2,400 | | | 2,399,963 |
0.88%, 1/4/10 | | | | | 1,200 | | | 1,199,987 |
Federal Home Loan Mortgage Corp. Discount Notes |
0.05%, 1/11/10 | | | | | 1,400 | | | 1,399,984 |
0.06%, 1/25/10 | | | | | 1,800 | | | 1,799,964 |
0.09%, 1/25/10 | | | | | 2,400 | | | 2,399,952 |
0.10%, 1/12/10 | | | | | 1,400 | | | 1,399,957 |
0.14%, 3/2/10 | | | | | 900 | | | 899,928 |
0.14%, 2/18/10 | | | | | 5,500 | | | 5,499,560 |
0.14%, 2/23/10 | | | | | 2,600 | | | 2,599,598 |
0.15%, 3/2/10 | | | | | 3,200 | | | 3,199,744 |
0.16%, 2/23/10 | | | | | 6,700 | | | 6,698,767 |
0.19%, 1/21/10 | | | | | 5,600 | | | 5,599,876 |
0.19%, 2/23/10 | | | | | 4,700 | | | 4,699,066 |
0.20%, 2/23/10 | | | | | 1,246 | | | 1,245,688 |
0.20%, 1/20/10 (6) | | | | | 6 | | | 5,999 |
0.25%, 3/22/10 | | | | | 1,700 | | | 1,699,813 |
0.68%, 1/5/10 (6) | | | | | 146 | | | 145,997 |
Federal National Mortgage Association Discount Notes |
0.07%, 2/1/10 | | | | | 4,000 | | | 3,999,768 |
0.07%, 2/4/10 | | | | | 1,900 | | | 1,899,874 |
0.09%, 1/11/10 | | | | | 7,700 | | | 7,699,925 |
0.09%, 1/20/10 | | | | | 5,900 | | | 5,899,969 |
0.11%, 1/19/10 | | | | | 14,600 | | | 14,599,708 |
0.13%, 2/17/10 | | | | | 800 | | | 799,929 |
0.13%, 2/5/10 | | | | | 17,300 | | | 17,299,159 |
0.14%, 3/15/10 | | | | | 1,200 | | | 1,199,880 |
0.16%, 4/7/10 | | | | | 200 | | | 199,948 |
0.18%, 4/19/10 | | | | | 2,700 | | | 2,699,217 |
0.18%, 5/5/10 | | | | | 1,500 | | | 1,499,400 |
0.19%, 4/14/10 | | | | | 1,400 | | | 1,399,608 |
0.21%, 3/10/10 | | | | | 3,100 | | | 3,099,721 |
0.23%, 3/10/10 | | | | | 3,400 | | | 3,399,694 |
See Notes to Financial Statements.
167
PIMCO TOTAL RETURN FUND
| | |
PORTFOLIO OF INVESTMENTS (Continued) December 31, 2009 | | Sun Capital Advisers Trust |
| | | | | | | | |
| | | Country
Code* | | Principal
Amount
(000) | | Value |
| | | | | | | | |
| | | | | | | | |
0.43%, 1/19/10 | | | | $ | 9,500 | | $ | 9,499,525 |
U.S. Treasury Bills | | | | | | | | |
0.01%, 4/1/10(6) | | | | | 103 | | | 102,986 |
0.07%, 3/18/10 (5) | | | | | 260 | | | 259,974 |
0.12%, 3/18/10 (6) | | | | | 453 | | | 452,955 |
0.14%, 4/1/10 | | | | | 1,300 | | | 1,299,818 |
| | | | | | | | |
Total U.S. Treasury and U.S. Government Agency Obligations
(Cost $152,499,689) | | | 152,503,941 |
| | | | | | | | |
MUTUAL FUNDS – 0.6% |
State Street Institutional U.S. Government Money Market Fund
(Cost $2,485,472) | | | 2,485,472 | | | 2,485,472 |
| | | | | | | | |
Total Short Term Investments
(Cost $154,985,161) | | | 154,989,413 |
| | | | | | | | |
| | | | |
| | |
Value | |
| | | | |
TOTAL INVESTMENTS – 115.8% | | | | |
(Cost $443,732,394) | | $ | 450,095,104 | |
Liabilities in excess of other assets – (15.8)% | | | (61,540,530 | ) |
| | | | |
NET ASSETS – 100.0% | | $ | 388,554,574 | |
| | | | |
| * | Unless otherwise noted the issuer country code for all securities is United States. |
| (1) | Variable rate security. The interest rate shown reflects the rate in effect at the period end. |
| (2) | Security is a “Step-up” bond where the coupon increases on a predetermined future date. |
| (3) | Eligible for resale under rule 144A of the Securities Act of 1933. These securities may be resold in transactions |
| | exempt from registration, normally to qualified institutional buyers. At the period end, the value of these securities amounted to $39,550,394, representing 10.2% of net assets. |
| (4) | Interest rates represent annualized yield at date of purchase. |
| (5) | Security (or a portion thereof) has been pledged as collateral for open swap and swaption contracts. At the period end, the value of the security pledged amounted to $259,974. |
| | |
| TBA | | To Be Announced. Securities are purchased on a forward commitment basis with an approximate principal amount and no definite maturity date. The actual principal and maturity date will be determined upon settlement when the specific mortgage pools are assigned. At the period end, total market value of the TBA securities amounts to $64,407,169 which represents approximately 16.6% of net assets. |
| GDR | | Global Depositary Receipt |
| TLGP | | Temporary Liquidity Guarantee Program. Under the Temporary Liquidity Guarantee Program, the Federal Deposit Insurance Corporation guarantees principal and interest in the event of payment default or bankruptcy until the earlier of maturity date of the debt or until June 30, 2012. |
| |
| AU | | Australia |
| BR | | Brazil |
| DE | | Germany |
| DK | | Denmark |
| FR | | France |
| GB | | Great Britain |
| IT | | Italy |
| KR | | Korea, Republic Of |
| KY | | Cayman Islands |
| MX | | Mexico |
| NL | | Netherlands |
| SE | | Sweden |
| SG | | Singapore |
See Notes to Financial Statements.
168
PIMCO TOTAL RETURN FUND
| | |
PORTFOLIO OF INVESTMENTS (Continued) December 31, 2009 | | Sun Capital Advisers Trust |
| (6) | At the period end, securities (or portions thereof) with an aggregate market value of $1,423,761 and cash of $81,000 have been pledged to cover margin requirements for the following open futures contracts: |
| | | | | | | | | | | | | |
Type | | Description | | Expiration
Date | | Contracts | | Aggregate
Face
Value ($) | | Aggregate
Notional
Value ($) | | Unrealized
Appreciation/
(Depreciation) ($) | |
Long | | 90-Day Euribor March Futures | | 3/15/10 | | 4 | | 1,409,878 | | 1,422,583 | | 12,705 | |
Long | | 90-Day Eurodollar June Futures | | 6/14/10 | | 259 | | 64,146,838 | | 64,309,700 | | 162,862 | |
Long | | 90-Day Eurodollar March Futures | | 3/15/10 | | 212 | | 52,634,363 | | 52,811,850 | | 177,487 | |
Long | | 90-Day Eurodollar September Futures | | 9/13/10 | | 83 | | 20,336,537 | | 20,521,750 | | 185,213 | |
Long | | German Euro-Bobl March Futures | | 3/8/10 | | 144 | | 24,078,979 | | 23,875,832 | | (203,147 | ) |
Long | | German Euro-Bund March Futures | | 3/8/10 | | 57 | | 10,052,035 | | 9,902,719 | | (149,316 | ) |
Long | | U.S. Treasury 10 Year Note March Futures | | 3/22/10 | | 92 | | 10,987,609 | | 10,621,687 | | (365,922 | ) |
Long | | U.S. Treasury 2 Year Note March Futures | | 3/31/10 | | 226 | | 49,107,719 | | 48,876,032 | | (231,687 | ) |
Long | | U.S. Treasury 5 Year Note March Futures | | 3/31/10 | | 1 | | 117,258 | | 114,383 | | (2,875 | ) |
Long | | United Kingdom 90-Day LIBOR Sterling Interest Rate December Futures | | 12/15/10 | | 8 | | 1,571,187 | | 1,582,574 | | 11,387 | |
Long | | United Kingdom 90-Day LIBOR Sterling Interest Rate June Futures | | 6/16/10 | | 10 | | 1,974,834 | | 1,998,811 | | 23,977 | |
Long | | United Kingdom 90-Day LIBOR Sterling Interest Rate September Futures | | 9/15/10 | | 26 | | 5,123,071 | | 5,172,237 | | 49,166 | |
| | | | | | | | | | | | | |
Net unrealized depreciation | | | | | | | | | | (330,150 | ) |
| | | | | | | | | | | | | |
| (7) | At the period end, open written options on foreign futures contracts were as follows: |
| | | | | | | | | | | | | |
Type | | Description | | Counterparty | | Expiration
Date | | Strike
Price ($) | | Number of
Contracts | | Unrealized
Appreciation/
(Depreciation) ($) | |
Call | | German Euro-Bund March Futures | | Credit Suisse Securities
LLC | | 2/26/10 | | 125 | | 2 | | 1,348 | |
Put | | German Euro-Bund March Futures | | Credit Suisse Securities
LLC | | 2/26/10 | | 121 | | 2 | | (1,821 | ) |
| | | | | | | | | | | | | |
Net unrealized depreciation | | | | | | | | 4 | | (473 | ) |
| | | | | | | | | | | | | |
| (8) | At the period end, open forward foreign currency exchange contracts were as follows: |
| | | | | | | | | | | | | | | | | |
Contracts to Deliver | | | | In Exchange For | | | | Settlement
Date | | | | Unrealized
Appreciation/
(Depreciation) ($) | |
| EUR | | 1,114,000 | | | | USD | | 1,681,026 | | | | 1/8/10 | | | | 84,058 | |
| EUR | | 721,000 | | | | USD | | 1,046,871 | | | | 1/26/10 | | | | 13,311 | |
| EUR | | 343,000 | | | | USD | | 489,346 | | | | 1/26/10 | | | | (2,347 | ) |
| EUR | | 250,000 | | | | USD | | 358,464 | | | | 1/26/10 | | | | 86 | |
| GBP | | 119,000 | | | | USD | | 197,916 | | | | 1/13/10 | | | | 5,716 | |
See Notes to Financial Statements.
169
PIMCO TOTAL RETURN FUND
| | |
PORTFOLIO OF INVESTMENTS (Continued) December 31, 2009 | | Sun Capital Advisers Trust |
| | | | | | | | | | | | | | | | | |
Contracts to Deliver | | | | In Exchange For | | | | Settlement
Date | | | | Unrealized
Appreciation/
(Depreciation) ($) | |
| GBP | | 26,000 | | | | USD | | 41,756 | | | | 1/13/10 | | | | (238 | ) |
| GBP | | 89,000 | | | | USD | | 142,872 | | | | 1/13/10 | | | | (875 | ) |
| GBP | | 26,000 | | | | USD | | 41,745 | | | | 1/13/10 | | | | (248 | ) |
| JPY | | 59,572,000 | | | | USD | | 665,663 | | | | 1/25/10 | | | | 25,963 | |
| USD | | 627,315 | | | | BRL | | 1,207,269 | | | | 2/2/10 | | | | 62,042 | |
| USD | | 484,000 | | | | BRL | | 892,012 | | | | 2/2/10 | | | | 25,344 | |
| USD | | 116,486 | | | | CAD | | 124,000 | | | | 1/21/10 | | | | 2,081 | |
| USD | | 26,000 | | | | CNY | | 176,722 | | | | 8/25/10 | | | | 13 | |
| USD | | 62,000 | | | | CNY | | 421,507 | | | | 8/25/10 | | | | 45 | |
| USD | | 38,750 | | | | CNY | | 263,306 | | | | 8/25/10 | | | | 8 | |
| USD | | 122,000 | | | | CNY | | 828,380 | | | | 8/25/10 | | | | (63 | ) |
| USD | | 12,000 | | | | CNY | | 81,540 | | | | 8/25/10 | | | | 3 | |
| USD | | 38,750 | | | | CNY | | 263,384 | | | | 8/25/10 | | | | 20 | |
| USD | | 38,750 | | | | CNY | | 263,345 | | | | 8/25/10 | | | | 14 | |
| USD | | 38,750 | | | | CNY | | 263,345 | | | | 8/25/10 | | | | 14 | |
| USD | | 1,440,000 | | | | CNY | | 9,698,400 | | | | 8/25/10 | | | | (12,405 | ) |
| USD | | 22,000 | | | | CNY | | 146,168 | | | | 8/25/10 | | | | (484 | ) |
| USD | | 44,000 | | | | CNY | | 292,468 | | | | 8/25/10 | | | | (949 | ) |
| USD | | 44,000 | | | | CNY | | 292,732 | | | | 8/25/10 | | | | (910 | ) |
| USD | | 22,000 | | | | CNY | | 146,168 | | | | 8/25/10 | | | | (484 | ) |
| USD | | 54,000 | | | | CNY | | 359,181 | | | | 8/25/10 | | | | (1,129 | ) |
| USD | | 242,000 | | | | IDR | | 2,365,550,000 | | | | 1/22/10 | | | | 8,983 | |
| USD | | 30,000 | | | | IDR | | 305,100,000 | | | | 10/7/10 | | | | 880 | |
| USD | | 120,000 | | | | IDR | | 1,219,260,000 | | | | 10/7/10 | | | | 3,404 | |
| USD | | 30,000 | | | | IDR | | 305,100,000 | | | | 10/7/10 | | | | 880 | |
| USD | | 120,000 | | | | KRW | | 141,144,000 | | | | 2/11/10 | | | | 1,544 | |
| USD | | 240,000 | | | | KRW | | 282,384,000 | | | | 2/11/10 | | | | 3,170 | |
| USD | | 97,131 | | | | KRW | | 114,595,000 | | | | 2/11/10 | | | | 1,551 | |
| USD | | 97,294 | | | | KRW | | 114,885,000 | | | | 2/11/10 | | | | 1,637 | |
| USD | | 54,418 | | | | KRW | | 64,937,285 | | | | 7/28/10 | | | | 1,846 | |
| USD | | 55,002 | | | | KRW | | 64,891,372 | | | | 7/28/10 | | | | 1,222 | |
| USD | | 91,220 | | | | KRW | | 107,881,000 | | | | 7/28/10 | | | | 2,252 | |
| USD | | 54,852 | | | | KRW | | 65,000,000 | | | | 7/28/10 | | | | 1,466 | |
| USD | | 213,735 | | | | KRW | | 254,708,000 | | | | 8/27/10 | | | | 7,037 | |
| USD | | 219,337 | | | | KRW | | 258,225,000 | | | | 8/27/10 | | | | 4,484 | |
| USD | | 99,185 | | | | KRW | | 116,126,000 | | | | 11/12/10 | | | | 1,615 | |
| USD | | 54,362 | | | | KRW | | 63,481,093 | | | | 11/12/10 | | | | 741 | |
| USD | | 488,365 | | | | MXN | | 6,516,745 | | | | 4/22/10 | | | | 3,468 | |
| USD | | 10,706 | | | | MYR | | 36,000 | | | | 2/12/10 | | | | (208 | ) |
| USD | | 10,953 | | | | MYR | | 37,000 | | | | 2/12/10 | | | | (164 | ) |
| USD | | 10,947 | | | | MYR | | 37,149 | | | | 2/12/10 | | | | (114 | ) |
| USD | | 10,991 | | | | MYR | | 37,149 | | | | 2/12/10 | | | | (158 | ) |
| USD | | 10,853 | | | | MYR | | 37,317 | | | | 2/12/10 | | | | 29 | |
| USD | | 18,514 | | | | MYR | | 63,324 | | | | 2/12/10 | | | | (48 | ) |
| USD | | 13,692 | | | | MYR | | 46,900 | | | | 2/12/10 | | | | (15 | ) |
| USD | | 110,000 | | | | MYR | | 382,415 | | | | 6/14/10 | | | | 996 | |
| USD | | 100,000 | | | | MYR | | 347,700 | | | | 6/14/10 | | | | 920 | |
| USD | | 8,704 | | | | MYR | | 29,829 | | | | 6/14/10 | | | | (46 | ) |
| USD | | 17,289 | | | | SGD | | 24,000 | | | | 2/11/10 | | | | (212 | ) |
| USD | | 17,962 | | | | SGD | | 25,000 | | | | 3/17/10 | | | | (179 | ) |
See Notes to Financial Statements.
170
PIMCO TOTAL RETURN FUND
| | |
PORTFOLIO OF INVESTMENTS (Continued) December 31, 2009 | | Sun Capital Advisers Trust |
| | | | | | | | | | | | | | | | | |
Contracts to Deliver | | | | In Exchange For | | | | Settlement
Date | | | | Unrealized
Appreciation/
(Depreciation) ($) | |
| USD | | 23,000 | | | | SGD | | 31,941 | | | | 3/17/10 | | | | (280 | ) |
| USD | | 9,557 | | | | SGD | | 13,295 | | | | 3/17/10 | | | | (100 | ) |
| USD | | 28,846 | | | | SGD | | 40,000 | | | | 6/16/10 | | | | (410 | ) |
| USD | | 30,460 | | | | TWD | | 966,662 | | | | 6/10/10 | | | | 704 | |
| USD | | 27,636 | | | | TWD | | 879,000 | | | | 6/10/10 | | | | 702 | |
| USD | | 23,540 | | | | TWD | | 748,210 | | | | 6/10/10 | | | | 582 | |
| USD | | 10,679 | | | | TWD | | 335,000 | | | | 10/12/10 | | | | 237 | |
| USD | | 3,869 | | | | TWD | | 121,000 | | | | 10/12/10 | | | | 74 | |
| USD | | 800 | | | | TWD | | 24,868 | | | | 10/12/10 | | | | 10 | |
| | | | | | | | | | | | | | | | | |
Net unrealized appreciation | | | | | | 247,086 | |
| | | | | | | | | | | | | | | | | |
| | | | |
| BRL | | – | | Brazilian Real |
| CAD | | – | | Canadian Dollar |
| CNY | | – | | Yuan Renminbi |
| EUR | | – | | Euro |
| GBP | | – | | Great British Pound |
| IDR | | – | | Indonesian Rupiah |
| JPY | | – | | Japanese Yen |
| KRW | | – | | South Korean Won |
| MXN | | – | | Mexican Peso |
| MYR | | – | | Malaysian Ringgit |
| SGD | | – | | Singapore Dollar |
| TWD | | – | | New Taiwan Dollar |
| USD | | – | | United States Dollar |
(9) At the period end, open written option contracts were as follows:
| | | | | | | | | | | | |
Type | | Description | | Counterparty | | Expiration
Date | | Strike
Price ($) | | Number of
Contracts | | Value ($) |
Call | | OTC -USD vs. JPY | | Citibank NA | | 2/19/10 | | 95 | | 1,100,000 | | 15,510 |
Put | | OTC -USD vs. JPY | | Citibank NA | | 2/19/10 | | 88 | | 1,100,000 | | 4,180 |
Call | | U.S. Treasury 10 Year Note March Futures | | JP Morgan Chase Bank, NA | | 2/19/10 | | 119 | | 2 | | 250 |
Call | | U.S. Treasury 10 Year Note March Futures | | Multiple | | 2/19/10 | | 120 | | 146 | | 6,844 |
Call | | U.S. Treasury 10 Year Note March Futures | | Multiple | | 2/19/10 | | 121 | | 26 | | 406 |
Put | | U.S. Treasury 10 Year Note March Futures | | Multiple | | 2/19/10 | | 116 | | 27 | | 38,812 |
Put | | U.S. Treasury 10 Year Note March Futures | | Multiple | | 2/19/10 | | 115 | | 109 | | 105,594 |
| | | | | | | | | | | | |
(Written Option Premium $154,585) | | | | | | | | 2,200,310 | | 171,596 |
| | | | | | | | | | | | |
See Notes to Financial Statements.
171
PIMCO TOTAL RETURN FUND
| | |
PORTFOLIO OF INVESTMENTS (Continued) December 31, 2009 | | Sun Capital Advisers Trust |
(10) At the period end, open written interest rate swaption contracts were as follows:
| | | | | | | | | | | | | | | | |
Type | | Description | | Counterparty | | Pay/Receive
Floating Rate | | Floating
Rate | | Exercise
Rate | | Expiration
Date | | Notional
Amount
(000) ($) | | Value ($) |
Call | | OTC -10 Year Interest Rate Swap | | Bank of America NA | | Receive | | 3-Month
USD-LIBOR | | 3.25% | | 2/17/10 | | 500 | | 161 |
Put | | OTC -10 Year Interest Rate Swap | | Bank of America NA | | Pay | | 3-Month
USD-LIBOR | | 4.00% | | 2/17/10 | | 500 | | 8,254 |
Call | | OTC -10 Year Interest Rate Swap | | Bank of America NA | | Receive | | 3-Month
USD-LIBOR | | 3.25% | | 4/19/10 | | 10,900 | | 19,860 |
Put | | OTC -10 Year Interest Rate Swap | | Bank of America NA | | Pay | | 3-Month
USD-LIBOR | | 4.25% | | 4/19/10 | | 3,800 | | 72,046 |
Put | | OTC -10 Year Interest Rate Swap | | Bank of America NA | | Pay | | 3-Month
USD-LIBOR | | 5.00% | | 4/19/10 | | 8,100 | | 38,783 |
Call | | OTC -10 Year Interest Rate Swap | | Barclays Bank PLC | | Receive | | 3-Month
USD-LIBOR | | 3.25% | | 4/19/10 | | 2,000 | | 3,644 |
Put | | OTC -10 Year Interest Rate Swap | | Barclays Bank PLC | | Pay | | 3-Month
USD-LIBOR | | 4.25% | | 4/19/10 | | 2,000 | | 37,919 |
Call | | OTC -10 Year Interest Rate Swap | | BNP Paribas SA | | Receive | | 3-Month
USD-LIBOR | | 3.25% | | 4/19/10 | | 500 | | 911 |
Put | | OTC -10 Year Interest Rate Swap | | BNP Paribas SA | | Pay | | 3-Month
USD-LIBOR | | 4.25% | | 4/19/10 | | 2,600 | | 49,295 |
Call | | OTC -10 Year Interest Rate Swap | | Citibank NA | | Receive | | 3-Month
USD-LIBOR | | 3.25% | | 2/17/10 | | 700 | | 225 |
Put | | OTC -10 Year Interest Rate Swap | | Citibank NA | | Pay | | 3-Month
USD-LIBOR | | 4.00% | | 2/17/10 | | 700 | | 11,555 |
Put | | OTC -10 Year Interest Rate Swap | | Citibank NA | | Pay | | 3-Month
USD-LIBOR | | 4.25% | | 4/19/10 | | 1,500 | | 28,439 |
Call | | OTC -10 Year Interest Rate Swap | | Deutsche Bank AG | | Receive | | 3-Month
USD-LIBOR | | 3.25% | | 4/19/10 | | 6,300 | | 11,479 |
Call | | OTC -7 Year Interest Rate Swap | | Deutsche Bank AG | | Receive | | 3-Month
USD-LIBOR | | 2.75% | | 4/19/10 | | 200 | | 202 |
Put | | OTC -10 Year Interest Rate Swap | | Deutsche Bank AG | | Pay | | 3-Month
USD-LIBOR | | 4.25% | | 4/19/10 | | 6,700 | | 127,029 |
Put | | OTC -10 Year Interest Rate Swap | | Deutsche Bank AG | | Pay | | 3-Month
USD-LIBOR | | 5.00% | | 4/19/10 | | 600 | | 2,873 |
Put | | OTC -7 Year Interest Rate Swap | | Deutsche Bank AG | | Pay | | 3-Month
USD-LIBOR | | 4.00% | | 4/19/10 | | 200 | | 2,197 |
Call | | OTC -10 Year Interest Rate Swap | | Goldman Sachs Bank | | Receive | | 3-Month
USD-LIBOR | | 3.25% | | 2/17/10 | | 300 | | 97 |
Put | | OTC -10 Year Interest Rate Swap | | Goldman Sachs Bank | | Pay | | 3-Month
USD-LIBOR | | 4.00% | | 2/17/10 | | 2,500 | | 41,268 |
Put | | OTC -7 Year Interest Rate Swap | | Goldman Sachs Bank | | Pay | | 3-Month
USD-LIBOR | | 3.50% | | 2/17/10 | | 11,400 | | 170,245 |
Call | | OTC -10 Year Interest Rate Swap | | Goldman Sachs Bank | | Receive | | 3-Month
USD-LIBOR | | 3.25% | | 4/19/10 | | 1,000 | | 1,700 |
Put | | OTC -10 Year Interest Rate Swap | | Goldman Sachs Bank | | Pay | | 3-Month
USD-LIBOR | | 5.00% | | 4/19/10 | | 1,000 | | 4,844 |
Put | | OTC -10 Year Interest Rate Swap | | Goldman Sachs Bank | | Pay | | 3-Month
USD-LIBOR | | 4.25% | | 4/19/10 | | 8,300 | | 157,364 |
See Notes to Financial Statements.
172
PIMCO TOTAL RETURN FUND
| | |
PORTFOLIO OF INVESTMENTS (Continued) December 31, 2009 | | Sun Capital Advisers Trust |
| | | | | | | | | | | | | | | | |
Type | | Description | | Counterparty | | Pay/Receive
Floating Rate | | Floating
Rate | | Exercise
Rate | | Expiration
Date | | Notional
Amount
(000) ($) | | Value ($) |
Call | | OTC -7 Year Interest Rate Swap | | Morgan Stanley Capital Services Inc. | | Receive | | 3-Month
USD-LIBOR | | 2.80% | | 2/17/10 | | 3,000 | | 311 |
Call | | OTC -7 Year Interest Rate Swap | | Morgan Stanley Capital Services Inc. | | Receive | | 3-Month
USD-LIBOR | | 2.75% | | 4/19/10 | | 1,700 | | 1,719 |
Call | | OTC -10 Year Interest Rate Swap | | Morgan Stanley Capital Services Inc. | | Receive | | 3-Month
USD-LIBOR | | 3.25% | | 4/19/10 | | 1,100 | | 2,004 |
Put | | OTC -7 Year Interest Rate Swap | | Morgan Stanley Capital Services Inc. | | Pay | | 3-Month
USD-LIBOR | | 4.00% | | 4/19/10 | | 1,700 | | 18,670 |
Put | | OTC -10 Year Interest Rate Swap | | Morgan Stanley Capital Services Inc. | | Pay | | 3-Month
USD-LIBOR | | 5.00% | | 4/19/10 | | 1,100 | | 5,267 |
Put | | OTC -10 Year Interest Rate Swap | | Morgan Stanley Capital Services Inc. | | Pay | | 3-Month
USD-LIBOR | | 10.00% | | 7/10/12 | | 2,000 | | 10,996 |
Put | | OTC -10 Year Interest Rate Swap | | Royal Bank of Scotland PLC | | Pay | | 3-Month
USD-LIBOR | | 5.00% | | 4/19/10 | | 2,000 | | 9,576 |
Put | | OTC -10 Year Interest Rate Swap | | Royal Bank of Scotland PLC | | Pay | | 3-Month
USD-LIBOR | | 6.00% | | 8/31/10 | | 3,000 | | 16,812 |
| | | | | | | | | | | | | | | | |
(Written Swaption Premium $843,266) | | | | | | | | | | 87,900 | | 855,745 |
| | | | | | | | | | | | | | | | |
At the period end, outstanding interest rate swap contracts were as follows:
| | | | | | | | | | | | | | | | | | | |
Counterparty | | Pay/Receive
Floating Rate | | Floating Rate
Index | | Fixed
Rate | | Expiration
Date | | Notional
Amount
(000) ($) | | Market
Value ($) | | | Upfront
Premiums
Paid /(Received) ($) | | | Unrealized
Appreciation/
(Depreciation) ($) | |
Bank of America NA | | Pay | | 3-Month
USD-LIBOR | | 3.00% | | 12/16/10 | | 2,200 | | 49,922 | | | 46,002 | | | 3,920 | |
Barclays Bank PLC | | Pay | | 6-Month
EUR-EURIBOR | | 3.00% | | 6/16/15 | | 17,633 | | (75,337 | ) | | 41,923 | | | (117,260 | ) |
Deutsche Bank AG | | Pay | | 3-Month
USD-LIBOR | | 4.00% | | 12/16/14 | | 3,800 | | 185,941 | | | 67,450 | | | 118,491 | |
Deutsche Bank AG | | Pay | | 6-Month
EUR-EURIBOR | | 3.00% | | 6/16/15 | | 5,447 | | (23,275 | ) | | (1,510 | ) | | (21,765 | ) |
Goldman Sachs Bank | | Pay | | 6-Month
EUR-EURIBOR | | 3.00% | | 6/16/15 | | 1,864 | | (7,962 | ) | | (794 | ) | | (7,168 | ) |
Morgan Stanley Capital Services Inc. | | Pay | | 3-Month
USD-LIBOR | | 3.00% | | 12/16/10 | | 10,700 | | 242,801 | | | 224,245 | | | 18,556 | |
Royal Bank of Scotland PLC | | Pay | | 3-Month
CAD-CDOR | | 5.70% | | 12/18/24 | | 3,060 | | (25,421 | ) | | (2,193 | ) | | (23,228 | ) |
| | | | | | | | | | | | | | | | | | | |
Total | | | | | | | | | | 44,704 | | 346,669 | | | 375,123 | | | (28,454 | ) |
| | | | | | | | | | | | | | | | | | | |
See Notes to Financial Statements.
173
PIMCO TOTAL RETURN FUND
| | |
PORTFOLIO OF INVESTMENTS (Continued) December 31, 2009 | | Sun Capital Advisers Trust |
| | | | |
| CAD | | – | | Canadian Dollar |
| CDOR | | – | | Canadian Deposit Offered Rate |
| EUR | | – | | Euro |
| EURIBOR | | – | | Euro Interbank Offered Rate |
| LIBOR | | – | | London InterBank Offered Rate |
| USD | | – | | United States Dollar |
At the period end, outstanding credit default swap contract on corporate issue – Buy Protection (a) was as follows:
| | | | | | | | | | | | | | | | |
Counterparty | | Reference
Entity | | (Pay)/Receive
Fixed Rate | | | Expiration
Date | | Implied
Credit
Spread (b) | | | Notional
Amount (c)
(000) ($) | | Market
Value ($) | | Unrealized
Appreciation ($) |
Barclays Bank PLC | | Tate & Lyle
International
Finance
PLC | | (1.15 | )% | | 6/20/16 | | 1.20 | % | | 500 | | 1,259 | | 1,259 |
| (a) | As a buyer of protection, the Fund will generally receive from the seller of protection an amount up to the notional amount of the swap if a credit event occurs. |
| (b) | Implied credit spreads, represented in absolute terms, utilized in determining the market value of credit default swap agreements on corporate issues as of period end serve as an indicator of the current status of the payment/performance risk and represent the likelihood or risk of default for the credit derivative. The implied credit spread of a particular referenced entity reflects the cost of buying/selling protection and may include upfront payments required to be made to enter into the agreement. Wider credit spreads represent a deterioration of the referenced entity’s credit soundness and a greater likelihood or risk of default or other credit event occurring as defined under the terms of that particular agreement. |
| (c) | The maximum potential amount the Fund could be required to pay as a seller of credit protection or receive as a buyer of credit protection if a credit event occurs as defined under the terms of that particular swap agreement. |
| (12) | Fair Value Measurements † |
The following table summarizes the inputs used to value the Fund’s assets and liabilities, as applicable, measured at fair value at the period end:
| | | | | | | | | | | | |
Assets | | Quoted Prices
in Active
Markets for
Identical
Assets and
Liabilities
(Level 1) | | Significant
Other
Observable
Inputs
(Level 2) | | Significant
Unobservable
Inputs
(Level 3) | | Total |
Asset Backed Securities | | $ | — | | $ | 2,991,599 | | $ | — | | $ | 2,991,599 |
Collateralized Mortgage Obligations | | | — | | | 1,316,729 | | | — | | | 1,316,729 |
Commercial Mortgage Backed Securities | | | — | | | 7,873,033 | | | — | | | 7,873,033 |
Corporate Debt Obligations (a) | | | — | | | 91,874,310 | | | — | | | 91,874,310 |
Foreign Government Agency Obligations | | | — | | | 3,145,866 | | | — | | | 3,145,866 |
Foreign Government Obligations | | | — | | | 192,260 | | | — | | | 192,260 |
Municipal Bonds | | | — | | | 1,622,219 | | | — | | | 1,622,219 |
U.S. Government Guaranteed Notes | | | — | | | 5,154,337 | | | — | | | 5,154,337 |
U.S. Treasury and U.S. Government Agency Obligations | | | 97,109,222 | | | 83,642,516 | | | — | | | 180,751,738 |
Convertible Preferred Stocks (a) | | | 183,600 | | | — | | | — | | | 183,600 |
See Notes to Financial Statements.
174
PIMCO TOTAL RETURN FUND
| | |
PORTFOLIO OF INVESTMENTS (Continued) December 31, 2009 | | Sun Capital Advisers Trust |
| | | | | | | | | | | | | | | |
Assets (Continued) | | Quoted Prices
in Active
Markets for
Identical
Assets and
Liabilities
(Level 1) | | | Significant
Other
Observable
Inputs
(Level 2) | | | Significant
Unobservable
Inputs
(Level 3) | | Total | |
Short Term Investments | | | | | | | | | | | | | | | |
U.S. Treasury and U.S. Government Agency Obligations | | $ | 2,115,733 | | | $ | 150,388,208 | | | $ | — | | $ | 152,503,941 | |
Mutual Funds | | | 2,485,472 | | | | — | | | | — | | | 2,485,472 | |
| | | | | | | | | | | | | | | |
Total Short Term Investments | | | 4,601,205 | | | | 150,388,208 | | | | — | | | 154,989,413 | |
| | | | | | | | | | | | | | | |
Total Investments | | | 101,894,027 | | | | 348,201,077 | | | | — | | | 450,095,104 | |
| | | | | | | | | | | | | | | |
Forward Foreign Currency Exchange Contracts | | | — | | | | 269,152 | | | | — | | | 269,152 | |
| | | | | | | | | | | | | | | |
Futures and Options on Futures Contracts | | | 624,145 | | | | — | | | | — | | | 624,145 | |
| | | | | | | | | | | | | | | |
Swap Contracts | | | — | | | | 142,226 | | | | — | | | 142,226 | |
| | | | | | | | | | | | | | | |
Total | | $ | 102,518,172 | | | $ | 348,612,455 | | | $ | — | | $ | 451,130,627 | |
| | | | | | | | | | | | | | | |
| | | | |
Liabilities | | | | | | | | | | | |
Forward Foreign Currency Exchange Contracts | | $ | — | | | $ | (22,066 | ) | | $ | — | | $ | (22,066 | ) |
| | | | | | | | | | | | | | | |
Futures and Options on Futures Contracts | | | (954,768 | ) | | | — | | | | — | | | (954,768 | ) |
| | | | | | | | | | | | | | | |
Swap Contracts | | | — | | | | (169,421 | ) | | | — | | | (169,421 | ) |
| | | | | | | | | | | | | | | |
Written Option Contracts | | | (151,906 | ) | | | (19,690 | ) | | | — | | | (171,596 | ) |
| | | | | | | | | | | | | | | |
Written Swaption Contracts | | | — | | | | (855,745 | ) | | | — | | | (855,745 | ) |
| | | | | | | | | | | | | | | |
Total | | $ | (1,106,674 | ) | | $ | (1,066,922 | ) | | $ | — | | $ | (2,173,596 | ) |
| | | | | | | | | | | | | | | |
| † | See Note 2b in the Notes to Financial Statements for additional information. |
| (a) | See Portfolio of Investments for additional detailed categorizations. |
See Notes to Financial Statements.
175
AIM SMALL CAP GROWTH FUND
| | |
PORTFOLIO OF INVESTMENTS December 31, 2009 | | Sun Capital Advisers Trust |
| | | | | | | |
| | | Country
Code** | | Shares | | Value |
| | | | | | | |
| | | | | | | |
COMMON STOCKS – 96.7% | | | | | |
AEROSPACE & DEFENSE – 2.0% | | | |
Hexcel Corp.* | | | | 9,017 | | $ | 117,040 |
TransDigm Group, Inc. | | | | 5,832 | | | 276,962 |
| | | | | | | |
| | | | | | | 394,002 |
| | | | | | | |
AIR FREIGHT & LOGISTICS – 1.5% | | | |
Forward Air Corp. | | | | 5,832 | | | 146,092 |
HUB Group, Inc.* | | | | 5,832 | | | 156,472 |
| | | | | | | |
| | | | | | | 302,564 |
| | | | | | | |
AUTO COMPONENTS – 0.8% | | | |
TRW Automotive Holdings Corp.* | | | | 6,676 | | | 159,423 |
| | | | | | | |
BIOTECHNOLOGY – 3.9% | | | |
Acorda Therapeutics, Inc.* | | | | 4,379 | | | 110,439 |
BioMarin Pharmaceutical, Inc.* | | | | 8,347 | | | 157,007 |
Isis Pharmaceuticals, Inc.* | | | | 4,412 | | | 48,973 |
Martek Biosciences Corp.* | | | | 4,512 | | | 85,457 |
Myriad Genetics, Inc.* | | | | 3,002 | | | 78,352 |
OSI Pharmaceuticals, Inc.* | | | | 2,566 | | | 79,623 |
United Therapeutics Corp.* | | | | 3,801 | | | 200,123 |
| | | | | | | |
| | | | | | | 759,974 |
| | | | | | | |
CAPITAL MARKETS – 3.8% | | | |
Affiliated Managers Group, Inc.* | | | | 2,547 | | | 171,540 |
Federated Investors, Inc., Class B | | | | 5,388 | | | 148,170 |
Greenhill & Co., Inc. | | | | 2,183 | | | 175,164 |
optionsXpress Holdings, Inc. | | | | 7,054 | | | 108,984 |
Stifel Financial Corp.* | | | | 2,423 | | | 143,539 |
| | | | | | | |
| | | | | | | 747,397 |
| | | | | | | |
CHEMICALS – 1.3% | | | |
Calgon Carbon Corp.* | | | | 8,347 | | | 116,023 |
Intrepid Potash, Inc.* | | | | 4,983 | | | 145,354 |
| | | | | | | |
| | | | | | | 261,377 |
| | | | | | | |
COMMERCIAL BANKS – 2.0% | | | |
City National Corp. | | | | 2,547 | | | 116,143 |
Cullen/Frost Bankers, Inc. | | | | 2,067 | | | 103,350 |
| | | | | | | |
| | | Country
Code** | | Shares | | Value |
| | | | | | | |
SVB Financial Group* | | | | 4,268 | | $ | 177,933 |
| | | | | | | |
| | | | | | | 397,426 |
| | | | | | | |
COMMERCIAL SERVICES & SUPPLIES – 4.6% |
Corrections Corp of America* | | | | 7,626 | | | 187,218 |
Costar Group, Inc.* | | | | 5,170 | | | 215,951 |
EnergySolutions, Inc. | | | | 14,988 | | | 127,248 |
Fuel Tech, Inc.* | | | | 9,017 | | | 73,669 |
Pike Electric Corp.* | | | | 12,915 | | | 119,851 |
Tetra Tech, Inc.* | | | | 6,914 | | | 187,854 |
| | | | | | | |
| | | | | | | 911,791 |
| | | | | | | |
COMMUNICATIONS EQUIPMENT – 2.8% | | | |
Harmonic, Inc.* | | | | 20,698 | | | 131,018 |
Nice Systems, Ltd. ADR* | | IL | | 6,471 | | | 200,860 |
Polycom, Inc.* | | | | 8,433 | | | 210,572 |
| | | | | | | |
| | | | | | | 542,450 |
| | | | | | | |
CONSTRUCTION & ENGINEERING – 0.5% | | | |
Quanta Services, Inc.* | | | | 4,512 | | | 94,030 |
| | | | | | | |
CONTAINERS & PACKAGING – 1.1% | | | |
Greif, Inc., Class A | | | | 3,871 | | | 208,957 |
| | | | | | | |
ELECTRIC UTILITIES – 0.8% | | | |
ITC Holdings Corp. | | | | 3,209 | | | 167,157 |
| | | | | | | |
ELECTRICAL EQUIPMENT – 1.8% | | | |
General Cable Corp.* | | | | 5,089 | | | 149,718 |
Regal-Beloit Corp. | | | | 3,787 | | | 196,697 |
| | | | | | | |
| | | | | | | 346,415 |
| | | | | | | |
ELECTRONIC EQUIPMENT & INSTRUMENTS – 2.1% |
Cogent, Inc.* | | | | 14,890 | | | 154,707 |
Coherent, Inc.* | | | | 3,210 | | | 95,434 |
Tech Data Corp.* | | | | 3,367 | | | 157,104 |
| | | | | | | |
| | | | | | | 407,245 |
| | | | | | | |
ENERGY EQUIPMENT & SERVICES – 2.9% |
Dril-Quip, Inc.* | | | | 4,512 | | | 254,838 |
FMC Technologies, Inc.* | | | | 3,105 | | | 179,593 |
Patterson-UTI Energy, Inc. | | | | 8,899 | | | 136,600 |
| | | | | | | |
| | | | | | | 571,031 |
| | | | | | | |
FOOD PRODUCTS – 0.6% | | | |
Ralcorp Holdings, Inc.* | | | | 1,816 | | | 108,433 |
| | | | | | | |
See Notes to Financial Statements.
176
AIM SMALL CAP GROWTH FUND
| | |
PORTFOLIO OF INVESTMENTS (Continued) December 31, 2009 | | Sun Capital Advisers Trust |
| | | | | | | |
| | | Country
Code** | | Shares | | Value |
| | | | | | | |
| | | | | | | |
HEALTH CARE EQUIPMENT & SUPPLIES – 3.7% |
American Medical Systems Holdings, Inc.* | | | | 8,272 | | $ | 159,567 |
Gen-probe, Inc.* | | | | 2,639 | | | 113,213 |
Insulet Corp.* | | | | 7,385 | | | 105,458 |
Meridian Bioscience, Inc. | | | | 6,471 | | | 139,450 |
NuVasive, Inc.* | | | | 2,827 | | | 90,408 |
Zoll Medical Corp.* | | | | 4,381 | | | 117,060 |
| | | | | | | |
| | | | | | | 725,156 |
| | | | | | | |
HEALTH CARE PROVIDERS & SERVICES – 4.7% |
Chemed Corp. | | | | 3,871 | | | 185,692 |
inVentiv Health, Inc.* | | | | 7,899 | | | 127,727 |
MEDNAX, Inc.* | | | | 3,209 | | | 192,893 |
PSS World Medical, Inc.* | | | | 5,363 | | | 121,043 |
Rehabcare Group, Inc.* | | | | 4,640 | | | 141,195 |
VCA Antech, Inc.* | | | | 6,473 | | | 161,307 |
| | | | | | | |
| | | | | | | 929,857 |
| | | | | | | |
HEALTH CARE TECHNOLOGY – 0.9% | | | |
Eclipsys Corp.* | | | | 9,084 | | | 168,236 |
| | | | | | | |
HOTELS, RESTAURANTS & LEISURE – 5.8% |
Brinker International, Inc. | | | | 8,506 | | | 126,910 |
Buffalo Wild Wings, Inc.* | | | | 2,712 | | | 109,212 |
Choice Hotels, Inc. | | | | 4,512 | | | 142,850 |
Darden Restaurants, Inc. | | | | 3,755 | | | 131,688 |
Jack In The Box, Inc.* | | | | 8,347 | | | 164,185 |
P.F. Chang’s China Bistro, Inc.* | | | | 5,170 | | | 195,995 |
Penn National Gaming, Inc.* | | | | 4,013 | | | 109,073 |
WMS Industries, Inc.* | | | | 3,949 | | | 157,960 |
| | | | | | | |
| | | | | | | 1,137,873 |
| | | | | | | |
HOUSEHOLD PRODUCTS – 0.9% | | | |
Church & Dwight Co., Inc. | | | | 2,958 | | | 178,811 |
| | | | | | | |
INSURANCE – 1.3% | | | |
Brown & Brown, Inc. | | | | 5,066 | | | 91,036 |
ProAssurance Corp.* | | | | 3,209 | | | 172,355 |
| | | | | | | |
| | | | | | | 263,391 |
| | | | | | | |
INTERNET & CATALOG RETAIL – 1.6% | | | |
GSI Commerce, Inc.* | | | | 5,503 | | | 139,721 |
| | | | | | | |
| | | Country
Code** | | Shares | | Value |
| | | | | | | |
Netflix, Inc.* | | | | 3,018 | | $ | 166,413 |
| | | | | | | |
| | | | | | | 306,134 |
| | | | | | | |
INTERNET SOFTWARE & SERVICES – 4.6% |
F5 Networks, Inc.* | | | | 3,671 | | | 194,490 |
Open Text Corp.* | | CA | | 3,577 | | | 145,405 |
SonicWall, Inc.* | | | | 15,636 | | | 118,990 |
The Knot, Inc.* | | | | 11,751 | | | 118,333 |
VistaPrint NV* | | NL | | 3,161 | | | 179,102 |
Websense, Inc.* | | | | 7,914 | | | 138,178 |
| | | | | | | |
| | | | | | | 894,498 |
| | | | | | | |
IT SERVICES – 2.8% | | | |
Alliance Data Systems Corp.* | | | | 2,292 | | | 148,040 |
Global Payments, Inc. | | | | 3,209 | | | 172,837 |
SRA International, Inc.* | | | | 7,029 | | | 134,254 |
Syntel, Inc. | | | | 2,309 | | | 87,811 |
| | | | | | | |
| | | | | | | 542,942 |
| | | | | | | |
LEISURE EQUIPMENT & PRODUCTS – 0.6% |
Pool Corp. | | | | 6,094 | | | 116,273 |
| | | | | | | |
LIFE SCIENCES TOOLS & SERVICES – 1.3% |
AMAG Pharmaceuticals, Inc.* | | | | 3,078 | | | 117,056 |
Techne Corp. | | | | 1,944 | | | 133,281 |
| | | | | | | |
| | | | | | | 250,337 |
| | | | | | | |
MACHINERY – 2.8% | | | |
Bucyrus International, Inc. | | | | 3,209 | | | 180,891 |
Kaydon Corp. | | | | 2,997 | | | 107,173 |
Lindsay Manufacturing Co. | | | | 2,547 | | | 101,498 |
Wabtec Corp. | | | | 3,871 | | | 158,092 |
| | | | | | | |
| | | | | | | 547,654 |
| | | | | | | |
MEDIA – 0.7% | | | |
National CineMedia, Inc. | | | | 8,679 | | | 143,811 |
| | | | | | | |
METALS & MINING – 0.5% | | | |
Carpenter Technology Corp. | | | | 3,871 | | | 104,323 |
| | | | | | | |
MULTI-LINE RETAIL – 0.8% | | | |
Big Lots, Inc.* | | | | 5,170 | | | 149,827 |
| | | | | | | |
OIL, GAS & CONSUMABLE FUELS – 4.1% | | | |
Arena Resources, Inc.* | | | | 3,868 | | | 166,788 |
Bill Barrett Corp.* | | | | 4,057 | | | 126,214 |
Carrizo Oil & Gas, Inc.* | | | | 5,941 | | | 157,377 |
See Notes to Financial Statements.
177
AIM SMALL CAP GROWTH FUND
| | |
PORTFOLIO OF INVESTMENTS (Continued) December 31, 2009 | | Sun Capital Advisers Trust |
| | | | | | | |
| | | Country
Code** | | Shares | | Value |
| | | | | | | |
| | | | | | | |
Goodrich Petroleum Corp.* | | | | 4,963 | | $ | 120,849 |
SandRidge Energy, Inc.* | | | | 10,116 | | | 95,394 |
Whiting Petroleum Corp.* | | | | 1,898 | | | 135,612 |
| | | | | | | |
| | | | | | | 802,234 |
| | | | | | | |
PHARMACEUTICALS – 2.3% | | | |
Biovail Corp. | | CA | | 9,559 | | | 133,444 |
Medicis Pharmaceutical Corp., Class A | | | | 5,501 | | | 148,802 |
Perrigo Co. | | | | 4,147 | | | 165,216 |
| | | | | | | |
| | | | | | | 447,462 |
| | | | | | | |
REAL ESTATE INVESTMENT TRUSTS – 0.7% |
BioMed Realty Trust, Inc. | | | | 8,539 | | | 134,745 |
| | | | | | | |
ROAD & RAIL – 1.2% | | | |
Knight Transportation, Inc. | | | | 12,268 | | | 236,650 |
| | | | | | | |
SEMICONDUCTORS & SEMICONDUCTOR EQUIPMENT – 5.8% |
Advanced Energy Industries, Inc.* | | | | 11,622 | | | 175,260 |
Cabot Microelectronics Corp.* | | | | 3,628 | | | 119,579 |
Cymer, Inc.* | | | | 2,632 | | | 101,016 |
Hittite Microwave Corp.* | | | | 3,688 | | | 150,286 |
Microsemi Corp.* | | | | 8,514 | | | 151,123 |
Monolithic Power Systems, Inc.* | | | | 5,579 | | | 133,729 |
ON Semiconductor Corp.* | | | | 18,169 | | | 160,069 |
Power Integrations, Inc. | | | | 3,970 | | | 144,349 |
| | | | | | | |
| | | | | | | 1,135,411 |
| | | | | | | |
SOFTWARE – 10.8% | | | |
ANSYS, Inc.* | | | | 3,557 | | | 154,587 |
Aspen Technology, Inc.* | | | | 12,915 | | | 126,567 |
Blackboard, Inc.* | | | | 3,106 | | | 140,981 |
Commvault Systems, Inc.* | | | | 6,740 | | | 159,671 |
Informatica Corp.* | | | | 11,622 | | | 300,545 |
Lawson Software, Inc.* | | | | 21,849 | | | 145,296 |
Manhattan Associates, Inc.* | | | | 7,040 | | | 169,171 |
MICROS Systems, Inc.* | | | | 4,767 | | | 147,920 |
Pegasystems, Inc. | | | | 57 | | | 1,938 |
| | | | | | | | | |
| | | Country
Code** | | Shares | | Value | |
| | | | | | | | | |
Quality Systems, Inc. | | | | | 4,359 | | $ | 273,702 | |
Quest Software, Inc.* | | | | | 7,193 | | | 132,351 | |
SuccessFactors, Inc.* | | | | | 8,074 | | | 133,867 | |
Sybase, Inc.* | | | | | 5,154 | | | 223,683 | |
| | | | | | | | | |
| | | | | | | | 2,110,279 | |
| | | | | | | | | |
SPECIALTY RETAIL – 3.1% | | | | |
Group 1 Automotive, Inc.* | | | | | 3,897 | | | 110,480 | |
Gymboree Corp.* | | | | | 3,057 | | | 132,949 | |
Hot Topic, Inc.* | | | | | 17,062 | | | 108,514 | |
Tractor Supply Co.* | | | | | 2,209 | | | 116,989 | |
Williams-Sonoma, Inc. | | | | | 7,032 | | | 146,125 | |
| | | | | | | | | |
| | | | | | | | 615,057 | |
| | | | | | | | | |
TEXTILES, APPAREL & LUXURY GOODS – 1.5% | |
Deckers Outdoor Corp.* | | | | | 1,622 | | | 164,990 | |
Warnaco Group, Inc.* | | | | | 3,123 | | | 131,759 | |
| | | | | | | | | |
| | | | | | | | 296,749 | |
| | | | | | | | | |
TRADING COMPANIES & DISTRIBUTORS – 0.6% | |
Watsco, Inc. | | | | | 2,289 | | | 112,115 | |
| | | | | | | | | |
WIRELESS TELECOMMUNICATION SERVICES – 1.1% | |
SBA Communications Corp.* | | | | | 6,473 | | | 221,118 | |
| | | | | | | | | |
Total Common Stocks
(Cost $17,279,915) | | | 18,950,615 | |
| | | | | | | | | |
| | | | | Principal
Amount
(000) | | | |
SHORT TERM INVESTMENTS – 3.6% | |
REPURCHASE AGREEMENTS – 3.6% | |
State Street Bank and Trust Company, 0.01%, dated 12/31/09, due 1/4/10 (collateralized by $685,000 FHLB, 4.375%, 9/17/10, with a value of $712,606, total to be received $695,898) (Amortized cost $695,898) | | $ | 696 | | | 695,898 | |
| | | | | | | | | |
TOTAL INVESTMENTS – 100.3% | |
(Cost $17,975,813) | | | | | | 19,646,513 | |
Liabilities in excess of other assets – (0.3)% | | | | | | (50,301 | ) |
| | | | | | | | | |
NET ASSETS – 100.0% | | | | | $ | 19,596,212 | |
| | | | | | | | | |
See Notes to Financial Statements.
178
AIM SMALL CAP GROWTH FUND
| | |
PORTFOLIO OF INVESTMENTS (Continued) December 31, 2009 | | Sun Capital Advisers Trust |
| * | Non-income producing security. |
| ** | Unless otherwise noted the issuer country code for all securities is United States. |
| | |
| ADR | | American Depositary Receipt |
| FHLB | | Federal Home Loan Bank |
| |
| CA | | Canada |
| IL | | Israel |
| NL | | Netherlands |
| (1) | Fair Value Measurements † |
The following table summarizes the inputs used to value the Fund’s assets and liabilities, as applicable, measured at fair value at the period end:
| | | | | | | | | | | | |
Assets | | Quoted Prices
in Active
Markets for
Identical
Assets and
Liabilities
(Level 1) | | Significant
Other
Observable
Inputs
(Level 2) | | Significant
Unobservable
Inputs
(Level 3) | | Total |
Common Stocks (a) | | $ | 18,950,615 | | $ | — | | $ | — | | $ | 18,950,615 |
Short Term Investments
Repurchase Agreements | | | — | | | 695,898 | | | — | | | 695,898 |
| | | | | | | | | | | | |
Total Investments | | | 18,950,615 | | | 695,898 | | | — | | | 19,646,513 |
| | | | | | | | | | | | |
Total | | $ | 18,950,615 | | $ | 695,898 | | $ | — | | $ | 19,646,513 |
| | | | | | | | | | | | |
| † | See Note 2b in the Notes to Financial Statements for additional information. |
| (a) | See Portfolio of Investments for additional detailed categorizations. |
See Notes to Financial Statements.
179
ALLIANCEBERNSTEIN INTERNATIONAL VALUE FUND
| | |
PORTFOLIO OF INVESTMENTS December 31, 2009 | | Sun Capital Advisers Trust |
| | | | | | | |
| | | Country
Code** | | Shares | | Value |
| | | | | | | |
| | | | | | | |
COMMON STOCKS – 95.4% | | | | | |
AEROSPACE & DEFENSE – 1.7% |
BAE Systems PLC | | GB | | 64,000 | | $ | 370,412 |
Bombardier, Inc. | | CA | | 41,100 | | | 188,631 |
Rolls-Royce Group PLC* | | GB | | 53,000 | | | 412,734 |
| | | | | | | |
| | | | | | | 971,777 |
| | | | | | | |
AIR FREIGHT & LOGISTICS – 0.8% | | | |
Deutsche Post AG | | DE | | 24,480 | | | 473,120 |
| | | | | | | |
AIRLINES – 0.1% | | | |
Qantas Airways, Ltd. | | AU | | 25,200 | | | 67,236 |
| | | | | | | |
AUTO COMPONENTS – 0.7% | | | |
GKN PLC* | | GB | | 139,000 | | | 260,343 |
NGK SPARK PLUG Co., Ltd. | | JP | | 13,000 | | | 147,477 |
| | | | | | | |
| | | | | | | 407,820 |
| | | | | | | |
AUTOMOBILES – 1.5% | | | |
Bayerische Motoren Werke AG | | DE | | 8,300 | | | 377,835 |
Nissan Motor Co., Ltd.* | | JP | | 57,500 | | | 505,305 |
| | | | | | | |
| | | | | | | 883,140 |
| | | | | | | |
BEVERAGES – 1.4% | | | |
Asahi Breweries, Ltd. | | JP | | 13,000 | | | 239,425 |
Carlsberg AS, Class B | | DK | | 4,575 | | | 336,787 |
Kirin Holdings Co., Ltd. | | JP | | 13,000 | | | 208,481 |
| | | | | | | |
| | | | | | | 784,693 |
| | | | | | | |
BUILDING PRODUCTS – 0.8% | | | |
Compagnie de Saint-Gobain | | FR | | 8,100 | | | 439,395 |
| | | | | | | |
CAPITAL MARKETS – 2.0% | | | |
Credit Suisse Group AG | | CH | | 2,800 | | | 138,716 |
Deutsche Bank AG | | DE | | 9,300 | | | 657,603 |
Macquarie Group, Ltd. | | AU | | 8,100 | | | 347,055 |
| | | | | | | |
| | | | | | | 1,143,374 |
| | | | | | | |
CHEMICALS – 1.5% | | | |
BASF SE | | DE | | 4,600 | | | 284,697 |
Israel Chemicals, Ltd. | | IL | | 11,600 | | | 152,321 |
Koninklijke DSM NV | | NL | | 6,000 | | | 294,801 |
Nippon Shokubai Co., Ltd. | | JP | | 13,000 | | | 111,752 |
| | | | | | | |
| | | | | | | 843,571 |
| | | | | | | |
| | | | | | | |
| | | Country
Code** | | Shares | | Value |
| | | | | | | |
COMMERCIAL BANKS – 15.7% | | | |
Australia & New Zealand Banking Group, Ltd. | | AU | | 24,200 | | $ | 493,159 |
Banca Popolare di Milano Scarl | | IT | | 31,600 | | | 224,510 |
Banco Bilbao Vizcaya Argentaria SA | | ES | | 18,600 | | | 338,985 |
Banco do Brasil SA | | BR | | 8,100 | | | 138,179 |
Banco Santander SA | | ES | | 68,593 | | | 1,133,476 |
Bank of Queensland Ltd. | | AU | | 16,200 | | | 166,778 |
Barclays PLC | | GB | | 128,300 | | | 565,349 |
Bendigo and Adelaide Bank Ltd. | | AU | | 22,800 | | | 200,137 |
BNP Paribas | | FR | | 9,900 | | | 785,249 |
Credit Agricole SA | | FR | | 25,095 | | | 440,414 |
Danske Bank A/S* | | DK | | 15,500 | | | 347,966 |
HSBC Holdings PLC | | GB | | 47,625 | | | 543,323 |
Intesa Sanpaolo SpA* | | IT | | 39,300 | | | 176,851 |
KB Financial Group, Inc. ADR* | | KR | | 4,047 | | | 205,790 |
Lloyds Banking Group PLC* | | GB | | 506,123 | | | 407,216 |
Mitsubishi UFJ Financial Group, Inc. | | JP | | 40,100 | | | 197,524 |
National Australia Bank, Ltd. | | AU | | 21,400 | | | 522,248 |
National Bank of Canada | | CA | | 3,300 | | | 190,077 |
Societe Generale | | FR | | 7,454 | | | 517,904 |
Standard Chartered PLC | | GB | | 7,500 | | | 189,344 |
Sumitomo Mitsui Financial Group, Inc. | | JP | | 15,300 | | | 439,039 |
Turkiye Garanti Bankasi AS | | TR | | 36,100 | | | 153,783 |
UniCredit SpA* | | IT | | 182,235 | | | 609,350 |
| | | | | | | |
| | | | | | | 8,986,651 |
| | | | | | | |
COMMERCIAL SERVICES & SUPPLIES – 0.3% |
Rentokil Initial PLC* | | GB | | 80,100 | | | 149,123 |
| | | | | | | |
COMMUNICATIONS EQUIPMENT – 1.6% | | | |
Nokia Oyj | | FI | | 56,200 | | | 726,666 |
Telefonaktiebolaget LM Ericsson | | SE | | 19,400 | | | 178,597 |
| | | | | | | |
| | | | | | | 905,263 |
| | | | | | | |
COMPUTERS & PERIPHERALS – 1.1% | | | |
NEC Corp.* | | JP | | 69,000 | | | 178,359 |
Toshiba Corp.* | | JP | | 86,000 | | | 477,206 |
| | | | | | | |
| | | | | | | 655,565 |
| | | | | | | |
See Notes to Financial Statements.
180
ALLIANCEBERNSTEIN INTERNATIONAL VALUE FUND
| | |
PORTFOLIO OF INVESTMENTS (Continued) December 31, 2009 | | Sun Capital Advisers Trust |
| | | | | | | |
| | | Country
Code** | | Shares | | Value |
| | | | | | | |
| | | | | | | |
CONSTRUCTION & ENGINEERING – 0.5% | | | |
Bouygues SA | | FR | | 5,148 | | $ | 266,657 |
| | | | | | | |
CONSTRUCTION MATERIALS – 0.4% | | | |
Fletcher Building, Ltd. | | NZ | | 37,100 | | | 213,011 |
| | | | | | | |
CONSUMER FINANCE – 0.6% | | | |
Orix Corp. | | JP | | 4,900 | | | 333,613 |
| | | | | | | |
CONTAINERS & PACKAGING – 1.0% | | | |
Amcor, Ltd. | | AU | | 58,500 | | | 325,690 |
Rexam PLC | | GB | | 58,800 | | | 274,884 |
| | | | | | | |
| | | | | | | 600,574 |
| | | | | | | |
DISTRIBUTORS – 0.3% | | | |
Inchcape PLC* | | GB | | 400,000 | | | 190,715 |
| | | | | | | |
DIVERSIFIED FINANCIAL SERVICES – 0.8% |
Challenger Financial Services Group Ltd. | | AU | | 39,000 | | | 146,794 |
ING Groep NV* | | NL | | 14,668 | | | 141,259 |
Onex Corp. | | CA | | 7,700 | | | 173,753 |
| | | | | | | |
| | | | | | | 461,806 |
| | | | | | | |
DIVERSIFIED TELECOMMUNICATION SERVICES – 6.2% | | | |
Deutsche Telekom AG | | DE | | 35,000 | | | 513,444 |
France Telecom SA | | FR | | 24,000 | | | 599,718 |
Nippon Telegraph & Telephone Corp. | | JP | | 13,100 | | | 517,490 |
Telecom Corp. of New Zealand, Ltd. | | NZ | | 111,964 | | | 201,927 |
Telecom Italia SpA | | IT | | 270,300 | | | 421,653 |
Telecom Italia SpA RSP | | IT | | 163,600 | | | 181,708 |
Telefonica SA | | ES | | 28,200 | | | 789,291 |
Telstra Corp., Ltd. | | AU | | 110,700 | | | 340,334 |
| | | | | | | |
| | | | | | | 3,565,565 |
| | | | | | | |
ELECTRIC UTILITIES – 3.3% | | | |
E.ON AG | | DE | | 18,600 | | | 780,717 |
Electricite de France | | FR | | 7,000 | | | 416,033 |
Enel SpA | | IT | | 35,928 | | | 208,001 |
Kyushu Electric Power Co., Inc. | | JP | | 10,400 | | | 214,208 |
The Tokyo Electric Power Co., Inc. | | JP | | 11,100 | | | 278,593 |
| | | | | | | |
| | | | | | | 1,897,552 |
| | | | | | | |
ELECTRONIC EQUIPMENT & INSTRUMENTS – 0.8% |
AU Optronics Corp. ADR | | TW | | 7,374 | | | 88,414 |
| | | | | | | |
| | | Country
Code** | | Shares | | Value |
| | | | | | | |
Murata Manufacturing Co., Ltd. | | JP | | 7,300 | | $ | 364,323 |
| | | | | | | |
| | | | | | | 452,737 |
| | | | | | | |
FOOD & STAPLES RETAILING – 2.2% | | | |
Aeon Co., Ltd. | | JP | | 21,800 | | | 176,943 |
Carrefour SA | | FR | | 1,600 | | | 76,747 |
Casino Guichard-Perrachon SA | | FR | | 3,000 | | | 267,285 |
Koninklijke Ahold NV | | NL | | 29,700 | | | 393,486 |
Metro AG | | DE | | 5,500 | | | 335,900 |
| | | | | | | |
| | | | | | | 1,250,361 |
| | | | | | | |
FOOD PRODUCTS – 1.7% | | | |
Associated British Foods PLC | | GB | | 6,800 | | | 90,150 |
Nestle SA | | CH | | 15,420 | | | 748,388 |
Premier Foods PLC* | | GB | | 218,000 | | | 124,998 |
| | | | | | | |
| | | | | | | 963,536 |
| | | | | | | |
GAS UTILITIES – 0.4% | | | |
Tokyo Gas Co., Ltd. | | JP | | 63,000 | | | 251,473 |
| | | | | | | |
HEALTH CARE PROVIDERS & SERVICES – 0.7% |
Celesio AG | | DE | | 4,900 | | | 124,070 |
Mediceo Paltac Holdings Co., Ltd. | | JP | | 21,600 | | | 267,726 |
| | | | | | | |
| | | | | | | 391,796 |
| | | | | | | |
HOTELS, RESTAURANTS & LEISURE – 0.9% |
Greene King PLC | | GB | | 16,200 | | | 106,620 |
Mitchells & Butlers PLC* | | GB | | 22,400 | | | 89,310 |
Thomas Cook Group PLC | | GB | | 42,500 | | | 157,002 |
Tui Travel PLC | | GB | | 40,000 | | | 163,933 |
| | | | | | | |
| | | | | | | 516,865 |
| | | | | | | |
HOUSEHOLD DURABLES – 0.5% | | | |
Sharp Corp. | | JP | | 22,000 | | | 277,822 |
| | | | | | | |
INDEPENDENT POWER PRODUCERS & ENERGY TRADERS – 0.2% |
Drax Group PLC | | GB | | 20,500 | | | 136,670 |
| | | | | | | |
INDUSTRIAL CONGLOMERATES – 0.5% |
Cookson Group PLC* | | GB | | 16,500 | | | 111,628 |
Tomkins PLC | | GB | | 55,000 | | | 170,914 |
| | | | | | | |
| | | | | | | 282,542 |
| | | | | | | |
See Notes to Financial Statements.
181
ALLIANCEBERNSTEIN INTERNATIONAL VALUE FUND
| | |
PORTFOLIO OF INVESTMENTS (Continued) December 31, 2009 | | Sun Capital Advisers Trust |
| | | | | | | |
| | | Country
Code** | | Shares | | Value |
| | | | | | | |
| | | | | | | |
INSURANCE – 3.9% | | | |
Allianz SE | | DE | | 6,550 | | $ | 811,938 |
Aviva PLC | | GB | | 25,600 | | | 162,845 |
Catlin Group, Ltd. | | BM | | 20,000 | | | 109,512 |
Insurance Australia Group, Ltd. | | AU | | 68,000 | | | 244,235 |
Irish Life & Permanent PLC* | | IE | | 24,560 | | | 108,140 |
Muenchener Rueckversicherungs AG | | DE | | 3,150 | | | 490,643 |
Old Mutual PLC* | | GB | | 193,600 | | | 339,032 |
| | | | | | | |
| | | | | | | 2,266,345 |
| | | | | | | |
LEISURE EQUIPMENT & PRODUCTS – 0.2% |
Namco Bandai Holdings, Inc. | | JP | | 10,600 | | | 101,262 |
| | | | | | | |
MACHINERY – 1.3% | | | | | | | |
Charter International PLC | | JE | | 18,900 | | | 218,944 |
Vallourec SA | | FR | | 1,484 | | | 268,484 |
Volvo AB | | SE | | 30,550 | | | 262,028 |
| | | | | | | |
| | | | | | | 749,456 |
| | | | | | | |
MARINE – 0.3% | | | |
Mitsui Osk Lines, Ltd. | | JP | | 5,000 | | | 26,414 |
Nippon Yusen Kabushiki Kaisha | | JP | | 48,000 | | | 147,832 |
| | | | | | | |
| | | | | | | 174,246 |
| | | | | | | |
MEDIA – 2.2% | | | |
Informa PLC | | JE | | 29,700 | | | 152,684 |
Pearson PLC | | GB | | 15,000 | | | 215,070 |
Vivendi | | FR | | 18,540 | | | 550,262 |
WPP PLC | | JE | | 34,400 | | | 336,443 |
| | | | | | | |
| | | | | | | 1,254,459 |
| | | | | | | |
METALS & MINING – 5.1% | | | |
BHP Billiton, Ltd. | | AU | | 5,000 | | | 191,334 |
JFE Holdings, Inc. | | JP | | 9,100 | | | 359,712 |
Kazakhmys PLC* | | GB | | 14,000 | | | 296,430 |
Mitsubishi Materials Corp.* | | JP | | 123,000 | | | 300,832 |
MMC Norilsk Nickel ADR* | | RU | | 9,078 | | | 128,792 |
Rio Tinto PLC | | GB | | 15,400 | | | 831,551 |
ThyssenKrupp AG | | DE | | 8,500 | | | 319,534 |
Xstrata PLC* | | GB | | 28,780 | | | 513,323 |
| | | | | | | |
| | | | | | | 2,941,508 |
| | | | | | | |
| | | | | | | |
| | | Country
Code** | | Shares | | Value |
| | | | | | | |
MULTI-LINE RETAIL – 0.8% | | | |
Debenhams PLC* | | GB | | 95,900 | | $ | 120,010 |
Marks & Spencer Group PLC | | GB | | 54,800 | | | 354,061 |
| | | | | | | |
| | | | | | | 474,071 |
| | | | | | | |
MULTI-UTILITIES – 0.8% | | | |
Centrica PLC | | GB | | 45,900 | | | 207,906 |
RWE AG | | DE | | 2,670 | | | 259,103 |
| | | | | | | |
| | | | | | | 467,009 |
| | | | | | | |
OFFICE ELECTRONICS – 0.4% | | | |
Konica Minolta Holdings, Inc. | | JP | | 23,000 | | | 237,020 |
| | | | | | | |
OIL, GAS & CONSUMABLE FUELS – 9.6% |
BP PLC | | GB | | 111,700 | | | 1,078,595 |
Eni SpA | | IT | | 16,500 | | | 420,186 |
Lukoil ADR | | RU | | 3,950 | | | 223,835 |
Nexen, Inc. | | CA | | 15,322 | | | 369,480 |
OMV AG | | AT | | 7,400 | | | 324,684 |
Royal Dutch Shell PLC | | GB | | 45,500 | | | 1,371,006 |
Statoilhydro ASA | | NO | | 19,050 | | | 475,100 |
Suncor Energy, Inc. | | CA | | 7,296 | | | 259,582 |
Talisman Energy, Inc. | | CA | | 11,900 | | | 224,039 |
Total SA | | FR | | 11,700 | | | 751,490 |
| | | | | | | |
| | | | | | | 5,497,997 |
| | | | | | | |
PAPER & FOREST PRODUCTS – 0.3% | | | |
Oji Paper Co., Ltd. | | JP | | 41,000 | | | 171,784 |
| | | | | | | |
PHARMACEUTICALS – 6.8% | | | |
Astellas Pharma, Inc. | | JP | | 3,300 | | | 123,119 |
AstraZeneca PLC | | GB | | 14,700 | | | 690,860 |
Bayer AG | | DE | | 8,300 | | | 664,195 |
GlaxoSmithKline PLC | | GB | | 39,700 | | | 841,875 |
Novartis AG | | CH | | 15,000 | | | 819,138 |
Sanofi-Aventis SA | | FR | | 10,000 | | | 786,429 |
| | | | | | | |
| | | | | | | 3,925,616 |
| | | | | | | |
PROFESSIONAL SERVICES – 1.2% | | | |
Adecco SA | | CH | | 5,900 | | | 325,473 |
Randstad Holding NV* | | NL | | 6,900 | | | 343,326 |
| | | | | | | |
| | | | | | | 668,799 |
| | | | | | | |
REAL ESTATE INVESTMENT TRUSTS – 1.0% |
Klepierre | | FR | | 5,900 | | | 239,040 |
Unibail-Rodamco | | FR | | 1,600 | | | 351,488 |
| | | | | | | |
| | | | | | | 590,528 |
| | | | | | | |
See Notes to Financial Statements.
182
ALLIANCEBERNSTEIN INTERNATIONAL VALUE FUND
| | |
PORTFOLIO OF INVESTMENTS (Continued) December 31, 2009 | | Sun Capital Advisers Trust |
| | | | | | | |
| | | Country
Code** | | Shares | | Value |
| | | | | | | |
| | | | | | | |
REAL ESTATE MANAGEMENT & DEVELOPMENT – 2.3% | | | |
Lend Lease Corp., Ltd. | | AU | | 14,000 | | $ | 129,233 |
Mitsui Fudosan Co., Ltd. | | JP | | 24,000 | | | 405,797 |
New World Development, Ltd. | | HK | | 145,000 | | | 295,423 |
NTT Urban Development Corp. | | JP | | 314 | | | 209,607 |
Sumitomo Realty & Development Co., Ltd. | | JP | | 16,000 | | | 302,040 |
| | | | | | | |
| | | | | | | 1,342,100 |
| | | | | | | |
ROAD & RAIL – 0.6% | | | |
East Japan Railway Co. | | JP | | 1,900 | | | 120,234 |
West Japan Railway Co. | | JP | | 67 | | | 224,627 |
| | | | | | | |
| | | | | | | 344,861 |
| | | | | | | |
SEMICONDUCTORS & SEMICONDUCTOR EQUIPMENT – 0.9% | | | |
Elpida Memory, Inc.* | | JP | | 14,700 | | | 239,580 |
Samsung Electronics Co., Ltd. GDR (1) | | KR | | 750 | | | 260,938 |
| | | | | | | |
| | | | | | | 500,518 |
| | | | | | | |
SPECIALTY RETAIL – 1.1% | | | |
Esprit Holdings Ltd. | | BM | | 51,407 | | | 341,068 |
Kingfisher PLC | | GB | | 76,400 | | | 281,245 |
| | | | | | | |
| | | | | | | 622,313 |
| | | | | | | |
TEXTILES, APPAREL & LUXURY GOODS – 0.1% |
Yue Yuen Industrial Holdings, Ltd. | | BM | | 26,000 | | | 75,611 |
| | | | | | | |
TOBACCO – 0.2% | | | |
Imperial Tobacco Group PLC | | GB | | 4,400 | | | 138,808 |
| | | | | | | |
TRADING COMPANIES & DISTRIBUTORS – 3.2% |
ITOCHU Corp. | | JP | | 46,000 | | | 339,791 |
Mitsubishi Corp. | | JP | | 20,500 | | | 510,626 |
Mitsui & Co., Ltd. | | JP | | 14,000 | | | 198,606 |
| | | | | | | |
| | | Country
Code** | | Shares | | Value |
| | | | | | | |
Noble Group Ltd. | | BM | | 140,000 | | $ | 321,125 |
Travis Perkins PLC* | | GB | | 7,600 | | | 104,083 |
Wolseley PLC* | | GB | | 18,700 | | | 374,316 |
| | | | | | | |
| | | | | | | 1,848,547 |
| | | | | | | |
TRANSPORTATION INFRASTRUCTURE – 0.2% |
Macquarie Infrastructure Group | | AU | | 81,900 | | | 97,546 |
| | | | | | | |
WIRELESS TELECOMMUNICATION SERVICES – 2.7% |
KDDI Corp. | | JP | | 64 | | | 338,989 |
Vodafone Group PLC | | GB | | 517,100 | | | 1,197,456 |
| | | | | | | |
| | | | | | | 1,536,445 |
| | | | | | | |
Total Common Stocks
(Cost $46,833,408) | | | 54,790,872 |
| | | | | | | |
EQUITY LINKED SECURITIES – 0.3% | | | |
ELECTRONIC EQUIPMENT & INSTRUMENTS – 0.0% + |
AU Optronics Corp., (Credit Suisse Group AG), expires 2/17/12* (1) | | CH | | 19,947 | | | 24,266 |
| | | | | | | |
SEMICONDUCTORS & SEMICONDUCTOR EQUIPMENT – 0.3% | | | |
Hynix Semiconductor, Inc., (Deutsche Bank AG), expires 8/16/19* (1) | | DE | | 8,700 | | | 173,028 |
| | | | | | | |
Total Equity Linked Securities
(Cost $164,539) | | | 197,294 |
| | | | | | | |
SHORT TERM INVESTMENTS – 3.7% | | | |
MUTUAL FUNDS – 3.7% | | | |
AllianceBernstein Government Short Term Investment Fund
(Cost $2,097,308) | | | | 2,097,308 | | | 2,097,308 |
| | | | | | | |
TOTAL INVESTMENTS – 99.4% | | | |
(Cost $49,095,255) | | | | | | | 57,085,474 |
Other assets less
liabilities – 0.6% | | | | | | | 326,909 |
| | | | | | | |
NET ASSETS – 100.0% | | | | | | $ | 57,412,383 |
| | | | | | | |
| * | Non-income producing security. |
| ** | Unless otherwise noted the issuer country code for all securities is United States. |
| + | Amount is less than 0.05%. |
| (1) | Eligible for resale under rule 144A of the Securities Act of 1933. These securities may be resold in transactions exempt from registration, normally to qualified institutional buyers. At the period end, the value of these securities amounted to $458,232, representing 0.8% of net assets. |
See Notes to Financial Statements.
183
ALLIANCEBERNSTEIN INTERNATIONAL VALUE FUND
| | |
PORTFOLIO OF INVESTMENTS (Continued) December 31, 2009 | | Sun Capital Advisers Trust |
| | |
| ADR | | American Depositary Receipt |
| GDR | | Global Depositary Receipt |
| |
| AT | | Austria |
| AU | | Australia |
| BM | | Bermuda |
| BR | | Brazil |
| CA | | Canada |
| CH | | Switzerland |
| DE | | Germany |
| DK | | Denmark |
| ES | | Spain |
| FI | | Finland |
| FR | | France |
| GB | | Great Britain |
| HK | | Hong Kong |
| IE | | Ireland |
| IL | | Israel |
| IT | | Italy |
| JE | | Jersey |
| JP | | Japan |
| KR | | Korea, Republic Of |
| NL | | Netherlands |
| NO | | Norway |
| NZ | | New Zealand |
| RU | | Russia |
| SE | | Sweden |
| TR | | Turkey |
| TW | | Taiwan, Province Of China |
Distribution of investments by country of issuer, as a percentage of net assets, is as follows. Figures may not total to 100% due to the exclusion of the Fund’s other assets and liabilities. (Unaudited)
| | | |
| Great Britain | | 23.7 | % |
| Japan | | 16.6 | |
| France | | 11.8 | |
| Germany | | 10.9 | |
| Australia | | 5.7 | |
| Spain | | 3.9 | |
| Italy | | 3.9 | |
| United States | | 3.7 | |
| Switzerland | | 3.6 | |
| Canada | | 2.4 | |
| Netherlands | | 2.0 | |
| Others (individually less than 2%) | | 11.2 | |
| (2) | At the period end, cash of $67,747 has been pledged to cover margin requirements for the following open futures contracts: |
| | | | | | | | | | | | |
Type | | Description | | Expiration
Date | | Contracts | | Aggregate
Face
Value ($) | | Aggregate
Notional
Value ($) | | Unrealized
Appreciation ($) |
Long | | DJ Euro Stoxx 50 Index March Futures | | 3/19/10 | | 14 | | 564,386 | | 596,472 | | 32,086 |
Long | | FTSE 100 Index March Futures | | 3/19/10 | | 3 | | 250,039 | | 259,797 | | 9,758 |
| | | | | | | | | | | | |
Net unrealized appreciation | | | | | | | | | | 41,844 |
| | | | | | | | | | | | |
See Notes to Financial Statements.
184
ALLIANCEBERNSTEIN INTERNATIONAL VALUE FUND
| | |
PORTFOLIO OF INVESTMENTS (Continued) December 31, 2009 | | Sun Capital Advisers Trust |
| (3) | Fair Value Measurements † |
The following table summarizes the inputs used to value the Fund’s assets and liabilities, as applicable, measured at fair value at the period end:
| | | | | | | | | | | | |
Assets | | Quoted Prices
in Active
Markets for
Identical
Assets and
Liabilities
(Level 1) | | Significant
Other
Observable
Inputs
(Level 2) | | Significant
Unobservable
Inputs
(Level 3) | | Total |
Common Stocks | | | | | | | | | | | | |
Aerospace & Defense | | $ | 188,631 | | $ | 783,146 | | $ | — | | $ | 971,777 |
Air Freight & Logistics | | | — | | | 473,120 | | | — | | | 473,120 |
Airlines | | | — | | | 67,236 | | | — | | | 67,236 |
Auto Components | | | — | | | 407,820 | | | — | | | 407,820 |
Automobiles | | | — | | | 883,140 | | | — | | | 883,140 |
Beverages | | | — | | | 784,693 | | | — | | | 784,693 |
Building Products | | | — | | | 439,395 | | | — | | | 439,395 |
Capital Markets | | | — | | | 1,143,374 | | | — | | | 1,143,374 |
Chemicals | | | — | | | 843,571 | | | — | | | 843,571 |
Commercial Banks | | | 534,046 | | | 8,452,605 | | | — | | | 8,986,651 |
Commercial Services & Supplies | | | — | | | 149,123 | | | — | | | 149,123 |
Communications Equipment | | | — | | | 905,263 | | | — | | | 905,263 |
Computers & Peripherals | | | — | | | 655,565 | | | — | | | 655,565 |
Construction & Engineering | | | — | | | 266,657 | | | — | | | 266,657 |
Construction Materials | | | — | | | 213,011 | | | — | | | 213,011 |
Consumer Finance | | | — | | | 333,613 | | | — | | | 333,613 |
Containers & Packaging | | | — | | | 600,574 | | | — | | | 600,574 |
Distributors | | | — | | | 190,715 | | | — | | | 190,715 |
Diversified Financial Services | | | 173,753 | | | 288,053 | | | — | | | 461,806 |
Diversified Telecommunication Services | | | — | | | 3,565,565 | | | — | | | 3,565,565 |
Electric Utilities | | | — | | | 1,897,552 | | | — | | | 1,897,552 |
Electronic Equipment & Instruments | | | 88,414 | | | 364,323 | | | — | | | 452,737 |
Food & Staples Retailing | | | — | | | 1,250,361 | | | — | | | 1,250,361 |
Food Products | | | — | | | 963,536 | | | — | | | 963,536 |
Gas Utilities | | | — | | | 251,473 | | | — | | | 251,473 |
Health Care Providers & Services | | | — | | | 391,796 | | | — | | | 391,796 |
Hotels, Restaurants & Leisure | | | — | | | 516,865 | | | — | | | 516,865 |
Household Durables | | | — | | | 277,822 | | | — | | | 277,822 |
Independent Power Producers & Energy Traders | | | — | | | 136,670 | | | — | | | 136,670 |
Industrial Conglomerates | | | — | | | 282,542 | | | — | | | 282,542 |
Insurance | | | — | | | 2,266,345 | | | — | | | 2,266,345 |
Leisure Equipment & Products | | | — | | | 101,262 | | | — | | | 101,262 |
Machinery | | | — | | | 749,456 | | | — | | | 749,456 |
Marine | | | — | | | 174,246 | | | — | | | 174,246 |
Media | | | — | | | 1,254,459 | | | — | | | 1,254,459 |
Metals & Mining | | | — | | | 2,941,508 | | | — | | | 2,941,508 |
Multi-Line Retail | | | — | | | 474,071 | | | — | | | 474,071 |
Multi-Utilities | | | — | | | 467,009 | | | — | | | 467,009 |
See Notes to Financial Statements.
185
ALLIANCEBERNSTEIN INTERNATIONAL VALUE FUND
| | |
PORTFOLIO OF INVESTMENTS (Continued) December 31, 2009 | | Sun Capital Advisers Trust |
| | | | | | | | | | | | |
Assets (Continued) | | Quoted Prices
in Active
Markets for
Identical
Assets and
Liabilities
(Level 1) | | Significant
Other
Observable
Inputs
(Level 2) | | Significant
Unobservable
Inputs
(Level 3) | | Total |
Office Electronics | | $ | — | | $ | 237,020 | | $ | — | | $ | 237,020 |
Oil, Gas & Consumable Fuels | | | 853,101 | | | 4,644,896 | | | — | | | 5,497,997 |
Paper & Forest Products | | | — | | | 171,784 | | | — | | | 171,784 |
Pharmaceuticals | | | — | | | 3,925,616 | | | — | | | 3,925,616 |
Professional Services | | | — | | | 668,799 | | | — | | | 668,799 |
Real Estate Investment Trusts | | | — | | | 590,528 | | | — | | | 590,528 |
Real Estate Management & Development | | | — | | | 1,342,100 | | | — | | | 1,342,100 |
Road & Rail | | | — | | | 344,861 | | | — | | | 344,861 |
Semiconductors & Semiconductor Equipment | | | — | | | 500,518 | | | — | | | 500,518 |
Specialty Retail | | | — | | | 622,313 | | | — | | | 622,313 |
Textiles, Apparel & Luxury Goods | | | — | | | 75,611 | | | — | | | 75,611 |
Tobacco | | | — | | | 138,808 | | | — | | | 138,808 |
Trading Companies & Distributors | | | — | | | 1,848,547 | | | — | | | 1,848,547 |
Transportation Infrastructure | | | — | | | 97,546 | | | — | | | 97,546 |
Wireless Telecommunication Services | | | — | | | 1,536,445 | | | — | | | 1,536,445 |
| | | | | | | | | | | | |
Total Common Stocks | | | 1,837,945 | | | 52,952,927 | | | — | | | 54,790,872 |
| | | | | | | | | | | | |
Equity Linked Securities (a) | | | — | | | 197,294 | | | — | | | 197,294 |
Short Term Investments | | | | | | | | | | | | |
Mutual Funds | | | 2,097,308 | | | — | | | — | | | 2,097,308 |
| | | | | | | | | | | | |
Total Investments | | | 3,935,253 | | | 53,150,221 | | | — | | | 57,085,474 |
| | | | | | | | | | | | |
Futures Contracts | | | 41,844 | | | — | | | — | | | 41,844 |
| | | | | | | | | | | | |
Total | | $ | 3,977,097 | | $ | 53,150,221 | | $ | — | | $ | 57,127,318 |
| | | | | | | | | | | | |
| † | See Note 2b in the Notes to Financial Statements for additional information. |
| (a) | See Portfolio of Investments for additional detailed categorizations. |
See Notes to Financial Statements.
186
BLACKROCK INFLATION PROTECTED BOND FUND
| | |
PORTFOLIO OF INVESTMENTS December 31, 2009 | | Sun Capital Advisers Trust |
| | | | | | | | |
| | | Country
Code* | | Principal
Amount
(000) | | Value |
| | | | | | | | |
| | | | | | | | |
ASSET BACKED SECURITIES – 1.1% | | | |
Bank of America Credit Card Trust, Series 2006-A9, Class A9 (1)
0.24%, 2/15/13 | | | | $ | 115 | | $ | 114,334 |
Bank of America Credit Card Trust, Series 2007-A2, Class A2 (1)
0.25%, 6/17/13 | | | | | 490 | | | 485,685 |
Bank of America Credit Card Trust, Series 2008-A5, Class A5 (1)
1.43%, 12/16/13 | | | | | 143 | | | 143,659 |
Capital One Auto Finance Trust,
Series 2006-C,
Class A4 (1)
0.26%, 5/15/13 | | | | | 328 | | | 323,644 |
Ford Credit Auto Owner Trust, Series 2009-A (1)
2.23%, 8/15/11 | | | | | 892 | | | 896,146 |
| | | | | | | | |
Total Asset Backed Securities
(Cost $1,963,233) | | | 1,963,468 |
| | | | | | | | |
CORPORATE DEBT OBLIGATIONS – 0.7% |
BANKS – 0.4% | | | |
Suncorp-Metway, Ltd. (1)(2)
0.63%, 12/17/10 | | AU | | | 650 | | | 651,439 |
| | | | | | | | |
SPECIAL PURPOSE ENTITIES – 0.1% | | | |
BA Credit Card Trust
4.15%, 4/19/10 | | | | | 107 | | | 154,202 |
| | | | | | | | |
TELECOMMUNICATIONS – 0.2% | | | |
Verizon Wireless Capital LLC (1)
2.87%, 5/20/11 | | | | | 395 | | | 408,405 |
| | | | | | | | |
Total Corporate Debt Obligations
(Cost $1,203,471) | | | 1,214,046 |
| | | | | | | | |
FOREIGN GOVERNMENT OBLIGATIONS – 11.9% |
Bundesrepublik Deutschland Inflation Index Bond
1.75%, 4/15/20 | | DE | | | 5,053 | | | 7,478,428 |
| | | | | | | | |
| | | Country
Code* | | Principal
Amount
(000) | | Value |
| | | | | | | | |
Buoni Poliennali Del Tesoro
0.95%, 9/15/10 | | IT | | $ | 3,965 | | $ | 5,740,640 |
France Government Bonds | | | | | | | | |
2.25%, 7/25/20 | | FR | | | 5,178 | | | 8,024,005 |
3.15%, 7/25/32 | | FR | | | 416 | | | 752,901 |
| | | | | | | | |
Total Foreign Government Obligations
(Cost $22,241,013) | | | 21,995,974 |
| | | | | | | | |
U.S. TREASURY AND U.S. GOVERNMENT AGENCY OBLIGATIONS – 64.7% |
Federal Home Loan Mortgage Corp. |
4.50%, 8/1/39 | | | | | 6,426 | | | 6,416,972 |
4.50%, 11/1/39 | | | | | 1,906 | | | 1,903,756 |
Federal National Mortgage Association |
4.50%, 7/1/39 | | | | | 6,421 | | | 6,415,901 |
4.50%, 12/1/39 | | | | | 2,000 | | | 1,998,333 |
Government National Mortgage Association |
4.50%, 7/15/39 | | | | | 8,415 | | | 8,435,394 |
U.S. Treasury Inflation Indexed Bonds |
1.38%, 7/15/18 (4) | | | | | 4,511 | | | 4,520,232 |
1.63%, 1/15/15 | | | | | 2,745 | | | 2,855,181 |
1.63%, 1/15/18 | | | | | 2,527 | | | 2,586,845 |
1.75%, 1/15/28 | | | | | 5,106 | | | 4,895,832 |
1.88%, 7/15/13 | | | | | 7,500 | | | 7,898,724 |
1.88%, 7/15/15 | | | | | 2,109 | | | 2,222,575 |
1.88%, 7/15/19 (3) | | | | | 7,820 | | | 8,116,847 |
2.00%, 1/15/14 | | | | | 6,213 | | | 6,570,718 |
2.00%, 7/15/14 | | | | | 9,395 | | | 9,952,476 |
2.00%, 1/15/16 | | | | | 2,530 | | | 2,671,797 |
2.00%, 1/15/26 | | | | | 3,573 | | | 3,588,824 |
2.13%, 1/15/19 | | | | | 3,508 | | | 3,719,983 |
2.38%, 1/15/17 | | | | | 2,815 | | | 3,040,299 |
2.38%, 1/15/25 | | | | | 6,471 | | | 6,828,388 |
2.38%, 1/15/27 | | | | | 3,850 | | | 4,051,917 |
2.50%, 7/15/16 | | | | | 2,038 | | | 2,219,415 |
2.50%, 1/15/29 | | | | | 3,358 | | | 3,601,550 |
2.63%, 7/15/17 | | | | | 3,027 | | | 3,328,788 |
3.38%, 4/15/32 | | | | | 300 | | | 370,373 |
3.63%, 4/15/28 | | | | | 4,372 | | | 5,403,602 |
3.88%, 4/15/29 | | | | | 4,786 | | | 6,159,195 |
| | | | | | | | |
Total U.S. Treasury and U.S. Government Agency Obligations
(Cost $118,402,947) | | | 119,773,917 |
| | | | | | | | |
See Notes to Financial Statements.
187
BLACKROCK INFLATION PROTECTED BOND FUND
| | |
PORTFOLIO OF INVESTMENTS (Continued) December 31, 2009 | | Sun Capital Advisers Trust |
| | | | | | | |
| | | | | Contracts | | Value |
| | | | | | | |
| | | | | | | |
OPTIONS PURCHASED – 0.1% | | | |
PUT OPTIONS – 0.1% | | | |
90-Day Eurodollar September Futures, strike price $98.75,
expires 9/13/10
(Cost $115,573) | | 270 | | $ | 195,750 |
| | | | | | | |
| | | | | | | |
| | | | | Shares | | Value |
| | | | | | | |
SHORT TERM INVESTMENTS – 20.9% | | | |
MUTUAL FUNDS – 20.9% | | | |
BlackRock Liquidity Funds TempFund | | 19,396,119 | | $ | 19,396,119 |
State Street Institutional U.S. Government Money Market Fund | | 19,387,187 | | | 19,387,187 |
| | | | | | | |
Total Short Term Investments
(Cost $38,783,306) | | | | | 38,783,306 |
| | | | | | | |
TOTAL INVESTMENTS – 99.4% | | | |
(Cost $182,709,543) | | | | | | | 183,926,461 |
Other assets less
liabilities – 0.6% | | | | | 1,176,434 |
| | | | | | | |
NET ASSETS – 100.0% | | | | | | $ | 185,102,895 |
| | | | | | | |
| * | Unless otherwise noted the issuer country code for all securities is United States. |
| (1) | Variable rate security. The interest rate shown reflects the rate in effect at the period end. |
| (2) | Eligible for resale under rule 144A of the Securities Act of 1933. This security may be resold in transactions exempt from registration, normally to qualified institutional buyers. At the period end, the value of this security amounted to $651,439, representing 0.4% of net assets. |
| (3) | Security (or a portion thereof) has been pledged as collateral for open swap and swaption contracts. At the period end, the value of securities pledged amounted to $262,715. |
| | |
| AU | | Australia |
| DE | | Germany |
| FR | | France |
| IT | | Italy |
| (4) | At the period end, securities (or portions thereof) with an aggregate market value of $331,484 have been pledged to cover margin requirements for the following open futures contracts: |
| | | | | | | | | | | | | |
Type | | Description | | Expiration
Date | | Contracts | | Aggregate
Face
Value ($) | | Aggregate
Notional
Value ($) | | Unrealized
Appreciation/
(Depreciation) ($) | |
Long | | U.S. Treasury 10 Year Note March Futures | | 3/22/10 | | 3 | | 347,257 | | 346,359 | | (898 | ) |
Long | | U.S. Treasury 2 Year Note March Futures | | 3/31/10 | | 57 | | 12,394,001 | | 12,327,141 | | (66,860 | ) |
Short | | U.S. Treasury 30 Year Bond March Futures | | 3/22/10 | | 12 | | 1,422,050 | | 1,384,500 | | 37,550 | |
Short | | U.S. Treasury 5 Year Note March Futures | | 3/31/10 | | 158 | | 18,354,912 | | 18,072,484 | | 282,428 | |
| | | | | | | | | | | | | |
Net unrealized appreciation | | | | | | | | | | 252,220 | |
| | | | | | | | | | | | | |
See Notes to Financial Statements.
188
| | |
BLACKROCK INFLATION PROTECTED BOND FUND PORTFOLIO OF INVESTMENTS (Continued) |
| December 31, 2009 | | Sun Capital Advisers Trust |
| (5) | At the period end, open forward foreign currency exchange contracts were as follows: |
| | | | | | | | | | | | | | | | | |
Contracts to Deliver | | | | In Exchange For | | | | Settlement
Date | | | | Unrealized
Appreciation/
(Depreciation) ($) | |
| EUR | | 15,082,500 | | | | USD | | 21,604,641 | | | | 1/20/10 | | | | (16,439 | ) |
| EUR | | 416,500 | | | | USD | | 594,501 | | | | 1/20/10 | | | | (2,560 | ) |
| USD | | 93,158 | | | | EUR | | 65,000 | | | | 1/20/10 | | | | 21 | |
| | | | | | | | | | | | | | | | | |
Net unrealized depreciation | | | | | | | | | | (18,978 | ) |
| | | | | | | | | | | | | | | | | |
| | | | |
| EUR | | – | | Euro |
| USD | | – | | United States Dollar |
| (6) | At the period end, open written option contracts were as follows: |
| | | | | | | | | | | | |
Type | | Description | | Counterparty | | Expiration
Date | | Strike
Price ($) | | Number of
Contracts | | Value ($) |
Put | | 90-Day Eurodollar September Futures | | Citigroup Global Markets, Inc. | | 9/13/10 | | 98.25 | | 270 | | 111,375 |
| | | | | | | | | | | | |
(Written Option Premium $66,677) | | | | | | | | | | 111,375 |
| | | | | | | | | | | | |
| (7) | At the period end, open written interest rate swaption contracts were as follows: |
| | | | | | | | | | | | | | | | |
Type | | Description | | Counterparty | | Pay/Receive
Floating
Rate | | Floating
Rate | | Exercise
Rate | | Expiration
Date | | Notional
Amount
(000) ($) | | Value ($) |
Call | | OTC -10 Year Interest Rate Swap | | Citibank NA | | Receive | | 3-Month
USD-LIBOR | | 4.26% | | 8/24/10 | | 3,300 | | 124,791 |
Put | | OTC -10 Year Interest Rate Swap | | Citibank NA | | Pay | | 3-Month
USD-LIBOR | | 4.26% | | 8/24/10 | | 3,300 | | 108,791 |
| | | | | | | | | | | | | | | | |
(Written Swaption Premium $325,050) | | | | | | | | | | 6,600 | | 233,582 |
| | | | | | | | | | | | | | | | |
At the period end, outstanding interest rate swap contract was as follows:
| | | | | | | | | | | | | | | | |
Counterparty | | Pay/Receive
Floating Rate | | Floating Rate Index | | Fixed
Rate | | Expiration
Date | | Notional
Amount
(000) ($) | | Market
Value ($) | | | Unrealized
Depreciation ($) | |
Citibank NA | | Receive | | 3-Month USD-LIBOR | | 3.59% | | 12/14/19 | | 500 | | (15,460 | ) | | (15,460 | ) |
See Notes to Financial Statements.
189
| | |
BLACKROCK INFLATION PROTECTED BOND FUND PORTFOLIO OF INVESTMENTS (Continued) |
| December 31, 2009 | | Sun Capital Advisers Trust |
At the period end, outstanding total return swap contract was as follows:
| | | | | | | | | | | | | | | | |
Pay/Receive
Total Return on
Reference Entity | | Counterparty | | Reference Entity | | Number of
Shares
or Units | | Floating
Rate | | Notional
Amount
(000) ($) | | Maturity
Date | | Market
Value ($) | | Unrealized
Appreciation ($) |
| Receive | | Barclays Bank PLC | | Barclays Capital
Inflation Linked
Index | | 183,791 | | 3-Month
USD-LIBOR | | 42,000 | | 1/25/10 | | 33,082 | | 33,082 |
| | | | |
| LIBOR | | – | | London InterBank Offered Rate |
| USD | | – | | United States Dollar |
| (9) | Fair Value Measurements † |
The following table summarizes the inputs used to value the Fund’s assets and liabilities, as applicable, measured at fair value at the period end:
| | | | | | | | | | | | | | | |
Assets | | Quoted Prices
in Active
Markets for
Identical
Assets and
Liabilities
(Level 1) | | | Significant
Other
Observable
Inputs
(Level 2) | | | Significant
Unobservable
Inputs
(Level 3) | | Total | |
Asset Backed Securities | | $ | — | | | $ | 1,963,468 | | | $ | — | | $ | 1,963,468 | |
Corporate Debt Obligations (a) | | | — | | | | 1,214,046 | | | | — | | | 1,214,046 | |
Foreign Government Obligations | | | — | | | | 21,995,974 | | | | — | | | 21,995,974 | |
U.S. Treasury and U.S. Government Agency Obligations | | | 94,603,561 | | | | 25,170,356 | | | | — | | | 119,773,917 | |
Options Purchased (a) | | | 195,750 | | | | — | | | | — | | | 195,750 | |
Short Term Investments | | | | | | | | | | | | | | | |
Mutual Funds | | | 38,783,306 | | | | — | | | | — | | | 38,783,306 | |
| | | | | | | | | | | | | | | |
Total Investments | | | 133,582,617 | | | | 50,343,844 | | | | — | | | 183,926,461 | |
| | | | | | | | | | | | | | | |
Forward Foreign Currency Exchange Contracts | | | — | | | | 21 | | | | — | | | 21 | |
| | | | | | | | | | | | | | | |
Futures Contracts | | | 319,978 | | | | — | | | | — | | | 319,978 | |
| | | | | | | | | | | | | | | |
Swap Contracts | | | — | | | | 33,082 | | | | — | | | 33,082 | |
| | | | | | | | | | | | | | | |
Total | | $ | 133,902,595 | | | $ | 50,376,947 | | | $ | — | | $ | 184,279,542 | |
| | | | | | | | | | | | | | | |
| | | | |
Liabilities | | | | | | | | | | | |
Forward Foreign Currency Exchange Contracts | | $ | — | | | $ | (18,999 | ) | | $ | — | | $ | (18,999 | ) |
| | | | | | | | | | | | | | | |
Futures Contracts | | | (67,758 | ) | | | — | | | | — | | | (67,758 | ) |
| | | | | | | | | | | | | | | |
Swap Contracts | | | — | | | | (15,460 | ) | | | — | | | (15,460 | ) |
| | | | | | | | | | | | | | | |
Written Option Contracts | | | (111,375 | ) | | | — | | | | — | | | (111,375 | ) |
| | | | | | | | | | | | | | | |
Written Swaption Contracts | | | — | | | | (233,582 | ) | | | — | | | (233,582 | ) |
| | | | | | | | | | | | | | | |
Total | | $ | (179,133 | ) | | $ | (268,041 | ) | | $ | — | | $ | (447,174 | ) |
| | | | | | | | | | | | | | | |
| † | See Note 2b in the Notes to Financial Statements for additional information. |
| (a) | See Portfolio of Investments for additional detailed categorizations. |
See Notes to Financial Statements.
190
IBBOTSON MODERATE FUND
| | |
PORTFOLIO OF INVESTMENTS December 31, 2009 | | Sun Capital Advisers Trust |
| | | | | |
| | |
Shares | | Value |
| | | | | |
| | | | | |
INVESTMENT COMPANIES (1) – 99.7% |
MFS International Growth Portfolio | | 1,200,129 | | $ | 14,557,567 |
MFS Research International Portfolio | | 578,197 | | | 7,250,596 |
MFS Value Portfolio | | 2,002,322 | | | 25,309,354 |
SC AllianceBernstein International Value Fund | | 1,114,659 | | | 10,945,956 |
SC BlackRock Inflation Protected Bond Fund | | 4,579,227 | | | 47,349,210 |
SC Davis Venture Value Fund | | 2,361,721 | | | 25,388,505 |
SC Dreman Small Cap Value Fund | | 900,573 | | | 9,077,771 |
SC Goldman Sachs Mid Cap Value Fund | | 2,282,373 | | | 18,099,221 |
SC Goldman Sachs Short Duration Fund | | 6,385,195 | | | 65,320,545 |
SC Oppenheimer Large Cap Core Fund | | 1,342,966 | | | 10,797,449 |
SC PIMCO High Yield Fund | | 1,800,333 | | | 17,031,153 |
SC PIMCO Total Return Fund | | 4,273,550 | | | 47,179,989 |
SC WMC Blue Chip Mid Cap Fund | | 591,985 | | | 7,174,858 |
SC WMC Large Cap Growth Fund | | 2,441,712 | | | 19,899,957 |
Sun Capital Investment Grade Bond Fund | | 4,413,809 | | | 39,989,110 |
| | | | | |
Total Investment Companies
(Cost $335,841,705) | | | | | 365,371,241 |
| | | | | |
| | | | | | |
| | | Principal
Amount
(000) | | Value |
SHORT TERM INVESTMENTS – 0.1% |
REPURCHASE AGREEMENTS – 0.1% |
State Street Bank and Trust Company, 0.01%, dated 12/31/09, due 1/4/10 (collateralized by $280,000 FHLB, 4.375%, 9/17/10, with a value of $291,284, total to be received $282,000) (Amortized cost $282,000) | | $ | 282 | | $ | 282,000 |
| | | | | | |
TOTAL INVESTMENTS – 99.8% |
(Cost $336,123,705) | | | | | | 365,653,241 |
Other assets less
liabilities – 0.2% | | | | | | 845,008 |
| | | | | | |
NET ASSETS – 100.0% | | | | | $ | 366,498,249 |
| | | | | | |
| (1) | Sun Capital Advisers LLC or its affiliate, Massachusetts Financial Services Company (“MFS”), serves as investment adviser to these underlying funds. These are affiliated securities. |
| | |
| FHLB | | Federal Home Loan Bank |
See Notes to Financial Statements.
191
| | |
IBBOTSON MODERATE FUND PORTFOLIO OF INVESTMENTS (Continued) |
| December 31, 2009 | | Sun Capital Advisers Trust |
| (2) | Fair Value Measurements † |
The following table summarizes the inputs used to value the Fund’s assets and liabilities, as applicable, measured at fair value at the period end:
| | | | | | | | | | | | |
Assets | | Quoted Prices
in Active
Markets for
Identical
Assets and
Liabilities
(Level 1) | | Significant
Other
Observable
Inputs
(Level 2) | | Significant
Unobservable
Inputs
(Level 3) | | Total |
Investment Companies | | $ | 365,371,241 | | $ | — | | $ | — | | $ | 365,371,241 |
Short Term Investments
Repurchase Agreements | | | — | | | 282,000 | | | — | | | 282,000 |
| | | | | | | | | | | | |
Total Investments | | | 365,371,241 | | | 282,000 | | | — | | | 365,653,241 |
| | | | | | | | | | | | |
Total | | $ | 365,371,241 | | $ | 282,000 | | $ | — | | $ | 365,653,241 |
| | | | | | | | | | | | |
| † | See Note 2b in the Notes to Financial Statements for additional information. |
See Notes to Financial Statements.
192
IBBOTSON BALANCED FUND
| | |
PORTFOLIO OF INVESTMENTS December 31, 2009 | | Sun Capital Advisers Trust |
| | | | | |
| | |
Shares | | Value |
| | | | | |
| | | | | |
INVESTMENT COMPANIES (1) – 99.7% |
MFS Emerging Markets Equity Portfolio | | 780,291 | | $ | 11,345,427 |
MFS International Growth Portfolio | | 2,776,450 | | | 33,678,336 |
MFS Research International Portfolio | | 1,339,150 | | | 16,792,938 |
MFS Value Portfolio | | 4,409,341 | | | 55,734,069 |
SC AIM Small Cap Growth Fund | | 726,029 | | | 6,962,619 |
SC AllianceBernstein International Value Fund | | 2,305,132 | | | 22,636,394 |
SC BlackRock Inflation Protected Bond Fund | | 3,814,278 | | | 39,439,630 |
SC Davis Venture Value Fund | | 4,677,891 | | | 50,287,329 |
SC Dreman Small Cap Value Fund | | 1,374,977 | | | 13,859,772 |
SC Goldman Sachs Mid Cap Value Fund | | 3,570,024 | | | 28,310,291 |
SC Goldman Sachs Short Duration Fund | | 6,026,186 | | | 61,647,882 |
SC Oppenheimer Large Cap Core Fund | | 3,457,792 | | | 27,800,648 |
SC PIMCO High Yield Fund | | 2,426,962 | | | 22,959,064 |
SC PIMCO Total Return Fund | | 5,078,160 | | | 56,062,884 |
SC WMC Blue Chip Mid Cap Fund | | 914,524 | | | 11,084,025 |
SC WMC Large Cap Growth Fund | | 5,476,367 | | | 44,632,393 |
Sun Capital Global Real Estate Fund | | 1,505,729 | | | 16,909,341 |
Sun Capital Investment Grade Bond Fund | | 4,950,422 | | | 44,850,825 |
| | | | | |
Total Investment Companies (Cost $510,050,194) | | | | | 564,993,867 |
| | | | | |
| | | | | | |
| | | Principal
Amount
(000) | | Value |
| | | | | | |
SHORT TERM INVESTMENTS – 0.3% |
REPURCHASE AGREEMENTS – 0.3% |
State Street Bank and Trust Company, 0.01%, dated 12/31/09, due 1/4/10 (collateralized by $1,470,000 FHLB, 4.375%, 9/17/10, with a value of $1,529,241, total to be received $1,495,001) (Amortized cost $1,495,000) | | $ | 1,495 | | $ | 1,495,000 |
| | | | | | |
TOTAL INVESTMENTS – 100.0% | | | |
(Cost $511,545,194) | | | | | | 566,488,867 |
Other assets less
liabilities – 0.0% + | | | | | | 229,749 |
| | | | | | |
NET ASSETS – 100.0% | | | | | $ | 566,718,616 |
| | | | | | |
| + | Amount is less than 0.05%. |
| (1) | Sun Capital Advisers LLC or its affiliate, MFS, serves as investment adviser to these underlying funds. These are affiliated securities. |
| | |
| FHLB | | Federal Home Loan Bank |
See Notes to Financial Statements.
193
| | |
IBBOTSON BALANCED FUND PORTFOLIO OF INVESTMENTS (Continued) |
| December 31, 2009 | | Sun Capital Advisers Trust |
| (2) | Fair Value Measurements † |
The following table summarizes the inputs used to value the Fund’s assets and liabilities, as applicable, measured at fair value at the period end:
| | | | | | | | | | | | |
Assets | | Quoted Prices
in Active
Markets for
Identical
Assets and
Liabilities
(Level 1) | | Significant
Other
Observable
Inputs
(Level 2) | | Significant
Unobservable
Inputs
(Level 3) | | Total |
Investment Companies | | $ | 564,993,867 | | $ | — | | $ | — | | $ | 564,993,867 |
Short Term Investments | | | | | | | | | | | | |
Repurchase Agreements | | | — | | | 1,495,000 | | | — | | | 1,495,000 |
| | | | | | | | | | | | |
Total Investments | | | 564,993,867 | | | 1,495,000 | | | — | | | 566,488,867 |
| | | | | | | | | | | | |
Total | | $ | 564,993,867 | | $ | 1,495,000 | | $ | — | | $ | 566,488,867 |
| | | | | | | | | | | | |
| † | See Note 2b in the Notes to Financial Statements for additional information. |
See Notes to Financial Statements.
194
IBBOTSON GROWTH FUND
| | |
PORTFOLIO OF INVESTMENTS December 31, 2009 | | Sun Capital Advisers Trust |
| | | | | |
| | |
Shares | | Value |
| | | | | |
| | | | | |
INVESTMENT COMPANIES (1) – 99.8% |
MFS Emerging Markets Equity Portfolio | | 684,611 | | $ | 9,954,243 |
MFS International Growth Portfolio | | 2,909,050 | | | 35,286,775 |
MFS Research International Portfolio | | 1,400,061 | | | 17,556,759 |
MFS Value Portfolio | | 3,813,396 | | | 48,201,321 |
SC AIM Small Cap Growth Fund | | 639,318 | | | 6,131,056 |
SC AllianceBernstein International Value Fund | | 2,249,751 | | | 22,092,552 |
SC BlackRock Inflation Protected Bond Fund | | 1,699,212 | | | 17,569,850 |
SC Davis Venture Value Fund | | 4,299,051 | | | 46,214,802 |
SC Dreman Small Cap Value Fund | | 1,063,840 | | | 10,723,509 |
SC Goldman Sachs Mid Cap Value Fund | | 2,774,117 | | | 21,998,746 |
SC Goldman Sachs Short Duration Fund | | 857,789 | | | 8,775,178 |
SC Lord Abbett Growth and Income Fund | | 1,760,994 | | | 13,242,674 |
SC Oppenheimer Large Cap Core Fund | | 3,799,681 | | | 30,549,439 |
SC Oppenheimer Main Street Small Cap Fund | | 827,345 | | | 8,753,305 |
SC PIMCO Total Return Fund | | 3,568,316 | | | 39,394,210 |
SC WMC Blue Chip Mid Cap Fund | | 1,018,515 | | | 12,344,403 |
SC WMC Large Cap Growth Fund | | 6,745,678 | | | 54,977,276 |
Sun Capital Global Real Estate Fund | | 1,972,689 | | | 22,153,295 |
Sun Capital Investment Grade Bond Fund | | 2,423,918 | | | 21,960,698 |
| | | | | |
Total Investment Companies
(Cost $396,470,184) | | | | | 447,880,091 |
| | | | | |
| | | | | | | |
| | | Principal
Amount
(000) | | Value | |
| | | | | | | |
SHORT TERM INVESTMENTS – 0.3% | |
REPURCHASE AGREEMENTS – 0.3% | |
State Street Bank and Trust Company, 0.01%, dated 12/31/09, due 1/4/10 (collateralized by $1,330,000 FHLB, 4.375%, 9/17/10, with a value of $1,383,599, total to be received $1,354,001) (Amortized cost $1,354,000) | | $ | 1,354 | | $ | 1,354,000 | |
| | | | | | | |
TOTAL INVESTMENTS – 100.1% | | | | |
(Cost $397,824,184) | | | | | | 449,234,091 | |
Liabilities in excess of other
assets – (0.1)% | | | | | | (501,641 | ) |
| | | | | | | |
NET ASSETS – 100.0% | | | | | $ | 448,732,450 | |
| | | | | | | |
| (1) | Sun Capital Advisers LLC or its affiliate, MFS, serves as investment adviser to these underlying funds. These are affiliated securities. |
| | |
| FHLB | | Federal Home Loan Bank |
See Notes to Financial Statements.
195
| | |
IBBOTSON GROWTH FUND PORTFOLIO OF INVESTMENTS (Continued) |
| December 31, 2009 | | Sun Capital Advisers Trust |
| (2) | Fair Value Measurements † |
The following table summarizes the inputs used to value the Fund’s assets and liabilities, as applicable, measured at fair value at the period end:
| | | | | | | | | | | | |
Assets | | Quoted Prices
in Active
Markets for
Identical
Assets and
Liabilities
(Level 1) | | Significant
Other
Observable
Inputs
(Level 2) | | Significant
Unobservable
Inputs
(Level 3) | | Total |
Investment Companies | | $ | 447,880,091 | | $ | — | | $ | — | | $ | 447,880,091 |
Short Term Investments | | | | | | | | | | | | |
Repurchase Agreements | | | — | | | 1,354,000 | | | — | | | 1,354,000 |
| | | | | | | | | | | | |
Total Investments | | | 447,880,091 | | | 1,354,000 | | | — | | | 449,234,091 |
| | | | | | | | | | | | |
Total | | $ | 447,880,091 | | $ | 1,354,000 | | $ | — | | $ | 449,234,091 |
| | | | | | | | | | | | |
| † | See Note 2b in the Notes to Financial Statements for additional information. |
See Notes to Financial Statements.
196
| | |
| STATEMENTSOF ASSETS AND LIABILITIES | | |
| December 31, 2009 | | Sun Capital Advisers Trust |
| | | | | | | | | | | | | | | | | | | | | |
| | | Investment
Grade
Bond Fund | | Money
Market
Fund | | Global
Real
Estate Fund | | | Davis
Venture
Value Fund | | | Oppenheimer
Main Street
Small Cap Fund | | | Oppenheimer
Large Cap
Core Fund |
ASSETS | | | | | | | | | | | | | | | | | | | | | |
Investments, at value | | | | | | | | | | | | | | | | | | | | | |
Securities | | $ | 214,367,263 | | $ | 203,994,735 | | $ | 223,099,444 | | | $ | 382,401,527 | | | $ | 184,248,763 | | | $ | 83,021,508 |
| | | | | | | | | | | | | | | | | | | | | |
Total Investments | | | 214,367,263 | | | 203,994,735 | | | 223,099,444 | | | | 382,401,527 | | | | 184,248,763 | | | | 83,021,508 |
Cash | | | — | | | — | | | — | | | | 410 | | | | 711 | | | | — |
Foreign currency, at value | | | — | | | — | | | 50,749 | | | | — | | | | 20 | | | | — |
Interest and dividends receivable | | | 1,323,666 | | | 115,029 | | | 1,000,631 | | | | 322,264 | | | | 212,441 | | | | 85,653 |
Receivable for Fund shares sold | | | 436,192 | | | 248,564 | | | 115,705 | | | | 468,251 | | | | 23,462 | | | | 218,015 |
Receivable for investments sold | | | — | | | — | | | — | | | | 202,685 | | | | 376 | | | | 1,213,339 |
Receivable due from Adviser | | | — | | | 38,321 | | | — | | | | — | | | | — | | | | — |
Other assets | | | 5,207 | | | 6,253 | | | 6,162 | | | | 9,756 | | | | 4,787 | | | | 2,077 |
| | | | | | | | | | | | | | | | | | | | | |
Total Assets | | | 216,132,328 | | | 204,402,902 | | | 224,272,691 | | | | 383,404,893 | | | | 184,490,560 | | | | 84,540,592 |
| | | | | | | | | | | | | | | | | | | | | |
LIABILITIES | | | | | | | | | | | | | | | | | | | | | |
Payable for investments purchased - regular delivery | | | — | | | — | | | — | | | | 428,000 | | | | 352,512 | | | | 2,072,855 |
Payable for investments purchased - delayed delivery | | | 14,787,822 | | | — | | | — | | | | — | | | | — | | | | — |
Payable for Fund shares redeemed | | | 67,695 | | | 25,328 | | | 31,987 | | | | 30,045 | | | | 37,141 | | | | 432 |
Investment advisory fee payable | | | 92,192 | | | — | | | 223,752 | | | | 232,427 | | | | 233,416 | | | | 40,454 |
Distribution fee (Service Class) payable | | | 13,278 | | | 24,602 | | | 29,381 | | | | 48,858 | | | | 27,941 | | | | 2,451 |
Accrued expenses and other liabilities | | | 131,686 | | | 58,036 | | | 71,286 | | | | 75,957 | | | | 70,993 | | | | 52,672 |
| | | | | | | | | | | | | | | | | | | | | |
Total Liabilities | | | 15,092,673 | | | 107,966 | | | 356,406 | | | | 815,287 | | | | 722,003 | | | | 2,168,864 |
| | | | | | | | | | | | | | | | | | | | | |
NET ASSETS | | $ | 201,039,655 | | $ | 204,294,936 | | $ | 223,916,285 | | | $ | 382,589,606 | | | $ | 183,768,557 | | | $ | 82,371,728 |
| | | | | | | | | | | | | | | | | | | | | |
COMPOSITION OF NET ASSETS | | | | | | | | | | | | | | | | | | | | | |
Paid-in Capital | | $ | 197,904,139 | | $ | 204,293,867 | | $ | 265,961,761 | | | $ | 333,345,681 | | | $ | 208,062,240 | | | $ | 75,853,588 |
Accumulated undistributed net investment income | | | 183,560 | | | 422 | | | 10,936,439 | | | | 905,316 | | | | 414,338 | | | | 936 |
Accumulated net realized gain (loss) on investments and foreign currency related transactions | | | 985,752 | | | 647 | | | (98,004,704 | ) | | | (14,940,002 | ) | | | (50,338,122 | ) | | | 114,510 |
Net unrealized appreciation (depreciation) on investments and assets and liabilities in foreign currencies | | | 1,966,204 | | | — | | | 45,022,789 | | | | 63,278,611 | | | | 25,630,101 | | | | 6,402,694 |
| | | | | | | | | | | | | | | | | | | | | |
| | $ | 201,039,655 | | $ | 204,294,936 | | $ | 223,916,285 | | | $ | 382,589,606 | | | $ | 183,768,557 | | | $ | 82,371,728 |
| | | | | | | | | | | | | | | | | | | | | |
Initial Class | | | | | | | | | | | | | | | | | | | | | |
Net Assets | | $ | 136,826,762 | | $ | 88,013,236 | | $ | 84,987,619 | | | $ | 147,349,805 | | | $ | 48,949,741 | | | $ | 70,637,582 |
Shares of beneficial interest | | | 15,106,417 | | | 87,989,958 | | | 7,564,803 | | | | 13,709,275 | | | | 4,624,986 | | | | 8,781,396 |
Net asset value per share | | $ | 9.06 | | $ | 1.00 | | $ | 11.23 | | | $ | 10.75 | | | $ | 10.58 | | | $ | 8.04 |
| | | | | | | | | | | | | | | | | | | | | |
Service Class | | | | | | | | | | | | | | | | | | | | | |
Net Assets | | $ | 64,212,893 | | $ | 116,281,700 | | $ | 138,928,666 | | | $ | 235,239,801 | | | $ | 134,818,816 | | | $ | 11,734,146 |
Shares of beneficial interest | | | 7,039,119 | | | 116,305,089 | | | 11,338,761 | | | | 21,940,742 | | | | 12,904,443 | | | | 1,422,949 |
Net asset value per share | | $ | 9.12 | | $ | 1.00 | | $ | 12.25 | | | $ | 10.72 | | | $ | 10.45 | | | $ | 8.25 |
| | | | | | | | | | | | | | | | | | | | | |
Investment in securities, at cost | | $ | 212,401,059 | | $ | 203,994,735 | | $ | 178,076,749 | | | $ | 319,124,207 | | | $ | 158,618,668 | | | $ | 76,618,814 |
| | | | | | | | | | | | | | | | | | | | | |
Foreign currency, at cost | | $ | — | | $ | — | | $ | 50,835 | | | $ | — | | | $ | 19 | | | $ | — |
| | | | | | | | | | | | | | | | | | | | | |
See Notes to Financial Statements.
197
| | |
| STATEMENTSOF ASSETS AND LIABILITIES (Continued) | | |
| December 31, 2009 | | Sun Capital Advisers Trust |
| | | | | | | | | | | | | | | | | | | | |
| | | WMC Large
Cap Growth
Fund | | | WMC Blue
Chip Mid Cap
Fund | | | Lord Abbett
Growth &
Income Fund | | Goldman Sachs
Mid Cap Value
Fund | | Goldman Sachs
Short Duration
Fund | | Dreman Small
Cap Value
Fund |
ASSETS | | | | | | | | | | | | | | | | | | | | |
Investments, at value | | | | | | | | | | | | | | | | | | | | |
Securities | | $ | 166,679,558 | | | $ | 112,654,510 | | | $ | 513,817,670 | | $ | 209,326,556 | | $ | 970,852,093 | | $ | 40,534,870 |
Repurchase Agreements | | | 1,111,000 | | | | 2,456,000 | | | | — | | | — | | | — | | | — |
| | | | | | | | | | | | | | | | | | | | |
Total Investments | | | 167,790,558 | | | | 115,110,510 | | | | 513,817,670 | | | 209,326,556 | | | 970,852,093 | | | 40,534,870 |
Cash | | | 412 | | | | 887 | | | | 154,440 | | | — | | | — | | | — |
Interest and dividends receivable | | | 75,579 | | | | 67,816 | | | | 350,591 | | | 271,813 | | | 6,402,350 | | | 45,714 |
Receivable for Fund shares sold | | | 231,673 | | | | 46,252 | | | | 49,163 | | | 106,592 | | | 614,510 | | | 2,301 |
Receivable for investments sold | | | 1,659,733 | | | | 1,062,754 | | | | 1,523,813 | | | — | | | 32,178,930 | | | — |
Other assets | | | 4,212 | | | | 3,102 | | | | 4,180 | | | 1,609 | | | 7,996 | | | 1,572 |
| | | | | | | | | | | | | | | | | | | | |
Total Assets | | | 169,762,167 | | | | 116,291,321 | | | | 515,899,857 | | | 209,706,570 | | | 1,010,055,879 | | | 40,584,457 |
| | | | | | | | | | | | | | | | | | | | |
LIABILITIES | | | | | | | | | | | | | | | | | | | | |
Due to Custodian | | | — | | | | — | | | | — | | | — | | | 156 | | | — |
Payable for investments purchased - regular delivery | | | 1,891,503 | | | | 138,473 | | | | 6,754,970 | | | — | | | — | | | 16,345 |
Payable for investments purchased - delayed delivery | | | — | | | | — | | | | — | | | — | | | 31,608,532 | | | — |
Payable for Fund shares redeemed | | | 215,075 | | | | 21,757 | | | | 60,122 | | | 26,184 | | | 18,194 | | | — |
Investment advisory fee payable | | | 87,646 | | | | 72,373 | | | | 1,019,381 | | | 457,564 | | | 1,376,183 | | | 31,093 |
Distribution fee (Service Class) payable | | | 3,779 | | | | 8,504 | | | | 1,915 | | | 3,825 | | | 22,572 | | | 1,427 |
Variation margin payable | | | — | | | | — | | | | — | | | 57,960 | | | 47,784 | | | — |
Accrued expenses and other liabilities | | | 60,034 | | | | 56,542 | | | | 2,500 | | | 953 | | | 4,760 | | | 51,892 |
| | | | | | | | | | | | | | | | | | | | |
Total Liabilities | | | 2,258,037 | | | | 297,649 | | | | 7,838,888 | | | 546,486 | | | 33,078,181 | | | 100,757 |
| | | | | | | | | | | | | | | | | | | | |
NET ASSETS | | $ | 167,504,130 | | | $ | 115,993,672 | | | $ | 508,060,969 | | $ | 209,160,084 | | $ | 976,977,698 | | $ | 40,483,700 |
| | | | | | | | | | | | | | | | | | | | |
COMPOSITION OF NET ASSETS | | | | | | | | | | | | | | | | | | | | |
Paid-in Capital | | $ | 168,388,703 | | | $ | 118,343,293 | | | $ | 361,871,333 | | $ | 168,204,566 | | $ | 967,086,973 | | $ | 31,098,349 |
Accumulated undistributed net investment income | | | 554,356 | | | | 63,374 | | | | — | | | — | | | — | | | — |
Accumulated net realized gain (loss) on investments and foreign currency related transactions | | | (24,494,649 | ) | | | (19,174,386 | ) | | | 21,350,876 | | | 5,564,221 | | | 169,096 | | | 3,907,505 |
Net unrealized appreciation (depreciation) on investments and assets and liabilities in foreign currencies | | | 23,055,720 | | | | 16,761,391 | | | | 124,838,760 | | | 35,391,297 | | | 9,721,629 | | | 5,477,846 |
| | | | | | | | | | | | | | | | | | | | |
| | $ | 167,504,130 | | | $ | 115,993,672 | | | $ | 508,060,969 | | $ | 209,160,084 | | $ | 976,977,698 | | $ | 40,483,700 |
| | | | | | | | | | | | | | | | | | | | |
Initial Class | | | | | | | | | | | | | | | | | | | | |
Net Assets | | $ | 149,621,443 | | | $ | 75,744,952 | | | $ | 498,639,036 | | $ | 190,461,397 | | $ | 869,648,325 | | $ | 33,674,402 |
Shares of beneficial interest | | | 18,350,627 | | | | 6,247,928 | | | | 66,298,532 | | | 24,006,000 | | | 84,977,752 | | | 3,342,225 |
Net asset value per share | | $ | 8.15 | | | $ | 12.12 | | | $ | 7.52 | | $ | 7.93 | | $ | 10.23 | | $ | 10.08 |
| | | | | | | | | | | | | | | | | | | | |
Service Class | | | | | | | | | | | | | | | | | | | | |
Net Assets | | $ | 17,882,687 | | | $ | 40,248,720 | | | $ | 9,421,933 | | $ | 18,698,687 | | $ | 107,329,373 | | $ | 6,809,298 |
Shares of beneficial interest | | | 2,208,247 | | | | 3,335,675 | | | | 1,254,127 | | | 2,359,070 | | | 10,493,826 | | | 676,003 |
Net asset value per share | | $ | 8.10 | | | $ | 12.07 | | | $ | 7.51 | | $ | 7.93 | | $ | 10.23 | | $ | 10.07 |
| | | | | | | | | | | | | | | | | | | | |
Investment in securities, at cost | | $ | 144,734,838 | | | $ | 98,349,111 | | | $ | 388,978,910 | | $ | 174,021,443 | | $ | 962,072,858 | | $ | 35,057,024 |
| | | | | | | | | | | | | | | | | | | | |
See Notes to Financial Statements.
198
| | |
| STATEMENTSOF ASSETS AND LIABILITIES (Continued) | | |
| December 31, 2009 | | Sun Capital Advisers Trust |
| | | | | | | | | | | | | | | | | |
| | | PIMCO High
Yield Fund | | | PIMCO Total
Return Fund | | AIM Small
Cap Growth
Fund | | AllianceBernstein
International
Value Fund | | | BlackRock Inflation
Protected
Bond Fund |
ASSETS | | | | | | | | | | | | | | | | | |
Investments, at value | | | | | | | | | | | | | | | | | |
Securities | | $ | 114,574,865 | | | $ | 450,095,104 | | $ | 18,950,615 | | $ | 57,085,474 | | | $ | 183,926,461 |
Repurchase Agreements | | | — | | | | — | | | 695,898 | | | — | | | | — |
| | | | | | | | | | | | | | | | | |
Total Investments | | | 114,574,865 | | | | 450,095,104 | | | 19,646,513 | | | 57,085,474 | | | | 183,926,461 |
Cash | | | 56,782 | | | | — | | | — | | | — | | | | — |
Foreign currency, at value | | | 510,404 | | | | 407,358 | | | — | | | 845,945 | | | | 238 |
Margin deposits with broker | | | — | | | | 81,000 | | | — | | | 67,747 | | | | — |
Interest and dividends receivable | | | 2,280,282 | | | | 1,404,757 | | | 5,683 | | | 93,213 | | | | 1,111,943 |
Receivable for Fund shares sold | | | 48,852 | | | | 1,608,715 | | | 9,252 | | | 87,942 | | | | 620,334 |
Receivable for investments sold | | | — | | | | 890,511 | | | 7,480 | | | 73,633 | | | | — |
Variation margin receivable | | | — | | | | — | | | — | | | 1,228 | | | | 38,951 |
Unrealized appreciation on forward foreign currency exchange contracts | | | 155,046 | | | | 269,152 | | | — | | | — | | | | 21 |
Unrealized appreciation on swaps | | | 1,102,487 | | | | 142,226 | | | — | | | — | | | | 33,082 |
Swap premiums paid | | | 164,572 | | | | 379,620 | | | — | | | — | | | | — |
Other assets | | | 15,249 | | | | 25,469 | | | 801 | | | 1,506 | | | | 1,548 |
| | | | | | | | | | | | | | | | | |
Total Assets | | | 118,908,539 | | | | 455,303,912 | | | 19,669,729 | | | 58,256,688 | | | | 185,732,578 |
| | | | | | | | | | | | | | | | | |
LIABILITIES | | | | | | | | | | | | | | | | | |
Due to Custodian | | | — | | | | 1,237 | | | — | | | — | | | | — |
Payable for investments purchased - regular delivery | | | — | | | | — | | | 15,095 | | | 776,224 | | | | — |
Payable for investments purchased - delayed delivery | | | — | | | | 64,899,139 | | | — | | | — | | | | — |
Cash collateral received from broker | | | 420,000 | | | | — | | | — | | | — | | | | — |
Payable for Fund shares redeemed | | | 23,351 | | | | — | | | 51 | | | 4 | | | | — |
Investment advisory fee payable | | | 167,975 | | | | 479,245 | | | 4,686 | | | 3,072 | | | | 228,144 |
Distribution fee (Service Class) payable | | | 5,214 | | | | 49,902 | | | 1,390 | | | 380 | | | | 15,954 |
Variation margin payable | | | 5,074 | | | | 92,641 | | | — | | | — | | | | — |
Options written (Premium $236,692; $997,851; $0; $0 and $391,727, respectively) | | | 160,293 | | | | 1,027,341 | | | — | | | — | | | | 344,957 |
Unrealized depreciation on forward foreign currency exchange contracts | | | 1,179 | | | | 22,066 | | | — | | | — | | | | 18,999 |
Accrued expenses and other liabilities | | | 3,789 | | | | 3,849 | | | 52,295 | | | 64,625 | | | | 6,169 |
Swap premiums received | | | 906,967 | | | | 4,497 | | | — | | | — | | | | — |
Unrealized depreciation on swaps | | | 113,055 | | | | 169,421 | | | — | | | — | | | | 15,460 |
| | | | | | | | | | | | | | | | | |
Total Liabilities | | | 1,806,897 | | | | 66,749,338 | | | 73,517 | | | 844,305 | | | | 629,683 |
| | | | | | | | | | | | | | | | | |
NET ASSETS | | $ | 117,101,642 | | | $ | 388,554,574 | | $ | 19,596,212 | | $ | 57,412,383 | | | $ | 185,102,895 |
| | | | | | | | | | | | | | | | | |
COMPOSITION OF NET ASSETS | | | | | | | | | | | | | | | | | |
Paid-in Capital | | $ | 102,502,044 | | | $ | 379,993,389 | | $ | 16,073,287 | | $ | 48,552,824 | | | $ | 181,169,596 |
Accumulated undistributed (distributions in excess of) net investment income | | | (93,986 | ) | | | 98,716 | | | — | | | (326,462 | ) | | | 12,276 |
Accumulated net realized gain (loss) on investments and foreign currency related transactions | | | 931,015 | | | | 2,245,201 | | | 1,852,225 | | | 1,155,552 | | | | 2,407,244 |
Net unrealized appreciation (depreciation) on investments and assets and liabilities in foreign currencies | | | 13,762,569 | | | | 6,217,268 | | | 1,670,700 | | | 8,030,469 | | | | 1,513,779 |
| | | | | | | | | | | | | | | | | |
| | $ | 117,101,642 | | | $ | 388,554,574 | | $ | 19,596,212 | | $ | 57,412,383 | | | $ | 185,102,895 |
| | | | | | | | | | | | | | | | | |
Initial Class | | | | | | | | | | | | | | | | | |
Net Assets | | $ | 92,421,917 | | | $ | 144,811,500 | | $ | 13,108,524 | | $ | 55,746,261 | | | $ | 106,264,225 |
Shares of beneficial interest | | | 9,767,948 | | | | 13,116,015 | | | 1,367,213 | | | 5,678,230 | | | | 10,279,716 |
Net asset value per share | | $ | 9.46 | | | $ | 11.04 | | $ | 9.59 | | $ | 9.82 | | | $ | 10.34 |
| | | | | | | | | | | | | | | | | |
Service Class | | | | | | | | | | | | | | | | | |
Net Assets | | $ | 24,679,725 | | | $ | 243,743,074 | | $ | 6,487,688 | | $ | 1,666,122 | | | $ | 78,838,670 |
Shares of beneficial interest | | | 2,608,495 | | | | 22,079,795 | | | 679,049 | | | 169,780 | | | | 7,641,999 |
Net asset value per share | | $ | 9.46 | | | $ | 11.04 | | $ | 9.55 | | $ | 9.81 | | | $ | 10.32 |
| | | | | | | | | | | | | | | | | |
Investment in securities, at cost | | $ | 102,414,495 | | | $ | 443,732,394 | | $ | 17,975,813 | | $ | 49,095,255 | | | $ | 182,709,543 |
| | | | | | | | | | | | | | | | | |
Foreign currency, at cost | | $ | 518,618 | | | $ | 412,452 | | $ | — | | $ | 845,563 | | | $ | 238 |
| | | | | | | | | | | | | | | | | |
See Notes to Financial Statements.
199
| | |
| STATEMENTSOF ASSETS AND LIABILITIES (Continued) | | |
| December 31, 2009 | | Sun Capital Advisers Trust |
| | | | | | | | | |
| | | Ibbotson
Moderate Fund | | Ibbotson
Balanced Fund | | Ibbotson
Growth Fund |
ASSETS | | | | | | | | | |
Investments, at value | | | | | | | | | |
Affiliated securities | | $ | 365,371,241 | | $ | 564,993,867 | | $ | 447,880,091 |
Repurchase Agreements | | | 282,000 | | | 1,495,000 | | | 1,354,000 |
| | | | | | | | | |
Total Investments | | | 365,653,241 | | | 566,488,867 | | | 449,234,091 |
Cash | | | 307 | | | 777 | | | 167 |
Interest and dividends receivable | | | 491,697 | | | 547,627 | | | 156,415 |
Receivable for Fund shares sold | | | 1,271,942 | | | 1,920,541 | | | 1,018,189 |
Other assets | | | 9,459 | | | 14,525 | | | 11,245 |
| | | | | | | | | |
Total Assets | | | 367,426,646 | | | 568,972,337 | | | 450,420,107 |
| | | | | | | | | |
LIABILITIES | | | | | | | | | |
Payable for investments purchased - regular delivery | | | 774,004 | | | 2,043,404 | | | 1,510,581 |
Investment advisory fee payable | | | 17,201 | | | 19,657 | | | 18,832 |
Distribution fee (Service Class) payable | | | 74,519 | | | 115,115 | | | 90,158 |
Accrued expenses and other liabilities | | | 62,673 | | | 75,545 | | | 68,086 |
| | | | | | | | | |
Total Liabilities | | | 928,397 | | | 2,253,721 | | | 1,687,657 |
| | | | | | | | | |
NET ASSETS | | $ | 366,498,249 | | $ | 566,718,616 | | $ | 448,732,450 |
| | | | | | | | | |
COMPOSITION OF NET ASSETS | | | | | | | | | |
Paid-in Capital | | $ | 325,721,661 | | $ | 495,747,740 | | $ | 384,682,606 |
Accumulated undistributed net investment income | | | 7,495,179 | | | 9,775,011 | | | 7,038,432 |
Accumulated net realized gain (loss) on investments and capital gain distributions from affiliated underlying funds | | | 3,751,873 | | | 6,252,192 | | | 5,601,505 |
Net unrealized appreciation (depreciation) on investments and assets and liabilities in foreign currencies | | | 29,529,536 | | | 54,943,673 | | | 51,409,907 |
| | | | | | | | | |
| | $ | 366,498,249 | | $ | 566,718,616 | | $ | 448,732,450 |
| | | | | | | | | |
Initial Class | | | | | | | | | |
Net Assets | | $ | 1,708,183 | | $ | 442,320 | | $ | 291,860 |
Shares of beneficial interest | | | 156,155 | | | 39,450 | | | 25,946 |
Net asset value per share | | $ | 10.94 | | $ | 11.21 | | $ | 11.25 |
| | | | | | | | | |
Service Class | | | | | | | | | |
Net Assets | | $ | 364,790,066 | | $ | 566,276,296 | | $ | 448,440,590 |
Shares of beneficial interest | | | 33,350,123 | | | 50,555,261 | | | 39,883,256 |
Net asset value per share | | $ | 10.94 | | $ | 11.20 | | $ | 11.24 |
| | | | | | | | | |
Investment in securities, at cost | | $ | 336,123,705 | | $ | 511,545,194 | | $ | 397,824,184 |
| | | | | | | | | |
See Notes to Financial Statements.
200
| | |
| STATEMENTSOF OPERATIONS | | |
| For the Year Ended December 31, 2009 | | Sun Capital Advisers Trust |
| | | | | | | | | | | | | | | | | | | | | | | | |
| | | Investment
Grade
Bond Fund | | | Money
Market
Fund | | | Global
Real
Estate Fund | | | Davis
Venture
Value Fund | | | Oppenheimer
Main Street
Small Cap Fund | | | Oppenheimer
Large Cap
Core Fund | |
INVESTMENT INCOME | | | | | | | | | | | | | | | | | | | | | | | | |
Interest | | $ | 6,289,314 | | | $ | 937,625 | | | $ | 28,361 | | | $ | 146,167 | | | $ | 1,204 | | | $ | 1,185 | |
Dividends (net of foreign withholding taxes of $0; $0; $372,406; $33,344; $3,081 and $0, respectively) | | | — | | | | — | | | | 8,728,256 | | | | 3,431,268 | | | | 2,354,455 | | | | 1,051,494 | |
| | | | | | | | | | | | | | | | | | | | | | | | |
Total investment income | | | 6,289,314 | | | | 937,625 | | | | 8,756,617 | | | | 3,577,435 | | | | 2,355,659 | | | | 1,052,679 | |
| | | | | | | | | | | | | | | | | | | | | | | | |
EXPENSES | | | | | | | | | | | | | | | | | | | | | | | | |
Investment advisory fee | | | 719,284 | | | | 1,105,945 | | | | 1,783,496 | | | | 1,733,945 | | | | 1,300,744 | | | | 298,792 | |
Distribution fee (Service Class) | | | 98,270 | | | | 218,549 | | | | 321,970 | | | | 394,953 | | | | 304,241 | | | | 18,850 | |
Custody and fund accounting | | | 99,576 | | | | 92,350 | | | | 145,693 | | | | 133,522 | | | | 428,913 | | | | 81,856 | |
Audit | | | 45,985 | | | | 30,957 | | | | 40,905 | | | | 34,841 | | | | 36,743 | | | | 36,151 | |
Legal | | | 24,197 | | | | 69,107 | | | | 44,482 | | | | 30,328 | | | | 24,150 | | | | 7,104 | |
Printing | | | 3,819 | | | | 10,043 | | | | 8,221 | | | | 11,208 | | | | 7,472 | | | | 2,041 | |
Administration | | | 88,145 | | | | 159,930 | | | | 133,202 | | | | 159,647 | | | | 119,779 | | | | 39,547 | |
Transfer agency | | | 15,171 | | | | 11,405 | | | | 16,785 | | | | 14,635 | | | | 12,141 | | | | 14,103 | |
Trustees fees | | | 8,209 | | | | 15,953 | | | | 12,219 | | | | 15,310 | | | | 10,536 | | | | 2,807 | |
Insurance | | | 7,362 | | | | 68,081 | | | | 15,899 | | | | 13,198 | | | | 15,987 | | | | 1,506 | |
Miscellaneous fees | | | 2,306 | | | | 1,812 | | | | 4,910 | | | | 3,817 | | | | 3,270 | | | | 1,642 | |
| | | | | | | | | | | | | | | | | | | | | | | | |
Total expenses | | | 1,112,324 | | | | 1,784,132 | | | | 2,527,782 | | | | 2,545,404 | | | | 2,263,976 | | | | 504,399 | |
| | | | | | | | | | | | | | | | | | | | | | | | |
Less: Reduction of investment advisory fees or unified management fees | | | (114,948 | ) | | | (1,105,945 | ) | | | (140,783 | ) | | | (69,717 | ) | | | (333,805 | ) | | | (101,347 | ) |
Reimbursement of operating expenses | | | — | | | | (80,690 | ) | | | — | | | | — | | | | — | | | | — | |
| | | | | | | | | | | | | | | | | | | | | | | | |
Net expenses | | | 997,376 | | | | 597,497 | | | | 2,386,999 | | | | 2,475,687 | | | | 1,930,171 | | | | 403,052 | |
| | | | | | | | | | | | | | | | | | | | | | | �� | |
Net investment income | | | 5,291,938 | | | | 340,128 | | | | 6,369,618 | | | | 1,101,748 | | | | 425,488 | | | | 649,627 | |
| | | | | | | | | | | | | | | | | | | | | | | | |
REALIZED AND UNREALIZED GAIN (LOSS) | | | | | | | | | | | | | | | | | | | | | | | | |
Net realized gain (loss) from: | | | | | | | | | | | | | | | | | | | | | | | | |
Investments | | | 1,727,150 | | | | 647 | | | | (91,921,344 | ) | | | (11,148,336 | ) | | | (25,104,245 | ) | | | 3,853,147 | |
Foreign currency related transactions | | | — | | | | — | | | | (20,905 | ) | | | (62,601 | ) | | | (684 | ) | | | — | |
| | | | | | | | | | | | | | | | | | | | | | | | |
Net realized gain (loss) | | | 1,727,150 | | | | 647 | | | | (91,942,249 | ) | | | (11,210,937 | ) | | | (25,104,929 | ) | | | 3,853,147 | |
| | | | | | | | | | | | | | | | | | | | | | | | |
Change in unrealized appreciation (depreciation) on: | | | | | | | | | | | | | | | | | | | | | | | | |
Investments | | | 13,693,333 | | | | 368,057 | | | | 155,580,799 | | | | 87,390,682 | | | | 83,844,821 | | | | 7,857,708 | |
Capital Support Agreement | | | — | | | | (368,057 | ) | | | — | | | | — | | | | — | | | | — | |
Assets and liabilities in foreign currencies | | | — | | | | — | | | | (2,524 | ) | | | 925 | | | | 23 | | | | — | |
| | | | | | | | | | | | | | | | | | | | | | | | |
Change in unrealized appreciation (depreciation) | | | 13,693,333 | | | | — | | | | 155,578,275 | | | | 87,391,607 | | | | 83,844,844 | | | | 7,857,708 | |
| | | | | | | | | | | | | | | | | | | | | | | | |
Net realized and unrealized gain (loss) | | | 15,420,483 | | | | 647 | | | | 63,636,026 | | | | 76,180,670 | | | | 58,739,915 | | | | 11,710,855 | |
| | | | | | | | | | | | | | | | | | | | | | | | |
Net increase (decrease) in net assets from operations | | $ | 20,712,421 | | | $ | 340,775 | | | $ | 70,005,644 | | | $ | 77,282,418 | | | $ | 59,165,403 | | | $ | 12,360,482 | |
| | | | | | | | | | | | | | | | | | | | | | | | |
See Notes to Financial Statements.
201
| | |
| STATEMENTSOF OPERATIONS (Continued) | | |
| For the Year Ended December 31, 2009 | | Sun Capital Advisers Trust |
| | | | | | | | | | | | | | | | | | | | | | | |
| | | WMC Large
Cap Growth
Fund | | | WMC Blue
Chip Mid Cap
Fund | | | Lord Abbett
Growth &
Income Fund | | | Goldman Sachs
Mid Cap Value
Fund | | Goldman Sachs
Short Duration
Fund | | | Dreman Small
Cap Value
Fund | |
INVESTMENT INCOME | | | | | | | | | | | | | | | | | | | | | | | |
Interest | | $ | 3 | | | $ | 1,616 | | | $ | 64,884 | | | $ | 18,445 | | $ | 17,963,889 | | | $ | 4,098 | |
Dividends (net of foreign withholding taxes of $5,099; $641; $36,490; $0; $0 and $0, respectively) | | | 1,369,587 | | | | 1,069,367 | | | | 6,281,878 | | | | 3,333,791 | | | — | | | | 511,259 | |
| | | | | | | | | | | | | | | | | | | | | | | |
Total investment income | | | 1,369,590 | | | | 1,070,983 | | | | 6,346,762 | | | | 3,352,236 | | | 17,963,889 | | | | 515,357 | |
| | | | | | | | | | | | | | | | | | | | | | | |
EXPENSES | | | | | | | | | | | | | | | | | | | | | | | |
Investment advisory fee | | | 717,672 | | | | 734,275 | | | | — | | | | — | | | — | | | | 256,185 | |
Unified management fee | | | — | | | | — | | | | 3,571,905 | | | | 1,404,247 | | | 4,639,254 | | | | — | |
Distribution fee (Service Class) | | | 40,146 | | | | 87,941 | | | | 14,465 | | | | 25,172 | | | 207,691 | | | | 11,161 | |
Custody and fund accounting | | | 120,700 | | | | 106,708 | | | | — | | | | — | | | — | | | | 99,946 | |
Audit | | | 36,186 | | | | 37,157 | | | | — | | | | — | | | — | | | | 36,739 | |
Legal | | | 19,348 | | | | 22,422 | | | | 13,916 | | | | 4,365 | | | 23,926 | | | | 4,321 | |
Printing | | | 4,175 | | | | 4,447 | | | | — | | | | — | | | — | | | | 624 | |
Administration | | | 72,473 | | | | 72,367 | | | | — | | | | — | | | — | | | | 30,912 | |
Transfer agency | | | 21,299 | | | | 14,883 | | | | — | | | | — | | | — | | | | 9,849 | |
Trustees fees | | | 6,393 | | | | 6,293 | | | | 29,916 | | | | 9,679 | | | 57,729 | | | | 1,912 | |
Insurance | | | 6,086 | | | | 8,936 | | | | 310 | | | | 288 | | | 3,377 | | | | 640 | |
Miscellaneous fees | | | 2,250 | | | | 2,234 | | | | — | | | | — | | | — | | | | 1,392 | |
| | | | | | | | | | | | | | | | | | | | | | | |
Total expenses | | | 1,046,728 | | | | 1,097,663 | | | | 3,630,512 | | | | 1,443,751 | | | 4,931,977 | | | | 453,681 | |
| | | | | | | | | | | | | | | | | | | | | | | |
Less: Reduction of investment advisory fees or unified management fees | | | (231,496 | ) | | | (91,879 | ) | | | (44,223 | ) | | | — | | | (15,758 | ) | | | (115,129 | ) |
| | | | | | | | | | | | | | | | | | | | | | | |
Net expenses | | | 815,232 | | | | 1,005,784 | | | | 3,586,289 | | | | 1,443,751 | | | 4,916,219 | | | | 338,552 | |
| | | | | | | | | | | | | | | | | | | | | | | |
Net investment income | | | 554,358 | | | | 65,199 | | | | 2,760,473 | | | | 1,908,485 | | | 13,047,670 | | | | 176,805 | |
| | | | | | | | | | | | | | | | | | | | | | | |
REALIZED AND UNREALIZED GAIN (LOSS) | | | | | | | | | | | | | | | | | | | | | | | |
Net realized gain (loss) from: | | | | | | | | | | | | | | | | | | | | | | | |
Investments | | | (3,983,702 | ) | | | (8,248,467 | ) | | | 69,452,147 | | | | 21,942,248 | | | 5,588,541 | | | | 5,271,543 | |
Futures | | | — | | | | — | | | | — | | | | 1,204,067 | | | 2,369,529 | | | | — | |
Foreign currency related transactions | | | — | | | | (227 | ) | | | 47 | | | | — | | | — | | | | 121 | |
| | | | | | | | | | | | | | | | | | | | | | | |
Net realized gain (loss) | | | (3,983,702 | ) | | | (8,248,694 | ) | | | 69,452,194 | | | | 23,146,315 | | | 7,958,070 | | | | 5,271,664 | |
| | | | | | | | | | | | | | | | | | | | | | | |
Change in unrealized appreciation (depreciation) on: | | | | | | | | | | | | | | | | | | | | | | | |
Investments | | | 37,481,869 | | | | 33,984,937 | | | | 125,484,977 | | | | 36,925,443 | | | 6,433,489 | | | | 5,615,472 | |
Forward Sales Contracts | | | — | | | | — | | | | — | | | | — | | | 93,556 | | | | — | |
Futures | | | — | | | | — | | | | — | | | | 59,187 | | | 828,356 | | | | — | |
Assets and liabilities in foreign currencies | | | — | | | | (8 | ) | | | — | | | | — | | | — | | | | 7 | |
| | | | | | | | | | | | | | | | | | | | | | | |
Change in unrealized appreciation (depreciation) | | | 37,481,869 | | | | 33,984,929 | | | | 125,484,977 | | | | 36,984,630 | | | 7,355,401 | | | | 5,615,479 | |
| | | | | | | | | | | | | | | | | | | | | | | |
Net realized and unrealized gain (loss) | | | 33,498,167 | | | | 25,736,235 | | | | 194,937,171 | | | | 60,130,945 | | | 15,313,471 | | | | 10,887,143 | |
| | | | | | | | | | | | | | | | | | | | | | | |
Net increase (decrease) in net assets from operations | | $ | 34,052,525 | | | $ | 25,801,434 | | | $ | 197,697,644 | | | $ | 62,039,430 | | $ | 28,361,141 | | | $ | 11,063,948 | |
| | | | | | | | | | | | | | | | | | | | | | | |
See Notes to Financial Statements.
202
| | |
| STATEMENTSOF OPERATIONS (Continued) | | |
| For the Year Ended December 31, 2009 | | Sun Capital Advisers Trust |
| | | | | | | | | | | | | | | | | | | | |
| | | PIMCO High
Yield Fund | | | PIMCO Total
Return Fund | | | AIM Small
Cap Growth
Fund | | | AllianceBernstein
International
Value Fund | | | BlackRock Inflation
Protected
Bond Fund | |
INVESTMENT INCOME | | | | | | | | | | | | | | | | | | | | |
Interest | | $ | 7,715,372 | | | $ | 5,733,995 | | | $ | 1 | | | $ | 2,905 | | | $ | 2,700,509 | |
Dividends (net of foreign withholding taxes of $0; $0; $0; $106,653 and $0, respectively) | | | 57,000 | | | | 18,625 | | | | 136,292 | | | | 1,093,660 | | | | — | |
| | | | | | | | | | | | | | | | | | | | |
Total investment income | | | 7,772,372 | | | | 5,752,620 | | | | 136,293 | | | | 1,096,565 | | | | 2,700,509 | |
| | | | | | | | | | | | | | | | | | | | |
EXPENSES | | | | | | | | | | | | | | | | | | | | |
Investment advisory fee | | | — | | | | — | | | | 144,796 | | | | 213,530 | | | | — | |
Unified management fee | | | 625,466 | | | | 1,220,427 | | | | — | | | | — | | | | 590,255 | |
Distribution fee (Service Class) | | | 47,776 | | | | 290,602 | | | | 9,919 | | | | 6,758 | | | | 84,628 | |
Custody and fund accounting | | | — | | | | — | | | | 117,879 | | | | 170,714 | | | | — | |
Audit | | | — | | | | — | | | | 36,712 | | | | 41,765 | | | | — | |
Legal | | | 2,638 | | | | 5,776 | | | | 2,525 | | | | 6,793 | | | | 2,765 | |
Printing | | | — | | | | — | | | | 242 | | | | 1,118 | | | | — | |
Administration | | | — | | | | — | | | | 19,632 | | | | 22,657 | | | | — | |
Transfer agency | | | — | | | | — | | | | 9,047 | | | | 8,193 | | | | — | |
Trustees fees | | | 6,267 | | | | 12,454 | | | | 1,034 | | | | 2,270 | | | | 6,056 | |
Insurance | | | 342 | | | | 693 | | | | 479 | | | | 1,230 | | | | 302 | |
Miscellaneous fees | | | — | | | | — | | | | 1,268 | | | | 1,716 | | | | — | |
| | | | | | | | | | | | | | | | | | | | |
Total expenses | | | 682,489 | | | | 1,529,952 | | | | 343,533 | | | | 476,744 | | | | 684,006 | |
| | | | | | | | | | | | | | | | | | | | |
Less: Reduction of investment advisory fees or unified management fees | | | (1,464 | ) | | | (18,941 | ) | | | (144,796 | ) | | | (213,530 | ) | | | (9,133 | ) |
Reimbursement of operating expenses | | | — | | | | — | | | | (13,392 | ) | | | (2,254 | ) | | | — | |
| | | | | | | | | | | | | | | | | | | | |
Net expenses | | | 681,025 | | | | 1,511,011 | | | | 185,345 | | | | 260,960 | | | | 674,873 | |
| | | | | | | | | | | | | | | | | | | | |
Net investment income (loss) | | | 7,091,347 | | | | 4,241,609 | | | | (49,052 | ) | | | 835,605 | | | | 2,025,636 | |
| | | | | | | | | | | | | | | | | | | | |
REALIZED AND UNREALIZED GAIN (LOSS) | | | | | | | | | | | | | | | | | | | | |
Net realized gain (loss) from: | | | | | | | | | | | | | | | | | | | | |
Investments | | | 4,123,092 | | | | 4,014,319 | | | | 2,524,434 | | | | 2,639,625 | | | | 3,065,514 | |
Futures | | | 132,957 | | | | 1,596,954 | | | | — | | | | 112,969 | | | | 15,201 | |
Written options | | | 224,482 | | | | 788,073 | | | | — | | | | — | | | | 99,475 | |
Swaps | | | (586,919 | ) | | | 254,149 | | | | — | | | | — | | | | 1,743,770 | |
Foreign currency related transactions | | | (279,448 | ) | | | (12,539 | ) | | | — | | | | (89,840 | ) | | | 21,419 | |
| | | | | | | | | | | | | | | | | | | | |
Net realized gain (loss) | | | 3,614,164 | | | | 6,640,956 | | | | 2,524,434 | | | | 2,662,754 | | | | 4,945,379 | |
| | | | | | | | | | | | | | | | | | | | |
Change in unrealized appreciation (depreciation) on: | | | | | | | | | | | | | | | | | | | | |
Investments | | | 13,583,158 | | | | 5,971,594 | | | | 2,250,746 | | | | 8,430,363 | | | | 1,033,771 | |
Futures and options on futures | | | 303,750 | | | | (480,628 | ) | | | — | | | | 34,936 | | | | 297,053 | |
Written options | | | 76,399 | | | | (29,490 | ) | | | — | | | | — | | | | 46,770 | |
Swaps | | | 1,353,663 | | | | (27,195 | ) | | | — | | | | — | | | | 27,029 | |
Assets and liabilities in foreign currencies | | | 186,776 | | | | 279,505 | | | | — | | | | 1,387 | | | | (19,751 | ) |
| | | | | | | | | | | | | | | | | | | | |
Change in unrealized appreciation (depreciation) | | | 15,503,746 | | | | 5,713,786 | | | | 2,250,746 | | | | 8,466,686 | | | | 1,384,872 | |
| | | | | | | | | | | | | | | | | | | | |
Net realized and unrealized gain (loss) | | | 19,117,910 | | | | 12,354,742 | | | | 4,775,180 | | | | 11,129,440 | | | | 6,330,251 | |
| | | | | | | | | | | | | | | | | | | | |
Net increase (decrease) in net assets from operations | | $ | 26,209,257 | | | $ | 16,596,351 | | | $ | 4,726,128 | | | $ | 11,965,045 | | | $ | 8,355,887 | |
| | | | | | | | | | | | | | | | | | | | |
See Notes to Financial Statements.
203
| | |
| STATEMENTSOF OPERATIONS (Continued) | | |
| For the Year Ended December 31, 2009 | | Sun Capital Advisers Trust |
| | | | | | | | | | | | |
| | | Ibbotson
Moderate Fund | | | Ibbotson
Balanced Fund | | | Ibbotson
Growth Fund | |
INVESTMENT INCOME | | | | | | | | | | | | |
Dividends from affiliated underlying funds | | $ | 4,573,661 | | | $ | 5,663,172 | | | $ | 3,331,937 | |
| | | | | | | | | | | | |
Total investment income | | | 4,573,661 | | | | 5,663,172 | | | | 3,331,937 | |
| | | | | | | | | | | | |
EXPENSES | | | | | | | | | | | | |
Investment advisory fee | | | 232,076 | | | | 331,013 | | | | 255,588 | |
Distribution fee (Service Class) | | | 462,630 | | | | 661,586 | | | | 510,697 | |
Custody and fund accounting | | | 82,535 | | | | 98,096 | | | | 92,451 | |
Audit | | | 28,170 | | | | 28,109 | | | | 28,217 | |
Legal | | | 27,622 | | | | 36,245 | | | | 28,234 | |
Printing | | | 6,257 | | | | 7,661 | | | | 6,460 | |
Administration | | | 125,946 | | | | 172,479 | | | | 135,682 | |
Transfer agency | | | 6,777 | | | | 6,843 | | | | 7,860 | |
Trustees fees | | | 12,251 | | | | 17,436 | | | | 13,356 | |
Insurance | | | 3,411 | | | | 3,999 | | | | 3,413 | |
Miscellaneous fees | | | 3,201 | | | | 3,729 | | | | 3,295 | |
| | | | | | | | | | | | |
Total expenses | | | 990,876 | | | | 1,367,196 | | | | 1,085,253 | |
| | | | | | | | | | | | |
Less: Reduction of investment advisory fees | | | (156,925 | ) | | | (175,989 | ) | | | (165,615 | ) |
| | | | | | | | | | | | |
Net expenses | | | 833,951 | | | | 1,191,207 | | | | 919,638 | |
| | | | | | | | | | | | |
Net investment income | | | 3,739,710 | | | | 4,471,965 | | | | 2,412,299 | |
| | | | | | | | | | | | |
REALIZED AND UNREALIZED GAIN (LOSS) | | | | | | | | | | | | |
Net realized gain (loss) from: | | | | | | | | | | | | |
Affiliated investments | | | 3,539,260 | | | | 5,868,907 | | | | 5,379,423 | |
Capital gain distributions from affiliated underlying funds | | | 3,978,566 | | | | 5,686,345 | | | | 4,865,372 | |
| | | | | | | | | | | | |
Net realized gain (loss) | | | 7,517,826 | | | | 11,555,252 | | | | 10,244,795 | |
| | | | | | | | | | | | |
Change in unrealized appreciation (depreciation) on: | | | | | | | | | | | | |
Affiliated investments | | | 28,588,643 | | | | 53,653,607 | | | | 49,767,168 | |
| | | | | | | | | | | | |
Change in unrealized appreciation (depreciation) | | | 28,588,643 | | | | 53,653,607 | | | | 49,767,168 | |
| | | | | | | | | | | | |
Net realized and unrealized gain (loss) | | | 36,106,469 | | | | 65,208,859 | | | | 60,011,963 | |
| | | | | | | | | | | | |
Net increase (decrease) in net assets from operations | | $ | 39,846,179 | | | $ | 69,680,824 | | | $ | 62,424,262 | |
| | | | | | | | | | | | |
See Notes to Financial Statements.
204
| | |
| STATEMENTSOF CHANGESIN NET ASSETS | | |
| | | Sun Capital Advisers Trust |
| | | | | | | | | | | | | | | | | | | | | | | | |
| | | Investment Grade
Bond Fund | | | Money Market Fund | | | Global Real Estate Fund | |
| | | Year Ended December 31, | | | Year Ended December 31, | | | Year Ended December 31, | |
| | | 2009 | | | 2008 | | | 2009 | | | 2008 | | | 2009 | | | 2008 | |
INCREASE (DECREASE) IN NET ASSETS FROM OPERATIONS | | | | | | | | | | | | | | | | | | | | | | | | |
Net investment income (loss) | | $ | 5,291,938 | | | $ | 3,475,891 | | | $ | 340,128 | | | $ | 3,213,550 | | | $ | 6,369,618 | | | $ | 2,635,710 | |
Net realized gain (loss) | | | 1,727,150 | | | | (593,956 | ) | | | 647 | | | | 407 | | | | (91,942,249 | ) | | | 3,934,208 | |
Change in unrealized appreciation (depreciation) | | | 13,693,333 | | | | (10,576,615 | ) | | | — | | | | — | | | | 155,578,275 | | | | (110,828,514 | ) |
| | | | | | | | | | | | | | | | | | | | | | | | |
Net increase (decrease) in net assets resulting from operations | | | 20,712,421 | | | | (7,694,680 | ) | | | 340,775 | | | | 3,213,957 | | | | 70,005,644 | | | | (104,258,596 | ) |
| | | | | | | | | | | | | | | | | | | | | | | | |
DISTRIBUTIONS TO SHAREHOLDERS FROM | | | | | | | | | | | | | | | | | | | | | | | | |
Net investment income: | | | | | | | | | | | | | | | | | | | | | | | | |
Initial Class | | | (3,544,244 | ) | | | (2,041,988 | ) | | | (331,634 | ) | | | (2,994,363 | ) | | | (2,511,768 | ) | | | (1,555,089 | ) |
Service Class | | | (1,634,523 | ) | | | (1,393,099 | ) | | | (8,299 | ) | | | (219,187 | ) | | | (3,915,725 | ) | | | (3,039,439 | ) |
Net realized gain on investments: | | | | | | | | | | | | | | | | | | | | | | | | |
Initial Class | | | (63,545 | ) | | | — | | | | — | | | | — | | | | (514,116 | ) | | | (6,037,186 | ) |
Service Class | | | (29,899 | ) | | | — | | | | — | | | | — | | | | (870,300 | ) | | | (13,357,483 | ) |
| | | | | | | | | | | | | | | | | | | | | | | | |
Net decrease in net assets from distributions | | | (5,272,211 | ) | | | (3,435,087 | ) | | | (339,933 | ) | | | (3,213,550 | ) | | | (7,811,909 | ) | | | (23,989,197 | ) |
| | | | | | | | | | | | | | | | | | | | | | | | |
SHARE TRANSACTIONS | | | | | | | | | | | | | | | | | | | | | | | | |
Net proceeds from sales | | | 134,907,828 | | | | 18,885,287 | | | | 156,250,942 | | | | 143,659,397 | | | | 56,809,092 | | | | 60,765,414 | |
Net proceeds from reinvestment of distributions | | | 5,272,211 | | | | 3,435,087 | | | | 339,933 | | | | 3,213,416 | | | | 7,811,909 | | | | 23,989,197 | |
Cost of shares redeemed | | | (11,711,227 | ) | | | (20,215,334 | ) | | | (156,820,840 | ) | | | (73,200,633 | ) | | | (75,577,163 | ) | | | (44,334,619 | ) |
| | | | | | | | | | | | | | | | | | | | | | | | |
Net increase (decrease) in net assets from share transactions | | | 128,468,812 | | | | 2,105,040 | | | | (229,965 | ) | | | 73,672,180 | | | | (10,956,162 | ) | | | 40,419,992 | |
| | | | | | | | | | | | | | | | | | | | | | | | |
Total increase (decrease) in net assets | | | 143,909,022 | | | | (9,024,727 | ) | | | (229,123 | ) | | | 73,672,587 | | | | 51,237,573 | | | | (87,827,801 | ) |
NET ASSETS | | | | | | | | | | | | | | | | | | | | | | | | |
Beginning of period | | | 57,130,633 | | | | 66,155,360 | | | | 204,524,059 | | | | 130,851,472 | | | | 172,678,712 | | | | 260,506,513 | |
| | | | | | | | | | | | | | | | | | | | | | | | |
End of period† | | $ | 201,039,655 | | | $ | 57,130,633 | | | $ | 204,294,936 | | | $ | 204,524,059 | | | $ | 223,916,285 | | | $ | 172,678,712 | |
| | | | | | | | | | | | | | | | | | | | | | | | |
† Accumulated undistributed net investment income | | $ | 183,560 | | | $ | 59,049 | | | $ | 422 | | | $ | 227 | | | $ | 10,936,439 | | | $ | 5,263,622 | |
| | | | | | | | | | | | | | | | | | | | | | | | |
See Notes to Financial Statements.
205
| | |
| STATEMENTSOF CHANGESIN NET ASSETS (Continued) | | |
| | | Sun Capital Advisers Trust |
| | | | | | | | | | | | | | | | | | | | | | | | |
| | | Davis Venture Value Fund | | | Oppenheimer Main Street
Small Cap Fund | | | Oppenheimer Large Cap
Core Fund | |
| | | Year Ended December 31, | | | Year Ended December 31, | | | Year Ended December 31, | |
| | | 2009 | | | 2008 | | | 2009 | | | 2008 | | | 2009 | | | 2008 | |
INCREASE (DECREASE) IN NET ASSETS FROM OPERATIONS | | | | | | | | | | | | | | | | | | | | | | | | |
Net investment income (loss) | | $ | 1,101,748 | | | $ | 675,952 | | | $ | 425,488 | | | $ | 170,075 | | | $ | 649,627 | | | $ | 135,617 | |
Net realized gain (loss) | | | (11,210,937 | ) | | | (3,477,790 | ) | | | (25,104,929 | ) | | | (23,596,823 | ) | | | 3,853,147 | | | | (3,695,987 | ) |
Change in unrealized appreciation (depreciation) | | | 87,391,607 | | | | (42,463,291 | ) | | | 83,844,844 | | | | (53,294,064 | ) | | | 7,857,708 | | | | (1,076,518 | ) |
| | | | | | | | | | | | | | | | | | | | | | | | |
Net increase (decrease) in net assets resulting from operations | | | 77,282,418 | | | | (45,265,129 | ) | | | 59,165,403 | | | | (76,720,812 | ) | | | 12,360,482 | | | | (4,636,888 | ) |
| | | | | | | | | | | | | | | | | | | | | | | | |
DISTRIBUTIONS TO SHAREHOLDERS FROM | | | | | | | | | | | | | | | | | | | | | | | | |
Net investment income: | | | | | | | | | | | | | | | | | | | | | | | | |
Initial Class | | | (375,796 | ) | | | (302,170 | ) | | | (24,361 | ) | | | (149,427 | ) | | | (619,650 | ) | | | (64,446 | ) |
Service Class | | | (290,015 | ) | | | (406,816 | ) | | | (70,061 | ) | | | (21,647 | ) | | | (73,322 | ) | | | (26,667 | ) |
Net realized gain on investments: | | | | | | | | | | | | | | | | | | | | | | | | |
Initial Class | | | — | | | | (349,234 | ) | | | — | | | | (2,072,831 | ) | | | — | | | | (15,750 | ) |
Service Class | | | — | | | | (673,944 | ) | | | — | | | | (5,137,272 | ) | | | — | | | | (23,323 | ) |
| | | | | | | | | | | | | | | | | | | | | | | | |
Net decrease in net assets from distributions | | | (665,811 | ) | | | (1,732,164 | ) | | | (94,422 | ) | | | (7,381,177 | ) | | | (692,972 | ) | | | (130,186 | ) |
| | | | | | | | | | | | | | | | | | | | | | | | |
SHARE TRANSACTIONS | | | | | | | | | | | | | | | | | | | | | | | | |
Net proceeds from sales | | | 213,128,717 | | | | 92,985,530 | | | | 26,384,791 | | | | 81,260,289 | | | | 60,497,249 | | | | 7,260,977 | |
Net proceeds from reinvestment of distributions | | | 665,811 | | | | 1,732,164 | | | | 94,422 | | | | 7,381,177 | | | | 692,972 | | | | 130,186 | |
Cost of shares redeemed | | | (21,730,381 | ) | | | (14,436,392 | ) | | | (55,314,564 | ) | | | (29,124,543 | ) | | | (3,826,640 | ) | | | (2,635,432 | ) |
| | | | | | | | | | | | | | | | | | | | | | | | |
Net increase (decrease) in net assets from share transactions | | | 192,064,147 | | | | 80,281,302 | | | | (28,835,351 | ) | | | 59,516,923 | | | | 57,363,581 | | | | 4,755,731 | |
| | | | | | | | | | | | | | | | | | | | | | | | |
Total increase (decrease) in net assets | | | 268,680,754 | | | | 33,284,009 | | | | 30,235,630 | | | | (24,585,066 | ) | | | 69,031,091 | | | | (11,343 | ) |
NET ASSETS | | | | | | | | | | | | | | | | | | | | | | | | |
Beginning of period | | | 113,908,852 | | | | 80,624,843 | | | | 153,532,927 | | | | 178,117,993 | | | | 13,340,637 | | | | 13,351,980 | |
| | | | | | | | | | | | | | | | | | | | | | | | |
End of period† | | $ | 382,589,606 | | | $ | 113,908,852 | | | $ | 183,768,557 | | | $ | 153,532,927 | | | $ | 82,371,728 | | | $ | 13,340,637 | |
| | | | | | | | | | | | | | | | | | | | | | | | |
† Accumulated undistributed net investment income | | $ | 905,316 | | | $ | 665,810 | | | $ | 414,338 | | | $ | 174,353 | | | $ | 936 | | | $ | 44,504 | |
| | | | | | | | | | | | | | | | | | | | | | | | |
See Notes to Financial Statements.
206
| | |
| STATEMENTSOF CHANGESIN NET ASSETS (Continued) | | |
| | | Sun Capital Advisers Trust |
| | | | | | | | | | | | | | | | | | | | | | | | |
| | | WMC Large Cap Growth
Fund | | | WMC Blue Chip Mid Cap
Fund | | | Lord Abbett Growth &
Income Fund | |
| | | Year Ended December 31, | | | Year Ended December 31, | | | Year Ended December 31, | |
| | | 2009 | | | 2008 | | | 2009 | | | 2008 | | | 2009 | | | 2008* | |
INCREASE (DECREASE) IN NET ASSETS FROM OPERATIONS | | | | | | | | | | | | | | | | | | | | | | | | |
Net investment income (loss) | | $ | 554,358 | | | $ | 231,272 | | | $ | 65,199 | | | $ | 39,417 | | | $ | 2,760,473 | | | $ | 40,054 | |
Net realized gain (loss) | | | (3,983,702 | ) | | | (18,232,380 | ) | | | (8,248,694 | ) | | | (10,895,757 | ) | | | 69,452,194 | | | | (423,325 | ) |
Change in unrealized appreciation (depreciation) | | | 37,481,869 | | | | (19,060,002 | ) | | | 33,984,929 | | | | (25,508,882 | ) | | | 125,484,977 | | | | (646,217 | ) |
| | | | | | | | | | | | | | | | | | | | | | | | |
Net increase (decrease) in net assets resulting from operations | | | 34,052,525 | | | | (37,061,110 | ) | | | 25,801,434 | | | | (36,365,222 | ) | | | 197,697,644 | | | | (1,029,488 | ) |
| | | | | | | | | | | | | | | | | | | | | | | | |
DISTRIBUTIONS TO SHAREHOLDERS FROM | | | | | | | | | | | | | | | | | | | | | | | | |
Net investment income: | | | | | | | | | | | | | | | | | | | | | | | | |
Initial Class | | | (197,983 | ) | | | — | | | | (16,377 | ) | | | (109,299 | ) | | | (2,736,418 | ) | | | (19,768 | ) |
Service Class | | | (33,289 | ) | | | — | | | | (9,615 | ) | | | (46,740 | ) | | | (27,899 | ) | | | (18,267 | ) |
Net realized gain on investments: | | | | | | | | | | | | | | | | | | | | | | | | |
Initial Class | | | — | | | | (6,208 | ) | | | — | | | | (12,915,287 | ) | | | (46,790,450 | ) | | | — | |
Service Class | | | — | | | | (3,443 | ) | | | — | | | | (5,523,070 | ) | | | (883,699 | ) | | | — | |
| | | | | | | | | | | | | | | | | | | | | | | | |
Net decrease in net assets from distributions | | | (231,272 | ) | | | (9,651 | ) | | | (25,992 | ) | | | (18,594,396 | ) | | | (50,438,466 | ) | | | (38,035 | ) |
| | | | | | | | | | | | | | | | | | | | | | | | |
SHARE TRANSACTIONS | | | | | | | | | | | | | | | | | | | | | | | | |
Net proceeds from sales | | | 93,346,643 | | | | 11,778,180 | | | | 29,411,187 | | | | 49,336,829 | | | | 87,024,697 | | | | 4,077,770 | |
Subscriptions in-kind | | | — | | | | — | | | | — | | | | — | | | | 342,061,308 | | | | — | |
Net proceeds from reinvestment of distributions | | | 231,272 | | | | 9,651 | | | | 25,992 | | | | 18,594,396 | | | | 50,438,466 | | | | 38,035 | |
Cost of shares redeemed | | | (10,011,918 | ) | | | (20,344,224 | ) | | | (16,198,087 | ) | | | (21,430,385 | ) | | | (123,572,200 | ) | | | (198,762 | ) |
| | | | | | | | | | | | | | | | | | | | | | | | |
Net increase (decrease) in net assets from share transactions | | | 83,565,997 | | | | (8,556,393 | ) | | | 13,239,092 | | | | 46,500,840 | | | | 355,952,271 | | | | 3,917,043 | |
| | | | | | | | | | | | | | | | | | | | | | | | |
Total increase (decrease) in net assets | | | 117,387,250 | | | | (45,627,154 | ) | | | 39,014,534 | | | | (8,458,778 | ) | | | 503,211,449 | | | | 2,849,520 | |
NET ASSETS | | | | | | | | | | | | | | | | | | | | | | | | |
Beginning of period | | | 50,116,880 | | | | 95,744,034 | | | | 76,979,138 | | | | 85,437,916 | | | | 4,849,520 | | | | 2,000,000 | ** |
| | | | | | | | | | | | | | | | | | | | | | | | |
End of period† | | $ | 167,504,130 | | | $ | 50,116,880 | | | $ | 115,993,672 | | | $ | 76,979,138 | | | $ | 508,060,969 | | | $ | 4,849,520 | |
| | | | | | | | | | | | | | | | | | | | | | | | |
† Accumulated undistributed net investment income | | $ | 554,356 | | | $ | 231,270 | | | $ | 63,374 | | | $ | 31,048 | | | $ | — | | | $ | 2,811 | |
| | | | | | | | | | | | | | | | | | | | | | | | |
| * | For the period March 7, 2008 (commencement of operations) to December 31, 2008. |
| ** | Amount represents initial seed investment. |
See Notes to Financial Statements.
207
| | |
| STATEMENTSOF CHANGESIN NET ASSETS (Continued) | | |
| | | Sun Capital Advisers Trust |
| | | | | | | | | | | | | | | | | | | | | | | | |
| | | Goldman Sachs Mid Cap
Value Fund | | | Goldman Sachs Short Duration
Fund | | | Dreman Small Cap Value
Fund | |
| | | Year Ended December 31, | | | Year Ended December 31, | | | Year Ended December 31, | |
| | | 2009 | | | 2008* | | | 2009 | | | 2008* | | | 2009 | | | 2008** | |
INCREASE (DECREASE) IN NET ASSETS FROM OPERATIONS | | | | | | | | | | | | | | | | | | | | | | | | |
Net investment income (loss) | | $ | 1,908,485 | | | $ | 86,795 | | | $ | 13,047,670 | | | $ | 1,045,101 | | | $ | 176,805 | | | $ | 8,947 | |
Net realized gain (loss) | | | 23,146,315 | | | | (662,469 | ) | | | 7,958,070 | | | | 466,456 | | | | 5,271,664 | | | | (284,288 | ) |
Change in unrealized appreciation (depreciation) | | | 36,984,630 | | | | (1,593,333 | ) | | | 7,355,401 | | | | 2,366,228 | | | | 5,615,479 | | | | (137,633 | ) |
| | | | | | | | | | | | | | | | | | | | | | | | |
Net increase (decrease) in net assets resulting from operations | | | 62,039,430 | | | | (2,169,007 | ) | | | 28,361,141 | | | | 3,877,785 | | | | 11,063,948 | | | | (412,974 | ) |
| | | | | | | | | | | | | | | | | | | | | | | | |
DISTRIBUTIONS TO SHAREHOLDERS FROM | | | | | | | | | | | | | | | | | | | | | | | | |
Net investment income: | | | | | | | | | | | | | | | | | | | | | | | | |
Initial Class | | | (1,781,536 | ) | | | (56,352 | ) | | | (12,528,695 | ) | | | (399,794 | ) | | | (160,938 | ) | | | (7,879 | ) |
Service Class | | | (127,774 | ) | | | (30,641 | ) | | | (1,486,390 | ) | | | (663,066 | ) | | | (15,265 | ) | | | (1,788 | ) |
Net realized gain on investments: | | | | | | | | | | | | | | | | | | | | | | | | |
Initial Class | | | (15,418,462 | ) | | | — | | | | (6,192,212 | ) | | | (149,333 | ) | | | (898,849 | ) | | | — | |
Service Class | | | (1,515,089 | ) | | | — | | | | (761,733 | ) | | | (176,210 | ) | | | (181,700 | ) | | | — | |
| | | | | | | | | | | | | | | | | | | | | | | | |
Net decrease in net assets from distributions | | | (18,842,861 | ) | | | (86,993 | ) | | | (20,969,030 | ) | | | (1,388,403 | ) | | | (1,256,752 | ) | | | (9,667 | ) |
| | | | | | | | | | | | | | | | | | | | | | | | |
SHARE TRANSACTIONS | | | | | | | | | | | | | | | | | | | | | | | | |
Net proceeds from sales | | | 82,966,501 | | | | 11,822,729 | | | | 1,025,662,269 | | | | 136,659,740 | | | | 43,962,372 | | | | 3,198,466 | |
Subscriptions in-kind | | | 86,276,287 | | | | — | | | | — | | | | — | | | | — | | | | — | |
Net proceeds from reinvestment of distributions | | | 18,842,861 | | | | 86,993 | | | | 20,969,030 | | | | 1,388,373 | | | | 1,256,752 | | | | 9,667 | |
Cost of shares redeemed | | | (33,069,713 | ) | | | (1,706,143 | ) | | | (195,070,121 | ) | | | (26,513,086 | ) | | | (20,282,746 | ) | | | (45,366 | ) |
| | | | | | | | | | | | | | | | | | | | | | | | |
Net increase (decrease) in net assets from share transactions | | | 155,015,936 | | | | 10,203,579 | | | | 851,561,178 | | | | 111,535,027 | | | | 24,936,378 | | | | 3,162,767 | |
| | | | | | | | | | | | | | | | | | | | | | | | |
Total increase (decrease) in net assets | | | 198,212,505 | | | | 7,947,579 | | | | 858,953,289 | | | | 114,024,409 | | | | 34,743,574 | | | | 2,740,126 | |
NET ASSETS | | | | | | | | | | | | | | | | | | | | | | | | |
Beginning of period | | | 10,947,579 | | | | 3,000,000 | *** | | | 118,024,409 | | | | 4,000,000 | *** | | | 5,740,126 | | | | 3,000,000 | *** |
| | | | | | | | | | | | | | | | | | | | | | | | |
End of period† | | $ | 209,160,084 | | | $ | 10,947,579 | | | $ | 976,977,698 | | | $ | 118,024,409 | | | $ | 40,483,700 | | | $ | 5,740,126 | |
| | | | | | | | | | | | | | | | | | | | | | | | |
† Accumulated undistributed net investment income | | $ | — | | | $ | 1,126 | | | $ | — | | | $ | — | | | $ | — | | | $ | 76 | |
| | | | | | | | | | | | | | | | | | | | | | | | |
| * | For the period March 7, 2008 (commencement of operations) to December 31, 2008. |
| ** | For the period October 1, 2008 (commencement of operations) to December 31, 2008. |
| *** | Amount represents initial seed investment. |
See Notes to Financial Statements.
208
| | |
| STATEMENTSOF CHANGESIN NET ASSETS (Continued) | | |
| | | Sun Capital Advisers Trust |
| | | | | | | | | | | | | | | | | | | | | | | | |
| | | PIMCO High Yield Fund | | | PIMCO Total Return Fund | | | AIM Small Cap Growth Fund | |
| | | Year Ended December 31, | | | Year Ended December 31, | | | Year Ended December 31, | |
| | | 2009 | | | 2008* | | | 2009 | | | 2008** | | | 2009 | | | 2008** | |
INCREASE (DECREASE) IN NET ASSETS FROM OPERATIONS | | | | | | | | | | | | | | | | | | | | | | | | |
Net investment income (loss) | | $ | 7,091,347 | | | $ | 415,933 | | | $ | 4,241,609 | | | $ | 35,190 | | | $ | (49,052 | ) | | $ | (3,977 | ) |
Net realized gain (loss) | | | 3,614,164 | | | | 314,151 | | | | 6,640,956 | | | | 425,704 | | | | 2,524,434 | | | | (61,812 | ) |
Change in unrealized appreciation (depreciation) | | | 15,503,746 | | | | (1,741,177 | ) | | | 5,713,786 | | | | 503,482 | | | | 2,250,746 | | | | (580,046 | ) |
| | | | | | | | | | | | | | | | | | | | | | | | |
Net increase (decrease) in net assets resulting from operations | | | 26,209,257 | | | | (1,011,093 | ) | | | 16,596,351 | | | | 964,376 | | | | 4,726,128 | | | | (645,835 | ) |
| | | | | | | | | | | | | | | | | | | | | | | | |
DISTRIBUTIONS TO SHAREHOLDERS FROM | | | | | | | | | | | | | | | | | | | | | | | | |
Net investment income: | | | | | | | | | | | | | | | | | | | | | | | | |
Initial Class | | | (5,611,869 | ) | | | (98,649 | ) | | | (1,777,999 | ) | | | (18,954 | ) | | | — | | | | — | |
Service Class | | | (1,584,958 | ) | | | (350,940 | ) | | | (2,556,449 | ) | | | (20,739 | ) | | | — | | | | — | |
Net realized gain on investments: | | | | | | | | | | | | | | | | | | | | | | | | |
Initial Class | | | (2,250,992 | ) | | | (20,890 | ) | | | (1,718,228 | ) | | | (2,111 | ) | | | (408,415 | ) | | | — | |
Service Class | | | (597,851 | ) | | | (83,930 | ) | | | (2,905,414 | ) | | | (2,868 | ) | | | (201,982 | ) | | | — | |
| | | | | | | | | | | | | | | | | | | | | | | | |
Net decrease in net assets from distributions | | | (10,045,670 | ) | | | (554,409 | ) | | | (8,958,090 | ) | | | (44,672 | ) | | | (610,397 | ) | | | — | |
| | | | | | | | | | | | | | | | | | | | | | | | |
SHARE TRANSACTIONS | | | | | | | | | | | | | | | | | | | | | | | | |
Net proceeds from sales | | | 113,481,631 | | | | 13,754,894 | | | | 357,694,132 | | | | 28,521,919 | | | | 23,398,241 | | | | 1,757,485 | |
Net proceeds from reinvestment of distributions | | | 10,045,670 | | | | 554,389 | | | | 8,958,090 | | | | 44,653 | | | | 610,397 | | | | — | |
Cost of shares redeemed | | | (38,023,439 | ) | | | (309,588 | ) | | | (17,955,774 | ) | | | (266,411 | ) | | | (12,602,418 | ) | | | (37,389 | ) |
| | | | | | | | | | | | | | | | | | | | | | | | |
Net increase (decrease) in net assets from share transactions | | | 85,503,862 | | | | 13,999,695 | | | | 348,696,448 | | | | 28,300,161 | | | | 11,406,220 | | | | 1,720,096 | |
| | | | | | | | | | | | | | | | | | | | | | | | |
Total increase (decrease) in net assets | | | 101,667,449 | | | | 12,434,193 | | | | 356,334,709 | | | | 29,219,865 | | | | 15,521,951 | | | | 1,074,261 | |
NET ASSETS | | | | | | | | | | | | | | | | | | | | | | | | |
Beginning of period | | | 15,434,193 | | | | 3,000,000 | *** | | | 32,219,865 | | | | 3,000,000 | *** | | | 4,074,261 | | | | 3,000,000 | *** |
| | | | | | | | | | | | | | | | | | | | | | | | |
End of period† | | $ | 117,101,642 | | | $ | 15,434,193 | | | $ | 388,554,574 | | | $ | 32,219,865 | | | $ | 19,596,212 | | | $ | 4,074,261 | |
| | | | | | | | | | | | | | | | | | | | | | | | |
† Accumulated undistributed (distributions in excess of) net investment income | | $ | (93,986 | ) | | $ | (43,005 | ) | | $ | 98,716 | | | $ | 1,678 | | | $ | — | | | $ | — | |
| | | | | | | | | | | | | | | | | | | | | | | | |
| * | For the period March 7, 2008 (commencement of operations) to December 31, 2008. |
| ** | For the period October 1, 2008 (commencement of operations) to December 31, 2008. |
| *** | Amount represents initial seed investment. |
See Notes to Financial Statements.
209
| | |
| STATEMENTSOF CHANGESIN NET ASSETS (Continued) | | |
| | | Sun Capital Advisers Trust |
| | | | | | | | | | | | | | | | |
| | | AllianceBernstein
International Value Fund | | | BlackRock Inflation
Protected Bond Fund | |
| | | Year Ended December 31, | | | Year Ended December 31, | |
| | | 2009 | | | 2008* | | | 2009 | | | 2008* | |
INCREASE (DECREASE) IN NET ASSETS FROM OPERATIONS | | | | | | | | | | | | | | | | |
Net investment income (loss) | | $ | 835,605 | | | $ | 18,942 | | | $ | 2,025,636 | | | $ | (71,356 | ) |
Net realized gain (loss) | | | 2,662,754 | | | | (160,299 | ) | | | 4,945,379 | | | | 155,696 | |
Change in unrealized appreciation (depreciation) | | | 8,466,686 | | | | (436,217 | ) | | | 1,384,872 | | | | 128,907 | |
| | | | | | | | | | | | | | | | |
Net increase (decrease) in net assets resulting from operations | | | 11,965,045 | | | | (577,574 | ) | | | 8,355,887 | | | | 213,247 | |
| | | | | | | | | | | | | | | | |
DISTRIBUTIONS TO SHAREHOLDERS FROM | | | | | | | | | | | | | | | | |
Net investment income: | | | | | | | | | | | | | | | | |
Initial Class | | | (1,184,943 | ) | | | (19,366 | ) | | | (1,172,205 | ) | | | (23,211 | ) |
Service Class | | | (32,563 | ) | | | (2,842 | ) | | | (603,807 | ) | | | (12,136 | ) |
Net realized gain on investments: | | | | | | | | | | | | | | | | |
Initial Class | | | (1,251,599 | ) | | | — | | | | (1,626,544 | ) | | | — | |
Service Class | | | (37,812 | ) | | | — | | | | (1,199,392 | ) | | | — | |
| | | | | | | | | | | | | | | | |
Net decrease in net assets from distributions | | | (2,506,917 | ) | | | (22,208 | ) | | | (4,601,948 | ) | | | (35,347 | ) |
| | | | | | | | | | | | | | | | |
SHARE TRANSACTIONS | | | | | | | | | | | | | | | | |
Net proceeds from sales | | | 41,717,363 | | | | 7,515,829 | | | | 170,986,380 | | | | 9,430,225 | |
Net proceeds from reinvestment of distributions | | | 2,506,917 | | | | 22,208 | | | | 4,601,948 | | | | 35,332 | |
Cost of shares redeemed | | | (8,084,384 | ) | | | (123,896 | ) | | | (6,826,654 | ) | | | (56,175 | ) |
| | | | | | | | | | | | | | | | |
Net increase (decrease) in net assets from share transactions | | | 36,139,896 | | | | 7,414,141 | | | | 168,761,674 | | | | 9,409,382 | |
| | | | | | | | | | | | | | | | |
Total increase (decrease) in net assets | | | 45,598,024 | | | | 6,814,359 | | | | 172,515,613 | | | | 9,587,282 | |
NET ASSETS | | | | | | | | | | | | | | | | |
Beginning of period | | | 11,814,359 | | | | 5,000,000 | ** | | | 12,587,282 | | | | 3,000,000 | ** |
| | | | | | | | | | | | | | | | |
End of period† | | $ | 57,412,383 | | | $ | 11,814,359 | | | $ | 185,102,895 | | | $ | 12,587,282 | |
| | | | | | | | | | | | | | | | |
† Accumulated undistributed (distributions in excess of) net investment income | | $ | (326,462 | ) | | $ | 6,997 | | | $ | 12,276 | | | $ | (60,868 | ) |
| | | | | | | | | | | | | | | | |
| * | For the period October 1, 2008 (commencement of operations) to December 31, 2008. |
| ** | Amount represents initial seed investment. |
See Notes to Financial Statements.
210
| | |
| STATEMENTSOF CHANGESIN NET ASSETS (Continued) | | |
| | | Sun Capital Advisers Trust |
| | | | | | | | | | | | | | | | | | | | | | | | |
| | | Ibbotson Moderate Fund | | | Ibbotson Balanced Fund | | | Ibbotson Growth Fund | |
| | | Year Ended December 31, | | | Year Ended December 31, | | | Year Ended December 31, | |
| | | 2009 | | | 2008* | | | 2009 | | | 2008* | | | 2009 | | | 2008* | |
INCREASE (DECREASE) IN NET ASSETS FROM OPERATIONS | | | | | | | | | | | | | | | | | | | | | | | | |
Net investment income (loss) | | $ | 3,739,710 | | | $ | 65,357 | | | $ | 4,471,965 | | | $ | 54,180 | | | $ | 2,412,299 | | | $ | 47,700 | |
Net realized gain (loss) | | | 7,517,826 | | | | 15,919 | | | | 11,555,252 | | | | 17,979 | | | | 10,244,795 | | | | 8,834 | |
Change in unrealized appreciation (depreciation) | | | 28,588,643 | | | | 940,893 | | | | 53,653,607 | | | | 1,290,066 | | | | 49,767,168 | | | | 1,642,739 | |
| | | | | | | | | | | | | | | | | | | | | | | | |
Net increase (decrease) in net assets resulting from operations | | | 39,846,179 | | | | 1,022,169 | | | | 69,680,824 | | | | 1,362,225 | | | | 62,424,262 | | | | 1,699,273 | |
| | | | | | | | | | | | | | | | | | | | | | | | |
DISTRIBUTIONS TO SHAREHOLDERS FROM | | | | | | | | | | | | | | | | | | | | | | | | |
Net investment income: | | | | | | | | | | | | | | | | | | | | | | | | |
Initial Class | | | (4,173 | ) | | | — | | | | (544 | ) | | | — | | | | (602 | ) | | | — | |
Service Class | | | (82,385 | ) | | | — | | | | (70,479 | ) | | | — | | | | (56,414 | ) | | | — | |
Net realized gain on investments: | | | | | | | | | | | | | | | | | | | | | | | | |
Initial Class | | | (72 | ) | | | — | | | | (4 | ) | | | — | | | | (18 | ) | | | — | |
Service Class | | | (12,037 | ) | | | — | | | | (8,075 | ) | | | — | | | | (23,977 | ) | | | — | |
| | | | | | | | | | | | | | | | | | | | | | | | |
Net decrease in net assets from distributions | | | (98,667 | ) | | | — | | | | (79,102 | ) | | | — | | | | (81,011 | ) | | | — | |
| | | | | | | | | | | | | | | | | | | | | | | | |
SHARE TRANSACTIONS | | | | | | | | | | | | | | | | | | | | | | | | |
Net proceeds from sales | | | 294,855,518 | | | | 32,979,255 | | | | 458,469,983 | | | | 37,341,768 | | | | 355,499,350 | | | | 32,548,692 | |
Net proceeds from reinvestment of distributions | | | 98,667 | | | | — | | | | 79,102 | | | | — | | | | 81,011 | | | | — | |
Cost of shares redeemed | | | (2,224,176 | ) | | | (80,696 | ) | | | (234,989 | ) | | | (1,195 | ) | | | (2,474,598 | ) | | | (1,064,529 | ) |
| | | | | | | | | | | | | | | | | | | | | | | | |
Net increase (decrease) in net assets from share transactions | | | 292,730,009 | | | | 32,898,559 | | | | 458,314,096 | | | | 37,340,573 | | | | 353,105,763 | | | | 31,484,163 | |
| | | | | | | | | | | | | | | | | | | | | | | | |
Total increase (decrease) in net assets | | | 332,477,521 | | | | 33,920,728 | | | | 527,915,818 | | | | 38,702,798 | | | | 415,449,014 | | | | 33,183,436 | |
NET ASSETS | | | | | | | | | | | | | | | | | | | | | | | | |
Beginning of period | | | 34,020,728 | | | | 100,000 | ** | | | 38,802,798 | | | | 100,000 | ** | | | 33,283,436 | | | | 100,000 | ** |
| | | | | | | | | | | | | | | | | | | | | | | | |
End of period† | | $ | 366,498,249 | | | $ | 34,020,728 | | | $ | 566,718,616 | | | $ | 38,802,798 | | | $ | 448,732,450 | | | $ | 33,283,436 | |
| | | | | | | | | | | | | | | | | | | | | | | | |
† Accumulated undistributed net investment income | | $ | 7,495,179 | | | $ | 86,547 | | | $ | 9,775,011 | | | $ | 71,014 | | | $ | 7,038,432 | | | $ | 57,004 | |
| | | | | | | | | | | | | | | | | | | | | | | | |
| * | For the period October 1, 2008 (commencement of operations) to December 31, 2008. |
| ** | Amount represents initial seed investment. |
See Notes to Financial Statements.
211
| | |
| FINANCIAL HIGHLIGHTS | | |
| | | Sun Capital Advisers Trust |
Selected data for a share outstanding throughout each period:
| | | | | | | | | | | | | | | | | | | | | | | | | | | | | | | | | | | | | | | | |
| | | Investment Grade Bond Fund
Initial Class Shares | | | Investment Grade Bond Fund
Service Class Shares | |
| | | Years Ended December 31, | | | Years Ended December 31, | |
| | | 2009 | | | 2008 | | | 2007 | | | 2006 | | | 2005 | | | 2009 | | | 2008 | | | 2007 | | | 2006 | | | 2005 | |
Net Asset Value, Beginning of Period | | $ | 7.84 | | | $ | 9.48 | | | $ | 9.62 | | | $ | 9.72 | | | $ | 10.09 | | | $ | 7.90 | | | $ | 9.55 | | | $ | 9.69 | | | $ | 9.79 | | | $ | 10.16 | |
| | | | | | | | | | | | | | | | | | | | | | | | | | | | | | | | | | | | | | | | |
Income (Loss) from Investment Operations: | | | | | | | | | | | | | | | | | | | | | | | | | | | | | | | | | | | | | | | | |
Net investment income (loss) (c) | | | 0.39 | † | | | 0.51 | | | | 0.49 | | | | 0.50 | | | | 0.46 | | | | 0.37 | † | | | 0.49 | | | | 0.47 | | | | 0.47 | | | | 0.44 | |
Net realized and unrealized gain (loss) on investments | | | 1.23 | | | | (1.65 | ) | | | (0.14 | ) | | | 0.00 | (d) | | | (0.27 | ) | | | 1.23 | | | | (1.66 | ) | | | (0.14 | ) | | | 0.01 | | | | (0.27 | ) |
| | | | | | | | | | | | | | | | | | | | | | | | | | | | | | | | | | | | | | | | |
Total from Investment Operations | | | 1.62 | | | | (1.14 | ) | | | 0.35 | | | | 0.50 | | | | 0.19 | | | | 1.60 | | | | (1.17 | ) | | | 0.33 | | | | 0.48 | | | | 0.17 | |
| | | | | | | | | | | | | | | | | | | | | | | | | | | | | | | | | | | | | | | | |
Less Distributions from: | | | | | | | | | | | | | | | | | | | | | | | | | | | | | | | | | | | | | | | | |
Net investment income | | | (0.39 | ) | | | (0.50 | ) | | | (0.49 | ) | | | (0.47 | ) | | | (0.47 | ) | | | (0.37 | ) | | | (0.48 | ) | | | (0.47 | ) | | | (0.45 | ) | | | (0.44 | ) |
Net realized gain on investments | | | (0.01 | ) | | | — | | | | — | | | | (0.11 | ) | | | (0.09 | ) | | | (0.01 | ) | | | — | | | | — | | | | (0.11 | ) | | | (0.10 | ) |
Capital | | | — | | | | — | | | | — | | | | (0.02 | ) | | | — | | | | — | | | | — | | | | — | | | | (0.02 | ) | | | — | |
| | | | | | | | | | | | | | | | | | | | | | | | | | | | | | | | | | | | | | | | |
Total distributions | | | (0.40 | ) | | | (0.50 | ) | | | (0.49 | ) | | | (0.60 | ) | | | (0.56 | ) | | | (0.38 | ) | | | (0.48 | ) | | | (0.47 | ) | | | (0.58 | ) | | | (0.54 | ) |
| | | | | | | | | | | | | | | | | | | | | | | | | | | | | | | | | | | | | | | | |
Net Asset Value, End of Period | | $ | 9.06 | | | $ | 7.84 | | | $ | 9.48 | | | $ | 9.62 | | | $ | 9.72 | | | $ | 9.12 | | | $ | 7.90 | | | $ | 9.55 | | | $ | 9.69 | | | $ | 9.79 | |
| | | | | | | | | | | | | | | | | | | | | | | | | | | | | | | | | | | | | | | | |
Total Return (a) | | | 21.00 | % | | | (12.47 | )% | | | 3.75 | % | | | 5.39 | % | | | 1.96 | % | | | 20.58 | % | | | (12.67 | )% | | | 3.51 | % | | | 5.13 | % | | | 1.73 | % |
| | | | | | | | | | | | | | | | | | | | | | | | | | | | | | | | | | | | | | | | |
Ratios and Supplemental Data: | | | | | | | | | | | | | | | | | | | | | | | | | | | | | | | | | | | | | | | | |
Net Assets, End of Period (000’s) | | $ | 136,827 | | | $ | 35,941 | | | $ | 40,696 | | | $ | 45,186 | | | $ | 53,630 | | | $ | 64,213 | | | $ | 21,189 | | | $ | 25,460 | | | $ | 9,393 | | | $ | 3,612 | |
Ratios to average net assets: | | | | | | | | | | | | | | | | | | | | | | | | | | | | | | | | | | | | | | | | |
Net expenses (b)(c) | | | 0.75 | % | | | 0.75 | % | | | 0.75 | % | | | 0.75 | % | | | 0.75 | % | | | 1.00 | % | | | 1.00 | % | | | 1.00 | % | | | 1.00 | % | | | 1.00 | % |
Gross expenses (c) | | | 0.84 | % | | | 1.06 | % | | | 1.00 | % | | | 1.06 | % | | | 1.03 | % | | | 1.10 | % | | | 1.31 | % | | | 1.24 | % | | | 1.31 | % | | | 1.28 | % |
Net investment income (loss) (b)(c) | | | 4.49 | % | | | 5.70 | % | | | 5.10 | % | | | 5.14 | % | | | 4.72 | % | | | 4.25 | % | | | 5.45 | % | | | 4.89 | % | | | 5.06 | % | | | 4.48 | % |
Portfolio turnover rate | | | 99 | % | | | 30 | % | | | 46 | % | | | 55 | % | | | 55 | % | | | 99 | % | | | 30 | % | | | 46 | % | | | 55 | % | | | 55 | % |
| † | Based on average shares outstanding during the period. |
| (a) | Total returns are historical and assume changes in share price, reinvestments of all dividends and distributions, and no sales charge. Had certain expenses not been reduced during the periods shown, total returns would have been lower. |
| (b) | Such percentages are after advisory fee or unified management fee waivers and expense reimbursements, as applicable. |
| (c) | Does not include any insurance charges imposed in connection with your variable insurance contract. |
| (d) | Amount is less than $0.005 per share. |
212
| | |
| FINANCIAL HIGHLIGHTS (Continued) | | |
| | | Sun Capital Advisers Trust |
Selected data for a share outstanding throughout each period:
| | | | | | | | | | | | | | | | | | | | | | | | | | | | | | | | | | | | | | | | |
| | | Money Market Fund
Initial Class Shares | | | Money Market Fund
Service Class Shares | |
| | | Years Ended December 31, | | | Years Ended December 31, | |
| | | 2009 | | | 2008 | | | 2007 | | | 2006 | | | 2005 | | | 2009 | | | 2008 | | | 2007 | | | 2006 | | | 2005* | |
Net Asset Value, Beginning of Period | | $ | 1.00 | | | $ | 1.00 | | | $ | 1.00 | | | $ | 1.00 | | | $ | 1.00 | | | $ | 1.00 | | | $ | 1.00 | | | $ | 1.00 | | | $ | 1.00 | | | $ | 1.00 | |
| | | | | | | | | | | | | | | | | | | | | | | | | | | | | | | | | | | | | | | | |
Income (Loss) from Investment Operations: | | | | | | | | | | | | | | | | | | | | | | | | | | | | | | | | | | | | | | | | |
Net investment income (loss) (d) | | | 0.00 | (e)† | | | 0.02 | | | | 0.05 | | | | 0.05 | | | | 0.03 | | | | 0.00 | (e)† | | | 0.02 | | | | 0.05 | | | | 0.04 | | | | 0.02 | |
Net realized and unrealized gain (loss) on investments | | | 0.00 | (e) | | | 0.00 | (e) | | | 0.00 | (e) | | | — | | | | — | | | | 0.00 | (e) | | | 0.00 | (e) | | | — | | | | — | | | | — | |
| | | | | | | | | | | | | | | | | | | | | | | | | | | | | | | | | | | | | | | | |
Total from Investment Operations | | | 0.00 | (e) | | | 0.02 | | | | 0.05 | | | | 0.05 | | | | 0.03 | | | | 0.00 | (e) | | | 0.02 | | | | 0.05 | | | | 0.04 | | | | 0.02 | |
| | | | | | | | | | | | | | | | | | | | | | | | | | | | | | | | | | | | | | | | |
Less Distributions from: | | | | | | | | | | | | | | | | | | | | | | | | | | | | | | | | | | | | | | | | |
Net investment income | | | (0.00 | )(e) | | | (0.02 | ) | | | (0.05 | ) | | | (0.05 | ) | | | (0.03 | ) | | | (0.00 | )(e) | | | (0.02 | ) | | | (0.05 | ) | | | (0.04 | ) | | | (0.02 | ) |
| | | | | | | | | | | | | | | | | | | | | | | | | | | | | | | | | | | | | | | | |
Total distributions | | | (0.00 | )(e) | | | (0.02 | ) | | | (0.05 | ) | | | (0.05 | ) | | | (0.03 | ) | | | (0.00 | )(e) | | | (0.02 | ) | | | (0.05 | ) | | | (0.04 | ) | | | (0.02 | ) |
| | | | | | | | | | | | | | | | | | | | | | | | | | | | | | | | | | | | | | | | |
Net Asset Value, End of Period | | $ | 1.00 | | | $ | 1.00 | | | $ | 1.00 | | | $ | 1.00 | | | $ | 1.00 | | | $ | 1.00 | | | $ | 1.00 | | | $ | 1.00 | | | $ | 1.00 | | | $ | 1.00 | |
| | | | | | | | | | | | | | | | | | | | | | | | | | | | | | | | | | | | | | | | |
Total Return (b) | | | 0.25 | % | | | 2.25 | % | | | 4.87 | % | | | 4.59 | % | | | 2.75 | % | | | 0.02 | % | | | 2.00 | % | | | 4.61 | % | | | 4.33 | % | | | 1.93 | % |
| | | | | | | | | | | | | | | | | | | | | | | | | | | | | | | | | | | | | | | | |
Ratios and Supplemental Data: | | | | | | | | | | | | | | | | | | | | | | | | | | | | | | | | | | | | | | | | |
Net Assets, End of Period (000’s) | | $ | 88,013 | | | $ | 150,416 | | | $ | 129,112 | | | $ | 120,164 | | | $ | 110,430 | | | $ | 116,282 | | | $ | 54,108 | | | $ | 1,740 | | | $ | 1,274 | | | $ | 509 | |
Ratios to average net assets: | | | | | | | | | | | | | | | | | | | | | | | | | | | | | | | | | | | | | | | | |
Net expenses (a)(c)(d) | | | 0.20 | % | | | 0.50 | % | | | 0.50 | % | | | 0.50 | % | | | 0.50 | % | | | 0.38 | % | | | 0.75 | % | | | 0.75 | % | | | 0.75 | % | | | 0.75 | % |
Gross expenses (a)(d) | | | 0.72 | % | | | 0.81 | % | | | 0.76 | % | | | 0.77 | % | | | 0.77 | % | | | 0.94 | % | | | 1.10 | % | | | 1.00 | % | | | 1.02 | % | | | 1.02 | % |
Net investment income (loss) (a)(c)(d) | | | 0.25 | % | | | 2.19 | % | | | 4.76 | % | | | 4.51 | % | | | 2.69 | % | | | 0.01 | % | | | 1.34 | % | | | 4.50 | % | | | 4.31 | % | | | 2.99 | % |
Portfolio turnover rate | | | N/A | | | | N/A | | | | N/A | | | | N/A | | | | N/A | | | | N/A | | | | N/A | | | | N/A | | | | N/A | | | | N/A | |
| * | For the period from April 25, 2005 (Commencement of Operations – Service Class Shares) through December 31, 2005. |
| † | Based on average shares outstanding during the period. |
| (a) | Annualized for periods of less than one year. |
| (b) | Total returns are historical and assume changes in share price, reinvestments of all dividends and distributions, and no sales charge. Had certain expenses not been reduced during the periods shown, total returns would have been lower. Total returns for periods of less than one year are not annualized. |
| (c) | Such percentages are after advisory fee or unified management fee waivers and expense reimbursements, as applicable. |
| (d) | Does not include any insurance charges imposed in connection with your variable insurance contract. |
| (e) | Amount is less than $0.005 per share. |
213
| | |
| FINANCIAL HIGHLIGHTS (Continued) | | |
| | | Sun Capital Advisers Trust |
Selected data for a share outstanding throughout each period:
| | | | | | | | | | | | | | | | | | | | | | | | | | | | | | | | | | | | | | | | |
| | | Global Real Estate Fund
Initial Class Shares | | | Global Real Estate Fund
Service Class Shares | |
| | | Years Ended December 31, | | | Years Ended December 31, | |
| | | 2009 | | | 2008 | | | 2007 | | | 2006 | | | 2005 | | | 2009 | | | 2008 | | | 2007 | | | 2006 | | | 2005 | |
Net Asset Value, Beginning of Period | | $ | 8.99 | | | $ | 18.24 | | | $ | 24.60 | | | $ | 18.80 | | | $ | 19.01 | | | $ | 9.77 | | | $ | 19.66 | | | $ | 26.23 | | | $ | 19.97 | | | $ | 20.08 | |
| | | | | | | | | | | | | | | | | | | | | | | | | | | | | | | | | | | | | | | | |
Income (Loss) from Investment Operations: | | | | | | | | | | | | | | | | | | | | | | | | | | | | | | | | | | | | | | | | |
Net investment income (loss) (c) | | | 0.32 | † | | | 0.18 | | | | 0.66 | | | | 0.81 | | | | 0.23 | | | | 0.32 | † | | | 0.18 | | | | 0.40 | | | | 0.64 | | | | 0.21 | |
Net realized and unrealized gain (loss) on investments | | | 2.35 | | | | (7.53 | ) | | | (3.70 | ) | | | 6.37 | | | | 1.59 | | | | 2.56 | | | | (8.22 | ) | | | (3.71 | ) | | | 6.94 | | | | 1.65 | |
| | | | | | | | | | | | | | | | | | | | | | | | | | | | | | | | | | | | | | | | |
Total from Investment Operations | | | 2.67 | | | | (7.35 | ) | | | (3.04 | ) | | | 7.18 | | | | 1.82 | | | | 2.88 | | | | (8.04 | ) | | | (3.31 | ) | | | 7.58 | | | | 1.86 | |
| | | | | | | | | | | | | | | | | | | | | | | | | | | | | | | | | | | | | | | | |
Less Distributions from: | | | | | | | | | | | | | | | | | | | | | | | | | | | | | | | | | | | | | | | | |
Net investment income | | | (0.36 | ) | | | (0.39 | ) | | | (0.36 | ) | | | (0.37 | ) | | | (0.32 | ) | | | (0.33 | ) | | | (0.34 | ) | | | (0.30 | ) | | | (0.31 | ) | | | (0.26 | ) |
Net realized gain on investments | | | (0.07 | ) | | | (1.51 | ) | | | (2.96 | ) | | | (1.01 | ) | | | (1.71 | ) | | | (0.07 | ) | | | (1.51 | ) | | | (2.96 | ) | | | (1.01 | ) | | | (1.71 | ) |
| | | | | | | | | | | | | | | | | | | | | | | | | | | | | | | | | | | | | | | | |
Total distributions | | | (0.43 | ) | | | (1.90 | ) | | | (3.32 | ) | | | (1.38 | ) | | | (2.03 | ) | | | (0.40 | ) | | | (1.85 | ) | | | (3.26 | ) | | | (1.32 | ) | | | (1.97 | ) |
| | | | | | | | | | | | | | | | | | | | | | | | | | | | | | | | | | | | | | | | |
Net Asset Value, End of Period | | $ | 11.23 | | | $ | 8.99 | | | $ | 18.24 | | | $ | 24.60 | | | $ | 18.80 | | | $ | 12.25 | | | $ | 9.77 | | | $ | 19.66 | | | $ | 26.23 | | | $ | 19.97 | |
| | | | | | | | | | | | | | | | | | | | | | | | | | | | | | | | | | | | | | | | |
Total Return (a) | | | 30.09 | % | | | (44.73 | )% | | | (13.13 | )% | | | 38.96 | % | | | 9.67 | % | | | 29.83 | % | | | (44.89 | )% | | | (13.34 | )% | | | 38.64 | % | | | 9.37 | % |
| | | | | | | | | | | | | | | | | | | | | | | | | | | | | | | | | | | | | | | | |
Ratios and Supplemental Data: | | | | | | | | | | | | | | | | | | | | | | | | | | | | | | | | | | | | | | | | |
Net Assets, End of Period (000’s) | | $ | 84,988 | | | $ | 45,841 | | | $ | 87,441 | | | $ | 121,197 | | | $ | 105,368 | | | $ | 138,929 | | | $ | 126,838 | | | $ | 173,065 | | | $ | 106,954 | | | $ | 50,778 | |
Ratios to average net assets: | | | | | | | | | | | | | | | | | | | | | | | | | | | | | | | | | | | | | | | | |
Net expenses (b)(c) | | | 1.10 | % | | | 1.10 | % | | | 1.10 | % | | | 1.10 | % | | | 1.10 | % | | | 1.35 | % | | | 1.35 | % | | | 1.35 | % | | | 1.35 | % | | | 1.35 | % |
Gross expenses (c) | | | 1.17 | % | | | 1.23 | % | | | 1.18 | % | | | 1.19 | % | | | 1.22 | % | | | 1.43 | % | | | 1.48 | % | | | 1.43 | % | | | 1.44 | % | | | 1.47 | % |
Net investment income (loss) (b)(c) | | | 3.52 | % | | | 1.28 | % | | | 2.65 | % | | | 3.08 | % | | | 3.55 | % | | | 3.33 | % | | | 1.15 | % | | | 2.82 | % | | | 2.95 | % | | | 3.56 | % |
Portfolio turnover rate | | | 110 | % | | | 76 | % | | | 25 | % | | | 44 | % | | | 32 | % | | | 110 | % | | | 76 | % | | | 25 | % | | | 44 | % | | | 32 | % |
| † | Based on average shares outstanding during the period. |
| (a) | Total returns are historical and assume changes in share price, reinvestments of all dividends and distributions, and no sales charge. Had certain expenses not been reduced during the periods shown, total returns would have been lower. |
| (b) | Such percentages are after advisory fee or unified management fee waivers and expense reimbursements, as applicable. |
| (c) | Does not include any insurance charges imposed in connection with your variable insurance contract. |
214
| | |
| FINANCIAL HIGHLIGHTS (Continued) | | |
| | | Sun Capital Advisers Trust |
Selected data for a share outstanding throughout each period:
| | | | | | | | | | | | | | | | | | | | | | | | | | | | | | | | | | | | |
| | | Davis Venture Value Fund
Initial Class Shares | | | Davis Venture Value Fund
Service Class Shares | |
| | | Years Ended December 31, | | | Years Ended December 31, | |
| | | 2009 | | | 2008 | | | 2007 | | | 2006 | | | 2005 | | | 2009 | | | 2008 | | | 2007 | | | 2006* | |
Net Asset Value, Beginning of Period | | $ | 8.34 | | | $ | 13.65 | | | $ | 13.17 | | | $ | 11.56 | | | $ | 10.61 | | | $ | 8.32 | | | $ | 13.61 | | | $ | 13.15 | | | $ | 12.08 | |
| | | | | | | | | | | | | | | | | | | | | | | | | | | | | | | | | | | | |
Income (Loss) from Investment Operations: | | | | | | | | | | | | | | | | | | | | | | | | | | | | | | | | | | | | |
Net investment income (loss) (d) | | | 0.06 | † | | | 0.10 | | | | 0.17 | | | | 0.09 | | | | 0.09 | | | | 0.04 | † | | | 0.06 | | | | 0.12 | | | | 0.04 | |
Net realized and unrealized gain (loss) on investments | | | 2.39 | | | | (5.21 | ) | | | 0.39 | | | | 1.61 | | | | 0.94 | | | | 2.37 | | | | (5.17 | ) | | | 0.39 | | | | 1.12 | |
| | | | | | | | | | | | | | | | | | | | | | | | | | | | | | | | | | | | |
Total from Investment Operations | | | 2.45 | | | | (5.11 | ) | | | 0.56 | | | | 1.70 | | | | 1.03 | | | | 2.41 | | | | (5.11 | ) | | | 0.51 | | | | 1.16 | |
| | | | | | | | | | | | | | | | | | | | | | | | | | | | | | | | | | | | |
Less Distributions from: | | | | | | | | | | | | | | | | | | | | | | | | | | | | | | | | | | | | |
Net investment income | | | (0.04 | ) | | | (0.09 | ) | | | (0.08 | ) | | | (0.09 | ) | | | (0.08 | ) | | | (0.01 | ) | | | (0.07 | ) | | | (0.05 | ) | | | (0.09 | ) |
Net realized gain on investments | | | — | | | | (0.11 | ) | | | — | | | | — | | | | — | | | | — | | | | (0.11 | ) | | | — | | | | — | |
| | | | | | | | | | | | | | | | | | | | | | | | | | | | | | | | | | | | |
Total distributions | | | (0.04 | ) | | | (0.20 | ) | | | (0.08 | ) | | | (0.09 | ) | | | (0.08 | ) | | | (0.01 | ) | | | (0.18 | ) | | | (0.05 | ) | | | (0.09 | ) |
| | | | | | | | | | | | | | | | | | | | | | | | | | | | | | | | | | | | |
Net Asset Value, End of Period | | $ | 10.75 | | | $ | 8.34 | | | $ | 13.65 | | | $ | 13.17 | | | $ | 11.56 | | | $ | 10.72 | | | $ | 8.32 | | | $ | 13.61 | | | $ | 13.15 | |
| | | | | | | | | | | | | | | | | | | | | | | | | | | | | | | | | | | | |
Total Return (b) | | | 29.39 | % | | | (37.81 | )% | | | 4.23 | % | | | 14.77 | % | | | 9.73 | % | | | 29.02 | % | | | (37.93 | )% | | | 3.91 | % | | | 9.66 | % |
| | | | | | | | | | | | | | | | | | | | | | | | | | | | | | | | | | | | |
Ratios and Supplemental Data: | | | | | | | | | | | | | | | | | | | | | | | | | | | | | | | | | | | | |
Net Assets, End of Period (000’s) | | $ | 147,350 | | | $ | 31,868 | | | $ | 52,861 | | | $ | 61,438 | | | $ | 54,216 | | | $ | 235,240 | | | $ | 82,041 | | | $ | 27,764 | | | $ | 27 | |
Ratios to average net assets: | | | | | | | | | | | | | | | | | | | | | | | | | | | | | | | | | | | | |
Net expenses (a)(c)(d) | | | 0.90 | % | | | 0.90 | % | | | 0.90 | % | | | 0.90 | % | | | 0.90 | % | | | 1.15 | % | | | 1.15 | % | | | 1.15 | % | | | 1.15 | % |
Gross expenses (a)(d) | | | 0.93 | % | | | 1.11 | % | | | 1.11 | % | | | 1.16 | % | | | 1.13 | % | | | 1.18 | % | | | 1.35 | % | | | 1.35 | % | | | 1.43 | % |
Net investment income (loss) (a)(c)(d) | | | 0.62 | % | | | 0.86 | % | | | 1.06 | % | | | 0.74 | % | | | 0.81 | % | | | 0.41 | % | | | 0.65 | % | | | 0.68 | % | | | 0.48 | % |
Portfolio turnover rate | | | 17 | % | | | 19 | % | | | 10 | % | | | 16 | % | | | 15 | % | | | 17 | % | | | 19 | % | | | 10 | % | | | 16 | % |
| * | For the period from May 1, 2006 (Commencement of Operations – Service Class Shares) through December 31, 2006. |
| † | Based on average shares outstanding during the period. |
| (a) | Annualized for periods of less than one year. |
| (b) | Total returns are historical and assume changes in share price, reinvestments of all dividends and distributions, and no sales charge. Had certain expenses not been reduced during the periods shown, total returns would have been lower. Total returns for periods of less than one year are not annualized. |
| (c) | Such percentages are after advisory fee or unified management fee waivers and expense reimbursements, as applicable. |
| (d) | Does not include any insurance charges imposed in connection with your variable insurance contract. |
215
| | |
| FINANCIAL HIGHLIGHTS (Continued) | | |
| | | Sun Capital Advisers Trust |
Selected data for a share outstanding throughout each period:
| | | | | | | | | | | | | | | | | | | | | | | | | | | | | | | | | | | | |
| | | Oppenheimer Main Street
Small Cap Fund
Initial Class Shares | | | Oppenheimer Main Street
Small Cap Fund
Service Class Shares | |
| | | Years Ended December 31, | | | Years Ended December 31, | |
| | | 2009 | | | 2008 | | | 2007 | | | 2006 | | | 2005 | | | 2009 | | | 2008 | | | 2007 | | | 2006* | |
Net Asset Value, Beginning of Period | | $ | 7.74 | | | $ | 12.98 | | | $ | 15.02 | | | $ | 13.79 | | | $ | 15.21 | | | $ | 7.66 | | | $ | 12.85 | | | $ | 14.99 | | | $ | 15.56 | |
| | | | | | | | | | | | | | | | | | | | | | | | | | | | | | | | | | | | |
Income (Loss) from Investment Operations: | | | | | | | | | | | | | | | | | | | | | | | | | | | | | | | | | | | | |
Net investment income (loss) (d) | | | 0.04 | † | | | 0.03 | | | | 0.05 | | | | 0.01 | | | | 0.01 | | | | 0.02 | † | | | (0.00 | )(e) | | | 0.01 | | | | (0.01 | ) |
Net realized and unrealized gain (loss) on investments | | | 2.81 | | | | (4.82 | ) | | | (0.23 | ) | | | 1.82 | | | | 0.57 | | | | 2.78 | | | | (4.77 | ) | | | (0.29 | ) | | | 0.04 | |
| | | | | | | | | | | | | | | | | | | | | | | | | | | | | | | | | | | | |
Total from Investment Operations | | | 2.85 | | | | (4.79 | ) | | | (0.18 | ) | | | 1.83 | | | | 0.58 | | | | 2.80 | | | | (4.77 | ) | | | (0.28 | ) | | | 0.03 | |
| | | | | | | | | | | | | | | | | | | | | | | | | | | | | | | | | | | | |
Less Distributions from: | | | | | | | | | | | | | | | | | | | | | | | | | | | | | | | | | | | | |
Net investment income | | | (0.01 | ) | | | (0.03 | ) | | | — | | | | — | | | | — | | | | (0.01 | ) | | | (0.00 | )(e) | | | — | | | | — | |
Net realized gain on investments | | | — | | | | (0.42 | ) | | | (1.86 | ) | | | (0.60 | ) | | | (2.00 | ) | | | — | | | | (0.42 | ) | | | (1.86 | ) | | | (0.60 | ) |
| | | | | | | | | | | | | | | | | | | | | | | | | | | | | | | | | | | | |
Total distributions | | | (0.01 | ) | | | (0.45 | ) | | | (1.86 | ) | | | (0.60 | ) | | | (2.00 | ) | | | (0.01 | ) | | | (0.42 | ) | | | (1.86 | ) | | | (0.60 | ) |
| | | | | | | | | | | | | | | | | | | | | | | | | | | | | | | | | | | | |
Net Asset Value, End of Period | | $ | 10.58 | | | $ | 7.74 | | | $ | 12.98 | | | $ | 15.02 | | | $ | 13.79 | | | $ | 10.45 | | | $ | 7.66 | | | $ | 12.85 | | | $ | 14.99 | |
| | | | | | | | | | | | | | | | | | | | | | | | | | | | | | | | | | | | |
Total Return (b) | | | 36.77 | % | | | (37.99 | )% | | | (1.44 | )% | | | 13.60 | % | | | 4.33 | % | | | 36.50 | % | | | (38.14 | )% | | | (2.11 | )% | | | 0.48 | % |
| | | | | | | | | | | | | | | | | | | | | | | | | | | | | | | | | | | | |
Ratios and Supplemental Data: | | | | | | | | | | | | | | | | | | | | | | | | | | | | | | | | | | | | |
Net Assets, End of Period (000’s) | | $ | 48,950 | | | $ | 38,435 | | | $ | 72,741 | | | $ | 87,215 | | | $ | 86,949 | | | $ | 134,819 | | | $ | 115,098 | | | $ | 105,377 | | | $ | 25 | |
Ratios to average net assets: | | | | | | | | | | | | | | | | | | | | | | | | | | | | | | | | | | | | |
Net expenses (a)(c)(d) | | | 1.00 | % | | | 1.00 | % | | | 1.00 | % | | | 1.00 | % | | | 1.00 | % | | | 1.25 | % | | | 1.25 | % | | | 1.25 | % | | | 1.25 | % |
Gross expenses (a)(d) | | | 1.21 | % | | | 1.29 | % | | | 1.38 | % | | | 1.42 | % | | | 1.10 | % | | | 1.46 | % | | | 1.55 | % | | | 1.61 | % | | | 1.82 | % |
Net investment income (loss) (a)(c)(d) | | | 0.45 | % | | | 0.21 | % | | | 0.31 | % | | | 0.02 | % | | | 0.03 | % | | | 0.20 | % | | | 0.04 | % | | | (0.06 | )% | | | (0.09 | )% |
Portfolio turnover rate | | | 132 | % | | | 126 | % | | | 126 | % | | | 206 | % | | | 58 | % | | | 132 | % | | | 126 | % | | | 126 | % | | | 206 | % |
| * | For the period from May 1, 2006 (Commencement of Operations – Service Class Shares) through December 31, 2006. |
| † | Based on average shares outstanding during the period. |
| (a) | Annualized for periods of less than one year. |
| (b) | Total returns are historical and assume changes in share price, reinvestments of all dividends and distributions, and no sales charge. Had certain expenses not been reduced during the periods shown, total returns would have been lower. Total returns for periods of less than one year are not annualized. |
| (c) | Such percentages are after advisory fee or unified management fee waivers and expenses reimbursements, as applicable. |
| (d) | Does not include any insurance charges imposed in connection with your variable insurance contract. |
| (e) | Amount is less than $0.005 per share. |
216
| | |
| FINANCIAL HIGHLIGHTS (Continued) | | |
| | | Sun Capital Advisers Trust |
Selected data for a share outstanding throughout each period:
| | | | | | | | | | | | | | | | | | | | | | | | | | | | | | | | | | | | | | | | |
| | | Oppenheimer Large Cap Core Fund
Initial Class Shares | | | Oppenheimer Large Cap Core Fund
Service Class Shares | |
| | | Years Ended December 31, | | | Years Ended December 31, | |
| | | 2009 | | | 2008 | | | 2007 | | | 2006 | | | 2005 | | | 2009 | | | 2008 | | | 2007 | | | 2006 | | | 2005 | |
Net Asset Value, Beginning of Period | | $ | 6.70 | | | $ | 10.77 | | | $ | 12.37 | | | $ | 10.47 | | | $ | 12.47 | | | $ | 6.87 | | | $ | 11.03 | | | $ | 12.65 | | | $ | 10.70 | | | $ | 12.72 | |
| | | | | | | | | | | | | | | | | | | | | | | | | | | | | | | | | | | | | | | | |
Income (Loss) from Investment Operations: | | | | | | | | | | | | | | | | | | | | | | | | | | | | | | | | | | | | | | | | |
Net investment income (loss) (c) | | | 0.11 | † | | | 0.04 | | | | 0.12 | | | | 0.17 | | | | 0.02 | | | | 0.10 | † | | | 0.10 | | | | 0.08 | | | | 0.12 | | | | (0.00 | )(d) |
Net realized and unrealized gain (loss) on investments | | | 1.30 | | | | (4.03 | ) | | | (0.84 | ) | | | 1.93 | | | | (0.09 | ) | | | 1.33 | | | | (4.19 | ) | | | (0.84 | ) | | | 2.00 | | | | (0.11 | ) |
| | | | | | | | | | | | | | | | | | | | | | | | | | | | | | | | | | | | | | | | |
Total from Investment Operations | | | 1.41 | | | | (3.99 | ) | | | (0.72 | ) | | | 2.10 | | | | (0.07 | ) | | | 1.43 | | | | (4.09 | ) | | | (0.76 | ) | | | 2.12 | | | | (0.11 | ) |
| | | | | | | | | | | | | | | | | | | | | | | | | | | | | | | | | | | | | | | | |
Less Distributions from: | | | | | | | | | | | | | | | | | | | | | | | | | | | | | | | | | | | | | | | | |
Net investment income | | | (0.07 | ) | | | (0.05 | ) | | | (0.10 | ) | | | (0.16 | ) | | | (0.02 | ) | | | (0.05 | ) | | | (0.04 | ) | | | (0.08 | ) | | | (0.13 | ) | | | — | |
Net realized gain on investments | | | — | | | | (0.03 | ) | | | (0.78 | ) | | | (0.04 | ) | | | (1.91 | ) | | | — | | | | (0.03 | ) | | | (0.78 | ) | | | (0.04 | ) | | | (1.91 | ) |
| | | | | | | | | | | | | | | | | | | | | | | | | | | | | | | | | | | | | | | | |
Total distributions | | | (0.07 | ) | | | (0.08 | ) | | | (0.88 | ) | | | (0.20 | ) | | | (1.93 | ) | | | (0.05 | ) | | | (0.07 | ) | | | (0.86 | ) | | | (0.17 | ) | | | (1.91 | ) |
| | | | | | | | | | | | | | | | | | | | | | | | | | | | | | | | | | | | | | | | |
Net Asset Value, End of Period | | $ | 8.04 | | | $ | 6.70 | | | $ | 10.77 | | | $ | 12.37 | | | $ | 10.47 | | | $ | 8.25 | | | $ | 6.87 | | | $ | 11.03 | | | $ | 12.65 | | | $ | 10.70 | |
| | | | | | | | | | | | | | | | | | | | | | | | | | | | | | | | | | | | | | | | |
Total Return (a) | | | 21.09 | % | | | (37.06 | )% | | | (5.81 | )% | | | 20.07 | % | | | (0.72 | )% | | | 20.85 | % | | | (37.15 | )% | | | (6.07 | )% | | | 19.78 | % | | | (0.98 | )% |
| | | | | | | | | | | | | | | | | | | | | | | | | | | | | | | | | | | | | | | | |
Ratios and Supplemental Data: | | | | | | | | | | | | | | | | | | | | | | | | | | | | | | | | | | | | | | | | |
Net Assets, End of Period (000’s) | | $ | 70,638 | | | $ | 8,366 | | | $ | 5,544 | | | $ | 6,183 | | | $ | 5,505 | | | $ | 11,734 | | | $ | 4,974 | | | $ | 7,808 | | | $ | 5,262 | | | $ | 1,594 | |
Ratios to average net assets: | | | | | | | | | | | | | | | | | | | | | | | | | | | | | | | | | | | | | | | | |
Net expenses (b)(c) | | | 0.90 | % | | | 0.90 | % | | | 0.90 | % | | | 0.90 | % | | | 0.90 | % | | | 1.15 | % | | | 1.15 | % | | | 1.15 | % | | | 1.15 | % | | | 1.15 | % |
Gross expenses (c) | | | 1.13 | % | | | 2.08 | % | | | 1.81 | % | | | 2.47 | % | | | 2.74 | % | | | 1.44 | % | | | 2.34 | % | | | 2.05 | % | | | 2.62 | % | | | 3.04 | % |
Net investment income (loss) (b)(c) | | | 1.55 | % | | | 1.39 | % | | | 0.89 | % | | | 1.47 | % | | | 0.15 | % | | | 1.37 | % | | | 1.05 | % | | | 0.63 | % | | | 1.44 | % | | | (0.05 | )% |
Portfolio turnover rate | | | 109 | % | | | 189 | % | | | 63 | % | | | 135 | % | | | 114 | % | | | 109 | % | | | 189 | % | | | 63 | % | | | 135 | % | | | 114 | % |
| † | Based on average shares outstanding during the period. |
| (a) | Total returns are historical and assume changes in share price, reinvestments of all dividends and distributions, and no sales charge. Had certain expenses not been reduced during the periods shown, total returns would have been lower. |
| (b) | Such percentages are after advisory fee or unified management fee waivers and expense reimbursements, as applicable. |
| (c) | Does not include any insurance charges imposed in connection with your variable insurance contract. |
| (d) | Amount is less than $0.005 per share. |
217
| | |
| FINANCIAL HIGHLIGHTS (Continued) | | |
| | | Sun Capital Advisers Trust |
Selected data for a share outstanding throughout the period:
| | | | | | | | | | | | | | | | | | | | | | | | | | | | |
| | | WMC Large Cap Growth Fund
Initial Class Shares | | | WMC Large Cap Growth Fund
Service Class Shares | |
| | | Years Ended December 31, | | | Years Ended December 31, | |
| | | 2009 | | | 2008 | | | 2007** | | | 2009 | | | 2008 | | | 2007 | | | 2006* | |
Net Asset Value, Beginning of Period | | $ | 5.95 | | | $ | 10.65 | | | $ | 9.99 | | | $ | 5.92 | | | $ | 10.63 | | | $ | 9.98 | | | $ | 10.00 | |
| | | | | | | | | | | | | | | | | | | | | | | | | | | | |
Income (Loss) from Investment Operations: | | | | | | | | | | | | | | | | | | | | | | | | | | | | |
Net investment income (loss) (d) | | | 0.04 | † | | | 0.04 | | | | (0.00 | )(e) | | | 0.03 | † | | | 0.02 | | | | (0.02 | ) | | | (0.01 | ) |
Net realized and unrealized gain (loss) on investments | | | 2.17 | | | | (4.74 | ) | | | 0.69 | | | | 2.16 | | | | (4.73 | ) | | | 0.70 | | | | (0.01 | ) |
| | | | | | | | | | | | | | | | | | | | | | | | | | | | |
Total from Investment Operations | | | 2.21 | | | | (4.70 | ) | | | 0.69 | | | | 2.19 | | | | (4.71 | ) | | | 0.68 | | | | (0.02 | ) |
| | | | | | | | | | | | | | | | | | | | | | | | | | | | |
Less Distributions from: | | | | | | | | | | | | | | | | | | | | | | | | | | | | |
Net investment income | | | (0.01 | ) | | | — | | | | — | | | | (0.01 | ) | | | — | | | | — | | | | — | |
Net realized gain on investments | | | — | | | | (0.00 | )(e) | | | (0.03 | ) | | | — | | | | (0.00 | )(e) | | | (0.03 | ) | | | — | |
| | | | | | | | | | | | | | | | | | | | | | | | | | | | |
Total distributions | | | (0.01 | ) | | | (0.00 | )(e) | | | (0.03 | ) | | | (0.01 | ) | | | (0.00 | )(e) | | | (0.03 | ) | | | — | |
| | | | | | | | | | | | | | | | | | | | | | | | | | | | |
Net Asset Value, End of Period | | $ | 8.15 | | | $ | 5.95 | | | $ | 10.65 | | | $ | 8.10 | | | $ | 5.92 | | | $ | 10.63 | | | $ | 9.98 | |
| | | | | | | | | | | | | | | | | | | | | | | | | | | | |
Total Return (b) | | | 37.23 | % | | | (44.12 | )% | | | 6.88 | % | | | 37.08 | % | | | (44.30 | )% | | | 6.78 | % | | | (0.20 | )% |
| | | | | | | | | | | | | | | | | | | | | | | | | | | | |
Ratios and Supplemental Data: | | | | | | | | | | | | | | | | | | | | | | | | | | | | |
Net Assets, End of Period (000’s) | | $ | 149,621 | | | $ | 34,599 | | | $ | 62,680 | | | $ | 17,883 | | | $ | 15,518 | | | $ | 33,064 | | | $ | 3,810 | |
Ratios to average net assets: | | | | | | | | | | | | | | | | | | | | | | | | | | | | |
Net expenses (a)(c)(d) | | | 0.81 | % | | | 0.81 | % | | | 0.81 | % | | | 1.06 | % | | | 1.06 | % | | | 1.06 | % | | | 1.06 | % |
Gross expenses (a)(d) | | | 1.05 | % | | | 1.17 | % | | | 1.06 | % | | | 1.33 | % | | | 1.43 | % | | | 1.46 | % | | | 5.26 | % |
Net investment income (loss) (a)(c)(d) | | | 0.60 | % | | | 0.43 | % | | | 0.01 | % | | | 0.46 | % | | | 0.17 | % | | | (0.25 | )% | | | (0.10 | )% |
Portfolio turnover rate | | | 72 | % | | | 265 | % | | | 307 | % | | | 72 | % | | | 265 | % | | | 307 | % | | | 110 | % |
| * | For the period from May 1, 2006 (Commencement of Operations – Service Class Shares) through December 31, 2006. |
| ** | For the period from April 2, 2007 (Commencement of Operations – Initial Class Shares) through December 31, 2007. |
| † | Based on average shares outstanding during the period. |
| (a) | Annualized for periods of less than one year. |
| (b) | Total returns are historical and assume changes in share price, reinvestments of all dividends and distributions, and no sales charge. Had certain expenses not been reduced during the periods shown, total returns would have been lower. Total returns for periods of less than one year are not annualized. |
| (c) | Such percentage are after advisory fee or unified management fee waivers and expense reimbursements, as applicable. |
| (d) | Does not include any insurance charges imposed in connection with your variable insurance contract. |
| (e) | Amount is less than $0.005 per share. |
218
| | |
| FINANCIAL HIGHLIGHTS (Continued) | | |
| | | Sun Capital Advisers Trust |
Selected data for a share outstanding throughout each period:
| | | | | | | | | | | | | | | | | | | | | | | | | | | | |
| | | WMC Blue Chip Mid Cap Fund
Initial Class Shares | | | WMC Blue Chip Mid Cap Fund
Service Class Shares | |
| | | Years Ended December 31, | | | Years Ended December 31, | |
| | | 2009 | | | 2008 | | | 2007 | | | 2006 | | | 2005 | | | 2009 | | | 2008* | |
Net Asset Value, Beginning of Period | | $ | 9.32 | | | $ | 17.95 | | | $ | 19.04 | | | $ | 20.60 | | | $ | 18.13 | | | $ | 9.30 | | | $ | 15.70 | |
| | | | | | | | | | | | | | | | | | | | | | | | | | | | |
Income (Loss) from Investment Operations: | | | | | | | | | | | | | | | | | | | | | | | | | | | | |
Net investment income (loss) (d) | | | 0.02 | † | | | 0.01 | | | | (0.00 | )(e) | | | 0.18 | | | | (0.00 | )(e) | | | (0.01 | )† | | | 0.02 | |
Net realized and unrealized gain (loss) on investments | | | 2.78 | | | | (5.41 | ) | | | 2.87 | | | | 1.87 | | | | 2.98 | | | | 2.78 | | | | (3.19 | ) |
| | | | | | | | | | | | | | | | | | | | | | | | | | | | |
Total from Investment Operations | | | 2.80 | | | | (5.40 | ) | | | 2.87 | | | | 2.05 | | | | 2.98 | | | | 2.77 | | | | (3.17 | ) |
| | | | | | | | | | | | | | | | | | | | | | | | | | | | |
Less Distributions from: | | | | | | | | | | | | | | | | | | | | | | | | | | | | |
Net investment income | | | (0.00 | )(e) | | | (0.03 | ) | | | (0.25 | ) | | | — | | | | (0.02 | ) | | | (0.00 | )(e) | | | (0.03 | ) |
Net realized gain on investments | | | — | | | | (3.20 | ) | | | (3.71 | ) | | | (3.61 | ) | | | (0.49 | ) | | | — | | | | (3.20 | ) |
| | | | | | | | | | | | | | | | | | | | | | | | | | | | |
Total distributions | | | (0.00 | )(e) | | | (3.23 | ) | | | (3.96 | ) | | | (3.61 | ) | | | (0.51 | ) | | | (0.00 | )(e) | | | (3.23 | ) |
| | | | | | | | | | | | | | | | | | | | | | | | | | | | |
Net Asset Value, End of Period | | $ | 12.12 | | | $ | 9.32 | | | $ | 17.95 | | | $ | 19.04 | | | $ | 20.60 | | | $ | 12.07 | | | $ | 9.30 | |
| | | | | | | | | | | | | | | | | | | | | | | | | | | | |
Total Return (b) | | | 30.07 | % | | | (35.14 | )% | | | 15.41 | % | | | 11.30 | % | | | 16.61 | % | | | 29.96 | % | | | (26.06 | )% |
| | | | | | | | | | | | | | | | | | | | | | | | | | | | |
Ratios and Supplemental Data: | | | | | | | | | | | | | | | | | | | | | | | | | | | | |
Net Assets, End of Period (000’s) | | $ | 75,745 | | | $ | 45,842 | | | $ | 85,438 | | | $ | 94,632 | | | $ | 94,928 | | | $ | 40,249 | | | $ | 31,137 | |
Ratio to average net assets: | | | | | | | | | | | | | | | | | | | | | | | | | | | | |
Net expenses (a)(c)(d) | | | 1.00 | % | | | 1.00 | % | | | 1.00 | % | | | 1.00 | % | | | 1.00 | % | | | 1.25 | % | | | 1.25 | % |
Gross expenses (a)(d) | | | 1.10 | % | | | 1.21 | % | | | 1.14 | % | | | 1.14 | % | | | 1.15 | % | | | 1.35 | % | | | 1.47 | % |
Net investment income (loss) (a)(c)(d) | | | 0.17 | % | | | 0.05 | % | | | (0.17 | )% | | | 0.92 | % | | | (0.03 | )% | | | (0.09 | )% | | | 0.02 | % |
Portfolio turnover rate | | | 82 | % | | | 104 | % | | | 75 | % | | | 83 | % | | | 67 | % | | | 82 | % | | | 104 | % |
| * | For the period from March 7, 2008 (Commencement of Operations – Service Class Shares) through December 31, 2008. |
| † | Based on average shares outstanding during the period. |
| (a) | Annualized for periods of less than one year. |
| (b) | Total returns are historical and assume changes in share price, reinvestments of all dividends and distributions, and no sales charge. Had certain expenses not been reduced during the periods shown, total returns would have been lower. Total returns for periods of less than one year are not annualized. |
| (c) | Such percentages are after advisory fee or unified management fee waivers and expense reimbursements, as applicable. |
| (d) | Does not include any insurance charges imposed in connection with your variable insurance contract. |
| (e) | Amount is less than $0.005 per share. |
219
| | |
| FINANCIAL HIGHLIGHTS (Continued) | | |
| | | Sun Capital Advisers Trust |
Selected data for a share outstanding throughout each period:
| | | | | | | | | | | | | | | | | | | | | | | | | | | | | | | | |
| | | Lord Abbett
Growth & Income Fund
Initial Class Shares | | | Lord Abbett
Growth & Income Fund
Service Class Shares | | | Goldman Sachs
Mid Cap Value Fund
Initial Class Shares | | | Goldman Sachs
Mid Cap Value Fund
Service Class Shares | |
| | | Years Ended December 31, | | | Years Ended December 31, | | | Years Ended December 31, | | | Years Ended December 31, | |
| | | 2009 | | | 2008* | | | 2009 | | | 2008* | | | 2009 | | | 2008* | | | 2009 | | | 2008* | |
Net Asset Value, Beginning of Period | | $ | 7.08 | | | $ | 10.00 | | | $ | 7.08 | | | $ | 10.00 | | | $ | 6.93 | | | $ | 10.00 | | | $ | 6.93 | | | $ | 10.00 | |
| | | | | | | | | | | | | | | | | | | | | | | | | | | | | | | | |
Income (Loss) from Investment Operations: | | | | | | | | | | | | | | | | | | | | | | | | | | | | | | | | |
Net investment income (loss) (d) | | | 0.05 | † | | | 0.06 | | | | 0.04 | † | | | 0.06 | | | | 0.11 | † | | | 0.05 | | | | 0.09 | † | | | 0.07 | |
Net realized and unrealized gain (loss) on investments | | | 1.22 | | | | (2.92 | ) | | | 1.19 | | | | (2.93 | ) | | | 1.68 | | | | (3.06 | ) | | | 1.68 | | | | (3.09 | ) |
| | | | | | | | | | | | | | | | | | | | | | | | | | | | | | | | |
Total from Investment Operations | | | 1.27 | | | | (2.86 | ) | | | 1.23 | | | | (2.87 | ) | | | 1.79 | | | | (3.01 | ) | | | 1.77 | | | | (3.02 | ) |
| | | | | | | | | | | | | | | | | | | | | | | | | | | | | | | | |
Less Distributions from: | | | | | | | | | | | | | | | | | | | | | | | | | | | | | | | | |
Net investment income | | | (0.05 | ) | | | (0.06 | ) | | | (0.02 | ) | | | (0.05 | ) | | | (0.08 | ) | | | (0.06 | ) | | | (0.06 | ) | | | (0.05 | ) |
Net realized gain on investments | | | (0.78 | ) | | | — | | | | (0.78 | ) | | | — | | | | (0.71 | ) | | | — | | | | (0.71 | ) | | | — | |
| | | | | | | | | | | | | | | | | | | | | | | | | | | | | | | | |
Total distributions | | | (0.83 | ) | | | (0.06 | ) | | | (0.80 | ) | | | (0.05 | ) | | | (0.79 | ) | | | (0.06 | ) | | | (0.77 | ) | | | (0.05 | ) |
| | | | | | | | | | | | | | | | | | | | | | | | | | | | | | | | |
Net Asset Value, End of Period | | $ | 7.52 | | | $ | 7.08 | | | $ | 7.51 | | | $ | 7.08 | | | $ | 7.93 | | | $ | 6.93 | | | $ | 7.93 | | | $ | 6.93 | |
| | | | | | | | | | | | | | | | | | | | | | | | | | | | | | | | |
Total Return (b) | | | 17.85 | % | | | (28.54 | )% | | | 17.41 | % | | | (28.68 | )% | | | 25.68 | % | | | (30.07 | )% | | | 25.38 | % | | | (30.21 | )% |
| | | | | | | | | | | | | | | | | | | | | | | | | | | | | | | | |
Ratios and Supplemental Data: | | | | | | | | | | | | | | | | | | | | | | | | | | | | | | | | |
Net Assets, End of Period (000’s) | | $ | 498,639 | | | $ | 2,229 | | | $ | 9,422 | | | $ | 2,620 | | | $ | 190,461 | | | $ | 6,496 | | | $ | 18,699 | | | $ | 4,452 | |
Ratio to average net assets: | | | | | | | | | | | | | | | | | | | | | | | | | | | | | | | | |
Net expenses (a)(c)(d) | | | 0.87 | % | | | 0.87 | % | | | 1.12 | % | | | 1.12 | % | | | 1.06 | % | | | 1.07 | % | | | 1.31 | % | | | 1.32 | % |
Gross expenses (a)(d) | | | 0.88 | % | | | 0.90 | % | | | 1.13 | % | | | 1.14 | % | | | 1.06 | % | | | 1.08 | % | | | 1.31 | % | | | 1.32 | % |
Net investment income (loss) (a)(c)(d) | | | 0.68 | % | | | 1.71 | % | | | 0.49 | % | | | 1.48 | % | | | 1.45 | % | | | 2.10 | % | | | 1.15 | % | | | 1.65 | % |
Portfolio turnover rate | | | 83 | % | | | 73 | % | | | 83 | % | | | 73 | % | | | 159 | % | | | 90 | % | | | 159 | % | | | 90 | % |
| * | For the period March 7, 2008 (Commencement of Operations) to December 31, 2008. |
| † | Based on average shares outstanding during the period. |
| (a) | Annualized for periods of less than one year. |
| (b) | Total returns are historical and assume changes in share price, reinvestments of all dividends and distributions, and no sales charge. Had certain expenses not been reduced during the periods shown, total returns would have been lower. Total returns for periods of less than one year are not annualized. |
| (c) | Such percentages are after advisory fee or unified management fee waivers and expense reimbursements, as applicable. |
| (d) | Does not include any insurance charges imposed in connection with your variable insurance contract. |
220
| | |
| FINANCIAL HIGHLIGHTS (Continued) | | |
| | | Sun Capital Advisers Trust |
Selected data for a share outstanding throughout each period:
| | | | | | | | | | | | | | | | | | | | | | | | | | | | | | | | |
| | | Goldman Sachs
Short Duration Fund
Initial Class Shares | | | Goldman Sachs
Short Duration Fund
Service Class Shares | | | Dreman
Small Cap Value Fund
Initial Class Shares | | | Dreman
Small Cap Value Fund
Service Class Shares | |
| | | Years Ended December 31, | | | Years Ended December 31, | | | Years Ended December 31, | | | Years Ended December 31, | |
| | | 2009 | | | 2008* | | | 2009 | | | 2008* | | | 2009 | | | 2008** | | | 2009 | | | 2008** | |
Net Asset Value, Beginning of Period | | $ | 10.13 | | | $ | 10.00 | | | $ | 10.13 | | | $ | 10.00 | | | $ | 7.97 | | | $ | 10.00 | | | $ | 7.97 | | | $ | 10.00 | |
| | | | | | | | | | | | | | | | | | | | | | | | | | | | | | | | |
Income (Loss) from Investment Operations: | | | | | | | | | | | | | | | | | | | | | | | | | | | | | | | | |
Net investment income (loss) (d) | | | 0.19 | † | | | 0.16 | | | | 0.17 | † | | | 0.14 | | | | 0.06 | † | | | 0.01 | | | | 0.04 | † | | | 0.01 | |
Net realized and unrealized gain (loss) on investments | | | 0.19 | | | | 0.16 | | | | 0.18 | | | | 0.16 | | | | 2.38 | | | | (2.03 | ) | | | 2.36 | | | | (2.03 | ) |
| | | | | | | | | | | | | | | | | | | | | | | | | | | | | | | | |
Total from Investment Operations | | | 0.38 | | | �� | 0.32 | | | | 0.35 | | | | 0.30 | | | | 2.44 | | | | (2.02 | ) | | | 2.40 | | | | (2.02 | ) |
| | | | | | | | | | | | | | | | | | | | | | | | | | | | | | | | |
Less Distributions from: | | | | | | | | | | | | | | | | | | | | | | | | | | | | | | | | |
Net investment income | | | (0.21 | ) | | | (0.16 | ) | | | (0.18 | ) | | | (0.14 | ) | | | (0.05 | ) | | | (0.01 | ) | | | (0.02 | ) | | | (0.01 | ) |
Net realized gain on investments | | | (0.07 | ) | | | (0.03 | ) | | | (0.07 | ) | | | (0.03 | ) | | | (0.28 | ) | | | — | | | | (0.28 | ) | | | — | |
| | | | | | | | | | | | | | | | | | | | | | | | | | | | | | | | |
Total distributions | | | (0.28 | ) | | | (0.19 | ) | | | (0.25 | ) | | | (0.17 | ) | | | (0.33 | ) | | | (0.01 | ) | | | (0.30 | ) | | | (0.01 | ) |
| | | | | | | | | | | | | | | | | | | | | | | | | | | | | | | | |
Net Asset Value, End of Period | | $ | 10.23 | | | $ | 10.13 | | | $ | 10.23 | | | $ | 10.13 | | | $ | 10.08 | | | $ | 7.97 | | | $ | 10.07 | | | $ | 7.97 | |
| | | | | | | | | | | | | | | | | | | | | | | | | | | | | | | | |
Total Return (b) | | | 3.78 | % | | | 3.22 | % | | | 3.52 | % | | | 3.00 | % | | | 30.52 | % | | | (20.15 | )% | | | 30.07 | % | | | (20.20 | )% |
| | | | | | | | | | | | | | | | | | | | | | | | | | | | | | | | |
Ratios and Supplemental Data: | | | | | | | | | | | | | | | | | | | | | | | | | | | | | | | | |
Net Assets, End of Period (000’s) | | $ | 869,648 | | | $ | 54,602 | | | $ | 107,329 | | | $ | 63,422 | | | $ | 33,674 | | | $ | 4,316 | | | $ | 6,809 | | | $ | 1,424 | |
Ratio to average net assets: | | | | | | | | | | | | | | | | | | | | | | | | | | | | | | | | |
Net expenses (a)(c)(d) | | | 0.65 | % | | | 0.65 | % | | | 0.90 | % | | | 0.90 | % | | | 1.15 | % | | | 1.15 | % | | | 1.40 | % | | | 1.40 | % |
Gross expenses (a)(d) | | | 0.65 | % | | | 0.68 | % | | | 0.90 | % | | | 0.92 | % | | | 1.54 | % | | | 8.84 | % | | | 1.87 | % | | | 6.68 | % |
Net investment income (loss) (a)(c)(d) | | | 1.82 | % | | | 2.34 | % | | | 1.66 | % | | | 1.95 | % | | | 0.65 | % | | | 1.18 | % | | | 0.44 | % | | | 0.72 | % |
Portfolio turnover rate | | | 231 | % | | | 333 | % | | | 231 | % | | | 333 | % | | | 110 | % | | | 28 | % | | | 110 | % | | | 28 | % |
| * | For the period March 7, 2008 (Commencement of Operations) to December 31, 2008. |
| ** | For the period October 1, 2008 (Commencement of Operations) to December 31, 2008. |
| † | Based on average shares outstanding during the period. |
| (a) | Annualized for periods of less than one year. |
| (b) | Total returns are historical and assume changes in share price, reinvestments of all dividends and distributions, and no sales charge. Had certain expenses not been reduced during the periods shown, total returns would have been lower. Total returns for periods of less than one year are not annualized. |
| (c) | Such percentages are after advisory fee or unified management fee waivers and expense reimbursements, as applicable. |
| (d) | Does not include any insurance charges imposed in connection with your variable insurance contract. |
221
| | |
| FINANCIAL HIGHLIGHTS (Continued) | | |
| | | Sun Capital Advisers Trust |
Selected data for a share outstanding throughout each period:
| | | | | | | | | | | | | | | | | | | | | | | | | | | | | | | | |
| | | PIMCO High Yield Fund
Initial Class Shares | | | PIMCO High Yield Fund
Service Class Shares | | | PIMCO
Total Return Fund
Initial Class Shares | | | PIMCO
Total Return Fund
Service Class Shares | |
| | | Years Ended December 31, | | | Years Ended December 31, | | | Years Ended December 31, | | | Years Ended December 31, | |
| | | 2009 | | | 2008* | | | 2009 | | | 2008* | | | 2009 | | | 2008** | | | 2009 | | | 2008** | |
Net Asset Value, Beginning of Period | | $ | 8.07 | | | $ | 10.00 | | | $ | 8.07 | | | $ | 10.00 | | | $ | 10.55 | | | $ | 10.00 | | | $ | 10.55 | | | $ | 10.00 | |
| | | | | | | | | | | | | | | | | | | | | | | | | | | | | | | | |
Income (Loss) from Investment Operations: | | | | | | | | | | | | | | | | | | | | | | | | | | | | | | | | |
Net investment income (loss) (d) | | | 0.75 | † | | | 0.53 | | | | 0.72 | † | | | 0.51 | | | | 0.27 | † | | | 0.03 | | | | 0.24 | † | | | 0.02 | |
Net realized and unrealized gain (loss) on investments | | | 1.62 | | | | (1.85 | ) | | | 1.62 | | | | (1.85 | ) | | | 0.65 | | | | 0.55 | | | | 0.65 | | | | 0.55 | |
| | | | | | | | | | | | | | | | | | | | | | | | | | | | | | | | |
Total from Investment Operations | | | 2.37 | | | | (1.32 | ) | | | 2.34 | | | | (1.34 | ) | | | 0.92 | | | | 0.58 | | | | 0.89 | | | | 0.57 | |
| | | | | | | | | | | | | | | | | | | | | | | | | | | | | | | | |
Less Distributions from: | | | | | | | | | | | | | | | | | | | | | | | | | | | | | | | | |
Net investment income | | | (0.74 | ) | | | (0.55 | ) | | | (0.71 | ) | | | (0.53 | ) | | | (0.29 | ) | | | (0.03 | ) | | | (0.26 | ) | | | (0.02 | ) |
Net realized gain on investments | | | (0.24 | ) | | | (0.06 | ) | | | (0.24 | ) | | | (0.06 | ) | | | (0.14 | ) | | | (0.00 | )(e) | | | (0.14 | ) | | | (0.00 | )(e) |
| | | | | | | | | | | | | | | | | | | | | | | | | | | | | | | | |
Total distributions | | | (0.98 | ) | | | (0.61 | ) | | | (0.95 | ) | | | (0.59 | ) | | | (0.43 | ) | | | (0.03 | ) | | | (0.40 | ) | | | (0.02 | ) |
| | | | | | | | | | | | | | | | | | | | | | | | | | | | | | | | |
Net Asset Value, End of Period | | $ | 9.46 | | | $ | 8.07 | | | $ | 9.46 | | | $ | 8.07 | | | $ | 11.04 | | | $ | 10.55 | | | $ | 11.04 | | | $ | 10.55 | |
| �� | | | | | | | | | | | | | | | | | | | | | | | | | | | | | | | |
Total Return (b) | | | 30.67 | % | | | (13.74 | )% | | | 30.34 | % | | | (13.92 | )% | | | 8.89 | % | | | 5.82 | % | | | 8.62 | % | | | 5.76 | % |
| | | | | | | | | | | | | | | | | | | | | | | | | | | | | | | | |
Ratios and Supplemental Data: | | | | | | | | | | | | | | | | | | | | | | | | | | | | | | | | |
Net Assets, End of Period (000’s) | | $ | 92,422 | | | $ | 3,134 | | | $ | 24,680 | | | $ | 12,300 | | | $ | 144,812 | | | $ | 13,823 | | | $ | 243,743 | | | $ | 18,397 | |
Ratio to average net assets: | | | | | | | | | | | | | | | | | | | | | | | | | | | | | | | | |
Net expenses (a)(c)(d) | | | 0.75 | % | | | 0.75 | % | | | 1.00 | % | | | 1.00 | % | | | 0.65 | % | | | 0.65 | % | | | 0.90 | % | | | 0.90 | % |
Gross expenses (a)(d) | | | 0.75 | % | | | 0.77 | % | | | 1.00 | % | | | 1.03 | % | | | 0.66 | % | | | 0.68 | % | | | 0.91 | % | | | 0.93 | % |
Net investment income (loss) (a)(c)(d) | | | 8.45 | % | | | 6.74 | % | | | 8.19 | % | | | 7.18 | % | | | 2.44 | % | | | 1.19 | % | | | 2.15 | % | | | 0.97 | % |
Portfolio turnover rate | | | 190 | % | | | 75 | % | | | 190 | % | | | 75 | % | | | 496 | % | | | 181 | % | | | 496 | % | | | 181 | % |
| * | For the period March 7, 2008 (Commencement of Operations) to December 31, 2008. |
| ** | For the period October 1, 2008 (Commencement of Operations) to December 31, 2008. |
| † | Based on average shares outstanding during the period. |
| (a) | Annualized for periods of less than one year. |
| (b) | Total returns are historical and assume changes in share price, reinvestments of all dividends and distributions, and no sales charge. Had certain expenses not been reduced during the periods shown, total returns would have been lower. Total returns for periods of less than one year are not annualized. |
| (c) | Such percentages are after advisory fee or unified management fee waivers and expense reimbursements, as applicable. |
| (d) | Does not include any insurance charges imposed in connection with your variable insurance contract. |
| (e) | Amount is less than $0.005 per share. |
222
| | |
| FINANCIAL HIGHLIGHTS (Continued) | | |
| | | Sun Capital Advisers Trust |
Selected data for a share outstanding throughout each period:
| | | | | | | | | | | | | | | | | | | | | | | | | | | | | | | | |
| | | AIM Small
Cap Growth Fund
Initial Class Shares | | | AIM Small
Cap Growth Fund
Service Class Shares | | | AllianceBernstein
International Value Fund
Initial Class Shares | | | AllianceBernstein
International Value Fund
Service Class Shares | |
| | | Years Ended December 31, | | | Years Ended December 31, | | | Years Ended December 31, | | | Years Ended December 31, | |
| | | 2009 | | | 2008* | | | 2009 | | | 2008* | | | 2009 | | | 2008* | | | 2009 | | | 2008* | |
Net Asset Value, Beginning of Period | | $ | 7.51 | | | $ | 10.00 | | | $ | 7.50 | | | $ | 10.00 | | | $ | 7.92 | | | $ | 10.00 | | | $ | 7.92 | | | $ | 10.00 | |
| | | | | | | | | | | | | | | | | | | | | | | | | | | | | | | | |
Income (Loss) from Investment Operations: | | | | | | | | | | | | | | | | | | | | | | | | | | | | | | | | |
Net investment income (loss) (d) | | | (0.02 | )† | | | (0.00 | )(e) | | | (0.04 | )† | | | (0.01 | ) | | | 0.22 | † | | | 0.01 | | | | 0.21 | † | | | 0.02 | |
Net realized and unrealized gain (loss) on investments | | | 2.41 | | | | (2.49 | ) | | | 2.40 | | | | (2.49 | ) | | | 2.13 | | | | (2.07 | ) | | | 2.11 | | | | (2.09 | ) |
| | | | | | | | | | | | | | | | | | | | | | | | | | | | | | | | |
Total from Investment Operations | | | 2.39 | | | | (2.49 | ) | | | 2.36 | | | | (2.50 | ) | | | 2.35 | | | | (2.06 | ) | | | 2.32 | | | | (2.07 | ) |
| | | | | | | | | | | | | | | | | | | | | | | | | | | | | | | | |
Less Distributions from: | | | | | | | | | | | | | | | | | | | | | | | | | | | | | | | | |
Net investment income | | | — | | | | — | | | | — | | | | — | | | | (0.22 | ) | | | (0.02 | ) | | | (0.20 | ) | | | (0.01 | ) |
Net realized gain on investments | | | (0.31 | ) | | | — | | | | (0.31 | ) | | | — | | | | (0.23 | ) | | | — | | | | (0.23 | ) | | | — | |
| | | | | | | | | | | | | | | | | | | | | | | | | | | | | | | | |
Total distributions | | | (0.31 | ) | | | — | | | | (0.31 | ) | | | — | | | | (0.45 | ) | | | (0.02 | ) | | | (0.43 | ) | | | (0.01 | ) |
| | | | | | | | | | | | | | | | | | | | | | | | | | | | | | | | |
Net Asset Value, End of Period | | $ | 9.59 | | | $ | 7.51 | | | $ | 9.55 | | | $ | 7.50 | | | $ | 9.82 | | | $ | 7.92 | | | $ | 9.81 | | | $ | 7.92 | |
| | | | | | | | | | | | | | | | | | | | | | | | | | | | | | | | |
Total Return (b) | | | 31.75 | % | | | (24.90 | )% | | | 31.39 | % | | | (25.00 | )% | | | 29.71 | % | | | (20.64 | )% | | | 29.26 | % | | | (20.96 | )% |
| | | | | | | | | | | | | | | | | | | | | | | | | | | | | | | | |
Ratios and Supplemental Data: | | | | | | | | | | | | | | | | | | | | | | | | | | | | | | | | |
Net Assets, End of Period (000’s) | | $ | 13,109 | | | $ | 2,530 | | | $ | 6,488 | | | $ | 1,544 | | | $ | 55,746 | | | $ | 9,763 | | | $ | 1,666 | | | $ | 2,051 | |
Ratio to average net assets: | | | | | | | | | | | | | | | | | | | | | | | | | | | | | | | | |
Net expenses (a)(c)(d) | | | 1.15 | % | | | 1.15 | % | | | 1.40 | % | | | 1.40 | % | | | 0.75 | % | | | 0.75 | % | | | 1.00 | % | | | 1.00 | % |
Gross expenses (a)(d) | | | 2.17 | % | | | 11.09 | % | | | 2.48 | % | | | 9.42 | % | | | 1.38 | % | | | 6.64 | % | | | 1.69 | % | | | 4.64 | % |
Net investment income (loss) (a)(c)(d) | | | (0.25 | )% | | | (0.40 | )% | | | (0.51 | )% | | | (0.72 | )% | | | 2.47 | % | | | 1.18 | % | | | 2.35 | % | | | 1.07 | % |
Portfolio turnover rate | | | 114 | % | | | 4 | % | | | 114 | % | | | 4 | % | | | 49 | % | | | 7 | % | | | 49 | % | | | 7 | % |
| * | For the period October 1, 2008 (Commencement of Operations) to December 31, 2008. |
| † | Based on average shares outstanding during the period. |
| (a) | Annualized for periods of less than one year. |
| (b) | Total returns are historical and assume changes in share price, reinvestments of all dividends and distributions, and no sales charge. Had certain expenses not been reduced during the periods shown, total returns would have been lower. Total returns for periods of less than one year are not annualized. |
| (c) | Such percentages are after advisory fee or unified management fee waivers and expense reimbursements, as applicable. |
| (d) | Does not include any insurance charges imposed in connection with your variable insurance contract. |
| (e) | Amount is less than $0.005 per share. |
223
| | |
| FINANCIAL HIGHLIGHTS (Continued) | | |
| | | Sun Capital Advisers Trust |
Selected data for a share outstanding throughout each period:
| | | | | | | | | | | | | | | | | | | | | | | | | | | | | | | | |
| | | BlackRock Inflation
Protected Bond Fund
Initial Class Shares | | | BlackRock Inflation
Protected Bond Fund
Service Class Shares | | | Ibbotson Moderate Fund
Initial Class Shares | | | Ibbotson Moderate Fund
Service Class Shares | |
| | | Years Ended December 31, | | | Years Ended December 31, | | | Years Ended December 31, | | | Years Ended December 31, | |
| | | 2009 | | | 2008* | | | 2009 | | | 2008* | | | 2009 | | | 2008* | | | 2009 | | | 2008* | |
Net Asset Value, Beginning of Period | | $ | 9.87 | | | $ | 10.00 | | | $ | 9.87 | | | $ | 10.00 | | | $ | 9.19 | | | $ | 10.00 | | | $ | 9.18 | | | $ | 10.00 | |
| | | | | | | | | | | | | | | | | | | | | | | | | | | | | | | | |
Income (Loss) from Investment Operations: | | | | | | | | | | | | | | | | | | | | | | | | | | | | | | | | |
Net investment income (loss) (e) | | | 0.24 | † | | | (0.05 | ) | | | 0.21 | † | | | (0.06 | ) | | | 0.33 | † | | | 0.03 | | | | 0.20 | † | | | 0.02 | |
Net realized and unrealized gain (loss) on investments | | | 0.61 | | | | (0.05 | )(c) | | | 0.60 | | | | (0.04 | )(c) | | | 1.45 | | | | (0.84 | )(c) | | | 1.56 | | | | (0.84 | )(c) |
| | | | | | | | | | | | | | | | | | | | | | | | | | | | | | | | |
Total from Investment Operations | | | 0.85 | | | | (0.10 | ) | | | 0.81 | | | | (0.10 | ) | | | 1.78 | | | | (0.81 | ) | | | 1.76 | | | | (0.82 | ) |
| | | | | | | | | | | | | | | | | | | | | | | | | | | | | | | | |
Less Distributions from: | | | | | | | | | | | | | | | | | | | | | | | | | | | | | | | | |
Net investment income | | | (0.22 | ) | | | (0.03 | ) | | | (0.20 | ) | | | (0.03 | ) | | | (0.03 | ) | | | — | | | | (0.00 | )(h) | | | — | |
Net realized gain on investments | | | (0.16 | ) | | | — | | | | (0.16 | ) | | | — | | | | (0.00 | )(h) | | | — | | | | (0.00 | )(h) | | | — | |
| | | | | | | | | | | | | | | | | | | | | | | | | | | | | | | | |
Total distributions | | | (0.38 | ) | | | (0.03 | ) | | | (0.36 | ) | | | (0.03 | ) | | | (0.03 | ) | | | — | | | | (0.00 | )(h) | | | — | |
| | | | | | | | | | | | | | | | | | | | | | | | | | | | | | | | |
Net Asset Value, End of Period | | $ | 10.34 | | | $ | 9.87 | | | $ | 10.32 | | | $ | 9.87 | | | $ | 10.94 | | | $ | 9.19 | | | $ | 10.94 | | | $ | 9.18 | |
| | | | | | | | | | | | | | | | | | | | | | | | | | | | | | | | |
Total Return (b) | | | 8.72 | % | | | (0.95 | )% | | | 8.34 | % | | | (0.96 | )% | | | 19.37 | % | | | (8.10 | )% | | | 19.22 | % | | | (8.20 | )% |
| | | | | | | | | | | | | | | | | | | | | | | | | | | | | | | | |
Ratios and Supplemental Data: | | | | | | | | | | | | | | | | | | | | | | | | | | | | | | | | |
Net Assets, End of Period (000’s) | | $ | 106,264 | | | $ | 8,311 | | | $ | 78,839 | | | $ | 4,276 | | | $ | 1,708 | | | $ | 46 | | | $ | 364,790 | | | $ | 33,974 | |
Ratio to average net assets: | | | | | | | | | | | | | | | | | | | | | | | | | | | | | | | | |
Net expenses (a)(d)(e) | | | 0.65 | % | | | 0.65 | % | | | 0.90 | % | | | 0.90 | % | | | 0.20 | %(f) | | | 0.20 | %(f) | | | 0.45 | %(f) | | | 0.45 | %(f) |
Gross expenses (a)(e) | | | 0.66 | % | | | 0.68 | % | | | 0.91 | % | | | 0.93 | % | | | 0.26 | %(f) | | | 17.09 | %(f) | | | 0.53 | %(f) | | | 2.12 | %(f) |
Net investment income (loss) (a)(d)(e) | | | 2.33 | % | | | (4.63 | )% | | | 2.07 | % | | | (4.60 | )% | | | 3.15 | %(f) | | | 1.15 | %(f) | | | 2.01 | %(f) | | | 2.22 | %(f) |
Portfolio turnover rate | | | 278 | % | | | 85 | % | | | 278 | % | | | 85 | % | | | 12 | %(g) | | | 1 | %(g) | | | 12 | %(g) | | | 1 | %(g) |
| * | For the period October 1, 2008 (Commencement of Operations) to December 31, 2008. |
| † | Based on average shares outstanding during the period. |
| (a) | Annualized for periods of less than one year. |
| (b) | Total returns are historical and assume changes in share price, reinvestments of all dividends and distributions, and no sales charge. Had certain expenses not been reduced during the periods shown, total returns would have been lower. Total returns for periods of less than one year are not annualized. |
| (c) | The amount shown for a share outstanding does not correspond with the net realized and unrealized gain (loss) on investments for the period due to timing of sales and repurchases of Fund shares in relation to fluctuating market values of the investments of the fund. |
| (d) | Such percentages are after advisory fee or unified management fee waivers and expense reimbursements, as applicable. |
| (e) | Does not include any insurance charges imposed in connection with your variable insurance contract. |
| (f) | Does not include expenses of the underlying funds in which the Fund invests. |
| (g) | Does not include the portfolio turnover activity of the underlying funds in which the Fund invests. |
| (h) | Amount is less than $0.005. |
224
| | |
| FINANCIAL HIGHLIGHTS (Continued) | | |
| | | Sun Capital Advisers Trust |
Selected data for a share outstanding throughout each period:
| | | | | | | | | | | | | | | | | | | | | | | | | | | | | | | | |
| | | Ibbotson Balanced Fund
Initial Class Shares | | | Ibbotson Balanced Fund
Service Class Shares | | | Ibbotson Growth Fund
Initial Class Shares | | | Ibbotson Growth Fund
Service Class Shares | |
| | | Years Ended December 31, | | | Years Ended December 31, | | | Years Ended December 31, | | | Years Ended December 31, | |
| | | 2009 | | | 2008* | | | 2009 | | | 2008* | | | 2009 | | | 2008* | | | 2009 | | | 2008* | |
Net Asset Value, Beginning of Period | | $ | 9.07 | | | $ | 10.00 | | | $ | 9.06 | | | $ | 10.00 | | | $ | 8.87 | | | $ | 10.00 | | | $ | 8.87 | | | $ | 10.00 | |
| | | | | | | | | | | | | | | | | | | | | | | | | | | | | | | | |
Income (Loss) from Investment Operations: | | | | | | | | | | | | | | | | | | | | | | | | | | | | | | | | |
Net investment income (loss) (e) | | | 0.20 | † | | | 0.02 | | | | 0.17 | † | | | 0.01 | | | | 0.06 | † | | | 0.02 | | | | 0.12 | † | | | 0.01 | |
Net realized and unrealized gain (loss) on investments | | | 1.97 | | | | (0.95 | )(c) | | | 1.97 | | | | (0.95 | )(c) | | | 2.35 | | | | (1.15 | )(c) | | | 2.25 | | | | (1.14 | )(c) |
| | | | | | | | | | | | | | | | | | | | | | | | | | | | | | | | |
Total from Investment Operations | | | 2.17 | | | | (0.93 | ) | | | 2.14 | | | | (0.94 | ) | | | 2.41 | | | | (1.13 | ) | | | 2.37 | | | | (1.13 | ) |
| | | | | | | | | | | | | | | | | | | | | | | | | | | | | | | | |
Less Distributions from: | | | | | | | | | | | | | | | | | | | | | | | | | | | | | | | | |
Net investment income | | | (0.03 | ) | | | — | | | | (0.00 | )(h) | | | — | | | | (0.03 | ) | | | — | | | | (0.00 | )(h) | | | — | |
Net realized gain on investments | | | (0.00 | )(h) | | | — | | | | (0.00 | )(h) | | | — | | | | (0.00 | )(h) | | | — | | | | (0.00 | )(h) | | | — | |
| | | | | | | | | | | | | | | | | | | | | | | | | | | | | | | | |
Total distributions | | | (0.03 | ) | | | — | | | | (0.00 | )(h) | | | — | | | | (0.03 | ) | | | — | | | | (0.00 | )(h) | | | — | |
| | | | | | | | | | | | | | | | | | | | | | | | | | | | | | | | |
Net Asset Value, End of Period | | $ | 11.21 | | | $ | 9.07 | | | $ | 11.20 | | | $ | 9.06 | | | $ | 11.25 | | | $ | 8.87 | | | $ | 11.24 | | | $ | 8.87 | |
| | | | | | | | | | | | | | | | | | | | | | | | | | | | | | | | |
Total Return (b) | | | 23.91 | % | | | (9.30 | )% | | | 23.65 | % | | | (9.40 | )% | | | 27.17 | % | | | (11.30 | )% | | | 26.75 | % | | | (11.30 | )% |
| | | | | | | | | | | | | | | | | | | | | | | | | | | | | | | | |
Ratios and Supplemental Data: | | | | | | | | | | | | | | | | | | | | | | | | | | | | | | | | |
Net Assets, End of Period (000’s) | | $ | 442 | | | $ | 56 | | | $ | 566,276 | | | $ | 38,747 | | | $ | 292 | | | $ | 92 | | | $ | 448,441 | | | $ | 33,191 | |
Ratio to average net assets: | | | | | | | | | | | | | | | | | | | | | | | | | | | | | | | | |
Net expenses (a)(d)(e)(f) | | | 0.20 | % | | | 0.20 | % | | | 0.45 | % | | | 0.45 | % | | | 0.20 | % | | | 0.20 | % | | | 0.45 | % | | | 0.45 | % |
Gross expenses (a)(e)(f) | | | 0.28 | % | | | 16.72 | % | | | 0.52 | % | | | 2.11 | % | | | 0.30 | % | | | 14.32 | % | | | 0.53 | % | | | 2.08 | % |
Net investment income (loss) (a)(d)(e)(f) | | | 1.95 | % | | | 0.88 | % | | | 1.69 | % | | | 1.82 | % | | | 0.61 | % | | | 1.20 | % | | | 1.18 | % | | | 1.53 | % |
Portfolio turnover rate (g) | | | 14 | % | | | 0 | % | | | 14 | % | | | 0 | % | | | 16 | % | | | 7 | % | | | 16 | % | | | 7 | % |
| * | For the period October 1, 2008 (Commencement of Operations) to December 31, 2008. |
| † | Based on average shares outstanding during the period. |
| (a) | Annualized for periods of less than one year. |
| (b) | Total returns are historical and assume changes in share price, reinvestments of all dividends and distributions, and no sales charge. Had certain expenses not been reduced during the periods shown, total returns would have been lower. Total returns for periods of less than one year are not annualized. |
| (c) | The amount shown for a share outstanding does not correspond with the net realized and unrealized gain (loss) on investments for the period due to timing of sales and repurchases of Fund shares in relation to fluctuating market values of the investments of the fund. |
| (d) | Such percentages are after advisory fee or unified management fee waivers and expense reimbursements, as applicable. |
| (e) | Does not include any insurance charges imposed in connection with your variable insurance contract. |
| (f) | Does not include expenses of the underlying funds in which the Fund invests. |
| (g) | Does not include the portfolio turnover activity of the underlying funds in which the Fund invests. |
| (h) | Amount is less than $0.005. |
225
| | |
| NOTESTO FINANCIAL STATEMENTS | | Sun Capital Advisers Trust |
1. ORGANIZATION
Sun Capital Advisers Trust (the “Trust”) is registered under the Investment Company Act of 1940, as amended (the “1940 Act”) as an open-end management investment company. The Trust was established as a Delaware statutory trust under the laws of Delaware by an Agreement and Declaration of Trust dated July 13, 1998. It currently consists of twenty funds (each referred to as a “Fund” and, collectively, as “the Funds”), which are offered only to qualified pension and retirement plans and variable annuity and variable life insurance separate accounts established by affiliated insurance companies to fund variable annuity contracts and variable life insurance policies. Three of the Funds (Ibbotson Moderate Fund, Ibbotson Balanced Fund and Ibbotson Growth Fund) are affiliated “Fund-of-Funds”, which invest in other Funds of the Trust and in other mutual funds managed by MFS, an affiliate of the investment adviser to each Fund of the Trust, Sun Capital Advisers LLC (“Sun Capital”).
Each of the Funds is an open-end mutual fund under the 1940 Act. Each is classified as a diversified mutual fund except for the Global Real Estate Fund and BlackRock Inflation Protected Bond Fund, which are not classified as diversified mutual funds. Each Fund offers Initial Class Shares and Service Class Shares. The Funds are:
Sun Capital Investment Grade Bond Fund (“Investment Grade Bond Fund”)
Sun Capital Money Market Fund (“Money Market Fund”)
Sun Capital Global Real Estate Fund (“Global Real Estate Fund”)
SC Davis Venture Value Fund (“Davis Venture Value Fund”)
SC Oppenheimer Main Street Small Cap Fund (“Oppenheimer Main Street Small Cap Fund”)
SC Oppenheimer Large Cap Core Fund (“Oppenheimer Large Cap Core Fund”)
SC WMC Large Cap Growth Fund (“WMC Large Cap Growth Fund”)
SC WMC Blue Chip Mid Cap Fund (“WMC Blue Chip Mid Cap Fund”)
SC Lord Abbett Growth & Income Fund (“Lord Abbett Growth & Income Fund”)
SC Goldman Sachs Mid Cap Value Fund (“Goldman Sachs Mid Cap Value Fund”)
SC Goldman Sachs Short Duration Fund (“Goldman Sachs Short Duration Fund”)
SC Dreman Small Cap Value Fund (“Dreman Small Cap Value Fund”)
SC PIMCO High Yield Fund (“PIMCO High Yield Fund”)
SC PIMCO Total Return Fund (“PIMCO Total Return Fund”)
SC AIM Small Cap Growth Fund (“AIM Small Cap Growth Fund”)
SC AllianceBernstein International Value Fund (“AllianceBernstein International Value Fund”)
SC BlackRock Inflation Protected Bond Fund (“BlackRock Inflation Protected Bond Fund”)
SC Ibbotson Moderate Fund (“Ibbotson Moderate Fund”)
SC Ibbotson Balanced Fund (“Ibbotson Balanced Fund”)
SC Ibbotson Growth Fund (“Ibbotson Growth Fund”)
Each Fund-of-Funds seeks to achieve its objective by investing in a portfolio of underlying affiliated funds (“underlying funds”) which, in turn, may invest in a variety of U.S. and foreign equity, fixed income, money market and derivative instruments. The Fund-of-Funds do not invest in the underlying funds for the purpose of exercising management or control; however, investments by the Fund-of-Funds, within their principal investment strategies, may represent a significant portion of the underlying funds’ net assets. Each Fund-of-Funds’ “Portfolio of Investments” lists the underlying funds held as an investment of the Fund-of-Funds as of period end, but does not include the holdings of the underlying funds. A complete list of the holdings of each underlying fund, as well as the financial statements of each underlying fund, each as of December 31, 2009, are available at the SEC’s website at www.sec.gov if not already provided in this report under the name of the underlying fund.
226
| | |
| NOTESTO FINANCIAL STATEMENTS (Continued) | | Sun Capital Advisers Trust |
2. SIGNIFICANT ACCOUNTING POLICIES
The preparation of financial statements in conformity with accounting principles generally accepted in the United States of America (“U.S. GAAP”) requires management to make estimates and assumptions that affect the reported amounts of assets and liabilities and disclosure of contingent assets and liabilities at the date of the financial statements and the reported amounts of revenues and expenses during the reporting period. Actual results could differ from those estimates.
The following is a summary of significant accounting policies followed by the Trust in the preparation of its financial statements:
a) Determination of Net Asset Value
The net asset value per share (“NAV”) of each Fund is determined as of the close of regular trading on the New York Stock Exchange (normally 4:00 p.m. New York time) on each day the New York Stock Exchange is open for business (a valuation day). If the New York Stock Exchange closes early for any reason, each Fund will accelerate the determination of its NAV to that earlier time.
b) Valuation of Investments
Valuation techniques of the Funds’ major categories of assets and liabilities are as follows:
Investments in securities and option contracts listed on the National Association of Securities Dealers Automation Quotation System (“NASDAQ”) are valued at the NASDAQ Official Closing Price on the day of valuation. Securities and option contracts listed on any other U.S. or foreign exchanges are valued at the last sale price on the exchange or system in which they are principally traded on the valuation date, or if no sales occurred on that day, at the mean between the closing bid and asked prices. Over-the-counter equity securities not quoted on the NASDAQ are valued at the last sale price on the valuation day, or, if no sale occurs, at the mean between the last bid and asked prices. If both bid and asked prices are not available on the valuation day, the last bid price is used to value securities and purchased option contracts and the last asked price is used to value written option contracts. Debt securities are valued by a dealer or by a pricing service based upon a computerized matrix system, which considers market transactions and dealer supplied valuations. Short-term securities maturing in 60 days or less are valued at amortized cost, which approximates market value. Investments in open end mutual funds and underlying funds are valued at their daily closing net asset value per share as reported by the investment company. Securities for which current market quotations are not readily available or are considered unreliable are stated at fair value as determined in good faith by an Internal Pricing Committee under the oversight of the Board of Trustees.
The close of foreign exchanges before the determination of each Fund’s NAV gives rise to the possibility that significant events, including broad market moves, may have occurred after these foreign exchanges close but before the Funds determine their NAVs. In consideration of this, the Board of Trustees has approved an independent pricing vendor to facilitate the fair value process of equity securities held by certain Funds and traded on particular foreign exchanges. The frequency with which this fair value process is used cannot be predicted and may be utilized to a significant extent. The value of securities used for net asset value calculation under this fair value process may differ from published prices for the same securities.
Exchange traded futures and certain options on futures contracts are valued at the settlement price determined by the relevant exchange. Swap contracts and over-the-counter options and swaptions are valued daily based upon quotations from an independent pricing vendor. The U.S. dollar value of forward foreign currency contracts is determined using forward currency exchange rates supplied by a quotation service.
In accordance with Rule 2a-7 of the 1940 Act, the Money Market Fund values its securities initially at cost, and thereafter, securities are assumed to have a constant amortization to maturity of any discount or premium. Amortized cost approximates fair value.
227
| | |
| NOTESTO FINANCIAL STATEMENTS (Continued) | | Sun Capital Advisers Trust |
U.S. GAAP defines the fair value of a financial instrument as the price that a Fund would receive to sell an asset or pay to transfer a liability in an orderly transaction between market participants at the measurement date. In accordance with U.S. GAAP, the Funds have categorized their financial instruments, based on priority of the inputs to the valuation technique, into a three-level hierarchy. The fair value hierarchy gives the highest priority to quoted prices in active markets for identical assets or liabilities (Level 1) and the lowest priority to significant unobservable inputs (Level 3). The Funds utilize valuation techniques that maximize the use of observable inputs and minimize the use of unobservable inputs. If the inputs used to measure fair value for a security fall within different levels of the hierarchy, the category level is based on the lowest priority level input that is significant to the fair value measurement of the instrument. The inputs or methodology used for valuing securities are not necessarily an indication of the risk associated with investing in those securities. Changes in valuation techniques may result in transfers into or out of an investment’s assigned level within the hierarchy.
The three-tier hierarchy of fair value measurements is summarized in the three broad levels listed below:
Level 1 – quoted prices in active markets for identical assets or liabilities
Level 2 – significant other observable inputs, including:
| | a) | Quoted prices for identical or similar assets or liabilities in active and non-active markets, |
| | b) | Inputs other than quoted market prices that are observable, and |
| | c) | Inputs that are derived principally from or corroborated by observable market data through correlation or other means |
Level 3 – significant unobservable inputs (including the Funds’ own assumptions in determining the fair value of assets or liabilities)
The tables summarizing the inputs used to value the Fund’s assets and liabilities measured at fair value as of December 31, 2009 are incorporated within each Fund’s Portfolio of Investments.
c) Investment Transactions and Income
Investment security transactions are accounted for as of trade date. Dividend income from securities and dividend and capital gain distributions from affiliated underlying funds are recorded on the ex-dividend date (net of foreign withholding taxes, as applicable). Non-cash dividends included in income, if any, are recorded at fair market value of securities received. Interest income is recorded on the accrual basis (net of foreign withholding taxes, as applicable). Discounts and premiums on debt securities are amortized using the interest method.
Upon notification from issuers some dividend income received from a real estate investment trust (“REIT”) may be redesignated as a reduction of cost of investment and/or realized gain. Realized gains and losses from security transactions are determined on the basis of identified cost for both financial statement and federal income tax purposes. Investment income, realized and unrealized gains and losses are allocated pro rata on the basis of relative net assets by all classes of shares.
d) Expenses
Expenses directly attributable to a Fund are charged to that Fund. Expenses not directly attributable to a particular Fund are allocated among the affected Funds on the basis of relative net assets. Expenses directly attributable to a particular class of a Fund are charged directly to such class. All other expenses are borne pro rata on the basis of relative net assets by all classes of shares.
e) Foreign Currency Translation and Foreign Investments
The accounting records of the Funds are maintained in U.S. dollars. Portfolio securities and other assets and liabilities denominated in a foreign currency are translated to U.S. dollars at the prevailing rates of exchange at
228
| | |
| NOTESTO FINANCIAL STATEMENTS (Continued) | | Sun Capital Advisers Trust |
period end. Purchases and sales of securities, income receipts and expense payments are translated into U.S. dollars at the prevailing exchange rate on the respective dates of transactions. The Funds do not isolate that portion of the results of operations resulting from changes in foreign exchange rates on investments from the fluctuations arising from changes in market prices of securities held. The effects of changes in foreign currency exchange rates on portfolio investments are included in the net realized and unrealized gains and losses on investments and assets and liabilities in foreign currencies. Net realized gains and losses on foreign currency transactions include disposition of foreign currencies, net gains or losses from assets or liabilities denominated in foreign currencies, and currency gains and losses between the accrual and receipt dates of portfolio investment income and between the trade and settlement dates of portfolio investment transactions.
3. SECURITIES AND OTHER INVESTMENTS
a) Mortgage Dollar Roll Transactions
Certain funds may enter into mortgage dollar roll (“MDR”) transactions to take advantage of opportunities in the mortgage market. A dollar roll transaction involves a sale by the Fund of mortgage-backed securities that it holds with an agreement by the Fund to repurchase substantially similar securities at an agreed upon price on a specified future date. The Fund treats mortgage dollar rolls as two separate transactions: one involving the purchase of a security and a separate transaction involving a sale. The Fund is paid a fee for entering into a dollar roll transaction, that is accrued as income over the life of the dollar roll contract. During the period between the sale and repurchase, the Fund will not be entitled to receive interest and principal payments on the securities sold. A Fund will only enter into “covered” rolls. A “covered” roll is a specific type of dollar roll for which there is an offsetting cash position or liquid security position.
The proceeds of the sale will generally be invested in additional instruments for the Fund, and the income from these investments, together with any additional fee income received on the dollar roll transaction, will generally exceed the interest income that would have been earned on the securities sold. Dollar roll transactions involve the risk that the market value of the securities sold by the Fund may decline below the repurchase price of those similar securities which the Fund is obligated to purchase or that the return earned by the Fund with the proceeds of a dollar roll may not exceed transaction costs. As of December 31, 2009, only Investment Grade Bond Fund had open MDR transactions.
b) Real Estate Investment Trusts
Certain Funds may invest in REITs. REITs are pooled investment vehicles that invest primarily in income producing real estate or real estate related loans or interests. REITs are generally classified as equity REITs, mortgage REITs or a combination of equity and mortgage REITs. Equity REITs invest most of their assets directly in real property and derive income primarily from the collection of rents. Equity REITs can also realize capital gains by selling properties that have appreciated in value. Mortgage REITs invest most of their assets in real estate mortgages and derive income from interest payments. Each Fund will indirectly bear its proportionate share of any expenses (such as operating expenses and advisory fees) paid by REITs in which it invests in addition to the expenses paid by the Fund.
Certain risks may arise when investing in REITs. Although Global Real Estate Fund does not invest directly in real estate, it does invest primarily in real estate equity securities and does concentrate its investments in the real estate industry, and, therefore, an investment in the Fund may be subject to certain risks associated with the direct ownership of real estate and with the real estate industry in general. Each of the other Funds that may invest in REITs may, to a lesser degree, be subject to these risks. Risks associated with the real estate industry may include risks resulting from future economic, political and environmental conditions.
c) Repurchase Agreements
The Funds may invest in repurchase agreements. In a repurchase agreement, a Fund buys a security (“collateral”) for a relatively short period (usually not more than 7 days) subject to the obligation to sell the security back to the
229
| | |
| NOTESTO FINANCIAL STATEMENTS (Continued) | | Sun Capital Advisers Trust |
repurchase agreement counterparty at a fixed time and price plus accrued interest. Securities serving as collateral for each repurchase agreement must be delivered to the Trust’s custodian. The value of the collateral must at least equal 102% of the principal amount of the repurchase transaction, until the agreement matures. The value of the collateral is marked to market on a daily basis to ensure the adequacy of the collateral. In the event of default, the Funds have the right to liquidate the collateral and apply the proceeds in satisfaction of the obligation. There is the risk that the collateral may be insufficient to meet the obligation in the event of default. As of December 31, 2009, WMC Large Cap Growth Fund, WMC Blue Chip Mid Cap Fund, AIM Small Cap Growth Fund, Ibbotson Moderate Fund, Ibbotson Balanced Fund and Ibbotson Growth Fund had open repurchase agreements as listed on each Fund’s Portfolio of Investments.
d) When Issued Securities and Forward Commitments
The Funds may purchase or sell securities on a when issued or forward commitment basis. These transactions are arrangements in which the Funds purchase and sell securities with payment and delivery scheduled for a future time. Settlement dates may be a month or more after entering into these transactions and such transactions may involve a risk of loss if the value of the underlying security declines prior to the settlement date. The price of the underlying securities and the date when these securities will be delivered and paid for are fixed at the time the transaction is negotiated. If the counterparty to the purchase transaction fails to deliver the securities, the Fund is at risk to subsequently invest at less advantageous prices and yields. In connection with such purchases the Funds maintain cash or liquid assets in an amount equal to purchase commitments for such underlying securities until settlement date, and for sales commitments the Funds maintain equivalent deliverable securities as “cover” for the transaction. Unsettled sales commitments are valued at the current market value of the underlying security. Daily fluctuations in the value of such contracts are recorded as unrealized gains or losses on the Fund’s Statement of Assets and Liabilities. As of December 31, 2009, there were no outstanding when issued or forward sales contracts.
e) Treasury Inflation-Protected Securities
Certain Funds may invest in Treasury Inflation-Protected Securities (“TIPS”), specially structured bonds in which the principal amount is adjusted daily to reflect changes to inflation, as measured by the U.S. Consumer Pricing Index for Urban Consumers (“CPIU”). The adjustments to principal due to inflation are reflected as increases or decreases to interest income. Such adjustments may have a significant impact on the Fund’s distributions. The repayment of the original bond principal upon maturity is guaranteed by the full faith and credit of the U.S. Government. At December 31, 2009, Investment Grade Bond Fund, Goldman Sachs Short Duration Fund and BlackRock Inflation Protected Bond Fund held TIPS as listed on each Fund’s Portfolio of Investments.
f) Equity Linked Securities
Certain Funds may invest in equity-linked securities which are privately issued securities with investment results that are designed to correspond generally to the performance of a specified stock index or “basket” of stocks, or a single stock. These securities may be used by a Fund to gain exposure to countries that place restrictions on direct investments by foreigners. To the extent that the Funds invest in equity-linked securities having returns that correspond to the performance of a foreign securities index or one or more foreign stocks, investing in equity-linked securities will involve risks similar to the risks of investing in foreign securities. In addition, the Funds bear the risk that the issuer of an equity-linked security may default on its obligation under the terms of the arrangement with the counterparty. At December 31, 2009, only AllianceBernstein International Value Fund held equity-linked securities as listed on the Fund’s Portfolio of Investments.
g) Loan Participations and Assignments
Certain Funds may invest in senior loans in the form of participations (“Participations”) or assignments of all or a portion of loans from third parties (“Assignments”). Loan participations typically represent direct participation in
230
| | |
| NOTESTO FINANCIAL STATEMENTS (Continued) | | Sun Capital Advisers Trust |
a loan owed by a corporate borrower, and generally are offered by banks, other financial institutions or lending syndicates. The Fund may participate in such syndications, or can buy part of a loan, becoming a co-lender. When purchasing loan participations, the Fund assumes the credit risk associated with the corporate borrower and may assume the credit risk associated with an interposed bank or other financial intermediary.
Assignments typically result in the Fund having a direct contractual relationship with the borrower, and the Fund may enforce compliance by the borrower with terms of the loan agreement. All senior loans involve interest rate risk, liquidity risk and credit risk, including the potential default or insolvency of the borrower. As of December 31, 2009, only PIMCO High Yield Fund had open senior loans as listed on the Fund’s Portfolio of Investments.
4. PRINCIPAL INVESTMENT RISKS
In the normal course of pursuing their investment objectives, the Funds may trade financial instruments and enter into financial transactions where risk of potential loss exists due to changes in the market (market or equity risk), failure of the other party to a transaction to perform or decline in credit quality of the issuer (credit and counterparty risk), fluctuations in foreign currencies (foreign currency exchange risk) and unfavorable changes in interest rates (interest rate risk). The potential loss due to any of these risks could exceed the value of the financial assets recorded in the Fund’s financial statements. Financial assets, which potentially expose the Funds to credit risk, consist principally of cash due from counterparties and investments. In addition, investing in foreign markets may also involve special risks and considerations not typically associated with investing in the U.S. such as high rates of inflation, repatriation restrictions on income and capital, and adverse political and economic developments. Moreover, securities issued in these markets may be less liquid, be subject to government ownership controls, have delayed settlements, and their prices may be more volatile than those of comparable securities in the U.S.
Counterparty risk, the type of credit risk associated with a default by an institution or other entity with which the Funds have unsettled or open transactions, is managed through evaluation of each counterparty prior to entering into transactions with them. Transactions in listed securities are generally settled/paid for upon delivery using approved counterparties. The risk of loss would generally be considered low as the trades will fail if either party fails to meet its obligation.
The Funds may also restrict their exposure to credit losses by entering into master agreements with counterparties (approved brokers) with whom they undertake a significant volume of transactions to include certain safeguards for derivatives and non-standard settlement trades. The credit risk associated with favorable contracts is reduced by master netting arrangements to the extent that if an event of default occurs, all amounts with the counterparty are terminated and settled on a net basis. The Funds’ overall exposure to credit risk on derivative instruments subject to master netting arrangements can change substantially within a short period, as it is affected by each transaction subject to the arrangement.
Funds attempt to reduce exposure to counterparty credit risk by entering into International Swaps and Derivatives Association, Inc. Master Agreements (“ISDA Master Agreements”) with select counterparties for certain over-the-counter derivative and foreign exchange contract transactions. The ISDA Master Agreements maintain provisions for general obligations, representations, agreements, collateral and events of default or termination. Events of termination include conditions that may entitle counterparties to elect to terminate early and cause settlement of all outstanding transactions under the applicable ISDA Master Agreement. Early termination could be detrimental to the Funds.
5. FINANCIAL DERIVATIVE INSTRUMENTS
The following disclosures contain information on the Funds’ objectives and strategies for using derivative instruments, the credit-risk-related contingent features in certain derivative instruments, and how derivative instruments affect the Funds’ financial position, results of operations, and cash flows. The derivative instruments outstanding as of December 31, 2009, as disclosed in the notes to each applicable Fund’s Portfolio of
231
| | |
| NOTESTO FINANCIAL STATEMENTS (Continued) | | Sun Capital Advisers Trust |
Investments, and the amount of realized and unrealized gains and losses on derivative instruments during the year ended December 31, 2009, as disclosed in each Fund’s Statement of Operations, serve as indicators of the volume of derivative activity for the Funds.
The following is a summary of the fair valuations of the Funds’ derivative instruments (not accounted for as hedging instruments under U.S. GAAP) categorized by risk exposure:
Fair Values of Derivative Instruments on the Statement of Assets and Liabilities as of December 31, 2009:
| | | | | | | | | | | | | | | | | |
| | | Asset Derivatives |
Fund | | Derivative Type | | Interest
Rate | | Foreign
Exchange | | Credit | | Equity | | Total |
Goldman Sachs Mid Cap Value | | Futures Contracts(a) | | $ | — | | $ | — | | $ | — | | $ | 86,184 | | $ | 86,184 |
| | | | | | | | | | | | | | | | | |
| | Total Value | | $ | — | | $ | — | | $ | — | | $ | 86,184 | | $ | 86,184 |
| | | | | | | | | | | | | | | | | |
| | | | | | |
Goldman Sachs Short Duration | | Futures Contracts(a) | | $ | 2,479,383 | | $ | — | | $ | — | | $ | — | | $ | 2,479,383 |
| | | | | | | | | | | | | | | | | |
| | Total Value | | $ | 2,479,383 | | $ | — | | $ | — | | $ | — | | $ | 2,479,383 |
| | | | | | | | | | | | | | | | | |
| | | | | | |
PIMCO High Yield | | Forward Foreign Currency Exchange Contracts(b) | | $ | — | | $ | 155,046 | | $ | — | | $ | — | | $ | 155,046 |
| | Futures Contracts(a) | | | 388,476 | | | — | | | — | | | — | | | 388,476 |
| | Swap Contracts(c) | | | — | | | — | | | 1,102,487 | | | — | | | 1,102,487 |
| | | | | | | | | | | | | | | | | |
| | Total Value | | $ | 388,476 | | $ | 155,046 | | $ | 1,102,487 | | $ | — | | $ | 1,646,009 |
| | | | | | | | | | | | | | | | | |
PIMCO Total Return | | Forward Foreign Currency Exchange Contracts(b) | | $ | — | | $ | 269,152 | | $ | — | | $ | — | | $ | 269,152 |
| | Futures and Options on Futures Contracts(a) | | | 624,145 | | | — | | | — | | | — | | | 624,145 |
| | Swap Contracts(c) | | | 140,967 | | | — | | | 1,259 | | | — | | | 142,226 |
| | | | | | | | | | | | | | | | | |
| | Total Value | | $ | 765,112 | | $ | 269,152 | | $ | 1,259 | | $ | — | | $ | 1,035,523 |
| | | | | | | | | | | | | | | | | |
| | | | | | |
AllianceBernstein International Value | | Futures Contracts(a) | | $ | — | | $ | — | | $ | — | | $ | 41,844 | | $ | 41,844 |
| | | | | | | | | | | | | | | | | |
| | Total Value | | $ | — | | $ | — | | $ | — | | $ | 41,844 | | $ | 41,844 |
| | | | | | | | | | | | | | | | | |
| | | | | | |
BlackRock Inflation Protected Bond | | Forward Foreign Currency Exchange Contracts(b) | | $ | — | | $ | 21 | | $ | — | | $ | — | | $ | 21 |
| | Futures Contracts(a) | | | 319,978 | | | — | | | — | | | — | | | 319,978 |
| | Purchased Option Contracts(d) | | | 195,750 | | | — | | | — | | | — | | | 195,750 |
| | Swap Contracts(c) | | | 33,082 | | | — | | | — | | | — | | | 33,082 |
| | | | | | | | | | | | | | | | | |
| | Total Value | | $ | 548,810 | | $ | 21 | | $ | — | | $ | — | | $ | 548,831 |
| | | | | | | | | | | | | | | | | |
| (a) | Statement of Assets and Liabilities location: Variation margin receivable or payable, as applicable. Amount includes cumulative appreciation (depreciation) of futures and options on futures contracts, as applicable, as reported in each Fund’s Portfolio of Investments. |
| (b) | Statement of Assets and Liabilities location: Unrealized appreciation on forward foreign currency exchange contracts. |
232
| | |
| NOTESTO FINANCIAL STATEMENTS (Continued) | | Sun Capital Advisers Trust |
| (c) | Statement of Assets and Liabilities location: Unrealized appreciation on swaps. |
| (d) | Statement of Assets and Liabilities location: Investments, at value. |
| | | | | | | | | | | | | | | | | | | | | |
| | | Liability Derivatives | |
Fund | | Derivative Type | | Interest
Rate | | | Foreign
Exchange | | | Credit | | | Equity | | Total | |
Goldman Sachs Short Duration | | Futures Contracts(a) | | $ | (1,536,989 | ) | | $ | — | | | $ | — | | | $ | — | | $ | (1,536,989 | ) |
| | | | | | | | | | | | | | | | | | | | | |
| | Total Value | | $ | (1,536,989 | ) | | $ | — | | | $ | — | | | $ | — | | $ | (1,536,989 | ) |
| | | | | | | | | | | | | | | | | | | | | |
| | | | | | |
PIMCO High Yield | | Forward Foreign Currency Exchange Contracts(b) | | $ | — | | | $ | (1,179 | ) | | $ | — | | | $ | — | | $ | (1,179 | ) |
| | Swap Contracts(c) | | | — | | | | — | | | | (113,055 | ) | | | — | | | (113,055 | ) |
| | Written Option Contracts(d) | | | (160,293 | ) | | | — | | | | — | | | | — | | | (160,293 | ) |
| | | | | | | | | | | | | | | | | | | | | |
| | Total Value | | $ | (160,293 | ) | | $ | (1,179 | ) | | $ | (113,055 | ) | | $ | — | | $ | (274,527 | ) |
| | | | | | | | | | | | | | | | | | | | | |
PIMCO Total Return | | Forward Foreign Currency Exchange Contracts(b) | | $ | — | | | $ | (22,066 | ) | | $ | — | | | $ | — | | $ | (22,066 | ) |
| | Futures and Options on Futures Contracts(a) | | | (954,768 | ) | | | — | | | | — | | | | — | | | (954,768 | ) |
| | Swap Contracts(c) | | | (169,421 | ) | | | — | | | | | | | | — | | | (169,421 | ) |
| | Written Option Contracts(d) | | | (1,007,651 | ) | | | (19,690 | ) | | | — | | | | — | | | (1,027,341 | ) |
| | | | | | | | | | | | | | | | | | | | | |
| | Total Value | | $ | (2,131,840 | ) | | $ | (41,756 | ) | | $ | — | | | $ | — | | $ | (2,173,596 | ) |
| | | | | | | | | | | | | | | | | | | | | |
| | | | | | |
BlackRock Inflation Protected Bond | | Forward Foreign Currency Exchange Contracts(b) | | $ | — | | | $ | (18,999 | ) | | $ | — | | | $ | — | | $ | (18,999 | ) |
| | Futures Contracts(a) | | | (67,758 | ) | | | — | | | | — | | | | — | | | (67,758 | ) |
| | Swap Contracts(c) | | | (15,460 | ) | | | — | | | | — | | | | — | | | (15,460 | ) |
| | Written Option Contracts(d) | | | (344,957 | ) | | | — | | | | — | | | | — | | | (344,957 | ) |
| | | | | | | | | | | | | | | | | | | | | |
| | Total Value | | $ | (428,175 | ) | | $ | (18,999 | ) | | $ | — | | | $ | — | | $ | (447,174 | ) |
| | | | | | | | | | | | | | | | | | | | | |
| (a) | Statement of Assets and Liabilities location: Variation margin receivable or payable, as applicable. Amount includes cumulative appreciation (depreciation) of futures and options on futures contracts, as applicable, as reported in each Fund’s Portfolio of Investments. |
| (b) | Statement of Assets and Liabilities location: Unrealized depreciation on forward foreign currency exchange contracts. |
| (c) | Statement of Assets and Liabilities location: Unrealized depreciation on swaps. |
| (d) | Statement of Assets and Liabilities location: Options written. |
233
| | |
| NOTESTO FINANCIAL STATEMENTS (Continued) | | Sun Capital Advisers Trust |
Effect of Derivative Instruments on the Statement of Operations for the Year Ended December 31, 2009:
| | | | | | | | | | | | | | | | | | | | | | |
| | | Realized Gain (Loss) | |
Fund | | Derivative Type | | Interest
Rate | | | Foreign
Exchange | | | Credit | | | Equity | | | Total | |
Goldman Sachs Mid Cap Value | | Futures Contracts(a) | | $ | — | | | $ | — | | | $ | — | | | $ | 1,204,067 | | | $ | 1,204,067 | |
| | | | | | | | | | | | | | | | | | | | | | |
| | Total Value | | $ | — | | | $ | — | | | $ | — | | | $ | 1,204,067 | | | $ | 1,204,067 | |
| | | | | | | | | | | | | | | | | | | | | | |
| | | | | | |
Goldman Sachs Short Duration | | Futures Contracts(a) | | $ | 2,369,529 | | | $ | — | | | $ | — | | | $ | — | | | $ | 2,369,529 | |
| | | | | | | | | | | | | | | | | | | | | | |
| | Total Value | | $ | 2,369,529 | | | $ | — | | | $ | — | | | $ | — | | | $ | 2,369,529 | |
| | | | | | | | | | | | | | | | | | | | | | |
| | | | | | |
PIMCO High Yield | | Forward Foreign Currency Exchange Contracts(b) | | $ | — | | | $ | (283,197 | ) | | $ | — | | | $ | — | | | $ | (283,197 | ) |
| | Futures Contracts(a) | | | 132,957 | | | | — | | | | — | | | | — | | | | 132,957 | |
| | Swap Contracts(c) | | | (580,144 | ) | | | — | | | | (6,775 | ) | | | — | | | | (586,919 | ) |
| | Written Option Contracts(d) | | | 225,737 | | | | — | | | | — | | | | (1,255 | ) | | | 224,482 | |
| | | | | | | | | | | | | | | | | | | | | | |
| | Total Value | | $ | (221,450 | ) | | $ | (283,197 | ) | | $ | (6,775 | ) | | $ | (1,255 | ) | | $ | (512,677 | ) |
| | | | | | | | | | | | | | | | | | | | | | |
PIMCO Total Return | | Forward Foreign Currency Exchange Contracts(b) | | $ | — | | | $ | (110,280 | ) | | $ | — | | | $ | — | | | $ | (110,280 | ) |
| | Futures Contracts(a) | | | 1,596,954 | | | | — | | | | — | | | | — | | | | 1,596,954 | |
| | Swap Contracts(c) | | | 259,683 | | | | — | | | | (5,534 | ) | | | — | | | | 254,149 | |
| | Written Option Contracts(d) | | | 771,023 | | | | 17,050 | | | | — | | | | — | | | | 788,073 | |
| | | | | | | | | | | | | | | | | | | | | | |
| | Total Value | | $ | 2,627,660 | | | $ | (93,230 | ) | | $ | (5,534 | ) | | $ | — | | | $ | 2,528,896 | |
| | | | | | | | | | | | | | | | | | | | | | |
| | | | | | |
AllianceBernstein International Value | | Forward Foreign Currency Exchange Contracts(b) | | $ | — | | | $ | (108,208 | ) | | $ | — | | | $ | — | | | $ | (108,208 | ) |
| | Futures Contracts(a) | | | — | | | | — | | | | — | | | | 112,969 | | | | 112,969 | |
| | | | | | | | | | | | | | | | | | | | | | |
| | Total Value | | $ | — | | | $ | (108,208 | ) | | $ | — | | | $ | 112,969 | | | $ | 4,761 | |
| | | | | | | | | | | | | | | | | | | | | | |
| | | | | | |
BlackRock Inflation Protected Bond | | Forward Foreign Currency Exchange Contracts(b) | | $ | — | | | $ | 8,509 | | | $ | — | | | $ | — | | | $ | 8,509 | |
| | Futures Contracts(a) | | | 15,201 | | | | — | | | | — | | | | — | | | | 15,201 | |
| | Purchased Option Contracts(e) | | | 89,825 | | | | — | | | | — | | | | — | | | | 89,825 | |
| | Swap Contracts(c) | | | 1,743,770 | | | | — | | | | — | | | | — | | | | 1,743,770 | |
| | Written Option Contracts(d) | | | 99,475 | | | | — | | | | — | | | | — | | | | 99,475 | |
| | | | | | | | | | | | | | | | | | | | | | |
| | Total Value | | $ | 1,948,271 | | | $ | 8,509 | | | $ | — | | | $ | — | | | $ | 1,956,780 | |
| | | | | | | | | | | | | | | | | | | | | | |
| (a) | Statement of Operations location: Net realized gain (loss) from: Futures. |
234
| | |
| NOTESTO FINANCIAL STATEMENTS (Continued) | | Sun Capital Advisers Trust |
| (b) | Statement of Operations location: Net realized gain (loss) from: Foreign currency related transactions (Statement of Operations includes both forward foreign currency exchange contracts and foreign currency transactions). |
| (c) | Statement of Operations location: Net realized gain (loss) from: Swaps. |
| (d) | Statement of Operations location: Net realized gain (loss) from: Written options. |
| (e) | Statement of Operations location: Net realized gain (loss) from: Investments. |
| | | | | | | | | | | | | | | | | | | | | |
| | | Change in Unrealized Appreciation (Depreciation) | |
Fund | | Derivative Type | | Interest
Rate | | | Foreign
Exchange | | | Credit | | | Equity | | Total | |
Money Market | | Capital Support Agreement(a) | | $ | — | | | $ | — | | | $ | (368,057 | ) | | $ | — | | $ | (368,057 | ) |
| | | | | | | | | | | | | | | | | | | | | |
| | Total Value | | $ | — | | | $ | — | | | $ | (368,057 | ) | | $ | — | | $ | (368,057 | ) |
| | | | | | | | | | | | | | | | | | | | | |
| | | | | | |
Goldman Sachs Mid Cap Value | | Futures Contracts(b) | | $ | — | | | $ | — | | | $ | — | | | $ | 59,187 | | $ | 59,187 | |
| | | | | | | | | | | | | | | | | | | | | |
| | Total Value | | $ | — | | | $ | — | | | $ | — | | | $ | 59,187 | | $ | 59,187 | |
| | | | | | | | | | | | | | | | | | | | | |
| | | | | | |
Goldman Sachs Short Duration | | Futures Contracts(b) | | $ | 828,356 | | | $ | — | | | $ | — | | | $ | — | | $ | 828,356 | |
| | | | | | | | | | | | | | | | | | | | | |
| | Total Value | | $ | 828,356 | | | $ | — | | | $ | — | | | $ | — | | $ | 828,356 | |
| | | | | | | | | | | | | | | | | | | | | |
PIMCO High Yield | | Forward Foreign Currency Exchange Contracts(c) | | $ | — | | | $ | 192,422 | | | $ | — | | | $ | — | | $ | 192,422 | |
| | Futures Contracts(b) | | | 303,750 | | | | — | | | | — | | | | — | | | 303,750 | |
| | Swap Contracts(d) | | | 308,573 | | | | — | | | | 1,045,090 | | | | — | | | 1,353,663 | |
| | Written Option Contracts(e) | | | 76,399 | | | | — | | | | — | | | | — | | | 76,399 | |
| | | | | | | | | | | | | | | | | | | | | |
| | Total Value | | $ | 688,722 | | | $ | 192,422 | | | $ | 1,045,090 | | | $ | — | | $ | 1,926,234 | |
| | | | | | | | | | | | | | | | | | | | | |
| | | | | | |
PIMCO Total Return | | Forward Foreign Currency Exchange Contracts(c) | | $ | — | | | $ | 284,937 | | | $ | — | | | $ | — | | $ | 284,937 | |
| | Futures and Options on Futures Contracts(b) | | | (480,628 | ) | | | — | | | | — | | | | — | | | (480,628 | ) |
| | Swap Contracts(d) | | | (28,454 | ) | | | — | | | | 1,259 | | | | — | | | (27,195 | ) |
| | Written Option Contracts(e) | | | (27,180 | ) | | | (2,310 | ) | | | — | | | | — | | | (29,490 | ) |
| | | | | | | | | | | | | | | | | | | | | |
| | Total Value | | $ | (536,262 | ) | | $ | 282,627 | | | $ | 1,259 | | | $ | — | | $ | (252,376 | ) |
| | | | | | | | | | | | | | | | | | | | | |
| | | | | | |
AllianceBernstein International Value | | Forward Foreign Currency Exchange Contracts(c) | | $ | — | | | $ | 2,975 | | | $ | — | | | $ | — | | $ | 2,975 | |
| | Futures Contracts(b) | | | — | | | | — | | | | — | | | | 34,936 | | | 34,936 | |
| | | | | | | | | | | | | | | | | | | | | |
| | Total Value | | $ | — | | | $ | 2,975 | | | $ | — | | | $ | 34,936 | | $ | 37,911 | |
| | | | | | | | | | | | | | | | | | | | | |
235
| | |
| NOTESTO FINANCIAL STATEMENTS (Continued) | | Sun Capital Advisers Trust |
| | | | | | | | | | | | | | | | | | | |
| | | Change in Unrealized Appreciation (Depreciation) | |
Fund | | Derivative Type | | Interest
Rate | | Foreign
Exchange | | | Credit | | Equity | | Total | |
| | | | | | |
BlackRock Inflation
Protected Bond | | Forward Foreign Currency Exchange Contracts(c) | | $ | — | | $ | (18,978 | ) | | $ | — | | $ | — | | $ | (18,978 | ) |
| | Futures Contracts(b) | | | 297,053 | | | — | | | | — | | | — | | | 297,053 | |
| | Purchased Option Contracts(f) | | | 80,177 | | | — | | | | — | | | — | | | 80,177 | |
| | Swap Contracts(d) | | | 27,029 | | | — | | | | — | | | — | | | 27,029 | |
| | Written Option Contracts(e) | | | 46,770 | | | — | | | | — | | | — | | | 46,770 | |
| | | | | | | | | | | | | | | | | | | |
| | Total Value | | $ | 451,029 | | $ | (18,978 | ) | | $ | — | | $ | — | | $ | 432,051 | |
| | | | | | | | | | | | | | | | | | | |
| (a) | Statement of Operations location: Change in unrealized appreciation (depreciation) on: Capital Support Agreement. |
| (b) | Statement of Operations location: Change in unrealized appreciation (depreciation) on: Futures and options on futures, as applicable. |
| (c) | Statement of Operations location: Change in unrealized appreciation (depreciation) on: Assets and liabilities in foreign currencies (Statement of Operations includes both forward foreign currency exchange contracts and foreign currency transactions). |
| (d) | Statement of Operations location: Change in unrealized appreciation (depreciation) on: Swaps. |
| (e) | Statement of Operations location: Change in unrealized appreciation (depreciation) on: Written options. |
| (f) | Statement of Operations location: Change in unrealized appreciation (depreciation) on: Investments. |
a) Swap Agreements
Certain Funds may invest in swap agreements. Swap agreements are privately negotiated contracts between a Fund and a counterparty to exchange or swap investment cash flows, assets, foreign currencies or market-linked returns at specified, future intervals. A Fund may enter into credit default, cross-currency, interest rate, total return and other forms of swap agreements to manage its exposure to credit, currency and interest rate risks. In connection with these agreements, securities or cash may be identified as collateral in accordance with the terms of the respective swap agreements to provide assets of value and recourse in the event of default or bankruptcy/insolvency. The amount of collateral posted or received by a Fund, as noted on each applicable Fund’s Portfolio of Investments, is generally subject to certain minimum requirements as determined between the Fund and each counterparty.
The value of the swap is adjusted daily based upon quotations from an independent pricing vendor and is recorded as unrealized appreciation or depreciation on the Fund’s Statement of Assets and Liabilities. Upfront swap premium payments paid or received by the Fund, if any, are recorded as such on the Fund’s Statement of Assets and Liabilities and represent payments paid or received upon entering into the swap contract to compensate for differences between stated terms of the swap contract and prevailing market conditions (credit spreads, currency exchange rates and other relevant factors). These upfront payments are recorded as realized gain or loss on the Fund’s Statement of Operations upon termination or maturity of the swap contract. Under the terms of the swap contracts, the Fund receives or makes net periodic payments which are included as part of realized gains or losses on the Fund’s Statement of Operations. Liquidation payments received or made upon termination of the swap contract are recorded as realized gain or loss in the Fund’s Statement of Operations.
Entering into swap agreements involves, to varying degrees, elements of credit, market and documentation risk in excess of the amounts recognized on the Statement of Operations. Swap agreements are also subject to risks related to the counterparty’s ability to perform, and may decline in value if the counterparty’s creditworthiness deteriorates. A Fund may also suffer losses if it is unable to terminate outstanding swap agreements or reduce its exposure through offsetting transactions. Swap agreements also bear the risk that the Fund will not be able to meet its obligations to the counterparty.
236
| | |
| NOTESTO FINANCIAL STATEMENTS (Continued) | | Sun Capital Advisers Trust |
The Funds may enter into certain interest rate, total return and credit default swap contracts that may contain provisions whereby the counterparty may terminate the contract under certain conditions, including but not limited to a decline in a Fund’s net assets below a certain level, which may result in a payment by the Funds for those swaps in a net liability position.
(i) Credit Default Swap Agreements
Certain Funds may enter into credit default swap agreements. A Fund may buy or sell credit default swap contracts to seek to increase the Fund’s income, to provide comparable exposure to fixed income securities that might not be available in primary market, to add leverage to the portfolio, or to hedge the risk of default on other securities held by the Fund. A credit default swap is a contract between a buyer and a seller of protection against a predefined credit event. As a seller in the credit default swap contract, the Fund would be required to pay the par (or other agreed-upon) value of certain third party debt obligations to the counterparty in the event of a credit event (generally including the occurrence of a bankruptcy, failure to make payments in respect of debt obligations, or debt restructurings) in respect of such third party, such as a U.S. or foreign corporate issuer. Such a payment would likely result in a loss to the Fund. In return, the Fund would receive from the counterparty a periodic stream of payments over the term of the contract provided that no credit event has occurred. If no credit event occurs, the Fund would keep the stream of payments and would have no payment obligations. The Fund may also buy credit default swap contracts in order to hedge against the risk of default of debt securities or to take a view as to the likelihood of default of debt securities. This would involve the risk that the contract may expire worthless if a credit event does not occur during the term of the transaction. It would also involve credit risk that the seller may fail to satisfy its payment obligations to the Fund in the event of a credit event.
Credit default swap agreements on corporate issues involve one party making a stream of payments to another party in exchange for the right to receive a specified return in the event of a credit event. If a credit event occurs and cash settlement is not elected, a variety of other deliverable obligations may be delivered in lieu of the specific referenced obligation. The ability to deliver other obligations may result in a cheapest-to-deliver option (the buyer of protection’s right to choose the deliverable obligation with the lowest value following a credit event). A Fund may use credit default swaps on corporate issues to provide a measure of protection against credit events in respect of the issuers (i.e., to reduce risk where a Fund owns or has exposure to the referenced obligation) or to take an active long or short position with respect to the likelihood of the occurrence of a credit event in respect of a particular issuer.
Credit default swap agreements on credit indices involve one party making a stream of payments to another party in exchange for the right to receive a specified return in the event of certain credit events in respect of or default of all or part of the referenced entities comprising the credit index. A credit index is a list or a basket of credit instruments or exposures designed to be representative of some part of the credit market as a whole. Index credit default swaps that reference asset-backed or mortgage-backed instruments may require payments in the event of a write-down, principal or interest shortfall in respect of the underlying instruments. Index credit default swaps that reference corporate entities or instruments generally include the same credit events that would be contained in a single-name credit default swap on the relevant corporate entity or instruments. An index credit default swap references all the entities in the index, and if there is a credit event, the credit event is settled based on that entity’s weight in the index. A Fund may use credit default swaps on credit indices to hedge a portfolio of credit default swaps or bonds with a credit default swap on indices which is less expensive than it would be to buy many individual credit default swaps to achieve a similar effect.
The maximum potential amount of future payments (undiscounted) that a Fund as a seller of protection could be required to make under a credit default swap agreement would be an amount equal to the notional amount of the agreement. Notional amounts of all credit default swap agreements outstanding as of December 31, 2009 for which a Fund is the seller of protection are disclosed in each Fund’s Portfolio of Investments. At December 31, 2009, only PIMCO High Yield Fund had open credit default swap contracts and was the seller of protection. As
237
| | |
| NOTESTO FINANCIAL STATEMENTS (Continued) | | Sun Capital Advisers Trust |
disclosed in the notes to the PIMCO High Yield Fund’s Portfolio of Investments, the aggregate market value of credit default swap contracts in a net liability position where the Fund is a seller of protection as of December 31, 2009 was $(148,617). There was no collateral posted for these swap contracts. If a defined credit event had occurred as of December 31, 2009, the swaps’ credit-risk-contingent features would have been triggered and the Fund would have been required to pay $5,450,000, representing 4.7% of the Fund’s net assets on December 31, 2009 to settle these swaps. These potential amounts would be partially offset by any recovery values of the respective referenced obligations, upfront payments received upon entering into the agreement, or net amounts received from the settlement of buy protection credit default swap agreements entered into by the Fund for the same referenced entity or entities.
As of December 31, 2009, PIMCO High Yield Fund and PIMCO Total Return Fund had open credit default swap agreements as listed on each Fund’s Portfolio of Investments.
(ii) Interest Rate Swap Agreements
Certain Funds may enter into interest rate swap agreements to manage the interest rate risk inherent in the Fund’s underlying investments such as fixed rate bonds. The value of these bonds may decrease if interest rates rise. In an interest rate swap, the Fund would agree to pay the other party to the interest rate swap (the “counterparty”) a fixed rate payment in exchange for the counterparty agreeing to pay to the Fund a variable rate payment, or the Fund would agree to receive from the counterparty a fixed rate payment in exchange for the counterparty agreeing to receive from the Fund a variable rate payment. The payment obligations would be based on the notional amount of the swap.
As of December 31, 2009, PIMCO Total Return Fund and BlackRock Inflation Protected Bond Fund had open interest rate swap agreements as listed on each Fund’s Portfolio of Investments.
(iii) Total Return Swap Agreements
Certain Funds may enter into total return swap agreements to obtain exposure to a security or market without owning or taking physical custody of such security or investing directly in such market. Total return swap agreements are contracts in which one party agrees to make periodic payments to another party based on the change in market value of the assets underlying the contract, which may include a specified security, basket of securities or securities indices during the specific period, in return for periodic payments based on a fixed or variable interest rate or the total return from other underlying assets. To the extent the total return of the security or index underlying the transaction exceeds or falls short of the offsetting interest rate obligation, a Fund will receive a payment from or make a payment to the counterparty.
As of December 31, 2009, only BlackRock Inflation Protected Bond Fund had outstanding total return swap agreements as listed on the Fund’s Portfolio of Investments.
b) Forward Foreign Currency Exchange and Spot Contracts
Certain Funds may engage in forward foreign currency exchange and spot contracts in an effort to enhance total return, to facilitate transactions in foreign securities and to reduce exposure to foreign currency exchange rates. Forward foreign currency exchange contracts are agreements to purchase or sell a specified currency at a specified future date and a price set at the time of the contract. The use of forward foreign currency exchange and spot contracts does not eliminate fluctuations in the underlying prices of the Fund’s securities, but it does establish a rate of exchange on a particular date. When a contract is used to hedge against movements in exchange rates, it will limit the risk of loss due to a decline in the value of the hedged currency during the relevant period, but will also limit any potential gain that might result should the value of the currency increase
238
| | |
| NOTESTO FINANCIAL STATEMENTS (Continued) | | Sun Capital Advisers Trust |
during that period. In addition, the Fund could be exposed to risks if the counterparties to the contracts are unable to meet the terms of their contracts. The Funds may segregate liquid assets to cover their obligations under these contracts.
The value of forward foreign currency exchange contracts is translated into U.S. dollars. The change in market values of forward foreign currency exchange contracts is recorded as unrealized appreciation (depreciation) on assets and liabilities in foreign currencies on the Statement of Assets and Liabilities. When the contract is closed, the Fund records a realized gain or loss from foreign currency related transactions equal to the difference between the value of the contract at the time it was opened and the value at the time it was closed which is included in realized gain/(loss) on foreign currency related transactions on the Statement of Operations.
As of December 31, 2009, PIMCO High Yield Fund, PIMCO Total Return Fund and BlackRock Inflation Protected Bond Fund had open forward foreign currency exchange contracts as listed on each Fund’s Portfolio of Investments.
c) Futures
Certain Funds may enter into futures contracts. A Fund may enter into futures contracts as a hedge against changes in interest rates or securities prices, for duration management, and return enhancement purposes. A futures contract is an agreement between a buyer or seller and an established futures exchange or its clearinghouse, regulated and approved by the Commodity Futures Trading Commission, in which the buyer or seller agrees to take or make a delivery of a specific amount of a financial instrument at a specified price on a specific date (the “settlement date”). Certain risks may arise upon entering into futures contracts, including the risk that an illiquid commodity market will limit the Fund’s ability to close out a futures contract prior to the settlement date and that a change in the value of a futures contract may not correlate exactly with the changes in the value of the securities. The Funds segregate liquid assets or engage in other appropriate measures to cover their obligations under these contracts, as noted on each applicable Fund’s Portfolio of Investments.
Upon entering into a futures contract, the Fund is required to deposit with a financial intermediary an amount (“initial margin”) equal to a certain percentage of the face value indicated in the futures contract. Subsequent payments (“variation margin”) made or received by the Fund are dependent upon the daily fluctuations in the value of the underlying security and are recorded as unrealized gains or losses in the Fund’s Statement of Operations. The value of futures contracts will be the sum of the initial margin plus or minus the difference between the value of the futures contract on the valuation date and the value on the date the futures contract is originated. Futures contracts involve, to a varying degree, risk of loss in excess of the variation margin disclosed on the Statement of Assets and Liabilities.
As of December 31, 2009, Goldman Sachs Mid Cap Value Fund, Goldman Sachs Short Duration Fund, PIMCO High Yield Fund, PIMCO Total Return Fund, AllianceBernstein International Value Fund and BlackRock Inflation Protected Bond Fund had open futures contracts as listed on each Fund’s Portfolio of Investments.
d) Options
Certain Funds may enter into option contracts on securities, futures, commodities or swaps (“swaptions”) it owns or in which it may invest. The Fund may enter into option contracts in order to hedge against potential adverse price movements in the value of portfolio investments; as a temporary substitute for purchasing or selling selected investments; to lock in the purchase price of a security or currency which it expects to purchase in the near future; or to enhance total return. An option contract is a contract in which the writer of the option grants the buyer of the option the right to purchase from (a “call option”), or sell to (a “put option”) the writer a designated instrument at a specified price within a specified period of time. Writing put options tends to increase a Fund’s exposure to the underlying instrument. Writing call options tends to decrease a Fund’s exposure to the underlying instruments. Swaptions are similar to options on securities except that instead of selling or purchasing the right to buy or sell a security, the writer or purchaser of the swap option is granting or buying the right to enter into a
239
| | |
| NOTESTO FINANCIAL STATEMENTS (Continued) | | Sun Capital Advisers Trust |
previously agreed upon interest rate swap agreement at any time before the expiration of the option. Certain options will require cash settlement by the Fund if the option is exercised.
Certain risks may arise upon entering into option contracts including the risk that an illiquid secondary market will limit the Fund’s ability to close out an option contract prior to the expiration date and that a change in the value of the option contract may not correlate exactly with changes in the value of the securities or currencies hedged. The Fund’s maximum exposure to purchased options is limited to the premium initially paid. If a Fund writes a put option, it accepts the risk of a decline in the value of the underlying security below the exercise price. Over-the-counter options have the risk of the potential inability of counterparties to meet the terms of their contracts. The Funds may segregate liquid assets to cover their obligations under option contracts.
The Fund pays a premium as cost for a purchased put or call option, which is disclosed in the Fund’s Portfolio of Investments and subsequently marked to market to reflect the current value of the option. When a Fund writes a call or put option, an amount equal to the premium received is recorded as a liability on the Statement of Assets and Liabilities and subsequently marked to market to reflect the current value of the option written. Realized gain or loss is recognized on the Statement of Operations when the option contract expires or is closed.
As of December 31, 2009, PIMCO High Yield Fund, PIMCO Total Return Fund and BlackRock Inflation Protected Bond Fund had open purchased option, written option or swaption contracts as listed on each Fund’s Portfolio of Investments.
Transactions in options and swaptions written during the year ended December 31, 2009 were as follows:
| | | | | | | | | | | |
PIMCO High Yield Fund | | Number of
Options Contracts | | | Swaptions Notional Par | | | Premium Amount | |
Beginning of period | | — | | | $ | — | | | $ | — | |
Written | | 232 | | | | 51,000,000 | | | | 464,492 | |
Bought back | | (47 | ) | | | (400,000 | ) | | | (5,123 | ) |
Expired | | (177 | ) | | | (24,500,000 | ) | | | (222,677 | ) |
| | | | | | | | | | | |
End of period | | 8 | | | $ | 26,100,000 | | | $ | 236,692 | |
| | | | | | | | | | | |
| | | |
PIMCO Total Return Fund | | Number of
Options Contracts | | | Swaptions Notional Par | | | Premium Amount | |
Beginning of period | | — | | | $ | — | | | $ | — | |
Written | | 4,200,537 | | | | 186,400,000 | | | | 1,785,916 | |
Bought back | | (25 | ) | | | — | | | | (5,880 | ) |
Expired | | (2,000,198 | ) | | | (98,500,000 | ) | | | (782,185 | ) |
| | | | | | | | | | | |
End of period | | 2,200,314 | | | $ | 87,900,000 | | | $ | 997,851 | |
| | | | | | | | | | | |
| | | |
BlackRock Inflation Protected Bond Fund | | Number of
Options Contracts | | | Swaptions Notional Par | | | Premium Amount | |
Beginning of period | | — | | | $ | — | | | $ | — | |
Written | | 270 | | | | 13,200,000 | | | | 724,037 | |
Bought back | | — | | | | (6,600,000 | ) | | | (332,310 | ) |
Expired | | — | | | | — | | | | — | |
| | | | | | | | | | | |
End of period | | 270 | | | $ | 6,600,000 | | | $ | 391,727 | |
| | | | | | | | | | | |
240
| | |
| NOTESTO FINANCIAL STATEMENTS (Continued) | | Sun Capital Advisers Trust |
6. INVESTMENT ADVISORY AND OTHER RELATED PARTY AGREEMENTS
a) Investment Advisory Agreement
Sun Capital (the “Adviser”) is the investment adviser to each of the Funds under separate investment advisory agreements with the Trust. The Adviser is a direct wholly-owned subsidiary of Sun Life Assurance Company of Canada U.S. Operations Holdings, Inc. (“Sun Life U.S. Ops Holdco”), a holding company. Sun Life Financial Inc. (“Sun Life Financial”), a publicly traded holding company, is the ultimate parent of Sun Life U.S. Ops Holdco and the Adviser. The Adviser, at its own cost, has retained Davis Selected Advisers, L.P., as subadviser for the Davis Venture Value Fund; Oppenheimer Funds, Inc., as subadviser for the Oppenheimer Main Street Small Cap Fund and the Oppenheimer Large Cap Core Fund and OFI Institutional Asset Management, Inc., an affiliate of OppenheimerFunds, Inc., as sub-subadviser to the Oppenheimer Large Cap Core Fund; Wellington Management Company, LLP, as subadviser for the WMC Blue Chip Mid Cap Fund and WMC Large Cap Growth Fund; Lord, Abbett & Co. LLC, as subadviser for the Lord Abbett Growth & Income Fund; Goldman Sachs Asset Management, L.P., as subadviser for the Goldman Sachs Mid Cap Value Fund and the Goldman Sachs Short Duration Fund; Dreman Value Management, LLC, as sub-adviser for the Dreman Small Cap Value Fund; Pacific Investment Management Company LLC, as subadviser for PIMCO High Yield Fund and PIMCO Total Return Fund; Invesco Advisers, Inc., as subadviser for AIM Small Cap Growth Fund; AllianceBernstein L.P., as subadviser for the AllianceBernstein International Value Fund; BlackRock Financial Management, Inc., as subadviser for the BlackRock Inflation Protected Bond Fund; and Ibbotson Associates, Inc., as subadviser for the Ibbotson Moderate Fund, Ibbotson Balanced Fund and Ibbotson Growth Fund.
As compensation for all services rendered, facilities provided and expenses paid or assumed by the Adviser under the advisory agreements, the following fourteen Funds pay compensation monthly to the Adviser at the following annual rates based on the average daily net assets of each Fund taken separately:
| | | | |
| Fund | | Asset Level | | Fee |
Investment Grade Bond | | All | | 0.60% |
| | | |
Money Market | | All | | 0.50% |
| | | |
Global Real Estate | | All | | 0.95% |
| | | |
Davis Venture Value | | $0-$500 million over $500 million | | 0.75%
0.70% |
| | | |
Oppenheimer Main Street Small Cap | | $0-$400 million $400 million-$800 million over $800 million | | 0.80%
0.75% 0.70% |
| | | |
Oppenheimer Large Cap Core | | All | | 0.70% |
| | | |
WMC Large Cap Growth | | $0-$750 million over $750 million | | 0.75%
0.70% |
| | | |
WMC Blue Chip Mid Cap | | $0-$300 million over $300 million | | 0.80%
0.75% |
| | | |
Dreman Small Cap Value | | $0-$250 million over $250 million | | 0.90%
0.85% |
| | | |
AIM Small Cap Growth | | $0-$250 million over $250 million | | 0.95%
0.90% |
| | | |
AllianceBernstein International Value | | All | | 0.63% |
| | | |
Ibbotson Moderate | | All | | 0.125% |
| | | |
Ibbotson Balanced | | All | | 0.125% |
| | | |
Ibbotson Growth | | All | | 0.125% |
241
| | |
| NOTESTO FINANCIAL STATEMENTS (Continued) | | Sun Capital Advisers Trust |
Under the investment advisory and management agreements, the following six Funds pay a unified management fee to the Adviser on a quarterly basis for its advisory and management services. Each fee is calculated based on the annual stated percentage of the Fund’s average daily net assets, as follows:
| | | | |
| Fund | | Asset Level | | Fee |
Lord Abbett Growth & Income | | All | | 0.87% |
| | | |
Goldman Sachs Mid Cap Value | | All | | 1.05% |
| | | |
Goldman Sachs Short Duration* | | All | | 0.64% |
| | | |
PIMCO High Yield* | | All | | 0.74% |
| | | |
PIMCO Total Return | | All | | 0.65% |
| | | |
BlackRock Inflation Protected Bond | | All | | 0.65% |
| * | Prior to February 23, 2009, the unified management fees for Goldman Sachs Short Duration and PIMCO High Yield were 0.65% and 0.75%, respectively. |
b) Limitations
The Adviser has contractually agreed (until at least April 30, 2011) to reduce its advisory fee and to reimburse each Fund’s other operating expenses to reduce each Fund’s total annual operating expenses to:
| | | | | | |
| | | Contractual Expense Limitations | |
Fund | | Initial Class | | | Service Class | |
Investment Grade Bond | | 0.75 | % | | 1.00 | % |
Money Market | | 0.50 | % | | 0.75 | % |
Global Real Estate | | 1.10 | % | | 1.35 | % |
Davis Venture Value | | 0.90 | % | | 1.15 | % |
Oppenheimer Main Street Small Cap | | 1.00 | % | | 1.25 | % |
Oppenheimer Large Cap Core | | 0.90 | % | | 1.15 | % |
WMC Large Cap Growth | | 0.81 | % | | 1.06 | % |
WMC Blue Chip Mid Cap | | 1.00 | % | | 1.25 | % |
Lord Abbett Growth & Income | | 0.87 | % | | 1.12 | % |
Goldman Sachs Mid Cap Value | | 1.07 | % | | 1.32 | % |
Goldman Sachs Short Duration | | 0.65 | % | | 0.90 | % |
Dreman Small Cap Value | | 1.15 | % | | 1.40 | % |
PIMCO High Yield | | 0.75 | % | | 1.00 | % |
PIMCO Total Return | | 0.65 | % | | 0.90 | % |
AIM Small Cap Growth | | 1.15 | % | | 1.40 | % |
AllianceBernstein International Value | | 0.75 | % | | 1.00 | % |
BlackRock Inflation Protected Bond | | 0.65 | % | | 0.90 | % |
Ibbotson Moderate | | 0.20 | % | | 0.45 | % |
Ibbotson Balanced | | 0.20 | % | | 0.45 | % |
Ibbotson Growth | | 0.20 | % | | 0.45 | % |
242
| | |
| NOTESTO FINANCIAL STATEMENTS (Continued) | | Sun Capital Advisers Trust |
To the extent that a Fund’s total expense ratio falls below the expense limit stated above in future years, the Adviser reserves the right to be reimbursed for advisory fees waived and fund expenses paid on behalf of each fund during the prior two fiscal years. For each of the periods below, the Adviser waived all or part of its investment advisory fee and reimbursed certain operating expenses in the following amounts:
| | | | | | | | | | | | | | |
| | | Year Ended
December 31, 2009 | | Two-year period ended
December 31, 2009 | |
Fund | | Advisory
Fees Waived | | Expenses
Reimbursed | | Advisory
Fees Waived | | | Expenses
Reimbursed | |
Investment Grade Bond | | $ | 114,948 | | $ | — | | $ | 306,931 | | | $ | — | |
Money Market | | | 1,105,945 | | | 80,690 | | | 1,588,645 | | | | 80,690 | |
Global Real Estate | | | 140,783 | | | — | | | 433,786 | | | | — | |
Davis Venture Value | | | 69,717 | | | — | | | 257,756 | | | | — | |
Oppenheimer Main Street Small Cap | | | 333,805 | | | — | | | 856,076 | | | | — | |
Oppenheimer Large Cap Core | | | 101,347 | | | — | | | 180,861 | | | | 55,013 | |
WMC Large Cap Growth | | | 231,496 | | | — | | | 479,615 | | | | — | |
WMC Blue Chip Mid Cap | | | 91,879 | | | — | | | 265,880 | | | | — | |
Lord Abbett Growth & Income | | | 44,223 | | | — | | | 44,863 | * | | | — | |
Goldman Sachs Mid Cap Value | | | — | | | — | | | 249 | * | | | — | |
Goldman Sachs Short Duration | | | 15,758 | | | — | | | 29,006 | * | | | — | |
Dreman Small Cap Value | | | 115,129 | | | — | | | 123,074 | ** | | | 52,104 | ** |
PIMCO High Yield | | | 1,464 | | | — | | | 3,031 | * | | | — | |
PIMCO Total Return | | | 18,941 | | | — | | | 19,888 | ** | | | — | |
AIM Small Cap Growth | | | 144,796 | | | 13,392 | | | 151,738 | ** | | | 72,740 | ** |
AllianceBernstein International Value | | | 213,530 | | | 2,254 | | | 223,934 | ** | | | 77,927 | ** |
BlackRock Inflation Protected Bond | | | 9,133 | | | — | | | 9,538 | ** | | | — | |
Ibbotson Moderate | | | 156,925 | | | — | | | 160,616 | ** | | | 47,279 | ** |
Ibbotson Balanced | | | 175,989 | | | — | | | 179,715 | ** | | | 47,659 | ** |
Ibbotson Growth | | | 165,615 | | | — | | | 169,506 | ** | | | 48,596 | ** |
| * | For the period March 7, 2008 (commencement of operations) to December 31, 2009. |
| ** | For the period October 1, 2008 (commencement of operations) to December 31, 2009. |
c) Distribution and Service Plan
The Trust has adopted a plan of distribution and service pursuant to Rule 12b-1 under the 1940 Act with respect to its Service Class Shares (the “Plan”), pursuant to which distribution and service fees are paid to Clarendon Insurance Agency, Inc. (“Clarendon”), which is a wholly-owned subsidiary of Sun Life Assurance Company of Canada (U.S.) (“Sun Life (U.S.)”). The fees of the Trust payable to Clarendon under the Plan are accrued daily at a rate with respect to each Fund which may not exceed 0.25% of the Fund’s average daily net assets attributable to Service Class Shares regardless of the level of expenses actually incurred by Clarendon and others. Clarendon uses the service and distribution fees to compensate Sun Life (U.S.) and Sun Life Insurance and Annuity Company of New York (“Sun Life (N.Y.)”) for services rendered in connection with maintenance and distribution of the variable contracts issued by Sun Life (U.S.) and Sun Life (N.Y.).
d) Trustees’ Compensation
Each independent trustee of the Trust is compensated by the Funds. The aggregate remuneration accrued and paid by the Funds to the independent trustees for the year ended December 31, 2009 was $248,080 and $226,422, respectively, including out of pocket expenses. The Trust pays no compensation directly to those of its Trustees
243
| | |
| NOTESTO FINANCIAL STATEMENTS (Continued) | | Sun Capital Advisers Trust |
or officers who are affiliated with the Adviser, or its affiliates, all of whom receive remuneration for their services to the Trust from the Adviser, or its affiliates. Certain officers and Trustees of the Trust are also officers and directors of the Adviser, and/or other companies affiliated with the Adviser.
7. INVESTMENT TRANSACTIONS
Cost of purchases and proceeds from sales and maturities of investments, excluding short-term securities, for the year ended December 31, 2009, were as follows:
| | | | | | | | | | | | |
Fund | | Non-
Government
Purchases | | Government
Purchases | | Non-
Government
Sales | | Government
Sales |
Investment Grade Bond | | $ | 126,043,723 | | $ | 80,522,782 | | $ | 78,402,519 | | $ | 25,717,956 |
Global Real Estate | | | 199,223,298 | | | — | | | 202,511,674 | | | — |
Davis Venture Value | | | 223,615,775 | | | — | | | 37,145,250 | | | — |
Oppenheimer Main Street Small Cap | | | 210,075,538 | | | — | | | 238,495,849 | | | — |
Oppenheimer Large Cap Core | | | 102,223,350 | | | — | | | 45,752,658 | | | — |
WMC Large Cap Growth | | | 152,427,806 | | | — | | | 67,597,817 | | | — |
WMC Blue Chip Mid Cap | | | 85,719,490 | | | — | | | 72,184,879 | | | — |
Lord Abbett Growth & Income | | | 321,400,875 | | | — | | | 364,948,676 | | | — |
Goldman Sachs Mid Cap Value | | | 325,562,659 | | | — | | | 203,251,900 | | | — |
Goldman Sachs Short Duration | | | 444,503,356 | | | 1,853,585,823 | | | 51,769,127 | | | 1,448,409,043 |
Dreman Small Cap Value | | | 52,930,841 | | | — | | | 28,406,474 | | | — |
PIMCO High Yield | | | 173,747,445 | | | 54,329,269 | | | 92,802,838 | | | 53,873,884 |
PIMCO Total Return | | | 101,586,609 | | | 1,168,181,593 | | | 18,204,066 | | | 990,222,857 |
AIM Small Cap Growth | | | 26,663,479 | | | — | | | 16,440,404 | | | — |
AllianceBernstein International Value | | | 48,767,846 | | | — | | | 16,065,908 | | | — |
BlackRock Inflation Protected Bond | | | 54,920,048 | | | 278,762,676 | | | 30,960,287 | | | 173,355,065 |
Ibbotson Moderate* | | | 321,549,167 | | | — | | | 21,749,313 | | | — |
Ibbotson Balanced* | | | 505,048,220 | | | — | | | 36,773,984 | | | — |
Ibbotson Growth* | | | 394,050,783 | | | — | | | 33,730,640 | | | — |
| * | Affiliated investment transactions. |
Purchases and sales, including maturities, of short-term securities by the Money Market Fund for the year ended December 31, 2009 were $1,122,125,745 and $1,122,650,025, respectively.
8. AFFILIATED COMPANY SECURITIES
The term “affiliated securities” includes securities issued by any company that is under common control with the Fund. At December 31, 2009, the Adviser or its affiliate, MFS, served as investment adviser to the underlying funds of Ibbotson Moderate Fund, Ibbotson Balanced Fund and Ibbotson Growth Fund. Purchases and proceeds from sales of affiliated investments are disclosed in Note 7 – Investment Transactions. Dividend and capital gains distributions from affiliated underlying funds are presented in each Fund’s Statement of Operations. Underlying funds managed by MFS seek to achieve capital appreciation by investing primarily in U.S. and foreign equity securities, including those in emerging markets.
9. LINE OF CREDIT
The Trust has entered into a $20 million committed unsecured revolving line of credit (the “Agreement”) primarily for temporary or emergency purposes. The Money Market Fund is not a party to this Agreement. Interest is charged to each Fund based on its borrowings at a rate equal to a variable lending rate. In addition, a
244
| | |
| NOTESTO FINANCIAL STATEMENTS (Continued) | | Sun Capital Advisers Trust |
commitment fee on the daily unused portion of the $20 million committed line is allocated among the participating Funds at the end of each calendar quarter. During the year ended December 31, 2009, the following Funds had borrowings and incurred commitment fees under this Agreement as follows:
| | | | | | | | | | | | |
Fund | | Maximum
Loan | | Average Daily
Amount of Loan | | Weighted
Average
Interest Rate | | | Commitment
Fees |
Investment Grade Bond | | $ | 250,000 | | $ | 685 | | 0.92 | % | | $ | 800 |
Global Real Estate | | | 17,403,000 | | | 156,142 | | 0.88 | | | | 940 |
Davis Venture Value | | | — | | | — | | — | | | | 1,739 |
Oppenheimer Main Street Small Cap | | | 4,288,000 | | | 37,551 | | 0.90 | | | | 938 |
Oppenheimer Large Cap Core | | | 512,000 | | | 1,403 | | 0.85 | | | | 313 |
WMC Large Cap Growth | | | — | | | — | | — | | | | 547 |
WMC Blue Chip Mid Cap | | | — | | | — | | — | | | | 590 |
Lord Abbett Growth & Income | | | 13,865,000 | | | 37,986 | | 0.89 | | | | 2,594 |
Goldman Sachs Mid Cap Value | | | — | | | — | | — | | | | 826 |
Goldman Sachs Short Duration | | | — | | | — | | — | | | | 5,075 |
Dreman Small Cap Value | | | — | | | — | | — | | | | 66 |
PIMCO High Yield | | | 1,270,000 | | | 10,033 | | 0.96 | | | | 565 |
PIMCO Total Return | | | 646,000 | | | 6,373 | | 0.84 | | | | 1,084 |
AIM Small Cap Growth | | | 310,000 | | | 1,499 | | 0.85 | | | | 97 |
AllianceBernstein International Value | | | 1,295,000 | | | 30,764 | | 0.87 | | | | 159 |
BlackRock Inflation Protected Bond | | | — | | | — | | — | | | | 514 |
Ibbotson Moderate | | | 1,179,000 | | | 4,271 | | 0.85 | | | | 1,379 |
Ibbotson Balanced | | | — | | | — | | — | | | | 1,944 |
Ibbotson Growth | | | 311,000 | | | 3,628 | | 0.83 | | | | 1,480 |
As of December 31, 2009, there were no outstanding borrowings under this Agreement.
10. SHARE TRANSACTIONS
Each of the Funds is authorized to issue an unlimited number of shares without par value. Transactions in classes of each Fund were as follows:
| | | | | | | | | | | | | | | | |
| | | Initial Class Shares | | | Service Class Shares | |
| | | Year Ended
December 31,
2009 | | | Year Ended
December 31,
2008 | | | Year Ended
December 31,
2009 | | | Year Ended
December 31,
2008 | |
Investment Grade Bond Fund (shares) | | | | | | | | | | | | | | | | |
Shares sold | | | 11,185,943 | | | | 1,374,910 | | | | 4,491,182 | | | | 840,979 | |
Shares issued as reinvestment of distributions | | | 416,021 | | | | 230,549 | | | | 191,092 | | | | 155,938 | |
Shares redeemed | | | (1,077,204 | ) | | | (1,314,407 | ) | | | (324,991 | ) | | | (980,280 | ) |
| | | | | | | | | | | | | | | | |
Net increase (decrease) in shares outstanding | | | 10,524,760 | | | | 291,052 | | | | 4,357,283 | | | | 16,637 | |
Beginning of period | | | 4,581,657 | | | | 4,290,605 | | | | 2,681,836 | | | | 2,665,199 | |
| | | | | | | | | | | | | | | | |
End of period | | | 15,106,417 | | | | 4,581,657 | | | | 7,039,119 | | | | 2,681,836 | |
| | | | | | | | | | | | | | | | |
Investment Grade Bond Fund ($) | | | | | | | | | | | | | | | | |
Net proceeds from sales | | $ | 95,812,537 | | | $ | 11,129,730 | | | $ | 39,095,291 | | | $ | 7,755,557 | |
Net proceeds on reinvestment of distributions | | | 3,607,789 | | | | 2,041,988 | | | | 1,664,422 | | | | 1,393,099 | |
Shares redeemed | | | (9,011,151 | ) | | | (11,545,254 | ) | | | (2,700,076 | ) | | | (8,670,080 | ) |
| | | | | | | | | | | | | | | | |
Net increase (decrease) in net assets | | $ | 90,409,175 | | | $ | 1,626,464 | | | $ | 38,059,637 | | | $ | 478,576 | |
| | | | | | | | | | | | | | | | |
245
| | |
| NOTESTO FINANCIAL STATEMENTS (Continued) | | Sun Capital Advisers Trust |
| | | | | | | | | | | | | | | | |
| | | Initial Class Shares | | | Service Class Shares | |
| | | Year Ended
December 31,
2009 | | | Year Ended
December 31,
2008 | | | Year Ended
December 31,
2009 | | | Year Ended
December 31,
2008 | |
Money Market Fund (shares) | | | | | | | | | | | | | | | | |
Shares sold | | | 50,417,264 | | | | 78,659,262 | | | | 105,833,678 | | | | 65,000,135 | |
Shares issued as reinvestment of distributions | | | 331,634 | | | | 2,994,238 | | | | 8,299 | | | | 219,178 | |
Shares redeemed | | | (113,149,690 | ) | | | (60,375,891 | ) | | | (43,671,150 | ) | | | (12,824,742 | ) |
| | | | | | | | | | | | | | | | |
Net increase (decrease) in shares outstanding | | | (62,400,792 | ) | | | 21,277,609 | | | | 62,170,827 | | | | 52,394,571 | |
Beginning of period | | | 150,390,750 | | | | 129,113,141 | | | | 54,134,262 | | | | 1,739,691 | |
| | | | | | | | | | | | | | | | |
End of period | | | 87,989,958 | | | | 150,390,750 | | | | 116,305,089 | | | | 54,134,262 | |
| | | | | | | | | | | | | | | | |
Money Market Fund ($) | | | | | | | | | | | | | | | | |
Net proceeds from sales | | $ | 50,417,264 | | | $ | 78,659,262 | | | $ | 105,833,678 | | | $ | 65,000,135 | |
Net proceeds on reinvestment of distributions | | | 331,634 | | | | 2,994,238 | | | | 8,299 | | | | 219,178 | |
Shares redeemed | | | (113,149,690 | ) | | | (60,375,891 | ) | | | (43,671,150 | ) | | | (12,824,742 | ) |
| | | | | | | | | | | | | | | | |
Net increase (decrease) in net assets | | $ | (62,400,792 | ) | | $ | 21,277,609 | | | $ | 62,170,827 | | | $ | 52,394,571 | |
| | | | | | | | | | | | | | | | |
Global Real Estate Fund (shares) | | | | | | | | | | | | | | | | |
Shares sold | | | 4,108,295 | | | | 1,375,371 | | | | 3,685,040 | | | | 4,448,663 | |
Shares issued as reinvestment of distributions | | | 287,905 | | | | 485,129 | | | | 417,264 | | | | 962,826 | |
Shares redeemed | | | (1,930,311 | ) | | | (1,555,179 | ) | | | (5,741,347 | ) | | | (1,236,005 | ) |
| | | | | | | | | | | | | | | | |
Net increase (decrease) in shares outstanding | | | 2,465,889 | | | | 305,321 | | | | (1,639,043 | ) | | | 4,175,484 | |
Beginning of period | | | 5,098,914 | | | | 4,793,593 | | | | 12,977,804 | | | | 8,802,320 | |
| | | | | | | | | | | | | | | | |
End of period | | | 7,564,803 | | | | 5,098,914 | | | | 11,338,761 | | | | 12,977,804 | |
| | | | | | | | | | | | | | | | |
Global Real Estate Fund ($) | | | | | | | | | | | | | | | | |
Net proceeds from sales | | $ | 34,655,047 | | | $ | 13,087,917 | | | $ | 22,154,045 | | | $ | 47,677,497 | |
Net proceeds on reinvestment of distributions | | | 3,025,884 | | | | 7,592,275 | | | | 4,786,025 | | | | 16,396,922 | |
Shares redeemed | | | (17,463,407 | ) | | | (23,692,885 | ) | | | (58,113,756 | ) | | | (20,641,734 | ) |
| | | | | | | | | | | | | | | | |
Net increase (decrease) in net assets | | $ | 20,217,524 | | | $ | (3,012,693 | ) | | $ | (31,173,686 | ) | | $ | 43,432,685 | |
| | | | | | | | | | | | | | | | |
Davis Venture Value Fund (shares) | | | | | | | | | | | | | | | | |
Shares sold | | | 10,680,746 | | | | 1,066,633 | | | | 13,579,231 | | | | 7,819,284 | |
Shares issued as reinvestment of distributions | | | 37,207 | | | | 57,241 | | | | 28,743 | | | | 95,137 | |
Shares redeemed | | | (828,912 | ) | | | (1,177,492 | ) | | | (1,526,348 | ) | | | (94,660 | ) |
| | | | | | | | | | | | | | | | |
Net increase (decrease) in shares outstanding | | | 9,889,041 | | | | (53,618 | ) | | | 12,081,626 | | | | 7,819,761 | |
Beginning of period | | | 3,820,234 | | | | 3,873,852 | | | | 9,859,116 | | | | 2,039,355 | |
| | | | | | | | | | | | | | | | |
End of period | | | 13,709,275 | | | | 3,820,234 | | | | 21,940,742 | | | | 9,859,116 | |
| | | | | | | | | | | | | | | | |
Davis Venture Value Fund ($) | | | | | | | | | | | | | | | | |
Net proceeds from sales | | $ | 98,509,305 | | | $ | 9,184,868 | | | $ | 114,619,412 | | | $ | 83,800,662 | |
Net proceeds on reinvestment of distributions | | | 375,796 | | | | 651,404 | | | | 290,015 | | | | 1,080,760 | |
Shares redeemed | | | (7,382,976 | ) | | | (13,464,808 | ) | | | (14,347,405 | ) | | | (971,584 | ) |
| | | | | | | | | | | | | | | | |
Net increase (decrease) in net assets | | $ | 91,502,125 | | | $ | (3,628,536 | ) | | $ | 100,562,022 | | | $ | 83,909,838 | |
| | | | | | | | | | | | | | | | |
246
| | |
| NOTESTO FINANCIAL STATEMENTS (Continued) | | Sun Capital Advisers Trust |
| | | | | | | | | | | | | | | | |
| | | Initial Class Shares | | | Service Class Shares | |
| | | Year Ended
December 31,
2009 | | | Year Ended
December 31,
2008 | | | Year Ended
December 31,
2009 | | | Year Ended
December 31,
2008 | |
Oppenheimer Main Street Small Cap Fund (shares) | | | | | | | | | | | | | |
Shares sold | | | 1,248,829 | | | | 916,325 | | | | 2,693,263 | | | | 7,386,771 | |
Shares issued as reinvestment of distributions | | | 2,426 | | | | 195,621 | | | | 7,063 | | | | 458,571 | |
Shares redeemed | | | (1,594,457 | ) | | | (1,746,969 | ) | | | (4,830,748 | ) | | | (1,010,665 | ) |
| | | | | | | | | | | | | | | | |
Net increase (decrease) in shares outstanding | | | (343,202 | ) | | | (635,023 | ) | | | (2,130,422 | ) | | | 6,834,677 | |
Beginning of period | | | 4,968,188 | | | | 5,603,211 | | | | 15,034,865 | | | | 8,200,188 | |
| | | | | | | | | | | | | | | | |
End of period | | | 4,624,986 | | | | 4,968,188 | | | | 12,904,443 | | | | 15,034,865 | |
| | | | | | | | | | | | | | | | |
Oppenheimer Main Street Small Cap Fund ($) | | | | | | | | | | | | | |
Net proceeds from sales | | $ | 10,256,665 | | | $ | 7,717,527 | | | $ | 16,128,126 | | | $ | 73,542,762 | |
Net proceeds on reinvestment of distributions | | | 24,361 | | | | 2,222,258 | | | | 70,061 | | | | 5,158,919 | |
Shares redeemed | | | (13,291,807 | ) | | | (18,320,015 | ) | | | (42,022,757 | ) | | | (10,804,528 | ) |
| | | | | | | | | | | | | | | | |
Net increase (decrease) in net assets | | $ | (3,010,781 | ) | | $ | (8,380,230 | ) | | $ | (25,824,570 | ) | | $ | 67,897,153 | |
| | | | | | | | | | | | | | | | |
Oppenheimer Large Cap Core Fund (shares) | | | | | | | | | | | | | |
Shares sold | | | 7,834,541 | | | | 815,994 | | | | 850,101 | | | | 230,404 | |
Shares issued as reinvestment of distributions | | | 76,567 | | | | 11,499 | | | | 8,853 | | | | 6,488 | |
Shares redeemed | | | (378,097 | ) | | | (94,101 | ) | | | (160,112 | ) | | | (220,692 | ) |
| | | | | | | | | | | | | | | | |
Net increase (decrease) in shares outstanding | | | 7,533,011 | | | | 733,392 | | | | 698,842 | | | | 16,200 | |
Beginning of period | | | 1,248,385 | | | | 514,993 | | | | 724,107 | | | | 707,907 | |
| | | | | | | | | | | | | | | | |
End of period | | | 8,781,396 | | | | 1,248,385 | | | | 1,422,949 | | | | 724,107 | |
| | | | | | | | | | | | | | | | |
Oppenheimer Large Cap Core Fund ($) | | | | | | | | | | | | | |
Net proceeds from sales | | $ | 54,434,294 | | | $ | 5,312,407 | | | $ | 6,062,955 | | | $ | 1,948,570 | |
Net proceeds on reinvestment of distributions | | | 619,650 | | | | 80,196 | | | | 73,322 | | | | 49,990 | |
Shares redeemed | | | (2,749,134 | ) | | | (802,060 | ) | | | (1,077,506 | ) | | | (1,833,372 | ) |
| | | | | | | | | | | | | | | | |
Net increase (decrease) in net assets | | $ | 52,304,810 | | | $ | 4,590,543 | | | $ | 5,058,771 | | | $ | 165,188 | |
| | | | | | | | | | | | | | | | |
WMC Large Cap Growth Fund (shares) | | | | | | | | | | | | | |
Shares sold | | | 13,334,566 | | | | 1,451,769 | | | | 247,637 | | | | 426,481 | |
Shares issued as reinvestment of distributions | | | 26,292 | | | | 758 | | | | 4,445 | | | | 421 | |
Shares redeemed | | | (829,734 | ) | | | (1,517,999 | ) | | | (664,821 | ) | | | (915,536 | ) |
| | | | | | | | | | | | | | | | |
Net increase (decrease) in shares outstanding | | | 12,531,124 | | | | (65,472 | ) | | | (412,739 | ) | | | (488,634 | ) |
Beginning of period | | | 5,819,503 | | | | 5,884,975 | | | | 2,620,986 | | | | 3,109,620 | |
| | | | | | | | | | | | | | | | |
End of period | | | 18,350,627 | | | | 5,819,503 | | | | 2,208,247 | | | | 2,620,986 | |
| | | | | | | | | | | | | | | | |
WMC Large Cap Growth Fund ($) | | | | | | | | | | | | | |
Net proceeds from sales | | $ | 91,673,236 | | | $ | 8,466,611 | | | $ | 1,673,407 | | | $ | 3,311,569 | |
Net proceeds on reinvestment of distributions | | | 197,983 | | | | 6,208 | | | | 33,289 | | | | 3,443 | |
Shares redeemed | | | (5,576,567 | ) | | | (12,637,314 | ) | | | (4,435,351 | ) | | | (7,706,910 | ) |
| | | | | | | | | | | | | | | | |
Net increase (decrease) in net assets | | $ | 86,294,652 | | | $ | (4,164,495 | ) | | $ | (2,728,655 | ) | | $ | (4,391,898 | ) |
| | | | | | | | | | | | | | | | |
247
| | |
| NOTESTO FINANCIAL STATEMENTS (Continued) | | Sun Capital Advisers Trust |
| | | | | | | | | | | | | | | | |
| | | Initial Class Shares | | | Service Class Shares | |
| | | Year Ended
December 31,
2009 | | | Year Ended
December 31,
2008 | | | Year Ended
December 31,
2009 | | | Year Ended
December 31,
2008 | |
WMC Blue Chip Mid Cap Fund (shares)(a) | | | | | | | | | | | | | |
Shares sold | | | 2,493,643 | | | | 644,278 | | | | 429,406 | | | | 2,968,949 | |
Shares issued as reinvestment of distributions | | | 1,443 | | | | 1,007,315 | | | | 850 | | | | 431,434 | |
Shares redeemed | | | (1,168,027 | ) | | | (1,491,561 | ) | | | (444,353 | ) | | | (50,611 | ) |
| | | | | | | | | | | | | | | | |
Net increase (decrease) in shares outstanding | | | 1,327,059 | | | | 160,032 | | | | (14,097 | ) | | | 3,349,772 | |
Beginning of period | | | 4,920,869 | | | | 4,760,837 | | | | 3,349,772 | | | | — | |
| | | | | | | | | | | | | | | | |
End of period | | | 6,247,928 | | | | 4,920,869 | | | | 3,335,675 | | | | 3,349,772 | |
| | | | | | | | | | | | | | | | |
WMC Blue Chip Mid Cap Fund ($)(a) | | | | | | | | | | | | | |
Net proceeds from sales | | $ | 25,342,933 | | | $ | 7,248,451 | | | $ | 4,068,254 | | | $ | 42,088,378 | |
Net proceeds on reinvestment of distributions | | | 16,377 | | | | 13,024,586 | | | | 9,615 | | | | 5,569,810 | |
Shares redeemed | | | (11,534,225 | ) | | | (20,911,785 | ) | | | (4,663,862 | ) | | | (518,600 | ) |
| | | | | | | | | | | | | | | | |
Net increase (decrease) in net assets | | $ | 13,825,085 | | | $ | (638,748 | ) | | $ | (585,993 | ) | | $ | 47,139,588 | |
| | | | | | | | | | | | | | | | |
Lord Abbett Growth & Income Fund (shares)(a)(b) | | | | | | | | | | | | | |
Shares sold | | | 14,884,765 | | | | 222,457 | | | | 928,732 | | | | 279,032 | |
Subscriptions in-kind | | | 61,521,818 | | | | — | | | | — | | | | — | |
Shares issued as reinvestment of distributions | | | 6,551,173 | | | | 2,852 | | | | 120,741 | | | | 2,636 | |
Shares redeemed | | | (16,973,942 | ) | | | (10,591 | ) | | | (165,243 | ) | | | (11,771 | ) |
| | | | | | | | | | | | | | | | |
Net increase (decrease) in shares outstanding | | | 65,983,814 | | | | 214,718 | | | | 884,230 | | | | 269,897 | |
Beginning of period | | | 314,718 | | | | 100,000 | | | | 369,897 | | | | 100,000 | |
| | | | | | | | | | | | | | | | |
End of period | | | 66,298,532 | | | | 314,718 | | | | 1,254,127 | | | | 369,897 | |
| | | | | | | | | | | | | | | | |
Lord Abbett Growth & Income Fund ($)(a)(b) | | | | | | | | | | | | | |
Net proceeds from sales | | $ | 80,394,556 | | | $ | 1,690,197 | | | $ | 6,630,141 | | | $ | 2,387,573 | |
Subscriptions in-kind | | | 342,061,308 | | | | — | | | | — | | | | — | |
Net proceeds on reinvestment of distributions | | | 49,526,868 | | | | 19,768 | | | | 911,598 | | | | 18,267 | |
Shares redeemed | | | (122,254,652 | ) | | | (87,749 | ) | | | (1,317,548 | ) | | | (111,013 | ) |
| | | | | | | | | | | | | | | | |
Net increase (decrease) in net assets | | $ | 349,728,080 | | | $ | 1,622,216 | | | $ | 6,224,191 | | | $ | 2,294,827 | |
| | | | | | | | | | | | | | | | |
Goldman Sachs Mid Cap Value Fund (shares)(a)(b) | | | | | | | | | | | | | |
Shares sold | | | 10,009,062 | | | | 858,895 | | | | 1,857,700 | | | | 614,069 | |
Subscriptions in-kind | | | 15,162,792 | | | | — | | | | — | | | | — | |
Shares issued as reinvestment of distributions | | | 2,136,646 | | | | 8,336 | | | | 204,336 | | | | 4,533 | |
Shares redeemed | | | (4,239,802 | ) | | | (79,929 | ) | | | (345,461 | ) | | | (126,107 | ) |
| | | | | | | | | | | | | | | | |
Net increase (decrease) in shares outstanding | | | 23,068,698 | | | | 787,302 | | | | 1,716,575 | | | | 492,495 | |
Beginning of period | | | 937,302 | | | | 150,000 | | | | 642,495 | | | | 150,000 | |
| | | | | | | | | | | | | | | | |
End of period | | | 24,006,000 | | | | 937,302 | | | | 2,359,070 | | | | 642,495 | |
| | | | | | | | | | | | | | | | |
Goldman Sachs Mid Cap Value Fund ($)(a)(b) | | | | | | | | | | | | | | | | |
Net proceeds from sales | | $ | 69,508,915 | | | $ | 6,385,274 | | | $ | 13,457,586 | | | $ | 5,437,455 | |
Subscription in-kind | | | 86,276,287 | | | | — | | | | — | | | | — | |
Net proceeds on reinvestment of distributions | | | 17,199,998 | | | | 56,352 | | | | 1,642,863 | | | | 30,641 | |
Shares redeemed | | | (30,422,726 | ) | | | (655,799 | ) | | | (2,646,987 | ) | | | (1,050,344 | ) |
| | | | | | | | | | | | | | | | |
Net increase (decrease) in net assets | | $ | 142,562,474 | | | $ | 5,785,827 | | | $ | 12,453,462 | | | $ | 4,417,752 | |
| | | | | | | | | | | | | | | | |
248
| | |
| NOTESTO FINANCIAL STATEMENTS (Continued) | | Sun Capital Advisers Trust |
| | | | | | | | | | | | | | | | |
| | | Initial Class Shares | | | Service Class Shares | |
| | | Year Ended
December 31,
2009 | | | Year Ended
December 31,
2008 | | | Year Ended
December 31,
2009 | | | Year Ended
December 31,
2008 | |
Goldman Sachs Short Duration Fund (shares)(a) | | | | | | | | | | | | | | | | |
Shares sold | | | 95,717,794 | | | | 5,768,762 | | | | 5,195,337 | | | | 7,992,460 | |
Shares issued as reinvestment of distributions | | | 1,824,407 | | | | 54,759 | | | | 219,420 | | | | 83,955 | |
Shares redeemed | | | (17,954,165 | ) | | | (633,805 | ) | | | (1,182,738 | ) | | | (2,014,608 | ) |
| | | | | | | | | | | | | | | | |
Net increase (decrease) in shares outstanding | | | 79,588,036 | | | | 5,189,716 | | | | 4,232,019 | | | | 6,061,807 | |
Beginning of period | | | 5,389,716 | | | | 200,000 | | | | 6,261,807 | | | | 200,000 | |
| | | | | | | | | | | | | | | | |
End of period | | | 84,977,752 | | | | 5,389,716 | | | | 10,493,826 | | | | 6,261,807 | |
| | | | | | | | | | | | | | | | |
Goldman Sachs Short Duration Fund ($)(a) | | | | | | | | | | | | | | | | |
Net proceeds from sales | | $ | 972,599,536 | | | $ | 57,374,714 | | | $ | 53,062,733 | | | $ | 79,285,026 | |
Net proceeds on reinvestment of distributions | | | 18,720,907 | | | | 549,121 | | | | 2,248,123 | | | | 839,252 | |
Shares redeemed | | | (183,043,674 | ) | | | (6,376,505 | ) | | | (12,026,447 | ) | | | (20,136,581 | ) |
| | | | | | | | | | | | | | | | |
Net increase (decrease) in net assets | | $ | 808,276,769 | | | $ | 51,547,330 | | | $ | 43,284,409 | | | $ | 59,987,697 | |
| | | | | | | | | | | | | | | | |
Dreman Small Cap Value Fund (shares)(c) | | | | | | | | | | | | | | | | |
Shares sold | | | 4,559,288 | | | | 395,205 | | | | 660,894 | | | | 29,118 | |
Shares issued as reinvestment of distributions | | | 103,698 | | | | 1,013 | | | | 19,272 | | | | 230 | |
Shares redeemed | | | (1,862,200 | ) | | | (4,779 | ) | | | (182,795 | ) | | | (716 | ) |
| | | | | | | | | | | | | | | | |
Net increase (decrease) in shares outstanding | | | 2,800,786 | | | | 391,439 | | | | 497,371 | | | | 28,632 | |
Beginning of period | | | 541,439 | | | | 150,000 | | | | 178,632 | | | | 150,000 | |
| | | | | | | | | | | | | | | | |
End of period | | | 3,342,225 | | | | 541,439 | | | | 676,003 | | | | 178,632 | |
| | | | | | | | | | | | | | | | |
Dreman Small Cap Value Fund ($)(c) | | | | | | | | | | | | | | | | |
Net proceeds from sales | | $ | 38,421,162 | | | $ | 2,974,536 | | | $ | 5,541,210 | | | $ | 223,930 | |
Net proceeds on reinvestment of distributions | | | 1,059,787 | | | | 7,879 | | | | 196,965 | | | | 1,788 | |
Shares redeemed | | | (18,513,699 | ) | | | (40,303 | ) | | | (1,769,047 | ) | | | (5,063 | ) |
| | | | | | | | | | | | | | | | |
Net increase (decrease) in net assets | | $ | 20,967,250 | | | $ | 2,942,112 | | | $ | 3,969,128 | | | $ | 220,655 | |
| | | | | | | | | | | | | | | | |
PIMCO High Yield Fund (shares)(a) | | | | | | | | | | | | | | | | |
Shares sold | | | 12,167,657 | | | | 225,014 | | | | 1,535,138 | | | | 1,357,957 | |
Shares issued as reinvestment of distributions | | | 863,319 | | | | 13,632 | | | | 242,170 | | | | 51,316 | |
Shares redeemed | | | (3,651,290 | ) | | | (384 | ) | | | (692,874 | ) | | | (35,212 | ) |
| | | | | | | | | | | | | | | | |
Net increase (decrease) in shares outstanding | | | 9,379,686 | | | | 238,262 | | | | 1,084,434 | | | | 1,374,061 | |
Beginning of period | | | 388,262 | | | | 150,000 | | | | 1,524,061 | | | | 150,000 | |
| | | | | | | | | | | | | | | | |
End of period | | | 9,767,948 | | | | 388,262 | | | | 2,608,495 | | | | 1,524,061 | |
| | | | | | | | | | | | | | | | |
PIMCO High Yield Fund ($)(a) | | | | | | | | | | | | | | | | |
Net proceeds from sales | | $ | 100,264,761 | | | $ | 1,739,109 | | | $ | 13,216,870 | | | $ | 12,015,785 | |
Net proceeds on reinvestment of distributions | | | 7,862,861 | | | | 119,537 | | | | 2,182,809 | | | | 434,852 | |
Shares redeemed | | | (31,827,180 | ) | | | (3,069 | ) | | | (6,196,259 | ) | | | (306,519 | ) |
| | | | | | | | | | | | | | | | |
Net increase (decrease) in net assets | | $ | 76,300,442 | | | $ | 1,855,577 | | | $ | 9,203,420 | | | $ | 12,144,118 | |
| | | | | | | | | | | | | | | | |
249
| | |
| NOTESTO FINANCIAL STATEMENTS (Continued) | | Sun Capital Advisers Trust |
| | | | | | | | | | | | | | | | |
| | | Initial Class Shares | | | Service Class Shares | |
| | | Year Ended
December 31,
2009 | | | Year Ended
December 31,
2008 | | | Year Ended
December 31,
2009 | | | Year Ended
December 31,
2008 | |
PIMCO Total Return Fund (shares)(c) | | | | | | | | | | | | | | | | |
Shares sold | | | 12,682,052 | | | | 1,169,446 | | | | 20,320,071 | | | | 1,607,235 | |
Shares issued as reinvestment of distributions | | | 318,228 | | | | 2,014 | | | | 496,571 | | | | 2,254 | |
Shares redeemed | | | (1,194,947 | ) | | | (10,778 | ) | | | (481,250 | ) | | | (15,086 | ) |
| | | | | | | | | | | | | | | | |
Net increase (decrease) in shares outstanding | | | 11,805,333 | | | | 1,160,682 | | | | 20,335,392 | | | | 1,594,403 | |
Beginning of period | | | 1,310,682 | | | | 150,000 | | | | 1,744,403 | | | | 150,000 | |
| | | | | | | | | | | | | | | | |
End of period | | | 13,116,015 | | | | 1,310,682 | | | | 22,079,795 | | | | 1,744,403 | |
| | | | | | | | | | | | | | | | |
PIMCO Total Return Fund ($)(c) | | | | | | | | | | | | | | | | |
Net proceeds from sales | | $ | 137,256,966 | | | $ | 12,027,546 | | | $ | 220,437,166 | | | $ | 16,494,373 | |
Net proceeds on reinvestment of distributions | | | 3,496,227 | | | | 21,046 | | | | 5,461,863 | | | | 23,607 | |
Shares redeemed | | | (12,737,635 | ) | | | (109,515 | ) | | | (5,218,139 | ) | | | (156,896 | ) |
| | | | | | | | | | | | | | | | |
Net increase (decrease) in net assets | | $ | 128,015,558 | | | $ | 11,939,077 | | | $ | 220,680,890 | | | $ | 16,361,084 | |
| | | | | | | | | | | | | | | | |
AIM Small Cap Growth Fund (shares)(c) | | | | | | | | | | | | | | | | |
Shares sold | | | 2,139,249 | | | | 190,788 | | | | 642,199 | | | | 56,833 | |
Shares issued as reinvestment of distributions | | | 42,061 | | | | — | | | | 20,866 | | | | — | |
Shares redeemed | | | (1,151,197 | ) | | | (3,688 | ) | | | (189,830 | ) | | | (1,019 | ) |
| | | | | | | | | | | | | | | | |
Net increase (decrease) in shares outstanding | | | 1,030,113 | | | | 187,100 | | | | 473,235 | | | | 55,814 | |
Beginning of period | | | 337,100 | | | | 150,000 | | | | 205,814 | | | | 150,000 | |
| | | | | | | | | | | | | | | | |
End of period | | | 1,367,213 | | | | 337,100 | | | | 679,049 | | | | 205,814 | |
| | | | | | | | | | | | | | | | |
AIM Small Cap Growth Fund ($)(c) | | | | | | | | | | | | | | | | |
Net proceeds from sales | | $ | 17,852,894 | | | $ | 1,353,803 | | | $ | 5,545,347 | | | $ | 403,682 | |
Net proceeds on reinvestment of distributions | | | 408,415 | | | | — | | | | 201,982 | | | | — | |
Shares redeemed | | | (10,858,399 | ) | | | (30,260 | ) | | | (1,744,019 | ) | | | (7,129 | ) |
| | | | | | | | | | | | | | | | |
Net increase (decrease) in net assets | | $ | 7,402,910 | | | $ | 1,323,543 | | | $ | 4,003,310 | | | $ | 396,553 | |
| | | | | | | | | | | | | | | | |
AllianceBernstein International Value Fund (shares)(c) | | | | | | | | | | | | | |
Shares sold | | | 4,771,893 | | | | 993,912 | | | | 184,843 | | | | 10,748 | |
Shares issued as reinvestment of distributions | | | 246,823 | | | | 2,464 | | | | 7,134 | | | | 361 | |
Shares redeemed | | | (573,626 | ) | | | (13,236 | ) | | | (281,329 | ) | | | (1,977 | ) |
| | | | | | | | | | | | | | | | |
Net increase (decrease) in shares outstanding | | | 4,445,090 | | | | 983,140 | | | | (89,352 | ) | | | 9,132 | |
Beginning of period | | | 1,233,140 | | | | 250,000 | | | | 259,132 | | | | 250,000 | |
| | | | | | | | | | | | | | | | |
End of period | | | 5,678,230 | | | | 1,233,140 | | | | 169,780 | | | | 259,132 | |
| | | | | | | | | | | | | | | | |
AllianceBernstein International Value Fund ($)(c) | | | | | | | | | | | | | | | | |
Net proceeds from sales | | $ | 40,083,978 | | | $ | 7,432,505 | | | $ | 1,633,385 | | | $ | 83,324 | |
Net proceeds on reinvestment of distributions | | | 2,436,542 | | | | 19,366 | | | | 70,375 | | | | 2,842 | |
Shares redeemed | | | (5,181,425 | ) | | | (109,007 | ) | | | (2,902,959 | ) | | | (14,889 | ) |
| | | | | | | | | | | | | | | | |
Net increase (decrease) in net assets | | $ | 37,339,095 | | | $ | 7,342,864 | | | $ | (1,199,199 | ) | | $ | 71,277 | |
| | | | | | | | | | | | | | | | |
250
| | |
| NOTESTO FINANCIAL STATEMENTS (Continued) | | Sun Capital Advisers Trust |
| | | | | | | | | | | | | | | | |
| | | Initial Class Shares | | | Service Class Shares | |
| | | Year Ended
December 31,
2009 | | | Year Ended
December 31,
2008 | | | Year Ended
December 31,
2009 | | | Year Ended
December 31,
2008 | |
BlackRock Inflation Protected Bond Fund (shares)(c) | | | | | | | | | | | | | |
Shares sold | | | 9,577,023 | | | | 694,093 | | | | 7,285,641 | | | | 283,469 | |
Shares issued as reinvestment of distributions | | | 272,217 | | | | 2,366 | | | | 175,494 | | | | 1,238 | |
Shares redeemed | | | (411,460 | ) | | | (4,523 | ) | | | (252,520 | ) | | | (1,323 | ) |
| | | | | | | | | | | | | | | | |
Net increase (decrease) in shares outstanding | | | 9,437,780 | | | | 691,936 | | | | 7,208,615 | | | | 283,384 | |
Beginning of period | | | 841,936 | | | | 150,000 | | | | 433,384 | | | | 150,000 | |
| | | | | | | | | | | | | | | | |
End of period | | | 10,279,716 | | | | 841,936 | | | | 7,641,999 | | | | 433,384 | |
| | | | | | | | | | | | | | | | |
BlackRock Inflation Protected Bond Fund ($)(c) | | | | | | | | | | | | | | | | |
Net proceeds from sales | | $ | 96,862,111 | | | $ | 6,709,684 | | | $ | 74,124,269 | | | $ | 2,720,541 | |
Net proceeds on reinvestment of distributions | | | 2,798,749 | | | | 23,196 | | | | 1,803,199 | | | | 12,136 | |
Shares redeemed | | | (4,267,952 | ) | | | (42,980 | ) | | | (2,558,702 | ) | | | (13,195 | ) |
| | | | | | | | | | | | | | | | |
Net increase (decrease) in net assets | | $ | 95,392,908 | | | $ | 6,689,900 | | | $ | 73,368,766 | | | $ | 2,719,482 | |
| | | | | | | | | | | | | | | | |
Ibbotson Moderate Fund (shares)(c) | | | | | | | | | | | | | | | | |
Shares sold | | | 155,902 | | | | 50 | | | | 29,858,809 | | | | 3,703,343 | |
Shares issued as reinvestment of distributions | | | 403 | | | | — | | | | 8,950 | | | | — | |
Shares redeemed | | | (5,200 | ) | | | — | | | | (217,241 | ) | | | (8,738 | ) |
| | | | | | | | | | | | | | | | |
Net increase (decrease) in shares outstanding | | | 151,105 | | | | 50 | | | | 29,650,518 | | | | 3,694,605 | |
Beginning of period | | | 5,050 | | | | 5,000 | | | | 3,699,605 | | | | 5,000 | |
| | | | | | | | | | | | | | | | |
End of period | | | 156,155 | | | | 5,050 | | | | 33,350,123 | | | | 3,699,605 | |
| | | | | | | | | | | | | | | | |
Ibbotson Moderate Fund ($)(c) | | | | | | | | | | | | | | | | |
Net proceeds from sales | | $ | 1,610,584 | | | $ | 451 | | | $ | 293,244,934 | | | $ | 32,978,804 | |
Net proceeds on reinvestment of distributions | | | 4,245 | | | | — | | | | 94,422 | | | | — | |
Shares redeemed | | | (55,236 | ) | | | — | | | | (2,168,940 | ) | | | (80,696 | ) |
| | | | | | | | | | | | | | | | |
Net increase (decrease) in net assets | | $ | 1,559,593 | | | $ | 451 | | | $ | 291,170,416 | | | $ | 32,898,108 | |
| | | | | | | | | | | | | | | | |
Ibbotson Balanced Fund (shares)(c) | | | | | | | | | | | | | | | | |
Shares sold | | | 44,827 | | | | 1,155 | | | | 46,286,079 | | | | 4,271,092 | |
Shares issued as reinvestment of distributions | | | 51 | | | | — | | | | 7,328 | | | | — | |
Shares redeemed | | | (11,574 | ) | | | (9 | ) | | | (14,111 | ) | | | (127 | ) |
| | | | | | | | | | | | | | | | |
Net increase (decrease) in shares outstanding | | | 33,304 | | | | 1,146 | | | | 46,279,296 | | | | 4,270,965 | |
Beginning of period | | | 6,146 | | | | 5,000 | | | | 4,275,965 | | | | 5,000 | |
| | | | | | | | | | | | | | | | |
End of period | | | 39,450 | | | | 6,146 | | | | 50,555,261 | | | | 4,275,965 | |
| | | | | | | | | | | | | | | | |
Ibbotson Balanced Fund ($)(c) | | | | | | | | | | | | | | | | |
Net proceeds from sales | | $ | 456,674 | | | $ | 10,063 | | | $ | 458,013,309 | | | $ | 37,331,705 | |
Net proceeds on reinvestment of distributions | | | 548 | | | | — | | | | 78,554 | | | | — | |
Shares redeemed | | | (107,698 | ) | | | (81 | ) | | | (127,291 | ) | | | (1,114 | ) |
| | | | | | | | | | | | | | | | |
Net increase (decrease) in net assets | | $ | 349,524 | | | $ | 9,982 | | | $ | 457,964,572 | | | $ | 37,330,591 | |
| | | | | | | | | | | | | | | | |
251
| | |
| NOTESTO FINANCIAL STATEMENTS (Continued) | | Sun Capital Advisers Trust |
| | | | | | | | | | | | | | | | |
| | | Initial Class Shares | | | Service Class Shares | |
| | | Year Ended
December 31,
2009 | | | Year Ended
December 31,
2008 | | | Year Ended
December 31,
2009 | | | Year Ended
December 31,
2008 | |
Ibbotson Growth Fund (shares)(c) | | | | | | | | | | | | | | | | |
Shares sold | | | 27,376 | | | | 5,400 | | | | 36,360,653 | | | | 3,857,782 | |
Shares issued as reinvestment of distributions | | | 58 | | | | — | | | | 7,506 | | | | — | |
Shares redeemed | | | (11,861 | ) | | | (27 | ) | | | (226,939 | ) | | | (120,746 | ) |
| | | | | | | | | | | | | | | | |
Net increase (decrease) in shares outstanding | | | 15,573 | | | | 5,373 | | | | 36,141,220 | | | | 3,737,036 | |
Beginning of period | | | 10,373 | | | | 5,000 | | | | 3,742,036 | | | | 5,000 | |
| | | | | | | | | | | | | | | | |
End of period | | | 25,946 | | | | 10,373 | | | | 39,883,256 | | | | 3,742,036 | |
| | | | | | | | | | | | | | | | |
Ibbotson Growth Fund ($)(c) | | | | | | | | | | | | | | | | |
Net proceeds from sales | | $ | 273,347 | | | $ | 46,493 | | | $ | 355,226,003 | | | $ | 32,502,199 | |
Net proceeds on reinvestment of distributions | | | 620 | | | | — | | | | 80,391 | | | | — | |
Shares redeemed | | | (125,048 | ) | | | (230 | ) | | | (2,349,550 | ) | | | (1,064,299 | ) |
| | | | | | | | | | | | | | | | |
Net increase (decrease) in net assets | | $ | 148,919 | | | $ | 46,263 | | | $ | 352,956,844 | | | $ | 31,437,900 | |
| | | | | | | | | | | | | | | | |
| (a) | The Lord Abbett Growth & Income Fund, Goldman Sachs Mid Cap Value Fund, Goldman Sachs Short Duration Fund, PIMCO High Yield Fund and the Service Class for the WMC Blue Chip Mid Cap Fund commenced operations on March 7, 2008 and share activity presented for the “Year Ended December 31, 2008” is for the period March 7, 2008 to December 31, 2008. |
| (b) | During the year ended December 31, 2009, the Lord Abbett Growth & Income Fund and Goldman Sachs Mid Cap Value Fund received securities with a value of $342,061,308 and $86,276,287, respectively, in exchange for 61,521,818 and 15,162,792 fund shares, respectively. Pursuant to a substitution order granted by the Securities and Exchange Commission, these assets were transferred from other third party funds that serve as investment options for certain Sun Life variable insurance products. |
| (c) | The Dreman Small Cap Value Fund, PIMCO Total Return Fund, AIM Small Cap Growth Fund, AllianceBernstein International Value Fund, BlackRock Inflation Protected Bond Fund, Ibbotson Moderate Fund, Ibbotson Balanced Fund, and the Ibbotson Growth Fund commenced operations on October 1, 2008 and share activity presented for the “Year Ended December 31, 2008” is for the period October 1, 2008 to December 31, 2008. |
11. FEDERAL INCOME TAX INFORMATION
Each Fund is treated as a separate entity for Federal tax purposes. Each Fund intends to elect or has elected to be treated and intends to qualify each year as a regulated investment company under Subchapter M of the Internal Revenue Code, as amended (“the Code”). By so qualifying, the Funds will not be subject to Federal income taxes to the extent that they distribute all of their taxable income, including realized capital gains, for the fiscal year. In addition, by distributing during each calendar year substantially all of their net investment income, capital gains and certain other amounts, if any, the Funds will not be subject to a Federal excise tax. As a result, no provision for income taxes is required.
There are no unrecognized tax benefits in the accompanying financial statements in connection with the tax positions taken by each Fund. Each of the Fund’s federal tax returns for the prior three fiscal years remains subject to examination by the Internal Revenue Service.
Capital accounts within the financial statements are adjusted for permanent book-tax differences. These adjustments have no impact on net assets or results of operations. Temporary book-tax differences will reverse in a subsequent period.
252
| | |
| NOTESTO FINANCIAL STATEMENTS (Continued) | | Sun Capital Advisers Trust |
Book-tax differences are primarily due to treatment of derivatives, distributions received from REIT securities, currency gain (loss), Passive Foreign Investment Companies, capital loss carryforwards, and losses deferred due to wash sales and excise tax regulations.
As of December 31, 2009, the components of distributable earnings on a tax basis were as follows:
| | | | | | | | | |
Fund | | Undistributed
Ordinary
Income | | Undistributed
Long-Term
Capital Gain | | Net Unrealized
Appreciation |
Investment Grade Bond | | $ | 1,178,687 | | $ | — | | $ | 1,966,204 |
Money Market | | | 1,116 | | | — | | | — |
Global Real Estate | | | 26,731,274 | | | — | | | 22,882,260 |
Davis Venture Value | | | 1,610,992 | | | — | | | 60,044,346 |
Oppenheimer Main Street Small Cap | | | 437,815 | | | — | | | 21,986,104 |
Oppenheimer Large Cap Core | | | 241,743 | | | — | | | 6,402,694 |
WMC Large Cap Growth | | | 554,356 | | | — | | | 20,251,179 |
WMC Blue Chip Mid Cap | | | 63,374 | | | — | | | 15,875,587 |
Lord Abbett Growth & Income | | | 22,800,712 | | | — | | | 123,388,924 |
Goldman Sachs Mid Cap Value | | | 5,810,131 | | | 405,106 | | | 34,740,281 |
Goldman Sachs Short Duration | | | 750,862 | | | 360,665 | | | 8,779,198 |
Dreman Small Cap Value | | | 3,987,648 | | | 325,135 | | | 5,072,568 |
PIMCO High Yield | | | 1,074,874 | | | 46,312 | | | 13,478,412 |
PIMCO Total Return | | | 2,523,331 | | | 93,314 | | | 5,944,540 |
AIM Small Cap Growth | | | 1,862,263 | | | 337,010 | | | 1,323,652 |
AllianceBernstein International Value | | | 1,251,305 | | | 39,102 | | | 7,569,152 |
BlackRock Inflation Protected Bond | | | 2,795,342 | | | 344,460 | | | 793,497 |
Ibbotson Moderate | | | 10,796,932 | | | 461,828 | | | 29,517,828 |
Ibbotson Balanced | | | 15,191,671 | | | 850,334 | | | 54,928,871 |
Ibbotson Growth | | | 11,613,620 | | | 1,051,131 | | | 51,385,093 |
At December 31, 2009, the following Funds had available for federal income tax purposes capital loss carryovers which can be used to offset certain future realized capital gains.
| | | | | | |
Fund | | Expires
December 31, 2016 | | Expires
December 31, 2017 |
Global Real Estate | | $ | — | | $ | 91,289,869 |
Davis Venture Value | | | — | | | 9,362,329 |
Oppenheimer Main Street Small Cap | | | 17,617,847 | | | 29,078,291 |
WMC Large Cap Growth | | | 17,593,194 | | | 3,895,483 |
WMC Blue Chip Mid Cap | | | 5,601,758 | | | 12,686,824 |
The following Funds utilized capital loss carryforwards during the year ended December 31, 2009, as follows:
| | | |
Fund | | Amount |
Oppenheimer Large Cap Core | | $ | 2,287,986 |
Lord Abbett Growth & Income | | | 218,915 |
Goldman Sachs Mid Cap Value | | | 155,839 |
AIM Small Cap Growth | | | 5,033 |
AllianceBernstein International Value | | | 19,725 |
253
| | |
| NOTESTO FINANCIAL STATEMENTS (Continued) | | Sun Capital Advisers Trust |
Under current tax law, certain capital or currency losses realized after October 31 within a taxable year may be deferred and treated as occurring on the first day of the following tax year. For the tax period ended December 31, 2009, the following Funds elected to defer net losses arising between November 1, 2009 and December 31, 2009.
| | | |
Fund | | Amount |
Investment Grade Bond | | $ | 9,375 |
Money Market | | | 47 |
Global Real Estate | | | 369,141 |
Davis Venture Value | | | 3,049,084 |
Oppenheimer Main Street Small Cap | | | 21,464 |
Oppenheimer Large Cap Core | | | 126,297 |
WMC Large Cap Growth | | | 201,431 |
The Investment Grade Bond Fund, Money Market Fund, Goldman Sachs Short Duration Fund, PIMCO High Yield Fund, PIMCO Total Return Fund and BlackRock Inflation Protected Bond Fund declare dividends from net investment income, if any, daily and pay dividends monthly. Each of the remaining Funds in the Trust declare and pay dividends from net investment income, if any, at least annually. Each Fund distributes its net realized capital gains, if any, at least annually. Income and capital gain distributions are determined in accordance with income tax regulations which may differ from U.S. GAAP.
The tax character of distributions paid during the year ended December 31, 2009 was as follows:
| | | | | | |
Fund | | Ordinary
Income | | Long-Term
Capital Gain |
Investment Grade Bond | | $ | 5,245,640 | | $ | 26,571 |
Money Market | | | 339,933 | | | — |
Global Real Estate | | | 6,427,509 | | | 1,384,400 |
Davis Venture Value | | | 665,811 | | | — |
Oppenheimer Main Street Small Cap | | | 94,422 | | | — |
Oppenheimer Large Cap Core | | | 692,972 | | | — |
WMC Large Cap Growth | | | 231,272 | | | — |
WMC Blue Chip Mid Cap | | | 25,992 | | | — |
Lord Abbett Growth & Income | | | 50,438,466 | | | — |
Goldman Sachs Mid Cap Value | | | 18,842,861 | | | — |
Goldman Sachs Short Duration | | | 18,976,898 | | | 1,992,132 |
Dreman Small Cap Value | | | 1,256,752 | | | — |
PIMCO High Yield | | | 9,989,286 | | | 56,384 |
PIMCO Total Return | | | 8,084,038 | | | 874,052 |
AIM Small Cap Growth | | | 545,255 | | | 65,142 |
AllianceBernstein International Value | | | 2,506,917 | | | — |
BlackRock Inflation Protected Bond | | | 4,545,855 | | | 56,093 |
Ibbotson Moderate | | | 86,730 | | | 11,937 |
Ibbotson Balanced | | | 71,023 | | | 8,079 |
Ibbotson Growth | | | 79,203 | | | 1,808 |
254
| | |
| NOTESTO FINANCIAL STATEMENTS (Continued) | | Sun Capital Advisers Trust |
The tax character of distributions paid during the year ended December 31, 2008 was as follows:
| | | | | | |
Fund | | Ordinary
Income | | Long-Term
Capital Gain |
Investment Grade Bond | | $ | 3,435,087 | | $ | — |
Money Market | | | 3,213,550 | | | — |
Global Real Estate | | | 9,984,130 | | | 14,005,067 |
Davis Venture Value | | | 708,988 | | | 1,023,176 |
Oppenheimer Main Street Small Cap | | | 3,066,891 | | | 4,314,286 |
Oppenheimer Large Cap Core | | | 91,113 | | | 39,073 |
WMC Large Cap Growth | | | 9,651 | | | — |
WMC Blue Chip Mid Cap | | | 6,107,397 | | | 12,486,999 |
Lord Abbett Growth & Income* | | | 38,035 | | | — |
Goldman Sachs Mid Cap Value* | | | 86,993 | | | — |
Goldman Sachs Short Duration* | | | 1,215,306 | | | 173,097 |
Dreman Small Cap Value** | | | 9,667 | | | — |
PIMCO High Yield* | | | 523,341 | | | 31,068 |
PIMCO Total Return** | | | 44,672 | | | — |
AllianceBernstein International Value** | | | 22,208 | | | — |
BlackRock Inflation Protected Bond** | | | 35,347 | | | — |
| * | For the period March 7, 2008 (commencement of operations) to December 31, 2008. |
| ** | For the period October 1, 2008 (commencement of operations) to December 31, 2008. |
The identified cost of investments and their respective gross unrealized appreciation and depreciation for federal income tax purposes at December 31, 2009 were as follows:
| | | | | | | | | | |
| | | Identified
Cost | | Gross Unrealized | | | Net
Appreciation |
Fund | | | Appreciation | | (Depreciation) | | |
Investment Grade Bond | | $ | 212,401,059 | | 5,180,544 | | (3,214,340 | ) | | 1,966,204 |
Money Market | | | 203,994,735 | | — | | — | | | — |
Global Real Estate | | | 200,217,278 | | 24,770,496 | | (1,888,330 | ) | | 22,882,166 |
Davis Venture Value | | | 322,358,472 | | 61,083,787 | | (1,040,732 | ) | | 60,043,055 |
Oppenheimer Main Street Small Cap | | | 162,262,665 | | 26,905,222 | | (4,919,124 | ) | | 21,986,098 |
Oppenheimer Large Cap Core | | | 76,618,814 | | 7,240,182 | | (837,488 | ) | | 6,402,694 |
WMC Large Cap Growth | | | 147,539,379 | | 21,193,112 | | (941,933 | ) | | 20,251,179 |
WMC Blue Chip Mid Cap | | | 99,234,915 | | 17,378,432 | | (1,502,837 | ) | | 15,875,595 |
Lord Abbett Growth & Income | | | 390,428,746 | | 129,054,789 | | (5,665,865 | ) | | 123,388,924 |
Goldman Sachs Mid Cap Value | | | 174,586,275 | | 36,550,985 | | (1,810,704 | ) | | 34,740,281 |
Goldman Sachs Short Duration | | | 962,072,895 | | 9,942,364 | | (1,163,166 | ) | | 8,779,198 |
Dreman Small Cap Value | | | 35,462,302 | | 5,522,684 | | (450,116 | ) | | 5,072,568 |
PIMCO High Yield | | | 102,423,639 | | 13,947,505 | | (1,796,279 | ) | | 12,151,226 |
PIMCO Total Return | | | 443,847,817 | | 8,847,081 | | (2,599,794 | ) | | 6,247,287 |
AIM Small Cap Growth | | | 18,322,861 | | 1,642,469 | | (318,817 | ) | | 1,323,652 |
AllianceBernstein International Value | | | 49,559,419 | | 8,459,312 | | (933,257 | ) | | 7,526,055 |
BlackRock Inflation Protected Bond | | | 183,161,105 | | 1,461,756 | | (696,400 | ) | | 765,356 |
Ibbotson Moderate | | | 336,135,413 | | 29,583,698 | | (65,870 | ) | | 29,517,828 |
Ibbotson Balanced | | | 511,559,996 | | 55,141,177 | | (212,306 | ) | | 54,928,871 |
Ibbotson Growth | | | 397,848,998 | | 51,420,493 | | (35,400 | ) | | 51,385,093 |
255
| | |
| NOTESTO FINANCIAL STATEMENTS (Continued) | | Sun Capital Advisers Trust |
12. INDEMNIFICATION
Under the Trust’s organizational documents, its officers and Trustees may be indemnified against certain liabilities and expenses arising out of the performance of their duties to the Trust. Additionally, in the normal course of business, the Trust enters into agreements with service providers that may contain indemnification clauses. The Trust’s maximum exposure under these agreements is unknown as this would involve future claims that may be made against the Trust that have not yet occurred.
13. EVALUATION OF SUBSEQUENT EVENTS
Management has evaluated the possibility of subsequent events existing in the Fund’s December 31, 2009 financial statements through February 25, 2010, the issuance date of the financial statements. Management has determined that there are no material events that would require additional disclosure in the Fund’s financial statements through this date.
256
REPORTOF INDEPENDENT REGISTERED PUBLIC ACCOUNTING FIRM
To the Trustees and the Shareholders of Sun Capital Advisers Trust:
We have audited the accompanying statements of assets and liabilities, including the portfolios of investments of Sun Capital Investment Grade Bond Fund, Sun Capital Money Market Fund, Sun Capital Global Real Estate Fund, SC Davis Venture Value Fund, SC Oppenheimer Main Street Small Cap Fund, SC Oppenheimer Large Cap Core Fund, SC WMC Large Cap Growth Fund, SC WMC Blue Chip Mid Cap Fund, SC Lord Abbett Growth & Income Fund, SC Goldman Sachs Mid Cap Value Fund, SC Goldman Sachs Short Duration Fund, SC Dreman Small Cap Value Fund, SC PIMCO High Yield Fund, SC PIMCO Total Return Fund, SC AIM Small Cap Growth Fund, SC AllianceBernstein International Value Fund, SC BlackRock Inflation Protected Bond Fund, SC Ibbotson Moderate Fund, SC Ibbotson Balanced Fund, and SC Ibbotson Growth Fund (collectively the “Funds”) (each a portfolio of Sun Capital Advisers Trust, the “Trust”) as of December 31, 2009, and the related statements of operations for the year then ended and the statements of changes in net assets and the financial highlights for each of the periods presented. These financial statements and financial highlights are the responsibility of the Trust’s management. Our responsibility is to express an opinion on these financial statements and financial highlights based on our audits.
We conducted our audits in accordance with the standards of the Public Company Accounting Oversight Board (United States). Those standards require that we plan and perform the audit to obtain reasonable assurance about whether the financial statements and financial highlights are free of material misstatement. The Trust is not required to have, nor were we engaged to perform, an audit of its internal control over financial reporting. Our audits included consideration of internal control over financial reporting as a basis for designing audit procedures that are appropriate in the circumstances, but not for the purpose of expressing an opinion on the effectiveness of the Trust’s internal control over financial reporting. Accordingly, we express no such opinion. An audit also includes examining, on a test basis, evidence supporting the amounts and disclosures in the financial statements, assessing the accounting principles used and significant estimates made by management, as well as evaluating the overall financial statement presentation. Our procedures included confirmation of securities owned as of December 31, 2009, by correspondence with the custodian and brokers; where replies were not received from brokers, we performed other auditing procedures. We believe that our audits provide a reasonable basis for our opinion.
In our opinion, such financial statements and financial highlights referred to above present fairly, in all material respects, the financial position of each of the Funds constituting Sun Capital Advisers Trust as of December 31, 2009, the results of their operations for the year then ended and the changes in their net assets and the financial highlights for each of the periods presented, in conformity with accounting principles generally accepted in the United States of America.
DELOITTE & TOUCHE LLP
Boston, Massachusetts
February 25, 2010
257
OTHER INFORMATION (Unaudited)
PROXY VOTING POLICIES AND PROCEDURES AND VOTING RECORDS
A description of the policies and procedures that the Funds use to determine how to vote proxies relating to portfolio securities and information regarding how the Funds voted proxies relating to portfolio securities during the most recent 12-month period ended June 30 are available (i) without charge, upon request, by calling (800) 432-1102 x 3330 and (ii) on the U.S. Securities and Exchange Commission’s website at www.sec.gov.
QUARTERLY FILING OF PORTFOLIO HOLDINGS
The Funds file their complete schedule of investments with the U.S. Securities and Exchange Commission (“SEC”) for the first and third quarters of each fiscal year on Form N-Q. The Funds’ Form N-Q are (i) available on the SEC’s website at www.sec.gov; and (ii) available for review and copying at the SEC’s Public Reference Room in Washington, D.C. Information about the operations of the Public Reference Room may be obtained by calling (800) SEC-0330.
TAX INFORMATION
For the year ended December 31, 2009, the following Funds paid distributions which were designated as long-term capital gains dividends:
| | | |
Fund | | Amount |
Investment Grade Bond | | $ | 26,571 |
Global Real Estate | | | 1,384,400 |
Goldman Sachs Short Duration | | | 1,992,132 |
PIMCO High Yield | | | 56,384 |
PIMCO Total Return | | | 874,052 |
AIM Small Cap Growth | | | 65,142 |
BlackRock Inflation Protected Bond | | | 56,093 |
Ibbotson Moderate | | | 11,937 |
Ibbotson Balanced | | | 8,079 |
Ibbotson Growth | | | 1,808 |
For federal tax purposes, the following information is furnished with respect to the distributions of the Trust for its fiscal year ended December 31, 2009:
Percentage of distributions which qualify for the corporate dividends received deduction:
| | | |
Fund | | Percentage | |
Global Real Estate | | 4.52 | % |
Davis Venture Value | | 100.00 | % |
Oppenheimer Main Street Small Cap | | 100.00 | % |
Oppenheimer Large Cap Core | | 100.00 | % |
WMC Large Cap Growth | | 100.00 | % |
WMC Blue Chip Mid Cap | | 100.00 | % |
Lord Abbett Growth & Income | | 7.91 | % |
Goldman Sachs Mid Cap Value | | 9.47 | % |
Dreman Small Cap Value | | 8.12 | % |
PIMCO High Yield | | 0.51 | % |
PIMCO Total Return | | 0.23 | % |
AIM Small Cap Growth | | 5.45 | % |
Ibbotson Moderate | | 21.59 | % |
Ibbotson Balanced | | 35.36 | % |
Ibbotson Growth | | 38.61 | % |
258
OTHER INFORMATION (Unaudited) (Continued)
The following Funds designate as income received from foreign sources and taxes paid to foreign countries the following amounts:
| | | | | | |
Fund | | Foreign Source
Income | | Foreign Taxes
Paid |
Global Real Estate | | $ | 5,409,886 | | $ | 372,406 |
AllianceBernstein International Value | | | 1,200,199 | | | 106,653 |
ADVISORY CONTRACT RENEWALS
Funds Having Investment Advisory and/or Subadvisory Agreements Renewed in 2009:
Sun Capital Investment Grade Bond Fund
Sun Capital Money Market Fund
Sun Capital Global Real Estate Fund
SC Davis Venture Value Fund
SC Goldman Sachs Mid Cap Value Fund
SC Goldman Sachs Short Duration Fund
SC Lord Abbett Growth & Income Fund
SC Oppenheimer Main Street Small Cap Fund
SC Oppenheimer Large Cap Core Fund
SC PIMCO High Yield Fund
SC WMC Large Cap Growth Fund
SC WMC Blue Chip Mid Cap Fund
Factors Considered by the Board of Trustees (the “Board”) in Approving the Continuation of each Investment Advisory Agreement.
The Funds’ Board approved the continuation of each above-referenced Fund’s current investment advisory agreement (including, in the case of the SC Davis Venture Value Fund, SC Goldman Sachs Mid Cap Value Fund, SC Goldman Sachs Short Duration Fund, SC Lord Abbett Growth & Income Fund, SC Oppenheimer Main Street Small Cap Fund, SC Oppenheimer Large Cap Core Fund, SC PIMCO High Yield Fund, SC WMC Large Cap Growth Fund and SC WMC Blue Chip Mid Cap Fund, each such Fund’s subadvisory agreement) for an additional twelve-month period at an in-person meeting held in November 2009.
In terms of the process that the Trustees followed prior to approving the continuation of each investment advisory and subadvisory agreement (together, the “investment advisory agreements”), Variable Contract Owners1 should know that:
| * | At present, all but one of the Funds’ Trustees, including the Board’s chairman, are independent of Sun Capital Advisers LLC (“Sun Capital”), which serves as investment adviser to each of the Funds, each subadviser, and their respective affiliates (“Independent Trustees”). |
| * | In connection with the Board’s 2009 contract review, the Independent Trustees met on multiple occasions to discuss and consider contract review matters, and were advised by, and held private meetings with, their independent legal counsel. |
| * | The Board engaged in a thorough review of each Fund’s investment advisory agreement(s). In this connection, the Board reviewed a wide range of materials furnished by Sun Capital and, as applicable, each subadviser, prior to reaching these decisions. |
| 1 | Shares of the Funds are owned by Sun Life (U.S.) and Sun Life (N.Y.) for the benefit of the owners of variable annuities and variable life insurance policies (“Variable Contract Owners”) issued by Sun Life (U.S.) or Sun Life (N.Y.). |
259
OTHER INFORMATION (Unaudited) (Continued)
| * | In connection with reviewing the Funds’ investment management agreements, the Board also reviewed the terms of the Funds’ Rule 12b-1 plans, distribution agreement, and servicing agreements. |
In determining to approve the continuation of each investment advisory agreement, the Board considered all factors that it believed relevant to the interests of Variable Contract Owners, including but not limited to:
| • | | Fees and expenses. The investment advisory and, as applicable, investment subadvisory fee schedules for each Fund, including (i) comparative information provided by Lipper regarding investment advisory fee rates paid to other advisers by similar funds; and (ii) fee rates paid to Sun Capital and each subadviser by each Fund relative to those paid by similar funds and institutional accounts advised by such firms. The Board considered that Sun Capital currently does not manage any institutional accounts in a manner similar to a Fund. The Board also received and considered information regarding the differences in the type and level of services required for the Funds and institutional accounts more generally. In the case of each sub-advised Fund, the Board noted that the investment subadvisory fees paid to each subadviser are paid by Sun Capital out of its fee, not by the Fund. Taking into account the foregoing, the Board concluded that the fee schedules in effect for each Fund represent reasonable compensation in light of the nature, extent and quality of the investment services being provided to such Fund. |
| • | | Economies of scale. The extent to which economies of scale would be realized as each Fund grows. In this regard, the Board observed that the advisory fees charged to the SC Davis Venture Value Fund, SC Oppenheimer Main Street Small Cap Fund, SC WMC Large Cap Growth Fund and SC WMC Blue Chip Mid Cap Fund contain breakpoints and, accordingly, reflect the potential to share economies of scale. In addition, with respect to each other Fund, the Board considered Sun Capital’s commitment to consider breakpoints on each such Fund to the extent any such Fund’s assets under management increase to more substantial, scaleable levels in the future. The Board concluded that each Fund’s fee schedule represents an appropriate sharing between the Variable Contract Owners and the investment advisers of such economies of scale as may exist in the management of each Fund at current asset levels. |
| • | | Profitability; Other benefits to Sun Capital. The costs of the services to be provided, and profits realized, by Sun Capital and its affiliates from their relationship with each Fund. In this regard, the Board observed that Sun Capital reported that it was operating several Funds at a net loss (suggesting that Sun Capital had assumed considerable economic risk in contracting with the Funds), and had committed to extend previously existing total operating expense caps applicable to each Fund through at least April 30, 2011. In analyzing Sun Capital’s costs and profits and its affiliates’ costs, the Board also reviewed the fees paid to and services provided by Sun Capital and its affiliates to each Fund for non-advisory services, such as distribution (including fees paid pursuant to Rule 12b-1 plans). The Board also considered other potential benefits to Sun Capital and its affiliates from the relationships with the Funds, including the roles of the Funds in supporting the variable contracts issued by Sun Life (U.S.) and Sun Life (N.Y.), both of which are affiliates of Sun Capital. The Board concluded that each Fund’s investment advisory fee schedule represented reasonable compensation in light of, among other factors, the costs incurred by the adviser and its affiliates in providing services to each Fund. |
| • | | Investment performance. The investment performance of each Fund, both absolute and relative to various benchmarks and industry peer groups, including comparative information provided by Lipper regarding each Fund’s performance relative to other similar Funds. |
| • | | Nature, quality and extent of services. The nature, scope and quality of the services that Sun Capital and each subadviser provide to the Funds. In this regard, the Board considered, among other things, Sun Capital’s and each subadviser’s personnel (including particularly those personnel with responsibilities for providing services to the Funds), resources, policies and investment processes. In addition to meeting with representatives of Sun Capital and each subadviser, the Board also considered, among other things, Sun Capital’s representation that |
260
OTHER INFORMATION (Unaudited) (Continued)
| | it was satisfied with the resources, compliance program and level of commitment put forth by each subadviser and its recommendation that each subadvisory agreement be continued. The Board considered that the types of services to be provided under the investment advisory agreements were comparable to those typically found in agreements of such type. In this regard, the Board concluded that the quality and range of services provided by Sun Capital and, as applicable, each subadviser, have benefited and should continue to benefit each Fund and its Variable Contract Owners. |
| • | | Brokerage practices. The practices of Sun Capital and each subadviser regarding the selection and compensation of brokers and dealers executing portfolio transactions for the Funds, including the brokers’ and dealers’ provision of brokerage and research services to Sun Capital and each subadviser. The Board indicated that it would continue to monitor the allocation of each Fund’s brokerage to ensure that the principle of “best price and execution” remains paramount in the portfolio trading process. |
| • | | Compliance. Sun Capital’s and each subadviser’s commitment to and record of compliance, including its written compliance policies and procedures. In this regard, the Board considered Sun Capital’s continued commitment of attention and resources to compliance functions relevant to the Funds’ operations, including the oversight of subadvisers. The Board also considered the Sun Life organization’s commitment of resources to its U.S. business more generally. |
After due consideration of these and other factors that it considered relevant, the Board determined to approve the continuation of each Fund’s investment advisory agreement and, as applicable, investment subadvisory agreement, and concluded that the continuation of such agreements was in the best interest of the Fund and the Variable Contract Owners.
In reaching this conclusion, the Board did not give particular weight to any single factor noted above. The Board considered these and other factors over the course of multiple meetings, certain of which were held in executive session with only the Independent Trustees and their counsel present. It is possible that individual Trustees may have weighed these factors differently in reaching their individual decisions to approve the continuation of the investment advisory agreements.
261
| | |
| OTHER INFORMATION (Unaudited) (Continued) | | Sun Capital Advisers Trust |
Each fund’s business is managed by the trustees. Several of the funds’ trustees and officers are also directors and officers of Sun Life Assurance Company of Canada or the adviser. The table below provides more information about the funds’ trustees and officers.
| | | | | | | | | | |
| Name, address and age | | Position with the
Trust | | Length of Time Served | | Principal occupation
past 5 years | | Number of Funds
Within Fund Complex
Overseen by Trustee | | Other Directorships Held
Outside of the Fund
Complex by Trustee |
Michael P. Castellano c/o Sun Capital Advisers Trust One Sun Life Executive Park Wellesley Hills, MA 02481 Year of birth: 1941 | | Trustee | | Since
February 2005 | | Retired | | 20 | | None |
Dawn-Marie Driscoll c/o Sun Capital Advisers Trust One Sun Life Executive Park Wellesley Hills, MA 02481 Year of birth: 1946 | | Trustee | | Since June 2007 | | President, Driscoll Associates (consulting firm); Executive Fellow, Center for Business Ethics, Bentley University; Directorships: Advisory Board, Center for Business Ethics, Bentley University; Trustee, Southwest Florida Community Foundation (charitable organization), Director, ICI Mutual; Former Directorships: Investment Company Institute; Former Memberships: Executive Committee of the Independent Directors Council of the Investment Company Institute. | | 20 | | Trustee, DWS Funds (New York) Board (126 mutual funds) since 1987. |
William N. Searcy, Jr. c/o Sun Capital Advisers Trust One Sun Life Executive Park Wellesley Hills, MA 02481 Year of birth: 1946 | | Chairman and Trustee | | Chairman since 2005 Trustee since October 1998 | | Private investor. Pension and Savings Trust Officer, Sprint Corp. (wireless and wireline communications services) 1989-2003. | | 20 | | Trustee, DWS Funds (New York) Board (126 mutual funds) since 1993. |
262
| | |
| OTHER INFORMATION (Unaudited) (Continued) | | Sun Capital Advisers Trust |
| | | | | | | | | | |
| Name, address and age | | Position with the
Trust | | Length of Time Served | | Principal occupation
past 5 years | | Number of Funds
Within Fund Complex
Overseen by Trustee | | Other Directorships Held
Outside of the Fund
Complex by Trustee |
John T. Donnelly* One Sun Life Executive Park Wellesley Hills, MA 02481 Year of birth: 1958 | | President, Chief Executive Officer and Trustee | | Since May 2009 | | Senior Managing Director, Investment Products and Strategies, Sun Life Assurance Company of Canada, since 2007. President, Chief Investment Officer and Manager, Sun Capital Advisers LLC, since 2009. Associated with Sun Life Financial since 1991. | | 20 | | Director, Crosspointe Shops I LLC since 2009; Director, Crosspointe Shops II LLC since 2009; Director, Sun Life Insurance and Annuity Company of New York since 2008; Director and Chairman, Sun Life Investments LLC since 2005; Director, Sun Life Financial Global Funding, L.L.C. since 2004; Director, Sun Life Financial Global Funding, U.L.C. since 2004; Director, Sun Life Financial Global Funding II, L.L.C. since 2006; Director, Sun Life Financial Global Funding II, U.L.C. since 2006; Director, Sun Life Financial Global Funding III, L.L.C. since 2006; Director, Sun Life Financial Global Funding III U.L.C. since 2006. |
James F. Alban* One Sun Life Executive Park Wellesley Hills, MA 02481 Year of birth: 1962 | | Chief Financial Officer and Treasurer | | Since October 1998; Serves at the discretion of the Trustees. | | Managing Director and Chief Financial Officer, Sun Capital Advisers LLC, since 2000. Associated with Sun Life Financial since 1998. | | N/A | | N/A |
Maura A. Murphy, Esq.* One Sun Life Executive Park Wellesley Hills, MA 02481 Year of birth: 1960 | | Secretary and Chief Legal Officer Chief Compliance Officer | | Since October 1998; Serves at the discretion of the Trustees. Since December 2009; Serves at the discretion of the Trustees. | | Managing Director and General Counsel since 2000, and Secretary since 1998, Sun Capital Advisers LLC. Assistant Vice President and Senior Counsel, Sun Life Assurance Company of Canada (U.S.). Associated with Sun Life Financial since 1998. | | N/A | | N/A |
| * | An interested person of the Funds for purposes of Section 2(a)(19) of the 1940 Act. |
The Statement of Additional Information (SAI) includes additional information about the Funds’ trustees and is available, without charge, upon request by calling 1-800-432-1102 x3330.
263
Sun Capital Advisers Trust
TRUSTEES AND OFFICERS
Michael P. Castellano, Trustee
Dawn-Marie Driscoll, Trustee
William N. Searcy, Jr., Chairman, Trustee
John T. Donnelly, President, Chief Executive Officer and Trustee
James F. Alban, Chief Financial Officer and Treasurer
Maura A. Murphy, Secretary, Chief Legal Officer and Chief Compliance Officer
INVESTMENT ADVISER
Sun Capital Advisers LLC
One Sun Life Executive Park
Wellesley Hills, MA 02481
INDEPENDENT REGISTERED PUBLIC ACCOUNTING FIRM
Deloitte & Touche LLP
200 Berkeley Street
Boston, MA 02116
ADMINISTRATOR, CUSTODIAN, TRANSFER AGENT
State Street Bank & Trust Company
One Lincoln Street
Boston, MA 02111
LEGAL COUNSEL
Dechert LLP
200 Clarendon Street
Boston, MA 02116
This report must be preceded or accompanied by a prospectus for Sun Capital Advisers Trust which includes more information about charges and expenses. Please read the prospectus carefully before you invest or send money.
Registrant has adopted a code of ethics that applies to registrant’s principal executive officer and principal financial officer. This code of ethics is available without charge, upon request, by calling 1-800-432-1102 x3330. A copy of this code of ethics is filed as an exhibit to this Form N-CSR. No substantive amendments were approved or waivers granted to this code of ethics during the period covered by this report.
| Item 3. | Audit Committee Financial Expert. |
The registrant’s Board of Trustees has determined that the registrant has at least one financial expert, Michael P. Castellano, serving on its Audit Committee. Mr. Castellano is considered “independent” for purposes of Item 3(a)(2) of Form N-CSR.
| Item 4. | Principal Accountant Fees and Services. |
Aggregate fees billed for professional services rendered to the registrant for the last two fiscal years by the registrant’s principal accountant were as follows:
(a) Audit Fees: Includes amounts related to the audit of the registrant’s annual financial statements and services normally provided by the accountant in connection with statutory and regulatory filings.
| | | |
FY 2009 | | FY 2008 |
$692,782 | | $ | 652,650 |
(b) Audit-related Fees: Includes amounts related to assurance and related services that are reasonably related to the performance of the audit of the registrant’s financial statements and are not reported under paragraph (a) of this Item.
| | |
FY 2009 | | FY 2008 |
None | | NoneA |
A Reflects current period presentation.
(c) Tax Fees: Includes amounts related to tax compliance, tax planning and tax advice.
| | | |
FY 2009 | | FY 2008 |
$81,160 | | $ | 77,850 |
(d) All Other Fees: Includes amounts related to products and services provided to the registrant by the registrant’s principal accountant, other than the services reported in paragraphs (a) through (c) of this Item.
(e)(1) The registrant’s Audit Committee has adopted a policy whereby audit and non-audit services performed by the registrant’s principal accountant for the registrant require pre-approval. In addition, non-audit services performed by the registrant’s principal accountant for the registrant’s investment adviser and any entity controlling, controlled by or under common control with the investment adviser that provides ongoing services to the registrant also require pre-approval if the services provided to those entities are related directly to the operations and financial reporting of the registrant.
The policy includes a list of specified services that are deemed to be pre-approved, subject to stated dollar limits, by the Audit Committee. The Audit Committee must provide specific advance approval for any service that is not included in the list of pre-approved services, or for any pre-approved service that exceeds the dollar limit set forth in the policy. In determining whether to approve services, the Audit Committee considers whether the services are consistent with maintaining the principal accountant’s independence.
(e)(2) No services included in this Item 4 (b) through (d) were approved pursuant to paragraph (c)(7)(i)(C) of Rule 2-01 of Regulation S-X.
(f) Not applicable
(g) During the registrant’s fiscal years ended December 31, 2009 and December 31, 2008, there were no fees billed by the registrant’s principal accountant for non-audit services rendered to the registrant, the registrant’s investment adviser, or to any entity controlling, controlled by, or under common control with the adviser that provides ongoing services to the registrant.
(h) Not applicable
| Item 5. | Audit Committee of Listed Registrants. |
Not applicable
| Item 6. | Schedule of Investments. |
Included in stockholder report filed under Item 1.
| Item 7. | Disclosure of Proxy Voting Policies and Procedures for Closed-End Management Investment Companies. |
Not applicable
| Item 8. | Portfolio Managers of Closed-End Management Investment Companies. |
Not Applicable
| Item 9. | Purchases of Equity Securities by Closed-End Management Investment Company and Affiliated Purchasers. |
Not Applicable
| Item 10. | Submission of Matters to a Vote of Security Holders. |
No material changes to the procedures by which shareholders may recommend nominees to the registrant’s Board of Trustees have been implemented since the registrant’s most recent disclosure to this Item.
| Item 11. | Controls and Procedures. |
| (a) | Based upon their evaluation of the registrant’s disclosure controls and procedures as conducted within 90 days of the filing date of this Form N-CSR, the registrant’s principal financial officer and principal executive officer have concluded that those disclosure controls and procedures provide reasonable assurance that the material information required to be disclosed by the registrant on this report is recorded, processed, summarized and reported within the time periods specified in the Securities and Exchange Commission’s rules and forms. |
| (b) | There have been no significant changes in the registrant’s internal control over financial reporting during the registrant’s second fiscal quarter of the period covered by this report that has materially affected, or is reasonably likely to materially affect, the registrant’s internal control over financial reporting. |
| (a) (1) | The code of ethics as required by Form N-CSR Item 2 is filed herewith. |
| (a) (2) | A separate certification for each principal executive officer and principal financial officer of the registrant as required by Rule 30a-2(a) under the Investment Company Act of 1940, as amended, are filed herewith. |
| (a) (3) | A combined certification by the principal executive and principal financial officers of the registrant as required by Rule 30a-2(b), under the Investment Company Act of 1940, as amended, is filed herewith. |
SIGNATURES
Pursuant to the requirements of the Securities Exchange Act of 1934 and the Investment Company Act of 1940, the registrant has duly caused this report to be signed on its behalf by the undersigned, thereunto duly authorized.
| | | | | | | | |
| (Registrant) | | | | SUN CAPITAL ADVISERS TRUST |
| | |
| By (Signature and Title)* | | | | /s/ JOHN T. DONNELLY |
| | | | | | John T. Donnelly, President |
Date: February 25, 2010
Pursuant to the requirements of the Securities Exchange Act of 1934 and the Investment Company Act of 1940, this report has been signed below by the following persons on behalf of the registrant and in the capacities and on the dates indicated.
| | | | | | | | |
| | |
| By (Signature and Title)* | | | | /s/ JOHN T. DONNELLY |
| | | | | | John T. Donnelly, President |
| | | | | | (Chief Executive Officer) |
Date: February 25, 2010
| | | | | | | | |
| | | | |
| | |
| By (Signature and Title)* | | | | /s/ JAMES F. ALBAN |
| | | | | | James F. Alban, Treasurer |
| | | | | | (Chief Financial Officer) |
Date: February 25, 2010
| * | Print name and title of each signing officer under his or her signature. |