Table of Contents
UNITED STATES
SECURITIES AND EXCHANGE COMMISSION
WASHINGTON, D.C. 20549
FORM 10-K
ý ANNUAL REPORT PURSUANT TO SECTION 13 OR 15(d) OF THE SECURITIES EXCHANGE ACT OF 1934
For the fiscal year ended December 31, 2008
OR
o TRANSITION REPORT PURSUANT TO SECTION 13 OR 15(d) OF THE SECURITIES EXCHANGE ACT OF 1934
For the transition period from to
Commission File Number 001-15253

Janus Capital Group Inc.
(Exact name of registrant as specified in its charter)
| | |
Delaware
(State or other jurisdiction of
incorporation or organization) | | 43-1804048
(I.R.S. Employer Identification No.) |
151 Detroit Street, Denver, Colorado
(Address of principal executive offices) |
|
80206
(Zip Code) |
(303) 333-3863
(Registrant's telephone number, including area code)
Securities registered pursuant to Section 12(b) of the Act:
| | |
Title of Each Class | | Name of Each Exchange on Which Registered |
|---|
Common Stock, $0.01 Per Share Par Value
Preferred Stock Purchase Rights | | New York Stock Exchange
New York Stock Exchange |
Securities registered pursuant to Section 12(g) of the Act:
None
|
Indicate by check mark if the registrant is a well-known seasoned issuer, as defined in Rule 405 of the Securities Act Yes ý No o
Indicate by check mark if the registrant is not required to file reports pursuant to Section 13 or Section 15(d) of the Act. Yes o No ý
Indicate by check mark whether the registrant: (1) has filed all reports required to be filed by Section 13 or 15(d) of the Securities Exchange Act of 1934 during the preceding 12 months (or for such shorter period that the Company was required to file such reports), and (2) has been subject to the filing requirements for the past 90 days. Yes ý No o
Indicate by check mark if disclosure of delinquent filers pursuant to Item 405 of Regulation S-K (§209 of this chapter) is not contained herein, and will not be contained, to the best of registrant's knowledge, in definitive proxy of information statements incorporated by reference in Part III of this Form 10-K or any amendment to this Form 10-K. o
Indicate by check mark whether the registrant is a large accelerated filer, an accelerated filer, a non-accelerated filer, or a smaller reporting company. See the definitions of "large accelerated filer," "accelerated filer" and "smaller reporting company" in Rule 12b-2 of the Exchange Act.
| | | | | | |
| Large accelerated filer ý | | Accelerated filer o | | Non-accelerated filer o
(Do not check if a smaller reporting company) | | Smaller reporting company o |
Indicate by check mark whether the registrant is a shell company (as defined in Rule 12b-2 of the Exchange Act). Yeso Noý
As of June 30, 2008, the aggregate market value of common equity held by nonaffiliates was $4,251,250,693. As of February 22, 2009, there were 158,118,027 shares of the Company's common stock, $.01 par value per share, issued and outstanding.
DOCUMENTS INCORPORATED BY REFERENCE
Portions of the following documents are incorporated herein by reference into Part of the Form 10-K as indicated:
| | |
Document
| | Part of Form 10-K into Which Incorporated |
| Company's Definitive Proxy Statement for the 2009 Annual Meeting of Stockholders | | Part III |
Table of Contents
JANUS CAPITAL GROUP INC.
2008 FORM 10-K ANNUAL REPORT
TABLE OF CONTENTS
| | | | |
| |
| | Page |
|---|
PART I |
Item 1. | | Business | | 2 |
Item 1A. | | Risk Factors | | 7 |
Item 1B. | | Unresolved Staff Comments | | 10 |
Item 2. | | Properties | | 10 |
Item 3. | | Legal Proceedings | | 10 |
Item 4. | | Submission of Matters to a Vote of Security Holders | | 10 |
PART II |
Item 5. | | Market for Registrant's Common Equity, Related Stockholder Matters and Issuer Purchases of Equity Securities | | 11 |
Item 6. | | Selected Financial Data | | 13 |
Item 7. | | Management's Discussion and Analysis of Financial Condition and Results of Operations | | 15 |
Item 7A. | | Quantitative and Qualitative Disclosures about Market Risk | | 27 |
Item 8. | | Financial Statements and Supplementary Data | | 30 |
Item 9. | | Changes in and Disagreements with Accountants on Accounting and Financial Disclosure | | 65 |
Item 9A. | | Controls and Procedures | | 65 |
Item 9B. | | Other Information | | 65 |
PART III |
Item 10. | | Directors, Executive Officers and Corporate Governance | | 65 |
Item 11. | | Executive Compensation | | 65 |
Item 12. | | Security Ownership of Certain Beneficial Owners and Management and Related Stockholder Matters | | 65 |
Item 13. | | Certain Relationships and Related Transactions, and Director Independence | | 65 |
Item 14. | | Principal Accountant Fees and Services | | 65 |
PART IV |
Item 15. | | Exhibits and Financial Statement Schedules | | 66 |
| | Signatures | | 73 |
1
Table of Contents
PART I
FORWARD-LOOKING STATEMENTS
This Annual Report on Form 10-K contains "forward-looking statements" within the meaning of the Private Securities Litigation Reform Act of 1995. In addition, Janus Capital Group Inc. (collectively "JCG" or the "Company") may make other written and oral communications from time to time (including, without limitation, in the Company's 2008 Annual Report to Stockholders) that contain such statements. Forward-looking statements include statements as to industry trends and future expectations of the Company and other matters that do not relate strictly to historical facts and are based on certain assumptions by management. These statements are often identified by the use of words such as "may," "will," "expect," "believe," "anticipate," "intend," "could," "should," "estimate" or "continue," and similar expressions or variations. These statements are based on the beliefs and assumptions of Company management based on information currently available to management. Such forward-looking statements are subject to risks, uncertainties and other factors that could cause actual results to differ materially from future results expressed or implied by such forward-looking statements. Important factors that could cause actual results to differ materially from the forward-looking statements include, among others, the risks described in Part I, Item 1A, Risk Factors, and elsewhere in this report and other documents filed or furnished by JCG from time to time with the Securities and Exchange Commission. JCG cautions readers to carefully consider such factors. Furthermore, such forward-looking statements speak only as of the date on which such statements are made. Except to the extent required by applicable law, JCG undertakes no obligation to update any forward-looking statements to reflect events or circumstances after the date of such statements.
ITEM 1. BUSINESS
Janus Capital Group Inc. and its subsidiaries (collectively, "JCG" or the "Company") provides investment management, administration, distribution and related services to individual and institutional investors through mutual funds, separate accounts and subadvised relationships (collectively referred to herein as "investment products") in both domestic and international markets. Over the last several years, JCG has expanded its business to become a more diversified manager with increased investment product offerings and distribution capabilities. JCG provides investment advisory services through its primary subsidiaries, Janus Capital Management LLC ("Janus"), INTECH Investment Management LLC ("INTECH", formerly known as Enhanced Investment Technologies, LLC) and Perkins Investment Management LLC ("Perkins," formerly known as Perkins, Wolf, McDonnell and Company, LLC). Each of JCG's three primary subsidiaries specializes in specific investment styles and disciplines. JCG's investment products are distributed through three channels: retail intermediary, institutional and international. Each distribution channel focuses on specific investor groups and the unique requirements of each group. As of December 31, 2008, JCG managed $123.5 billion of assets under management.
Revenues are generally based upon a percentage of the market value of assets under management and are calculated as a percentage of the daily average asset balance in accordance with contractual agreements with the Company's investment products. Certain investment products are also subject to performance fees which vary based on their relative performance as compared to a benchmark index and the level of assets subject to such fees. Assets under management primarily consist of domestic and international equity and debt securities. Accordingly, fluctuations in domestic and international financial markets, relative investment performance, sales and redemptions of investment products, and changes in the composition of assets under management are all factors that have a direct effect on JCG's operating results.
2
Table of Contents
Subsidiaries
Janus
Janus considers itself a leader in equity investing, beginning with the launch of the Janus Fund approximately 40 years ago. Janus offers growth equity, core and international equity funds, as well as balanced, fixed-income, alternative and money market investment products. Janus' investment teams are led by its co-Chief Investment Officers, who are charged with driving investment performance across all disciplines while maintaining a structured investment approach. Janus' investment teams seek to identify strong businesses with sustainable competitive advantages or improving returns on capital that sell at a discount to what the teams believe they are worth. Janus believes its depth of research; its experienced portfolio managers and analysts; its willingness to make concentrated investments when Janus believes it has a research edge; and its commitment to delivering strong, long-term results for its investors are what differentiate Janus from its competitors. At December 31, 2008, Janus managed $64.1 billion of long-term assets and $7.9 billion of money market assets, or 59% of total Company assets under management.
Despite short-term underperformance in 2008 (41% of equity mutual funds in the top two quartiles of their Lipper categories on a one-year total return basis), Janus equity mutual funds outperformed the majority of peers over longer periods with 74% and 79% of equity mutual funds ranking in the top two quartiles of their Lipper categories on a three- and five-year total return basis, respectively, as of December 31, 2008. (See Exhibit 99.1 for complete Lipper rankings.)
INTECH
INTECH's unique investment process is based on a mathematical theorem that attempts to capitalize on the volatility in stock price movements. The goal is to achieve long-term returns that outperform the benchmark index while controlling risks and trading costs. At December 31, 2008, INTECH managed $42.4 billion, or 34% of total Company assets under management.
INTECH has managed institutional portfolios since 1987, establishing one of the industry's longest continuous performance records of mathematically driven equity investing strategies. From inception through December 31, 2008, 11 out of 12 INTECH investment strategies have outperformed their respective benchmarks, net of fees and on a gross fee basis. Additionally, INTECH's short-term relative investment performance rebounded from underperformance in 2007, while longer-term performance remained strong with 83%, 56%, 100% and 100% of strategies outperforming their respective benchmarks over the one-,three-,five- and 10-year periods ended December 31, 2008.
Perkins
Perkins has managed value discipline investment products since 1980. With its industry experience, fundamental research and careful consideration for risk, Perkins has established a reputation as a respected value manager. As of December 31, 2008, Perkins' funds ranked in the top 15% of their respective Lipper categories on a one-, three- and five-year total-return basis. Perkins expanded its product offerings in late 2008 with the launch of the Large Cap Value Fund. Perkins' assets under management totaled $9.1 billion at the end of 2008, or 7% of total Company assets under management. On December 31, 2008, JCG purchased an additional 50% ownership stake in Perkins for $90.0 million, increasing its ownership of Perkins to approximately 80%.
Distribution Channels
Retail Intermediary Channel
The retail intermediary channel serves financial intermediaries and retirement plans for the advice-driven market, which includes asset managers, bank/trust officers, broker-dealers, independent planners,
3
Table of Contents
third-party administrators and insurance companies. In addition, this channel serves individual investors who access JCG's investment products directly. JCG has aligned the channel to focus resources on distributor needs and is targeting product platforms that tend to have high asset retention rates to enhance long-term profitability. Significant investments have been made in building out the Company's retail intermediary channel over the last several years, with the number of external wholesalers more than doubling from 2004 through the end of 2008. Assets in the retail intermediary channel totaled $70.8 billion, or 57% of total Company assets under management at December 31, 2008.
Institutional Channel
The institutional channel serves corporations, endowments, foundations, Taft-Hartley and public fund clients and focuses on distribution through consulting relationships and on a direct basis. Investors in the institutional channel often rely on advice from third-party consultants. Accordingly, JCG has assembled a Consultant Relations team dedicated to providing information and services to third-party institutional consultants. Although the current asset base in this channel is weighted heavily toward INTECH's risk-managed products, the Company is seeking increased penetration of Janus and Perkins products. Assets in the institutional channel totaled $42.9 billion, or 35% of total Company assets under management at December 31, 2008.
International Channel
The international channel serves professional investors outside of the United States, including central and local government pensions, corporate pensions, multi-managers, insurance companies and private banks. International products are offered through Janus Capital Funds Plc, separate accounts and subadvisory relationships. Assets in the international channel totaled $9.8 billion, or 8% of total Company assets under management at December 31, 2008.
COMPETITION
The investment management industry is relatively mature and saturated with competitors that provide services similar to JCG. As such, JCG encounters significant competition in all areas of its business. JCG competes with other investment managers, mutual fund advisers, brokerage and investment banking firms, insurance companies, hedge funds, venture capitalists, banks and other financial institutions, many of which are larger, have proprietary access to distribution, have a broader range of product choices and investment capabilities, and have greater capital resources. Additionally, the marketplace for investment products is rapidly changing; investors are becoming more sophisticated; the demand for and access to investment advice and information are becoming more widespread; and more investors are demanding investment vehicles that are customized to their personal requirements.
JCG believes its ability to successfully compete in the investment management industry will be based on its ability to achieve consistently strong investment performance; maintain and build upon its distribution relationships and continue to create new ones; develop appropriately priced investment products well-suited for its distribution channels and attractive to underlying clients and investors; offer multiple investment choices; provide effective shareowner servicing; retain and strengthen the confidence of its clients; attract and retain talented investment and sales personnel; and develop and leverage its brand in existing and new distribution channels.
REGULATION
The investment management industry is subject to extensive federal, state and international laws and regulations intended to benefit or protect the shareholders of investment products managed by JCG subsidiaries and advisory clients of JCG subsidiaries. The costs of complying with such laws and regulations have significantly increased and may continue to contribute significantly to the costs of
4
Table of Contents
doing business as an investment adviser. These laws and regulations generally grant supervisory agencies broad administrative powers, including the power to limit or restrict the conduct of JCG's business and to impose sanctions for failure to comply with the laws and regulations. Possible consequences or sanctions for such failure to comply include, but are not limited to, voiding of investment advisory and subadvisory agreements; the suspension of individual employees (particularly investment management and sales personnel); limitations on engaging in certain lines of business for specified periods of time; revocation of registrations; disgorgement of profits; and censures and fines. Further, such laws and regulations may provide the basis for litigation that may also result in significant costs and reputational harm to JCG.
The Investment Advisers Act
The Securities and Exchange Commission ("SEC") is the federal agency generally responsible for administering the federal securities laws. Certain subsidiaries of JCG are registered investment advisers under the Investment Advisers Act of 1940, as amended (the "Investment Advisers Act") and, as such, are regulated by the SEC. The Investment Advisers Act requires registered investment advisers to comply with numerous and pervasive obligations, including among others, record-keeping requirements, operational procedures, registration and reporting and disclosure obligations. Certain subsidiaries of JCG are also registered with regulatory authorities in various states, and thus are subject to the oversight and regulation of such states' regulatory agencies.
The 1940 Act
Certain of JCG's subsidiaries act as adviser or subadviser to both proprietary and non-proprietary mutual funds, which are registered with the SEC pursuant to the Investment Company Act of 1940, as amended (the "1940 Act"). Certain of JCG's subsidiaries also serve as adviser or subadviser to separately managed accounts and commingled accounts that are not required to register under the 1940 Act. As an adviser or subadviser to a registered investment company, these subsidiaries must comply with the requirements of the 1940 Act and related regulations including among others, requirements relating to operations, fees charged, sales, accounting, recordkeeping, disclosure and governance. In addition, the adviser or subadviser to a registered investment company generally has obligations with respect to the qualification of the registered investment company under the Internal Revenue Code of 1986, as amended (the "Code").
Broker-Dealer Regulations
JCG's limited purpose broker-dealer subsidiary, Janus Distributors LLC ("JD"), is registered with the SEC under the Securities Exchange Act of 1934, as amended (the "Exchange Act"), and is a member of the Financial Industry Regulatory Authority ("FINRA"), the securities industry's self-regulatory organization. JD is the general distributor and agent of the sale and distribution of shares of certain mutual funds that are directly advised or serviced by certain of JCG's subsidiaries. The SEC imposes various requirements on JD's operations including disclosure, recordkeeping and accounting. FINRA has established conduct rules for all securities transactions among broker-dealers and private investors, trading rules for the over-the-counter markets and operational rules for its member firms. The SEC and FINRA also impose net capital requirements on registered broker-dealers.
JD is also subject to regulation under state law. The federal securities laws prohibit states from imposing substantive requirements on broker-dealers that exceed those under federal law. This does not preclude the states from imposing registration requirements on broker-dealers that operate within their jurisdiction or from sanctioning these broker-dealers and their employees for engaging in misconduct.
5
Table of Contents
ERISA
Certain JCG subsidiaries are also subject to the Employee Retirement Income Security Act of 1974, as amended ("ERISA") and related regulations to the extent they are considered "fiduciaries" under ERISA with respect to some of their clients. ERISA, related provisions of the Code and regulations issued by the Department of Labor impose duties on persons who are fiduciaries under ERISA and prohibit some transactions involving the assets of each ERISA plan that is a client of a JCG subsidiary as well as some transactions by the fiduciaries (and several other related parties) to such plans.
International Regulations
Certain JCG subsidiaries are authorized to conduct investment business in international markets and are subject to foreign regulation. JCG's international subsidiaries are subject to the regulatory supervision and requirements of various agencies, including the Financial Services Authority in the United Kingdom, the Irish Financial Services Regulatory Authority, the Securities and Futures Commission of Hong Kong, the Monetary Authority of Singapore, the Financial Services Agency of Japan and Canadian Securities Commissions. These regulatory agencies have broad supervisory and disciplinary powers, including, among others, the power to temporarily or permanently revoke the authorization to conduct regulated business, the suspension of registered employees, and censures and fines for both regulated businesses and their registered employees.
Many of the non-U.S. securities exchanges and regulatory authorities have imposed rules (and others may impose rules) relating to capital requirements applicable to JCG's foreign subsidiaries. These rules, which specify minimum capital requirements, are designed to measure general financial integrity and liquidity, and require that a minimum amount of assets be kept in relatively liquid form.
EMPLOYEES
As of December 31, 2008, JCG had 1,164 full-time employees. None of these employees are represented by a labor union.
AVAILABLE INFORMATION
Copies of JCG's filings with the SEC can be obtained from the SEC's Public Reference Room at 100 F Street, N.E., Washington, D.C. 20549. Information can be obtained about the operation of the Public Reference Room by calling the SEC at 1-800-SEC-0330. The SEC also maintains an Internet site that contains reports, proxy and information statements, and other information regarding issuers that file electronically with the SEC at http://www.sec.gov.
JCG makes available free of charge its annual reports on Form 10-K, quarterly reports on Form 10-Q and current reports on Form 8-K and amendments thereto as soon as reasonably practical after such filing has been made with the SEC. Reports may be obtained through the Investor Relations section of JCG's website (http://ir.janus.com) or by contacting JCG at (888) 834-2536. The contents of JCG's website are not incorporated herein for any purpose.
JCG's Officer Code of Ethics for Principal Executive Officer and Senior Financial Officers (including its chief executive officer, chief financial officer and controller) (the "Officer Code"); Corporate Code of Business Conduct and Ethics for all employees; corporate governance guidelines; and the charters of key committees of the board of directors (including the Audit, Compensation and Nominating and Corporate Governance, and Planning and Strategy committees) are available on its website (http://ir.janus.com/governance.cfm), and printed copies are available to any shareholder upon request by calling JCG at (888) 834-2536. Any future amendments to or waivers of the Officer Code will be posted to the Investor Relations section of JCG's website.
6
Table of Contents
ADDITIONAL FINANCIAL INFORMATION
See additional financial information about segments and geographical areas in Part II, Item 8, Financial Statements and Supplementary Data, Note 19 — Segment and Geographic Information, of this Annual Report on Form 10-K.
ITEM 1A. RISK FACTORS
The volatility and disruption of the capital and credit markets, and adverse changes in the global economy have and will continue to negatively impact JCG's results of operations, financial condition and liquidity.
The capital and credit markets have been experiencing volatility and disruption for more than 12 months. The decline in global market conditions has, and may continue to result in, decreases in JCG's assets under management and revenues. Such declines have and are likely to continue to have an adverse impact on JCG's operating results, financial condition, liquidity, credit ratings, ability to access its credit facility and capital markets. In addition, the deterioration in global market conditions may adversely impact JCG's goodwill and intangible asset impairment analyses, and its ability to attract and retain key employees. Because JCG's cost structure includes fixed components, operating results will likely decline at a higher rate than decreases in assets under management and revenues.
JCG's revenues and profits are dependent on the value, composition and relative investment performance of its investment products.
Any decrease in the value or amount of assets under management will cause a decline in revenues and operating results. Assets under management may decline for various reasons, many of which are not under JCG's control.
Factors that could cause assets under management and revenues to decline include the following:
- •
- Declines in equity markets. JCG's assets under management are concentrated in the U.S. equity markets and, to a lesser extent, in the international equity markets. As such, declines in the equity markets or the market segments in which JCG's investment products are concentrated will cause assets under management to decrease.
- •
- Declines in fixed income markets. In the case of fixed income investment products, which invest in high-quality short-term instruments, as well as other fixed income securities, the value of the assets may decline as a result of changes in interest rates, available liquidity in the markets in which a security trades, an issuer's actual or perceived creditworthiness, or an issuer's ability to meet its obligations.
- •
- Redemptions and other withdrawals. Investors (in response to adverse market conditions, inconsistent investment performance, the pursuit of other investment opportunities, or other factors) may reduce their investments in specific JCG investment products or in the market segments in which JCG's investment products are concentrated.
- •
- Political and general economic risks. The investment products managed by JCG may invest significant funds in international markets that are subject to risk of loss from political or diplomatic developments, government policies, civil unrest, currency fluctuations and changes in legislation related to foreign ownership. International markets, particularly emerging markets, are often smaller, may not have the liquidity of established markets, may lack established regulations and may experience significantly more volatility than established markets.
- •
- Relative investment performance. JCG's investment products are often judged on their performance as compared to benchmark indices, peer groups or on an absolute return basis. Any period of prolonged underperformance of investment products may result in the loss of existing assets and impact JCG's ability to attract new assets. In addition, approximately 18% of the Company's assets
7
Table of Contents
under management at December 31, 2008, are subject to performance fees, and more investment products may become subject to performance fees in the future. Performance fees are based on each product's investment performance as compared to an established benchmark index over a specified period of time. If investment products subject to performance fees underperform their respective benchmark index for a prolonged period, JCG's results of operations may be adversely impacted.
JCG's results are dependent on its ability to attract and retain key personnel.
The investment management business is highly dependent on the ability to attract, retain and motivate highly skilled, and often highly specialized, technical, executive, sales and investment management personnel. The market for investment and sales professionals is extremely competitive and is increasingly characterized by the frequent movement of portfolio managers, analysts and salespersons among different firms. Any cost-reduction initiative, changes to management structure, shifts in corporate culture, changes to corporate governance authority, or adjustments or reductions to compensation have and could continue to impact JCG's ability to retain key personnel and may result in additional legal claims. If JCG is unable to retain key personnel, it could have an adverse effect on JCG's results of operations and financial condition.
JCG is dependent upon third-party distribution channels to access clients and potential clients.
JCG's ability to market and distribute its investment products is significantly dependent on access to the client base of insurance companies, defined contribution plan administrators, securities firms, broker-dealers, banks and other distribution channels. These companies generally offer their clients various investment products in addition to, and in competition with, JCG. Further, the private account business uses referrals from financial planners, investment advisers and other professionals. JCG cannot be certain that it will continue to have access to these third-party distribution channels or have an opportunity to offer some or all of its investment products through these channels. In addition, JCG's existing relationships with third-party distributors and access to new distributors could be adversely impacted by recent consolidation within the financial services industry. The impact of the consolidation is currently unknown, but may result in increased distribution costs, a reduction in the number of third parties distributing JCG's investment products or increased competition to access third-party distribution channels. The inability to access clients through third-party distribution channels could have a material adverse effect on JCG's ability to maintain or increase assets under management, its financial condition, results of operations or business prospects.
INTECH's investment process is highly dependent on key employees and proprietary software.
INTECH's investment process is based on complex and proprietary mathematical models that seek to outperform various indices by capitalizing on the volatility in stock price movements while controlling trading costs and overall risk relative to the index. The maintenance of such models for current products and the development of new products are highly dependent on certain key INTECH employees. If INTECH is unable to retain key personnel or if the mathematical investment strategies fail to produce the intended results, INTECH may not be able to maintain the historical level of strong investment performance and clients may redeem assets, which could have an adverse effect on JCG's results of operations and financial condition.
The regulatory environment in which JCG operates has changed and may continue to change.
JCG may be adversely affected as a result of new or revised legislation or regulations or by changes in the interpretation or enforcement of existing laws and regulations. Compliance with these and other new reporting and operational requirements and regulations has increased significantly and may continue to increase the cost of operating mutual funds and other investment products, which could
8
Table of Contents
have an adverse effect on JCG's results of operations and financial condition. (See Part I, Item 1, Business — Regulation.)
JCG's business is vulnerable to failures in support systems and customer service functions.
The ability to consistently and reliably obtain securities pricing information, process shareowner transactions and provide reports and other customer service to the shareowners of funds and other investment products managed by JCG is essential to JCG's operations. Any delays or inaccuracies in obtaining pricing information, JCG's ability to price illiquid or thinly traded securities without readily obtainable market quotes, processing shareowner transactions or providing reports, and any other inadequacies in other customer service functions could alienate customers and potentially give rise to claims against JCG. JCG's customer service capabilities as well as JCG's ability to obtain prompt and accurate securities pricing information and to process shareowner transactions and reports are dependent on communication and information systems and services provided by third-party vendors.
Although JCG has established disaster recovery plans, these systems could suffer failures or interruptions due to various natural or man-made causes, and the backup procedures and capabilities may not be adequate to avoid extended interruptions. Additionally, JCG places significant reliance on its automated systems, thereby increasing the related risks if such systems were to fail. A failure of these systems could have an adverse effect on JCG's results of operations and financial condition.
JCG's business is dependent on investment advisory agreements that are subject to termination, non-renewal or reductions in fees.
JCG derives revenue and net income from investment advisory agreements with mutual funds and other investment products. The termination of, or failure to renew, one or more of these agreements or the reduction of the fee rates applicable to such agreements could have a material adverse effect on revenues and profits. With respect to investment advisory agreements with mutual funds, these agreements may be terminated by either party with notice, or terminated in the event of an "assignment" (as defined in the 1940 Act), and must be approved and renewed annually by the independent members of each fund's board of directors or trustees, or its shareowners, as required by law. In addition, the board of directors or trustees of certain funds and separate accounts generally may terminate these investment advisory agreements upon written notice for any reason and without penalty.
JCG's substantial indebtedness could adversely affect its financial condition and results of operations.
JCG has a significant amount of indebtedness which could limit its ability to obtain additional financing for working capital, capital expenditures, acquisitions, debt servicing requirements or other purposes. In addition, debt servicing requirements will increase JCG's vulnerability to adverse economic, market and industry conditions; limit JCG's flexibility in planning for, or reacting to, changes in business operations or to the asset management industry overall; and place JCG at a disadvantage in relation to competitors that have lower debt levels. In addition, all of JCG's outstanding debt is subject to an increase in interest rates in the event of a credit rating downgrade. Certain of JCG's indebtedness is also subject to repurchase at 101% of the principal balance if the Company experiences a change in control and the applicable notes are rated below investment grade. (See Part II, Item 8, Financial Statements and Supplementary Data, Note 11 — Debt.) Any or all of the above events and/or factors have and could continue adversely affecting JCG's results of operations and financial condition.
JCG may incur losses as a result of providing support to money market funds advised by the Company.
JCG's money market funds (the "Money Funds") attempt to provide current income and limit exposure to losses by investing in high-quality, investment-grade securities with short-term durations. Adverse
9
Table of Contents
events or circumstances related to individual securities or the market in which the securities trade may cause other-than-temporary declines in value. In these situations, JCG may elect to support the Money Funds in a variety of means, including but not limited to, purchasing securities held by the Money Funds, reimbursing for any losses incurred or providing a letter of credit. JCG is not contractually or legally obligated to support the Money Funds. JCG has, however, provided financial support in the past and may do so in the future.
JCG is named as a defendant in class action lawsuits and other related litigation.
JCG, certain of the Janus funds, and certain (past and present) officers of JCG are named as defendants in class action lawsuits and other litigation. (See Part II, Item 8, Financial Statements and Supplemental Data, Note 16 — Litigation, of this Annual Report on Form 10-K.) These lawsuits seek specified or unspecified compensatory and punitive damages. JCG is unable to estimate the range of potential losses that would be incurred if the plaintiffs in any of these actions were to prevail, or to determine the total potential effect that they may have on JCG's results of operations, financial position and cash flows. Any settlement or judgment on the merits of these actions could have a material adverse effect on JCG's liquidity, results of operations and financial condition.
ITEM 1B. UNRESOLVED STAFF COMMENTS
None.
ITEM 2. PROPERTIES
JCG's headquarters are located in Denver, Colorado. JCG leases office space from non-affiliated companies for administrative, investment and shareowner servicing operations in Denver and Aurora, Colorado; New York, New York; Princeton, New Jersey; West Palm Beach, Florida; London; Hong Kong; Tokyo; and Singapore.
In the opinion of management, the space and equipment owned or leased by the Company are adequate for existing operating needs.
ITEM 3. LEGAL PROCEEDINGS
The information set forth in response to Item 3 of Regulation S-K under "Legal Proceedings" is incorporated by reference from Part II, Item 8, Financial Statements and Supplemental Data,
Note 16 — Litigation, of this Annual Report on Form 10-K.
ITEM 4. SUBMISSION OF MATTERS TO A VOTE OF SECURITY HOLDERS
No matters were submitted to a vote of security holders during the three-month period ended December 31, 2008.
10
Table of Contents
PART II
ITEM 5. MARKET FOR REGISTRANT'S COMMON EQUITY, RELATED STOCKHOLDER MATTERS AND ISSUER PURCHASES OF EQUITY SECURITIES
JCG Common Stock
JCG's common stock is traded on the New York Stock Exchange ("NYSE") (symbol: JNS). The following table sets forth the high and low sale prices as reported on the NYSE composite tape for each completed quarter since January 1, 2007.
| | | | | | | | | | | | | |
| | 2008 | | 2007 | |
|---|
Quarter | | High | | Low | | High | | Low | |
|---|
First | | $ | 33.00 | | $ | 21.65 | | $ | 22.60 | | $ | 19.35 | |
Second | | $ | 31.54 | | $ | 22.65 | | $ | 29.83 | | $ | 20.76 | |
Third | | $ | 36.88 | | $ | 19.70 | | $ | 32.13 | | $ | 24.90 | |
Fourth | | $ | 25.72 | | $ | 5.18 | | $ | 37.08 | | $ | 28.58 | |
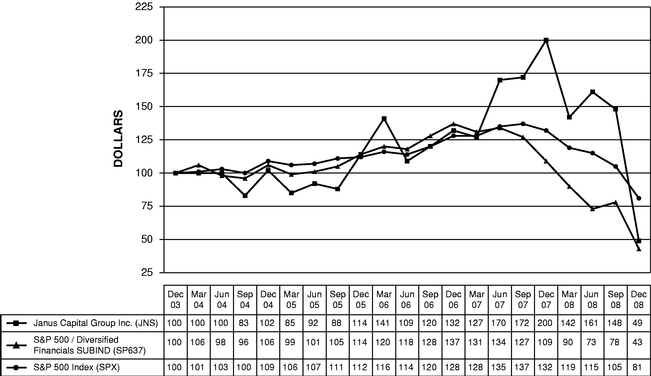
The following graph illustrates the cumulative total shareholder return (rounded to the nearest whole dollar) of JCG's common stock over the five-year period ending December 31, 2008, the last trading day of 2008, and compares it to the cumulative total return on the Standard & Poor's ("S&P") 500 Index and the S&P Diversified Financials Index. The comparison assumes a $100 investment on December 31, 2003, in JCG's common stock and in each of the foregoing indices and assumes reinvestment of dividends, if any. This table is not intended to forecast future performance of JCG's common stock.
On December 31, 2008, there were approximately 3,935 holders of record of JCG's outstanding common stock.
JCG declared an annual $0.04 per share dividend in the second quarter of 2008, 2007 and 2006. The payment of cash dividends is within the discretion of JCG's Board of Directors and will depend on many other factors, including, but not limited to, JCG's results of operations, financial condition,
11
Table of Contents
capital requirements, restrictions imposed by financing arrangements, general business conditions and legal requirements.
Common Stock Repurchases
The following table presents total 2008 JCG common share repurchases by month:
| | | | | | | | | | | | | | |
Period | | (a) Total
Number of
Shares
(or Units)
Purchased | | (b) Average
Price Paid
Per Share
(or Unit) | | (c) Total Number of
Shares (or Units)
Purchased as Part of
Publicly Announced
Plans or Programs | | (d) Maximum Number (or
Approximate Dollar Value)
of Shares (or Units) that
May Yet Be Purchased
Under the Plans or
Programs (End of Month) | |
|---|
January | | | 2,098,252 | | $ | 27.46 | | | 2,096,800 | | $ | 245 million | |
February | | | 2,459,497 | | $ | 25.57 | | | 2,156,592 | | $ | 190 million | |
March | | | 955,693 | | $ | 23.07 | | | 955,693 | | $ | 168 million | |
April | | | 8,683 | | $ | 23.56 | | | – | | $ | 168 million | |
May | | | 554,600 | | $ | 27.58 | | | 554,600 | | $ | 153 million | |
June | | | 2,039,587 | | $ | 29.29 | | | 2,037,500 | | $ | 93 million | |
July | | | 1,635,919 | | $ | 24.53 | | | 1,629,700 | | $ | 553 million | |
August | | | 586,600 | | $ | 25.10 | | | 586,600 | | $ | 538 million | |
September | | | 737,800 | | $ | 23.27 | | | 737,800 | | $ | 521 million | |
October | | | 73,597 | | $ | 24.64 | | | – | | $ | 521 million | |
November | | | – | | | – | | | – | | $ | 521 million | |
December | | | – | | | – | | | – | | $ | 521 million | |
| | | | | | | | | | | |
| | Total | | | 11,150,228 | | $ | 26.15 | | | 10,755,285 | | | | |
| | | | | | | | | | | |
On July 22, 2008, JCG's Board of Directors authorized a fifth $500 million stock repurchase program with no expiration date, to take effect when the prior authorization is utilized. During 2008, JCG repurchased 10,755,285 shares at an aggregate cost of $281.0 million under the current and previous authorizations. Given the current market conditions, JCG suspended stock buybacks in the fourth quarter 2008 to preserve liquidity and financial flexibility.
In addition to this program, for the year ended December 31, 2008, JCG repurchased 394,943 shares from employees as part of a share withholding program (established under Rule 10b5-1 of the Securities Exchange Act of 1934) to satisfy employees' income tax liabilities attributable to the vesting of restricted stock awards.
12
Table of Contents
ITEM 6. SELECTED FINANCIAL DATA
The selected financial data below should be read in conjunction with Part II, Item 7, Management's Discussion and Analysis of Financial Condition and Results of Operations, of this Annual Report on Form 10-K and Part II, Item 8, Financial Statements and Supplementary Data, of this Annual Report on Form 10-K.
| | | | | | | | | | | | | | | | | | |
| | Year Ended December 31, | |
|---|
| | 2008 | | 2007 | | 2006 | | 2005 | | 2004 | |
|---|
| | (dollars in millions, except operating data and per share data)
| |
|---|
Income Statement: | | | | | | | | | | | | | | | | |
| | Revenues (1) | | $ | 1,037.9 | | $ | 1,117.0 | | $ | 935.8 | | $ | 868.3 | | $ | 921.8 | |
| | Operating expenses (2) | | |
704.8 | | |
767.7 | | |
696.9 | | |
675.1 | | |
791.2 | |
| | | | | | | | | | | | |
| | | Operating income | | | 333.1 | | | 349.3 | | | 238.9 | | | 193.2 | | | 130.6 | |
| | Interest expense (3) | | | (75.5 | ) | | (58.8 | ) | | (32.3 | ) | | (28.6 | ) | | (38.4 | ) |
| | Other, net (4) | | | (50.8 | ) | | 32.4 | | | 37.0 | | | 37.9 | | | 18.9 | |
| | Loss on early extinguishment of debt (5) | | | — | | | — | | | — | | | — | | | (55.5 | ) |
| | Gain on disposition of DST common shares (5) | | | — | | | — | | | — | | | — | | | 228.0 | |
| | Income tax provision | | | (68.8 | ) | | (116.4 | ) | | (90.1 | ) | | (72.8 | ) | | (99.4 | ) |
| | Equity in earnings of unconsolidated affiliates | | | 9.0 | | | 7.2 | | | 7.1 | | | 7.1 | | | 6.1 | |
| | Minority interest | | | (8.6 | ) | | (21.7 | ) | | (21.7 | ) | | (20.0 | ) | | (10.0 | ) |
| | | | | | | | | | | | |
| | | Income from continuing operations | | | 138.4 | | | 192.0 | | | 138.9 | | | 116.8 | | | 180.3 | |
| | Discontinued operations (6) | | | (1.5 | ) | | (75.7 | ) | | (5.3 | ) | | (29.0 | ) | | (10.8 | ) |
| | | | | | | | | | | | |
| | Net income | | $ | 136.9 | | $ | 116.3 | | $ | 133.6 | | $ | 87.8 | | $ | 169.5 | |
| | | | | | | | | | | | |
Earnings per Share — Basic (7) | | | | | | | | | | | | | | | | |
| | Income from continuing operations | | $ | 0.87 | | $ | 1.09 | | $ | 0.69 | | $ | 0.53 | | $ | 0.78 | |
| | Discontinued operations | | | (0.01 | ) | | (0.43 | ) | | (0.03 | ) | | (0.13 | ) | | (0.05 | ) |
| | | | | | | | | | | | |
| | Net income per share | | $ | 0.86 | | $ | 0.66 | | $ | 0.66 | | $ | 0.40 | | $ | 0.73 | |
| | | | | | | | | | | | |
Earnings per Share — Diluted (7) | | | | | | | | | | | | | | | | |
| | Income from continuing operations | | $ | 0.86 | | $ | 1.07 | | $ | 0.68 | | $ | 0.53 | | $ | 0.78 | |
| | Discontinued operations | | | (0.01 | ) | | (0.42 | ) | | (0.03 | ) | | (0.13 | ) | | (0.05 | ) |
| | | | | | | | | | | | |
| | Net income per share | | $ | 0.85 | | $ | 0.65 | | $ | 0.66 | | $ | 0.40 | | $ | 0.73 | |
| | | | | | | | | | | | |
Dividends Declared per Share | | $ | 0.04 | | $ | 0.04 | | $ | 0.04 | | $ | 0.04 | | $ | 0.04 | |
Balance Sheet: | | | | | | | | | | | | | | | | |
| | Total assets | | $ | 3,336.7 | | $ | 3,564.1 | | $ | 3,537.9 | | $ | 3,628.5 | | $ | 3,767.6 | |
| | Long-term debt obligations | | $ | 1,106.0 | | $ | 1,127.7 | | $ | 537.2 | | $ | 262.2 | | $ | 377.5 | |
| | Other long-term liabilities | | $ | 450.5 | | $ | 470.0 | | $ | 490.9 | | $ | 501.5 | | $ | 495.9 | |
Operating Data (in billions): | | | | | | | | | | | | | | | | |
| | Year-end assets under management | | $ | 123.5 | | $ | 206.7 | | $ | 167.7 | | $ | 148.5 | | $ | 139.0 | |
| | Average assets under management | | $ | 174.2 | | $ | 190.4 | | $ | 156.7 | | $ | 135.2 | | $ | 137.8 | |
| | Long-term net flows (8) | | $ | (0.6 | ) | $ | 9.8 | | $ | 2.3 | | $ | 2.0 | | $ | (20.6 | ) |
- (1)
- Revenues generally vary with average assets under management. However, revenues also include performance fees, which vary with relative investment performance and the amount of assets subject to such fees. Beginning in 2007, certain mutual funds became subject to performance fees. JCG earned
13
Table of Contents
$11.2 million of performance fees from mutual funds during each of the years ended December 31, 2008 and 2007.
- (2)
- Operating expenses include impairments, restructuring and regulatory investigation charges and recoveries. Impairment charges are related to terminated investment management relationships with assigned intangible values, and facility closures. Restructuring and impairment charges totaled $11.0 million, $5.5 million and $26.6 million in 2006, 2005 and 2004, respectively. Regulatory investigation charges represent legal fees and settlement costs, net of insurance recoveries for such expenses. Regulatory investigation charges, net of recoveries, totaled $(14.1) million, $(9.3) million and $65.0 million in 2006, 2005 and 2004, respectively.
- (3)
- Interest expense for 2007 increased from 2006 as a result of issuing $748.4 million of additional debt in 2007.
- (4)
- During 2007, JCG classified certain investment securities as trading. Net gains/(losses) on trading securities of $(41.1) million and $17.6 million were recognized in earnings for 2008 and 2007, respectively. In addition, JCG recognized impairment charges of $21.0 million and $18.2 million in 2008 and 2007, respectively, associated with structured investment vehicle ("SIV") securities acquired from money market funds advised by Janus.
- (5)
- In 2004, JCG incurred a debt extinguishment charge of $55.5 million primarily related to the premium paid to exchange certain notes with high interest rates for new notes with lower interest rates. Also during 2004, JCG sold its investment in DST Systems, Inc. common shares for a gain of $228.0 million in a taxable transaction.
- (6)
- During the third quarter 2007, JCG initiated a plan to dispose of Rapid Solutions Group ("RSG"), previously reported as the Printing and Fulfillment segment. Prior periods have been reclassified to separately present the results of continuing and discontinued operations. The results of discontinued operations for 2007 include impairment charges totaling $67.1 million (net of a $6.2 million tax benefit) to write-down the carrying value of RSG to estimated fair value less costs to sell.
- (7)
- Each component of earnings per share presented has been individually rounded.
- (8)
- Money market flows have been excluded due to the short-term nature of such investments.
14
Table of Contents
ITEM 7. MANAGEMENT'S DISCUSSION AND ANALYSIS OF FINANCIAL CONDITION AND RESULTS OF OPERATIONS
RECENT DEVELOPMENTS AND STRATEGIC PRIORITIES
Global markets declined significantly during 2008 with the majority of the deterioration occurring in the fourth quarter. The deterioration in global market conditions caused a significant decline in JCG's assets under management, revenues, operating margin and net income.
In response, JCG reduced its workforce by approximately 9% during the fourth quarter 2008 to decrease future compensation costs by approximately $20.0 million annually. In addition, planned reductions in future discretionary administrative, marketing and advertising costs are expected to result in further savings of $20.0 million to $25.0 million annually. Further expense reductions may be necessary if market conditions continue to deteriorate.
Despite actions taken to reduce 2009 fixed and discretionary expenses, JCG remains committed to achieving its long-term strategic objectives, which include the following:
- •
- Maintain strong long-term investment performance.
- •
- Continue expanding global product offerings.
- •
- Complete transition to advisor distribution platform.
- •
- Broaden alternative product capabilities through Janus and INTECH.
- •
- Build-out value franchise by capitalizing on Perkins' established investment process and brand.
- •
- Leverage INTECH's products to meet market demand for large cap value, global/international and alternative strategies.
- •
- Continue to build trust in the Janus brand.
- •
- Increase institutional acceptance of Janus strategies.
2008 SUMMARY
- •
- JCG finished 2008 with assets under management of $123.5 billion, a decrease of 40% from the end of 2007.
- •
- Long-term net outflows for 2008 totaled $0.6 billion compared to inflows of $9.8 billion for 2007.
- •
- Relative long-term investment performance remained strong across all subsidiaries despite short-term underperformance for Janus, with approximately 55%, 79% and 83% of JCG's mutual funds in the top half of their Lipper categories on a one-, three- and five-year total return basis, respectively, as of December 31, 2008. (See Exhibit 99.1 for complete Lipper rankings.)
- •
- Operating margin was 32.1% for 2008 compared with 31.3% in 2007.
- •
- Diluted earnings per share from continuing operations declined 20% to $0.86.
- •
- JCG completed the acquisition of an additional 50% interest in Perkins during the fourth quarter 2008.
JCG's operating results for 2008 reflect strong results for the first three quarters followed by substantial declines in the fourth quarter from the deterioration of global market conditions. Total Company average assets under management of $190.8 billion for the nine months ended September 30, 2008, decreased 34.9% to $124.3 billion in the fourth quarter 2008. Operating margin for the nine months ended September 30, 2008, totaled 33.4% compared with 25.5% for the fourth quarter 2008. In the event that market conditions experienced during the fourth quarter 2008 continue, JCG expects 2009
15
Table of Contents
results of operations to be more consistent with or below the fourth quarter 2008, on an annualized basis, as opposed to full-year 2008.
INVESTMENT MANAGEMENT OPERATIONS (CONTINUING OPERATIONS)
Assets Under Management and Flows
The following table presents the components of JCG's assets under management (in billions):
| | | | | | | | | | | | | |
| | Year Ended December 31, | |
|---|
| | 2008 | | 2007 | | 2006 | |
|---|
Beginning of period assets | | $ | 206.7 | | $ | 167.7 | | $ | 148.5 | |
| | Long-term sales | | | | | | | | | | |
| | | Janus | | | 29.9 | | | 30.9 | | | 16.0 | |
| | | INTECH | | | 12.3 | | | 15.5 | | | 18.5 | |
| | | Perkins | | | 6.3 | | | 2.9 | | | 3.0 | |
| | Long-term redemptions | | | | | | | | | | |
| | | Janus | | | (31.1 | ) | | (22.7 | ) | | (24.6 | ) |
| | | INTECH | | | (14.0 | ) | | (13.2 | ) | | (6.5 | ) |
| | | Perkins | | | (4.0 | ) | | (3.6 | ) | | (4.1 | ) |
| | | | | | | | |
| | Long-term net flows* | | | | | | | | | | |
| | | Janus | | | (1.2 | ) | | 8.2 | | | (8.6 | ) |
| | | INTECH | | | (1.7 | ) | | 2.3 | | | 12.0 | |
| | | Perkins | | | 2.3 | | | (0.7 | ) | | (1.1 | ) |
| | | | | | | | |
| | | | Total long-term net flows | | | (0.6 | ) | | 9.8 | | | 2.3 | |
| | Net money market flows | | | (5.0 | ) | | 5.2 | | | — | |
| | Market/fund performance | | | (77.6 | ) | | 24.0 | | | 16.9 | |
| | | | | | | | |
End of period assets | | $ | 123.5 | | $ | 206.7 | | $ | 167.7 | |
| | | | | | | | |
Long-term net flows by distribution channel | | | | | | | | | | |
| | Retail intermediary | | $ | 0.8 | | $ | 6.9 | | $ | (7.9 | ) |
| | Institutional | | | (3.1 | ) | | 1.7 | | | 9.3 | |
| | International | | | 1.7 | | | 1.2 | | | 0.9 | |
| | | | | | | | |
Total | | $ | (0.6 | ) | $ | 9.8 | | $ | 2.3 | |
| | | | | | | | |
Average assets under management | | | | | | | | | | |
| | Janus | | $ | 95.6 | | $ | 100.1 | | $ | 86.1 | |
| | INTECH | | | 57.4 | | | 68.1 | | | 53.1 | |
| | Perkins | | | 10.2 | | | 11.6 | | | 7.5 | |
| | Money market | | | 11.0 | | | 10.6 | | | 10.0 | |
| | | | | | | | |
Total | | $ | 174.2 | | $ | 190.4 | | $ | 156.7 | |
| | | | | | | | |
- *
- Excludes money market flows. Sales and redemptions are presented net on a separate line due to the short-term nature of the investments.
Total Company assets under management totaled $123.5 billion in 2008, a decrease of $83.2 billion from 2007 and $44.2 billion from 2006. The decreases were driven primarily by deteriorating markets in the last half of 2008.
Janus' net long-term outflows were $1.2 billion in 2008 compared to long-term net inflows of $8.2 billion in 2007. The decline from 2007 is largely the result of increased redemptions in the retail
16
Table of Contents
intermediary channel as a result of short-term underperformance and adverse market conditions. Industrywide, retail investors redeemed out of long-term investments at the highest rate since 1992.
INTECH's net long-term outflows were $1.7 billion in 2008 compared to long-term net inflows of $2.3 billion in 2007, primarily as a result of the relative short-term underperformance of certain key investment strategies primarily during 2007 and clients reallocating assets from INTECH to other investment strategies in response to adverse market conditions. INTECH's sales are primarily to institutional investors, which historically have allocated investments away from equity investments in deteriorating markets and reinvested as markets stabilize and begin improving.
Perkins' long-term net flows increased $3.0 billion over 2007 as a result of improved sales and strong investment performance. Perkins' 2008 positive net flows were primarily derived through the retail intermediary channel.
Both Janus and INTECH achieved positive net long-term flows internationally in 2008, which marked the 10th consecutive year of positive net flows in the international channel.
Net money market flows declined $10.2 billion from 2007. Money market flows are short-term in nature and vary widely from period to period. In January 2009, Janus announced plans to exit its institutional money market business by managing assets for capital preservation and liquidity and requiring investors to redeem no later than April 30, 2009. The institutional money market funds include the Janus Institutional Cash Management Fund, Janus Institutional Government Money Market Fund and Janus Institutional Money Market Fund. Total assets in the Janus institutional money market discipline totaled $5.8 billion at December 31, 2008. Janus will continue to offer retail money market funds which totaled $2.1 billion as of December 31, 2008. The institutional money market business contributed approximately $0.02 per diluted share to JCG's full-year 2008 diluted earnings per share.
Revenues
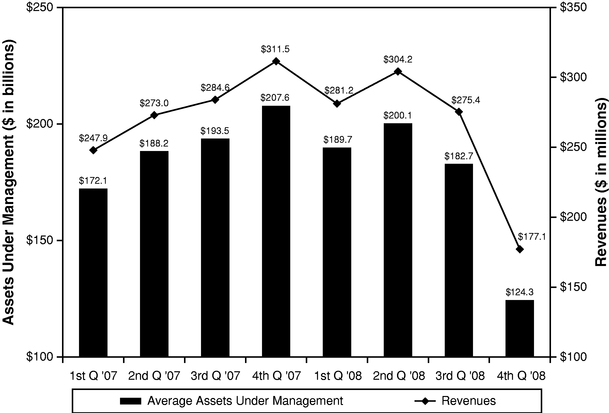
Revenues are generally based upon a percentage of the market value of assets under management and are calculated as a percentage of the daily average asset balance in accordance with contractual agreements with the Company's investment products. Certain investment products are also subject to performance fees that vary based on their relative performance as compared to a benchmark index and the level of assets subject to such fees. Assets under management primarily consist of domestic and international equity and debt securities. Accordingly, fluctuations in the financial markets, relative investment performance, sales and redemptions of investment products, and changes in the composition of assets under management are all factors that have a direct effect on JCG's operating results. The following graph depicts the direct relationship between average assets under management and investment management revenues:
17
Table of Contents
2008 Compared to 2007
Investment management fees decreased $71.2 million, or 7.9%, as a result of a decrease in average assets under management driven primarily by declining markets.
Performance fee revenue is derived from certain mutual funds and separate accounts. The increase in performance fee revenue of $8.1 million, or 41.5%, was principally due to one separate account reaching its one-year anniversary during the second quarter 2008 on which the first contractual performance fee was recognized for the previous 12 months. Going forward, performance fees on this account will be recognized quarterly.
Shareowner servicing fees and other revenue decreased $16.0 million, or 8.0%, over the comparable prior period primarily from a decrease in transfer agent fees. Transfer agent fees are calculated based on long-term average assets under management in Janus' largest fund series (Janus Investment Fund) ("JIF"), which declined at a comparable rate.
Employee compensation and benefits decreased $42.8 million, or 11.9%, principally due to lower incentive compensation partially offset by $8.0 million in severance incurred primarily as a result of the 9% workforce reduction in October 2008. Investment team compensation decreased $33.7 million as a result of lower revenue and a decline in short-term relative investment performance. The investment team compensation plan is linked to individual investment performance, but also ties the aggregate level of compensation to revenue. Sales commissions decreased $9.9 million due to lower sales and the company-wide bonus accrual decreased $16.7 million as a result of the impact of adverse market conditions on the Company's operating results.
Long-term incentive compensation decreased $36.4 million, or 45.6%, primarily as a result of the performance-based acceleration and contractual acceleration of awards in 2007, and a $2.9 million net benefit from revising JCG's forfeiture estimate in the fourth quarter 2008 due to higher than projected
18
Table of Contents
employee departures. Long-term incentive compensation in 2007 also included a $17.0 million charge for the contractual acceleration of awards related to certain portfolio managers who resigned.
Long-term incentive grants made during 2008 totaled $84.3 million and will be recognized ratably over a three-year period. In addition to these awards, retention awards were granted to certain Janus investment team members and INTECH employees to facilitate succession planning and incentivize key personnel to remain with the Company. The Janus retention grant totaled $21.0 million and will be recognized ratably over a four-year period. The INTECH retention grant totaled $10.0 million and will be recognized ratably over a 10-year period. Future long-term incentive amortization will also be impacted by the 2009 annual grant totaling $70.0 million, which will be recognized ratably over a four-year period.
Distribution expenses decreased $6.8 million, or 4.8%, as a result of a similar decrease in assets under management subject to third-party concessions. Distribution fees are calculated based on a contractual percentage of the market value of assets under management distributed through third-party intermediaries.
Interest expense increased $16.7 million, or 28.4%, from the issuance of additional debt in June 2007. All of JCG's outstanding debt includes an interest rate adjustment covenant that provides that the interest rate payable will increase by 25 basis points for each level that the Company's debt rating is decreased by Moody's Investors Service, Inc. ("Moody's") from its existing rating of Baa3 or by S&P from its existing rating of BBB-, up to a maximum increase of 200 basis points. On February 23, 2009, S&P lowered JCG's credit rating to BB+, which will result in a 25 basis point increase in the interest rates payable on all of JCG's outstanding debt, or approximately $2.8 million of additional annual interest expense.
Net investment losses totaled $60.4 million in 2008 and include a $21.0 million impairment charge on SIV securities and $41.1 million of mark-to-market losses on consolidated investment products, net of $1.7 million of realized gains. Net investment gains of $4.7 million in 2007 include $17.6 million of income previously recorded as unrealized gains in equity partially offset by an $18.2 million impairment charge on SIV securities. JCG implemented a hedge strategy in December 2008 covering the majority of invested seed capital to mitigate a portion of the earnings volatility created by the mark-to-market accounting of seed capital investments.
The decrease in minority interest is largely the result of a decline in INTECH earnings associated with lower average assets under management in the relevant investment products and approximately $4.0 million of losses associated with the minority interest in consolidated investment products.
JCG's tax rate will decrease by approximately 1.25% from the current rate effective January 1, 2009 as a result of a legislative change in Colorado state taxes enacted during the second quarter 2008. The income tax provision for 2008 includes a $12.9 million tax benefit as a result of applying the lower tax rate to deferred tax assets and liabilities expected to be realized or settled on or after January 1, 2009.
2007 Compared to 2006
Investment management fees increased $147.7 million, or 19.7%, from a similar increase in average assets under management driven primarily by market appreciation and investment performance combined with positive long-term net inflows.
The increase in performance fee revenue was primarily due to fees of $11.2 million earned on mutual funds, partially offset by a decrease of $6.5 million of fees on INTECH private accounts as a result of recent relative underperformance.
19
Table of Contents
Shareowner servicing fees and other revenue improved $28.9 million, or 16.9%, over the comparable prior period primarily as a result of an increase in transfer agent fees. Average JIF assets, excluding money market assets, increased 15.6% over the prior year.
Employee compensation and benefits increased $45.5 million, or 14.4%, principally due to higher base salaries, investment team compensation and sales commissions. Base salaries increased $11.5 million from annual merit increases and an 8.3% growth in the average number of employees. Investment team compensation increased $21.0 million due to higher management fee revenue and relative investment performance. Sales commissions increased $6.6 million due to improved sales, primarily in the retail intermediary channel.
Long-term incentive compensation decreased $2.8 million due to the final vesting of a previous grant in the first quarter 2007, partially offset by an increase related to the 2007 annual grant awarded in February, a $17.0 million charge for the contractual acceleration of awards related to certain portfolio managers who resigned in 2007 and accelerated vesting of previous awards based on 2007 financial performance.
Distribution expenses increased $31.5 million, or 28.6%, from a similar increase in assets under management subject to third-party concessions.
Interest expense increased $26.5 million as a result of the issuance of additional debt during 2007.
Investment gains decreased $7.0 million primarily from the recognition of an $18.2 million impairment charge on SIV securities acquired from money market funds advised by Janus and a decrease in realized gains related to the sale of seed capital investments. The impairment charge and decrease in realized gains were partially offset by $17.6 million of income previously recorded as unrealized gains in equity. In the fourth quarter 2007, JCG evaluated its seed capital investments and determined that mutual funds and separate accounts in which it owns a majority interest should be consolidated, with changes in market value reported in current period earnings.
DISCONTINUED OPERATIONS
During the second quarter 2008, JCG disposed of its Printing and Fulfillment operations for $14.5 million.
LIQUIDITY AND CAPITAL RESOURCES
Cash Flows
A summary of cash flow data from continuing operations for the years ended December 31 is as follows(in millions):
| | | | | | | | | | | |
| | 2008 | | 2007 | | 2006 | |
|---|
Cash flows provided by (used for): | | | | | | | | | | |
| | Operating activities | | $ | 238.2 | | $ | 290.8 | | $ | 298.6 | |
| | Investing activities | | | (148.8 | ) | | (103.3 | ) | | 48.0 | |
| | Financing activities | | | (287.5 | ) | | (213.9 | ) | | (340.5 | ) |
| | | | | | | | |
Net increase (decrease) in cash and cash equivalents | | | (198.1 | ) | | (26.4 | ) | | 6.1 | |
Balance at beginning of year | | | 480.7 | | | 507.1 | | | 501.0 | |
| | | | | | | | |
Balance at end of year | |
$ |
282.6 | |
$ |
480.7 | |
$ |
507.1 | |
| | | | | | | | |
20
Table of Contents
2008 Cash Flows
JCG's cash flow from operations historically has been positive and sufficient to fund ordinary operations and capital requirements. Fluctuations in operating cash flows are attributable to changes in net income and working capital items, which can vary from period to period based on the amount and timing of cash receipts and payments. The decline in cash flow from operations in 2008 was driven by lower revenues in the second half of 2008 as a result of the deterioration in global market conditions.
Net cash used for investing activities in 2008 primarily represents $67.7 million for the purchase of an additional 3% interest in INTECH and $90.0 million for an additional 50% interest in Perkins.
Cash used for financing activities in 2008 primarily represents stock buybacks of $291.7 million.
2007 Cash Flows
Operating cash flows in 2007 decreased $7.8 million to $290.8 million due to changes in net income and working capital items.
Net cash used for investing activities in 2007 includes $81.0 million for the purchase of an additional 4% interest in INTECH and $108.5 million (including $3.5 million of purchased accrued interest) for the purchase of SIV securities from money market funds advised by Janus, partially offset by $55.2 million of proceeds from the net sale of investments in advised funds.
Cash used for financing activities in 2007 includes $748.4 million of proceeds from the issuance of long-term debt, offset by the repayment of $158.1 million of long-term debt and common stock buybacks of $845.6 million.
2006 Cash Flows
Operating cash flows in 2006 increased $31.1 million to $298.6 million due to changes in net income and working capital items.
Net cash generated from investing activities in 2006 includes proceeds from the maturity and sale of marketable securities, partially offset by $90.0 million for the purchase of an additional 5% interest in INTECH and capital expenditures.
Cash used for financing activities in 2006 consists primarily of common stock repurchases of $516.4 million and the repayment of $113.1 million of long-term debt, partially offset by the issuance of $275.0 million of debt.
Money Market Funds Advised by Janus
Janus advises the Money Funds that attempt to provide current income and limit exposure to losses by investing in high-quality securities with short-term durations that present minimal credit risk. Adverse events or circumstances related to individual securities or the market in which the securities trade may cause other-than-temporary declines in value. JCG continuously evaluates the securities held by the Money Funds to determine if any holdings are distressed or may become distressed in the near future. In such circumstances, JCG would consider whether taking any action, including, but not limited to, a potential election by JCG to provide further support to the Money Funds that could result in additional impairments and financial losses, would be appropriate. Under certain situations, JCG may elect to support one or more of the Money Funds to enable them to maintain a net asset value equal to one dollar through a variety of means, including but not limited to, purchasing securities held by the Money Funds, reimbursing for any losses incurred or providing a letter of credit. However, JCG is not contractually or legally obligated to provide support to the Money Funds. JCG's recently announced plan to exit the institutional money market business is expected to substantially reduce the likelihood of
21
Table of Contents
the Money Funds holding a distressed security. Institutional money market portfolios typically hold higher yielding assets, and therefore have a higher risk, as compared to retail money market portfolios.
JCG's decision to provide support to the Money Funds is based on the facts and circumstances at the time a holding in the Money Funds becomes or is expected to become distressed. A holding is considered distressed when there is significant doubt regarding the issuer's ability to pay required amounts when due, often resulting in a decline in the securities' credit ratings. If a security falls below the minimum rating required by investment restrictions, the Money Funds must dispose of the investment unless the Money Funds' Board of Trustees determines that such disposition is not in the best interests of the Money Funds. In determining whether to take any action in response to a distressed condition or a downgrade affecting securities held by the Money Funds, JCG considers many factors, which may include the potential financial and reputational impact to the Money Funds and JCG, the regulatory and operational restrictions, the size of a holding, a security's expected time to maturity and likelihood of payment at maturity, general market conditions, discussions with the Money Funds' Board of Trustees and JCG's Board of Directors, and JCG's liquidity and financial condition. No single factor is determinative and there is no predetermined threshold with respect to each factor that would lead JCG to consider providing support to the Money Funds.
Given recent market events impacting liquidity for mutual funds, including money market funds, JCG has enhanced its emphasis on managing the Money Funds for capital preservation and liquidity while remaining in line with their investment objectives. The Money Funds elected to participate in the U.S. Department of Treasury's Temporary Guarantee Program for money market mutual funds (the "Program"). The Program guarantees for shareholders of a Money Fund as of September 19, 2008 the lesser of (i) the amount the shareholder held as of the close of business on September 19, 2008; or (ii) the number of shares held as of the date that the Program is utilized. A Money Fund must be in liquidation to utilize the guarantee provided by the Program. The Program was originally effective until December 18, 2008, but was extended to April 30, 2009.
Financial Support Provided to the Funds
On December 21, 2007, Moody's Investors Service, Inc. downgraded securities issued by certain SIVs including those issued by Stanfield Victoria Funding LLC ("Stanfield securities") to a rating below what is generally permitted to be held by the Money Funds. The Money Funds held $105.0 million of Stanfield securities plus $3.5 million of accrued interest at the time of the downgrade. In connection with this downgrade, JCG determined that it was in the best interests of the applicable Money Funds and their shareholders for JCG to purchase the Stanfield securities from the Money Funds at amortized cost plus accrued interest. Subsequent to purchase, JCG has recognized impairment charges totaling $39.2 million (including $3.5 million of purchased accrued interest), reflecting the difference between the low end of the range of estimated fair value and the purchase price of the Stanfield securities. In addition, JCG received a cash distribution totaling $17.1 million which reduced the carrying value of the Stanfield securities. Included in JCG's estimate of fair value is the assumption that no interest income payable on the securities will be received. JCG's total additional risk of loss with respect to the Stanfield securities at December 31, 2008 is limited to the $52.2 million carrying value of its investment. Additional impairment charges on the Stanfield securities may be recognized if the underlying assets experience further other-than-temporary deterioration in value.
In January 2008, the Stanfield securities were placed with an enforcement manager to be restructured or sold at the election of each senior note holder. JCG elected to participate in the restructuring of the Stanfield securities. In addition, the collateral agent, Deutsche Bank, filed an interpleader complaint due to conflicting positions of note holders that effectively prevented the enforcement manager from making any cash payments and other distributions, or from restructuring the Stanfield securities.
22
Table of Contents
An amendment to the security agreement for the Stanfield securities was approved in December 2008 following the resolution of the interpleader complaint allowing available cash in the Stanfield vehicle to be distributed to security holders. A new legal structure is expected to be announced in 2009 at which time JCG may elect to receive its proportionate share of underlying assets or participate in the new legal structure.
Short-Term Liquidity and Capital Requirements
The Company has cash and marketable securities of $407.9 million at December 31, 2008. JCG believes that existing cash and cash from operations should be sufficient to satisfy its short-term capital requirements. However, significant further deterioration in global market conditions and JCG's operating results may adversely impact liquidity. Expected short-term uses of cash include ordinary operations, capital expenditures, income tax payments, and interest and principal payments on outstanding debt.
Common Stock Repurchase Program
JCG's Board of Directors authorized five separate $500 million share repurchase programs beginning in July 2004 with the most recent authorization in July 2008. During 2008 and 2007, the Company repurchased 10.8 million shares for $281.0 million and 31.5 million shares for $828.6 million, respectively, under these authorizations. As of December 31, 2008, $521.2 million is available under the current authorizations. Given the current market conditions, JCG suspended stock buybacks in the fourth quarter 2008 to preserve liquidity and financial flexibility.
Long-Term Liquidity and Capital Requirements
Expected long-term commitments at December 31, 2008, include the following(in millions):
| | | | | | | | | | | | | |
| | Current | | 2 to 3 Years | | 4 to 5 Years | | After 5 Years | |
|---|
Debt | | $ | 22.0 | | $ | 275.0 | | $ | 300.0 | | $ | 532.4 | |
Interest payments | | | 74.5 | | | 142.3 | | | 81.6 | | | 107.5 | |
Operating leases | | | 18.1 | | | 34.0 | | | 29.4 | | | 59.8 | |
| | | | | | | | | | |
Total | | $ | 114.6 | | $ | 451.3 | | $ | 411.0 | | $ | 699.7 | |
| | | | | | | | | | |
The information presented above does not include operating related liabilities or capital expenditures that will be committed to in the normal course of business. JCG expects to fund its long-term commitments over the next three years from existing cash and cash generated from normal operations. For commitments beyond three years, JCG anticipates using cash generated from normal operations, refinancing debt or accessing capital and credit markets as necessary.
Operating lease obligations are presented net of estimated sublease income of $4.7 million.
INTECH
Each fiscal year through 2012, each of the two INTECH founding members has the option to require JCG to purchase from him an ownership interest of up to approximately 1.5% of INTECH ("Annual Option Shares") at fair value. At December 31, 2008, the two founders have an aggregate ownership interest of approximately 8% in INTECH. In the event that either INTECH founder does not fully exercise his annual voluntary sale option in a given year, JCG has the option to require the INTECH founder to sell the remaining balance of the Annual Option Shares for that year at fair value.
23
Table of Contents
In addition, the founders can require JCG to purchase their INTECH interests if the founder's employment is terminated. The purchase price of the departing founder's INTECH interests will be based on fair value. Each founder is entitled to retain approximately 1% of INTECH's shares then outstanding after employment until his death unless he is terminated for cause or leaves voluntarily while not in good standing. An INTECH founder will be deemed to be in good standing if he voluntarily leaves on or after January 1, 2009, after providing 12 months' prior notice and cooperation with the transition.
The long-term commitments schedule above does not include any estimate for the purchase of the outstanding INTECH interests due to the uncertainty of this obligation and the price at which it may occur. Total INTECH interests held by the two founders would be valued at approximately $128.0 million, based on the last determination of fair value.
Perkins
On December 31, 2008, JCG increased its ownership of Perkins to approximately 80% with the purchase of an additional 50% ownership interest for $90.0 million in cash. Upon closing the transaction, Perkins granted profit interest awards designed to retain and incentivize key employees to grow the business. These awards vest on the fifth anniversary of grant and are generally entitled to a total of 5% of Perkins' annual net income. In addition, these awards have a formula-driven terminal value based on revenue growth and relative investment performance of products managed by Perkins. JCG can call and terminate any or all of the awards on the fifth, seventh or each subsequent anniversary of grant or prior to the fifth anniversary of grant if the formula yields a terminal value of $40.0 million. Participants can require JCG to terminate the awards in exchange for the then-applicable formula price on the sixth anniversary of grant. The profit interests are also subject to termination at premiums or discounts to the formula at the option of JCG or the relevant employee, as applicable, upon certain corporate or employment-related events affecting Perkins or the relevant employee.
JCG also has the option to acquire any or all of the remaining 20% interest of Perkins at fair value on the third, fifth, seventh or each subsequent anniversary of closing. The minority owners of Perkins have the option to require JCG to purchase any or all of their remaining interests on the fourth or sixth anniversary of closing at fair value. The total Perkins minority interest would be valued at approximately $36.0 million, based on the negotiated fair value at acquisition.
Other Sources of Liquidity
Credit Facility
JCG has a $350 million Five-Year Competitive Advance and Revolving Credit Facility Agreement (the "Credit Facility") with a syndicate of banks. The Credit Facility contains a number of financial covenants, including a specified financing leverage ratio and interest coverage ratio. At December 31, 2008, JCG was in compliance with all covenants and there were no borrowings under the Credit Facility. In the event that assets under management continue to decline, JCG may not be able to access or utilize all or a portion of its credit available under the Credit Facility. Accordingly, JCG may seek less restrictive financial covenants that, if obtained, would allow for continued access to the Credit Facility in the event that current market conditions persist or further deteriorate. JCG's credit line may decrease and its costs to borrow under the Credit Facility may increase in exchange for less restrictive financial covenants. There is no guarantee that any efforts undertaken by JCG to renegotiate the terms of the Credit Facility will be successful.
24
Table of Contents
Shelf Registration
The Company has effective a Shelf-Registration Statement ("Shelf Registration") with the SEC, under which JCG could register an indeterminate amount of JCG's common stock, preferred stock and debt securities.
CRITICAL ACCOUNTING POLICIES AND ESTIMATES
JCG's consolidated financial statements and accompanying notes have been prepared in accordance with accounting principles generally accepted in the United States of America ("GAAP"). The preparation of financial statements in conformity with GAAP requires management to make estimates and assumptions that affect the reported amounts of assets and liabilities, the disclosure of contingent assets and liabilities at the date of the financial statements, and the reported amounts of revenues and expenses during the reporting periods.
JCG continually evaluates the accounting policies and estimates used to prepare the consolidated financial statements. In general, management's estimates are based on historical experience, information from third-party professionals and various other assumptions that are believed to be reasonable under current facts and circumstances. Actual results could differ from those estimates made by management. JCG's critical accounting policies and estimates include income taxes, intangible assets and goodwill, marketable securities and equity compensation.
Accounting for Intangible Assets and Goodwill
Intangible assets and goodwill comprise $2.6 billion, or 79%, of total assets at December 31, 2008. Intangible assets and goodwill require significant management estimates and judgment, including the valuation and expected life determination in connection with the initial purchase price allocation and the ongoing evaluation for impairment. JCG separately tests goodwill and indefinite-lived intangible assets for impairment annually or more frequently if events or changes in circumstances indicate that the asset may be impaired.
In connection with the purchase price allocation of acquisitions, JCG will rely on in-house financial expertise or utilize a third-party expert, if considered necessary. Valuations generally rely on management's estimates and judgments as to growth rates and operating margins over a range of possible assumptions for various products, distribution channels and business strategies.
Goodwill represents the excess of cost over the fair value of the identifiable net assets of acquired companies and is not amortized. Goodwill is tested for impairment by comparing the fair value of the "reporting unit" associated with the goodwill to the reporting unit's recorded value. If the fair value of the reporting unit is less than its recorded value, a process similar to a purchase price allocation is undertaken to determine the amount, if any, of the goodwill impairment. All assets, including previously unrecognized intangible assets, and liabilities are fair valued and any unallocated value is assigned to goodwill. Because the allocation of fair value includes intangible assets not previously recognized, the amount of the goodwill impairment charge may significantly exceed the difference between the fair value of the reporting unit and its recorded value. For purposes of testing goodwill for impairment, JCG has identified one reporting unit.
Indefinite-lived intangible assets primarily represent mutual fund advisory contracts, brand name and trademark. The assignment of indefinite lives to mutual fund advisory contracts, brand name and trademark is based on the assumption that they are expected to generate cash flows indefinitely. This assumption, with respect to mutual fund advisory contracts, is supported by the fact that historically there have not been significant switches between fund managers in the mutual fund industry. Indefinite-lived intangible assets are tested for impairment by comparing the fair value of the asset to its recorded value.
25
Table of Contents
Definite-lived intangible assets represent client relationships, which are amortized over their estimated lives of seven to 25 years using the straight-line method. Definite-lived intangible assets are tested only when there are indications of impairment. One component of JCG's definite-lived intangible assets is subadvised contracts. Each subadvised contract has a specific allocation of value and therefore, the loss of an individual contract will cause an impairment charge. JCG recorded impairments of $0.4 million and $11.0 million in 2007 and 2006, respectively, associated with the termination of subadvised contracts. There were no impairments of subadvised contracts in 2008. At December 31, 2008, the net book value of intangible assets related to subadvised contracts was $12.7 million.
To complete the tests for potential impairment of goodwill and intangible assets, JCG uses a discounted cash flow analysis that requires assumptions regarding projected future earnings and discount rates. In projecting future earnings, JCG considers the following: equity market performance; performance compared to peers; significant changes in the underlying business and products; material and ongoing negative industry or economic trends; and/or other factors that may influence future earnings. Changes in the assumptions underlying the discounted cash flow analysis could materially affect JCG's impairment conclusion. Due to the significance of the identified intangible assets and goodwill to JCG's consolidated balance sheet, any impairment charge could have a material adverse effect on the Company's results of operations.
Subsequent to the annual impairment test for goodwill performed as of October 1, global market conditions rapidly deteriorated and JCG's market capitalization declined below net book value. In response, JCG completed another goodwill impairment test as of December 31, 2008, and concluded that goodwill was not impaired. JCG's fair value was estimated using a discounted cash flow analysis as well as analyzing current and historical control premiums within the financial services industry. Based on this analysis, JCG's estimated fair value exceeded net book value as of December 31, 2008. In the event that global market conditions and JCG's results of operations continue to deteriorate, further analysis will be undertaken which may result in a material impairment charge.
Accounting for Income Taxes
Significant management judgment is required in developing JCG's provision for income taxes, including the valuation allowances that might be required against deferred tax assets and the evaluation of various income tax contingencies.
Valuation Allowance
JCG has not recorded a valuation allowance on its deferred tax assets as of December 31, 2008, based on management's belief that future income will more likely than not be sufficient to realize the benefit of the Company's deferred tax assets over time. In the event that actual results differ from these estimates, or if JCG's historical trend of positive income changes, JCG may be required to record a valuation allowance on deferred tax assets, which could have a material adverse effect on JCG's consolidated financial condition and results of operations.
Income Tax Contingencies
At December 31, 2008, JCG has an accrued liability of $37.0 million related to tax contingencies for issues raised by various taxing authorities. At any one time, tax returns filed in previous years are subject to audit by various taxing authorities. As a result of these audits and negotiations, additional tax assessments may be proposed or tax contingencies recorded in prior years may be reversed. On January 1, 2007, JCG reduced its tax contingencies liability by $29.3 million as a result of the implementation of Financial Accounting Standards Board Interpretation No. 48, "Accounting for Uncertainty in Income Taxes." The reduction in the liability and the related change in deferred taxes were accounted for as an increase to retained earnings.
26
Table of Contents
Valuation of Marketable Securities
JCG records all marketable securities classified as trading or available-for-sale at fair value. Fair value is generally determined using observable market data based on recent trading activity. Where observable market data is unavailable due to a lack of trading activity, JCG uses internally developed models to estimate fair value and independent third parties to validate assumptions when appropriate. Estimating fair value requires significant management judgment, including benchmarking to similar instruments with observable market data and applying appropriate discounts that reflect differences between the securities that JCG is valuing and the selected benchmark. Depending on the type of securities owned by JCG, other valuation methodologies may be required. Any variation in the assumptions used to approximate fair value could have a material adverse effect on the Company's financial condition and results of operations.
JCG periodically evaluates the carrying value of marketable securities for potential impairment. In determining if an impairment exists, JCG considers the duration, extent and circumstances of any decline in fair value. If the decline in value is determined to be other-than-temporary, the carrying value of the security is written down to fair value with the loss recognized currently in earnings.
Equity Compensation
JCG uses the Black-Scholes option pricing model to estimate the fair value of stock options for recording compensation expense. The Black-Scholes model requires management to estimate certain variables, including the lives of options from grant date to exercise date, the volatility of the underlying shares and future dividend rates. The two most significant estimates in the Black-Scholes model are volatility and expected life. An increase in the volatility rate increases the value of stock options and a decrease causes a decline in value. JCG estimated expected volatility using an average of JCG's historical volatility and industry and market averages, as appropriate. For expected lives, an increase in the expected life of an option increases its value. JCG factored in employee termination rates combined with vesting periods to determine the average expected life used in the model.
JCG records equity compensation net of estimated forfeitures over the vesting term. Determining the forfeiture estimate requires significant judgment as to the number of actual awards that will ultimately vest over the term of the award. The estimate is reviewed quarterly and any change in actual forfeitures in comparison to estimates may cause an increase or decrease in the ultimate expense recognized in that period and future periods. During the fourth quarter 2008 and third quarter 2006, the forfeiture estimate was adjusted to reflect higher than projected employee departures resulting in $2.9 million and $5.0 million, respectively, of decreases to long-term incentive compensation expense.
Recent Accounting Pronouncements
Information regarding accounting pronouncements that have been issued but not yet adopted by the Company is incorporated by reference from Part II, Item 8, Financial Statements and Supplemental Data, Note 3 — Recent Accounting Pronouncements, of this Annual Report on Form 10-K.
ITEM 7A. QUANTITATIVE AND QUALITATIVE DISCLOSURES ABOUT MARKET RISK
The following information, together with information included in other parts of this Management's Discussion and Analysis of Financial Condition and Results of Operations, describes the key aspects of certain financial instruments that have market risk to JCG.
Investment Management Fees
Revenues are generally based upon a percentage of the market value of assets under management and are calculated as a percentage of the daily average asset balance in accordance with contractual
27
Table of Contents
agreements with the Company's investment advisory clients. Assets under management primarily include domestic and international equity and debt securities. Accordingly, fluctuations in the financial markets have a direct effect on JCG's operating results. In addition, fluctuations in interest rates may affect the value of assets under management in the money market and other fixed income investment products. The graph in Item 7, Management Discussion and Analysis of Financial Condition and Results of Operations — Investment Management Operations, presents the historical direct relationship between revenue and average assets under management.
Performance Fees
Performance fee revenue is derived from certain private accounts and mutual funds. JCG recognized performance fees of $27.6 million, $19.5 million and $14.9 million in 2008, 2007 and 2006, respectively.
Private account performance fees are specified in client contracts and are based on investment performance as compared to an established benchmark index over a specified period of time. Performance fees are recognized at the end of the contractual period if the stated performance criteria are achieved. At December 31, 2008, $6.7 billion of assets under management were subject to private account performance fees.
Mutual fund performance fees were recorded beginning in the first quarter 2007. The investment management fee paid by each fund is the base management fee plus or minus a performance fee adjustment as determined by the relative investment performance of each fund compared to a specified benchmark index. The performance fee adjustment is up to 15 basis points, calculated using each fund's daily net average assets over the performance period. The measurement period begins as a trailing 12-month period and each subsequent month will be added to each successive measurement period until a 36-month period is achieved. At that point, the measurement period will become a rolling 36-month period. At December 31, 2008, $16.1 billion of assets under management were subject to mutual fund performance fees.
Trading Securities
At December 31, 2008, seed capital investments classified as trading totaled $62.4 million. Trading securities are carried in JCG's consolidated financial statements at fair value, with changes in value recognized as gains and losses currently in earnings. JCG recognized losses of $41.1 million in earnings on securities classified as trading for the year ended December 31, 2008.
JCG implemented an economic hedge strategy in December 2008 covering the majority of invested seed capital to mitigate a portion of the earnings volatility created by the mark-to-market accounting of seed capital investments. The strategy utilizes futures contracts and call options on various market indices to minimize market losses while allowing for limited participation in market gains. These instruments are accounted for at fair value under Statement of Financial Accounting Standard No. 133 (as amended and interpreted), "Accounting for Derivatives and Hedging Activities" ("SFAS 133"), with changes in fair value reported currently in earnings but have not been designated as hedging instruments under SFAS 133. At December 31, 2008, the total fair value of derivative instruments totaled $0.8 million and is included in marketable securities.
Available-for-Sale Securities
At December 31, 2008, seed capital investments classified as available-for-sale totaled $62.1 million, representing $9.9 million of investments in advised funds and $52.2 million of SIV securities issued by Stanfield Victoria Funding LLC. Investments in advised funds are carried in JCG's consolidated financial statements at fair value, with changes in value recognized as gains and losses in other comprehensive income. Accumulated gains and losses are reclassified to earnings when the securities are sold. SIV securities are carried in JCG's consolidated financial statements based on JCG's estimate
28
Table of Contents
of fair value. An other-than-temporary impairment charge of $21.0 million was recognized on JCG's SIV investment during the third quarter 2008. No other impairment charges were recognized on available-for-sale securities during 2008. In the event that current market conditions persist or further deteriorate, JCG may recognize impairment charges on available-for-sale securities.
Foreign Currency Exchange Sensitivity
JCG has international subsidiaries that conduct business within other foreign countries. With respect to these operations, matters arise as to financial accounting and reporting for foreign currency transactions and for translating foreign currency financial statements into U.S. dollars. The exposure to foreign currency fluctuations is not material as the majority of the revenue earned by international subsidiaries is denominated in U.S. dollars.
Interest Rate Risk on Long-Term Debt
JCG is not exposed to interest rate risk other than from the potential change in interest rates on the Company's debt in the event of a change in credit ratings by Moody's or S&P. All of JCG's outstanding debt includes an interest rate adjustment covenant that provides that the interest rate payable will increase by 25 basis points for each level that the Company's debt rating is decreased by Moody's from its existing rating of Baa3 or by S&P from its existing rating of BBB-, up to a maximum increase of 200 basis points. If at any time after the interest has been adjusted upward, either Moody's or S&P increases its rating, then for each level of such increase in the rating, the interest payable will be decreased by 25 basis points, but in no event to a rate less than the interest rate payable on the date of their issuance. The interest rate adjustment covenant will permanently terminate if the Company's debt ratings increase to Baa2 by Moody's and BBB by S&P (or higher), with a stable or positive outlook regardless of any subsequent decrease in the ratings by either or both rating agencies. On February 23, 2009, S&P lowered JCG's credit rating to BB+, which will result in a 25 basis point increase in the interest rates payable on all of JCG's outstanding debt, or approximately $2.8 million of additional annual interest expense.
29
Table of Contents
ITEM 8. FINANCIAL STATEMENTS AND SUPPLEMENTARY DATA
Index to Financial Statements
| | | |
| | Page |
|---|
Financial Statements: | | |
| | Reports of Independent Registered Public Accounting Firm — Deloitte & Touche LLP | | 31 |
| | Management Report on Internal Control Over Financial Reporting | | 33 |
| | Consolidated Balance Sheets as of December 31, 2008 and 2007 | | 34 |
| | Consolidated Statements of Income for the Three Years Ended December 31, 2008 | | 35 |
| | Consolidated Statements of Cash Flows for the Three Years Ended December 31, 2008 | | 36 |
| | Consolidated Statements of Changes in Stockholders' Equity for the Three Years Ended December 31, 2008 | | 37 |
| | Notes to Consolidated Financial Statements | | 38 |
Financial Statement Schedules: | | |
| | All schedules are omitted because they are not applicable or are insignificant, or the required information is shown in the consolidated financial statements or notes thereto. | | |
30
Table of Contents
REPORT OF INDEPENDENT REGISTERED PUBLIC ACCOUNTING FIRM
To the Board of Directors and Stockholders of
Janus Capital Group Inc.
We have audited the accompanying consolidated balance sheets of Janus Capital Group Inc. and subsidiaries (the "Company") as of December 31, 2008 and 2007, and the related consolidated statements of income, stockholders' equity, and cash flows for each of the three years in the period ended December 31, 2008. These financial statements are the responsibility of the Company's management. Our responsibility is to express an opinion on these financial statements based on our audits.
We conducted our audits in accordance with the standards of the Public Company Accounting Oversight Board (United States). Those standards require that we plan and perform the audit to obtain reasonable assurance about whether the financial statements are free of material misstatement. An audit includes examining, on a test basis, evidence supporting the amounts and disclosures in the financial statements. An audit also includes assessing the accounting principles used and significant estimates made by management, as well as evaluating the overall financial statement presentation. We believe that our audits provide a reasonable basis for our opinion.
In our opinion, such consolidated financial statements present fairly, in all material respects, the financial position of the Company as of December 31, 2008 and 2007, and the results of their operations and their cash flows for each of the three years in the period ended December 31, 2008, in conformity with accounting principles generally accepted in the United States of America.
We have also audited, in accordance with the standards of the Public Company Accounting Oversight Board (United States), the Company's internal control over financial reporting as of December 31, 2008, based on the criteria established inInternal Control — Integrated Framework issued by the Committee of Sponsoring Organizations of the Treadway Commission and our report dated February 26, 2009 expressed an unqualified opinion on the Company's internal control over financial reporting.
| | |
| /s/ Deloitte & Touche LLP | | |
Denver, CO
February 26, 2009
|
|
|
31
Table of Contents
REPORT OF INDEPENDENT REGISTERED PUBLIC ACCOUNTING FIRM
To the Board of Directors and Stockholders of
Janus Capital Group Inc.
We have audited the internal control over financial reporting of Janus Capital Group Inc. and subsidiaries (the "Company") as of December 31, 2008, based on criteria established inInternal
Control — Integrated Framework issued by the Committee of Sponsoring Organizations of the Treadway Commission. The Company's management is responsible for maintaining effective internal control over financial reporting and for its assessment of the effectiveness of internal control over financial reporting, included in the accompanying Management Report on Internal Control Over Financial Reporting. Our responsibility is to express an opinion on the Company's internal control over financial reporting based on our audit.
We conducted our audit in accordance with the standards of the Public Company Accounting Oversight Board (United States). Those standards require that we plan and perform the audit to obtain reasonable assurance about whether effective internal control over financial reporting was maintained in all material respects. Our audit included obtaining an understanding of internal control over financial reporting, assessing the risk that a material weakness exists, testing and evaluating the design and operating effectiveness of internal control based on the assessed risk, and performing such other procedures as we considered necessary in the circumstances. We believe that our audit provides a reasonable basis for our opinion.
A company's internal control over financial reporting is a process designed by, or under the supervision of, the company's principal executive and principal financial officers, or persons performing similar functions, and effected by the company's board of directors, management, and other personnel to provide reasonable assurance regarding the reliability of financial reporting and the preparation of financial statements for external purposes in accordance with generally accepted accounting principles. A company's internal control over financial reporting includes those policies and procedures that (1) pertain to the maintenance of records that, in reasonable detail, accurately and fairly reflect the transactions and dispositions of the assets of the company; (2) provide reasonable assurance that transactions are recorded as necessary to permit preparation of financial statements in accordance with generally accepted accounting principles, and that receipts and expenditures of the company are being made only in accordance with authorizations of management and directors of the company; and (3) provide reasonable assurance regarding prevention or timely detection of unauthorized acquisition, use or disposition of the company's assets that could have a material effect on the financial statements.
Because of the inherent limitations of internal control over financial reporting, including the possibility of collusion or improper management override of controls, material misstatements due to error or fraud may not be prevented or detected on a timely basis. Also, projections of any evaluation of the effectiveness of the internal control over financial reporting to future periods are subject to the risk that the controls may become inadequate because of changes in conditions, or that the degree of compliance with the policies or procedures may deteriorate.
In our opinion, the Company maintained, in all material respects, effective internal control over financial reporting as of December 31, 2008, based on the criteria established inInternal Control — Integrated Framework issued by the Committee of Sponsoring Organizations of the Treadway Commission.
We have also audited, in accordance with the standards of the Public Company Accounting Oversight Board (United States), the accompanying consolidated financial statements as of and for the year ended December 31, 2008 of the Company and our report dated February 26, 2009 expressed an unqualified opinion on those financial statements.
/s/ Deloitte & Touche LLP
Denver, CO
February 26, 2009
32
Table of Contents
MANAGEMENT REPORT ON INTERNAL CONTROL OVER FINANCIAL REPORTING
Janus Capital Group Inc. ("JCG") management is responsible for establishing and maintaining adequate internal control over JCG's financial reporting, as defined in Rules 13a-15(f) and 15d-15(f) under the Exchange Act. JCG' internal control system was designed to provide reasonable assurance to JCG's management and board of directors regarding the preparation and fair presentation of published financial statements. There are inherent limitations in the effectiveness of any internal control, including the possibility of human error and the circumvention or overriding of controls. Accordingly, even effective internal controls can provide only reasonable assurances with respect to financial statement preparation. Further, because of changes in conditions, the effectiveness of internal controls may vary over time.
JCG has assessed the effectiveness of JCG's internal controls over financial reporting as of December 31, 2008. In making this assessment, JCG used the criteria set forth in the Committee of Sponsoring Organizations of the Treadway Commission (COSO) inInternal Control — Integrated Framework.
Based on the assessment using those criteria, JCG believes that, as of December 31, 2008, internal control over financial reporting is effective.
JCG's independent registered public accounting firm audited the financial statements included in the Annual Report on Form 10-K and have issued an audit report on management's assessment of JCG's internal control over financial reporting. This report appears on page 32 of this Annual Report on Form 10-K.
February 26, 2009
33
Table of Contents
JANUS CAPITAL GROUP INC.
CONSOLIDATED BALANCE SHEETS
(Dollars in Millions, Except Share Data)
| | | | | | | | | |
| | December 31, | |
|---|
| | 2008 | | 2007 | |
|---|
ASSETS | | | | | | | |
Current assets: | | | | | | | |
| | Cash and cash equivalents | | $ | 282.6 | | $ | 480.7 | |
| | Marketable securities | | | 125.3 | | | 210.7 | |
| | Accounts receivable | | | 101.1 | | | 164.5 | |
| | Income taxes receivable | | | 16.4 | | | 5.9 | |
| | Other current assets | | | 58.5 | | | 62.3 | |
| | Assets related to discontinued operations | | | — | | | 29.8 | |
| | | | | | |
| | | Total current assets | | | 583.9 | | | 953.9 | |
Other assets | | | 60.2 | | | 112.2 | |
Property and equipment, net | | | 51.1 | | | 46.5 | |
Intangibles, net | | | 1,321.2 | | | 1,310.4 | |
Goodwill | | | 1,320.3 | | | 1,141.1 | |
| | | | | | |
Total assets | | $ | 3,336.7 | | $ | 3,564.1 | |
| | | | | | |
LIABILITIES AND STOCKHOLDERS' EQUITY | | | | | | | |
Current liabilities: | | | | | | | |
| | Accounts payable | | $ | 0.5 | | $ | 2.2 | |
| | Accrued compensation and benefits | | | 90.0 | | | 134.5 | |
| | Current portion of long-term debt | | | 22.0 | | | — | |
| | Other accrued liabilities | | | 44.1 | | | 79.2 | |
| | Liabilities related to discontinued operations | | | — | | | 10.8 | |
| | | | | | |
| | | Total current liabilities | | | 156.6 | | | 226.7 | |
Other liabilities: | | | | | | | |
| | Long-term debt | | | 1,106.0 | | | 1,127.7 | |
| | Deferred income taxes | | | 388.1 | | | 404.3 | |
| | Other liabilities | | | 62.4 | | | 65.7 | |
| | | | | | |
| | | Total liabilities | | | 1,713.1 | | | 1,824.4 | |
| | | | | | |
Commitments and contingencies | | | | | | | |
Minority interest | | | 15.5 | | | 16.2 | |
| | | | | | |
STOCKHOLDERS' EQUITY | | | | | | | |
Preferred stock ($1.00 par, 10,000,000 shares authorized, none issued) | | | — | | | — | |
Common stock ($.01 par, 1,000,000,000 shares authorized; 244,591,618 shares issued, 157,890,142 and 166,287,937 shares outstanding, respectively) | | | 1.6 | | | 1.7 | |
Retained earnings | | | 1,611.8 | | | 1,717.0 | |
Accumulated other comprehensive income (loss) | | | (5.3 | ) | | 4.8 | |
| | | | | | |
| | | Total stockholders' equity | | | 1,608.1 | | | 1,723.5 | |
| | | | | | |
Total liabilities and stockholders' equity | | $ | 3,336.7 | | $ | 3,564.1 | |
| | | | | | |
The accompanying notes are an integral part of these consolidated financial statements.
34
Table of Contents
JANUS CAPITAL GROUP INC.
CONSOLIDATED STATEMENTS OF INCOME
(Dollars in Millions, Except Per Share Data)
| | | | | | | | | | | | |
| | For the year ended December 31, | |
|---|
| | 2008 | | 2007 | | 2006 | |
|---|
Revenues: | | | | | | | | | | |
| | Investment management fees | | $ | 826.7 | | $ | 897.9 | | $ | 750.2 | |
| | Performance fees | | | 27.6 | | | 19.5 | | | 14.9 | |
| | Shareowner servicing fees and other | | | 183.6 | | | 199.6 | | | 170.7 | |
| | | | | | | | |
| | | Total | | | 1,037.9 | | | 1,117.0 | | | 935.8 | |
| | | | | | | | |
Operating Expenses: | | | | | | | | | | |
| | Employee compensation and benefits | | | 317.9 | | | 360.7 | | | 315.2 | |
| | Long-term incentive compensation | | | 43.5 | | | 79.9 | | | 82.7 | |
| | Marketing and advertising | | | 33.1 | | | 25.9 | | | 28.3 | |
| | Distribution | | | 134.9 | | | 141.7 | | | 110.2 | |
| | Depreciation and amortization | | | 40.2 | | | 33.8 | | | 32.0 | |
| | General, administrative and occupancy | | | 135.2 | | | 125.3 | | | 117.5 | |
| | Restructuring and impairments | | | – | | | 0.4 | | | 11.0 | |
| | | | | | | | |
| | | Total | | | 704.8 | | | 767.7 | | | 696.9 | |
| | | | | | | | |
Operating Income | | | 333.1 | | | 349.3 | | | 238.9 | |
Interest expense | | | (75.5 | ) | | (58.8 | ) | | (32.3 | ) |
Investment gains (losses), net | | | (60.4 | ) | | 4.7 | | | 11.7 | |
Other income, net | | | 9.6 | | | 27.7 | | | 25.3 | |
| | | | | | | | |
Income before taxes, equity earnings and minority interest | | | 206.8 | | | 322.9 | | | 243.6 | |
Income tax provision | | | (68.8 | ) | | (116.4 | ) | | (90.1 | ) |
Equity in earnings of unconsolidated affiliate | | | 9.0 | | | 7.2 | | | 7.1 | |
Minority interest in consolidated earnings | | | (8.6 | ) | | (21.7 | ) | | (21.7 | ) |
| | | | | | | | |
Income from continuing operations | | | 138.4 | | | 192.0 | | | 138.9 | |
Loss from discontinued operations | | | (1.5 | ) | | (75.7 | ) | | (5.3 | ) |
| | | | | | | | |
Net Income | | $ | 136.9 | | $ | 116.3 | | $ | 133.6 | |
| | | | | | | | |
Earnings per Share-Basic: | | | | | | | | | | |
| | Income from continuing operations | | $ | 0.87 | | $ | 1.09 | | $ | 0.69 | |
| | Loss from discontinued operations | | | (0.01 | ) | | (0.43 | ) | | (0.03 | ) |
| | | | | | | | |
| | | Net income | | $ | 0.86 | | $ | 0.66 | | $ | 0.66 | |
| | | | | | | | |
Earnings per Share-Diluted: | | | | | | | | | | |
| | Income from continuing operations | | $ | 0.86 | | $ | 1.07 | | $ | 0.68 | |
| | Loss from discontinued operations | | | (0.01 | ) | | (0.42 | ) | | (0.03 | ) |
| | | | | | | | |
| | | Net income | | $ | 0.85 | | $ | 0.65 | | $ | 0.66 | |
| | | | | | | | |
The accompanying notes are an integral part of these consolidated financial statements.
35
Table of Contents
JANUS CAPITAL GROUP INC.
CONSOLIDATED STATEMENTS OF CASH FLOWS
(Dollars in Millions)
| | | | | | | | | | | | | |
| | For the year ended December 31, | |
|---|
| | 2008 | | 2007 | | 2006 | |
|---|
CASH FLOWS PROVIDED BY (USED FOR): | | | | | | | | | | |
Continuing Operations | | | | | | | | | | |
Operating Activities: | | | | | | | | | | |
| | Net income | | $ | 138.4 | | $ | 192.0 | | $ | 138.9 | |
| | Adjustments to net income: | | | | | | | | | | |
| | | Depreciation and amortization | | | 40.2 | | | 33.8 | | | 32.2 | |
| | | Deferred income taxes | | | (29.0 | ) | | 16.2 | | | (20.5 | ) |
| | | Minority interest in consolidated earnings | | | 8.6 | | | 21.7 | | | 21.7 | |
| | | Amortization of stock-based compensation | | | 31.1 | | | 49.6 | | | 71.9 | |
| | | Investment (gains) losses, net | | | 60.4 | | | (6.1 | ) | | (10.4 | ) |
| | Payment of deferred commissions, net | | | (0.7 | ) | | (27.7 | ) | | 2.1 | |
| | Other, net | | | 5.6 | | | (4.8 | ) | | 6.5 | |
| | Changes in working capital items: | | | | | | | | | | |
| | | Accounts receivable | | | 66.3 | | | (30.1 | ) | | 3.7 | |
| | | Other current assets | | | (4.7 | ) | | 12.6 | | | 0.2 | |
| | | Accounts payable and accrued compensation payable | | | (49.0 | ) | | 31.0 | | | 14.4 | |
| | | Other accrued liabilities | | | (29.0 | ) | | 2.6 | | | 37.9 | |
| | | | | | | | |
| | | | Net operating | | | 238.2 | | | 290.8 | | | 298.6 | |
| | | | | | | | |
Investing Activities: | | | | | | | | | | |
| | Purchase of property and equipment | | | (20.1 | ) | | (16.7 | ) | | (14.8 | ) |
| | Acquisitions | | | (161.4 | ) | | (81.0 | ) | | (90.0 | ) |
| | Distribution of cash from discontinued operations | | | 13.5 | | | 44.2 | | | – | |
| | Purchase of marketable securities | | | (72.3 | ) | | (177.5 | ) | | (65.3 | ) |
| | Proceeds from sales and maturities of marketable securities | | | 91.5 | | | 127.7 | | | 218.1 | |
| | | | | | | | |
| | | | Net investing | | | (148.8 | ) | | (103.3 | ) | | 48.0 | |
| | | | | | | | |
Financing Activities: | | | | | | | | | | |
| | Proceeds from issuance of long-term debt | | | – | | | 748.4 | | | 275.0 | |
| | Debt issuance costs | | | – | | | (6.9 | ) | | (2.2 | ) |
| | Repayment of long-term debt | | | – | | | (158.1 | ) | | (113.1 | ) |
| | Proceeds from stock plans | | | 21.6 | | | 73.2 | | | 41.9 | |
| | Excess tax benefit from equity-based compensation | | | 4.4 | | | 10.6 | | | 4.4 | |
| | Repurchase of common stock | | | (291.7 | ) | | (845.6 | ) | | (516.4 | ) |
| | Distributions to minority interest | | | (15.3 | ) | | (28.2 | ) | | (21.8 | ) |
| | Dividends paid to shareholders | | | (6.5 | ) | | (7.2 | ) | | (8.3 | ) |
| | Other, net | | | – | | | (0.1 | ) | | – | |
| | | | | | | | |
| | | | Net financing | | | (287.5 | ) | | (213.9 | ) | | (340.5 | ) |
| | | | | | | | |
Cash and Cash Equivalents: | | | | | | | | | | |
| | Net increase (decrease) | | | (198.1 | ) | | (26.4 | ) | | 6.1 | |
| | At beginning of period | | | 480.7 | | | 507.1 | | | 501.0 | |
| | | | | | | | |
| | At end of period | | $ | 282.6 | | $ | 480.7 | | $ | 507.1 | |
| | | | | | | | |
Discontinued Operations | | | | | | | | | | |
| | Operating activities | | $ | (6.7 | ) | $ | (2.1 | ) | $ | 3.3 | |
| | Investing activities | | | 2.8 | | | (46.2 | ) | | (2.2 | ) |
| | | | | | | | |
Cash and Cash Equivalents: | | | | | | | | | | |
| | Net increase (decrease) | | | (3.9 | ) | | (48.3 | ) | | 1.1 | |
| | At beginning of period | | | 4.3 | | | 52.6 | | | 51.5 | |
| | | | | | | | |
| | At end of period | | $ | 0.4 | | $ | 4.3 | | $ | 52.6 | |
| | | | | | | | |
Supplemental Cash Flow Information: | | | | | | | | | | |
| | Cash paid for interest | | $ | 71.8 | | $ | 55.5 | | $ | 32.5 | |
| | Cash paid for income taxes | | $ | 99.9 | | $ | 85.7 | | $ | 81.7 | |
The accompanying notes are an integral part of these consolidated financial statements.
36
Table of Contents
JANUS CAPITAL GROUP INC.
CONSOLIDATED STATEMENTS OF CHANGES IN STOCKHOLDERS' EQUITY
(Amounts in Millions, Except Per Share Data)
| | | | | | | | | | | | | | | | | | |
| | Shares | | Common
Stock | | Retained
Earnings | | Accumulated
Other
Comprehensive
Income (Loss) | | Total
Stockholders'
Equity | |
|---|
Balance at December 31, 2005 | | | 216.0 | | $ | 2.2 | | $ | 2,569.3 | | $ | 9.7 | | $ | 2,581.2 | |
| | Net income | | | | | | | | | 133.6 | | | | | | 133.6 | |
| | Net unrealized gain on marketable securities | | | | | | | | | | | | 15.4 | | | 15.4 | |
| | Amortization of net loss on cash flow hedge | | | | | | | | | | | | (2.4 | ) | | (2.4 | ) |
| | Reclassification for gains included in net income | | | | | | | | | | | | (6.5 | ) | | (6.5 | ) |
| | Foreign currency translation adjustment | | | | | | | | | | | | (5.1 | ) | | (5.1 | ) |
| | | | | | | | | | | | | | | | |
| | | Comprehensive income | | | | | | | | | | | | | | | 135.0 | |
Amortization of stock-based compensation | | | | | | | | | 72.4 | | | | | | 72.4 | |
Issuance and forfeitures of restricted stock awards | | | 0.3 | | | | | | | | | | | | – | |
Stock option exercises | | | 3.1 | | | | | | 42.1 | | | | | | 42.1 | |
Common stock repurchased | | | (25.9 | ) | | (0.3 | ) | | (516.1 | ) | | | | | (516.4 | ) |
Change of interest in subsidiary | | | | | | | | | 0.4 | | | | | | 0.4 | |
Common stock dividends ($0.04 per share) | | | | | | | | | (8.3 | ) | | | | | (8.3 | ) |
| | | | | | | | | | | | |
Balance at December 31, 2006 | | | 193.5 | | | 1.9 | | | 2,293.4 | | | 11.1 | | | 2,306.4 | |
Cumulative-effect adjustment for the adoption of a new accounting principle | | | | | | | | | 29.9 | | | | | | 29.9 | |
| | Net income | | | | | | | | | 116.3 | | | | | | 116.3 | |
| | Net unrealized gain on marketable securities | | | | | | | | | | | | 5.2 | | | 5.2 | |
| | Amortization of net loss on cash flow hedge | | | | | | | | | | | | 0.4 | | | 0.4 | |
| | Reclassification for gains included in net income | | | | | | | | | | | | (12.8 | ) | | (12.8 | ) |
| | Foreign currency translation adjustment | | | | | | | | | | | | 0.9 | | | 0.9 | |
| | | | | | | | | | | | | | | | |
| | | Comprehensive income | | | | | | | | | | | | | | | 110.0 | |
Amortization of stock-based compensation | | | | | | | | | 50.1 | | | | | | 50.1 | |
Issuance and forfeitures of restricted stock awards | | | 0.9 | | | | | | | | | | | | – | |
Tax impact of stock-based compensation | | | | | | | | | 6.7 | | | | | | 6.7 | |
Stock option exercises | | | 4.2 | | | | | | 73.2 | | | | | | 73.2 | |
Common stock repurchased | | | (32.3 | ) | | (0.2 | ) | | (845.4 | ) | | | | | (845.6 | ) |
Common stock dividends ($0.04 per share) | | | | | | | | | (7.2 | ) | | | | | (7.2 | ) |
| | | | | | | | | | | | |
Balance at December 31, 2007 | | | 166.3 | | | 1.7 | | | 1,717.0 | | | 4.8 | | | 1,723.5 | |
| | Net income | | | | | | | | | 136.9 | | | | | | 136.9 | |
| | Net unrealized loss on marketable securities | | | | | | | | | | | | (3.8 | ) | | (3.8 | ) |
| | Amortization of net loss on cash flow hedge | | | | | | | | | | | | 0.5 | | | 0.5 | |
| | Reclassification for gains included in net income | | | | | | | | | | | | (0.9 | ) | | (0.9 | ) |
| | Foreign currency translation adjustment | | | | | | | | | | | | (5.9 | ) | | (5.9 | ) |
| | | | | | | | | | | | | | | | |
| | | Comprehensive income | | | | | | | | | | | | | | | 126.8 | |
Amortization of stock-based compensation | | | | | | | | | 29.3 | | | | | | 29.3 | |
Issuance and forfeitures of restricted stock awards | | | 1.6 | | | | | | | | | | | | – | |
Tax impact of stock-based compensation | | | | | | | | | 3.4 | | | | | | 3.4 | |
Stock option exercises | | | 1.1 | | | | | | 21.6 | | | | | | 21.6 | |
Common stock repurchased | | | (11.1 | ) | | (0.1 | ) | | (291.6 | ) | | | | | (291.7 | ) |
Change of interest in subsidiary | | | | | | | | | 1.7 | | | | | | 1.7 | |
Common stock dividends ($0.04 per share) | | | | | | | | | (6.5 | ) | | | | | (6.5 | ) |
| | | | | | | | | | | | |
Balance at December 31, 2008 | | | 157.9 | | $ | 1.6 | | $ | 1,611.8 | | $ | (5.3 | ) | $ | 1,608.1 | |
| | | | | | | | | | | | |
The accompanying notes are an integral part of these consolidated financial statements.
37
Table of Contents
JANUS CAPITAL GROUP INC.
NOTES TO CONSOLIDATED FINANCIAL STATEMENTS
Note 1 — DESCRIPTION OF THE BUSINESS
Janus Capital Group Inc. and its subsidiaries (collectively, "JCG" or the "Company") derive revenue and net income from providing investment management, administration, distribution and related services to individual and institutional investors through mutual funds, separate accounts and subadvised relationships (collectively referred to herein as "investment products") in both domestic and international markets. Revenue is largely dependent on the total value and composition of assets under management, which include domestic equity, international equity and debt securities. Accordingly, fluctuations in the financial markets and in the composition of assets under management affect revenue and operating results. A significant portion of JCG's revenue is derived from contracts to manage mutual funds, which are subject to annual review and approval by each fund's Board of Trustees and/or its shareholders.
JCG's significant subsidiaries at December 31, 2008, include:
- •
- Janus Capital Management LLC ("Janus") (wholly-owned subsidiary). Janus offers growth equity, core and international equity funds, as well as balanced, fixed-income, alternative and money market funds.
- •
- INTECH Investment Management LLC ("INTECH"), formerly known as Enhanced Investment Technologies, LLC (approximate 90% owned subsidiary). INTECH offers risk-managed investment products that are based on a mathematical theorem that attempts to capitalize on the volatility in stock price movements. INTECH's goal is to achieve long-term returns that outperform a passive index, while controlling risks and trading costs. INTECH manages institutional and private accounts and subadvises certain Janus mutual funds.
- •
- Perkins Investment Management LLC ("Perkins"), formerly known as Perkins, Wolf, McDonnell and Company, LLC (approximate 80% owned subsidiary). On December 31, 2008, JCG increased its ownership of Perkins with the purchase of an additional 50% ownership interest. Perkins offers value-disciplined investment products, including small, mid and large cap value funds.
NOTE 2 — SUMMARY OF SIGNIFICANT ACCOUNTING POLICIES
Basis of Presentation
The financial statements include all majority-owned subsidiaries, and all intercompany accounts and transactions have been eliminated. The equity method of accounting was used for Perkins prior to December 31, 2008, as JCG had significant influence but did not have the ability to exercise control.
Accounting Estimates
The preparation of financial statements in conformity with accounting principles generally accepted in the United States of America ("GAAP") requires management to make estimates and assumptions that affect the reported amounts of assets and liabilities, the disclosure of contingent assets and liabilities at the date of the financial statements, and the reported amounts of revenues and expenses during the reporting period. Actual results could differ from those estimates. JCG's significant estimates relate to income taxes, intangible assets and goodwill, marketable securities and equity compensation.
38
Table of Contents
Segment Information
During the third quarter 2007, the Printing and Fulfillment segment, represented by Rapid Solutions Group, was reclassified to discontinued operations. The Company operates one business segment, its Investment Management operations.
Cash and Cash Equivalents
Short-term liquid investments with an initial maturity of generally three months or less, including investments in money market funds, are considered cash equivalents.
Property and Equipment
Property and equipment is recorded at cost. Depreciation and amortization is recorded using the straight-line method over the estimated useful life of the related assets (or the lease term, if shorter). Depreciation and amortization expense totaled $15.9 million, $14.2 million and $13.8 million for the years ended December 31, 2008, 2007 and 2006, respectively. Property and equipment is summarized as follows(in millions):
| | | | | | | | | | | |
| | Depreciation and Amortization Period | | December 31, | |
|---|
| | 2008 | | 2007 | |
|---|
Furniture, fixtures and equipment, including computer equipment and systems | | 3-7 years | | $ | 155.6 | | $ | 145.8 | |
Leasehold improvements | | 3-24 years | | | 34.9 | | | 26.0 | |
| | | | | | | | |
| | | Subtotal | | | | | 190.5 | | | 171.8 | |
Less accumulated depreciation | | | | | (139.4 | ) | | (125.3 | ) |
| | | | | | | | |
Property and equipment, net | | | | $ | 51.1 | | $ | 46.5 | |
| | | | | | | | |
JCG evaluates its long-lived assets for impairment whenever events or changes in circumstances indicate that the carrying amount of an asset may not be recoverable. The evaluation is based on an estimate of the future cash flows expected to result from the use of the asset and its eventual disposition. If expected future undiscounted cash flows are less than the carrying amount of the asset, an impairment loss is recognized to the extent that the carrying amount of the asset exceeds its fair value.
Software
Purchased software is recorded at cost and amortized over its estimated useful life. Computer software and development costs incurred in the preliminary project stage, as well as training and maintenance costs, are expensed as incurred. Direct and indirect costs associated with the application development stage of internal use software are capitalized until such time that the software is substantially complete and ready for its intended use. Capitalized costs are amortized on a straight-line basis over the estimated useful life of the software.
Deferred Commissions
Sales commissions paid to financial intermediaries on sales of certain mutual fund shares are deferred and amortized over various periods, not exceeding four years, based on the estimated recoverability of the asset through distribution fee payments or contingent deferred sales charges. Contingent deferred sales charges received from early withdrawal charges reduce the unamortized deferred commissions balance. Amortization expense for the years ended December 31, 2008, 2007 and 2006, totaled
39
Table of Contents
$11.4 million, $8.9 million and $7.8 million, respectively. Deferred commissions, which are recorded as components of other assets, are summarized as follows(in millions):
| | | | | | | | |
| | December 31, | |
|---|
| | 2008 | | 2007 | |
|---|
Deferred commissions — current | | $ | 5.0 | | $ | 10.3 | |
Deferred commissions — long term | | | 5.6 | | | 11.1 | |
| | | | | | |
| | Total | | $ | 10.6 | | $ | 21.4 | |
| | | | | | |
Marketable Securities
JCG classifies marketable securities as trading, available-for-sale or held-to-maturity at the time of purchase and periodically re-evaluates such classifications. Trading securities are carried at fair value and consist primarily of investments in equity and debt securities held in the portfolios of consolidated advised funds and separate accounts. Changes in fair value are reflected as a component of investment gains (losses), net on the consolidated statements of income.
Marketable securities classified as available-for-sale consist of investments in advised funds and other securities and are carried at fair value. Changes in fair value are reflected as a component of accumulated other comprehensive income until realized. Realized gains, losses and declines in fair value that are judged to be other-than-temporary are reflected as a component of investment gains (losses), net on the consolidated statements of income. Realized gains and losses are determined using the first-in, first-out cost method.
Fair value of trading and available-for-sale securities is determined using observable market data based on recent trading activity. Where observable market data is unavailable due to a lack of trading activity, JCG utilizes internally developed models to estimate fair value and independent third parties to validate assumptions when appropriate. Estimating fair value requires significant management judgment, including benchmarking to similar instruments with observable market data and applying appropriate discounts that reflect differences between the securities that JCG is valuing and the selected benchmark. Depending on the type of securities owned by JCG, other valuation methodologies may be required.
Marketable securities are classified as held-to-maturity when JCG has the intent and ability to hold the securities to maturity. Held-to-maturity securities are stated at cost with corresponding premiums or discounts amortized over the life of the investment to other income. Realized gains, losses and declines in fair value that are judged to be other-than-temporary are reflected as a component of investment gains (losses), net on the consolidated statements of income.
JCG periodically evaluates the carrying value of investment securities classified as available-for-sale or held-to-maturity for potential impairment. In determining if an impairment exists, JCG considers the duration, extent and circumstances of any decline in fair value. If the decline in value is determined to be other-than-temporary, the carrying value of the security is written down to fair value with the loss recognized currently in earnings.
Income Taxes
Deferred income tax assets and liabilities are recorded for the temporary differences between the financial statement and income tax bases of assets and liabilities as measured by the enacted income tax rates that may be in effect when these differences reverse. Significant management judgment is required in developing JCG's provision for income taxes, including the valuation allowances that might be required against deferred tax assets and the evaluation of various income tax contingencies.
40
Table of Contents
Goodwill and Intangible Assets
Goodwill represents the excess of cost over the fair value of the identifiable net assets of acquired companies. JCG's identifiable intangible assets generally represent the cost of client relationships and management contracts acquired. Goodwill and indefinite-lived intangible assets are tested for impairment annually or more frequently if events or circumstances indicate that the asset might be impaired. Intangibles subject to amortization are tested for impairment whenever events or circumstances indicate that the asset may be impaired. Goodwill and intangible assets require significant management estimates and judgment, including the valuation and expected life determination in connection with the initial purchase price allocation and the ongoing evaluation for impairment.
Revenue Recognition
Investment management and shareholder servicing fees are recognized as services are provided. These revenues are generally determined in accordance with contracts based upon a percentage of assets under management.
Performance fees are based on the performance of certain investment products as compared to an established benchmark over a specified period of time and are recognized at the end of the period if the stated performance criteria are achieved.
Marketing
Marketing and promotional costs are expensed as incurred.
Stock-Based Compensation
Stock-based compensation cost is based on the grant date fair value of awards expected to vest at the end of the stated service period, comprised of the total value of the awards less an estimate for forfeitures. The grant date fair value of stock options is determined using the Black-Scholes option pricing model and the grant date fair value of restricted stock is determined from a quoted market price. The Black-Scholes model requires significant management estimates including volatility and expected life.
Other Income, Net
The components of other income are as follows(in millions):
| | | | | | | | | | | |
| | 2008 | | 2007 | | 2006 | |
|---|
Dividend income | | $ | 1.9 | | $ | 15.3 | | $ | 10.4 | |
Interest income | | | 5.4 | | | 12.4 | | | 14.9 | |
Translation gains and losses, net | | | 2.3 | | | – | | | – | |
| | | | | | | | |
| | Total | | $ | 9.6 | | $ | 27.7 | | $ | 25.3 | |
| | | | | | | | |
41
Table of Contents
Other Comprehensive Income
The components of other comprehensive income include the change in fair value of available-for-sale investments owned by JCG as well as foreign currency translation adjustments, as follows(in millions):
| | | | | | | | | | | |
Year ended December 31, 2008
| | Pre-tax amount | | Tax (expense)
benefit | | Net amount | |
|---|
| | Net unrealized loss on marketable securities | | $ | (6.0 | ) | $ | 2.2 | | $ | (3.8 | ) |
| | Amortization of net loss on cash flow hedge | | | 0.9 | | | (0.4 | ) | | 0.5 | |
| | Reclassification for gains included in net income | | | (1.5 | ) | | 0.6 | | | (0.9 | ) |
| | Foreign currency translation adjustment | | | (3.0 | ) | | (2.9 | ) | | (5.9 | ) |
| | | | | | | | |
| | Total | | $ | (9.6 | ) | $ | (0.5 | ) | $ | (10.1 | ) |
| | | | | | | | |
| | | | | | | | | | | |
Year ended December 31, 2007
| | Pre-tax amount | | Tax (expense)
benefit | | Net amount | |
|---|
| | Net unrealized gain on marketable securities | | $ | 8.5 | | $ | (3.3 | ) | $ | 5.2 | |
| | Amortization of net loss on cash flow hedge | | | 0.7 | | | (0.3 | ) | | 0.4 | |
| | Reclassification for gains included in net income | | | (20.8 | ) | | 8.0 | | | (12.8 | ) |
| | Foreign currency translation adjustment | | | 1.5 | | | (0.6 | ) | | 0.9 | |
| | | | | | | | |
| | Total | | $ | (10.1 | ) | $ | 3.8 | | $ | (6.3 | ) |
| | | | | | | | |
| | | | | | | | | | | |
Year ended December 31, 2006
| | Pre-tax amount | | Tax (expense) benefit | | Net amount | |
|---|
| | Net unrealized gain on marketable securities | | $ | 22.3 | | $ | (6.9 | ) | $ | 15.4 | |
| | Amortization of net loss on cash flow hedge | | | (4.0 | ) | | 1.6 | | | (2.4 | ) |
| | Reclassification for gains included in net income | | | (10.5 | ) | | 4.0 | | | (6.5 | ) |
| | Foreign currency translation adjustment | | | (8.2 | ) | | 3.1 | | | (5.1 | ) |
| | | | | | | | |
| | Total | | $ | (0.4 | ) | $ | 1.8 | | $ | 1.4 | |
| | | | | | | | |
NOTE 3 — RECENT ACCOUNTING PRONOUNCEMENTS
In February 2007, the Financial Accounting Standards Board ("FASB") issued Statement of Financial Accounting Standard No. 159, "The Fair Value Option for Financial Assets and Financial Liabilities" ("SFAS 159"), which permits an entity to measure certain financial assets and financial liabilities at fair value. JCG has not applied the provisions of SFAS 159 to any financial assets or financial liabilities.
In December 2007, the FASB issued Statement of Financial Accounting Standard No. 141 (revised 2007), "Business Combinations" ("SFAS 141R"), which establishes principles and requirements for how an acquirer recognizes and measures the identifiable assets acquired, the liabilities assumed and any noncontrolling interest in an acquiree, including the recognition and measurement of goodwill acquired in a business combination. The effective date of SFAS 141R is the Company's fiscal year beginning January 1, 2009. JCG will apply SFAS 141R to any future acquisitions completed on or after January 1, 2009.
In December 2007, the FASB issued Statement of Financial Accounting Standard No. 160, "Noncontrolling Interests in Consolidated Financial Statements, an amendment of Accounting Research Bulletin No. 51" ("SFAS 160"), which establishes accounting and reporting standards for the noncontrolling interest in a subsidiary, and requires noncontrolling interests to be classified as a component of equity in the consolidated financial statements. The effective date of SFAS 160 is the
42
Table of Contents
Company's fiscal year beginning January 1, 2009. Subsequently, the Securities and Exchange Commission ("SEC") announced revisions to Emerging Issues Task Force Topic D-98 "Classification and Measurement of Redeemable Securities" ("EITF D-98"), which clarified that noncontrolling interests that are redeemable and whose redemption is not solely controlled by the issuer are not within the scope of SFAS 160. Such interests are within the scope of EITF D-98, which requires that redeemable noncontrolling interests be classified outside of permanent equity at the aggregate of the redemption value and undistributed earnings attributable to the noncontrolling interest at each balance sheet date. The effective date of EITF D-98 is the Company's fiscal year beginning January 1, 2009. Based on the most recent fair value measurements, the noncontrolling interests in INTECH and Perkins would be valued at approximately $128.0 million and $36.0 million, respectively. Beginning in 2009, JCG will reflect the fair value of noncontrolling interests on the consolidated balance sheets.
In February 2008, the FASB issued Staff Position 157-2, "Effective Date of FASB 157" ("FSP 157-2"), which deferred the provisions of Statement of Financial Accounting Standard No. 157, "Fair Value Measurements" ("SFAS 157"), to annual periods beginning after November 15, 2008 for nonfinancial assets and liabilities. The application of the provisions of SFAS 157 to JCG's nonfinancial assets and liabilities will likely result in additional disclosures but is not expected to have a material impact on JCG's fair value measurements.
In October 2008, the FASB issued Staff Position 157-3, "Determining the Fair Value of a Financial Asset in a Market That Is Not Active" ("FSP 157-3"), which clarifies the application of SFAS 157 in an inactive market and provides an illustrative example to demonstrate how the fair value of a financial asset is determined when the market for that financial asset is not active. The guidance provided by FSP 157-3 is consistent with JCG's approach to valuing financial assets for which there are no active markets, including its investment in securities issued by Stanfield Victoria Funding LLC ("Stanfield securities").
In March 2008, the FASB issued Statement of Financial Accounting Standard No. 161, "Disclosures about Derivative Instruments and Hedging Activities, an amendment of FASB Statement No. 133" ("SFAS 161"), which requires enhanced disclosures about an entity's derivative and hedging activities. The effective date of SFAS 161 is the Company's fiscal year beginning January 1, 2009. SFAS 161 is not expected to result in significant additional disclosures regarding derivative instruments and hedging activities.
NOTE 4 — EARNINGS PER SHARE
Basic earnings per common share is calculated by dividing net income by the weighted average number of common shares outstanding during the period. Diluted earnings per common share adjusts the weighted average shares outstanding by the dilutive impact of shares underlying stock options and
43
Table of Contents
unvested restricted stock awards. The following is a summary of the earnings per share calculation(in millions, except per share data):
| | | | | | | | | | | | |
| | For the year ended December 31, | |
|---|
| | 2008 | | 2007 | | 2006 | |
|---|
| | Income from continuing operations | | $ | 138.4 | | $ | 192.0 | | $ | 138.9 | |
| | Loss from discontinued operations | | | (1.5 | ) | | (75.7 | ) | | (5.3 | ) |
| | | | | | | | |
Net income | | $ | 136.9 | | $ | 116.3 | | $ | 133.6 | |
| | | | | | | | |
Basic earnings per share: | | | | | | | | | | |
| | Weighted average common shares outstanding | | | 159.1 | | | 176.5 | | | 202.4 | |
| | | | | | | | |
| | Income from continuing operations | | $ | 0.87 | | $ | 1.09 | | $ | 0.69 | |
| | Loss from discontinued operations | | | (0.01 | ) | | (0.43 | ) | | (0.03 | ) |
| | | | | | | | |
| | | Basic earnings per share | | $ | 0.86 | | $ | 0.66 | | $ | 0.66 | |
| | | | | | | | |
Diluted earnings per share: | | | | | | | | | | |
| | Weighted average common shares outstanding | | | 159.1 | | | 176.5 | | | 202.4 | |
| | Dilutive effect of stock options and unvested restricted stock using the treasury stock method | | | 1.6 | | | 2.1 | | | 1.1 | |
| | | | | | | | |
| | Weighted average diluted common shares outstanding | | | 160.7 | | | 178.6 | | | 203.5 | |
| | Income from continuing operations | | $ | 0.86 | | $ | 1.07 | | $ | 0.68 | |
| | Loss from discontinued operations | | | (0.01 | ) | | (0.42 | ) | | (0.03 | ) |
| | | | | | | | |
| | | Diluted earnings per share | | $ | 0.85 | | $ | 0.65 | | $ | 0.66 | |
| | | | | | | | |
The following stock options and unvested restricted stock are anti-dilutive and have not been included in the weighted average diluted shares outstanding calculation(in millions):
| | | | | | | | | | |
| | For the year ended December 31, | |
|---|
| | 2008 | | 2007 | | 2006 | |
|---|
Stock options | | | 4.0 | | | 3.2 | | | 3.5 | |
Unvested restricted stock | | | 1.4 | | | – | | | 1.0 | |
All shares held in the JCG Employee Stock Ownership Plan (the "ESOP") are treated as outstanding for purposes of computing basic earnings per share.
44
Table of Contents
NOTE 5 — MARKETABLE SECURITIES
JCG's marketable securities at December 31, 2008 and 2007, are summarized as follows(in millions):
| | | | | | | | | | | | | | | | | | | | | | | | | | | |
| | December 31, 2008 | | December 31, 2007 | |
|---|
| | Cost
Basis | | Gross
Unrealized
Gains | | Gross
Unrealized
Losses | | Estimated
Fair
Value | | Cost
Basis | | Gross
Unrealized
Gains | | Gross
Unrealized
Losses | | Estimated
Fair
Value | |
|---|
Trading securities (carried at fair value) | | $ | 81.9 | | $ | 1.0 | | $ | (20.5 | ) | $ | 62.4 | | $ | 100.9 | | $ | 3.4 | | $ | – | | $ | 104.3 | |
Available-for-sale securities (carried at fair value) | | | | | | | | | | | | | | | | | | | | | | | | | |
| | | Structured investment vehicle | | | 52.2 | | | – | | | – | | | 52.2 | | | 90.3 | | | – | | | – | | | 90.3 | |
| | | Investment in advised funds | | | 14.7 | | | – | | | (4.8 | ) | | 9.9 | | | 13.2 | | | 3.1 | | | (0.2 | ) | | 16.1 | |
Derivative instruments | | | 0.8 | | | – | | | – | | | 0.8 | | | – | | | – | | | – | | | – | |
| | | | | | | | | | | | | | | | | | |
| | $ | 149.6 | | $ | 1.0 | | $ | (25.3 | ) | $ | 125.3 | | $ | 204.4 | | $ | 6.5 | | $ | (0.2 | ) | $ | 210.7 | |
| | | | | | | | | | | | | | | | | | |
JCG periodically adds new investment strategies to its investment product offerings by providing the initial cash investment or "seeding" of these investment products. Seeded investment products are initially consolidated and the individual securities within the portfolio are accounted for as trading securities. JCG will consolidate such investment products as long as it holds a controlling interest, defined as greater than 50% ownership. Upon deconsolidation, JCG accounts for its investments as available-for-sale securities.
JCG may redeem invested seed capital for a variety of reasons, including when third-party capital invested in the relevant product is sufficient to sustain the given investment strategy. JCG recognized $1.7 million, $3.2 million and $10.5 million of gains from the redemption of seed capital investments for the twelve months ended December 31, 2008, 2007 and 2006, respectively.
Investments in seed capital are classified as follows:
Trading Securities
At December 31, 2008, seed capital investments classified as trading securities totaled $62.4 million, representing $37.9 million of securities held in separately managed accounts and $24.5 million of securities held in the portfolios of advised funds consolidated by the Company. Trading securities are carried in JCG's consolidated financial statements at fair value, with changes in value recognized as gains and losses currently in earnings. JCG recognized losses of $41.1 million in earnings on securities classified as trading for the year ended December 31, 2008.
Proceeds from the sale of trading securities totaled $31.2 million for the year ended December 31, 2008.
Available-for-Sale Securities
Investments in Advised Funds
At December 31, 2008, investments in advised funds totaled $9.9 million. Investments in advised funds are carried in JCG's consolidated financial statements at fair value, with changes in value recognized as gains and losses in other comprehensive income. Accumulated gains and losses are reclassified to earnings when the securities are sold. JCG periodically reviews the carrying value of investments in advised funds for impairment by evaluating the nature, duration and extent of any decline in fair value. If the decline in value is determined to be other-than-temporary, the carrying value of the security is
45
Table of Contents
written down to fair value through earnings. No impairment charges have been recognized during the years ended December 31, 2008, 2007 or 2006, for investments in advised funds.
Proceeds from the sale of investments in advised funds totaled $6.8 million, $28.7 million and $59.9 million for the years ended December 31, 2008, 2007 and 2006, respectively.
Prior to the fourth quarter 2007, JCG accounted for all seed account investments as available-for-sale securities with unrealized gains and losses recorded as a component of other comprehensive income. In the fourth quarter 2007, JCG evaluated its seed capital investments and determined that investment products in which JCG owns a majority interest should be consolidated with changes in value recognized as gains and losses in earnings. JCG assessed the impact to 2007 and prior years under Staff Accounting Bulletin ("SAB") Topic 1M "Materiality" and SAB 108 "Quantifying Misstatements" and concluded that the impact was not quantitatively material to 2007 results in the aggregate or any individual previous year. JCG reclassified the $17.6 million of unrealized gains associated with seed capital investments into 2007 earnings.
Structured Investment Vehicle ("SIV")
At December 31, 2008, the fair value of JCG's SIV investment totaled $52.2 million. The SIV investment is carried in JCG's consolidated financial statements based on JCG's estimate of fair value, with changes in fair value recognized as gains and losses in other comprehensive income. JCG recognized impairment charges of $21.0 million and $18.2 million for the years ended December 31, 2008 and 2007 (See Note 6 — Adoption of New Accounting Principle.)
Derivative Instruments
JCG implemented an economic hedge strategy in December 2008 covering the majority of invested seed capital to mitigate a portion of the net income volatility created by the mark-to-market accounting of seed capital investments. The strategy utilizes futures contracts and call options on various market indices to minimize market losses while allowing for limited participation in market gains. These instruments are accounted for at fair value under Statement of Financial Accounting Standard No. 133 (as amended and interpreted) "Accounting for Derivatives and Hedging Activities" ("SFAS 133"), with changes in fair value reported currently in earnings but have not been designated as hedging instruments under SFAS 133. At December 31, 2008, the fair value of derivative instruments totaled $0.8 million and is included in marketable securities.
NOTE 6 — ADOPTION OF NEW ACCOUNTING PRINCIPLE
JCG adopted the provisions of SFAS 157 on January 1, 2008. SFAS 157 defines fair value as the price that would be received to sell an asset or paid to transfer a liability in an orderly transaction between market participants at the measurement date. SFAS 157 also establishes a framework for measuring fair value and a valuation hierarchy based upon the transparency of inputs used in the valuation of an asset or liability. Classification within the hierarchy is based upon the lowest level of input that is significant to the fair value measurement. The valuation hierarchy contains three levels:
- •
- Level 1 — Valuation inputs are unadjusted quoted market prices for identical assets or liabilities in active markets.
- •
- Level 2 — Valuation inputs are quoted market prices for identical assets or liabilities in markets that are not active, quoted market prices for similar assets and liabilities in active markets and other observable inputs directly or indirectly related to the asset or liability being measured.
- •
- Level 3 — Valuation inputs are unobservable and significant to the fair value measurement.
46
Table of Contents
The following table presents the marketable securities carried at fair value as of December 31, 2008(in millions):
| | | | | | | | | | | | |
| | Level 1 | | Level 2 | | Level 3 | |
|---|
Trading securities | | $ | 62.4 | | $ | – | | $ | – | |
Available-for-sale securities | | | | | | | | | | |
| | Investments in advised funds | | | 9.9 | | | – | | | – | |
| | Structured investment vehicle securities | | | – | | | – | | | 52.2 | |
Derivative instruments | | | 0.8 | | | – | | | – | |
| | | | | | | | |
| | Total marketable securities | | | 73.1 | | | – | | | 52.2 | |
Other assets | | | | | | | | | | |
| | Mutual fund unit award hedge asset | | | 29.9 | | | – | | | – | |
| | Deferred compensation hedge asset | | | 5.1 | | | – | | | – | |
| | | | | | | | |
| | | Total assets at fair value | | $ | 108.1 | | $ | – | | $ | 52.2 | |
| | | | | | | | |
JCG's Level 1 fair value measurements consist of exchange-traded equity and debt securities underlying separate accounts and consolidated mutual funds, and mutual fund securities.
JCG's Level 3 fair value measurements consist of the Stanfield securities that were issued by a SIV which purchased high grade medium- and long-term fixed-income instruments financed by issuing low-cost, short-term senior debt instruments such as asset-backed commercial paper and asset-backed medium-term notes. To measure fair value, JCG undertook a detailed analysis of the assets underlying the Stanfield securities and benchmarked those assets against instruments of a similar type with comparable yields, maturities and credit ratings for which quoted market prices are readily available. Discounts have been applied to the quoted market prices of the benchmark instruments to adjust for varying yields, credit ratings or other distinguishing characteristics. The valuation methodology for the Stanfield securities has been consistently applied. Because of the significance of the unobservable inputs in JCG's analysis, the fair value measurement of the Stanfield securities has been classified as Level 3. There were no other securities classified as Level 3 during the twelve months ended December 31, 2008.
JCG measured the fair value of the Stanfield securities as of the end of each fiscal quarter in 2008, and recognized a $21.0 million impairment charge in the third quarter 2008 in investment gains (losses) net. The decline in value was primarily caused by a general deterioration in overall market conditions, particularly in financial institution-related debt, and the portfolio custodian's establishment of a reserve for litigation and operating expenses. In December 2008, an amendment was approved allowing available cash in the Stanfield vehicle to be distributed to security holders and the restructuring of the Stanfield vehicle. JCG received its proportionate share of the cash distribution totaling $17.1 million which reduced the carrying value of the Stanfield securities. A new legal structure is expected to be announced in 2009 at which time JCG may elect to receive its proportionate share of the underlying assets or participate in the new structure.
The following table presents the change in fair value of the Stanfield securities(in millions):
| | | | | | |
Estimated fair value at December 31, 2007 | | $ | 90.3 | |
| | Distributions | | | (17.1 | ) |
| | Total losses | | | | |
| | | Included in net income | | | (21.0 | ) |
| | | | |
Estimated fair value at December 31, 2008 | | $ | 52.2 | |
| | | | |
47
Table of Contents
JCG also uses fair value measurements for business acquisitions and impairment testing of tangible and intangible assets. However, the application of SFAS 157 to fair value measurements of tangible and intangible assets has been postponed in accordance with FSP 157-2.
Note 7 — Acquisitions
INTECH
JCG increased its ownership of INTECH with the following purchases(in millions, except ownership %):
| | | | | | | | | | | | | |
| |
| |
| | Purchase Price Allocation | |
|---|
Acquisition Date | | Interest Acquired | | Purchase Price | | Goodwill | | Intangible Assets | |
|---|
March 31, 2008 | | | 3 | % | $ | 60.7 | | $ | 37.0 | | $ | 23.7 | |
March 30, 2007 | | | 4 | % | $ | 81.0 | | $ | 49.3 | | $ | 31.7 | |
The pro forma results of operations have not been presented as they would not have been materially different from reported amounts. Intangible assets acquired represent customer relationships that are amortized over 12 years. The March 31, 2008 purchase price allocation is preliminary and will be finalized in the first quarter 2009.
Perkins
On December 31, 2008, JCG increased its ownership of Perkins to approximately 80% with the purchase of an additional 50% ownership interest for $90.0 million in cash. The preliminary purchase price allocation resulted in the recognition of $135.5 million of goodwill which includes JCG's 30% original interest of $41.6 million previously accounted for as an equity method investment. The purchase price will be finalized in 2009. The total amount of goodwill recognized is expected to be amortizable for tax purposes. Other than goodwill, the acquisition did not result in the recognition of any material assets or liabilities. The pro forma results of operations have not been presented as they would not have been materially different from reported amounts.
Upon closing the transaction, Perkins granted profit interest awards designed to retain and incentivize key employees to grow the business. These awards vest on the fifth anniversary of grant and are generally entitled to a total of 5% of Perkins' annual net income. In addition, these awards have a formula-driven terminal value based on revenue growth and relative investment performance of products managed by Perkins. JCG can call and terminate any or all of the awards on the fifth, seventh or each subsequent anniversary of grant or prior to the fifth anniversary of grant if the formula yields a terminal value of $40.0 million. Participants can require JCG to terminate the awards in exchange for the then-applicable formula price on the sixth anniversary of grant. The profit interests are also subject to termination at premiums or discounts to the formula at the option of JCG or the relevant employee, as applicable, upon certain corporate- or employment-related events affecting Perkins or the relevant employee. Compensation expense for these awards will be recognized over the vesting period based on the results of the application of the terminal value formula at the end of each relevant reporting period.
JCG also has the option to acquire any or all of the remaining 20% interest of Perkins at fair value on the third, fifth, seventh or each subsequent anniversary of closing. The minority owners of Perkins have the option to require JCG to purchase any or all of their remaining interests on the fourth or sixth anniversary of closing at fair value.
Note 8 — Dispositions
During the second quarter 2008, JCG disposed of its Printing and Fulfillment operations for $14.5 million.
48
Table of Contents
Note 9 —GOODWILL AND INTANGIBLE ASSETS
Changes in the carrying amount of goodwill are as follows(in millions):
| | | | | | | | |
| | December 31, | |
|---|
| | 2008 | | 2007 | |
|---|
Beginning of period | | $ | 1,141.1 | | $ | 1,090.5 | |
| | Additions | | | 179.2 | | | 50.6 | |
| | | | | | |
End of period | | $ | 1,320.3 | | $ | 1,141.1 | |
| | | | | | |
The following is a summary of identified intangible assets(in millions):
| | | | | | | | |
| | December 31, | |
|---|
| | 2008 | | 2007 | |
|---|
Non-amortized intangible assets | | | | | | | |
| | Mutual fund advisory contracts | | $ | 943.1 | | $ | 943.1 | |
| | Brand name and trademark | | | 270.5 | | | 270.5 | |
Amortized intangible assets | | | | | | | |
| | Client relationships | | | 162.5 | | | 138.8 | |
| | Accumulated amortization | | | (54.9 | ) | | (42.0 | ) |
| | | | | | |
Net intangible assets | | $ | 1,321.2 | | $ | 1,310.4 | |
| | | | | | |
Client relationships are amortized over their estimated lives of seven to 25 years using the straight-line method. Amortization expense was $12.9 million, $10.7 million and $10.4 million for the years ended December 31, 2008, 2007 and 2006, respectively. Amortization expense over the next five years is expected to be $12.1 million in 2009, $11.8 million in 2010, $11.8 million in 2011, $11.8 million in 2012 and $11.8 million in 2013.
The majority of goodwill and intangible assets were generated from transactions in 2001 to buy out the minority interest of Janus and resulted in the recognition of $803.8 million of goodwill and $1,164.6 million of intangible assets, representing mutual fund advisory contracts, brand name, trademark and client relationships.
Acquisitions of interests in INTECH resulted in goodwill of $228.7 million and intangible assets of $133.1 million, representing client relationships. Acquisitions of interests in Perkins resulted in goodwill of $135.5 million.
JCG separately tests goodwill and indefinite-lived intangible assets for impairment annually or more frequently if events or changes in circumstances indicate that the asset may be impaired. Subsequent to the annual impairment test for goodwill, global market conditions rapidly deteriorated and JCG's market capitalization declined below net book value. In response, JCG completed another goodwill impairment test as of December 31, 2008, and concluded that goodwill was not impaired. JCG's fair value was estimated using a discounted cash flow analysis as well as applying current and historical control premiums within the financial services industry to JCG's stock price as of December 31, 2008. Based on this analysis, JCG's estimated fair value exceeded net book value as of December 31, 2008. Changes in the assumptions underlying the discounted cash flow analysis could materially affect JCG's impairment conclusion. In the event that global market conditions and JCG's results of operations continue to deteriorate, further analysis will be undertaken which may result in a material impairment charge.
49
Table of Contents
Intangibles Impairment
Within client relationships, JCG has subadvised contracts that have an allocated intangible value. To the extent such subadvised contracts are terminated, JCG recognizes an impairment charge equal to the unamortized value of the intangible asset recorded for such contract. There were no impairments of subadvised contracts in 2008. JCG recognized impairment charges on subadvised contracts of $0.4 million and $11.4 million for the years ended December 31, 2007 and 2006, respectively.
NOTE 10 — OTHER BALANCE SHEET CAPTIONS
Other current assets are composed of the following(in millions):
| | | | | | | |
| | December 31, | |
|---|
| | 2008 | | 2007 | |
|---|
Deferred compensation | | $ | 11.9 | | $ | 28.2 | |
Deferred commissions | | | 5.0 | | | 10.3 | |
Deferred income taxes | | | 23.2 | | | 8.6 | |
Other current assets | | | 18.4 | | | 15.2 | |
| | | | | | |
Total | | $ | 58.5 | | $ | 62.3 | |
| | | | | | |
Other current accrued liabilities are composed of the following(in millions):
| | | | | | | |
| | December 31, | |
|---|
| | 2008 | | 2007 | |
|---|
Accrued marketing and distribution | | $ | 15.1 | | $ | 18.8 | |
Deferred compensation | | | 2.5 | | | 30.2 | |
Other accrued liabilities | | | 26.5 | | | 30.2 | |
| | | | | | |
Total | | $ | 44.1 | | $ | 79.2 | |
| | | | | | |
NOTE 11 — DEBT
Debt at December 31, 2008 and 2007, consisted of the following(in millions):
| | | | | | | | | | | | | |
| | 2008 | | 2007 | |
|---|
| | Carrying
Value | | Fair
Value | | Carrying
Value | | Fair
Value | |
|---|
7.750% Senior Notes due 2009 | | $ | 22.0 | | $ | 21.8 | | $ | 22.0 | | $ | 22.9 | |
5.875% Senior Notes due 2011 | | | 275.0 | | | 234.3 | | | 275.0 | | | 274.4 | |
6.250% Senior Notes due 2012 | | | 299.8 | | | 240.5 | | | 299.6 | | | 308.5 | |
6.119% Senior Notes due 2014 | | | 82.2 | | | 63.9 | | | 82.2 | | | 82.1 | |
6.700% Senior Notes due 2017 | | | 449.0 | | | 346.9 | | | 448.9 | | | 465.8 | |
| | | | | | | | | | |
Total | | | 1,128.0 | | | 907.4 | | | 1,127.7 | | | 1,153.7 | |
Less: current maturities | | | (22.0 | ) | | (21.8 | ) | | – | | | – | |
| | | | | | | | | | |
Total long-term debt | | $ | 1,106.0 | | $ | 885.6 | | $ | 1,127.7 | | $ | 1,153.7 | |
| | | | | | | | | | |
Fair Value of Debt
The fair value of debt was calculated using broker quotes or, if broker quotes were not available, by discounting future cash flows using market interest rates for debt with similar terms and maturities.
50
Table of Contents
6.250% Senior Notes Due June 15, 2012, and 6.700% Senior Notes Due June 15, 2017
On June 14, 2007, JCG issued $300.0 million of 6.250% Senior Notes that are due June 15, 2012, and $450.0 million of 6.700% Senior Notes that are due June 15, 2017 (collectively, the "2007 senior notes") and are not callable by JCG or redeemable by the holders prior to maturity. Interest is paid semiannually on June 15 and December 15 of each year. The proceeds from the 2007 senior note issuances were $748.4 million. On June 26, 2007, approximately $160.0 million of the total proceeds were used to repay the 7.875% Senior Notes due 2032 plus accrued and unpaid interest as of the redemption date. The remaining proceeds were used for acquisitions, the repurchase of JCG's common stock and general corporate purposes.
If the Company experiences a change of control and the 2007 senior notes are rated below investment grade by Standard & Poor's ("S&P") Rating Service and Moody's, the Company must offer to repurchase all of the 2007 senior notes at a price equal to 101% of the principal amount plus accrued and unpaid interest to the repurchase date.
5.875% Senior Notes Due 2011
On September 18, 2006, JCG issued $275.0 million of 5.875% Senior Notes that are due September 15, 2011, and are not callable by JCG or redeemable at the option of the holders prior to maturity. Interest is paid semiannually on March 15 and September 15.
On May 2, 2006, JCG entered into a pay-fixed receive-variable interest rate swap (the "Swap") in anticipation of a $272.0 million fixed rate debt issuance with a mandatory termination date of May 4, 2007. The Swap was designated and accounted for as a cash flow hedge under SFAS No. 133 and was designed to hedge the variability in interest payments on the anticipated fixed rate debt as a result of changes in the interest rate between inception of the Swap and the issuance of the debt. On September 18, 2006, the Swap was terminated and JCG incurred a loss of $4.4 million, or $2.7 million net of tax, which has been recorded in accumulated other comprehensive income on the consolidated balance sheet and will be amortized to interest expense over the life of the 5.875% Senior Notes.
6.119% Senior Notes Due 2014
On April 26, 2004, JCG issued $527.4 million of 6.119% Senior Notes that are due April 15, 2014, in exchange for $465.1 million of senior notes (comprised of $286.9 million of 7.000% senior notes and $178.2 million of 7.750% senior notes). The 6.119% Senior Notes pay interest semiannually on April 15 and October 15.
7.750% Senior Notes Due 2009
On July 2, 2002, JCG issued 7.750% Senior Notes that are due June 15, 2009, and are not callable by JCG or redeemable by the holders prior to maturity. Interest is paid semiannually on June 15 and December 15.
51
Table of Contents
Interest Rate Adjustment Covenant
All of JCG's outstanding debt includes an interest rate adjustment covenant that provides that the interest rate payable will increase by 25 basis points for each level that the Company's debt rating is decreased by Moody's from its existing rating of Baa3 or by S&P from its existing rating of BBB-, up to a maximum increase of 200 basis points. If at any time after the interest has been adjusted upward, either Moody's or S&P increases its rating, then for each level of such increase in the rating, the interest payable will be decreased by 25 basis points, but in no event to a rate less than the interest rate payable on the date of their issuance. The interest rate adjustment covenant will permanently terminate if the Company's debt ratings increase to Baa2 by Moody's and BBB by S&P (or higher), with a stable or positive outlook regardless of any subsequent decrease in the ratings by either or both rating agencies. On February 23, 2009, S&P lowered JCG's credit rating to BB+, which will result in a 25 basis point increase in the interest rates payable on all of JCG's outstanding debt, or approximately $2.8 million of additional annual interest expense.
Credit Facility
JCG has a $350 million Five-Year Competitive Advance and Revolving Credit Facility Agreement (the "Credit Facility") with a syndicate of banks. The Credit Facility contains a number of financial covenants, including a specified financing leverage ratio and interest coverage ratio. At December 31, 2008, JCG was in compliance with all covenants and there were no borrowings under the Credit Facility. In the event that assets under management continue to decline, JCG may not be able to access or utilize all or a portion of its credit available under the Credit Facility. Accordingly, JCG may seek less restrictive financial covenants that, if obtained, would allow for continued access to the Credit Facility in the event that current market conditions persist or further deteriorate. JCG's credit line may decrease and its costs to borrow under the Credit Facility may increase in exchange for less restrictive financial covenants. There is no guarantee that any efforts undertaken by JCG to renegotiate the terms of the Credit Facility will be successful.
Aggregate Maturities of Indebtedness
The aggregate amounts of debt maturing in the next five years are as follow(in millions):
| | | | |
2009 | | $ | 22.0 | |
2010 | | | – | |
2011 | | | 275.0 | |
2012 | | | 300.0 | |
2013 | | | – | |
Thereafter | | | 532.4 | |
| | | | |
Total | | $ | 1,129.4 | |
| | | | |
52
Table of Contents
NOTE 12 — INCOME TAXES
JCG's provision for income taxes is summarized as follows(in millions):
| | | | | | | | | | | | |
| | December 31, | |
|---|
| | 2008 | | 2007 | | 2006 | |
|---|
Current: | | | | | | | | | | |
| | Federal | | $ | 76.2 | | $ | 83.2 | | $ | 92.5 | |
| | State and local | | | 11.9 | | | 11.1 | | | 12.4 | |
| | International | | | 11.7 | | | 5.5 | | | 5.9 | |
| | | | | | | | |
| | | Total current | | | 99.8 | | | 99.8 | | | 110.8 | |
| | | | | | | | |
Deferred: | | | | | | | | | | |
| | Federal | | | (10.1 | ) | | 13.2 | | | (17.2 | ) |
| | State and local | | | (20.9 | ) | | 2.0 | | | (3.0 | ) |
| | International | | | – | | | 1.4 | | | (0.5 | ) |
| | | | | | | | |
| | | Total deferred | | | (31.0 | ) | | 16.6 | | | (20.7 | ) |
| | | | | | | | |
Total income tax expense | | $ | 68.8 | | $ | 116.4 | | $ | 90.1 | |
| | | | | | | | |
The income tax provision for 2008 includes a $12.9 million tax benefit as a result of applying a lower tax rate to deferred tax assets and liabilities expected to be realized or settled on or after January 1, 2009. The lower tax rate is the result of a legislative change in Colorado state taxes enacted during the second quarter 2008 under which JCG's tax rate will decrease by approximately 1.25% effective January 1, 2009.
JCG's deferred income tax liabilities (assets) are summarized as follows(in millions):
| | | | | | | | | |
| | December 31, | |
|---|
| | 2008 | | 2007 | |
|---|
Income Tax Liabilities: | | | | | | | |
| | Intangible assets | | $ | 444.6 | | $ | 459.5 | |
| | Other | | | 27.3 | | | 27.3 | |
| | | | | | |
| | | Gross deferred tax liabilities | | | 471.9 | | | 486.8 | |
| | | | | | |
Income Tax Assets: | | | | | | | |
| | Compensation and benefits | | | (48.5 | ) | | (55.5 | ) |
| | Accrued liabilities | | | (14.2 | ) | | (13.8 | ) |
| | Debt issue costs | | | (13.8 | ) | | (16.5 | ) |
| | Investments | | | (18.5 | ) | | (1.1 | ) |
| | Other | | | (12.0 | ) | | (4.2 | ) |
| | | | | | |
| | | Gross deferred tax assets | | | (107.0 | ) | | (91.1 | ) |
| | | | | | |
Net deferred income tax liabilities | | $ | 364.9 | | $ | 395.7 | |
| | | | | | |
53
Table of Contents
The current deferred income tax amounts at December 31, 2008 and 2007, are included within other current assets. Deferred tax assets and liabilities are reflected on the balance sheet as follows(in millions):
| | | | | | | |
| | December 31, | |
|---|
| | 2008 | | 2007 | |
|---|
Current deferred income tax asset, net | | $ | (23.2 | ) | $ | (8.6 | ) |
Long-term deferred income tax liability, net | | | 388.1 | | | 404.3 | |
| | | | | | |
Net deferred income tax liabilities | | $ | 364.9 | | $ | 395.7 | |
| | | | | | |
JCG's effective income tax rate differs from the statutory federal income tax rate as follows:
| | | | | | | | | | |
| | December 31, | |
|---|
| | 2008 | | 2007 | | 2006 | |
|---|
Federal statutory rate | | | 35.0 | % | | 35.0 | % | | 35.0 | % |
State and local income taxes | | | 3.0 | % | | 3.2 | % | | 3.1 | % |
INTECH minority interest | | | (2.0 | )% | | (2.3 | )% | | (3.0 | )% |
Effect of state rate change | | | (5.9 | )% | | 0.0 | % | | 0.0 | % |
Tax adjustments | | | 0.8 | % | | (0.9 | )% | | 0.8 | % |
Other | | | 0.5 | % | | 0.2 | % | | 0.0 | % |
| | | | | | | | |
Total effective income tax rate | | | 31.4 | % | | 35.2 | % | | 35.9 | % |
| | | | | | | | |
JCG adopted the provisions of FASB Interpretation No. 48, "Accounting for Uncertainty in Income Taxes" ("FIN 48"), on January 1, 2007, which sets forth a specific method for the financial statement recognition and measurement of a tax position taken or expected to be taken on a tax return. As a result of the implementation of FIN 48, JCG reduced its tax contingencies liability by $29.3 million, which had previously been accounted for under the provisions of Statement of Financial Accounting Standard No. 5, "Accounting for Contingencies." The reduction in the liability and the related change in deferred taxes were accounted for as an increase to retained earnings on January 1, 2007. The tax contingencies liability has been recorded in other long-term liabilities. A reconciliation of the beginning and ending liability is as follows(in millions):
| | | | | | | |
| | December 31, | |
|---|
| | 2008 | | 2007 | |
|---|
Beginning of period | | $ | 34.7 | | $ | 59.5 | |
Cumulative effect of adoption of FIN 48 | | | – | | | (29.3 | ) |
Additions for tax positions of current year | | | 0.6 | | | – | |
Additions for tax positions of prior years | | | 0.8 | | | 1.9 | |
Reduction due to statute expirations | | | (0.3 | ) | | – | |
Reduction due to settlement of audits | | | (0.7 | ) | | – | |
Accrued interest | | | 1.9 | | | 2.6 | |
| | | | | | |
End of period | | $ | 37.0 | | $ | 34.7 | |
| | | | | | |
A deferred tax asset of $13.2 million has been recorded associated with the tax contingencies liability. If the tax contingencies liability and related deferred tax asset are reversed in future periods, the effective tax rate would be favorably impacted by $23.8 million.
Tax returns filed in previous years are subject to audit by various federal, state and international taxing authorities, and as a result of such audits, additional tax assessments may be proposed. As of December 31, 2008, the majority of tax years from 1996 and forward remain subject to audit. Based on
54
Table of Contents
information currently available, JCG management does not anticipate any material changes in the liability within the next twelve months.
Taxing authorities generally charge interest and may assess penalties in the event that a tax position taken is subsequently reversed upon examination. JCG has accrued interest on its uncertain tax provisions based on the rates specified by the applicable taxing authorities and has recorded the interest as a component of the tax provision. At December 31, 2008 and 2007, $12.9 million and $10.9 million, respectively, of accrued interest are included in the liability for tax contingencies. Any potential penalties associated with a tax contingency will also be included as a component of the tax provision in the period in which the assessment of a penalty becomes likely. JCG does not believe that it is subject to any penalties related to its tax contingencies and, therefore, has not accrued a liability for tax penalties.
In the event of an overpayment of income taxes, taxing authorities generally pay interest from the date of the overpayment through the date on which an amended return is filed. JCG records interest income from taxing authorities as a component of the tax provision.
NOTE 13 — LONG-TERM INCENTIVE COMPENSATION
The components of JCG's long-term incentive compensation expense are summarized as follows(in millions):
| | | | | | | | | | |
| | December 31, | |
|---|
| | 2008 | | 2007 | | 2006 | |
|---|
Stock options | | $ | 8.3 | | $ | 17.1 | | $ | 24.4 | |
Restricted stock awards | | | 20.7 | | | 32.2 | | | 47.1 | |
Mutual fund units | | | 14.3 | | | 30.4 | | | 11.0 | |
Employee stock purchase plan | | | 0.2 | | | 0.2 | | | 0.2 | |
| | | | | | | | |
Total long-term incentive compensation | | $ | 43.5 | | $ | 79.9 | | $ | 82.7 | |
| | | | | | | | |
Compensation cost associated with restricted stock includes $2.2 million, $0.8 million and $0.7 million of amortization of INTECH interests granted to certain key employees of INTECH for the years ended December 31, 2008, 2007 and 2006, respectively.
Historical long-term incentive awards have been granted with ratable vesting schedules of between three and five years. The awards granted in 2008 were granted with a three-year ratable vesting schedule and are not subject to accelerated vesting. In addition to these awards, retention awards were granted to certain Janus investment team members and INTECH employees to facilitate succession planning and incentivize key personnel to remain with the Company. The Janus and INTECH retention grants will be recognized ratably over a four- and 10-year period, respectively, and were not subject to accelerated vesting. The majority of awards granted in 2007 and 2006 were granted with a four-year ratable vesting schedule, subject to accelerated vesting up to 50% if certain financial performance criteria are achieved. Based on such criteria, the 2007 and 2006 awards qualified for accelerated vesting of 45% and 50%, respectively, on February 1, 2008. At December 31, 2008, unrecognized compensation, net of estimated forfeitures, and the weighted-average number of years over which the
55
Table of Contents
compensation cost will be recognized are summarized as follows(in millions and assuming no further accelerated vesting):
| | | | | | | |
| | Unrecognized
Compensation | | Weighted-
Average Years | |
|---|
Stock options | | $ | 14.8 | | | 2.1 | |
Restricted stock awards | | | 45.3 | | | 3.1 | |
Mutual fund units | | | 23.9 | | | 2.1 | |
| | | | | | |
Total | | $ | 84.0 | | | 2.6 | |
| | | | | | |
Unrecognized INTECH interests included in restricted stock awards in the table above totaled $11.5 million and will be recognized over a weighted-average period of 7.6 years.
JCG generally grants annual long-term incentive awards in February of each year. The 2009 annual grant, not included in the table above, totaled $70.0 million and will be recognized ratably over a four-year period. The 2009 annual grant is not subject to performance-based accelerated vesting.
Stock Options
The fair value of stock options granted to JCG employees was estimated on the date of each grant using the Black-Scholes option pricing model with the following assumptions:
| | | | | | |
| | 2008 | | 2007 | | 2006 |
|---|
Dividend yield | | 0.13% | | 0.22% | | 0.20% to 0.27% |
Expected volatility | | 32% | | 28% | | 27% to 30% |
Risk-free interest rate | | 2.81% | | 4.86% | | 4.55% to 4.89% |
Expected life | | 5 years | | 5 years | | 5 years |
Expected volatility was determined using an average of JCG's historical volatility and industry and market averages, as appropriate. Expected life was determined using employee termination rates and vesting periods of each grant. The risk-free interest rate for periods within the contractual life of the options is based on the U.S. Treasury yield curve in effect at the time of each grant. Stock options granted prior to February 2006 have a maximum contractual term of 10 years and seven years for options granted thereafter.
56
Table of Contents
The table below summarizes JCG's outstanding options:
| | | | | | | | | | | | | | | | | | | | |
| | 2008 | | 2007 | | 2006 | |
|---|
| | Shares | | Weighted
Average
Exercise
Price | | Shares | | Weighted
Average
Exercise
Price | | Shares | | Weighted
Average
Exercise
Price | |
|---|
Outstanding at January 1 | | | 11,085,975 | | $ | 20.54 | | | 13,746,429 | | $ | 19.42 | | | 15,678,666 | | $ | 17.97 | |
Granted | | | 2,083,761 | | | 27.23 | | | 1,810,378 | | | 21.01 | | | 1,721,951 | | | 21.54 | |
Exercised | | | (1,118,411 | ) | | 18.02 | | | (4,185,901 | ) | | 17.22 | | | (3,045,261 | ) | | 13.35 | |
Expired | | | (346,446 | ) | | 22.17 | | | (284,931 | ) | | 18.77 | | | (608,927 | ) | | 18.55 | |
| | | | | | | | | | | | | | | | | |
Outstanding at December 31 | | | 11,704,879 | | $ | 21.91 | | | 11,085,975 | | $ | 20.54 | | | 13,746,429 | | $ | 19.42 | |
| | | | | | | | | | | | | | | | | |
Exercisable | | | – | | $ | – | | | 8,257,081 | | $ | 20.76 | | | 10,281,666 | | $ | 19.79 | |
| | | | | | | | | | | | | | | | | |
Vested or expected to vest | | | 11,265,777 | | $ | 21.89 | | | 10,712,913 | | $ | 20.52 | | | | | | | |
| | | | | | | | | | | | | | | | | | |
Weighted average fair value of options granted during the year | | $ | 9.92 | | | | | $ | 7.02 | | | | | $ | 6.45 | | | | |
| | | | | | | | | | | | | | | | | |
Intrinsic value of options at December 31(in millions): | | | | | | | | | | | | | | | | | | | |
| | Exercised | | $ | 11.0 | | | | | $ | 43.8 | | | | | $ | 22.3 | | | | |
| | | | | | | | | | | | | | | | | |
| | Outstanding | | $ | – | | | | | $ | 140.7 | | | | | $ | 56.0 | | | | |
| | | | | | | | | | | | | | | | | |
| | Exercisable | | $ | – | | | | | $ | 104.1 | | | | | $ | 44.7 | | | | |
| | | | | | | | | | | | | | | | | |
The following table summarizes the information about stock options that were outstanding at December 31, 2008:
| | | | | | | | | | |
Range of
Exercise Prices | | Number
Outstanding | | Weighted
Average
Remaining
Contractual
Life (years) | | Weighted
Average
Exercise
Price | |
|---|
| $8 to $20 | | | 4,940,888 | | | 5.08 | | $ | 15.35 | |
| $20 to $30 | | | 5,192,621 | | | 4.97 | | | 24.08 | |
| $30 to $47 | | | 1,571,370 | | | 1.31 | | | 35.35 | |
| | | | | | | | |
| $8 to $47 | | | 11,704,879 | | | 4.53 | | | 21.91 | |
| | | | | | | | |
There were no exercisable stock options at December 31, 2008, based on the exercise prices of outstanding options and JCG's stock price.
57
Table of Contents
Restricted Stock Awards
The table below summarizes unvested restricted stock awards for the years ended December 31, 2008 and 2007:
| | | | | | | | | | | | | |
| | 2008 | | 2007 | |
|---|
| | Shares | | Weighted
Average
Grant-Date
Fair Value | | Shares | | Weighted
Average
Grant-Date
Fair Value | |
|---|
Unvested at January 1 | | | 1,534,921 | | $ | 18.52 | | | 2,820,345 | | $ | 19.07 | |
Granted | | | 1,735,176 | | | 27.88 | | | 1,035,246 | | | 21.76 | |
Vested | | | (1,216,882 | ) | | 21.76 | | | (2,190,508 | ) | | 22.21 | |
Forfeited | | | (106,026 | ) | | 24.82 | | | (130,162 | ) | | 18.55 | |
| | | | | | | | | | |
Unvested at December 31 | | | 1,947,189 | | $ | 25.89 | | | 1,534,921 | | $ | 18.52 | |
| | | | | | | | | | |
The total fair value of restricted stock that vested during the years ended December 31, 2008, 2007 and 2006 was $32.6 million, $48.6 million and $44.3 million, respectively.
Mutual Fund Units
During 2008 and 2007, JCG granted $33.9 million and $26.5 million, respectively, in awards that are indexed to certain mutual funds managed by the Company. Upon vesting, participants receive the value of the award adjusted for earnings or losses attributable to the mutual funds to which the award was indexed. At the time of grant, the Company creates a fair value hedge accounted for in accordance with SFAS 133 to protect against the market variability of the mutual funds to which the awards are indexed by making investments equal to the amount of the awards in the mutual funds selected by the participants. Subsequent changes in market value increase/decrease the Company's asset with the offset to the mutual fund share award liability. Any hedge ineffectiveness will result in an increase or decrease in long-term incentive compensation expense. Hedge effectiveness is assessed quarterly and has been 100% effective since inception and, therefore, no gain or loss has been recognized. At December 31, 2008, the notional amount of the fair value hedge is $39.5 million and represents the cost basis of unvested awards.
Forfeiture Estimate
JCG estimates, at the time of grant, the amount of awards that are not expected to vest based on historical forfeiture rates. As a result of higher than projected employee departures prior to vesting during the fourth quarter 2008 and third quarter 2006, JCG revised the estimate of forfeitures related to long-term incentive compensation. The effect of increasing the forfeiture estimate was recorded as a $2.9 million decrease in long-term incentive compensation expense ($1.8 million net of tax) for the year ended December 31, 2008, and a $5.0 million decrease in long-term incentive compensation ($3.1 million net of tax) for the year ended December 31, 2006.
Long-Term Incentive Stock Plans
On May 10, 2005, JCG shareholders approved the 2005 Long-Term Incentive Stock Plan ("2005 Plan"), which allows the Board of Directors to grant up to 15.0 million shares of equity-based awards, including stock options and restricted stock. Subsequent to the 2009 annual grant in January, approximately 1.2 million shares of equity-based awards are available to be granted under the 2005 Plan.
58
Table of Contents
NOTE 14 — EMPLOYEE BENEFIT PLANS
Substantially all full-time employees of JCG are eligible to participate in a company-sponsored 401(k) and profit-sharing plan. Employees also participate in an ESOP. JCG matches a maximum of 3% of employee compensation in the 401(k) plan. Contributions to the ESOP and the profit-sharing plan are made at the discretion of the Board of Directors. Participants vest ratably in the ESOP and profit-sharing contributions over a five-year period. Expense related to the 401(k) plan, ESOP and profit-sharing plan was $10.8 million, $12.5 million and $10.7 million in 2008, 2007 and 2006, respectively.
The Company also has a deferred compensation plan for certain highly compensated employees. Eligible participants may defer a portion of their compensation and have the ability to earn a return by indexing their deferrals to mutual funds managed by the Company. The Company makes no contributions to the plan and is liable to the participants for the amount of the deferrals as adjusted for changes in market value. To protect against market variability of the liability, the Company creates a fair value hedge accounted for in accordance with SFAS 133 by investing in mutual funds that are consistent with the deferred amounts and mutual fund elections of the participants. Changes in market value increase/decrease the investment asset held by the Company with the offset recorded to the liability to the participants. Any hedge ineffectiveness will result in increases or decreases in employee compensation and benefits expense. Hedge effectiveness is assessed quarterly and has been 100% effective since inception and, therefore, no gain or loss has been recognized. At December 31, 2008, the notional amount of the fair value hedge is $10.3 million and represents total payroll deferrals.
NOTE 15 — COMMITMENTS AND CONTINGENCIES
Operating Leases
JCG rents office space and equipment under the terms of various operating lease agreements. As of December 31, 2008, future minimum rental commitments under non-cancelable operating leases are as follows(in millions):
| | | | |
2009 | | $ | 18.1 | |
2010 | | | 17.2 | |
2011 | | | 16.8 | |
2012 | | | 16.8 | |
2013 | | | 12.6 | |
Thereafter | | | 59.8 | |
| | | | |
Total | | $ | 141.3 | |
| | | | |
Rent expense was $19.3 million, $14.8 million and $15.2 million in 2008, 2007 and 2006, respectively.
Investment Management Contracts
Most of JCG's revenues are derived pursuant to investment advisory agreements with its investment advisory clients. Investment advisory agreements with mutual funds may be terminated by either party with notice, or terminated in the event of an "assignment" (as defined in the Investment Company Act of 1940 as amended (the "1940 Act"), and must be approved and renewed annually by the disinterested members of each fund's trustees, or its shareowners, as required by law. Generally, any change in control of JCG would constitute an "assignment" under the 1940 Act. In addition, a mutual fund's trustees or directors may terminate these investment advisory agreements upon written notice for any reason.
59
Table of Contents
INTECH Minority Interest
Each fiscal year through 2012, each of the two INTECH founding members has the option to require JCG to purchase from him an ownership interest of up to approximately 1.5% of INTECH ("Annual Option Shares") at fair value. Subsequent to the March 31, 2008, sale of a 3% interest in INTECH to JCG by the founders, the two founders have an aggregate ownership interest of approximately 8% in INTECH. In the event that either INTECH founder does not fully exercise his annual voluntary sale option in a given year, JCG has the option to require the INTECH founder to sell the remaining balance of the Annual Option Shares for that year at fair value.
In addition, the founders can require JCG to purchase their INTECH interests if the founder's employment is terminated. The purchase price of the departing founder's INTECH interests will be based on fair value. Each founder is entitled to retain approximately 1% of INTECH's shares then outstanding after employment until his death unless he is terminated for cause or leaves voluntarily while not in good standing. An INTECH founder will be deemed to be in good standing if he voluntarily leaves on or after January 1, 2009, after providing 12 months' prior notice and cooperation with the transition.
Total INTECH interests held by the two founders would be valued at approximately $128.0 million, based on the last determination of fair value.
NOTE 16 — LITIGATION
JCG is subject to various legal proceedings arising from normal business operations. Although there can be no assurances, based on information currently available, management believes that it is probable that the ultimate outcome of each of the actions described below will not have a material adverse effect on JCG's consolidated financial condition. However, an adverse outcome in any of the actions could have a material adverse effect on the Company's financial position or results of operations for the period in which it is recorded. As of December 31, 2008, JCG had no litigation reserves as management believes that the claims made in the civil actions described below have little or no merit and intends to defend against them.
Market Timing Litigation
Following the market timing investigations by the New York Attorney General ("NYAG") and the SEC in 2003, JCG and certain affiliates were named as defendants in a consolidated lawsuit in the U.S. District Court in Baltimore, Maryland (Case No. MDL No. 1586, 04-MD-15863). Five amended complaints were originally filed in these coordinated proceedings, four of which are remaining, including: (i) claims by a putative class of Janus fund investors asserting claims on behalf of the investor class (Marini, et al. v. Janus Investment Fund, et al., U.S. District Court, District of Maryland, Case No. 04-CV-00497); (ii) derivative claims by investors in the Janus funds ostensibly on behalf of the Janus funds (Steinberg et al. v. Janus Capital Management, LLC et al., U.S. District Court, District of Maryland, Case No. 04-CV-00518); (iii) claims on behalf of participants in the JCG 401(k) plan (Wangberger v. Janus Capital Group Inc., 401(k) Advisory Committee, et al., U.S. District Court, District of Maryland, Case No. JFM-05-2711); and (iv) claims by a putative class of JCG shareholders asserting claims on behalf of the shareholders (Wiggins, et al. v. Janus Capital Group Inc., et al.,U.S. District Court, District of Maryland, Case No. 04-CV-00818).
In August 2005, the U.S. District Court entered orders dismissing most of the claims asserted against the Company and its affiliates by fund investors in theMarini andSteinberg cases described above, except certain claims under Section 10(b) of the Securities Exchange Act of 1934 and under Section 36(b) of the Investment Company Act of 1940. On December 30, 2008, the court granted, at least in part, summary judgment in the Company's favor with respect to plaintiffs' damage demands in theMarini andSteinberg cases as it relates to "approved" market timing because there was no evidence
60
Table of Contents
that investors suffered damages that exceed the $50 million they are entitled to receive under the regulatory settlement. The court did not grant summary judgment on the remaining causes of action and requested the parties to submit additional briefing with respect to "unapproved" market timing. In theWiggins matter, the U.S. District Court also entered an order dismissing all claims in theWiggins lawsuit. Plaintiffs have appealed that dismissal to the U.S. Court of Appeals for the Fourth Circuit. That appeal is currently pending. In August 2006, the U.S. District Court in theWangberger 401(k) plan class action dismissed the action with prejudice, and the plaintiff appealed the dismissal to the U.S. Court of Appeals for the Fourth Circuit. In June 2008, the Fourth Circuit reversed the U.S. District Court's order of dismissal and remanded the case for further proceedings. As a result of the above events, the Company and Janus are the remaining defendants, in some capacity, in one or more of the actions described in the preceding paragraph.
The Auditor of the State of West Virginia, in his capacity as securities commissioner, initiated administrative proceedings against many of the defendants in the market timing cases (including JCG) and seeks disgorgement and other monetary relief based on similar market timing allegations (In the Matter of Janus Capital Group Inc. et al., Before the Securities Commissioner, State of West Virginia, Summary Order No. 05-1320). In September 2006, JCG filed its answer to the Auditor's summary order instituting proceedings, as well as a Motion to Discharge Order to Show Cause. This action is still pending.
Miscellaneous Proceedings
During 2007, two former portfolio managers filed suit against a JCG subsidiary alleging that it implemented certain changes to their compensation arrangements in violation of prior agreements(Edward Keely v. Janus Management Holdings Corporation, Denver District Court, Case No. 2007 CV 7366 andTom Malley v. Janus Management Holdings Corporation, Denver District Court, Case No. 2007 CV 10719). These complaints allege some or all of the following claims in addition to other allegations: (1) breach of contract; (2) willful and wanton breach of contract; (3) breach of good faith and fair dealing; and (4) estoppel. JCG answered the complaints, denying any liability and challenging the merits of Mr. Keely's and Mr. Malley's allegations. Trial for the suit brought by Mr. Keely was set to commence in October 2008 but has been postponed to May 2009. Mr. Malley's trial was scheduled to commence in December 2008 but has been reset for April 2009.
NOTE 17 — RELATED PARTY TRANSACTIONS
JCG earns fees from the various registered investment companies for which it acts as investment adviser. Accounts receivable include amounts due from these investment companies. The table below presents this related party activity as of and for the years ended December 31(in millions):
| | | | | | | | | | |
| | Investment
Management and
Shareowner
Servicing Fees | | Accounts
Receivable
from Registered
Investment
Companies | | 12b-1 Plan
Fees Earned | |
|---|
2008 | | $ | 808.6 | | $ | 54.0 | | $ | 6.8 | |
2007 | | | 867.6 | | | 89.9 | | | 3.5 | |
2006 | | | 708.7 | | | 70.8 | | | 1.3 | |
61
Table of Contents
Certain officers and directors of JCG are also officers, directors and/or trustees for the various registered investment companies for which JCG acts as investment adviser.
NOTE 18 — SHAREHOLDER RIGHTS PLAN
JCG entered into the Shareholder Rights Plan ("Rights Plan") with UMB Bank, N.A., as rights agent as of June 14, 2000. Effective October 2, 2006, UMB Bank, N.A. was replaced as rights agent by Wells Fargo Bank N.A. In connection with the Rights Plan, the JCG Board of Directors declared a dividend of one right ("Right") for each outstanding share of JCG common stock as of the close of business on June 14, 2000 (the "Rights Record Date"). The Rights are not exercisable or transferable separately from the shares of JCG common stock until the earlier of (i) 10 days following a public announcement that a person or group has acquired or obtained the right to acquire beneficial ownership of 15% or more of the outstanding shares of JCG common stock (unless beneficial ownership of 15% or more is a result of Company repurchases of its own stock or other reduction in the number of shares outstanding), or (ii) 10 days following the commencement or announcement of an intention to make a tender or exchange offer that would result in an acquiring person or group beneficially owning 15% or more of the outstanding shares of JCG common stock (an "Acquiring Person"), unless the JCG Board of Directors sets a later date in either event (the earlier of (i) or (ii) being the "Rights Distribution Date"). Under the Rights Plan, the JCG Board of Directors has the option to redeem the Rights at a nominal cost or prevent the Rights from being triggered by designating certain offers for all the outstanding JCG common stock as Permitted Offers (as defined in the Rights Plan). No supplement or amendment may be made to the Rights Plan which changes the Redemption Price, the Final Expiration Date, the Purchase Price (as those terms are defined in the Rights Plan) or the number of1/1000ths of a share of Preferred Stock for which a Right is exercisable. Subject to the foregoing, prior to the Rights Distribution Date, JCG may amend or supplement the Rights Plan without the consent of any of the holders of the Rights. Following the Rights Distribution Date, the Rights Plan may be amended to cure any ambiguity, correct or supplement any provision that is defective or inconsistent with any other provision of the Rights Plan, or change or supplement any provision so long as such amendment or supplement does not adversely affect the holders of the Rights (other than an Acquiring Person or group). The Rights expire 10 years after the Rights Record Date unless earlier redeemed by JCG.
The Rights, when exercisable, entitle their holders (other than those held by an Acquiring Person) to purchase1/1000th of a share of Series A JCG Preferred Stock (subject to adjustment) or, in certain instances, other securities of JCG, including JCG common stock, having a market value equal to twice the exercise price of the Right. In certain circumstances, if JCG is involved in a merger or consolidation and is not the surviving entity or disposes of more than 50% of its assets or earnings power, the Rights also entitle their holders (other than an acquiring person or group) to purchase the highest priority voting shares in the surviving entity or its affiliates having a market value of two times the exercise price of the Rights.
The Rights Plan is intended to encourage a potential Acquiring Person or group to negotiate directly with the JCG Board of Directors but may have certain anti-takeover consequences. The Rights Plan could significantly dilute the interests in JCG of an Acquiring Person. The Rights Plan may therefore have the effect of delaying, deterring or preventing a change in control of JCG.
The JCG Board of Directors evaluates the Rights Plan every three years, and in October 2007 approved the continuation of the Rights Plan until the Rights expire.
NOTE 19 — SEGMENT AND GEOGRAPHIC INFORMATION
The Company operates in one business segment, its Investment Management operations.
62
Table of Contents
The following summary provides information concerning JCG's principal geographic areas as of and for the years ended December 31, 2008, 2007 and 2006(in millions):
| | | | | | | | | | | | |
| | 2008 | | 2007 | | 2006 | |
|---|
Revenues: | | | | | | | | | | |
| | United States | | $ | 930.5 | | $ | 1,000.2 | | $ | 833.5 | |
| | International* | | | 107.4 | | | 116.8 | | | 102.3 | |
| | | | | | | | |
| | | Total | | $ | 1,037.9 | | $ | 1,117.0 | | $ | 935.8 | |
| | | | | | | | |
Long-lived assets: | | | | | | | | | | |
| | United States | | $ | 2,626.1 | | $ | 2,448.8 | | $ | 2,395.8 | |
| | International* | | | 11.6 | | | 14.7 | | | 4.1 | |
| | | | | | | | |
| | | Total | | $ | 2,637.7 | | $ | 2,463.5 | | $ | 2,399.9 | |
| | | | | | | | |
- *
- International revenues and assets are attributed to countries based on location at which services are performed, primarily the United Kingdom.
NOTE 20 — QUARTERLY FINANCIAL DATA (UNAUDITED)
| | | | | | | | | | | | | | | | | | |
| | 2008 | |
|---|
(in millions, except per share amounts) | | First
Quarter | | Second
Quarter | | Third
Quarter | | Fourth
Quarter | | Full
Year | |
|---|
Total revenue | | $ | 281.2 | | $ | 304.2 | | $ | 275.4 | | $ | 177.1 | | $ | 1,037.9 | |
Operating income | | | 89.5 | | | 105.1 | | | 93.3 | | | 45.2 | | | 333.1 | |
Income from continuing operations | | | 39.0 | | | 65.6 | | | 26.0 | | | 7.8 | | | 138.4 | |
Income (loss) from discontinued operations | | | (1.6 | ) | | 0.7 | | | (0.6 | ) | | – | | | (1.5 | ) |
Net income | | | 37.4 | | | 66.3 | | | 25.4 | | | 7.8 | | | 136.9 | |
Basic earnings per share: | | | | | | | | | | | | | | | | |
| | Continuing operations | | $ | 0.24 | | $ | 0.41 | | $ | 0.17 | | $ | 0.05 | | $ | 0.87 | |
| | Discontinued operations | | | (0.01 | ) | | – | | | – | | | – | | | (0.01 | ) |
| | | | | | | | | | | | |
| | | Basic earnings per share | | $ | 0.23 | | $ | 0.41 | | $ | 0.17 | | $ | 0.05 | | $ | 0.86 | |
| | | | | | | | | | | | |
Diluted earnings per share: | | | | | | | | | | | | | | | | |
| | Continuing operations | | $ | 0.24 | | $ | 0.40 | | $ | 0.16 | | $ | 0.05 | | $ | 0.86 | |
| | Discontinued operations | | | (0.01 | ) | | – | | | – | | | – | | | (0.01 | ) |
| | | | | | | | | | | | |
| | | Diluted earnings per share | | $ | 0.23 | | $ | 0.41 | | $ | 0.16 | | $ | 0.05 | | $ | 0.85 | |
| | | | | | | | | | | | |
63
Table of Contents
| | | | | | | | | | | | | | | | | | |
| | 2007 | |
|---|
(in millions, except per share amounts) | | First
Quarter | | Second
Quarter | | Third
Quarter | | Fourth
Quarter | | Full
Year | |
|---|
Total revenue | | $ | 247.9 | | $ | 273.0 | | $ | 284.6 | | $ | 311.5 | | $ | 1,117.0 | |
Operating income | | | 68.9 | | | 94.4 | | | 95.8 | | | 90.2 | | | 349.3 | |
Income from continuing operations | | | 38.0 | | | 51.6 | | | 50.8 | | | 51.6 | | | 192.0 | |
Loss from discontinued operations | | | (2.4 | ) | | (2.8 | ) | | (38.6 | ) | | (31.9 | ) | | (75.7 | ) |
Net income | | | 35.6 | | | 48.8 | | | 12.2 | | | 19.7 | | | 116.3 | |
Basic earnings per share: | | | | | | | | | | | | | | | | |
| | Continuing operations | | $ | 0.20 | | $ | 0.29 | | $ | 0.30 | | $ | 0.31 | | $ | 1.09 | |
| | Discontinued operations | | | (0.01 | ) | | (0.02 | ) | | (0.23 | ) | | (0.19 | ) | | (0.43 | ) |
| | | | | | | | | | | | |
| | | Basic earnings per share | | $ | 0.19 | | $ | 0.27 | | $ | 0.07 | | $ | 0.12 | | $ | 0.66 | |
| | | | | | | | | | | | |
Diluted earnings per share: | | | | | | | | | | | | | | | | |
| | Continuing operations | | $ | 0.20 | | $ | 0.28 | | $ | 0.29 | | $ | 0.30 | | $ | 1.07 | |
| | Discontinued operations | | | (0.01 | ) | | (0.02 | ) | | (0.22 | ) | | (0.19 | ) | | (0.42 | ) |
| | | | | | | | | | | | |
| | | Diluted earnings per share | | $ | 0.19 | | $ | 0.27 | | $ | 0.07 | | $ | 0.12 | | $ | 0.65 | |
| | | | | | | | | | | | |
64
Table of Contents
ITEM 9. CHANGES IN AND DISAGREEMENTS WITH ACCOUNTANTS ON ACCOUNTING AND FINANCIAL DISCLOSURE
None.
ITEM 9A. CONTROLS AND PROCEDURES
EVALUATION OF CONTROLS AND PROCEDURES
As of December 31, 2008, JCG's management evaluated the effectiveness of the design and operation of its disclosure controls and procedures (as such term is defined in Rules 13a-15(e) and 15d-15(e) under the Exchange Act). Disclosure controls and procedures are the controls and other procedures that the Company designed to ensure that it records, processes, summarizes and reports in a timely manner the information it must disclose in reports that it files with or submits to the SEC. Gary D. Black, Chief Executive Officer, and Gregory A. Frost, Executive Vice President and Chief Financial Officer, reviewed and participated in this evaluation. Based on this evaluation, Messrs. Black and Frost concluded that, as of the date of their evaluation, JCG's disclosure controls and procedures were effective.
There has been no change in JCG's internal controls over financial reporting (as such term is defined in Rules 13a-15(e) and 15d-15(e) under the Exchange Act) during the fourth quarter of 2008 that has materially affected, or is reasonably likely to materially affect, JCG's internal controls over financial reporting.
NYSE ANNUAL CEO CERTIFICATION
The CEO of the Company has previously submitted to the NYSE the annual certifications required by Section 303A.12(a) of the NYSE Corporate Governance Rules.
ITEM 9B. OTHER INFORMATION
None.
PART III
ITEMS 10, 11, 12, 13 AND 14.
The Company's Proxy Statement for its 2009 Annual Meeting of Stockholders, which, when filed pursuant to Regulation 14A under the Securities Exchange Act of 1934, will be incorporated by reference in this Annual Report on Form 10-K pursuant to General Instruction G(3) of Form 10-K, provides the information required under Part III (Items 10, 11, 12, 13 and 14).
65
Table of Contents
PART IV
ITEM 15. EXHIBITS AND FINANCIAL STATEMENT SCHEDULES
(a) List of Documents Filed as Part of this Report
- (1)
- Financial Statements
The financial statements and related notes, together with the report of Deloitte & Touche LLP dated February 26, 2009, appear in Part II, Item 8, Financial Statements and Supplementary Data, of this Annual Report on Form 10-K.
- (2)
- Financial Statement Schedules
The schedules and exhibits for which provision is made in the applicable accounting regulation of the Securities and Exchange Commission appear in Part II, Item 8, Financial Statements and Supplementary Data, under the Index to Financial Statements of this Annual Report on Form 10-K.
- (3)
- List of Exhibits
(b) Exhibits
The Company has incorporated by reference herein certain exhibits as specified below pursuant to Rule 12b-32 under the Exchange Act.
| | |
| | | (3) Articles of Incorporation and Bylaws |
3.1.1 |
|
Delaware Certificate of Incorporation as Amended and Restated on June 14, 2000, is hereby incorporated by reference from Exhibit 3.1.1 to JCG's Registration Statement on Form 10 declared effective on June 15, 2000 (File No. 001-15253) |
3.1.2 |
|
Certificate of Designation dated June 15, 2000, establishing Series A Preferred Stock, is hereby incorporated by reference from Exhibit 3.1.2 to JCG's Registration Statement on Form 10 declared effective on June 15, 2000 (File No. 001-15253) |
3.2 |
|
Bylaws of Janus Capital Group Inc. as Amended and Restated on October 21, 2008, is hereby incorporated by reference from Exhibit 3.1 to JCG's Form 10-Q for the quarterly period ended September 30, 2008 (File No. 001-15253) |
3.3 |
|
Certificate of Ownership and Merger, merging Janus Capital Corporation with and into Stilwell Financial Inc., is hereby incorporated by reference from Exhibit 3.1 to JCG's Registration Statement on Form S-4 declared effective on February 11, 2003 (File No. 333-102783) |
|
|
(4) Instruments Defining the Rights of Security Holders, Including Indentures |
4.1 |
|
Form of Certificate representing Common Stock is hereby incorporated by reference from Exhibit 4.1 to JCG's Registration Statement on Form 10 declared effective on June 15, 2000 (File No. 001-15253) |
4.2.1 |
|
Stockholders' Rights Agreement, dated as of June 14, 2000, between Janus Capital Group Inc. and UMB Bank, N.A., as Rights Agent is hereby incorporated by reference from Exhibit 4.2.1 to JCG's Registration Statement on Form 10 declared effective on June 15, 2000 (File No. 001-15253) |
4.2.2 |
|
Certificate of Designation establishing Series A Preferred Stock set forth on Exhibit 3.1.2 above, is hereby incorporated by reference |
66
Table of Contents
| | |
| 4.2.3 | | Amendment No. 1 to Rights Agreement between Janus Capital Group Inc. and UMB Bank N.A., as Rights Agent, dated February 23, 2005, is hereby incorporated by reference from Exhibit 4.1 to JCG's Current Report on Form 8-K, dated February 28, 2005 (File No. 001-15253) |
4.2.4 |
|
Amendment No. 2 to Rights Agreement between Janus Capital Group Inc. and Wells Fargo Bank N.A., as successor Rights Agent, dated October 2, 2006, is hereby incorporated by reference from Exhibit 4.1 to JCG's Annual Report on Form 10-K for the year ended December 31, 2006 (File No. 001-15253) |
4.3 |
|
Article FOURTH, Article FIFTH, Article SIXTH, Article SEVENTH and Article ELEVENTH of Exhibit 3.1.1 above are hereby incorporated by reference |
4.4 |
|
Article II; Article III, Section 2; and Article V of Exhibit 3.2 above are hereby incorporated by reference |
4.5.1 |
|
7.00% Senior Notes due 2006 Indenture, dated as of November 6, 2001, between Janus Capital Group Inc. and The Chase Manhattan Bank, is hereby incorporated by reference from Exhibit 4.1 to JCG's Current Report on Form 8-K, dated November 6, 2001 |
4.5.2 |
|
Officers' Certificate pursuant to the Indenture (as per Exhibit 4.5.1 above) is hereby incorporated by reference from Exhibit 4.2 to JCG's Current Report on Form 8-K, dated November 6, 2001 (File No. 001-15253) |
4.5.3 |
|
Officers' Certificate pursuant to the Indenture (as per Exhibit 4.5.1 above) is hereby incorporated by reference from Exhibit 4.1 to JCG's Current Report on Form 8-K, dated April 5, 2002 (File No. 001-15253) |
4.5.4 |
|
Officers' Certificate pursuant to the Indenture (as per Exhibit 4.5.1 above) is hereby incorporated by reference from Exhibit 4.1 to JCG's Current Report on Form 8-K, dated July 2, 2002 (File No. 001-15253) |
4.6 |
|
7.75% Notes due 2009 Prospectus Supplement (to Prospectus dated April 25, 2002) is hereby incorporated by reference from Form 424B2, filed June 28, 2002 (File No. 333-86606) |
4.7 |
|
6.119% Senior Notes Due 2014 Indenture, dated as of April 26, 2004, between Janus Capital Group Inc. and JP Morgan Chase Bank, as Trustee is hereby incorporated by reference from Exhibit 4.2 to JCG's Form 10-Q for the quarterly period ended March 31, 2004 (File No. 001-15253) |
4.8 |
|
5.875% Senior Notes Due 2011 Prospectus Supplement (to Prospectus dated April 25, 2002) is hereby incorporated by reference from Form 424B5, filed September 15, 2006 (File No. 333-86606) |
4.9 |
|
$325,000,000 Shelf Registration Statement is hereby incorporated by reference from Form S-3ASR, filed June 5, 2007 (File No. 333-143510) |
4.10 |
|
6.250% Senior Notes Due 2012 and 6.700% Senior Notes Due 2017 Prospectus Supplement (to Prospectus dated June 5, 2007) is hereby incorporated by reference from Form 424B5, filed June 11, 2007 (File No. 333-143510) |
4.11 |
|
First Supplemental Indenture to the 2001 Indenture, dated as of June 14, 2007, between the Company and The Bank of New York Trust Company, N.A. (as successor to the Chase Manhattan Bank), is hereby incorporated by reference from Exhibit 4.5 to JCG's Current Report on Form 8-K, dated June 14, 2007 (File No. 001-15253) |
67
Table of Contents
| | |
| 4.12 | | First Supplemental Indenture to the 2004 Indenture, dated as of June 14, 2007, between the Company and The Bank of New York Trust Company, N.A. (as successor to JP Morgan Chase Bank), is hereby incorporated by reference from Exhibit 4.6 to JCG's Current Report on Form 8-K, dated June 14, 2007 (File No. 001-15253) |
|
|
(10) Material Contracts |
10.1 |
|
Representative Director Indemnification Agreement is hereby incorporated by reference from Exhibit 10.1 to JCG's Registration Statement on Form 10 declared effective on June 15, 2000 (File No. 001-15253) |
10.2 |
|
Intercompany Agreement, dated as of August 16, 1999, between Kansas City Southern Industries, Inc. and Janus Capital Group Inc., is hereby incorporated by reference from Exhibit 10.3 to JCG's Registration Statement on Form 10 declared effective on June 15, 2000 (File No. 001-15253) |
10.3 |
|
Tax Disaffiliation Agreement, dated as of August 16, 1999, between Kansas City Southern Industries, Inc. and Janus Capital Group Inc., is hereby incorporated by reference from Exhibit 10.4 to JCG's Registration Statement on Form 10 declared effective on June 15, 2000 (File No. 001-15253) |
10.4 |
|
$325 million Five-Year Competitive Advance and Revolving Credit Facility Agreement (the "Facility"), dated as of June 1, 2007, with Citibank, N.A., as administrative agent and swingline lender and JPMorgan Chase Bank, N.A., as syndication agent for the lenders amending the $200 million Three-Year Competitive Advance and Revolving Credit Facility Agreement dated as of October 19, 2005, is hereby incorporated by reference from Exhibit 10.1 to JCG's Current Report on Form 8-K, dated June 4, 2007 (File No. 001-15253) |
10.5 |
|
Share Exchange Agreement with DST Systems, Inc., dated August 25, 2003, is hereby incorporated by reference from Exhibit 99.A to JCG's SC 13D/A, dated August 25, 2003 (File No. 001-15253) |
10.6 |
|
Amended and Restated Limited Liability Company Agreement of Janus Capital Management LLC, dated as of March 13, 2002, is hereby incorporated by reference to JCG's Annual Report on Form 10-K for the year ended December 31, 2002 (File No. 001-15253) |
10.7 |
|
Assignment and Assumption Agreement, dated March 16, 2004, between Janus Capital Group Inc. and Capital Group Partners, Inc. is hereby incorporated by reference from Exhibit 10.3 to JCG's quarterly report on Form 10-Q, dated May 6, 2004 (File No. 001-15253) |
10.8 |
|
Amended and Restated Janus Capital Group Inc. 1998 Long Term Incentive Stock Plan, effective as of January 22, 2008, is attached to this Form 10-K as Exhibit 10.8.* |
10.9 |
|
Janus Capital Group Inc. Employee Stock Purchase Plan, as Amended and Restated Effective October 23, 2006, is hereby incorporated by reference from Exhibit 10.1 to JCG's Form 10-Q for the quarterly period ended September 30, 2006 (File No. 001- 15253)* |
10.10 |
|
Stilwell Financial Inc. Savings-Related Share Option Scheme dated March 1, 2001, is hereby incorporated by reference from Exhibit 4.1 on Form S-8 dated April 27, 2001 (File No. 333-59636) * |
10.11 |
|
Janus Capital Group Inc. Amended and Restated 2004 Employment Inducement Award Plan, effective as of January 22, 2008, is hereby incorporated by reference from Exhibit 10.2 to JCG's Form 10-Q for the quarterly period ended September 30, 2008 (File No. 001-15253)* |
68
Table of Contents
| | |
| 10.12 | | Janus Capital Group Inc. Amended and Restated Mutual Fund Share Investment Plan, effective January 22, 2008, is hereby incorporated by reference from Exhibit 10.1 to JCG's Annual Report on Form 10-K for the year ended December 31, 2007 (File No. 001-15253)* |
10.13 |
|
Janus Capital Group Inc. Management Incentive Compensation Plan, effective January 1, 2008, is hereby incorporated by reference from Appendix D to JCG's 2008 Proxy Statement on Schedule 14A (File No. 001-15253)* |
10.14 |
|
Janus Capital Group Inc. 401(k), Profit Sharing and Employee Stock Ownership Plan, as amended and restated effective January 1, 2009, is attached to this Form 10-K as Exhibit 10.14.* |
10.15 |
|
Janus Capital Group Inc. Amended and Restated Income Deferral Program, effective as of January 22, 2008, is hereby incorporated by reference from Exhibit 10.1 to JCG's Form 10-Q for the quarterly period ended September 30, 2008 (File No. 001-15253)* |
10.16 |
|
Janus Capital Group Inc. Amended and Restated Directors' Deferred Fee Plan, effective as of October 20, 2008, is hereby incorporated by reference from Exhibit 10.3 to JCG's Form 10-Q for the quarterly period ended September 30, 2008 (File No. 001-15253)* |
10.17 |
|
Form of Long-Term Incentive Acceptance Form with Appendix A (Restricted Stock), Appendix B (Stock Options) and Appendix C (Mutual Fund Units), effective for awards granted in 2007, is hereby incorporated by reference from Exhibit 10.3 to JCG's Annual Report on Form 10-K for the year ended December 31, 2006 (File No. 001- 15253)* |
10.17.1 |
|
Form of Long-Term Incentive Acceptance Form with Appendix A (Restricted Stock), Appendix B (Stock Options) and Appendix C (Mutual Fund Units), effective for awards granted in 2008, is hereby incorporated by reference from Exhibit 10.3 to JCG's Annual Report on Form 10-K for the year ended December 31, 2007 (File No. 001- 15253)* |
10.17.2 |
|
Form of Long-Term Incentive Acceptance Form with Appendix A (Restricted Stock), Appendix B (Stock Options) and Appendix C (Mutual Fund Units), effective for awards granted in 2009, is attached to this Form 10-K as Exhibit 10.17.2.* |
10.18 |
|
Amended and Restated Janus Capital Group Inc. 2005 Long-Term Incentive Stock Plan, effective January 22, 2008, is hereby incorporated by reference from Exhibit 10.2 to JCG's Annual Report on Form 10-K for the year ended December 31, 2007 (File No. 001- 15253)* |
10.18.1 |
|
Registration Statement of additional common stock for JCG's 2005 Long-Term Incentive Stock Plan is hereby incorporated by reference from Form S-8, filed January 25, 2007 (File No. 333-140220) |
10.19 |
|
Amended and Restated Employment Agreement by and between Janus Capital Group Inc. and Gary Black, dated September 25, 2006, is hereby incorporated by reference from Exhibit 10.1 to JCG's Current Report on Form 8-K, dated September 28, 2006 (File No. 001-15253)* |
10.19.1 |
|
Severance Rights Agreement by and between the Company and Gary D. Black, dated May 1, 2008, is hereby incorporated by reference from Exhibit 10.1 to JCG's Form 8-K, dated April 2, 2008 (File No. 001-15253)* |
10.20 |
|
Amended and Restated Change in Control Agreement by and between the Company and Robin C. Beery, effective as of October 1, 2008, is attached to this Form 10-K as Exhibit 10.20.* |
69
Table of Contents
| | |
| 10.21 | | Transition Agreement by and between Janus Capital Group Inc. and Girard C. Miller dated as of August 2, 2005, is hereby incorporated by reference from Exhibit 10.2 to JCG's Form 10-Q for the quarterly period ended June 30, 2005 (File No. 001-15253)* |
10.22 |
|
Consulting and Separation Agreement by and between Janus Capital Group Inc. and Mark B. Whiston, dated as of April 20, 2004, is hereby incorporated by reference from Exhibit 10.1 to JCG's Form 10-Q for the quarterly period ended March 1, 2004 (File No. 001-15253)* |
10.23 |
|
Separation Agreement by and between Janus Capital Group Inc. and Lars O. Soderberg, dated as of July 21, 2004, is hereby incorporated by reference from Exhibit 10.1 to JCG's Form 10-Q for the quarterly period ended June 30, 2004 (File No. 001-15253)* |
10.24 |
|
Amended and Restated Form of Change in Control Agreement by and between Janus Management Holdings Corporation and each of the following: Gary D. Black, Daniel P. Charles, Gregory A. Frost, Scott S. Grace, Kelley A. Howes and Dominic C. Martellaro, dated October 1, 2008, is attached to this Form 10-K as Exhibit 10.24.* |
10.25 |
|
Employment Agreement dated as of January 1, 2007, by and between the Company and Jonathan D. Coleman, is hereby incorporated by reference from Exhibit 10.1 to JCG's Form 8-K dated September 25, 2007 (File No. 001-15253)* |
10.25.1 |
|
Amended and Restated Form of Change in Control Agreement by and between Janus Management Holdings Corporation and each of the following: Jonathan D. Coleman and Richard Gibson Smith, dated October 1, 2008, is hereby attached to this Form 10-K as Exhibit 10.25.1.* |
10.25.2 |
|
Severance Rights Agreement by and between Janus Management Holdings Corporation and Jonathan D. Coleman, dated January 1, 2009, is hereby incorporated by reference from Exhibit 10.1 to JCG's Form 8-K, dated November 12, 2008 (File No. 001-15253)* |
10.26 |
|
Employment Agreement dated as of January 1, 2007, by and between the Company and Richard Gibson Smith, is hereby incorporated by reference from Exhibit 10.1 to JCG's Form 8-K dated September 25, 2007 (File No. 001-15253)* |
10.26.1 |
|
Severance Rights Agreement by and between Janus Management Holdings Corporation and Richard Gibson Smith, dated January 1, 2009, is hereby incorporated by reference from Exhibit 10.2 to JCG's Form 8-K, dated November 12, 2008 (File No. 001-15253)* |
10.26.2 |
|
Amended and Restated Change in Control Agreement by and between Janus Management Holdings Corporation and James P. Goff, dated October 1, 2008, is attached to this Form 10-K as Exhibit 10.26.2.* |
10.26.3 |
|
Amended Severance Letter Agreement by and between Janus Management Holdings Corporation and James Goff, dated October 1, 2008, is attached to this Form 10-K as Exhibit 10.26.3.* |
10.27 |
|
Amendment to long-term incentive awards granted to Steven L. Scheid approved on November 11, 2005 is hereby incorporated by reference to JCG's Current Report on Form 8-K, dated November 16, 2005 (File No. 001-15253)* |
10.28 |
|
Summary of Janus Capital Group Inc. Outside Director Compensation Program effective May 1, 2008, is attached to this Form 10-K as Exhibit 10.28.* |
|
|
*Compensatory plan or agreement. |
70
Table of Contents
| | |
| | | (12) Statements Re Computation of Ratios |
12.1 |
|
The Computation of Ratio of Earnings to Fixed Charges prepared pursuant to Item 601(b)(12) of Regulation S-K is attached to this Annual Report on Form 10-K as Exhibit 12.1 |
|
|
(21) Subsidiaries of the Company |
21.1 |
|
The List of the Subsidiaries of the Company prepared pursuant to Item 601(b)(21) of Regulation S-K is attached to this Annual Report on Form 10-K as Exhibit 21.1 |
|
|
(23) Consents of Experts and Counsel |
23.1 |
|
The Consent of Independent Registered Public Accounting Firm prepared pursuant to Item 601(b)(23) of Regulation S-K is attached to this Annual Report on Form 10-K as Exhibit 23.1 |
|
|
(31) Rule 13a-14(a)/15d-14(a) Certifications |
31.1 |
|
Certification of Gary D. Black, Chief Executive Officer of Registrant |
31.2 |
|
Certification of Gregory A. Frost, Executive Vice President and Chief Financial Officer of Registrant |
|
|
(32) Section 1350 Certificates |
32.1 |
|
Certification of Gary D. Black, Chief Executive Officer of Registrant, pursuant to 18 U.S.C. Section 1350, as adopted pursuant to Section 906 of the Sarbanes-Oxley Act of 2002 |
32.2 |
|
Certification of Gregory A. Frost, Executive Vice President and Chief Financial Officer of Registrant, pursuant to 18 U.S.C. Section 1350, as adopted pursuant to Section 906 of the Sarbanes-Oxley Act of 2002 |
|
|
(99) Additional Exhibits |
99.1 |
|
Lipper Rankings |
71
Table of Contents
(c) Exhibits
JANUS CAPITAL GROUP INC.
2008 FORM 10-K ANNUAL REPORT
INDEX TO EXHIBITS
| | | | |
| Exhibit No. | | Document | | Regulation S-K Item 601(b) Exhibit No. |
|---|
| 10.8 | | Amended and Restated Janus Capital Group Inc. 1998 Long Term Incentive Stock Plan, effective January 22, 2008 | | 10 |
10.14 |
|
Amended Janus Capital Group Inc. 401(k), Profit Sharing and Employee Stock Ownership Plan, effective January 1, 2009 |
|
10 |
10.17.2 |
|
Form of Long-Term Incentive Acceptance Form with Appendix A (Restricted Stock), Appendix B (Stock Options) and Appendix C (Mutual Fund Units), effective for awards granted in 2009 |
|
10 |
10.20 |
|
Amended and Restated Change in Control Agreement by and between the Company and Robin C. Beery, effective October 1, 2008 |
|
10 |
10.24 |
|
Form of Change in Control Agreement by and between Janus Management Holdings Corporation and the following: Gary D. Black, Daniel P. Charles, Gregory A. Frost, Scott S. Grace, Kelley A. Howes and Dominic C. Martellaro, effective October 1, 2008 |
|
10 |
10.25.1 |
|
Amended and Restated Form of Change in Control Agreement by and between Janus Management Holdings Corporation and each of the following: Jonathan D. Coleman and Richard Gibson Smith, effective October 1, 2008 |
|
10 |
10.26.2 |
|
Amended and Restated Change in Control Agreement by and between Janus Management Holdings Corporation and James P. Goff, effective October 1, 2008 |
|
10 |
10.26.3 |
|
Amended Severance Letter Agreement by and between Janus Management Holdings Corporation and James P. Goff, effective October 1, 2008 |
|
10 |
10.28 |
|
Summary of Janus Capital Group Inc. Outside Director Compensation Program, effective May 1, 2008 |
|
10 |
12.1 |
|
The Computation of Ratio of Earnings to Fixed Charges prepared pursuant to Item 601(b)(12) of Regulation S-K |
|
12 |
21.1 |
|
The List of the Subsidiaries of the Company prepared pursuant to Item 601(b)(21) of Regulation S-K |
|
21 |
23.1 |
|
The Consent of Independent Registered Public Accounting Firm — Deloitte & Touche LLP |
|
23 |
31.1 |
|
Certification of Gary D. Black, Chief Executive Officer of Registrant |
|
31 |
31.2 |
|
Certification of Gregory A. Frost, Executive Vice President and Chief Financial Officer of Registrant |
|
31 |
32.1 |
|
Certification of Gary D. Black, Chief Executive Officer of Registrant, pursuant to 18 U.S.C. Section 1350, as adopted pursuant to Section 906 of the Sarbanes-Oxley Act of 2002 |
|
32 |
32.2 |
|
Certification of Gregory A. Frost, Executive Vice President and Chief Financial Officer of Registrant, pursuant to 18 U.S.C. Section 1350, as adopted pursuant to Section 906 of the Sarbanes-Oxley Act of 2002 |
|
32 |
99.1 |
|
Lipper Rankings |
|
99 |
72
Table of Contents
Signatures
Pursuant to the requirements of Section 13 or 15(d) of the Securities Exchange Act of 1934, the Registrant has duly caused this report to be signed on its behalf by the undersigned, thereunto duly authorized.
| | | | |
| | | Janus Capital Group Inc. |
|
|
By: |
|
/s/ GARY D. BLACK
Gary D. Black
Chief Executive Officer |
February 26, 2009
The officers and directors of Janus Capital Group Inc., whose signatures appear below, hereby constitute and appoint Kelley A. Howes or Gregory A. Frost, and each of them (with full power to each of them to act alone), the true and lawful attorney-in-fact to sign and execute, on behalf of the undersigned, any amendment(s) to this Form 10-K Annual Report for the year ended December 31, 2008, and any instrument or document filed as part of, as an exhibit to or in connection with any amendment, and each of the undersigned does hereby ratify and confirm as his or her own act and deed all that said attorneys shall do or cause to be done by virtue thereof.
Pursuant to the requirements of the Securities Exchange Act of 1934, this report has been signed below by the following persons on behalf of the Registrant and in the capacities indicated on February 26, 2009.
| | |
Signature | | Title |
|---|
|
|
|
/s/ GARY D. BLACK
Gary D. Black | | Director and Chief Executive Officer |
/s/ GREGORY A. FROST
Gregory A. Frost |
|
Executive Vice President and Chief Financial Officer
(Principal Financial Officer) |
/s/ ROBERT W. BLAKLEY
Robert W. Blakley |
|
Vice President and Controller
(Principal Accounting Officer) |
/s/ STEVEN L. SCHEID
Steven L. Scheid |
|
Chairman of the Board |
/s/ TIMOTHY K. ARMOUR
Timothy K. Armour |
|
Director |
/s/ PAUL F. BALSER
Paul F. Balser |
|
Director |
73
Table of Contents
| | |
Signature | | Title |
|---|
|
|
|
/s/ G. ANDREW COX
G. Andrew Cox | | Director |
/s/ JEFFREY J. DIERMEIER
Jeffrey J. Diermeier |
|
Director |
/s/ J. RICHARD FREDERICKS
J. Richard Fredericks |
|
Director |
/s/ DEBORAH R. GATZEK
Deborah R. Gatzek |
|
Director |
/s/ LAWRENCE E. KOCHARD
Lawrence E. Kochard |
|
Director |
/s/ ROBERT T. PARRY
Robert T. Parry |
|
Director |
Jock Patton |
|
Director |
/s/ LANDON H. ROWLAND
Landon H. Rowland |
|
Director |
/s/ GLENN S. SCHAFER
Glenn S. Schafer |
|
Director |
/s/ ROBERT SKIDELSKY
Robert Skidelsky |
|
Director |
74