InSinkErator A Business Unit of Emerson Electric Co. Consolidated and Combined Financial Statements as of September 30, 2020 and 2021, and for the Years Ended September 30, 2019, 2020 and 2021 (with Independent Auditors’ Report Thereon)
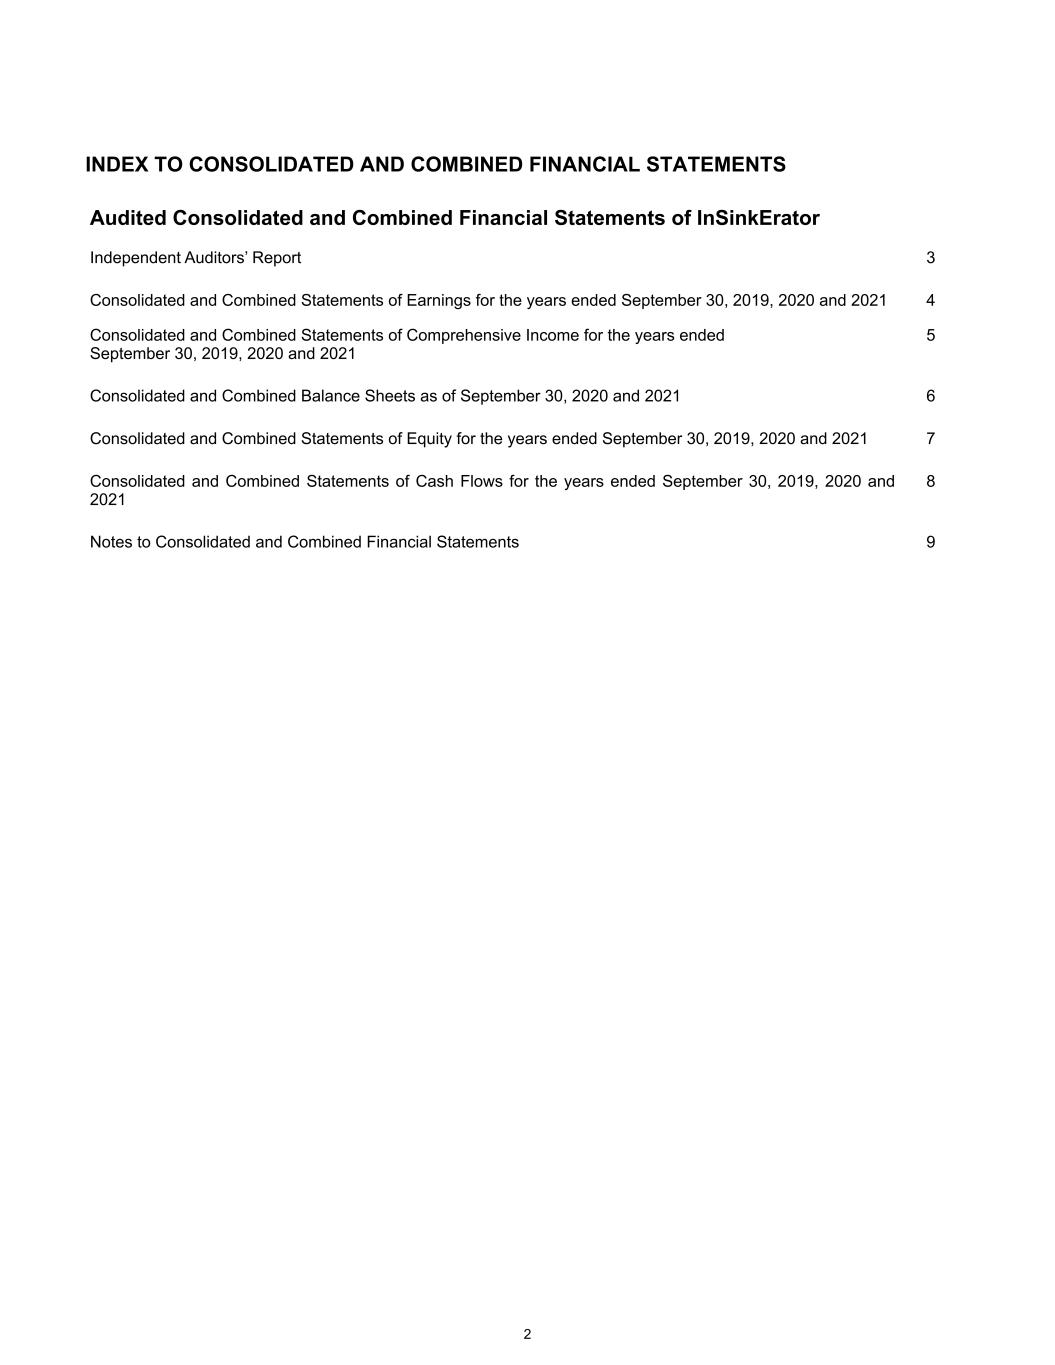
INDEX TO CONSOLIDATED AND COMBINED FINANCIAL STATEMENTS Audited Consolidated and Combined Financial Statements of InSinkErator Independent Auditors’ Report 3 Consolidated and Combined Statements of Earnings for the years ended September 30, 2019, 2020 and 2021 4 Consolidated and Combined Statements of Comprehensive Income for the years ended September 30, 2019, 2020 and 2021 5 Consolidated and Combined Balance Sheets as of September 30, 2020 and 2021 6 Consolidated and Combined Statements of Equity for the years ended September 30, 2019, 2020 and 2021 7 Consolidated and Combined Statements of Cash Flows for the years ended September 30, 2019, 2020 and 2021 8 Notes to Consolidated and Combined Financial Statements 9 2
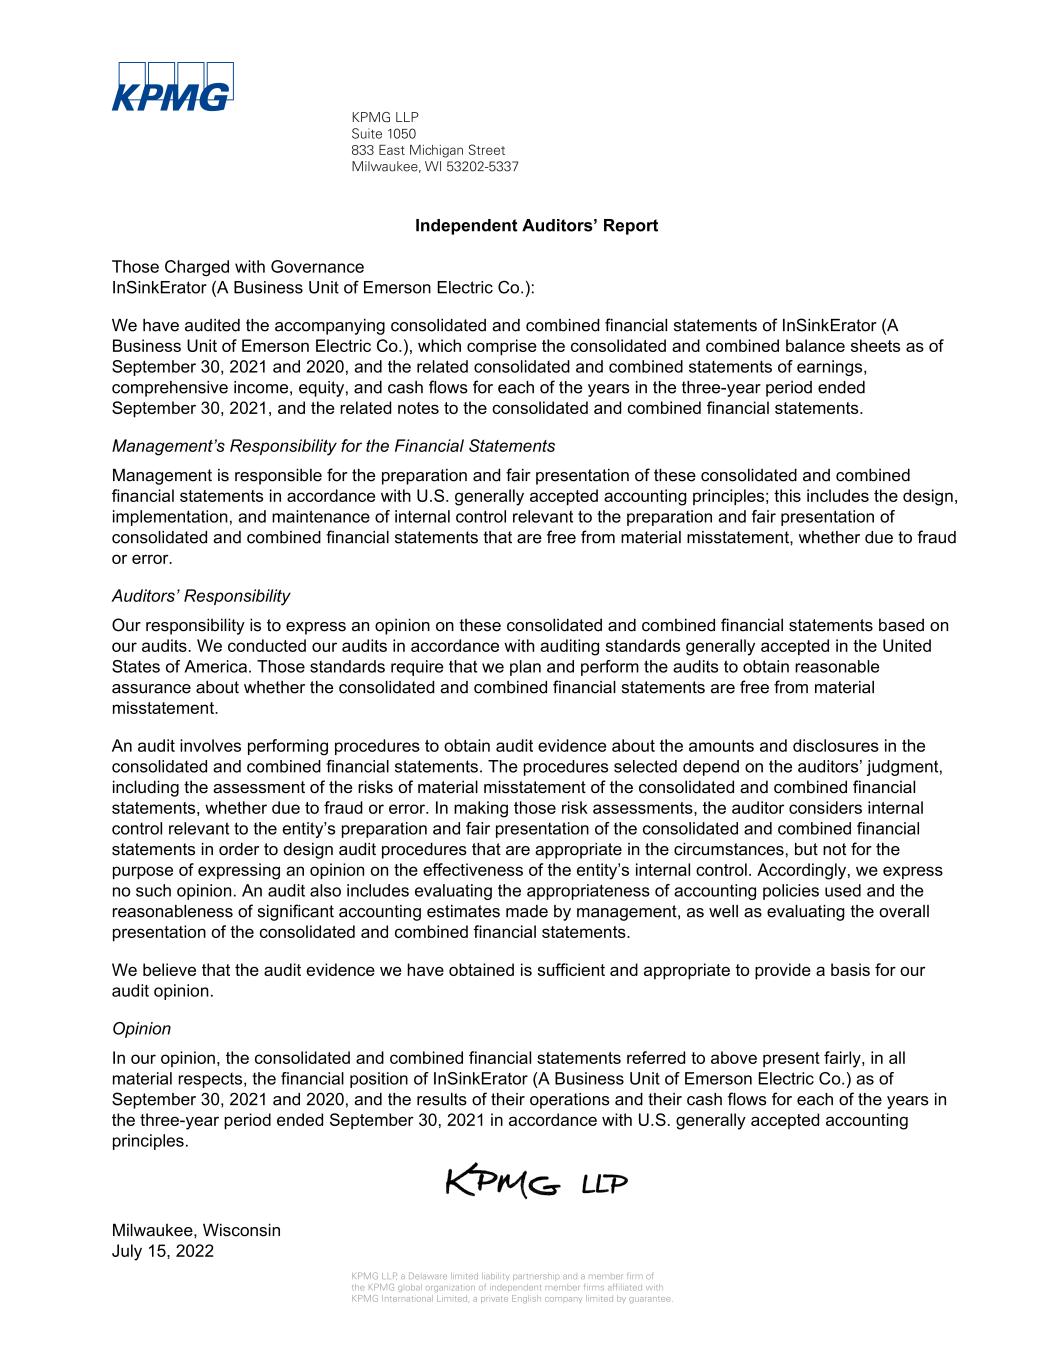
KPMG LLP Suite 1050 833 East Michigan Street Milwaukee, WI 53202-5337 KPMG LLP, a Delaware limited liability partnership and a member firm of the KPMG global organization of independent member firms affiliated with KPMG International Limited, a private English company limited by guarantee. Independent Auditors’ Report Those Charged with Governance InSinkErator (A Business Unit of Emerson Electric Co.): We have audited the accompanying consolidated and combined financial statements of InSinkErator (A Business Unit of Emerson Electric Co.), which comprise the consolidated and combined balance sheets as of September 30, 2021 and 2020, and the related consolidated and combined statements of earnings, comprehensive income, equity, and cash flows for each of the years in the three-year period ended September 30, 2021, and the related notes to the consolidated and combined financial statements. Management’s Responsibility for the Financial Statements Management is responsible for the preparation and fair presentation of these consolidated and combined financial statements in accordance with U.S. generally accepted accounting principles; this includes the design, implementation, and maintenance of internal control relevant to the preparation and fair presentation of consolidated and combined financial statements that are free from material misstatement, whether due to fraud or error. Auditors’ Responsibility Our responsibility is to express an opinion on these consolidated and combined financial statements based on our audits. We conducted our audits in accordance with auditing standards generally accepted in the United States of America. Those standards require that we plan and perform the audits to obtain reasonable assurance about whether the consolidated and combined financial statements are free from material misstatement. An audit involves performing procedures to obtain audit evidence about the amounts and disclosures in the consolidated and combined financial statements. The procedures selected depend on the auditors’ judgment, including the assessment of the risks of material misstatement of the consolidated and combined financial statements, whether due to fraud or error. In making those risk assessments, the auditor considers internal control relevant to the entity’s preparation and fair presentation of the consolidated and combined financial statements in order to design audit procedures that are appropriate in the circumstances, but not for the purpose of expressing an opinion on the effectiveness of the entity’s internal control. Accordingly, we express no such opinion. An audit also includes evaluating the appropriateness of accounting policies used and the reasonableness of significant accounting estimates made by management, as well as evaluating the overall presentation of the consolidated and combined financial statements. We believe that the audit evidence we have obtained is sufficient and appropriate to provide a basis for our audit opinion. Opinion In our opinion, the consolidated and combined financial statements referred to above present fairly, in all material respects, the financial position of InSinkErator (A Business Unit of Emerson Electric Co.) as of September 30, 2021 and 2020, and the results of their operations and their cash flows for each of the years in the three-year period ended September 30, 2021 in accordance with U.S. generally accepted accounting principles. Milwaukee, Wisconsin July 15, 2022

Consolidated and Combined Statements of Earnings InSinkErator Years ended September 30 (Dollars in millions) 2019 2020 2021 Net sales $ 534.0 530.6 565.2 Cost of sales 323.0 324.5 337.0 Selling, general and administrative expenses 80.0 80.0 84.7 Other deductions, net 5.3 4.4 2.9 Earnings before income taxes 125.7 121.7 140.6 Income taxes 31.8 30.5 35.4 Net earnings $ 93.9 91.2 105.2 See accompanying Notes to Consolidated and Combined Financial Statements. 4

Consolidated and Combined Statements of Comprehensive Income InSinkErator Years ended September 30 (Dollars in millions) 2019 2020 2021 Net earnings $ 93.9 91.2 105.2 Other comprehensive income (loss), net of tax: Foreign currency translation (0.4) 0.5 0.5 Comprehensive income $ 93.5 91.7 105.7 See accompanying Notes to Consolidated and Combined Financial Statements. 5
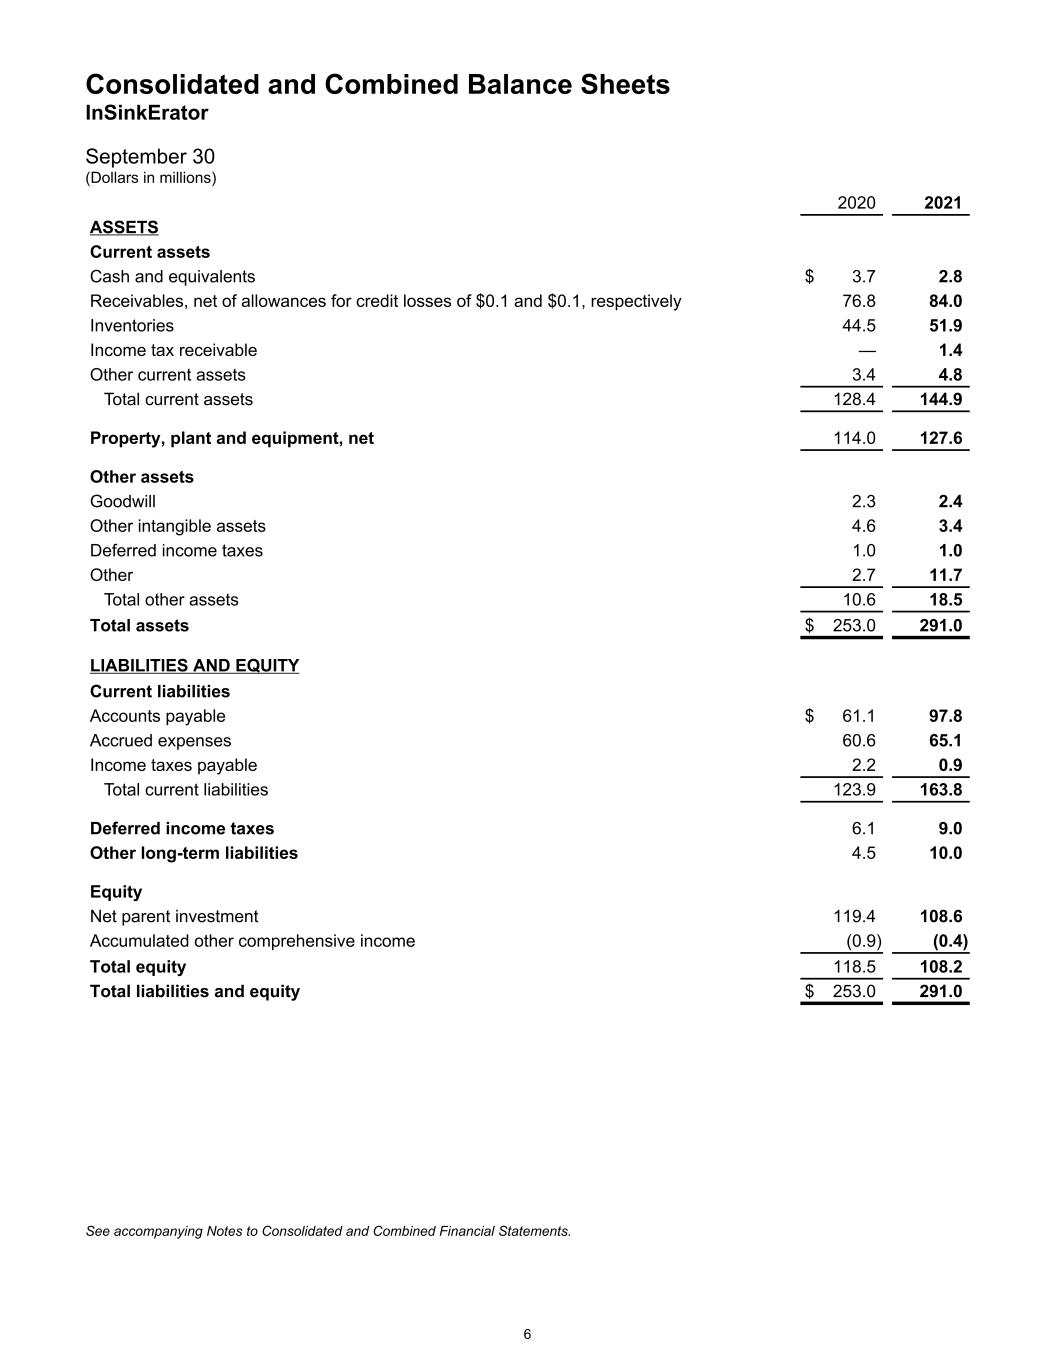
Consolidated and Combined Balance Sheets InSinkErator September 30 (Dollars in millions) 2020 2021 ASSETS Current assets Cash and equivalents $ 3.7 2.8 Receivables, net of allowances for credit losses of $0.1 and $0.1, respectively 76.8 84.0 Inventories 44.5 51.9 Income tax receivable — 1.4 Other current assets 3.4 4.8 Total current assets 128.4 144.9 Property, plant and equipment, net 114.0 127.6 Other assets Goodwill 2.3 2.4 Other intangible assets 4.6 3.4 Deferred income taxes 1.0 1.0 Other 2.7 11.7 Total other assets 10.6 18.5 Total assets $ 253.0 291.0 LIABILITIES AND EQUITY Current liabilities Accounts payable $ 61.1 97.8 Accrued expenses 60.6 65.1 Income taxes payable 2.2 0.9 Total current liabilities 123.9 163.8 Deferred income taxes 6.1 9.0 Other long-term liabilities 4.5 10.0 Equity Net parent investment 119.4 108.6 Accumulated other comprehensive income (0.9) (0.4) Total equity 118.5 108.2 Total liabilities and equity $ 253.0 291.0 See accompanying Notes to Consolidated and Combined Financial Statements. 6

Consolidated and Combined Statements of Equity InSinkErator Years ended September 30 (Dollars in millions) 2019 2020 2021 Net parent investment Beginning balance $ 136.4 125.1 119.4 Net earnings 93.9 91.2 105.2 Net transfer to Emerson (105.2) (96.9) (116.0) Ending balance 125.1 119.4 108.6 Accumulated other comprehensive income (loss) Beginning balance (1.0) (1.4) (0.9) Foreign currency translation (0.4) 0.5 0.5 Ending balance (1.4) (0.9) (0.4) Total equity $ 123.7 118.5 108.2 See accompanying Notes to Consolidated and Combined Financial Statements. 7
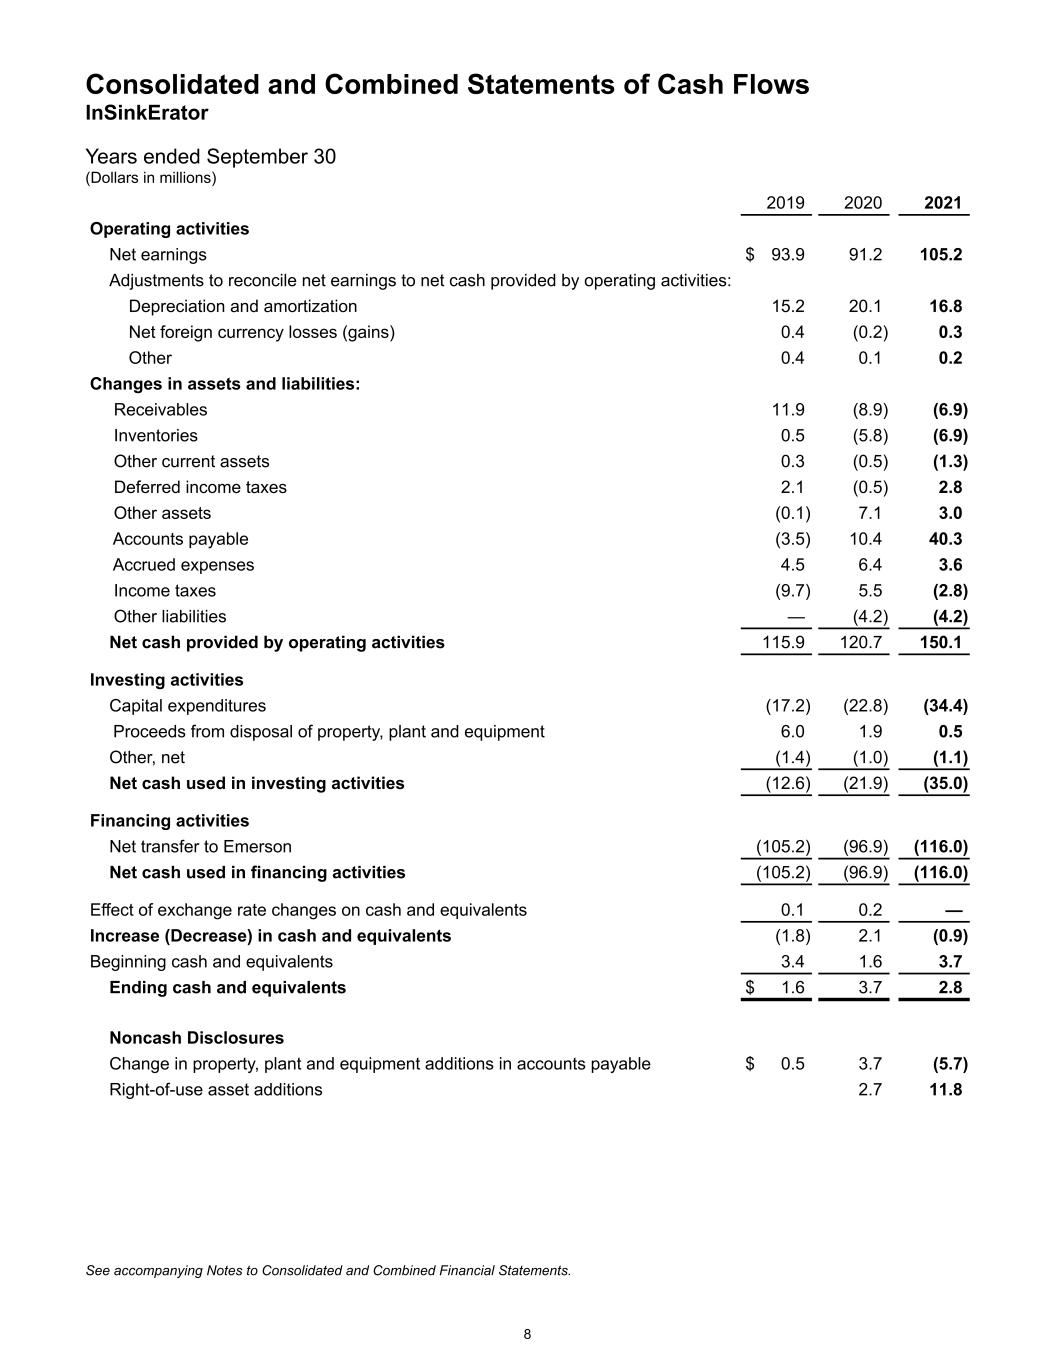
Consolidated and Combined Statements of Cash Flows InSinkErator Years ended September 30 (Dollars in millions) 2019 2020 2021 Operating activities Net earnings $ 93.9 91.2 105.2 Adjustments to reconcile net earnings to net cash provided by operating activities: Depreciation and amortization 15.2 20.1 16.8 Net foreign currency losses (gains) 0.4 (0.2) 0.3 Other 0.4 0.1 0.2 Changes in assets and liabilities: Receivables 11.9 (8.9) (6.9) Inventories 0.5 (5.8) (6.9) Other current assets 0.3 (0.5) (1.3) Deferred income taxes 2.1 (0.5) 2.8 Other assets (0.1) 7.1 3.0 Accounts payable (3.5) 10.4 40.3 Accrued expenses 4.5 6.4 3.6 Income taxes (9.7) 5.5 (2.8) Other liabilities — (4.2) (4.2) Net cash provided by operating activities 115.9 120.7 150.1 Investing activities Capital expenditures (17.2) (22.8) (34.4) Proceeds from disposal of property, plant and equipment 6.0 1.9 0.5 Other, net (1.4) (1.0) (1.1) Net cash used in investing activities (12.6) (21.9) (35.0) Financing activities Net transfer to Emerson (105.2) (96.9) (116.0) Net cash used in financing activities (105.2) (96.9) (116.0) Effect of exchange rate changes on cash and equivalents 0.1 0.2 — Increase (Decrease) in cash and equivalents (1.8) 2.1 (0.9) Beginning cash and equivalents 3.4 1.6 3.7 Ending cash and equivalents $ 1.6 3.7 2.8 Noncash Disclosures Change in property, plant and equipment additions in accounts payable $ 0.5 3.7 (5.7) Right-of-use asset additions 2.7 11.8 See accompanying Notes to Consolidated and Combined Financial Statements. 8
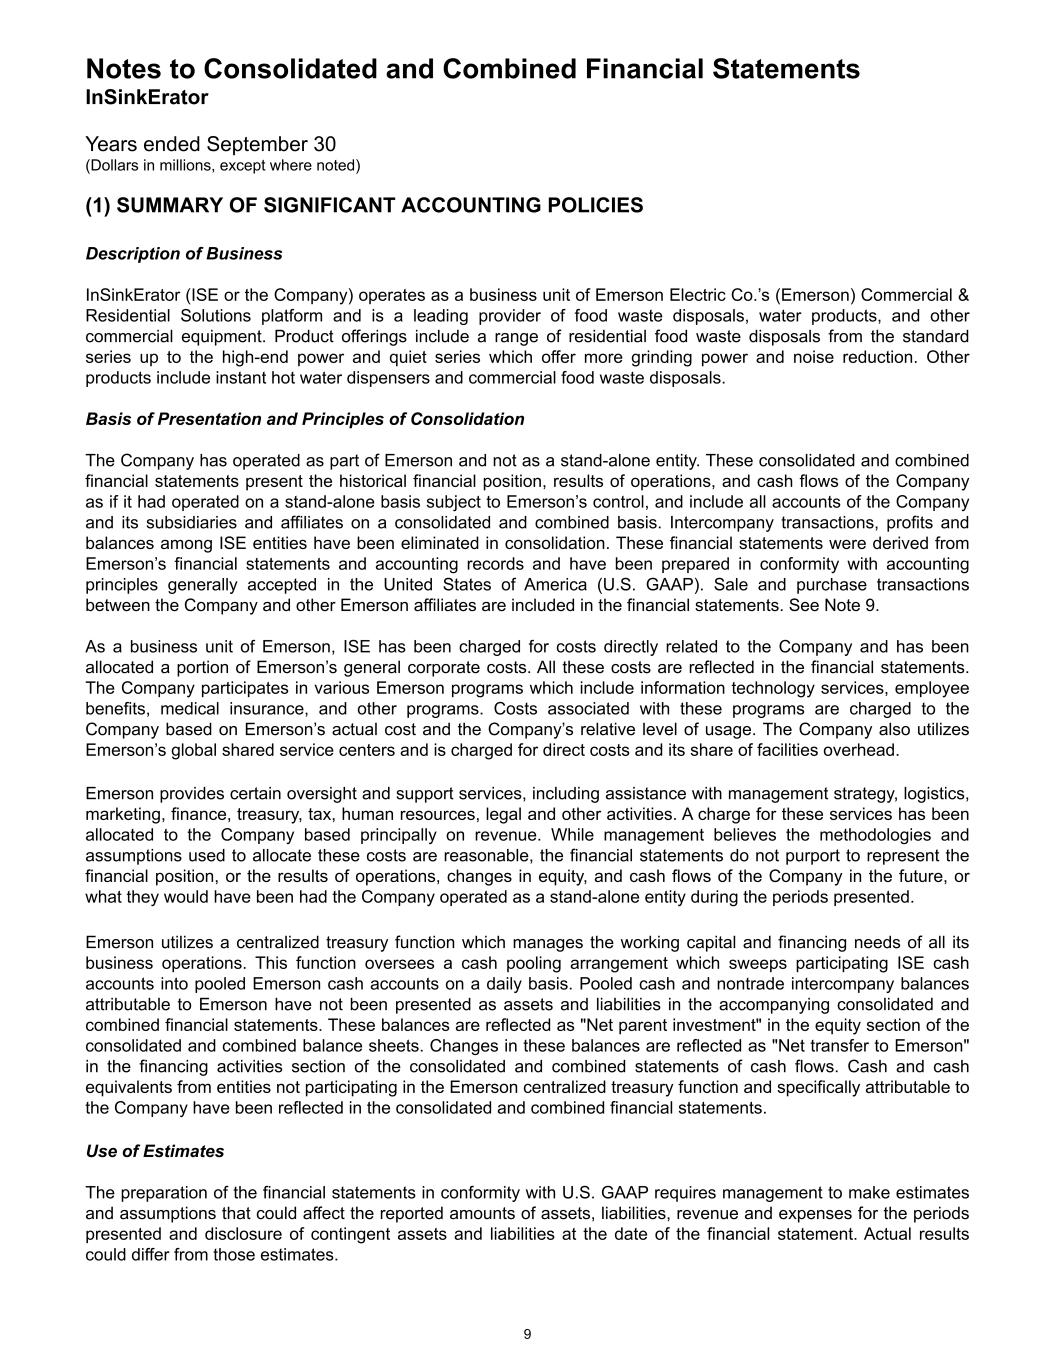
Notes to Consolidated and Combined Financial Statements InSinkErator Years ended September 30 (Dollars in millions, except where noted) (1) SUMMARY OF SIGNIFICANT ACCOUNTING POLICIES Description of Business InSinkErator (ISE or the Company) operates as a business unit of Emerson Electric Co.’s (Emerson) Commercial & Residential Solutions platform and is a leading provider of food waste disposals, water products, and other commercial equipment. Product offerings include a range of residential food waste disposals from the standard series up to the high-end power and quiet series which offer more grinding power and noise reduction. Other products include instant hot water dispensers and commercial food waste disposals. Basis of Presentation and Principles of Consolidation The Company has operated as part of Emerson and not as a stand-alone entity. These consolidated and combined financial statements present the historical financial position, results of operations, and cash flows of the Company as if it had operated on a stand-alone basis subject to Emerson’s control, and include all accounts of the Company and its subsidiaries and affiliates on a consolidated and combined basis. Intercompany transactions, profits and balances among ISE entities have been eliminated in consolidation. These financial statements were derived from Emerson’s financial statements and accounting records and have been prepared in conformity with accounting principles generally accepted in the United States of America (U.S. GAAP). Sale and purchase transactions between the Company and other Emerson affiliates are included in the financial statements. See Note 9. As a business unit of Emerson, ISE has been charged for costs directly related to the Company and has been allocated a portion of Emerson’s general corporate costs. All these costs are reflected in the financial statements. The Company participates in various Emerson programs which include information technology services, employee benefits, medical insurance, and other programs. Costs associated with these programs are charged to the Company based on Emerson’s actual cost and the Company’s relative level of usage. The Company also utilizes Emerson’s global shared service centers and is charged for direct costs and its share of facilities overhead. Emerson provides certain oversight and support services, including assistance with management strategy, logistics, marketing, finance, treasury, tax, human resources, legal and other activities. A charge for these services has been allocated to the Company based principally on revenue. While management believes the methodologies and assumptions used to allocate these costs are reasonable, the financial statements do not purport to represent the financial position, or the results of operations, changes in equity, and cash flows of the Company in the future, or what they would have been had the Company operated as a stand-alone entity during the periods presented. Emerson utilizes a centralized treasury function which manages the working capital and financing needs of all its business operations. This function oversees a cash pooling arrangement which sweeps participating ISE cash accounts into pooled Emerson cash accounts on a daily basis. Pooled cash and nontrade intercompany balances attributable to Emerson have not been presented as assets and liabilities in the accompanying consolidated and combined financial statements. These balances are reflected as "Net parent investment" in the equity section of the consolidated and combined balance sheets. Changes in these balances are reflected as "Net transfer to Emerson" in the financing activities section of the consolidated and combined statements of cash flows. Cash and cash equivalents from entities not participating in the Emerson centralized treasury function and specifically attributable to the Company have been reflected in the consolidated and combined financial statements. Use of Estimates The preparation of the financial statements in conformity with U.S. GAAP requires management to make estimates and assumptions that could affect the reported amounts of assets, liabilities, revenue and expenses for the periods presented and disclosure of contingent assets and liabilities at the date of the financial statement. Actual results could differ from those estimates. 9
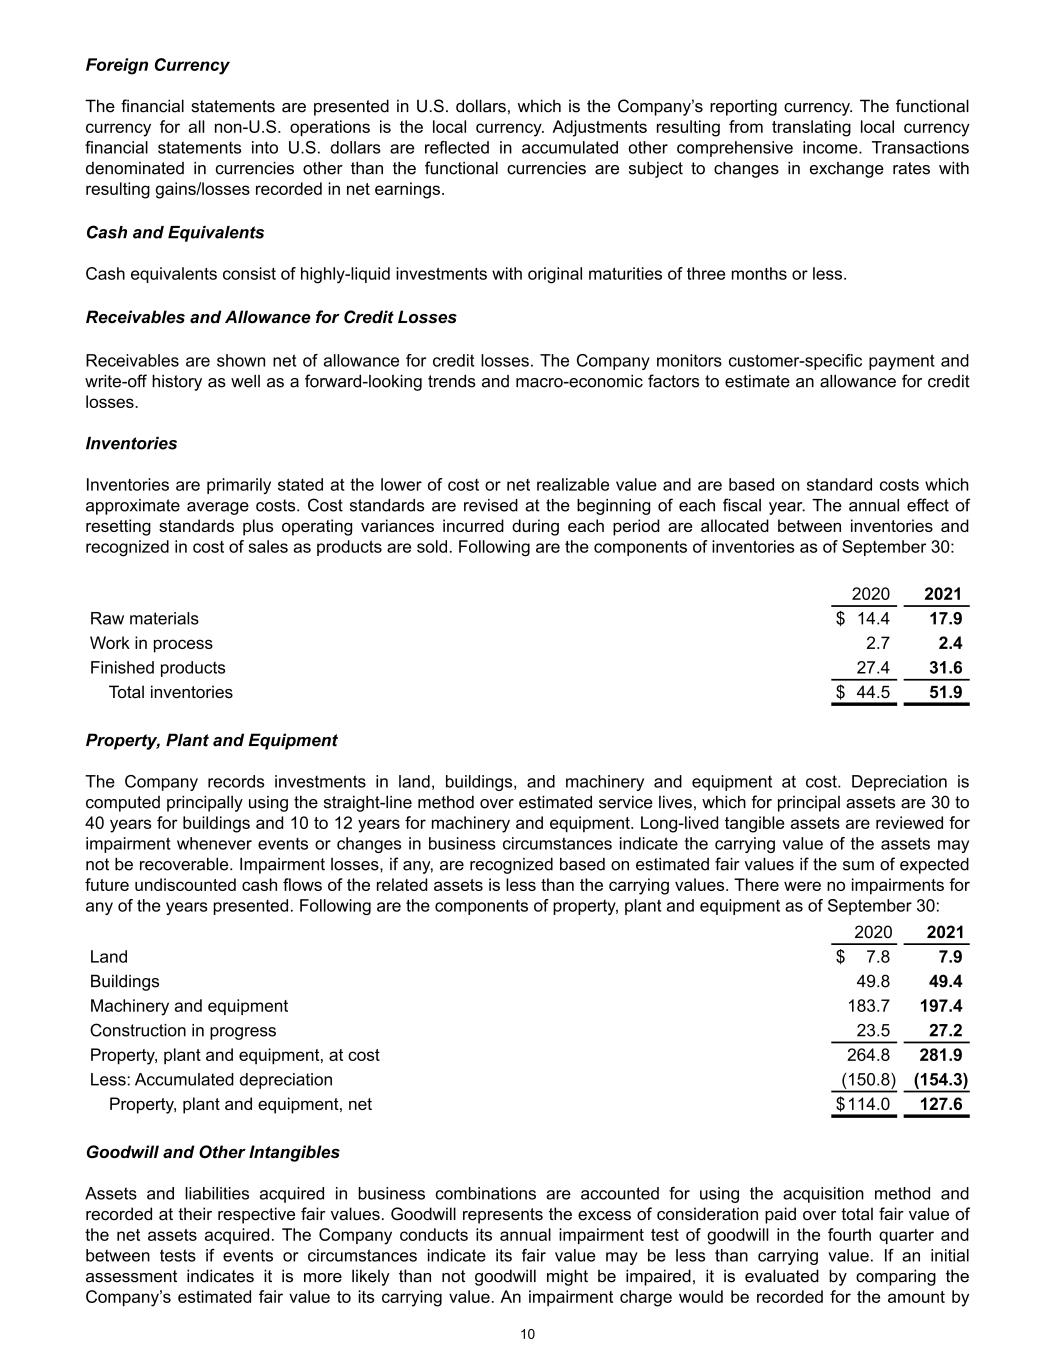
Foreign Currency The financial statements are presented in U.S. dollars, which is the Company’s reporting currency. The functional currency for all non-U.S. operations is the local currency. Adjustments resulting from translating local currency financial statements into U.S. dollars are reflected in accumulated other comprehensive income. Transactions denominated in currencies other than the functional currencies are subject to changes in exchange rates with resulting gains/losses recorded in net earnings. Cash and Equivalents Cash equivalents consist of highly-liquid investments with original maturities of three months or less. Receivables and Allowance for Credit Losses Receivables are shown net of allowance for credit losses. The Company monitors customer-specific payment and write-off history as well as a forward-looking trends and macro-economic factors to estimate an allowance for credit losses. Inventories Inventories are primarily stated at the lower of cost or net realizable value and are based on standard costs which approximate average costs. Cost standards are revised at the beginning of each fiscal year. The annual effect of resetting standards plus operating variances incurred during each period are allocated between inventories and recognized in cost of sales as products are sold. Following are the components of inventories as of September 30: 2020 2021 Raw materials $ 14.4 17.9 Work in process 2.7 2.4 Finished products 27.4 31.6 Total inventories $ 44.5 51.9 Property, Plant and Equipment The Company records investments in land, buildings, and machinery and equipment at cost. Depreciation is computed principally using the straight-line method over estimated service lives, which for principal assets are 30 to 40 years for buildings and 10 to 12 years for machinery and equipment. Long-lived tangible assets are reviewed for impairment whenever events or changes in business circumstances indicate the carrying value of the assets may not be recoverable. Impairment losses, if any, are recognized based on estimated fair values if the sum of expected future undiscounted cash flows of the related assets is less than the carrying values. There were no impairments for any of the years presented. Following are the components of property, plant and equipment as of September 30: 2020 2021 Land $ 7.8 7.9 Buildings 49.8 49.4 Machinery and equipment 183.7 197.4 Construction in progress 23.5 27.2 Property, plant and equipment, at cost 264.8 281.9 Less: Accumulated depreciation (150.8) (154.3) Property, plant and equipment, net $ 114.0 127.6 Goodwill and Other Intangibles Assets and liabilities acquired in business combinations are accounted for using the acquisition method and recorded at their respective fair values. Goodwill represents the excess of consideration paid over total fair value of the net assets acquired. The Company conducts its annual impairment test of goodwill in the fourth quarter and between tests if events or circumstances indicate its fair value may be less than carrying value. If an initial assessment indicates it is more likely than not goodwill might be impaired, it is evaluated by comparing the Company’s estimated fair value to its carrying value. An impairment charge would be recorded for the amount by 10

which the carrying value of the company exceeds its estimated fair value. Estimated fair values are developed primarily under an income approach that discounts estimated future cash flows using risk adjusted interest rates, as well as earnings multiples or other techniques as warranted. Fair values are subject to changes in underlying economic conditions. All of the Company’s identifiable intangible assets are subject to amortization on a straight-line basis over their estimated useful lives. Identifiable intangible assets primarily consist of capitalized software and are also subject to evaluation for potential impairment if events or circumstances indicate the carrying value may not be recoverable. No goodwill or intangible asset impairment was recorded for any of the periods presented. Leases The Company leases offices; manufacturing facilities and equipment; and transportation, information technology, and office equipment primarily under operating lease arrangements. The Company determines whether an arrangement is, or contains, a lease at contract inception. An arrangement contains a lease if the Company has the right to direct the use of and obtain substantially all of the economic benefits of an identified asset. Right-of-use assets and lease liabilities are recognized at lease commencement based on the present value of lease payments over the lease term. Leases with an initial term of 12 months or less are not recognized on the balance sheet and are recorded as short-term lease expense. The discount rate used to calculate present value is the Company’s incremental borrowing rate based on the lease term and the economic environment of the applicable country or region. Certain leases have renewal options or options to terminate prior to lease expiration, which are included in the measurement of right-of-use assets and lease liabilities when it is reasonably certain they will be exercised. The Company has elected to account for lease and non-lease components as a single lease component for its offices and manufacturing facilities. Some lease arrangements include payments that are adjusted periodically based on actual charges incurred for common area maintenance, utilities, taxes and insurance, or changes in an index or rate referenced in the lease. The fixed portion of these payments is included in the measurement of right-of-use assets and lease liabilities at lease commencement, while the variable portion is recorded as variable lease expense. The Company’s leases do not contain material residual value guarantees or restrictive covenants. Net Parent Investment The net parent investment balance included in the consolidated and combined balance sheets represents Emerson’s historical investment in the Company, the Company’s accumulated net earnings after income taxes, and the net effect of transactions with Emerson. Revenue Recognition In accordance with Accounting Standards Codification (ASC) 606, Revenue from Contracts with Customers, the Company evaluates its contracts with customers to identify the promised goods or services and recognize revenue for the identified performance obligations at the amount the Company expects to be entitled to in exchange for those goods or services. A performance obligation is a promise in a contract to transfer a distinct good or service to a customer. Revenue is recognized when, or as performance obligations are satisfied, and control has transferred to the customer, typically when products are shipped or delivered, title and risk of loss pass to the customer, and the Company has a present right to payment. Substantially all of Company’s revenues are performance obligations related to the sale of manufactured products which are recognized at a point in time when control transfers in accordance with shipping terms. For certain customers, rebates and other sales incentives, promotional allowances or discounts are offered, typically related to customer purchase volumes, most of which are fixed and determinable and are recorded as a reduction in revenue at the time of sale. Although some are cash settled, amounts due to customers are typically settled via issuance of debit and credit memos between the parties at various intervals throughout the year. The revenue cycle is short-term in nature with shipments typically occurring within four weeks from order and does not include a material long-term financing component, implicitly or explicitly. Payment terms generally range between 10 to 120 days, with the majority between 30 and 60 days, and vary by geography, product type and volume, among other factors. Other than standard product warranty provisions, sales arrangements generally provide no other post shipment performance obligations on the Company. In most instances, returns are limited to product quality issues. 11
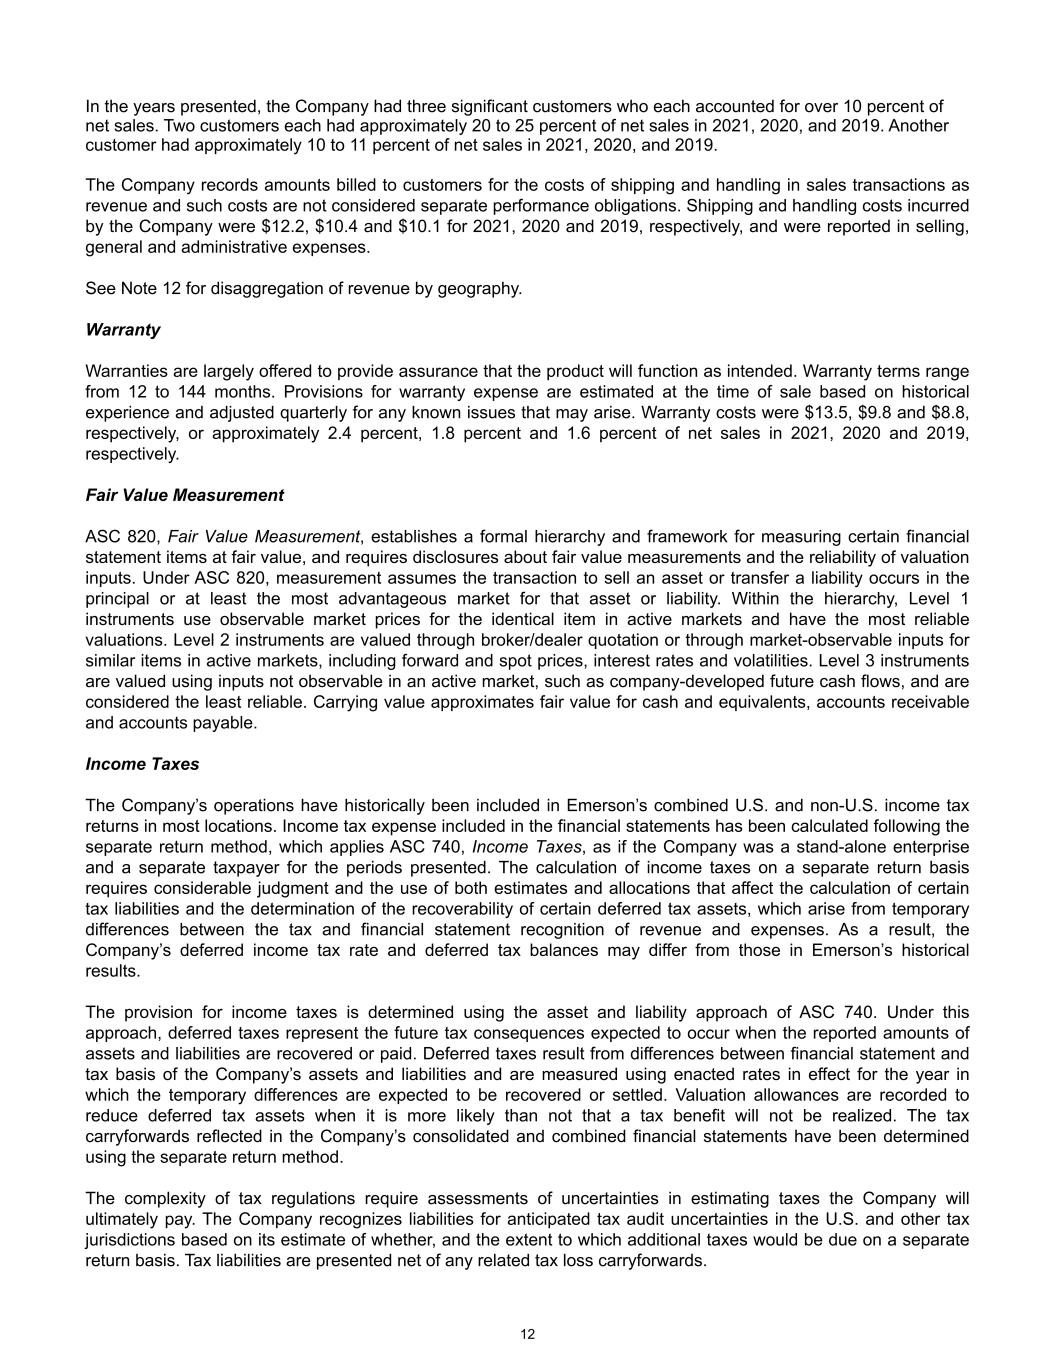
In the years presented, the Company had three significant customers who each accounted for over 10 percent of net sales. Two customers each had approximately 20 to 25 percent of net sales in 2021, 2020, and 2019. Another customer had approximately 10 to 11 percent of net sales in 2021, 2020, and 2019. The Company records amounts billed to customers for the costs of shipping and handling in sales transactions as revenue and such costs are not considered separate performance obligations. Shipping and handling costs incurred by the Company were $12.2, $10.4 and $10.1 for 2021, 2020 and 2019, respectively, and were reported in selling, general and administrative expenses. See Note 12 for disaggregation of revenue by geography. Warranty Warranties are largely offered to provide assurance that the product will function as intended. Warranty terms range from 12 to 144 months. Provisions for warranty expense are estimated at the time of sale based on historical experience and adjusted quarterly for any known issues that may arise. Warranty costs were $13.5, $9.8 and $8.8, respectively, or approximately 2.4 percent, 1.8 percent and 1.6 percent of net sales in 2021, 2020 and 2019, respectively. Fair Value Measurement ASC 820, Fair Value Measurement, establishes a formal hierarchy and framework for measuring certain financial statement items at fair value, and requires disclosures about fair value measurements and the reliability of valuation inputs. Under ASC 820, measurement assumes the transaction to sell an asset or transfer a liability occurs in the principal or at least the most advantageous market for that asset or liability. Within the hierarchy, Level 1 instruments use observable market prices for the identical item in active markets and have the most reliable valuations. Level 2 instruments are valued through broker/dealer quotation or through market-observable inputs for similar items in active markets, including forward and spot prices, interest rates and volatilities. Level 3 instruments are valued using inputs not observable in an active market, such as company-developed future cash flows, and are considered the least reliable. Carrying value approximates fair value for cash and equivalents, accounts receivable and accounts payable. Income Taxes The Company’s operations have historically been included in Emerson’s combined U.S. and non-U.S. income tax returns in most locations. Income tax expense included in the financial statements has been calculated following the separate return method, which applies ASC 740, Income Taxes, as if the Company was a stand-alone enterprise and a separate taxpayer for the periods presented. The calculation of income taxes on a separate return basis requires considerable judgment and the use of both estimates and allocations that affect the calculation of certain tax liabilities and the determination of the recoverability of certain deferred tax assets, which arise from temporary differences between the tax and financial statement recognition of revenue and expenses. As a result, the Company’s deferred income tax rate and deferred tax balances may differ from those in Emerson’s historical results. The provision for income taxes is determined using the asset and liability approach of ASC 740. Under this approach, deferred taxes represent the future tax consequences expected to occur when the reported amounts of assets and liabilities are recovered or paid. Deferred taxes result from differences between financial statement and tax basis of the Company’s assets and liabilities and are measured using enacted rates in effect for the year in which the temporary differences are expected to be recovered or settled. Valuation allowances are recorded to reduce deferred tax assets when it is more likely than not that a tax benefit will not be realized. The tax carryforwards reflected in the Company’s consolidated and combined financial statements have been determined using the separate return method. The complexity of tax regulations require assessments of uncertainties in estimating taxes the Company will ultimately pay. The Company recognizes liabilities for anticipated tax audit uncertainties in the U.S. and other tax jurisdictions based on its estimate of whether, and the extent to which additional taxes would be due on a separate return basis. Tax liabilities are presented net of any related tax loss carryforwards. 12

The Company also provides for income taxes, net of any potentially available foreign tax credits, on earnings intended to be repatriated from foreign subsidiaries. The undistributed earnings of foreign subsidiaries as of September 30, 2021 are considered permanently invested or otherwise indefinitely retained for continuing international operations. Recognition of income taxes on undistributed foreign earnings, if any, would be triggered by a decision to repatriate earnings. Determination of the amount of taxes that might be paid on any undistributed earnings if eventually remitted is not practicable. Adopted Accounting Pronouncements Effective October 1, 2020, the Company adopted the following accounting standards update and one new accounting standard both of which had an immaterial impact on the Company’s financial statements. • Updates to ASC 350, Intangibles – Goodwill and Other, which eliminate the requirement to measure impairment based on the implied fair value of goodwill compared to the carrying amount of a reporting unit’s goodwill. Instead, goodwill impairment will be measured as the excess of a reporting unit’s carrying amount over its estimated fair value. • Adoption of ASC 326, Financial Instruments – Credit Losses, which amends the impairment model by requiring entities to use a forward-looking approach to estimate lifetime expected credit losses on certain types of financial instruments, including trade receivables. On October 1, 2019, the Company adopted ASC 842, Leases, which requires rights and obligations related to lease arrangements to be recognized on the balance sheet, using the optional transition method under which prior periods were not adjusted. The Company elected the package of practical expedients for leases that commenced prior to the adoption date, which included carrying forward the historical lease classification as operating or finance. The adoption of ASC 842 resulted in the recognition of operating lease right-of-use assets and related lease liabilities of approximately $7.0 as of October 1, 2019, but did not materially impact the Company’s earnings or cash flows for the year ended September 30, 2020. The Company’s financial statements for 2019 continue to be reported in accordance with the Company’s historical accounting under ASC 840, Leases. On October 1, 2018, the Company adopted ASC 606, Revenue from Contracts with Customers, which updated and consolidated revenue recognition guidance from multiple sources into a single, comprehensive standard to be applied for all contracts with customers. The fundamental principle of the revised standard is to recognize revenue based on the transfer of goods and services to customers at the amount the Company expects to be entitled to in exchange for those goods and services. The adoption of ASC 606 did not materially impact the Company’s consolidated and combined financial statements as of and for the year ended September 30, 2019. (2) OTHER DEDUCTIONS, NET Other deductions, net are summarized as follows: 2019 2020 2021 Restructuring expense (see Note 3) $ 4.3 4.4 2.4 Other, net 1.0 — 0.5 Total $ 5.3 4.4 2.9 Other, net is composed of several items that are individually immaterial, including foreign currency transaction gains or losses, losses on disposals of property, plant and equipment and other items. (3) RESTRUCTURING Restructuring activity reflects costs associated with the Company's efforts to continually improve operational efficiency and deploy assets to remain competitive. Shutdown costs can include severance, benefits, stay bonuses, contract terminations and asset write-downs. Start-up and moving costs include costs of moving fixed assets, employee training and relocation. Vacant facility costs include security, maintenance, utilities and other costs. Restructuring expenses were $2.4, $4.4 and $4.3, for 2021, 2020 and 2019, respectively. 13
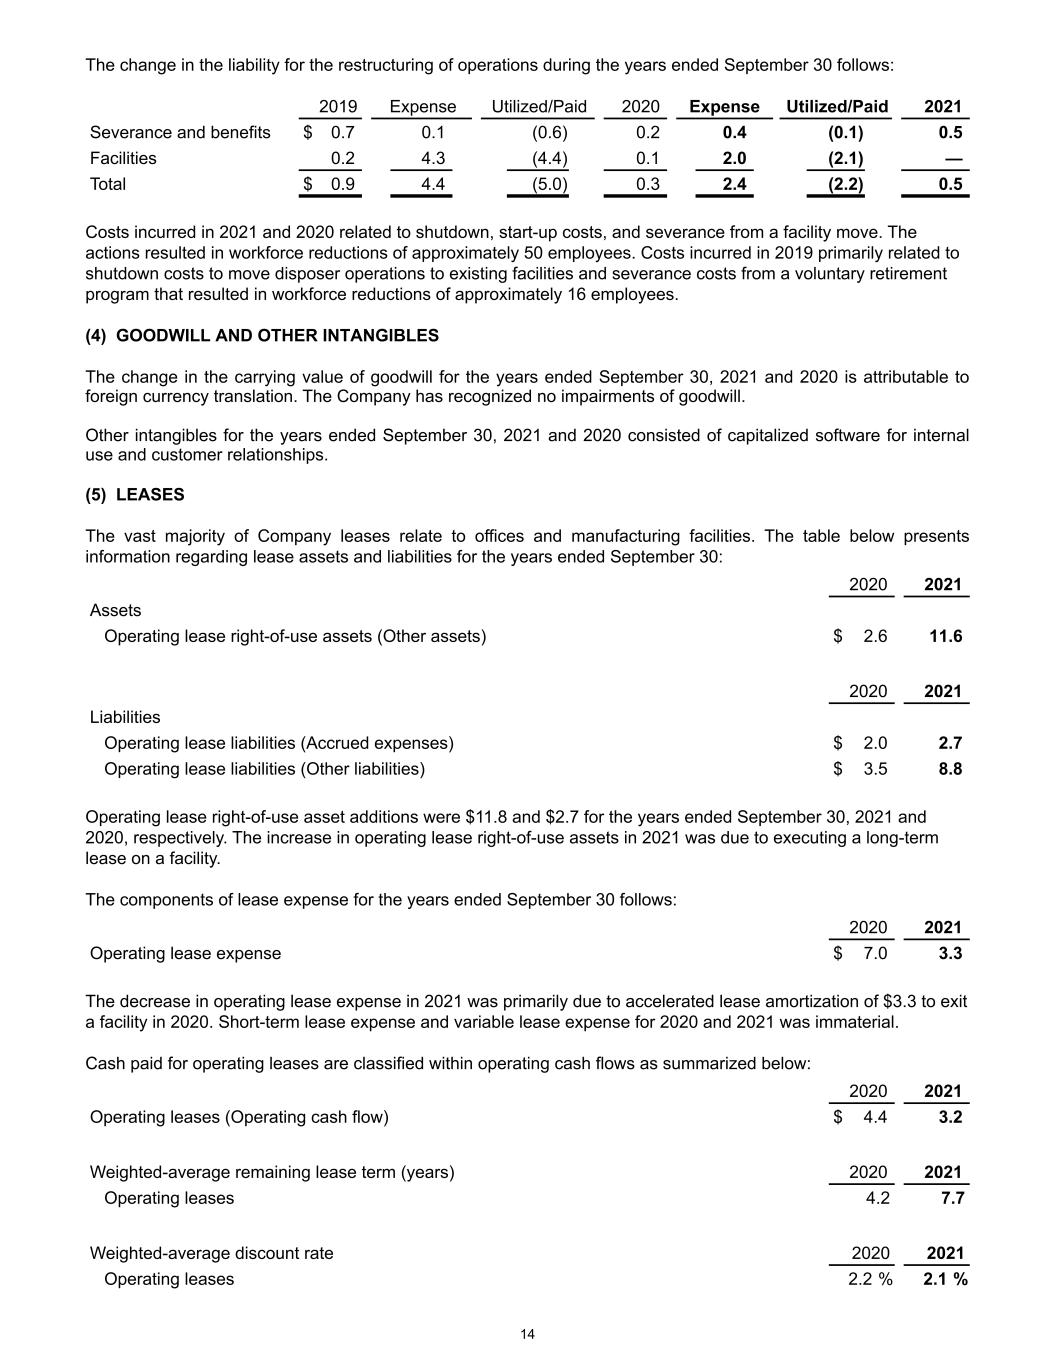
The change in the liability for the restructuring of operations during the years ended September 30 follows: 2019 Expense Utilized/Paid 2020 Expense Utilized/Paid 2021 Severance and benefits $ 0.7 0.1 (0.6) 0.2 0.4 (0.1) 0.5 Facilities 0.2 4.3 (4.4) 0.1 2.0 (2.1) — Total $ 0.9 4.4 (5.0) 0.3 2.4 (2.2) 0.5 Costs incurred in 2021 and 2020 related to shutdown, start-up costs, and severance from a facility move. The actions resulted in workforce reductions of approximately 50 employees. Costs incurred in 2019 primarily related to shutdown costs to move disposer operations to existing facilities and severance costs from a voluntary retirement program that resulted in workforce reductions of approximately 16 employees. (4) GOODWILL AND OTHER INTANGIBLES The change in the carrying value of goodwill for the years ended September 30, 2021 and 2020 is attributable to foreign currency translation. The Company has recognized no impairments of goodwill. Other intangibles for the years ended September 30, 2021 and 2020 consisted of capitalized software for internal use and customer relationships. (5) LEASES The vast majority of Company leases relate to offices and manufacturing facilities. The table below presents information regarding lease assets and liabilities for the years ended September 30: 2020 2021 Assets Operating lease right-of-use assets (Other assets) $ 2.6 11.6 2020 2021 Liabilities Operating lease liabilities (Accrued expenses) $ 2.0 2.7 Operating lease liabilities (Other liabilities) $ 3.5 8.8 Operating lease right-of-use asset additions were $11.8 and $2.7 for the years ended September 30, 2021 and 2020, respectively. The increase in operating lease right-of-use assets in 2021 was due to executing a long-term lease on a facility. The components of lease expense for the years ended September 30 follows: 2020 2021 Operating lease expense $ 7.0 3.3 The decrease in operating lease expense in 2021 was primarily due to accelerated lease amortization of $3.3 to exit a facility in 2020. Short-term lease expense and variable lease expense for 2020 and 2021 was immaterial. Cash paid for operating leases are classified within operating cash flows as summarized below: 2020 2021 Operating leases (Operating cash flow) $ 4.4 3.2 Weighted-average remaining lease term (years) 2020 2021 Operating leases 4.2 7.7 Weighted-average discount rate 2020 2021 Operating leases 2.2 % 2.1 % 14
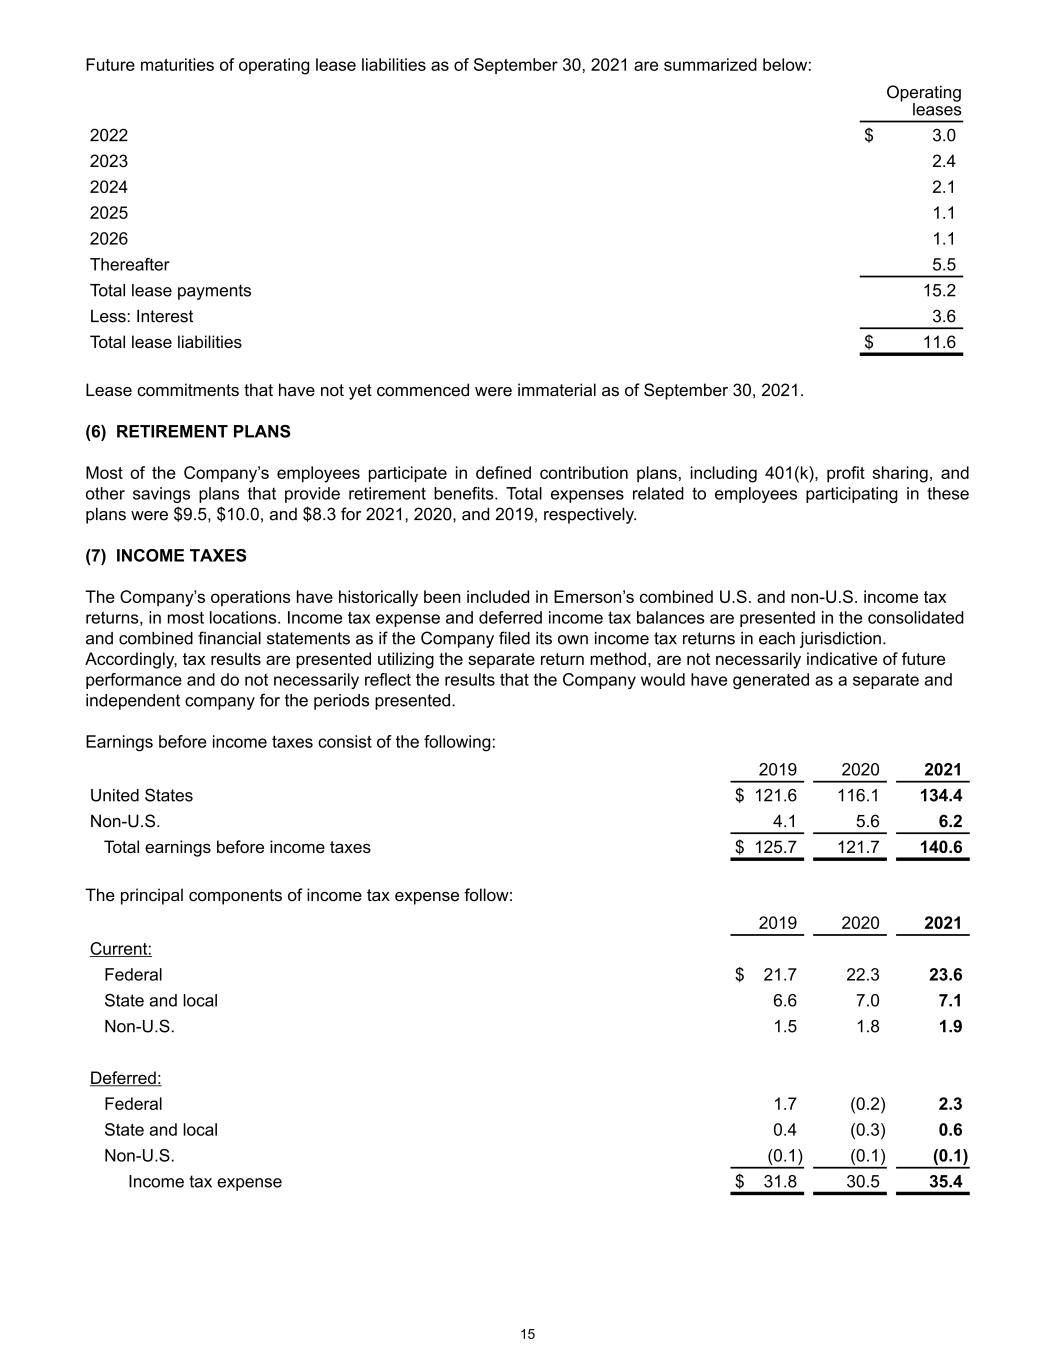
Future maturities of operating lease liabilities as of September 30, 2021 are summarized below: Operating leases 2022 $ 3.0 2023 2.4 2024 2.1 2025 1.1 2026 1.1 Thereafter 5.5 Total lease payments 15.2 Less: Interest 3.6 Total lease liabilities $ 11.6 Lease commitments that have not yet commenced were immaterial as of September 30, 2021. (6) RETIREMENT PLANS Most of the Company’s employees participate in defined contribution plans, including 401(k), profit sharing, and other savings plans that provide retirement benefits. Total expenses related to employees participating in these plans were $9.5, $10.0, and $8.3 for 2021, 2020, and 2019, respectively. (7) INCOME TAXES The Company’s operations have historically been included in Emerson’s combined U.S. and non-U.S. income tax returns, in most locations. Income tax expense and deferred income tax balances are presented in the consolidated and combined financial statements as if the Company filed its own income tax returns in each jurisdiction. Accordingly, tax results are presented utilizing the separate return method, are not necessarily indicative of future performance and do not necessarily reflect the results that the Company would have generated as a separate and independent company for the periods presented. Earnings before income taxes consist of the following: 2019 2020 2021 United States $ 121.6 116.1 134.4 Non-U.S. 4.1 5.6 6.2 Total earnings before income taxes $ 125.7 121.7 140.6 The principal components of income tax expense follow: 2019 2020 2021 Current: Federal $ 21.7 22.3 23.6 State and local 6.6 7.0 7.1 Non-U.S. 1.5 1.8 1.9 Deferred: Federal 1.7 (0.2) 2.3 State and local 0.4 (0.3) 0.6 Non-U.S. (0.1) (0.1) (0.1) Income tax expense $ 31.8 30.5 35.4 15

Reconciliation of U.S. federal statutory taxes to the Company’s total income tax expense follows: 2019 2020 2021 Taxes at U.S. statutory rate (21%) $ 26.4 25.6 29.5 State and local taxes, net of federal tax benefit 5.5 5.3 6.1 Non-U.S. rate differential 0.2 0.3 0.5 Other (0.3) (0.7) (0.7) Total income tax expense $ 31.8 30.5 35.4 The Company has elected to recognize the U.S. tax on global intangible low-taxed income as a period expense when it is incurred. The Company has no unrecognized tax benefits and is not expecting a significant increase in the next 12 months. The Company accrues interest and penalties related to income taxes in income tax expense. No interest and penalties were recognized or accrued for all periods presented. The U.S. is the major jurisdiction for which the Company files income tax returns. Examinations for the U.S. are complete through 2017, with the exception of 2014. The status of state and other non-U.S. tax examinations varies due to the numerous legal entities and jurisdictions in which the Company operates. The principal items that gave rise to deferred income tax assets and liabilities follow: 2020 2021 Deferred tax assets: Net operating losses and tax credits $ 0.6 0.7 Accrued liabilities 2.4 2.8 Employee compensation and benefits 3.1 2.8 Other 3.0 3.1 Total $ 9.1 9.4 Valuation allowances $ (0.6) (0.7) Deferred tax liabilities: Property, equipment and leasehold improvements (12.4) (16.0) Other (1.2) (0.6) Total $ (13.6) (16.6) Net deferred income tax asset $ (5.1) (7.9) Total income taxes paid were approximately $35.4, $25.7, $37.0, in 2021, 2020, and 2019, respectively. The $0.7 of net operating losses and tax credits can be carried forward indefinitely. (8) STOCK-BASED COMPENSATION Certain employees of the Company participate in Emerson stock-based compensation plans, which include stock options, performance shares and restricted stock. Compensation expense is recognized based on Emerson’s cost of the awards determined under ASC 718, Compensation – Stock Compensation. Stock-based compensation expense recognized by Emerson related to Company employees was $2.8, $1.5 and $1.6 for 2021, 2020 and 2019, respectively. These costs are reflected as compensation expense in these consolidated and combined financial statements. (9) RELATED PARTY TRANSACTIONS As a business unit of Emerson, the Company has been charged for costs directly attributable to ISE and allocated a portion of Emerson’s general corporate costs. All these costs are reflected in the Company’s financial statements. Management believes the methodologies and assumptions used to allocate costs to the Company are reasonable. 16
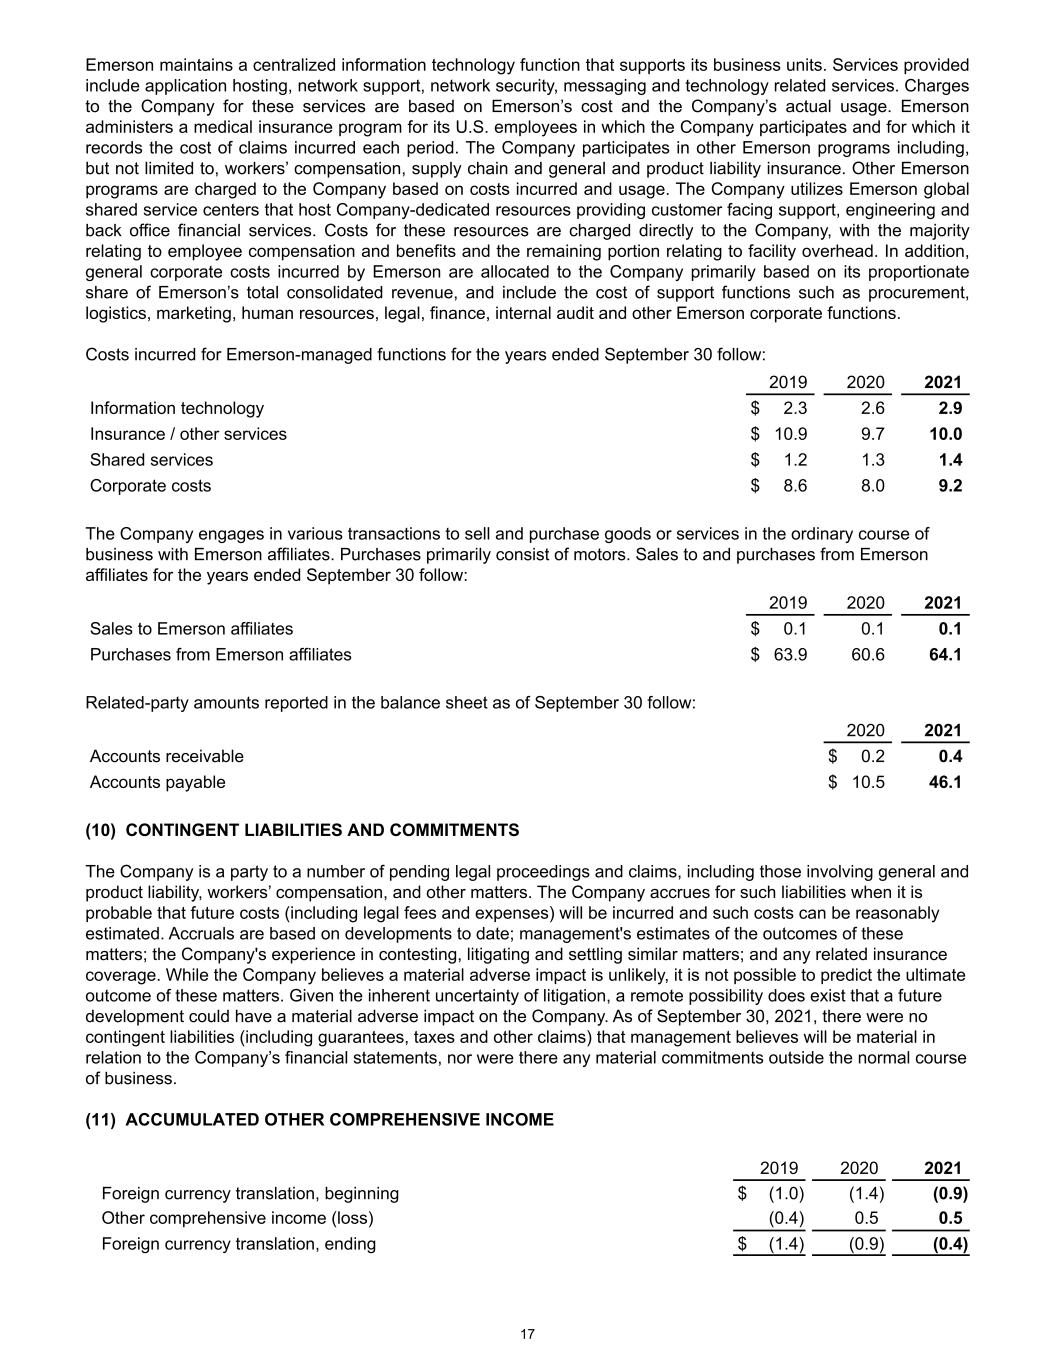
Emerson maintains a centralized information technology function that supports its business units. Services provided include application hosting, network support, network security, messaging and technology related services. Charges to the Company for these services are based on Emerson’s cost and the Company’s actual usage. Emerson administers a medical insurance program for its U.S. employees in which the Company participates and for which it records the cost of claims incurred each period. The Company participates in other Emerson programs including, but not limited to, workers’ compensation, supply chain and general and product liability insurance. Other Emerson programs are charged to the Company based on costs incurred and usage. The Company utilizes Emerson global shared service centers that host Company-dedicated resources providing customer facing support, engineering and back office financial services. Costs for these resources are charged directly to the Company, with the majority relating to employee compensation and benefits and the remaining portion relating to facility overhead. In addition, general corporate costs incurred by Emerson are allocated to the Company primarily based on its proportionate share of Emerson’s total consolidated revenue, and include the cost of support functions such as procurement, logistics, marketing, human resources, legal, finance, internal audit and other Emerson corporate functions. Costs incurred for Emerson-managed functions for the years ended September 30 follow: 2019 2020 2021 Information technology $ 2.3 2.6 2.9 Insurance / other services $ 10.9 9.7 10.0 Shared services $ 1.2 1.3 1.4 Corporate costs $ 8.6 8.0 9.2 The Company engages in various transactions to sell and purchase goods or services in the ordinary course of business with Emerson affiliates. Purchases primarily consist of motors. Sales to and purchases from Emerson affiliates for the years ended September 30 follow: 2019 2020 2021 Sales to Emerson affiliates $ 0.1 0.1 0.1 Purchases from Emerson affiliates $ 63.9 60.6 64.1 Related-party amounts reported in the balance sheet as of September 30 follow: 2020 2021 Accounts receivable $ 0.2 0.4 Accounts payable $ 10.5 46.1 (10) CONTINGENT LIABILITIES AND COMMITMENTS The Company is a party to a number of pending legal proceedings and claims, including those involving general and product liability, workers’ compensation, and other matters. The Company accrues for such liabilities when it is probable that future costs (including legal fees and expenses) will be incurred and such costs can be reasonably estimated. Accruals are based on developments to date; management's estimates of the outcomes of these matters; the Company's experience in contesting, litigating and settling similar matters; and any related insurance coverage. While the Company believes a material adverse impact is unlikely, it is not possible to predict the ultimate outcome of these matters. Given the inherent uncertainty of litigation, a remote possibility does exist that a future development could have a material adverse impact on the Company. As of September 30, 2021, there were no contingent liabilities (including guarantees, taxes and other claims) that management believes will be material in relation to the Company’s financial statements, nor were there any material commitments outside the normal course of business. (11) ACCUMULATED OTHER COMPREHENSIVE INCOME 2019 2020 2021 Foreign currency translation, beginning $ (1.0) (1.4) (0.9) Other comprehensive income (loss) (0.4) 0.5 0.5 Foreign currency translation, ending $ (1.4) (0.9) (0.4) 17
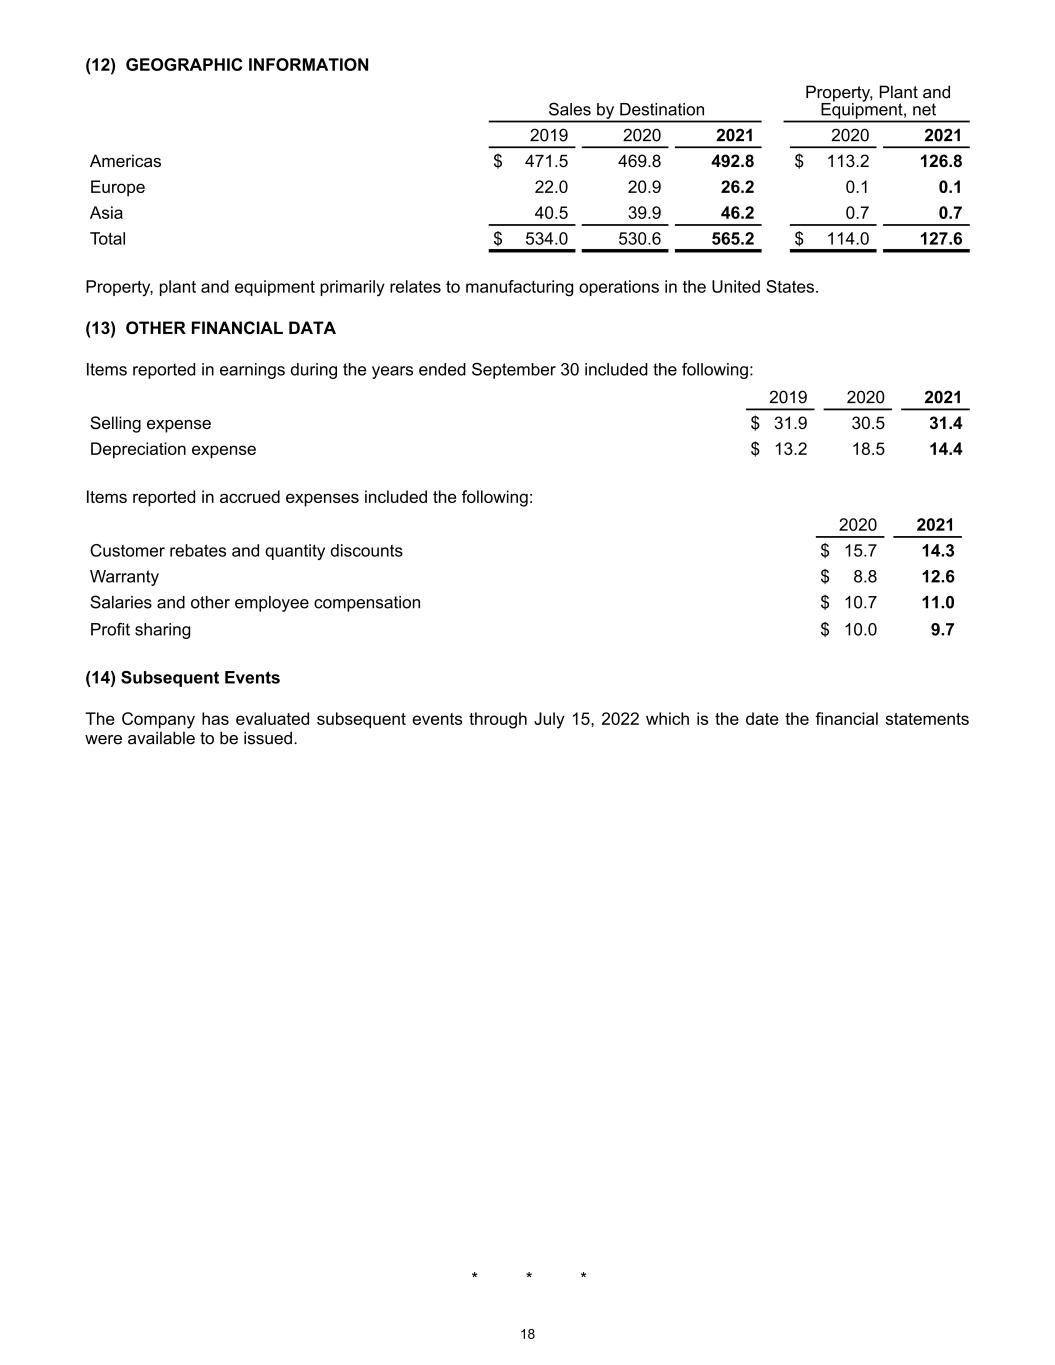
(12) GEOGRAPHIC INFORMATION Sales by Destination Property, Plant and Equipment, net 2019 2020 2021 2020 2021 Americas $ 471.5 469.8 492.8 $ 113.2 126.8 Europe 22.0 20.9 26.2 0.1 0.1 Asia 40.5 39.9 46.2 0.7 0.7 Total $ 534.0 530.6 565.2 $ 114.0 127.6 Property, plant and equipment primarily relates to manufacturing operations in the United States. (13) OTHER FINANCIAL DATA Items reported in earnings during the years ended September 30 included the following: 2019 2020 2021 Selling expense $ 31.9 30.5 31.4 Depreciation expense $ 13.2 18.5 14.4 Items reported in accrued expenses included the following: 2020 2021 Customer rebates and quantity discounts $ 15.7 14.3 Warranty $ 8.8 12.6 Salaries and other employee compensation $ 10.7 11.0 Profit sharing $ 10.0 9.7 (14) Subsequent Events The Company has evaluated subsequent events through July 15, 2022 which is the date the financial statements were available to be issued. '* * * 18


