UNITED STATES
SECURITIES AND EXCHANGE COMMISSION
Washington, D.C. 20549
Form N-CSR
CERTIFIED SHAREHOLDER REPORT OF
REGISTERED MANAGEMENT INVESTMENT COMPANIES
Investment Company Act file number: 811-08895
Voya Funds Trust
(Exact name of registrant as specified in charter)
| 7337 East Doubletree Ranch Road, Suite 100, Scottsdale, AZ | 85258 |
| (Address of principal executive offices) | (Zip code) |
The Corporation Trust Company, 1209 Orange Street, Wilmington, DE 19801
(Name and address of agent for service)
Registrant’s telephone number, including area code: 1-800-992-0180
Date of fiscal year end: March 31
Date of reporting period: March 31, 2022
Item 1. Reports to Stockholders.
The following is a copy of the report transmitted to stockholders pursuant to Rule 30e-1 under the Act (17 CFR 270.30e-1):
![[MISSING IMAGE: ing_cov.jpg]](https://capedge.com/proxy/N-CSR/0001104659-22-067897/ing_cov.jpg)
| | | As permitted by regulations adopted by the U.S. Securities and Exchange Commission, paper copies of each fund’s annual and semi-annual shareholder reports, like this annual report, are not sent by mail, unless you specifically request paper copies of the reports. Instead, the reports will be made available on the Voya funds’ website (www.voyainvestments.com/literature), and you will be notified by mail each time a report is posted and provided with a website link to access the report. | | |
| | | If you already elected to receive shareholder reports electronically, you need not take any action. You may elect to receive shareholder reports and other communications from each fund electronically anytime by contacting your financial intermediary (such as a broker-dealer or bank) or, if you are a direct investor, by calling 1-800-992-0180 or by sending an e-mail request to Voyaim_literature@voya.com. | | |
| | | You may elect to receive all future reports in paper free of charge. If you received this document in the mail, please follow the instructions to elect to continue receiving paper copies of your shareholder reports. If you received this document through a financial intermediary, you can contact your financial intermediary to request that you continue to receive paper copies of your shareholder reports. If you invest directly with us, you can call 1-800-992-0180 or send an email request to Voyaim_literature@voya.com to let each fund know you wish to continue receiving paper copies of your shareholder reports. Your election to receive reports in paper will apply to all funds held in your account if you invest through your financial intermediary or all funds held with the Voya funds complex if you invest directly with the funds. | | |
| | | This report is submitted for general information to shareholders of the Voya mutual funds. It is not authorized for distribution to prospective shareholders unless accompanied or preceded by a prospectus which includes details regarding the funds’ investment objectives, risks, charges, expenses and other information. This information should be read carefully. | | |
| | ![[MISSING IMAGE: ing_e.jpg]](https://capedge.com/proxy/N-CSR/0001104659-22-067897/ing_e.jpg) | | | E-Delivery Sign-up – details inside | |
![[MISSING IMAGE: voya_covinvmgt.jpg]](https://capedge.com/proxy/N-CSR/0001104659-22-067897/voya_covinvmgt.jpg)
| | | | | | 1 | | | |
| | | | | | 3 | | | |
| | | | | | 14 | | | |
| | | | | | 16 | | | |
| | | | | | 17 | | | |
| | | | | | 21 | | | |
| | | | | | 23 | | | |
| | | | | | 26 | | | |
| | | | | | 32 | | | |
| | | | | | 52 | | | |
| | | | | | 253 | | | |
| | | | | | 254 | | | |
| | | | | | 259 | | |
| | | | | | Go Paperless with E-Delivery! | | | | | |
| | | Sign up now for on-line prospectuses, fund reports, and proxy statements. | | | ||||||
| | | Just go to www.individuals.voya.com/page/e-delivery, follow the directions and complete the quick 5 Steps to Enroll. | | | ||||||
| | | You will be notified by e-mail when these communications become available on the internet. | | | ||||||
![[MISSING IMAGE: ph_dina-santoro.jpg]](https://capedge.com/proxy/N-CSR/0001104659-22-067897/ph_dina-santoro.jpg)
![[MISSING IMAGE: sg_dina-santoro.jpg]](https://capedge.com/proxy/N-CSR/0001104659-22-067897/sg_dina-santoro.jpg)
President
Voya Family of Funds
April 28, 2022
| | | Index | | | | Description | | |
| | | ICE BofAML U.S. Dollar 3-Month Deposit Offered Rate Constant Maturity Index | | | | The index is designed to track the performance of a synthetic asset paying London Interbank Offered Rate (“LIBOR”) to a stated maturity. The index is based on the assumed purchase at par of a synthetic instrument having exactly its stated maturity and with a coupon equal to that day’s fixing rate. That issue is assumed to be sold the following business day (priced at a yield equal to the current day rate) and rolled into a new instrument. | | |
| | | Bloomberg GNMA Index | | | | An index comprised of all fixed security mortgage pools sponsored by GNMA, including GNMA Graduated Payment Mortgages. | | |
| | | Bloomberg High Yield Bond — 2% Issuer Constrained Composite Index | | | | An index that includes all fixed income securities having a maximum quality rating of Ba1, a minimum amount outstanding of $150 million, and at least one year to maturity. | | |
| | | Bloomberg U.S. 1-3 Year Government/Credit Bond Index | | | | A widely recognized index of publicly issued fixed rate, investment grade debt securities, including Treasuries, Agencies and credit securities with a maturity of one to three years. | | |
| | | Bloomberg U.S. Aggregate Bond Index | | | | An index of publicly issued investment grade U.S. government, mortgage-backed, asset-backed and corporate debt securities. | | |
| | | Bloomberg U.S. Universal Bond Index | | | | The index represents the union of the U.S. Aggregate Index, U.S. Corporate High Yield Index, Investment Grade 144A Index, Eurodollar Index, U.S. Emerging Markets Index, and the non-ERISA eligible portion of the CMBS Index. The index covers USD-denominated, taxable bonds that are rated either investment grade or high-yield. | | |
| Voya GNMA Income Fund | Portfolio Managers’ Report |
| | Investment Type Allocation as of March 31, 2022 (as a percentage of net assets) | | |||
| | | | | | |
| | U.S. Government Agency Obligations | | | 68.1% | |
| | Collateralized Mortgage Obligations | | | 55.3% | |
| | Commercial Mortgage-Backed Securities | | | 3.4% | |
| | Asset-Backed Securities | | | 0.1% | |
| | Liabilities in Excess of Other Assets* | | | (26.9)% | |
| | Net Assets | | | 100.0% | |
| | * Includes short-term investments. | | |||
| | Portfolio holdings are subject to change daily. | | |||
| Portfolio Managers’ Report | Voya GNMA Income Fund |
| | | ![[MISSING IMAGE: tm2211659d3-lc_gnmabw.jpg]](https://capedge.com/proxy/N-CSR/0001104659-22-067897/tm2211659d3-lc_gnmabw.jpg) | | |
| | | Average Annual Total Returns for the Periods Ended March 31, 2022 | | | ||||||||||||||||||
| | | | | | 1 Year | | | 5 Year | | | 10 Year | | | |||||||||
| | | Including Sales Charge: | | | ||||||||||||||||||
| | | Class A(1) | | | | | -6.77% | | | | | | 0.64% | | | | | | 1.24% | | | |
| | | Class C(2) | | | | | -6.05% | | | | | | 0.42% | | | | | | 0.74% | | | |
| | | Class I | | | | | -4.18% | | | | | | 1.46% | | | | | | 1.79% | | | |
| | | Class P(3) | | | | | -3.82% | | | | | | 1.60% | | | | | | 1.86% | | | |
| | | Class R6(3) | | | | | -4.06% | | | | | | 1.48% | | | | | | 1.80% | | | |
| | | Class W | | | | | -4.22% | | | | | | 1.42% | | | | | | 1.75% | | | |
| | | Excluding Sales Charge: | | | | | ||||||||||||||||
| | | Class A | | | | | -4.36% | | | | | | 1.16% | | | | | | 1.49% | | | |
| | | Class C | | | | | -5.10% | | | | | | 0.42% | | | | | | 0.74% | | | |
| | | Class I | | | | | -4.18% | | | | | | 1.46% | | | | | | 1.79% | | | |
| | | Class P(3) | | | | | -3.82% | | | | | | 1.60% | | | | | | 1.86% | | | |
| | | Class R6(3) | | | | | -4.06% | | | | | | 1.48% | | | | | | 1.80% | | | |
| | | Class W | | | | | -4.22% | | | | | | 1.42% | | | | | | 1.75% | | | |
| | | Bloomberg GNMA | | | | | -4.60% | | | | | | 1.24% | | | | | | 1.52% | | | |
| | | | | | ||||||||||||||||||
| Voya High Yield Bond Fund | Portfolio Managers’ Report |
| | Sector Diversification as of March 31, 2022 (as a percentage of net assets) | | |||
| | | | | | |
| | Consumer, Cyclical | | | 22.2% | |
| | Communications | | | 15.8% | |
| | Energy | | | 15.1% | |
| | Consumer, Non-cyclical | | | 14.6% | |
| | Industrials | | | 8.8% | |
| | Financials | | | 7.4% | |
| | Basic Materials | | | 6.4% | |
| | Technology | | | 3.4% | |
| | Electronics/Electrical | | | 1.0% | |
| | Utilities | | | 0.9% | |
| | Consumer Staples | | | 0.4% | |
| | Health Care | | | 0.1% | |
| | Assets in Excess of Other Liabilities* | | | 3.9% | |
| | Net Assets | | | 100.0% | |
| | * Includes short-term investments. | | |||
| | Portfolio holdings are subject to change daily. | | |||
| | Top Ten Holdings as of March 31, 2022* (as a percentage of net assets) | | |||
| | | | | | |
| | Occidental Petroleum Corp., 6.625%, 09/01/30 | | | 0.6% | |
| | Royal Caribbean Cruises Ltd., 5.375%, 07/15/27 | | | 0.6% | |
| | Sprint Corp., 7.125%, 06/15/24 | | | 0.6% | |
| | AP Core Holdings II, LLC High-Yield Term Loan B2, 6.250%, 09/01/27 | | | 0.5% | |
| | CSC Holdings LLC, 5.750%, 01/15/30 | | | 0.5% | |
| | HCA, Inc., 5.375%, 02/01/25 | | | 0.5% | |
| | American Airlines Group, Inc., 3.750%, 03/01/25 | | | 0.5% | |
| | Occidental Petroleum Corp., 4.200%, 03/15/48 | | | 0.5% | |
| | DIRECTV Holdings LLC / DIRECTV Financing Co., Inc., 5.875%, 08/15/27 | | | 0.5% | |
| | Univision Communications, Inc., 6.625%, 06/01/27 | | | 0.5% | |
| | * Excludes short-term investments. | | |||
| | Portfolio holdings are subject to change daily. | | |||
| Portfolio Managers’ Report | Voya High Yield Bond Fund |
| | | ![[MISSING IMAGE: tm2211659d3-lc_hybfbw.jpg]](https://capedge.com/proxy/N-CSR/0001104659-22-067897/tm2211659d3-lc_hybfbw.jpg) | | |
| | | Average Annual Total Returns for the Periods Ended March 31, 2022 | | | ||||||||||||||||||||||||||||||||||||
| | | | | | 1 Year | | | 5 Year | | | 10 Year | | | Since Inception of Class P June 14, 2013 | | | Since Inception of Class R January 30, 2014 | | | Since Inception of Class P3 June 1, 2018 | | | ||||||||||||||||||
| | | Including Sales Charge: | | | | | | | | |||||||||||||||||||||||||||||||
| | | Class A(1) | | | | | -3.05% | | | | | | 3.31% | | | | | | 4.86% | | | | | | — | | | | | | — | | | | | | — | | | |
| | | Class C(2) | | | | | -2.32% | | | | | | 3.07% | | | | | | 4.34% | | | | | | — | | | | | | — | | | | | | — | | | |
| | | Class I | | | | | -0.28% | | | | | | 4.21% | | | | | | 5.49% | | | | | | — | | | | | | — | | | | | | — | | | |
| | | Class P | | | | | 0.38% | | | | | | 4.88% | | | | | | — | | | | | | 5.37% | | | | | | | | | | | | | | | |
| | | Class P3 | | | | | 0.58% | | | | | | — | | | | | | — | | | | | | — | | | | | | — | | | | | | 5.40% | | | |
| | | Class R | | | | | -0.87% | | | | | | 3.61% | | | | | | — | | | | | | — | | | | | | 3.78% | | | | | | — | | | |
| | | Class R6(3) | | | | | -0.21% | | | | | | 4.29% | | | | | | 5.37% | | | | | | — | | | | | | — | | | | | | — | | | |
| | | Class W | | | | | -0.24% | | | | | | 4.13% | | | | | | 5.42% | | | | | | — | | | | | | — | | | | | | — | | | |
| | | Excluding Sales Charge: | | | | | | | | |||||||||||||||||||||||||||||||
| | | Class A | | | | | -0.62% | | | | | | 3.84% | | | | | | 5.12% | | | | | | — | | | | | | — | | | | | | — | | | |
| | | Class C | | | | | -1.37% | | | | | | 3.07% | | | | | | 4.34% | | | | | | — | | | | | | — | | | | | | — | | | |
| | | Class I | | | | | -0.28% | | | | | | 4.21% | | | | | | 5.49% | | | | | | — | | | | | | — | | | | | | — | | | |
| | | Class P | | | | | 0.38% | | | | | | 4.88% | | | | | | — | | | | | | 5.37% | | | | | | — | | | | | | | | | |
| | | Class P3 | | | | | 0.58% | | | | | | — | | | | | | — | | | | | | — | | | | | | — | | | | | | 5.40% | | | |
| | | Class R | | | | | -0.87% | | | | | | 3.61% | | | | | | — | | | | | | — | | | | | | 3.78% | | | | | | — | | | |
| | | Class R6(3) | | | | | -0.21% | | | | | | 4.29% | | | | | | 5.37% | | | | | | — | | | | | | — | | | | | | — | | | |
| | | Class W | | | | | -0.24% | | | | | | 4.13% | | | | | | 5.42% | | | | | | — | | | | | | — | | | | | | — | | | |
| | | Bloomberg High Yield Bond – 2% Issuer Constrained Composite | | | | | -0.66% | | | | | | 4.68% | | | | | | 5.74% | | | | | | 5.08% | | | | | | 4.82% | | | | | | 4.93% | | | |
| | | | | | ||||||||||||||||||||||||||||||||||||
| Voya Intermediate Bond Fund | Portfolio Managers’ Report |
| | Investment Type Allocation as of March 31, 2022 (as a percentage of net assets) | | |||
| | | | | | |
| | Corporate Bonds/Notes | | | 39.2% | |
| | U.S. Government Agency Obligations | | | 15.8% | |
| | Collateralized Mortgage Obligations | | | 15.6% | |
| | Asset-Backed Securities | | | 10.7% | |
| | U.S. Treasury Obligations | | | 9.8% | |
| | Commercial Mortgage-Backed Securities | | | 7.5% | |
| | Sovereign Bonds | | | 1.8% | |
| | Purchased Options | | | 0.1% | |
| | Liabilities in Excess of Other Assets* | | | (0.5)% | |
| | Net Assets | | | 100.0% | |
| | * Includes short-term investments. | | |||
| | Portfolio holdings are subject to change daily. | | |||
| | Top Ten Holdings as of March 31, 2022* (as a percentage of net assets) | | |||
| | | | | | |
| | United States Treasury Bond, 2.375%, 02/15/42 | | | 2.7% | |
| | Uniform Mortgage-Backed Securities, 2.500%, 04/15/52 | | | 2.1% | |
| | United States Treasury Bond, 1.875%, 11/15/51 | | | 1.5% | |
| | United States Treasury Note, 2.250%, 03/31/24 | | | 1.3% | |
| | Ginnie Mae TBA, 2.500%, 04/15/52 | | | 1.2% | |
| | Uniform Mortgage-Backed Securities, 3.000%, 04/15/52 | | | 1.1% | |
| | United States Treasury Note, 2.500%, 03/31/27 | | | 1.0% | |
| | Uniform Mortgage-Backed Securities, 2.000%, 04/15/52 | | | 0.8% | |
| | United States Treasury Bond, 1.875%, 02/15/32 | | | 0.7% | |
| | United States Treasury Note, 1.750%, 03/15/25 | | | 0.6% | |
| | * Excludes short-term investments. | | |||
| | Portfolio holdings are subject to change daily. | | |||
| Portfolio Managers’ Report | Voya Intermediate Bond Fund |
| | | ![[MISSING IMAGE: tm2211659d3-lc_ibfbw.jpg]](https://capedge.com/proxy/N-CSR/0001104659-22-067897/tm2211659d3-lc_ibfbw.jpg) | | |
| | | Average Annual Total Returns for the Periods Ended March 31, 2022 | | | ||||||||||||||||||||||||
| | | | | | 1 Year | | | 5 Year | | | 10 Year | | | Since Inception of Class P3 June 1, 2018 | | | ||||||||||||
| | | Including Sales Charge: | | | | | | |||||||||||||||||||||
| | | Class A(1) | | | | | -7.06% | | | | | | 1.76% | | | | | | 2.60% | | | | | | — | | | |
| | | Class C(2) | | | | | -6.36% | | | | | | 1.49% | | | | | | 2.08% | | | | | | — | | | |
| | | Class I | | | | | -4.39% | | | | | | 2.61% | | | | | | 3.20% | | | | | | — | | | |
| | | Class P3 | | | | | -4.06% | | | | | | — | | | | | | — | | | | | | 3.34% | | | |
| | | Class R | | | | | -4.93% | | | | | | 2.02% | | | | | | 2.60% | | | | | | — | | | |
| | | Class R6(3) | | | | | -4.25% | | | | | | 2.68% | | | | | | 3.23% | | | | | | — | | | |
| | | Class W | | | | | -4.47% | | | | | | 2.53% | | | | | | 3.12% | | | | | | — | | | |
| | | Excluding Sales Charge: | | | | | | |||||||||||||||||||||
| | | Class A | | | | | -4.70% | | | | | | 2.28% | | | | | | 2.86% | | | | | | — | | | |
| | | Class C | | | | | -5.43% | | | | | | 1.49% | | | | | | 2.08% | | | | | | — | | | |
| | | Class I | | | | | -4.39% | | | | | | 2.61% | | | | | | 3.20% | | | | | | — | | | |
| | | Class P3 | | | | | -4.06% | | | | | | — | | | | | | — | | | | | | 3.34% | | | |
| | | Class R | | | | | -4.93% | | | | | | 2.02% | | | | | | 2.60% | | | | | | — | | | |
| | | Class R6(3) | | | | | -4.25% | | | | | | 2.68% | | | | | | 3.23% | | | | | | — | | | |
| | | Class W | | | | | -4.47% | | | | | | 2.53% | | | | | | 3.12% | | | | | | — | | | |
| | | Bloomberg U.S. Aggregate Bond | | | | | -4.15% | | | | | | 2.14% | | | | | | 2.24% | | | | | | 2.59% | | | |
| | | | | | ||||||||||||||||||||||||
| Voya Short Term Bond Fund | Portfolio Managers’ Report |
| | Investment Type Allocation as of March 31, 2022 (as a percentage of net assets) | | |||
| | | | | | |
| | Corporate Bonds/Notes | | | 42.4% | |
| | Asset-Backed Securities | | | 17.3% | |
| | U.S. Treasury Obligations | | | 13.7% | |
| | Commercial Mortgage-Backed Securities | | | 11.5% | |
| | Collateralized Mortgage Obligations | | | 6.6% | |
| | U.S. Government Agency Obligations | | | 0.1% | |
| | Assets in Excess of Other Liabilities* | | | 8.4% | |
| | Net Assets | | | 100.0% | |
| | * Includes short-term investments. | | |||
| | Portfolio holdings are subject to change daily. | | |||
| | Top Ten Holdings as of March 31, 2022* (as a percentage of net assets) | | |||
| | | | | | |
| | United States Treasury Note, 1.750%, 03/15/25 | | | 7.9% | |
| | United States Treasury Note, 0.125%, 03/31/23 | | | 3.0% | |
| | United States Treasury Note, 2.250%, 03/31/24 | | | 2.4% | |
| | JP Morgan Chase Commercial Mortgage Securities Trust 2016-JP4 A3, 3.393%, 12/15/49 | | | 1.1% | |
| | UBS-Barclays Commercial Mortgage Trust 2013-C6 C, 4.022%, 04/10/46 | | | 1.0% | |
| | Atrium Hotel Portfolio Trust 2018-ATRM D, 2.697%, 06/15/35 | | | 1.0% | |
| | Ginnie Mae 2015-H32 FH, 0.766%, 12/20/65 | | | 1.0% | |
| | Bank of America Corp., 3.004%, 12/20/23 | | | 0.9% | |
| | Ginnie Mae Series 2016-H16 FE, 0.627%, 06/20/66 | | | 0.9% | |
| | BRSP 2021-FL1 B Ltd., 2.349%, 08/19/38 | | | 0.8% | |
| | * Excludes short-term investments. | | |||
| | Portfolio holdings are subject to change daily. | | |||
| Portfolio Managers’ Report | Voya Short Term Bond Fund |
| | | ![[MISSING IMAGE: tm2211659d3-lc_stbfbw.jpg]](https://capedge.com/proxy/N-CSR/0001104659-22-067897/tm2211659d3-lc_stbfbw.jpg) | | |
| | | Average Annual Total Returns for the Periods Ended March 31, 2022 | | | ||||||||||||||||||||||||||||||||||||
| | | | | | 1 Year | | | 5 Year | | | Since Inception of Classes A, C, I, and W December 19, 2012 | | | Since Inception of Class R July 31, 2014 | | | Since Inception of Class P3 June 1, 2018 | | | Since Inception of Class P2 October 22, 2019 | | | ||||||||||||||||||
| | | Including Sales Charge: | | | | | | | | |||||||||||||||||||||||||||||||
| | | Class A(1) | | | | | -5.28% | | | | | | 0.79% | | | | | | 0.91% | | | | | | — | | | | | | — | | | | | | — | | | |
| | | Class C(2) | | | | | -4.50% | | | | | | 0.54% | | | | | | 0.43% | | | | | | — | | | | | | — | | | | | | — | | | |
| | | Class I | | | | | -2.52% | | | | | | 1.58% | | | | | | 1.47% | | | | | | — | | | | | | — | | | | | | — | | | |
| | | Class P2 | | | | | -2.37% | | | | | | — | | | | | | — | | | | | | — | | | | | | — | | | | | | 0.91% | | | |
| | | Class P3 | | | | | -2.24% | | | | | | — | | | | | | — | | | | | | — | | | | | | 2.24% | | | | | | — | | | |
| | | Class R | | | | | -3.04% | | | | | | 1.11% | | | | | | — | | | | | | 0.99% | | | | | | — | | | | | | — | | | |
| | | Class R6(3) | | | | | -2.49% | | | | | | 1.63% | | | | | | 1.51% | | | | | | — | | | | | | — | | | | | | — | | | |
| | | Class W | | | | | -2.65% | | | | | | 1.57% | | | | | | 1.45% | | | | | | — | | | | | | — | | | | | | — | | | |
| | | Excluding Sales Charge: | | | | | | | | |||||||||||||||||||||||||||||||
| | | Class A | | | | | -2.81% | | | | | | 1.30% | | | | | | 1.19% | | | | | | — | | | | | | — | | | | | | — | | | |
| | | Class C | | | | | -3.54% | | | | | | 0.54% | | | | | | 0.43% | | | | | | — | | | | | | — | | | | | | — | | | |
| | | Class I | | | | | -2.52% | | | | | | 1.58% | | | | | | 1.47% | | | | | | — | | | | | | — | | | | | | — | | | |
| | | Class P2 | | | | | -2.37% | | | | | | — | | | | | | — | | | | | | — | | | | | | — | | | | | | 0.91% | | | |
| | | Class P3 | | | | | -2.24% | | | | | | — | | | | | | — | | | | | | — | | | | | | 2.24% | | | | | | — | | | |
| | | Class R | | | | | -3.04% | | | | | | 1.11% | | | | | | — | | | | | | 0.99% | | | | | | — | | | | | | — | | | |
| | | Class R6(3) | | | | | -2.49% | | | | | | 1.63% | | | | | | 1.51% | | | | | | — | | | | | | — | | | | | | — | | | |
| | | Class W | | | | | -2.65% | | | | | | 1.57% | | | | | | 1.45% | | | | | | — | | | | | | — | | | | | | — | | | |
| | | Bloomberg U.S. 1-3 Year Government/Credit Bond | | | | | -2.91% | | | | | | 1.26% | | | | | | 1.09% | | | | | | 1.16% | | | | | | 1.54% | | | | | | 0.28% | | | |
| | | | | | ||||||||||||||||||||||||||||||||||||
| Voya Strategic Income Opportunities Fund | Portfolio Managers’ Report |
| | Investment Type Allocation as of March 31, 2022 (as a percentage of net assets) | | |||
| | | | | | |
| | Collateralized Mortgage Obligations | | | 22.6% | |
| | Corporate Bonds/Notes | | | 18.3% | |
| | Commercial Mortgage-Backed Securities | | | 17.2% | |
| | Asset-Backed Securities | | | 13.2% | |
| | Bank Loans | | | 12.9% | |
| | U.S. Treasury Obligations | | | 3.5% | |
| | Sovereign Bonds | | | 2.6% | |
| | Purchased Options | | | 0.1% | |
| | Common Stock | | | 0.0% | |
| | Preferred Stock | | | 0.0% | |
| | Convertible Bonds/Notes | | | 0.0% | |
| | Warrants | | | 0.0% | |
| | U.S. Government Agency Obligations | | | 0.0% | |
| | Assets in Excess of Other Liabilities* | | | 9.6% | |
| | Net Assets | | | 100.0% | |
| | * Includes short-term investments. | | |||
| | Portfolio holdings are subject to change daily. | | |||
| | Top Ten Holdings as of March 31, 2022* (as a percentage of net assets) | | |||
| | | | | | |
| | FREMF 2016-K55 D Mortgage Trust, 04/25/49 | | | 1.0% | |
| | United States Treasury Note, 2.250%, 03/31/24 | | | 0.7% | |
| | United States Treasury Note, 2.500%, 03/31/27 | | | 0.6% | |
| | GS Mortgage Securities Trust 2012-GCJ7 E, 5.000%, 05/10/45 | | | 0.6% | |
| | Prima Capital CRE Securitization 2019-7A D Ltd., 4.250%, 12/25/50 | | | 0.5% | |
| | WFRBS Commercial Mortgage Trust 2013-C12 E, 3.500%, 03/15/48 | | | 0.4% | |
| | FREMF 2019-KG01 C Mortgage Trust, 05/25/29 | | | 0.4% | |
| | WFRBS Commercial Mortgage Trust 2013-C17 D, 5.032%, 12/15/46 | | | 0.4% | |
| | WFRBS Commercial Mortgage Trust 2013-C11 E, 4.238%, 03/15/45 | | | 0.3% | |
| | Citigroup Commercial Mortgage Trust 2016-P4 E, 4.694%, 07/10/49 | | | 0.3% | |
| | * Excludes short-term investments. | | |||
| | Portfolio holdings are subject to change daily. | | |||
| Portfolio Managers’ Report | Voya Strategic Income Opportunities Fund |
| Voya Strategic Income Opportunities Fund | Portfolio Managers’ Report |
| | | ![[MISSING IMAGE: tm2211659d3-lc_siofbw.jpg]](https://capedge.com/proxy/N-CSR/0001104659-22-067897/tm2211659d3-lc_siofbw.jpg) | | |
| | | Average Annual Total Returns for the Periods Ended March 31, 2022 | | | ||||||||||||||||||
| | | | | | 1 Year | | | 5 Years | | | Since Inception of Classes A, C, I, R, and W November 2, 2012 | | | |||||||||
| | | Including Sales Charge: | | | | | ||||||||||||||||
| | | Class A(1) | | | | | -4.92% | | | | | | 2.03% | | | | | | 2.71% | | | |
| | | Class C(2) | | | | | -4.13% | | | | | | 1.81% | | | | | | 2.20% | | | |
| | | Class I | | | | | -2.22% | | | | | | 2.87% | | | | | | 3.34% | | | |
| | | Class P(3) | | | | | -1.67% | | | | | | 3.17% | | | | | | 3.50% | | | |
| | | Class R | | | | | -2.76% | | | | | | 2.29% | | | | | | 2.70% | | | |
| | | Class R6(3) | | | | | -2.17% | | | | | | 2.89% | | | | | | 3.34% | | | |
| | | Class W | | | | | -2.24% | | | | | | 2.83% | | | | | | 3.16% | | | |
| | | Excluding Sales Charge: | | | | | | | | | | | | | | | | | | | | |
| | | Class A | | | | | -2.47% | | | | | | 2.55% | | | | | | 2.99% | | | |
| | | Class C | | | | | -3.18% | | | | | | 1.81% | | | | | | 2.20% | | | |
| | | Class I | | | | | -2.22% | | | | | | 2.87% | | | | | | 3.34% | | | |
| | | Class P(3) | | | | | -1.67% | | | | | | 3.17% | | | | | | 3.50% | | | |
| | | Class R | | | | | -2.76% | | | | | | 2.29% | | | | | | 2.70% | | | |
| | | Class R6(3) | | | | | -2.17% | | | | | | 2.89% | | | | | | 3.34% | | | |
| | | Class W | | | | | -2.24% | | | | | | 2.83% | | | | | | 3.16% | | | |
| | | ICE BofA U.S. Dollar 3-Month Deposit Offered Rate Constant Maturity Index | | | | | 0.05% | | | | | | 1.35% | | | | | | 0.89% | | | |
| | | Bloomberg U.S. Universal Bond Index | | | | | -4.23% | | | | | | 2.31% | | | | | | 2.28% | | | |
| | | | | | ||||||||||||||||||
| | | | Actual Fund Return | | | Hypothetical (5% return before expenses) | | ||||||||||||||||||||||||||||||||||||||||||
| | | | Beginning Account Value October 1, 2021 | | | Ending Account Value March 31, 2022 | | | Annualized Expense Ratio | | | Expenses Paid During the Period Ended March 31, 2022* | | | Beginning Account Value October 1, 2021 | | | Ending Account Value March 31, 2022 | | | Annualized Expense Ratio | | | Expenses Paid During the Period Ended March 31, 2022* | | ||||||||||||||||||||||||
| Voya GNMA Income Fund | | ||||||||||||||||||||||||||||||||||||||||||||||||
| Class A | | | | $ | 1,000.00 | | | | | $ | 955.70 | | | | | | 0.84% | | | | | $ | 4.10 | | | | | $ | 1,000.00 | | | | | $ | 1,020.74 | | | | | | 0.84% | | | | | $ | 4.23 | | |
| Class C | | | | | 1,000.00 | | | | | | 951.80 | | | | | | 1.59 | | | | | | 7.74 | | | | | | 1,000.00 | | | | | | 1,017.00 | | | | | | 1.59 | | | | | | 8.00 | | |
| Class I | | | | | 1,000.00 | | | | | | 957.10 | | | | | | 0.54 | | | | | | 2.63 | | | | | | 1,000.00 | | | | | | 1,022.24 | | | | | | 0.54 | | | | | | 2.72 | | |
| Class P | | | | | 1,000.00 | | | | | | 958.30 | | | | | | 0.15 | | | | | | 0.73 | | | | | | 1,000.00 | | | | | | 1,024.18 | | | | | | 0.15 | | | | | | 0.76 | | |
| Class R6 | | | | | 1,000.00 | | | | | | 957.20 | | | | | | 0.48 | | | | | | 2.34 | | | | | | 1,000.00 | | | | | | 1,022.54 | | | | | | 0.48 | | | | | | 2.42 | | |
| Class W | | | | | 1,000.00 | | | | | | 957.00 | | | | | | 0.59 | | | | | | 2.88 | | | | | | 1,000.00 | | | | | | 1,021.99 | | | | | | 0.59 | | | | | | 2.97 | | |
| Voya High Yield Bond Fund | | ||||||||||||||||||||||||||||||||||||||||||||||||
| Class A | | | | $ | 1,000.00 | | | | | $ | 960.20 | | | | | | 1.04% | | | | | $ | 5.08 | | | | | $ | 1,000.00 | | | | | $ | 1,019.75 | | | | | | 1.04% | | | | | $ | 5.24 | | |
| Class C | | | | | 1,000.00 | | | | | | 956.60 | | | | | | 1.79 | | | | | | 8.73 | | | | | | 1,000.00 | | | | | | 1,016.01 | | | | | | 1.79 | | | | | | 9.00 | | |
| Class I | | | | | 1,000.00 | | | | | | 961.80 | | | | | | 0.69 | | | | | | 3.37 | | | | | | 1,000.00 | | | | | | 1,021.49 | | | | | | 0.69 | | | | | | 3.48 | | |
| Class P | | | | | 1,000.00 | | | | | | 965.10 | | | | | | 0.04 | | | | | | 0.20 | | | | | | 1,000.00 | | | | | | 1,024.73 | | | | | | 0.04 | | | | | | 0.20 | | |
| Class P3 | | | | | 1,000.00 | | | | | | 966.70 | | | | | | 0.00 | | | | | | 0.00 | | | | | | 1,000.00 | | | | | | 1,024.93 | | | | | | 0.00 | | | | | | 0.00 | | |
| Class R | | | | | 1,000.00 | | | | | | 959.10 | | | | | | 1.29 | | | | | | 6.30 | | | | | | 1,000.00 | | | | | | 1,018.50 | | | | | | 1.29 | | | | | | 6.49 | | |
| Class R6 | | | | | 1,000.00 | | | | | | 962.30 | | | | | | 0.63 | | | | | | 3.08 | | | | | | 1,000.00 | | | | | | 1,021.79 | | | | | | 0.63 | | | | | | 3.18 | | |
| Class W | | | | | 1,000.00 | | | | | | 961.60 | | | | | | 0.79 | | | | | | 3.86 | | | | | | 1,000.00 | | | | | | 1,020.99 | | | | | | 0.79 | | | | | | 3.98 | | |
| | | | Actual Fund Return | | | Hypothetical (5% return before expenses) | | ||||||||||||||||||||||||||||||||||||||||||
| | | | Beginning Account Value October 1, 2021 | | | Ending Account Value March 31, 2022 | | | Annualized Expense Ratio | | | Expenses Paid During the Period Ended March 31, 2022* | | | Beginning Account Value October 1, 2021 | | | Ending Account Value March 31, 2022 | | | Annualized Expense Ratio | | | Expenses Paid During the Period Ended March 31, 2022* | | ||||||||||||||||||||||||
| Voya Intermediate Bond Fund | | ||||||||||||||||||||||||||||||||||||||||||||||||
| Class A | | | | $ | 1,000.00 | | | | | $ | 934.60 | | | | | | 0.69% | | | | | $ | 3.33 | | | | | $ | 1,000.00 | | | | | $ | 1,021.49 | | | | | | 0.69% | | | | | $ | 3.48 | | |
| Class C | | | | | 1,000.00 | | | | | | 930.90 | | | | | | 1.44 | | | | | | 6.93 | | | | | | 1,000.00 | | | | | | 1,017.75 | | | | | | 1.44 | | | | | | 7.24 | | |
| Class I | | | | | 1,000.00 | | | | | | 936.10 | | | | | | 0.35 | | | | | | 1.69 | | | | | | 1,000.00 | | | | | | 1,023.19 | | | | | | 0.35 | | | | | | 1.77 | | |
| Class P3 | | | | | 1,000.00 | | | | | | 937.70 | | | | | | 0.00 | | | | | | 0.00 | | | | | | 1,000.00 | | | | | | 1,024.93 | | | | | | 0.00 | | | | | | 0.00 | | |
| Class R | | | | | 1,000.00 | | | | | | 933.50 | | | | | | 0.94 | | | | | | 4.53 | | | | | | 1,000.00 | | | | | | 1,020.24 | | | | | | 0.94 | | | | | | 4.73 | | |
| Class R6 | | | | | 1,000.00 | | | | | | 936.30 | | | | | | 0.29 | | | | | | 1.40 | | | | | | 1,000.00 | | | | | | 1,023.49 | | | | | | 0.29 | | | | | | 1.46 | | |
| Class W | | | | | 1,000.00 | | | | | | 935.70 | | | | | | 0.44 | | | | | | 2.12 | | | | | | 1,000.00 | | | | | | 1,022.74 | | | | | | 0.44 | | | | | | 2.22 | | |
| Voya Short Term Bond Fund | | ||||||||||||||||||||||||||||||||||||||||||||||||
| Class A | | | | $ | 1,000.00 | | | | | $ | 966.80 | | | | | | 0.63% | | | | | $ | 3.09 | | | | | $ | 1,000.00 | | | | | $ | 1,021.79 | | | | | | 0.63% | | | | | $ | 3.18 | | |
| Class C | | | | | 1,000.00 | | | | | | 963.20 | | | | | | 1.38 | | | | | | 6.75 | | | | | | 1,000.00 | | | | | | 1,018.05 | | | | | | 1.38 | | | | | | 6.94 | | |
| Class I | | | | | 1,000.00 | | | | | | 968.30 | | | | | | 0.35 | | | | | | 1.72 | | | | | | 1,000.00 | | | | | | 1,023.19 | | | | | | 0.35 | | | | | | 1.77 | | |
| Class P2 | | | | | 1,000.00 | | | | | | 969.00 | | | | | | 0.15 | | | | | | 0.74 | | | | | | 1,000.00 | | | | | | 1,024.18 | | | | | | 0.15 | | | | | | 0.76 | | |
| Class P3 | | | | | 1,000.00 | | | | | | 969.60 | | | | | | 0.00 | | | | | | 0.00 | | | | | | 1,000.00 | | | | | | 1,024.93 | | | | | | 0.00 | | | | | | 0.00 | | |
| Class R | | | | | 1,000.00 | | | | | | 965.80 | | | | | | 0.88 | | | | | | 4.31 | | | | | | 1,000.00 | | | | | | 1,020.54 | | | | | | 0.88 | | | | | | 4.43 | | |
| Class R6 | | | | | 1,000.00 | | | | | | 968.40 | | | | | | 0.30 | | | | | | 1.47 | | | | | | 1,000.00 | | | | | | 1,023.44 | | | | | | 0.30 | | | | | | 1.51 | | |
| Class W | | | | | 1,000.00 | | | | | | 968.10 | | | | | | 0.38 | | | | | | 1.86 | | | | | | 1,000.00 | | | | | | 1,023.04 | | | | | | 0.38 | | | | | | 1.92 | | |
| Voya Strategic Income Opportunities Fund | | ||||||||||||||||||||||||||||||||||||||||||||||||
| Class A | | | | $ | 1,000.00 | | | | | $ | 967.50 | | | | | | 0.85% | | | | | $ | 4.17 | | | | | $ | 1,000.00 | | | | | $ | 1,020.69 | | | | | | 0.85% | | | | | $ | 4.28 | | |
| Class C | | | | | 1,000.00 | | | | | | 964.10 | | | | | | 1.60 | | | | | | 7.83 | | | | | | 1,000.00 | | | | | | 1,016.95 | | | | | | 1.60 | | | | | | 8.05 | | |
| Class I | | | | | 1,000.00 | | | | | | 969.20 | | | | | | 0.62 | | | | | | 3.04 | | | | | | 1,000.00 | | | | | | 1,021.84 | | | | | | 0.62 | | | | | | 3.13 | | |
| Class P | | | | | 1,000.00 | | | | | | 971.80 | | | | | | 0.03 | | | | | | 0.15 | | | | | | 1,000.00 | | | | | | 1,024.78 | | | | | | 0.03 | | | | | | 0.15 | | |
| Class R | | | | | 1,000.00 | | | | | | 966.80 | | | | | | 1.10 | | | | | | 5.39 | | | | | | 1,000.00 | | | | | | 1,019.45 | | | | | | 1.10 | | | | | | 5.54 | | |
| Class R6 | | | | | 1,000.00 | | | | | | 969.40 | | | | | | 0.54 | | | | | | 2.65 | | | | | | 1,000.00 | | | | | | 1,022.24 | | | | | | 0.54 | | | | | | 2.72 | | |
| Class W | | | | | 1,000.00 | | | | | | 969.50 | | | | | | 0.60 | | | | | | 2.95 | | | | | | 1,000.00 | | | | | | 1,021.94 | | | | | | 0.60 | | | | | | 3.02 | | |
![[MISSING IMAGE: sg_ernst-young.jpg]](https://capedge.com/proxy/N-CSR/0001104659-22-067897/sg_ernst-young.jpg)
May 27, 2022
| | | | Voya GNMA Income Fund | | | Voya High Yield Bond Fund | | | Voya Intermediate Bond Fund | | |||||||||
| ASSETS: | | | | | | | | | | | | | | | | | | | |
| Investments in securities at fair value+* | | | | $ | 1,854,276,877 | | | | | $ | 625,098,211 | | | | | $ | 9,474,366,774 | | |
| Short-term investments at fair value† | | | | | 899,888 | | | | | | 171,894,219 | | | | | | 1,032,624,774 | | |
| Cash | | | | | 5,782,648 | | | | | | 66,100 | | | | | | 23,056,031 | | |
| Cash collateral for futures contracts | | | | | 2,052,570 | | | | | | — | | | | | | 12,851,775 | | |
| Cash pledged for centrally cleared swaps (Note 2) | | | | | — | | | | | | — | | | | | | 15,410,000 | | |
| Cash pledged as collateral for OTC derivatives (Note 2) | | | | | — | | | | | | — | | | | | | 2,810,000 | | |
| Cash pledged as collateral for delayed-delivery or when-issued securities (Note 2) | | | | | 5,194,759 | | | | | | — | | | | | | 12,459,495 | | |
| Receivables: | | | | | | | | | | | | | | | | | | | |
| Investment securities sold | | | | | 77,568,486 | | | | | | 44,790 | | | | | | 91,333,463 | | |
| Investment securities sold on a delayed-delivery or when-issued basis | | | | | 422,564,133 | | | | | | — | | | | | | 111,104,590 | | |
| Fund shares sold | | | | | 4,264,991 | | | | | | 531,273 | | | | | | 27,821,054 | | |
| Dividends | | | | | — | | | | | | 369 | | | | | | 1,696 | | |
| Interest | | | | | 3,663,149 | | | | | | 9,978,324 | | | | | | 56,176,475 | | |
| Foreign tax reclaims | | | | | — | | | | | | — | | | | | | 89,506 | | |
| Variation margin on futures contracts | | | | | — | | | | | | — | | | | | | 1,849,116 | | |
| Unrealized appreciation on forward foreign currency contracts | | | | | — | | | | | | — | | | | | | 162,717 | | |
| Prepaid expenses | | | | | 46,570 | | | | | | 66,313 | | | | | | 114,615 | | |
| Reimbursement due from Investment Adviser | | | | | 6,450 | | | | | | 486 | | | | | | 17,899 | | |
| Other assets | | | | | 42,518 | | | | | | 18,908 | | | | | | 170,024 | | |
| Total assets | | | | | 2,376,363,039 | | | | | | 807,698,993 | | | | | | 10,862,420,004 | | |
| LIABILITIES: | | | | | | | | | | | | | | | | | | | |
| Income distribution payable | | | | | 299,849 | | | | | | 81,549 | | | | | | 2,326,025 | | |
| Payable for investment securities purchased | | | | | — | | | | | | 5,456,661 | | | | | | 209,912,088 | | |
| Payable for investment securities purchased on a delayed-delivery or when-issued basis | | | | | 909,859,462 | | | | | | — | | | | | | 605,369,391 | | |
| Payable for fund shares redeemed | | | | | 3,617,373 | | | | | | 364,890 | | | | | | 30,690,214 | | |
| Payable upon receipt of securities loaned | | | | | — | | | | | | 150,750,719 | | | | | | 572,294,878 | | |
| Unrealized depreciation on forward foreign currency contracts | | | | | — | | | | | | — | | | | | | 16,528 | | |
| Variation margin payable on centrally cleared swaps | | | | | — | | | | | | — | | | | | | 429,349 | | |
| Variation margin payable on futures contracts | | | | | 289,349 | | | | | | — | | | | | | — | | |
| Cash received as collateral for OTC derivatives (Note 2) | | | | | — | | | | | | — | | | | | | 5,170,000 | | |
| Payable for investment management fees | | | | | 561,103 | | | | | | 187,821 | | | | | | 2,193,649 | | |
| Payable for distribution and shareholder service fees | | | | | 123,876 | | | | | | 17,897 | | | | | | 153,931 | | |
| Payable to trustees under the deferred compensation plan (Note 6) | | | | | 42,518 | | | | | | 18,908 | | | | | | 170,024 | | |
| Payable for trustee fees | | | | | 8,609 | | | | | | 4,488 | | | | | | 898 | | |
| Other accrued expenses and liabilities | | | | | 678,658 | | | | | | 176,240 | | | | | | 1,400,047 | | |
| Written options, at fair value^ | | | | | — | | | | | | — | | | | | | 3,242,890 | | |
| Total liabilities | | | | | 915,480,797 | | | | | | 157,059,173 | | | | | | 1,433,369,912 | | |
| NET ASSETS | | | | $ | 1,460,882,242 | | | | | $ | 650,639,820 | | | | | $ | 9,429,050,092 | | |
| NET ASSETS WERE COMPRISED OF: | | | | | | | | | | | | | | | | | | | |
| Paid-in capital | | | | $ | 1,557,868,710 | | | | | $ | 659,284,588 | | | | | $ | 10,042,902,507 | | |
| Total distributable loss | | | | | (96,986,468) | | | | | | (8,644,768) | | | | | | (613,852,415) | | |
| NET ASSETS | | | | $ | 1,460,882,242 | | | | | $ | 650,639,820 | | | | | $ | 9,429,050,092 | | |
+ Including securities loaned at value | | | | $ | — | | | | | $ | 147,137,756 | | | | | $ | 559,867,008 | | |
* Cost of investments in securities | | | | $ | 1,899,949,534 | | | | | $ | 638,711,318 | | | | | $ | 9,915,959,794 | | |
† Cost of short-term investments | | | | $ | 899,867 | | | | | $ | 171,893,545 | | | | | $ | 1,032,619,539 | | |
^ Premiums received on written options | | | | $ | — | | | | | $ | — | | | | | $ | 4,696,594 | | |
| | | | Voya GNMA Income Fund | | | Voya High Yield Bond Fund | | | Voya Intermediate Bond Fund | | |||||||||
| Class A | | | | | | | | | | | | | | | | | | | |
| Net assets | | | | $ | 464,614,501 | | | | | $ | 45,841,796 | | | | | $ | 364,120,524 | | |
| Shares authorized | | | | | unlimited | | | | | | unlimited | | | | | | unlimited | | |
| Par value | | | | $ | 0.001 | | | | | $ | 0.001 | | | | | $ | 0.001 | | |
| Shares outstanding | | | | | 57,886,100 | | | | | | 6,043,942 | | | | | | 38,135,277 | | |
| Net asset value and redemption price per share† | | | | $ | 8.03 | | | | | $ | 7.58 | | | | | $ | 9.55 | | |
Maximum offering price per share (2.50%)(1) | | | | $ | 8.24 | | | | | $ | 7.77 | | | | | $ | 9.79 | | |
| Class C | | | | | | | | | | | | | �� | | | | | | |
| Net assets | | | | $ | 26,836,638 | | | | | $ | 9,496,123 | | | | | $ | 15,563,759 | | |
| Shares authorized | | | | | unlimited | | | | | | unlimited | | | | | | unlimited | | |
| Par value | | | | $ | 0.001 | | | | | $ | 0.001 | | | | | $ | 0.001 | | |
| Shares outstanding | | | | | 3,360,434 | | | | | | 1,252,439 | | | | | | 1,632,332 | | |
| Net asset value and redemption price per share† | | | | $ | 7.99 | | | | | $ | 7.58 | | | | | $ | 9.53 | | |
| Class I | | | | | | | | | | | | | | | | | | | |
| Net assets | | | | $ | 834,623,477 | | | | | $ | 193,356,934 | | | | | $ | 6,092,395,932 | | |
| Shares authorized | | | | | unlimited | | | | | | unlimited | | | | | | unlimited | | |
| Par value | | | | $ | 0.001 | | | | | $ | 0.001 | | | | | $ | 0.001 | | |
| Shares outstanding | | | | | 103,791,598 | | | | | | 25,533,134 | | | | | | 637,921,843 | | |
| Net asset value and redemption price per share | | | | $ | 8.04 | | | | | $ | 7.57 | | | | | $ | 9.55 | | |
| Class P | | | | | | | | | | | | | | | | | | | |
| Net assets | | | | $ | 32,067 | | | | | $ | 272,100,738 | | | | | | n/a | | |
| Shares authorized | | | | | unlimited | | | | | | unlimited | | | | | | n/a | | |
| Par value | | | | $ | 0.001 | | | | | $ | 0.001 | | | | | | n/a | | |
| Shares outstanding | | | | | 3,998 | | | | | | 35,878,453 | | | | | | n/a | | |
| Net asset value and redemption price per share | | | | $ | 8.02 | | | | | $ | 7.58 | | | | | | n/a | | |
| Class P3 | | | | | | | | | | | | | | | | | | | |
| Net assets | | | | | n/a | | | | | $ | 896,851 | | | | | $ | 76,078,310 | | |
| Shares authorized | | | | | n/a | | | | | | unlimited | | | | | | unlimited | | |
| Par value | | | | | n/a | | | | | $ | 0.001 | | | | | $ | 0.001 | | |
| Shares outstanding | | | | | n/a | | | | | | 118,083 | | | | | | 7,963,021 | | |
| Net asset value and redemption price per share | | | | | n/a | | | | | $ | 7.60 | | | | | $ | 9.55 | | |
| Class R | | | | | | | | | | | | | | | | | | | |
| Net assets | | | | | n/a | | | | | $ | 182,147 | | | | | $ | 143,084,592 | | |
| Shares authorized | | | | | n/a | | | | | | unlimited | | | | | | unlimited | | |
| Par value | | | | | n/a | | | | | $ | 0.001 | | | | | $ | 0.001 | | |
| Shares outstanding | | | | | n/a | | | | | | 23,998 | | | | | | 14,965,886 | | |
| Net asset value and redemption price per share | | | | | n/a | | | | | $ | 7.59 | | | | | $ | 9.56 | | |
| Class R6 | | | | | | | | | | | | | | | | | | | |
| Net assets | | | | $ | 23,951,404 | | | | | $ | 44,337,564 | | | | | $ | 2,563,037,959 | | |
| Shares authorized | | | | | unlimited | | | | | | unlimited | | | | | | unlimited | | |
| Par value | | | | $ | 0.001 | | | | | $ | 0.001 | | | | | $ | 0.001 | | |
| Shares outstanding | | | | | 2,976,914 | | | | | | 5,839,169 | | | | | | 268,210,038 | | |
| Net asset value and redemption price per share | | | | $ | 8.05 | | | | | $ | 7.59 | | | | | $ | 9.56 | | |
| Class W | | | | | | | | | | | | | | | | | | | |
| Net assets | | | | $ | 110,824,155 | | | | | $ | 84,427,667 | | | | | $ | 174,769,016 | | |
| Shares authorized | | | | | unlimited | | | | | | unlimited | | | | | | unlimited | | |
| Par value | | | | $ | 0.001 | | | | | $ | 0.001 | | | | | $ | 0.001 | | |
| Shares outstanding | | | | | 13,765,403 | | | | | | 11,108,911 | | | | | | 18,315,480 | | |
| Net asset value and redemption price per share | | | | $ | 8.05 | | | | | $ | 7.60 | | | | | $ | 9.54 | | |
| | | | Voya Short Term Bond Fund | | | Voya Strategic Income Opportunities Fund | | ||||||
| ASSETS: | | | | | | | | | | | | | |
| Investments in securities at fair value+* | | | | $ | 432,962,734 | | | | | $ | 2,228,984,565 | | |
| Short-term investments at fair value† | | | | | 68,104,110 | | | | | | 343,794,725 | | |
| Cash | | | | | 305,638 | | | | | | 6,188,931 | | |
| Cash collateral for futures contracts | | | | | 769,835 | | | | | | 6,451,555 | | |
| Cash pledged for centrally cleared swaps (Note 2) | | | | | — | | | | | | 16,326,846 | | |
| Cash pledged as collateral for OTC derivatives (Note 2) | | | | | — | | | | | | 2,890,000 | | |
| Receivables: | | | | | | | | | | | | | |
| Investment securities sold | | | | | 16,420,504 | | | | | | 41,870,603 | | |
| Fund shares sold | | | | | 199,778 | | | | | | 3,600,079 | | |
| Dividends | | | | | 2,127 | | | | | | 20,075 | | |
| Interest | | | | | 1,722,501 | | | | | | 14,951,930 | | |
| Variation margin on futures contracts | | | | | 102,680 | | | | | | — | | |
| Unrealized appreciation on forward foreign currency contracts | | | | | — | | | | | | 22,696,093 | | |
| Unrealized appreciation on OTC swap agreements | | | | | — | | | | | | 71,287 | | |
| Prepaid expenses | | | | | 56,937 | | | | | | 56,567 | | |
| Reimbursement due from Investment Adviser | | | | | 8,652 | | | | | | — | | |
| Other assets | | | | | 4,880 | | | | | | 27,484 | | |
| Total assets | | | | | 520,660,376 | | | | | | 2,687,930,740 | | |
| LIABILITIES: | | | | | | | | | | | | | |
| Income distribution payable | | | | | 402 | | | | | | 626,278 | | |
| Payable for investment securities purchased | | | | | 42,763,778 | | | | | | 44,656,860 | | |
| Payable for fund shares redeemed | | | | | 121,806 | | | | | | 5,765,094 | | |
| Payable upon receipt of securities loaned | | | | | 5,117,906 | | | | | | 136,481,551 | | |
| Unrealized depreciation on forward foreign currency contracts | | | | | — | | | | | | 24,085,499 | | |
| Variation margin payable on centrally cleared swaps | | | | | — | | | | | | 333,781 | | |
| Variation margin payable on futures contracts | | | | | — | | | | | | 882,424 | | |
| Cash received as collateral for OTC derivatives (Note 2) | | | | | — | | | | | | 2,750,000 | | |
| Payable for investment management fees | | | | | 95,945 | | | | | | 1,053,195 | | |
| Payable for distribution and shareholder service fees | | | | | 3,798 | | | | | | 74,010 | | |
| Payable to trustees under the deferred compensation plan (Note 6) | | | | | 4,880 | | | | | | 27,484 | | |
| Payable for trustee fees | | | | | 2,060 | | | | | | 12,646 | | |
| Unfunded loan commitments (Note 10) | | | | | — | | | | | | 867,826 | | |
| Other accrued expenses and liabilities | | | | | 19,290 | | | | | | 621,577 | | |
| Written options, at fair value^ | | | | | — | | | | | | 2,584,504 | | |
| Total liabilities | | | | | 48,129,865 | | | | | | 220,822,729 | | |
| NET ASSETS | | | | $ | 472,530,511 | | | | | $ | 2,467,108,011 | | |
| NET ASSETS WERE COMPRISED OF: | | | | | | | | | | | | | |
| Paid-in capital | | | | $ | 491,450,858 | | | | | $ | 2,639,423,698 | | |
| Total distributable loss | | | | | (18,920,347) | | | | | | (172,315,687) | | |
| NET ASSETS | | | | $ | 472,530,511 | | | | | $ | 2,467,108,011 | | |
+ Including securities loaned at value | | | | $ | 5,002,922 | | | | | $ | 133,282,929 | | |
* Cost of investments in securities | | | | $ | 444,174,963 | | | | | $ | 2,329,112,345 | | |
† Cost of short-term investments | | | | $ | 68,103,388 | | | | | $ | 343,794,725 | | |
^ Premiums received on written options | | | | $ | — | | | | | $ | 3,380,392 | | |
| | | | Voya Short Term Bond Fund | | | Voya Strategic Income Opportunities Fund | | ||||||
| Class A | | | | | | | | | | | | | |
| Net assets | | | | $ | 15,350,579 | | | | | $ | 104,975,269 | | |
| Shares authorized | | | | | unlimited | | | | | | unlimited | | |
| Par value | | | | $ | 0.001 | | | | | $ | 0.001 | | |
| Shares outstanding | | | | | 1,602,858 | | | | | | 10,944,546 | | |
| Net asset value and redemption price per share† | | | | $ | 9.58 | | | | | $ | 9.59 | | |
Maximum offering price per share (2.50%)(1) | | | | $ | 9.83 | | | | | $ | 9.84 | | |
| Class C | | | | | | | | | | | | | |
| Net assets | | | | $ | 442,449 | | | | | $ | 49,838,565 | | |
| Shares authorized | | | | | unlimited | | | | | | unlimited | | |
| Par value | | | | $ | 0.001 | | | | | $ | 0.001 | | |
| Shares outstanding | | | | | 46,165 | | | | | | 5,274,896 | | |
| Net asset value and redemption price per share† | | | | $ | 9.58 | | | | | $ | 9.45 | | |
| Class I | | | | | | | | | | | | | |
| Net assets | | | | $ | 31,691,345 | | | | | $ | 2,096,038,064 | | |
| Shares authorized | | | | | unlimited | | | | | | unlimited | | |
| Par value | | | | $ | 0.001 | | | | | $ | 0.001 | | |
| Shares outstanding | | | | | 3,312,092 | | | | | | 218,187,783 | | |
| Net asset value and redemption price per share | | | | $ | 9.57 | | | | | $ | 9.61 | | |
| Class P | | | | | | | | | | | | | |
| Net assets | | | | | n/a | | | | | $ | 3,255 | | |
| Shares authorized | | | | | n/a | | | | | | unlimited | | |
| Par value | | | | | n/a | | | | | $ | 0.001 | | |
| Shares outstanding | | | | | n/a | | | | | | 341 | | |
| Net asset value and redemption price per share | | | | | n/a | | | | | $ | 9.55 | | |
| Class P2 | | | | | | | | | | | | | |
| Net assets | | | | $ | 26,650,447 | | | | | | n/a | | |
| Shares authorized | | | | | unlimited | | | | | | n/a | | |
| Par value | | | | $ | 0.001 | | | | | | n/a | | |
| Shares outstanding | | | | | 2,814,593 | | | | | | n/a | | |
| Net asset value and redemption price per share | | | | $ | 9.47 | | | | | | n/a | | |
| Class P3 | | | | | | | | | | | | | |
| Net assets | | | | $ | 5,804,659 | | | | | | n/a | | |
| Shares authorized | | | | | unlimited | | | | | | n/a | | |
| Par value | | | | $ | 0.001 | | | | | | n/a | | |
| Shares outstanding | | | | | 608,847 | | | | | | n/a | | |
| Net asset value and redemption price per share | | | | $ | 9.53 | | | | | | n/a | | |
| Class R | | | | | | | | | | | | | |
| Net assets | | | | $ | 16,845 | | | | | $ | 20,854,083 | | |
| Shares authorized | | | | | unlimited | | | | | | unlimited | | |
| Par value | | | | $ | 0.001 | | | | | $ | 0.001 | | |
| Shares outstanding | | | | | 1,753 | | | | | | 2,192,262 | | |
| Net asset value and redemption price per share | | | | $ | 9.61 | | | | | $ | 9.51 | | |
| Class R6 | | | | | | | | | | | | | |
| Net assets | | | | $ | 372,852,971 | | | | | $ | 159,174,599 | | |
| Shares authorized | | | | | unlimited | | | | | | unlimited | | |
| Par value | | | | $ | 0.001 | | | | | $ | 0.001 | | |
| Shares outstanding | | | | | 38,924,669 | | | | | | 16,620,194 | | |
| Net asset value and redemption price per share | | | | $ | 9.58 | | | | | $ | 9.58 | | |
| Class W | | | | | | | | | | | | | |
| Net assets | | | | $ | 19,721,216 | | | | | $ | 36,224,176 | | |
| Shares authorized | | | | | unlimited | | | | | | unlimited | | |
| Par value | | | | $ | 0.001 | | | | | $ | 0.001 | | |
| Shares outstanding | | | | | 2,053,472 | | | | | | 3,786,383 | | |
| Net asset value and redemption price per share | | | | $ | 9.60 | | | | | $ | 9.57 | | |
| | | | Voya GNMA Income Fund | | | Voya High Yield Bond Fund | | | Voya Intermediate Bond Fund | | |||||||||
| INVESTMENT INCOME: | | | | | | | | | | | | | | | | | | | |
| Dividends | | | | $ | — | | | | | $ | 243,537 | | | | | $ | 9,642 | | |
| Interest, net of foreign taxes withheld* | | | | | 22,123,268 | | | | | | 49,446,253 | | | | | | 265,765,752 | | |
| Securities lending income, net | | | | | — | | | | | | 309,900 | | | | | | 840,848 | | |
| Total investment income | | | | | 22,123,268 | | | | | | 49,999,690 | | | | | | 266,616,242 | | |
| EXPENSES: | | | | | | | | | | | | | | | | | | | |
| Investment management fees | | | | | 7,559,124 | | | | | | 5,235,999 | | | | | | 27,029,283 | | |
| Distribution and shareholder service fees: | | | | | | | | | | | | | | | | | | | |
| Class A | | | | | 1,350,132 | | | | | | 125,858 | | | | | | 1,069,963 | | |
| Class C | | | | | 390,704 | | | | | | 101,505 | | | | | | 201,618 | | |
| Class R | | | | | — | | | | | | 1,608 | | | | | | 820,825 | | |
| Transfer agent fees: | | | | | | | | | | | | | | | | | | | |
| Class A | | | | | 600,393 | | | | | | 81,814 | | | | | | 630,143 | | |
| Class C | | | | | 43,951 | | | | | | 16,495 | | | | | | 29,679 | | |
| Class I | | | | | 804,987 | | | | | | 134,123 | | | | | | 3,482,842 | | |
| Class P | | | | | 243 | | | | | | 9,654 | | | | | | — | | |
| Class P3 | | | | | — | | | | | | 201 | | | | | | 488 | | |
| Class R | | | | | — | | | | | | 523 | | | | | | 241,723 | | |
| Class R6 | | | | | 315 | | | | | | 4,468 | | | | | | 30,947 | | |
| Class W | | | | | 139,736 | | | | | | 155,740 | | | | | | 298,133 | | |
| Shareholder reporting expense | | | | | 131,220 | | | | | | 32,528 | | | | | | 137,583 | | |
| Registration fees | | | | | 176,557 | | | | | | 165,825 | | | | | | 392,752 | | |
| Professional fees | | | | | 69,263 | | | | | | 36,770 | | | | | | 313,125 | | |
| Custody and accounting expense | | | | | 175,200 | | | | | | 82,702 | | | | | | 972,932 | | |
| Trustee fees | | | | | 68,872 | | | | | | 35,898 | | | | | | 240,201 | | |
| Miscellaneous expense | | | | | 51,823 | | | | | | 15,986 | | | | | | 261,834 | | |
| Interest expense | | | | | 522 | | | | | | — | | | | | | 25 | | |
| Total expenses | | | | | 11,563,042 | | | | | | 6,237,697 | | | | | | 36,154,096 | | |
| Waived and reimbursed fees | | | | | (169,900) | | | | | | (1,890,297) | | | | | | (157,319) | | |
| Net expenses | | | | | 11,393,142 | | | | | | 4,347,400 | | | | | | 35,996,777 | | |
| Net investment income | | | | | 10,730,126 | | | | | | 45,652,290 | | | | | | 230,619,465 | | |
| REALIZED AND UNREALIZED GAIN (LOSS): | | | | | | | | | | | | | | | | | | | |
| Net realized gain (loss) on: | | | | | | | | | | | | | | | | | | | |
| Investments | | | | | (27,645,928) | | | | | | 22,024,852 | | | | | | (28,896,790) | | |
| Forward foreign currency contracts | | | | | — | | | | | | — | | | | | | 994,079 | | |
| Foreign currency related transactions | | | | | — | | | | | | — | | | | | | (422,488) | | |
| Futures | | | | | 18,657,031 | | | | | | — | | | | | | (21,965,325) | | |
| Swaps | | | | | — | | | | | | — | | | | | | (4,081,201) | | |
| Written options | | | | | — | | | | | | — | | | | | | (1,348,713) | | |
| Net realized gain (loss) | | | | | (8,988,897) | | | | | | 22,024,852 | | | | | | (55,720,438) | | |
| Net change in unrealized appreciation (depreciation) on: | | | | | | | | | | | | | | | | | | | |
| Investments | | | | | (67,313,284) | | | | | | (61,579,754) | | | | | | (620,267,594) | | |
| Forward foreign currency contracts | | | | | — | | | | | | — | | | | | | (2,258,230) | | |
| Foreign currency related transactions | | | | | — | | | | | | — | | | | | | (633,948) | | |
| Futures | | | | | (2,029,245) | | | | | | — | | | | | | 12,134,633 | | |
| Swaps | | | | | — | | | | | | — | | | | | | 206,363 | | |
| Written options | | | | | — | | | | | | — | | | | | | 3,849,524 | | |
| Net change in unrealized appreciation (depreciation) | | | | | (69,342,529) | | | | | | (61,579,754) | | | | | | (606,969,252) | | |
| Net realized and unrealized loss | | | | | (78,331,426) | | | | | | (39,554,902) | | | | | | (662,689,690) | | |
| Increase (decrease) in net assets resulting from operations | | | | $ | (67,601,300) | | | | | $ | 6,097,388 | | | | | $ | (432,070,225) | | |
* Foreign taxes withheld | | | | $ | — | | | | | $ | — | | | | | $ | 83,381 | | |
| | | | Voya Short Term Bond Fund | | | Voya Strategic Income Opportunities Fund | | ||||||
| INVESTMENT INCOME: | | | | | | | | | | | | | |
| Dividends | | | | $ | 4,411 | | | | | $ | 60,538 | | |
| Interest, net of foreign taxes withheld* | | | | | 6,191,134 | | | | | | 92,839,062 | | |
| Securities lending income, net | | | | | 18,193 | | | | | | 127,749 | | |
| Total investment income | | | | | 6,213,738 | | | | | | 93,027,349 | | |
| EXPENSES: | | | | | | | | | | | | | |
| Investment management fees | | | | | 1,029,716 | | | | | | 12,645,085 | | |
| Distribution and shareholder service fees: | | | | | | | | | | | | | |
| Class A | | | | | 48,054 | | | | | | 324,167 | | |
| Class C | | | | | 4,642 | | | | | | 530,581 | | |
| Class R | | | | | 57 | | | | | | 112,470 | | |
| Transfer agent fees: | | | | | | | | | | | | | |
| Class A | | | | | 14,053 | | | | | | 81,199 | | |
| Class C | | | | | 340 | | | | | | 33,212 | | |
| Class I | | | | | 21,223 | | | | | | 1,693,703 | | |
| Class P2 | | | | | 643 | | | | | | — | | |
| Class P3 | | | | | 80 | | | | | | — | | |
| Class R | | | | | 8 | | | | | | 14,079 | | |
| Class R6 | | | | | 587 | | | | | | 4,179 | | |
| Class W | | | | | 15,291 | | | | | | 28,096 | | |
| Shareholder reporting expense | | | | | 4,865 | | | | | | 85,675 | | |
| Registration fees | | | | | 126,432 | | | | | | 186,210 | | |
| Professional fees | | | | | 21,733 | | | | | | 97,735 | | |
| Custody and accounting expense | | | | | 70,050 | | | | | | 388,050 | | |
| Trustee fees | | | | | 16,475 | | | | | | 101,161 | | |
| Miscellaneous expense | | | | | 12,015 | | | | | | 77,481 | | |
| Total expenses | | | | | 1,386,264 | | | | | | 16,403,083 | | |
| Waived and reimbursed fees | | | | | (142,038) | | | | | | (18) | | |
| Net expenses | | | | | 1,244,226 | | | | | | 16,403,065 | | |
| Net investment income | | | | | 4,969,512 | | | | | | 76,624,284 | | |
| REALIZED AND UNREALIZED GAIN (LOSS): | | | | | | | | | | | | | |
| Net realized gain (loss) on: | | | | | | | | | | | | | |
| Investments | | | | | (1,969,297) | | | | | | (2,558,362) | | |
| Forward foreign currency contracts | | | | | — | | | | | | (4,617,185) | | |
| Foreign currency related transactions | | | | | (133) | | | | | | 1,388,547 | | |
| Futures | | | | | (1,458,613) | | | | | | (7,580,973) | | |
| Swaps | | | | | — | | | | | | (11,806,498) | | |
| Written options | | | | | — | | | | | | 11,631,444 | | |
| Net realized loss | | | | | (3,428,043) | | | | | | (13,543,027) | | |
| Net change in unrealized appreciation (depreciation) on: | | | | | | | | | | | | | |
| Investments | | | | | (12,868,741) | | | | | | (106,866,911) | | |
| Forward foreign currency contracts | | | | | — | | | | | | (2,581,391) | | |
| Foreign currency related transactions | | | | | (14,612) | | | | | | (572,217) | | |
| Futures | | | | | (1,255,918) | | | | | | (13,155,343) | | |
| Swaps | | | | | — | | | | | | (5,317) | | |
| Written options | | | | | — | | | | | | 1,800,963 | | |
| Net change in unrealized appreciation (depreciation) | | | | | (14,139,271) | | | | | | (121,380,216) | | |
| Net realized and unrealized loss | | | | | (17,567,314) | | | | | | (134,923,243) | | |
| Decrease in net assets resulting from operations | | | | $ | (12,597,802) | | | | | $ | (58,298,959) | | |
* Foreign taxes withheld | | | | $ | — | | | | | $ | 51,038 | | |
| | | | Voya GNMA Income Fund | | | Voya High Yield Bond Fund | | ||||||||||||||||||
| | | | Year Ended March 31, 2022 | | | Year Ended March 31, 2021 | | | Year Ended March 31, 2022 | | | Year Ended March 31, 2021 | | ||||||||||||
| FROM OPERATIONS: | | | | | | | | | | | | | | | | | | | | | | | | | |
| Net investment income | | | | $ | 10,730,126 | | | | | $ | 15,176,171 | | | | | $ | 45,652,290 | | | | | $ | 43,783,222 | | |
| Net realized gain (loss) | | | | | (8,988,897) | | | | | | 17,477,758 | | | | | | 22,024,852 | | | | | | 9,678,584 | | |
| Net change in unrealized appreciation (depreciation) | | | | | (69,342,529) | | | | | | (15,379,355) | | | | | | (61,579,754) | | | | | | 83,281,518 | | |
| Increase (decrease) in net assets resulting from operations | | | | | (67,601,300) | | | | | | 17,274,574 | | | | | | 6,097,388 | | | | | | 136,743,324 | | |
| FROM DISTRIBUTIONS TO SHAREHOLDERS: | | | | | | | | | | | | | | | | | | | | | | | | | |
| Total distributions (excluding return of capital): | | | | | | | | | | | | | | | | | | | | | | | | | |
| Class A | | | | | (6,296,795) | | | | | | (9,377,238) | | | | | | (2,339,943) | | | | | | (2,347,151) | | |
| Class C | | | | | (170,951) | | | | | | (455,335) | | | | | | (394,886) | | | | | | (447,906) | | |
| Class I | | | | | (14,433,811) | | | | | | (14,869,649) | | | | | | (10,110,459) | | | | | | (5,258,208) | | |
| Class P | | | | | (648) | | | | | | (653) | | | | | | (17,710,462) | | | | | | (15,894,893) | | |
| Class P3 | | | | | — | | | | | | — | | | | | | (553,963) | | | | | | (415,677) | | |
| Class R | | | | | — | | | | | | — | | | | | | (14,342) | | | | | | (33,483) | | |
| Class R6 | | | | | (367,322) | | | | | | (371,629) | | | | | | (10,925,724) | | | | | | (12,023,544) | | |
| Class W | | | | | (1,773,989) | | | | | | (2,783,574) | | | | | | (4,683,936) | | | | | | (7,324,885) | | |
| Return of capital: | | | | | | | | | | | | | | | | | | | | | | | | | |
| Class A | | | | | (394,744) | | | | | | (1,926,810) | | | | | | — | | | | | | (114,765) | | |
| Class C | | | | | (23,585) | | | | | | (159,566) | | | | | | — | | | | | | (23,566) | | |
| Class I | | | | | (714,563) | | | | | | (2,889,673) | | | | | | — | | | | | | (359,331) | | |
| Class P | | | | | (27) | | | | | | (108) | | | | | | — | | | | | | (719,676) | | |
| Class P3 | | | | | — | | | | | | — | | | | | | — | | | | | | (19,834) | | |
| Class R | | | | | — | | | | | | — | | | | | | — | | | | | | (1,496) | | |
| Class R6 | | | | | (19,980) | | | | | | (126,940) | | | | | | — | | | | | | (554,730) | | |
| Class W | | | | | (93,830) | | | | | | (567,620) | | | | | | — | | | | | | (367,110) | | |
| Total distributions | | | | | (24,290,245) | | | | | | (33,528,795) | | | | | | (46,733,715) | | | | | | (45,906,255) | | |
| FROM CAPITAL SHARE TRANSACTIONS: | | | | | | | | | | | | | | | | | | | | | | | | | |
| Net proceeds from sale of shares | | | | | 610,998,074 | | | | | | 1,168,302,809 | | | | | | 327,195,769 | | | | | | 665,909,788 | | |
| Reinvestment of distributions | | | | | 20,272,704 | | | | | | 28,307,653 | | | | | | 45,439,824 | | | | | | 44,999,241 | | |
| | | | | | 631,270,778 | | | | | | 1,196,610,462 | | | | | | 372,635,593 | | | | | | 710,909,029 | | |
| Cost of shares redeemed | | | | | (908,840,569) | | | | | | (651,435,706) | | | | | | (623,750,985) | | | | | | (347,677,664) | | |
| Net increase (decrease) in net assets resulting from capital share transactions | | | | | (277,569,791) | | | | | | 545,174,756 | | | | | | (251,115,392) | | | | | | 363,231,365 | | |
| Net increase (decrease) in net assets | | | | | (369,461,336) | | | | | | 528,920,535 | | | | | | (291,751,719) | | | | | | 454,068,434 | | |
| NET ASSETS: | | | | | | | | | | | | | | | | | | | | | | | | | |
| Beginning of year or period | | | | | 1,830,343,578 | | | | | | 1,301,423,043 | | | | | | 942,391,539 | | | | | | 488,323,105 | | |
| End of year or period | | | | $ | 1,460,882,242 | | | | | $ | 1,830,343,578 | | | | | $ | 650,639,820 | | | | | $ | 942,391,539 | | |
| | | | Voya Intermediate Bond Fund | | | Voya Short Term Bond Fund | | ||||||||||||||||||
| | | | Year Ended March 31, 2022 | | | Year Ended March 31, 2021 | | | Year Ended March 31, 2022 | | | Year Ended March 31, 2021 | | ||||||||||||
| FROM OPERATIONS: | | | | | | | | | | | | | | | | | | | | | | | | | |
| Net investment income | | | | $ | 230,619,465 | | | | | $ | 257,060,237 | | | | | $ | 4,969,512 | | | | | $ | 3,935,631 | | |
| Net realized gain (loss) | | | | | (55,720,438) | | | | | | (17,879,152) | | | | | | (3,428,043) | | | | | | 817,392 | | |
| Net change in unrealized appreciation (depreciation) | | | | | (606,969,252) | | | | | | 284,489,546 | | | | | | (14,139,271) | | | | | | 7,316,228 | | |
| Increase (decrease) in net assets resulting from operations | | | | | (432,070,225) | | | | | | 523,670,631 | | | | | | (12,597,802) | | | | | | 12,069,251 | | |
| FROM DISTRIBUTIONS TO SHAREHOLDERS: | | | | | | | | | | | | | | | | | | | | | | | | | |
| Total distributions (excluding return of capital): | | | | | | | | | | | | | | | | | | | | | | | | | |
| Class A | | | | | (9,143,624) | | | | | | (20,564,182) | | | | | | (189,601) | | | | | | (278,104) | | |
| Class C | | | | | (282,354) | | | | | | (893,744) | | | | | | (1,343) | | | | | | (3,952) | | |
| Class I | | | | | (154,758,798) | | | | | | (275,242,006) | | | | | | (295,881) | | | | | | (288,052) | | |
| Class P2 | | | | | — | | | | | | — | | | | | | (1,393,182) | | | | | | (2,186,280) | | |
| Class P3 | | | | | (1,438,907) | | | | | | (1,562,771) | | | | | | (66,502) | | | | | | (81,188) | | |
| Class R | | | | | (3,083,013) | | | | | | (7,528,131) | | | | | | (63) | | | | | | (55) | | |
| Class R6 | | | | | (68,083,038) | | | | | | (127,827,065) | | | | | | (3,123,798) | | | | | | (1,089,714) | | |
| Class W | | | | | (4,830,730) | | | | | | (11,423,548) | | | | | | (257,675) | | | | | | (337,343) | | |
| Return of capital: | | | | | | | | | | | | | | | | | | | | | | | | | |
| Class A | | | | | (615,654) | | | | | | (1,426,181) | | | | | | (49,663) | | | | | | (41,825) | | |
| Class C | | | | | (27,387) | | | | | | (69,869) | | | | | | (1,053) | | | | | | (1,134) | | |
| Class I | | | | | (10,216,623) | | | | | | (19,029,063) | | | | | | (87,449) | | | | | | (34,181) | | |
| Class P2 | | | | | — | | | | | | — | | | | | | (52,614) | | | | | | (198,897) | | |
| Class P3 | | | | | (116,882) | | | | | | (107,543) | | | | | | (14,140) | | | | | | (6,905) | | |
| Class R | | | | | (241,500) | | | | | | (534,794) | | | | | | (45) | | | �� | | | (14) | | |
| Class R6 | | | | | (4,247,795) | | | | | | (8,604,830) | | | | | | (1,037,071) | | | | | | (103,871) | | |
| Class W | | | | | (293,532) | | | | | | (813,151) | | | | | | (55,355) | | | | | | (44,753) | | |
| Total distributions | | | | | (257,379,837) | | | | | | (475,626,878) | | | | | | (6,625,435) | | | | | | (4,696,268) | | |
| FROM CAPITAL SHARE TRANSACTIONS: | | | | | | | | | | | | | | | | | | | | | | | | | |
| Net proceeds from sale of shares | | | | | 3,464,507,865 | | | | | | 4,097,730,949 | | | | | | 464,474,302 | | | | | | 122,358,355 | | |
| Reinvestment of distributions | | | | | 227,363,588 | | | | | | 425,239,101 | | | | | | 6,602,660 | | | | | | 4,616,589 | | |
| | | | | | 3,691,871,453 | | | | | | 4,522,970,050 | | | | | | 471,076,962 | | | | | | 126,974,944 | | |
| Cost of shares redeemed | | | | | (3,574,389,538) | | | | | | (2,798,974,263) | | | | | | (187,837,124) | | | | | | (98,064,607) | | |
| Net increase in net assets resulting from capital share transactions | | | | | 117,481,915 | | | | | | 1,723,995,787 | | | | | | 283,239,838 | | | | | | 28,910,337 | | |
| Net increase (decrease) in net assets | | | | | (571,968,147) | | | | | | 1,772,039,540 | | | | | | 264,016,601 | | | | | | 36,283,320 | | |
| NET ASSETS: | | | | | | | | | | | | | | | | | | | | | | | | | |
| Beginning of year or period | | | | | 10,001,018,239 | | | | | | 8,228,978,699 | | | | | | 208,513,910 | | | | | | 172,230,590 | | |
| End of year or period | | | | $ | 9,429,050,092 | | | | | $ | 10,001,018,239 | | | | | $ | 472,530,511 | | | | | $ | 208,513,910 | | |
| | | | Voya Strategic Income Opportunities Fund | | |||||||||
| | | | Year Ended March 31, 2022 | | | Year Ended March 31, 2021 | | ||||||
| FROM OPERATIONS: | | | | | | | | | | | | | |
| Net investment income | | | | $ | 76,624,284 | | | | | $ | 87,624,973 | | |
| Net realized loss | | | | | (13,543,027) | | | | | | (11,401,028) | | |
| Net change in unrealized appreciation (depreciation) | | | | | (121,380,216) | | | | | | 285,287,987 | | |
| Increase (decrease) in net assets resulting from operations | | | | | (58,298,959) | | | | | | 361,511,932 | | |
| FROM DISTRIBUTIONS TO SHAREHOLDERS: | | | | | | | | | | | | | |
| Total distributions (excluding return of capital): | | | | | | | | | | | | | |
| Class A | | | | | (3,060,993) | | | | | | (4,573,237) | | |
| Class C | | | | | (811,189) | | | | | | (1,296,760) | | |
| Class I | | | | | (55,102,083) | | | | | | (70,280,162) | | |
| Class P | | | | | (107) | | | | | | (435,158) | | |
| Class P3 | | | | | — | | | | | | (61,640) | | |
| Class R | | | | | (457,854) | | | | | | (571,163) | | |
| Class R6 | | | | | (4,473,785) | | | | | | (6,311,083) | | |
| Class W | | | | | (1,173,982) | | | | | | (1,869,031) | | |
| Return of capital: | | | | | | | | | | | | | |
| Class A | | | | | (681,504) | | | | | | (764,196) | | |
| Class C | | | | | (315,718) | | | | | | (285,148) | | |
| Class I | | | | | (12,906,476) | | | | | | (10,402,184) | | |
| Class P | | | | | (20) | | | | | | (17) | | |
| Class R | | | | | (132,830) | | | | | | (114,529) | | |
| Class R6 | | | | | (989,355) | | | | | | (796,329) | | |
| Class W | | | | | (232,114) | | | | | | (244,753) | | |
| Total distributions | | | | | (80,338,010) | | | | | | (98,005,390) | | |
| FROM CAPITAL SHARE TRANSACTIONS: | | | | | | | | | | | | | |
| Net proceeds from sale of shares | | | | | 936,075,526 | | | | | | 1,049,049,671 | | |
| Reinvestment of distributions | | | | | 71,575,250 | | | | | | 87,221,563 | | |
| | | | | | 1,007,650,776 | | | | | | 1,136,271,234 | | |
| Cost of shares redeemed | | | | | (858,047,976) | | | | | | (1,520,530,385) | | |
| Net increase (decrease) in net assets resulting from capital share transactions | | | | | 149,602,800 | | | | | | (384,259,151) | | |
| Net increase (decrease) in net assets | | | | | 10,965,831 | | | | | | (120,752,609) | | |
| NET ASSETS: | | | | | | | | | | | | | |
| Beginning of year or period | | | | | 2,456,142,180 | | | | | | 2,576,894,789 | | |
| End of year or period | | | | $ | 2,467,108,011 | | | | | $ | 2,456,142,180 | | |
| | | | | | | | | | Income (loss) from investment operations | | | | | | | | | Less Distributions | | | | | | Ratios to average net assets | | | Supplemental Data | | ||||||||||||||||||||||||||||||||||||||||||||||||||||||||||||||||||
| | | | Net asset value, beginning of year or period | | | Net investment income (loss) | | | Net realized and unrealized gain (loss) | | | Total from investment operations | | | From net investment income | | | From net realized gains | | | From return of capital | | | Total distributions | | | Payment by affiliate | | | Net asset value, end of year or period | | | Total Return(1) | | | Expenses before reductions/additions(2)(3) | | | Expenses net of fee waivers and/or recoupments if any(2)(3) | | | Expenses net of all reductions/additions(2)(3) | | | Net investment income (loss)(2)(3) | | | Net assets, end of year or period | | | Portfolio turnover rate | | ||||||||||||||||||||||||||||||||||||||||||
| Year or period ended | | | ($) | | | ($) | | | ($) | | | ($) | | | ($) | | | ($) | | | ($) | | | ($) | | | ($) | | | ($) | | | (%) | | | (%) | | | (%) | | | (%) | | | (%) | | | ($000’s) | | | (%) | | ||||||||||||||||||||||||||||||||||||||||||
| Voya GNMA Income Fund | | | | | | | | | | | | | | | | | | | | | | | | | | | | | | | | | | | | | | | | | | | | | | | | | | | | | | | | | | | | | | | | | | | | | | | | | | | | | | | | | | | | | | | | | | | | | | |
| Class A | | | | | | | | | | | | | | | | | | | | | | | | | | | | | | | | | | | | | | | | | | | | | | | | | | | | | | | | | | | | | | | | | | | | | | | | | | | | | | | | | | | | | | | | | | | | | | |
| 03-31-22 | | | | | 8.50 | | | | | | 0.04• | | | | | | (0.40) | | | | | | (0.36) | | | | | | 0.10 | | | | | | — | | | | | | 0.01 | | | | | | 0.11 | | | | | | — | | | | | | 8.03 | | | | | | (4.36) | | | | | | 0.84 | | | | 0.84 | | | 0.84 | | | 0.45 | | | | | 464,615 | | | | | | 539 | | |
| 03-31-21 | | | | | 8.58 | | | | | | 0.07• | | | | | | 0.02 | | | | | | 0.09 | | | | | | 0.14 | | | | | | — | | | | | | 0.03 | | | | | | 0.17 | | | | | | — | | | | | | 8.50 | | | | | | 1.08 | | | | | | 0.85 | | | | 0.84 | | | 0.84 | | | 0.82 | | | | | 591,762 | | | | | | 419 | | |
| 03-31-20 | | | | | 8.36 | | | | | | 0.18• | | | | | | 0.27 | | | | | | 0.45 | | | | | | 0.23 | | | | | | — | | | | | | — | | | | | | 0.23 | | | | | | — | | | | | | 8.58 | | | | | | 5.43 | | | | | | 0.93 | | | | 0.92 | | | 0.92 | | | 2.12 | | | | | 493,737 | | | | | | 421 | | |
| 03-31-19 | | | | | 8.25 | | | | | | 0.18 | | | | | | 0.13 | | | | | | 0.31 | | | | | | 0.20 | | | | | | — | | | | | | — | | | | | | 0.20 | | | | | | — | | | | | | 8.36 | | | | | | 3.85 | | | | | | 0.97 | | | | 0.95 | | | 0.95 | | | 2.25 | | | | | 394,763 | | | | | | 398 | | |
| 03-31-18 | | | | | 8.44 | | | | | | 0.14• | | | | | | (0.13) | | | | | | 0.01 | | | | | | 0.18 | | | | | | — | | | | | | 0.02 | | | | | | 0.20 | | | | | | — | | | | | | 8.25 | | | | | | 0.08 | | | | | | 0.95 | | | | 0.95 | | | 0.95 | | | 1.66 | | | | | 435,118 | | | | | | 367 | | |
| Class C | | | | | | | | | | | | | | | | | | | | | | | | | | | | | | | | | | | | | | | | | | | | | | | | | | | | | | | | | | | | | | | | | | | | | | | | | | | | | | | | | | | | | | | | | | | | | | |
| 03-31-22 | | | | | 8.46 | | | | | | (0.03)• | | | | | | (0.40) | | | | | | (0.43) | | | | | | 0.03 | | | | | | — | | | | | | 0.01 | | | | | | 0.04 | | | | | | — | | | | | | 7.99 | | | | | | (5.10) | | | | | | 1.59 | | | | 1.59 | | | 1.59 | | | (0.32) | | | | | 26,837 | | | | | | 539 | | |
| 03-31-21 | | | | | 8.53 | | | | | | 0.01• | | | | | | 0.03 | | | | | | 0.04 | | | | | | 0.08 | | | | | | — | | | | | | 0.03 | | | | | | 0.11 | | | | | | — | | | | | | 8.46 | | | | | | 0.44 | | | | | | 1.60 | | | | 1.59 | | | 1.59 | | | 0.09 | | | | | 48,911 | | | | | | 419 | | |
| 03-31-20 | | | | | 8.31 | | | | | | 0.12• | | | | | | 0.26 | | | | | | 0.38 | | | | | | 0.16 | | | | | | — | | | | | | — | | | | | | 0.16 | | | | | | — | | | | | | 8.53 | | | | | | 4.66 | | | | | | 1.68 | | | | 1.67 | | | 1.67 | | | 1.37 | | | | | 47,577 | | | | | | 421 | | |
| 03-31-19 | | | | | 8.21 | | | | | | 0.12 | | | | | | 0.12 | | | | | | 0.24 | | | | | | 0.14 | | | | | | — | | | | | | — | | | | | | 0.14 | | | | | | — | | | | | | 8.31 | | | | | | 2.96 | | | | | | 1.72 | | | | 1.70 | | | 1.70 | | | 1.49 | | | | | 62,769 | | | | | | 398 | | |
| 03-31-18 | | | | | 8.39 | | | | | | 0.06 | | | | | | (0.10) | | | | | | (0.04) | | | | | | 0.12 | | | | | | — | | | | | | 0.02 | | | | | | 0.14 | | | | | | — | | | | | | 8.21 | | | | | | (0.56) | | | | | | 1.70 | | | | 1.70 | | | 1.70 | | | 0.90 | | | | | 76,535 | | | | | | 367 | | |
| Class I | | | | | | | | | | | | | | | | | | | | | | | | | | | | | | | | | | | | | | | | | | | | | | | | | | | | | | | | | | | | | | | | | | | | | | | | | | | | | | | | | | | | | | | | | | | | | | |
| 03-31-22 | | | | | 8.52 | | | | | | 0.06• | | | | | | (0.41) | | | | | | (0.35) | | | | | | 0.12 | | | | | | — | | | | | | 0.01 | | | | | | 0.13 | | | | | | — | | | | | | 8.04 | | | | | | (4.18) | | | | | | 0.56 | | | | 0.54 | | | 0.54 | | | 0.74 | | | | | 834,623 | | | | | | 539 | | |
| 03-31-21 | | | | | 8.59 | | | | | | 0.09• | | | | | | 0.04 | | | | | | 0.13 | | | | | | 0.17 | | | | | | — | | | | | | 0.03 | | | | | | 0.20 | | | | | | — | | | | | | 8.52 | | | | | | 1.50 | | | | | | 0.57 | | | | 0.54 | | | 0.54 | | | 1.10 | | | | | 968,367 | | | | | | 419 | | |
| 03-31-20 | | | | | 8.37 | | | | | | 0.21• | | | | | | 0.26 | | | | | | 0.47 | | | | | | 0.25 | | | | | | — | | | | | | — | | | | | | 0.25 | | | | | | — | | | | | | 8.59 | | | | | | 5.75 | | | | | | 0.67 | | | | 0.62 | | | 0.62 | | | 2.42 | | | | | 604,194 | | | | | | 421 | | |
| 03-31-19 | | | | | 8.26 | | | | | | 0.21 | | | | | | 0.13 | | | | | | 0.34 | | | | | | 0.23 | | | | | | — | | | | | | — | | | | | | 0.23 | | | | | | — | | | | | | 8.37 | | | | | | 4.16 | | | | | | 0.71 | | | | 0.65 | | | 0.65 | | | 2.55 | | | | | 387,607 | | | | | | 398 | | |
| 03-31-18 | | | | | 8.45 | | | | | | 0.16• | | | | | | (0.13) | | | | | | 0.03 | | | | | | 0.20 | | | | | | — | | | | | | 0.02 | | | | | | 0.22 | | | | | | — | | | | | | 8.26 | | | | | | 0.37 | | | | | | 0.70 | | | | 0.65 | | | 0.65 | | | 1.95 | | | | | 350,326 | | | | | | 367 | | |
| Class P | | | | | | | | | | | | | | | | | | | | | | | | | | | | | | | | | | | | | | | | | | | | | | | | | | | | | | | | | | | | | | | | | | | | | | | | | | | | | | | | | | | | | | | | | | | | | | |
| 03-31-22 | | | | | 8.51 | | | | | | 0.10• | | | | | | (0.42) | | | | | | (0.32) | | | | | | 0.16 | | | | | | — | | | | | | 0.01 | | | | | | 0.17 | | | | | | — | | | | | | 8.02 | | | | | | (3.82) | | | | | | 1.21 | | | | 0.15 | | | 0.15 | | | 1.15 | | | | | 32 | | | | | | 539 | | |
| 05-22-20(4) - 03-31-21 | | | | | 8.62 | | | | | | 0.09• | | | | | | 0.00* | | | | | | 0.09 | | | | | | 0.17 | | | | | | — | | | | | | 0.03 | | | | | | 0.20 | | | | | | — | | | | | | 8.51 | | | | | | 1.03 | | | | | | 1.67 | | | | 0.15 | | | 0.15 | | | 1.28 | | | | | 33 | | | | | | 419 | | |
| Class R6 | | | | | | | | | | | | | | | | | | | | | | | | | | | | | | | | | | | | | | | | | | | | | | | | | | | | | | | | | | | | | | | | | | | | | | | | | | | | | | | | | | | | | | | | | | | | | | |
| 03-31-22 | | | | | 8.52 | | | | | | 0.07• | | | | | | (0.41) | | | | | | (0.34) | | | | | | 0.12 | | | | | | — | | | | | | 0.01 | | | | | | 0.13 | | | | | | — | | | | | | 8.05 | | | | | | (4.06) | | | | | | 0.48 | | | | 0.48 | | | 0.48 | | | 0.81 | | | | | 23,951 | | | | | | 539 | | |
| 07-31-20(4) - 03-31-21 | | | | | 8.58 | | | | | | 0.04• | | | | | | 0.02 | | | | | | 0.06 | | | | | | 0.09 | | | | | | — | | | | | | 0.03 | | | | | | 0.11 | | | | | | — | | | | | | 8.52 | | | | | | 0.64 | | | | | | 0.48 | | | | 0.48 | | | 0.48 | | | 0.62 | | | | | 41,739 | | | | | | 419 | | |
| Class W | | | | | | | | | | | | | | | | | | | | | | | | | | | | | | | | | | | | | | | | | | | | | | | | | | | | | | | | | | | | | | | | | | | | | | | | | | | | | | | | | | | | | | | | | | | | | | |
| 03-31-22 | | | | | 8.53 | | | | | | 0.06• | | | | | | (0.41) | | | | | | (0.35) | | | | | | 0.12 | | | | | | — | | | | | | 0.01 | | | | | | 0.13 | | | | | | — | | | | | | 8.05 | | | | | | (4.22) | | | | | | 0.59 | | | | 0.59 | | | 0.59 | | | 0.70 | | | | | 110,824 | | | | | | 539 | | |
| 03-31-21 | | | | | 8.60 | | | | | | 0.09• | | | | | | 0.04 | | | | | | 0.13 | | | | | | 0.17 | | | | | | — | | | | | | 0.03 | | | | | | 0.20 | | | | | | — | | | | | | 8.53 | | | | | | 1.45 | | | | | | 0.60 | | | | 0.59 | | | 0.59 | | | 1.02 | | | | | 179,530 | | | | | | 419 | | |
| 03-31-20 | | | | | 8.38 | | | | | | 0.20• | | | | | | 0.27 | | | | | | 0.47 | | | | | | 0.25 | | | | | | — | | | | | | — | | | | | | 0.25 | | | | | | — | | | | | | 8.60 | | | | | | 5.69 | | | | | | 0.68 | | | | 0.67 | | | 0.67 | | | 2.38 | | | | | 155,915 | | | | | | 421 | | |
| 03-31-19 | | | | | 8.27 | | | | | | 0.20• | | | | | | 0.13 | | | | | | 0.33 | | | | | | 0.22 | | | | | | — | | | | | | — | | | | | | 0.22 | | | | | | — | | | | | | 8.38 | | | | | | 4.11 | | | | | | 0.72 | | | | 0.70 | | | 0.70 | | | 2.47 | | | | | 91,383 | | | | | | 398 | | |
| 03-31-18 | | | | | 8.46 | | | | | | 0.16• | | | | | | (0.13) | | | | | | 0.03 | | | | | | 0.20 | | | | | | — | | | | | | 0.02 | | | | | | 0.22 | | | | | | — | | | | | | 8.27 | | | | | | 0.33 | | | | | | 0.70 | | | | 0.70 | | | 0.70 | | | 1.92 | | | | | 156,625 | | | | | | 367 | | |
| Voya High Yield Bond Fund | | | | | | | | | | | | | | | | | | | | | | | | | | | | | | | | | | | | | | | | | | | | | | | | | | | | | | | | | | | | | | | | | | | | | | | | | | | | | | | | | | | | | | | | | | | | | | |
| Class A | | | | | | | | | | | | | | | | | | | | | | | | | | | | | | | | | | | | | | | | | | | | | | | | | | | | | | | | | | | | | | | | | | | | | | | | | | | | | | | | | | | | | | | | | | | | | | |
| 03-31-22 | | | | | 7.99 | | | | | | 0.36• | | | | | | (0.40) | | | | | | (0.04) | | | | | | 0.37 | | | | | | 0.00* | | | | | | — | | | | | | 0.37 | | | | | | — | | | | | | 7.58 | | | | | | (0.62) | | | | | | 1.04 | | | | 1.04 | | | 1.04 | | | 4.55 | | | | | 45,842 | | | | | | 63 | | |
| 03-31-21 | | | | | 7.02 | | | | | | 0.38• | | | | | | 0.99 | | | | | | 1.37 | | | | | | 0.38 | | | | | | — | | | | | | 0.02 | | | | | | 0.40 | | | | | | — | | | | | | 7.99 | | | | | | 19.76 | | | | | | 1.04 | | | | 1.04 | | | 1.04 | | | 4.86 | | | | | 49,805 | | | | | | 78 | | |
| 03-31-20 | | | | | 7.86 | | | | | | 0.39• | | | | | | (0.81) | | | | | | (0.42) | | | | | | 0.42 | | | | | | — | | | | | | — | | | | | | 0.42 | | | | | | — | | | | | | 7.02 | | | | | | (5.76) | | | | | | 1.10 | | | | 1.10 | | | 1.10 | | | 4.97 | | | | | 44,060 | | | | | | 57 | | |
| 03-31-19 | | | | | 7.89 | | | | | | 0.43 | | | | | | (0.05) | | | | | | 0.38 | | | | | | 0.41 | | | | | | — | | | | | | — | | | | | | 0.41 | | | | | | — | | | | | | 7.86 | | | | | | 5.03 | | | | | | 1.10 | | | | 1.10 | | | 1.10 | | | 5.49 | | | | | 60,390 | | | | | | 33 | | |
| 03-31-18 | | | | | 8.11 | | | | | | 0.43 | | | | | | (0.22) | | | | | | 0.21 | | | | | | 0.43 | | | | | | — | | | | | | — | | | | | | 0.43 | | | | | | — | | | | | | 7.89 | | | | | | 2.52 | | | | | | 1.07 | | | | 1.07 | | | 1.07 | | | 5.27 | | | | | 52,994 | | | | | | 40 | | |
| | | | | | | | | | Income (loss) from investment operations | | | | | | | | | Less Distributions | | | | | | Ratios to average net assets | | | Supplemental Data | | ||||||||||||||||||||||||||||||||||||||||||||||||||||||||||||||||||
| | | | Net asset value, beginning of year or period | | | Net investment income (loss) | | | Net realized and unrealized gain (loss) | | | Total from investment operations | | | From net investment income | | | From net realized gains | | | From return of capital | | | Total distributions | | | Payment by affiliate | | | Net asset value, end of year or period | | | Total Return(1) | | | Expenses before reductions/additions(2)(3) | | | Expenses net of fee waivers and/or recoupments if any(2)(3) | | | Expenses net of all reductions/additions(2)(3) | | | Net investment income (loss)(2)(3) | | | Net assets, end of year or period | | | Portfolio turnover rate | | ||||||||||||||||||||||||||||||||||||||||||
| Year or period ended | | | ($) | | | ($) | | | ($) | | | ($) | | | ($) | | | ($) | | | ($) | | | ($) | | | ($) | | | ($) | | | (%) | | | (%) | | | (%) | | | (%) | | | (%) | | | ($000’s) | | | (%) | | ||||||||||||||||||||||||||||||||||||||||||
| Voya High Yield Bond Fund (continued) | | | | | | | | | | | | | | | | | | | | | | | | | | | | | | | | | | | | | | | | | | | | | | | | | | | | | | | | | | | | | | | | | | | | | | | | | | | | | | | | | | | | | | | | | | | | | | |
| Class C | | | | | | | | | | | | | | | | | | | | | | | | | | | | | | | | | | | | | | | | | | | | | | | | | | | | | | | | | | | | | | | | | | | | | | | | | | | | | | | | | | | | | | | | | | | | | | |
| 03-31-22 | | | | | 7.99 | | | | | | 0.30• | | | | | | (0.40) | | | | | | (0.10) | | | | | | 0.31 | | | | | | 0.00* | | | | | | — | | | | | | 0.31 | | | | | | — | | | | | | 7.58 | | | | | | (1.37) | | | | | | 1.79 | | | | 1.79 | | | 1.79 | | | 3.80 | | | | | 9,496 | | | | | | 63 | | |
| 03-31-21 | | | | | 7.02 | | | | | | 0.32• | | | | | | 0.99 | | | | | | 1.31 | | | | | | 0.32 | | | | | | — | | | | | | 0.02 | | | | | | 0.34 | | | | | | — | | | | | | 7.99 | | | | | | 18.88 | | | | | | 1.79 | | | | 1.79 | | | 1.79 | | | 4.12 | | | | | 10,150 | | | | | | 78 | | |
| 03-31-20 | | | | | 7.86 | | | | | | 0.34• | | | | | | (0.82) | | | | | | (0.48) | | | | | | 0.36 | | | | | | — | | | | | | — | | | | | | 0.36 | | | | | | — | | | | | | 7.02 | | | | | | (6.47) | | | | | | 1.85 | | | | 1.85 | | | 1.85 | | | 4.23 | | | | | 11,215 | | | | | | 57 | | |
| 03-31-19 | | | | | 7.89 | | | | | | 0.37 | | | | | | (0.05) | | | | | | 0.32 | | | | | | 0.35 | | | | | | — | | | | | | — | | | | | | 0.35 | | | | | | — | | | | | | 7.86 | | | | | | 4.24 | | | | | | 1.85 | | | | 1.85 | | | 1.85 | | | 4.77 | | | | | 15,945 | | | | | | 33 | | |
| 03-31-18 | | | | | 8.11 | | | | | | 0.37 | | | | | | (0.23) | | | | | | 0.14 | | | | | | 0.36 | | | | | | — | | | | | | — | | | | | | 0.36 | | | | | | — | | | | | | 7.89 | | | | | | 1.75 | | | | | | 1.82 | | | | 1.82 | | | 1.82 | | | 4.52 | | | | | 10,513 | | | | | | 40 | | |
| Class I | | | | | | | | | | | | | | | | | | | | | | | | | | | | | | | | | | | | | | | | | | | | | | | | | | | | | | | | | | | | | | | | | | | | | | | | | | | | | | | | | | | | | | | | | | | | | | |
| 03-31-22 | | | | | 7.98 | | | | | | 0.39• | | | | | | (0.40) | | | | | | (0.01) | | | | | | 0.40 | | | | | | 0.00* | | | | | | — | | | | | | 0.40 | | | | | | — | | | | | | 7.57 | | | | | | (0.28) | | | | | | 0.69 | | | | 0.69 | | | 0.69 | | | 4.90 | | | | | 193,357 | | | | | | 63 | | |
| 03-31-21 | | | | | 7.01 | | | | | | 0.40• | | | | | | 0.99 | | | | | | 1.39 | | | | | | 0.40 | | | | | | — | | | | | | 0.02 | | | | | | 0.42 | | | | | | — | | | | | | 7.98 | | | | | | 20.19 | | | | | | 0.69 | | | | 0.69 | | | 0.69 | | | 5.18 | | | | | 171,058 | | | | | | 78 | | |
| 03-31-20 | | | | | 7.85 | | | | | | 0.42• | | | | | | (0.81) | | | | | | (0.39) | | | | | | 0.45 | | | | | | — | | | | | | — | | | | | | 0.45 | | | | | | — | | | | | | 7.01 | | | | | | (5.45) | | | | | | 0.75 | | | | 0.75 | | | 0.75 | | | 5.32 | | | | | 68,214 | | | | | | 57 | | |
| 03-31-19 | | | | | 7.88 | | | | | | 0.47 | | | | | | (0.06) | | | | | | 0.41 | | | | | | 0.44 | | | | | | — | | | | | | — | | | | | | 0.44 | | | | | | — | | | | | | 7.85 | | | | | | 5.39 | | | | | | 0.75 | | | | 0.75 | | | 0.75 | | | 5.82 | | | | | 81,121 | | | | | | 33 | | |
| 03-31-18 | | | | | 8.10 | | | | | | 0.46 | | | | | | (0.23) | | | | | | 0.23 | | | | | | 0.45 | | | | | | — | | | | | | — | | | | | | 0.45 | | | | | | — | | | | | | 7.88 | | | | | | 2.87 | | | | | | 0.72 | | | | 0.72 | | | 0.72 | | | 5.62 | | | | | 149,279 | | | | | | 40 | | |
| Class P | | | | | | | | | | | | | | | | | | | | | | | | | | | | | | | | | | | | | | | | | | | | | | | | | | | | | | | | | | | | | | | | | | | | | | | | | | | | | | | | | | | | | | | | | | | | | | |
| 03-31-22 | | | | | 7.99 | | | | | | 0.44• | | | | | | (0.40) | | | | | | 0.04 | | | | | | 0.45 | | | | | | 0.00* | | | | | | — | | | | | | 0.45 | | | | | | — | | | | | | 7.58 | | | | | | 0.38 | | | | | | 0.63 | | | | 0.04 | | | 0.04 | | | 5.54 | | | | | 272,101 | | | | | | 63 | | |
| 03-31-21 | | | | | 7.02 | | | | | | 0.45• | | | | | | 1.00 | | | | | | 1.45 | | | | | | 0.46 | | | | | | — | | | | | | 0.02 | | | | | | 0.48 | | | | | | — | | | | | | 7.99 | | | | | | 20.96 | | | | | | 0.63 | | | | 0.04 | | | 0.04 | | | 5.83 | | | | | 313,306 | | | | | | 78 | | |
| 03-31-20 | | | | | 7.87 | | | | | | 0.47• | | | | | | (0.82) | | | | | | (0.35) | | | | | | 0.50 | | | | | | — | | | | | | — | | | | | | 0.50 | | | | | | — | | | | | | 7.02 | | | | | | (4.92) | | | | | | 0.69 | | | | 0.08 | | | 0.08 | | | 5.98 | | | | | 99,000 | | | | | | 57 | | |
| 03-31-19 | | | | | 7.90 | | | | | | 0.51 | | | | | | (0.05) | | | | | | 0.46 | | | | | | 0.49 | | | | | | — | | | | | | — | | | | | | 0.49 | | | | | | — | | | | | | 7.87 | | | | | | 6.05 | | | | | | 0.69 | | | | 0.08 | | | 0.08 | | | 6.51 | | | | | 120,464 | | | | | | 33 | | |
| 03-31-18 | | | | | 8.11 | | | | | | 0.51 | | | | | | (0.22) | | | | | | 0.29 | | | | | | 0.50 | | | | | | — | | | | | | — | | | | | | 0.50 | | | | | | — | | | | | | 7.90 | | | | | | 3.63 | | | | | | 0.66 | | | | 0.06 | | | 0.06 | | | 6.28 | | | | | 132,713 | | | | | | 40 | | |
| Class P3 | | | | | | | | | | | | | | | | | | | | | | | | | | | | | | | | | | | | | | | | | | | | | | | | | | | | | | | | | | | | | | | | | | | | | | | | | | | | | | | | | | | | | | | | | | | | | | |
| 03-31-22 | | | | | 8.00 | ��� | | | | | 0.44• | | | | | | (0.38) | | | | | | 0.06 | | | | | | 0.46 | | | | | | 0.00* | | | | | | — | | | | | | 0.46 | | | | | | — | | | | | | 7.60 | | | | | | 0.58 | | | | | | 0.63 | | | | 0.00* | | | 0.00* | | | 5.52 | | | | | 897 | | | | | | 63 | | |
| 03-31-21 | | | | | 7.02 | | | | | | 0.46• | | | | | | 1.00 | | | | | | 1.46 | | | | | | 0.46 | | | | | | — | | | | | | 0.02 | | | | | | 0.48 | | | | | | — | | | | | | 8.00 | | | | | | 21.18 | | | | | | 0.63 | | | | 0.00* | | | 0.00* | | | 5.88 | | | | | 8,814 | | | | | | 78 | | |
| 03-31-20 | | | | | 7.86 | | | | | | 0.46• | | | | | | (0.79) | | | | | | (0.33) | | | | | | 0.51 | | | | | | — | | | | | | — | | | | | | 0.51 | | | | | | — | | | | | | 7.02 | | | | | | (4.74) | | | | | | 0.74 | | | | 0.00* | | | 0.00* | | | 7.32 | | | | | 1,143 | | | | | | 57 | | |
| 06-01-18(4) - 03-31-19 | | | | | 7.85 | | | | | | 0.41• | | | | | | 0.00* | | | | | | 0.41 | | | | | | 0.40 | | | | | | — | | | | | | — | | | | | | 0.40 | | | | | | — | | | | | | 7.86 | | | | | | 5.36 | | | | | | 0.69 | | | | 0.00* | | | 0.00* | | | 6.25 | | | | | 3 | | | | | | 33 | | |
| Class R | | | | | | | | | | | | | | | | | | | | | | | | | | | | | | | | | | | | | | | | | | | | | | | | | | | | | | | | | | | | | | | | | | | | | | | | | | | | | | | | | | | | | | | | | | | | | | |
| 03-31-22 | | | | | 8.00 | | | | | | 0.34• | | | | | | (0.40) | | | | | | (0.06) | | | | | | 0.35 | | | | | | 0.00* | | | | | | — | | | | | | 0.35 | | | | | | — | | | | | | 7.59 | | | | | | (0.87) | | | | | | 1.29 | | | | 1.29 | | | 1.29 | | | 4.29 | | | | | 182 | | | | | | 63 | | |
| 03-31-21 | | | | | 7.03 | | | | | | 0.36• | | | | | | 0.99 | | | | | | 1.35 | | | | | | 0.36 | | | | | | — | | | | | | 0.02 | | | | | | 0.38 | | | | | | — | | | | | | 8.00 | | | | | | 19.44 | | | | | | 1.29 | | | | 1.29 | | | 1.29 | | | 4.61 | | | | | 547 | | | | | | 78 | | |
| 03-31-20 | | | | | 7.87 | | | | | | 0.37• | | | | | | (0.81) | | | | | | (0.44) | | | | | | 0.40 | | | | | | — | | | | | | — | | | | | | 0.40 | | | | | | — | | | | | | 7.03 | | | | | | (5.99) | | | | | | 1.35 | | | | 1.35 | | | 1.35 | | | 4.72 | | | | | 684 | | | | | | 57 | | |
| 03-31-19 | | | | | 7.90 | | | | | | 0.41 | | | | | | (0.05) | | | | | | 0.36 | | | | | | 0.39 | | | | | | — | | | | | | — | | | | | | 0.39 | | | | | | — | | | | | | 7.87 | | | | | | 4.76 | | | | | | 1.35 | | | | 1.35 | | | 1.35 | | | 5.25 | | | | | 1,185 | | | | | | 33 | | |
| 03-31-18 | | | | | 8.11 | | | | | | 0.41 | | | | | | (0.21) | | | | | | 0.20 | | | | | | 0.41 | | | | | | — | | | | | | — | | | | | | 0.41 | | | | | | — | | | | | | 7.90 | | | | | | 2.39 | | | | | | 1.32 | | | | 1.32 | | | 1.32 | | | 5.00 | | | | | 791 | | | | | | 40 | | |
| Class R6 | | | | | | | | | | | | | | | | | | | | | | | | | | | | | | | | | | | | | | | | | | | | | | | | | | | | | | | | | | | | | | | | | | | | | | | | | | | | | | | | | | | | | | | | | | | | | | |
| 03-31-22 | | | | | 8.00 | | | | | | 0.40• | | | | | | (0.41) | | | | | | (0.01) | | | | | | 0.40 | | | | | | 0.00* | | | | | | — | | | | | | 0.40 | | | | | | — | | | | | | 7.59 | | | | | | (0.21) | | | | | | 0.63 | | | | 0.63 | | | 0.63 | | | 4.91 | | | | | 44,338 | | | | | | 63 | | |
| 03-31-21 | | | | | 7.02 | | | | | | 0.41• | | | | | | 1.00 | | | | | | 1.41 | | | | | | 0.41 | | | | | | — | | | | | | 0.02 | | | | | | 0.43 | | | | | | — | | | | | | 8.00 | | | | | | 20.39 | | | | | | 0.63 | | | | 0.63 | | | 0.63 | | | 5.26 | | | | | 242,749 | | | | | | 78 | | |
| 03-31-20 | | | | | 7.87 | | | | | | 0.43• | | | | | | (0.82) | | | | | | (0.39) | | | | | | 0.46 | | | | | | — | | | | | | — | | | | | | 0.46 | | | | | | — | | | | | | 7.02 | | | | | | (5.49) | | | | | | 0.69 | | | | 0.69 | | | 0.69 | | | 5.44 | | | | | 125,036 | | | | | | 57 | | |
| 03-31-19 | | | | | 7.89 | | | | | | 0.45• | | | | | | (0.03) | | | | | | 0.42 | | | | | | 0.44 | | | | | | — | | | | | | — | | | | | | 0.44 | | | | | | — | | | | | | 7.87 | | | | | | 5.52 | | | | | | 0.69 | | | | 0.69 | | | 0.69 | | | 5.72 | | | | | 10,002 | | | | | | 33 | | |
| 03-31-18 | | | | | 8.10 | | | | | | 0.46 | | | | | | (0.22) | | | | | | 0.24 | | | | | | 0.45 | | | | | | — | | | | | | — | | | | | | 0.45 | | | | | | — | | | | | | 7.89 | | | | | | 2.97 | | | | | | 0.66 | | | | 0.66 | | | 0.66 | | | 5.67 | | | | | 117,343 | | | | | | 40 | | |
| Class W | | | | | | | | | | | | | | | | | | | | | | | | | | | | | | | | | | | | | | | | | | | | | | | | | | | | | | | | | | | | | | | | | | | | | | | | | | | | | | | | | | | | | | | | | | | | | | |
| 03-31-22 | | | | | 8.00 | | | | | | 0.38• | | | | | | (0.39) | | | | | | (0.01) | | | | | | 0.39 | | | | | | 0.00* | | | | | | — | | | | | | 0.39 | | | | | | — | | | | | | 7.60 | | | | | | (0.24) | | | | | | 0.79 | | | | 0.79 | | | 0.79 | | | 4.79 | | | | | 84,428 | | | | | | 63 | | |
| 03-31-21 | | | | | 7.03 | | | | | | 0.40• | | | | | | 0.99 | | | | | | 1.39 | | | | | | 0.40 | | | | | | — | | | | | | 0.02 | | | | | | 0.42 | | | | | | — | | | | | | 8.00 | | | | | | 20.03 | | | | | | 0.79 | | | | 0.79 | | | 0.79 | | | 5.09 | | | | | 145,963 | | | | | | 78 | | |
| 03-31-20 | | | | | 7.87 | | | | | | 0.41• | | | | | | (0.81) | | | | | | (0.40) | | | | | | 0.44 | | | | | | — | | | | | | — | | | | | | 0.44 | | | | | | — | | | | | | 7.03 | | | | | | (5.51) | | | | | | 0.85 | | | | 0.85 | | | 0.85 | | | 5.22 | | | | | 138,971 | | | | | | 57 | | |
| 03-31-19 | | | | | 7.90 | | | | | | 0.45 | | | | | | (0.05) | | | | | | 0.40 | | | | | | 0.43 | | | | | | — | | | | | | — | | | | | | 0.43 | | | | | | — | | | | | | 7.87 | | | | | | 5.29 | | | | | | 0.85 | | | | 0.85 | | | 0.85 | | | 5.74 | | | | | 98,192 | | | | | | 33 | | |
| 03-31-18 | | | | | 8.12 | | | | | | 0.45 | | | | | | (0.22) | | | | | | 0.23 | | | | | | 0.45 | | | | | | — | | | | | | — | | | | | | 0.45 | | | | | | — | | | | | | 7.90 | | | | | | 2.78 | | | | | | 0.82 | | | | 0.82 | | | 0.82 | | | 5.51 | | | | | 98,970 | | | | | | 40 | | |
| | | | | | | | | | Income (loss) from investment operations | | | | | | | | | Less Distributions | | | | | | Ratios to average net assets | | | Supplemental Data | | ||||||||||||||||||||||||||||||||||||||||||||||||||||||||||||||||||
| | | | Net asset value, beginning of year or period | | | Net investment income (loss) | | | Net realized and unrealized gain (loss) | | | Total from investment operations | | | From net investment income | | | From net realized gains | | | From return of capital | | | Total distributions | | | Payment by affiliate | | | Net asset value, end of year or period | | | Total Return(1) | | | Expenses before reductions/additions(2)(3) | | | Expenses net of fee waivers and/or recoupments if any(2)(3) | | | Expenses net of all reductions/additions(2)(3) | | | Net investment income (loss)(2)(3) | | | Net assets, end of year or period | | | Portfolio turnover rate | | ||||||||||||||||||||||||||||||||||||||||||
| Year or period ended | | | ($) | | | ($) | | | ($) | | | ($) | | | ($) | | | ($) | | | ($) | | | ($) | | | ($) | | | ($) | | | (%) | | | (%) | | | (%) | | | (%) | | | (%) | | | ($000’s) | | | (%) | | ||||||||||||||||||||||||||||||||||||||||||
| Voya Intermediate Bond Fund | | | | | | | | | | | | | | | | | | | | | | | | | | | | | | | | | | | | | | | | | | | | | | | | | | | | | | | | | | | | | | | | | | | | | | | | | | | | | | | | | | | | | | | | | | | | | | |
| Class A | | | | | | | | | | | | | | | | | | | | | | | | | | | | | | | | | | | | | | | | | | | | | | | | | | | | | | | | | | | | | | | | | | | | | | | | | | | | | | | | | | | | | | | | | | | | | �� | |
| 03-31-22 | | | | | 10.25 | | | | | | 0.20• | | | | | | (0.66) | | | | | | (0.46) | | | | | | 0.22 | | | | | | — | | | | | | 0.02 | | | | | | 0.24 | | | | | | — | | | | | | 9.55 | | | | | | (4.70) | | | | | | 0.69 | | | | 0.69 | | | 0.69 | | | 1.97 | | | | | 364,121 | | | | | | 222†† | | |
| 03-31-21 | | | | | 10.11 | | | | | | 0.25• | | | | | | 0.38 | | | | | | 0.63 | | | | | | 0.29 | | | | | | 0.17 | | | | | | 0.03 | | | | | | 0.49 | | | | | | — | | | | | | 10.25 | | | | | | 6.12 | | | | | | 0.70 | | | | 0.70 | | | 0.70 | | | 2.35 | | | | | 459,960 | | | | | | 159†† | | |
| 03-31-20 | | | | | 10.02 | | | | | | 0.30 | | | | | | 0.13 | | | | | | 0.43 | | | | | | 0.33 | | | | | | 0.01 | | | | | | — | | | | | | 0.34 | | | | | | — | | | | | | 10.11 | | | | | | 4.29 | | | | | | 0.69 | | | | 0.69 | | | 0.69 | | | 2.88 | | | | | 451,338 | | | | | | 253†† | | |
| 03-31-19 | | | | | 9.90 | | | | | | 0.30 | | | | | | 0.11 | | | | | | 0.41 | | | | | | 0.29 | | | | | | — | | | | | | — | | | | | | 0.29 | | | | | | — | | | | | | 10.02 | | | | | | 4.28 | | | | | | 0.70 | | | | 0.70 | | | 0.70 | | | 3.06 | | | | | 431,210 | | | | | | 329†† | | |
| 03-31-18 | | | | | 10.01 | | | | | | 0.27 | | | | | | (0.09) | | | | | | 0.18 | | | | | | 0.29 | | | | | | — | | | | | | — | | | | | | 0.29 | | | | | | — | | | | | | 9.90 | | | | | | 1.75 | | | | | | 0.67 | | | | 0.67 | | | 0.67 | | | 2.63 | | | | | 444,865 | | | | | | 482†† | | |
| Class C | | | | | | | | | | | | | | | | | | | | | | | | | | | | | | | | | | | | | | | | | | | | | | | | | | | | | | | | | | | | | | | | | | | | | | | | | | | | | | | | | | | | | | | | | | | | | | |
| 03-31-22 | | | | | 10.23 | | | | | | 0.12• | | | | | | (0.66) | | | | | | (0.54) | | | | | | 0.14 | | | | | | — | | | | | | 0.02 | | | | | | 0.16 | | | | | | — | | | | | | 9.53 | | | | | | (5.43) | | | | | | 1.44 | | | | 1.44 | | | 1.44 | | | 1.22 | | | | | 15,564 | | | | | | 222†† | | |
| 03-31-21 | | | | | 10.09 | | | | | | 0.17• | | | | | | 0.38 | | | | | | 0.55 | | | | | | 0.21 | | | | | | 0.17 | | | | | | 0.03 | | | | | | 0.41 | | | | | | — | | | | | | 10.23 | | | | | | 5.34 | | | | | | 1.45 | | | | 1.45 | | | 1.45 | | | 1.62 | | | | | 22,702 | | | | | | 159†† | | |
| 03-31-20 | | | | | 10.01 | | | | | | 0.21 | | | | | | 0.14 | | | | | | 0.35 | | | | | | 0.26 | | | | | | 0.01 | | | | | | — | | | | | | 0.27 | | | | | | — | | | | | | 10.09 | | | | | | 3.41 | | | | | | 1.44 | | | | 1.44 | | | 1.44 | | | 2.06 | | | | | 25,556 | | | | | | 253†† | | |
| 03-31-19 | | | | | 9.89 | | | | | | 0.23 | | | | | | 0.11 | | | | | | 0.34 | | | | | | 0.22 | | | | | | — | | | | | | — | | | | | | 0.22 | | | | | | — | | | | | | 10.01 | | | | | | 3.51 | | | | | | 1.45 | | | | 1.45 | | | 1.45 | | | 2.31 | | | | | 28,657 | | | | | | 329†† | | |
| 03-31-18 | | | | | 10.00 | | | | | | 0.19 | | | | | | (0.09) | | | | | | 0.10 | | | | | | 0.21 | | | | | | — | | | | | | — | | | | | | 0.21 | | | | | | — | | | | | | 9.89 | | | | | | 0.99 | | | | | | 1.42 | | | | 1.42 | | | 1.42 | | | 1.89 | | | | | 30,922 | | | | | | 482†† | | |
| Class I | | | | | | | | | | | | | | | | | | | | | | | | | | | | | | | | | | | | | | | | | | | | | | | | | | | | | | | | | | | | | | | | | | | | | | | | | | | | | | | | | | | | | | | | | | | | | | |
| 03-31-22 | | | | | 10.25 | | | | | | 0.24• | | | | | | (0.67) | | | | | | (0.43) | | | | | | 0.25 | | | | | | — | | | | | | 0.02 | | | | | | 0.27 | | | | | | — | | | | | | 9.55 | | | | | | (4.39) | | | | | | 0.35 | | | | 0.35 | | | 0.35 | | | 2.32 | | | | | 6,092,396 | | | | | | 222†† | | |
| 03-31-21 | | | | | 10.10 | | | | | | 0.29• | | | | | | 0.38 | | | | | | 0.67 | | | | | | 0.32 | | | | | | 0.17 | | | | | | 0.03 | | | | | | 0.52 | | | | | | — | | | | | | 10.25 | | | | | | 6.57 | | | | | | 0.34 | | | | 0.34 | | | 0.34 | | | 2.70 | | | | | 6,175,479 | | | | | | 159†† | | |
| 03-31-20 | | | | | 10.02 | | | | | | 0.32 | | | | | | 0.14 | | | | | | 0.46 | | | | | | 0.37 | | | | | | 0.01 | | | | | | — | | | | | | 0.38 | | | | | | — | | | | | | 10.10 | | | | | | 4.53 | | | | | | 0.36 | | | | 0.36 | | | 0.36 | | | 3.13 | | | | | 4,988,317 | | | | | | 253†† | | |
| 03-31-19 | | | | | 9.90 | | | | | | 0.33 | | | | | | 0.12 | | | | | | 0.45 | | | | | | 0.33 | | | | | | — | | | | | | — | | | | | | 0.33 | | | | | | — | | | | | | 10.02 | | | | | | 4.63 | | | | | | 0.36 | | | | 0.36 | | | 0.36 | | | 3.41 | | | | | 4,142,382 | | | | | | 329†† | | |
| 03-31-18 | | | | | 10.01 | | | | | | 0.30 | | | | | | (0.09) | | | | | | 0.21 | | | | | | 0.32 | | | | | | — | | | | | | — | | | | | | 0.32 | | | | | | — | | | | | | 9.90 | | | | | | 2.09 | | | | | | 0.35 | | | | 0.35 | | | 0.35 | | | 2.96 | | | | | 2,510,746 | | | | | | 482†† | | |
| Class P3 | | | | | | | | | | | | | | | | | | | | | | | | | | | | | | | | | | | | | | | | | | | | | | | | | | | | | | | | | | | | | | | | | | | | | | | | | | | | | | | | | | | | | | | | | | | | | | |
| 03-31-22 | | | | | 10.25 | | | | | | 0.27• | | | | | | (0.67) | | | | | | (0.40) | | | | | | 0.28 | | | | | | — | | | | | | 0.02 | | | | | | 0.30 | | | | | | — | | | | | | 9.55 | | | | | | (4.06) | | | | | | 0.29 | | | | 0.00* | | | 0.00* | | | 2.67 | | | | | 76,078 | | | | | | 222†† | | |
| 03-31-21 | | | | | 10.11 | | | | | | 0.32• | | | | | | 0.38 | | | | | | 0.70 | | | | | | 0.36 | | | | | | 0.17 | | | | | | 0.03 | | | | | | 0.56 | | | | | | — | | | | | | 10.25 | �� | | | | | 6.83 | | | | | | 0.30 | | | | 0.00* | | | 0.00* | | | 3.02 | | | | | 36,991 | | | | | | 159†† | | |
| 03-31-20 | | | | | 10.02 | | | | | | 0.36 | | | | | | 0.14 | | | | | | 0.50 | | | | | | 0.40 | | | | | | 0.01 | | | | | | — | | | | | | 0.41 | | | | | | — | | | | | | 10.11 | | | | | | 4.99 | | | | | | 0.30 | | | | 0.00* | | | 0.00* | | | 3.49 | | | | | 20,936 | | | | | | 253†† | | |
| 06-01-18(4) - 03-31-19 | | | | | 9.80 | | | | | | 0.31• | | | | | | 0.21 | | | | | | 0.52 | | | | | | 0.30 | | | | | | — | | | | | | — | | | | | | 0.30 | | | | | | — | | | | | | 10.02 | | | | | | 5.40 | | | | | | 0.31 | | | | 0.00* | | | 0.00* | | | 3.80 | | | | | 16,286 | | | | | | 329†† | | |
| Class R | | | | | | | | | | | | | | | | | | | | | | | | | | | | | | | | | | | | | | | | | | | | | | | | | | | | | | | | | | | | | | | | | | | | | | | | | | | | | | | | | | | | | | | | | | | | | | |
| 03-31-22 | | | | | 10.26 | | | | | | 0.18• | | | | | | (0.67) | | | | | | (0.49) | | | | | | 0.19 | | | | | | — | | | | | | 0.02 | | | | | | 0.21 | | | | | | — | | | | | | 9.56 | | | | | | (4.93) | | | | | | 0.94 | | | | 0.94 | | | 0.94 | | | 1.72 | | | | | 143,085 | | | | | | 222†† | | |
| 03-31-21 | | | | | 10.12 | | | | | | 0.22• | | | | | | 0.38 | | | | | | 0.60 | | | | | | 0.26 | | | | | | 0.17 | | | | | | 0.03 | | | | | | 0.46 | | | | | | — | | | | | | 10.26 | | | | | | 5.86 | | | | | | 0.95 | | | | 0.95 | | | 0.95 | | | 2.11 | | | | | 175,289 | | | | | | 159†† | | |
| 03-31-20 | | | | | 10.03 | | | | | | 0.26 | | | | | | 0.15 | | | | | | 0.41 | | | | | | 0.31 | | | | | | 0.01 | | | | | | — | | | | | | 0.32 | | | | | | — | | | | | | 10.12 | | | | | | 4.03 | | | | | | 0.94 | | | | 0.94 | | | 0.94 | | | 2.56 | | | | | 186,915 | | | | | | 253†† | | |
| 03-31-19 | | | | | 9.92 | | | | | | 0.28 | | | | | | 0.10 | | | | | | 0.38 | | | | | | 0.27 | | | | | | — | | | | | | — | | | | | | 0.27 | | | | | | — | | | | | | 10.03 | | | | | | 3.92 | | | | | | 0.95 | | | | 0.95 | | | 0.95 | | | 2.81 | | | | | 170,236 | | | | | | 329†† | | |
| 03-31-18 | | | | | 10.02 | | | | | | 0.24 | | | | | | (0.08) | | | | | | 0.16 | | | | | | 0.26 | | | | | | — | | | | | | — | | | | | | 0.26 | | | | | | — | | | | | | 9.92 | | | | | | 1.60 | | | | | | 0.92 | | | | 0.92 | | | 0.92 | | | 2.38 | | | | | 186,904 | | | | | | 482†† | | |
| Class R6 | | | | | | | | | | | | | | | | | | | | | | | | | | | | | | | | | | | | | | | | | | | | | | | | | | | | | | | | | | | | | | | | | | | | | | | | | | | | | | | | | | | | | | | | | | | | | | |
| 03-31-22 | | | | | 10.25 | | | | | | 0.24• | | | | | | (0.66) | | | | | | (0.42) | | | | | | 0.25 | | | | | | — | | | | | | 0.02 | | | | | | 0.27 | | | | | | — | | | | | | 9.56 | | | | | | (4.25) | | | | | | 0.29 | | | | 0.29 | | | 0.29 | | | 2.37 | | | | | 2,563,038 | | | | | | 222†† | | |
| 03-31-21 | | | | | 10.11 | | | | | | 0.29• | | | | | | 0.38 | | | | | | 0.67 | | | | | | 0.33 | | | | | | 0.17 | | | | | | 0.03 | | | | | | 0.53 | | | | | | — | | | | | | 10.25 | | | | | | 6.50 | | | | | | 0.30 | | | | 0.30 | | | 0.30 | | | 2.74 | | | | | 2,861,963 | | | | | | 159†† | | |
| 03-31-20 | | | | | 10.02 | | | | | | 0.33 | | | | | | 0.14 | | | | | | 0.47 | | | | | | 0.37 | | | | | | 0.01 | | | | | | — | | | | | | 0.38 | | | | | | — | | | | | | 10.11 | | | | | | 4.67 | | | | | | 0.30 | | | | 0.30 | | | 0.30 | | | 3.19 | | | | | 2,306,857 | | | | | | 253†† | | |
| 03-31-19 | | | | | 9.90 | | | | | | 0.34 | | | | | | 0.11 | | | | | | 0.45 | | | | | | 0.33 | | | | | | — | | | | | | — | | | | | | 0.33 | | | | | | — | | | | | | 10.02 | | | | | | 4.65 | | | | | | 0.31 | | | | 0.31 | | | 0.31 | | | 3.46 | | | | | 1,851,627 | | | | | | 329†† | | |
| 03-31-18 | | | | | 10.00 | | | | | | 0.31 | | | | | | (0.09) | | | | | | 0.22 | | | | | | 0.32 | | | | | | — | | | | | | — | | | | | | 0.32 | | | | | | — | | | | | | 9.90 | | | | | | 2.20 | | | | | | 0.31 | | | | 0.31 | | | 0.31 | | | 3.00 | | | | | 1,514,795 | | | | | | 482†† | | |
| Class W | | | | | | | | | | | | | | | | | | | | | | | | | | | | | | | | | | | | | | | | | | | | | | | | | | | | | | | | | | | | | | | | | | | | | | | | | | | | | | | | | | | | | | | | | | | | | | |
| 03-31-22 | | | | | 10.24 | | | | | | 0.23• | | | | | | (0.67) | | | | | | (0.44) | | | | | | 0.24 | | | | | | — | | | | | | 0.02 | | | | | | 0.26 | | | | | | — | | | | | | 9.54 | | | | | | (4.47) | | | | | | 0.44 | | | | 0.44 | | | 0.44 | | | 2.22 | | | | | 174,769 | | | | | | 222†† | | |
| 03-31-21 | | | | | 10.10 | | | | | | 0.27• | | | | | | 0.38 | | | | | | 0.65 | | | | | | 0.31 | | | | | | 0.17 | | | | | | 0.03 | | | | | | 0.51 | | | | | | — | | | | | | 10.24 | | | | | | 6.39 | | | | | | 0.45 | | | | 0.45 | | | 0.45 | | | 2.59 | | | | | 268,634 | | | | | | 159†† | | |
| 03-31-20 | | | | | 10.01 | | | | | | 0.32 | | | | | | 0.14 | | | | | | 0.46 | | | | | | 0.36 | | | | | | 0.01 | | | | | | — | | | | | | 0.37 | | | | | | — | | | | | | 10.10 | | | | | | 4.56 | | | | | | 0.44 | | | | 0.44 | | | 0.44 | | | 3.05 | | | | | 249,060 | | | | | | 253†† | | |
| 03-31-19 | | | | | 9.89 | | | | | | 0.32• | | | | | | 0.12 | | | | | | 0.44 | | | | | | 0.32 | | | | | | — | | | | | | — | | | | | | 0.32 | | | | | | — | | | | | | 10.01 | | | | | | 4.55 | | | | | | 0.45 | | | | 0.45 | | | 0.45 | | | 3.25 | | | | | 174,570 | | | | | | 329†† | | |
| 03-31-18 | | | | | 10.00 | | | | | | 0.29 | | | | | | (0.09) | | | | | | 0.20 | | | | | | 0.31 | | | | | | — | | | | | | — | | | | | | 0.31 | | | | | | — | | | | | | 9.89 | | | | | | 2.00 | | | | | | 0.42 | | | | 0.42 | | | 0.42 | | | 2.89 | | | | | 760,186 | | | | | | 482†† | | |
| | | | | | | | | | Income (loss) from investment operations | | | | | | | | | Less Distributions | | | | | | Ratios to average net assets | | | Supplemental Data | | ||||||||||||||||||||||||||||||||||||||||||||||||||||||||||||||||||
| | | | Net asset value, beginning of year or period | | | Net investment income (loss) | | | Net realized and unrealized gain (loss) | | | Total from investment operations | | | From net investment income | | | From net realized gains | | | From return of capital | | | Total distributions | | | Payment by affiliate | | | Net asset value, end of year or period | | | Total Return(1) | | | Expenses before reductions/additions(2)(3) | | | Expenses net of fee waivers and/or recoupments if any(2)(3) | | | Expenses net of all reductions/additions(2)(3) | | | Net investment income (loss)(2)(3) | | | Net assets, end of year or period | | | Portfolio turnover rate | | ||||||||||||||||||||||||||||||||||||||||||
| Year or period ended | | | ($) | | | ($) | | | ($) | | | ($) | | | ($) | | | ($) | | | ($) | | | ($) | | | ($) | | | ($) | | | (%) | | | (%) | | | (%) | | | (%) | | | (%) | | | ($000’s) | | | (%) | | ||||||||||||||||||||||||||||||||||||||||||
| Voya Short Term Bond Fund | | | | | | | | | | | | | | | | | | | | | | | | | | | | | | | | | | | | | | | | | | | | | | | | | | | | | | | | | | | | | | | | | | | | | | | | | | | | | | | | | | | | | | | | | | | | | | |
| Class A | | | | | | | | | | | | | | | | | | | | | | | | | | | | | | | | | | | | | | | | | | | | | | | | | | | | | | | | | | | | | | | | | | | | | | | | | | | | | | | | | | | | | | | | | | | | | | |
| 03-31-22 | | | | | 9.98 | | | | | | 0.09• | | | | | | (0.36) | | | | | | (0.27) | | | | | | 0.10 | | | | | | — | | | | | | 0.03 | | | | | | 0.13 | | | | | | — | | | | | | 9.58 | | | | | | (2.81) | | | | | | 0.64 | | | | 0.63 | | | 0.63 | | | 0.93 | | | | | 15,351 | | | | | | 250 | | |
| 03-31-21 | | | | | 9.55 | | | | | | 0.16• | | | | | | 0.46 | | | | | | 0.62 | | | | | | 0.17 | | | | | | — | | | | | | 0.02 | | | | | | 0.19 | | | | | | — | | | | | | 9.98 | | | | | | 6.48 | | | | | | 0.68 | | | | 0.60 | | | 0.60 | | | 1.62 | | | | | 19,499 | | | | | | 145 | | |
| 03-31-20 | | | | | 9.77 | | | | | | 0.22• | | | | | | (0.23) | | | | | | (0.01) | | | | | | 0.21 | | | | | | — | | | | | | — | | | | | | 0.21 | | | | | | — | | | | | | 9.55 | | | | | | (0.14) | | | | | | 0.72 | | | | 0.65 | | | 0.65 | | | 2.19 | | | | | 6,907 | | | | | | 192 | | |
| 03-31-19 | | | | | 9.72 | | | | | | 0.21• | | | | | | 0.06 | | | | | | 0.27 | | | | | | 0.22 | | | | | | — | | | | | | — | | | | | | 0.22 | | | | | | — | | | | | | 9.77 | | | | | | 2.85 | | | | | | 0.93 | | | | 0.77 | | | 0.77 | | | 2.14 | | | | | 14,247 | | | | | | 137 | | |
| 03-31-18 | | | | | 9.84 | | | | | | 0.16 | | | | | | (0.12) | | | | | | 0.04 | | | | | | 0.16 | | | | | | — | | | | | | — | | | | | | 0.16 | | | | | | — | | | | | | 9.72 | | | | | | 0.35 | | | | | | 0.88 | | | | 0.77 | | | 0.77 | | | 1.55 | | | | | 2,618 | | | | | | 165 | | |
| Class C | | | | | | | | | | | | | | | | | | | | | | | | | | | | | | | | | | | | | | | | | | | | | | | | | | | | | | | | | | | | | | | | | | | | | | | | | | | | | | | | | | | | | | | | | | | | | | |
| 03-31-22 | | | | | 9.98 | | | | | | 0.02• | | | | | | (0.37) | | | | | | (0.35) | | | | | | 0.02 | | | | | | — | | | | | | 0.03 | | | | | | 0.05 | | | | | | — | | | | | | 9.58 | | | | | | (3.54) | | | | | | 1.39 | | | | 1.38 | | | 1.38 | | | 0.18 | | | | | 442 | | | | | | 250 | | |
| 03-31-21 | | | | | 9.55 | | | | | | 0.09• | | | | | | 0.45 | | | | | | 0.54 | | | | | | 0.09 | | | | | | — | | | | | | 0.02 | | | | | | 0.11 | | | | | | — | | | | | | 9.98 | | | | | | 5.69 | | | | | | 1.43 | | | | 1.35 | | | 1.35 | | | 0.89 | | | | | 548 | | | | | | 145 | | |
| 03-31-20 | | | | | 9.76 | | | | | | 0.14• | | | | | | (0.21) | | | | | | (0.07) | | | | | | 0.14 | | | | | | — | | | | | | — | | | | | | 0.14 | | | | | | — | | | | | | 9.55 | | | | | | (0.78) | | | | | | 1.47 | | | | 1.40 | | | 1.40 | | | 1.41 | | | | | 335 | | | | | | 192 | | |
| 03-31-19 | | | | | 9.72 | | | | | | 0.12 | | | | | | 0.07 | | | | | | 0.19 | | | | | | 0.15 | | | | | | — | | | | | | — | | | | | | 0.15 | | | | | | — | | | | | | 9.76 | | | | | | 1.97 | | | | | | 1.68 | | | | 1.52 | | | 1.52 | | | 1.38 | | | | | 1,038 | | | | | | 137 | | |
| 03-31-18 | | | | | 9.84 | | | | | | 0.08 | | | | | | (0.12) | | | | | | (0.04) | | | | | | 0.08 | | | | | | — | | | | | | — | | | | | | 0.08 | | | | | | — | | | | | | 9.72 | | | | | | (0.40) | | | | | | 1.63 | | | | 1.52 | | | 1.52 | | | 0.81 | | | | | 728 | | | | | | 165 | | |
| Class I | | | | | | | | | | | | | | | | | | | | | | | | | | | | | | | | | | | | | | | | | | | | | | | | | | | | | | | | | | | | | | | | | | | | | | | | | | | | | | | | | | | | | | | | | | | | | | |
| 03-31-22 | | | | | 9.97 | | | | | | 0.12• | | | | | | (0.36) | | | | | | (0.24) | | | | | | 0.13 | | | | | | — | | | | | | 0.03 | | | | | | 0.16 | | | | | | — | | | | | | 9.57 | | | | | | (2.52) | | | | | | 0.40 | | | | 0.35 | | | 0.35 | | | 1.19 | | | | | 31,691 | | | | | | 250 | | |
| 03-31-21 | | | | | 9.54 | | | | | | 0.19• | | | | | | 0.46 | | | | | | 0.65 | | | | | | 0.20 | | | | | | — | | | | | | 0.02 | | | | | | 0.22 | | | | | | — | | | | | | 9.97 | | | | | | 6.81 | | | | | | 0.48 | | | | 0.35 | | | 0.35 | | | 1.91 | | | | | 16,762 | | | | | | 145 | | |
| 03-31-20 | | | | | 9.76 | | | | | | 0.24• | | | | | | (0.22) | | | | | | 0.02 | | | | | | 0.24 | | | | | | — | | | | | | — | | | | | | 0.24 | | | | | | — | | | | | | 9.54 | | | | | | 0.16 | | | | | | 0.57 | | | | 0.40 | | | 0.40 | | | 2.43 | | | | | 11,925 | | | | | | 192 | | |
| 03-31-19 | | | | | 9.71 | | | | | | 0.23 | | | | | | 0.07 | | | | | | 0.30 | | | | | | 0.25 | | | | | | — | | | | | | — | | | | | | 0.25 | | | | | | — | | | | | | 9.76 | | | | | | 3.15 | | | | | | 0.78 | | | | 0.50 | | | 0.50 | | | 2.37 | | | | | 9,283 | | | | | | 137 | | |
| 03-31-18 | | | | | 9.84 | | | | | | 0.18 | | | | | | (0.13) | | | | | | 0.05 | | | | | | 0.18 | | | | | | — | | | | | | — | | | | | | 0.18 | | | | | | — | | | | | | 9.71 | | | | | | 0.55 | | | | | | 0.71 | | | | 0.51 | | | 0.51 | | | 1.84 | | | | | 9,578 | | | | | | 165 | | |
| Class P2 | | | | | | | | | | | | | | | | | | | | | | | | | | | | | | | | | | | | | | | | | | | | | | | | | | | | | | | | | | | | | | | | | | | | | | | | | | | | | | | | | | | | | | | | | | | | | | |
| 03-31-22 | | | | | 9.94 | | | | | | 0.14• | | | | | | (0.37) | | | | | | (0.23) | | | | | | 0.21 | | | | | | — | | | | | | 0.03 | | | | | | 0.24 | | | | | | — | | | | | | 9.47 | | | | | | (2.37) | | | | | | 0.31 | | | | 0.15 | | | 0.15 | | | 1.43 | | | | | 26,650 | | | | | | 250 | | |
| 03-31-21 | | | | | 9.54 | | | | | | 0.21• | | | | | | 0.46 | | | | | | 0.67 | | | | | | 0.25 | | | | | | — | | | | | | 0.02 | | | | | | 0.27 | | | | | | — | | | | | | 9.94 | | | | | | 7.03 | | | | | | 0.38 | | | | 0.15 | | | 0.15 | | | 2.11 | | | | | 95,093 | | | | | | 145 | | |
| 10-22-19(4) - 03-31-20 | | | | | 9.88 | | | | | | 0.26• | | | | | | (0.47) | | | | | | (0.21) | | | | | | 0.13 | | | | | | — | | | | | | — | | | | | | 0.13 | | | | | | — | | | | | | 9.54 | | | | | | (2.16) | | | | | | 0.36 | | | | 0.15 | | | 0.15 | | | 2.67 | | | | | 49,296 | | | | | | 192 | | |
| Class P3 | | | | | | | | | | | | | | | | | | | | | | | | | | | | | | | | | | | | | | | | | | | | | | | | | | | | | | | | | | | | | | | | | | | | | | | | | | | | | | | | | | | | | | | | | | | | | | |
| 03-31-22 | | | | | 9.95 | | | | | | 0.15• | | | | | | (0.36) | | | | | | (0.21) | | | | | | 0.18 | | | | | | — | | | | | | 0.03 | | | | | | 0.21 | | | | | | — | | | | | | 9.53 | | | | | | (2.24) | | | | | | 0.31 | | | | 0.00* | | | 0.00* | | | 1.54 | | | | | 5,805 | | | | | | 250 | | |
| 03-31-21 | | | | | 9.54 | | | | | | 0.23• | | | | | | 0.45 | | | | | | 0.68 | | | | | | 0.25 | | | | | | — | | | | | | 0.02 | | | | | | 0.27 | | | | | | — | | | | | | 9.95 | | | | | | 7.13 | | | | | | 0.38 | | | | 0.00* | | | 0.00* | | | 2.30 | | | | | 3,324 | | | | | | 145 | | |
| 03-31-20 | | | | | 9.76 | | | | | | 0.28• | | | | | | (0.21) | | | | | | 0.07 | | | | | | 0.29 | | | | | | — | | | | | | — | | | | | | 0.29 | | | | | | — | | | | | | 9.54 | | | | | | 0.67 | | | | | | 0.42 | | | | 0.00* | | | 0.00* | | | 2.83 | | | | | 5,288 | | | | | | 192 | | |
| 06-01-18(4) - 03-31-19 | | | | | 9.71 | | | | | | 0.23• | | | | | | 0.08 | | | | | | 0.31 | | | | | | 0.26 | | | | | | — | | | | | | — | | | | | | 0.26 | | | | | | — | | | | | | 9.76 | | | | | | 3.22 | | | | | | 0.63 | | | | 0.00* | | | 0.00* | | | 2.90 | | | | | 3,341 | | | | | | 137 | | |
| Class R | | | | | | | | | | | | | | | | | | | | | | | | | | | | | | | | | | | | | | | | | | | | | | | | | | | | | | | | | | | | | | | | | | | | | | | | | | | | | | | | | | | | | | | | | | | | | | |
| 03-31-22 | | | | | 10.01 | | | | | | 0.07• | | | | | | (0.37) | | | | | | (0.30) | | | | | | 0.07 | | | | | | — | | | | | | 0.03 | | | | | | 0.10 | | | | | | — | | | | | | 9.61 | | | | | | (3.04) | | | | | | 0.89 | | | | 0.88 | | | 0.88 | | | 0.66 | | | | | 17 | | | | | | 250 | | |
| 03-31-21 | | | | | 9.57 | | | | | | 0.14• | | | | | | 0.46 | | | | | | 0.60 | | | | | | 0.14 | | | | | | — | | | | | | 0.02 | | | | | | 0.16 | | | | | | — | | | | | | 10.01 | | | | | | 6.32 | | | | | | 0.93 | | | | 0.85 | | | 0.85 | | | 1.39 | | | | | 8 | | | | | | 145 | | |
| 03-31-20 | | | | | 9.77 | | | | | | 0.19• | | | | | | (0.20) | | | | | | (0.01) | | | | | | 0.19 | | | | | | — | | | | | | — | | | | | | 0.19 | | | | | | — | | | | | | 9.57 | | | | | | (0.18) | | | | | | 0.97 | | | | 0.90 | | | 0.90 | | | 1.93 | | | | | 3 | | | | | | 192 | | |
| 03-31-19 | | | | | 9.72 | | | | | | 0.18 | | | | | | 0.07 | | | | | | 0.25 | | | | | | 0.20 | | | | | | — | | | | | | — | | | | | | 0.20 | | | | | | — | | | | | | 9.77 | | | | | | 2.60 | | | | | | 1.18 | | | | 1.02 | | | 1.02 | | | 1.85 | | | | | 3 | | | | | | 137 | | |
| 03-31-18 | | | | | 9.84 | | | | | | 0.13 | | | | | | (0.12) | | | | | | 0.01 | | | | | | 0.13 | | | | | | — | | | | | | — | | | | | | 0.13 | | | | | | — | | | | | | 9.72 | | | | | | 0.10 | | | | | | 1.13 | | | | 1.02 | | | 1.02 | | | 1.33 | | | | | 3 | | | | | | 165 | | |
| Class R6 | | | | | | | | | | | | | | | | | | | | | | | | | | | | | | | | | | | | | | | | | | | | | | | | | | | | | | | | | | | | | | | | | | | | | | | | | | | | | | | | | | | | | | | | | | | | | | |
| 03-31-22 | | | | | 9.98 | | | | | | 0.12• | | | | | | (0.36) | | | | | | (0.24) | | | | | | 0.13 | | | | | | — | | | | | | 0.03 | | | | | | 0.16 | | | | | | — | | | | | | 9.58 | | | | | | (2.49) | | | | | | 0.31 | | | | 0.30 | | | 0.30 | | | 1.18 | | | | | 372,853 | | | | | | 250 | | |
| 03-31-21 | | | | | 9.55 | | | | | | 0.20• | | | | | | 0.45 | | | | | | 0.65 | | | | | | 0.20 | | | | | | — | | | | | | 0.02 | | | | | | 0.22 | | | | | | — | | | | | | 9.98 | | | | | | 6.83 | | | | | | 0.38 | | | | 0.30 | | | 0.30 | | | 2.01 | | | | | 51,298 | | | | | | 145 | | |
| 03-31-20 | | | | | 9.76 | | | | | | 0.24• | | | | | | (0.21) | | | | | | 0.03 | | | | | | 0.24 | | | | | | — | | | | | | — | | | | | | 0.24 | | | | | | — | | | | | | 9.55 | | | | | | 0.29 | | | | | | 0.42 | | | | 0.35 | | | 0.35 | | | 2.47 | | | | | 98,380 | | | | | | 192 | | |
| 03-31-19 | | | | | 9.72 | | | | | | 0.23 | | | | | | 0.06 | | | | | | 0.29 | | | | | | 0.25 | | | | | | — | | | | | | — | | | | | | 0.25 | | | | | | — | | | | | | 9.76 | | | | | | 3.08 | | | | | | 0.63 | | | | 0.47 | | | 0.47 | | | 2.40 | | | | | 86,628 | | | | | | 137 | | |
| 03-31-18 | | | | | 9.84 | | | | | | 0.18 | | | | | | (0.11) | | | | | | 0.07 | | | | | | 0.19 | | | | | | — | | | | | | — | | | | | | 0.19 | | | | | | — | | | | | | 9.72 | | | | | | 0.68 | | | | | | 0.59 | | | | 0.48 | | | 0.48 | | | 1.85 | | | | | 93,094 | | | | | | 165 | | |
| | | | | | | | | | Income (loss) from investment operations | | | | | | | | | Less Distributions | | | | | | Ratios to average net assets | | | Supplemental Data | | ||||||||||||||||||||||||||||||||||||||||||||||||||||||||||||||||||
| | | | Net asset value, beginning of year or period | | | Net investment income (loss) | | | Net realized and unrealized gain (loss) | | | Total from investment operations | | | From net investment income | | | From net realized gains | | | From return of capital | | | Total distributions | | | Payment by affiliate | | | Net asset value, end of year or period | | | Total Return(1) | | | Expenses before reductions/additions(2)(3) | | | Expenses net of fee waivers and/or recoupments if any(2)(3) | | | Expenses net of all reductions/additions(2)(3) | | | Net investment income (loss)(2)(3) | | | Net assets, end of year or period | | | Portfolio turnover rate | | ||||||||||||||||||||||||||||||||||||||||||
| Year or period ended | | | ($) | | | ($) | | | ($) | | | ($) | | | ($) | | | ($) | | | ($) | | | ($) | | | ($) | | | ($) | | | (%) | | | (%) | | | (%) | | | (%) | | | (%) | | | ($000’s) | | | (%) | | ||||||||||||||||||||||||||||||||||||||||||
| Voya Short Term Bond Fund (continued) | | | | | | | | | | | | | | | | | | | | | | | | | | | | | | | | | | | | | | | | | | | | | | | | | | | | | | | | | | | | | | | | | | | | | | | | | | | | | | | | | | | | | | | | | | | | | | |
| Class W | | | | | | | | | | | | | | | | | | | | | | | | | | | | | | | | | | | | | | | | | | | | | | | | | | | | | | | | | | | | | | | | | | | | | | | | | | | | | | | | | | | | | | | | | | | | | | |
| 03-31-22 | | | | | 10.01 | | | | | | 0.12• | | | | | | (0.38) | | | | | | (0.26) | | | | | | 0.12 | | | | | | — | | | | | | 0.03 | | | | | | 0.15 | | | | | | — | | | | | | 9.60 | | | | | | (2.65) | | | | | | 0.39 | | | | 0.38 | | | 0.38 | | | 1.18 | | | | | 19,721 | | | | | | 250 | | |
| 03-31-21 | | | | | 9.57 | | | | | | 0.18• | | | | | | 0.47 | | | | | | 0.65 | | | | | | 0.19 | | | | | | — | | | | | | 0.02 | | | | | | 0.21 | | | | | | — | | | | | | 10.01 | | | | | | 6.84 | | | | | | 0.43 | | | | 0.35 | | | 0.35 | | | 1.85 | | | | | 21,981 | | | | | | 145 | | |
| 03-31-20 | | | | | 9.79 | | | | | | 0.24• | | | | | | (0.22) | | | | | | 0.02 | | | | | | 0.24 | | | | | | — | | | | | | — | | | | | | 0.24 | | | | | | — | | | | | | 9.57 | | | | | | 0.12 | | | | | | 0.47 | | | | 0.40 | | | 0.40 | | | 2.41 | | | | | 97 | | | | | | 192 | | |
| 03-31-19 | | | | | 9.72 | | | | | | 0.22 | | | | | | 0.10 | | | | | | 0.32 | | | | | | 0.25 | | | | | | — | | | | | | — | | | | | | 0.25 | | | | | | — | | | | | | 9.79 | | | | | | 3.31 | | | | | | 0.68 | | | | 0.52 | | | 0.52 | | | 2.38 | | | | | 523 | | | | | | 137 | | |
| 03-31-18 | | | | | 9.85 | | | | | | 0.18• | | | | | | (0.13) | | | | | | 0.05 | | | | | | 0.18 | | | | | | — | | | | | | — | | | | | | 0.18 | | | | | | — | | | | | | 9.72 | | | | | | 0.50 | | | | | | 0.63 | | | | 0.52 | | | 0.52 | | | 1.83 | | | | | 79 | | | | | | 165 | | |
| Voya Strategic Income Opportunities Fund | | | | | | | | | | | | | | | | | | | | | | | | | | | | | | | | | | | | | | | | | | | | | | | | | | | | | | | | | | | | | | | | | | | | | | | | | | | | | | | | | | | | | | | | | | | | | | |
| Class A | | | | | | | | | | | | | | | | | | | | | | | | | | | | | | | | | | | | | | | | | | | | | | | | | | | | | | | | | | | | | | | | | | | | | | | | | | | | | | | | | | | | | | | | | | | | | | |
| 03-31-22 | | | | | 10.12 | | | | | | 0.28• | | | | | | (0.52) | | | | | | (0.24) | | | | | | 0.23 | | | | | | — | | | | | | 0.06 | | | | | | 0.29 | | | | | | — | | | | | | 9.59 | | | | | | (2.47) | | | | | | 0.85 | | | | 0.85 | | | 0.85 | | | 2.81 | | | | | 104,975 | | | | | | 76 | | |
| 03-31-21 | | | | | 9.12 | | | | | | 0.32• | | | | | | 1.03 | | | | | | 1.35 | | | | | | 0.30 | | | | | | — | | | | | | 0.05 | | | | | | 0.35 | | | | | | — | | | | | | 10.12 | | | | | | 14.99 | | | | | | 0.88 | | | | 0.88 | | | 0.88 | | | 3.26 | | | | | 147,463 | | | | | | 45 | | |
| 03-31-20 | | | | | 10.15 | | | | | | 0.35• | | | | | | (0.97) | | | | | | (0.62) | | | | | | 0.41 | | | | | | — | | | | | | — | | | | | | 0.41 | | | | | | — | | | | | | 9.12 | | | | | | (6.48) | | | | | | 0.86 | | | | 0.86 | | | 0.86 | | | 3.45 | | | | | 146,080 | | | | | | 167 | | |
| 03-31-19 | | | | | 10.16 | | | | | | 0.37 | | | | | | 0.03 | | | | | | 0.40 | | | | | | 0.41 | | | | | | — | | | | | | — | | | | | | 0.41 | | | | | | — | | | | | | 10.15 | | | | | | 3.99 | | | | | | 0.94 | | | | 0.94 | | | 0.94 | | | 3.63 | | | | | 128,224 | | | | | | 155 | | |
| 03-31-18 | | | | | 10.12 | | | | | | 0.37 | | | | | | 0.03 | | | | | | 0.40 | | | | | | 0.36 | | | | | | — | | | | | | — | | | | | | 0.36 | | | | | | — | | | | | | 10.16 | | | | | | 4.01 | | | | | | 1.13 | | | | 1.05 | | | 1.05 | | | 3.52 | | | | | 30,921 | | | | | | 103 | | |
| Class C | | | | | | | | | | | | | | | | | | | | | | | | | | | | | | | | | | | | | | | | | | | | | | | | | | | | | | | | | | | | | | | | | | | | | | | | | | | | | | | | | | | | | | | | | | | | | | |
| 03-31-22 | | | | | 9.97 | | | | | | 0.20• | | | | | | (0.51) | | | | | | (0.31) | | | | | | 0.15 | | | | | | — | | | | | | 0.06 | | | | | | 0.21 | | | | | | — | | | | | | 9.45 | | | | | | (3.18) | | | | | | 1.60 | | | | 1.60 | | | 1.60 | | | 2.07 | | | | | 49,839 | | | | | | 76 | | |
| 03-31-21 | | | | | 8.98 | | | | | | 0.24• | | | | | | 1.02 | | | | | | 1.26 | | | | | | 0.22 | | | | | | — | | | | | | 0.05 | | | | | | 0.27 | | | | | | — | | | | | | 9.97 | | | | | | 14.20 | | | | | | 1.63 | | | | 1.63 | | | 1.63 | | | 2.51 | | | | | 53,646 | | | | | | 45 | | |
| 03-31-20 | | | | | 10.00 | | | | | | 0.27• | | | | | | (0.96) | | | | | | (0.69) | | | | | | 0.33 | | | | | | — | | | | | | — | | | | | | 0.33 | | | | | | — | | | | | | 8.98 | | | | | | (7.24) | | | | | | 1.61 | | | | 1.61 | | | 1.61 | | | 2.68 | | | | | 53,333 | | | | | | 167 | | |
| 03-31-19 | | | | | 10.00 | | | | | | 0.29 | | | | | | 0.04 | | | | | | 0.33 | | | | | | 0.33 | | | | | | — | | | | | | — | | | | | | 0.33 | | | | | | — | | | | | | 10.00 | | | | | | 3.32 | | | | | | 1.69 | | | | 1.69 | | | 1.69 | | | 2.87 | | | | | 25,999 | | | | | | 155 | | |
| 03-31-18 | | | | | 9.96 | | | | | | 0.29 | | | | | | 0.03 | | | | | | 0.32 | | | | | | 0.28 | | | | | | — | | | | | | — | | | | | | 0.28 | | | | | | — | | | | | | 10.00 | | | | | | 3.24 | | | | | | 1.88 | | | | 1.80 | | | 1.80 | | | 2.79 | | | | | 8,150 | | | | | | 103 | | |
| Class I | | | | | | | | | | | | | | | | | | | | | | | | | | | | | | | | | | | | | | | | | | | | | | | | | | | | | | | | | | | | | | | | | | | | | | | | | | | | | | | | | | | | | | | | | | | | | | |
| 03-31-22 | | | | | 10.15 | | | | | | 0.31• | | | | | | (0.53) | | | | | | (0.22) | | | | | | 0.26 | | | | | | — | | | | | | 0.06 | | | | | | 0.32 | | | | | | — | | | | | | 9.61 | | | | | | (2.22) | | | | | | 0.62 | | | | 0.62 | | | 0.62 | | | 3.06 | | | | | 2,096,038 | | | | | | 76 | | |
| 03-31-21 | | | | | 9.15 | | | | | | 0.34• | | | | | | 1.04 | | | | | | 1.38 | | | | | | 0.33 | | | | | | — | | | | | | 0.05 | | | | | | 0.38 | | | | | | — | | | | | | 10.15 | | | | | | 15.35 | | | | | | 0.63 | | | | 0.63 | | | 0.63 | | | 3.51 | | | | | 2,029,154 | | | | | | 45 | | |
| 03-31-20 | | | | | 10.20 | | | | | | 0.38• | | | | | | (0.98) | | | | | | (0.60) | | | | | | 0.45 | | | | | | — | | | | | | — | | | | | | 0.45 | | | | | | — | | | | | | 9.15 | | | | | | (6.30) | | | | | | 0.60 | | | | 0.60 | | | 0.60 | | | 3.68 | | | | | 2,046,289 | | | | | | 167 | | |
| 03-31-19 | | | | | 10.21 | | | | | | 0.42 | | | | | | 0.02 | | | | | | 0.44 | | | | | | 0.45 | | | | | | — | | | | | | — | | | | | | 0.45 | | | | | | — | | | | | | 10.20 | | | | | | 4.42 | | | | | | 0.61 | | | | 0.61 | | | 0.61 | | | 3.99 | | | | | 1,151,236 | | | | | | 155 | | |
| 03-31-18 | | | | | 10.18 | | | | | | 0.40• | | | | | | 0.04 | | | | | | 0.44 | | | | | | 0.41 | | | | | | — | | | | | | — | | | | | | 0.41 | | | | | | — | | | | | | 10.21 | | | | | | 4.37 | | | | | | 0.78 | | | | 0.70 | | | 0.70 | | | 3.87 | | | | | 194,924 | | | | | | 103 | | |
| Class P | | | | | | | | | | | | | | | | | | | | | | | | | | | | | | | | | | | | | | | | | | | | | | | | | | | | | | | | | | | | | | | | | | | | | | | | | | | | | | | | | | | | | | | | | | | | | | |
| 03-31-22 | | | | | 10.09 | | | | | | 0.36• | | | | | | (0.52) | | | | | | (0.16) | | | | | | 0.32 | | | | | | — | | | | | | 0.06 | | | | | | 0.38 | | | | | | — | | | | | | 9.55 | | | | | | (1.67) | | | | | | 0.53 | | | | 0.03 | | | 0.03 | | | 3.64 | | | | | 3 | | | | | | 76 | | |
| 03-31-21 | | | | | 9.11 | | | | | | 0.40• | | | | | | 1.02 | | | | | | 1.42 | | | | | | 0.39 | | | | | | — | | | | | | 0.05 | | | | | | 0.44 | | | | | | — | | | | | | 10.09 | | | | | | 15.82 | | | | | | 0.57 | | | | 0.07 | | | 0.07 | | | 4.13 | | | | | 3 | | | | | | 45 | | |
| 03-31-20 | | | | | 10.18 | | | | | | 0.44• | | | | | | (1.01) | | | | | | (0.57) | | | | | | 0.50 | | | | | | — | | | | | | — | | | | | | 0.50 | | | | | | — | | | | | | 9.11 | | | | | | (5.99) | | | | | | 0.55 | | | | 0.05 | | | 0.05 | | | 4.26 | | | | | 9,529 | | | | | | 167 | | |
| 02-01-19(4) - 03-31-19 | | | | | 10.13 | | | | | | 0.05• | | | | | | 0.08 | | | | | | 0.13 | | | | | | 0.08 | | | | | | — | | | | | | — | | | | | | 0.08 | | | | | | — | | | | | | 10.18 | | | | | | 1.33 | | | | | | 0.58 | | | | 0.08 | | | 0.08 | | | 3.22 | | | | | 3 | | | | | | 155 | | |
| Class R | | | | | | | | | | | | | | | | | | | | | | | | | | | | | | | | | | | | | | | | | | | | | | | | | | | | | | | | | | | | | | | | | | | | | | | | | | | | | | | | | | | | | | | | | | | | | | |
| 03-31-22 | | | | | 10.04 | | | | | | 0.26• | | | | | | (0.53) | | | | | | (0.27) | | | | | | 0.20 | | | | | | — | | | | | | 0.06 | | | | | | 0.26 | | | | | | — | | | | | | 9.51 | | | | | | (2.76) | | | | | | 1.10 | | | | 1.10 | | | 1.10 | | | 2.58 | | | | | 20,854 | | | | | | 76 | | |
| 03-31-21 | | | | | 9.04 | | | | | | 0.29• | | | | | | 1.03 | | | | | | 1.32 | | | | | | 0.27 | | | | | | — | | | | | | 0.05 | | | | | | 0.32 | | | | | | — | | | | | | 10.04 | | | | | | 14.81 | | | | | | 1.13 | | | | 1.13 | | | 1.13 | | | 3.00 | | | | | 22,403 | | | | | | 45 | | |
| 03-31-20 | | | | | 10.07 | | | | | | 0.32• | | | | | | (0.97) | | | | | | (0.65) | | | | | | 0.38 | | | | | | — | | | | | | — | | | | | | 0.38 | | | | | | — | | | | | | 9.04 | | | | | | (6.80) | | | | | | 1.11 | | | | 1.11 | | | 1.11 | | | 3.20 | | | | | 18,459 | | | | | | 167 | | |
| 03-31-19 | | | | | 10.08 | | | | | | 0.34 | | | | | | 0.03 | | | | | | 0.37 | | | | | | 0.38 | | | | | | — | | | | | | — | | | | | | 0.38 | | | | | | — | | | | | | 10.07 | | | | | | 3.73 | | | | | | 1.19 | | | | 1.19 | | | 1.19 | | | 3.37 | | | | | 12,425 | | | | | | 155 | | |
| 03-31-18 | | | | | 10.04 | | | | | | 0.33 | | | | | | 0.04 | | | | | | 0.37 | | | | | | 0.33 | | | | | | — | | | | | | — | | | | | | 0.33 | | | | | | — | | | | | | 10.08 | | | | | | 3.76 | | | | | | 1.38 | | | | 1.30 | | | 1.30 | | | 3.26 | | | | | 5,168 | | | | | | 103 | | |
| Class R6 | | | | | | | | | | | | | | | | | | | | | | | | | | | | | | | | | | | | | | | | | | | | | | | | | | | | | | | | | | | | | | | | | | | | | | | | | | | | | | | | | | | | | | | | | | | | | | |
| 03-31-22 | | | | | 10.12 | | | | | | 0.31• | | | | | | (0.52) | | | | | | (0.21) | | | | | | 0.27 | | | | | | — | | | | | | 0.06 | | | | | | 0.33 | | | | | | — | | | | | | 9.58 | | | | | | (2.17) | | | | | | 0.54 | | | | 0.54 | | | 0.54 | | | 3.14 | | | | | 159,175 | | | | | | 76 | | |
| 03-31-21 | | | | | 9.12 | | | | | | 0.35• | | | | | | 1.04 | | | | | | 1.39 | | | | | | 0.34 | | | | | | — | | | | | | 0.05 | | | | | | 0.39 | | | | | | — | | | | | | 10.12 | | | | | | 15.46 | | | | | | 0.57 | | | | 0.57 | | | 0.57 | | | 3.59 | | | | | 154,515 | | | | | | 45 | | |
| 03-31-20 | | | | | 10.17 | | | | | | 0.38• | | | | | | (0.98) | | | | | | (0.60) | | | | | | 0.45 | | | | | | — | | | | | | — | | | | | | 0.45 | | | | | | — | | | | | | 9.12 | | | | | | (6.28) | | | | | | 0.55 | | | | 0.55 | | | 0.55 | | | 3.75 | | | | | 229,913 | | | | | | 167 | | |
| 03-31-19 | | | | | 10.19 | | | | | | 0.39 | | | | | | 0.04 | | | | | | 0.43 | | | | | | 0.45 | | | | | | — | | | | | | — | | | | | | 0.45 | | | | | | — | | | | | | 10.17 | | | | | | 4.36 | | | | | | 0.58 | | | | 0.58 | | | 0.58 | | | 3.82 | | | | | 47,004 | | | | | | 155 | | |
| 03-31-18 | | | | | 10.16 | | | | | | 0.40 | | | | | | 0.04 | | | | | | 0.44 | | | | | | 0.41 | | | | | | — | | | | | | — | | | | | | 0.41 | | | | | | — | | | | | | 10.19 | | | | | | 4.41 | | | | | | 0.74 | | | | 0.66 | | | 0.66 | | | 3.88 | | | | | 112,151 | | | | | | 103 | | |
| | | | | | | | | | Income (loss) from investment operations | | | | | | | | | Less Distributions | | | | | | Ratios to average net assets | | | Supplemental Data | | ||||||||||||||||||||||||||||||||||||||||||||||||||||||||||||||||||
| | | | Net asset value, beginning of year or period | | | Net investment income (loss) | | | Net realized and unrealized gain (loss) | | | Total from investment operations | | | From net investment income | | | From net realized gains | | | From return of capital | | | Total distributions | | | Payment by affiliate | | | Net asset value, end of year or period | | | Total Return(1) | | | Expenses before reductions/additions(2)(3) | | | Expenses net of fee waivers and/or recoupments if any(2)(3) | | | Expenses net of all reductions/additions(2)(3) | | | Net investment income (loss)(2)(3) | | | Net assets, end of year or period | | | Portfolio turnover rate | | ||||||||||||||||||||||||||||||||||||||||||
| Year or period ended | | | ($) | | | ($) | | | ($) | | | ($) | | | ($) | | | ($) | | | ($) | | | ($) | | | ($) | | | ($) | | | (%) | | | (%) | | | (%) | | | (%) | | | (%) | | | ($000’s) | | | (%) | | ||||||||||||||||||||||||||||||||||||||||||
| Voya Strategic Income Opportunities Fund (continued) | | | | | | | | | | | | | | | | | | | | | | | | | | | | | | | | | | | | | | | | | | | | | | | | | | | | | | | | | | | | | | | | | | | | | | | | | | | | | | | | | | | | | | | | | | | | | | |
| Class W | | | | | | | | | | | | | | | | | | | | | | | | | | | | | | | | | | | | | | | | | | | | | | | | | | | | | | | | | | | | | | | | | | | | | | | | | | | | | | | | | | | | | | | | | | | | | | |
| 03-31-22 | | | | | 10.10 | | | | | | 0.31• | | | | | | (0.53) | | | | | | (0.22) | | | | | | 0.25 | | | | | | — | | | | | | 0.06 | | | | | | 0.31 | | | | | | — | | | | | | 9.57 | | | | | | (2.24) | | | | | | 0.60 | | | | 0.60 | | | 0.60 | | | 3.06 | | | | | 36,224 | | | | | | 76 | | |
| 03-31-21 | | | | | 9.09 | | | | | | 0.34• | | | | | | 1.04 | | | | | | 1.38 | | | | | | 0.32 | | | | | | — | | | | | | 0.05 | | | | | | 0.37 | | | | | | — | | | | | | 10.10 | | | | | | 15.42 | | | | | | 0.63 | | | | 0.63 | | | 0.63 | | | 3.53 | | | | | 48,958 | | | | | | 45 | | |
| 03-31-20 | | | | | 10.13 | | | | | | 0.38• | | | | | | (0.99) | | | | | | (0.61) | | | | | | 0.43 | | | | | | — | | | | | | — | | | | | | 0.43 | | | | | | — | | | | | | 9.09 | | | | | | (6.37) | | | | | | 0.61 | | | | 0.61 | | | 0.61 | | | 3.69 | | | | | 69,522 | | | | | | 167 | | |
| 03-31-19 | | | | | 10.13 | | | | | | 0.39 | | | | | | 0.04 | | | | | | 0.43 | | | | | | 0.43 | | | | | | — | | | | | | — | | | | | | 0.43 | | | | | | — | | | | | | 10.13 | | | | | | 4.35 | | | | | | 0.69 | | | | 0.69 | | | 0.69 | | | 3.75 | | | | | 48,251 | | | | | | 155 | | |
| 03-31-18 | | | | | 10.09 | | | | | | 0.39 | | | | | | 0.04 | | | | | | 0.43 | | | | | | 0.39 | | | | | | — | | | | | | — | | | | | | 0.39 | | | | | | — | | | | | | 10.13 | | | | | | 4.27 | | | | | | 0.88 | | | | 0.80 | | | 0.80 | | | 3.77 | | | | | 26,567 | | | | | | 103 | | |
| | | | Buy | | | Sell | | ||||||
| Intermediate Bond | | | | $ | 3,864,069 | | | | | $ | 27,405,766 | | |
| Strategic Income Opportunities | | | | | 1,460,387,836 | | | | | | 1,472,881,623 | | |
| | | | Purchased | | | Sold | | ||||||
| GNMA Income | | | | $ | 21,040,145 | | | | | $ | 331,635,163 | | |
| Intermediate Bond | | | | | 929,347,493 | | | | | | 384,144,566 | | |
| Short Term Bond | | | | | 127,274,772 | | | | | | 37,364,680 | | |
| Strategic Income Opportunities | | | | | 398,337,430 | | | | | | 481,643,535 | | |
| | | | Purchases | | | Sales | | ||||||
| GNMA Income | | | | $ | 13,394,974 | | | | | $ | 7,469,115 | | |
| High Yield Bond | | | | | 541,233,730 | | | | | | 776,215,449 | | |
| Intermediate Bond | | | | | 4,500,681,812 | | | | | | 5,104,681,544 | | |
| Short Term Bond | | | | | 395,546,513 | | | | | | 217,771,729 | | |
| Strategic Income Opportunities | | | | | 1,132,868,507 | | | | | | 1,157,794,751 | | |
| | | | Purchases | | | Sales | | ||||||
| GNMA Income | | | | $ | 11,143,197,984 | | | | | $ | 11,279,967,092 | | |
| Intermediate Bond | | | | | 18,101,595,711 | | | | | | 17,339,778,179 | | |
| Short Term Bond | | | | | 858,438,073 | | | | | | 792,354,264 | | |
| Strategic Income Opportunities | | | | | 693,969,060 | | | | | | 628,079,243 | | |
| Fund | | | Fee | |
| GNMA Income | | | 0.45% on the first $1 billion, 0.43% on the next $500 million and 0.41% on assets thereafter | |
| High Yield Bond | | | 0.61% on the first $500 million, 0.55% on the next $4.5 billion and 0.50% on assets thereafter | |
| Intermediate Bond | | | 0.27% on all assets | |
| Short Term Bond | | | 0.25% on all assets | |
| Strategic Income Opportunities | | | 0.50% on all assets | |
| Fund | | | Class A | | | Class C | | | Class R | | |||||||||
| GNMA Income | | | | | 0.25% | | | | | | 1.00% | | | | | | N/A | | |
| High Yield Bond | | | | | 0.25% | | | | | | 1.00% | | | | | | 0.50% | | |
| Intermediate Bond | | | | | 0.25% | | | | | | 1.00% | | | | | | 0.50% | | |
| Short Term Bond | | | | | 0.25% | | | | | | 1.00% | | | | | | 0.50% | | |
| Strategic Income Opportunities | | | | | 0.25% | | | | | | 1.00% | | | | | | 0.50% | | |
| | | | Class A | | | Class C | | ||||||
| Initial Sales Charges: | | | | | | | | | | | | | |
| GNMA Income | | | | $ | 6,997 | | | | | $ | — | | |
| High Yield Bond | | | | | 4,434 | | | | | | — | | |
| Intermediate Bond | | | | | 6,617 | | | | | | — | | |
| Short Term Bond | | | | | 131 | | | | | | — | | |
| Strategic Income Opportunities | | | | | 7,341 | | | | | | — | | |
| Contingent Deferred Sales Charges: | | | | | | | | | | | | | |
| GNMA Income | | | | $ | 38,480 | | | | | $ | 8,334 | | |
| High Yield Bond | | | | | 13 | | | | | | 59 | | |
| Intermediate Bond | | | | | 1,241 | | | | | | 1,957 | | |
| Short Term Bond | | | | | 1,997 | | | | | | 4 | | |
| Strategic Income Opportunities | | | | | 7,634 | | | | | | 6,380 | | |
| Subsidiary/Affiliated Investment Company | | | Fund | | | Percentage | | |||
| Voya Index Solution Income Portfolio | | | Short Term Bond | | | | | 5.70% | | |
| Voya Institutional Trust Company | | | GNMA Income | | | | | 16.33 | | |
| Voya Intermediate Bond Portfolio | | | High Yield Bond | | | | | 24.09 | | |
| Voya Investment Management Co. LLC | | | High Yield Bond | | | | | 8.14 | | |
| Voya Retirement Conservative Portfolio | | | Short Term Bond | | | | | 6.59 | | |
| Voya Retirement Growth Portfolio | | | Short Term Bond | | | | | 24.90 | | |
| Voya Retirement Insurance and Annuity Company | | | Intermediate Bond | | | | | 8.71 | | |
| Voya Retirement Moderate Growth Portfolio | | | Short Term Bond | | | | | 17.15 | | |
| Voya Retirement Moderate Portfolio | | | Short Term Bond | | | | | 15.43 | | |
| Voya Solution Income Portfolio | | | Short Term Bond | | | | | 7.22 | | |
| Fund | | | Amount | | |||
| GNMA Income | | | | $ | 364,196 | | |
| High Yield Bond | | | | | 13,309 | | |
| Intermediate Bond | | | | | 456,662 | | |
| Short Term Bond | | | | | 23 | | |
| Strategic Income Opportunities | | | | | 17,478 | | |
| Fund | | | Class A | | | Class C | | | Class I | | | Class P | | | Class P2 | | | Class P3 | | | Class R | | | Class R6 | | | Class W | | |||||||||||||||||||||||||||
| GNMA Income | | | | | 0.84% | | | | | | 1.59% | | | | | | 0.54% | | | | | | 0.15% | | | | | | N/A | | | | | | N/A | | | | | | N/A | | | | | | 0.54% | | | | | | 0.59% | | |
| High Yield Bond | | | | | 1.10% | | | | | | 1.85% | | | | | | 0.85% | | | | | | 0.15% | | | | | | N/A | | | | | | 0.00% | | | | | | 1.35% | | | | | | 0.83% | | | | | | 0.85% | | |
| Intermediate Bond | | | | | 0.75% | | | | | | 1.50% | | | | | | 0.50% | | | | | | N/A | | | | | | N/A | | | | | | 0.00% | | | | | | 1.00% | | | | | | 0.50% | | | | | | 0.50% | | |
| Fund | | | Class A | | | Class C | | | Class I | | | Class P | | | Class P2 | | | Class P3 | | | Class R | | | Class R6 | | | Class W | | |||||||||||||||||||||||||||
| Short Term Bond | | | | | 0.65% | | | | | | 1.40% | | | | | | 0.35% | | | | | | N/A | | | | | | 0.15% | | | | | | 0.00% | | | | | | 0.90% | | | | | | 0.30% | | | | | | 0.40% | | |
| Strategic Income Opportunities | | | | | 1.15% | | | | | | 1.90% | | | | | | 0.72% | | | | | | 0.15% | | | | | | N/A | | | | | | N/A | | | | | | 1.40% | | | | | | 0.60% | | | | | | 0.90% | | |
| | | | March 31, | | | Total | | ||||||||||||||||||
| | | | 2023 | | | 2024 | | | 2025 | | |||||||||||||||
| GNMA Income | | | | $ | 78,050 | | | | | $ | — | | | | | $ | — | | | | | $ | 78,050 | | |
| High Yield Bond | | | | | 224 | | | | | | 44,399 | | | | | | 60,176 | | | | | | 104,799 | | |
| Intermediate Bond | | | | | 58,675 | | | | | | 91,806 | | | | | | 157,319 | | | | | | 307,800 | | |
| Short Term Bond | | | | | 178,941 | | | | | | 288,006 | | | | | | 133,268 | | | | | | 600,215 | | |
| | | | March 31, | | | Total | | ||||||||||||||||||
| | | | 2023 | | | 2024 | | | 2025 | | |||||||||||||||
| GNMA Income | | | | | | | | | | | | | | | | | | | | | | | | | |
| Class A | | | | $ | — | | | | | $ | 68,885 | | | | | $ | — | | | | | $ | 68,885 | | |
| Class C | | | | | — | | | | | | 6,083 | | | | | | — | | | | | | 6,083 | | |
| Class I | | | | | 180,602 | | | | | | 220,385 | | | | | | 169,548 | | | | | | 570,535 | | |
| | | | March 31, | | | Total | | ||||||||||||||||||
| | | | 2023 | | | 2024 | | | 2025 | | |||||||||||||||
| Class P | | | | | — | | | | | | 300 | | | | | | 203 | | | | | | 503 | | |
| Class W | | | | | — | | | | | | 16,599 | | | | | | — | | | | | | 16,599 | | |
| Short Term Bond | | | | | | | | | | | | | | | | | | | | | | | | | |
| Class I | | | | | 12,071 | | | | | | 8,563 | | | | | | 8,770 | | | | | | 29,404 | | |
| Fund | | | Days Utilized | | | Approximate Average Daily Balance For Days Utilized | | | Approximate Weighted Average Interest Rate For Days Utilized | | |||||||||
| GNMA Income | | | | | 6 | | | | | $ | 2,353,167 | | | | | | 1.33% | | |
| Intermediate Bond | | | | | 1 | | | | | | 673,000 | | | | | | 1.33 | | |
| | | | Shares sold | | | Shares issued in merger | | | Reinvestment of distributions | | | Shares redeemed | | | Shares converted | | | Net increase (decrease) in shares outstanding | | | Shares sold | | | Proceeds from shares issued in merger | | | Reinvestment of distributions | | | Shares redeemed | | | Shares converted | | | Net increase (decrease) | | ||||||||||||||||||||||||||||||||||||
| Year or period ended | | | # | | | # | | | # | | | # | | | # | | | # | | | ($) | | | ($) | | | ($) | | | ($) | | | ($) | | | ($) | | ||||||||||||||||||||||||||||||||||||
| GNMA Income | | ||||||||||||||||||||||||||||||||||||||||||||||||||||||||||||||||||||||||
| Class A | | | | | | | | | | | | | | | | | | | | | | | | | | | | | | | | | | | | | | | | | | | | | | | | | | | | | | | | | | | | | | | | | | | | | | | | | |
| 3/31/2022 | | | | | 11,277,527 | | | | | | — | | | | | | 720,684 | | | | | | (23,725,800) | | | | | | — | | | | | | (11,727,589) | | | | | | 95,005,028 | | | | | | — | | | | | | 6,054,296 | | | | | | (199,441,916) | | | | | | — | | | | | | (98,382,592) | | |
| 3/31/2021 | | | | | 26,944,868 | | | | | | — | | | | | | 1,200,962 | | | | | | (16,087,280) | | | | | | — | | | | | | 12,058,550 | | | | | | 231,045,151 | | | | | | — | | | | | | 10,292,022 | | | | | | (137,788,797) | | | | | | — | | | | | | 103,548,376 | | |
| Class C | | | | | | | | | | | | | | | | | | | | | | | | | | | | | | | | | | | | | | | | | | | | | | | | | | | | | | | | | | | | | | | | | | | | | | | | | |
| 3/31/2022 | | | | | 434,519 | | | | | | — | | | | | | 21,361 | | | | | | (2,878,820) | | | | | | — | | | | | | (2,422,940) | | | | | | 3,655,918 | | | | | | — | | | | | | 179,138 | | | | | | (24,082,916) | | | | | | — | | | | | | (20,247,860) | | |
| 3/31/2021 | | | | | 1,967,981 | | | | | | — | | | | | | 64,684 | | | | | | (1,823,764) | | | | | | — | | | | | | 208,901 | | | | | | 16,786,460 | | | | | | — | | | | | | 551,827 | | | | | | (15,553,503) | | | | | | — | | | | | | 1,784,784 | | |
| Class I | | | | | | | | | | | | | | | | | | | | | | | | | | | | | | | | | | | | | | | | | | | | | | | | | | | | | | | | | | | | | | | | | | | | | | | | | |
| 3/31/2022 | | | | | 57,283,966 | | | | | | — | | | | | | 1,410,379 | | | | | | (68,604,093) | | | | | | — | | | | | | (9,909,748) | | | | | | 482,886,816 | | | | | | — | | | | | | 11,867,348 | | | | | | (575,307,247) | | | | | | — | | | | | | (80,553,083) | | |
| 3/31/2021 | | | | | 89,156,852 | | | | | | — | | | | | | 1,593,392 | | | | | | (47,354,775) | | | | | | — | | | | | | 43,395,469 | | | | | | 765,178,344 | | | | | | — | | | | | | 13,675,785 | | | | | | (406,391,460) | | | | | | — | | | | | | 372,462,669 | | |
| Class P | | | | | | | | | | | | | | | | | | | | | | | | | | | | | | | | | | | | | | | | | | | | | | | | | | | | | | | | | | | | | | | | | | | | | | | | | |
| 3/31/2022 | | | | | — | | | | | | — | | | | | | 80 | | | | | | — | | | | | | — | | | | | | 80 | | | | | | — | | | | | | — | | | | | | 675 | | | | | | — | | | | | | — | | | | | | 675 | | |
| 5/22/2020(1) - 3/31/2021 | | | | | 3,828 | | | | | | — | | | | | | 89 | | | | | | — | | | | | | — | | | | | | 3,917 | | | | | | 33,000 | | | | | | — | | | | | | 761 | | | | | | — | | | | | | — | | | | | | 33,761 | | |
| Class R6 | | | | | | | | | | | | | | | | | | | | | | | | | | | | | | | | | | | | | | | | | | | | | | | | | | | | | | | | | | | | | | | | | | | | | | | | | |
| 3/31/2022 | | | | | 759,585 | | | | | | — | | | | | | 46,034 | | | | | | (2,729,091) | | | | | | — | | | | | | (1,923,472) | | | | | | 6,415,735 | | | | | | — | | | | | | 387,301 | | | | | | (23,219,105) | | | | | | — | | | | | | (16,416,069) | | |
| 7/31/2020(1) - 3/31/2021 | | | | | 5,139,871 | | | | | | — | | | | | | 58,209 | | | | | | (297,695) | | | | | | — | | | | | | 4,900,385 | | | | | | 44,091,192 | | | | | | — | | | | | | 498,569 | | | | | | (2,551,069) | | | | | | — | | | | | | 42,038,692 | | |
| Class W | | | | | | | | | | | | | | | | | | | | | | | | | | | | | | | | | | | | | | | | | | | | | | | | | | | | | | | | | | | | | | | | | | | | | | | | | |
| 3/31/2022 | | | | | 2,733,426 | | | | | | — | | | | | | 211,783 | | | | | | (10,233,228) | | | | | | — | | | | | | (7,288,019) | | | | | | 23,034,577 | | | | | | — | | | | | | 1,783,946 | | | | | | (86,789,385) | | | | | | — | | | | | | (61,970,862) | | |
| 3/31/2021 | | | | | 12,911,284 | | | | | | — | | | | | | 382,737 | | | | | | (10,360,560) | | | | | | — | | | | | | 2,933,461 | | | | | | 111,168,662 | | | | | | — | | | | | | 3,288,689 | | | | | | (89,150,877) | | | | | | — | | | | | | 25,306,474 | | |
| High Yield Bond | | ||||||||||||||||||||||||||||||||||||||||||||||||||||||||||||||||||||||||
| Class A | | | | | | | | | | | | | | | | | | | | | | | | | | | | | | | | | | | | | | | | | | | | | | | | | | | | | | | | | | | | | | | | | | | | | | | | | |
| 3/31/2022 | | | | | 649,906 | | | | | | — | | | | | | 259,104 | | | | | | (1,099,273) | | | | | | — | | | | | | (190,263) | | | | | | 5,218,071 | | | | | | — | | | | | | 2,063,621 | | | | | | (8,762,057) | | | | | | — | | | | | | (1,480,365) | | |
| 3/31/2021 | | | | | 1,277,866 | | | | | | — | | | | | | 278,827 | | | | | | (1,602,122) | | | | | | — | | | | | | (45,429) | | | | | | 9,799,174 | | | | | | — | | | | | | 2,166,595 | | | | | | (12,205,285) | | | | | | — | | | | | | (239,516) | | |
| Class C | | | | | | | | | | | | | | | | | | | | | | | | | | | | | | | | | | | | | | | | | | | | | | | | | | | | | | | | | | | | | | | | | | | | | | | | | |
| 3/31/2022 | | | | | 164,725 | | | | | | — | | | | | | 49,194 | | | | | | (232,402) | | | | | | — | | | | | | (18,483) | | | | | | 1,325,876 | | | | | | — | | | | | | 391,638 | | | | | | (1,848,988) | | | | | | — | | | | | | (131,474) | | |
| 3/31/2021 | | | | | 52,327 | | | | | | — | | | | | | 56,970 | | | | | | (437,035) | | | | | | — | | | | | | (327,738) | | | | | | 407,776 | | | | | | — | | | | | | 442,005 | | | | | | (3,379,701) | | | | | | — | | | | | | (2,529,920) | | |
| Class I | | | | | | | | | | | | | | | | | | | | | | | | | | | | | | | | | | | | | | | | | | | | | | | | | | | | | | | | | | | | | | | | | | | | | | | | | |
| 3/31/2022 | | | | | 14,248,586 | | | | | | — | | | | | | 1,180,689 | | | | | | (11,341,157) | | | | | | — | | | | | | 4,088,118 | | | | | | 114,040,363 | | | | | | — | | | | | | 9,385,111 | | | | | | (90,093,198) | | | | | | — | | | | | | 33,332,276 | | |
| 3/31/2021 | | | | | 17,254,831 | | | | | | — | | | | | | 676,970 | | | | | | (6,224,650) | | | | | | — | | | | | | 11,707,151 | | | | | | 135,709,963 | | | | | | — | | | | | | 5,288,007 | | | | | | (48,118,788) | | | | | | — | | | | | | 92,879,182 | | |
| Class P | | | | | | | | | | | | | | | | | | | | | | | | | | | | | | | | | | | | | | | | | | | | | | | | | | | | | | | | | | | | | | | | | | | | | | | | | |
| 3/31/2022 | | | | | 16,740,632 | | | | | | — | | | | | | 2,200,106 | | | | | | (22,270,858) | | | | | | — | | | | | | (3,330,120) | | | | | | 131,212,122 | | | | | | — | | | | | | 17,529,964 | | | | | | (175,094,969) | | | | | | — | | | | | | (26,352,883) | | |
| 3/31/2021 | | | | | 30,843,627 | | | | | | — | | | | | | 2,122,977 | | | | | | (7,863,387) | | | | | | — | | | | | | 25,103,217 | | | | | | 230,588,862 | | | | | | — | | | | | | 16,599,577 | | | | | | (62,071,848) | | | | | | — | | | | | | 185,116,591 | | |
| Class P3 | | | | | | | | | | | | | | | | | | | | | | | | | | | | | | | | | | | | | | | | | | | | | | | | | | | | | | | | | | | | | | | | | | | | | | | | | |
| 3/31/2022 | | | | | 891,755 | | | | | | — | | | | | | 68,009 | | | | | | (1,943,676) | | | | | | — | | | | | | (983,912) | | | | | | 7,142,828 | | | | | | — | | | | | | 545,174 | | | | | | (15,234,842) | | | | | | — | | | | | | (7,546,840) | | |
| 3/31/2021 | | | | | 1,065,181 | | | | | | — | | | | | | 55,612 | | | | | | (181,619) | | | | | | — | | | | | | 939,174 | | | | | | 7,925,155 | | | | | | — | | | | | | 435,511 | | | | | | (1,424,482) | | | | | | — | | | | | | 6,936,184 | | |
| Class R | | | | | | | | | | | | | | | | | | | | | | | | | | | | | | | | | | | | | | | | | | | | | | | | | | | | | | | | | | | | | | | | | | | | | | | | | |
| 3/31/2022 | | | | | 5,116 | | | | | | — | | | | | | 1,691 | | | | | | (51,173) | | | | | | — | | | | | | (44,366) | | | | | | 40,858 | | | | | | — | | | | | | 13,528 | | | | | | (411,270) | | | | | | — | | | | | | (356,884) | | |
| 3/31/2021 | | | | | 12,372 | | | | | | — | | | | | | 4,474 | | | | | | (45,872) | | | | | | — | | | | | | (29,026) | | | | | | 96,072 | | | | | | — | | | | | | 34,769 | | | | | | (362,000) | | | | | | — | | | | | | (231,159) | | |
| Class R6 | | | | | | | | | | | | | | | | | | | | | | | | | | | | | | | | | | | | | | | | | | | | | | | | | | | | | | | | | | | | | | | | | | | | | | | | | |
| 3/31/2022 | | | | | 4,066,896 | | | | | | — | | | | | | 1,352,792 | | | | | | (29,933,291) | | | | | | — | | | | | | (24,513,603) | | | | | | 32,690,991 | | | | | | — | | | | | | 10,846,577 | | | | | | (235,228,704) | | | | | | — | | | | | | (191,691,136) | | |
| 3/31/2021 | | | | | 25,766,653 | | | | | | — | | | | | | 1,585,305 | | | | | | (14,803,857) | | | | | | — | | | | | | 12,548,101 | | | | | | 189,942,494 | | | | | | — | | | | | | 12,382,591 | | | | | | (111,639,906) | | | | | | — | | | | | | 90,685,179 | | |
| Class W | | | | | | | | | | | | | | | | | | | | | | | | | | | | | | | | | | | | | | | | | | | | | | | | | | | | | | | | | | | | | | | | | | | | | | | | | |
| 3/31/2022 | | | | | 4,432,494 | | | | | | — | | | | | | 584,438 | | | | | | (12,143,760) | | | | | | — | | | | | | (7,126,828) | | | | | | 35,524,660 | | | | | | — | | | | | | 4,664,211 | | | | | | (97,076,957) | | | | | | — | | | | | | (56,888,086) | | |
| 3/31/2021 | | | | | 12,079,442 | | | | | | — | | | | | | 978,485 | | | | | | (14,599,434) | | | | | | — | | | | | | (1,541,507) | | | | | | 91,440,292 | | | | | | — | | | | | | 7,650,186 | | | | | | (108,475,654) | | | | | | — | | | | | | (9,385,176) | | |
| Intermediate Bond | | ||||||||||||||||||||||||||||||||||||||||||||||||||||||||||||||||||||||||
| Class A | | | | | | | | | | | | | | | | | | | | | | | | | | | | | | | | | | | | | | | | | | | | | | | | | | | | | | | | | | | | | | | | | | | | | | | | | |
| 3/31/2022 | | | | | 7,936,708 | | | | | | — | | | | | | 687,990 | | | | | | (15,367,870) | | | | | | — | | | | | | (6,743,172) | | | | | | 81,104,507 | | | | | | — | | | | | | 7,040,999 | | | | | | (157,102,969) | | | | | | — | | | | | | (68,957,463) | | |
| 3/31/2021 | | | | | 14,337,503 | | | | | | — | | | | | | 1,552,224 | | | | | | (15,665,755) | | | | | | — | | | | | | 223,972 | | | | | | 152,354,422 | | | | | | — | | | | | | 16,466,501 | | | | | | (165,401,171) | | | | | | — | | | | | | 3,419,752 | | |
| Class C | | | | | | | | | | | | | | | | | | | | | | | | | | | | | | | | | | | | | | | | | | | | | | | | | | | | | | | | | | | | | | | | | | | | | | | | | |
| 3/31/2022 | | | | | 172,368 | | | | | | — | | | | | | 23,132 | | | | | | (781,431) | | | | | | — | | | | | | (585,931) | | | | | | 1,768,576 | | | | | | — | | | | | | 236,689 | | | | | | (7,948,052) | | | | | | — | | | | | | (5,942,787) | | |
| 3/31/2021 | | | | | 674,364 | | | | | | — | | | | | | 65,573 | | | | | | (1,053,723) | | | | | | — | | | | | | (313,786) | | | | | | 7,134,581 | | | | | | — | | | | | | 695,023 | | | | | | (11,175,900) | | | | | | — | | | | | | (3,346,296) | | |
| Class I | | | | | | | | | | | | | | | | | | | | | | | | | | | | | | | | | | | | | | | | | | | | | | | | | | | | | | | | | | | | | | | | | | | | | | | | | |
| 3/31/2022 | | | | | 241,997,846 | | | | | | — | | | | | | 14,032,171 | | | | | | (220,648,390) | | | | | | — | | | | | | 35,381,627 | | | | | | 2,453,548,509 | | | | | | — | | | | | | 143,362,404 | | | | | | (2,226,904,558) | | | | | | — | | | | | | 370,006,355 | | |
| 3/31/2021 | | | | | 253,636,822 | | | | | | — | | | | | | 24,279,303 | | | | | | (169,105,998) | | | | | | — | | | | | | 108,810,127 | | | | | | 2,687,298,658 | | | | | | — | | | | | | 257,485,987 | | | | | | (1,780,411,799) | | | | | | — | | | | | | 1,164,372,846 | | |
| Class P3 | | | | | | | | | | | | | | | | | | | | | | | | | | | | | | | | | | | | | | | | | | | | | | | | | | | | | | | | | | | | | | | | | | | | | | | | | |
| 3/31/2022 | | | | | 6,732,245 | | | | | | — | | | | | | 152,870 | | | | | | (2,529,951) | | | | | | — | | | | | | 4,355,164 | | | | | | 67,863,845 | | | | | | — | | | | | | 1,554,909 | | | | | | (25,314,324) | | | | | | — | | | | | | 44,104,430 | | |
| 3/31/2021 | | | | | 2,626,038 | | | | | | — | | | | | | 157,427 | | | | | | (1,246,780) | | | | | | — | | | | | | 1,536,685 | | | | | | 27,738,103 | | | | | | — | | | | | | 1,670,315 | | | | | | (13,195,021) | | | | | | — | | | | | | 16,213,397 | | |
| Class R | | | | | | | | | | | | | | | | | | | | | | | | | | | | | | | | | | | | | | | | | | | | | | | | | | | | | | | | | | | | | | | | | | | | | | | | | |
| 3/31/2022 | | | | | 1,952,651 | | | | | | — | | | | | | 321,947 | | | | | | (4,389,254) | | | | | | — | | | | | | (2,114,656) | | | | | | 19,998,676 | | | | | | — | | | | | | 3,298,237 | | | | | | (44,929,985) | | | | | | — | | | | | | (21,633,072) | | |
| 3/31/2021 | | | | | 3,335,407 | | | | | | — | | | | | | 743,273 | | | | | | (5,467,067) | | | | | | — | | | | | | (1,388,387) | | | | | | 35,462,358 | | | | | | — | | | | | | 7,897,423 | | | | | | (58,088,638) | | | | | | — | | | | | | (14,728,857) | | |
| | | | Shares sold | | | Shares issued in merger | | | Reinvestment of distributions | | | Shares redeemed | | | Shares converted | | | Net increase (decrease) in shares outstanding | | | Shares sold | | | Proceeds from shares issued in merger | | | Reinvestment of distributions | | | Shares redeemed | | | Shares converted | | | Net increase (decrease) | | ||||||||||||||||||||||||||||||||||||
| Year or period ended | | | # | | | # | | | # | | | # | | | # | | | # | | | ($) | | | ($) | | | ($) | | | ($) | | | ($) | | | ($) | | ||||||||||||||||||||||||||||||||||||
| Intermediate Bond (continued) | | ||||||||||||||||||||||||||||||||||||||||||||||||||||||||||||||||||||||||
| Class R6 | | | | | | | | | | | | | | | | | | | | | | | | | | | | | | | | | | | | | | | | | | | | | | | | | | | | | | | | | | | | | | | | | | | | | | | | | |
| 3/31/2022 | | | | | 79,215,568 | | | | | | — | | | | | | 6,563,347 | | | | | | (96,696,703) | | | | | | — | | | | | | (10,917,788) | | | | | | 808,317,892 | | | | | | — | | | | | | 67,098,886 | | | | | | (994,110,333) | | | | | | — | | | | | | (118,693,555) | | |
| 3/31/2021 | | | | | 100,455,433 | | | | | | — | | | | | | 12,213,279 | | | | | | (61,776,505) | | | | | | — | | | | | | 50,892,207 | | | | | | 1,064,229,002 | | | | | | — | | | | | | 129,554,847 | | | | | | (654,642,138) | | | | | | — | | | | | | 539,141,711 | | |
| Class W | | | | | | | | | | | | | | | | | | | | | | | | | | | | | | | | | | | | | | | | | | | | | | | | | | | | | | | | | | | | | | | | | | | | | | | | | |
| 3/31/2022 | | | | | 3,124,623 | | | | | | — | | | | | | 466,739 | | | | | | (11,502,032) | | | | | | — | | | | | | (7,910,670) | | | | | | 31,905,860 | | | | | | — | | | | | | 4,771,464 | | | | | | (118,079,317) | | | | | | — | | | | | | (81,401,993) | | |
| 3/31/2021 | | | | | 11,639,725 | | | | | | — | | | | | | 1,081,979 | | | | | | (11,153,189) | | | | | | — | | | | | | 1,568,515 | | | | | | 123,513,825 | | | | | | — | | | | | | 11,469,005 | | | | | | (116,059,596) | | | | | | — | | | | | | 18,923,234 | | |
| Short Term Bond | | ||||||||||||||||||||||||||||||||||||||||||||||||||||||||||||||||||||||||
| Class A | | | | | | | | | | | | | | | | | | | | | | | | | | | | | | | | | | | | | | | | | | | | | | | | | | | | | | | | | | | | | | | | | | | | | | | | | |
| 3/31/2022 | | | | | 225,939 | | | | | | — | | | | | | 24,149 | | | | | | (601,354) | | | | | | — | | | | | | (351,266) | | | | | | 2,248,805 | | | | | | — | | | | | | 239,174 | | | | | | (5,901,999) | | | | | | — | | | | | | (3,414,020) | | |
| 3/31/2021 | | | | | 1,387,184 | | | | | | — | | | | | | 32,156 | | | | | | (188,734) | | | | | | — | | | | | | 1,230,606 | | | | | | 13,693,922 | | | | | | — | | | | | | 319,816 | | | | | | (1,881,765) | | | | | | — | | | | | | 12,131,973 | | |
| Class C | | | | | | | | | | | | | | | | | | | | | | | | | | | | | | | | | | | | | | | | | | | | | | | | | | | | | | | | | | | | | | | | | | | | | | | | | |
| 3/31/2022 | | | | | 13,819 | | | | | | — | | | | | | 241 | | | | | | (22,792) | | | | | | — | | | | | | (8,732) | | | | | | 134,109 | | | | | | — | | | | | | 2,396 | | | | | | (225,983) | | | | | | — | | | | | | (89,478) | | |
| 3/31/2021 | | | | | 39,979 | | | | | | — | | | | | | 511 | | | | | | (20,714) | | | | | | — | | | | | | 19,776 | | | | | | 397,712 | | | | | | — | | | | | | 5,073 | | | | | | (206,085) | | | | | | — | | | | | | 196,700 | | |
| Class I | | | | | | | | | | | | | | | | | | | | | | | | | | | | | | | | | | | | | | | | | | | | | | | | | | | | | | | | | | | | | | | | | | | | | | | | | |
| 3/31/2022 | | | | | 2,346,060 | | | | | | — | | | | | | 38,184 | | | | | | (753,122) | | | | | | — | | | | | | 1,631,122 | | | | | | 23,155,647 | | | | | | — | | | | | | 376,908 | | | | | | (7,420,186) | | | | | | — | | | | | | 16,112,369 | | |
| 3/31/2021 | | | | | 715,015 | | | | | | — | | | | | | 31,098 | | | | | | (314,891) | | | | | | — | | | | | | 431,222 | | | | | | 7,108,557 | | | | | | — | | | | | | 308,686 | | | | | | (3,134,143) | | | | | | — | | | | | | 4,283,100 | | |
| Class P2 | | | | | | | | | | | | | | | | | | | | | | | | | | | | | | | | | | | | | | | | | | | | | | | | | | | | | | | | | | | | | | | | | | | | | | | | | |
| 3/31/2022 | | | | | 3,710,644 | | | | | | — | | | | | | 144,599 | | | | | | (10,608,845) | | | | | | — | | | | | | (6,753,602) | | | | | | 35,617,003 | | | | | | — | | | | | | 1,429,581 | | | | | | (104,288,052) | | | | | | — | | | | | | (67,241,468) | | |
| 3/31/2021 | | | | | 5,953,129 | | | | | | — | | | | | | 240,462 | | | | | | (1,791,711) | | | | | | — | | | | | | 4,401,880 | | | | | | 58,091,606 | | | | | | — | | | | | | 2,385,177 | | | | | | (17,709,956) | | | | | | — | | | | | | 42,766,827 | | |
| Class P3 | | | | | | | | | | | | | | | | | | | | | | | | | | | | | | | | | | | | | | | | | | | | | | | | | | | | | | | | | | | | | | | | | | | | | | | | | |
| 3/31/2022 | | | | | 389,625 | | | | | | — | | | | | | 8,196 | | | | | | (123,016) | | | | | | — | | | | | | 274,805 | | | | | | 3,793,284 | | | | | | — | | | | | | 80,642 | | | | | | (1,203,965) | | | | | | — | | | | | | 2,669,961 | | |
| 3/31/2021 | | | | | 127,704 | | | | | | — | | | | | | 8,539 | | | | | | (356,586) | | | | | | — | | | | | | (220,343) | | | | | | 1,265,904 | | | | | | — | | | | | | 84,609 | | | | | | (3,461,267) | | | | | | — | | | | | | (2,110,754) | | |
| Class R | | | | | | | | | | | | | | | | | | | | | | | | | | | | | | | | | | | | | | | | | | | | | | | | | | | | | | | | | | | | | | | | | | | | | | | | | |
| 3/31/2022 | | | | | 1,087 | | | | | | — | | | | | | 11 | | | | | | (191) | | | | | | — | | | | | | 907 | | | | | | 10,787 | | | | | | — | | | | | | 108 | | | | | | (1,897) | | | | | | — | | | | | | 8,998 | | |
| 3/31/2021 | | | | | 512 | | | | | | — | | | | | | 7 | | | | | | (0)* | | | | | | — | | | | | | 519 | | | | | | 5,119 | | | | | | — | | | | | | 69 | | | | | | (2) | | | | | | — | | | | | | 5,186 | | |
| Class R6 | | | | | | | | | | | | | | | | | | | | | | | | | | | | | | | | | | | | | | | | | | | | | | | | | | | | | | | | | | | | | | | | | | | | | | | | | |
| 3/31/2022 | | | | | 39,456,260 | | | | | | — | | | | | | 422,058 | | | | | | (6,095,498) | | | | | | — | | | | | | 33,782,820 | | | | | | 392,726,125 | | | | | | — | | | | | | 4,160,869 | | | | | | (60,250,814) | | | | | | — | | | | | | 336,636,180 | | |
| 3/31/2021 | | | | | 1,665,203 | | | | | | — | | | | | | 114,007 | | | | | | (6,943,954) | | | | | | — | | | | | | (5,164,744) | | | | | | 16,524,973 | | | | | | — | | | | | | 1,131,114 | | | | | | (67,439,922) | | | | | | — | | | | | | (49,783,835) | | |
| Class W | | | | | | | | | | | | | | | | | | | | | | | | | | | | | | | | | | | | | | | | | | | | | | | | | | | | | | | | | | | | | | | | | | | | | | | | | |
| 3/31/2022 | | | | | 683,926 | | | | | | — | | | | | | 31,532 | | | | | | (858,904) | | | | | | — | | | | | | (143,446) | | | | | | 6,788,542 | | | | | | — | | | | | | 312,982 | | | | | | (8,544,228) | | | | | | — | | | | | | (1,442,704) | | |
| 3/31/2021 | | | | | 2,572,329 | | | | | | — | | | | | | 38,283 | | | | | | (423,843) | | | | | | — | | | | | | 2,186,769 | | | | | | 25,270,562 | | | | | | — | | | | | | 382,045 | | | | | | (4,231,467) | | | | | | — | | | | | | 21,421,140 | | |
| Strategic Income Opportunities | | ||||||||||||||||||||||||||||||||||||||||||||||||||||||||||||||||||||||||
| Class A | | | | | | | | | | | | | | | | | | | | | | | | | | | | | | | | | | | | | | | | | | | | | | | | | | | | | | | | | | | | | | | | | | | | | | | | | |
| 3/31/2022 | | | | | 3,051,116 | | | | | | — | | | | | | 339,546 | | | | | | (7,012,470) | | | | | | — | | | | | | (3,621,808) | | | | | | 30,535,738 | | | | | | — | | | | | | 3,392,473 | | | | | | (70,001,927) | | | | | | — | | | | | | (36,073,716) | | |
| 3/31/2021 | | | | | 5,638,505 | | | | | | — | | | | | | 502,590 | | | | | | (7,594,730) | | | | | | — | | | | | | (1,453,635) | | | | | | 55,160,875 | | | | | | — | | | | | | 4,935,133 | | | | | | (74,321,820) | | | | | | — | | | | | | (14,225,812) | | |
| Class C | | | | | | | | | | | | | | | | | | | | | | | | | | | | | | | | | | | | | | | | | | | | | | | | | | | | | | | | | | | | | | | | | | | | | | | | | |
| 3/31/2022 | | | | | 1,305,996 | | | | | | — | | | | | | 102,460 | | | | | | (1,513,122) | | | | | | — | | | | | | (104,666) | | | | | | 12,857,088 | | | | | | — | | | | | | 1,007,742 | | | | | | (14,880,582) | | | | | | — | | | | | | (1,015,752) | | |
| 3/31/2021 | | | | | 1,279,251 | | | | | | — | | | | | | 145,324 | | | | | | (1,982,228) | | | | | | — | | | | | | (557,653) | | | | | | 12,318,707 | | | | | | — | | | | | | 1,406,352 | | | | | | (19,227,048) | | | | | | — | | | | | | (5,501,989) | | |
| Class I | | | | | | | | | | | | | | | | | | | | | | | | | | | | | | | | | | | | | | | | | | | | | | | | | | | | | | | | | | | | | | | | | | | | | | | | | |
| 3/31/2022 | | | | | 85,696,320 | | | | | | — | | | | | | 6,007,076 | | | | | | (73,414,564) | | | | | | — | | | | | | 18,288,832 | | | | | | 856,763,572 | | | | | | — | | | | | | 60,036,542 | | | | | | (732,917,242) | | | | | | — | | | | | | 183,882,872 | | |
| 3/31/2021 | | | | | 92,126,382 | | | | | | — | | | | | | 7,205,439 | | | | | | (122,990,435) | | | | | | — | | | | | | (23,658,614) | | | | | | 905,049,159 | | | | | | — | | | | | | 71,006,762 | | | | | | (1,206,675,912) | | | | | | — | | | | | | (230,619,991) | | |
| Class P | | | | | | | | | | | | | | | | | | | | | | | | | | | | | | | | | | | | | | | | | | | | | | | | | | | | | | | | | | | | | | | | | | | | | | | | | |
| 3/31/2022 | | | | | — | | | | | | — | | | | | | 13 | | | | | | — | | | | | | — | | | | | | 13 | | | | | | — | | | | | | — | | | | | | 127 | | | | | | — | | | | | | — | | | | | | 127 | | |
| 3/31/2021 | | | | | 691,537 | | | | | | — | | | | | | 38,288 | | | | | | (1,775,035) | | | | | | — | | | | | | (1,045,210) | | | | | | 6,382,889 | | | | | | — | | | | | | 369,485 | | | | | | (17,409,442) | | | | | | — | | | | | | (10,657,068) | | |
| Class P3 | | | | | | | | | | | | | | | | | | | | | | | | | | | | | | | | | | | | | | | | | | | | | | | | | | | | | | | | | | | | | | | | | | | | | | | | | |
| 3/31/2022 | | | | | — | | | | | | — | | | | | | — | | | | | | — | | | | | | — | | | | | | — | | | | | | — | | | | | | — | | | | | | — | | | | | | — | | | | | | — | | | | | | — | | |
| 3/31/2021 | | | | | 103,085 | | | | | | — | | | | | | 5,890 | | | | | | (520,666) | | | | | | — | | | | | | (411,691) | | | | | | 980,634 | | | | | | — | | | | | | 56,632 | | | | | | (5,082,987) | | | | | | — | | | | | | (4,045,721) | | |
| Class R | | | | | | | | | | | | | | | | | | | | | | | | | | | | | | | | | | | | | | | | | | | | | | | | | | | | | | | | | | | | | | | | | | | | | | | | | |
| 3/31/2022 | | | | | 257,601 | | | | | | — | | | | | | 59,664 | | | | | | (356,374) | | | | | | — | | | | | | (39,109) | | | | | | 2,565,310 | | | | | | — | | | | | | 590,684 | | | | | | (3,516,584) | | | | | | — | | | | | | (360,590) | | |
| 3/31/2021 | | | | | 659,184 | | | | | | — | | | | | | 70,301 | | | | | | (539,213) | | | | | | — | | | | | | 190,272 | | | | | | 6,418,592 | | | | | | — | | | | | | 685,666 | | | | | | (5,232,485) | | | | | | — | | | | | | 1,871,773 | | |
| Class R6 | | | | | | | | | | | | | | | | | | | | | | | | | | | | | | | | | | | | | | | | | | | | | | | | | | | | | | | | | | | | | | | | | | | | | | | | | |
| 3/31/2022 | | | | | 2,340,912 | | | | | | — | | | | | | 548,112 | | | | | | (1,538,747) | | | | | | — | | | | | | 1,350,277 | | | | | | 23,553,792 | | | | | | — | | | | | | 5,463,117 | | | | | | (15,322,706) | | | | | | — | | | | | | 13,694,203 | | |
| 3/31/2021 | | | | | 4,356,387 | | | | | | — | | | | | | 704,515 | | | | | | (14,987,777) | | | | | | — | | | | | | (9,926,875) | | | | | | 42,894,452 | | | | | | — | | | | | | 6,902,093 | | | | | | (144,013,867) | | | | | | — | | | | | | (94,217,322) | | |
| Class W | | | | | | | | | | | | | | | | | | | | | | | | | | | | | | | | | | | | | | | | | | | | | | | | | | | | | | | | | | | | | | | | | | | | | | | | | |
| 3/31/2022 | | | | | 980,152 | | | | | | — | | | | | | 108,854 | | | | | | (2,151,161) | | | | | | — | | | | | | (1,062,155) | | | | | | 9,800,026 | | | | | | — | | | | | | 1,084,565 | | | | | | (21,408,935) | | | | | | — | | | | | | (10,524,344) | | |
| 3/31/2021 | | | | | 2,029,429 | | | | | | — | | | | | | 190,661 | | | | | | (5,016,103) | | | | | | — | | | | | | (2,796,013) | | | | | | 19,844,363 | | | | | | — | | | | | | 1,859,440 | | | | | | (48,566,824) | | | | | | — | | | | | | (26,863,021) | | |
| Loan | | | Unfunded Loan Commitment | | |||
| Athenahealth, Inc. 2022 Delayed Draw Term Loan | | | | $ | 51,449 | | |
| BCPE North Star US HoldCo 2, Inc. Delayed Draw Term Loan | | | | | 108,158 | | |
| ENC Holding Corporation Delayed Draw Term Loan | | | | | 37,551 | | |
| Holley Purchaser, Inc. 2021 Delayed Draw Term Loan | | | | | 58,000 | | |
| IPS Corporation 2021 Delayed Draw Term Loan | | | | | 80,000 | | |
| Medical Solutions Holdings, Inc. 2021 Delayed Draw Term Loan | | | | | 88,000 | | |
| Pacific Bells, LLC Delayed Draw Term Loan | | | | | 5,825 | | |
| Pediatric Associates Holding Company, LLC 2022 Delayed Draw Term Loan | | | | | 93,421 | | |
| Pro Mach Group, Inc. 2021 Delayed Draw Term Loan | | | | | 124,637 | | |
| Refficiency Holdings LLC 2021 Delayed Draw Term Loan | | | | | 33,662 | | |
| Service Logic Acquisition, Inc Delayed Draw Term Loan | | | | | 65,082 | | |
| Sovos Compliance, LLC 2021 Delayed Draw Term Loan | | | | | 80,257 | | |
| Trident TPI Holdings, Inc. 2021 Delayed Draw Term Loan | | | | | 32,810 | | |
| VT Topco, Inc. 2021 Delayed Draw Term Loan | | | | | 8,975 | | |
| | | | | $ | 867,826 | | |
| Counterparty | | | Securities Loaned at Value | | | Cash Collateral Received(1) | | | Net Amount | | |||||||||
| Barclays Capital Inc. | | | | $ | 13,117,153 | | | | | $ | (13,117,153) | | | | | $ | — | | |
| BNP Paribas | | | | | 2,618,929 | | | | | | (2,618,929) | | | | | | — | | |
| BNP Paribas Securities Corp. | | | | | 245,319 | | | | | | (245,319) | | | | | | — | | |
| BNP Paribas Prime Brokerage Intl Ltd | | | | | 13,002,834 | | | | | | (13,002,834) | | | | | | — | | |
| Cantor Fitzgerald & Co | | | | | 132,438 | | | | | | (132,438) | | | | | | — | | |
| Citadel Clearing LLC | | | | | 1,939,791 | | | | | | (1,939,791) | | | | | | — | | |
| Citigroup Global Markets Inc. | | | | | 6,813,714 | | | | | | (6,813,714) | | | | | | — | | |
| Deutsche Bank Securities Inc. | | | | | 1,443,683 | | | | | | (1,443,683) | | | | | | — | | |
| Goldman, Sachs & Co. LLC | | | | | 8,339,979 | | | | | | (8,339,979) | | | | | | — | | |
| Jefferies LLC | | | | | 2,300,776 | | | | | | (2,300,776) | | | | | | — | | |
| J.P. Morgan Securities LLC | | | | | 70,246,872 | | | | | | (70,246,872) | | | | | | — | | |
| Morgan Stanley & Co. LLC | | | | | 13,280,072 | | | | | | (13,280,072) | | | | | | — | | |
| National Financial Services LLC | | | | | 5,121 | | | | | | (5,121) | | | | | | — | | |
| Counterparty | | | Securities Loaned at Value | | | Cash Collateral Received(1) | | | Net Amount | | |||||||||
| NatWest Markets Securities Inc. | | | | | 4,804 | | | | | | (4,804) | | | | | | — | | |
| Scotia Capital (USA) Inc | | | | | 2,634,027 | | | | | | (2,634,027) | | | | | | — | | |
| State Street Bank and Trust Company | | | | | 2,324,746 | | | | | | (2,324,746) | | | | | | — | | |
| SunTrust Robinson Humphrey, Inc | | | | | 207,328 | | | | | | (207,328) | | | | | | — | | |
| TD Prime Services LLC | | | | | 656,247 | | | | | | (656,247) | | | | | | — | | |
| TD Securities (USA) Inc. | | | | | 362,928 | | | | | | (362,928) | | | | | | — | | |
| TD Securities Inc. | | | | | 668,659 | | | | | | (668,659) | | | | | | — | | |
| UBS AG | | | | | 2,006,251 | | | | | | (2,006,251) | | | | | | — | | |
| Wells Fargo Bank NA | | | | | 2,383,296 | | | | | | (2,383,296) | | | | | | — | | |
| Wells Fargo Securities LLC | | | | | 2,402,789 | | | | | | (2,402,789) | | | | | | — | | |
| | | | | $ | 147,137,756 | | | | | $ | (147,137,756) | | | | | $ | — | | |
| | |||||||||||||||||||
| Counterparty | | | Securities Loaned at Value | | | Cash Collateral Received(1) | | | Net Amount | | |||||||||
| Barclays Bank PLC | | | | $ | 20,152,665 | | | | | $ | (20,152,665) | | | | | $ | — | | |
| Barclays Capital Inc. | | | | | 9,022,143 | | | | | | (9,022,143) | | | | | | — | | |
| BMO Capital Markets Corp | | | | | 7,823,448 | | | | | | (7,823,448) | | | | | | — | | |
| BNP Paribas | | | | | 3,504,033 | | | | | | (3,504,033) | | | | | | — | | |
| BNP Paribas Securities Corp. | | | | | 5,973,419 | | | | | | (5,973,419) | | | | | | — | | |
| BNP Paribas Prime Brokerage Intl Ltd | | | | | 19,258,155 | | | | | | (19,258,155) | | | | | | — | | |
| BofA Securities Inc | | | | | 71,489,360 | | | | | | (71,489,360) | | | | | | — | | |
| Canadian Imperial Bank of Commerce | | | | | 13,668,740 | | | | | | (13,668,740) | | | | | | — | | |
| CIBC World Markets INC | | | | | 4,611,910 | | | | | | (4,611,910) | | | | | | — | | |
| Citadel Clearing LLC | | | | | 3,191,070 | | | | | | (3,191,070) | | | | | | — | | |
| Citigroup Global Markets Inc. | | | | | 21,770,254 | | | | | | (21,770,254) | | | | | | — | | |
| Daiwa Capital Markets America Inc. | | | | | 4,333,981 | | | | | | (4,333,981) | | | | | | — | | |
| Deutsche Bank, AG | | | | | 880,076 | | | | | | (878,800) | | | | | | 1,276 | | |
| Deutsche Bank Securities Inc. | | | | | 1,919,474 | | | | | | (1,919,474) | | | | | | — | | |
| Goldman Sachs & Co. LLC | | | | | 4,115,191 | | | | | | (4,115,191) | | | | | | — | | |
| Goldman Sachs International | | | | | 440,038 | | | | | | (434,750) | | | | | | 5,288 | | |
| HSBC Securities (USA) Inc. | | | | | 15,592,467 | | | | | | (15,592,467) | | | | | | — | | |
| Jefferies LLC | | | | | 3,888,791 | | | | | | (3,888,791) | | | | | | — | | |
| J.P. Morgan Securities LLC | | | | | 114,900,176 | | | | | | (114,900,176) | | | | | | — | | |
| Mirae Asset Securities (USA) INC. | | | | | 590,097 | | | | | | (590,097) | | | | | | — | | |
| MUFG Securities Americas Inc. | | | | | 3,753,231 | | | | | | (3,753,231) | | | | | | — | | |
| Mizuho Securities USA LLC. | | | | | 1,397,408 | | | | | | (1,397,408) | | | | | | — | | |
| Morgan Stanley & Co. LLC | | | | | 33,531,102 | | | | | | (33,531,102) | | | | | | — | | |
| National Bank Financial INC | | | | | 45,940 | | | | | | (45,940) | | | | | | — | | |
| National Financial Services LLC | | | | | 4,110,763 | | | | | | (4,110,763) | | | | | | — | | |
| Nomura International PLC | | | | | 1,622,631 | | | | | | (1,622,631) | | | | | | — | | |
| Nomura Securities International, Inc. | | | | | 13,574,895 | | | | | | (13,574,895) | | | | | | — | | |
| Raymond James & Associates, Inc. | | | | | 705,329 | | | | | | (705,329) | | | | | | — | | |
| RBC Capital Markets, LLC | | | | | 17,794,501 | | | | | | (17,794,501) | | | | | | — | | |
| RBC Dominion Securities Inc | | | | | 2,081,670 | | | | | | (2,081,670) | | | | | | — | | |
| Scotia Capital (USA) INC | | | | | 2,524,720 | | | | | | (2,524,720) | | | | | | — | | |
| Societe Generale | | | | | 78,964,945 | | | | | | (78,964,945) | | | | | | — | | |
| State Street Bank and Trust Company | | | | | 17,135,359 | | | | | | (17,135,359) | | | | | | — | | |
| Counterparty | | | Securities Loaned at Value | | | Cash Collateral Received(1) | | | Net Amount | | |||||||||
| SunTrust Robinson Humphrey, Inc | | | | | 3,924,125 | | | | | | (3,924,125) | | | | | | — | | |
| TD Prime Services LLC | | | | | 2,429,935 | | | | | | (2,429,935) | | | | | | — | | |
| TD Securities (USA) Inc. | | | | | 5,848,081 | | | | | | (5,848,081) | | | | | | — | | |
| TD Securities INC | | | | | 818,122 | | | | | | (818,122) | | | | | | — | | |
| UBS AG | | | | | 7,648,119 | | | | | | (7,648,119) | | | | | | — | | |
| UBS Securities LLC. | | | | | 22,363,417 | | | | | | (22,363,417) | | | | | | — | | |
| Wells Fargo Bank NA | | | | | 2,903,161 | | | | | | (2,903,161) | | | | | | — | | |
| Wells Fargo Clearing Services, LLC | | | | | 1,842,087 | | | | | | (1,842,087) | | | | | | — | | |
| Wells Fargo Securities LLC | | | | | 7,721,979 | | | | | | (7,721,979) | | | | | | — | | |
| | | | | $ | 559,867,008 | | | | | $ | (559,860,444) | | | | | $ | 6,564 | | |
| | |||||||||||||||||||
| Counterparty | | | Securities Loaned at Value | | | Cash Collateral Received(1) | | | Net Amount | | |||||||||
| Barclays Capital Inc. | | | | $ | 1,408,858 | | | | | $ | (1,408,858) | | | | | $ | — | | |
| BofA Securities Inc | | | | | 370,648 | | | | | | (370,648) | | | | | | — | | |
| Citadel Clearing LLC | | | | | 552,311 | | | | | | (552,311) | | | | | | — | | |
| Citigroup Global Markets Inc. | | | | | 81,888 | | | | | | (81,888) | | | | | | — | | |
| Goldman Sachs & Co. LLC | | | | | 447,424 | | | | | | (447,424) | | | | | | — | | |
| J.P. Morgan Securities LLC | | | | | 113,463 | | | | | | (113,463) | | | | | | — | | |
| RBC Capital Markets, LLC | | | | | 513,882 | | | | | | (513,882) | | | | | | — | | |
| Societe Generale | | | | | 1,220,342 | | | | | | (1,220,342) | | | | | | — | | |
| Wells Fargo Securities LLC | | | | | 294,106 | | | | | | (294,106) | | | | | | — | | |
| | | | | $ | 5,002,922 | | | | | $ | (5,002,922) | | | | | $ | — | | |
| Counterparty | | | Securities Loaned at Value | | | Cash Collateral Received(1) | | | Net Amount | | |||||||||
| Barclays Capital Inc. | | | | $ | 8,946,952 | | | | | $ | (8,946,952) | | | | | $ | — | | |
| BNP Paribas | | | | | 2,374,993 | | | | | | (2,374,993) | | | | | | — | | |
| BNP Paribas Prime Brokerage Intl Ltd | | | | | 6,223,774 | | | | | | (6,223,774) | | | | | | — | | |
| BofA Securities Inc | | | | | 11,968,245 | | | | | | (11,968,245) | | | | | | — | | |
| Citadel Clearing LLC | | | | | 2,757,751 | | | | | | (2,757,751) | | | | | | — | | |
| Citigroup Global Markets Limited | | | | | 1,522,043 | | | | | | (1,522,043) | | | | | | — | | |
| Citigroup Global Markets Inc. | | | | | 15,133,549 | | | | | | (15,133,549) | | | | | | — | | |
| Credit Suisse Securities (USA) LLC | | | | | 368,106 | | | | | | (368,106) | | | | | | — | | |
| Deutsche Bank Securities Inc. | | | | | 149,784 | | | | | | (149,784) | | | | | | — | | |
| Goldman Sachs & Co. LLC | | | | | 3,535,202 | | | | | | (3,535,202) | | | | | | — | | |
| Jefferies LLC | | | | | 1,199,182 | | | | | | (1,199,182) | | | | | | — | | |
| J.P. Morgan Securities LLC | | | | | 38,408,796 | | | | | | (38,408,796) | | | | | | — | | |
| Morgan Stanley & Co. LLC | | | | | 6,820,037 | | | | | | (6,820,037) | | | | | | — | | |
| National Financial Services LLC | | | | | 129,323 | | | | | | (129,323) | | | | | | — | | |
| NatWest Markets Securities Inc. | | | | | 102,157 | | | | | | (102,157) | | | | | | — | | |
| Nomura Securities International, Inc. | | | | | 9,952,769 | | | | | | (9,952,769) | | | | | | — | | |
| RBC Capital Markets, LLC | | | | | 8,169,690 | | | | | | (8,169,690) | | | | | | — | | |
| RBC Dominion Securities Inc | | | | | 450,965 | | | | | | (450,965) | | | | | | — | | |
| Societe Generale | | | | | 6,121,237 | | | | | | (6,121,237) | | | | | | — | | |
| Counterparty | | | Securities Loaned at Value | | | Cash Collateral Received(1) | | | Net Amount | | |||||||||
| State Street Bank and Trust Company | | | | | 833,748 | | | | | | (833,748) | | | | | | — | | |
| SunTrust Robinson Humphrey, Inc | | | | | 260,367 | | | | | | (260,367) | | | | | | — | | |
| TD Prime Services LLC | | | | | 741,996 | | | | | | (741,996) | | | | | | — | | |
| TD Securities (USA) Inc. | | | | | 47,143 | | | | | | (47,143) | | | | | | — | | |
| Counterparty | | | Securities Loaned at Value | | | Cash Collateral Received(1) | | | Net Amount | | |||||||||
| TD Securities INC | | | | | 188,983 | | | | | | (188,983) | | | | | | — | | |
| UBS AG | | | | | 439,698 | | | | | | (439,698) | | | | | | — | | |
| Wells Fargo Bank NA | | | | | 858,579 | | | | | | (858,579) | | | | | | — | | |
| Wells Fargo Securities LLC | | | | | 5,577,860 | | | | | | (5,577,860) | | | | | | — | | |
| Total | | | | $ | 133,282,929 | | | | | $ | (133,282,929) | | | | | $ | — | | |
| | |||||||||||||||||||
| | | | Paid-in Capital | | | Distributable Earnings | | ||||||
| High Yield Bond | | | | $ | 526,482 | | | | | $ | (526,482) | | |
| | | | Year Ended March 31, 2022 | | | Year Ended March 31, 2021 | | ||||||||||||||||||||||||
| | | | Ordinary Income | | | Return of Capital | | | Ordinary Income | | | Long-term Capital Gains | | | Return of Capital | | |||||||||||||||
| GNMA Income | | | | $ | 23,043,516 | | | | | $ | 1,246,729 | | | | | $ | 27,858,078 | | | | | $ | — | | | | | $ | 5,670,717 | | |
| High Yield Bond | | | | | 46,733,715 | | | | | | — | | | | | | 43,745,747 | | | | | | — | | | | | | 2,160,508 | | |
| Intermediate Bond | | | | | 241,620,464 | | | | | | 15,759,373 | | | | | | 419,034,382 | | | | | | 26,007,065 | | | | | | 30,585,431 | | |
| Short Term Bond | | | | | 5,328,045 | | | | | | 1,297,390 | | | | | | 4,264,688 | | | | | | — | | | | | | 431,580 | | |
| Strategic Income Opportunities | | | | | 65,079,993 | | | | | | 15,258,017 | | | | | | 85,398,234 | | | | | | — | | | | | | 12,607,156 | | |
| | | | Undistributed Ordinary Income | | | Undistributed Long-term Capital Gains | | | Unrealized Appreciation/ (Depreciation) | | | Capital Loss Carryforwards | | | Other | | | Total Distributable Earnings/(Loss) | | ||||||||||||||||||||||||||||||
| | Amount | | | Character | | | Expiration | | |||||||||||||||||||||||||||||||||||||||||
| GNMA Income | | | | $ | — | | | | | $ | — | | | | | $ | (50,664,914) | | | | | $ | (28,867,322) | | | | | | Short-term | | | | | | None | | | | | $ | (325,565) | | | | | $ | (96,986,468) | | |
| | | | | | | | | | | | | | | | | | | | | | | | (17,128,667) | | | | | | Long-term | | | | | | None | | | | | | | | | | | | | | |
| | | | | | | | | | | | | | | | | | | | | | | $ | (45,995,989) | | | | | | | | | | | | | | | | | | | | | | | | | | |
| High Yield Bond | | | | | 2,846,583 | | | | | | 3,451,344 | | | | | | (14,850,077) | | | | | | — | | | | | | — | | | | | | — | | | | | | (92,618) | | | | | | (8,644,768) | | |
| Intermediate Bond | | | | | — | | | | | | — | | | | | | (464,851,180) | | | | | | (119,411,929) | | | | | | Short-term | | | | | | None | | | | | | (2,427,098) | | | | | | (613,852,415) | | |
| | | | | | | | | | | | | | | | | | | | | | | | (27,162,208) | | | | | | Long-term | | | | | | None | | | | | | | | | | | | | | |
| | | | | | | | | | | | | | | | | | | | | | | $ | (146,574,137) | | | | | | | | | | | | | | | | | | | | | | | | | | |
| Short Term Bond | | | | | — | | | | | | — | | | | | | (11,301,169) | | | | | | (4,572,060) | | | | | | Short-term | | | | | | None | | | | | | (3,322) | | | | | | (18,920,347) | | |
| | | | | | | | | | | | | | | | | | | | | | | | (3,043,796) | | | | | | Long-term | | | | | | None | | | | | | | | | | | | | | |
| | | | | | | | | | | | | | | | | | | | | | | $ | (7,615,856) | | | | | | | | | | | | | | | | | | | | | | | | | | |
| Strategic Income Opportunities | | | | | — | | | | | | — | | | | | | (103,800,647) | | | | | | (28,220,535) | | | | | | Short-term | | | | | | None | | | | | | (642,821) | | | | | | (172,315,687) | | |
| | | | | | | | | | | | | | | | | | | | | | | | (39,651,684) | | | | | | Long-term | | | | | | None | | | | | | | | | | | | | | |
| | | | | | | | | | | | | | | | | | | | | | | $ | (67,872,219) | | | | | | | | | | | | | | | | | | | | | | | | | | |
| | | | Per Share Amount | | | Payable Date | | | Record Date | | ||||||
| GNMA Income | | | | | | | | | | | | | | | | |
| Class A | | | | $ | 0.0078 | | | | May 2, 2022 | | | | | Daily | | |
| Class C | | | | $ | 0.0028 | | | | May 2, 2022 | | | | | Daily | | |
| Class I | | | | $ | 0.0098 | | | | May 2, 2022 | | | | | Daily | | |
| | | | Per Share Amount | | | Payable Date | | | Record Date | | ||||||
| Class P | | | | $ | 0.0130 | | | | May 2, 2022 | | | | | Daily | | |
| Class R6 | | | | $ | 0.0098 | | | | May 2, 2022 | | | | | Daily | | |
| Class W | | | | $ | 0.0095 | | | | May 2, 2022 | | | | | Daily | | |
| High Yield Bond | | | | | | | | | | | | | | | | |
| Class A | | | | $ | 0.0267 | | | | May 2, 2022 | | | | | Daily | | |
| Class C | | | | $ | 0.0220 | | | | May 2, 2022 | | | | | Daily | | |
| Class I | | | | $ | 0.0288 | | | | May 2, 2022 | | | | | Daily | | |
| Class P | | | | $ | 0.0330 | | | | May 2, 2022 | | | | | Daily | | |
| Class P3 | | | | $ | 0.0334 | | | | May 2, 2022 | | | | | Daily | | |
| Class R | | | | $ | 0.0251 | | | | May 2, 2022 | | | | | Daily | | |
| Class R6 | | | | $ | 0.0293 | | | | May 2, 2022 | | | | | Daily | | |
| Class W | | | | $ | 0.0283 | | | | May 2, 2022 | | | | | Daily | | |
| Intermediate Bond | | | | | | | | | | | | | | | | |
| Class A | | | | $ | 0.0154 | | | | May 2, 2022 | | | | | Daily | | |
| Class C | | | | $ | 0.0095 | | | | May 2, 2022 | | | | | Daily | | |
| Class I | | | | $ | 0.0178 | | | | May 2, 2022 | | | | | Daily | | |
| Class P3 | | | | $ | 0.0206 | | | | May 2, 2022 | | | | | Daily | | |
| Class R | | | | $ | 0.0134 | | | | May 2, 2022 | | | | | Daily | | |
| Class R6 | | | | $ | 0.0182 | | | | May 2, 2022 | | | | | Daily | | |
| Class W | | | | $ | 0.0173 | | | | May 2, 2022 | | | | | Daily | | |
| Short Term Bond | | | | | | | | | | | | | | | | |
| Class A | | | | $ | 0.0094 | | | | May 2, 2022 | | | | | Daily | | |
| Class C | | | | $ | 0.0035 | | | | May 2, 2022 | | | | | Daily | | |
| Class I | | | | $ | 0.0117 | | | | May 2, 2022 | | | | | Daily | | |
| Class P2 | | | | $ | 0.0210 | | | | May 2, 2022 | | | | | Daily | | |
| Class P3 | | | | $ | 0.0156 | | | | May 2, 2022 | | | | | Daily | | |
| Class R | | | | $ | 0.0074 | | | | May 2, 2022 | | | | | Daily | | |
| Class R6 | | | | $ | 0.0120 | | | | May 2, 2022 | | | | | Daily | | |
| Class W | | | | $ | 0.0113 | | | | May 2, 2022 | | | | | Daily | | |
| Strategic Income Opportunities | | | | | | | | | | | | | | | | |
| Class A | | | | $ | 0.0196 | | | | May 2, 2022 | | | | | Daily | | |
| Class C | | | | $ | 0.0135 | | | | May 2, 2022 | | | | | Daily | | |
| Class I | | | | $ | 0.0225 | | | | May 2, 2022 | | | | | Daily | | |
| Class P | | | | $ | 0.0266 | | | | May 2, 2022 | | | | | Daily | | |
| Class R | | | | $ | 0.0175 | | | | May 2, 2022 | | | | | Daily | | |
| Class R6 | | | | $ | 0.0229 | | | | May 2, 2022 | | | | | Daily | | |
| Class W | | | | $ | 0.0216 | | | | May 2, 2022 | | | | | Daily | | |
| Voya GNMA Income Fund | as of March 31, 2022 |
| Principal Amount† | | | Value | | | Percentage of Net Assets | | |||||||||
| COLLATERALIZED MORTGAGE OBLIGATIONS: 55.3% | | |||||||||||||||
| 1,864,335 | | | Fannie Mae 2004-28 PZ, 6.000%, 05/25/2034 | | | | $ | 2,191,356 | | | | | | 0.2 | | |
| 2,126,180 | | | Fannie Mae 2004-88 ZC, 6.500%, 12/25/2034 | | | | | 2,431,877 | | | | | | 0.2 | | |
| 5,920,258 | | | Fannie Mae 2005-17 B, 6.500%, (US0001M + 6.500%), 03/25/2035 | | | | | 7,084,383 | | | | | | 0.5 | | |
| 1,547,883 | | | Fannie Mae 2005-43 PZ, 6.000%, 05/25/2035 | | | | | 1,705,968 | | | | | | 0.1 | | |
| 777,268 | | | Fannie Mae 2007-60 ZB, 4.750%, 05/25/2037 | | | | | 801,493 | | | | | | 0.1 | | |
| 1,191,205 (1) | | | Fannie Mae 2010-150 PS, 6.143%, (-1.000*US0001M + 6.600%), 12/25/2039 | | | | | 25,555 | | | | | | 0.0 | | |
| 3,313,772 (1) | | | Fannie Mae 2010-95 SB, 6.143%, (-1.000*US0001M + 6.600%), 09/25/2040 | | | | | 387,800 | | | | | | 0.0 | | |
| 5,386,279 | | | Fannie Mae 2011-99 CZ, 4.500%, 10/25/2041 | | | | | 5,632,637 | | | | | | 0.4 | | |
| 5,521,089 (1) | | | Fannie Mae 2012-148 HI, 3.500%, 05/25/2042 | | | | | 617,797 | | | | | | 0.0 | | |
| 13,230,305 (1) | | | Fannie Mae 2012-148 IM, 3.000%, 01/25/2028 | | | | | 743,698 | | | | | | 0.1 | | |
| 167,187 (2) | | | Fannie Mae REMIC Trust 2002-W1 3A, 3.225%, 04/25/2042 | | | | | 167,030 | | | | | | 0.0 | | |
| 842,838 (2) | | | Fannie Mae REMIC Trust 2002-W6 3A, 3.740%, 01/25/2042 | | | | | 848,480 | | | | | | 0.1 | | |
| 938,242 | | | Fannie Mae REMIC Trust 2003-16 CX, 6.500%, 03/25/2033 | | | | | 1,032,965 | | | | | | 0.1 | | |
| 2,189,118 | | | Fannie Mae REMIC Trust 2003-34 LN, 5.000%, 05/25/2033 | | | | | 2,250,065 | | | | | | 0.2 | | |
| 81,980 | | | Fannie Mae REMIC Trust 2004-61 SH, 22.162%, (-3.998*US0001M + 23.988%), 11/25/2032 | | | | | 105,914 | | | | | | 0.0 | | |
| 2,732,174 (2) | | | Fannie Mae REMIC Trust 2004-W11 2A, 3.411%, 03/25/2043 | | | | | 2,587,609 | | | | | | 0.2 | | |
| 2,346,548 | | | Fannie Mae REMIC Trust 2004-W3 A8, 5.500%, 05/25/2034 | | | | | 2,420,240 | | | | | | 0.2 | | |
| 392,364 (1) | | | Fannie Mae REMIC Trust 2005-17 ES, 6.293%, (-1.000*US0001M + 6.750%), 03/25/2035 | | | | | 29,060 | | | | | | 0.0 | | |
| Principal Amount† | | | Value | | | Percentage of Net Assets | | |||||||||
| COLLATERALIZED MORTGAGE OBLIGATIONS: (continued) | | |||||||||||||||
| 333,446 | | | Fannie Mae REMIC Trust 2005-59 NQ, 15.734%, (-2.500*US0001M + 16.875%), 05/25/2035 | | | | $ | 378,709 | | | | | | 0.0 | | |
| 480,575 | | | Fannie Mae REMIC Trust 2005-88 ZC, 5.000%, 10/25/2035 | | | | | 507,930 | | | | | | 0.0 | | |
| 107,186 | | | Fannie Mae REMIC Trust 2006-115 ES, 24.734%, (-4.000*US0001M + 26.560%), 12/25/2036 | | | | | 145,857 | | | | | | 0.0 | | |
| 752,666 (1) | | | Fannie Mae REMIC Trust 2006-36 SP, 6.243%, (-1.000*US0001M + 6.700%), 05/25/2036 | | | | | 85,116 | | | | | | 0.0 | | |
| 2,653,468 (1) | | | Fannie Mae REMIC Trust 2006-79 SH, 5.993%, (-1.000*US0001M + 6.450%), 08/25/2036 | | | | | 419,896 | | | | | | 0.0 | | |
| 160,884 (2) | | | Fannie Mae REMIC Trust 2009-12 LK, 11.269%, 03/25/2039 | | | | | 182,693 | | | | | | 0.0 | | |
| 1,861,549 | | | Fannie Mae REMIC Trust 2009-66 XA, 5.500%, 12/25/2035 | | | | | 2,124,795 | | | | | | 0.1 | | |
| 2,071,169 | | | Fannie Mae REMIC Trust 2010-155 JC, 4.000%, 12/25/2039 | | | | | 2,098,515 | | | | | | 0.1 | | |
| 5,028,150 | | | Fannie Mae REMIC Trust 2010-2 LC, 5.000%, 02/25/2040 | | | | | 5,406,541 | | | | | | 0.4 | | |
| 1,290,933 | | | Fannie Mae REMIC Trust 2011-30 ZA, 5.000%, 04/25/2041 | | | | | 1,375,976 | | | | | | 0.1 | | |
| 3,954,758 (1) | | | Fannie Mae REMIC Trust 2012-128 VS, 5.793%, (-1.000*US0001M + 6.250%), 06/25/2042 | | | | | 346,629 | | | | | | 0.0 | | |
| 2,301,460 (1) | | | Fannie Mae REMIC Trust 2012-142 BI, 3.000%, 11/25/2027 | | | | | 116,362 | | | | | | 0.0 | | |
| 1,963,750 (1) | | | Fannie Mae REMIC Trust 2012-154 PI, 4.000%, 05/25/2042 | | | | | 241,762 | | | | | | 0.0 | | |
| 1,627,307 (1) | | | Fannie Mae REMIC Trust 2012-68 SD, 6.243%, (-1.000*US0001M + 6.700%), 06/25/2032 | | | | | 188,801 | | | | | | 0.0 | | |
| Voya GNMA Income Fund | as of March 31, 2022 (continued) |
| Principal Amount† | | | Value | | | Percentage of Net Assets | | |||||||||
| COLLATERALIZED MORTGAGE OBLIGATIONS: (continued) | | |||||||||||||||
| 3,457,000 | | | Fannie Mae REMIC Trust 2012-97 PC, 3.500%, 09/25/2042 | | | | $ | 3,528,750 | | | | | | 0.2 | | |
| 660,781 (1) | | | Fannie Mae REMIC Trust 2013-13 PI, 3.500%, 04/25/2042 | | | | | 55,617 | | | | | | 0.0 | | |
| 1,561,604 (1) | | | Fannie Mae REMIC Trust 2013-54 ID, 3.000%, 01/25/2033 | | | | | 133,958 | | | | | | 0.0 | | |
| 469,800 | | | Fannie Mae REMICS 2005-122 SE, 21.502%, (-3.500*US0001M + 23.100%), 11/25/2035 | | | | | 555,138 | | | | | | 0.0 | | |
| 2,714,842 (1) | | | Fannie Mae REMICS 2005-17 SA, 6.243%, (-1.000*US0001M + 6.700%), 03/25/2035 | | | | | 444,026 | | | | | | 0.0 | | |
| 449,781 | | | Fannie Mae REMICS 2005-75 GS, 18.880%, (-3.000*US0001M + 20.250%), 08/25/2035 | | | | | 548,460 | | | | | | 0.0 | | |
| 3,453 (3) | | | Fannie Mae REMICS 2006-44 P, 0.000%, 12/25/2033 | | | | | 3,013 | | | | | | 0.0 | | |
| 5,714,002 (1) | | | Fannie Mae REMICS 2006-8 HL, 6.243%, (-1.000*US0001M + 6.700%), 03/25/2036 | | | | | 828,793 | | | | | | 0.1 | | |
| 580,446 | | | Fannie Mae REMICS 2007-1 NR, 44.030%, (-7.600*US0001M + 47.500%), 02/25/2037 | | | | | 1,392,878 | | | | | | 0.1 | | |
| 7,168,919 (1) | | | Fannie Mae REMICS 2010-147 LS, 5.993%, (-1.000*US0001M + 6.450%), 01/25/2041 | | | | | 1,230,143 | | | | | | 0.1 | | |
| 1,168,293 | | | Fannie Mae REMICS 2010-26 F, 1.227%, (US0001M + 0.770%), 11/25/2036 | | | | | 1,191,306 | | | | | | 0.1 | | |
| 1,159,559 | | | Fannie Mae REMICS 2010-39 FN, 1.287%, (US0001M + 0.830%), 05/25/2040 | | | | | 1,183,095 | | | | | | 0.1 | | |
| 718,916 | | | Fannie Mae REMICS 2010-80 PZ, 5.000%, 07/25/2040 | | | | | 776,425 | | | | | | 0.1 | | |
| 1,000,000 | | | Fannie Mae REMICS 2010-87 PL, 4.000%, 06/25/2040 | | | | | 1,021,231 | | | | | | 0.1 | | |
| Principal Amount† | | | Value | | | Percentage of Net Assets | | |||||||||
| COLLATERALIZED MORTGAGE OBLIGATIONS: (continued) | | |||||||||||||||
| 1,137,659 | | | Fannie Mae REMICS 2011-10 ZC, 5.000%, 02/25/2041 | | | | $ | 1,217,275 | | | | | | 0.1 | | |
| 750,000 | | | Fannie Mae REMICS 2011-105 MB, 4.000%, 10/25/2041 | | | | | 780,262 | | | | | | 0.1 | | |
| 1,830,000 | | | Fannie Mae REMICS 2011-131 PB, 4.500%, 12/25/2041 | | | | | 1,940,304 | | | | | | 0.1 | | |
| 2,643,692 (1) | | | Fannie Mae REMICS 2012-137 EI, 3.000%, 12/25/2027 | | | | | 141,904 | | | | | | 0.0 | | |
| 2,255,249 | | | Fannie Mae REMICS 2012-148 KH, 3.000%, 03/25/2042 | | | | | 2,231,352 | | | | | | 0.2 | | |
| 5,495,599 | | | Fannie Mae REMICS 2012-17 QZ, 4.000%, 03/25/2042 | | | | | 5,642,179 | | | | | | 0.4 | | |
| 2,895,087 | | | Fannie Mae REMICS 2012-27 EZ, 4.250%, 03/25/2042 | | | | | 3,013,383 | | | | | | 0.2 | | |
| 2,500,000 | | | Fannie Mae REMICS 2012-40 MY, 3.500%, 04/25/2042 | | | | | 2,541,469 | | | | | | 0.2 | | |
| 746,790 | | | Fannie Mae REMICS 2013-125 AZ, 4.000%, 11/25/2039 | | | | | 797,837 | | | | | | 0.1 | | |
| 1,521,695 (3) | | | Fannie Mae REMICS 2013-135 PO, 0.000%, 01/25/2044 | | | | | 1,269,034 | | | | | | 0.1 | | |
| 2,916,597 (1) | | | Fannie Mae REMICS 2013-25 BI, 3.000%, 03/25/2033 | | | | | 242,376 | | | | | | 0.0 | | |
| 1,303,000 | | | Fannie Mae REMICS 2013-55 VZ, 3.000%, 06/25/2043 | | | | | 1,289,556 | | | | | | 0.1 | | |
| 2,135,992 (1) | | | Fannie Mae REMICS 2013-62 AI, 3.000%, 06/25/2033 | | | | | 209,625 | | | | | | 0.0 | | |
| 1,401,927 | | | Fannie Mae REMICS 2015-22 DY, 3.000%, 04/25/2045 | | | | | 1,333,036 | | | | | | 0.1 | | |
| 1,302,865 | | | Fannie Mae REMICS 2015-26 UZ, 3.000%, 05/25/2045 | | | | | 1,216,717 | | | | | | 0.1 | | |
| 711,932 | | | Fannie Mae REMICS 2015-68 JW, 3.500%, 09/25/2030 | | | | | 723,576 | | | | | | 0.1 | | |
| Voya GNMA Income Fund | as of March 31, 2022 (continued) |
| Principal Amount† | | | Value | | | Percentage of Net Assets | | |||||||||
| COLLATERALIZED MORTGAGE OBLIGATIONS: (continued) | | |||||||||||||||
| 1,410,000 | | | Fannie Mae REMICS 2016-103 PB, 3.000%, 01/25/2047 | | | | $ | 1,398,475 | | | | | | 0.1 | | |
| 5,361,617 (1) | | | Fannie Mae REMICS 2016-4 DS, 5.643%, (-1.000*US0001M + 6.100%), 02/25/2046 | | | | | 893,661 | | | | | | 0.1 | | |
| 4,283,554 | | | Fannie Mae REMICS 2016-64 LD, 3.500%, 09/25/2046 | | | | | 4,399,381 | | | | | | 0.3 | | |
| 5,248,766 | | | Fannie Mae REMICS 2017-22 DZ, 4.000%, 04/25/2047 | | | | | 5,408,144 | | | | | | 0.4 | | |
| 6,089,761 | | | Fannie Mae REMICS 2018-11 BX, 4.000%, 12/25/2047 | | | | | 6,177,597 | | | | | | 0.4 | | |
| 7,510,000 | | | Fannie Mae REMICS 2018-16 TV, 3.000%, 05/25/2041 | | | | | 7,363,355 | | | | | | 0.5 | | |
| 161,580 | | | Fannie Mae REMICS 2018-25 AL, 3.500%, 04/25/2048 | | | | | 165,088 | | | | | | 0.0 | | |
| 524,437 | | | Fannie Mae REMICS 2018-37 DZ, 4.000%, 06/25/2048 | | | | | 555,984 | | | | | | 0.0 | | |
| 8,051,100 (1) | | | Fannie Mae REMICS 2019-49 IG, 3.000%, 03/25/2033 | | | | | 674,685 | | | | | | 0.0 | | |
| 1,606,062 | | | Fannie Mae REMICS 2019-6 GZ, 4.000%, 03/25/2059 | | | | | 1,775,963 | | | | | | 0.1 | | |
| 5,271,831 (1) | | | Fannie Mae REMICS 2020-44 TI, 5.500%, 12/25/2035 | | | | | 914,741 | | | | | | 0.1 | | |
| 3,200,977 | | | Fannie Mae Series 2016-51 S, 5.463%, (-1.000*US0001M + 5.920%), 10/25/2043 | | | | | 3,236,882 | | | | | | 0.2 | | |
| 1,614,488 (2) | | | Fannie Mae Trust 2004-W2 3A, 2.879%, 02/25/2044 | | | | | 1,649,366 | | | | | | 0.1 | | |
| 1,484,966 (2) | | | Fannie Mae Trust 2004-W2 4A, 2.918%, 02/25/2044 | | | | | 1,515,767 | | | | | | 0.1 | | |
| 2,397,641 | | | Freddie Mac 3770 GA, 4.500%, 10/15/2040 | | | | | 2,556,962 | | | | | | 0.2 | | |
| 1,831,961 | | | Freddie Mac REMIC Trust 2005-S001 2A2, 0.607%, (US0001M + 0.150%), 09/25/2045 | | | | | 1,817,415 | | | | | | 0.1 | | |
| Principal Amount† | | | Value | | | Percentage of Net Assets | | |||||||||
| COLLATERALIZED MORTGAGE OBLIGATIONS: (continued) | | |||||||||||||||
| 346,722 | | | Freddie Mac REMIC Trust 2653 SC, 6.685%, (-0.500*US0001M + 6.800%), 07/15/2033 | | | | $ | 361,957 | | | | | | 0.0 | | |
| 829,151 | | | Freddie Mac REMIC Trust 2767 ZW, 6.000%, 03/15/2034 | | | | | 915,205 | | | | | | 0.1 | | |
| 92,664 | | | Freddie Mac REMIC Trust 3012 ST, 20.532%, (-3.600*US0001M + 21.960%), 04/15/2035 | | | | | 109,023 | | | | | | 0.0 | | |
| 244,082 | | | Freddie Mac REMIC Trust 3065 DC, 18.670%, (-3.000*US0001M + 19.860%), 03/15/2035 | | | | | 287,748 | | | | | | 0.0 | | |
| 369,917 | | | Freddie Mac REMIC Trust 3158 NE, 5.500%, 05/15/2036 | | | | | 403,782 | | | | | | 0.0 | | |
| 3,143,830 (1) | | | Freddie Mac REMIC Trust 3181 TA, 0.500%, (-0.794*US0001M + 5.635%), 07/15/2036 | | | | | 56,933 | | | | | | 0.0 | | |
| 223,805 (1) | | | Freddie Mac REMIC Trust 3507 IA, 5.500%, 09/15/2035 | | | | | 32,947 | | | | | | 0.0 | | |
| 296,733 | | | Freddie Mac REMIC Trust 3864 NT, 5.500%, (-9.167*US0001M + 60.500%), 03/15/2039 | | | | | 309,356 | | | | | | 0.0 | | |
| 1,372,524 | | | Freddie Mac REMIC Trust 3888 ZG, 4.000%, 07/15/2041 | | | | | 1,393,179 | | | | | | 0.1 | | |
| 94,723 (1) | | | Freddie Mac REMIC Trust 4027 QI, 4.500%, 12/15/2040 | | | | | 810 | | | | | | 0.0 | | |
| 8,772,635 (1) | | | Freddie Mac REMIC Trust 4176 IA, 2.500%, 03/15/2028 | | | | | 414,439 | | | | | | 0.0 | | |
| 144,536 (3) | | | Freddie Mac REMICS 2974 KO, 0.000%, 05/15/2035 | | | | | 122,103 | | | | | | 0.0 | | |
| 3,569,935 | | | Freddie Mac REMICS 3196 ZK, 6.500%, 04/15/2032 | | | | | 4,319,003 | | | | | | 0.3 | | |
| 1,071,070 | | | Freddie Mac REMICS 3658 CZ, 5.000%, 04/15/2040 | | | | | 1,181,721 | | | | | | 0.1 | | |
| Voya GNMA Income Fund | as of March 31, 2022 (continued) |
| Principal Amount† | | | Value | | | Percentage of Net Assets | | |||||||||
| COLLATERALIZED MORTGAGE OBLIGATIONS: (continued) | | |||||||||||||||
| 5,207,018 (1) | | | Freddie Mac REMICS 3960 SG, 5.603%, (-1.000*US0001M + 6.000%), 11/15/2041 | | | | $ | 780,841 | | | | | | 0.1 | | |
| 5,075,000 | | | Freddie Mac REMICS 4059 DY, 3.500%, 06/15/2042 | | | | | 5,274,557 | | | | | | 0.4 | | |
| 1,397,840 | | | Freddie Mac REMICS 4097 ZA, 3.500%, 08/15/2042 | | | | | 1,408,807 | | | | | | 0.1 | | |
| 42,833 | | | Freddie Mac REMICS 4136 LU, 3.000%, 07/15/2032 | | | | | 42,825 | | | | | | 0.0 | | |
| 3,968,003 | | | Freddie Mac REMICS 4136 ZG, 3.000%, 11/15/2042 | | | | | 3,898,901 | | | | | | 0.3 | | |
| 9,309,895 | | | Freddie Mac REMICS 4159 LZ, 3.500%, 01/15/2043 | | | | | 9,481,171 | | | | | | 0.7 | | |
| 1,921,537 | | | Freddie Mac REMICS 4249 CS, 4.477%, (-0.750*US0001M + 4.650%), 09/15/2043 | | | | | 1,682,278 | | | | | | 0.1 | | |
| 2,877,185 | | | Freddie Mac REMICS 4274 US, 5.453%, (-1.000*US0001M + 5.850%), 10/15/2035 | | | | | 2,623,160 | | | | | | 0.2 | | |
| 10,212,498 | | | Freddie Mac REMICS 4367 MZ, 4.000%, 07/15/2044 | | | | | 10,725,517 | | | | | | 0.7 | | |
| 2,588,084 | | | Freddie Mac REMICS 4372 Z, 3.000%, 08/15/2044 | | | | | 2,537,921 | | | | | | 0.2 | | |
| 9,293,690 (1) | | | Freddie Mac REMICS 4438 AS, 5.803%, (-1.000*US0001M + 6.200%), 02/15/2045 | | | | | 1,413,367 | | | | | | 0.1 | | |
| 6,361,853 | | | Freddie Mac REMICS 4480 ZX, 4.000%, 11/15/2044 | | | | | 6,542,368 | | | | | | 0.4 | | |
| 172,201 | | | Freddie Mac REMICS 4764 CJ, 4.000%, 06/15/2045 | | | | | 172,528 | | | | | | 0.0 | | |
| 286,937 | | | Freddie Mac REMICS 4764 DA, 4.000%, 07/15/2045 | | | | | 288,737 | | | | | | 0.0 | | |
| 3,096,209 | | | Freddie Mac REMICS 4818 GZ, 4.000%, 08/15/2048 | | | | | 3,118,610 | | | | | | 0.2 | | |
| 2,597,868 | | | Freddie Mac REMICS 5000 DC, 2.500%, 03/25/2040 | | | | | 2,474,830 | | | | | | 0.2 | | |
| 1,384,232 | | | Freddie Mac Series 4040 UZ, 5.000%, 05/15/2042 | | | | | 1,607,454 | | | | | | 0.1 | | |
| 1,175,358 (2) | | | Freddie Mac Structured Pass-Through Certificates T-54 2A, 3.491%, 07/25/2033 | | | | | 1,191,689 | | | | | | 0.1 | | |
| 674,736 (2) | | | Freddie Mac Structured Pass-Through Certificates T-54 4A, 3.473%, 02/25/2043 | | | | | 694,267 | | | | | | 0.0 | | |
| Principal Amount† | | | Value | | | Percentage of Net Assets | | |||||||||
| COLLATERALIZED MORTGAGE OBLIGATIONS: (continued) | | |||||||||||||||
| 6,197,907 | | | Freddie Mac Whole Loan Securities Trust 2017-SC02 1A2, 3.000%, 05/25/2047 | | | | $ | 6,005,462 | | | | | | 0.4 | | |
| 35,567 (1) | | | Freddie Mac-Ginnie Mae Series 21 SA, 7.543%, (-1.000*US0001M + 8.000%), 10/25/2023 | | | | | 1,366 | | | | | | 0.0 | | |
| 772,402 | | | Ginnie Mae 2004-65 ZG, 5.500%, 07/20/2034 | | | | | 825,270 | | | | | | 0.1 | | |
| 5,962,238 | | | Ginnie Mae 2009-110 ZA, 5.500%, 11/16/2039 | | | | | 6,561,507 | | | | | | 0.5 | | |
| 829,131 | | | Ginnie Mae 2009-32 QZ, 5.500%, 05/16/2039 | | | | | 906,155 | | | | | | 0.1 | | |
| 661,259 | | | Ginnie Mae 2009-32 YZ, 7.000%, 05/16/2039 | | | | | 769,654 | | | | | | 0.1 | | |
| 4,742,833 | | | Ginnie Mae 2009-50 MZ, 6.000%, 07/16/2039 | | | | | 5,141,577 | | | | | | 0.4 | | |
| 394,154 | | | Ginnie Mae 2009-54 HZ, 5.000%, 07/20/2039 | | | | | 420,920 | | | | | | 0.0 | | |
| 1,143,372 | | | Ginnie Mae 2009-79 PZ, 6.000%, 09/20/2039 | | | | | 1,362,842 | | | | | | 0.1 | | |
| 804,029 | | | Ginnie Mae 2009-H01 FA, 1.599%, (US0001M + 1.150%), 11/20/2059 | | | | | 811,749 | | | | | | 0.1 | | |
| 2,000,000 | | | Ginnie Mae 2010-116 PB, 5.000%, 06/16/2040 | | | | | 2,131,325 | | | | | | 0.1 | | |
| 2,815,797 | | | Ginnie Mae 2010-125 BZ, 4.500%, 09/16/2040 | | | | | 2,938,377 | | | | | | 0.2 | | |
| 2,561,018 (3) | | | Ginnie Mae 2011-70 PO, 0.000%, 05/16/2041 | | | | | 2,201,870 | | | | | | 0.2 | | |
| 2,128,856 (1) | | | Ginnie Mae 2014-107 XS, 5.169%, (-1.000*US0001M + 5.600%), 07/16/2044 | | | | | 258,136 | | | | | | 0.0 | | |
| 1,850,316 | | | Ginnie Mae 2014-149 KL, 4.000%, 10/16/2044 | | | | | 1,997,837 | | | | | | 0.1 | | |
| 1,055,989 (1) | | | Ginnie Mae 2014-96 SQ, 5.169%, (-1.000*US0001M + 5.600%), 07/16/2044 | | | | | 126,986 | | | | | | 0.0 | | |
| 130,000 | | | Ginnie Mae 2015-123 GY, 3.000%, 09/20/2045 | | | | | 126,206 | | | | | | 0.0 | | |
| 6,783,441 | | | Ginnie Mae 2015-H13 FG, 0.506%, (US0001M + 0.400%), 04/20/2065 | | | | | 6,756,528 | | | | | | 0.5 | | |
| 15,034,480 (1) | | | Ginnie Mae 2016-120 IM, 3.500%, 07/20/2046 | | | | | 1,728,044 | | | | | | 0.1 | | |
| 627,344 (1) | | | Ginnie Mae 2016-84 IO, 5.000%, 12/20/2040 | | | | | 25,375 | | | | | | 0.0 | | |
| Voya GNMA Income Fund | as of March 31, 2022 (continued) |
| Principal Amount† | | | Value | | | Percentage of Net Assets | | |||||||||
| COLLATERALIZED MORTGAGE OBLIGATIONS: (continued) | | |||||||||||||||
| 13,174,965 | | | Ginnie Mae 2016-H20 FB, 0.656%, (US0001M + 0.550%), 09/20/2066 | | | | $ | 13,158,515 | | | | | | 0.9 | | |
| 1,000,000 | | | Ginnie Mae 2017-117 BE, 2.500%, 08/20/2047 | | | | | 935,440 | | | | | | 0.1 | | |
| 1,000,000 | | | Ginnie Mae 2017-117 NG, 2.500%, 08/20/2047 | | | | | 931,717 | | | | | | 0.1 | | |
| 750,000 | | | Ginnie Mae 2017-163 YA, 2.500%, 11/20/2047 | | | | | 704,400 | | | | | | 0.1 | | |
| 10,000,000 | | | Ginnie Mae 2017-180 QB, 2.500%, 12/20/2047 | | | | | 9,392,100 | | | | | | 0.6 | | |
| 4,602,189 | | | Ginnie Mae 2018-64 ZH, 2.500%, 05/16/2045 | | | | | 4,391,699 | | | | | | 0.3 | | |
| 945,268 (1) | | | Ginnie Mae 2018-78 IC, 4.000%, 02/20/2047 | | | | | 114,098 | | | | | | 0.0 | | |
| 1,000,000 | | | Ginnie Mae 2018-91 JN, 3.000%, 07/20/2048 | | | | | 995,579 | | | | | | 0.1 | | |
| 109,899 | | | Ginnie Mae 2019-71 EN, 4.000%, 06/20/2049 | | | | | 112,709 | | | | | | 0.0 | | |
| 7,487,357 (1) | | | Ginnie Mae 2021-74 KI, 3.000%, 04/20/2051 | | | | | 1,058,441 | | | | | | 0.1 | | |
| 2,346,452 | | | Ginnie Mae 2022-47 EB, 3.000%, 03/20/2037 | | | | | 2,331,364 | | | | | | 0.2 | | |
| 354,665 | | | Ginnie Mae Series 2002-92 EA, 4.500%, 02/20/2029 | | | | | 358,676 | | | | | | 0.0 | | |
| 80,561 | | | Ginnie Mae Series 2004-16 AE, 5.500%, 02/20/2034 | | | | | 85,931 | | | | | | 0.0 | | |
| 748,456 | | | Ginnie Mae Series 2004-17 MZ, 5.500%, 03/16/2034 | | | | | 789,275 | | | | | | 0.1 | | |
| 515,376 | | | Ginnie Mae Series 2004-28 CZ, 5.500%, 04/20/2034 | | | | | 549,115 | | | | | | 0.0 | | |
| 256,186 (3) | | | Ginnie Mae Series 2004-37 OA, 0.000%, 04/17/2034 | | | | | 225,727 | | | | | | 0.0 | | |
| 1,939,345 | | | Ginnie Mae Series 2004-4 MG, 5.000%, 01/16/2034 | | | | | 2,027,123 | | | | | | 0.1 | | |
| 1,905,299 | | | Ginnie Mae Series 2004-81 Z, 5.000%, 10/20/2034 | | | | | 1,996,527 | | | | | | 0.1 | | |
| 806,385 (1) | | | Ginnie Mae Series 2004-98 SA, 6.251%, (-1.000*US0001M + 6.700%), 11/20/2034 | | | | | 140,811 | | | | | | 0.0 | | |
| 664,871 | | | Ginnie Mae Series 2005-21 Z, 5.000%, 03/20/2035 | | | | | 704,896 | | | | | | 0.1 | | |
| 163,050 (1) | | | Ginnie Mae Series 2005-25 SI, 6.000%, (-6.000*US0001M + 43.200%), 01/20/2034 | | | | | 22,084 | | | | | | 0.0 | | |
| Principal Amount† | | | Value | | | Percentage of Net Assets | | |||||||||
| COLLATERALIZED MORTGAGE OBLIGATIONS: (continued) | | |||||||||||||||
| 512,775 (1) | | | Ginnie Mae Series 2005-7 AH, 6.339%, (-1.000*US0001M + 6.770%), 02/16/2035 | | | | $ | 68,233 | | | | | | 0.0 | | |
| 584,394 (1) | | | Ginnie Mae Series 2005-73 IM, 5.500%, 09/20/2035 | | | | | 107,221 | | | | | | 0.0 | | |
| 344,309 | | | Ginnie Mae Series 2005-80 Z, 5.000%, 10/20/2035 | | | | | 364,814 | | | | | | 0.0 | | |
| 138,003 | | | Ginnie Mae Series 2005-91 UP, 13.439%, (-2.000*US0001M + 14.300%), 09/16/2031 | | | | | 152,122 | | | | | | 0.0 | | |
| 6,215,230 | | | Ginnie Mae Series 2006-10 ZT, 6.000%, 03/20/2036 | | | | | 6,683,403 | | | | | | 0.5 | | |
| 1,105,522 | | | Ginnie Mae Series 2006-17 TW, 6.000%, 04/20/2036 | | | | | 1,206,248 | | | | | | 0.1 | | |
| 5,440,792 (1) | | | Ginnie Mae Series 2006-26 TB, 0.250%, (-1.000*US0001M + 6.500%), 06/20/2036 | | | | | 49,210 | | | | | | 0.0 | | |
| 1,710,526 | | | Ginnie Mae Series 2006-7 ZA, 5.500%, 02/20/2036 | | | | | 1,833,313 | | | | | | 0.1 | | |
| 1,292,218 (1) | | | Ginnie Mae Series 2007-17 CI, 7.500%, 04/16/2037 | | | | | 282,720 | | | | | | 0.0 | | |
| 1,293,106 (3) | | | Ginnie Mae Series 2007-41 OL, 0.000%, 07/20/2037 | | | | | 1,095,434 | | | | | | 0.1 | | |
| 75,524 | | | Ginnie Mae Series 2007-45 PE, 5.500%, 07/16/2037 | | | | | 80,473 | | | | | | 0.0 | | |
| 254,713 | | | Ginnie Mae Series 2007-48 SY, 18.958%, (-3.000*US0001M + 20.250%), 08/16/2037 | | | | | 302,920 | | | | | | 0.0 | | |
| 1,474,836 (1) | | | Ginnie Mae Series 2007-53 SC, 6.051%, (-1.000*US0001M + 6.500%), 09/20/2037 | | | | | 237,826 | | | | | | 0.0 | | |
| 37,740 | | | Ginnie Mae Series 2007-53 SW, 18.859%, (-3.000*US0001M + 20.205%), 09/20/2037 | | | | | 48,314 | | | | | | 0.0 | | |
| 751,593 | | | Ginnie Mae Series 2007-60 YZ, 5.500%, 10/20/2037 | | | | | 793,384 | | | | | | 0.1 | | |
| 3,305,479 | | | Ginnie Mae Series 2008-20 PZ, 6.000%, 03/20/2038 | | | | | 3,522,419 | | | | | | 0.2 | | |
| Voya GNMA Income Fund | as of March 31, 2022 (continued) |
| Principal Amount† | | | Value | | | Percentage of Net Assets | | |||||||||
| COLLATERALIZED MORTGAGE OBLIGATIONS: (continued) | | |||||||||||||||
| 416,373 (1) | | | Ginnie Mae Series 2008-3 SA, 6.101%, (-1.000*US0001M + 6.550%), 01/20/2038 | | | | $ | 73,887 | | | | | | 0.0 | | |
| 727,047 (1) | | | Ginnie Mae Series 2008-40 PS, 6.069%, (-1.000*US0001M + 6.500%), 05/16/2038 | | | | | 97,365 | | | | | | 0.0 | | |
| 949,809 (1) | | | Ginnie Mae Series 2008-51 GS, 5.799%, (-1.000*US0001M + 6.230%), 06/16/2038 | | | | | 150,440 | | | | | | 0.0 | | |
| 1,796,081 (1) | | | Ginnie Mae Series 2008-82 SA, 5.551%, (-1.000*US0001M + 6.000%), 09/20/2038 | | | | | 274,884 | | | | | | 0.0 | | |
| 2,214,700 (1) | | | Ginnie Mae Series 2009-110 SA, 5.919%, (-1.000*US0001M + 6.350%), 04/16/2039 | | | | | 120,571 | | | | | | 0.0 | | |
| 870,067 | | | Ginnie Mae Series 2009-110 ZC, 4.500%, 11/16/2039 | | | | | 922,948 | | | | | | 0.1 | | |
| 2,472,819 | | | Ginnie Mae Series 2009-118 XZ, 5.000%, 12/20/2039 | | | | | 2,592,563 | | | | | | 0.2 | | |
| 1,070,196 | | | Ginnie Mae Series 2009-121 ZQ, 5.500%, 09/20/2039 | | | | | 1,147,735 | | | | | | 0.1 | | |
| 1,024,662 | | | Ginnie Mae Series 2009-31 BP, 5.000%, 05/20/2039 | | | | | 1,079,212 | | | | | | 0.1 | | |
| 1,521,027 | | | Ginnie Mae Series 2009-31 ZL, 4.500%, 05/20/2039 | | | | | 1,595,533 | | | | | | 0.1 | | |
| 1,446,937 | | | Ginnie Mae Series 2009-34 Z, 4.500%, 05/16/2039 | | | | | 1,512,056 | | | | | | 0.1 | | |
| 1,996,241 | | | Ginnie Mae Series 2009-53 ZB, 6.000%, 07/16/2039 | | | | | 2,142,739 | | | | | | 0.1 | | |
| 184,958 (1) | | | Ginnie Mae Series 2009-55 BI, 1.000%, (-25.000*US0001M + 162.500%), 06/16/2037 | | | | | 6,950 | | | | | | 0.0 | | |
| 2,228,209 | | | Ginnie Mae Series 2009-61 EZ, 7.500%, 08/20/2039 | | | | | 2,508,807 | | | | | | 0.2 | | |
| 6,633,484 | | | Ginnie Mae Series 2009-61 PZ, 7.500%, 08/20/2039 | | | | | 7,850,845 | | | | | | 0.5 | | |
| 3,725,016 | | | Ginnie Mae Series 2009-61 ZQ, 6.000%, 08/16/2039 | | | | | 4,264,699 | | | | | | 0.3 | | |
| 905,208 (1) | | | Ginnie Mae Series 2009-66 QS, 5.651%, (-1.000*US0001M + 6.100%), 07/20/2039 | | | | | 77,708 | | | | | | 0.0 | | |
| 1,134,200 | | | Ginnie Mae Series 2009-68 ZC, 5.500%, 08/16/2039 | | | | | 1,256,747 | | | | | | 0.1 | | |
| Principal Amount† | | | Value | | | Percentage of Net Assets | | |||||||||
| COLLATERALIZED MORTGAGE OBLIGATIONS: (continued) | | |||||||||||||||
| 584,199 (1) | | | Ginnie Mae Series 2009-77 SA, 5.719%, (-1.000*US0001M + 6.150%), 09/16/2039 | | | | $ | 87,421 | | | | | | 0.0 | | |
| 3,685,179 | | | Ginnie Mae Series 2009-77 ZB, 5.500%, 09/16/2039 | | | | | 3,941,873 | | | | | | 0.3 | | |
| 2,270,737 | | | Ginnie Mae Series 2009-87 WZ, 6.000%, 10/20/2039 | | | | | 2,684,989 | | | | | | 0.2 | | |
| 663,844 | | | Ginnie Mae Series 2009-92 DZ, 4.500%, 10/16/2039 | | | | | 702,016 | | | | | | 0.0 | | |
| 1,579,368 | | | Ginnie Mae Series 2009-98 MZ, 5.000%, 10/16/2039 | | | | | 1,722,029 | | | | | | 0.1 | | |
| 1,206,986 (1) | | | Ginnie Mae Series 2010-106 IP, 5.000%, 03/20/2040 | | | | | 105,864 | | | | | | 0.0 | | |
| 8,426,880 | | | Ginnie Mae Series 2010-113 BE, 4.500%, 09/20/2040 | | | | | 8,850,104 | | | | | | 0.6 | | |
| 1,143,713 (1) | | | Ginnie Mae Series 2010-116 NS, 6.219%, (-1.000*US0001M + 6.650%), 09/16/2040 | | | | | 149,323 | | | | | | 0.0 | | |
| 3,889,893 | | | Ginnie Mae Series 2010-117 ZQ, 4.500%, 09/20/2040 | | | | | 4,181,789 | | | | | | 0.3 | | |
| 51,519 (1) | | | Ginnie Mae Series 2010-130 KI, 5.500%, 09/16/2040 | | | | | 2,631 | | | | | | 0.0 | | |
| 1,500,000 | | | Ginnie Mae Series 2010-14 B, 4.500%, 02/16/2040 | | | | | 1,575,019 | | | | | | 0.1 | | |
| 745,162 (1) | | | Ginnie Mae Series 2010-158 SA, 5.601%, (-1.000*US0001M + 6.050%), 12/20/2040 | | | | | 114,071 | | | | | | 0.0 | | |
| 1,035,667 | | | Ginnie Mae Series 2010-162 ZE, 4.000%, 12/16/2040 | | | | | 1,076,452 | | | | | | 0.1 | | |
| 10,764,557 (1) | | | Ginnie Mae Series 2010-166 GS, 5.551%, (-1.000*US0001M + 6.000%), 12/20/2040 | | | | | 1,327,801 | | | | | | 0.1 | | |
| 664,801 (1) | | | Ginnie Mae Series 2010-166 NI, 4.500%, 04/20/2039 | | | | | 28,027 | | | | | | 0.0 | | |
| 1,131,271 | | | Ginnie Mae Series 2010-169 AW, 4.500%, 12/20/2040 | | | | | 1,169,402 | | | | | | 0.1 | | |
| 1,101,034 | | | Ginnie Mae Series 2010-169 JZ, 4.000%, 12/20/2040 | | | | | 1,104,395 | | | | | | 0.1 | | |
| 243,691 (1) | | | Ginnie Mae Series 2010-19 LI, 5.000%, 07/16/2039 | | | | | 15,394 | | | | | | 0.0 | | |
| 1,072,262 | | | Ginnie Mae Series 2010-31 BP, 5.000%, 03/20/2040 | | | | | 1,110,444 | | | | | | 0.1 | | |
| 1,155,025 (1) | | | Ginnie Mae Series 2010-4 WI, 6.000%, 01/16/2040 | | | | | 165,660 | | | | | | 0.0 | | |
| Voya GNMA Income Fund | as of March 31, 2022 (continued) |
| Principal Amount† | | | Value | | | Percentage of Net Assets | | |||||||||
| COLLATERALIZED MORTGAGE OBLIGATIONS: (continued) | | |||||||||||||||
| 4,863,155 | | | Ginnie Mae Series 2010-42 VZ, 5.500%, 10/20/2039 | | | | $ | 5,196,757 | | | | | | 0.4 | | |
| 832,802 | | | Ginnie Mae Series 2010-59 ZA, 4.500%, 05/20/2040 | | | | | 865,162 | | | | | | 0.1 | | |
| 2,750,393 | | | Ginnie Mae Series 2010-H01 FA, 1.051%, (US0001M + 0.820%), 01/20/2060 | | | | | 2,759,092 | | | | | | 0.2 | | |
| 8,020,241 | | | Ginnie Mae Series 2010-H10 FB, 1.231%, (US0001M + 1.000%), 05/20/2060 | | | | | 8,081,145 | | | | | | 0.6 | | |
| 4,541,728 | | | Ginnie Mae Series 2010-H10 FC, 1.231%, (US0001M + 1.000%), 05/20/2060 | | | | | 4,568,809 | | | | | | 0.3 | | |
| 1,474,769 | | | Ginnie Mae Series 2010-H20 AF, 0.436%, (US0001M + 0.330%), 10/20/2060 | | | | | 1,466,920 | | | | | | 0.1 | | |
| 236,969 | | | Ginnie Mae Series 2010-H26 LF, 0.456%, (US0001M + 0.350%), 08/20/2058 | | | | | 235,891 | | | | | | 0.0 | | |
| 495,431 | | | Ginnie Mae Series 2011-116 CI, 4.000%, 05/16/2026 | | | | | 22,323 | | | | | | 0.0 | | |
| 219,908 (1) | | | Ginnie Mae Series 2011-123 QI, 5.000%, 05/20/2041 | | | | | 23,308 | | | | | | 0.0 | | |
| 503,666 | | | Ginnie Mae Series 2011-128 TF, 0.881%, (US0001M + 0.450%), 05/16/2041 | | | | | 505,440 | | | | | | 0.0 | | |
| 2,675,367 (1) | | | Ginnie Mae Series 2011-141 PS, 6.269%, (-1.000*US0001M + 6.700%), 06/16/2041 | | | | | 308,256 | | | | | | 0.0 | | |
| 1,998,299 (1) | | | Ginnie Mae Series 2011-146 EI, 5.000%, 11/16/2041 | | | | | 346,585 | | | | | | 0.0 | | |
| 945,000 | | | Ginnie Mae Series 2011-151 PY, 3.000%, 11/20/2041 | | | | | 933,758 | | | | | | 0.1 | | |
| 56,666 | | | Ginnie Mae Series 2011-169 BC, 7.000%, 05/16/2032 | | | | | 60,301 | | | | | | 0.0 | | |
| 195,852 (2) | | | Ginnie Mae Series 2011-169 BG, 5.430%, 04/16/2039 | | | | | 204,942 | | | | | | 0.0 | | |
| 6,851,523 | | | Ginnie Mae Series 2011-25 Z, 4.000%, 02/20/2041 | | | | | 6,974,304 | | | | | | 0.5 | | |
| 1,297,752 | | | Ginnie Mae Series 2011-59 QC, 4.000%, 12/20/2040 | | | | | 1,323,413 | | | | | | 0.1 | | |
| 1,955,857 | | | Ginnie Mae Series 2011-69 HW, 4.000%, 04/20/2040 | | | | | 1,979,672 | | | | | | 0.1 | | |
| 1,351,078 (1) | | | Ginnie Mae Series 2011-73 LS, 6.241%, (-1.000*US0001M + 6.690%), 08/20/2039 | | | | | 36,821 | | | | | | 0.0 | | |
| 2,365,094 | | | Ginnie Mae Series 2011-89 Z, 3.500%, 06/20/2041 | | | | | 2,399,438 | | | | | | 0.2 | | |
| Principal Amount† | | | Value | | | Percentage of Net Assets | | |||||||||
| COLLATERALIZED MORTGAGE OBLIGATIONS: (continued) | | |||||||||||||||
| 1,557,573 | | | Ginnie Mae Series 2011-H01 AF, 0.556%, (US0001M + 0.450%), 11/20/2060 | | | | $ | 1,552,593 | | | | | | 0.1 | | |
| 2,178,498 | | | Ginnie Mae Series 2011-H03 FA, 0.606%, (US0001M + 0.500%), 01/20/2061 | | | | | 2,173,522 | | | | | | 0.2 | | |
| 515,494 | | | Ginnie Mae Series 2011-H07 FA, 0.606%, (US0001M + 0.500%), 02/20/2061 | | | | | 514,377 | | | | | | 0.0 | | |
| 188,709 | | | Ginnie Mae Series 2011-H08 FD, 0.606%, (US0001M + 0.500%), 02/20/2061 | | | | | 188,268 | | | | | | 0.0 | | |
| 567,605 | | | Ginnie Mae Series 2011-H09 AF, 0.606%, (US0001M + 0.500%), 03/20/2061 | | | | | 566,328 | | | | | | 0.0 | | |
| 522,215 | | | Ginnie Mae Series 2011-H11 FB, 0.606%, (US0001M + 0.500%), 04/20/2061 | | | | | 521,058 | | | | | | 0.0 | | |
| 731,760 | | | Ginnie Mae Series 2011-H19 FA, 0.576%, (US0001M + 0.470%), 08/20/2061 | | | | | 729,804 | | | | | | 0.1 | | |
| 1,543,837 | | | Ginnie Mae Series 2011-H20 FA, 0.656%, (US0001M + 0.550%), 09/20/2061 | | | | | 1,541,703 | | | | | | 0.1 | | |
| 341,722 | | | Ginnie Mae Series 2011-H21 FT, 1.108%, (H15T1Y + 0.700%), 10/20/2061 | | | | | 340,615 | | | | | | 0.0 | | |
| 1,275,592 (1) | | | Ginnie Mae Series 2012-103 IC, 3.500%, 08/16/2040 | | | | | 68,868 | | | | | | 0.0 | | |
| 291,903 (1) | | | Ginnie Mae Series 2012-124 MI, 4.000%, 03/20/2042 | | | | | 21,434 | | | | | | 0.0 | | |
| 3,366,940 (1) | | | Ginnie Mae Series 2012-136 BI, 3.500%, 11/20/2042 | | | | | 535,716 | | | | | | 0.0 | | |
| 3,391,357 (1) | | | Ginnie Mae Series 2012-146 AI, 3.000%, 10/20/2037 | | | | | 128,001 | | | | | | 0.0 | | |
| 331,542 (1) | | | Ginnie Mae Series 2012-34 MS, 6.269%, (-1.000*US0001M + 6.700%), 04/16/2041 | | | | | 34,569 | | | | | | 0.0 | | |
| 2,974,149 (1) | | | Ginnie Mae Series 2012-48 SA, 6.219%, (-1.000*US0001M + 6.650%), 04/16/2042 | | | | | 526,173 | | | | | | 0.0 | | |
| 3,828,008 (1) | | | Ginnie Mae Series 2012-60 SG, 5.669%, (-1.000*US0001M + 6.100%), 05/16/2042 | | | | | 637,198 | | | | | | 0.0 | | |
| 4,269,314 | | | Ginnie Mae Series 2012-77 FE, 0.821%, (US0001M + 0.390%), 05/16/2041 | | | | | 4,281,168 | | | | | | 0.3 | | |
| Voya GNMA Income Fund | as of March 31, 2022 (continued) |
| Principal Amount† | | | Value | | | Percentage of Net Assets | | |||||||||
| COLLATERALIZED MORTGAGE OBLIGATIONS: (continued) | | |||||||||||||||
| 800,641 (1) | | | Ginnie Mae Series 2012-93 NS, 5.651%, (-1.000*US0001M + 6.100%), 07/20/2042 | | | | $ | 113,762 | | | | | | 0.0 | | |
| 955,750 (1) | | | Ginnie Mae Series 2012-98 EI, 4.000%, 04/20/2041 | | | | | 104,765 | | | | | | 0.0 | | |
| 2,405,653 | | | Ginnie Mae Series 2012-H06 FS, 0.806%, (US0001M + 0.700%), 03/20/2062 | | | | | 2,410,916 | | | | | | 0.2 | | |
| 7,351,263 | | | Ginnie Mae Series 2012-H08 FA, 0.706%, (US0001M + 0.600%), 01/20/2062 | | | | | 7,348,151 | | | | | | 0.5 | | |
| 2,528,739 | | | Ginnie Mae Series 2012-H08 FB, 0.706%, (US0001M + 0.600%), 03/20/2062 | | | | | 2,527,217 | | | | | | 0.2 | | |
| 473,774 | | | Ginnie Mae Series 2012-H11 FA, 0.806%, (US0001M + 0.700%), 02/20/2062 | | | | | 474,316 | | | | | | 0.0 | | |
| 805,896 | | | Ginnie Mae Series 2012-H11 GA, 0.686%, (US0001M + 0.580%), 05/20/2062 | | | | | 805,218 | | | | | | 0.1 | | |
| 1,228,497 | | | Ginnie Mae Series 2012-H11 VA, 0.756%, (US0001M + 0.650%), 05/20/2062 | | | | | 1,229,987 | | | | | | 0.1 | | |
| 2,131,348 | | | Ginnie Mae Series 2012-H12 FA, 0.656%, (US0001M + 0.550%), 04/20/2062 | | | | | 2,128,534 | | | | | | 0.1 | | |
| 11,622,674 | | | Ginnie Mae Series 2012-H12 FB, 1.156%, (US0001M + 1.050%), 02/20/2062 | | | | | 11,702,511 | | | | | | 0.8 | | |
| 613,413 | | | Ginnie Mae Series 2012-H14 FK, 0.686%, (US0001M + 0.580%), 07/20/2062 | | | | | 613,915 | | | | | | 0.0 | | |
| 4,559,196 | | | Ginnie Mae Series 2012-H20 BA, 0.666%, (US0001M + 0.560%), 09/20/2062 | | | | | 4,553,819 | | | | | | 0.3 | | |
| 2,230,306 | | | Ginnie Mae Series 2012-H20 PT, 1.129%, 07/20/2062 | | | | | 2,225,151 | | | | | | 0.2 | | |
| 2,393,125 | | | Ginnie Mae Series 2012-H26 BA, 0.456%, (US0001M + 0.350%), 10/20/2062 | | | | | 2,381,598 | | | | | | 0.2 | | |
| 620,104 | | | Ginnie Mae Series 2012-H29 FA, 0.621%, (US0001M + 0.515%), 10/20/2062 | | | | | 618,926 | | | | | | 0.0 | | |
| 1,232,069 | | | Ginnie Mae Series 2012-H30 GA, 0.456%, (US0001M + 0.350%), 12/20/2062 | | | | | 1,226,643 | | | | | | 0.1 | | |
| 1,581,483 | | | Ginnie Mae Series 2012-H31 FD, 0.446%, (US0001M + 0.340%), 12/20/2062 | | | | | 1,572,727 | | | | | | 0.1 | | |
| Principal Amount† | | | Value | | | Percentage of Net Assets | | |||||||||
| COLLATERALIZED MORTGAGE OBLIGATIONS: (continued) | | |||||||||||||||
| 1,301,837 | | | Ginnie Mae Series 2013-119 TZ, 3.000%, 08/20/2043 | | | | $ | 1,259,488 | | | | | | 0.1 | | |
| 7,000,000 | | | Ginnie Mae Series 2013-147 BE, 4.000%, 12/20/2039 | | | | | 7,326,546 | | | | | | 0.5 | | |
| 1,453,997 | | | Ginnie Mae Series 2013-167 Z, 3.000%, 10/16/2043 | | | | | 1,406,114 | | | | | | 0.1 | | |
| 1,900,000 (1) | | | Ginnie Mae Series 2013-186 UI, 2.500%, 11/20/2043 | | | | | 392,711 | | | | | | 0.0 | | |
| 602,479 (1) | | | Ginnie Mae Series 2013-186 VI, 4.000%, 12/20/2042 | | | | | 80,655 | | | | | | 0.0 | | |
| 3,754,793 (1) | | | Ginnie Mae Series 2013-20 LI, 4.500%, 12/16/2042 | | | | | 461,408 | | | | | | 0.0 | | |
| 1,911,768 (1) | | | Ginnie Mae Series 2013-23 IO, 3.500%, 02/20/2043 | | | | | 311,551 | | | | | | 0.0 | | |
| 885,220 (1) | | | Ginnie Mae Series 2013-41 PI, 3.500%, 04/20/2040 | | | | | 17,062 | | | | | | 0.0 | | |
| 907,105 (1) | | | Ginnie Mae Series 2013-88 AI, 5.619%, (-1.000*US0001M + 5.850%), 06/20/2043 | | | | | 116,893 | | | | | | 0.0 | | |
| 1,387,656 (1) | | | Ginnie Mae Series 2013-99 SK, 5.669%, (-1.000*US0001M + 5.900%), 07/20/2043 | | | | | 166,936 | | | | | | 0.0 | | |
| 1,991,070 | | | Ginnie Mae Series 2013-H02 FD, 0.446%, (US0001M + 0.340%), 12/20/2062 | | | | | 1,982,017 | | | | | | 0.1 | | |
| 298,049 | | | Ginnie Mae Series 2013-H07 HA, 0.862%, (US0001M + 0.410%), 03/20/2063 | | | | | 296,843 | | | | | | 0.0 | | |
| 2,164,090 | | | Ginnie Mae Series 2013-H08 BF, 0.506%, (US0001M + 0.400%), 03/20/2063 | | | | | 2,154,307 | | | | | | 0.1 | | |
| 2,174,088 | | | Ginnie Mae Series 2013-H10 FT, 1.140%, (H15T1Y + 0.450%), 04/20/2063 | | | | | 2,159,344 | | | | | | 0.1 | | |
| 1,670,617 | | | Ginnie Mae Series 2013-H13 FS, 1.106%, (US0001M + 1.000%), 06/20/2063 | | | | | 1,686,966 | | | | | | 0.1 | | |
| 2,670,110 | | | Ginnie Mae Series 2013-H14 FC, 0.576%, (US0001M + 0.470%), 06/20/2063 | | | | | 2,663,228 | | | | | | 0.2 | | |
| 812,715 | | | Ginnie Mae Series 2013-H14 FD, 0.576%, (US0001M + 0.470%), 06/20/2063 | | | | | 810,453 | | | | | | 0.1 | | |
| 783,847 | | | Ginnie Mae Series 2013-H14 FG, 0.576%, (US0001M + 0.470%), 05/20/2063 | | | | | 781,709 | | | | | | 0.1 | | |
| Voya GNMA Income Fund | as of March 31, 2022 (continued) |
| Principal Amount† | | | Value | | | Percentage of Net Assets | | |||||||||
| COLLATERALIZED MORTGAGE OBLIGATIONS: (continued) | | |||||||||||||||
| 653,714 | | | Ginnie Mae Series 2013-H15 FA, 0.646%, (US0001M + 0.540%), 06/20/2063 | | | | $ | 652,744 | | | | | | 0.0 | | |
| 1,759,023 | | | Ginnie Mae Series 2013-H17 FA, 0.656%, (US0001M + 0.550%), 07/20/2063 | | | | | 1,756,652 | | | | | | 0.1 | | |
| 563,508 | | | Ginnie Mae Series 2013-H18 BA, 0.706%, (US0001M + 0.600%), 07/20/2063 | | | | | 563,234 | | | | | | 0.0 | | |
| 1,043,873 | | | Ginnie Mae Series 2013-H18 EA, 0.606%, (US0001M + 0.500%), 07/20/2063 | | | | | 1,041,747 | | | | | | 0.1 | | |
| 1,776,460 | | | Ginnie Mae Series 2013-H18 FA, 0.606%, (US0001M + 0.500%), 06/20/2063 | | | | | 1,772,365 | | | | | | 0.1 | | |
| 2,305,425 | | | Ginnie Mae Series 2013-H19 DF, 0.756%, (US0001M + 0.650%), 05/20/2063 | | | | | 2,305,362 | | | | | | 0.2 | | |
| 1,388,998 | | | Ginnie Mae Series 2013-H20 FB, 1.106%, (US0001M + 1.000%), 08/20/2063 | | | | | 1,393,586 | | | | | | 0.1 | | |
| 746,441 | | | Ginnie Mae Series 2013-H21 FB, 0.806%, (US0001M + 0.700%), 09/20/2063 | | | | | 746,854 | | | | | | 0.1 | | |
| 1,268,407 | | | Ginnie Mae Series 2013-H22 FB, 0.806%, (US0001M + 0.700%), 08/20/2063 | | | | | 1,269,503 | | | | | | 0.1 | | |
| 2,055,726 | | | Ginnie Mae Series 2013-H22 FT, 1.340%, (H15T1Y + 0.650%), 04/20/2063 | | | | | 2,048,114 | | | | | | 0.1 | | |
| 2,166,739 | | | Ginnie Mae Series 2013-H23 FA, 1.406%, (US0001M + 1.300%), 09/20/2063 | | | | | 2,181,774 | | | | | | 0.2 | | |
| 248,302 | | | Ginnie Mae Series 2013-H24 FB, 0.836%, (US0001M + 0.730%), 09/20/2063 | | | | | 248,420 | | | | | | 0.0 | | |
| 2,793,200 | | | Ginnie Mae Series 2014-115 EM, 4.000%, 08/20/2044 | | | | | 2,923,439 | | | | | | 0.2 | | |
| 3,285,893 | | | Ginnie Mae Series 2014-118 ZP, 4.000%, 08/20/2044 | | | | | 3,334,753 | | | | | | 0.2 | | |
| 1,368,465 (1) | | | Ginnie Mae Series 2014-129 WS, 5.669%, (-1.000*US0001M + 5.900%), 09/20/2044 | | | | | 174,006 | | | | | | 0.0 | | |
| 1,280,309 (1) | | | Ginnie Mae Series 2014-161 WS, 5.669%, (-1.000*US0001M + 5.900%), 11/20/2044 | | | | | 156,642 | | | | | | 0.0 | | |
| 1,300,740 (1) | | | Ginnie Mae Series 2014-183 IM, 5.000%, 06/20/2035 | | | | | 216,973 | | | | | | 0.0 | | |
| Principal Amount† | | | Value | | | Percentage of Net Assets | | |||||||||
| COLLATERALIZED MORTGAGE OBLIGATIONS: (continued) | | |||||||||||||||
| 1,519,074 (1) | | | Ginnie Mae Series 2014-30 ES, 4.551%, (-1.000*US0001M + 5.000%), 03/20/2040 | | | | $ | 176,581 | | | | | | 0.0 | | |
| 2,302,546 (1) | | | Ginnie Mae Series 2014-99 IO, 4.500%, 06/20/2044 | | | | | 472,425 | | | | | | 0.0 | | |
| 9,064,046 | | | Ginnie Mae Series 2014-H03 FS, 0.756%, (US0001M + 0.650%), 02/20/2064 | | | | | 9,075,583 | | | | | | 0.6 | | |
| 1,711,175 | | | Ginnie Mae Series 2014-H04 FB, 0.756%, (US0001M + 0.650%), 02/20/2064 | | | | | 1,711,161 | | | | | | 0.1 | | |
| 5,440,732 | | | Ginnie Mae Series 2014-H05 FB, 0.706%, (US0001M + 0.600%), 12/20/2063 | | | | | 5,436,134 | | | | | | 0.4 | | |
| 1,306,239 | | | Ginnie Mae Series 2014-H06 FA, 0.676%, (US0001M + 0.570%), 03/20/2064 | | | | | 1,304,892 | | | | | | 0.1 | | |
| 566,941 | | | Ginnie Mae Series 2014-H06 HB, 0.756%, (US0001M + 0.650%), 03/20/2064 | | | | | 567,100 | | | | | | 0.0 | | |
| 2,739,903 | | | Ginnie Mae Series 2014-H11 VA, 0.606%, (US0001M + 0.500%), 06/20/2064 | | | | | 2,732,934 | | | | | | 0.2 | | |
| 3,407,176 | | | Ginnie Mae Series 2014-H15 FA, 0.606%, (US0001M + 0.500%), 07/20/2064 | | | | | 3,398,572 | | | | | | 0.2 | | |
| 1,671,658 | | | Ginnie Mae Series 2014-H21 FA, 0.756%, (US0001M + 0.650%), 10/20/2064 | | | | | 1,673,968 | | | | | | 0.1 | | |
| 8,698,666 (2) | | | Ginnie Mae Series 2015-10 Q, 2.376%, 10/20/2044 | | | | | 8,691,217 | | | | | | 0.6 | | |
| 2,364,266 (1) | | | Ginnie Mae Series 2015-141 IX, 1.978%, (-0.714*US0001M + 2.142%), 06/20/2045 | | | | | 88,944 | | | | | | 0.0 | | |
| 12,125,000 | | | Ginnie Mae Series 2015-143 B, 3.500%, 04/20/2045 | | | | | 12,301,094 | | | | | | 0.8 | | |
| 2,400,452 (1) | | | Ginnie Mae Series 2015-149 IL, 4.500%, 10/20/2045 | | | | | 489,263 | | | | | | 0.0 | | |
| 1,511,789 (1) | | | Ginnie Mae Series 2015-157 PI, 4.000%, 03/20/2044 | | | | | 147,275 | | | | | | 0.0 | | |
| 3,109,342 | | | Ginnie Mae Series 2015-165 ZA, 3.500%, 07/20/2045 | | | | | 3,086,615 | | | | | | 0.2 | | |
| 6,876,071 | | | Ginnie Mae Series 2015-27 PB, 3.000%, 08/20/2044 | | | | | 6,795,436 | | | | | | 0.5 | | |
| 2,161,777 | | | Ginnie Mae Series 2015-H03 FA, 0.606%, (US0001M + 0.500%), 12/20/2064 | | | | | 2,156,970 | | | | | | 0.1 | | |
| Voya GNMA Income Fund | as of March 31, 2022 (continued) |
| Principal Amount† | | | Value | | | Percentage of Net Assets | | |||||||||
| COLLATERALIZED MORTGAGE OBLIGATIONS: (continued) | | |||||||||||||||
| 96,928 | | | Ginnie Mae Series 2015-H04 FL, 0.576%, (US0001M + 0.470%), 02/20/2065 | | | | $ | 96,626 | | | | | | 0.0 | | |
| 2,863,514 | | | Ginnie Mae Series 2015-H05 FC, 0.586%, (US0001M + 0.480%), 02/20/2065 | | | | | 2,854,827 | | | | | | 0.2 | | |
| 1,435,083 | | | Ginnie Mae Series 2015-H06 FA, 0.586%, (US0001M + 0.480%), 02/20/2065 | | | | | 1,430,994 | | | | | | 0.1 | | |
| 2,635,503 | | | Ginnie Mae Series 2015-H08 FB, 0.736%, (US0001M + 0.630%), 03/20/2065 | | | | | 2,636,694 | | | | | | 0.2 | | |
| 2,079,806 | | | Ginnie Mae Series 2015-H08 FC, 0.586%, (US0001M + 0.480%), 03/20/2065 | | | | | 2,073,610 | | | | | | 0.1 | | |
| 3,360,753 | | | Ginnie Mae Series 2015-H09 FA, 0.726%, (US0001M + 0.620%), 04/20/2065 | | | | | 3,361,706 | | | | | | 0.2 | | |
| 5,940,365 | | | Ginnie Mae Series 2015-H10 FA, 0.706%, (US0001M + 0.600%), 04/20/2065 | | | | | 5,940,045 | | | | | | 0.4 | | |
| 1,727,969 | | | Ginnie Mae Series 2015-H10 FH, 0.706%, (US0001M + 0.600%), 04/20/2065 | | | | | 1,727,724 | | | | | | 0.1 | | |
| 220,777 | | | Ginnie Mae Series 2015-H12 FA, 0.586%, (US0001M + 0.480%), 05/20/2065 | | | | | 220,125 | | | | | | 0.0 | | |
| 1,603,800 | | | Ginnie Mae Series 2015-H12 FL, 0.336%, (US0001M + 0.230%), 05/20/2065 | | | | | 1,592,790 | | | | | | 0.1 | | |
| 544,364 | | | Ginnie Mae Series 2015-H14 FB, 0.536%, (US0001M + 0.430%), 05/20/2065 | | | | | 542,589 | | | | | | 0.0 | | |
| 1,195,800 | | | Ginnie Mae Series 2015-H18 FB, 0.706%, (US0001M + 0.600%), 07/20/2065 | | | | | 1,195,749 | | | | | | 0.1 | | |
| 1,150,458 | | | Ginnie Mae Series 2015-H20 FB, 0.706%, (US0001M + 0.600%), 08/20/2065 | | | | | 1,150,390 | | | | | | 0.1 | | |
| 1,725,372 | | | Ginnie Mae Series 2015-H22 FC, 0.706%, (US0001M + 0.600%), 09/20/2065 | | | | | 1,725,460 | | | | | | 0.1 | | |
| 2,153,265 | | | Ginnie Mae Series 2015-H23 FB, 0.626%, (US0001M + 0.520%), 09/20/2065 | | | | | 2,149,029 | | | | | | 0.1 | | |
| 1,433,248 | | | Ginnie Mae Series 2015-H26 FA, 0.626%, (US0001M + 0.520%), 10/20/2065 | | | | | 1,430,425 | | | | | | 0.1 | | |
| Principal Amount† | | | Value | | | Percentage of Net Assets | | |||||||||
| COLLATERALIZED MORTGAGE OBLIGATIONS: (continued) | | |||||||||||||||
| 2,919,527 | | | Ginnie Mae Series 2015-H26 FC, 0.706%, (US0001M + 0.600%), 08/20/2065 | | | | $ | 2,916,928 | | | | | | 0.2 | | |
| 508,810 | | | Ginnie Mae Series 2015-H26 FG, 0.626%, (US0001M + 0.520%), 10/20/2065 | | | | | 507,803 | | | | | | 0.0 | | |
| 1,873,826 | | | Ginnie Mae Series 2015-H27 FA, 0.856%, (US0001M + 0.750%), 09/20/2065 | | | | | 1,880,569 | | | | | | 0.1 | | |
| 2,415,922 | | | Ginnie Mae Series 2015-H29 FL, 0.706%, (US0001M + 0.600%), 11/20/2065 | | | | | 2,416,400 | | | | | | 0.2 | | |
| 29,395,612 | | | Ginnie Mae Series 2015-H30 FC, 0.766%, (US0001M + 0.660%), 11/20/2065 | | | | | 29,445,940 | | | | | | 2.0 | | |
| 110,056 | | | Ginnie Mae Series 2015-H30 FD, 0.706%, (US0001M + 0.600%), 10/20/2065 | | | | | 110,008 | | | | | | 0.0 | | |
| 3,097,312 | | | Ginnie Mae Series 2015-H30 FE, 0.706%, (US0001M + 0.600%), 11/20/2065 | | | | | 3,098,169 | | | | | | 0.2 | | |
| 2,202,026 | | | Ginnie Mae Series 2015-H31 FT, 0.756%, (US0001M + 0.650%), 11/20/2065 | | | | | 2,201,435 | | | | | | 0.2 | | |
| 6,107,459 (1) | | | Ginnie Mae Series 2016-145 IU, 3.500%, 10/20/2046 | | | | | 875,412 | | | | | | 0.1 | | |
| 5,660,149 (1) | | | Ginnie Mae Series 2016-20 BS, 5.651%, (-1.000*US0001M + 6.100%), 02/20/2046 | | | | | 874,191 | | | | | | 0.1 | | |
| 3,649,569 (2) | | | Ginnie Mae Series 2016-5 AB, 4.684%, 01/20/2046 | | | | | 3,834,086 | | | | | | 0.3 | | |
| 5,476,721 | | | Ginnie Mae Series 2016-69 B, 3.000%, 05/20/2046 | | | | | 5,413,685 | | | | | | 0.4 | | |
| 558,196 | | | Ginnie Mae Series 2016-H01 FL, 0.756%, (US0001M + 0.650%), 12/20/2065 | | | | | 558,232 | | | | | | 0.0 | | |
| 998,598 | | | Ginnie Mae Series 2016-H02 FH, 1.106%, (US0001M + 1.000%), 01/20/2066 | | | | | 1,008,476 | | | | | | 0.1 | | |
| 206,552 | | | Ginnie Mae Series 2016-H03 FB, 0.756%, (US0001M + 0.650%), 01/20/2066 | | | | | 206,849 | | | | | | 0.0 | | |
| 2,526,401 | | | Ginnie Mae Series 2016-H04 FK, 1.156%, (US0001M + 1.050%), 02/20/2066 | | | | | 2,553,974 | | | | | | 0.2 | | |
| Voya GNMA Income Fund | as of March 31, 2022 (continued) |
| Principal Amount† | | | Value | | | Percentage of Net Assets | | |||||||||
| COLLATERALIZED MORTGAGE OBLIGATIONS: (continued) | | |||||||||||||||
| 335,954 | | | Ginnie Mae Series 2016-H07 FK, 1.106%, (US0001M + 1.000%), 03/20/2066 | | | | $ | 339,309 | | | | | | 0.0 | | |
| 5,840,028 | | | Ginnie Mae Series 2016-H08 FT, 0.826%, (US0001M + 0.720%), 02/20/2066 | | | | | 5,842,649 | | | | | | 0.4 | | |
| 1,073,032 | | | Ginnie Mae Series 2016-H09 FB, 1.006%, (US0001M + 0.900%), 04/20/2066 | | | | | 1,081,712 | | | | | | 0.1 | | |
| 2,382,483 | | | Ginnie Mae Series 2016-H11 F, 0.906%, (US0001M + 0.800%), 05/20/2066 | | | | | 2,395,142 | | | | | | 0.2 | | |
| 1,015,901 | | | Ginnie Mae Series 2016-H11 FE, 0.956%, (US0001M + 0.850%), 04/20/2066 | | | | | 1,022,391 | | | | | | 0.1 | | |
| 2,622,263 | | | Ginnie Mae Series 2016-H13 FD, 1.140%, (H15T1Y + 0.450%), 05/20/2066 | | | | | 2,604,559 | | | | | | 0.2 | | |
| 531,176 | | | Ginnie Mae Series 2016-H13 FT, 0.686%, (US0001M + 0.580%), 05/20/2066 | | | | | 530,626 | | | | | | 0.0 | | |
| 324,897 | | | Ginnie Mae Series 2016-H20 FG, 0.806%, (US0001M + 0.700%), 08/20/2066 | | | | | 325,041 | | | | | | 0.0 | | |
| 2,056,400 | | | Ginnie Mae Series 2016-H21 FH, 0.956%, (US0001M + 0.850%), 09/20/2066 | | | | | 2,070,788 | | | | | | 0.1 | | |
| 5,042,649 | | | Ginnie Mae Series 2016-H23 F, 0.856%, (US0001M + 0.750%), 10/20/2066 | | | | | 5,062,974 | | | | | | 0.3 | | |
| 3,677,066 | | | Ginnie Mae Series 2017-107 QZ, 3.000%, 08/20/2045 | | | | | 3,645,686 | | | | | | 0.3 | | |
| 1,623,295 | | | Ginnie Mae Series 2017-122 CZ, 3.000%, 08/20/2047 | | | | | 1,603,881 | | | | | | 0.1 | | |
| 2,524,893 (1) | | | Ginnie Mae Series 2017-123 IO, 5.000%, 08/16/2047 | | | | | 572,153 | | | | | | 0.0 | | |
| 2,890,000 | | | Ginnie Mae Series 2017-162 PL, 3.000%, 10/20/2047 | | | | | 2,814,209 | | | | | | 0.2 | | |
| 1,663,599 | | | Ginnie Mae Series 2017-56 HM, 3.000%, 12/20/2046 | | | | | 1,663,505 | | | | | | 0.1 | | |
| 4,896,255 | | | Ginnie Mae Series 2017-56 JZ, 3.000%, 04/20/2047 | | | | | 4,862,907 | | | | | | 0.3 | | |
| 25,655,512 | | | Ginnie Mae Series 2017-H05 FC, 0.856%, (US0001M + 0.750%), 02/20/2067 | | | | | 25,775,364 | | | | | | 1.8 | | |
| 1,188,327 | | | Ginnie Mae Series 2017-H07 FG, 0.566%, (US0001M + 0.460%), 02/20/2067 | | | | | 1,184,767 | | | | | | 0.1 | | |
| Principal Amount† | | | Value | | | Percentage of Net Assets | | |||||||||
| COLLATERALIZED MORTGAGE OBLIGATIONS: (continued) | | |||||||||||||||
| 158,884 | | | Ginnie Mae Series 2017-H14 FD, 0.576%, (US0001M + 0.470%), 06/20/2067 | | | | $ | 158,392 | | | | | | 0.0 | | |
| 1,424,125 | | | Ginnie Mae Series 2017-H14 FV, 0.606%, (US0001M + 0.500%), 06/20/2067 | | | | | 1,420,509 | | | | | | 0.1 | | |
| 2,117,364 | | | Ginnie Mae Series 2017-H17 FG, 0.606%, (US0001M + 0.500%), 08/20/2067 | | | | | 2,112,479 | | | | | | 0.1 | | |
| 1,446,979 | | | Ginnie Mae Series 2017-H19 FA, 0.556%, (US0001M + 0.450%), 08/20/2067 | | | | | 1,443,174 | | | | | | 0.1 | | |
| 24,899,091 | | | Ginnie Mae Series 2017-H23 FC, 0.556%, (US0001M + 0.450%), 11/20/2067 | | | | | 24,818,612 | | | | | | 1.7 | | |
| 1,480,148 | | | Ginnie Mae Series 2018-112 AL, 3.500%, 08/20/2048 | | | | | 1,493,837 | | | | | | 0.1 | | |
| 327,515 | | | Ginnie Mae Series 2018-163 DZ, 4.500%, 11/20/2048 | | | | | 345,370 | | | | | | 0.0 | | |
| 2,625,224 | | | Ginnie Mae Series 2018-H04 FM, 0.406%, (US0001M + 0.300%), 03/20/2068 | | | | | 2,607,941 | | | | | | 0.2 | | |
| 599,075 | | | Ginnie Mae Series 2018-H07 FE, 0.456%, (US0001M + 0.350%), 02/20/2068 | | | | | 596,351 | | | | | | 0.0 | | |
| 6,165,698 | | | Ginnie Mae Series 2018-H14 FG, 0.456%, (US0001M + 0.350%), 09/20/2068 | | | | | 6,131,697 | | | | | | 0.4 | | |
| 6,822,936 | | | Ginnie Mae Series 2018-H18 FC, 0.456%, (US0001M + 0.350%), 08/20/2065 | | | | | 6,792,738 | | | | | | 0.5 | | |
| 2,792,571 | | | Ginnie Mae Series 2019-1 LZ, 3.500%, 01/20/2049 | | | | | 2,884,989 | | | | | | 0.2 | | |
| 2,184,254 | | | Ginnie Mae Series 2019-1 Z, 4.000%, 01/20/2049 | | | | | 2,190,146 | | | | | | 0.2 | | |
| 3,927,717 | | | Ginnie Mae Series 2019-100 FD, 0.849%, (US0001M + 0.400%), 08/20/2049 | | | | | 3,928,604 | | | | | | 0.3 | | |
| 1,069,873 | | | Ginnie Mae Series 2019-29 AI, 5.000%, 07/20/2048 | | | | | 185,200 | | | | | | 0.0 | | |
| 12,000,000 (1) | | | Ginnie Mae Series 2019-56 YI, 5.000%, 05/20/2049 | | | | | 3,418,492 | | | | | | 0.2 | | |
| 1,012,738 | | | Ginnie Mae Series 2019-H01 FJ, 0.406%, (US0001M + 0.300%), 09/20/2068 | | | | | 1,008,898 | | | | | | 0.1 | | |
| 1,435,090 | | | Ginnie Mae Series 2019-H01 FL, 0.556%, (US0001M + 0.450%), 12/20/2068 | | | | | 1,430,138 | | | | | | 0.1 | | |
| Voya GNMA Income Fund | as of March 31, 2022 (continued) |
| Principal Amount† | | | Value | | | Percentage of Net Assets | | |||||||||
| COLLATERALIZED MORTGAGE OBLIGATIONS: (continued) | | |||||||||||||||
| 3,674,517 | | | Ginnie Mae Series 2019-H05 FL, 0.586%, (US0001M + 0.480%), 03/20/2069 | | | | $ | 3,664,418 | | | | | | 0.3 | | |
| 239,724 | | | Ginnie Mae Series 2019-H10 FM, 0.506%, (US0001M + 0.400%), 05/20/2069 | | | | | 238,596 | | | | | | 0.0 | | |
| 2,808,761 | | | Ginnie Mae Series 2019-H19 FB, 0.556%, (US0001M + 0.450%), 11/20/2069 | | | | | 2,799,731 | | | | | | 0.2 | | |
| 24,510,927 (1) | | | Ginnie Mae Series 2020-47 LI, 3.500%, 04/20/2050 | | | | | 3,703,400 | | | | | | 0.3 | | |
| 1,446,474 | | | Ginnie Mae Series 2020-H01 FT, 0.710%, (H15T1Y + 0.500%), 01/20/2070 | | | | | 1,440,031 | | | | | | 0.1 | | |
| 7,346,170 | | | Ginnie Mae Series 2020-H10 FD, 0.849%, (US0001M + 0.400%), 05/20/2070 | | | | | 7,319,953 | | | | | | 0.5 | | |
| 10,339,467 (1) | | | Ginnie Mae Series 2021-58 SB, 5.851%, (-1.000*US0001M + 6.300%), 04/20/2051 | | | | | 1,408,977 | | | | | | 0.1 | | |
| 17,378,464 (1) | | | Ginnie Mae Series 2021-77 SK, 2.851%, (-1.000*US0001M + 3.300%), 05/20/2051 | | | | | 890,450 | | | | | | 0.1 | | |
| 102,177 (2) | | | Ginnie Mae Series 2021-H09 Z, 3.074%, 10/20/2066 | | | | | 102,232 | | | | | | 0.0 | | |
| 796,853 | | | Seasoned Credit Risk Transfer Trust Series 2017-2 MA, 3.000%, 08/25/2056 | | | | | 792,282 | | | | | | 0.1 | | |
| 4,910,356 | | | Seasoned Credit Risk Transfer Trust Series 2019-1 M55D, 4.000%, 07/25/2058 | | | | | 5,006,162 | | | | | | 0.3 | | |
| 2,009,760 | | | Seasoned Credit Risk Transfer Trust Series 2019-3 M55D, 4.000%, 10/25/2058 | | | | | 2,046,600 | | | | | | 0.1 | | |
| 6,035,000 | | | Seasoned Loans Structured Transaction Series 2019-1 A2, 3.500%, 05/25/2029 | | | | | 6,101,927 | | | | | | 0.4 | | |
| 4,006,079 | | | Seasoned Loans Structured Transaction Trust Series 2019-2 A1C, 2.750%, 09/25/2029 | | | | | 3,986,315 | | | | | | 0.3 | | |
| 5,590,000 | | | Seasoned Loans Structured Transaction Trust Series 2019-3 A2C, 2.750%, 11/25/2029 | | | | | 5,527,576 | | | | | | 0.4 | | |
| 1,448,414 | | | Vendee Mortgage Trust 2011-2 DZ, 3.750%, 10/15/2041 | | | | | 1,441,583 | | | | | | 0.1 | | |
| Principal Amount† | | | Value | | | Percentage of Net Assets | | |||||||||
| COLLATERALIZED MORTGAGE OBLIGATIONS: (continued) | | |||||||||||||||
| 27,069,347 (1)(2) | | | Vendee Mortgage Trust 2011-2 IO, 0.366%, 10/15/2041 | | | | $ | 339,368 | | | | | | 0.0 | | |
| | | | Total Collateralized Mortgage Obligations | | | | | | | | | | | | | |
| | | | (Cost $830,976,133) | | | | | 808,343,809 | | | | | | 55.3 | | |
| | | | | | ||||||||||||
| U.S. GOVERNMENT AGENCY OBLIGATIONS: 68.1% | | |||||||||||||||
| | | | Federal Home Loan Mortgage Corporation: 1.3%(4) | | ||||||||||||
| 844,098 | | | 3.500%, 07/01/2047 | | | | | 855,922 | | | | | | 0.1 | | |
| 1,992,632 | | | 3.500%, 12/01/2047 | | | | | 2,022,276 | | | | | | 0.2 | | |
| 3,539,099 | | | 3.500%, 03/01/2048 | | | | | 3,591,714 | | | | | | 0.3 | | |
| 3,998,796 | | | 3.500%, 11/01/2048 | | | | | 4,057,361 | | | | | | 0.3 | | |
| 1,227,135 | | | 4.000%, 07/01/2047 | | | | | 1,267,748 | | | | | | 0.1 | | |
| 497,169 | | | 4.500%, 08/01/2047 | | | | | 521,694 | | | | | | 0.1 | | |
| 474,595 | | | 5.000%, 11/01/2035 | | | | | 505,931 | | | | | | 0.0 | | |
| 26,101 | | | 5.000%, 12/01/2035 | | | | | 28,293 | | | | | | 0.0 | | |
| 13,388 | | | 5.000%, 01/01/2038 | | | | | 14,564 | | | | | | 0.0 | | |
| 14,016 | | | 5.000%, 03/01/2038 | | | | | 15,184 | | | | | | 0.0 | | |
| 45,110 | | | 5.000%, 03/01/2038 | | | | | 48,907 | | | | | | 0.0 | | |
| 103,329 | | | 5.000%, 02/01/2039 | | | | | 108,954 | | | | | | 0.0 | | |
| 481,348 | | | 5.000%, 07/01/2039 | | | | | 520,400 | | | | | | 0.0 | | |
| 159,472 | | | 5.000%, 01/01/2040 | | | | | 172,445 | | | | | | 0.0 | | |
| 528,086 | | | 5.000%, 04/01/2040 | | | | | 567,762 | | | | | | 0.1 | | |
| 1,541,602 | | | 5.000%, 10/01/2040 | | | | | 1,670,684 | | | | | | 0.1 | | |
| 156,458 | | | 5.000%, 05/01/2041 | | | | | 165,015 | | | | | | 0.0 | | |
| 135,243 | | | 5.290%, 10/01/2037 | | | | | 143,424 | | | | | | 0.0 | | |
| 24,911 | | | 5.410%, 07/01/2037 | | | | | 26,484 | | | | | | 0.0 | | |
| 12,742 | | | 5.410%, 08/01/2037 | | | | | 13,537 | | | | | | 0.0 | | |
| 36,171 | | | 5.440%, 01/01/2037 | | | | | 38,475 | | | | | | 0.0 | | |
| 18,396 | | | 5.440%, 02/01/2037 | | | | | 19,561 | | | | | | 0.0 | | |
| 47,269 | | | 5.440%, 04/01/2037 | | | | | 50,304 | | | | | | 0.0 | | |
| 29,399 | | | 5.440%, 09/01/2037 | | | | | 31,269 | | | | | | 0.0 | | |
| 27,966 | | | 5.440%, 02/01/2038 | | | | | 29,748 | | | | | | 0.0 | | |
| 99,981 | | | 5.450%, 12/01/2037 | | | | | 105,731 | | | | | | 0.0 | | |
| 129,694 | | | 5.450%, 12/01/2037 | | | | | 136,602 | | | | | | 0.0 | | |
| 38,497 | | | 5.460%, 05/01/2037 | | | | | 40,966 | | | | | | 0.0 | | |
| 33,286 | | | 5.460%, 08/01/2037 | | | | | 35,422 | | | | | | 0.0 | | |
| 36,691 | | | 5.460%, 01/01/2038 | | | | | 38,815 | | | | | | 0.0 | | |
| 35,452 | | | 5.480%, 08/01/2037 | | | | | 37,740 | | | | | | 0.0 | | |
| 74,350 | | | 5.500%, 08/01/2037 | | | | | 79,922 | | | | | | 0.0 | | |
| 88,002 | | | 5.500%, 11/01/2037 | | | | | 93,999 | | �� | | | | 0.0 | | |
| 16,951 | | | 5.520%, 10/01/2037 | | | | | 18,056 | | | | | | 0.0 | | |
| Voya GNMA Income Fund | as of March 31, 2022 (continued) |
| Principal Amount† | | | Value | | | Percentage of Net Assets | | |||||||||
| U.S. GOVERNMENT AGENCY OBLIGATIONS: (continued) | | |||||||||||||||
| | | | Federal Home Loan Mortgage Corporation (continued) | | ||||||||||||
| 37,202 | | | 5.620%, 12/01/2036 | | | | $ | 39,663 | | | | | | 0.0 | | |
| 61,455 | | | 5.620%, 03/01/2037 | | | | | 65,559 | | | | | | 0.0 | | |
| 63,108 | | | 5.620%, 08/01/2037 | | | | | 67,334 | | | | | | 0.0 | | |
| 72,918 | | | 5.625%, 12/01/2036 | | | | | 77,730 | | | | | | 0.0 | | |
| 173,081 | | | 5.625%, 01/01/2037 | | | | | 184,626 | | | | | | 0.0 | | |
| 162,753 | | | 5.625%, 03/01/2037 | | | | | 173,571 | | | | | | 0.0 | | |
| 88,509 | | | 5.625%, 06/01/2037 | | | | | 94,345 | | | | | | 0.0 | | |
| 78,205 | | | 5.625%, 07/01/2037 | | | | | 83,361 | | | | | | 0.0 | | |
| 43,201 | | | 5.625%, 02/01/2038 | | | | | 46,050 | | | | | | 0.0 | | |
| 452,438 | | | 5.750%, 09/01/2037 | | | | | 492,101 | | | | | | 0.0 | | |
| 75,849 | | | 5.750%, 10/01/2037 | | | | | 80,947 | | | | | | 0.0 | | |
| 59,470 | | | 5.750%, 11/01/2037 | | | | | 63,450 | | | | | | 0.0 | | |
| 92,477 | | | 6.090%, 12/01/2037 | | | | | 98,996 | | | | | | 0.0 | | |
| 4,885 | | | 7.500%, 01/01/2030 | | | | | 5,389 | | | | | | 0.0 | | |
| 7,434 | | | 8.000%, 01/01/2030 | | | | | 7,465 | | | | | | 0.0 | | |
| | | | | | | | | 18,655,496 | | | | | | 1.3 | | |
| | | | Federal National Mortgage Association: 0.6%(4) | | ||||||||||||
| 64,731 | | | 3.125%, 11/01/2041 | | | | | 65,138 | | | | | | 0.0 | | |
| 27,807 | | | 3.250%, 04/01/2041 | | | | | 28,071 | | | | | | 0.0 | | |
| 98,944 | | | 3.475%, 10/01/2041 | | | | | 99,978 | | | | | | 0.0 | | |
| 87,398 | | | 3.750%, 09/01/2041 | | | | | 89,531 | | | | | | 0.0 | | |
| 62,707 | | | 3.750%, 10/01/2041 | | | | | 64,240 | | | | | | 0.0 | | |
| 5,285,935 | | | 4.000%, 07/01/2056 | | | | | 5,504,743 | | | | | | 0.4 | | |
| 950,148 | | | 4.500%, 09/01/2047 | | | | | 1,039,529 | | | | | | 0.1 | | |
| 249,527 | | | 5.290%, 09/01/2037 | | | | | 252,296 | | | | | | 0.0 | | |
| 274,666 | | | 5.290%, 11/01/2037 | | | | | 285,520 | | | | | | 0.0 | | |
| 78,738 | | | 5.290%, 12/01/2037 | | | | | 80,090 | | | | | | 0.0 | | |
| 251,645 | | | 5.290%, 04/01/2038 | | | | | 260,035 | | | | | | 0.0 | | |
| 46,178 | | | 5.350%, 04/01/2029 | | | | | 48,538 | | | | | | 0.0 | | |
| 34,024 | | | 5.350%, 09/01/2029 | | | | | 35,853 | | | | | | 0.0 | | |
| 65,798 | | | 5.390%, 05/01/2038 | | | | | 71,550 | | | | | | 0.0 | | |
| 172,891 | | | 5.440%, 08/01/2047 | | | | | 178,077 | | | | | | 0.0 | | |
| 162,779 | | | 5.440%, 08/01/2047 | | | | | 167,635 | | | | | | 0.0 | | |
| 115,109 | | | 5.440%, 08/01/2047 | | | | | 120,587 | | | | | | 0.0 | | |
| 173,949 | | | 5.440%, 09/01/2047 | | | | | 179,169 | | | | | | 0.0 | | |
| 272,606 | | | 5.440%, 10/01/2047 | | | | | 286,196 | | | | | | 0.1 | | |
| 92,300 | | | 5.440%, 05/01/2048 | | | | | 96,693 | | | | | | 0.0 | | |
| 63,043 | | | 5.620%, 12/01/2036 | | | | | 65,463 | | | | | | 0.0 | | |
| 13,765 | | | 5.875%, 06/01/2035 | | | | | 13,817 | | | | | | 0.0 | | |
| 101,833 | | | 5.890%, 08/01/2047 | | | | | 105,349 | | | | | | 0.0 | | |
| 109,970 | | | 5.890%, 10/01/2047 | | | | | 114,003 | | | | | | 0.0 | | |
| 11,922 | | | 5.900%, 09/01/2028 | | | | | 12,325 | | | | | | 0.0 | | |
| Principal Amount† | | | Value | | | Percentage of Net Assets | | |||||||||
| U.S. GOVERNMENT AGENCY OBLIGATIONS: (continued) | | |||||||||||||||
| | | | Federal National Mortgage Association (continued) | | ||||||||||||
| 9,455 | | | 6.600%, 07/01/2027 | | | | $ | 9,495 | | | | | | 0.0 | | |
| 16,807 | | | 6.600%, 09/01/2027 | | | | | 16,856 | | | | | | 0.0 | | |
| 24,402 | | | 6.600%, 11/01/2027 | | | | | 24,555 | | | | | | 0.0 | | |
| 21,273 | | | 6.600%, 06/01/2028 | | | | | 21,407 | | | | | | 0.0 | | |
| | | | | | | | | 9,336,739 | | | | | | 0.6 | | |
| | | | Government National Mortgage Association: 60.9% | | ||||||||||||
| 22,725,375 | | | 2.000%, 01/20/2051 | | | | | 21,712,629 | | | | | | 1.5 | | |
| 16,451,443 | | | 2.000%, 02/20/2051 | | | | | 15,717,448 | | | | | | 1.1 | | |
| 8,774,615 | | | 2.000%, 06/20/2051 | | | | | 8,383,058 | | | | | | 0.6 | | |
| 17,113,115 | | | 2.000%, 08/20/2051 | | | | | 16,348,855 | | | | | | 1.1 | | |
| 2,958,882 | | | 2.000%, 11/20/2051 | | | | | 2,826,159 | | | | | | 0.2 | | |
| 94,154,000 (5) | | | 2.000%, 04/15/2052 | | | | | 89,578,704 | | | | | | 6.1 | | |
| 11,549,804 | | | 2.500%, 12/20/2050 | | | | | 11,201,204 | | | | | | 0.8 | | |
| 19,059,161 | | | 2.500%, 03/20/2051 | | | | | 18,516,339 | | | | | | 1.3 | | |
| 47,275,664 | | | 2.500%, 04/20/2051 | | | | | 45,929,210 | | | | | | 3.2 | | |
| 21,105,814 | | | 2.500%, 05/20/2051 | | | | | 20,504,702 | | | | | | 1.4 | | |
| 58,982,664 | | | 2.500%, 09/20/2051 | | | | | 57,302,784 | | | | | | 3.9 | | |
| 73,420,000 (5) | | | 2.500%, 04/15/2052 | | | | | 71,214,531 | | | | | | 4.9 | | |
| 170,232 | | | 3.000%, 12/15/2041 | | | | | 172,114 | | | | | | 0.0 | | |
| 177,475 | | | 3.000%, 01/15/2042 | | | | | 179,675 | | | | | | 0.0 | | |
| 127,650 | | | 3.000%, 01/15/2042 | | | | | 129,317 | | | | | | 0.0 | | |
| 177,441 | | | 3.000%, 01/15/2042 | | | | | 179,660 | | | | | | 0.0 | | |
| 562,801 | | | 3.000%, 02/15/2042 | | | | | 557,930 | | | | | | 0.1 | | |
| 328,032 | | | 3.000%, 03/15/2042 | | | | | 325,099 | | | | | | 0.0 | | |
| 144,274 | | | 3.000%, 04/15/2042 | | | | | 146,168 | | | | | | 0.0 | | |
| 59,756 | | | 3.000%, 05/15/2042 | | | | | 60,533 | | | | | | 0.0 | | |
| 46,659 | | | 3.000%, 06/15/2042 | | | | | 47,267 | | | | | | 0.0 | | |
| 734,486 | | | 3.000%, 04/20/2045 | | | | | 732,761 | | | | | | 0.1 | | |
| 345,540 | | | 3.000%, 11/20/2045 | | | | | 342,172 | | | | | | 0.0 | | |
| 110,428 | | | 3.000%, 12/20/2045 | | | | | 109,350 | | | | | | 0.0 | | |
| 222,000 | | | 3.000%, 12/20/2045 | | | | | 219,833 | | | | | | 0.0 | | |
| 180,039 | | | 3.000%, 12/20/2045 | | | | | 178,273 | | | | | | 0.0 | | |
| 66,187 | | | 3.000%, 01/20/2046 | | | | | 65,539 | | | | | | 0.0 | | |
| 2,688,844 | | | 3.000%, 02/20/2050 | | | | | 2,656,134 | | | | | | 0.2 | | |
| 24,688,997 | | | 3.000%, 10/20/2051 | | | | | 24,736,145 | | | | | | 1.7 | | |
| 3,363,123 | | | 3.000%, 10/20/2051 | | | | | 3,333,280 | | | | | | 0.2 | | |
| 19,862,516 | | | 3.000%, 11/20/2051 | | | | | 19,900,468 | | | | | | 1.4 | | |
| 223,540,000 (5) | | | 3.000%, 04/15/2052 | | | | | 220,946,587 | | | | | | 15.1 | | |
| 17,718 | | | 3.250%, 11/15/2040 | | | | | 17,670 | | | | | | 0.0 | | |
| 51,406 | | | 3.250%, 03/15/2041 | | | | | 51,263 | | | | | | 0.0 | | |
| 358,578 | | | 3.250%, 04/15/2041 | | | | | 359,854 | | | | | | 0.0 | | |
| 142,327 | | | 3.250%, 05/15/2041 | | | | | 141,778 | | | | | | 0.0 | | |
| Voya GNMA Income Fund | as of March 31, 2022 (continued) |
| Principal Amount† | | | Value | | | Percentage of Net Assets | | |||||||||
| U.S. GOVERNMENT AGENCY OBLIGATIONS: (continued) | | |||||||||||||||
| | | | Government National Mortgage Association (continued) | | ||||||||||||
| 363,981 | | | 3.250%, 06/15/2041 | | | | $ | 365,426 | | | | | | 0.0 | | |
| 515,365 | | | 3.250%, 07/15/2041 | | | | | 519,098 | | | | | | 0.1 | | |
| 60,639 | | | 3.250%, 07/15/2041 | | | | | 60,471 | | | | | | 0.0 | | |
| 674,288 | | | 3.250%, 08/15/2041 | | | | | 680,853 | | | | | | 0.1 | | |
| 339,545 | | | 3.250%, 09/15/2041 | | | | | 340,718 | | | | | | 0.0 | | |
| 210,219 | | | 3.250%, 09/15/2041 | | | | | 209,767 | | | | | | 0.0 | | |
| 42,474 | | | 3.250%, 11/15/2041 | | | | | 42,356 | | | | | | 0.0 | | |
| 182,061 | | | 3.250%, 11/15/2041 | | | | | 181,681 | | | | | | 0.0 | | |
| 68,105 | | | 3.250%, 12/15/2041 | | | | | 67,916 | | | | | | 0.0 | | |
| 39,295 | | | 3.250%, 04/15/2042 | | | | | 39,186 | | | | | | 0.0 | | |
| 84,384 | | | 3.250%, 06/15/2042 | | | | | 84,150 | | | | | | 0.0 | | |
| 80,505 | | | 3.250%, 06/15/2042 | | | | | 80,282 | | | | | | 0.0 | | |
| 1,065,437 | | | 3.500%, 04/20/2043 | | | | | 1,080,697 | | | | | | 0.1 | | |
| 1,244,386 | | | 3.500%, 06/20/2045 | | | | | 1,266,656 | | | | | | 0.1 | | |
| 3,217,585 | | | 3.500%, 04/20/2046 | | | | | 3,280,856 | | | | | | 0.2 | | |
| 5,127,329 | | | 3.500%, 03/20/2047 | | | | | 5,311,254 | | | | | | 0.4 | | |
| 624,008 | | | 3.500%, 07/20/2047 | | | | | 633,173 | | | | | | 0.1 | | |
| 1,114,527 | | | 3.500%, 07/20/2047 | | | | | 1,129,697 | | | | | | 0.1 | | |
| 25,198,899 | | | 3.500%, 12/20/2047 | | | | | 25,652,417 | | | | | | 1.8 | | |
| 9,037,190 | | | 3.500%, 01/20/2048 | | | | | 9,216,570 | | | | | | 0.6 | | |
| 6,758,058 | | | 3.500%, 02/20/2048 | | | | | 6,892,210 | | | | | | 0.5 | | |
| 3,697,626 | | | 3.500%, 02/20/2048 | | | | | 3,771,013 | | | | | | 0.3 | | |
| 13,152,833 | | | 3.500%, 03/20/2048 | | | | | 13,413,917 | | | | | | 0.9 | | |
| 11,000,000 (5) | | | 3.500%, 05/15/2052 | | | | | 11,030,938 | | | | | | 0.8 | | |
| 54,337 | | | 3.650%, 12/15/2040 | | | | | 56,134 | | | | | | 0.0 | | |
| 311,466 | | | 3.750%, 09/15/2041 | | | | | 320,478 | | | | | | 0.0 | | |
| 18,730 | | | 3.750%, 09/15/2041 | | | | | 19,068 | | | | | | 0.0 | | |
| 120,627 | | | 3.750%, 10/15/2041 | | | | | 122,886 | | | | | | 0.0 | | |
| 135,021 | | | 3.750%, 10/15/2041 | | | | | 137,519 | | | | | | 0.0 | | |
| 2,137,185 | | | 3.750%, 05/20/2042 | | | | | 2,174,437 | | | | | | 0.2 | | |
| 2,716,247 | | | 3.750%, 05/20/2042 | | | | | 2,772,338 | | | | | | 0.2 | | |
| 131,864 | | | 3.900%, 10/15/2041 | | | | | 135,334 | | | | | | 0.0 | | |
| 75,141 | | | 4.000%, 05/20/2033 | | | | | 77,523 | | | | | | 0.0 | | |
| 9,061 | | | 4.000%, 08/15/2033 | | | | | 9,332 | | | | | | 0.0 | | |
| 32,181 | | | 4.000%, 01/15/2034 | | | | | 33,173 | | | | | | 0.0 | | |
| 418,704 | | | 4.000%, 05/20/2034 | | | | | 429,287 | | | | | | 0.0 | | |
| 470,325 | | | 4.000%, 07/20/2034 | | | | | 482,177 | | | | | | 0.1 | | |
| 1,048,898 | | | 4.000%, 07/20/2034 | | | | | 1,079,508 | | | | | | 0.1 | | |
| 81,266 | | | 4.000%, 08/20/2035 | | | | | 83,106 | | | | | | 0.0 | | |
| 647,723 | | | 4.000%, 09/20/2040 | | | | | 665,461 | | | | | | 0.1 | | |
| 1,341,361 | | | 4.000%, 07/20/2041 | | | | | 1,357,860 | | | | | | 0.1 | | |
| 5,324,715 | | | 4.000%, 08/20/2042 | | | | | 5,597,915 | | | | | | 0.4 | | |
| 173,244 | | | 4.000%, 09/15/2042 | | | | | 178,645 | | | | | | 0.0 | | |
| Principal Amount† | | | Value | | | Percentage of Net Assets | | |||||||||
| U.S. GOVERNMENT AGENCY OBLIGATIONS: (continued) | | |||||||||||||||
| | | | Government National Mortgage Association (continued) | | ||||||||||||
| 963,929 | | | 4.000%, 10/20/2043 | | | | $ | 1,016,322 | | | | | | 0.1 | | |
| 1,477,298 | | | 4.000%, 12/20/2044 | | | | | 1,523,475 | | | | | | 0.1 | | |
| 1,524,476 | | | 4.000%, 01/20/2045 | | | | | 1,572,875 | | | | | | 0.1 | | |
| 374,958 | | | 4.000%, 06/20/2045 | | | | | 394,140 | | | | | | 0.0 | | |
| 1,579,380 | | | 4.000%, 07/20/2045 | | | | | 1,659,154 | | | | | | 0.1 | | |
| 1,721,602 | | | 4.000%, 09/20/2045 | | | | | 1,808,070 | | | | | | 0.1 | | |
| 105,177 | | | 4.000%, 12/20/2045 | | | | | 107,548 | | | | | | 0.0 | | |
| 3,395,351 | | | 4.000%, 01/20/2046 | | | | | 3,537,220 | | | | | | 0.3 | | |
| 376,270 | | | 4.000%, 01/20/2046 | | | | | 387,220 | | | | | | 0.0 | | |
| 79,997 | | | 4.000%, 02/20/2046 | | | | | 83,731 | | | | | | 0.0 | | |
| 1,989,847 | | | 4.000%, 03/20/2046 | | | | | 2,063,133 | | | | | | 0.2 | | |
| 971,149 | | | 4.000%, 04/20/2046 | | | | | 1,001,651 | | | | | | 0.1 | | |
| 416,670 | | | 4.000%, 08/20/2046 | | | | | 430,359 | | | | | | 0.0 | | |
| 1,624,240 | | | 4.000%, 09/20/2047 | | | | | 1,666,313 | | | | | | 0.1 | | |
| 16,728,732 | | | 4.000%, 02/20/2050 | | | | | 17,115,569 | | | | | | 1.2 | | |
| 46,900,000 (5) | | | 4.000%, 04/15/2052 | | | | | 47,838,000 | | | | | | 3.3 | | |
| 1,040 (2) | | | 4.140%, 04/20/2063 | | | | | 1,045 | | | | | | 0.0 | | |
| 979,808 (2) | | | 4.252%, 10/20/2064 | | | | | 997,263 | | | | | | 0.1 | | |
| 5,233 (2) | | | 4.338%, 09/20/2062 | | | | | 5,167 | | | | | | 0.0 | | |
| 16,317 (2) | | | 4.381%, 04/20/2065 | | | | | 16,582 | | | | | | 0.0 | | |
| 114,817 | | | 4.450%, 07/15/2040 | | | | | 118,211 | | | | | | 0.0 | | |
| 63,795 | | | 4.450%, 09/15/2040 | | | | | 65,846 | | | | | | 0.0 | | |
| 62,179 | | | 4.450%, 10/15/2040 | | | | | 64,179 | | | | | | 0.0 | | |
| 40,772 (2) | | | 4.456%, 02/20/2068 | | | | | 41,450 | | | | | | 0.0 | | |
| 727,357 (2) | | | 4.492%, 01/20/2065 | | | | | 744,369 | | | | | | 0.1 | | |
| 5,246 | | | 4.500%, 07/20/2036 | | | | | 5,436 | | | | | | 0.0 | | |
| 501,531 | | | 4.500%, 10/15/2039 | | | | | 540,494 | | | | | | 0.1 | | |
| 319,339 | | | 4.500%, 11/15/2039 | | | | | 344,881 | | | | | | 0.0 | | |
| 378,334 | | | 4.500%, 11/15/2039 | | | | | 408,500 | | | | | | 0.0 | | |
| 110,571 | | | 4.500%, 12/15/2039 | | | | | 119,163 | | | | | | 0.0 | | |
| 261,975 | | | 4.500%, 01/15/2040 | | | | | 282,771 | | | | | | 0.0 | | |
| 25,121 | | | 4.500%, 01/20/2040 | | | | | 26,206 | | | | | | 0.0 | | |
| 1,195,587 | | | 4.500%, 02/15/2040 | | | | | 1,286,113 | | | | | | 0.1 | | |
| 52,461 | | | 4.500%, 06/15/2040 | | | | | 55,879 | | | | | | 0.0 | | |
| 23,605 | | | 4.500%, 07/20/2040 | | | | | 24,614 | | | | | | 0.0 | | |
| 126,165 | | | 4.500%, 08/20/2040 | | | | | 131,497 | | | | | | 0.0 | | |
| 696,531 | | | 4.500%, 09/20/2041 | | | | | 742,694 | | | | | | 0.1 | | |
| 275,291 | | | 4.500%, 10/20/2048 | | | | | 286,622 | | | | | | 0.0 | | |
| 129,007 | | | 4.500%, 11/20/2048 | | | | | 134,299 | | | | | | 0.0 | | |
| 3,920,437 | | | 4.500%, 12/20/2048 | | | | | 4,080,818 | | | | | | 0.3 | | |
| 97,329 | | | 4.500%, 01/20/2049 | | | | | 101,259 | | | | | | 0.0 | | |
| 340,841 | | | 4.500%, 03/20/2049 | | | | | 354,606 | | | | | | 0.0 | | |
| 56,140 | | | 4.500%, 05/20/2049 | | | | | 58,228 | | | | | | 0.0 | | |
| Voya GNMA Income Fund | as of March 31, 2022 (continued) |
| Principal Amount† | | | Value | | | Percentage of Net Assets | | |||||||||
| U.S. GOVERNMENT AGENCY OBLIGATIONS: (continued) | | |||||||||||||||
| | | | Government National Mortgage Association (continued) | | ||||||||||||
| 6,072,074 | | | 4.500%, 11/20/2049 | | | | $ | 6,321,344 | | | | | | 0.5 | | |
| 7,755,903 | | | 4.500%, 12/20/2049 | | | | | 8,033,061 | | | | | | 0.6 | | |
| 1,546,373 (2) | | | 4.515%, 01/20/2065 | | | | | 1,582,271 | | | | | | 0.1 | | |
| 18,720 (2) | | | 4.531%, 10/20/2067 | | | | | 19,069 | | | | | | 0.0 | | |
| 27,734 (2) | | | 4.536%, 04/20/2066 | | | | | 28,230 | | | | | | 0.0 | | |
| 1,773,394 (2) | | | 4.550%, 02/20/2065 | | | | | 1,815,474 | | | | | | 0.1 | | |
| 32,295 | | | 4.580%, 12/20/2033 | | | | | 33,764 | | | | | | 0.0 | | |
| 28,398 | | | 4.580%, 01/20/2034 | | | | | 29,725 | | | | | | 0.0 | | |
| 43,524 | | | 4.580%, 03/20/2034 | | | | | 45,172 | | | | | | 0.0 | | |
| 34,107 | | | 4.580%, 04/20/2034 | | | | | 35,704 | | | | | | 0.0 | | |
| 44,175 | | | 4.580%, 04/20/2034 | | | | | 46,242 | | | | | | 0.0 | | |
| 42,959 | | | 4.580%, 06/20/2034 | | | | | 44,970 | | | | | | 0.0 | | |
| 132,796 (2) | | | 4.665%, 09/20/2064 | | | | | 136,975 | | | | | | 0.0 | | |
| 331,034 (2) | | | 4.682%, 10/20/2064 | | | | | 339,497 | | | | | | 0.0 | | |
| 445,610 (2) | | | 4.686%, 09/20/2064 | | | | | 454,569 | | | | | | 0.0 | | |
| 418 (2) | | | 4.700%, 06/20/2061 | | | | | 435 | | | | | | 0.0 | | |
| 3,866 (2) | | | 4.700%, 08/20/2061 | | | | | 3,943 | | | | | | 0.0 | | |
| 544,597 | | | 4.750%, 06/15/2029 | | | | | 572,207 | | | | | | 0.1 | | |
| 141,379 | | | 4.750%, 01/15/2030 | | | | | 147,781 | | | | | | 0.0 | | |
| 52,689 | | | 4.750%, 06/20/2033 | | | | | 54,914 | | | | | | 0.0 | | |
| 57,623 | | | 4.750%, 07/20/2033 | | | | | 60,048 | | | | | | 0.0 | | |
| 47,790 | | | 4.750%, 07/20/2033 | | | | | 49,809 | | | | | | 0.0 | | |
| 30,816 | | | 4.750%, 07/20/2033 | | | | | 31,941 | | | | | | 0.0 | | |
| 26,276 | | | 4.750%, 08/20/2033 | | | | | 27,381 | | | | | | 0.0 | | |
| 62,100 | | | 4.750%, 08/20/2033 | | | | | 64,712 | | | | | | 0.0 | | |
| 22,117 | | | 4.750%, 09/20/2033 | | | | | 23,047 | | | | | | 0.0 | | |
| 55,458 | | | 4.750%, 10/20/2033 | | | | | 58,158 | | | | | | 0.0 | | |
| 24,463 | | | 4.750%, 11/20/2033 | | | | | 25,490 | | | | | | 0.0 | | |
| 21,773 | | | 4.750%, 12/20/2033 | | | | | 22,686 | | | | | | 0.0 | | |
| 207,573 | | | 4.750%, 09/15/2034 | | | | | 222,515 | | | | | | 0.0 | | |
| 37,307 | | | 4.920%, 03/20/2033 | | | | | 38,974 | | | | | | 0.0 | | |
| 45,539 | | | 4.920%, 04/20/2033 | | | | | 47,568 | | | | | | 0.0 | | |
| 23,496 | | | 4.920%, 04/20/2033 | | | | | 24,537 | | | | | | 0.0 | | |
| 27,182 | | | 4.920%, 05/20/2033 | | | | | 28,387 | | | | | | 0.0 | | |
| 29,407 | | | 4.920%, 05/20/2033 | | | | | 30,721 | | | | | | 0.0 | | |
| 29,878 | | | 4.920%, 05/20/2033 | | | | | 31,210 | | | | | | 0.0 | | |
| 30,061 | | | 4.920%, 05/20/2033 | | | | | 31,392 | | | | | | 0.0 | | |
| 6,484 | | | 5.000%, 03/20/2024 | | | | | 6,797 | | | | | | 0.0 | | |
| 606,397 | | | 5.000%, 04/20/2030 | | | | | 645,898 | | | | | | 0.1 | | |
| 163,603 | | | 5.000%, 07/15/2033 | | | | | 176,816 | | | | | | 0.0 | | |
| 52,679 | | | 5.000%, 03/15/2034 | | | | | 57,430 | | | | | | 0.0 | | |
| 63,619 | | | 5.000%, 01/15/2035 | | | | | 68,778 | | | | | | 0.0 | | |
| 87,472 | | | 5.000%, 03/15/2035 | | | | | 94,563 | | | | | | 0.0 | | |
| Principal Amount† | | | Value | | | Percentage of Net Assets | | |||||||||
| U.S. GOVERNMENT AGENCY OBLIGATIONS: (continued) | | |||||||||||||||
| | | | Government National Mortgage Association (continued) | | ||||||||||||
| 8,477 | | | 5.000%, 03/15/2035 | | | | $ | 9,206 | | | | | | 0.0 | | |
| 201,800 | | | 5.000%, 04/15/2035 | | | | | 220,998 | | | | | | 0.0 | | |
| 47,720 | | | 5.000%, 04/15/2035 | | | | | 52,347 | | | | | | 0.0 | | |
| 17,356 | | | 5.000%, 05/15/2035 | | | | | 18,907 | | | | | | 0.0 | | |
| 47,441 | | | 5.000%, 05/20/2035 | | | | | 51,467 | | | | | | 0.0 | | |
| 249,348 | | | 5.000%, 11/20/2035 | | | | | 270,541 | | | | | | 0.0 | | |
| 115,929 | | | 5.000%, 04/20/2036 | | | | | 125,773 | | | | | | 0.0 | | |
| 41,481 | | | 5.000%, 06/20/2038 | | | | | 42,664 | | | | | | 0.0 | | |
| 15,023 | | | 5.000%, 08/20/2038 | | | | | 15,806 | | | | | | 0.0 | | |
| 168,690 | | | 5.000%, 10/20/2038 | | | | | 176,150 | | | | | | 0.0 | | |
| 29,940 | | | 5.000%, 11/20/2038 | | | | | 30,754 | | | | | | 0.0 | | |
| 112,718 | | | 5.000%, 01/20/2039 | | | | | 117,577 | | | | | | 0.0 | | |
| 49,716 | | | 5.000%, 02/15/2039 | | | | | 53,718 | | | | | | 0.0 | | |
| 156,653 | | | 5.000%, 03/15/2039 | | | | | 169,444 | | | | | | 0.0 | | |
| 59,630 | | | 5.000%, 11/15/2039 | | | | | 64,468 | | | | | | 0.0 | | |
| 537,771 | | | 5.000%, 11/15/2039 | | | | | 585,397 | | | | | | 0.1 | | |
| 673,871 | | | 5.000%, 11/15/2039 | | | | | 739,225 | | | | | | 0.1 | | |
| 72,644 | | | 5.000%, 04/15/2040 | | | | | 79,255 | | | | | | 0.0 | | |
| 675,456 | | | 5.000%, 09/15/2040 | | | | | 741,050 | | | | | | 0.1 | | |
| 531,546 | | | 5.000%, 07/20/2041 | | | | | 583,812 | | | | | | 0.1 | | |
| 8,147 | | | 5.250%, 01/15/2024 | | | | | 8,061 | | | | | | 0.0 | | |
| 38,851 | | | 5.250%, 06/15/2028 | | | | | 41,261 | | | | | | 0.0 | | |
| 60,535 | | | 5.250%, 06/15/2029 | | | | | 64,580 | | | | | | 0.0 | | |
| 871,188 | | | 5.250%, 01/20/2036 | | | | | 937,472 | | | | | | 0.1 | | |
| 112,271 | | | 5.290%, 07/20/2037 | | | | | 118,598 | | | | | | 0.0 | | |
| 160,529 | | | 5.290%, 08/20/2037 | | | | | 169,624 | | | | | | 0.0 | | |
| 227,139 | | | 5.290%, 09/20/2037 | | | | | 240,054 | | | | | | 0.0 | | |
| 97,300 | | | 5.290%, 09/20/2037 | | | | | 102,764 | | | | | | 0.0 | | |
| 112,847 | | | 5.290%, 01/20/2038 | | | | | 119,195 | | | | | | 0.0 | | |
| 4,692 | | | 5.350%, 01/15/2029 | | | | | 5,063 | | | | | | 0.0 | | |
| 8,623 | | | 5.350%, 01/20/2029 | | | | | 9,103 | | | | | | 0.0 | | |
| 28,919 | | | 5.350%, 04/20/2029 | | | | | 30,589 | | | | | | 0.0 | | |
| 28,089 | | | 5.350%, 06/20/2029 | | | | | 29,709 | | | | | | 0.0 | | |
| 33,705 | | | 5.350%, 10/20/2029 | | | | | 35,647 | | | | | | 0.0 | | |
| 77,057 | | | 5.350%, 07/20/2033 | | | | | 82,137 | | | | | | 0.0 | | |
| 13,423 | | | 5.350%, 08/20/2033 | | | | | 14,195 | | | | | | 0.0 | | |
| 144,543 | | | 5.390%, 08/20/2038 | | | | | 147,316 | | | | | | 0.0 | | |
| 72,164 | | | 5.390%, 09/15/2038 | | | | | 77,866 | | | | | | 0.0 | | |
| 25,293 | | | 5.490%, 08/20/2033 | | | | | 26,849 | | | | | | 0.0 | | |
| 45,168 | | | 5.490%, 09/20/2033 | | | | | 47,937 | | | | | | 0.0 | | |
| 43,594 | | | 5.490%, 09/20/2033 | | | | | 46,135 | | | | | | 0.0 | | |
| 221,074 | | | 5.490%, 09/20/2033 | | | | | 235,079 | | | | | | 0.0 | | |
| 53,751 | | | 5.490%, 09/20/2033 | | | | | 57,056 | | | | | | 0.0 | | |
| Voya GNMA Income Fund | as of March 31, 2022 (continued) |
| Principal Amount† | | | Value | | | Percentage of Net Assets | | |||||||||
| U.S. GOVERNMENT AGENCY OBLIGATIONS: (continued) | | |||||||||||||||
| | | | Government National Mortgage Association (continued) | | ||||||||||||
| 197,464 | | | 5.490%, 10/20/2033 | | | | $ | 209,801 | | | | | | 0.0 | | |
| 284,119 | | | 5.490%, 10/20/2033 | | | | | 302,828 | | | | | | 0.0 | | |
| 267,388 | | | 5.490%, 11/20/2033 | | | | | 285,196 | | | | | | 0.0 | | |
| 142,202 | | | 5.490%, 11/20/2033 | | | | | 150,889 | | | | | | 0.0 | | |
| 140,047 | | | 5.490%, 12/20/2033 | | | | | 148,811 | | | | | | 0.0 | | |
| 166,976 | | | 5.490%, 12/20/2033 | | | | | 177,496 | | | | | | 0.0 | | |
| 222,604 | | | 5.490%, 12/20/2033 | | | | | 235,799 | | | | | | 0.0 | | |
| 45,231 | | | 5.490%, 01/20/2034 | | | | | 47,997 | | | | | | 0.0 | | |
| 128,263 | | | 5.490%, 03/20/2034 | | | | | 135,785 | | | | | | 0.0 | | |
| 38,466 | | | 5.490%, 03/20/2034 | | | | | 40,785 | | | | | | 0.0 | | |
| 38,790 | | | 5.490%, 06/20/2034 | | | | | 41,177 | | | | | | 0.0 | | |
| 15,654 | | | 5.500%, 08/15/2024 | | | | | 15,762 | | | | | | 0.0 | | |
| 12,770 | | | 5.500%, 08/20/2024 | | | | | 13,537 | | | | | | 0.0 | | |
| 485 | | | 5.500%, 04/20/2029 | | | | | 515 | | | | | | 0.0 | | |
| 179,086 | | | 5.500%, 09/15/2029 | | | | | 193,511 | | | | | | 0.0 | | |
| 130,360 | | | 5.500%, 10/15/2029 | | | | | 141,493 | | | | | | 0.0 | | |
| 27,214 | | | 5.500%, 12/20/2032 | | | | | 30,158 | | | | | | 0.0 | | |
| 87,807 | | | 5.500%,08/20/2033 | | | | | 97,446 | | | | | | 0.0 | | |
| 58,933 | | | 5.500%, 11/20/2033 | | | | | 59,913 | | | | | | 0.0 | | |
| 24,961 | | | 5.500%, 12/20/2033 | | | | | 27,630 | | | | | | 0.0 | | |
| 61,932 | | | 5.500%, 03/20/2034 | | | | | 62,973 | | | | | | 0.0 | | |
| 144,918 | | | 5.500%, 04/20/2034 | | | | | 160,899 | | | | | | 0.0 | | |
| 111,946 | | | 5.500%, 04/20/2034 | | | | | 114,132 | | | | | | 0.0 | | |
| 161,108 | | | 5.500%, 06/20/2034 | | | | | 171,268 | | | | | | 0.0 | | |
| 80,847 | | | 5.500%, 06/20/2034 | | | | | 82,524 | | | | | | 0.0 | | |
| 70,157 | | | 5.500%, 07/20/2034 | | | | | 74,510 | | | | | | 0.0 | | |
| 101,728 | | | 5.500%, 01/20/2035 | | | | | 104,591 | | | | | | 0.0 | | |
| 150,738 | | | 5.500%, 05/15/2035 | | | | | 161,273 | | | | | | 0.0 | | |
| 24,192 | | | 5.500%, 06/20/2035 | | | | | 25,687 | | | | | | 0.0 | | |
| 191,994 | | | 5.500%, 07/15/2035 | | | | | 205,667 | | | | | | 0.0 | | |
| 85,046 | | | 5.500%, 08/15/2035 | | | | | 90,859 | | | | | | 0.0 | | |
| 82,252 | | | 5.500%, 09/20/2035 | | | | | 87,288 | | | | | | 0.0 | | |
| 146,736 | | | 5.500%, 04/15/2036 | | | | | 156,935 | | | | | | 0.0 | | |
| 32,386 | | | 5.500%, 06/20/2036 | | | | | 35,955 | | | | | | 0.0 | | |
| 2,812 | | | 5.500%, 06/20/2038 | | | | | 3,009 | | | | | | 0.0 | | |
| 15,316 | | | 5.500%, 08/20/2038 | | | | | 16,410 | | | | | | 0.0 | | |
| 7,586 | | | 5.500%, 09/20/2038 | | | | | 8,110 | | | | | | 0.0 | | |
| 1,498 | | | 5.500%, 10/20/2038 | | | | | 1,574 | | | | | | 0.0 | | |
| 24,004 | | | 5.500%, 11/20/2038 | | | | | 25,712 | | | | | | 0.0 | | |
| 2,153 | | | 5.500%, 12/20/2038 | | | | | 2,303 | | | | | | 0.0 | | |
| 47,634 | | | 5.500%, 01/15/2039 | | | | | 50,921 | | | | | | 0.0 | | |
| 5,765 | | | 5.500%, 01/20/2039 | | | | | 6,046 | | | | | | 0.0 | | |
| 27,163 | | | 5.500%, 06/15/2039 | | | | | 29,007 | | | | | | 0.0 | | |
| Principal Amount† | | | Value | | | Percentage of Net Assets | | |||||||||
| U.S. GOVERNMENT AGENCY OBLIGATIONS: (continued) | | |||||||||||||||
| | | | Government National Mortgage Association (continued) | | ||||||||||||
| 16,288 | | | 5.500%, 06/20/2039 | | | | $ | 17,143 | | | | | | 0.0 | | |
| 24,092 | | | 5.500%, 10/20/2039 | | | | | 26,711 | | | | | | 0.0 | | |
| 168,208 | | | 5.500%, 09/15/2040 | | | | | 180,091 | | | | | | 0.0 | | |
| 38,278 | | | 5.580%, 12/20/2033 | | | | | 40,990 | | | | | | 0.0 | | |
| 70,937 | | | 5.580%, 12/20/2033 | | | | | 75,199 | | | | | | 0.0 | | |
| 169,956 | | | 5.580%, 01/20/2034 | | | | | 180,618 | | | | | | 0.0 | | |
| 48,585 | | | 5.580%, 02/20/2034 | | | | | 51,550 | | | | | | 0.0 | | |
| 40,112 | | | 5.580%, 03/20/2034 | | | | | 42,552 | | | | | | 0.0 | | |
| 126,185 | | | 5.580%, 04/20/2034 | | | | | 134,080 | | | | | | 0.0 | | |
| 99,207 | | | 5.580%, 04/20/2034 | | | | | 106,480 | | | | | | 0.0 | | |
| 46,332 | | | 5.580%, 04/20/2034 | | | | | 49,609 | | | | | | 0.0 | | |
| 32,044 | | | 5.580%, 06/20/2034 | | | | | 34,323 | | | | | | 0.0 | | |
| 34,815 | | | 5.580%, 06/20/2034 | | | | | 37,379 | | | | | | 0.0 | | |
| 54,314 | | | 5.580%, 09/20/2034 | | | | | 58,178 | | | | | | 0.0 | | |
| 202,939 | | | 5.590%, 06/20/2033 | | | | | 216,132 | | | | | | 0.0 | | |
| 157,170 | | | 5.590%, 07/20/2033 | | | | | 166,933 | | | | | | 0.0 | | |
| 14,317 | | | 5.590%, 07/20/2033 | | | | | 15,196 | | | | | | 0.0 | | |
| 92,671 | | | 5.590%, 07/20/2033 | | | | | 98,362 | | | | | | 0.0 | | |
| 31,071 | | | 5.590%, 07/20/2033 | | | | | 33,346 | | | | | | 0.0 | | |
| 128,989 | | | 5.590%, 08/20/2033 | | | | | 137,030 | | | | | | 0.0 | | |
| 24,523 | | | 5.590%, 09/20/2033 | | | | | 26,269 | | | | | | 0.0 | | |
| 161,889 | | | 5.590%, 09/20/2033 | | | | | 172,134 | | | | | | 0.0 | | |
| 41,179 | | | 5.590%, 09/20/2033 | | | | | 44,180 | | | | | | 0.0 | | |
| 62,756 | | | 5.590%, 10/20/2033 | | | | | 67,348 | | | | | | 0.0 | | |
| 47,327 | | | 5.590%, 11/20/2033 | | | | | 50,786 | | | | | | 0.0 | | |
| 48,476 | | | 5.590%, 11/20/2033 | | | | | 52,029 | | | | | | 0.0 | | |
| 34,071 | | | 5.590%, 11/20/2033 | | | | | 36,504 | | | | | | 0.0 | | |
| 26,134 | | | 5.590%, 11/20/2033 | | | | | 27,973 | | | | | | 0.0 | | |
| 75,717 | | | 5.590%, 12/20/2033 | | | | | 81,084 | | | | | | 0.0 | | |
| 122,997 | | | 5.740%, 08/20/2037 | | | | | 130,489 | | | | | | 0.0 | | |
| 243,843 | | | 5.740%, 09/20/2037 | | | | | 258,936 | | | | | | 0.0 | | |
| 79,836 | | | 5.740%, 09/20/2037 | | | | | 84,682 | | | | | | 0.0 | | |
| 83,528 | | | 5.740%, 10/20/2037 | | | | | 88,554 | | | | | | 0.0 | | |
| 88,326 | | | 5.740%, 04/20/2038 | | | | | 93,707 | | | | | | 0.0 | | |
| 23,585 | | | 5.750%, 11/15/2024 | | | | | 23,783 | | | | | | 0.0 | | |
| 467,697 | | | 5.750%, 07/15/2029 | | | | | 489,334 | | | | | | 0.1 | | |
| 321,958 | | | 5.750%, 08/15/2029 | | | | | 339,755 | | | | | | 0.0 | | |
| 62,119 | | | 5.750%, 11/15/2029 | | | | | 65,554 | | | | | | 0.0 | | |
| 399,429 | | | 5.750%, 11/15/2029 | | | | | 417,896 | | | | | | 0.0 | | |
| 39,567 | | | 5.770%, 03/20/2033 | | | | | 41,969 | | | | | | 0.0 | | |
| 142,510 | | | 5.770%, 03/20/2033 | | | | | 151,274 | | | | | | 0.0 | | |
| 35,371 | | | 5.770%, 04/20/2033 | | | | | 37,513 | | | | | | 0.0 | | |
| 71,963 | | | 5.770%, 04/20/2033 | | | | | 76,274 | | | | | | 0.0 | | |
| Voya GNMA Income Fund | as of March 31, 2022 (continued) |
| Principal Amount† | | | Value | | | Percentage of Net Assets | | |||||||||
| U.S. GOVERNMENT AGENCY OBLIGATIONS: (continued) | | |||||||||||||||
| | | | Government National Mortgage Association (continued) | | ||||||||||||
| 80,216 | | | 5.770%, 05/20/2033 | | | | $ | 85,077 | | | | | | 0.0 | | |
| 34,373 | | | 5.770%, 05/20/2033 | | | | | 36,457 | | | | | | 0.0 | | |
| 88,751 | | | 5.770%, 05/20/2033 | | | | | 94,069 | | | | | | 0.0 | | |
| 36,231 | | | 5.770%, 06/20/2033 | | | | | 38,406 | | | | | | 0.0 | | |
| 71,924 | | | 5.770%, 07/20/2033 | | | | | 76,277 | | | | | | 0.0 | | |
| 61,191 | | | 5.770%, 07/20/2033 | | | | | 64,897 | | | | | | 0.0 | | |
| 28,909 | | | 5.900%, 05/20/2028 | | | �� | | 30,638 | | | | | | 0.0 | | |
| 25,380 | | | 5.900%, 09/20/2028 | | | | | 26,886 | | | | | | 0.0 | | |
| 1,162,498 | | | 5.970%, 11/15/2031 | | | | | 1,161,709 | | | | | | 0.1 | | |
| 5,276 | | | 6.000%, 01/20/2024 | | | | | 5,315 | | | | | | 0.0 | | |
| 19,145 | | | 6.000%, 10/15/2025 | | | | | 20,483 | | | | | | 0.0 | | |
| 110,636 | | | 6.000%, 04/15/2026 | | | | | 115,638 | | | | | | 0.0 | | |
| 31,064 | | | 6.000%, 10/20/2027 | | | | | 32,904 | | | | | | 0.0 | | |
| 92,742 | | | 6.000%, 05/15/2029 | | | | | 96,865 | | | | | | 0.0 | | |
| 66,799 | | | 6.000%, 07/15/2029 | | | | | 66,039 | | | | | | 0.0 | | |
| 46,932 | | | 6.000%, 10/20/2034 | | | | | 52,149 | | | | | | 0.0 | | |
| 119,752 | | | 6.000%, 03/15/2037 | | | | | 134,459 | | | | | | 0.0 | | |
| 62,836 | | | 6.000%, 08/20/2038 | | | | | 67,861 | | | | | | 0.0 | | |
| 11,979 | | | 6.000%, 09/20/2038 | | | | | 12,569 | | | | | | 0.0 | | |
| 25,759 | | | 6.000%, 10/20/2038 | | | | | 27,796 | | | | | | 0.0 | | |
| 70,046 | | | 6.000%, 11/15/2038 | | | | | 74,854 | | | | | | 0.0 | | |
| 74,506 | | | 6.000%, 12/15/2038 | | | | | 79,612 | | | | | | 0.0 | | |
| 232,253 | | | 6.000%, 08/15/2039 | | | | | 249,288 | | | | | | 0.0 | | |
| 179,277 | | | 6.000%, 08/15/2039 | | | | | 191,751 | | | | | | 0.0 | | |
| 14,620 | | | 6.490%, 01/15/2028 | | | | | 15,669 | | | | | | 0.0 | | |
| 18,241 | | | 6.500%, 07/20/2029 | | | | | 19,595 | | | | | | 0.0 | | |
| 42,985 | | | 6.500%, 07/20/2032 | | | | | 43,875 | | | | | | 0.0 | | |
| 75,058 | | | 6.500%, 02/15/2034 | | | | | 77,808 | | | | | | 0.0 | | |
| 180 | | | 6.500%, 09/20/2034 | | | | | 183 | | | | | | 0.0 | | |
| 5,421 | | | 7.500%, 08/20/2027 | | | | | 5,837 | | | | | | 0.0 | | |
| | | | | | | | | 889,159,079 | | | | | | 60.9 | | |
| | | | Uniform Mortgage-Backed Securities: 5.3% | | ||||||||||||
| 2,957,021 | | | 2.000%, 12/01/2051 | | | | | 2,753,629 | | | | | | 0.2 | | |
| 2,942,771 | | | 2.500%, 12/01/2051 | | | | | 2,812,427 | | | | | | 0.2 | | |
| 1,996,016 | | | 2.500%, 02/01/2052 | | | | | 1,919,600 | | | | | | 0.1 | | |
| 1,000,000 (5) | | | 2.500%, 04/15/2052 | | | | | 954,141 | | | | | | 0.1 | | |
| 2,892,436 | | | 3.000%, 11/01/2051 | | | | | 2,833,430 | | | | | | 0.2 | | |
| 1,980,111 | | | 3.000%, 01/01/2052 | | | | | 1,955,315 | | | | | | 0.1 | | |
| 1,996,885 | | | 3.500%, 02/01/2052 | | | | | 2,011,104 | | | | | | 0.2 | | |
| 38,000,000 (5) | | | 3.500%, 05/15/2052 | | | | | 37,952,066 | | | | | | 2.6 | | |
| 6,673,677 | | | 4.000%, 05/01/2042 | | | | | 6,986,075 | | | | | | 0.5 | | |
| 389,148 | | | 4.000%, 05/01/2045 | | | | | 404,940 | | | | | | 0.0 | | |
| 398,574 | | | 4.000%, 08/01/2046 | | | | | 415,417 | | | | | | 0.0 | | |
| Principal Amount† | | | Value | | | Percentage of Net Assets | | |||||||||
| U.S. GOVERNMENT AGENCY OBLIGATIONS: (continued) | | |||||||||||||||
| | | | Uniform Mortgage-Backed Securities (continued) | | ||||||||||||
| 323,307 | | | 4.250%, 08/01/2035 | | | | $ | 335,611 | | | | | | 0.0 | | |
| 362,209 | | | 4.750%, 11/01/2034 | | | | | 383,705 | | | | | | 0.0 | | |
| 186,243 | | | 4.750%, 11/01/2034 | | | | | 194,790 | | | | | | 0.0 | | |
| 260,324 | | | 4.750%, 02/01/2035 | | | | | 273,815 | | | | | | 0.0 | | |
| 477,437 | | | 4.750%, 04/01/2035 | | | | | 508,501 | | | | | | 0.0 | | |
| 400,715 | | | 4.750%, 05/01/2035 | | | | | 426,775 | | | | | | 0.0 | | |
| 71,131 | | | 4.750%, 07/01/2035 | | | | | 74,351 | | | | | | 0.0 | | |
| 555,334 | | | 4.750%, 07/01/2035 | | | | | 592,979 | | | | | | 0.1 | | |
| 49,459 | | | 5.000%, 04/01/2029 | | | | | 52,563 | | | | | | 0.0 | | |
| 47,409 | | | 5.000%, 02/01/2033 | | | | | 49,939 | | | | | | 0.0 | | |
| 26,828 | | | 5.000%, 05/01/2033 | | | | | 28,708 | | | | | | 0.0 | | |
| 480,096 | | | 5.000%, 06/01/2033 | | | | | 517,615 | | | | | | 0.0 | | |
| 89,690 | | | 5.000%, 07/01/2033 | | | | | 94,487 | | | | | | 0.0 | | |
| 74,865 | | | 5.000%, 11/01/2033 | | | | | 81,059 | | | | | | 0.0 | | |
| 1,251,213 | | | 5.000%, 03/01/2034 | | | | | 1,353,017 | | | | | | 0.1 | | |
| 604,522 | | | 5.000%, 04/01/2034 | | | | | 654,420 | | | | | | 0.1 | | |
| 95,137 | | | 5.000%, 03/01/2035 | | | | | 102,947 | | | | | | 0.0 | | |
| 1,116,779 | | | 5.000%, 07/01/2035 | | | | | 1,206,021 | | | | | | 0.1 | | |
| 603,693 | | | 5.000%, 08/01/2035 | | | | | 651,920 | | | | | | 0.1 | | |
| 141,454 | | | 5.000%, 05/01/2036 | | | | | 149,083 | | | | | | 0.0 | | |
| 755,750 | | | 5.000%, 01/01/2040 | | | | | 818,565 | | | | | | 0.1 | | |
| 1,525,734 | | | 5.000%, 05/01/2040 | | | | | 1,639,096 | | | | | | 0.1 | | |
| 145,454 | | | 5.000%, 06/01/2040 | | | | | 156,410 | | | | | | 0.0 | | |
| 526,869 | | | 5.000%, 09/01/2040 | | | | | 570,648 | | | | | | 0.1 | | |
| 1,242,037 | | | 5.000%, 02/01/2041 | | | | | 1,337,678 | | | | | | 0.1 | | |
| 1,836,592 | | | 5.000%, 09/01/2041 | | | | | 1,984,415 | | | | | | 0.2 | | |
| 169,115 | | | 5.000%, 05/01/2042 | | | | | 181,574 | | | | | | 0.0 | | |
| 88,197 | | | 5.030%, 05/01/2037 | | | | | 92,974 | | | | | | 0.0 | | |
| 96,142 | | | 5.030%, 09/01/2037 | | | | | 101,369 | | | | | | 0.0 | | |
| 45,795 | | | 5.155%, 11/01/2036 | | | | | 48,395 | | | | | | 0.0 | | |
| 151,610 | | | 5.155%, 01/01/2037 | | | | | 160,250 | | | | | | 0.0 | | |
| 119,805 | | | 5.250%, 04/01/2032 | | | | | 126,996 | | | | | | 0.0 | | |
| 37,514 | | | 5.250%, 04/01/2032 | | | | | 39,712 | | | | | | 0.0 | | |
| 25,826 | | | 5.280%, 11/01/2036 | | | | | 27,363 | | | | | | 0.0 | | |
| 104,198 | | | 5.280%, 11/01/2036 | | | | | 110,380 | | | | | | 0.0 | | |
| 43,630 | | | 5.280%, 01/01/2037 | | | | | 46,221 | | | | | | 0.0 | | |
| 90,335 | | | 5.290%, 08/01/2037 | | | | | 95,683 | | | | | | 0.0 | | |
| 70,031 | | | 5.290%, 09/01/2037 | | | | | 74,179 | | | | | | 0.0 | | |
| 185,977 | | | 5.290%, 09/01/2037 | | | | | 197,010 | | | | | | 0.0 | | |
| 17,908 | | | 5.300%, 10/01/2036 | | | | | 18,970 | | | | | | 0.0 | | |
| 113,127 | | | 5.300%, 12/01/2036 | | | | | 119,862 | | | | | | 0.0 | | |
| 77,233 | | | 5.300%, 12/01/2036 | | | | | 81,808 | | | | | | 0.0 | | |
| 64,027 | | | 5.300%, 02/01/2037 | | | | | 67,859 | | | | | | 0.0 | | |
| Voya GNMA Income Fund | as of March 31, 2022 (continued) |
| Principal Amount† | | | Value | | | Percentage of Net Assets | | |||||||||
| U.S. GOVERNMENT AGENCY OBLIGATIONS: (continued) | | |||||||||||||||
| | | | Uniform Mortgage-Backed Securities (continued) | | ||||||||||||
| 49,755 | | | 5.300%, 05/01/2037 | | | | $ | 52,734 | | | | | | 0.0 | | |
| 233,038 | | | 5.300%, 08/01/2037 | | | | | 247,729 | | | | | | 0.0 | | |
| 118,674 | | | 5.390%, 12/01/2037 | | | | | 125,923 | | | | | | 0.0 | | |
| 164,345 | | | 5.405%, 11/01/2036 | | | | | 174,553 | | | | | | 0.0 | | |
| 214,075 | | | 5.405%, 02/01/2037 | | | | | 227,608 | | | | | | 0.0 | | |
| 78,924 | | | 5.740%, 07/01/2037 | | | | | 84,050 | | | | | | 0.0 | | |
| 10,486 | | | 7.500%, 05/01/2028 | | | | | 10,521 | | | | | | 0.0 | | |
| | | | | | | | | 77,750,985 | | | | | | 5.3 | | |
| | | | Total U.S. Government Agency Obligations (Cost $1,013,846,951) | | | | | 994,902,299 | | | | | | 68.1 | | |
| | | | | | | | | | | | | | | | | |
| COMMERCIAL MORTGAGE-BACKED SECURITIES: 3.4% | | |||||||||||||||
| 9,272,437 (1)(2) | | | Freddie Mac Multifamily Structured Pass Through Certificates K106 X1, 1.354%, 01/25/2030 | | | | | 823,378 | | | | | | 0.1 | | |
| 28,109,576 (1)(2) | | | Freddie Mac Multifamily Structured Pass Through Certificates K107 X1, 1.690%, 03/25/2030 | | | | | 3,166,769 | | | | | | 0.2 | | |
| 19,449,997 (1)(2) | | | Freddie Mac Multifamily Structured Pass Through Certificates K110 X1, 1.697%, 04/25/2030 | | | | | 2,140,097 | | | | | | 0.2 | | |
| 2,990,592 (1)(2) | | | Freddie Mac Multifamily Structured Pass Through Certificates K119 X1, 0.932%, 09/25/2030 | | | | | 194,064 | | | | | | 0.0 | | |
| 16,529,326 (1)(2) | | | Freddie Mac Multifamily Structured Pass Through Certificates K-1516 X1, 1.512%, 05/25/2035 | | | | | 2,446,841 | | | | | | 0.2 | | |
| 14,977,743 (1)(2) | | | Freddie Mac Multifamily Structured Pass Through Certificates K-1517 X1, 1.330%, 07/25/2035 | | | | | 1,977,192 | | | | | | 0.1 | | |
| 34,851,315 (1)(2) | | | Freddie Mac Multifamily Structured Pass Through Certificates K-1519 X1, 0.609%, 12/25/2035 | | | | | 2,103,462 | | | | | | 0.2 | | |
| 24,920,701 (1)(2) | | | Freddie Mac Multifamily Structured Pass Through Certificates K740 X1, 0.758%, 09/25/2027 | | | | | 880,316 | | | | | | 0.1 | | |
| Principal Amount† | | | Value | | | Percentage of Net Assets | | |||||||||
| COMMERCIAL MORTGAGE-BACKED SECURITIES: (continued) | | |||||||||||||||
| 31,466,000 (1) | | | Freddie Mac Multifamily Structured Pass Through Certificates KL06 XFX, 1.364%, 12/25/2029 | | | | $ | 2,553,217 | | | | | | 0.2 | | |
| 34,843,747 (1)(2) | | | Freddie Mac Multifamily Structured Pass Through Certificates KLU3 X1, 1.938%, 01/25/2031 | | | | | 4,400,406 | | | | | | 0.3 | | |
| 276,801 (2) | | | Ginnie Mae 2004-23 Z, 5.762%, 03/16/2044 | | | | | 288,113 | | | | | | 0.0 | | |
| 4,098,288 (1)(2) | | | Ginnie Mae 2006-67 IO, 0.550%, 11/16/2046 | | | | | 11,250 | | | | | | 0.0 | | |
| 46,692 (2) | | | Ginnie Mae 2007-52 Z, 4.350%, 01/16/2048 | | | | | 46,654 | | | | | | 0.0 | | |
| 564,828 | | | Ginnie Mae 2008-39 Z, 4.500%, 02/16/2048 | | | | | 572,310 | | | | | | 0.0 | | |
| 228,573 (1)(2) | | | Ginnie Mae 2008-45 IO, 0.856%, 02/16/2048 | | | | | 287 | | | | | | 0.0 | | |
| 125,756 (2) | | | Ginnie Mae 2009-115 D, 4.776%, 01/16/2050 | | | | | 127,254 | | | | | | 0.0 | | |
| 339,445 (1)(2) | | | Ginnie Mae 2010-122 IO, 0.255%, 02/16/2044 | | | | | 98 | | | | | | 0.0 | | |
| 59,648 (1)(2) | | | Ginnie Mae 2010-123 IA, 2.050%, 10/16/2052 | | | | | 670 | | | | | | 0.0 | | |
| 14,275,663 (1)(2) | | | Ginnie Mae 2011-47 IO, 0.156%, 01/16/2051 | | | | | 46,594 | | | | | | 0.0 | | |
| 1,887,390 (2) | | | Ginnie Mae 2018-114 Z, 3.100%, 04/16/2060 | | | | | 1,821,377 | | | | | | 0.1 | | |
| 10,670,151 | | | Ginnie Mae 2018-116 Z, 3.000%, 06/16/2058 | | | | | 10,354,893 | | | | | | 0.7 | | |
| 1,904,735 | | | Ginnie Mae 2018-169 Z, 3.000%, 04/16/2061 | | | | | 1,804,727 | | | | | | 0.1 | | |
| 1,894,808 | | | Ginnie Mae 2019-17 Z, 3.000%, 12/16/2060 | | | | | 1,795,089 | | | | | | 0.1 | | |
| 2,505,066 (2) | | | Ginnie Mae 2019-19 Z, 3.200%, 11/16/2060 | | | | | 2,421,770 | | | | | | 0.2 | | |
| 2,210,584 | | | Ginnie Mae 2019-53 Z, 3.000%, 06/16/2061 | | | | | 2,079,747 | | | | | | 0.1 | | |
| 5,073,397 | | | Ginnie Mae 2021-79, 1.750%, 08/16/2063 | | | | | 3,647,041 | | | | | | 0.3 | | |
| 2,531,426 | | | Ginnie Mae 2021-80 Z, 1.500%, 12/16/2062 | | | | | 1,878,922 | | | | | | 0.1 | | |
| 2,333,712 | | | Ginnie Mae 2021-90 B, 1.750%, 05/16/2061 | | | | | 1,885,610 | | | | | | 0.1 | | |
| Voya GNMA Income Fund | as of March 31, 2022 (continued) |
| Principal Amount† | | | Value | | | Percentage of Net Assets | | |||||||||
| COMMERCIAL MORTGAGE-BACKED SECURITIES: (continued) | | |||||||||||||||
| | | | Total Commercial Mortgage-Backed Securities (Cost $53,566,058) | | | | $ | 49,468,148 | | | | | | 3.4 | | |
| ASSET-BACKED SECURITIES: 0.1% | | |||||||||||||||
| | | | Other Asset-Backed Securities: 0.1% | | ||||||||||||
| 1,428,300 | | | Fannie Mae Grantor Trust 2001-T9 A1, 0.567%, (US0001M + 0.220%), 09/25/2031 | | | | | 1,409,973 | | | | | | 0.1 | | |
| 96,360 (2) | | | Fannie Mae Grantor Trust 2003-T4 2A6, 4.607%, 07/26/2033 | | | | | 97,965 | | | | | | 0.0 | | |
| 18,510 (2) | | | Fannie Mae REMIC Trust 2001-W4 AF6, 5.110%, 01/25/2032 | | | | | 19,215 | | | | | | 0.0 | | |
| 17,412 (2) | | | Fannie Mae REMIC Trust 2002-W12 AF6, 5.066%, 02/25/2033 | | | | | 17,331 | | | | | | 0.0 | | |
| 16,933 (2) | | | Fannie Mae REMIC Trust 2002-W2 AF6, 6.000%, 05/25/2032 | | | | | 18,137 | | | | | | 0.0 | | |
| | | | Total Asset-Backed Securities (Cost $1,560,392) | | | | | 1,562,621 | | | | | | 0.1 | | |
| | | | Total Long-Term Investments (Cost $1,899,949,534) | | | | | 1,854,276,877 | | | | | | 126.9 | | |
| | | | | | | | | | | | | | | | | |
| SHORT-TERM INVESTMENTS: 0.1% | | |||||||||||||||
| | | | U.S. Government Agency Obligations: 0.1% | | ||||||||||||
| 900,000 (6) | | | Federal Home Loan Bank Discount Notes, 0.160%, 04/29/2022 (Cost $899,867) | | | | | 899,888 | | | | | | 0.1 | | |
| Principal Amount† | | | Value | | | Percentage of Net Assets | | |||||||||
| SHORT-TERM INVESTMENTS: (continued) | | |||||||||||||||
| | | | U.S. Government Agency Obligations (continued) | | ||||||||||||
| | | | Total Short-Term Investments (Cost $899,867) | | | | $ | 899,888 | | | | | | 0.1 | | |
| | | | Total Investments in Securities (Cost $1,900,849,401) | | | | $ | 1,855,176,765 | | | | | | 127.0 | | |
| | | | Liabilities in Excess of Other Assets | | | | | (394,294,523) | | | | | | (27.0) | | |
| | | | Net Assets | | | | $ | 1,460,882,242 | | | | | | 100.0 | | |
| | ||||||||||||||||
| | H15T1Y | | | U.S. Treasury 1-Year Constant Maturity | |
| | US0001M | | | 1-month LIBOR | |
| | | | Quoted Prices in Active Markets for Identical Investments (Level 1) | | | Significant Other Observable Inputs (Level 2) | | | Significant Unobservable Inputs (Level 3) | | | Fair Value at March 31, 2022 | | ||||||||||||
| Asset Table | | | | | | | | | | | | | | | | | | | | | | | | | |
| Investments, at fair value | | | | | | | | | | | | | | | | | | | | | | | | | |
| Collateralized Mortgage Obligations | | | | $ | — | | | | | $ | 808,343,809 | | | | | $ | — | | | | | $ | 808,343,809 | | |
| U.S. Government Agency Obligations | | | | | — | | | | | | 994,902,299 | | | | | | — | | | | | | 994,902,299 | | |
| Voya GNMA Income Fund | as of March 31, 2022 (continued) |
| | | | Quoted Prices in Active Markets for Identical Investments (Level 1) | | | Significant Other Observable Inputs (Level 2) | | | Significant Unobservable Inputs (Level 3) | | | Fair Value at March 31, 2022 | | ||||||||||||
| Commercial Mortgage-Backed Securities | | | | | — | | | | | | 49,468,148 | | | | | | — | | | | | | 49,468,148 | | |
| Asset-Backed Securities | | | | | — | | | | | | 1,562,621 | | | | | | — | | | | | | 1,562,621 | | |
| Short-Term Investments | | | | | — | | | | | | 899,888 | | | | | | — | | | | | | 899,888 | | |
| Total Investments, at fair value | | | | $ | — | | | | | $ | 1,855,176,765 | | | | | $ | — | | | | | $ | 1,855,176,765 | | |
| Other Financial Instruments+ | | | | | | | | | | | | | | | | | | | | | | | | | |
| Futures | | | | | 4,980,728 | | | | | | — | | | | | | — | | | | | | 4,980,728 | | |
| Total Assets | | | | $ | 4,980,728 | | | | | $ | 1,855,176,765 | | | | | $ | — | | | | | $ | 1,860,157,493 | | |
| | |||||||||||||||||||||||||
| Description | | | Number of Contracts | | | Expiration Date | | | Notional Amount | | | Unrealized Appreciation/ (Depreciation) | | ||||||||||||
| Long Contracts: | | | | | | | | | | | | | | | | | | | | | | | | | |
| U.S. Treasury Ultra Long Bond | | | | | 80 | | | | | | 06/21/22 | | | | | $ | 14,170,000 | | | | | $ | 203,351 | | |
| | | | | | | | | | | | | | | | | $ | 14,170,000 | | | | | $ | 203,351 | | |
| Short Contracts: | | | | | | | | | | | | | | | | | | | | | | | | | |
| U.S. Treasury 10-Year Note | | | | | (560) | | | | | | 06/21/22 | | | | | | (68,810,000) | | | | | | 1,875,744 | | |
| U.S. Treasury 2-Year Note | | | | | (418) | | | | | | 06/30/22 | | | | | | (88,583,344) | | | | | | 215,128 | | |
| U.S. Treasury 5-Year Note | | | | | (909) | | | | | | 06/30/22 | | | | | | (104,250,937) | | | | | | 2,495,660 | | |
| U.S. Treasury Long Bond | | | | | (44) | | | | | | 06/21/22 | | | | | | (6,602,750) | | | | | | 185,480 | | |
| U.S. Treasury Ultra 10-Year Note | | | | | (97) | | | | | | 06/21/22 | | | | | | (13,140,469) | | | | | | 5,365 | | |
| | | | | | | | | | | | | | | | | $ | (281,387,500) | | | | | $ | 4,777,377 | | |
| Derivatives not accounted for as hedging instruments | | | Location on Statement of Assets and Liabilities | | | Fair Value | | |||
| Asset Derivatives | | | | | | | | | | |
| Interest rate contracts | | | Variation margin receivable on futures contracts* | | | | $ | 4,980,728 | | |
| Total Asset Derivatives | | | | | | | $ | 4,980,728 | | |
| | | | Amount of Realized Gain or (Loss) on Derivatives Recognized in Income | | |||
| Derivatives not accounted for as hedging instruments | | | Futures | | |||
| Interest rate contracts | | | | $ | 18,657,031 | | |
| Total | | | | $ | 18,657,031 | | |
| Voya GNMA Income Fund | as of March 31, 2022 (continued) |
| | | | Change in Unrealized Appreciation or (Depreciation) on Derivatives Recognized in Income | | |||
| Derivatives not accounted for as hedging instruments | | | Futures | | |||
| Interest rate contracts | | | | $ | (2,029,245) | | |
| Total | | | | $ | (2,029,245) | | |
| | Cost for federal income tax purposes was $1,910,822,407. | | | | | | | |
| | Net unrealized depreciation consisted of: | | | |||||
| | Gross Unrealized Appreciation | | | | $ | 3,308,995 | | |
| | Gross Unrealized Depreciation | | | | | (53,973,909) | | |
| | Net Unrealized Depreciation | | | | $ | (50,664,914) | | |
| Voya High Yield Bond Fund | as of March 31, 2022 |
| Principal Amount† | | | Value | | | Percentage of Net Assets | | |||||||||
| CORPORATE BONDS/NOTES: 94.1% | | |||||||||||||||
| | | | Basic Materials: 6.4% | | ||||||||||||
| 525,000 (1) | | | ASP Unifrax Holdings, Inc., 5.250%, 09/30/2028 | | | | $ | 488,371 | | | | | | 0.1 | | |
1,375,000 (1)(2) | | | ASP Unifrax Holdings, Inc., 7.500%, 09/30/2029 | | | | | 1,225,443 | | | | | | 0.2 | | |
1,325,000 (1)(2) | | | Cleveland-Cliffs, Inc., 4.625%, 03/01/2029 | | | | | 1,309,550 | | | | | | 0.2 | | |
1,000,000 (1)(2) | | | Cleveland-Cliffs, Inc., 4.875%, 03/01/2031 | | | | | 990,890 | | | | | | 0.2 | | |
1,750,000 (1)(2) | | | Coeur Mining, Inc., 5.125%, 02/15/2029 | | | | | 1,522,675 | | | | | | 0.2 | | |
| 1,300,000 (1) | | | Compass Minerals International, Inc., 6.750%, 12/01/2027 | | | | | 1,317,979 | | | | | | 0.2 | | |
1,750,000 (1)(2) | | | Consolidated Energy Finance S.A., 5.625%, 10/15/2028 | | | | | 1,622,206 | | | | | | 0.3 | | |
1,500,000 (1)(2) | | | Constellium SE, 5.625%, 06/15/2028 | | | | | 1,508,182 | | | | | | 0.2 | | |
1,800,000 (1)(2) | | | Diamond BC BV, 4.625%, 10/01/2029 | | | | | 1,618,938 | | | | | | 0.3 | | |
| 1,500,000 (1) | | | First Quantum Minerals Ltd., 6.875%, 10/15/2027 | | | | | 1,572,825 | | | | | | 0.2 | | |
| 2,950,000 (1)(2) | | | Hudbay Minerals, Inc., 4.500%, 04/01/2026 | | | | | 2,871,810 | | | | | | 0.4 | | |
| 1,850,000 (1) | | | Illuminate Buyer LLC / Illuminate Holdings IV, Inc., 9.000%, 07/01/2028 | | | | | 1,875,437 | | | | | | 0.3 | | |
| 2,275,000 (1) | | | INEOS Quattro Finance 2 Plc, 3.375%, 01/15/2026 | | | | | 2,120,982 | | | | | | 0.3 | | |
| 2,175,000 (1)(3) | | | Iris Holdings, Inc., 8.750% (PIK Rate 9.500%, Cash Rate 8.750%), 02/15/2026 | | | | | 2,177,730 | | | | | | 0.3 | | |
| 2,000,000 (1)(2) | | | LSF11 A5 Holdco LLC, 6.625%, 10/15/2029 | | | | | 1,863,150 | | | | | | 0.3 | | |
| 1,850,000 (1)(2) | | | Novelis Corp., 3.875%, 08/15/2031 | | | | | 1,695,146 | | | | | | 0.3 | | |
| 475,000 (1) | | | Novelis Corp., 4.750%, 01/30/2030 | | | | | 462,047 | | | | | | 0.1 | | |
| 1,650,000 (1) | | | Nufarm Australia Ltd. / Nufarm Americas, Inc., 5.000%, 01/27/2030 | | | | | 1,628,930 | | | | | | 0.3 | | |
| 2,050,000 (2) | | | Olin Corp., 5.000%, 02/01/2030 | | | | | 2,033,815 | | | | | | 0.3 | | |
| 975,000 | | | Olin Corp., 5.125%, 09/15/2027 | | | | | 973,138 | | | | | | 0.2 | | |
| 1,750,000 (1)(2) | | | PMHC II, Inc., 9.000%, 02/15/2030 | | | | | 1,542,258 | | | | | | 0.2 | | |
| 2,325,000 (1) | | | Schweitzer-Mauduit International, Inc., 6.875%, 10/01/2026 | | | | | 2,199,915 | | | | | | 0.3 | | |
| Principal Amount† | | | Value | | | Percentage of Net Assets | | |||||||||
| CORPORATE BONDS/NOTES: (continued) | | |||||||||||||||
| | | | Basic Materials (continued) | | ||||||||||||
| 2,125,000 (1) | | | Taseko Mines Ltd., 7.000%, 02/15/2026 | | | | $ | 2,191,141 | | | | | | 0.3 | | |
| 1,690,000 (1)(2) | | | Trinseo Materials Operating SCA / Trinseo Materials Finance, Inc., 5.125%, 04/01/2029 | | | | | 1,562,642 | | | | | | 0.2 | | |
| 2,075,000 (1)(2) | | | Tronox, Inc., 4.625%, 03/15/2029 | | | | | 1,945,219 | | | | | | 0.3 | | |
| 1,375,000 (1)(2) | | | Venator Finance Sarl / Venator Materials LLC, 5.750%, 07/15/2025 | | | | | 1,107,019 | | | | | | 0.2 | | |
| | | | | | | | | 41,427,438 | | | | | | 6.4 | | |
| | | | Communications: 15.7% | | ||||||||||||
| 1,750,000 (1) | | | Acuris Finance US, Inc. / Acuris Finance SARL, 5.000%, 05/01/2028 | | | | | 1,611,557 | | | | | | 0.2 | | |
| 2,500,000 (1)(2) | | | Altice France Holding SA, 6.000%, 02/15/2028 | | | | | 2,161,212 | | | | | | 0.3 | | |
| 2,350,000 (1) | | | Altice France SA/France, 5.500%, 10/15/2029 | | | | | 2,111,804 | | | | | | 0.3 | | |
| 1,500,000 (1) | | | Altice France SA/France, 8.125%, 02/01/2027 | | | | | 1,548,285 | | | | | | 0.2 | | |
| 2,025,000 (2) | | | AMC Networks, Inc., 4.250%, 02/15/2029 | | | | | 1,892,362 | | | | | | 0.3 | | |
| 2,250,000 (1)(2) | | | Audacy Capital Corp., 6.500%, 05/01/2027 | | | | | 2,115,517 | | | | | | 0.3 | | |
| 2,225,000 (1) | | | Beasley Mezzanine Holdings LLC, 8.625%, 02/01/2026 | | | | | 2,116,286 | | | | | | 0.3 | | |
| 1,990,000 (1) | | | CCO Holdings LLC / CCO Holdings Capital Corp., 4.250%, 01/15/2034 | | | | | 1,731,300 | | | | | | 0.3 | | |
| 2,740,000 | | | CCO Holdings LLC / CCO Holdings Capital Corp., 4.500%, 05/01/2032 | | | | | 2,510,114 | | | | | | 0.4 | | |
| 1,450,000 (1) | | | CCO Holdings LLC / CCO Holdings Capital Corp., 5.000%, 02/01/2028 | | | | | 1,437,544 | | | | | | 0.2 | | |
| 2,390,000 (1) | | | CCO Holdings LLC / CCO Holdings Capital Corp., 5.125%, 05/01/2027 | | | | | 2,396,692 | | | | | | 0.4 | | |
| 1,300,000 (1)(2) | | | Clear Channel Outdoor Holdings, Inc., 7.500%, 06/01/2029 | | | | | 1,298,739 | | | | | | 0.2 | | |
| 1,125,000 (1)(2) | | | Clear Channel Outdoor Holdings, Inc., 7.750%, 04/15/2028 | | | | | 1,132,161 | | | | | | 0.2 | | |
| 750,000 (1)(2) | | | CommScope Tech Finance LLC, 6.000%, 06/15/2025 | | | | | 711,217 | | | | | | 0.1 | | |
| Voya High Yield Bond Fund | as of March 31, 2022 (continued) |
| Principal Amount† | | | Value | | | Percentage of Net Assets | | |||||||||
| CORPORATE BONDS/NOTES: (continued) | | |||||||||||||||
| | | | Communications (continued) | | ||||||||||||
| 475,000 (1)(2) | | | CommScope Technologies LLC, 5.000%, 03/15/2027 | | | | $ | 413,563 | | | | | | 0.1 | | |
| 925,000 (1)(2) | | | CommScope, Inc., 4.750%, 09/01/2029 | | | | | 853,201 | | | | | | 0.1 | | |
| 1,850,000 (1)(2) | | | CommScope, Inc., 7.125%, 07/01/2028 | | | | | 1,673,325 | | | | | | 0.3 | | |
| 2,800,000 (1) | | | Connect Finco SARL / Connect US Finco LLC, 6.750%, 10/01/2026 | | | | | 2,852,346 | | | | | | 0.4 | | |
| 2,225,000 (1)(2) | | | CSC Holdings LLC, 4.625%, 12/01/2030 | | | | | 1,863,816 | | | | | | 0.3 | | |
| 815,000 (2) | | | CSC Holdings LLC, 5.250%, 06/01/2024 | | | | | 817,445 | | | | | | 0.1 | | |
| 4,000,000 (1) | | | CSC Holdings LLC, 5.750%, 01/15/2030 | | | | | 3,566,900 | | | | | | 0.5 | | |
| 575,000 (1) | | | CSC Holdings LLC, 7.500%, 04/01/2028 | | | | | 566,007 | | | | | | 0.1 | | |
| 3,225,000 (1) | | | DIRECTV Holdings LLC / DIRECTV Financing Co., Inc., 5.875%, 08/15/2027 | | | | | 3,176,867 | | | | | | 0.5 | | |
| 2,350,000 | | | DISH DBS Corp., 5.125%, 06/01/2029 | | | | | 2,004,315 | | | | | | 0.3 | | |
| 700,000 (1) | | | DISH DBS Corp., 5.250%, 12/01/2026 | | | | | 668,062 | | | | | | 0.1 | | |
| 1,025,000 (1) | | | DISH DBS Corp., 5.750%, 12/01/2028 | | | | | 971,828 | | | | | | 0.1 | | |
| 1,175,000 (2) | | | DISH DBS Corp., 7.375%, 07/01/2028 | | | | | 1,114,634 | | | | | | 0.2 | | |
| 1,535,000 | | | Embarq Corp., 7.995%, 06/01/2036 | | | | | 1,481,521 | | | | | | 0.2 | | |
| 400,000 (1) | | | Frontier Communications Holdings LLC, 5.000%, 05/01/2028 | | | | | 384,490 | | | | | | 0.1 | | |
| 600,000 (1)(2) | | | Frontier Communications Holdings LLC, 6.000%, 01/15/2030 | | | | | 555,801 | | | | | | 0.1 | | |
| 1,190,000 (1)(2) | | | Frontier Communications Holdings LLC, 6.750%, 05/01/2029 | | | | | 1,144,042 | | | | | | 0.2 | | |
| 1,900,000 (1) | | | GCI LLC, 4.750%, 10/15/2028 | | | | | 1,858,504 | | | | | | 0.3 | | |
| 2,225,000 (1)(2) | | | Gray Escrow II, Inc., 5.375%, 11/15/2031 | | | | | 2,130,438 | | | | | | 0.3 | | |
| 2,250,000 (2) | | | Hughes Satellite Systems Corp., 6.625%, 08/01/2026 | | | | | 2,336,355 | | | | | | 0.4 | | |
| 725,000 (1)(2) | | | iHeartCommunications, Inc., 5.250%, 08/15/2027 | | | | | 718,127 | | | | | | 0.1 | | |
| 2,425,000 (2) | | | iHeartCommunications, Inc., 8.375%, 05/01/2027 | | | | | 2,510,360 | | | | | | 0.4 | | |
| Principal Amount† | | | Value | | | Percentage of Net Assets | | |||||||||
| CORPORATE BONDS/NOTES: (continued) | | |||||||||||||||
| | | | Communications (continued) | | ||||||||||||
| 1,800,000 (1) | | | ION Trading Technologies Sarl, 5.750%, 05/15/2028 | | | | $ | 1,740,222 | | | | | | 0.3 | | |
| 1,175,000 (1)(2) | | | LCPR Senior Secured Financing DAC, 5.125%, 07/15/2029 | | | | | 1,124,123 | | | | | | 0.2 | | |
| 1,975,000 (1) | | | LCPR Senior Secured Financing DAC, 6.750%, 10/15/2027 | | | | | 2,031,564 | | | | | | 0.3 | | |
| 540,000 | | | Lumen Technologies, Inc., 5.625%, 04/01/2025 | | | | | 544,801 | | | | | | 0.1 | | |
| 1,950,000 (1)(2) | | | McGraw-Hill Education, Inc., 8.000%, 08/01/2029 | | | | | 1,846,952 | | | | | | 0.3 | | |
| 510,000 (1) | | | Millennium Escrow Corp., 6.625%, 08/01/2026 | | | | | 485,046 | | | | | | 0.1 | | |
| 1,550,000 | | | Netflix, Inc., 5.875%, 11/15/2028 | | | | | 1,712,440 | | | | | | 0.3 | | |
| 1,275,000 (4) | | | Paramount Global, 6.250%, 02/28/2057 | | | | | 1,287,782 | | | | | | 0.2 | | |
| 2,575,000 (1)(2) | | | Radiate Holdco LLC / Radiate Finance, Inc., 6.500%, 09/15/2028 | | | | | 2,439,813 | | | | | | 0.4 | | |
| 300,000 (1) | | | Scripps Escrow II, Inc., 3.875%, 01/15/2029 | | | | | 279,161 | | | | | | 0.0 | | |
| 600,000 (1)(2) | | | Scripps Escrow II, Inc., 5.375%, 01/15/2031 | | | | | 575,328 | | | | | | 0.1 | | |
| 1,950,000 (1)(2) | | | Scripps Escrow, Inc., 5.875%, 07/15/2027 | | | | | 1,954,290 | | | | | | 0.3 | | |
| 825,000 (1)(2) | | | Sinclair Television Group, Inc., 4.125%, 12/01/2030 | | | | | 737,138 | | | | | | 0.1 | | |
| 1,125,000 (1)(2) | | | Sinclair Television Group, Inc., 5.500%, 03/01/2030 | | | | | 975,803 | | | | | | 0.1 | | |
| 1,380,000 (1) | | | Sirius XM Radio, Inc., 5.000%, 08/01/2027 | | | | | 1,379,048 | | | | | | 0.2 | | |
| 2,050,000 (1) | | | Spanish Broadcasting System, Inc., 9.750%, 03/01/2026 | | | | | 2,062,751 | | | | | | 0.3 | | |
| 3,350,000 | | | Sprint Corp., 7.125%, 06/15/2024 | | | | | 3,597,230 | | | | | | 0.6 | | |
| 940,000 | | | Sprint Corp., 7.625%, 03/01/2026 | | | | | 1,062,021 | | | | | | 0.2 | | |
| 1,875,000 (1) | | | Stagwell Global LLC, 5.625%, 08/15/2029 | | | | | 1,771,313 | | | | | | 0.3 | | |
| 1,000,000 | | | Telecom Italia Capital SA, 6.000%, 09/30/2034 | | | | | 941,920 | | | | | | 0.1 | | |
| 1,150,000 | | | Telecom Italia Capital SA, 6.375%, 11/15/2033 | | | | | 1,101,125 | | | | | | 0.2 | | |
| 725,000 (1)(2) | | | Univision Communications, Inc., 4.500%, 05/01/2029 | | | | | 691,070 | | | | | | 0.1 | | |
| Voya High Yield Bond Fund | as of March 31, 2022 (continued) |
| Principal Amount† | | | Value | | | Percentage of Net Assets | | |||||||||
| CORPORATE BONDS/NOTES: (continued) | | |||||||||||||||
| | | | Communications (continued) | | ||||||||||||
| 3,025,000 (1) | | | Univision Communications, Inc., 6.625%, 06/01/2027 | | | | $ | 3,172,212 | | | | | | 0.5 | | |
| 1,475,000 (1) | | | Urban One, Inc., 7.375%, 02/01/2028 | | | | | 1,482,795 | | | | | | 0.2 | | |
| 1,725,000 (1)(2) | | | ViaSat, Inc., 5.625%, 09/15/2025 | | | | | 1,687,628 | | | | | | 0.3 | | |
| 400,000 (1) | | | ViaSat, Inc., 5.625%, 04/15/2027 | | | | | 394,726 | | | | | | 0.1 | | |
| 775,000 (1)(2) | | | ViaSat, Inc., 6.500%, 07/15/2028 | | | | | 744,980 | | | | | | 0.1 | | |
| 1,525,000 (1) | | | Viavi Solutions, Inc., 3.750%, 10/01/2029 | | | | | 1,433,062 | | | | | | 0.2 | | |
| 2,850,000 (1)(2) | | | Virgin Media Vendor Financing Notes IV DAC, 5.000%, 07/15/2028 | | | | | 2,741,429 | | | | | | 0.4 | | |
| 1,700,000 (1) | | | Vmed O2 UK Financing I PLC, 4.750%, 07/15/2031 | | | | | 1,604,792 | | | | | | 0.2 | | |
| | | | | | | | | 102,039,302 | | | | | | 15.7 | | |
| | | | Consumer, Cyclical: 22.2% | | ||||||||||||
| 1,535,000 (1) | | | 1011778 BC ULC / New Red Finance, Inc., 4.000%, 10/15/2030 | | | | | 1,386,704 | | | | | | 0.2 | | |
| 2,175,000 (1)(2) | | | Academy Ltd., 6.000%, 11/15/2027 | | | | | 2,229,375 | | | | | | 0.3 | | |
| 2,025,000 (1) | | | Adams Homes, Inc., 7.500%, 02/15/2025 | | | | | 2,026,934 | | | | | | 0.3 | | |
| 2,325,000 (1)(2) | | | Adient Global Holdings Ltd., 4.875%, 08/15/2026 | | | | | 2,216,783 | | | | | | 0.3 | | |
| 2,600,000���(1) | | | Affinity Gaming, 6.875%, 12/15/2027 | | | | | 2,533,583 | | | | | | 0.4 | | |
| 525,000 (1)(2) | | | Allison Transmission, Inc., 3.750%, 01/30/2031 | | | | | 477,041 | | | | | | 0.1 | | |
| 1,900,000 (1)(2) | | | Allison Transmission, Inc., 5.875%, 06/01/2029 | | | | | 1,941,059 | | | | | | 0.3 | | |
| 1,144,549 | | | American Airlines 2015-2 Class A Pass Through Trust, 4.000%, 03/22/2029 | | | | | 1,057,530 | | | | | | 0.2 | | |
| 3,500,000 (1)(2) | | | American Airlines Group, Inc., 3.750%, 03/01/2025 | | | | | 3,197,127 | | | | | | 0.5 | | |
| 2,925,000 (1) | | | American Airlines, Inc./ AAdvantage Loyalty IP Ltd., 5.750%, 04/20/2029 | | | | | 2,918,053 | | | | | | 0.4 | | |
| 1,950,000 (1) | | | Arko Corp., 5.125%, 11/15/2029 | | | | | 1,778,098 | | | | | | 0.3 | | |
| 1,075,000 | | | Asbury Automotive Group, Inc., 4.500%, 03/01/2028 | | | | | 1,034,902 | | | | | | 0.2 | | |
| 425,000 (1)(2) | | | Asbury Automotive Group, Inc., 4.625%, 11/15/2029 | | | | | 396,304 | | | | | | 0.1 | | |
| 1,025,000 | | | Asbury Automotive Group, Inc., 4.750%, 03/01/2030 | | | | | 968,676 | | | | | | 0.1 | | |
| Principal Amount† | | | Value | | | Percentage of Net Assets | | |||||||||
| CORPORATE BONDS/NOTES: (continued) | | |||||||||||||||
| | | | Consumer, Cyclical (continued) | | ||||||||||||
| 2,150,000 | | | Bath & Body Works, Inc., 6.750%, 07/01/2036 | | | | $ | 2,193,957 | | | | | | 0.3 | | |
| 308,000��(1) | | | Bath & Body Works, Inc., 9.375%, 07/01/2025 | | | | | 351,921 | | | | | | 0.1 | | |
| 425,000 (1)(3) | | | BCPE Ulysses Intermediate, Inc., 7.750% (PIK Rate 8.500%, Cash Rate 7.750%), 04/01/2027 | | | | | 386,180 | | | | | | 0.1 | | |
| 2,275,000 (1)(2) | | | Caesars Entertainment, Inc., 4.625%, 10/15/2029 | | | | | 2,129,969 | | | | | | 0.3 | | |
| 1,575,000 (1) | | | Caesars Entertainment, Inc., 6.250%, 07/01/2025 | | | | | 1,628,109 | | | | | | 0.2 | | |
| 775,000 (1)(2) | | | Carnival Corp., 6.000%, 05/01/2029 | | | | | 731,344 | | | | | | 0.1 | | |
| 2,350,000 (1)(2) | | | Carnival Corp., 7.625%, 03/01/2026 | | | | | 2,368,095 | | | | | | 0.4 | | |
| 800,000 (1) | | | Carnival Corp., 9.875%, 08/01/2027 | | | | | 885,576 | | | | | | 0.1 | | |
| 1,825,000 (1) | | | CCM Merger, Inc., 6.375%, 05/01/2026 | | | | | 1,845,467 | | | | | | 0.3 | | |
| 1,475,000 (1)(2) | | | Century Communities, Inc., 3.875%, 08/15/2029 | | | | | 1,325,502 | | | | | | 0.2 | | |
| 1,575,000 (1) | | | Cinemark USA, Inc., 8.750%, 05/01/2025 | | | | | 1,649,805 | | | | | | 0.3 | | |
| 1,425,000 (1)(2) | | | CROCS INC COMPANY GUAR 144A 08/31 4.125, 4.125%, 08/15/2031 | | | | | 1,206,711 | | | | | | 0.2 | | |
| 455,000 (2) | | | Delta Air Lines, Inc., 7.375%, 01/15/2026 | | | | | 494,630 | | | | | | 0.1 | | |
| 2,715,000 (1)(2) | | | Fertitta Entertainment LLC / Fertitta Entertainment Finance Co., Inc., 6.750%, 01/15/2030 | | | | | 2,501,153 | | | | | | 0.4 | | |
| 1,450,000 (1)(2) | | | Foot Locker, Inc., 4.000%, 10/01/2029 | | | | | 1,271,592 | | | | | | 0.2 | | |
| 2,165,000 | | | Ford Motor Credit Co. LLC, 2.700%, 08/10/2026 | | | | | 2,016,178 | | | | | | 0.3 | | |
| 300,000 | | | Ford Motor Credit Co. LLC, 3.625%, 06/17/2031 | | | | | 271,503 | | | | | | 0.0 | | |
| 1,570,000 (2) | | | Ford Motor Credit Co. LLC, 4.125%, 08/17/2027 | | | | | 1,536,543 | | | | | | 0.2 | | |
| 1,760,000 | | | Ford Motor Credit Co. LLC, 4.542%, 08/01/2026 | | | | | 1,760,352 | | | | | | 0.3 | | |
| 1,430,000 | | | Ford Motor Credit Co. LLC, 5.113%, 05/03/2029 | | | | | 1,441,011 | | | | | | 0.2 | | |
| 1,850,000 | | | Ford Motor Credit Co. LLC, 5.584%, 03/18/2024 | | | | | 1,904,778 | | | | | | 0.3 | | |
| 1,875,000 (1)(2) | | | Foundation Building Materials, Inc., 6.000%, 03/01/2029 | | | | | 1,691,137 | | | | | | 0.3 | | |
| Voya High Yield Bond Fund | as of March 31, 2022 (continued) |
| Principal Amount† | | | Value | | | Percentage of Net Assets | | |||||||||
| CORPORATE BONDS/NOTES: (continued) | | |||||||||||||||
| | | | Consumer, Cyclical (continued) | | ||||||||||||
| 1,700,000 (1)(2) | | | Gap, Inc./The, 3.875%, 10/01/2031 | | | | $ | 1,484,185 | | | | | | 0.2 | | |
| 1,150,000 (1) | | | Golden Entertainment, Inc., 7.625%, 04/15/2026 | | | | | 1,198,904 | | | | | | 0.2 | | |
| 1,775,000 (1) | | | Installed Building Products, Inc., 5.750%, 02/01/2028 | | | | | 1,733,820 | | | | | | 0.3 | | |
| 2,125,000 (1) | | | Interface, Inc., 5.500%, 12/01/2028 | | | | | 2,067,657 | | | | | | 0.3 | | |
| 1,825,000 (1)(2) | | | LBM Acquisition LLC, 6.250%, 01/15/2029 | | | | | 1,711,677 | | | | | | 0.3 | | |
| 2,150,000 (1)(2) | | | LCM Investments Holdings II LLC, 4.875%, 05/01/2029 | | | | | 2,033,298 | | | | | | 0.3 | | |
| 1,685,000 (1) | | | LGI Homes, Inc, 4.000%, 07/15/2029 | | | | | 1,481,191 | | | | | | 0.2 | | |
| 510,000 (1) | | | Lindblad Expeditions LLC, 6.750%, 02/15/2027 | | | | | 511,918 | | | | | | 0.1 | | |
| 2,075,000 (1) | | | Lions Gate Capital Holdings LLC, 5.500%, 04/15/2029 | | | | | 2,002,437 | | | | | | 0.3 | | |
| 550,000 (2) | | | M/I Homes, Inc., 3.950%, 02/15/2030 | | | | | 484,974 | | | | | | 0.1 | | |
| 1,450,000 | | | M/I Homes, Inc., 4.950%, 02/01/2028 | | | | | 1,369,561 | | | | | | 0.2 | | |
| 680,000 | | | Macy’s Retail Holdings LLC, 4.500%, 12/15/2034 | | | | | 581,046 | | | | | | 0.1 | | |
| 350,000 (1)(2) | | | Macy’s Retail Holdings LLC, 5.875%, 03/15/2030 | | | | | 345,684 | | | | | | 0.1 | | |
| 1,150,000 (1) | | | Macy’s Retail Holdings LLC, 6.125%, 03/15/2032 | | | | | 1,137,154 | | | | | | 0.2 | | |
| 1,000,000 | | | Mattel, Inc., 5.450%, 11/01/2041 | | | | | 1,066,640 | | | | | | 0.2 | | |
| 1,625,000 (1)(2) | | | Melco Resorts Finance Ltd., 5.375%, 12/04/2029 | | | | | 1,385,312 | | | | | | 0.2 | | |
| 750,000 | | | Meritage Homes Corp., 5.125%, 06/06/2027 | | | | | 759,000 | | | | | | 0.1 | | |
| 2,175,000 (1) | | | Meritor, Inc., 4.500%, 12/15/2028 | | | | | 2,184,570 | | | | | | 0.3 | | |
| 500,000 (2) | | | MGM Resorts International, 5.500%, 04/15/2027 | | | | | 505,862 | | | | | | 0.1 | | |
| 475,000 | | | MGM Resorts International, 6.000%, 03/15/2023 | | | | | 486,336 | | | | | | 0.1 | | |
| 1,800,000 (1) | | | Midwest Gaming Borrower LLC / Midwest Gaming Finance Corp., 4.875%, 05/01/2029 | | | | | 1,663,002 | | | | | | 0.3 | | |
| 1,400,000 | | | Murphy Oil USA, Inc., 4.750%, 09/15/2029 | | | | | 1,391,155 | | | | | | 0.2 | | |
| 350,000 | | | Murphy Oil USA, Inc., 5.625%, 05/01/2027 | | | | | 356,260 | | | �� | | | 0.1 | | |
| 1,470,000 (1)(2) | | | NCL Corp. Ltd., 7.750%, 02/15/2029 | | | | | 1,485,619 | | | | | | 0.2 | | |
| Principal Amount† | | | Value | | | Percentage of Net Assets | | |||||||||
| CORPORATE BONDS/NOTES: (continued) | | |||||||||||||||
| | | | Consumer, Cyclical (continued) | | ||||||||||||
| 1,200,000 (1) | | | NCL Finance Ltd., 6.125%, 03/15/2028 | | | | $ | 1,115,250 | | | | | | 0.2 | | |
| 1,450,000 (1)(2) | | | Penn National Gaming, Inc., 4.125%, 07/01/2029 | | | | | 1,299,635 | | | | | | 0.2 | | |
| 1,150,000 (1)(2) | | | Penn National Gaming, Inc., 5.625%, 01/15/2027 | | | | | 1,141,795 | | | | | | 0.2 | | |
| 2,925,000 (1)(2) | | | PetSmart, Inc. / PetSmart Finance Corp., 7.750%, 02/15/2029 | | | | | 3,023,631 | | | | | | 0.5 | | |
| 1,400,000 (1) | | | Picasso Finance Sub, Inc., 6.125%, 06/15/2025 | | | | | 1,425,179 | | | | | | 0.2 | | |
| 2,225,000 (1)(2) | | | Real Hero Merger Sub 2, Inc., 6.250%, 02/01/2029 | | | | | 2,031,670 | | | | | | 0.3 | | |
| 3,825,000 (1)(2) | | | Royal Caribbean Cruises Ltd., 5.375%, 07/15/2027 | | | | | 3,680,625 | | | | | | 0.6 | | |
| 425,000 (1) | | | Royal Caribbean Cruises Ltd., 9.125%, 06/15/2023 | | | | | 443,026 | | | | | | 0.1 | | |
| 975,000 (1) | | | Royal Caribbean Cruises Ltd., 11.500%, 06/01/2025 | | | | | 1,072,422 | | | | | | 0.2 | | |
| 2,000,000 (1)(2) | | | Scientific Games Holdings L.P./Scientific Games US FinCo, Inc., 6.625%, 03/01/2030 | | | | | 1,974,000 | | | | | | 0.3 | | |
| 1,550,000 (1) | | | Scientific Games International, Inc., 7.000%, 05/15/2028 | | | | | 1,609,287 | | | | | | 0.2 | | |
| 675,000 (1) | | | Scientific Games International, Inc., 8.250%, 03/15/2026 | | | | | 702,844 | | | | | | 0.1 | | |
| 625,000 (1) | | | Scientific Games International, Inc., 8.625%, 07/01/2025 | | | | | 658,125 | | | | | | 0.1 | | |
| 1,750,000 (1) | | | Shea Homes L.P. / Shea Homes Funding Corp., 4.750%, 04/01/2029 | | | | | 1,639,750 | | | | | | 0.2 | | |
| 2,150,000 (1) | | | Sizzling Platter LLC / Sizzling Platter Finance Corp., 8.500%, 11/28/2025 | | | | | 1,991,695 | | | | | | 0.3 | | |
| 2,125,000 (1)(2) | | | Sonic Automotive, Inc., 4.625%, 11/15/2029 | | | | | 1,915,167 | | | | | | 0.3 | | |
| 2,550,000 (1) | | | Specialty Building Products Holdings LLC / SBP Finance Corp., 6.375%, 09/30/2026 | | | | | 2,596,793 | | | | | | 0.4 | | |
| 700,000 (1) | | | SRS Distribution, Inc., 6.000%, 12/01/2029 | | | | | 648,882 | | | | | | 0.1 | | |
| 1,700,000 (1) | | | SRS Distribution, Inc., 6.125%, 07/01/2029 | | | | | 1,570,315 | | | | | | 0.2 | | |
| 3,100,000 (1)(2) | | | Staples, Inc., 10.750%, 04/15/2027 | | | | | 2,762,209 | | | | | | 0.4 | | |
| Voya High Yield Bond Fund | as of March 31, 2022 (continued) |
| Principal Amount† | | | Value | | | Percentage of Net Assets | | |||||||||
| CORPORATE BONDS/NOTES: (continued) | | |||||||||||||||
| | | | Consumer, Cyclical (continued) | | ||||||||||||
| 2,375,000 (1)(2) | | | Station Casinos LLC, 4.500%, 02/15/2028 | | | | $ | 2,256,749 | | | | | | 0.3 | | |
| 2,025,000 (1) | | | STL Holding Co. LLC, 7.500%, 02/15/2026 | | | | | 2,045,250 | | | | | | 0.3 | | |
| 1,625,000 (1)(2) | | | Taylor Morrison Communities, Inc., 5.125%, 08/01/2030 | | | | | 1,590,818 | | | | | | 0.2 | | |
| 1,675,000 (1) | | | Tempur Sealy International, Inc., 3.875%, 10/15/2031 | | | | | 1,438,792 | | | | | | 0.2 | | |
| 1,600,000 (2) | | | United Airlines Holdings, Inc., 4.875%, 01/15/2025 | | | | | 1,595,400 | | | | | | 0.2 | | |
| 600,000 (1) | | | United Airlines, Inc., 4.375%, 04/15/2026 | | | | | 591,000 | | | | | | 0.1 | | |
| 1,550,000 (1) | | | United Airlines, Inc., 4.625%, 04/15/2029 | | | | | 1,475,949 | | | | | | 0.2 | | |
| 1,675,000 (1) | | | Univar Solutions USA, Inc./Washington, 5.125%, 12/01/2027 | | | | | 1,676,591 | | | | | | 0.3 | | |
| 2,425,000 (1) | | | Victoria’s Secret & Co., 4.625%, 07/15/2029 | | | | | 2,187,047 | | | | | | 0.3 | | |
| 2,550,000 (1)(2) | | | Viking Cruises Ltd., 5.875%, 09/15/2027 | | | | | 2,329,196 | | | | | | 0.4 | | |
| 840,000 (1) | | | Viking Cruises Ltd., 13.000%, 05/15/2025 | | | | | 934,933 | | | | | | 0.1 | | |
| 2,075,000 (1)(2) | | | Wheel Pros, Inc., 6.500%, 05/15/2029 | | | | | 1,822,224 | | | | | | 0.3 | | |
| 1,700,000 (1)(2) | | | White Cap Buyer LLC, 6.875%, 10/15/2028 | | | | | 1,612,952 | | | | | | 0.2 | | |
| 775,000 (1)(2)(3) | | | White Cap Parent LLC, 8.250% (PIK Rate 9.000%, Cash Rate 8.250%), 03/15/2026 | | | | | 762,356 | | | | | | 0.1 | | |
| 1,375,000 (1) | | | William Carter Co/The, 5.625%, 03/15/2027 | | | | | 1,397,028 | | | | | | 0.2 | | |
| 775,000 (1) | | | Williams Scotsman International, Inc., 4.625%, 08/15/2028 | | | | | 756,509 | | | | | | 0.1 | | |
| 1,975,000 (1)(2) | | | Wolverine World Wide, Inc., 4.000%, 08/15/2029 | | | | | 1,756,368 | | | | | | 0.3 | | |
| | | | | | | | | 144,712,406 | | | | | | 22.2 | | |
| | | | Consumer, Non-cyclical: 14.6% | | ||||||||||||
| 1,825,000 (1) | | | Acadia Healthcare Co., Inc., 5.500%, 07/01/2028 | | | | | 1,836,406 | | | | | | 0.3 | | |
| 1,850,000 (1)(2) | | | ACCO Brands Corp., 4.250%, 03/15/2029 | | | | | 1,711,712 | | | | | | 0.3 | | |
| 2,300,000 (1)(2) | | | ADT Security Corp./The, 4.125%, 08/01/2029 | | | | | 2,139,115 | | | | | | 0.3 | | |
| 1,425,000 (1) | | | Albertsons Cos, Inc. / Safeway, Inc. / New Albertsons L.P. / Albertsons LLC, 3.500%, 03/15/2029 | | | | | 1,287,772 | | | | | | 0.2 | | |
| Principal Amount† | | | Value | | | Percentage of Net Assets | | |||||||||
| CORPORATE BONDS/NOTES: (continued) | | |||||||||||||||
| | | | Consumer, Non-cyclical (continued) | | ||||||||||||
| 675,000 (1)(2) | | | Albertsons Cos, Inc. / Safeway, Inc. / New Albertsons L.P. / Albertsons LLC, 4.875%, 02/15/2030 | | | | $ | 658,547 | | | | | | 0.1 | | |
| 1,600,000 (1)(2) | | | Albertsons Cos, Inc. / Safeway, Inc. / New Albertsons L.P. / Albertsons LLC, 5.875%, 02/15/2028 | | | | | 1,597,520 | | | | | | 0.2 | | |
| 900,000 (1)(2) | | | Allied Universal Holdco LLC / Allied Universal Finance Corp., 6.000%, 06/01/2029 | | | | | 795,150 | | | | | | 0.1 | | |
| 900,000 (1) | | | Allied Universal Holdco LLC / Allied Universal Finance Corp., 6.625%, 07/15/2026 | | | | | 911,880 | | | | | | 0.1 | | |
| 2,525,000 (1)(2) | | | Allied Universal Holdco LLC / Allied Universal Finance Corp., 9.750%, 07/15/2027 | | | | | 2,612,870 | | | | | | 0.4 | | |
| 2,150,000 (1) | | | Alta Equipment Group, Inc., 5.625%, 04/15/2026 | | | | | 2,046,983 | | | | | | 0.3 | | |
| 1,500,000 (1) | | | AMN Healthcare, Inc., 4.625%, 10/01/2027 | | | | | 1,461,307 | | | | | | 0.2 | | |
| 1,025,000 (1) | | | APi Escrow Corp., 4.750%, 10/15/2029 | | | | | 953,906 | | | | | | 0.1 | | |
| 700,000 (1) | | | APi Group DE, Inc., 4.125%, 07/15/2029 | | | | | 646,415 | | | | | | 0.1 | | |
| 2,625,000 (1)(2) | | | Bausch Health Americas, Inc., 8.500%, 01/31/2027 | | | | | 2,620,538 | | | | | | 0.4 | | |
| 525,000 (1) | | | Bausch Health Cos, Inc., 4.875%, 06/01/2028 | | | | | 503,399 | | | | | | 0.1 | | |
| 1,975,000 (1)(2) | | | Bausch Health Cos, Inc., 5.250%, 01/30/2030 | | | | | 1,554,611 | | | | | | 0.2 | | |
| 1,200,000 (1) | | | Bausch Health Cos, Inc., 7.000%, 01/15/2028 | | | | | 1,076,250 | | | | | | 0.2 | | |
| 1,625,000 (1) | | | BellRing Brands, Inc., 7.000%, 03/15/2030 | | | | | 1,661,562 | | | | | | 0.3 | | |
| 900,000 (1)(2) | | | Catalent Pharma Solutions, Inc., 5.000%, 07/15/2027 | | | | | 911,637 | | | | | | 0.1 | | |
| 575,000 | | | Centene Corp., 2.625%, 08/01/2031 | | | | | 512,681 | | | | | | 0.1 | | |
| 2,130,000 | | | Centene Corp., 4.625%, 12/15/2029 | | | | | 2,150,959 | | | | | | 0.3 | | |
| 1,975,000 (1) | | | Cheplapharm Arzneimittel GmbH, 5.500%, 01/15/2028 | | | | | 1,914,654 | | | | | | 0.3 | | |
| 525,000 (1) | | | Chobani LLC / Chobani Finance Corp., Inc., 4.625%, 11/15/2028 | | | | | 485,292 | | | | | | 0.1 | | |
| 1,550,000 (1)(2) | | | Chobani LLC / Chobani Finance Corp., Inc., 7.500%, 04/15/2025 | | | | | 1,501,113 | | | | | | 0.2 | | |
| Voya High Yield Bond Fund | as of March 31, 2022 (continued) |
| Principal Amount† | | | Value | | | Percentage of Net Assets | | |||||||||
| CORPORATE BONDS/NOTES: (continued) | | |||||||||||||||
| | | | Consumer, Non-cyclical (continued) | | ||||||||||||
| 775,000 (1) | | | CHS/Community Health Systems, Inc., 4.750%, 02/15/2031 | | | | $ | 733,452 | | | | | | 0.1 | | |
| 500,000 (1)(2) | | | CHS/Community Health Systems, Inc., 5.250%, 05/15/2030 | | | | | 480,625 | | | | | | 0.1 | | |
| 1,150,000 (1) | | | CHS/Community Health Systems, Inc., 5.625%, 03/15/2027 | | | | | 1,172,666 | | | | | | 0.2 | | |
| 2,525,000 (1)(2) | | | CHS/Community Health Systems, Inc., 6.875%, 04/15/2029 | | | | | 2,484,297 | | | | | | 0.4 | | |
| 2,340,000 (1) | | | CoreLogic, Inc., 4.500%, 05/01/2028 | | | | | 2,211,078 | | | | | | 0.3 | | |
| 2,035,000 (1) | | | CPI Acquisition, Inc., 8.625%, 03/15/2026 | | | | | 1,983,026 | | | | | | 0.3 | | |
| 625,000 (1) | | | DaVita, Inc., 3.750%, 02/15/2031 | | | | | 547,641 | | | | | | 0.1 | | |
| 1,200,000 (1)(2) | | | DaVita, Inc., 4.625%, 06/01/2030 | | | | | 1,122,240 | | | | | | 0.2 | | |
| 429,000 (1) | | | Endo Dac / Endo Finance LLC / Endo Finco, Inc., 6.000%, 06/30/2028 | | | | | 243,994 | | | | | | 0.0 | | |
| 377,000 (1)(2) | | | Endo Dac / Endo Finance LLC / Endo Finco, Inc., 9.500%, 07/31/2027 | | | | | 331,194 | | | | | | 0.1 | | |
| 1,425,000 (1) | | | Graham Holdings Co., 5.750%, 06/01/2026 | | | | | 1,466,225 | | | | | | 0.2 | | |
| 3,070,000 | | | HCA, Inc., 5.375%, 02/01/2025 | | | | | 3,198,157 | | | | | | 0.5 | | |
| 680,000 | | | HCA, Inc., 5.625%, 09/01/2028 | | | | | 736,260 | | | | | | 0.1 | | |
| 1,125,000 (1)(2) | | | Jazz Securities DAC, 4.375%, 01/15/2029 | | | | | 1,091,357 | | | | | | 0.2 | | |
| 1,957,000 (1) | | | KeHE Distributors LLC / KeHE Finance Corp., 8.625%, 10/15/2026 | | | | | 2,080,614 | | | | | | 0.3 | | |
| 1,175,000 (1) | | | Legacy LifePoint Health LLC, 4.375%, 02/15/2027 | | | | | 1,137,635 | | | | | | 0.2 | | |
| 650,000 (1)(2) | | | LifePoint Health, Inc., 5.375%, 01/15/2029 | | | | | 615,477 | | | | | | 0.1 | | |
| 1,500,000 (1) | | | Mozart Debt Merger Sub, Inc., 3.875%, 04/01/2029 | | | | | 1,389,412 | | | | | | 0.2 | | |
| 1,550,000 (1)(2) | | | Mozart Debt Merger Sub, Inc., 5.250%, 10/01/2029 | | | | | 1,442,973 | | | | | | 0.2 | | |
| 1,425,000 (1)(2) | | | MPH Acquisition Holdings LLC, 5.750%, 11/01/2028 | | | | | 1,289,326 | | | | | | 0.2 | | |
| 2,000,000 (1) | | | NESCO Holdings II, Inc., 5.500%, 04/15/2029 | | | | | 1,967,480 | | | | | | 0.3 | | |
| Principal Amount† | | | Value | | | Percentage of Net Assets | | |||||||||
| CORPORATE BONDS/NOTES: (continued) | | |||||||||||||||
| | | | Consumer, Non-cyclical (continued) | | ||||||||||||
| 1,450,000 | | | New Albertsons L.P., 7.450%, 08/01/2029 | | | | $ | 1,552,921 | | | | | | 0.2 | | |
| 1,050,000 (1)(2) | | | Nielsen Finance LLC / Nielsen Finance Co., 4.750%, 07/15/2031 | | | | | 1,051,013 | | | | | | 0.2 | | |
| 1,600,000 (1) | | | Nielsen Finance LLC / Nielsen Finance Co., 5.875%, 10/01/2030 | | | | | 1,605,672 | | | | | | 0.3 | | |
| 1,850,000 (1)(2) | | | Organon & Co. / Organon Foreign Debt Co-Issuer BV, 5.125%, 04/30/2031 | | | | | 1,787,748 | | | | | | 0.3 | | |
| 900,000 (1) | | | Owens & Minor, Inc., 6.625%, 04/01/2030 | | | | | 927,396 | | | | | | 0.1 | | |
| 1,153,000 (1)(2) | | | Par Pharmaceutical, Inc., 7.500%, 04/01/2027 | | | | | 1,077,847 | | | | | | 0.2 | | |
| 1,825,000 (1)(2) | | | PECF USS Intermediate Holding III Corp., 8.000%, 11/15/2029 | | | | | 1,764,684 | | | | | | 0.3 | | |
| 1,025,000 (1) | | | Post Holdings, Inc., 4.625%, 04/15/2030 | | | | | 924,653 | | | | | | 0.1 | | |
| 2,075,000 (1)(2) | | | Post Holdings, Inc., 5.625%, 01/15/2028 | | | | | 2,040,119 | | | | | | 0.3 | | |
| 2,250,000 (1)(2) | | | Primo Water Holdings, Inc., 4.375%, 04/30/2029 | | | | | 2,039,389 | | | | | | 0.3 | | |
| 2,300,000 (1)(2) | | | Select Medical Corp., 6.250%, 08/15/2026 | | | | | 2,383,651 | | | | | | 0.4 | | |
| 2,325,000 (1) | | | Simmons Foods, Inc./ Simmons Prepared Foods, Inc./Simmons Pet Food, Inc./Simmons Feed, 4.625%, 03/01/2029 | | | | | 2,182,710 | | | | | | 0.3 | | |
| 825,000 (1)(2) | | | Spectrum Brands, Inc., 3.875%, 03/15/2031 | | | | | 729,259 | | | | | | 0.1 | | |
| 900,000 (1) | | | Spectrum Brands, Inc., 5.500%, 07/15/2030 | | | | | 865,593 | | | | | | 0.1 | | |
| 890,000 (1) | | | Tenet Healthcare Corp., 4.250%, 06/01/2029 | | | | | 854,453 | | | | | | 0.1 | | |
| 2,700,000 (1)(2) | | | Tenet Healthcare Corp., 6.125%, 10/01/2028 | | | | | 2,746,859 | | | | | | 0.4 | | |
| 2,165,000 | | | Tenet Healthcare Corp., 6.750%, 06/15/2023 | | | | | 2,257,489 | | | | | | 0.4 | | |
| 2,005,000 (1)(2) | | | Triton Water Holdings, Inc., 6.250%, 04/01/2029 | | | | | 1,713,593 | | | | | | 0.3 | | |
| 2,075,000 (1)(2) | | | United Natural Foods, Inc., 6.750%, 10/15/2028 | | | | | 2,129,324 | | | | | | 0.3 | | |
| 455,000 | | | United Rentals North America, Inc., 3.750%, 01/15/2032 | | | | | 425,086 | | | | | | 0.1 | | |
| Voya High Yield Bond Fund | as of March 31, 2022 (continued) |
| Principal Amount† | | | Value | | | Percentage of Net Assets | | |||||||||
| CORPORATE BONDS/NOTES: (continued) | | |||||||||||||||
| | | | Consumer, Non-cyclical (continued) | | ||||||||||||
| 1,010,000 | | | United Rentals North America, Inc., 4.875%, 01/15/2028 | | | | $ | 1,027,069 | | | | | | 0.2 | | |
| 315,000 | | | United Rentals North America, Inc., 5.250%, 01/15/2030 | | | | | 325,420 | | | | | | 0.1 | | |
| 1,250,000 (1) | | | Vizient, Inc., 6.250%, 05/15/2027 | | | | | 1,288,969 | | | | | | 0.2 | | |
| | | | | | | | | 94,978,325 | | | | | | 14.6 | | |
| | | | Energy: 15.1% | | ||||||||||||
| 2,685,000 (1)(2) | | | Aethon United BR L.P. / Aethon United Finance Corp., 8.250%, 02/15/2026 | | | | | 2,790,829 | | | | | | 0.4 | | |
| 1,050,000 (1) | | | Antero Midstream Partners L.P. / Antero Midstream Finance Corp., 5.375%, 06/15/2029 | | | | | 1,050,766 | | | | | | 0.2 | | |
| 1,350,000 (1) | | | Antero Midstream Partners L.P. / Antero Midstream Finance Corp., 5.750%, 03/01/2027 | | | | | 1,377,027 | | | | | | 0.2 | | |
| 1,700,000 (1)(2) | | | Antero Resources Corp., 5.375%, 03/01/2030 | | | | | 1,738,692 | | | | | | 0.3 | | |
| 450,000 (1)(2) | | | Antero Resources Corp., 7.625%, 02/01/2029 | | | | | 487,289 | | | | | | 0.1 | | |
| 1,125,000 | | | Apache Corp., 5.100%, 09/01/2040 | | | | | 1,135,671 | | | | | | 0.2 | | |
| 2,150,000 (1) | | | Archrock Partners L.P. / Archrock Partners Finance Corp., 6.250%, 04/01/2028 | | | | | 2,123,125 | | | | | | 0.3 | | |
| 775,000 (1) | | | Archrock Partners L.P. / Archrock Partners Finance Corp., 6.875%, 04/01/2027 | | | | | 784,618 | | | | | | 0.1 | | |
| 1,900,000 (1) | | | Atlantica Sustainable Infrastructure PLC, 4.125%, 06/15/2028 | | | | | 1,834,792 | | | | | | 0.3 | | |
| 954,000 (1) | | | Baytex Energy Corp., 5.625%, 06/01/2024 | | | | | 955,736 | | | | | | 0.1 | | |
| 1,580,000 (1) | | | Baytex Energy Corp., 8.750%, 04/01/2027 | | | | | 1,696,612 | | | | | | 0.3 | | |
| 1,625,000 (1) | | | Blue Racer Midstream LLC / Blue Racer Finance Corp., 6.625%, 07/15/2026 | | | | | 1,652,576 | | | | | | 0.3 | | |
| 775,000 (1) | | | Blue Racer Midstream LLC / Blue Racer Finance Corp., 7.625%, 12/15/2025 | | | | | 811,816 | | | | | | 0.1 | | |
| 1,695,000 | | | Callon Petroleum Co., 6.125%, 10/01/2024 | | | | | 1,688,890 | | | | | | 0.3 | | |
| 1,600,000 | | | Callon Petroleum Co., 6.375%, 07/01/2026 | | | | | 1,592,952 | | | | | | 0.2 | | |
| Principal Amount† | | | Value | | | Percentage of Net Assets | | |||||||||
| CORPORATE BONDS/NOTES: (continued) | | |||||||||||||||
| | | | Energy (continued) | | ||||||||||||
| 2,225,000 (1)(2) | | | Chesapeake Energy Corp., 6.750%, 04/15/2029 | | | | $ | 2,359,857 | | | | | | 0.4 | | |
| 750,000 (1) | | | CNX Midstream Partners L.P., 4.750%, 04/15/2030 | | | | | 703,200 | | | | | | 0.1 | | |
| 1,865,000 (1)(2) | | | Colgate Energy Partners III LLC, 5.875%, 07/01/2029 | | | | | 1,926,023 | | | | | | 0.3 | | |
| 2,875,000 (1) | | | Crescent Energy Finance LLC, 7.250%, 05/01/2026 | | | | | 2,893,055 | | | | | | 0.4 | | |
| 2,475,000 (1)(2) | | | Crestwood Midstream Partners L.P. / Crestwood Midstream Finance Corp., 6.000%, 02/01/2029 | | | | | 2,470,867 | | | | | | 0.4 | | |
| 1,075,000 | | | DCP Midstream Operating L.P., 5.125%, 05/15/2029 | | | | | 1,107,782 | | | | | | 0.2 | | |
| 650,000 | | | DCP Midstream Operating L.P., 5.375%, 07/15/2025 | | | | | 671,131 | | | | | | 0.1 | | |
| 200,000 | | | DCP Midstream Operating L.P., 5.600%, 04/01/2044 | | | | | 210,576 | | | | | | 0.0 | | |
| 1,550,000 | | | DCP Midstream Operating L.P., 5.625%, 07/15/2027 | | | | | 1,628,143 | | | | | | 0.2 | | |
| 1,390,000 | | | Delek Logistics Partners L.P. / Delek Logistics Finance Corp., 6.750%, 05/15/2025 | | | | | 1,392,432 | | | | | | 0.2 | | |
| 1,295,000 (1) | | | Delek Logistics Partners L.P. / Delek Logistics Finance Corp., 7.125%, 06/01/2028 | | | | | 1,271,794 | | | | | | 0.2 | | |
| 750,000 (1) | | | DT Midstream, Inc., 4.125%, 06/15/2029 | | | | | 720,217 | | | | | | 0.1 | | |
| 1,475,000 (1)(2) | | | DT Midstream, Inc., 4.375%, 06/15/2031 | | | | | 1,414,835 | | | | | | 0.2 | | |
| 2,025,000 (1) | | | Encino Acquisition Partners Holdings LLC, 8.500%, 05/01/2028 | | | | | 2,087,562 | | | | | | 0.3 | | |
| 2,900,000 (2) | | | EnLink Midstream LLC, 5.375%, 06/01/2029 | | | | | 2,897,738 | | | | | | 0.4 | | |
| 1,875,000 (1) | | | Enviva Partners L.P. / Enviva Partners Finance Corp., 6.500%, 01/15/2026 | | | | | 1,930,866 | | | | | | 0.3 | | |
| 650,000 | | | EQM Midstream Partners L.P., 5.500%, 07/15/2028 | | | | | 653,698 | | | | | | 0.1 | | |
| 775,000 (1) | | | EQM Midstream Partners L.P., 6.000%, 07/01/2025 | | | | | 791,817 | | | | | | 0.1 | | |
| 1,200,000 (1) | | | Hess Midstream Operations L.P., 4.250%, 02/15/2030 | | | | | 1,134,360 | | | | | | 0.2 | | |
| 1,075,000 (1)(2) | | | Hess Midstream Operations L.P., 5.125%, 06/15/2028 | | | | | 1,076,397 | | | | | | 0.2 | | |
| 975,000 (1) | | | Hilcorp Energy I L.P. / Hilcorp Finance Co., 5.750%, 02/01/2029 | | | | | 977,535 | | | | | | 0.2 | | |
| Voya High Yield Bond Fund | as of March 31, 2022 (continued) |
| Principal Amount† | | | Value | | | Percentage of Net Assets | | |||||||||
| CORPORATE BONDS/NOTES: (continued) | | |||||||||||||||
| | | | Energy (continued) | | ||||||||||||
| 1,125,000 (1) | | | Hilcorp Energy I L.P. / Hilcorp Finance Co., 6.000%, 02/01/2031 | | | | $ | 1,132,031 | | | | | | 0.2 | | |
| 2,125,000 (1) | | | Howard Midstream Energy Partners LLC, 6.750%, 01/15/2027 | | | | | 2,084,827 | | | | | | 0.3 | | |
| 3,000,000 (1) | | | Moss Creek Resources Holdings, Inc., 7.500%, 01/15/2026 | | | | | 2,757,090 | | | | | | 0.4 | | |
| 1,350,000 (2) | | | Murphy Oil Corp., 5.875%, 12/01/2027 | | | | | 1,375,988 | | | | | | 0.2 | | |
| 1,800,000 | | | Murphy Oil Corp., 6.375%, 07/15/2028 | | | | | 1,875,087 | | | | | | 0.3 | | |
| 1,775,000 (1)(2) | | | Nabors Industries Ltd., 7.500%, 01/15/2028 | | | | | 1,734,264 | | | | | | 0.3 | | |
| 900,000 | | | Nabors Industries, Inc., 5.100%, 09/15/2023 | | | | | 921,816 | | | | | | 0.1 | | |
| 750,000 (1) | | | Nabors Industries, Inc., 7.375%, 05/15/2027 | | | | | 780,330 | | | | | | 0.1 | | |
| 1,925,000 (1) | | | Oasis Petroleum, Inc., 6.375%, 06/01/2026 | | | | | 1,975,599 | | | | | | 0.3 | | |
| 3,400,000 | | | Occidental Petroleum Corp., 4.200%, 03/15/2048 | | | | | 3,185,086 | | | | | | 0.5 | | |
| 2,450,000 | | | Occidental Petroleum Corp., 5.500%, 12/01/2025 | | | | | 2,582,055 | | | | | | 0.4 | | |
| 3,375,000 (2) | | | Occidental Petroleum Corp., 6.625%, 09/01/2030 | | | | | 3,877,031 | | | | | | 0.6 | | |
| 1,675,000 | | | Occidental Petroleum Corp., 8.500%, 07/15/2027 | | | | | 1,984,614 | | | | | | 0.3 | | |
| 565,000 (2) | | | Southwestern Energy Co., 4.750%, 02/01/2032 | | | | | 565,082 | | | | | | 0.1 | | |
| 2,175,000 | | | Southwestern Energy Co., 5.375%, 02/01/2029 | | | | | 2,205,167 | | | | | | 0.3 | | |
| 525,000 (2) | | | Southwestern Energy Co., 5.375%, 03/15/2030 | | | | | 534,272 | | | | | | 0.1 | | |
| 2,000,000 (1) | | | Strathcona Resources Ltd., 6.875%, 08/01/2026 | | | | | 2,017,820 | | | | | | 0.3 | | |
| 1,850,000 (1) | | | SunCoke Energy, Inc., 4.875%, 06/30/2029 | | | | | 1,746,400 | | | | | | 0.3 | | |
| 625,000 | | | Sunoco L.P. / Sunoco Finance Corp., 4.500%, 05/15/2029 | | | | | 590,438 | | | | | | 0.1 | | |
| 1,575,000 (1) | | | Sunoco L.P. / Sunoco Finance Corp., 4.500%, 04/30/2030 | | | | | 1,453,410 | | | | | | 0.2 | | |
| 825,000 (1) | | | Tallgrass Energy Partners L.P. / Tallgrass Energy Finance Corp., 5.500%, 01/15/2028 | | | | | 799,817 | | | | | | 0.1 | | |
| Principal Amount† | | | Value | | | Percentage of Net Assets | | |||||||||
| CORPORATE BONDS/NOTES: (continued) | | |||||||||||||||
| | | | Energy (continued) | | ||||||||||||
| 1,075,000 (1) | | | Tallgrass Energy Partners L.P. / Tallgrass Energy Finance Corp., 7.500%, 10/01/2025 | | | | $ | 1,133,932 | | | | | | 0.2 | | |
| 1,593,750 (1) | | | Transocean Poseidon Ltd., 6.875%, 02/01/2027 | | | | | 1,580,355 | | | | | | 0.2 | | |
| 2,825,000 (1) | | | Transocean, Inc., 7.500%, 01/15/2026 | | | | | 2,457,750 | | | | | | 0.4 | | |
| 2,475,000 (1) | | | Weatherford International Ltd., 8.625%, 04/30/2030 | | | | | 2,515,875 | | | | | | 0.4 | | |
| 2,325,000 | | | Western Midstream Operating L.P., 5.450%, 04/01/2044 | | | | | 2,361,921 | | | | | | 0.4 | | |
| | | | | | | | | 98,269,333 | | | | | | 15.1 | | |
| | | | Financial: 7.4% | | ||||||||||||
| 1,225,000 (2) | | | Ally Financial, Inc., 5.750%, 11/20/2025 | | | | | 1,289,249 | | | | | | 0.2 | | |
| 1,800,000 (1) | | | AmWINS Group, Inc., 4.875%, 06/30/2029 | | | | | 1,730,340 | | | | | | 0.3 | | |
| 1,750,000 (1) | | | Aretec Escrow Issuer, Inc., 7.500%, 04/01/2029 | | | | | 1,685,136 | | | | | | 0.3 | | |
| 2,100,000 (1)(2) | | | AssuredPartners, Inc., 5.625%, 01/15/2029 | | | | | 1,936,882 | | | | | | 0.3 | | |
| 2,200,000 (1) | | | BroadStreet Partners, Inc., 5.875%, 04/15/2029 | | | | | 2,056,010 | | | | | | 0.3 | | |
| 2,200,000 (1) | | | Cushman & Wakefield US Borrower LLC, 6.750%, 05/15/2028 | | | | | 2,302,652 | | | | | | 0.4 | | |
| 800,000 (1)(2) | | | Freedom Mortgage Corp., 6.625%, 01/15/2027 | | | | | 743,000 | | | | | | 0.1 | | |
| 1,000,000 (1)(2) | | | Freedom Mortgage Corp., 7.625%, 05/01/2026 | | | | | 956,560 | | | | | | 0.1 | | |
| 1,475,000 (1) | | | Freedom Mortgage Corp., 8.250%, 04/15/2025 | | | | | 1,472,773 | | | | | | 0.2 | | |
| 2,050,000 (1) | | | Ladder Capital Finance Holdings LLLP / Ladder Capital Finance Corp., 4.750%, 06/15/2029 | | | | | 1,936,041 | | | | | | 0.3 | | |
| 775,000 (1) | | | LPL Holdings, Inc., 4.000%, 03/15/2029 | | | | | 736,536 | | | | | | 0.1 | | |
| 450,000 (1) | | | LPL Holdings, Inc., 4.375%, 05/15/2031 | | | | | 436,045 | | | | | | 0.1 | | |
| 1,475,000 (1) | | | LPL Holdings, Inc., 4.625%, 11/15/2027 | | | | | 1,451,960 | | | | | | 0.2 | | |
| 950,000 (1) | | | MGM Growth Properties Operating Partnership L.P. / MGP Finance Co-Issuer, Inc., 4.625%, 06/15/2025 | | | | | 958,517 | | | | | | 0.1 | | |
| Voya High Yield Bond Fund | as of March 31, 2022 (continued) |
| Principal Amount† | | | Value | | | Percentage of Net Assets | | |||||||||
| CORPORATE BONDS/NOTES: (continued) | | |||||||||||||||
| | | | Financial (continued) | | ||||||||||||
| 1,300,000 | | | MGM Growth Properties Operating Partnership L.P. / MGP Finance Co-Issuer, Inc., 5.625%, 05/01/2024 | | | | $ | 1,340,430 | | | | | | 0.2 | | |
| 875,000 (1) | | | Midcap Financial Issuer Trust, 5.625%, 01/15/2030 | | | | | 774,878 | | | | | | 0.1 | | |
| 1,550,000 (1) | | | Midcap Financial Issuer Trust, 6.500%, 05/01/2028 | | | | | 1,459,961 | | | | | | 0.2 | | |
| 1,465,000 | | | MPT Operating Partnership L.P. / MPT Finance Corp., 5.000%, 10/15/2027 | | | | | 1,491,370 | | | | | | 0.2 | | |
| 2,050,000 (1)(2) | | | Nationstar Mortgage Holdings, Inc., 5.125%, 12/15/2030 | | | | | 1,900,063 | | | | | | 0.3 | | |
| 2,125,000 (2) | | | Navient Corp., 4.875%, 03/15/2028 | | | | | 1,956,992 | | | | | | 0.3 | | |
| 1,150,000 (2) | | | Navient Corp., 5.000%, 03/15/2027 | | | | | 1,097,451 | | | | | | 0.2 | | |
| 400,000 | | | Navient Corp., 7.250%, 09/25/2023 | | | | | 416,042 | | | | | | 0.1 | | |
| 1,000,000 (2) | | | OneMain Finance Corp., 4.000%, 09/15/2030 | | | | | 883,890 | | | | | | 0.1 | | |
| 2,575,000 (2) | | | OneMain Finance Corp., 5.375%, 11/15/2029 | | | | | 2,506,145 | | | | | | 0.4 | | |
| 1,800,000 (1) | | | PRA Group, Inc., 5.000%, 10/01/2029 | | | | | 1,709,307 | | | | | | 0.3 | | |
| 800,000 (1) | | | Realogy Group LLC / Realogy Co-Issuer Corp., 5.250%, 04/15/2030 | | | | | 737,000 | | | | | | 0.1 | | |
| 2,085,000 (1)(2) | | | Realogy Group LLC / Realogy Co-Issuer Corp., 5.750%, 01/15/2029 | | | | | 1,969,157 | | | | | | 0.3 | | |
| 1,700,000 (1)(2) | | | RLJ Lodging Trust L.P., 4.000%, 09/15/2029 | | | | | 1,574,506 | | | | | | 0.2 | | |
| 850,000 (1)(2) | | | Starwood Property Trust, Inc., 4.375%, 01/15/2027 | | | | | 825,643 | | | | | | 0.1 | | |
| 2,525,000 (1)(2) | | | United Wholesale Mortgage LLC, 5.750%, 06/15/2027 | | | | | 2,348,250 | | | | | | 0.4 | | |
| 875,000 (1) | | | Uniti Group L.P. / Uniti Fiber Holdings, Inc. / CSL Capital LLC, 6.000%, 01/15/2030 | | | | | 789,285 | | | | | | 0.1 | | |
| 1,425,000 (1)(2) | | | Uniti Group L.P. / Uniti Group Finance, Inc. / CSL Capital LLC, 6.500%, 02/15/2029 | | | | | 1,330,466 | | | | | | 0.2 | | |
| 1,750,000 (1)(2) | | | VistaJet Malta Finance PLC / XO Management Holding, Inc., 6.375%, 02/01/2030 | | | | | 1,648,850 | | | | | | 0.3 | | |
| 1,775,000 (1) | | | XHR L.P., 4.875%, 06/01/2029 | | | | | 1,726,436 | | | | | | 0.3 | | |
| | | | | | | | | 48,177,823 | | | | | | 7.4 | | |
| Principal Amount† | | | Value | | | Percentage of Net Assets | | |||||||||
| CORPORATE BONDS/NOTES: (continued) | | |||||||||||||||
| | | | Industrial: 8.8% | | ||||||||||||
| 2,400,000 (1)(3) | | | ARD Finance SA, 6.500% (PIK Rate 7.250%, Cash Rate 6.500%), 06/30/2027 | | | | $ | 2,198,856 | | | | | | 0.3 | | |
| 2,125,000 (1) | | | Brundage-Bone Concrete Pumping Holdings, Inc., 6.000%, 02/01/2026 | | | | | 2,048,149 | | | | | | 0.3 | | |
| 1,675,000 (1) | | | Builders FirstSource, Inc., 5.000%, 03/01/2030 | | | | | 1,650,712 | | | | | | 0.3 | | |
| 2,350,000 (1) | | | Cargo Aircraft Management, Inc., 4.750%, 02/01/2028 | | | | | 2,298,241 | | | | | | 0.3 | | |
| 2,550,000 (1) | | | Cascades, Inc./Cascades USA, Inc., 5.375%, 01/15/2028 | | | | | 2,550,319 | | | | | | 0.4 | | |
| 1,370,000 (1) | | | Clark Equipment Co., 5.875%, 06/01/2025 | | | | | 1,387,543 | | | | | | 0.2 | | |
| 2,125,000 (1)(2) | | | Fortress Transportation and Infrastructure Investors LLC, 5.500%, 05/01/2028 | | | | | 1,934,791 | | | | | | 0.3 | | |
| 2,075,000 (1)(2) | | | GFL Environmental, Inc., 4.000%, 08/01/2028 | | | | | 1,911,231 | | | | | | 0.3 | | |
| 1,050,000 (1)(2) | | | GFL Environmental, Inc., 4.375%, 08/15/2029 | | | | | 971,875 | | | | | | 0.1 | | |
| 1,450,000 (1) | | | Global Infrastructure Solutions, Inc., 5.625%, 06/01/2029 | | | | | 1,399,873 | | | | | | 0.2 | | |
| 1,825,000 (1) | | | GrafTech Finance, Inc., 4.625%, 12/15/2028 | | | | | 1,700,599 | | | | | | 0.3 | | |
| 1,925,000 (1)(2) | | | Graham Packaging Co., Inc., 7.125%, 08/15/2028 | | | | | 1,750,691 | | | | | | 0.3 | | |
| 1,725,000 (1)(2) | | | Granite US Holdings Corp., 11.000%, 10/01/2027 | | | | | 1,821,936 | | | | | | 0.3 | | |
| 2,050,000 (1) | | | II-VI, Inc., 5.000%, 12/15/2029 | | | | | 2,006,796 | | | | | | 0.3 | | |
| 2,475,000 (1) | | | Imola Merger Corp., 4.750%, 05/15/2029 | | | | | 2,386,643 | | | | | | 0.4 | | |
| 1,025,000 (1)(3) | | | Intelligent Packaging Holdco Issuer L.P., 9.000% (PIK Rate 9.750%, Cash Rate 9.000%), 01/15/2026 | | | | | 1,031,750 | | | | | | 0.2 | | |
| 2,075,000 (1) | | | Intelligent Packaging Ltd. Finco, Inc. / Intelligent Packaging Ltd. Co-Issuer LLC, 6.000%, 09/15/2028 | | | | | 2,049,063 | | | | | | 0.3 | | |
| 1,450,000 (1) | | | Koppers, Inc., 6.000%, 02/15/2025 | | | | | 1,422,762 | | | | | | 0.2 | | |
| 950,000 (1) | | | Maxar Space Robotics LLC, 9.750%, 12/31/2023 | | | | | 1,012,847 | | | | | | 0.2 | | |
| 2,300,000 (1) | | | New Enterprise Stone & Lime Co., Inc., 9.750%, 07/15/2028 | | | | | 2,322,655 | | | | | | 0.4 | | |
| Voya High Yield Bond Fund | as of March 31, 2022 (continued) |
| Principal Amount† | | | Value | | | Percentage of Net Assets | | |||||||||
| CORPORATE BONDS/NOTES: (continued) | | |||||||||||||||
| | | | Industrial (continued) | | ||||||||||||
| 2,300,000 (1)(2) | | | PGT Innovations, Inc., 4.375%, 10/01/2029 | | | | $ | 2,149,051 | | | | | | 0.3 | | |
| 1,575,000 (1)(2) | | | Roller Bearing Co. of America, Inc., 4.375%, 10/15/2029 | | | | | 1,470,656 | | | | | | 0.2 | | |
| 1,575,000 (1) | | | Rolls-Royce PLC, 5.750%, 10/15/2027 | | | | | 1,619,643 | | | | | | 0.2 | | |
| 1,825,000 (1)(2) | | | Sensata Technologies, Inc., 3.750%, 02/15/2031 | | | | | 1,690,963 | | | | | | 0.3 | | |
| 1,975,000 (1) | | | Standard Industries, Inc./NJ, 3.375%, 01/15/2031 | | | | | 1,731,097 | | | | | | 0.3 | | |
| 1,075,000 (1) | | | Standard Industries, Inc./NJ, 4.375%, 07/15/2030 | | | | | 985,990 | | | | | | 0.1 | | |
| 1,850,000 (1) | | | Stevens Holding Co., Inc., 6.125%, 10/01/2026 | | | | | 1,912,789 | | | | | | 0.3 | | |
| 1,300,000 (1) | | | Summit Materials LLC / Summit Materials Finance Corp., 5.250%, 01/15/2029 | | | | | 1,285,141 | | | | | | 0.2 | | |
| 1,225,000 (1) | | | Summit Materials LLC / Summit Materials Finance Corp., 6.500%, 03/15/2027 | | | | | 1,247,957 | | | | | | 0.2 | | |
| 455,000 (1)(2) | | | TK Elevator Holdco GmbH, 7.625%, 07/15/2028 | | | | | 451,913 | | | | | | 0.1 | | |
| 1,250,000 (2) | | | TransDigm, Inc., 4.625%, 01/15/2029 | | | | | 1,170,294 | | | | | | 0.2 | | |
| 1,075,000 | | | TransDigm, Inc., 5.500%, 11/15/2027 | | | | | 1,068,276 | | | | | | 0.2 | | |
| 1,500,000 | | | TransDigm, Inc., 6.375%, 06/15/2026 | | | | | 1,515,450 | | | | | | 0.2 | | |
| 1,750,000 (1) | | | Vertiv Group Corp., 4.125%, 11/15/2028 | | | | | 1,599,150 | | | | | | 0.2 | | |
| 1,675,000 (1) | | | Weekley Homes LLC / Weekley Finance Corp., 4.875%, 09/15/2028 | | | | | 1,546,779 | | | | | | 0.2 | | |
| | | | | | | | | 57,302,481 | | | | | | 8.8 | | |
| | | | Technology: 3.0% | | ||||||||||||
| 1,725,000 (1) | | | Castle US Holding Corp., 9.500%, 02/15/2028 | | | | | 1,715,952 | | | | | | 0.3 | | |
| 2,225,000 (1)(2) | | | Condor Merger Sub, Inc., 7.375%, 02/15/2030 | | | | | 2,137,391 | | | | | | 0.3 | | |
| 1,675,000 (1) | | | Consensus Cloud Solutions, Inc., 6.500%, 10/15/2028 | | | | | 1,667,605 | | | | | | 0.3 | | |
| 925,000 (1)(2) | | | Minerva Merger Sub, Inc., 6.500%, 02/15/2030 | | | | | 898,526 | | | | | | 0.1 | | |
| 2,850,000 (1)(2) | | | NCR Corp., 5.125%, 04/15/2029 | | | | | 2,743,253 | | | | | | 0.4 | | |
| 450,000 (1) | | | Open Text Corp., 3.875%, 02/15/2028 | | | | | 432,229 | | | | | | 0.1 | | |
| Principal Amount† | | | Value | | | Percentage of Net Assets | | |||||||||
| CORPORATE BONDS/NOTES: (continued) | | |||||||||||||||
| | | | Technology (continued) | | ||||||||||||
| 1,575,000 (1) | | | Open Text Holdings, Inc., 4.125%, 02/15/2030 | | | | $ | 1,496,565 | | | | | | 0.2 | | |
| 750,000 (1)(2) | | | OpenText Corp., 3.875%, 12/01/2029 | | | | | 713,689 | | | | | | 0.1 | | |
| 1,925,000 (1)(2) | | | Playtika Holding Corp., 4.250%, 03/15/2029 | | | | | 1,779,537 | | | | | | 0.3 | | |
| 2,100,000 (1)(2) | | | Rackspace Technology Global, Inc., 5.375%, 12/01/2028 | | | | | 1,825,971 | | | | | | 0.3 | | |
| 2,325,000 (1) | | | Veritas US, Inc. / Veritas Bermuda Ltd., 7.500%, 09/01/2025 | | | | | 2,208,518 | | | | | | 0.3 | | |
| 2,300,000 (1) | | | Virtusa Corp., 7.125%, 12/15/2028 | | | | | 2,143,612 | | | | | | 0.3 | | |
| | | | | | | | | 19,762,848 | | | | | | 3.0 | | |
| | | | Utilities: 0.9% | | ||||||||||||
| 325,000 (1) | | | Clearway Energy Operating LLC, 3.750%, 01/15/2032 | | | | | 299,634 | | | | | | 0.1 | | |
| 1,450,000 (1) | | | Clearway Energy Operating LLC, 4.750%, 03/15/2028 | | | | | 1,458,765 | | | | | | 0.2 | | |
| 1,750,000 (1) | | | Drax Finco PLC, 6.625%, 11/01/2025 | | | | | 1,772,269 | | | | | | 0.3 | | |
| 700,000 (1) | | | Vistra Operations Co. LLC, 5.500%, 09/01/2026 | | | | | 704,585 | | | | | | 0.1 | | |
| 1,550,000 (1) | | | Vistra Operations Co. LLC, 5.625%, 02/15/2027 | | | | | 1,550,465 | | | | | | 0.2 | | |
| | | | | | | | | 5,785,718 | | | | | | 0.9 | | |
| | | | Total Corporate Bonds/Notes (Cost $627,585,373) | | | | | 612,455,674 | | | | | | 94.1 | | |
| BANK LOANS: 1.5% | | |||||||||||||||
| | | | Electronics/Electrical: 1.0% | | ||||||||||||
| 3,600,000 | | | AP Core Holdings II, LLC High-Yield Term Loan B2, 6.250%, (US0001M + 5.500%), 09/01/2027 | | | | | 3,583,501 | | | | | | 0.5 | | |
| 770,000 | | | Banff Merger Sub Inc 2021 USD 2nd Lien Term Loan, 6.000%, (US0001M + 5.500%), 02/27/2026 | | | | | 764,465 | | | | | | 0.1 | | |
| 2,550,000 | | | Quest Software US Holdings Inc. 2022 Term Loan, 4.750%, (SOFRRATE + 4.250%), 02/01/2029 | | | | | 2,515,394 | | | | | | 0.4 | | |
| | | | | | | | | 6,863,360 | | | | | | 1.0 | | |
| Voya High Yield Bond Fund | as of March 31, 2022 (continued) |
| Principal Amount† | | | Value | | | Percentage of Net Assets | | |||||||||
| BANK LOANS: (continued) | | |||||||||||||||
| | | | Health Care: 0.1% | | ||||||||||||
| 588,791 | | | Bausch Health Companies Inc. 2018 Term Loan B, 3.457%, (US0001M + 3.000%), 06/02/2025 | | | | $ | 584,927 | | | | | | 0.1 | | |
| | | | | | ||||||||||||
| | | | Technology: 0.4% | | ||||||||||||
| 2,400,000 | | | Ascend Learning LLC TL B 1L, 6.250%, (US0001M + 5.750%), 11/16/2029 | | | | | 2,374,500 | | | | | | 0.4 | | |
| | | | Total Bank Loans (Cost $9,829,358) | | | | | 9,822,787 | | | | | | 1.5 | | |
| CONVERTIBLE BONDS/NOTES: 0.1% | | |||||||||||||||
| | | | Communications: 0.1% | | ||||||||||||
| 625,000 | | | DISH Network Corp., 3.375%, 08/15/2026 | | | | | 563,750 | | | | | | 0.1 | | |
| | | | Total Convertible Bonds/Notes (Cost $619,800) | | | | | 563,750 | | | | | | 0.1 | | |
| | ||||||||||||||||
| Shares | | | Value | | | Percentage of Net Assets | | |||||||||
| COMMON STOCK: 0.4% | | |||||||||||||||
| | | | Consumer Staples: 0.4% | | ||||||||||||
| 96,000 (5) | | | Southeastern Grocers, Inc. | | | | | 2,256,000 | | | | | | 0.4 | | |
| | | | Total Common Stock | | | | | | | | | | | | | |
| | | | (Cost $676,787) | | | | | 2,256,000 | | | | | | 0.4 | | |
| | | | Total Long-Term Investments | | | | | | | | | | | | | |
| | | | (Cost $638,711,318) | | | | | 625,098,211 | | | | | | 96.1 | | |
| Principal Amount† | | | Value | | | Percentage of Net Assets | | | | | |||||||||
| SHORT-TERM INVESTMENTS: 26.4% | | | |||||||||||||||||
| | | | Commercial Paper: 2.1% | | | ||||||||||||||
| 3,000,000 | | | AT&T, Inc., 0.650%, 04/12/2022 | | | | | 2,999,360 | | | | | | 0.4 | | | | ||
| 3,000,000 | | | Fiserv, Inc., 0.560%, 04/05/2022 | | | | | 2,999,769 | | | | | | 0.5 | | | | ||
| 4,000,000 | | | HP, Inc., 0.850%, 04/25/2022 | | | | | 3,997,667 | | | | | | 0.6 | | | | ||
| 4,000,000 | | | Lowe’s Cos, Inc., 0.540%, 04/05/2022 | | | | | 3,999,704 | | | | | | 0.6 | | | | ||
| | | | Total Commercial Paper (Cost $13,995,826) | | | | | 13,996,500 | | | | | | 2.1 | | | | ||
| Principal Amount† | | | Value | | | Percentage of Net Assets | | | | | |||||||||
| SHORT-TERM INVESTMENTS: (continued) | | | |||||||||||||||||
| | | | Floating Rate Notes: 6.1% | | | ||||||||||||||
| 800,000 (6) | | | ANZ Bank, 0.420%, 08/18/2022 | | | | $ | 799,494 | | | | | | 0.1 | | | | ||
| 950,000 (6) | | | Bank of America N.A., 0.410%, 06/22/2022 | | | | | 949,590 | | | | | | 0.1 | | | | ||
| 275,000 (6) | | | Bank of America N.A., 0.420%, 08/16/2022 | | | | | 275,000 | | | | | | 0.0 | | | | ||
| 925,000 (6) | | | Bank of Montreal, 0.410%, 07/25/2022 | | | | | 924,309 | | | | | | 0.1 | | | | ||
| 650,000 (6) | | | Bank of Nova Scotia, 0.440%, 07/18/2022 | | | | | 649,611 | | | | | | 0.1 | | | | ||
| 975,000 (6) | | | Barclays Bank PLC, 0.440%, 07/22/2022 | | | | | 973,900 | | | | | | 0.1 | | | | ||
| 600,000 (6) | | | Barclays Bank PLC, 0.470%, 08/03/2022 | | | | | 599,216 | | | | | | 0.1 | | | | ||
| 950,000 (6) | | | Bayeriche Landesbank of New York, 0.470%, 07/27/2022 | | | | | 949,363 | | | | | | 0.1 | | | | ||
| 900,000 (6) | | | Collateralized Commercial Paper V Co., LLC, 0.490%, 08/25/2022 | | | | | 899,105 | | | | | | 0.1 | | | | ||
| 850,000 (6) | | | Commonwealth Bank of Australia, 0.450%, 09/01/2022 | | | | | 849,241 | | | | | | 0.1 | | | | ||
| 975,000 (6) | | | Cooperatieve Rabobank U.A./New York, 0.410%, 08/03/2022 | | | | | 974,195 | | | | | | 0.2 | | | | ||
| 600,000 (6) | | | Cooperatieve Rabobank U.A./New York, 0.420%, 08/16/2022 | | | | | 599,485 | | | | | | 0.1 | | | | ||
| 975,000 (6) | | | Credit Agricole, 0.390%, 07/21/2022 | | | | | 974,324 | | | | | | 0.2 | | | | ||
| 500,000 (6) | | | Credit Agricole, 0.410%, 08/04/2022 | | | | | 499,647 | | | | | | 0.1 | | | | ||
| 975,000 (6) | | | Credit Industriel et Commercial, 0.440%, 08/08/2022 | | | | | 974,251 | | | | | | 0.2 | | | | ||
| 900,000 (6) | | | Credit Suisse AG, 0.450%, 05/02/2022 | | | | | 899,962 | | | | | | 0.1 | | | | ||
| 975,000 (6) | | | Credit Suisse AG, 0.430%, 07/19/2022 | | | | | 974,428 | | | | | | 0.2 | | | | ||
| 525,000 (6) | | | Landesbank Baden-Wurttemberg, 0.440%, 06/17/2022 | | | | | 524,775 | | | | | | 0.1 | | | | ||
| 900,000 (6) | | | Mitsubishi UFJ Trust and Banking Corp., 0.430%, 07/22/2022 | | | | | 899,427 | | | | | | 0.1 | | | | ||
| 950,000 (6) | | | Mitsubishi UFJ Trust and Banking Corp., 0.460%, 07/26/2022 | | | | | 949,454 | | | | | | 0.1 | | | | ||
| Voya High Yield Bond Fund | as of March 31, 2022 (continued) |
| Principal Amount† | | | Value | | | Percentage of Net Assets | | | | | |||||||||
| SHORT-TERM INVESTMENTS: (continued) | | | |||||||||||||||||
| | | | Floating Rate Notes (continued) | | | ||||||||||||||
| 900,000 (6) | | | Mizuho Bank Ltd., 0.440%, 07/25/2022 | | | | $ | 899,041 | | | | | | 0.1 | | | | ||
| 975,000 (6) | | | Mizuho Bank Ltd., 0.450%, 07/28/2022 | | | | | 973,977 | | | | | | 0.1 | | | | ||
| 575,000 (6) | | | Mizuho Bank Ltd., 0.460%, 08/10/2022 | | | | | 574,360 | | | | | | 0.1 | | | | ||
| 975,000 (6) | | | National Australia Bank Ltd., 0.400%, 08/08/2022 | | | | | 974,146 | | | | | | 0.2 | | | | ||
| 975,000 (6) | | | National Australia Bank Ltd., 0.420%, 08/15/2022 | | | | | 974,189 | | | | | | 0.2 | | | | ||
| 975,000 (6) | | | National Bank of Canada, 0.430%, 08/09/2022 | | | | | 974,206 | | | | | | 0.2 | | | | ||
| 975,000 (6) | | | Natixis SA, 0.440%, 06/17/2022 | | | | | 974,751 | | | | | | 0.2 | | | | ||
| 900,000 (6) | | | Norinchukin Bank of New York, 0.390%, 05/27/2022 | | | | | 899,744 | | | | | | 0.1 | | | | ||
| 975,000 (6) | | | Norinchukin Bank of New York, 0.420%, 06/22/2022 | | | | | 974,622 | | | | | | 0.2 | | | | ||
| 875,000 (6) | | | Royal Bank of Canada, 0.420%, 08/16/2022 | | | | | 874,277 | | | | | | 0.1 | | | | ||
| 1,000,000 (6) | | | Royal Bank of Canada, 0.450%, 08/23/2022 | | | | | 999,244 | | | | | | 0.2 | | | | ||
| 800,000 (6) | | | Sheffield Receivables Company LLC, 0.480%, 07/27/2022 | | | | | 799,392 | | | | | | 0.1 | | | | ||
| 975,000 (6) | | | Skandinaviska Enskilda Banken AB, 0.410%, 07/20/2022 | | | | | 974,438 | | | | | | 0.2 | | | | ||
| 975,000 (6) | | | Societe Generale, 0.430%, 08/08/2022 | | | | | 974,146 | | | | | | 0.2 | | | | ||
| 925,000 (6) | | | Societe Generale, 0.470%, 08/31/2022 | | | | | 924,172 | | | | | | 0.1 | | | | ||
| 875,000 (6) | | | Starbird Funding Corp., 0.450%, 08/23/2022 | | | | | 873,600 | | | | | | 0.1 | | | | ||
| 800,000 (6) | | | Sumitomo Mitsui Trust Bank Ltd., 0.430%, 07/25/2022 | | | | | 799,524 | | | | | | 0.1 | | | | ||
| 975,000 (6) | | | Sumitomo Mitsui Trust Bank Ltd., 0.430%, 07/28/2022 | | | | | 974,392 | | | | | | 0.2 | | | | ||
| 375,000 (6) | | | Sumitomo Mitsui Trust Bank Ltd., 0.440%, 07/29/2022 | | | | | 374,788 | | | | | | 0.1 | | | | ||
| 900,000 (6) | | | Sumitomo Mitsui Trust Bank Ltd., 0.450%, 08/01/2022 | | | | | 899,466 | | | | | | 0.1 | | | | ||
| 950,000 (6) | | | Sumitomo Mitsui Trust Bank Ltd., 0.450%, 08/04/2022 | | | | | 949,409 | | | | | | 0.1 | | | | ||
| 700,000 (6) | | | Sumitomo Mitsui Trust Bank Ltd., 0.450%, 08/08/2022 | | | | | 699,553 | | | | | | 0.1 | | | | ||
| 1,000,000 (6) | | | Svenska Handelsbanken AB, 0.420%, 07/29/2022 | | | | | 999,201 | | | | | | 0.2 | | | | ||
| Principal Amount† | | | Value | | | Percentage of Net Assets | | | | | |||||||||
| SHORT-TERM INVESTMENTS: (continued) | | | |||||||||||||||||
| | | | Floating Rate Notes (continued) | | | ||||||||||||||
| 950,000 (6) | | | Toronto-Dominion Bank, 0.430%, 07/25/2022 | | | | $ | 949,599 | | | | | | 0.1 | | | | ||
| 975,000 (6) | | | Toronto-Dominion Bank, 0.440%, 08/19/2022 | | | | | 974,318 | | | | | | 0.2 | | | | ||
| 1,000,000 (6) | | | Westpac Banking Corp., 0.410%, 08/02/2022 | | | | | 999,377 | | | | | | 0.2 | | | | ||
| | | | Total Floating Rate Notes (Cost $39,396,709) | | | | | 39,396,709 | | | | | | 6.1 | | | | ||
| | | | | | | ||||||||||||||
| | | | Repurchase Agreements: 15.5% | | | ||||||||||||||
| 3,009,112 (6) | | | Amherst Pierpoint Securities LLC, Repurchase Agreement dated 03/31/22, 0.28%, due 04/01/22 (Repurchase Amount $3,009,135, collateralized by various U.S. Government/ U.S. Government Agency Obligations, 0.000%-6.750%, Market Value plus accrued interest $3,069,294, due 06/01/24-02/20/72) | | | | | 3,009,112 | | | | | | 0.5 | | | | ||
| 3,365,883 (6) | | | Bethesda Securities LLC, Repurchase Agreement dated 03/31/22, 0.33%, due 04/01/22 (Repurchase Amount $3,365,913, collateralized by various U.S. Government Agency Obligations, 2.000%-5.500%, Market Value plus accrued interest $3,466,859, due 04/01/23-03/01/52) | | | | | 3,365,883 | | | | | | 0.5 | | | | ||
| 27,288,855 (6) | | | Cantor Fitzgerald Securities, Repurchase Agreement dated 03/31/22, 0.29%, due 04/01/22 (Repurchase Amount $27,289,072, collateralized by various U.S. Government Agency Obligations, 0.000%-9.000%, Market Value plus accrued interest $27,834,632, due 04/25/22-12/20/71) | | | | | 27,288,855 | | | | | | 4.2 | | | | ||
| Voya High Yield Bond Fund | as of March 31, 2022 (continued) |
| Principal Amount† | | | Value | | | Percentage of Net Assets | | | | | |||||||||
| SHORT-TERM INVESTMENTS: (continued) | | | |||||||||||||||||
| | | | Repurchase Agreements (continued) | | | ||||||||||||||
| 6,974,774 (6) | | | CF Secured LLC, Repurchase Agreement dated 03/31/22, 0.29%, due 04/01/22 (Repurchase Amount $6,974,829, collateralized by various U.S. Government/U.S. Government Agency Obligations, 0.000%-5.500%, Market Value plus accrued interest $7,114,270, due 04/05/22-03/01/52) | | | | $ | 6,974,774 | | | | | | 1.1 | | | | ||
| 13,806,519 (6) | | | Citadel Securities LLC, Repurchase Agreement dated 03/31/22, 0.33%, due 04/01/22 (Repurchase Amount $13,806,644, collateralized by various U.S. Government Securities, 0.000%-7.625%, Market Value plus accrued interest $14,082,816, due 04/19/22-02/15/52) | | | | | 13,806,519 | | | | | | 2.1 | | | | ||
| 27,503,685 (6) | | | Daiwa Capital Markets, Repurchase Agreement dated 03/31/22, 0.30%, due 04/01/22 (Repurchase Amount $27,503,911, collateralized by various U.S. Government/U.S. Government Agency Obligations, 0.000%-6.500%, Market Value plus accrued interest $28,053,759, due 04/05/22-04/01/52) | | | | | 27,503,685 | | | | | | 4.2 | | | | ||
| 6,070,784 (6) | | | Industrial & Comm. Bank of China, Repurchase Agreement dated 03/31/22, 0.28%, due 04/01/22 (Repurchase Amount $6,070,831, collateralized by various U.S. Government Securities, 0.000%-2.250%, Market Value plus accrued interest $6,192,200, due 03/23/23-02/28/27) | | | | | 6,070,784 | | | | | | 0.9 | | | | ||
| Principal Amount† | | | Value | | | Percentage of Net Assets | | | | | |||||||||
| SHORT-TERM INVESTMENTS: (continued) | | | |||||||||||||||||
| | | | Repurchase Agreements (continued) | | | ||||||||||||||
| 8,231,935 (6) | | | Mirae Asset Securities USA Inc., Repurchase Agreement dated 03/31/22, 0.33%, due 04/01/22 (Repurchase Amount $8,232,009, collateralized by various U.S. Government Agency Obligations, 0.550%-8.250%, Market Value plus accrued interest $8,396,651, due 05/01/22-02/20/72) | | | | $ | 8,231,935 | | | | | | 1.3 | | | | ||
| 4,449,463 (6) | | | Stonex Financial Inc., Repurchase Agreement dated 03/31/22, 0.35%, due 04/01/22 (Repurchase Amount $4,449,506, collateralized by various U.S. Government/U.S. Government Agency Obligations, 0.000%-9.500%, Market Value plus accrued interest $4,671,937, due 04/15/22-02/20/72) | | | | | 4,449,463 | | | | | | 0.7 | | | | ||
| | | | Total Repurchase Agreements (Cost $100,701,010) | | | | | 100,701,010 | | | | | | 15.5 | | | | ||
| | | | | | | | | | | | | | | | | | | ||
| Shares | | | Value | | | Percentage of Net Assets | | |||||||||
| | | | Mutual Funds: 2.7% | | ||||||||||||
| 10,952,000 (6)(7) | | | BlackRock Liquidity Funds, FedFund, Institutional Class, 0.230% | | | | | 10,952,000 | | | | | | 1.7 | | |
| 3,805,000 (6)(7) | | | Goldman Sachs Financial Square Government Fund - Institutional Shares, 0.250% | | | | | 3,805,000 | | | | | | 0.6 | | |
| 3,043,000 (6)(7) | | | Morgan Stanley Institutional Liquidity Funds - Government Portfolio (Institutional Share Class), 0.230% | | | | | 3,043,000 | | | | | | 0.4 | | |
| Voya High Yield Bond Fund | as of March 31, 2022 (continued) |
| Shares | | | Value | | | Percentage of Net Assets | | |||||||||
| SHORT-TERM INVESTMENTS: (continued) | | |||||||||||||||
| | | | Mutual Funds: (continued) | | ||||||||||||
| | | | Total Mutual Funds (Cost $17,800,000) | | | | $ | 17,800,000 | | | | | | 2.7 | | |
| | | | Total Short-Term Investments (Cost $171,893,545) | | | | | 171,894,219 | | | | | | 26.4 | | |
| | | | Total Investments in Securities (Cost $810,604,863) | | | | $ | 796,992,430 | | | | | | 122.5 | | |
| | | | Liabilities in Excess of Other Assets | | | | | (146,352,610) | | | | | | (22.5) | | |
| | | | Net Assets | | | | $ | 650,639,820 | | | | | | 100.0 | | |
| | SOFRRATE | | | 1-day Secured Overnight Financing Rate | |
| | US0001M | | | 1-month LIBOR | |
| | | | Quoted Prices in Active Markets for Identical Investments (Level 1) | | | Significant Other Observable Inputs (Level 2) | | | Significant Unobservable Inputs (Level 3) | | | Fair Value at March 31, 2022 | | ||||||||||||
| Asset Table | | | | | | | | | | | | | | | | | | | | | | | | | |
| Investments, at fair value | | | | | | | | | | | | | | | | | | | | | | | | | |
| Common Stock | | | | | | | | | | | | | | | | | | | | | | | | | |
| Consumer Staples | | | | $ | — | | | | | $ | — | | | | | $ | 2,256,000 | | | | | $ | 2,256,000 | | |
| Total Common Stock | | | | | — | | | | | | — | | | | | | 2,256,000 | | | | | | 2,256,000 | | |
| Corporate Bonds/Notes | | | | | — | | | | | | 612,455,674 | | | | | | — | | | | | | 612,455,674 | | |
| Convertible Bonds/Notes | | | | | — | | | | | | 563,750 | | | | | | — | | | | | | 563,750 | | |
| Bank Loans | | | | | — | | | | | | 9,822,787 | | | | | | — | | | | | | 9,822,787 | | |
| Short-Term Investments | | | | | 17,800,000 | | | | | | 154,094,219 | | | | | | — | | | | | | 171,894,219 | | |
| Total Investments, at fair value | | | | $ | 17,800,000 | | | | | $ | 776,936,430 | | | | | $ | 2,256,000 | | | | | $ | 796,992,430 | | |
| | Cost for federal income tax purposes was $811,842,507. | | | |||||
| | Net unrealized depreciation consisted of: | | | |||||
| | Gross Unrealized Appreciation | | | | $ | 10,001,390 | | |
| | Gross Unrealized Depreciation | | | | | (24,851,467) | | |
| | Net Unrealized Depreciation | | | | $ | (14,850,077) | | |
| Voya Intermediate Bond Fund | as of March 31, 2022 |
| Principal Amount† | | | Value | | | Percentage of Net Assets | | |||||||||
| CORPORATE BONDS/NOTES: 39.2% | | |||||||||||||||
| | | | Basic Materials: 1.4% | | ||||||||||||
| 1,700,000 (1) | | | Alpek SAB de CV, 3.250%, 02/25/2031 | | | | $ | 1,552,763 | | | | | | 0.0 | | |
| 1,725,000 (1)(2) | | | Anglo American Capital PLC, 2.250%, 03/17/2028 | | | | | 1,578,603 | | | | | | 0.0 | | |
| 1,377,000 (1) | | | Anglo American Capital PLC, 3.625%, 09/11/2024 | | | | | 1,376,352 | | | | | | 0.0 | | |
| 671,000 (1) | | | Anglo American Capital PLC, 4.875%, 05/14/2025 | | | | | 695,027 | | | | | | 0.0 | | |
| 1,846,000 (1) | | | Anglo American Capital PLC, 5.625%, 04/01/2030 | | | | | 2,037,443 | | | | | | 0.0 | | |
| 3,545,000 | | | Celanese US Holdings LLC, 1.400%, 08/05/2026 | | | | | 3,197,735 | | | | | | 0.0 | | |
| 4,505,000 | | | Celulosa Arauco y Constitucion SA, 3.875%, 11/02/2027 | | | | | 4,569,895 | | | | | | 0.1 | | |
| 3,883,000 | | | Dow Chemical Co., 4.375%, 11/15/2042 | | | | | 4,048,127 | | | | | | 0.1 | | |
| 2,092,000 | | | Dow Chemical Co/The, 4.250%, 10/01/2034 | | | | | 2,157,421 | | | | | | 0.0 | | |
| 1,810,000 | | | Ecolab, Inc., 2.700%, 12/15/2051 | | | | | 1,554,634 | | | | | | 0.0 | | |
| 4,695,000 | | | Ecolab, Inc., 2.750%, 08/18/2055 | | | | | 3,893,768 | | | | | | 0.1 | | |
| 9,470,000 (1)(2) | | | Element Solutions, Inc., 3.875%, 09/01/2028 | | | | | 8,859,848 | | | | | | 0.1 | | |
| 5,000,000 (1) | | | Equate Petrochemical BV, 2.625%, 04/28/2028 | | | | | 4,643,750 | | | | | | 0.1 | | |
| 5,795,000 | | | Freeport-McMoRan, Inc., 4.250%, 03/01/2030 | | | | | 5,843,881 | | | | | | 0.1 | | |
| 3,000,000 (1)(2) | | | GC Treasury Center Co. Ltd., 2.980%, 03/18/2031 | | | | | 2,753,316 | | | | | | 0.0 | | |
| 3,750,000 (1)(2) | | | Georgia-Pacific LLC, 0.950%, 05/15/2026 | | | | | 3,426,576 | | | | | | 0.0 | | |
| 9,460,000 (1) | | | Ingevity Corp., 3.875%, 11/01/2028 | | | | | 8,567,591 | | | | | | 0.1 | | |
| 4,087,000 (2) | | | Inversiones CMPC SA, 4.375%, 04/04/2027 | | | | | 4,283,074 | | | | | | 0.1 | | |
| 5,352,000 | | | Mosaic Co/The, 5.450%, 11/15/2033 | | | | | 6,170,504 | | | | | | 0.1 | | |
| 2,217,000 (2) | | | Newmont Corp., 2.250%, 10/01/2030 | | | | | 2,028,936 | | | | | | 0.0 | | |
| 8,795,000 (1) | | | Novelis Corp., 4.750%, 01/30/2030 | | | | | 8,555,160 | | | | | | 0.1 | | |
| 2,956,000 | | | Nucor Corp., 3.850%, 04/01/2052 | | | | | 2,960,052 | | | | | | 0.0 | | |
| 4,630,000 (1) | | | OCI NV, 4.625%, 10/15/2025 | | | | | 4,669,980 | | | | | | 0.1 | | |
| 1,325,000 (1) | | | OCP SA, 3.750%, 06/23/2031 | | | | | 1,205,591 | | | | | | 0.0 | | |
| 3,000,000 | | | PPG Industries, Inc., 1.200%, 03/15/2026 | | | | | 2,781,437 | | | | | | 0.0 | | |
| Principal Amount† | | | Value | | | Percentage of Net Assets | | |||||||||
| CORPORATE BONDS/NOTES: (continued) | | |||||||||||||||
| | | | Basic Materials (continued) | | ||||||||||||
| 4,038,000 (2) | | | Rio Tinto Finance USA Ltd., 2.750%, 11/02/2051 | | | | $ | 3,499,686 | | | | | | 0.0 | | |
| 2,412,000 | | | RPM International, Inc., 2.950%, 01/15/2032 | | | | | 2,213,928 | | | | | | 0.0 | | |
| 1,000,000 | | | Sasol Financing USA LLC, 5.500%, 03/18/2031 | | | | | 935,550 | | | | | | 0.0 | | |
| 3,189,000 (2) | | | Steel Dynamics, Inc., 1.650%, 10/15/2027 | | | | | 2,901,616 | | | | | | 0.0 | | |
| 2,139,000 | | | Steel Dynamics, Inc., 2.400%, 06/15/2025 | | | | | 2,070,500 | | | | | | 0.0 | | |
| 2,425,000 | | | Suzano Austria GmbH, 3.750%, 01/15/2031 | | | | | 2,287,309 | | | | | | 0.0 | | |
| 4,825,000 | | | Suzano Austria GmbH, 6.000%, 01/15/2029 | | | | | 5,217,417 | | | | | | 0.1 | | |
| 2,133,000 | | | Teck Resources Ltd., 5.400%, 02/01/2043 | | | | | 2,310,604 | | | | | | 0.0 | | |
| 1,499,000 | | | Teck Resources Ltd., 6.000%, 08/15/2040 | | | | | 1,725,652 | | | | | | 0.0 | | |
| 7,989,000 | | | Teck Resources Ltd., 6.125%, 10/01/2035 | | | | | 9,456,098 | | | | | | 0.1 | | |
| 5,565,000 (1) | | | Valvoline, Inc., 3.625%, 06/15/2031 | | | | | 4,817,565 | | | | | | 0.1 | | |
| 800,000 (1)(2) | | | Vedanta Resources Finance II PLC, 8.950%, 03/11/2025 | | | | | 779,044 | | | | | | 0.0 | | |
| | | | | | | | | 131,626,433 | | | | | | 1.4 | | |
| | | | Communications: 3.2% | | ||||||||||||
| 1,350,000 (2) | | | Alibaba Group Holding Ltd., 2.125%, 02/09/2031 | | | | | 1,175,637 | | | | | | 0.0 | | |
| 2,550,000 | | | Alibaba Group Holding Ltd., 2.700%, 02/09/2041 | | | | | 1,946,966 | | | | | | 0.0 | | |
| 4,500,000 | | | Amazon.com, Inc., 2.875%, 05/12/2041 | | | | | 4,163,496 | | | | | | 0.1 | | |
| 2,464,000 (2) | | | Amazon.com, Inc., 3.100%, 05/12/2051 | | | | | 2,323,878 | | | | | | 0.0 | | |
| 9,485,000 (1)(2) | | | ANGI Group LLC, 3.875%, 08/15/2028 | | | | | 8,052,480 | | | | | | 0.1 | | |
| 3,110,000 | | | AT&T, Inc., 2.550%, 12/01/2033 | | | | | 2,769,268 | | | | | | 0.0 | | |
| 7,317,000 (2) | | | AT&T, Inc., 3.100%, 02/01/2043 | | | | | 6,335,496 | | | | | | 0.1 | | |
| 4,990,000 | | | AT&T, Inc., 3.300%, 02/01/2052 | | | | | 4,293,081 | | | | | | 0.1 | | |
| 1,750,000 | | | AT&T, Inc., 3.500%, 06/01/2041 | | | | | 1,615,801 | | | | | | 0.0 | | |
| 6,715,000 | | | AT&T, Inc., 3.550%, 09/15/2055 | | | | | 5,945,383 | | | | | | 0.1 | | |
| 9,727,000 | | | AT&T, Inc., 3.650%, 09/15/2059 | | | | | 8,563,727 | | | | | | 0.1 | | |
| Voya Intermediate Bond Fund | as of March 31, 2022 (continued) |
| Principal Amount† | | | Value | | | Percentage of Net Assets | | |||||||||
| CORPORATE BONDS/NOTES: (continued) | | |||||||||||||||
| | | | Communications (continued) | | ||||||||||||
| 3,058,000 (2) | | | AT&T, Inc., 3.800%, 12/01/2057 | | | | $ | 2,802,102 | | | | | | 0.0 | | |
| 2,219,000 | | | AT&T, Inc., 4.500%, 05/15/2035 | | | | | 2,355,740 | | | | | | 0.0 | | |
| 2,314,000 (2) | | | Charter Communications Operating LLC / Charter Communications Operating Capital, 2.250%, 01/15/2029 | | | | | 2,085,364 | | | | | | 0.0 | | |
| 3,235,000 | | | Charter Communications Operating LLC / Charter Communications Operating Capital, 3.500%, 03/01/2042 | | | | | 2,683,684 | | | | | | 0.0 | | |
| 4,515,000 | | | Charter Communications Operating LLC / Charter Communications Operating Capital, 3.850%, 04/01/2061 | | | | | 3,644,073 | | | | | | 0.0 | | |
| 2,520,000 | | | Charter Communications Operating LLC / Charter Communications Operating Capital, 3.900%, 06/01/2052 | | | | | 2,132,921 | | | | | | 0.0 | | |
| 4,725,000 | | | Charter Communications Operating LLC / Charter Communications Operating Capital, 4.464%, 07/23/2022 | | | | | 4,742,663 | | | | | | 0.1 | | |
| 3,860,000 | | | Charter Communications Operating LLC / Charter Communications Operating Capital, 4.800%, 03/01/2050 | | | | | 3,678,242 | | | | | | 0.0 | | |
| 5,882,000 | | | Charter Communications Operating LLC / Charter Communications Operating Capital, 4.908%, 07/23/2025 | | | | | 6,105,389 | | | | | | 0.1 | | |
| 5,000,000 (2) | | | Comcast Corp., 2.650%, 02/01/2030 | | | | | 4,806,042 | | | | | | 0.1 | | |
| 4,178,000 (1) | | | Comcast Corp., 2.887%, 11/01/2051 | | | | | 3,539,716 | | | | | | 0.0 | | |
| 3,288,000 | | | Comcast Corp., 3.900%, 03/01/2038 | | | | | 3,397,672 | | | | | | 0.0 | | |
| 1,750,000 | | | Comcast Corp., 3.999%, 11/01/2049 | | | | | 1,772,692 | | | | | | 0.0 | | |
| 4,440,000 | | | Comcast Corp., 4.000%, 03/01/2048 | | | | | 4,573,402 | | | | | | 0.1 | | |
| Principal Amount† | | | Value | | | Percentage of Net Assets | | |||||||||
| CORPORATE BONDS/NOTES: (continued) | | |||||||||||||||
| | | | Communications (continued) | | ||||||||||||
| 5,625,000 (1)(2) | | | CommScope Technologies LLC, 5.000%, 03/15/2027 | | | | $ | 4,897,462 | | | | | | 0.1 | | |
| 1,690,000 | | | Corning, Inc., 5.450%, 11/15/2079 | | | | | 1,877,046 | | | | | | 0.0 | | |
| 9,000,000 (1) | | | CSC Holdings LLC, 5.750%, 01/15/2030 | | | | | 8,025,525 | | | | | | 0.1 | | |
| 6,310,000 | | | Discovery Communications LLC, 4.000%, 09/15/2055 | | | | | 5,467,374 | | | | | | 0.1 | | |
| 4,750,000 | | | Discovery Communications LLC, 5.300%, 05/15/2049 | | | | | 4,987,183 | | | | | | 0.1 | | |
| 4,655,000 | | | DISH DBS Corp., 5.125%, 06/01/2029 | | | | | 3,970,250 | | | | | | 0.1 | | |
| 4,420,000 (1) | | | GCI LLC, 4.750%, 10/15/2028 | | | | | 4,323,467 | | | | | | 0.1 | | |
| 8,700,000 (1)(2) | | | Gray Television, Inc., 7.000%, 05/15/2027 | | | | | 9,018,290 | | | | | | 0.1 | | |
| 2,000,000 (1)(2) | | | Millicom International Cellular SA, 4.500%, 04/27/2031 | | | | | 1,865,160 | | | | | | 0.0 | | |
| 2,160,000 (1) | | | NBN Co. Ltd., 1.450%, 05/05/2026 | | | | | 2,001,259 | | | | | | 0.0 | | |
| 4,080,000 (1) | | | NBN Co. Ltd., 1.625%, 01/08/2027 | | | | | 3,748,997 | | | | | | 0.0 | | |
| 3,125,000 (1)(3) | | | Network i2i Ltd., 3.975%, 12/31/2199 | | | | | 2,903,297 | | | | | | 0.0 | | |
| 2,375,000 (1) | | | Ooredoo International Finance Ltd., 2.625%, 04/08/2031 | | | | | 2,233,134 | | | | | | 0.0 | | |
| 5,140,000 (1) | | | Sinclair Television Group, Inc., 5.125%, 02/15/2027 | | | | | 4,675,370 | | | | | | 0.1 | | |
| 8,700,000 (1)(2) | | | Sirius XM Radio, Inc., 5.500%, 07/01/2029 | | | | | 8,846,160 | | | | | | 0.1 | | |
| 4,020,000 | | | Sprint Nextel Corp., 6.875%, 11/15/2028 | | | | | 4,665,250 | | | | | | 0.1 | | |
| 5,690,000 | | | Telecom Italia Capital SA, 7.721%, 06/04/2038 | | | | | 5,814,668 | | | | | | 0.1 | | |
| 4,400,000 (1) | | | Tencent Holdings Ltd., 2.390%, 06/03/2030 | | | | | 3,917,116 | | | | | | 0.0 | | |
| 900,000 (1)(2) | | | Tencent Holdings Ltd., 2.880%, 04/22/2031 | | | | | 822,964 | | | | | | 0.0 | | |
| 3,420,000 (1) | | | Tencent Holdings Ltd., 2.985%, 01/19/2023 | | | | | 3,419,605 | | | | | | 0.0 | | |
| 1,350,000 (1) | | | Tencent Holdings Ltd., 3.680%, 04/22/2041 | | | | | 1,196,196 | | | | | | 0.0 | | |
| Voya Intermediate Bond Fund | as of March 31, 2022 (continued) |
| Principal Amount† | | | Value | | | Percentage of Net Assets | | |||||||||
| CORPORATE BONDS/NOTES: (continued) | | |||||||||||||||
| | | | Communications (continued) | | ||||||||||||
| 2,350,000 | | | Time Warner Cable LLC, 5.500%, 09/01/2041 | | | | $ | 2,445,543 | | | | | | 0.0 | | |
| 2,829,000 | | | Time Warner Cable LLC, 5.875%, 11/15/2040 | | | | | 3,047,592 | | | | | | 0.0 | | |
| 2,569,000 (2) | | | T-Mobile USA, Inc., 2.050%, 02/15/2028 | | | | | 2,351,035 | | | | | | 0.0 | | |
| 2,033,000 | | | T-Mobile USA, Inc., 3.300%, 02/15/2051 | | | | | 1,716,801 | | | | | | 0.0 | | |
| 2,981,000 (1) | | | T-Mobile USA, Inc., 3.600%, 11/15/2060 | | | | ��� | 2,571,551 | | | | | | 0.0 | | |
| 4,084,000 | | | T-Mobile USA, Inc., 3.750%, 04/15/2027 | | | | | 4,114,712 | | | | | | 0.1 | | |
| 10,865,000 | | | T-Mobile USA, Inc., 3.875%, 04/15/2030 | | | | | 10,922,174 | | | | | | 0.1 | | |
| 1,048,000 | | | T-Mobile USA, Inc., 4.375%, 04/15/2040 | | | | | 1,055,577 | | | | | | 0.0 | | |
| 5,080,000 | | | Verizon Communications, Inc., 2.100%, 03/22/2028 | | | | | 4,744,978 | | | | | | 0.1 | | |
| 18,523,000 (1) | | | Verizon Communications, Inc., 2.355%, 03/15/2032 | | | | | 16,761,456 | | | | | | 0.2 | | |
| 1,518,000 | | | Verizon Communications, Inc., 2.987%, 10/30/2056 | | | | | 1,254,923 | | | | | | 0.0 | | |
| 2,312,000 | | | Verizon Communications, Inc., 3.400%, 03/22/2041 | | | | | 2,173,501 | | | | | | 0.0 | | |
| 11,195,000 | | | Verizon Communications, Inc., 3.700%, 03/22/2061 | | | | | 10,430,146 | | | | | | 0.1 | | |
| 3,610,000 | | | Verizon Communications, Inc., 3.850%, 11/01/2042 | | | | | 3,617,504 | | | | | | 0.0 | | |
| 1,159,000 | | | Verizon Communications, Inc., 4.000%, 03/22/2050 | | | | | 1,181,146 | | | | | | 0.0 | | |
| 2,816,000 | | | Verizon Communications, Inc., 4.500%, 08/10/2033 | | | | | 3,028,824 | | | | | | 0.0 | | |
| 6,432,000 | | | Verizon Communications, Inc., 4.812%, 03/15/2039 | | | | | 7,298,036 | | | | | | 0.1 | | |
| 8,990,000 (1)(2) | | | ViaSat, Inc., 5.625%, 04/15/2027 | | | | | 8,871,467 | | | | | | 0.1 | | |
| 9,400,000 (1) | | | Vmed O2 UK Financing I PLC, 4.750%, 07/15/2031 | | | | | 8,873,553 | | | | | | 0.1 | | |
| 7,365,000 | | | Vodafone Group PLC, 4.375%, 02/19/2043 | | | | | 7,412,438 | | | | | | 0.1 | | |
| 2,548,000 | | | Vodafone Group PLC, 5.125%, 06/19/2059 | | | | | 2,840,865 | | | | | | 0.0 | | |
| 1,093,000 | | | Walt Disney Co/The, 2.000%, 09/01/2029 | | | | | 1,011,756 | | | | | | 0.0 | | |
| 9,400,000 (1)(2) | | | Zayo Group Holdings, Inc., 4.000%, 03/01/2027 | | | | | 8,666,988 | | | | | | 0.1 | | |
| | | | | | | | | 300,573,254 | | | | | | 3.2 | | |
| | | | Consumer, Cyclical: 3.1% | | ||||||||||||
| 9,460,000 (1) | | | 1011778 BC ULC / New Red Finance, Inc., 4.000%, 10/15/2030 | | | | | 8,546,069 | | | | | | 0.1 | | |
| Principal Amount† | | | Value | | | Percentage of Net Assets | | |||||||||
| CORPORATE BONDS/NOTES: (continued) | | |||||||||||||||
| | | | Consumer, Cyclical (continued) | | ||||||||||||
| 3,908,227 (1) | | | Alaska Airlines 2020-1 Class A Pass Through Trust, 4.800%, 02/15/2029 | | | | $ | 4,004,832 | | | | | | 0.0 | | |
| 10,785,000 (1) | | | Allison Transmission, Inc., 3.750%, 01/30/2031 | | | | | 9,799,790 | | | | | | 0.1 | | |
| 8,563,002 | | | American Airlines 2015-2 Class A Pass Through Trust, 4.000%, 03/22/2029 | | | | | 7,911,961 | | | | | | 0.1 | | |
| 480,293 | | | American Airlines 2015-2 Class AA Pass Through Trust, 3.600%, 03/22/2029 | | | | | 467,863 | | | | | | 0.0 | | |
| 5,396,342 | | | American Airlines 2016-1 Class A Pass Through Trust, 4.100%, 07/15/2029 | | | | | 4,973,848 | | | | | | 0.1 | | |
| 876,882 | | | American Airlines 2016-2 Class A Pass Through Trust, 3.650%, 12/15/2029 | | | | | 778,171 | | | | | | 0.0 | | |
| 3,931,059 | | | American Airlines 2016-2 Class AA Pass Through Trust, 3.200%, 12/15/2029 | | | | | 3,740,243 | | | | | | 0.0 | | |
| 2,515,624 (2) | | | American Airlines 2016-3 Class A Pass Through Trust, 3.250%, 04/15/2030 | | | | | 2,258,885 | | | | | | 0.0 | | |
| 1,149,885 | | | American Airlines 2017-1 Class A Pass Through Trust, 4.000%, 08/15/2030 | | | | | 1,061,918 | | | | | | 0.0 | | |
| 2,354,709 | | | American Airlines 2017-2 Class A Pass Through Trust, 3.600%, 04/15/2031 | | | | | 2,177,455 | | | | | | 0.0 | | |
| 570,643 | | | American Airlines 2017-2 Class AA Pass Through Trust, 3.350%, 04/15/2031 | | | | | 548,409 | | | | | | 0.0 | | |
| 4,900,000 | | | Asbury Automotive Group, Inc., 4.750%, 03/01/2030 | | | | | 4,630,745 | | | | | | 0.1 | | |
| 10,000,000 | | | Bath & Body Works, Inc., 6.750%, 07/01/2036 | | | | | 10,204,450 | | | | | | 0.1 | | |
| 1,416,309 (1) | | | British Airways 2020-1 Class A Pass Through Trust, 4.250%, 05/15/2034 | | | | | 1,419,562 | | | | | | 0.0 | | |
| 8,250,000 (1)(2) | | | CK Hutchison International 21 Ltd., 2.500%, 04/15/2031 | | | | | 7,615,939 | | | | | | 0.1 | | |
| 276,549 | | | Continental Airlines 2012-2 Class A Pass Through Trust, 4.000%, 04/29/2026 | | | | | 276,116 | | | | | | 0.0 | | |
| 4,640,000 (1) | | | Daimler Finance North America LLC, 2.125%, 03/10/2025 | | | | | 4,483,171 | | | | | | 0.1 | | |
| Voya Intermediate Bond Fund | as of March 31, 2022 (continued) |
| Principal Amount† | | | Value | | | Percentage of Net Assets | | |||||||||
| CORPORATE BONDS/NOTES: (continued) | | |||||||||||||||
| | | | Consumer, Cyclical (continued) | | ||||||||||||
| 5,000,000 (1) | | | Daimler Finance North America LLC, 2.550%, 08/15/2022 | | | | $ | 5,018,267 | | | | | | 0.1 | | |
| 2,895,000 (2) | | | Dana, Inc., 5.375%, 11/15/2027 | | | | | 2,880,742 | | | | | | 0.0 | | |
| 6,165,000 | | | Dana, Inc., 5.625%, 06/15/2028 | | | | | 6,237,346 | | | | | | 0.1 | | |
| 1,274,476 | | | Delta Air Lines 2015-1 Class AA Pass Through Trust, 3.625%, 01/30/2029 | | | | | 1,264,434 | | | | | | 0.0 | | |
| 4,433,824 | | | Delta Air Lines 2020-1 Class A Pass Through Trust, 2.500%, 12/10/2029 | | | | | 4,120,176 | | | | | | 0.1 | | |
| 2,975,000 (1) | | | Delta Air Lines, Inc. / SkyMiles IP Ltd., 4.500%, 10/20/2025 | | | | | 2,994,625 | | | | | | 0.0 | | |
| 4,762,884 (1) | | | Delta Air Lines, Inc. / SkyMiles IP Ltd., 4.750%, 10/20/2028 | | | | | 4,807,672 | | | | | | 0.1 | | |
| 1,920,000 (1) | | | Falabella SA, 3.375%, 01/15/2032 | | | | | 1,794,346 | | | | | | 0.0 | | |
| 1,650,000 | | | Falabella SA, 3.750%, 10/30/2027 | | | | | 1,659,455 | | | | | | 0.0 | | |
| 1,900,000 | | | Ford Motor Credit Co. LLC, 4.000%, 11/13/2030 | | | | | 1,792,251 | | | | | | 0.0 | | |
| 3,720,000 | | | Ford Motor Credit Co. LLC, 5.113%, 05/03/2029 | | | | | 3,748,644 | | | | | | 0.0 | | |
| 9,750,000 (1)(2) | | | Gap, Inc./The, 3.875%, 10/01/2031 | | | | | 8,512,237 | | | | | | 0.1 | | |
| 4,946,000 | | | General Motors Co., 5.400%, 04/01/2048 | | | | | 5,219,557 | | | | | | 0.1 | | |
| 2,333,000 | | | General Motors Co., 6.125%, 10/01/2025 | | | | | 2,506,717 | | | | | | 0.0 | | |
| 5,150,000 (2) | | | General Motors Financial Co., Inc., 2.350%, 02/26/2027 | | | | | 4,811,181 | | | | | | 0.1 | | |
| 3,665,000 | | | General Motors Financial Co., Inc., 4.150%, 06/19/2023 | | | | | 3,720,516 | | | | | | 0.0 | | |
| 1,732,000 | | | General Motors Financial Co., Inc., 4.350%, 01/17/2027 | | | | | 1,764,007 | | | | | | 0.0 | | |
| 1,000,000 (1) | | | Genm Capital Labuan Ltd., 3.882%, 04/19/2031 | | | | | 872,702 | | | | | | 0.0 | | |
| 9,550,000 (1) | | | H&E Equipment Services, Inc., 3.875%, 12/15/2028 | | | | | 8,965,015 | | | | | | 0.1 | | |
| 10,905,000 (1) | | | Harley-Davidson Financial Services, Inc., 3.050%, 02/14/2027 | | | | | 10,392,144 | | | | | | 0.1 | | |
| 3,750,000 (2) | | | Hasbro, Inc., 3.000%, 11/19/2024 | | | | | 3,723,267 | | | | | | 0.0 | | |
| Principal Amount† | | | Value | | | Percentage of Net Assets | | |||||||||
| CORPORATE BONDS/NOTES: (continued) | | |||||||||||||||
| | | | Consumer, Cyclical (continued) | | ||||||||||||
| 2,518,000 | | | Home Depot, Inc./The, 3.250%, 04/15/2032 | | | | $ | 2,522,413 | | | | | | 0.0 | | |
| 3,020,000 | | | Home Depot, Inc./The, 3.625%, 04/15/2052 | | | | | 3,002,673 | | | | | | 0.0 | | |
| 3,995,000 (2) | | | Honda Motor Co. Ltd., 2.967%, 03/10/2032 | | | | | 3,868,905 | | | | | | 0.0 | | |
| 5,725,000 (1) | | | InRetail Consumer, 3.250%, 03/22/2028 | | | | | 5,378,952 | | | | | | 0.1 | | |
| 2,557,000 | | | Lowe’s Cos, Inc., 3.750%, 04/01/2032 | | | | | 2,587,654 | | | | | | 0.0 | | |
| 2,045,000 | | | Lowe’s Cos, Inc., 4.250%, 04/01/2052 | | | | | 2,118,478 | | | | | | 0.0 | | |
| 2,094,000 | | | Lowe’s Cos, Inc., 4.450%, 04/01/2062 | | | | | 2,182,622 | | | | | | 0.0 | | |
| 9,092,000 (1)(2) | | | Magallanes, Inc., 3.755%, 03/15/2027 | | | | | 9,090,617 | | | | | | 0.1 | | |
| 4,258,000 (1) | | | Magallanes, Inc., 4.279%, 03/15/2032 | | | | | 4,282,218 | | | | | | 0.1 | | |
| 5,303,000 (1) | | | Magallanes, Inc., 5.050%, 03/15/2042 | | | | | 5,420,215 | | | | | | 0.1 | | |
| 6,560,000 (1) | | | Magallanes, Inc., 5.141%, 03/15/2052 | | | | | 6,727,088 | | | | | | 0.1 | | |
| 2,642,000 (1) | | | Magallanes, Inc., 5.391%, 03/15/2062 | | | | | 2,737,319 | | | | | | 0.0 | | |
| 2,795,000 (2) | | | McDonald’s Corp., 3.500%, 07/01/2027 | | | | | 2,845,619 | | | | | | 0.0 | | |
| 4,305,000 (2) | | | MGM Resorts International, 5.500%, 04/15/2027 | | | | | 4,355,476 | | | | | | 0.1 | | |
| 4,338,000 (1) | | | Mileage Plus Holdings LLC / Mileage Plus Intellectual Property Assets Ltd., 6.500%, 06/20/2027 | | | | | 4,527,788 | | | | | | 0.1 | | |
| 6,054,000 (1) | | | Nissan Motor Co. Ltd., 4.810%, 09/17/2030 | | | | | 6,014,107 | | | | | | 0.1 | | |
| 8,500,000 (1)(2) | | | Sonic Automotive, Inc., 4.875%, 11/15/2031 | | | | | 7,559,050 | | | | | | 0.1 | | |
| 4,610,000 (1)(2) | | | Tempur Sealy International, Inc., 4.000%, 04/15/2029 | | | | | 4,196,714 | | | | | | 0.1 | | |
| 4,414,000 | | | Toyota Motor Credit Corp., 1.150%, 08/13/2027 | | | | | 4,006,766 | | | | | | 0.0 | | |
| 4,238,000 | | | Toyota Motor Credit Corp., 2.150%, 02/13/2030 | | | | | 3,935,798 | | | | | | 0.0 | | |
| 4,014,000 | | | Toyota Motor Credit Corp., 3.050%, 03/22/2027 | | | | | 4,010,052 | | | | | | 0.1 | | |
| 1,322,070 | | | United Airlines 2012-1 Class A Pass Through Trust, 4.150%, 10/11/2025 | | | | | 1,327,512 | | | | | | 0.0 | | |
| Voya Intermediate Bond Fund | as of March 31, 2022 (continued) |
| Principal Amount† | | | Value | | | Percentage of Net Assets | | |||||||||
| CORPORATE BONDS/NOTES: (continued) | | |||||||||||||||
| | | | Consumer, Cyclical (continued) | | ||||||||||||
| 822,096 | | | United Airlines 2013-1 Class A Pass Through Trust, 4.300%, 02/15/2027 | | | | $ | 822,232 | | | | | | 0.0 | | |
| 1,646,755 | | | United Airlines 2014-1 Class A Pass Through Trust, 4.000%, 10/11/2027 | | | | | 1,655,612 | | | | | | 0.0 | | |
| 385,852 | | | United Airlines 2016-1 Class AA Pass Through Trust, 3.100%, 01/07/2030 | | | | | 374,660 | | | | | | 0.0 | | |
| 2,980,727 | | | United Airlines 2016-2 Class A Pass Through Trust, 3.100%, 04/07/2030 | | | | | 2,737,616 | | | | | | 0.0 | | |
| 7,328,804 | | | United Airlines 2016-2 Class AA Pass Through Trust, 2.875%, 04/07/2030 | | | | | 6,963,970 | | | | | | 0.1 | | |
| 2,087,107 | | | United Airlines 2019-2 Class A Pass Through Trust, 2.900%, 11/01/2029 | | | | | 1,898,730 | | | | | | 0.0 | | |
| 3,219,386 | | | United Airlines 2020-1 Class A Pass Through Trust, 5.875%, 04/15/2029 | | | | | 3,337,731 | | | | | | 0.0 | | |
| 5,921,122 | | | US Airways 2012-1 Class A Pass Through Trust, 5.900%, 04/01/2026 | | | | | 6,124,523 | | | | | | 0.1 | | |
| 584,661 | | | US Airways 2012-2 Class A Pass Through Trust, 4.625%, 12/03/2026 | | | | | 564,297 | | | | | | 0.0 | | |
| 9,625,000 (1)(2) | | | Wolverine World Wide, Inc., 4.000%, 08/15/2029 | | | | | 8,559,513 | | | | | | 0.1 | | |
| 1,915,000 (1)(2) | | | Wyndham Hotels & Resorts, Inc., 4.375%, 08/15/2028 | | | | | 1,845,399 | | | | | | 0.0 | | |
| | | | | | | | | 289,287,047 | | | | | | 3.1 | | |
| | | | Consumer, Non-cyclical: 5.9% | | ||||||||||||
| 2,740,000 | | | AbbVie, Inc., 2.300%, 11/21/2022 | | | | | 2,750,126 | | | | | | 0.0 | | |
| 5,636,000 | | | AbbVie, Inc., 2.600%, 11/21/2024 | | | | | 5,602,217 | | | | | | 0.1 | | |
| 3,442,000 | | | AbbVie, Inc., 2.900%, 11/06/2022 | | | | | 3,465,174 | | | | | | 0.0 | | |
| 1,609,000 | | | AbbVie, Inc., 4.050%, 11/21/2039 | | | | | 1,657,977 | | | | | | 0.0 | | |
| 10,195,000 | | | AbbVie, Inc., 4.300%, 05/14/2036 | | | | | 10,669,643 | | | | | | 0.1 | | |
| 4,325,000 | | | AbbVie, Inc., 4.400%, 11/06/2042 | | | | | 4,576,164 | | | | | | 0.1 | | |
| 601,000 | | | AbbVie, Inc., 4.450%, 05/14/2046 | | | | | 640,449 | | | | | | 0.0 | | |
| 7,965,000 | | | AbbVie, Inc., 4.500%, 05/14/2035 | | | | | 8,567,604 | | | | | | 0.1 | | |
| Principal Amount† | | | Value | | | Percentage of Net Assets | | |||||||||
| CORPORATE BONDS/NOTES: (continued) | | |||||||||||||||
| | | | Consumer, Non-cyclical (continued) | | ||||||||||||
| 1,538,000 | | | AbbVie, Inc., 4.550%, 03/15/2035 | | | | $ | 1,654,747 | | | | | | 0.0 | | |
| 2,298,000 | | | AbbVie, Inc., 4.625%, 10/01/2042 | | | | | 2,450,340 | | | | | | 0.0 | | |
| 4,825,000 (1)(2) | | | ADT Security Corp./The, 4.125%, 08/01/2029 | | | | | 4,487,491 | | | | | | 0.1 | | |
| 6,638,000 | | | Aetna, Inc., 4.500%, 05/15/2042 | | | | | 6,938,310 | | | | | | 0.1 | | |
| 3,398,000 | | | Aetna, Inc., 6.625%, 06/15/2036 | | | | | 4,294,659 | | | | | | 0.1 | | |
| 7,490,000 (1) | | | Albertsons Cos, Inc. / Safeway, Inc. / New Albertsons L.P. / Albertsons LLC, 3.500%, 03/15/2029 | | | | | 6,768,713 | | | | | | 0.1 | | |
| 1,760,000 (1) | | | Albertsons Cos, Inc. / Safeway, Inc. / New Albertsons L.P. / Albertsons LLC, 5.875%, 02/15/2028 | | | | | 1,757,272 | | | | | | 0.0 | | |
| 5,717,000 (2) | | | Altria Group, Inc., 2.450%, 02/04/2032 | | | | | 4,980,228 | | | | | | 0.1 | | |
| 4,971,000 | | | Altria Group, Inc., 3.700%, 02/04/2051 | | | | | 4,032,829 | | | | | | 0.1 | | |
| 533,000 | | | Altria Group, Inc., 4.800%, 02/14/2029 | | | | | 559,651 | | | | | | 0.0 | | |
| 1,325,000 | | | Altria Group, Inc., 5.800%, 02/14/2039 | | | | | 1,432,419 | | | | | | 0.0 | | |
| 1,326,000 | | | Altria Group, Inc., 5.950%, 02/14/2049 | | | | | 1,441,083 | | | | | | 0.0 | | |
| 8,000,000 (2) | | | AmerisourceBergen Corp., 3.400%, 05/15/2024 | | | | | 8,079,975 | | | | | | 0.1 | | |
| 10,519,000 | | | Anheuser-Busch Cos LLC / Anheuser-Busch InBev Worldwide, Inc., 4.700%, 02/01/2036 | | | | | 11,310,277 | | | | | | 0.1 | | |
| 10,000,000 | | | Anheuser-Busch Cos LLC / Anheuser-Busch InBev Worldwide, Inc., 4.900%, 02/01/2046 | | | | | 11,137,433 | | | | | | 0.1 | | |
| 2,495,000 | | | Anheuser-Busch InBev Finance, Inc., 4.000%, 01/17/2043 | | | | | 2,462,106 | | | | | | 0.0 | | |
| 4,324,000 | | | Anheuser-Busch InBev Worldwide, Inc., 5.450%, 01/23/2039 | | | | | 5,065,635 | | | | | | 0.1 | | |
| 1,598,000 | | | Anthem, Inc., 3.500%, 08/15/2024 | | | | | 1,622,656 | | | | | | 0.0 | | |
| 2,636,000 | | | Astrazeneca Finance LLC, 1.750%, 05/28/2028 | | | | | 2,434,184 | | | | | | 0.0 | | |
| Voya Intermediate Bond Fund | as of March 31, 2022 (continued) |
| Principal Amount† | | | Value | | | Percentage of Net Assets | | |||||||||
| CORPORATE BONDS/NOTES: (continued) | | |||||||||||||||
| | | | Consumer, Non-cyclical (continued) | | ||||||||||||
| 7,854,000 | | | AstraZeneca PLC, 3.375%, 11/16/2025 | | | | $ | 7,975,403 | | | | | | 0.1 | | |
| 14,471,000 | | | BAT Capital Corp., 2.259%, 03/25/2028 | | | | | 13,010,113 | | | | | | 0.1 | | |
| 2,393,000 | | | BAT Capital Corp., 2.726%, 03/25/2031 | | | | | 2,112,444 | | | | | | 0.0 | | |
| 1,005,000 | | | BAT Capital Corp., 3.557%, 08/15/2027 | | | | | 979,840 | | | | | | 0.0 | | |
| 2,393,000 (2) | | | BAT Capital Corp., 3.734%, 09/25/2040 | | | | | 1,965,906 | | | | | | 0.0 | | |
| 4,880,000 | | | BAT Capital Corp., 4.390%, 08/15/2037 | | | | | 4,548,781 | | | | | | 0.1 | | |
| 5,731,000 (2) | | | BAT International Finance PLC, 4.448%, 03/16/2028 | | | | | 5,755,486 | | | | | | 0.1 | | |
| 2,120,000 (1)(2) | | | Bausch Health Cos, Inc., 5.250%, 01/30/2030 | | | | | 1,668,747 | | | | | | 0.0 | | |
| 2,491,000 (1) | | | Baxter International, Inc., 1.915%, 02/01/2027 | | | | | 2,331,872 | | | | | | 0.0 | | |
| 4,955,000 (1) | | | Baxter International, Inc., 2.272%, 12/01/2028 | | | | | 4,594,829 | | | | | | 0.1 | | |
| 1,233,000 | | | Becton Dickinson and Co., 3.363%, 06/06/2024 | | | | | 1,244,099 | | | | | | 0.0 | | |
| 1,606,000 | | | Bio-Rad Laboratories, Inc., 3.300%, 03/15/2027 | | | | | 1,582,929 | | | | | | 0.0 | | |
| 162,000 (2) | | | Bristol-Myers Squibb Co., 2.550%, 11/13/2050 | | | | | 134,920 | | | | | | 0.0 | | |
| 2,246,000 (2) | | | Bristol-Myers Squibb Co., 2.950%, 03/15/2032 | | | | | 2,200,098 | | | | | | 0.0 | | |
| 1,426,000 (2) | | | Bristol-Myers Squibb Co., 3.550%, 03/15/2042 | | | | | 1,413,627 | | | | | | 0.0 | | |
| 8,267,000 | | | Bristol-Myers Squibb Co., 3.700%, 03/15/2052 | | | | | 8,333,210 | | | | | | 0.1 | | |
| 3,421,000 | | | Bristol-Myers Squibb Co., 4.125%, 06/15/2039 | | | | | 3,685,953 | | | | | | 0.0 | | |
| 2,201,000 | | | Bristol-Myers Squibb Co., 4.250%, 10/26/2049 | | | | | 2,410,302 | | | | | | 0.0 | | |
| 5,040,000 (1) | | | Cargill, Inc., 2.125%, 11/10/2031 | | | | | 4,560,170 | | | | | | 0.1 | | |
| 2,971,000 (1) | | | Cargill, Inc., 3.875%, 05/23/2049 | | | | | 3,103,555 | | | | | | 0.0 | | |
| 4,420,000 | | | Centene Corp., 4.625%, 12/15/2029 | | | | | 4,463,493 | | | | | | 0.1 | | |
| 9,230,000 (2) | | | Central Garden & Pet Co., 4.125%, 10/15/2030 | | | | | 8,345,443 | | | | | | 0.1 | | |
| 3,471,000 | | | Cigna Corp., 3.250%, 04/15/2025 | | | | | 3,492,943 | | | | | | 0.0 | | |
| 3,441,000 | | | Cigna Corp., 3.400%, 03/15/2050 | | | | | 3,111,556 | | | | | | 0.0 | | |
| 7,297,000 | | | Cigna Corp., 4.800%, 08/15/2038 | | | | | 8,012,833 | | | | | | 0.1 | | |
| Principal Amount† | | | Value | | | Percentage of Net Assets | | |||||||||
| CORPORATE BONDS/NOTES: (continued) | | |||||||||||||||
| | | | Consumer, Non-cyclical (continued) | | ||||||||||||
| 4,165,000 | | | Cigna Corp., 4.900%, 12/15/2048 | | | | $ | 4,687,270 | | | | | | 0.1 | | |
| 2,800,000 | | | Coca-Cola Co/The, 2.875%, 05/05/2041 | | | | | 2,592,453 | | | | | | 0.0 | | |
| 4,020,000 (2) | | | CVS Health Corp., 2.125%, 09/15/2031 | | | | | 3,597,741 | | | | | | 0.0 | | |
| 4,475,000 | | | CVS Health Corp., 2.700%, 08/21/2040 | | | | | 3,826,966 | | | | | | 0.0 | | |
| 2,465,000 | | | CVS Health Corp., 3.875%, 07/20/2025 | | | | | 2,517,140 | | | | | | 0.0 | | |
| 3,492,000 | | | CVS Health Corp., 4.125%, 04/01/2040 | | | | | 3,561,657 | | | | | | 0.0 | | |
| 2,326,000 | | | CVS Health Corp., 4.780%, 03/25/2038 | | | | | 2,548,048 | | | | | | 0.0 | | |
| 6,817,000 | | | CVS Health Corp., 5.050%, 03/25/2048 | | | | | 7,740,453 | | | | | | 0.1 | | |
| 7,379,000 (1) | | | Danone SA, 2.947%, 11/02/2026 | | | | | 7,346,794 | | | | | | 0.1 | | |
| 6,150,000 (1) | | | DaVita, Inc., 3.750%, 02/15/2031 | | | | | 5,388,784 | | | | | | 0.1 | | |
| 4,395,000 (1)(2) | | | DaVita, Inc., 4.625%, 06/01/2030 | | | | | 4,110,204 | | | | | | 0.1 | | |
| 4,189,000 (1) | | | Element Fleet Management Corp., 3.850%, 06/15/2025 | | | | | 4,198,472 | | | | | | 0.1 | | |
| 3,720,000 (1) | | | Fresenius Medical Care US Finance III, Inc., 1.875%, 12/01/2026 | | | | | 3,447,305 | | | | | | 0.0 | | |
| 4,340,000 | | | General Mills, Inc., 4.000%, 04/17/2025 | | | | | 4,434,535 | | | | | | 0.1 | | |
| 1,718,000 (2) | | | Gilead Sciences, Inc., 0.750%, 09/29/2023 | | | | | 1,678,631 | | | | | | 0.0 | | |
| 1,540,000 | | | Gilead Sciences, Inc., 3.500%, 02/01/2025 | | | | | 1,561,797 | | | | | | 0.0 | | |
| 4,928,000 (2) | | | Global Payments, Inc., 1.200%, 03/01/2026 | | | | | 4,546,614 | | | | | | 0.1 | | |
| 11,343,000 | | | Global Payments, Inc., 2.650%, 02/15/2025 | | | | | 11,109,986 | | | | | | 0.1 | | |
| 1,917,000 (1) | | | GSK Consumer Healthcare Capital US LLC, 3.375%, 03/24/2029 | | | | | 1,898,866 | | | | | | 0.0 | | |
| 1,843,000 (1) | | | GXO Logistics, Inc., 1.650%, 07/15/2026 | | | | | 1,666,489 | | | | | | 0.0 | | |
| 2,570,000 (1)(2) | | | HCA, Inc., 3.125%, 03/15/2027 | | | | | 2,515,170 | | | | | | 0.0 | | |
| 1,995,000 (1) | | | HCA, Inc., 3.625%, 03/15/2032 | | | | | 1,957,208 | | | | | | 0.0 | | |
| 8,542,000 | | | HCA, Inc., 4.125%, 06/15/2029 | | | | | 8,718,791 | | | | | | 0.1 | | |
| Voya Intermediate Bond Fund | as of March 31, 2022 (continued) |
| Principal Amount† | | | Value | | | Percentage of Net Assets | | |||||||||
| CORPORATE BONDS/NOTES: (continued) | | |||||||||||||||
| | | | Consumer, Non-cyclical (continued) | | ||||||||||||
| 3,544,000 (1) | | | HCA, Inc., 4.375%, 03/15/2042 | | | | $ | 3,502,083 | | | | | | 0.0 | | |
| 3,076,000 | | | HCA, Inc., 4.500%, 02/15/2027 | | | | | 3,181,537 | | | | | | 0.0 | | |
| 1,425,000 | | | HCA, Inc., 5.125%, 06/15/2039 | | | | | 1,541,307 | | | | | | 0.0 | | |
| 1,449,000 | | | HCA, Inc., 5.250%, 04/15/2025 | | | | | 1,526,628 | | | | | | 0.0 | | |
| 622,000 | | | HCA, Inc., 5.250%, 06/15/2049 | | | | | 683,878 | | | | | | 0.0 | | |
| 1,820,000 (2) | | | HCA, Inc., 5.500%, 06/15/2047 | | | | | 2,061,624 | | | | | | 0.0 | | |
| 2,509,000 (1) | | | Health Care Service Corp. A Mutual Legal Reserve Co., 1.500%, 06/01/2025 | | | | | 2,389,973 | | | | | | 0.0 | | |
| 3,305,000 | | | Humana, Inc., 1.350%, 02/03/2027 | | | | | 2,998,842 | | | | | | 0.0 | | |
| 4,605,000 (2) | | | Humana, Inc., 2.150%, 02/03/2032 | | | | | 4,042,794 | | | | | | 0.1 | | |
| 909,000 | | | Humana, Inc., 3.125%, 08/15/2029 | | | | | 880,885 | | | | | | 0.0 | | |
| 4,873,000 | | | Humana, Inc., 4.500%, 04/01/2025 | | | | | 5,051,567 | | | | | | 0.1 | | |
| 3,350,000 (1) | | | Hutama Karya Persero PT, 3.750%, 05/11/2030 | | | | | 3,373,379 | | | | | | 0.0 | | |
| 3,705,000 (2) | | | Johnson & Johnson, 3.625%, 03/03/2037 | | | | | 3,838,986 | | | | | | 0.1 | | |
| 1,506,000 (2) | | | Johnson & Johnson, 3.700%, 03/01/2046 | | | | | 1,592,187 | | | | | | 0.0 | | |
| 4,801,000 | | | Johnson & Johnson, 3.750%, 03/03/2047 | | | | | 5,149,201 | | | | | | 0.1 | | |
| 4,490,000 | | | Kraft Heinz Foods Co., 4.625%, 10/01/2039 | | | | | 4,572,751 | | | | | | 0.1 | | |
| 3,255,000 | | | Kraft Heinz Foods Co., 6.875%, 01/26/2039 | | | | | 4,011,788 | | | | | | 0.1 | | |
| 1,400,000 | | | Laboratory Corp. of America Holdings, 3.250%, 09/01/2024 | | | | | 1,406,875 | | | | | | 0.0 | | |
| 1,434,000 | | | Laboratory Corp. of America Holdings, 4.000%, 11/01/2023 | | | | | 1,453,912 | | | | | | 0.0 | | |
| 10,340,000 (1)(2) | | | Lamb Weston Holdings, Inc., 4.375%, 01/31/2032 | | | | | 9,676,379 | | | | | | 0.1 | | |
| 3,585,000 (1)(2) | | | Mars, Inc., 0.875%, 07/16/2026 | | | | | 3,266,937 | | | | | | 0.0 | | |
| 2,495,000 (1) | | | Mars, Inc., 3.875%, 04/01/2039 | | | | | 2,530,693 | | | | | | 0.0 | | |
| 841,000 (1) | | | Mars, Inc., 4.125%, 04/01/2054 | | | | | 901,368 | | | | | | 0.0 | | |
| 4,730,000 | | | McKesson Corp., 1.300%, 08/15/2026 | | | | | 4,348,989 | | | | | | 0.1 | | |
| Principal Amount† | | | Value | | | Percentage of Net Assets | | |||||||||
| CORPORATE BONDS/NOTES: (continued) | | |||||||||||||||
| | | | Consumer, Non-cyclical (continued) | | ||||||||||||
| 1,484,000 | | | Medtronic, Inc., 4.375%, 03/15/2035 | | | | $ | 1,651,724 | | | | | | 0.0 | | |
| 2,027,000 | | | Merck & Co., Inc., 2.750%, 12/10/2051 | | | | | 1,769,816 | | | | | | 0.0 | | |
| 2,095,000 | | | Merck & Co., Inc., 2.900%, 12/10/2061 | | | | | 1,789,561 | | | | | | 0.0 | | |
| 9,750,000 (1) | | | Mozart Debt Merger Sub, Inc., 3.875%, 04/01/2029 | | | | | 9,031,181 | | | | | | 0.1 | | |
| 4,946,000 | | | Mylan, Inc., 5.200%, 04/15/2048 | | | | | 4,866,432 | | | | | | 0.1 | | |
| 4,616,000 (1)(2) | | | Nestle Holdings, Inc., 1.500%, 09/14/2028 | | | | | 4,159,086 | | | | | | 0.1 | | |
| 4,875,000 (1) | | | Organon & Co. / Organon Foreign Debt Co-Issuer BV, 4.125%, 04/30/2028 | | | | | 4,650,750 | | | | | | 0.1 | | |
| 3,295,000 (2) | | | PayPal Holdings, Inc., 2.850%, 10/01/2029 | | | | | 3,229,648 | | | | | | 0.0 | | |
| 712,000 (2) | | | PerkinElmer, Inc., 1.900%, 09/15/2028 | | | | | 644,990 | | | | | | 0.0 | | |
| 3,682,000 | | | PerkinElmer, Inc., 3.300%, 09/15/2029 | | | | | 3,595,357 | | | | | | 0.0 | | |
| 1,689,000 | | | Philip Morris International, Inc., 3.875%, 08/21/2042 | | | | | 1,576,562 | | | | | | 0.0 | | |
| 3,510,000 (1)(2) | | | Pilgrim’s Pride Corp., 3.500%, 03/01/2032 | | | | | 3,071,952 | | | | | | 0.0 | | |
| 6,400,000 (1) | | | Pilgrim’s Pride Corp., 4.250%, 04/15/2031 | | | | | 5,933,632 | | | | | | 0.1 | | |
| 1,330,000 (1) | | | Post Holdings, Inc., 4.625%, 04/15/2030 | | | | | 1,199,793 | | | | | | 0.0 | | |
| 8,000,000 (1) | | | Post Holdings, Inc., 5.500%, 12/15/2029 | | | | | 7,709,840 | | | | | | 0.1 | | |
| 9,830,000 (1) | | | Prestige Brands, Inc., 3.750%, 04/01/2031 | | | | | 8,792,640 | | | | | | 0.1 | | |
| 10,350,000 (1) | | | Primo Water Holdings, Inc., 4.375%, 04/30/2029 | | | | | 9,381,188 | | | | | | 0.1 | | |
| 1,488,000 | | | Regeneron Pharmaceuticals, Inc., 1.750%, 09/15/2030 | | | | | 1,293,206 | | | | | | 0.0 | | |
| 3,755,000 | | | Reynolds American, Inc., 5.700%, 08/15/2035 | | | | | 3,971,287 | | | | | | 0.1 | | |
| 3,028,000 | | | Reynolds American, Inc., 5.850%, 08/15/2045 | | | | | 3,125,983 | | | | | | 0.0 | | |
| 818,000 | | | Reynolds American, Inc., 6.150%, 09/15/2043 | | | | | 867,574 | | | | | | 0.0 | | |
| 3,480,000 (1)(2) | | | Roche Holdings, Inc., 1.930%, 12/13/2028 | | | | | 3,238,420 | | | | | | 0.0 | | |
| 6,490,000 (1)(2) | | | Roche Holdings, Inc., 2.076%, 12/13/2031 | | | | | 5,978,586 | | | | | | 0.1 | | |
| 2,915,000 (1) | | | Roche Holdings, Inc., 2.607%, 12/13/2051 | | | | | 2,530,729 | | | | | | 0.0 | | |
| Voya Intermediate Bond Fund | as of March 31, 2022 (continued) |
| Principal Amount† | | | Value | | | Percentage of Net Assets | | |||||||||
| CORPORATE BONDS/NOTES: (continued) | | |||||||||||||||
| | | | Consumer, Non-cyclical (continued) | | ||||||||||||
| 1,626,000 | | | Royalty Pharma PLC, 1.200%, 09/02/2025 | | | | $ | 1,497,493 | | | | | | 0.0 | | |
| 2,055,000 (2) | | | Royalty Pharma PLC, 1.750%, 09/02/2027 | | | | | 1,868,530 | | | | | | 0.0 | | |
| 2,921,000 (2) | | | Royalty Pharma PLC, 2.200%, 09/02/2030 | | | | | 2,558,229 | | | | | | 0.0 | | |
| 13,026,000 | | | Royalty Pharma PLC, 3.550%, 09/02/2050 | | | | | 10,861,347 | | | | | | 0.1 | | |
| 5,049,000 (1) | | | S&P Global, Inc., 2.700%, 03/01/2029 | | | | | 4,898,141 | | | | | | 0.1 | | |
| 2,110,000 (1)(2) | | | S&P Global, Inc., 3.700%, 03/01/2052 | | | | | 2,145,860 | | | | | | 0.0 | | |
| 1,457,000 (1) | | | S&P Global, Inc., 3.900%, 03/01/2062 | | | | | 1,502,969 | | | | | | 0.0 | | |
| 3,420,000 | | | Takeda Pharmaceutical Co. Ltd., 2.050%, 03/31/2030 | | | | | 3,091,357 | | | | | | 0.0 | | |
| 9,250,000 (1) | | | Tenet Healthcare Corp., 4.250%, 06/01/2029 | | | | | 8,880,555 | | | | | | 0.1 | | |
| 2,461,000 (1) | | | Triton Container International Ltd., 2.050%, 04/15/2026 | | | | | 2,297,828 | | | | | | 0.0 | | |
| 2,636,000 (1) | | | Triton Container International Ltd., 3.150%, 06/15/2031 | | | | | 2,412,840 | | | | | | 0.0 | | |
| 4,190,000 (2) | | | United Rentals North America, Inc., 4.000%, 07/15/2030 | | | | | 4,014,711 | | | | | | 0.1 | | |
| 1,470,000 (2) | | | UnitedHealth Group, Inc., 2.750%, 05/15/2040 | | | | | 1,325,091 | | | | | | 0.0 | | |
| 748,000 | | | UnitedHealth Group, Inc., 3.050%, 05/15/2041 | | | | | 698,390 | | | | | | 0.0 | | |
| 5,425,000 | | | UnitedHealth Group, Inc., 3.250%, 05/15/2051 | | | | | 5,112,997 | | | | | | 0.1 | | |
| 2,117,000 | | | UnitedHealth Group, Inc., 3.500%, 08/15/2039 | | | | | 2,107,486 | | | | | | 0.0 | | |
| 4,990,000 | | | Viatris, Inc., 2.700%, 06/22/2030 | | | | | 4,396,083 | | | | | | 0.1 | | |
| 9,504,000 | | | Viatris, Inc., 3.850%, 06/22/2040 | | | | | 8,244,747 | | | | | | 0.1 | | |
| 3,086,000 (1) | | | Viterra Finance BV, 2.000%, 04/21/2026 | | | | | 2,845,358 | | | | | | 0.0 | | |
| | | | | | | | | 556,333,800 | | | | | | 5.9 | | |
| | | | Energy: 3.9% | | ||||||||||||
| 5,000,000 (1)(2) | | | Antero Resources Corp., 5.375%, 03/01/2030 | | | | | 5,113,800 | | | | | | 0.1 | | |
| 9,210,000 | | | Apache Corp., 5.100%, 09/01/2040 | | | | | 9,297,357 | | | | | | 0.1 | | |
| Principal Amount† | | | Value | | | Percentage of Net Assets | | |||||||||
| CORPORATE BONDS/NOTES: (continued) | | |||||||||||||||
| | | | Energy (continued) | | ||||||||||||
| 1,924,000 (2) | | | Baker Hughes Holdings LLC / Baker Hughes Co-Obligor, Inc., 2.061%, 12/15/2026 | | | | $ | 1,835,040 | | | | | | 0.0 | | |
| 2,621,000 (2) | | | BP Capital Markets America, Inc., 1.749%, 08/10/2030 | | | | | 2,321,405 | | | | | | 0.0 | | |
| 2,647,000 | | | BP Capital Markets America, Inc., 3.379%, 02/08/2061 | | | | | 2,365,653 | | | | | | 0.0 | | |
| 3,610,000 (3) | | | BP Capital Markets PLC, 4.875%, 12/31/2199 | | | | | 3,630,306 | | | | | | 0.1 | | |
| 1,220,000 | | | Canadian Natural Resources Ltd., 6.750%, 02/01/2039 | | | | | 1,506,176 | | | | | | 0.0 | | |
| 3,260,000 | | | Cenovus Energy, Inc., 5.400%, 06/15/2047 | | | | | 3,684,255 | | | | | | 0.1 | | |
| 3,309,000 (2) | | | Cenovus Energy, Inc./CA, 3.750%, 02/15/2052 | | | | | 2,971,268 | | | | | | 0.0 | | |
| 2,001,000 | | | Cheniere Corpus Christi Holdings LLC, 3.700%, 11/15/2029 | | | | | 1,997,870 | | | | | | 0.0 | | |
| 533,000 | | | Cheniere Corpus Christi Holdings LLC, 5.125%, 06/30/2027 | | | | | 568,803 | | | | | | 0.0 | | |
| 1,140,000 (1) | | | ConocoPhillips Co., 4.025%, 03/15/2062 | | | | | 1,159,284 | | | | | | 0.0 | | |
| 2,765,000 (2) | | | Continental Resources, Inc., 4.900%, 06/01/2044 | | | | | 2,741,447 | | | | | | 0.0 | | |
| 6,000,000 (1) | | | Coterra Energy, Inc., 3.900%, 05/15/2027 | | | | | 6,054,384 | | | | | | 0.1 | | |
| 9,480,000 (1) | | | Crestwood Midstream Partners L.P. / Crestwood Midstream Finance Corp., 5.625%, 05/01/2027 | | | | | 9,412,882 | | | | | | 0.1 | | |
| 3,233,000 (2) | | | Diamondback Energy, Inc., 3.125%, 03/24/2031 | | | | | 3,093,133 | | | | | | 0.0 | | |
| 8,892,000 | | | Diamondback Energy, Inc., 3.500%, 12/01/2029 | | | | | 8,818,297 | | | | | | 0.1 | | |
| 54,000 (2) | | | Diamondback Energy, Inc., 4.400%, 03/24/2051 | | | | | 54,999 | | | | | | 0.0 | | |
| 8,250,000 | | | Ecopetrol SA, 6.875%, 04/29/2030 | | | | | 8,671,492 | | | | | | 0.1 | | |
| 3,450,000 (1) | | | EIG Pearl Holdings Sarl, 3.545%, 08/31/2036 | | | | | 3,296,623 | | | | | | 0.0 | | |
| 7,100,000 | | | Empresa Nacional del Petroleo, 3.750%, 08/05/2026 | | | | | 7,083,102 | | | | | | 0.1 | | |
| Voya Intermediate Bond Fund | as of March 31, 2022 (continued) |
| Principal Amount† | | | Value | | | Percentage of Net Assets | | |||||||||
| CORPORATE BONDS/NOTES: (continued) | | |||||||||||||||
| | | | Energy (continued) | | ||||||||||||
| 400,000 (1) | | | Empresa Nacional del Petroleo, 3.750%, 08/05/2026 | | | | $ | 399,048 | | | | | | 0.0 | | |
| 5,373,000 (2)(3) | | | Enbridge, Inc., 5.750%, 07/15/2080 | | | | | 5,574,487 | | | | | | 0.1 | | |
| 325,000 | | | Energy Transfer L.P., 4.250%, 04/01/2024 | | | | | 331,519 | | | | | | 0.0 | | |
| 645,000 | | | Energy Transfer L.P., 4.900%, 03/15/2035 | | | | | 654,302 | | | | | | 0.0 | | |
| 4,946,000 | | | Energy Transfer L.P., 5.300%, 04/01/2044 | | | | | 5,105,245 | | | | | | 0.1 | | |
| 7,500,000 | | | Energy Transfer L.P., 5.300%, 04/15/2047 | | | | | 7,736,439 | | | | | | 0.1 | | |
| 1,003,000 | | | Energy Transfer L.P., 5.350%, 05/15/2045 | | | | | 1,035,893 | | | | | | 0.0 | | |
| 3,075,000 | | | Energy Transfer L.P., 5.800%, 06/15/2038 | | | | | 3,339,536 | | | | | | 0.0 | | |
| 1,263,000 | | | Energy Transfer L.P. / Regency Energy Finance Corp., 4.500%, 11/01/2023 | | | | | 1,282,810 | | | | | | 0.0 | | |
| 1,389,000 | | | Enterprise Products Operating LLC, 3.950%, 01/31/2060 | | | | | 1,296,155 | | | | | | 0.0 | | |
| 3,800,000 (2)(3) | | | Enterprise Products Operating LLC, 4.875%, 08/16/2077 | | | | | 3,400,313 | | | | | | 0.0 | | |
| 2,642,000 (2) | | | Equinor ASA, 3.125%, 04/06/2030 | | | | | 2,635,224 | | | | | | 0.0 | | |
| 825,000 (1)(2) | | | Galaxy Pipeline Assets Bidco Ltd., 2.160%, 03/31/2034 | | | | | 761,715 | | | | | | 0.0 | | |
| 1,000,000 (1) | | | Galaxy Pipeline Assets Bidco Ltd., 2.940%, 09/30/2040 | | | | | 905,694 | | | | | | 0.0 | | |
| 3,450,000 | | | Gazprom PJSC Via Gaz Capital SA, 4.950%, 02/06/2028 | | | | | 1,480,050 | | | | | | 0.0 | | |
| 3,250,000 (1) | | | Gazprom PJSC via Gaz Finance PLC, 2.950%, 01/27/2029 | | | | | 1,316,250 | | | | | | 0.0 | | |
| 9,050,000 (1) | | | Gazprom PJSC via Gaz Finance PLC, 3.250%, 02/25/2030 | | | | | 3,801,000 | | | | | | 0.1 | | |
| 9,800,000 (1)(3) | | | Gazprom PJSC via Gaz Finance PLC, 4.599%, 12/31/2199 | | | | | 2,450,000 | | | | | | 0.0 | | |
| 163,000 | | | Halliburton Co., 3.500%, 08/01/2023 | | | | | 164,573 | | | | | | 0.0 | | |
| 136,000 (2) | | | Halliburton Co., 3.800%, 11/15/2025 | | | | | 139,041 | | | | | | 0.0 | | |
| Principal Amount† | | | Value | | | Percentage of Net Assets | | |||||||||
| CORPORATE BONDS/NOTES: (continued) | | |||||||||||||||
| | | | Energy (continued) | | ||||||||||||
| 9,127,000 (2) | | | Hess Corp., 5.600%, 02/15/2041 | | | | $ | 10,281,989 | | | | | | 0.1 | | |
| 9,750,000 (1) | | | Hess Midstream Operations L.P., 4.250%, 02/15/2030 | | | | | 9,216,675 | | | | | | 0.1 | | |
| 5,775,000 | | | KazMunayGas National Co. JSC, 4.750%, 04/19/2027 | | | | | 5,616,534 | | | | | | 0.1 | | |
| 2,650,000 | | | KazMunayGas National Co. JSC, 5.375%, 04/24/2030 | | | | | 2,553,787 | | | | | | 0.0 | | |
| 1,575,000 (1) | | | KazMunayGas National Co. JSC, 5.375%, 04/24/2030 | | | | | 1,517,817 | | | | | | 0.0 | | |
| 1,295,000 | | | Kinder Morgan Energy Partners L.P., 4.250%, 09/01/2024 | | | | | 1,326,920 | | | | | | 0.0 | | |
| 2,332,000 | | | Kinder Morgan, Inc., 5.550%, 06/01/2045 | | | | | 2,614,755 | | | | | | 0.0 | | |
| 2,000,000 (1) | | | Lukoil Capital DAC, 3.600%, 10/26/2031 | | | | | 1,068,000 | | | | | | 0.0 | | |
| 1,971,000 (1) | | | Lundin Energy Finance BV, 2.000%, 07/15/2026 | | | | | 1,838,196 | | | | | | 0.0 | | |
| 3,850,000 | | | Marathon Petroleum Corp., 4.700%, 05/01/2025 | | | | | 4,005,175 | | | | | | 0.1 | | |
| 4,062,000 | | | Marathon Petroleum Corp., 4.750%, 09/15/2044 | | | | | 4,141,620 | | | | | | 0.1 | | |
| 1,443,000 | | | Marathon Petroleum Corp., 5.000%, 09/15/2054 | | | | | 1,477,751 | | | | | | 0.0 | | |
| 2,897,000 | | | MPLX L.P., 1.750%, 03/01/2026 | | | | | 2,718,420 | | | | | | 0.0 | | |
| 2,026,000 | | | MPLX L.P., 2.650%, 08/15/2030 | | | | | 1,859,383 | | | | | | 0.0 | | |
| 1,095,000 | | | MPLX L.P., 4.700%, 04/15/2048 | | | | | 1,106,474 | | | | | | 0.0 | | |
| 5,080,000 | | | MPLX L.P., 4.875%, 06/01/2025 | | | | | 5,268,329 | | | | | | 0.1 | | |
| 1,388,000 | | | MPLX L.P., 5.200%, 03/01/2047 | | | | | 1,492,523 | | | | | | 0.0 | | |
| 2,671,000 | | | MPLX L.P., 5.200%, 12/01/2047 | | | | | 2,842,459 | | | | | | 0.0 | | |
| 3,230,000 | | | MPLX L.P., 5.500%, 02/15/2049 | | | | | 3,588,064 | | | | | | 0.1 | | |
| 2,015,000 (1) | | | Northern Natural Gas Co., 3.400%, 10/16/2051 | | | | | 1,768,798 | | | | | | 0.0 | | |
| 2,187,000 | | | ONEOK Partners L.P., 6.125%, 02/01/2041 | | | | | 2,412,861 | | | | | | 0.0 | | |
| Voya Intermediate Bond Fund | as of March 31, 2022 (continued) |
| Principal Amount† | | | Value | | | Percentage of Net Assets | | |||||||||
| CORPORATE BONDS/NOTES: (continued) | | |||||||||||||||
| | | | Energy (continued) | | ||||||||||||
| 2,785,000 | | | ONEOK Partners L.P., 6.200%, 09/15/2043 | | | | $ | 3,072,342 | | | | | | 0.0 | | |
| 1,910,000 | | | ONEOK, Inc., 2.200%, 09/15/2025 | | | | | 1,831,671 | | | | | | 0.0 | | |
| 6,250,000 | | | Ovintiv Exploration, Inc., 5.625%, 07/01/2024 | | | | | 6,574,700 | | | | | | 0.1 | | |
| 5,000,000 (1)(2) | | | Pertamina Persero PT, 2.300%, 02/09/2031 | | | | | 4,418,750 | | | | | | 0.1 | | |
| 6,075,000 (1) | | | Pertamina Persero PT, 3.100%, 01/21/2030 | | | | | 5,768,998 | | | | | | 0.1 | | |
| 750,000 | | | Pertamina Persero PT, 5.625%, 05/20/2043 | | | | | 798,060 | | | | | | 0.0 | | |
| 16,250,000 (2) | | | Petrobras Global Finance BV, 5.600%, 01/03/2031 | | | | | 16,475,063 | | | | | | 0.2 | | |
| 4,000,000 (1)(2) | | | Petroleos del Peru SA, 4.750%, 06/19/2032 | | | | | 3,589,500 | | | | | | 0.1 | | |
| 2,280,000 | | | Petroleos del Peru SA, 4.750%, 06/19/2032 | | | | | 2,046,015 | | | | | | 0.0 | | |
| 7,000,000 (2) | | | Petroleos Mexicanos, 5.950%, 01/28/2031 | | | | | 6,471,150 | | | | | | 0.1 | | |
| 11,603,000 (2) | | | Petroleos Mexicanos, 6.700%, 02/16/2032 | | | | | 11,034,917 | | | | | | 0.1 | | |
| 1,250,000 (1) | | | Petronas Capital Ltd., 2.480%, 01/28/2032 | | | | | 1,166,020 | | | | | | 0.0 | | |
| 4,200,000 (1) | | | Petronas Energy Canada Ltd., 2.112%, 03/23/2028 | | | | | 3,936,606 | | | | | | 0.1 | | |
| 1,425,000 | | | Phillips 66, 0.900%, 02/15/2024 | | | | | 1,379,885 | | | | | | 0.0 | | |
| 8,387,000 | | | Plains All American Pipeline L.P. / PAA Finance Corp., 3.550%, 12/15/2029 | | | | | 8,116,454 | | | | | | 0.1 | | |
| 3,962,000 (2) | | | Plains All American Pipeline L.P. / PAA Finance Corp., 4.500%, 12/15/2026 | | | | | 4,078,048 | | | | | | 0.1 | | |
| 3,468,000 | | | Plains All American Pipeline L.P. / PAA Finance Corp., 4.650%, 10/15/2025 | | | | | 3,565,679 | | | | | | 0.0 | | |
| 4,825,000 | | | Plains All American Pipeline L.P. / PAA Finance Corp., 4.900%, 02/15/2045 | | | | | 4,642,124 | | | | | | 0.1 | | |
| 510,000 | | | Plains All American Pipeline L.P. / PAA Finance Corp., 5.150%, 06/01/2042 | | | | | 495,791 | | | | | | 0.0 | | |
| 1,450,000 (1) | | | PTTEP Treasury Center Co. Ltd., 2.587%, 06/10/2027 | | | | | 1,390,818 | | | | | | 0.0 | | |
| Principal Amount† | | | Value | | | Percentage of Net Assets | | |||||||||
| CORPORATE BONDS/NOTES: (continued) | | |||||||||||||||
| | | | Energy (continued) | | ||||||||||||
| 950,000 (1) | | | Qatar Energy, 3.125%, 07/12/2041 | | | | $ | 866,729 | | | | | | 0.0 | | |
| 2,025,000 (1) | | | Qatar Energy, 3.300%, 07/12/2051 | | | | | 1,864,531 | | | | | | 0.0 | | |
| 10,500,000 (1)(2) | | | Reliance Industries Ltd., 2.875%, 01/12/2032 | | | | | 9,645,096 | | | | | | 0.1 | | |
| 5,250,000 (1)(2) | | | Reliance Industries Ltd., 3.625%, 01/12/2052 | | | | | 4,668,850 | | | | | | 0.1 | | |
| 2,550,000 (1) | | | SA Global Sukuk Ltd., 2.694%, 06/17/2031 | | | | | 2,418,945 | | | | | | 0.0 | | |
| 1,890,000 | | | Sabine Pass Liquefaction LLC, 4.200%, 03/15/2028 | | | | | 1,944,401 | | | | | | 0.0 | | |
| 2,203,000 | | | Sabine Pass Liquefaction LLC, 5.000%, 03/15/2027 | | | | | 2,332,285 | | | | | | 0.0 | | |
| 2,150,000 | | | Sabine Pass Liquefaction LLC, 5.625%, 03/01/2025 | | | | | 2,274,593 | | | | | | 0.0 | | |
| 3,104,000 (1)(2) | | | Santos Finance Ltd., 3.649%, 04/29/2031 | | | | | 2,903,578 | | | | | | 0.0 | | |
| 3,750,000 (1) | | | Saudi Arabian Oil Co., 2.250%, 11/24/2030 | | | | | 3,446,415 | | | | | | 0.0 | | |
| 1,750,000 (1) | | | Saudi Arabian Oil Co., 3.250%, 11/24/2050 | | | | | 1,504,542 | | | | | | 0.0 | | |
| 2,675,000 (1) | | | Schlumberger Holdings Corp., 3.750%, 05/01/2024 | | | | | 2,725,446 | | | | | | 0.0 | | |
| 3,000,000 (1)(2) | | | Schlumberger Investment SA, 2.400%, 08/01/2022 | | | | | 3,002,106 | | | | | | 0.0 | | |
| 4,360,000 | | | Shell International Finance BV, 4.125%, 05/11/2035 | | | | | 4,617,401 | | | | | | 0.1 | | |
| 4,675,000 (2) | | | Southwestern Energy Co., 5.375%, 02/01/2029 | | | | | 4,739,842 | | | | | | 0.1 | | |
| 3,000,000 (1) | | | Tengizchevroil Finance Co. International Ltd., 3.250%, 08/15/2030 | | | | | 2,447,715 | | | | | | 0.0 | | |
| 4,282,000 | | | TotalEnergies Capital International SA, 2.986%, 06/29/2041 | | | | | 3,915,990 | | | | | | 0.1 | | |
| 1,290,000 | | | Transcontinental Gas Pipe Line Co. LLC, 3.250%, 05/15/2030 | | | | | 1,259,896 | | | | | | 0.0 | | |
| 1,207,000 | | | Valero Energy Corp., 2.850%, 04/15/2025 | | | | | 1,193,835 | | | | | | 0.0 | | |
| 2,975,000 | | | Valero Energy Corp., 3.650%, 12/01/2051 | | | | | 2,633,296 | | | | | | 0.0 | | |
| 9,065,000 (2) | | | Western Midstream Operating L.P., 5.300%, 03/01/2048 | | | | | 8,991,438 | | | | | | 0.1 | | |
| 10,875,000 | | | Williams Cos, Inc./The, 4.000%, 09/15/2025 | | | | | 11,077,037 | | | | | | 0.1 | | |
| Voya Intermediate Bond Fund | as of March 31, 2022 (continued) |
| Principal Amount† | | | Value | | | Percentage of Net Assets | | |||||||||
| CORPORATE BONDS/NOTES: (continued) | | |||||||||||||||
| | | | Energy (continued) | | ||||||||||||
| 2,726,000 | | | Williams Cos, Inc./The, 5.400%, 03/04/2044 | | | | $ | 3,007,154 | | | | | | 0.0 | | |
| | | | | | | | | 372,537,112 | | | | | | 3.9 | | |
| | | | Financial: 12.8% | | ||||||||||||
| 3,581,000 (1)(2)(3) | | | ABN AMRO Bank NV, 2.470%, 12/13/2029 | | | | | 3,276,288 | | | | | | 0.0 | | |
| 5,031,000 (1)(2)(3) | | | ABN AMRO Bank NV, 3.324%, 03/13/2037 | | | | | 4,578,255 | | | | | | 0.1 | | |
| 1,000,000 (3) | | | ABN AMRO Bank NV, 4.400%, 03/27/2028 | | | | | 1,005,893 | | | | | | 0.0 | | |
| 6,000,000 (1) | | | ABN AMRO Bank NV, 4.750%, 07/28/2025 | | | | | 6,141,732 | | | | | | 0.1 | | |
| 3,463,000 | | | AerCap Ireland Capital DAC / AerCap Global Aviation Trust, 3.300%, 01/30/2032 | | | | | 3,127,324 | | | | | | 0.0 | | |
| 10,894,000 | | | AerCap Ireland Capital DAC / AerCap Global Aviation Trust, 3.400%, 10/29/2033 | | | | | 9,786,166 | | | | | | 0.1 | | |
| 1,818,000 | | | Alexandria Real Estate Equities, Inc., 3.550%, 03/15/2052 | | | | | 1,694,713 | | | | | | 0.0 | | |
| 2,344,000 | | | Alleghany Corp., 3.625%, 05/15/2030 | | | | | 2,362,938 | | | | | | 0.0 | | |
| 6,085,000 | | | American Campus Communities Operating Partnership L.P., 2.250%, 01/15/2029 | | | | | 5,569,366 | | | | | | 0.1 | | |
| 2,537,000 | | | American Homes 4 Rent L.P., 2.375%, 07/15/2031 | | | | | 2,243,845 | | | | | | 0.0 | | |
| 1,993,000 | | | American Homes 4 Rent LP, 3.625%, 04/15/2032 | | | | | 1,943,514 | | | | | | 0.0 | | |
| 2,488,000 | | | American Homes 4 Rent LP, 4.300%, 04/15/2052 | | | | | 2,419,257 | | | | | | 0.0 | | |
| 4,934,000 | | | American International Group, Inc., 3.400%, 06/30/2030 | | | | | 4,927,620 | | | | | | 0.1 | | |
| 8,464,000 | | | American International Group, Inc., 3.875%, 01/15/2035 | | | | | 8,642,864 | | | | | | 0.1 | | |
| 3,670,000 | | | American International Group, Inc., 3.900%, 04/01/2026 | | | | | 3,767,303 | | | | | | 0.0 | | |
| 5,627,000 | | | American International Group, Inc., 4.250%, 03/15/2029 | | | | | 5,894,835 | | | | | | 0.1 | | |
| 1,147,000 | | | American International Group, Inc., 4.375%, 01/15/2055 | | | | | 1,230,700 | | | | | | 0.0 | | |
| Principal Amount† | | | Value | | | Percentage of Net Assets | | |||||||||
| CORPORATE BONDS/NOTES: (continued) | | |||||||||||||||
| | | | Financial (continued) | | ||||||||||||
| 4,248,000 | | | American International Group, Inc., 4.500%, 07/16/2044 | | | | $ | 4,597,168 | | | | | | 0.1 | | |
| 2,202,000 | | | American International Group, Inc., 4.800%, 07/10/2045 | | | | | 2,490,477 | | | | | | 0.0 | | |
| 2,537,000 | | | American Tower Corp., 3.650%, 03/15/2027 | | | | | 2,531,923 | | | | | | 0.0 | | |
| 799,000 (1) | | | Antares Holdings L.P., 3.750%, 07/15/2027 | | | | | 738,480 | | | | | | 0.0 | | |
| 2,767,000 (1) | | | ASB Bank Ltd., 1.625%, 10/22/2026 | | | | | 2,572,202 | | | | | | 0.0 | | |
| 4,004,000 | | | Assurant, Inc., 2.650%, 01/15/2032 | | | | | 3,501,937 | | | | | | 0.0 | | |
| 6,442,000 | | | Assurant, Inc., 3.700%, 02/22/2030 | | | | | 6,235,084 | | | | | | 0.1 | | |
| 5,689,000 (1)(2) | | | Athene Global Funding, 2.800%, 05/26/2023 | | | | | 5,692,834 | | | | | | 0.1 | | |
| 3,452,000 (1)(2) | | | Athene Global Funding, 2.950%, 11/12/2026 | | | | | 3,347,216 | | | | | | 0.0 | | |
| 2,378,000 (1) | | | Aviation Capital Group LLC, 1.950%, 09/20/2026 | | | | | 2,154,412 | | | | | | 0.0 | | |
| 1,137,000 (1) | | | Aviation Capital Group LLC, 3.875%, 05/01/2023 | | | | | 1,142,530 | | | | | | 0.0 | | |
| 2,027,000 (1) | | | Aviation Capital Group LLC, 4.375%, 01/30/2024 | | | | | 2,025,454 | | | | | | 0.0 | | |
| 4,559,000 (1) | | | Aviation Capital Group LLC, 5.500%, 12/15/2024 | | | | | 4,696,752 | | | | | | 0.1 | | |
| 3,134,000 (1) | | | Avolon Holdings Funding Ltd., 2.125%, 02/21/2026 | | | | | 2,865,341 | | | | | | 0.0 | | |
| 3,170,000 (1) | | | Avolon Holdings Funding Ltd., 2.528%, 11/18/2027 | | | | | 2,805,860 | | | | | | 0.0 | | |
| 2,062,000 (1) | | | Avolon Holdings Funding Ltd., 2.750%, 02/21/2028 | | | | | 1,837,304 | | | | | | 0.0 | | |
| 1,151,000 (1) | | | Avolon Holdings Funding Ltd., 2.875%, 02/15/2025 | | | | | 1,106,241 | | | | | | 0.0 | | |
| 4,775,000 (1) | | | Avolon Holdings Funding Ltd., 4.250%, 04/15/2026 | | | | | 4,715,590 | | | | | | 0.1 | | |
| 4,250,000 (2) | | | Banco de Bogota SA, 6.250%, 05/12/2026 | | | | | 4,351,129 | | | | | | 0.1 | | |
| 3,750,000 (1) | | | Banco Nacional de Panama, 2.500%, 08/11/2030 | | | | | 3,319,369 | | | | | | 0.0 | | |
| 2,000,000 | | | Banco Nacional de Panama, 2.500%, 08/11/2030 | | | | | 1,770,330 | | | | | | 0.0 | | |
| 4,200,000 | | | Banco Santander SA, 2.746%, 05/28/2025 | | | | | 4,097,319 | | | | | | 0.1 | | |
| 3,600,000 | | | Banco Santander SA, 3.125%, 02/23/2023 | | | | | 3,627,534 | | | | | | 0.0 | | |
| Voya Intermediate Bond Fund | as of March 31, 2022 (continued) |
| Principal Amount† | | | Value | | | Percentage of Net Assets | | |||||||||
| CORPORATE BONDS/NOTES: (continued) | | |||||||||||||||
| | | | Financial (continued) | | ||||||||||||
| 4,000,000 (3) | | | Banco Santander SA, 3.225%, 11/22/2032 | | | | $ | 3,594,831 | | | | | | 0.0 | | |
| 4,175,000 | | | Bancolombia SA, 3.000%, 01/29/2025 | | | | | 4,065,615 | | | | | | 0.1 | | |
| 7,100,000 (1)(3) | | | Bangkok Bank PCL/Hong Kong, 5.000%, 12/31/2199 | | | | | 7,012,315 | | | | | | 0.1 | | |
| 3,975,000 | | | Bank Hapoalim, 3.255%, 01/21/2032 | | | | | 3,657,000 | | | | | | 0.0 | | |
| 8,000,000 (3) | | | Bank of America Corp., 0.981%, 09/25/2025 | | | | | 7,588,964 | | | | | | 0.1 | | |
| 5,462,000 (3) | | | Bank of America Corp., 1.197%, 10/24/2026 | | | | | 5,054,477 | | | | | | 0.1 | | |
| 4,500,000 (3) | | | Bank of America Corp., 1.734%, 07/22/2027 | | | | | 4,183,147 | | | | | | 0.1 | | |
| 1,820,000 (3) | | | Bank of America Corp., 1.898%, 07/23/2031 | | | | | 1,592,433 | | | | | | 0.0 | | |
| 1,901,000 (3) | | | Bank of America Corp., 1.922%, 10/24/2031 | | | | | 1,653,483 | | | | | | 0.0 | | |
| 1,495,000 (3) | | | Bank of America Corp., 2.015%, 02/13/2026 | | | | | 1,440,027 | | | | | | 0.0 | | |
| 6,145,000 (3) | | | Bank of America Corp., 2.087%, 06/14/2029 | | | | | 5,619,373 | | | | | | 0.1 | | |
| 4,990,000 (3) | | | Bank of America Corp., 2.572%, 10/20/2032 | | | | | 4,542,054 | | | | | | 0.1 | | |
| 7,858,000 (3) | | | Bank of America Corp., 2.676%, 06/19/2041 | | | | | 6,659,543 | | | | | | 0.1 | | |
| 5,800,000 (3) | | | Bank of America Corp., 2.687%, 04/22/2032 | | | | | 5,342,598 | | | | | | 0.1 | | |
| 5,000,000 (3) | | | Bank of America Corp., 2.884%, 10/22/2030 | | | | | 4,747,635 | | | | | | 0.1 | | |
| 3,625,000 (3) | | | Bank of America Corp., 3.194%, 07/23/2030 | | | | | 3,511,752 | | | | | | 0.0 | | |
| 2,300,000 (2)(3) | | | Bank of America Corp., 3.550%, 03/05/2024 | | | | | 2,314,222 | | | | | | 0.0 | | |
| 10,583,000 (3) | | | Bank of America Corp., 3.846%, 03/08/2037 | | | | | 10,149,262 | | | | | | 0.1 | | |
| 1,941,000 | | | Bank of America Corp., 3.950%, 04/21/2025 | | | | | 1,979,376 | | | | | | 0.0 | | |
| 1,718,000 (3) | | | Bank of America Corp., 3.970%, 03/05/2029 | | | | | 1,746,656 | | | | | | 0.0 | | |
| 2,645,000 (3) | | | Bank of America Corp., 4.078%, 04/23/2040 | | | | | 2,725,206 | | | | | | 0.0 | | |
| 2,000,000 (3) | | | Bank of America Corp., 4.083%, 03/20/2051 | | | | | 2,079,301 | | | | | | 0.0 | | |
| 7,307,000 | | | Bank of America Corp., 4.183%, 11/25/2027 | | | | | 7,458,865 | | | | | | 0.1 | | |
| 4,495,000 | | | Bank of America Corp., 4.250%, 10/22/2026 | | | | | 4,631,938 | | | | | | 0.1 | | |
| 9,614,000 (3) | | | Bank of America Corp., 4.271%, 07/23/2029 | | | | | 9,928,710 | | | | | | 0.1 | | |
| Principal Amount† | | | Value | | | Percentage of Net Assets | | |||||||||
| CORPORATE BONDS/NOTES: (continued) | | |||||||||||||||
| | | | Financial (continued) | | ||||||||||||
| 5,594,000 (3) | | | Bank of Montreal, 3.803%, 12/15/2032 | | | | $ | 5,535,860 | | | | | | 0.1 | | |
| 2,618,000 (2) | | | Bank of Nova Scotia/The, 1.950%, 02/02/2027 | | | | | 2,477,384 | | | | | | 0.0 | | |
| 1,750,000 (2) | | | Bank of Nova Scotia/The, 2.200%, 02/03/2025 | | | | | 1,705,804 | | | | | | 0.0 | | |
| 4,740,000 (3) | | | Bank of Nova Scotia/The, 4.900%, 12/31/2199 | | | | | 4,751,850 | | | | | | 0.1 | | |
| 2,828,000 (1) | | | Banque Federative du Credit Mutuel SA, 1.604%, 10/04/2026 | | | | | 2,605,047 | | | | | | 0.0 | | |
| 11,500,000 (1) | | | Banque Federative du Credit Mutuel SA, 2.375%, 11/21/2024 | | | | | 11,208,420 | | | | | | 0.1 | | |
| 3,687,000 (3) | | | Barclays PLC, 3.564%, 09/23/2035 | | | | | 3,401,019 | | | | | | 0.0 | | |
| 1,687,000 | | | Berkshire Hathaway Finance Corp., 2.850%, 10/15/2050 | | | | | 1,467,524 | | | | | | 0.0 | | |
| 3,254,000 | | | Berkshire Hathaway Finance Corp., 3.850%, 03/15/2052 | | | | | 3,331,611 | | | | | | 0.0 | | |
| 1,500,000 | | | Berkshire Hathaway Finance Corp., 4.250%, 01/15/2049 | | | | | 1,650,148 | | | | | | 0.0 | | |
| 2,362,000 (1)(2) | | | Blackstone Holdings Finance Co. LLC, 1.625%, 08/05/2028 | | | | | 2,113,295 | | | | | | 0.0 | | |
| 6,340,000 (1) | | | Blackstone Holdings Finance Co. LLC, 2.000%, 01/30/2032 | | | | | 5,533,276 | | | | | | 0.1 | | |
| 4,915,000 (1) | | | Blackstone Holdings Finance Co. LLC, 2.850%, 08/05/2051 | | | | | 3,969,855 | | | | | | 0.1 | | |
| 6,670,000 (1) | | | Blackstone Holdings Finance Co. LLC, 3.200%, 01/30/2052 | | | | | 5,787,428 | | | | | | 0.1 | | |
| 3,574,000 (1) | | | Blackstone Private Credit Fund, 2.625%, 12/15/2026 | | | | | 3,222,112 | | | | | | 0.0 | | |
| 4,577,000 (1) | | | Blackstone Private Credit Fund, 4.000%, 01/15/2029 | | | | | 4,241,966 | | | | | | 0.1 | | |
| 5,150,000 (1)(3) | | | BNP Paribas SA, 2.219%, 06/09/2026 | | | | | 4,901,275 | | | | | | 0.1 | | |
| 2,641,000 (1)(3) | | | BNP Paribas SA, 2.588%, 08/12/2035 | | | | | 2,296,083 | | | | | | 0.0 | | |
| 8,000,000 (1)(3) | | | BNP Paribas SA, 2.819%, 11/19/2025 | | | | | 7,816,034 | | | | | | 0.1 | | |
| 4,499,000 (1) | | | BNP Paribas SA, 3.375%, 01/09/2025 | | | | | 4,479,212 | | | | | | 0.1 | | |
| Voya Intermediate Bond Fund | as of March 31, 2022 (continued) |
| Principal Amount† | | | Value | | | Percentage of Net Assets | | |||||||||
| CORPORATE BONDS/NOTES: (continued) | | |||||||||||||||
| | | | Financial (continued) | | ||||||||||||
| 3,062,000 | | | Boston Properties L.P., 3.250%, 01/30/2031 | | | | $ | 2,966,217 | | | | | | 0.0 | | |
| 4,875,000 (1)(3) | | | BPCE SA, 2.277%, 01/20/2032 | | | | | 4,288,021 | | | | | | 0.1 | | |
| 7,000,000 (1)(2) | | | BPCE SA, 2.700%, 10/01/2029 | | | | | 6,655,327 | | | | | | 0.1 | | |
| 2,075,000 (1)(3) | | | BPCE SA, 3.116%, 10/19/2032 | | | | | 1,881,596 | | | | | | 0.0 | | |
| 2,348,000 (1)(3) | | | BPCE SA, 3.582%, 10/19/2042 | | | | | 2,041,375 | | | | | | 0.0 | | |
| 2,094,000 (1) | | | BPCE SA, 5.150%, 07/21/2024 | | | | | 2,159,617 | | | | | | 0.0 | | |
| 7,020,000 (1) | | | BPCE SA, 5.700%, 10/22/2023 | | | | | 7,264,646 | | | | | | 0.1 | | |
| 11,000,000 (2) | | | Canadian Imperial Bank of Commerce, 2.250%, 01/28/2025 | | | | | 10,751,219 | | | | | | 0.1 | | |
| 6,465,000 | | | Canadian Imperial Bank of Commerce, 3.600%, 04/07/2032 | | | | | 6,442,432 | | | | | | 0.1 | | |
| 4,975,000 (3) | | | Capital One Financial Corp., 1.878%, 11/02/2027 | | | | | 4,598,243 | | | | | | 0.1 | | |
| 3,707,000 (3) | | | Capital One Financial Corp., 3.273%, 03/01/2030 | | | | | 3,583,197 | | | | | | 0.0 | | |
| 1,127,000 (2) | | | Capital One Financial Corp., 3.650%, 05/11/2027 | | | | | 1,129,784 | | | | | | 0.0 | | |
| 3,000,000 | | | CBRE Services, Inc., 2.500%, 04/01/2031 | | | | | 2,715,133 | | | | | | 0.0 | | |
| 1,064,000 | | | Charles Schwab Corp./ The, 2.300%, 05/13/2031 | | | | | 983,379 | | | | | | 0.0 | | |
| 4,103,000 | | | Charles Schwab Corp./ The, 2.900%, 03/03/2032 | | | | | 3,955,928 | | | | | | 0.1 | | |
| 3,329,000 (2)(3) | | | Charles Schwab Corp./ The, 5.375%, 12/31/2199 | | | | | 3,445,515 | | | | | | 0.0 | | |
| 3,760,000 | | | Chubb INA Holdings, Inc., 2.850%, 12/15/2051 | | | | | 3,274,971 | | | | | | 0.0 | | |
| 1,071,000 | | | Chubb INA Holdings, Inc., 3.050%, 12/15/2061 | | | | | 925,669 | | | | | | 0.0 | | |
| 3,161,000 | | | CI Financial Corp., 4.100%, 06/15/2051 | | | | | 2,798,635 | | | | | | 0.0 | | |
| 3,850,000 (1) | | | CIMB Bank Bhd, 2.125%, 07/20/2027 | | | | | 3,647,857 | | | | | | 0.0 | | |
| 2,459,000 (3) | | | Citigroup, Inc., 1.462%, 06/09/2027 | | | | | 2,261,800 | | | | | | 0.0 | | |
| 1,897,000 (3) | | | Citigroup, Inc., 2.904%, 11/03/2042 | | | | | 1,631,710 | | | | | | 0.0 | | |
| 4,915,000 (2) | | | Citigroup, Inc., 5.500%, 09/13/2025 | | | | | 5,252,532 | | | | | | 0.1 | | |
| Principal Amount† | | | Value | | | Percentage of Net Assets | | |||||||||
| CORPORATE BONDS/NOTES: (continued) | | |||||||||||||||
| | | | Financial (continued) | | ||||||||||||
| 1,147,000 (1) | | | Citizens Financial Group, Inc., 4.150%, 09/28/2022 | | | | $ | 1,160,007 | | | | | | 0.0 | | |
| 4,990,000 | | | CME Group, Inc., 2.650%, 03/15/2032 | | | | | 4,780,133 | | | | | | 0.1 | | |
| 3,705,000 (1) | | | CNO Global Funding, 2.650%, 01/06/2029 | | | | | 3,428,762 | | | | | | 0.0 | | |
| 2,977,000 (1) | | | Commonwealth Bank of Australia, 2.688%, 03/11/2031 | | | | | 2,652,619 | | | | | | 0.0 | | |
| 1,520,000 (1) | | | Commonwealth Bank of Australia, 3.743%, 09/12/2039 | | | | | 1,426,606 | | | | | | 0.0 | | |
| 3,765,000 (1) | | | Commonwealth Bank of Australia, 3.784%, 03/14/2032 | | | | | 3,643,589 | | | | | | 0.0 | | |
| 3,693,000 (1)(2)(3) | | | Cooperatieve Rabobank UA, 1.004%, 09/24/2026 | | | | | 3,404,241 | | | | | | 0.0 | | |
| 4,027,000 (1)(3) | | | Cooperatieve Rabobank UA, 1.339%, 06/24/2026 | | | | | 3,762,865 | | | | | | 0.0 | | |
| 2,905,000 (1)(3) | | | Cooperatieve Rabobank UA, 3.758%, 04/06/2033 | | | | | 2,900,064 | | | | | | 0.0 | | |
| 9,163,000 | | | Cooperatieve Rabobank UA, 4.375%, 08/04/2025 | | | | | 9,319,893 | | | | | | 0.1 | | |
| 5,001,000 | | | Corebridge Financial, Inc., 3.850%, 04/05/2029 | | | | | 4,996,449 | | | | | | 0.1 | | |
| 6,543,000 | | | Corebridge Financial, Inc., 3.900%, 04/05/2032 | | | | | 6,529,935 | | | | | | 0.1 | | |
| 1,993,000 | | | Corebridge Financial, Inc., 4.350%, 04/05/2042 | | | | | 1,993,979 | | | | | | 0.0 | | |
| 4,205,000 | | | Corebridge Financial, Inc., 4.400%, 04/05/2052 | | | | | 4,214,470 | | | | | | 0.0 | | |
| 2,700,000 (1) | | | Corp Financiera de Desarrollo SA, 2.400%, 09/28/2027 | | | | | 2,488,792 | | | | | | 0.0 | | |
| 8,474,000 (1)(3) | | | Credit Agricole SA, 4.750%, 12/31/2199 | | | | | 7,710,747 | | | | | | 0.1 | | |
| 13,000,000 (1)(3) | | | Credit Agricole SA/ London, 1.907%, 06/16/2026 | | | | | 12,286,054 | | | | | | 0.1 | | |
| 4,068,000 (1) | | | Credit Suisse AG, 6.500%, 08/08/2023 | | | | | 4,181,131 | | | | | | 0.1 | | |
| 3,611,000 | | | Credit Suisse AG/New York NY, 1.000%, 05/05/2023 | | | | | 3,558,289 | | | | | | 0.0 | | |
| 3,222,000 (1)(3) | | | Credit Suisse Group AG, 2.193%, 06/05/2026 | | | | | 3,029,163 | | | | | | 0.0 | | |
| 6,870,000 (1)(3) | | | Credit Suisse Group AG, 2.997%, 12/14/2023 | | | | | 6,871,811 | | | | | | 0.1 | | |
| 8,409,000 | | | Credit Suisse Group Funding Guernsey Ltd., 3.800%, 09/15/2022 | | | | | 8,497,647 | | | | | | 0.1 | | |
| Voya Intermediate Bond Fund | as of March 31, 2022 (continued) |
| Principal Amount† | | | Value | | | Percentage of Net Assets | | |||||||||
| CORPORATE BONDS/NOTES: (continued) | | |||||||||||||||
| | | | Financial (continued) | | ||||||||||||
| 1,732,000 | | | Crown Castle International Corp., 1.050%, 07/15/2026 | | | | $ | 1,567,191 | | | | | | 0.0 | | |
| 2,566,000 (2) | | | Crown Castle International Corp., 2.900%, 03/15/2027 | | | | | 2,484,877 | | | | | | 0.0 | | |
| 3,580,000 (2) | | | CubeSmart L.P., 2.250%, 12/15/2028 | | | | | 3,256,210 | | | | | | 0.0 | | |
| 4,910,000 (1)(3) | | | Danske Bank A/S, 1.621%, 09/11/2026 | | | | | 4,545,864 | | | | | | 0.1 | | |
| 3,297,000 (1) | | | Danske Bank A/S, 4.375%, 06/12/2028 | | | | | 3,337,384 | | | | | | 0.0 | | |
| 2,407,000 (1)(3) | | | Depository Trust & Clearing Corp./The, 3.375%, 12/31/2199 | | | | | 2,220,457 | | | | | | 0.0 | | |
| 3,557,000 (3) | | | Deutsche Bank AG/New York NY, 2.552%, 01/07/2028 | | | | | 3,287,228 | | | | | | 0.0 | | |
| 2,000,000 (1) | | | Development Bank of Kazakhstan JSC, 2.950%, 05/06/2031 | | | | | 1,643,940 | | | | | | 0.0 | | |
| 2,897,000 (2) | | | Discover Bank, 4.250%, 03/13/2026 | | | | | 2,981,473 | | | | | | 0.0 | | |
| 2,404,000 (2)(3) | | | Discover Bank, 4.682%, 08/09/2028 | | | | | 2,438,987 | | | | | | 0.0 | | |
| 4,868,000 (1)(2) | | | Empower Finance 2020 L.P., 1.357%, 09/17/2027 | | | | | 4,392,080 | | | | | | 0.1 | | |
| 10,350,000 (2) | | | Essex Portfolio L.P., 3.375%, 04/15/2026 | | | | | 10,371,780 | | | | | | 0.1 | | |
| 7,000,000 (1) | | | Federation des Caisses Desjardins du Quebec, 2.050%, 02/10/2025 | | | | | 6,758,910 | | | | | | 0.1 | | |
| 750,000 | | | Fondo Mivivienda SA, 3.500%, 01/31/2023 | | | | | 757,530 | | | | | | 0.0 | | |
| 5,493,000 | | | Goldman Sachs Group, Inc., 4.250%, 10/21/2025 | | | | | 5,632,745 | | | | | | 0.1 | | |
| 1,680,000 | | | Goldman Sachs Group, Inc., 5.150%, 05/22/2045 | | | | | 1,884,438 | | | | | | 0.0 | | |
| 792,000 | | | Goldman Sachs Group, Inc., 6.750%, 10/01/2037 | | | | | 1,000,797 | | | | | | 0.0 | | |
| 4,913,000 (3) | | | Goldman Sachs Group, Inc./The, 1.542%, 09/10/2027 | | | | | 4,496,985 | | | | | | 0.1 | | |
| 95,000 (3) | | | Goldman Sachs Group, Inc./The, 3.210%, 04/22/2042 | | | | | 86,304 | | | | | | 0.0 | | |
| 8,526,000 (1) | | | Hartford Financial Services Group, Inc./The, 2.631%, (US0003M + 2.125)%, 02/12/2067 | | | | | 7,549,805 | | | | | | 0.1 | | |
| Principal Amount† | | | Value | | | Percentage of Net Assets | | |||||||||
| CORPORATE BONDS/NOTES: (continued) | | |||||||||||||||
| | | | Financial (continued) | | ||||||||||||
| 1,171,000 | | | Hartford Financial Services Group, Inc./The, 5.950%, 10/15/2036 | | | | $ | 1,384,629 | | | | | | 0.0 | | |
| 3,779,000 (3) | | | HSBC Holdings PLC, 1.589%, 05/24/2027 | | | | | 3,454,038 | | | | | | 0.0 | | |
| 2,569,000 (2)(3) | | | HSBC Holdings PLC, 1.645%, 04/18/2026 | | | | | 2,419,878 | | | | | | 0.0 | | |
| 5,105,000 (3) | | | HSBC Holdings PLC, 2.013%, 09/22/2028 | | | | | 4,634,684 | | | | | | 0.1 | | |
| 6,500,000 (3) | | | HSBC Holdings PLC, 2.099%, 06/04/2026 | | | | | 6,186,542 | | | | | | 0.1 | | |
| 7,605,000 (3) | | | HSBC Holdings PLC, 2.206%, 08/17/2029 | | | | | 6,852,039 | | | | | | 0.1 | | |
| 4,759,000 (3) | | | HSBC Holdings PLC, 2.633%, 11/07/2025 | | | | | 4,644,822 | | | | | | 0.1 | | |
| 3,307,000 (2)(3) | | | HSBC Holdings PLC, 2.871%, 11/22/2032 | | | | | 3,010,119 | | | | | | 0.0 | | |
| 3,307,000 (2)(3) | | | HSBC Holdings PLC, 2.999%, 03/10/2026 | | | | | 3,244,620 | | | | | | 0.0 | | |
| 2,924,000 (3) | | | HSBC Holdings PLC, 3.973%, 05/22/2030 | | | | | 2,930,000 | | | | | | 0.0 | | |
| 4,593,000 (3) | | | HSBC Holdings PLC, 4.041%, 03/13/2028 | | | | | 4,611,487 | | | | | | 0.1 | | |
| 4,085,000 | | | HSBC Holdings PLC, 4.300%, 03/08/2026 | | | | | 4,195,785 | | | | | | 0.1 | | |
| 4,751,000 (2)(3) | | | HSBC Holdings PLC, 4.700%, 12/31/2199 | | | | | 4,269,961 | | | | | | 0.1 | | |
| 4,831,000 (3) | | | HSBC Holdings PLC, 6.000%, 12/31/2199 | | | | | 4,927,620 | | | | | | 0.1 | | |
| 6,599,000 | | | ING Groep NV, 3.550%, 04/09/2024 | | | | | 6,684,045 | | | | | | 0.1 | | |
| 2,147,000 (3) | | | ING Groep NV, 4.017%, 03/28/2028 | | | | | 2,161,273 | | | | | | 0.0 | | |
| 1,659,000 (3) | | | ING Groep NV, 4.252%, 03/28/2033 | | | | | 1,709,630 | | | | | | 0.0 | | |
| 3,483,000 | | | Intercontinental Exchange, Inc., 2.650%, 09/15/2040 | | | | | 2,970,255 | | | | | | 0.0 | | |
| 4,325,000 | | | Invitation Homes Operating Partnership L.P., 2.300%, 11/15/2028 | | | | | 3,921,845 | | | | | | 0.1 | | |
| 1,200,000 (1)(3) | | | Itau Unibanco Holding SA/Cayman Island, 3.875%, 04/15/2031 | | | | | 1,138,956 | | | | | | 0.0 | | |
| 6,236,000 (3) | | | JPMorgan Chase & Co., 0.969%, 06/23/2025 | | | | | 5,958,891 | | | | | | 0.1 | | |
| 3,479,000 (3) | | | JPMorgan Chase & Co., 1.040%, 02/04/2027 | | | | | 3,192,138 | | | | | | 0.0 | | |
| 7,030,000 (2)(3) | | | JPMorgan Chase & Co., 1.470%, 09/22/2027 | | | | | 6,486,547 | | | | | | 0.1 | | |
| Voya Intermediate Bond Fund | as of March 31, 2022 (continued) |
| Principal Amount† | | | Value | | | Percentage of Net Assets | | |||||||||
| CORPORATE BONDS/NOTES: (continued) | | |||||||||||||||
| | | | Financial (continued) | | ||||||||||||
| 3,644,000 (3) | | | JPMorgan Chase & Co., 1.953%, 02/04/2032 | | | | $ | 3,196,066 | | | | | | 0.0 | | |
| 6,322,000 (3) | | | JPMorgan Chase & Co., 2.069%, 06/01/2029 | | | | | 5,831,966 | | | | | | 0.1 | | |
| 3,784,000 (3) | | | JPMorgan Chase & Co., 2.182%, 06/01/2028 | | | | | 3,554,609 | | | | | | 0.0 | | |
| 5,000,000 (3) | | | JPMorgan Chase & Co., 2.301%, 10/15/2025 | | | | | 4,900,182 | | | | | | 0.1 | | |
| 4,205,000 (3) | | | JPMorgan Chase & Co., 2.525%, 11/19/2041 | | | | | 3,466,239 | | | | | | 0.0 | | |
| 9,121,000 (3) | | | JPMorgan Chase & Co., 2.545%, 11/08/2032 | | | | | 8,346,800 | | | | | | 0.1 | | |
| 1,548,000 (3) | | | JPMorgan Chase & Co., 2.580%, 04/22/2032 | | | | | 1,420,350 | | | | | | 0.0 | | |
| 4,938,000 (2)(3) | | | JPMorgan Chase & Co., 2.595%, 02/24/2026 | | | | | 4,846,255 | | | | | | 0.1 | | |
| 4,938,000 (2)(3) | | | JPMorgan Chase & Co., 2.947%, 02/24/2028 | | | | | 4,824,472 | | | | | | 0.1 | | |
| 6,204,000 (3) | | | JPMorgan Chase & Co., 2.963%, 01/25/2033 | | | | | 5,855,270 | | | | | | 0.1 | | |
| 6,884,000 (3) | | | JPMorgan Chase & Co., 3.157%, 04/22/2042 | | | | | 6,263,624 | | | | | | 0.1 | | |
| 3,766,000 (3) | | | JPMorgan Chase & Co., 3.328%, 04/22/2052 | | | | | 3,497,655 | | | | | | 0.0 | | |
| 10,000 (3) | | | JPMorgan Chase & Co., 3.559%, 04/23/2024 | | | | | 10,099 | | | | | | 0.0 | | |
| 4,270,000 (3) | | | JPMorgan Chase & Co., 3.797%, 07/23/2024 | | | | | 4,320,057 | | | | | | 0.1 | | |
| 3,700,000 (2) | | | JPMorgan Chase & Co., 3.875%, 09/10/2024 | | | | | 3,781,761 | | | | | | 0.0 | | |
| 2,423,000 (3) | | | JPMorgan Chase & Co., 3.964%, 11/15/2048 | | | | | 2,485,787 | | | | | | 0.0 | | |
| 2,825,000 (3) | | | JPMorgan Chase & Co., 4.452%, 12/05/2029 | | | | | 2,948,247 | | | | | | 0.0 | | |
| 3,310,000 | | | Kilroy Realty L.P., 2.650%, 11/15/2033 | | | | | 2,874,270 | | | | | | 0.0 | | |
| 5,408,000 | | | Kilroy Realty L.P., 3.450%, 12/15/2024 | | | | | 5,412,315 | | | | | | 0.1 | | |
| 1,644,000 | | | Kite Realty Group L.P., 4.000%, 10/01/2026 | | | | | 1,647,252 | | | | | | 0.0 | | |
| 2,500,000 (1) | | | Kookmin Bank, 2.500%, 11/04/2030 | | | | | 2,236,534 | | | | | | 0.0 | | |
| 9,750,000 (1) | | | Ladder Capital Finance Holdings LLLP / Ladder Capital Finance Corp., 4.750%, 06/15/2029 | | | | | 9,207,998 | | | | | | 0.1 | | |
| 2,545,000 (3) | | | Lloyds Banking Group PLC, 2.438%, 02/05/2026 | | | | | 2,456,529 | | | | | | 0.0 | | |
| 2,849,000 (3) | | | Lloyds Banking Group PLC, 2.907%, 11/07/2023 | | | | | 2,853,843 | | | | | | 0.0 | | |
| Principal Amount† | | | Value | | | Percentage of Net Assets | | |||||||||
| CORPORATE BONDS/NOTES: (continued) | | |||||||||||||||
| | | | Financial (continued) | | ||||||||||||
| 9,810,000 (2) | | | Main Street Capital Corp., 3.000%, 07/14/2026 | | | | $ | 9,108,515 | | | | | | 0.1 | | |
| 4,310,000 | | | Main Street Capital Corp., 5.200%, 05/01/2024 | | | | | 4,401,383 | | | | | | 0.1 | | |
| 7,183,000 | | | Mitsubishi UFJ Financial Group, Inc., 1.412%, 07/17/2025 | | | | | 6,737,183 | | | | | | 0.1 | | |
| 3,475,000 (3) | | | Mitsubishi UFJ Financial Group, Inc., 1.538%, 07/20/2027 | | | | | 3,194,359 | | | | | | 0.0 | | |
| 4,479,000 | | | Mitsubishi UFJ Financial Group, Inc., 2.193%, 02/25/2025 | | | | | 4,334,525 | | | | | | 0.1 | | |
| 725,000 | | | Mitsubishi UFJ Financial Group, Inc., 2.757%, 09/13/2026 | | | | | 704,679 | | | | | | 0.0 | | |
| 2,750,000 (1)(3) | | | Mizrahi Tefahot Bank Ltd., 3.077%, 04/07/2031 | | | | | 2,568,143 | | | | | | 0.0 | | |
| 5,500,000 | | | Mizuho Financial Group Cayman 2 Ltd., 4.200%, 07/18/2022 | | | | | 5,534,986 | | | | | | 0.1 | | |
| 4,597,000 (3) | | | Mizuho Financial Group, Inc., 1.241%, 07/10/2024 | | | | | 4,500,634 | | | | | | 0.1 | | |
| 3,417,000 (3) | | | Mizuho Financial Group, Inc., 2.226%, 05/25/2026 | | | | | 3,279,185 | | | | | | 0.0 | | |
| 2,726,000 (3) | | | Mizuho Financial Group, Inc., 2.555%, 09/13/2025 | | | | | 2,672,289 | | | | | | 0.0 | | |
| 660,000 (1) | | | Mizuho Financial Group, Inc., 3.477%, 04/12/2026 | | | | | 657,935 | | | | | | 0.0 | | |
| 3,912,000 (3) | | | Morgan Stanley, 0.790%, 05/30/2025 | | | | | 3,719,399 | | | | | | 0.0 | | |
| 15,500,000 (3) | | | Morgan Stanley, 1.512%, 07/20/2027 | | | | | 14,269,906 | | | | | | 0.2 | | |
| 3,968,000 (3) | | | Morgan Stanley, 1.593%, 05/04/2027 | | | | | 3,691,679 | | | | | | 0.0 | | |
| 3,009,000 (3) | | | Morgan Stanley, 1.794%, 02/13/2032 | | | | | 2,591,381 | | | | | | 0.0 | | |
| 5,414,000 (3) | | | Morgan Stanley, 2.188%, 04/28/2026 | | | | | 5,235,200 | | | | | | 0.1 | | |
| 21,541,000 (3) | | | Morgan Stanley, 2.239%, 07/21/2032 | | | | | 19,116,649 | | | | | | 0.2 | | |
| 2,030,000 (3) | | | Morgan Stanley, 2.475%, 01/21/2028 | | | | | 1,938,269 | | | | | | 0.0 | | |
| 5,581,000 (3) | | | Morgan Stanley, 2.511%, 10/20/2032 | | | | | 5,043,829 | | | | | | 0.1 | | |
| 7,461,000 (2)(3) | | | Morgan Stanley, 2.630%, 02/18/2026 | | | | | 7,324,211 | | | | | | 0.1 | | |
| 4,374,000 (3) | | | Morgan Stanley, 2.943%, 01/21/2033 | | | | | 4,106,877 | | | | | | 0.1 | | |
| Voya Intermediate Bond Fund | as of March 31, 2022 (continued) |
| Principal Amount† | | | Value | | | Percentage of Net Assets | | |||||||||
| CORPORATE BONDS/NOTES: (continued) | | |||||||||||||||
| | | | Financial (continued) | | ||||||||||||
| 1,736,000 (3) | | | Morgan Stanley, 3.737%, 04/24/2024 | | | | $ | 1,754,168 | | | | | | 0.0 | | |
| 2,750,000 | | | Morgan Stanley, 3.875%, 01/27/2026 | | | | | 2,804,850 | | | | | | 0.0 | | |
| 3,524,000 | | | Morgan Stanley, 4.000%, 07/23/2025 | | | | | 3,609,737 | | | | | | 0.0 | | |
| 2,439,000 (3) | | | Morgan Stanley, 4.457%, 04/22/2039 | | | | | 2,638,521 | | | | | | 0.0 | | |
| 5,135,000 | | | MPT Operating Partnership L.P. / MPT Finance Corp., 3.500%, 03/15/2031 | | | | | 4,777,692 | | | | | | 0.1 | | |
| 5,050,000 (1) | | | National Australia Bank Ltd., 2.332%, 08/21/2030 | | | | | 4,400,028 | | | | | | 0.1 | | |
| 4,040,000 (1)(3) | | | National Australia Bank Ltd., 3.347%, 01/12/2037 | | | | | 3,734,256 | | | | | | 0.0 | | |
| 3,590,000 (1)(3) | | | National Australia Bank Ltd., 3.933%, 08/02/2034 | | | | | 3,516,667 | | | | | | 0.0 | | |
| 3,865,000 (1)(2) | | | Nationwide Building Society, 1.500%, 10/13/2026 | | | | | 3,550,921 | | | | | | 0.0 | | |
| 9,520,000 (1)(2)(3) | | | Nationwide Building Society, 4.363%, 08/01/2024 | | | | | 9,669,534 | | | | | | 0.1 | | |
| 3,595,000 (3) | | | NatWest Group PLC, 3.032%, 11/28/2035 | | | | | 3,194,367 | | | | | | 0.0 | | |
| 2,910,000 (3) | | | NatWest Group PLC, 3.073%, 05/22/2028 | | | | | 2,796,762 | | | | | | 0.0 | | |
| 6,418,000 | | | NatWest Group PLC, 3.875%, 09/12/2023 | | | | | 6,486,004 | | | | | | 0.1 | | |
| 459,000 (3) | | | NatWest Group PLC, 4.269%, 03/22/2025 | | | | | 464,546 | | | | | | 0.0 | | |
| 5,954,000 (3) | | | NatWest Group PLC, 4.519%, 06/25/2024 | | | | | 6,045,597 | | | | | | 0.1 | | |
| 4,725,000 (2) | | | Navient Corp., 5.000%, 03/15/2027 | | | | | 4,509,091 | | | | | | 0.1 | | |
| 1,000,000 (1)(3) | | | NBK Tier 1 Financing 2 Ltd., 4.500%, 12/31/2199 | | | | | 976,459 | | | | | | 0.0 | | |
| 4,015,000 (1)(2)(3) | | | Nordea Bank Abp, 3.750%, 12/31/2199 | | | | | 3,456,232 | | | | | | 0.0 | | |
| 1,345,000 (1)(2)(3) | | | Nordea Bank ABP, 6.125%, 12/31/2199 | | | | | 1,394,503 | | | | | | 0.0 | | |
| DKK 2 (4) | | | Nordea Kredit Realkreditaktieselskab, 6.000%, 07/01/2029 | | | | | — | | | | | | — | | |
| 4,918,000 (1) | | | Northwestern Mutual Global Funding, 1.700%, 06/01/2028 | | | | | 4,511,148 | | | | | | 0.1 | | |
| 4,068,000 (1) | | | Northwestern Mutual Life Insurance Co/The, 3.625%, 09/30/2059 | | | | | 3,703,047 | | | | | | 0.0 | | |
| Principal Amount† | | | Value | | | Percentage of Net Assets | | |||||||||
| CORPORATE BONDS/NOTES: (continued) | | |||||||||||||||
| | | | Financial (continued) | | ||||||||||||
| 2,866,000 | | | Old Republic International Corp., 3.850%, 06/11/2051 | | | | $ | 2,669,967 | | | | | | 0.0 | | |
| 7,000,000 | | | ORIX Corp., 3.250%, 12/04/2024 | | | | | 7,014,853 | | | | | | 0.1 | | |
| 2,000,000 (1)(3) | | | Oversea-Chinese Banking Corp. Ltd., 1.832%, 09/10/2030 | | | | | 1,886,520 | | | | | | 0.0 | | |
| 2,467,000 | | | Owl Rock Capital Corp., 2.875%, 06/11/2028 | | | | | 2,156,270 | | | | | | 0.0 | | |
| 2,891,000 (1)(2) | | | OWL Rock Core Income Corp., 4.700%, 02/08/2027 | | | | | 2,784,062 | | | | | | 0.0 | | |
| 1,094,000 (1) | | | Pacific Life Global Funding II, 1.200%, 06/24/2025 | | | | | 1,024,918 | | | | | | 0.0 | | |
| 1,406,000 (1) | | | Pacific Life Global Funding II, 1.375%, 04/14/2026 | | | | | 1,309,391 | | | | | | 0.0 | | |
| 7,385,000 (3) | | | PartnerRe Finance B LLC, 4.500%, 10/01/2050 | | | | | 7,163,450 | | | | | | 0.1 | | |
| 3,412,000 | | | Piedmont Operating Partnership L.P., 3.150%, 08/15/2030 | | | | | 3,197,062 | | | | | | 0.0 | | |
| 1,580,000 | | | Piedmont Operating Partnership L.P., 4.450%, 03/15/2024 | | | | | 1,607,641 | | | | | | 0.0 | | |
| 1,747,000 | | | Public Storage, 1.950%, 11/09/2028 | | | | | 1,620,297 | | | | | | 0.0 | | |
| 5,928,000 | | | Realty Income Corp., 2.200%, 06/15/2028 | | | | | 5,477,182 | | | | | | 0.1 | | |
| 726,000 | | | Realty Income Corp., 3.950%, 08/15/2027 | | | | | 746,753 | | | | | | 0.0 | | |
| 2,498,000 | | | Realty Income Corp., 4.875%, 06/01/2026 | | | | | 2,637,721 | | | | | | 0.0 | | |
| 3,152,000 | | | Regency Centers L.P., 2.950%, 09/15/2029 | | | | | 3,006,878 | | | | | | 0.0 | | |
| 1,417,000 | | | Regency Centers L.P., 3.700%, 06/15/2030 | | | | | 1,419,419 | | | | | | 0.0 | | |
| 1,250,000 | | | Retail Opportunity Investments Partnership L.P., 5.000%, 12/15/2023 | | | | | 1,274,773 | | | | | | 0.0 | | |
| 5,055,000 (1)(2) | | | Rocket Mortgage LLC / Rocket Mortgage Co-Issuer, Inc., 3.875%, 03/01/2031 | | | | | 4,582,484 | | | | | | 0.1 | | |
| 5,175,000 (1)(2) | | | Rocket Mortgage LLC / Rocket Mortgage Co-Issuer, Inc., 4.000%, 10/15/2033 | | | | | 4,542,874 | | | | | | 0.1 | | |
| Voya Intermediate Bond Fund | as of March 31, 2022 (continued) |
| Principal Amount† | | | Value | | | Percentage of Net Assets | | |||||||||
| CORPORATE BONDS/NOTES: (continued) | | |||||||||||||||
| | | | Financial (continued) | | ||||||||||||
| 2,604,000 | | | Sabra Health Care L.P., 3.200%, 12/01/2031 | | | | $ | 2,328,197 | | | | | | 0.0 | | |
| 2,622,000 (3) | | | Santander Holdings USA, Inc., 2.490%, 01/06/2028 | | | | | 2,450,252 | | | | | | 0.0 | | |
| 5,965,000 (3) | | | Santander UK Group Holdings PLC, 2.469%, 01/11/2028 | | | | | 5,557,023 | | | | | | 0.1 | | |
| 1,938,000 (1) | | | Scentre Group Trust 1 / Scentre Group Trust 2, 3.625%, 01/28/2026 | | | | | 1,948,848 | | | | | | 0.0 | | |
| 1,350,000 (1)(3) | | | Shinhan Financial Group Co. Ltd., 2.875%, 12/31/2199 | | | | | 1,233,968 | | | | | | 0.0 | | |
| 2,250,000 | | | Simon Property Group L.P., 1.750%, 02/01/2028 | | | | | 2,053,711 | | | | | | 0.0 | | |
| 6,383,000 (1)(3) | | | Societe Generale SA, 1.792%, 06/09/2027 | | | | | 5,760,513 | | | | | | 0.1 | | |
| 7,765,000 (1)(3) | | | Societe Generale SA, 3.337%, 01/21/2033 | | | | | 7,151,724 | | | | | | 0.1 | | |
| 2,815,000 (1)(3) | | | Standard Chartered PLC, 1.456%, 01/14/2027 | | | | | 2,563,274 | | | | | | 0.0 | | |
| 5,170,000 (1)(3) | | | Standard Chartered PLC, 1.822%, 11/23/2025 | | | | | 4,916,494 | | | | | | 0.1 | | |
| 3,977,000 (1)(3) | | | Standard Chartered PLC, 2.608%, 01/12/2028 | | | | | 3,722,604 | | | | | | 0.0 | | |
| 6,104,000 (1)(3) | | | Standard Chartered PLC, 3.265%, 02/18/2036 | | | | | 5,480,595 | | | | | | 0.1 | | |
| 9,953,000 (1)(2)(3) | | | Standard Chartered PLC, 3.603%, 01/12/2033 | | | | | 9,225,175 | | | | | | 0.1 | | |
| 4,349,000 (1)(3) | | | Standard Chartered PLC, 3.971%, 03/30/2026 | | | | | 4,344,556 | | | | | | 0.1 | | |
| 3,225,000 | | | Sumitomo Mitsui Financial Group, Inc., 2.448%, 09/27/2024 | | | | | 3,170,790 | | | | | | 0.0 | | |
| 300,000 | | | Sumitomo Mitsui Financial Group, Inc., 3.010%, 10/19/2026 | | | | | 294,397 | | | | | | 0.0 | | |
| 3,351,000 (1) | | | Sumitomo Mitsui Trust Bank Ltd., 1.050%, 09/12/2025 | | | | | 3,109,516 | | | | | | 0.0 | | |
| 2,817,000 (1) | | | Sumitomo Mitsui Trust Bank Ltd., 2.800%, 03/10/2027 | | | | | 2,719,448 | | | | | | 0.0 | | |
| 3,451,000 (1)(3) | | | Svenska Handelsbanken AB, 1.418%, 06/11/2027 | | | | | 3,183,469 | | | | | | 0.0 | | |
| 3,004,000 (2) | | | Toronto-Dominion Bank/The, 2.800%, 03/10/2027 | | | | | 2,953,483 | | | | | | 0.0 | | |
| 3,244,000 (2) | | | Truist Financial Corp., 1.125%, 08/03/2027 | | | | | 2,918,656 | | | | | | 0.0 | | |
| Principal Amount† | | | Value | | | Percentage of Net Assets | | |||||||||
| CORPORATE BONDS/NOTES: (continued) | | |||||||||||||||
| | | | Financial (continued) | | ||||||||||||
| 4,450,000 (2)(3) | | | Truist Financial Corp., 1.267%, 03/02/2027 | | | | $ | 4,126,758 | | | | | | 0.1 | | |
| 3,609,000 (3) | | | Truist Financial Corp., 5.100%, 12/31/2199 | | | | | 3,677,571 | | | | | | 0.0 | | |
| 1,500,000 (1) | | | Turkiye Vakiflar Bankasi TAO, 6.500%, 01/08/2026 | | | | | 1,439,445 | | | | | | 0.0 | | |
| 3,180,000 | | | UBS AG, 5.125%, 05/15/2024 | | | | | 3,258,877 | | | | | | 0.0 | | |
| 4,162,000 (1)(3) | | | UBS Group AG, 1.008%, 07/30/2024 | | | | | 4,050,572 | | | | | | 0.1 | | |
| 3,853,000 (1)(3) | | | UBS Group AG, 1.364%, 01/30/2027 | | | | | 3,544,694 | | | | | | 0.0 | | |
| 1,375,000 (1)(3) | | | UBS Group AG, 1.494%, 08/10/2027 | | | | | 1,250,046 | | | | | | 0.0 | | |
| 5,650,000 (1)(3) | | | UBS Group AG, 2.095%, 02/11/2032 | | | | | 4,950,713 | | | | | | 0.1 | | |
| 7,779,000 (1)(3) | | | UBS Group AG, 2.859%, 08/15/2023 | | | | | 7,792,172 | | | | | | 0.1 | | |
| 4,328,000 (1)(2)(3) | | | UBS Group AG, 3.179%, 02/11/2043 | | | | | 3,853,880 | | | | | | 0.0 | | |
| 1,005,000 | | | Ventas Realty L.P., 5.700%, 09/30/2043 | | | | | 1,192,633 | | | | | | 0.0 | | |
| 6,142,000 | | | Visa, Inc., 4.300%, 12/14/2045 | | | | | 6,912,742 | | | | | | 0.1 | | |
| 5,017,000 (3) | | | Wells Fargo & Co., 2.393%, 06/02/2028 | | | | | 4,749,797 | | | | | | 0.1 | | |
| 17,000,000 (3) | | | Wells Fargo & Co., 2.406%, 10/30/2025 | | | | | 16,652,609 | | | | | | 0.2 | | |
| 2,500,000 (3) | | | Wells Fargo & Co., 3.068%, 04/30/2041 | | | | | 2,255,438 | | | | | | 0.0 | | |
| 6,670,000 | | | Wells Fargo & Co., 3.750%, 01/24/2024 | | | | | 6,794,310 | | | | | | 0.1 | | |
| 1,556,000 | | | Wells Fargo & Co., 4.750%, 12/07/2046 | | | | | 1,698,044 | | | | | | 0.0 | | |
| 2,514,000 (2) | | | Westpac Banking Corp., 1.953%, 11/20/2028 | | | | | 2,319,293 | | | | | | 0.0 | | |
| 4,347,000 (2) | | | Westpac Banking Corp., 2.963%, 11/16/2040 | | | | | 3,663,158 | | | | | | 0.0 | | |
| 5,020,000 (2)(3) | | | Westpac Banking Corp., 3.020%, 11/18/2036 | | | | | 4,468,802 | | | | | | 0.1 | | |
| 6,067,000 | | | XLIT Ltd., 4.450%, 03/31/2025 | | | | | 6,241,092 | | | | | | 0.1 | | |
| 2,000,000 | | | XLIT Ltd., 5.250%, 12/15/2043 | | | | | 2,410,363 | | | | | | 0.0 | | |
| 2,296,000 | | | XLIT Ltd., 5.500%, 03/31/2045 | | | | | 2,723,839 | | | | | | 0.0 | | |
| 750,000 (1)(3) | | | Yapi ve Kredi Bankasi AS, 7.875%, 01/22/2031 | | | | | 739,440 | | | | | | 0.0 | | |
| | | | | | | | | 1,208,724,945 | | | | | | 12.8 | | |
| Voya Intermediate Bond Fund | as of March 31, 2022 (continued) |
| Principal Amount† | | | Value | | | Percentage of Net Assets | | |||||||||
| CORPORATE BONDS/NOTES: (continued) | | |||||||||||||||
| | | | Industrial: 2.1% | | ||||||||||||
| 975,000 (1)(2) | | | ATP Tower Holdings LLC / Andean Tower Partners Colombia SAS / Andean Telecom Par, 4.050%, 04/27/2026 | | | | $ | 927,474 | | | | | | 0.0 | | |
| 3,482,000 | | | Berry Global, Inc., 0.950%, 02/15/2024 | | | | | 3,335,732 | | | | | | 0.0 | | |
| 4,500,000 | | | Berry Global, Inc., 1.650%, 01/15/2027 | | | | | 4,106,251 | | | | | | 0.1 | | |
| 4,700,000 (1)(2) | | | Berry Global, Inc., 5.625%, 07/15/2027 | | | | | 4,759,173 | | | | | | 0.1 | | |
| 3,395,000 | | | Boeing Co/The, 3.250%, 02/01/2028 | | | | | 3,276,952 | | | | | | 0.0 | | |
| 5,645,000 | | | Boeing Co/The, 3.250%, 02/01/2035 | | | | | 5,050,978 | | | | | | 0.1 | | |
| 1,709,000 (2) | | | Boeing Co/The, 3.625%, 02/01/2031 | | | | | 1,666,374 | | | | | | 0.0 | | |
| 1,269,000 | | | Boeing Co/The, 3.850%, 11/01/2048 | | | | | 1,116,744 | | | | | | 0.0 | | |
| 3,324,000 | | | Boeing Co/The, 4.875%, 05/01/2025 | | | | | 3,432,441 | | | | | | 0.0 | | |
| 5,400,000 | | | Boeing Co/The, 5.150%, 05/01/2030 | | | | | 5,767,185 | | | | | | 0.1 | | |
| 2,599,000 | | | Boeing Co/The, 5.805%, 05/01/2050 | | | | | 3,010,319 | | | | | | 0.0 | | |
| 4,735,000 (1) | | | Builders FirstSource, Inc., 5.000%, 03/01/2030 | | | | | 4,666,342 | | | | | | 0.1 | | |
| 2,000,000 | | | Burlington Northern Santa Fe LLC, 3.900%, 08/01/2046 | | | | | 2,078,224 | | | | | | 0.0 | | |
| 1,165,000 | | | Burlington Northern Santa Fe LLC, 4.450%, 03/15/2043 | | | | | 1,279,998 | | | | | | 0.0 | | |
| 2,728,000 | | | Burlington Northern Santa Fe LLC, 5.150%, 09/01/2043 | | | | | 3,256,778 | | | | | | 0.0 | | |
| 1,740,000 (2) | | | Canadian Pacific Railway Co., 2.450%, 12/02/2031 | | | | | 1,618,274 | | | | | | 0.0 | | |
| 4,300,000 (1) | | | Cascades, Inc./Cascades USA, Inc., 5.375%, 01/15/2028 | | | | | 4,300,537 | | | | | | 0.1 | | |
| 2,375,000 (1)(2)(3) | | | Cemex SAB de CV, 5.125%, 12/31/2199 | | | | | 2,334,376 | | | | | | 0.0 | | |
| 4,350,000 (1) | | | Cemex SAB de CV, 5.200%, 09/17/2030 | | | | | 4,334,905 | | | | | | 0.1 | | |
| 890,000 | | | CSX Corp., 4.500%, 08/01/2054 | | | | | 984,873 | | | | | | 0.0 | | |
| 2,715,000 | | | CSX Corp., 4.650%, 03/01/2068 | | | | | 2,994,184 | | | | | | 0.0 | | |
| Principal Amount† | | | Value | | | Percentage of Net Assets | | |||||||||
| CORPORATE BONDS/NOTES: (continued) | | |||||||||||||||
| | | | Industrial (continued) | | ||||||||||||
| 1,550,000 (1) | | | ENA Master Trust, 4.000%, 05/19/2048 | | | | $ | 1,459,271 | | | | | | 0.0 | | |
| 1,428,000 | | | FedEx Corp., 3.900%, 02/01/2035 | | | | | 1,423,296 | | | | | | 0.0 | | |
| 4,000,000 | | | FedEx Corp., 4.050%, 02/15/2048 | | | | | 3,963,588 | | | | | | 0.0 | | |
| 2,096,000 | | | FedEx Corp., 4.250%, 05/15/2030 | | | | | 2,201,692 | | | | | | 0.0 | | |
| 2,647,000 | | | FedEx Corp., 4.400%, 01/15/2047 | | | | | 2,718,191 | | | | | | 0.0 | | |
| 2,765,812 | | | FedEx Corp. 2020-1 Class AA Pass Through Trust, 1.875%, 08/20/2035 | | | | | 2,527,806 | | | | | | 0.0 | | |
| 2,583,000 (2) | | | Fortune Brands Home & Security, Inc., 4.000%, 03/25/2032 | | | | | 2,590,073 | | | | | | 0.0 | | |
| 2,500,000 (1)(2) | | | GCC SAB de CV, 3.614%, 04/20/2032 | | | | | 2,323,750 | | | | | | 0.0 | | |
| 2,436,000 | | | GE Capital International Funding Co. Unlimited Co., 4.418%, 11/15/2035 | | | | | 2,620,990 | | | | | | 0.0 | | |
| 4,000,000 | | | General Dynamics Corp., 3.500%, 04/01/2027 | | | | | 4,081,017 | | | | | | 0.1 | | |
| 5,085,000 (1)(2) | | | GFL Environmental, Inc., 3.500%, 09/01/2028 | | | | | 4,780,917 | | | | | | 0.1 | | |
| 2,000,000 (1) | | | Klabin Austria GmbH, 3.200%, 01/12/2031 | | | | | 1,746,780 | | | | | | 0.0 | | |
| 3,379,000 (2) | | | Norfolk Southern Corp., 3.650%, 08/01/2025 | | | | | 3,423,138 | | | | | | 0.0 | | |
| 1,514,000 | | | Norfolk Southern Corp., 4.100%, 05/15/2121 | | | | | 1,417,021 | | | | | | 0.0 | | |
| 434,000 | | | Northrop Grumman Corp., 2.930%, 01/15/2025 | | | | | 435,348 | | | | | | 0.0 | | |
| 3,618,000 (1)(2) | | | Penske Truck Leasing Co. Lp / PTL Finance Corp., 1.200%, 11/15/2025 | | | | | 3,324,969 | | | | | | 0.0 | | |
| 4,922,000 (1)(2) | | | Penske Truck Leasing Co. Lp / PTL Finance Corp., 1.700%, 06/15/2026 | | | | | 4,574,019 | | | | | | 0.1 | | |
| 2,335,000 | | | Raytheon Technologies Corp., 3.200%, 03/15/2024 | | | | | 2,361,831 | | | | | | 0.0 | | |
| 3,686,000 (2) | | | Raytheon Technologies Corp., 3.500%, 03/15/2027 | | | | | 3,741,656 | | | | | | 0.0 | | |
| 211,000 | | | Raytheon Technologies Corp., 3.650%, 08/16/2023 | | | | | 213,841 | | | | | | 0.0 | | |
| Voya Intermediate Bond Fund | as of March 31, 2022 (continued) |
| Principal Amount† | | | Value | | | Percentage of Net Assets | | |||||||||
| CORPORATE BONDS/NOTES: (continued) | | |||||||||||||||
| | | | Industrial (continued) | | ||||||||||||
| 3,933,000 | | | Raytheon Technologies Corp., 4.450%, 11/16/2038 | | | | $ | 4,279,686 | | | | | | 0.1 | | |
| 7,750,000 | | | Raytheon Technologies Corp., 4.500%, 06/01/2042 | | | | | 8,576,835 | | | | | | 0.1 | | |
| 2,591,000 | | | Republic Services, Inc., 1.750%, 02/15/2032 | | | | | 2,227,894 | | | | | | 0.0 | | |
| 3,235,000 (1) | | | Sealed Air Corp., 1.573%, 10/15/2026 | | | | | 2,951,969 | | | | | | 0.0 | | |
| 5,180,000 (1)(2) | | | Sensata Technologies, Inc., 3.750%, 02/15/2031 | | | | | 4,799,555 | | | | | | 0.1 | | |
| 4,773,000 (2) | | | Silgan Holdings, Inc., 4.125%, 02/01/2028 | | | | | 4,588,380 | | | | | | 0.1 | | |
| 2,399,000 (1) | | | SMBC Aviation Capital Finance DAC, 1.900%, 10/15/2026 | | | | | 2,147,152 | | | | | | 0.0 | | |
| 5,083,000 (2) | | | Sonoco Products Co., 2.250%, 02/01/2027 | | | | | 4,821,108 | | | | | | 0.1 | | |
| 6,089,000 (2) | | | Sonoco Products Co., 2.850%, 02/01/2032 | | | | | 5,698,755 | | | | | | 0.1 | | |
| 3,005,000 (1) | | | Standard Industries, Inc./NJ, 3.375%, 01/15/2031 | | | | | 2,633,898 | | | | | | 0.0 | | |
| 6,625,000 (1) | | | Standard Industries, Inc./NJ, 4.375%, 07/15/2030 | | | | | 6,076,450 | | | | | | 0.1 | | |
| 3,275,000 (1) | | | Summit Digitel Infrastructure Pvt Ltd., 2.875%, 08/12/2031 | | | | | 2,827,392 | | | | | | 0.0 | | |
| 5,340,000 (1) | | | Summit Materials LLC / Summit Materials Finance Corp., 5.250%, 01/15/2029 | | | | | 5,278,964 | | | | | | 0.1 | | |
| 1,160,000 (1) | | | TD SYNNEX Corp., 1.750%, 08/09/2026 | | | | | 1,064,095 | | | | | | 0.0 | | |
| 6,225,000 | | | Teledyne Technologies, Inc., 1.600%, 04/01/2026 | | | | | 5,808,642 | | | | | | 0.1 | | |
| 5,745,000 (1) | | | TTX Co., 3.600%, 01/15/2025 | | | | | 5,839,889 | | | | | | 0.1 | | |
| 2,523,000 (2) | | | Union Pacific Corp., 2.800%, 02/14/2032 | | | | | 2,425,503 | | | | | | 0.0 | | |
| 6,633,000 | | | Union Pacific Corp., 3.500%, 02/14/2053 | | | | | 6,509,226 | | | | | | 0.1 | | |
| 1,145,000 | | | Union Pacific Corp., 3.550%, 05/20/2061 | | | | | 1,092,825 | | | | | | 0.0 | | |
| | | | | | | | | 195,875,526 | | | | | | 2.1 | | |
| | | | Industrials: 0.1% | | ||||||||||||
| 12,925,000 | | | Misc Capital Two (Labuan) Ltd., 3.750%, 04/06/2027 | | | | | 12,888,293 | | | | | | 0.1 | | |
| Principal Amount† | | | Value | | | Percentage of Net Assets | | |||||||||
| CORPORATE BONDS/NOTES: (continued) | | |||||||||||||||
| | | | Technology: 2.2% | | ||||||||||||
| 1,977,000 | | | Analog Devices, Inc., 2.800%, 10/01/2041 | | | | $ | 1,780,987 | | | | | | 0.0 | | |
| 6,345,000 | | | Apple, Inc., 2.650%, 02/08/2051 | | | | | 5,490,948 | | | | | | 0.1 | | |
| 8,526,000 | | | Apple, Inc., 2.800%, 02/08/2061 | | | | | 7,358,200 | | | | | | 0.1 | | |
| 2,825,000 | | | Apple, Inc., 2.850%, 08/05/2061 | | | | | 2,446,490 | | | | | | 0.0 | | |
| 3,900,000 | | | Apple, Inc., 3.750%, 09/12/2047 | | | | | 4,072,778 | | | | | | 0.1 | | |
| 963,000 | | | Apple, Inc., 4.450%, 05/06/2044 | | | | | 1,095,191 | | | | | | 0.0 | | |
| 1,385,000 (2) | | | Apple, Inc., 4.500%, 02/23/2036 | | | | | 1,586,756 | | | | | | 0.0 | | |
| 3,177,000 | | | CDW LLC / CDW Finance Corp., 3.250%, 02/15/2029 | | | | | 2,923,047 | | | | | | 0.0 | | |
| 3,352,000 | | | Citrix Systems, Inc., 1.250%, 03/01/2026 | | | | | 3,263,067 | | | | | | 0.0 | | |
| 960,000 (2) | | | Citrix Systems, Inc., 3.300%, 03/01/2030 | | | | | 950,940 | | | | | | 0.0 | | |
| 2,143,000 | | | Dell International LLC / EMC Corp., 6.020%, 06/15/2026 | | | | | 2,323,360 | | | | | | 0.0 | | |
| 2,310,000 (2) | | | DXC Technology Co., 1.800%, 09/15/2026 | | | | | 2,120,967 | | | | | | 0.0 | | |
| 2,315,000 (2) | | | DXC Technology Co., 2.375%, 09/15/2028 | | | | | 2,096,037 | | | | | | 0.0 | | |
| 6,895,000 | | | Fiserv, Inc., 3.500%, 07/01/2029 | | | | | 6,794,998 | | | | | | 0.1 | | |
| 3,690,000 | | | HP, Inc., 2.650%, 06/17/2031 | | | | | 3,307,500 | | | | | | 0.0 | | |
| 7,470,000 | | | HP, Inc., 4.000%, 04/15/2029 | | | | | 7,448,904 | | | | | | 0.1 | | |
| 2,895,000 (2) | | | HP, Inc., 4.050%, 09/15/2022 | | | | | 2,925,792 | | | | | | 0.0 | | |
| 2,139,000 (1) | | | Infor, Inc., 1.450%, 07/15/2023 | | | | | 2,096,864 | | | | | | 0.0 | | |
| 1,975,000 | | | Intel Corp., 3.100%, 02/15/2060 | | | | | 1,706,262 | | | | | | 0.0 | | |
| 4,751,000 (2) | | | Intel Corp., 3.200%, 08/12/2061 | | | | | 4,225,498 | | | | | | 0.1 | | |
| 12,903,000 | | | Intel Corp., 3.250%, 11/15/2049 | | | | | 11,955,012 | | | | | | 0.1 | | |
| 7,595,000 | | | International Business Machines Corp., 3.300%, 05/15/2026 | | | | | 7,681,679 | | | | | | 0.1 | | |
| 4,000,000 | | | International Business Machines Corp., 3.500%, 05/15/2029 | | | | | 4,082,903 | | | | | | 0.1 | | |
| Voya Intermediate Bond Fund | as of March 31, 2022 (continued) |
| Principal Amount† | | | Value | | | Percentage of Net Assets | | |||||||||
| CORPORATE BONDS/NOTES: (continued) | | |||||||||||||||
| | | | Technology (continued) | | ||||||||||||
| 2,708,000 (1) | | | Kyndryl Holdings, Inc., 2.050%, 10/15/2026 | | | | $ | 2,421,628 | | | | | | 0.0 | | |
| 6,028,000 (1)(2) | | | Kyndryl Holdings, Inc., 2.700%, 10/15/2028 | | | | | 5,227,650 | | | | | | 0.1 | | |
| 2,667,000 (1)(2) | | | Kyndryl Holdings, Inc., 3.150%, 10/15/2031 | | | | | 2,251,244 | | | | | | 0.0 | | |
| 5,223,000 | | | Microchip Technology, Inc., 2.670%, 09/01/2023 | | | | | 5,208,282 | | | | | | 0.1 | | |
| 9,677,000 (2) | | | Microsoft Corp., 2.921%, 03/17/2052 | | | | | 9,107,924 | | | | | | 0.1 | | |
| 2,332,000 | | | NetApp, Inc., 1.875%, 06/22/2025 | | | | | 2,232,645 | | | | | | 0.0 | | |
| 7,006,000 (2) | | | NVIDIA Corp., 1.550%, 06/15/2028 | | | | | 6,447,340 | | | | | | 0.1 | | |
| 4,533,000 (1) | | | NXP BV / NXP Funding LLC, 5.350%, 03/01/2026 | | | | | 4,776,040 | | | | | | 0.1 | | |
| 2,510,000 (1) | | | NXP BV / NXP Funding LLC / NXP USA, Inc., 3.250%, 11/30/2051 | | | | | 2,128,732 | | | | | | 0.0 | | |
| 2,761,000 (1) | | | NXP BV / NXP Funding LLC / NXP USA, Inc., 3.400%, 05/01/2030 | | | | | 2,680,227 | | | | | | 0.0 | | |
| 4,960,000 (1) | | | ON Semiconductor Corp., 3.875%, 09/01/2028 | | | | | 4,742,330 | | | | | | 0.1 | | |
| 10,030,000 (1)(2) | | | Open Text Holdings, Inc., 4.125%, 12/01/2031 | | | | | 9,411,600 | | | | | | 0.1 | | |
| 6,520,000 | | | Oracle Corp., 2.300%, 03/25/2028 | | | | | 5,967,975 | | | | | | 0.1 | | |
| 1,027,000 | | | Oracle Corp., 3.600%, 04/01/2050 | | | | | 854,301 | | | | | | 0.0 | | |
| 2,948,000 | | | Oracle Corp., 3.650%, 03/25/2041 | | | | | 2,582,782 | | | | | | 0.0 | | |
| 2,966,000 | | | Oracle Corp., 3.800%, 11/15/2037 | | | | | 2,688,683 | | | | | | 0.0 | | |
| 370,000 | | | Oracle Corp., 3.850%, 07/15/2036 | | | | | 341,332 | | | | | | 0.0 | | |
| 5,402,000 | | | Oracle Corp., 3.950%, 03/25/2051 | | | | | 4,739,806 | | | | | | 0.1 | | |
| 6,590,000 | | | Oracle Corp., 4.000%, 11/15/2047 | | | | | 5,845,489 | | | | | | 0.1 | | |
| 1,885,000 (1) | | | Renesas Electronics Corp., 2.170%, 11/25/2026 | | | | | 1,757,321 | | | | | | 0.0 | | |
| 2,498,000 | | | Roper Technologies, Inc., 1.400%, 09/15/2027 | | | | | 2,268,099 | | | | | | 0.0 | | |
| 3,601,000 | | | salesforce.com, Inc., 2.700%, 07/15/2041 | | | | | 3,199,579 | | | | | | 0.0 | | |
| 1,352,000 | | | salesforce.com, Inc., 2.900%, 07/15/2051 | | | | | 1,204,649 | | | | | | 0.0 | | |
| 5,821,000 | | | Seagate HDD Cayman, 3.375%, 07/15/2031 | | | | | 5,187,501 | | | | | | 0.1 | | |
| Principal Amount† | | | Value | | | Percentage of Net Assets | | | |||||||||||
| CORPORATE BONDS/NOTES: (continued) | | | |||||||||||||||||
| | | | Technology (continued) | | | ||||||||||||||
| 2,755,000 (1) | | | TSMC Global Ltd., 0.750%, 09/28/2025 | | | | $ | 2,554,192 | | | | | | 0.0 | | | | ||
| 2,915,000 (1) | | | TSMC Global Ltd., 1.000%, 09/28/2027 | | | | | 2,562,345 | | | | | | 0.0 | | | | ||
| 5,540,000 | | | VMware, Inc., 1.400%, 08/15/2026 | | | | | 5,094,187 | | | | | | 0.1 | | | | ||
| 2,395,000 | | | VMware, Inc., 1.800%, 08/15/2028 | | | | | 2,129,057 | | | | | | 0.0 | | | | ||
| 360,000 (2) | | | Western Digital Corp., 2.850%, 02/01/2029 | | | | | 329,616 | | | | | | 0.0 | | | | ||
| 1,980,000 | | | Workday, Inc., 3.500%, 04/01/2027 | | | | | 1,980,835 | | | | | | 0.0 | | | | ||
| 3,465,000 | | | Workday, Inc., 3.700%, 04/01/2029 | | | | | 3,475,860 | | | | | | 0.0 | | | | ||
| 2,986,000 | | | Workday, Inc., 3.800%, 04/01/2032 | | | | | 2,984,007 | | | | | | 0.0 | | | | ||
| 7,806,000 (1) | | | Ziff Davis, Inc., 4.625%, 10/15/2030 | | | | | 7,445,051 | | | | | | 0.1 | | | | ||
| | | | | | | | | 211,562,489 | | | | | | 2.2 | | | | ||
| | | | Utilities: 4.5% | | | ||||||||||||||
| 1,059,000 | | | AEP Texas, Inc., 3.450%, 01/15/2050 | | | | | 944,303 | | | | | | 0.0 | | | | ||
| 3,671,000 (1) | | | AEP Texas, Inc., 3.850%, 10/01/2025 | | | | | 3,713,486 | | | | | | 0.1 | | | | ||
| 2,870,000 | | | AES Corp./The, 1.375%, 01/15/2026 | | | | | 2,642,902 | | | | | | 0.0 | | | | ||
| 3,943,000 (1) | | | AES Corp./The, 3.950%, 07/15/2030 | | | | | 3,913,966 | | | | | | 0.1 | | | | ||
| 2,480,000 | | | Alabama Power Co., 3.450%, 10/01/2049 | | | | | 2,311,137 | | | | | | 0.0 | | | | ||
| 3,573,000 (1)(2) | | | Alliant Energy Finance LLC, 3.600%, 03/01/2032 | | | | | 3,479,014 | | | | | | 0.1 | | | | ||
| 10,755,000 (1) | | | Alliant Energy Finance LLC, 3.750%, 06/15/2023 | | | | | 10,880,674 | | | | | | 0.1 | | | | ||
| 3,136,000 (2) | | | American Electric Power Co., Inc., 3.250%, 03/01/2050 | | | | | 2,723,212 | | | | | | 0.0 | | | | ||
| 3,830,000 (3) | | | American Electric Power Co., Inc., 3.875%, 02/15/2062 | | | | | 3,541,093 | | | | | | 0.1 | | | | ||
| 4,045,000 (1) | | | American Transmission Systems, Inc., 2.650%, 01/15/2032 | | | | | 3,741,816 | | | | | | 0.1 | | | | ||
| 4,130,000 (1) | | | American Transmission Systems, Inc., 5.000%, 09/01/2044 | | | | | 4,559,765 | | | | | | 0.1 | | | | ||
| 2,812,000 (2) | | | Appalachian Power Co., 2.700%, 04/01/2031 | | | | | 2,609,602 | | | | | | 0.0 | | | | | |
| 2,011,000 | | | Appalachian Power Co., 3.700%, 05/01/2050 | | | | | 1,883,103 | | | | | | 0.0 | | | | ||
| Voya Intermediate Bond Fund | as of March 31, 2022 (continued) |
| Principal Amount† | | | Value | | | Percentage of Net Assets | | |||||||||
| CORPORATE BONDS/NOTES: (continued) | | |||||||||||||||
| | | | Utilities (continued) | | ||||||||||||
| 2,595,000 | | | Arizona Public Service Co., 4.200%, 08/15/2048 | | | | $ | 2,576,418 | | | | | | 0.0 | | |
| 9,776,000 | | | Avangrid, Inc., 3.200%, 04/15/2025 | | | | | 9,756,058 | | | | | | 0.1 | | |
| 3,422,000 | | | Baltimore Gas and Electric Co., 2.250%, 06/15/2031 | | | | | 3,119,544 | | | | | | 0.0 | | |
| 3,953,000 (2) | | | Berkshire Hathaway Energy Co., 1.650%, 05/15/2031 | | | | | 3,447,392 | | | | | | 0.0 | | |
| 3,615,000 | | | Black Hills Corp., 2.500%, 06/15/2030 | | | | | 3,291,780 | | | | | | 0.0 | | |
| 3,250,000 | | | Black Hills Corp., 3.050%, 10/15/2029 | | | | | 3,119,503 | | | | | | 0.0 | | |
| 1,720,000 | | | Black Hills Corp., 4.250%, 11/30/2023 | | | | | 1,753,791 | | | | | | 0.0 | | |
| 2,750,000 | | | Black Hills Corp., 4.350%, 05/01/2033 | | | | | 2,803,067 | | | | | | 0.0 | | |
| 566,000 | | | CenterPoint Energy Houston Electric LLC, 3.550%, 08/01/2042 | | | | | 555,524 | | | | | | 0.0 | | |
| 2,166,000 (1) | | | Cleveland Electric Illuminating Co/The, 3.500%, 04/01/2028 | | | | | 2,119,861 | | | | | | 0.0 | | |
| 3,430,000 (3) | | | CMS Energy Corp., 3.750%, 12/01/2050 | | | | | 3,035,550 | | | | | | 0.0 | | |
| 7,338,000 (3) | | | CMS Energy Corp., 4.750%, 06/01/2050 | | | | | 7,282,965 | | | | | | 0.1 | | |
| 2,519,000 | | | Commonwealth Edison Co., 3.750%, 08/15/2047 | | | | | 2,516,030 | | | | | | 0.0 | | |
| 1,864,000 | | | Consolidated Edison Co. of New York, Inc., 4.000%, 11/15/2057 | | | | | 1,830,032 | | | | | | 0.0 | | |
| 2,591,000 | | | Consolidated Edison Co. of New York, Inc., 4.625%, 12/01/2054 | | | | | 2,831,301 | | | | | | 0.0 | | |
| 831,000 | | | Consolidated Edison Co. of New York, Inc., 5.300%, 03/01/2035 | | | | | 928,516 | | | | | | 0.0 | | |
| 2,732,000 (2) | | | Dominion Energy South Carolina, Inc., 2.300%, 12/01/2031 | | | | | 2,496,231 | | | | | | 0.0 | | |
| 8,182,000 (3) | | | Dominion Energy, Inc., 4.350%, 12/31/2199 | | | | | 7,953,395 | | | | | | 0.1 | | |
| 4,865,000 (3) | | | Dominion Energy, Inc., 4.650%, 12/31/2199 | | | | | 4,840,675 | | | | | | 0.1 | | |
| 1,472,000 (2) | | | Duke Energy Carolinas LLC, 2.550%, 04/15/2031 | | | | | 1,383,027 | | | | | | 0.0 | | |
| 2,523,000 | | | Duke Energy Carolinas LLC, 3.700%, 12/01/2047 | | | | | 2,471,869 | | | | | | 0.0 | | |
| Principal Amount† | | | Value | | | Percentage of Net Assets | | |||||||||
| CORPORATE BONDS/NOTES: (continued) | | |||||||||||||||
| | | | Utilities (continued) | | ||||||||||||
| 587,000 | | | Duke Energy Carolinas LLC, 3.750%, 06/01/2045 | | | | $ | 579,901 | | | | | | 0.0 | | |
| 1,832,000 | | | Duke Energy Carolinas LLC, 3.875%, 03/15/2046 | | | | | 1,848,682 | | | | | | 0.0 | | |
| 185,000 | | | Duke Energy Carolinas LLC, 3.950%, 03/15/2048 | | | | | 190,644 | | | | | | 0.0 | | |
| 3,620,000 | | | Duke Energy Carolinas LLC, 4.000%, 09/30/2042 | | | | | 3,715,150 | | | | | | 0.1 | | |
| 182,000 | | | Duke Energy Carolinas LLC, 4.250%, 12/15/2041 | | | | | 191,022 | | | | | | 0.0 | | |
| 2,155,000 (3) | | | Duke Energy Corp., 4.875%, 12/31/2199 | | | | | 2,183,295 | | | | | | 0.0 | | |
| 4,575,000 | | | Duke Energy Florida LLC, 2.400%, 12/15/2031 | | | | | 4,226,947 | | | | | | 0.1 | | |
| 2,249,000 (2) | | | Duke Energy Florida LLC, 3.000%, 12/15/2051 | | | | | 2,015,600 | | | | | | 0.0 | | |
| 720,000 | | | Duke Energy Florida LLC, 4.200%, 07/15/2048 | | | | | 770,505 | | | | | | 0.0 | | |
| 2,000,000 | | | Duke Energy Indiana LLC, 2.750%, 04/01/2050 | | | | | 1,692,434 | | | | | | 0.0 | | |
| 5,147,000 | | | Duke Energy Indiana LLC, 3.250%, 10/01/2049 | | | | | 4,593,107 | | | | | | 0.1 | | |
| 1,890,000 | | | Duke Energy Ohio, Inc., 2.125%, 06/01/2030 | | | | | 1,720,002 | | | | | | 0.0 | | |
| 2,588,000 | | | Duke Energy Ohio, Inc., 3.700%, 06/15/2046 | | | | | 2,518,951 | | | | | | 0.0 | | |
| 3,723,000 | | | Duke Energy Progress LLC, 3.700%, 10/15/2046 | | | | | 3,623,588 | | | | | | 0.1 | | |
| 5,143,000 | | | Duke Energy Progress LLC, 4.100%, 05/15/2042 | | | | | 5,318,215 | | | | | | 0.1 | | |
| 219,000 | | | Duke Energy Progress LLC, 4.100%, 03/15/2043 | | | | | 224,096 | | | | | | 0.0 | | |
| 2,505,000 | | | Duke Energy Progress LLC, 4.200%, 08/15/2045 | | | | | 2,627,775 | | | | | | 0.0 | | |
| 2,390,000 (1) | | | Duquesne Light Holdings, Inc., 2.532%, 10/01/2030 | | | | | 2,147,528 | | | | | | 0.0 | | |
| 4,699,000 | | | Entergy Arkansas LLC, 2.650%, 06/15/2051 | | | | | 3,850,406 | | | | | | 0.1 | | |
| 4,827,000 (2) | | | Entergy Arkansas LLC, 4.200%, 04/01/2049 | | | | | 5,193,332 | | | | | | 0.1 | | |
| 4,202,000 | | | Entergy Corp., 0.900%, 09/15/2025 | | | | | 3,858,135 | | | | | | 0.1 | | |
| 3,955,000 | | | Entergy Corp., 2.400%, 06/15/2031 | | | | | 3,556,199 | | | | | | 0.1 | | |
| 1,869,000 | | | Entergy Corp., 2.800%, 06/15/2030 | | | | | 1,754,454 | | | | | | 0.0 | | |
| 4,000,000 | | | Entergy Louisiana LLC, 4.200%, 04/01/2050 | | | | | 4,246,841 | | | | | | 0.1 | | |
| Voya Intermediate Bond Fund | as of March 31, 2022 (continued) |
| Principal Amount† | | | Value | | | Percentage of Net Assets | | |||||||||
| CORPORATE BONDS/NOTES: (continued) | | |||||||||||||||
| | | | Utilities (continued) | | ||||||||||||
| 2,172,000 | | | Entergy Texas, Inc., 4.000%, 03/30/2029 | | | | $ | 2,268,155 | | | | | | 0.0 | | |
| 2,882,000 | | | Evergy Kansas Central, Inc., 3.250%, 09/01/2049 | | | | | 2,609,171 | | | | | | 0.0 | | |
| 2,520,000 (2) | | | Evergy Metro, Inc., 2.250%, 06/01/2030 | | | | | 2,316,842 | | | | | | 0.0 | | |
| 2,943,000 | | | Eversource Energy, 0.800%, 08/15/2025 | | | | | 2,711,203 | | | | | | 0.0 | | |
| 2,750,000 | | | Eversource Energy, 1.400%, 08/15/2026 | | | | | 2,541,225 | | | | | | 0.0 | | |
| 4,991,000 | | | Eversource Energy, 2.900%, 03/01/2027 | | | | | 4,899,028 | | | | | | 0.1 | | |
| 2,991,000 | | | Eversource Energy, 3.375%, 03/01/2032 | | | | | 2,929,133 | | | | | | 0.0 | | |
| 1,060,000 | | | Exelon Corp., 4.050%, 04/15/2030 | | | | | 1,095,655 | | | | | | 0.0 | | |
| 1,585,000 | | | Exelon Corp., 4.700%, 04/15/2050 | | | | | 1,748,939 | | | | | | 0.0 | | |
| 3,500,000 | | | Florida Power & Light Co., 2.875%, 12/04/2051 | | | | | 3,144,831 | | | | | | 0.0 | | |
| 1,725,000 | | | Fortis, Inc./Canada, 3.055%, 10/04/2026 | | | | | 1,707,534 | | | | | | 0.0 | | |
| 3,055,000 | | | Georgia Power Co., 2.200%, 09/15/2024 | | | | | 2,998,466 | | | | | | 0.0 | | |
| 2,124,000 | | | Georgia Power Co., 5.750%, 04/15/2023 | | | | | 2,188,089 | | | | | | 0.0 | | |
| 4,000,000 | | | Indiana Michigan Power Co., 3.250%, 05/01/2051 | | | | | 3,585,679 | | | | | | 0.1 | | |
| 6,060,000 | | | Inkia Energy Ltd., 5.875%, 11/09/2027 | | | | | 5,860,050 | | | | | | 0.1 | | |
| 2,513,000 | | | Interstate Power and Light Co., 3.100%, 11/30/2051 | | | | | 2,156,555 | | | | | | 0.0 | | |
| 4,400,000 (2) | | | Interstate Power and Light Co., 3.250%, 12/01/2024 | | | | | 4,423,504 | | | | | | 0.1 | | |
| 3,462,000 | | | IPALCO Enterprises, Inc., 4.250%, 05/01/2030 | | | | | 3,473,229 | | | | | | 0.0 | | |
| 1,579,000 (1) | | | Jersey Central Power & Light Co., 2.750%, 03/01/2032 | | | | | 1,472,678 | | | | | | 0.0 | | |
| 3,199,000 (1) | | | Jersey Central Power & Light Co., 4.300%, 01/15/2026 | | | | | 3,269,288 | | | | | | 0.0 | | |
| 1,950,000 (1) | | | Metropolitan Edison Co., 3.500%, 03/15/2023 | | | | | 1,960,777 | | | | | | 0.0 | | |
| 500,000 | | | MidAmerican Energy Co., 4.400%, 10/15/2044 | | | | | 538,748 | | | | | | 0.0 | | |
| 4,552,000 | | | Mississippi Power Co., 4.250%, 03/15/2042 | | | | | 4,576,228 | | | | | | 0.1 | | |
| 271,000 | | | Mississippi Power Co., 4.750%, 10/15/2041 | | | | | 274,479 | | | | | | 0.0 | | |
| Principal Amount† | | | Value | | | Percentage of Net Assets | | |||||||||
| CORPORATE BONDS/NOTES: (continued) | | |||||||||||||||
| | | | Utilities (continued) | | ||||||||||||
| 2,460,000 (1)(2) | | | Monongahela Power Co., 3.550%, 05/15/2027 | | | | $ | 2,461,126 | | | | | | 0.0 | | |
| 3,392,000 (1) | | | Narragansett Electric Co/The, 3.395%, 04/09/2030 | | | | | 3,338,605 | | | | | | 0.0 | | |
| 5,417,000 | | | National Rural Utilities Cooperative Finance Corp., 2.400%, 03/15/2030 | | | | | 5,055,596 | | | | | | 0.1 | | |
| 5,090,000 (2) | | | National Rural Utilities Cooperative Finance Corp., 2.750%, 04/15/2032 | | | | | 4,816,051 | | | | | | 0.1 | | |
| 2,880,000 (3) | | | National Rural Utilities Cooperative Finance Corp., 4.750%, 04/30/2043 | | | | | 2,810,630 | | | | | | 0.0 | | |
| 8,110,000 (2) | | | NextEra Energy Capital Holdings, Inc., 1.875%, 01/15/2027 | | | | | 7,619,188 | | | | | | 0.1 | | |
| 2,635,000 (2) | | | NextEra Energy Capital Holdings, Inc., 1.900%, 06/15/2028 | | | | | 2,433,143 | | | | | | 0.0 | | |
| 2,698,000 | | | NextEra Energy Capital Holdings, Inc., 2.440%, 01/15/2032 | | | | | 2,470,273 | | | | | | 0.0 | | |
| 5,680,000 (3) | | | NextEra Energy Capital Holdings, Inc., 3.800%, 03/15/2082 | | | | | 5,249,849 | | | | | | 0.1 | | |
| 4,000,000 | | | NiSource, Inc., 0.950%, 08/15/2025 | | | | | 3,680,368 | | | | | | 0.1 | | |
| 1,453,000 | | | NiSource, Inc., 5.950%, 06/15/2041 | | | | | 1,700,437 | | | | | | 0.0 | | |
| 1,915,000 | | | NSTAR Electric Co., 1.950%, 08/15/2031 | | | | | 1,693,633 | | | | | | 0.0 | | |
| 2,992,000 (2) | | | Oglethorpe Power Corp., 3.750%, 08/01/2050 | | | | | 2,823,372 | | | | | | 0.0 | | |
| 7,408,000 | | | ONE Gas, Inc., 1.100%, 03/11/2024 | | | | | 7,150,731 | | | | | | 0.1 | | |
| 1,861,000 | | | Pacific Gas and Electric Co., 4.250%, 03/15/2046 | | | | | 1,614,474 | | | | | | 0.0 | | |
| 4,188,000 | | | Pacific Gas and Electric Co., 4.300%, 03/15/2045 | | | | | 3,577,279 | | | | | | 0.1 | | |
| 2,484,000 | | | Pacific Gas and Electric Co., 4.450%, 04/15/2042 | | | | | 2,208,559 | | | | | | 0.0 | | |
| 664,000 | | | PacifiCorp, 4.150%, 02/15/2050 | | | | | 694,526 | | | | | | 0.0 | | |
| 500,000 | | | PECO Energy Co., 3.700%, 09/15/2047 | | | | | 504,426 | | | | | | 0.0 | | |
| Voya Intermediate Bond Fund | as of March 31, 2022 (continued) |
| Principal Amount† | | | Value | | | Percentage of Net Assets | | |||||||||
| CORPORATE BONDS/NOTES: (continued) | | |||||||||||||||
| | | | Utilities (continued) | | ||||||||||||
| 1,138,000 | | | PECO Energy Co., 4.150%, 10/01/2044 | | | | $ | 1,186,531 | | | | | | 0.0 | | |
| 750,000 (1) | | | Perusahaan Listrik Negara PT, 5.375%, 01/25/2029 | | | | | 805,043 | | | | | | 0.0 | | |
| 2,675,000 | | | Perusahaan Listrik Negara PT, 5.450%, 05/21/2028 | | | | | 2,873,164 | | | | | | 0.0 | | |
| 4,500,000 (1) | | | Perusahaan Listrik Negara PT, 5.450%, 05/21/2028 | | | | | 4,833,360 | | | | | | 0.1 | | |
| 2,035,000 | | | Piedmont Natural Gas Co., Inc., 3.350%, 06/01/2050 | | | | | 1,821,754 | | | | | | 0.0 | | |
| 1,200,000 (1) | | | Promigas SA ESP / Gases del Pacifico SAC, 3.750%, 10/16/2029 | | | | | 1,089,090 | | | | | | 0.0 | | |
| 500,000 | | | Public Service Electric and Gas Co., 3.600%, 12/01/2047 | | | | | 496,417 | | | | | | 0.0 | | |
| 2,889,000 | | | Public Service Enterprise Group, Inc., 0.800%, 08/15/2025 | | | | | 2,667,018 | | | | | | 0.0 | | |
| 2,541,000 (2) | | | Public Service Enterprise Group, Inc., 1.600%, 08/15/2030 | | | | | 2,176,444 | | | | | | 0.0 | | |
| 9,295,000 | | | Public Service Enterprise Group, Inc., 2.450%, 11/15/2031 | | | | | 8,454,484 | | | | | | 0.1 | | |
| 3,937,000 | | | Sempra Energy, 3.800%, 02/01/2038 | | | | | 3,870,405 | | | | | | 0.1 | | |
| 8,135,000 (3) | | | Sempra Energy, 4.125%, 04/01/2052 | | | | | 7,615,146 | | | | | | 0.1 | | |
| 3,344,000 (2)(3) | | | Sempra Energy, 4.875%, 12/31/2199 | | | | | 3,369,080 | | | | | | 0.0 | | |
| 5,750,000 | | | Sierra Pacific Power Co., 2.600%, 05/01/2026 | | | | | 5,654,497 | | | | | | 0.1 | | |
| 9,284,000 | | | South Jersey Industries, Inc., 5.020%, 04/15/2031 | | | | | 9,131,176 | | | | | | 0.1 | | |
| 1,570,000 (2) | | | Southern California Edison Co., 3.650%, 02/01/2050 | | | | | 1,459,797 | | | | | | 0.0 | | |
| 813,000 | | | Southern California Edison Co., 4.050%, 03/15/2042 | | | | | 784,201 | | | | | | 0.0 | | |
| 1,444,000 | | | Southern Co. Gas Capital Corp., 4.400%, 05/30/2047 | | | | | 1,457,525 | | | | | | 0.0 | | |
| 1,680,000 | | | Southern Co. Gas Capital Corp., 5.875%, 03/15/2041 | | | | | 1,982,506 | | | | | | 0.0 | | |
| 6,902,000 (3) | | | Southern Co/The, 3.750%, 09/15/2051 | | | | | 6,381,244 | | | | | | 0.1 | | |
| Principal Amount† | | | Value | | | Percentage of Net Assets | | |||||||||
| CORPORATE BONDS/NOTES: (continued) | | |||||||||||||||
| | | | Utilities (continued) | | ||||||||||||
| 4,975,000 (3) | | | Southern Co/The, 4.000%, 01/15/2051 | | | | $ | 4,825,750 | | | | | | 0.1 | | |
| 2,508,000 | | | Southwest Gas Corp., 4.050%, 03/15/2032 | | | | | 2,504,140 | | | | | | 0.0 | | |
| 4,444,000 | | | Southwestern Electric Power Co., 1.650%, 03/15/2026 | | | | | 4,183,289 | | | | | | 0.1 | | |
| 1,709,000 | | | Tampa Electric Co., 4.350%, 05/15/2044 | | | | | 1,778,619 | | | | | | 0.0 | | |
| 3,623,000 | | | Tucson Electric Power Co., 1.500%, 08/01/2030 | | | | | 3,104,143 | | | | | | 0.0 | | |
| 1,710,000 | | | Tucson Electric Power Co., 4.850%, 12/01/2048 | | | | | 1,931,043 | | | | | | 0.0 | | |
| 2,260,000 | | | Union Electric Co., 3.900%, 09/15/2042 | | | | | 2,245,478 | | | | | | 0.0 | | |
| 1,915,000 | | | Virginia Electric and Power Co., 3.450%, 09/01/2022 | | | | | 1,920,972 | | | | | | 0.0 | | |
| 5,165,000 | | | Virginia Electric and Power Co., 3.800%, 09/15/2047 | | | | | 5,179,788 | | | | | | 0.1 | | |
| 5,000,000 (1)(2) | | | Vistra Operations Co. LLC, 4.375%, 05/01/2029 | | | | | 4,731,450 | | | | | | 0.1 | | |
| 2,276,000 | | | Washington Gas Light Co., 3.650%, 09/15/2049 | | | | | 2,200,607 | | | | | | 0.0 | | |
| 4,673,000 | | | WEC Energy Group, Inc., 1.375%, 10/15/2027 | | | | | 4,211,647 | | | | | | 0.1 | | |
| 2,748,000 | | | WEC Energy Group, Inc., 2.200%, 12/15/2028 | | | | | 2,523,586 | | | | | | 0.0 | | |
| 1,500,000 (2) | | | Wisconsin Electric Power Co., 1.700%, 06/15/2028 | | | | | 1,358,195 | | | | | | 0.0 | | |
| 3,590,000 | | | Wisconsin Public Service Corp., 3.671%, 12/01/2042 | | | | | 3,450,383 | | | | | | 0.0 | | |
| | | | | | | | | 420,613,135 | | | | | | 4.5 | | |
| | | | Total Corporate Bonds/Notes | | | | | | | | | | | | | |
| | | | (Cost $3,930,184,835) | | | | | 3,700,022,034 | | | | | | 39.2 | | |
| COLLATERALIZED MORTGAGE OBLIGATIONS: 15.6% | | |||||||||||||||
| 1,919,765 | | | Alternative Loan Trust 2004-J7 MI, 1.477%, (US0001M + 1.020%), 10/25/2034 | | | | | 1,915,225 | | | | | | 0.0 | | |
| 478,113 | | | Alternative Loan Trust 2005-65CB 2A4, 5.500%, 12/25/2035 | | | | | 413,750 | | | | | | 0.0 | | |
| 593,764 | | | Alternative Loan Trust 2005-6CB 1A3, 5.250%, 04/25/2035 | | | | | 554,718 | | | | | | 0.0 | | |
| Voya Intermediate Bond Fund | as of March 31, 2022 (continued) |
| Principal Amount† | | | Value | | | Percentage of Net Assets | | |||||||||
| COLLATERALIZED MORTGAGE OBLIGATIONS: (continued) | | |||||||||||||||
| 1,202,108 | | | Alternative Loan Trust 2005-J2 1A12, 0.857%, (US0001M + 0.400%), 04/25/2035 | | | | $ | 1,007,124 | | | | | | 0.0 | | |
| 645,004 | | | Alternative Loan Trust 2006-13T1 A9, 6.000%, 05/25/2036 | | | | | 414,897 | | | | | | 0.0 | | |
| 127,377 | | | Alternative Loan Trust 2006-18CB A10, 0.857%, (US0001M + 0.400%), 07/25/2036 | | | | | 68,327 | | | | | | 0.0 | | |
| 765,818 | | | Alternative Loan Trust 2006-19CB A28, 1.057%, (US0001M + 0.600%), 08/25/2036 | | | | | 388,312 | | | | | | 0.0 | | |
| 900,814 | | | Alternative Loan Trust 2007-23CB A3, 0.957%, (US0001M + 0.500%), 09/25/2037 | | | | | 435,119 | | | | | | 0.0 | | |
| 2,042,208 | | | Alternative Loan Trust 2007-2CB 2A1, 1.057%, (US0001M + 0.600%), 03/25/2037 | | | | | 953,752 | | | | | | 0.0 | | |
| 877,156 | | | Alternative Loan Trust 2007-3T1 1A11, 6.000%, 04/25/2037 | | | | | 524,536 | | | | | | 0.0 | | |
| 800,282 | | | Alternative Loan Trust 2007-8CB A3, 0.957%, (US0001M + 0.500%), 05/25/2037 | | | | | 423,653 | | | | | | 0.0 | | |
| 1,696,004 | | | American Home Mortgage Assets Trust 2007-4 A4, 1.037%, (US0001M + 0.290%), 08/25/2037 | | | | | 1,633,388 | | | | | | 0.0 | | |
| 1,046,333 (1)(3) | | | Arroyo Mortgage Trust 2019-3 A3, 3.416%, 10/25/2048 | | | | | 1,017,171 | | | | | | 0.0 | | |
| 619,315 | | | Banc of America Funding 2007-2 1A16 Trust, 1.057%, (US0001M + 0.600%), 03/25/2037 | | | | | 499,883 | | | | | | 0.0 | | |
| 755,210 (5) | | | Banc of America Mortgage 2007-2 A8 Trust, 6.000%, 05/25/2037 | | | | | 64,955 | | | | | | 0.0 | | |
| 873,659 (3) | | | Bear Stearns ALT-A Trust 2005-4 23A1, 2.627%, 05/25/2035 | | | | | 869,224 | | | | | | 0.0 | | |
| 1,121,480 (3) | | | Bear Stearns ALT-A Trust 2005-7 21A1, 2.627%, 09/25/2035 | | | | | 1,013,993 | | | | | | 0.0 | | |
| Principal Amount† | | | Value | | | Percentage of Net Assets | | |||||||||
| COLLATERALIZED MORTGAGE OBLIGATIONS: (continued) | | |||||||||||||||
| 2,367,819 | | | Bear Stearns Mortgage Funding Trust 2006-AR5 2A1, 0.647%, (US0001M + 0.190%), 01/25/2037 | | | | $ | 2,197,959 | | | | | | 0.0 | | |
| 2,000,000 (1) | | | Bellemeade Re 2019-1A M2 Ltd., 3.157%, (US0001M + 2.700%), 03/25/2029 | | | | | 1,982,705 | | | | | | 0.0 | | |
| 13,147,000 (1) | | | Bellemeade RE 2021-3 A M1C Ltd., 1.649%, (SOFR30A + 1.550%), 09/25/2031 | | | | | 12,652,980 | | | | | | 0.2 | | |
| 1,000,000 (1) | | | Bellemeade Re 2022-1 M1C Ltd., 3.799%, (SOFR30A + 3.700%), 01/26/2032 | | | | | 964,093 | | | | | | 0.0 | | |
| 1,826,462 (1)(3) | | | Chase Mortgage Finance Corp. 2019-1 B2, 3.917%, 03/25/2050 | | | | | 1,793,204 | | | | | | 0.0 | | |
| 2,134,913 (1)(3) | | | Chase Mortgage Finance Corp. 2019-1 B3, 3.917%, 03/25/2050 | | | | | 2,093,888 | | | | | | 0.0 | | |
| 1,119,119 (3) | | | CHL Mortgage Pass-Through Trust 2004-22 A3, 2.696%, 11/25/2034 | | | | | 1,115,248 | | | | | | 0.0 | | |
| 480,178 | | | CHL Mortgage Pass-Through Trust 2007-7 A7, 5.750%, 06/25/2037 | | | | | 315,186 | | | | | | 0.0 | | |
| 951,239 (1)(3) | | | CHNGE Mortgage Trust 2022-1 A1, 3.007%, 01/25/2067 | | | | | 929,038 | | | | | | 0.0 | | |
| 154,506 (1)(3) | | | CIM Trust 2019-INV1 A1, 4.000%, 02/25/2049 | | | | | 155,268 | | | | | | 0.0 | | |
| 339,379 (1)(3) | | | CIM Trust 2019-INV3 A3, 3.500%, 08/25/2049 | | | | | 337,745 | | | | | | 0.0 | | |
| 2,837,489 (1)(3) | | | CIM Trust 2019-J2 B2, 3.770%, 10/25/2049 | | | | | 2,778,827 | | | | | | 0.0 | | |
| 945,830 (1)(3) | | | CIM Trust 2019-J2 B3, 3.770%, 10/25/2049 | | | | | 922,796 | | | | | | 0.0 | | |
| 2,600,000 (1)(3) | | | CIM Trust 2019-R5 M2, 3.250%, 09/25/2059 | | | | | 2,528,767 | | | | | | 0.0 | | |
| 3,170,729 (1)(3) | | | CIM Trust 2020-J1 B3, 3.451%, 07/25/2050 | | | | | 2,986,159 | | | | | | 0.0 | | |
| 867,783 | | | Citicorp Mortgage Securities Trust Series 2006-3 1A4, 6.000%, 06/25/2036 | | | | | 851,937 | | | | | | 0.0 | | |
| Voya Intermediate Bond Fund | as of March 31, 2022 (continued) |
| Principal Amount† | | | Value | | | Percentage of Net Assets | | |||||||||
| COLLATERALIZED MORTGAGE OBLIGATIONS: (continued) | | |||||||||||||||
| 736,903 (3) | | | Citigroup Mortgage Loan Trust 2006-AR9 2A, 2.829%, 11/25/2036 | | | | $ | 673,437 | | | | | | 0.0 | | |
| 342,339 (3) | | | Citigroup Mortgage Loan Trust 2007-10 22AA, 3.185%, 09/25/2037 | | | | | 324,203 | | | | | | 0.0 | | |
| 1,018,874 (1)(3) | | | Citigroup Mortgage Loan Trust 2015-A B2, 4.500%, 06/25/2058 | | | | | 1,013,094 | | | | | | 0.0 | | |
| 1,375,505 (1)(3) | | | Citigroup Mortgage Loan Trust 2021-J2 B2W, 2.775%, 07/25/2051 | | | | | 1,238,894 | | | | | | 0.0 | | |
| 1,545,974 (1)(3) | | | Citigroup Mortgage Loan Trust 2021-J2 B3W, 2.775%, 07/25/2051 | | | | | 1,374,817 | | | | | | 0.0 | | |
| 4,578,457 (1) | | | Connecticut Avenue Securities Trust 2020-R02 2B1, 3.457%, (US0001M + 3.000%), 01/25/2040 | | | | | 4,207,528 | | | | | | 0.1 | | |
| 3,168,775 (1) | | | Connecticut Avenue Securities Trust 2020-R02 2M2, 2.457%, (US0001M + 2.000%), 01/25/2040 | | | | | 3,159,355 | | | | | | 0.1 | | |
| 4,800,000 (1) | | | Connecticut Avenue Securities Trust 2021-R01 1B1, 3.199%, (SOFR30A + 3.100%), 10/25/2041 | | | | | 4,431,830 | | | | | | 0.1 | | |
| 2,000,000 (1) | | | Connecticut Avenue Securities Trust 2021-R03 1B1, 2.849%, (SOFR30A + 2.750%), 12/25/2041 | | | | | 1,817,368 | | | | | | 0.0 | | |
| 13,600,000 (1) | | | Connecticut Avenue Securities Trust 2022-R01 1B1, 3.249%, (SOFR30A + 3.150%), 12/25/2041 | | | | | 12,661,924 | | | | | | 0.2 | | |
| 1,500,000 (1) | | | Connecticut Avenue Securities Trust 2022-R02 2B1, 4.599%, (SOFR30A + 4.500%), 01/25/2042 | | | | | 1,421,380 | | | | | | 0.0 | | |
| 433,470 | | | Countrywide Alternative Loan Trust 2005-53T2 2A6, 0.957%, (US0001M + 0.500%), 11/25/2035 | | | | | 233,298 | | | | | | 0.0 | | |
| Principal Amount† | | | Value | | | Percentage of Net Assets | | |||||||||
| COLLATERALIZED MORTGAGE OBLIGATIONS: (continued) | | |||||||||||||||
| 963,144 (1) | | | CSMC Series 2008-2R 1A1, 6.000%, 07/25/2037 | | | | $ | 900,061 | | | | | | 0.0 | | |
| 869,187 (1)(3) | | | CSMC Trust 2015-2 B3, 3.906%, 02/25/2045 | | | | | 866,577 | | | | | | 0.0 | | |
| 58,736,587 (3)(5) | | | Deutsche ALT-A Securities, Inc. ALT 07-AB1 X, 0.777%, 04/25/2037 | | | | | 2,231,949 | | | | | | 0.0 | | |
| 5,000,000 (1) | | | Eagle RE 2021-2 M1C Ltd., 3.549%, (SOFR30A + 3.450%), 04/25/2034 | | | | | 4,765,177 | | | | | | 0.1 | | |
| 800,000 (1) | | | Fannie Mae Connecticut Avenue Securities Trust 2020-SBT1 1M2, 4.107%, (US0001M + 3.650%), 02/25/2040 | | | | | 785,090 | | | | | | 0.0 | | |
| 2,680,360 (5) | | | Fannie Mae 2008-12 SC, 5.893%, (-1.000*US0001M + 6.350%), 03/25/2038 | | | | | 423,380 | | | | | | 0.0 | | |
| 9,144,334 | | | Fannie Mae 2011-99 CZ, 4.500%, 10/25/2041 | | | | | 9,562,580 | | | | | | 0.1 | | |
| 500,819 | | | Fannie Mae 2012-110 CA, 3.000%, 10/25/2042 | | | | | 493,292 | | | | | | 0.0 | | |
| 5,919,751 | | | Fannie Mae 2012-66 EP, 4.000%, 06/25/2042 | | | | | 6,347,558 | | | | | | 0.1 | | |
| 1,520,500 | | | Fannie Mae 2013-116 UB, 4.000%, 11/25/2043 | | | | | 1,519,755 | | | | | | 0.0 | | |
| 2,276,383 | | | Fannie Mae 2013-20 DL, 4.000%, 03/25/2033 | | | | | 2,339,898 | | | | | | 0.0 | | |
| 17,564,525 (5) | | | Fannie Mae 2016-82 SD, 5.593%, (-1.000*US0001M + 6.050%), 11/25/2046 | | | | | 2,579,491 | | | | | | 0.0 | | |
| 1,053,269 | | | Fannie Mae 2016-88 EA, 3.500%, 01/25/2045 | | | | | 1,061,107 | | | | | | 0.0 | | |
| 10,828,579 (5) | | | Fannie Mae 2018-86 US, 6.133%, (-1.000*US0001M + 6.590%), 09/25/2040 | | | | | 1,877,776 | | | | | | 0.0 | | |
| 4,811,429 | | | Fannie Mae Connecticut Avenue Securities, 6.157%, (US0001M + 5.700%), 04/25/2028 | | | | | 5,151,558 | | | | | | 0.1 | | |
| Voya Intermediate Bond Fund | as of March 31, 2022 (continued) |
| Principal Amount† | | | Value | | | Percentage of Net Assets | | |||||||||
| COLLATERALIZED MORTGAGE OBLIGATIONS: (continued) | | |||||||||||||||
| 2,384,184 | | | Fannie Mae Connecticut Avenue Securities 2015-C02 1M2, 4.457%, (US0001M + 4.000%), 05/25/2025 | | | | $ | 2,387,328 | | | | | | 0.0 | | |
| 6,761,312 | | | Fannie Mae Connecticut Avenue Securities 2015-C04 2M2, 6.007%, (US0001M + 5.550%), 04/25/2028 | | | | | 7,027,798 | | | | | | 0.1 | | |
| 984,986 | | | Fannie Mae Connecticut Avenue Securities 2015-CO1 1M2, 4.757%, (US0001M + 4.300%), 02/25/2025 | | | | | 993,396 | | | | | | 0.0 | | |
| 325,699 | | | Fannie Mae Connecticut Avenue Securities 2016-C01 2M2, 7.407%, (US0001M + 6.950%), 08/25/2028 | | | | | 346,128 | | | | | | 0.0 | | |
| 2,163,731 | | | Fannie Mae Connecticut Avenue Securities 2017-C01 1M2, 4.007%, (US0001M + 3.550%), 07/25/2029 | | | | | 2,204,575 | | | | | | 0.0 | | |
| 3,709,193 | | | Fannie Mae Connecticut Avenue Securities 2017-C03 1M2, 3.457%, (US0001M + 3.000%), 10/25/2029 | | | | | 3,790,633 | | | | | | 0.1 | | |
| 10,100,515 | | | Fannie Mae Connecticut Avenue Securities 2017-C04 2M2, 3.307%, (US0001M + 2.850%), 11/25/2029 | | | | | 10,282,470 | | | | | | 0.1 | | |
| 5,618,079 | | | Fannie Mae Connecticut Avenue Securities 2017-C07 2M2, 2.957%, (US0001M + 2.500%), 05/25/2030 | | | | | 5,660,895 | | | | | | 0.1 | | |
| 7,568,064 | | | Fannie Mae Connecticut Avenue Securities 2017-CO6 2M2, 3.257%, (US0001M + 2.800%), 02/25/2030 | | | | | 7,708,912 | | | | | | 0.1 | | |
| 528,800 | | | Fannie Mae Connecticut Avenue Securities 2018-C03 1M2, 2.607%, (US0001M + 2.150%), 10/25/2030 | | | | | 531,289 | | | | | | 0.0 | | |
| Principal Amount† | | | Value | | | Percentage of Net Assets | | |||||||||
| COLLATERALIZED MORTGAGE OBLIGATIONS: (continued) | | |||||||||||||||
| 9,884,847 | | | Fannie Mae Connecticut Avenue Securities 2018-C06 1M2, 2.457%, (US0001M + 2.000%), 03/25/2031 | | | | $ | 9,884,633 | | | | | | 0.1 | | |
| 8,580,332 | | | Fannie Mae Connecticut Avenue Securities 2018-C06 2M2, 2.557%, (US0001M + 2.100%), 03/25/2031 | | | | | 8,567,556 | | | | | | 0.1 | | |
| 670,356 (1) | | | Fannie Mae Connecticut Avenue Securities 2019-R02 1M2, 2.757%, (US0001M + 2.300%), 08/25/2031 | | | | | 670,585 | | | | | | 0.0 | | |
| 2,500,000 (1) | | | Fannie Mae Connecticut Avenue Securities 2021-R02 2B1, 3.399%, (SOFR30A + 3.300%), 11/25/2041 | | | | | 2,327,111 | | | | | | 0.0 | | |
| 2,736,865 (1) | | | Fannie Mae Connecticut Avenue Securities Trust 2019-R01 2M2, 2.907%, (US0001M + 2.450%), 07/25/2031 | | | | | 2,744,962 | | | | | | 0.0 | | |
| 1,000,000 (1) | | | Fannie Mae Connecticut Avenue Securities Trust 2019-R05 1B1, 4.557%, (US0001M + 4.100%), 07/25/2039 | | | | | 999,478 | | | | | | 0.0 | | |
| 1,331,415 (1) | | | Fannie Mae Connecticut Avenue Securities Trust 2020-R01 1M2, 2.507%, (US0001M + 2.050%), 01/25/2040 | | | | | 1,330,897 | | | | | | 0.0 | | |
| 500,000 (1) | | | Fannie Mae Connecticut Avenue Securities Trust 2020-SBT1 2M2, 4.107%, (US0001M + 3.650%), 02/25/2040 | | | | | 498,885 | | | | | | 0.0 | | |
| 6,644 | | | Fannie Mae Grantor Trust 1998-T2 A6, 1.002%, (US0001M + 0.550%), 01/25/2032 | | | | | 6,580 | | | | | | 0.0 | | |
| 138,704 (5) | | | Fannie Mae Interest Strip Series 418 20, 3.000%, 05/25/2043 | | | | | 16,635 | | | | | | 0.0 | | |
| Voya Intermediate Bond Fund | as of March 31, 2022 (continued) |
| Principal Amount† | | | Value | | | Percentage of Net Assets | | |||||||||
| COLLATERALIZED MORTGAGE OBLIGATIONS: (continued) | | |||||||||||||||
| 642,768 (5) | | | Fannie Mae Interest Strip Series 418 59, 3.000%, 08/25/2028 | | | | $ | 33,944 | | | | | | 0.0 | | |
| 80,802 | | | Fannie Mae REMIC Trust 1999-33 Z, 6.000%, 07/25/2029 | | | | | 84,842 | | | | | | 0.0 | | |
| 28,353 (5) | | | Fannie Mae REMIC Trust 1999-6 SE, 7.244%, (-1.000*US0001M + 7.685%), 02/17/2029 | | | | | 774 | | | | | | 0.0 | | |
| 769,889 | | | Fannie Mae REMIC Trust 2003-105 AZ, 5.500%, 10/25/2033 | | | | | 830,622 | | | | | | 0.0 | | |
| 290,115 | | | Fannie Mae REMIC Trust 2003-45 FJ, 1.731%, (US0001M + 1.500%), 06/25/2033 | | | | | 303,851 | | | | | | 0.0 | | |
| 929,803 (5) | | | Fannie Mae REMIC Trust 2003-66 SA, 7.193%, (-1.000*US0001M + 7.650%), 07/25/2033 | | | | | 176,178 | | | | | | 0.0 | | |
| 188,350 (5) | | | Fannie Mae REMIC Trust 2003-74 IO, 6.000%, 08/25/2033 | | | | | 39,730 | | | | | | 0.0 | | |
| 458,594 | | | Fannie Mae REMIC Trust 2003-84 PZ, 5.000%, 09/25/2033 | | | | | 484,904 | | | | | | 0.0 | | |
| 707,650 | | | Fannie Mae REMIC Trust 2004-50 VZ, 5.500%, 07/25/2034 | | | | | 753,663 | | | | | | 0.0 | | |
| 15,486 | | | Fannie Mae REMIC Trust 2004-56 FE, 0.907%, (US0001M + 0.450%), 10/25/2033 | | | | | 15,559 | | | | | | 0.0 | | |
| 366,313 | | | Fannie Mae REMIC Trust 2004-7 Z, 5.500%, 02/25/2034 | | | | | 389,292 | | | | | | 0.0 | | |
| 702,608 | | | Fannie Mae REMIC Trust 2004-75 ZG, 4.500%, 10/25/2034 | | | | | 735,602 | | | | | | 0.0 | | |
| 2,003,046 | | | Fannie Mae REMIC Trust 2005-25 Z, 5.000%, 04/25/2035 | | | | | 2,120,337 | | | | | | 0.0 | | |
| 90,524 | | | Fannie Mae REMIC Trust 2006-104 ES, 31.167%, (-5.000*US0001M + 33.450%), 11/25/2036 | | | | | 151,613 | | | | | | 0.0 | | |
| 1,611,308 (5) | | | Fannie Mae REMIC Trust 2006-12 SD, 6.293%, (-1.000*US0001M + 6.750%), 10/25/2035 | | | | | 197,929 | | | | | | 0.0 | | |
| Principal Amount† | | | Value | | | Percentage of Net Assets | | |||||||||
| COLLATERALIZED MORTGAGE OBLIGATIONS: (continued) | | |||||||||||||||
| 580,789 (5) | | | Fannie Mae REMIC Trust 2006-123 UI, 6.283%, (-1.000*US0001M + 6.740%), 01/25/2037 | | | | $ | 102,640 | | | | | | 0.0 | | |
| 102,433 (5) | | | Fannie Mae REMIC Trust 2006-72 HS, 6.243%, (-1.000*US0001M + 6.700%), 08/25/2026 | | | | | 7,621 | | | | | | 0.0 | | |
| 16,385 | | | Fannie Mae REMIC Trust 2007-10 Z, 6.000%, 02/25/2037 | | | | | 17,996 | | | | | | 0.0 | | |
| 2,871,606 (5) | | | Fannie Mae REMIC Trust 2007-91 AS, 5.943%, (-1.000*US0001M + 6.400%), 10/25/2037 | | | | | 501,012 | | | | | | 0.0 | | |
| 1,206,624 | | | Fannie Mae REMIC Trust 2009-19 PW, 4.500%, 10/25/2036 | | | | | 1,261,400 | | | | | | 0.0 | | |
| 5,743,423 (3) | | | Fannie Mae REMIC Trust 2009-50 HZ, 5.534%, 02/25/2049 | | | | | 6,198,076 | | | | | | 0.1 | | |
| 1,261,396 (5) | | | Fannie Mae REMIC Trust 2009-90 TS, 5.693%, (-1.000*US0001M + 6.150%), 11/25/2039 | | | | | 183,894 | | | | | | 0.0 | | |
| 745,983 (5) | | | Fannie Mae REMIC Trust 2010-118 GS, 5.493%, (-1.000*US0001M + 5.950%), 10/25/2039 | | | | | 19,116 | | | | | | 0.0 | | |
| 3,276,553 (5) | | | Fannie Mae REMIC Trust 2010-123 SL, 5.613%, (-1.000*US0001M + 6.070%), 11/25/2040 | | | | | 404,343 | | | | | | 0.0 | | |
| 4,041,977 (5) | | | Fannie Mae REMIC Trust 2010-41 SB, 5.943%, (-1.000*US0001M + 6.400%), 05/25/2040 | | | | | 583,236 | | | | | | 0.0 | | |
| 1,019,165 (5) | | | Fannie Mae REMIC Trust 2010-43 VS, 5.993%, (-1.000*US0001M + 6.450%), 05/25/2040 | | | | | 133,354 | | | | | | 0.0 | | |
| 5,941,933 | | | Fannie Mae REMIC Trust 2010-59 PC, 5.000%, 06/25/2040 | | | | | 6,317,221 | | | | | | 0.1 | | |
| 811,094 (5) | | | Fannie Mae REMIC Trust 2011-102 SA, 6.143%, (-1.000*US0001M + 6.600%), 10/25/2041 | | | | | 127,138 | | | | | | 0.0 | | |
| 2,323,680 | | | Fannie Mae REMIC Trust 2011-30 ZA, 5.000%, 04/25/2041 | | | | | 2,476,756 | | | | | | 0.0 | | |
| Voya Intermediate Bond Fund | as of March 31, 2022 (continued) |
| Principal Amount† | | | Value | | | Percentage of Net Assets | | |||||||||
| COLLATERALIZED MORTGAGE OBLIGATIONS: (continued) | | |||||||||||||||
| 1,929,598 (5) | | | Fannie Mae REMIC Trust 2011-93 GS, 6.093%, (-1.000*US0001M + 6.550%), 04/25/2039 | | | | $ | 315,383 | | | | | | 0.0 | | |
| 3,608,505 (5) | | | Fannie Mae REMIC Trust 2012-122 SB, 5.693%, (-1.000*US0001M + 6.150%), 11/25/2042 | | | | | 656,324 | | | | | | 0.0 | | |
| 2,019,848 (5) | | | Fannie Mae REMIC Trust 2012-128 LI, 3.500%, 06/25/2042 | | | | | 139,923 | | | | | | 0.0 | | |
| 4,653,790 (5) | | | Fannie Mae REMIC Trust 2012-133 AS, 5.743%, (-1.000*US0001M + 6.200%), 10/25/2042 | | | | | 794,115 | | | | | | 0.0 | | |
| 681,164 (5) | | | Fannie Mae REMIC Trust 2012-149 GI, 3.500%, 06/25/2042 | | | | | 58,377 | | | | | | 0.0 | | |
| 873,997 (5) | | | Fannie Mae REMIC Trust 2012-15 SP, 6.163%, (-1.000*US0001M + 6.620%), 06/25/2040 | | | | | 22,282 | | | | | | 0.0 | | |
| 1,078,006 (5) | | | Fannie Mae REMIC Trust 2012-24 HS, 6.093%, (-1.000*US0001M + 6.550%), 09/25/2040 | | | | | 71,584 | | | | | | 0.0 | | |
| 1,455,553 (5) | | | Fannie Mae REMIC Trust 2012-30 QS, 6.143%, (-1.000*US0001M + 6.600%), 04/25/2031 | | | | | 47,441 | | | | | | 0.0 | | |
| 652,299 (5) | | | Fannie Mae REMIC Trust 2012-68 YS, 6.243%, (-1.000*US0001M + 6.700%), 07/25/2042 | | | | | 91,167 | | | | | | 0.0 | | |
| 1,347,344 (5) | | | Fannie Mae REMIC Trust 2013-26 JS, 5.743%, (-1.000*US0001M + 6.200%), 10/25/2032 | | | | | 130,249 | | | | | | 0.0 | | |
| 5,089,735 (5) | | | Fannie Mae REMIC Trust 2013-60 DS, 5.743%, (-1.000*US0001M + 6.200%), 06/25/2033 | | | | | 660,124 | | | | | | 0.0 | | |
| 5,104,779 (5) | | | Fannie Mae REMIC Trust 2013-9 SM, 5.793%, (-1.000*US0001M + 6.250%), 02/25/2033 | | | | | 655,483 | | | | | | 0.0 | | |
| 1,423,727 (5) | | | Fannie Mae REMIC Trust 2014-17 DS, 5.743%, (-1.000*US0001M + 6.200%), 02/25/2043 | | | | | 78,484 | | | | | | 0.0 | | |
| Principal Amount† | | | Value | | | Percentage of Net Assets | | |||||||||
| COLLATERALIZED MORTGAGE OBLIGATIONS: (continued) | | |||||||||||||||
| 1,231,661 (5) | | | Fannie Mae REMIC Trust 2014-28 BS, 5.743%, (-1.000*US0001M + 6.200%), 08/25/2043 | | | | $ | 113,018 | | | | | | 0.0 | | |
| 32,356,160 (5) | | | Fannie Mae REMIC Trust 2015-79 SA, 5.793%, (-1.000*US0001M + 6.250%), 11/25/2045 | | | | | 4,778,270 | | | | | | 0.1 | | |
| 13,251,183 (5) | | | Fannie Mae REMIC Trust 2015-9 IO, 5.500%, 03/25/2045 | | | | | 2,768,352 | | | | | | 0.0 | | |
| 22,004,108 (5) | | | Fannie Mae REMICS 16-60 SB, 5.643%, (-1.000*US0001M + 6.100%), 09/25/2046 | | | | | 3,200,189 | | | | | | 0.1 | | |
| 78,961 (5) | | | Fannie Mae REMICS 1997-18 SG, 7.659%, (-1.000*US0001M + 8.100%), 03/17/2027 | | | | | 4,872 | | | | | | 0.0 | | |
| 24,806 (5) | | | Fannie Mae REMICS 1997-91 FC, 0.452%, (US0001M + (8.500)%), 11/25/2023 | | | | | 8 | | | | | | 0.0 | | |
| 38 (5) | | | Fannie Mae REMICS 1999-57 SC, 9.309%, (-1.000*US0001M + 9.750%), 11/17/2029 | | | | | 2 | | | | | | 0.0 | | |
| 208,618 (5) | | | Fannie Mae REMICS 2001-72 SC, 1.000%, (-1.000*US0001M + 8.500%), 12/25/2031 | | | | | 6,869 | | | | | | 0.0 | | |
| 48,161 (5) | | | Fannie Mae REMICS 2001-8 SK, 8.282%, (-1.000*US0001M + 8.750%), 03/18/2031 | | | | | 3,620 | | | | | | 0.0 | | |
| 406,279 (5) | | | Fannie Mae REMICS 2003-49 SW, 6.543%, (-1.000*US0001M + 7.000%), 01/25/2033 | | | | | 64,149 | | | | | | 0.0 | | |
| 3,752,251 (5) | | | Fannie Mae REMICS 2004-54 SN, 6.593%, (-1.000*US0001M + 7.050%), 07/25/2034 | | | | | 562,845 | | | | | | 0.0 | | |
| 7,051,572 (5) | | | Fannie Mae REMICS 2005-75 ES, 5.593%, (-1.000*US0001M + 6.050%), 09/25/2035 | | | | | 1,009,028 | | | | | | 0.0 | | |
| Voya Intermediate Bond Fund | as of March 31, 2022 (continued) |
| Principal Amount† | | | Value | | | Percentage of Net Assets | | |||||||||
| COLLATERALIZED MORTGAGE OBLIGATIONS: (continued) | | |||||||||||||||
| 719,650 (5) | | | Fannie Mae REMICS 2005-75 SP, 6.293%, (-1.000*US0001M + 6.750%), 08/25/2035 | | | | $ | 78,467 | | | | | | 0.0 | | |
| 1,865,751 (5) | | | Fannie Mae REMICS 2006-56 SM, 6.293%, (-1.000*US0001M + 6.750%), 07/25/2036 | | | | | 260,549 | | | | | | 0.0 | | |
| 420,386 (5) | | | Fannie Mae REMICS 2007-21 SB, 5.943%, (-1.000*US0001M + 6.400%), 03/25/2037 | | | | | 27,968 | | | | | | 0.0 | | |
| 1,095,035 (5) | | | Fannie Mae REMICS 2007-52 NS, 5.993%, (-1.000*US0001M + 6.450%), 06/25/2037 | | | | | 183,794 | | | | | | 0.0 | | |
| 932,105 (5) | | | Fannie Mae REMICS 2007-85 SM, 6.003%, (-1.000*US0001M + 6.460%), 09/25/2037 | | | | | 147,534 | | | | | | 0.0 | | |
| 309,885 | | | Fannie Mae REMICS 2008-16 Z, 5.500%, 03/25/2038 | | | | | 331,119 | | | | | | 0.0 | | |
| 5,730,916 (5) | | | Fannie Mae REMICS 2009-66 SP, 5.643%, (-1.000*US0001M + 6.100%), 09/25/2039 | | | | | 740,972 | | | | | | 0.0 | | |
| 3,681,562 (5) | | | Fannie Mae REMICS 2010-1 S, 5.793%, (-1.000*US0001M + 6.250%), 02/25/2040 | | | | | 600,994 | | | | | | 0.0 | | |
| 5,719,444 (5) | | | Fannie Mae REMICS 2010-150 SJ, 6.023%, (-1.000*US0001M + 6.480%), 01/25/2041 | | | | | 950,799 | | | | | | 0.0 | | |
| 1,048,667 (5) | | | Fannie Mae REMICS 2010-35 CS, 5.993%, (-1.000*US0001M + 6.450%), 04/25/2050 | | | | | 129,862 | | | | | | 0.0 | | |
| 1,028,269 | | | Fannie Mae REMICS 2011-10 ZC, 5.000%, 02/25/2041 | | | | | 1,100,229 | | | | | | 0.0 | | |
| 6,144,522 | | | Fannie Mae REMICS 2011-101 DB, 4.000%, 10/25/2041 | | | | | 6,317,008 | | | | | | 0.1 | | |
| 3,315,825 | | | Fannie Mae REMICS 2011-116 ZA, 3.500%, 11/25/2041 | | | | | 3,343,513 | | | | | | 0.1 | | |
| 77,068 | | | Fannie Mae REMICS 2011-127 UY, 3.500%, 12/25/2041 | | | | | 75,475 | | | | | | 0.0 | | |
| Principal Amount† | | | Value | | | Percentage of Net Assets | | |||||||||
| COLLATERALIZED MORTGAGE OBLIGATIONS: (continued) | | |||||||||||||||
| 5,944,862 | | | Fannie Mae REMICS 2011-136 PZ, 4.000%, 01/25/2042 | | | | $ | 6,135,564 | | | | | | 0.1 | | |
| 7,309,461 (5) | | | Fannie Mae REMICS 2011-47 GS, 5.473%, (-1.000*US0001M + 5.930%), 06/25/2041 | | | | | 932,673 | | | | | | 0.0 | | |
| 2,217,118 | | | Fannie Mae REMICS 2011-8 ZA, 4.000%, 02/25/2041 | | | | | 2,251,690 | | | | | | 0.0 | | |
| 4,528,773 | | | Fannie Mae REMICS 2011-84 Z, 5.250%, 09/25/2041 | | | | | 4,665,700 | | | | | | 0.1 | | |
| 6,530,310 | | | Fannie Mae REMICS 2011-87 GB, 4.500%, 09/25/2041 | | | | | 7,201,097 | | | | | | 0.1 | | |
| 2,206,792 (5) | | | Fannie Mae REMICS 2012-111 SL, 5.643%, (-1.000*US0001M + 6.100%), 05/25/2041 | | | | | 306,726 | | | | | | 0.0 | | |
| 4,232,795 | | | Fannie Mae REMICS 2012-111 ZK, 3.500%, 10/25/2042 | | | | | 4,238,726 | | | | | | 0.1 | | |
| 4,789,908 (5) | | | Fannie Mae REMICS 2012-120 WI, 3.000%, 11/25/2027 | | | | | 286,179 | | | | | | 0.0 | | |
| 137,485 | | | Fannie Mae REMICS 2012-134 KV, 3.000%, 07/25/2031 | | | | | 137,862 | | | | | | 0.0 | | |
| 10,087,456 | | | Fannie Mae REMICS 2012-15 PZ, 4.000%, 03/25/2042 | | | | | 10,546,054 | | | | | | 0.1 | | |
| 5,571,034 | | | Fannie Mae REMICS 2012-17 QZ, 4.000%, 03/25/2042 | | | | | 5,719,626 | | | | | | 0.1 | | |
| 3,904,041 | | | Fannie Mae REMICS 2012-2 HE, 4.000%, 02/25/2042 | | | | | 4,045,699 | | | | | | 0.1 | | |
| 1,084,189 | | | Fannie Mae REMICS 2012-30 AB, 4.000%, 04/25/2042 | | | | | 1,122,673 | | | | | | 0.0 | | |
| 1,502,065 | | | Fannie Mae REMICS 2012-33 BW, 4.000%, 04/25/2042 | | | | | 1,504,513 | | | | | | 0.0 | | |
| 21,213 | | | Fannie Mae REMICS 2012-44 KW, 3.500%, 05/25/2032 | | | | | 22,373 | | | | | | 0.0 | | |
| 2,169,883 | | | Fannie Mae REMICS 2012-55 PC, 3.500%, 05/25/2042 | | | | | 2,126,408 | | | | | | 0.0 | | |
| Voya Intermediate Bond Fund | as of March 31, 2022 (continued) |
| Principal Amount† | | | Value | | | Percentage of Net Assets | | |||||||||
| COLLATERALIZED MORTGAGE OBLIGATIONS: (continued) | | |||||||||||||||
| 8,396,000 | | | Fannie Mae REMICS 2012-63 MW, 4.000%, 05/25/2034 | | | | $ | 8,492,987 | | | | | | 0.1 | | |
| 500,000 | | | Fannie Mae REMICS 2012-80 MY, 3.250%, 08/25/2042 | | | | | 505,188 | | | | | | 0.0 | | |
| 15,552,647 | | | Fannie Mae REMICS 2012-94 LZ, 3.500%, 09/25/2042 | | | | | 15,677,986 | | | | | | 0.2 | | |
| 2,700,000 | | | Fannie Mae REMICS 2013-111 BA, 3.000%, 11/25/2033 | | | | | 2,703,088 | | | | | | 0.0 | | |
| 1,403,000 | | | Fannie Mae REMICS 2013-13 BE, 4.000%, 03/25/2043 | | | | | 1,554,904 | | | | | | 0.0 | | |
| 224,788 | | | Fannie Mae REMICS 2013-16 GD, 3.000%, 03/25/2033 | | | | | 224,565 | | | | | | 0.0 | | |
| 4,958,639 (5) | | | Fannie Mae REMICS 2013-40 LS, 5.693%, (-1.000*US0001M + 6.150%), 05/25/2043 | | | | | 752,305 | | | | | | 0.0 | | |
| 5,931,277 (5) | | | Fannie Mae REMICS 2013-70 BI, 3.000%, 07/25/2033 | | | | | 595,805 | | | | | | 0.0 | | |
| 3,865,458 | | | Fannie Mae REMICS 2013-70 JZ, 3.000%, 07/25/2043 | | | | | 3,800,133 | | | | | | 0.1 | | |
| 7,643,478 (5) | | | Fannie Mae REMICS 2014-15 SB, 6.193%, (-1.000*US0001M + 6.650%), 04/25/2044 | | | | | 1,455,418 | | | | | | 0.0 | | |
| 970,000 | | | Fannie Mae REMICS 2014-61 PY, 3.500%, 10/25/2044 | | | | | 985,384 | | | | | | 0.0 | | |
| 7,978,146 (5) | | | Fannie Mae REMICS 2014-70 IO, 5.500%, 10/25/2044 | | | | | 1,452,526 | | | | | | 0.0 | | |
| 30,714,887 (5) | | | Fannie Mae REMICS 2014-79 KS, 5.693%, (-1.000*US0001M + 6.150%), 12/25/2044 | | | | | 5,033,046 | | | | | | 0.1 | | |
| 17,725,184 | | | Fannie Mae REMICS 2015-20 EZ, 3.500%, 04/25/2045 | | | | | 18,175,258 | | | | | | 0.2 | | |
| 5,312,730 (5) | | | Fannie Mae REMICS 2015-56 IC, 6.000%, 08/25/2045 | | | | | 947,523 | | | | | | 0.0 | | |
| 2,000,000 | | | Fannie Mae REMICS 2015-67 AV, 3.500%, 01/25/2036 | | | | | 2,046,248 | | | | | | 0.0 | | |
| Principal Amount† | | | Value | | | Percentage of Net Assets | | |||||||||
| COLLATERALIZED MORTGAGE OBLIGATIONS: (continued) | | |||||||||||||||
| 4,673,979 | | | Fannie Mae REMICS 2015-67 QV, 3.000%, 12/25/2040 | | | | $ | 4,622,429 | | | | | | 0.1 | | |
| 2,211,331 (5) | | | Fannie Mae REMICS 2015-76 PI, 6.000%, 09/25/2045 | | | | | 372,397 | | | | | | 0.0 | | |
| 18,308,842 (5) | | | Fannie Mae REMICS 2015-86 BS, 5.243%, (-1.000*US0001M + 5.700%), 11/25/2045 | | | | | 2,117,928 | | | | | | 0.0 | | |
| 30,230,998 (5) | | | Fannie Mae REMICS 2015-88 IO, 6.500%, 12/25/2045 | | | | | 7,251,773 | | | | | | 0.1 | | |
| 6,519,338 (5) | | | Fannie Mae REMICS 2015-97 BI, 5.500%, 01/25/2046 | | | | | 1,195,797 | | | | | | 0.0 | | |
| 4,282,521 (5) | | | Fannie Mae REMICS 2016-104 BI, 6.000%, 01/25/2047 | | | | | 930,108 | | | | | | 0.0 | | |
| 6,468,775 (5) | | | Fannie Mae REMICS 2016-52 MI, 4.000%, 12/25/2045 | | | | | 999,547 | | | | | | 0.0 | | |
| 28,518,284 (5) | | | Fannie Mae REMICS 2016-81 CS, 5.643%, (-1.000*US0001M + 6.100%), 11/25/2046 | | | | | 3,654,076 | | | | | | 0.1 | | |
| 432,236 | | | Fannie Mae REMICS 2016-9 D, 3.000%, 03/25/2046 | | | | | 424,554 | | | | | | 0.0 | | |
| 24,500,959 (5) | | | Fannie Mae REMICS 2017-10 SA, 5.643%, (-1.000*US0001M + 6.100%), 03/25/2047 | | | | | 3,273,120 | | | | | | 0.1 | | |
| 5,678,903 | | | Fannie Mae REMICS 2017-54 D, 3.000%, 07/25/2047 | | | | | 5,578,105 | | | | | | 0.1 | | |
| 31,983,598 (5) | | | Fannie Mae REMICS 2018-15 SC, 5.843%, (-1.000*US0001M + 6.300%), 03/25/2048 | | | | | 4,828,122 | | | | | | 0.1 | | |
| 5,309,459 | | | Fannie Mae REMICS 2018-26 A, 3.500%, 04/25/2048 | | | | | 5,274,598 | | | | | | 0.1 | | |
| 1,376,782 | | | Fannie Mae REMICS 2018-38 LA, 3.000%, 06/25/2048 | | | | | 1,357,155 | | | | | | 0.0 | | |
| 13,838,517 | | | Fannie Mae REMICS 2018-73 AB, 3.000%, 10/25/2048 | | | | | 13,610,529 | | | | | | 0.2 | | |
| Voya Intermediate Bond Fund | as of March 31, 2022 (continued) |
| Principal Amount† | | | Value | | | Percentage of Net Assets | | |||||||||
| COLLATERALIZED MORTGAGE OBLIGATIONS: (continued) | | |||||||||||||||
| 1,558,145 | | | Fannie Mae REMICS 2018-8 AB, 3.500%, 10/25/2047 | | | | $ | 1,523,839 | | | | | | 0.0 | | |
| 40,733,646 (5) | | | Fannie Mae REMICS 2018-82 SA, 5.743%, (-1.000*US0001M + 6.200%), 11/25/2048 | | | | | 5,992,111 | | | | | | 0.1 | | |
| 9,553,119 (5) | | | Fannie Mae REMICS 2018-86 AS, 5.743%, (-1.000*US0001M + 6.200%), 12/25/2048 | | | | | 1,316,472 | | | | | | 0.0 | | |
| 40,781,480 (5) | | | Fannie Mae REMICS 2018-86 SM, 5.743%, (-1.000*US0001M + 6.200%), 12/25/2048 | | | | | 5,794,261 | | | | | | 0.1 | | |
| 35,735,987 (5) | | | Fannie Mae REMICS 2018-91 SB, 5.643%, (-1.000*US0001M + 6.100%), 12/25/2058 | | | | | 5,974,135 | | | | | | 0.1 | | |
| 11,903,543 (5) | | | Fannie Mae REMICS 2019-21 AI, 5.000%, 05/25/2059 | | | | | 2,961,130 | | | | | | 0.0 | | |
| 11,935,421 (5) | | | Fannie Mae REMICS 2019-30 SB, 5.643%, (-1.000*US0001M + 6.100%), 07/25/2049 | | | | | 2,048,217 | | | | | | 0.0 | | |
| 17,926,260 (5) | | | Fannie Mae REMICS 2019-34 BS, 5.593%, (-1.000*US0001M + 6.050%), 07/25/2049 | | | | | 2,738,383 | | | | | | 0.0 | | |
| 10,152,478 (5) | | | Fannie Mae REMICS 2019-39 SA, 5.643%, (-1.000*US0001M + 6.100%), 08/25/2049 | | | | | 1,572,858 | | | | | | 0.0 | | |
| 63,391,668 (5) | | | Fannie Mae REMICS 2019-41 S, 5.543%, (-1.000*US0001M + 6.000%), 08/25/2059 | | | | | 8,702,237 | | | | | | 0.1 | | |
| 6,595,526 (5) | | | Fannie Mae REMICS 2019-47 SB, 5.643%, (-1.000*US0001M + 6.100%), 05/25/2040 | | | | | 1,177,787 | | | | | | 0.0 | | |
| 27,278,716 (5) | | | Fannie Mae REMICS 2020-35 IO, 5.000%, 06/25/2050 | | | | | 4,557,834 | | | | | | 0.1 | | |
| 25,298,759 (5) | | | Fannie Mae REMICS 2020-44 DI, 2.500%, 07/25/2050 | | | | | 3,362,536 | | | | | | 0.1 | | |
| 12,743,831 (5) | | | Fannie Mae REMICS 2020-44 EI, 3.500%, 09/25/2042 | | | | | 2,224,433 | | | | | | 0.0 | | |
| Principal Amount† | | | Value | | | Percentage of Net Assets | | |||||||||
| COLLATERALIZED MORTGAGE OBLIGATIONS: (continued) | | |||||||||||||||
| 57,068,348 (5) | | | Fannie Mae REMICS 2021-1 BI, 3.000%, 02/25/2049 | | | | $ | 8,268,285 | | | | | | 0.1 | | |
| 100,351,792 (5) | | | Fannie Mae REMICS 2021-10 AI, 3.000%, 03/25/2041 | | | | | 10,894,773 | | | | | | 0.1 | | |
| 35,697,970 (5) | | | Fannie Mae REMICS 2021-22 BI, 4.000%, 04/25/2051 | | | | | 6,440,963 | | | | | | 0.1 | | |
| 51,017,264 (5) | | | Fannie Mae REMICS 2021-41 MI, 5.000%, 06/25/2048 | | | | | 9,186,107 | | | | | | 0.1 | | |
| 45,916,864 (5) | | | Fannie Mae REMICS 2021-55 SA, 3.051%, (-1.000*SOFR30A + 3.150%), 08/25/2061 | | | | | 2,778,691 | | | | | | 0.0 | | |
| 32,927,976 (5) | | | Fannie Mae REMICS 2021-8 TI, 4.000%, 03/25/2051 | | | | | 5,557,077 | | | | | | 0.1 | | |
| 18,684,613 (5) | | | Fannie Mae REMICS 2021-81 LI, 2.500%, 11/25/2051 | | | | | 2,867,384 | | | | | | 0.0 | | |
| 78,805,551 (5) | | | Fannie Mae REMICS 2021-93 AI, 3.000%, 01/25/2052 | | | | | 12,034,869 | | | | | | 0.1 | | |
| 17,749,400 | | | Fannie Mae REMICS 2022-5 CZ, 2.500%, 02/25/2052 | | | | | 15,175,475 | | | | | | 0.2 | | |
| 1,559 | | | Fannie Mae REMICS G93-35 ZQ, 6.500%, 11/25/2023 | | | | | 1,595 | | | | | | 0.0 | | |
| 2,225,155 | | | Fannie Mae REMICS Trust 2010-53 JZ, 5.000%, 07/25/2040 | | | | | 2,241,214 | | | | | | 0.0 | | |
| 20,028,122 (5) | | | Fannie Mae Series 2013-44 DI, 3.000%, 05/25/2033 | | | | | 1,988,602 | | | | | | 0.0 | | |
| 1,195,118 (5) | | | Fannie Mae Series 2013-72 YS, 5.693%, (-1.000*US0001M + 6.150%), 07/25/2033 | | | | | 185,770 | | | | | | 0.0 | | |
| 48,620 (5) | | | FHLMC-GNMA 20 S, 8.443%, (-1.000*US0001M + 8.900%), 10/25/2023 | | | | | 2,079 | | | | | | 0.0 | | |
| 555,315 | | | First Horizon Alternative Mortgage Securities Trust 2006-FA8 1A11, 6.000%, 02/25/2037 | | | | | 319,827 | | | | | | 0.0 | | |
| Voya Intermediate Bond Fund | as of March 31, 2022 (continued) |
| Principal Amount† | | | Value | | | Percentage of Net Assets | | |||||||||
| COLLATERALIZED MORTGAGE OBLIGATIONS: (continued) | | |||||||||||||||
| 1,087,635 (1)(3) | | | First Republic Mortgage Trust 2020-1 B2, 2.872%, 04/25/2050 | | | | $ | 950,306 | | | | | | 0.0 | | |
| 1,812,826 (1)(3) | | | Flagstar Mortgage Trust 2018-1 B1, 3.968%, 03/25/2048 | | | | | 1,786,488 | | | | | | 0.0 | | |
| 2,363,925 (1)(3) | | | Flagstar Mortgage Trust 2018-1 B3, 3.968%, 03/25/2048 | | | | | 2,304,239 | | | | | | 0.0 | | |
| 1,212,359 (1)(3) | | | Flagstar Mortgage Trust 2018-2 B2, 4.030%, 04/25/2048 | | | | | 1,194,848 | | | | | | 0.0 | | |
| 944,476 (1)(3) | | | Flagstar Mortgage Trust 2018-3INV A3, 4.000%, 05/25/2048 | | | | | 946,299 | | | | | | 0.0 | | |
| 920,761 (1)(3) | | | Flagstar Mortgage Trust 2018-4 B3, 4.245%, 07/25/2048 | | | | | 912,091 | | | | | | 0.0 | | |
| 1,743,288 (1)(3) | | | Flagstar Mortgage Trust 2018-5 B3, 4.500%, 09/25/2048 | | | | | 1,725,968 | | | | | | 0.0 | | |
| 2,905,415 (1)(3) | | | Flagstar Mortgage Trust 2018-6RR B3, 4.934%, 10/25/2048 | | | | | 2,897,455 | | | | | | 0.0 | | |
| 1,451,444 (1)(3) | | | Flagstar Mortgage Trust 2019-2 B1, 4.056%, 12/25/2049 | | | | | 1,422,783 | | | | | | 0.0 | | |
| 1,407,605 (1)(3) | | | Flagstar Mortgage Trust 2019-2 B2, 4.056%, 12/25/2049 | | | | | 1,373,614 | | | | | | 0.0 | | |
| 1,977,386 (1)(3) | | | Flagstar Mortgage Trust 2020-1NV B1A, 4.242%, 03/25/2050 | | | | | 1,913,383 | | | | | | 0.0 | | |
| 2,393,475 (1)(3) | | | Flagstar Mortgage Trust 2020-1NV B2A, 4.242%, 03/25/2050 | | | | | 2,309,813 | | | | | | 0.0 | | |
| 11,825,411 | | | Freddie Mac 326 350, 3.500%, 03/15/2044 | | | | | 11,865,385 | | | | | | 0.1 | | |
| 6,715,713 (5) | | | Freddie Mac 3510 AS, 6.013%, (-1.000*US0001M + 6.410%), 04/15/2037 | | | | | 1,054,919 | | | | | | 0.0 | | |
| 4,503,781 (5) | | | Freddie Mac 4191 SA, 5.803%, (-1.000*US0001M + 6.200%), 03/15/2043 | | | | | 552,114 | | | | | | 0.0 | | |
| 4,648,023 | | | Freddie Mac 4316 XZ, 4.500%, 03/15/2044 | | | | | 4,934,066 | | | | | | 0.1 | | |
| 522,044 | | | Freddie Mac Reference Series R007 ZA, 6.000%, 05/15/2036 | | | | | 571,499 | | | | | | 0.0 | | |
| Principal Amount† | | | Value | | | Percentage of Net Assets | | |||||||||
| COLLATERALIZED MORTGAGE OBLIGATIONS: (continued) | | |||||||||||||||
| 229,973 | | | Freddie Mac Reference Series R008 ZA, 6.000%, 07/15/2036 | | | | $ | 251,048 | | | | | | 0.0 | | |
| 64,992 | | | Freddie Mac REMIC Trust 2110 PG, 6.000%, 01/15/2029 | | | | | 69,460 | | | | | | 0.0 | | |
| 60,242 | | | Freddie Mac REMIC Trust 2114 ZM, 6.000%, 01/15/2029 | | | | | 63,952 | | | | | | 0.0 | | |
| 422,006 | | | Freddie Mac REMIC Trust 2143 ZB, 6.000%, 04/15/2029 | | | | | 456,603 | | | | | | 0.0 | | |
| 15,167 | | | Freddie Mac REMIC Trust 2528 KM, 5.500%, 11/15/2022 | | | | | 15,283 | | | | | | 0.0 | | |
| 186,304 | | | Freddie Mac REMIC Trust 2541 NE, 5.500%, 12/15/2032 | | | | | 200,577 | | | | | | 0.0 | | |
| 60,139 (5) | | | Freddie Mac REMIC Trust 2594 IY, 6.000%, 04/15/2033 | | | | | 12,050 | | | | | | 0.0 | | |
| 391,113 | | | Freddie Mac REMIC Trust 2845 QH, 5.000%, 08/15/2034 | | | | | 414,694 | | | | | | 0.0 | | |
| 82,921 | | | Freddie Mac REMIC Trust 2861 Z, 5.500%, 09/15/2034 | | | | | 88,962 | | | | | | 0.0 | | |
| 136,181 | | | Freddie Mac REMIC Trust 2930 ZL, 5.000%, 02/15/2035 | | | | | 144,455 | | | | | | 0.0 | | |
| 198,786 | | | Freddie Mac REMIC Trust 2931 ZY, 5.000%, 02/15/2035 | | | | | 211,653 | | | | | | 0.0 | | |
| 4,315,750 (5) | | | Freddie Mac REMIC Trust 3045 DI, 6.333%, (-1.000*US0001M + 6.730%), 10/15/2035 | | | | | 628,844 | | | | | | 0.0 | | |
| 742,564 | | | Freddie Mac REMIC Trust 3117 ZA, 5.500%, 02/15/2036 | | | | | 796,322 | | | | | | 0.0 | | |
| 788,075 (5) | | | Freddie Mac REMIC Trust 3171 PS, 6.088%, (-1.000*US0001M + 6.485%), 06/15/2036 | | | | | 95,930 | | | | | | 0.0 | | |
| 4,488,811 (5) | | | Freddie Mac REMIC Trust 3199 S, 6.053%, (-1.000*US0001M + 6.450%), 08/15/2036 | | | | | 708,815 | | | | | | 0.0 | | |
| 344,244 | | | Freddie Mac REMIC Trust 3351 ZC, 5.500%, 07/15/2037 | | | | | 365,886 | | | | | | 0.0 | | |
| Voya Intermediate Bond Fund | as of March 31, 2022 (continued) |
| Principal Amount† | | | Value | | | Percentage of Net Assets | | |||||||||
| COLLATERALIZED MORTGAGE OBLIGATIONS: (continued) | | |||||||||||||||
| 96,891 | | | Freddie Mac REMIC Trust 3394 ZY, 6.000%, 11/15/2037 | | | | $ | 106,069 | | | | | | 0.0 | | |
| 194,322 (3) | | | Freddie Mac REMIC Trust 3524 LA, 5.146%, 03/15/2033 | | | | | 195,937 | | | | | | 0.0 | | |
| 16,757 | | | Freddie Mac REMIC Trust 3556 NT, 3.497%, (US0001M + 3.100%), 03/15/2038 | | | | | 16,947 | | | | | | 0.0 | | |
| 4,036,762 | | | Freddie Mac REMIC Trust 3639 ZN, 5.500%, 12/15/2034 | | | | | 4,365,946 | | | | | | 0.1 | | |
| 354,045 | | | Freddie Mac REMIC Trust 3662 ZB, 5.500%, 08/15/2036 | | | | | 385,371 | | | | | | 0.0 | | |
| 257,618 | | | Freddie Mac REMIC Trust 3724 CM, 5.500%, 06/15/2037 | | | | | 275,572 | | | | | | 0.0 | | |
| 33,775 | | | Freddie Mac REMIC Trust 3753 DC, 3.500%, 09/15/2039 | | | | | 33,866 | | | | | | 0.0 | | |
| 890,511 (5) | | | Freddie Mac REMIC Trust 3856 KS, 6.153%, (-1.000*US0001M + 6.550%), 05/15/2041 | | | | | 132,805 | | | | | | 0.0 | | |
| 383,738 (5) | | | Freddie Mac REMIC Trust 3925 SD, 5.653%, (-1.000*US0001M + 6.050%), 07/15/2040 | | | | | 17,305 | | | | | | 0.0 | | |
| 1,826,533 (5) | | | Freddie Mac REMIC Trust 3925 SL, 5.653%, (-1.000*US0001M + 6.050%), 01/15/2041 | | | | | 72,639 | | | | | | 0.0 | | |
| 172,946 | | | Freddie Mac REMIC Trust 4000 PA, 4.500%, 01/15/2042 | | | | | 181,341 | | | | | | 0.0 | | |
| 142,085 (5) | | | Freddie Mac REMIC Trust 4027 QI, 4.500%, 12/15/2040 | | | | | 1,215 | | | | | | 0.0 | | |
| 835,369 (5) | | | Freddie Mac REMIC Trust 4088 CS, 5.603%, (-1.000*US0001M + 6.000%), 08/15/2042 | | | | | 159,618 | | | | | | 0.0 | | |
| 4,922,105 (5) | | | Freddie Mac REMIC Trust 4161 WI, 3.000%, 02/15/2033 | | | | | 560,324 | | | | | | 0.0 | | |
| 2,312,567 (5) | | | Freddie Mac REMIC Trust 4194 GI, 4.000%, 04/15/2043 | | | | | 327,671 | | | | | | 0.0 | | |
| Principal Amount† | | | Value | | | Percentage of Net Assets | | |||||||||
| COLLATERALIZED MORTGAGE OBLIGATIONS: (continued) | | |||||||||||||||
| 2,794,322 | | | Freddie Mac REMIC Trust 4203 BN, 3.000%, 04/15/2033 | | | | $ | 2,787,014 | | | | | | 0.0 | | |
| 1,222,467 | | | Freddie Mac REMIC Trust 4246 ZX, 4.500%, 04/15/2041 | | | | | 1,264,189 | | | | | | 0.0 | | |
| 1,014,466 (5) | | | Freddie Mac REMIC Trust 4293 KI, 4.500%, 08/15/2043 | | | | | 115,755 | | | | | | 0.0 | | |
| 5,401,079 | | | Freddie Mac REMIC Trust 4335 ZX, 4.250%, 05/15/2044 | | | | | 5,664,976 | | | | | | 0.1 | | |
| 7,249,896 | | | Freddie Mac REMIC Trust 435 XZ, 4.250%, 05/15/2044 | | | | | 7,590,487 | | | | | | 0.1 | | |
| 994,988 | | | Freddie Mac REMIC Trust 4370 AD, 3.000%, 08/15/2040 | | | | | 999,355 | | | | | | 0.0 | | |
| 3,100,012 (5) | | | Freddie Mac REMIC Trust 4386 LS, 5.703%, (-1.000*US0001M + 6.100%), 09/15/2044 | | | | | 426,384 | | | | | | 0.0 | | |
| 27,097,423 (5) | | | Freddie Mac REMIC Trust 5103 HI, 4.000%, 05/25/2051 | | | | | 4,880,389 | | | | | | 0.1 | | |
| 13,287 (5) | | | Freddie Mac REMICS 2074 S, 8.259%, (-1.000*US0001M + 8.700%), 07/17/2028 | | | | | 426 | | | | | | 0.0 | | |
| 8,813 (5) | | | Freddie Mac REMICS 2232 SA, 8.159%, (-1.000*US0001M + 8.600%), 05/17/2030 | | | | | 447 | | | | | | 0.0 | | |
| 10,999 (5) | | | Freddie Mac REMICS 2301 SP, 8.853%, (-1.000*US0001M + 9.250%), 04/15/2031 | | | | | 848 | | | | | | 0.0 | | |
| 272,349 (5) | | | Freddie Mac REMICS 2953 LS, 6.303%, (-1.000*US0001M + 6.700%), 12/15/2034 | | | | | 3,245 | | | | | | 0.0 | | |
| 692,639 (5) | | | Freddie Mac REMICS 2993 GS, 5.753%, (-1.000*US0001M + 6.150%), 06/15/2025 | | | | | 27,467 | | | | | | 0.0 | | |
| 648,695 (5) | | | Freddie Mac REMICS 3006 SI, 6.343%, (-1.000*US0001M + 6.740%), 07/15/2035 | | | | | 103,070 | | | | | | 0.0 | | |
| Voya Intermediate Bond Fund | as of March 31, 2022 (continued) |
| Principal Amount† | | | Value | | | Percentage of Net Assets | | |||||||||
| COLLATERALIZED MORTGAGE OBLIGATIONS: (continued) | | |||||||||||||||
| 669,083 (5) | | | Freddie Mac REMICS 3006 YI, 6.343%, (-1.000*US0001M + 6.740%), 07/15/2035 | | | | $ | 105,293 | | | | | | 0.0 | | |
| 4,062,181 (5) | | | Freddie Mac REMICS 3213 JS, 6.803%, (-1.000*US0001M + 7.200%), 09/15/2036 | | | | | 807,408 | | | | | | 0.0 | | |
| 8,447,809 (5) | | | Freddie Mac REMICS 3346 SC, 6.153%, (-1.000*US0001M + 6.550%), 10/15/2033 | | | | | 1,206,405 | | | | | | 0.0 | | |
| 994,308 (5) | | | Freddie Mac REMICS 3375 QI, 0.600%, (-10.000*US0001M + 64.600%), 10/15/2037 | | | | | 23,299 | | | | | | 0.0 | | |
| 6,781,256 (5) | | | Freddie Mac REMICS 3629 CS, 5.953%, (-1.000*US0001M + 6.350%), 01/15/2040 | | | | | 1,038,448 | | | | | | 0.0 | | |
| 2,440,623 | | | Freddie Mac REMICS 3736 ZP, 4.000%, 10/15/2040 | | | | | 2,479,698 | | | | | | 0.0 | | |
| 1,814,290 | | | Freddie Mac REMICS 3740 KE, 4.000%, 10/15/2040 | | | | | 1,842,727 | | | | | | 0.0 | | |
| 22,913,267 | | | Freddie Mac REMICS 3753 KZ, 4.500%, 11/15/2040 | | | | | 23,742,566 | | | | | | 0.3 | | |
| 4,490,771 | | | Freddie Mac REMICS 3775 GZ, 4.500%, 12/15/2040 | | | | | 4,494,148 | | | | | | 0.1 | | |
| 1,900,000 | | | Freddie Mac REMICS 3820 NC, 4.500%, 03/15/2041 | | | | | 2,049,666 | | | | | | 0.0 | | |
| 784,320 | | | Freddie Mac REMICS 3843 JZ, 5.100%, 04/15/2041 | | | | | 878,692 | | | | | | 0.0 | | |
| 450,404 | | | Freddie Mac REMICS 3848 WX, 5.000%, 04/15/2041 | | | | | 470,038 | | | | | | 0.0 | | |
| 2,650,000 | | | Freddie Mac REMICS 3890 ME, 5.000%, 07/15/2041 | | | | | 2,908,438 | | | | | | 0.0 | | |
| 2,417,635 | | | Freddie Mac REMICS 3893 PU, 4.000%, 07/15/2041 | | | | | 2,452,258 | | | | | | 0.0 | | |
| 4,611,286 | | | Freddie Mac REMICS 3919 BY, 4.000%, 09/15/2041 | | | | | 4,746,145 | | | | | | 0.1 | | |
| Principal Amount† | | | Value | | | Percentage of Net Assets | | |||||||||
| COLLATERALIZED MORTGAGE OBLIGATIONS: (continued) | | |||||||||||||||
| 8,951,200 | | | Freddie Mac REMICS 3919 ZB, 4.000%, 09/15/2041 | | | | $ | 9,133,865 | | | | | | 0.1 | | |
| 3,790,000 | | | Freddie Mac REMICS 3923 GY, 4.000%, 09/15/2041 | | | | | 3,906,157 | | | | | | 0.1 | | |
| 1,640,209 | | | Freddie Mac REMICS 3934 CB, 4.000%, 10/15/2041 | | | | | 1,701,937 | | | | | | 0.0 | | |
| 420,000 | | | Freddie Mac REMICS 3934 KB, 5.000%, 10/15/2041 | | | | | 453,971 | | | | | | 0.0 | | |
| 1,029,246 | | | Freddie Mac REMICS 3997 PB, 4.000%, 02/15/2042 | | | | | 1,067,639 | | | | | | 0.0 | | |
| 3,423,837 (5) | | | Freddie Mac REMICS 4057 SN, 6.253%, (-1.000*US0001M + 6.650%), 12/15/2041 | | | | | 449,832 | | | | | | 0.0 | | |
| 3,145,409 | | | Freddie Mac REMICS 4057 ZB, 3.500%, 06/15/2042 | | | | | 3,160,841 | | | | | | 0.1 | | |
| 13,950,307 | | | Freddie Mac REMICS 4084 TZ, 4.000%, 07/15/2042 | | | | | 14,156,132 | | | | | | 0.2 | | |
| 1,839,643 (5) | | | Freddie Mac REMICS 4090 SN, 6.303%, (-1.000*US0001M + 6.700%), 08/15/2032 | | | | | 301,786 | | | | | | 0.0 | | |
| 675,659 | | | Freddie Mac REMICS 4100 JA, 3.500%, 10/15/2041 | | | | | 674,876 | | ��� | | | | 0.0 | | |
| 2,128,000 | | | Freddie Mac REMICS 4193 BP, 4.000%, 04/15/2043 | | | | | 2,315,836 | | | | | | 0.0 | | |
| 310,000 | | | Freddie Mac REMICS 4235 QD, 3.000%, 08/15/2033 | | | | | 310,594 | | | | | | 0.0 | | |
| 28,911,826 (5) | | | Freddie Mac REMICS 4301 SD, 5.703%, (-1.000*US0001M + 6.100%), 07/15/2037 | | | | | 3,763,348 | | | | | | 0.1 | | |
| 6,709,734 | | | Freddie Mac REMICS 4310 BZ, 4.000%, 02/15/2044 | | | | | 6,927,038 | | | | | | 0.1 | | |
| 3,102,000 | | | Freddie Mac REMICS 4401 BL, 3.500%, 10/15/2034 | | | | | 3,151,069 | | | | | | 0.1 | | |
| Voya Intermediate Bond Fund | as of March 31, 2022 (continued) |
| Principal Amount† | | | Value | | | Percentage of Net Assets | | |||||||||
| COLLATERALIZED MORTGAGE OBLIGATIONS: (continued) | | |||||||||||||||
| 11,116,945 (5) | | | Freddie Mac REMICS 4407 CS, 5.803%, (-1.000*US0001M + 6.200%), 06/15/2044 | | | | $ | 1,274,065 | | | | | | 0.0 | | |
| 16,563,337 (5) | | | Freddie Mac REMICS 4407 PS, 5.203%, (-1.000*US0001M + 5.600%), 06/15/2044 | | | | | 1,556,940 | | | | | | 0.0 | | |
| 3,709,315 | | | Freddie Mac REMICS 4444 CZ, 3.000%, 02/15/2045 | | | | | 3,592,726 | | | | | | 0.1 | | |
| 15,423,142 (5) | | | Freddie Mac REMICS 4461 AS, 5.203%, (-1.000*US0001M + 5.600%), 04/15/2045 | | | | | 1,908,435 | | | | | | 0.0 | | |
| 3,124,000 | | | Freddie Mac REMICS 4492 VB, 3.500%, 05/15/2035 | | | | | 3,183,372 | | | | | | 0.1 | | |
| 162,590 | | | Freddie Mac REMICS 4500 HC, 3.000%, 11/15/2042 | | | | | 162,801 | | | | | | 0.0 | | |
| 2,913,000 | | | Freddie Mac REMICS 4505 PB, 3.000%, 08/15/2045 | | | | | 2,856,601 | | | | | | 0.0 | | |
| 13,784,461 (5) | | | Freddie Mac REMICS 4574 ST, 5.603%, (-1.000*US0001M + 6.000%), 04/15/2046 | | | | | 2,336,616 | | | | | | 0.0 | | |
| 75,212,450 (5) | | | Freddie Mac REMICS 4585 AS, 5.703%, (-1.000*US0001M + 6.100%), 05/15/2046 | | | | | 10,598,653 | | | | | | 0.1 | | |
| 5,395,294 | | | Freddie Mac REMICS 4608 JV, 3.500%, 01/15/2055 | | | | | 5,592,188 | | | | | | 0.1 | | |
| 21,194,759 (5) | | | Freddie Mac REMICS 4611 BS, 5.703%, (-1.000*US0001M + 6.100%), 06/15/2041 | | | | | 3,011,565 | | | | | | 0.0 | | |
| 10,658,938 | | | Freddie Mac REMICS 4664 KZ, 3.500%, 02/15/2047 | | | | | 10,646,601 | | | | | | 0.1 | | |
| 6,811,109 | | | Freddie Mac REMICS 4682 HZ, 3.500%, 04/15/2047 | | | | | 6,815,660 | | | | | | 0.1 | | |
| 3,965,401 | | | Freddie Mac REMICS 4753 VZ, 3.000%, 12/15/2047 | | | | | 3,820,767 | | | | | | 0.1 | | |
| 3,238,659 | | | Freddie Mac REMICS 4755 Z, 3.000%, 02/15/2048 | | | | | 3,155,433 | | | | | | 0.1 | | |
| Principal Amount† | | | Value | | | Percentage of Net Assets | | |||||||||
| COLLATERALIZED MORTGAGE OBLIGATIONS: (continued) | | |||||||||||||||
| 34,601,811 | | | Freddie Mac REMICS 4771 HZ, 3.500%, 03/15/2048 | | | | $ | 34,757,038 | | | | | | 0.4 | | |
| 2,457,000 | | | Freddie Mac REMICS 4772 VG, 4.500%, 08/15/2036 | | | | | 2,503,383 | | | | | | 0.0 | | |
| 19,504,666 | | | Freddie Mac REMICS 4776 AZ, 4.000%, 07/15/2047 | | | | | 19,856,258 | | | | | | 0.2 | | |
| 518,889 | | | Freddie Mac REMICS 4787 PY, 4.000%, 05/15/2048 | | | | | 522,506 | | | | | | 0.0 | | |
| 11,052,424 | | | Freddie Mac REMICS 4795 D, 5.000%, 05/15/2048 | | | | | 11,683,179 | | | | | | 0.1 | | |
| 2,599,270 | | | Freddie Mac REMICS 4834 AZ, 3.500%, 10/15/2048 | | | | | 2,620,167 | | | | | | 0.0 | | |
| 44,489,430 (5) | | | Freddie Mac REMICS 4879 DS, 5.703%, (-1.000*US0001M + 6.100%), 08/15/2034 | | | | | 5,524,902 | | | | | | 0.1 | | |
| 36,305,729 (5) | | | Freddie Mac REMICS 4892 SA, 5.653%, (-1.000*US0001M + 6.050%), 07/15/2049 | | | | | 5,921,326 | | | | | | 0.1 | | |
| 1,632,872 | | | Freddie Mac REMICS 4904 HB, 3.000%, 08/25/2049 | | | | | 1,595,896 | | | | | | 0.0 | | |
| 10,033,432 (5) | | | Freddie Mac REMICS 4906 SQ, 5.593%, (-1.000*US0001M + 6.050%), 09/25/2049 | | | | | 1,406,443 | | | | | | 0.0 | | |
| 606,535 | | | Freddie Mac REMICS 4914 DB, 3.000%, 09/25/2049 | | | | | 575,251 | | | | | | 0.0 | | |
| 2,139,480 | | | Freddie Mac REMICS 4941 CZ, 3.000%, 11/25/2049 | | | | | 2,068,775 | | | | | | 0.0 | | |
| 3,209,220 | | | Freddie Mac REMICS 4941 WZ, 3.000%, 11/25/2049 | | | | | 3,114,308 | | | | | | 0.1 | | |
| 6,337,647 | | | Freddie Mac REMICS 4950 KE, 2.500%, 12/25/2049 | | | | | 6,216,587 | | | | | | 0.1 | | |
| 62,177,472 (5) | | | Freddie Mac REMICS 5014 HI, 4.000%, 09/25/2050 | | | | | 11,649,963 | | | | | | 0.1 | | |
| Voya Intermediate Bond Fund | as of March 31, 2022 (continued) |
| Principal Amount† | | | Value | | | Percentage of Net Assets | | |||||||||
| COLLATERALIZED MORTGAGE OBLIGATIONS: (continued) | | |||||||||||||||
| 38,281,786 (5) | | | Freddie Mac REMICS 5019 HI, 3.500%, 10/25/2050 | | | | $ | 6,635,313 | | | | | | 0.1 | | |
| 27,555,763 (5) | | | Freddie Mac REMICS 5045 BS, 6.101%, (-1.000*SOFR30A + 6.200%), 11/25/2050 | | | | | 5,633,715 | | | | | | 0.1 | | |
| 11,364,817 (5) | | | Freddie Mac REMICS 5048 IN, 2.500%, 12/25/2050 | | | | | 1,827,174 | | | | | | 0.0 | | |
| 33,728,575 (5) | | | Freddie Mac REMICS 5072 NI, 3.000%, 01/25/2050 | | | | | 5,112,841 | | | | | | 0.1 | | |
| 54,066,972 (5) | | | Freddie Mac REMICS 5082 IQ, 3.000%, 03/25/2051 | | | | | 8,065,759 | | | | | | 0.1 | | |
| 28,416,411 (5) | | | Freddie Mac REMICS 5113 AI, 4.000%, 06/25/2041 | | | | | 4,669,865 | | | | | | 0.1 | | |
| 82,181,606 | | | Freddie Mac REMICS 5117 IO, 3.000%, 06/25/2051 | | | | | 11,596,260 | | | | | | 0.1 | | |
| 35,135,975 (5) | | | Freddie Mac REMICS 5128 IC, 5.500%, 09/25/2041 | | | | | 7,345,344 | | | | | | 0.1 | | |
| 12,633,944 | | | Freddie Mac Series 4348 ZX, 4.250%, 06/15/2044 | | | | | 12,973,375 | | | | | | 0.2 | | |
| 5,439,453 (1) | | | Freddie Mac STACR Remic Trust 2020-DNA2 M2, 2.307%, (US0001M + 1.850%), 02/25/2050 | | | | | 5,430,088 | | | | | | 0.1 | | |
| 2,844,021 (1) | | | Freddie Mac STACR REMIC Trust 2020-HQA1 M2, 2.357%, (US0001M + 1.900%), 01/25/2050 | | | | | 2,847,897 | | | | | | 0.0 | | |
| 8,740,000 (1) | | | Freddie Mac Stacr Remic Trust 2020-HQA2 B1, 4.557%, (US0001M + 4.100%), 03/25/2050 | | | | | 8,565,474 | | | | | | 0.1 | | |
| 4,158,293 (1) | | | Freddie Mac Stacr Remic Trust 2020-HQA2 M2, 3.557%, (US0001M + 3.100%), 03/25/2050 | | | | | 4,180,342 | | | | | | 0.1 | | |
| 1,689,448 (1) | | | Freddie Mac STACR REMIC Trust 2020-HQA3 M2, 4.057%, (US0001M + 3.600%), 07/25/2050 | | | | | 1,691,823 | | | | | | 0.0 | | |
| 3,825,000 (1) | | | Freddie Mac STACR REMIC Trust 2021-DNA6 B1, 3.499%, (SOFR30A + 3.400%), 10/25/2041 | | | | | 3,542,006 | | | | | | 0.1 | | |
| Principal Amount† | | | Value | | | Percentage of Net Assets | | |||||||||
| COLLATERALIZED MORTGAGE OBLIGATIONS: (continued) | | |||||||||||||||
| 3,390,000 (1) | | | Freddie Mac STACR REMIC Trust 2021-HQA1 M2, 2.349%, (SOFR30A + 2.250%), 08/25/2033 | | | | $ | 3,262,507 | | | | | | 0.1 | | |
| 6,500,000 (1) | | | Freddie Mac STACR REMIC Trust 2021-HQA3 M2, 2.199%, (SOFR30A + 2.100%), 09/25/2041 | | | | | 6,109,123 | | | | | | 0.1 | | |
| 15,000,000 (1) | | | Freddie Mac STACR REMIC Trust 2021-HQA4 B1, 3.849%, (SOFR30A + 3.750%), 12/25/2041 | | | | | 13,544,345 | | | | | | 0.2 | | |
| 10,000,000 (1) | | | Freddie Mac STACR REMIC Trust 2021-HQA4 M2, 2.449%, (SOFR30A + 2.350%), 12/25/2041 | | | | | 9,419,733 | | | | | | 0.1 | | |
| 13,500,000 (1) | | | Freddie Mac STACR REMIC Trust 2022-DNA1 B1, 3.499%, (SOFR30A + 3.400%), 01/25/2042 | | | | | 12,301,106 | | | | | | 0.1 | | |
| 9,200,000 (1) | | | Freddie Mac STACR REMIC Trust 2022-DNA1 M1B, 1.949%, (SOFR30A + 1.850%), 01/25/2042 | | | | | 8,686,370 | | | | | | 0.1 | | |
| 7,000,000 (1) | | | Freddie Mac STACR REMIC Trust 2022-DNA1 M2, 2.599%, (SOFR30A + 2.500%), 01/25/2042 | | | | | 6,545,141 | | | | | | 0.1 | | |
| 8,197,879 (1) | | | Freddie Mac STACR Trust 2018-DNA3 M2, 2.557%, (US0001M + 2.100%), 09/25/2048 | | | | | 8,242,521 | | | | | | 0.1 | | |
| 1,860,000 (1) | | | Freddie Mac Stacr Trust 2018-HQA2 M2, 2.757%, (US0001M + 2.300%), 10/25/2048 | | | | | 1,857,755 | | | | | | 0.0 | | |
| 9,512,130 (1) | | | Freddie Mac STACR Trust 2019-DNA3 M2, 2.507%, (US0001M + 2.050%), 07/25/2049 | | | | | 9,520,865 | | | | | | 0.1 | | |
| 6,153,320 (1) | | | Freddie Mac Stacr Trust 2019-HQA1 M2, 2.807%, (US0001M + 2.350%), 02/25/2049 | | | | | 6,159,008 | | | | | | 0.1 | | |
| 3,074,771 | | | Freddie Mac Strips 277 30, 3.000%, 09/15/2042 | | | | | 3,049,483 | | | | | | 0.1 | | |
| 3,809,405 (5) | | | Freddie Mac Strips 303 C17, 3.500%, 01/15/2043 | | | | | 653,486 | | | | | | 0.0 | | |
| 929,076 (3)(5) | | | Freddie Mac Strips 344 68, 3.000%, 02/15/2045 | | | | | 120,724 | | | | | | 0.0 | | |
| Voya Intermediate Bond Fund | as of March 31, 2022 (continued) |
| Principal Amount† | | | Value | | | Percentage of Net Assets | | |||||||||
| COLLATERALIZED MORTGAGE OBLIGATIONS: (continued) | | |||||||||||||||
| 322,206 (3)(5) | | | Freddie Mac Strips 344 89, 4.500%, 02/15/2045 | | | | $ | 64,117 | | | | | | 0.0 | | |
| 4,348,775 (5) | | | Freddie Mac Strips 344 C13, 4.500%, 02/15/2045 | | | | | 784,840 | | | | | | 0.0 | | |
| 6,154,667 (5) | | | Freddie Mac Strips 344 C18, 4.000%, 02/15/2045 | | | | | 1,060,773 | | | | | | 0.0 | | |
| 3,009,110 (3)(5) | | | Freddie Mac Strips 344 C18, 4.000%, 02/15/2045 | | | | | 524,750 | | | | | | 0.0 | | |
| 3,629,335 (3)(5) | | | Freddie Mac Strips 344 C19, 3.500%, 02/15/2045 | | | | | 602,445 | | | | | | 0.0 | | |
| 6,041,518 (5) | | | Freddie Mac Strips 344 C2, 4.000%, 02/15/2045 | | | | | 1,033,957 | | | | | | 0.0 | | |
| 5,006,359 (5) | | | Freddie Mac Strips 344 C4, 4.000%, 02/15/2045 | | | | | 828,459 | | | | | | 0.0 | | |
| 8,435,589 (5) | | | Freddie Mac Strips 344 C5, 3.500%, 02/15/2045 | | | | | 1,411,420 | | | | | | 0.0 | | |
| 9,108,041 (5) | | | Freddie Mac Strips 344 C6, 4.000%, 02/15/2045 | | | | | 1,549,266 | | | | | | 0.0 | | |
| 4,665,964 (5) | | | Freddie Mac Strips 344 C7, 4.000%, 02/15/2045 | | | | | 753,586 | | | | | | 0.0 | | |
| 4,491,142 (5) | | | Freddie Mac Strips 344 C9, 3.500%, 02/15/2045 | | | | | 763,848 | | | | | | 0.0 | | |
| 3,881,592 (5) | | | Freddie Mac Strips 344 C9, 3.500%, 02/15/2045 | | | | | 623,776 | | | | | | 0.0 | | |
| 9,975,790 (5) | | | Freddie Mac Strips 347 C14, 3.500%, 02/15/2044 | | | | | 1,785,173 | | | | | | 0.0 | | |
| 6,203,086 (5) | | | Freddie Mac Strips 347 C22, 4.000%, 02/15/2044 | | | | | 1,071,717 | | | | | | 0.0 | | |
| 6,747,094 (5) | | | Freddie Mac Strips 347 C23, 4.000%, 02/15/2044 | | | | | 1,206,060 | | | | | | 0.0 | | |
| 6,429,422 (5) | | | Freddie Mac Strips 347 C24, 4.000%, 02/15/2044 | | | | | 1,156,450 | | | | | | 0.0 | | |
| 5,829,430 (5) | | | Freddie Mac Strips 347 C25, 4.000%, 02/15/2044 | | | | | 979,358 | | | | | | 0.0 | | |
| 7,732,044 (5) | | | Freddie Mac Strips 347 C26, 4.000%, 02/15/2044 | | | | | 1,325,280 | | | | | | 0.0 | | |
| 7,465,280 (5) | | | Freddie Mac Strips 347 C28, 4.500%, 02/15/2044 | | | | | 1,398,129 | | | | | | 0.0 | | |
| 10,888,600 (5) | | | Freddie Mac Strips 347 C5, 3.000%, 05/15/2043 | | | | | 1,697,729 | | | | | | 0.0 | | |
| 24,431,997 (5) | | | Freddie Mac Strips 365 C23, 3.500%, 10/15/2047 | | | | | 3,860,358 | | | | | | 0.1 | | |
| 31,101,499 (5) | | | Freddie Mac Strips Series 311 S1, 5.553%, (-1.000*US0001M + 5.950%), 08/15/2043 | | | | | 4,911,493 | | | | | | 0.1 | | |
| 550,837 | | | Freddie Mac Structured Agency Credit Risk Debt Notes 2015-DNA2 M3, 4.357%, (US0001M + 3.900%), 12/25/2027 | | | | | 552,582 | | | | | | 0.0 | | |
| Principal Amount† | | | Value | | | Percentage of Net Assets | | |||||||||
| COLLATERALIZED MORTGAGE OBLIGATIONS: (continued) | | |||||||||||||||
| 1,362,137 | | | Freddie Mac Structured Agency Credit Risk Debt Notes 2018-HQA1 M2, 2.757%, (US0001M + 2.300%), 09/25/2030 | | | | $ | 1,364,521 | | | | | | 0.0 | | |
| 8,483,065 (1) | | | Freddie Mac Structured Agency Credit Risk Debt Notes 2019-DNA1 M2, 3.107%, (US0001M + 2.650%), 01/25/2049 | | | | | 8,534,593 | | | | | | 0.1 | | |
| 8,508,068 (1) | | | Freddie Mac Structured Agency Credit Risk Debt Notes 2019-HQA2 M2, 2.507%, (US0001M + 2.050%), 04/25/2049 | | | | | 8,510,830 | | | | | | 0.1 | | |
| 6,000,000 (1) | | | Freddie Mac Structured Agency Credit Risk Debt Notes 2021-DNA2 M2, 2.399%, (SOFR30A + 2.300%), 08/25/2033 | | | | | 5,920,186 | | | | | | 0.1 | | |
| 5,000,000 (1) | | | Freddie Mac Structured Agency Credit Risk Debt Notes 2021-DNA7 B1, 3.749%, (SOFR30A + 3.650%), 11/25/2041 | | | | | 4,750,283 | | | | | | 0.1 | | |
| 983,197 (3) | | | Freddie Mac Structured Pass Through Certificates T-48 1A, 4.503%, 07/25/2033 | | | | | 1,001,904 | | | | | | 0.0 | | |
| 1,063,539 (1)(3) | | | Galton Funding Mortgage Trust 2018-2 A51, 4.500%, 10/25/2058 | | | | | 1,068,723 | | | | | | 0.0 | | |
| 3,818,961 (1)(3) | | | Galton Funding Mortgage Trust 2018-2 B2, 4.702%, 10/25/2058 | | | | | 3,782,664 | | | | | | 0.1 | | |
| 1,286,877 (5) | | | Ginnie Mae 2005-37 SI, 5.701%, (-1.000*US0001M + 6.150%), 05/20/2035 | | | | | 188,028 | | | | | | 0.0 | | |
| 1,188,716 (5) | | | Ginnie Mae 2007-23 ST, 5.751%, (-1.000*US0001M + 6.200%), 04/20/2037 | | | | | 142,346 | | | | | | 0.0 | | |
| 1,421,695 (5) | | | Ginnie Mae 2007-40 SE, 6.301%, (-1.000*US0001M + 6.750%), 07/20/2037 | | | | | 239,082 | | | | | | 0.0 | | |
| 982,898 (5) | | | Ginnie Mae 2007-7 EI, 5.751%, (-1.000*US0001M + 6.200%), 02/20/2037 | | | | | 140,573 | | | | | | 0.0 | | |
| Voya Intermediate Bond Fund | as of March 31, 2022 (continued) |
| Principal Amount† | | | Value | | | Percentage of Net Assets | | |||||||||
| COLLATERALIZED MORTGAGE OBLIGATIONS: (continued) | | |||||||||||||||
| 3,365,497 (5) | | | Ginnie Mae 2010-11 SA, 5.989%, (-1.000*US0001M + 6.420%), 01/16/2040 | | | | $ | 532,370 | | | | | | 0.0 | | |
| 1,517,224 (5) | | | Ginnie Mae 2010-14 SB, 6.351%, (-1.000*US0001M + 6.800%), 11/20/2035 | | | | | 240,416 | | | | | | 0.0 | | |
| 1,192,444 (5) | | | Ginnie Mae 2010-99 IT, 5.000%, 08/16/2040 | | | | | 173,362 | | | | | | 0.0 | | |
| 475,978 | | | Ginnie Mae 2013-69 KA, 1.250%, 08/20/2042 | | | | | 444,893 | | | | | | 0.0 | | |
| 4,305,293 | | | Ginnie Mae 2018-1 LZ, 3.000%, 01/20/2048 | | | | | 4,183,580 | | | | | | 0.1 | | |
| 19,962,659 (5) | | | Ginnie Mae 2018-167 CS, 5.651%, (-1.000*US0001M + 6.100%), 12/20/2048 | | | | | 2,302,960 | | | | | | 0.0 | | |
| 383,916 (5) | | | Ginnie Mae Series 2005-7 AH, 6.339%, (-1.000*US0001M + 6.770%), 02/16/2035 | | | | | 51,086 | | | | | | 0.0 | | |
| 7,195,647 (5) | | | Ginnie Mae Series 2007-17 IC, 5.819%, (-1.000*US0001M + 6.250%), 04/16/2037 | | | | | 785,372 | | | | | | 0.0 | | |
| 7,758,634 (5) | | | Ginnie Mae Series 2007-41 SL, 6.251%, (-1.000*US0001M + 6.700%), 07/20/2037 | | | | | 1,276,631 | | | | | | 0.0 | | |
| 818,086 (5) | | | Ginnie Mae Series 2008-2 SW, 6.101%, (-1.000*US0001M + 6.550%), 01/20/2038 | | | | | 136,524 | | | | | | 0.0 | | |
| 454,360 (5) | | | Ginnie Mae Series 2008-35 SN, 5.951%, (-1.000*US0001M + 6.400%), 04/20/2038 | | | | | 56,571 | | | | | | 0.0 | | |
| 251,139 (5) | | | Ginnie Mae Series 2008-40 PS, 6.069%, (-1.000*US0001M + 6.500%), 05/16/2038 | | | | | 33,632 | | | | | | 0.0 | | |
| 678,658 (5) | | | Ginnie Mae Series 2009-25 KS, 5.751%, (-1.000*US0001M + 6.200%), 04/20/2039 | | | | | 103,040 | | | | | | 0.0 | | |
| Principal Amount† | | | Value | | | Percentage of Net Assets | | |||||||||
| COLLATERALIZED MORTGAGE OBLIGATIONS: (continued) | | |||||||||||||||
| 494,903 | | | Ginnie Mae Series 2009-29 PB, 4.750%, 05/20/2039 | | | | $ | 517,633 | | | | | | 0.0 | | |
| 464,758 | | | Ginnie Mae Series 2009-31 ZL, 4.500%, 05/20/2039 | | | | | 487,524 | | | | | | 0.0 | | |
| 10,087,575 | | | Ginnie Mae Series 2009-33 ZB, 6.000%, 05/20/2039 | | | | | 10,428,298 | | | | | | 0.1 | | |
| 964,624 | | | Ginnie Mae Series 2009-34 Z, 4.500%, 05/16/2039 | | | | | 1,008,037 | | | | | | 0.0 | | |
| 1,230,281 | | | Ginnie Mae Series 2009-98 DA, 3.250%, 07/16/2039 | | | | | 1,235,325 | | | | | | 0.0 | | |
| 2,646,854 | | | Ginnie Mae Series 2010-108 WL, 4.000%, 04/16/2040 | | | | | 2,721,352 | | | | | | 0.0 | | |
| 1,292,893 (5) | | | Ginnie Mae Series 2010-116 NS, 6.219%, (-1.000*US0001M + 6.650%), 09/16/2040 | | | | | 168,800 | | | | | | 0.0 | | |
| 3,878,654 (5) | | | Ginnie Mae Series 2010-116 SK, 6.171%, (-1.000*US0001M + 6.620%), 08/20/2040 | | | | | 561,620 | | | | | | 0.0 | | |
| 4,475,585 (5) | | | Ginnie Mae Series 2010-149 HS, 5.669%, (-1.000*US0001M + 6.100%), 05/16/2040 | | | | | 272,035 | | | | | | 0.0 | | |
| 394,330 | | | Ginnie Mae Series 2010-164 MD, 4.000%, 12/20/2040 | | | | | 410,536 | | | | | | 0.0 | | |
| 1,520,307 (5) | | | Ginnie Mae Series 2010-168 BI, 5.000%, 04/20/2040 | | | | | 226,417 | | | | | | 0.0 | | |
| 878,752 (5) | | | Ginnie Mae Series 2010-68 MS, 5.401%, (-1.000*US0001M + 5.850%), 06/20/2040 | | | | | 116,475 | | | | | | 0.0 | | |
| 1,409,998 | | | Ginnie Mae Series 2011-52 PA, 4.250%, 02/16/2041 | | | | | 1,447,163 | | | | | | 0.0 | | |
| Voya Intermediate Bond Fund | as of March 31, 2022 (continued) |
| Principal Amount† | | | Value | | | Percentage of Net Assets | | |||||||||
| COLLATERALIZED MORTGAGE OBLIGATIONS: (continued) | | |||||||||||||||
| 2,029,733 (5) | | | Ginnie Mae Series 2011-72 SA, 4.919%, (-1.000*US0001M + 5.350%), 05/16/2041 | | | | $ | 242,388 | | | | | | 0.0 | | |
| 1,351,078 (5) | | | Ginnie Mae Series 2011-73 LS, 6.241%, (-1.000*US0001M + 6.690%), 08/20/2039 | | | | | 36,821 | | | | | | 0.0 | | |
| 347,980 (5) | | | Ginnie Mae Series 2012-91 QI, 4.500%, 09/20/2041 | | | | | 34,665 | | | | | | 0.0 | | |
| 3,080,281 (5) | | | Ginnie Mae Series 2013-111 SA, 6.251%, (-1.000*US0001M + 6.700%), 07/20/2043 | | | | | 505,253 | | | | | | 0.0 | | |
| 1,032,970 | | | Ginnie Mae Series 2013-116 KB, 3.500%, 12/20/2042 | | | | | 1,043,760 | | | | | | 0.0 | | |
| 4,445,544 (5) | | | Ginnie Mae Series 2013-167 PI, 5.500%, 11/20/2043 | | | | | 764,608 | | | | | | 0.0 | | |
| 146,250 | | | Ginnie Mae Series 2013-27 KA, 2.250%, 02/20/2043 | | | | | 142,262 | | | | | | 0.0 | | |
| 681,414 (5) | | | Ginnie Mae Series 2014-10 GI, 4.500%, 01/16/2029 | | | | | 27,846 | | | | | | 0.0 | | |
| 3,097,060 (5) | | | Ginnie Mae Series 2014-185 SB, 5.151%, (-1.000*US0001M + 5.600%), 12/20/2044 | | | | | 429,055 | | | | | | 0.0 | | |
| 2,198,679 (5) | | | Ginnie Mae Series 2014-3 QS, 5.701%, (-1.000*US0001M + 6.150%), 03/20/2043 | | | | | 196,205 | | | | | | 0.0 | | |
| 5,149,062 (5) | | | Ginnie Mae Series 2014-3 SU, 5.601%, (-1.000*US0001M + 6.050%), 07/20/2039 | | | | | 717,359 | | | | | | 0.0 | | |
| 3,090,341 (5) | | | Ginnie Mae Series 2014-56 SP, 5.769%, (-1.000*US0001M + 6.200%), 12/16/2039 | | | | | 337,629 | | | | | | 0.0 | | |
| 7,351,023 (5) | | | Ginnie Mae Series 2014-58 SG, 5.169%, (-1.000*US0001M + 5.600%), 04/16/2044 | | | | | 851,661 | | | | | | 0.0 | | |
| Principal Amount† | | | Value | | | Percentage of Net Assets | | |||||||||
| COLLATERALIZED MORTGAGE OBLIGATIONS: (continued) | | |||||||||||||||
| 18,930,562 (5) | | | Ginnie Mae Series 2015-110 MS, 5.261%, (-1.000*US0001M + 5.710%), 08/20/2045 | | | | $ | 2,433,069 | | | | | | 0.0 | | |
| 1,695,869 | | | Ginnie Mae Series 2015-27 PB, 3.000%, 08/20/2044 | | | | | 1,675,982 | | | | | | 0.0 | | |
| 17,588,344 (5) | | | Ginnie Mae Series 2016-160 GS, 5.651%, (-1.000*US0001M + 6.100%), 11/20/2046 | | | | | 2,845,171 | | | | | | 0.0 | | |
| 478,508 | | | Ginnie Mae Series 2016-44 JA, 3.500%, 03/20/2046 | | | | | 480,481 | | | | | | 0.0 | | |
| 37,780,671 (5) | | | Ginnie Mae Series 2016-6 SB, 5.201%, (-1.000*US0001M + 5.650%), 01/20/2046 | | | | | 4,956,465 | | | | | | 0.1 | | |
| 8,941,295 (5) | | | Ginnie Mae Series 2017-101 SA, 5.751%, (-1.000*US0001M + 6.200%), 07/20/2047 | | | | | 1,147,294 | | | | | | 0.0 | | |
| 18,723,965 (5) | | | Ginnie Mae Series 2017-163 SH, 5.751%, (-1.000*US0001M + 6.200%), 11/20/2047 | | | | | 2,690,424 | | | | | | 0.0 | | |
| 321,462 | | | Ginnie Mae Series 2018-104 HZ, 3.500%, 08/20/2048 | | | | | 316,453 | | | | | | 0.0 | | |
| 1,505,635 | | | Ginnie Mae Series 2018-120 DE, 3.500%, 09/20/2048 | | | | | 1,500,910 | | | | | | 0.0 | | |
| 192,352 | | | Ginnie Mae Series 2018-122 GZ, 3.500%, 09/20/2048 | | | | | 199,320 | | | | | | 0.0 | | |
| 2,019,883 | | | Ginnie Mae Series 2018-126 A, 3.500%, 09/20/2048 | | | | | 2,039,245 | | | | | | 0.0 | | |
| 191,902 | | | Ginnie Mae Series 2018-147 KZ, 3.750%, 10/20/2048 | | | | | 200,366 | | | | | | 0.0 | | |
| 176,532 | | | Ginnie Mae Series 2019-100 JB, 3.000%, 08/20/2049 | | | | | 167,226 | | | | | | 0.0 | | |
| 532,322 | | | Ginnie Mae Series 2019-100 KB, 3.000%, 08/20/2049 | | | | | 503,738 | | | | | | 0.0 | | |
| Voya Intermediate Bond Fund | as of March 31, 2022 (continued) |
| Principal Amount† | | | Value | | | Percentage of Net Assets | | |||||||||
| COLLATERALIZED MORTGAGE OBLIGATIONS: (continued) | | |||||||||||||||
| 1,349,931 | �� | | Ginnie Mae Series 2019-100 MC, 3.000%, 08/20/2049 | | | | $ | 1,276,849 | | | | | | 0.0 | | |
| 24,932,359 (5) | | | Ginnie Mae Series 2019-159 SM, 5.601%, (-1.000*US0001M + 6.050%), 12/20/2049 | | | | | 4,099,206 | | | | | | 0.1 | | |
| 1,081,376 | | | Ginnie Mae Series 2019-23 NG, 3.500%, 02/20/2049 | | | | | 1,082,415 | | | | | | 0.0 | | |
| 71,326 | | | Ginnie Mae Series 2019-54 AB, 3.000%, 04/20/2049 | | | | | 68,511 | | | | | | 0.0 | | |
| 798,785 | | | Ginnie Mae Series 2019-78 MB, 3.000%, 06/20/2049 | | | | | 791,187 | | | | | | 0.0 | | |
| 416,445 | | | Ginnie Mae Series 2019-89 KB, 3.000%, 07/20/2049 | | | | | 411,562 | | | | | | 0.0 | | |
| 299,424 | | | Ginnie Mae Series 2019-89 WB, 3.000%, 07/20/2049 | | | | | 279,711 | | | | | | 0.0 | | |
| 25,243,341 (5) | | | Ginnie Mae Series 2020-188 PI, 3.500%, 06/20/2050 | | | | | 3,801,362 | | | | | | 0.1 | | |
| 25,004,488 (5) | | | Ginnie Mae Series 2020-32 SG, 5.651%, (-1.000*US0001M + 6.100%), 03/20/2050 | | | | | 3,858,623 | | | | | | 0.1 | | |
| 39,916,556 (5) | | | Ginnie Mae Series 2020-46 BS, 2.901%, (-1.000*US0001M + 3.350%), 04/20/2050 | | | | | 1,226,300 | | | | | | 0.0 | | |
| 21,211,960 (5) | | | Ginnie Mae Series 2020-77 JS, 5.651%, (-1.000*US0001M + 6.100%), 10/20/2048 | | | | | 2,131,740 | | | | | | 0.0 | | |
| 99,694,974 (5) | | | Ginnie Mae Series 2021-139 PI, 2.500%, 08/20/2051 | | | | | 14,556,902 | | | | | | 0.2 | | |
| 392,242 (1)(3) | | | GS Mortage-Backed Securities Trust 2020-PJ1 A1, 3.500%, 05/25/2050 | | | | | 389,986 | | | | | | 0.0 | | |
| 629,082 (1)(3) | | | GS Mortage-Backed Securities Trust 2020-PJ1 A4, 3.500%, 05/25/2050 | | | | | 625,463 | | | | | | 0.0 | | |
| Principal Amount† | | | Value | | | Percentage of Net Assets | | |||||||||
| COLLATERALIZED MORTGAGE OBLIGATIONS: (continued) | | |||||||||||||||
| 1,569,046 (1)(3) | | | GS Mortage-Backed Securities Trust 2020-PJ1 A8, 3.500%, 05/25/2050 | | | | $ | 1,560,020 | | | | | | 0.0 | | |
| 621,526 (1)(3) | | | GS Mortgage-Backed Securities Corp. Trust 2019-PJ2 A1, 4.000%, 11/25/2049 | | | | | 623,004 | | | | | | 0.0 | | |
| 2,907,792 (1)(3) | | | GS Mortgage-Backed Securities Corp. Trust 2019-PJ2 B3, 4.374%, 11/25/2049 | | | | | 2,859,120 | | | | | | 0.0 | | |
| 1,114,346 (1)(3) | | | GS Mortgage-Backed Securities Corp. Trust 2019-PJ3 B1, 3.986%, 03/25/2050 | | | | | 1,102,289 | | | | | | 0.0 | | |
| 1,592,721 (1)(3) | | | GS Mortgage-Backed Securities Corp. Trust 2020-PJ3 B2A, 3.434%, 10/25/2050 | | | | | 1,481,616 | | | | | | 0.0 | | |
| 970,285 (1)(3) | | | GS Mortgage-Backed Securities Corp. Trust 2020-PJ3 B4, 3.434%, 10/25/2050 | | | | | 874,776 | | | | | | 0.0 | | |
| 1,462,579 (1)(3) | | | GS Mortgage-Backed Securities Trust 2021-GR3 B4, 3.395%, 04/25/2052 | | | | | 1,250,715 | | | | | | 0.0 | | |
| 1,893 | | | GSR Mortgage Loan Trust 2005-5F 8A1, 0.957%, (US0001M + 0.500%), 06/25/2035 | | | | | 1,870 | | | | | | 0.0 | | |
| 130,124 | | | GSR Mortgage Loan Trust 2007-1F 3A13, 6.000%, 01/25/2037 | | | | | 106,602 | | | | | | 0.0 | | |
| 1,737,519 | | | HarborView Mortgage Loan Trust 2007-5 A1A, 0.639%, (US0001M + 0.190%), 09/19/2037 | | | | | 1,682,246 | | | | | | 0.0 | | |
| 82,428 | | | HomeBanc Mortgage Trust 2004-1 2A, 1.317%, (US0001M + 0.860%), 08/25/2029 | | | | | 81,323 | | | | | | 0.0 | | |
| 632,844 | | | Impac CMB Trust Series 2005-1 M1, 1.147%, (US0001M + 0.690%), 04/25/2035 | | | | | 615,335 | | | | | | 0.0 | | |
| 2,000,000 (1)(3) | | | Imperial Fund Mortgage Trust 2021-NQM4 M1, 3.446%, 01/25/2057 | | | | | 1,827,043 | | | | | | 0.0 | | |
| Voya Intermediate Bond Fund | as of March 31, 2022 (continued) |
| Principal Amount† | | | Value | | | Percentage of Net Assets | | |||||||||
| COLLATERALIZED MORTGAGE OBLIGATIONS: (continued) | | |||||||||||||||
| 1,837,816 | | | IndyMac INDX Mortgage Loan Trust 2006-AR2 2A1, 0.877%, (US0001M + 0.420%), 02/25/2046 | | | | $ | 1,455,347 | | | | | | 0.0 | | |
| 98,750 (1)(3) | | | J.P. Morgan Mortgage Trust 2019-2 A3, 4.000%, 08/25/2049 | | | | | 99,088 | | | | | | 0.0 | | |
| 15,539 (1)(3) | | | J.P. Morgan Mortgage Trust 2019-LTV1 A3, 4.000%, 06/25/2049 | | | | | 15,531 | | | | | | 0.0 | | |
| 2,269,496 (1)(3) | | | J.P. Morgan Mortgage Trust 2021-14 B4, 3.170%, 05/25/2052 | | | | | 1,924,448 | | | | | | 0.0 | | |
| 326,161 | | | JP Morgan Alternative Loan Trust 2005-S1 1A1, 5.500%, 12/25/2035 | | | | | 173,248 | | | | | | 0.0 | | |
| 2,063,942 (3) | | | JP Morgan Mortgage Trust 2005-A4 B1, 2.569%, 07/25/2035 | | | | | 2,037,314 | | | | | | 0.0 | | |
| 1,040,168 (1)(3) | | | JP Morgan Mortgage Trust 2017-1 B4, 3.460%, 01/25/2047 | | | | | 1,008,590 | | | | | | 0.0 | | |
| 1,855,620 (1)(3) | | | JP Morgan Mortgage Trust 2017-3 B2, 3.769%, 08/25/2047 | | | | | 1,831,143 | | | | | | 0.0 | | |
| 1,364,416 (1)(3) | | | JP Morgan Mortgage Trust 2017-6 B3, 3.786%, 12/25/2048 | | | | | 1,330,934 | | | | | | 0.0 | | |
| 1,961,782 (1)(3) | | | JP Morgan Mortgage Trust 2018-1 B1, 3.665%, 06/25/2048 | | | | | 1,922,473 | | | | | | 0.0 | | |
| 1,888,385 (1)(3) | | | JP Morgan Mortgage Trust 2018-1 B2, 3.665%, 06/25/2048 | | | | | 1,843,754 | | | | | | 0.0 | | |
| 2,495,490 (1)(3) | | | JP Morgan Mortgage Trust 2018-1 B3, 3.665%, 06/25/2048 | | | | | 2,451,548 | | | | | | 0.0 | | |
| 2,415,512 (1)(3) | | | JP Morgan Mortgage Trust 2018-3 B1, 3.725%, 09/25/2048 | | | | | 2,373,714 | | | | | | 0.0 | | |
| 2,082,731 (1)(3) | | | JP Morgan Mortgage Trust 2018-4 B2, 3.726%, 10/25/2048 | | | | | 2,036,114 | | | | | | 0.0 | | |
| 2,808,619 (1)(3) | | | JP Morgan Mortgage Trust 2018-9 B3, 4.263%, 02/25/2049 | | | | | 2,699,298 | | | | | | 0.0 | | |
| 288,265 (1)(3) | | | JP Morgan Mortgage Trust 2019-1 A3, 4.000%, 05/25/2049 | | | | | 289,181 | | | | | | 0.0 | | |
| Principal Amount† | | | Value | | | Percentage of Net Assets | | |||||||||
| COLLATERALIZED MORTGAGE OBLIGATIONS: (continued) | | |||||||||||||||
| 2,694,800 (1)(3) | | | JP Morgan Mortgage Trust 2019-6 B1, 4.256%, 12/25/2049 | | | | $ | 2,641,557 | | | | | | 0.0 | | |
| 372,893 (1)(3) | | | JP Morgan Mortgage Trust 2019-8 A15, 3.500%, 03/25/2050 | | | | | 372,571 | | | | | | 0.0 | | |
| 828,655 (1)(3) | | | JP Morgan Mortgage Trust 2019-8 A5, 3.500%, 03/25/2050 | | | | | 827,920 | | | | | | 0.0 | | |
| 1,916,411 (1)(3) | | | JP Morgan Mortgage Trust 2019-9 B2A, 3.441%, 05/25/2050 | | | | | 1,830,830 | | | | | | 0.0 | | |
| 1,744,545 (1)(3) | | | JP Morgan Mortgage Trust 2019-INV1 B3, 5.015%, 10/25/2049 | | | | | 1,734,875 | | | | | | 0.0 | | |
| 211,456 (1)(3) | | | JP Morgan Mortgage Trust 2019-LTV2 A18, 4.000%, 12/25/2049 | | | | | 211,550 | | | | | | 0.0 | | |
| 989,245 (1)(3) | | | JP Morgan Mortgage Trust 2020-1 A7, 3.500%, 06/25/2050 | | | | | 960,084 | | | | | | 0.0 | | |
| 358,584 (1)(3) | | | JP Morgan Mortgage Trust 2020-2 A15, 3.500%, 07/25/2050 | | | | | 355,791 | | | | | | 0.0 | | |
| 365,326 (1)(3) | | | JP Morgan Mortgage Trust 2020-3 A15, 3.500%, 08/25/2050 | | | | | 362,159 | | | | | | 0.0 | | |
| 765,947 (1)(3) | | | JP Morgan Mortgage Trust 2020-3 B2, 3.866%, 08/25/2050 | | | | | 728,143 | | | | | | 0.0 | | |
| 2,072,790 (1)(3) | | | JP Morgan Mortgage Trust 2020-5 B3, 3.616%, 12/25/2050 | | | | | 1,907,941 | | | | | | 0.0 | | |
| 964,279 (1)(3) | | | JP Morgan Mortgage Trust 2020-8 B2, 3.523%, 03/25/2051 | | | | | 912,501 | | | | | | 0.0 | | |
| 309,150 (1)(3) | | | JP Morgan Mortgage Trust 2020-INV1 A3, 3.500%, 08/25/2050 | | | | | 308,854 | | | | | | 0.0 | | |
| 2,021,777,012 (1)(5) | | | L Street Securities 2017-PM1 XIO, 0.010%, 10/25/2048 | | | | | 2,280,564 | | | | | | 0.0 | | |
| 13,185,174 (5) | | | Lehman Mortgage Trust 2006-7 2A4, 6.093%, (-1.000*US0001M + 6.550%), 11/25/2036 | | | | | 2,196,853 | | | | | | 0.0 | | |
| 8,598,438 (5) | | | Lehman Mortgage Trust 2006-9 2A5, 6.163%, (-1.000*US0001M + 6.620%), 01/25/2037 | | | | | 1,432,780 | | | | | | 0.0 | | |
| Voya Intermediate Bond Fund | as of March 31, 2022 (continued) |
| Principal Amount† | | | Value | | | Percentage of Net Assets | | |||||||||
| COLLATERALIZED MORTGAGE OBLIGATIONS: (continued) | | |||||||||||||||
| 10,250,000 (1) | | | Mello Warehouse Securitization Trust 2021-1 A, 1.157%, (US0001M + 0.700%), 02/25/2055 | | | | $ | 10,179,457 | | | | | | 0.1 | | |
| 6,150,000 (1) | | | Mello Warehouse Securitization Trust 2021-1 C, 1.557%, (US0001M + 1.100%), 02/25/2055 | | | | | 6,104,433 | | | | | | 0.1 | | |
| 483,133 (1)(3) | | | MFA 2020-NQM3 A3 Trust, 1.632%, 01/26/2065 | | | | | 473,667 | | | | | | 0.0 | | |
| 4,064,538 | | | Morgan Stanley Mortgage Loan Trust 2007-13 6A1, 6.000%, 10/25/2037 | | | | | 3,009,082 | | | | | | 0.0 | | |
| 1,000,000 (1)(3) | | | Morgan Stanley Residential Mortgage Loan Trust 2020-1 A5A, 2.500%, 12/25/2050 | | | | | 877,443 | | | | | | 0.0 | | |
| 10,200,000 (1) | | | Mortgage Insurance-Linked Notes 2021-3 M1B, 2.999%, (SOFR30A + 2.900%), 02/25/2034 | | | | | 9,864,541 | | | | | | 0.1 | | |
| 2,379,276 (1)(3) | | | New Residential Mortgage Loan Trust 2017-3A B2, 4.750%, 04/25/2057 | | | | | 2,379,526 | | | | | | 0.0 | | |
| 777,999 (1)(3) | | | New Residential Mortgage Loan Trust 2017-6A B2, 4.000%, 08/27/2057 | | | | | 772,465 | | | | | | 0.0 | | |
| 1,000,000 (1) | | | Oaktown Re VI Ltd. 2021-1A M1C, 3.099%, (SOFR30A + 3.000%), 10/25/2033 | | | | | 967,694 | | | | | | 0.0 | | |
| 6,000,000 (1) | | | Oaktown Re VII Ltd. 2021-2 M1C, 3.449%, (SOFR30A + 3.350%), 04/25/2034 | | | | | 5,780,995 | | | | | | 0.1 | | |
| 315,152 (1)(3) | | | OBX 2019-EXP1 1A3 Trust, 4.000%, 01/25/2059 | | | | | 311,845 | | | | | | 0.0 | | |
| 439,460 (1)(3) | | | OBX 2019-INV2 A25 Trust, 4.000%, 05/27/2049 | | | | | 438,457 | | | | | | 0.0 | | |
| 84,085 | | | Prime Mortgage Trust 2007-1 A4, 5.500%, 03/25/2037 | | | | | 77,117 | | | | | | 0.0 | | |
| 1,229,508 (1)(3) | | | Provident Funding Mortgage Trust 2020-1 B3, 3.291%, 02/25/2050 | | | | | 1,170,161 | | | | | | 0.0 | | |
| 10,000,000 (1) | | | Radnor RE 2021-1 M1C Ltd., 2.799%, (SOFR30A + 2.700%), 12/27/2033 | | | | | 9,433,393 | | | | | | 0.1 | | |
| Principal Amount† | | | Value | | | Percentage of Net Assets | | |||||||||
| COLLATERALIZED MORTGAGE OBLIGATIONS: (continued) | | |||||||||||||||
| 867,846 (1)(3) | | | RCKT Mortgage Trust 2019-1 A13, 3.500%, 09/25/2049 | | | | $ | 864,275 | | | | | | 0.0 | | |
| 38,262,352 | | | Seasoned Credit Risk Transfer Trust 2017-4 HT, 3.250%, 06/25/2057 | | | | | 38,155,371 | | | | | | 0.4 | | |
| 263,803 (1)(3) | | | Seasoned Credit Risk Transfer Trust Series 2016-1 M2, 3.750%, 09/25/2055 | | | | | 254,738 | | | | | | 0.0 | | |
| 8,566,399 | | | Seasoned Credit Risk Transfer Trust Series 2018-2, 3.500%, 11/25/2057 | | | | | 8,697,043 | | | | | | 0.1 | | |
| 3,074,045 | | | Seasoned Credit Risk Transfer Trust Series 2018-2 HT, 3.000%, 11/25/2057 | | | | | 3,023,934 | | | | | | 0.0 | | |
| 3,744,946 | | | Seasoned Credit Risk Transfer Trust Series 2018-3 HT, 3.000%, 08/25/2057 | | | | | 3,683,189 | | | | | | 0.1 | | |
| 2,886,498 | | | Seasoned Credit Risk Transfer Trust Series 2018-4 HT, 3.000%, 03/25/2058 | | | | | 2,838,957 | | | | | | 0.0 | | |
| 3,366,441 | | | Seasoned Credit Risk Transfer Trust Series 2019-1 HT, 3.000%, 07/25/2058 | | | | | 3,311,311 | | | | | | 0.1 | | |
| 1,992,804 | | | Seasoned Credit Risk Transfer Trust Series 2019-2 HT, 3.000%, 08/25/2058 | | | | | 1,960,434 | | | | | | 0.0 | | |
| 876,438 | | | Seasoned Credit Risk Transfer Trust Series 2019-3 HT, 3.000%, 10/25/2058 | | | | | 862,155 | | | | | | 0.0 | | |
| 1,167,062 | | | Seasoned Credit Risk Transfer Trust Series 2019-3 MA, 3.500%, 10/25/2058 | | | | | 1,173,185 | | | | | | 0.0 | | |
| 639,047 | | | Seasoned Credit Risk Transfer Trust Series 2019-4 M55D, 4.000%, 02/25/2059 | | | | | 651,074 | | | | | | 0.0 | | |
| 32,340,000 | | | Seasoned Loans Structured Transaction Trust Series 2019-3 A2C, 2.750%, 11/25/2029 | | | | | 31,978,859 | | | | | | 0.4 | | |
| Voya Intermediate Bond Fund | as of March 31, 2022 (continued) |
| Principal Amount† | | | Value | | | Percentage of Net Assets | | |||||||||
| COLLATERALIZED MORTGAGE OBLIGATIONS: (continued) | | |||||||||||||||
| 1,117,263 (1)(3) | | | Sequoia Mortgage Trust 2015-2 B3, 3.774%, 05/25/2045 | | | | $ | 1,077,788 | | | | | | 0.0 | | |
| 982,625 (1)(3) | | | Sequoia Mortgage Trust 2015-3 B3, 3.722%, 07/25/2045 | | | | | 937,806 | | | | | | 0.0 | | |
| 713,448 (1)(3) | | | Sequoia Mortgage Trust 2017-5 B3, 3.803%, 08/25/2047 | | | | | 692,536 | | | | | | 0.0 | | |
| 248,647 (1)(3) | | | Sequoia Mortgage Trust 2018-CH1 A19, 4.000%, 03/25/2048 | | | | | 249,225 | | | | | | 0.0 | | |
| 2,484,148 (1)(3) | | | Sequoia Mortgage Trust 2018-CH1 B2B, 4.472%, 03/25/2048 | | | | | 2,402,390 | | | | | | 0.0 | | |
| 666,738 (1)(3) | | | Sequoia Mortgage Trust 2019-4 A19, 3.500%, 11/25/2049 | | | | | 641,639 | | | | | | 0.0 | | |
| 13,445 (1)(3) | | | Sequoia Mortgage Trust 2019-CH1 A1, 4.500%, 03/25/2049 | | | | | 13,437 | | | | | | 0.0 | | |
| 409,889 (1)(3) | | | Sequoia Mortgage Trust 2019-CH2 A1, 4.500%, 08/25/2049 | | | | | 411,889 | | | | | | 0.0 | | |
| 1,931,845 (1)(3) | | | Sequoia Mortgage Trust 2020-2 B2, 3.662%, 03/25/2050 | | | | | 1,860,226 | | | | | | 0.0 | | |
| 2,942,969 (1)(3) | | | Sequoia Mortgage Trust 2020-3 B2, 3.326%, 04/25/2050 | | | | | 2,810,948 | | | | | | 0.0 | | |
| 982,908 (1)(3) | | | Sequoia Mortgage Trust 2021-5 B3, 3.054%, 07/25/2051 | | | | | 874,500 | | | | | | 0.0 | | |
| 1,797,707 (1)(3) | | | Shellpoint Co-Originator Trust 2017-2 B2, 3.665%, 10/25/2047 | | | | | 1,800,634 | | | | | | 0.0 | | |
| 1,000,000 (1)(3) | | | Starwood Mortgage Residential Trust 2022-2 M1, 4.200%, 02/25/2067 | | | | | 985,938 | | | | | | 0.0 | | |
| 2,306,124 (1)(3) | | | TIAA Bank Mortgage Loan Trust 2018-2 B2, 3.755%, 07/25/2048 | | | | | 2,276,200 | | | | | | 0.0 | | |
| 420,715 (3) | | | Wachovia Mortgage Loan LLC Series 2005-B 2A1, 2.194%, 10/20/2035 | | | | | 418,234 | | | | | | 0.0 | | |
| 197,160 (3) | | | WaMu Mortgage Pass Through Certificates Series 2006-AR12 2A3, 2.469%, 10/25/2036 | | | | | 190,836 | | | | | | 0.0 | | |
| Principal Amount† | | | Value | | | Percentage of Net Assets | | |||||||||
| COLLATERALIZED MORTGAGE OBLIGATIONS: (continued) | | |||||||||||||||
| 2,630,941 (3) | | | WaMu Mortgage Pass-Through Certificates Series 2004-AR4 A6 Trust, 2.636%, 06/25/2034 | | | | $ | 2,639,603 | | | | | | 0.0 | | |
| 1,481,983 | | | WaMu Mortgage Pass-Through Certificates Series 2005-AR11 A1C3, 1.477%, (US0001M + 0.510%), 08/25/2045 | | | | | 1,474,028 | | | | | | 0.0 | | |
| 48,101,783 (3)(5) | | | WaMu Mortgage Pass-Through Certificates Series 2005-AR11 X, 1.788%, 08/25/2045 | | | | | 860,416 | | | | | | 0.0 | | |
| 1,133,391 | | | WaMu Mortgage Pass-Through Certificates Series 2005-AR13 A1C3, 1.437%, (US0001M + 0.490%), 10/25/2045 | | | | | 1,116,358 | | | | | | 0.0 | | |
| 266,367 (3) | | | WaMu Mortgage Pass-Through Certificates Series 2006-AR12 1A1, 2.987%, 10/25/2036 | | | | | 264,781 | | | | | | 0.0 | | |
| 570,705 (3) | | | WaMu Mortgage Pass-Through Certificates Series 2006-AR14 1A4, 2.567%, 11/25/2036 | | | | | 554,896 | | | | | | 0.0 | | |
| 719,652 (3) | | | WaMu Mortgage Pass-Through Certificates Series 2006-AR16 2A1, 2.388%, 12/25/2036 | | | | | 684,660 | | | | | | 0.0 | | |
| 1,663,759 (3) | | | WaMu Mortgage Pass-Through Certificates Series 2006-AR16 2A3, 2.388%, 12/25/2036 | | | | | 1,582,860 | | | | | | 0.0 | | |
| 896,469 (3) | | | WaMu Mortgage Pass-Through Certificates Series 2006-AR8 1A4, 2.854%, 08/25/2046 | | | | | 880,997 | | | | | | 0.0 | | |
| 1,259,118 (3) | | | WaMu Mortgage Pass-Through Certificates Series 2007-HY2 1A1, 3.030%, 12/25/2036 | | | | | 1,243,086 | | | | | | 0.0 | | |
| 348,857 (3) | | | WaMu Mortgage Pass-Through Certificates Series 2007-HY3 1A1, 2.921%, 03/25/2037 | | | | | 322,311 | | | | | | 0.0 | | |
| Voya Intermediate Bond Fund | as of March 31, 2022 (continued) |
| Principal Amount† | | | Value | | | Percentage of Net Assets | | |||||||||
| COLLATERALIZED MORTGAGE OBLIGATIONS: (continued) | | |||||||||||||||
| 1,151,456 | | | Washington Mutual Mortgage Pass-Through Certificates WMALT Series 2005-10 2A3, 1.357%, (US0001M + 0.900%), 11/25/2035 | | | | $ | 1,080,768 | | | | | | 0.0 | | |
| 973,802 | | | Washington Mutual Mortgage Pass-Through Certificates WMALT Series 2005-11 A1, 5.750%, 01/25/2036 | | | | | 895,196 | | | | | | 0.0 | | |
| 674,998 | | | Washington Mutual Mortgage Pass-Through Certificates WMALT Series 2005-5 CB3, 5.500%, 07/25/2035 | | | | | 659,638 | | | | | | 0.0 | | |
| 275,904 | | | Washington Mutual Mortgage Pass-Through Certificates WMALT Series 2005-8 1A2, 5.500%, 10/25/2035 | | | | | 272,678 | | | | | | 0.0 | | |
| 3,347,021 | | | Washington Mutual Mortgage Pass-Through Certificates WMALT Series 2006-AR6 2A, 1.101%, (12MTA + 0.960%), 08/25/2046 | | | | | 2,299,725 | | | | | | 0.0 | | |
| 541,303 | | | Washington Mutual Mortgage Pass-Through Certificates WMALT Series 2007-OC1 A3, 0.687%, (US0001M + 0.230%), 01/25/2047 | | | | | 549,282 | | | | | | 0.0 | | |
| 1,121,415 | | | Washington Mutual Mortgage Pass-Through Certificates WMALT Series 2007-OC1 A4, 0.777%, (US0001M + 0.320%), 01/25/2047 | | | | | 1,150,200 | | | | | | 0.0 | | |
| 538,508 | | | Wells Fargo Alternative Loan 2007-PA2 2A1, 0.887%, (US0001M + 0.430%), 06/25/2037 | | | | | 437,377 | | | | | | 0.0 | | |
| 628,624 | | | Wells Fargo Alternative Loan 2007-PA3 3A1, 6.250%, 07/25/2037 | | | | | 592,195 | | | | | | 0.0 | | |
| 169,435 (3) | | | Wells Fargo Mortgage Backed Securities 2006-AR4 2A4, 2.885%, 04/25/2036 | | | | | 165,038 | | | | | | 0.0 | | |
| Principal Amount† | | | Value | | | Percentage of Net Assets | | | | | |||||||||||||||
| COLLATERALIZED MORTGAGE OBLIGATIONS: (continued) | | | | | |||||||||||||||||||||
| 1,959,620 (1)(3) | | | Wells Fargo Mortgage Backed Securities 2019-4 B3 Trust, 3.523%, 09/25/2049 | | | | $ | 1,847,756 | | | | | | 0.0 | | | | | | ||||||
| 670,138 (1)(3) | | | WinWater Mortgage Loan Trust 2015-5 B3, 3.762%, 08/20/2045 | | | | | 647,748 | | | | | | 0.0 | | | | | | ||||||
| 1,093,210 (1)(3) | | | WinWater Mortgage Loan Trust 2015-5 B4, 3.762%, 08/20/2045 | | | | | 1,049,078 | | | | | | 0.0 | | | | | | ||||||
| | | | Total Collateralized Mortgage Obligations | | | | | | | | | | | | |||||||||||
| | | | (Cost $1,538,169,177) | | | | | 1,470,648,406 | | | | | | 15.6 | | | | | | ||||||
| U.S. TREASURY OBLIGATIONS: 9.8% | | | | | | | | | | | |||||||||||||||
| | | | U.S. Treasury Bonds: 4.9% | | | | | | | ||||||||||||||||
| 58,000 | | | 1.250%, 05/15/2050 | | | | | 43,332 | | | | | | 0.0 | | | | | | ||||||
| 2,699,000 | | | 1.375%, 11/15/2040 | | | | | 2,208,541 | | | | | | 0.0 | | | | | | ||||||
| 268,000 | | | 1.625%, 11/15/2050 | | | | | 219,949 | | | | | | 0.0 | | | | | | ||||||
| 68,902,200 | | | 1.875%, 02/15/2032 | | | | | 66,178,410 | | | | | | 0.7 | | | | | | ||||||
| 159,173,100 | | | 1.875%, 11/15/2051 | | | | | 139,674,395 | | | | | | 1.5 | | | | | | ||||||
| 259,367,900 (2) | | | 2.375%, 02/15/2042 | | | | | 250,249,497 | | | | | | 2.7 | | | | | | ||||||
| | | | | | | | | 458,574,124 | | | | | | 4.9 | | | | | | ||||||
| | | | U.S. Treasury Notes: 4.9% | | | | | | | ||||||||||||||||
| 100,000 | | | 0.125%, 10/15/2023 | | | | | 96,939 | | | | | | 0.0 | | | | | | ||||||
| 25,162,000 | | | 0.500%, 11/30/2023 | | | | | 24,460,708 | | | | | | 0.3 | | | | | | ||||||
| 132,000 | | | 0.625%, 05/15/2030 | | | | | 115,123 | | | | | | 0.0 | | | | | | ||||||
| 32,536,700 (2) | | | 0.875%, 01/31/2024 | | | | | 31,713,115 | | | | | | 0.3 | | | | | | ||||||
| 2,336,000 | | | 1.125%, 02/15/2031 | | | | | 2,109,882 | | | | | | 0.0 | | | | | | ||||||
| 8,184,600 | | | 1.250%, 11/30/2026 | | | | | 7,744,838 | | | | | | 0.1 | | | | | | ||||||
| 25,131,200 | | | 1.250%, 09/30/2028 | | | | | 23,325,877 | | | | | | 0.2 | | | | | | ||||||
| 27,486,000 (2) | | | 1.500%, 02/29/2024 | | | | | 27,087,668 | | | | | | 0.3 | | | | | | ||||||
| 3,309,100 (2) | | | 1.500%, 01/31/2027 | | | | | 3,162,776 | | | | | | 0.0 | | | | | | ||||||
| 17,183,400 | | | 1.500%, 11/30/2028 | | | | | 16,188,306 | | | | | | 0.2 | | | | | | ||||||
| 54,784,000 | | | 1.750%, 03/15/2025 | | | | | 53,628,400 | | | | | | 0.6 | | | | | | ||||||
| 20,604,600 (2) | | | 1.875%, 02/28/2027 | | | | | 20,055,681 | | | | | | 0.2 | | | | | | ||||||
| 20,076,000 (2) | | | 1.875%, 02/28/2029 | | | | | 19,384,319 | | | | | | 0.2 | | | | | | ||||||
| 118,759,000 | | | 2.250%, 03/31/2024 | | | | | 118,603,593 | | | | | | 1.3 | | | | | | ||||||
| 21,166,000 | | | 2.375%, 03/31/2029 | | | | | 21,106,471 | | | | | | 0.2 | | | | | | ||||||
| 92,259,000 | | | 2.500%, 03/31/2027 | | | | | 92,468,024 | | | | | | 1.0 | | | | | | ||||||
| | | | | | | | | 461,251,720 | | | | | | 4.9 | | | | | | ||||||
| | | | Total U.S. Treasury Obligations | | | | | | | | | | | | |||||||||||
| | | | (Cost $939,508,998) | | | | | 919,825,844 | | | | | | 9.8 | | | | | | ||||||
| U.S. GOVERNMENT AGENCY OBLIGATIONS: 15.8% | | | | | |||||||||||||||||||||
| | | | Federal Home Loan Mortgage Corporation: 2.0%(6) | | | | | ||||||||||||||||||
| 3,025 | | | 2.049%, (US0012M + 1.773%), 05/01/2037 | | | | | 3,179 | | | | | | 0.0 | | | | | | ||||||
| Voya Intermediate Bond Fund | as of March 31, 2022 (continued) |
| Principal Amount† | | | Value | | | Percentage of Net Assets | | |||||||||
| U.S. GOVERNMENT AGENCY OBLIGATIONS: (continued) | | |||||||||||||||
| | | | Federal Home Loan Mortgage Corporation: (continued) | | ||||||||||||
| 590,033 | | | 2.500%, 05/01/2030 | | | | $ | 585,170 | | | | | | 0.0 | | |
| 329,185 | | | 2.500%, 05/01/2030 | | | | | 326,551 | | | | | | 0.0 | | |
| 649,062 | | | 2.500%, 06/01/2030 | | | | | 643,626 | | | | | | 0.0 | | |
| 872,516 | | | 3.000%, 11/01/2042 | | | | | 872,569 | | | | | | 0.0 | | |
| 963,383 | | | 3.000%, 02/01/2043 | | | | | 963,148 | | | | | | 0.0 | | |
| 1,175,484 | | | 3.000%, 03/01/2045 | | | | | 1,173,386 | | | | | | 0.0 | | |
| 809,327 | | | 3.000%, 03/01/2045 | | | | | 804,198 | | | | | | 0.0 | | |
| 2,653,310 | | | 3.000%, 04/01/2045 | | | | | 2,640,402 | | | | | | 0.0 | | |
| 2,950,359 | | | 3.000%, 04/01/2045 | | | | | 2,936,003 | | | | | | 0.0 | | |
| 10,710,844 | | | 3.000%, 10/01/2046 | | | | | 10,647,645 | | | | | | 0.1 | | |
| 1,284,033 | | | 3.000%, 10/01/2046 | | | | | 1,277,772 | | | | | | 0.0 | | |
| 4,002,394 | | | 3.000%, 03/01/2048 | | | | | 3,980,044 | | | | | | 0.1 | | |
| 5,056,782 | | | 3.000%, 03/01/2048 | | | | | 5,027,379 | | | | | | 0.1 | | |
| 11,813,442 | | | 3.000%, 08/01/2048 | | | | | 11,676,017 | | | | | | 0.1 | | |
| 4,109,201 | | | 3.500%, 01/01/2045 | | | | | 4,203,556 | | | | | | 0.1 | | |
| 1,251,715 | | | 3.500%, 03/01/2045 | | | | | 1,273,464 | | | | | | 0.0 | | |
| 6,574,342 | | | 3.500%, 12/01/2046 | | | | | 6,684,921 | | | | | | 0.1 | | |
| 11,744,063 | | | 3.500%, 12/01/2046 | | | | | 11,943,845 | | | | | | 0.1 | | |
| 4,853,362 | | | 3.500%, 04/01/2047 | | | | | 4,937,597 | | | | | | 0.1 | | |
| 3,508,994 | | | 3.500%, 07/01/2047 | | | | | 3,558,147 | | | | | | 0.1 | | |
| 3,254,818 | | | 3.500%, 10/01/2047 | | | | | 3,300,959 | | | | | | 0.1 | | |
| 12,470,302 | | | 3.500%, 01/01/2048 | | | | | 12,640,413 | | | | | | 0.2 | | |
| 1,709,763 | | | 3.500%, 03/01/2048 | | | | | 1,735,116 | | | | | | 0.0 | | |
| 30,945,536 | | | 3.500%, 03/01/2048 | | | | | 31,405,591 | | | | | | 0.3 | | |
| 20,438,292 | | | 3.500%, 11/01/2048 | | | | | 20,737,624 | | | | | | 0.2 | | |
| 373,320 | | | 4.000%, 10/01/2041 | | | | | 388,747 | | | | | | 0.0 | | |
| 675,114 | | | 4.000%, 12/01/2041 | | | | | 705,474 | | | | | | 0.0 | | |
| 2,078,527 | | | 4.000%, 08/01/2044 | | | | | 2,171,834 | | | | | | 0.0 | | |
| 502,089 | | | 4.000%, 07/01/2045 | | | | | 523,446 | | | | | | 0.0 | | |
| 860,965 | | | 4.000%, 09/01/2045 | | | | | 894,776 | | | | | | 0.0 | | |
| 1,817,553 | | | 4.000%, 09/01/2045 | | | | | 1,898,908 | | | | | | 0.0 | | |
| 1,306,183 | | | 4.000%, 09/01/2045 | | | | | 1,364,726 | | | | | | 0.0 | | |
| 11,235,301 | | | 4.000%, 11/01/2045 | | | | | 11,657,519 | | | | | | 0.1 | | |
| 1,251,144 | | | 4.000%, 05/01/2046 | | | | | 1,301,799 | | | | | | 0.0 | | |
| 828,392 | | | 4.000%, 05/01/2047 | | | | | 859,079 | | | | | | 0.0 | | |
| 4,197,296 | | | 4.000%, 11/01/2047 | | | | | 4,315,003 | | | | | | 0.1 | | |
| 287,776 | | | 4.000%, 03/01/2048 | | | | | 296,733 | | | | | | 0.0 | | |
| 4,875,787 | | | 4.000%, 06/01/2048 | | | | | 5,078,528 | | | | | | 0.1 | | |
| 208,166 | | | 4.500%, 08/01/2041 | | | | | 217,872 | | | | | | 0.0 | | |
| 658,312 | | | 4.500%, 09/01/2041 | | | | | 701,422 | | | | | | 0.0 | | |
| 446,353 | | | 4.500%, 10/01/2041 | | | | | 473,085 | | | | | | 0.0 | | |
| 1,084,336 | | | 4.500%, 03/01/2044 | | | | | 1,148,399 | | | | | | 0.0 | | |
| 2,016,855 | | | 4.500%, 02/01/2048 | | | | | 2,111,366 | | | | | | 0.0 | | |
| 344,547 | | | 4.500%, 06/01/2048 | | | | | 359,224 | | | | | | 0.0 | | |
| 41,066 | | | 5.000%, 01/01/2041 | | | | | 44,264 | | | | | | 0.0 | | |
| 222,399 | | | 5.000%, 04/01/2041 | | | | | 238,299 | | | | | | 0.0 | | |
| 16,954 | | | 5.500%, 07/01/2037 | | | | | 18,601 | | | | | | 0.0 | | |
| 1,039,655 | | | 5.500%, 11/01/2038 | | | | | 1,128,656 | | | | | | 0.0 | | |
| 1,042 | | | 6.000%, 12/01/2028 | | | | | 1,114 | | | | | | 0.0 | | |
| Principal Amount† | | | Value | | | Percentage of Net Assets | | |||||||||
| U.S. GOVERNMENT AGENCY OBLIGATIONS: (continued) | | |||||||||||||||
| | | | Federal Home Loan Mortgage Corporation: (continued) | | ||||||||||||
| 12,445 | | | 6.000%, 01/01/2029 | | | | $ | 13,303 | | | | | | 0.0 | | |
| 1,368 | | | 6.500%, 01/01/2024 | | | | | 1,470 | | | | | | 0.0 | | |
| 2,951 | | | 6.500%, 12/01/2031 | | | | | 3,216 | | | | | | 0.0 | | |
| 303,300 | | | 6.500%, 09/01/2034 | | | | | 328,419 | | | | | | 0.0 | | |
| 383 | | | 7.000%, 03/01/2032 | | | | | 390 | | | | | | 0.0 | | |
| | | | | | | | | 184,223,994 | | | | | | 2.0 | | |
| | | | Federal National Mortgage Association: 0.2%(6) | | ||||||||||||
| 25,182 | | | 1.637%, (US0012M + 1.486%), 07/01/2035 | | | | | 25,241 | | | | | | 0.0 | | |
| 2,900,558 | | | 3.500%, 01/01/2044 | | | | | 2,965,205 | | | | | | 0.0 | | |
| 3,751,173 | | | 4.000%, 12/01/2046 | | | | | 3,907,066 | | | | | | 0.1 | | |
| 1,461,095 | | | 4.500%, 09/01/2047 | | | | | 1,598,541 | | | | | | 0.0 | | |
| 10,186,811 | | | 5.000%, 08/01/2056 | | | | | 11,161,027 | | | | | | 0.1 | | |
| 76,336 | | | 6.000%, 05/01/2038 | | | | | 80,757 | | | | | | 0.0 | | |
| | | | | | | | | 19,737,837 | | | | | | 0.2 | | |
| | | | Government National Mortgage Association: 2.7% | | ||||||||||||
| 11,008,308 | | | 2.500%, 03/20/2051 | | | | | 10,694,782 | | | | | | 0.1 | | |
| 25,786,726 | | | 2.500%, 04/20/2051 | | | | | 25,052,296 | | | | | | 0.3 | | |
| 8,794,089 | | | 2.500%, 05/20/2051 | | | | | 8,543,626 | | | | | | 0.1 | | |
| 9,669,289 | | | 2.500%, 09/20/2051 | | | | | 9,393,899 | | | | | | 0.1 | | |
| 111,706,000 (7) | | | 2.500%, 04/15/2052 | | | | | 108,350,456 | | | | | | 1.2 | | |
| 7,401,112 | | | 3.000%, 10/20/2049 | | | | | 7,438,214 | | | | | | 0.1 | | |
| 3,917,292 | | | 3.000%, 11/20/2049 | | | | | 3,936,962 | | | | | | 0.0 | | |
| 4,858,477 | | | 3.000%, 10/20/2051 | | | | | 4,867,755 | | | | | | 0.1 | | |
| 2,979,377 | | | 3.000%, 11/20/2051 | | | | | 2,985,070 | | | | | | 0.0 | | |
| 5,120,000 (7) | | | 3.000%, 04/15/2052 | | | | | 5,060,600 | | | | | | 0.1 | | |
| 3,896,361 | | | 3.500%, 07/20/2046 | | | | | 3,945,356 | | | | | | 0.0 | | |
| 639,651 | | | 3.500%, 07/20/2046 | | | | | 647,916 | | | | | | 0.0 | | |
| 1,025,535 | | | 3.500%, 10/20/2046 | | | | | 1,062,231 | | | | | | 0.0 | | |
| 470,571 | | | 3.500%, 02/20/2047 | | | | | 475,991 | | | | | | 0.0 | | |
| 395,285 | | | 3.500%, 03/20/2047 | | | | | 398,828 | | | | | | 0.0 | | |
| 374,405 | | | 3.500%, 07/20/2047 | | | | | 379,904 | | | | | | 0.0 | | |
| 858,657 | | | 3.500%, 08/20/2047 | | | | | 875,562 | | | | | | 0.0 | | |
| 935,981 | | | 3.500%, 09/20/2047 | | | | | 951,505 | | | | | | 0.0 | | |
| 7,509,605 | | | 3.500%, 12/20/2047 | | | | | 7,644,759 | | | | | | 0.1 | | |
| 4,518,595 | | | 3.500%, 01/20/2048 | | | | | 4,608,285 | | | | | | 0.0 | | |
| 3,893,962 | | | 3.500%, 02/20/2048 | | | | | 3,971,260 | | | | | | 0.0 | | |
| 7,415,878 | | | 3.500%, 02/20/2048 | | | | | 7,563,062 | | | | | | 0.1 | | |
| 18,413,967 | | | 3.500%, 03/20/2048 | | | | | 18,779,485 | | | | | | 0.2 | | |
| 707,387 | | | 3.500%, 03/20/2048 | | | | | 726,735 | | | | | | 0.0 | | |
| 137,676 | | | 4.000%, 11/20/2040 | | | | | 144,737 | | | | | | 0.0 | | |
| 807,539 | | | 4.000%, 03/20/2046 | | | | | 837,281 | | | | | | 0.0 | | |
| 10,608,951 | | | 4.000%, 09/20/2047 | | | | | 10,964,574 | | | | | | 0.1 | | |
| 5,288,931 | | | 4.000%, 02/20/2050 | | | | | 5,411,233 | | | | | | 0.1 | | |
| 190,318 | | | 4.500%, 10/15/2039 | | | | | 205,103 | | | | | | 0.0 | | |
| 135,495 | | | 4.500%, 11/15/2039 | | | | | 146,333 | | | | | | 0.0 | | |
| 139,813 | | | 4.500%, 11/15/2039 | | | | | 150,961 | | | | | | 0.0 | | |
| Voya Intermediate Bond Fund | as of March 31, 2022 (continued) |
| Principal Amount† | | | Value | | | Percentage of Net Assets | | |||||||||
| U.S. GOVERNMENT AGENCY OBLIGATIONS: (continued) | | |||||||||||||||
| | | | Government National Mortgage Association (continued) | | ||||||||||||
| 45,433 | | | 4.500%, 12/15/2039 | | | | $ | 48,964 | | | | | | 0.0 | | |
| 40,585 | | | 4.500%, 08/20/2041 | | | | | 43,239 | | | | | | 0.0 | | |
| 802,476 | | | 4.500%, 09/15/2047 | | | | | 858,314 | | | | | | 0.0 | | |
| | | | | | | | | 257,165,278 | | | | | | 2.7 | | |
| | | | Uniform Mortgage-Backed Securities: 10.9% | | ||||||||||||
| 741,000 (7) | | | 2.000%, 05/15/2037 | | | | | 718,119 | | | | | | 0.0 | | |
| 37,336,454 | | | 2.000%, 05/01/2051 | | | | | 34,740,271 | | | | | | 0.4 | | |
| 28,342,723 | | | 2.000%, 05/01/2051 | | | | | 26,368,631 | | | | | | 0.3 | | |
| 13,410,385 | | | 2.000%, 05/01/2051 | | | | | 12,494,912 | | | | | | 0.1 | | |
| 5,528,506 | | | 2.000%, 08/01/2051 | | | | | 5,141,716 | | | | | | 0.1 | | |
| 10,520,993 | | | 2.000%, 10/01/2051 | | | | | 9,782,100 | | | | | | 0.1 | | |
| 2,283,011 | | | 2.000%, 11/01/2051 | | | | | 2,123,288 | | | | | | 0.0 | | |
| 1,052,457 | | | 2.000%, 11/01/2051 | | | | | 978,825 | | | | | | 0.0 | | |
| 10,209,202 | | | 2.000%, 12/01/2051 | | | | | 9,506,948 | | | | | | 0.1 | | |
| 15,520,362 | | | 2.000%, 02/01/2052 | | | | | 14,462,396 | | | | | | 0.2 | | |
| 29,968,445 | | | 2.000%, 02/01/2052 | | | | | 27,892,280 | | | | | | 0.3 | | |
| 4,896,955 | | | 2.000%, 02/01/2052 | | | | | 4,561,656 | | | | | | 0.1 | | |
| 5,375,111 | | | 2.000%, 02/01/2052 | | | | | 5,002,730 | | | | | | 0.1 | | |
| 12,996,424 | | | 2.000%, 02/01/2052 | | | | | 12,108,228 | | | | | | 0.1 | | |
| 12,899,397 | | | 2.000%, 02/01/2052 | | | | | 12,021,749 | | | | | | 0.1 | | |
| 9,326,827 | | | 2.000%, 02/01/2052 | | | | | 8,685,890 | | | | | | 0.1 | | |
| 9,909,391 | | | 2.000%, 02/01/2052 | | | | | 9,230,875 | | | | | | 0.1 | | |
| 6,673,999 | | | 2.000%, 03/01/2052 | | | | | 6,205,440 | | | | | | 0.1 | | |
| 5,291,562 | | | 2.000%, 03/01/2052 | | | | | 4,924,977 | | | | | | 0.1 | | |
| 79,094,000 (7) | | | 2.000%, 04/15/2052 | | | | | 73,430,746 | | | | | | 0.8 | | |
| 940,952 | | | 2.500%, 05/01/2030 | | | | | 932,431 | | | | | | 0.0 | | |
| 1,842,460 | | | 2.500%, 06/01/2030 | | | | | 1,825,208 | | | | | | 0.0 | | |
| 1,334,017 | | | 2.500%, 06/01/2030 | | | | | 1,321,526 | | | | | | 0.0 | | |
| 827,061 | | | 2.500%, 07/01/2030 | | | | | 819,311 | | | | | | 0.0 | | |
| 29,694,966 | | | 2.500%, 01/01/2052 | | | | | 28,438,033 | | | | | | 0.3 | | |
| 4,723,214 | | | 2.500%, 02/01/2052 | | | | | 4,542,390 | | | | | | 0.1 | | |
| 4,990,204 | | | 2.500%, 02/01/2052 | | | | | 4,791,428 | | | | | | 0.1 | | |
| 7,391,130 | | | 2.500%, 03/01/2052 | | | | | 7,087,572 | | | | | | 0.1 | | |
| 10,986,042 | | | 2.500%, 03/01/2052 | | | | | 10,521,222 | | | | | | 0.1 | | |
| 34,082,419 | | | 2.500%, 03/01/2052 | | | | | 32,640,434 | | | | | | 0.4 | | |
| 201,937,000 (7) | | | 2.500%, 04/15/2052 | | | | | 192,676,296 | | | | | | 2.1 | | |
| 1,231,374 | | | 3.000%, 08/01/2030 | | | | | 1,244,581 | | | | | | 0.0 | | |
| 624,249 | | | 3.000%, 09/01/2030 | | | | | 630,950 | | | | | | 0.0 | | |
| 2,147,354 | | | 3.000%, 04/01/2043 | | | | | 2,144,910 | | | | | | 0.0 | | |
| 1,782,709 | | | 3.000%, 07/01/2043 | | | | | 1,779,949 | | | | | | 0.0 | | |
| 585,461 | | | 3.000%, 08/01/2043 | | | | | 584,974 | | | | | | 0.0 | | |
| 371,689 | | | 3.000%, 09/01/2043 | | | | | 371,231 | | | | | | 0.0 | | |
| 6,293,216 | | | 3.000%, 04/01/2045 | | | | | 6,258,333 | | | | | | 0.1 | | |
| 2,743,591 | | | 3.000%, 08/01/2046 | | | | | 2,728,425 | | | | | | 0.0 | | |
| 1,162,002 | | | 3.000%, 08/01/2046 | | | | | 1,155,566 | | | | | | 0.0 | | |
| 821,474 | | | 3.000%, 11/01/2046 | | | | | 816,405 | | | | | | 0.0 | | |
| 1,886,090 | | | 3.000%, 12/01/2046 | | | | | 1,878,570 | | | | | | 0.0 | | |
| 7,430,173 | | | 3.000%, 12/01/2046 | | | | | 7,386,236 | | | | | | 0.1 | | |
| Principal Amount† | | | Value | | | Percentage of Net Assets | | |||||||||
| U.S. GOVERNMENT AGENCY OBLIGATIONS: (continued) | | |||||||||||||||
| | | | Uniform Mortgage-Backed Securities (continued) | | ||||||||||||
| 13,979,578 | | | 3.000%, 01/01/2047 | | | | $ | 13,877,884 | | | | | | 0.2 | | |
| 3,367,613 | | | 3.000%, 02/01/2047 | | | | | 3,343,558 | | | | | | 0.0 | | |
| 3,944,396 | | | 3.000%, 03/01/2047 | | | | | 3,916,239 | | | | | | 0.0 | | |
| 3,362,415 | | | 3.000%, 07/01/2047 | | | | | 3,340,702 | | | | | | 0.0 | | |
| 25,336,651 | | | 3.000%, 10/01/2050 | | | | | 24,884,351 | | | | | | 0.3 | | |
| 2,414,106 | | | 3.000%, 03/01/2051 | | | | | 2,364,928 | | | | | | 0.0 | | |
| 6,234,514 | | | 3.000%, 01/01/2052 | | | | | 6,156,443 | | | | | | 0.1 | | |
| 49,998,862 | | | 3.000%, 01/01/2052 | | | | | 49,123,689 | | | | | | 0.5 | | |
| 4,363,355 | | | 3.000%, 02/01/2052 | | | | | 4,302,648 | | | | | | 0.1 | | |
| 6,920,987 | | | 3.000%, 02/01/2052 | | | | | 6,834,316 | | | | | | 0.1 | | |
| 6,711,946 | | | 3.000%, 02/01/2052 | | | | | 6,604,565 | | | | | | 0.1 | | |
| 13,586,102 | | | 3.000%, 02/01/2052 | | | | | 13,368,750 | | | | | | 0.1 | | |
| 6,987,668 | | | 3.000%, 02/01/2052 | | | | | 6,882,757 | | | | | | 0.1 | | |
| 5,507,196 | | | 3.000%, 02/01/2052 | | | | | 5,424,513 | | | | | | 0.1 | | |
| 12,255,542 | | | 3.000%, 03/01/2052 | | | | | 12,071,543 | | | | | | 0.1 | | |
| 19,893,154 | | | 3.000%, 03/01/2052 | | | | | 19,530,540 | | | | | | 0.2 | | |
| 101,092,000 (7) | | | 3.000%, 04/15/2052 | | | | | 98,896,408 | | | | | | 1.1 | | |
| 17,633,353 | | | 3.500%, 06/01/2034 | | | | | 18,189,588 | | | | | | 0.2 | | |
| 2,192,479 | | | 3.500%, 10/01/2042 | | | | | 2,237,066 | | | | | | 0.0 | | |
| 1,051,400 | | | 3.500%, 04/01/2043 | | | | | 1,072,839 | | | | | | 0.0 | | |
| 3,076,287 | | | 3.500%, 08/01/2043 | | | | | 3,133,633 | | | | | | 0.0 | | |
| 1,905,059 | | | 3.500%, 03/01/2044 | | | | | 1,935,498 | | | | | | 0.0 | | |
| 217,530 | | | 3.500%, 01/01/2046 | | | | | 221,667 | | | | | | 0.0 | | |
| 161,309 | | | 3.500%, 02/01/2046 | | | | | 164,378 | | | | | | 0.0 | | |
| 330,288 | | | 3.500%, 02/01/2046 | | | | | 336,570 | | | | | | 0.0 | | |
| 13,569,137 | | | 3.500%, 08/01/2046 | | | | | 13,822,928 | | | | | | 0.2 | | |
| 903,278 | | | 3.500%, 08/01/2047 | | | | | 915,113 | | | | | | 0.0 | | |
| 1,244,000 | | | 3.500%, 09/01/2047 | | | | | 1,255,453 | | | | | | 0.0 | | |
| 15,778,093 | | | 3.500%, 11/01/2047 | | | | | 16,014,311 | | | | | | 0.2 | | |
| 469,069 | | | 3.500%, 12/01/2047 | | | | | 473,278 | | | | | | 0.0 | | |
| 949,495 | | | 3.500%, 02/01/2048 | | | | | 959,227 | | | | | | 0.0 | | |
| 981,212 | | | 3.500%, 05/01/2048 | | | | | 990,988 | | | | | | 0.0 | | |
| 9,426,712 | | | 3.500%, 07/01/2048 | | | | | 9,558,601 | | | | | | 0.1 | | |
| 2,281,386 | | | 3.500%, 10/01/2049 | | | | | 2,321,470 | | | | | | 0.0 | | |
| 2,995,327 | | | 3.500%, 02/01/2052 | | | | | 3,016,656 | | | | | | 0.0 | | |
| 150,004 | | | 4.000%, 03/01/2042 | | | | | 156,615 | | | | | | 0.0 | | |
| 319,303 | | | 4.000%, 07/01/2042 | | | | | 326,793 | | | | | | 0.0 | | |
| 129,253 | | | 4.000%, 07/01/2042 | | | | | 134,333 | | | | | | 0.0 | | |
| 1,078,483 | | | 4.000%, 07/01/2042 | | | | | 1,129,118 | | | | | | 0.0 | | |
| 499,902 | | | 4.000%, 09/01/2043 | | | | | 522,347 | | | | | | 0.0 | | |
| 10,170,838 | | | 4.000%, 01/01/2045 | | | | | 10,627,024 | | | | | | 0.1 | | |
| 1,273,181 | | | 4.000%, 01/01/2045 | | | | | 1,322,367 | | | | | | 0.0 | | |
| 1,003,334 | | | 4.000%, 03/01/2045 | | | | | 1,045,268 | | | | | | 0.0 | | |
| 3,843,990 | | | 4.000%, 05/01/2045 | | | | | 3,999,981 | | | | | | 0.1 | | |
| 991,102 | | | 4.000%, 06/01/2045 | | | | | 1,034,769 | | | | | | 0.0 | | |
| 1,093,877 | | | 4.000%, 11/01/2045 | | | | | 1,141,617 | | | | | | 0.0 | | |
| 3,169,276 | | | 4.000%, 02/01/2046 | | | | | 3,308,736 | | | | | | 0.0 | | |
| 5,467,655 | | | 4.000%, 07/01/2047 | | | | | 5,655,183 | | | | | | 0.1 | | |
| 1,576,609 | | | 4.000%, 08/01/2047 | | | | | 1,621,812 | | | | | | 0.0 | | |
| Voya Intermediate Bond Fund | as of March 31, 2022 (continued) |
| Principal Amount† | | | Value | | | Percentage of Net Assets | | |||||||||
| U.S. GOVERNMENT AGENCY OBLIGATIONS: (continued) | | |||||||||||||||
| | | | Uniform Mortgage-Backed Securities (continued) | | ||||||||||||
| 507,090 | | | 4.000%, 08/01/2047 | | | | $ | 521,574 | | | | | | 0.0 | | |
| 165,801 | | | 4.000%, 03/01/2048 | | | | | 169,801 | | | | | | 0.0 | | |
| 610,628 | | | 4.000%, 03/01/2048 | | | | | 627,570 | | | | | | 0.0 | | |
| 4,060,962 | | | 4.000%, 09/01/2048 | | | | | 4,208,595 | | | | | | 0.1 | | |
| 10,819,164 | | | 4.000%, 04/01/2049 | | | | | 11,168,477 | | | | | | 0.1 | | |
| 1,409,119 | | | 4.250%, 11/01/2043 | | | | | 1,486,584 | | | | | | 0.0 | | |
| 110,104 | | | 4.500%, 11/01/2040 | | | | | 117,182 | | | | | | 0.0 | | |
| 248,281 | | | 4.500%, 11/01/2040 | | | | | 264,308 | | | | | | 0.0 | | |
| 1,670,931 | | | 4.500%, 11/01/2040 | | | | | 1,778,456 | | | | | | 0.0 | | |
| 4,404 | | | 4.500%, 12/01/2040 | | | | | 4,689 | | | | | | 0.0 | | |
| 2,504 | | | 4.500%, 12/01/2040 | | | | | 2,652 | | | | | | 0.0 | | |
| 4,834 | | | 4.500%, 01/01/2041 | | | | | 5,147 | | | | | | 0.0 | | |
| 3,412 | | | 4.500%, 01/01/2041 | | | | | 3,632 | | | | | | 0.0 | | |
| 185,065 | | | 4.500%, 10/01/2041 | | | | | 195,779 | | | | | | 0.0 | | |
| 261,691 | | | 4.500%, 10/01/2044 | | | | | 272,154 | | | | | | 0.0 | | |
| 480,250 | | | 4.500%, 12/01/2045 | | | | | 504,866 | | | | | | 0.0 | | |
| 3,008,750 | | | 4.500%, 04/01/2047 | | | | | 3,174,176 | | | | | | 0.0 | | |
| 517,043 | | | 4.500%, 04/01/2047 | | | | | 538,810 | | | | | | 0.0 | | |
| 1,940,835 | | | 4.500%, 04/01/2047 | | | | | 2,044,366 | | | | | | 0.0 | | |
| 2,114,608 | | | 4.500%, 04/01/2047 | | | | | 2,226,808 | | | | | | 0.0 | | |
| 1,448,620 | | | 4.500%, 05/01/2047 | | | | | 1,517,065 | | | | | | 0.0 | | |
| 1,223,276 | | | 4.500%, 05/01/2047 | | | | | 1,289,403 | | | | | | 0.0 | | |
| 1,120,269 | | | 4.500%, 05/01/2047 | | | | | 1,184,173 | | | | | | 0.0 | | |
| 867,917 | | | 4.500%, 05/01/2047 | | | | | 915,719 | | | | | | 0.0 | | |
| 1,393,999 | | | 4.500%, 05/01/2047 | | | | | 1,473,651 | | | | | | 0.0 | | |
| 923,788 | | | 4.500%, 06/01/2047 | | | | | 974,689 | | | | | | 0.0 | | |
| 777,049 | | | 4.500%, 06/01/2047 | | | | | 812,774 | | | | | | 0.0 | | |
| 545,291 | | | 4.500%, 06/01/2047 | | | | | 570,517 | | | | | | 0.0 | | |
| 2,021,784 | | | 4.500%, 07/01/2047 | | | | | 2,117,648 | | | | | | 0.0 | | |
| 105,469 | | | 4.500%, 08/01/2047 | | | | | 109,401 | | | | | | 0.0 | | |
| 62,654 | | | 5.000%, 06/01/2033 | | | | | 67,842 | | | | | | 0.0 | | |
| 14,072 | | | 5.000%, 09/01/2033 | | | | | 15,065 | | | | | | 0.0 | | |
| 42,712 | | | 5.000%, 11/01/2033 | | | | | 46,237 | | | | | | 0.0 | | |
| 12,906 | | | 5.000%, 03/01/2034 | | | | | 13,707 | | | | | | 0.0 | | |
| 14,566 | | | 5.000%, 03/01/2034 | | | | | 15,751 | | | | | | 0.0 | | |
| 96,040 | | | 5.000%, 02/01/2035 | | | | | 103,981 | | | | | | 0.0 | | |
| 60,557 | | | 5.000%, 06/01/2035 | | | | | 65,487 | | | | | | 0.0 | | |
| 3,583 | | | 5.000%, 06/01/2035 | | | | | 3,875 | | | | | | 0.0 | | |
| 36,326 | | | 5.000%, 07/01/2035 | | | | | 39,293 | | | | | | 0.0 | | |
| 243,642 | | | 5.000%, 08/01/2035 | | | | | 263,727 | | | | | | 0.0 | | |
| 13,759 | | | 5.000%, 10/01/2035 | | | | | 14,889 | | | | | | 0.0 | | |
| 290,704 | | | 5.000%, 10/01/2035 | | | | | 314,491 | | | | | | 0.0 | | |
| 167,153 | | | 5.000%, 02/01/2036 | | | | | 180,996 | | | | | | 0.0 | | |
| 2,441 | | | 5.000%, 03/01/2036 | | | | | 2,642 | | | | | | 0.0 | | |
| 31,748 | | | 5.000%, 03/01/2036 | | | | | 34,360 | | | | | | 0.0 | | |
| 4,897 | | | 5.000%, 05/01/2036 | | | | | 5,299 | | | | | | 0.0 | | |
| 3,372 | | | 5.000%, 06/01/2036 | | | | | 3,649 | | | | | | 0.0 | | |
| 134,814 | | | 5.000%, 07/01/2036 | | | | | 145,818 | | | | | | 0.0 | | |
| Principal Amount† | | | Value | | | Percentage of Net Assets | | | |||||||||||
| U.S. GOVERNMENT AGENCY OBLIGATIONS: (continued) | | | |||||||||||||||||
| | | | Uniform Mortgage-Backed Securities (continued) | | | ||||||||||||||
| 69,193 | | | 5.000%, 11/01/2040 | | | | $ | 74,730 | | | | | | 0.0 | | | | ||
| 41,746 | | | 5.000%, 05/01/2041 | | | | | 45,207 | | | | | | 0.0 | | | | ||
| 279,411 | | | 5.000%, 06/01/2041 | | | | | 302,467 | | | | | | 0.0 | | | | ||
| 128,499 | | | 5.000%, 06/01/2041 | | | | | 139,151 | | | | | | 0.0 | | | | ||
| 86,619 | | | 5.500%, 03/01/2037 | | | | | 93,225 | | | | | | 0.0 | | | | ||
| 92,742 | | | 5.500%, 06/01/2039 | | | | | 101,977 | | | | | | 0.0 | | | | ||
| 761,018 | | | 5.500%, 10/01/2039 | | | | | 833,713 | | | | | | 0.0 | | | | ||
| 39,572 | | | 6.000%, 09/01/2036 | | | | | 42,260 | | | | | | 0.0 | | | | ||
| 216 | | | 6.500%, 02/01/2028 | | | | | 232 | | | | | | 0.0 | | | | ||
| 490 | | | 6.500%, 09/01/2031 | | | | | 533 | | | | | | 0.0 | | | | ||
| 129 | | | 6.500%, 09/01/2031 | | | | | 139 | | | | | | 0.0 | | | | ||
| 13,728 | | | 6.500%, 11/01/2031 | | | | | 14,789 | | | | | | 0.0 | | | | ||
| 5,298 | | | 6.500%, 04/01/2032 | | | | | 5,694 | | | | | | 0.0 | | | | ||
| 1,176 | | | 6.500%, 08/01/2032 | | | | | 1,269 | | | | | | 0.0 | | | | ||
| 3,803 | | | 6.500%, 08/01/2032 | | | | | 4,088 | | | | | | 0.0 | | | | ||
| 5,039 | | | 7.000%, 12/01/2027 | | | | | 5,086 | | | | | | 0.0 | | | | ||
| 794 | | | 7.000%, 10/01/2031 | | | | | 806 | | | | | | 0.0 | | | | ||
| 577 | | | 7.000%, 03/01/2032 | | | | | 591 | | | | | | 0.0 | | | | ||
| 713 | | | 7.500%, 09/01/2030 | | | | | 779 | | | | | | 0.0 | | | | ||
| 2,212 | | | 7.500%, 09/01/2031 | | | | | 2,400 | | | | | | 0.0 | | | | ||
| 12,569 | | | 7.500%, 02/01/2032 | | | | | 13,579 | | | | | | 0.0 | | | | ||
| | | | | | | | | 1,025,827,309 | | | | | | 10.9 | | | | ||
| | | | Total U.S. Government Agency Obligations (Cost $1,515,208,918) | | | | | 1,486,954,418 | | | | | | 15.8 | | | | | |
| COMMERCIAL MORTGAGE-BACKED SECURITIES: 7.5% | | | |||||||||||||||||
| 6,240,000 (1) | | | ACRE Commercial Mortgage 2021-FL4 C Ltd., 2.218%, (US0001M + 1.750%), 12/18/2037 | | | | | 6,120,282 | | | | | | 0.1 | | | | ||
| 5,310,000 (1)(8) | | | BAMLL Re-REMIC Trust 2015-FRR11 CK25, 0.000%, 09/27/2045 | | | | | 5,177,854 | | | | | | 0.1 | | | | ||
| 4,656,000 (1) | | | BANK 2017-BNK4 D, 3.357%, 05/15/2050 | | | | | 4,068,965 | | | | | | 0.0 | | | | ||
| 31,828,472 (3)(5) | | | BANK 2017-BNK4 XA, 1.340%, 05/15/2050 | | | | | 1,593,747 | | | | | | 0.0 | | | | ||
| 167,655,000 (3)(5) | | | BANK 2017-BNK8 XB, 0.174%, 11/15/2050 | | | | | 1,526,566 | | | | | | 0.0 | | | | ||
| 3,600,000 (1) | | | BANK 2017-BNK9 D, 2.800%, 11/15/2054 | | | | | 2,949,200 | | | | | | 0.0 | | | | ||
| 184,714,437 (3)(5) | | | BANK 2018-BNK14 XA, 0.492%, 09/15/2060 | | | | | 4,507,254 | | | | | | 0.1 | | | | ||
| 19,110,000 (1)(3)(5) | | | BANK 2018-BNK14 XD, 1.610%, 09/15/2060 | | | | | 1,626,674 | | | | | | 0.0 | | | | ||
| 23,999,656 (3)(5) | | | BANK 2019-BNK16 XA, 0.944%, 02/15/2052 | | | | | 1,214,068 | | | | | | 0.0 | | | | ||
| Voya Intermediate Bond Fund | as of March 31, 2022 (continued) |
| Principal Amount† | | | Value | | | Percentage of Net Assets | | |||||||||
| COMMERCIAL MORTGAGE-BACKED SECURITIES: (continued) | | |||||||||||||||
| 5,210,000 (1) | | | BANK 2019-BNK18 D, 3.000%, 05/15/2062 | | | | $ | 4,393,595 | | | | | | 0.0 | | |
| 99,813,259 (3)(5) | | | Bank 2019-BNK19 XA, 0.954%, 08/15/2061 | | | | | 5,712,792 | | | | | | 0.1 | | |
| 6,212,773 (3)(5) | | | BANK 2020-BNK30 XA, 1.329%, 12/15/2053 | | | | | 523,689 | | | | | | 0.0 | | |
| 92,840,000 (1)(3)(5) | | | BBCCRE Trust 2015-GTP XA, 0.597%, 08/10/2033 | | | | | 1,783,299 | | | | | | 0.0 | | |
| 8,200,000 (1) | | | BBCMS Trust 2021-AGW E, 3.547%, (US0001M + 3.150%), 06/15/2036 | | | | | 8,036,032 | | | | | | 0.1 | | |
| 20,393,491 (3)(5) | | | BBCMS Trust 2021-C10 XA, 1.306%, 07/15/2054 | | | | | 1,809,231 | | | | | | 0.0 | | |
| 3,228,254 (1) | | | BCRR 2016-FRR3 E Trust, 2.040%, (US0001M + 18.348%), 05/26/2026 | | | | | 2,886,016 | | | | | | 0.0 | | |
| 2,620,000 (1)(3) | | | Benchmark 2018-B3 D Mortgage Trust, 3.037%, 04/10/2051 | | | | | 2,236,494 | | | | | | 0.0 | | |
| 54,103,519 (3)(5) | | | Benchmark 2019-B12 XA Mortgage Trust, 1.061%, 08/15/2052 | | | | | 2,805,203 | | | | | | 0.0 | | |
| 7,470,000 (1) | | | Benchmark 2019-B9 D Mortgage Trust, 3.000%, 03/15/2052 | | | | | 6,286,041 | | | | | | 0.1 | | |
| 36,304,840 (3)(5) | | | Benchmark 2019-B9 XA Mortgage Trust, 1.037%, 03/15/2052 | | | | | 2,095,664 | | | | | | 0.0 | | |
| 92,549,177 (3)(5) | | | Benchmark 2020-B17 XA Mortgage Trust, 1.418%, 03/15/2053 | | | | | 6,576,998 | | | | | | 0.1 | | |
| 8,640,000 (1) | | | Benchmark 2020-B18 AGNE Mortgage Trust, 3.759%, 07/15/2053 | | | | | 7,836,472 | | | | | | 0.1 | | |
| 1,000,000 (1) | | | Benchmark 2020-B18 AGNF Mortgage Trust, 4.139%, 07/15/2053 | | | | | 896,625 | | | | | | 0.0 | | |
| 110,279,078 (3)(5) | | | Benchmark 2020-B19 XA Mortgage Trust, 1.775%, 09/15/2053 | | | | | 10,503,685 | | | | | | 0.1 | | |
| 60,167,743 (3)(5) | | | Benchmark 2020-B20 XA Mortgage Trust, 1.622%, 10/15/2053 | | | | | 5,731,429 | | | | | | 0.1 | | |
| 47,581,152 (3)(5) | | | Benchmark 2020-B21 xa Mortgage Trust, 1.456%, 12/17/2053 | | | | | 4,519,320 | | | | | | 0.1 | | |
| Principal Amount† | | | Value | | | Percentage of Net Assets | | |||||||||
| COMMERCIAL MORTGAGE-BACKED SECURITIES: (continued) | | |||||||||||||||
| 10,000,000 (1)(3) | | | Benchmark 2021-B25 E Mortgage Trust, 2.000%, 04/15/2054 | | | | $ | 6,852,715 | | | | | | 0.1 | | |
| 4,965,878 (3)(5) | | | Benchmark 2021-B28 XA Mortgage Trust, 1.289%, 08/15/2054 | | | | | 439,391 | | | | | | 0.0 | | |
| 11,041,000 (1)(8) | | | BMD2 Re-Remic Trust 2019-FRR1 3AB, 0.000%, 05/25/2052 | | | | | 7,877,240 | | | | | | 0.1 | | |
| 8,000,000 (1)(3) | | | BMD2 Re-Remic Trust 2019-FRR1 5B13, 2.209%, 05/25/2052 | | | | | 6,364,074 | | | | | | 0.1 | | |
| 5,414,000 (1)(3) | | | BMD2 Re-Remic Trust 2019-FRR1 6B10, 2.521%, 05/25/2052 | | | | | 4,409,240 | | | | | | 0.1 | | |
| 4,000,000 (1) | | | BX Commercial Mortgage Trust 2021-IRON E, 2.747%, (US0001M + 2.350%), 02/15/2038 | | | | | 3,895,540 | | | | | | 0.0 | | |
| 10,000,000 (1) | | | Cascade Funding Mortgage Trust 2021-FRR1 AK99, 4.170%, 09/29/2029 | | | | | 7,319,816 | | | | | | 0.1 | | |
| 92,490,267 (3)(5) | | | CCUBS Commercial Mortgage Trust 2017-C1 XA, 0.996%, 11/15/2050 | | | | | 3,135,892 | | | | | | 0.0 | | |
| 21,226,722 (3)(5) | | | CD 2016-CD1 Mortgage Trust XA, 1.376%, 08/10/2049 | | | | | 957,966 | | | | | | 0.0 | | |
| 45,113,000 (1)(3)(5) | | | CD 2016-CD1 Mortgage Trust XB, 0.703%, 08/10/2049 | | | | | 1,174,783 | | | | | | 0.0 | | |
| 32,884,547 (3)(5) | | | CD 2017-CD4 Mortgage Trust XA, 1.270%, 05/10/2050 | | | | | 1,402,605 | | | | | | 0.0 | | |
| 7,745,000 (1)(3) | | | Citigroup Commercial Mortgage Trust 2016-C2 E, 4.432%, 08/10/2049 | | | | | 5,941,338 | | | | | | 0.1 | | |
| 36,875,504 (3)(5) | | | Citigroup Commercial Mortgage Trust 2016-P4 XA, 1.900%, 07/10/2049 | | | | | 2,243,712 | | | | | | 0.0 | | |
| 78,557,840 (3)(5) | | | Citigroup Commercial Mortgage Trust 2017-C4 XA, 1.081%, 10/12/2050 | | | | | 3,035,357 | | | | | | 0.0 | | |
| 39,441,258 (3)(5) | | | Citigroup Commercial Mortgage Trust 2017-P8 XA, 0.886%, 09/15/2050 | | | | | 1,518,966 | | | | | | 0.0 | | |
| Voya Intermediate Bond Fund | as of March 31, 2022 (continued) |
| Principal Amount† | | | Value | | | Percentage of Net Assets | | |||||||||
| COMMERCIAL MORTGAGE-BACKED SECURITIES: (continued) | | |||||||||||||||
| 77,876,117 (3)(5) | | | Citigroup Commercial Mortgage Trust 2018-C5 XA, 0.535%, 06/10/2051 | | | | $ | 2,557,732 | | | | | | 0.0 | | |
| 5,000,000 (1)(3) | | | Citigroup Commercial Mortgage Trust 2020-420K E, 3.312%, 11/10/2042 | | | | | 4,165,164 | | | | | | 0.0 | | |
| 22,745,128 (3)(5) | | | COMM 2012-CR2 XA, 1.601%, 08/15/2045 | | | | | 9,096 | | | | | | 0.0 | | |
| 30,363,748 (3)(5) | | | COMM 2012-CR4 XA, 1.685%, 10/15/2045 | | | | | 115,950 | | | | | | 0.0 | | |
| 27,260,000 (1)(3)(5) | | | COMM 2012-CR4 XB, 0.614%, 10/15/2045 | | | | | 88,540 | | | | | | 0.0 | | |
| 4,640,000 (1)(3) | | | COMM 2013-CR10 E Mortgage Trust, 4.901%, 08/10/2046 | | | | | 4,421,049 | | | | | | 0.1 | | |
| 9,645,000 (1)(3) | | | COMM 2013-CR10 F Mortgage Trust, 4.901%, 08/10/2046 | | | | | 8,736,645 | | | | | | 0.1 | | |
| 106,180,251 (1)(3)(5) | | | COMM 2015-PC1 XA, 0.469%, 07/10/2050 | | | | | 988,028 | | | | | | 0.0 | | |
| 920,000 (3) | | | COMM 2016-COR1 C, 4.332%, 10/10/2049 | | | | | 905,607 | | | | | | 0.0 | | |
| 61,580,586 (3)(5) | | | COMM 2016-CR28 XA, 0.709%, 02/10/2049 | | | | | 1,211,309 | | | | | | 0.0 | | |
| 33,517,723 (3)(5) | | | COMM 2017-COR2 XA, 1.164%, 09/10/2050 | | | | | 1,685,844 | | | | | | 0.0 | | |
| 2,000,000 (1)(3) | | | COMM 2019-GC44 180B Mortgage Trust, 3.400%, 08/15/2057 | | | | | 1,831,799 | | | | | | 0.0 | | |
| 8,261,000 (1)(3) | | | COMM 2020-CBM F Mortgage Trust, 3.633%, 02/10/2037 | | | | | 7,442,683 | | | | | | 0.1 | | |
| 4,100,000 (1)(3) | | | Credit Suisse Mortgage Capital Certificates 2020-NET C, 3.526%, 08/15/2037 | | | | | 3,954,748 | | | | | | 0.0 | | |
| 4,340,000 (1)(3) | | | CSAIL 2017-CX10 D Commercial Mortgage Trust, 4.106%, 11/15/2050 | | | | | 3,675,454 | | | | | | 0.0 | | |
| 2,992,272 (1) | | | CSWF 2018-TOP E, 2.647%, (US0001M + 2.250%), 08/15/2035 | | | | | 2,975,966 | | | | | | 0.0 | | |
| 3,339,262 (1) | | | CSWF 2021-SOP2 D, 2.713%, (US0001M + 2.317%), 06/15/2034 | | | | | 3,240,145 | | | | | | 0.0 | | |
| 8,562,209 (1) | | | CSWF 2021-SOP2 E, 3.763%, (US0001M + 3.367%), 06/15/2034 | | | | | 8,315,076 | | | | | | 0.1 | | |
| Principal Amount† | | | Value | | | Percentage of Net Assets | | |||||||||
| COMMERCIAL MORTGAGE-BACKED SECURITIES: (continued) | | |||||||||||||||
| 4,460,000 (1)(3) | | | DBJPM 16-C3 Mortgage Trust, 3.484%, 08/10/2049 | | | | $ | 3,654,418 | | | | | | 0.0 | | |
| 7,202,536 (1)(4) | | | DBUBS 2011-LC2A F Mortgage Trust, 3.881%, (US0001M + 3.650%), 07/10/2044 | | | | | 7,193,809 | | | | | | 0.0 | | |
| 15,781,159 | | | Freddie Mac Multifamily 2021-ML08-X-US Certificates Sustainability Bonds, 1.846%, 07/25/ 2037 | | | | | 2,816,850 | | | | | | 0.0 | | |
| 10,423,072 (1)(3)(5) | | | Freddie Mac Multifamily ML Certificates 2021-ML11 XUS, 0.769%, 03/25/2038 | | | | | 663,230 | | | | | | 0.0 | | |
| 42,047,111 (3)(5) | | | Freddie Mac Multifamily Structured Pass Through Certificates K020 X3, 1.955%, 05/25/2040 | | | | | 68,339 | | | | | | 0.0 | | |
| 31,879,545 (3)(5) | | | Freddie Mac Multifamily Structured Pass Through Certificates K029 X3, 1.590%, 05/25/2041 | | | | | 524,744 | | | | | | 0.0 | | |
| 9,770,955 (3)(5) | | | Freddie Mac Multifamily Structured Pass Through Certificates K106 X1, 1.354%, 01/25/2030 | | | | | 867,645 | | | | | | 0.0 | | |
| 23,391,326 (3)(5) | | | Freddie Mac Multifamily Structured Pass Through Certificates K107 X1, 1.690%, 03/25/2030 | | | | | 2,635,220 | | | | | | 0.0 | | |
| 68,740,373 (3)(5) | | | Freddie Mac Multifamily Structured Pass Through Certificates K109 X1, 1.582%, 04/25/2030 | | | | | 7,133,072 | | | | | | 0.1 | | |
| 110,715,052 (3)(5) | | | Freddie Mac Multifamily Structured Pass Through Certificates K118 X1, 0.960%, 09/25/2030 | | | | | 7,384,406 | | | | | | 0.1 | | |
| 101,281,373 (3)(5) | | | Freddie Mac Multifamily Structured Pass Through Certificates K119 X1, 0.932%, 09/25/2030 | | | | | 6,572,290 | | | | | | 0.1 | | |
| 41,038,268 (3)(5) | | | Freddie Mac Multifamily Structured Pass Through Certificates K123 X1, 0.774%, 12/25/2030 | | | | | 2,249,890 | | | | | | 0.0 | | |
| Voya Intermediate Bond Fund | as of March 31, 2022 (continued) |
| Principal Amount† | | | Value | | | Percentage of Net Assets | | |||||||||
| COMMERCIAL MORTGAGE-BACKED SECURITIES: (continued) | | |||||||||||||||
| 13,342,950 (3)(5) | | | Freddie Mac Multifamily Structured Pass Through Certificates K-1516 X1, 1.512%, 05/25/2035 | | | | $ | 1,975,161 | | | | | | 0.0 | | |
| 223,355,545 (3)(5) | | | Freddie Mac Multifamily Structured Pass Through Certificates KHG2 X, 0.304%, 02/25/2030 | | | | | 4,321,170 | | | | | | 0.0 | | |
| 77,189,788 (3)(5) | | | Freddie Mac Multifamily Structured Pass Through CertificatesK151 X1, 0.391%, 04/25/2030 | | | | | 1,849,151 | | | | | | 0.0 | | |
| 62,235,237 (1)(8) | | | FREMF 2016-K55 D Mortgage Trust, 0.000%, 04/25/2049 | | | | | 47,142,514 | | | | | | 0.5 | | |
| 32,187,797 (1)(8) | | | FREMF 2016-K60 D Mortgage Trust, 0.000%, 12/25/2049 | | | | | 23,554,531 | | | | | | 0.3 | | |
| 1,177,881,608 (1)(5) | | | FREMF 2017-K64 X2A Mortgage Trust, 0.100%, 05/25/2050 | | | | | 4,596,919 | | | | | | 0.1 | | |
| 292,563,019 (1)(5) | | | FREMF 2017-K64 X2B Mortgage Trust, 0.100%, 05/25/2050 | | | | | 1,179,263 | | | | | | 0.0 | | |
| 7,072,514 (1) | | | FREMF 2018-KBF2 C Mortgage Trust, 4.741%, (US0001M + 4.500%), 10/25/2025 | | | | | 7,111,934 | | | | | | 0.1 | | |
| 4,981,479 (1) | | | FREMF 2019-KBF3 C Mortgage Trust, 4.991%, (US0001M + 4.750%), 01/25/2029 | | | | | 4,972,144 | | | | | | 0.1 | | |
| 5,000,000 (1)(3) | | | FRR Re-REMIC Trust 2018-C1 B725, 2.964%, 02/27/2050 | | | | | 4,809,228 | | | | | | 0.1 | | |
| 5,000,000 (1)(3)(9) | | | FRR Re-REMIC Trust 2018-C1 C725, 0.330%, 02/27/2050 | | | | | 4,554,506 | | | | | | 0.1 | | |
| 8,971,340 (1)(3)(9) | | | FRR Re-REMIC Trust 2018-C1 CK43, 0.600%, 02/27/2048 | | | | | 7,683,543 | | | | | | 0.1 | | |
| 10,325,000 (1) | | | GAM RE-REMIC TR 2021-FFR2 BK44, 2.071%, 09/27/2051 | | | | | 9,341,375 | | | | | | 0.1 | | |
| 11,599,000 (1) | | | GAM RE-REMIC TR 2021-FFR2 BK78, 2.435%, 09/27/2051 | | | | | 9,630,667 | | | | | | 0.1 | | |
| 8,825,000 (1)(8) | | | GAM RE-REMIC TR 2021-FFR2 C730, 0.000%, 09/27/2051 | | | | | 7,543,164 | | | | | | 0.1 | | |
| Principal Amount† | | | Value | | | Percentage of Net Assets | | |||||||||
| COMMERCIAL MORTGAGE-BACKED SECURITIES: (continued) | | |||||||||||||||
| 10,728,000 (1)(8) | | | GAM RE-REMIC TR 2021-FFR2 CK44, 0.000%, 09/27/2051 | | | | $ | 8,922,787 | | | | | | 0.1 | | |
| 8,727,000 (1) | | | GAM RE-REMIC TR 2021-FFR2 CK49, 1.079%, 09/27/2051 | | | | | 7,510,065 | | | | | | 0.1 | | |
| 7,409,000 (1)(8) | | | GAM RE-REMIC TR 2021-FFR2 CK78, 0.000%, 09/27/2051 | | | | | 4,884,365 | | | | | | 0.1 | | |
| 8,821,000 (1)(8) | | | GAM RE-REMIC TR 2021-FFR2 D730, 0.000%, 09/27/2051 | | | | | 7,336,680 | | | | | | 0.1 | | |
| 8,724,000 (1)(8) | | | GAM RE-REMIC TR 2021-FFR2 DK49, 0.000%, 09/27/2051 | | | | | 6,982,498 | | | | | | 0.1 | | |
| 12,584,000 (1) | | | GAM Re-REMIC Trust 2021-FRR1 1B, 0.800%, 11/29/2050 | | | | | 9,998,225 | | | | | | 0.1 | | |
| 15,763,000 (1) | | | GAM Re-REMIC Trust 2021-FRR1 2B, 1.070%, 11/29/2050 | | | | | 11,594,669 | | | | | | 0.1 | | |
| 18,282,000 (1)(5) | | | GAM Resecuritization Trust 2022-FRR3 BK47, 2.038%, 01/29/2052 | | | | | 15,580,955 | | | | | | 0.2 | | |
| 12,445,000 (1)(9) | | | GAM Resecuritization Trust 2022-FRR3 BK61, 0.730%, 01/29/2052 | | | | | 10,019,399 | | | | | | 0.1 | | |
| 13,548,000 (1)(9) | | | GAM Resecuritization Trust 2022-FRR3 BK89, 1.130%, 01/27/2052 | | | | | 9,677,942 | | | | | | 0.1 | | |
| 7,076,000 (1)(9) | | | GAM Resecuritization Trust 2022-FRR3 C728, 0.420%, 08/27/2050 | | | | | 6,282,195 | | | | | | 0.1 | | |
| 7,212,000 (1)(9) | | | GAM Resecuritization Trust 2022-FRR3 CK47, 0.580%, 05/27/2048 | | | | | 6,197,346 | | | | | | 0.1 | | |
| 8,725,000 (1)(9) | | | GAM Resecuritization Trust 2022-FRR3 CK61, 0.970%, 11/27/2049 | | | | | 6,675,971 | | | | | | 0.1 | | |
| 6,092,000 (1)(5) | | | GAM Resecuritization Trust 2022-FRR3 CK71, 1.411%, 01/29/2052 | | | | | 4,760,780 | | | | | | 0.1 | | |
| 7,095,000 (1)(9) | | | GAM Resecuritization Trust 2022-FRR3 CK89, 1.320%, 01/27/2052 | | | | | 4,786,199 | | | | | | 0.1 | | |
| 7,080,000 (1)(9) | | | GAM Resecuritization Trust 2022-FRR3 D728, 0.490%, 01/29/2052 | | | | | 6,114,910 | | | | | | 0.1 | | |
| Voya Intermediate Bond Fund | as of March 31, 2022 (continued) |
| Principal Amount† | | | Value | | | Percentage of Net Assets | | |||||||||
| COMMERCIAL MORTGAGE-BACKED SECURITIES: (continued) | | |||||||||||||||
| 9,559,000 (1)(9) | | | GAM Resecuritization Trust 2022-FRR3 DK27, 0.150%, 12/27/2045 | | | | $ | 9,225,285 | | | | | | 0.1 | | |
| 5,698,000 (1)(9) | | | GAM Resecuritization Trust 2022-FRR3 DK41, 0.510%, 10/27/2047 | | | | | 5,002,952 | | | | | | 0.1 | | |
| 7,208,000 (1)(9) | | | GAM Resecuritization Trust 2022-FRR3 DK47, 0.670%, 05/27/2048 | | | | | 6,052,543 | | | | | | 0.1 | | |
| 2,380,000 (1)(9) | | | GAM Resecuritization Trust 2022-FRR3 EK27, 0.210%, 12/27/2045 | | | | | 2,265,892 | | | | | | 0.0 | | |
| 3,796,000 (1)(9) | | | GAM Resecuritization Trust 2022-FRR3 EK41, 0.580%, 01/29/2052 | | | | | 3,194,436 | | | | | | 0.0 | | |
| 4,400,000 (1) | | | GS Mortgage Securities Corp. II 2018-RIVR F, 2.497%, (US0001M + 2.100%), 07/15/2035 | | | | | 4,036,596 | | | | | | 0.0 | | |
| 6,140,000 (1) | | | GS Mortgage Securities Trust 2013-GC16 G, 3.500%, 11/10/2046 | | | | | 3,896,997 | | | | | | 0.0 | | |
| 43,981,542 (3)(5) | | | GS Mortgage Securities Trust 2013-GC16 XA, 1.007%, 11/10/2046 | | | | | 539,869 | | | | | | 0.0 | | |
| 54,640,229 (3)(5) | | | GS Mortgage Securities Trust 2014-GC22 XA, 0.942%, 06/10/2047 | | | | | 764,439 | | | | | | 0.0 | | |
| 58,411,681 (3)(5) | | | GS Mortgage Securities Trust 2016-GS4 XA, 0.572%, 11/10/2049 | | | | | 1,219,513 | | | | | | 0.0 | | |
| 68,606,852 (3)(5) | | | GS Mortgage Securities Trust 2017-GS6 XA, 1.019%, 05/10/2050 | | | | | 3,071,145 | | | | | | 0.0 | | |
| 77,870,793 (3)(5) | | | GS Mortgage Securities Trust 2019-GC38 XA, 0.955%, 02/10/2052 | | | | | 4,132,291 | | | | | | 0.0 | | |
| 2,400,000 (1)(3) | | | JP Morgan Chase Commercial Mortgage Securities Trust 2011-C4 E, 5.535%, 07/15/2046 | | | | | 2,354,827 | | | | | | 0.0 | | |
| 4,500,000 (1)(3) | | | JP Morgan Chase Commercial Mortgage Securities Trust 2011-C4 G, 3.873%, 07/15/2046 | | | | | 4,199,713 | | | | | | 0.0 | | |
| 22,947,170 (3)(5) | | | JP Morgan Chase Commercial Mortgage Securities Trust 2012-CIBX XA, 0.784%, 06/15/2045 | | | | | 553 | | | | | | 0.0 | | |
| Principal Amount† | | | Value | | | Percentage of Net Assets | | |||||||||
| COMMERCIAL MORTGAGE-BACKED SECURITIES: (continued) | | |||||||||||||||
| 5,550,000 (1)(3) | | | JP Morgan Chase Commercial Mortgage Securities Trust 2013-C13 E, 3.986%, 01/15/2046 | | | | $ | 5,257,763 | | | | | | 0.1 | | |
| 7,345,454 (1)(3) | | | JP Morgan Chase Commercial Mortgage Securities Trust 2013-C16 E, 3.744%, 12/15/2046 | | | | | 6,803,058 | | | | | | 0.1 | | |
| 5,000,000 (1)(3) | | | JP Morgan Chase Commercial Mortgage Securities Trust 2014-C20 D, 4.580%, 07/15/2047 | | | | | 4,154,847 | | | | | | 0.0 | | |
| 78,927,545 (3)(5) | | | JP Morgan Chase Commercial Mortgage Securities Trust 2016-JP4 XA, 0.591%, 12/15/2049 | | | | | 1,708,663 | | | | | | 0.0 | | |
| 10,720,000 (1)(3) | | | JP Morgan Chase Commercial Mortgage Securities Trust 2020-LOOP E, 3.862%, 12/05/2038 | | | | | 9,464,843 | | | | | | 0.1 | | |
| 6,363,797 (1)(3) | | | JPMBB Commercial Mortgage Securities Trust 2013-C15 D, 5.192%, 11/15/2045 | | | | | 6,354,522 | | | | | | 0.1 | | |
| 7,840,000 (1)(3) | | | JPMBB Commercial Mortgage Securities Trust 2013-C17 D, 4.886%, 01/15/2047 | | | | | 7,449,859 | | | | | | 0.1 | | |
| 6,470,000 (1)(3) | | | JPMBB Commercial Mortgage Securities Trust 2013-C17 F, 3.867%, 01/15/2047 | | | | | 5,219,386 | | | | | | 0.1 | | |
| 8,624,204 (3)(5) | | | JPMBB Commercial Mortgage Securities Trust 2014-C19 XA, 0.647%, 04/15/2047 | | | | | 78,246 | | | | | | 0.0 | | |
| 1,222,046 (3)(5) | | | JPMBB Commercial Mortgage Securities Trust 2015-C28 XA, 0.961%, 10/15/2048 | | | | | 25,309 | | | | | | 0.0 | | |
| 649,297 (1)(3)(5) | | | LB-UBS Commercial Mortgage Trust 2006-C7 XW, 0.052%, 11/15/2038 | | | | | 2,101 | | | | | | 0.0 | | |
| 589,782 (1) | | | Life 2021-BMR F Mortgage Trust, 2.747%, (US0001M + 2.350%), 03/15/2038 | | | | | 566,413 | | | | | | 0.0 | | |
| Voya Intermediate Bond Fund | as of March 31, 2022 (continued) |
| Principal Amount† | | | Value | | | Percentage of Net Assets | | |||||||||
| COMMERCIAL MORTGAGE-BACKED SECURITIES: (continued) | | |||||||||||||||
| 850,000 (1)(3) | | | LSTAR Commercial Mortgage Trust 2015-3 D, 3.165%, 04/20/2048 | | | | $ | 813,990 | | | | | | 0.0 | | |
| 37,363,418 (1)(3)(5) | | | LSTAR Commercial Mortgage Trust 2017-5 X, 0.790%, 03/10/2050 | | | | | 892,440 | | | | | | 0.0 | | |
| 6,472,490 (1) | | | MBRT 2019-MBR H1, 4.647%, (US0001M + 4.000%), 11/15/2036 | | | | | 6,342,932 | | | | | | 0.1 | | |
| 8,541,000 (1) | | | MF1 Multifamily Housing Mortgage Loan Trust 2021-FL5 D, 2.943%, (TSFR1M + 2.500%), 07/15/2036 | | | | | 8,440,126 | | | | | | 0.1 | | |
| 3,000,000 (1)(3) | | | Morgan Stanley Bank of America Merrill Lynch Trust 2012-C6 E, 4.586%, 11/15/2045 | | | | | 2,879,689 | | | | | | 0.0 | | |
| 4,340,000 (1)(3) | | | Morgan Stanley Bank of America Merrill Lynch Trust 2013-C13 D, 4.897%, 11/15/2046 | | | | | 4,059,278 | | | | | | 0.0 | | |
| 67,157,721 (3)(5) | | | Morgan Stanley Bank of America Merrill Lynch Trust 2014 C19 XA, 0.959%, 12/15/2047 | | | | | 1,307,306 | | | | | | 0.0 | | |
| 3,470,000 (1)(3) | | | Morgan Stanley Bank of America Merrill Lynch Trust 2014-C15 D, 4.898%, 04/15/2047 | | | | | 3,420,358 | | | | | | 0.0 | | |
| 14,914,000 (1)(4) | | | Morgan Stanley Capital I Trust 2011-C1 J, 4.193%, 09/15/2047 | | | | | 7,457,000 | | | | | | 0.1 | | |
| 31,781,408 (3)(5) | | | Morgan Stanley Capital I Trust 2021-L6 XA, 1.236%, 06/15/2054 | | | | | 2,483,005 | | | | | | 0.0 | | |
| 4,670,000 | | | Morgan Stanley Capital I, Inc. 2017-HR2 D, 2.730%, 12/15/2050 | | | | | 3,876,480 | | | | | | 0.0 | | |
| 46,028,075 (3)(5) | | | Morgan Stanley Capital I, Inc. 2017-HR2 XA, 0.777%, 12/15/2050 | | | | | 1,592,940 | | | | | | 0.0 | | |
| 6,130,000 (1) | | | MRCD 2019-PARK E Mortgage Trust, 2.718%, 12/15/2036 | | | | | 5,639,179 | | | | | | 0.1 | | |
| 5,280,000 (1)(3) | | | UBS-Barclays Commercial Mortgage Trust 2012-C4 D, 4.461%, 12/10/2045 | | | | | 4,873,713 | | | | | | 0.1 | | |
| Principal Amount† | | | Value | | | Percentage of Net Assets | | |||||||||
| COMMERCIAL MORTGAGE-BACKED SECURITIES: (continued) | | |||||||||||||||
| 9,020,000 (1)(3) | | | UBS-Barclays Commercial Mortgage Trust 2012-C4 E, 4.461%, 12/10/2045 | | | | $ | 6,845,312 | | | | | | 0.1 | | |
| 2,000,000 (1) | | | Wells Fargo Commercial Mortgage Trust 2021-C59 C, 2.500%, 04/15/2054 | | | | | 1,504,041 | | | | | | 0.0 | | |
| 6,000,000 (1)(8) | | | Wells Fargo Re-REMIC Trust 2013-FRR1 BK26, 0.000%, 01/27/2045 | | | | | 5,717,062 | | | | | | 0.1 | | |
| 1,437,310 (1)(3) | | | WFRBS Commercial Mortgage Trust 2011-C5 E, 5.521%, 11/15/2044 | | | | | 1,434,545 | | | | | | 0.0 | | |
| 7,514,536 (1)(3)(5) | | | WFRBS Commercial Mortgage Trust 2012-C8 XA, 1.687%, 08/15/2045 | | | | | 370 | | | | | | 0.0 | | |
| 8,210,517 (1)(3)(5) | | | WFRBS Commercial Mortgage Trust 2012-C9 XA, 1.852%, 11/15/2045 | | | | | 28,479 | | | | | | 0.0 | | |
| 12,946,000 (1)(3) | | | WFRBS Commercial Mortgage Trust 2013-C11 F, 4.238%, 03/15/2045 | | | | | 11,088,432 | | | | | | 0.1 | | |
| 3,920,000 (1) | | | WFRBS Commercial Mortgage Trust 2013-C17 E, 3.500%, 12/15/2046 | | | | | 3,553,729 | | | | | | 0.0 | | |
| 2,000,000 (1) | | | WFRBS Commercial Mortgage Trust 2014-C21 D, 3.497%, 08/15/2047 | | | | | 1,791,235 | | | | | | 0.0 | | |
| 73,696,063 (3)(5) | | | WFRBS Commercial Mortgage Trust 2014-C25 XA, 0.797%, 11/15/2047 | | | | | 1,313,234 | | | | | | 0.0 | | |
| | | | Total Commercial Mortgage-Backed Securities (Cost $744,883,992) | | | | | 710,057,770 | | | | | | 7.5 | | |
| ASSET-BACKED SECURITIES: 10.7% | | |||||||||||||||
| | | | Automobile Asset-Backed Securities: 0.2% | | ||||||||||||
| 5,050,000 | | | AmeriCredit Automobile Receivables Trust 2019-3 D, 2.580%, 09/18/2025 | | | | | 5,030,546 | | | | | | 0.1 | | |
| 1,500,000 | | | Carmax Auto Owner Trust 2018-4 D, 4.150%, 04/15/2025 | | | | | 1,516,641 | | | | | | 0.0 | | |
| 550,000 | | | Drive Auto Receivables Trust 2021-2 D, 1.390%, 03/15/2029 | | | | | 523,078 | | | | | | 0.0 | | |
| Voya Intermediate Bond Fund | as of March 31, 2022 (continued) |
| Principal Amount† | | | Value | | | Percentage of Net Assets | | |||||||||
| ASSET-BACKED SECURITIES: (continued) | | |||||||||||||||
| | | | Automobile Asset-Backed Securities (continued) | | ||||||||||||
| 3,250,000 (1) | | | GLS Auto Receivables Issuer Trust 2021-4 C, 1.940%, 10/15/2027 | | | | $ | 3,114,636 | | | | | | 0.0 | | |
| 748,060 | | | Santander Drive Auto Receivables Trust 2019-3 C, 2.490%, 10/15/2025 | | | | | 749,628 | | | | | | 0.0 | | |
| 4,550,000 | | | Santander Drive Auto Receivables Trust 2020-2 D, 2.220%, 09/15/2026 | | | | | 4,515,888 | | | | | | 0.0 | | |
| 6,050,000 (1) | | | Westlake Automobile Receivables Trust 2021-2A C, 0.890%, 07/15/2026 | | | | | 5,813,251 | | | | | | 0.1 | | |
| | | | | | | | | 21,263,668 | | | | | | 0.2 | | |
| | | | Credit Card Asset-Backed Securities: 0.0% | | ||||||||||||
| 600,000 | | | Synchrony Credit Card Master Note Trust 2017-2 C, 3.010%, 10/15/2025 | | | | | 602,093 | | | | | | 0.0 | | |
| | | | | | | | ||||||||||
| | | | Home Equity Asset-Backed Securities: 0.1% | | ||||||||||||
| 3,094,854 (1)(3) | | | ACE Securities Corp. Mortgage Loan Trust Series 2007-D1 A2, 6.336%, 02/25/2038 | | | | | 2,852,155 | | | | | | 0.0 | | |
| 5,253,305 | | | Freddie Mac Structured Pass Through Certificates T-31 A7, 0.707%, (US0001M + 0.250%), 05/25/2031 | | | | | 5,236,659 | | | | | | 0.1 | | |
| 2,894,273 (3) | | | GSAA Trust 2006-7 AF2, 5.995%, 03/25/2046 | | | | | 1,467,034 | | | | | | 0.0 | | |
| 157,935 (3) | | | HSI Asset Loan Obligation Trust 2007-WF1 A6, 4.710%, 12/25/2036 | | | | | 138,309 | | | | | | 0.0 | | |
| 566,582 | | | Nomura Home Equity Loan, Inc. Home Equity Loan Trust Series 2007-1 2A3, 0.777%, (US0001M + 0.160%), 02/25/2037 | | | | | 562,776 | | | | | | 0.0 | | |
| 685,981 | | | Nomura Home Equity Loan, Inc. Home Equity Loan Trust Series 2007-1 2A4A, 0.917%, (US0001M + 0.230%), 02/25/2037 | | | | | 672,846 | | | | | | 0.0 | | |
| Principal Amount† | | | Value | | | Percentage of Net Assets | | |||||||||
| ASSET-BACKED SECURITIES: (continued) | | |||||||||||||||
| | | | Home Equity Asset-Backed Securities (continued) | | ||||||||||||
| 1,514,018 (3) | | | Renaissance Home Equity Loan Trust 2005-3 AF4, 5.140%, 11/25/2035 | | | | $ | 1,541,812 | | | | | | 0.0 | | |
| | | | | | | | | 12,471,591 | | | | | | 0.1 | | |
| | | | Other Asset-Backed Securities: 9.3% | | ||||||||||||
| 9,500,000 (1) | | | AGL CLO 5 Ltd. 2020-5A A1R, 1.414%, (US0003M + 1.160%), 07/20/2034 | | | | | 9,436,321 | | | | | | 0.1 | | |
| 6,750,000 (1) | | | AIG CLO 2021-1A C, 2.009%, (US0003M + 1.750%), 04/22/2034 | | | | | 6,551,273 | | | | | | 0.1 | | |
| 3,000,000 (1) | | | Aimco CLO 11 Ltd. 2020-11A AR, 1.371%, (US0003M + 1.130%), 10/17/2034 | | | | | 2,967,594 | | | | | | 0.0 | | |
| 1,050,538 (1)(3)(4)(5) | | | American Homes 4 Rent 2015-SFR1 XS, 3.232%, 04/17/2052 | | | | | — | | | | | | — | | |
| 1,850,000 (1) | | | AMMC CLO 16 Ltd. 2015-16A CR2, 2.188%, (US0003M + 1.950%), 04/14/2029 | | | | | 1,835,411 | | | | | | 0.0 | | |
| 500,000 (1) | | | Apidos CLO XII 2013-12A CR, 2.041%, (US0003M + 1.800%), 04/15/2031 | | | | | 480,263 | | | | | | 0.0 | | |
| 10,000,000 (1) | | | Apidos CLO XXXV 2021-35A C, 1.904%, (US0003M + 1.650%), 04/20/2034 | | | | | 9,698,930 | | | | | | 0.1 | | |
| 4,405,500 (1) | | | Applebee’s Funding LLC / IHOP Funding LLC 2019-1A A2I, 4.194%, 06/05/2049 | | | | | 4,388,335 | | | | | | 0.1 | | |
| 2,029,500 (1) | | | Applebee’s Funding LLC / IHOP Funding LLC 2019-1A A2II, 4.723%, 06/05/2049 | | | | | 2,030,483 | | | | | | 0.0 | | |
| 1,586,200 (1) | | | Aqua Finance Trust 2019-A A, 3.140%, 07/16/2040 | | | | | 1,569,545 | | | | | | 0.0 | | |
| 3,371,812 (1) | | | Aqua Finance Trust 2020-AA A, 1.900%, 07/17/2046 | | | | | 3,280,843 | | | | | | 0.0 | | |
| 7,190,500 (1) | | | Arbys Funding LLC 2020-1A A2, 3.237%, 07/30/2050 | | | | | 6,893,460 | | | | | | 0.1 | | |
| Voya Intermediate Bond Fund | as of March 31, 2022 (continued) |
| Principal Amount† | | | Value | | | Percentage of Net Assets | | |||||||||
| ASSET-BACKED SECURITIES: (continued) | | |||||||||||||||
| | | | Other Asset-Backed Securities (continued) | | ||||||||||||
| 3,890,000 (1) | | | Babson CLO Ltd. 2017-1A A2, 1.591%, (US0003M + 1.350%), 07/18/2029 | | | | $ | 3,855,706 | | | | | | 0.0 | | |
| 6,361,000 (1) | | | Babson CLO Ltd. 2018-3A A2, 1.554%, (US0003M + 1.300%), 07/20/2029 | | | | | 6,348,361 | | | | | | 0.1 | | |
| 3,750,000 (1) | | | Barings Clo Ltd. 2019-4A C, 3.041%, (US0003M + 2.800%), 01/15/2033 | | | | | 3,700,357 | | | | | | 0.0 | | |
| 1,200,000 (1) | | | BDS 2021-FL9 D Ltd., 2.718%, (US0001M + 2.250%), 11/16/2038 | | | | | 1,182,878 | | | | | | 0.0 | | |
| 8,339,675 (1) | | | Beacon Container Finance II LLC 2021-1A A, 2.250%, 10/22/2046 | | | | | 7,843,135 | | | | | | 0.1 | | |
| 6,500,000 (1) | | | Benefit Street Partners CLO IV Ltd. 2014-IVA BRRR, 2.404%, (US0003M + 2.150%), 01/20/2032 | | | | | 6,363,389 | | | | | | 0.1 | | |
| 13,900,000 (1) | | | Benefit Street Partners CLO Ltd. 2021-23A A1, 1.338%, (US0003M + 1.080%), 04/25/2034 | | | | | 13,765,670 | | | | | | 0.2 | | |
| 4,600,000 (1) | | | Benefit Street Partners CLO Ltd. 2021-23A C, 2.458%, (US0003M + 2.200%), 04/25/2034 | | | | | 4,574,332 | | | | | | 0.1 | | |
| 450,000 (1) | | | Benefit Street Partners CLO VIII Ltd. 2015-8A A1BR, 1.454%, (US0003M + 1.200%), 01/20/2031 | | | | | 444,668 | | | | | | 0.0 | | |
| 11,560,000 (1) | | | Benefit Street Partners CLO X Ltd. 2016-10A BRR, 2.404%, (US0003M + 2.150%), 04/20/2034 | | | | | 11,390,923 | | | | | | 0.1 | | |
| 5,000,000 (1) | | | Benefit Street Partners CLO XIV Ltd. 2018-14A A2, 1.404%, (US0003M + 1.150%), 04/20/2031 | | | | | 4,932,795 | | | | | | 0.1 | | |
| 7,550,000 (1) | | | Benefit Street Partners CLO XVIII Ltd. 2019-18A A1R, 1.411%, (US0003M + 1.170%), 10/15/2034 | | | | | 7,476,463 | | | | | | 0.1 | | |
| Principal Amount† | | | Value | | | Percentage of Net Assets | | |||||||||
| ASSET-BACKED SECURITIES: (continued) | | |||||||||||||||
| | | | Other Asset-Backed Securities (continued) | | ||||||||||||
| 2,000,000 (1) | | | BlueMountain CLO 2014-2A A2R2 Ltd., 1.654%, (US0003M + 1.400%), 10/20/2030 | | | | $ | 1,984,282 | | | | | | 0.0 | | |
| 5,350,000 (1) | | | BlueMountain CLO Ltd. 2021-28A C, 2.241%, (US0003M + 2.000%), 04/15/2034 | | | | | 5,254,064 | | | | | | 0.1 | | |
| 6,500,000 (1) | | | Bojangles Issuer LLC 2020-3A A2, 3.832%, 10/20/2050 | | | | | 6,380,462 | | | | | | 0.1 | | |
| 7,570,000 (1) | | | Broad River Bsl Funding Clo Ltd. 2020-1A AR, 1.424%, (US0003M + 1.170%), 07/20/2034 | | | | | 7,475,534 | | | | | | 0.1 | | |
| 4,400,000 (1) | | | Broad River Bsl Funding Clo Ltd. 2020-1A CR, 2.254%, (US0003M + 2.000%), 07/20/2034 | | | | | 4,308,872 | | | | | | 0.0 | | |
| 6,600,000 (1) | | | California Street CLO IX L.P. 2012-9A CR3, 2.741%, (US0003M + 2.500%), 07/16/2032 | | | | | 6,443,369 | | | | | | 0.1 | | |
| 3,250,000 (1) | | | Carlyle Global Market Strategies CLO Ltd. 2014-1A A2R2, 1.371%, (US0003M + 1.130%), 04/17/2031 | | | | | 3,219,145 | | | | | | 0.0 | | |
| 11,000,000 (1) | | | Carlyle US CLO 2017-3A BR Ltd., 2.254%, (US0003M + 2.000%), 07/20/2029 | | | | | 10,707,081 | | | | | | 0.1 | | |
| 8,900,000 (1) | | | CARLYLE US CLO 2021-1A A1 Ltd., 1.381%, (US0003M + 1.140%), 04/15/2034 | | | | | 8,829,405 | | | | | | 0.1 | | |
| 10,000,000 (1) | | | Cedar Funding IV CLO Ltd. 2014-4A CRR, 2.259%, (US0003M + 2.000%), 07/23/2034 | | | | | 9,863,030 | | | | | | 0.1 | | |
| 21,700,000 (1) | | | Cedar Funding IV CLO Ltd.2014-4A ARR, 1.419%, (US0003M + 1.160%), 07/23/2034 | | | | | 21,448,063 | | | | | | 0.2 | | |
| Voya Intermediate Bond Fund | as of March 31, 2022 (continued) |
| Principal Amount† | | | Value | | | Percentage of Net Assets | | |||||||||
| ASSET-BACKED SECURITIES: (continued) | | |||||||||||||||
| | | | Other Asset-Backed Securities (continued) | | ||||||||||||
| 12,400,000 (1) | | | Cedar Funding VIII Clo Ltd. 2017-8A A1R, 1.391%, (US0003M + 1.150%), 10/17/2034 | | | | $ | 12,320,057 | | | | | | 0.1 | | |
| 11,200,000 (1) | | | Cedar Funding VIII Clo Ltd. 2017-8A A2R, 1.691%, (US0003M + 1.450%), 10/17/2034 | | | | | 11,075,254 | | | | | | 0.1 | | |
| 37,149 | | | Chase Funding Trust Series 2003-5 2A2, 1.057%, (US0001M + 0.600%), 07/25/2033 | | | | | 35,462 | | | | | | 0.0 | | |
| 2,150,000 (1) | | | CIFC Funding 2017-2A CR Ltd., 2.104%, (US0003M + 1.850%), 04/20/2030 | | | | | 2,118,849 | | | | | | 0.0 | | |
| 3,000,000 (1) | | | CIFC Funding 2019-6A A2 Ltd., 1.991%, (US0003M + 1.750%), 01/16/2033 | | | | | 2,989,002 | | | | | | 0.0 | | |
| 1,600,000 (1) | | | CIFC Funding Ltd. 2022-1A A, 1.749%, (TSFR3M + 1.320%), 04/17/2035 | | | | | 1,594,414 | | | | | | 0.0 | | |
| 2,815,675 (1) | | | CLI Funding VI LLC 2020-1A A, 2.080%, 09/18/2045 | | | | | 2,644,191 | | | | | | 0.0 | | |
| 8,918,810 (1) | | | CLI Funding VIII LLC 2021-1A A, 1.640%, 02/18/2046 | | | | | 8,114,457 | | | | | | 0.1 | | |
| 10,389,413 (1) | | | CLI Funding VIII LLC 2022-1A A1, 2.720%, 01/18/2047 | | | | | 9,824,488 | | | | | | 0.1 | | |
| 4,631,250 (1) | | | DB Master Finance LLC 2019-1A A23, 4.352%, 05/20/2049 | | | | | 4,645,171 | | | | | | 0.1 | | |
| 2,388,750 (1) | | | DB Master Finance LLC 2019-1A A2II, 4.021%, 05/20/2049 | | | | | 2,403,969 | | | | | | 0.0 | | |
| 15,760,500 (1) | | | DB Master Finance LLC 2021-1A A23, 2.791%, 11/20/2051 | | | | | 14,171,043 | | | | | | 0.2 | | |
| 2,563,875 (1) | | | Domino’s Pizza Master Issuer LLC 2018-1A A211, 4.328%, 07/25/2048 | | | | | 2,572,766 | | | | | | 0.0 | | |
| 10,976,000 (1) | | | Domino’s Pizza Master Issuer LLC 2019-1A A2, 3.668%, 10/25/2049 | | | | | 10,559,308 | | | | | | 0.1 | | |
| 11,711,500 (1) | | | Domino’s Pizza Master Issuer LLC 2021-1A A2II, 3.151%, 04/25/2051 | | | | | 10,721,610 | | | | | | 0.1 | | |
| Principal Amount† | | | Value | | | Percentage of Net Assets | | |||||||||
| ASSET-BACKED SECURITIES: (continued) | | |||||||||||||||
| | | | Other Asset-Backed Securities (continued) | | ||||||||||||
| 2,261,875 (1) | | | Driven Brands Funding LLC 2018-1A A2, 4.739%, 04/20/2048 | | | | $ | 2,287,402 | | | | | | 0.0 | | |
| 5,674,500 (1) | | | Driven Brands Funding LLC 2019-1A A2, 4.641%, 04/20/2049 | | | | | 5,674,626 | | | | | | 0.1 | | |
| 5,436,375 (1) | | | Driven Brands Funding LLC 2021-1A A2, 2.791%, 10/20/2051 | | | | | 4,896,205 | | | | | | 0.1 | | |
| 6,400,000 (1) | | | Dryden 49 Senior Loan Fund 2017-49A CR, 2.291%, (US0003M + 2.050%), 07/18/2030 | | | | | 6,400,282 | | | | | | 0.1 | | |
| 11,400,000 (1) | | | Dryden 75 CLO Ltd. 2019-75A CR2, 2.041%, (US0003M + 1.800%), 04/15/2034 | | | | | 11,101,343 | | | | | | 0.1 | | |
| 8,850,000 (1) | | | Dryden 78 CLO Ltd. 2020-78A A, 1.421%, (US0003M + 1.180%), 04/17/2033 | | | | | 8,783,457 | | | | | | 0.1 | | |
| 8,000,000 (1) | | | Eaton Vance Clo 2015-1A A2R Ltd., 1.504%, (US0003M + 1.250%), 01/20/2030 | | | | | 7,963,144 | | | | | | 0.1 | | |
| 4,228,050 (1) | | | Five Guys Holdings, Inc. 2017-1A A2, 4.600%, 07/25/2047 | | | | | 4,194,730 | | | | | | 0.0 | | |
| 4,337,515 (1) | | | Helios Issuer LLC 2018-1A A, 4.870%, 07/20/2048 | | | | | 4,347,569 | | | | | | 0.1 | | |
| 3,546,131 (1) | | | Helios Issuer LLC 2021-A A4, 1.800%, 02/20/2048 | | | | | 3,309,696 | | | | | | 0.0 | | |
| 725,383 (1) | | | HERO Funding Trust 2015-2A A, 3.990%, 09/20/2040 | | | | | 727,438 | | | | | | 0.0 | | |
| 675,448 (1) | | | HERO Funding Trust 2016-2A A, 3.750%, 09/20/2041 | | | | | 673,505 | | | | | | 0.0 | | |
| 1,728,604 (1) | | | HERO Funding Trust 2016-4A A2, 4.290%, 09/20/2047 | | | | | 1,730,886 | | | | | | 0.0 | | |
| 7,750,000 (1) | | | Jay Park CLO Ltd. 2016-1A BR, 2.254%, (US0003M + 2.000%), 10/20/2027 | | | | | 7,715,745 | | | | | | 0.1 | | |
| 3,685,863 (1) | | | JG Wentworth XLII LLC 2018-2A A, 3.960%, 10/15/2075 | | | | | 3,845,165 | | | | | | 0.0 | | |
| Voya Intermediate Bond Fund | as of March 31, 2022 (continued) |
| Principal Amount† | | | Value | | | Percentage of Net Assets | | |||||||||
| ASSET-BACKED SECURITIES: (continued) | | |||||||||||||||
| | | | Other Asset-Backed Securities (continued) | | ||||||||||||
| 2,640,487 (1) | | | JGWPT XXXIII LLC 2014-3A A, 3.500%, 06/15/2077 | | | | $ | 2,672,329 | | | | | | 0.0 | | |
| 6,000,000 (1) | | | Kayne CLO 6 Ltd. 2019-6A A2, 2.104%, (US0003M + 1.850%), 01/20/2033 | | | | | 6,000,300 | | | | | | 0.1 | | |
| 7,130,000 (1) | | | Kayne CLO I Ltd. 2018-1A CR, 1.991%, (US0003M + 1.750%), 07/15/2031 | | | | | 7,079,284 | | | | | | 0.1 | | |
| 6,000,000 (1) | | | LCM 26A A2 Ltd., 1.504%, (US0003M + 1.250%), 01/20/2031 | | | | | 5,951,880 | | | | | | 0.1 | | |
| 5,000,000 (1) | | | LCM XVIII L.P. 18A A2R, 1.474%, (US0003M + 1.220%), 04/20/2031 | | | | | 4,967,915 | | | | | | 0.1 | | |
| 11,900,000 (1) | | | LCM XXIV Ltd. 24A CR, 2.154%, (US0003M + 1.900%), 03/20/2030 | | | | | 11,575,332 | | | | | | 0.1 | | |
| 6,812,689 (1) | | | Loanpal Solar Loan 2020-2GF A Ltd., 2.750%, 07/20/2047 | | | | | 6,481,241 | | | | | | 0.1 | | |
| 6,012,566 (1) | | | Loanpal Solar Loan 2021-1 1GS A Ltd., 2.290%, 01/20/2048 | | | | | 5,509,010 | | | | | | 0.1 | | |
| 9,525,959 (1) | | | Loanpal Solar Loan 2021-2GS A Ltd., 2.220%, 03/20/2048 | | | | | 8,855,285 | | | | | | 0.1 | | |
| 6,150,000 (1) | | | Madison Park Funding XLVIII Ltd. 2021-48A C, 2.248%, (US0003M + 2.000%), 04/19/2033 | | | | | 6,109,576 | | | | | | 0.1 | | |
| 6,250,000 (1) | | | Madison Park Funding XXI Ltd. 2016-21A ABRR, 1.641%, (US0003M + 1.400%), 10/15/2032 | | | | | 6,203,475 | | | | | | 0.1 | | |
| 1,400,000 (1) | | | Madison Park Funding XXVII Ltd. 2018-27A B, 2.054%, (US0003M + 1.800%), 04/20/2030 | | | | | 1,377,555 | | | | | | 0.0 | | |
| 1,858,588 (1) | | | Marlette Funding Trust 2018-4A C, 4.910%, 12/15/2028 | | | | | 1,860,001 | | | | | | 0.0 | | |
| 477 (1) | | | Marlette Funding Trust 2019-2 A2A, 3.530%, 07/16/2029 | | | | | 478 | | | | | | 0.0 | | |
| 4,200,000 (1) | | | Marlette Funding Trust 2019-2A C, 4.110%, 07/16/2029 | | | | | 4,193,456 | | | | | | 0.0 | | |
| Principal Amount† | | | Value | | | Percentage of Net Assets | | |||||||||
| ASSET-BACKED SECURITIES: (continued) | | |||||||||||||||
| | | | Other Asset-Backed Securities (continued) | | ||||||||||||
| 3,000,000 (1) | | | MF1 2021-FL7 D Ltd., 2.981%, (US0001M + 2.550%), 10/16/2036 | | | | $ | 2,912,625 | | | | | | 0.0 | | |
| 1,000,000 (1) | | | MF1 2021-FL7 E Ltd., 3.231%, (US0001M + 2.800%), 10/16/2036 | | | | | 967,227 | | | | | | 0.0 | | |
| 1,100,000 (1)(3) | | | Mill City Mortgage Loan Trust 2017-1 M2, 3.250%, 11/25/2058 | | | | | 1,099,890 | | | | | | 0.0 | | |
| 3,200,000 (1)(3) | | | Mill City Mortgage Loan Trust 2017-2 M2, 3.250%, 07/25/2059 | | | | | 3,152,028 | | | | | | 0.0 | | |
| 2,482,000 (1)(3) | | | Mill City Mortgage Trust 2015-2 B2, 3.620%, 09/25/2057 | | | | | 2,459,414 | | | | | | 0.0 | | |
| 804,726 (1) | | | Mill City Solar Loan 2019-1A A Ltd., 4.340%, 03/20/2043 | | | | | 815,298 | | | | | | 0.0 | | |
| 4,083,279 (1) | | | Mill City Solar Loan 2019-2GS A Ltd., 3.690%, 07/20/2043 | | | | | 4,064,503 | | | | | | 0.0 | | |
| 3,026,372 (1) | | | Mosaic Solar Loan Trust 2018-1A A, 4.010%, 06/22/2043 | | | | | 3,033,669 | | | | | | 0.0 | | |
| 4,979,910 (1) | | | Mosaic Solar Loan Trust 2018-2-GS A, 4.200%, 02/22/2044 | | | | | 4,955,596 | | | | | | 0.1 | | |
| 1,272,429 (1) | | | Mosaic Solar Loan Trust 2018-2-GS B, 4.740%, 02/22/2044 | | | | | 1,257,912 | | | | | | 0.0 | | |
| 3,480,798 (1) | | | Mosaic Solar Loan Trust 2019-2A A, 2.880%, 09/20/2040 | | | | | 3,384,451 | | | | | | 0.0 | | |
| 4,784,782 (1) | | | Mosaic Solar Loan Trust 2020-1A B, 3.100%, 04/20/2046 | | | | | 4,599,432 | | | | | | 0.1 | | |
| 9,420,150 (1) | | | Mosaic Solar Loan Trust 2020-2A A, 1.440%, 08/20/2046 | | | | | 8,603,505 | | | | | | 0.1 | | |
| 4,110,916 (1) | | | Mosaic Solar Loan Trust 2021-1A B, 2.050%, 12/20/2046 | | | | | 3,799,574 | | | | | | 0.0 | | |
| 1,843,761 (1) | | | Mosaic Solar Loans 2017-2A A LLC, 3.820%, 06/22/2043 | | | | | 1,824,548 | | | | | | 0.0 | | |
| Voya Intermediate Bond Fund | as of March 31, 2022 (continued) |
| Principal Amount† | | | Value | | | Percentage of Net Assets | | |||||||||
| ASSET-BACKED SECURITIES: (continued) | | |||||||||||||||
| | | | Other Asset-Backed Securities (continued) | | ||||||||||||
| 2,000,000 (1) | | | Neuberger Berman Loan Advisers CLO 47 Ltd. 2022-47A A, 1.548%, (TSFR3M + 1.300%), 04/14/2035 | | | | $ | 1,993,068 | | | | | | 0.0 | | |
| 14,050,000 (1) | | | Newark BSL CLO 2 Ltd. 2017-1A BR, 2.008%, (US0003M + 1.750%), 07/25/2030 | | | | | 13,855,955 | | | | | | 0.2 | | |
| 5,750,000 (1) | | | Oak Hill Credit Partners 2021-8A C, 2.141%, (US0003M + 1.900%), 01/18/2034 | | | | | 5,679,919 | | | | | | 0.1 | | |
| 14,950,000 (1) | | | Octagon Investment Partners 30 Ltd. 2017-1A BR, 2.204%, (US0003M + 1.950%), 03/17/2030 | | | | | 14,604,416 | | | | | | 0.2 | | |
| 3,500,000 (1) | | | Octagon Investment Partners 32 Ltd. 2017-1A CR, 2.291%, (US0003M + 2.050%), 07/15/2029 | | | | | 3,438,299 | | | | | | 0.0 | | |
| 25,350,000 (1) | | | Octagon Investment Partners XIV Ltd. 2012-1A BRR, 2.341%, (US0003M + 2.100%), 07/15/2029 | | | | | 24,499,584 | | | | | | 0.3 | | |
| 4,060,000 (1) | | | Octagon Investment Partners XV Ltd. 2013-1A A2R, 1.598%, (US0003M + 1.350%), 07/19/2030 | | | | | 4,037,987 | | | | | | 0.0 | | |
| 6,000,000 (1) | | | Octagon Investment Partners XXI Ltd. 2014-1A BR3, 2.145%, (US0003M + 1.750%), 02/14/2031 | | | | | 5,881,896 | | | | | | 0.1 | | |
| 7,830,000 (1) | | | OHA Credit Funding 2019-3A AR Ltd., 1.394%, (US0003M + 1.140%), 07/02/2035 | | | | | 7,779,191 | | | | | | 0.1 | | |
| 10,250,000 (1) | | | OHA Credit Funding 2020-6A AR Ltd., 1.394%, (US0003M + 1.140%), 07/20/2034 | | | | | 10,185,845 | | | | | | 0.1 | | |
| 6,650,000 (1) | | | OHA Credit Funding 4 Ltd. 2019-4A AR, 1.409%, (US0003M + 1.150%), 10/22/2036 | | | | | 6,603,310 | | | | | | 0.1 | | |
| Principal Amount† | | | Value | | | Percentage of Net Assets | | |||||||||
| ASSET-BACKED SECURITIES: (continued) | | |||||||||||||||
| | | | Other Asset-Backed Securities (continued) | | ||||||||||||
| 7,000,000 (1) | | | OHA Credit Funding 7 Ltd. 2020-7A AR, 1.975%, (TSFR3M + 1.300%), 02/24/2037 | | | | $ | 6,967,261 | | | | | | 0.1 | | |
| 6,700,000 (1) | | | OHA Credit Funding 9 Ltd. 2021-9A C, 2.148%, (US0003M + 1.900%), 07/19/2035 | | | | | 6,632,678 | | | | | | 0.1 | | |
| 10,700,000 (1) | | | OHA Credit Partners VII Ltd. 2012-7A CR3, 2.280%, (US0003M + 1.800%), 02/20/2034 | | | | | 10,499,889 | | | | | | 0.1 | | |
| 3,214,660 (1) | | | Pagaya AI Debt Selection Trust 2021-3 A, 1.150%, 05/15/2029 | | | | | 3,150,137 | | | | | | 0.0 | | |
| 4,080,751 (1) | | | Pagaya AI Debt Selection Trust 2021-HG1 A, 1.220%, 01/16/2029 | | | | | 3,955,563 | | | | | | 0.0 | | |
| 9,350,000 (1) | | | Pagaya AI Debt Trust 2022-1 A, 2.030%, 10/15/2029 | | | | | 9,182,996 | | | | | | 0.1 | | |
| 5,800,000 (1) | | | Palmer Square CLO 2021-1A B Ltd., 1.954%, (US0003M + 1.700%), 04/20/2034 | | | | | 5,670,179 | | | | | | 0.1 | | |
| 7,550,000 (1) | | | Palmer Square CLO 2021-3A A2 Ltd., 1.633%, (US0003M + 1.400%), 01/15/2035 | | | | | 7,504,511 | | | | | | 0.1 | | |
| 275,737 (3) | | | Popular ABS Mortgage Pass-Through Trust 2005-D A5, 3.541%, 01/25/2036 | | | | | 270,408 | | | | | | 0.0 | | |
| 4,936,375 (1) | | | Primose Funding LLC 2019-1A A2, 4.475%, 07/30/2049 | | | | | 4,830,541 | | | | | | 0.1 | | |
| 9,150,000 (1) | | | Rockland Park CLO Ltd. 2021-1A C, 2.154%, (US0003M + 1.900%), 04/20/2034 | | | | | 9,046,944 | | | | | | 0.1 | | |
| 1,347,228 (1) | | | SoFi Consumer Loan Program 2019-2 C Trust, 3.460%, 04/25/2028 | | | | | 1,352,900 | | | | | | 0.0 | | |
| 2,000,000 (1) | | | SoFi Consumer Loan Program 2019-2 D Trust, 4.200%, 04/25/2028 | | | | | 1,997,287 | | | | | | 0.0 | | |
| Voya Intermediate Bond Fund | as of March 31, 2022 (continued) |
| Principal Amount† | | | Value | | | Percentage of Net Assets | | |||||||||
| ASSET-BACKED SECURITIES: (continued) | | |||||||||||||||
| | | | Other Asset-Backed Securities (continued) | | ||||||||||||
| 4,100,000 (1) | | | SoFi Consumer Loan Program 2019-4 C Trust, 2.840%, 08/25/2028 | | | | $ | 4,098,450 | | | | | | 0.0 | | |
| 1,300,000 (1) | | | SoFi Consumer Loan Program 2019-4 D Trust, 3.480%, 08/25/2028 | | | | | 1,296,027 | | | | | | 0.0 | | |
| 2,350,000 (1) | | | SoFi Consumer Loan Program 2021-1 C Trust, 1.610%, 09/25/2030 | | | | | 2,213,517 | | | | | | 0.0 | | |
| 7,184,417 (1) | | | Sonic Capital LLC 2020-1A A2I, 3.845%, 01/20/2050 | | | | | 7,043,281 | | | | | | 0.1 | | |
| 3,980,000 (1) | | | Sonic Capital LLC 2021-1A A2II, 2.636%, 08/20/2051 | | | | | 3,401,879 | | | | | | 0.0 | | |
| 20,950,000 (1) | | | Sound Point Clo XVI Ltd. 2017-2A CR, 2.458%, (US0003M + 2.200%), 07/25/2030 | | | | | 20,426,166 | | | | | | 0.2 | | |
| 9,950,000 (1) | | | Sound Point CLO XXIX Ltd. 2021-1A C1, 2.558%, (US0003M + 2.300%), 04/25/2034 | | | | | 9,766,452 | | | | | | 0.1 | | |
| 7,731,680 (1) | | | Sunnova Sol II Issuer LLC 2020-2A A, 2.730%, 11/01/2055 | | | | | 7,265,986 | | | | | | 0.1 | | |
| 9,732,609 (1) | | | Sunnova Sol III Issuer LLC 2021-1 A, 2.580%, 04/28/2056 | | | | | 8,893,289 | | | | | | 0.1 | | |
| 4,624,386 (1) | | | Sunrun Athena Issuer 2018-1 A LLC, 5.310%, 04/30/2049 | | | | | 4,770,404 | | | | | | 0.1 | | |
| 4,091,909 (1) | | | Sunrun Xanadu Issuer 2019-1A A LLC, 3.980%, 06/30/2054 | | | | | 4,036,220 | | | | | | 0.0 | | |
| 8,450,000 (1) | | | Symphony CLO XXVI Ltd. 2021-26A CR, 2.254%, (US0003M + 2.000%), 04/20/2033 | | | | | 8,402,663 | | | | | | 0.1 | | |
| 5,950,125 (1) | | | Taco Bell Funding LLC 2018-1A A2II, 4.940%, 11/25/2048 | | | | | 6,022,495 | | | | | | 0.1 | | |
| 13,167,000 (1) | | | Taco Bell Funding LLC 2021-1A A23, 2.542%, 08/25/2051 | | | | | 11,451,239 | | | | | | 0.1 | | |
| 5,000,000 (1) | | | TCW CLO 2017-1A A2RR Ltd., 1.749%, (US0003M + 1.450%), 10/29/2034 | | | | | 4,963,375 | | | | | | 0.1 | | |
| Principal Amount† | | | Value | | | Percentage of Net Assets | | |||||||||
| ASSET-BACKED SECURITIES: (continued) | | |||||||||||||||
| | | | Other Asset-Backed Securities (continued) | | ||||||||||||
| 13,150,000 (1) | | | TCW CLO 2021-1A C Ltd., 2.154%, (US0003M + 1.900%), 03/18/2034 | | | | $ | 12,956,314 | | | | | | 0.1 | | |
| 7,200,000 (1) | | | TES LLC 2017-1A B, 7.740%, 10/20/2047 | | | | | 7,154,634 | | | | | | 0.1 | | |
| 6,578,000 (1) | | | Textainer Marine Containers Ltd. 2021-3A A, 1.940%, 08/20/2046 | | | | | 5,982,108 | | | | | | 0.1 | | |
| 5,617,000 (1) | | | Textainer Marine Containers VII Ltd. 2021-1A A, 1.680%, 02/20/2046 | | | | | 5,094,828 | | | | | | 0.1 | | |
| 1,400,000 (1)(3) | | | Towd Point Mortgage Trust 2015-2 1B1, 3.306%, 11/25/2060 | | | | | 1,380,631 | | | | | | 0.0 | | |
| 2,640,000 (1)(3) | | | Towd Point Mortgage Trust 2015-2 2B2, 3.930%, 11/25/2057 | | | | | 2,657,674 | | | | | | 0.0 | | |
| 4,346,000 (1)(3) | | | Towd Point Mortgage Trust 2016-2 M1, 3.000%, 08/25/2055 | | | | | 4,306,487 | | | | | | 0.0 | | |
| 3,200,000 (1)(3) | | | Towd Point Mortgage Trust 2017-1 M1, 3.750%, 10/25/2056 | | | | | 3,168,701 | | | | | | 0.0 | | |
| 2,200,000 (1)(3) | | | Towd Point Mortgage Trust 2017-3 M1, 3.500%, 07/25/2057 | | | | | 2,186,032 | | | | | | 0.0 | | |
| 4,500,000 (1) | | | Trafigura Securitisation Finance PLC 2021-1A A2, 1.080%, 01/15/2025 | | | | | 4,303,935 | | | | | | 0.0 | | |
| 11,483,250 (1) | | | Triton Container Finance VIII LLC 2021-1A A, 1.860%, 03/20/2046 | | | | | 10,414,944 | | | | | | 0.1 | | |
| 3,533,175 (1) | | | Wendy’s Funding LLC 2018-1A A2II, 3.884%, 03/15/2048 | | | | | 3,508,408 | | | | | | 0.0 | | |
| 8,535,500 (1) | | | Wendy’s Funding LLC 2021-1A A2II, 2.775%, 06/15/2051 | | | | | 7,572,313 | | | | | | 0.1 | | |
| 10,000,000 (1) | | | Wind River 2021-1A C CLO Ltd., 2.204%, (US0003M + 1.950%), 04/20/2034 | | | | | 9,776,080 | | | | | | 0.1 | | |
| 15,770,750 (1) | | | Zaxby’s Funding LLC 2021-1A A2, 3.238%, 07/30/2051 | | | | | 14,618,957 | | | | | | 0.2 | | |
| | | | | | | | | 870,886,718 | | | | | | 9.3 | | |
| Voya Intermediate Bond Fund | as of March 31, 2022 (continued) |
| Principal Amount† | | | Value | | | Percentage of Net Assets | | |||||||||
| ASSET-BACKED SECURITIES: (continued) | | |||||||||||||||
| | | | Student Loan Asset-Backed Securities: 1.1% | | ||||||||||||
| 323,154 (1) | | | Commonbond Student Loan Trust 2016-B, 4.000%, 10/25/2040 | | | | $ | 324,735 | | | | | | 0.0 | | |
| 994,907 (1) | | | Commonbond Student Loan Trust 2017-BGS B, 3.260%, 09/25/2042 | | | | | 994,493 | | | | | | 0.0 | | |
| 1,395,797 (1) | | | Commonbond Student Loan Trust 2018-AGS A1, 3.210%, 02/25/2044 | | | | | 1,390,229 | | | | | | 0.0 | | |
| 88,566 (1) | | | Commonbond Student Loan Trust 2018-A-GS C, 3.820%, 02/25/2044 | | | | | 83,658 | | | | | | 0.0 | | |
| 2,487,658 (1) | | | Commonbond Student Loan Trust 2018-CGS A2, 1.257%, (US0001M + 0.800%), 02/25/2046 | | | | | 2,479,188 | | | | | | 0.0 | | |
| 4,408,263 (1) | | | Commonbond Student Loan Trust 2020-AGS A, 1.980%, 08/25/2050 | | | | | 4,304,884 | | | | | | 0.1 | | |
| 2,250,000 (1)(3) | | | ELFI Graduate Loan Program 2021-A B LLC, 2.090%, 12/26/2046 | | | | | 2,116,249 | | | | | | 0.0 | | |
| 452,715 (1) | | | Laurel Road Prime Student Loan Trust 2017-B A4, 3.020%, 08/25/2042 | | | | | 452,678 | | | | | | 0.0 | | |
| 7,192,784 (1) | | | Laurel Road Prime Student Loan Trust 2020-A AFX, 1.400%, 11/25/2050 | | | | | 6,888,341 | | | | | | 0.1 | | |
| 3,664,424 (1) | | | Navient Private Education Refi Loan Trust 2020-DA A, 1.690%, 05/15/2069 | | | | | 3,568,164 | | | | | | 0.0 | | |
| 4,347,421 (1) | | | Navient Private Education Refi Loan Trust 2020-GA A, 1.170%, 09/16/2069 | | | | | 4,206,005 | | | | | | 0.1 | | |
| 1,850,000 (1) | | | Navient Private Education Refi Loan Trust 2021-F B, 2.120%, 02/18/2070 | | | | | 1,658,676 | | | | | | 0.0 | | |
| 2,700,000 (1) | | | SMB Private Education Loan Trust 2014-A C, 4.500%, 09/15/2045 | | | | | 2,508,177 | | | | | | 0.0 | | |
| 1,450,000 (1) | | | SMB Private Education Loan Trust 2017-A B, 3.500%, 06/17/2041 | | | | | 1,425,754 | | | | | | 0.0 | | |
| 17,763,688 (1) | | | SMB Private Education Loan Trust 2020-PTA A2A, 1.600%, 09/15/2054 | | | | | 17,017,095 | | | | | | 0.2 | | |
| Principal Amount† | | | Value | | | Percentage of Net Assets | | |||||||||
| ASSET-BACKED SECURITIES: (continued) | | |||||||||||||||
| | | | Student Loan Asset-Backed Securities (continued) | | ||||||||||||
| 4,100,000 (1)(3) | | | SoFi Professional Loan Program 2016-E C, 4.430%, 10/25/2041 | | | | $ | 4,137,267 | | | | | | 0.1 | | |
| 3,000,000 (1)(3) | | | SoFi Professional Loan Program 2017-C B, 3.560%, 07/25/2040 | | | | | 2,974,955 | | | | | | 0.0 | | |
| 3,900,000 (1) | | | SoFi Professional Loan Program 2017-F BFX LLC, 3.620%, 01/25/2041 | | | | | 3,885,259 | | | | | | 0.0 | | |
| 3,250,000 (1) | | | Sofi Professional Loan Program 2018-A B LLC, 3.610%, 02/25/2042 | | | | | 3,244,661 | | | | | | 0.0 | | |
| 8,000,000 (1) | | | Sofi Professional Loan Program 2018-B BFX Trust, 3.830%, 08/25/2047 | | | | | 7,933,221 | | | | | | 0.1 | | |
| 6,174,301 (1) | | | Sofi Professional Loan Program 2018-C A2FX Trust, 3.590%, 01/25/2048 | | | | | 6,215,763 | | | | | | 0.1 | | |
| 5,800,000 (1) | | | Sofi Professional Loan Program 2018-C BFX Trust, 4.130%, 01/25/2048 | | | | | 5,835,328 | | | | | | 0.1 | | |
| 2,825,429 (1) | | | Sofi Professional Loan Program 2018-D A2FX Trust, 3.600%, 02/25/2048 | | | | | 2,831,246 | | | | | | 0.0 | | |
| 6,000,000 (1) | | | Sofi Professional Loan Program 2018-D BFX Trust, 4.140%, 02/25/2048 | | | | | 5,926,812 | | | | | | 0.1 | | |
| 3,000,000 (1) | | | Sofi Professional Loan Program 2019-B BFX LLC, 3.730%, 08/17/2048 | | | | | 2,951,984 | | | | | | 0.0 | | |
| 10,706,475 (1) | | | SoFi Professional Loan Program 2020-C AFX Trust, 1.950%, 02/15/2046 | | | | | 10,495,106 | | | | | | 0.1 | | |
| | | | | | | | | 105,849,928 | | | | | | 1.1 | | |
| | | | Total Asset-Backed Securities | | | | | | | | | |||||
| | | | (Cost $1,039,305,903) | | | | | 1,011,073,998 | | | | | | 10.7 | | |
| SOVEREIGN BONDS: 1.8% | | |||||||||||||||
| 8,471,964 (10) | | | Argentine Republic Government International Bond, 0.500% (Step Rate @ 0.750% on 07/09/2027), 07/09/2030 | | | | | 2,859,373 | | | | | | 0.0 | | |
| 504,551 | | | Argentine Republic Government International Bond, 1.000%, 07/09/2029 | | | | | 173,601 | | | | | | 0.0 | | |
| Voya Intermediate Bond Fund | as of March 31, 2022 (continued) |
| Principal Amount† | | | Value | | | Percentage of Net Assets | | |||||||||
| SOVEREIGN BONDS: (continued) | | |||||||||||||||
| 1,819,735 (10) | | | Argentine Republic Government International Bond, 1.125% (Step Rate @ 1.500% on 07/09/2023), 07/09/2035 | | | | $ | 557,130 | | | | | | 0.0 | | |
| 7,775,000 (2) | | | Brazilian Government International Bond, 3.875%, 06/12/2030 | | | | | 7,181,379 | | | | | | 0.1 | | |
| 5,900,000 (2) | | | Brazilian Government International Bond, 4.625%, 01/13/2028 | | | | | 5,926,107 | | | | | | 0.1 | | |
| 700,000 (2) | | | Brazilian Government International Bond, 6.000%, 04/07/2026 | | | | | 759,692 | | | | | | 0.0 | | |
| 1,000,000 | | | Colombia Government International Bond, 3.125%, 04/15/2031 | | | | | 848,000 | | | | | | 0.0 | | |
| 5,225,000 | | | Colombia Government International Bond, 3.875%, 04/25/2027 | | | | | 5,019,553 | | | | | | 0.1 | | |
| 2,500,000 | | | Croatia Government International Bond, 5.500%, 04/04/2023 | | | | | 2,581,825 | | | | | | 0.0 | | |
| 5,900,000 (1) | | | Dominican Republic International Bond, 4.500%, 01/30/2030 | | | | | 5,428,059 | | | | | | 0.1 | | |
| 2,700,000 (1) | | | Dominican Republic International Bond, 4.875%, 09/23/2032 | | | | | 2,450,277 | | | | | | 0.0 | | |
| 1,100,000 (1) | | | Dominican Republic International Bond, 5.300%, 01/21/2041 | | | | | 958,386 | | | | | | 0.0 | | |
| 1,500,000 (1)(2) | | | Egypt Government International Bond, 5.875%, 02/16/2031 | | | | | 1,262,890 | | | | | | 0.0 | | |
| 1,300,000 (2) | | | Egypt Government International Bond, 6.588%, 02/21/2028 | | | | | 1,210,030 | | | | | | 0.0 | | |
| 7,500,000 (2) | | | Egypt Government International Bond, 7.500%, 01/31/2027 | | | | | 7,410,248 | | | | | | 0.1 | | |
| 7,675,000 (1) | | | Egypt Government International Bond, 7.625%, 05/29/2032 | | | | | 6,972,899 | | | | | | 0.1 | | |
| 1,500,000 (1) | | | Egypt Government International Bond, 8.750%, 09/30/2051 | | | | | 1,296,589 | | | | | | 0.0 | | |
| 1,240,000 (1) | | | Gabon Government International Bond, 6.625%, 02/06/2031 | | | | | 1,179,054 | | | | | | 0.0 | | |
| Principal Amount† | | | Value | | | Percentage of Net Assets | | |||||||||
| SOVEREIGN BONDS: (continued) | | |||||||||||||||
12,725,000 (1) | | | Ghana Government International Bond, 6.375%, 02/11/2027 | | | | $ | 9,610,493 | | | | | | 0.1 | | |
EUR 2,800,000 (1) | | | Ivory Coast Government International Bond, 4.875%, 01/30/2032 | | | | | 2,736,501 | | | | | | 0.0 | | |
3,725,535 (3) | | | Ivory Coast Government International Bond, 5.750%, 12/31/2032 | | | | | 3,667,085 | | | | | | 0.1 | | |
2,350,000 (1) | | | Jordan Government International Bond, 5.850%, 07/07/2030 | | | | | 2,197,398 | | | | | | 0.0 | | |
| 1,000,000 | | | Jordan Government International Bond, 6.125%, 01/29/2026 | | | | | 1,011,629 | | | | | | 0.0 | | |
1,200,000 (1) | | | Kenya Government International Bond, 7.000%, 05/22/2027 | | | | | 1,159,758 | | | | | | 0.0 | | |
| 7,000,000 | | | Mexico Government International Bond, 3.500%, 02/12/2034 | | | | | 6,523,930 | | | | | | 0.1 | | |
| 3,000,000 | | | Mexico Government International Bond, 3.750%, 04/19/2071 | | | | | 2,386,740 | | | | | | 0.0 | | |
| 1,750,000 | | | Mexico Government International Bond, 3.771%, 05/24/2061 | | | | | 1,420,011 | | | | | | 0.0 | | |
| 1,375,000 | | | Mexico Government International Bond, 4.280%, 08/14/2041 | | | | | 1,285,171 | | | | | | 0.0 | | |
5,675,000 (1) | | | Morocco Government International Bond, 2.375%, 12/15/2027 | | | | | 5,192,511 | | | | | | 0.1 | | |
5,850,000 (1) | | | Morocco Government International Bond, 3.000%, 12/15/2032 | | | | | 5,082,188 | | | | | | 0.1 | | |
1,450,000 (1) | | | Morocco Government International Bond, 4.000%, 12/15/2050 | | | | | 1,166,380 | | | | | | 0.0 | | |
| 2,250,000 | | | Morocco Government International Bond, 4.250%, 12/11/2022 | | | | | 2,278,982 | | | | | | 0.0 | | |
600,000 (1) | | | Morocco Government International Bond, 4.250%, 12/11/2022 | | | | | 607,729 | | | | | | 0.0 | | |
| 3,400,000 | | | Oman Government International Bond, 6.000%, 08/01/2029 | | | | | 3,555,057 | | | | | | 0.1 | | |
| Voya Intermediate Bond Fund | as of March 31, 2022 (continued) |
| Principal Amount† | | | Value | | | Percentage of Net Assets | | |||||||||
| SOVEREIGN BONDS: (continued) | | |||||||||||||||
2,350,000 (1) | | | Oman Government International Bond, 6.750%, 10/28/2027 | | | | $ | 2,561,674 | | | | | | 0.0 | | |
5,250,000 (1) | | | Oman Government International Bond, 7.375%, 10/28/2032 | | | | | 6,018,915 | | | | | | 0.1 | | |
3,000,000 (2) | | | Panama Government International Bond, 3.298%, 01/19/2033 | | | | | 2,870,325 | | | | | | 0.0 | | |
600,000 (1) | | | Paraguay Government International Bond, 4.625%, 01/25/2023 | | | | | 607,500 | | | | | | 0.0 | | |
| 3,375,000 | | | Peruvian Government International Bond, 1.862%, 12/01/2032 | | | | | 2,892,206 | | | | | | 0.0 | | |
2,525,000 (2) | | | Peruvian Government International Bond, 2.780%, 12/01/2060 | | | | | 1,982,403 | | | | | | 0.0 | | |
4,450,000 (2) | | | Republic of South Africa Government International Bond, 4.300%, 10/12/2028 | | | | | 4,312,010 | | | | | | 0.1 | | |
12,300,000 (2) | | | Republic of South Africa Government International Bond, 4.850%, 09/30/2029 | | | | | 12,056,927 | | | | | | 0.1 | | |
EUR 2,050,000 (1) | | | Romanian Government International Bond, 2.625%, 12/02/2040 | | | | | 1,732,743 | | | | | | 0.0 | | |
4,900,000 (1) | | | Romanian Government International Bond, 3.625%, 03/27/2032 | | | | | 4,638,193 | | | | | | 0.1 | | |
| 3,600,000 | | | Russian Foreign Bond - Eurobond, 4.250%, 06/23/2027 | | | | | 828,000 | | | | | | 0.0 | | |
| 2,600,000 | | | Russian Foreign Bond - Eurobond, 4.750%, 05/27/2026 | | | | | 572,000 | | | | | | 0.0 | | |
2,450,000 (1)(2) | | | Saudi Government International Bond, 3.450%, 02/02/2061 | | | | | 2,177,947 | | | | | | 0.0 | | |
| 1,200,000 | | | Sri Lanka Government International Bond, 6.350%, 06/28/2024 | | | | | 600,000 | | | | | | 0.0 | | |
| 9,475,000 | | | Turkey Government International Bond, 4.875%, 10/09/2026 | | | | | 8,570,507 | | | | | | 0.1 | | |
| 1,000,000 | | | Turkey Government International Bond, 5.125%, 02/17/2028 | | | | | 881,740 | | | | | | 0.0 | | |
| Principal Amount† | | | Value | | | Percentage of Net Assets | | |||||||||
| SOVEREIGN BONDS: (continued) | | |||||||||||||||
| 1,000,000 | | | Turkey Government International Bond, 6.125%, 10/24/2028 | | | | $ | 912,741 | | | | | | 0.0 | | |
| 1,700,000 | | | Turkey Government International Bond, 6.375%, 10/14/2025 | | | | | 1,668,210 | | | | | | 0.0 | | |
| 2,083,000 | | | Turkey Government International Bond, 7.375%, 02/05/2025 | | | | | 2,114,864 | | | | | | 0.0 | | |
| 2,250,000 (1) | | | Turkiye Ihracat Kredi Bankasi AS, 5.750%, 07/06/2026 | | | | | 2,066,006 | | | | | | 0.0 | | |
| 500,000 | | | Ukraine Government International Bond, 7.375%, 09/25/2032 | | | | | 206,250 | | | | | | 0.0 | | |
| 1,500,000 | | | Ukraine Government International Bond, 7.750%, 09/01/2023 | | | | | 750,000 | | | | | | 0.0 | | |
| 10,400,000 | | | Ukraine Government International Bond, 7.750%, 09/01/2025 | | | | | 4,420,000 | | | | | | 0.1 | | |
| 1,890,000 | | | Ukraine Government International Bond, 7.750%, 09/01/2026 | | | | | 793,800 | | | | | | 0.0 | | |
| 850,000 | | | Ukraine Government International Bond, 7.750%, 09/01/2027 | | | | | 357,000 | | | | | | 0.0 | | |
| 389,000 | | | Ukraine Government International Bond, 9.750%, 11/01/2028 | | | | | 163,380 | | | | | | 0.0 | | |
| | | | Total Sovereign Bonds (Cost $201,532,222) | | | | | 170,711,996 | | | | | | 1.8 | | |
| PURCHASED OPTIONS(11): 0.1% | | |||||||||||||||
| | | | Total Purchased Options | | | | | | | | | |||||
| | | | (Cost $7,165,749) | | | | | 5,072,308 | | | | | | 0.1 | | |
| | | | Total Long-Term Investments | | | | | | | | | |||||
| | | | (Cost $9,915,959,794) | | | | | 9,474,366,774 | | | | | | 100.5 | | |
| | ||||||||||||||||
| Principal Amount† | | | Value | | | Percentage of Net Assets | | |||||||||
| SHORT-TERM INVESTMENTS: 10.9% | | |||||||||||||||
| | | | Commercial Paper: 5.1% | | ||||||||||||
| 8,375,000 | | | American Electric Power Co., 0.900%, 04/27/2022 | | | | | 8,369,397 | | | | | | 0.1 | | |
| 35,000,000 | | | Auto Zone, 0.690%, 04/14/2022 | | | | | 34,990,690 | | | | | | 0.4 | | |
| 30,000,000 | | | Auto Zone, 0.760%, 04/18/2022 | | | | | 29,988,780 | | | | | | 0.3 | | |
| Voya Intermediate Bond Fund | as of March 31, 2022 (continued) |
| Principal Amount† | | | Value | | | Percentage of Net Assets | | |||||||||
| SHORT-TERM INVESTMENTS: (continued) | | |||||||||||||||
| | | | Commercial Paper (continued) | | ||||||||||||
| 1,850,000 (12) | | | Bank of Montreal, 0.220%, 04/18/2022 | | | | $ | 1,849,649 | | | | | | 0.0 | | |
| 1,600,000 (12) | | | Collateralized Commercial Paper V Co., LLC, 0.360%, 06/08/2022 | | | | | 1,597,307 | | | | | | 0.0 | | |
| 39,020,000 | | | Consolidated Edison Company, 0.530%, 04/01/2022 | | | | | 39,019,429 | | | | | | 0.4 | | |
| 5,359,000 | | | Consolidated Edison Company, 0.660%, 04/12/2022 | | | | | 5,357,837 | | | | | | 0.1 | | |
| 1,975,000 (12) | | | Credit Suisse AG, 0.330%, 06/09/2022 | | | | | 1,971,978 | | | | | | 0.0 | | |
| 30,000,000 (1) | | | Crown Point Capital Co. LLC, 0.640%, 04/29/2022 | | | | | 29,993,102 | | | | | | 0.3 | | |
| 1,875,000 (12) | | | DNB Bank ASA, 0.220%, 05/03/2022 | | | | | 1,874,464 | | | | | | 0.0 | | |
| 3,200,000 | | | Dominion Resources, Inc., 0.790%, 04/20/2022 | | | | | 3,198,613 | | | | | | 0.1 | | |
| 11,750,000 | | | Dominion Resources, Inc., 0.990%, 05/06/2022 | | | | | 11,738,579 | | | | | | 0.1 | | |
| 25,400,000 | | | Duke Energy Corp., 0.620%, 04/11/2022 | | | | | 25,395,266 | | | | | | 0.3 | | |
| 20,000,000 | | | Duke Energy Corp., 0.780%, 04/21/2022 | | | | | 19,991,063 | | | | | | 0.2 | | |
| 25,000,000 | | | Enbridge (US) Inc., 0.980%, 04/22/2022 | | | | | 24,985,272 | | | | | | 0.3 | | |
| 25,000,000 | | | Entergy Corp., 0.750%, 05/17/2022 | | | | | 24,976,010 | | | | | | 0.3 | | |
| 3,155,000 | | | Entergy Corp., 0.760%, 05/19/2022 | | | | | 3,151,784 | | | | | | 0.1 | | |
| 21,142,000 (12) | | | Exxon Mobile Corporation, 0.290%, 04/01/2022 | | | | | 21,141,831 | | | | | | 0.2 | | |
| 2,400,000 | | | Fiserv, Inc., 0.560%, 04/05/2022 | | | | | 2,399,815 | | | | | | 0.0 | | |
| 30,000,000 | | | Fiserv, Inc., 0.820%, 04/22/2022 | | | | | 29,985,650 | | | | | | 0.3 | | |
| 20,000,000 | | | HP, Inc., 0.790%, 04/22/2022 | | | | | 19,990,467 | | | | | | 0.2 | | |
| 10,000,000 | | | Kellogg Co., 0.590%, 04/08/2022 | | | | | 9,998,698 | | | | | | 0.1 | | |
| 1,675,000 (12) | | | Landesbank Baden-Wurttemberg, 0.230%, 05/05/2022 | | | | | 1,674,157 | | | | | | 0.0 | | |
| 1,400,000 (12) | | | LMA-Americas LLC, 0.270%, 05/04/2022 | | | | | 1,399,171 | | | | | | 0.0 | | |
| 750,000 (12) | | | Mitsubishi UFJ Trust and Banking Corp., 0.270%, 04/18/2022 | | | | | 749,861 | | | | | | 0.0 | | |
| 27,750,000 | | | National Grid, 0.990%, 05/06/2022 | | | | | 27,723,027 | | | | | | 0.3 | | |
| Principal Amount† | | | Value | | | Percentage of Net Assets | | |||||||||
| SHORT-TERM INVESTMENTS: (continued) | | |||||||||||||||
| | | | Commercial Paper (continued) | | ||||||||||||
| 375,000 (12) | | | Old Line Funding LLC, 0.250%, 04/27/2022 | | | | $ | 374,844 | | | | | | 0.0 | | |
| 2,200,000 | | | PPG Industries, Inc., 0.540%, 04/04/2022 | | | | | 2,199,870 | | | | | | 0.0 | | |
| 3,200,000 | | | PPG Industries, Inc., 0.540%, 04/05/2022 | | | | | 3,199,763 | | | | | | 0.1 | | |
| 12,000,000 | | | PPG Industries, Inc., 0.740%, 04/18/2022 | | | | | 11,995,620 | | | | | | 0.1 | | |
| 2,000,000 (12) | | | Santander UK PLC, 0.230%, 04/08/2022 | | | | | 1,999,850 | | | | | | 0.0 | | |
| 1,350,000 (12) | | | Santander UK PLC, 0.290%, 05/03/2022 | | | | | 1,349,397 | | | | | | 0.0 | | |
| 20,650,000 | | | Sherwin-Williams Co., 0.450%, 04/11/2022 | | | | | 20,647,224 | | | | | | 0.2 | | |
| 40,000,000 | | | Sherwin-Williams Co., 0.500%, 04/19/2022 | | | | | 39,989,656 | | | | | | 0.4 | | |
| 2,325,000 (12) | | | Skandinaviska Enskilda Banken AB, 0.140%, 04/04/2022 | | | | | 2,324,921 | | | | | | 0.0 | | |
| 350,000 (12) | | | Starbird Funding Corp., 0.300%, 05/12/2022 | | | | | 349,722 | | | | | | 0.0 | | |
| 1,975,000 (12) | | | Sumitomo Mitsui Trust Bank Ltd., 0.290%, 04/08/2022 | | | | | 1,974,858 | | | | | | 0.0 | | |
| 13,750,000 | | | Verizon Communications, Inc., 1.000%, 05/09/2022 | | | | | 13,735,283 | | | | | | 0.2 | | |
| | | | Total Commercial Paper | | | | | | | | | |||||
| | | | (Cost $483,647,670) | | | | | 483,652,905 | | | | | | 5.1 | | |
| | | | | | | | | | | | | | | | | |
| | | | Floating Rate Notes: 2.4% | | ||||||||||||
| 1,650,000 (12) | | | ANZ Bank, 0.380%, 07/13/2022 | | | | | 1,649,243 | | | | | | 0.0 | | |
| 1,200,000 (12) | | | ANZ Bank, 0.400%, 07/14/2022 | | | | | 1,199,511 | | | | | | 0.0 | | |
| 4,800,000 (12) | | | ANZ Bank, 0.420%, 08/18/2022 | | | | | 4,796,962 | | | | | | 0.0 | | |
| 5,700,000 (12) | | | Bank of America N.A., 0.410%, 06/22/2022 | | | | | 5,697,538 | | | | | | 0.1 | | |
| 2,000,000 (12) | | | Bank of America N.A., 0.380%, 07/06/2022 | | | | | 2,000,000 | | | | | | 0.0 | | |
| 1,700,000 (12) | | | Bank of America N.A., 0.420%, 08/16/2022 | | | | | 1,700,000 | | | | | | 0.0 | | |
| 5,675,000 (12) | | | Bank of Montreal, 0.410%, 07/25/2022 | | | | | 5,670,763 | | | | | | 0.1 | | |
| 1,825,000 (12) | | | Bank of Nova Scotia, 0.410%, 07/12/2022 | | | | | 1,823,926 | | | | | | 0.0 | | |
| 3,625,000 (12) | | | Bank of Nova Scotia, 0.440%, 07/18/2022 | | | | | 3,622,830 | | | | | | 0.0 | | |
| 5,975,000 (12) | | | Barclays Bank PLC, 0.440%, 07/22/2022 | | | | | 5,968,258 | | | | | | 0.1 | | |
| Voya Intermediate Bond Fund | as of March 31, 2022 (continued) |
| Principal Amount† | | | Value | | | Percentage of Net Assets | | |||||||||
| SHORT-TERM INVESTMENTS: (continued) | | |||||||||||||||
| | | | Floating Rate Notes (continued) | | ||||||||||||
| 5,850,000 (12) | | | Bayeriche Landesbank of New York, 0.470%, 07/27/2022 | | | | $ | 5,846,075 | | | | | | 0.1 | | |
| 5,150,000 (12) | | | Commonwealth Bank of Australia, 0.450%, 09/01/2022 | | | | | 5,145,403 | | | | | | 0.0 | | |
| 450,000 (12) | | | Cooperatieve Rabobank U.A./New York, 0.400%, 06/16/2022 | | | | | 449,821 | | | | | | 0.0 | | |
| 1,975,000 (12) | | | Cooperatieve Rabobank U.A./New York, 0.400%, 07/11/2022 | | | | | 1,973,804 | | | | | | 0.0 | | |
| 5,500,000 (12) | | | Cooperatieve Rabobank U.A./New York, 0.410%, 08/03/2022 | | | | | 5,495,462 | | | | | | 0.1 | | |
| 2,275,000 (12) | | | Cooperatieve Rabobank U.A./New York, 0.420%, 08/16/2022 | | | | | 2,273,049 | | | | | | 0.0 | | |
| 4,000,000 (12) | | | Credit Agricole, 0.390%, 07/21/2022 | | | | | 3,997,228 | | | | | | 0.0 | | |
| 1,000,000 (12) | | | Credit Agricole, 0.410%, 08/04/2022 | | | | | 999,294 | | | | | | 0.0 | | |
| 1,975,000 (12) | | | Credit Industriel et Commercial, 0.390%, 07/05/2022 | | | | | 1,973,885 | | | | | | 0.0 | | |
| 1,875,000 (12) | | | Credit Industriel et Commercial, 0.410%, 07/07/2022 | | | | | 1,873,950 | | | | | | 0.0 | | |
| 5,925,000 (12) | | | Credit Industriel et Commercial, 0.440%, 08/08/2022 | | | | | 5,920,449 | | | | | | 0.1 | | |
| 5,000,000 (12) | | | Credit Suisse AG, 0.450%, 05/02/2022 | | | | | 4,999,790 | | | | | | 0.0 | | |
| 6,075,000 (12) | | | Credit Suisse AG, 0.430%, 07/19/2022 | | | | | 6,071,434 | | | | | | 0.1 | | |
| 900,000 (12) | | | Landesbank Baden-Wurttemberg, 0.440%, 06/17/2022 | | | | | 899,614 | | | | | | 0.0 | | |
| 6,000,000 (12) | | | Mitsubishi UFJ Trust and Banking Corp., 0.430%, 07/22/2022 | | | | | 5,996,181 | | | | | | 0.1 | | |
| 5,550,000 (12) | | | Mitsubishi UFJ Trust and Banking Corp., 0.460%, 07/26/2022 | | | | | 5,546,812 | | | | | | 0.1 | | |
| 6,000,000 (12) | | | Mizuho Bank Ltd., 0.440%, 07/25/2022 | | | | | 5,993,610 | | | | | | 0.1 | | |
| 2,325,000 (12) | | | Mizuho Bank Ltd., 0.450%, 07/28/2022 | | | | | 2,322,560 | | | | | | 0.0 | | |
| 1,675,000 (12) | | | Mizuho Bank Ltd., 0.460%, 08/10/2022 | | | | | 1,673,136 | | | | | | 0.0 | | |
| 5,925,000 (12) | | | National Australia Bank Ltd., 0.400%, 08/08/2022 | | | | | 5,919,808 | | | | | | 0.1 | | |
| Principal Amount† | | | Value | | | Percentage of Net Assets | | |||||||||
| SHORT-TERM INVESTMENTS: (continued) | | |||||||||||||||
| | | | Floating Rate Notes (continued) | | ||||||||||||
| 5,225,000 (12) | | | National Australia Bank Ltd., 0.420%, 08/15/2022 | | | | $ | 5,220,652 | | | | | | 0.1 | | |
| 5,875,000 (12) | | | National Bank of Canada, 0.430%, 08/09/2022 | | | | | 5,870,218 | | | | | | 0.1 | | |
| 5,875,000 (12) | | | Natixis SA, 0.440%, 06/17/2022 | | | | | 5,873,498 | | | | | | 0.1 | | |
| 1,950,000 (12) | | | Natixis SA, 0.390%, 07/11/2022 | | | | | 1,949,017 | | | | | | 0.0 | | |
| 5,800,000 (12) | | | Norinchukin Bank of New York, 0.390%, 05/27/2022 | | | | | 5,798,347 | | | | | | 0.1 | | |
| 6,000,000 (12) | | | Norinchukin Bank of New York, 0.420%, 06/22/2022 | | | | | 5,997,677 | | | | | | 0.1 | | |
| 5,425,000 (12) | | | Royal Bank of Canada, 0.420%, 08/16/2022 | | | | | 5,420,515 | | | | | | 0.1 | | |
| 4,775,000 (12) | | | Royal Bank of Canada, 0.450%, 08/23/2022 | | | | | 4,771,390 | | | | | | 0.0 | | |
| 3,300,000 (12) | | | Sheffield Receivables Company LLC, 0.480%, 07/27/2022 | | | | | 3,297,492 | | | | | | 0.0 | | |
| 12,025,000 (12) | | | Skandinaviska Enskilda Banken AB, 0.410%, 07/20/2022 | | | | | 12,018,074 | | | | | | 0.1 | | |
| 6,025,000 (12) | | | Societe Generale, 0.430%, 08/08/2022 | | | | | 6,019,721 | | | | | | 0.1 | | |
| 2,025,000 (12) | | | Societe Generale, 0.470%, 08/31/2022 | | | | | 2,023,187 | | | | | | 0.0 | | |
| 5,275,000 (12) | | | Starbird Funding Corp., 0.450%, 08/23/2022 | | | | | 5,266,561 | | | | | | 0.1 | | |
| 1,700,000 (12) | | | Sumitomo Mitsui Trust Bank Ltd., 0.490%, 06/24/2022 | | | | | 1,699,607 | | | | | | 0.0 | | |
| 5,000,000 (12) | | | Sumitomo Mitsui Trust Bank Ltd., 0.430%, 07/25/2022 | | | | | 4,997,023 | | | | | | 0.0 | | |
| 4,950,000 (12) | | | Sumitomo Mitsui Trust Bank Ltd., 0.430%, 07/28/2022 | | | | | 4,946,911 | | | | | | 0.0 | | |
| 2,375,000 (12) | | | Sumitomo Mitsui Trust Bank Ltd., 0.440%, 07/29/2022 | | | | | 2,373,656 | | | | | | 0.0 | | |
| 6,000,000 (12) | | | Sumitomo Mitsui Trust Bank Ltd., 0.450%, 08/01/2022 | | | | | 5,996,438 | | | | | | 0.1 | | |
| 1,900,000 (12) | | | Sumitomo Mitsui Trust Bank Ltd., 0.450%, 08/04/2022 | | | | | 1,898,818 | | | | | | 0.0 | | |
| 1,925,000 (12) | | | Svenska Handelsbanken AB, 0.400%, 07/11/2022 | | | | | 1,923,779 | | | | | | 0.0 | | |
| 5,425,000 (12) | | | Svenska Handelsbanken AB, 0.420%, 07/29/2022 | | | | | 5,420,666 | | | | | | 0.1 | | |
| 5,800,000 (12) | | | Toronto-Dominion Bank, 0.430%, 07/25/2022 | | | | | 5,797,554 | | | | | | 0.1 | | |
| Voya Intermediate Bond Fund | as of March 31, 2022 (continued) |
| Principal Amount† | | | Value | | | Percentage of Net Assets | | |||||||||
| SHORT-TERM INVESTMENTS: (continued) | | |||||||||||||||
| | | | Floating Rate Notes (continued) | | ||||||||||||
| 6,025,000 (12) | | | Toronto-Dominion Bank, 0.440%, 08/19/2022 | | | | $ | 6,020,786 | | | | | | 0.1 | | |
| 5,150,000 (12) | | | Westpac Banking Corp., 0.410%, 08/02/2022 | | | | | 5,146,793 | | | | | | 0.0 | | |
| | | | Total Floating Rate Notes | | | | | | | | | |||||
| | | | (Cost $225,248,776) | | | | | 225,248,776 | | | | | | 2.4 | | |
| | | | | | ||||||||||||
| | | | Repurchase Agreements: 2.7% | | ||||||||||||
| 6,172,500 (12) | | | Amherst Pierpoint Securities LLC, Repurchase Agreement dated 03/31/22, 0.28%, due 04/01/22 (Repurchase Amount $6,172,547, collateralized by various U.S. Government/U.S. Government Agency Obligations, 0.000%-6.750%, Market Value plus accrued interest $6,295,950, due 06/01/24-02/20/72) | | | | | 6,172,500 | | | | | | 0.1 | | |
| 6,904,335 (12) | | | Bethesda Securities LLC, Repurchase Agreement dated 03/31/22, 0.33%, due 04/01/22 (Repurchase Amount $6,904,397, collateralized by various U.S. Government Agency Obligations, 2.000%-5.500%, Market Value plus accrued interest $7,111,465, due 04/01/23-03/01/52) | | | | | 6,904,335 | | | | | | 0.1 | | |
| 55,976,816 (12) | | | Cantor Fitzgerald Securities, Repurchase Agreement dated 03/31/22, 0.29%, due 04/01/22 (Repurchase Amount $55,977,261, collateralized by various U.S. Government Agency Obligations, 0.000%-9.000%, Market Value plus accrued interest $57,096,352, due 04/25/22-12/20/71) | | | | | 55,976,816 | | | | | | 0.6 | | |
| Principal Amount† | | | Value | | | Percentage of Net Assets | | |||||||||
| SHORT-TERM INVESTMENTS: (continued) | | |||||||||||||||
| | | | Repurchase Agreements (continued) | | ||||||||||||
| 14,307,146 (12) | | | CF Secured LLC, Repurchase Agreement dated 03/31/22, 0.29%, due 04/01/22 (Repurchase Amount $14,307,260, collateralized by various U.S. Government/U.S. Government Agency Obligations, 0.000%-5.500%, Market Value plus accrued interest $14,593,291, due 04/05/22-03/01/52) | | | | $ | 14,307,146 | | | | | | 0.1 | | |
| 28,906,082 (12) | | | Citadel Securities LLC, Repurchase Agreement dated 03/31/22, 0.33%, due 04/01/22 (Repurchase Amount $28,906,343, collateralized by various U.S. Government Securities, 0.000%-7.625%, Market Value plus accrued interest $29,484,552, due 04/19/22-02/15/52) | | | | | 28,906,082 | | | | | | 0.3 | | |
| 62,601,228 (12) | | | Deutsche Bank Securities Inc., Repurchase Agreement dated 03/31/ 22, 0.28%, due 04/01/22 (Repurchase Amount $62,601,708, collateralized by various U.S. Government/U.S. Government Agency Obligations, 0.000%-6.375%, Market Value plus accrued interest $63,853,260, due 04/07/22-11/15/51) | | | | | 62,601,228 | | | | | | 0.7 | | |
| Voya Intermediate Bond Fund | as of March 31, 2022 (continued) |
| Principal Amount† | | | Value | | | Percentage of Net Assets | | |||||||||
| SHORT-TERM INVESTMENTS: (continued) | | |||||||||||||||
| | | | Repurchase Agreements (continued) | | ||||||||||||
| 12,710,120 (12) | | | Industrial & Comm. Bank of China, Repurchase Agreement dated 03/31/22, 0.28%, due 04/01/22 (Repurchase Amount $12,710,218, collateralized by various U.S. Government Securities, 0.000%-2.250%, Market Value plus accrued interest $12,964,323, due 03/23/23-02/28/27) | | | | $ | 12,710,120 | | | | | | 0.1 | | |
| 3,297,826 (12) | | | Jefferies LLC, Repurchase Agreement dated 03/31/22, 0.27%, due 04/01/22 (Repurchase Amount $3,297,850, collateralized by various U.S. Government Securities, 0.000%-6.625%, Market Value plus accrued interest $3,363,783, due 04/14/22-11/15/51) | | | | | 3,297,826 | | | | | | 0.0 | | |
| 16,885,923 (12) | | | Mirae Asset Securities USA Inc., Repurchase Agreement dated 03/31/22, 0.33%, due 04/01/22 (Repurchase Amount $16,886,076, collateralized by various U.S. Government Agency Obligations, 0.550%-8.250%, Market Value plus accrued interest $17,223,800, due 05/01/22-02/20/72) | | | | | 16,885,923 | | | | | | 0.2 | | |
| 36,481,357 (12) | | | State of Wisconsin Investment Board, Repurchase Agreement dated 03/31/22, 0.33%, due 04/01/22 (Repurchase Amount $36,481,687, collateralized by various U.S. Government Securities, 0.125%-3.875%, Market Value plus accrued interest $37,211,008, due 01/15/25-02/15/51) | | | | | 36,481,357 | | | | | | 0.4 | | |
| Principal Amount† | | | Value | | | Percentage of Net Assets | | |||||||||
| SHORT-TERM INVESTMENTS: (continued) | | |||||||||||||||
| | | | Repurchase Agreements (continued) | | ||||||||||||
| 9,127,053 (12) | | | Stonex Financial Inc., Repurchase Agreement dated 03/31/22, 0.35%, due 04/01/22 (Repurchase Amount $9,127,141, collateralized by various U.S. Government/U.S. Government Agency Obligations, 0.000%-9.500%, Market Value plus accrued interest $9,583,408, due 04/15/22-02/20/72) | | | | $ | 9,127,053 | | | | | | 0.1 | | |
| | | | Total Repurchase Agreements | | | | | | | | | |||||
| | | | (Cost $253,370,386) | | | | | 253,370,386 | | | | | | 2.7 | | |
| | | | | | | | | | | | | | | | | |
| | | | Certificates of Deposit: 0.0% | | ||||||||||||
| 1,775,000 (12) | | | Bayeriche Landesbank of New York, 0.210%, 04/05/2022 | | | | | 1,774,966 | | | | | | 0.0 | | |
| 500,000 (12) | | | Norinchukin Bank of New York, 0.230%, 04/19/2022 | | | | | 499,961 | | | | | | 0.0 | | |
| 975,000 (12) | | | Toronto-Dominion Bank, 0.280%, 05/10/2022 | | | | | 974,780 | | | | | | 0.0 | | |
| | | | Total Certificates of Deposit | | | | | | | | | | | | | |
| | | | (Cost $3,249,707) | | | | | 3,249,707 | | | | | | 0.0 | | |
| | ||||||||||||||||
| Shares | | | Value | | | Percentage of Net Assets | | |||||||||
| | | | Mutual Funds: 0.7% | | ||||||||||||
| 33,907,000 (12)(13) | | | BlackRock Liquidity Funds, FedFund, Institutional Class, 0.230% | | | | | 33,907,000 | | | | | | 0.3 | | |
| 16,598,000 (12)(13) | | | Goldman Sachs Financial Square Government Fund Institutional Shares, 0.250% | | | | | 16,598,000 | | | | | | 0.2 | | |
| 16,598,000 (12)(13) | | | Morgan Stanley Institutional Liquidity Funds - Government Portfolio (Institutional Share Class), 0.230% | | | | | 16,598,000 | | | | | | 0.2 | | |
| | | | Total Mutual Funds (Cost $67,103,000) | | | | | 67,103,000 | | | | | | 0.7 | | |
| Voya Intermediate Bond Fund | as of March 31, 2022 (continued) |
| Shares | | | Value | | | Percentage of Net Assets | | |||||||||
| | | | Mutual Funds (continued) | | ||||||||||||
| | | | Total Short-Term Investments (Cost $1,032,619,539) | | | | $ | 1,032,624,774 | | | | | | 10.9 | | |
| | | | Total Investments in Securities (Cost $10,948,579,333) | | | | $ | 10,506,991,548 | | | | | | 111.4 | | |
| | | | Liabilities in Excess of Other Assets | | | | | (1,077,941,456) | | | | | | (11.4) | | |
| | | | Net Assets | | | | $ | 9,429,050,092 | | | | | | 100.0 | | |
| | ||||||||||||||||
| | | | Quoted Prices in Active Markets for Identical Investments (Level 1) | | | Significant Other Observable Inputs (Level 2) | | | Significant Unobservable Inputs (Level 3) | | | Fair Value at March 31, 2022 | | ||||||||||||
| Asset Table | | | | | | | | | | | | | | | | | | | | | |||||
| Investments, at fair value | | | | | | | | | | | | | | | | | | | | | |||||
| Purchased Options | | | | $ | — | | | | | $ | 5,072,308 | | | | | $ | — | | | | | $ | 5,072,308 | | |
| Corporate Bonds/Notes | | | | | — | | | | | | 3,700,022,034 | | | | | | — | | | | | | 3,700,022,034 | | |
| Collateralized Mortgage Obligations | | | | | — | | | | | | 1,470,648,406 | | | | | | — | | | | | | 1,470,648,406 | | |
| Asset-Backed Securities | | | | | — | | | | | | 1,011,073,998 | | | | | | — | | | | | | 1,011,073,998 | | |
| Commercial Mortgage-Backed Securities | | | | | — | | | | | | 695,406,961 | | | | | | 14,650,809 | | | | | | 710,057,770 | | |
| U.S. Government Agency Obligations | | | | | — | | | | | | 1,486,954,418 | | | | | | — | | | | | | 1,486,954,418 | | |
| Sovereign Bonds | | | | | — | | | | | | 170,711,996 | | | | | | — | | | | | | 170,711,996 | | |
| U.S. Treasury Obligations | | | | | — | | | | | | 919,825,844 | | | | | | — | | | | | | 919,825,844 | | |
| Short-Term Investments | | | | | 67,103,000 | | | | | | 965,521,774 | | | | | | — | | | | | | 1,032,624,774 | | |
| Total Investments, at fair value | | | | $ | 67,103,000 | | | | | $ | 10,425,237,739 | | | | | $ | 14,650,809 | | | | | $ | 10,506,991,548 | | |
| Other Financial Instruments+ | | | | | | | | | | | | | | | | | | | | | |||||
| Centrally Cleared Swaps | | | | | — | | | | | | 1,245,370 | | | | | | — | | | | | | 1,245,370 | | |
| Forward Foreign Currency Contracts | | | | | — | | | | | | 162,717 | | | | | | — | | | | | | 162,717 | | |
| Futures | | | | | 9,116,604 | | | | | | — | | | | | | — | | | | | | 9,116,604 | | |
| Total Assets | | | | $ | 76,219,604 | | | | | $ | 10,426,645,826 | | | | | $ | 14,650,809 | | | | | $ | 10,517,516,239 | | |
| Voya Intermediate Bond Fund | as of March 31, 2022 (continued) |
| | | | Quoted Prices in Active Markets for Identical Investments (Level 1) | | | Significant Other Observable Inputs (Level 2) | | | Significant Unobservable Inputs (Level 3) | | | Fair Value at March 31, 2022 | | ||||||||||||
| Liabilities Table | | | | | | | | | | | | | | | | | | | | | |||||
| Other Financial Instruments+ | | | | | | | | | | | | | | | | | | | | | |||||
| Centrally Cleared Swaps | | | | $ | — | | | | | $ | (1,039,007) | | | | | $ | — | | | | | $ | (1,039,007) | | |
| Forward Foreign Currency Contracts | | | | | — | | | | | | (16,528) | | | | | | — | | | | | | (16,528) | | |
| Futures | | | | | (17,560,253) | | | | | | — | | | | | | — | | | | | | (17,560,253) | | |
| Written Options | | | | | — | | | | | | (3,242,890) | | | | | | — | | | | | | (3,242,890) | | |
| Total Liabilities | | | | $ | (17,560,253) | | | | | $ | (4,298,425) | | | | | $ | — | | | | | $ | (21,858,678) | | |
| | |||||||||||||||||||||||||
| Currency Purchased | | | Currency Sold | | | Counterparty | | | Settlement Date | | | Unrealized Appreciation (Depreciation) | | ||||||
| USD 190 | | | HUF 65,822 | | | Barclays Bank PLC | | | | | 04/29/22 | | | | | $ | (8) | | |
| USD 9,179 | | | MYR 38,391 | | | Barclays Bank PLC | | | | | 04/29/22 | | | | | | 80 | | |
| PHP 5,077 | | | USD 96 | | | Barclays Bank PLC | | | | | 04/29/22 | | | | | | 1 | | |
| COP 32,809,987 | | | USD 8,644 | | | Barclays Bank PLC | | | | | 05/06/22 | | | | | | 15 | | |
| IDR 8,987,240,083 | | | USD 623,333 | | | BNP Paribas | | | | | 04/29/22 | | | | | | 2,628 | | |
| PEN 292,662 | | | USD 78,617 | | | Citibank N.A. | | | | | 05/06/22 | | | | ��� | | 722 | | |
| USD 98 | | | TRY 1,549 | | | Goldman Sachs International | | | | | 04/29/22 | | | | | | (5) | | |
| RON 5,424,744 | | | USD 1,194,193 | | | Goldman Sachs International | | | | | 04/29/22 | | | | | | 16,163 | | |
| USD 230,388 | | | BRL 1,183,486 | | | HSBC Bank USA N.A. | | | | | 05/06/22 | | | | | | (15,979) | | |
| ILS 1,663 | | | USD 509 | | | JPMorgan Chase Bank N.A. | | | | | 04/29/22 | | | | | | 12 | | |
| PLN 1,479 | | | USD 336 | | | JPMorgan Chase Bank N.A. | | | | | 04/29/22 | | | | | | 15 | | |
| MXN 201,960 | | | USD 9,587 | | | JPMorgan Chase Bank N.A. | | | | | 05/06/22 | | | | | | 510 | | |
| EUR 212,552 | | | USD 233,980 | | | Morgan Stanley Capital Services LLC | | | | | 04/08/22 | | | | | | 1,185 | | |
| DKK 7 | | | USD 1 | | | Morgan Stanley Capital Services LLC | | | | | 04/08/22 | | | | | | — | | |
| ZAR 1,187 | | | USD 78 | | | Morgan Stanley Capital Services LLC | | | | | 04/29/22 | | | | | | 3 | | |
| USD 280 | | | CZK 6,471 | | | Morgan Stanley Capital Services LLC | | | | | 04/29/22 | | | | | | (12) | | |
| CNY 1,332,393 | | | USD 210,025 | | | Morgan Stanley Capital Services LLC | | | | | 04/29/22 | | | | | | (524) | | |
| CLP 1,567,550 | | | USD 1,923 | | | Morgan Stanley Capital Services LLC | | | | | 05/06/22 | | | | | | 58 | | |
| USD 5,569,027 | | | EUR 4,905,799 | | | Standard Chartered Bank | | | | | 04/08/22 | | | | | | 141,325 | | |
| | | | | | | | | | | | | | | | | $ | 146,189 | | |
| Description | | | Number of Contracts | | | Expiration Date | | | Notional Amount | | | Unrealized Appreciation/ (Depreciation) | | ||||||||||||
| Long Contracts: | | | | | | | | | | | | | | | | | | | | | | | | | |
| U.S. Treasury 5-Year Note | | | | | 108 | | | | | | 06/30/22 | | | | | $ | 12,386,250 | | | | | $ | (347,708) | | |
| U.S. Treasury Long Bond | | | | | 1,440 | | | | | | 06/21/22 | | | | | | 216,090,000 | | | | | | (5,457,700) | | |
| U.S. Treasury Ultra Long Bond | | | | | 1,844 | | | | | | 06/21/22 | | | | | | 326,618,500 | | | | | | (11,754,845) | | |
| | | | | | | | | | | | | | | | | $ | 555,094,750 | | | | | $ | (17,560,253) | | |
| Short Contracts: | | | | | | | | | | | | | | | | | | | | | | | | | |
| U.S. Treasury 10-Year Note | | | | | (1,360) | | | | | | 06/21/22 | | | | | | (167,110,000) | | | | | | 5,152,715 | | |
| U.S. Treasury 2-Year Note | | | | | (124) | | | | | | 06/30/22 | | | | | | (26,278,313) | | | | | | 318,560 | | |
| U.S. Treasury Ultra 10-Year Note | | | | | (892) | | | | | | 06/21/22 | | | | | | (120,838,125) | | | | | | 3,645,329 | | |
| | | | | | | | | | | | | | | | | $ | (314,226,438) | | | | | $ | 9,116,604 | | |
| Voya Intermediate Bond Fund | as of March 31, 2022 (continued) |
| Reference Entity/Obligation | | | Buy/Sell Protection | | | (Pay)/ Receive Financing Rate (%)(2) | | | Termination Date | | | Notional Amount(3) | | | Fair Value(4) | | | Unrealized Appreciation/ (Depreciation) | | |||||||||||||||
| CDX North American High Yield Index, Series 37, Version 1 | | | | | Sell | | | | | | 5.000 | | | | | | 12/20/26 | | | | USD 136,125,996 | | | | $ | 8,586,459 | | | | | $ | 1,040,371 | | |
| | | | | | | | | | | | | | | | | | | | | | | | | | $ | 8,586,459 | | | | | $ | 1,040,371 | | |
| Pay/Receive Floating Rate | | | Floating Rate Index | | | Floating Rate Index Payment Frequency | | | Fixed Rate | | | Fixed Rate Payment Frequency | | | Maturity Date | | | Notional Amount | | | Fair Value | | | Unrealized Appreciation/ (Depreciation) | | ||||||||||||||||||
| Pay | | | 1-day Secured Overnight Financing Rate | | | | | Annual | | | | | | 2.109% | | | | | | Annual | | | | | | 05/06/32 | | | | USD 20,382,000 | | | | $ | (9,680) | | | | | $ | (9,680) | | |
| Pay | | | 1-day Secured Overnight Financing Rate | | | | | Annual | | | | | | 2.161 | | | | | | Annual | | | | | | 05/06/32 | | | | USD 11,589,800 | | | | | 48,511 | | | | | | 48,511 | | |
| Pay | | | 1-day Secured Overnight Financing Rate | | | | | Annual | | | | | | 2.212 | | | | | | Annual | | | | | | 05/06/32 | | | | USD 11,589,800 | | | | | 101,586 | | | | | | 101,586 | | |
| Receive | | | 1-day Secured Overnight Financing Rate | | | | | Annual | | | | | | 2.041 | | | | | | Annual | | | | | | 04/19/32 | | | | USD 9,477,700 | | | | | 54,902 | | | | | | 54,902 | | |
| Receive | | | 1-day Secured Overnight Financing Rate | | | | | Annual | | | | | | 2.171 | | | | | | Annual | | | | | | 04/19/32 | | | | USD 9,756,000 | | | | | (58,832) | | | | | | (58,832) | | |
| Receive | | | 1-day Secured Overnight Financing Rate | | | | | Annual | | | | | | 2.206 | | | | | | Annual | | | | | | 04/19/32 | | | | USD 17,375,900 | | | | | (158,925) | | | | | | (158,925) | | |
| Receive | | | 1-day Secured Overnight Financing Rate | | | | | Annual | | | | | | 2.146 | | | | | | Annual | | | | | | 05/06/32 | | | | USD 17,412,324 | | | | | (48,992) | | | | | | (48,992) | | |
| Receive | | | 1-day Secured Overnight Financing Rate | | | | | Annual | | | | | | 2.150 | | | | | | Annual | | | | | | 05/06/32 | | | | USD 17,375,676 | | | | | (55,185) | | | | | | (55,185) | | |
| Receive | | | 1-day Secured Overnight Financing Rate | | | | | Annual | | | | | | 2.275 | | | | | | Annual | | | | | | 05/06/32 | | | | USD 22,828,400 | | | | | (330,155) | | | | | | (330,155) | | |
| Receive | | | 1-day Secured Overnight Financing Rate | | | | | Annual | | | | | | 2.306 | | | | | | Annual | | | | | | 05/06/32 | | | | USD 21,844,000 | | | | | (377,238) | | | | | | (377,238) | | |
| | | | | | | | | | | | | | | | | | | | | | | | | | | | | | | | | | | $ | (834,008) | | | | | $ | (834,008) | | |
| Voya Intermediate Bond Fund | as of March 31, 2022 (continued) |
| Description | | | Counterparty | | | Expiration Date | | | Exercise Price | | | Notional Amount | | | Cost | | | Fair Value | | ||||||
| Call JPY vs. Put USD | | | BNP Paribas | | | 02/27/25 | | | 107.500 | | | USD 19,009,400 | | | | $ | 942,866 | | | | | $ | 700,285 | | |
| Call JPY vs. Put USD | | | Standard Chartered Bank | | | 02/27/25 | | | 107.500 | | | USD 19,009,000 | | | | | 953,967 | | | | | | 700,271 | | |
| Call USD vs. Put AUD | | | Goldman Sachs International | | | 06/15/22 | | | 0.674 | | | USD 526,866,000 | | | | | 3,372,103 | | | | | | 833,470 | | |
| Call USD vs. Put JPY | | | BNP Paribas | | | 02/27/25 | | | 107.500 | | | USD 19,009,000 | | | | | 942,846 | | | | | | 1,419,141 | | |
| Call USD vs. Put JPY | | | Standard Chartered Bank | | | 02/27/25 | | | 107.500 | | | USD 19,009,000 | | | | | 953,967 | | | | | | 1,419,141 | | |
| | | | | | | | | | | | | | | | | $ | 7,165,749 | | | | | $ | 5,072,308 | | |
| Description | | | Counterparty | | | Expiration Date | | | Exercise Price | | | Notional Amount | | | Premiums Received | | | Fair Value | | ||||||
| Call USD vs. Put AUD | | | Goldman Sachs International | | | 04/13/22 | | | 0.710 | | | USD 263,433,000 | | | | $ | 2,037,746 | | | | | $ | (69,486) | | |
| | | | | | | | | | | | | | | | | $ | 2,037,746 | | | | | $ | (69,486) | | |
| Description | | | Counterparty | | | Pay/Receive Exercise Rate | | | Exercise Rate | | | Floating Rate Index | | | Expiration Date | | | Notional Amount | | | Premiums Received | | | Fair Value | | ||||||
Call on 10-Year Interest Rate Swap(1) | | | BNP Paribas | | | Pay | | | 2.230% | | | 1-day Secured Overnight Financing Rate | | | 04/29/22 | | | USD 28,159,000 | | | | $ | 336,500 | | | | | $ | (435,679) | | |
Call on 10-Year Interest Rate Swap(1) | | | Morgan Stanley Capital Services LLC | | | Pay | | | 2.296% | | | 1-day Secured Overnight Financing Rate | | | 04/28/22 | | | USD 28,159,000 | | | | | 366,912 | | | | | | (545,531) | | |
Put on 10-Year Interest Rate Swap(2) | | | Bank of America N.A. | | | Receive | | | 2.010% | | | 1-day Secured Overnight Financing Rate | | | 04/14/22 | | | USD 56,294,000 | | | | | 537,607 | | | | | | (761,253) | | |
Put on 10-Year Interest Rate Swap(2) | | | BNP Paribas | | | Receive | | | 2.230% | | | 1-day Secured Overnight Financing Rate | | | 04/29/22 | | | USD 28,159,000 | | | | | 336,500 | | | | | | (192,084) | | |
Put on 10-Year Interest Rate Swap(2) | | | Morgan Stanley Capital Services LLC | | | Receive | | | 2.000% | | | 1-day Secured Overnight Financing Rate | | | 04/20/22 | | | USD 71,406,000 | | | | | 714,417 | | | | | | (1,104,364) | | |
Put on 10-Year Interest Rate Swap(2) | | | Morgan Stanley Capital Services LLC | | | Receive | | | 2.296% | | | 1-day Secured Overnight Financing Rate | | | 04/28/22 | | | USD 28,159,000 | | | | | 366,912 | | | | | | (134,493) | | |
| | | | | | | | | | | | | | | | | | | | | | | $ | 2,658,848 | | | | | $ | (3,173,404) | | |
| Voya Intermediate Bond Fund | as of March 31, 2022 (continued) |
| Derivatives not accounted for as hedging instruments | | | Location on Statement of Assets and Liabilities | | | Fair Value | | |||
| Asset Derivatives | | | | | | |||||
| Foreign exchange contracts | | | Investments in securities at value* | | | | $ | 5,072,308 | | |
| Foreign exchange contracts | | | Unrealized appreciation on forward foreign currency contracts | | | | | 162,717 | | |
| Interest rate contracts | | | Variation margin receivable on futures contracts** | | | | | 9,116,604 | | |
| Interest rate contracts | | | Variation margin receivable on centrally cleared swaps** | | | | | 204,999 | | |
| Credit contracts | | | Variation margin receivable on centrally cleared swaps** | | | | | 1,040,371 | | |
| Total Asset Derivatives | | | | | | | $ | 15,596,999 | | |
| Liability Derivatives | | | | | | |||||
| Foreign exchange contracts | | | Unrealized depreciation on forward foreign currency contracts | | | | $ | 16,528 | | |
| Interest rate contracts | | | Variation margin payable on futures contracts** | | | | | 17,560,253 | | |
| Interest rate contracts | | | Variation margin payable on centrally cleared swaps** | | | | | 1,039,007 | | |
| Interest rate contracts | | | Written options, at fair value | | | | | 3,173,404 | | |
| Foreign exchange contracts | | | Written options, at fair value | | | | | 69,486 | | |
| Total Liability Derivatives | | | | | | | $ | 21,858,678 | | |
| Derivatives not accounted for as hedging instruments | | | Investments* | | | Forward foreign currency contracts | | | Futures | | | Swaps | | | Written options | | | Total | | ||||||||||||||||||
| Credit contracts | | | | $ | — | | | | | $ | — | | | | | $ | — | | | | | $ | (1,897,376) | | | | | $ | — | | | | | $ | (1,897,376) | | |
| Equity contracts | | | | | (21,580) | | | | | | — | | | | | | 543,877 | | | | | | — | | | | | | (1,198,393) | | | | | | (676,096) | | |
| Foreign exchange contracts | | | | | (74,654) | | | | | | 994,079 | | | | | | — | | | | | | — | | | | | | (2,046,889) | | | | | | (1,127,464) | | |
| Interest rate contracts | | | | | (4,640,368) | | | | | | — | | | | | | (22,509,202) | | | | | | (2,183,825) | | | | | | 1,896,569 | | | | | | (27,436,826) | | |
| Total | | | | $ | (4,736,602) | | | | | $ | 994,079 | | | | | $ | (21,965,325) | | | | | $ | (4,081,201) | | | | | $ | (1,348,713) | | | | | $ | (31,137,762) | | |
| Derivatives not accounted for as hedging instruments | | | Investments* | | | Forward foreign currency contracts | | | Futures | | | Swaps | | | Written options | | | Total | | ||||||||||||||||||
| Credit contracts | | | | $ | 582,584 | | | | | $ | — | | | | | $ | — | | | | | $ | 1,040,371 | | | | | $ | — | | | | | $ | 1,622,955 | | |
| Foreign exchange contracts | | | | | (3,083,783) | | | | | | (2,258,229) | | | | | | — | | | | | | — | | | | | | 4,307,085 | | | | | | (1,034,927) | | |
| Interest rate contracts | | | | | — | | | | | | — | | | | | | 12,134,633 | | | | | | (834,008) | | | | | | (457,561) | | | | | | 10,843,064 | | |
| Total | | | | $ | (2,501,199) | | | | | $ | (2,258,229) | | | | | $ | 12,134,633 | | | | | $ | 206,363 | | | | | $ | 3,849,524 | | | | | $ | 11,431,092 | | |
| Voya Intermediate Bond Fund | as of March 31, 2022 (continued) |
| | | | Bank of America N.A. | | | Barclays Bank PLC | | | BNP Paribas | | | Citibank N.A. | | | Goldman Sachs International | | | HSBC Bank USA N.A. | | | JPMorgan Chase Bank N.A. | | | Morgan Stanley Capital Services LLC | | | Standard Chartered Bank | | | Totals | | ||||||||||||||||||||||||||||||
| Assets: | | | | | | | | | | | | | | | | | | | | | | | | | | | | | | | | | | | | | | | | | | | | | | | | | | | | | | | | | |||||
| Purchased options | | | | $ | — | | | | | $ | — | | | | | $ | 2,119,426 | | | | | $ | — | | | | | $ | 833,470 | | | | | $ | — | | | | | $ | — | | | | | $ | — | | | | | $ | 2,119,412 | | | | | $ | 5,072,308 | | |
| Forward foreign currency contracts | | | | | — | | | | | | 96 | | | | | | 2,628 | | | | | | 722 | | | | | | 16,163 | | | | | | — | | | | | | 537 | | | | | | 1,246 | | | | | | 141,325 | | | | | | 162,717 | | |
| Total Assets | | | | $ | — | | | | | $ | 96 | | | | | $ | 2,122,054 | | | | | $ | 722 | | | | | $ | 849,633 | | | | | $ | — | | | | | $ | 537 | | | | | $ | 1,246 | | | | | $ | 2,260,737 | | | | | $ | 5,235,025 | | |
| Liabilities: | | | | | | | | | | | | | | | | | | | | | | | | | | | | | | | | | | | | | | | | | | | | | | | | | | | | | | | | | |||||
| Forward foreign currency contracts | | | | $ | — | | | | | $ | 8 | | | | | $ | — | | | | | $ | — | | | | | $ | 5 | | | | | $ | 15,979 | | | | | $ | — | | | | | $ | 536 | | | | | $ | — | | | | | $ | 16,528 | | |
| Written options | | | | | 761,253 | | | | | | — | | | | | | 627,763 | | | | | | — | | | | | | 69,486 | | | | | | — | | | | | | — | | | | | | 1,784,388 | | | | | | — | | | | | | 3,242,890 | | |
| Total Liabilities | | | | $ | 761,253 | | | | | $ | 8 | | | | | $ | 627,763 | | | | | $ | — | | | | | $ | 69,491 | | | | | $ | 15,979 | | | | | $ | — | | | | | $ | 1,784,924 | | | | | $ | — | | | | | $ | 3,259,418 | | |
| Net OTC derivative instruments by counterparty, at fair value | | | | $ | (761,253) | | | | | $ | 88 | | | | | $ | 1,494,291 | | | | | $ | 722 | | | | | $ | 780,142 | | | | | $ | (15,979) | | | | | $ | 537 | | | | | $ | (1,783,678) | | | | | $ | 2,260,737 | | | | | $ | 1,975,607 | | |
| Total collateral pledged by the Fund/(Received from counterparty) | | | | $ | 761,253 | | | | | $ | — | | | | | $ | (1,494,291) | | | | | $ | — | | | | | $ | (780,142) | | | | | $ | — | | | | | $ | — | | | | | $ | 1,290,000 | | | | | $ | (2,260,737) | | | | | $ | (2,483,917) | | |
Net Exposure(1)(2) | | | | $ | — | | | | | $ | 88 | | | | | $ | — | | | | | $ | 722 | | | | | $ | — | | | | | $ | (15,979) | | | | | $ | 537 | | | | | $ | (493,678) | | | | | $ | — | | | | | $ | (508,310) | | |
| | Gross Unrealized Appreciation | | | | $ | 63,182,262 | | |
| | Gross Unrealized Depreciation | | | | | (528,033,442) | | |
| | Net Unrealized Depreciation | | | | $ | (464,851,180) | | |
| Voya Short Term Bond Fund | as of March 31, 2022 |
| Principal Amount† | | | Value | | | Percentage of Net Assets | | |||||||||
| CORPORATE BONDS/NOTES: 42.4% | | |||||||||||||||
| | | | Basic Materials: 0.9% | | ||||||||||||
| 200,000 | | | CF Industries, Inc., 3.450%, 06/01/2023 | | | | $ | 202,925 | | | | | | 0.0 | | |
| 300,000 | | | Freeport-McMoRan, Inc., 3.875%, 03/15/2023 | | | | | 303,649 | | | | | | 0.1 | | |
| 600,000 | | | Freeport-McMoRan, Inc., 4.550%, 11/14/2024 | | | | | 618,963 | | | | | | 0.1 | | |
| 963,000 (1) | | | Georgia-Pacific LLC, 1.750%, 09/30/2025 | | | | | 914,803 | | | | | | 0.2 | | |
| 227,000 | | | Nucor Corp., 2.000%, 06/01/2025 | | | | | 219,984 | | | | | | 0.1 | | |
| 1,007,000 | | | Nutrien Ltd., 3.150%, 10/01/2022 | | | | | 1,011,577 | | | | | | 0.2 | | |
| 900,000 (1) | | | Tronox, Inc., 6.500%, 05/01/2025 | | | | | 931,477 | | | | | | 0.2 | | |
| | | | | | | | | 4,203,378 | | | | | | 0.9 | | |
| | | | Communications: 2.0% | | ||||||||||||
| 230,000 | | | Alibaba Group Holding Ltd., 2.800%, 06/06/2023 | | | | | 229,238 | | | | | | 0.0 | | |
| 160,000 | | | AMC Networks, Inc., 5.000%, 04/01/2024 | | | | | 159,810 | | | | | | 0.0 | | |
| 351,000 | | | AT&T, Inc., 1.700%, 03/25/2026 | | | | | 332,772 | | | | | | 0.1 | | |
| 423,000 | | | AT&T, Inc., 4.050%, 12/15/2023 | | | | | 432,515 | | | | | | 0.1 | | |
| 501,000 | | | Bell Telephone Co. of Canada or Bell Canada/ The, 0.750%, 03/17/2024 | | | | | 483,361 | | | | | | 0.1 | | |
| 759,000 | | | British Telecommunications PLC, 4.500%, 12/04/2023 | | | | | 774,520 | | | | | | 0.2 | | |
| 200,000 | | | CSC Holdings LLC, 5.875%, 09/15/2022 | | | | | 201,821 | | | | | | 0.0 | | |
| 600,000 | | | DISH DBS Corp., 5.875%, 11/15/2024 | | | | | 599,319 | | | | | | 0.1 | | |
| 400,000 | | | Fox Corp., 3.050%, 04/07/2025 | | | | | 400,214 | | | | | | 0.1 | | |
| 626,000 | | | Fox Corp., 4.030%, 01/25/2024 | | | | | 639,460 | | | | | | 0.1 | | |
| 700,000 | | | Motorola Solutions, Inc., 4.000%, 09/01/2024 | | | | | 711,506 | | | | | | 0.2 | | |
| 1,104,000 (1) | | | NTT Finance Corp., 0.583%, 03/01/2024 | | | | | 1,058,990 | | | | | | 0.2 | | |
| 300,000 | | | Sprint Communications, Inc., 6.000%, 11/15/2022 | | | | | 307,122 | | | | | | 0.1 | | |
| 600,000 | | | T-Mobile USA, Inc., 2.625%, 04/15/2026 | | | | | 573,852 | | | | | | 0.1 | | |
| 413,000 | | | T-Mobile USA, Inc., 3.500%, 04/15/2025 | | | | | 416,156 | | | | | | 0.1 | | |
| 300,000 (1) | | | Univision Communications, Inc., 5.125%, 02/15/2025 | | | | | 300,650 | | | | | | 0.1 | | |
| 416,000 | | | Verizon Communications, Inc., 0.850%, 11/20/2025 | | | | | 385,397 | | | | | | 0.1 | | |
| Principal Amount† | | | Value | | | Percentage of Net Assets | | |||||||||
| CORPORATE BONDS/NOTES: (continued) | | |||||||||||||||
| | | | Communications (continued) | | ||||||||||||
| 912,000 | | | Verizon Communications, Inc., 3.500%, 11/01/2024 | | | | $ | 929,125 | | | | | | 0.2 | | |
| 453,000 | | | Walt Disney Co/The, 4.000%, 10/01/2023 | | | | | 462,600 | | | | | | 0.1 | | |
| | | | | | | | | 9,398,428 | | | | | | 2.0 | | |
| | | | Consumer, Cyclical: 5.8% | | ||||||||||||
| 325,000 (1) | | | 7-Eleven, Inc., 0.950%, 02/10/2026 | | | | | 295,807 | | | | | | 0.1 | | |
| 795,959 | | | American Airlines 2015-2 Class A Pass Through Trust, 4.000%, 03/22/2029 | | | | | 735,443 | | | | | | 0.2 | | |
| 47,239 | | | American Airlines 2016-1 Class A Pass Through Trust, 4.100%, 07/15/2029 | | | | | 43,541 | | | | | | 0.0 | | |
| 1,103,479 | | | American Airlines 2016-3 Class A Pass Through Trust, 3.250%, 04/15/2030 | | | | | 990,861 | | | | | | 0.2 | | |
| 544,000 (2) | | | American Axle & Manufacturing, Inc., 6.250%, 03/15/2026 | | | | | 549,402 | | | | | | 0.1 | | |
| 712,000 | | | American Honda Finance Corp., 0.875%, 07/07/2023 | | | | | 700,194 | | | | | | 0.1 | | |
| 160,000 | | | American Honda Finance Corp., 1.300%, 09/09/2026 | | | | | 148,723 | | | | | | 0.0 | | |
| 900,000 (1) | | | Avient Corp., 5.750%, 05/15/2025 | | | | | 925,470 | | | | | | 0.2 | | |
| 252,000 (1) | | | BMW US Capital LLC, 0.800%, 04/01/2024 | | | | | 241,781 | | | | | | 0.1 | | |
| 615,000 (1) | | | BMW US Capital LLC, 3.250%, 04/01/2025 | | | | | 617,694 | | | | | | 0.1 | | |
| 595,000 (1) | | | BMW US Capital LLC, 3.900%, 04/09/2025 | | | | | 607,549 | | | | | | 0.1 | | |
| 900,000 (1) | | | Cedar Fair L.P. / Canada’s Wonderland Co. / Magnum Management Corp. / Millennium Op, 5.500%, 05/01/2025 | | | | | 925,308 | | | | | | 0.2 | | |
| 432,258 | | | Continental Airlines 2012-2 Class A Pass Through Trust, 4.000%, 04/29/2026 | | | | | 431,582 | | | | | | 0.1 | | |
| 870,000 | | | Daimler Finance North America LLC, 3.500%, 04/07/2025 | | | | | 869,043 | | | | | | 0.2 | | |
| 400,000 (1) | | | Dana Financing Luxembourg Sarl, 5.750%, 04/15/2025 | | | | | 404,400 | | | | | | 0.1 | | |
| 338,084 | | | Delta Air Lines 2015-1 Class B Pass Through Trust, 4.250%, 01/30/2025 | | | | | 338,917 | | | | | | 0.1 | | |
| 160,000 | | | Delta Air Lines 2019-1 Class A Pass Through Trust, 3.404%, 10/25/2025 | | | | | 158,926 | | | | | | 0.0 | | |
| Voya Short Term Bond Fund | as of March 31, 2022 (continued) |
| Principal Amount† | | | Value | | | Percentage of Net Assets | | |||||||||
| CORPORATE BONDS/NOTES: (continued) | | |||||||||||||||
| | | | Consumer, Cyclical (continued) | | ||||||||||||
| 127,940 | | | Delta Air Lines 2020-1 Class A Pass Through Trust, 2.500%, 12/10/2029 | | | | $ | 118,890 | | | | | | 0.0 | | |
| 624,000 (1) | | | Delta Air Lines, Inc. / SkyMiles IP Ltd., 4.500%, 10/20/2025 | | | | | 628,116 | | | | | | 0.1 | | |
| 500,000 | | | Ford Motor Credit Co. LLC, 4.389%, 01/08/2026 | | | | | 499,352 | | | | | | 0.1 | | |
| 400,000 | | | Ford Motor Credit Co. LLC, 5.584%, 03/18/2024 | | | | | 411,844 | | | | | | 0.1 | | |
| 861,000 | | | General Motors Financial Co., Inc., 1.700%, 08/18/2023 | | | | | 852,137 | | | | | | 0.2 | | |
| 478,000 (2) | | | General Motors Financial Co., Inc., 2.350%, 02/26/2027 | | | | | 446,552 | | | | | | 0.1 | | |
| 439,000 | | | General Motors Financial Co., Inc., 5.250%, 03/01/2026 | | | | | 460,230 | | | | | | 0.1 | | |
| 543,000 (1) | | | Harley-Davidson Financial Services, Inc., 3.050%, 02/14/2027 | | | | | 517,463 | | | | | | 0.1 | | |
| 900,000 (1) | | | Hilton Domestic Operating Co., Inc., 5.375%, 05/01/2025 | | | | | 921,960 | | | | | | 0.2 | | |
| 274,000 | | | Home Depot, Inc./The, 2.700%, 04/15/2025 | | | | | 273,259 | | | | | | 0.1 | | |
| 644,000 | | | Honda Motor Co. Ltd., 2.534%, 03/10/2027 | | | | | 624,188 | | | | | | 0.1 | | |
| 505,000 (1) | | | Hyundai Capital America, 1.300%, 01/08/2026 | | | | | 463,228 | | | | | | 0.1 | | |
| 900,000 (1) | | | International Game Technology PLC, 4.125%, 04/15/2026 | | | | | 890,293 | | | | | | 0.2 | | |
| 300,000 | | | KB Home, 7.625%, 05/15/2023 | | | | | 309,000 | | | | | | 0.1 | | |
| 800,000 | | | Lennar Corp., 4.500%, 04/30/2024 | | | | | 820,656 | | | | | | 0.2 | | |
| 227,000 | | | Lowe’s Cos, Inc., 3.350%, 04/01/2027 | | | | | 228,583 | | | | | | 0.0 | | |
| 677,000 (1) | | | Magallanes, Inc., 3.755%, 03/15/2027 | | | | | 676,897 | | | | | | 0.1 | | |
| 900,000 (1) | | | Mattel, Inc., 3.375%, 04/01/2026 | | | | | 882,738 | | | | | | 0.2 | | |
| 300,000 | | | MGM Resorts International, 6.000%, 03/15/2023 | | | | | 307,159 | | | | | | 0.1 | | |
| 516,000 (1) | | | Mileage Plus Holdings LLC / Mileage Plus Intellectual Property Assets Ltd., 6.500%, 06/20/2027 | | | | | 538,575 | | | | | | 0.1 | | |
| 574,000 (1) | | | Panasonic Holdings Corp., 2.536%, 07/19/2022 | | | | | 574,838 | | | | | | 0.1 | | |
| Principal Amount† | | | Value | | | Percentage of Net Assets | | |||||||||
| CORPORATE BONDS/NOTES: (continued) | | |||||||||||||||
| | | | Consumer, Cyclical (continued) | | ||||||||||||
| 900,000 | | | Penske Automotive Group, Inc., 3.500%, 09/01/2025 | | | | $ | 894,654 | | | | | | 0.2 | | |
| 1,002,000 | | | Ross Stores, Inc., 4.600%, 04/15/2025 | | | | | 1,042,632 | | | | | | 0.2 | | |
| 250,000 (1) | | | Six Flags Entertainment Corp., 4.875%, 07/31/2024 | | | | | 250,300 | | | | | | 0.1 | | |
| 900,000 (1) | | | Taylor Morrison Communities, Inc. / Taylor Morrison Holdings II, Inc., 5.625%, 03/01/2024 | | | | | 927,216 | | | | | | 0.2 | | |
| 989,000 | | | Toyota Motor Corp., 0.681%, 03/25/2024 | | | | | 955,339 | | | | | | 0.2 | | |
| 400,000 | | | TRI Pointe Group, Inc. / TRI Pointe Homes, Inc., 5.875%, 06/15/2024 | | | | | 416,004 | | | | | | 0.1 | | |
| 12,214 | | | United Airlines 2012-1 Class A Pass Through Trust, 4.150%, 10/11/2025 | | | | | 12,265 | | | | | | 0.0 | | |
| 449,044 | | | United Airlines 2013-1 Class A Pass Through Trust, 4.300%, 02/15/2027 | | | | | 449,119 | | | | | | 0.1 | | |
| 170,802 | | | US Airways 2012-1 Class A Pass Through Trust, 5.900%, 04/01/2026 | | | | | 176,669 | | | | | | 0.0 | | |
| 900,000 (1) | | | William Carter Co/The, 5.500%, 05/15/2025 | | | | | 928,494 | | | | | | 0.2 | | |
| 900,000 (1) | | | Wynn Las Vegas LLC / Wynn Las Vegas Capital Corp., 4.250%, 05/30/2023 | | | | | 898,978 | | | | | | 0.2 | | |
| | | | | | | | | 27,382,269 | | | | | | 5.8 | | |
| | | | Consumer, Non-cyclical: 4.3% | | ||||||||||||
| 939,000 | | | AbbVie, Inc., 2.600%, 11/21/2024 | | | | | 933,371 | | | | | | 0.2 | | |
| 300,000 | | | ADT Security Corp./The, 4.125%, 06/15/2023 | | | | | 303,750 | | | | | | 0.1 | | |
| 683,000 | | | Altria Group, Inc., 2.350%, 05/06/2025 | | | | | 663,889 | | | | | | 0.1 | | |
| 880,000 | | | AmerisourceBergen Corp., 0.737%, 03/15/2023 | | | | | 867,498 | | | | | | 0.2 | | |
| 1,000,000 | | | Anthem, Inc., 2.375%, 01/15/2025 | | | | | 986,936 | | | | | | 0.2 | | |
| 598,000 | | | BAT International Finance PLC, 1.668%, 03/25/2026 | | | | | 549,482 | | | | | | 0.1 | | |
| 244,000 (1) | | | Bausch Health Cos, Inc., 6.125%, 04/15/2025 | | | | | 246,288 | | | | | | 0.1 | | |
| 466,000 (1) | | | Baxter International, Inc., 1.322%, 11/29/2024 | | | | | 445,420 | | | | | | 0.1 | | |
| 363,000 | | | Boston Scientific Corp., 1.900%, 06/01/2025 | | | | | 348,810 | | | | | | 0.1 | | |
| 494,000 | | | Bunge Ltd. Finance Corp., 1.630%, 08/17/2025 | | | | | 468,489 | | | | | | 0.1 | | |
| Voya Short Term Bond Fund | as of March 31, 2022 (continued) |
| Principal Amount† | | | Value | | | Percentage of Net Assets | | |||||||||
| CORPORATE BONDS/NOTES: (continued) | | |||||||||||||||
| | | | Consumer, Non-cyclical (continued) | | ||||||||||||
| 800,000 (2) | | | Cigna Corp., 1.250%, 03/15/2026 | | | | $ | 748,061 | | | | | | 0.2 | | |
| 891,000 | | | Constellation Brands, Inc., 3.200%, 02/15/2023 | | | | | 900,160 | | | | | | 0.2 | | |
| 919,000 | | | Diageo Capital PLC, 1.375%, 09/29/2025 | | | | | 871,361 | | | | | | 0.2 | | |
| 566,000 (1) | | | Element Fleet Management Corp., 3.850%, 06/15/2025 | | | | | 567,280 | | | | | | 0.1 | | |
| 256,000 | | | Gilead Sciences, Inc., 2.500%, 09/01/2023 | | | | | 256,543 | | | | | | 0.1 | | |
| 829,000 | | | Global Payments, Inc., 1.200%, 03/01/2026 | | | | | 764,842 | | | | | | 0.2 | | |
| 900,000 | | | HCA, Inc., 5.875%, 02/15/2026 | | | | | 958,221 | | | | | | 0.2 | | |
| 541,000 (1) | | | Health Care Service Corp. A Mutual Legal Reserve Co., 1.500%, 06/01/2025 | | | | | 515,335 | | | | | | 0.1 | | |
| 366,000 | | | Humana, Inc., 0.650%, 08/03/2023 | | | | | 357,229 | | | | | | 0.1 | | |
| 1,047,000 | | | Illumina, Inc., 0.550%, 03/23/2023 | | | | | 1,027,568 | | | | | | 0.2 | | |
| 529,000 (1) | | | Imperial Brands Finance PLC, 3.750%, 07/21/2022 | | | | | 530,282 | | | | | | 0.1 | | |
| 592,000 | | | Keurig Dr Pepper, Inc., 4.057%, 05/25/2023 | | | | | 602,624 | | | | | | 0.1 | | |
| 539,000 | | | Laboratory Corp. of America Holdings, 3.600%, 02/01/2025 | | | | | 544,870 | | | | | | 0.1 | | |
| 998,000 (1) | | | Mylan, Inc., 3.125%, 01/15/2023 | | | | | 1,002,325 | | | | | | 0.2 | | |
| 203,000 | | | Mylan, Inc., 4.200%, 11/29/2023 | | | | | 206,423 | | | | | | 0.0 | | |
| 382,000 (1) | | | Nestle Holdings, Inc., 1.150%, 01/14/2027 | | | | | 350,520 | | | | | | 0.1 | | |
| 535,000 | | | PerkinElmer, Inc., 0.850%, 09/15/2024 | | | | | 507,999 | | | | | | 0.1 | | |
| 200,000 (1) | | | PRA Health Sciences, Inc., 2.875%, 07/15/2026 | | | | | 190,559 | | | | | | 0.0 | | |
| 144,000 | | | RELX Capital, Inc., 3.500%, 03/16/2023 | | | | | 145,300 | | | | | | 0.0 | | |
| 906,000 | | | Royalty Pharma PLC, 0.750%, 09/02/2023 | | | | | 880,081 | | | | | | 0.2 | | |
| 504,000 (1) | | | S&P Global, Inc., 2.450%, 03/01/2027 | | | | | 491,011 | | | | | | 0.1 | | |
| 1,049,000 (1) | | | Triton Container International Ltd., 1.150%, 06/07/2024 | | | | | 995,856 | | | | | | 0.2 | | |
| 316,000 | | | UnitedHealth Group, Inc., 3.375%, 04/15/2027 | | | | | 321,368 | | ��� | | | | 0.1 | | |
| 594,000 | | | Viatris, Inc., 1.650%, 06/22/2025 | | | | | 553,416 | | | | | | 0.1 | | |
| | | | | | | | | 20,103,167 | | | | | | 4.3 | | |
| Principal Amount† | | | Value | | | Percentage of Net Assets | | |||||||||
| CORPORATE BONDS/NOTES: (continued) | | |||||||||||||||
| | | | Energy: 1.9% | | ||||||||||||
| 375,000 | | | Baker Hughes Holdings LLC / Baker Hughes Co-Obligor, Inc., 2.061%, 12/15/2026 | | | | $ | 357,661 | | | | | | 0.1 | | |
| 571,000 | | | Canadian Natural Resources Ltd., 2.050%, 07/15/2025 | | | | | 548,176 | | | | | | 0.1 | | |
| 300,000 | | | DCP Midstream Operating L.P., 3.875%, 03/15/2023 | | | | | 300,384 | | | | | | 0.1 | | |
| 668,000 | | | Enbridge, Inc., 0.550%, 10/04/2023 | | | | | 647,724 | | | | | | 0.1 | | |
| 1,266,000 | | | Energy Transfer L.P., 4.250%, 03/15/2023 | | | | | 1,280,273 | | | | | | 0.3 | | |
| 900,000 | | | EnLink Midstream Partners L.P., 4.150%, 06/01/2025 | | | | | 898,380 | | | | | | 0.2 | | |
| 243,000 | | | Equinor ASA, 2.875%, 04/06/2025 | | | | | 243,193 | | | | | | 0.0 | | |
| 430,000 | | | Kinder Morgan, Inc., 1.750%, 11/15/2026 | | | | | 400,264 | | | | | | 0.1 | | |
| 252,000 | | | MPLX L.P., 3.500%, 12/01/2022 | | | | | 254,080 | | | | | | 0.1 | | |
| 900,000 | | | Occidental Petroleum Corp., 3.500%, 06/15/2025 | | | | | 903,645 | | | | | | 0.2 | | |
| 347,000 | | | Ovintiv Exploration, Inc., 5.375%, 01/01/2026 | | | | | 368,123 | | | | | | 0.1 | | |
| 160,000 | | | Ovintiv Exploration, Inc., 5.625%, 07/01/2024 | | | | | 168,312 | | | | | | 0.0 | | |
| 497,000 | | | Phillips 66, 3.850%, 04/09/2025 | | | | | 507,472 | | | | | | 0.1 | | |
| 209,000 | | | Pioneer Natural Resources Co., 0.550%, 05/15/2023 | | | | | 204,472 | | | | | | 0.0 | | |
| 449,000 | | | Pioneer Natural Resources Co., 1.125%, 01/15/2026 | | | | | 416,957 | | | | | | 0.1 | | |
| 202,000 (1) | | | Southern Natural Gas Co. LLC, 0.625%, 04/28/2023 | | | | | 198,110 | | | | | | 0.0 | | |
| 300,000 | | | TransCanada PipeLines Ltd., 1.000%, 10/12/2024 | | | | | 285,281 | | | | | | 0.1 | | |
| 34,000 | | | Valero Energy Corp., 2.850%, 04/15/2025 | | | | | 33,629 | | | | | | 0.0 | | |
| 801,000 | | | Williams Cos, Inc./The, 4.550%, 06/24/2024 | | | | | 823,413 | | | | | | 0.2 | | |
| | | | | | | | | 8,839,549 | | | | | | 1.9 | | |
| | | | Financial: 19.4% | | ||||||||||||
| 427,000 | | | AerCap Ireland Capital DAC / AerCap Global Aviation Trust, 1.650%, 10/29/2024 | | | | | 403,620 | | | | | | 0.1 | | |
| 604,000 | | | Ally Financial, Inc., 3.875%, 05/21/2024 | | | | | 611,387 | | | | | | 0.1 | | |
| 329,000 | | | American Express Co., 2.500%, 07/30/2024 | | | | | 327,619 | | | | | | 0.1 | | |
| 1,000,000 | | | American Express Co., 3.700%, 08/03/2023 | | | | | 1,018,676 | | | | | | 0.2 | | |
| Voya Short Term Bond Fund | as of March 31, 2022 (continued) |
| Principal Amount† | | | Value | | | Percentage of Net Assets | | |||||||||
| CORPORATE BONDS/NOTES: (continued) | | |||||||||||||||
| | | | Financial (continued) | | ||||||||||||
| 1,233,000 | | | American International Group, Inc., 3.750%, 07/10/2025 | | | | $ | 1,254,221 | | | | | | 0.3 | | |
| 354,000 | | | American Tower Corp., 3.500%, 01/31/2023 | | | | | 357,442 | | | | | | 0.1 | | |
| 394,000 | | | American Tower Corp., 3.650%, 03/15/2027 | | | | | 393,212 | | | | | | 0.1 | | |
| 766,000 | | | Ameriprise Financial, Inc., 3.000%, 04/02/2025 | | | | | 763,621 | | | | | | 0.2 | | |
| 513,000 | | | Assurant, Inc., 4.200%, 09/27/2023 | | | | | 521,949 | | | | | | 0.1 | | |
| 229,000 (1) | | | Athene Global Funding, 2.550%, 06/29/2025 | | | | | 222,576 | | | | | | 0.0 | | |
| 760,000 (1) | | | Aviation Capital Group LLC, 5.500%, 12/15/2024 | | | | | 782,964 | | | | | | 0.2 | | |
| 517,000 (1) | | | Avolon Holdings Funding Ltd., 4.375%, 05/01/2026 | | | | | 510,839 | | | | | | 0.1 | | |
| 1,000,000 | | | Banco Santander SA, 3.500%, 04/11/2022 | | | | | 1,000,430 | | | | | | 0.2 | | |
| 1,556,000 (3) | | | Bank of America Corp., 0.810%, 10/24/2024 | | | | | 1,506,248 | | | | | | 0.3 | | |
| 1,266,000 (3) | | | Bank of America Corp., 0.976%, 04/22/2025 | | | | | 1,214,328 | | | | | | 0.3 | | |
| 1,372,000 (3) | | | Bank of America Corp., 0.981%, 09/25/2025 | | | | | 1,301,507 | | | | | | 0.3 | | |
| 749,000 (3) | | | Bank of America Corp., 1.530%, 12/06/2025 | | | | | 716,799 | | | | | | 0.1 | | |
| 215,000 (3) | | | Bank of America Corp., 1.658%, 03/11/2027 | | | | | 200,622 | | | | | | 0.0 | | |
| 329,000 (3) | | | Bank of America Corp., 2.015%, 02/13/2026 | | | | | 316,902 | | | | | | 0.1 | | |
| 4,386,000 (3) | | | Bank of America Corp., 3.004%, 12/20/2023 | | | | | 4,398,733 | | | | | | 0.9 | | |
| 502,000 (3) | | | Bank of America Corp., 3.384%, 04/02/2026 | | | | | 501,537 | | | | | | 0.1 | | |
| 437,000 (3) | | | Bank of America Corp., 3.550%, 03/05/2024 | | | | | 439,702 | | | | | | 0.1 | | |
| 419,000 | | | Bank of Nova Scotia/The, 0.550%, 09/15/2023 | | | | | 407,665 | | | | | | 0.1 | | |
| 1,000,000 | | | Bank of Nova Scotia/The, 0.700%, 04/15/2024 | | | | | 959,901 | | | | | | 0.2 | | |
| 534,000 | | | Bank of Nova Scotia/The, 1.450%, 01/10/2025 | | | | | 512,996 | | | | | | 0.1 | | |
| 300,000 | | | Berkshire Hathaway, Inc., 3.125%, 03/15/2026 | | | | | 303,042 | | | | | | 0.1 | | |
| 595,000 (1) | | | BPCE SA, 5.700%, 10/22/2023 | | | | | 615,736 | | | | | | 0.1 | | |
| 1,010,000 | | | Brookfield Finance, Inc., 4.000%, 04/01/2024 | | | | | 1,025,677 | | | | | | 0.2 | | |
| 507,000 | | | Canadian Imperial Bank of Commerce, 0.500%, 12/14/2023 | | | | | 489,868 | | | | | | 0.1 | | |
| Principal Amount† | | | Value | | | Percentage of Net Assets | | |||||||||
| CORPORATE BONDS/NOTES: (continued) | | |||||||||||||||
| | | | Financial (continued) | | ||||||||||||
| 604,000 | | | Canadian Imperial Bank of Commerce, 0.950%, 06/23/2023 | | | | $ | 592,952 | | | | | | 0.1 | | |
| 342,000 (3) | | | Canadian Imperial Bank of Commerce, 2.606%, 07/22/2023 | | | | | 342,111 | | | | | | 0.1 | | |
| 437,000 | | | Canadian Imperial Bank of Commerce, 3.300%, 04/07/2025 | | | | | 436,801 | | | | | | 0.1 | | |
| 430,000 (3) | | | Capital One Financial Corp., 1.878%, 11/02/2027 | | | | | 397,436 | | | | | | 0.1 | | |
| 1,500,000 | | | Capital One Financial Corp., 3.200%, 01/30/2023 | | | | | 1,513,309 | | | | | | 0.3 | | |
| 456,000 (3) | | | Citigroup, Inc., 0.981%, 05/01/2025 | | | | | 435,034 | | | | | | 0.1 | | |
| 366,000 (3) | | | Citigroup, Inc., 1.678%, 05/15/2024 | | | | | 363,197 | | | | | | 0.1 | | |
| 71,000 (3) | | | Citigroup, Inc., 3.106%, 04/08/2026 | | | | | 70,447 | | | | | | 0.0 | | |
| 503,000 | | | Citizens Bank NA/ Providence RI, 3.700%, 03/29/2023 | | | | | 508,930 | | | | | | 0.1 | | |
| 615,000 (1) | | | CNO Global Funding, 1.650%, 01/06/2025 | | | | | 586,220 | | | | | | 0.1 | | |
| 550,000 (1)(3) | | | Cooperatieve Rabobank UA, 1.339%, 06/24/2026 | | | | | 513,925 | | | | | | 0.1 | | |
| 457,000 | | | Corebridge Financial, Inc., 3.650%, 04/05/2027 | | | | | 456,360 | | | | | | 0.1 | | |
| 500,000 (1)(3) | | | Credit Agricole SA/London, 1.907%, 06/16/2026 | | | | | 472,541 | | | | | | 0.1 | | |
| 121,000 | | | Credit Suisse AG/New York NY, 2.950%, 04/09/2025 | | | | | 119,763 | | | | | | 0.0 | | |
| 1,500,000 | | | Credit Suisse AG/New York NY, 3.625%, 09/09/2024 | | | | | 1,518,047 | | | | | | 0.3 | | |
| 338,000 (1)(3) | | | Danske Bank A/S, 3.773%, 03/28/2025 | | | | | 338,872 | | | | | | 0.1 | | |
| 311,000 (1)(3) | | | Danske Bank A/S, 4.298%, 04/01/2028 | | | | | 313,717 | | | | | | 0.1 | | |
| 801,000 (3) | | | Deutsche Bank AG/New York NY, 2.222%, 09/18/2024 | | | | | 783,884 | | | | | | 0.2 | | |
| 853,000 | | | Discover Financial Services, 3.950%, 11/06/2024 | | | | | 868,892 | | | | | | 0.2 | | |
| 561,000 (1)(3) | | | DNB Bank ASA, 2.968%, 03/28/2025 | | | | | 560,714 | | | | | | 0.1 | | |
| 469,000 | | | Equinix, Inc., 1.250%, 07/15/2025 | | | | | 437,763 | | | | | | 0.1 | | |
| 859,000 | | | Federal Realty Investment Trust, 3.950%, 01/15/2024 | | | | | 870,594 | | | | | | 0.2 | | |
| 1,430,000 (1) | | | Federation des Caisses Desjardins du Quebec, 2.050%, 02/10/2025 | | | | | 1,380,749 | | | | | | 0.3 | | |
| Voya Short Term Bond Fund | as of March 31, 2022 (continued) |
| Principal Amount† | | | Value | | | Percentage of Net Assets | | |||||||||
| CORPORATE BONDS/NOTES: (continued) | | |||||||||||||||
| | | | Financial (continued) | | ||||||||||||
| 432,000 (1) | | | Five Corners Funding Trust, 4.419%, 11/15/2023 | | | | $ | 441,719 | | | | | | 0.1 | | |
| 257,000 (3) | | | Goldman Sachs Group, Inc./The, 0.925%, 10/21/2024 | | | | | 249,252 | | | | | | 0.0 | | |
| 319,000 (3) | | | Goldman Sachs Group, Inc./The, 2.640%, 02/24/2028 | | | | | 305,347 | | | | | | 0.1 | | |
| 292,000 | | | Hanover Insurance Group, Inc./The, 4.500%, 04/15/2026 | | | | | 304,148 | | | | | | 0.1 | | |
| 300,000 (1) | | | HAT Holdings I LLC / HAT Holdings II LLC, 3.375%, 06/15/2026 | | | | | 285,415 | | | | | | 0.1 | | |
| 620,000 (3) | | | HSBC Holdings PLC, 0.732%, 08/17/2024 | | | | | 599,963 | | | | | | 0.1 | | |
| 824,000 (3) | | | HSBC Holdings PLC, 1.162%, 11/22/2024 | | | | | 796,115 | | | | | | 0.2 | | |
| 1,000,000 (3) | | | HSBC Holdings PLC, 1.645%, 04/18/2026 | | | | | 941,953 | | | | | | 0.2 | | |
| 567,000 (3) | | | HSBC Holdings PLC, 2.999%, 03/10/2026 | | | | | 556,305 | | | | | | 0.1 | | |
| 900,000 | | | Icahn Enterprises L.P. / Icahn Enterprises Finance Corp., 4.750%, 09/15/2024 | | | | | 905,238 | | | | | | 0.2 | | |
| 535,000 (3) | | | ING Groep NV, 3.869%, 03/28/2026 | | | | | 537,947 | | | | | | 0.1 | | |
| 510,000 | | | Intercontinental Exchange, Inc., 3.450%, 09/21/2023 | | | | | 516,404 | | | | | | 0.1 | | |
| 642,000 (1) | | | Jackson Financial, Inc., 1.125%, 11/22/2023 | | | | | 623,046 | | | | | | 0.1 | | |
| 1,840,000 (3) | | | JPMorgan Chase & Co., 0.824%, 06/01/2025 | | | | | 1,756,005 | | | | | | 0.4 | | |
| 1,120,000 (3) | | | JPMorgan Chase & Co., 0.969%, 06/23/2025 | | | | | 1,070,231 | | | | | | 0.2 | | |
| 578,000 (3) | | | JPMorgan Chase & Co., 1.470%, 09/22/2027 | | | | | 533,318 | | | | | | 0.1 | | |
| 1,411,000 (3) | | | JPMorgan Chase & Co., 1.514%, 06/01/2024 | | | | | 1,392,304 | | | | | | 0.3 | | |
| 273,000 (3) | | | JPMorgan Chase & Co., 1.578%, 04/22/2027 | | | | | 254,540 | | | | | | 0.1 | | |
| 119,000 (3) | | | JPMorgan Chase & Co., 2.083%, 04/22/2026 | | | | | 114,923 | | | | | | 0.0 | | |
| 117,000 (3) | | | JPMorgan Chase & Co., 2.301%, 10/15/2025 | | | | | 114,664 | | | | | | 0.0 | | |
| 519,000 (3) | | | JPMorgan Chase & Co., 2.595%, 02/24/2026 | | | | | 509,357 | | | | | | 0.1 | | |
| 1,721,000 (3) | | | JPMorgan Chase & Co., 2.776%, 04/25/2023 | | | | | 1,721,453 | | | | | | 0.4 | | |
| 1,000,000 (3) | | | JPMorgan Chase & Co., 3.797%, 07/23/2024 | | | | | 1,011,723 | | | | | | 0.2 | | |
| Principal Amount† | | | Value | | | Percentage of Net Assets | | |||||||||
| CORPORATE BONDS/NOTES: (continued) | | |||||||||||||||
| | | | Financial (continued) | | ||||||||||||
| 664,000 (3) | | | Lloyds Banking Group PLC, 0.695%, 05/11/2024 | | | | $ | 647,171 | | | | | | 0.1 | | |
| 491,000 (3) | | | Lloyds Banking Group PLC, 3.870%, 07/09/2025 | | | | | 496,458 | | | | | | 0.1 | | |
| 1,047,000 (1) | | | LSEGA Financing PLC, 0.650%, 04/06/2024 | | | | | 999,743 | | | | | | 0.2 | | |
| 1,024,000 | | | Marsh & McLennan Cos, Inc., 4.050%, 10/15/2023 | | | | | 1,039,336 | | | | | | 0.2 | | |
| 700,000 (1) | | | MGM Growth Properties Operating Partnership L.P. / MGP Finance Co-Issuer, Inc., 4.625%, 06/15/2025 | | | | | 706,275 | | | | | | 0.1 | | |
| 200,000 | | | MGM Growth Properties Operating Partnership L.P. / MGP Finance Co-Issuer, Inc., 5.625%, 05/01/2024 | | | | | 206,220 | | | | | | 0.0 | | |
| 406,000 (3) | | | Mitsubishi UFJ Financial Group, Inc., 0.848%, 09/15/2024 | | | | | 393,687 | | | | | | 0.1 | | |
| 404,000 (3) | | | Mitsubishi UFJ Financial Group, Inc., 0.962%, 10/11/2025 | | | | | 381,155 | | | | | | 0.1 | | |
| 400,000 | | | Mitsubishi UFJ Financial Group, Inc., 1.412%, 07/17/2025 | | | | | 375,174 | | | | | | 0.1 | | |
| 455,000 (3) | | | Mitsubishi UFJ Financial Group, Inc., 2.341%, 01/19/2028 | | | | | 430,451 | | | | | | 0.1 | | |
| 400,000 (3) | | | Mizuho Financial Group, Inc., 0.849%, 09/08/2024 | | | | | 387,946 | | | | | | 0.1 | | |
| 1,037,000 | | | Mizuho Financial Group, Inc., 1.128%, (US0003M + 0.630)%, 05/25/2024 | | | | | 1,037,191 | | | | | | 0.2 | | |
| 200,000 (3) | | | Mizuho Financial Group, Inc., 2.555%, 09/13/2025 | | | | | 196,059 | | | | | | 0.0 | | |
| 1,463,000 (3) | | | Morgan Stanley, 0.790%, 05/30/2025 | | | | | 1,390,972 | | | | | | 0.3 | | |
| 1,683,000 (3) | | | Morgan Stanley, 0.791%, 01/22/2025 | | | | | 1,616,680 | | | | | | 0.3 | | |
| 829,000 (3) | | | Morgan Stanley, 1.164%, 10/21/2025 | | | | | 788,229 | | | | | | 0.2 | | |
| 426,000 (3) | | | Morgan Stanley, 2.475%, 01/21/2028 | | | | | 406,750 | | | | | | 0.1 | | |
| 519,000 (3) | | | Morgan Stanley, 2.630%, 02/18/2026 | | | | | 509,485 | | | | | | 0.1 | | |
| 3,214,000 | | | Morgan Stanley, 3.750%, 02/25/2023 | | | | | 3,266,056 | | | | | | 0.7 | | |
| 329,000 | | | Morgan Stanley, 4.000%, 07/23/2025 | | | | | 337,004 | | | | | | 0.1 | | |
| 487,000 | | | National Bank of Canada, 0.750%, 08/06/2024 | | | | | 462,038 | | | | | | 0.1 | | |
| Voya Short Term Bond Fund | as of March 31, 2022 (continued) |
| Principal Amount† | | | Value | | | Percentage of Net Assets | | |||||||||
| CORPORATE BONDS/NOTES: (continued) | | |||||||||||||||
| | | | Financial (continued) | | ||||||||||||
| 258,000 (1) | | | Nationwide Building Society, 1.500%, 10/13/2026 | | | | $ | 237,034 | | | | | | 0.0 | | |
| 1,200,000 (3) | | | NatWest Group PLC, 2.359%, 05/22/2024 | | | | | 1,190,960 | | | | | | 0.2 | | |
| 403,000 | | | NatWest Group PLC, 3.875%, 09/12/2023 | | | | | 407,270 | | | | | | 0.1 | | |
| 398,000 (3) | | | NatWest Group PLC, 4.269%, 03/22/2025 | | | | | 402,809 | | | | | | 0.1 | | |
| 900,000 | | | Navient Corp., 6.750%, 06/25/2025 | | | | | 925,830 | | | | | | 0.2 | | |
| 403,000 (1) | | | Nordea Bank Abp, 0.625%, 05/24/2024 | | | | | 384,059 | | | | | | 0.1 | | |
| 869,000 (1) | | | Nordea Bank Abp, 4.250%, 09/21/2022 | | | | | 877,630 | | | | | | 0.2 | | |
| 804,000 | | | Old Republic International Corp., 4.875%, 10/01/2024 | | | | | 830,897 | | | | | | 0.2 | | |
| 600,000 | | | OneMain Finance Corp., 6.875%, 03/15/2025 | | | | | 631,560 | | | | | | 0.1 | | |
| 48,000 (1) | | | Owl Rock Technology Finance Corp., 6.750%, 06/30/2025 | | | | | 50,485 | | | | | | 0.0 | | |
| 198,000 (1) | | | Pacific Life Global Funding II, 1.200%, 06/24/2025 | | | | | 185,497 | | | | | | 0.0 | | |
| 255,000 (1) | | | Pacific Life Global Funding II, 1.375%, 04/14/2026 | | | | | 237,478 | | | | | | 0.0 | | |
| 600,000 | | | Royal Bank of Canada, 1.150%, 06/10/2025 | | | | | 566,908 | | | | | | 0.1 | | |
| 275,000 | | | Royal Bank of Canada, 1.150%, 07/14/2026 | | | | | 252,472 | | | | | | 0.1 | | |
| 533,000 (2) | | | Royal Bank of Canada, 1.600%, 01/21/2025 | | | | | 512,709 | | | | | | 0.1 | | |
| 210,000 | | | Royal Bank of Canada, 1.627%, (US0003M + 0.660)%, 10/05/2023 | | | | | 211,274 | | | | | | 0.0 | | |
| 391,000 | | | Royal Bank of Canada, 3.700%, 10/05/2023 | | | | | 398,272 | | | | | | 0.1 | | |
| 411,000 | | | Royal Bank of Canada, 4.650%, 01/27/2026 | | | | | 428,825 | | | | | | 0.1 | | |
| 315,000 (1) | | | Scentre Group Trust 1 / Scentre Group Trust 2, 3.625%, 01/28/2026 | | | | | 316,763 | | | | | | 0.1 | | |
| 506,000 | | | Sixth Street Specialty Lending, Inc., 3.875%, 11/01/2024 | | | | | 504,716 | | | | | | 0.1 | | |
| 810,000 (1) | | | Skandinaviska Enskilda Banken AB, 0.650%, 09/09/2024 | | | | | 766,102 | | | | | | 0.2 | | |
| 544,000 (1)(3) | | | Societe Generale SA, 2.226%, 01/21/2026 | | | | | 516,954 | | | | | | 0.1 | | |
| Principal Amount† | | | Value | | | Percentage of Net Assets | | |||||||||
| CORPORATE BONDS/NOTES: (continued) | | |||||||||||||||
| | | | Financial (continued) | | ||||||||||||
| 1,000,000 (1)(3) | | | Standard Chartered PLC, 0.991%, 01/12/2025 | | | | $ | 955,977 | | | | | | 0.2 | | |
| 327,000 (1)(3) | | | Standard Chartered PLC, 2.608%, 01/12/2028 | | | | | 306,083 | | | | | | 0.1 | | |
| 572,000 (1) | | | Standard Chartered PLC, 3.950%, 01/11/2023 | | | | | 575,114 | | | | | | 0.1 | | |
| 950,000 (1) | | | Starwood Property Trust, Inc., 3.625%, 07/15/2026 | | | | | 908,404 | | | | | | 0.2 | | |
| 450,000 (1) | | | Starwood Property Trust, Inc., 3.750%, 12/31/2024 | | | | | 437,110 | | | | | | 0.1 | | |
| 440,000 | | | Sumitomo Mitsui Financial Group, Inc., 2.348%, 01/15/2025 | | | | | 427,982 | | | | | | 0.1 | | |
| 750,000 | | | Sumitomo Mitsui Financial Group, Inc., 2.696%, 07/16/2024 | | | | | 743,303 | | | | | | 0.2 | | |
| 535,000 (1) | | | Sumitomo Mitsui Trust Bank Ltd., 0.800%, 09/16/2024 | | | | | 505,411 | | | | | | 0.1 | | |
| 1,000,000 (1) | | | Swedbank AB, 0.600%, 09/25/2023 | | | | | 970,139 | | | | | | 0.2 | | |
| 447,000 (1) | | | Swedbank AB, 3.356%, 04/04/2025 | | | | | 448,677 | | | | | | 0.1 | | |
| 535,000 | | | Toronto-Dominion Bank/The, 0.700%, 09/10/2024 | | | | | 508,203 | | | | | | 0.1 | | |
| 533,000 (2) | | | Toronto-Dominion Bank/The, 1.450%, 01/10/2025 | | | | | 511,032 | | | | | | 0.1 | | |
| 282,000 | | | Toronto-Dominion Bank/The, 2.800%, 03/10/2027 | | | | | 277,258 | | | | | | 0.1 | | |
| 515,000 (1) | | | UBS AG/London, 0.700%, 08/09/2024 | | | | | 488,600 | | | | | | 0.1 | | |
| 1,000,000 (1)(3) | | | UBS Group AG, 1.008%, 07/30/2024 | | | | | 973,227 | | | | | | 0.2 | | |
| 900,000 (1) | | | VICI Properties L.P. / VICI Note Co., Inc., 3.500%, 02/15/2025 | | | | | 888,080 | | | | | | 0.2 | | |
| 1,600,000 (3) | | | Wells Fargo & Co., 2.406%, 10/30/2025 | | | | | 1,567,304 | | | | | | 0.3 | | |
| 54,000 | | | Wells Fargo & Co., 4.125%, 08/15/2023 | | | | | 55,222 | | | | | | 0.0 | | |
| 828,000 | | | XLIT Ltd., 4.450%, 03/31/2025 | | | | | 851,759 | | | | | | 0.2 | | |
| | | | | | | | | 91,812,916 | | | | | | 19.4 | | |
| | | | Industrial: 2.5% | | ||||||||||||
| 300,000 | | | Ball Corp., 4.000%, 11/15/2023 | | | | | 303,359 | | | | | | 0.1 | | |
| 600,000 | | | Ball Corp., 4.875%, 03/15/2026 | | | | | 622,200 | | | | | | 0.1 | | |
| 830,000 | | | Boeing Co/The, 4.875%, 05/01/2025 | | | | | 857,078 | | | | | | 0.2 | | |
| 900,000 (1) | | | Brundage-Bone Concrete Pumping Holdings, Inc., 6.000%, 02/01/2026 | | | | | 867,452 | | | | | | 0.2 | | |
| Voya Short Term Bond Fund | as of March 31, 2022 (continued) |
| Principal Amount† | | | Value | | | Percentage of Net Assets | | |||||||||
| CORPORATE BONDS/NOTES: (continued) | | |||||||||||||||
| | | | Industrial (continued) | | ||||||||||||
| 505,000 | | | General Dynamics Corp., 3.250%, 04/01/2025 | | | | $ | 510,782 | | | | | | 0.1 | | |
| 433,000 (1) | | | Graphic Packaging International LLC, 0.821%, 04/15/2024 | | | | | 411,854 | | | | | | 0.1 | | |
| 665,000 (1) | | | Huntington Ingalls Industries, Inc., 0.670%, 08/16/2023 | | | | | 645,608 | | | | | | 0.1 | | |
| 202,000 | | | John Deere Capital Corp., 2.125%, 03/07/2025 | | | | | 198,941 | | | | | | 0.0 | | |
| 151,000 | | | John Deere Capital Corp., 2.350%, 03/08/2027 | | | | | 147,078 | | | | | | 0.0 | | |
| 597,000 (1) | | | Owens-Brockway Glass Container, Inc., 5.875%, 08/15/2023 | | | | | 610,940 | | | | | | 0.1 | | |
| 705,000 | | | Raytheon Technologies Corp., 3.200%, 03/15/2024 | | | | | 713,101 | | | | | | 0.2 | | |
| 669,000 | | | Raytheon Technologies Corp., 3.700%, 12/15/2023 | | | | | 680,769 | | | | | | 0.1 | | |
| 700,000 | | | Republic Services, Inc., 2.500%, 08/15/2024 | | | | | 693,142 | | | | | | 0.2 | | |
| 300,000 (1) | | | Sealed Air Corp., 5.250%, 04/01/2023 | | | | | 304,125 | | | | | | 0.1 | | |
| 600,000 (1) | | | Sealed Air Corp., 5.500%, 09/15/2025 | | | | | 629,442 | | | | | | 0.1 | | |
| 515,000 (1) | | | Siemens Financieringsmaatschappij NV, 0.650%, 03/11/2024 | | | | | 496,510 | | | | | | 0.1 | | |
| 200,000 (1) | | | SMBC Aviation Capital Finance DAC, 1.900%, 10/15/2026 | | | | | 179,004 | | | | | | 0.0 | | |
| 426,000 | | | Sonoco Products Co., 2.250%, 02/01/2027 | | | | | 404,051 | | | | | | 0.1 | | |
| 829,000 | | | Teledyne Technologies, Inc., 0.950%, 04/01/2024 | | | | | 796,381 | | | | | | 0.2 | | |
| 900,000 (1) | | | TransDigm, Inc., 8.000%, 12/15/2025 | | | | | 942,219 | | | | | | 0.2 | | |
| 900,000 (1) | | | WESCO Distribution, Inc., 7.125%, 06/15/2025 | | | | | 937,269 | | | | | | 0.2 | | |
| | | | | | | | | 11,951,305 | | | | | | 2.5 | | |
| | | | Technology: 2.1% | | ||||||||||||
| 900,000 | | | CDW LLC / CDW Finance Corp., 5.500%, 12/01/2024 | | | | | 932,535 | | | | | | 0.2 | | |
| 332,000 (1) | | | CGI, Inc., 1.450%, 09/14/2026 | | | | | 305,493 | | | | | | 0.1 | | |
| 992,000 | | | Fidelity National Information Services, Inc., 0.600%, 03/01/2024 | | | | | 950,360 | | | | | | 0.2 | | |
| 941,000 | | | Fiserv, Inc., 2.750%, 07/01/2024 | | | | | 938,838 | | | | | | 0.2 | | |
| 954,000 | | | HP, Inc., 2.200%, 06/17/2025 | | | | | 921,158 | | | | | | 0.2 | | |
| 441,000 | | | Intel Corp., 3.700%, 07/29/2025 | | | | | 451,983 | | | | | | 0.1 | | |
| Principal Amount† | | | Value | | | Percentage of Net Assets | | |||||||||
| CORPORATE BONDS/NOTES: (continued) | | |||||||||||||||
| | | | Technology (continued) | | ||||||||||||
| 505,000 (1) | | | Kyndryl Holdings, Inc., 2.050%, 10/15/2026 | | | | $ | 451,596 | | | | | | 0.1 | | |
| 900,000 | | | Microchip Technology, Inc., 4.250%, 09/01/2025 | | | | | 911,598 | | | | | | 0.2 | | |
| 909,000 | | | NetApp, Inc., 1.875%, 06/22/2025 | | | | | 870,272 | | | | | | 0.2 | | |
| 832,000 (1) | | | NXP BV / NXP Funding LLC / NXP USA, Inc., 2.700%, 05/01/2025 | | | | | 807,310 | | | | | | 0.2 | | |
| 447,000 | | | Oracle Corp., 1.650%, 03/25/2026 | | | | | 417,412 | | | | | | 0.1 | | |
| 282,000 | | | Oracle Corp., 2.500%, 04/01/2025 | | | | | 275,691 | | | | | | 0.0 | | |
| 570,000 | | | Oracle Corp., 2.650%, 07/15/2026 | | | | | 547,330 | | | | | | 0.1 | | |
| 703,000 | | | VMware, Inc., 1.000%, 08/15/2024 | | | | | 670,884 | | | | | | 0.1 | | |
| 395,000 | | | VMware, Inc., 4.500%, 05/15/2025 | | | | | 407,314 | | | | | | 0.1 | | |
| 262,000 | | | Workday, Inc., 3.500%, 04/01/2027 | | | | | 262,110 | | | | | | 0.0 | | |
| | | | | | | | | 10,121,884 | | | | | | 2.1 | | |
| | | | Utilities: 3.5% | | ||||||||||||
| 467,000 (1) | | | AEP Texas, Inc., 3.850%, 10/01/2025 | | | | | 472,405 | | | | | | 0.1 | | |
| 360,000 | | | AES Corp./The, 1.375%, 01/15/2026 | | | | | 331,514 | | | | | | 0.1 | | |
| 269,000 (1) | | | AES Corp./The, 3.300%, 07/15/2025 | | | | | 264,490 | | | | | | 0.1 | | |
| 497,000 | | | American Electric Power Co., Inc., 0.750%, 11/01/2023 | | | | | 481,808 | | | | | | 0.1 | | |
| 507,000 | | | American Electric Power Co., Inc., 2.031%, 03/15/2024 | | | | | 498,567 | | | | | | 0.1 | | |
| 258,000 (1) | | | Aquarion Co., 4.000%, 08/15/2024 | | | | | 261,006 | | | | | | 0.1 | | |
| 152,000 | | | Arizona Public Service Co., 3.350%, 06/15/2024 | | | | | 152,733 | | | | | | 0.0 | | |
| 602,000 | | | Atmos Energy Corp., 0.625%, 03/09/2023 | | | | | 593,350 | | | | | | 0.1 | | |
| 282,000 | | | Avangrid, Inc., 3.200%, 04/15/2025 | | | | | 281,425 | | | | | | 0.1 | | |
| 363,000 | | | Black Hills Corp., 1.037%, 08/23/2024 | | | | | 346,833 | | | | | | 0.1 | | |
| 282,000 | | | Connecticut Light and Power Co/The, 0.750%, 12/01/2025 | | | | | 259,398 | | | | | | 0.0 | | |
| 955,000 (1) | | | Dominion Energy, Inc., 2.450%, 01/15/2023 | | | | | 955,771 | | | | | | 0.2 | | |
| 242,000 | | | Duke Energy Progress LLC, 3.375%, 09/01/2023 | | | | | 244,898 | | | | | | 0.0 | | |
| 930,000 (1) | | | East Ohio Gas Co/The, 1.300%, 06/15/2025 | | | | | 878,731 | | | | | | 0.2 | | |
| Voya Short Term Bond Fund | as of March 31, 2022 (continued) |
| Principal Amount† | | | Value | | | Percentage of Net Assets | | |||||||||
| CORPORATE BONDS/NOTES: (continued) | | |||||||||||||||
| | | | Utilities (continued) | | ||||||||||||
| 463,000 | | | Entergy Arkansas LLC, 3.050%, 06/01/2023 | | | | $ | 462,844 | | | | | | 0.1 | | |
| 835,000 | | | Entergy Corp., 0.900%, 09/15/2025 | | | | | 766,669 | | | | | | 0.2 | | |
| 640,000 | | | Entergy Louisiana LLC, 0.950%, 10/01/2024 | | | | | 610,454 | | | | | | 0.1 | | |
| 145,000 | | | Entergy Louisiana LLC, 3.300%, 12/01/2022 | | | | | 145,986 | | | | | | 0.0 | | |
| 160,000 | | | Entergy Louisiana LLC, 4.050%, 09/01/2023 | | | | | 163,202 | | | | | | 0.0 | | |
| 303,000 | | | Eversource Energy, 2.900%, 03/01/2027 | | | | | 297,416 | | | | | | 0.1 | | |
| 478,000 | | | Interstate Power and Light Co., 3.250%, 12/01/2024 | | | | | 480,553 | | | | | | 0.1 | | |
| 317,000 | | | IPALCO Enterprises, Inc., 3.700%, 09/01/2024 | | | | | 318,086 | | | | | | 0.1 | | |
| 465,000 | | | National Rural Utilities Cooperative Finance Corp., 1.000%, 10/18/2024 | | | | | 443,710 | | | | | | 0.1 | | |
| 376,000 | | | National Rural Utilities Cooperative Finance Corp., 1.875%, 02/07/2025 | | | | | 364,647 | | | | | | 0.1 | | |
| 536,000 | | | NextEra Energy Capital Holdings, Inc., 1.875%, 01/15/2027 | | | | | 503,562 | | | | | | 0.1 | | |
| 443,000 (1) | | | Niagara Mohawk Power Corp., 2.721%, 11/28/2022 | | | | | 445,762 | | | | | | 0.1 | | |
| 559,000 | | | NiSource, Inc., 0.950%, 08/15/2025 | | | | | 514,331 | | | | | | 0.1 | | |
| 883,000 | | | OGE Energy Corp., 0.703%, 05/26/2023 | | | | | 865,397 | | | | | | 0.2 | | |
| 260,000 | | | Oncor Electric Delivery Co. LLC, 2.750%, 06/01/2024 | | | | | 258,069 | | | | | | 0.0 | | |
| 180,000 | | | Public Service Electric and Gas Co., 3.750%, 03/15/2024 | | | | | 182,312 | | | | | | 0.0 | | |
| 282,000 | | | Public Service Enterprise Group, Inc., 0.800%, 08/15/2025 | | | | | 260,332 | | | | | | 0.1 | | |
| 740,000 | | | Southern Co. Gas Capital Corp., 2.450%, 10/01/2023 | | | | | 737,477 | | | | | | 0.2 | | |
| 255,000 | | | Southern Co. Gas Capital Corp., 3.250%, 06/15/2026 | | | | | 254,070 | | | | | | 0.0 | | |
| 1,378,000 | | | Southern Co/The, 0.600%, 02/26/2024 | | | | | 1,325,479 | | | | | | 0.3 | | |
| 826,000 | | | WEC Energy Group, Inc., 0.550%, 09/15/2023 | | | | | 802,710 | | | | | | 0.2 | | |
| 150,000 | | | Wisconsin Power and Light Co., 2.250%, 11/15/2022 | | | | | 150,182 | | | | | | 0.0 | | |
| | | | | | | | | 16,376,179 | | | | | | 3.5 | | |
| Principal Amount† | | | Value | | | Percentage of Net Assets | | |||||||||
| CORPORATE BONDS/NOTES: (continued) | | |||||||||||||||
| | | | Utilities (continued) | | ||||||||||||
| | | | Total Corporate Bonds/Notes (Cost $207,185,811) | | | | $ | 200,189,075 | | | | | | 42.4 | | |
| COLLATERALIZED MORTGAGE OBLIGATIONS: 6.6% | | |||||||||||||||
| 220,396 | | | Fannie Mae Connecticut Avenue Securities 2016-C05 2M2, 4.907%, (US0001M + 4.450)%, 01/25/2029 | | | | | 229,032 | | | | | | 0.1 | | |
| 317,479 | | | Fannie Mae Connecticut Avenue Securities 2016-C07 2M2, 4.807%, (US0001M + 4.350)%, 05/25/2029 | | | | | 331,094 | | | | | | 0.1 | | |
| 430,634 | | | Fannie Mae Connecticut Avenue Securities 2017-C03 1M2, 3.457%, (US0001M + 3.000)%, 10/25/2029 | | | | | 440,089 | | | | | | 0.1 | | |
| 387,693 | | | Fannie Mae Connecticut Avenue Securities 2017-C07 1M2, 2.857%, (US0001M + 2.400)%, 05/25/2030 | | | | | 392,572 | | | | | | 0.1 | | |
| 1,289,012 | | | Fannie Mae Connecticut Avenue Securities 2018-C03 1M2, 2.607%, (US0001M + 2.150)%, 10/25/2030 | | | | | 1,295,079 | | | | | | 0.3 | | |
| 199,626 | | | Fannie Mae Connecticut Avenue Securities 2018-C06 2M2, 2.557%, (US0001M + 2.100)%, 03/25/2031 | | | | | 199,328 | | | | | | 0.0 | | |
| 349,269 (1) | | | Fannie Mae Connecticut Avenue Securities Trust 2019-R06 2M2, 2.557%, (US0001M + 2.100)%, 09/25/2039 | | | | | 349,245 | | | | | | 0.1 | | |
| 88,737 | | | Fannie Mae Interest Strip Series 404 8, 3.000%, 05/25/2040 | | | | | 88,068 | | | | | | 0.0 | | |
| 10,188 | | | Fannie Mae REMIC Trust 2010-137 XP, 4.500%, 10/25/2040 | | | | | 10,268 | | | | | | 0.0 | | |
| 70,324 | | | Fannie Mae REMIC Trust 2010-54 LC, 3.000%, 04/25/2040 | | | | | 69,303 | | | | | | 0.0 | | |
| 2,365,187 | | | Fannie Mae REMICS 2006-85 PF, 0.837%, (US0001M + 0.380)%, 09/25/2036 | | | | | 2,370,235 | | | | | | 0.5 | | |
| Voya Short Term Bond Fund | as of March 31, 2022 (continued) |
| Principal Amount† | | | Value | | | Percentage of Net Assets | | |||||||||
| COLLATERALIZED MORTGAGE OBLIGATIONS: (continued) | | |||||||||||||||
| 496,338 | | | Fannie Mae REMICS 2013-114 NA, 3.000%, 08/25/2032 | | | | $ | 492,790 | | | | | | 0.1 | | |
| 1,176,695 | | | Freddie Mac 3049 XF, 0.747%, (US0001M + 0.350)%, 05/15/2033 | | | | | 1,177,493 | | | | | | 0.3 | | |
| 161,032 | | | Freddie Mac REMIC Trust 2103 TE, 6.000%, 12/15/2028 | | | | | 173,489 | | | | | | 0.0 | | |
| 555,521 | | | Freddie Mac REMICS 3255 FA, 0.677%, (US0001M + 0.280)%, 12/15/2036 | | | | | 554,244 | | | | | | 0.1 | | |
| 35,820 | | | Freddie Mac REMICS 3747 FA, 0.897%, (US0001M + 0.500)%, 10/15/2040 | | | | | 36,091 | | | | | | 0.0 | | |
| 15,714 | | | Freddie Mac REMICS 3878 FA, 0.747%, (US0001M + 0.350)%, 04/15/2041 | | | | | 15,716 | | | | | | 0.0 | | |
| 1,418,453 (1) | | | Freddie Mac STACR 2019-HQA3 M2, 2.307%, (US0001M + 1.850)%, 09/25/2049 | | | | | 1,417,487 | | | | | | 0.3 | | |
| 25,405 (1) | | | Freddie Mac STACR REMIC Trust 2020-HQA3 M2, 4.057%, (US0001M + 3.600)%, 07/25/2050 | | | | | 25,441 | | | | | | 0.0 | | |
| 1,400,000 (1) | | | Freddie Mac STACR REMIC Trust 2021-HQA1 M2, 2.349%, (SOFR30A + 2.250)%, 08/25/2033 | | | | | 1,347,348 | | | | | | 0.3 | | |
| 100,000 (1) | | | Freddie Mac Stacr Trust 2018-HQA2 M2, 2.757%, (US0001M + 2.300)%, 10/25/2048 | | | | | 99,879 | | | | | | 0.0 | | |
| 314,727 (1) | | | Freddie Mac Structured Agency Credit Risk Debt Notes 2020-HQA5 M2, 2.699%, (SOFR30A + 2.600)%, 11/25/2050 | | | | | 314,587 | | | | | | 0.1 | | |
| 4,533,739 | | | Ginnie Mae 2015-H32 FH, 0.766%, (US0001M + 0.660)%, 12/20/2065 | | | | | 4,541,600 | | | | | | 1.0 | | |
| 500,589 | | | Ginnie Mae Series 2010-H03 FA, 0.781%, (US0001M + 0.550)%, 03/20/2060 | | | | | 499,952 | | | | | | 0.1 | | |
| 43,158 | | | Ginnie Mae Series 2010-H10 FC, 1.231%, (US0001M + 1.000)%, 05/20/2060 | | | | | 43,415 | | | | | | 0.0 | | |
| 2,249,580 | | | Ginnie Mae Series 2010-H11 FA, 1.231%, (US0001M + 1.000)%, 06/20/2060 | | | | | 2,267,271 | | | | | | 0.5 | | |
| Principal Amount† | | | Value | | | Percentage of Net Assets | | |||||||||
| COLLATERALIZED MORTGAGE OBLIGATIONS: (continued) | | |||||||||||||||
| 94,375 | | | Ginnie Mae Series 2011-H03 FA, 0.606%, (US0001M + 0.500)%, 01/20/2061 | | | | $ | 94,160 | | | | | | 0.0 | | |
| 88,831 | | | Ginnie Mae Series 2011-H05 FA, 0.606%, (US0001M + 0.500)%, 12/20/2060 | | | | | 88,628 | | | | | | 0.0 | | |
| 121,139 | | | Ginnie Mae Series 2011-H05 FB, 0.606%, (US0001M + 0.500)%, 12/20/2060 | | | | | 120,854 | | | | | | 0.0 | | |
| 627,889 | | | Ginnie Mae Series 2011-H06 FA, 0.556%, (US0001M + 0.450)%, 02/20/2061 | | | | | 625,851 | | | | | | 0.1 | | |
| 76,997 | | | Ginnie Mae Series 2011-H07 FA, 0.606%, (US0001M + 0.500)%, 02/20/2061 | | | | | 76,830 | | | | | | 0.0 | | |
| 143,583 | | | Ginnie Mae Series 2011-H08 FD, 0.606%, (US0001M + 0.500)%, 02/20/2061 | | | | | 143,248 | | | | | | 0.0 | | |
| 517,170 | | | Ginnie Mae Series 2011-H08 FG, 0.586%, (US0001M + 0.480)%, 03/20/2061 | | | | | 515,790 | | | | | | 0.1 | | |
| 774,007 | | | Ginnie Mae Series 2011-H09 AF, 0.606%, (US0001M + 0.500)%, 03/20/2061 | | | | | 772,266 | | | | | | 0.2 | | |
| 58,590 | | | Ginnie Mae Series 2011-H11 FB, 0.606%, (US0001M + 0.500)%, 04/20/2061 | | | | | 58,461 | | | | | | 0.0 | | |
| 204,154 | | | Ginnie Mae Series 2012-H18 NA, 0.626%, (US0001M + 0.520)%, 08/20/2062 | | | | | 204,133 | | | | | | 0.0 | | |
| 1,410,452 | | | Ginnie Mae Series 2012-H23 SA, 0.636%, (US0001M + 0.530)%, 10/20/2062 | | | | | 1,416,874 | | | | | | 0.3 | | |
| 1,145,846 | | | Ginnie Mae Series 2012-H23 WA, 0.626%, (US0001M + 0.520)%, 10/20/2062 | | | | | 1,143,771 | | | | | | 0.2 | | |
| 409,111 | | | Ginnie Mae Series 2014-3 EP, 2.750%, 02/16/2043 | | | | | 405,196 | | | | | | 0.1 | | |
| 261,602 (3) | | | Ginnie Mae Series 2014-53 JM, 7.021%, 04/20/2039 | | | | | 285,302 | | | | | | 0.1 | | |
| 4,267,657 | | | Ginnie Mae Series 2016-H16 FE, 0.627%, (US0012M + 0.380)%, 06/20/2066 | | | | | 4,229,027 | | | | | | 0.9 | | |
| 1,501,074 | | | Ginnie Mae Series 2017-H06 FE, 0.656%, (US0001M + 0.550)%, 02/20/2067 | | | | | 1,499,228 | | | | | | 0.3 | | |
| 870,570 | | | Ginnie Mae Series 2017-H07 FG, 0.566%, (US0001M + 0.460)%, 02/20/2067 | | | | | 867,961 | | | | | | 0.2 | | |
| Voya Short Term Bond Fund | as of March 31, 2022 (continued) |
| Principal Amount† | | | Value | | | Percentage of Net Assets | | |||||||||
| COLLATERALIZED MORTGAGE OBLIGATIONS: (continued) | | |||||||||||||||
| 150,000 (1) | | | Mello Warehouse Securitization Trust 2020-2 A, 1.257%, (US0001M + 0.800)%, 11/25/2053 | | | | $ | 149,575 | | | | | | 0.0 | | |
| | | | Total Collateralized Mortgage Obligations (Cost $31,720,683) | | | | | 31,478,271 | | | | | | 6.6 | | |
| U.S. TREASURY OBLIGATIONS: 13.7% | | |||||||||||||||
| | | | U.S. Treasury Notes: 13.7% | | ||||||||||||
| 14,314,000 | | | 0.125%, 03/31/2023 | | | | | 14,091,599 | | | | | | 3.0 | | |
| 1,257,500 (2) | | | 0.875%, 01/31/2024 | | | | | 1,225,670 | | | | | | 0.3 | | |
| 194,000 (2) | | | 1.500%, 02/29/2024 | | | | | 191,189 | | | | | | 0.1 | | |
| 118,400 (2) | | | 1.500%, 01/31/2027 | | | | | 113,164 | | | | | | 0.0 | | |
| 38,296,000 | | | 1.750%, 03/15/2025 | | | | | 37,487,665 | | | | | | 7.9 | | |
| 104,000 (2) | | | 1.875%, 02/28/2027 | | | | | 101,229 | | | | | | 0.0 | | |
| 11,346,000 | | | 2.250%, 03/31/2024 | | | | | 11,331,153 | | | | | | 2.4 | | |
| 112,000 | | | 2.500%, 03/31/2027 | | | | | 112,254 | | | | | | 0.0 | | |
| | | | Total U.S. Treasury Obligations (Cost $65,034,189) | | | | | 64,653,923 | | | | | | 13.7 | | |
| COMMERCIAL MORTGAGE-BACKED SECURITIES: 11.5% | | |||||||||||||||
| 604,500 (1) | | | AREIT 2019-CRE3 C Trust, 2.065%, (SOFR30A + 2.014)%, 09/14/2036 | | | | | 600,598 | | | | | | 0.1 | | |
| 5,000,000 (1) | | | Atrium Hotel Portfolio Trust 2018-ATRM D, 2.697%, (US0001M + 2.300)%, 06/15/2035 | | | | | 4,861,156 | | | | | | 1.0 | | |
| 4,000,000 (1) | | | BBCMS Trust 2021-AGW E, 3.547%, (US0001M + 3.150)%, 06/15/2036 | | | | | 3,920,016 | | | | | | 0.8 | | |
| 1,000,000 (1) | | | BDS 2018-FL8 E, 2.718%, (US0001M + 2.250)%, 01/18/2036 | | | | | 985,132 | | | | | | 0.2 | | |
| 2,917,000 (1) | | | BHMS 2018-ATLS C, 2.297%, (US0001M + 1.900)%, 07/15/2035 | | | | | 2,871,496 | | | | | | 0.6 | | |
| 2,500,000 (1) | | | BX Trust 2021-VIEW E, 3.997%, (US0001M + 3.600)%, 06/15/2023 | | | | | 2,421,491 | | | | | | 0.5 | | |
| 733,000 (1)(3) | | | Century Plaza Towers 2019-CPT B, 2.997%, 11/13/2039 | | | | | 682,431 | | | | | | 0.1 | | |
| 500,000 (1)(3) | | | Century Plaza Towers 2019-CPT C, 2.997%, 11/13/2039 | | | | | 457,149 | | | | | | 0.1 | | |
| 225,000 (1)(3) | | | Century Plaza Towers 2019-CPT D, 2.997%, 11/13/2039 | | | | | 199,183 | | | | | | 0.0 | | |
| Principal Amount† | | | Value | | | Percentage of Net Assets | | |||||||||
| COMMERCIAL MORTGAGE-BACKED SECURITIES: (continued) | | |||||||||||||||
| 360,000 (1) | | | CGDB Commercial Mortgage Trust 2019-MOB F, 2.947%, (US0001M + 2.550)%, 11/15/2036 | | | | $ | 346,367 | | | | | | 0.1 | | |
| 2,508,000 (1) | | | CLNY Trust 2019-IKPR C, 2.073%, (US0001M + 1.676)%, 11/15/2038 | | | | | 2,464,806 | | | | | | 0.5 | | |
| 2,000,000 (1)(3) | | | COMM 2013-CCRE11 C Mortgage Trust, 5.119%, 08/10/2050 | | | | | 2,021,695 | | | | | | 0.4 | | |
| 120,000 (1)(3) | | | COMM 2013-CR10 E Mortgage Trust, 4.901%, 08/10/2046 | | | | | 114,337 | | | | | | 0.0 | | |
| 380,000 (1)(3) | | | COMM 2013-SFS A2 Mortgage Trust, 2.988%, 04/12/2035 | | | | | 378,294 | | | | | | 0.1 | | |
| 856,221 (1) | | | CSWF 2021-SOP2 D, 2.713%, (US0001M + 2.317)%, 06/15/2034 | | | | | 830,806 | | | | | | 0.2 | | |
| 2,200,000 (1)(4) | | | FREMF 2019-KG01 C Mortgage Trust, 0.000%, 05/25/2029 | | | | | 1,345,780 | | | | | | 0.3 | | |
| 548,000 (1) | | | GAM Re-REMIC Trust 2021-FRR1 1B, 0.800%, 11/29/2050 | | | | | 435,396 | | | | | | 0.1 | | |
| 710,000 (1) | | | GAM Re-REMIC Trust 2021-FRR1 2B, 1.070%, 11/29/2050 | | | | | 522,249 | | | | | | 0.1 | | |
| 10,734 | | | Ginnie Mae 2015-183 AC, 2.350%, 07/16/2056 | | | | | 10,738 | | | | | | 0.0 | | |
| 4,961 (3) | | | Ginnie Mae 2015-21 AF, 2.199%, 07/16/2048 | | | | | 4,943 | | | | | | 0.0 | | |
| 33,143 | | | Ginnie Mae 2016-110 AB, 2.000%, 05/16/2049 | | | | | 32,976 | | | | | | 0.0 | | |
| 1,981 | | | Ginnie Mae 2016-86 AB, 2.500%, 09/16/2056 | | | | | 1,981 | | | | | | 0.0 | | |
| 83,036 | | | Ginnie Mae 2017-100 AB, 2.300%, 04/16/2052 | | | | | 82,479 | | | | | | 0.0 | | |
| 47,992 | | | Ginnie Mae 2017-51 AB, 2.350%, 04/16/2057 | | | | | 47,680 | | | | | | 0.0 | | |
| 15,782 | | | Ginnie Mae 2017-69 AB, 2.350%, 05/16/2053 | | | | | 15,707 | | | | | | 0.0 | | |
| 32,728 | | | Ginnie Mae 2017-70 A, 2.500%, 10/16/2057 | | | | | 32,531 | | | | | | 0.0 | | |
| 105,289 | | | Ginnie Mae 2017-86 AB, 2.300%, 11/16/2051 | | | | | 104,643 | | | | | | 0.0 | | |
| 97,871 | | | Ginnie Mae 2017-89 A, 2.500%, 08/16/2057 | | | | | 97,333 | | | | | | 0.0 | | |
| Voya Short Term Bond Fund | as of March 31, 2022 (continued) |
| Principal Amount† | | | Value | | | Percentage of Net Assets | | |||||||||
| COMMERCIAL MORTGAGE-BACKED SECURITIES: (continued) | | |||||||||||||||
| 18,944 | | | Ginnie Mae 2018-41 A, 2.400%, 09/16/2058 | | | | $ | 18,926 | | | | | | 0.0 | | |
| 600,000 (1) | | | Great Wolf Trust 2019-WOLF C, 2.030%, (US0001M + 1.633)%, 12/15/2036 | | | | | 589,377 | | | | | | 0.1 | | |
| 330,000 (1) | | | GS Mortgage Securities Corp. Trust 2017-GPTX B, 3.104%, 05/10/2034 | | | | | 328,466 | | | | | | 0.1 | | |
| 1,039,000 (1)(3) | | | GS Mortgage Securities Corp. Trust 2017-SLP E, 4.591%, 10/10/2032 | | | | | 1,019,681 | | | | | | 0.2 | | |
| 1,070,000 (1) | | | GS Mortgage Securities Corp. Trust 2019-70P C, 1.897%, (US0001M + 1.500)%, 10/15/2036 | | | | | 1,030,209 | | | | | | 0.2 | | |
| 190,000 (1) | | | GSCG Trust 2019-600C A, 2.936%, 09/06/2034 | | | | | 186,240 | | | | | | 0.0 | | |
| 330,000 (1) | | | Houston Galleria Mall Trust 2015-HGLR A1A2, 3.087%, 03/05/2037 | | | | | 320,646 | | | | | | 0.1 | | |
| 264,940 (1) | | | JP Morgan Chase Commercial Mortgage Securities Corp. 2012-HSBC A, 3.093%, 07/05/2032 | | | | | 264,963 | | | | | | 0.1 | | |
| 242,208 | | | JP Morgan Chase Commercial Mortgage Securities Trust 2012-C8 A3, 2.829%, 10/15/2045 | | | | | 242,447 | | | | | | 0.1 | | |
| 210,000 (3) | | | JP Morgan Chase Commercial Mortgage Securities Trust 2013-C10 C, 4.096%, 12/15/2047 | | | | | 208,978 | | | | | | 0.0 | | |
| 900,000 (1)(3) | | | JP Morgan Chase Commercial Mortgage Securities Trust 2013-C13 E, 3.986%, 01/15/2046 | | | | | 852,610 | | | | | | 0.2 | | |
| 5,000,000 | | | JP Morgan Chase Commercial Mortgage Securities Trust 2016-JP4 A3, 3.393%, 12/15/2049 | | | | | 4,956,929 | | | | | | 1.1 | | |
| 360,000 (1) | | | JP Morgan Chase Commercial Mortgage Securities Trust 2018-WPT CFX, 4.950%, 07/05/2033 | | | | | 363,694 | | | | | | 0.1 | | |
| 100,000 (1)(3) | | | JP Morgan Chase Commercial Mortgage Securities Trust 2020-LOOP E, 3.862%, 12/05/2038 | | | | | 88,291 | | | | | | 0.0 | | |
| Principal Amount† | | | Value | | | Percentage of Net Assets | | |||||||||
| COMMERCIAL MORTGAGE-BACKED SECURITIES: (continued) | | |||||||||||||||
| 1,100,000 (1)(3) | | | JPMBB Commercial Mortgage Securities Trust 2013-C15 D, 5.192%, 11/15/2045 | | | | $ | 1,098,397 | | | | | | 0.2 | | |
| 820,000 (3) | | | JPMBB Commercial Mortgage Securities Trust 2014-C19 C, 4.654%, 04/15/2047 | | | | | 806,786 | | | | | | 0.2 | | |
| 900,000 (1)(3) | | | JPMBB Commercial Mortgage Securities Trust 2014-C19 D, 4.654%, 04/15/2047 | | | | | 867,332 | | | | | | 0.2 | | |
| 430,000 (1) | | | JPMBB Commercial Mortgage Securities Trust 2014-C24 A4A2, 3.373%, 11/15/2047 | | | | | 425,888 | | | | | | 0.1 | | |
| 1,000,000 (1)(3) | | | LSTAR Commercial Mortgage Trust 2016-4 F, 4.585%, 03/10/2049 | | | | | 771,077 | | | | | | 0.2 | | |
| 273,960 | | | Morgan Stanley Bank of America Merrill Lynch Trust 2012-C5 A4, 3.176%, 08/15/2045 | | | | | 273,934 | | | | | | 0.1 | | |
| 2,300,000 (1)(3) | | | Morgan Stanley Bank of America Merrill Lynch Trust 2012-C6 E, 4.586%, 11/15/2045 | | | | | 2,207,762 | | | | | | 0.5 | | |
| 400,000 (1)(3) | | | Morgan Stanley Bank of America Merrill Lynch Trust 2013-C8 E, 4.017%, 12/15/2048 | | | | | 376,551 | | | | | | 0.1 | | |
| 290,000 (1)(5) | | | Morgan Stanley Capital I Trust 2011-C1 J, 4.193%, 09/15/2047 | | | | | 145,000 | | | | | | 0.0 | | |
| 271,374 | | | Morgan Stanley Capital I Trust 2017-H1 A2, 3.089%, 06/15/2050 | | | | | 270,841 | | | | | | 0.1 | | |
| 910,000 | | | Morgan Stanley Capital I Trust 2019-H6 A2, 3.228%, 06/15/2052 | | | | | 899,243 | | | | | | 0.2 | | |
| 700,454 (1) | | | Ready Capital Mortgage Financing 2020-FL4 A LLC, 2.607%, (US0001M + 2.150)%, 02/25/2035 | | | | | 699,983 | | | | | | 0.2 | | |
| 1,200,000 (1) | | | STWD 2021-LIH D Mortgage Trust, 2.702%, (US0001M + 2.305)%, 11/15/2036 | | | | | 1,172,950 | | | | | | 0.3 | | |
| Voya Short Term Bond Fund | as of March 31, 2022 (continued) |
| Principal Amount† | | | Value | | | Percentage of Net Assets | | |||||||||
| COMMERCIAL MORTGAGE-BACKED SECURITIES: (continued) | | |||||||||||||||
| 157,893 | | | UBS Commercial Mortgage Trust 2018-C8 A2, 3.713%, 02/15/2051 | | | | $ | 158,775 | | | | | | 0.0 | | |
| 5,000,000 (1)(3) | | | UBS-Barclays Commercial Mortgage Trust 2013-C6 C, 4.022%, 04/10/2046 | | | | | 4,874,891 | | | | | | 1.0 | | |
| 547,952 (1) | | | VMC Finance 2019-FL3 A LLC, 1.541%, (US0001M + 1.100)%, 09/15/2036 | | | | | 545,517 | | | | | | 0.1 | | |
| 1,642,500 (1)(3) | | | Wells Fargo Commercial Mortgage Trust 2015-C30 D, 4.499%, 09/15/2058 | | | | | 1,536,970 | | | | | | 0.3 | | |
| 535,764 (1) | | | West Town Mall Trust 2017-KNOX A, 3.823%, 07/05/2030 | | | | | 535,295 | | | | | | 0.1 | | |
| 500,000 (3) | | | WFRBS Commercial Mortgage Trust 2014-C21 C, 4.234%, 08/15/2047 | | | | | 483,227 | | | | | | 0.1 | | |
| | | | Total Commercial Mortgage-Backed Securities (Cost $56,611,441) | | | | | 54,511,269 | | | | | | 11.5 | | |
| ASSET-BACKED SECURITIES: 17.3% | | |||||||||||||||
| | | | Automobile Asset-Backed Securities: 4.2% | | ||||||||||||
| 100,000 | | | Ally Auto Receivables Trust 2019-1 A4, 3.020%, 04/15/2024 | | | | | 100,687 | | | | | | 0.0 | | |
| 197,531 | | | Americredit Automobile Receivables Trust 2019-1 B, 3.130%, 02/18/2025 | | | | | 198,161 | | | | | | 0.0 | | |
| 400,000 | | | AmeriCredit Automobile Receivables Trust 2019-3 B, 2.130%, 07/18/2025 | | | | | 400,633 | | | | | | 0.1 | | |
| 283,773 | | | AmeriCredit Automobile Receivables Trust 2020-1 A3, 1.110%, 08/19/2024 | | | | | 283,607 | | | | | | 0.1 | | |
| 400,000 | | | AmeriCredit Automobile Receivables Trust 2020-1 C, 1.590%, 10/20/2025 | | | | | 395,297 | | | | | | 0.1 | | |
| 400,000 | | | AmeriCredit Automobile Receivables Trust 2020-2 B, 0.970%, 02/18/2026 | | | | | 393,580 | | | | | | 0.1 | | |
| 700,000 | | | AmeriCredit Automobile Receivables Trust 2021-3 B, 1.170%, 08/18/2027 | | | | | 664,747 | | | | | | 0.1 | | |
| 253,106 | | | BMW Vehicle Owner Trust 2020-A A3, 0.480%, 10/25/2024 | | | | | 251,108 | | | | | | 0.1 | | |
| 100,000 | | | Carmax Auto Owner Trust 2019-2 A4, 2.770%, 12/16/2024 | | | | | 100,650 | | | | | | 0.0 | | |
| Principal Amount† | | | Value | | | Percentage of Net Assets | | |||||||||
| ASSET-BACKED SECURITIES: (continued) | | |||||||||||||||
| | | | Automobile Asset-Backed Securities (continued) | | ||||||||||||
| 150,000 | | | CarMax Auto Owner Trust 2021-2 B, 1.030%, 12/15/2026 | | | | $ | 140,710 | | | | | | 0.0 | | |
| 300,000 | | | CarMax Auto Owner Trust 2022-1 B, 1.950%, 09/15/2027 | | | | | 287,818 | | | | | | 0.1 | | |
| 700,000 | | | Carvana Auto Receivables Trust 2022-P1 A3, 3.350%, 02/10/2027 | | | | | 696,784 | | | | | | 0.1 | | |
| 650,000 | | | Drive Auto Receivables Trust 2021-1 B, 0.650%, 07/15/2025 | | | | | 644,403 | | | | | | 0.1 | | |
| 2,750,000 | | | Drive Auto Receivables Trust 2021-2 B, 0.580%, 12/15/2025 | | | | | 2,682,815 | | | | | | 0.6 | | |
| 1,500,000 | | | Exeter Automobile Receivables Trust 2021-3A B, 0.690%, 01/15/2026 | | | | | 1,464,180 | | | | | | 0.3 | | |
| 1,600,000 | | | Exeter Automobile Receivables Trust 2021-4 A3, 0.680%, 07/15/2025 | | | | | 1,576,584 | | | | | | 0.3 | | |
| 900,000 | | | Ford Credit Auto Owner Trust 2022-A B, 1.910%, 07/15/2027 | | | | | 865,820 | | | | | | 0.2 | | |
| 300,000 | | | GM Financial Automobile Leasing Trust 2019-4 A4, 1.760%, 01/16/2025 | | | | | 298,939 | | | | | | 0.1 | | |
| 380,379 | | | GM Financial Automobile Leasing Trust 2020-2 A3, 0.800%, 07/20/2023 | | | | | 379,926 | | | | | | 0.1 | | |
| 193,715 | | | Honda Auto Receivables 2018-4 A4 Owner Trust, 3.300%, 07/15/2025 | | | | | 194,094 | | | | | | 0.0 | | |
| 381,800 | | | Honda Auto Receivables 2020-2 A3 Owner Trust, 0.820%, 07/15/2024 | | | | | 379,263 | | | | | | 0.1 | | |
| 1,050,000 | | | Hyundai Auto Receivables Trust 2021-C B, 1.490%, 12/15/2027 | | | | | 987,769 | | | | | | 0.2 | | |
| 568,092 (1) | | | JPMorgan Chase Bank NA - CACLN 2021-3 B, 0.760%, 02/26/2029 | | | | | 552,096 | | | | | | 0.1 | | |
| 125,750 | | | Mercedes-Benz Auto Receivables Trust 2018-1 A4, 3.150%, 10/15/2024 | | | | | 126,380 | | | | | | 0.0 | | |
| 350,000 | | | Nissan Auto Receivables 2018-C A4 Owner Trust, 3.270%, 06/16/2025 | | | | | 353,004 | | | | | | 0.1 | | |
| Voya Short Term Bond Fund | as of March 31, 2022 (continued) |
| Principal Amount† | | | Value | | | Percentage of Net Assets | | |||||||||
| ASSET-BACKED SECURITIES: (continued) | | |||||||||||||||
| | | | Automobile Asset-Backed Securities (continued) | | ||||||||||||
| 1,350,000 (1) | | | Oscar US Funding XIII LLC 2021-2A A3, 0.860%, 09/10/2025 | | | | $ | 1,311,270 | | | | | | 0.3 | | |
| 243,229 | | | Santander Drive Auto Receivables Trust 2020-2 B, 0.960%, 11/15/2024 | | | | | 243,141 | | | | | | 0.0 | | |
| 369,497 | | | Santander Drive Auto Receivables Trust 2020-3 B, 0.690%, 03/17/2025 | | | | | 368,924 | | | | | | 0.1 | | |
| 350,000 | | | Santander Drive Auto Receivables Trust 2021-2 B, 0.590%, 09/15/2025 | | | | | 346,505 | | | | | | 0.1 | | |
| 2,700,000 | | | Santander Drive Auto Receivables Trust 2021-3 B, 0.600%, 12/15/2025 | | | | | 2,654,722 | | | | | | 0.6 | | |
| 116,133 (1) | | | Santander Retail Auto Lease Trust 2019-B A4, 2.380%, 08/21/2023 | | | | | 116,186 | | | | | | 0.0 | | |
| 350,000 | | | Toyota Auto Receivables 2019-C A4 Owner Trust, 1.880%, 11/15/2024 | | | | | 349,391 | | | | | | 0.1 | | |
| | | | | | | | | 19,809,194 | | | | | | 4.2 | | |
| | | | Credit Card Asset-Backed Securities: 0.2% | | ||||||||||||
| 800,000 (1) | | | CARDS II Trust 2021-1A A, 0.602%, 04/15/2027 | | | | | 764,451 | | | | | | 0.2 | | |
| | | | | | ||||||||||||
| | | | Other Asset-Backed Securities: 12.2% | | ||||||||||||
| 2,750,000 (1) | | | AIG CLO 2021-2A A Ltd., 1.424%, (US0003M + 1.170)%, 07/20/2034 | | | | | 2,714,500 | | | | | | 0.6 | | |
| 600,000 (1) | | | Allegany Park CLO Ltd. 2019-1A AR, 1.559%, (TSFR3M + 1.300)%, 01/20/2035 | | | | | 597,923 | | | | | | 0.1 | | |
| 700,000 (1) | | | Apidos CLO XXXII 2019-32A A1, 1.574%, (US0003M + 1.320)%, 01/20/2033 | | | | | 696,744 | | | | | | 0.1 | | |
| 400,000 (1) | | | ARES XLVI CLO Ltd. 2017-46A A2, 1.471%, (US0003M + 1.230)%, 01/15/2030 | | | | | 396,361 | | | | | | 0.1 | | |
| 250,000 (1) | | | Babson CLO Ltd. 2017-1A A2, 1.591%, (US0003M + 1.350)%, 07/18/2029 | | | | | 247,796 | | | | | | 0.0 | | |
| 1,900,000 (1) | | | Ballyrock CLO 17 Ltd. 2021-17A A1B, 1.536%, (US0003M + 1.400)%, 10/20/2034 | | | | | 1,880,673 | | | | | | 0.4 | | |
| 500,000 (1) | | | Barings Clo Ltd. 2019-4A A1, 1.571%, (US0003M + 1.330)%, 01/15/2033 | | | | | 498,060 | | | | | | 0.1 | | |
| Principal Amount† | | | Value | | | Percentage of Net Assets | | |||||||||
| ASSET-BACKED SECURITIES: (continued) | | |||||||||||||||
| | | | Other Asset-Backed Securities (continued) | | ||||||||||||
| 2,900,000 (1) | | | BDS 2021-FL10 E Ltd., 3.818%, (US0001M + 3.350)%, 12/16/2036 | | | | $ | 2,861,849 | | | | | | 0.6 | | |
| 2,000,000 (1) | | | Benefit Street Partners CLO XX Ltd. 2020-20A AR, 1.411%, (US0003M + 1.170)%, 07/15/2034 | | | | | 1,983,396 | | | | | | 0.4 | | |
| 2,500,000 (1) | | | BlueMountain CLO XXXII Ltd. 2021-32A A, 1.411%, (US0003M + 1.170)%, 10/15/2034 | | | | | 2,473,255 | | | | | | 0.5 | | |
| 4,000,000 (1) | | | BRSP 2021-FL1 B Ltd., 2.349%, (US0001M + 1.900)%, 08/19/2038 | | | | | 3,935,953 | | | | | | 0.8 | | |
| 450,000 (1) | | | Carlyle US Clo 2017-2A CR Ltd., 1.654%, (US0003M + 1.400)%, 07/20/2031 | | | | | 448,848 | | | | | | 0.1 | | |
| 500,000 (1) | | | Carlyle US CLO 2020-2A A1R Ltd., 1.398%, (US0003M + 1.140)%, 01/25/2035 | | | | | 495,648 | | | | | | 0.1 | | |
| 800,000 (1) | | | Carlyle US Clo 2021-4A A2 Ltd., 1.654%, (US0003M + 1.400)%, 04/20/2034 | | | | | 797,087 | | | | | | 0.2 | | |
| 500,000 (1) | | | Cedar Funding IV CLO Ltd.2014-4A ARR, 1.419%, (US0003M + 1.160)%, 07/23/2034 | | | | | 494,195 | | | | | | 0.1 | | |
| 250,000 (1) | | | CIFC Funding 2015-IA ARR Ltd., 1.369%, (US0003M + 1.110)%, 01/22/2031 | | | | | 248,408 | | | | | | 0.1 | | |
| 600,000 (1) | | | CIFC Funding 2019-6A A1 Ltd., 1.571%, (US0003M + 1.330)%, 01/16/2033 | | | | | 598,384 | | | | | | 0.1 | | |
| 250,000 (1) | | | CIFC Funding 2019-6A A2 Ltd., 1.991%, (US0003M + 1.750)%, 01/16/2033 | | | | | 249,083 | | | | | | 0.1 | | |
| 500,000 (1) | | | CIFC Funding 2020-2A AR Ltd., 1.424%, (US0003M + 1.170)%, 10/20/2034 | | | | | 496,782 | | | | | | 0.1 | | |
| 2,750,000 (1) | | | CIFC Funding 2020-IA A1R Ltd., 1.391%, (US0003M + 1.150)%, 07/15/2036 | | | | | 2,732,859 | | | | | | 0.6 | | |
| 2,650,000 | | | CNH Equipment Trust 2021-B A3, 0.440%, 08/17/2026 | | | | | 2,549,654 | | | | | | 0.5 | | |
| 650,000 | | | CNH Equipment Trust 2021-C A3, 0.810%, 12/15/2026 | | | | | 622,039 | | | | | | 0.1 | | |
| 250,000 (1) | | | Deer Creek Clo Ltd. 2017-1A A, 1.434%, (US0003M + 1.180)%, 10/20/2030 | | | | | 248,517 | | | | | | 0.1 | | |
| Voya Short Term Bond Fund | as of March 31, 2022 (continued) |
| Principal Amount† | | | Value | | | Percentage of Net Assets | | |||||||||
| ASSET-BACKED SECURITIES: (continued) | | |||||||||||||||
| | | | Other Asset-Backed Securities (continued) | | ||||||||||||
| 360,000 (1) | | | Dryden XXVIII Senior Loan Fund 2013-28A A1LR, 1.706%, (US0003M + 1.200)%, 08/15/2030 | | | | $ | 359,594 | | | | | | 0.1 | | |
| 250,000 (1) | | | Eaton Vance Clo 2015-1A A2R Ltd., 1.504%, (US0003M + 1.250)%, 01/20/2030 | | | | | 248,848 | | | | | | 0.1 | | |
| 343,294 (1) | | | Elevation CLO 2014-2A A1R Ltd., 1.471%, (US0003M + 1.230)%, 10/15/2029 | | | | | 342,645 | | | | | | 0.1 | | |
| 250,000 (1) | | | Elmwood CLO IX Ltd. 2021-2A A, 1.384%, (US0003M + 1.130)%, 07/20/2034 | | | | | 248,169 | | | | | | 0.1 | | |
| 2,500,000 | | | John Deere Owner Trust 2021-B A3, 0.520%, 03/16/2026 | | | | | 2,396,353 | | | | | | 0.5 | | |
| 450,000 | | | John Deere Owner Trust 2022-A A4, 2.490%, 01/16/2029 | | | | | 442,306 | | | | | | 0.1 | | |
| 750,000 (1) | | | Kayne CLO 6 Ltd. 2019-6A A1, 1.634%, (US0003M + 1.380)%, 01/20/2033 | | | | | 747,374 | | | | | | 0.2 | | |
| 500,000 (1) | | | Kayne CLO 7 Ltd. 2020-7A A1, 1.441%, (US0003M + 1.200)%, 04/17/2033 | | | | | 497,937 | | | | | | 0.1 | | |
| 2,600,000 (1) | | | Kubota Credit Owner Trust 2021-2A A3, 0.560%, 11/17/2025 | | | | | 2,481,005 | | | | | | 0.5 | | |
| 92,614 (1) | | | LoanCore 2019-CRE2 A Issuer Ltd., 1.527%, (US0001M + 1.130)%, 05/15/2036 | | | | | 91,981 | | | | | | 0.0 | | |
| 2,750,000 (1) | | | Magnetite XXVI Ltd. 2020-26A A2R, 1.658%, (US0003M + 1.400)%, 07/25/2034 | | | | | 2,716,280 | | | | | | 0.6 | | |
| 500,000 (1) | | | Marble Point CLO XIV Ltd. 2018-2A A1R, 1.534%, (US0003M + 1.280)%, 01/20/2032 | | | | | 496,036 | | | | | | 0.1 | | |
| 146,312 (1) | | | Marlette Funding Trust 2020-1A B, 2.380%, 03/15/2030 | | | | | 146,378 | | | | | | 0.0 | | |
| 600,000 (1) | | | Marlette Funding Trust 2021-1A B, 1.000%, 06/16/2031 | | | | | 588,201 | | | | | | 0.1 | | |
| Principal Amount† | | | Value | | | Percentage of Net Assets | | |||||||||
| ASSET-BACKED SECURITIES: (continued) | | |||||||||||||||
| | | | Other Asset-Backed Securities (continued) | | ||||||||||||
| 1,575,000 (1) | | | MF1 Multifamily Housing Mortgage Loan Trust 2021-FL6 C, 2.318%, (US0001M + 1.850)%, 07/16/2036 | | | | $ | 1,558,868 | | | | | | 0.3 | | |
| 340,000 (1) | | | Neuberger Berman Loan Advisers CLO 35 Ltd. 2019-35A A1, 1.588%, (US0003M + 1.340)%, 01/19/2033 | | | | | 339,332 | | | | | | 0.1 | | |
| 400,000 (1) | | | Oaktree CLO Ltd. 2021-1A A1, 1.401%, (US0003M + 1.160)%, 07/15/2034 | | | | | 396,858 | | | | | | 0.1 | | |
| 1,550,000 (1) | | | OCP CLO 2020-19A AR Ltd., 1.404%, (US0003M + 1.150)%, 10/20/2034 | | | | | 1,532,511 | | | | | | 0.3 | | |
| 400,000 (1) | | | OCP CLO 2021-22A A Ltd., 1.296%, (US0003M + 1.180)%, 12/02/2034 | | | | | 396,855 | | | | | | 0.1 | | |
| 250,000 (1) | | | Octagon Investment Partners XV Ltd. 2013-1A A2R, 1.598%, (US0003M + 1.350)%, 07/19/2030 | | | | | 248,645 | | | | | | 0.1 | | |
| 600,000 (1) | | | Octagon Loan Funding Ltd. 2014-1A ARR, 1.668%, (US0003M + 1.180)%, 11/18/2031 | | | | | 596,534 | | | | | | 0.1 | | |
| 3,700,000 (1) | | | OHA Credit Partners XIII Ltd. 2016-13A AR, 1.425%, (US0003M + 1.170)%, 10/25/2034 | | | | | 3,669,775 | | | | | | 0.8 | | |
| 3,000,000 (1) | | | OHA Credit Partners XVI 2021-16A A, 1.314%, (US0003M + 1.150)%, 10/18/2034 | | | | | 2,982,207 | | | | | | 0.6 | | |
| 500,000 (1) | | | OHA Loan Funding 2015-1A AR3 Ltd., 1.360%, (US0003M + 1.150)%, 01/19/2037 | | | | | 496,645 | | | | | | 0.1 | | |
| 500,000 (1) | | | Palmer Square CLO 2015-2A A1R2 Ltd., 1.354%, (US0003M + 1.100)%, 07/20/2030 | | | | | 498,132 | | | | | | 0.1 | | |
| 1,650,000 (1) | | | Palmer Square CLO 2019-1A A1R Ltd., 1.545%, (US0003M + 1.150)%, 11/14/2034 | | | | | 1,639,204 | | | | | | 0.3 | | |
| Voya Short Term Bond Fund | as of March 31, 2022 (continued) |
| Principal Amount† | | | Value | | | Percentage of Net Assets | | |||||||||
| ASSET-BACKED SECURITIES: (continued) | | |||||||||||||||
| | | | Other Asset-Backed Securities (continued) | | ||||||||||||
| 350,000 (1) | | | PFS Financing Corp. 2021-B A, 0.770%, 08/15/2026 | | | | $ | 329,523 | | | | | | 0.1 | | |
| 20,538 (1) | | | SoFi Consumer Loan Program 2020-1 A Trust, 2.020%, 01/25/2029 | | | | | 20,549 | | | | | | 0.0 | | |
| 410,000 (1) | | | Sound Point CLO XXV Ltd. 2019-4A A1R, 1.955%, (TSFR3M + 1.280)%, 04/25/2033 | | | | | 409,511 | | | | | | 0.1 | | |
| 500,000 (1) | | | THL Credit Wind River 2019-1A AR CLO Ltd., 1.414%, (US0003M + 1.160)%, 07/20/2034 | | | | | 496,612 | | | | | | 0.1 | | |
| 1,650,000 (1) | | | Trafigura Securitisation Finance PLC 2021-1A A2, 1.080%, 01/15/2025 | | | | | 1,578,110 | | | | | | 0.3 | | |
| 300,000 (1) | | | Wellman Park CLO Ltd. 2021-1A A, 1.341%, (US0003M + 1.100)%, 07/15/2034 | | | | | 298,302 | | | | | | 0.1 | | |
| | | | | | | | | 57,559,294 | | | | | | 12.2 | | |
| | | | Student Loan Asset-Backed Securities: 0.7% | | ||||||||||||
| 18,094 (1) | | | DRB Prime Student Loan Trust 2017-A A2B, 2.850%, 05/27/2042 | | | | | 18,164 | | | | | | 0.0 | | |
| 67,847 (1) | | | Laurel Road Prime Student Loan Trust 2018-B A2FX, 3.540%, 05/26/2043 | | | | | 68,309 | | | | | | 0.0 | | |
| 300,000 (1) | | | Navient Private Education Loan Trust 2014-AA A3, 1.997%, (US0001M + 1.600)%, 10/15/2031 | | | | | 302,537 | | | | | | 0.1 | | |
| 259,120 (1) | | | Navient Private Education Refi Loan Trust 2019-FA A2, 2.600%, 08/15/2068 | | | | | 256,819 | | | | | | 0.0 | | |
| 80,359 (1) | | | Navient Private Education Refi Loan Trust 2020-GA A, 1.170%, 09/16/2069 | | | | | 77,745 | | | | | | 0.0 | | |
| 140,379 (1) | | | Navient Private Education Refi Loan Trust 2021-A A, 0.840%, 05/15/2069 | | | | | 134,098 | | | | | | 0.0 | | |
| 1,905,597 (1) | | | Navient Private Education Refi Loan Trust 2021-EA A, 0.970%, 12/16/2069 | | | | | 1,795,403 | | | | | | 0.4 | | |
| 450,016 (1) | | | Navient Private Education Refi Loan Trust 2021-F A, 1.110%, 02/18/2070 | | | | | 419,804 | | | | | | 0.1 | | |
| Principal Amount† | | | Value | | | Percentage of Net Assets | | |||||||||
| ASSET-BACKED SECURITIES: (continued) | | |||||||||||||||
| | | | Student Loan Asset-Backed Securities (continued) | | ||||||||||||
| 524,683 (1) | | | SoFi Professional Loan Program 2021-B AFX Trust, 1.140%, 02/15/2047 | | | | $ | 488,665 | | | | | | 0.1 | | |
| | | | | | | | | 3,561,544 | | | | | | 0.7 | | |
| | | | Total Asset-Backed Securities (Cost $83,189,235) | | | | | 81,694,483 | | | | | | 17.3 | | |
| U.S. GOVERNMENT AGENCY OBLIGATIONS: 0.1% | | |||||||||||||||
| | | | Federal Home Loan Mortgage Corporation: 0.1%(6) | | ||||||||||||
| 23,471 | | | 5.500%, 01/01/2037 | | | | | 25,002 | | | | | | 0.0 | | |
| 18,682 | | | 5.500%, 08/01/2038 | | | | | 19,894 | | | | | | 0.0 | | |
| 6,807 | | | 5.500%, 10/01/2038 | | | | | 7,248 | | | | | | 0.0 | | |
| 3,442 | | | 5.500%, 10/01/2038 | | | | | 3,665 | | | | | | 0.0 | | |
| 154,126 | | | 5.500%, 11/01/2038 | | | | | 167,320 | | | | | | 0.1 | | |
| 101,558 | | | 5.500%, 02/01/2039 | | | | | 108,209 | | | | | | 0.0 | | |
| | | | | | | | | 331,338 | | | | | | 0.1 | | |
| | | | Uniform Mortgage-Backed Securities: 0.0% | | ||||||||||||
| 23,231 | | | 5.000%, 03/01/2027 | | | | | 23,711 | | | | | | 0.0 | | |
| 74,641 | | | 5.000%, 07/01/2034 | | | | | 80,664 | | | | | | 0.0 | | |
| | | | | | | | | 104,375 | | | | | | 0.0 | | |
| | | | Total U.S. Government Agency Obligations (Cost $433,604) | | | | | 435,713 | | | | | | 0.1 | | |
| | | | Total Long-Term Investments (Cost $444,174,963) | | | | | 432,962,734 | | | | | | 91.6 | | |
| SHORT-TERM INVESTMENTS: 14.4% | | |||||||||||||||
| | | | Commercial Paper: 7.1% | | ||||||||||||
| 3,000,000 | | | American Electric Power Co., 0.890%, 04/26/2022 | | | | | 2,998,102 | | | | | | 0.6 | | |
| 5,000,000 | | | Auto Zone, 0.560%, 04/04/2022 | | | | | 4,999,695 | | | | | | 1.1 | | |
| 5,000,000 | | | Consolidated Edison Company, 0.590%, 04/08/2022 | | | | | 4,999,349 | | | | | | 1.1 | | |
| 9,000,000 | | | Entergy Corp., 0.490%, 04/01/2022 | | | | | 8,999,880 | | | | | | 1.9 | | |
| 4,000,000 | | | HP, Inc., 0.850%, 04/25/2022 | | | | | 3,997,666 | | | | | | 0.8 | | |
| 5,000,000 | | | Lowe’s Cos, Inc., 0.540%, 04/05/2022 | | | | | 4,999,629 | | | | | | 1.1 | | |
| 2,600,000 | | | Sherwin-Williams Co., 0.410%, 04/04/2022 | | | | | 2,599,883 | | | | | | 0.5 | | |
| | | | Total Commercial Paper (Cost $33,593,482) | | | | | 33,594,204 | | | | | | 7.1 | | |
| Voya Short Term Bond Fund | as of March 31, 2022 (continued) |
| Principal Amount† | | | Value | | | Percentage of Net Assets | | |||||||||
| SHORT-TERM INVESTMENTS: (continued) | | |||||||||||||||
| | | | Repurchase Agreements: 1.1% | | ||||||||||||
| 1,191,202 (7) | | | Bank of America Inc., Repurchase Agreement dated 03/31/22, 0.30%, due 04/01/22 (Repurchase Amount $1,191,212, collateralized by various U.S. Government Agency Obligations, 2.000%-4.000%, Market Value plus accrued interest $1,215,026, due 02/01/36-03/01/52) | | | | $ | 1,191,202 | | | | | | 0.3 | | |
| 1,191,202 (7) | | | Citigroup, Inc., Repurchase Agreement dated 03/31/22, 0.31%, due 04/01/22 (Repurchase Amount $1,191,212, collateralized by various U.S. Government Agency Obligations, 2.000%-10.000%, Market Value plus accrued interest $1,215,026, due 06/15/22-01/20/52) | | | | | 1,191,202 | | | | | | 0.3 | | |
| 1,191,202 (7) | | | Daiwa Capital Markets, Repurchase Agreement dated 03/31/22, 0.30%, due 04/01/22 (Repurchase Amount $1,191,212, collateralized by various U.S. Government/U.S. Government Agency Obligations, 0.000%-6.500%, Market Value plus accrued interest $1,215,026, due 04/05/22-04/01/52) | | | | | 1,191,202 | | | | | | 0.2 | | |
| 297,098 (7) | | | JPMorgan Securities LLC, Repurchase Agreement dated 03/31/22, 0.28%, due 04/01/22 (Repurchase Amount $297,100, collateralized by various U.S. Government Securities, 1.875%-2.875%, Market Value plus accrued interest $303,040, due 08/31/24-08/15/49) | | | | | 297,098 | | | | | | 0.1 | | |
| Principal Amount† | | | Value | | | Percentage of Net Assets | | |||||||||
| SHORT-TERM INVESTMENTS: (continued) | ��� | |||||||||||||||
| | | | Repurchase Agreements (continued) | | ||||||||||||
| 1,191,202 (7) | | | RBC Dominion Securities Inc., Repurchase Agreement dated 03/31/22, 0.30%, due 04/01/22 (Repurchase Amount $1,191,212, collateralized by various U.S. Government/U.S. Government Agency Obligations, 0.000%-5.500%, Market Value plus accrued interest $1,215,026, due 04/26/22-03/20/52) | | | | $ | 1,191,202 | | | | | | 0.2 | | |
| | | | Total Repurchase Agreements (Cost $5,061,906) | | | | | 5,061,906 | | | | | | 1.1 | | |
| Shares | | | Value | | | Percentage of Net Assets | | |||||||||
| | | | Mutual Funds: 6.2% | | ||||||||||||
| 29,392,000 (8) | | | BlackRock Liquidity Funds, FedFund, Institutional Class, 0.230% | | | | | 29,392,000 | | | | | | 6.2 | | |
| 56,000 (7)(8) | | | Goldman Sachs Financial Square Government Fund - Institutional Shares, 0.250% | | | | | 56,000 | | | | | | 0.0 | | |
| | | | Total Mutual Funds (Cost $29,448,000) | | | | | 29,448,000 | | | | | | 6.2 | | |
| | | | Total Short-Term Investments (Cost $68,103,388) | | | | | 68,104,110 | | | | | | 14.4 | | |
| | | | Total Investments in Securities (Cost $512,278,351) | | | | $ | 501,066,844 | | | | | | 106.0 | | |
| | | | Liabilities in Excess of Other Assets | | | | | (28,536,333) | | | | | | (6.0) | | |
| | | | Net Assets | | | | $ | 472,530,511 | | | | | | 100.0 | | |
| Voya Short Term Bond Fund | as of March 31, 2022 (continued) |
| | | | Quoted Prices in Active Markets for Identical Investments (Level 1) | | | Significant Other Observable Inputs (Level 2) | | | Significant Unobservable Inputs (Level 3) | | | Fair Value at March 31, 2022 | | ||||||||||||
| Asset Table | | | | | | | | | | | | | | | | | | | | | | | | | |
| Investments, at fair value | | | | | | | | | | | | | | | | | | | | | | | | | |
| Corporate Bonds/Notes | | | | $ | — | | | | | $ | 200,189,075 | | | | | $ | — | | | | | $ | 200,189,075 | | |
| Collateralized Mortgage Obligations | | | | | — | | | | | | 31,478,271 | | | | | | — | | | | | | 31,478,271 | | |
| Asset-Backed Securities | | | | | — | | | | | | 81,694,483 | | | | | | — | | | | | | 81,694,483 | | |
| Commercial Mortgage-Backed Securities | | | | | — | | | | | | 54,366,269 | | | | | | 145,000 | | | | | | 54,511,269 | | |
| U.S. Government Agency Obligations | | | | | — | | | | | | 435,713 | | | | | | — | | | | | | 435,713 | | |
| U.S. Treasury Obligations | | | | | — | | | | | | 64,653,923 | | | | | | — | | | | | | 64,653,923 | | |
| Short-Term Investments | | | | | 29,448,000 | | | | | | 38,656,110 | | | | | | — | | | | | | 68,104,110 | | |
| Total Investments, at fair value | | | | $ | 29,448,000 | | | | | $ | 471,473,844 | | | | | $ | 145,000 | | | | | $ | 501,066,844 | | |
| Other Financial Instruments+ | | | | | | | | | | | | | | | | | | | | | | | | | |
| Futures | | | | | 684,269 | | | | | | — | | | | | | — | | | | | | 684,269 | | |
| Total Assets | | | | $ | 30,132,269 | | | | | $ | 471,473,844 | | | | | $ | 145,000 | | | | | $ | 501,751,113 | | |
| Liabilities Table | | | | | | | | | | | | | | | | | | | | | | | | | |
| Other Financial Instruments+ | | | | | | | | | | | | | | | | | | | | | | | | | |
| Futures | | | | $ | (1,849,218) | | | | | $ | — | | | | | $ | — | | | | | $ | (1,849,218) | | |
| Total Liabilities | | | | $ | (1,849,218) | | | | | $ | — | | | | | $ | — | | | | | $ | (1,849,218) | | |
| Description | | | Number of Contracts | | | Expiration Date | | | Notional Amount | | | Unrealized Appreciation/ (Depreciation) | | ||||||
| Long Contracts: | | | | | | | | | | | | | | | | | | | |
| U.S. Treasury 2-Year Note | | | 756 | | | 06/30/22 | | | | $ | 160,212,938 | | | | | $ | (1,849,218) | | |
| | | | | | | | | | | $ | 160,212,938 | | | | | $ | (1,849,218) | | |
| Short Contracts: | | | | | | | | | | | | | | | | | | | |
| U.S. Treasury 10-Year Note | | | (19) | | | 06/21/22 | | | | | (2,334,625) | | | | | | 28,094 | | |
| U.S. Treasury 5-Year Note | | | (239) | | | 06/30/22 | | | | | (27,410,312) | | | | | | 656,175 | | |
| | | | | | | | | | | $ | (29,744,937) | | | | | $ | 684,269 | | |
| Voya Short Term Bond Fund | as of March 31, 2022 (continued) |
| Derivatives not accounted for as hedging instruments | | | Location on Statement of Assets and Liabilities | | | Fair Value | | |||
| Asset Derivatives | | | | | | | | | | |
| Interest rate contracts | | | Variation margin receivable on futures contracts* | | | | $ | 684,269 | | |
| Total Asset Derivatives | | | | | | | $ | 684,269 | | |
| Liability Derivatives | | | | | | | | | | |
| Interest rate contracts | | | Variation margin payable on futures contracts* | | | | $ | 1,849,218 | | |
| Total Liability Derivatives | | | | | | | $ | 1,849,218 | | |
| Derivatives not accounted for as hedging instruments | | | Futures | | |||
| Interest rate contracts | | | | $ | (1,458,613) | | |
| Total | | | | $ | (1,458,613) | | |
| | | | Change in Unrealized Appreciation or (Depreciation) on Derivatives Recognized in Income | | |||
| Derivatives not accounted for as hedging instruments | | | Futures | | |||
| Interest rate contracts | | | | $ | (1,255,918) | | |
| Total | | | | $ | (1,255,918) | | |
| | Cost for federal income tax purposes was $511,203,066. | | | | | | | |
| | Net unrealized depreciation consisted of: | | | | | | | |
| | Gross Unrealized Appreciation | | | | $ | 871,574 | | |
| | Gross Unrealized Depreciation | | | | | (12,172,743) | | |
| | Net Unrealized Depreciation | | | | $ | (11,301,169) | | |
| Voya Strategic Income | PORTFOLIO OF INVESTMENTS |
| Opportunities Fund | as of March 31, 2022 |
| Principal Amount† | | | Value | | | Percentage of Net Assets | | |||||||||
| CORPORATE BONDS/NOTES: 18.2% | | |||||||||||||||
| | | | Basic Materials: 1.4% | | ||||||||||||
| 1,250,000 (1)(2) | | | Alpek SAB de CV, 4.250%, 09/18/2029 | | | | $ | 1,237,631 | | | | | | 0.1 | | |
| 200,000 (2) | | | ASP Unifrax Holdings, Inc., 5.250%, 09/30/2028 | | | | | 186,046 | | | | | | 0.0 | | |
| 575,000 (1)(2) | | | ASP Unifrax Holdings, Inc., 7.500%, 09/30/2029 | | | | | 512,458 | | | | | | 0.0 | | |
| 1,350,000 | | | Celulosa Arauco y Constitucion SA, 3.875%, 11/02/2027 | | | | | 1,369,447 | | | | | | 0.1 | | |
| 1,500,000 (2) | | | Celulosa Arauco y Constitucion SA, 4.250%, 04/30/2029 | | | | | 1,495,665 | | | | | | 0.1 | | |
| 525,000 (1)(2) | | | Cleveland-Cliffs, Inc., 4.625%, 03/01/2029 | | | | | 518,878 | | | | | | 0.0 | | |
| 410,000 (1)(2) | | | Cleveland-Cliffs, Inc., 4.875%, 03/01/2031 | | | | | 406,265 | | | | | | 0.0 | | |
| 625,000 (1)(2) | | | Coeur Mining, Inc., 5.125%, 02/15/2029 | | | | | 543,813 | | | | | | 0.0 | | |
| 450,000 (2) | | | Compass Minerals International, Inc., 6.750%, 12/01/2027 | | | | | 456,224 | | | | | | 0.0 | | |
| 600,000 (1)(2) | | | Consolidated Energy Finance S.A., 5.625%, 10/15/2028 | | | | | 556,185 | | | | | | 0.0 | | |
| 625,000 (1)(2) | | | Constellium SE, 5.625%, 06/15/2028 | | | | | 628,409 | | | | | | 0.0 | | |
| 610,000 (1)(2) | | | Diamond BC BV, 4.625%, 10/01/2029 | | | | | 548,640 | | | | | | 0.0 | | |
| 3,016,000 (1) | | | Dow Chemical Co/The, 3.600%, 11/15/2050 | | | | | 2,816,685 | | | | | | 0.1 | | |
| 1,000,000 (2) | | | Equate Petrochemical BV, 2.625%, 04/28/2028 | | | | | 928,750 | | | | | | 0.1 | | |
| 1,250,000 (2) | | | Evraz PLC, 5.250%, 04/02/2024 | | | | | 700,625 | | | | | | 0.0 | | |
| 600,000 (2) | | | First Quantum Minerals Ltd., 6.875%, 10/15/2027 | | | | | 629,130 | | | | | | 0.0 | | |
| 1,800,000 (2) | | | GC Treasury Center Co. Ltd., 4.400%, 03/30/2032 | | | | | 1,826,946 | | | | | | 0.1 | | |
| 750,000 (2) | | | Gold Fields Orogen Holdings BVI Ltd., 5.125%, 05/15/2024 | | | | | 766,073 | | | | | | 0.0 | | |
| 1,200,000 (1)(2) | | | Hudbay Minerals, Inc., 4.500%, 04/01/2026 | | | | | 1,168,194 | | | | | | 0.1 | | |
| 560,000 (2) | | | Illuminate Buyer LLC / Illuminate Holdings IV, Inc., 9.000%, 07/01/2028 | | | | | 567,700 | | | | | | 0.0 | | |
| 800,000 (2) | | | INEOS Quattro Finance 2 Plc, 3.375%, 01/15/2026 | | | | | 745,840 | | | | | | 0.0 | | |
| Principal Amount† | | | Value | | | Percentage of Net Assets | | |||||||||
| CORPORATE BONDS/NOTES: (continued) | | |||||||||||||||
| | | | Basic Materials (continued) | | ||||||||||||
| 2,000,000 (2) | | | Inversiones CMPC SA, 3.850%, 01/13/2030 | | | | $ | 1,947,020 | | | | | | 0.1 | | |
| 400,000 (1) | | | Inversiones CMPC SA, 4.375%, 04/04/2027 | | | | | 419,190 | | | | | | 0.0 | | |
| 925,000 (2)(3) | | | Iris Holdings, Inc., 8.750% (PIK Rate 9.500%, Cash Rate 8.750)%, 02/15/2026 | | | | | 926,161 | | | | | | 0.1 | | |
| 850,000 (1)(2) | | | LSF11 A5 Holdco LLC, 6.625%, 10/15/2029 | | | | | 791,839 | | | | | | 0.1 | | |
| 750,000 (1)(2) | | | Novelis Corp., 3.875%, 08/15/2031 | | | | | 687,221 | | | | | | 0.0 | | |
| 200,000 (2) | | | Novelis Corp., 4.750%, 01/30/2030 | | | | | 194,546 | | | | | | 0.0 | | |
| 675,000 (2) | | | Nufarm Australia Ltd. / Nufarm Americas, Inc., 5.000%, 01/27/2030 | | | | | 666,380 | | | | | | 0.0 | | |
| 325,000 (2) | | | OCP SA, 3.750%, 06/23/2031 | | | | | 295,711 | | | | | | 0.0 | | |
| 650,000 (1) | | | Olin Corp., 5.000%, 02/01/2030 | | | | | 644,868 | | | | | | 0.0 | | |
| 475,000 | | | Olin Corp., 5.125%, 09/15/2027 | | | | | 474,093 | | | | | | 0.0 | | |
| 725,000 (1)(2) | | | PMHC II, Inc., 9.000%, 02/15/2030 | | | | | 638,935 | | | | | | 0.0 | | |
| 400,000 | | | Sasol Financing USA LLC, 5.500%, 03/18/2031 | | | | | 374,220 | | | | | | 0.0 | | |
| 925,000 (2) | | | Schweitzer-Mauduit International, Inc., 6.875%, 10/01/2026 | | | | | 875,235 | | | | | | 0.1 | | |
| 2,500,000 (2) | | | Severstal OAO Via Steel Capital SA, 3.150%, 09/16/2024 | | | | | 237,500 | | | | | | 0.0 | | |
| 2,425,000 (2) | | | Sibur Securities DAC, 2.950%, 07/08/2025 | | | | | 606,250 | | | | | | 0.0 | | |
| 350,000 | | | Southern Copper Corp., 5.875%, 04/23/2045 | | | | | 428,531 | | | | | | 0.0 | | |
| 1,350,000 | | | Suzano Austria GmbH, 5.000%, 01/15/2030 | | | | | 1,378,229 | | | | | | 0.1 | | |
| 200,000 | | | Suzano Austria GmbH, 6.000%, 01/15/2029 | | | | | 216,266 | | | | | | 0.0 | | |
| 700,000 (2) | | | Taseko Mines Ltd., 7.000%, 02/15/2026 | | | | | 721,788 | | | | | | 0.0 | | |
| 675,000 (1)(2) | | | Trinseo Materials Operating SCA / Trinseo Materials Finance, Inc., 5.125%, 04/01/2029 | | | | | 624,132 | | | | | | 0.0 | | |
| 825,000 (1)(2) | | | Tronox, Inc., 4.625%, 03/15/2029 | | | | | 773,400 | | | | | | 0.1 | | |
| Voya Strategic Income | PORTFOLIO OF INVESTMENTS |
| Opportunities Fund | as of March 31, 2022 (continued) |
| Principal Amount† | | | Value | | | Percentage of Net Assets | | |||||||||
| CORPORATE BONDS/NOTES: (continued) | | |||||||||||||||
| | | | Basic Materials (continued) | | ||||||||||||
| 2,600,000 | | | Vale Overseas Ltd., 3.750%, 07/08/2030 | | | | $ | 2,512,718 | | | | | | 0.1 | | |
| 375,000 (1)(2) | | | Venator Finance Sarl / Venator Materials LLC, 5.750%, 07/15/2025 | | | | | 301,914 | | | | | | 0.0 | | |
| | | | | | | | | 35,345,751 | | | | | | 1.4 | | |
| | | | Communications: 2.1% | | ||||||||||||
| 700,000 (2) | | | Acuris Finance US, Inc. / Acuris Finance SARL, 5.000%, 05/01/2028 | | | | | 644,623 | | | | | | 0.0 | | |
| 600,000 (1) | | | Alibaba Group Holding Ltd., 2.125%, 02/09/2031 | | | | | 522,505 | | | | | | 0.0 | | |
| 600,000 | | | Alibaba Group Holding Ltd., 2.700%, 02/09/2041 | | | | | 458,110 | | | | | | 0.0 | | |
| 1,000,000 (1)(2) | | | Altice France Holding SA, 6.000%, 02/15/2028 | | | | | 864,485 | | | | | | 0.1 | | |
| 1,000,000 (2) | | | Altice France SA/France, 5.500%, 10/15/2029 | | | | | 898,640 | | | | | | 0.1 | | |
| 575,000 (2) | | | Altice France SA/France, 8.125%, 02/01/2027 | | | | | 593,509 | | | | | | 0.0 | | |
| 800,000 (1) | | | AMC Networks, Inc., 4.250%, 02/15/2029 | | | | | 747,600 | | | | | | 0.0 | | |
| 875,000 (1)(2) | | | Audacy Capital Corp., 6.500%, 05/01/2027 | | | | | 822,701 | | | | | | 0.0 | | |
| 900,000 (2) | | | Beasley Mezzanine Holdings LLC, 8.625%, 02/01/2026 | | | | | 856,026 | | | | | | 0.1 | | |
| 825,000 (2) | | | CCO Holdings LLC / CCO Holdings Capital Corp., 4.250%, 01/15/2034 | | | | | 717,750 | | | | | | 0.0 | | |
| 1,125,000 (1) | | | CCO Holdings LLC / CCO Holdings Capital Corp., 4.500%, 05/01/2032 | | | | | 1,030,612 | | | | | | 0.1 | | |
| 600,000 (2) | | | CCO Holdings LLC / CCO Holdings Capital Corp., 5.000%, 02/01/2028 | | | | | 594,846 | | | | | | 0.0 | | |
| 975,000 (2) | | | CCO Holdings LLC / CCO Holdings Capital Corp., 5.125%, 05/01/2027 | | | | | 977,730 | | | | | | 0.1 | | |
| 550,000 (1)(2) | | | Clear Channel Outdoor Holdings, Inc., 7.500%, 06/01/2029 | | | | | 549,466 | | | | | | 0.0 | | |
| 475,000 (1)(2) | | | Clear Channel Outdoor Holdings, Inc., 7.750%, 04/15/2028 | | | | | 478,023 | | | | | | 0.0 | | |
| 3,016,000 (2) | | | Comcast Corp., 2.937%, 11/01/2056 | | | | | 2,503,459 | | | | | | 0.1 | | |
| 325,000 (1)(2) | | | CommScope Tech Finance LLC, 6.000%, 06/15/2025 | | | | | 308,194 | | | | | | 0.0 | | |
| Principal Amount† | | | Value | | | Percentage of Net Assets | | |||||||||
| CORPORATE BONDS/NOTES: (continued) | | |||||||||||||||
| | | | Communications (continued) | | ||||||||||||
| 200,000 (2) | | | CommScope Technologies LLC, 5.000%, 03/15/2027 | | | | $ | 174,132 | | | | | | 0.0 | | |
| 375,000 (1)(2) | | | CommScope, Inc., 4.750%, 09/01/2029 | | | | | 345,892 | | | | | | 0.0 | | |
| 750,000 (1)(2) | | | CommScope, Inc., 7.125%, 07/01/2028 | | | | | 678,375 | | | | | | 0.0 | | |
| 1,125,000 (2) | | | Connect Finco SARL / Connect US Finco LLC, 6.750%, 10/01/2026 | | | | | 1,146,032 | | | | | | 0.1 | | |
| 800,000 (1)(2) | | | CSC Holdings LLC, 4.625%, 12/01/2030 | | | | | 670,136 | | | | | | 0.0 | | |
| 325,000 (1) | | | CSC Holdings LLC, 5.250%, 06/01/2024 | | | | | 325,975 | | | | | | 0.0 | | |
| 1,600,000 (2) | | | CSC Holdings LLC, 5.750%, 01/15/2030 | | | | | 1,426,760 | | | | | | 0.1 | | |
| 400,000 (1)(2) | | | CSC Holdings LLC, 7.500%, 04/01/2028 | | | | | 393,744 | | | | | | 0.0 | | |
| 1,325,000 (2) | | | DIRECTV Holdings LLC / DIRECTV Financing Co., Inc., 5.875%, 08/15/2027 | | | | | 1,305,224 | | | | | | 0.1 | | |
| 950,000 | | | DISH DBS Corp., 5.125%, 06/01/2029 | | | | | 810,255 | | | | | | 0.0 | | |
| 275,000 (2) | | | DISH DBS Corp., 5.250%, 12/01/2026 | | | | | 262,453 | | | | | | 0.0 | | |
| 425,000 (2) | | | DISH DBS Corp., 5.750%, 12/01/2028 | | | | | 402,953 | | | | | | 0.0 | | |
| 525,000 (1) | | | DISH DBS Corp., 7.375%, 07/01/2028 | | | | | 498,028 | | | | | | 0.0 | | |
| 700,000 | | | Embarq Corp., 7.995%, 06/01/2036 | | | | | 675,612 | | | | | | 0.0 | | |
| 150,000 (2) | | | Frontier Communications Holdings LLC, 5.000%, 05/01/2028 | | | | | 144,184 | | | | | | 0.0 | | |
| 225,000 (1)(2) | | | Frontier Communications Holdings LLC, 6.000%, 01/15/2030 | | | | | 208,425 | | | | | | 0.0 | | |
| 495,000 (1)(2) | | | Frontier Communications Holdings LLC, 6.750%, 05/01/2029 | | | | | 475,883 | | | | | | 0.0 | | |
| 775,000 (2) | | | GCI LLC, 4.750%, 10/15/2028 | | | | | 758,074 | | | | | | 0.0 | | |
| 900,000 (1)(2) | | | Gray Escrow II, Inc., 5.375%, 11/15/2031 | | | | | 861,750 | | | | | | 0.1 | | |
| 900,000 (1) | | | Hughes Satellite Systems Corp., 6.625%, 08/01/2026 | | | | | 934,542 | | | | | | 0.1 | | |
| 275,000 (2) | | | iHeartCommunications, Inc., 5.250%, 08/15/2027 | | | | | 272,393 | | | | | | 0.0 | | |
| 875,000 (1) | | | iHeartCommunications, Inc., 8.375%, 05/01/2027 | | | | | 905,800 | | | | | | 0.1 | | |
| Voya Strategic Income | PORTFOLIO OF INVESTMENTS |
| Opportunities Fund | as of March 31, 2022 (continued) |
| Principal Amount† | | | Value | | | Percentage of Net Assets | | |||||||||
| CORPORATE BONDS/NOTES: (continued) | | |||||||||||||||
| | | | Communications (continued) | | ||||||||||||
| 600,000 (2) | | | ION Trading Technologies Sarl, 5.750%, 05/15/2028 | | | | $ | 580,074 | | | | | | 0.0 | | |
| 450,000 (1)(2) | | | LCPR Senior Secured Financing DAC, 5.125%, 07/15/2029 | | | | | 430,515 | | | | | | 0.0 | | |
| 720,000 (2) | | | LCPR Senior Secured Financing DAC, 6.750%, 10/15/2027 | | | | | 740,621 | | | | | | 0.0 | | |
| 270,000 | | | Lumen Technologies, Inc., 5.625%, 04/01/2025 | | | | | 272,400 | | | | | | 0.0 | | |
| 655,000 (2) | | | McGraw-Hill Education, Inc., 8.000%, 08/01/2029 | | | | | 620,387 | | | | | | 0.0 | | |
| 215,000 (2) | | | Millennium Escrow Corp., 6.625%, 08/01/2026 | | | | | 204,480 | | | | | | 0.0 | | |
| 700,000 | | | Netflix, Inc., 5.875%, 11/15/2028 | | | | | 773,360 | | | | | | 0.0 | | |
| 800,000 (2)(4) | | | Network i2i Ltd., 3.975%, 12/31/2199 | | | | | 743,244 | | | | | | 0.0 | | |
| 1,000,000 (2) | | | Ooredoo International Finance Ltd., 2.625%, 04/08/2031 | | | | | 940,267 | | | | | | 0.1 | | |
| 475,000 (4) | | | Paramount Global, 6.250%, 02/28/2057 | | | | | 479,762 | | | | | | 0.0 | | |
| 3,650,000 (4) | | | Paramount Global, 6.375%, 03/30/2062 | | | | | 3,689,037 | | | | | | 0.2 | | |
| 875,000 (1)(2) | | | Radiate Holdco LLC / Radiate Finance, Inc., 6.500%, 09/15/2028 | | | | | 829,063 | | | | | | 0.1 | | |
| 125,000 (1)(2) | | | Scripps Escrow II, Inc., 3.875%, 01/15/2029 | | | | | 116,317 | | | | | | 0.0 | | |
| 250,000 (1)(2) | | | Scripps Escrow II, Inc., 5.375%, 01/15/2031 | | | | | 239,720 | | | | | | 0.0 | | |
| 825,000 (1)(2) | | | Scripps Escrow, Inc., 5.875%, 07/15/2027 | | | | | 826,815 | | | | | | 0.1 | | |
| 325,000 (1)(2) | | | Sinclair Television Group, Inc., 4.125%, 12/01/2030 | | | | | 290,388 | | | | | | 0.0 | | |
| 460,000 (1)(2) | | | Sinclair Television Group, Inc., 5.500%, 03/01/2030 | | | | | 398,995 | | | | | | 0.0 | | |
| 600,000 (2) | | | Sirius XM Radio, Inc., 5.000%, 08/01/2027 | | | | | 599,586 | | | | | | 0.0 | | |
| 625,000 (2) | | | Spanish Broadcasting System, Inc., 9.750%, 03/01/2026 | | | | | 628,888 | | | | | | 0.0 | | |
| 1,350,000 | | | Sprint Corp., 7.125%, 06/15/2024 | | | | | 1,449,630 | | | | | | 0.1 | | |
| 375,000 | | | Sprint Corp., 7.625%, 03/01/2026 | | | | | 423,679 | | | | | | 0.0 | | |
| 650,000 (2) | | | Stagwell Global LLC, 5.625%, 08/15/2029 | | | | | 614,055 | | | | | | 0.0 | | |
| Principal Amount† | | | Value | | | Percentage of Net Assets | | |||||||||
| CORPORATE BONDS/NOTES: (continued) | | |||||||||||||||
| | | | Communications (continued) | | ||||||||||||
| 175,000 | | | Telecom Italia Capital SA, 6.000%, 09/30/2034 | | | | $ | 164,836 | | | | | | 0.0 | | |
| 775,000 | | | Telecom Italia Capital SA, 6.375%, 11/15/2033 | | | | | 742,063 | | | | | | 0.0 | | |
| 300,000 (1)(2) | | | Tencent Holdings Ltd., 2.880%, 04/22/2031 | | | | | 274,321 | | | | | | 0.0 | | |
| 300,000 (2) | | | Tencent Holdings Ltd., 3.680%, 04/22/2041 | | | | | 265,821 | | | | | | 0.0 | | |
| 2,000,000 | | | Tencent Holdings Ltd., 3.975%, 04/11/2029 | | | | | 1,996,890 | | | | | | 0.1 | | |
| 275,000 (2) | | | Univision Communications, Inc., 4.500%, 05/01/2029 | | | | | 262,130 | | | | | | 0.0 | | |
| 1,225,000 (2) | | | Univision Communications, Inc., 6.625%, 06/01/2027 | | | | | 1,284,615 | | | | | | 0.1 | | |
| 500,000 (2) | | | Urban One, Inc., 7.375%, 02/01/2028 | | | | | 502,643 | | | | | | 0.0 | | |
| 600,000 (1)(2) | | | ViaSat, Inc., 5.625%, 09/15/2025 | | | | | 587,001 | | | | | | 0.0 | | |
| 140,000 (2) | | | ViaSat, Inc., 5.625%, 04/15/2027 | | | | | 138,154 | | | | | | 0.0 | | |
| 325,000 (2) | | | ViaSat, Inc., 6.500%, 07/15/2028 | | | | | 312,411 | | | | | | 0.0 | | |
| 625,000 (1)(2) | | | Viavi Solutions, Inc., 3.750%, 10/01/2029 | | | | | 587,320 | | | | | | 0.0 | | |
| 1,100,000 (1)(2) | | | Virgin Media Vendor Financing Notes IV DAC, 5.000%, 07/15/2028 | | | | | 1,058,096 | | | | | | 0.1 | | |
| 700,000 (2) | | | Vmed O2 UK Financing I PLC, 4.750%, 07/15/2031 | | | | | 660,797 | | | | | | 0.0 | | |
| 200,000 (2) | | | VTR Comunicaciones SpA, 5.125%, 01/15/2028 | | | | | 190,897 | | | | | | 0.0 | | |
| | | | | | | | | 52,164,179 | | | | | | 2.1 | | |
| | | | Consumer, Cyclical: 3.1% | | ||||||||||||
| 575,000 (2) | | | 1011778 BC ULC / New Red Finance, Inc., 4.000%, 10/15/2030 | | | | | 519,449 | | | | | | 0.0 | | |
| 875,000 (1)(2) | | | Academy Ltd., 6.000%, 11/15/2027 | | | | | 896,875 | | | | | | 0.1 | | |
| 710,000 (2) | | | Adams Homes, Inc., 7.500%, 02/15/2025 | | | | | 710,678 | | | | | | 0.0 | | |
| 900,000 (1)(2) | | | Adient Global Holdings Ltd., 4.875%, 08/15/2026 | | | | | 858,109 | | | | | | 0.1 | | |
| 975,000 (2) | | | Affinity Gaming, 6.875%, 12/15/2027 | | | | | 950,094 | | | | | | 0.1 | | |
| 175,000 (2) | | | Allison Transmission, Inc., 3.750%, 01/30/2031 | | | | | 159,014 | | | | | | 0.0 | | |
| 800,000 (2) | | | Allison Transmission, Inc., 5.875%, 06/01/2029 | | | | | 817,288 | | | | | | 0.1 | | |
| Voya Strategic Income | PORTFOLIO OF INVESTMENTS |
| Opportunities Fund | as of March 31, 2022 (continued) |
| Principal Amount† | | | Value | | | Percentage of Net Assets | | |||||||||
| CORPORATE BONDS/NOTES: (continued) | | |||||||||||||||
| | | | Consumer, Cyclical (continued) | | ||||||||||||
| 747,285 | | | American Airlines 2015-2 Class A Pass Through Trust, 4.000%, 03/22/2029 | | | | $ | 690,470 | | | | | | 0.0 | | |
| 43,549 | | | American Airlines 2016-1 Class A Pass Through Trust, 4.100%, 07/15/2029 | | | | | 40,139 | | | | | | 0.0 | | |
| 1,405,000 (1)(2) | | | American Airlines Group, Inc., 3.750%, 03/01/2025 | | | | | 1,283,418 | | | | | | 0.1 | | |
| 1,200,000 (2) | | | American Airlines, Inc./ AAdvantage Loyalty IP Ltd., 5.750%, 04/20/2029 | | | | | 1,197,150 | | | | | | 0.1 | | |
| 725,000 (2) | | | Arko Corp., 5.125%, 11/15/2029 | | | | | 661,088 | | | | | | 0.0 | | |
| 400,000 (1) | | | Asbury Automotive Group, Inc., 4.500%, 03/01/2028 | | | | | 385,080 | | | | | | 0.0 | | |
| 170,000 (1)(2) | | | Asbury Automotive Group, Inc., 4.625%, 11/15/2029 | | | | | 158,522 | | | | | | 0.0 | | |
| 290,000 | | | Asbury Automotive Group, Inc., 4.750%, 03/01/2030 | | | | | 274,064 | | | | | | 0.0 | | |
| 1,025,000 | | | Bath & Body Works, Inc., 6.750%, 07/01/2036 | | | | | 1,045,956 | | | | | | 0.1 | | |
| 150,000 (2)(3) | | | BCPE Ulysses Intermediate, Inc., 7.750% (PIK Rate 8.500%, Cash Rate 7.750)%, 04/01/2027 | | | | | 136,299 | | | | | | 0.0 | | |
| 925,000 (1)(2) | | | Caesars Entertainment, Inc., 4.625%, 10/15/2029 | | | | | 866,031 | | | | | | 0.1 | | |
| 650,000 (2) | | | Caesars Entertainment, Inc., 6.250%, 07/01/2025 | | | | | 671,918 | | | | | | 0.0 | | |
| 325,000 (1)(2) | | | Carnival Corp., 6.000%, 05/01/2029 | | | | | 306,693 | | | | | | 0.0 | | |
| 1,000,000 (2) | | | Carnival Corp., 7.625%, 03/01/2026 | | | | | 1,007,700 | | | | | | 0.1 | | |
| 325,000 (2) | | | Carnival Corp., 9.875%, 08/01/2027 | | | | | 359,765 | | | | | | 0.0 | | |
| 650,000 (2) | | | CCM Merger, Inc., 6.375%, 05/01/2026 | | | | | 657,290 | | | | | | 0.0 | | |
| 600,000 (1)(2) | | | Century Communities, Inc., 3.875%, 08/15/2029 | | | | | 539,187 | | | | | | 0.0 | | |
| 600,000 (2) | | | Cinemark USA, Inc., 8.750%, 05/01/2025 | | | | | 628,497 | | | | | | 0.0 | | |
| 2,475,000 (2) | | | CK Hutchison International 21 Ltd., 2.500%, 04/15/2031 | | | | | 2,284,782 | | | | | | 0.1 | | |
| 575,000 (2) | | | CROCS INC COMPANY GUAR 144A 08/31 4.125, 4.125%, 08/15/2031 | | | | | 486,919 | | | | | | 0.0 | | |
| 200,000 (1) | | | Delta Air Lines, Inc., 7.375%, 01/15/2026 | | | | | 217,420 | | | | | | 0.0 | | |
| Principal Amount† | | | Value | | | Percentage of Net Assets | | |||||||||
| CORPORATE BONDS/NOTES: (continued) | | |||||||||||||||
| | | | Consumer, Cyclical (continued) | | ||||||||||||
| 674,782 (2) | | | Delta Air Lines, Inc. / SkyMiles IP Ltd., 4.750%, 10/20/2028 | | | | $ | 681,127 | | | | | | 0.0 | | |
| 2,500,000 (2) | | | Falabella SA, 3.375%, 01/15/2032 | | | | | 2,336,387 | | | | | | 0.1 | | |
| 600,000 | | | Falabella SA, 3.750%, 10/30/2027 | | | | | 603,438 | | | | | | 0.0 | | |
| 975,000 (1)(2) | | | Fertitta Entertainment LLC / Fertitta Entertainment Finance Co., Inc., 6.750%, 01/15/2030 | | | | | 898,204 | | | | | | 0.1 | | |
| 525,000 (1)(2) | | | Foot Locker, Inc., 4.000%, 10/01/2029 | | | | | 460,404 | | | | | | 0.0 | | |
| 800,000 | | | Ford Motor Credit Co. LLC, 2.700%, 08/10/2026 | | | | | 745,008 | | | | | | 0.0 | | |
| 300,000 | | | Ford Motor Credit Co. LLC, 3.625%, 06/17/2031 | | | | | 271,503 | | | | | | 0.0 | | |
| 550,000 (1) | | | Ford Motor Credit Co. LLC, 4.125%, 08/17/2027 | | | | | 538,279 | | | | | | 0.0 | | |
| 675,000 | | | Ford Motor Credit Co. LLC, 4.542%, 08/01/2026 | | | | | 675,135 | | | | | | 0.0 | | |
| 600,000 | | | Ford Motor Credit Co. LLC, 5.113%, 05/03/2029 | | | | | 604,620 | | | | | | 0.0 | | |
| 800,000 | | | Ford Motor Credit Co. LLC, 5.584%, 03/18/2024 | | | | | 823,688 | | | | | | 0.1 | | |
| 700,000 (1)(2) | | | Foundation Building Materials, Inc., 6.000%, 03/01/2029 | | | | | 631,358 | | | | | | 0.0 | | |
| 700,000 (1)(2) | | | Gap, Inc./The, 3.875%, 10/01/2031 | | | | | 611,135 | | | | | | 0.0 | | |
| 300,000 (2) | | | Genm Capital Labuan Ltd., 3.882%, 04/19/2031 | | | | | 261,811 | | | | | | 0.0 | | |
| 495,000 (2) | | | Golden Entertainment, Inc., 7.625%, 04/15/2026 | | | | | 516,050 | | | | | | 0.0 | | |
| 2,920,000 | | | Home Depot, Inc./The, 3.625%, 04/15/2052 | | | | | 2,903,247 | | | | | | 0.1 | | |
| 3,000,000 (2) | | | InRetail Consumer, 3.250%, 03/22/2028 | | | | | 2,818,665 | | | | | | 0.1 | | |
| 725,000 (2) | | | Installed Building Products, Inc., 5.750%, 02/01/2028 | | | | | 708,180 | | | | | | 0.0 | | |
| 725,000 (2) | | | Interface, Inc., 5.500%, 12/01/2028 | | | | | 705,436 | | | | | | 0.0 | | |
| 615,000 (1)(2) | | | LBM Acquisition LLC, 6.250%, 01/15/2029 | | | | | 576,812 | | | | | | 0.0 | | |
| 850,000 (2) | | | LCM Investments Holdings II LLC, 4.875%, 05/01/2029 | | | | | 803,862 | | | | | | 0.0 | | |
| 600,000 (2) | | | LGI Homes, Inc, 4.000%, 07/15/2029 | | | | | 527,427 | | | | | | 0.0 | | |
| Voya Strategic Income | PORTFOLIO OF INVESTMENTS |
| Opportunities Fund | as of March 31, 2022 (continued) |
| Principal Amount† | | | Value | | | Percentage of Net Assets | | |||||||||
| CORPORATE BONDS/NOTES: (continued) | | |||||||||||||||
| | | | Consumer, Cyclical (continued) | | ||||||||||||
| 210,000 (2) | | | Lindblad Expeditions LLC, 6.750%, 02/15/2027 | | | | $ | 210,790 | | | | | | 0.0 | | |
| 850,000 (1)(2) | | | Lions Gate Capital Holdings LLC, 5.500%, 04/15/2029 | | | | | 820,275 | | | | | | 0.1 | | |
| 2,183,000 | | | Lowe’s Cos, Inc., 4.450%, 04/01/2062 | | | | | 2,275,389 | | | | | | 0.1 | | |
| 200,000 (1) | | | M/I Homes, Inc., 3.950%, 02/15/2030 | | | | | 176,354 | | | | | | 0.0 | | |
| 550,000 (1) | | | M/I Homes, Inc., 4.950%, 02/01/2028 | | | | | 519,489 | | | | ��� | | 0.0 | | |
| 305,000 | | | Macy’s Retail Holdings LLC, 4.500%, 12/15/2034 | | | | | 260,616 | | | | | | 0.0 | | |
| 135,000 (1)(2) | | | Macy’s Retail Holdings LLC, 5.875%, 03/15/2030 | | | | | 133,335 | | | | | | 0.0 | | |
| 475,000 (2) | | | Macy’s Retail Holdings LLC, 6.125%, 03/15/2032 | | | | | 469,694 | | | | | | 0.0 | | |
| 4,447,000 (2) | | | Magallanes, Inc., 5.141%, 03/15/2052 | | | | | 4,560,268 | | | | | | 0.2 | | |
| 400,000 | | | Mattel, Inc., 5.450%, 11/01/2041 | | | | | 426,656 | | | | | | 0.0 | | |
| 600,000 (1)(2) | | | Melco Resorts Finance Ltd., 5.375%, 12/04/2029 | | | | | 511,500 | | | | | | 0.0 | | |
| 525,000 | | | Meritage Homes Corp., 5.125%, 06/06/2027 | | | | | 531,300 | | | | | | 0.0 | | |
| 975,000 (2) | | | Meritor, Inc., 4.500%, 12/15/2028 | | | | | 979,290 | | | | | | 0.1 | | |
| 130,000 (1) | | | MGM Resorts International, 5.500%, 04/15/2027 | | | | | 131,524 | | | | | | 0.0 | | |
| 300,000 | | | MGM Resorts International, 6.000%, 03/15/2023 | | | | | 307,159 | | | | | | 0.0 | | |
| 625,000 (2) | | | Midwest Gaming Borrower LLC / Midwest Gaming Finance Corp., 4.875%, 05/01/2029 | | | | | 577,431 | | | | | | 0.0 | | |
| 150,000 (1)(2) | | | Murphy Oil USA, Inc., 3.750%, 02/15/2031 | | | | | 137,188 | | | | | | 0.0 | | |
| 450,000 | | | Murphy Oil USA, Inc., 4.750%, 09/15/2029 | | | | | 447,157 | | | | | | 0.0 | | |
| 165,000 | | | Murphy Oil USA, Inc., 5.625%, 05/01/2027 | | | | | 167,951 | | | | | | 0.0 | | |
| 620,000 (1)(2) | | | NCL Corp. Ltd., 7.750%, 02/15/2029 | | | | | 626,587 | | | | | | 0.0 | | |
| 500,000 (2) | | | NCL Finance Ltd., 6.125%, 03/15/2028 | | | | | 464,687 | | | | | | 0.0 | | |
| 500,000 (1)(2) | | | Penn National Gaming, Inc., 4.125%, 07/01/2029 | | | | | 448,150 | | | | | | 0.0 | | |
| 450,000 (1)(2) | | | Penn National Gaming, Inc., 5.625%, 01/15/2027 | | | | | 446,789 | | | | | | 0.0 | | |
| Principal Amount† | | | Value | | | Percentage of Net Assets | | |||||||||
| CORPORATE BONDS/NOTES: (continued) | | |||||||||||||||
| | | | Consumer, Cyclical (continued) | | ||||||||||||
| 1,250,000 (2) | | | PetSmart, Inc. / PetSmart Finance Corp., 7.750%, 02/15/2029 | | | | $ | 1,292,150 | | | | | | 0.1 | | |
| 568,000 (2) | | | Picasso Finance Sub, Inc., 6.125%, 06/15/2025 | | | | | 578,215 | | | | | | 0.0 | | |
| 975,000 (2) | | | Real Hero Merger Sub 2, Inc., 6.250%, 02/01/2029 | | | | | 890,282 | | | | | | 0.1 | | |
| 1,550,000 (1)(2) | | | Royal Caribbean Cruises Ltd., 5.375%, 07/15/2027 | | | | | 1,491,495 | | | | | | 0.1 | | |
| 145,000 (2) | | | Royal Caribbean Cruises Ltd., 9.125%, 06/15/2023 | | | | | 151,150 | | | | | | 0.0 | | |
| 850,000 (1)(2) | | | Scientific Games Holdings L.P./Scientific Games US FinCo, Inc., 6.625%, 03/01/2030 | | | | | 838,950 | | | | | | 0.1 | | |
| 500,000 (2) | | | Scientific Games International, Inc., 7.000%, 05/15/2028 | | | | | 519,125 | | | | | | 0.0 | | |
| 300,000 (2) | | | Scientific Games International, Inc., 8.250%, 03/15/2026 | | | | | 312,375 | | | | | | 0.0 | | |
| 325,000 (2) | | | Scientific Games International, Inc., 8.625%, 07/01/2025 | | | | | 342,225 | | | | | | 0.0 | | |
| 625,000 (2) | | | Shea Homes L.P. / Shea Homes Funding Corp., 4.750%, 04/01/2029 | | | | | 585,625 | | | | | | 0.0 | | |
| 875,000 (2) | | | Sizzling Platter LLC / Sizzling Platter Finance Corp., 8.500%, 11/28/2025 | | | | | 810,574 | | | | | | 0.1 | | |
| 800,000 (2) | | | Sonic Automotive, Inc., 4.625%, 11/15/2029 | | | | | 721,004 | | | | | | 0.0 | | |
| 1,025,000 (2) | | | Specialty Building Products Holdings LLC / SBP Finance Corp., 6.375%, 09/30/2026 | | | | | 1,043,809 | | | | | | 0.1 | | |
| 375,000 (2) | | | SRS Distribution, Inc., 6.000%, 12/01/2029 | | | | | 347,616 | | | | | | 0.0 | | |
| 625,000 (1)(2) | | | SRS Distribution, Inc., 6.125%, 07/01/2029 | | | | | 577,322 | | | | | | 0.0 | | |
| 1,275,000 (1)(2) | | | Staples, Inc., 10.750%, 04/15/2027 | | | | | 1,136,070 | | | | | | 0.1 | | |
| 975,000 (2) | | | Station Casinos LLC, 4.500%, 02/15/2028 | | | | | 926,455 | | | | | | 0.1 | | |
| 700,000 (2) | | | STL Holding Co. LLC, 7.500%, 02/15/2026 | | | | | 707,000 | | | | | | 0.0 | | |
| 675,000 (2) | | | Taylor Morrison Communities, Inc., 5.125%, 08/01/2030 | | | | | 660,801 | | | | | | 0.0 | | |
| Voya Strategic Income | PORTFOLIO OF INVESTMENTS |
| Opportunities Fund | as of March 31, 2022 (continued) |
| Principal Amount† | | | Value | | | Percentage of Net Assets | | |||||||||
| CORPORATE BONDS/NOTES: (continued) | | |||||||||||||||
| | | | Consumer, Cyclical (continued) | | ||||||||||||
| 675,000 (2) | | | Tempur Sealy International, Inc., 3.875%, 10/15/2031 | | | | $ | 579,812 | | | | | | 0.0 | | |
| 650,000 (1) | | | United Airlines Holdings, Inc., 4.875%, 01/15/2025 | | | | | 648,131 | | | | | | 0.0 | | |
| 250,000 (1)(2) | | | United Airlines, Inc., 4.375%, 04/15/2026 | | | | | 246,250 | | | | | | 0.0 | | |
| 650,000 (2) | | | United Airlines, Inc., 4.625%, 04/15/2029 | | | | | 618,946 | | | | | | 0.0 | | |
| 850,000 (2) | | | Univar Solutions USA, Inc./Washington, 5.125%, 12/01/2027 | | | | | 850,808 | | | | | | 0.1 | | |
| 1,025,000 (2) | | | Victoria’s Secret & Co., 4.625%, 07/15/2029 | | | | | 924,422 | | | | | | 0.1 | | |
| 1,075,000 (1)(2) | | | Viking Cruises Ltd., 5.875%, 09/15/2027 | | | | | 981,916 | | | | | | 0.1 | | |
| 255,000 (2) | | | Viking Cruises Ltd., 13.000%, 05/15/2025 | | | | | 283,819 | | | | | | 0.0 | | |
| 750,000 (1)(2) | | | Wheel Pros, Inc., 6.500%, 05/15/2029 | | | | | 658,635 | | | | | | 0.0 | | |
| 600,000 (1)(2) | | | White Cap Buyer LLC, 6.875%, 10/15/2028 | | | | | 569,277 | | | | | | 0.0 | | |
| 300,000 (1)(2)(3) | | | White Cap Parent LLC, 8.250% (PIK Rate 9.000%, Cash Rate 8.250)%, 03/15/2026 | | | | | 295,106 | | | | | | 0.0 | | |
| 550,000 (2) | | | William Carter Co/The, 5.625%, 03/15/2027 | | | | | 558,811 | | | | | | 0.0 | | |
| 275,000 (1)(2) | | | Williams Scotsman International, Inc., 4.625%, 08/15/2028 | | | | | 268,439 | | | | | | 0.0 | | |
| 750,000 (1)(2) | | | Wolverine World Wide, Inc., 4.000%, 08/15/2029 | | | | | 666,975 | | | | | | 0.0 | | |
| 100,000 (1)(2) | | | Wyndham Hotels & Resorts, Inc., 4.375%, 08/15/2028 | | | | | 96,366 | | | | | | 0.0 | | |
| | | | | | | | | 76,321,206 | | | | | | 3.1 | | |
| | | | Consumer, Non-cyclical: 2.0% | | ||||||||||||
| 750,000 (2) | | | Acadia Healthcare Co., Inc., 5.500%, 07/01/2028 | | | | | 754,687 | | | | | | 0.0 | | |
| 700,000 (1)(2) | | | ACCO Brands Corp., 4.250%, 03/15/2029 | | | | | 647,675 | | | | | | 0.0 | | |
| 875,000 (2) | | | Adani Ports & Special Economic Zone Ltd., 4.375%, 07/03/2029 | | | | | 841,871 | | | | | | 0.1 | | |
| 805,000 (1)(2) | | | ADT Security Corp./The, 4.125%, 08/01/2029 | | | | | 748,690 | | | | | | 0.0 | | |
| 525,000 (2) | | | Albertsons Cos, Inc. / Safeway, Inc. / New Albertsons L.P. / Albertsons LLC, 3.500%, 03/15/2029 | | | | | 474,442 | | | | | | 0.0 | | |
| Principal Amount† | | | Value | | | Percentage of Net Assets | | |||||||||
| CORPORATE BONDS/NOTES: (continued) | | |||||||||||||||
| | | | Consumer, Non-cyclical (continued) | | ||||||||||||
| 275,000 (2) | | | Albertsons Cos, Inc. / Safeway, Inc. / New Albertsons L.P. / Albertsons LLC, 4.875%, 02/15/2030 | | | | $ | 268,297 | | | | | | 0.0 | | |
| 675,000 (1)(2) | | | Albertsons Cos, Inc. / Safeway, Inc. / New Albertsons L.P. / Albertsons LLC, 5.875%, 02/15/2028 | | | | | 673,954 | | | | | | 0.0 | | |
| 300,000 (1)(2) | | | Allied Universal Holdco LLC / Allied Universal Finance Corp., 6.000%, 06/01/2029 | | | | | 265,050 | | | | | | 0.0 | | |
| 400,000 (2) | | | Allied Universal Holdco LLC / Allied Universal Finance Corp., 6.625%, 07/15/2026 | | | | | 405,280 | | | | | | 0.0 | | |
| 1,000,000 (1)(2) | | | Allied Universal Holdco LLC / Allied Universal Finance Corp., 9.750%, 07/15/2027 | | | | | 1,034,800 | | | | | | 0.1 | | |
| 825,000 (2) | | | Alta Equipment Group, Inc., 5.625%, 04/15/2026 | | | | | 785,470 | | | | | | 0.0 | | |
| 600,000 (2) | | | AMN Healthcare, Inc., 4.625%, 10/01/2027 | | | | | 584,523 | | | | | | 0.0 | | |
| 450,000 (2) | | | APi Escrow Corp., 4.750%, 10/15/2029 | | | | | 418,788 | | | | | | 0.0 | | |
| 300,000 (2) | | | APi Group DE, Inc., 4.125%, 07/15/2029 | | | | | 277,035 | | | | | | 0.0 | | |
| 1,100,000 (1)(2) | | | Bausch Health Americas, Inc., 8.500%, 01/31/2027 | | | | | 1,098,130 | | | | | | 0.1 | | |
| 225,000 (2) | | | Bausch Health Cos, Inc., 4.875%, 06/01/2028 | | | | | 215,742 | | | | | | 0.0 | | |
| 825,000 (2) | | | Bausch Health Cos, Inc., 5.250%, 01/30/2030 | | | | | 649,395 | | | | | | 0.0 | | |
| 450,000 (2) | | | Bausch Health Cos, Inc., 7.000%, 01/15/2028 | | | | | 403,594 | | | | | | 0.0 | | |
| 675,000 (1)(2) | | | BellRing Brands, Inc., 7.000%, 03/15/2030 | | | | | 690,187 | | | | | | 0.0 | | |
| 350,000 (2) | | | Catalent Pharma Solutions, Inc., 5.000%, 07/15/2027 | | | | | 354,525 | | | | | | 0.0 | | |
| 225,000 | | | Centene Corp., 2.625%, 08/01/2031 | | | | | 200,614 | | | | | | 0.0 | | |
| 975,000 | | | Centene Corp., 4.625%, 12/15/2029 | | | | | 984,594 | | | | | | 0.1 | | |
| 800,000 (2) | | | Cheplapharm Arzneimittel GmbH, 5.500%, 01/15/2028 | | | | | 775,556 | | | | | | 0.0 | | |
| 225,000 (2) | | | Chobani LLC / Chobani Finance Corp., Inc., 4.625%, 11/15/2028 | | | | | 207,982 | | | | | | 0.0 | | |
| Voya Strategic Income | PORTFOLIO OF INVESTMENTS |
| Opportunities Fund | as of March 31, 2022 (continued) |
| Principal Amount† | | | Value | | | Percentage of Net Assets | | |||||||||
| CORPORATE BONDS/NOTES: (continued) | | |||||||||||||||
| | | | Consumer, Non-cyclical (continued) | | ||||||||||||
| 750,000 (1)(2) | | | Chobani LLC / Chobani Finance Corp., Inc., 7.500%, 04/15/2025 | | | | $ | 726,345 | | | | | | 0.0 | | |
| 325,000 (2) | | | CHS/Community Health Systems, Inc., 4.750%, 02/15/2031 | | | | | 307,577 | | | | | | 0.0 | | |
| 200,000 (2) | | | CHS/Community Health Systems, Inc., 5.250%, 05/15/2030 | | | | | 192,250 | | | | | | 0.0 | | |
| 500,000 (2) | | | CHS/Community Health Systems, Inc., 5.625%, 03/15/2027 | | | | | 509,855 | | | | | | 0.0 | | |
| 1,075,000 (1)(2) | | | CHS/Community Health Systems, Inc., 6.875%, 04/15/2029 | | | | | 1,057,671 | | | | | | 0.1 | | |
| 3,016,000 | | | Cigna Corp., 3.400%, 03/15/2051 | | | | | 2,728,163 | | | | | | 0.1 | | |
| 835,000 (2) | | | CoreLogic, Inc., 4.500%, 05/01/2028 | | | | | 788,996 | | | | | | 0.0 | | |
| 710,000 (2) | | | CPI Acquisition, Inc., 8.625%, 03/15/2026 | | | | | 691,867 | | | | | | 0.0 | | |
| 275,000 (2) | | | DaVita, Inc., 3.750%, 02/15/2031 | | | | | 240,962 | | | | | | 0.0 | | |
| 525,000 (2) | | | DaVita, Inc., 4.625%, 06/01/2030 | | | | | 490,980 | | | | | | 0.0 | | |
| 1,325,000 (2) | | | DP World Crescent Ltd., 3.750%, 01/30/2030 | | | | | 1,326,015 | | | | | | 0.1 | | |
| 1,050,000 | | | DP World Crescent Ltd., 3.875%, 07/18/2029 | | | | | 1,056,878 | | | | | | 0.1 | | |
| 329,000 (2) | | | Endo Dac / Endo Finance LLC / Endo Finco, Inc., 6.000%, 06/30/2028 | | | | | 187,119 | | | | | | 0.0 | | |
| 140,000 (1)(2) | | | Endo Dac / Endo Finance LLC / Endo Finco, Inc., 9.500%, 07/31/2027 | | | | | 122,990 | | | | | | 0.0 | | |
| 575,000 (2) | | | Graham Holdings Co., 5.750%, 06/01/2026 | | | | | 591,635 | | | | | | 0.0 | | |
| 1,250,000 | | | HCA, Inc., 5.375%, 02/01/2025 | | | | | 1,302,181 | | | | | | 0.1 | | |
| 275,000 | | | HCA, Inc., 5.625%, 09/01/2028 | | | | | 297,752 | | | | | | 0.0 | | |
| 1,225,000 (2) | | | Hutama Karya Persero PT, 3.750%, 05/11/2030 | | | | | 1,233,549 | | | | | | 0.1 | | |
| 400,000 (1)(2) | | | Jazz Securities DAC, 4.375%, 01/15/2029 | | | | | 388,038 | | | | | | 0.0 | | |
| 599,000 (2) | | | KeHE Distributors LLC / KeHE Finance Corp., 8.625%, 10/15/2026 | | | | | 636,836 | | | | | | 0.0 | | |
| 545,000 (2) | | | Legacy LifePoint Health LLC, 4.375%, 02/15/2027 | | | | | 527,669 | | | | | | 0.0 | | |
| Principal Amount† | | | Value | | | Percentage of Net Assets | | |||||||||
| CORPORATE BONDS/NOTES: (continued) | | |||||||||||||||
| | | | Consumer, Non-cyclical (continued) | | ||||||||||||
| 275,000 (1)(2) | | | LifePoint Health, Inc., 5.375%, 01/15/2029 | | | | $ | 260,394 | | | | | | 0.0 | | |
| 555,000 (2) | | | Mozart Debt Merger Sub, Inc., 3.875%, 04/01/2029 | | | | | 514,083 | | | | | | 0.0 | | |
| 600,000 (1)(2) | | | Mozart Debt Merger Sub, Inc., 5.250%, 10/01/2029 | | | | | 558,570 | | | | | | 0.0 | | |
| 555,000 (1)(2) | | | MPH Acquisition Holdings LLC, 5.750%, 11/01/2028 | | | | | 502,158 | | | | | | 0.0 | | |
| 1,500,000 (1)(2) | | | Natura Cosmeticos SA, 4.125%, 05/03/2028 | | | | | 1,447,162 | | | | | | 0.1 | | |
| 850,000 (2) | | | NESCO Holdings II, Inc., 5.500%, 04/15/2029 | | | | | 836,179 | | | | | | 0.1 | | |
| 400,000 | | | New Albertsons L.P., 7.450%, 08/01/2029 | | | | | 428,392 | | | | | | 0.0 | | |
| 425,000 (1)(2) | | | Nielsen Finance LLC / Nielsen Finance Co., 4.750%, 07/15/2031 | | | | | 425,410 | | | | | | 0.0 | | |
| 550,000 (2) | | | Nielsen Finance LLC / Nielsen Finance Co., 5.875%, 10/01/2030 | | | | | 551,950 | | | | | | 0.0 | | |
| 600,000 (1)(2) | | | Organon & Co. / Organon Foreign Debt Co-Issuer BV, 5.125%, 04/30/2031 | | | | | 579,810 | | | | | | 0.0 | | |
| 350,000 (2) | | | Owens & Minor, Inc., 6.625%, 04/01/2030 | | | | | 360,654 | | | | | | 0.0 | | |
| 480,000 (2) | | | Par Pharmaceutical, Inc., 7.500%, 04/01/2027 | | | | | 448,714 | | | | | | 0.0 | | |
| 630,000 (2) | | | PECF USS Intermediate Holding III Corp., 8.000%, 11/15/2029 | | | | | 609,178 | | | | | | 0.0 | | |
| 425,000 (2) | | | Post Holdings, Inc., 4.625%, 04/15/2030 | | | | | 383,393 | | | | | | 0.0 | | |
| 1,000,000 (1)(2) | | | Post Holdings, Inc., 5.625%, 01/15/2028 | | | | | 983,190 | | | | | | 0.1 | | |
| 875,000 (2) | | | Primo Water Holdings, Inc., 4.375%, 04/30/2029 | | | | | 793,096 | | | | | | 0.1 | | |
| 1,809,000 (2) | | | S&P Global, Inc., 3.700%, 03/01/2052 | | | | | 1,839,744 | | | | | | 0.1 | | |
| 895,000 (1)(2) | | | Select Medical Corp., 6.250%, 08/15/2026 | | | | | 927,551 | | | | | | 0.1 | | |
| 925,000 (2) | | | Simmons Foods, Inc./ Simmons Prepared Foods, Inc./Simmons Pet Food, Inc./Simmons Feed, 4.625%, 03/01/2029 | | | | | 868,390 | | | | | | 0.1 | | |
| 355,000 (1)(2) | | | Spectrum Brands, Inc., 3.875%, 03/15/2031 | | | | | 313,802 | | | | | | 0.0 | | |
| 375,000 (2) | | | Spectrum Brands, Inc., 5.500%, 07/15/2030 | | | | | 360,664 | | | | | | 0.0 | | |
| Voya Strategic Income | PORTFOLIO OF INVESTMENTS |
| Opportunities Fund | as of March 31, 2022 (continued) |
| Principal Amount† | | | Value | | | Percentage of Net Assets | | |||||||||
| CORPORATE BONDS/NOTES: (continued) | | |||||||||||||||
| | | | Consumer, Non-cyclical (continued) | | ||||||||||||
| 350,000 (2) | | | Tenet Healthcare Corp., 4.250%, 06/01/2029 | | | | $ | 336,021 | | | | | | 0.0 | | |
| 1,150,000 (2) | | | Tenet Healthcare Corp., 6.125%, 10/01/2028 | | | | | 1,169,958 | | | | | | 0.1 | | |
| 900,000 | | | Tenet Healthcare Corp., 6.750%, 06/15/2023 | | | | | 938,448 | | | | | | 0.1 | | |
| 875,000 (1) | | | Teva Pharmaceutical Finance Netherlands III BV, 5.125%, 05/09/2029 | | | | | 842,275 | | | | | | 0.1 | | |
| 820,000 (2) | | | Triton Water Holdings, Inc., 6.250%, 04/01/2029 | | | | | 700,821 | | | | | | 0.0 | | |
| 675,000 (1)(2) | | | United Natural Foods, Inc., 6.750%, 10/15/2028 | | | | | 692,672 | | | | | | 0.0 | | |
| 200,000 (1) | | | United Rentals North America, Inc., 3.750%, 01/15/2032 | | | | | 186,851 | | | | | | 0.0 | | |
| 425,000 | | | United Rentals North America, Inc., 4.875%, 01/15/2028 | | | | | 432,183 | | | | | | 0.0 | | |
| 125,000 | | | United Rentals North America, Inc., 5.250%, 01/15/2030 | | | | | 129,135 | | | | | | 0.0 | | |
| 525,000 (2) | | | Vizient, Inc., 6.250%, 05/15/2027 | | | | | 541,367 | | | | | | 0.0 | | |
| | | | | | | | | 49,128,424 | | | | | | 2.0 | | |
| | | | Energy: 4.0% | | ||||||||||||
| 950,000 (2) | | | Aethon United BR L.P. / Aethon United Finance Corp., 8.250%, 02/15/2026 | | | | | 987,444 | | | | | | 0.1 | | |
| 350,000 (2) | | | Antero Midstream Partners L.P. / Antero Midstream Finance Corp., 5.375%, 06/15/2029 | | | | | 350,255 | | | | | | 0.0 | | |
| 525,000 (2) | | | Antero Midstream Partners L.P. / Antero Midstream Finance Corp., 5.750%, 03/01/2027 | | | | | 535,510 | | | | | | 0.0 | | |
| 550,000 (1)(2) | | | Antero Resources Corp., 5.375%, 03/01/2030 | | | | | 562,518 | | | | | | 0.0 | | |
| 175,000 (2) | | | Antero Resources Corp., 7.625%, 02/01/2029 | | | | | 189,501 | | | | | | 0.0 | | |
| 450,000 | | | Apache Corp., 5.100%, 09/01/2040 | | | | | 454,268 | | | | | | 0.0 | | |
| 850,000 (2) | | | Archrock Partners L.P. / Archrock Partners Finance Corp., 6.250%, 04/01/2028 | | | | | 839,375 | | | | | | 0.0 | | |
| 250,000 (2) | | | Archrock Partners L.P. / Archrock Partners Finance Corp., 6.875%, 04/01/2027 | | | | | 253,102 | | | | | | 0.0 | | |
| Principal Amount† | | | Value | | | Percentage of Net Assets | | |||||||||
| CORPORATE BONDS/NOTES: (continued) | | |||||||||||||||
| | | | Energy (continued) | | ||||||||||||
| 800,000 (2) | | | Atlantica Sustainable Infrastructure PLC, 4.125%, 06/15/2028 | | | | $ | 772,544 | | | | | | 0.0 | | |
| 422,000 (2) | | | Baytex Energy Corp., 5.625%, 06/01/2024 | | | | | 422,768 | | | | | | 0.0 | | |
| 675,000 (1)(2) | | | Baytex Energy Corp., 8.750%, 04/01/2027 | | | | | 724,818 | | | | | | 0.0 | | |
| 650,000 (2) | | | Blue Racer Midstream LLC / Blue Racer Finance Corp., 6.625%, 07/15/2026 | | | | | 661,030 | | | | | | 0.0 | | |
| 250,000 (2) | | | Blue Racer Midstream LLC / Blue Racer Finance Corp., 7.625%, 12/15/2025 | | | | | 261,876 | | | | | | 0.0 | | |
| 700,000 | | | Callon Petroleum Co., 6.125%, 10/01/2024 | | | | | 697,476 | | | | | | 0.0 | | |
| 650,000 | | | Callon Petroleum Co., 6.375%, 07/01/2026 | | | | | 647,137 | | | | | | 0.0 | | |
| 975,000 (2) | | | Canacol Energy Ltd., 5.750%, 11/24/2028 | | | | | 918,435 | | | | | | 0.1 | | |
| 825,000 | | | Cenovus Energy, Inc., 5.250%, 06/15/2037 | | | | | 896,169 | | | | | | 0.0 | | |
| 900,000 (2) | | | Chesapeake Energy Corp., 6.750%, 04/15/2029 | | | | | 954,549 | | | | | | 0.1 | | |
| 325,000 (2) | | | CNX Midstream Partners L.P., 4.750%, 04/15/2030 | | | | | 304,720 | | | | | | 0.0 | | |
| 538,000 (2) | | | Colgate Energy Partners III LLC, 5.875%, 07/01/2029 | | | | | 555,603 | | | | | | 0.0 | | |
| 1,050,000 (2) | | | Crescent Energy Finance LLC, 7.250%, 05/01/2026 | | | | | 1,056,594 | | | | | | 0.1 | | |
| 1,050,000 (2) | | | Crestwood Midstream Partners L.P. / Crestwood Midstream Finance Corp., 6.000%, 02/01/2029 | | | | | 1,048,247 | | | | | | 0.1 | | |
| 425,000 | | | DCP Midstream Operating L.P., 5.125%, 05/15/2029 | | | | | 437,960 | | | | | | 0.0 | | |
| 250,000 | | | DCP Midstream Operating L.P., 5.375%, 07/15/2025 | | | | | 258,128 | | | | | | 0.0 | | |
| 100,000 | | | DCP Midstream Operating L.P., 5.600%, 04/01/2044 | | | | | 105,288 | | | | | | 0.0 | | |
| 650,000 | | | DCP Midstream Operating L.P., 5.625%, 07/15/2027 | | | | | 682,770 | | | | | | 0.0 | | |
| 600,000 | | | Delek Logistics Partners L.P. / Delek Logistics Finance Corp., 6.750%, 05/15/2025 | | | | | 601,050 | | | | | | 0.0 | | |
| 525,000 (2) | | | Delek Logistics Partners L.P. / Delek Logistics Finance Corp., 7.125%, 06/01/2028 | | | | | 515,592 | | | | | | 0.0 | | |
| Voya Strategic Income | PORTFOLIO OF INVESTMENTS |
| Opportunities Fund | as of March 31, 2022 (continued) |
| Principal Amount† | | | Value | | | Percentage of Net Assets | | |||||||||
| CORPORATE BONDS/NOTES: (continued) | | |||||||||||||||
| | | | Energy (continued) | | ||||||||||||
| 162,000 | | | Devon Energy Corp., 4.500%, 01/15/2030 | | | | $ | 167,328 | | | | | | 0.0 | | |
| 275,000 (2) | | | DT Midstream, Inc., 4.125%, 06/15/2029 | | | | | 264,080 | | | | | | 0.0 | | |
| 575,000 (2) | | | DT Midstream, Inc., 4.375%, 06/15/2031 | | | | | 551,546 | | | | | | 0.0 | | |
| 1,800,000 | | | Ecopetrol SA, 5.375%, 06/26/2026 | | | | | 1,823,751 | | | | | | 0.1 | | |
| 2,500,000 (1) | | | Ecopetrol SA, 6.875%, 04/29/2030 | | | | | 2,627,725 | | | | | | 0.1 | | |
| 1,450,000 (2) | | | EIG Pearl Holdings Sarl, 3.545%, 08/31/2036 | | | | | 1,385,537 | | | | | | 0.1 | | |
| 500,000 | | | Empresa Nacional del Petroleo, 3.750%, 08/05/2026 | | | | | 498,810 | | | | | | 0.0 | | |
| 1,200,000 | | | Empresa Nacional del Petroleo, 5.250%, 11/06/2029 | | | | | 1,254,300 | | | | | | 0.1 | | |
| 340,000 (2) | | | Empresa Nacional del Petroleo, 5.250%, 11/06/2029 | | | | | 355,385 | | | | | | 0.0 | | |
| 825,000 (2) | | | Encino Acquisition Partners Holdings LLC, 8.500%, 05/01/2028 | | | | | 850,488 | | | | | | 0.0 | | |
| 5,725,000 (4) | | | Energy Transfer L.P., 7.125%, 12/31/2199 | | | | | 5,596,188 | | | | | | 0.2 | | |
| 1,225,000 (1) | | | EnLink Midstream LLC, 5.375%, 06/01/2029 | | | | | 1,224,045 | | | | | | 0.1 | | |
| 700,000 (2) | | | Enviva Partners L.P. / Enviva Partners Finance Corp., 6.500%, 01/15/2026 | | | | | 720,856 | | | | | | 0.0 | | |
| 285,000 (1) | | | EQM Midstream Partners L.P., 5.500%, 07/15/2028 | | | | | 286,622 | | | | | | 0.0 | | |
| 355,000 (2) | | | EQM Midstream Partners L.P., 6.000%, 07/01/2025 | | | | | 362,704 | | | | | | 0.0 | | |
| 1,100,000 | | | Gazprom PJSC Via Gaz Capital SA, 4.950%, 03/23/2027 | | | | | 451,000 | | | | | | 0.0 | | |
| 750,000 | | | Gazprom PJSC Via Gaz Capital SA, 4.950%, 02/06/2028 | | | | | 321,750 | | | | | | 0.0 | | |
| 2,700,000 (2) | | | Gazprom PJSC via Gaz Finance PLC, 3.250%, 02/25/2030 | | | | | 1,134,000 | | | | | | 0.1 | | |
| 2,300,000 (2)(4) | | | Gazprom PJSC via Gaz Finance PLC, 4.599%, 12/31/2199 | | | | | 575,000 | | | | | | 0.0 | | |
| 500,000 (2) | | | Hess Midstream Operations L.P., 4.250%, 02/15/2030 | | | | | 472,650 | | | | | | 0.0 | | |
| Principal Amount† | | | Value | | | Percentage of Net Assets | | |||||||||
| CORPORATE BONDS/NOTES: (continued) | | |||||||||||||||
| | | | Energy (continued) | | ||||||||||||
| 425,000 (1)(2) | | | Hess Midstream Operations L.P., 5.125%, 06/15/2028 | | | | $ | 425,553 | | | | | | 0.0 | | |
| 400,000 (2) | | | Hilcorp Energy I L.P. / Hilcorp Finance Co., 5.750%, 02/01/2029 | | | | | 401,040 | | | | | | 0.0 | | |
| 475,000 (2) | | | Hilcorp Energy I L.P. / Hilcorp Finance Co., 6.000%, 02/01/2031 | | | | | 477,969 | | | | | | 0.0 | | |
| 725,000 (2) | | | Howard Midstream Energy Partners LLC, 6.750%, 01/15/2027 | | | | | 711,294 | | | | | | 0.0 | | |
| 2,625,000 | | | KazMunayGas National Co. JSC, 4.750%, 04/19/2027 | | | | | 2,552,970 | | | | | | 0.1 | | |
| 2,550,000 | | | KazMunayGas National Co. JSC, 5.375%, 04/24/2030 | | | | | 2,457,417 | | | | | | 0.1 | | |
| 300,000 (2) | | | KazMunayGas National Co. JSC, 5.375%, 04/24/2030 | | | | | 289,108 | | | | | | 0.0 | | |
| 2,250,000 (2) | | | Lukoil Capital DAC, 3.600%, 10/26/2031 | | | | | 1,201,500 | | | | | | 0.1 | | |
| 1,150,000 (1)(2) | | | Moss Creek Resources Holdings, Inc., 7.500%, 01/15/2026 | | | | | 1,056,885 | | | | | | 0.1 | | |
| 550,000 (1) | | | Murphy Oil Corp., 5.875%, 12/01/2027 | | | | | 560,588 | | | | | | 0.0 | | |
| 725,000 | | | Murphy Oil Corp., 6.375%, 07/15/2028 | | | | | 755,243 | | | | | | 0.0 | | |
| 750,000 (1)(2) | | | Nabors Industries Ltd., 7.500%, 01/15/2028 | | | | | 732,788 | | | | | | 0.0 | | |
| 255,000 | | | Nabors Industries, Inc., 5.100%, 09/15/2023 | | | | | 261,181 | | | | | | 0.0 | | |
| 300,000 (2) | | | Nabors Industries, Inc., 7.375%, 05/15/2027 | | | | | 312,132 | | | | | | 0.0 | | |
| 625,000 (2) | | | Oasis Petroleum, Inc., 6.375%, 06/01/2026 | | | | | 641,428 | | | | | | 0.0 | | |
| 1,580,000 (1) | | | Occidental Petroleum Corp., 4.200%, 03/15/2048 | | | | | 1,480,128 | | | | | | 0.1 | | |
| 1,005,000 | | | Occidental Petroleum Corp., 5.500%, 12/01/2025 | | | | | 1,059,170 | | | | | | 0.1 | | |
| 1,300,000 (1) | | | Occidental Petroleum Corp., 6.625%, 09/01/2030 | | | | | 1,493,375 | | | | | | 0.1 | | |
| 575,000 (1) | | | Occidental Petroleum Corp., 8.500%, 07/15/2027 | | | | | 681,285 | | | | | | 0.0 | | |
| 1,000,000 (2) | | | Oleoducto Central SA, 4.000%, 07/14/2027 | | | | | 943,730 | | | | | | 0.1 | | |
| 2,100,000 (2) | | | Pertamina Persero PT, 2.300%, 02/09/2031 | | | | | 1,855,875 | | | | | | 0.1 | | |
| 1,375,000 (2) | | | Pertamina Persero PT, 3.100%, 01/21/2030 | | | | | 1,305,740 | | | | | | 0.1 | | |
| Voya Strategic Income | PORTFOLIO OF INVESTMENTS |
| Opportunities Fund | as of March 31, 2022 (continued) |
| Principal Amount† | | | Value | | | Percentage of Net Assets | | |||||||||
| CORPORATE BONDS/NOTES: (continued) | | |||||||||||||||
| | | | Energy (continued) | | ||||||||||||
| 750,000 (2) | | | Pertamina Persero PT, 3.100%, 08/27/2030 | | | | $ | 710,625 | | | | | | 0.0 | | |
| 4,125,000 (1) | | | Petrobras Global Finance BV, 5.600%, 01/03/2031 | | | | | 4,182,131 | | | | | | 0.2 | | |
| 1,000,000 (1) | | | Petroleos del Peru SA, 4.750%, 06/19/2032 | | | | | 897,375 | | | | | | 0.1 | | |
| 7,450,000 (1) | | | Petroleos Mexicanos, 5.950%, 01/28/2031 | | | | | 6,887,153 | | | | | | 0.3 | | |
| 2,053,000 | | | Petroleos Mexicanos, 6.700%, 02/16/2032 | | | | | 1,952,485 | | | | | | 0.1 | | |
| 1,000,000 (2) | | | Petronas Capital Ltd., 2.480%, 01/28/2032 | | | | | 932,816 | | | | | | 0.1 | | |
| 750,000 | | | Petronas Capital Ltd., 2.480%, 01/28/2032 | | | | | 699,612 | | | | | | 0.0 | | |
| 2,000,000 (1) | | | Petronas Capital Ltd., 3.500%, 04/21/2030 | | | | | 2,039,252 | | | | | | 0.1 | | |
| 2,000,000 (2) | | | PTTEP Treasury Center Co. Ltd., 2.587%, 06/10/2027 | | | | | 1,918,370 | | | | | | 0.1 | | |
| 975,000 (2) | | | Qatar Energy, 3.125%, 07/12/2041 | | | | | 889,537 | | | | | | 0.0 | | |
| 3,250,000 (2) | | | Reliance Industries Ltd., 2.875%, 01/12/2032 | | | | | 2,985,387 | | | | | | 0.1 | | |
| 1,700,000 (2) | | | Reliance Industries Ltd., 3.625%, 01/12/2052 | | | | | 1,511,818 | | | | | | 0.1 | | |
| 600,000 (2) | | | Rockcliff Energy II LLC, 5.500%, 10/15/2029 | | | | | 601,548 | | | | | | 0.0 | | |
| 2,200,000 (2) | | | SA Global Sukuk Ltd., 2.694%, 06/17/2031 | | | | | 2,086,933 | | | | | | 0.1 | | |
| 1,150,000 | | | Saudi Arabian Oil Co., 2.250%, 11/24/2030 | | | | | 1,056,901 | | | | | | 0.1 | | |
| 750,000 (2) | | | Saudi Arabian Oil Co., 3.250%, 11/24/2050 | | | | | 644,804 | | | | | | 0.0 | | |
| 140,000 (1) | | | Southwestern Energy Co., 4.750%, 02/01/2032 | | | | | 140,020 | | | | | | 0.0 | | |
| 825,000 | | | Southwestern Energy Co., 5.375%, 02/01/2029 | | | | | 836,443 | | | | | | 0.0 | | |
| 175,000 (1) | | | Southwestern Energy Co., 5.375%, 03/15/2030 | | | | | 178,091 | | | | | | 0.0 | | |
| 642,000 (2) | | | Strathcona Resources Ltd., 6.875%, 08/01/2026 | | | | | 647,720 | | | | | | 0.0 | | |
| 625,000 (2) | | | SunCoke Energy, Inc., 4.875%, 06/30/2029 | | | | | 590,000 | | | | | | 0.0 | | |
| 250,000 | | | Sunoco L.P. / Sunoco Finance Corp., 4.500%, 05/15/2029 | | | | | 236,175 | | | | | | 0.0 | | |
| 650,000 (2) | | | Sunoco L.P. / Sunoco Finance Corp., 4.500%, 04/30/2030 | | | | | 599,820 | | | | | | 0.0 | | |
| Principal Amount† | | | Value | | | Percentage of Net Assets | | |||||||||
| CORPORATE BONDS/NOTES: (continued) | | |||||||||||||||
| | | | Energy (continued) | | ||||||||||||
| 350,000 (2) | | | Tallgrass Energy Partners L.P. / Tallgrass Energy Finance Corp., 5.500%, 01/15/2028 | | | | $ | 339,316 | | | | | | 0.0 | | |
| 450,000 (2) | | | Tallgrass Energy Partners L.P. / Tallgrass Energy Finance Corp., 7.500%, 10/01/2025 | | | | | 474,669 | | | | | | 0.0 | | |
| 950,000 (2) | | | Tengizchevroil Finance Co. International Ltd., 3.250%, 08/15/2030 | | | | | 775,110 | | | | | | 0.0 | | |
| 656,250 (2) | | | Transocean Poseidon Ltd., 6.875%, 02/01/2027 | | | | | 650,734 | | | | | | 0.0 | | |
| 1,150,000 (2) | | | Transocean, Inc., 7.500%, 01/15/2026 | | | | | 1,000,500 | | | | | | 0.1 | | |
| 1,025,000 (2) | | | Weatherford International Ltd., 8.625%, 04/30/2030 | | | | | 1,041,928 | | | | | | 0.1 | | |
| 975,000 | | | Western Midstream Operating L.P., 5.450%, 04/01/2044 | | | | | 990,483 | | | | | | 0.1 | | |
| | | | | | | | | 97,772,647 | | | | | | 4.0 | | |
| | | | Financial: 1.8% | | ||||||||||||
| 1,950,000 (2) | | | Akbank TAS, 6.800%, 02/06/2026 | | | | | 1,904,633 | | | | | | 0.1 | | |
| 500,000 (1) | | | Ally Financial, Inc., 5.750%, 11/20/2025 | | | | | 526,224 | | | | | | 0.0 | | |
| 745,000 (2) | | | AmWINS Group, Inc., 4.875%, 06/30/2029 | | | | | 716,168 | | | | | | 0.0 | | |
| 625,000 (2) | | | Aretec Escrow Issuer, Inc., 7.500%, 04/01/2029 | | | | | 601,834 | | | | | | 0.0 | | |
| 900,000 (2) | | | AssuredPartners, Inc., 5.625%, 01/15/2029 | | | | | 830,092 | | | | | | 0.1 | | |
| 1,550,000 | | | Banco de Bogota SA, 6.250%, 05/12/2026 | | | | | 1,586,882 | | | | | | 0.1 | | |
| 1,550,000 (2) | | | Banco Internacional del Peru SAA Interbank, 3.250%, 10/04/2026 | | | | | 1,533,368 | | | | | | 0.1 | | |
| 1,250,000 | | | Banco Nacional de Panama, 2.500%, 08/11/2030 | | | | | 1,106,456 | | | | | | 0.1 | | |
| 1,500,000 | | | Bancolombia SA, 3.000%, 01/29/2025 | | | | | 1,460,700 | | | | | | 0.1 | | |
| 3,325,000 (2)(4) | | | Bangkok Bank PCL/Hong Kong, 5.000%, 12/31/2199 | | | | | 3,283,936 | | | | | | 0.1 | | |
| 3,300,000 | | | Bank Hapoalim, 3.255%, 01/21/2032 | | | | | 3,036,000 | | | | | | 0.1 | | |
| 875,000 (2) | | | BroadStreet Partners, Inc., 5.875%, 04/15/2029 | | | | | 817,731 | | | | | | 0.1 | | |
| Voya Strategic Income | PORTFOLIO OF INVESTMENTS |
| Opportunities Fund | as of March 31, 2022 (continued) |
| Principal Amount† | | | Value | | | Percentage of Net Assets | | |||||||||
| CORPORATE BONDS/NOTES: (continued) | | |||||||||||||||
| | | | Financial (continued) | | ||||||||||||
| 1,750,000 (2) | | | CIMB Bank Bhd, 2.125%, 07/20/2027 | | | | $ | 1,658,117 | | | | | | 0.1 | | |
| 2,190,000 | | | Corebridge Financial, Inc., 4.400%, 04/05/2052 | | | | | 2,194,144 | | | | | | 0.1 | | |
| 2,250,000 (2) | | | Credit Bank of Moscow Via CBOM Finance PLC, 3.875%, 09/21/2026 | | | | | 247,500 | | | | | | 0.0 | | |
| 875,000 (2) | | | Cushman & Wakefield US Borrower LLC, 6.750%, 05/15/2028 | | | | | 915,828 | | | | | | 0.1 | | |
| 1,000,000 (2) | | | Development Bank of Kazakhstan JSC, 2.950%, 05/06/2031 | | | | | 821,970 | | | | | | 0.1 | | |
| 255,000 (1)(2) | | | Freedom Mortgage Corp., 6.625%, 01/15/2027 | | | | | 236,831 | | | | | | 0.0 | | |
| 375,000 (1)(2) | | | Freedom Mortgage Corp., 7.625%, 05/01/2026 | | | | | 358,710 | | | | | | 0.0 | | |
| 527,000 (2) | | | Freedom Mortgage Corp., 8.250%, 04/15/2025 | | | | | 526,204 | | | | | | 0.0 | | |
| 1,050,000 (2)(4) | | | Kookmin Bank, 4.350%, 12/31/2199 | | | | | 1,052,615 | | | | | | 0.1 | | |
| 825,000 (2) | | | Ladder Capital Finance Holdings LLLP / Ladder Capital Finance Corp., 4.750%, 06/15/2029 | | | | | 779,138 | | | | | | 0.0 | | |
| 300,000 (2) | | | LPL Holdings, Inc., 4.000%, 03/15/2029 | | | | | 285,111 | | | | | | 0.0 | | |
| 150,000 (2) | | | LPL Holdings, Inc., 4.375%, 05/15/2031 | | | | | 145,349 | | | | | | 0.0 | | |
| 515,000 (2) | | | LPL Holdings, Inc., 4.625%, 11/15/2027 | | | | | 506,956 | | | | | | 0.0 | | |
| 150,000 (2) | | | MGM Growth Properties Operating Partnership L.P. / MGP Finance Co-Issuer, Inc., 3.875%, 02/15/2029 | | | | | 147,661 | | | | | | 0.0 | | |
| 215,000 (2) | | | MGM Growth Properties Operating Partnership L.P. / MGP Finance Co-Issuer, Inc., 4.625%, 06/15/2025 | | | | | 216,927 | | | | | | 0.0 | | |
| 575,000 | | | MGM Growth Properties Operating Partnership L.P. / MGP Finance Co-Issuer, Inc., 5.625%, 05/01/2024 | | | | | 592,883 | | | | | | 0.0 | | |
| 400,000 (2) | | | Midcap Financial Issuer Trust, 5.625%, 01/15/2030 | | | | | 354,230 | | | | | | 0.0 | | |
| 515,000 (2) | | | Midcap Financial Issuer Trust, 6.500%, 05/01/2028 | | | | | 485,084 | | | | | | 0.0 | | |
| 550,000 (2)(4) | | | Mizrahi Tefahot Bank Ltd., 3.077%, 04/07/2031 | | | | | 513,629 | | | | | | 0.0 | | |
| Principal Amount† | | | Value | | | Percentage of Net Assets | | |||||||||
| CORPORATE BONDS/NOTES: (continued) | | |||||||||||||||
| | | | Financial (continued) | | ||||||||||||
| 675,000 | | | MPT Operating Partnership L.P. / MPT Finance Corp., 5.000%, 10/15/2027 | | | | $ | 687,150 | | | | | | 0.0 | | |
| 2,591,000 | | | Nasdaq, Inc., 3.950%, 03/07/2052 | | | | | 2,521,412 | | | | | | 0.1 | | |
| 850,000 (1)(2) | | | Nationstar Mortgage Holdings, Inc., 5.125%, 12/15/2030 | | | | | 787,831 | | | | | | 0.0 | | |
| 875,000 (1) | | | Navient Corp., 4.875%, 03/15/2028 | | | | | 805,820 | | | | | | 0.0 | | |
| 475,000 (1) | | | Navient Corp., 5.000%, 03/15/2027 | | | | | 453,295 | | | | | | 0.0 | | |
| 165,000 | | | Navient Corp., 7.250%, 09/25/2023 | | | | | 171,617 | | | | | | 0.0 | | |
| 1,100,000 (2)(4) | | | NBK Tier 1 Financing 2 Ltd., 4.500%, 12/31/2199 | | | | | 1,074,105 | | | | | | 0.1 | | |
| 425,000 (1) | | | OneMain Finance Corp., 4.000%, 09/15/2030 | | | | | 375,653 | | | | | | 0.0 | | |
| 1,050,000 (1) | | | OneMain Finance Corp., 5.375%, 11/15/2029 | | | | | 1,021,923 | | | | | | 0.1 | | |
| 700,000 (2) | | | PRA Group, Inc., 5.000%, 10/01/2029 | | | | | 664,731 | | | | | | 0.0 | | |
| 255,000 (2) | | | Realogy Group LLC / Realogy Co-Issuer Corp., 5.250%, 04/15/2030 | | | | | 234,919 | | | | | | 0.0 | | |
| 800,000 (1)(2) | | | Realogy Group LLC / Realogy Co-Issuer Corp., 5.750%, 01/15/2029 | | | | | 755,552 | | | | | | 0.0 | | |
| 700,000 (2) | | | RLJ Lodging Trust L.P., 4.000%, 09/15/2029 | | | | | 648,326 | | | | | | 0.0 | | |
| 500,000 (2)(4) | | | Shinhan Financial Group Co. Ltd., 2.875%, 12/31/2199 | | | | | 457,025 | | | | | | 0.0 | | |
| 290,000 (2) | | | Starwood Property Trust, Inc., 4.375%, 01/15/2027 | | | | | 281,690 | | | | | | 0.0 | | |
| 300,000 (2) | | | Turkiye Vakiflar Bankasi TAO, 6.500%, 01/08/2026 | | | | | 287,889 | | | | | | 0.0 | | |
| 1,000,000 (1)(2) | | | United Wholesale Mortgage LLC, 5.750%, 06/15/2027 | | | | | 930,000 | | | | | | 0.1 | | |
| 325,000 (2) | | | Uniti Group L.P. / Uniti Fiber Holdings, Inc. / CSL Capital LLC, 6.000%, 01/15/2030 | | | | | 293,163 | | | | | | 0.0 | | |
| 500,000 (2) | | | Uniti Group L.P. / Uniti Group Finance, Inc. / CSL Capital LLC, 6.500%, 02/15/2029 | | | | | 466,830 | | | | | | 0.0 | | |
| 700,000 (1)(2) | | | VistaJet Malta Finance PLC / XO Management Holding, Inc., 6.375%, 02/01/2030 | | | | | 659,540 | | | | | | 0.0 | | |
| Voya Strategic Income | PORTFOLIO OF INVESTMENTS |
| Opportunities Fund | as of March 31, 2022 (continued) |
| Principal Amount† | | | Value | | | Percentage of Net Assets | | |||||||||
| CORPORATE BONDS/NOTES: (continued) | | |||||||||||||||
| | | | Financial (continued) | | ||||||||||||
| 725,000 (2) | | | XHR L.P., 4.875%, 06/01/2029 | | | | $ | 705,164 | | | | | | 0.0 | | |
| 200,000 (2)(4) | | | Yapi ve Kredi Bankasi AS, 7.875%, 01/22/2031 | | | | | 197,184 | | | | | | 0.0 | | |
| | | | | | | | | 43,923,730 | | | | | | 1.8 | | |
| | | | Industrial: 1.4% | | ||||||||||||
| 1,025,000 (2)(3) | | | ARD Finance SA, 6.500% (PIK Rate 7.250%, Cash Rate 6.500)%, 06/30/2027 | | | | | 939,095 | | | | | | 0.1 | | |
| 775,000 (2) | | | Brundage-Bone Concrete Pumping Holdings, Inc., 6.000%, 02/01/2026 | | | | | 746,972 | | | | | | 0.0 | | |
| 200,000 (2) | | | Builders FirstSource, Inc., 4.250%, 02/01/2032 | | | | | 186,568 | | | | | | 0.0 | | |
| 475,000 (2) | | | Builders FirstSource, Inc., 5.000%, 03/01/2030 | | | | | 468,112 | | | | | | 0.0 | | |
| 950,000 (2) | | | Cargo Aircraft Management, Inc., 4.750%, 02/01/2028 | | | | | 929,076 | | | | | | 0.1 | | |
| 1,025,000 (2) | | | Cascades, Inc./Cascades USA, Inc., 5.375%, 01/15/2028 | | | | | 1,025,128 | | | | | | 0.1 | | |
| 575,000 (1)(2)(4) | | | Cemex SAB de CV, 5.125%, 12/31/2199 | | | | | 565,165 | | | | | | 0.0 | | |
| 1,275,000 (2) | | | Cemex SAB de CV, 5.200%, 09/17/2030 | | | | | 1,270,576 | | | | | | 0.1 | | |
| 430,000 (2) | | | Clark Equipment Co., 5.875%, 06/01/2025 | | | | | 435,506 | | | | | | 0.0 | | |
| 500,000 (2) | | | Empresa de Transporte de Pasajeros Metro SA, 3.693%, 09/13/2061 | | | | | 407,962 | | | | | | 0.0 | | |
| 2,217,000 | | | FedEx Corp., 4.100%, 02/01/2045 | | | | | 2,166,479 | | | | | | 0.1 | | |
| 775,000 (2) | | | Fortress Transportation and Infrastructure Investors LLC, 5.500%, 05/01/2028 | | | | | 705,630 | | | | | | 0.0 | | |
| 875,000 (1)(2) | | | GFL Environmental, Inc., 4.000%, 08/01/2028 | | | | | 805,941 | | | | | | 0.1 | | |
| 425,000 (2) | | | GFL Environmental, Inc., 4.375%, 08/15/2029 | | | | | 393,378 | | | | | | 0.0 | | |
| 425,000 (2) | | | Global Infrastructure Solutions, Inc., 5.625%, 06/01/2029 | | | | | 410,308 | | | | | | 0.0 | | |
| 625,000 (2) | | | GrafTech Finance, Inc., 4.625%, 12/15/2028 | | | | | 582,397 | | | | | | 0.0 | | |
| 775,000 (1)(2) | | | Graham Packaging Co., Inc., 7.125%, 08/15/2028 | | | | | 704,824 | | | | | | 0.0 | | |
| 600,000 (2) | | | Granite US Holdings Corp., 11.000%, 10/01/2027 | | | | | 633,717 | | | | | | 0.0 | | |
| Principal Amount† | | | Value | | | Percentage of Net Assets | | |||||||||
| CORPORATE BONDS/NOTES: (continued) | | |||||||||||||||
| | | | Industrial (continued) | | ||||||||||||
| 775,000 (2) | | | II-VI, Inc., 5.000%, 12/15/2029 | | | | $ | 758,667 | | | | | | 0.1 | | |
| 775,000 (2) | | | Imola Merger Corp., 4.750%, 05/15/2029 | | | | | 747,332 | | | | | | 0.1 | | |
| 2,775,000 (1)(2) | | | Indian Railway Finance Corp. Ltd., 3.249%, 02/13/2030 | | | | | 2,602,443 | | | | | | 0.1 | | |
| 1,750,000 (2) | | | Indian Railway Finance Corp. Ltd., 3.570%, 01/21/2032 | | | | | 1,656,777 | | | | | | 0.1 | | |
| 325,000 (2)(3) | | | Intelligent Packaging Holdco Issuer L.P., 9.000% (PIK Rate 9.750%, Cash Rate 9.000)%, 01/15/2026 | | | | | 327,140 | | | | | | 0.0 | | |
| 725,000 (2) | | | Intelligent Packaging Ltd. Finco, Inc. / Intelligent Packaging Ltd. Co-Issuer LLC, 6.000%, 09/15/2028 | | | | | 715,937 | | | | | | 0.0 | | |
| 1,550,000 (1)(2) | | | Klabin Austria GmbH, 5.750%, 04/03/2029 | | | | | 1,634,731 | | | | | | 0.1 | | |
| 600,000 (2) | | | Koppers, Inc., 6.000%, 02/15/2025 | | | | | 588,729 | | | | | | 0.0 | | |
| 367,000 (2) | | | Maxar Space Robotics LLC, 9.750%, 12/31/2023 | | | | | 391,279 | | | | | | 0.0 | | |
| 800,000 (2) | | | New Enterprise Stone & Lime Co., Inc., 9.750%, 07/15/2028 | | | | | 807,880 | | | | | | 0.1 | | |
| 1,005,000 (1)(2) | | | PGT Innovations, Inc., 4.375%, 10/01/2029 | | | | | 939,042 | | | | | | 0.1 | | |
| 575,000 (1)(2) | | | Roller Bearing Co. of America, Inc., 4.375%, 10/15/2029 | | | | | 536,906 | | | | | | 0.0 | | |
| 600,000 (2) | | | Rolls-Royce PLC, 5.750%, 10/15/2027 | | | | | 617,007 | | | | | | 0.0 | | |
| 585,000 (1)(2) | | | Sensata Technologies, Inc., 3.750%, 02/15/2031 | | | | | 542,035 | | | | | | 0.0 | | |
| 825,000 (2) | | | Standard Industries, Inc./NJ, 3.375%, 01/15/2031 | | | | | 723,117 | | | | | | 0.0 | | |
| 425,000 (2) | | | Standard Industries, Inc./NJ, 4.375%, 07/15/2030 | | | | | 389,810 | | | | | | 0.0 | | |
| 675,000 (2) | | | Stevens Holding Co., Inc., 6.125%, 10/01/2026 | | | | | 697,909 | | | | | | 0.0 | | |
| 1,475,000 (2) | | | Summit Digitel Infrastructure Pvt Ltd., 2.875%, 08/12/2031 | | | | | 1,273,406 | | | | | | 0.1 | | |
| 475,000 (2) | | | Summit Materials LLC / Summit Materials Finance Corp., 5.250%, 01/15/2029 | | | | | 469,571 | | | | | | 0.0 | | |
| Voya Strategic Income | PORTFOLIO OF INVESTMENTS |
| Opportunities Fund | as of March 31, 2022 (continued) |
| Principal Amount† | | | Value | | | Percentage of Net Assets | | |||||||||
| CORPORATE BONDS/NOTES: (continued) | | |||||||||||||||
| | | | Industrial (continued) | | ||||||||||||
| 490,000 (2) | | | Summit Materials LLC / Summit Materials Finance Corp., 6.500%, 03/15/2027 | | | | $ | 499,183 | | | | | | 0.0 | | |
| 205,000 (1)(2) | | | TK Elevator Holdco GmbH, 7.625%, 07/15/2028 | | | | | 203,609 | | | | | | 0.0 | | |
| 425,000 | | | TransDigm, Inc., 4.625%, 01/15/2029 | | | | | 397,900 | | | | | | 0.0 | | |
| 500,000 | | | TransDigm, Inc., 5.500%, 11/15/2027 | | | | | 496,872 | | | | | | 0.0 | | |
| 575,000 | | | TransDigm, Inc., 6.375%, 06/15/2026 | | | | | 580,922 | | | | | | 0.0 | | |
| 700,000 (2) | | | Vertiv Group Corp., 4.125%, 11/15/2028 | | | | | 639,660 | | | | | | 0.0 | | |
| 575,000 (2) | | | Weekley Homes LLC / Weekley Finance Corp., 4.875%, 09/15/2028 | | | | | 530,984 | | | | | | 0.0 | | |
| | | | | | | | | 33,145,682 | | | | | | 1.4 | | |
| | | | Industrials: 0.1% | | ||||||||||||
| 3,425,000 | | | Misc Capital Two (Labuan) Ltd., 3.750%, 04/06/2027 | | | | | 3,415,273 | | | | | | 0.1 | | |
| | | | | | | | | | | | | | | | | |
| | | | Technology: 0.4% | | ||||||||||||
| 575,000 (2) | | | Castle US Holding Corp., 9.500%, 02/15/2028 | | | | | 571,984 | | | | | | 0.0 | | |
| 900,000 (1)(2) | | | Condor Merger Sub, Inc., 7.375%, 02/15/2030 | | | | | 864,562 | | | | | | 0.1 | | |
| 625,000 (2) | | | Consensus Cloud Solutions, Inc., 6.500%, 10/15/2028 | | | | | 622,241 | | | | | | 0.0 | | |
| 400,000 (1)(2) | | | Minerva Merger Sub, Inc., 6.500%, 02/15/2030 | | | | | 388,552 | | | | | | 0.0 | | |
| 1,175,000 (2) | | | NCR Corp., 5.125%, 04/15/2029 | | | | | 1,130,990 | | | | | | 0.1 | | |
| 175,000 (2) | | | Open Text Corp., 3.875%, 02/15/2028 | | | | | 168,089 | | | | | | 0.0 | | |
| 650,000 (2) | | | Open Text Holdings, Inc., 4.125%, 02/15/2030 | | | | | 617,630 | | | | | | 0.0 | | |
| 300,000 (2) | | | OpenText Corp., 3.875%, 12/01/2029 | | | | | 285,476 | | | | | | 0.0 | | |
| 3,016,000 | | | Oracle Corp., 3.950%, 03/25/2051 | | | | | 2,646,290 | | | | | | 0.1 | | |
| 600,000 (1)(2) | | | Playtika Holding Corp., 4.250%, 03/15/2029 | | | | | 554,661 | | | | | | 0.0 | | |
| 825,000 (1)(2) | | | Rackspace Technology Global, Inc., 5.375%, 12/01/2028 | | | | | 717,346 | | | | | | 0.0 | | |
| 810,000 (2) | | | Veritas US, Inc. / Veritas Bermuda Ltd., 7.500%, 09/01/2025 | | | | | 769,419 | | | | | | 0.1 | | |
| Principal Amount† | | | Value | | | Percentage of Net Assets | | |||||||||
| CORPORATE BONDS/NOTES: (continued) | | |||||||||||||||
| | | | Technology (continued) | | ||||||||||||
| 825,000 (2) | | | Virtusa Corp., 7.125%, 12/15/2028 | | | | $ | 768,904 | | | | | | 0.0 | | |
| | | | | | | | | 10,106,144 | | | | | | 0.4 | | |
| | | | Utilities: 2.0% | | ||||||||||||
| 1,325,000 (2) | | | AES Panama Generation Holdings SRL, 4.375%, 05/31/2030 | | | | | 1,264,732 | | | | | | 0.1 | | |
| 1,625,000 (2) | | | Alfa Desarrollo SpA, 4.550%, 09/27/2051 | | | | | 1,412,856 | | | | | | 0.1 | | |
| 2,967,000 (1) | | | Avista Corp., 4.000%, 04/01/2052 | | | | | 3,015,776 | | | | | | 0.1 | | |
| 85,000 (2) | | | Clearway Energy Operating LLC, 3.750%, 01/15/2032 | | | | | 78,366 | | | | | | 0.0 | | |
| 600,000 (2) | | | Clearway Energy Operating LLC, 4.750%, 03/15/2028 | | | | | 603,627 | | | | | | 0.0 | | |
| 1,850,000 (1)(2) | | | Colbun SA, 3.150%, 03/06/2030 | | | | | 1,717,762 | | | | | | 0.1 | | |
| 1,250,000 (1)(2) | | | Comision Federal de Electricidad, 4.688%, 05/15/2029 | | | | | 1,228,306 | | | | | | 0.1 | | |
| 5,670,000 (4) | | | Dominion Energy, Inc., 4.650%, 12/31/2199 | | | | | 5,641,650 | | | | | | 0.2 | | |
| 600,000 (2) | | | Drax Finco PLC, 6.625%, 11/01/2025 | | | | | 607,635 | | | | | | 0.0 | | |
| 229,000 | | | Duke Energy Carolinas LLC, 3.700%, 12/01/2047 | | | | | 224,359 | | | | | | 0.0 | | |
| 733,000 | | | Duke Energy Carolinas LLC, 3.750%, 06/01/2045 | | | | | 724,135 | | | | | | 0.0 | | |
| 230,000 | | | Duke Energy Carolinas LLC, 3.950%, 03/15/2048 | | | | | 237,017 | | | | | | 0.0 | | |
| 228,000 | | | Duke Energy Carolinas LLC, 4.250%, 12/15/2041 | | | | | 239,302 | | | | | | 0.0 | | |
| 3,935,000 (4) | | | Duke Energy Corp., 4.875%, 12/31/2199 | | | | | 3,986,667 | | | | | | 0.2 | | |
| 895,000 | | | Duke Energy Florida LLC, 4.200%, 07/15/2048 | | | | | 957,781 | | | | | | 0.0 | | |
| 1,266,000 | | | Duke Energy Indiana LLC, 3.250%, 10/01/2049 | | | | | 1,129,760 | | | | | | 0.1 | | |
| 273,000 | | | Duke Energy Progress LLC, 4.100%, 03/15/2043 | | | | | 279,353 | | | | | | 0.0 | | |
| 386,000 | | | Duke Energy Progress LLC, 4.200%, 08/15/2045 | | | | | 404,919 | | | | | | 0.0 | | |
| 2,156,000 | | | Entergy Arkansas LLC, 4.200%, 04/01/2049 | | | | | 2,319,624 | | | | | | 0.1 | | |
| 3,175,000 | | | Inkia Energy Ltd., 5.875%, 11/09/2027 | | | | | 3,070,241 | | | | | | 0.1 | | |
| Voya Strategic Income | PORTFOLIO OF INVESTMENTS |
| Opportunities Fund | as of March 31, 2022 (continued) |
| Principal Amount† | | | Value | | | Percentage of Net Assets | | |||||||||
| CORPORATE BONDS/NOTES: (continued) | | |||||||||||||||
| | | | Utilities (continued) | | ||||||||||||
| 2,500,000 (2) | | | Israel Electric Corp. Ltd., 3.750%, 02/22/2032 | | | | $ | 2,408,395 | | | | | | 0.1 | | |
| 500,000 (2) | | | Israel Electric Corp. Ltd., 4.250%, 08/14/2028 | | | | | 505,201 | | | | | | 0.0 | | |
| 2,875,000 (4) | | | NextEra Energy Capital Holdings, Inc., 5.650%, 05/01/2079 | | | | | 2,955,298 | | | | | | 0.1 | | |
| 2,325,000 (2) | | | Perusahaan Listrik Negara PT, 3.875%, 07/17/2029 | | | | | 2,286,998 | | | | | | 0.1 | | |
| 2,950,000 | | | Perusahaan Listrik Negara PT, 5.450%, 05/21/2028 | | | | | 3,168,536 | | | | | | 0.1 | | |
| 300,000 (2) | | | Promigas SA ESP / Gases del Pacifico SAC, 3.750%, 10/16/2029 | | | | | 272,272 | | | | | | 0.0 | | |
| 3,938,000 | | | South Jersey Industries, Inc., 5.020%, 04/15/2031 | | | | | 3,873,177 | | | | | | 0.2 | | |
| 3,625,000 (4) | | | Southern Co/The, 4.000%, 01/15/2051 | | | | | 3,516,250 | | | | | | 0.2 | | |
| 300,000 (2) | | | Vistra Operations Co. LLC, 5.500%, 09/01/2026 | | | | | 301,965 | | | | | | 0.0 | | |
| 625,000 (2) | | | Vistra Operations Co. LLC, 5.625%, 02/15/2027 | | | | | 625,187 | | | | | | 0.0 | | |
| | | | | | | | | 49,057,147 | | | | | | 2.0 | | |
| | | | Total Corporate Bonds/Notes (Cost $475,904,460) | | | | | 450,380,183 | | | | | | 18.3 | | |
| COLLATERALIZED MORTGAGE OBLIGATIONS: 22.6% | | |||||||||||||||
| 235,891 (4) | | | Adjustable Rate Mortgage Trust 2006-2 1A1, 3.194%, 05/25/2036 | | | | | 227,021 | | | | | | 0.0 | | |
| 1,418,892 (2)(4) | | | Agate Bay Mortgage Trust 2015-2 B3, 3.642%, 03/25/2045 | | | | | 1,407,523 | | | | | | 0.1 | | |
| 552,519 (2)(4) | | | Agate Bay Mortgage Trust 2015-4 B3, 3.535%, 06/25/2045 | | | | | 548,206 | | | | | | 0.0 | | |
| 1,834,331 (2)(4) | | | Agate Bay Mortgage Trust 2016-1 B3, 3.669%, 12/25/2045 | | | | | 1,832,862 | | | | | | 0.1 | | |
| 1,000,000 (2)(4) | | | Agate Bay Mortgage Trust 2016-1 B4, 3.669%, 12/25/2045 | | | | | 988,540 | | | | | | 0.0 | | |
| 1,137,085 (2)(4) | | | Agate Bay Mortgage Trust 2016-2 B4, 3.766%, 03/25/2046 | | | | | 1,128,600 | | | | | | 0.1 | | |
| 495,423 | | | Alternative Loan Trust 2004-J7 MI, 1.477%, (US0001M + 1.020)%, 10/25/2034 | | | | | 494,252 | | | | | | 0.0 | | |
| Principal Amount† | | | Value | | | Percentage of Net Assets | | |||||||||
| COLLATERALIZED MORTGAGE OBLIGATIONS: (continued) | | |||||||||||||||
| 372,538 | | | Alternative Loan Trust 2005-10CB 1A2, 0.907%, (US0001M + 0.450)%, 05/25/2035 | | | | $ | 314,000 | | | | | | 0.0 | | |
| 366,166 | | | Alternative Loan Trust 2005-23CB A15, 5.500%, 07/25/2035 | | | | | 336,829 | | | | | | 0.0 | | |
| 41,067 | | | Alternative Loan Trust 2005-6CB 1A3, 5.250%, 04/25/2035 | | | | | 38,367 | | | | | | 0.0 | | |
| 209,863 | | | Alternative Loan Trust 2005-J2 1A12, 0.857%, (US0001M + 0.400)%, 04/25/2035 | | | | | 175,823 | | | | | | 0.0 | | |
| 31,464 | | | Alternative Loan Trust 2006-13T1 A9, 6.000%, 05/25/2036 | | | | | 20,239 | | | | | | 0.0 | | |
| 509,509 | | | Alternative Loan Trust 2006-18CB A10, 0.857%, (US0001M + 0.400)%, 07/25/2036 | | | | | 273,306 | | | | | | 0.0 | | |
| 121,666 | | | Alternative Loan Trust 2006-19CB A12, 0.857%, (US0001M + 0.400)%, 08/25/2036 | | | | | 60,172 | | | | | | 0.0 | | |
| 515,229 | | | Alternative Loan Trust 2006-19CB A28, 1.057%, (US0001M + 0.600)%, 08/25/2036 | | | | | 261,250 | | | | | | 0.0 | | |
| 874,901 | | | Alternative Loan Trust 2006-27CB A5, 6.000%, 11/25/2036 | | | | | 637,993 | | | | | | 0.0 | | |
| 297,300 | | | Alternative Loan Trust 2006-HY11 A1, 0.697%, (US0001M + 0.120)%, 06/25/2036 | | | | | 290,889 | | | | | | 0.0 | | |
| 931,767 | | | Alternative Loan Trust 2007-15CB A5, 5.750%, 07/25/2037 | | | | | 715,385 | | | | | | 0.0 | | |
| 127,708 | | | Alternative Loan Trust 2007-2CB 2A1, 1.057%, (US0001M + 0.600)%, 03/25/2037 | | | | | 59,642 | | | | | | 0.0 | | |
| 208,167 | | | Alternative Loan Trust 2007-HY8C A1, 0.617%, (US0001M + 0.160)%, 09/25/2047 | | | | | 200,332 | | | | | | 0.0 | | |
| 646,615 | | | Alternative Loan Trust 2007-OA4 A1, 0.797%, (US0001M + 0.170)%, 05/25/2047 | | | | | 611,367 | | | | | | 0.0 | | |
| Voya Strategic Income | PORTFOLIO OF INVESTMENTS |
| Opportunities Fund | as of March 31, 2022 (continued) |
| Principal Amount† | | | Value | | | Percentage of Net Assets | | |||||||||
| COLLATERALIZED MORTGAGE OBLIGATIONS: (continued) | | |||||||||||||||
| 697,556 (2)(4) | | | Arroyo Mortgage Trust 2019-3 A3, 3.416%, 10/25/2048 | | | | $ | 678,114 | | | | | | 0.0 | | |
| 328,584 | | | Banc of America Funding 2007-2 1A16 Trust, 1.057%, (US0001M + 0.600)%, 03/25/2037 | | | | | 265,218 | | | | | | 0.0 | | |
| 1,708,315 | | | Banc of America Funding 2007-C 7A1 Trust, 0.869%, (US0001M + 0.210)%, 05/20/2047 | | | | | 1,658,048 | | | | | | 0.1 | | |
| 212,895 (4) | | | Bear Stearns ALT-A Trust 2005-3 4A3, 2.483%, 04/25/2035 | | | | | 215,119 | | | | | | 0.0 | | |
| 428,665 (4) | | | Bear Stearns ALT-A Trust 2006-6 31A1, 3.051%, 11/25/2036 | | | | | 307,439 | | | | | | 0.0 | | |
| 602,597 (4) | | | Bear Stearns ALT-A Trust 2006-6 32A1, 2.880%, 11/25/2036 | | | | | 380,829 | | | | | | 0.0 | | |
| 119,939 (4) | | | Bear Stearns Structured Products, Inc. Trust 2007-R6 1A1, 2.728%, 01/26/2036 | | | | | 102,121 | | | | | | 0.0 | | |
| 1,300,000 (2) | | | Bellemeade Re 2019-1A M2 Ltd., 3.157%, (US0001M + 2.700)%, 03/25/2029 | | | | | 1,288,758 | | | | | | 0.1 | | |
| 885,271 (2) | | | Bellemeade Re 2019-4 M1B Ltd., 2.457%, (US0001M + 2.000)%, 10/25/2029 | | | | | 885,375 | | | | | | 0.0 | | |
| 2,100,000 (2) | | | Bellemeade RE 2021-3 A M1C Ltd., 1.649%, (SOFR30A + 1.550)%, 09/25/2031 | | | | | 2,021,089 | | | | | | 0.1 | | |
| 164,506 (2)(4) | | | Chase Home Lending Mortgage Trust 2019-ATR2 A3, 3.500%, 07/25/2049 | | | | | 164,292 | | | | | | 0.0 | | |
| 950,787 (2)(4) | | | Chase Mortgage Finance Corp. 2019-1 B2, 3.917%, 03/25/2050 | | | | | 933,475 | | | | | | 0.0 | | |
| 1,236,803 (2)(4) | | | Chase Mortgage Finance Corp. 2019-1 B3, 3.917%, 03/25/2050 | | | | | 1,213,037 | | | | | | 0.1 | | |
| 340,897 (4) | | | Chase Mortgage Finance Trust Series 2006-A1 2A3, 2.879%, 09/25/2036 | | | | | 317,732 | | | | | | 0.0 | | |
| 46,744 (4) | | | CHL Mortgage Pass-Through Trust 2004-22 A3, 2.696%, 11/25/2034 | | | | | 46,582 | | | | | | 0.0 | | |
| Principal Amount† | | | Value | | | Percentage of Net Assets | | |||||||||
| COLLATERALIZED MORTGAGE OBLIGATIONS: (continued) | | |||||||||||||||
| 327,755 | | | CHL Mortgage Pass-Through Trust 2005-HYB9 2A1, 1.987%, (US0012M + 1.750)%, 02/20/2036 | | | | $ | 313,539 | | | | | | 0.0 | | |
| 2,378,097 (2)(4) | | | CHNGE Mortgage Trust 2022-1 A1, 3.007%, 01/25/2067 | | | | | 2,322,595 | | | | | | 0.1 | | |
| 210,690 (2)(4) | | | CIM Trust 2019-INV1 A1, 4.000%, 02/25/2049 | | | | | 211,729 | | | | | | 0.0 | | |
| 236,018 (2)(4) | | | CIM Trust 2019-INV2 A3, 4.000%, 05/25/2049 | | | | | 236,600 | | | | | | 0.0 | | |
| 226,253 (2)(4) | | | CIM Trust 2019-INV3 A15, 3.500%, 08/25/2049 | | | | | 226,146 | | | | | | 0.0 | | |
| 339,379 (2)(4) | | | CIM Trust 2019-INV3 A3, 3.500%, 08/25/2049 | | | | | 337,745 | | | | | | 0.0 | ��� | |
| 1,674,298 (2)(4) | | | CIM Trust 2019-J1 B3, 3.979%, 08/25/2049 | | | | | 1,651,013 | | | | | | 0.1 | | |
| 3,075,838 (2)(4) | | | CIM Trust 2019-J2 B2, 3.770%, 10/25/2049 | | | | | 3,012,249 | | | | | | 0.1 | | |
| 1,931,384 (2)(4) | | | CIM Trust 2019-J2 B3, 3.770%, 10/25/2049 | | | | | 1,884,348 | | | | | | 0.1 | | |
| 1,257,885 (2)(4) | | | CIM Trust 2020-J2 B3, 2.767%, 01/25/2051 | | | | | 1,094,057 | | | | | | 0.1 | | |
| 1,878,781 (2)(4) | | | CIM Trust 2021-J3 B3, 2.619%, 06/25/2051 | | | | | 1,628,570 | | | | | | 0.1 | | |
| 463,571 | | | Citicorp Mortgage Securities Trust Series 2006-3 1A4, 6.000%, 06/25/2036 | | | | | 455,106 | | | | | | 0.0 | | |
| 86,562 (4) | | | Citigroup Mortgage Loan Trust 2006-AR2 1A1, 2.772%, 03/25/2036 | | | | | 74,393 | | | | | | 0.0 | | |
| 37,732 (4) | | | Citigroup Mortgage Loan Trust 2006-AR9 2A, 2.829%, 11/25/2036 | | | | | 34,482 | | | | | | 0.0 | | |
| 226,417 (2)(4) | | | Citigroup Mortgage Loan Trust 2015-A B2, 4.500%, 06/25/2058 | | | | | 225,132 | | | | | | 0.0 | | |
| 117,487 (4) | | | Citigroup Mortgage Loan Trust, Inc. 2005-4 A, 2.660%, 08/25/2035 | | | | | 119,789 | | | | | | 0.0 | | |
| 328,054 | | | Citigroup Mortgage Loan Trust, Inc. 2005-9 22A2, 6.000%, 11/25/2035 | | | | | 328,552 | | | | | | 0.0 | | |
| 934,880 (2) | | | Connecticut Avenue Securities Trust 2019-R07 1M2, 2.557%, (US0001M + 2.100)%, 10/25/2039 | | | | | 935,262 | | | | | | 0.0 | | |
| Voya Strategic Income | PORTFOLIO OF INVESTMENTS |
| Opportunities Fund | as of March 31, 2022 (continued) |
| Principal Amount† | | | Value | | | Percentage of Net Assets | | |||||||||
| COLLATERALIZED MORTGAGE OBLIGATIONS: (continued) | | |||||||||||||||
| 700,000 (2) | | | Connecticut Avenue Securities Trust 2020-R02 2B1, 3.457%, (US0001M + 3.000)%, 01/25/2040 | | | | $ | 643,289 | | | | | | 0.0 | | |
| 2,409,108 (2) | | | Connecticut Avenue Securities Trust 2020-R02 2M2, 2.457%, (US0001M + 2.000)%, 01/25/2040 | | | | | 2,401,946 | | | | | | 0.1 | | |
| 2,500,000 (2) | | | Connecticut Avenue Securities Trust 2022-R01 1B1, 3.249%, (SOFR30A + 3.150)%, 12/25/2041 | | | | | 2,327,559 | | | | | | 0.1 | | |
| 21,022 | | | Countrywide Alternative Loan Trust 2005-53T2 2A6, 0.957%, (US0001M + 0.500)%, 11/25/2035 | | | | | 11,314 | | | | | | 0.0 | | |
| 355,909 (2)(4) | | | CSMC 2017-HL1 A12 Trust, 3.500%, 06/25/2047 | | | | | 354,080 | | | | | | 0.0 | | |
| 2,302,719 (2) | | | CSMC 2019-AFC1 A3 Trust, 2.877%, 07/25/2049 | | | | | 2,244,591 | | | | | | 0.1 | | |
| 2,969,575 (2)(4) | | | CSMC 2021-AFC1 M1 Trust, 2.193%, 03/25/2056 | | | | | 2,813,060 | | | | | | 0.1 | | |
| 309,368 | | | CSMC Series 2007-2 3A6, 5.400%, 03/25/2037 | | | | | 207,999 | | | | | | 0.0 | | |
| 505,679 (2)(4) | | | CSMC Trust 2013-7 A11, 3.500%, 08/25/2043 | | | | | 491,181 | | | | | | 0.0 | | |
| 6,822,000 (2)(4) | | | Deephaven Residential Mortgage Trust 2022-2 A1, 4.300%, 03/25/2067 | | | | | 6,813,309 | | | | | | 0.3 | | |
| 2,500,000 (2)(4) | | | Deephaven Residential Mortgage Trust 2022-2 A3, 4.300%, 03/25/2067 | | | | | 2,473,313 | | | | | | 0.1 | | |
| 420,294 | | | Deutsche ALT-A Securities, Inc. ALT 2007-AB1 A1, 0.757%, (US0001M + 0.300)%, 04/25/2037 | | | | | 299,640 | | | | | | 0.0 | | |
| 93,845 (2)(4) | | | Deutsche Mortgage Securities, Inc. Re-REMIC Trust Certificates Series 2007-WM1 A1, 3.085%, 06/27/2037 | | | | | 93,863 | | | | | | 0.0 | | |
| 1,700,000 (2) | | | Fannie Mae Connecticut Avenue Securities Trust 2020-SBT1 1M2, 4.107%, (US0001M + 3.650)%, 02/25/2040 | | | | | 1,668,317 | | | | | | 0.1 | | |
| 471,332 (5) | | | Fannie Mae 2007-18 BS, 6.143%, (-1.000*US0001M + 6.600)%, 06/25/2035 | | | | | 72,868 | | | | | | 0.0 | | |
| Principal Amount† | | | Value | | | Percentage of Net Assets | | |||||||||
| COLLATERALIZED MORTGAGE OBLIGATIONS: (continued) | | |||||||||||||||
| 1,640,696 (5) | | | Fannie Mae 2008-94 SI, 5.043%, (-1.000*US0001M + 5.500)%, 04/25/2036 | | | | $ | 229,052 | | | | | | 0.0 | | |
| 187,945 | | | Fannie Mae 2010-15 FD, 1.197%, (US0001M + 0.740)%, 03/25/2040 | | | | | 190,946 | | | | | | 0.0 | | |
| 488,126 | | | Fannie Mae 2011-47 GF, 1.027%, (US0001M + 0.570)%, 06/25/2041 | | | | | 492,519 | | | | | | 0.0 | | |
| 52,872 | | | Fannie Mae 2012-10 UF, 1.007%, (US0001M + 0.550)%, 02/25/2042 | | | | | 53,460 | | | | | | 0.0 | | |
| 193,860 (5) | | | Fannie Mae 2012-84 KI, 6.000%, (US0001M + 6.000)%, 08/25/2042 | | | | | 45,677 | | | | | | 0.0 | | |
| 526,395 (5) | | | Fannie Mae 2012-93 IL, 3.000%, 09/25/2027 | | | | | 28,247 | | | | | | 0.0 | | |
| 3,320,301 (5) | | | Fannie Mae 2013-67 AI, 3.000%, 07/25/2028 | | | | | 180,858 | | | | | | 0.0 | | |
| 97,486 (5) | | | Fannie Mae 2015-56 DI, 3.000%, 12/25/2032 | | | | | 328 | | | | | | 0.0 | | |
| 22,277,362 (5) | | | Fannie Mae 2018-86 US, 5.743%, (-1.000*US0001M + 6.200)%, 12/25/2048 | | | | | 2,949,681 | | | | | | 0.1 | | |
| 36 | | | Fannie Mae Connecticut Avenue Securities, 6.157%, (US0001M + 5.700)%, 04/25/2028 | | | | | 38 | | | | | | 0.0 | | |
| 50,651 | | | Fannie Mae Connecticut Avenue Securities 2014-CO4 1M2, 5.357%, (US0001M + 4.900)%, 11/25/2024 | | | | | 52,198 | | | | | | 0.0 | | |
| 688,822 | | | Fannie Mae Connecticut Avenue Securities 2015-C02 1M2, 4.457%, (US0001M + 4.000)%, 05/25/2025 | | | | | 689,730 | | | | | | 0.0 | | |
| 1,391,636 | | | Fannie Mae Connecticut Avenue Securities 2015-C04 2M2, 6.007%, (US0001M + 5.550)%, 04/25/2028 | | | | | 1,446,485 | | | | | | 0.1 | | |
| 1,407,123 | | | Fannie Mae Connecticut Avenue Securities 2015-CO1 1M2, 4.757%, (US0001M + 4.300)%, 02/25/2025 | | | | | 1,419,137 | | | | | | 0.1 | | |
| Voya Strategic Income | PORTFOLIO OF INVESTMENTS |
| Opportunities Fund | as of March 31, 2022 (continued) |
| Principal Amount† | | | Value | | | Percentage of Net Assets | | |||||||||
| COLLATERALIZED MORTGAGE OBLIGATIONS: (continued) | | |||||||||||||||
| 1,502,591 | | | Fannie Mae Connecticut Avenue Securities 2017-C01 1M2, 4.007%, (US0001M + 3.550)%, 07/25/2029 | | | | $ | 1,530,955 | | | | | | 0.1 | | |
| 6,100,647 | | | Fannie Mae Connecticut Avenue Securities 2017-C03 1M2, 3.457%, (US0001M + 3.000)%, 10/25/2029 | | | | | 6,234,594 | | | | | | 0.3 | | |
| 1,122,280 | | | Fannie Mae Connecticut Avenue Securities 2017-C04 2M2, 3.307%, (US0001M + 2.850)%, 11/25/2029 | | | | | 1,142,497 | | | | | | 0.1 | | |
| 3,778,526 | | | Fannie Mae Connecticut Avenue Securities 2017-C07 2M2, 2.957%, (US0001M + 2.500)%, 05/25/2030 | | | | | 3,807,323 | | | | | | 0.2 | | |
| 3,575,463 | | | Fannie Mae Connecticut Avenue Securities 2017-CO6 2M2, 3.257%, (US0001M + 2.800)%, 02/25/2030 | | | | | 3,642,006 | | | | | | 0.2 | | |
| 1,020,000 | | | Fannie Mae Connecticut Avenue Securities 2018-C05 1B1, 4.707%, (US0001M + 4.250)%, 01/25/2031 | | | | | 1,025,395 | | | | | | 0.0 | | |
| 5,145,255 | | | Fannie Mae Connecticut Avenue Securities 2018-C06 1M2, 2.457%, (US0001M + 2.000)%, 03/25/2031 | | | | | 5,145,144 | | | | | | 0.2 | | |
| 2,927,840 | | | Fannie Mae Connecticut Avenue Securities 2018-C06 2M2, 2.557%, (US0001M + 2.100)%, 03/25/2031 | | | | | 2,923,480 | | | | | | 0.1 | | |
| 5,362,588 | | | Fannie Mae Connecticut Avenue Securities 2018-CO1 1M2, 2.707%, (US0001M + 2.250)%, 07/25/2030 | | | | | 5,408,021 | | | | | | 0.2 | | |
| 882,192 (2) | | | Fannie Mae Connecticut Avenue Securities 2019-R02 1M2, 2.757%, (US0001M + 2.300)%, 08/25/2031 | | | | | 882,494 | | | | | | 0.0 | | |
| 421,705 (2) | | | Fannie Mae Connecticut Avenue Securities 2019-RO3 1M2, 2.607%, (US0001M + 2.150)%, 09/25/2031 | | | | | 421,856 | | | | | | 0.0 | | |
| 1,070,063 (2) | | | Fannie Mae Connecticut Avenue Securities Trust 2019-R01 2M2, 2.907%, (US0001M + 2.450)%, 07/25/2031 | | | | | 1,073,229 | | | | | | 0.1 | | |
| Principal Amount† | | | Value | | | Percentage of Net Assets | | |||||||||
| COLLATERALIZED MORTGAGE OBLIGATIONS: (continued) | | |||||||||||||||
| 1,000,000 (2) | | | Fannie Mae Connecticut Avenue Securities Trust 2019-R05 1B1, 4.557%, (US0001M + 4.100)%, 07/25/2039 | | | | $ | 999,477 | | | | | | 0.0 | | |
| 1,755,046 (2) | | | Fannie Mae Connecticut Avenue Securities Trust 2020-R01 1M2, 2.507%, (US0001M + 2.050)%, 01/25/2040 | | | | | 1,754,364 | | | | | | 0.1 | | |
| 3,898,000 (2) | | | Fannie Mae Connecticut Avenue Securities Trust 2020-SBT1 2M2, 4.107%, (US0001M + 3.650)%, 02/25/2040 | | | | | 3,889,305 | | | | | | 0.2 | | |
| 527,005 (5) | | | Fannie Mae Interest Strip Series 346 6, 5.000%, 10/25/2033 | | | | | 87,029 | | | | | | 0.0 | | |
| 96,857 (5) | | | Fannie Mae REMIC Trust 2000-26 SP, 8.043%, (-1.000*US0001M + 8.500)%, 08/25/2030 | | | | | 10,383 | | | | | | 0.0 | | |
| 124,601 (5) | | | Fannie Mae REMIC Trust 2002-13 SR, 6.143%, (-1.000*US0001M + 6.600)%, 03/25/2032 | | | | | 12,530 | | | | | | 0.0 | | |
| 77,433 (5) | | | Fannie Mae REMIC Trust 2004-64 SW, 6.593%, (-1.000*US0001M + 7.050)%, 08/25/2034 | | | | | 11,274 | | | | | | 0.0 | | |
| 53,792 (5) | | | Fannie Mae REMIC Trust 2004-66 SE, 6.043%, (-1.000*US0001M + 6.500)%, 09/25/2034 | | | | | 6,823 | | | | | | 0.0 | | |
| 271,042 (5) | | | Fannie Mae REMIC Trust 2009-25 SN, 6.093%, (-1.000*US0001M + 6.550)%, 04/25/2039 | | | | | 47,745 | | | | | | 0.0 | | |
| 10,338,123 (5) | | | Fannie Mae REMIC Trust 2012-66 IB, 0.050%, (-1.000*US0001M + 6.050)%, 06/25/2042 | | | | | 21,668 | | | | | | 0.0 | | |
| 310,517 (5) | | | Fannie Mae REMIC Trust 2013-116 SC, 5.743%, (-1.000*US0001M + 6.200)%, 04/25/2033 | | | | | 16,207 | | | | | | 0.0 | | |
| 1,339,145 (5) | | | Fannie Mae REMICS 2004-53 UC, 7.093%, (-1.000*US0001M + 7.550)%, 07/25/2034 | | | | | 238,166 | | | | | | 0.0 | | |
| Voya Strategic Income | PORTFOLIO OF INVESTMENTS |
| Opportunities Fund | as of March 31, 2022 (continued) |
| Principal Amount† | | | Value | | | Percentage of Net Assets | | |||||||||
| COLLATERALIZED MORTGAGE OBLIGATIONS: (continued) | | |||||||||||||||
| 982,170 (5) | | | Fannie Mae REMICS 2005-59 NS, 6.293%, (-1.000*US0001M + 6.750)%, 05/25/2035 | | | | $ | 76,481 | | | | | | 0.0 | | |
| 130,644 | | | Fannie Mae REMICS 2006-46 SP, 22.526%, (-3.667*US0001M + 24.200)%, 06/25/2036 | | | | | 244,322 | | | | | | 0.0 | | |
| 4,219,314 (5) | | | Fannie Mae REMICS 2007-22 SD, 5.943%, (-1.000*US0001M + 6.400)%, 03/25/2037 | | | | | 679,172 | | | | | | 0.0 | | |
| 3,716,610 (5) | | | Fannie Mae REMICS 2007-30 IE, 6.283%, (-1.000*US0001M + 6.740)%, 04/25/2037 | | | | | 717,696 | | | | | | 0.0 | | |
| 2,325,134 (5) | | | Fannie Mae REMICS 2007-55 S, 6.303%, (-1.000*US0001M + 6.760)%, 06/25/2037 | | | | | 355,766 | | | | | | 0.0 | | |
| 1,186,591 (5) | | | Fannie Mae REMICS 2011-123 SD, 6.143%, (-1.000*US0001M + 6.600)%, 08/25/2039 | | | | | 24,218 | | | | | | 0.0 | | |
| 12,534,852 (5) | | | Fannie Mae REMICS 2012-111 UI, 3.000%, 10/25/2027 | | | | | 708,499 | | | | | | 0.0 | | |
| 1,022,918 (5) | | | Fannie Mae REMICS 2012-121 DI, 2.500%, 11/25/2027 | | | | | 51,277 | | | | | | 0.0 | | |
| 10,260,598 (5) | | | Fannie Mae REMICS 2012-128 KI, 3.000%, 11/25/2027 | | | | | 569,558 | | | | | | 0.0 | | |
| 8,651,817 (5) | | | Fannie Mae REMICS 2012-133 NS, 5.693%, (-1.000*US0001M + 6.150)%, 12/25/2042 | | | | | 1,391,421 | | | | | | 0.1 | | |
| 2,331,873 (5) | | | Fannie Mae REMICS 2012-148 IB, 3.500%, 01/25/2028 | | | | | 157,440 | | | | | | 0.0 | | |
| 4,282,822 (5) | | | Fannie Mae REMICS 2012-150 PS, 5.693%, (-1.000*US0001M + 6.150)%, 01/25/2043 | | | | | 691,540 | | | | | | 0.0 | | |
| 10,225,390 (5) | | | Fannie Mae REMICS 2013-1 LI, 2.500%, 02/25/2028 | | | | | 471,209 | | | | | | 0.0 | | |
| 1,750,208 (5) | | | Fannie Mae REMICS 2013-137 PI, 5.000%, 10/25/2041 | | | | | 340,515 | | | | | | 0.0 | | |
| Principal Amount† | | | Value | | | Percentage of Net Assets | | |||||||||
| COLLATERALIZED MORTGAGE OBLIGATIONS: (continued) | | |||||||||||||||
| 9,487,269 (5) | | | Fannie Mae REMICS 2013-19 JS, 5.743%, (-1.000*US0001M + 6.200)%, 10/25/2041 | | | | $ | 874,274 | | | | | | 0.0 | | |
| 1,442,505 (5) | | | Fannie Mae REMICS 2013-2 NI, 4.000%, 02/25/2043 | | | | | 189,923 | | | | | | 0.0 | | |
| 4,054,189 (5) | | | Fannie Mae REMICS 2013-21 KI, 3.000%, 03/25/2028 | | | | | 228,233 | | | | | | 0.0 | | |
| 4,728,842 (5) | | | Fannie Mae REMICS 2013-32 EI, 2.500%, 04/25/2033 | | | | | 477,136 | | | | | | 0.0 | | |
| 1,469,757 (5) | | | Fannie Mae REMICS 2013-41 BI, 3.000%, 05/25/2028 | | | | | 93,364 | | | | | | 0.0 | | |
| 1,588,467 (5) | | | Fannie Mae REMICS 2013-69 PI, 3.000%, 04/25/2033 | | | | | 145,217 | | | | | | 0.0 | | |
| 3,597,569 (5) | | | Fannie Mae REMICS 2013-97 JS, 5.693%, (-1.000*US0001M + 6.150)%, 04/25/2038 | | | | | 439,407 | | | | | | 0.0 | | |
| 7,539,665 (5) | | | Fannie Mae REMICS 2016-19 SB, 5.643%, (-1.000*US0001M + 6.100)%, 04/25/2046 | | | | | 1,070,933 | | | | | | 0.1 | | |
| 2,401,524 (5) | | | Fannie Mae REMICS 2016-4 BI, 4.000%, 02/25/2046 | | | | | 473,328 | | | | | | 0.0 | | |
| 1,678,480 (5) | | | Fannie Mae REMICS 2016-61 PI, 4.500%, 01/25/2046 | | | | | 313,686 | | | | | | 0.0 | | |
| 17,169,686 (5) | | | Fannie Mae REMICS 2017-16 SG, 5.593%, (-1.000*US0001M + 6.050)%, 03/25/2047 | | | | | 2,855,439 | | | | | | 0.1 | | |
| 10,438,087 (5) | | | Fannie Mae REMICS 2019-15 AI, 4.000%, 04/25/2059 | | | | | 2,521,873 | | | | | | 0.1 | | |
| 17,722,566 (5) | | | Fannie Mae REMICS 2019-17 SA, 5.643%, (-1.000*US0001M + 6.100)%, 04/25/2049 | | | | | 2,356,596 | | | | | | 0.1 | | |
| 15,786,373 (5) | | | Fannie Mae REMICS 2019-8 SB, 5.643%, (-1.000*US0001M + 6.100)%, 03/25/2049 | | | | | 2,129,369 | | | | | | 0.1 | | |
| Voya Strategic Income | PORTFOLIO OF INVESTMENTS |
| Opportunities Fund | as of March 31, 2022 (continued) |
| Principal Amount† | | | Value | | | Percentage of Net Assets | | |||||||||
| COLLATERALIZED MORTGAGE OBLIGATIONS: (continued) | | |||||||||||||||
| 21,356,611 (5) | | | Fannie Mae REMICS 2020-49 SB, 5.643%, (-1.000*US0001M + 6.100)%, 07/25/2050 | | | | $ | 4,677,044 | | | | | | 0.2 | | |
| 42,721,725 (5) | | | Fannie Mae REMICS 2020-64 IO, 3.000%, 09/25/2050 | | | | | 8,037,994 | | | | | | 0.3 | | |
| 26,929,731 (5) | | | Fannie Mae REMICS 2020-65 CI, 4.000%, 09/25/2050 | | | | | 4,859,478 | | | | | | 0.2 | | |
| 20,830,181 (5) | | | Fannie Mae REMICS 2021-2 PI, 2.000%, 02/25/2051 | | | | | 2,119,938 | | | | | | 0.1 | | |
| 46,928,934 (5) | | | Fannie Mae REMICS 2021-65 KI, 3.500%, 10/25/2051 | | | | | 7,831,923 | | | | | | 0.3 | | |
| 383,171 | | | Fannie Mae Series 2006-11 FA, 0.757%, (US0001M + 0.300)%, 03/25/2036 | | | | | 382,777 | | | ��� | | | 0.0 | | |
| 67,292 | | | First Horizon Alternative Mortgage Securities Trust 2006-FA8 1A7, 6.000%, 02/25/2037 | | | | | 38,756 | | | | | | 0.0 | | |
| 214,179 (2)(4) | | | Flagstar Mortgage Trust 2017-2 A7, 3.500%, 10/25/2047 | | | | | 215,246 | | | | | | 0.0 | | |
| 634,489 (2)(4) | | | Flagstar Mortgage Trust 2018-1 B3, 3.968%, 03/25/2048 | | | | | 618,469 | | | | | | 0.0 | | |
| 4,585,319 (2)(4) | | | Flagstar Mortgage Trust 2018-2 B2, 4.030%, 04/25/2048 | | | | | 4,519,090 | | | | | | 0.2 | | |
| 962,965 (2)(4) | | | Flagstar Mortgage Trust 2018-3INV A3, 4.000%, 05/25/2048 | | | | | 964,824 | | | | | | 0.0 | | |
| 3,683,042 (2)(4) | | | Flagstar Mortgage Trust 2018-4 B3, 4.245%, 07/25/2048 | | | | | 3,648,365 | | | | | | 0.2 | | |
| 928,268 (2)(4) | | | Flagstar Mortgage Trust 2018-5 B3, 4.500%, 09/25/2048 | | | | | 919,046 | | | | | | 0.0 | | |
| 294,103 (2)(4) | | | Flagstar Mortgage Trust 2018-6RR 1A7, 4.000%, 10/25/2048 | | | | | 293,201 | | | | | | 0.0 | | |
| 3,507,689 (2)(4) | | | Flagstar Mortgage Trust 2018-6RR B1, 4.934%, 10/25/2048 | | | | | 3,521,402 | | | | | | 0.2 | | |
| 1,429,524 (2)(4) | | | Flagstar Mortgage Trust 2019-2 B1, 4.056%, 12/25/2049 | | | | | 1,401,296 | | | | | | 0.1 | | |
| Principal Amount† | | | Value | | | Percentage of Net Assets | | |||||||||
| COLLATERALIZED MORTGAGE OBLIGATIONS: (continued) | | |||||||||||||||
| 2,001,334 (2)(4) | | | Flagstar Mortgage Trust 2019-2 B2, 4.056%, 12/25/2049 | | | | $ | 1,953,005 | | | | | | 0.1 | | |
| 3,371,092 (2)(4) | | | Flagstar Mortgage Trust 2020-1NV B2A, 4.242%, 03/25/2050 | | | | | 3,253,258 | | | | | | 0.1 | | |
| 2,889,507 (2)(4) | | | Flagstar Mortgage Trust 2020-1NV B3, 4.242%, 03/25/2050 | | | | | 2,773,649 | | | | | | 0.1 | | |
| 3,779,568 (2)(4) | | | Flagstar Mortgage Trust 2021-2 B3, 2.790%, 04/25/2051 | | | | | 3,261,577 | | | | | | 0.1 | | |
| 1,105,871 (5) | | | Freddie Mac 2009-70 PS, 6.293%, (-1.000*US0001M + 6.750)%, 01/25/2037 | | | | | 186,576 | | | | | | 0.0 | | |
| 30,613 (5) | | | Freddie Mac 2524 SH, 7.103%, (-1.000*US0001M + 7.500)%, 11/15/2032 | | | | | 140 | | | | | | 0.0 | | |
| 283,879 (5) | | | Freddie Mac 2525 SM, 7.603%, (-1.000*US0001M + 8.000)%, 02/15/2032 | | | | | 51,111 | | | | | | 0.0 | | |
| 265,319 (5) | | | Freddie Mac 2981 CS, 6.323%, (-1.000*US0001M + 6.720)%, 05/15/2035 | | | | | 35,249 | | | | | | 0.0 | | |
| 236,955 (5) | | | Freddie Mac 2989 HS, 6.753%, (-1.000*US0001M + 7.150)%, 08/15/2034 | | | | | 68,505 | | | | | | 0.0 | | |
| 131,658 (5) | | | Freddie Mac 3018 SM, 6.803%, (-1.000*US0001M + 7.200)%, 08/15/2035 | | | | | 26,314 | | | | | | 0.0 | | |
| 1,609,070 (5) | | | Freddie Mac 3222 SN, 6.203%, (-1.000*US0001M + 6.600)%, 09/15/2036 | | | | | 225,404 | | | | | | 0.0 | | |
| 261,753 (4)(5) | | | Freddie Mac 324 144, 6.000%, 06/15/2039 | | | | | 57,346 | | | | | | 0.0 | | |
| 514,638 (5) | | | Freddie Mac 3523 SA, 5.603%, (-1.000*US0001M + 6.000)%, 09/15/2036 | | | | | 71,616 | | | | | | 0.0 | | |
| 444,652 (5) | | | Freddie Mac 3582 MS, 5.753%, (-1.000*US0001M + 6.150)%, 10/15/2039 | | | | | 65,101 | | | | | | 0.0 | | |
| Voya Strategic Income | PORTFOLIO OF INVESTMENTS |
| Opportunities Fund | as of March 31, 2022 (continued) |
| Principal Amount† | | | Value | | | Percentage of Net Assets | | |||||||||
| COLLATERALIZED MORTGAGE OBLIGATIONS: (continued) | | |||||||||||||||
| 649,566 (5) | | | Freddie Mac 3688 BI, 5.000%, 07/15/2040 | | | | $ | 125,525 | | | | | | 0.0 | | |
| 2,558,370 (5) | | | Freddie Mac 4186 IA, 3.000%, 03/15/2033 | | | | | 253,942 | | | | | | 0.0 | | |
| 95,306 (5) | | | Freddie Mac 4333 AI, 5.500%, 02/15/2044 | | | | | 16,421 | | | | | | 0.0 | | |
| 5,408,712 (5) | | | Freddie Mac 4813 IO, 5.500%, 08/15/2048 | | | | | 1,118,168 | | | | | | 0.1 | | |
| 29,319 (5) | | | Freddie Mac REMIC Trust 2266 S, 8.153%, (-1.000*US0001M + 8.550)%, 11/15/2030 | | | | | 3,293 | | | | | | 0.0 | | |
| 137,409 (5) | | | Freddie Mac REMIC Trust 2374 S, 7.703%, (-1.000*US0001M + 8.100)%, 06/15/2031 | | | | | 22,813 | | | | | | 0.0 | | |
| 76,440 (5) | | | Freddie Mac REMIC Trust 2417 SY, 8.003%, (-1.000*US0001M + 8.400)%, 12/15/2031 | | | | | 14,749 | | | | | | 0.0 | | |
| 134,128 (5) | | | Freddie Mac REMIC Trust 2577 SA, 7.053%, (-1.000*US0001M + 7.450)%, 02/15/2033 | | | | | 23,702 | | | | | | 0.0 | | |
| 72,711 (5) | | | Freddie Mac REMIC Trust 2981 SU, 7.403%, (-1.000*US0001M + 7.800)%, 05/15/2030 | | | | | 10,380 | | | | | | 0.0 | | |
| 139,839 | | | Freddie Mac REMIC Trust 3031 BP, 8.000%, (-6.723*US0001M + 44.975)%, 08/15/2035 | | | | | 145,169 | | | | | | 0.0 | | |
| 506,319 (5) | | | Freddie Mac REMIC Trust 3049 PI, 6.253%, (-1.000*US0001M + 6.650)%, 10/15/2035 | | | | | 78,892 | | | | | | 0.0 | | |
| 44,635 | | | Freddie Mac REMIC Trust 3085 SK, 61.241%, (-12.000*US0001M + 66.000)%, 12/15/2035 | | | | | 106,258 | | | | | | 0.0 | | |
| 62,333 (6) | | | Freddie Mac REMIC Trust 3151 PO, 0.000%, 05/15/2036 | | | | | 53,847 | | | | | | 0.0 | | |
| 169,939 (5) | | | Freddie Mac REMIC Trust 3624 TS, 4.403%, (-1.000*US0001M + 4.800)%, 01/15/2040 | | | | | 15,682 | | | | | | 0.0 | | |
| 170,739 (5) | | | Freddie Mac REMIC Trust 4261 ID, 6.500%, 06/15/2032 | | | | | 19,831 | | | | | | 0.0 | | |
| Principal Amount† | | | Value | | | Percentage of Net Assets | | |||||||||
| COLLATERALIZED MORTGAGE OBLIGATIONS: (continued) | | |||||||||||||||
| 518,938 (5) | | | Freddie Mac REMIC Trust 4287 CI, 4.500%, 07/15/2041 | | | | $ | 59,616 | | | | | | 0.0 | | |
| 1,386,164 (5) | | | Freddie Mac REMICS 2781 SB, 6.753%, (-1.000*US0001M + 7.150)%, 04/15/2034 | | | | | 225,844 | | | | | | 0.0 | | |
| 286,046 | | | Freddie Mac REMICS 2921 PF, 0.747%, (US0001M + 0.350)%, 01/15/2035 | | | | | 286,315 | | | | | | 0.0 | | |
| 3,289,052 (5) | | | Freddie Mac REMICS 3128 JI, 6.233%, (-1.000*US0001M + 6.630)%, 03/15/2036 | | | | | 529,224 | | | | | | 0.0 | | |
| 1,544,931 (5) | | | Freddie Mac REMICS 3298 S, 5.713%, (-1.000*US0001M + 6.110)%, 04/15/2037 | | | | | 222,471 | | | | | | 0.0 | | |
| 2,951,982 (5) | | | Freddie Mac REMICS 4097 IC, 2.500%, 08/15/2027 | | | | | 131,949 | | | | | | 0.0 | | |
| 999,932 (5) | | | Freddie Mac REMICS 4116 IL, 4.500%, 05/15/2042 | | | | | 131,646 | | | | | | 0.0 | | |
| 10,286,858 (5) | | | Freddie Mac REMICS 4120 TI, 2.500%, 10/15/2027 | | | | | 449,783 | | | | | | 0.0 | | |
| 1,433,803 (5) | | | Freddie Mac REMICS 4136 QI, 3.000%, 11/15/2032 | | | | | 83,801 | | | | | | 0.0 | | |
| 818,680 (5) | | | Freddie Mac REMICS 4143 IK, 4.000%, 10/15/2041 | | | | | 63,754 | | | | | | 0.0 | | |
| 14,071,397 (5) | | | Freddie Mac REMICS 4146 SA, 5.753%, (-1.000*US0001M + 6.150)%, 12/15/2042 | | | | | 2,250,052 | | | | | | 0.1 | | |
| 821,438 (5) | | | Freddie Mac REMICS 4153 YI, 3.000%, 09/15/2042 | | | | | 31,079 | | | | | | 0.0 | | |
| 1,950,772 (5) | | | Freddie Mac REMICS 4157 IH, 3.500%, 01/15/2043 | | | | | 373,477 | | | | | | 0.0 | | |
| 1,294,565 (5) | | | Freddie Mac REMICS 4162 DI, 2.000%, 02/15/2028 | | | | | 49,736 | | | | | | 0.0 | | |
| 4,911,278 (5) | | | Freddie Mac REMICS 4182 IL, 3.000%, 03/15/2028 | | | | | 291,498 | | | | | | 0.0 | | |
| 676,054 (5) | | | Freddie Mac REMICS 4266 LI, 3.500%, 06/15/2028 | | | | | 18,782 | | | | | | 0.0 | | |
| Voya Strategic Income | PORTFOLIO OF INVESTMENTS |
| Opportunities Fund | as of March 31, 2022 (continued) |
| Principal Amount† | | | Value | | | Percentage of Net Assets | | |||||||||
| COLLATERALIZED MORTGAGE OBLIGATIONS: (continued) | | |||||||||||||||
| 29,048,576 (5) | | | Freddie Mac REMICS 4273 PS, 5.703%, (-1.000*US0001M + 6.100)%, 11/15/2043 | | | | $ | 3,960,192 | | | | | | 0.2 | | |
| 1,960,166 (5) | | | Freddie Mac REMICS 4290 EI, 5.000%, 12/15/2043 | | | | | 360,514 | | | | | | 0.0 | | |
| 1,046,048 | | | Freddie Mac REMICS 4385 LS, 8.795%, (-2.333*US0001M + 9.333)%, 07/15/2037 | | | | | 982,840 | | | | | | 0.0 | | |
| 2,450,867 (5) | | | Freddie Mac REMICS 4494 LI, 5.000%, 12/15/2043 | | | | | 276,162 | | | | | | 0.0 | | |
| 7,484,712 (5) | | | Freddie Mac REMICS 4618 SA, 5.603%, (-1.000*US0001M + 6.000)%, 09/15/2046 | | | | | 1,322,060 | | | | | | 0.1 | | |
| 1,776,046 | | | Freddie Mac REMICS 4625 BI, 3.500%, 06/15/2046 | | | | | 280,592 | | | | | | 0.0 | | |
| 2,226,413 (5) | | | Freddie Mac REMICS 4708 KI, 4.500%, 11/15/2046 | | | | | 369,905 | | | | | | 0.0 | | |
| 25,444,304 (5) | | | Freddie Mac REMICS 4903 NS, 5.643%, (-1.000*US0001M + 6.100)%, 08/25/2049 | | | | | 4,115,810 | | | | | | 0.2 | | |
| 12,727,336 (5) | | | Freddie Mac REMICS 4909 SJ, 5.593%, (-1.000*US0001M + 6.050)%, 09/25/2049 | | | | | 2,224,657 | | | | | | 0.1 | | |
| 4,851,553 (5) | | | Freddie Mac REMICS 4910 SD, 5.653%, (-1.000*US0001M + 6.050)%, 06/15/2049 | | | | | 854,409 | | | | | | 0.0 | | |
| 16,853,105 (5) | | | Freddie Mac REMICS 4910 SH, 5.593%, (-1.000*US0001M + 6.050)%, 09/25/2049 | | | | | 2,970,699 | | | | | | 0.1 | | |
| 21,567,850 (5) | | | Freddie Mac REMICS 4924 SY, 5.593%, (-1.000*US0001M + 6.050)%, 10/25/2049 | | | | | 3,876,355 | | | | | | 0.2 | | |
| 16,213,229 (5) | | | Freddie Mac REMICS 4967 IQ, 4.000%, 02/25/2050 | | | | | 3,066,450 | | | | | | 0.1 | | |
| 43,972,841 (5) | | | Freddie Mac REMICS 4974 I, 4.000%, 04/25/2050 | | | | | 8,208,863 | | | | | | 0.3 | | |
| 37,791,793 (5) | | | Freddie Mac REMICS 5010 MI, 3.000%, 09/25/2050 | | | | | 5,721,394 | | | | | | 0.2 | | |
| 29,859,755 (5) | | | Freddie Mac REMICS 5049 UI, 3.000%, 12/25/2050 | | | | | 5,327,255 | | | | | | 0.2 | | |
| 15,204,709 (5) | | | Freddie Mac REMICS 5074 GI, 2.000%, 02/25/2051 | | | | | 1,574,367 | | | | | | 0.1 | | |
| Principal Amount† | | | Value | | | Percentage of Net Assets | | |||||||||
| COLLATERALIZED MORTGAGE OBLIGATIONS: (continued) | | |||||||||||||||
| 25,651,616 (5) | | | Freddie Mac REMICS 5081 CI, 2.000%, 03/25/2051 | | | | $ | 2,723,691 | | | | | | 0.1 | | |
| 11,878,639 (5) | | | Freddie Mac REMICS 5142 LI, 2.500%, 09/25/2051 | | | | | 1,960,139 | | | | | | 0.1 | | |
| 410,302 | | | Freddie Mac REMICS Trust 3740 FB, 0.897%, (US0001M + 0.500)%, 10/15/2040 | | | | | 413,873 | | | | | | 0.0 | | |
| 1,163,519 (2) | | | Freddie Mac STACR Remic Trust 2020-DNA2 M2, 2.307%, (US0001M + 1.850)%, 02/25/2050 | | | | | 1,161,516 | | | | | | 0.1 | | |
| 1,770,805 (2) | | | Freddie Mac STACR REMIC Trust 2020-HQA1 M2, 2.357%, (US0001M + 1.900)%, 01/25/2050 | | | | | 1,773,219 | | | | | | 0.1 | | |
| 5,100,000 (2) | | | Freddie Mac STACR REMIC Trust 2021-DNA6 B1, 3.499%, (SOFR30A + 3.400)%, 10/25/2041 | | | | | 4,722,675 | | | | | | 0.2 | | |
| 2,500,000 (2) | | | Freddie Mac STACR REMIC Trust 2021-HQA3 M2, 2.199%, (SOFR30A + 2.100)%, 09/25/2041 | | | | | 2,349,662 | | | | | | 0.1 | | |
| 6,100,000 (2) | | | Freddie Mac STACR REMIC Trust 2021-HQA4 B1, 3.849%, (SOFR30A + 3.750)%, 12/25/2041 | | | | | 5,508,033 | | | | | | 0.2 | | |
| 2,800,000 (2) | | | Freddie Mac STACR REMIC Trust 2022-DNA1 B1, 3.499%, (SOFR30A + 3.400)%, 01/25/2042 | | | | | 2,551,340 | | | | | | 0.1 | | |
| 2,500,000 (2) | | | Freddie Mac STACR REMIC Trust 2022-DNA1 M1B, 1.949%, (SOFR30A + 1.850)%, 01/25/2042 | | | | | 2,360,427 | | | | | | 0.1 | | |
| 2,000,000 (2) | | | Freddie Mac STACR REMIC Trust 2022-DNA1 M2, 2.599%, (SOFR30A + 2.500)%, 01/25/2042 | | | | | 1,870,040 | | | | | | 0.1 | | |
| 1,200,000 (2) | | | Freddie Mac STACR REMIC Trust 2022-HQA1 M2, 5.300%, (SOFR30A + 5.250)%, 03/25/2042 | | | | | 1,226,840 | | | | | | 0.1 | | |
| 3,684,440 (2) | | | Freddie Mac STACR Trust 2018-DNA3 M2, 2.557%, (US0001M + 2.100)%, 09/25/2048 | | | | | 3,704,504 | | | | | | 0.2 | | |
| 1,375,152 (5) | | | Freddie Mac Strips 287 IO, 3.000%, 10/15/2027 | | | | | 79,679 | | | | | | 0.0 | | |
| Voya Strategic Income | PORTFOLIO OF INVESTMENTS |
| Opportunities Fund | as of March 31, 2022 (continued) |
| Principal Amount† | | | Value | | | Percentage of Net Assets | | |||||||||
| COLLATERALIZED MORTGAGE OBLIGATIONS: (continued) | | |||||||||||||||
| 909,772 (5) | | | Freddie Mac Strips Series 224 IO, 6.000%, 03/01/2033 | | | | $ | 199,157 | | | | | | 0.0 | | |
| 430,162 (5) | | | Freddie Mac Strips Series 237 S23, 6.703%, (-1.000*US0001M + 7.100)%, 05/15/2036 | | | | | 73,786 | | | | | | 0.0 | | |
| 514,029 (5) | | | Freddie Mac Strips Series 260 33, 4.000%, 05/15/2039 | | | | | 88,638 | | | | | | 0.0 | | |
| 312,169 | | | Freddie Mac Structured Agency Credit Risk Debt Notes 2014-DN3 M3, 4.457%, (US0001M + 4.000)%, 08/25/2024 | | | | | 317,032 | | | | | | 0.0 | | |
| 1,840,000 | | | Freddie Mac Structured Agency Credit Risk Debt Notes 2018-DNA1 B1, 3.607%, (US0001M + 3.150)%, 07/25/2030 | | | | | 1,776,007 | | | | | | 0.1 | | |
| 2,497,251 | | | Freddie Mac Structured Agency Credit Risk Debt Notes 2018-HQA1 M2, 2.757%, (US0001M + 2.300)%, 09/25/2030 | | | | | 2,501,623 | | | | | | 0.1 | | |
| 4,342,043 (2) | | | Freddie Mac Structured Agency Credit Risk Debt Notes 2019-DNA1 M2, 3.107%, (US0001M + 2.650)%, 01/25/2049 | | | | | 4,368,417 | | | | | | 0.2 | | |
| 7,693,750 (2) | | | Freddie Mac Structured Agency Credit Risk Debt Notes 2019-HQA2 M2, 2.507%, (US0001M + 2.050)%, 04/25/2049 | | | | | 7,696,247 | | | | | | 0.3 | | |
| 3,000,000 (2) | | | Freddie Mac Structured Agency Credit Risk Debt Notes 2021-DNA2 M2, 2.399%, (SOFR30A + 2.300)%, 08/25/2033 | | | | | 2,960,093 | | | | | | 0.1 | | |
| 2,300,000 (2) | | | Freddie Mac Structured Agency Credit Risk Debt Notes 2021-DNA7 B1, 3.749%, (SOFR30A + 3.650)%, 11/25/2041 | | | | | 2,185,130 | | | | | | 0.1 | | |
| 1,600,622 (2)(4) | | | Galton Funding Mortgage Trust 2018-2 B2, 4.702%, 10/25/2058 | | | | | 1,585,409 | | | | | | 0.1 | | |
| 2,396,114 (2)(4) | | | Galton Funding Mortgage Trust 2019-1 B1, 4.250%, 02/25/2059 | | | | | 2,359,077 | | | | | | 0.1 | | |
| Principal Amount† | | | Value | | | Percentage of Net Assets | | |||||||||
| COLLATERALIZED MORTGAGE OBLIGATIONS: (continued) | | |||||||||||||||
| 1,921,275 (2)(4) | | | Galton Funding Mortgage Trust 2019-1 B2, 4.500%, 02/25/2059 | | | | $ | 1,894,431 | | | | | | 0.1 | | |
| 3,796,439 (5) | | | Ginnie Mae 2007-59 SC, 6.051%, (-1.000*US0001M + 6.500)%, 07/20/2037 | | | | | 600,338 | | | | | | 0.0 | | |
| 130,795 (5) | | | Ginnie Mae 2011-101 EI, 6.000%, (-19.355*US0001M + 109.161)%, 10/16/2039 | | | | | 31,503 | | | | | | 0.0 | | |
| 22,377,011 (5) | | | Ginnie Mae 2013-130 SB, 4.819%, (-1.000*US0001M + 5.050)%, 09/16/2043 | | | | | 2,175,160 | | | | | | 0.1 | | |
| 8,856,539 (5) | | | Ginnie Mae 2014-58 SM, 5.669%, (-1.000*US0001M + 6.100)%, 04/16/2044 | | | | | 1,317,893 | | | | | | 0.1 | | |
| 45,666,164 (5) | | | Ginnie Mae 2021-194 IK, 3.000%, 11/20/2051 | | | | | 8,104,790 | | | | | | 0.3 | | |
| 344,601 (5) | | | Ginnie Mae Series 2008-40 SA, 5.969%, (-1.000*US0001M + 6.400)%, 05/16/2038 | | | | | 44,317 | | | | | | 0.0 | | |
| 579,748 (5) | | | Ginnie Mae Series 2009-116 SJ, 6.049%, (-1.000*US0001M + 6.480)%, 12/16/2039 | | | | | 88,126 | | | | | | 0.0 | | |
| 784,856 (5) | | | Ginnie Mae Series 2010-143 JI, 4.000%, 08/16/2039 | | | | | 47,637 | | | | | | 0.0 | | |
| 1,286,371 (5) | | | Ginnie Mae Series 2010-4 IP, 5.000%, 01/16/2039 | | | | | 107,524 | | | | | | 0.0 | | |
| 552,531 (5) | | | Ginnie Mae Series 2010-4 SL, 5.969%, (-1.000*US0001M + 6.400)%, 01/16/2040 | | | | | 90,951 | | | | | | 0.0 | | |
| 55,975 (5) | | | Ginnie Mae Series 2010-98 QS, 6.151%, (-1.000*US0001M + 6.600)%, 01/20/2040 | | | | | 1,993 | | | | | | 0.0 | | |
| 1,576,164 (5) | | | Ginnie Mae Series 2011-101 BI, 0.650%, (-1.000*US0001M + 6.650)%, 11/20/2037 | | | | | 35,280 | | | | | | 0.0 | | |
| 1,991,697 (5) | | | Ginnie Mae Series 2011-124 KI, 4.000%, 08/20/2039 | | | | | 123,557 | | | | | | 0.0 | | |
| Voya Strategic Income | PORTFOLIO OF INVESTMENTS |
| Opportunities Fund | as of March 31, 2022 (continued) |
| Principal Amount† | | | Value | | | Percentage of Net Assets | | |||||||||
| COLLATERALIZED MORTGAGE OBLIGATIONS: (continued) | | |||||||||||||||
| 4,567,682 (5) | | | Ginnie Mae Series 2011-25 AS, 5.611%, (-1.000*US0001M + 6.060)%, 02/20/2041 | | | | $ | 633,273 | | | | | | 0.0 | | |
| 2,157,993 (5) | | | Ginnie Mae Series 2012-148 IP, 3.500%, 04/20/2041 | | | | | 115,207 | | | | | | 0.0 | | |
| 18,697 (5) | | | Ginnie Mae Series 2012-149 BI, 3.500%, 10/20/2041 | | | | | 1,741 | | | | | | 0.0 | | |
| 2,269,730 (5) | | | Ginnie Mae Series 2012-39 PI, 4.000%, 03/16/2042 | | | | | 250,572 | | | | | | 0.0 | | |
| 1,867,971 (5) | | | Ginnie Mae Series 2013-103 DS, 5.701%, (-1.000*US0001M + 6.150)%, 07/20/2043 | | | | | 270,249 | | | | | | 0.0 | | |
| 80,454 (5) | | | Ginnie Mae Series 2013-134 DS, 5.651%, (-1.000*US0001M + 6.100)%, 09/20/2043 | | | | | 11,452 | | | | | | 0.0 | | |
| 211,866 (5) | | | Ginnie Mae Series 2013-44 LI, 4.500%, 01/16/2043 | | | | | 27,421 | | | | | | 0.0 | | |
| 957,145 (5) | | | Ginnie Mae Series 2013-81 IO, 4.500%, 01/16/2040 | | | | | 79,956 | | | | | | 0.0 | | |
| 2,414,491 (5) | | | Ginnie Mae Series 2014-84 PI, 4.500%, 04/20/2043 | | | | | 253,975 | | | | | | 0.0 | | |
| 2,215,967 (5) | | | Ginnie Mae Series 2015-132 BI, 4.000%, 11/20/2044 | | | | | 259,023 | | | | | | 0.0 | | |
| 18,037,651 (5) | | | Ginnie Mae Series 2015-144 SA, 5.751%, (-1.000*US0001M + 6.200)%, 10/20/2045 | | | | | 3,021,390 | | | | | | 0.1 | | |
| 3,336,437 (5) | | | Ginnie Mae Series 2015-69 IL, 0.200%, (-1.000*US0001M + 6.700)%, 07/20/2034 | | | | | 22,699 | | | | | | 0.0 | | |
| 216,919 (5) | | | Ginnie Mae Series 2015-98 IU, 4.000%, 08/20/2044 | | | | | 28,148 | | | | | | 0.0 | | |
| 7,089,527 (5) | | | Ginnie Mae Series 2016-66 ES, 5.601%, (-1.000*US0001M + 6.050)%, 05/20/2046 | | | | | 1,088,476 | | | | | | 0.1 | | |
| 500,977 (5) | | | Ginnie Mae Series 2016-8 PI, 4.000%, 10/20/2044 | | | | | 55,332 | | | | | | 0.0 | | |
| 6,704,414 (5) | | | Ginnie Mae Series 2018-153 SQ, 5.751%, (-1.000*US0001M + 6.200)%, 11/20/2048 | | | | | 995,346 | | | | | | 0.0 | | |
| 17,318,080 (5) | | | Ginnie Mae Series 2018-93 SJ, 5.751%, (-1.000*US0001M + 6.200)%, 07/20/2048 | | | | | 2,441,889 | | | | | | 0.1 | | |
| Principal Amount† | | | Value | | | Percentage of Net Assets | | |||||||||
| COLLATERALIZED MORTGAGE OBLIGATIONS: (continued) | | |||||||||||||||
| 215,001 (5) | | | Ginnie Mae Series 2019-111 TI, 5.000%, 09/20/2049 | | | | $ | 28,473 | | | | | | 0.0 | | |
| 120,861 (5) | | | Ginnie Mae Series 2019-86 GI, 6.500%, 07/20/2049 | | | | | 22,314 | | | | | | 0.0 | | |
| 512,153 (5) | | | Ginnie Mae Series 2019-86 HI, 5.500%, 07/20/2049 | | | | | 93,890 | | | | | | 0.0 | | |
| 13,593,618 (5) | | | Ginnie Mae Series 2019-89 SC, 5.651%, (-1.000*US0001M + 6.100)%, 07/20/2049 | | | | | 1,928,440 | | | | | | 0.1 | | |
| 317,529 (2)(4) | | | GS Mortage-Backed Securities Trust 2020-PJ1 A1, 3.500%, 05/25/2050 | | | | | 315,703 | | | | | | 0.0 | | |
| 504,311 (2)(4) | | | GS Mortage-Backed Securities Trust 2020-PJ1 A4, 3.500%, 05/25/2050 | | | | | 501,410 | | | | | | 0.0 | | |
| 1,270,180 (2)(4) | | | GS Mortage-Backed Securities Trust 2020-PJ1 A8, 3.500%, 05/25/2050 | | | | | 1,262,874 | | | | | | 0.1 | | |
| 2,364,448 (2)(4) | | | GS Mortage-Backed Securities Trust 2020-PJ1 B2, 3.669%, 05/25/2050 | | | | | 2,291,526 | | | | | | 0.1 | | |
| 3,694,777 (2)(4) | | | GS Mortage-Backed Securities Trust 2020-PJ1 B3, 3.669%, 05/25/2050 | | | | | 3,504,075 | | | | | | 0.1 | | |
| 1,737,018 (2)(4) | | | GS Mortgage-Backed Securities Corp. Trust 2019-PJ1 B3, 4.300%, 08/25/2049 | | | | | 1,735,075 | | | | | | 0.1 | | |
| 124,305 (2)(4) | | | GS Mortgage-Backed Securities Corp. Trust 2019-PJ2 A1, 4.000%, 11/25/2049 | | | | | 124,601 | | | | | | 0.0 | | |
| 3,788,824 (2)(4) | | | GS Mortgage-Backed Securities Corp. Trust 2019-PJ2 B2, 4.374%, 11/25/2049 | | | | | 3,757,116 | | | | | | 0.2 | | |
| 3,877,056 (2)(4) | | | GS Mortgage-Backed Securities Corp. Trust 2019-PJ2 B3, 4.374%, 11/25/2049 | | | | | 3,812,159 | | | | | | 0.2 | | |
| 464,311 (2)(4) | | | GS Mortgage-Backed Securities Corp. Trust 2019-PJ3 B1, 3.986%, 03/25/2050 | | | | | 459,287 | | | | | | 0.0 | | |
| 473,226 (2)(4) | | | GS Mortgage-Backed Securities Corp. Trust 2019-PJ3 B2, 3.986%, 03/25/2050 | | | | | 466,407 | | | | | | 0.0 | | |
| Voya Strategic Income | PORTFOLIO OF INVESTMENTS |
| Opportunities Fund | as of March 31, 2022 (continued) |
| Principal Amount† | | | Value | | | Percentage of Net Assets | | |||||||||
| COLLATERALIZED MORTGAGE OBLIGATIONS: (continued) | | |||||||||||||||
| 1,793,087 (2)(4) | | | GS Mortgage-Backed Securities Corp. Trust 2020-PJ3 B4, 3.434%, 10/25/2050 | | | | $ | 1,616,587 | | | | | | 0.1 | | |
| 1,710,131 (2)(4) | | | GS Mortgage-Backed Securities Corp. Trust 2021-PJ3 B3, 2.652%, 08/25/2051 | | | | | 1,510,409 | | | | | | 0.1 | | |
| 3,909,046 (2)(4) | | | GS Mortgage-Backed Securities Corp. Trust 2021-PJ4 B3, 2.620%, 09/25/2051 | | | | | 3,481,869 | | | | | | 0.1 | | |
| 5,062,757 (2)(4) | | | GS Mortgage-Backed Securities Corp. Trust 2021-PJ5 B3, 2.591%, 10/25/2051 | | | | | 4,470,380 | | | | | | 0.2 | | |
| 993,600 (2)(4) | | | GS Mortgage-Backed Securities Trust 2021-GR3 B3, 3.395%, 04/25/2052 | | | | | 894,558 | | | | | | 0.0 | | |
| 993,600 (2)(4) | | | GS Mortgage-Backed Securities Trust 2021-GR3 B4, 3.395%, 04/25/2052 | | | | | 849,670 | | | | | | 0.0 | | |
| 2,720,496 (2)(4) | | | GS Mortgage-Backed Securities Trust 2021-PJ9 A4, 2.500%, 02/26/2052 | | | | | 2,493,856 | | | | | | 0.1 | | |
| 2,914,861 (2)(4) | | | GS Mortgage-Backed Securities Trust 2022-NQM1 A4, 4.000%, 05/25/2062 | | | | | 2,906,240 | | | | | | 0.1 | | |
| 346,147 | | | HarborView Mortgage Loan Trust 2006-14 2A1A, 0.599%, (US0001M + 0.150)%, 01/25/2047 | | | | | 322,237 | | | | | | 0.0 | | |
| 386,115 | | | HarborView Mortgage Loan Trust 2007-5 A1A, 0.639%, (US0001M + 0.190)%, 09/19/2037 | | | | | 373,833 | | | | | | 0.0 | | |
| 4,769,000 (2) | | | Home RE 2019-1 M2 Ltd., 3.707%, (US0001M + 3.250)%, 05/25/2029 | | | | | 4,794,999 | | | | | | 0.2 | | |
| 1,534 | | | HomeBanc Mortgage Trust 2004-1 2A, 1.317%, (US0001M + 0.860)%, 08/25/2029 | | | | | 1,514 | | | | | | 0.0 | | |
| 2,600,000 (2)(4) | | | Imperial Fund Mortgage Trust 2021-NQM4 M1, 3.446%, 01/25/2057 | | | | | 2,375,156 | | | | | | 0.1 | | |
| 60,169 | | | IndyMac INDX Mortgage Loan Trust 2006-AR2 1A1B, 0.877%, (US0001M + 0.420)%, 04/25/2046 | | | | | 56,703 | | | | | | 0.0 | | |
| Principal Amount† | | | Value | | | Percentage of Net Assets | | |||||||||
| COLLATERALIZED MORTGAGE OBLIGATIONS: (continued) | | |||||||||||||||
| 134,659 (2)(4) | | | J.P. Morgan Mortgage Trust 2019-2 A3, 4.000%, 08/25/2049 | | | | $ | 135,120 | | | | | | 0.0 | | |
| 1,071,351 (2)(4) | | | J.P. Morgan Mortgage Trust 2019-2 B1, 4.491%, 08/25/2049 | | | | | 1,063,861 | | | | | | 0.1 | | |
| 2,595,785 (2)(4) | | | J.P. Morgan Mortgage Trust 2019-2 B2, 4.491%, 08/25/2049 | | | | | 2,568,092 | | | | | | 0.1 | | |
| 8,072 (2)(4) | | | J.P. Morgan Mortgage Trust 2019-LTV1 A3, 4.000%, 06/25/2049 | | | | | 8,068 | | | | | | 0.0 | | |
| 1,796,832 (2)(4) | | | J.P. Morgan Mortgage Trust 2019-LTV1 B2, 4.617%, 06/25/2049 | | | | | 1,773,102 | | | | | | 0.1 | | |
| 2,483,037 (2)(4) | | | J.P. Morgan Mortgage Trust 2021-14 B4, 3.170%, 05/25/2052 | | | | | 2,105,523 | | | | | | 0.1 | | |
| 1,745,682 (4) | | | JP Morgan Mortgage Trust 2005-A4 B1, 2.569%, 07/25/2035 | | | | | 1,723,161 | | | | | | 0.1 | | |
| 74,569 | | | JP Morgan Mortgage Trust 2005-S3 1A10, 6.000%, 01/25/2036 | | | | | 47,545 | | | | | | 0.0 | | |
| 159,443 | | | JP Morgan Mortgage Trust 2006-S2 1A18, 6.000%, 07/25/2036 | | | | | 110,414 | | | | | | 0.0 | | |
| 396,014 | | | JP Morgan Mortgage Trust 2006-S3 1A30, 6.500%, 08/25/2036 | | | | | 202,710 | | | | | | 0.0 | | |
| 784,352 (2)(4) | | | JP Morgan Mortgage Trust 2014-5 B3, 2.858%, 10/25/2029 | | | | | 727,117 | | | | | | 0.0 | | |
| 508,848 (2)(4) | | | JP Morgan Mortgage Trust 2016-1 B3, 3.818%, 05/25/2046 | | | | | 502,456 | | | | | | 0.0 | | |
| 2,095,000 (2)(4) | | | JP Morgan Mortgage Trust 2016-1 B4, 3.818%, 05/25/2046 | | | | | 2,059,573 | | | | | | 0.1 | | |
| 435,390 (2)(4) | | | JP Morgan Mortgage Trust 2016-4 A13, 3.500%, 10/25/2046 | | | | | 427,675 | | | | | | 0.0 | | |
| 876,300 (2)(4) | | | JP Morgan Mortgage Trust 2017-1 B4, 3.460%, 01/25/2047 | | | | | 849,696 | | | | | | 0.0 | | |
| 1,414,638 (2)(4) | | | JP Morgan Mortgage Trust 2017-3 B1, 3.769%, 08/25/2047 | | | | | 1,399,865 | | | | | | 0.1 | | |
| Voya Strategic Income | PORTFOLIO OF INVESTMENTS |
| Opportunities Fund | as of March 31, 2022 (continued) |
| Principal Amount† | | | Value | | | Percentage of Net Assets | | |||||||||
| COLLATERALIZED MORTGAGE OBLIGATIONS: (continued) | | |||||||||||||||
| 1,047,880 (2)(4) | | | JP Morgan Mortgage Trust 2017-3 B2, 3.769%, 08/25/2047 | | | | $ | 1,034,057 | | | | | | 0.0 | | |
| 1,897,154 (2)(4) | | | JP Morgan Mortgage Trust 2017-5 B1, 3.050%, 10/26/2048 | | | | | 1,897,275 | | | | | | 0.1 | | |
| 545,767 (2)(4) | | | JP Morgan Mortgage Trust 2017-6 B3, 3.786%, 12/25/2048 | | | | | 532,374 | | | | | | 0.0 | | |
| 1,534,513 (2)(4) | | | JP Morgan Mortgage Trust 2017-6 B4, 3.786%, 12/25/2048 | | | | | 1,483,319 | | | | | | 0.1 | | |
| 1,047,325 (2)(4) | | | JP Morgan Mortgage Trust 2017-6 B5, 3.786%, 12/25/2048 | | | | | 964,006 | | | | | | 0.0 | | |
| 2,235,434 (2)(4) | | | JP Morgan Mortgage Trust 2018-1 B2, 3.665%, 06/25/2048 | | | | | 2,182,601 | | | | | | 0.1 | | |
| 3,646,056 (2)(4) | | | JP Morgan Mortgage Trust 2018-3 B1, 3.725%, 09/25/2048 | | | | | 3,582,964 | | | | | | 0.2 | | |
| 2,278,785 (2)(4) | | | JP Morgan Mortgage Trust 2018-3 B3, 3.725%, 09/25/2048 | | | | | 2,243,176 | | | | | | 0.1 | | |
| 457,542 (2)(4) | | | JP Morgan Mortgage Trust 2018-4 B1, 3.726%, 10/25/2048 | | | | | 449,100 | | | | | | 0.0 | | |
| 457,542 (2)(4) | | | JP Morgan Mortgage Trust 2018-4 B2, 3.726%, 10/25/2048 | | | | | 447,301 | | | | | | 0.0 | | |
| 1,850,683 (2)(4) | | | JP Morgan Mortgage Trust 2018-5 A13, 3.500%, 10/25/2048 | | | | | 1,798,223 | | | | | | 0.1 | | |
| 134,388 (2)(4) | | | JP Morgan Mortgage Trust 2018-6 1A10, 3.500%, 12/25/2048 | | | | | 134,265 | | | | | | 0.0 | | |
| 264,961 (2)(4) | | | JP Morgan Mortgage Trust 2018-8 A3, 4.000%, 01/25/2049 | | | | | 265,604 | | | | | | 0.0 | | |
| 7,963,048 (2)(4) | | | JP Morgan Mortgage Trust 2018-8 B1, 4.108%, 01/25/2049 | | | | | 7,906,732 | | | | | | 0.3 | | |
| 3,711,079 (2)(4) | | | JP Morgan Mortgage Trust 2018-8 B2, 4.108%, 01/25/2049 | | | | | 3,675,661 | | | | | | 0.2 | | |
| 939,857 (2)(4) | | | JP Morgan Mortgage Trust 2018-9 B2, 4.263%, 02/25/2049 | | | | | 905,780 | | | | | | 0.0 | | |
| 1,857,552 (2)(4) | | | JP Morgan Mortgage Trust 2018-9 B3, 4.263%, 02/25/2049 | | | | | 1,785,250 | | | | | | 0.1 | | |
| Principal Amount† | | | Value | | | Percentage of Net Assets | | |||||||||
| COLLATERALIZED MORTGAGE OBLIGATIONS: (continued) | | |||||||||||||||
| 313,332 (2)(4) | | | JP Morgan Mortgage Trust 2019-1 A3, 4.000%, 05/25/2049 | | | | $ | 314,328 | | | | | | 0.0 | | |
| 141,476 (2)(4) | | | JP Morgan Mortgage Trust 2019-3 A3, 4.000%, 09/25/2049 | | | | | 141,704 | | | | | | 0.0 | | |
| 772,847 (2)(4) | | | JP Morgan Mortgage Trust 2019-5 A3, 4.000%, 11/25/2049 | | | | | 774,375 | | | | | | 0.0 | | |
| 2,848,356 (2)(4) | | | JP Morgan Mortgage Trust 2019-5 B1, 4.482%, 11/25/2049 | | | | | 2,851,019 | | | | | | 0.1 | | |
| 4,752,801 (2)(4) | | | JP Morgan Mortgage Trust 2019-5 B2, 4.482%, 11/25/2049 | | | | | 4,752,733 | | | | | | 0.2 | | |
| 167,313 (2)(4) | | | JP Morgan Mortgage Trust 2019-6 A3, 3.500%, 12/25/2049 | | | | | 167,356 | | | | | | 0.0 | | |
| 2,853,654 (2)(4) | | | JP Morgan Mortgage Trust 2019-6 B1, 4.256%, 12/25/2049 | | | | | 2,797,272 | | | | | | 0.1 | | |
| 6,182,917 (2)(4) | | | JP Morgan Mortgage Trust 2019-6 B2, 4.256%, 12/25/2049 | | | | | 6,191,253 | | | | | | 0.3 | | |
| 944,070 (2)(4) | | | JP Morgan Mortgage Trust 2019-7 B3A, 3.260%, 02/25/2050 | | | | | 903,149 | | | | | | 0.0 | | |
| 580,056 (2)(4) | | | JP Morgan Mortgage Trust 2019-8 A15, 3.500%, 03/25/2050 | | | | | 579,555 | | | | | | 0.0 | | |
| 954,863 (2)(4) | | | JP Morgan Mortgage Trust 2019-8 B3A, 3.438%, 03/25/2050 | | | | | 924,493 | | | | | | 0.0 | | |
| 3,796,616 (2)(4) | | | JP Morgan Mortgage Trust 2019-INV1 B2, 5.015%, 10/25/2049 | | | | | 3,784,008 | | | | | | 0.2 | | |
| 356,211 (2)(4) | | | JP Morgan Mortgage Trust 2019-INV2 A15, 3.500%, 02/25/2050 | | | | | 355,672 | | | | | | 0.0 | | |
| 4,034,061 (2)(4) | | | JP Morgan Mortgage Trust 2019-INV3 B3, 4.409%, 05/25/2050 | | | | | 3,916,669 | | | | | | 0.2 | | |
| 236,126 (2)(4) | | | JP Morgan Mortgage Trust 2019-LTV2 A18, 4.000%, 12/25/2049 | | | | | 236,231 | | | | | | 0.0 | | |
| 1,878,557 (2)(4) | | | JP Morgan Mortgage Trust 2019-LTV2 B2, 4.745%, 12/25/2049 | | | | | 1,869,296 | | | | | | 0.1 | | |
| 1,904,265 (2)(4) | | | JP Morgan Mortgage Trust 2019-LTV2 B3, 4.745%, 12/25/2049 | | | | | 1,893,468 | | | | | | 0.1 | | |
| Voya Strategic Income | PORTFOLIO OF INVESTMENTS |
| Opportunities Fund | as of March 31, 2022 (continued) |
| Principal Amount† | | | Value | | | Percentage of Net Assets | | |||||||||
| COLLATERALIZED MORTGAGE OBLIGATIONS: (continued) | | |||||||||||||||
| 2,679,635 (2)(4) | | | JP Morgan Mortgage Trust 2019-LTV3 B2, 4.459%, 03/25/2050 | | | | $ | 2,632,177 | | | | | | 0.1 | | |
| 6,237,288 (2)(4) | | | JP Morgan Mortgage Trust 2019-LTV3 B3, 4.459%, 03/25/2050 | | | | | 6,119,352 | | | | | | 0.3 | | |
| 358,584 (2)(4) | | | JP Morgan Mortgage Trust 2020-2 A15, 3.500%, 07/25/2050 | | | | | 355,791 | | | | | | 0.0 | | |
| 2,993,896 (2)(4) | | | JP Morgan Mortgage Trust 2020-3 B2, 3.866%, 08/25/2050 | | | | | 2,846,129 | | | | | | 0.1 | | |
| 4,819,690 (2)(4) | | | JP Morgan Mortgage Trust 2020-4 B1, 3.680%, 11/25/2050 | | | | | 4,608,907 | | | | | | 0.2 | | |
| 1,735,088 (2)(4) | | | JP Morgan Mortgage Trust 2020-4 B2, 3.680%, 11/25/2050 | | | | | 1,655,051 | | | | | | 0.1 | | |
| 295,965 (2)(4) | | | JP Morgan Mortgage Trust 2020-LTV1 A15, 3.500%, 06/25/2050 | | | | | 296,299 | | | | | | 0.0 | | |
| 1,528,957 (2)(4) | | | JP Morgan Mortgage Trust 2020-LTV1 A5, 3.500%, 06/25/2050 | | | | | 1,530,680 | | | | | | 0.1 | | |
| 2,530,886 (2)(4) | | | JP Morgan Mortgage Trust 2022-2 B3, 3.138%, 08/25/2052 | | | | | 2,182,977 | | | | | | 0.1 | | |
| 680,931 (2)(4) | | | JP Morgan Trust 2015-3 B3, 3.598%, 05/25/2045 | | | | | 672,356 | | | | | | 0.0 | | |
| 1,327,529 (2)(4) | | | JP Morgan Trust 2015-3 B4, 3.598%, 05/25/2045 | | | | | 1,319,277 | | | | | | 0.1 | | |
| 1,460,564,398 (2)(5) | | | L Street Securities 2017-PM1 XIO, 0.010%, 10/25/2048 | | | | | 1,647,517 | | | | | | 0.1 | | |
| 74,310 | | | Lehman XS Trust Series 2005-5N 1A2, 0.817%, (US0001M + 0.360)%, 11/25/2035 | | | | | 72,066 | | | | | | 0.0 | | |
| 1,867,439 (2)(4) | | | Mello Mortgage Capital Acceptance 2021-MTG3 B3, 2.909%, 07/01/2051 | | | | | 1,632,061 | | | | | | 0.1 | | |
| 2,863,568 (2)(4) | | | Mello Mortgage Capital Acceptance 2022-INV1 B3, 3.329%, 03/25/2052 | | | | | 2,530,836 | | | | | | 0.1 | | |
| 2,000,000 (2)(4) | | | MFA 2021-INV2 M1 Trust, 3.199%, 11/25/2056 | | | | | 1,827,838 | | | | | | 0.1 | | |
| 655,000 | | | Morgan Stanley Mortgage Loan Trust 2005-5AR 1B1, 2.257%, (US0001M + 1.800)%, 09/25/2035 | | | | | 666,192 | | | | | | 0.0 | | |
| Principal Amount† | | | Value | | | Percentage of Net Assets | | |||||||||
| COLLATERALIZED MORTGAGE OBLIGATIONS: (continued) | | |||||||||||||||
| 1,069,326 | | | Morgan Stanley Mortgage Loan Trust 2006-9AR A2, 0.757%, (US0001M + 0.150)%, 08/25/2036 | | | | $ | 383,877 | | | | | | 0.0 | | |
| 6,000,000 (2) | | | Mortgage Insurance-Linked Notes 2021-3 M1B, 2.999%, (SOFR30A + 2.900)%, 02/25/2034 | | | | | 5,802,671 | | | | | | 0.2 | | |
| 371,762 (2)(4) | | | New Residential Mortgage Loan Trust 2017-3A B2, 4.750%, 04/25/2057 | | | | | 371,801 | | | | | | 0.0 | | |
| 1,300,000 (2) | | | Oaktown Re VII Ltd. 2021-2 M1C, 3.449%, (SOFR30A + 3.350)%, 04/25/2034 | | | | | 1,252,549 | | | | | | 0.1 | | |
| 371,179 (2)(4) | | | OBX 2019-EXP3 1A9 Trust, 3.500%, 10/25/2059 | | | | | 366,673 | | | | | | 0.0 | | |
| 502,239 (2)(4) | | | OBX 2019-INV2 A25 Trust, 4.000%, 05/27/2049 | | | | | 501,094 | | | | | | 0.0 | | |
| 348,736 (2)(4) | | | OBX 2020-INV1 A21 Trust, 3.500%, 12/25/2049 | | | | | 346,943 | | | | | | 0.0 | | |
| 2,257,824 (2)(4) | | | Oceanview Mortgage Trust 2021-1 B3, 2.733%, 05/25/2051 | | | | | 1,965,869 | | | | | | 0.1 | | |
| 20,421 | | | Prime Mortgage Trust 2007-1 A4, 5.500%, 03/25/2037 | | | | | 18,729 | | | | | | 0.0 | | |
| 212,378 (2)(4) | | | PSMC 2019-3 A12 Trust, 3.500%, 11/25/2049 | | | | | 212,667 | | | | | | 0.0 | | |
| 6,856,000 (2) | | | Radnor RE 2021-1 M1C Ltd., 2.799%, (SOFR30A + 2.700)%, 12/27/2033 | | | | | 6,467,534 | | | | | | 0.3 | | |
| 3,653,479 (2)(4) | | | RCKT Mortgage Trust 2019-1 B1A, 3.834%, 09/25/2049 | | | | | 3,591,609 | | | | | | 0.2 | | |
| 2,372,106 (2)(4) | | | RCKT Mortgage Trust 2019-1 B2A, 3.834%, 09/25/2049 | | | | | 2,321,874 | | | | | | 0.1 | | |
| 1,597,669 (2)(4) | | | RCKT Mortgage Trust 2020-1 B2A, 3.488%, 02/25/2050 | | | | | 1,528,796 | | | | | | 0.1 | | |
| 2,742,300 (2)(4) | | | RCKT Mortgage Trust 2021-4 A21, 2.500%, 09/25/2051 | | | | | 2,518,050 | | | | | | 0.1 | | |
| 5,559,335 (2)(4) | | | RCKT Mortgage Trust 2021-6 B3, 2.795%, 12/25/2051 | | | | | 4,740,218 | | | | | | 0.2 | | |
| 1,017,115 (2) | | | Sequoia Mortgage Trust 2013-9 B2, 3.500%, 07/25/2043 | | | | | 1,013,455 | | | | | | 0.0 | | |
| Voya Strategic Income | PORTFOLIO OF INVESTMENTS |
| Opportunities Fund | as of March 31, 2022 (continued) |
| Principal Amount† | | | Value | | | Percentage of Net Assets | | |||||||||
| COLLATERALIZED MORTGAGE OBLIGATIONS: (continued) | | |||||||||||||||
| 671,489 (2)(4) | | | Sequoia Mortgage Trust 2015-1 B1, 3.916%, 01/25/2045 | | | | $ | 667,572 | | | | | | 0.0 | | |
| 1,486,886 (2)(4) | | | Sequoia Mortgage Trust 2017-1 B2, 3.612%, 02/25/2047 | | | | | 1,447,582 | | | | | | 0.1 | | |
| 1,143,939 (2)(4) | | | Sequoia Mortgage Trust 2018-6 B1, 4.176%, 07/25/2048 | | | | | 1,128,051 | | | | | | 0.1 | | |
| 549,996 (2)(4) | | | Sequoia Mortgage Trust 2018-CH1 B2B, 4.472%, 03/25/2048 | | | | | 531,895 | | | | | | 0.0 | | |
| 1,678,753 (2)(4) | | | Sequoia Mortgage Trust 2019-2 B2, 4.262%, 06/25/2049 | | | | | 1,634,126 | | | | | | 0.1 | | |
| 1,587,410 (2)(4) | | | Sequoia Mortgage Trust 2019-2 B3, 4.262%, 06/25/2049 | | | | | 1,535,190 | | | | | | 0.1 | | |
| 2,055,880 (2)(4) | | | Sequoia Mortgage Trust 2019-5 B2, 3.738%, 12/25/2049 | | | | | 1,983,208 | | | | | | 0.1 | | |
| 2,056,825 (2)(4) | | | Sequoia Mortgage Trust 2019-5 B3, 3.738%, 12/25/2049 | | | | | 1,979,327 | | | | | | 0.1 | | |
| 946,641 (2)(4) | | | Sequoia Mortgage Trust 2019-CH1 B2B, 4.914%, 03/25/2049 | | | | | 945,400 | | | | | | 0.0 | | |
| 288,654 (2)(4) | | | Sequoia Mortgage Trust 2019-CH2 A1, 4.500%, 08/25/2049 | | | | | 290,062 | | | | | | 0.0 | | |
| 300,542 (2)(4) | | | Sequoia Mortgage Trust 2019-CH3 A13, 4.000%, 09/25/2049 | | | | | 301,939 | | | | | | 0.0 | | |
| 1,908,039 (2)(4) | | | Sequoia Mortgage Trust 2019-CH3 B1B, 4.529%, 09/25/2049 | | | | | 1,852,829 | | | | | | 0.1 | | |
| 227,153 (2)(4) | | | Sequoia Mortgage Trust 2020-1 A1, 3.500%, 02/25/2050 | | | | | 224,238 | | | | | | 0.0 | | |
| 1,452,042 (2)(4) | | | Sequoia Mortgage Trust 2020-2 B3, 3.662%, 03/25/2050 | | | | | 1,391,065 | | | | | | 0.1 | | |
| 568,063 (2)(4) | | | Sequoia Mortgage Trust 2021-3 B3, 2.654%, 05/25/2051 | | | | | 498,949 | | | | | | 0.0 | | |
| 1,233,549 (2)(4) | | | Sequoia Mortgage Trust 2021-5 B3, 3.054%, 07/25/2051 | | | | | 1,097,498 | | | | | | 0.1 | | |
| 1,118,373 (2)(4) | | | Sequoia Mortgage Trust 2022-1 B3, 2.949%, 02/25/2052 | | | | | 990,176 | | | | | | 0.0 | | |
| Principal Amount† | | | Value | | | Percentage of Net Assets | | |||||||||
| COLLATERALIZED MORTGAGE OBLIGATIONS: (continued) | | |||||||||||||||
| 2,271,402 (2)(4) | | | Shellpoint Co-Originator Trust 2017-2 B2, 3.665%, 10/25/2047 | | | | $ | 2,275,101 | | | | | | 0.1 | | |
| 3,011,158 (2)(4) | | | Shellpoint Co-Originator Trust 2017-2 B3, 3.665%, 10/25/2047 | | | | | 3,009,376 | | | | | | 0.1 | | |
| 2,000,000 (2)(4) | | | Starwood Mortgage Residential Trust 2022-2 M1, 4.200%, 02/25/2067 | | | | | 1,971,876 | | | | | | 0.1 | | |
| 42,604 (4) | | | Structured Adjustable Rate Mortgage Loan Trust 2005-4 3A1, 2.493%, 03/25/2035 | | | | | 41,654 | | | | | | 0.0 | | |
| 2,524,164 (2)(4) | | | UWM Mortgage Trust 2021-INV4 B3, 3.234%, 12/25/2051 | | | | | 2,263,448 | | | | | | 0.1 | | |
| 65,906 (4) | | | WaMu Mortgage Pass Through Certificates Series 2006-AR12 2A3, 2.469%, 10/25/2036 | | | | | 63,792 | | | | | | 0.0 | | |
| 148,412 (4) | | | WaMu Mortgage Pass-Through Certificates Series 2004-AR4 A6 Trust, 2.636%, 06/25/2034 | | | | | 148,901 | | | | | | 0.0 | | |
| 997,636 (4) | | | WaMu Mortgage Pass-Through Certificates Series 2004-AR7 A6, 2.553%, 07/25/2034 | | | | | 1,000,871 | | | | | | 0.0 | | |
| 76,309,302 (4)(5) | | | WaMu Mortgage Pass-Through Certificates Series 2005-AR1 X Trust, 1.678%, 01/25/2045 | | | | | 276,453 | | | | | | 0.0 | | |
| 156,164 (4) | | | WaMu Mortgage Pass-Through Certificates Series 2005-AR10 1A3, 2.943%, 09/25/2035 | | | | | 154,924 | | | | | | 0.0 | | |
| 28,678,317 (4)(5) | | | WaMu Mortgage Pass-Through Certificates Series 2005-AR2 X Trust, 1.883%, 01/25/2045 | | | | | 660,877 | | | | | | 0.0 | | |
| 13,131 (4) | | | WaMu Mortgage Pass-Through Certificates Series 2006-AR12 1A1, 2.987%, 10/25/2036 | | | | | 13,053 | | | | | | 0.0 | | |
| 84,686 (4) | | | WaMu Mortgage Pass-Through Certificates Series 2006-AR14 1A3, 2.567%, 11/25/2036 | | | | | 82,340 | | | | | | 0.0 | | |
| 325,456 (4) | | | WaMu Mortgage Pass-Through Certificates Series 2006-AR14 1A4, 2.567%, 11/25/2036 | | | | | 316,441 | | | | | | 0.0 | | |
| Voya Strategic Income | PORTFOLIO OF INVESTMENTS |
| Opportunities Fund | as of March 31, 2022 (continued) |
| Principal Amount† | | | Value | | | Percentage of Net Assets | | |||||||||
| COLLATERALIZED MORTGAGE OBLIGATIONS: (continued) | | |||||||||||||||
| 44,492 (4) | | | WaMu Mortgage Pass-Through Certificates Series 2006-AR8 1A4, 2.854%, 08/25/2046 | | | | $ | 43,724 | | | | | | 0.0 | | |
| 77,430 (4) | | | WaMu Mortgage Pass-Through Certificates Series 2007-HY2 1A1, 3.030%, 12/25/2036 | | | | | 76,444 | | | | | | 0.0 | | |
| 402,273 (4) | | | WaMu Mortgage Pass-Through Certificates Series 2007-HY3 1A1, 2.921%, 03/25/2037 | | | | | 371,662 | | | | | | 0.0 | | |
| 8,574 (4) | | | WaMu Mortgage Pass-Through Certificates Series 2007-HY4 1A1, 2.714%, 04/25/2037 | | | | | 8,422 | | | | | | 0.0 | | |
| 50,896 (4) | | | WaMu Mortgage Pass-Through Certificates Series 2007-HY7 2A2, 2.950%, 07/25/2037 | | | | | 50,591 | | | | | | 0.0 | | |
| 497,220 | | | Washington Mutual Mortgage Pass-Through Certificates WMALT Series 2005-10 2A3, 1.357%, (US0001M + 0.900)%, 11/25/2035 | | | | | 466,695 | | | | | | 0.0 | | |
| 527,230 | | | Washington Mutual Mortgage Pass-Through Certificates WMALT Series 2005-10 2A9, 6.000%, 11/25/2035 | | | | | 527,194 | | | | | | 0.0 | | |
| 447,348 | | | Washington Mutual Mortgage Pass-Through Certificates WMALT Series 2005-11 A1, 5.750%, 01/25/2036 | | | | | 411,238 | | | | | | 0.0 | | |
| 594,573 | | | Washington Mutual Mortgage Pass-Through Certificates WMALT Series 2005-5 CB3, 5.500%, 07/25/2035 | | | | | 581,043 | | | | | | 0.0 | | |
| 106,463 | | | Washington Mutual Mortgage Pass-Through Certificates WMALT Series 2005-8 1A2, 5.500%, 10/25/2035 | | | | | 105,218 | | | | | | 0.0 | | |
| 666,576 | | | Washington Mutual Mortgage Pass-Through Certificates WMALT Series 2006-5 2CB2, 1.057%, (US0001M + 0.600)%, 07/25/2036 | | | | | 380,373 | | | | | | 0.0 | | |
| Principal Amount† | | | Value | | | Percentage of Net Assets | | |||||||||
| COLLATERALIZED MORTGAGE OBLIGATIONS: (continued) | | |||||||||||||||
| 1,723,157 | | | Washington Mutual Mortgage Pass-Through Certificates WMALT Series 2006-AR5 3A Trust, 1.081%, (12MTA + 0.940)%, 07/25/2046 | | | | $ | 1,158,665 | | | | | | 0.1 | | |
| 713,252 | | | Washington Mutual Mortgage Pass-Through Certificates WMALT Series 2006-AR6 2A, 1.101%, (12MTA + 0.960)%, 08/25/2046 | | | | | 490,073 | | | | | | 0.0 | | |
| 26,593 | | | Wells Fargo Alternative Loan 2007-PA2 2A1, 0.887%, (US0001M + 0.430)%, 06/25/2037 | | | | | 21,599 | | | | | | 0.0 | | |
| 510,595 (4) | | | Wells Fargo Mortgage Backed Securities 2006-AR12 1A1, 2.244%, 09/25/2036 | | | | | 487,026 | | | | | | 0.0 | | |
| 106,523 (4) | | | Wells Fargo Mortgage Backed Securities 2007-AR7 A1, 2.868%, 12/28/2037 | | | | | 105,050 | | | | | | 0.0 | | |
| 1,368,048 (2)(4) | | | Wells Fargo Mortgage Backed Securities 2018-1 B3, 3.681%, 07/25/2047 | | | | | 1,319,499 | | | | | | 0.1 | | |
| 1,536,957 (2)(4) | | | Wells Fargo Mortgage Backed Securities 2019-4 B3 Trust, 3.523%, 09/25/2049 | | | | | 1,449,220 | | | | | | 0.1 | | |
| 1,944,019 (2)(4) | | | Wells Fargo Mortgage Backed Securities 2020-1 B3 Trust, 3.377%, 12/25/2049 | | | | | 1,797,512 | | | | | | 0.1 | | |
| 2,880,215 (2)(4) | | | Wells Fargo Mortgage Backed Securities 2020-4 B2 Trust, 3.179%, 07/25/2050 | | | | | 2,668,867 | | | | | | 0.1 | | |
| 1,988,586 (2)(4) | | | Wells Fargo Mortgage Backed Securities 2021-1 B3 Trust, 2.720%, 12/25/2050 | | | | | 1,692,441 | | | | | | 0.1 | | |
| 437,284 (2)(4) | | | WinWater Mortgage Loan Trust 2015-5 B4, 3.762%, 08/20/2045 | | | | | 419,631 | | | | | | 0.0 | | |
| | | | Total Collateralized Mortgage Obligations (Cost $579,755,612) | | | | | 556,685,425 | | | | | | 22.6 | | |
| | ||||||||||||||||
| Voya Strategic Income | PORTFOLIO OF INVESTMENTS |
| Opportunities Fund | as of March 31, 2022 (continued) |
| Principal Amount† | | | Value | | | Percentage of Net Assets | | |||||||||
| COMMERCIAL MORTGAGE-BACKED SECURITIES: 17.2% | | |||||||||||||||
| 1,290,000 (2)(6) | | | BAMLL Re-REMIC Trust 2015-FRR11 CK25, 0.000%, 09/27/2045 | | | | $ | 1,257,897 | | | | | | 0.1 | | |
| 6,700,000 (2) | | | BANK 2017-BNK4 E, 3.357%, 05/15/2050 | | | | | 4,873,320 | | | | | | 0.2 | | |
| 5,320,000 (2)(4)(5) | | | BANK 2017-BNK4 XE, 1.453%, 05/15/2050 | | | | | 326,469 | | | | | | 0.0 | | |
| 4,380,000 (2) | | | BANK 2017-BNK6 D, 3.100%, 07/15/2060 | | | | | 3,773,016 | | | | | | 0.2 | | |
| 1,600,000 (2)(4) | | | BANK 2017-BNK6 E, 2.643%, 07/15/2060 | | | | | 1,091,869 | | | | | | 0.0 | | |
| 16,600,000 (2)(4)(5) | | | BANK 2017-BNK6 XE, 1.500%, 07/15/2060 | | | | | 1,095,401 | | | | | | 0.0 | | |
| 50,630,782 (4)(5) | | | BANK 2019-BN17 XA, 1.027%, 04/15/2052 | | | | | 2,987,955 | | | | | | 0.1 | | |
| 9,990,195 (4)(5) | | | BANK 2019-BNK16 XA, 0.944%, 02/15/2052 | | | | | 505,373 | | | | | | 0.0 | | |
| 29,136,414 (4)(5) | | | Bank 2019-BNK19 XA, 0.954%, 08/15/2061 | | | | | 1,667,617 | | | | | | 0.1 | | |
| 58,237,348 (4)(5) | | | BANK 2019-BNK22 XA, 0.598%, 11/15/2062 | | | | | 2,215,005 | | | | | | 0.1 | | |
| 4,590,000 (2) | | | BANK 2020-BNK25 D, 2.500%, 01/15/2063 | | | | | 3,657,051 | | | | | | 0.1 | | |
| 10,764,615 (4)(5) | | | BBCMS Trust 2021-C10 XA, 1.306%, 07/15/2054 | | | | | 954,995 | | | | | | 0.0 | | |
| 103,442,858 (4)(5) | | | Benchmark 2018-B7 XA Mortgage Trust, 0.434%, 05/15/2053 | | | | | 2,212,384 | | | | | | 0.1 | | |
| 52,905,891 (4)(5) | | | Benchmark 2019-B10 XA Mortgage Trust, 1.225%, 03/15/2062 | | | | | 3,354,879 | | | | | | 0.1 | | |
| 42,285,000 (2)(4)(5) | | | BENCHMARK 2019-B10 XB Mortgage Trust, 0.900%, 03/15/2062 | | | | | 2,375,948 | | | | | | 0.1 | | |
| 43,618,110 (4)(5) | | | Benchmark 2019-B12 XA Mortgage Trust, 1.061%, 08/15/2052 | | | | | 2,261,547 | | | | | | 0.1 | | |
| 1,270,000 (2) | | | Benchmark 2019-B14 D Mortgage Trust, 2.500%, 12/15/2062 | | | | | 1,001,010 | | | | | | 0.0 | | |
| 3,090,000 (2) | | | Benchmark 2019-B9 D Mortgage Trust, 3.000%, 03/15/2052 | | | | | 2,600,250 | | | | | | 0.1 | | |
| 7,330,000 (2)(4)(5) | | | Benchmark 2019-B9 XD Mortgage Trust, 2.002%, 03/15/2052 | | | | | 842,647 | | | | | | 0.0 | | |
| 2,440,000 (2) | | | Benchmark 2020-B18 AGNE Mortgage Trust, 3.759%, 07/15/2053 | | | | | 2,213,078 | | | | | | 0.1 | | |
| Principal Amount† | | | Value | | | Percentage of Net Assets | | |||||||||
| COMMERCIAL MORTGAGE-BACKED SECURITIES: (continued) | | |||||||||||||||
| 1,741,000 (2) | | | Benchmark 2020-B18 AGNF Mortgage Trust, 4.139%, 07/15/2053 | | | | $ | 1,561,025 | | | | | | 0.1 | | |
| 17,475,198 (4)(5) | | | Benchmark 2021-B24 XA Mortgage Trust, 1.154%, 03/15/2054 | | | | | 1,315,231 | | | | | | 0.1 | | |
| 9,932,753 (4)(5) | | | Benchmark 2021-B28 XA Mortgage Trust, 1.289%, 08/15/2054 | | | | | 878,871 | | | | | | 0.0 | | |
| 2,653,000 (2)(6) | | | BMD2 Re-Remic Trust 2019-FRR1 3AB, 0.000%, 05/25/2052 | | | | | 1,892,792 | | | | | | 0.1 | | |
| 8,069,000 (2)(4) | | | BMD2 Re-Remic Trust 2019-FRR1 5B13, 2.209%, 05/25/2052 | | | | | 6,418,964 | | | | | | 0.3 | | |
| 3,002,000 (2)(4) | | | BMD2 Re-Remic Trust 2019-FRR1 6B10, 2.521%, 05/25/2052 | | | | | 2,444,872 | | | | | | 0.1 | | |
| 4,500,000 (2) | | | BPR Trust 2021-WILL D, 5.397%, (US0001M + 5.000%), 06/15/2038 | | | | | 4,372,705 | | | | | | 0.2 | | |
| 3,710,000 (2)(4) | | | BX Trust 2019-OC11 E, 4.076%, 12/09/2041 | | | | | 3,236,398 | | | | | | 0.1 | | |
| 91,733,807 (4)(5) | | | Cantor Commercial Real Estate Lending 2019-CF1 XA, 1.137%, 05/15/2052 | | | | | 5,187,042 | | | | | | 0.2 | | |
| 38,346,695 (4)(5) | | | Cantor Commercial Real Estate Lending 2019-CF2 XA, 1.194%, 11/15/2052 | | | | | 2,517,388 | | | | | | 0.1 | | |
| 6,941,969 (4)(5) | | | CD 2016-CD1 Mortgage Trust XA, 1.376%, 08/10/2049 | | | | | 313,292 | | | | | | 0.0 | | |
| 14,660,000 (2)(4)(5) | | | CD 2016-CD1 Mortgage Trust XB, 0.703%, 08/10/2049 | | | | | 381,760 | | | | | | 0.0 | | |
| 1,000,000 (2)(4) | | | Citigroup Commercial Mortgage Trust 2013-GC17 D, 5.102%, 11/10/2046 | | | | | 926,767 | | | | | | 0.0 | | |
| 4,126,000 (2)(4) | | | Citigroup Commercial Mortgage Trust 2014-GC19 E, 4.591%, 03/10/2047 | | | | | 3,970,444 | | | | | | 0.2 | | |
| 6,030,000 (2)(4) | | | Citigroup Commercial Mortgage Trust 2014-GC19 F, 3.665%, 03/10/2047 | | | | | 4,134,492 | | | | | | 0.2 | | |
| 2,130,000 (2)(4) | | | Citigroup Commercial Mortgage Trust 2016-C2 E, 4.432%, 08/10/2049 | | | | | 1,633,964 | | | | | | 0.1 | | |
| Voya Strategic Income | PORTFOLIO OF INVESTMENTS |
| Opportunities Fund | as of March 31, 2022 (continued) |
| Principal Amount† | | | Value | | | Percentage of Net Assets | | |||||||||
| COMMERCIAL MORTGAGE-BACKED SECURITIES: (continued) | | |||||||||||||||
| 12,040,000 (2)(4) | | | Citigroup Commercial Mortgage Trust 2016-P4 E, 4.694%, 07/10/2049 | | | | $ | 8,265,955 | | | | | | 0.3 | | |
| 5,790,000 (2)(4) | | | Citigroup Commercial Mortgage Trust 2016-P4 F, 4.694%, 07/10/2049 | | | | | 3,322,620 | | | | | | 0.1 | | |
| 5,680,000 (2) | | | Citigroup Commercial Mortgage Trust 2016-P5 D, 3.000%, 10/10/2049 | | | | | 4,811,491 | | | | | | 0.2 | | |
| 26,253,769 (4)(5) | | | Citigroup Commercial Mortgage Trust 2017-C4 XA, 1.081%, 10/12/2050 | | | | | 1,014,406 | | | | | | 0.0 | | |
| 33,791,305 (4)(5) | | | Citigroup Commercial Mortgage Trust 2019-C7 XA, 0.873%, 12/15/2072 | | | | | 1,778,055 | | | | | | 0.1 | | |
| 40,775,545 (4)(5) | | | Citigroup Commercial Mortgage Trust 2019-GC41 XA, 1.055%, 08/10/2056 | | | | | 2,314,905 | | | | | | 0.1 | | |
| 3,000,000 (4) | | | COMM 2012-CCRE2 C Mortgage Trust, 4.837%, 08/15/2045 | | | | | 2,985,543 | | | | | | 0.1 | | |
| 8,759,176 (4)(5) | | | COMM 2012-CR3 XA, 1.824%, 10/15/2045 | | | | | 26,803 | | | | | | 0.0 | | |
| 843,635 (4)(5) | | | COMM 2012-CR4 XA, 1.685%, 10/15/2045 | | | | | 3,222 | | | | | | 0.0 | | |
| 6,391,791 (2)(4)(5) | | | COMM 2012-LTRT XA, 0.827%, 10/05/2030 | | | | | 169 | | | | | | 0.0 | | |
| 1,670,000 (2)(4) | | | COMM 2013-CR10 E Mortgage Trust, 4.901%, 08/10/2046 | | | | | 1,591,197 | | | | | | 0.1 | | |
| 3,460,000 (2)(4) | | | COMM 2013-CR10 F Mortgage Trust, 4.901%, 08/10/2046 | | | | | 3,134,141 | | | | | | 0.1 | | |
| 5,070,000 (2)(4) | | | COMM 2013-GAM F, 3.418%, 02/10/2028 | | | | | 4,617,167 | | | | | | 0.2 | | |
| 2,611,000 (2)(4) | | | COMM 2013-LC6 D Mortgage Trust, 4.289%, 01/10/2046 | | | | | 2,563,958 | | | | | | 0.1 | | |
| 9,745,869 (4)(5) | | | COMM 2016-COR1 XA, 1.311%, 10/10/2049 | | | | | 443,589 | | | | | | 0.0 | | |
| 2,515,437 (4)(5) | | | COMM 2016-CR28 XA, 0.709%, 02/10/2049 | | | | | 49,479 | | | | | | 0.0 | | |
| 19,883,084 (4)(5) | | | COMM 2017-COR2 XA, 1.164%, 09/10/2050 | | | | | 1,000,062 | | | | | | 0.0 | | |
| 5,725,000 (2)(4) | | | COMM 2020-CBM F Mortgage Trust, 3.633%, 02/10/2037 | | | | | 5,157,894 | | | | | | 0.2 | | |
| 2,792,000 (2) | | | CSAIL 2020-C19 E Commercial Mortgage Trust, 2.500%, 03/15/2053 | | | | | 2,218,326 | | | | | | 0.1 | | |
| Principal Amount† | | | Value | | | Percentage of Net Assets | | |||||||||
| COMMERCIAL MORTGAGE-BACKED SECURITIES: (continued) | | |||||||||||||||
| 607,917 (2) | | | CSWF 2021-SOP2 D, 2.713%, (US0001M + 2.317%), 06/15/2034 | | | | $ | 589,873 | | | | | | 0.0 | | |
| 1,532,635 (2) | | | CSWF 2021-SOP2 E, 3.763%, (US0001M + 3.367%), 06/15/2034 | | | | | 1,488,399 | | | | | | 0.1 | | |
| 2,588,978 (2)(7) | | | DBUBS 2011-LC2A F Mortgage Trust, 3.881%, (US0001M + 3.650%), 07/10/2044 | | | | | 2,585,841 | | | | | | 0.1 | | |
| 20,134,457 (4)(5) | | | Freddie Mac Multifamily Structured Pass Through Certificates K109 X1, 1.582%, 04/25/2030 | | | | | 2,089,318 | | | | | | 0.1 | | |
| 2,447,255 (4)(5) | | | Freddie Mac Multifamily Structured Pass Through Certificates K-1521 X1, 0.981%, 08/25/2036 | | | | | 248,466 | | | | | | 0.0 | | |
| 760,672 (4)(5) | | | Freddie Mac Multifamily Structured Pass Through Certificates K715 X3, 3.619%, 02/25/2041 | | | | | 1,985 | | | | | | 0.0 | | |
| 33,780,000 (2)(6) | | | FREMF 2016-K55 D Mortgage Trust, 0.000%, 04/25/2049 | | | | | 25,587,982 | | | | | | 1.0 | | |
| 8,502,000 (2)(6) | | | FREMF 2016-K60 D Mortgage Trust, 0.000%, 12/25/2049 | | | | | 6,221,632 | | | | | | 0.3 | | |
| 1,721,516 (2) | | | FREMF 2018-KBF2 C Mortgage Trust, 4.741%, (US0001M + 4.500%), 10/25/2025 | | | | | 1,731,111 | | | | | | 0.1 | | |
| 2,739,814 (2) | | | FREMF 2019-KBF3 C Mortgage Trust, 4.991%, (US0001M + 4.750%), 01/25/2029 | | | | | 2,734,679 | | | | | | 0.1 | | |
| 14,878,000 (2)(6) | | | FREMF 2019-KG01 C Mortgage Trust, 0.000%, 05/25/2029 | | | | | 9,101,146 | | | | | | 0.4 | | |
| 189,741,930 (2)(5) | | | FREMF 2019-KG01 X2A Mortgage Trust, 0.100%, 04/25/2029 | | | | | 752,839 | | | | | | 0.0 | | |
| 21,120,000 (2)(5) | | | FREMF 2019-KG01 X2B Mortgage Trust, 0.100%, 05/25/2029 | | | | | 104,776 | | | | | | 0.0 | | |
| 2,000,000 (2)(4) | | | FRR Re-REMIC Trust 2018-C1 B725, 2.964%, 02/27/2050 | | | | | 1,923,691 | | | | | | 0.1 | | |
| Voya Strategic Income | PORTFOLIO OF INVESTMENTS |
| Opportunities Fund | as of March 31, 2022 (continued) |
| Principal Amount† | | | Value | | | Percentage of Net Assets | | |||||||||
| COMMERCIAL MORTGAGE-BACKED SECURITIES: (continued) | | |||||||||||||||
| 1,268,740 (2)(4)(8) | | | FRR Re-REMIC Trust 2018-C1 C725, 0.000%, 02/27/2050 | | | | $ | 1,155,697 | | | | | | 0.0 | | |
| 2,648,000 (2) | | | GAM RE-REMIC TR 2021-FFR2 BK44, 2.071%, 09/27/2051 | | | | | 2,395,735 | | | | | | 0.1 | | |
| 2,975,000 (2) | | | GAM RE-REMIC TR 2021-FFR2 BK78, 2.435%, 09/27/2051 | | | | | 2,470,147 | | | | | | 0.1 | | |
| 2,263,000 (2)(6) | | | GAM RE-REMIC TR 2021-FFR2 C730, 0.000%, 09/27/2051 | | | | | 1,934,298 | | | | | | 0.1 | | |
| 2,751,000 (2)(6) | | | GAM RE-REMIC TR 2021-FFR2 CK44, 0.000%, 09/27/2051 | | | | | 2,288,086 | | | | | | 0.1 | | |
| 2,238,000 (2) | | | GAM RE-REMIC TR 2021-FFR2 CK49, 1.079%, 09/27/2051 | | | | | 1,925,923 | | | | | | 0.1 | | |
| 1,900,000 (2)(6) | | | GAM RE-REMIC TR 2021-FFR2 CK78, 0.000%, 09/27/2051 | | | | | 1,252,570 | | | | | | 0.1 | | |
| 2,263,000 (2)(6) | | | GAM RE-REMIC TR 2021-FFR2 D730, 0.000%, 09/27/2051 | | | | | 1,882,202 | | | | | | 0.1 | | |
| 2,237,000 (2)(6) | | | GAM RE-REMIC TR 2021-FFR2 DK49, 0.000%, 09/27/2051 | | | | | 1,790,446 | | | | | | 0.1 | | |
| 3,000,000 (2) | | | GAM Re-REMIC Trust 2021-FRR1 2D, 1.410%, 11/29/2050 | | | | | 2,004,673 | | | | | | 0.1 | | |
| 4,690,000 (2)(5) | | | GAM Resecuritization Trust 2022-FRR3 BK47, 2.038%, 01/29/2052 | | | | | 3,997,083 | | | | | | 0.2 | | |
| 3,192,000 (2)(8) | | | GAM Resecuritization Trust 2022-FRR3 BK61, 0.730%, 01/29/2052 | | | | | 2,569,861 | | | | | | 0.1 | | |
| 3,476,000 (2)(8) | | | GAM Resecuritization Trust 2022-FRR3 BK89, 1.130%, 01/27/2052 | | | | | 2,483,062 | | | | | | 0.1 | | |
| 1,815,000 (2)(8) | | | GAM Resecuritization Trust 2022-FRR3 C728, 0.420%, 08/27/2050 | | | | | 1,611,388 | | | | | | 0.1 | | |
| 1,850,000 (2)(8) | | | GAM Resecuritization Trust 2022-FRR3 CK47, 0.580%, 05/27/2048 | | | | | 1,589,724 | | | | | | 0.1 | | |
| 2,238,000 (2)(8) | | | GAM Resecuritization Trust 2022-FRR3 CK61, 0.970%, 11/27/2049 | | | | | 1,712,415 | | | | | | 0.1 | | |
| 1,563,000 (2)(5) | | | GAM Resecuritization Trust 2022-FRR3 CK71, 1.411%, 01/29/2052 | | | | | 1,221,454 | | | | | | 0.1 | | |
| Principal Amount† | | | Value | | | Percentage of Net Assets | | |||||||||
| COMMERCIAL MORTGAGE-BACKED SECURITIES: (continued) | | |||||||||||||||
| 1,820,000 (2)(8) | | | GAM Resecuritization Trust 2022-FRR3 CK89, 1.320%, 01/27/2052 | | | | $ | 1,227,749 | | | | | | 0.1 | | |
| 1,816,000 (2)(8) | | | GAM Resecuritization Trust 2022-FRR3 D728, 0.490%, 01/29/2052 | | | | | 1,568,457 | | | | | | 0.1 | | |
| 2,453,000 (2)(8) | | | GAM Resecuritization Trust 2022-FRR3 DK27, 0.150%, 12/27/2045 | | | | | 2,367,363 | | | | | | 0.1 | | |
| 1,462,000 (2)(8) | | | GAM Resecuritization Trust 2022-FRR3 DK41, 0.510%, 10/27/2047 | | | | | 1,283,664 | | | | | | 0.1 | | |
| 1,849,000 (2)(8) | | | GAM Resecuritization Trust 2022-FRR3 DK47, 0.670%, 05/27/2048 | | | | | 1,552,602 | | | | | | 0.1 | | |
| 610,000 (2)(8) | | | GAM Resecuritization Trust 2022-FRR3 EK27, 0.210%, 12/27/2045 | | | | | 580,754 | | | | | | 0.0 | | |
| 974,000 (2)(8) | | | GAM Resecuritization Trust 2022-FRR3 EK41, 0.580%, 01/29/2052 | | | | | 819,647 | | | | | | 0.0 | | |
| 2,000,000 (2) | | | GS Mortgage Securities Corp. II 2018-RIVR F, 2.497%, (US0001M + 2.100%), 07/15/2035 | | | | | 1,834,816 | | | | | | 0.1 | | |
| 15,518,000 (2)(4) | | | GS Mortgage Securities Trust 2012-GCJ7 E, 5.000%, 05/10/2045 | | | | | 13,857,105 | | | | | | 0.6 | | |
| 1,330,000 (2) | | | GS Mortgage Securities Trust 2013-GC16 G, 3.500%, 11/10/2046 | | | | | 844,138 | | | | | | 0.0 | | |
| 15,318,617 (4)(5) | | | GS Mortgage Securities Trust 2019-GC38 XA, 0.955%, 02/10/2052 | | | | | 812,898 | | | | | | 0.0 | | |
| 40,784,719 (4)(5) | | | GS Mortgage Securities Trust 2019-GC40 XA, 1.083%, 07/10/2052 | | | | | 2,360,444 | | | | | | 0.1 | | |
| 84,253,339 (4)(5) | | | GS Mortgage Securities Trust 2019-GSA1 XA, 0.826%, 11/10/2052 | | | | | 4,291,823 | | | | | | 0.2 | | |
| 180,000 (2)(4) | | | IMT Trust 2017-APTS EFX, 3.497%, 06/15/2034 | | | | | 172,243 | | | | | | 0.0 | | |
| 5,910,000 (2)(4) | | | J.P. Morgan Chase Commercial Mortgage Securities Trust 2018-WPT FFX, 5.542%, 07/05/2033 | | | | | 5,839,802 | | | | | | 0.2 | | |
| 5,440,000 (2) | | | J.P. Morgan Chase Commercial Mortgage Securities Trust 2019-MFP E, 2.557%, (US0001M + 2.160%), 07/15/2036 | | | | | 5,300,338 | | | | | | 0.2 | | |
| Voya Strategic Income | PORTFOLIO OF INVESTMENTS |
| Opportunities Fund | as of March 31, 2022 (continued) |
| Principal Amount† | | | Value | | | Percentage of Net Assets | | |||||||||
| COMMERCIAL MORTGAGE-BACKED SECURITIES: (continued) | | |||||||||||||||
| 6,150,000 (2)(4) | | | JP Morgan Chase Commercial Mortgage Securities Trust 2011-C4 F, 3.873%, 07/15/2046 | | | | $ | 5,861,794 | | | | | | 0.2 | | |
| 5,000,000 (2)(4) | | | JP Morgan Chase Commercial Mortgage Securities Trust 2011-C4 G, 3.873%, 07/15/2046 | | | | | 4,666,348 | | �� | | | | 0.2 | | |
| 282,365 (2)(4) | | | JP Morgan Chase Commercial Mortgage Securities Trust 2011-C5 D, 5.735%, 08/15/2046 | | | | | 281,116 | | | | | | 0.0 | | |
| 1,635,159 (4)(5) | | | JP Morgan Chase Commercial Mortgage Securities Trust 2012-CIBX XA, 0.784%, 06/15/2045 | | | | | 39 | | | | | | 0.0 | | |
| 2,000,000 (4) | | | JP Morgan Chase Commercial Mortgage Securities Trust 2013-C10 D, 4.096%, 12/15/2047 | | | | | 1,968,976 | | | | | | 0.1 | | |
| 5,500,000 (2)(4) | | | JP Morgan Chase Commercial Mortgage Securities Trust 2013-C10 E, 3.500%, 12/15/2047 | | | | | 5,029,382 | | | | | | 0.2 | | |
| 3,630,000 (2)(4) | | | JP Morgan Chase Commercial Mortgage Securities Trust 2013-C13 E, 3.986%, 01/15/2046 | | | | | 3,438,861 | | | | | | 0.1 | | |
| 7,470,000 (2)(4) | | | JP Morgan Chase Commercial Mortgage Securities Trust 2013-C13 F, 3.986%, 01/15/2046 | | | | | 6,187,941 | | | | | | 0.3 | | |
| 3,810,000 (2)(4) | | | JP Morgan Chase Commercial Mortgage Securities Trust 2020-LOOP E, 3.862%, 12/05/2038 | | | | | 3,363,904 | | | | | | 0.1 | | |
| 3,640,000 (2)(4) | | | JP Morgan Chase Commercial Mortgage Securities Trust 2020-LOOP F, 3.862%, 12/05/2038 | | | | | 3,105,181 | | | | | | 0.1 | | |
| 1,000,000 (2)(4) | | | JPMBB Commercial Mortgage Securities Trust 2013-C15 D, 5.192%, 11/15/2045 | | | | | 998,543 | | | | | | 0.0 | | |
| 2,549,000 (2)(4) | | | JPMBB Commercial Mortgage Securities Trust 2013-C17 D, 4.886%, 01/15/2047 | | | | | 2,422,154 | | | | | | 0.1 | | |
| Principal Amount† | | | Value | | | Percentage of Net Assets | | |||||||||
| COMMERCIAL MORTGAGE-BACKED SECURITIES: (continued) | | |||||||||||||||
| 9,560,000 (2)(4) | | | JPMBB Commercial Mortgage Securities Trust 2013-C17 E, 3.867%, 01/15/2047 | | | | $ | 8,133,381 | | | | | | 0.3 | | |
| 2,200,000 (2)(4) | | | JPMBB Commercial Mortgage Securities Trust 2013-C17 F, 3.867%, 01/15/2047 | | | | | 1,774,753 | | | | | | 0.1 | | |
| 1,000,000 (2)(4) | | | JPMBB Commercial Mortgage Securities Trust 2014-C19 D, 4.654%, 04/15/2047 | | | | | 963,702 | | | | | | 0.0 | | |
| 1,405,000 (4) | | | JPMBB Commercial Mortgage Securities Trust 2014-C21 C, 4.642%, 08/15/2047 | | | | | 1,366,140 | | | | | | 0.1 | | |
| 45,448,366 (4)(5) | | | JPMBB Commercial Mortgage Securities Trust 2015-C27 XA, 1.141%, 02/15/2048 | | | | | 1,180,230 | | | | | | 0.0 | | |
| 48,447,954 (4)(5) | | | JPMBB Commercial Mortgage Securities Trust 2015-C28 XA, 0.961%, 10/15/2048 | | | | | 1,003,381 | | | | | | 0.0 | | |
| 10,271,339 (2)(4)(5) | | | LSTAR Commercial Mortgage Trust 2017-5 X, 0.790%, 03/10/2050 | | | | | 245,335 | | | | | | 0.0 | | |
| 4,472,490 (2) | | | MBRT 2019-MBR H1, 4.647%, (US0001M + 4.000%), 11/15/2036 | | | | | 4,382,966 | | | | | | 0.2 | | |
| 2,817,000 (2)(4) | | | Morgan Stanley Bank of America Merrill Lynch Trust 2012-C6 E, 4.586%, 11/15/2045 | | | | | 2,704,028 | | | | | | 0.1 | | |
| 6,737,000 (2) | | | Morgan Stanley Bank of America Merrill Lynch Trust 2013-C13 F, 3.707%, 11/15/2046 | | | | | 5,142,908 | | | | | | 0.2 | | |
| 10,811,924 (4)(5) | | | Morgan Stanley Bank of America Merrill Lynch Trust 2013-C13 XA, 0.942%, 11/15/2046 | | | | | 117,361 | | | | | | 0.0 | | |
| 12,590,282 (4)(5) | | | Morgan Stanley Bank of America Merrill Lynch Trust 2014 C19 XA, 0.959%, 12/15/2047 | | | | | 245,085 | | | | | | 0.0 | | |
| Voya Strategic Income | PORTFOLIO OF INVESTMENTS |
| Opportunities Fund | as of March 31, 2022 (continued) |
| Principal Amount† | | | Value | | | Percentage of Net Assets | | |||||||||
| COMMERCIAL MORTGAGE-BACKED SECURITIES: (continued) | | |||||||||||||||
| 3,180,000 | | | Morgan Stanley Bank of America Merrill Lynch Trust 2015-C25 D, 3.068%, 10/15/2048 | | | | $ | 2,861,698 | | | | | | 0.1 | | |
| 560,000 (2) | | | Morgan Stanley Bank of America Merrill Lynch Trust 2015-C26 D, 3.060%, 10/15/2048 | | | | | 502,201 | | | | | | 0.0 | | |
| 15,228,414 (4)(5) | | | Morgan Stanley Bank of America Merrill Lynch Trust 2017-C34 XA, 0.776%, 11/15/2052 | | | | | 467,161 | | | | | | 0.0 | | |
| 5,970,000 (2)(7) | | | Morgan Stanley Capital I Trust 2011-C1 K, 4.193%, 09/15/2047 | | | | | 479,034 | | | | | | 0.0 | | |
| 4,268,000 (2)(7) | | | Morgan Stanley Capital I Trust 2011-C1 L, 4.193%, 09/15/2047 | | | | | 71,385 | | | | | | 0.0 | | |
| 2,021,315 (2)(7) | | | Morgan Stanley Capital I Trust 2011-C1 M, 4.193%, 09/15/2047 | | | | | 15,012 | | | | | | 0.0 | | |
| 4,841,000 (2)(4) | | | Morgan Stanley Capital I Trust 2016-BNK2 D, 3.000%, 11/15/2049 | | | | | 3,983,169 | | | | | | 0.2 | | |
| 25,660,000 (2)(4)(5) | | | Morgan Stanley Capital I Trust 2018-L1 XD, 1.794%, 10/15/2051 | | | | | 2,503,556 | | | | | | 0.1 | | |
| 22,462,819 (4)(5) | | | Morgan Stanley Capital I Trust 2021-L6 XA, 1.236%, 06/15/2054 | | | | | 1,754,966 | | | | | | 0.1 | | |
| 910,000 | | | Morgan Stanley Capital I, Inc. 2017-HR2 D, 2.730%, 12/15/2050 | | | | | 755,374 | | | | | | 0.0 | | |
| 38,009,233 (4)(5) | | | Morgan Stanley Capital I, Inc. 2017-HR2 XA, 0.777%, 12/15/2050 | | | | | 1,315,424 | | | | | | 0.1 | | |
| 13,000,000 (2) | | | Prima Capital CRE Securitization 2019-7A D Ltd., 4.250%, 12/25/2050 | | | | | 11,723,751 | | | | | | 0.5 | | |
| 1,000,000 (2)(4) | | | UBS Commercial Mortgage Trust 2017-C5, 4.310%, 11/15/2050 | | | | | 898,204 | | | | | | 0.0 | | |
| 24,315,804 (4)(5) | | | UBS Commercial Mortgage Trust 2019-C16 XA, 1.549%, 04/15/2052 | | | | | 1,935,737 | | | | | | 0.1 | | |
| 1,900,000 (2)(4) | | | UBS-Barclays Commercial Mortgage Trust 2012-C4 D, 4.461%, 12/10/2045 | | | | | 1,753,798 | | | | | | 0.1 | | |
| 3,240,000 (2)(4) | | | UBS-Barclays Commercial Mortgage Trust 2012-C4 E, 4.461%, 12/10/2045 | | | | | 2,458,848 | | | | | | 0.1 | | |
| Principal Amount† | | | Value | | | Percentage of Net Assets | | |||||||||
| COMMERCIAL MORTGAGE-BACKED SECURITIES: (continued) | | |||||||||||||||
| 5,940,000 (2) | | | Wells Fargo Commercial Mortgage Trust 2015-NXS3 D, 3.153%, 09/15/2057 | | | | $ | 5,429,522 | | | | | | 0.2 | | |
| 78,780,000 (4)(5) | | | Wells Fargo Commercial Mortgage Trust 2016-NXS6 XB, 0.582%, 11/15/2049 | | | | | 1,794,884 | | | | | | 0.1 | | |
| 20,138,880 (4)(5) | | | Wells Fargo Commercial Mortgage Trust 2017-C40 XA, 0.926%, 10/15/2050 | | | | | 719,878 | | | | | | 0.0 | | |
| 37,751,131 (4)(5) | | | Wells Fargo Commercial Mortgage Trust 2019-C52 XA, 1.591%, 08/15/2052 | | | | | 3,264,820 | | | | | | 0.1 | | |
| 2,500,000 (2) | | | Wells Fargo Commercial Mortgage Trust 2021-C59 C, 2.500%, 04/15/2054 | | | | | 1,880,051 | | | | | | 0.1 | | |
| 19,320,444 (4)(5) | | | Wells Fargo Commercial Mortgage Trust 2021-C59 E, 1.548%, 04/15/2054 | | | | | 1,943,065 | | | | | | 0.1 | | |
| 7,735,000 (2)(4) | | | West Town Mall Trust 2017-KNOX E, 4.347%, 07/05/2030 | | | | | 7,612,959 | | | | | | 0.3 | | |
| 1,500,000 (2)(4) | | | WFLD 2014-MONT D Mortgage Trust, 3.755%, 08/10/2031 | | | | | 1,162,699 | | | | | | 0.0 | | |
| 211,165 (2)(4)(5) | | | WFRBS Commercial Mortgage Trust 2012-C8 XA, 1.687%, 08/15/2045 | | | | | 10 | | | | | | 0.0 | | |
| 2,472,461 (2)(4)(5) | | | WFRBS Commercial Mortgage Trust 2012-C9 XA, 1.852%, 11/15/2045 | | | | | 8,576 | | | | | | 0.0 | | |
| 9,230,000 (2)(4) | | | WFRBS Commercial Mortgage Trust 2013-C11 E, 4.238%, 03/15/2045 | | | | | 8,568,947 | | | | | | 0.3 | | |
| 960,000 (2)(4) | | | WFRBS Commercial Mortgage Trust 2013-C11 F, 4.238%, 03/15/2045 | | | | | 822,254 | | | | | | 0.0 | | |
| 10,350,000 (2) | | | WFRBS Commercial Mortgage Trust 2013-C12 E, 3.500%, 03/15/2048 | | | | | 9,410,554 | | | | | | 0.4 | | |
| 5,950,000 (2) | | | WFRBS Commercial Mortgage Trust 2013-C12 F, 3.500%, 03/15/2048 | | | | | 5,275,719 | | | | | | 0.2 | | |
| 2,729,789 (2)(4)(5) | | | WFRBS Commercial Mortgage Trust 2013-C12 XA, 1.088%, 03/15/2048 | | | | | 17,472 | | | | | | 0.0 | | |
| Voya Strategic Income | PORTFOLIO OF INVESTMENTS |
| Opportunities Fund | as of March 31, 2022 (continued) |
| Principal Amount† | | | Value | | | Percentage of Net Assets | | |||||||||
| COMMERCIAL MORTGAGE-BACKED SECURITIES: (continued) | | |||||||||||||||
| 9,000,000 (2)(4) | | | WFRBS Commercial Mortgage Trust 2013-C17 D, 5.032%, 12/15/2046 | | | | $ | 8,728,482 | | | | | | 0.4 | | |
| 760,000 (2) | | | WFRBS Commercial Mortgage Trust 2013-C17 E, 3.500%, 12/15/2046 | | | | | 688,988 | | | | | | 0.0 | | |
| 3,000,000 (2) | | | WFRBS Commercial Mortgage Trust 2013-C17 F, 3.500%, 12/15/2046 | | | | | 2,401,131 | | | | | | 0.1 | | |
| 23,534,539 (4)(5) | | | WFRBS Commercial Mortgage Trust 2013-UBS1 XA, 0.943%, 03/15/2046 | | | | | 277,830 | | | | | | 0.0 | | |
| 2,000,000 (4) | | | WFRBS Commercial Mortgage Trust 2014-C21 C, 4.234%, 08/15/2047 | | | | | 1,932,908 | | | | | | 0.1 | | |
| 1,900,000 (2) | | | WFRBS Commercial Mortgage Trust 2014-C21 D, 3.497%, 08/15/2047 | | | | | 1,701,674 | | | | | | 0.1 | | |
| | | | Total Commercial Mortgage-Backed Securities (Cost $452,350,794) | | | | | 423,618,295 | | | | | | 17.2 | | |
| U.S. TREASURY OBLIGATIONS: 3.5% | | |||||||||||||||
| | | | U.S. Treasury Bonds: 0.1% | | ||||||||||||
| 1,000 | | | 1.250%, 05/15/2050 | | | | | 747 | | | | | | 0.0 | | |
| 7,900 | | | 1.625%, 11/15/2050 | | | | | 6,483 | | | | | | 0.0 | | |
| 1,039,000 (1) | | | 2.375%, 02/15/2042 | | | | | 1,002,473 | | | | | | 0.1 | | |
| | | | | | | | | 1,009,703 | | | | | | 0.1 | | |
| | | | U.S. Treasury Notes: 3.4% | | ||||||||||||
| 1,558,000 | | | 0.125%, 05/31/2023 | | | | | 1,526,505 | | | | | | 0.1 | | |
| 3,600,000 | | | 0.250%, 06/15/2024 | | | | | 3,434,203 | | | | | | 0.1 | | |
| 858,000 | | | 0.375%, 09/30/2027 | | | | | 766,167 | | | | | | 0.0 | | |
| 3,638,200 | | | 0.500%, 11/30/2023 | | | | | 3,536,799 | | | | | | 0.1 | | |
| 6,348,300 | | | 0.875%, 01/31/2024 | | | | | 6,187,609 | | | | | | 0.3 | | |
| 7,000 | | | 1.125%, 02/15/2031 | | | | | 6,322 | | | | | | 0.0 | | |
| 3,137,700 | | | 1.250%, 11/30/2026 | | | | | 2,969,110 | | | | | | 0.1 | | |
| 725,000 | | | 1.250%, 09/30/2028 | | | | | 672,919 | | | | | | 0.0 | | |
| 5,979,000 (1) | | | 1.500%, 02/29/2024 | | | | | 5,892,351 | | | | | | 0.2 | | |
| 7,367,100 (1) | | | 1.500%, 01/31/2027 | | | | | 7,041,336 | | | | | | 0.3 | | |
| 4,855,000 | | | 1.750%, 03/15/2025 | | | | | 4,752,590 | | | | | | 0.2 | | |
| 6,638,000 (1) | | | 1.875%, 02/28/2027 | | | | | 6,461,160 | | | | | | 0.3 | | |
| Principal Amount† | | | Value | | | Percentage of Net Assets | | |||||||||
| U.S. TREASURY OBLIGATIONS: (continued) | | |||||||||||||||
| | | | U.S. Treasury Notes (continued) | | ||||||||||||
| 6,338,000 (1) | | | 1.875%, 02/28/2029 | | | | $ | 6,119,636 | | | | | | 0.3 | | |
| 17,124,000 | | | 2.250%, 03/31/2024 | | | | | 17,101,592 | | | | | | 0.7 | | |
| 2,776,000 | | | 2.375%, 03/31/2029 | | | | | 2,768,193 | | | | | | 0.1 | | |
| 15,044,000 | | | 2.500%, 03/31/2027 | | | | | 15,078,084 | | | | | | 0.6 | | |
| | | | | | | | | 84,314,576 | | | | | | 3.4 | | |
| | | | Total U.S. Treasury Obligations (Cost $86,917,181) | | | | | 85,324,279 | | | | | | 3.5 | | |
| ASSET-BACKED SECURITIES: 13.2% | | |||||||||||||||
| | | | Automobile Asset-Backed Securities: 1.1% | | ||||||||||||
| 2,450,000 | | | AmeriCredit Automobile Receivables Trust 2019-3 D, 2.580%, 09/18/2025 | | | | | 2,440,562 | | | | | | 0.1 | | |
| 4,400,000 | | | AmeriCredit Automobile Receivables Trust 2020-1 D, 1.800%, 12/18/2025 | | | | | 4,294,829 | | | | | | 0.2 | | |
| 3,000,000 | | | Carmax Auto Owner Trust 2019-2 D, 3.410%, 10/15/2025 | | | | | 3,017,973 | | | | | | 0.1 | | |
| 4,450,000 | | | Santander Drive Auto Receivables Trust 2019- 2 D, 3.220%, 07/15/2025 | | | | | 4,468,858 | | | | | | 0.2 | | |
| 6,000,000 | | | Santander Drive Auto Receivables Trust 2019-3 D, 2.680%, 10/15/2025 | | | | | 6,022,874 | | | | | | 0.2 | | |
| 2,650,000 | | | Santander Drive Auto Receivables Trust 2021-3 D, 1.330%, 09/15/2027 | | | | | 2,539,635 | | | | | | 0.1 | | |
| 3,800,000 (2) | | | Tesla Auto Lease Trust 2019-A C, 2.680%, 01/20/2023 | | | | | 3,809,451 | | | | | | 0.2 | | |
| | | | | | | | | 26,594,182 | | | | | | 1.1 | | |
| | | | Home Equity Asset-Backed Securities: 0.5% | | ||||||||||||
| 2,407,109 (2)(4) | | | ACE Securities Corp. Mortgage Loan Trust Series 2007-D1 A2, 6.336%, 02/25/2038 | | | | | 2,218,342 | | | | | | 0.1 | | |
| 2,884,880 (2) | | | ACE Securities Corp. Mortgage Loan Trust Series 2007-D1 A3, 7.250%, 02/25/2038 | | | | | 2,649,422 | | | | | | 0.1 | | |
| Voya Strategic Income | PORTFOLIO OF INVESTMENTS |
| Opportunities Fund | as of March 31, 2022 (continued) |
| Principal Amount† | | | Value | | | Percentage of Net Assets | | |||||||||
| ASSET-BACKED SECURITIES: (continued) | | |||||||||||||||
| | | | Home Equity Asset-Backed Securities (continued) | | ||||||||||||
| 340,566 | | | GSAA Home Equity Trust 2006-3 A3, 1.057%, (US0001M + 0.300%), 03/25/2036 | | | | $ | 216,088 | | | | | | 0.0 | | |
| 2,173,618 (4) | | | GSAA Home Equity Trust 2006-4 4A3, 2.965%, 03/25/2036 | | | | | 1,632,273 | | | | | | 0.1 | | |
| 881,170 | | | GSAA Home Equity Trust 2007-1 1A1, 0.617%, (US0001M + 0.080%), 02/25/2037 | | | | | 329,467 | | | | | | 0.0 | | |
| 894,940 (4) | | | GSAA Trust 2006-7 AF2, 5.995%, 03/25/2046 | | | | | 453,623 | | | | | | 0.0 | | |
| 837,066 (4) | | | Morgan Stanley Mortgage Loan Trust 2007-10XS A2, 6.250%, 02/25/2037 | | | | | 498,637 | | | | | | 0.0 | | |
| 416,799 | | | Nomura Home Equity Loan, Inc. Home Equity Loan Trust Series 2007-1 2A4A, 0.917%, (US0001M + 0.230%), 02/25/2037 | | | | | 408,818 | | | | | | 0.0 | | |
| 3,792,554 (4) | | | Renaissance Home Equity Loan Trust 2004-4 MF2, 5.818%, 02/25/2035 | | | | | 3,490,783 | | | | | | 0.2 | | |
| | | | | | | | | 11,897,453 | | | | | | 0.5 | | |
| | | | Other Asset-Backed Securities: 10.7% | | ||||||||||||
| 3,089,000 (2)(9) | | | Ajax Mortgage Loan Trust 2019-D A2, 3.500%, 09/25/2065 | | | | | 3,091,927 | | | | | | 0.1 | | |
| 4,234,000 (2) | | | Ajax Mortgage Loan Trust 2019-F A2, 3.500%, 07/25/2059 | | | | | 4,114,063 | | | | | | 0.2 | | |
| 2,500,000 (2) | | | AMMC CLO 16 Ltd. 2015-16A CR2, 2.188%, (US0003M + 1.950%), 04/14/2029 | | | | | 2,480,285 | | | | | | 0.1 | | |
| 2,000,000 (2) | | | AMMC CLO XI Ltd. 2012-11A CR2, 2.199%, (US0003M + 1.900%), 04/30/2031 | | | | | 1,941,982 | | | | | | 0.1 | | |
| 2,700,000 (2) | | | Apidos CLO XXIV 2016-24A BRR, 2.304%, (US0003M + 2.050%), 10/20/2030 | | | | | 2,643,791 | | | | | | 0.1 | | |
| 2,900,000 (2) | | | Apidos CLO XXXIII 2020-33A CR, 2.159%, (US0003M + 1.900%), 10/24/2034 | | | | | 2,861,363 | | | | | | 0.1 | | |
| Principal Amount† | | | Value | | | Percentage of Net Assets | | |||||||||
| ASSET-BACKED SECURITIES: (continued) | | |||||||||||||||
| | | | Other Asset-Backed Securities (continued) | | ||||||||||||
| 1,633,500 (2) | | | Applebee’s Funding LLC / IHOP Funding LLC 2019-1A A2I, 4.194%, 06/05/2049 | | | | $ | 1,627,136 | | | | | | 0.1 | | |
| 742,500 (2) | | | Applebee’s Funding LLC / IHOP Funding LLC 2019-1A A2II, 4.723%, 06/05/2049 | | | | | 742,860 | | | | | | 0.0 | | |
| 778,680 (2) | | | Aqua Finance Trust 2019-A A, 3.140%, 07/16/2040 | | | | | 770,504 | | | | | | 0.0 | | |
| 750,000 (2) | | | Atrium CDO Corp. 12A CR, 1.909%, (US0003M + 1.650%), 04/22/2027 | | | | | 747,703 | | | | | | 0.0 | | |
| 2,500,000 (2) | | | Atrium XIV LLC 14A A2BR, 2.304%, 08/23/2030 | | | | | 2,333,642 | | | | | | 0.1 | | |
| 2,000,000 (2) | | | Babson CLO Ltd. 2018-3A C, 2.154%, (US0003M + 1.900%), 07/20/2029 | | | | | 1,985,212 | | | | | | 0.1 | | |
| 2,000,000 (2) | | | Benefit Street Partners CLO V-B Ltd. 2018-5BA B, 2.404%, (US0003M + 2.150%), 04/20/2031 | | | | | 1,963,838 | | | | | | 0.1 | | |
| 2,760,000 (2) | | | Benefit Street Partners CLO X Ltd. 2016-10A BRR, 2.404%, (US0003M + 2.150%), 04/20/2034 | | | | | 2,719,632 | | | | | | 0.1 | | |
| 1,000,000 (2) | | | BlueMountain CLO 2013-2A CR, 2.209%, (US0003M + 1.950%), 10/22/2030 | | | | | 970,580 | | | | | | 0.0 | | |
| 1,000,000 (2) | | | BlueMountain CLO 2015-4 CR Ltd., 2.154%, (US0003M + 1.900%), 04/20/2030 | | | | | 971,048 | | | | | | 0.0 | | |
| 1,250,000 (2) | | | BlueMountain CLO Ltd. 2021-28A C, 2.241%, (US0003M + 2.000%), 04/15/2034 | | | | | 1,227,585 | | | | | | 0.1 | | |
| 2,000,000 (2) | | | BlueMountain CLO XXIX Ltd. 2020-29A CR, 2.358%, (US0003M + 2.100%), 07/25/2034 | | | | | 1,977,192 | | | | | | 0.1 | | |
| 4,000,000 (2) | | | Bristol Park CLO Ltd. 2016-1A CR, 2.191%, (US0003M + 1.950%), 04/15/2029 | | | | | 4,000,000 | | | | | | 0.2 | | |
| 750,000 (2) | | | Buttermilk Park CLO Ltd. 2018-1A C, 2.341%, (US0003M + 2.100%), 10/15/2031 | | | | | 736,467 | | | | | | 0.0 | | |
| Voya Strategic Income | PORTFOLIO OF INVESTMENTS |
| Opportunities Fund | as of March 31, 2022 (continued) |
| Principal Amount† | | | Value | | | Percentage of Net Assets | | |||||||||
| ASSET-BACKED SECURITIES: (continued) | | |||||||||||||||
| | | | Other Asset-Backed Securities (continued) | | ||||||||||||
| 1,500,000 (2) | | | Carlyle US CLO 2016-4A BR Ltd., 2.354%, (US0003M + 2.100%), 10/20/2027 | | | | $ | 1,474,491 | | | | | | 0.1 | | |
| 1,000,000 (2) | | | Cent CLO C17A BR Ltd., 2.149%, (US0003M + 1.850%), 04/30/2031 | | | | | 981,010 | | | | | | 0.0 | | |
| 5,900,000 (2) | | | CIFC Funding 2015-4A BR2 Ltd., 2.154%, (US0003M + 1.900%), 04/20/2034 | | | | | 5,829,047 | | | | | | 0.2 | | |
| 7,500,000 (2) | | | CIFC Funding 2017-2A CR Ltd., 2.104%, (US0003M + 1.850%), 04/20/2030 | | | | | 7,391,332 | | | | | | 0.3 | | |
| 5,500,000 (2) | | | CIFC Funding 2019-2A CR Ltd., 2.341%, (US0003M + 2.100%), 04/17/2034 | | | | | 5,526,829 | | | | | | 0.2 | | |
| 997,727 | | | Countrywide Asset-Backed Certificates 2005-AB2 M1, 1.162%, (US0001M + 0.705%), 09/25/2035 | | | | | 977,988 | | | | | | 0.0 | | |
| 828,750 (2) | | | DB Master Finance LLC 2019-1A A23, 4.352%, 05/20/2049 | | | | | 831,241 | | | | | | 0.0 | | |
| 438,750 (2) | | | DB Master Finance LLC 2019-1A A2II, 4.021%, 05/20/2049 | | | | | 441,545 | | | | | | 0.0 | | |
| 4,089,750 (2) | | | DB Master Finance LLC 2021-1A A23, 2.791%, 11/20/2051 | | | | | 3,677,296 | | | | | | 0.2 | | |
| 3,000,000 (2) | | | Dewolf Park CLO Ltd. 2017-1A DR, 3.091%, (US0003M + 2.850%), 10/15/2030 | | | | | 2,938,497 | | | | | | 0.1 | | |
| 568,500 (2) | | | Domino’s Pizza Master Issuer LLC 2015-1A A1II, 4.474%, 10/25/2045 | | | | | 573,807 | | | | | | 0.0 | | |
| 1,056,000 (2) | | | Domino’s Pizza Master Issuer LLC 2017-1A A23, 4.118%, 07/25/2047 | | | | | 1,051,184 | | | | | | 0.0 | | |
| 2,283,300 (2) | | | Domino’s Pizza Master Issuer LLC 2018-1A A2I, 4.116%, 07/25/2048 | | | | | 2,303,547 | | | | | | 0.1 | | |
| 3,479,000 (2) | | | Domino’s Pizza Master Issuer LLC 2019-1A A2, 3.668%, 10/25/2049 | | | | | 3,346,924 | | | | | | 0.1 | | |
| Principal Amount† | | | Value | | | Percentage of Net Assets | | |||||||||
| ASSET-BACKED SECURITIES: (continued) | | |||||||||||||||
| | | | Other Asset-Backed Securities (continued) | | ||||||||||||
| 1,203,125 (2) | | | Driven Brands Funding LLC 2018-1A A2, 4.739%, 04/20/2048 | | | | $ | 1,216,703 | | | | | | 0.1 | | |
| 2,134,000 (2) | | | Driven Brands Funding LLC 2019-1A A2, 4.641%, 04/20/2049 | | | | | 2,134,047 | | | | | | 0.1 | | |
| 2,750,000 (2) | | | Dryden 30 Senior Loan Fund 2013-30A DR, 3.106%, (US0003M + 2.600%), 11/15/2028 | | | | | 2,642,255 | | | | | | 0.1 | | |
| 1,750,000 (2) | | | Dryden 55 CLO Ltd. 2018-55A C, 2.141%, (US0003M + 1.900%), 04/15/2031 | | | | | 1,715,528 | | | | | | 0.1 | | |
| 5,000,000 (2) | | | Dryden 75 CLO Ltd. 2019-75A CR2, 2.041%, (US0003M + 1.800%), 04/15/2034 | | | | | 4,869,010 | | | | | | 0.2 | | |
| 6,000,000 (2) | | | Dryden 86 CLO Ltd. 2020-86A DR, 3.441%, (US0003M + 3.200%), 07/17/2034 | | | | | 5,866,572 | | | | | | 0.2 | | |
| 3,061,863 (2) | | | Five Guys Holdings, Inc. 2017-1A A2, 4.600%, 07/25/2047 | | | | | 3,037,733 | | | | | | 0.1 | | |
| 867,503 (2) | | | Helios Issuer LLC 2018-1A A, 4.870%, 07/20/2048 | | | | | 869,514 | | | | | | 0.0 | | |
| 3,537,678 (2) | | | Helios Issuer, LLC 2018-1A B, 7.710%, 07/20/2048 | | | | | 3,475,429 | | | | | | 0.1 | | |
| 1,000,000 (2) | | | JG Wentworth XLII LLC 2018-2A B, 4.700%, 10/15/2077 | | | | | 1,023,261 | | | | | | 0.0 | | |
| 1,600,000 (2) | | | Kayne CLO 10 Ltd. 2021-10A C, 2.009%, (US0003M + 1.750%), 04/23/2034 | | | | | 1,559,653 | | | | | | 0.1 | | |
| 1,710,000 (2) | | | Kayne CLO I Ltd. 2018-1A CR, 1.991%, (US0003M + 1.750%), 07/15/2031 | | | | | 1,697,837 | | | | | | 0.1 | | |
| 1,350,000 (2) | | | LCM XVIII L.P. 18A CR, 2.104%, (US0003M + 1.850%), 04/20/2031 | | | | | 1,311,942 | | | | | | 0.1 | | |
| 1,000,000 (2) | | | LCM XX L.P. 20A-CR, 2.204%, (US0003M + 1.950%), 10/20/2027 | | | | | 999,699 | | | | | | 0.0 | | |
| Voya Strategic Income | PORTFOLIO OF INVESTMENTS |
| Opportunities Fund | as of March 31, 2022 (continued) |
| Principal Amount† | | | Value | | | Percentage of Net Assets | | |||||||||
| ASSET-BACKED SECURITIES: (continued) | | |||||||||||||||
| | | | Other Asset-Backed Securities (continued) | | ||||||||||||
| 2,800,000 (2) | | | LCM XXIV Ltd. 24A CR, 2.154%, (US0003M + 1.900%), 03/20/2030 | | | | $ | 2,723,608 | | | | | | 0.1 | | |
| 850,308 (2) | | | LCSS Financing 2018-A A LLC, 4.700%, 12/15/2062 | | | | | 820,310 | | | | | | 0.0 | | |
| 1,000,000 (2) | | | Madison Park Funding XIII Ltd. 2014-13A CR2, 2.148%, (US0003M + 1.900%), 04/19/2030 | | | | | 987,772 | | | | | | 0.0 | | |
| 2,500,000 (2) | | | Madison Park Funding XIX Ltd. 2015-19A B1R2, 2.109%, (US0003M + 1.850%), 01/22/2028 | | | | | 2,486,020 | | | | | | 0.1 | | |
| 1,000,000 (2) | | | Magnetite VIII Ltd. 2014-8A CR2, 2.091%, (US0003M + 1.850%), 04/15/2031 | | | | | 989,568 | | | | | | 0.0 | | |
| 905,848 (2) | | | Marlette Funding Trust 2018-4A C, 4.910%, 12/15/2028 | | | | | 906,537 | | | | | | 0.0 | | |
| 2,000,000 (2) | | | Marlette Funding Trust 2019-2A C, 4.110%, 07/16/2029 | | | | | 1,996,884 | | | | | | 0.1 | | |
| 4,006,927 (2) | | | Marlette Funding Trust 2019-3A C, 3.790%, 09/17/2029 | | | | | 4,009,405 | | | | | | 0.2 | | |
| 1,163,544 (2) | | | Marlette Funding Trust 2019-4A B, 2.950%, 12/17/2029 | | | | | 1,163,663 | | | | | | 0.1 | | |
| 1,600,000 (2) | | | Marlette Funding Trust 2020-1A C, 2.800%, 03/15/2030 | | | | | 1,601,881 | | | | | | 0.1 | | |
| 1,795,485 (2) | | | Mill City Solar Loan 2019-2GS A Ltd., 3.690%, 07/20/2043 | | | | | 1,787,228 | | | | | | 0.1 | | |
| 620,243 (2) | | | Mosaic Solar Loan Trust 2018-1A A, 4.010%, 06/22/2043 | | | | | 621,739 | | | | | | 0.0 | | |
| 1,524,963 (2) | | | Mosaic Solar Loan Trust 2018-2-GS B, 4.740%, 02/22/2044 | | | | | 1,507,565 | | | | | | 0.1 | | |
| 1,412,844 (2) | | | Mosaic Solar Loan Trust 2019-1A A, 4.370%, 12/21/2043 | | | | | 1,404,569 | | | | | | 0.1 | | |
| 580,133 (2) | | | Mosaic Solar Loan Trust 2019-2A A, 2.880%, 09/20/2040 | | | | | 564,075 | | | | | | 0.0 | | |
| Principal Amount† | | | Value | | | Percentage of Net Assets | | |||||||||
| ASSET-BACKED SECURITIES: (continued) | | |||||||||||||||
| | | | Other Asset-Backed Securities (continued) | | ||||||||||||
| 1,106,256 (2) | | | Mosaic Solar Loans 2017-2A A LLC, 3.820%, 06/22/2043 | | | | $ | 1,094,729 | | | | | | 0.1 | | |
| 3,500,000 (2) | | | Neuberger Berman Loan Advisers CLO 24 Ltd. 2017-24A CR, 2.198%, (US0003M + 1.950%), 04/19/2030 | | | | | 3,442,887 | | | | | | 0.1 | | |
| 7,700,000 (2) | | | Neuberger Berman Loan Advisers CLO 30 Ltd. 2018-30A CR, 2.004%, (US0003M + 1.750%), 01/20/2031 | | | | | 7,564,957 | | | | | | 0.3 | | |
| 2,300,000 (2) | | | Neuberger Berman Loan Advisers CLO 33 Ltd. 2019-33A CR, 2.141%, (US0003M + 1.900%), 10/16/2033 | | | | | 2,274,318 | | | | | | 0.1 | | |
| 4,750,000 (2) | | | Neuberger Berman Loan Advisers Clo 44 Ltd. 2021-44A C, 2.141%, (US0003M + 1.900%), 10/16/2034 | | | | | 4,680,783 | | | | | | 0.2 | | |
| 6,000,000 (2) | | | Oaktree CLO Ltd. 2021-1A C, 2.191%, (US0003M + 1.950%), 07/15/2034 | | | | | 5,905,818 | | | | | | 0.2 | | |
| 2,500,000 (2) | | | Oaktree CLO Ltd. 2021-1A D, 3.491%, (US0003M + 3.250%), 07/15/2034 | | | | | 2,457,135 | | | | | | 0.1 | | |
| 3,550,000 (2) | | | Octagon Investment Partners 30 Ltd. 2017-1A BR, 2.204%, (US0003M + 1.950%), 03/17/2030 | | | | | 3,467,938 | | | | | | 0.1 | | |
| 7,470,000 (2) | | | Octagon Investment Partners 31 Ltd. 2017-1A CR, 2.304%, (US0003M + 2.050%), 07/20/2030 | | | | | 7,322,333 | | | | | | 0.3 | | |
| 4,500,000 (2) | | | Octagon Investment Partners 32 Ltd. 2017-1A CR, 2.291%, (US0003M + 2.050%), 07/15/2029 | | | | | 4,420,670 | | | | | | 0.2 | | |
| 600,000 (2) | | | Octagon Investment Partners 33 Ltd. 2017-1A B, 2.104%, (US0003M + 1.850%), 01/20/2031 | | | | | 588,904 | | | | | | 0.0 | | |
| Voya Strategic Income | PORTFOLIO OF INVESTMENTS |
| Opportunities Fund | as of March 31, 2022 (continued) |
| Principal Amount† | | | Value | | | Percentage of Net Assets | | |||||||||
| ASSET-BACKED SECURITIES: (continued) | | |||||||||||||||
| | | | Other Asset-Backed Securities (continued) | | ||||||||||||
| 1,500,000 (2) | | | OHA Credit Funding 9 Ltd. 2021-9A C, 2.148%, (US0003M + 1.900%), 07/19/2035 | | | | $ | 1,484,928 | | | | | | 0.1 | | |
| 5,000,000 (2) | | | Palmer Square CLO 2020-3A CR Ltd., 3.456%, (US0003M + 2.950%), 11/15/2031 | | | | | 4,912,440 | | | | | | 0.2 | | |
| 4,250,000 (2) | | | Palmer Square Loan Funding 2021-2A C Ltd., 2.880%, (US0003M + 2.400%), 05/20/2029 | | | | | 4,112,122 | | | | | | 0.2 | | |
| 265,132 (4) | | | Popular ABS Mortgage Pass-Through Trust 2005-D A5, 3.541%, 01/25/2036 | | | | | 260,008 | | | | | | 0.0 | | |
| 2,394,875 (2) | | | Primose Funding LLC 2019-1A A2, 4.475%, 07/30/2049 | | | | | 2,343,530 | | | | | | 0.1 | | |
| 1,100,000 (2) | | | Recette Clo Ltd. 2015-1A CRR, 2.004%, (US0003M + 1.750%), 04/20/2034 | | | | | 1,061,633 | | | | | | 0.0 | | |
| 2,050,000 (2) | | | Rockland Park CLO Ltd. 2021-1A C, 2.154%, (US0003M + 1.900%), 04/20/2034 | | | | | 2,026,911 | | | | | | 0.1 | | |
| 3,270,000 (2) | | | Shackleton 2019-15A CR CLO Ltd., 2.391%, (US0003M + 2.150%), 01/15/2032 | | | | | 3,193,665 | | | | | | 0.1 | | |
| 3,000,000 (2) | | | SoFi Consumer Loan Program 2018-4 D Trust, 4.760%, 11/26/2027 | | | | | 3,018,565 | | | | | | 0.1 | | |
| 2,750,000 (2) | | | SoFi Consumer Loan Program 2019-1 D Trust, 4.420%, 02/25/2028 | | | | | 2,764,681 | | | | | | 0.1 | | |
| 3,000,000 (2) | | | SoFi Consumer Loan Program 2019-2 D Trust, 4.200%, 04/25/2028 | | | | | 2,995,931 | | | | | | 0.1 | | |
| 4,000,000 (2) | | | SoFi Consumer Loan Program 2019-3 D Trust, 3.890%, 05/25/2028 | | | | | 4,016,570 | | | | | | 0.2 | | |
| 2,000,000 (2) | | | SoFi Consumer Loan Program 2019-4 C Trust, 2.840%, 08/25/2028 | | | | | 1,999,244 | | | | | | 0.1 | | |
| 600,000 (2) | | | SoFi Consumer Loan Program 2019-4 D Trust, 3.480%, 08/25/2028 | | | | | 598,166 | | | | | | 0.0 | | |
| Principal Amount† | | | Value | | | Percentage of Net Assets | | |||||||||
| ASSET-BACKED SECURITIES: (continued) | | |||||||||||||||
| | | | Other Asset-Backed Securities (continued) | | ||||||||||||
| 2,100,000 (2) | | | SoFi Consumer Loan Program 2020-1 C Trust, 2.500%, 01/25/2029 | | | | $ | 2,087,027 | | | | | | 0.1 | | |
| 1,200,000 (2) | | | SoFi Consumer Loan Program 2020-1 D Trust, 2.940%, 01/25/2029 | | | | | 1,193,972 | | | | | | 0.1 | | |
| 1,919,125 (2) | | | Sonic Capital LLC 2020-1A A2I, 3.845%, 01/20/2050 | | | | | 1,881,424 | | | | | | 0.1 | | |
| 5,700,000 (2) | | | Sound Point Clo XIV Ltd. 2016-3A CR, 2.309%, (US0003M + 2.050%), 01/23/2029 | | | | | 5,642,618 | | | | | | 0.2 | | |
| 4,857,938 (2) | | | Sunnova Sol Issuer LLC 2020-1A A, 3.350%, 02/01/2055 | | | | | 4,680,637 | | | | | | 0.2 | | |
| 1,849,754 (2) | | | Sunrun Athena Issuer 2018-1 A LLC, 5.310%, 04/30/2049 | | | | | 1,908,162 | | | | | | 0.1 | | |
| 3,620,503 (2) | | | Sunrun Atlas Issuer 2019-2 A LLC, 3.610%, 02/01/2055 | | | | | 3,557,730 | | | | | | 0.2 | | |
| 1,064,250 (2) | | | Taco Bell Funding LLC 2018-1A A2II, 4.940%, 11/25/2048 | | | | | 1,077,194 | | | | | | 0.1 | | |
| 1,000,000 (2) | | | TCI-Flatiron Clo 2017- 1A C Ltd., 2.319%, (US0003M + 1.850%), 11/18/2030 | | | | | 987,745 | | | | | | 0.0 | | |
| 2,250,000 (2) | | | TCI-Flatiron Clo 2018-1A CR Ltd., 2.049%, (US0003M + 1.750%), 01/29/2032 | | | | | 2,211,631 | | | | | | 0.1 | | |
| 4,100,000 (2) | | | TCW CLO 2020-1A DRR Ltd., 3.654%, (US0003M + 3.400%), 04/20/2034 | | | | | 4,051,157 | | | | | | 0.2 | | |
| 3,100,000 (2) | | | TCW CLO 2021-1A C Ltd., 2.154%, (US0003M + 1.900%), 03/18/2034 | | | | | 3,054,340 | | | | | | 0.1 | | |
| 3,000,000 (2) | | | TCW CLO 2021-2A D Ltd., 3.508%, (US0003M + 3.250%), 07/25/2034 | | | | | 2,971,842 | | | | | | 0.1 | | |
| 4,000,000 (2) | | | TES 2017-2A B LLC, 6.990%, 02/20/2048 | | | | | 3,767,463 | | | | | | 0.2 | | |
| 3,450,000 (2) | | | TES LLC 2017-1A B, 7.740%, 10/20/2047 | | | | | 3,428,262 | | | | | | 0.1 | | |
| Voya Strategic Income | PORTFOLIO OF INVESTMENTS |
| Opportunities Fund | as of March 31, 2022 (continued) |
| Principal Amount† | | | Value | | | Percentage of Net Assets | | |||||||||
| ASSET-BACKED SECURITIES: (continued) | | |||||||||||||||
| | | | Other Asset-Backed Securities (continued) | | ||||||||||||
| 2,000,000 (2) | | | THL Credit Wind River 2014-1 CRR CLO Ltd., 2.191%, (US0003M + 1.950%), 07/18/2031 | | | | $ | 1,945,290 | | | | | | 0.1 | | |
| 1,000,000 (2) | | | THL Credit Wind River 2016-1A CR CLO Ltd., 2.339%, (US0003M + 2.100%), 07/15/2028 | | | | | 1,000,037 | | | | | | 0.0 | | |
| 2,000,000 (2)(4) | | | Towd Point Mortgage Trust 2015-6 M2, 3.750%, 04/25/2055 | | | | | 1,965,656 | | | | | | 0.1 | | |
| 1,500,000 (2) | | | Upland CLO Ltd. 2016-1A BR, 2.104%, (US0003M + 1.850%), 04/20/2031 | | | | | 1,486,661 | | | | | | 0.1 | | |
| 957,500 (2) | | | Wendy’s Funding LLC 2018-1A A2II, 3.884%, 03/15/2048 | | | | | 950,788 | | | | | | 0.0 | | |
| 3,119,500 (2) | | | Wendy’s Funding LLC 2019-1A A2I, 3.783%, 06/15/2049 | | | | | 3,093,164 | | | | | | 0.1 | | |
| 1,750,000 (2) | | | Whetstone Park CLO Ltd. 2021-1A D, 2.900%, (US0003M + 2.900%), 01/20/2035 | | | | | 1,705,638 | | | | | | 0.1 | | |
| | | | | | | | | 265,898,859 | | | | | | 10.7 | | |
| | | | Student Loan Asset-Backed Securities: 0.9% | | ||||||||||||
| 81,469 (2) | | | Commonbond Student Loan Trust 2018- CGS C, 4.350%, 02/25/2046 | | | | | 81,416 | | | | | | 0.0 | | |
| 305,544 (2) | | | ELFI Graduate Loan Program 2018-A B LLC, 4.000%, 08/25/2042 | | | | | 306,225 | | | | | | 0.0 | | |
| 967,407 (2)(4) | | | ELFI Graduate Loan Program 2019-A B LLC, 2.940%, 03/25/2044 | | | | | 951,550 | | | | | | 0.0 | | |
| 1,092,294 (2) | | | Laurel Road Prime Student Loan Trust 2018-B BFX, 3.720%, 05/26/2043 | | | | | 1,093,562 | | | | | | 0.1 | | |
| 4,000,000 (2) | | | SMB Private Education Loan Trust 2014-A C, 4.500%, 09/15/2045 | | | | | 3,715,818 | | | | | | 0.2 | | |
| 1,000,000 (2) | | | SMB Private Education Loan Trust 2017-A B, 3.500%, 06/17/2041 | | | | | 983,279 | | | | | | 0.0 | | |
| Principal Amount† | | | Value | | | Percentage of Net Assets | | |||||||||
| ASSET-BACKED SECURITIES: (continued) | | |||||||||||||||
| | | | Student Loan Asset-Backed Securities (continued) | | ||||||||||||
| 2,250,000 (2)(4) | | | SoFi Professional Loan Program 2017-A B LLC, 3.440%, 03/26/2040 | | | | $ | 2,256,844 | | | | | | 0.1 | | |
| 1,000,000 (2)(4) | | | SoFi Professional Loan Program 2017-A C, 4.430%, 03/26/2040 | | | | | 1,012,164 | | | | | | 0.1 | | |
| 1,000,000 (2)(4) | | | SoFi Professional Loan Program 2017-C C, 4.210%, 07/25/2040 | | | | | 998,089 | | | | | | 0.0 | | |
| 1,000,000 (2) | | | SoFi Professional Loan Program 2017-E C LLC, 4.160%, 11/26/2040 | | | | | 992,801 | | | | | | 0.0 | | |
| 1,000,000 (2) | | | Sofi Professional Loan Program 2018-D BFX Trust, 4.140%, 02/25/2048 | | | | | 987,802 | | | | | | 0.0 | | |
| 2,000,000 (2) | | | Sofi Professional Loan Program 2019-B BFX LLC, 3.730%, 08/17/2048 | | | | | 1,967,989 | | | | | | 0.1 | | |
| 3,000,000 (2) | | | Sofi Professional Loan Program 2019-C BFX LLC, 3.050%, 11/16/2048 | | | | | 2,899,002 | | | | | | 0.1 | | |
| 4,400,000 (2) | | | SoFi Professional Loan Program 2020-B BFX Trust, 2.730%, 05/15/2046 | | | | | 4,080,893 | | | | | | 0.2 | | |
| | | | | | | | | 22,327,434 | | | | | | 0.9 | | |
| | | | Total Asset-Backed Securities (Cost $332,703,007) | | | | | 326,717,928 | | | | | | 13.2 | | |
| SOVEREIGN BONDS: 2.6% | | |||||||||||||||
| 368,192 (9) | | | Argentine Republic Government International Bond, 0.500% (Step Rate @ 0.750% on 07/09/2027), 07/09/2030 | | | | | 124,268 | | | | | | 0.0 | | |
| 44,281 | | | Argentine Republic Government International Bond, 1.000%, 07/09/2029 | | | | | 15,236 | | | | | | 0.0 | | |
| 674,557 (9) | | | Argentine Republic Government International Bond, 1.125% (Step Rate @ 1.500% on 07/09/2022), 07/09/2035 | | | | | 206,522 | | | | | | 0.0 | | |
| Voya Strategic Income | PORTFOLIO OF INVESTMENTS |
| Opportunities Fund | as of March 31, 2022 (continued) |
| Principal Amount† | | | Value | | | Percentage of Net Assets | | |||||||||
| SOVEREIGN BONDS: (continued) | | |||||||||||||||
| 1,700,000 | | | Brazilian Government International Bond, 3.875%, 06/12/2030 | | | | $ | 1,570,205 | | | | | | 0.1 | | |
| 475,000 | | | Brazilian Government International Bond, 6.000%, 04/07/2026 | | | | | 515,506 | | | | | | 0.0 | | |
| 2,425,000 (1) | | | Colombia Government International Bond, 3.250%, 04/22/2032 | | | | | 2,030,622 | | | | | | 0.1 | | |
| 2,700,000 | | | Colombia Government International Bond, 3.875%, 04/25/2027 | | | | | 2,593,836 | | | | | | 0.1 | | |
| 1,000,000 | | | Colombia Government International Bond, 5.200%, 05/15/2049 | | | | | 856,020 | | | | | | 0.0 | | |
EUR 1,875,000 | | | Croatia Government International Bond, 1.125%, 06/19/2029 | | | | | 1,946,665 | | | | | | 0.1 | | |
| 800,000 | | | Croatia Government International Bond, 5.500%, 04/04/2023 | | | | | 826,184 | | | | | | 0.0 | | |
| 2,000,000 (1)(2) | | | Dominican Republic International Bond, 4.500%, 01/30/2030 | | | | | 1,840,020 | | | | | | 0.1 | | |
| 500,000 | | | Dominican Republic International Bond, 6.000%, 07/19/2028 | | | | | 508,755 | | | | | | 0.0 | | |
| 2,800,000 (1)(2) | | | Dominican Republic International Bond, 6.000%, 02/22/2033 | | | | | 2,743,328 | | | | | | 0.1 | | |
| 700,000 (1)(2) | | | Egypt Government International Bond, 5.875%, 02/16/2031 | | | | | 589,349 | | | | | | 0.0 | | |
| 1,900,000 (1) | | | Egypt Government International Bond, 6.588%, 02/21/2028 | | | | | 1,768,505 | | | | | | 0.1 | | |
| 2,650,000 | | | Egypt Government International Bond, 7.500%, 01/31/2027 | | | | | 2,618,287 | | | | | | 0.1 | | |
| 3,200,000 (2) | | | Egypt Government International Bond, 7.625%, 05/29/2032 | | | | | 2,907,267 | | | | | | 0.1 | | |
| 400,000 (2) | | | Egypt Government International Bond, 8.750%, 09/30/2051 | | | | | 345,757 | | | | | | 0.0 | | |
| 1,000,000 | | | Export-Import Bank of India, 2.250%, 01/13/2031 | | | | | 860,072 | | | | | | 0.0 | | |
| 1,400,000 (2) | | | Export-Import Bank of India, 3.250%, 01/15/2030 | | | | | 1,328,559 | | | | | | 0.1 | | |
| Principal Amount† | | | Value | | | Percentage of Net Assets | | |||||||||
| SOVEREIGN BONDS: (continued) | | |||||||||||||||
| 440,000 (2) | | | Gabon Government International Bond, 6.625%, 02/06/2031 | | | | $ | 418,374 | | | | | | 0.0 | | |
| 4,525,000 (2) | | | Ghana Government International Bond, 6.375%, 02/11/2027 | | | | | 3,417,484 | | | | | | 0.1 | | |
| 1,001,841 | | | Ivory Coast Government International Bond, 5.750%, 12/31/2032 | | | | | 986,123 | | | | | | 0.1 | | |
| 1,275,000 (2) | | | Jordan Government International Bond, 5.850%, 07/07/2030 | | | | | 1,192,205 | | | | | | 0.1 | | |
| 650,000 | | | Jordan Government International Bond, 6.125%, 01/29/2026 | | | | | 657,559 | | | | | | 0.0 | | |
| 1,350,000 (2) | | | Kenya Government International Bond, 7.000%, 05/22/2027 | | | | | 1,304,728 | | | | | | 0.1 | | |
| 750,000 (2) | | | Malaysia Wakala Sukuk Bhd, 2.070%, 04/28/2031 | | | | | 704,551 | | | | | | 0.0 | | |
| 1,200,000 (1) | | | Mexico Government International Bond, 3.250%, 04/16/2030 | | | | | 1,158,084 | | | | | | 0.1 | | |
| 950,000 | | | Mexico Government International Bond, 3.500%, 02/12/2034 | | | | | 885,391 | | | | | | 0.0 | | |
| 700,000 | | | Mexico Government International Bond, 3.750%, 04/19/2071 | | | | | 556,906 | | | | | | 0.0 | | |
| 1,600,000 (1) | | | Mexico Government International Bond, 4.500%, 04/22/2029 | | | | | 1,690,264 | | | | | | 0.1 | | |
| 450,000 | | | Nigeria Government International Bond, 6.500%, 11/28/2027 | | | | | 429,165 | | | | | | 0.0 | | |
| 600,000 | | | Oman Government International Bond, 6.000%, 08/01/2029 | | | | | 627,363 | | | | | | 0.0 | | |
| 500,000 (2) | | | Oman Government International Bond, 6.750%, 10/28/2027 | | | | | 545,037 | | | | | | 0.0 | | |
| 1,300,000 (2) | | | Oman Government International Bond, 7.375%, 10/28/2032 | | | | | 1,490,398 | | | | | | 0.1 | | |
| 600,000 | | | Panama Government International Bond, 3.160%, 01/23/2030 | | | | | 588,498 | | | | | | 0.0 | | |
| 1,200,000 (1) | | | Panama Government International Bond, 3.298%, 01/19/2033 | | | | | 1,148,130 | | | | | | 0.1 | | |
| Voya Strategic Income | PORTFOLIO OF INVESTMENTS |
| Opportunities Fund | as of March 31, 2022 (continued) |
| Principal Amount† | | | Value | | | Percentage of Net Assets | | |||||||||
| SOVEREIGN BONDS: (continued) | | |||||||||||||||
| 700,000 (1) | | | Republic of South Africa Government International Bond, 4.300%, 10/12/2028 | | | | $ | 678,294 | | | | | | 0.0 | | |
| 5,750,000 (1) | | | Republic of South Africa Government International Bond, 4.850%, 09/30/2029 | | | | | 5,636,369 | | | | | | 0.2 | | |
| 1,360,000 (1)(2) | | | Romanian Government International Bond, 3.000%, 02/14/2031 | | | | | 1,260,838 | | | | | | 0.1 | | |
| 1,800,000 (2) | | | Romanian Government International Bond, 3.625%, 03/27/2032 | | | | | 1,703,826 | | | | | | 0.1 | | |
| 800,000 | | | Russian Foreign Bond - Eurobond, 4.375%, 03/21/2029 | | | | | 128,000 | | | | | | 0.0 | | |
| 1,300,000 | | | South Africa Government International Bond, 5.875%, 09/16/2025 | | | | | 1,378,085 | | | | | | 0.1 | | |
| 950,000 | | | Sri Lanka Government International Bond, 6.350%, 06/28/2024 | | | | | 475,000 | | | | | | 0.0 | | |
| 3,075,000 | | | Turkey Government International Bond, 4.875%, 10/09/2026 | | | | | 2,781,457 | | | | | | 0.1 | | |
| 1,100,000 | | | Turkey Government International Bond, 5.600%, 11/14/2024 | | | | | 1,071,840 | | | | | | 0.1 | | |
| 500,000 | | | Turkey Government International Bond, 6.375%, 10/14/2025 | | | | | 490,650 | | | | | | 0.0 | | |
| 550,000 | | | Turkey Government International Bond, 7.375%, 02/05/2025 | | | | | 558,413 | | | | | | 0.0 | | |
| 350,000 (2) | | | Turkiye Ihracat Kredi Bankasi AS, 5.750%, 07/06/2026 | | | | | 321,379 | | | | | | 0.0 | | |
| 450,000 | | | Ukraine Government International Bond, 7.375%, 09/25/2032 | | | | | 185,625 | | | | | | 0.0 | | |
| 975,000 | | | Ukraine Government International Bond, 7.750%, 09/01/2023 | | | | | 487,500 | | | | | | 0.0 | | |
| 4,550,000 | | | Ukraine Government International Bond, 7.750%, 09/01/2025 | | | | | 1,933,750 | | | | | | 0.1 | | |
| Principal Amount† | | | Value | | | Percentage of Net Assets | | |||||||||
| SOVEREIGN BONDS: (continued) | | |||||||||||||||
| | | | Total Sovereign Bonds (Cost $72,263,395) | | | | $ | 63,086,249 | | | | | | 2.6 | | |
| BANK LOANS: 12.9% | | |||||||||||||||
| | | | Aerospace & Defense: 0.3% | | ||||||||||||
| 543,813 | | | ADS Tactical, Inc. 2021 Term Loan B, 6.750%, (US0003M + 5.750%), 03/19/2026 | | | | | 524,779 | | | | | | 0.0 | | |
| 95,000 | | | Amentum Government Services Holdings LLC 2022 Term Loan, 4.647%, (SOFRRATE + 4.000%), 02/15/2029 | | | | | 94,485 | | | | | | 0.0 | | |
| 1,040,412 | | | American Airlines, Inc. 2018 Term Loan B, 2.197%, (US0001M + 1.750%), 06/27/2025 | | | | | 982,214 | | | | | | 0.1 | | |
| 793,734 | | | Geo Group, Inc. (The) 2018 Term Loan B, 2.750%, (US0001M + 2.000%), 03/22/2024 | | | | | 743,691 | | | | | | 0.0 | | |
| 491,873 | | | KBR, Inc. 2020 Term Loan B, 3.207%, (US0001M + 2.750%), 02/05/2027 | | | | | 490,335 | | | | | | 0.0 | | |
| 3,011,124 | | | Peraton Corp. Term Loan B, 4.500%, (US0001M + 3.750%), 02/01/2028 | | | | | 2,990,691 | | | | | | 0.1 | | |
| 1,195,000 | | | Setanta Aircraft Leasing Designated Activity Compa Term Loan B, 3.006%, (US0003M + 2.000%), 11/05/2028 | | | | | 1,179,849 | | | | | | 0.1 | | |
| 360,000 | | | Vertex Aerospace Services Corp. 2021 First Lien Term Loan, 4.750%, (US0001M + 4.000%), 12/06/2028 | | | | | 359,325 | | | | | | 0.0 | | |
| | | | | | | | | 7,365,369 | | | | | | 0.3 | | |
| | | | Air Transport: 0.0% | | ||||||||||||
| 498,744 | | | United Airlines, Inc. 2021 Term Loan B, 4.500%, (US0003M + 3.750%), 04/21/2028 | | | | | 493,756 | | | | | | 0.0 | | |
| | | | | | | | | | | | | | | | | |
| Voya Strategic Income | PORTFOLIO OF INVESTMENTS |
| Opportunities Fund | as of March 31, 2022 (continued) |
| Principal Amount† | | | Value | | | Percentage of Net Assets | | |||||||||
| BANK LOANS: (continued) | | |||||||||||||||
| | | | Auto Components: 0.0% | | ||||||||||||
| 741,521 | | | Broadstreet Partners, Inc. 2020 Term Loan B, 3.457%, (US0001M + 3.000%), 01/27/2027 | | | | $ | 730,861 | | | | | | 0.0 | | |
| | | | | | | | | | | | | | | | | |
| | | | Automotive: 0.5% | | ||||||||||||
| 870,625 | | | Autokiniton US Holdings, Inc. 2021 Term Loan B, 5.000%, (US0003M + 4.500%), 04/06/2028 | | | | | 860,831 | | | | | | 0.0 | | |
| 1,195,000 | | | Avis Budget Car Rental, LLC 2022 Term Loan C, 4.000%, (SOFRRATE + 3.500%), 03/16/2029 | | | | | 1,188,278 | | | | | | 0.1 | | |
| 400,000 | | | Bright Bidco B.V. 2018 Term Loan B, 4.970%, (US0006M + 3.500%), 06/30/2024 | | | | | 242,500 | | | | | | 0.0 | | |
| 908,312 | | | Dealer Tire, LLC 2020 Term Loan B, 4.707%, (US0001M + 4.250%), 12/12/2025 | | | | | 902,408 | | | | | | 0.1 | | |
| 896,639 | | | Gates Global LLC 2021 Term Loan B3, 3.250%, (US0001M + 2.500%), 03/31/2027 | | | | | 886,391 | | | | | | 0.0 | | |
| 695,772 | | | Hertz Corporation, (The) 2021 Term Loan B, 3.707%, (US0001M + 3.250%), 06/30/2028 | | | | | 691,946 | | | | | | 0.0 | | |
| 131,785 | | | Hertz Corporation, (The) 2021 Term Loan C, 3.702%, (US0001M + 3.250%), 06/30/2028 | | | | | 131,061 | | | | | | 0.0 | | |
| 82,795 (10) | | | Holley Purchaser, Inc. 2021 Delayed Draw Term Loan, 4.576%, (US0003M + 3.750%), 11/17/2028 | | | | | 81,812 | | | | | | 0.0 | | |
| 495,900 | | | Holley Purchaser, Inc. 2021 Term Loan, 4.500%, (US0003M + 3.750%), 11/17/2028 | | | | | 490,011 | | | | | | 0.0 | | |
| 951,591 | | | Les Schwab Tire Centers Term Loan B, 4.000%, (US0003M + 3.250%), 11/02/2027 | | | | | 941,678 | | | | | | 0.1 | | |
| 738,816 | | | Mister Car Wash Holdings, Inc. 2019 Term Loan B, 3.457%, (US0001M + 3.000%), 05/14/2026 | | | | | 731,151 | | | | | | 0.0 | | |
| Principal Amount† | | | Value | | | Percentage of Net Assets | | |||||||||
| BANK LOANS: (continued) | | |||||||||||||||
| | | | Automotive (continued) | | ||||||||||||
| 285,000 | | | Rough Country, LLC 2021 2nd Lien Term Loan, 7.506%, (US0003M + 6.500%), 07/26/2029 | | | | $ | 283,931 | | | | | | 0.0 | | |
| 325,875 | | | Rough Country, LLC 2021 Term Loan, 4.506%, (US0003M + 3.500%), 07/28/2028 | | | | | 323,431 | | | | | | 0.0 | | |
| 596,915 | | | Tenneco, Inc. 2018 Term Loan B, 3.457%, (US0001M + 3.000%), 10/01/2025 | | | | | 591,816 | | | | | | 0.0 | | |
| 242,481 | | | TI Group Automotive Systems, L.L.C. 2021 USD Term Loan, 4.256%, (US0003M + 3.250%), 12/16/2026 | | | | | 239,905 | | | | | | 0.0 | | |
| 1,118,700 | | | Truck Hero, Inc. 2021 Term Loan B, 4.000%, (US0001M + 3.250%), 01/31/2028 | | | | | 1,086,886 | | | | | | 0.1 | | |
| 1,228,705 | | | Wand NewCo 3, Inc. 2020 Term Loan, 3.457%, (US0001M + 3.000%), 02/05/2026 | | | | | 1,195,223 | | | | | | 0.1 | | |
| 766,825 | | | Wheel Pros, LLC 2021 Term Loan, 5.250%, (US0001M + 4.500%), 05/11/2028 | | | | | 733,596 | | | | | | 0.0 | | |
| | | | | | | | | 11,602,855 | | | | | | 0.5 | | |
| | | | Beverage & Tobacco: 0.1% | | ||||||||||||
| 750,000 | | | Aramark Services, Inc. 2019 Term Loan B4, 2.207%, (US0001M + 1.750%), 01/15/2027 | | | | | 737,266 | | | | | | 0.0 | | |
| 25,364 | | | Naked Juice LLC Delayed Draw Term Loan, 3.750%, (SOFRRATE + 3.250%), 01/24/2029 | | | | | 24,991 | | | | | | 0.0 | | |
| 439,636 | | | Naked Juice LLC Term Loan, 3.750%, (SOFRRATE + 3.250%), 01/24/2029 | | | | | 433,179 | | | | | | 0.0 | | |
| 424,098 | | | Sunshine Investments B.V. USD Term Loan B3, 3.219%, (US0003M + 2.750%), 03/28/2025 | | | | | 421,447 | | | | | | 0.0 | | |
| Voya Strategic Income | PORTFOLIO OF INVESTMENTS |
| Opportunities Fund | as of March 31, 2022 (continued) |
| Principal Amount† | | | Value | | | Percentage of Net Assets | | |||||||||
| BANK LOANS: (continued) | | |||||||||||||||
| | | | Beverage & Tobacco (continued) | | ||||||||||||
| 1,474,597 | | | Triton Water Holdings, Inc Term Loan, 4.506%, (US0003M + 3.500%), 03/31/2028 | | | | $ | 1,441,879 | | | | | | 0.1 | | |
| | | | | | | | | 3,058,762 | | | | | | 0.1 | | |
| | | | Building & Development: 0.6% | | ||||||||||||
| 248,750 | | | Aegion Corporation Term Loan, 5.500%, (US0003M + 4.750%), 05/17/2028 | | | | | 247,817 | | | | | | 0.0 | | |
| 496,183 | | | American Builders & Contractors Supply Co., Inc. 2019 Term Loan, 2.457%, (US0001M + 2.000%), 01/15/2027 | | | | | 490,787 | | | | | | 0.0 | | |
| 1,145,000 | | | Chamberlain Group Inc Term Loan B, 4.506%, (US0003M + 3.500%), 11/03/2028 | | | | | 1,132,119 | | | | | | 0.1 | | |
| 848,159 | | | Core & Main LP 2021 Term Loan B, 2.947%, (US0001M + 2.500%), 07/27/2028 | | | | | 839,809 | | | | | | 0.1 | | |
| 746,241 | | | Cornerstone Building Brands, Inc. 2021 Term Loan B, 3.750%, (US0003M + 3.250%), 04/12/2028 | | | | | 724,320 | | | | | | 0.0 | | |
| 223,899 | | | CP Atlas Buyer, Inc. 2021 Term Loan B, 4.250%, (US0001M + 3.750%), 11/23/2027 | | | | | 218,161 | | | | | | 0.0 | | |
| 666,924 | | | Empire Today, LLC 2021 Term Loan, 5.750%, (US0006M + 5.000%), 04/03/2028 | | | | | 636,357 | | | | | | 0.0 | | |
| 670,000 | | | Foley Products Company, LLC 2021 Term Loan, 4.894%, (SOFRRATE + 4.750%), 12/29/2028 | | | | | 666,650 | | | | | | 0.0 | | |
| 560,763 | | | Foundation Building Materials Holding Company LLC 2021 Term Loan, 3.750%, (US0003M + 3.250%), 02/03/2028 | | | | | 550,949 | | | | | | 0.0 | | |
| 418,950 | | | Installed Building Products, Inc. 2021 Term Loan B, 2.750%, (US0001M + 2.250%), 12/14/2028 | | | | | 418,217 | | | | | | 0.0 | | |
| Principal Amount† | | | Value | | | Percentage of Net Assets | | |||||||||
| BANK LOANS: (continued) | | |||||||||||||||
| | | | Building & Development (continued) | | ||||||||||||
| 80,000 (10) | | | IPS Corporation 2021 Delayed Draw Term Loan, 4.712%, (US0003M + 3.750%), 10/02/2028 | | | | $ | 78,400 | | | | | | 0.0 | | |
| 400,000 | | | IPS Corporation 2021 Term Loan, 4.000%, (US0001M + 3.500%), 10/02/2028 | | | | | 392,000 | | | | | | 0.0 | | |
| 495,000 | | | Latham Pool Products, Inc. 2022 Term Loan B, 3.799%, (SOFRRATE + 3.750%), 02/23/2029 | | | | | 490,875 | | | | | | 0.0 | | |
| 998,154 | | | LBM Acquisition LLC Term Loan B, 4.500%, (US0001M + 3.750%), 12/17/2027 | | | | | 976,632 | | | | | | 0.1 | | |
| 641,875 | | | LEB Holdings (USA), Inc Term Loan B, 4.756%, (US0003M + 3.750%), 11/02/2027 | | | | | 639,067 | | | | | | 0.0 | | |
| 248,709 | | | MX Holdings US, Inc. 2018 USD Term Loan B1C, 3.250%, (US0001M + 2.500%), 07/31/2025 | | | | | 246,533 | | | | | | 0.0 | | |
| 628,823 | | | Northstar Group Services, INC. 2020 Term Loan B, 6.500%, (US0001M + 5.500%), 11/12/2026 | | | | | 626,465 | | | | | | 0.0 | | |
| 525,000 | | | Smyrna Ready Mix Concrete, LLC Term Loan B, 4.552%, (TSFR1M + 4.250%), 03/24/2029 | | | | | 519,094 | | | | | | 0.0 | | |
| 565,000 | | | Specialty Building Products Holdings, LLC 2021 Term Loan B, 4.250%, (US0001M + 3.750%), 10/15/2028 | | | | | 552,994 | | | | | | 0.0 | | |
| 1,009,925 | | | SRS Distribution Inc. 2021 Term Loan B, 4.000%, (US0003M + 3.500%), 06/02/2028 | | | | | 996,291 | | | | | | 0.1 | | |
| 1,708,869 | | | Standard Industries Inc. 2021 Term Loan B, 3.788%, (US0006M + 2.500%), 09/22/2028 | | | | | 1,703,315 | | | | | | 0.1 | | |
| 1,307,125 | | | White Cap Buyer LLC Term Loan B, 4.250%, (SOFRRATE + 3.750%), 10/19/2027 | | | | | 1,293,646 | | | | | | 0.1 | | |
| Voya Strategic Income | PORTFOLIO OF INVESTMENTS |
| Opportunities Fund | as of March 31, 2022 (continued) |
| Principal Amount† | | | Value | | | Percentage of Net Assets | | |||||||||
| BANK LOANS: (continued) | | |||||||||||||||
| | | | Building & Development (continued) | | ||||||||||||
| 399,903 | | | Wilsonart LLC 2021 Term Loan E, 4.250%, (US0003M + 3.250%), 12/31/2026 | | | | $ | 390,477 | | | | | | 0.0 | | |
| | | | | | | | | 14,830,975 | | | | | | 0.6 | | |
| | | | Business Equipment & Services: 1.3% | | ||||||||||||
| 402,912 | | | 24-7 Intouch Inc 2018 Term Loan, 5.207%, (US0001M + 4.750%), 08/25/2025 | | | | | 396,869 | | | | | | 0.0 | | |
| 966,459 | | | AlixPartners, LLP 2021 USD Term Loan B, 3.250%, (US0001M + 2.750%), 02/04/2028 | | | | | 953,875 | | | | | | 0.1 | | |
| 776,100 | | | Allied Universal Holdco LLC 2021 USD Incremental Term Loan B, 4.250%, (US0001M + 3.750%), 05/12/2028 | | | | | 766,075 | | | | | | 0.0 | | |
| 588,525 | | | Anticimex International AB 2021 USD Incremental Term Loan, 4.508%, (US0003M + 4.000%), 11/16/2028 | | | | | 584,847 | | | | | | 0.0 | | |
| 916,450 | | | APX Group, Inc. 2021 Term Loan B, 4.005%, (US0001M + 3.500%), 07/10/2028 | | | | | 905,949 | | | | | | 0.1 | | |
| 775,000 | | | Ascend Learning, LLC 2021 Term Loan, 4.000%, (US0001M + 3.500%), 12/11/2028 | | | | | 766,766 | | | | | | 0.0 | | |
| 428,872 | | | Atlas CC Acquisition Corp Term Loan B, 5.000%, (US0003M + 4.250%), 05/25/2028 | | | | | 428,068 | | | | | | 0.0 | | |
| 87,228 | | | Atlas CC Acquisition Corp Term Loan C, 5.000%, (US0003M + 4.250%), 05/25/2028 | | | | | 87,065 | | | | | | 0.0 | | |
| 785,000 | | | Belfor Holdings Inc. 2022 Incremental Term Loan, 4.540%, (SOFRRATE + 4.250%), 04/06/2026 | | | | | 782,056 | | | | | | 0.0 | | |
| 440,471 | | | Belfor Holdings Inc. Term Loan B, 4.207%, (US0001M + 3.750%), 04/06/2026 | | | | | 438,819 | | | | | | 0.0 | | |
| Principal Amount† | | | Value | | | Percentage of Net Assets | | |||||||||
| BANK LOANS: (continued) | | |||||||||||||||
| | | | Business Equipment & Services (continued) | | ||||||||||||
| 462,094 | | | Castle US Holding Corporation 2021 Incremental Term Loan B, 5.006%, (US0003M + 4.000%), 01/29/2027 | | | | $ | 447,846 | | | | | | 0.0 | | |
| 432,825 | | | Cimpress Public Limited Company USD Term Loan B, 4.000%, (US0001M + 3.500%), 05/17/2028 | | | | | 428,767 | | | | | | 0.0 | | |
| 160,000 | | | DG Investment Intermediate Holdings 2, Inc. 2021 2nd Lien Term Loan, 7.500%, (US0001M + 6.750%), 03/30/2029 | | | | | 160,000 | | | | | | 0.0 | | |
| 808,900 | | | DG Investment Intermediate Holdings 2, Inc. 2021 Term Loan, 4.250%, (US0001M + 3.500%), 03/31/2028 | | | | | 802,074 | | | | | | 0.0 | | |
| 1,482,550 | | | Endure Digital Inc. Term Loan, 4.250%, (US0003M + 3.500%), 02/10/2028 | | | | | 1,439,000 | | | | | | 0.1 | | |
| 857,850 | | | Ensono, LP 2021 Term Loan, 4.750%, (US0003M + 4.000%), 05/26/2028 | | | | | 845,250 | | | | | | 0.0 | | |
| 230,000 | | | EP Purchaser, LLC 2021 Term Loan B, 4.506%, (US0003M + 3.500%), 11/06/2028 | | | | | 228,802 | | | | | | 0.0 | | |
| 285,000 | | | Escape Velocity Acquisition, Inc. 2021 Term Loan, 5.256%, (US0003M + 4.250%), 10/08/2028 | | | | | 280,369 | | | | | | 0.0 | | |
| 1,057,338 | | | Finastra USA, Inc. USD 1st Lien Term Loan, 4.500%, (US0003M + 3.500%), 06/13/2024 | | | | | 1,045,113 | | | | | | 0.1 | | |
| 220,984 | | | First Advantage Holdings, LLC 2021 Term Loan B, 3.195%, (US0001M + 2.750%), 01/31/2027 | | | | | 219,630 | | | | | | 0.0 | | |
| 248,126 | | | Fleetcor Technologies Operating Company, LLC 2021 Term Loan B4, 2.195%, (US0001M + 1.750%), 04/28/2028 | | | | | 244,537 | | | | | | 0.0 | | |
| Voya Strategic Income | PORTFOLIO OF INVESTMENTS |
| Opportunities Fund | as of March 31, 2022 (continued) |
| Principal Amount† | | | Value | | | Percentage of Net Assets | | |||||||||
| BANK LOANS: (continued) | | |||||||||||||||
| | | | Business Equipment & Services (continued) | | ||||||||||||
| 1,042,790 | | | Gainwell Acquisition Corp. Term Loan B, 5.006%, (US0003M + 4.000%), 10/01/2027 | | | | $ | 1,038,880 | | | | | | 0.1 | | |
| 798,962 | | | Gloves Buyer, Inc. 2021 Term Loan, 4.750%, (US0001M + 4.000%), 12/29/2027 | | | | | 786,978 | | | | | | 0.0 | | |
| 1,285,275 | | | Intrado Corporation 2017 Term Loan, 5.000%, (US0003M + 4.000%), 10/10/2024 | | | | | 1,178,781 | | | | | | 0.1 | | |
| 555,800 | | | ION Trading Finance Limited 2021 USD Term Loan, 5.207%, (US0003M + 4.750%), 04/03/2028 | | | | | 552,531 | | | | | | 0.0 | | |
| 731,437 | | | KUEHG Corp. 2018 Incremental Term Loan, 4.756%, (US0003M + 3.750%), 02/21/2025 | | | | | 722,751 | | | | | | 0.0 | | |
| 1,023,444 | | | Paysafe Holdings (US) Corp USD Term Loan B1, 3.250%, (US0001M + 2.750%), 06/28/2028 | | | | | 982,933 | | | | | | 0.1 | | |
| 220,000 | | | PECF USS Intermediate Holding III Corporation Term Loan B, 4.758%, (US0003M + 4.250%), 12/15/2028 | | | | | 218,272 | | | | | | 0.0 | | |
| 1,253,700 | | | Polaris Newco LLC USD Term Loan B, 4.500%, (US0001M + 4.000%), 06/02/2028 | | | | | 1,246,335 | | | | | | 0.1 | | |
| 75,000 | | | Pre-Paid Legal Services, Inc. 2021 2nd Lien Term Loan, 8.006%, (US0003M + 7.000%), 12/14/2029 | | | | | 74,156 | | | | | | 0.0 | | |
| 955,000 | | | Pre-Paid Legal Services, Inc. 2021 Term Loan, 4.250%, (US0001M + 3.750%), 12/15/2028 | | | | | 944,754 | | | | | | 0.1 | | |
| 496,144 | | | Red Ventures, LLC 2020 Term Loan B2, 2.957%, (US0001M + 2.500%), 11/08/2024 | | | | | 490,810 | | | | | | 0.0 | | |
| 35,553 (10) | | | Refficiency Holdings LLC 2021 Delayed Draw Term Loan, 4.500%, (US0003M + 3.750%), 12/16/2027 | | | | | 35,175 | | | | | | 0.0 | | |
| Principal Amount† | | | Value | | | Percentage of Net Assets | | |||||||||
| BANK LOANS: (continued) | | |||||||||||||||
| | | | Business Equipment & Services (continued) | | ||||||||||||
| 182,584 | | | Refficiency Holdings LLC 2021 Term Loan, 4.500%, (US0001M + 3.750%), 12/16/2027 | | | | $ | 180,644 | | | | | | 0.0 | | |
| 625,000 | | | Renaissance Holding Corp. 2018 2nd Lien Term Loan, 7.457%, (US0001M + 7.000%), 05/29/2026 | | | | | 621,094 | | | | | | 0.0 | | |
| 50,000 | | | Renaissance Holding Corp. 2022 Incremental Term Loan, 4.790%, (SOFRRATE + 4.500%), 03/17/2027 | | | | | 49,771 | | | | | | 0.0 | | |
| 1,000,000 | | | Research Now Group, Inc. 2017 1st Lien Term Loan, 6.500%, (US0006M + 5.500%), 12/20/2024 | | | | | 984,688 | | | | | | 0.1 | | |
| 751,089 | | | Rockwood Service Corporation 2020 Term Loan, 4.457%, (US0001M + 4.000%), 01/23/2027 | | | | | 751,558 | | | | | | 0.0 | | |
| 750,000 | | | Sandvine Corporation 2018 1st Lien Term Loan, 4.957%, (US0001M + 4.500%), 10/31/2025 | | | | | 742,500 | | | | | | 0.0 | | |
| 65,082 (10) | | | Service Logic Acquisition, Inc Delayed Draw Term Loan, 4.962%, (US0003M + 4.000%), 10/29/2027 | | | | | 64,594 | | | | | | 0.0 | | |
| 784,469 | | | Service Logic Acquisition, Inc Term Loan, 4.750%, (US0002M + 4.000%), 10/29/2027 | | | | | 778,586 | | | | | | 0.0 | | |
| 1,154,200 | | | Skopima Merger Sub Inc. Term Loan B, 4.500%, (US0001M + 4.000%), 05/12/2028 | | | | | 1,142,947 | | | | | | 0.1 | | |
| 497,429 | | | SSH Group Holdings, Inc. 2018 1st Lien Term Loan, 5.256%, (US0003M + 4.250%), 07/30/2025 | | | | | 483,750 | | | | | | 0.0 | | |
| 1,032,776 | | | Staples, Inc. 7 Year Term Loan, 5.317%, (US0003M + 5.000%), 04/16/2026 | | | | | 978,038 | | | | | | 0.1 | | |
| 314,989 | | | SurveyMonkey Inc. 2018 Term Loan B, 4.210%, (US0001M + 3.750%), 10/10/2025 | | | | | 313,414 | | | | | | 0.0 | | |
| Voya Strategic Income | PORTFOLIO OF INVESTMENTS |
| Opportunities Fund | as of March 31, 2022 (continued) |
| Principal Amount† | | | Value | | | Percentage of Net Assets | | |||||||||
| BANK LOANS: (continued) | | |||||||||||||||
| | | | Business Equipment & Services (continued) | | ||||||||||||
| 651,750 | | | TruGreen Limited Partnership 2020 Term Loan, 4.750%, (US0001M + 4.000%), 11/02/2027 | | | | $ | 649,306 | | | | | | 0.0 | | |
| 1,729,237 | | | Verscend Holding Corp. 2021 Term Loan B, 4.457%, (US0001M + 4.000%), 08/27/2025 | | | | | 1,727,075 | | | | | | 0.1 | | |
| 780,356 | | | Virtusa Corporation First Lien Term Loan B, 4.500%, (US0001M + 3.750%), 02/11/2028 | | | | | 772,309 | | | | | | 0.0 | | |
| 470,669 | | | VM Consolidated, Inc. 2021 Term Loan B, 4.256%, (US0003M + 3.250%), 03/19/2028 | | | | | 468,512 | | | | | | 0.0 | | |
| 8,975 (10) | | | VT Topco, Inc. 2021 Delayed Draw Term Loan, 4.712%, (US0003M + 3.750%), 08/01/2025 | | | | | 8,902 | | | | | | 0.0 | | |
| 135,830 | | | VT Topco, Inc. 2021 Incremental Term Loan, 4.500%, (US0001M + 3.750%), 08/01/2025 | | | | | 134,726 | | | | | | 0.0 | | |
| 567,150 | | | Waterlogic Holdings Limited 2021 USD Term Loan B, 5.756%, (US0003M + 4.750%), 08/04/2028 | | | | | 566,441 | | | | | | 0.0 | | |
| 377,324 | | | West Corporation 2018 Term Loan B1, 4.500%, (US0003M + 3.500%), 10/10/2024 | | | | | 342,799 | | | | | | 0.0 | | |
| 332,687 | | | Yak Access, LLC 2018 1st Lien Term Loan B, 5.508%, (US0003M + 5.000%), 07/11/2025 | | | | | 295,676 | | | | | | 0.0 | | |
| 208,333 | | | Yak Access, LLC 2018 2nd Lien Term Loan B, 10.954%, (US0003M + 10.000%), 07/10/2026 | | | | | 136,198 | | | | | | 0.0 | | |
| | | | | | | | | 32,717,661 | | | | | | 1.3 | | |
| | | | Cable & Satellite Television: 0.4% | | ||||||||||||
| 585,000 | | | Atlantic Broadband Finance, LLC 2021 Term Loan, 3.000%, (US0001M + 2.500%), 09/01/2028 | | | | | 581,918 | | | | | | 0.0 | | |
| Principal Amount† | | | Value | | | Percentage of Net Assets | | |||||||||
| BANK LOANS: (continued) | | |||||||||||||||
| | | | Cable & Satellite Television (continued) | | ||||||||||||
| 218,666 | | | CSC Holdings, LLC 2019 Term Loan B5, 2.897%, (US0001M + 2.500%), 04/15/2027 | | | | $ | 215,332 | | | | | | 0.0 | | |
| 2,038,925 | | | DirecTV Financing, LLC Term Loan, 5.750%, (US0001M + 5.000%), 08/02/2027 | | | | | 2,039,137 | | | | | | 0.1 | | |
| 1,501,238 | | | Radiate Holdco, LLC 2021 Term Loan B, 4.000%, (US0001M + 3.250%), 09/25/2026 | | | | | 1,490,514 | | | | | | 0.1 | | |
| 2,747,551 | | | Telesat Canada Term Loan B5, 3.207%, (US0001M + 2.750%), 12/07/2026 | | | | | 2,060,663 | | | | | | 0.1 | | |
| 1,250,000 | | | UPC Financing Partnership 2021 USD Term Loan AX, 3.397%, (US0003M + 3.000%), 01/31/2029 | | | | | 1,239,688 | | | | | | 0.1 | | |
| 900,000 | | | Virgin Media Bristol LLC 2020 USD Term Loan Q, 3.647%, (US0001M + 3.250%), 01/31/2029 | | | | | 894,235 | | | | | | 0.0 | | |
| 335,000 | | | WideOpenWest Finance LLC 2021 Term Loan B, 3.500%, (SOFRRATE + 3.000%), 12/20/2028 | | | | | 333,639 | | | | | | 0.0 | | |
| | | | | | | | | 8,855,126 | | | | | | 0.4 | | |
| | | | Chemicals & Plastics: 0.5% | | ||||||||||||
| 323,375 | | | Avantor Funding, Inc. 2021 Term Loan B5, 2.750%, (US0001M + 2.250%), 11/08/2027 | | | | | 321,421 | | | | | | 0.0 | | |
| 495,557 | | | Axalta Coating Systems US Holdings Inc. USD Term Loan B3, 2.756%, (US0003M + 1.750%), 06/01/2024 | | | | | 492,357 | | | | | | 0.0 | | |
| 115,000 | | | CPC Acquisition Corp Second Lien Term Loan, 8.712%, (US0003M + 7.750%), 12/29/2028 | | | | | 111,262 | | | | | | 0.0 | | |
| 472,625 | | | GEON Performance Solutions, LLC 2021 Term Loan, 5.500%, (US0001M + 4.750%), 08/18/2028 | | | | | 472,034 | | | | | | 0.0 | | |
| Voya Strategic Income | PORTFOLIO OF INVESTMENTS |
| Opportunities Fund | as of March 31, 2022 (continued) |
| Principal Amount† | | | Value | | | Percentage of Net Assets | | |||||||||
| BANK LOANS: (continued) | | |||||||||||||||
| | | | Chemicals & Plastics (continued) | | ||||||||||||
| 1,060,000 | | | Hexion Holdings Corporation 2022 USD Term Loan, 5.000%, (SOFRRATE + 4.500%), 03/15/2029 | | | | $ | 1,039,463 | | | | | | 0.1 | | |
| 305,000 | | | Hexion Inc 2022 2nd Lien Term Loan, 7.049%, (SOFRRATE + 7.000%), 03/02/2030 | | | | | 295,850 | | | | | | 0.0 | | |
| 1,060,292 | | | INEOS Styrolution US Holding LLC 2021 USD Term Loan B, 3.250%, (US0001M + 2.750%), 01/29/2026 | | | | | 1,041,957 | | | | | | 0.1 | | |
| 550,000 | | | Ineos US Finance LLC 2021 USD Term Loan B, 3.712%, (US0003M + 2.750%), 11/08/2028 | | | | | 541,063 | | | | | | 0.0 | | |
| 288,550 | | | Lonza Group AG USD Term Loan B, 4.750%, (US0006M + 4.000%), 07/03/2028 | | | | | 282,508 | | | | | | 0.0 | | |
| 830,000 | | | LSF11 A5 Holdco LLC Term Loan, 4.000%, (SOFRRATE + 3.500%), 10/15/2028 | | | | | 818,934 | | | | | | 0.1 | | |
| 763,088 | | | Olympus Water US Holding Corporation 2021 USD Term Loan B, 4.746%, (US0003M + 3.750%), 11/09/2028 | | | | | 745,237 | | | | | | 0.0 | | |
| 145,000 | | | Olympus Water US Holding Corporation Term Loan B, 5.000%, (TSFR1M + 3.000%), 11/09/2028 | | | | | 142,100 | | | | | | 0.0 | | |
| 608,836 | | | Polar US Borrower, LLC 2018 1st Lien Term Loan, 4.926%, (US0003M + 4.750%), 10/15/2025 | | | | | 592,093 | | | | | | 0.0 | | |
| 655,050 | | | Potters Industries, LLC Term Loan B, 4.962%, (US0003M + 4.000%), 12/14/2027 | | | | | 653,822 | | | | | | 0.0 | | |
| 593,250 | | | PQ Corporation 2021 Term Loan B, 3.250%, (US0003M + 2.500%), 06/09/2028 | | | | | 587,169 | | | | | | 0.0 | | |
| Principal Amount† | | | Value | | | Percentage of Net Assets | | |||||||||
| BANK LOANS: (continued) | | |||||||||||||||
| | | | Chemicals & Plastics (continued) | | ||||||||||||
| 525,000 | | | Sparta U.S. HoldCo LLC 2021 Term Loan, 4.250%, (US0001M + 3.500%), 08/02/2028 | | | | $ | 523,031 | | | | | | 0.0 | | |
| 1,227,915 | | | Starfruit Finco B.V 2018 USD Term Loan B, 4.006%, (US0003M + 3.000%), 10/01/2025 | | | | | 1,210,008 | | | | | | 0.1 | | |
| 204,257 | | | Tronox Finance LLC 2021 Term Loan B, 3.164%, (US0003M + 2.250%), 03/10/2028 | | | | | 201,193 | | | | | | 0.0 | | |
| 1,000,000 | | | Tronox Finance LLC 2022 Term Loan, 3.540%, (SOFRRATE + 3.250%), 03/03/2029 | | | | | 996,250 | | | | | | 0.1 | | |
| | | | | | | | | 11,067,752 | | | | | | 0.5 | | |
| | | | Clothing/Textiles: 0.0% | | ||||||||||||
| 411,045 | | | ABG Intermediate Holdings 2 LLC 2021 Delayed Draw Term Loan B2, 3.790%, (SOFRRATE + 3.500%), 12/08/2028 | | | | | 405,735 | | | | | | 0.0 | | |
| 64,478 | | | ABG Intermediate Holdings 2 LLC 2021 Delayed Draw Term Loan B3, 3.790%, (SOFRRATE + 3.500%), 12/08/2028 | | | | | 63,645 | | | | | | 0.0 | | |
| 64,478 | | | ABG Intermediate Holdings 2 LLC 2021 Term Loan B1, 3.790%, (SOFRRATE + 3.500%), 12/21/2028 | | | | | 63,645 | | | | | | 0.0 | | |
| 338,300 | | | Birkenstock GmbH & Co. KG USD Term Loan B, 3.750%, (US0006M + 3.250%), 04/28/2028 | | | | | 335,199 | | | | | | 0.0 | | |
| 55,000 | | | Crocs Inc Term Loan B, 4.447%, (SOFRRATE + 3.500%), 02/20/2029 | | | | | 53,848 | | | | | | 0.0 | | |
| | | | | | | | | 922,072 | | | | | | 0.0 | | |
| | | | Conglomerates: 0.0% | | ||||||||||||
| 264,379 | | | Fender Musical Instruments Corporation 2021 Term Loan B, 4.500%, (SOFRRATE + 4.000%), 12/01/2028 | | | | | 262,727 | | | | | | 0.0 | | |
| Voya Strategic Income | PORTFOLIO OF INVESTMENTS |
| Opportunities Fund | as of March 31, 2022 (continued) |
| Principal Amount† | | | Value | | | Percentage of Net Assets | | |||||||||
| BANK LOANS: (continued) | | |||||||||||||||
| | | | Containers & Glass Products: 0.5% | | ||||||||||||
| 148,458 | | | Albea Beauty Holdings S.A 2018 USD Term Loan B2, 4.006%, (US0003M + 3.000%), 04/22/2024 | | | | $ | 144,375 | | | | | | 0.0 | | |
| 640,744 | | | Altium Packaging LLC 2021 Term Loan B, 3.250%, (US0001M + 2.750%), 02/03/2028 | | | | | 619,439 | | | | | | 0.0 | | |
| 1,151,211 | | | BWAY Holding Company 2017 Term Loan B, 3.481%, (US0001M + 3.250%), 04/03/2024 | | | | | 1,137,541 | | | | | | 0.1 | | |
| 1,050,233 | | | Charter NEX US, Inc. 2021 Term Loan, 4.500%, (US0001M + 3.750%), 12/01/2027 | | | | | 1,044,435 | | | | | | 0.1 | | |
| 630,000 | | | Clydesdale Acquisition Holdings Inc Term Loan, 4.552%, (TSFR1M + 4.250%), 03/30/2029 | | | | | 620,100 | | | | | | 0.0 | | |
| 743,305 | | | Flex Acquisition Company, Inc. 2018 Incremental Term Loan, 3.962%, (US0003M + 3.000%), 06/29/2025 | | | | | 742,840 | | | | | | 0.1 | | |
| 570,000 | | | Plastipak Packaging, Inc. 2021 Term Loan B, 2.952%, (US0001M + 2.500%), 12/01/2028 | | | | | 560,263 | | | | | | 0.0 | | |
| 489,345 | | | Plaze, Inc. 2020 Incremental Term Loan, 4.712%, (US0003M + 3.750%), 08/03/2026 | | | | | 473,441 | | | | | | 0.0 | | |
| 641,388 | | | Pretium PKG Holdings, Inc. 2021 1st Lien Term Loan, 4.500%, (US0001M + 4.000%), 10/02/2028 | | | | | 624,551 | | | | | | 0.0 | | |
| 205,000 | | | Pretium PKG Holdings, Inc. 2021 2nd Lien Term Loan, 7.250%, (US0003M + 6.750%), 10/01/2029 | | | | | 199,619 | | | | | | 0.0 | | |
| 168,575 (10) | | | Pro Mach Group, Inc. 2021 Delayed Draw Term Loan, 5.000%, (US0003M + 4.000%), 08/31/2028 | | | | | 168,049 | | | | | | 0.0 | | |
| 1,021,425 | | | Pro Mach Group, Inc. 2021 Term Loan B, 5.000%, (US0003M + 4.000%), 08/31/2028 | | | | | 1,018,233 | | | | | | 0.1 | | |
| Principal Amount† | | | Value | | | Percentage of Net Assets | | |||||||||
| BANK LOANS: (continued) | | |||||||||||||||
| | | | Containers & Glass Products (continued) | | ||||||||||||
| 1,312,057 | | | Proampac PG Borrower LLC 2020 Term Loan, 4.630%, (US0003M + 3.750%), 11/03/2025 | | | | $ | 1,286,908 | | | | | | 0.1 | | |
| 495,671 | | | Reynolds Consumer Products LLC Term Loan, 2.207%, (US0001M + 1.750%), 02/04/2027 | | | | | 488,979 | | | | | | 0.0 | | |
| 538,418 | | | Reynolds Group Holdings Inc. 2020 Term Loan B2, 3.707%, (US0001M + 3.250%), 02/05/2026 | | | | | 525,150 | | | | | | 0.0 | | |
| 598,234 | | | Reynolds Group Holdings Inc. 2021 Term Loan B, 4.000%, (US0001M + 3.500%), 09/20/2028 | | | | | 583,578 | | | | | | 0.0 | | |
| 654,517 | | | Tosca Services, LLC 2021 Term Loan, 4.250%, (US0001M + 3.500%), 08/18/2027 | | | | | 642,244 | | | | | | 0.0 | | |
| 488,769 | | | TricorBraun Holdings, Inc. 2021 Term Loan, 3.750%, (US0001M + 3.250%), 03/03/2028 | | | | | 477,597 | | | | | | 0.0 | | |
| 68,265 (10) | | | Trident TPI Holdings, Inc. 2021 Delayed Draw Term Loan, 5.006%, (US0003M + 4.000%), 09/15/2028 | | | | | 67,554 | | | | | | 0.0 | | |
| 618,692 | | | Trident TPI Holdings, Inc. 2021 Incremental Term Loan, 4.500%, (US0001M + 4.000%), 09/15/2028 | | | | | 612,247 | | | | | | 0.0 | | |
| 430,000 | | | Valcour Packaging LLC 2021 1st Lien Term Loan, 4.250%, (US0003M + 3.750%), 10/04/2028 | | | | | 421,400 | | | | | | 0.0 | | |
| 200,000 | | | Valcour Packaging LLC 2021 2nd Lien Term Loan, 7.500%, (US0003M + 7.000%), 10/04/2029 | | | | | 191,000 | | | | | | 0.0 | | |
| | | | | | | | | 12,649,543 | | | | | | 0.5 | | |
| | | | Cosmetics/Toiletries: 0.0% | | ||||||||||||
| 496,511 | | | Anastasia Parent, LLC 2018 Term Loan B, 4.756%, (US0003M + 3.750%), 08/11/2025 | | | | | 435,378 | | | | | | 0.0 | | |
| | | | | | | | | | | | | | | | | |
| Voya Strategic Income | PORTFOLIO OF INVESTMENTS |
| Opportunities Fund | as of March 31, 2022 (continued) |
| Principal Amount† | | | Value | | | Percentage of Net Assets | | |||||||||
| BANK LOANS: (continued) | | |||||||||||||||
| | | | Drugs: 0.3% | | ||||||||||||
| 481,250 | | | Alvogen Pharma US, Inc. 2020 Extended Term Loan, 6.260%, (US0003M + 5.250%), 12/31/2023 | | | | $ | 450,871 | | | | | | 0.0 | | |
| 744,168 | | | Amneal Pharmaceuticals LLC 2018 Term Loan B, 3.947%, (US0001M + 3.500%), 05/04/2025 | | | | | 734,401 | | | | | | 0.0 | | |
| 304,238 | | | ANI Pharmaceuticals, Inc Term Loan B, 6.750%, (US0001M + 6.000%), 04/27/2028 | | | | | 304,238 | | | | | | 0.0 | | |
| 1,392,965 | | | Endo Luxembourg Finance Company I S.a r.l. 2021 Term Loan, 5.750%, (US0001M + 5.000%), 03/27/2028 | | | | | 1,306,775 | | | | | | 0.1 | | |
| 1,613,807 | | | Jazz Financing Lux S.a.r.l. USD Term Loan, 4.000%, (US0001M + 3.500%), 05/05/2028 | | | | | 1,610,333 | | | | | | 0.1 | | |
| 1,590,875 | | | Organon & Co USD Term Loan, 3.563%, (US0003M + 3.000%), 06/02/2028 | | | | | 1,584,163 | | | | | | 0.1 | | |
| | | | | | | | | 5,990,781 | | | | | | 0.3 | | |
| | | | Ecological Services & Equipment: 0.1% | | ||||||||||||
| 540,000 | | | Clean Harbors Inc. 2021 Incremental Term Loan B, 2.457%, (US0001M + 2.000%), 10/08/2028 | | | | | 536,828 | | | | | | 0.0 | | |
| 660,013 | | | Denali Water Solutions Term Loan B, 5.216%, (US0003M + 4.250%), 03/25/2028 | | | | | 646,812 | | | | | | 0.0 | | |
| 1,026,026 | | | GFL Environmental Inc. 2020 Term Loan, 3.500%, (US0003M + 3.000%), 05/30/2025 | | | | | 1,023,552 | | | | | | 0.1 | | |
| | | | | | | | | 2,207,192 | | | | | | 0.1 | | |
| | | | Electronics/Electrical: 1.6% | | ||||||||||||
| 410,000 | | | Altar Bidco, Inc. 2021 2nd Lien Term Loan, 6.100%, (US0001M + 5.600%), 02/01/2030 | | | | | 405,900 | | | | | | 0.0 | | |
| 5,000 | | | Altar Bidco, Inc. 2021 Term Loan, 3.850%, (SOFRRATE + 3.350%), 02/01/2029 | | | | | 4,944 | | | | | | 0.0 | | |
| Principal Amount† | | | Value | | | Percentage of Net Assets | | |||||||||
| BANK LOANS: (continued) | | |||||||||||||||
| | | | Electronics/Electrical (continued) | | ||||||||||||
| 405,119 | | | AP Core Holdings II, LLC Amortization Term Loan B1, 6.250%, (US0001M + 5.500%), 09/01/2027 | | | | $ | 403,430 | | | | | | 0.0 | | |
| 680,000 | | | AP Core Holdings II, LLC High-Yield Term Loan B2, 6.250%, (US0001M + 5.500%), 09/01/2027 | | | | | 676,884 | | | | | | 0.0 | | |
| 328,350 | | | Atlas Purchaser, Inc. 2021 Term Loan, 6.000%, (US0003M + 5.250%), 05/08/2028 | | | | | 319,731 | | | | | | 0.0 | | |
| 375,000 | | | Banff Merger Sub Inc 2021 USD 2nd Lien Term Loan, 6.000%, (US0001M + 5.500%), 02/27/2026 | | | | | 372,304 | | | | | | 0.0 | | |
| 1,999,189 | | | Banff Merger Sub Inc 2021 USD Term Loan, 4.756%, (US0003M + 3.750%), 10/02/2025 | | | | | 1,989,646 | | | | | | 0.1 | | |
| 709,083 | | | Barracuda Networks, Inc. 1st Lien Term Loan, 4.733%, (US0003M + 3.750%), 02/12/2025 | | | | | 707,133 | | | | | | 0.0 | | |
| 384,930 | | | CentralSquare Technologies, LLC 2018 1st Lien Term Loan, 4.760%, (US0003M + 3.750%), 08/29/2025 | | | | | 364,529 | | | | | | 0.0 | | |
| 935,000 | | | Cloudera, Inc. 2021 Term Loan, 4.250%, (US0001M + 3.750%), 10/08/2028 | | | | | 926,819 | | | | | | 0.1 | | |
| 131,189 | | | Cohu, Inc. 2018 Term Loan B, 3.519%, (US0001M + 3.000%), 10/01/2025 | | | | | 130,287 | | | | | | 0.0 | | |
| 299,250 | | | ConnectWise, LLC 2021 Term Loan B, 4.000%, (US0001M + 3.500%), 09/29/2028 | | | | | 297,679 | | | | | | 0.0 | | |
| 697,241 | | | Constant Contact Inc Term Loan, 4.750%, (US0003M + 4.000%), 02/10/2028 | | | | | 690,269 | | | | | | 0.0 | | |
| 1,999,988 | | | CoreLogic, Inc. Term Loan, 4.000%, (US0001M + 3.500%), 06/02/2028 | | | | | 1,972,988 | | | | | | 0.1 | | |
| Voya Strategic Income | PORTFOLIO OF INVESTMENTS |
| Opportunities Fund | as of March 31, 2022 (continued) |
| Principal Amount† | | | Value | | | Percentage of Net Assets | | |||||||||
| BANK LOANS: (continued) | | |||||||||||||||
| | | | Electronics/Electrical (continued) | | ||||||||||||
| 1,345,000 | | | Cornerstone OnDemand, Inc. 2021 Term Loan, 4.250%, (US0003M + 3.750%), 10/16/2028 | | | | $ | 1,333,231 | | | | | | 0.1 | | |
| 485,000 | | | Creation Technologies Inc. 2021 Term Loan, 6.000%, (US0003M + 5.500%), 10/05/2028 | | | | | 474,694 | | | | | | 0.0 | | |
| 724,525 | | | Delta TopCo, Inc. 2020 Term Loan B, 4.500%, (US0003M + 3.750%), 12/01/2027 | | | | | 714,045 | | | | | | 0.0 | | |
| 744,231 | | | EagleView Technology Corporation 2018 Add On Term Loan B, 4.506%, (US0003M + 3.500%), 08/14/2025 | | | | | 725,160 | | | | | | 0.0 | | |
| 415,000 | | | Entegris, Inc. 2022 Term Loan B, 3.290%, (SOFRRATE + 3.000%), 03/02/2029 | | | | | 414,222 | | | | | | 0.0 | | |
| 1,508,419 | | | GoTo Group, Inc. Term Loan B, 5.218%, (US0001M + 4.750%), 08/31/2027 | | | | | 1,485,479 | | | | | | 0.1 | | |
| 1,546,270 | | | Greeneden U.S. Holdings II, LLC 2020 USD Term Loan B4, 4.545%, (US0001M + 4.000%), 12/01/2027 | | | | | 1,545,788 | | | | | | 0.1 | | |
| 538,571 | | | Helios Software Holdings, Inc. 2021 USD Term Loan B, 5.250%, (US0006M + 3.750%), 03/11/2028 | | | | | 534,757 | | | | | | 0.0 | | |
| 1,545,483 | | | Hyland Software, Inc. 2018 1st Lien Term Loan, 4.250%, (US0001M + 3.500%), 07/01/2024 | | | | | 1,539,929 | | | | | | 0.1 | | |
| 436,371 | | | Imperva, Inc. 1st Lien Term Loan, 5.000%, (US0003M + 4.000%), 01/12/2026 | | | | | 431,689 | | | | | | 0.0 | | |
| 1,015,000 | | | Informatica LLC 2021 USD Term Loan B, 3.250%, (US0001M + 2.750%), 10/27/2028 | | | | | 1,004,850 | | | | | | 0.1 | | |
| 1,199,672 | | | Ingram Micro Inc. 2021 Term Loan B, 4.506%, (US0003M + 3.500%), 06/30/2028 | | | | | 1,190,374 | | | | | | 0.1 | | |
| Principal Amount† | | | Value | | | Percentage of Net Assets | | |||||||||
| BANK LOANS: (continued) | | |||||||||||||||
| | | | Electronics/Electrical (continued) | | ||||||||||||
| 645,000 | | | Instructure Holdings 2021 Term Loan B, 3.269%, (US0003M + 2.750%), 10/30/2028 | | | | $ | 643,388 | | | | | | 0.0 | | |
| 150,000 | | | Ivanti Software, Inc. 2021 2nd Lien Term Loan, 7.773%, (US0003M + 7.250%), 12/01/2028 | | | | | 148,125 | | | | | | 0.0 | | |
| 84,150 | | | Ivanti Software, Inc. 2021 Add On Term Loan B, 4.750%, (US0001M + 4.000%), 12/01/2027 | | | | | 82,914 | | | | | | 0.0 | | |
| 1,034,170 | | | Ivanti Software, Inc. 2021 Term Loan B, 5.000%, (US0003M + 4.250%), 12/01/2027 | | | | | 1,021,428 | | | | | | 0.1 | | |
| 1,685,775 | | | Magenta Buyer LLC 2021 USD 1st Lien Term Loan, 5.750%, (US0003M + 5.000%), 07/27/2028 | | | | | 1,673,658 | | | | | | 0.1 | | |
| 375,000 | | | Magenta Buyer LLC 2021 USD 2nd Lien Term Loan, 9.000%, (US0003M + 8.250%), 07/27/2029 | | | | | 370,938 | | | | | | 0.0 | | |
| 265,000 | | | Mediaocean LLC 2021 Term Loan, 4.000%, (US0001M + 3.500%), 12/15/2028 | | | | | 262,792 | | | | | | 0.0 | | |
| 405,000 | | | MH Sub I, LLC 2021 2nd Lien Term Loan, 6.707%, (US0001M + 6.250%), 02/23/2029 | | | | | 402,216 | | | | | | 0.0 | | |
| 1,265,000 | | | Mitchell International, Inc. 2021 Term Loan B, 4.250%, (US0001M + 3.750%), 10/15/2028 | | | | | 1,245,156 | | | | | | 0.1 | | |
| 202,893 | | | NAVEX TopCo, Inc. 2018 2nd Lien Term Loan, 7.460%, (US0001M + 7.000%), 09/04/2026 | | | | | 201,372 | | | | | | 0.0 | | |
| 496,183 | | | ON Semiconductor Corporation 2019 Term Loan B, 2.457%, (US0001M + 2.000%), 09/19/2026 | | | | | 495,046 | | | | | | 0.0 | | |
| 293,975 | | | Panther Commercial Holdings L.P Term Loan, 5.000%, (US0003M + 4.500%), 01/07/2028 | | | | | 292,652 | | | | | | 0.0 | | |
| Voya Strategic Income | PORTFOLIO OF INVESTMENTS |
| Opportunities Fund | as of March 31, 2022 (continued) |
| Principal Amount† | | | Value | | | Percentage of Net Assets | | |||||||||
| BANK LOANS: (continued) | | |||||||||||||||
| | | | Electronics/Electrical (continued) | | ||||||||||||
| 180,000 | | | Ping Identity Corporation 2021 Term Loan B, 4.705%, (SOFRRATE + 3.750%), 11/22/2028 | | | | $ | 178,875 | | | | | | 0.0 | | |
| 398,613 | | | Planview Parent, Inc. Term Loan, 5.006%, (US0003M + 4.000%), 12/17/2027 | | | | | 394,626 | | | | | | 0.0 | | |
| 496,124 | | | Project Accelerate Parrent LLC 1st Lien Term Loan, 5.250%, (US0001M + 4.250%), 01/02/2025 | | | | | 493,023 | | | | | | 0.0 | | |
| 192,527 | | | Project Leopard Holdings, Inc. 2019 Term Loan, 5.750%, (US0003M + 4.750%), 07/07/2024 | | | | | 192,166 | | | | | | 0.0 | | |
| 460,000 | | | Quest Software US Holdings Inc. 2022 2nd Lien Term Loan, 8.150%, (SOFRRATE + 7.500%), 02/01/2030 | | | | | 446,775 | | | | | | 0.0 | | |
| 1,389,080 | | | Rackspace Technology Global, Inc. 2021 Term Loan, 3.500%, (US0003M + 2.750%), 02/15/2028 | | | | | 1,363,903 | | | | | | 0.1 | | |
| 597,000 | | | RealPage, Inc 1st Lien Term Loan, 3.750%, (US0001M + 3.250%), 04/24/2028 | | | | | 591,179 | | | | | | 0.0 | | |
| 1,950,200 | | | Redstone Buyer LLC 2021 Term Loan, 5.500%, (US0003M + 4.750%), 04/27/2028 | | | | | 1,920,947 | | | | | | 0.1 | | |
| 921,119 (3) | | | Riverbed Technology, Inc. 2021 PIK Exit Term Loan, 7.000%, (US0003M + 6.000%) (PIK Rate 0.000%, Cash Rate 0.000%), 12/08/2026 | | | | | 801,373 | | | | | | 0.1 | | |
| 795,053 | | | Rocket Software, Inc. 2018 Term Loan, 4.707%, (US0001M + 4.250%), 11/28/2025 | | | | | 786,357 | | | | | | 0.1 | | |
| 238,800 | | | Rocket Software, Inc. 2021 USD Incremental Term Loan B, 4.750%, (US0001M + 4.250%), 11/28/2025 | | | | | 235,994 | | | | | | 0.0 | | |
| 263,997 | | | Sabre GLBL Inc. 2021 Term Loan B1, 4.000%, (US0001M + 3.500%), 12/17/2027 | | | | | 261,291 | | | | | | 0.0 | | |
| Principal Amount† | | | Value | | | Percentage of Net Assets | | |||||||||
| BANK LOANS: (continued) | | |||||||||||||||
| | | | Electronics/Electrical (continued) | | ||||||||||||
| 420,828 | | | Sabre GLBL Inc. 2021 Term Loan B2, 4.000%, (US0001M + 3.500%), 12/17/2027 | | | | $ | 416,514 | | | | | | 0.0 | | |
| 573,164 | | | Seattle Spinco, Inc. USD Term Loan B3, 3.207%, (US0001M + 2.750%), 06/21/2024 | | | | | 567,074 | | | | | | 0.0 | | |
| 375,722 | | | SonicWall US Holdings Inc. 1st Lien Term Loan, 4.250%, (US0003M + 3.750%), 05/16/2025 | | | | | 371,025 | | | | | | 0.0 | | |
| 80,257 (10) | | | Sovos Compliance, LLC 2021 Delayed Draw Term Loan, 5.462%, (US0003M + 4.500%), 08/11/2028 | | | | | 80,257 | | | | | | 0.0 | | |
| 463,581 | | | Sovos Compliance, LLC 2021 Term Loan, 5.000%, (US0001M + 4.500%), 08/11/2028 | | | | | 463,581 | | | | | | 0.0 | | |
| 235,000 | | | Tenable Holdings, Inc. Term Loan B, 3.269%, (US0006M + 2.750%), 07/07/2028 | | | | | 233,237 | | | | | | 0.0 | | |
| 425,854 | | | Trader Interactive, LLC 2021 Term Loan B, 4.500%, (US0001M + 4.000%), 07/28/2028 | | | | | 421,595 | | | | | | 0.0 | | |
| 6,289 | | | Travelport Finance (Luxembourg) S.a.r.l. 2020 Super Priority Term Loan, 9.712%, (US0003M + 8.750%), 02/28/2025 | | | | | 6,537 | | | | | | 0.0 | | |
| 3,005 | | | Travelport Finance (Luxembourg) S.a.r.l. 2021 Consented Term Loan, 6.006%, (US0003M + 5.000%), 05/29/2026 | | | | | 2,667 | | | | | | 0.0 | | |
| 591,430 | | | TTM Technologies, Inc. 2017 Term Loan, 2.731%, (US0001M + 2.500%), 09/28/2024 | | | | | 589,212 | | | | | | 0.0 | | |
| 145,894 | | | Ultra Clean Holdings, Inc 2021 Term Loan B, 4.207%, (US0001M + 3.750%), 08/27/2025 | | | | | 145,461 | | | | | | 0.0 | | |
| 50,000 | | | Virtusa Corporation 2022 Incremental Term Loan, 4.600%, (SOFRRATE + 3.850%), 02/11/2028 | | | | | 49,484 | | | | | | 0.0 | | |
| Voya Strategic Income | PORTFOLIO OF INVESTMENTS |
| Opportunities Fund | as of March 31, 2022 (continued) |
| Principal Amount† | | | Value | | | Percentage of Net Assets | | |||||||||
| BANK LOANS: (continued) | | |||||||||||||||
| | | | Electronics/Electrical (continued) | | ||||||||||||
| 339,533 | | | Watlow Electric Manufacturing Company Term Loan B, 4.250%, (US0003M + 3.750%), 03/02/2028 | | | | $ | 336,243 | | | | | | 0.0 | | |
| 428,933 | | | Xperi Corporation 2020 Term Loan B, 3.957%, (US0001M + 3.500%), 06/08/2028 | | | | | 424,510 | | | | | | 0.0 | | |
| | | | | | | | | 39,270,352 | | | | | | 1.6 | | |
| | | | Equipment Leasing: 0.1% | | ||||||||||||
| 289,275 | | | Albion Financing 3 SARL USD Term Loan, 5.750%, (US0003M + 5.250%), 08/17/2026 | | | | | 286,021 | | | | | | 0.0 | | |
| 710,752 | | | Rent-A-Center, Inc. 2021 First Lien Term Loan B, 3.813%, (US0003M + 3.250%), 02/17/2028 | | | | | 697,204 | | | | | | 0.1 | | |
| | | | | | | | | 983,225 | | | | | | 0.1 | | |
| | | | Financial: 0.0% | | ||||||||||||
| 455,000 | | | SkillSoft Corporation 2022 Incremental Term Loan B, 5.552%, (TSFR1M + 5.250%), 07/14/2028 | | | | | 451,587 | | | | | | 0.0 | | |
| | | | | | | | | | | | | | | | | |
| | | | Financial Intermediaries: 0.6% | | ||||||||||||
| 777,594 | | | Advisor Group, Inc. 2021 Term Loan, 4.957%, (US0001M + 4.500%), 07/31/2026 | | | | | 773,545 | | | | | | 0.1 | | |
| 415,000 | | | AqGen Ascensus, Inc. 2021 2nd Lien Term Loan, 7.000%, (US0003M + 6.500%), 08/02/2029 | | | | | 410,591 | | | | | | 0.0 | | |
| 540,000 | | | AqGen Island Holdings, Inc. Term Loan, 4.462%, (US0003M + 3.500%), 08/02/2028 | | | | | 536,962 | | | | | | 0.0 | | |
| 386,100 | | | Blackstone Mortgage Trust, Inc. 2021 Term Loan B2, 3.250%, (US0001M + 2.750%), 04/23/2026 | | | | | 384,652 | | | | | | 0.0 | | |
| 424,341 | | | Blucora, Inc. 2017 Term Loan B, 5.006%, (US0003M + 4.000%), 05/22/2024 | | | | | 424,871 | | | | | | 0.0 | | |
| Principal Amount† | | | Value | | | Percentage of Net Assets | | |||||||||
| BANK LOANS: (continued) | | |||||||||||||||
| | | | Financial Intermediaries (continued) | | ||||||||||||
| 96,610 | | | Castlelake Aviation Limited Delayed Draw Term Loan, 3.962%, (US0003M + 3.000%), 10/07/2026 | | | | $ | 94,316 | | | | | | 0.0 | | |
| 567,150 | | | Castlelake Aviation Limited Term Loan B, 3.250%, (US0003M + 2.750%), 10/22/2026 | | | | | 553,680 | | | | | | 0.0 | | |
| 1,694,479 | | | Citadel Securities LP 2021 Term Loan B, 2.957%, (US0001M + 2.500%), 02/02/2028 | | | | | 1,687,369 | | | | | | 0.1 | | |
| 676,791 | | | Cushman & Wakefield U.S. Borrower, LLC 2020 Term Loan B, 3.207%, (US0001M + 2.750%), 08/21/2025 | | | | | 668,860 | | | | | | 0.0 | | |
| 1,243,030 | | | Deerfield Dakota Holding, LLC 2020 USD Term Loan B, 4.750%, (US0001M + 3.750%), 04/09/2027 | | | | | 1,239,456 | | | | | | 0.1 | | |
| 1,600,669 | | | Edelman Financial Center, LLC 2021 Term Loan B, 4.250%, (US0001M + 3.500%), 04/07/2028 | | | | | 1,585,161 | | | | | | 0.1 | | |
| 1,145,035 | | | First Eagle Holdings, Inc. 2020 Term Loan B, 3.462%, (US0003M + 2.500%), 02/01/2027 | | | | | 1,127,144 | | | | | | 0.1 | | |
| 636,946 | | | Focus Financial Partners, LLC 2021 Term Loan, 3.000%, (US0001M + 2.500%), 06/30/2028 | | | | | 629,449 | | | | | | 0.0 | | |
| 636,800 | | | HighTower Holdings LLC 2021 Term Loan B, 4.750%, (US0003M + 4.000%), 04/21/2028 | | | | | 630,432 | | | | | | 0.0 | | |
| 570,666 | | | Jane Street Group, LLC 2021 Term Loan, 3.207%, (US0001M + 2.750%), 01/26/2028 | | | | | 564,531 | | | | | | 0.0 | | |
| 248,731 | | | LPL Holdings, Inc. 2019 Term Loan B1, 1.981%, (US0001M + 1.750%), 11/12/2026 | | | | | 245,959 | | | | | | 0.0 | | |
| Voya Strategic Income | PORTFOLIO OF INVESTMENTS |
| Opportunities Fund | as of March 31, 2022 (continued) |
| Principal Amount† | | | Value | | | Percentage of Net Assets | | |||||||||
| BANK LOANS: (continued) | | |||||||||||||||
| | | | Financial Intermediaries (continued) | | ||||||||||||
| 495,669 | | | Trans Union, LLC 2019 Term Loan B5, 2.207%, (US0001M + 1.750%), 11/16/2026 | | | | $ | 487,968 | | | | | | 0.0 | | |
| 816,360 | | | Trans Union, LLC 2021 Term Loan B6, 2.750%, (US0001M + 2.250%), 12/01/2028 | | | | | 810,747 | | | | | | 0.1 | | |
| 625,000 | | | VFH Parent LLC 2022 Term Loan B, 3.500%, (SOFRRATE + 3.000%), 01/13/2029 | | | | | 620,052 | | | | | | 0.0 | | |
| 200,000 | | | Walker & Dunlop, Inc. 2021 Term Loan, 2.331%, (SOFRRATE + 2.250%), 12/16/2028 | | | | | 199,250 | | | | | | 0.0 | | |
| | | | | | | | | 13,674,995 | | | | | | 0.6 | | |
| | | | Food Products: 0.3% | | ||||||||||||
| 489,873 | | | 8th Avenue Food & Provisions, Inc. 2018 1st Lien Term Loan, 4.207%, (US0001M + 3.750%), 10/01/2025 | | | | | 429,047 | | | | | | 0.0 | | |
| 688,275 | | | 8th Avenue Food & Provisions, Inc. 2021 Incremental Term Loan, 5.500%, (US0001M + 4.750%), 10/01/2025 | | | | | 621,168 | | | | | | 0.0 | | |
| 285,000 | | | BCPE North Star US HoldCo 2, Inc. 2021 2nd Lien Term Loan, 7.616%, (US0003M + 7.250%), 06/08/2029 | | | | | 280,725 | | | | | | 0.0 | | |
| 785,000 | | | CHG PPC Parent LLC 2021 Term Loan, 3.500%, (US0001M + 3.000%), 12/08/2028 | | | | | 768,319 | | | | | | 0.1 | | |
| 108,158 (10) | | | Dessert Holdings Inc. Delayed Draw Term Loan, 4.962%, (US0003M + 4.000%), 06/09/2028 | | | | | 106,197 | | | | | | 0.0 | | |
| 575,400 | | | Dessert Holdings Inc. Term Loan, 5.006%, (US0003M + 4.000%), 06/09/2028 | | | | | 564,971 | | | | | | 0.0 | | |
| 2,663,350 | | | IRB Holding Corp 2022 Term Loan B, 3.750%, (SOFRRATE + 3.000%), 12/15/2027 | | | | | 2,643,375 | | | | | | 0.1 | | |
| Principal Amount† | | | Value | | | Percentage of Net Assets | | |||||||||
| BANK LOANS: (continued) | | |||||||||||||||
| | | | Food Products (continued) | | ||||||||||||
| 497,442 | | | JBS USA Lux S.A. 2019 Term Loan B, 2.804%, (US0006M + 2.000%), 05/01/2026 | | | | $ | 493,712 | | | | | | 0.0 | | |
| 475,000 | | | Primary Products Finance LLC Term Loan, 4.962%, (US0003M + 4.000%), 10/25/2028 | | | | | 472,229 | | | | | | 0.0 | | |
| 517,357 | | | Sigma Bidco B.V. 2018 USD Term Loan B2, 3.345%, (US0006M + 3.000%), 07/02/2025 | | | | | 474,675 | | | | | | 0.0 | | |
| 260,928 | | | Simply Good Foods USA, Inc. 2017 Term Loan B, 3.792%, (SOFRRATE + 3.250%), 07/07/2024 | | | | | 259,950 | | | | | | 0.0 | | |
| 645,713 | | | Weber-Stephen Products LLC Term Loan B, 4.022%, (US0001M + 3.250%), 10/30/2027 | | | | | 627,149 | | | | | | 0.1 | | |
| 208,425 | | | WOOF Holdings, Inc 1st Lien Term Loan, 4.678%, (US0003M + 3.750%), 12/21/2027 | | | | | 207,122 | | | | | | 0.0 | | |
| | | | | | | | | 7,948,639 | | | | | | 0.3 | | |
| | | | Food Service: 0.3% | | ||||||||||||
| 744,289 | | | 1011778 B.C. Unlimited Liability Company Term Loan B4, 2.207%, (US0001M + 1.750%), 11/19/2026 | | | | | 729,776 | | | | | | 0.0 | | |
| 1,540,000 | | | Fertitta Entertainment, LLC 2022 Term Loan B, 4.500%, (SOFRRATE + 4.000%), 01/27/2029 | | | | | 1,533,438 | | | | | | 0.1 | | |
| 862,838 | | | Flynn Restaurant Group LP 2021 Term Loan B, 4.695%, (US0001M + 4.250%), 12/01/2028 | | | | | 854,209 | | | | | | 0.1 | | |
| 500,000 | | | Fogo De Chao, Inc. 2018 Add On Term Loan, 5.250%, (US0001M + 4.250%), 04/07/2025 | | | | | 488,750 | | | | | | 0.0 | | |
| 631,013 | | | H Food Holdings LLC 2018 Term Loan B, 4.145%, (US0001M + 3.688%), 05/23/2025 | | | | | 609,210 | | | | | | 0.0 | | |
| Voya Strategic Income | PORTFOLIO OF INVESTMENTS |
| Opportunities Fund | as of March 31, 2022 (continued) |
| Principal Amount† | | | Value | | | Percentage of Net Assets | | |||||||||
| BANK LOANS: (continued) | | |||||||||||||||
| | | | Food Service (continued) | | ||||||||||||
| 52,000 | | | K-Mac Holdings Corp 2021 2nd Lien Term Loan, 7.250%, (US0001M + 6.750%), 07/30/2029 | | | | $ | 51,220 | | | | | | 0.0 | | |
| 5,825 (10) | | | Pacific Bells, LLC Delayed Draw Term Loan, 5.462%, (US0003M + 4.500%), 10/13/2028 | | | | | 5,672 | | | | | | 0.0 | | |
| 557,777 | | | Pacific Bells, LLC Term Loan B, 5.000%, (US0001M + 4.500%), 10/13/2028 | | | | | 543,136 | | | | | | 0.0 | | |
| 233,974 | | | Tacala, LLC 1st Lien Term Loan, 3.957%, (US0001M + 3.500%), 02/05/2027 | | | | | 230,952 | | | | | | 0.0 | | |
| 996,173 | | | US Foods, Inc. 2019 Term Loan B, 2.508%, (US0003M + 2.000%), 09/13/2026 | | | | | 978,602 | | | | | | 0.1 | | |
| 580,000 | | | US Foods, Inc. 2021 Term Loan B, 3.258%, (US0003M + 2.750%), 11/22/2028 | | | | | 573,423 | | | | | | 0.0 | | |
| 750,000 | | | Welbilt, Inc. 2018 Term Loan B, 2.957%, (US0001M + 2.500%), 10/23/2025 | | | | | 745,625 | | | | | | 0.0 | | |
| | | | | | | | | 7,344,013 | | | | | | 0.3 | | |
| | | | Food/Drug Retailers: 0.1% | | ||||||||||||
| 1,117,250 | | | EG America LLC 2018 USD Term Loan, 4.997%, (US0003M + 4.000%), 02/07/2025 | | | | | 1,104,681 | | | | | | 0.1 | | |
| 184,082 | | | EG Group Limited 2021 Term Loan, 5.246%, (US0003M + 4.250%), 03/31/2026 | | | | | 182,011 | | | | | | 0.0 | | |
| 43,994 (3) | | | Moran Foods, LLC 2020 2nd Lien Term Loan, 11.756%, (US0003M + 10.750%) (PIK Rate 10.750%, Cash Rate 1.000%), 10/01/2024 | | | | | 36,295 | | | | | | 0.0 | | |
| 32,157 (3) | | | Moran Foods, LLC 2020 Term Loan, 8.006%, (US0003M + 7.000%) (PIK Rate 7.000%, Cash Rate 1.000%), 04/01/2024 | | | | | 31,970 | | | | | | 0.0 | | |
| Principal Amount† | | | Value | | | Percentage of Net Assets | | |||||||||
| BANK LOANS: (continued) | | |||||||||||||||
| | | | Food/Drug Retailers (continued) | | ||||||||||||
| 214,333 | | | Portillos Holdings, LLC 2019 1st Lien Term Loan B3, 6.500%, (US0001M + 5.500%), 09/06/2024 | | | | $ | 213,708 | | | | | | 0.0 | | |
| | | | | | | | | 1,568,665 | | | | | | 0.1 | | |
| | | | Forest Products: 0.0% | | ||||||||||||
| 290,000 | | | ASP Blade Holdings, Inc Initial Term Loan, 4.457%, (US0001M + 4.000%), 10/13/2028 | | | | | 286,828 | | | | | ��� | 0.0 | | |
| 353,225 | | | Osmose Utilities Services, Inc. Term Loan, 3.750%, (US0001M + 3.250%), 06/23/2028 | | | | | 348,810 | | | | | | 0.0 | | |
| 341,563 | | | Spa Holdings 3 Oy USD Term Loan B, 4.500%, (US0003M + 3.750%), 02/04/2028 | | | | | 334,091 | | | | | | 0.0 | | |
| | | | | | | | | 969,729 | | | | | | 0.0 | | |
| | | | Health Care: 1.5% | | ||||||||||||
| 570,000 | | | Accelerated Health Systems, LLC 2022 Term Loan B, 5.160%, (SOFRRATE + 4.250%), 02/15/2029 | | | | | 566,912 | | | | | | 0.0 | | |
| 472,625 | | | ADMI Corp. 2021 Incremental Term Loan B3, 4.000%, (US0001M + 3.500%), 12/23/2027 | | | | | 467,840 | | | | | | 0.0 | | |
| 757,350 | | | ADMI Corp. 2021 Term Loan B2, 3.875%, (US0001M + 3.375%), 12/23/2027 | | | | | 745,595 | | | | | | 0.0 | | |
| 295,274 | | | Agiliti Health, Inc Term Loan, 3.000%, (US0001M + 2.750%), 01/04/2026 | | | | | 293,798 | | | | | | 0.0 | | |
| 631,102 | | | Air Methods Corporation 2017 Term Loan B, 4.506%, (US0003M + 3.500%), 04/22/2024 | | | | | 604,675 | | | | | | 0.0 | | |
| 51,449 (10) | | | Athenahealth, Inc. 2022 Delayed Draw Term loan, 3.790%, (SOFRRATE + 3.500%), 02/15/2029 | | | | | 51,015 | | | | | | 0.0 | | |
| Voya Strategic Income | PORTFOLIO OF INVESTMENTS |
| Opportunities Fund | as of March 31, 2022 (continued) |
| Principal Amount† | | | Value | | | Percentage of Net Assets | | |||||||||
| BANK LOANS: (continued) | | |||||||||||||||
| | | | Health Care (continued) | | ||||||||||||
| 303,551 | | | Athenahealth, Inc. 2022 Term Loan, 4.000%, (SOFRRATE + 3.500%), 02/15/2029 | | | | $ | 300,989 | | | | | | 0.0 | | |
| 3,175,360 | | | Bausch Health Companies Inc. 2018 Term Loan B, 3.457%, (US0001M + 3.000%), 06/02/2025 | | | | | 3,154,524 | | | | | | 0.1 | | |
| 671,625 | | | Bella Holding Company, LLC 2021 Term Loan B, 4.500%, (US0001M + 3.750%), 05/10/2028 | | | | | 665,539 | | | | | | 0.0 | | |
| 244,166 | | | Carestream Dental Equipment, Inc 2017 1st Lien Term Loan, 4.256%, (US0003M + 3.250%), 09/01/2024 | | | | | 237,859 | | | | | | 0.0 | | |
| 502,135 | | | CCRR Parent, Inc Term Loan B, 4.756%, (US0003M + 3.750%), 03/06/2028 | | | | | 504,489 | | | | | | 0.0 | | |
| 702,072 | | | Change Healthcare Holdings LLC 2017 Term Loan B, 3.500%, (US0001M + 2.500%), 03/01/2024 | | | | | 699,188 | | | | | | 0.0 | | |
| 726,350 | | | CHG Healthcare Services Inc. 2021 Term Loan, 4.999%, (US0006M + 3.500%), 09/29/2028 | | | | | 721,205 | | | | | | 0.0 | | |
| 739,903 | | | Curia Global, Inc. 2021 Term Loan, 4.500%, (US0003M + 3.750%), 08/30/2026 | | | | | 734,909 | | | | | | 0.0 | | |
| 813,470 | | | Da Vinci Purchaser Corp. 2019 Term Loan, 5.006%, (US0003M + 4.000%), 01/08/2027 | | | | | 811,776 | | | | | | 0.1 | | |
| 156,957 | | | Embecta Corp Term Loan B, 3.302%, (TSFR1M + 3.000%), 01/27/2029 | | | | | 155,269 | | | | | | 0.0 | | |
| 1,201,338 | | | Envision Healthcare Corporation 2018 1st Lien Term Loan, 4.207%, (US0001M + 3.750%), 10/10/2025 | | | | | 808,329 | | | | | | 0.1 | | |
| 648,401 | | | eResearchTechnology, Inc. 2020 1st Lien Term Loan, 5.500%, (US0001M + 4.500%), 02/04/2027 | | | | | 646,577 | | | | | | 0.0 | | |
| Principal Amount† | | | Value | | | Percentage of Net Assets | | |||||||||
| BANK LOANS: (continued) | | |||||||||||||||
| | | | Health Care (continued) | | ||||||||||||
| 1,279,089 | | | Global Medical Response, Inc. 2017 Incremental Term Loan, 5.250%, (US0006M + 4.250%), 03/14/2025 | | | | $ | 1,273,227 | | | | | | 0.1 | | |
| 952,887 | | | Global Medical Response, Inc. 2020 Term Loan B, 5.250%, (US0003M + 4.250%), 10/02/2025 | | | | | 948,123 | | | | | | 0.1 | | |
| 587,896 | | | GoodRx, Inc. 1st Lien Term Loan, 3.207%, (US0001M + 2.750%), 10/10/2025 | | | | | 583,927 | | | | | | 0.0 | | |
| 248,698 | | | Greenway Health, LLC 2017 1st Lien Term Loan, 4.750%, (US0003M + 3.750%), 02/16/2024 | | | | | 233,388 | | | | | | 0.0 | | |
| 431,738 | | | Heartland Dental, LLC 2021 Incremental Term Loan, 4.447%, (US0001M + 4.000%), 04/30/2025 | | | | | 429,444 | | | | | | 0.0 | | |
| 1,142,650 | | | Hunter Holdco 3 Limited USD Term Loan B, 5.256%, (US0003M + 4.250%), 08/19/2028 | | | | | 1,139,793 | | | | | | 0.1 | | |
| 345,000 | | | ICU Medical, Inc. Term Loan B, 3.000%, (SOFRRATE + 2.500%), 01/08/2029 | | | | | 344,353 | | | | | | 0.0 | | |
| 936,990 | | | Lifescan Global Corporation 2018 1st Lien Term Loan, 6.214%, (US0003M + 6.000%), 10/01/2024 | | | | | 897,168 | | | | | | 0.1 | | |
| 462,000 | | | Medical Solutions Holdings, Inc. 2021 1st Lien Term Loan, 4.462%, (US0003M + 3.500%), 11/01/2028 | | | | | 458,968 | | | | | | 0.0 | | |
| 88,000 (10) | | | Medical Solutions Holdings, Inc. 2021 Delayed Draw Term Loan, 4.462%, (US0003M + 3.500%), 11/01/2028 | | | | | 87,423 | | | | | | 0.0 | | |
| 1,310,000 | | | Medline Borrower, LP USD Term Loan B, 3.750%, (US0001M + 3.250%), 10/23/2028 | | | | | 1,297,715 | | | | | | 0.1 | | |
| 280,000 | | | MJH Healthcare Holdings, LLC 2021 Term Loan B, 4.000%, (SOFRRATE + 3.500%), 01/28/2029 | | | | | 276,500 | | | | | | 0.0 | | |
| Voya Strategic Income | PORTFOLIO OF INVESTMENTS |
| Opportunities Fund | as of March 31, 2022 (continued) |
| Principal Amount† | | | Value | | | Percentage of Net Assets | | |||||||||
| BANK LOANS: (continued) | | |||||||||||||||
| | | | Health Care (continued) | | ||||||||||||
| 935,150 | | | MPH Acquisition Holdings LLC 2021 Term Loan B, 4.758%, (US0003M + 4.250%), 09/01/2028 | | | | $ | 910,894 | | | | | | 0.1 | | |
| 150,000 | | | National Mentor Holdings, Inc. 2021 2nd Lien Term Loan, 8.260%, (US0003M + 7.250%), 03/02/2029 | | | | | 145,500 | | | | | | 0.0 | | |
| 1,196,672 | | | National Mentor Holdings, Inc. 2021 Term Loan, 4.756%, (US0001M + 3.750%), 03/02/2028 | | | | | 1,162,268 | | | | | | 0.1 | | |
| 40,256 | | | National Mentor Holdings, Inc. 2021 Term Loan C, 4.760%, (US0003M + 3.750%), 03/02/2028 | | | | | 39,098 | | | | | | 0.0 | | |
| 218,350 | | | New Trojan Parent, Inc. 1st Lien Term Loan, 3.750%, (US0003M + 3.250%), 01/06/2028 | | | | | 212,345 | | | | | | 0.0 | | |
| 776,616 | | | Ortho-Clinical Diagnostics SA 2018 Term Loan B, 3.235%, (US0001M + 3.000%), 06/30/2025 | | | | | 774,856 | | | | | | 0.0 | | |
| 305,000 | | | Owens & Minor, Inc. 2022 Term Loan B, 4.052%, (TSFR1M + 3.750%), 03/29/2029 | | | | | 304,619 | | | | | | 0.0 | | |
| 427,850 | | | Pacific Dental Services,LLC 2021 Term Loan, 4.000%, (US0001M + 3.250%), 05/05/2028 | | | | | 423,483 | | | | | | 0.0 | | |
| 774,996 | | | Pathway Vet Alliance LLC 2021 Term Loan, 4.207%, (US0001M + 3.750%), 03/31/2027 | | | | | 768,700 | | | | | | 0.0 | | |
| 616,579 | | | Pediatric Associates Holding Company, LLC 2021 Term Loan B, 3.750%, (US0003M + 3.250%), 12/29/2028 | | | | | 608,872 | | | | | | 0.0 | | |
| 93,421 (10) | | | Pediatric Associates Holding Company, LLC 2022 Delayed Draw Term loan, 4.212%, (US0003M + 3.250%), 12/29/2028 | | | | | 92,253 | | | | | | 0.0 | | |
| 856,921 | | | PetVet Care Centers, LLC 2021 Term Loan B3, 3.952%, (US0001M + 3.500%), 02/14/2025 | | | | | 852,815 | | | | | | 0.1 | | |
| Principal Amount† | | | Value | | | Percentage of Net Assets | | |||||||||
| BANK LOANS: (continued) | | |||||||||||||||
| | | | Health Care (continued) | | ||||||||||||
| 1,022,621 | | | Phoenix Guarantor Inc 2020 Term Loan B, 3.702%, (US0001M + 3.250%), 03/05/2026 | | | | $ | 1,011,846 | | | | | | 0.1 | | |
| 480,000 | | | Physician Partners LLC Term Loan, 4.500%, (SOFRRATE + 4.000%), 12/26/2028 | | | | | 475,500 | | | | | | 0.0 | | |
| 203,463 | | | Pluto Acquisition I, Inc. 2021 1st Lien Term Loan, 4.508%, (US0003M + 4.000%), 06/22/2026 | | | | | 200,919 | | | | | | 0.0 | | |
| 630,000 | | | PointClickCare Technologies, Inc. 2022 Term Loan B, 4.775%, (SOFRRATE + 4.000%), 12/29/2027 | | | | | 625,275 | | | | | | 0.0 | | |
| 485,000 | | | Press Ganey Holdings, Inc. 2022 Incremental Term Loan, 4.040%, (SOFRRATE + 3.750%), 07/24/2026 | | | | | 481,363 | | | | | | 0.0 | | |
| 277,200 | | | Project Ruby Ultimate Parent Corp. 2021 Term Loan, 4.000%, (US0001M + 3.250%), 03/03/2028 | | | | | 274,497 | | | | | | 0.0 | | |
| 2,035,765 | | | RegionalCare Hospital Partners Holdings, Inc. 2018 Term Loan B, 4.197%, (US0001M + 3.750%), 11/16/2025 | | | | | 2,025,586 | | | | | | 0.1 | | |
| 369,075 | | | Resonetics, LLC 2021 Term Loan, 4.750%, (US0003M + 4.000%), 04/28/2028 | | | | | 366,076 | | | | | | 0.0 | | |
| 580,657 | | | RxBenefits, Inc. 2020 Term Loan, 5.250%, (US0003M + 4.500%), 12/17/2027 | | | | | 578,480 | | | | | | 0.0 | | |
| 500,000 | | | Select Medical Corporation 2017 Term Loan B, 2.710%, (US0001M + 2.250%), 03/06/2025 | | | | | 495,313 | | | | | | 0.0 | | |
| 635,000 | | | Sotera Health Holdings, LLC 2021 Term Loan, 3.250%, (US0003M + 2.750%), 12/11/2026 | | | | | 629,047 | | | | | | 0.0 | | |
| 818,813 | | | Surgery Center Holdings, Inc. 2021 Term Loan, 4.500%, (US0001M + 3.750%), 08/31/2026 | | | | | 813,467 | | | | | | 0.1 | | |
| Voya Strategic Income | PORTFOLIO OF INVESTMENTS |
| Opportunities Fund | as of March 31, 2022 (continued) |
| Principal Amount† | | | Value | | | Percentage of Net Assets | | |||||||||
| BANK LOANS: (continued) | | |||||||||||||||
| | | | Health Care (continued) | | ||||||||||||
| 395,282 | | | Tecomet Inc. 2017 Repriced Term Loan, 4.500%, (US0003M + 3.500%), 05/01/2024 | | | | $ | 372,059 | | | | | | 0.0 | | |
| 614,175 | | | Unified Physician Management, LLC 2020 Term Loan, 5.000%, (US0001M + 4.250%), 12/16/2027 | | | | | 609,377 | | | | | | 0.0 | | |
| 867,825 | | | US Anesthesia Partners Inc 2021 Term Loan, 4.750%, (US0001M + 4.250%), 10/01/2028 | | | | | 863,215 | | | | | | 0.1 | | |
| 800,975 | | | Virgin Pulse, Inc. 2021 Term Loan, 4.750%, (US0001M + 4.000%), 04/06/2028 | | | | | 792,965 | | | | | | 0.0 | | |
| 630,000 | | | WP CityMD Bidco LLC 2021 1st Lien Term Loan B, 3.750%, (US0006M + 3.250%), 12/22/2028 | | | | | 627,178 | | | | | | 0.0 | | |
| | | | | | | | | 37,678,383 | | | | | | 1.5 | | |
| | | | Home Furnishings: 0.1% | | ||||||||||||
| 528,675 | | | Conair Holdings, LLC Term Loan B, 4.756%, (US0003M + 3.750%), 05/17/2028 | | | | | 521,141 | | | | | | 0.0 | | |
| 750,000 | | | Illuminate Merger Sub Corp. Term Loan, 4.506%, (US0003M + 3.500%), 07/21/2028 | | | | | 726,965 | | | | | | 0.0 | | |
| 992,186 | | | Prime Security Services Borrower, LLC 2021 Term Loan, 3.500%, (US0006M + 2.750%), 09/23/2026 | | | | | 985,917 | | | | | | 0.1 | | |
| 25,000 | | | Solis IV BV USD Term Loan B1, 4.000%, (SOFRRATE + 3.500%), 02/26/2029 | | | | | 24,552 | | | | | | 0.0 | | |
| | | | | | | | | 2,258,575 | | | | | | 0.1 | | |
| | | | Industrial Equipment: 0.2% | | ||||||||||||
| 480,559 | | | Alliance Laundry Systems LLC Term Loan B, 4.251%, (US0003M + 3.500%), 10/08/2027 | | | | | 475,954 | | | | | | 0.0 | | |
| 495,000 | | | CMBF LLC Term Loan, 6.500%, (US0001M + 6.000%), 08/02/2028 | | | | | 488,001 | | | | | | 0.0 | | |
| Principal Amount† | | | Value | | | Percentage of Net Assets | | |||||||||
| BANK LOANS: (continued) | | |||||||||||||||
| | | | Industrial Equipment (continued) | | ||||||||||||
| 248,718 | | | CPM Holdings, Inc. 2018 1st Lien Term Loan, 3.731%, (US0001M + 3.500%), 11/17/2025 | | | | $ | 245,298 | | | | | | 0.0 | | |
| 184,538 | | | Filtration Group Corporation 2021 Incremental Term Loan, 4.000%, (US0001M + 3.500%), 10/21/2028 | | | | | 183,038 | | | | | | 0.0 | | |
| 773,436 | | | Granite Holdings US Acquisition Co. 2021 Term Loan B, 4.962%, (US0003M + 4.000%), 09/30/2026 | | | | | 767,635 | | | | | | 0.1 | | |
| 159,115 | | | I-Logic Technologies Bidco Limited 2021 USD Term Loan B, 4.500%, (US0001M + 4.000%), 02/16/2028 | | | | | 158,239 | | | | | | 0.0 | | |
| 945,847 | | | Kenan Advantage Group, Inc. 2021 Term Loan B, 4.500%, (US0003M + 3.750%), 03/24/2026 | | | | | 934,970 | | | | | | 0.1 | | |
| 500,000 | | | Madison IAQ LLC Term Loan, 4.720%, (US0006M + 3.250%), 06/21/2028 | | | | | 493,594 | | | | | | 0.0 | | |
| 75,000 | | | MKS Instruments, Inc. 2021 USD Term Loan, 3.212%, (US0003M + 2.250%), 10/21/2028 | | | | | 74,494 | | | | | | 0.0 | | |
| 330,000 | | | SPX Flow, Inc. 2022 Term Loan, 4.802%, (TSFR1M + 4.500%), 03/16/2029 | | | | | 321,801 | | | | | | 0.0 | | |
| 417,870 | | | Star US Bidco LLC Term Loan B, 5.250%, (US0001M + 4.250%), 03/17/2027 | | | | | 414,997 | | | | | | 0.0 | | |
| 662,101 | | | Vertical US Newco Inc Term Loan B, 4.000%, (US0006M + 3.500%), 07/30/2027 | | | | | 657,301 | | | | | | 0.0 | | |
| | | | | | | | | 5,215,322 | | | | | | 0.2 | | |
| | | | Insurance: 0.5% | | ||||||||||||
| 676,512 | | | Acrisure, LLC 2020 Term Loan B, 3.957%, (US0001M + 3.500%), 02/15/2027 | | | | | 667,379 | | | | | | 0.0 | | |
| Voya Strategic Income | PORTFOLIO OF INVESTMENTS |
| Opportunities Fund | as of March 31, 2022 (continued) |
| Principal Amount† | | | Value | | | Percentage of Net Assets | | |||||||||
| BANK LOANS: (continued) | | |||||||||||||||
| | | | Insurance (continued) | | ||||||||||||
| 588,525 | | | Acrisure, LLC 2021 First Lien Term Loan B, 4.750%, (US0001M + 4.250%), 02/15/2027 | | | | $ | 587,054 | | | | | | 0.0 | | |
| 169,150 | | | Acrisure, LLC 2021 Incremental Term Loan B, 4.250%, (US0001M + 3.750%), 02/15/2027 | | | | | 168,304 | | | | | | 0.0 | | |
| 769,305 | | | Alliant Holdings Intermediate, LLC 2018 Term Loan B, 3.707%, (US0001M + 3.250%), 05/09/2025 | | | | | 761,708 | | | | | | 0.0 | | |
| 1,249,701 | | | Alliant Holdings Intermediate, LLC 2021 Term Loan B4, 4.000%, (US0001M + 3.500%), 11/06/2027 | | | | | 1,243,341 | | | | | | 0.1 | | |
| 744,350 | | | AmWINS Group, Inc. 2021 Term Loan B, 3.000%, (US0001M + 2.250%), 02/19/2028 | | | | | 733,417 | | | | | | 0.0 | | |
| 390,959 | | | Aretec Group, Inc. 2018 Term Loan, 4.707%, (US0001M + 4.250%), 10/01/2025 | | | | | 388,222 | | | | | | 0.0 | | |
| 1,064,239 | | | AssuredPartners, Inc. 2020 Term Loan B, 3.957%, (US0001M + 3.500%), 02/12/2027 | | | | | 1,053,098 | | | | | | 0.1 | | |
| 758,817 | | | AssuredPartners, Inc. 2021 Term Loan B, 4.000%, (US0001M + 3.500%), 02/12/2027 | | | | | 752,652 | | | | | | 0.0 | | |
| 385,000 | | | AssuredPartners, Inc. 2022 Term Loan, 4.000%, (SOFRRATE + 3.500%), 02/12/2027 | | | | | 381,150 | | | | | | 0.0 | | |
| 1,913,554 | | | Hub International Limited 2018 Term Loan B, 3.267%, (US0003M + 2.750%), 04/25/2025 | | | | | 1,894,309 | | | | | | 0.1 | | |
| 578,550 | | | IMA Financial Group, Inc. Term Loan, 4.250%, (US0001M + 3.750%), 11/01/2028 | | | | | 573,307 | | | | | | 0.0 | | |
| 1,304,134 | | | NFP Corp. 2020 Term Loan, 3.707%, (US0001M + 3.250%), 02/15/2027 | | | | | 1,282,535 | | | | | | 0.1 | | |
| Principal Amount† | | | Value | | | Percentage of Net Assets | | |||||||||
| BANK LOANS: (continued) | | |||||||||||||||
| | | | Insurance (continued) | | ||||||||||||
| 951,751 | | | OneDigital Borrower LLC 2021 Term Loan, 4.750%, (SOFRRATE + 4.250%), 11/16/2027 | | | | $ | 946,992 | | | | | | 0.0 | | |
| 1,318,911 | | | Sedgwick Claims Management Services, Inc. 2018 Term Loan B, 3.707%, (US0001M + 3.250%), 12/31/2025 | | | | | 1,307,606 | | | | | | 0.1 | | |
| 248,087 | | | Sedgwick Claims Management Services, Inc. 2019 Term Loan B, 4.207%, (US0001M + 3.750%), 09/03/2026 | | | | | 246,979 | | | | | | 0.0 | | |
| | | | | | | | | 12,988,053 | | | | | | 0.5 | | |
| | | | Leisure Good/Activities/Movies: 0.4% | | ||||||||||||
| 337,748 (3) | | | 24 Hour Fitness Worldwide, Inc. 2021 Delayed Draw Term Loan, 15.000% (PIK Rate 12.000%, Cash Rate 3.000%), 08/26/2022 | | | | | 336,059 | | | | | | 0.0 | | |
| 341,824 (3) | | | 24 Hour Fitness Worldwide, Inc. 2021 Exit Delayed Draw Term Loan, 15.000% (PIK Rate 12.000%, Cash Rate 3.000%), 09/29/2026 | | | | | 317,896 | | | | | | 0.0 | | |
| 1,217,849 | | | Alterra Mountain Company 2021 Series B-2 Consenting Term Loan, 4.000%, (US0001M + 3.500%), 08/17/2028 | | | | | 1,207,954 | | | | | | 0.1 | | |
| 919,597 | | | AMC Entertainment Holdings, Inc. 2019 Term Loan B, 3.352%, (US0001M + 3.000%), 04/22/2026 | | | | | 821,243 | | | | | | 0.0 | | |
| 927,675 | | | AppLovin Corporation 2021 Term Loan B, 3.500%, (US0001M + 3.000%), 10/25/2028 | | | | | 922,385 | | | | | | 0.1 | | |
| 497,462 | | | Bombardier Recreational Products, Inc. 2020 Term Loan, 2.457%, (US0001M + 2.000%), 05/24/2027 | | | | | 489,565 | | | | | | 0.0 | | |
| 335,000 | | | City Football Group Limited Term Loan, 4.000%, (US0006M + 3.500%), 07/21/2028 | | | | | 330,394 | | | | | | 0.0 | | |
| Voya Strategic Income | PORTFOLIO OF INVESTMENTS |
| Opportunities Fund | as of March 31, 2022 (continued) |
| Principal Amount† | | | Value | | | Percentage of Net Assets | | |||||||||
| BANK LOANS: (continued) | | |||||||||||||||
| | | | Leisure Good/Activities/ Movies (continued) | | ||||||||||||
| 776,075 | | | ClubCorp Holdings, Inc. 2017 Term Loan B, 3.756%, (US0003M + 2.750%), 09/18/2024 | | | | $ | 739,090 | | | | | | 0.0 | | |
| 6,438 | | | Crown Finance US, Inc. 2020 Term Loan B1, 8.006%, 05/23/2024 | | | | | 7,621 | | | | | | 0.0 | | |
| 1,026,604 | | | CWGS Group, LLC 2021 Term Loan B, 3.250%, (US0001M + 2.500%), 06/03/2028 | | | | | 990,159 | | | | | | 0.1 | | |
| 694,495 | | | Hayward Industries, Inc. 2021 Term Loan, 3.000%, (US0001M + 2.500%), 05/30/2028 | | | | | 687,116 | | | | | | 0.0 | | |
| 835,800 | | | MajorDrive Holdings IV LLC Term Loan B, 4.563%, (US0003M + 4.000%), 06/01/2028 | | | | | 824,830 | | | | | | 0.1 | | |
| 497,494 | | | Playtika Holding Corp 2021 Term Loan, 3.207%, (US0001M + 2.750%), 03/13/2028 | | | | | 491,586 | | | | | | 0.0 | | |
| 10,769 | | | RV Retailer, LLC Term Loan B, 4.500%, (SOFRRATE + 3.750%), 02/08/2028 | | | | | 10,311 | | | | | | 0.0 | | |
| 665,000 | | | Scientific Games Holdings LP 2022 USD Term Loan B, 3.790%, (SOFRRATE + 3.500%), 02/04/2029 | | | | | 659,735 | | | | | | 0.0 | | |
| 384,803 | | | The Knot Worldwide Inc. 2022 Term Loan, 4.581%, (SOFRRATE + 4.500%), 12/19/2025 | | | | | 384,322 | | | | | | 0.0 | | |
| 423,724 | | | Thor Industries, Inc. 2021 USD Term Loan, 3.500%, (US0001M + 3.000%), 02/01/2026 | | | | | 422,930 | | | | | | 0.0 | | |
| 250,000 | | | WMG Acquisition Corp. 2021 Term Loan G, 2.582%, (US0001M + 2.125%), 01/20/2028 | | | | | 248,438 | | | | | | 0.0 | | |
| 496,144 | | | Wyndham Hotels & Resorts, Inc. Term Loan B, 2.207%, (US0001M + 1.750%), 05/30/2025 | | | | | 492,371 | | | | | | 0.0 | | |
| | | | | | | | | 10,384,005 | | | | | | 0.4 | | |
| Principal Amount† | | | Value | | | Percentage of Net Assets | | |||||||||
| BANK LOANS: (continued) | | |||||||||||||||
| | | | Lodging & Casinos: 0.3% | | ||||||||||||
| 670,835 | | | Aimbridge Acquisition Co., Inc. 2019 Term Loan B, 4.199%, (US0001M + 3.750%), 02/02/2026 | | | | $ | 659,934 | | | | | | 0.0 | | |
| 737,550 | | | Arches Buyer Inc. 2021 Term Loan B, 3.750%, (US0001M + 3.250%), 12/06/2027 | | | | | 726,659 | | | | | | 0.0 | | |
| 1,130,057 | | | Caesars Resort Collection, LLC 2020 Term Loan B1, 3.957%, (US0001M + 3.500%), 07/21/2025 | | | | | 1,125,348 | | | | | | 0.1 | | |
| 590,000 | | | Century Casinos, Inc 2022 Term Loan, 6.302%, (TSFR1M + 6.000%), 03/23/2029 | | | | | 590,000 | | | | | | 0.0 | | |
| 473,171 | | | Golden Entertainment, Inc. 2017 1st Lien Term Loan, 4.000%, (US0001M + 3.000%), 10/21/2024 | | | | | 469,179 | | | | | | 0.0 | | |
| 995,000 | | | Hilton Grand Vacations Borrower LLC 2021 Term Loan B, 3.500%, (US0001M + 3.000%), 08/02/2028 | | | | | 990,492 | | | | | | 0.1 | | |
| 500,000 | | | Hilton Worldwide Finance, LLC 2019 Term Loan B2, 2.207%, (US0001M + 1.750%), 06/22/2026 | | | | | 495,173 | | | | | | 0.0 | | |
| 935 | | | J&J Ventures Gaming, LLC Term Loan, 4.750%, (US0001M + 4.000%), 04/26/2028 | | | | | 930 | | | | | | 0.0 | | |
| 236,508 | | | PCI Gaming Authority Term Loan, 2.957%, (US0001M + 2.500%), 05/29/2026 | | | | | 234,970 | | | | | | 0.0 | | |
| 490,522 | | | Stars Group Holdings B.V. TL B 1L, 3.256%, (US0003M + 2.250%), 07/21/2026 | | | | | 486,843 | | | | | | 0.0 | | |
| 496,179 | | | Station Casinos LLC 2020 Term Loan B, 2.710%, (US0001M + 2.250%), 02/08/2027 | | | | | 490,287 | | | | | | 0.0 | | |
| 221,644 | | | The Enterprise Development Authority Term Loan B, 5.000%, (US0001M + 4.250%), 02/28/2028 | | | | | 220,397 | | | | | | 0.0 | | |
| Voya Strategic Income | PORTFOLIO OF INVESTMENTS |
| Opportunities Fund | as of March 31, 2022 (continued) |
| Principal Amount† | | | Value | | | Percentage of Net Assets | | |||||||||
| BANK LOANS: (continued) | | |||||||||||||||
| | | | Lodging & Casinos (continued) | | ||||||||||||
| 1,326,675 | | | Twin River Worldwide Holdings, Inc. 2021 Term Loan B, 3.750%, (US0006M + 3.250%), 10/02/2028 | | | | $ | 1,320,456 | | | | | | 0.1 | | |
| | | | | | | | | 7,810,668 | | | | | | 0.3 | | |
| | | | Mortgage REITs: 0.0% | | ||||||||||||
| 495,169 | | | BIFM CA Buyer Inc. Term Loan B, 3.957%, (US0001M + 3.500%), 06/01/2026 | | | | | 487,742 | | | | | | 0.0 | | |
| | | | | | | | | | | | | | | | | |
| | | | Nonferrous Metals/Minerals: 0.1% | | ||||||||||||
| 536,685 | | | Covia Holdings Corporation 2020 PIK Take Back Term Loan, 5.000%, (US0003M + 4.000%), 07/31/2026 | | | | | 528,970 | | | | | | 0.0 | | |
| 1,775,299 | | | U.S. Silica Company 2018 Term Loan B, 5.000%, (US0001M + 4.000%), 05/01/2025 | | | | | 1,748,988 | | | | | | 0.1 | | |
| | | | | | | | | 2,277,958 | | | | | | 0.1 | | |
| | | | Oil & Gas: 0.3% | | ||||||||||||
| 89,067 | | | BCP Renaissance Parent LLC 2017 Term Loan B, 4.500%, (US0003M + 3.500%), 10/31/2024 | | | | | 87,991 | | | | | | 0.0 | | |
| 745,998 | | | Brazos Delaware II, LLC Term Loan B, 4.449%, (US0001M + 4.000%), 05/21/2025 | | | | | 737,979 | | | | | | 0.1 | | |
| 577,100 | | | ITT Holdings LLC 2021 Term Loan, 3.250%, (US0001M + 2.750%), 07/10/2028 | | | | | 571,149 | | | | | | 0.0 | | |
| 850,000 | | | Lucid Energy Group II Borrower, LLC 2021 Term Loan, 5.000%, (US0001M + 4.250%), 11/24/2028 | | | | | 844,068 | | | | | | 0.1 | | |
| 558,600 | | | Medallion Midland Acquisition, LLC 2021 Term Loan, 4.500%, (US0001M + 3.750%), 10/18/2028 | | | | | 554,271 | | | | | | 0.0 | | |
| 598,454 | | | NorthRiver Midstream Finance LP 2018 Term Loan B, 3.457%, (US0003M + 3.250%), 10/01/2025 | | | | | 593,644 | | | | | | 0.0 | | |
| Principal Amount† | | | Value | | | Percentage of Net Assets | | |||||||||
| BANK LOANS: (continued) | | |||||||||||||||
| | | | Oil & Gas (continued) | | ||||||||||||
| 640,000 | | | Oryx Midstream Services Permian Basin LLC Term Loan B, 3.750%, (US0003M + 3.250%), 10/05/2028 | | | | $ | 635,500 | | | | | | 0.0 | | |
| 347,250 | | | Southwestern Energy Company 2021 Term Loan, 3.301%, (SOFRRATE + 2.500%), 06/22/2027 | | | | | 345,080 | | | | | | 0.0 | | |
| 807,975 | | | TransMontaigne Operating Company L.P. Term Loan B, 4.000%, (US0001M + 3.500%), 11/17/2028 | | | | | 803,177 | | | | | | 0.1 | | |
| 663,180 | | | Traverse Midstream Partners LLC 2017 Term Loan, 5.250%, (SOFRRATE + 4.250%), 09/27/2024 | | | | | 661,522 | | | | | | 0.0 | | |
| 742,366 | | | Waterbridge Midstream Operating LLC Term Loan B, 6.750%, (US0006M + 5.750%), 06/22/2026 | | | | | 717,577 | | | | | | 0.0 | | |
| | | | | | | | | 6,551,958 | | | | | | 0.3 | | |
| | | | Publishing: 0.2% | | ||||||||||||
| 1,022,438 | �� | | Adevinta ASA USD Term Loan B, 3.712%, (US0003M + 2.750%), 06/26/2028 | | | | | 1,009,146 | | | | | | 0.1 | | |
| 650,121 | | | Alchemy Copyrights, LLC Term Loan B, 3.500%, (US0001M + 3.000%), 03/10/2028 | | | | | 649,308 | | | | | | 0.0 | | |
| 498,750 | | | Cengage Learning, Inc. 2021 Term Loan B, 5.750%, (US0003M + 4.750%), 07/14/2026 | | | | | 495,789 | | | | | | 0.0 | | |
| 1,037,400 | | | Dotdash Meredith Inc Term Loan B, 4.500%, (SOFRRATE + 4.000%), 12/01/2028 | | | | | 1,031,780 | | | | | | 0.1 | | |
| 947,625 | | | McGraw-Hill Global Education Holdings, LLC 2021 First Lien Term Loan B, 5.554%, (US0006M + 4.750%), 07/28/2028 | | | | | 940,222 | | | | | | 0.0 | | |
| | | | | | | | | 4,126,245 | | | | | | 0.2 | | |
| Voya Strategic Income | PORTFOLIO OF INVESTMENTS |
| Opportunities Fund | as of March 31, 2022 (continued) |
| Principal Amount† | | | Value | | | Percentage of Net Assets | | |||||||||
| BANK LOANS: (continued) | | |||||||||||||||
| | | | Radio & Television: 0.3% | | ||||||||||||
| 397,900 | | | A-L Parent LLC 2016 1st Lien Term Loan, 4.250%, (US0001M + 3.250%), 12/01/2023 | | | | $ | 379,435 | | | | | | 0.0 | | |
| 1,158,662 | | | Clear Channel Outdoor Holdings, Inc. Term Loan B, 3.799%, (US0003M + 3.500%), 08/21/2026 | | | | | 1,141,066 | | | | | | 0.1 | | |
| 1,253,911 | | | CMG Media Corporation 2021 Term Loan, 3.957%, (US0001M + 3.500%), 12/17/2026 | | | | | 1,236,781 | | | | | | 0.1 | | |
| 2,785,805 | | | Diamond Sports Group, LLC 2022 2nd Lien Term Loan, 3.445%, (SOFRRATE + 3.250%), 08/24/2026 | | | | | 965,463 | | | | | | 0.0 | | |
| 434,304 | | | Diamond Sports Group, LLC 2022 First Priority Term Loan, 9.000%, (SOFRRATE + 8.000%), 05/26/2026 | | | | | 441,836 | | | | | | 0.0 | | |
| 885,000 | | | Gray Television, Inc. 2021 Term Loan D, 3.231%, (US0001M + 3.000%), 12/01/2028 | | | | | 881,773 | | | | | | 0.0 | | |
| 497,484 | | | iHeartCommunications, Inc. 2020 Incremental Term Loan, 3.750%, (US0001M + 3.250%), 05/01/2026 | | | | | 495,485 | | | | | | 0.0 | | |
| 752,363 | | | iHeartCommunications, Inc. 2020 Term Loan, 3.457%, (US0001M + 3.000%), 05/01/2026 | | | | | 749,307 | | | | | | 0.0 | | |
| 966,303 | | | NASCAR Holdings, Inc Term Loan B, 2.957%, (US0001M + 2.500%), 10/19/2026 | | | | | 961,472 | | | | | | 0.0 | | |
| 1,040,483 | | | Univision Communications Inc. 2021 First Lien Term Loan B, 4.000%, (US0001M + 3.250%), 03/15/2026 | | | | | 1,036,971 | | | | | | 0.1 | | |
| | | | | | | | | 8,289,589 | | | | | | 0.3 | | |
| | | | Rail Industries: 0.0% | | ||||||||||||
| 744,304 | | | Genesee & Wyoming Inc. (New) Term Loan, 3.006%, (US0003M + 2.000%), 12/30/2026 | | | | | 737,419 | | | | | | 0.0 | | |
| Principal Amount† | | | Value | | | Percentage of Net Assets | | |||||||||
| BANK LOANS: (continued) | | |||||||||||||||
| | | | Retailers (Except Food & Drug): 0.4% | | ||||||||||||
| 28,889 | | | AI Aqua Merger Sub, Inc. 2021 1st Lien Delayed Draw Term Loan, 4.962%, (US0003M + 4.000%), 07/31/2028 | | | | $ | 28,660 | | | | | | 0.0 | | |
| 231,111 | | | AI Aqua Merger Sub, Inc. 2021 1st Lien Term Loan B, 4.250%, (TSFR1M + 3.750%), 07/31/2028 | | | | | 229,281 | | | | | | 0.0 | | |
| 79,630 | | | AI Aqua Merger Sub, Inc. 2022 Delayed Draw Term loan, 4.290%, (SOFRRATE + 4.000%), 07/31/2028 | | | | | 78,999 | | | | | | 0.0 | | |
| 350,370 | | | AI Aqua Merger Sub, Inc. 2022 Term Loan B, 4.302%, (TSFR1M + 4.000%), 07/31/2028 | | | | | 347,597 | | | | | | 0.0 | | |
| 452,572 | | | Franchise Group Intermediate Holdco, LLC 2021 First Out Term Loan B, 5.500%, (US0003M + 4.750%), 03/10/2026 | | | | | 452,572 | | | | | | 0.0 | | |
| 1,150,481 | | | Great Outdoors Group, LLC 2021 Term Loan B1, 4.500%, (US0001M + 3.750%), 03/06/2028 | | | | | 1,147,785 | | | | | | 0.1 | | |
| 1,936,897 | | | Harbor Freight Tools USA, Inc. 2021 Term Loan B, 3.250%, (US0001M + 2.750%), 10/19/2027 | | | | | 1,900,178 | | | | | | 0.1 | | |
| 538,048 | | | Jo-Ann Stores, Inc. 2021 Term Loan B1, 5.500%, (US0003M + 4.750%), 07/07/2028 | | | | | 473,482 | | | | | | 0.0 | | |
| 185,000 | | | Lakeshore Intermediate LLC Term Loan, 4.000%, (US0003M + 3.500%), 09/29/2028 | | | | | 182,456 | | | | | | 0.0 | | |
| 561,107 | | | Leslies Poolmart, Inc. 2021 Term Loan B, 3.019%, (US0003M + 2.500%), 03/09/2028 | | | | | 554,694 | | | | | | 0.0 | | |
| 368,381 | | | Mens Wearhouse, Inc. (The) 2020 Take Back Term Loan, 9.000%, (US0003M + 8.000%), 12/01/2025 | | | | | 343,515 | | | | | | 0.0 | | |
| Voya Strategic Income | PORTFOLIO OF INVESTMENTS |
| Opportunities Fund | as of March 31, 2022 (continued) |
| Principal Amount† | | | Value | | | Percentage of Net Assets | | |||||||||
| BANK LOANS: (continued) | | |||||||||||||||
| | | | Retailers (Except Food & Drug) (continued) | | ||||||||||||
| 121,439 | | | Mens Wearhouse, Inc. (The) 2020 Term Loan, 12.000%, (US0003M + 11.000%), 06/01/2025 | | | | $ | 122,047 | | | | | | 0.0 | | |
| 764,225 | | | Michaels Companies, Inc. 2021 Term Loan B, 5.256%, (US0003M + 4.250%), 04/15/2028 | | | | | 716,461 | | | | | | 0.1 | | |
| 560,763 | | | Petco Animal Supplies, Inc. 2021 Term Loan B, 4.256%, (US0003M + 3.250%), 03/03/2028 | | | | | 556,066 | | | | | | 0.0 | | |
| 580,000 | | | Petmate Incremental Term Loan B, 6.250%, (US0001M + 5.500%), 09/15/2028 | | | | | 568,038 | | | | | | 0.0 | | |
| 832,913 | | | Pilot Travel Centers LLC 2021 Term Loan B, 2.452%, (US0001M + 2.000%), 08/04/2028 | | | | | 822,605 | | | | | | 0.1 | | |
| 591,377 | | | Tory Burch LLC Term Loan B, 3.500%, (US0001M + 3.000%), 04/16/2028 | | | | | 576,839 | | | | | | 0.0 | | |
| 344,138 | | | Victorias Secret & Co. Term Loan B, 3.750%, (US0003M + 3.250%), 08/02/2028 | | | | | 339,621 | | | | | | 0.0 | | |
| | | | | | | | | 9,440,896 | | | | | | 0.4 | | |
| | | | Surface Transport: 0.2% | | ||||||||||||
| 1,456,379 | | | American Trailer World Corp. Term Loan B, 4.500%, (SOFRRATE + 3.750%), 03/03/2028 | | | | | 1,406,619 | | | | | | 0.1 | | |
| 421,393 | | | ENC Holding Corporation 2021 Term Loan, 5.256%, (US0003M + 4.250%), 08/04/2028 | | | | | 415,072 | | | | | | 0.0 | | |
| 37,551 (10) | | | ENC Holding Corporation Delayed Draw Term Loan, 5.212%, (US0003M + 4.250%), 08/04/2028 | | | | | 36,988 | | | | | | 0.0 | | |
| 200,000 | | | LaserShip, Inc. 2021 2nd Lien Term Loan, 8.250%, (US0003M + 7.500%), 05/07/2029 | | | | | 199,500 | | | | | | 0.0 | | |
| Principal Amount† | | | Value | | | Percentage of Net Assets | | |||||||||
| BANK LOANS: (continued) | | |||||||||||||||
| | | | Surface Transport (continued) | | ||||||||||||
| 890,525 | | | LaserShip, Inc. 2021 Term Loan, 5.250%, (US0003M + 4.500%), 05/07/2028 | | | | $ | 887,557 | | | | | | 0.1 | | |
| 510,421 | | | Savage Enterprises LLC 2021 Term Loan B, 3.750%, (US0001M + 3.250%), 09/15/2028 | | | | | 507,486 | | | | | | 0.0 | | |
| 847,875 | | | Worldwide Express Operations, LLC 2021 1st Lien Term Loan, 5.750%, (US0003M + 4.250%), 07/26/2028 | | | | | 840,456 | | | | | | 0.0 | | |
| 170,000 | | | Worldwide Express Operations, LLC 2021 2nd Lien Term Loan, 8.006%, (US0003M + 7.000%), 07/26/2029 | | | | | 167,662 | | | | | | 0.0 | | |
| 500,000 | | | XPO Logistics, Inc. 2018 Term Loan B, 1.992%, (US0001M + 1.750%), 02/24/2025 | | | | | 495,669 | | | | | | 0.0 | | |
| | | | | | | | | 4,957,009 | | | | | | 0.2 | | |
| | | | Technology: 0.0% | | ||||||||||||
| 1,014,752 | | | Veritas US Inc. 2021 USD Term Loan B, 6.000%, (US0003M + 5.000%), 09/01/2025 | | | | | 954,712 | | | | | | 0.0 | | |
| | | | | | ||||||||||||
| | | | Telecommunications: 0.7% | | ||||||||||||
| 505,380 | | | Altice Financing SA USD 2017 1st Lien Term Loan, 2.989%, (US0003M + 2.750%), 01/31/2026 | | | | | 489,587 | | | | | | 0.0 | | |
| 989,717 | | | Asurion LLC 2018 Term Loan B7, 3.457%, (US0001M + 3.000%), 11/03/2024 | | | | | 978,377 | | | | | | 0.1 | | |
| 330,000 | | | Asurion LLC 2021 2nd Lien Term Loan B3, 5.707%, (US0001M + 5.250%), 01/31/2028 | | | | | 324,087 | | | | | | 0.0 | | |
| 810,000 | | | Asurion LLC 2021 Second Lien Term Loan B4, 5.707%, (US0001M + 5.250%), 01/20/2029 | | | | | 793,800 | | | | | | 0.0 | | |
| Voya Strategic Income | PORTFOLIO OF INVESTMENTS |
| Opportunities Fund | as of March 31, 2022 (continued) |
| Principal Amount† | | | Value | | | Percentage of Net Assets | | |||||||||
| BANK LOANS: (continued) | | |||||||||||||||
| | | | Telecommunications (continued) | | ||||||||||||
| 1,484,950 | | | Asurion LLC 2021 Term Loan B9, 3.707%, (US0001M + 3.250%), 07/31/2027 | | | | $ | 1,456,798 | | | | | | 0.1 | | |
| 497,925 | | | Avaya, Inc. 2020 Term Loan B, 4.647%, (US0001M + 4.250%), 12/15/2027 | | | | | 494,917 | | | | | | 0.0 | | |
| 250,000 | | | Avaya, Inc. 2021 Term Loan B2, 4.397%, (US0001M + 4.000%), 12/15/2027 | | | | | 247,250 | | | | | | 0.0 | | |
| 646,265 | | | Cablevision Lightpath LLC Term Loan B, 3.750%, (US0003M + 3.250%), 11/30/2027 | | | | | 639,237 | | | | | | 0.0 | | |
| 1,215,000 | | | CCI Buyer, Inc. Term Loan, 4.750%, (US0003M + 4.000%), 12/17/2027 | | | | | 1,202,343 | | | | | | 0.1 | | |
| 1,492,366 | | | CenturyLink, Inc. 2020 Term Loan B, 2.707%, (US0001M + 2.250%), 03/15/2027 | | | | | 1,455,290 | | | | | | 0.1 | | |
| 1,274,800 | | | CommScope, Inc. 2019 Term Loan B, 3.707%, (US0001M + 3.250%), 04/06/2026 | | | | | 1,246,715 | | | | | | 0.1 | | |
| 956,718 | | | Connect Finco Sarl 2021 Term Loan B, 4.500%, (US0001M + 3.500%), 12/11/2026 | | | | | 949,942 | | | | | | 0.1 | | |
| 640,175 | | | Digi International Inc. Term Loan B, 5.500%, (US0001M + 5.000%), 11/01/2028 | | | | | 640,175 | | | | | | 0.0 | | |
| 415,046 | | | Global Tel*Link Corporation 2018 1st Lien Term Loan, 4.707%, (US0001M + 4.250%), 11/29/2025 | | | | | 395,807 | | | | | | 0.0 | | |
| 78,042 | | | Global Tel*Link Corporation 2018 2nd Lien Term Loan, 10.413%, (SOFRRATE + 10.000%), 11/29/2026 | | | | | 75,311 | | | | | | 0.0 | | |
| 253,725 | | | GOGO Intermediate Holdings LLC Term Loan B, 4.500%, (US0003M + 3.750%), 04/30/2028 | | | | | 252,218 | | | | | | 0.0 | | |
| 492,959 | | | GTT Communications, Inc. 2018 USD Term Loan B, 7.250%, (PRIME + 3.750%), 05/31/2025 | | | | | 405,212 | | | | | | 0.0 | | |
| Principal Amount† | | | Value | | | Percentage of Net Assets | | |||||||||
| BANK LOANS: (continued) | | |||||||||||||||
| | | | Telecommunications (continued) | | ||||||||||||
| 29,913 | | | Intelsat Jackson Holdings S.A. 2021 Exit Term Loan B, 4.920%, (SOFRRATE + 4.250%), 02/01/2029 | | | | $ | 29,470 | | | | | | 0.0 | | |
| 500,000 | | | Level 3 Financing Inc. 2019 Term Loan B, 2.207%, (US0001M + 1.750%), 03/01/2027 | | | | | 491,473 | | | | | | 0.0 | | |
| 216,000 | | | MTN Infrastructure TopCo Inc 2021 Term Loan, 5.506%, (US0003M + 4.500%), 10/04/2028 | | | | | 212,220 | | | | | | 0.0 | | |
| 934,134 | | | Numericable Group SA USD Term Loan B11, 3.049%, (US0001M + 2.750%), 07/31/2025 | | | | | 913,894 | | | | | | 0.0 | | |
| 596,883 | | | Securus Technologies Holdings, Inc. 2017 1st Lien Term Loan, 5.506%, (US0003M + 4.500%), 11/01/2024 | | | | | 566,964 | | | | | | 0.0 | | |
| 520,000 | | | Venga Finance Sarl 2021 USD Term Loan B, 5.712%, (US0003M + 4.750%), 12/04/2028 | | | | | 507,217 | | | | | | 0.0 | | |
| 375,000 | | | ViaSat, Inc. Term Loan, 5.000%, (SOFRRATE + 4.500%), 03/02/2029 | | | | | 369,375 | | | | | | 0.0 | | |
| 1,260,597 | | | Zayo Group Holdings, Inc. USD Term Loan, 3.457%, (US0001M + 3.000%), 03/09/2027 | | | | | 1,228,294 | | | | | | 0.1 | | |
| | | | | | | | | 16,365,973 | | | | | | 0.7 | | |
| | | | Utilities: 0.1% | | ||||||||||||
| 348,868 | | | Covanta Holding Corporation 2021 Term Loan B, 3.000%, (US0001M + 2.500%), 11/30/2028 | | | | | 347,741 | | | | | | 0.0 | | |
| 26,132 | | | Covanta Holding Corporation 2021 Term Loan C, 3.000%, (US0001M + 2.500%), 11/30/2028 | | | | | 26,048 | | | | | | 0.0 | | |
| 1,022,368 | | | Edgewater Generation, L.L.C. Term Loan, 4.207%, (US0001M + 3.750%), 12/13/2025 | | | | | 947,608 | | | | | | 0.1 | | |
| Voya Strategic Income | PORTFOLIO OF INVESTMENTS |
| Opportunities Fund | as of March 31, 2022 (continued) |
| Principal Amount† | | | Value | | | Percentage of Net Assets | | |||||||||
| BANK LOANS: (continued) | | |||||||||||||||
| | | | Utilities (continued) | | ||||||||||||
| 376,200 | | | Generation Bridge Acquisition, LLC Term Loan B, 6.006%, (US0003M + 5.000%), 12/01/2028 | | | | $ | 376,670 | | | | | | 0.0 | | |
| 7,857 | | | Generation Bridge Acquisition, LLC Term Loan C, 6.006%, (US0003M + 5.000%), 12/01/2028 | | | | | 7,867 | | | | | | 0.0 | | |
| 916,324 | | | Nautilus Power, LLC Term Loan B, 5.250%, (US0001M + 4.250%), 05/16/2024 | | | | | 741,077 | | | | | | 0.0 | | |
| 338,300 | | | Tiger Acquisition, LLC 2021 Term Loan, 3.758%, (US0003M + 3.250%), 06/01/2028 | | | | | 325,233 | | | | | | 0.0 | | |
| | | | | | | | | 2,772,244 | | | | | | 0.1 | | |
| | | | Total Bank Loans (Cost $323,911,101) | | | | | 318,698,766 | | | | | | 12.9 | | |
| CONVERTIBLE BONDS/NOTES: 0.0% | | |||||||||||||||
| | | | Communications: 0.0% | | ||||||||||||
| 210,000 | | | DISH Network Corp., 3.375%, 08/15/2026 | | | | | 189,420 | | | | | | 0.0 | | |
| | | | Total Convertible Bonds/Notes (Cost $205,804) | | | | | 189,420 | | | | | | 0.0 | | |
| U.S. GOVERNMENT AGENCY OBLIGATIONS: 0.0% | | |||||||||||||||
| | | | Uniform Mortgage-Backed Securities: 0.0% | | ||||||||||||
| 3,476 | | | 5.500%,10/01/2039 | | | | | 3,808 | | | | | | 0.0 | | |
| | | | Total U.S. Government Agency Obligations (Cost $3,733) | | | | | 3,808 | | | | | | 0.0 | | |
| | ||||||||||||||||
| Shares | | | Value | | | Percentage of Net Assets | | |||||||||
| COMMON STOCK: 0.0% | | |||||||||||||||
| | | | Consumer Discretionary: 0.0% | | ||||||||||||
| 142,000 (11) | | | 24 Hour Fitness Worldwide, Inc. | | | | | 59,356 | | | | | | 0.0 | | |
| | | | | | | | | | | | | | | | | |
| | | | Consumer Staples: — % | | ||||||||||||
| 2,038 (7)(11) | | | Save-A-Lot, Inc. / Moran Foods | | | | | — | | | | | | — | | |
| Shares | | | Value | | | Percentage of Net Assets | | |||||||||
| COMMON STOCK: (continued) | | |||||||||||||||
| | | | Materials: 0.0% | | ||||||||||||
| 53,269 (11) | | | Covia Specialty Minerals, Inc. | | | | $ | 652,545 | | | | | | 0.0 | | |
| | | | Total Common Stock (Cost $663,295) | | | | | 711,901 | | | | | | 0.0 | | |
| PREFERRED STOCK: 0.0% | | |||||||||||||||
| | | | Consumer Discretionary: 0.0% | | ||||||||||||
| 189,193 (11) | | | 24 Hour Fitness Worldwide, Inc. | | | | | 378,386 | | | | | | 0.0 | | |
| | | | Information Technology: 0.0% | | ||||||||||||
| 2,393 (11) | | | Riverbed Technology, Inc. | | | | | 23,451 | | | | | | 0.0 | | |
| | | | Total Preferred Stock (Cost $267,309) | | | | | 401,837 | | | | | | 0.0 | | |
| WARRANTS: 0.0% | | |||||||||||||||
| | | | Communication Services: 0.0% | | ||||||||||||
| 26,686 (11) | | | Cineworld Group PLC | | | | | 4,032 | | | | | | 0.0 | | |
| | | | Total Warrants (Cost $—) | | | | | 4,032 | | | | | | 0.0 | | |
| | ||||||||||||||||
| | | | Value | | | Percentage of Net Assets | | |||||||||
| PURCHASED OPTIONS(12): 0.1% | | |||||||||||||||
| | | | Total Purchased Options (Cost $4,166,654) | | | | | 3,162,442 | | | | | | 0.1 | | |
| | | | Total Long-Term Investments (Cost $2,329,112,345) | | | | | 2,228,984,565 | | | | | | 90.3 | | |
| Principal Amount† | | | Value | | | Percentage of Net Assets | | |||||||||
| SHORT-TERM INVESTMENTS: 13.9% | | |||||||||||||||
| | | | Floating Rate Notes: 0.7% | | ||||||||||||
| 400,000 (13) | | | ANZ Bank, 0.420%, 08/18/2022 | | | | | 399,747 | | | | | | 0.0 | | |
| 475,000 (13) | | | Bank of America N.A., 0.410%, 06/22/2022 | | | | | 474,795 | | | | | | 0.1 | | |
| 450,000 (13) | | | Bank of Montreal, 0.410%, 07/25/2022 | | | | | 449,664 | | | | | | 0.0 | | |
| 325,000 (13) | | | Bank of Nova Scotia, 0.440%, 07/18/2022 | | | | | 324,805 | | | | | | 0.0 | | |
| 475,000 (13) | | | Barclays Bank PLC, 0.440%, 07/22/2022 | | | | | 474,464 | | | | | | 0.0 | | |
| 475,000 (13) | | | Bayeriche Landesbank of New York, 0.470%, 07/27/2022 | | | | | 474,681 | | | | | | 0.0 | | |
| Voya Strategic Income | PORTFOLIO OF INVESTMENTS |
| Opportunities Fund | as of March 31, 2022 (continued) |
| Principal Amount† | | | Value | | | Percentage of Net Assets | | |||||||||
| SHORT-TERM INVESTMENTS: (continued) | | |||||||||||||||
| | | | Floating Rate Notes (continued) | | ||||||||||||
| 425,000 (13) | | | Commonwealth Bank of Australia, 0.450%, 09/01/2022 | | | | $ | 424,621 | | | | | | 0.0 | | |
| 475,000 (13) | | | Cooperatieve Rabobank U.A./New York, 0.410%, 08/03/2022 | | | | | 474,608 | | | | | | 0.0 | | |
| 325,000 (13) | | | Cooperatieve Rabobank U.A./New York, 0.420%, 08/16/2022 | | | | | 324,721 | | | | | | 0.0 | | |
| 475,000 (13) | | | Credit Agricole, 0.390%, 07/21/2022 | | | | | 474,671 | | | | | | 0.0 | | |
| 275,000 (13) | | | Credit Agricole, 0.410%, 08/04/2022 | | | | | 274,806 | | | | | | 0.0 | | |
| 475,000 (13) | | | Credit Industriel et Commercial, 0.440%, 08/08/2022 | | | | | 474,635 | | | | | | 0.0 | | |
| 400,000 (13) | | | Credit Suisse AG, 0.450%, 05/02/2022 | | | | | 399,983 | | | | | | 0.0 | | |
| 275,000 (13) | | | Landesbank Baden-Wurttemberg, 0.440%, 06/17/2022 | | | | | 274,882 | | | | | | 0.0 | | |
| 400,000 (13) | | | Mitsubishi UFJ Trust and Banking Corp., 0.430%, 07/22/2022 | | | | | 399,745 | | | | | | 0.0 | | |
| 475,000 (13) | | | Mitsubishi UFJ Trust and Banking Corp., 0.460%, 07/26/2022 | | | | | 474,727 | | | | | | 0.0 | | |
| 400,000 (13) | | | Mizuho Bank Ltd., 0.440%, 07/25/2022 | | | | | 399,574 | | | | | | 0.0 | | |
| 475,000 (13) | | | Mizuho Bank Ltd., 0.450%, 07/28/2022 | | | | | 474,501 | | | | | | 0.0 | | |
| 350,000 (13) | | | Mizuho Bank Ltd., 0.460%, 08/10/2022 | | | | | 349,610 | | | | | | 0.0 | | |
| 475,000 (13) | | | National Australia Bank Ltd., 0.400%, 08/08/2022 | | | | | 474,584 | | | | | | 0.0 | | |
| 475,000 (13) | | | National Australia Bank Ltd., 0.420%, 08/15/2022 | | | | | 474,605 | | | | | | 0.0 | | |
| 475,000 (13) | | | National Bank of Canada, 0.430%, 08/09/2022 | | | | | 474,613 | | | | | | 0.0 | | |
| 475,000 (13) | | | Natixis SA, 0.440%, 06/17/2022 | | | | | 474,879 | | | | | | 0.1 | | |
| Principal Amount† | | | Value | | | Percentage of Net Assets | | |||||||||
| SHORT-TERM INVESTMENTS: (continued) | | |||||||||||||||
| | | | Floating Rate Notes (continued) | | ||||||||||||
| 400,000 (13) | | | Norinchukin Bank of New York, 0.390%, 05/27/2022 | | | | $ | 399,886 | | | | | | 0.0 | | |
| 475,000 (13) | | | Norinchukin Bank of New York, 0.420%, 06/22/2022 | | | | | 474,816 | | | | | | 0.1 | | |
| 425,000 (13) | | | Royal Bank of Canada, 0.420%, 08/16/2022 | | | | | 424,649 | | | | | | 0.0 | | |
| 500,000 (13) | | | Royal Bank of Canada, 0.450%, 08/23/2022 | | | | | 499,622 | | | | | | 0.1 | | |
| 400,000 (13) | | | Sheffield Receivables Company LLC, 0.480%, 07/27/2022 | | | | | 399,696 | | | | | | 0.0 | | |
| 475,000 (13) | | | Skandinaviska Enskilda Banken AB, 0.410%, 07/20/2022 | | | | | 474,726 | | | | | | 0.0 | | |
| 475,000 (13) | | | Societe Generale, 0.430%, 08/08/2022 | | | | | 474,584 | | | | | | 0.0 | | |
| 475,000 (13) | | | Societe Generale, 0.470%, 08/31/2022 | | | | | 474,575 | | | | | | 0.0 | | |
| 425,000 (13) | | | Starbird Funding Corp., 0.450%, 08/23/2022 | | | | | 424,320 | | | | | | 0.0 | | |
| 400,000 (13) | | | Sumitomo Mitsui Trust Bank Ltd., 0.430%, 07/25/2022 | | | | | 399,762 | | | | | | 0.0 | | |
| 475,000 (13) | | | Sumitomo Mitsui Trust Bank Ltd., 0.430%, 07/28/2022 | | | | | 474,704 | | | | | | 0.0 | | |
| 400,000 (13) | | | Sumitomo Mitsui Trust Bank Ltd., 0.450%, 08/01/2022 | | | | | 399,762 | | | | | | 0.0 | | |
| 475,000 (13) | | | Sumitomo Mitsui Trust Bank Ltd., 0.450%, 08/04/2022 | | | | | 474,704 | | | | | | 0.0 | | |
| 350,000 (13) | | | Sumitomo Mitsui Trust Bank Ltd., 0.450%, 08/08/2022 | | | | | 349,777 | | | | | | 0.0 | | |
| 500,000 (13) | | | Svenska Handelsbanken AB, 0.420%, 07/29/2022 | | | | | 499,601 | | | | | | 0.1 | | |
| 475,000 (13) | | | Toronto-Dominion Bank, 0.430%, 07/25/2022 | | | | | 474,800 | | | | | | 0.1 | | |
| 475,000 (13) | | | Toronto-Dominion Bank, 0.440%, 08/19/2022 | | | | | 474,668 | | | | | | 0.0 | | |
| 500,000 (13) | | | Westpac Banking Corp., 0.410%, 08/02/2022 | | | | | 499,689 | | | | | | 0.1 | | |
| | | | Total Floating Rate Notes (Cost $17,812,262) | | | | | 17,812,262 | | | | | | 0.7 | | |
| | ||||||||||||||||
| Voya Strategic Income | PORTFOLIO OF INVESTMENTS |
| Opportunities Fund | as of March 31, 2022 (continued) |
| Principal Amount† | | | Value | | | Percentage of Net Assets | | |||||||||
| SHORT-TERM INVESTMENTS: (continued) | | |||||||||||||||
| | | | Repurchase Agreements: 3.2% | | ||||||||||||
| 18,309,488 (13) | | | Cantor Fitzgerald Securities, Repurchase Agreement dated 03/31/22, 0.29%, due 04/01/22 (Repurchase Amount $18,309,633, collateralized by various U.S. Government Agency Obligations, 0.000%- 9.000%, Market Value plus accrued interest $18,675,678, due 04/25/22-12/20/71) | | | | $ | 18,309,488 | | | | | | 0.7 | | |
| 4,679,733 (13) | | | CF Secured LLC, Repurchase Agreement dated 03/31/22, 0.29%, due 04/01/22 (Repurchase Amount $4,679,770, collateralized by various U.S. Government/U.S. Government Agency Obligations, 0.000%- 5.500%, Market Value plus accrued interest $4,773,328, due 04/05/22-03/01/52) | | | | | 4,679,733 | | | | | | 0.2 | | |
| 9,263,500 (13) | | | Citadel Securities LLC, Repurchase Agreement dated 03/31/22, 0.33%, due 04/01/22 (Repurchase Amount $9,263,584, collateralized by various U.S. Government Securities, 0.000%-7.625%, Market Value plus accrued interest $9,448,882, due 04/19/22-02/15/52) | | | | | 9,263,500 | | | | | | 0.4 | | |
| 23,437,631 (13) | | | Daiwa Capital Markets, Repurchase Agreement dated 03/31/22, 0.30%, due 04/01/22 (Repurchase Amount $23,437,824, collateralized by various U.S. Government/U.S. Government Agency Obligations, 0.000%- 6.500%, Market Value plus accrued interest $23,906,384, due 04/05/22-04/01/52) | | | | | 23,437,631 | | | | | | 0.9 | | |
| Principal Amount† | | | Value | | | Percentage of Net Assets | | |||||||||
| SHORT-TERM INVESTMENTS: (continued) | | |||||||||||||||
| | | | Repurchase Agreements (continued) | | ||||||||||||
| 4,073,198 (13) | | | Industrial & Comm. Bank of China, Repurchase Agreement dated 03/31/22, 0.28%, due 04/01/22 (Repurchase Amount $4,073,229, collateralized by various U.S. Government Securities, 0.000%-2.250%, Market Value plus accrued interest $4,154,662, due 03/23/23-02/28/27) | | | | $ | 4,073,198 | | | | | | 0.2 | | |
| 5,523,225 (13) | | | Mirae Asset Securities USA Inc., Repurchase Agreement dated 03/31/22, 0.33%, due 04/01/22 (Repurchase Amount $5,523,275, collateralized by various U.S. Government Agency Obligations, 0.550%- 8.250%, Market Value plus accrued interest $5,633,741, due 05/01/22-02/20/72) | | | | | 5,523,225 | | | | | | 0.2 | | |
| 11,691,140 (13) | | | State of Wisconsin Investment Board, Repurchase Agreement dated 03/31/22, 0.33%, due 04/01/22 (Repurchase Amount $11,691,246, collateralized by various U.S. Government Securities, 0.125%-3.875%, Market Value plus accrued interest $11,924,970, due 01/15/25-02/15/51) | | | | | 11,691,140 | | | | | | 0.5 | | |
| 2,985,374 (13) | | | Stonex Financial Inc., Repurchase Agreement dated 03/31/22, 0.35%, due 04/01/22 (Repurchase Amount $2,985,403, collateralized by various U.S. Government/U.S. Government Agency Obligations, 0.000%- 9.500%, Market Value plus accrued interest $3,134,643, due 04/15/22-02/20/72) | | | | | 2,985,374 | | | | | | 0.1 | | |
| Voya Strategic Income | PORTFOLIO OF INVESTMENTS |
| Opportunities Fund | as of March 31, 2022 (continued) |
| Principal Amount† | | | Value | | | Percentage of Net Assets | | |||||||||
| SHORT-TERM INVESTMENTS: (continued) | | |||||||||||||||
| | | | Repurchase Agreements (continued) | | ||||||||||||
| | | | Total Repurchase Agreements (Cost $79,963,289) | | | | $ | 79,963,289 | | | | | | 3.2 | | |
| | | | | | ||||||||||||
| | | | Certificates of Deposit: 0.1% | | ||||||||||||
| 1,680,000 (13) | | | Sumitomo Mitsui Trust Bank Ltd., 0.300%, 04/01/2022 (Cost $1,680,000) | | | | | 1,680,000 | | | | | | 0.1 | | |
| | | | | | | | | | | | | | | | | |
| | | | Time Deposits: 1.1% | | ||||||||||||
| 2,280,000 (13) | | | ANZ Bank, 0.310%, 04/01/2022 | | | | | 2,280,000 | | | | | | 0.1 | | |
| 3,040,000 (13) | | | Barclays Bank PLC, 0.340%, 04/01/2022 | | | | | 3,040,000 | | | | | | 0.1 | | |
| 3,280,000 (13) | | | BNP Paribas, 0.310%, 04/01/2022 | | | | | 3,280,000 | | | | | | 0.1 | | |
| 3,080,000 (13) | | | Cooperatieve Rabobank U.A./New York, 0.300%, 04/01/2022 | | | | | 3,080,000 | | | | | | 0.1 | | |
| 1,760,000 (13) | | | Credit Agricole, 0.310%, 04/01/2022 | | | | | 1,760,000 | | | | | | 0.1 | | |
| 1,350,000 (13) | | | Landesbank Baden-Wurttemberg, 0.330%, 04/01/2022 | | | | | 1,350,000 | | | | | | 0.1 | | |
| 2,670,000 (13) | | | Mizuho Bank Ltd., 0.320%, 04/01/2022 | | | | | 2,670,000 | | | | | | 0.1 | | |
| 2,900,000 (13) | | | Royal Bank of Canada, 0.300%, 04/01/2022 | | | | | 2,900,000 | | | | | | 0.1 | | |
| 3,380,000 (13) | | | Skandinaviska Enskilda Banken AB, 0.300%, 04/01/2022 | | | | | 3,380,000 | | | | | | 0.2 | | |
| 3,350,000 (13) | | | Svenska Handelsbanken AB, 0.270%, 04/01/2022 | | | | | 3,350,000 | | | | | | 0.1 | | |
| | | | Total Time Deposits | | | | | | | | | | | | | |
| | | | (Cost $27,090,000) | | | | | 27,090,000 | | | | | | 1.1 | | |
| | ||||||||||||||||
| Shares | | | Value | | | Percentage of Net Assets | | |||||||||
| | | | Mutual Funds: 8.8% | | ||||||||||||
| 210,401,174 (13)(14) | | | BlackRock Liquidity Funds, FedFund, Institutional Class, 0.230% | | | | | 210,401,174 | | | | | | 8.5 | | |
| 3,540,000 (13)(14) | | | Goldman Sachs Financial Square Government Fund - Institutional Shares, 0.250% | | | | | 3,540,000 | | | | | | 0.2 | | |
| Shares | | | Value | | | Percentage of Net Assets | | |||||||||
| | | | Mutual Funds (continued): 8.8% | | ||||||||||||
| 3,308,000 (13)(14) | | | Morgan Stanley Institutional Liquidity Funds - Government Portfolio (Institutional Share Class), 0.230% | | | | $ | 3,308,000 | | | | | | 0.1 | | |
| | | | Total Mutual Funds (Cost $217,249,174) | | | | | 217,249,174 | | | | | | 8.8 | | |
| | | | Total Short-Term Investments (Cost $343,794,725) | | | | | 343,794,725 | | | | | | 13.9 | | |
| | | | Total Investments in Securities (Cost $2,672,907,070) | | | | $ | 2,572,779,290 | | | | | | 104.3 | | |
| | | | Liabilities in Excess of Other Assets | | | | | (105,671,279) | | | | | | (4.3) | | |
| | | | Net Assets | | | | $ | 2,467,108,011 | | | | | | 100.0 | | |
| | ||||||||||||||||
payment rates.
| Voya Strategic Income | PORTFOLIO OF INVESTMENTS |
| Opportunities Fund | as of March 31, 2022 (continued) |
| | | | Quoted Prices in Active Markets for Identical Investments (Level 1) | | | Significant Other Observable Inputs# (Level 2) | | | Significant Unobservable Inputs (Level 3) | | | Fair Value at March 31, 2022 | | ||||||||||||
| Asset Table | | | | | | | | | | | | | | | | | | | | | | | | | |
| Investments, at fair value | | | | | | | | | | | | | | | | | | | | | | | | | |
| Common Stock | | | | | | | | | | | | | | | | | | | | | | | | | |
| Consumer Discretionary | | | | $ | — | | | | | $ | 59,356 | | | | | $ | — | | | | | $ | 59,356 | | |
| Consumer Staples | | | | | — | | | | | | — | | | | | | — | | | | | | — | | |
| Materials | | | | | — | | | | | | 652,545 | | | | | | — | | | | | | 652,545 | | |
| Total Common Stock | | | | | — | | | | | | 711,901 | | | | | | — | | | | | | 711,901 | | |
| Preferred Stock | | | | | — | | | | | | 401,837 | | | | | | — | | | | | | 401,837 | | |
| Warrants | | | | | — | | | | | | 4,032 | | | | | | — | | | | | | 4,032 | | |
| Purchased Options | | | | | — | | | | | | 3,162,442 | | | | | | — | | | | | | 3,162,442 | | |
| Corporate Bonds/Notes | | | | | — | | | | | | 450,380,183 | | | | | | — | | | | | | 450,380,183 | | |
| Collateralized Mortgage Obligations | | | | | — | | | | | | 556,685,425 | | | | | | — | | | | | | 556,685,425 | | |
| Asset-Backed Securities | | | | | — | | | | | | 326,717,928 | | | | | | — | | | | | | 326,717,928 | | |
| Sovereign Bonds | | | | | — | | | | | | 63,086,249 | | | | | | — | | | | | | 63,086,249 | | |
| Commercial Mortgage-Backed Securities | | | | | — | | | | | | 420,467,023 | | | | | | 3,151,272 | | | | | | 423,618,295 | | |
| Convertible Bonds/Notes | | | | | — | | | | | | 189,420 | | | | | | — | | | | | | 189,420 | | |
| U.S. Government Agency Obligations | | | | | — | | | | | | 3,808 | | | | | | — | | | | | | 3,808 | | |
| U.S. Treasury Obligations | | | | | — | | | | | | 85,324,279 | | | | | | — | | | | | | 85,324,279 | | |
| Bank Loans | | | | | — | | | | | | 318,698,766 | | | | | | — | | | | | | 318,698,766 | | |
| Short-Term Investments | | | | | 217,249,174 | | | | | | 126,545,551 | | | | | | — | | | | | | 343,794,725 | | |
| Total Investments, at fair value | | | | $ | 217,249,174 | | | | | $ | 2,352,378,844 | | | | | $ | 3,151,272 | | | | | $ | 2,572,779,290 | | |
| Other Financial Instruments+ | | | | | | | | | | | | | | | | | | | | | | | | | |
| Centrally Cleared Swaps | | | | | — | | | | | | 1,031,796 | | | | | | — | | | | | | 1,031,796 | | |
| Forward Foreign Currency Contracts | | | | | — | | | | | | 22,696,093 | | | | | | — | | | | | | 22,696,093 | | |
| Futures | | | | | 10,830,867 | | | | | | — | | | | | | — | | | | | | 10,830,867 | | |
| Volatility Swaps | | | | | — | | | | | | 71,287 | | | | | | — | | | | | | 71,287 | | |
| Total Assets | | | | $ | 228,080,041 | | | | | $ | 2,376,178,020 | | | | | $ | 3,151,272 | | | | | $ | 2,607,409,333 | | |
| Liabilities Table | | | | | | | | | | | | | | | | | | | | | | | | | |
| Other Financial Instruments+ | | | | | | | | | | | | | | | | | | | | | | | | | |
| Centrally Cleared Swaps | | | | $ | — | | | | | $ | (1,109,806) | | | | | $ | — | | | | | $ | (1,109,806) | | |
| Forward Foreign Currency Contracts | | | | | — | | | | | | (24,085,499) | | | | | | — | | | | | | (24,085,499) | | |
| Futures | | | | | (8,999,992) | | | | | | — | | | | | | — | | | | | | (8,999,992) | | |
| Written Options | | | | | — | | | | | | (2,584,504) | | | | | | — | | | | | | (2,584,504) | | |
| Total Liabilities | | | | $ | (8,999,992) | | | | | $ | (27,779,809) | | | | | $ | — | | | | | $ | (36,779,801) | | |
| Voya Strategic Income | PORTFOLIO OF INVESTMENTS |
| Opportunities Fund | as of March 31, 2022 (continued) |
| Currency Purchased | | | Currency Sold | | | Counterparty | | | Settlement Date | | | Unrealized Appreciation (Depreciation) | | ||||||
| USD 23,292,152 | | | NOK 203,912,313 | | | Bank of America N.A. | | | | | 04/08/22 | | | | | $ | 131,604 | | |
| NOK 189,631,724 | | | USD 21,285,602 | | | Bank of America N.A. | | | | | 04/08/22 | | | | | | 252,944 | | |
| USD 22,221,714 | | | SEK 210,115,192 | | | Bank of America N.A. | | | | | 04/08/22 | | | | | | (126,876) | | |
| NOK 210,154,778 | | | USD 23,994,654 | | | Bank of America N.A. | | | | | 04/08/22 | | | | | | (125,081) | | |
| USD 24,549,214 | | | NOK 213,174,324 | | | Bank of America N.A. | | | | | 04/08/22 | | | | | | 336,678 | | |
| EUR 11,529,056 | | | USD 12,802,094 | | | Bank of America N.A. | | | | | 04/08/22 | | | | | | (64,227) | | |
| AUD 39,637,840 | | | USD 29,710,147 | | | Bank of America N.A. | | | | | 04/08/22 | | | | | | 31,067 | | |
| CHF 1,834,701 | | | USD 1,951,130 | | | Barclays Bank PLC | | | | | 04/08/22 | | | | | | 34,638 | | |
| USD 18,817,351 | | | CHF 17,275,232 | | | Barclays Bank PLC | | | | | 04/08/22 | | | | | | 119,697 | | |
| USD 389 | | | PHP 20,502 | | | Barclays Bank PLC | | | | | 04/29/22 | | | | | | (6) | | |
| MYR 131,109 | | | USD 31,348 | | | Barclays Bank PLC | | | | | 04/29/22 | | | | | | (273) | | |
| HUF 655,795 | | | USD 1,893 | | | Barclays Bank PLC | | | | | 04/29/22 | | | | | | 75 | | |
| COP 17,635,054 | | | USD 4,646 | | | Barclays Bank PLC | | | | | 05/06/22 | | | | | | 8 | | |
| CHF 18,585,835 | | | USD 19,908,560 | | | BNP Paribas | | | | | 04/08/22 | | | | | | 207,611 | | |
| GBP 29,757,657 | | | USD 39,099,175 | | | BNP Paribas | | | | | 04/08/22 | | | | | | (75,554) | | |
| USD 6,245,258 | | | EUR 5,619,601 | | | BNP Paribas | | | | | 04/08/22 | | | | | | 36,447 | | |
| USD 13,964,837 | | | AUD 19,111,133 | | | BNP Paribas | | | | | 04/08/22 | | | | | | (336,720) | | |
| EUR 11,395,811 | | | USD 12,693,633 | | | BNP Paribas | | | | | 04/08/22 | | | | | | (85,480) | | |
| USD 24,457,308 | | | SEK 229,665,034 | | | BNP Paribas | | | | | 04/08/22 | | | | | | (65,548) | | |
| JPY 1,664,976,067 | | | USD 13,552,235 | | | BNP Paribas | | | | | 04/08/22 | | | | | | 125,330 | | |
| GBP 13,640,332 | | | USD 18,081,413 | | | BNP Paribas | | | | | 04/08/22 | | | | | | (163,284) | | |
| USD 19,132,752 | | | EUR 16,852,225 | | | BNP Paribas | | | | | 04/08/22 | | | | | | 487,705 | | |
| JPY 828,300,871 | | | USD 6,871,669 | | | BNP Paribas | | | | | 04/08/22 | | | | | | (67,283) | | |
| AUD 37,048,150 | | | USD 27,634,797 | | | BNP Paribas | | | | | 04/08/22 | | | | | | 89,685 | | |
| SEK 226,330,027 | | | USD 23,850,266 | | | BNP Paribas | | | | | 04/08/22 | | | | | | 222,990 | | |
| USD 7,532,000 | | | EUR 6,850,251 | | | BNP Paribas | | | | | 04/08/22 | | | | | | (47,014) | | |
| USD 18,256,619 | | | GBP 13,824,411 | | | BNP Paribas | | | | | 04/08/22 | | | | | | 96,680 | | |
| USD 1,832,301 | | | JPY 221,220,321 | | | BNP Paribas | | | | | 04/08/22 | | | | | | 15,005 | | |
| USD 29,322,544 | | | AUD 39,051,374 | | | BNP Paribas | | | | | 04/08/22 | | | | | | 98,977 | | |
| USD 2,290,297 | | | EUR 2,076,818 | | | BNP Paribas | | | | | 04/08/22 | | | | | | (7,463) | | |
| JPY 348,331,964 | | | USD 2,852,275 | | | BNP Paribas | | | | | 04/08/22 | | | | | | 9,227 | | |
| USD 35,730,850 | | | EUR 32,576,768 | | | BNP Paribas | | | | | 04/08/22 | | | | | | (311,593) | | |
| NZD 22,145,967 | | | USD 15,060,143 | | | BNP Paribas | | | | | 04/08/22 | | | | | | 287,155 | | |
| CAD 43,935,530 | | | USD 34,525,075 | | | BNP Paribas | | | | | 04/08/22 | | | | | | 618,416 | | |
| USD 20,381,170 | | | CHF 19,101,437 | | | BNP Paribas | | | | | 04/08/22 | | | | | | (293,056) | | |
| GBP 11,987,900 | | | USD 15,608,195 | | | BNP Paribas | | | | | 04/08/22 | | | | | | 139,278 | | |
| USD 14,677,181 | | | EUR 13,323,875 | | | BNP Paribas | | | | | 04/08/22 | | | | | | (64,153) | | |
| CHF 19,373,079 | | | USD 20,577,479 | | | BNP Paribas | | | | | 04/08/22 | | | | | | 390,757 | | |
| USD 40,312,936 | | | JPY 4,782,590,915 | | | BNP Paribas | | | | | 04/08/22 | | | | | | 1,024,564 | | |
| Voya Strategic Income | PORTFOLIO OF INVESTMENTS |
| Opportunities Fund | as of March 31, 2022 (continued) |
| Currency Purchased | | | Currency Sold | | | Counterparty | | | Settlement Date | | | Unrealized Appreciation (Depreciation) | | ||||||
| CAD 18,524,785 | | | USD 14,663,457 | | | BNP Paribas | | | | | 04/08/22 | | | | | | 154,291 | | |
| EUR 12,772,249 | | | USD 13,947,223 | | | BNP Paribas | | | | | 04/08/22 | | | | | | 183,800 | | |
| AUD 19,519,492 | | | USD 14,070,530 | | | BNP Paribas | | | | | 04/08/22 | | | | | | 536,617 | | |
| NZD 17,377,559 | | | USD 11,936,825 | | | BNP Paribas | | | | | 04/08/22 | | | | | | 105,937 | | |
| CAD 48,627,788 | | | USD 38,453,052 | | | BNP Paribas | | | | | 04/08/22 | | | | | | 443,718 | | |
| JPY 2,412,184,650 | | | USD 20,794,797 | | | BNP Paribas | | | | | 04/08/22 | | | | | | (979,009) | | |
| USD 15,023,703 | | | CHF 13,963,180 | | | BNP Paribas | | | | | 04/08/22 | | | | | | (89,189) | | |
| USD 21,965,311 | | | EUR 19,873,658 | | | BNP Paribas | | | | | 04/08/22 | | | | | | (22,604) | | |
| JPY 5,109,709,978 | | | USD 44,510,890 | | | BNP Paribas | | | | | 04/08/22 | | | | | | (2,535,277) | | |
| EUR 35,390,619 | | | USD 39,876,571 | | | BNP Paribas | | | | | 04/08/22 | | | | | | (720,925) | | |
| GBP 31,460,863 | | | USD 42,136,170 | | | BNP Paribas | | | | | 04/08/22 | | | | | | (808,741) | | |
| CHF 21,326,028 | | | USD 23,278,387 | | | BNP Paribas | | | | | 04/08/22 | | | | | | (196,398) | | |
| USD 40,902,782 | | | CAD 51,106,083 | | | BNP Paribas | | | | | 04/08/22 | | | | | | 23,654 | | |
| IDR 9,821,549,302 | | | USD 681,199 | | | BNP Paribas | | | | | 04/29/22 | | | | | | 2,872 | | |
| USD 30,857,646 | | | GBP 23,027,235 | | | Brown Brothers Harriman & Co. | | | | | 04/08/22 | | | | | | 608,749 | | |
| USD 1,929,441 | | | NZD 2,803,321 | | | Brown Brothers Harriman & Co. | | | | | 04/08/22 | | | | | | (13,278) | | |
| USD 31,192,035 | | | JPY 3,858,860,210 | | | Brown Brothers Harriman & Co. | | | | | 04/08/22 | | | | | | (508,008) | | |
| CHF 19,362,583 | | | USD 21,134,961 | | | Brown Brothers Harriman & Co. | | | | | 04/08/22 | | | | | | (178,085) | | |
| USD 20,884,231 | | | JPY 2,448,446,321 | | | Brown Brothers Harriman & Co. | | | | | 04/08/22 | | | | | | 770,558 | | |
| USD 40,854,729 | | | CAD 52,037,894 | | | Brown Brothers Harriman & Co. | | | | | 04/08/22 | | | | | | (769,743) | | |
| EUR 25,735,215 | | | USD 28,277,854 | | | Brown Brothers Harriman & Co. | | | | | 04/08/22 | | | | | | 195,199 | | |
| GBP 25,046,951 | | | USD 33,526,095 | | | Brown Brothers Harriman & Co. | | | | | 04/08/22 | | | | | | (624,071) | | |
| CAD 50,845,404 | | | USD 40,743,795 | | | Brown Brothers Harriman & Co. | | | | | 04/08/22 | | | | | | (113,741) | | |
| USD 46,127,377 | | | CHF 43,001,785 | | | Brown Brothers Harriman & Co. | | | | | 04/08/22 | | | | | | (415,126) | | |
| USD 38,845,504 | | | EUR 35,089,522 | | | Brown Brothers Harriman & Co. | | | | | 04/08/22 | | | | | | 76,876 | | |
| JPY 5,152,007,469 | | | USD 43,454,854 | | | Brown Brothers Harriman & Co. | | | | | 04/08/22 | | | | | | (1,131,772) | | |
| NOK 213,970,780 | | | USD 24,972,227 | | | Brown Brothers Harriman & Co. | | | | | 04/08/22 | | | | | | (669,229) | | |
| NZD 42,053,572 | | | USD 29,355,496 | | | Brown Brothers Harriman & Co. | | | | | 04/08/22 | | | | | | (264,113) | | |
| USD 3,055,223 | | | EUR 2,741,290 | | | Brown Brothers Harriman & Co. | | | | | 04/08/22 | | | | | | 22,301 | | |
| EUR 2,106,840 | | | USD 2,305,515 | | | Citibank N.A. | | | | | 04/08/22 | | | | | | 25,462 | | |
| USD 8,028,907 | | | GBP 6,022,034 | | | Citibank N.A. | | | | | 04/08/22 | | | | | | 118,279 | | |
| USD 4,324,198 | | | EUR 3,821,533 | | | Citibank N.A. | | | | | 04/08/22 | | | | | | 96,111 | | |
| USD 8,415,308 | | | SEK 81,409,937 | | | Citibank N.A. | | | | | 04/08/22 | | | | | | (243,738) | | |
| USD 21,425,852 | | | CAD 27,199,849 | | | Citibank N.A. | | | | | 04/08/22 | | | | | | (330,973) | | |
| SEK 82,782,877 | | | USD 8,588,226 | | | Citibank N.A. | | | | | 04/08/22 | | | | | | 216,851 | | |
| THB 122,156 | | | USD 3,678 | | | Citibank N.A. | | | | | 04/29/22 | | | | | | (3) | | |
| PEN 2,236,668 | | | USD 600,835 | | | Citibank N.A. | | | | | 05/06/22 | | | | | | 5,516 | | |
| USD 23,037,273 | | | CHF 21,178,165 | | | Goldman Sachs International | | | | | 04/08/22 | | | | | | 115,323 | | |
| SEK 22,888,825 | | | USD 2,435,908 | | | Goldman Sachs International | | | | | 04/08/22 | | | | | | (1,372) | | |
| USD 3,735,673 | | | GBP 2,841,528 | | | Goldman Sachs International | | | | | 04/08/22 | | | | | | 3,002 | | |
| NZD 20,681,499 | | | USD 13,980,280 | | | Goldman Sachs International | | | | | 04/08/22 | | | | | | 352,133 | | |
| USD 26,846,590 | | | AUD 36,675,268 | | | Goldman Sachs International | | | | | 04/08/22 | | | | | | (598,851) | | |
| USD 4,532,552 | | | EUR 4,086,084 | | | Goldman Sachs International | | | | | 04/08/22 | | | | | | 11,771 | | |
| USD 9,921,302 | | | NOK 89,592,503 | | | Goldman Sachs International | | | | | 04/08/22 | | | | | | (254,697) | | |
| SEK 184,598,513 | | | USD 19,566,949 | | | Goldman Sachs International | | | | | 04/08/22 | | | | | | 67,597 | | |
| NOK 89,919,344 | | | USD 10,012,175 | | | Goldman Sachs International | | | | | 04/08/22 | | | | | | 200,947 | | |
| USD 15,068,161 | | | GBP 11,446,710 | | | Goldman Sachs International | | | | | 04/08/22 | | | | | | 31,603 | | |
| USD 21,251,269 | | | CHF 19,614,071 | | | Goldman Sachs International | | | | | 04/08/22 | | | | | | 56,198 | | |
| AUD 39,127,698 | | | USD 28,409,056 | | | Goldman Sachs International | | | | | 04/08/22 | | | | | | 871,627 | | |
| USD 15,029,617 | | | JPY 1,831,772,190 | | | Goldman Sachs International | | | | | 04/08/22 | | | | | | (18,157 | ) | |
| Voya Strategic Income | PORTFOLIO OF INVESTMENTS |
| Opportunities Fund | as of March 31, 2022 (continued) |
| Currency Purchased | | | Currency Sold | | | Counterparty | | | Settlement Date | | | Unrealized Appreciation (Depreciation) | | ||||||
| USD 17,014,495 | | | CAD 21,831,733 | | | Goldman Sachs International | | | | | 04/08/22 | | | | | | (448,440) | | |
| USD 14,676,852 | | | NZD 21,804,861 | | | Goldman Sachs International | | | | | 04/08/22 | | | | | | (434,058) | | |
| EUR 3,279,175 | | | USD 3,684,166 | | | Goldman Sachs International | | | | | 04/08/22 | | | | | | (56,136) | | |
| SEK 22,059,926 | | | USD 2,333,776 | | | Goldman Sachs International | | | | | 04/08/22 | | | | | | 12,595 | | |
| USD 33,301,194 | | | AUD 46,454,899 | | | Goldman Sachs International | | | | | 04/08/22 | | | | | | (1,462,700) | | |
| SEK 165,002,718 | | | USD 16,615,513 | | | Goldman Sachs International | | | | | 04/08/22 | | | | | | 934,755 | | |
| USD 2,234,402 | | | CAD 2,858,379 | | | Goldman Sachs International | | | | | 04/08/22 | | | | | | (51,980) | | |
| USD 2,704,922 | | | JPY 313,265,306 | | | Goldman Sachs International | | | | | 04/08/22 | | | | | | 131,487 | | |
| SEK 18,049,318 | | | USD 1,836,435 | | | Goldman Sachs International | | | | | 04/08/22 | | | | | | 83,354 | | |
| USD 20,699,663 | | | SEK 194,904,349 | | | Goldman Sachs International | | | | | 04/08/22 | | | | | | (31,048) | | |
| CAD 15,271,345 | | | USD 12,009,929 | | | Goldman Sachs International | | | | | 04/08/22 | | | | | | 205,433 | | |
| RON 2,123,064 | | | USD 467,367 | | | Goldman Sachs International | | | | | 04/29/22 | | | | | | 6,326 | | |
| USD 191,313 | | | TRY 3,018,928 | | | Goldman Sachs International | | | | | 04/29/22 | | | | | | (10,317) | | |
| USD 139,057 | | | BRL 714,325 | | | HSBC Bank USA N.A. | | | | | 05/06/22 | | | | | | (9,645) | | |
| GBP 1,512,082 | | | USD 2,013,550 | | | JPMorgan Chase Bank N.A. | | | | | 04/08/22 | | | | | | (27,258) | | |
| USD 391 | | | ILS 1,277 | | | JPMorgan Chase Bank N.A. | | | | | 04/29/22 | | | | | | (9) | | |
| USD 162,801 | | | PLN 716,080 | | | JPMorgan Chase Bank N.A. | | | | | 04/29/22 | | | | | | (7,218) | | |
| USD 8,268 | | | MXN 174,180 | | | JPMorgan Chase Bank N.A. | | | | | 05/06/22 | | | | | | (440) | | |
| USD 24,429,603 | | | NZD 35,119,582 | | | Morgan Stanley Capital Services LLC | | | | | 04/08/22 | | | | | | 91,505 | | |
| NOK 204,477,249 | | | USD 23,157,147 | | | Morgan Stanley Capital Services LLC | | | | | 04/08/22 | | | | | | 67,567 | | |
| CHF 29,899,104 | | | USD 32,305,645 | | | Morgan Stanley Capital Services LLC | | | | | 04/08/22 | | | | | | 55,316 | | |
| USD 9,137,853 | | | NOK 81,844,135 | | | Morgan Stanley Capital Services LLC | | | | | 04/08/22 | | | | | | (158,080) | | |
| CHF 2,594,073 | | | USD 2,805,982 | | | Morgan Stanley Capital Services LLC | | | | | 04/08/22 | | | | | | 1,684 | | |
| USD 1,798,841 | | | NOK 16,267,978 | | | Morgan Stanley Capital Services LLC | | | | | 04/08/22 | | | | | | (48,891) | | |
| USD 14,397,840 | | | EUR 13,094,624 | | | Morgan Stanley Capital Services LLC | | | | | 04/08/22 | | | | | | (89,854) | | |
| GBP 13,122,253 | | | USD 17,369,669 | | | Morgan Stanley Capital Services LLC | | | | | 04/08/22 | | | | | | (132,095) | | |
| JPY 2,982,417,125 | | | USD 25,855,742 | | | Morgan Stanley Capital Services LLC | | | | | 04/08/22 | | | | | | (1,355,567) | | |
| EUR 507,584 | | | USD 557,617 | | | Morgan Stanley Capital Services LLC | | | | | 04/08/22 | | | | | | 3,966 | | |
| NZD 40,705,056 | | | USD 27,479,332 | | | Morgan Stanley Capital Services LLC | | | | | 04/08/22 | | | | | | 729,535 | | |
| USD 41,477,185 | | | JPY 4,790,614,844 | | | Morgan Stanley Capital Services LLC | | | | | 04/08/22 | | | | | | 2,122,897 | | |
| AUD 18,195,801 | | | USD 13,397,210 | | | Morgan Stanley Capital Services LLC | | | | | 04/08/22 | | | | | | 219,371 | | |
| USD 13,869,791 | | | NZD 20,375,546 | | | Morgan Stanley Capital Services LLC | | | | | 04/08/22 | | | | | | (250,594) | | |
| CHF 43,778,046 | | | USD 46,956,056 | | | Morgan Stanley Capital Services LLC | | | | | 04/08/22 | | | | | | 426,624 | | |
| USD 15,633,282 | | | GBP 11,986,989 | | | Morgan Stanley Capital Services LLC | | | | | 04/08/22 | | | | | | (112,994) | | |
| USD 24,590,125 | | | NOK 217,551,171 | | | Morgan Stanley Capital Services LLC | | | | | 04/08/22 | | | | | | (119,537) | | |
| USD 26,066,689 | | | NZD 38,283,597 | | | Morgan Stanley Capital Services LLC | | | | | 04/08/22 | | | | | | (464,092) | | |
| USD 12,755,681 | | | AUD 17,754,575 | | | Morgan Stanley Capital Services LLC | | | | | 04/08/22 | | | | | | (530,716) | | |
| USD 24,844,272 | | | NOK 218,501,749 | | | Morgan Stanley Capital Services LLC | | | | | 04/08/22 | | | | | | (136,150) | | |
| USD 14,007,158 | | | EUR 12,766,924 | | | Morgan Stanley Capital Services LLC | | | | | 04/08/22 | | | | | | (117,974) | | |
| USD 26,444,185 | | | JPY 3,043,741,571 | | | Morgan Stanley Capital Services LLC | | | | | 04/08/22 | | | | | | 1,440,238 | | |
| USD 22,527,642 | | | CHF 20,811,425 | | | Morgan Stanley Capital Services LLC | | | | | 04/08/22 | | | | | | 2,628 | | |
| JPY 2,466,774,642 | | | USD 20,894,316 | | | Morgan Stanley Capital Services LLC | | | | | 04/08/22 | | | | | | (630,079) | | |
| USD 15,552,962 | | | GBP 11,937,915 | | | Morgan Stanley Capital Services LLC | | | | | 04/08/22 | | | | | | (128,850) | | |
| NZD 35,380,831 | | | USD 24,339,889 | | | Morgan Stanley Capital Services LLC | | | | | 04/08/22 | | | | | | 179,256 | | |
| USD 25,796,947 | | | SEK 242,213,724 | | | Morgan Stanley Capital Services LLC | | | | | 04/08/22 | | | | | | 34,245 | | |
| USD 14,124,012 | | | NZD 20,903,311 | | | Morgan Stanley Capital Services LLC | | | | | 04/08/22 | | | | | | (362,118) | | |
| SEK 83,396,672 | | | USD 8,570,223 | | | Morgan Stanley Capital Services LLC | | | | | 04/08/22 | | | | | | 300,139 | | |
| USD 11,194,641 | | | CAD 14,252,277 | | | Morgan Stanley Capital Services LLC | | | | | 04/08/22 | | | | | | (205,580) | | |
| CHF 38,286,822 | | | USD 41,140,915 | | | Morgan Stanley Capital Services LLC | | | | | 04/08/22 | | | | | | 298,399 | | |
| USD 9,540,666 | | | CHF 8,802,457 | | | Morgan Stanley Capital Services LLC | | | | | 04/08/22 | | | | | | 13,425 | | |
| Voya Strategic Income | PORTFOLIO OF INVESTMENTS |
| Opportunities Fund | as of March 31, 2022 (continued) |
| Currency Purchased | | | Currency Sold | | | Counterparty | | | Settlement Date | | | Unrealized Appreciation (Depreciation) | | ||||||
| USD 12,819,688 | | | NZD 18,960,389 | | | Morgan Stanley Capital Services LLC | | | | | 04/08/22 | | | | | | (319,984) | | |
| EUR 28,235,844 | | | USD 31,129,337 | | | Morgan Stanley Capital Services LLC | | | | | 04/08/22 | | | | | | 110,374 | | |
| USD 45,637,831 | | | CHF 42,735,808 | | | Morgan Stanley Capital Services LLC | | | | | 04/08/22 | | | | | | (616,793) | | |
| ZAR 532,456 | | | USD 34,965 | | | Morgan Stanley Capital Services LLC | | | | | 04/29/22 | | | | | | 1,358 | | |
| CZK 42,445 | | | USD 1,838 | | | Morgan Stanley Capital Services LLC | | | | | 04/29/22 | | | | | | 80 | | |
| CLP 32,943,291 | | | USD 40,407 | | | Morgan Stanley Capital Services LLC | | | | | 05/06/22 | | | | | | 1,221 | | |
| USD 13,913,875 | | | EUR 12,463,163 | | | Standard Chartered Bank | | | | | 04/08/22 | | | | | | 124,820 | | |
| GBP 2,552,716 | | | USD 3,350,505 | | | Standard Chartered Bank | | | | | 04/08/22 | | | | | | 2,779 | | |
| USD 23,993,566 | | | EUR 21,367,139 | | | Standard Chartered Bank | | | | | 04/08/22 | | | | | | 353,286 | | |
| EUR 7,817,555 | | | USD 8,658,223 | | | Standard Chartered Bank | | | | | 04/08/22 | | | | | | (8,999) | | |
| SEK 118,691,863 | | | USD 12,765,991 | | | Standard Chartered Bank | | | | | 04/08/22 | | | | | | (141,508) | | |
| USD 9,308,658 | | | EUR 8,352,651 | | | Standard Chartered Bank | | | | | 04/08/22 | | | | | | 67,411 | | |
| JPY 387,023,685 | | | USD 3,368,449 | | | Standard Chartered Bank | | | | | 04/08/22 | | | | | | (189,099) | | |
| USD 8,607,176 | | | NZD 12,873,432 | | | Standard Chartered Bank | | | | | 04/08/22 | | | | | | (314,195) | | |
| EUR 4,505,339 | | | USD 5,008,743 | | | Standard Chartered Bank | | | | | 04/08/22 | | | | | | (24,104) | | |
| NOK 110,888,786 | | | USD 12,527,471 | | | Standard Chartered Bank | | | | | 04/08/22 | | | | | | 67,380 | | |
| USD 3,744,439 | | | JPY 456,077,545 | | | State Street Bank and Trust Co. | | | | | 04/08/22 | | | | | | (2,180) | | |
| CAD 21,953,496 | | | USD 17,165,822 | | | State Street Bank and Trust Co. | | | | | 04/08/22 | | | | | | 394,510 | | |
| USD 33,829,877 | | | GBP 25,340,640 | | | State Street Bank and Trust Co. | | | | | 04/08/22 | | | | | | 542,058 | | |
| JPY 2,265,227,882 | | | USD 19,147,689 | | | State Street Bank and Trust Co. | | | | | 04/08/22 | | | | | | (539,132) | | |
| USD 9,041,805 | | | GBP 6,675,130 | | | State Street Bank and Trust Co. | | | | | 04/08/22 | | | | | | 273,262 | | |
| USD 8,621,124 | | | SEK 82,818,530 | | | State Street Bank and Trust Co. | | | | | 04/08/22 | | | | | | (187,746) | | |
| NZD 12,742,027 | | | USD 8,607,176 | | | State Street Bank and Trust Co. | | | | | 04/08/22 | | | | | | 223,130 | | |
| USD 10,017,741 | | | NOK 90,561,603 | | | State Street Bank and Trust Co. | | | | | 04/08/22 | | | | | | (268,329) | | |
| USD 13,568,283 | | | GBP 9,986,545 | | | State Street Bank and Trust Co. | | | | | 04/08/22 | | | | | | 449,817 | | |
| CHF 2,305,291 | | | USD 2,464,106 | | | State Street Bank and Trust Co. | | | | | 04/08/22 | | | | | | 30,999 | | |
| CAD 8,026,215 | | | USD 6,270,002 | | | State Street Bank and Trust Co. | | | | | 04/08/22 | | | | | | 150,069 | | |
| AUD 26,817,127 | | | USD 19,522,890 | | | State Street Bank and Trust Co. | | | | | 04/08/22 | | | | | | 545,344 | | |
| USD 12,073,663 | | | CAD 15,469,992 | | | State Street Bank and Trust Co. | | | | | 04/08/22 | | | | | | (300,593) | | |
| USD 2,303,654 | | | EUR 2,051,958 | | | State Street Bank and Trust Co. | | | | | 04/08/22 | | | | | | 33,398 | | |
| USD 2,226,597 | | | JPY 272,292,966 | | | State Street Bank and Trust Co. | | | | | 04/08/22 | | | | | | (10,254) | | |
| USD 8,721,364 | | | NZD 12,841,825 | | | State Street Bank and Trust Co. | | | | | 04/08/22 | | | | | | (178,104) | | |
| USD 4,689,677 | | | AUD 6,490,266 | | | State Street Bank and Trust Co. | | | | | 04/08/22 | | | | | | (167,225) | | |
| EUR 8,978,368 | | | USD 9,958,272 | | | State Street Bank and Trust Co. | | | | | 04/08/22 | | | | | | (24,742) | | |
| EUR 24,819,904 | | | USD 27,507,294 | | | State Street Bank and Trust Co. | | | | | 04/08/22 | | | | | | (46,927) | | |
| EUR 11,284,329 | | | USD 12,527,265 | | | State Street Bank and Trust Co. | | | | | 04/08/22 | | | | | | (42,454) | | |
| NZD 13,654,636 | | | USD 9,281,057 | | | State Street Bank and Trust Co. | | | | | 04/08/22 | | | | | | 181,694 | | |
| CAD 2,472,479 | | | USD 1,941,547 | | | State Street Bank and Trust Co. | | | | | 04/08/22 | | | | | | 36,159 | | |
| AUD 5,364,015 | | | USD 3,873,846 | | | State Street Bank and Trust Co. | | | | | 04/08/22 | | | | | | 140,243 | | |
| USD 5,465,962 | | | JPY 630,326,570 | | | State Street Bank and Trust Co. | | | | | 04/08/22 | | | | | | 287,910 | | |
| EUR 20,721,337 | | | USD 22,790,696 | | | State Street Bank and Trust Co. | | | | | 04/08/22 | | | | | | 135,078 | | |
| USD 10,890,776 | | | EUR 9,809,052 | | | State Street Bank and Trust Co. | | | | | 04/08/22 | | | | | | 38,189 | | |
| GBP 8,851,812 | | | USD 11,602,980 | | | State Street Bank and Trust Co. | | | | | 04/08/22 | | | | | | 24,884 | | |
| USD 18,396,529 | | | JPY 2,109,608,547 | | | State Street Bank and Trust Co. | | | | | 04/08/22 | | | | | | 1,066,365 | | |
| | | | | | | | | | | | | | | | | $ | (1,389,406) | | |
| | |||||||||||||||||||
| Voya Strategic Income | PORTFOLIO OF INVESTMENTS |
| Opportunities Fund | as of March 31, 2022 (continued) |
| Description | | | Number of Contracts | | | Expiration Date | | | Notional Amount | | | Unrealized Appreciation/ (Depreciation) | | ||||||||||||
| Long Contracts: | | | | | | | | | | | | | | | | | | | | | | | | | |
| U.S. Treasury 2-Year Note | | | | | 605 | | | | | | 06/30/22 | | | | | $ | 128,212,735 | | | | | $ | (1,450,589) | | |
| U.S. Treasury 5-Year Note | | | | | 2,536 | | | | | | 06/30/22 | | | | | | 290,847,500 | | | | | | (7,549,403) | | |
| | | | | | | | | | | | | | | | | $ | 419,060,235 | | | | | $ | (8,999,992) | | |
| Short Contracts: | | | | | | | | | | | | | | | | | | | | | | | | | |
| U.S. Treasury 10-Year Note | | | | | (1,639) | | | | | | 06/21/22 | | | | | | (201,392,125) | | | | | | 4,048,893 | | |
| U.S. Treasury Long Bond | | | | | (107) | | | | | | 06/21/22 | | | | | | (16,056,687) | | | | | | 708,653 | | |
| U.S. Treasury Ultra 10-Year Note | | | | | (1,602) | | | | | | 06/21/22 | | | | | | (217,020,938) | | | | | | 4,802,811 | | |
| U.S. Treasury Ultra Long Bond | | | | | (181) | | | | | | 06/21/22 | | | | | | (32,059,625) | | | | | | 1,270,510 | | |
| | | | | | | | | | | | | | | | | $ | (466,529,375) | | | | | $ | 10,830,867 | | |
| Reference Entity/Obligation | | | Buy/Sell Protection | | | (Pay)/ Receive Financing Rate (%)(2) | | | Termination Date | | | Notional Amount(3) | | | Fair Value(4) | | | Unrealized Appreciation/ (Depreciation) | | ||||||||||||||||||
| Prudential Financial Inc. 3.50%, due 05/15/2024 | | | | | Buy | | | | | | (1.000) | | | | | | 12/20/24 | | | | | | USD 15,120,000 | | | | | $ | (259,254) | | | | | $ | (15,778) | | |
| | | | | | | | | | | | | | | | | | | | | | | | | | | | | $ | (259,254) | | | | | $ | (15,778) | | |
| Reference Entity/Obligation | | | Buy/Sell Protection | | | (Pay)/ Receive Financing Rate (%)(6) | | | Termination Date | | | Notional Amount(3) | | | Fair Value(4) | | | Unrealized Appreciation/ (Depreciation) | | ||||||||||||||||||
| CDX North American High Yield Index, Series 37, Version 1 | | | | | Sell | | | | | | 5.000 | | | | | | 12/20/26 | | | | | | USD 56,011,428 | | | | | $ | 3,533,049 | | | | | $ | 869,455 | | |
| CDX North American High Yield Index, Series 38, Version 1 | | | | | Sell | | | | | | 5.000 | | | | | | 06/20/27 | | | | | | USD 94,580,000 | | | | | | 5,214,555 | | | | | | (271,085) | | |
| | | | | | | | | | | | | | | | | | | | | | | | | | | | | $ | 8,747,604 | | | | | $ | 598,370 | | |
| Voya Strategic Income | PORTFOLIO OF INVESTMENTS |
| Opportunities Fund | as of March 31, 2022 (continued) |
| Pay/Receive Floating Rate | | | Floating Rate Index | | | Floating Rate Index Payment Frequency | | | Fixed Rate | | | Fixed Rate Payment Frequency | | | Maturity Date | | | Notional Amount | | | Fair Value | | | Unrealized Appreciation/ (Depreciation) | | ||||||
| Pay | | | 1-day Secured Overnight Financing Rate | | | Annual | | | 2.109% | | | Annual | | | 05/06/32 | | | USD 16,145,000 | | | | $ | (7,668) | | | | | $ | (7,668) | | |
| Pay | | | 1-day Secured Overnight Financing Rate | | | Annual | | | 2.161 | | | Annual | | | 05/06/32 | | | USD 9,177,100 | | | | | 38,412 | | | | | | 38,412 | | |
| Pay | | | 1-day Secured Overnight Financing Rate | | | Annual | | | 2.212 | | | Annual | | | 05/06/32 | | | USD 9,177,100 | | | | | 80,439 | | | | | | 80,439 | | |
| Receive | | | 1-day Secured Overnight Financing Rate | | | Annual | | | 2.041 | | | Annual | | | 04/19/32 | | | USD 7,507,700 | | | | | 43,490 | | | | | | 43,490 | | |
| Receive | | | 1-day Secured Overnight Financing Rate | | | Annual | | | 2.171 | | | Annual | | | 04/19/32 | | | USD 7,728,000 | | | | | (46,602) | | | | | | (46,602) | | |
| Receive | | | 1-day Secured Overnight Financing Rate | | | Annual | | | 2.206 | | | Annual | | | 04/19/32 | | | USD 13,764,200 | | | | | (125,891) | | | | | | (125,891) | | |
| Receive | | | 1-day Secured Overnight Financing Rate | | | Annual | | | 2.146 | | | Annual | | | 05/06/32 | | | USD 13,793,015 | | | | | (38,808) | | | | | | (38,808) | | |
| Receive | | | 1-day Secured Overnight Financing Rate | | | Annual | | | 2.150 | | | Annual | | | 05/06/32 | | | USD 13,763,985 | | | | | (43,715) | | | | | | (43,715) | | |
| Receive | | | 1-day Secured Overnight Financing Rate | | | Annual | | | 2.275 | | | Annual | | | 05/06/32 | | | USD 18,076,100 | | | | | (261,425) | | | | | | (261,425) | | |
| Receive | | | 1-day Secured Overnight Financing Rate | | | Annual | | | 2.306 | | | Annual | | | 05/06/32 | | | USD 17,304,000 | | | | | (298,834) | | | | | | (298,834) | | |
| | | | | | | | | | | | | | | | | | | | | | | $ | (660,602) | | | | | $ | (660,602) | | |
| Pay/Receive Volatility (1) | | | Reference Entity | | | Volatility Strike Rate | | | Counterparty | | | Maturity Date | | | Currency | | | Notional Amount | | | Fair Value | | | Unrealized Appreciation (Depreciation) | |
| Receive | | | EUR vs. USD Spot Exchange Rate | | | 6.400% | | | Goldman Sachs International | | | 06/14/22 | | | EUR | | | 17,798,100 | | | $71,287 | | | $71,287 | |
| | | | | | | | | | | | | | | | | | | | | | $71,287 | | | $71,287 | |
| Description | | | Counterparty | | | Expiration Date | | | Exercise Price | | | Notional Amount | | | Cost | | | Fair Value | | |||||||||
| Call JPY vs. Put USD | | | BNP Paribas | | | | | 02/27/25 | | | | 107.500 | | | USD 12,280,000 | | | | $ | 609,088 | | | | | $ | 452,381 | | |
| Call JPY vs. Put USD | | | Standard Chartered Bank | | | | | 02/27/25 | | | | 107.500 | | | USD 12,280,000 | | | | | 616,272 | | | | | | 452,382 | | |
| Call USD vs. Put AUD | | | Goldman Sachs International | | | | | 06/15/22 | | | | 0.674 | | | USD 268,102,000 | | | | | 1,715,934 | | | | | | 424,121 | | |
| Call USD vs. Put JPY | | | BNP Paribas | | | | | 02/27/25 | | | | 107.500 | | | USD 12,280,000 | | | | | 609,088 | | | | | | 916,779 | | |
| Call USD vs. Put JPY | | | Standard Chartered Bank | | | | | 02/27/25 | | | | 107.500 | | | USD 12,280,000 | | | | | 616,272 | | | | | | 916,779 | | |
| | | | | | | | | | | | | | | | | | | | $ | 4,166,654 | | | | | $ | 3,162,442 | | |
| Description | | | Counterparty | | | Expiration Date | | | Exercise Price | | | Notional Amount | | | Premiums Received | | | Fair Value | | |||||||||
| Call EUR vs. Put USD | | | Morgan Stanley Capital Services LLC | | | | | 04/13/22 | | | | 1.120 | | | USD 28,337,300 | | | | $ | 118,110 | | | | | $ | (64,424) | | |
| Call JPY vs. Put USD | | | Standard Chartered Bank | | | | | 04/26/22 | | | | 119.000 | | | USD 29,053,000 | | | | | 60,633 | | | | | | (95,859) | | |
| Call USD vs. Put AUD | | | Goldman Sachs International | | | | | 04/13/22 | | | | 0.710 | | | USD 134,051,000 | | | | | 1,036,931 | | | | | | (35,359) | | |
| Call USD vs. Put EUR | | | Morgan Stanley Capital Services LLC | | | | | 04/13/22 | | | | 1.080 | | | USD 28,337,300 | | | | | 118,110 | | | | | | (24,890) | | |
| Call USD vs. Put JPY | | | Standard Chartered Bank | | | | | 04/26/22 | | | | 126.500 | | | USD 29,053,000 | | | | | 60,634 | | | | | | (35,736) | | |
| | | | | | | | | | | | | | | | | | | | $ | 1,394,418 | | | | | $ | (256,268) | | |
| Voya Strategic Income | PORTFOLIO OF INVESTMENTS |
| Opportunities Fund | as of March 31, 2022 (continued) |
| Description | | | Counterparty | | | Pay/ Receive Exercise Rate | | | Exercise Rate | | | Floating Rate Index | | | Expiration Date | | | Notional Amount | | | Premiums Received | | | Fair Value | | ||||||||||||
Call on 10-Year Interest Rate Swap (2) | | | BNP Paribas | | | Pay | | | | | 2.230% | | | | 1-day Secured Overnight Financing Rate | | | | | 04/29/22 | | | | USD 22,297,000 | | | | $ | 266,449 | | | | | $ | (344,982) | | |
Call on 10-Year Interest Rate Swap (2) | | | Morgan Stanley Capital Services LLC | | | Pay | | | | | 2.296% | | | | 1-day Secured Overnight Financing Rate | | | | | 04/28/22 | | | | USD 22,297,000 | | | | | 290,530 | | | | | | (431,965) | | |
Put on 10-Year Interest Rate Swap (3) | | | Bank of America N.A. | | | Receive | | | | | 2.010% | | | | 1-day Secured Overnight Financing Rate | | | | | 04/20/22 | | | | USD 44,593,000 | | | | | 425,863 | | | | | | (603,023) | | |
Put on 10-Year Interest Rate Swap (3) | | | BNP Paribas | | | Receive | | | | | 2.230% | | | | 1-day Secured Overnight Financing Rate | | | | | 04/29/22 | | | | USD 22,297,000 | | | | | 266,449 | | | | | | (152,097) | | |
Put on 10-Year Interest Rate Swap (3) | | | Morgan Stanley Capital Services LLC | | | Receive | | | | | 2.000% | | | | 1-day Secured Overnight Financing Rate | | | | | 04/20/22 | | | | USD 44,593,000 | | | | | 446,153 | | | | | | (689,674) | | |
Put on 10-Year Interest Rate Swap (3) | | | Morgan Stanley Capital Services LLC | | | Receive | | | | | 2.296% | | | | 1-day Secured Overnight Financing Rate | | | | | 04/28/22 | | | | USD 22,297,000 | | | | | 290,530 | | | | | | (106,495) | | |
| | | | | | | | | | | | | | | | | | | | | | | | | | | | | $ | 1,985,974 | | | | | $ | (2,328,236) | | |
| Voya Strategic Income | PORTFOLIO OF INVESTMENTS |
| Opportunities Fund | as of March 31, 2022 (continued) |
| Derivatives not accounted for as hedging instruments | | | Location on Statement of Assets and Liabilities | | | Fair Value | | |||
| Asset Derivatives | | | | | | | | | | |
| Foreign exchange contracts | | | Investments in securities at value* | | | | $ | 3,162,442 | | |
| Foreign exchange contracts | | | Unrealized appreciation on forward foreign currency contracts | | | | | 22,696,093 | | |
| Interest rate contracts | | | Variation margin receivable on futures contracts** | | | | | 10,830,867 | | |
| Foreign exchange contracts | | | Unrealized appreciation on OTC Swaps | | | | | 71,287 | | |
| Interest rate contracts | | | Variation margin receivable on centrally cleared swaps** | | | | | 162,341 | | |
| Credit contracts | | | Variation margin receivable on centrally cleared swaps** | | | | | 869,455 | | |
| Total Asset Derivatives | | | | | | | $ | 37,792,485 | | |
| Liability Derivatives | | | | | | | | | | |
| Foreign exchange contracts | | | Unrealized depreciation on forward foreign currency contracts | | | | $ | 24,085,499 | | |
| Interest rate contracts | | | Variation margin payable on futures contracts** | | | | | 8,999,992 | | |
| Credit contracts | | | Variation margin payable on centrally cleared swaps** | | | | | 271,085 | | |
| Interest rate contracts | | | Variation margin payable on centrally cleared swaps** | | | | | 838,721 | | |
| Interest rate contracts | | | Written options, at fair value | | | | | 2,328,236 | | |
| Foreign exchange contracts | | | Written options, at fair value | | | | | 256,268 | | |
| Total Liability Derivatives | | | | | | | $ | 36,779,801 | | |
| Derivatives not accounted for as hedging instruments | | | Investments* | | | Forward foreign currency contracts | | | Futures | | | Swaps | | | Written options | | | Total | | ||||||||||||||||||
| Credit contracts | | | | $ | — | | | | | $ | — | | | | | $ | — | | | | | $ | 1,206,792 | | | | | $ | — | | | | | $ | 1,206,792 | | |
| Equity contracts | | | | | (12,117) | | | | | | — | | | | | | 269,241 | | | | | | — | | | | | | (587,874) | | | | | | (330,750) | | |
| Foreign exchange contracts | | | | | 573,131 | | | | | | (4,617,185) | | | | | | — | | | | | | 245,970 | | | | | | (736,593) | | | | | | (4,534,677) | | |
| Interest rate contracts | | | | | (1,732,854) | | | | | | — | | | | | | (7,850,214) | | | | | | (13,259,260) | | | | | | 12,955,911 | | | | | | (9,886,417) | | |
| Total | | | | $ | (1,171,840) | | | | | $ | (4,617,185) | | | | | $ | (7,580,973) | | | | | $ | (11,806,498) | | | | | $ | 11,631,444 | | | | | $ | (13,545,052) | | |
| Voya Strategic Income | PORTFOLIO OF INVESTMENTS |
| Opportunities Fund | as of March 31, 2022 (continued) |
| Derivatives not accounted for as hedging instruments | | | Investments* | | | Forward foreign currency contracts | | | Futures | | | Swaps | | | Written options | | | Total | | ||||||||||||||||||
| Credit contracts | | | | $ | 277,089 | | | | | $ | — | | | | | $ | — | | | | | $ | 594,391 | | | | | $ | — | | | | | $ | 871,480 | | |
| Foreign exchange contracts | | | | | (1,492,829) | | | | | | (2,581,391) | | | | | | — | | | | | | 71,287 | | | | | | 2,286,517 | | | | | | (1,716,416) | | |
| Interest rate contracts | | | | | — | | | | | | — | | | | | | (13,155,343) | | | | | | (670,995) | | | | | | (485,554) | | | | | | (14,311,892) | | |
| Total | | | | $ | (1,215,740) | | | | | $ | (2,581,391) | | | | | $ | (13,155,343) | | | | | $ | (5,317) | | | | | $ | 1,800,963 | | | | | $ | (15,156,828) | | |
| | | | Bank of America N.A. | | | Barclays Bank PLC | | | BNP Paribas | | | Brown Brothers Harriman & Co. | | | Citibank N.A. | | | Goldman Sachs International | | | HSBC Bank USA N.A. | | | JPMorgan Chase Bank N.A. | | | Morgan Stanley Capital Services LLC | | | Standard Chartered Bank | | | State Street Bank and Trust Co. | | | Totals | | ||||||||||||||||||||||||||||||||||||
| Assets: | | | | | | | | | | | | | | | | | | | | | | | | | | | | | | | | | | | | | | | | | | | | | | | | | | | | | | | | | | | | | | | | | | | | | | | | | |
| Purchased options | | | | $ | — | | | | | $ | — | | | | | $ | 1,369,160 | | | | | $ | — | | | | | $ | — | | | | | $ | 424,121 | | | | | $ | — | | | | | $ | — | | | | | $ | — | | | | | $ | 1,369,161 | | | | | $ | — | | | | | $ | 3,162,442 | | |
| Forward foreign currency contracts | | | | | 752,293 | | | | | | 154,418 | | | | | | 5,300,716 | | | | | | 1,673,683 | | | | | | 462,219 | | | | | | 3,084,151 | | | | | | — | | | | | | — | | | | | | 6,099,828 | | | | | | 615,676 | | | | | | 4,553,109 | | | | | | 22,696,093 | | |
| Total Assets | | | | $ | 752,293 | | | | | $ | 154,418 | | | | | $ | 6,669,876 | | | | | $ | 1,673,683 | | | | | $ | 462,219 | | | | | $ | 3,508,272 | | | | | $ | — | | | | | $ | — | | | | | $ | 6,099,828 | | | | | $ | 1,984,837 | | | | | $ | 4,553,109 | | | | | $ | 25,858,535 | | |
| Liabilities: | | | | | | | | | | | | | | | | | | | | | | | | | | | | | | | | | | | | | | | | | | | | | | | | | | | | | | | | | | | | | | | | | | | | | | | | | |
| Forward foreign currency contracts | | | | $ | 316,184 | | | | | $ | 279 | | | | | $ | 6,869,291 | | | | | $ | 4,687,166 | | | | | $ | 574,714 | | | | | $ | 3,367,756 | | | | | $ | 9,645 | | | | | $ | 34,925 | | | | | $ | 5,779,948 | | | | | $ | 677,905 | | | | | $ | 1,767,686 | | | | | $ | 24,085,499 | | |
| Written options | | | | | 603,023 | | | | | | — | | | | | | 497,079 | | | | | | — | | | | | | — | | | | | | 35,359 | | | | | | — | | | | | | — | | | | | | 1,317,448 | | | | | | 131,595 | | | | | | — | | | | | | 2,584,504 | | |
| Total Liabilities | | | | $ | 919,207 | | | | | $ | 279 | | | | | $ | 7,366,370 | | | | | $ | 4,687,166 | | | | | $ | 574,714 | | | | | $ | 3,403,115 | | | | | $ | 9,645 | | | | | $ | 34,925 | | | | | $ | 7,097,396 | | | | | $ | 809,500 | | | | | $ | 1,767,686 | | | | | $ | 26,670,003 | | |
| Net OTC derivative instruments by counterparty, at fair value | | | | $ | (166,914) | | | | | $ | 154,139 | | | | | $ | (696,494) | | | | | $ | (3,013,483) | | | | | $ | (112,495) | | | | | $ | 105,157 | | | | | $ | (9,645) | | | | | $ | (34,925) | | | | | $ | (997,568) | | | | | $ | 1,175,337 | | | | | $ | 2,785,423 | | | | | $ | (811,468) | | |
| Total cash collateral pledged by the Fund/(Received from counterparty) | | | | $ | — | | | | | $ | (154,139) | | | | | $ | 696,494 | | | | | $ | — | | | | | $ | — | | | | | $ | (105,157) | | | | | $ | — | | | | | $ | — | | | | | $ | 980,000 | | | | | $ | (1,175,337) | | | | | $ | — | | | | | $ | 241,861 | | |
Total non-cash collateral pledged by the Fund/(Received from counterparty) | | | | | — | | | | | | — | | | | | | — | | | | | | — | | | | | | — | | | | | | — | | | | | | — | | | | | | — | | | | | | — | | | | | | — | | | | | | (2,785,423) | | | | | | (2,785,423) | | |
Net Exposure(1)(2)(3) | | | | $ | (166,914) | | | | | $ | — | | | | | $ | — | | | | | $ | (3,013,483) | | | | | $ | (112,495) | | | | | $ | — | | | | | $ | (9,645) | | | | | $ | (34,925) | | | | | $ | (17,568) | | | | | $ | — | | | | | $ | — | | | | | $ | (3,355,030) | | |
| | Cost for federal income tax purposes was $2,682,335,209. | | | |||||
| | Net unrealized depreciation consisted of: | | ||||||
| | Gross Unrealized Appreciation | | | | $ | 54,770,588 | | |
| | Gross Unrealized Depreciation | | | | | (158,571,235) | | |
| | Net Unrealized Depreciation | | | | $ | (103,800,647) | | |
| Fund Name | | | Type | | | Per Share Amount | | |||
| Voya GNMA Income Fund | | |||||||||
| Class A | | | NII | | | | $ | 0.0967 | | |
| Class C | | | NII | | | | $ | 0.0332 | | |
| Class I | | | NII | | | | $ | 0.1222 | | |
| Class P | | | NII | | | | $ | 0.1640 | | |
| Class R6 | | | NII | | | | $ | 0.1222 | | |
| Class W | | | NII | | | | $ | 0.1181 | | |
| All Classes | | | ROC | | | | $ | 0.0067 | | |
| Voya High Yield Bond Fund | | |||||||||
| Class A | | | NII | | | | $ | 0.3691 | | |
| Class C | | | NII | | | | $ | 0.3091 | | |
| Class I | | | NII | | | | $ | 0.3964 | | |
| Class P | | | NII | | | | $ | 0.4497 | | |
| Class P3 | | | NII | | | | $ | 0.4550 | | |
| Class R | | | NII | | | | $ | 0.3494 | | |
| Class R6 | | | NII | | | | $ | 0.4022 | | |
| Class W | | | NII | | | | $ | 0.3897 | | |
| All Classes | | | STCG | | | | $ | 0.0012 | | |
| Voya Intermediate Bond Fund | | |||||||||
| Class A | | | NII | | | | $ | 0.2152 | | |
| Class C | | | NII | | | | $ | 0.1380 | | |
| Class I | | | NII | | | | $ | 0.2481 | | |
| Class P3 | | | NII | | | | $ | 0.2841 | | |
| Class R | | | NII | | | | $ | 0.1898 | | |
| Fund Name | | | Type | | | Per Share Amount | | |||
| Voya Intermediate Bond Fund (continued) | | |||||||||
| Class R6 | | | NII | | | | $ | 0.2523 | | |
| Class W | | | NII | | | | $ | 0.2407 | | |
| All Classes | | | ROC | | | | $ | 0.0159 | | |
| Voya Short Term Bond Fund | | |||||||||
| Class A | | | NII | | | | $ | 0.0955 | | |
| Class C | | | NII | | | | $ | 0.0210 | | |
| Class I | | | NII | | | | $ | 0.1251 | | |
| Class P2 | | | NII | | | | $ | 0.2136 | | |
| Class P3 | | | NII | | | | $ | 0.1752 | | |
| Class R | | | NII | | | | $ | 0.0709 | | |
| Class R6 | | | NII | | | | $ | 0.1282 | | |
| Class W | | | NII | | | | $ | 0.1206 | | |
| All Classes | | | ROC | | | | $ | 0.0273 | | |
| Voya Strategic Income Opportunities Fund | | |||||||||
| Class A | | | NII | | | | $ | 0.2273 | | |
| Class C | | | NII | | | | $ | 0.1491 | | |
| Class I | | | NII | | | | $ | 0.2631 | | |
| Class P | | | NII | | | | $ | 0.3198 | | |
| Class R | | | NII | | | | $ | 0.2002 | | |
| Class R6 | | | NII | | | | $ | 0.2681 | | |
| Class W | | | NII | | | | $ | 0.2516 | | |
| All Classes | | | ROC | | | | $ | 0.0599 | | |
| | Voya GNMA Income Fund | | | | | 100.00% | | |
| | Voya High Yield Bond Fund | | | | | 98.97% | | |
| | Voya Intermediate Bond Fund | | | | | 100.00% | | |
| | Voya Short Term Bond Fund | | | | | 99.44% | | |
| | Voya Strategic Income Opportunities Fund | | | | | 100.00% | | |
| | Voya High Yield Bond Fund | | | | | 100.00% | | |
| Name, Address and Age | | | Position(s) Held with the Trust | | | Term of Office and Length of Time Served(1) | | | Principal Occupation(s) – During the Past 5 Years | | | Number of funds in Fund Complex Overseen by Trustee(2) | | | Other Board Positions Held by Trustee | |
| Independent Trustees: | | | | | | | | | | | | | | | | |
| Colleen D. Baldwin 7337 East Doubletree Ranch Rd. Suite 100 Scottsdale, Arizona 85258 Age: 61 | | | Trustee Chairperson | | | November 2007 – Present January 2020 – Present | | | President, Glantuam Partners, LLC, a business consulting firm (January 2009 – Present). | | | 132 | | | Dentaquest (February 2014 – Present); RSR Partners, Inc. (2016 – Present). | |
| John V. Boyer 7337 East Doubletree Ranch Rd. Suite 100 Scottsdale, Arizona 85258 Age: 68 | | | Trustee | | | January 2005 – Present | | | Retired. Formerly, President and Chief Executive Officer, Bechtler Arts Foundation, an arts and education foundation (January 2008 – December 2019). | | | 132 | | | None. | |
| Patricia W. Chadwick 7337 East Doubletree Ranch Rd. Suite 100 Scottsdale, Arizona 85258 Age: 73 | | | Trustee | | | January 2006 – Present | | | Consultant and President, Ravengate Partners LLC, a consulting firm that provides advice regarding financial markets and the global economy (January 2000 – Present). | | | 132 | | | Wisconsin Energy Corporation (June 2006 – Present); The Royce Funds (22 funds) (December 2009 – Present); and AMICA Mutual Insurance Company (1992 – Present). | |
| Martin J. Gavin 7337 East Doubletree Ranch Rd. Suite 100 Scottsdale, AZ 85258 Age: 72 | | | Trustee | | | August 2015 – Present | | | Retired. | | | 132 | | | None. | |
| Joseph E. Obermeyer 7337 East Doubletree Ranch Rd. Suite 100 Scottsdale, Arizona 85258 Age: 64 | | | Trustee | | | May 2013 – Present | | | President, Obermeyer & Associates, Inc., a provider of financial and economic consulting services (November 1999 – Present). | | | 132 | | | None. | |
| Sheryl K. Pressler 7337 East Doubletree Ranch Rd. Suite 100 Scottsdale, Arizona 85258 Age: 71 | | | Trustee | | | January 2006 – Present | | | Consultant (May 2001 – Present). | | | 132 | | | Centerra Gold Inc. (May 2008 – Present). | |
| Christopher P. Sullivan 7337 East Doubletree Ranch Rd. Suite 100 Scottsdale, Arizona 85258 Age: 68 | | | Trustee | | | October 2015 – Present | | | Retired. | | | 132 | | | None. | |
| Name, Address and Age | | | Position(s) Held with the Trust | | | Term of Office and Length of Time Served(1) | | | Principal Occupation(s) – During the Past 5 Years | | | Number of funds in Fund Complex Overseen by Trustee(2) | | | Other Board Positions Held by Trustee | | | | | | | ||||||||||
| Trustee who is an “interested person”: | | | | | | | | | | | | | | | | | |||||||||||||||
| Dina Santoro 230 Park Avenue New York, New York 10169 Age: 49 | | | Trustee | | | July 2018 – Present | | | President, Voya Investments, LLC and Voya Capital, LLC (March 2018 – Present); Senior Vice President, Voya Investments Distributor, LLC (April 2018 – Present); Chief Operating Officer and Senior Managing Director, Voya Investment Management (January 2022 – Present). Formerly, Senior Managing Director, Head of Product and Marketing Strategy, Voya Investment Management (September 2017 – December 2021); Managing Director, Quantitative Management Associates, LLC (January 2004 – August 2017). | | | 132 | | | Voya Investments, LLC, Voya Capital, LLC, and Voya Funds Services, LLC (March 2018 – Present); Voya Investments Distributor, LLC (April 2018 – Present). | | | | | | | ||||||||||
| Name, Address and Age | | | Position(s) Held With the Trust | | | Term of Office and Length of Time Served(1) | | | Principal Occupation(s) – During the Past 5 Years | |
| Michael Bell One Orange Way Windsor, Connecticut 06095 Age: 53 | | | Chief Executive Officer | | | March 2018 – Present | | | Chief Executive Officer and Director, Voya Investments, LLC, Voya Capital, LLC, and Voya Funds Services, LLC (March 2018 – Present); Senior Vice President, Voya Investments Distributor, LLC (March 2020 – Present); Chief Financial Officer, Voya Investment Management (September 2014 – Present). Formerly, Senior Vice President and Chief Financial Officer, Voya Investments Distributor, LLC (September 2019 – March 2020); Senior Vice President and Treasurer, Voya Investments Distributor, LLC (November 2015 – September 2019); Senior Vice President, Chief Financial Officer and Treasurer, Voya Investments, LLC (November 2015 – March 2018). | |
| Dina Santoro 230 Park Avenue New York, New York 10169 Age: 49 | | | President | | | March 2018 – Present | | | President and Director, Voya Investments, LLC and Voya Capital, LLC (March 2018 – Present); Director, Voya Funds Services, LLC (March 2018 – Present); Director and Senior Vice President, Voya Investments Distributor, LLC (April 2018 – Present); Chief Operating Officer and Senior Managing Director, Voya Investment Management (January 2022 – Present). Formerly, Senior Managing Director, Head of Product and Marketing Strategy, Voya Investment Management (September 2017 – December 2021); Managing Director, Quantitative Management Associates, LLC (January 2004 – August 2017). | |
| Jonathan Nash 230 Park Avenue New York, New York 10169 Age: 54 | | | Executive Vice President Chief Investment Risk Officer | | | March 2020 – Present March 2020 – Present | | | Executive Vice President and Chief Investment Risk Officer, Voya Investments, LLC (March 2020 – Present) and Senior Vice President, Investment Risk Management, Voya Investment Management (March 2017 – Present). Formerly, Vice President, Voya Investments, LLC (September 2018 – March 2020); Consultant, DA Capital LLC (January 2016 – March 2017). | |
| James M. Fink 5780 Powers Ferry Road NW Atlanta, Georgia 30327 Age: 64 | | | Executive Vice President | | | March 2018 – Present | | | Managing Director, Voya Investments, LLC, Voya Capital, LLC, and Voya Funds Services, LLC (March 2018-Present); Senior Vice President, Voya Investments Distributor, LLC (April 2018 – Present); Chief Administrative Officer, Voya Investment Management (September 2017-Present). Formerly, Managing Director, Operations, Voya Investment Management (March 1999 – September 2017). | |
| Kristin M. Lynch 7337 East Doubletree Ranch Rd. Suite 100 Scottsdale, Arizona 85258 Age: 40 | | | Chief Compliance Officer | | | April 2022 – Present | | | Vice President, Voya Investment Management and Chief Compliance Officer, Voya Family of Funds (April 2022 – Present); Vice President, Voya Investment Management (March 2019 – April 2022); and Assistant Vice President, Voya Investment Management (March 2014 – March 2019). | |
| Todd Modic 7337 East Doubletree Ranch Rd. Suite 100 Scottsdale, Arizona 85258 Age: 54 | | | Senior Vice President, Chief/Principal Financial Officer and Assistant Secretary | | | March 2005 – Present | | | President, Voya Funds Services, LLC (March 2018 – Present) and Senior Vice President, Voya Investments, LLC (April 2005 – Present). | |
| Kimberly A. Anderson 7337 East Doubletree Ranch Rd. Suite 100 Scottsdale, Arizona 85258 Age: 57 | | | Senior Vice President | | | November 2003 – Present | | | Senior Vice President, Voya Investments, LLC (September 2003 – Present). | |
| Micheline S. Faver 7337 East Doubletree Ranch Rd. Suite 100 Scottsdale, Arizona 85258 Age: 44 | | | Senior Vice President | | | September 2020 – Present | | | Senior Vice President, Head of Fund Compliance and Chief Compliance Officer, Voya Investments, LLC (March 2021 – Present). Formerly, Vice President, Head of Fund Compliance and Chief Compliance Officer, Voya Investments, LLC (June 2016 – March 2021). | |
| Name, Address and Age | | | Position(s) Held With the Trust | | | Term of Office and Length of Time Served(1) | | | Principal Occupation(s) – During the Past 5 Years | |
| Robert Terris 5780 Powers Ferry Road NW Atlanta, Georgia 30327 Age: 51 | | | Senior Vice President | | | May 2006 – Present | | | Senior Vice President, Voya Investments Distributor, LLC (April 2018 – Present); Senior Vice President, Head of Investment Services, Voya Investments, LLC (April 2018 – Present) and Voya Funds Services, LLC (March 2006 – Present). Formerly, Senior Vice President, Head of Division Operations, Voya Investments, LLC (October 2015 – April 2018). | |
| Fred Bedoya 7337 East Doubletree Ranch Rd. Suite 100 Scottsdale, Arizona 85258 Age: 49 | | | Vice President Treasurer | | | September 2012 – Present | | | Vice President, Voya Investments, LLC (October 2015 – Present) and Voya Funds Services, LLC (July 2012 – Present). | |
| Maria M. Anderson 7337 East Doubletree Ranch Rd. Suite 100 Scottsdale, Arizona 85258 Age: 64 | | | Vice President | | | September 2004 – Present | | | Vice President, Voya Investments, LLC (October 2015 – Present) and Voya Funds Services, LLC (September 2004 – Present). | |
| Sara M. Donaldson 7337 East Doubletree Ranch Rd. Suite 100 Scottsdale, Arizona 85258 Age: 62 | | | Vice President | | | September 2014 – Present | | | Senior Vice President, Voya Investments, LLC (February 2022 – Present). Formerly, Vice President, Voya Investments, LLC (October 2015 – February 2022). | |
| Robyn L. Ichilov 7337 East Doubletree Ranch Rd. Suite 100 Scottsdale, Arizona 85258 Age: 54 | | | Vice President | | | October 2000 – Present | | | Vice President, Voya Funds Services, LLC (November 1995 – Present) and Voya Investments, LLC (August 1997 – Present). | |
| Jason Kadavy 7337 East Doubletree Ranch Rd. Suite 100 Scottsdale, Arizona 85258 Age: 46 | | | Vice President | | | September 2012 – Present | | | Vice President, Voya Investments, LLC (October 2015 – Present) and Voya Funds Services, LLC (July 2007 – Present). | |
| Andrew K. Schlueter 7337 East Doubletree Ranch Rd. Suite 100 Scottsdale, Arizona 85258 Age: 46 | | | Vice President | | | March 2018 – Present | | | Vice President, Voya Investments Distributor, LLC (April 2018 – Present); Vice President, Voya Investments, LLC and Voya Funds Services, LLC (March 2018 – Present); Senior Vice President, Head of Mutual Fund Operations, Voya Investment Management (March 2022 – Present). Formerly, Vice President, Head of Mutual Fund Operations, Voya Investment Management (February 2018 – February 2022). Formerly, Vice President, Voya Investment Management (March 2014 – February 2018). | |
| Craig Wheeler 7337 East Doubletree Ranch Rd. Suite 100 Scottsdale, Arizona 85258 Age: 53 | | | Vice President | | | May 2013 – Present | | | Vice President – Director of Tax, Voya Investments, LLC (October 2015 – Present). | |
| Monia Piacenti One Orange Way Windsor, Connecticut 06095 Age: 45 | | | Anti-Money Laundering Officer | | | June 2018 – Present | | | Anti-Money Laundering Officer, Voya Investments Distributor, LLC, Voya Investment Management and Voya Investment Management Trust Co. (June 2018 – Present); Compliance Consultant, Voya Financial, Inc. (January 2019 – Present). Formerly, Senior Compliance Officer, Voya Investment Management (December 2009 – December 2018). | |
| Joanne F. Osberg 7337 East Doubletree Ranch Rd. Suite 100 Scottsdale, Arizona 85258 Age: 40 | | | Secretary | | | September 2020 – Present | | | Vice President and Senior Counsel, Voya Investment Management – Mutual Fund Legal Department (September 2020 – Present). Formerly, Vice President, Counsel, Voya Investment Management – Mutual Fund Legal Department (January 2013 – September 2020). | |
| Name, Address and Age | | | Position(s) Held With the Trust | | | Term of Office and Length of Time Served(1) | | | Principal Occupation(s) – During the Past 5 Years | |
| Paul A. Caldarelli 7337 East Doubletree Ranch Rd. Suite 100 Scottsdale, Arizona 85258 Age: 70 | | | Assistant Secretary | | | June 2010 – Present | | | Vice President and Senior Counsel, Voya Investment Management – Mutual Fund Legal Department (March 2010 – Present). | |
Voya Investments, LLC
7337 East Doubletree Ranch Road, Suite 100
Scottsdale, Arizona 85258
Voya Investments Distributor, LLC
7337 East Doubletree Ranch Road, Suite 100
Scottsdale, Arizona 85258
BNY Mellon Investment Servicing (U.S.) Inc.
301 Bellevue Parkway
Wilmington, Delaware 19809
Ernst & Young LLP
200 Clarendon Street
Boston, Massachusetts 02116
The Bank of New York Mellon
225 Liberty Street
New York, New York 10286
Ropes & Gray LLP
Prudential Tower
800 Boylston Street
Boston, Massachusetts 02199
![[MISSING IMAGE: lg_voya-r.jpg]](https://capedge.com/proxy/N-CSR/0001104659-22-067897/lg_voya-r.jpg)
| | | As permitted by regulations adopted by the U.S. Securities and Exchange Commission, paper copies of the fund’s annual and semi-annual shareholder reports, like this annual report, are not sent by mail, unless you specifically request paper copies of the reports. Instead, the reports will be made available on the Voya funds’ website (www.voyainvestments.com/literature), and you will be notified by mail each time a report is posted and provided with a website link to access the report. | | |
| | | If you already elected to receive shareholder reports electronically, you need not take any action. You may elect to receive shareholder reports and other communications from the fund electronically anytime by contacting your financial intermediary (such as a broker-dealer or bank) or, if you are a direct investor, by calling 1-800-992-0180 or by sending an e-mail request to Voyaim_literature@voya.com. | | |
| | | You may elect to receive all future reports in paper free of charge. If you received this document in the mail, please follow the instructions to elect to continue receiving paper copies of your shareholder reports. If you received this document through a financial intermediary, you can contact your financial intermediary to request that you continue to receive paper copies of your shareholder reports. If you invest directly with us, you can call 1-800-992-0180 or send an email request to Voyaim_literature@voya.com to let the fund know you wish to continue receiving paper copies of your shareholder reports. Your election to receive reports in paper will apply to all funds held in your account if you invest through your financial intermediary or all funds held with the Voya funds complex if you invest directly with the funds. | | |
| | | This report is submitted for general information to shareholders of the Voya mutual funds. It is not authorized for distribution to prospective shareholders unless accompanied or preceded by a prospectus which includes details regarding the fund’s investment objectives, risks, charges, expenses and other information. This information should be read carefully. | | |
| | | | | E-Delivery Sign-up – details inside | |
![[MISSING IMAGE: voya_covinvmgt.jpg]](https://capedge.com/proxy/N-CSR/0001104659-22-067897/voya_covinvmgt-1.jpg)
| | | | | | 1 | | | |
| | | | | | 2 | | | |
| | | | | | 3 | | | |
| | | | | | 4 | | | |
| | | | | | 5 | | | |
| | | | | | 7 | | | |
| | | | | | 8 | | | |
| | | | | | 9 | | | |
| | | | | | 10 | | | |
| | | | | | 17 | | | |
| | | | | | 19 | | | |
| | | | | | 20 | | | |
| | | | | | 25 | | |
| | | | | | Go Paperless with E-Delivery! | | | | | |
| | | Sign up now for on-line prospectuses, fund reports, and proxy statements. | | | ||||||
| | | Just go to www.individuals.voya.com/page/e-delivery, follow the directions and complete the quick 5 Steps to Enroll. | | | ||||||
| | | You will be notified by e-mail when these communications become available on the internet. | | | ||||||
President
Voya Family of Funds
April 28, 2022
| Portfolio Managers’ Report | Voya Government Money Market Fund |
| | Investment Type Allocation as of March 31, 2022 (as a percentage of net assets) | | |||
| | | | | | |
| | U.S. Government Agency Debt | | | 23.2% | |
| | U.S. Treasury Repurchase Agreement | | | 22.8% | |
| | U.S. Treasury Debt | | | 14.5% | |
| | Investment Companies | | | 9.0% | |
| | Assets in Excess of Other Liabilities | | | 30.5% | |
| | Net Assets | | | 100.0% | |
| | Portfolio holdings are subject to change daily. | | |||
| | | | Actual Fund Return | | | Hypothetical (5% return before expenses) | | ||||||||||||||||||||||||||||||||||||||||||
| | | | Beginning Account Value October 1, 2021 | | | Ending Account Value March 31, 2022 | | | Annualized Expense Ratio* | | | Expenses Paid During the Period Ended March 31, 2022** | | | Beginning Account Value October 1, 2021 | | | Ending Account Value March 31, 2022 | | | Annualized Expense Ratio* | | | Expenses Paid During the Period Ended March 31, 2022** | | ||||||||||||||||||||||||
| Class A | | | | $ | 1,000.00 | | | | | $ | 1,000.00 | | | | | | 0.05% | | | | | $ | 0.25 | | | | | $ | 1,000.00 | | | | | $ | 1,024.68 | | | | | | 0.05% | | | | | $ | 0.25 | | |
| Class C | | | | | 1,000.00 | | | | | | 1,000.00 | | | | | | 0.05 | | | | | | 0.25 | | | | | | 1,000.00 | | | | | | 1,024.68 | | | | | | 0.05 | | | | | | 0.25 | | |
| Class I | | | | | 1,000.00 | | | | | | 1,000.00 | | | | | | 0.05 | | | | | | 0.25 | | | | | | 1,000.00 | | | | | | 1,024.68 | | | | | | 0.05 | | | | | | 0.25 | | |
| Class W | | | | | 1,000.00 | | | | | | 1,000.00 | | | | | | 0.05 | | | | | | 0.25 | | | | | | 1,000.00 | | | | | | 1,024.68 | | | | | | 0.05 | | | | | | 0.25 | | |
May 27, 2022
| | ASSETS: | | | | | | | |
| | Short-term investments at amortized cost | | | | $ | 93,486,895 | | |
| | Repurchase agreements | | | | | 45,812,000 | | |
| | Cash | | | | | 998 | | |
| | Receivables: | | | | | | | |
| | Investment securities sold | | | | | 68,979,879 | | |
| | Fund shares sold | | | | | 791,514 | | |
| | Dividends | | | | | 1,462 | | |
| | Interest | | | | | 7,841 | | |
| | Prepaid expenses | | | | | 33,936 | | |
| | Reimbursement due from Investment Adviser | | | | | 39,184 | | |
| | Other assets | | | | | 23,674 | | |
| | Total assets | | | | | 209,177,383 | | |
| | LIABILITIES: | | | | | | | |
| | Payable for fund shares redeemed | | | | | 8,406,312 | | |
| | Payable for investment management fees | | | | | 20,529 | | |
| | Payable to trustees under the deferred compensation plan (Note 5) | | | | | 23,674 | | |
| | Payable for trustee fees | | | | | 1,331 | | |
| | Other accrued expenses and liabilities | | | | | 167,625 | | |
| | Total liabilities | | | | | 8,619,471 | | |
| | NET ASSETS | | | | $ | 200,557,912 | | |
| | NET ASSETS WERE COMPRISED OF: | | | | | | | |
| | Paid-in capital | | | | $ | 200,626,507 | | |
| | Total distributable loss | | | | | (68,595) | | |
| | NET ASSETS | | | | $ | 200,557,912 | | |
| | Class A | | | | | | | |
| | Net assets | | | | $ | 156,625,911 | | |
| | Shares authorized | | | | | unlimited | | |
| | Par value | | | | $ | 0.001 | | |
| | Shares outstanding | | | | | 156,663,270 | | |
| | Net asset value and redemption price per share† | | | | $ | 1.00 | | |
| | Class C | | | | | | | |
| | Net assets | | | | $ | 2,014,523 | | |
| | Shares authorized | | | | | unlimited | | |
| | Par value | | | | $ | 0.001 | | |
| | Shares outstanding | | | | | 2,014,976 | | |
| | Net asset value and redemption price per share† | | | | $ | 1.00 | | |
| | Class I | | | | | | | |
| | Net assets | | | | $ | 41,744,566 | | |
| | Shares authorized | | | | | unlimited | | |
| | Par value | | | | $ | 0.001 | | |
| | Shares outstanding | | | | | 41,753,877 | | |
| | Net asset value and redemption price per share | | | | $ | 1.00 | | |
| | Class W | | | | | | | |
| | Net assets | | | | $ | 172,912 | | |
| | Shares authorized | | | | | unlimited | | |
| | Par value | | | | $ | 0.001 | | |
| | Shares outstanding | | | | | 172,951 | | |
| | Net asset value and redemption price per share | | | | $ | 1.00 | | |
| | INVESTMENT INCOME: | | | | | | | |
| | Dividends | | | | $ | 3,475 | | |
| | Interest | | | | | 110,775 | | |
| | Total investment income | | | | | 114,250 | | |
| | EXPENSES: | | | | | | | |
| | Investment management fees | | | | | 749,832 | | |
| | Distribution and shareholder service fees: | | | | | | | |
| | Class C | | | | | 22,123 | | |
| | Transfer agent fees: | | | | | | | |
| | Class A | | | | | 375,510 | | |
| | Class C | | | | | 4,968 | | |
| | Class I | | | | | 38,484 | | |
| | Class W | | | | | 736 | | |
| | Shareholder reporting expense | | | | | 8,665 | | |
| | Registration fees | | | | | 77,539 | | |
| | Professional fees | | | | | 20,997 | | |
| | Custody and accounting expense | | | | | 12,300 | | |
| | Trustee fees | | | | | 3,410 | | |
| | Miscellaneous expense | | | | | 11,228 | | |
| | Total expenses | | | | | 1,325,792 | | |
| | Waived and reimbursed fees | | | | | (1,211,542) | | |
| | Net expenses | | | | | 114,250 | | |
| | Net investment income | | | | | — | | |
| | REALIZED AND UNREALIZED GAIN (LOSS): | | | | | | | |
| | Net realized gain on investments | | | | | 135,524 | | |
| | Increase in net assets resulting from operations | | | | $ | 135,524 | | |
| | | | Year Ended March 31, 2022 | | | Year Ended March 31, 2021 | | ||||||
| FROM OPERATIONS: | | | | | | | | | | | | | |
| Net investment income | | | | $ | — | | | | | $ | 19,428 | | |
| Net realized gain | | | | | 135,524 | | | | | | 56,235 | | |
| Increase in net assets resulting from operations | | | | | 135,524 | | | | | | 75,663 | | |
| FROM DISTRIBUTIONS TO SHAREHOLDERS: | | | | | | | | | | | | | |
| Total distributions (excluding return of capital): | | | | | | | | | | | | | |
| Class A | | | | | (148,550) | | | | | | (61,749) | | |
| Class C | | | | | (2,129) | | | | | | (892) | | |
| Class I | | | | | (42,621) | | | | | | (15,624) | | |
| Class W | | | | | (313) | | | | | | (118) | | |
| Total distributions | | | | | (193,613) | | | | | | (78,383) | | |
| FROM CAPITAL SHARE TRANSACTIONS: | | | | | | | | | | | | | |
| Net proceeds from sale of shares | | | | | 1,095,071,009 | | | | | | 984,320,378 | | |
| Reinvestment of distributions | | | | | 193,061 | | | | | | 77,989 | | |
| | | | | | 1,095,264,070 | | | | | | 984,398,367 | | |
| Cost of shares redeemed | | | | | (1,099,422,799) | | | | | | (988,549,408) | | |
| Net decrease in net assets resulting from capital share transactions | | | | | (4,158,729) | | | | | | (4,151,041) | | |
| Net decrease in net assets | | | | | (4,216,818) | | | | | | (4,153,761) | | |
| NET ASSETS: | | | | | | | | | | | | | |
| Beginning of year or period | | | | | 204,774,730 | | | | | | 208,928,491 | | |
| End of year or period | | | | $ | 200,557,912 | | | | | $ | 204,774,730 | | |
| | | | | | | | | | Income (loss) from investment operations | | | | | | | | | Less Distributions | | | | | | Ratios to average net assets | | | Supplemental Data | | |||||||||||||||||||||||||||||||||||||||||||||||||||||||||||||||||||||||||||
| | | | Net asset value, beginning of year or period | | | Net investment income (loss) | | | Net realized and unrealized gain (loss) | | | Total from investment operations | | | From net investment income | | | From net realized gains | | | From return of capital | | | Total distributions | | | Payment by affiliate | | | Net asset value, end of year or period | | | Total Return(1) | | | Expenses before reductions/additions(2)(3) | | | Expenses net of fee waivers and/or recoupments if any(2)(3) | | | Expenses net of all reductions/additions(2)(3) | | | Net investment income (loss)(2)(3) | | | Net assets, end of year or period | | | Portfolio turnover rate | | |||||||||||||||||||||||||||||||||||||||||||||||||||
| Year or period ended | | | ($) | | | ($) | | | ($) | | | ($) | | | ($) | | | ($) | | | ($) | | | ($) | | | ($) | | | ($) | | | (%) | | | (%) | | | (%) | | | (%) | | | (%) | | | ($000’s) | | | (%) | | |||||||||||||||||||||||||||||||||||||||||||||||||||
| Class A | | | | | | | | | | | | | | | | | | | | | | | | | | | | | | | | | | | | | | | | | | | | | | | | | | | | | | | | | | | | | | | | | | | | | | | | | | | | | | | | | | | | | | | | | | | | | | | | | | | | | | | |
| 03-31-22 | | | | | 1.00 | | | | —• | | | | | 0.00* | | | | | | 0.00* | | | | — | | | | | 0.00* | | | | | | — | | | | | | 0.00* | | | | | | — | | | | | | 1.00 | | | | | | 0.09 | | | | | | 0.64 | | | | | | 0.05(4) | | | | | | 0.05 | | | | — | | | | | 156,626 | | | | — | | ||||||||||||
| 03-31-21 | | | | | 1.00 | | | | | | 0.00*• | | | | | | 0.00* | | | | | | 0.00* | | | | | | 0.00* | | | | | | 0.00* | | | | | | — | | | | | | 0.00* | | | | | | — | | | | | | 1.00 | | | | | | 0.04 | | | | | | 0.68 | | | | | | 0.11(5) | | | | | | 0.11 | | | | | | 0.01 | | | | | | 156,808 | | | | | | — | | |
| 03-31-20 | | | | | 1.00 | | | | | | 0.02 | | | | | | 0.00* | | | | | | 0.02 | | | | | | 0.02 | | | | | | 0.00* | | | | | | — | | | | | | 0.02 | | | | | | — | | | | | | 1.00 | | | | | | 1.61 | | | | | | 0.63 | | | | | | 0.41(6) | | | | | | 0.41 | | | | | | 1.49 | | | | | | 161,828 | | | | | | — | | |
| 03-31-19 | | | | | 1.00 | | | | | | 0.02 | | | | | | 0.00* | | | | | | 0.02 | | | | | | 0.02 | | | | | | 0.00* | | | | | | — | | | | | | 0.02 | | | | | | — | | | | | | 1.00 | | | | | | 1.76 | | | | | | 0.57 | | | | | | 0.40 | | | | | | 0.40 | | | | | | 1.75 | | | | | | 157,178 | | | | | | — | | |
| 03-31-18 | | | | | 1.00 | | | | | | 0.01 | | | | | | 0.00* | | | | | | 0.01 | | | | | | 0.01 | | | | | | 0.00* | | | | | | — | | | | | | 0.01 | | | | | | — | | | | | | 1.00 | | | | | | 0.53 | | | | | | 0.69 | | | | | | 0.64 | | | | | | 0.64 | | | | | | 0.50 | | | | | | 155,574 | | | | | | — | | |
| Class C | | | | | | | | | | | | | | | | | | | | | | | | | | | | | | | | | | | | | | | | | | | | | | | | | | | | | | | | | | | | | | | | | | | | | | | | | | | | | | | | | | | | | | | | | | | | | | | | | | | | | | | |
| 03-31-22 | | | | | 1.00 | | | | —• | | | | | 0.00* | | | | | | 0.00 | | | | — | | | | | 0.00* | | | | — | | | | | 0.00* | | | | | | — | | | | | | 1.00 | | | | | | 0.09 | | | | | | 1.64 | | | | | | 0.05(4) | | | | | | 0.05 | | | | — | | | | | 2,015 | | | | | | — | | | ||||||||||||
| 03-31-21 | | | | | 1.00 | | | | | | 0.00*• | | | | | | 0.00* | | | | | | 0.00* | | | | | | 0.00* | | | | | | 0.00* | | | | | | — | | | | | | 0.00* | | | | | | — | | | | | | 1.00 | | | | | | 0.03 | | | | | | 1.68 | | | | | | 0.11(5) | | | | | | 0.11 | | | | | | 0.01 | | | | | | 2,321 | | | | | | — | | |
| 03-31-20 | | | | | 1.00 | | | | | | 0.01 | | | | | | 0.00* | | | | | | 0.01 | | | | | | 0.01 | | | | | | 0.00* | | | | | | — | | | | | | 0.01 | | | | | | — | | | | | | 1.00 | | | | | | 0.65 | | | | | | 1.63 | | | | | | 1.41(6) | | | | | | 1.41 | | | | | | 0.56 | | | | | | 2,870 | | | | | | — | | |
| 03-31-19 | | | | | 1.00 | | | | | | 0.01 | | | | | | 0.00* | | | | | | 0.01 | | | | | | 0.01 | | | | | | 0.00* | | | | | | — | | | | | | 0.01 | | | | | | — | | | | | | 1.00 | | | | | | 0.75 | | | | | | 1.57 | | | | | | 1.40 | | | | | | 1.40 | | | | | | 0.74 | | | | | | 4,256 | | | | | | — | | |
| 03-31-18 | | | | | 1.00 | | | | | | 0.00* | | | | | | 0.00* | | | | | | 0.00* | | | | | | 0.00* | | | | | | 0.00* | | | | | | — | | | | | | 0.00* | | | | | | — | | | | | | 1.00 | | | | | | 0.06 | | | | | | 1.69 | | | | | | 1.15(7) | | | | | | 1.15 | | | | | | 0.02 | | | | | | 4,054 | | | | | | — | | |
| Class I | | | | | | | | | | | | | | | | | | | | | | | | | | | | | | | | | | | | | | | | | | | | | | | | | | | | | | | | | | | | | | | | | | | | | | | | | | | | | | | | | | | | | | | | | | | | | | | | | | | | | | | |
| 03-31-22 | | | | | 1.00 | | | | —• | | | | | 0.00* | | | | | | 0.00* | | | | — | | | | | 0.00* | | | | | | — | | | | | | 0.00* | | | | | | — | | | | | | 1.00 | | | | | | 0.09 | | | | | | 0.50 | | | | | | 0.05(4) | | | | | | 0.05 | | | | — | | | | | 41,745 | | | | | | — | | | |||||||||
| 03-31-21 | | | | | 1.00 | | | | | | 0.00*• | | | | | | 0.00* | | | | | | 0.00* | | | | | | 0.00* | | | | | | 0.00* | | | | | | — | | | | | | 0.00* | | | | | | — | | | | | | 1.00 | | | | | | 0.03 | | | | | | 0.57 | | | | | | 0.11(5) | | | | | | 0.11 | | | | | | 0.01 | | | | | | 45,260 | | | | | | — | | |
| 03-31-20 | | | | | 1.00 | | | | | | 0.02 | | | | | | 0.00* | | | | | | 0.02 | | | | | | 0.02 | | | | | | 0.00* | | | | | | — | | | | | | 0.02 | | | | | | — | | | | | | 1.00 | | | | | | 1.63 | | | | | | 0.61 | | | | | | 0.41(6) | | | | | | 0.41 | | | | | | 1.53 | | | | | | 43,994 | | | | | | — | | |
| 03-31-19 | | | | | 1.00 | | | | | | 0.02 | | | | | | 0.00* | | | | | | 0.02 | | | | | | 0.02 | | | | | | 0.00* | | | | | | — | | | | | | 0.02 | | | | | | — | | | | | | 1.00 | | | | | | 1.76 | | | | | | 0.57 | | | | | | 0.40 | | | | | | 0.40 | | | | | | 1.72 | | | | | | 39,581 | | | | | | — | | |
| 03-31-18 | | | | | 1.00 | | | | | | 0.01 | | | | | | 0.00* | | | | | | 0.01 | | | | | | 0.01 | | | | | | 0.00* | | | | | | — | | | | | | 0.01 | | | | | | — | | | | | | 1.00 | | | | | | 0.53 | | | | | | 0.69 | | | | | | 0.64 | | | | | | 0.64 | | | | | | 0.50 | | | | | | 39,617 | | | | | | — | | |
| Class W | | | | | | | | | | | | | | | | | | | | | | | | | | | | | | | | | | | | | | | | | | | | | | | | | | | | | | | | | | | | | | | | | | | | | | | | | | | | | | | | | | | | | | | | | | | | | | | | | | | | | | | |
| 03-31-22 | | | | | 1.00 | | | | | | 0.00*• | | | | | | 0.00* | | | | | | 0.00* | | | | | | 0.00* | | | | | | 0.00* | | | | | | — | | | | | | 0.00* | | | | | | — | | | | | | 1.00 | | | | | | 0.09 | | | | | | 0.64 | | | | | | 0.05(4) | | | | | | 0.05 | | | | | | 0.00* | | | | | | 173 | | | | | | — | | |
| 03-31-21 | | | | | 1.00 | | | | | | 0.00*• | | | | | | 0.00* | | | | | | 0.00* | | | | | | 0.00* | | | | | | 0.00* | | | | | | — | | | | | | 0.00* | | | | | | — | | | | | | 1.00 | | | | | | 0.04 | | | | | | 0.68 | | | | | | 0.11(5) | | | | | | 0.11 | | | | | | 0.01 | | | | | | 386 | | | | | | — | | |
| 03-31-20 | | | | | 1.00 | | | | | | 0.02 | | | | | | 0.00* | | | | | | 0.02 | | | | | | 0.02 | | | | | | 0.00* | | | | | | — | | | | | | 0.02 | | | | | | — | | | | | | 1.00 | | | | | | 1.61 | | | | | | 0.63 | | | | | | 0.41(6) | | | | | | 0.41 | | | | | | 1.52 | | | | | | 236 | | | | | | — | | |
| 03-31-19 | | | | | 1.00 | | | | | | 0.02 | | | | | | 0.00* | | | | | | 0.02 | | | | | | 0.02 | | | | | | 0.00* | | | | | | — | | | | | | 0.02 | | | | | | — | | | | | | 1.00 | | | | | | 1.76 | | | | | | 0.57 | | | | | | 0.40 | | | | | | 0.40 | | | | | | 1.82 | | | | | | 269 | | | | | | — | | |
| 03-31-18 | | | | | 1.00 | | | | | | 0.01 | | | | | | 0.00* | | | | | | 0.01 | | | | | | 0.01 | | | | | | 0.00* | | | | | | — | | | | | | 0.01 | | | | | | — | | | | | | 1.00 | | | | | | 0.53 | | | | | | 0.69 | | | | | | 0.64 | | | | | | 0.64 | | | | | | 0.48 | | | | | | 64 | | | | | | — | | |
| | | | Distribution Fee | | | Shareholder Servicing Fee | | ||||||
| Class C | | | | $ | 16,592 | | | | | $ | 5,529 | | |
| | March 31, | | | |||||||||||||||||
| | 2023 | | | 2024 | | | 2025 | | | Total | | |||||||||
| | $19,696 | | | | $ | 651,190 | | | | | $ | 745,440 | | | | | $ | 1,416,326 | | |
| | | | Class A | | | Class C | | ||||||
| Contingent Deferred Sales Charges: | | | | $ | 1 | | | | | $ | 161 | | |
| Subsidiary | | | Percentage | | |||
| Voya Institutional Trust Company | | | | | 23.53% | | |
| Voya Investments Distributor, LLC | | | | | 14.03 | | |
| Voya Retirement Insurance and Annuity Company | | | | | 32.76 | | |
| Class A | | | Class C | | | Class I | | | Class W | |
| 0.40% | | | 1.40% | | | 0.40% | | | 0.40% | |
| | March 31, | | | |||||||||||||||||
| | 2023 | | | 2024 | | | 2025 | | | Total | | |||||||||
| | $392,267 | | | | $ | 369,161 | | | | | $ | 209,753 | | | | | $ | 971,181 | | |
| | | | March 31, | | | | | | | | |||||||||||||||
| | | | 2023 | | | 2024 | | | 2025 | | | Total | | ||||||||||||
| Class A | | | | $ | 36,363 | | | | | $ | 184,848 | | | | | $ | 230,726 | | | | | $ | 451,937 | | |
| Class C | | | | | 493 | | | | | | 2,910 | | | | | | 3,050 | | | | | | 6,453 | | |
| Class W | | | | | 48 | | | | | | 385 | | | | | | 452 | | | | | | 885 | | |
| | | | Shares sold | | | Shares issued in merger | | | Reinvestment of distributions | | | Shares redeemed | | | Shares converted | | | Net increase (decrease) in shares outstanding | | | Shares sold | | | Proceeds from shares issued in merger | | | Reinvestment of distributions | | | Shares redeemed | | | Shares converted | | | Net increase (decrease) | | ||||||||||||||||||||||||||||||||||||
| Year or period ended | | | # | | | # | | | # | | | # | | | # | | | # | | | ($) | | | ($) | | | ($) | | | ($) | | | ($) | | | ($) | | ||||||||||||||||||||||||||||||||||||
| Class A | | | | | | | | | | | | | | | | | | | | | | | | | | | | | | | | | | | | | | | | | | | | | | | | | | | | | | | | | | | | | | | | | | | | | | | | | |
| 3/31/2022 | | | | | 1,082,229,317 | | | | | | — | | | | | | 148,086 | | | | | | (1,082,514,007) | | | | | | — | | | | | | (136,604) | | | | | | 1,082,229,317 | | | | | | — | | | | | | 148,086 | | | | | | (1,082,514,007) | | | | | | — | | | | | | (136,604) | | |
| 3/31/2021 | | | | | 969,878,923 | | | | | | — | | | | | | 61,524 | | | | | | (974,950,546) | | | | | | — | | | | | | (5,010,099) | | | | | | 969,878,923 | | | | | | — | | | | | | 61,524 | | | | | | (974,950,546) | | | | | | — | | | | | | (5,010,099) | | |
| Class C | | | | | | | | | | | | | | | | | | | | | | | | | | | | | | | | | | | | | | | | | | | | | | | | | | | | | | | | | | | | | | | | | | | | | | | | | |
| 3/31/2022 | | | | | 1,064,174 | | | | | | — | | | | | | 2,089 | | | | | | (1,371,981) | | | | | | — | | | | | | (305,718) | | | | | | 1,064,174 | | | | | | — | | | | | | 2,089 | | | | | | (1,371,981) | | | | | | — | | | | | | (305,718) | | |
| 3/31/2021 | | | | | 1,862,404 | | | | | | — | | | | | | 881 | | | | | | (2,413,640) | | | | | | — | | | | | | (550,355) | | | | | | 1,862,404 | | | | | | — | | | | | | 881 | | | | | | (2,413,640) | | | | | | — | | | | | | (550,355) | | |
| Class I | | | | | | | | | | | | | | | | | | | | | | | | | | | | | | | | | | | | | | | | | | | | | | | | | | | | | | | | | | | | | | | | | | | | | | | | | |
| 3/31/2022 | | | | | 11,682,107 | | | | | | — | | | | | | 42,573 | | | | | | (15,228,373) | | | | | | — | | | | | | (3,503,693) | | | | | | 11,682,107 | | | | | | — | | | | | | 42,573 | | | | | | (15,228,373) | | | | | | — | | | | | | (3,503,693) | | |
| 3/31/2021 | | | | | 12,338,261 | | | | | | — | | | | | | 15,466 | | | | | | (11,093,667) | | | | | | — | | | | | | 1,260,060 | | | | | | 12,338,261 | | | | | | — | | | | | | 15,466 | | | | | | (11,093,667) | | | | | | — | | | | | | 1,260,060 | | |
| Class W | | | | | | | | | | | | | | | | | | | | | | | | | | | | | | | | | | | | | | | | | | | | | | | | | | | | | | | | | | | | | | | | | | | | | | | | | |
| 3/31/2022 | | | | | 95,411 | | | | | | — | | | | | | 313 | | | | | | (308,438) | | | | | | — | | | | | | (212,714) | | | | | | 95,411 | | | | | | — | | | | | | 313 | | | | | | (308,438) | | | | | | — | | | | | | (212,714) | | |
| 3/31/2021 | | | | | 240,790 | | | | | | — | | | | | | 118 | | | | | | (91,555) | | | | | | — | | | | | | 149,353 | | | | | | 240,790 | | | | | | — | | | | | | 118 | | | | | | (91,555) | | | | | | — | | | | | | 149,353 | | |
| | Paid-in Capital | | | Distributable Earnings | | |||
| | $(4,785) | | | | $ | 4,785 | | |
| | Year Ended March 31, 2022 | | | Year Ended March 31, 2021 | | |||
| | Ordinary Income | | | Ordinary Income | | |||
| | $193,613 | | | | $ | 78,383 | | |
| | Late Year Ordinary Losses Deferred | | | Post- October Capital Losses Deferred | | | Capital Loss Carryforwards | | | Other | | | Total Distributable Earnings/ (Loss) | | ||||||||||||
| | $(1,436) | | | | $ | (53,304) | | | | | $ | — | | | | | $ | (13,855) | | | | | $ | (68,595) | | |
| | | | Type | | | Per Share Amount | | | Payable Date | | | Record Date | |
| Class A | | | NII | | | $0.0000* | | | May 2, 2022 | | | Daily | |
| Class C | | | NII | | | $ — | | | May 2, 2022 | | | Daily | |
| Class I | | | NII | | | $0.0000* | | | May 2, 2022 | | | Daily | |
| Class W | | | NII | | | $0.0000* | | | May 2, 2022 | | | Daily | |
| Voya Government Money Market Fund | as of March 31, 2022 |
| Principal Amount† | | | Value | | | Percentage of Net Assets | | |||||||||
| U.S. GOVERNMENT AGENCY DEBT: 23.2% | | |||||||||||||||
| 1,500,000 | | | Fannie Mae, 0.500%, (SOFRRATE + 0.230%), 05/06/2022 | | | | $ | 1,500,316 | | | | | | 0.8 | | |
| 2,500,000 | | | Federal Farm Credit Banks, 0.290%, (SOFRRATE + 0.020%), 04/10/2023 | | | | | 2,499,741 | | | | | | 1.3 | | |
| 7,000,000 | | | Federal Farm Credit Banks Funding Corp., 0.278%, (SOFRRATE + 0.008%), 11/22/2022 | | | | | 6,999,543 | | | | | | 3.5 | | |
| 4,000,000 | | | Federal Farm Credit Banks Funding Corp., 0.295%, (SOFRRATE + 0.025%), 12/16/2022 | | | | | 4,000,072 | | | | | | 2.0 | | |
| 5,000,000 | | | Federal Farm Credit Banks Funding Corp., 0.310%, (PRIME + (3.190)%), 05/25/2022 | | | | | 4,999,925 | | | | | | 2.5 | | |
| 3,500,000 | | | Federal Home Loan Banks, 0.270%, (SOFRRATE + 0.000%), 04/25/2022 | | | | | 3,500,000 | | | | | | 1.7 | | |
| 16,000,000 | | | Federal Home Loan Banks, 0.280%, (SOFRRATE + 0.010%), 09/06/2022 | | | | | 16,000,000 | | | | | | 8.0 | | |
| 3,500,000 | | | Federal Home Loan Banks, 0.280%, (SOFRRATE + 0.010%), 10/07/2022 | | | | | 3,500,000 | | | | | | 1.7 | | |
| 3,500,000 | | | Federal Home Loan Banks, 0.280%, (SOFRRATE + 0.010%), 10/07/2022 | | | | | 3,500,000 | | | | | | 1.7 | | |
| | | | Total U.S. Government Agency Debt | | | | | | | | | | | | | |
| | | | (Cost $46,499,597) | | | | | 46,499,597 | | | | | | 23.2 | | |
| U.S. TREASURY DEBT: 14.5% | | |||||||||||||||
| 29,000,000 (1) | | | United States Treasury Bill, 0.300%, 05/24/2022 | | | | | 28,987,298 | | | | | | 14.5 | | |
| | | | Total U.S. Treasury Debt (Cost $28,987,298) | | | | | 28,987,298 | | | | | | 14.5 | | |
| Principal Amount† | | | Value | | | Percentage of Net Assets | | |||||||||
| U.S. TREASURY REPURCHASE AGREEMENT: 22.8% | | |||||||||||||||
| | | | Repurchase Agreement: 22.8% | | ||||||||||||
| 45,812,000 | | | Deutsche Bank Repurchase Agreement dated 3/31/22, $45,812,318 to be received upon repurchase (Collateralized by $78,710,080, U.S. Treasury Interest-only, 0.000%, Market Value plus accrued interest $47,186,360 due 5/15/40-5/15/41), 0.250%, 04/01/2022 | | | | $ | 45,812,000 | | | | | | 22.8 | | |
| | | | Total U.S. Treasury Repurchase Agreement (Cost $45,812,000) | | | | | 45,812,000 | | | | | | 22.8 | | |
| | ||||||||||||||||
| Shares | | | Value | | | Percentage of Net Assets | | |||||||||
| INVESTMENT COMPANIES: 9.0% | | |||||||||||||||
| 9,000,000 (2) | | | BlackRock Liquidity Funds, FedFund, Institutional Class, 0.240%, 04/01/22 | | | | | 9,000,000 | | | | | | 4.5 | | |
| 9,000,000 (2) | | | Morgan Stanley Institutional Liquidity Funds - Government Portfolio (Institutional Share Class), 0.230%, 04/01/22 | | | | | 9,000,000 | | | | | | 4.5 | | |
| | | | Total Investment Companies (Cost $18,000,000) | | | | | 18,000,000 | | | | | | 9.0 | | |
| | | | Total Investments in Securities (Cost $139,298,895) | | | | $ | 139,298,895 | | | | | | 69.5 | | |
| | | | Assets in Excess of Other Liabilities | | | | | 61,259,017 | | | | | | 30.5 | | |
| | | | Net Assets | | | | $ | 200,557,912 | | | | | | 100.0 | | |
| Voya Government Money Market Fund | as of March 31, 2022 (continued) |
| | | | Quoted Prices in Active Markets for Identical Investments (Level 1) | | | Significant Other Observable Inputs (Level 2) | | | Significant Unobservable Inputs (Level 3) | | | Fair Value at March 31, 2022 | | ||||||||||||
| Asset Table | | | | | | | | | | | | | | | | | | | | | | | | | |
| Investments, at fair value | | | | | | | | | | | | | | | | | | | | | | | | | |
| Investment Companies | | | | $ | 18,000,000 | | | | | $ | — | | | | | $ | — | | | | | $ | 18,000,000 | | |
| U.S. Government Agency Debt | | | | | — | | | | | | 46,499,597 | | | | | | — | | | | | | 46,499,597 | | |
| U.S. Treasury Debt | | | | | — | | | | | | 28,987,298 | | | | | | — | | | | | | 28,987,298 | | |
| U.S. Treasury Repurchase Agreement | | | | | — | | | | | | 45,812,000 | | | | | | — | | | | | | 45,812,000 | | |
| Total Investments, at fair value | | | | $ | 18,000,000 | | | | | $ | 121,298,895 | | | | | $ | — | | | | | $ | 139,298,895 | | |
| Counterparty | | | U.S. Treasury Repurchase Agreement, at fair value | | | Fair Value of Non-Cash Collateral Received Including Accrued Interest(1) | | | Net Amount | | ||||||
| Deutsche Bank | | | $45,812,000 | | | | $ | (45,812,000) | | | | | $ | — | | |
| Totals | | | $45,812,000 | | | | $ | (45,812,000) | | | | | $ | — | | |
| Fund Name | | | Type | | | Per Share Amount | | |||
| Voya Government Money Market Fund | | | | | | | | | | |
| Class A | | | NII | | | | $ | — | | |
| Class C | | | NII | | | | $ | — | | |
| Class I | | | NII | | | | $ | — | | |
| Class W | | | NII | | | | $ | 0.0000* | | |
| All Classes | | | STCG | | | | $ | 0.0009 | | |
| Name, Address and Age | | | Position(s) Held with the Trust | | | Term of Office and Length of Time Served(1) | | | Principal Occupation(s) – During the Past 5 Years | | | Number of funds in Fund Complex Overseen by Trustee(2) | | | Other Board Positions Held by Trustee | |
| Independent Trustees: | | | | | | | | | | | | | | | | |
| Colleen D. Baldwin 7337 East Doubletree Ranch Rd. Suite 100 Scottsdale, Arizona 85258 Age: 61 | | | Trustee Chairperson | | | November 2007 – Present January 2020 – Present | | | President, Glantuam Partners, LLC, a business consulting firm (January 2009 – Present). | | | 132 | | | Dentaquest (February 2014 – Present); RSR Partners, Inc. (2016 – Present). | |
| John V. Boyer 7337 East Doubletree Ranch Rd. Suite 100 Scottsdale, Arizona 85258 Age: 68 | | | Trustee | | | January 2005 – Present | | | Retired. Formerly, President and Chief Executive Officer, Bechtler Arts Foundation, an arts and education foundation (January 2008 – December 2019). | | | 132 | | | None. | |
| Patricia W. Chadwick 7337 East Doubletree Ranch Rd. Suite 100 Scottsdale, Arizona 85258 Age: 73 | | | Trustee | | | January 2006 – Present | | | Consultant and President, Ravengate Partners LLC, a consulting firm that provides advice regarding financial markets and the global economy (January 2000 – Present). | | | 132 | | | Wisconsin Energy Corporation (June 2006 – Present); The Royce Funds (22 funds) (December 2009 – Present); and AMICA Mutual Insurance Company (1992 – Present). | |
| Martin J. Gavin 7337 East Doubletree Ranch Rd. Suite 100 Scottsdale, AZ 85258 Age: 72 | | | Trustee | | | August 2015 – Present | | | Retired. | | | 132 | | | None. | |
| Joseph E. Obermeyer 7337 East Doubletree Ranch Rd. Suite 100 Scottsdale, Arizona 85258 Age: 64 | | | Trustee | | | May 2013 – Present | | | President, Obermeyer & Associates, Inc., a provider of financial and economic consulting services (November 1999 – Present). | | | 132 | | | None. | |
| Sheryl K. Pressler 7337 East Doubletree Ranch Rd. Suite 100 Scottsdale, Arizona 85258 Age: 71 | | | Trustee | | | January 2006 – Present | | | Consultant (May 2001 – Present). | | | 132 | | | Centerra Gold Inc. (May 2008 – Present). | |
| Christopher P. Sullivan 7337 East Doubletree Ranch Rd. Suite 100 Scottsdale, Arizona 85258 Age: 68 | | | Trustee | | | October 2015 – Present | | | Retired. | | | 132 | | | None. | |
| Name, Address and Age | | | Position(s) Held with the Trust | | | Term of Office and Length of Time Served(1) | | | Principal Occupation(s) – During the Past 5 Years | | | Number of funds in Fund Complex Overseen by Trustee(2) | | | Other Board Positions Held by Trustee | | | | ||||
| Trustee who is an “interested person”: | | | | | | | | | | | | | | | | | ||||||
| Dina Santoro 230 Park Avenue New York, New York 10169 Age: 49 | | | Trustee | | | July 2018 – Present | | | President, Voya Investments, LLC and Voya Capital, LLC (March 2018 – Present); Senior Vice President, Voya Investments Distributor, LLC (April 2018 – Present); Chief Operating Officer and Senior Managing Director, Voya Investment Management (January 2022 – Present). Formerly, Senior Managing Director, Head of Product and Marketing Strategy, Voya Investment Management (September 2017 – December 2021); Managing Director, Quantitative Management Associates, LLC (January 2004 – August 2017). | | | 132 | | | Voya Investments, LLC, Voya Capital, LLC, and Voya Funds Services, LLC (March 2018 – Present); Voya Investments Distributor, LLC (April 2018 – Present). | | | | ||||
| Name, Address and Age | | | Position(s) Held With the Trust | | | Term of Office and Length of Time Served(1) | | | Principal Occupation(s) – During the Past 5 Years | |
| Michael Bell One Orange Way Windsor, Connecticut 06095 Age: 53 | | | Chief Executive Officer | | | March 2018 – Present | | | Chief Executive Officer and Director, Voya Investments, LLC, Voya Capital, LLC, and Voya Funds Services, LLC (March 2018 – Present); Senior Vice President, Voya Investments Distributor, LLC (March 2020 – Present); Chief Financial Officer, Voya Investment Management (September 2014 – Present). Formerly, Senior Vice President and Chief Financial Officer, Voya Investments Distributor, LLC (September 2019 – March 2020); Senior Vice President and Treasurer, Voya Investments Distributor, LLC (November 2015 – September 2019); Senior Vice President, Chief Financial Officer and Treasurer, Voya Investments, LLC (November 2015 – March 2018). | |
| Dina Santoro 230 Park Avenue New York, New York 10169 Age: 49 | | | President | | | March 2018 – Present | | | President and Director, Voya Investments, LLC and Voya Capital, LLC (March 2018 – Present); Director, Voya Funds Services, LLC (March 2018 – Present); Director and Senior Vice President, Voya Investments Distributor, LLC (April 2018 – Present); Chief Operating Officer and Senior Managing Director, Voya Investment Management (January 2022 – Present). Formerly, Senior Managing Director, Head of Product and Marketing Strategy, Voya Investment Management (September 2017 – December 2021); Managing Director, Quantitative Management Associates, LLC (January 2004 – August 2017). | |
| Jonathan Nash 230 Park Avenue New York, New York 10169 Age: 54 | | | Executive Vice President Chief Investment Risk Officer | | | March 2020 – Present March 2020 – Present | | | Executive Vice President and Chief Investment Risk Officer, Voya Investments, LLC (March 2020 – Present) and Senior Vice President, Investment Risk Management, Voya Investment Management (March 2017 – Present). Formerly, Vice President, Voya Investments, LLC (September 2018 – March 2020); Consultant, DA Capital LLC (January 2016 – March 2017). | |
| James M. Fink 5780 Powers Ferry Road NW Atlanta, Georgia 30327 Age: 64 | | | Executive Vice President | | | March 2018 – Present | | | Managing Director, Voya Investments, LLC, Voya Capital, LLC, and Voya Funds Services, LLC (March 2018 – Present); Senior Vice President, Voya Investments Distributor, LLC (April 2018 – Present); Chief Administrative Officer, Voya Investment Management (September 2017 – Present). Formerly, Managing Director, Operations, Voya Investment Management (March 1999 – September 2017). | |
| Kristin M. Lynch 7337 East Doubletree Ranch Rd. Suite 100 Scottsdale, Arizona 85258 Age: 40 | | | Chief Compliance Officer | | | April 2022 – Present | | | Vice President, Voya Investment Management and Chief Compliance Officer, Voya Family of Funds (April 2022 – Present); Vice President, Voya Investment Management (March 2019 – April 2022); and Assistant Vice President, Voya Investment Management (March 2014 – March 2019). | |
| Todd Modic 7337 East Doubletree Ranch Rd. Suite 100 Scottsdale, Arizona 85258 Age: 54 | | | Senior Vice President, Chief/Principal Financial Officer and Assistant Secretary | | | March 2005 – Present | | | President, Voya Funds Services, LLC (March 2018 – Present) and Senior Vice President, Voya Investments, LLC (April 2005 – Present). | |
| Name, Address and Age | | | Position(s) Held With the Trust | | | Term of Office and Length of Time Served(1) | | | Principal Occupation(s) – During the Past 5 Years | |
| Kimberly A. Anderson 7337 East Doubletree Ranch Rd. Suite 100 Scottsdale, Arizona 85258 Age: 57 | | | Senior Vice President | | | November 2003 – Present | | | Senior Vice President, Voya Investments, LLC (September 2003 – Present). | |
| Micheline S. Faver 7337 East Doubletree Ranch Rd. Suite 100 Scottsdale, Arizona 85258 Age: 44 | | | Senior Vice President | | | September 2020 – Present | | | Senior Vice President, Head of Fund Compliance and Chief Compliance Officer, Voya Investments, LLC (March 2021 – Present). Formerly, Vice President, Head of Fund Compliance and Chief Compliance Officer, Voya Investments, LLC (June 2016 – March 2021). | |
| Robert Terris 5780 Powers Ferry Road NW Atlanta, Georgia 30327 Age: 51 | | | Senior Vice President | | | May 2006 – Present | | | Senior Vice President, Voya Investments Distributor, LLC (April 2018 – Present); Senior Vice President, Head of Investment Services, Voya Investments, LLC (April 2018 – Present) and Voya Funds Services, LLC (March 2006 – Present). Formerly, Senior Vice President, Head of Division Operations, Voya Investments, LLC (October 2015 – April 2018). | |
| Fred Bedoya 7337 East Doubletree Ranch Rd. Suite 100 Scottsdale, Arizona 85258 Age: 49 | | | Vice President Treasurer | | | September 2012 – Present | | | Vice President, Voya Investments, LLC (October 2015 – Present) and Voya Funds Services, LLC (July 2012 – Present). | |
| Maria M. Anderson 7337 East Doubletree Ranch Rd. Suite 100 Scottsdale, Arizona 85258 Age: 64 | | | Vice President | | | September 2004 – Present | | | Vice President, Voya Investments, LLC (October 2015 – Present) and Voya Funds Services, LLC (September 2004 – Present). | |
| Sara M. Donaldson 7337 East Doubletree Ranch Rd. Suite 100 Scottsdale, Arizona 85258 Age: 62 | | | Vice President | | | September 2014 – Present | | | Senior Vice President, Voya Investments, LLC (February 2022 – Present). Formerly, Vice President, Voya Investments, LLC (October 2015 – February 2022). | |
| Robyn L. Ichilov 7337 East Doubletree Ranch Rd. Suite 100 Scottsdale, Arizona 85258 Age: 54 | | | Vice President | | | October 2000 – Present | | | Vice President, Voya Funds Services, LLC (November 1995 – Present) and Voya Investments, LLC (August 1997 – Present). | |
| Jason Kadavy 7337 East Doubletree Ranch Rd. Suite 100 Scottsdale, Arizona 85258 Age: 46 | | | Vice President | | | September 2012 – Present | | | Vice President, Voya Investments, LLC (October 2015 – Present) and Voya Funds Services, LLC (July 2007 – Present). | |
| Andrew K. Schlueter 7337 East Doubletree Ranch Rd. Suite 100 Scottsdale, Arizona 85258 Age: 46 | | | Vice President | | | March 2018 – Present | | | Vice President, Voya Investments Distributor, LLC (April 2018 – Present); Vice President, Voya Investments, LLC and Voya Funds Services, LLC (March 2018 – Present); Senior Vice President, Head of Mutual Fund Operations, Voya Investment Management (March 2022 – Present). Formerly, Vice President, Head of Mutual Fund Operations, Voya Investment Management (February 2018 – February 2022). Formerly, Vice President, Voya Investment Management (March 2014 – February 2018). | |
| Name, Address and Age | | | Position(s) Held With the Trust | | | Term of Office and Length of Time Served(1) | | | Principal Occupation(s) – During the Past 5 Years | |
| Craig Wheeler 7337 East Doubletree Ranch Rd. Suite 100 Scottsdale, Arizona 85258 Age: 53 | | | Vice President | | | May 2013 – Present | | | Vice President – Director of Tax, Voya Investments, LLC (October 2015 – Present). | |
| Monia Piacenti One Orange Way Windsor, Connecticut 06095 Age: 45 | | | Anti-Money Laundering Officer | | | June 2018 – Present | | | Anti-Money Laundering Officer, Voya Investments Distributor, LLC, Voya Investment Management and Voya Investment Management Trust Co. (June 2018 – Present); Compliance Consultant, Voya Financial, Inc. (January 2019 – Present). Formerly, Senior Compliance Officer, Voya Investment Management (December 2009 – December 2018). | |
| Joanne F. Osberg 7337 East Doubletree Ranch Rd. Suite 100 Scottsdale, Arizona 85258 Age: 40 | | | Secretary | | | September 2020 – Present | | | Vice President and Senior Counsel, Voya Investment Management – Mutual Fund Legal Department (September 2020 – Present). Formerly, Vice President, Counsel, Voya Investment Management – Mutual Fund Legal Department (January 2013 – September 2020). | |
| Paul A. Caldarelli 7337 East Doubletree Ranch Rd. Suite 100 Scottsdale, Arizona 85258 Age: 70 | | | Assistant Secretary | | | June 2010 – Present | | | Vice President and Senior Counsel, Voya Investment Management – Mutual Fund Legal Department (March 2010 – Present). | |
Voya Investments, LLC
7337 East Doubletree Ranch Road, Suite 100
Scottsdale, Arizona 85258
Voya Investments Distributor, LLC
7337 East Doubletree Ranch Road, Suite 100
Scottsdale, Arizona 85258
BNY Mellon Investment Servicing (U.S.) Inc.
301 Bellevue Parkway
Wilmington, Delaware 19809
Ernst & Young LLP
200 Clarendon Street
Boston, Massachusetts 02116
The Bank of New York Mellon
225 Liberty Street
New York, New York 10286
Ropes & Gray LLP
Prudential Tower
800 Boylston Street
Boston, Massachusetts 02199


Voya Floating Rate Fund
Classes A, C, I, P, R and W
As permitted by regulations adopted by the U.S. Securities and Exchange Commission, paper copies of the fund’s annual and semi-annual shareholder reports, like this annual report, will no longer be sent by mail, unless you specifically request paper copies of the reports. Instead, the reports will be made available on the Voya funds’website (www.voyainvestments.com/literature), and you will be notified by mail each time a report is posted and provided with a website link to access the report. If you already elected to receive shareholder reports electronically, you need not take any action. You may elect to receive shareholder reports and other communications from the fund electronically anytime by contacting your financial intermediary (such as a broker-dealer or bank) or, if you are a direct investor, by calling 1-800-992-0180 or by sending an e-mail request to Voyaim_literature@voya.com. You may elect to receive all future reports in paper free of charge. If you received this document in the mail, please follow the instructions to elect to continue receiving paper copies of your shareholder reports. If you received this document through a financial intermediary, you can contact your financial intermediary to request that you continue to receive paper copies of your shareholder reports. If you invest directly with us, you can call 1-800-992-0180 or send an email request to Voyaim_literature@voya.com to let the fund know you wish to continue receiving paper copies of your shareholder reports. Your election to receive reports in paper will apply to all funds held in your account if you invest through your financial intermediary or all funds held with the Voya funds complex if you invest directly with the funds. |
This report is submitted for general information to shareholders of the Voya mutual funds. It is not authorized for distribution to prospective shareholders unless accompanied or preceded by a prospectus which includes details regarding the fund’s investment objectives, risks, charges, expenses and other information. This information should be read carefully. |
 E-Delivery Sign-up – details inside
INVESTMENT MANAGEMENT voyainvestments.com |  |
| 1 | ||
| 3 | ||
| 6 | ||
| 7 | ||
| 8 | ||
| 10 | ||
| 11 | ||
| 12 | ||
| 13 | ||
| 22 | ||
| 42 | ||
| 43 | ||
| 47 |
| Go Paperless with E-Delivery! | |
| Sign up now for on-line prospectuses, fund reports, and proxy statements. | ||
| Just go to www.individuals.voya.com/page/e-delivery, follow the directions and complete the quick 5 Steps to Enroll. | ||
| You will be notified by e-mail when these communications become available on the internet. | ||
PROXY VOTING INFORMATION
A description of the policies and procedures that the Fund uses to determine how to vote proxies related to portfolio securities is available: (1) without charge, upon request, by calling Shareholder Services toll-free at (800) 992-0180; (2) on the Fund’s website at www.voyainvestments.com; and (3) on the U.S. Securities and Exchange Commission’s (“SEC’s”) website at www.sec.gov. Information regarding how the Fund voted proxies related to portfolio securities during the most recent 12-month period ended June 30 is available without charge on the Fund’s website at www.voyainvestments.com and on the SEC’s website at www.sec.gov.
QUARTERLY PORTFOLIO HOLDINGS
The Fund files its complete schedule of portfolio holdings with the SEC for the first and third quarters of each fiscal year on Form NPORT-P. The Fund’s Forms NPORT-P are available on the SEC’s website at www.sec.gov. The Fund’s complete schedule of portfolio holdings is available at: www.voyainvestments.com and without charge upon request from the Fund by calling Shareholder Services toll-free at (800) 992-0180.


President
Voya Family of Funds
April 28, 2022
BENCHMARK DESCRIPTIONS
| Index | Description | |
|---|---|---|
| The S&P/LSTA Leveraged Loan Index | An unmanaged total return index that captures accrued interest, repayments, and market value changes. It represents a broad cross section of leveraged loans syndicated in the United States, including dollar-denominated loans to overseas issuers. Standard & Poor’s (“S&P”) and the Loan Syndications and Trading Association (“LSTA”) conceived the index to establish a performance benchmark for the syndicated leveraged loan industry. |
| VOYA FLOATING RATE FUND | PORTFOLIO MANAGERS’ REPORT |
| Ratings Distribution as of March 31, 2022 | |||
| BB or above | 23.18 | % | |
| B | 68.88 | % | |
| CCC or below | 5.94 | % | |
| Not rated* | 2.0 | % | |
| Loan ratings apply to the underlying holdings of the Fund and not the Fund itself. Ratings distribution shows the percentage of the Fund’s loan commitments (excluding cash and foreign cash) that are rated in each ratings category, based upon the categories provided by Standard & Poor. Ratings distribution is based on Standard & Poor’s senior secured facility ratings. The Standard & Poor’s rating scale is as follows, from excellent (high grade) to poor (including default): AAA to D, with intermediate ratings offered at each level between AA and CCC. Anything lower than a BBB- rating is considered a non-investment grade or junk bond. Any security that is not rated by Standard & Poor’s is placed in the NR (Not Rated) category. Ratings can change from time to time, and current ratings may not fully reflect the actual credit condition or risks posed by a loan. | |||
| * Not rated includes loans to non-U.S. borrowers (which are typically unrated) and loans for which the rating has been withdrawn. | |||
Voya Floating Rate Fund (the “Fund”) seeks to provide investors with a high level of current income. The Fund is managed by Jeffrey A. Bakalar and Kelly Byrne, CFA, Portfolio Managers* of Voya Investment Management Co. LLC — the Sub-Adviser.
| TOP TEN LOAN ISSUERS AS OF MARCH 31, 2022 AS A PERCENTAGE OF: | ||||
| NET ASSETS | ||||
| Asurion, LLC | 1.1% | |||
| CSC Holdings LLC | 0.8% | |||
| Acrisure, LLC | 0.7% | |||
| Peraton Holding Corp | 0.7% | |||
| Bausch Health Companies, Inc. | 0.6% | |||
| Global Tel*Link Corporation | 0.6% | |||
| Moran Foods | 0.6% | |||
| AP Core Holdings, II LLC | 0.6% | |||
| CenturyLink, Inc. | 0.6% | |||
| Endure Digital Inc. | 0.6% | |||
| VOYA FLOATING RATE FUND | PORTFOLIO MANAGERS’ REPORT |
 | ||||||
Jeffrey A. Bakalar Senior Managing Director Voya Investment Management Co. LLC | ||||||
 | ||||||
Kelly Byrne Senior Vice President Voya Investment Management Co. LLC | ||||||
* | Effective May 31, 2021, Kelly Byrne was added as a portfolio manager of the Fund. In addition, Charles LeMieux, Portfolio Manager, and Senior Vice President of Voya Investment Management’s Senior Loan Group retired on May 31, 2021, and no longer serves as a portfolio manager of the Fund. | |
** | Effective for all portfolio reporting as of April 30, 2022, the Global Industry Classification Standard (GICS®) industries will be shown, consistent with a change by S&P/Dow Jones Indices for determining industry designations for all Leveraged Loan Sector Indices. |
| VOYA FLOATING RATE FUND | PORTFOLIO MANAGERS’ REPORT |
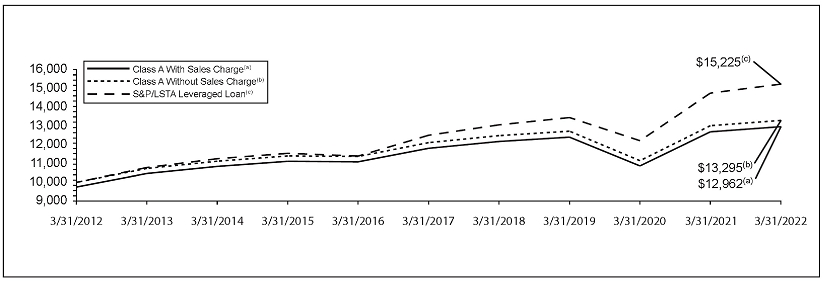
| Average Annual Total Returns for the Periods Ended March 31, 2022 | |||||||||||||||||||||
|---|---|---|---|---|---|---|---|---|---|---|---|---|---|---|---|---|---|---|---|---|---|
| 1 Year | 5 Year | 10 Year | Since Inception of Class P June 14, 2013 | ||||||||||||||||||
Including Sales Charge: | |||||||||||||||||||||
Class A(1) | -0.38 | % | 1.37 | % | 2.63 | % | — | ||||||||||||||
Class C(2) | 0.29 | % | 1.10 | % | 2.11 | % | — | ||||||||||||||
| Class I | 2.41 | % | 2.14 | % | 3.15 | % | — | ||||||||||||||
| Class P | 2.88 | % | 2.78 | % | — | 3.30 | % | ||||||||||||||
| Class R | 1.78 | % | 1.63 | % | 2.63 | % | — | ||||||||||||||
| Class W | 2.29 | % | 2.12 | % | 3.13 | % | — | ||||||||||||||
Excluding Sales Charge: | |||||||||||||||||||||
| Class A | 2.15 | % | 1.88 | % | 2.89 | % | — | ||||||||||||||
| Class C | 1.27 | % | 1.10 | % | 2.11 | % | — | ||||||||||||||
| Class I | 2.41 | % | 2.14 | % | 3.15 | % | — | ||||||||||||||
| Class P | 2.88 | % | 2.78 | % | — | 3.30 | % | ||||||||||||||
| Class R | 1.78 | % | 1.63 | % | 2.63 | % | — | ||||||||||||||
| Class W | 2.29 | % | 2.12 | % | 3.13 | % | — | ||||||||||||||
| S&P/LSTA Leveraged Loan | 3.25 | % | 4.01 | % | 4.30 | % | 3.93 | % | |||||||||||||
(1) | Reflects deduction of the maximum Class A sales charge of 2.50%. |
(2) | Reflects deduction of the Class C deferred sales charge of 1% for the 1 year return. |
| Actual Fund Return | Hypothetical (5% return before expenses) | |||||||||||||||||||||||||||||||
| Beginning Account Value October 1, 2021 | Ending Account Value March 31, 2022 | Annualized Expense Ratio | Expenses Paid During the Period Ended March 31, 2022* | Beginning Account Value October 1, 2021 | Ending Account Value March 31, 2022 | Annualized Expense Ratio | Expenses Paid During the Period Ended March 31, 2022* | |||||||||||||||||||||||||
| Class A | $ | 1,000.00 | $ | 998.80 | 1.02 | % | $ | 5.08 | $ | 1,000.00 | $ | 1,019.85 | 1.02 | % | $ | 5.14 | ||||||||||||||||
| Class C | 1,000.00 | 993.90 | 1.77 | 8.80 | 1,000.00 | 1,016.11 | 1.77 | 8.90 | ||||||||||||||||||||||||
| Class I | 1,000.00 | 1,000.00 | 0.77 | 3.89 | 1,000.00 | 1,021.09 | 0.77 | 3.88 | ||||||||||||||||||||||||
| Class P | 1,000.00 | 1,002.20 | 0.18 | 0.90 | 1,000.00 | 1,024.03 | 0.18 | 0.91 | ||||||||||||||||||||||||
| Class R | 1,000.00 | 997.50 | 1.27 | 6.32 | 1,000.00 | 1,018.60 | 1.27 | 6.39 | ||||||||||||||||||||||||
| Class W | 1,000.00 | 1,000.00 | 0.77 | 3.84 | 1,000.00 | 1,021.09 | 0.77 | 3.88 | ||||||||||||||||||||||||
| * | Expenses are equal to the Fund’s annualized expense ratios multiplied by the average account value over the period, multiplied by 182/365 to reflect the most recent fiscal half-year. |
REPORT OF INDEPENDENT REGISTERED PUBLIC ACCOUNTING FIRM
To the Shareholders of Voya Floating Rate Fund and the Board of Trustees of Voya Funds Trust

May 27, 2022
STATEMENT OF ASSETS AND LIABILITIES as of March 31, 2022
ASSETS: | ||||||
| Investments in securities at fair value (Cost $489,551,627) | $ | 481,918,772 | ||||
| Cash | 3,782,253 | |||||
| Receivables: | ||||||
| Investment securities sold | 54,105,390 | |||||
| Fund shares sold | 335,603 | |||||
| Interest | 1,743,757 | |||||
| Prepaid structuring fee (Note 7) | 24,424 | |||||
| Prepaid expenses | 61,629 | |||||
| Reimbursement due from Investment Adviser | 35,553 | |||||
| Other assets | 43,978 | |||||
| Total assets | 542,051,359 | |||||
LIABILITIES: | ||||||
| Notes Payable | 4,500,000 | |||||
| Payable for investment securities purchased | 48,687,788 | |||||
| Payable for fund shares redeemed | 559,340 | |||||
| Income distribution payable | 29,932 | |||||
| Payable for investment management fees | 228,701 | |||||
| Payable for distribution and shareholder service fees | 65,530 | |||||
| Payable for trustee fees | 42,865 | |||||
| Payable to trustees under the deferred compensation plan (Note 8) | 43,978 | |||||
| Payable for commitment fees on line of credit (Note 7) | 62,135 | |||||
| Unfunded loan commitments (Note 9) | 982,250 | |||||
| Other accrued expenses and liabilities | 807,271 | |||||
| Total liabilities | 56,009,790 | |||||
NET ASSETS | $ | 486,041,569 | ||||
NET ASSETS WERE COMPRISED OF: | ||||||
| Paid-in capital | 679,448,823 | |||||
| Total distributable loss | (193,407,254 | ) | ||||
NET ASSETS | $ | 486,041,569 |
STATEMENT OF ASSETS AND LIABILITIES as of March 31, 2022 (continued)
Class A: | ||||||
| Net assets | $ | 41,989,603 | ||||
| Shares authorized | unlimited | |||||
| Par value | $ | 0.001 | ||||
| Shares outstanding | 4,699,121 | |||||
Net asset value and redemption price per share(2) | $ | 8.94 | ||||
Maximum offering price per share (2.50%)(1) | $ | 9.17 | ||||
Class C: | ||||||
| Net assets | $ | 9,658,365 | ||||
| Shares authorized | unlimited | |||||
| Par value | $ | 0.001 | ||||
| Shares outstanding | 1,081,146 | |||||
Net asset value and redemption price per share(2) | $ | 8.93 | ||||
Class I: | ||||||
| Net assets | $ | 225,339,430 | ||||
| Shares authorized | unlimited | |||||
| Par value | $ | 0.001 | ||||
| Shares outstanding | 25,218,019 | |||||
| Net asset value and redemption price per share | $ | 8.94 | ||||
Class P: | ||||||
| Net assets | $ | 86,232,836 | ||||
| Shares authorized | unlimited | |||||
| Par value | $ | 0.001 | ||||
| Shares outstanding | 9,688,587 | |||||
| Net asset value and redemption price per share | $ | 8.90 | ||||
Class R: | ||||||
| Net assets | $ | 109,837,253 | ||||
| Shares authorized | unlimited | |||||
| Par value | $ | 0.001 | ||||
| Shares outstanding | 12,315,003 | |||||
| Net asset value and redemption price per share | $ | 8.92 | ||||
Class W: | ||||||
| Net assets | $ | 12,984,082 | ||||
| Shares authorized | unlimited | |||||
| Par value | $ | 0.001 | ||||
| Shares outstanding | 1,450,721 | |||||
| Net asset value and redemption price per share | $ | 8.95 |
| (1) | Maximum offering price is computed at 100/97.50 of net asset value. On purchases of $100,000 or more, the offering price is reduced. |
| (2) | Redemption price per share may be reduced for any applicable contingent deferred sales charge. |
STATEMENT OF OPERATIONS for the year ended March 31, 2022
INVESTMENT INCOME: | ||||||
| Interest | $ | 22,175,610 | ||||
| Dividend | 21,051 | |||||
| Other | 541,277 | |||||
| Total investment income | 22,737,938 | |||||
EXPENSES: | ||||||
| Investment management fees | 3,314,667 | |||||
| Distribution and shareholder service fees: | ||||||
| Class A | 122,661 | |||||
| Class C | 119,618 | |||||
| Class R | 487,729 | |||||
| Transfer agent fees: | ||||||
| Class A | 64,763 | |||||
| Class C | 16,041 | |||||
| Class I | 77,268 | |||||
| Class P | 587 | |||||
| Class R | 128,853 | |||||
| Class W | 15,763 | |||||
| Shareholder reporting expense | 12,640 | |||||
| Custody and accounting expense | 233,150 | |||||
| Registration fees | 121,503 | |||||
| Professional fees | 69,459 | |||||
| Trustees fees | 16,820 | |||||
| Commitment fees on line of credit (Note 7) | 174,348 | |||||
| Miscellaneous expense | 126,696 | |||||
| Structuring Fee (Note 7) | 187,169 | |||||
| Interest expense | 7,352 | |||||
| Total expenses | 5,297,087 | |||||
| Waived and reimbursed fees | (1,205,986 | ) | ||||
| Net expenses | 4,091,101 | |||||
| Net investment income | 18,646,837 | |||||
REALIZED AND UNREALIZED GAIN (LOSS): | ||||||
| Net realized loss on investments | (3,991,011 | ) | ||||
| Net change in unrealized appreciation (depreciation) on Investments | (4,050,628 | ) | ||||
| Net realized and unrealized loss | (8,041,639 | ) | ||||
| Increase in net assets resulting from operations | 10,605,198 |
STATEMENTS OF CHANGES IN NET ASSETS
| Year Ended March 31, 2022 | Year Ended March 31, 2021 | |||||||||
FROM OPERATIONS: | ||||||||||
| Net investment income | $ | 18,646,837 | $ | 20,582,073 | ||||||
| Net realized loss | (3,991,011 | ) | (69,403,189 | ) | ||||||
| Net change in unrealized appreciation (depreciation) | (4,050,628 | ) | 146,713,774 | |||||||
| Net increase in net assets resulting from operations | 10,605,198 | 97,892,658 | ||||||||
FROM DISTRIBUTIONS TO SHAREHOLDERS: | ||||||||||
| Total distributions (excluding return of capital): | ||||||||||
| Class A | (1,594,693 | ) | (1,468,080 | ) | ||||||
| Class C | (295,898 | ) | (468,126 | ) | ||||||
| Class I | (8,279,050 | ) | (10,499,471 | ) | ||||||
| Class P | (4,674,962 | ) | (4,171,498 | ) | ||||||
Class P3(1) | — | (11,866 | ) | |||||||
| Class R | (2,930,331 | ) | (2,932,507 | ) | ||||||
| Class W | (416,280 | ) | (596,512 | ) | ||||||
| Total distributions | (18,191,214 | ) | (20,148,060 | ) | ||||||
FROM CAPITAL SHARE TRANSACTIONS: | ||||||||||
| Net proceeds from sale of shares | 200,165,448 | 191,534,218 | ||||||||
| Reinvestment of distributions | 17,562,082 | 19,198,707 | ||||||||
| 217,727,530 | 210,732,925 | |||||||||
| Cost of shares redeemed | (213,682,601 | ) | (558,987,147 | ) | ||||||
| Net increase (decrease) in net assets resulting from capital share transactions | 4,044,929 | (348,254,222 | ) | |||||||
| Net decrease in net assets | (3,541,087 | ) | (270,509,624 | ) | ||||||
NET ASSETS: | ||||||||||
| Beginning of year or period | 489,582,656 | 760,092,280 | ||||||||
| End of year or period | $ | 486,041,569 | $ | 489,582,656 | ||||||
| (1) | Class P3 was fully redeemed on April 30, 2020. |
| Income (loss) from investment operations | Less distributions | Ratios to average net assets | Supplemental data | |||||||||||||||||||||||||||||||||||||||||||||||||||||||||||||
| Net asset value, beginning of year or period | Net investment income (loss) | Net realized and unrealized gain (loss) | Total from investment operations | From net investment income | From net realized gains | From return of capital | Total distributions | Net asset value, end of year or period | Total Return(1) | Expenses before reductions/ additions(2)(3) | Expenses, net of fee waivers and/or recoupments, if any(2)(3) | Expenses, net of all reductions/ additions(2)(3) | Net investment income (loss)(2)(3) | Net assets, end of year or period | Portfolio Turnover rate | |||||||||||||||||||||||||||||||||||||||||||||||||
| Year or period ended | ($) | ($) | ($) | ($) | ($) | ($) | ($) | ($) | ($) | (%) | (%) | (%) | (%) | (%) | ($000’s) | (%) | ||||||||||||||||||||||||||||||||||||||||||||||||
Class A | ||||||||||||||||||||||||||||||||||||||||||||||||||||||||||||||||
| 03-31-22 | 9.04 | 0.30 | * | (0.11 | ) | 0.19 | 0.29 | — | — | 0.29 | 8.94 | 2.15 | 1.20 | 1.02 | 1.02 | 3.37 | 41,990 | 89 | ||||||||||||||||||||||||||||||||||||||||||||||
| 03-31-21 | 8.00 | 0.29 | * | 1.03 | 1.32 | 0.28 | — | — | 0.28 | 9.04 | 16.69 | 1.34 | 1.13 | 1.13 | 3.35 | 39,518 | 60 | |||||||||||||||||||||||||||||||||||||||||||||||
| 03-31-20 | 9.59 | 0.46 | (1.58 | ) | (1.12 | ) | 0.47 | — | — | 0.47 | 8.00 | (12.34 | ) | 1.18 | 1.10 | 1.10 | 4.83 | 52,014 | 52 | |||||||||||||||||||||||||||||||||||||||||||||
| 03-31-19 | 9.86 | 0.46 | (0.28 | ) | 0.18 | 0.45 | — | — | 0.45 | 9.59 | 1.90 | 1.14 | 1.05 | 1.05 | 4.75 | 59,614 | 58 | |||||||||||||||||||||||||||||||||||||||||||||||
| 03-31-18 | 9.93 | 0.35 | (0.05 | ) | 0.30 | 0.35 | — | 0.02 | 0.37 | 9.86 | 3.09 | 1.13 | 1.02 | 1.02 | 3.58 | 43,839 | 82 | |||||||||||||||||||||||||||||||||||||||||||||||
Class C | ||||||||||||||||||||||||||||||||||||||||||||||||||||||||||||||||
| 03-31-22 | 9.04 | 0.23 | * | (0.11 | ) | 0.12 | 0.23 | — | — | 0.23 | 8.93 | 1.27 | 1.95 | 1.77 | 1.77 | 2.59 | 9,658 | 89 | ||||||||||||||||||||||||||||||||||||||||||||||
| 03-31-21 | 8.00 | 0.23 | * | 1.03 | 1.26 | 0.22 | — | — | 0.22 | 9.04 | 15.83 | 2.09 | 1.88 | 1.88 | 2.59 | 14,914 | 60 | |||||||||||||||||||||||||||||||||||||||||||||||
| 03-31-20 | 9.59 | 0.38 | (1.58 | ) | (1.20 | ) | 0.39 | — | — | 0.39 | 8.00 | (13.00 | ) | 1.93 | 1.85 | 1.85 | 4.12 | 20,446 | 52 | |||||||||||||||||||||||||||||||||||||||||||||
| 03-31-19 | 9.87 | 0.38 | * | (0.28 | ) | 0.10 | 0.38 | — | — | 0.38 | 9.59 | 1.04 | 1.89 | 1.80 | 1.80 | 3.93 | 39,455 | 58 | ||||||||||||||||||||||||||||||||||||||||||||||
| 03-31-18 | 9.93 | 0.28 | (0.04 | ) | 0.24 | 0.28 | — | 0.02 | 0.30 | 9.87 | 2.42 | 1.88 | 1.77 | 1.77 | 2.85 | 45,848 | 82 | |||||||||||||||||||||||||||||||||||||||||||||||
Class I | ||||||||||||||||||||||||||||||||||||||||||||||||||||||||||||||||
| 03-31-22 | 9.04 | 0.33 | * | (0.11 | ) | 0.22 | 0.32 | — | — | 0.32 | 8.94 | 2.41 | 0.85 | 0.77 | 0.77 | 3.60 | 225,339 | 89 | ||||||||||||||||||||||||||||||||||||||||||||||
| 03-31-21 | 8.00 | 0.31 | * | 1.03 | 1.34 | 0.30 | — | — | 0.30 | 9.04 | 16.97 | 1.00 | 0.88 | 0.88 | 3.61 | 235,804 | 60 | |||||||||||||||||||||||||||||||||||||||||||||||
| 03-31-20 | 9.59 | 0.48 | (1.58 | ) | (1.10 | ) | 0.49 | — | — | 0.49 | 8.00 | (12.12 | ) | 0.88 | 0.85 | 0.85 | 5.15 | 427,504 | 52 | |||||||||||||||||||||||||||||||||||||||||||||
| 03-31-19 | 9.87 | 0.48 | (0.28 | ) | 0.20 | 0.48 | — | — | 0.48 | 9.59 | 2.07 | 0.80 | 0.80 | 0.80 | 4.93 | 1,160,464 | 58 | |||||||||||||||||||||||||||||||||||||||||||||||
| 03-31-18 | 9.93 | 0.38 | * | (0.04 | ) | 0.34 | 0.38 | — | 0.02 | 0.40 | 9.87 | 3.46 | 0.75 | 0.75 | 0.75 | 3.89 | 1,338,826 | 82 | ||||||||||||||||||||||||||||||||||||||||||||||
Class P | ||||||||||||||||||||||||||||||||||||||||||||||||||||||||||||||||
| 03-31-22 | 9.02 | 0.38 | * | (0.12 | ) | 0.26 | 0.38 | — | — | 0.38 | 8.90 | 2.88 | 0.82 | 0.18 | 0.18 | 4.18 | 86,233 | 89 | ||||||||||||||||||||||||||||||||||||||||||||||
| 03-31-21 | 7.99 | 0.37 | * | 1.03 | 1.40 | 0.37 | — | — | 0.37 | 9.02 | 17.72 | 0.96 | 0.29 | 0.29 | 4.19 | 95,986 | 60 | |||||||||||||||||||||||||||||||||||||||||||||||
| 03-31-20 | 9.58 | 0.53 | * | (1.56 | ) | (1.03 | ) | 0.56 | — | — | 0.56 | 7.99 | (11.52 | ) | 0.85 | 0.20 | 0.20 | 5.70 | 122,016 | 52 | ||||||||||||||||||||||||||||||||||||||||||||
| 03-31-19 | 9.86 | 0.55 | (0.29 | ) | 0.26 | 0.54 | — | — | 0.54 | 9.58 | 2.75 | 0.77 | 0.12 | 0.12 | 5.65 | 53,416 | 58 | |||||||||||||||||||||||||||||||||||||||||||||||
| 03-31-18 | 9.92 | 0.45 | (0.05 | ) | 0.40 | 0.44 | — | 0.02 | 0.46 | 9.86 | 4.15 | 0.74 | 0.09 | 0.09 | 4.56 | 42,522 | 82 | |||||||||||||||||||||||||||||||||||||||||||||||
Class R | ||||||||||||||||||||||||||||||||||||||||||||||||||||||||||||||||
| 03-31-22 | 9.03 | 0.28 | * | (0.12 | ) | 0.16 | 0.27 | — | — | 0.27 | 8.92 | 1.78 | 1.45 | 1.27 | 1.27 | 3.12 | 109,837 | 89 | ||||||||||||||||||||||||||||||||||||||||||||||
| 03-31-21 | 7.99 | 0.27 | * | 1.03 | 1.30 | 0.26 | — | — | 0.26 | 9.03 | 16.42 | 1.59 | 1.38 | 1.38 | 3.08 | 91,934 | 60 | |||||||||||||||||||||||||||||||||||||||||||||||
| 03-31-20 | 9.58 | 0.43 | (1.58 | ) | (1.15 | ) | 0.44 | — | — | 0.44 | 7.99 | (12.57 | ) | 1.43 | 1.35 | 1.35 | 4.60 | 99,774 | 52 | |||||||||||||||||||||||||||||||||||||||||||||
| 03-31-19 | 9.85 | 0.44 | * | (0.28 | ) | 0.16 | 0.43 | — | — | 0.43 | 9.58 | 1.65 | 1.39 | 1.30 | 1.30 | 4.48 | 139,026 | 58 | ||||||||||||||||||||||||||||||||||||||||||||||
| 03-31-18 | 9.91 | 0.33 | (0.04 | ) | 0.29 | 0.33 | — | 0.02 | 0.35 | 9.85 | 2.94 | 1.38 | 1.27 | 1.27 | 3.36 | 118,071 | 82 | |||||||||||||||||||||||||||||||||||||||||||||||
Class W | ||||||||||||||||||||||||||||||||||||||||||||||||||||||||||||||||
| 03-31-22 | 9.06 | 0.33 | * | (0.12 | ) | 0.21 | 0.32 | — | — | 0.32 | 8.95 | 2.29 | 0.95 | 0.77 | 0.77 | 3.62 | 12,984 | 89 | ||||||||||||||||||||||||||||||||||||||||||||||
| 03-31-21 | 8.01 | 0.32 | * | 1.03 | 1.35 | 0.30 | — | — | 0.30 | 9.06 | 17.08 | 1.09 | 0.88 | 0.88 | 3.69 | 11,426 | 60 | |||||||||||||||||||||||||||||||||||||||||||||||
| 03-31-20 | 9.60 | 0.48 | (1.58 | ) | (1.10 | ) | 0.49 | — | — | 0.49 | 8.01 | (12.10 | ) | 0.93 | 0.85 | 0.85 | 5.11 | 35,543 | 52 | |||||||||||||||||||||||||||||||||||||||||||||
| 03-31-19 | 9.89 | 0.46 | * | (0.27 | ) | 0.19 | 0.48 | — | — | 0.48 | 9.60 | 1.96 | 0.89 | 0.80 | 0.80 | 4.60 | 52,642 | 58 | ||||||||||||||||||||||||||||||||||||||||||||||
| 03-31-18 | 9.95 | 0.38 | * | (0.04 | ) | 0.34 | 0.38 | — | 0.02 | 0.40 | 9.89 | 3.46 | 0.88 | 0.77 | 0.77 | 3.88 | 557,067 | 82 | ||||||||||||||||||||||||||||||||||||||||||||||
(1) | Total return is calculated assuming reinvestment of all dividends, capital gain distributions and return of capital distributions, if any, at net asset value and excluding the deduction of sales charges or contingent deferred sales charges, if applicable. Total return for periods less than one year is not annualized. |
(2) | Annualized for periods less than one year. |
(3) | Ratios reflect operating expenses of a Fund. Expenses before reductions/additions do not reflect amounts reimbursed by the Investment Adviser and/or Distributor or reductions from brokerage service arrangements or other expense offset arrangements and do not represent the amount paid by a Fund during periods when reimbursements or reductions occur. Expenses net of fee waivers reflect expenses after reimbursement by an Investment Adviser and/or Distributor but prior to reductions from brokerage service arrangements or other expense offset arrangements. Expenses net of all reductions/additions represent the net expenses paid by a Fund. Net investment income (loss) is net of all such additions or reductions. |
| * | Calculated using average number of shares outstanding throughout the period. |
NOTE 1 — ORGANIZATION
A. Loan and Other Security Valuation. The Fund is open for business every day the New York Stock Exchange
(“NYSE”) opens for regular trading (each such day, a “Business Day”). The net asset value (“NAV”) per share for each class of the Fund is determined each Business Day as of the close of the regular trading session (“Market Close”), as determined by the Consolidated Tape Association (“CTA”), the central distributor of transaction prices for exchange-traded securities (normally 4:00 p.m. Eastern time unless otherwise designated by the CTA). The data reflected on the consolidated tape provided by the CTA is generated by various market centers, including all securities exchanges, electronic communications networks, and third-market broker-dealers. The NAV per share of each class of the Fund is calculated by taking the value of the Fund’s assets attributable to that class, subtracting the Fund’s liabilities attributable to that class, and dividing by the number of shares of that class that are outstanding. On days when the Fund is closed for business, Fund shares will not be priced and the Fund does not transact purchase and redemption orders. To the extent the Fund’s assets are traded in other markets on days when the Fund does not price its shares, the value of the Fund’s assets will likely change and you will not be able to purchase or redeem shares of the Fund.
When a market quotation is not readily available or is deemed unreliable, the Fund will determine a fair value for the relevant asset in accordance with procedures adopted by the Board of Trustees (“Board”). Such procedures provide, for example, that: (a) Exchange-traded securities are valued at the mean of the closing bid and ask; (b) Debt obligations are valued using an evaluated price provided by an independent pricing service. Evaluated prices provided by the pricing service may be determined without exclusive reliance on quoted prices, and may reflect factors such
NOTES TO FINANCIAL STATEMENTS as of March 31, 2022 (continued)
All other assets for which market quotations are not readily available or became unreliable (or if the above fair valuation
NOTES TO FINANCIAL STATEMENTS as of March 31, 2022 (continued)
D. When-Issued and Delayed-Delivery Transactions. Securities purchased or sold on a when-issued, delayed-delivery or forward purchase commitment basis may have extended settlement periods. The value of the security so purchased is subject to market fluctuations during this period. Due to the nature of the loan market, the actual settlement date may not be certain at the time of the
| (1) | Market value of investment securities, other assets and liabilities — at the exchange rates prevailing at Market Close. |
| (2) | Purchases and sales of investment securities, income and expenses — at the rates of exchange prevailing on the respective dates of such transactions. |
Although the net assets and the market values are presented at the foreign exchange rates at Market Close, the Fund does not isolate the portion of the results of operations resulting from changes in foreign exchange rates on investments from the fluctuations arising from changes in market prices of securities held. Such fluctuations are included with the net realized and unrealized gains or losses from investments. For securities, which are subject to foreign withholding tax upon disposition, liabilities are recorded on the Statement of Assets and Liabilities for the estimated tax withholding based on the securities current market value. Upon disposition, realized gains or losses on such securities are recorded net of foreign withholding tax.
NOTES TO FINANCIAL STATEMENTS as of March 31, 2022 (continued)
The Fund has entered into an investment management agreement (“Management Agreement”) with the Investment Adviser. The Investment Adviser has overall responsibility for the management of the Fund. The Investment Adviser
| Class A | Class C | Class R | ||
|---|---|---|---|---|
| 0.25% | 1.00% | 0.50% |
The Distributor may also retain the proceeds of the initial sales charge paid by shareholders upon the purchase of Class A shares of the Fund and the contingent deferred sales charge paid by shareholders upon certain redemptions for Class A and Class C shares. For the year
NOTES TO FINANCIAL STATEMENTS as of March 31, 2022 (continued)
| Class A | Class C | |||||||||
|---|---|---|---|---|---|---|---|---|---|---|
| Initial Sales Charges | $ | 2,831 | $ | — | ||||||
| Contingent Deferred Sales Charges | 91,133 | 106 | ||||||||
(as a percentage of average daily net assets)
Class C — 1.75%
Class I — 0.75%
Class P — 0.15%
Class R — 1.25%
Class W — 0.75%
(1). | Pursuant to a side letter agreement through August 1, 2022, the Investment Adviser has further lowered expenses to 0.95%, 1.70%, 0.70%, 1.20% and 0.70% for Class A, Class C, Class I, Class R and Class W, respectively. Any fees waived pursuant to the side letter agreement shall not be eligible for recoupment. Termination or modification of this obligation requires approval by the Board. |
| March 31, | ||||||||
|---|---|---|---|---|---|---|---|---|
| 2023 | 2024 | 2025 | Total | |||||
| $401,550 | $483,309 | $— | $884,859 | |||||
As of March 31, 2022, the amount of class specific fees waived or reimbursed that are subject to possible recoupment by the Investment Adviser and the related expiration dates are as follows:
| March 31, | ||||||||||||||||||
|---|---|---|---|---|---|---|---|---|---|---|---|---|---|---|---|---|---|---|
| 2023 | 2024 | 2025 | Total | |||||||||||||||
| Class A | $ | 25,765 | $ | 31,824 | $ | — | $ | 57,589 | ||||||||||
| Class C | 13,630 | 13,636 | — | 27,266 | ||||||||||||||
| Class R | 55,890 | 69,455 | — | 125,345 | ||||||||||||||
| Class W | 20,153 | 12,533 | — | 32,686 | ||||||||||||||
| Days Utilized | Approximate Average Daily Balance For Days Utilized | Approximate Weighted Average Interest Rate For Days Utilized | ||
|---|---|---|---|---|
| 16 | $9,775,000 | 1.70% |
NOTES TO FINANCIAL STATEMENTS as of March 31, 2022 (continued)
| Subsidiary | Percentage | |||||
|---|---|---|---|---|---|---|
| Voya Institutional Trust Company | 23.25 | % | ||||
| Voya Investment Management Co. LLC | 11.70 | |||||
The Fund may engage in purchase and sale transactions with funds that have a common investment adviser (or affiliated investment adviser), a common sub-adviser and/or common officers or trustees. These interfund transactions are made pursuant to Rule 17a-7 under the
| Unfunded Loan Commitment | ||||||
|---|---|---|---|---|---|---|
| Athenahealth, Inc. 2022 Delayed Draw Term Loan | $ | 250,000 | ||||
| Dessert Holdings Inc. Delayed Draw Term Loan | 101,053 | |||||
| ENC Holding Corporation Delayed Draw Term Loan | 55,918 | |||||
| Holley Purchaser, Inc. 2021 Delayed Draw Term Loan | 75,500 | |||||
| IPS Corporation 2021 Delayed Draw Term Loan | 106,667 | |||||
| Pacific Bells, LLC Delayed Draw Term Loan | 7,577 | |||||
| Pro Mach Group, Inc. 2021 Delayed Draw Term Loan | 89,162 | |||||
| Refficiency Holdings LLC 2021 Delayed Draw Term Loan | 47,131 | |||||
| Service Logic Acquisition, Inc. Delayed Draw Term Loan | 90,963 | |||||
| Sovos Compliance, LLC 2021 Delayed Draw Term Loan | 101,610 | |||||
| Trident TPI Holdings, Inc. 2021 Delayed Draw Term Loan | 43,207 | |||||
| VT Topco, Inc. 2021 Delayed Draw Term Loan | 13,462 | |||||
| $ | 982,250 | |||||
| Shares sold | Reinvestment of distributions | Shares redeemed | Net increase (decrease) in shares outstanding | Shares sold | Reinvestment of distributions | Shares redeemed | Net increase (decrease) | |||||||||||||||||||||||||||
|---|---|---|---|---|---|---|---|---|---|---|---|---|---|---|---|---|---|---|---|---|---|---|---|---|---|---|---|---|---|---|---|---|---|---|
| Year or period ended | # | # | # | # | ($) | ($) | ($) | ($) | ||||||||||||||||||||||||||
Class A | ||||||||||||||||||||||||||||||||||
| 03-31-22 | 2,807,222 | 166,299 | (2,645,969 | ) | 327,552 | 25,486,720 | 1,504,356 | (23,735,826 | ) | 3,255,250 | ||||||||||||||||||||||||
| 03-31-21 | 2,008,628 | 154,435 | (4,291,805 | ) | (2,128,742 | ) | 17,733,818 | 1,346,994 | (37,508,698 | ) | (18,427,886 | ) | ||||||||||||||||||||||
Class C | ||||||||||||||||||||||||||||||||||
| 03-31-22 | 286,932 | 30,341 | (885,874 | ) | (568,601 | ) | 2,593,297 | 274,709 | (8,030,902 | ) | (5,162,896 | ) | ||||||||||||||||||||||
| 03-31-21 | 44,477 | 47,917 | (997,888 | ) | (905,494 | ) | 389,139 | 417,671 | (8,782,845 | ) | (7,976,035 | ) | ||||||||||||||||||||||
Class I | ||||||||||||||||||||||||||||||||||
| 03-31-22 | 11,313,808 | 858,414 | (13,035,476 | ) | (863,254 | ) | 102,408,364 | 7,767,659 | (117,079,536 | ) | (6,903,513 | ) | ||||||||||||||||||||||
| 03-31-21 | 15,594,417 | 1,120,953 | (44,070,088 | ) | (27,354,718 | ) | 136,684,255 | 9,754,137 | (379,186,518 | ) | (232,748,126 | ) | ||||||||||||||||||||||
NOTES TO FINANCIAL STATEMENTS as of March 31, 2022 (continued)
| Shares sold | Reinvestment of distributions | Shares redeemed | Net increase (decrease) in shares outstanding | Shares sold | Reinvestment of distributions | Shares redeemed | Net increase (decrease) | |||||||||||||||||||||||||||
|---|---|---|---|---|---|---|---|---|---|---|---|---|---|---|---|---|---|---|---|---|---|---|---|---|---|---|---|---|---|---|---|---|---|---|
| Year or period ended | # | # | # | # | ($) | ($) | ($) | ($) | ||||||||||||||||||||||||||
Class P | ||||||||||||||||||||||||||||||||||
| 03-31-22 | 4,017,588 | 518,285 | (5,493,305 | ) | (957,432 | ) | 36,364,970 | 4,674,700 | (49,120,082 | ) | (8,080,412 | ) | ||||||||||||||||||||||
| 03-31-21 | 2,675,660 | 477,360 | (7,772,864 | ) | (4,619,844 | ) | 23,818,763 | 4,157,021 | (67,288,532 | ) | (39,312,748 | ) | ||||||||||||||||||||||
Class P3 (1) | ||||||||||||||||||||||||||||||||||
| 03-31-22 | — | — | — | — | — | — | — | — | ||||||||||||||||||||||||||
| 03-31-21 | 7,394 | — | (356,813 | ) | (349,419 | ) | 61,269 | — | (2,939,936 | ) | (2,878,667 | ) | ||||||||||||||||||||||
Class R | ||||||||||||||||||||||||||||||||||
| 03-31-22 | 3,100,886 | 324,372 | (1,296,530 | ) | 2,128,728 | 28,008,280 | 2,930,129 | (11,715,549 | ) | 19,222,860 | ||||||||||||||||||||||||
| 03-31-21 | 1,071,929 | 336,403 | (3,710,891 | ) | (2,302,559 | ) | 9,380,249 | 2,932,362 | (32,433,169 | ) | (20,120,558 | ) | ||||||||||||||||||||||
Class W | ||||||||||||||||||||||||||||||||||
| 03-31-22 | 585,613 | 45,293 | (441,949 | ) | 188,957 | 5,303,817 | 410,529 | (4,000,706 | ) | 1,713,640 | ||||||||||||||||||||||||
| 03-31-21 | 1,523,717 | 260,120 | (2,828,336 | ) | (1,044,499 | ) | 14,318,648 | 2,446,680 | (26,338,046 | ) | (9,572,718 | ) | ||||||||||||||||||||||
(1) | Share class was fully redeemed on April 30, 2020. |
| Paid-in Capital | Distributable Earnings | |||
|---|---|---|---|---|
| $(13,113) | $13,113 |
| Year Ended March 31, 2022 | Year Ended March 31, 2021 | |||
|---|---|---|---|---|
| Ordinary Income | Ordinary Income | |||
| $18,191,214 | $20,148,060 |
| Undistributed Ordinary Income | Unrealized Appreciation/ (Depreciation) | Capital Loss Carryforwards | Total Distributable Earnings/(Loss) | ||||||||||||||
|---|---|---|---|---|---|---|---|---|---|---|---|---|---|---|---|---|---|
| Amount | Character | Expiration | Other | ||||||||||||||
| $1,248,810 | $(7,850,822) | $ | (38,551,513 | ) | Short-term | None | $(53,773) | $(193,407,254) | |||||||||
| (148,199,956 | ) | Long-term | None | ||||||||||||||
| $ | (186,751,469 | ) | |||||||||||||||
NOTES TO FINANCIAL STATEMENTS as of March 31, 2022 (continued)
(“LIBOR”)
The Program includes a number of elements that support the management and assessment of liquidity risk, including an annual assessment of liquidity risk factors and the periodic classification (or re-classification, as necessary) of
In addition, military action by Russia in Ukraine could adversely affect global energy and financial markets and therefore could affect the value of a Fund’s investments, including beyond a Fund’s direct exposure to Russian issuers or nearby geographic regions. The extent and duration of the military action, sanctions and resulting market disruptions are impossible to predict and could be substantial. Those events as well as other changes in non-U.S. and domestic economic, social, and political
NOTES TO FINANCIAL STATEMENTS as of March 31, 2022 (continued)
| Per Share Amount | Payable Date | Record Date | ||||||
|---|---|---|---|---|---|---|---|---|
| Class A | $ 0.0261 | May 2, 2022 | Daily | |||||
| Class C | $ 0.0206 | May 2, 2022 | Daily | |||||
| Class I | $ 0.0280 | May 2, 2022 | Daily | |||||
| Class P | $ 0.0329 | May 2, 2022 | Daily | |||||
| Class R | $ 0.0243 | May 2, 2022 | Daily | |||||
| Class W | $ 0.0280 | May 2, 2022 | Daily |
The Fund has evaluated events occurring after the Statement of Assets and Liabilities date through the date that the financial statements were issued (“subsequent events”) to determine whether any subsequent events necessitated adjustment to or disclosure in the financial statements. Other than above, no such subsequent events were identified.
| VOYA FLOATING RATE FUND | PORTFOLIO OF INVESTMENTS AS OF MARCH 31, 2022 |
| Principal Amount† | Borrower/Tranche Description | Fair Value | Percentage of Net Assets | |||||||||||
|---|---|---|---|---|---|---|---|---|---|---|---|---|---|---|
LOANS*: 94.6% | ||||||||||||||
Aerospace & Defense: 1.6% | ||||||||||||||
| 793,250 | ADS Tactical, Inc. 2021 Term Loan B, 6.750%, (US0003M + 5.750%), 03/19/26 | $ | 765,486 | 0.1 | ||||||||||
| 2,381,201 | Geo Group, Inc. (The) 2018 Term Loan B, 2.750%, (US0001M + 2.000%), 03/22/24 | 2,231,073 | 0.5 | |||||||||||
| 458,425 | KBR, Inc. 2020 Term Loan B, 3.207%, (US0001M + 2.750%), 02/05/27 | 456,992 | 0.1 | |||||||||||
| 3,280,880 | Peraton Corp. Term Loan B, 4.500%, (US0001M + 3.750%), 02/01/28 | 3,258,616 | 0.7 | |||||||||||
| 560,000 | Setanta Aircraft Leasing Designated Activity Compa Term Loan B, 3.006%, (US0003M + 2.000%), 11/05/28 | 552,900 | 0.1 | |||||||||||
| 465,000 | Vertex Aerospace Services Corp. 2021 First Lien Term Loan, 4.750%, (US0001M + 4.000%), 12/06/28 | 464,128 | 0.1 | |||||||||||
| 7,729,195 | 1.6 | |||||||||||||
Air Transport: 0.4% | ||||||||||||||
| 1,989,950 | United Airlines, Inc. 2021 Term Loan B, 4.500%, (US0003M + 3.750%), 04/21/28 | 1,970,050 | 0.4 | |||||||||||
Auto Components: 0.2% | ||||||||||||||
| 895,500 | Broadstreet Partners, Inc. 2021 Term Loan B2, 3.750%, (US0001M + 3.250%), 01/27/27 | 883,886 | 0.2 | |||||||||||
Automotive: 3.1% | ||||||||||||||
| 1,348,973 | Autokiniton US Holdings, Inc. 2021 Term Loan B, 5.000%, (US0003M + 4.500%), 04/06/28 | 1,333,797 | 0.3 | |||||||||||
| 1,725,000 | Avis Budget Car Rental, LLC 2022 Term Loan C, 4.000%, (SOFRRATE + 3.500%), 03/16/29 | 1,715,297 | 0.4 | |||||||||||
| 500,000 | Bright Bidco B.V. 2018 Term Loan B, 4.970%, (US0006M + 3.500%), 06/30/24 | 303,125 | 0.1 | |||||||||||
| 1,082,693 | Dealer Tire, LLC 2020 Term Loan B, 4.707%, (US0001M + 4.250%), 12/12/25 | 1,075,655 | 0.2 | |||||||||||
| 1,284,222 | Gates Global LLC 2021 Term Loan B3, 3.250%, (US0001M + 2.500%), 03/31/27 | 1,269,545 | 0.3 | |||||||||||
| Principal Amount† | Borrower/Tranche Description | Fair Value | Percentage of Net Assets | |||||||||||
|---|---|---|---|---|---|---|---|---|---|---|---|---|---|---|
LOANS*: (continued) | ||||||||||||||
Automotive: (continued) | ||||||||||||||
| 912,595 | Hertz Corporation, (The) 2021 Term Loan B, 3.707%, (US0001M + 3.250%), 06/30/28 | $ | 907,575 | 0.2 | ||||||||||
| 173,048 | Hertz Corporation, (The) 2021 Term Loan C, 3.750%, (US0001M + 3.250%), 06/30/28 | 172,097 | 0.0 | |||||||||||
| 107,695 | (1) | Holley Purchaser, Inc. 2021 Delayed Draw Term Loan, 4.576%, (US0003M + 3.750%), 11/17/28 | 106,573 | 0.0 | ||||||||||
| 643,907 | Holley Purchaser, Inc. 2021 Term Loan, 4.500%, (US0003M + 3.750%), 11/17/28 | 637,198 | 0.1 | |||||||||||
| 1,371,319 | Les Schwab Tire Centers Term Loan B, 4.000%, (US0003M + 3.250%), 11/02/27 | 1,357,034 | 0.3 | |||||||||||
| 733,234 | Mister Car Wash Holdings, Inc. 2019 Term Loan B, 3.457%, (US0001M + 3.000%), 05/14/26 | 725,627 | 0.1 | |||||||||||
| 425,000 | Rough Country, LLC 2021 2nd Lien Term Loan, 7.506%, (US0003M + 6.500%), 07/26/29 | 423,406 | 0.1 | |||||||||||
| 488,813 | Rough Country, LLC 2021 Term Loan, 4.506%, (US0003M + 3.500%), 07/28/28 | 485,147 | 0.1 | |||||||||||
| 795,887 | Tenneco, Inc. 2018 Term Loan B, 3.457%, (US0001M + 3.000%), 10/01/25 | 789,089 | 0.2 | |||||||||||
| 1,259,170 | Truck Hero, Inc. 2021 Term Loan B, 4.000%, (US0001M + 3.250%), 01/31/28 | 1,223,362 | 0.2 | |||||||||||
| 979,950 | Wand NewCo 3, Inc. 2020 Term Loan, 3.457%, (US0001M + 3.000%), 02/05/26 | 953,246 | 0.2 | |||||||||||
| 1,621,850 | Wheel Pros, LLC 2021 Term Loan, 5.250%, (US0001M + 4.500%), 05/11/28 | 1,551,570 | 0.3 | |||||||||||
| 15,029,343 | 3.1 | |||||||||||||
Beverage & Tobacco: 1.0% | ||||||||||||||
| 750,000 | Aramark Services, Inc. 2019 Term Loan B4, 2.207%, (US0001M + 1.750%), 01/15/27 | 737,266 | 0.1 | |||||||||||
| 365,000 | Naked Juice LLC 2nd Lien Term Loan, 6.751%, (SOFRRATE + 6.000%), 01/24/30 | 365,304 | 0.1 | |||||||||||
| 615,000 | Naked Juice LLC Term Loan, 3.750%, (SOFRRATE + 3.250%), 01/24/29 | 605,967 | 0.1 | |||||||||||
| VOYA FLOATING RATE FUND | PORTFOLIO OF INVESTMENTS AS OF MARCH 31, 2022 (CONTINUED) |
| Principal Amount† | Borrower/Tranche Description | Fair Value | Percentage of Net Assets | |||||||||||
|---|---|---|---|---|---|---|---|---|---|---|---|---|---|---|
LOANS*: (continued) | ||||||||||||||
Beverage & Tobacco: (continued) | ||||||||||||||
| 1,313,386 | Sunshine Investments B.V. USD Term Loan B3, 3.219%, (US0003M + 2.750%), 03/28/25 | $ | 1,305,177 | 0.3 | ||||||||||
| 1,960,207 | Triton Water Holdings, Inc Term Loan, 4.506%, (US0003M + 3.500%), 03/31/28 | 1,916,714 | 0.4 | |||||||||||
| 4,930,428 | 1.0 | |||||||||||||
Brokers, Dealers & Investment Houses: 0.2% | ||||||||||||||
| 1,170,286 | Forest City Enterprises, L.P. 2019 Term Loan B, 3.957%, (US0003M + 3.500%), 12/08/25 | 1,164,313 | 0.2 | |||||||||||
Building & Development: 4.2% | ||||||||||||||
| 496,250 | ACProducts, Inc. 2021 Term Loan B, 4.750%, (US0006M + 4.250%), 05/17/28 | 451,450 | 0.1 | |||||||||||
| 368,150 | Aegion Corporation Term Loan, 5.500%, (US0003M + 4.750%), 05/17/28 | 366,769 | 0.1 | |||||||||||
| 1,244,949 | Applecaramel Buyer, LLC Term Loan B, 4.250%, (SOFRRATE + 3.750%), 10/19/27 | 1,232,112 | 0.2 | |||||||||||
| 1,486,275 | Chamberlain Group Inc Term Loan B, 4.506%, (US0003M + 3.500%), 11/03/28 | 1,469,554 | 0.3 | |||||||||||
| 748,120 | Core & Main LP 2021 Term Loan B, 2.947%, (US0001M + 2.500%), 07/27/28 | 740,756 | 0.1 | |||||||||||
| 2,415,600 | Cornerstone Building Brands, Inc. 2021 Term Loan B, 3.750%, (US0003M + 3.250%), 04/12/28 | 2,344,642 | 0.5 | |||||||||||
| 303,507 | CP Atlas Buyer, Inc. 2021 Term Loan B, 4.250%, (US0001M + 3.750%), 11/23/27 | 295,730 | 0.1 | |||||||||||
| 898,412 | Empire Today, LLC 2021 Term Loan B, 5.750%, (US0006M + 5.000%), 04/03/28 | 857,235 | 0.2 | |||||||||||
| 915,000 | Foley Products Company, LLC 2021 Term Loan, 4.894%, (SOFRRATE + 4.750%), 12/29/28 | 910,425 | 0.2 | |||||||||||
| 858,512 | Foundation Building Materials Holding Company LLC 2021 Term Loan, 3.750%, (US0003M + 3.250%), 02/03/28 | 843,488 | 0.2 | |||||||||||
| 548,625 | Installed Building Products, Inc. 2021 Term Loan B, 2.750%, (US0001M + 2.250%), 12/14/28 | 547,665 | 0.1 | |||||||||||
| Principal Amount† | Borrower/Tranche Description | Fair Value | Percentage of Net Assets | |||||||||||
|---|---|---|---|---|---|---|---|---|---|---|---|---|---|---|
LOANS*: (continued) | ||||||||||||||
Building & Development: (continued) | ||||||||||||||
| 106,667 | (1) | IPS Corporation 2021 Delayed Draw Term Loan, 3.923%, (US0003M + 3.750%), 10/02/28 | $ | 104,533 | 0.0 | |||||||||
| 533,333 | IPS Corporation 2021 Term Loan, 4.000%, (US0001M + 3.500%), 10/02/28 | 522,667 | 0.1 | |||||||||||
| 273,618 | Kodiak Building Partners Inc. Term Loan B, 4.000%, (US0003M + 3.250%), 03/12/28 | 268,488 | 0.1 | |||||||||||
| 680,000 | Latham Pool Products, Inc. 2022 Term Loan B, 3.799%, (SOFRRATE + 3.750%), 02/23/29 | 674,334 | 0.1 | |||||||||||
| 1,787,340 | LBM Acquisition LLC Term Loan B, 4.500%, (US0001M + 3.750%), 12/17/27 | 1,748,801 | 0.4 | |||||||||||
| 920,000 | Leaf Home Solutions LLC 2022 Term Loan B, 5.250%, (SOFRRATE + 4.750%), 02/16/29 | 911,950 | 0.2 | |||||||||||
| 497,418 | MX Holdings US, Inc. Term Loan B1B, 3.250%, (US0001M + 2.500%), 07/31/25 | 493,066 | 0.1 | |||||||||||
| 556,570 | Northstar Group Services, INC. 2020 Term Loan B, 6.500%, (US0001M + 5.500%), 11/12/26 | 554,483 | 0.1 | |||||||||||
| 770,000 | Smyrna Ready Mix Concrete, LLC Term Loan B, 4.552%, (TSFR1M + 4.250%), 03/24/29 | 761,337 | 0.2 | |||||||||||
| 1,200,000 | Specialty Building Products Holdings, LLC 2021 Term Loan B, 4.250%, (US0001M + 3.750%), 10/15/28 | 1,174,500 | 0.2 | |||||||||||
| 1,238,775 | SRS Distribution Inc. 2021 Term Loan B, 4.000%, (US0003M + 3.500%), 06/02/28 | 1,222,051 | 0.2 | |||||||||||
| 1,336,086 | Standard Industries Inc. 2021 Term Loan B, 3.788%, (US0006M + 2.500%), 09/22/28 | 1,331,744 | 0.3 | |||||||||||
| 592,449 | Wilsonart LLC 2021 Term Loan E, 4.250%, (US0003M + 3.250%), 12/31/26 | 578,484 | 0.1 | |||||||||||
| 20,406,264 | 4.2 | |||||||||||||
Business Equipment & Services: 9.5% | ||||||||||||||
| 527,838 | 24-7 Intouch Inc 2018 Term Loan, 5.207%, (US0001M + 4.750%), 08/25/25 | 519,920 | 0.1 | |||||||||||
| VOYA FLOATING RATE FUND | PORTFOLIO OF INVESTMENTS AS OF MARCH 31, 2022 (CONTINUED) |
| Principal Amount† | Borrower/Tranche Description | Fair Value | Percentage of Net Assets | |||||||||||
|---|---|---|---|---|---|---|---|---|---|---|---|---|---|---|
LOANS*: (continued) | ||||||||||||||
Business Equipment & Services: (continued) | ||||||||||||||
| 497,500 | Allied Universal Holdco LLC 2021 USD Incremental Term Loan B, 4.250%, (US0001M + 3.750%), 05/12/28 | $ | 491,074 | 0.1 | ||||||||||
| 728,175 | Anticimex International AB 2021 USD Incremental Term Loan, 4.508%, (US0003M + 4.000%), 11/16/28 | 723,624 | 0.2 | |||||||||||
| 379,050 | Anticimex International AB 2021 USD Term Loan B1, 4.008%, (US0003M + 3.500%), 11/16/28 | 375,023 | 0.1 | |||||||||||
| 1,119,375 | APX Group, Inc. 2021 Term Loan B, 4.005%, (US0001M + 3.500%), 07/10/28 | 1,106,549 | 0.2 | |||||||||||
| 1,007,475 | Ascend Learning, LLC 2021 Term Loan, 4.000%, (US0001M + 3.500%), 12/11/28 | 996,771 | 0.2 | |||||||||||
| 878,983 | Atlas CC Acquisition Corp Term Loan B, 5.000%, (US0003M + 4.250%), 05/25/28 | 877,335 | 0.2 | |||||||||||
| 178,776 | Atlas CC Acquisition Corp Term Loan C, 5.000%, (US0003M + 4.250%), 05/25/28 | 178,441 | 0.0 | |||||||||||
| 620,000 | Belfor Holdings Inc. 2022 Incremental Term Loan, 4.540%, (SOFRRATE + 4.250%), 04/06/26 | 620,000 | 0.1 | |||||||||||
| 1,152,000 | Belfor Holdings Inc. Term Loan B, 4.207%, (US0001M + 3.750%), 04/06/26 | 1,147,680 | 0.2 | |||||||||||
| 225,000 | DG Investment Intermediate Holdings 2, Inc. 2021 2nd Lien Term Loan, 7.500%, (US0001M + 6.750%), 03/30/29 | 225,000 | 0.1 | |||||||||||
| 1,647,605 | DG Investment Intermediate Holdings 2, Inc. 2021 Term Loan, 4.250%, (US0001M + 3.500%), 03/31/28 | 1,633,702 | 0.3 | |||||||||||
| 2,987,462 | Endure Digital Inc. Term Loan, 4.250%, (US0003M + 3.500%), 02/10/28 | 2,899,706 | 0.6 | |||||||||||
| 1,323,350 | Ensono, LP 2021 Term Loan, 4.750%, (US0003M + 4.000%), 05/26/28 | 1,303,913 | 0.3 | |||||||||||
| 810,000 | EP Purchaser, LLC 2021 Term Loan B, 4.506%, (US0003M + 3.500%), 11/06/28 | 805,782 | 0.2 | |||||||||||
| Principal Amount† | Borrower/Tranche Description | Fair Value | Percentage of Net Assets | |||||||||||
|---|---|---|---|---|---|---|---|---|---|---|---|---|---|---|
LOANS*: (continued) | ||||||||||||||
Business Equipment & Services: (continued) | ||||||||||||||
| 395,000 | Escape Velocity Holdings, Inc. 2021 Term Loan, 5.256%, (US0003M + 4.250%), 10/08/28 | $ | 388,581 | 0.1 | ||||||||||
| 93,434 | First Advantage Holdings, LLC 2021 Term Loan B, 3.195%, (US0001M + 2.750%), 01/31/27 | 92,862 | 0.0 | |||||||||||
| 950,000 | Garda World Security Corporation 2022 Term Loan B, 4.567%, (TSFR1M + 4.250%), 02/01/29 | 941,687 | 0.2 | |||||||||||
| 997,487 | Gloves Buyer, Inc. 2021 Term Loan, 4.750%, (US0001M + 4.000%), 12/29/27 | 982,525 | 0.2 | |||||||||||
| 992,246 | Indy US Bidco, LLC 2021 USD Term Loan, 4.207%, (US0001M + 3.750%), 03/05/28 | 986,044 | 0.2 | |||||||||||
| 1,136,044 | Intrado Corporation 2017 Term Loan, 5.000%, (US0003M + 4.000%), 10/10/24 | 1,041,915 | 0.2 | |||||||||||
| 818,813 | ION Trading Finance Limited 2021 USD Term Loan, 5.207%, (US0003M + 4.750%), 04/03/28 | 813,997 | 0.2 | |||||||||||
| 1,347,381 | KUEHG Corp. 2018 Incremental Term Loan, 4.756%, (US0003M + 3.750%), 02/21/25 | 1,331,381 | 0.3 | |||||||||||
| 1,585,470 | Milano Acquisition Corp Term Loan B, 5.006%, (US0003M + 4.000%), 10/01/27 | 1,579,524 | 0.3 | |||||||||||
| 1,371,031 | Paysafe Holdings (US) Corp USD Term Loan B1, 3.250%, (US0001M + 2.750%), 06/28/28 | 1,316,761 | 0.3 | |||||||||||
| 773,063 | PECF USS Intermediate Holding III Corporation Term Loan B, 4.758%, (US0003M + 4.250%), 12/15/28 | 766,989 | 0.2 | |||||||||||
| 1,346,978 | Polaris Newco LLC USD Term Loan B, 4.500%, (US0001M + 4.000%), 06/02/28 | 1,339,065 | 0.3 | |||||||||||
| 100,000 | Pre-Paid Legal Services, Inc. 2021 2nd Lien Term Loan, 8.006%, (US0003M + 7.000%), 12/14/29 | 98,875 | 0.0 | |||||||||||
| 1,250,000 | Pre-Paid Legal Services, Inc. 2021 Term Loan, 4.250%, (US0001M + 3.750%), 12/15/28 | 1,236,589 | 0.3 | |||||||||||
| VOYA FLOATING RATE FUND | PORTFOLIO OF INVESTMENTS AS OF MARCH 31, 2022 (CONTINUED) |
| Principal Amount† | Borrower/Tranche Description | Fair Value | Percentage of Net Assets | |||||||||||
|---|---|---|---|---|---|---|---|---|---|---|---|---|---|---|
LOANS*: (continued) | ||||||||||||||
Business Equipment & Services: (continued) | ||||||||||||||
| 48,435 | (1) | Refficiency Holdings LLC 2021 Delayed Draw Term Loan, 4.500%, (US0003M + 3.750%), 12/16/27 | $ | 47,920 | 0.0 | |||||||||
| 248,739 | Refficiency Holdings LLC 2021 Term Loan, 4.500%, (US0001M + 3.750%), 12/16/27 | 246,096 | 0.1 | |||||||||||
| 715,000 | Renaissance Holding Corp. 2018 2nd Lien Term Loan, 7.457%, (US0001M + 7.000%), 05/29/26 | 710,531 | 0.1 | |||||||||||
| 220,000 | Renaissance Holding Corp. 2022 Incremental Term Loan, 4.790%, (SOFRRATE + 4.500%), 03/17/27 | 218,992 | 0.0 | |||||||||||
| 1,496,094 | Research Now Group, Inc. 2017 1st Lien Term Loan, 6.500%, (US0006M + 5.500%), 12/20/24 | 1,473,186 | 0.3 | |||||||||||
| 980,891 | Rockwood Service Corporation 2020 Term Loan, 4.457%, (US0001M + 4.000%), 01/23/27 | 981,504 | 0.2 | |||||||||||
| 1,250,000 | Sandvine Corporation 2018 1st Lien Term Loan, 4.957%, (US0001M + 4.500%), 10/31/25 | 1,237,500 | 0.3 | |||||||||||
| 90,963 | (1) | Service Logic Acquisition, Inc Delayed Draw Term Loan, 4.504%, (US0003M + 4.000%), 10/29/27 | 90,204 | 0.0 | ||||||||||
| 1,096,422 | Service Logic Acquisition, Inc Term Loan, 4.750%, (US0002M + 4.000%), 10/29/27 | 1,088,199 | 0.2 | |||||||||||
| 1,626,825 | Skopima Merger Sub Inc. Term Loan B, 4.500%, (US0001M + 4.000%), 05/12/28 | 1,610,963 | 0.3 | |||||||||||
| 1,326,889 | Staples, Inc. 7 Year Term Loan, 5.317%, (US0003M + 5.000%), 04/16/26 | 1,256,564 | 0.3 | |||||||||||
| 1,546,161 | SurveyMonkey Inc. 2018 Term Loan B, 4.210%, (US0001M + 3.750%), 10/10/25 | 1,538,430 | 0.3 | |||||||||||
| 248,598 | Turing Midco LLC 2021 Term Loan B, 3.250%, (US0001M + 2.750%), 03/23/28 | 245,724 | 0.1 | |||||||||||
| 997,423 | Verifone Systems, Inc. 2018 1st Lien Term Loan, 4.498%, (US0003M + 4.000%), 08/20/25 | 985,786 | 0.2 | |||||||||||
| Principal Amount† | Borrower/Tranche Description | Fair Value | Percentage of Net Assets | |||||||||||
|---|---|---|---|---|---|---|---|---|---|---|---|---|---|---|
LOANS*: (continued) | ||||||||||||||
Business Equipment & Services: (continued) | ||||||||||||||
| 997,487 | Verscend Holding Corp. 2021 Term Loan B, 4.457%, (US0001M + 4.000%), 08/27/25 | $ | 996,241 | 0.2 | ||||||||||
| 1,110,000 | Virtusa Corporation 2022 Incremental Term Loan, 4.600%, (SOFRRATE + 3.850%), 02/11/28 | 1,100,287 | 0.2 | |||||||||||
| 1,567,359 | VM Consolidated, Inc. 2021 Term Loan B, 4.256%, (US0003M + 3.250%), 03/19/28 | 1,560,176 | 0.3 | |||||||||||
| 13,462 | (1) | VT Topco, Inc. 2021 Delayed Draw Term Loan, 3.923%, (US0003M + 3.750%), 08/01/25 | 13,353 | 0.0 | ||||||||||
| 203,234 | VT Topco, Inc. 2021 Incremental Term Loan, 4.500%, (US0001M + 3.750%), 08/01/25 | 201,583 | 0.0 | |||||||||||
| 845,750 | Waterlogic Holdings Limited 2021 USD Term Loan B, 5.756%, (US0003M + 4.750%), 08/04/28 | 844,693 | 0.2 | |||||||||||
| 2,326,963 | Yak Access, LLC 2018 1st Lien Term Loan B, 5.508%, (US0003M + 5.000%), 07/11/25 | 2,068,088 | 0.4 | |||||||||||
| 970,000 | Yak Access, LLC 2018 2nd Lien Term Loan B, 10.954%, (US0003M + 10.000%), 07/10/26 | 634,137 | 0.1 | |||||||||||
| 45,971,472 | 9.5 | |||||||||||||
Cable & Satellite Television: 2.9% | ||||||||||||||
| 670,000 | Cogeco Financing 2 LP 2021 Incremental Term Loan B, 3.000%, (US0001M + 2.500%), 09/01/28 | 666,470 | 0.1 | |||||||||||
| 2,493,456 | CSC Holdings LLC, 2.647%, (US0001M + 2.250%), 07/17/25 | 2,459,170 | 0.5 | |||||||||||
| 1,496,183 | CSC Holdings, LLC 2019 Term Loan B5, 2.897%, (US0001M + 2.500%), 04/15/27 | 1,473,366 | 0.3 | |||||||||||
| 2,588,050 | DirecTV Financing, LLC Term Loan, 5.750%, (US0001M + 5.000%), 08/02/27 | 2,588,319 | 0.5 | |||||||||||
| 1,955,100 | Radiate Holdco, LLC 2021 Term Loan B, 4.000%, (US0001M + 3.250%), 09/25/26 | 1,941,135 | 0.4 | |||||||||||
| 3,479,765 | Telesat Canada Term Loan B5, 3.207%, (US0001M + 2.750%), 12/07/26 | 2,609,824 | 0.5 | |||||||||||
| VOYA FLOATING RATE FUND | PORTFOLIO OF INVESTMENTS AS OF MARCH 31, 2022 (CONTINUED) |
| Principal Amount† | Borrower/Tranche Description | Fair Value | Percentage of Net Assets | |||||||||||
|---|---|---|---|---|---|---|---|---|---|---|---|---|---|---|
LOANS*: (continued) | ||||||||||||||
Cable & Satellite Television: (continued) | ||||||||||||||
| 750,000 | UPC Financing Partnership 2021 USD Term Loan AX, 3.397%, (US0003M + 3.000%), 01/31/29 | $ | 743,813 | 0.2 | ||||||||||
| 1,250,000 | Virgin Media Bristol LLC 2020 USD Term Loan Q, 3.647%, (US0001M + 3.250%), 01/31/29 | 1,241,993 | 0.3 | |||||||||||
| 438,900 | WideOpenWest Finance LLC 2021 Term Loan B, 3.500%, (SOFRRATE + 3.000%), 12/20/28 | 437,117 | 0.1 | |||||||||||
| 14,161,207 | 2.9 | |||||||||||||
Chemicals & Plastics: 3.5% | ||||||||||||||
| 994,962 | Ascend Performance Materials Operations LLC 2021 Term Loan B, 5.500%, (US0003M + 4.750%), 08/27/26 | 993,097 | 0.2 | |||||||||||
| 422,875 | Avantor Funding, Inc. 2021 Term Loan B5, 2.750%, (US0001M + 2.250%), 11/08/27 | 420,320 | 0.1 | |||||||||||
| 1,703,944 | GEON Performance Solutions, LLC 2021 Term Loan, 5.500%, (US0001M + 4.750%), 08/18/28 | 1,701,814 | 0.4 | |||||||||||
| 410,000 | Hexion Holdings Corporation 2022 USD 2nd Lien Term Loan, 7.049%, (SOFRRATE + 7.000%), 03/02/30 | 397,700 | 0.1 | |||||||||||
| 1,405,000 | Hexion Holdings Corporation 2022 USD Term Loan, 5.000%, (SOFRRATE + 4.500%), 03/15/29 | 1,377,778 | 0.3 | |||||||||||
| 686,421 | INEOS Styrolution US Holding LLC 2021 USD Term Loan B, 3.250%, (US0001M + 2.750%), 01/29/26 | 674,551 | 0.1 | |||||||||||
| 715,000 | Ineos US Finance LLC 2021 USD Term Loan B, 2.673%, (US0003M + 2.750%), 11/08/28 | 703,381 | 0.1 | |||||||||||
| 416,855 | Lonza Group AG USD Term Loan B, 4.750%, (US0006M + 4.000%), 07/03/28 | 408,127 | 0.1 | |||||||||||
| 500,000 | LSF11 A5 Holdco LLC Term Loan, 4.000%, (SOFRRATE + 3.500%), 10/15/28 | 493,333 | 0.1 | |||||||||||
| 190,000 | NIC Acquisition Corp. Second Lien Term Loan, 8.500%, (US0003M + 7.750%), 12/29/28 | 183,825 | 0.0 | |||||||||||
| Principal Amount† | Borrower/Tranche Description | Fair Value | Percentage of Net Assets | |||||||||||
|---|---|---|---|---|---|---|---|---|---|---|---|---|---|---|
LOANS*: (continued) | ||||||||||||||
Chemicals & Plastics: (continued) | ||||||||||||||
| 1,269,938 | Olympus Water US Holding Corporation 2021 USD Term Loan B, 4.746%, (US0003M + 3.750%), 11/09/28 | $ | 1,240,230 | 0.3 | ||||||||||
| 1,650,000 | PMHC II, Inc. 2022 Term Loan B, 4.300%, (SOFRRATE + 4.250%), 02/01/29 | 1,576,163 | 0.3 | |||||||||||
| 1,110,910 | Polar US Borrower, LLC 2018 1st Lien Term Loan, 4.926%, (US0003M + 4.750%), 10/15/25 | 1,080,360 | 0.2 | |||||||||||
| 306,900 | Potters Industries, LLC Term Loan B, 4.750%, (US0003M + 4.000%), 12/14/27 | 306,325 | 0.1 | |||||||||||
| 501,213 | PQ Corporation 2021 Term Loan B, 3.250%, (US0003M + 2.500%), 06/09/28 | 496,075 | 0.1 | |||||||||||
| 1,765,575 | Sparta U.S. HoldCo LLC 2021 Term Loan, 4.250%, (US0001M + 3.500%), 08/02/28 | 1,758,954 | 0.4 | |||||||||||
| 630,731 | Starfruit Finco B.V 2018 USD Term Loan B, 4.006%, (US0003M + 3.000%), 10/01/25 | 621,533 | 0.1 | |||||||||||
| 1,540,000 | Tronox Finance LLC 2022 Term Loan, 3.540%, (SOFRRATE + 3.250%), 03/03/29 | 1,534,225 | 0.3 | |||||||||||
| 997,500 | W.R. Grace & Co.-Conn. 2021 Term Loan B, 4.813%, (US0003M + 3.750%), 09/22/28 | 991,421 | 0.2 | |||||||||||
| 16,959,212 | 3.5 | |||||||||||||
Clothing/Textiles: 0.3% | ||||||||||||||
| 536,642 | ABG Intermediate Holdings 2 LLC 2021 Delayed Draw Term Loan B2, 4.000%, (SOFRRATE + 3.500%), 12/08/28 | 529,710 | 0.1 | |||||||||||
| 84,179 | ABG Intermediate Holdings 2 LLC 2021 Delayed Draw Term Loan B3, 4.000%, (SOFRRATE + 3.500%), 12/08/28 | 83,091 | 0.0 | |||||||||||
| 84,179 | ABG Intermediate Holdings 2 LLC 2021 Term Loan B1, 4.000%, (SOFRRATE + 3.500%), 12/21/28 | 83,092 | 0.0 | |||||||||||
| 1,000,000 | Crocs Inc Term Loan B, 4.447%, (SOFRRATE + 3.500%), 02/20/29 | 979,062 | 0.2 | |||||||||||
| 1,674,955 | 0.3 | |||||||||||||
| VOYA FLOATING RATE FUND | PORTFOLIO OF INVESTMENTS AS OF MARCH 31, 2022 (CONTINUED) |
| Principal Amount† | Borrower/Tranche Description | Fair Value | Percentage of Net Assets | |||||||||||
|---|---|---|---|---|---|---|---|---|---|---|---|---|---|---|
LOANS*: (continued) | ||||||||||||||
Conglomerates: 0.1% | ||||||||||||||
| 339,203 | Fender Musical Instruments Corporation 2021 Term Loan B, 4.500%, (SOFRRATE + 4.000%), 12/01/28 | $ | 337,083 | 0.1 | ||||||||||
Consumer, Cyclical: 0.2% | ||||||||||||||
| 497,503 | MOTION FINCO SARL USD TERM LOAN B1, 4.256%, (US0003M + 3.250%), 11/12/26 | 489,937 | 0.1 | |||||||||||
| 381,150 | WellPet—TL B 1L, 4.678%, (US0003M + 3.750%), 12/21/27 | 378,768 | 0.1 | |||||||||||
| 868,705 | 0.2 | |||||||||||||
Consumer, Non-cyclical: 0.6% | ||||||||||||||
| 1,611,900 | CoreLogic, Inc. TL B 1L, 4.000%, (US0001M + 3.500%), 06/02/28 | 1,590,139 | 0.3 | |||||||||||
| 1,287,477 | Lifescan Global Corporation 2018 1st Lien Term Loan, 6.214%, (US0003M + 6.000%), 10/01/24 | 1,232,759 | 0.3 | |||||||||||
| 2,822,898 | 0.6 | |||||||||||||
Containers & Glass Products: 3.4% | ||||||||||||||
| 1,435,500 | Altium Packaging LLC 2021 Term Loan B, 3.250%, (US0001M + 2.750%), 02/03/28 | 1,387,770 | 0.3 | |||||||||||
| 1,237,966 | BWAY Holding Company 2017 Term Loan B, 3.481%, (US0001M + 3.250%), 04/03/24 | 1,223,265 | 0.2 | |||||||||||
| 945,295 | Charter NEX US, Inc. 2021 Term Loan, 4.500%, (US0001M + 3.750%), 12/01/27 | 940,076 | 0.2 | |||||||||||
| 910,000 | Clydesdale Acquisition Holdings Inc Term Loan, 4.552%, (TSFR1M + 4.250%), 03/30/29 | 895,700 | 0.2 | |||||||||||
| 991,073 | Flex Acquisition Company, Inc. 2018 Incremental Term Loan, 3.962%, (US0003M + 3.000%), 06/29/25 | 990,454 | 0.2 | |||||||||||
| 495,637 | Flex Acquisition Company, Inc. 2021 Term Loan, 4.000%, (US0001M + 3.500%), 03/02/28 | 494,785 | 0.1 | |||||||||||
| 738,150 | Plastipak Packaging, Inc. 2021 Term Loan B, 3.000%, (US0001M + 2.500%), 12/01/28 | 725,540 | 0.1 | |||||||||||
| 724,319 | Plaze, Inc. 2020 Incremental Term Loan, 4.500%, (US0003M + 3.750%), 08/03/26 | 700,779 | 0.1 | |||||||||||
| Principal Amount† | Borrower/Tranche Description | Fair Value | Percentage of Net Assets | |||||||||||
|---|---|---|---|---|---|---|---|---|---|---|---|---|---|---|
LOANS*: (continued) | ||||||||||||||
Containers & Glass Products: (continued) | ||||||||||||||
| 1,341,638 | Pretium PKG Holdings, Inc. 2021 1st Lien Term Loan, 4.500%, (US0001M + 4.000%), 10/02/28 | $ | 1,306,419 | 0.3 | ||||||||||
| 280,000 | Pretium PKG Holdings, Inc. 2021 2nd Lien Term Loan, 7.250%, (US0003M + 6.750%), 10/01/29 | 272,650 | 0.1 | |||||||||||
| 138,547 | (1) | Pro Mach Group, Inc. 2021 Delayed Draw Term Loan, 5.000%, (US0003M + 4.000%), 08/31/28 | 138,114 | 0.0 | ||||||||||
| 899,020 | Pro Mach Group, Inc. 2021 Term Loan B, 5.000%, (US0003M + 4.000%), 08/31/28 | 896,210 | 0.2 | |||||||||||
| 1,247,345 | Proampac PG Borrower LLC 2020 Term Loan, 4.630%, (US0003M + 3.750%), 11/03/25 | 1,223,437 | 0.2 | |||||||||||
| 1,424,394 | Reynolds Group Holdings Inc. 2020 Term Loan B2, 3.707%, (US0001M + 3.250%), 02/05/26 | 1,389,293 | 0.3 | |||||||||||
| 1,376,205 | Reynolds Group Holdings Inc. 2021 Term Loan B, 4.000%, (US0001M + 3.500%), 09/20/28 | 1,342,488 | 0.3 | |||||||||||
| 353,212 | Tosca Services, LLC 2021 Term Loan, 4.250%, (US0001M + 3.500%), 08/18/27 | 346,589 | 0.1 | |||||||||||
| 648,367 | TricorBraun Holdings, Inc. 2021 Term Loan, 3.750%, (US0001M + 3.250%), 03/03/28 | 633,547 | 0.1 | |||||||||||
| 115,850 | (1) | Trident TPI Holdings, Inc. 2021 Delayed Draw Term Loan, 5.006%, (US0003M + 4.000%), 09/15/28 | 114,643 | 0.0 | ||||||||||
| 814,757 | Trident TPI Holdings, Inc. 2021 Incremental Term Loan, 4.500%, (US0001M + 4.000%), 09/15/28 | 806,269 | 0.2 | |||||||||||
| 495,000 | Valcour Packaging LLC 2021 1st Lien Term Loan, 4.250%, (US0003M + 3.750%), 10/04/28 | 485,100 | 0.1 | |||||||||||
| 300,000 | Valcour Packaging LLC 2021 2nd Lien Term Loan, 7.500%, (US0003M + 7.000%), 10/04/29 | 286,500 | 0.1 | |||||||||||
| 16,599,628 | 3.4 | |||||||||||||
| VOYA FLOATING RATE FUND | PORTFOLIO OF INVESTMENTS AS OF MARCH 31, 2022 (CONTINUED) |
| Principal Amount† | Borrower/Tranche Description | Fair Value | Percentage of Net Assets | |||||||||||
|---|---|---|---|---|---|---|---|---|---|---|---|---|---|---|
LOANS*: (continued) | ||||||||||||||
Cosmetics/Toiletries: 0.9% | ||||||||||||||
| 2,159,652 | Anastasia Parent, LLC 2018 Term Loan B, 4.756%, (US0003M + 3.750%), 08/11/25 | $ | 1,893,745 | 0.4 | ||||||||||
| 2,270,000 | Olaplex, Inc 2022 Term Loan, 4.250%, (SOFRRATE + 3.750%), 02/23/29 | 2,267,163 | 0.5 | |||||||||||
| 4,160,908 | 0.9 | |||||||||||||
Drugs: 0.9% | ||||||||||||||
| 989,660 | Amneal Pharmaceuticals LLC 2018 Term Loan B, 3.947%, (US0001M + 3.500%), 05/04/25 | 976,670 | 0.2 | |||||||||||
| 443,888 | ANI Pharmaceuticals, Inc Term Loan B, 6.750%, (US0001M + 6.000%), 04/27/28 | 443,888 | 0.1 | |||||||||||
| 1,790,955 | Endo Luxembourg Finance Company I S.a r.l. 2021 Term Loan, 5.750%, (US0001M + 5.000%), 03/27/28 | 1,680,140 | 0.3 | |||||||||||
| 1,361,693 | Jazz Financing Lux S.a.r.l. USD Term Loan, 4.000%, (US0001M + 3.500%), 05/05/28 | 1,358,761 | 0.3 | |||||||||||
| 4,459,459 | 0.9 | |||||||||||||
Ecological Services & Equipment: 0.4% | ||||||||||||||
| 718,200 | Clean Harbors Inc. 2021 Incremental Term Loan B, 2.457%, (US0001M + 2.000%), 10/08/28 | 713,980 | 0.1 | |||||||||||
| 739,413 | Denali Water Solutions Term Loan B, 5.216%, (US0003M + 4.250%), 03/25/28 | 724,624 | 0.2 | |||||||||||
| 497,481 | GFL Environmental Inc. 2020 Term Loan, 3.500%, (US0003M + 3.000%), 05/30/25 | 496,282 | 0.1 | |||||||||||
| 1,934,886 | 0.4 | |||||||||||||
Electronics/Electrical: 12.1% | ||||||||||||||
| 535,000 | Altar Bidco, Inc. 2021 2nd Lien Term Loan, 6.100%, (US0001M + 5.600%), 02/01/30 | 529,650 | 0.1 | |||||||||||
| 985,000 | Altar Bidco, Inc. 2021 Term Loan, 3.850%, (SOFRRATE + 3.350%), 02/01/29 | 973,919 | 0.2 | |||||||||||
| 1,711,125 | AP Core Holdings II, LLC Amortization Term Loan B1, 6.250%, (US0001M + 5.500%), 09/01/27 | 1,703,995 | 0.3 | |||||||||||
| 1,245,000 | AP Core Holdings II, LLC High-Yield Term Loan B2, 6.250%, (US0001M + 5.500%), 09/01/27 | 1,239,294 | 0.3 | |||||||||||
| Principal Amount† | Borrower/Tranche Description | Fair Value | Percentage of Net Assets | |||||||||||
|---|---|---|---|---|---|---|---|---|---|---|---|---|---|---|
LOANS*: (continued) | ||||||||||||||
Electronics/Electrical: (continued) | ||||||||||||||
| 481,363 | Atlas Purchaser, Inc. 2021 Term Loan, 6.000%, (US0003M + 5.250%), 05/08/28 | $ | 468,727 | 0.1 | ||||||||||
| 505,000 | Banff Merger Sub Inc 2021 USD 2nd Lien Term Loan, 6.000%, (US0001M + 5.500%), 02/27/26 | 501,370 | 0.1 | |||||||||||
| 248,557 | Banff Merger Sub Inc 2021 USD Term Loan, 4.756%, (US0003M + 3.750%), 10/02/25 | 247,371 | 0.1 | |||||||||||
| 709,083 | Barracuda Networks, Inc. 1st Lien Term Loan, 4.733%, (US0003M + 3.750%), 02/12/25 | 707,133 | 0.1 | |||||||||||
| 997,423 | CentralSquare Technologies, LLC 2018 1st Lien Term Loan, 4.760%, (US0003M + 3.750%), 08/29/25 | 944,559 | 0.2 | |||||||||||
| 1,390,000 | Cloudera, Inc. 2021 Term Loan, 4.250%, (US0001M + 3.750%), 10/08/28 | 1,377,838 | 0.3 | |||||||||||
| 403,988 | ConnectWise, LLC 2021 Term Loan B, 4.000%, (US0001M + 3.500%), 09/29/28 | 401,867 | 0.1 | |||||||||||
| 994,088 | Constant Contact Inc Term Loan, 4.750%, (US0003M + 4.000%), 02/10/28 | 984,147 | 0.2 | |||||||||||
| 1,805,000 | Cornerstone OnDemand, Inc. 2021 Term Loan, 4.250%, (US0003M + 3.750%), 10/16/28 | 1,789,206 | 0.4 | |||||||||||
| 650,000 | Creation Technologies Inc. 2021 Term Loan, 6.000%, (US0003M + 5.500%), 10/05/28 | 636,187 | 0.1 | |||||||||||
| 987,538 | Delta TopCo, Inc. 2020 Term Loan B, 4.500%, (US0003M + 3.750%), 12/01/27 | 973,254 | 0.2 | |||||||||||
| 1,440,283 | EagleView Technology Corporation 2018 Add On Term Loan B, 4.506%, (US0003M + 3.500%), 08/14/25 | 1,403,376 | 0.3 | |||||||||||
| 530,000 | Entegris, Inc. 2022 Term Loan B, 3.290%, (SOFRRATE + 3.000%), 03/02/29 | 529,006 | 0.1 | |||||||||||
| 494,991 | Grab Holdings Inc Term Loan B, 5.500%, (US0003M + 4.500%), 01/29/26 | 485,091 | 0.1 | |||||||||||
| 795,429 | Helios Software Holdings, Inc. 2021 USD Term Loan B, 5.250%, (US0006M + 3.750%), 03/11/28 | 789,795 | 0.2 | |||||||||||
| VOYA FLOATING RATE FUND | PORTFOLIO OF INVESTMENTS AS OF MARCH 31, 2022 (CONTINUED) |
| Principal Amount† | Borrower/Tranche Description | Fair Value | Percentage of Net Assets | |||||||||||
|---|---|---|---|---|---|---|---|---|---|---|---|---|---|---|
LOANS*: (continued) | ||||||||||||||
Electronics/Electrical: (continued) | ||||||||||||||
| 1,384,111 | Hyland Software, Inc. 2018 1st Lien Term Loan, 4.250%, (US0001M + 3.500%), 07/01/24 | $ | 1,379,136 | 0.3 | ||||||||||
| 895,000 | II-VI Incorporated 2021 Term Loan B, 2.959%, (US0003M + 2.750%), 12/01/28 | 885,304 | 0.2 | |||||||||||
| 1,475,605 | Imperva, Inc. 1st Lien Term Loan, 5.000%, (US0003M + 4.000%), 01/12/26 | 1,459,773 | 0.3 | |||||||||||
| 1,368,871 | Imperva, Inc. 2nd Lien Term Loan, 8.750%, (US0003M + 7.750%), 01/11/27 | 1,368,529 | 0.3 | |||||||||||
| 1,620,000 | Informatica LLC 2021 USD Term Loan B, 3.250%, (US0001M + 2.750%), 10/27/28 | 1,603,800 | 0.3 | |||||||||||
| 1,409,350 | Ingram Micro Inc. 2021 Term Loan B, 4.506%, (US0003M + 3.500%), 06/30/28 | 1,398,428 | 0.3 | |||||||||||
| 1,590,000 | Instructure Holdings, Inc. 2021 Term Loan B, 3.269%, (US0003M + 2.750%), 10/30/28 | 1,586,025 | 0.3 | |||||||||||
| 150,000 | Ivanti Software, Inc. 2021 2nd Lien Term Loan, 7.773%, (US0003M + 7.250%), 12/01/28 | 148,125 | 0.0 | |||||||||||
| 257,400 | Ivanti Software, Inc. 2021 Add On Term Loan B, 4.750%, (US0001M + 4.000%), 12/01/27 | 253,619 | 0.1 | |||||||||||
| 1,553,447 | Ivanti Software, Inc. 2021 Term Loan B, 5.000%, (US0003M + 4.250%), 12/01/27 | 1,534,307 | 0.3 | |||||||||||
| 2,577,475 | LogMeIn, Inc. Term Loan B, 5.218%, (US0001M + 4.750%), 08/31/27 | 2,538,277 | 0.5 | |||||||||||
| 1,384,650 | Magenta Buyer LLC 2021 USD 1st Lien Term Loan, 5.750%, (US0003M + 5.000%), 07/27/28 | 1,374,697 | 0.3 | |||||||||||
| 560,000 | Magenta Buyer LLC 2021 USD 2nd Lien Term Loan, 9.000%, (US0003M + 8.250%), 07/27/29 | 555,800 | 0.1 | |||||||||||
| 345,000 | Mediaocean LLC 2021 Term Loan, 4.000%, (US0001M + 3.500%), 12/15/28 | 342,125 | 0.1 | |||||||||||
| 1,668,769 | MH Sub I, LLC 2020 Incremental Term Loan, 4.750%, (US0001M + 3.750%), 09/13/24 | 1,655,557 | 0.3 | |||||||||||
| Principal Amount† | Borrower/Tranche Description | Fair Value | Percentage of Net Assets | |||||||||||
|---|---|---|---|---|---|---|---|---|---|---|---|---|---|---|
LOANS*: (continued) | ||||||||||||||
Electronics/Electrical: (continued) | ||||||||||||||
| 615,000 | MH Sub I, LLC 2021 2nd Lien Term Loan, 6.707%, (US0001M + 6.250%), 02/23/29 | $ | 610,772 | 0.1 | ||||||||||
| 1,785,000 | Mitchell International, Inc. 2021 Term Loan B, 4.250%, (US0001M + 3.750%), 10/15/28 | 1,756,999 | 0.4 | |||||||||||
| 202,894 | NAVEX TopCo, Inc. 2018 2nd Lien Term Loan, 7.460%, (US0001M + 7.000%), 09/04/26 | 201,372 | 0.0 | |||||||||||
| 1,057,013 | Panther Commercial Holdings L.P Term Loan, 5.000%, (US0003M + 4.500%), 01/07/28 | 1,052,256 | 0.2 | |||||||||||
| 230,000 | Ping Identity Corporation 2021 Term Loan B, 4.705%, (SOFRRATE + 3.750%), 11/22/28 | 228,563 | 0.0 | |||||||||||
| 1,150,438 | Planview Parent, Inc. Term Loan, 5.006%, (US0003M + 4.000%), 12/17/27 | 1,138,933 | 0.2 | |||||||||||
| 2,259,696 | Project Leopard Holdings, Inc. 2019 Term Loan, 5.750%, (US0003M + 4.750%), 07/07/24 | 2,255,459 | 0.5 | |||||||||||
| 997,500 | Proofpoint, Inc. 1st Lien Term Loan, 3.758%, (US0003M + 3.250%), 08/31/28 | 987,758 | 0.2 | |||||||||||
| 610,000 | Quest Software US Holdings Inc. 2022 2nd Lien Term Loan, 8.150%, (SOFRRATE + 7.500%), 02/01/30 | 593,609 | 0.1 | |||||||||||
| 1,588,855 | Rackspace Technology Global, Inc. 2021 Term Loan, 3.500%, (US0003M + 2.750%), 02/15/28 | 1,560,057 | 0.3 | |||||||||||
| 2,926,048 | Redstone Buyer LLC 2021 Term Loan, 5.500%, (US0003M + 4.750%), 04/27/28 | 2,882,157 | 0.6 | |||||||||||
| 1,423,000 | (2) | Riverbed Technology, Inc. 2021 PIK Exit Term Loan, 7.000%, (US0003M + 6.000%) (PIK Rate 2.000%, Cash Rate 7.000%), 12/08/26 | 1,238,010 | 0.3 | ||||||||||
| 1,538,249 | Rocket Software, Inc. 2018 Term Loan, 4.707%, (US0001M + 4.250%), 11/28/25 | 1,521,424 | 0.3 | |||||||||||
| 1,312,569 | Rocket Software, Inc. 2021 USD Incremental Term Loan B, 4.750%, (US0001M + 4.250%), 11/28/25 | 1,297,146 | 0.3 | |||||||||||
| VOYA FLOATING RATE FUND | PORTFOLIO OF INVESTMENTS AS OF MARCH 31, 2022 (CONTINUED) |
| Principal Amount† | Borrower/Tranche Description | Fair Value | Percentage of Net Assets | |||||||||||
|---|---|---|---|---|---|---|---|---|---|---|---|---|---|---|
LOANS*: (continued) | ||||||||||||||
Electronics/Electrical: (continued) | ||||||||||||||
| 470,895 | Seattle Spinco, Inc. USD Term Loan B3, 3.207%, (US0001M + 2.750%), 06/21/24 | $ | 465,891 | 0.1 | ||||||||||
| 1,374,330 | SonicWall US Holdings Inc. 1st Lien Term Loan, 4.250%, (US0003M + 3.750%), 05/16/25 | 1,357,151 | 0.3 | |||||||||||
| 101,610 | (1) | Sovos Compliance, LLC 2021 Delayed Draw Term Loan, 4.709%, (US0003M + 4.500%), 08/11/28 | 101,610 | 0.0 | ||||||||||
| 586,919 | Sovos Compliance, LLC 2021 Term Loan, 5.000%, (US0001M + 4.500%), 08/11/28 | 586,919 | 0.1 | |||||||||||
| 354,113 | Tenable Holdings, Inc. Term Loan B, 3.269%, (US0006M + 2.750%), 07/07/28 | 351,457 | 0.1 | |||||||||||
| 520,488 | Trader Interactive, LLC 2021 Term Loan B, 4.500%, (US0001M + 4.000%), 07/28/28 | 515,283 | 0.1 | |||||||||||
| 32,094 | (2) | Travelport Finance (Luxembourg) S.a.r.l. 2020 Super Priority Term Loan, 2.500%, (US0003M + 8.750%) (PIK Rate 7.250%, Cash Rate 2.500%), 02/28/25 | 33,362 | 0.0 | ||||||||||
| 2,924 | (2) | Travelport Finance (Luxembourg) S.a.r.l. 2021 Consented Term Loan, 6.006%, (US0003M + 5.000%) (PIK Rate 1.750%, Cash Rate 0.000%), 05/29/26 | 2,595 | 0.0 | ||||||||||
| 1,090,778 | Ultra Clean Holdings, Inc 2021 Term Loan B, 4.207%, (US0001M + 3.750%), 08/27/25 | 1,087,540 | 0.2 | |||||||||||
| 1,089,620 | Watlow Electric Manufacturing Company Term Loan B, 4.250%, (US0003M + 3.750%), 03/02/28 | 1,079,064 | 0.2 | |||||||||||
| 1,309,584 | Xperi Corporation 2020 Term Loan B, 3.957%, (US0001M + 3.500%), 06/08/28 | 1,296,080 | 0.3 | |||||||||||
| 58,970,754 | 12.1 | |||||||||||||
Equipment Leasing: 0.3% | ||||||||||||||
| 379,050 | Albion Financing 3 SARL USD Term Loan, 5.750%, (US0003M + 5.250%), 08/17/26 | 374,785 | 0.1 | |||||||||||
| Principal Amount† | Borrower/Tranche Description | Fair Value | Percentage of Net Assets | |||||||||||
|---|---|---|---|---|---|---|---|---|---|---|---|---|---|---|
LOANS*: (continued) | ||||||||||||||
Equipment Leasing: (continued) | ||||||||||||||
| 1,001,358 | Rent-A-Center, Inc. 2021 First Lien Term Loan B, 3.813%, (US0003M + 3.250%), 02/17/28 | $ | 982,270 | 0.2 | ||||||||||
| 1,357,055 | 0.3 | |||||||||||||
Financial: 0.4% | ||||||||||||||
| 641,775 | Acrisure, LLC 2021 Incremental Term Loan B, 4.250%, (US0001M + 3.750%), 02/15/27 | 638,566 | 0.1 | |||||||||||
| 1,307,373 | Blucora, Inc. 2017 Term Loan B, 5.006%, (US0003M + 4.000%), 05/22/24 | 1,309,007 | 0.3 | |||||||||||
| 198,992 | HUB International Ltd. — TL B3 1L, 4.001%, (US0003M + 3.250%), 04/25/25 | 197,973 | 0.0 | |||||||||||
| 2,145,546 | 0.4 | |||||||||||||
Financial Intermediaries: 3.4% | ||||||||||||||
| 444,318 | Advisor Group, Inc. 2021 Term Loan, 4.957%, (US0001M + 4.500%), 07/31/26 | 442,004 | 0.1 | |||||||||||
| 541,129 | AllSpring Buyer LLC Term Loan B, 4.313%, (US0003M + 3.250%), 11/01/28 | 538,559 | 0.1 | |||||||||||
| 545,000 | AqGen Ascensus, Inc. 2021 2nd Lien Term Loan, 7.000%, (US0003M + 6.500%), 08/02/29 | 539,209 | 0.1 | |||||||||||
| 773,063 | AqGen Island Holdings, Inc. Term Loan, 4.000%, (US0003M + 3.500%), 08/02/28 | 768,714 | 0.2 | |||||||||||
| 741,275 | Castlelake Aviation Limited Term Loan B, 3.250%, (US0003M + 2.750%), 10/22/26 | 723,670 | 0.1 | |||||||||||
| 2,088,200 | Citadel Securities LP 2021 Term Loan B, 2.957%, (US0001M + 2.500%), 02/02/28 | 2,079,438 | 0.4 | |||||||||||
| 908,726 | Cushman & Wakefield U.S. Borrower, LLC 2020 Term Loan B, 3.207%, (US0001M + 2.750%), 08/21/25 | 898,077 | 0.2 | |||||||||||
| 994,937 | Deerfield Dakota Holding, LLC 2020 USD Term Loan B, 4.750%, (US0001M + 3.750%), 04/09/27 | 992,076 | 0.2 | |||||||||||
| 1,492,481 | Edelman Financial Center, LLC 2021 Term Loan B, 4.250%, (US0001M + 3.500%), 04/07/28 | 1,478,022 | 0.3 | |||||||||||
| VOYA FLOATING RATE FUND | PORTFOLIO OF INVESTMENTS AS OF MARCH 31, 2022 (CONTINUED) |
| Principal Amount† | Borrower/Tranche Description | Fair Value | Percentage of Net Assets | |||||||||||
|---|---|---|---|---|---|---|---|---|---|---|---|---|---|---|
LOANS*: (continued) | ||||||||||||||
Financial Intermediaries: (continued) | ||||||||||||||
| 1,489,555 | First Eagle Holdings, Inc. 2020 Term Loan B, 2.647%, (US0003M + 2.500%), 02/01/27 | $ | 1,466,281 | 0.3 | ||||||||||
| 1,693,008 | Focus Financial Partners, LLC 2021 Term Loan, 3.000%, (US0001M + 2.500%), 06/30/28 | 1,673,079 | 0.3 | |||||||||||
| 830,825 | HighTower Holdings LLC 2021 Term Loan B, 4.750%, (US0003M + 4.000%), 04/21/28 | 822,517 | 0.2 | |||||||||||
| 1,277,314 | Jane Street Group, LLC 2021 Term Loan, 3.207%, (US0001M + 2.750%), 01/26/28 | 1,263,583 | 0.3 | |||||||||||
| 1,628,377 | Trans Union, LLC 2021 Term Loan B6, 2.750%, (US0001M + 2.250%), 12/01/28 | 1,617,182 | 0.3 | |||||||||||
| 820,000 | VFH Parent LLC 2022 Term Loan B, 3.500%, (SOFRRATE + 3.000%), 01/13/29 | 813,508 | 0.2 | |||||||||||
| 259,350 | Walker & Dunlop, Inc. 2021 Term Loan, 2.331%, (SOFRRATE + 2.250%), 12/16/28 | 258,377 | 0.1 | |||||||||||
| 16,374,296 | 3.4 | |||||||||||||
Food Products: 2.0% | ||||||||||||||
| 984,733 | 8th Avenue Food & Provisions, Inc. 2018 1st Lien Term Loan, 4.207%, (US0001M + 3.750%), 10/01/25 | 862,462 | 0.2 | |||||||||||
| 549,750 | 8th Avenue Food & Provisions, Inc. 2021 Incremental Term Loan, 5.500%, (US0001M + 4.750%), 10/01/25 | 496,149 | 0.1 | |||||||||||
| 1,316,552 | Atkins Nutritionals Holdings II, Inc. 2017 Term Loan B, 3.792%, (SOFRRATE + 3.250%), 07/07/24 | 1,311,615 | 0.3 | |||||||||||
| 660,000 | BCPE North Star US HoldCo 2, Inc. 2021 2nd Lien Term Loan, 7.616%, (US0003M + 7.250%), 06/08/29 | 650,100 | 0.1 | |||||||||||
| 1,020,000 | CHG PPC Parent LLC 2021 Term Loan, 3.500%, (US0001M + 3.000%), 12/08/28 | 998,325 | 0.2 | |||||||||||
| 101,053 | (1) | Dessert Holdings Inc. Delayed Draw Term Loan, 4.146%, (US0003M + 4.000%), 06/09/28 | 99,221 | 0.0 | ||||||||||
| 537,600 | Dessert Holdings Inc. Term Loan, 5.006%, (US0003M + 4.000%), 06/09/28 | 527,856 | 0.1 | |||||||||||
| Principal Amount† | Borrower/Tranche Description | Fair Value | Percentage of Net Assets | |||||||||||
|---|---|---|---|---|---|---|---|---|---|---|---|---|---|---|
LOANS*: (continued) | ||||||||||||||
Food Products: (continued) | ||||||||||||||
| 2,045,985 | IRB Holding Corp 2022 Term Loan B, 3.750%, (SOFRRATE + 3.000%), 12/15/27 | $ | 2,026,804 | 0.4 | ||||||||||
| 970,000 | NPC International, Inc. 2nd Lien Term Loan, 1.000%, 04/18/25 | 19,400 | 0.0 | |||||||||||
| 1,115,000 | Primary Products Finance LLC Term Loan, 4.173%, (US0003M + 4.000%), 10/25/28 | 1,108,496 | 0.2 | |||||||||||
| 1,081,203 | Sigma Bidco B.V. 2018 USD Term Loan B, 3.345%, (US0006M + 3.000%), 07/02/25 | 992,004 | 0.2 | |||||||||||
| 798,496 | Weber-Stephen Products LLC Term Loan B, 4.022%, (US0001M + 3.250%), 10/30/27 | 775,539 | 0.2 | |||||||||||
| 9,867,971 | 2.0 | |||||||||||||
Food Service: 1.6% | ||||||||||||||
| 992,386 | 1011778 B.C. Unlimited Liability Company Term Loan B4, 2.207%, (US0001M + 1.750%), 11/19/26 | 973,034 | 0.2 | |||||||||||
| 1,285,000 | Fertitta Entertainment, LLC 2022 Term Loan B, 4.500%, (SOFRRATE + 4.000%), 01/27/29 | 1,279,525 | 0.3 | |||||||||||
| 1,122,188 | Flynn Restaurant Group LP 2021 Term Loan B, 4.695%, (US0001M + 4.250%), 12/01/28 | 1,110,966 | 0.2 | |||||||||||
| 900,571 | Fogo De Chao, Inc. 2018 Add On Term Loan, 5.250%, (US0001M + 4.250%), 04/07/25 | 880,308 | 0.2 | |||||||||||
| 78,000 | K-Mac Holdings Corp 2021 2nd Lien Term Loan, 7.250%, (US0001M + 6.750%), 07/30/29 | 76,830 | 0.0 | |||||||||||
| 7,577 | (1) | Pacific Bells, LLC Delayed Draw Term Loan, 4.673%, (US0003M + 4.500%), 10/13/28 | 7,379 | 0.0 | ||||||||||
| 725,604 | Pacific Bells, LLC Term Loan B, 5.000%, (US0001M + 4.500%), 10/13/28 | 706,557 | 0.1 | |||||||||||
| 982,244 | Tacala, LLC 1st Lien Term Loan, 3.957%, (US0001M + 3.500%), 02/05/27 | 970,702 | 0.2 | |||||||||||
| 598,469 | US Foods, Inc. 2019 Term Loan B, 2.508%, (US0003M + 2.000%), 09/13/26 | 587,913 | 0.1 | |||||||||||
| VOYA FLOATING RATE FUND | PORTFOLIO OF INVESTMENTS AS OF MARCH 31, 2022 (CONTINUED) |
| Principal Amount† | Borrower/Tranche Description | Fair Value | Percentage of Net Assets | |||||||||||
|---|---|---|---|---|---|---|---|---|---|---|---|---|---|---|
LOANS*: (continued) | ||||||||||||||
Food Service: (continued) | ||||||||||||||
| 1,300,000 | US Foods, Inc. 2021 Term Loan B, 3.258%, (US0003M + 2.750%), 11/22/28 | $ | 1,285,259 | 0.3 | ||||||||||
| 7,878,473 | 1.6 | |||||||||||||
Food/Drug Retailers: 1.1% | ||||||||||||||
| 1,389,905 | EG Finco Limited 2018 USD Term Loan, 4.997%, (US0003M + 4.000%), 02/07/25 | 1,374,269 | 0.3 | |||||||||||
| 1,915,245 | Moran Foods, LLC 2020 2nd Lien Term Loan, 11.756%, (US0003M + 10.750%), 10/01/24 | 1,580,077 | 0.3 | |||||||||||
| 1,398,569 | Moran Foods, LLC 2020 Term Loan, 8.006%, (US0003M + 7.000%), 04/01/24 | 1,390,415 | 0.3 | |||||||||||
| 994,898 | Portillos Holdings, LLC 2019 1st Lien Term Loan B3, 6.500%, (US0001M + 5.500%), 09/06/24 | 991,996 | 0.2 | |||||||||||
| 5,336,757 | 1.1 | |||||||||||||
Forest Products: 0.2% | ||||||||||||||
| 374,118 | ASP Blade Holdings, Inc Initial Term Loan, 4.457%, (US0001M + 4.000%), 10/13/28 | 370,026 | 0.1 | |||||||||||
| 485,118 | Spa Holdings 3 Oy USD Term Loan B, 4.500%, (US0003M + 3.750%), 02/04/28 | 474,506 | 0.1 | |||||||||||
| 844,532 | 0.2 | |||||||||||||
Health Care: 10.7% | ||||||||||||||
| 770,000 | Accelerated Health Systems, LLC 2022 Term Loan B, 5.160%, (SOFRRATE + 4.250%), 02/15/29 | 765,829 | 0.2 | |||||||||||
| 864,928 | ADMI Corp. 2021 Term Loan B2, 3.875%, (US0001M + 3.375%), 12/23/27 | 851,504 | 0.2 | |||||||||||
| 407,897 | Agiliti Health, Inc Term Loan, 3.000%, (US0001M + 2.750%), 01/04/26 | 405,858 | 0.1 | |||||||||||
| 1,178,873 | Air Methods Corporation 2017 Term Loan B, 4.506%, (US0003M + 3.500%), 04/22/24 | 1,129,508 | 0.2 | |||||||||||
| 250,000 | (1) | Athenahealth, Inc. 2022 Delayed Draw Term loan, 3.550%, (SOFRRATE + 3.500%), 02/15/29 | 247,890 | 0.1 | ||||||||||
| 1,475,000 | Athenahealth, Inc. 2022 Term Loan B, 4.000%, (SOFRRATE + 3.500%), 02/15/29 | 1,462,554 | 0.3 | |||||||||||
| Principal Amount† | Borrower/Tranche Description | Fair Value | Percentage of Net Assets | |||||||||||
|---|---|---|---|---|---|---|---|---|---|---|---|---|---|---|
LOANS*: (continued) | ||||||||||||||
Health Care: (continued) | ||||||||||||||
| 1,505,000 | Bausch Health Companies Inc. 2022 Term Loan B, 5.300%, (SOFRRATE + 5.250%), 01/27/27 | $ | 1,493,041 | 0.3 | ||||||||||
| 1,632,555 | Bausch Health Companies, Inc. 2018 Term Loan B, 3.457%, (US0001M + 3.000%), 06/02/25 | 1,620,878 | 0.3 | |||||||||||
| 880,575 | Bella Holding Company, LLC 2021 Term Loan B, 4.500%, (US0001M + 3.750%), 05/10/28 | 872,595 | 0.2 | |||||||||||
| 643,388 | Carestream Dental Equipment, Inc 2021 Term Loan, 5.000%, (US0001M + 4.500%), 09/01/24 | 640,171 | 0.1 | |||||||||||
| 655,973 | CCRR Parent, Inc Term Loan B, 4.756%, (US0003M + 3.750%), 03/06/28 | 659,048 | 0.1 | |||||||||||
| 970,125 | CHG Healthcare Services Inc. 2021 Term Loan, 4.999%, (US0006M + 3.500%), 09/29/28 | 963,254 | 0.2 | |||||||||||
| 997,382 | Commerce Merger Sub, Inc. 2017 1st Lien Term Loan, 4.256%, (US0003M + 3.250%), 06/28/24 | 993,641 | 0.2 | |||||||||||
| 1,231,710 | Curia Global, Inc. 2021 Term Loan, 4.500%, (US0003M + 3.750%), 08/30/26 | 1,223,396 | 0.3 | |||||||||||
| 1,626,722 | Da Vinci Purchaser Corp. 2019 Term Loan, 5.006%, (US0003M + 4.000%), 01/08/27 | 1,623,333 | 0.3 | |||||||||||
| 206,522 | Embecta Corp Term Loan B, 3.302%, (TSFR1M + 3.000%), 01/27/29 | 204,302 | 0.0 | |||||||||||
| 1,959,939 | Envision Healthcare Corporation 2018 1st Lien Term Loan, 4.207%, (US0001M + 3.750%), 10/10/25 | 1,318,759 | 0.3 | |||||||||||
| 748,643 | eResearchTechnology, Inc. 2020 1st Lien Term Loan, 5.500%, (US0001M + 4.500%), 02/04/27 | 746,538 | 0.2 | |||||||||||
| 1,989,710 | Global Medical Response, Inc. 2017 Incremental Term Loan, 5.250%, (US0006M + 4.250%), 03/14/25 | 1,980,591 | 0.4 | |||||||||||
| 877,009 | GoodRx, Inc. 1st Lien Term Loan, 3.207%, (US0001M + 2.750%), 10/10/25 | 871,090 | 0.2 | |||||||||||
| VOYA FLOATING RATE FUND | PORTFOLIO OF INVESTMENTS AS OF MARCH 31, 2022 (CONTINUED) |
| Principal Amount† | Borrower/Tranche Description | Fair Value | Percentage of Net Assets | |||||||||||
|---|---|---|---|---|---|---|---|---|---|---|---|---|---|---|
LOANS*: (continued) | ||||||||||||||
Health Care: (continued) | ||||||||||||||
| 496,094 | Greenway Health, LLC 2017 1st Lien Term Loan, 4.750%, (US0003M + 3.750%), 02/16/24 | $ | 465,553 | 0.1 | ||||||||||
| 635,200 | Heartland Dental, LLC 2021 Incremental Term Loan, 4.447%, (US0001M + 4.000%), 04/30/25 | 631,826 | 0.1 | |||||||||||
| 455,000 | ICU Medical, Inc. Term Loan B, 3.000%, (SOFRRATE + 2.500%), 01/08/29 | 454,147 | 0.1 | |||||||||||
| 1,090,000 | Medline Borrower, LP USD Term Loan B, 3.750%, (US0001M + 3.250%), 10/23/28 | 1,079,778 | 0.2 | |||||||||||
| 370,000 | MJH Healthcare Holdings, LLC 2022 Term Loan B, 4.000%, (SOFRRATE + 3.500%), 01/28/29 | 365,375 | 0.1 | |||||||||||
| 1,422,825 | MPH Acquisition Holdings LLC 2021 Term Loan B, 4.758%, (US0003M + 4.250%), 09/01/28 | 1,385,920 | 0.3 | |||||||||||
| 150,000 | National Mentor Holdings, Inc. 2021 2nd Lien Term Loan, 8.260%, (US0003M + 7.250%), 03/02/29 | 145,500 | 0.0 | |||||||||||
| 59,728 | National Mentor Holdings, Inc. 2021 Term Loan C, 4.760%, (US0003M + 3.750%), 03/02/28 | 58,011 | 0.0 | |||||||||||
| 1,773,914 | National Mentor Holdings, Inc. 2021 Term Loan, 4.756%, (US0001M + 3.750%), 03/02/28 | 1,722,914 | 0.4 | |||||||||||
| 1,355,529 | Ortho-Clinical Diagnostics SA 2018 Term Loan B, 3.235%, (US0001M + 3.000%), 06/30/25 | 1,352,457 | 0.3 | |||||||||||
| 450,000 | Owens & Minor, Inc. 2022 Term Loan B, 4.052%, (TSFR1M + 3.750%), 03/29/29 | 449,437 | 0.1 | |||||||||||
| 640,163 | Pacific Dental Services,LLC 2021 Term Loan, 4.000%, (US0001M + 3.250%), 05/05/28 | 633,628 | 0.1 | |||||||||||
| 757,325 | Packaging Coordinators Midco, Inc. 2020 1st Lien Term Loan, 4.500%, (US0003M + 3.750%), 11/30/27 | 754,169 | 0.2 | |||||||||||
| 250,000 | Padagis LLC Term Loan B, 5.250%, (US0003M + 4.750%), 07/06/28 | 248,594 | 0.1 | |||||||||||
| Principal Amount† | Borrower/Tranche Description | Fair Value | Percentage of Net Assets | |||||||||||
|---|---|---|---|---|---|---|---|---|---|---|---|---|---|---|
LOANS*: (continued) | ||||||||||||||
Health Care: (continued) | ||||||||||||||
| 1,000,000 | Parexel International Corporation 2021 1st Lien Term Loan, 4.000%, (US0003M + 3.500%), 11/15/28 | $ | 993,672 | 0.2 | ||||||||||
| 1,008,974 | Pathway Vet Alliance LLC 2021 Term Loan, 4.207%, (US0001M + 3.750%), 03/31/27 | 1,000,776 | 0.2 | |||||||||||
| 833,684 | Pediatric Associates Holding Company, LLC 2021 Term Loan B, 3.750%, (US0003M + 3.250%), 12/29/28 | 823,263 | 0.2 | |||||||||||
| 126,316 | Pediatric Associates Holding Company, LLC 2022 Delayed Draw Term loan, 3.754%, (US0003M + 3.250%), 12/29/28 | 124,737 | 0.0 | |||||||||||
| 974,987 | PetVet Care Centers, LLC 2021 Term Loan B3, 4.250%, (US0001M + 3.500%), 02/14/25 | 970,315 | 0.2 | |||||||||||
| 1,327,034 | Phoenix Guarantor Inc 2020 Term Loan B, 3.459%, (US0001M + 3.250%), 03/05/26 | 1,313,052 | 0.3 | |||||||||||
| 1,183,075 | Phoenix Guarantor Inc 2021 Term Loan B3, 3.947%, (US0001M + 3.500%), 03/05/26 | 1,170,610 | 0.2 | |||||||||||
| 650,000 | Physician Partners LLC Term Loan, 4.500%, (SOFRRATE + 4.000%), 12/26/28 | 643,906 | 0.1 | |||||||||||
| 1,305,162 | Pluto Acquisition I, Inc. 2021 1st Lien Term Loan, 4.508%, (US0003M + 4.000%), 06/22/26 | 1,288,848 | 0.3 | |||||||||||
| 615,000 | PointClickCare Technologies, Inc. 2022 Term Loan B, 4.775%, (SOFRRATE + 4.000%), 12/29/27 | 612,694 | 0.1 | |||||||||||
| 247,500 | PointClickCare Technologies, Inc. Term Loan B, 3.750%, (US0006M + 3.000%), 12/29/27 | 245,644 | 0.0 | |||||||||||
| 665,000 | Press Ganey Holdings, Inc. 2022 Incremental Term Loan, 3.800%, (SOFRRATE + 3.750%), 07/24/26 | 660,012 | 0.1 | |||||||||||
| 1,400,850 | Project Ruby Ultimate Parent Corp. 2021 Term Loan, 4.000%, (US0001M + 3.250%), 03/03/28 | 1,387,192 | 0.3 | |||||||||||
| 2,132,803 | RegionalCare Hospital Partners Holdings, Inc. 2018 Term Loan B, 4.197%, (US0001M + 3.750%), 11/16/25 | 2,122,139 | 0.4 | |||||||||||
| VOYA FLOATING RATE FUND | PORTFOLIO OF INVESTMENTS AS OF MARCH 31, 2022 (CONTINUED) |
| Principal Amount† | Borrower/Tranche Description | Fair Value | Percentage of Net Assets | |||||||||||
|---|---|---|---|---|---|---|---|---|---|---|---|---|---|---|
LOANS*: (continued) | ||||||||||||||
Health Care: (continued) | ||||||||||||||
| 482,575 | Resonetics, LLC 2021 Term Loan, 4.750%, (US0003M + 4.000%), 04/28/28 | $ | 478,654 | 0.1 | ||||||||||
| 756,707 | RxBenefits, Inc. 2020 Term Loan, 5.250%, (US0003M + 4.500%), 12/17/27 | 753,869 | 0.2 | |||||||||||
| 1,035,000 | Sotera Health Holdings, LLC 2021 Term Loan, 3.250%, (US0003M + 2.750%), 12/11/26 | 1,025,297 | 0.2 | |||||||||||
| 1,188,463 | Surgery Center Holdings, Inc. 2021 Term Loan, 4.500%, (US0001M + 3.750%), 08/31/26 | 1,180,704 | 0.2 | |||||||||||
| 1,492,125 | Tecomet Inc. 2017 Repriced Term Loan, 4.500%, (US0003M + 3.500%), 05/01/24 | 1,404,463 | 0.3 | |||||||||||
| 1,162,088 | U.S. Anesthesia Partners, Inc. 2021 Term Loan, 4.750%, (US0001M + 4.250%), 10/01/28 | 1,155,914 | 0.2 | |||||||||||
| 923,963 | Unified Physician Management, LLC 2020 Term Loan, 5.000%, (US0001M + 4.250%), 12/16/27 | 916,745 | 0.2 | |||||||||||
| 1,039,775 | Virgin Pulse, Inc. 2021 Term Loan, 4.750%, (US0001M + 4.000%), 04/06/28 | 1,029,377 | 0.2 | |||||||||||
| 820,000 | WP CityMD Bidco LLC 2021 1st Lien Term Loan B, 3.750%, (US0006M + 3.250%), 12/22/28 | 816,327 | 0.2 | |||||||||||
| 51,939,299 | 10.7 | |||||||||||||
Home Furnishings: 0.3% | ||||||||||||||
| 761,175 | Conair Holdings, LLC Term Loan B, 4.756%, (US0003M + 3.750%), 05/17/28 | 750,328 | 0.1 | |||||||||||
| 867,825 | Illuminate Merger Sub Corp. Term Loan, 4.506%, (US0003M + 3.500%), 07/21/28 | 841,171 | 0.2 | |||||||||||
| 1,591,499 | 0.3 | |||||||||||||
Industrial Equipment: 1.5% | ||||||||||||||
| 497,454 | Alliance Laundry Systems LLC Term Loan B, 4.251%, (US0003M + 3.500%), 10/08/27 | 492,686 | 0.1 | |||||||||||
| 740,000 | CMBF LLC Term Loan, 6.500%, (US0001M + 6.000%), 08/02/28 | 728,900 | 0.1 | |||||||||||
| Principal Amount† | Borrower/Tranche Description | Fair Value | Percentage of Net Assets | |||||||||||
|---|---|---|---|---|---|---|---|---|---|---|---|---|---|---|
LOANS*: (continued) | ||||||||||||||
Industrial Equipment: (continued) | ||||||||||||||
| 1,000,000 | Crown Subsea Communications Holding,Inc. 2021 Term Loan, 5.500%, (US0003M + 4.750%), 04/27/27 | $ | 998,333 | 0.2 | ||||||||||
| 1,493,254 | Granite Holdings US Acquisition Co. 2021 Term Loan B, 4.250%, (US0003M + 4.000%), 09/30/26 | 1,482,055 | 0.3 | |||||||||||
| 250,521 | I-Logic Technologies Bidco Limited 2021 USD Term Loan B, 4.500%, (US0001M + 4.000%), 02/16/28 | 249,143 | 0.1 | |||||||||||
| 854,756 | Kenan Advantage Group, Inc. 2021 Term Loan B1, 4.500%, (US0003M + 3.750%), 03/24/26 | 844,927 | 0.2 | |||||||||||
| 500,000 | Madison IAQ LLC Term Loan, 3.754%, (US0006M + 3.250%), 06/21/28 | 493,594 | 0.1 | |||||||||||
| 281,625 | Star US Bidco LLC Term Loan B, 5.250%, (US0001M + 4.250%), 03/17/27 | 279,689 | 0.1 | |||||||||||
| 1,697,391 | Vertical US Newco Inc Term Loan B, 4.000%, (US0006M + 3.500%), 07/30/27 | 1,685,085 | 0.3 | |||||||||||
| 7,254,412 | 1.5 | |||||||||||||
Insurance: 3.4% | ||||||||||||||
| 1,727,276 | Acrisure, LLC 2020 Term Loan B, 3.957%, (US0001M + 3.500%), 02/15/27 | 1,703,958 | 0.3 | |||||||||||
| 1,107,225 | Acrisure, LLC 2021 First Lien Term Loan B, 4.750%, (US0001M + 4.250%), 02/15/27 | 1,104,457 | 0.2 | |||||||||||
| 1,307,178 | Alliant Holdings Intermediate, LLC 2021 Term Loan B4, 4.000%, (US0001M + 3.500%), 11/06/27 | 1,300,526 | 0.3 | |||||||||||
| 1,361,278 | Alliant Holdings Intermediate, LLC Term Loan B, 3.707%, (US0001M + 3.250%), 05/09/25 | 1,347,948 | 0.3 | |||||||||||
| 1,243,573 | Aretec Group, Inc. 2018 Term Loan, 4.707%, (US0001M + 4.250%), 10/01/25 | 1,234,868 | 0.3 | |||||||||||
| 1,785,887 | AssuredPartners, Inc. 2020 Term Loan B, 3.957%, (US0001M + 3.500%), 02/12/27 | 1,767,190 | 0.4 | |||||||||||
| 1,176,939 | Hub International Limited 2018 Term Loan B, 3.267%, (US0003M + 2.750%), 04/25/25 | 1,165,102 | 0.2 | |||||||||||
| VOYA FLOATING RATE FUND | PORTFOLIO OF INVESTMENTS AS OF MARCH 31, 2022 (CONTINUED) |
| Principal Amount† | Borrower/Tranche Description | Fair Value | Percentage of Net Assets | |||||||||||
|---|---|---|---|---|---|---|---|---|---|---|---|---|---|---|
LOANS*: (continued) | ||||||||||||||
Insurance: (continued) | ||||||||||||||
| 753,113 | IMA Financial Group, Inc. Term Loan, 4.250%, (US0001M + 3.750%), 11/01/28 | $ | 746,288 | 0.2 | ||||||||||
| 1,709,069 | NFP Corp. 2020 Term Loan, 3.707%, (US0001M + 3.250%), 02/15/27 | 1,680,763 | 0.3 | |||||||||||
| 2,369,930 | OneDigital Borrower LLC 2021 Term Loan, 4.750%, (SOFRRATE + 4.250%), 11/16/27 | 2,358,080 | 0.5 | |||||||||||
| 496,222 | Ryan Specialty Group, LLC Term Loan, 3.750%, (US0001M + 3.000%), 09/01/27 | 493,741 | 0.1 | |||||||||||
| 1,714,944 | Sedgwick Claims Management Services, Inc. 2018 Term Loan B, 3.707%, (US0001M + 3.250%), 12/31/25 | 1,700,245 | 0.3 | |||||||||||
| 16,603,166 | 3.4 | |||||||||||||
Leisure Good/Activities/Movies: 4.2% | ||||||||||||||
| 633,489 | (2) | 24 Hour Fitness Worldwide, Inc. 2021 Delayed Draw Term Loan, 15.000%, (US0003M + 2.000%) (PIK Rate 0.000%, Cash Rate 0.000%), 08/26/22 | 630,321 | 0.1 | ||||||||||
| 983,571 | (2) | 24 Hour Fitness Worldwide, Inc. 2021 Exit Delayed Draw Term Loan, 15.000%, (US0003M + 14.000%) (PIK Rate 0.000%, Cash Rate 0.000%), 09/29/26 | 914,721 | 0.2 | ||||||||||
| 1,355,975 | Alterra Mountain Company 2021 Series B-2 Consenting Term Loan, 4.000%, (US0001M + 3.500%), 08/17/28 | 1,344,958 | 0.3 | |||||||||||
| 709,516 | AMC Entertainment Holdings Inc. 2019 Term Loan B, 3.352%, (US0001M + 3.000%), 04/22/26 | 633,631 | 0.1 | |||||||||||
| 2,204,475 | AppLovin Corporation 2021 Term Loan B, 3.500%, (US0001M + 3.000%), 10/25/28 | 2,191,903 | 0.5 | |||||||||||
| 1,985,025 | City Football Group Limited Term Loan, 4.000%, (US0006M + 3.500%), 07/21/28 | 1,957,731 | 0.4 | |||||||||||
| 1,719,121 | ClubCorp Club Operations, Inc. 2017 Incremental Term Loan, 3.756%, (US0003M + 2.750%), 09/18/24 | 1,637,194 | 0.3 | |||||||||||
| Principal Amount† | Borrower/Tranche Description | Fair Value | Percentage of Net Assets | |||||||||||
|---|---|---|---|---|---|---|---|---|---|---|---|---|---|---|
LOANS*: (continued) | ||||||||||||||
Leisure Good/Activities/Movies: (continued) | ||||||||||||||
| 15,037 | (2) | Crown Finance US, Inc. 2020 Term Loan B1, 8.006% (PIK Rate 8.250%, Cash Rate 7.000%), 05/23/24 | $ | 17,800 | 0.0 | |||||||||
| 2,118,625 | CWGS Group, LLC 2021 Term Loan B, 3.250%, (US0001M + 2.500%), 06/03/28 | 2,043,414 | 0.4 | |||||||||||
| 500,000 | Delta 2 (LUX) S.a.r.l. 2018 USD Term Loan, 3.500%, (US0001M + 2.500%), 02/01/24 | 497,437 | 0.1 | |||||||||||
| 1,620,760 | Hayward Industries, Inc. 2021 Term Loan, 3.000%, (US0001M + 2.500%), 05/30/28 | 1,603,539 | 0.3 | |||||||||||
| 486,325 | MajorDrive Holdings IV LLC Term Loan B, 4.563%, (US0003M + 4.000%), 06/01/28 | 479,942 | 0.1 | |||||||||||
| 494,937 | PUG LLC USD Term Loan, 3.957%, (US0001M + 3.500%), 02/12/27 | 486,585 | 0.1 | |||||||||||
| 1,333,148 | RV Retailer, LLC Term Loan B, 4.500%, (SOFRRATE + 3.750%), 02/08/28 | 1,276,490 | 0.3 | |||||||||||
| 1,278,361 | Samsonite International S.A. 2020 Incremental Term Loan B2, 3.750%, (US0003M + 3.000%), 04/25/25 | 1,260,184 | 0.3 | |||||||||||
| 895,000 | Scientific Games Holdings LP 2022 USD Term Loan B, 3.550%, (SOFRRATE + 3.500%), 02/04/29 | 887,914 | 0.2 | |||||||||||
| 955,882 | SRAM, LLC 2021 Term Loan B, 4.220%, (US0006M + 2.750%), 05/18/28 | 946,324 | 0.2 | |||||||||||
| 1,101,785 | The Knot Worldwide Inc. 2022 Term Loan, 4.581%, (SOFRRATE + 4.500%), 12/19/25 | 1,100,408 | 0.2 | |||||||||||
| 685,325 | Thor Industries, Inc. 2021 USD Term Loan, 3.500%, (US0001M + 3.000%), 02/01/26 | 684,040 | 0.1 | |||||||||||
| 20,594,536 | 4.2 | |||||||||||||
Lodging & Casinos: 1.7% | ||||||||||||||
| 989,979 | Aimbridge Acquisition Co., Inc. 2020 Incremental Term Loan B, 5.500%, (US0001M + 4.750%), 02/02/26 | 986,267 | 0.2 | |||||||||||
| 742,163 | Arches Buyer Inc. 2021 Term Loan B, 3.750%, (US0001M + 3.250%), 12/06/27 | 731,204 | 0.1 | |||||||||||
| VOYA FLOATING RATE FUND | PORTFOLIO OF INVESTMENTS AS OF MARCH 31, 2022 (CONTINUED) |
| Principal Amount† | Borrower/Tranche Description | Fair Value | Percentage of Net Assets | |||||||||||
|---|---|---|---|---|---|---|---|---|---|---|---|---|---|---|
LOANS*: (continued) | ||||||||||||||
Lodging & Casinos: (continued) | ||||||||||||||
| 544,512 | Caesars Resort Collection, LLC 2020 Term Loan B1, 3.957%, (US0001M + 3.500%), 07/21/25 | $ | 542,243 | 0.1 | ||||||||||
| 865,000 | Century Casinos, Inc 2022 Term Loan, 6.302%, (TSFR1M + 6.000%), 03/23/29 | 859,594 | 0.2 | |||||||||||
| 925,926 | Golden Entertainment, Inc. 2017 1st Lien Term Loan, 4.000%, (US0001M + 3.000%), 10/21/24 | 918,113 | 0.2 | |||||||||||
| 1,298,475 | Hilton Grand Vacations Borrower LLC 2021 Term Loan B, 3.500%, (US0001M + 3.000%), 08/02/28 | 1,292,592 | 0.3 | |||||||||||
| 500,000 | Hilton Worldwide Finance, LLC 2019 Term Loan B2, 2.207%, (US0001M + 1.750%), 06/22/26 | 495,173 | 0.1 | |||||||||||
| 667,329 | Stars Group Holdings B.V. (The) 2018 USD Incremental Term Loan, 3.256%, (US0003M + 2.250%), 07/21/26 | 662,324 | 0.1 | |||||||||||
| 726,750 | The Enterprise Development Authority Term Loan B, 5.000%, (US0001M + 4.250%), 02/28/28 | 722,662 | 0.1 | |||||||||||
| 1,233,800 | Twin River Worldwide Holdings, Inc. 2021 Term Loan B, 3.750%, (US0006M + 3.250%), 10/02/28 | 1,228,016 | 0.3 | |||||||||||
| 8,438,188 | 1.7 | |||||||||||||
Mortgage REITs: 0.2% | ||||||||||||||
| 737,802 | BIFM CA Buyer Inc. Term Loan B, 3.957%, (US0001M + 3.500%), 06/01/26 | 726,735 | 0.2 | |||||||||||
Nonferrous Metals/Minerals: 0.9% | ||||||||||||||
| 1,336,122 | Covia Holdings Corporation 2020 Take Back Term Loan, 5.000%, (US0003M + 4.000%), 07/31/26 | 1,316,915 | 0.3 | |||||||||||
| 2,930,807 | U.S. Silica Company 2018 Term Loan B, 5.000%, (US0001M + 4.000%), 05/01/25 | 2,887,369 | 0.6 | |||||||||||
| 4,204,284 | 0.9 | |||||||||||||
Oil & Gas: 2.4% | ||||||||||||||
| 167,813 | BCP Renaissance Parent LLC 2017 Term Loan B, 4.500%, (US0003M + 3.500%), 10/31/24 | 165,716 | 0.0 | |||||||||||
| Principal Amount† | Borrower/Tranche Description | Fair Value | Percentage of Net Assets | |||||||||||
|---|---|---|---|---|---|---|---|---|---|---|---|---|---|---|
LOANS*: (continued) | ||||||||||||||
Oil & Gas: (continued) | ||||||||||||||
| 1,582,088 | Brazos Delaware II, LLC Term Loan B, 4.449%, (US0001M + 4.000%), 05/21/25 | $ | 1,565,081 | 0.3 | ||||||||||
| 449,344 | Glass Mountain Pipeline Holdings, LLC 2021 Exit Term Loan, 5.500%, (US0003M + 4.500%), 10/28/27 | 417,890 | 0.1 | |||||||||||
| 860,675 | ITT Holdings LLC 2021 Term Loan, 3.250%, (US0001M + 2.750%), 07/10/28 | 851,800 | 0.2 | |||||||||||
| 1,750,000 | Lucid Energy Group II Borrower, LLC 2021 Term Loan, 5.000%, (US0001M + 4.250%), 11/24/28 | 1,737,787 | 0.3 | |||||||||||
| 730,544 | Medallion Midland Acquisition, LLC 2021 Term Loan, 4.500%, (US0001M + 3.750%), 10/18/28 | 724,882 | 0.1 | |||||||||||
| 795,876 | NorthRiver Midstream Finance LP 2018 Term Loan B, 3.457%, (US0003M + 3.250%), 10/01/25 | 789,480 | 0.2 | |||||||||||
| 877,800 | Oryx Midstream Services Permian Basin LLC Term Loan B, 3.750%, (US0003M + 3.250%), 10/05/28 | 871,628 | 0.2 | |||||||||||
| 1,446,375 | Southwestern Energy Company 2021 Term Loan, 3.301%, (SOFRRATE + 2.500%), 06/22/27 | 1,437,335 | 0.3 | |||||||||||
| 804,306 | TransMontaigne Operating Company L.P. Term Loan B, 4.000%, (US0001M + 3.500%), 11/17/28 | 799,530 | 0.2 | |||||||||||
| 975,790 | Traverse Midstream Partners LLC 2017 Term Loan, 5.250%, (SOFRRATE + 4.250%), 09/27/24 | 973,351 | 0.2 | |||||||||||
| 1,486,031 | WaterBridge Midstream Operating LLC Term Loan B, 6.750%, (US0006M + 5.750%), 06/22/26 | 1,436,408 | 0.3 | |||||||||||
| 11,770,888 | 2.4 | |||||||||||||
Publishing: 0.8% | ||||||||||||||
| 822,501 | Alchemy Copyrights, LLC Term Loan B, 3.500%, (US0001M + 3.000%), 03/10/28 | 821,473 | 0.2 | |||||||||||
| 995,000 | Cengage Learning, Inc. 2021 Term Loan B, 5.750%, (US0003M + 4.750%), 07/14/26 | 989,092 | 0.2 | |||||||||||
| VOYA FLOATING RATE FUND | PORTFOLIO OF INVESTMENTS AS OF MARCH 31, 2022 (CONTINUED) |
| Principal Amount† | Borrower/Tranche Description | Fair Value | Percentage of Net Assets | |||||||||||
|---|---|---|---|---|---|---|---|---|---|---|---|---|---|---|
LOANS*: (continued) | ||||||||||||||
Publishing: (continued) | ||||||||||||||
| 1,097,250 | Dotdash Meredith Inc Term Loan B, 4.500%, (SOFRRATE + 4.000%), 12/01/28 | $ | 1,091,306 | 0.2 | ||||||||||
| 1,228,825 | McGraw-Hill Global Education Holdings, LLC 2021 Term Loan, 5.554%, (US0006M + 4.750%), 07/28/28 | 1,219,225 | 0.2 | |||||||||||
| 4,121,096 | 0.8 | |||||||||||||
Radio & Television: 2.5% | ||||||||||||||
| 1,494,744 | A-L Parent LLC 2016 1st Lien Term Loan, 4.250%, (US0001M + 3.250%), 12/01/23 | 1,425,379 | 0.3 | |||||||||||
| 1,384,775 | Clear Channel Outdoor Holdings, Inc. Term Loan B, 3.799%, (US0003M + 3.500%), 08/21/26 | 1,363,745 | 0.3 | |||||||||||
| 1,658,503 | CMG Media Corporation 2021 Term Loan, 3.957%, (US0001M + 3.500%), 12/17/26 | 1,635,846 | 0.3 | |||||||||||
| 4,803,946 | Diamond Sports Group, LLC 2022 2nd Lien Term Loan, 3.445%, (SOFRRATE + 3.250%), 08/24/26 | 1,676,375 | 0.3 | |||||||||||
| 748,929 | Diamond Sports Group, LLC 2022 First Priority Term Loan, 9.000%, (SOFRRATE + 8.000%), 05/26/26 | 761,919 | 0.2 | |||||||||||
| 1,401,488 | Gray Television, Inc. 2021 Term Loan D, 3.231%, (US0001M + 3.000%), 12/01/28 | 1,396,378 | 0.3 | |||||||||||
| 280,000 | iHeartCommunications, Inc. 2020 Incremental Term Loan, 3.750%, (US0001M + 3.250%), 05/01/26 | 278,875 | 0.1 | |||||||||||
| 1,533,849 | iHeartCommunications, Inc. 2020 Term Loan, 3.457%, (US0001M + 3.000%), 05/01/26 | 1,527,619 | 0.3 | |||||||||||
| 686,672 | NASCAR Holdings, Inc Term Loan B, 2.957%, (US0001M + 2.500%), 10/19/26 | 683,239 | 0.1 | |||||||||||
| 160,358 | Sinclair Television Group Inc. Term Loan B2B, 2.960%, (US0001M + 2.500%), 09/30/26 | 155,881 | 0.0 | |||||||||||
| 1,346,474 | Univision Communications Inc. 2021 First Lien Term Loan B, 4.000%, (US0001M + 3.250%), 03/15/26 | 1,341,930 | 0.3 | |||||||||||
| 12,247,186 | 2.5 | |||||||||||||
| Principal Amount† | Borrower/Tranche Description | Fair Value | Percentage of Net Assets | |||||||||||
|---|---|---|---|---|---|---|---|---|---|---|---|---|---|---|
LOANS*: (continued) | ||||||||||||||
Retailers (Except Food & Drug): 2.7% | ||||||||||||||
| 42,778 | AI Aqua Merger Sub, Inc. 2021 1st Lien Delayed Draw Term Loan, 4.209%, (US0003M + 4.000%), 07/31/28 | $ | 42,439 | 0.0 | ||||||||||
| 342,222 | AI Aqua Merger Sub, Inc. 2021 1st Lien Term Loan B, 4.250%, (TSFR1M + 3.750%), 07/31/28 | 339,513 | 0.1 | |||||||||||
| 102,778 | AI Aqua Merger Sub, Inc. 2022 Delayed Draw Term loan, 4.050%, (SOFRRATE + 4.000%), 07/31/28 | 101,814 | 0.0 | |||||||||||
| 452,222 | AI Aqua Merger Sub, Inc. 2022 Term Loan B, 4.050%, (TSFR1M + 4.000%), 07/31/28 | 447,983 | 0.1 | |||||||||||
| 606,369 | CNT Holdings I Corp 2020 Term Loan, 4.250%, (US0003M + 3.500%), 11/08/27 | 603,868 | 0.1 | |||||||||||
| 672,742 | Franchise Group Intermediate Holdco, LLC 2021 First Out Term Loan B, 5.500%, (US0003M + 4.750%), 03/10/26 | 672,742 | 0.1 | |||||||||||
| 1,708,440 | Great Outdoors Group, LLC 2021 Term Loan B1, 4.500%, (US0001M + 3.750%), 03/06/28 | 1,704,435 | 0.4 | |||||||||||
| 2,434,375 | Harbor Freight Tools USA, Inc. 2021 Term Loan B, 3.250%, (US0001M + 2.750%), 10/19/27 | 2,388,224 | 0.5 | |||||||||||
| 752,223 | Jo-Ann Stores, Inc. 2021 Term Loan B1, 5.500%, (US0003M + 4.750%), 07/07/28 | 661,956 | 0.1 | |||||||||||
| 639,256 | Leslies Poolmart, Inc. 2021 Term Loan B, 3.019%, (US0003M + 2.500%), 03/09/28 | 631,950 | 0.1 | |||||||||||
| 623,993 | Mens Wearhouse, Inc. (The) 2020 Take Back Term Loan, 9.000%, (US0003M + 8.000%), 12/01/25 | 581,873 | 0.1 | |||||||||||
| 205,704 | Mens Wearhouse, Inc. (The) 2020 Term Loan, 12.000%, (US0003M + 11.000%), 06/01/25 | 206,732 | 0.1 | |||||||||||
| 1,067,684 | Michaels Companies, Inc. 2021 Term Loan B, 5.256%, (US0003M + 4.250%), 04/15/28 | 1,000,954 | 0.2 | |||||||||||
| 997,481 | Petco Animal Supplies, Inc. 2021 Term Loan B, 4.256%, (US0003M + 3.250%), 03/03/28 | 989,127 | 0.2 | |||||||||||
| VOYA FLOATING RATE FUND | PORTFOLIO OF INVESTMENTS AS OF MARCH 31, 2022 (CONTINUED) |
| Principal Amount† | Borrower/Tranche Description | Fair Value | Percentage of Net Assets | |||||||||||
|---|---|---|---|---|---|---|---|---|---|---|---|---|---|---|
LOANS*: (continued) | ||||||||||||||
Retailers (Except Food & Drug): (continued) | ||||||||||||||
| 798,000 | Petmate Incremental Term Loan B, 6.250%, (US0001M + 5.500%), 09/15/28 | $ | 781,541 | 0.2 | ||||||||||
| 1,243,750 | Pilot Travel Centers LLC 2021 Term Loan B, 2.209%, (US0001M + 2.000%), 08/04/28 | 1,228,359 | 0.3 | |||||||||||
| 507,450 | Victorias Secret & Co. Term Loan B, 3.750%, (US0003M + 3.250%), 08/02/28 | 500,790 | 0.1 | |||||||||||
| 12,884,300 | 2.7 | |||||||||||||
Surface Transport: 1.2% | ||||||||||||||
| 2,097,838 | American Trailer World Corp. Term Loan B, 4.500%, (SOFRRATE + 3.750%), 03/03/28 | 2,026,161 | 0.4 | |||||||||||
| 627,509 | ENC Holding Corporation 2021 Term Loan, 5.256%, (US0003M + 4.250%), 08/04/28 | 618,096 | 0.1 | |||||||||||
| 55,918 | (1) | ENC Holding Corporation Delayed Draw Term Loan, 4.370%, (US0003M + 4.250%), 08/04/28 | 55,080 | 0.0 | ||||||||||
| 150,000 | LaserShip, Inc. 2021 2nd Lien Term Loan, 8.250%, (US0003M + 7.500%), 05/07/29 | 149,625 | 0.0 | |||||||||||
| 995,000 | LaserShip, Inc. 2021 Term Loan, 5.250%, (US0003M + 4.500%), 05/07/28 | 991,684 | 0.2 | |||||||||||
| 787,038 | Savage Enterprises LLC 2021 Term Loan B, 3.750%, (US0001M + 3.250%), 09/15/28 | 782,513 | 0.2 | |||||||||||
| 887,775 | Worldwide Express Operations, LLC 2021 1st Lien Term Loan, 5.750%, (US0003M + 4.250%), 07/26/28 | 880,007 | 0.2 | |||||||||||
| 250,000 | Worldwide Express Operations, LLC 2021 2nd Lien Term Loan, 8.006%, (US0003M + 7.000%), 07/26/29 | 246,562 | 0.1 | |||||||||||
| 5,749,728 | 1.2 | |||||||||||||
Technology: 0.6% | ||||||||||||||
| 1,224,390 | Misys (Finastra) — TL B 1L, 4.500%, (US0003M + 3.500%), 06/13/24 | 1,210,233 | 0.2 | |||||||||||
| 782,070 | RealPage, Inc. Term Loan B 1L, 3.750%, (US0001M + 3.250%), 04/24/28 | 774,445 | 0.2 | |||||||||||
| 1,039,032 | Veritas US Inc. 2021 USD Term Loan B, 6.000%, (US0003M + 5.000%), 09/01/25 | 977,556 | 0.2 | |||||||||||
| 2,962,234 | 0.6 | |||||||||||||
| Principal Amount† | Borrower/Tranche Description | Fair Value | Percentage of Net Assets | |||||||||||
|---|---|---|---|---|---|---|---|---|---|---|---|---|---|---|
LOANS*: (continued) | ||||||||||||||
Telecommunications: 6.1% | ||||||||||||||
| 895,951 | Altice Financing SA 2017 USD Term Loan B, 2.991%, (US0003M + 2.750%), 07/15/25 | $ | 874,672 | 0.2 | ||||||||||
| 896,611 | Altice Financing SA USD 2017 1st Lien Term Loan, 2.989%, (US0003M + 2.750%), 01/31/26 | 868,592 | 0.2 | |||||||||||
| 629,640 | Altice France S.A. USD Term Loan B11, 3.049%, (US0001M + 2.750%), 07/31/25 | 615,997 | 0.1 | |||||||||||
| 1,979,950 | Asurion LLC 2020 Term Loan B8, 3.707%, (US0001M + 3.250%), 12/23/26 | 1,939,820 | 0.4 | |||||||||||
| 530,000 | Asurion LLC 2021 2nd Lien Term Loan B3, 5.707%, (US0001M + 5.250%), 01/31/28 | 520,504 | 0.1 | |||||||||||
| 1,170,000 | Asurion LLC 2021 Second Lien Term Loan B4, 5.707%, (US0001M + 5.250%), 01/20/29 | 1,146,600 | 0.2 | |||||||||||
| 1,972,437 | Asurion LLC 2021 Term Loan B9, 3.707%, (US0001M + 3.250%), 07/31/27 | 1,935,044 | 0.4 | |||||||||||
| 747,235 | Avaya, Inc. 2020 Term Loan B, 4.647%, (US0001M + 4.250%), 12/15/27 | 742,720 | 0.2 | |||||||||||
| 814,140 | Cablevision Lightpath LLC Term Loan B, 3.750%, (US0003M + 3.250%), 11/30/27 | 805,286 | 0.2 | |||||||||||
| 2,496,222 | CCI Buyer, Inc. Term Loan, 4.750%, (US0003M + 4.000%), 12/17/27 | 2,470,219 | 0.5 | |||||||||||
| 2,984,733 | CenturyLink, Inc. 2020 Term Loan B, 2.707%, (US0001M + 2.250%), 03/15/27 | 2,910,580 | 0.6 | |||||||||||
| 1,781,585 | CommScope, Inc. 2019 Term Loan B, 3.707%, (US0001M + 3.250%), 04/06/26 | 1,742,334 | 0.4 | |||||||||||
| 2,386,300 | Connect Finco Sarl 2021 Term Loan B, 4.500%, (US0001M + 3.500%), 12/11/26 | 2,369,398 | 0.5 | |||||||||||
| 824,995 | Digi International Inc. Term Loan B, 5.500%, (US0001M + 5.000%), 11/01/28 | 824,995 | 0.2 | |||||||||||
| 1,746,811 | Global Tel*Link Corporation 2018 1st Lien Term Loan, 4.707%, (US0001M + 4.250%), 11/29/25 | 1,665,839 | 0.3 | |||||||||||
| VOYA FLOATING RATE FUND | PORTFOLIO OF INVESTMENTS AS OF MARCH 31, 2022 (CONTINUED) |
| Principal Amount† | Borrower/Tranche Description | Fair Value | Percentage of Net Assets | |||||||||||
|---|---|---|---|---|---|---|---|---|---|---|---|---|---|---|
LOANS*: (continued) | ||||||||||||||
Telecommunications: (continued) | ||||||||||||||
| 1,447,028 | Global Tel*Link Corporation 2018 2nd Lien Term Loan, 10.413%, (SOFRRATE + 10.000%), 11/29/26 | $ | 1,396,382 | 0.3 | ||||||||||
| 382,113 | GOGO Intermediate Holdings LLC Term Loan B, 4.500%, (US0003M + 3.750%), 04/30/28 | 379,844 | 0.1 | |||||||||||
| 253,478 | (3) | GTT Communications, Inc. 2018 USD Term Loan B, 7.250%, (PRIME + 3.750%), 05/31/25 | 208,359 | 0.0 | ||||||||||
| 750,000 | Level 3 Financing Inc. 2019 Term Loan B, 2.207%, (US0001M + 1.750%), 03/01/27 | 737,210 | 0.2 | |||||||||||
| 1,793,240 | Securus Technologies Holdings, Inc. 2017 1st Lien Term Loan, 5.506%, (US0003M + 4.500%), 11/01/24 | 1,703,354 | 0.3 | |||||||||||
| 989,691 | Syniverse Holdings, Inc. 2018 1st Lien Term Loan, 6.000%, (US0003M + 5.000%), 03/09/23 | 964,454 | 0.2 | |||||||||||
| 675,000 | Venga Finance Sarl 2021 USD Term Loan B, 4.923%, (US0003M + 4.750%), 12/04/28 | 658,406 | 0.1 | |||||||||||
| 515,000 | ViaSat, Inc. Term Loan, 5.000%, (SOFRRATE + 4.500%), 03/02/29 | 507,275 | 0.1 | |||||||||||
| 1,477,299 | Zayo Group Holdings, Inc. USD Term Loan, 3.457%, (US0001M + 3.000%), 03/09/27 | 1,439,443 | 0.3 | |||||||||||
| 29,427,327 | 6.1 | |||||||||||||
Utilities: 0.9% | ||||||||||||||
| 1,361,880 | Edgewater Generation, L.L.C. Term Loan, 4.207%, (US0001M + 3.750%), 12/13/25 | 1,262,293 | 0.3 | |||||||||||
| 561,857 | Generation Bridge Acquisition, LLC Term Loan B, 6.006%, (US0003M + 5.000%), 12/01/28 | 562,559 | 0.1 | |||||||||||
| 11,735 | Generation Bridge Acquisition, LLC Term Loan C, 6.006%, (US0003M + 5.000%), 12/01/28 | 11,749 | 0.0 | |||||||||||
| 2,539,970 | Nautilus Power, LLC Term Loan B, 5.250%, (US0001M + 4.250%), 05/16/24 | 2,054,201 | 0.4 | |||||||||||
| Principal Amount† | Borrower/Tranche Description | Fair Value | Percentage of Net Assets | |||||||||||
|---|---|---|---|---|---|---|---|---|---|---|---|---|---|---|
LOANS*: (continued) | ||||||||||||||
Utilities: (continued) | ||||||||||||||
| 492,525 | Tiger Acquisition, LLC 2021 Term Loan, 3.758%, (US0003M + 3.250%), 06/01/28 | $ | 473,501 | 0.1 | ||||||||||
| 4,364,303 | 0.9 | |||||||||||||
Total Loans (Cost $466,031,118) | 459,718,457 | 94.6 | ||||||||||||
CORPORATE BONDS/NOTES: 3.6% | ||||||||||||||
Basic Materials: 0.6% | ||||||||||||||
| 325,000 | # | Diamond BC BV, 4.625%, 10/01/29 | 292,308 | 0.0 | ||||||||||
| 1,000,000 | # | INEOS Quattro Finance 2 Plc, 3.375%, 01/15/26 | 932,300 | 0.2 | ||||||||||
| 2,000,000 | # | LSF11 A5 Holdco LLC, 6.625%, 10/15/29 | 1,863,150 | 0.4 | ||||||||||
| 3,087,758 | 0.6 | |||||||||||||
Communications: 0.6% | ||||||||||||||
| 500,000 | # | DISH DBS Corp., 5.250%, 12/01/26 | 477,187 | 0.1 | ||||||||||
| 500,000 | # | DISH DBS Corp., 5.750%, 12/01/28 | 474,063 | 0.1 | ||||||||||
| 1,000,000 | # | Gray Escrow II, Inc., 5.375%, 11/15/31 | 957,500 | 0.2 | ||||||||||
| 835,000 | # | Match Group Holdings II LLC, 3.625%, 10/01/31 | 748,160 | 0.2 | ||||||||||
| 2,656,910 | 0.6 | |||||||||||||
Consumer, Cyclical: 1.0% | ||||||||||||||
| 530,000 | # | CROCS INC COMPANY GUAR 144A 08/31 4.125, 4.125%, 08/15/31 | 448,812 | 0.1 | ||||||||||
| 965,000 | # | Gap, Inc./The, 3.875%, 10/01/31 | 842,493 | 0.2 | ||||||||||
| 1,000,000 | # | LGI Homes, Inc, 4.000%, 07/15/29 | 879,045 | 0.2 | ||||||||||
| 220,000 | # | MACY S RETAIL HLDGS LLC COMPANY GUAR 144A 03/30 5.875, 5.875%, 03/15/30 | 217,288 | 0.0 | ||||||||||
| 1,000,000 | # | Sonic Automotive, Inc., 4.625%, 11/15/29 | 901,255 | 0.2 | ||||||||||
| 835,000 | # | Tempur Sealy International, Inc., 3.875%, 10/15/31 | 717,248 | 0.1 | ||||||||||
| 1,000,000 | # | Wabash National Corp., 4.500%, 10/15/28 | 901,250 | 0.2 | ||||||||||
| 4,907,391 | 1.0 | |||||||||||||
Consumer, Non-cyclical: 0.4% | ||||||||||||||
| 1,000,000 | # | ACCO Brands Corp., 4.250%, 03/15/29 | 925,250 | 0.2 | ||||||||||
| 500,000 | # | ADT Security Corp./The, 4.125%, 08/01/29 | 465,025 | 0.1 | ||||||||||
| 715,000 | # | Mozart Debt Merger Sub, Inc., 5.250%, 10/01/29 | 665,629 | 0.1 | ||||||||||
| 2,055,904 | 0.4 | |||||||||||||
| VOYA FLOATING RATE FUND | PORTFOLIO OF INVESTMENTS AS OF MARCH 31, 2022 (CONTINUED) |
| Principal Amount† | Borrower/Tranche Description | Fair Value | Percentage of Net Assets | |||||||||||
|---|---|---|---|---|---|---|---|---|---|---|---|---|---|---|
CORPORATE BONDS/NOTES: (continued) | ||||||||||||||
Energy: 0.4% | ||||||||||||||
| 1,000,000 | # | Hess Midstream Operations L.P., 4.250%, 02/15/30 | $ | 945,300 | 0.2 | |||||||||
| 1,000,000 | # | SunCoke Energy, Inc., 4.875%, 06/30/29 | 944,000 | 0.2 | ||||||||||
| 1,889,300 | 0.4 | |||||||||||||
Financial: 0.2% | ||||||||||||||
| 1,000,000 | # | PRA Group, Inc., 5.000%, 10/01/29 | 949,615 | 0.2 | ||||||||||
Industrial: 0.2% | ||||||||||||||
| 500,000 | # | GFL Environmental, Inc., 4.000%, 08/01/28 | 460,538 | 0.1 | ||||||||||
| 425,000 | # | Vertiv Group Corp., 4.125%, 11/15/28 | 388,365 | 0.1 | ||||||||||
| 848,903 | 0.2 | |||||||||||||
Technology: 0.2% | ||||||||||||||
| 1,000,000 | # | OpenText Corp., 3.875%, 12/01/29 | 951,585 | 0.2 | ||||||||||
Total Corporate Bonds/Notes (Cost $18,702,948) | 17,347,366 | 3.6 | ||||||||||||
| Shares | Value | Percentage of Net Assets | ||||||||||||
|---|---|---|---|---|---|---|---|---|---|---|---|---|---|---|
EQUITIES AND OTHER ASSETS: 1.0% | ||||||||||||||
| 408,271 | (4) | 24 Hour Fitness Worldwide, Inc. | 170,657 | 0.1 | ||||||||||
| 544,388 | (4) | 24 Hour Fitness Worldwide, Inc. — Preferred | 1,088,776 | 0.2 | ||||||||||
| 50,201 | Cineworld Group PLC | 7,584 | 0.0 | |||||||||||
| 132,618 | (4) | Covia Specialty Minerals, Inc. | 1,624,570 | 0.3 | ||||||||||
| 69,381 | (4) | Cumulus Media, Inc. Class-A | 690,341 | 0.2 | ||||||||||
| 7,543 | (4) | Harvey Gulf International Marine LLC | 56,573 | 0.0 | ||||||||||
| 4,783 | (4) | Harvey Gulf International Marine LLC — Warrants | 35,872 | 0.0 | ||||||||||
| 7,471 | (4) | iQor | 52,297 | 0.0 | ||||||||||
| 102,480 | (4) | Longview Power LLC | 1,058,926 | 0.2 | ||||||||||
| 6,829 | (4) | Riverbed Technology, Inc. | 66,924 | 0.0 | ||||||||||
| Shares | Value | Percentage of Net Assets | ||||||||||||
|---|---|---|---|---|---|---|---|---|---|---|---|---|---|---|
EQUITIES AND OTHER ASSETS: (continued) | ||||||||||||||
| 88,701 | (4),(5) | Save-A-Lot, Inc. / Moran Foods | $ | — | 0.0 | |||||||||
| 42,856 | (4) | The Oneida Group (formerly EveryWare Global, Inc.) | 429 | 0.0 | ||||||||||
Total Equities and Other Assets (Cost $4,817,561) | 4,852,949 | 1.0 | ||||||||||||
Total Investments (Cost $489,551,627) | $ | 481,918,772 | 99.2 | |||||||||||
Assets in Excess of Other Liabilities | 4,122,797 | 0.8 | ||||||||||||
Net Assets | $ | 486,041,569 | 100.0 | |||||||||||
| * | Loans, while exempt from registration under the Securities Act of 1933, as amended, contain certain restrictions on resale and cannot be sold publicly. These loans bear interest (unless otherwise noted) at rates that float periodically at a margin above the London Inter-Bank Offered Rate (“LIBOR”) and other short-term rates. | |
| † | Unless otherwise indicated, principal amount is shown in USD. | |
| # | Securities with purchases pursuant to Rule 144A or section 4(2), under the Securities Act of 1933 and may not be resold subject to that rule except to qualified institutional buyers. | |
| (1) | All or a portion of this holding is subject to unfunded loan commitments. Please refer to Note 8 for additional details. | |
| (2) | All or a portion of this Loan is payment-in-kind (“PIK”) which may pay interest or additional principal at the issuer’s discretion. Rates shown are the current rate and possible payment rates. | |
| (3) | Defaulted loan. Currently, the borrower is partially or fully in default with respect to principal and/or interest payments. | |
| (4) | Non-income producing security. | |
| (5) | For fair value measurement disclosure purposes, security is categorized as Level 3, whose value was determined using significant unobservable inputs. |
Reference Rate Abbreviations:
| PRIME | Federal Reserve Bank Prime Loan Rate | |
| SOFRRATE | 1-day Secured Overnight Financing Rate | |
| TSFR1M | 1-month CME Term Secured Overnight Financing Rate | |
| US0001M | 1-month LIBOR | |
| US0002M | 2-month LIBOR | |
| US0003M | 3-month LIBOR | |
| US0006M | 6-month LIBOR |
| VOYA FLOATING RATE FUND | PORTFOLIO OF INVESTMENTS AS OF MARCH 31, 2022 (CONTINUED) |
| Quoted Prices in Active Markets for Identical Investments (Level 1) | Significant Other Observable Inputs (Level 2) | Significant Unobservable Inputs (Level 3) | Fair Value at March 31, 2022 | |||||||||||||||
|---|---|---|---|---|---|---|---|---|---|---|---|---|---|---|---|---|---|---|
Asset Table | ||||||||||||||||||
Investments, at fair value | ||||||||||||||||||
| Loans | $ | — | $ | 459,718,457 | $ | — | $ | 459,718,457 | ||||||||||
| Equities and Other Assets | 690,341 | 4,162,608 | — | 4,852,949 | ||||||||||||||
| Corporate Bonds/Notes | — | 17,347,366 | — | 17,347,366 | ||||||||||||||
| Total Investments, at fair value | $ | 690,341 | $ | 481,228,431 | $ | — | $ | 481,918,772 | ||||||||||
Cost for federal income tax purposes was $489,769,594. | |||||
| Net unrealized depreciation consisted of: | |||||
| Gross Unrealized Appreciation | $ | 3,326,740 | |||
| Gross Unrealized Depreciation | (11,177,562 | ) | |||
| Net Unrealized Depreciation | $ | (7,850,822 | ) |
| Fund Name | Type | Per Share Amount | ||||||
|---|---|---|---|---|---|---|---|---|
| Voya Floating Rate Fund | ||||||||
| Class A | NII | $ | 0.2935 | |||||
| Class C | NII | $ | 0.2256 | |||||
| Class I | NII | $ | 0.3162 | |||||
| Class P | NII | $ | 0.3774 | |||||
| Class R | NII | $ | 0.2710 | |||||
| Class W | NII | $ | 0.3162 | |||||
| Name, Address and Age | Position(s) Held with the Trust | Term of Office and Length of Time Served (1) | Principal Occupation(s) — During the Past 5 Years | Number of Funds in Fund Complex Overseen by Trustee (2) | Other Board Positions Held by Trustee | |||||
|---|---|---|---|---|---|---|---|---|---|---|
Independent Trustees: | ||||||||||
| Colleen D. Baldwin 7337 East Doubletree Ranch Rd. Suite 100 Scottsdale, Arizona 85258 Age: 61 | Trustee Chairperson | November 2007–Present January 2020–Present | President, Glantuam Partners, LLC, a business consulting firm (January 2009–Present). | 132 | Dentaquest (February 2014–Present); RSR Partners, Inc. (2016–Present). | |||||
| John V. Boyer 7337 East Doubletree Ranch Rd. Suite 100 Scottsdale, Arizona 85258 Age: 68 | Trustee | January 2005–Present | Retired. Formerly, President and Chief Executive Officer, Bechtler Arts Foundation, an arts and education foundation (January 2008–December 2019). | 132 | None. | |||||
| Patricia W. Chadwick 7337 East Doubletree Ranch Rd. Suite 100 Scottsdale, Arizona 85258 Age: 73 | Trustee | January 2006–Present | Consultant and President, Ravengate Partners LLC, a consulting firm that provides advice regarding financial markets and the global economy (January 2000–Present). | 132 | Wisconsin Energy Corporation (June 2006–Present); The Royce Funds (22 funds) (December 2009–Present); and AMICA Mutual Insurance Company (1992–Present). | |||||
| Martin J. Gavin 7337 East Doubletree Ranch Rd. Suite 100 Scottsdale, AZ 85258 Age: 72 | Trustee | August 2015–Present | Retired. | 132 | None. | |||||
| Joseph E. Obermeyer 7337 East Doubletree Ranch Rd. Suite 100 Scottsdale, Arizona 85258 Age: 64 | Trustee | May 2013–Present | President, Obermeyer & Associates, Inc., a provider of financial and economic consulting services (November 1999–Present). | 132 | None. | |||||
| Sheryl K. Pressler 7337 East Doubletree Ranch Rd. Suite 100 Scottsdale, Arizona 85258 Age: 71 | Trustee | January 2006–Present | Consultant (May 2001–Present). | 132 | Centerra Gold Inc. (May 2008–Present). | |||||
| Christopher P. Sullivan 7337 East Doubletree Ranch Rd. Suite 100 Scottsdale, Arizona 85258 Age: 68 | Trustee | October 2015–Present | Retired. | 132 | None. |
| Name, Address and Age | Position(s) Held with the Trust | Term of Office and Length of Time Served (1) | Principal Occupation(s) — During the Past 5 Years | Number of Funds in Fund Complex Overseen by Trustee (2) | Other Board Positions Held by Trustee | |||||
|---|---|---|---|---|---|---|---|---|---|---|
Trustee who is an “interested person”: | ||||||||||
| Dina Santoro 230 Park Avenue New York, New York 10169 Age: 49 | Trustee | July 2018–Present | President, Voya Investments, LLC and Voya Capital, LLC (March 2018–Present); Senior Vice President, Voya Investments Distributor, LLC (April 2018–Present); Chief Operating Officer and Senior Managing Director, Voya Investment Management (January 2022–Present). Formerly, Senior Managing Director, Head of Product and Marketing Strategy, Voya Investment Management (September 2017–December 2021); Managing Director, Quantitative Management Associates, LLC (January 2004–August 2017). | 132 | Voya Investments, LLC, Voya Capital, LLC, and Voya Funds Services, LLC (March 2018–Present); Voya Investments Distributor, LLC (April 2018–Present). |
| (1) | Trustees serve until their successors are duly elected and qualified. The tenure of each Trustee who is not an “interested person” as defined in the 1940 Act, of each Fund (“Independent Trustee”) is subject to the Board’s retirement policy which states that each duly elected or appointed Independent Trustee shall retire from and cease to be a member of the Board of Trustees at the close of business on December 31 of the calendar year in which the Independent Trustee attains the age of 75. A majority vote of the Board’s other Independent Trustees may extend the retirement date of an Independent Trustee if the retirement would trigger a requirement to hold a meeting of shareholders of the Trust under applicable law, whether for the purposes of appointing a successor to the Independent Trustee or otherwise comply under applicable law, in which case the extension would apply until such time as the shareholder meeting can be held or is no longer required (as determined by a vote of a majority of the other Independent Trustees). |
| (2) | For the purposes of this table, “Fund Complex” means the Voya family of funds including the following investment companies: Voya Asia Pacific High Dividend Equity Income Fund; Voya Balanced Portfolio, Inc.; Voya Emerging Markets High Dividend Equity Fund; Voya Equity Trust; Voya Funds Trust; Voya Global Advantage and Premium Opportunity Fund; Voya Global Equity Dividend and Premium Opportunity Fund; Voya Government Money Market Portfolio; Voya Infrastructure, Industrials and Materials Fund; Voya Intermediate Bond Portfolio; Voya Investors Trust; Voya Mutual Funds; Voya Partners, Inc.; Voya Senior Income Fund; Voya Separate Portfolios Trust; Voya Strategic Allocation Portfolios, Inc.; Voya Variable Funds; Voya Variable Insurance Trust; Voya Variable Portfolios, Inc.; and Voya Variable Products Trust. The number of funds in the Fund Complex is as of April 30, 2022. |
| Name, Address and Age | Position(s) Held With the Trust | Term of Office and Length of Time Served (1) | Principal Occupation(s) — During the Past 5 Years | |||
|---|---|---|---|---|---|---|
| Michael Bell One Orange Way Windsor, Connecticut 06095 Age: 53 | Chief Executive Officer | March 2018–Present | Chief Executive Officer and Director, Voya Investments, LLC, Voya Capital, LLC, and Voya Funds Services, LLC (March 2018–Present); Senior Vice President, Voya Investments Distributor, LLC (March 2020–Present); Chief Financial Officer, Voya Investment Management (September 2014–Present). Formerly, Senior Vice President and Chief Financial Officer, Voya Investments Distributor, LLC (September 2019–March 2020); Senior Vice President and Treasurer, Voya Investments Distributor, LLC (November 2015–September 2019); Senior Vice President, Chief Financial Officer and Treasurer, Voya Investments, LLC (November 2015–March 2018). | |||
| Dina Santoro 230 Park Avenue New York, New York 10169 Age: 49 | President | March 2018–Present | President and Director, Voya Investments, LLC and Voya Capital, LLC (March 2018–Present); Director, Voya Funds Services, LLC (March 2018–Present); Director and Senior Vice President, Voya Investments Distributor, LLC (April 2018–Present); Chief Operating Officer and Senior Managing Director, Voya Investment Management (January 2022–Present). Formerly, Senior Managing Director, Head of Product and Marketing Strategy, Voya Investment Management (September 2017–December 2021); Managing Director, Quantitative Management Associates, LLC (January 2004–August 2017). | |||
| Jonathan Nash 230 Park Avenue New York, New York 10169 Age: 54 | Executive Vice President Chief Investment Risk Officer | March 2020–Present March 2020–Present | Executive Vice President and Chief Investment Risk Officer, Voya Investments, LLC (March 2020–Present) and Senior Vice President, Investment Risk Management, Voya Investment Management (March 2017–Present). Formerly, Vice President, Voya Investments, LLC (September 2018–March 2020); Consultant, DA Capital LLC (January 2016–March 2017). | |||
| James M. Fink 5780 Powers Ferry Road NW Atlanta, Georgia 30327 Age: 64 | Executive Vice President | March 2018–Present | Managing Director, Voya Investments, LLC, Voya Capital, LLC, and Voya Funds Services, LLC (March 2018–Present); Senior Vice President, Voya Investments Distributor, LLC (April 2018–Present); Chief Administrative Officer, Voya Investment Management (September 2017–Present). Formerly, Managing Director, Operations, Voya Investment Management (March 1999–September 2017). | |||
| Kristin M. Lynch 7337 East Doubletree Ranch Rd. Suite 100 Scottsdale, Arizona 85258 Age: 40 | Chief Compliance Officer | April 2022–Present | Vice President, Voya Investment Management and Chief Compliance Officer, Voya Family of Funds (April 2022–Present); Vice President, Voya Investment Management (March 2019–April 2022); and Assistant Vice President, Voya Investment Management (March 2014–March 2019). | |||
| Todd Modic 7337 East Doubletree Ranch Rd. Suite 100 Scottsdale, Arizona 85258 Age: 54 | Senior Vice President, Chief/Principal Financial Officer and Assistant Secretary | March 2005–Present | President, Voya Funds Services, LLC (March 2018–Present) and Senior Vice President, Voya Investments, LLC (April 2005 Present). | |||
| Kimberly A. Anderson 7337 East Doubletree Ranch Rd. Suite 100 Scottsdale, Arizona 85258 Age: 57 | Senior Vice President | November 2003–Present | Senior Vice President, Voya Investments, LLC (September 2003–Present). | |||
| Micheline S. Faver 7337 East Doubletree Ranch Rd. Suite 100 Scottsdale, Arizona 85258 Age: 44 | Senior Vice President | September 2020–Present | Senior Vice President, Head of Fund Compliance and Chief Compliance Officer, Voya Investments, LLC (March 2021–Present). Formerly, Vice President, Head of Fund Compliance and Chief Compliance Officer, Voya Investments, LLC (June 2016–March 2021). |
| Name, Address and Age | Position(s) Held With the Trust | Term of Office and Length of Time Served (1) | Principal Occupation(s) — During the Past 5 Years | |||
|---|---|---|---|---|---|---|
| Robert Terris 5780 Powers Ferry Road NW Atlanta, Georgia 30327 Age: 51 | Senior Vice President | May 2006–Present | Senior Vice President, Voya Investments Distributor, LLC (April 2018–Present); Senior Vice President, Head of Investment Services, Voya Investments, LLC (April 2018–Present) and Voya Funds Services, LLC (March 2006–Present). Formerly, Senior Vice President, Head of Division Operations, Voya Investments, LLC (October 2015–April 2018). | |||
| Fred Bedoya 7337 East Doubletree Ranch Rd. Suite 100 Scottsdale, Arizona 85258 Age: 49 | Vice President Treasurer | September 2012–Present | Vice President, Voya Investments, LLC (October 2015–Present) and Voya Funds Services, LLC (July 2012–Present). | |||
| Maria M. Anderson 7337 East Doubletree Ranch Rd. Suite 100 Scottsdale, Arizona 85258 Age: 64 | Vice President | September 2004–Present | Vice President, Voya Investments, LLC (October 2015–Present) and Voya Funds Services, LLC (September 2004–Present). | |||
| Sara M. Donaldson 7337 East Doubletree Ranch Rd. Suite 100 Scottsdale, Arizona 85258 Age: 62 | Vice President | September 2014–Present | Senior Vice President, Voya Investments, LLC (February 2022–Present). Formerly, Vice President, Voya Investments, LLC (October 2015–February 2022). | |||
| Robyn L. Ichilov 7337 East Doubletree Ranch Rd. Suite 100 Scottsdale, Arizona 85258 Age: 54 | Vice President | October 2000–Present | Vice President, Voya Funds Services, LLC (November 1995–Present) and Voya Investments, LLC (August 1997–Present). | |||
| Jason Kadavy 7337 East Doubletree Ranch Rd. Suite 100 Scottsdale, Arizona 85258 Age: 46 | Vice President | September 2012–Present | Vice President, Voya Investments, LLC (October 2015–Present) and Voya Funds Services, LLC (July 2007–Present). | |||
| Andrew K. Schlueter 7337 East Doubletree Ranch Rd. Suite 100 Scottsdale, Arizona 85258 Age: 46 | Vice President | March 2018–Present | Vice President, Voya Investments Distributor, LLC (April 2018–Present); Vice President, Voya Investments, LLC and Voya Funds Services, LLC (March 2018–Present); Senior Vice President, Head of Mutual Fund Operations, Voya Investment Management (March 2022–Present). Formerly, Vice President, Head of Mutual Fund Operations, Voya Investment Management (February 2018–February 2022). Formerly, Vice President, Voya Investment Management (March 2014–February 2018). | |||
| Craig Wheeler 7337 East Doubletree Ranch Rd. Suite 100 Scottsdale, Arizona 85258 Age: 53 | Vice President | May 2013–Present | Vice President–Director of Tax, Voya Investments, LLC (October 2015–Present). | |||
| Monia Piacenti One Orange Way Windsor, Connecticut 06095 Age: 45 | Anti-Money Laundering Officer | June 2018–Present | Anti-Money Laundering Officer, Voya Investments Distributor, LLC, Voya Investment Management and Voya Investment Management Trust Co. (June 2018–Present); Compliance Consultant, Voya Financial, Inc. (January 2019–Present). Formerly, Senior Compliance Officer, Voya Investment Management (December 2009–December 2018). | |||
| Joanne F. Osberg 7337 East Doubletree Ranch Rd. Suite 100 Scottsdale, Arizona 85258 Age: 40 | Secretary | September 2020–Present | Vice President and Senior Counsel, Voya Investment Management — Mutual Fund Legal Department (September 2020–Present). Formerly, Vice President, Counsel, Voya Investment Management — Mutual Fund Legal Department (January 2013–September 2020). | |||
| Paul A. Caldarelli 7337 East Doubletree Ranch Rd. Suite 100 Scottsdale, Arizona 85258 Age: 70 | Assistant Secretary | June 2010–Present | Vice President and Senior Counsel, Voya Investment Management — Mutual Fund Legal Department (March 2010–Present). |
(1) | The Officers hold office until the next annual meeting of the Board of Trustees and until their successors shall have been elected and qualified. |
ADVISORY AND SUB-ADVISORY CONTRACT APPROVAL DISCUSSION (UNAUDITED)
The Board has established a Contracts Committee and two Investment Review Committees (the “IRCs”), each of which includes only Independent Trustees as members. The Contracts Committee meets several times throughout the year to provide oversight with respect to the management and sub-advisory contracts approval and renewal process for the Voya funds, among other functions, and each IRC meets several times throughout the year with respect to each Voya fund (assigned to that IRC) to provide oversight regarding the investment performance of the sub-advisers, as well as the Manager’s role in monitoring the sub-advisers.
The Manager oversees, subject to the authority of the Board, and is responsible for the provision of, all investment advisory and portfolio management services for the Fund, but may delegate certain of these responsibilities to one or more sub-advisers. In addition, the Manager provides administrative services reasonably necessary for the operation of the Fund as set forth in the Management Contract, including oversight of the Fund’s operations and
ADVISORY AND SUB-ADVISORY CONTRACT APPROVAL DISCUSSION (UNAUDITED) (CONTINUED)
In assessing the investment management and sub-advisory relationships, the Board placed emphasis on the investment returns of the Fund, including its investment performance over certain time periods compared to the Fund’s Morningstar category and primary benchmark, a
The Board reviewed and considered the contractual management fee schedule and net management fee rate payable by the Fund to the Manager compared to the Fund’s Selected Peer Group. The Board also considered the compensation payable by the Manager to the Sub-Adviser for sub-advisory services for the Fund, including the portion of the contractual and net management fee rates that are paid to the Sub-Adviser, as compared to the compensation paid to the Manager. In addition, the Board considered the fee waivers, expense limitations, and recoupment arrangements that apply to the fees payable by the Fund, including whether the Manager intends to
ADVISORY AND SUB-ADVISORY CONTRACT APPROVAL DISCUSSION (UNAUDITED) (CONTINUED)
The Board also considered that the Manager and the Voya-affiliated Sub-Adviser are entitled to earn a reasonable level of profits for the services that they provide to the Fund. The Board also considered information regarding the potential fall-out benefits to the Manager and Sub-Adviser and their respective affiliates from their association with the Fund, including their ability to engage in soft-dollar
In considering the fees payable under the Contracts for the Fund, the Board took into account the factors described above and also considered: (1) the economies of scale benefits to the Fund and its shareholders from breakpoint discounts applicable to the Fund’s management fee rate, which result in lower fees at higher asset levels; and (2) the pricing structure (including the net expense ratio to be
ADVISORY AND SUB-ADVISORY CONTRACT APPROVAL DISCUSSION (UNAUDITED) (CONTINUED)
After its deliberation, the Board concluded that, in its business judgment, the terms of the Contracts are fair and
Voya Investments, LLC
7337 East Doubletree Ranch Road, Suite 100
Scottsdale, Arizona 85258
Voya Investments Distributor, LLC
7337 East Doubletree Ranch Road, Suite 100
Scottsdale, Arizona 85258
BNY Mellon Investment Servicing (U.S.) Inc.
301 Bellevue Parkway
Wilmington, Delaware 19809
Ernst & Young LLP
200 Clarendon Street
Boston, Massachusetts, 02116
State Street Bank and Trust Company
801 Pennsylvania Avenue
Kansas City, Missouri 64105
Ropes & Gray LLP
Prudential Tower
800 Boylston Street
Boston, Massachusetts 02199
| RETIREMENT | INVESTMENTS | INSURANCE | |
voyainvestments.com | 163061 (0322-052422) |
Item 2. Code of Ethics.
As of the end of the period covered by this report, Registrant had adopted a code of ethics, as defined in Item 2 of Form N-CSR, that applies to the Registrant’s principal executive officer and principal financial officer. There were no amendments to the Code during the period covered by the report. The Registrant did not grant any waivers, including implicit waivers, from any provisions of the Code during the period covered by this report. The code of ethics is filed herewith pursuant to Item 10(a)(1), Ex-99.CODE ETH.
Item 3. Audit Committee Financial Expert.
The Board of Trustees has determined that Colleen D. Baldwin, Martin J. Gavin, and Joseph E. Obermeyer are audit committee financial experts, as defined in Item 3 of Form N-CSR. Ms. Baldwin, Mr. Gavin, and Mr. Obermeyer are “independent” for purposes of Item 3 of Form N-CSR.
Item 4. Principal Accountant Fees and Services.
Below are the amount of fees that Ernst & Young LLP (“EY”), the Fund’s current Independent Registered Public Accounting Firm, billed to the Fund during the Fund’s fiscal years ended March 31, 2022 and March 31, 2021 and the amount of fees that the previous independent public accounting firm billed to the Fund during the Fund’s fiscal year ended March 31, 2021.
| (a) | Audit Fees: The aggregate fees billed for each of the last two fiscal years for professional services rendered by Ernst & Young LLP (“EY”), the principal accountant for the audit of the registrant’s annual financial statements or services that are normally provided by the accountant in connection with statutory and regulatory filings or engagements for those fiscal years were $173,700 for the year ended March 31, 2022 and $173,700 for the year ended March 31, 2021. |
| (b) | Audit-Related Fees: The aggregate fees billed in each of the last two fiscal years for assurance and related services by EY that are reasonably related to the performance of the audit of the registrant’s financial statements and are not reported under paragraph (a) of this Item were $0 for the year ended March 31, 2022 and $0 for the year ended March 31, 2021. |
| (c) | Tax Fees(1): The aggregate fees billed in each of the last two fiscal years for professional services rendered by EY for tax compliance, tax advice, and tax planning were $61,300 for the year ended March 31, 2022 and $61,300 for the year ended March 31, 2021. Such services included review of excise distribution calculations (if applicable), preparation of the Funds’ federal, state, and excise tax returns, tax services related to mergers and routine consulting. |
| (d) | All Other Fees: The aggregate fees billed in each of the last two fiscal years for products and services provided by EY, other than the services reported in paragraphs (a) through (c) of this Item were $0 for the year ended March 31, 2022 and $0 for the year ended March 31, 2021. |
(2) For the fiscal year ended March 31, 2021, the previous independent public accounting firm billed $13,380 for Tax Fees.
| (e)(1) | Audit Committee Pre-Approval Policies and Procedures |
Appendix A
AUDIT AND NON-AUDIT SERVICES
PRE-APPROVAL POLICY
| I. | Statement of Principles |
Under the Sarbanes-Oxley Act of 2002 (the “Act”), the Audit Committee of the Board of Directors or Trustees (the “Committee”) of the Voya funds (each a “Fund,” collectively, the “Funds”) set out on Exhibit A to this Audit and Non-Audit Services Pre-Approval Policy (“Policy”) is responsible for the oversight of the work of the Funds’ independent auditors. As part of its responsibilities, the Committee must pre-approve the audit and non-audit services performed by the auditors in order to assure that the provision of these services does not impair the auditors’ independence from the Funds. The Committee has adopted, and the Board has ratified, this Policy, which sets out the procedures and conditions under which the services of the independent auditors may be pre-approved.
Under Securities and Exchange Commission (“SEC”) rules promulgated in accordance with the Act, the Funds may establish two different approaches to pre-approving audit and non-audit services. The Committee may approve services without consideration of specific case-by-case services (“general pre-approval”) or it may pre-approve specific services (“specific pre-approval”). The Committee believes that the combination of these approaches contemplated in this Policy results in an effective and efficient method for pre-approving audit and non-audit services to be performed by the Funds’ independent auditors. Under this Policy, services that are not of a type that may receive general pre-approval require specific pre-approval by the Committee. Any proposed services that exceed pre-approved cost levels or budgeted amounts will also require the Committee’s specific pre-approval.
For both types of approval, the Committee considers whether the subject services are consistent with the SEC’s rules on auditor independence and that such services are compatible with maintaining the auditors independence. The Committee also considers whether a particular audit firm is in the best position to provide effective and efficient services to the Funds. Reasons that the auditors are in the best position include the auditors’ familiarity with the Funds’ business, personnel, culture, accounting systems, risk profile, and other factors, and whether the services will enhance the Funds’ ability to manage and control risk or improve audit quality. Such factors will be considered as a whole, with no one factor being determinative.
The appendices attached to this Policy describe the audit, audit-related, tax-related, and other services that have the Committee’s general pre-approval. For any service that has been approved through general pre-approval, the general pre-approval will remain in place for a period 12 months from the date of pre-approval, unless the Committee determines that a different period is appropriate. The Committee will annually review and pre-approve the services that may be provided by the independent auditors without specific pre-approval. The Committee will revise the list of services subject to general pre-approval as appropriate. This Policy does not serve as a delegation to Fund management of the Committee’s duty to pre-approve services performed by the Funds’ independent auditors.
1
| II. | Audit Services |
The annual audit services engagement terms and fees are subject to the Committee’s specific pre-approval. Audit services are those services that are normally provided by auditors in connection with statutory and regulatory filings or engagements or those that generally only independent auditors can reasonably provide. They include the Funds’ annual financial statement audit and procedures that the independent auditors must perform in order to form an opinion on the Funds’ financial statements (e.g., information systems and procedural reviews and testing). The Committee will monitor the audit services engagement and approve any changes in terms, conditions or fees deemed by the Committee to be necessary or appropriate.
The Committee may grant general pre-approval to other audit services, such as statutory audits and services associated with SEC registration statements, periodic reports and other documents filed with the SEC or issued in connection with securities offerings.
The Committee has pre-approved the audit services listed on Appendix A. The Committee must specifically approve all audit services not listed on Appendix A.
| III. | Audit-related Services |
Audit-related services are assurance and related services that are reasonably related to the performance of the audit or the review of the Funds’ financial statements or are traditionally performed by the independent auditors. The Committee believes that the provision of audit-related services will not impair the independent auditors’ independence, and therefore may grant pre-approval to audit-related services. Audit-related services include accounting consultations related to accounting, financial reporting or disclosure matters not classified as “audit services;” assistance with understanding and implementing new accounting and financial reporting guidance from rulemaking authorities; agreed-upon or expanded audit procedures relating to accounting and/or billing records required to respond to or comply with financial, accounting or regulatory reporting matters; and assistance with internal control reporting requirements under Form N-CEN or Form N-CSR.
The Committee has pre-approved the audit-related services listed on Appendix B. The Committee must specifically approve all audit-related services not listed on Appendix B.
| IV. | Tax Services |
The Committee believes the independent auditors can provide tax services to the Funds, including tax compliance, tax planning, and tax advice, without compromising the auditors’ independence. Therefore, the Committee may grant general pre-approval with respect to tax services historically provided by the Funds’ independent auditors that do not, in the Committee’s view, impair auditor independence and that are consistent with the SEC’s rules on auditor independence.
The Committee will not grant pre-approval if the independent auditors initially recommends a transaction the sole business purpose of which is tax avoidance and the tax treatment of which may not be supported in the Internal Revenue Code and related regulations. The Committee may consult outside counsel to determine that tax planning and reporting positions are consistent with this Policy.
The Committee has pre-approved the tax-related services listed on Appendix C. The Committee must specifically approve all tax-related services not listed on Appendix C.
| V. | Other Services |
The Committee believes it may grant approval of non-audit services that are permissible services for independent auditors to a Fund. The Committee has determined to grant general pre-approval to other services that it believes are routine and recurring, do not impair auditor independence, and are consistent with SEC rules on auditor independence.
The Committee has pre-approved the non-audit services listed on Appendix D. The Committee must specifically approve all non-audit services not listed on Appendix D.
A list of the SEC’s prohibited non-audit services is attached to this Policy as Appendix E. The SEC’s rules and relevant guidance should be consulted to determine the precise definitions of these impermissible services and the applicability of exceptions to certain of the SEC’s prohibitions.
| VI. | Pre-approval of Fee levels and Budgeted Amounts |
The Committee will annually establish pre-approval fee levels or budgeted amounts for audit, audit-related, tax and non-audit services to be provided to the Funds by the independent auditors. Any proposed services exceeding these levels or amounts require the Committee’s specific pre-approval. The Committee considers fees for audit and non-audit services when deciding whether to pre-approve services. The Committee may determine, for a pre-approval period of 12 months, the appropriate ratio between the total amount of fees for the Fund’s audit, audit-related, and tax services (including fees for services provided to Fund affiliates that are subject to pre-approval), and the total amount of fees for certain permissible non-audit services for the Fund classified as other services (including any such services provided to Fund affiliates that are subject to pre-approval).
| VII. | Procedures |
Requests or applications for services to be provided by the independent auditors will be submitted to management. If management determines that the services do not fall within those services generally pre-approved by the Committee and set out in the appendices to these procedures, management will submit the services to the Committee or its delagee. Any such submission will include a detailed description of the services to be rendered. Notwithstanding this paragraph, the Committee will, on a quarterly basis, receive from the independent auditors a list of services provided for the previous calendar quarter on a cumulative basis by the auditors during the Pre-Approval Period.
| VIII. | Delegation |
The Committee may delegate pre-approval authority to one or more of the Committee’s members. Any member or members to whom such pre-approval authority is delegated must report any pre-approval decisions, including any pre-approved services, to the Committee at its next scheduled meeting. The Committee will identify any member to whom pre-approval authority is delegated in writing. The member will retain such authority for a period of 12 months from the date of pre-approval unless the Committee determines that a different period is appropriate. The period of delegated authority may be terminated by the Committee or at the option of the member.
| IX. | Additional Requirements |
The Committee will take any measures the Committee deems necessary or appropriate to oversee the work of the independent auditors and to assure the auditors’ independence from the Funds. This may include reviewing a formal written statement from the independent auditors delineating all relationships between the auditors and the Funds, consistent with Independence Standards Board No. 1, and discussing with the auditors their methods and procedures for ensuring independence.
Last Approved: November 18, 2021
Appendix A
Pre-Approved Audit Services for the Pre-Approval Period January 1, 2022 through December 31, 2022
| Service | ||
| The Fund(s) | Fee Range | |
| Statutory audits or financial audits (including tax services associated with audit services) | √ | As presented to Audit Committee1 |
| Services associated with SEC registration statements, periodic reports and other documents filed with the SEC or other documents issued in connection with securities offerings (e.g., consents), and assistance in responding to SEC comment letters. | √ | Not to exceed $9,750 per filing |
| Consultations by Fund management with respect to accounting or disclosure treatment of transactions or events and/or the actual or potential effect of final or proposed rules, standards or interpretations by the SEC, Financial Accounting Standards Board, or other regulatory or standard setting bodies. | √ | Not to exceed $8,000 during the Pre-Approval Period |
| Seed capital audit and related review and issuance of consent on the N-2 registration statement | √ | Not to exceed $14,750 per audit |
| Audit of summary portfolio of investments | √ | Not to exceed $750 per fund |
| 1 | For new Funds launched during the Pre-Approval Period, the fee ranges pre-approved will be the same as those for existing Funds, pro-rated in accordance with inception dates as provided in the auditors’ Proposal or any Engagement Letter covering the period at issue. Fees in the Engagement Letter will be controlling. |
Appendix B
Pre-Approved Audit-Related Services for the Pre-Approval Period January 1, 2022 through December 31, 2022
| Service | |||
| The Fund(s) | Fund Affiliates | Fee Range | |
| Services related to Fund mergers (Excludes tax services - See Appendix C for tax services associated with Fund mergers) | √ | √ | Not to exceed $10,000 per merger |
| Consultations by Fund management with respect to accounting or disclosure treatment of transactions or events and/or the actual or potential effect of final or proposed rules, standards or interpretations by the SEC, Financial Accounting Standards Board, or other regulatory or standard setting bodies. [Note: Under SEC rules some consultations may be “audit” services and others may be “audit-related” services.] | √ | Not to exceed $5,000 per occurrence during the Pre-Approval Period | |
| Review of the Funds’ semi-annual and quarterly financial statements | √ | Not to exceed $2,700 per set of financial statements per fund | |
| Reports to regulatory or government agencies related to the annual engagement | √ | Up to $5,000 per occurrence during the Pre-Approval Period | |
| Regulatory compliance assistance | √ | √ | Not to exceed $5,000 per quarter |
| Training courses | √ | Not to exceed $5,000 per course | |
Appendix C
Pre-Approved Tax Services for the Pre-Approval Period January 1, 2022 through December 31, 2022
| Service | |||
| The Fund(s) | Fund Affiliates | Fee Range | |
| Preparation of federal and state income tax returns and federal excise tax returns for the Funds including assistance and review with excise tax distributions | √ | As presented to Audit Committee2 | |
| Review of IRC Sections 851(b) and 817(h) diversification testing on a real-time basis | √ | As presented to Audit Committee2 | |
| Tax assistance and advice regarding statutory, regulatory or administrative developments | √ | √ | Not to exceed $5,000 for the Funds or for the Funds’ investment adviser during the Pre-Approval Period |
| 2 | For new Funds launched during the Pre-Approval Period, the fee ranges pre-approved will be the same as those for existing Funds, pro-rated in accordance with inception dates as provided in the auditors’ Proposal or any Engagement Letter covering the period at issue. Fees in the Engagement Letter will be controlling. |
Appendix C, continued Pre-Approved Tax Services for the Pre-Approval Period January 1, 2022 through December 31, 2022
| Service | |||
| The Fund(s) | Fund Affiliates | Fee Range | |
| Tax and technology training sessions | √ | Not to exceed $5,000 per course during the Pre-Approval Period | |
| Tax services associated with Fund mergers | √ | √ | Not to exceed $4,000 per fund per merger during the Pre-Approval Period |
| Ernst & Young LLP Passive Foreign Investment Company (“PFIC”) Analyzer | √ | Not to exceed $95,000 during the Pre-Approval Period | |
| Other tax-related assistance and consultation, including, without limitation, assistance in evaluating derivative financial instruments and international tax issues, qualification and distribution issues, year-end reporting for 1099’s, tax compliance services in foreign jurisdictions and similar routine tax consultations as requested. | √ | Not to exceed $300,000 during the Pre-Approval Period | |
Appendix D
Pre-Approved Other Services for the Pre-Approval Period January 1, 2022 through December 31, 2022
| Service | |||
| The Fund(s) | Fund Affiliates | Fee Range | |
| Agreed-upon procedures for Class B share 12b-1 programs | √ | Not to exceed $60,000 during the Pre-Approval Period | |
Security counts performed pursuant to Rule 17f-2 of the 1940 Act (i.e., counts for Funds holding securities with affiliated sub-custodians)
Cost to be borne 50% by the Funds and 50% by Voya Investments, LLC. | √ | √ | Not to exceed $5,700 per Fund during the Pre-Approval Period |
| Agreed upon procedures for 15 (c) FACT Books | √ | Not to exceed $50,000 during the Pre-Approval Period | |
Appendix E
Prohibited Non-Audit Services
Dated: January 1, 2022 to December 31, 2022
| ● | Bookkeeping or other services related to the accounting records or financial statements of the Funds |
| ● | Financial information systems design and implementation |
| ● | Appraisal or valuation services, fairness opinions, or contribution-in-kind reports |
| ● | Actuarial services |
| ● | Internal audit outsourcing services |
| ● | Management functions |
| ● | Human resources |
| ● | Broker-dealer, investment adviser, or investment banking services |
| ● | Legal services |
| ● | Expert services unrelated to the audit |
| ● | Any other service that the Public Company Accounting Oversight Board determines, by regulation, is impermissible |
EXHIBIT A
VOYA ASIA PACIFIC HIGH DIVIDEND EQUITY INCOME FUND
VOYA BALANCED PORTFOLIO, INC.
VOYA EMERGING MARKETS HIGH DIVIDEND EQUITY FUND
VOYA EQUITY TRUST
VOYA FUNDS TRUST
VOYA GLOBAL ADVANTAGE AND PREMIUM OPPORTUNITY FUND
VOYA GLOBAL EQUITY DIVIDEND AND PREMIUM OPPORTUNITY FUND
VOYA INFRASTRUCTURE, INDUSTRIALS, AND MATERIALS FUND
VOYA INTERMEDIATE BOND PORTFOLIO
VOYA INVESTORS TRUST
VOYA GOVERNMENT MONEY MARKET PORTFOLIO
VOYA MUTUAL FUNDS
VOYA PARTNERS, INC.
VOYA SENIOR INCOME FUND
VOYA SEPARATE PORTFOLIOS TRUST
VOYA STRATEGIC ALLOCATIONS PORTFOLIOS, INC.
VOYA VARIABLE FUNDS
VOYA VARIABLE INSURANCE TRUST
VOYA VARIABLE PORTFOLIOS INC,
VOYA VARIABLE PRODUCTS TRUST
| (e)(2) | Percentage of services referred to in 4(b) – (4)(d) that were approved by the audit committee |
100% of the services were approved by the audit committee.
| (f) | Percentage of hours expended attributable to work performed by other than full time employees of EY if greater than 50% |
Not applicable.
| (g) | Non-Audit Fees: The following table presents (i) the aggregate non-audit fees (i.e., fees for audit-related, tax, and other services) billed to each Registrant by the independent registered public accounting firm for each Registrant’s fiscal years ended March 31, 2022 and March 31, 2021; and (ii) the aggregate non-audit fees billed to the investment adviser, or any of its affiliates that provide ongoing services to the registrant, by the independent registered public accounting firm for the same time periods. |
| Registrant/Investment Adviser | 2022 | 2021(1) | ||||||
| Voya Funds Trust | $ | 61,300 | $ | 61,300 | ||||
| Voya Investments, LLC (2) | $ | 12,427,919 | $ | 14,017,470 | ||||
(1) For the fiscal year ended March 31, 2021, the previous independent public accounting firm billed the Registrant $13,380 for Non-Audit Fees.
(2) Each Registrant’s investment adviser and any of its affiliates, which are subsidiaries of Voya Financial, Inc.
| (h) | Principal Accountants Independence: The Registrant’s Audit committee has considered whether the provision of non-audit services that were rendered to the registrant’s investment adviser and any entity controlling, controlled by, or under common control with the investment adviser that provides ongoing services to the registrant that were not pre-approved pursuant to Rule 2-01(c)(7)(ii) of Regulation S-X is compatible with maintaining EY’s independence. |
Item 5. Audit Committee of Listed Registrants.
Not applicable.
Item 6. Schedule of Investments.
Schedule is included as part of the report to shareholders filed under Item 1 of this Form.
Item 7. Disclosure of Proxy Voting Policies and Procedures for Closed-End Management Investment Companies.
Not applicable.
Item 8. Portfolio Managers of Closed-End Management Investment Companies.
Not applicable.
Item 9. Purchases of Equity Securities by Closed-End Management Investment Company and Affiliated Purchasers.
Not applicable.
Item 10. Submission of Matters to a Vote of Security Holders.
Not applicable.
Item 11. Controls and Procedures.
| (a) | Based on our evaluation conducted within 90 days of the filing date, hereof, the design and operation of the registrant’s disclosure controls and procedures are effective to ensure that material information relating to the registrant is made known to the certifying officers by others within the appropriate entities, particularly during the period in which Forms N-CSR are being prepared, and the registrant’s disclosure controls and procedures allow timely preparation and review of the information for the registrant’s Form N-CSR and the officer certifications of such Form N-CSR. |
| (b) | There were no significant changes in the registrant’s internal controls that occurred during the second fiscal quarter of the period covered by this report that has materially affected, or is reasonably likely to materially affect, the registrant’s internal control over financial reporting. |
Item 12. Disclosure of Securities Lending Activities for Closed-End Management Investment Companies.
Not applicable.
Item 13. Exhibits.
SIGNATURES
Pursuant to the requirements of the Securities Exchange Act of 1934 and the Investment Company Act of 1940, the registrant has duly caused this report to be signed on its behalf by the undersigned, thereunto duly authorized.
(Registrant): Voya Funds Trust
| By | /s/ Michael Bell | |
| Michael Bell | ||
| Chief Executive Officer |
Date: June 3, 2022
Pursuant to the requirements of the Securities Exchange Act of 1934 and the Investment Company Act of 1940, this report has been signed below by the following persons on behalf of the registrant and in the capacities and on the dates indicated.
| By | /s/ Michael Bell | |
| Michael Bell | ||
| Chief Executive Officer |
Date: June 3, 2022
| By | /s/ Todd Modic | |
| Todd Modic | ||
| Senior Vice President and Chief Financial Officer |
Date: June 3, 2022