UNITED STATES
SECURITIES AND EXCHANGE COMMISSION
Washington, D.C. 20549
Form N-CSR
CERTIFIED SHAREHOLDER REPORT OF
REGISTERED MANAGEMENT INVESTMENT COMPANIES
Investment Company Act file number:811-08895
Voya Funds Trust
(Exact name of registrant as specified in charter)
| 7337 East Doubletree Ranch Road, Suite 100, Scottsdale, AZ | 85258 |
| (Address of principal executive offices) | (Zip code) |
The Corporation Trust Company, 1209 Orange Street, Wilmington, DE 19801
(Name and address of agent for service)
Registrant’s telephone number, including area code:1-800-992-0180
Date of fiscal year end:March 31
Date of reporting period:March 31, 2020
Item 1. Reports to Stockholders.
The following is a copy of the report transmitted to stockholders pursuant to Rule 30e-1 under the Act (17 CFR 270.30e-1):
![[MISSING IMAGE: ing_cov.jpg]](https://capedge.com/proxy/N-CSR/0001104659-20-070882/ing_cov.jpg)
| | | Beginning on January 1, 2021, as permitted by regulations adopted by the U.S. Securities and Exchange Commission, paper copies of each Fund’s annual and semi-annual shareholder reports, like this annual report, will no longer be sent by mail, unless you specifically request paper copies of the reports. Instead, the reports will be made available on the Voya funds’ website (www.voyainvestments.com/literature), and you will be notified by mail each time a report is posted and provided with a website link to access the report. | | |
| | | If you already elected to receive shareholder reports electronically, you will not be affected by this change and you need not take any action. You may elect to receive shareholder reports and other communications from each Fund electronically anytime by contacting your financial intermediary (such as a broker-dealer or bank) or, if you are a direct investor, by calling 1-800-992-0180 or by sending an e-mail request to Voyaim_literature@voya.com. | | |
| | | You may elect to receive all future reports in paper free of charge. If you received this document in the mail, please follow the instructions to elect to continue receiving paper copies of your shareholder reports. If you received this document through a financial intermediary, you can contact your financial intermediary to request that you continue to receive paper copies of your shareholder reports. If you invest directly with us, you can call 1-800-992-0180 or send an email request to Voyaim_literature@voya.com to let each Fund know you wish to continue receiving paper copies of your shareholder reports. Your election to receive reports in paper will apply to all funds held in your account if you invest through your financial intermediary or all funds held with the Voya funds complex if you invest directly with the funds. | | |
| | | This report is submitted for general information to shareholders of the Voya mutual funds. It is not authorized for distribution to prospective shareholders unless accompanied or preceded by a prospectus which includes details regarding the funds’ investment objectives, risks, charges, expenses and other information. This information should be read carefully. | | |
| | | | E-Delivery Sign-up – details inside | |
![[MISSING IMAGE: voya_covinvmgt.jpg]](https://capedge.com/proxy/N-CSR/0001104659-20-070882/voya_covinvmgt.jpg)
| | | | | | 1 | | | |
| | | | | | 3 | | | |
| | | | | | 16 | | | |
| | | | | | 18 | | | |
| | | | | | 19 | | | |
| | | | | | 23 | | | |
| | | | | | 25 | | | |
| | | | | | 28 | | | |
| | | | | | 34 | | | |
| | | | | | 53 | | | |
| | | | | | 193 | | | |
| | | | | | 194 | | | |
| | | | | | 199 | | |
| | | | | Go Paperless with E-Delivery! | | | | | ||
| | | Sign up now for on-line prospectuses, fund reports, and proxy statements. In less than five minutes, you can help reduce paper mail and lower fund costs. | | | ||||||
| | | Just go to www.individuals.voya.com/page/e-delivery, follow the directions and complete the quick 5 Steps to Enroll. | | | ||||||
| | | You will be notified by e-mail when these communications become available on the internet. Documents that are not available on the internet will continue to be sent by mail. | | | ||||||
![[MISSING IMAGE: ph_dina-santoro.jpg]](https://capedge.com/proxy/N-CSR/0001104659-20-070882/ph_dina-santoro.jpg)
President
Voya Family of Funds
April 2, 2020
| | | Index | | | | Description | | |
| | | ICE BofAML U.S. Dollar 3-Month Deposit Offered Rate Constant Maturity Index | | | | The index is designed to track the performance of a synthetic asset paying London Interbank Offered Rate (“LIBOR”) to a stated maturity. The index is based on the assumed purchase at par of a synthetic instrument having exactly its stated maturity and with a coupon equal to that day’s fixing rate. That issue is assumed to be sold the following business day (priced at a yield equal to the current day rate) and rolled into a new instrument. | | |
| | | Bloomberg Barclays GNMA Index | | | | An index comprised of all fixed security mortgage pools sponsored by GNMA, including GNMA Graduated Payment Mortgages. | | |
| | | Bloomberg Barclays High Yield Bond — 2% Issuer Constrained Composite Index | | | | An index that includes all fixed income securities having a maximum quality rating of Ba1, a minimum amount outstanding of $150 million, and at least one year to maturity. | | |
| | | Bloomberg Barclays U.S. 1-3 Year Government/Credit Bond Index | | | | A widely recognized index of publicly issued fixed rate, investment grade debt securities, including Treasuries, Agencies and credit securities with a maturity of one to three years. | | |
| | | Bloomberg Barclays U.S. Aggregate Bond Index | | | | An index of publicly issued investment grade U.S. government, mortgage-backed, asset-backed and corporate debt securities. | | |
| | | Bloomberg Barclays U.S. Universal Bond Index | | | | The index represents the union of the U.S. Aggregate Index, U.S. Corporate High Yield Index, Investment Grade 144A Index, Eurodollar Index, U.S. Emerging Markets Index, and the non-ERISA eligible portion of the CMBS Index. The index covers USD-denominated, taxable bonds that are rated either investment grade or high-yield. | | |
| | | MSCI All Country World IndexSM | | | | A free-float adjusted market capitalization index that is designed to measure equity performance in the global developed and emerging markets. | | |
| Portfolio Managers’ Report | Voya GNMA Income Fund |
| | Investment Type Allocation as of March 31, 2020 (as a percentage of net assets) | | |||
| | | | | | |
| | U.S. Government Agency Obligations | | | 75.2% | |
| | Collateralized Mortgage Obligations | | | 49.3% | |
| | Commercial Mortgage-Backed Securities | | | 0.2% | |
| | Asset-Backed Securities | | | 0.2% | |
| | Liabilities in Excess of Other Assets* | | | (24.9)% | |
| | Net Assets | | | 100.0% | |
| | * Includes short-term investments. | | |||
| | Portfolio holdings are subject to change daily. | | |||
| Voya GNMA Income Fund | Portfolio Managers’ Report |
| | | ![[MISSING IMAGE: tm2016814d2-lc_gnmabw.jpg]](https://capedge.com/proxy/N-CSR/0001104659-20-070882/tm2016814d2-lc_gnmabw.jpg) | | |
| | | Average Annual Total Returns for the Periods Ended March 31, 2020 | | | ||||||||||||||||||
| | | | | | 1 Year | | | 5 Year | | | 10 Year | | | |||||||||
| | | Including Sales Charge: | | | | | ||||||||||||||||
| | | Class A(1) | | | | | 2.85% | | | | | | 1.87% | | | | | | 2.79% | | | |
| | | Class C(2) | | | | | 3.66% | | | | | | 1.61% | | | | | | 2.27% | | | |
| | | Class I | | | | | 5.75% | | | | | | 2.69% | | | | | | 3.34% | | | |
| | | Class W | | | | | 5.69% | | | | | | 2.64% | | | | | | 3.30% | | | |
| | | Excluding Sales Charge: | | | | | ||||||||||||||||
| | | Class A | | | | | 5.43% | | | | | | 2.38% | | | | | | 3.04% | | | |
| | | Class C | | | | | 4.66% | | | | | | 1.61% | | | | | | 2.27% | | | |
| | | Class I | | | | | 5.75% | | | | | | 2.69% | | | | | | 3.34% | | | |
| | | Class W | | | | | 5.69% | | | | | | 2.64% | | | | | | 3.30% | | | |
| | | Bloomberg Barclays GNMA | | | | | 6.83% | | | | | | 2.78% | | | | | | 3.32% | | | |
| | | | | | ||||||||||||||||||
| Portfolio Managers’ Report | Voya High Yield Bond Fund |
| | Sector Diversification as of March 31, 2020 (as a percentage of net assets) | | |||
| | | | | | |
| | Communications | | | 23.0% | |
| | Consumer, Non-cyclical | | | 19.9% | |
| | Consumer, Cyclical | | | 16.2% | |
| | Industrials | | | 12.0% | |
| | Financials | | | 5.4% | |
| | Technology | | | 5.2% | |
| | Basic Materials | | | 5.1% | |
| | Energy | | | 4.1% | |
| | Utilities | | | 2.3% | |
| | Electronics/Electrical | | | 0.3% | |
| | Consumer Staples | | | 0.2% | |
| | Containers & Glass Products | | | 0.2% | |
| | Health Care | | | 0.2% | |
| | Assets in Excess of Other Liabilities* | | | 5.9% | |
| | Net Assets | | | 100.0% | |
| | * Includes short-term investments. | | |||
| | Portfolio holdings are subject to change daily. | | |||
| | Top Ten Holdings as of March 31, 2020* (as a percentage of net assets) | | |||
| | | | | | |
| | Sprint Corp., 7.125%, 06/15/24 | | | 1.1% | |
| | HCA, Inc., 5.375%, 02/01/25 | | | 0.9% | |
| | Kraft Heinz Foods Co., 5.000%, 07/15/35 | | | 0.9% | |
| | Bausch Health Americas, Inc., 8.500%, 01/31/27 | | | 0.8% | |
| | Post Holdings, Inc., 5.625%, 01/15/28 | | | 0.8% | |
| | 1011778 BC ULC / New Red Finance, Inc., 5.000%, 10/15/25 | | | 0.8% | |
| | Dell International LLC / EMC Corp., 7.125%, 06/15/24 | | | 0.7% | |
| | CSC Holdings LLC, 5.250%, 06/01/24 | | | 0.7% | |
| | Standard Industries, Inc./NJ, 6.000%, 10/15/25 | | | 0.7% | |
| | Icahn Enterprises L.P. / Icahn Enterprises Finance Corp., 6.250%, 05/15/26 | | | 0.6% | |
| | * Excludes short-term investments. | | |||
| | Portfolio holdings are subject to change daily. | | |||
| Voya High Yield Bond Fund | Portfolio Managers’ Report |
| | | ![[MISSING IMAGE: tm2016814d2-lc_hybfbw.jpg]](https://capedge.com/proxy/N-CSR/0001104659-20-070882/tm2016814d2-lc_hybfbw.jpg) | | |
| | | Average Annual Total Returns for the Periods Ended March 31, 2020 | | | ||||||||||||||||||||||||||||||||||||
| | | | | | 1 Year | | | 5 Year | | | 10 Year | | | Since Inception of Class P June 14, 2013 | | | Since Inception of Class R January 30, 2014 | | | Since Inception of Class P3 June 1, 2018 | | | ||||||||||||||||||
| | | Including Sales Charge: | | | | | | | | |||||||||||||||||||||||||||||||
| | | Class A(1) | | | | | -8.10% | | | | | | 1.81% | | | | | | 5.11% | | | | | | — | | | | | | — | | | | | | — | | | |
| | | Class C(2) | | | | | -7.37% | | | | | | 1.57% | | | | | | 4.59% | | | | | | — | | | | | | — | | | | | | — | | | |
| | | Class I | | | | | -5.45% | | | | | | 2.67% | | | | | | 5.78% | | | | | | — | | | | | | — | | | | | | — | | | |
| | | Class P | | | | | -4.92% | | | | | | 3.34% | | | | | | — | | | | | | 3.99% | | | | | | — | | | | | | | | | |
| | | Class P3 | | | | | -4.74% | | | | | | — | | | | | | — | | | | | | — | | | | | | — | | | | | | 0.20% | | | |
| | | Class R | | | | | -5.99% | | | | | | 2.09% | | | | | | — | | | | | | — | | | | | | 2.19% | | | | | | — | | | |
| | | Class R6(3) | | | | | -5.49% | | | | | | 2.62% | | | | | | 5.52% | | | | | | — | | | | | | — | | | | | | — | | | |
| | | Class W(3) | | | | | -5.51% | | | | | | 2.60% | | | | | | 5.75% | | | | | | — | | | | | | — | | | | | | — | | | |
| | | Excluding Sales Charge: | | | | | | | | |||||||||||||||||||||||||||||||
| | | Class A | | | | | -5.76% | | | | | | 2.33% | | | | | | 5.37% | | | | | | — | | | | | | — | | | | | | — | | | |
| | | Class C | | | | | -6.47% | | | | | | 1.57% | | | | | | 4.59% | | | | | | — | | | | | | — | | | | | | — | | | |
| | | Class I | | | | | -5.45% | | | | | | 2.67% | | | | | | 5.78% | | | | | | — | | | | | | — | | | | | | — | | | |
| | | Class P | | | | | -4.92% | | | | | | 3.34% | | | | | | — | | | | | | 3.99% | | | | | | — | | | | | | | | | |
| | | Class P3 | | | | | -4.74% | | | | | | — | | | | | | — | | | | | | — | | | | | | — | | | | | | 0.20% | | | |
| | | Class R | | | | | -5.99% | | | | | | 2.09% | | | | | | — | | | | | | — | | | | | | 2.19% | | | | | | — | | | |
| | | Class R6(3) | | | | | -5.49% | | | | | | 2.62% | | | | | | 5.52% | | | | | | — | | | | | | — | | | | | | — | | | |
| | | Class W(3) | | | | | -5.51% | | | | | | 2.60% | | | | | | 5.75% | | | | | | — | | | | | | — | | | | | | — | | | |
| | | Bloomberg Barclays High Yield Bond – 2% Issuer Constrained Composite | | | | | -6.94% | | | | | | 2.78% | | | | | | 5.64% | | | | | | 3.45% | | | | | | 2.95% | | | | | | -1.16% | | | |
| | | | | | ||||||||||||||||||||||||||||||||||||
| Portfolio Managers’ Report | Voya Intermediate Bond Fund |
| | Investment Type Allocation as of March 31, 2020 (as a percentage of net assets) | | |||
| | | | | | |
| | Corporate Bonds/Notes | | | 32.5% | |
| | Collateralized Mortgage Obligations | | | 20.8% | |
| | U.S. Government Agency Obligations | | | 16.6% | |
| | Asset-Backed Securities | | | 10.0% | |
| | Commercial Mortgage-Backed Securities | | | 9.1% | |
| | U.S. Treasury Obligations | | | 7.0% | |
| | Sovereign Bonds | | | 2.6% | |
| | Purchased Options | | | 0.1% | |
| | Convertible Bonds/Notes | | | 0.0% | |
| | Assets in Excess of Other Liabilities* | | | 1.3% | |
| | Net Assets | | | 100.0% | |
| | * Includes short-term investments. | | |||
| | Portfolio holdings are subject to change daily. | | |||
| | Top Ten Holdings as of March 31, 2020 (as a percentage of net assets) | | |||
| | | | | | |
| | United States Treasury Inflation Indexed Bonds, 0.125%, 01/15/30 | | | 2.3% | |
| | United States Treasury Bond, 3.500%, 02/15/39 | | | 1.2% | |
| | Uniform Mortgage-Backed Securities, 3.500%, 09/01/49 | | | 1.0% | |
| | United States Treasury Note, 0.500%, 03/15/23 | | | 0.8% | |
| | United States Treasury Note, 0.625%, 03/31/27 | | | 0.8% | |
| | Freddie Mac, 3.500%, 03/01/48 | | | 0.8% | |
| | United States Treasury Bond, 2.375%, 11/15/49 | | | 0.7% | |
| | United States Treasury Note, 0.375%, 03/31/22 | | | 0.7% | |
| | Uniform Mortgage-Backed Securities, 3.500%, 06/01/34 | | | 0.6% | |
| | Freddie Mac, 3.500%, 11/01/48 | | | 0.5% | |
| | Portfolio holdings are subject to change daily. | | |||
| Voya Intermediate Bond Fund | Portfolio Managers’ Report |
| Portfolio Managers’ Report | Voya Intermediate Bond Fund |
| | | ![[MISSING IMAGE: tm2016814d2-lc_ibfbw.jpg]](https://capedge.com/proxy/N-CSR/0001104659-20-070882/tm2016814d2-lc_ibfbw.jpg) | | |
| | | Average Annual Total Returns for the Periods Ended March 31, 2020 | | | ||||||||||||||||||||||||
| | | | | | 1 Year | | | 5 Year | | | 10 Year | | | Since Inception of Class P3 June 1, 2018 | | | ||||||||||||
| | | Including Sales Charge: | | | | | | |||||||||||||||||||||
| | | Class A(1) | | | | | 1.66% | | | | | | 2.21% | | | | | | 4.12% | | | | | | — | | | |
| | | Class C(2) | | | | | 2.41% | | | | | | 1.95% | | | | | | 3.60% | | | | | | — | | | |
| | | Class I | | | | | 4.53% | | | | | | 3.04% | | | | | | 4.72% | | | | | | — | | | |
| | | Class P3 | | | | | 4.99% | | | | | | — | | | | | | — | | | | | | 5.69% | | | |
| | | Class R | | | | | 4.03% | | | | | | 2.47% | | | | | | 4.13% | | | | | | — | | | |
| | | Class R6(3) | | | | | 4.67% | | | | | | 3.10% | | | | | | 4.74% | | | | | | — | | | |
| | | Class W | | | | | 4.56% | | | | | | 2.98% | | | | | | 4.78% | | | | | | — | | | |
| | | Excluding Sales Charge: | | | | | | |||||||||||||||||||||
| | | Class A | | | | | 4.29% | | | | | | 2.72% | | | | | | 4.39% | | | | | | — | | | |
| | | Class C | | | | | 3.41% | | | | | | 1.95% | | | | | | 3.60% | | | | | | — | | | |
| | | Class I | | | | | 4.53% | | | | | | 3.04% | | | | | | 4.72% | | | | | | — | | | |
| | | Class P3 | | | | | 4.99% | | | | | | — | | | | | | — | | | | | | 5.69% | | | |
| | | Class R | | | | | 4.03% | | | | | | 2.47% | | | | | | 4.13% | | | | | | — | | | |
| | | Class R6(3) | | | | | 4.67% | | | | | | 3.10% | | | | | | 4.74% | | | | | | — | | | |
| | | Class W | | | | | 4.56% | | | | | | 2.98% | | | | | | 4.78% | | | | | | — | | | |
| | | Bloomberg Barclays U.S. Aggregate Bond | | | | | 8.93% | | | | | | 3.36% | | | | | | 3.88% | | | | | | 7.56% | | | |
| | | | | | ||||||||||||||||||||||||
| Voya Short Term Bond Fund | Portfolio Managers’ Report |
| | Investment Type Allocation as of March 31, 2020 (as a percentage of net assets) | | |||
| | | | | | |
| | Corporate Bonds/Notes | | | 46.3% | |
| | Commercial Mortgage-Backed Securities | | | 20.5% | |
| | Asset-Backed Securities | | | 19.5% | |
| | Collateralized Mortgage Obligations | | | 7.5% | |
| | U.S. Treasury Obligations | | | 4.4% | |
| | U.S. Government Agency Obligations | | | 0.4% | |
| | Supranational Bonds | | | 0.0% | |
| | Assets in Excess of Other Liabilities* | | | 1.4% | |
| | Net Assets | | | 100.0% | |
| | * Includes short-term investments. | | |||
| | Portfolio holdings are subject to change daily. | | |||
| | Top Ten Holdings as of March 31, 2020* (as a percentage of net assets) | | |||
| | | | | | |
| | United States Treasury Note, 0.375%, 03/31/22 | | | 2.8% | |
| | United States Treasury Note, 0.500%, 03/15/23 | | | 1.3% | |
| | Freddie Mac 3049 XF, 1.055%, 05/15/33 | | | 1.1% | |
| | Ginnie Mae Series 2016-H23 F, 2.412%, 10/20/66 | | | 0.8% | |
| | WFRBS Commercial Mortgage Trust 2011-C5 A4, 3.667%, 11/15/44 | | | 0.7% | |
| | Fannie Mae REMICS 2013-114 NA, 3.000%, 08/25/32 | | | 0.7% | |
| | DBRR 2011-LC2 A4B Trust, 4.537%, 07/12/44 | | | 0.7% | |
| | JP Morgan Chase Commercial Mortgage Securities Trust 2011-C5 B, 5.419%, 08/15/46 | | | 0.6% | |
| | Credit Suisse Mortgage Capital Certificates 2019-ICE4 B, 1.935%, 05/15/36 | | | 0.6% | |
| | JPMBB Commercial Mortgage Securities Trust 2013-C15 D, 5.198%, 11/15/45 | | | 0.6% | |
| | * Excludes short-term investments. | | |||
| | Portfolio holdings are subject to change daily. | | |||
| Portfolio Managers’ Report | Voya Short Term Bond Fund |
| Voya Short Term Bond Fund | Portfolio Managers’ Report |
| | | ![[MISSING IMAGE: tm2016814d2-lc_stbfbw.jpg]](https://capedge.com/proxy/N-CSR/0001104659-20-070882/tm2016814d2-lc_stbfbw.jpg) | | |
| | | Average Annual Total Returns for the Periods Ended March 31, 2020 | | | ||||||||||||||||||||||||||||||||||||
| | | | | | 1 Year | | | 5 Year | | | Since Inception of Classes A, C, I, and W December 19, 2012 | | | Since Inception of Class R July 31, 2014 | | | Since Inception of Class P3 June 1, 2018 | | | Since Inception of Class P2 October 22, 2019 | | | ||||||||||||||||||
| | | Including Sales Charge: | | | | | | | | |||||||||||||||||||||||||||||||
| | | Class A(1) | | | | | -2.63% | | | | | | 0.46% | | | | | | 0.69% | | | | | | — | | | | | | — | | | | | | — | | | |
| | | Class C(2) | | | | | -1.76% | | | | | | 0.20% | | | | | | 0.28% | | | | | | — | | | | | | — | | | | | | — | | | |
| | | Class I | | | | | 0.16% | | | | | | 1.23% | | | | | | 1.32% | | | | | | — | | | | | | — | | | | | | — | | | |
| | | Class P2 | | | | | — | | | | | | — | | | | | | — | | | | | | — | | | | | | — | | | | | | -2.16% | | | |
| | | Class P3 | | | | | 0.67% | | | | | | — | | | | | | — | | | | | | — | | | | | | 2.12% | | | | | | — | | | |
| | | Class R | | | | | -0.18% | | | | | | 0.76% | | | | | | — | | | | | | 0.80% | | | | | | — | | | | | | | | | |
| | | Class R6(3) | | | | | 0.29% | | | | | | 1.28% | | | | | | 1.36% | | | | | | — | | | | | | — | | | | | | — | | | |
| | | Class W | | | | | 0.12% | | | | | | 1.24% | | | | | | 1.30% | | | | | | — | | | | | | — | | | | | | — | | | |
| | | Excluding Sales Charge: | | | | | | | | |||||||||||||||||||||||||||||||
| | | Class A | | | | | -0.14% | | | | | | 0.97% | | | | | | 1.05% | | | | | | — | | | | | | — | | | | | | — | | | |
| | | Class C | | | | | -0.78% | | | | | | 0.20% | | | | | | 0.28% | | | | | | — | | | | | | — | | | | | | — | | | |
| | | Class I | | | | | 0.16% | | | | | | 1.23% | | | | | | 1.32% | | | | | | — | | | | | | — | | | | | | — | | | |
| | | Class P2 | | | | | — | | | | | | — | | | | | | — | | | | | | — | | | | | | — | | | | | | -2.16% | | | |
| | | Class P3 | | | | | 0.67% | | | | | | — | | | | | | — | | | | | | — | | | | | | 2.12% | | | | | | — | | | |
| | | Class R | | | | | -0.18% | | | | | | 0.76% | | | | | | — | | | | | | 0.80% | | | | | | — | | | | | | — | | | |
| | | Class R6(3) | | | | | 0.29% | | | | | | 1.28% | | | | | | 1.36% | | | | | | — | | | | | | — | | | | | | — | | | |
| | | Class W | | | | | 0.12% | | | | | | 1.24% | | | | | | 1.30% | | | | | | — | | | | | | — | | | | | | — | | | |
| | | Bloomberg Barclays U.S. 1-3 Year Government/Credit Bond | | | | | 4.53% | | | | | | 1.90% | | | | | | 1.58% | | | | | | 1.83% | | | | | | 4.04% | | | | | | 2.10% | | | |
| | | | | | ||||||||||||||||||||||||||||||||||||
| Portfolio Managers’ Report | Voya Strategic Income Opportunities Fund |
| | Investment Type Allocation as of March 31, 2020 (as a percentage of net assets) | | |||
| | | | | | |
| | Collateralized Mortgage Obligations | | | 29.2% | |
| | Commercial Mortgage-Backed Securities | | | 20.6% | |
| | Corporate Bonds/Notes | | | 15.3% | |
| | Bank Loans | | | 13.5% | |
| | Asset-Backed Securities | | | 12.0% | |
| | Sovereign Bonds | | | 3.2% | |
| | U.S. Treasury Obligations | | | 0.6% | |
| | Purchased Options | | | 0.2% | |
| | Convertible Bonds/Notes | | | 0.0% | |
| | U.S. Government Agency Obligations | | | 0.0% | |
| | Assets in Excess of Other Liabilities* | | | 5.4% | |
| | Net Assets | | | 100.0% | |
| | * Includes short-term investments. | | |||
| | Portfolio holdings are subject to change daily. | | |||
| | Top Ten Holdings as of March 31, 2020* (as a percentage of net assets) | | |||
| | | | | | |
| | Prima Capital CRE Securitization 2019-7A D Ltd., 4.250%, 12/25/50 | | | 0.6% | |
| | United States Treasury Inflation Indexed Bonds, 0.125%, 01/15/30 | | | 0.6% | |
| | Freddie Mac REMICS 4903 NS, 5.395%, 08/25/49 | | | 0.4% | |
| | Fannie Mae Connecticut Avenue Securities 2018-C05 1M2, 3.297%, 01/25/31 | | | 0.4% | |
| | Freddie Mac REMICS 4273 PS, 5.395%, 11/15/43 | | | 0.4% | |
| | GS Mortgage Securities Trust 2012-GCJ7 E, 5.000%, 05/10/45 | | | 0.4% | |
| | COMM 2014-LC15 D Mortgage Trust, 4.984%, 04/10/47 | | | 0.4% | |
| | Turkey Government International Bond, 4.875%, 10/09/26 | | | 0.4% | |
| | Prima Capital CRE Securitization 2019-RK1 DD Ltd., 3.500%, 04/15/38 | | | 0.4% | |
| | Freddie Mac Structured Agency Credit Risk Debt Notes 2019-HQA2 M2, 2.997%, 04/25/49 | | | 0.3% | |
| | * Excludes short-term investments. | | |||
| | Portfolio holdings are subject to change daily. | | |||
| Voya Strategic Income Opportunities Fund | Portfolio Managers’ Report |
| Portfolio Managers’ Report | Voya Strategic Income Opportunities Fund |
| | | ![[MISSING IMAGE: tm2016814d2-lc_siofbw.jpg]](https://capedge.com/proxy/N-CSR/0001104659-20-070882/tm2016814d2-lc_siofbw.jpg) | | |
| | | Average Annual Total Returns for the Periods Ended March 31, 2020 | | | ||||||||||||||||||||||||
| | | | | | 1 Year | | | 5 Years | | | Since Inception of Classes A, C, I, R, and W November 2, 2012 | | | Since Inception of Class P3 August 1, 2019 | | | ||||||||||||
| | | Including Sales Charge: | | | | | | |||||||||||||||||||||
| | | Class A(1) | | | | | -8.82% | | | | | | 1.09% | | | | | | 1.86% | | | | | | — | | | |
| | | Class C(2) | | | | | -8.14% | | | | | | 0.85% | | | | | | 1.42% | | | | | | — | | | |
| | | Class I | | | | | -6.30% | | | | | | 2.05% | | | | | | 2.58% | | | | | | — | | | |
| | | Class P(3) | | | | | -5.99% | | | | | | 2.15% | | | | | | 2.65% | | | | | | — | | | |
| | | Class P3 | | | | | — | | | | | | — | | | | | | — | | | | | | -8.83% | | | |
| | | Class R | | | | | -6.80% | | | | | | 1.37% | | | | | | 1.92% | | | | | | — | | | |
| | | Class R6(3) | | | | | -6.28% | | | | | | 2.01% | | | | | | 2.56% | | | | | | — | | | |
| | | Class W | | | | | -6.48% | | | | | | 1.61% | | | | | | 2.22% | | | | | | ��� | | | |
| | | Excluding Sales Charge: | | | | | | |||||||||||||||||||||
| | | Class A | | | | | -6.48% | | | | | | 1.61% | | | | | | 2.22% | | | | | | — | | | |
| | | Class C | | | | | -7.24% | | | | | | 0.85% | | | | | | 1.42% | | | | | | — | | | |
| | | Class I | | | | | -6.30% | | | | | | 2.05% | | | | | | 2.58% | | | | | | — | | | |
| | | Class P(3) | | | | | -5.99% | | | | | | 2.15% | | | | | | 2.65% | | | | | | — | | | |
| | | Class P3 | | | | | — | | | | | | — | | | | | | — | | | | | | -8.83% | | | |
| | | Class R | | | | | -6.80% | | | | | | 1.37% | | | | | | 1.92% | | | | | | — | | | |
| | | Class R6(3) | | | | | -6.28% | | | | | | 2.01% | | | | | | 2.56% | | | | | | — | | | |
| | | Class W | | | | | -6.37% | | | | | | 1.81% | | | | | | 2.34% | | | | | | — | | | |
| | | ICE BofA U.S. Dollar 3-Month Deposit Offered Rate Constant Maturity | | | | | 2.38% | | | | | | 1.42% | | | | | | 1.04% | | | | | | 1.44% | | | |
| | | Bloomberg Barclays U.S. Universal Bond | | | | | 7.15% | | | | | | 3.35% | | | | | | 3.10% | | | | | | 3.02% | | | |
| | | | | | ||||||||||||||||||||||||
| | | | Actual Fund Return | | | Hypothetical (5% return before expenses) | | ||||||||||||||||||||||||||||||||||||||||||
| | | | Beginning Account Value October 1, 2019 | | | Ending Account Value March 31, 2020 | | | Annualized Expense Ratio | | | Expenses Paid During the Period Ended March 31, 2020* | | | Beginning Account Value October 1, 2019 | | | Ending Account Value March 31, 2020 | | | Annualized Expense Ratio | | | Expenses Paid During the Period Ended March 31, 2020* | | ||||||||||||||||||||||||
| Voya GNMA Income Fund | | ||||||||||||||||||||||||||||||||||||||||||||||||
| Class A | | | | $ | 1,000.00 | | | | | $ | 1,024.80 | | | | | | 0.92% | | | | | $ | 4.66 | | | | | $ | 1,000.00 | | | | | $ | 1,020.40 | | | | | | 0.92% | | | | | $ | 4.65 | | |
| Class C | | | | | 1,000.00 | | | | | | 1,019.80 | | | | | | 1.67 | | | | | | 8.43 | | | | | | 1,000.00 | | | | | | 1,016.65 | | | | | | 1.67 | | | | | | 8.42 | | |
| Class I | | | | | 1,000.00 | | | | | | 1,025.10 | | | | | | 0.62 | | | | | | 3.14 | | | | | | 1,000.00 | | | | | | 1,021.90 | | | | | | 0.62 | | | | | | 3.13 | | |
| Class W | | | | | 1,000.00 | | | | | | 1,024.80 | | | | | | 0.67 | | | | | | 3.39 | | | | | | 1,000.00 | | | | | | 1,021.65 | | | | | | 0.67 | | | | | | 3.39 | | |
| Voya High Yield Bond Fund | | ||||||||||||||||||||||||||||||||||||||||||||||||
| Class A | | | | $ | 1,000.00 | | | | | $ | 905.20 | | | | | | 1.10% | | | | | $ | 5.24 | | | | | $ | 1,000.00 | | | | | $ | 1,019.50 | | | | | | 1.10% | | | | | $ | 5.55 | | |
| Class C | | | | | 1,000.00 | | | | | | 901.70 | | | | | | 1.85 | | | | | | 8.80 | | | | | | 1,000.00 | | | | | | 1,015.75 | | | | | | 1.85 | | | | | | 9.32 | | |
| Class I | | | | | 1,000.00 | | | | | | 906.60 | | | | | | 0.75 | | | | | | 3.57 | | | | | | 1,000.00 | | | | | | 1,021.25 | | | | | | 0.75 | | | | | | 3.79 | | |
| Class P | | | | | 1,000.00 | | | | | | 908.70 | | | | | | 0.08 | | | | | | 0.38 | | | | | | 1,000.00 | | | | | | 1,024.60 | | | | | | 0.08 | | | | | | 0.40 | | |
| Class P3 | | | | | 1,000.00 | | | | | | 909.00 | | | | | | 0.00 | | | | | | 0.00 | | | | | | 1,000.00 | | | | | | 1,025.00 | | | | | | 0.00 | | | | | | 0.00 | | |
| Class R | | | | | 1,000.00 | | | | | | 904.20 | | | | | | 1.35 | | | | | | 6.43 | | | | | | 1,000.00 | | | | | | 1,018.25 | | | | | | 1.35 | | | | | | 6.81 | | |
| Class R6 | | | | | 1,000.00 | | | | | | 905.90 | | | | | | 0.69 | | | | | | 3.29 | | | | | | 1,000.00 | | | | | | 1,021.55 | | | | | | 0.69 | | | | | | 3.49 | | |
| Class W | | | | | 1,000.00 | | | | | | 905.40 | | | | | | 0.85 | | | | | | 4.05 | | | | | | 1,000.00 | | | | | | 1,020.75 | | | | | | 0.85 | | | | | | 4.29 | | |
| | | | Actual Fund Return | | | Hypothetical (5% return before expenses) | | ||||||||||||||||||||||||||||||||||||||||||
| | | | Beginning Account Value October 1, 2019 | | | Ending Account Value March 31, 2020 | | | Annualized Expense Ratio | | | Expenses Paid During the Period Ended March 31, 2020* | | | Beginning Account Value October 1, 2019 | | | Ending Account Value March 31, 2020 | | | Annualized Expense Ratio | | | Expenses Paid During the Period Ended March 31, 2020* | | ||||||||||||||||||||||||
| Voya Intermediate Bond Fund | | ||||||||||||||||||||||||||||||||||||||||||||||||
| Class A | | | | $ | 1,000.00 | | | | | $ | 985.30 | | | | | | 0.69% | | | | | $ | 3.42 | | | | | $ | 1,000.00 | | | | | $ | 1,021.55 | | | | | | 0.69% | | | | | $ | 3.49 | | |
| Class C | | | | | 1,000.00 | | | | | | 980.60 | | | | | | 1.44 | | | | | | 7.13 | | | | | | 1,000.00 | | | | | | 1,017.80 | | | | | | 1.44 | | | | | | 7.26 | | |
| Class I | | | | | 1,000.00 | | | | | | 985.90 | | | | | | 0.36 | | | | | | 1.79 | | | | | | 1,000.00 | | | | | | 1,023.20 | | | | | | 0.36 | | | | | | 1.82 | | |
| Class P3 | | | | | 1,000.00 | | | | | | 988.60 | | | | | | 0.00 | | | | | | 0.00 | | | | | | 1,000.00 | | | | | | 1,025.00 | | | | | | 0.00 | | | | | | 0.00 | | |
| Class R | | | | | 1,000.00 | | | | | | 983.20 | | | | | | 0.94 | | | | | | 4.66 | | | | | | 1,000.00 | | | | | | 1,020.30 | | | | | | 0.94 | | | | | | 4.75 | | |
| Class R6 | | | | | 1,000.00 | | | | | | 987.10 | | | | | | 0.30 | | | | | | 1.49 | | | | | | 1,000.00 | | | | | | 1,023.50 | | | | | | 0.30 | | | | | | 1.52 | | |
| Class W | | | | | 1,000.00 | | | | | | 985.60 | | | | | | 0.44 | | | | | | 2.18 | | | | | | 1,000.00 | | | | | | 1,022.80 | | | | | | 0.44 | | | | | | 2.23 | | |
| Voya Short Term Bond Fund | | ||||||||||||||||||||||||||||||||||||||||||||||||
| Class A | | | | $ | 1,000.00 | | | | | $ | 978.70 | | | | | | 0.65% | | | | | $ | 3.22 | | | | | $ | 1,000.00 | | | | | $ | 1,021.75 | | | | | | 0.65% | | | | | $ | 3.29 | | |
| Class C | | | | | 1,000.00 | | | | | | 975.00 | | | | | | 1.40 | | | | | | 6.91 | | | | | | 1,000.00 | | | | | | 1,018.00 | | | | | | 1.40 | | | | | | 7.06 | | |
| Class I | | | | | 1,000.00 | | | | | | 979.20 | | | | | | 0.40 | | | | | | 1.98 | | | | | | 1,000.00 | | | | | | 1,023.00 | | | | | | 0.40 | | | | | | 2.02 | | |
| Class P2(1) | | | | | 1,000.00 | | | | | | 978.40 | | | | | | 0.15 | | | | | | 0.74 | | | | | | 1,000.00 | | | | | | 1,024.25 | | | | | | 0.15 | | | | | | 0.76 | | |
| Class P3 | | | | | 1,000.00 | | | | | | 981.70 | | | | | | 0.00 | | | | | | 0.00 | | | | | | 1,000.00 | | | | | | 1,025.00 | | | | | | 0.00 | | | | | | 0.00 | | |
| Class R | | | | | 1,000.00 | | | | | | 977.60 | | | | | | 0.90 | | | | | | 4.45 | | | | | | 1,000.00 | | | | | | 1,020.50 | | | | | | 0.90 | | | | | | 4.55 | | |
| Class R6 | | | | | 1,000.00 | | | | | | 980.30 | | | | | | 0.35 | | | | | | 1.73 | | | | | | 1,000.00 | | | | | | 1,023.25 | | | | | | 0.35 | | | | | | 1.77 | | |
| Class W | | | | | 1,000.00 | | | | | | 978.00 | | | | | | 0.40 | | | | | | 1.98 | | | | | | 1,000.00 | | | | | | 1,023.00 | | | | | | 0.40 | | | | | | 2.02 | | |
| Voya Strategic Income Opportunities Fund | | ||||||||||||||||||||||||||||||||||||||||||||||||
| Class A | | | | $ | 1,000.00 | | | | | $ | 902.60 | | | | | | 0.86% | | | | | $ | 4.09 | | | | | $ | 1,000.00 | | | | | $ | 1,020.70 | | | | | | 0.86% | | | | | $ | 4.34 | | |
| Class C | | | | | 1,000.00 | | | | | | 898.40 | | | | | | 1.61 | | | | | | 7.54 | | | | | | 1,000.00 | | | | | | 1,016.95 | | | | | | 1.61 | | | | | | 8.12 | | |
| Class I | | | | | 1,000.00 | | | | | | 902.80 | | | | | | 0.60 | | | | | | 2.85 | | | | | | 1,000.00 | | | | | | 1,022.00 | | | | | | 0.60 | | | | | | 3.03 | | |
| Class P | | | | | 1,000.00 | | | | | | 904.90 | | | | | | 0.05 | | | | | | 0.24 | | | | | | 1,000.00 | | | | | | 1,024.75 | | | | | | 0.05 | | | | | | 0.25 | | |
| Class P3 | | | | | 1,000.00 | | | | | | 906.60 | | | | | | 0.00 | | | | | | 0.00 | | | | | | 1,000.00 | | | | | | 1,025.00 | | | | | | 0.00 | | | | | | 0.00 | | |
| Class R | | | | | 1,000.00 | | | | | | 900.50 | | | | | | 1.11 | | | | | | 5.27 | | | | | | 1,000.00 | | | | | | 1,019.45 | | | | | | 1.11 | | | | | | 5.60 | | |
| Class R6 | | | | | 1,000.00 | | | | | | 902.70 | | | | | | 0.55 | | | | | | 2.62 | | | | | | 1,000.00 | | | | | | 1,022.25 | | | | | | 0.55 | | | | | | 2.78 | | |
| Class W | | | | | 1,000.00 | | | | | | 902.50 | | | | | | 0.61 | | | | | | 2.90 | | | | | | 1,000.00 | | | | | | 1,021.95 | | | | | | 0.61 | | | | | | 3.08 | | |
![[MISSING IMAGE: sg_ernst-young.jpg]](https://capedge.com/proxy/N-CSR/0001104659-20-070882/sg_ernst-young.jpg)
May 26, 2020
| | | | Voya GNMA Income Fund | | | Voya High Yield Bond Fund | | | Voya Intermediate Bond Fund | | |||||||||
| ASSETS: | | | | | | | | | | | | | | | | | | | |
| Investments in securities at fair value+* | | | | $ | 1,625,762,446 | | | | | $ | 459,405,461 | | | | | $ | 8,122,735,917 | | |
| Short-term investments at fair value** | | | | | 64,299,519 | | | | | | 60,803,841 | | | | | | 180,256,376 | | |
| Cash | | | | | 2,830,884 | | | | | | 1,386,298 | | | | | | 4,135,862 | | |
| Cash collateral for futures | | | | | 6,370,790 | | | | | | — | | | | | | 25,069,247 | | |
| Cash pledged for centrally cleared swaps (Note 2) | | | | | — | | | | | | — | | | | | | 26,528,579 | | |
| Cash pledged as collateral for OTC derivatives (Note 2) | | | | | — | | | | | | — | | | | | | 2,110,000 | | |
| Due from broker | | | | | 1,092,000 | | | | | | — | | | | | | — | | |
| Foreign currencies at value*** | | | | | — | | | | | | — | | | | | | 4,671,063 | | |
| Receivables: | | | | | | | | | | | | | | | | | | | |
| Investment securities sold | | | | | 10,231,875 | | | | | | 7,406,735 | | | | | | 61,378,363 | | |
| Investment securities sold on a delayed-delivery or when-issued basis | | | | | 302,320,131 | | | | | | — | | | | | | 173,809,857 | | |
| Fund shares sold | | | | | 7,695,601 | | | | | | 312,523 | | | | | | 31,243,880 | | |
| Dividends | | | | | — | | | | | | 3,706 | | | | | | 29,101 | | |
| Interest | | | | | 3,936,090 | | | | | | 8,535,611 | | | | | | 47,626,579 | | |
| Foreign tax reclaims | | | | | — | | | | | | — | | | | | | 90,917 | | |
| Unrealized appreciation on forward foreign currency contracts | | | | | — | | | | | | — | | | | | | 15,088,865 | | |
| Variation margin receivable on centrally cleared swaps | | | | | — | | | | | | — | | | | | | 5,939,142 | | |
| Prepaid expenses | | | | | 46,268 | | | | | | 62,193 | | | | | | 223,946 | | |
| Reimbursement due from Investment Adviser | | | | | 55,727 | | | | | | 203 | | | | | | 5,554 | | |
| Other assets | | | | | 36,505 | | | | | | 15,067 | | | | | | 123,991 | | |
| Total assets | | | | | 2,024,677,836 | | | | | | 537,931,638 | | | | | | 8,701,067,239 | | |
| LIABILITIES: | | | | | | | | | | | | | | | | | | | |
| Income distribution payable | | | | | 416,078 | | | | | | 58,416 | | | | | | 2,844,529 | | |
| Payable for investment securities purchased | | | | | 3,192,004 | | | | | | 7,672,971 | | | | | | 68,870,264 | | |
| Payable for investment securities purchased on a delayed-delivery or when-issued basis | | | | | 701,186,947 | | | | | | — | | | | | | 171,924,100 | | |
| Payable for fund shares redeemed | | | | | 5,160,614 | | | | | | 431,394 | | | | | | 23,739,125 | | |
| Payable to broker | | | | | — | | | | | | — | | | | | | 3,551,794 | | |
| Payable upon receipt of securities loaned | | | | | — | | | | | | 40,976,455 | | | | | | 168,207,376 | | |
| Unrealized depreciation on forward foreign currency contracts | | | | | — | | | | | | — | | | | | | 345,538 | | |
| Cash received as collateral for OTC derivatives (Note 2) | | | | | — | | | | | | — | | | | | | 14,110,000 | | |
| Cash received as collateral for delayed-delivery or when-issued securities (Note 2) | | | | | 12,096,000 | | | | | | — | | | | | | 2,066,448 | | |
| Payable for investment management fees | | | | | 472,452 | | | | | | 183,682 | | | | | | 1,958,133 | | |
| Payable for distribution and shareholder service fees | | | | | 140,966 | | | | | | 20,162 | | | | | | 202,015 | | |
| Payable to trustees under the deferred compensation plan (Note 6) | | | | | 36,505 | | | | | | 15,067 | | | | | | 123,991 | | |
| Payable for trustee fees | | | | | 5,347 | | | | | | 2,117 | | | | | | 38,001 | | |
| Other accrued expenses and liabilities | | | | | 547,880 | | | | | | 248,269 | | | | | | 1,991,980 | | |
| Written options, at fair value^ | | | | | — | | | | | | — | | | | | | 12,115,246 | | |
| Total liabilities | | | | | 723,254,793 | | | | | | 49,608,533 | | | | | | 472,088,540 | | |
| NET ASSETS | | | | $ | 1,301,423,043 | | | | | $ | 488,323,105 | | | | | $ | 8,228,978,699 | | |
| NET ASSETS WERE COMPRISED OF: | | | | | | | | | | | | | | | | | | | |
| Paid-in capital | | | | $ | 1,297,181,191 | | | | | $ | 548,802,641 | | | | | $ | 8,247,769,609 | | |
| Total distributable earnings (loss) | | | | | 4,241,852 | | | | | | (60,479,536) | | | | | | (18,790,910) | | |
| NET ASSETS | | | | $ | 1,301,423,043 | | | | | $ | 488,323,105 | | | | | $ | 8,228,978,699 | | |
+ Including securities loaned at value | | | | $ | — | | | | | $ | 39,954,468 | | | | | $ | 163,951,605 | | |
* Cost of investments in securities | | | | $ | 1,571,401,349 | | | | | $ | 494,718,279 | | | | | $ | 8,296,114,079 | | |
** Cost of short-term investments | | | | $ | 64,298,746 | | | | | $ | 60,805,220 | | | | | $ | 180,256,376 | | |
*** Cost of foreign currencies | | | | $ | — | | | | | $ | — | | | | | $ | 5,241,990 | | |
^ Premiums received on written options | | | | $ | — | | | | | $ | — | | | | | $ | 990,880 | | |
| | | | Voya GNMA Income Fund | | | Voya High Yield Bond Fund | | | Voya Intermediate Bond Fund | | |||||||||
| Class A | | | | | | | | | | | | | | | | | | | |
| Net assets | | | | $ | 493,736,685 | | | | | $ | 44,060,331 | | | | | $ | 451,337,661 | | |
| Shares authorized | | | | | unlimited | | | | | | unlimited | | | | | | unlimited | | |
| Par value | | | | $ | 0.001 | | | | | $ | 0.001 | | | | | $ | 0.001 | | |
| Shares outstanding | | | | | 57,555,140 | | | | | | 6,279,633 | | | | | | 44,654,478 | | |
| Net asset value and redemption price per share† | | | | $ | 8.58 | | | | | $ | 7.02 | | | | | $ | 10.11 | | |
Maximum offering price per share (2.50%)(1) | | | | $ | 8.80 | | | | | $ | 7.20 | | | | | $ | 10.37 | | |
| Class C | | | | | | | | | | | | | | | | | | | |
| Net assets | | | | $ | 47,577,041 | | | | | $ | 11,215,095 | | | | | $ | 25,555,556 | | |
| Shares authorized | | | | | unlimited | | | | | | unlimited | | | | | | unlimited | | |
| Par value | | | | $ | 0.001 | | | | | $ | 0.001 | | | | | $ | 0.001 | | |
| Shares outstanding | | | | | 5,574,473 | | | | | | 1,598,659 | | | | | | 2,532,049 | | |
| Net asset value and redemption price per share† | | | | $ | 8.53 | | | | | $ | 7.02 | | | | | $ | 10.09 | | |
| Class I | | | | | | | | | | | | | | | | | | | |
| Net assets | | | | $ | 604,194,413 | | | | | $ | 68,213,749 | | | | | $ | 4,988,317,288 | | |
| Shares authorized | | | | | unlimited | | | | | | unlimited | | | | | | unlimited | | |
| Par value | | | | $ | 0.001 | | | | | $ | 0.001 | | | | | $ | 0.001 | | |
| Shares outstanding | | | | | 70,305,877 | | | | | | 9,737,865 | | | | | | 493,730,090 | | |
| Net asset value and redemption price per share | | | | $ | 8.59 | | | | | $ | 7.01 | | | | | $ | 10.10 | | |
| Class P | | | | | | | | | | | | | | | | | | | |
| Net assets | | | | | n/a | | | | | $ | 99,000,100 | | | | | | n/a | | |
| Shares authorized | | | | | n/a | | | | | | unlimited | | | | | | n/a | | |
| Par value | | | | | n/a | | | | | $ | 0.001 | | | | | | n/a | | |
| Shares outstanding | | | | | n/a | | | | | | 14,105,356 | | | | | | n/a | | |
| Net asset value and redemption price per share | | | | | n/a | | | | | $ | 7.02 | | | | | | n/a | | |
| Class P3 | | | | | | | | | | | | | | | | | | | |
| Net assets | | | | | n/a | | | | | $ | 1,143,385 | | | | | $ | 20,936,303 | | |
| Shares authorized | | | | | n/a | | | | | | unlimited | | �� | | | | unlimited | | |
| Par value | | | | | n/a | | | | | $ | 0.001 | | | | | $ | 0.001 | | |
| Shares outstanding | | | | | n/a | | | | | | 162,821 | | | | | | 2,071,172 | | |
| Net asset value and redemption price per share | | | | | n/a | | | | | $ | 7.02 | | | | | $ | 10.11 | | |
| Class R | | | | | | | | | | | | | | | | | | | |
| Net assets | | | | | n/a | | | | | $ | 684,165 | | | | | $ | 186,915,275 | | |
| Shares authorized | | | | | n/a | | | | | | unlimited | | | | | | unlimited | | |
| Par value | | | | | n/a | | | | | $ | 0.001 | | | | | $ | 0.001 | | |
| Shares outstanding | | | | | n/a | | | | | | 97,390 | | | | | | 18,468,929 | | |
| Net asset value and redemption price per share | | | | | n/a | | | | | $ | 7.03 | | | | | $ | 10.12 | | |
| Class R6 | | | | | | | | | | | | | | | | | | | |
| Net assets | | | | | n/a | | | | | $ | 125,035,564 | | | | | $ | 2,306,856,993 | | |
| Shares authorized | | | | | n/a | | | | | | unlimited | | | | | | unlimited | | |
| Par value | | | | | n/a | | | | | $ | 0.001 | | | | | $ | 0.001 | | |
| Shares outstanding | | | | | n/a | | | | | | 17,804,672 | | | | | | 228,235,618 | | |
| Net asset value and redemption price per share | | | | | n/a | | | | | $ | 7.02 | | | | | $ | 10.11 | | |
| Class W | | | | | | | | | | | | | | | | | | | |
| Net assets | | | | $ | 155,914,904 | | | | | $ | 138,970,716 | | | | | $ | 249,059,623 | | |
| Shares authorized | | | | | unlimited | | | | | | unlimited | | | | | | unlimited | | |
| Par value | | | | $ | 0.001 | | | | | $ | 0.001 | | | | | $ | 0.001 | | |
| Shares outstanding | | | | | 18,119,961 | | | | | | 19,777,246 | | | | | | 24,657,634 | | |
| Net asset value and redemption price per share | | | | $ | 8.60 | | | | | $ | 7.03 | | | | | $ | 10.10 | | |
| | | | Voya Short Term Bond Fund | | | Voya Strategic Income Opportunities Fund | | ||||||
| ASSETS: | | | | | | | | | | | | | |
| Investments in securities at fair value+* | | | | $ | 169,782,749 | | | | | $ | 2,437,394,466 | | |
| Short-term investments at fair value** | | | | | 1,880,706 | | | | | | 76,426,525 | | |
| Cash | | | | | 19,306 | | | | | | 6,007,632 | | |
| Cash collateral for futures | | | | | 159,359 | | | | | | 65,663 | | |
| Cash pledged for centrally cleared swaps (Note 2) | | | | | 250,000 | | | | | | 17,036,846 | | |
| Cash pledged as collateral for OTC derivatives (Note 2) | | | | | — | | | | | | 110,000 | | |
| Due from broker | | | | | — | | | | | | 700,000 | | |
| Foreign currencies at value*** | | | | | 1,774 | | | | | | 632,576 | | |
| Receivables: | | | | | | | | | | | | | |
| Investment securities sold | | | | | 450,977 | | | | | | 21,174,741 | | |
| Investment securities sold on a delayed-delivery or when-issued basis | | | | | 2,271,533 | | | | | | 262,196,338 | | |
| Fund shares sold | | | | | 149,677 | | | | | | 70,660,395 | | |
| Dividends | | | | | 790 | | | | | | 141,390 | | |
| Interest | | | | | 1,006,690 | | | | | | 15,765,452 | | |
| Unrealized appreciation on forward foreign currency contracts | | | | | — | | | | | | 19,836,927 | | |
| Variation margin receivable on centrally cleared swaps | | | | | — | | | | | | 3,494,956 | | |
| Prepaid expenses | | | | | 61,455 | | | | | | 203,728 | | |
| Reimbursement due from Investment Adviser | | | | | 30,999 | | | | | | 1,919 | | |
| Other assets | | | | | 3,552 | | | | | | 15,171 | | |
| Total assets | | | | | 176,069,567 | | | | | | 2,931,864,725 | | |
| LIABILITIES: | | | | | | | | | | | | | |
| Income distribution payable | | | | | 1,653 | | | | | | 813,218 | | |
| Payable for investment securities purchased | | | | | 991,181 | | | | | | 17,319,060 | | |
| Payable for investment securities purchased on a delayed-delivery or when-issued basis | | | | | 2,284,497 | | | | | | 258,413,102 | | |
| Payable for fund shares redeemed | | | | | 242,721 | | | | | | 21,350,913 | | |
| Payable to broker | | | | | — | | | | | | 1,524,818 | | |
| Payable upon receipt of securities loaned | | | | | 239,706 | | | | | | 10,799,391 | | |
| Unrealized depreciation on forward foreign currency contracts | | | | | — | | | | | | 12,373,218 | | |
| Variation margin payable on centrally cleared swaps | | | | | 5,329 | | | | | | — | | |
| Cash received as collateral for OTC derivatives (Note 2) | | | | | — | | | | | | 24,090,000 | | |
| Cash received as collateral for delayed-delivery or when-issued securities (Note 2) | | | | | — | | | | | | 2,370,000 | | |
| Payable for investment management fees | | | | | 43,113 | | | | | | 1,205,407 | | |
| Payable for distribution and shareholder service fees | | | | | 1,799 | | | | | | 94,315 | | |
| Payable to trustees under the deferred compensation plan (Note 6) | | | | | 3,552 | | | | | | 15,171 | | |
| Payable for trustee fees | | | | | 956 | | | | | | 12,063 | | |
| Other accrued expenses and liabilities | | | | | 24,470 | | | | | | 239,711 | | |
| Written options, at fair value^ | | | | | — | | | | | | 4,349,549 | | |
| Total liabilities | | | | | 3,838,977 | | | | | | 354,969,936 | | |
| NET ASSETS | | | | $ | 172,230,590 | | | | | $ | 2,576,894,789 | | |
| NET ASSETS WERE COMPRISED OF: | | | | | | | | | | | | | |
| Paid-in capital | | | | $ | 181,029,653 | | | | | $ | 2,901,945,222 | | |
| Total distributable loss | | | | | (8,799,063) | | | | | | (325,050,433) | | |
| NET ASSETS | | | | $ | 172,230,590 | | | | | $ | 2,576,894,789 | | |
+ Including securities loaned at value | | | | $ | 233,036 | | | | | $ | 10,530,906 | | |
* Cost of investments in securities | | | | $ | 175,770,767 | | | | | $ | 2,715,232,287 | | |
** Cost of short-term investments | | | | $ | 1,880,706 | | | | | $ | 76,426,525 | | |
*** Cost of foreign currencies | | �� | | $ | 7,147 | | | | | $ | 773,351 | | |
^ Premiums received on written options | | | | $ | — | | | | | $ | 355,740 | | |
| | | | Voya Short Term Bond Fund | | | Voya Strategic Income Opportunities Fund | | ||||||
| Class A | | | | | | | | | | | | | |
| Net assets | | | | $ | 6,906,886 | | | | | $ | 146,079,509 | | |
| Shares authorized | | | | | unlimited | | | | | | unlimited | | |
| Par value | | | | $ | 0.001 | | | | | $ | 0.001 | | |
| Shares outstanding | | | | | 723,518 | | | | | | 16,019,989 | | |
| Net asset value and redemption price per share† | | | | $ | 9.55 | | | | | $ | 9.12 | | |
Maximum offering price per share (2.50%)(1) | | | | $ | 9.79 | | | | | $ | 9.35 | | |
| Class C | | | | | | | | | | | | | |
| Net assets | | | | $ | 335,407 | | | | | $ | 53,332,793 | | |
| Shares authorized | | | | | unlimited | | | | | | unlimited | | |
| Par value | | | | $ | 0.001 | | | | | $ | 0.001 | | |
| Shares outstanding | | | | | 35,120 | | | | | | 5,937,215 | | |
| Net asset value and redemption price per share† | | | | $ | 9.55 | | | | | $ | 8.98 | | |
| Class I | | | | | | | | | | | | | |
| Net assets | | | | $ | 11,925,226 | | | | | $ | 2,046,289,285 | | |
| Shares authorized | | | | | unlimited | | | | | | unlimited | | |
| Par value | | | | $ | 0.001 | | | | | $ | 0.001 | | |
| Shares outstanding | | | | | 1,249,747 | | | | | | 223,557,563 | | |
| Net asset value and redemption price per share | | | | $ | 9.54 | | | | | $ | 9.15 | | |
| Class P | | | | | | | | | | | | | |
| Net assets | | | | | n/a | | | | | $ | 9,528,800 | | |
| Shares authorized | | | | | n/a | | | | | | unlimited | | |
| Par value | | | | | n/a | | | | | $ | 0.001 | | |
| Shares outstanding | | | | | n/a | | | | | | 1,045,538 | | |
| Net asset value and redemption price per share | | | | | n/a | | | | | $ | 9.11 | | |
| Class��P2 | | | | | | | | | | | | | |
| Net assets | | | | $ | 49,295,558 | | | | | | n/a | | |
| Shares authorized | | | | | unlimited | | | | | | n/a | | |
| Par value | | | | $ | 0.001 | | | | | | n/a | | |
| Shares outstanding | | | | | 5,166,315 | | | | | | n/a | | |
| Net asset value and redemption price per share | | | | $ | 9.54 | | | | | | n/a | | |
| Class P3 | | | | | | | | | | | | | |
| Net assets | | | | $ | 5,287,696 | | | | | $ | 3,769,580 | | |
| Shares authorized | | | | | unlimited | | | | | | unlimited | | |
| Par value | | | | $ | 0.001 | | | | | $ | 0.001 | | |
| Shares outstanding | | | | | 554,385 | | | | | | 411,691 | | |
| Net asset value and redemption price per share | | | | $ | 9.54 | | | | | $ | 9.16 | | |
| Class R | | �� | | | | | | | | | | | |
| Net assets | | | | $ | 3,135 | | | | | $ | 18,459,404 | | |
| Shares authorized | | | | | unlimited | | | | | | unlimited | | |
| Par value | | | | $ | 0.001 | | | | | $ | 0.001 | | |
| Shares outstanding | | | | | 328 | | | | | | 2,041,099 | | |
| Net asset value and redemption price per share | | | | $ | 9.57 | | | | | $ | 9.04 | | |
| Class R6 | | | | | | | | | | | | | |
| Net assets | | | | $ | 98,379,507 | | | | | $ | 229,913,335 | | |
| Shares authorized | | | | | unlimited | | | | | | unlimited | | |
| Par value | | | | $ | 0.001 | | | | | $ | 0.001 | | |
| Shares outstanding | | | | | 10,306,594 | | | | | | 25,196,793 | | |
| Net asset value and redemption price per share | | | | $ | 9.55 | | | | | $ | 9.12 | | |
| Class W | | | | | | | | | | | | | |
| Net assets | | | | $ | 97,175 | | | | | $ | 69,522,083 | | |
| Shares authorized | | | | | unlimited | | | | | | unlimited | | |
| Par value | | | | $ | 0.001 | | | | | $ | 0.001 | | |
| Shares outstanding | | | | | 10,151 | | | | | | 7,644,551 | | |
| Net asset value and redemption price per share | | | | $ | 9.57 | | | | | $ | 9.09 | | |
| | | | Voya GNMA Income Fund | | | Voya High Yield Bond Fund | | | Voya Intermediate Bond Fund | | |||||||||
| INVESTMENT INCOME: | | | | | | | | | | | | | | | | | | | |
| Dividends | | | | $ | — | | | | | $ | 41,583 | | | | | $ | 410,513 | | |
| Interest, net of foreign taxes withheld* | | | | | 32,609,335 | | | | | | 25,428,501 | | | | | | 264,362,177 | | |
| Securities lending income, net | | | | | — | | | | | | 347,938 | | | | | | 1,414,484 | | |
| Total investment income | | | | | 32,609,335 | | | | | | 25,818,022 | | | | | | 266,187,174 | | |
| EXPENSES: | | | | | | | | | | | | | | | | | | | |
| Investment management fees | | | | | 5,704,814 | | | | | | 2,583,331 | | | | | | 20,525,473 | | |
| Distribution and shareholder service fees: | | | | | |||||||||||||||
| Class A | | | | | 1,067,278 | | | | | | 131,465 | | | | | | 1,149,126 | | |
| Class C | | | | | 561,298 | | | | | | 146,618 | | | | | | 286,633 | | |
Class O(1) | | | | | — | | | | | | — | | | | | | 4,452 | | |
| Class R | | | | | — | | | | | | 6,634 | | | | | | 920,387 | | |
| Transfer agent fees: | | | | | | | | | | | | | | | | | | | |
| Class A | | | | | 414,475 | | | | | | 85,282 | | | | | | 651,947 | | |
| Class C | | | | | 53,019 | | | | | | 23,776 | | | | | | 40,456 | | |
| Class I | | | | | 411,916 | | | | | | 52,033 | | | | | | 2,981,074 | | |
Class O(1) | | | | | — | | | | | | — | | | | | | 2,442 | | |
| Class P | | | | | — | | | | | | 2,978 | | | | | | — | | |
| Class P3 | | | | | — | | | | | | 1 | | | | | | 409 | | |
| Class R | | | | | — | | | | | | 2,153 | | | | | | 260,827 | | |
| Class R6 | | | | | — | | | | | | 1,447 | | | | | | 25,011 | | |
| Class W | | | | | 108,694 | | | | | | 179,438 | | | | | | 295,095 | | |
| Shareholder reporting expense | | | | | 168,800 | | | | | | 49,776 | | | | | | 267,546 | | |
| Registration fees | | | | | 101,085 | | | | | | 129,189 | | | | | | 484,533 | | |
| Professional fees | | | | | 45,932 | | | | | | 38,796 | | | | | | 260,836 | | |
| Custody and accounting expense | | | | | 112,020 | | | | | | 66,360 | | | | | | 735,210 | | |
| Trustee fees | | | | | 42,775 | | | | | | 16,940 | | | | | | 304,011 | | |
| Miscellaneous expense | | | | | 41,499 | | | | | | 44,526 | | | | | | 278,355 | | |
| Interest expense | | | | | 49 | | | | | | 21 | | | | | | 2,055 | | |
| Total expenses | | | | | 8,833,654 | | | | | | 3,560,764 | | | | | | 29,475,878 | | |
| Waived and reimbursed fees | | | | | (266,718) | | | | | | (574,592) | | | | | | (117,672) | | |
| Net expenses | | | | | 8,566,936 | | | | | | 2,986,172 | | | | | | 29,358,206 | | |
| Net investment income | | | | | 24,042,399 | | | | | | 22,831,850 | | | | | | 236,828,968 | | |
| REALIZED AND UNREALIZED GAIN (LOSS): | | | | | | | | | | | | | | | | | | | |
| Net realized gain (loss) on: | | | | | | | | | | | | | | | | | | | |
| Investments | | | | | 13,887,823 | | | | | | (7,355,188) | | | | | | 193,420,495 | | |
| Forward foreign currency contracts | | | | | — | | | | | | — | | | | | | 5,767,026 | | |
| Foreign currency related transactions | | | | | — | | | | | | — | | | | | | 204,095 | | |
| Futures | | | | | (22,163,857) | | | | | | — | | | | | | 57,394,212 | | |
| Swaps | | | | | — | | | | | | — | | | | | | 7,929,669 | | |
| Written options | | | | | — | | | | | | — | | | | | | (12,979,414) | | |
| Net realized gain (loss) | | | | | (8,276,034) | | | | | | (7,355,188) | | | | | | 251,736,083 | | |
| Net change in unrealized appreciation (depreciation) on: | | | | | | | | | | | | | | | | | | | |
| Investments | | | | | 50,494,709 | | | | | | (36,492,863) | | | | | | (267,980,386) | | |
| Forward foreign currency contracts | | | | | — | | | | | | — | | | | | | 14,632,990 | | |
| Foreign currency related transactions | | | | | — | | | | | | — | | | | | | (518,530) | | |
| Futures | | | | | (7,092,706) | | | | | | — | | | | | | 23,449,297 | | |
| Swaps | | | | | — | | | | | | — | | | | | | 16,887,708 | | |
| Written options | | | | | — | | | | | | — | | | | | | (897,396) | | |
| Net change in unrealized appreciation (depreciation) | | | | | 43,402,003 | | | | | | (36,492,863) | | | | | | (214,426,317) | | |
| Net realized and unrealized gain (loss) | | | | | 35,125,969 | | | | | | (43,848,051) | | | | | | 37,309,766 | | |
| Increase (decrease) in net assets resulting from operations | | | | $ | 59,168,368 | | | | | $ | (21,016,201) | | | | | $ | 274,138,734 | | |
* Foreign taxes withheld | | | | $ | — | | | | | $ | — | | | | | $ | 78,055 | | |
| | | | Voya Short Term Bond Fund | | | Voya Strategic Income Opportunities Fund | | ||||||
| INVESTMENT INCOME: | | | | | | | | | | | | | |
| Dividends | | | | $ | 53,036 | | | | | $ | 5,308,638 | | |
| Interest, net of foreign taxes withheld* | | | | | 5,358,464 | | | | | | 98,291,541 | | |
| Securities lending income, net | | | | | 4,385 | | | | | | 114,311 | | |
| Total investment income | | | | | 5,415,885 | | | | | | 103,714,490 | | |
| EXPENSES: | | | | | | | | | | | | | |
| Investment management fees | | | | | 583,086 | | | | | | 12,055,079 | | |
| Distribution and shareholder service fees: | | | | ||||||||||
| Class A | | | | | 19,414 | | | | | | 460,741 | | |
| Class C | | | | | 6,391 | | | | | | 429,074 | | |
| Class R | | | | | 14 | | | | | | 81,326 | | |
| Transfer agent fees: | | | | | | | | | | | | | |
| Class A | | | | | 3,903 | | | | | | 109,142 | | |
| Class C | | | | | 320 | | | | | | 24,732 | | |
| Class I | | | | | 16,872 | | | | | | 1,045,691 | | |
| Class P | | | | | — | | | | | | 59 | | |
| Class P2 | | | | | 705 | | | | | | — | | |
| Class P3 | | | | | 124 | | | | | | 63 | | |
| Class R | | | | | 2 | | | | | | 9,558 | | |
| Class R6 | | | | | 895 | | | | | | 1,334 | | |
| Class W | | | | | 240 | | | | | | 37,688 | | |
| Shareholder reporting expense | | | | | 3,087 | | | | | | 151,980 | | |
| Registration fees | | | | | 115,186 | | | | | | 474,095 | | |
| Professional fees | | | | | 29,799 | | | | | | 92,870 | | |
| Custody and accounting expense | | | | | 41,344 | | | | | | 265,120 | | |
| Trustee fees | | | | | 7,650 | | | | | | 96,508 | | |
| Miscellaneous expense | | | | | 10,387 | | | | | | 112,263 | | |
| Interest expense | | | | | 2,676 | | | | | | 2,686 | | |
| Total expenses | | | | | 842,095 | | | | | | 15,450,009 | | |
| Waived and reimbursed fees | | | | | (192,631) | | | | | | (88,402) | | |
| Net expenses | | | | | 649,464 | | | | | | 15,361,607 | | |
| Net investment income | | | | | 4,766,421 | | | | | | 88,352,883 | | |
| REALIZED AND UNREALIZED GAIN (LOSS): | | | | | | | | | | | | | |
| Net realized gain (loss) on: | | | | | | | | | | | | | |
| Investments (net of Indian and Chilean capital gains tax withheld^) | | | | | (497,212) | | | | | | 5,128,973 | | |
| Forward foreign currency contracts | | | | | — | | | | | | (1,339,511) | | |
| Foreign currency related transactions | | | | | (1,758) | | | | | | (63,939) | | |
| Futures | | | | | 116,921 | | | | | | (51,395,850) | | |
| Swaps | | | | | 311,884 | | | | | | 11,028,890 | | |
| Written options | | | | | — | | | | | | (4,343,835) | | |
| Net realized loss | | | | | (70,165) | | | | | | (40,985,272) | | |
| Net change in unrealized appreciation (depreciation) on: | | | | | | | | | | | | | |
| Investments | | | | | (6,032,335) | | | | | | (297,708,867) | | |
| Forward foreign currency contracts | | | | | — | | | | | | 7,013,752 | | |
| Foreign currency related transactions | | | | | (5,373) | | | | | | (165,262) | | |
| Futures | | | | | 243,609 | | | | | | 2,272,315 | | |
| Swaps | | | | | 174,506 | | | | | | 12,070,011 | | |
| Written options | | | | | — | | | | | | 161,851 | | |
| Net change in unrealized appreciation (depreciation) | | | | | (5,619,593) | | | | | | (276,356,200) | | |
| Net realized and unrealized loss | | | | | (5,689,758) | | | | | | (317,341,472) | | |
| Decrease in net assets resulting from operations | | | | $ | (923,337) | | | | | $ | (228,988,589) | | |
* Foreign taxes withheld | | | | $ | — | | | | | $ | 35,363 | | |
^ Foreign taxes on sale of Indian and Chilean investments | | | | $ | — | | | | | $ | 22,739 | | |
| | | | Voya GNMA Income Fund | | | Voya High Yield Bond Fund | | ||||||||||||||||||
| | | | Year Ended March 31, 2020 | | | Year Ended March 31, 2019 | | | Year Ended March 31, 2020 | | | Year Ended March 31, 2019 | | ||||||||||||
| FROM OPERATIONS: | | | | | | | | | | | | | | | | | | | | | | | | | |
| Net investment income | | | | $ | 24,042,399 | | | | | $ | 21,560,880 | | | | | $ | 22,831,850 | | | | | $ | 27,856,169 | | |
| Net realized gain (loss) | | | | | (8,276,034) | | | | | | 2,343,872 | | | | | | (7,355,188) | | | | | | (6,872,765) | | |
| Net change in unrealized appreciation (depreciation) | | | | | 43,402,003 | | | | | | 10,408,080 | | | | | | (36,492,863) | | | | | | 2,684,003 | | |
| Increase (decrease) in net assets resulting from operations | | | | | 59,168,368 | | | | | | 34,312,832 | | | | | | (21,016,201) | | | | | | 23,667,407 | | |
| FROM DISTRIBUTIONS TO SHAREHOLDERS: | | | | | | | | | | | | | | | | | | | | | | | | | |
| Total distributions (excluding return of capital): | | | | | | | | | | | | | | | | | | | | | | | | | |
| Class A | | | | | (11,550,826) | | | | | | (9,827,938) | | | | | | (2,809,390) | | | | | | (2,748,509) | | |
| Class C | | | | | (1,094,068) | | | | | | (1,140,077) | | | | | | (672,337) | | | | | | (591,813) | | |
| Class I | | | | | (14,382,786) | | | | | | (9,374,950) | | | | | | (4,782,685) | | | | | | (7,603,228) | | |
| Class P | | | | | — | | | | | | — | | | | | | (5,968,215) | | | | | | (8,144,797) | | |
| Class P3 | | | | | — | | | | | | — | | | | | | (2,446) | | | | | | (7,000) | | |
| Class R | | | | | — | | | | | | — | | | | | | (67,635) | | | | | | (56,295) | | |
| Class R6 | | | | | — | | | | | | — | | | | | | (3,873,671) | | | | | | (2,325,159) | | |
| Class W | | | | | (3,203,430) | | | | | | (3,177,709) | | | | | | (6,214,047) | | | | | | (5,401,996) | | |
| Total distributions | | | | | (30,231,110) | | | | | | (23,520,674) | | | | | | (24,390,426) | | | | | | (26,878,797) | | |
| FROM CAPITAL SHARE TRANSACTIONS: | | | | | | | | | | | | | | | | | | | | | | | | | |
| Net proceeds from sale of shares | | | | | 674,186,979 | | | | | | 299,698,040 | | | | | | 304,226,953 | | | | | | 129,449,281 | | |
| Reinvestment of distributions | | | | | 26,105,948 | | | | | | 20,435,153 | | | | | | 23,799,386 | | | | | | 25,774,203 | | |
| | | | | | 700,292,927 | | | | | | 320,133,193 | | | | | | 328,026,339 | | | | | | 155,223,484 | | |
| Cost of shares redeemed | | | | | (364,328,264) | | | | | | (413,007,982) | | | | | | (181,600,825) | | | | | | (327,310,168) | | |
| Net increase (decrease) in net assets resulting from capital share transactions | | | | | 335,964,663 | | | | | | (92,874,789) | | | | | | 146,425,514 | | | | | | (172,086,684) | | |
| Net increase (decrease) in net assets | | | | | 364,901,921 | | | | | | (82,082,631) | | | | | | 101,018,887 | | | | | | (175,298,074) | | |
| NET ASSETS: | | | | | | | | | | | | | | | | | | | | | | | | | |
| Beginning of year or period | | | | | 936,521,122 | | | | | | 1,018,603,753 | | | | | | 387,304,218 | | | | | | 562,602,292 | | |
| End of year or period | | | | $ | 1,301,423,043 | | | | | $ | 936,521,122 | | | | | $ | 488,323,105 | | | | | $ | 387,304,218 | | |
| | | | Voya Intermediate Bond Fund | | | Voya Short Term Bond Fund | | ||||||||||||||||||
| | | | Year Ended March 31, 2020 | | | Year Ended March 31, 2019 | | | Year Ended March 31, 2020 | | | Year Ended March 31, 2019 | | ||||||||||||
| FROM OPERATIONS: | | | | | | | | | | | | | | | | | | | | | | | | | |
| Net investment income | | | | $ | 236,828,968 | | | | | $ | 199,690,220 | | | | | $ | 4,766,421 | | | | | $ | 2,589,034 | | |
| Net realized gain (loss) | | | | | 251,736,083 | | | | | | (33,160,230) | | | | | | (70,165) | | | | | | (428,122) | | |
| Net change in unrealized appreciation (depreciation) | | | | | (214,426,317) | | | | | | 116,988,400 | | | | | | (5,619,593) | | | | | | 1,215,787 | | |
| Increase (decrease) in net assets resulting from operations | | | | | 274,138,734 | | | | | | 283,518,390 | | | | | | (923,337) | | | | | | 3,376,699 | | |
| FROM DISTRIBUTIONS TO SHAREHOLDERS: | | | | | | | | | | | | | | | | | | | | | | | | | |
| Total distributions (excluding return of capital): | | | | | | | | | | | | | | | | | | | | | | | | | |
| Class A | | | | | (15,303,664) | | | | | | (12,785,646) | | | | | | (163,981) | | | | | | (178,112) | | |
| Class C | | | | | (737,285) | | | | | | (657,047) | | | | | | (8,799) | | | | | | (12,147) | | |
| Class I | | | | | (170,342,310) | | | | | | (112,219,555) | | | | | | (280,703) | | | | | | (252,369) | | |
Class O(1) | | | | | (51,556) | | | | | | (508,150) | | | | | | — | | | | | | — | | |
| Class P2 | | | | | — | | | | | | — | | | | | | (660,465) | | | | | | — | | |
| Class P3 | | | | | (785,587) | | | | | | (317,801) | | | | | | (168,320) | | | | | | (66,908) | | |
| Class R | | | | | (5,667,590) | | | | | | (4,815,812) | | | | | | (61) | | | | | | (63) | | |
| Class R6 | | | | | (75,467,807) | | | | | | (55,243,059) | | | | | | (3,538,580) | | | | | | (2,325,122) | | |
| Class W | | | | | (7,387,108) | | | | | | (8,458,842) | | | | | | (11,347) | | | | | | (8,782) | | |
| Total distributions | | | | | (275,742,907) | | | | | | (195,005,912) | | | | | | (4,832,256) | | | | | | (2,843,503) | | |
| FROM CAPITAL SHARE TRANSACTIONS: | | | | | | | | | | | | | | | | | | | | | | | | | |
| Net proceeds from sale of shares | | | | | 3,992,382,313 | | | | | | 3,279,968,665 | | | | | | 223,489,488 | | | | | | 60,247,012 | | |
| Reinvestment of distributions | | | | | 247,954,219 | | | | | | 176,965,795 | | | | | | 4,734,147 | | | | | | 2,819,886 | | |
| | | | | | 4,240,336,532 | | | | | | 3,456,934,460 | | | | | | 228,223,635 | | | | | | 63,066,898 | | |
| Cost of shares redeemed | | | | | (2,827,431,133) | | | | | | (2,206,938,732) | | | | | | (165,300,289) | | | | | | (54,637,735) | | |
| Net increase in net assets resulting from capital share transactions | | | | | 1,412,905,399 | | | | | | 1,249,995,728 | | | | | | 62,923,346 | | | | | | 8,429,163 | | |
| Net increase in net assets | | | | | 1,411,301,226 | | | | | | 1,338,508,206 | | | | | | 57,167,753 | | | | | | 8,962,359 | | |
| NET ASSETS: | | | | | | | | | | | | | | | | | | | | | | | | | |
| Beginning of year or period | | | | | 6,817,677,473 | | | | | | 5,479,169,267 | | | | | | 115,062,837 | | | | | | 106,100,478 | | |
| End of year or period | | | | $ | 8,228,978,699 | | | | | $ | 6,817,677,473 | | | | | $ | 172,230,590 | | | | | $ | 115,062,837 | | |
| | | | Voya Strategic Income Opportunities Fund | | |||||||||
| | | | Year Ended March 31, 2020 | | | Year Ended March 31, 2019 | | ||||||
| FROM OPERATIONS: | | | | | | | | | | | | | |
| Net investment income | | | | $ | 88,352,883 | | | | | $ | 30,788,744 | | |
| Net realized loss | | | | | (40,985,272) | | | | | | (3,666,029) | | |
| Net change in unrealized appreciation (depreciation) | | | | | (276,356,200) | | | | | | 12,374,322 | | |
| Increase (decrease) in net assets resulting from operations | | | | | (228,988,589) | | | | | | 39,497,037 | | |
| FROM DISTRIBUTIONS TO SHAREHOLDERS: | | | | | | | | | | | | | |
| Total distributions (excluding return of capital): | | | | | | | | | | | | | |
| Class A | | | | | (7,268,307) | | | | | | (3,146,921) | | |
| Class C | | | | | (1,334,631) | | | | | | (551,876) | | |
| Class I | | | | | (78,896,166) | | | | | | (26,121,006) | | |
| Class P | | | | | (502,612) | | | | | | (25) | | |
| Class P3 | | | | | (139,449) | | | | | | — | | |
| Class R | | | | | (599,354) | | | | | | (327,613) | | |
| Class R6 | | | | | (9,781,658) | | | | | | (3,187,145) | | |
| Class W | | | | | (2,688,325) | | | | | | (2,041,599) | | |
| Total distributions | | | | | (101,210,502) | | | | | | (35,376,185) | | |
| FROM CAPITAL SHARE TRANSACTIONS: | | | | | | | | | | | | | |
| Net proceeds from sale of shares | | | | | 2,687,928,062 | | | | | | 1,467,080,904 | | |
| Reinvestment of distributions | | | | | 95,332,067 | | | | | | 32,263,680 | | |
| | | | | | 2,783,260,129 | | | | | | 1,499,344,584 | | |
| Cost of shares redeemed | | | | | (1,289,308,113) | | | | | | (468,204,434) | | |
| Net increase in net assets resulting from capital share transactions | | | | | 1,493,952,016 | | | | | | 1,031,140,150 | | |
| Net increase in net assets | | | | | 1,163,752,925 | | | | | | 1,035,261,002 | | |
| NET ASSETS: | | | | | | | | | | | | | |
| Beginning of year or period | | | | | 1,413,141,864 | | | | | | 377,880,862 | | |
| End of year or period | | | | $ | 2,576,894,789 | | | | | $ | 1,413,141,864 | | |
| | | | | | | | | | Income (loss) from investment operations | | | | | | | | | Less Distributions | | | | | | Ratios to average net assets | | | Supplemental Data | | ||||||||||||||||||||||||||||||||||||||||||||||||||||||||||||||||||
| | | | Net asset value, beginning of year or period | | | Net investment income (loss) | | | Net realized and unrealized gain (loss) | | | Total from investment operations | | | From net investment income | | | From net realized gains | | | From retun of capital | | | Total distributions | | | Payment by affiliate | | | Net asset value, end of year or period | | | Total Return(1) | | | Expenses before reductions/additions(2)(3) | | | Expenses net of fee waivers and/or recoupments if any(2)(3) | | | Expenses net of all reductions/additions(2)(3) | | | Net investment income (loss)(2)(3) | | | Net assets, end of year or period | | | Portfolio turnover rate | | ||||||||||||||||||||||||||||||||||||||||||
| Year or period ended | | | ($) | | | ($) | | | ($) | | | ($) | | | ($) | | | ($) | | | ($) | | | ($) | | | ($) | | | ($) | | | (%) | | | (%) | | | (%) | | | (%) | | | (%) | | | ($000’s) | | | (%) | | ||||||||||||||||||||||||||||||||||||||||||
| Voya GNMA Income Fund | | | | | | | | | | | | | | | | | | | | | | | | | | | | | | | | | | | | | | | | | | | | | | | | | | | | | | | | | | | | | | | | | | | | | | | | | | | | | | | | | | | | | | | | | | | | | | |
| Class A | | | | | | | | | | | | | | | | | | | | | | | | | | | | | | | | | | | | | | | | | | | | | | | | | | | | | | | | | | | | | | | | | | | | | | | | | | | | | | | | | | | | | | | | | | | | | | |
| 03-31-20 | | | | | 8.36 | | | | | | 0.18• | | | | | | 0.27 | | | | | | 0.45 | | | | | | 0.23 | | | | | | — | | | | | | — | | | | | | 0.23 | | | | | | — | | | | | | 8.58 | | | | | | 5.43 | | | | | | 0.93 | | | | 0.92 | | | 0.92 | | | 2.12 | | | | | 493,737 | | | | | | 421 | | |
| 03-31-19 | | | | | 8.25 | | | | | | 0.18 | | | | | | 0.13 | | | | | | 0.31 | | | | | | 0.20 | | | | | | — | | | | | | — | | | | | | 0.20 | | | | | | — | | | | | | 8.36 | | | | | | 3.85 | | | | | | 0.97 | | | | 0.95 | | | 0.95 | | | 2.25 | | | | | 394,763 | | | | | | 398 | | |
| 03-31-18 | | | | | 8.44 | | | | | | 0.14• | | | | | | (0.13) | | | | | | 0.01 | | | | | | 0.18 | | | | | | — | | | | | | 0.02 | | | | | | 0.20 | | | | | | — | | | | | | 8.25 | | | | | | 0.08 | | | | | | 0.95 | | | | 0.95 | | | 0.95 | | | 1.66 | | | | | 435,118 | | | | | | 367 | | |
| 03-31-17 | | | | | 8.63 | | | | | | 0.08 | | | | | | (0.04) | | | | | | 0.04 | | | | | | 0.13 | | | | | | 0.01 | | | | | | 0.09 | | | | | | 0.23 | | | | | | — | | | | | | 8.44 | | | | | | 0.44 | | | | | | 0.93 | | | | 0.93 | | | 0.93 | | | 1.02 | | | | | 513,223 | | | | | | 580 | | |
| 03-31-16 | | | | | 8.70 | | | | | | 0.13 | | | | | | 0.06 | | | | | | 0.19 | | | | | | 0.17 | | | | | | — | | | | | | 0.09 | | | | | | 0.26 | | | | | | — | | | | | | 8.63 | | | | | | 2.21 | | | | | | 0.93 | | | | 0.93 | | | 0.93 | | | 1.39 | | | | | 630,448 | | | | | | 508 | | |
| Class C | | | | | | | | | | | | | | | | | | | | | | | | | | | | | | | | | | | | | | | | | | | | | | | | | | | | | | | | | | | | | | | | | | | | | | | | | | | | | | | | | | | | | | | | | | | | | | |
| 03-31-20 | | | | | 8.31 | | | | | | 0.12• | | | | | | 0.26 | | | | | | 0.38 | | | | | | 0.16 | | | | | | — | | | | | | — | | | | | | 0.16 | | | | | | — | | | | | | 8.53 | | | | | | 4.66 | | | | | | 1.68 | | | | 1.67 | | | 1.67 | | | 1.37 | | | | | 47,577 | | | | | | 421 | | |
| 03-31-19 | | | | | 8.21 | | | | | | 0.12 | | | | | | 0.12 | | | | | | 0.24 | | | | | | 0.14 | | | | | | — | | | | | | — | | | | | | 0.14 | | | | | | — | | | | | | 8.31 | | | | | | 2.96 | | | | | | 1.72 | | | | 1.70 | | | 1.70 | | | 1.49 | | | | | 62,769 | | | | | | 398 | | |
| 03-31-18 | | | | | 8.39 | | | | | | 0.06 | | | | | | (0.10) | | | | | | (0.04) | | | | | | 0.12 | | | | | | — | | | | | | 0.02 | | | | | | 0.14 | | | | | | — | | | | | | 8.21 | | | | | | (0.56) | | | | | | 1.70 | | | | 1.70 | | | 1.70 | | | 0.90 | | | | | 76,535 | | | | | | 367 | | |
| 03-31-17 | | | | | 8.58 | | | | | | 0.02 | | | | | | (0.05) | | | | | | (0.03) | | | | | | 0.06 | | | | | | 0.01 | | | | | | 0.09 | | | | | | 0.16 | | | | | | — | | | | | | 8.39 | | | | | | (0.37) | | | | | | 1.68 | | | | 1.68 | | | 1.68 | | | 0.27 | | | | | 111,103 | | | | | | 580 | | |
| 03-31-16 | | | | | 8.65 | | | | | | 0.05• | | | | | | 0.07 | | | | | | 0.12 | | | | | | 0.10 | | | | | | — | | | | | | 0.09 | | | | | | 0.19 | | | | | | — | | | | | | 8.58 | | | | | | 1.46 | | | | | | 1.68 | | | | 1.68 | | | 1.68 | | | 0.64 | | | | | 108,278 | | | | | | 508 | | |
| Class I | | | | | | | | | | | | | | | | | | | | | | | | | | | | | | | | | | | | | | | | | | | | | | | | | | | | | | | | | | | | | | | | | | | | | | | | | | | | | | | | | | | | | | | | | | | | | | |
| 03-31-20 | | | | | 8.37 | | | | | | 0.21• | | | | | | 0.26 | | | | | | 0.47 | | | | | | 0.25 | | | | | | — | | | | | | — | | | | | | 0.25 | | | | | | — | | | | | | 8.59 | | | | | | 5.75 | | | | | | 0.67 | | | | 0.62 | | | 0.62 | | | 2.42 | | | | | 604,194 | | | | | | 421 | | |
| 03-31-19 | | | | | 8.26 | | | | | | 0.21 | | | | | | 0.13 | | | | | | 0.34 | | | | | | 0.23 | | | | | | — | | | | | | — | | | | | | 0.23 | | | | | | — | | | | | | 8.37 | | | | | | 4.16 | | | | | | 0.71 | | | | 0.65 | | | 0.65 | | | 2.55 | | | | | 387,607 | | | | | | 398 | | |
| 03-31-18 | | | | | 8.45 | | | | | | 0.16• | | | | | | (0.13) | | | | | | 0.03 | | | | | | 0.20 | | | | | | — | | | | | | 0.02 | | | | | | 0.22 | | | | | | — | | | | | | 8.26 | | | | | | 0.37 | | | | | | 0.70 | | | | 0.65 | | | 0.65 | | | 1.95 | | | | | 350,326 | | | | | | 367 | | |
| 03-31-17 | | | | | 8.64 | | | | | | 0.10 | | | | | | (0.03) | | | | | | 0.07 | | | | | | 0.16 | | | | | | 0.01 | | | | | | 0.09 | | | | | | 0.26 | | | | | | — | | | | | | 8.45 | | | | | | 0.76 | | | | | | 0.64 | | | | 0.64 | | | 0.64 | | | 1.29 | | | | | 461,076 | | | | | | 580 | | |
| 03-31-16 | | | | | 8.71 | | | | | | 0.14• | | | | | | 0.07 | | | | | | 0.21 | | | | | | 0.19 | | | | | | — | | | | | | 0.09 | | | | | | 0.28 | | | | | | — | | | | | | 8.64 | | | | | | 2.50 | | | | | | 0.64 | | | | 0.64 | | | 0.64 | | | 1.65 | | | | | 506,384 | | | | | | 508 | | |
| Class W | | | | | | | | | | | | | | | | | | | | | | | | | | | | | | | | | | | | | | | | | | | | | | | | | | | | | | | | | | | | | | | | | | | | | | | | | | | | | | | | | | | | | | | | | | | | | | |
| 03-31-20 | | | | | 8.38 | | | | | | 0.20• | | | | | | 0.27 | | | | | | 0.47 | | | | | | 0.25 | | | | | | — | | | | | | — | | | | | | 0.25 | | | | | | — | | | | | | 8.60 | | | | | | 5.69 | | | | | | 0.68 | | | | 0.67 | | | 0.67 | | | 2.38 | | | | | 155,915 | | | | | | 421 | | |
| 03-31-19 | | | | | 8.27 | | | | | | 0.20• | | | | | | 0.13 | | | | | | 0.33 | | | | | | 0.22 | | | | | | — | | | | | | — | | | | | | 0.22 | | | | | | — | | | | | | 8.38 | | | | | | 4.11 | | | | | | 0.72 | | | | 0.70 | | | 0.70 | | | 2.47 | | | | | 91,383 | | | | | | 398 | | |
| 03-31-18 | | | | | 8.46 | | | | | | 0.16• | | | | | | (0.13) | | | | | | 0.03 | | | | | | 0.20 | | | | | | — | | | | | | 0.02 | | | | | | 0.22 | | | | | | — | | | | | | 8.27 | | | | | | 0.33 | | | | | | 0.70 | | | | 0.70 | | | 0.70 | | | 1.92 | | | | | 156,625 | | | | | | 367 | | |
| 03-31-17 | | | | | 8.65 | | | | | | 0.12 | | | | | | (0.05) | | | | | | 0.07 | | | | | | 0.16 | | | | | | 0.01 | | | | | | 0.09 | | | | | | 0.26 | | | | | | — | | | | | | 8.46 | | | | | | 0.72 | | | | | | 0.68 | | | | 0.68 | | | 0.68 | | | 1.26 | | | | | 141,853 | | | | | | 580 | | |
| 03-31-16 | | | | | 8.72 | | | | | | 0.14• | | | | | | 0.07 | | | | | | 0.21 | | | | | | 0.19 | | | | | | — | | | | | | 0.09 | | | | | | 0.28 | | | | | | — | | | | | | 8.65 | | | | | | 2.46 | | | | | | 0.68 | | | | 0.68 | | | 0.68 | | | 1.60 | | | | | 118,638 | | | | | | 508 | | |
| Voya High Yield Bond Fund | | | | | | | | | | | | | | | | | | | | | | | | | | | | | | | | | | | | | | | | | | | | | | | | | | | | | | | | | | | | | | | | | | | | | | | | | | | | | | | | | | | | | | | | | | | | | | |
| Class A | | | | | | | | | | | | | | | | | | | | | | | | | | | | | | | | | | | | | | | | | | | | | | | | | | | | | | | | | | | | | | | | | | | | | | | | | | | | | | | | | | | | | | | | | | | | | | |
| 03-31-20 | | | | | 7.86 | | | | | | 0.39• | | | | | | (0.81) | | | | | | (0.42) | | | | | | 0.42 | | | | | | — | | | | | | — | | | | | | 0.42 | | | | | | — | | | | | | 7.02 | | | | | | (5.76) | | | | | | 1.10 | | | | 1.10 | | | 1.10 | | | 4.97 | | | | | 44,060 | | | | | | 57 | | |
| 03-31-19 | | | | | 7.89 | | | | | | 0.43 | | | | | | (0.05) | | | | | | 0.38 | | | | | | 0.41 | | | | | | — | | | | | | — | | | | | | 0.41 | | | | | | — | | | | | | 7.86 | | | | | | 5.03 | | | | | | 1.10 | | | | 1.10 | | | 1.10 | | | 5.49 | | | | | 60,390 | | | | | | 33 | | |
| 03-31-18 | | | | | 8.11 | | | | | | 0.43 | | | | | | (0.22) | | | | | | 0.21 | | | | | | 0.43 | | | | | | — | | | | | | — | | | | | | 0.43 | | | | | | — | | | | | | 7.89 | | | | | | 2.52 | | | | | | 1.07 | | | | 1.07 | | | 1.07 | | | 5.27 | | | | | 52,994 | | | | | | 40 | | |
| 03-31-17 | | | | | 7.62 | | | | | | 0.41 | | | | | | 0.50 | | | | | | 0.91 | | | | | | 0.42 | | | | | | — | | | | | | — | | | | | | 0.42 | | | | | | — | | | | | | 8.11 | | | | | | 12.13 | | | | | | 1.06 | | | | 1.06 | | | 1.06 | | | 5.23 | | | | | 60,927 | | | | | | 41 | | |
| 03-31-16 | | | | | 8.14 | | | | | | 0.41 | | | | | | (0.52) | | | | | | (0.11) | | | | | | 0.41 | | | | | | — | | | | | | — | | | | | | 0.41 | | | | | | — | | | | | | 7.62 | | | | | | (1.36) | | | | | | 1.07 | | | | 1.07 | | | 1.07 | | | 5.23 | | | | | 78,352 | | | | | | 22 | | |
| Class C | | | | | | | | | | | | | | | | | | | | | | | | | | | | | | | | | | | | | | | | | | | | | | | | | | | | | | | | | | | | | | | | | | | | | | | | | | | | | | | | | | | | | | | | | | | | | | |
| 03-31-20 | | | | | 7.86 | | | | | | 0.34• | | | | | | (0.82) | | | | | | (0.48) | | | | | | 0.36 | | | | | | — | | | | | | — | | | | | | 0.36 | | | | | | — | | | | | | 7.02 | | | | | | (6.47) | | | | | | 1.85 | | | | 1.85 | | | 1.85 | | | 4.23 | | | | | 11,215 | | | | | | 57 | | |
| 03-31-19 | | | | | 7.89 | | | | | | 0.37 | | | | | | (0.05) | | | | | | 0.32 | | | | | | 0.35 | | | | | | — | | | | | | — | | | | | | 0.35 | | | | | | — | | | | | | 7.86 | | | | | | 4.24 | | | | | | 1.85 | | | | 1.85 | | | 1.85 | | | 4.77 | | | | | 15,945 | | | | | | 33 | | |
| 03-31-18 | | | | | 8.11 | | | | | | 0.37 | | | | | | (0.23) | | | | | | 0.14 | | | | | | 0.36 | | | | | | — | | | | | | — | | | | | | 0.36 | | | | | | — | | | | | | 7.89 | | | | | | 1.75 | | | | | | 1.82 | | | | 1.82 | | | 1.82 | | | 4.52 | | | | | 10,513 | | | | | | 40 | | |
| 03-31-17 | | | | | 7.61 | | | | | | 0.36 | | | | | | 0.50 | | | | | | 0.86 | | | | | | 0.36 | | | | | | — | | | | | | — | | | | | | 0.36 | | | | | | — | | | | | | 8.11 | | | | | | 11.45 | | | | | | 1.81 | | | | 1.81 | | | 1.81 | | | 4.49 | | | | | 13,113 | | | | | | 41 | | |
| 03-31-16 | | | | | 8.14 | | | | | | 0.35 | | | | | | (0.53) | | | | | | (0.18) | | | | | | 0.35 | | | | | | — | | | | | | — | | | | | | 0.35 | | | | | | — | | | | | | 7.61 | | | | | | (2.24) | | | | | | 1.82 | | | | 1.82 | | | 1.82 | | | 4.48 | | | | | 12,677 | | | | | | 22 | | |
| | | | | | | | | | Income (loss) from investment operations | | | | | | | | | Less Distributions | | | | | | Ratios to average net assets | | | Supplemental Data | | ||||||||||||||||||||||||||||||||||||||||||||||||||||||||||||||||||
| | | | Net asset value, beginning of year or period | | | Net investment income (loss) | | | Net realized and unrealized gain (loss) | | | Total from investment operations | | | From net investment income | | | From net realized gains | | | From retun of capital | | | Total distributions | | | Payment by affiliate | | | Net asset value, end of year or period | | | Total Return(1) | | | Expenses before reductions/additions(2)(3) | | | Expenses net of fee waivers and/or recoupments if any(2)(3) | | | Expenses net of all reductions/additions(2)(3) | | | Net investment income (loss)(2)(3) | | | Net assets, end of year or period | | | Portfolio turnover rate | | ||||||||||||||||||||||||||||||||||||||||||
| Year or period ended | | | ($) | | | ($) | | | ($) | | | ($) | | | ($) | | | ($) | | | ($) | | | ($) | | | ($) | | | ($) | | | (%) | | | (%) | | | (%) | | | (%) | | | (%) | | | ($000’s) | | | (%) | | ||||||||||||||||||||||||||||||||||||||||||
| Voya High Yield Bond Fund (continued) | | | | | | | | | | | | | | | | | | | | | | | | | | | | | | | | | | | | | | | | | | | | | | | | | | | | | | | | | | | | | | | | | | | | | | | | | | | | | | | | | | | | | | | | | | | | | | |
| Class I | | | | | | | | | | | | | | | | | | | | | | | | | | | | | | | | | | | | | | | | | | | | | | | | | | | | | | | | | | | | | | | | | | | | | | | | | | | | | | | | | | | | | | | | | | | | | | |
| 03-31-20 | | | | | 7.85 | | | | | | 0.42• | | | | | | (0.81) | | | | | | (0.39) | | | | | | 0.45 | | | | | | — | | | | | | — | | | | | | 0.45 | | | | | | — | | | | | | 7.01 | | | | | | (5.45) | | | | | | 0.75 | | | | 0.75 | | | 0.75 | | | 5.32 | | | | | 68,214 | | | | | | 57 | | |
| 03-31-19 | | | | | 7.88 | | | | | | 0.47 | | | | | | (0.06) | | | | | | 0.41 | | | | | | 0.44 | | | | | | — | | | | | | — | | | | | | 0.44 | | | | | | — | | | | | | 7.85 | | | | | | 5.39 | | | | | | 0.75 | | | | 0.75 | | | 0.75 | | | 5.82 | | | | | 81,121 | | | | | | 33 | | |
| 03-31-18 | | | | | 8.10 | | | | | | 0.46 | | | | | | (0.23) | | | | | | 0.23 | | | | | | 0.45 | | | | | | — | | | | | | — | | | | | | 0.45 | | | | | | — | | | | | | 7.88 | | | | | | 2.87 | | | | | | 0.72 | | | | 0.72 | | | 0.72 | | | 5.62 | | | | | 149,279 | | | | | | 40 | | |
| 03-31-17 | | | | | 7.61 | | | | | | 0.44 | | | | | | 0.49 | | | | | | 0.93 | | | | | | 0.44 | | | | | | — | | | | | | — | | | | | | 0.44 | | | | | | — | | | | | | 8.10 | | | | | | 12.54 | | | | | | 0.71 | | | | 0.71 | | | 0.71 | | | 5.56 | | | | | 204,818 | | | | | | 41 | | |
| 03-31-16 | | | | | 8.14 | | | | | | 0.44 | | | | | | (0.53) | | | | | | (0.09) | | | | | | 0.44 | | | | | | — | | | | | | — | | | | | | 0.44 | | | | | | — | | | | | | 7.61 | | | | | | (1.12) | | | | | | 0.69 | | | | 0.69 | | | 0.69 | | | 5.63 | | | | | 352,052 | | | | | | 22 | | |
| Class P | | | | | | | | | | | | | | | | | | | | | | | | | | | | | | | | | | | | | | | | | | | | | | | | | | | | | | | | | | | | | | | | | | | | | | | | | | | | | | | | | | | | | | | | | | | | | | |
| 03-31-20 | | | | | 7.87 | | | | | | 0.47• | | | | | | (0.82) | | | | | | (0.35) | | | | | | 0.50 | | | | | | — | | | | | | — | | | | | | 0.50 | | | | | | — | | | | | | 7.02 | | | | | | (4.92) | | | | | | 0.69 | | | | 0.08 | | | 0.08 | | | 5.98 | | | | | 99,000 | | | | | | 57 | | |
| 03-31-19 | | | | | 7.90 | | | | | | 0.51 | | | | | | (0.05) | | | | | | 0.46 | | | | | | 0.49 | | | | | | — | | | | | | — | | | | | | 0.49 | | | | | | — | | | | | | 7.87 | | | | | | 6.05 | | | | | | 0.69 | | | | 0.08 | | | 0.08 | | | 6.51 | | | | | 120,464 | | | | | | 33 | | |
| 03-31-18 | | | | | 8.11 | | | | | | 0.51 | | | | | | (0.22) | | | | | | 0.29 | | | | | | 0.50 | | | | | | — | | | | | | — | | | | | | 0.50 | | | | | | — | | | | | | 7.90 | | | | | | 3.63 | | | | | | 0.66 | | | | 0.06 | | | 0.06 | | | 6.28 | | | | | 132,713 | | | | | | 40 | | |
| 03-31-17 | | | | | 7.61 | | | | | | 0.50 | | | | | | 0.49 | | | | | | 0.99 | | | | | | 0.49 | | | | | | — | | | | | | — | | | | | | 0.49 | | | | | | — | | | | | | 8.11 | | | | | | 13.36 | | | | | | 0.66 | | | | 0.07 | | | 0.07 | | | 6.25 | | | | | 149,606 | | | | | | 41 | | |
| 03-31-16 | | | | | 8.14 | | | | | | 0.49 | | | | | | (0.53) | | | | | | (0.04) | | | | | | 0.49 | | | | | | — | | | | | | — | | | | | | 0.49 | | | | | | — | | | | | | 7.61 | | | | | | (0.51) | | | | | | 0.67 | | | | 0.06 | | | 0.06 | | | 6.23 | | | | | 104,009 | | | | | | 22 | | |
| Class P3 | | | | | | | | | | | | | | | | | | | | | | | | | | | | | | | | | | | | | | | | | | | | | | | | | | | | | | | | | | | | | | | | | | | | | | | | | | | | | | | | | | | | | | | | | | | | | | |
| 03-31-20 | | | | | 7.86 | | | | | | 0.46• | | | | | | (0.79) | | | | | | (0.33) | | | | | | 0.51 | | | | | | — | | | | | | — | | | | | | 0.51 | | | | | | — | | | | | | 7.02 | | | | | | (4.74) | | | | | | 0.74 | | | | 0.00* | | | 0.00* | | | 7.32 | | | | | 1,143 | | | | | | 57 | | |
| 06-01-18(4) - 03-31-19 | | | | | 7.85 | | | | | | 0.41• | | | | | | 0.00* | | | | | | 0.41 | | | | | | 0.40 | | | | | | — | | | | | | — | | | | | | 0.40 | | | | | | — | | | | | | 7.86 | | | | | | 5.36 | | | | | | 0.69 | | | | 0.00* | | | 0.00* | | | 6.25 | | | | | 3 | | | | | | 33 | | |
| Class R | | | | | | | | | | | | | | | | | | | | | | | | | | | | | | | | | | | | | | | | | | | | | | | | | | | | | | | | | | | | | | | | | | | | | | | | | | | | | | | | | | | | | | | | | | | | | | |
| 03-31-20 | | | | | 7.87 | | | | | | 0.37• | | | | | | (0.81) | | | | | | (0.44) | | | | | | 0.40 | | | | | | — | | | | | | — | | | | | | 0.40 | | | | | | — | | | | | | 7.03 | | | | | | (5.99) | | | | | | 1.35 | | | | 1.35 | | | 1.35 | | | 4.72 | | | | | 684 | | | | | | 57 | | |
| 03-31-19 | | | | | 7.90 | | | | | | 0.41 | | | | | | (0.05) | | | | | | 0.36 | | | | | | 0.39 | | | | | | — | | | | | | — | | | | | | 0.39 | | | | | | — | | | | | | 7.87 | | | | | | 4.76 | | | | | | 1.35 | | | | 1.35 | | | 1.35 | | | 5.25 | | | | | 1,185 | | | | | | 33 | | |
| 03-31-18 | | | | | 8.11 | | | | | | 0.41 | | | | | | (0.21) | | | | | | 0.20 | | | | | | 0.41 | | | | | | — | | | | | | — | | | | | | 0.41 | | | | | | — | | | | | | 7.90 | | | | | | 2.39 | | | | | | 1.32 | | | | 1.32 | | | 1.32 | | | 5.00 | | | | | 791 | | | | | | 40 | | |
| 03-31-17 | | | | | 7.62 | | | | | | 0.40 | | | | | | 0.49 | | | | | | 0.89 | | | | | | 0.40 | | | | | | — | | | | | | — | | | | | | 0.40 | | | | | | — | | | | | | 8.11 | | | | | | 11.85 | | | | | | 1.31 | | | | 1.31 | | | 1.31 | | | 4.99 | | | | | 267 | | | | | | 41 | | |
| 03-31-16 | | | | | 8.15 | | | | | | 0.39 | | | | | | (0.53) | | | | | | (0.14) | | | | | | 0.39 | | | | | | — | | | | | | — | | | | | | 0.39 | | | | | | — | | | | | | 7.62 | | | | | | (1.71) | | | | | | 1.32 | | | | 1.32 | | | 1.32 | | | 5.00 | | | | | 323 | | | | | | 22 | | |
| Class R6 | | | | | | | | | | | | | | | | | | | | | | | | | | | | | | | | | | | | | | | | | | | | | | | | | | | | | | | | | | | | | | | | | | | | | | | | | | | | | | | | | | | | | | | | | | | | | | |
| 03-31-20 | | | | | 7.87 | | | | | | 0.43• | | | | | | (0.82) | | | | | | (0.39) | | | | | | 0.46 | | | | | | — | | | | | | — | | | | | | 0.46 | | | | | | — | | | | | | 7.02 | | | | | | (5.49) | | | | | | 0.69 | | | | 0.69 | | | 0.69 | | | 5.44 | | | | | 125,036 | | | | | | 57 | | |
| 03-31-19 | | | | | 7.89 | | | | | | 0.45• | | | | | | (0.03) | | | | | | 0.42 | | | | | | 0.44 | | | | | | — | | | | | | — | | | | | | 0.44 | | | | | | — | | | | | | 7.87 | | | | | | 5.52 | | | | | | 0.69 | | | | 0.69 | | | 0.69 | | | 5.72 | | | | | 10,002 | | | | | | 33 | | |
| 03-31-18 | | | | | 8.10 | | | | | | 0.46 | | | | | | (0.22) | | | | | | 0.24 | | | | | | 0.45 | | | | | | — | | | | | | — | | | | | | 0.45 | | | | | | — | | | | | | 7.89 | | | | | | 2.97 | | | | | | 0.66 | | | | 0.66 | | | 0.66 | | | 5.67 | | | | | 117,343 | | | | | | 40 | | |
| 08-03-16(4) - 03-31-17 | | | | | 7.89 | | | | | | 0.30• | | | | | | 0.20 | | | | | | 0.50 | | | | | | 0.29 | | | | | | — | | | | | | — | | | | | | 0.29 | | | | | | — | | | | | | 8.10 | | | | | | 6.39 | | | | | | 0.66 | | | | 0.66 | | | 0.66 | | | 5.74 | | | | | 120,605 | | | | | | 41 | | |
| Class W | | | | | | | | | | | | | | | | | | | | | | | | | | | | | | | | | | | | | | | | | | | | | | | | | | | | | | | | | | | | | | | | | | | | | | | | | | | | | | | | | | | | | | | | | | | | | | |
| 03-31-20 | | | | | 7.87 | | | | | | 0.41• | | | | | | (0.81) | | | | | | (0.40) | | | | | | 0.44 | | | | | | — | | | | | | — | | | | | | 0.44 | | | | | | — | | | | | | 7.03 | | | | | | (5.51) | | | | | | 0.85 | | | | 0.85 | | | 0.85 | | | 5.22 | | | | | 138,971 | | | | | | 57 | | |
| 03-31-19 | | | | | 7.90 | | | | | | 0.45 | | | | | | (0.05) | | | | | | 0.40 | | | | | | 0.43 | | | | | | — | | | | | | — | | | | | | 0.43 | | | | | | — | | | | | | 7.87 | | | | | | 5.29 | | | | | | 0.85 | | | | 0.85 | | | 0.85 | | | 5.74 | | | | | 98,192 | | | | | | 33 | | |
| 03-31-18 | | | | | 8.12 | | | | | | 0.45 | | | | | | (0.22) | | | | | | 0.23 | | | | | | 0.45 | | | | | | — | | | | | | — | | | | | | 0.45 | | | | | | — | | | | | | 7.90 | | | | | | 2.78 | | | | | | 0.82 | | | | 0.82 | | | 0.82 | | | 5.51 | | | | | 98,970 | | | | | | 40 | | |
| 03-31-17 | | | | | 7.63 | | | | | | 0.44 | | | | | | 0.49 | | | | | | 0.93 | | | | | | 0.44 | | | | | | — | | | | | | — | | | | | | 0.44 | | | | | | — | | | | | | 8.12 | | | | | | 12.40 | | | | | | 0.81 | | | | 0.81 | | | 0.81 | | | 5.49 | | | | | 90,878 | | | | | | 41 | | |
| 03-31-16 | | | | | 8.15 | | | | | | 0.43 | | | | | | (0.52) | | | | | | (0.09) | | | | | | 0.43 | | | | | | — | | | | | | — | | | | | | 0.43 | | | | | | — | | | | | | 7.63 | | | | | | (1.08) | | | | | | 0.82 | | | | 0.82 | | | 0.82 | | | 5.51 | | | | | 82,981 | | | | | | 22 | | |
| Voya Intermediate Bond Fund | | | | | | | | | | | | | | | | | | | | | | | | | | | | | | | | | | | | | | | | | | | | | | | | | | | | | | | | | | | | | | | | | | | | | | | | | | | | | | | | | | | | | | | | | | | | | | |
| Class A | | | | | | | | | | | | | | | | | | | | | | | | | | | | | | | | | | | | | | | | | | | | | | | | | | | | | | | | | | | | | | | | | | | | | | | | | | | | | | | | | | | | | | | | | | | | | | |
| 03-31-20 | | | | | 10.02 | | | | | | 0.30 | | | | | | 0.13 | | | | | | 0.43 | | | | | | 0.33 | | | | | | 0.01 | | | | | | — | | | | | | 0.34 | | | | | | — | | | | | | 10.11 | | | | | | 4.29 | | | | | | 0.69 | | | | 0.69 | | | 0.69 | | | 2.88 | | | | | 451,338 | | | | | | 253†† | | |
| 03-31-19 | | | | | 9.90 | | | | | | 0.30 | | | | | | 0.11 | | | | | | 0.41 | | | | | | 0.29 | | | | | | — | | | | | | — | | | | | | 0.29 | | | | | | — | | | | | | 10.02 | | | | | | 4.28 | | | | | | 0.70 | | | | 0.70 | | | 0.70 | | | 3.06 | | | | | 431,210 | | | | | | 329†† | | |
| 03-31-18 | | | | | 10.01 | | | | | | 0.27 | | | | | | (0.09) | | | | | | 0.18 | | | | | | 0.29 | | | | | | — | | | | | | — | | | | | | 0.29 | | | | | | — | | | | | | 9.90 | | | | | | 1.75 | | | | | | 0.67 | | | | 0.67 | | | 0.67 | | | 2.63 | | | | | 444,865 | | | | | | 482†† | | |
| 03-31-17 | | | | | 10.09 | | | | | | 0.27 | | | | | | (0.05) | | | | | | 0.22 | | | | | | 0.30 | | | | | | — | | | | | | — | | | | | | 0.30 | | | | | | — | | | | | | 10.01 | | | | | | 2.19 | | | | | | 0.65 | | | | 0.65 | | | 0.65 | | | 2.65 | | | | | 436,938 | | | | | | 403†† | | |
| 03-31-16 | | | | | 10.23 | | | | | | 0.26 | | | | | | (0.15) | | | | | | 0.11 | | | | | | 0.25 | | | | | | — | | | | | | — | | | | | | 0.25 | | | | | | — | | | | | | 10.09 | | | | | | 1.12 | | | | | | 0.65 | | | | 0.65 | | | 0.65 | | | 2.57 | | | | | 490,902 | | | | | | 465†† | | |
| | | | | | | | | | Income (loss) from investment operations | | | | | | | | | Less Distributions | | | | | | Ratios to average net assets | | | Supplemental Data | | ||||||||||||||||||||||||||||||||||||||||||||||||||||||||||||||||||
| | | | Net asset value, beginning of year or period | | | Net investment income (loss) | | | Net realized and unrealized gain (loss) | | | Total from investment operations | | | From net investment income | | | From net realized gains | | | From retun of capital | | | Total distributions | | | Payment by affiliate | | | Net asset value, end of year or period | | | Total Return(1) | | | Expenses before reductions/additions(2)(3) | | | Expenses net of fee waivers and/or recoupments if any(2)(3) | | | Expenses net of all reductions/additions(2)(3) | | | Net investment income (loss)(2)(3) | | | Net assets, end of year or period | | | Portfolio turnover rate | | ||||||||||||||||||||||||||||||||||||||||||
| Year or period ended | | | ($) | | | ($) | | | ($) | | | ($) | | | ($) | | | ($) | | | ($) | | | ($) | | | ($) | | | ($) | | | (%) | | | (%) | | | (%) | | | (%) | | | (%) | | | ($000’s) | | | (%) | | ||||||||||||||||||||||||||||||||||||||||||
| Voya Intermediate Bond Fund (continued) | | | | | | | | | | | | | | | | | | | | | | | | | | | | | | | | | | | | | | | | | | | | | | | | | | | | | | | | | | | | | | | | | | | | | | | | | | | | | | | | | | | | | | | | | | | | | | |
| Class C | | | | | | | | | | | | | | | | | | | | | | | | | | | | | | | | | | | | | | | | | | | | | | | | | | | | | | | | | | | | | | | | | | | | | | | | | | | | | | | | | | | | | | | | | | | | | | |
| 03-31-20 | | | | | 10.01 | | | | | | 0.21 | | | | | | 0.14 | | | | | | 0.35 | | | | | | 0.26 | | | | | | 0.01 | | | | | | — | | | | | | 0.27 | | | | | | — | | | | | | 10.09 | | | | | | 3.41 | | | | | | 1.44 | | | | 1.44 | | | 1.44 | | | 2.06 | | | | | 25,556 | | | | | | 253†† | | |
| 03-31-19 | | | | | 9.89 | | | | | | 0.23 | | | | | | 0.11 | | | | | | 0.34 | | | | | | 0.22 | | | | | | — | | | | | | — | | | | | | 0.22 | | | | | | — | | | | | | 10.01 | | | | | | 3.51 | | | | | | 1.45 | | | | 1.45 | | | 1.45 | | | 2.31 | | | | | 28,657 | | | | | | 329†† | | |
| 03-31-18 | | | | | 10.00 | | | | | | 0.19 | | | | | | (0.09) | | | | | | 0.10 | | | | | | 0.21 | | | | | | — | | | | | | — | | | | | | 0.21 | | | | | | — | | | | | | 9.89 | | | | | | 0.99 | | | | | | 1.42 | | | | 1.42 | | | 1.42 | | | 1.89 | | | | | 30,922 | | | | | | 482†† | | |
| 03-31-17 | | | | | 10.07 | | | | | | 0.19 | | | | | | (0.04) | | | | | | 0.15 | | | | | | 0.22 | | | | | | — | | | | | | — | | | | | | 0.22 | | | | | | — | | | | | | 10.00 | | | | | | 1.53 | | | | | | 1.40 | | | | 1.40 | | | 1.40 | | | 1.91 | | | | | 28,270 | | | | | | 403†† | | |
| 03-31-16 | | | | | 10.21 | | | | | | 0.18 | | | | | | (0.14) | | | | | | 0.04 | | | | | | 0.18 | | | | | | — | | | | | | — | | | | | | 0.18 | | | | | | — | | | | | | 10.07 | | | | | | 0.37 | | | | | | 1.40 | | | | 1.40 | | | 1.40 | | | 1.85 | | | | | 31,945 | | | | | | 465†† | | |
| Class I | | | | | | | | | | | | | | | | | | | | | | | | | | | | | | | | | | | | | | | | | | | | | | | | | | | | | | | | | | | | | | | | | | | | | | | | | | | | | | | | | | | | | | | | | | | | | | |
| 03-31-20 | | | | | 10.02 | | | | | | 0.32 | | | | | | 0.14 | | | | | | 0.46 | | | | | | 0.37 | | | | | | 0.01 | | | | | | — | | | | | | 0.38 | | | | | | — | | | | | | 10.10 | | | | | | 4.53 | | | | | | 0.36 | | | | 0.36 | | | 0.36 | | | 3.13 | | | | | 4,988,317 | | | | | | 253†† | | |
| 03-31-19 | | | | | 9.90 | | | | | | 0.33 | | | | | | 0.12 | | | | | | 0.45 | | | | | | 0.33 | | | | | | — | | | | | | — | | | | | | 0.33 | | | | | | — | | | | | | 10.02 | | | | | | 4.63 | | | | | | 0.36 | | | | 0.36 | | | 0.36 | | | 3.41 | | | | | 4,142,382 | | | | | | 329†† | | |
| 03-31-18 | | | | | 10.01 | | | | | | 0.30 | | | | | | (0.09) | | | | | | 0.21 | | | | | | 0.32 | | | | | | — | | | | | | — | | | | | | 0.32 | | | | | | — | | | | | | 9.90 | | | | | | 2.09 | | | | | | 0.35 | | | | 0.35 | | | 0.35 | | | 2.96 | | | | | 2,510,746 | | | | | | 482†† | | |
| 03-31-17 | | | | | 10.08 | | | | | | 0.30 | | | | | | (0.04) | | | | | | 0.26 | | | | | | 0.33 | | | | | | — | | | | | | — | | | | | | 0.33 | | | | | | — | | | | | | 10.01 | | | | | | 2.63 | | | | | | 0.33 | | | | 0.33 | | | 0.33 | | | 3.00 | | | | | 1,578,844 | | | | | | 403†† | | |
| 03-31-16 | | | | | 10.23 | | | | | | 0.29 | | | | | | (0.16) | | | | | | 0.13 | | | | | | 0.28 | | | | | | — | | | | | | — | | | | | | 0.28 | | | | | | — | | | | | | 10.08 | | | | | | 1.36 | | | | | | 0.32 | | | | 0.32 | | | 0.32 | | | 2.93 | | | | | 1,137,655 | | | | | | 465†† | | |
| Class P3 | | | | | | | | | | | | | | | | | | | | | | | | | | | | | | | | | | | | | | | | | | | | | | | | | | | | | | | | | | | | | | | | | | | | | | | | | | | | | | | | | | | | | | | | | | | | | | |
| 03-31-20 | | | | | 10.02 | | | | | | 0.36 | | | | | | 0.14 | | | | | | 0.50 | | | | | | 0.40 | | | | | | 0.01 | | | | | | — | | | | | | 0.41 | | | | | | — | | | | | | 10.11 | | | | | | 4.99 | | | | | | 0.30 | | | | 0.00* | | | 0.00* | | | 3.49 | | | | | 20,936 | | | | | | 253†† | | |
| 06-01-18(4) - 03-31-19 | | | | | 9.80 | | | | | | 0.31• | | | | | | 0.21 | | | | | | 0.52 | | | | | | 0.30 | | | | | | — | | | | | | — | | | | | | 0.30 | | | | | | — | | | | | | 10.02 | | | | | | 5.40 | | | | | | 0.31 | | | | 0.00* | | | 0.00* | | | 3.80 | | | | | 16,286 | | | | | | 329†† | | |
| Class R | | | | | | | | | | | | | | | | | | | | | | | | | | | | | | | | | | | | | | | | | | | | | | | | | | | | | | | | | | | | | | | | | | | | | | | | | | | | | | | | | | | | | | | | | | | | | | |
| 03-31-20 | | | | | 10.03 | | | | | | 0.26 | | | | | | 0.15 | | | | | | 0.41 | | | | | | 0.31 | | | | | | 0.01 | | | | | | — | | | | | | 0.32 | | | | | | — | | | | | | 10.12 | | | | | | 4.03 | | | | | | 0.94 | | | | 0.94 | | | 0.94 | | | 2.56 | | | | | 186,915 | | | | | | 253†† | | |
| 03-31-19 | | | | | 9.92 | | | | | | 0.28 | | | | | | 0.10 | | | | | | 0.38 | | | | | | 0.27 | | | | | | — | | | | | | — | | | | | | 0.27 | | | | | | — | | | | | | 10.03 | | | | | | 3.92 | | | | | | 0.95 | | | | 0.95 | | | 0.95 | | | 2.81 | | | | | 170,236 | | | | | | 329†† | | |
| 03-31-18 | | | | | 10.02 | | | | | | 0.24 | | | | | | (0.08) | | | | | | 0.16 | | | | | | 0.26 | | | | | | — | | | | | | — | | | | | | 0.26 | | | | | | — | | | | | | 9.92 | | | | | | 1.60 | | | | | | 0.92 | | | | 0.92 | | | 0.92 | | | 2.38 | | | | | 186,904 | | | | | | 482†† | | |
| 03-31-17 | | | | | 10.10 | | | | | | 0.24 | | | | | | (0.04) | | | | | | 0.20 | | | | | | 0.28 | | | | | | — | | | | | | — | | | | | | 0.28 | | | | | | — | | | | | | 10.02 | | | | | | 1.93 | | | | | | 0.90 | | | | 0.90 | | | 0.90 | | | 2.42 | | | | | 166,268 | | | | | | 403†† | | |
| 03-31-16 | | | | | 10.24 | | | | | | 0.23 | | | | | | (0.14) | | | | | | 0.09 | | | | | | 0.23 | | | | | | — | | | | | | — | | | | | | 0.23 | | | | | | — | | | | | | 10.10 | | | | | | 0.88 | | | | | | 0.90 | | | | 0.90 | | | 0.90 | | | 2.36 | | | | | 145,437 | | | | | | 465†† | | |
| Class R6 | | | | | | | | | | | | | | | | | | | | | | | | | | | | | | | | | | | | | | | | | | | | | | | | | | | | | | | | | | | | | | | | | | | | | | | | | | | | | | | | | | | | | | | | | | | | | | |
| 03-31-20 | | | | | 10.02 | | | | | | 0.33 | | | | | | 0.14 | | | | | | 0.47 | | | | | | 0.37 | | | | | | 0.01 | | | | | | — | | | | | | 0.38 | | | | | | — | | | | | | 10.11 | | | | | | 4.67 | | | | | | 0.30 | | | | 0.30 | | | 0.30 | | | 3.19 | | | | | 2,306,857 | | | | | | 253†† | | |
| 03-31-19 | | | | | 9.90 | | | | | | 0.34 | | | | | | 0.11 | | | | | | 0.45 | | | | | | 0.33 | | | | | | — | | | | | | — | | | | | | 0.33 | | | | | | — | | | | | | 10.02 | | | | | | 4.65 | | | | | | 0.31 | | | | 0.31 | | | 0.31 | | | 3.46 | | | | | 1,851,627 | | | | | | 329†† | | |
| 03-31-18 | | | | | 10.00 | | | | | | 0.31 | | | | | | (0.09) | | | | | | 0.22 | | | | | | 0.32 | | | | | | — | | | | | | — | | | | | | 0.32 | | | | | | — | | | | | | 9.90 | | | | | | 2.20 | | | | | | 0.31 | | | | 0.31 | | | 0.31 | | | 3.00 | | | | | 1,514,795 | | | | | | 482†† | | |
| 03-31-17 | | | | | 10.08 | | | | | | 0.30 | | | | | | (0.04) | | | | | | 0.26 | | | | | | 0.34 | | | | | | — | | | | | | — | | | | | | 0.34 | | | | | | — | | | | | | 10.00 | | | | | | 2.54 | | | | | | 0.31 | | | | 0.31 | | | 0.31 | | | 3.01 | | | | | 832,462 | | | | | | 403†† | | |
| 03-31-16 | | | | | 10.22 | | | | | | 0.29 | | | | | | (0.15) | | | | | | 0.14 | | | | | | 0.28 | | | | | | — | | | | | | — | | | | | | 0.28 | | | | | | — | | | | | | 10.08 | | | | | | 1.47 | | | | | | 0.31 | | | | 0.31 | | | 0.31 | | | 2.97 | | | | | 605,884 | | | | | | 465†† | | |
| Class W | | | | | | | | | | | | | | | | | | | | | | | | | | | | | | | | | | | | | | | | | | | | | | | | | | | | | | | | | | | | | | | | | | | | | | | | | | | | | | | | | | | | | | | | | | | | | | |
| 03-31-20 | | | | | 10.01 | | | | | | 0.32 | | | | | | 0.14 | | | | | | 0.46 | | | | | | 0.36 | | | | | | 0.01 | | | | | | — | | | | | | 0.37 | | | | | | — | | | | | | 10.10 | | | | | | 4.56 | | | | | | 0.44 | | | | 0.44 | | | 0.44 | | | 3.05 | | | | | 249,060 | | | | | | 253†† | | |
| 03-31-19 | | | | | 9.89 | | | | | | 0.32• | | | | | | 0.12 | | | | | | 0.44 | | | | | | 0.32 | | | | | | — | | | | | | — | | | | | | 0.32 | | | | | | — | | | | | | 10.01 | | | | | | 4.55 | | | | | | 0.45 | | | | 0.45 | | | 0.45 | | | 3.25 | | | | | 174,570 | | | | | | 329†† | | |
| 03-31-18 | | | | | 10.00 | | | | | | 0.29 | | | | | | (0.09) | | | | | | 0.20 | | | | | | 0.31 | | | | | | — | | | | | | — | | | | | | 0.31 | | | | | | — | | | | | | 9.89 | | | | | | 2.00 | | | | | | 0.42 | | | | 0.42 | | | 0.42 | | | 2.89 | | | | | 760,186 | | | | | | 482†† | | |
| 03-31-17 | | | | | 10.07 | | | | | | 0.29 | | | | | | (0.03) | | | | | | 0.26 | | | | | | 0.33 | | | | | | — | | | | | | — | | | | | | 0.33 | | | | | | — | | | | | | 10.00 | | | | | | 2.54 | | | | | | 0.40 | | | | 0.40 | | | 0.40 | | | 2.92 | | | | | 654,374 | | | | | | 403†† | | |
| 03-31-16 | | | | | 10.22 | | | | | | 0.28 | | | | | | (0.15) | | | | | | 0.13 | | | | | | 0.28 | | | | | | — | | | | | | — | | | | | | 0.28 | | | | | | — | | | | | | 10.07 | | | | | | 1.28 | | | | | | 0.40 | | | | 0.40 | | | 0.40 | | | 2.87 | | | | | 588,181 | | | | | | 465†† | | |
| | | | | | | | | | Income (loss) from investment operations | | | | | | | | | Less Distributions | | | | | | Ratios to average net assets | | | Supplemental Data | | ||||||||||||||||||||||||||||||||||||||||||||||||||||||||||||||||||
| | | | Net asset value, beginning of year or period | | | Net investment income (loss) | | | Net realized and unrealized gain (loss) | | | Total from investment operations | | | From net investment income | | | From net realized gains | | | From retun of capital | | | Total distributions | | | Payment by affiliate | | | Net asset value, end of year or period | | | Total Return(1) | | | Expenses before reductions/additions(2)(3) | | | Expenses net of fee waivers and/or recoupments if any(2)(3) | | | Expenses net of all reductions/additions(2)(3) | | | Net investment income (loss)(2)(3) | | | Net assets, end of year or period | | | Portfolio turnover rate | | ||||||||||||||||||||||||||||||||||||||||||
| Year or period ended | | | ($) | | | ($) | | | ($) | | | ($) | | | ($) | | | ($) | | | ($) | | | ($) | | | ($) | | | ($) | | | (%) | | | (%) | | | (%) | | | (%) | | | (%) | | | ($000’s) | | | (%) | | ||||||||||||||||||||||||||||||||||||||||||
| Voya Short Term Bond Fund | | | | | | | | | | | | | | | | | | | | | | | | | | | | | | | | | | | | | | | | | | | | | | | | | | | | | | | | | | | | | | | | | | | | | | | | | | | | | | | | | | | | | | | | | | | | | | |
| Class A | | | | | | | | | | | | | | | | | | | | | | | | | | | | | | | | | | | | | | | | | | | | | | | | | | | | | | | | | | | | | | | | | | | | | | | | | | | | | | | | | | | | | | | | | | | | | | |
| 03-31-20 | | | | | 9.77 | | | | | | 0.22• | | | | | | (0.23) | | | | | | (0.01) | | | | | | 0.21 | | | | | | — | | | | | | — | | | | | | 0.21 | | | | | | — | | | | | | 9.55 | | | | | | (0.14) | | | | | | 0.72 | | | | 0.65 | | | 0.65 | | | 2.19 | | | | | 6,907 | | | | | | 192 | | |
| 03-31-19 | | | | | 9.72 | | | | | | 0.21• | | | | | | 0.06 | | | | | | 0.27 | | | | | | 0.22 | | | | | | — | | | | | | — | | | | | | 0.22 | | | | | | — | | | | | | 9.77 | | | | | | 2.85 | | | | | | 0.93 | | | | 0.77 | | | 0.77 | | | 2.14 | | | | | 14,247 | | | | | | 137 | | |
| 03-31-18 | | | | | 9.84 | | | | | | 0.16 | | | | | | (0.12) | | | | | | 0.04 | | | | | | 0.16 | | | | | | — | | | | | | — | | | | | | 0.16 | | | | | | — | | | | | | 9.72 | | | | | | 0.35 | | | | | | 0.88 | | | | 0.77 | | | 0.77 | | | 1.55 | | | | | 2,618 | | | | | | 165 | | |
| 03-31-17 | | | | | 9.88 | | | | | | 0.12• | | | | | | (0.01) | | | | | | 0.11 | | | | | | 0.15 | | | | | | — | | | | | | — | | | | | | 0.15 | | | | | | — | | | | | | 9.84 | | | | | | 1.16 | | | | | | 0.85 | | | | 0.76 | | | 0.76 | | | 1.18 | | | | | 4,894 | | | | | | 227 | | |
| 03-31-16 | | | | | 9.97 | | | | | | 0.13• | | | | | | (0.06) | | | | | | 0.07 | | | | | | 0.16 | | | | | | — | | | | | | — | | | | | | 0.16 | | | | | | — | | | | | | 9.88 | | | | | | 0.67 | | | | | | 0.96 | | | | 0.80 | | | 0.80 | | | 1.28 | | | | | 9,658 | | | | | | 109 | | |
| Class C | | | | | | | | | | | | | | | | | | | | | | | | | | | | | | | | | | | | | | | | | | | | | | | | | | | | | | | | | | | | | | | | | | | | | | | | | | | | | | | | | | | | | | | | | | | | | | |
| 03-31-20 | | | | | 9.76 | | | | | | 0.14• | | | | | | (0.21) | | | | | | (0.07) | | | | | | 0.14 | | | | | | — | | | | | | — | | | | | | 0.14 | | | | | | — | | | | | | 9.55 | | | | | | (0.78) | | | | | | 1.47 | | | | 1.40 | | | 1.40 | | | 1.41 | | | | | 335 | | | | | | 192 | | |
| 03-31-19 | | | | | 9.72 | | | | | | 0.12 | | | | | | 0.07 | | | | | | 0.19 | | | | | | 0.15 | | | | | | — | | | | | | — | | | | | | 0.15 | | | | | | — | | | | | | 9.76 | | | | | | 1.97 | | | | | | 1.68 | | | | 1.52 | | | 1.52 | | | 1.38 | | | | | 1,038 | | | | | | 137 | | |
| 03-31-18 | | | | | 9.84 | | | | | | 0.08 | | | | | | (0.12) | | | | | | (0.04) | | | | | | 0.08 | | | | | | — | | | | | | — | | | | | | 0.08 | | | | | | — | | | | | | 9.72 | | | | | | (0.40) | | | | | | 1.63 | | | | 1.52 | | | 1.52 | | | 0.81 | | | | | 728 | | | | | | 165 | | |
| 03-31-17 | | | | | 9.88 | | | | | | 0.04 | | | | | | 0.00* | | | | | | 0.04 | | | | | | 0.08 | | | | | | — | | | | | | — | | | | | | 0.08 | | | | | | — | | | | | | 9.84 | | | | | | 0.40 | | | | | | 1.60 | | | | 1.51 | | | 1.51 | | | 0.45 | | | | | 1,079 | | | | | | 227 | | |
| 03-31-16 | | | | | 9.98 | | | | | | 0.06 | | | | | | (0.08) | | | | | | (0.02) | | | | | | 0.08 | | | | | | — | | | | | | — | | | | | | 0.08 | | | | | | — | | | | | | 9.88 | | | | | | (0.19) | | | | | | 1.71 | | | | 1.55 | | | 1.55 | | | 0.51 | | | | | 898 | | | | | | 109 | | |
| Class I | | | | | | | | | | | | | | | | | | | | | | | | | | | | | | | | | | | | | | | | | | | | | | | | | | | | | | | | | | | | | | | | | | | | | | | | | | | | | | | | | | | | | | | | | | | | | | |
| 03-31-20 | | | | | 9.76 | | | | | | 0.24• | | | | | | (0.22) | | | | | | 0.02 | | | | | | 0.24 | | | | | | — | | | | | | — | | | | | | 0.24 | | | | | | — | | | | | | 9.54 | | | | | | 0.16 | | | | | | 0.57 | | | | 0.40 | | | 0.40 | | | 2.43 | | | | | 11,925 | | | | | | 192 | | |
| 03-31-19 | | | | | 9.71 | | | | | | 0.23 | | | | | | 0.07 | | | | | | 0.30 | | | | | | 0.25 | | | | | | — | | | | | | — | | | | | | 0.25 | | | | | | — | | | | | | 9.76 | | | | | | 3.15 | | | | | | 0.78 | | | | 0.50 | | | 0.50 | | | 2.37 | | | | | 9,283 | | | | | | 137 | | |
| 03-31-18 | | | | | 9.84 | | | | | | 0.18 | | | | | | (0.13) | | | | | | 0.05 | | | | | | 0.18 | | | | | | — | | | | | | — | | | | | | 0.18 | | | | | | — | | | | | | 9.71 | | | | | | 0.55 | | | | | | 0.71 | | | | 0.51 | | | 0.51 | | | 1.84 | | | | | 9,578 | | | | | | 165 | | |
| 03-31-17 | | | | | 9.88 | | | | | | 0.15 | | | | | | (0.01) | | | | | | 0.14 | | | | | | 0.18 | | | | | | — | | | | | | — | | | | | | 0.18 | | | | | | — | | | | | | 9.84 | | | | | | 1.46 | | | | | | 0.67 | | | | 0.50 | | | 0.50 | | | 1.46 | | | | | 12,921 | | | | | | 227 | | |
| 03-31-16 | | | | | 9.98 | | | | | | 0.16 | | | | | | (0.08) | | | | | | 0.08 | | | | | | 0.18 | | | | | | — | | | | | | — | | | | | | 0.18 | | | | | | — | | | | | ��� | 9.88 | | | | | | 0.85 | | | | | | 0.63 | | | | 0.50 | | | 0.50 | | | 1.53 | | | | | 9,954 | | | | | | 109 | | |
| Class P2 | | | | | | | | | | | | | | | | | | | | | | | | | | | | | | | | | | | | | | | | | | | | | | | | | | | | | | | | | | | | | | | | | | | | | | | | | | | | | | | | | | | | | | | | | | | | | | |
| 10-22-19(4) - 03-31-20 | | | | | 9.88 | | | | | | 0.26• | | | | | | (0.47) | | | | | | (0.21) | | | | | | 0.13 | | | | | | — | | | | | | — | | | | | | 0.13 | | | | | | — | | | | | | 9.54 | | | | | | (2.16) | | | | | | 0.36 | | | | 0.15 | | | 0.15 | | | 2.67 | | | | | 49,296 | | | | | | 192 | | |
| Class P3 | | | | | | | | | | | | | | | | | | | | | | | | | | | | | | | | | | | | | | | | | | | | | | | | | | | | | | | | | | | | | | | | | | | | | | | | | | | | | | | | | | | | | | | | | | | | | | |
| 03-31-20 | | | | | 9.76 | | | | | | 0.28• | | | | | | (0.21) | | | | | | 0.07 | | | | | | 0.29 | | | | | | — | | | | | | — | | | | | | 0.29 | | | | | | — | | | | | | 9.54 | | | | | | 0.67 | | | | | | 0.42 | | | | 0.00* | | | 0.00* | | | 2.83 | | | | | 5,288 | | | | | | 192 | | |
| 06-01-18(4) - 03-31-19 | | | | | 9.71 | | | | | | 0.23• | | | | | | 0.08 | | | | | | 0.31 | | | | | | 0.26 | | | | | | — | | | | | | — | | | | | | 0.26 | | | | | | — | | | | | | 9.76 | | | | | | 3.22 | | | | | | 0.63 | | | | 0.00* | | | 0.00* | | | 2.90 | | | | | 3,341 | | | | | | 137 | | |
| Class R | | | | | | | | | | | | | | | | | | | | | | | | | | | | | | | | | | | | | | | | | | | | | | | | | | | | | | | | | | | | | | | | | | | | | | | | | | | | | | | | | | | | | | | | | | | | | | |
| 03-31-20 | | | | | 9.77 | | | | | | 0.19• | | | | | | (0.20) | | | | | | (0.01) | | | | | | 0.19 | | | | | | — | | | | | | — | | | | | | 0.19 | | | | | | — | | | | | | 9.57 | | | | | | (0.18) | | | | | | 0.97 | | | | 0.90 | | | 0.90 | | | 1.93 | | | | | 3 | | | | | | 192 | | |
| 03-31-19 | | | | | 9.72 | | | | | | 0.18 | | | | | | 0.07 | | | | | | 0.25 | | | | | | 0.20 | | | | | | — | | | | | | — | | | | | | 0.20 | | | | | | — | | | | | | 9.77 | | | | | | 2.60 | | | | | | 1.18 | | | | 1.02 | | | 1.02 | | | 1.85 | | | | | 3 | | | | | | 137 | | |
| 03-31-18 | | | | | 9.84 | | | | | | 0.13 | | | | | | (0.12) | | | | | | 0.01 | | | | | | 0.13 | | | | | | — | | | | | | — | | | | | | 0.13 | | | | | | — | | | | | | 9.72 | | | | | | 0.10 | | | | | | 1.13 | | | | 1.02 | | | 1.02 | | | 1.33 | | | | | 3 | | | | | | 165 | | |
| 03-31-17 | | | | | 9.88 | | | | | | 0.09 | | | | | | 0.00* | | | | | | 0.09 | | | | | | 0.13 | | | | | | — | | | | | | — | | | | | | 0.13 | | | | | | — | | | | | | 9.84 | | | | | | 0.89 | | | | | | 1.10 | | | | 1.01 | | | 1.01 | | | 0.93 | | | | | 3 | | | | | | 227 | | |
| 03-31-16 | | | | | 9.97 | | | | | | 0.10 | | | | | | (0.06) | | | | | | 0.04 | | | | | | 0.13 | | | | | | — | | | | | | — | | | | | | 0.13 | | | | | | — | | | | | | 9.88 | | | | | | 0.40 | | | | | | 1.21 | | | | 1.05 | | | 1.05 | | | 0.97 | | | | | 3 | | | | | | 109 | | |
| Class R6 | | | | | | | | | | | | | | | | | | | | | | | | | | | | | | | | | | | | | | | | | | | | | | | | | | | | | | | | | | | | | | | | | | | | | | | | | | | | | | | | | | | | | | | | | | | | | | |
| 03-31-20 | | | | | 9.76 | | | | | | 0.24• | | | | | | (0.21) | | | | | | 0.03 | | | | | | 0.24 | | | | | | — | | | | | | — | | | | | | 0.24 | | | | | | — | | | | | | 9.55 | | | | | | 0.29 | | | | | | 0.42 | | | | 0.35 | | | 0.35 | | | 2.47 | | | | | 98,380 | | | | | | 192 | | |
| 03-31-19 | | | | | 9.72 | | | | | | 0.23 | | | | | | 0.06 | | | | | | 0.29 | | | | | | 0.25 | | | | | | — | | | | | | — | | | | | | 0.25 | | | | | | — | | | | | | 9.76 | | | | | | 3.08 | | | | | | 0.63 | | | | 0.47 | | | 0.47 | | | 2.40 | | | | | 86,628 | | | | | | 137 | | |
| 03-31-18 | | | | | 9.84 | | | | | | 0.18 | | | | | | (0.11) | | | | | | 0.07 | | | | | | 0.19 | | | | | | — | | | | | | — | | | | | | 0.19 | | | | | | — | | | | | | 9.72 | | | | | | 0.68 | | | | | | 0.59 | | | | 0.48 | | | 0.48 | | | 1.85 | | | | | 93,094 | | | | | | 165 | | |
| 03-31-17 | | | | | 9.89 | | | | | | 0.14 | | | | | | 0.00* | | | | | | 0.14 | | | | | | 0.19 | | | | | | — | | | | | | — | | | | | | 0.19 | | | | | | — | | | | | | 9.84 | | | | | | 1.39 | | | | | | 0.56 | | | | 0.47 | | | 0.47 | | | 1.47 | | | | | 73,871 | | | | | | 227 | | |
| 03-31-16 | | | | | 9.98 | | | | | | 0.15 | | | | | | (0.05) | | | | | | 0.10 | | | | | | 0.19 | | | | | | — | | | | | | — | | | | | | 0.19 | | | | | | — | | | | | | 9.89 | | | | | | 0.98 | | | | | | 0.55 | | | | 0.47 | | | 0.47 | | | 1.55 | | | | | 110,520 | | | | | | 109 | | |
| | | | | | | | | | Income (loss) from investment operations | | | | | | | | | Less Distributions | | | | | | Ratios to average net assets | | | Supplemental Data | | ||||||||||||||||||||||||||||||||||||||||||||||||||||||||||||||||||
| | | | Net asset value, beginning of year or period | | | Net investment income (loss) | | | Net realized and unrealized gain (loss) | | | Total from investment operations | | | From net investment income | | | From net realized gains | | | From retun of capital | | | Total distributions | | | Payment by affiliate | | | Net asset value, end of year or period | | | Total Return(1) | | | Expenses before reductions/additions(2)(3) | | | Expenses net of fee waivers and/or recoupments if any(2)(3) | | | Expenses net of all reductions/additions(2)(3) | | | Net investment income (loss)(2)(3) | | | Net assets, end of year or period | | | Portfolio turnover rate | | ||||||||||||||||||||||||||||||||||||||||||
| Year or period ended | | | ($) | | | ($) | | | ($) | | | ($) | | | ($) | | | ($) | | | ($) | | | ($) | | | ($) | | | ($) | | | (%) | | | (%) | | | (%) | | | (%) | | | (%) | | | ($000’s) | | | (%) | | ||||||||||||||||||||||||||||||||||||||||||
| Voya Short Term Bond Fund (continued) | | | | | | | | | | | | | | | | | | | | | | | | | | | | | | | | | | | | | | | | | | | | | | | | | | | | | | | | | | | | | | | | | | | | | | | | | | | | | | | | | | | | | | | | | | | | | | |
| Class W | | | | | | | | | | | | | | | | | | | | | | | | | | | | | | | | | | | | | | | | | | | | | | | | | | | | | | | | | | | | | | | | | | | | | | | | | | | | | | | | | | | | | | | | | | | | | | |
| 03-31-20 | | | | | 9.79 | | | | | | 0.24• | | | | | | (0.22) | | | | | | 0.02 | | | | | | 0.24 | | | | | | — | | | | | | — | | | | | | 0.24 | | | | | | — | | | | | | 9.57 | | | | | | 0.12 | | | | | | 0.47 | | | | 0.40 | | | 0.40 | | | 2.41 | | | | | 97 | | | | | | 192 | | |
| 03-31-19 | | | | | 9.72 | | | | | | 0.22 | | | | | | 0.10 | | | | | | 0.32 | | | | | | 0.25 | | | | | | — | | | | | | — | | | | | | 0.25 | | | | | | — | | | | | | 9.79 | | | | | | 3.31 | | | | | | 0.68 | | | | 0.52 | | | 0.52 | | | 2.38 | | | | | 523 | | | | | | 137 | | |
| 03-31-18 | | | | | 9.85 | | | | | | 0.18• | | | | | | (0.13) | | | | | | 0.05 | | | | | | 0.18 | | | | | | — | | | | | | — | | | | | | 0.18 | | | | | | — | | | | | | 9.72 | | | | | | 0.50 | | | | | | 0.63 | | | | 0.52 | | | 0.52 | | | 1.83 | | | | | 79 | | | | | | 165 | | |
| 03-31-17 | | | | | 9.89 | | | | | | 0.14• | | | | | | 0.00* | | | | | | 0.14 | | | | | | 0.18 | | | | | | — | | | | | | — | | | | | | 0.18 | | | | | | — | | | | | | 9.85 | | | | | | 1.41 | | | | | | 0.60 | | | | 0.51 | | | 0.51 | | | 1.42 | | | | | 393 | | | | | | 227 | | |
| 03-31-16 | | | | | 9.98 | | | | | | 0.17 | | | | | | (0.08) | | | | | | 0.09 | | | | | | 0.18 | | | | | | — | | | | | | — | | | | | | 0.18 | | | | | | — | | | | | | 9.89 | | | | | | 0.91 | | | | | | 0.71 | | | | 0.55 | | | 0.55 | | | 1.61 | | | | | 531 | | | | | | 109 | | |
| Voya Strategic Income Opportunities Fund | | | | | | | | | | | | | | | | | | | | | | | | | | | | | | | | | | | | | | | | | | | | | | | | | | | | | | | | | | | | | | | | | | | | | | | | | | | | | | | | | | | | | | | | | | | | | | |
| Class A | | | | | | | | | | | | | | | | | | | | | | | | | | | | | | | | | | | | | | | | | | | | | | | | | | | | | | | | | | | | | | | | | | | | | | | | | | | | | | | | | | | | | | | | | | | | | | |
| 03-31-20 | | | | | 10.15 | | | | | | 0.35• | | | | | | (0.97) | | | | | | (0.62) | | | | | | 0.41 | | | | | | — | | | | | | — | | | | | | 0.41 | | | | | | — | | | | | | 9.12 | | | | | | (6.48) | | | | | | 0.86 | | | | 0.86 | | | 0.86 | | | 3.45 | | | | | 146,080 | | | | | | 167 | | |
| 03-31-19 | | | | | 10.16 | | | | | | 0.37 | | | | | | 0.03 | | | | | | 0.40 | | | | | | 0.41 | | | | | | — | | | | | | — | | | | | | 0.41 | | | | | | — | | | | | | 10.15 | | | | | | 3.99 | | | | | | 0.94 | | | | 0.94 | | | 0.94 | | | 3.63 | | | | | 128,224 | | | | | | 155 | | |
| 03-31-18 | | | | | 10.12 | | | | | | 0.37 | | | | | | 0.03 | | | | | | 0.40 | | | | | | 0.36 | | | | | | — | | | | | | — | | | | | | 0.36 | | | | | | — | | | | | | 10.16 | | | | | | 4.01 | | | | | | 1.13 | | | | 1.05 | | | 1.05 | | | 3.52 | | | | | 30,921 | | | | | | 103 | | |
| 03-31-17 | | | | | 9.94 | | | | | | 0.42• | | | | | | 0.24 | | | | | | 0.66 | | | | | | 0.48 | | | | | | — | | | | | | — | | | | | | 0.48 | | | | | | — | | | | | | 10.12 | | | | | | 6.82 | | | | | | 1.22 | | | | 1.06 | | | 1.06 | | | 4.17 | | | | | 11,255 | | | | | | 68 | | |
| 03-31-16 | | | | | 9.97 | | | | | | 0.30• | | | | | | (0.27) | | | | | | 0.03 | | | | | | 0.06 | | | | | | — | | | | | | — | | | | | | 0.06 | | | | | | — | | | | | | 9.94 | | | | | | 0.25 | | | | | | 1.25 | | | | 1.01 | | | 1.01 | | | 2.99 | | | | | 1,492 | | | | | | 83 | | |
| Class C | | | | | | | | | | | | | | | | | | | | | | | | | | | | | | | | | | | | | | | | | | | | | | | | | | | | | | | | | | | | | | | | | | | | | | | | | | | | | | | | | | | | | | | | | | | | | | |
| 03-31-20 | | | | | 10.00 | | | | | | 0.27• | | | | | | (0.96) | | | | | | (0.69) | | | | | | 0.33 | | | | | | — | | | | | | — | | | | | | 0.33 | | | | | | — | | | | | | 8.98 | | | | | | (7.24) | | | | | | 1.61 | | | | 1.61 | | | 1.61 | | | 2.68 | | | | | 53,333 | | | | | | 167 | | |
| 03-31-19 | | | | | 10.00 | | | | | | 0.29 | | | | | | 0.04 | | | | | | 0.33 | | | | | | 0.33 | | | | | | — | | | | | | — | | | | | | 0.33 | | | | | | — | | | | | | 10.00 | | | | | | 3.32 | | | | | | 1.69 | | | | 1.69 | | | 1.69 | | | 2.87 | | | | | 25,999 | | | | | | 155 | | |
| 03-31-18 | | | | | 9.96 | | | | | | 0.29 | | | | | | 0.03 | | | | | | 0.32 | | | | | | 0.28 | | | | | | — | | | | | | — | | | | | | 0.28 | | | | | | — | | | | | | 10.00 | | | | | | 3.24 | | | | | | 1.88 | | | | 1.80 | | | 1.80 | | | 2.79 | | | | | 8,150 | | | | | | 103 | | |
| 03-31-17 | | | | | 9.78 | | | | | | 0.33• | | | | | | 0.25 | | | | | | 0.58 | | | | | | 0.40 | | | | | | — | | | | | | — | | | | | | 0.40 | | | | | | — | | | | | | 9.96 | | | | | | 6.05 | | | | | | 1.97 | | | | 1.81 | | | 1.81 | | | 3.38 | | | | | 1,893 | | | | | | 68 | | |
| 03-31-16 | | | | | 9.85 | | | | | | 0.22• | | | | | | (0.28) | | | | | | (0.06) | | | | | | 0.01 | | | | | | — | | | | | | — | | | | | | 0.01 | | | | | | — | | | | | | 9.78 | | | | | | (0.57) | | | | | | 2.00 | | | | 1.76 | | | 1.76 | | | 2.25 | | | | | 421 | | | | | | 83 | | |
| Class I | | | | | | | | | | | | | | | | | | | | | | | | | | | | | | | | | | | | | | | | | | | | | | | | | | | | | | | | | | | | | | | | | | | | | | | | | | | | | | | | | | | | | | | | | | | | | | |
| 03-31-20 | | | | | 10.20 | | | | | | 0.38• | | | | | | (0.98) | | | | | | (0.60) | | | | | | 0.45 | | | | | | — | | | | | | — | | | | | | 0.45 | | | | | | — | | | | | | 9.15 | | | | | | (6.30) | | | | | | 0.60 | | | | 0.60 | | | 0.60 | | | 3.68 | | | | | 2,046,289 | | | | | | 167 | | |
| 03-31-19 | | | | | 10.21 | | | | | | 0.42 | | | | | | 0.02 | | | | | | 0.44 | | | | | | 0.45 | | | | | | — | | | | | | — | | | | | | 0.45 | | | | | | — | | | | | | 10.20 | | | | | | 4.42 | | | | | | 0.61 | | | | 0.61 | | | 0.61 | | | 3.99 | | | | | 1,151,236 | | | | | | 155 | | |
| 03-31-18 | | | | | 10.18 | | | | | | 0.40• | | | | | | 0.04 | | | | | | 0.44 | | | | | | 0.41 | | | | | | — | | | | | | — | | | | | | 0.41 | | | | | | — | | | | | | 10.21 | | | | | | 4.37 | | | | | | 0.78 | | | | 0.70 | | | 0.70 | | | 3.87 | | | | | 194,924 | | | | | | 103 | | |
| 03-31-17 | | | | | 9.99 | | | | | | 0.45• | | | | | | 0.27 | | | | | | 0.72 | | | | | | 0.53 | | | | | | — | | | | | | — | | | | | | 0.53 | | | | | | — | | | | | | 10.18 | | | | | | 7.38 | | | | | | 0.85 | | | | 0.69 | | | 0.69 | | | 4.51 | | | | | 27,339 | | | | | | 68 | | |
| 03-31-16 | | | | | 9.98 | | | | | | 0.38• | | | | | | (0.29) | | | | | | 0.09 | | | | | | 0.08 | | | | | | — | | | | | | — | | | | | | 0.08 | | | | | | — | | | | | | 9.99 | | | | | | 0.91 | | | | | | 0.87 | | | | 0.63 | | | 0.63 | | | 3.77 | | | | | 6,046 | | | | | | 83 | | |
| Class P | | | | | | | | | | | | | | | | | | | | | | | | | | | | | | | | | | | | | | | | | | | | | | | | | | | | | | | | | | | | | | | | | | | | | | | | | | | | | | | | | | | | | | | | | | | | | | |
| 03-31-20 | | | | | 10.18 | | | | | | 0.44• | | | | | | (1.01) | | | | | | (0.57) | | | | | | 0.50 | | | | | | — | | | | | | — | | | | | | 0.50 | | | | | | — | | | | | | 9.11 | | | | | | (5.99) | | | | | | 0.55 | | | | 0.05 | | | 0.05 | | | 4.26 | | | | | 9,529 | | | | | | 167 | | |
| 02-01-19(4) - 03-31-19 | | | | | 10.13 | | | | | | 0.05• | | | | | | 0.08 | | | | | | 0.13 | | | | | | 0.08 | | | | | | — | | | | | | — | | | | | | 0.08 | | | | | | — | | | | | | 10.18 | | | | | | 1.33 | | | | | | 0.58 | | | | 0.08 | | | 0.08 | | | 3.22 | | | | | 3 | | | | | | 155 | | |
| Class P3 | | | | | | | | | | | | | | | | | | | | | | | | | | | | | | | | | | | | | | | | | | | | | | | | | | | | | | | | | | | | | | | | | | | | | | | | | | | | | | | | | | | | | | | | | | | | | | |
| 08-01-19(4) - 03-31-20 | | | | | 10.33 | | | | | | 0.29• | | | | | | (1.18) | | | | | | (0.89) | | | | | | 0.28 | | | | | | — | | | | | | — | | | | | | 0.28 | | | | | | — | | | | | | 9.16 | | | | | | (8.83) | | | | | | 0.55 | | | | 0.00* | | | 0.00* | | | 4.21 | | | | | 3,770 | | | | | | 167 | | |
| Class R | | | | | | | | | | | | | | | | | | | | | | | | | | | | | | | | | | | | | | | | | | | | | | | | | | | | | | | | | | | | | | | | | | | | | | | | | | | | | | | | | | | | | | | | | | | | | | |
| 03-31-20 | | | | | 10.07 | | | | | | 0.32• | | | | | | (0.97) | | | | | | (0.65) | | | | | | 0.38 | | | | | | — | | | | | | — | | | | | | 0.38 | | | | | | — | | | | | | 9.04 | | | | | | (6.80) | | | | | | 1.11 | | | | 1.11 | | | 1.11 | | | 3.20 | | | | | 18,459 | | | | | | 167 | | |
| 03-31-19 | | | | | 10.08 | | | | | | 0.34 | | | | | | 0.03 | | | | | | 0.37 | | | | | | 0.38 | | | | | | — | | | | | | — | | | | | | 0.38 | | | | | | — | | | | | | 10.07 | | | | | | 3.73 | | | | | | 1.19 | | | | 1.19 | | | 1.19 | | | 3.37 | | | | | 12,425 | | | | | | 155 | | |
| 03-31-18 | | | | | 10.04 | | | | | | 0.33 | | | | | | 0.04 | | | | | | 0.37 | | | | | | 0.33 | | | | | | — | | | | | | — | | | | | | 0.33 | | | | | | — | | | | | | 10.08 | | | | | | 3.76 | | | | | | 1.38 | | | | 1.30 | | | 1.30 | | | 3.26 | | | | | 5,168 | | | | | | 103 | | |
| 03-31-17 | | | | | 9.86 | | | | | | 0.37 | | | | | | 0.26 | | | | | | 0.63 | | | | | | 0.45 | | | | | | — | | | | | | — | | | | | | 0.45 | | | | | | — | | | | | | 10.04 | | | | | | 6.57 | | | | | | 1.47 | | | | 1.31 | | | 1.31 | | | 3.82 | | | | | 3,955 | | | | | | 68 | | |
| 03-31-16 | | | | | 9.90 | | | | | | 0.30• | | | | | | (0.28) | | | | | | 0.02 | | | | | | 0.06 | | | | | | — | | | | | | — | | | | | | 0.06 | | | | | | — | | | | | | 9.86 | | | | | | 0.17 | | | | | | 1.50 | | | | 1.26 | | | 1.26 | | | 3.05 | | | | | 3,397 | | | | | | 83 | | |
| | | | | | | | | | Income (loss) from investment operations | | | | | | | | | Less Distributions | | | | | | Ratios to average net assets | | | Supplemental Data | | ||||||||||||||||||||||||||||||||||||||||||||||||||||||||||||||||||
| | | | Net asset value, beginning of year or period | | | Net investment income (loss) | | | Net realized and unrealized gain (loss) | | | Total from investment operations | | | From net investment income | | | From net realized gains | | | From retun of capital | | | Total distributions | | | Payment by affiliate | | | Net asset value, end of year or period | | | Total Return(1) | | | Expenses before reductions/additions(2)(3) | | | Expenses net of fee waivers and/or recoupments if any(2)(3) | | | Expenses net of all reductions/additions(2)(3) | | | Net investment income (loss)(2)(3) | | | Net assets, end of year or period | | | Portfolio turnover rate | | ||||||||||||||||||||||||||||||||||||||||||
| Year or period ended | | | ($) | | | ($) | | | ($) | | | ($) | | | ($) | | | ($) | | | ($) | | | ($) | | | ($) | | | ($) | | | (%) | | | (%) | | | (%) | | | (%) | | | (%) | | | ($000’s) | | | (%) | | ||||||||||||||||||||||||||||||||||||||||||
| Voya Strategic Income Opportunities Fund (continued) | | | | | | | | | | | | | | | | | | | | | | | | | | | | | | | | | | | | | | | | | | | | | | | | | | | | | | | | | | | | | | | | | | | | | | | | | | | | | | | | | | | | | | | | | | | | | | |
| Class R6 | | | | | | | | | | | | | | | | | | | | | | | | | | | | | | | | | | | | | | | | | | | | | | | | | | | | | | | | | | | | | | | | | | | | | | | | | | | | | | | | | | | | | | | | | | | | | | |
| 03-31-20 | | | | | 10.17 | | | | | | 0.38• | | | | | | (0.98) | | | | | | (0.60) | | | | | | 0.45 | | | | | | — | | | | | | — | | | | | | 0.45 | | | | | | — | | | | | | 9.12 | | | | | | (6.28) | | | | | | 0.55 | | | | 0.55 | | | 0.55 | | | 3.75 | | | | | 229,913 | | | | | | 167 | | |
| 03-31-19 | | | | | 10.19 | | | | | | 0.39 | | | | | | 0.04 | | | | | | 0.43 | | | | | | 0.45 | | | | | | — | | | | | | — | | | | | | 0.45 | | | | | | — | | | | | | 10.17 | | | | | | 4.36 | | | | | | 0.58 | | | | 0.58 | | | 0.58 | | | 3.82 | | | | | 47,004 | | | | | | 155 | | |
| 03-31-18 | | | | | 10.16 | | | | | | 0.40 | | | | | | 0.04 | | | | | | 0.44 | | | | | | 0.41 | | | | | | — | | | | | | — | | | | | | 0.41 | | | | | | — | | | | | | 10.19 | | | | | | 4.41 | | | | | | 0.74 | | | | 0.66 | | | 0.66 | | | 3.88 | | | | | 112,151 | | | | | | 103 | | |
| 03-31-17 | | | | | 9.99 | | | | | | 0.45 | | | | | | 0.25 | | | | | | 0.70 | | | | | | 0.53 | | | | | | — | | | | | | — | | | | | | 0.53 | | | | | | — | | | | | | 10.16 | | | | | | 7.21 | | | | | | 0.83 | | | | 0.67 | | | 0.67 | | | 4.46 | | | | | 111,530 | | | | | | 68 | | |
| 10-23-15(4) - 03-31-16 | | | | | 10.05 | | | | | | 0.16• | | | | | | (0.14) | | | | | | 0.02 | | | | | | 0.08 | | | | | | — | | | | | | — | | | | | | 0.08 | | | | | | — | | | | | | 9.99 | | | | | | 0.21 | | | | | | 0.87 | | | | 0.63 | | | 0.63 | | | 3.70 | | | | | 109,630 | | | | | | 83 | | |
| Class W | | | | | | | | | | | | | | | | | | | | | | | | | | | | | | | | | | | | | | | | | | | | | | | | | | | | | | | | | | | | | | | | | | | | | | | | | | | | | | | | | | | | | | | | | | | | | | |
| 03-31-20 | | | | | 10.13 | | | | | | 0.38• | | | | | | (0.99) | | | | | | (0.61) | | | | | | 0.43 | | | | | | — | | | | | | — | | | | | | 0.43 | | | | | | — | | | | | | 9.09 | | | | | | (6.37) | | | | | | 0.61 | | | | 0.61 | | | 0.61 | | | 3.69 | | | | | 69,522 | | | | | | 167 | | |
| 03-31-19 | | | | | 10.13 | | | | | | 0.39 | | | | | | 0.04 | | | | | | 0.43 | | | | | | 0.43 | | | | | | — | | | | | | — | | | | | | 0.43 | | | | | | — | | | | | | 10.13 | | | | | | 4.35 | | | | | | 0.69 | | | | 0.69 | | | 0.69 | | | 3.75 | | | | | 48,251 | | | | | | 155 | | |
| 03-31-18 | | | | | 10.09 | | | | | | 0.39 | | | | | | 0.04 | | | | | | 0.43 | | | | | | 0.39 | | | | | | — | | | | | | — | | | | | | 0.39 | | | | | | — | | | | | | 10.13 | | | | | | 4.27 | | | | | | 0.88 | | | | 0.80 | | | 0.80 | | | 3.77 | | | | | 26,567 | | | | | | 103 | | |
| 03-31-17 | | | | | 9.90 | | | | | | 0.44• | | | | | | 0.26 | | | | | | 0.70 | | | | | | 0.51 | | | | | | — | | | | | | — | | | | | | 0.51 | | | | | | — | | | | | | 10.09 | | | | | | 7.19 | | | | | | 0.97 | | | | 0.81 | | | 0.81 | | | 4.38 | | | | | 4,161 | | | | | | 68 | | |
| 03-31-16 | | | | | 9.96 | | | | | | 0.33• | | | | | | (0.31) | | | | | | 0.02 | | | | | | 0.08 | | | | | | — | | | | | | — | | | | | | 0.08 | | | | | | — | | | | | | 9.90 | | | | | | 0.17 | | | | | | 1.00 | | | | 0.76 | | | 0.76 | | | 3.33 | | | | | 54 | | | | | | 83 | | |
| | | | Buy | | | Sell | | ||||||
| Intermediate Bond | | | | $ | 16,986,825 | | | | | $ | 86,867,412 | | |
| Strategic Income Opportunities | | | | | 493,897,360 | | | | | | 482,099,656 | | |
| | | | Purchased | | | Sold | | ||||||
| GNMA Income | | | | $ | 24,374,979 | | | | | $ | 263,903,039 | | |
| Intermediate Bond | | | | | 982,693,729 | | | | | | 629,043,298 | | |
| Short Term Bond | | | | | 55,537,333 | | | | | | 14,490,092 | | |
| Strategic Income Opportunities | | | | | 130,951,786 | | | | | | 285,836,117 | | |
| | | | Purchased | | | Sold | | ||||||
| Intermediate Bond | | | | $ | 287,814,199 | | | | | $ | 89,857,403 | | |
| Short Tem Bond | | | | | 3,916,861 | | | | | | 3,706,225 | | |
| Strategic Income Opportunities | | | | | 181,502,948 | | | | | | 67,872,380 | | |
| | | | Purchases | | | Sales | | ||||||
| GNMA Income | | | | $ | 11,139,965 | | | | | $ | 1,730,436 | | |
| High Yield Bond | | | | | 363,596,387 | | | | | | 233,581,722 | | |
| Intermediate Bond | | | | | 3,835,562,903 | | | | | | 2,219,294,856 | | |
| Short Term Bond | | | | | 155,820,782 | | | | | | 100,364,057 | | |
| Strategic Income Opportunities | | | | | 1,938,307,985 | | | | | | 634,455,104 | | |
| | | | Purchases | | | Sales | | ||||||
| GNMA Income | | | | $ | 5,815,452,200 | | | | | $ | 5,436,045,846 | | |
| Intermediate Bond | | | | | 17,157,575,549 | | | | | | 17,522,223,077 | | |
| Short Term Bond | | | | | 263,077,934 | | | | | | 256,781,369 | | |
| Strategic Income Opportunities | | | | | 3,208,833,445 | | | | | | 3,124,876,840 | | |
| Fund | | | Fee | |
| GNMA Income(1) | | | 0.45% on the first $1 billion, 0.43% on the next $500 million and 0.41% on assets thereafter | |
| High Yield Bond | | | 0.61% on the first $500 million, 0.55% on the next $4.5 billion and 0.50% on assets thereafter | |
| Intermediate Bond | | | 0.27% on all assets | |
| Short Term Bond(2) | | | 0.25% on all assets | |
| Strategic Income Opportunities | | | 0.50% on all assets | |
| Fund | | | Class A | | | Class C | | | Class R | | |||||||||
| GNMA Income | | | | | 0.25% | | | | | | 1.00% | | | | | | N/A | | |
| High Yield Bond | | | | | 0.25% | | | | | | 1.00% | | | | | | 0.50% | | |
| Intermediate Bond | | | | | 0.25% | | | | | | 1.00% | | | | | | 0.50% | | |
| Short Term Bond | | | | | 0.25% | | | | | | 1.00% | | | | | | 0.50% | | |
| Strategic Income Opportunities | | | | | 0.25% | | | | | | 1.00% | | | | | | 0.50% | | |
| | | | Class A | | | Class C | | ||||||
| Initial Sales Charges: | | | | | | | | | | | | | |
| GNMA Income | | | | $ | 4,336 | | | | | $ | — | | |
| High Yield Bond | | | | | 5,954 | | | | | | — | | |
| Intermediate Bond | | | | | 17,753 | | | | | | — | | |
| Short Term Bond | | | | | 20 | | | | | | — | | |
| Strategic Income Opportunities | | | | | 55,435 | | | | | | — | | |
| Contingent Deferred Sales Charges: | | | | | | | | | | | | | |
| GNMA Income | | | | $ | 17,449 | | | | | $ | 1,196 | | |
| High Yield Bond | | | | | 6,750 | | | | | | 756 | | |
| Intermediate Bond | | | | | 86 | | | | | | 4,101 | | |
| Short Term Bond | | | | | — | | | | | | 746 | | |
| Strategic Income Opportunities | | | | | 47,056 | | | | | | 20,108 | | |
| Subsidiary/Affiliated Investment Company | | | Fund | | | Percentage | | |||
| Voya Index Solution 2020 Portfolio | | | Short Term Bond | | | | | 12.13% | | |
| Voya Index Solution Income Portfolio | | | Short Term Bond | | | | | 16.58 | | |
| Voya Institutional Trust Company | | | GNMA Income | | | | | 18.49 | | |
| Voya Intermediate Bond Portfolio | | | High Yield Bond | | | | | 12.37 | | |
| Voya Retirement Insurance and Annuity Company | | | Intermediate Bond | | | | | 11.67 | | |
| Voya Solution 2025 Portfolio | | | Short Term Bond | | | | | 10.08 | | |
| Voya Solution 2035 Portfolio | | | Short Term Bond | | | | | 5.15 | | |
| Voya Solution Income Portfolio | | | Short Term Bond | | | | | 21.96 | | |
| Fund | | | Class A | | | Class C | | | Class I | | | Class P | | | Class P2 | | | Class P3 | | | Class R | | | Class R6 | | | Class W | | |||||||||||||||||||||||||||
GNMA Income(1) | | | | | 0.84% | | | | | | 1.59% | | | | | | 0.54% | | | | | | N/A | | | | | | N/A | | | | | | N/A | | | | | | N/A | | | | | | N/A | | | | | | 0.59% | | |
| High Yield Bond | | | | | 1.10% | | | | | | 1.85% | | | | | | 0.85% | | | | | | 0.15% | | | | | | N/A | | | | | | 0.00% | | | | | | 1.35% | | | | | | 0.83% | | | | | | 0.85% | | |
| Intermediate Bond | | | | | 0.75% | | | | | | 1.50% | | | | | | 0.50% | | | | | | N/A | | | | | | N/A | | | | | | 0.00% | | | | | | 1.00% | | | | | | 0.50% | | | | | | 0.50% | | |
Short Term Bond(2) | | | | | 0.65% | | | | | | 1.40% | | | | | | 0.35% | | | | | | N/A | | | | | | 0.15% | | | | | | 0.00% | | | | | | 0.90% | | | | | | 0.30% | | | | | | 0.40% | | |
| Strategic Income Opportunities | | | | | 1.15% | | | | | | 1.90% | | | | | | 0.72% | | | | | | 0.15% | | | | | | N/A | | | | | | 0.00% | | | | | | 1.40% | | | | | | 0.60% | | | | | | 0.90% | | |
| | | | March 31, | | | ||||||||||||||||||||
| | | | 2021 | | | 2022 | | | 2023 | | | Total | | ||||||||||||
| GNMA Income | | | | $ | — | | | | | $ | 114,673 | | | | | $ | 78,050 | | | | | $ | 192,723 | | |
| High Yield Bond | | | | | — | | | | | | 11,464 | | | | | | 224 | | | | | | 11,688 | | |
| Intermediate Bond | | | | | — | | | | | | 26,399 | | | | | | 58,675 | | | | | | 85,074 | | |
| Short Term Bond | | | | | 112,174 | | | | | | 180,697 | | | | | | 178,941 | | | | | | 471,812 | | |
| | | | March 31, | | | ||||||||||||||||||||
| | | | 2021 | | | 2022 | | | 2023 | | | Total | | ||||||||||||
| GNMA Income | | | | | | | | | | | | | | | | | | | | | | | | | |
| Class I | | | | $ | 207,535 | | | | | $ | 145,938 | | | | | $ | 180,602 | | | | | $ | 534,075 | | |
| Short Term Bond | | | | | | | | | | | | | | | | | | | | | | | | | |
| Class I | | | | | 7,319 | | | | | | 11,389 | | | | | | 12,071 | | | | | | 30,779 | | |
| Fund | | | Days Utilized | | | Approximate Average Daily Balance For Days Utilized | | | Approximate Weighted Average Interest Rate For Days Utilized | | |||||||||
| GNMA Income | | | | | 1 | | | | | $ | 1,436,000 | | | | | | 1.25% | | |
| High Yield Bond | | | | | 1 | | | | | | 604,000 | | | | | | 1.25 | | |
| Intermediate Bond | | | | | 2 | | | | | | 1,910,000 | | | | | | 2.58 | | |
| Short Term Bond | | | | | 6 | | | | | | 11,405,667 | | | | | | 1.20 | | |
| Strategic Income Opportunities | | | | | 4 | | | | | | 21,183,250 | | | | | | 1.16 | | |
| | | | Shares sold | | | Shares issued in merger | | | Reinvestment of distributions | | | Shares redeemed | | | Shares converted | | | Net increase (decrease) in shares outstanding | | | Shares sold | | | Proceeds from shares issued in merger | | | Reinvestment of distributions | | | Shares redeemed | | | Shares converted | | | Net increase (decrease) | | ||||||||||||||||||||||||||||||||||||
| Year or period ended | | | # | | | # | | | # | | | # | | | # | | | # | | | ($) | | | ($) | | | ($) | | | ($) | | | ($) | | | ($) | | ||||||||||||||||||||||||||||||||||||
| GNMA Income | | ||||||||||||||||||||||||||||||||||||||||||||||||||||||||||||||||||||||||
| Class A | | | | | | | | | | | | | | | | | | | | | | | | | | | | | | | | | | | | | | | | | | | | | | | | | | | | | | | | | | | | | | | | | | | | | | | | | |
| 3/31/2020 | | | | | 20,741,177 | | | | | | — | | | | | | 1,241,380 | | | | | | (11,670,558) | | | | | | — | | | | | | 10,311,999 | | | | | | 175,424,054 | | | | | | — | | | | | | 10,520,814 | | | | | | (98,564,317) | | | | | | — | | | | | | 87,380,551 | | |
| 3/31/2019 | | | | | 7,735,666 | | | | | | — | | | | | | 1,096,143 | | | | | | (14,337,451) | | | | | | — | | | | | | (5,505,642) | | | | | | 63,545,335 | | | | | | — | | | | | | 9,010,912 | | | | | | (117,661,246) | | | | | | — | | | | | | (45,104,999) | | |
| Class C | | | | | | | | | | | | | | | | | | | | | | | | | | | | | | | | | | | | | | | | | | | | | | | | | | | | | | | | | | | | | | | | | | | | | | | | | |
| 3/31/2020 | | | | | 715,957 | | | | | | — | | | | | | 113,821 | | | | | | (2,805,702) | | | | | | — | | | | | | (1,975,924) | | | | | | 6,017,633 | | | | | | — | | | | | | 958,864 | | | | | | (23,590,724) | | | | | | — | | | | | | (16,614,227) | | |
| 3/31/2019 | | | | | 824,466 | | | | | | — | | | | | | 120,688 | | | | | | (2,720,384) | | | | | | — | | | | | | (1,775,230) | | | | | | 6,764,856 | | | | | | — | | | | | | 986,923 | | | | | | (22,216,846) | | | | | | — | | | | | | (14,465,067) | | |
| Class I | | | | | | | | | | | | | | | | | | | | | | | | | | | | | | | | | | | | | | | | | | | | | | | | | | | | | | | | | | | | | | | | | | | | | | | | | |
| 3/31/2020 | | | | | 47,467,729 | | | | | | — | | | | | | 1,345,831 | | | | | | (24,816,202) | | | | | | — | | | | | | 23,997,358 | | | | | | 402,637,399 | | | | | | — | | | | | | 11,427,997 | | | | | | (210,089,972) | | | | | | — | | | | | | 203,975,424 | | |
| 3/31/2019 | | | | | 22,696,308 | | | | | | — | | | | | | 909,825 | | | | | | (19,705,146) | | | | | | — | | | | | | 3,900,987 | | | | | | 186,475,611 | | | | | | — | | | | | | 7,493,420 | | | | | | (161,780,210) | | | | | | — | | | | | | 32,188,821 | | |
| Class W | | | | | | | | | | | | | | | | | | | | | | | | | | | | | | | | | | | | | | | | | | | | | | | | | | | | | | | | | | | | | | | | | | | | | | | | | |
| 3/31/2020 | | | | | 10,623,196 | | | | | | — | | | | | | 376,031 | | | | | | (3,784,558) | | | | | | — | | | | | | 7,214,669 | | | | | | 90,107,893 | | | | | | — | | | | | | 3,198,273 | | | | | | (32,083,251) | | | | | | — | | | | | | 61,222,915 | | |
| 3/31/2019 | | | | | 5,217,008 | | | | | | — | | | | | | 357,374 | | | | | | (13,606,518) | | | | | | — | | | | | | (8,032,136) | | | | | | 42,912,238 | | | | | | — | | | | | | 2,943,898 | | | | | | (111,349,680) | | | | | | — | | | | | | (65,493,544) | | |
| High Yield Bond | | ||||||||||||||||||||||||||||||||||||||||||||||||||||||||||||||||||||||||
| Class A | | | | | | | | | | | | | | | | | | | | | | | | | | | | | | | | | | | | | | | | | | | | | | | | | | | | | | | | | | | | | | | | | | | | | | | | | |
| 3/31/2020 | | | | | 2,165,022 | | | | | | — | | | | | | 314,805 | | | | | | (3,880,925) | | | | | | — | | | | | | (1,401,098) | | | | | | 17,163,512 | | | | | | — | | | | | | 2,475,988 | | | | | | (30,378,845) | | | | | | — | | | | | | (10,739,345) | | |
| 3/31/2019 | | | | | 2,263,969 | | | | | | — | | | | | | 306,868 | | | | | | (1,603,020) | | | | | | — | | | | | | 967,817 | | | | | | 17,482,991 | | | | | | — | | | | | | 2,389,976 | | | | | | (12,480,973) | | | | | | — | | | | | | 7,391,994 | | |
| Class C | | | | | | | | | | | | | | | | | | | | | | | | | | | | | | | | | | | | | | | | | | | | | | | | | | | | | | | | | | | | | | | | | | | | | | | | | |
| 3/31/2020 | | | | | 135,657 | | | | | | — | | | | | | 74,510 | | | | | | (640,022) | | | | | | — | | | | | | (429,855) | | | | | | 1,043,649 | | | | | | — | | | | | | 586,632 | | | | | | (5,074,288) | | | | | | — | | | | | | (3,444,007) | | |
| 3/31/2019 | | | | | 1,006,541 | | | | | | — | | | | | | 60,586 | | | | | | (370,750) | | | | | | — | | | | | | 696,377 | | | | | | 7,879,685 | | | | | | — | | | | | | 469,777 | | | | | | (2,864,421) | | | | | | — | | | | | | 5,485,041 | | |
| Class I | | | | | | | | | | | | ��� | | | | | | | | | | | | | | | | | | | | | | | | | | | | | | | | | | | | | | | | | | | | | | | | | | | | | | | | | | | | | |
| 3/31/2020 | | | | | 5,514,232 | | | | | | — | | | | | | 588,273 | | | | | | (6,700,287) | | | | | | — | | | | | | (597,782) | | | | | | 43,825,729 | | | | | | — | | | | | | 4,624,462 | | | | | | (52,967,067) | | | | | | — | | | | | | (4,516,876) | | |
| 3/31/2019 | | | | | 5,168,890 | | | | | | — | | | | | | 934,446 | | | | | | (14,709,211) | | | | | | — | | | | | | (8,605,875) | | | | | | 40,387,598 | | | | | | — | | | | | | 7,268,448 | | | | | | (114,043,540) | | | | | | — | | | | | | (66,387,494) | | |
| Class P | | | | | | | | | | | | | | | | | | | | | | | | | | | | | | | | | | | | | | | | | | | | | | | | | | | | | | | | | | | | | | | | | | | | | | | | | |
| 3/31/2020 | | | | | 4,444,532 | | | | | | — | | | | | | 758,284 | | | | | | (6,410,069) | | | | | | — | | | | | | (1,207,253) | | | | | | 31,961,979 | | | | | | — | | | | | | 5,961,665 | | | | | | (50,868,102) | | | | | | — | | | | | | (12,944,458) | | |
| 3/31/2019 | | | | | 3,130,598 | | | | | | — | | | | | | 1,041,632 | | | | | | (5,667,443) | | | | | | — | | | | | | (1,495,213) | | | | | | 24,209,497 | | | | | | — | | | | | | 8,111,823 | | | | | | (44,203,296) | | | | | | — | | | | | | (11,881,976) | | |
| Class P3 | | | | | | | | | | | | | | | | | | | | | | | | | | | | | | | | | | | | | | | | | | | | | | | | | | | | | | | | | | | | | | | | | | | | | | | | | |
| 3/31/2020 | | | | | 163,946 | | | | | | — | | | | | | 345 | | | | | | (1,870) | | | | | | — | | | | | | 162,421 | | | | | | 1,079,822 | | | | | | — | | | | | | 2,446 | | | | | | (12,210) | | | | | | — | | | | | | 1,070,058 | | |
| 6/1/2018(1) - 3/31/2019 | | | | | 148,707 | | | | | | — | | | | | | 626 | | | | | | (148,934) | | | | | | — | | | | | | 399 | | | | | | 1,168,681 | | | | | | — | | | | | | 4,906 | | | | | | (1,169,417) | | | | | | — | | | | | | 4,170 | | |
| Class R | | | | | | | | | | | | | | | | | | | | | | | | | | | | | | | | | | | | | | | | | | | | | | | | | | | | | | | | | | | | | | | | | | | | | | | | | |
| 3/31/2020 | | | | | 86,955 | | | | | | — | | | | | | 8,075 | | | | | | (148,314) | | | | | | — | | | | | | (53,284) | | | | | | 685,862 | | | | | | — | | | | | | 63,829 | | | | | | (1,092,964) | | | | | | — | | | | | | (343,273) | | |
| 3/31/2019 | | | | | 49,306 | | | | | | — | | | | | | 7,220 | | | | | | (6,007) | | | | | | — | | | | | | 50,519 | | | | | | 388,518 | | | | | | — | | | | | | 56,247 | | | | | | (46,782) | | | | | | — | | | | | | 397,983 | | |
| | | | Shares sold | | | Shares issued in merger | | | Reinvestment of distributions | | | Shares redeemed | | | Shares converted | | | Net increase (decrease) in shares outstanding | | | Shares sold | | | Proceeds from shares issued in merger | | | Reinvestment of distributions | | | Shares redeemed | | | Shares converted | | | Net increase (decrease) | | ||||||||||||||||||||||||||||||||||||
| Year or period ended | | | # | | | # | | | # | | | # | | | # | | | # | | | ($) | | | ($) | | | ($) | | | ($) | | | ($) | | | ($) | | ||||||||||||||||||||||||||||||||||||
| High Yield Bond (continued) | | ||||||||||||||||||||||||||||||||||||||||||||||||||||||||||||||||||||||||
| Class R6 | | | | | | | | | | | | | | | | | | | | | | | | | | | | | | | | | | | | | | | | | | | | | | | | | | | | | | | | | | | | | | | | | | | | | | | | | |
| 3/31/2020 | | | | | 18,190,543 | | | | | | — | | | | | | 494,422 | | | | | | (2,151,871) | | | | | | — | | | | | | 16,533,094 | | | | | | 132,931,513 | | | | | | — | | | | | | 3,873,560 | | | | | | (16,605,178) | | | | | | — | | | | | | 120,199,895 | | |
| 3/31/2019 | | | | | 2,066,814 | | | | | | — | | | | | | 268,645 | | | | | | (15,930,702) | | | | | | — | | | | | | (13,595,243) | | | | | | 16,264,665 | | | | | | — | | | | | | 2,105,742 | | | | | | (125,115,579) | | | | | | — | | | | | | (106,745,172) | | |
| Class W | | | | | | | | | | | | | | | | | | | | | | | | | | | | | | | | | | | | | | | | | | | | | | | | | | | | | | | | | | | | | | | | | | | | | | | | | |
| 3/31/2020 | | | | | 9,673,020 | | | | | | — | | | | | | 791,877 | | | | | | (3,159,631) | | | | | | — | | | | | | 7,305,266 | | | | | | 75,534,887 | | | | | | — | | | | | | 6,210,804 | | | | | | (24,602,171) | | | | | | — | | | | | | 57,143,520 | | |
| 3/31/2019 | | | | | 2,777,224 | | | | | | — | | | | | | 688,469 | | | | | | (3,514,401) | | | | | | — | | | | | | (48,708) | | | | | | 21,667,646 | | | | | | — | | | | | | 5,367,284 | | | | | | (27,386,160) | | | | | | — | | | | | | (351,230) | | |
| Intermediate Bond | | ||||||||||||||||||||||||||||||||||||||||||||||||||||||||||||||||||||||||
| Class A | | | | | | | | | | | | | | | | | | | | | | | | | | | | | | | | | | | | | | | | | | | | | | | | | | | | | | | | | | | | | | | | | | | | | | | | | |
| 3/31/2020 | | | | | 16,071,031 | | | | | | — | | | | | | 1,099,851 | | | | | | (15,811,149) | | | | | | 267,957 | | | | | | 1,627,690 | | | | | | 166,370,297 | | | | | | — | | | | | | 11,386,329 | | | | | | (162,385,511) | | | | | | 2,789,429 | | | | | | 18,160,544 | | |
| 3/31/2019 | | | | | 13,578,312 | | | | | | — | | | | | | 978,213 | | | | | | (16,453,328) | | | | | | — | | | | | | (1,896,803) | | | | | | 132,667,248 | | | | | | — | | | | | | 9,590,616 | | | | | | (161,014,270) | | | | | | — | | | | | | (18,756,406) | | |
| Class C | | | | | | | | | | | | | | | | | | | | | | | | | | | | | | | | | | | | | | | | | | | | | | | | | | | | | | | | | | | | | | | | | | | | | | | | | |
| 3/31/2020 | | | | | 1,055,682 | | | | | | — | | | | | | 48,840 | | | | | | (1,436,355) | | | | | | — | | | | | | (331,833) | | | | | | 10,927,142 | | | | | | — | | | | | | 504,562 | | | | | | (14,810,623) | | | | | | — | | | | | | (3,378,919) | | |
| 3/31/2019 | | | | | 968,636 | | | | | | — | | | | | | 50,845 | | | | | | (1,282,819) | | | | | | — | | | | | | (263,338) | | | | | | 9,479,971 | | | | | | — | | | | | | 497,473 | | | | | | (12,526,022) | | | | | | — | | | | | | (2,548,578) | | |
| Class I | | | | | | | | | | | | | | | | | | | | | | | | | | | | | | | | | | | | | | | | | | | | | | | | | | | | | | | | | | | | | | | | | | | | | | | | | |
| 3/31/2020 | | | | | 250,260,793 | | | | | | — | | | | | | 14,521,492 | | | | | | (184,603,928) | | | | | | — | | | | | | 80,178,357 | | | | | | 2,588,026,639 | | | | | | — | | | | | | 150,301,009 | | | | | | (1,891,112,199) | | | | | | — | | | | | | 847,215,449 | | |
| 3/31/2019 | | | | | 244,423,316 | | | | | | — | | | | | | 10,253,180 | | | | | | (94,826,592) | | | | | | — | | | | | | 159,849,904 | | | | | | 2,389,561,300 | | | | | | — | | | | | | 100,461,880 | | | | | | (924,841,424) | | | | | | — | | | | | | 1,565,181,756 | | |
| Class O(2) | | | | | | | | | | | | | | | | | | | | | | | | | | | | | | | | | | | | | | | | | | | | | | | | | | | | | | | | | | | | | | | | | | | | | | | | | |
| 3/31/2020 | | | | | 764 | | | | | | — | | | | | | 4,926 | | | | | | (8,086) | | | | | | (267,957) | | | | | | (270,353) | | | | | | 7,896 | | | | | | — | | | | | | 50,749 | | | | | | (82,889) | | | | | | (2,789,429) | | | | | | (2,813,673) | | |
| 3/31/2019 | | | | | 83,469 | | | | | | — | | | | | | 8,035 | | | | | | (2,926,665) | | | | | | — | | | | | | (2,835,161) | | | | | | 819,111 | | | | | | — | | | | | | 78,777 | | | | | | (28,342,558) | | | | | | — | | | | | | (27,444,670) | | |
| Class P3 | | | | | | | | | | | | | | | | | | | | | | | | | | | | | | | | | | | | | | | | | | | | | | | | | | | | | | | | | | | | | | | | | | | | | | | | | |
| 3/31/2020 | | | | | 2,525,823 | | | | | | — | | | | | | 75,862 | | | | | | (2,155,864) | | | | | | — | | | | | | 445,821 | | | | | | 26,002,901 | | | | | | — | | | | | | 785,587 | | | | | | (22,158,664) | | | | | | — | | | | | | 4,629,824 | | |
| 6/1/2018(1) - 3/31/2019 | | | | | 2,276,168 | | | | | | — | | | | | | 32,378 | | | | | | (683,195) | | | | | | — | | | | | | 1,625,351 | | | | | | 22,324,061 | | | | | | — | | | | | | 317,800 | | | | | | (6,690,353) | | | | | | — | | | | | | 15,951,508 | | |
| Class R | | | | | | | | | | | | | | | | | | | | | | | | | | | | | | | | | | | | | | | | | | | | | | | | | | | | | | | | | | | | | | | | | | | | | | | | | |
| 3/31/2020 | | | | | 5,658,896 | | | | | | — | | | | | | 514,077 | | | | | | (4,668,322) | | | | | | — | | | | �� | | 1,504,651 | | | | | | 58,523,196 | | | | | | — | | | | | | 5,328,302 | | | | | | (48,214,716) | | | | | | — | | | | | | 15,636,782 | | |
| 3/31/2019 | | | | | 2,461,071 | | | | | | — | | | | | | 469,450 | | | | | | (4,816,056) | | | | | | — | | | | | | (1,885,535) | | | | | | 24,152,217 | | | | | | — | | | | | | 4,607,177 | | | | | | (47,237,348) | | | | | | — | | | | | | (18,477,954) | | |
| Class R6 | | | | | | | | | | | | | | | | | | | | | | | | | | | | | | | | | | | | | | | | | | | | | | | | | | | | | | | | | | | | | | | | | | | | | | | | | |
| 3/31/2020 | | | | | 98,347,226 | | | | | | — | | | | | | 7,012,519 | | | | | | (61,939,704) | | | | | | — | | | | | | 43,420,041 | | | | | | 1,021,901,643 | | | | | | — | | | | | | 72,601,626 | | | | | | (636,316,473) | | | | | | — | | | | | | 458,186,796 | | |
| 3/31/2019 | | | | | 60,855,232 | | | | | | — | | | | | | 5,465,280 | | | | | | (34,587,228) | | | | | | — | | | | | | 31,733,284 | | | | | | 597,376,305 | | | | | | — | | | | | | 53,547,787 | | | | | | (337,832,058) | | | | | | — | | | | | | 313,092,034 | | |
| Class W | | | | | | | | | | | | | | | | | | | | | | | | | | | | | | | | | | | | | | | | | | | | | | | | | | | | | | | | | | | | | | | | | | | | | | | | | |
| 3/31/2020 | | | | | 11,653,738 | | | | | | — | | | | | | 675,903 | | | | | | (5,103,415) | | | | | | — | | | | | | 7,226,226 | | | | | | 120,622,599 | | | | | | — | | | | | | 6,996,055 | | | | | | (52,350,058) | | | | | | — | | | | | | 75,268,596 | | |
| 3/31/2019 | | | | | 10,595,457 | | | | | | — | | | | | | 802,768 | | | | | | (70,834,512) | | | | | | — | | | | | | (59,436,287) | | | | | | 103,588,452 | | | | | | — | | | | | | 7,864,285 | | | | | | (688,454,699) | | | | | | — | | | | | | (577,001,962) | | |
| Short Term Bond | | ||||||||||||||||||||||||||||||||||||||||||||||||||||||||||||||||||||||||
| Class A | | | | | | | | | | | | | | | | | | | | | | | | | | | | | | | | | | | | | | | | | | | | | | | | | | | | | | | | | | | | | | | | | | | | | | | | | |
| 3/31/2020 | | | | | 1,018,684 | | | | | | — | | | | | | 16,685 | | | | | | (1,770,466) | | | | | | — | | | | | | (735,097) | | | | | | 10,049,550 | | | | | | — | | | | | | 163,960 | | | | | | (17,465,867) | | | | | | — | | | | | | (7,252,357) | | |
| 3/31/2019 | | | | | 2,030,833 | | | | | | — | | | | | | 18,358 | | | | | | (859,952) | | | | | | — | | | | | | 1,189,239 | | | | | | 19,682,733 | | | | | | — | | | | | | 178,029 | | | | | | (8,335,252) | | | | | | — | | | | | | 11,525,510 | | |
| Class C | | | | | | | | | | | | | | | | | | | | | | | | | | | | | | | | | | | | | | | | | | | | | | | | | | | | | | | | | | | | | | | | | | | | | | | | | |
| 3/31/2020 | | | | | 67,423 | | | | | | — | | | | | | 890 | | | | | | (139,551) | | | | | | — | | | | | | (71,238) | | | | | | 666,843 | | | | | | — | | | | | | 8,753 | | | | | | (1,370,500) | | | | | | — | | | | | | (694,904) | | |
| 3/31/2019 | | | | | 81,133 | | | | | | — | | | | | | 1,223 | | | | | | (50,953) | | | | | | — | | | | | | 31,403 | | | | | | 783,345 | | | | | | — | | | | | | 11,853 | | | | | | (495,052) | | | | | | — | | | | | | 300,146 | | |
| Class I | | | | | | | | | | | | | | | | | | | | | | | | | | | | | | | | | | | | | | | | | | | | | | | | | | | | | | | | | | | | | | | | | | | | | | | | | |
| 3/31/2020 | | | | | 585,982 | | | | | | — | | | | | | 27,123 | | | | | | (314,732) | | | | | | — | | | | | | 298,373 | | | | | | 5,768,478 | | | | | | — | | | | | | 266,726 | | | | | | (3,090,252) | | | | | | — | | | | | | 2,944,952 | | |
| 3/31/2019 | | | | | 539,107 | | | | | | — | | | | | | 25,042 | | | | | | (598,797) | | | | | | — | | | | | | (34,648) | | | | | | 5,229,570 | | | | | | — | | | | | | 242,582 | | | | | | (5,807,807) | | | | | | — | | | | | | (335,655) | | |
| Class P2 | | | | | | | | | | | | | | | | | | | | | | | | | | | | | | | | | | | | | | | | | | | | | | | | | | | | | | | | | | | | | | | | | | | | | | | | | |
| 10/22/2019(1) - 3/31/2020 | | | | | 6,211,230 | | | | | | — | | | | | | 67,215 | | | | | | (1,112,130) | | | | | | — | | | | | | 5,166,315 | | | | | | 61,353,506 | | | | | | — | | | | | | 660,465 | | | | | | (10,775,852) | | | | | | — | | | | | | 51,238,119 | | |
| Class P3 | | | | | | | | | | | | | | | | | | | | | | | | | | | | | | | | | | | | | | | | | | | | | | | | | | | | | | | | | | | | | | | | | | | | | | | | | |
| 3/31/2020 | | | | | 670,165 | | | | | | — | | | | | | 17,116 | | | | | | (475,172) | | | | | | — | | | | | | 212,109 | | | | | | 6,579,444 | | | | | | — | | | | | | 168,320 | | | | | | (4,594,498) | | | | | | — | | | | | | 2,153,266 | | |
| 6/1/2018(1) - 3/31/2019 | | | | | 501,406 | | | | | | — | | | | | | 6,902 | | | | | | (166,032) | | | | | | — | | | | | | 342,276 | | | | | | 4,863,867 | | | | | | — | | | | | | 66,908 | | | | | | (1,611,735) | | | | | | — | | | | | | 3,319,040 | | |
| Class R | | | | | | | | | | | | | | | | | | | | | | | | | | | | | | | | | | | | | | | | | | | | | | | | | | | | | | | | | | | | | | | | | | | | | | | | | |
| 3/31/2020 | | | | | — | | | | | | — | | | | | | 6 | | | | | | — | | | | | | — | | | | | | 6 | | | | | | — | | | | | | — | | | | | | 60 | | | | | | — | | | | | | — | | | | | | 60 | | |
| 3/31/2019 | | | | | — | | | | | | — | | | | | | 7 | | | | | | — | | | | | | — | | | | | | 7 | | | | | | — | | | | | | — | | | | | | 63 | | | | | | — | �� | | | | | — | | | | | | 63 | | |
| Class R6 | | | | | | | | | | | | | | | | | | | | | | | | | | | | | | | | | | | | | | | | | | | | | | | | | | | | | | | | | | | | | | | | | | | | | | | | | |
| 3/31/2020 | | | | | 14,157,093 | | | | | | — | | | | | | 350,993 | | | | | | (13,078,412) | | | | | | — | | | | | | 1,429,674 | | | | | | 138,912,667 | | | | | | — | | | | | | 3,454,516 | | | | | | (127,422,594) | | | | | | — | | | | | | 14,944,589 | | |
| 3/31/2019 | | | | | 2,961,631 | | | | | | — | | | | | | 238,612 | | | | | | (3,905,672) | | | | | | — | | | | | | (705,429) | | | | | | 28,712,200 | | | | | | — | | | | | | 2,311,673 | | | | | | (37,842,340) | | | | | | — | | | | | | (6,818,467) | | |
| Class W | | | | | | | | | | | | | | | | | | | | | | | | | | | | | | | | | | | | | | | | | | | | | | | | | | | | | | | | | | | | | | | | | | | | | | | | | |
| 3/31/2020 | | | | | 16,095 | | | | | | — | | | | | | 1,149 | | | | | | (60,465) | | | | | | — | | | | | | (43,221) | | | | | | 159,000 | | | | | | — | | | | | | 11,347 | | | | | | (580,726) | | | | | | — | | | | | | (410,379) | | |
| 3/31/2019 | | | | | 100,566 | | | | | | — | | | | | | 903 | | | | | | (56,255) | | | | | | — | | | | | | 45,214 | | | | | | 975,297 | | | | | | — | | | | | | 8,778 | | | | | | (545,549) | | | | | | — | | | | | | 438,526 | | |
| | | | Shares sold | | | Shares issued in merger | | | Reinvestment of distributions | | | Shares redeemed | | | Shares converted | | | Net increase (decrease) in shares outstanding | | | Shares sold | | | Proceeds from shares issued in merger | | | Reinvestment of distributions | | | Shares redeemed | | | Shares converted | | | Net increase (decrease) | | ||||||||||||||||||||||||||||||||||||
| Year or period ended | | | # | | | # | | | # | | | # | | | # | | | # | | | ($) | | | ($) | | | ($) | | | ($) | | | ($) | | | ($) | | ||||||||||||||||||||||||||||||||||||
| Strategic Income Opportunities | | ||||||||||||||||||||||||||||||||||||||||||||||||||||||||||||||||||||||||
| Class A | | | | | | | | | | | | | | | | | | | | | | | | | | | | | | | | | | | | | | | | | | | | | | | | | | | | | | | | | | | | | | | | | | | | | | | | | |
| 3/31/2020 | | | | | 23,902,684 | | | | | | — | | | | | | 695,363 | | | | | | (21,206,575) | | | | | | — | | | | | | 3,391,472 | | | | | | 244,819,457 | | | | | | — | | | | | | 7,089,898 | | | | | | (214,573,951) | | | | | | — | | | | | | 37,335,404 | | |
| 3/31/2019 | | | | | 15,498,082 | | | | | | — | | | | | | 306,369 | | | | | | (6,220,083) | | | | | | — | | | | | | 9,584,368 | | | | | | 156,920,387 | | | | | | — | | | | | | 3,097,438 | | | | | | (62,727,853) | | | | | | — | | | | | | 97,289,972 | | |
| Class C | | | | | | | | | | | | | | | | | | | | | | | | | | | | | | | | | | | | | | | | | | | | | | | | | | | | | | | | | | | | | | | | | | | | | | | | | |
| 3/31/2020 | | | | | 4,396,854 | | | | | | — | | | | | | 126,789 | | | | | | (1,186,101) | | | | | | — | | | | | | 3,337,542 | | | | | | 44,456,409 | | | | | | — | | | | | | 1,269,302 | | | | | | (11,772,089) | | | | | | — | | | | | | 33,953,622 | | |
| 3/31/2019 | | | | | 2,179,226 | | | | | | — | | | | | | 53,923 | | | | | | (448,113) | | | | | | — | | | | | | 1,785,036 | | | | | | 21,701,940 | | | | | | — | | | | | | 536,759 | | | | | | (4,443,411) | | | | | | — | | | | | | 17,795,288 | | |
| Class I | | | | | | | | | | | | | | | | | | | | | | | | | | | | | | | | | | | | | | | | | | | | | | | | | | | | | | | | | | | | | | | | | | | | | | | | | |
| 3/31/2020 | | | | | 195,469,467 | | | | | | — | | | | | | 7,191,414 | | | | | | (91,955,251) | | | | | | — | | | | | | 110,705,630 | | | | | | 2,000,948,486 | | | | | | — | | | | | | 73,423,768 | | | | | | (914,265,041) | | | | | | — | | | | | | 1,160,107,213 | | |
| 3/31/2019 | | | | | 108,847,527 | | | | | | — | | | | | | 2,517,849 | | | | | | (17,602,887) | | | | | | — | | | | | | 93,762,489 | | | | | | 1,105,256,775 | | | | | | — | | | | | | 25,563,862 | | | | | | (178,482,653) | | | | | | — | | | | | | 952,337,984 | | |
| Class P | | | | | | | | | | | | | | | | | | | | | | | | | | | | | | | | | | | | | | | | | | | | | | | | | | | | | | | | | | | | | | | | | | | | | | | | | |
| 3/31/2020 | | | | | 1,163,131 | | | | | | — | | | | | | 49,314 | | | | | | (167,206) | | | | | | — | | | | | | 1,045,239 | | | | | | 11,845,242 | | | | | | — | | | | | | 502,612 | | | | | | (1,717,991) | | | | | | — | | | | | | 10,629,863 | | |
| 2/1/2019(1) - 3/31/2019 | | | | | 296 | | | | | | — | | | | | | 3 | | | | | | — | | | | | | — | | | | | | 299 | | | | | | 3,000 | | | | | | — | | | | | | 25 | | | | | | — | | | | | | — | | | | | | 3,025 | | |
| Class P3 | | | | | | | | | | | | | | | | | | | | | | | | | | | | | | | | | | | | | | | | | | | | | | | | | | | | | | | | | | | | | | | | | | | | | | | | | |
| 8/1/2019(1) - 3/31/2020 | | | | | 763,159 | | | | | | — | | | | | | 13,658 | | | | | | (365,126) | | | | | | — | | | | | | 411,691 | | | | | | 7,839,386 | | | | | | — | | | | | | 139,321 | | | | | | (3,751,777) | | | | | | — | | | | | | 4,226,930 | | |
| Class R | | | | | | | | | | | | | | | | | | | | | | | | | | | | | | | | | | | | | | | | | | | | | | | | | | | | | | | | | | | | | | | | | | | | | | | | | |
| 3/31/2020 | | | | | 988,581 | | | | | | — | | | | | | 59,448 | | | | | | (240,623) | | | | | | — | | | | | | 807,406 | | | | | | 10,052,447 | | | | | | — | | | | | | 599,353 | | | | | | (2,353,160) | | | | | | — | | | | | | 8,298,640 | | |
| 3/31/2019 | | | | | 804,836 | | | | | | — | | | | | | 32,679 | | | | | | (116,704) | | | | | | — | | | | | | 720,811 | | | | | | 8,071,920 | | | | | | — | | | | | | 327,613 | | | | | | (1,167,318) | | | | | | — | | | | | | 7,232,215 | | |
| Class R6 | | | | | | | | | | | | | | | | | | | | | | | | | | | | | | | | | | | | | | | | | | | | | | | | | | | | | | | | | | | | | | | | | | | | | | | | | |
| 3/31/2020 | | | | | 30,312,878 | | | | | | — | | | | | | 957,844 | | | | | | (10,693,475) | | | | | | — | | | | | | 20,577,247 | | | | | | 308,585,262 | | | | | | — | | | | | | 9,766,425 | | | | | | (109,376,847) | | | | | | — | | | | | | 208,974,840 | | |
| 3/31/2019 | | | | | 4,694,239 | | | | | | — | | | | | | 87,497 | | | | | | (11,169,402) | | | | | | — | | | | | | (6,387,666) | | | | | | 47,523,600 | | | | | | — | | | | | | 884,913 | | | | | | (113,497,012) | | | | | | — | | | | | | (65,088,499) | | |
| Class W | | | | | | | | | | | | | | | | | | | | | | | | | | | | | | | | | | | | | | | | | | | | | | | | | | | | | | | | | | | | | | | | | | | | | | | | | |
| 3/31/2020 | | | | | 5,835,417 | | | | | | — | | | | | | 250,569 | | | | | | (3,206,738) | | | | | | — | | | | | | 2,879,248 | | | | | | 59,381,373 | | | | | | — | | | | | | 2,541,388 | | | | | | (31,497,257) | | | | | | — | | | | | | 30,425,504 | | |
| 3/31/2019 | | | | | 12,643,921 | | | | | | — | | | | | | 183,528 | | | | | | (10,685,218) | | | | | | — | | | | | | 2,142,231 | | | | | | 127,603,282 | | | | | | — | | | | | | 1,853,070 | | | | | | (107,886,187) | | | | | | — | | | | | | 21,570,165 | | |
| Counterparty | | | Securities Loaned at Value | | | Cash Collateral Received(1) | | | Net Amount | | |||||||||
| Barclays Capital Inc. | | | | $ | 2,179,209 | | | | | $ | (2,179,209) | | | | | $ | — | | |
| BNP Paribas | | | | | 2,233,333 | | | | | | (2,233,333) | | | | | | — | | |
| BNP Paribas Prime Brokerage Intl Ltd | | | | | 930,864 | | | | | | (930,864) | | | | | | — | | |
| Citadel Clearing LLC | | | | | 2,317,434 | | | | | | (2,317,434) | | | | | | — | | |
| Citigroup Global Markets Inc. | | | | | 1,132,283 | | | | | | (1,132,283) | | | | | | — | | |
| Cowen Execution Services LLC | | | | | 1,402,327 | | | | | | (1,402,327) | | | | | | — | | |
| Credit Suisse Securities (USA) LLC | | | | | 167,928 | | | | | | (167,928) | | | | | | — | | |
| Deutsche Bank Securities Inc. | | | | | 546,269 | | | | | | (546,269) | | | | | | — | | |
| Goldman Sachs & Co. LLC | | | | | 6,140,837 | | | | | | (6,140,837) | | | | | | — | | |
| J.P. Morgan Securities LLC | | | | | 14,343,376 | | | | | | (14,343,376) | | | | | | — | | |
| Mizuho Securities USA LLC | | | | | 229,404 | | | | | | (229,404) | | | | | | — | | |
| Morgan Stanley & Co. LLC | | | | | 1,601,632 | | | | | | (1,601,632) | | | | | | — | | |
| Scotia Capital (USA) Inc. | | | | | 3,090,289 | | | | | | (3,090,289) | | | | | | — | | |
| TD Prime Services LLC | | | | | 293,969 | | | | | | (293,969) | | | | | | — | | |
| TD Securities Inc. | | | | | 934,001 | | | | | | (934,001) | | | | | | — | | |
| UBS AG | | | | | 494,470 | | | | | | (494,470) | | | | | | — | | |
| Wells Fargo Clearing Services, LLC | | | | | 490,318 | | | | | | (490,318) | | | | | | — | | |
| Wells Fargo Securities LLC | | | | | 1,426,525 | | | | | | (1,426,525) | | | | | | — | | |
| | | | | $ | 39,954,468 | | | | | $ | (39,954,468) | | | | | $ | — | | |
| Counterparty | | | Securities Loaned at Value | | | Cash Collateral Received(1) | | | Net Amount | | |||||||||
| Barclays Bank PLC | | | | $ | 6,185,174 | | | | | $ | (6,185,174) | | | | | $ | — | | |
| Barclays Capital Inc. | | | | | 397,633 | | | | | | (397,633) | | | | | | — | | |
| BMO Capital Markets Corp | | | | | 961,199 | | | | | | (961,199) | | | | | | — | | |
| BNP Paribas | | | | | 14,408,034 | | | | | | (14,408,034) | | | | | | — | | |
| BNP Paribas Prime Brokerage Intl Ltd | | | | | 3,940,510 | | | | | | (3,940,510) | | | | | | — | | |
| BNP Paribas Securities Corp. | | | | | 2,011,892 | | | | | | (2,011,892) | | | | | | — | | |
| BofA Securities Inc. | | | | | 4,582,581 | | | | | | (4,582,581) | | | | | | — | | |
| Citadel Clearing LLC | | | | | 5,745,601 | | | | | | (5,745,601) | | | | | | — | | |
| Citigroup Global Markets Inc. | | | | | 11,093,542 | | | | | | (11,093,542) | | | | | | — | | |
| Cowen Execution Services LLC | | | | | 661,526 | | | | | | (661,526) | | | | | | — | | |
| Credit Suisse Securities (USA) LLC | | | | | 1,581,800 | | | | | | (1,581,800) | | | | | | — | | |
| Daiwa Capital Markets America Inc. | | | | | 1,687,801 | | | | | | (1,687,801) | | | | | | — | | |
| Deutsche Bank Securities Inc. | | | | | 3,519,008 | | | | | | (3,519,008) | | | | | | — | | |
| Goldman Sachs & Co. LLC | | | | | 55,843 | | | | | | (55,843) | | | | | | — | | |
| HSBC Securities (USA) Inc. | | | | | 3,940,910 | | | | | | (3,940,910) | | | | | | — | | |
| J.P. Morgan Securities LLC | | | | | 18,495,065 | | | | | | (18,495,065) | | | | | | — | | |
| Jefferies LLC | | | | | 430,428 | | | | | | (430,428) | | | | | | — | | |
| Merrill Lynch International | | | | | 3,463,490 | | | | | | (3,463,490) | | | | | | — | | |
| Morgan Stanley & Co. LLC | | | | | 4,093,362 | | | | | | (4,093,362) | | | | | | — | | |
| Counterparty | | | Securities Loaned at Value | | | Cash Collateral Received(1) | | | Net Amount | | |||||||||
| MUFG Securities Americas Inc. | | | | | 13,481,180 | | | | | | (13,481,180) | | | | | | — | | |
| National Financial Bank Inc. | | | | | 100,619 | | | | | | (100,619) | | | | | | — | | |
| Nomura Securities International, Inc. | | | | | 1,994,668 | | | | | | (1,994,668) | | | | | | — | | |
| RBC Capital Markets, LLC | | | | | 901,297 | | | | | | (901,297) | | | | | | — | | |
| RBC Dominion Securities Inc. | | | | | 1,889,117 | | | | | | (1,889,117) | | | | | | — | | |
| Scotia Capital (USA) Inc. | | | | | 4,131,293 | | | | | | (4,131,293) | | | | | | — | | |
| State Street Bank and Trust Company | | | | | 1,150,073 | | | | | | (1,150,073) | | | | | | — | | |
| SunTrust Robinson Humphrey,Inc. | | | | | 4,034,971 | | | | | | (4,034,971) | | | | | | — | | |
| UBS AG | | | | | 4,016,458 | | | | | | (4,016,458) | | | | | | — | | |
| Wells Fargo Securities LLC | | | | | 44,996,530 | | | | | | (44,996,530) | | | | | | — | | |
| | | | | $ | 163,951,605 | | | | | $ | (163,951,605) | | | | | $ | — | | |
| | |||||||||||||||||||
| Counterparty | | | Securities Loaned at Value | | | Cash Collateral Received(1) | | | Net Amount | | |||||||||
| Citadel Clearing LLC | | | | $ | 153,237 | | | | | $ | (153,237) | | | | | $ | — | | |
| Citigroup Global Markets Inc. | | | | | 19,543 | | | | | | (19,543) | | | | | | — | | |
| RBC Capital Markets, LLC | | | | | 60,256 | | | | | | (60,256) | | | | | | — | | |
| | | | | $ | 233,036 | | | | | $ | (233,036) | | | | | $ | — | | |
| Counterparty | | | Securities Loaned at Value | | | Cash Collateral Received(1) | | | Net Amount | | |||||||||
| Barclays Capital Inc. | | | | $ | 940,350 | | | | | $ | (940,350) | | | | | $ | — | | |
| BofA Securities Inc. | | | | | 366,839 | | | | | | (366,839) | | | | | | — | | |
| Citigroup Global Markets Inc. | | | | | 1,648,378 | | | | | | (1,648,378) | | | | | | — | | |
| Cowen Execution Services LLC | | | | | 78,124 | | | | | | (78,124) | | | | | | — | | |
| Credit Suisse Securities (USA) LLC | | | | | 390,231 | | | | | | (390,231) | | | | | | — | | |
| Deutsche Bank Securities Inc. | | | | | 697,107 | | | | | | (697,107) | | | | | | — | | |
| Goldman Sachs & Co. LLC | | | | | 674,742 | | | | | | (674,742) | | | | | | — | | |
| J.P. Morgan Securities LLC | | | | | 692,543 | | | | | | (692,543) | | | | | | — | | |
| Jefferies LLC | | | | | 77,130 | | | | | | (77,130) | | | | | | — | | |
| Morgan Stanley & Co. LLC | | | | | 2,145,769 | | | | | | (2,145,769) | | | | | | — | | |
| Nomura Securities International, Inc. | | | | | 521,247 | | | | | | (521,247) | | | | | | — | | |
| RBC Capital Markets, LLC | | | | | 295,008 | | | | | | (295,008) | | | | | | — | | |
| RBC Dominion Securities Inc. | | | | | 1,325,000 | | | | | | (1,325,000) | | | | | | — | | |
| SunTrust Robinson Humphrey,Inc. | | | | | 38,899 | | | | | | (38,899) | | | | | | — | | |
| UBS AG | | | | | 639,539 | | | | | | (639,539) | | | | | | — | | |
| Total | | | | $ | 10,530,906 | | | | | $ | (10,530,906) | | | | | $ | — | | |
| | | | Paid-in Capital | | | Distributable Earnings | | ||||||
| High Yield Bond | | | | $ | (106,631) | | | | | $ | 106,631 | | |
| | | | Year Ended March 31, 2020 | | | Year Ended March 31, 2019 | | ||||||
| | | | Ordinary Income | | | Ordinary Income | | ||||||
| GNMA Income | | | | $ | 30,231,110 | | | | | $ | 23,520,674 | | |
| High Yield Bond | | | | | 24,390,426 | | | | | | 26,878,797 | | |
| Intermediate Bond | | | | | 275,742,907 | | | | | | 195,005,912 | | |
| Short Term Bond | | | | | 4,832,256 | | | | | | 2,843,503 | | |
| Strategic Income Opportunities | | | | | 101,210,502 | | | | | | 35,376,185 | | |
| | | | Undistributed Ordinary Income | | | Undistributed Long-term Capital Gains | | | Unrealized Appreciation/ (Depreciation) | | | Capital Loss Carryforwards | | ||||||||||||||||||||||||
| | | | Amount | | | Character | | | Expiration | | |||||||||||||||||||||||||||
| GNMA Income | | | | $ | 426,852 | | | | | $ | — | | | | | $ | 52,502,339 | | | | | $ | (21,981,363) | | | | | | Short-term | | | | | | None | | |
| | | | | | | | | | | | | | | | | | | | | | | | (26,259,304) | | | | | | Long-term | | | | | | None | | |
| | | | | | | | | | | | | | | | | | | | | | | $ | (48,240,667) | | | | | | | | | | | | | | |
| High Yield Bond | | | | | — | | | | | | — | | | | | | (35,540,695) | | | | | | (1,269,613) | | | | | | Short-term | | | | | | None | | |
| | | | | | | | | | | | | | | | | | | | | | | | (23,599,479) | | | | | | Long-term | | | | | | None | | |
| | | | | | | | | | | | | | | | | | | | | | | $ | (24,869,092) | | | | | | | | | | | | | | |
| Intermediate Bond | | | | | 146,781,086 | | | | | | 26,007,065 | | | | | | (186,852,493) | | | | | | — | | | | | | — | | | | | | — | | |
| Short Term Bond | | | | | 237,023 | | | | | | — | | | | | | (5,993,397) | | | | | | (1,143,123) | | | | | | Short-term | | | | | | None | | |
| | | | | | | | | | | | | | | | | | | | | | | | (1,895,273) | | | | | | Long-term | | | | | | None | | |
| | | | | | | | | | | | | | | | | | | | | | | $ | (3,038,396) | | | | | | | | | | | | | | |
| Strategic Income Opportunities | | | | | 1,587,263 | | | | | | — | | | | | | (282,167,307) | | | | | | (5,275,074) | | | | | | Short-term | | | | | | None | | |
| | | | | | | | | | | | | | | | | | | | | | | | (38,368,607) | | | | | | Long-term | | | | | | None | | |
| | | | | | | | | | | | | | | | | | | | | | | $ | (43,643,681) | | | | | | | | | | | | | | |
| | | | Per Share Amount | | | Payable Date | | | Record Date | | ||||||
| GNMA Income | | | | | | | | | | | | | | | | |
| Class A | | | | $ | 0.0180 | | | | May 1, 2020 | | | | | Daily | | |
| Class C | | | | $ | 0.0126 | | | | May 1, 2020 | | | | | Daily | | |
| Class I | | | | $ | 0.0201 | | | | May 1, 2020 | | | | | Daily | | |
| Class W | | | | $ | 0.0198 | | | | May 1, 2020 | | | | | Daily | | |
| | | | Per Share Amount | | | Payable Date | | | Record Date | | ||||||
| High Yield Bond | | | | | | | | | | | | | | | | |
| Class A | | | | $ | 0.0308 | | | | May 1, 2020 | | | | | Daily | | |
| Class C | | | | $ | 0.0264 | | | | May 1, 2020 | | | | | Daily | | |
| Class I | | | | $ | 0.0327 | | | | May 1, 2020 | | | | | Daily | | |
| Class P | | | | $ | 0.0366 | | | | May 1, 2020 | | | | | Daily | | |
| Class P3 | | | | $ | 0.0369 | | | | May 1, 2020 | | | | | Daily | | |
| Class R | | | | $ | 0.0293 | | | | May 1, 2020 | | | | | Daily | | |
| Class R6 | | | | $ | 0.0331 | | | | May 1, 2020 | | | | | Daily | | |
| Class W | | | | $ | 0.0323 | | | | May 1, 2020 | | | | | Daily | | |
| Intermediate Bond | | | | | | | | | | | | | | | | |
| Class A | | | | $ | 0.0273 | | | | May 1, 2020 | | | | | Daily | | |
| Class C | | | | $ | 0.0210 | | | | May 1, 2020 | | | | | Daily | | |
| Class I | | | | $ | 0.0299 | | | | May 1, 2020 | | | | | Daily | | |
| Class P3 | | | | $ | 0.0328 | | | | May 1, 2020 | | | | | Daily | | |
| Class R | | | | $ | 0.0252 | | | | May 1, 2020 | | | | | Daily | | |
| Class R6 | | | | $ | 0.0302 | | | | May 1, 2020 | | | | | Daily | | |
| Class W | | | | $ | 0.0293 | | | | May 1, 2020 | | | | | Daily | | |
| Short Term Bond | | | | | | | | | | | | | | | | |
| Class A | | | | $ | 0.0160 | | | | May 1, 2020 | | | | | Daily | | |
| Class C | | | | $ | 0.0101 | | | | May 1, 2020 | | | | | Daily | | |
| Class I | | | | $ | 0.0184 | | | | May 1, 2020 | | | | | Daily | | |
| Class P2 | | | | $ | 0.0212 | | | | May 1, 2020 | | | | | Daily | | |
| Class P3 | | | | $ | 0.0224 | | | | May 1, 2020 | | | | | Daily | | |
| Class R | | | | $ | 0.0140 | | | | May 1, 2020 | | | | | Daily | | |
| Class R6 | | | | $ | 0.0186 | | | | May 1, 2020 | | | | | Daily | | |
| Class W | | | | $ | 0.0180 | | | | May 1, 2020 | | | | | Daily | | |
| Strategic Income Opportunities | | | | | | | | | | | | | | | | |
| Class A | | | | $ | 0.0247 | | | | May 1, 2020 | | | | | Daily | | |
| Class C | | | | $ | 0.0188 | | | | May 1, 2020 | | | | | Daily | | |
| Class I | | | | $ | 0.0274 | | | | May 1, 2020 | | | | | Daily | | |
| Class P | | | | $ | 0.0316 | | | | May 1, 2020 | | | | | Daily | | |
| Class P3 | | | | $ | 0.0279 | | | | May 1, 2020 | | | | | Daily | | |
| Class R | | | | $ | 0.0226 | | | | May 1, 2020 | | | | | Daily | | |
| Class R6 | | | | $ | 0.0278 | | | | May 1, 2020 | | | | | Daily | | |
| Class W | | | | $ | 0.0265 | | | | May 1, 2020 | | | | | Daily | | |
| Voya GNMA Income Fund | as of March 31, 2020 |
| Principal Amount† | | | Value | | | Percentage of Net Assets | | |||||||||
| COLLATERALIZED MORTGAGE OBLIGATIONS: 49.3% | | |||||||||||||||
| 1,654,011 | | | Fannie Mae 2004-28 PZ, 6.000%, 05/25/2034 | | | | $ | 2,278,290 | | | | | | 0.2 | | |
| 2,622,179 | | | Fannie Mae 2004-88 ZC, 6.500%, 12/25/2034 | | | | | 3,314,216 | | | | | | 0.3 | | |
| 7,989,880 | | | Fannie Mae 2005-17 B, 6.500%, (US0001M + 6.500%), 03/25/2035 | | | | | 10,239,309 | | | | | | 0.8 | | |
| 2,459,331 | | | Fannie Mae 2005-43 PZ, 6.000%, 05/25/2035 | | | | | 2,943,807 | | | | | | 0.2 | | |
| 1,223,456 | | | Fannie Mae 2007-60 ZB, 4.750%, 05/25/2037 | | | | | 1,358,718 | | | | | | 0.1 | | |
| 5,418,252 (1) | | | Fannie Mae 2010-150 PS, 5.653%, (-1.000*US0001M + 6.600%), 12/25/2039 | | | | | 409,869 | | | | | | 0.0 | | |
| 6,122,620 (1) | | | Fannie Mae 2010-95 SB, 5.653%, (-1.000*US0001M + 6.600%), 09/25/2040 | | | | | 1,131,992 | | | | | | 0.1 | | |
| 4,923,517 | | | Fannie Mae 2011-99 CZ, 4.500%, 10/25/2041 | | | | | 5,772,563 | | | | | | 0.5 | | |
| 8,719,456 (1) | | | Fannie Mae 2012-148 HI, 3.500%, 05/25/2042 | | | | | 960,198 | | | | | | 0.1 | | |
| 26,956,665 (1) | | | Fannie Mae 2012-148 IM, 3.000%, 01/25/2028 | | | | | 1,827,309 | | | | | | 0.1 | | |
| 260,156 (2) | | | Fannie Mae REMIC Trust 2002-W1 3A, 4.033%, 04/25/2042 | | | | | 273,686 | | | | | | 0.0 | | |
| 1,177,788 (2) | | | Fannie Mae REMIC Trust 2002-W6 3A, 4.428%, 01/25/2042 | | | | | 1,245,398 | | | | | | 0.1 | | |
| 1,360,969 | | | Fannie Mae REMIC Trust 2003-16 CX, 6.500%, 03/25/2033 | | | | | 1,612,199 | | | | | | 0.1 | | |
| 3,113,787 | | | Fannie Mae REMIC Trust 2003-34 LN, 5.000%, 05/25/2033 | | | | | 3,554,344 | | | | | | 0.3 | | |
| 123,814 | | | Fannie Mae REMIC Trust 2004-61 SH, 20.203%, (-3.998*US0001M + 23.988%), 11/25/2032 | | | | | 198,475 | | | | | | 0.0 | | |
| 3,613,358 (2) | | | Fannie Mae REMIC Trust 2004-W11 2A, 4.194%, 03/25/2043 | | | | | 3,676,037 | | | | | | 0.3 | | |
| 3,233,541 | | | Fannie Mae REMIC Trust 2004-W3 A8, 5.500%, 05/25/2034 | | | | | 3,707,161 | | | | | | 0.3 | | |
| 813,063 (1) | | | Fannie Mae REMIC Trust 2005-17 ES, 5.803%, (-1.000*US0001M + 6.750%), 03/25/2035 | | | | | 113,927 | | | | | | 0.0 | | |
| Principal Amount† | | | Value | | | Percentage of Net Assets | | |||||||||
| COLLATERALIZED MORTGAGE OBLIGATIONS: (continued) | | |||||||||||||||
| 730,227 | | | Fannie Mae REMIC Trust 2005-59 NQ, 14.508%, (-2.500*US0001M + 16.875%), 05/25/2035 | | | | $ | 937,070 | | | | | | 0.1 | | |
| 768,484 | | | Fannie Mae REMIC Trust 2005-88 ZC, 5.000%, 10/25/2035 | | | | | 877,499 | | | | | | 0.1 | | |
| 200,467 | | | Fannie Mae REMIC Trust 2006-115 ES, 22.774%, (-4.000*US0001M + 26.560%), 12/25/2036 | | | | | 328,954 | | | | | | 0.0 | | |
| 1,446,301 (1) | | | Fannie Mae REMIC Trust 2006-36 SP, 5.753%, (-1.000*US0001M + 6.700%), 05/25/2036 | | | | | 265,117 | | | | | | 0.0 | | |
| 4,087,781 (1) | | | Fannie Mae REMIC Trust 2006-79 SH, 5.503%, (-1.000*US0001M + 6.450%), 08/25/2036 | | | | | 1,036,546 | | | | | | 0.1 | | |
| 324,954 (2) | | | Fannie Mae REMIC Trust 2009-12 LK, 10.079%, 03/25/2039 | | | | | 387,128 | | | | | | 0.0 | | |
| 1,861,549 | | | Fannie Mae REMIC Trust 2009-66 XA, 5.500%, 12/25/2035 | | | | | 2,399,083 | | | | | | 0.2 | | |
| 5,069,928 | | | Fannie Mae REMIC Trust 2010-155 JC, 4.000%, 12/25/2039 | | | | | 5,423,393 | | | | | | 0.4 | | |
| 5,084,839 | | | Fannie Mae REMIC Trust 2010-2 LC, 5.000%, 02/25/2040 | | | | | 6,076,082 | | | | | | 0.5 | | |
| 1,767,407 | | | Fannie Mae REMIC Trust 2011-30 ZA, 5.000%, 04/25/2041 | | | | | 1,991,714 | | | | | | 0.2 | | |
| 7,287,686 (1) | | | Fannie Mae REMIC Trust 2012-128 VS, 5.303%, (-1.000*US0001M + 6.250%), 06/25/2042 | | | | | 1,156,662 | | | | | | 0.1 | | |
| 5,564,506 (1) | | | Fannie Mae REMIC Trust 2012-142 BI, 3.000%, 11/25/2027 | | | | | 310,763 | | | | | | 0.0 | | |
| 3,472,323 (1) | | | Fannie Mae REMIC Trust 2012-154 PI, 4.000%, 05/25/2042 | | | | | 407,081 | | | | | | 0.0 | | |
| 2,674,096 (1) | | | Fannie Mae REMIC Trust 2012-68 SD, 5.753%, (-1.000*US0001M + 6.700%), 06/25/2032 | | | | | 518,157 | | | | | | 0.0 | | |
| Voya GNMA Income Fund | as of March 31, 2020 (continued) |
| Principal Amount† | | | Value | | | Percentage of Net Assets | | |||||||||
| COLLATERALIZED MORTGAGE OBLIGATIONS: (continued) | | |||||||||||||||
| 3,457,000 | | | Fannie Mae REMIC Trust 2012-97 PC, 3.500%, 09/25/2042 | | | | $ | 4,113,366 | | | | | | 0.3 | | |
| 1,077,355 (1) | | | Fannie Mae REMIC Trust 2013-13 PI, 3.500%, 04/25/2042 | | | | | 113,728 | | | | | | 0.0 | | |
| 3,214,111 (1) | | | Fannie Mae REMIC Trust 2013-54 ID, 3.000%, 01/25/2033 | | | | | 192,856 | | | | | | 0.0 | | |
| 372,631 | | | Fannie Mae REMICS 2004-89 ES, 11.476%, (-1.850*US0001M + 13.228%), 08/25/2034 | | | | | 386,445 | | | | | | 0.0 | | |
| 5,113 (3) | | | Fannie Mae REMICS 2006-44 P, 0.000%, 12/25/2033 | | | | | 4,816 | | | | | | 0.0 | | |
| 1,000,000 | | | Fannie Mae REMICS 2010-87 PL, 4.000%, 06/25/2040 | | | | | 1,152,151 | | | | | | 0.1 | | |
| 2,358,961 | | | Fannie Mae REMICS 2011-10 ZC, 5.000%, 02/25/2041 | | | | | 2,730,907 | | | | | | 0.2 | | |
| 5,228,832 (1) | | | Fannie Mae REMICS 2012-137 EI, 3.000%, 12/25/2027 | | | | | 329,695 | | | | | | 0.0 | | |
| 10,081,177 | | | Fannie Mae REMICS 2012-17 QZ, 4.000%, 03/25/2042 | | | | | 11,281,635 | | | | | | 0.9 | | |
| 2,500,000 | | | Fannie Mae REMICS 2012-40 MY, 3.500%, 04/25/2042 | | | | | 2,870,206 | | | | | | 0.2 | | |
| 3,239,952 (3) | | | Fannie Mae REMICS 2013-135 PO, 0.000%, 01/25/2044 | | | | | 2,997,651 | | | | | | 0.2 | | |
| 1,227,211 | | | Fannie Mae REMICS 2013-55 VZ, 3.000%, 06/25/2043 | | | | | 1,279,060 | | | | | | 0.1 | | |
| 18,038,564 (1) | | | Fannie Mae REMICS 2019-49 IG, 3.000%, 03/25/2033 | | | | | 1,333,080 | | | | | | 0.1 | | |
| 5,699,532 | | | Fannie Mae Series 2016-51 S, 4.973%, (-1.000*US0001M + 5.920%), 10/25/2043 | | | | | 6,282,559 | | | | | | 0.5 | | |
| 2,571,308 (2) | | | Fannie Mae Trust 2004-W2 3A, 4.165%, 02/25/2044 | | | | | 2,700,134 | | | | | | 0.2 | | |
| Principal Amount† | | | Value | | | Percentage of Net Assets | | |||||||||
| COLLATERALIZED MORTGAGE OBLIGATIONS: (continued) | | |||||||||||||||
| 2,488,326 (2) | | | Fannie Mae Trust 2004-W2 4A, 4.139%, 02/25/2044 | | | | $ | 2,606,967 | | | | | | 0.2 | | |
| 1,857,332 | | | Fannie Mae REMICS 2010-26 F, 1.717%, (US0001M + 0.770%), 11/25/2036 | | | | | 1,869,014 | | | | | | 0.2 | | |
| 1,994,338 | | | Fannie Mae REMICS 2010-39 FN, 1.777%, (US0001M + 0.830%), 05/25/2040 | | | | | 2,009,486 | | | | | | 0.2 | | |
| 4,845,867 | | | Fannie Mae REMICS 2017-22 DZ, 4.000%, 04/25/2047 | | | | | 5,712,027 | | | | | | 0.4 | | |
| 969,345 | | | Freddie Mac REMICS 3658 CZ, 5.000%, 04/15/2040 | | | | | 1,210,786 | | | | | | 0.1 | | |
| 4,369,480 | | | Freddie Mac REMICS 4249 CS, 3.633%, (-0.750*US0001M + 4.650%), 09/15/2043 | | | | | 4,352,639 | | | | | | 0.3 | | |
| 6,648,772 | | | Freddie Mac REMICS 4480 ZX, 4.000%, 11/15/2044 | | | | | 7,419,886 | | | | | | 0.6 | | |
| 9,318,150 | | | Freddie Mac REMICS 4764 CJ, 4.000%, 06/15/2045 | | | | | 9,810,699 | | | | | | 0.8 | | |
| 6,473,979 | | | Freddie Mac REMICS 4764 DA, 4.000%, 07/15/2045 | | | | | 6,806,902 | | | | | | 0.5 | | |
| 3,268,659 | | | Ginnie Mae Series 2009-118 XZ, 5.000%, 12/20/2039 | | | | | 3,749,328 | | | | | | 0.3 | | |
| 6,832,572 | | | Ginnie Mae Series 2010-117 ZQ, 4.500%, 09/20/2040 | | | | | 8,189,625 | | | | | | 0.6 | | |
| 7,529,368 | | | Ginnie Mae Series 2011-69 HW, 4.000%, 04/20/2040 | | | | | 8,035,011 | | | | | | 0.6 | | |
| 3,023,308 | | | Ginnie Mae Series 2011-H03 FA, 2.162%, (US0001M + 0.500%), 01/20/2061 | | | | | 2,991,144 | | | | | | 0.2 | | |
| 1,410,091 (1) | | | Ginnie Mae Series 2012-93 NS, 5.327%, (-1.000*US0001M + 6.100%), 07/20/2042 | | | | | 278,014 | | | | | | 0.0 | | |
| 4,909,512 | | | Ginnie Mae Series 2012-H08 FB, 2.262%, (US0001M + 0.600%), 03/20/2062 | | | | | 4,878,931 | | | | | | 0.4 | | |
| 2,436,106 | | | Ginnie Mae Series 2013-119 TZ, 3.000%, 08/20/2043 | | | | | 2,632,828 | | | | | | 0.2 | | |
| Voya GNMA Income Fund | as of March 31, 2020 (continued) |
| Principal Amount† | | | Value | | | Percentage of Net Assets | | |||||||||
| COLLATERALIZED MORTGAGE OBLIGATIONS: (continued) | | |||||||||||||||
| 1,552,863 (1) | | | Ginnie Mae Series 2013-88 AI, 4.269%, (-1.000*US0001M + 5.850%), 06/20/2043 | | | | $ | 297,021 | | | | | | 0.0 | | |
| 2,129,273 (1) | | | Ginnie Mae Series 2013-99 SK, 4.319%, (-1.000*US0001M + 5.900%), 07/20/2043 | | | | | 387,695 | | | | | | 0.0 | | |
| 2,443,578 | | | Ginnie Mae Series 2013-H02 FD, 2.002%, (US0001M + 0.340%), 12/20/2062 | | | | | 2,414,511 | | | | | | 0.2 | | |
| 2,773,275 (1) | | | Ginnie Mae Series 2014-129 WS, 4.319%, (-1.000*US0001M + 5.900%), 09/20/2044 | | | | | 509,433 | | | | | | 0.0 | | |
| 2,589,548 (1) | | | Ginnie Mae Series 2014-161 WS, 4.319%, (-1.000*US0001M + 5.900%), 11/20/2044 | | | | | 456,388 | | | | | | 0.0 | | |
| 1,566,095 | | | Ginnie Mae Series 2014-H21 FA, 2.312%, (US0001M + 0.650%), 10/20/2064 | | | | | 1,544,047 | | | | | | 0.1 | | |
| 3,789,570 | | | Ginnie Mae Series 2015-165 ZA, 3.500%, 07/20/2045 | | | | | 4,283,073 | | | | | | 0.3 | | |
| 1,382,892 | | | Ginnie Mae Series 2015-H26 FA, 2.182%, (US0001M + 0.520%), 10/20/2065 | | | | | 1,360,452 | | | | | | 0.1 | | |
| 10,442,727 (1) | | | Ginnie Mae Series 2016-20 BS, 5.327%, (-1.000*US0001M + 6.100%), 02/20/2046 | | | | | 2,056,838 | | | | | | 0.2 | | |
| 1,392,724 | | | Ginnie Mae Series 2016-H11 FE, 2.512%, (US0001M + 0.850%), 04/20/2066 | | | | | 1,382,641 | | | | | | 0.1 | | |
| 583,499 | | | Ginnie Mae Series 2016-H20 FG, 2.362%, (US0001M + 0.700%), 08/20/2066 | | | | | 580,378 | | | | | | 0.1 | | |
| 3,032,447 | | | Ginnie Mae Series 2017-56 HM, 3.000%, 12/20/2046 | | | | | 3,218,456 | | | | | | 0.3 | | |
| 5,590,494 | | | Ginnie Mae Series 2019-1 Z, 4.000%, 01/20/2049 | | | | | 6,148,877 | | | | | | 0.5 | | |
| 5,723,936 | | | Ginnie Mae Series 2019-H05 FL, 2.142%, (US0001M + 0.480%), 03/20/2069 | | | | | 5,732,639 | | | | | | 0.4 | | |
| 2,649,939 | | | Freddie Mac 3770 GA, 4.500%, 10/15/2040 | | | | | 3,163,990 | | | | | | 0.3 | | |
| 2,850,574 | | | Freddie Mac REMIC Trust 2005-S001 2A2, 1.777%, (US0001M + 0.150%), 09/25/2045 | | | | | 2,818,009 | | | | | | 0.2 | | |
| Principal Amount† | | | Value | | | Percentage of Net Assets | | |||||||||
| COLLATERALIZED MORTGAGE OBLIGATIONS: (continued) | | |||||||||||||||
| 524,640 | | | Freddie Mac REMIC Trust 2653 SC, 6.122%, (-0.500*US0001M + 6.800%), 07/15/2033 | | | | $ | 599,379 | | | | | | 0.1 | | |
| 1,390,511 | | | Freddie Mac REMIC Trust 2767 ZW, 6.000%, 03/15/2034 | | | | | 1,691,948 | | | | | | 0.1 | | |
| 166,937 | | | Freddie Mac REMIC Trust 3012 ST, 19.423%, (-3.600*US0001M + 21.960%), 04/15/2035 | | | | | 242,621 | | | | | | 0.0 | | |
| 359,887 | | | Freddie Mac REMIC Trust 3065 DC, 17.746%, (-3.000*US0001M + 19.860%), 03/15/2035 | | | | | 513,036 | | | | | | 0.0 | | |
| 671,028 | | | Freddie Mac REMIC Trust 3158 NE, 5.500%, 05/15/2036 | | | | | 784,087 | | | | | | 0.1 | | |
| 4,592,523 (1) | | | Freddie Mac REMIC Trust 3181 TA, 0.500%, (-0.794*US0001M + 5.635%), 07/15/2036 | | | | | 95,701 | | | | | | 0.0 | | |
| 377,804 (1) | | | Freddie Mac REMIC Trust 3507 IA, 5.500%, 09/15/2035 | | | | | 70,182 | | | | | | 0.0 | | |
| 35,913 (1) | | | Freddie Mac REMIC Trust 3753 PS, 5.395%, (-1.000*US0001M + 6.100%), 06/15/2040 | | | | | 520 | | | | | | 0.0 | | |
| 493,624 | | | Freddie Mac REMIC Trust 3864 NT, 5.500%, (-9.167*US0001M + 60.500%), 03/15/2039 | | | | | 534,263 | | | | | | 0.1 | | |
| 2,980,256 | | | Freddie Mac REMIC Trust 3888 ZG, 4.000%, 07/15/2041 | | | | | 3,325,011 | | | | | | 0.3 | | |
| 1,153,151 (1) | | | Freddie Mac REMIC Trust 4027 QI, 4.500%, 12/15/2040 | | | | | 63,211 | | | | | | 0.0 | | |
| 3,135,844 | | | Freddie Mac REMICS 3196 ZK, 6.500%, 04/15/2032 | | | | | 4,368,634 | | | | | | 0.3 | | |
| 1,303,471 | | | Freddie Mac REMICS 4097 ZA, 3.500%, 08/15/2042 | | | | | 1,412,009 | | | | | | 0.1 | | |
| 6,573,000 | | | Freddie Mac REMICS 4136 LU, 3.000%, 07/15/2032 | | | | | 6,921,408 | | | | | | 0.5 | | |
| 1,252,765 | | | Freddie Mac Series 4040 UZ, 5.000%, 05/15/2042 | | | | | 1,684,660 | | | | | | 0.1 | | |
| Voya GNMA Income Fund | as of March 31, 2020 (continued) |
| Principal Amount† | | | Value | | | Percentage of Net Assets | | |||||||||
| COLLATERALIZED MORTGAGE OBLIGATIONS: (continued) | | |||||||||||||||
| 1,689,170 (2) | | | Freddie Mac Structured Pass-Through Certificates T-54 2A, 4.062%, 07/25/ 2033 | | | | $ | 1,769,914 | | | | | | 0.1 | | |
| 1,101,151 (2) | | | Freddie Mac Structured Pass-Through Certificates T-54 4A, 4.122%, 02/25/ 2043 | | | | | 1,172,477 | | | | | | 0.1 | | |
| 134,807 (1) | | | Freddie Mac-Ginnie Mae Series 21 SA, 7.053%, (-1.000*US0001M + 8.000%), 10/25/2023 | | | | | 13,929 | | | | | | 0.0 | | |
| 1,301,531 | | | Ginnie Mae 2004-65 ZG, 5.500%, 07/20/2034 | | | | | 1,504,681 | | | | | | 0.1 | | |
| 5,342,518 | | | Ginnie Mae 2009-110 ZA, 5.500%, 11/16/2039 | | | | | 6,877,507 | | | | | | 0.5 | | |
| 742,950 | | | Ginnie Mae 2009-32 QZ, 5.500%, 05/16/2039 | | | | | 960,098 | | | | | | 0.1 | | |
| 575,105 | | | Ginnie Mae 2009-32 YZ, 7.000%, 05/16/2039 | | | | | 821,417 | | | | | | 0.1 | | |
| 3,261,044 | | | Ginnie Mae 2009-50 MZ, 6.000%, 07/16/2039 | | | | | 4,036,642 | | | | | | 0.3 | | |
| 725,715 | | | Ginnie Mae 2009-54 HZ, 5.000%, 07/20/2039 | | | | | 835,985 | | | | | | 0.1 | | |
| 1,893,215 | | | Ginnie Mae 2009-H01 FA, 1.923%, (US0001M + 1.150%), 11/20/2059 | | | | | 1,910,773 | | | | | | 0.2 | | |
| 2,000,000 | | | Ginnie Mae 2010-116 PB, 5.000%, 06/16/2040 | | | | | 2,439,678 | | | | | | 0.2 | | |
| 3,984,213 | | | Ginnie Mae 2010-125 BZ, 4.500%, 09/16/2040 | | | | | 4,405,375 | | | | | | 0.3 | | |
| 5,054,853 (3) | | | Ginnie Mae 2011-70 PO, 0.000%, 05/16/2041 | | | | | 4,713,795 | | | | | | 0.4 | | |
| 3,938,954 (1) | | | Ginnie Mae 2014-107 XS, 4.895%, (-1.000*US0001M + 5.600%), 07/16/2044 | | | | | 718,510 | | | | | | 0.1 | | |
| 1,925,909 (1) | | | Ginnie Mae 2014-96 SQ, 4.895%, (-1.000*US0001M + 5.600%), 07/16/2044 | | | | | 338,237 | | | | | | 0.0 | | |
| 3,385,962 | | | Ginnie Mae 2015-H13 FG, 2.062%, (US0001M + 0.400%), 04/20/2065 | | | | | 3,345,010 | | | | | | 0.3 | | |
| 22,052,580 (1) | | | Ginnie Mae 2016-120 IM, 3.500%, 07/20/2046 | | | | | 2,657,111 | | | | | | 0.2 | | |
| 2,185,344 (1) | | | Ginnie Mae 2016-84 IO, 5.000%, 12/20/2040 | | | | | 138,999 | | | | | | 0.0 | | |
| 19,988,807 | | | Ginnie Mae 2016-H20 FB, 2.212%, (US0001M + 0.550%), 09/20/2066 | | | | | 19,758,764 | | | | | | 1.5 | | |
| Principal Amount† | | | Value | | | Percentage of Net Assets | | |||||||||
| COLLATERALIZED MORTGAGE OBLIGATIONS: (continued) | | |||||||||||||||
| 2,890,000 | | | Ginnie Mae 2017-162 PL, 3.000%, 10/20/2047 | | | | $ | 3,103,138 | | | | | | 0.2 | | |
| 1,567,532 (1) | | | Ginnie Mae 2018-78 IC, 4.000%, 02/20/2047 | | | | | 200,263 | | | | | | 0.0 | | |
| 3,566,566 | | | Ginnie Mae Series 2003-86 ZC, 4.500%, 10/20/2033 | | | | | 3,957,979 | | | | | | 0.3 | | |
| 131,889 | | | Ginnie Mae Series 2004-16 AE, 5.500%, 02/20/2034 | | | | | 151,160 | | | | | | 0.0 | | |
| 1,248,305 | | | Ginnie Mae Series 2004-17 MZ, 5.500%, 03/16/2034 | | | | | 1,417,421 | | | | | | 0.1 | | |
| 840,362 | | | Ginnie Mae Series 2004-28 CZ, 5.500%, 04/20/2034 | | | | | 975,285 | | | | | | 0.1 | | |
| 409,090 (3) | | | Ginnie Mae Series 2004-37 OA, 0.000%, 04/17/2034 | | | | | 386,502 | | | | | | 0.0 | | |
| 3,164,192 | | | Ginnie Mae Series 2004-4 MG, 5.000%, 01/16/2034 | | | | | 3,569,644 | | | | | | 0.3 | | |
| 3,298,420 | | | Ginnie Mae Series 2004-81 Z, 5.000%, 10/20/2034 | | | | | 3,720,057 | | | | | | 0.3 | | |
| 1,276,279 (1) | | | Ginnie Mae Series 2004-98 SA, 5.927%, (-1.000*US0001M + 6.700%), 11/20/2034 | | | | | 323,818 | | | | | | 0.0 | | |
| 1,110,414 | | | Ginnie Mae Series 2005-21 Z, 5.000%, 03/20/2035 | | | | | 1,269,878 | | | | | | 0.1 | | |
| 322,400 (1) | | | Ginnie Mae Series 2005-25 SI, 6.000%, (-6.000*US0001M + 43.200%), 01/20/2034 | | | | | 50,046 | | | | | | 0.0 | | |
| 842,624 (1) | | | Ginnie Mae Series 2005-7 AH, 6.065%, (-1.000*US0001M + 6.770%), 02/16/2035 | | | | | 178,772 | | | | | | 0.0 | | |
| 1,002,557 (1) | | | Ginnie Mae Series 2005-73 IM, 5.500%, 09/20/2035 | | | | | 186,087 | | | | | | 0.0 | | |
| 578,838 | | | Ginnie Mae Series 2005-80 Z, 5.000%, 10/20/2035 | | | | | 657,323 | | | | | | 0.1 | | |
| 281,749 | | | Ginnie Mae Series 2005-91 UP, 12.891%, (-2.000*US0001M + 14.300%), 09/16/2031 | | | | | 356,566 | | | | | | 0.0 | | |
| 8,203,598 | | | Ginnie Mae Series 2006-10 ZT, 6.000%, 03/20/2036 | | | | | 9,596,221 | | | | | | 0.7 | | |
| 1,756,969 | | | Ginnie Mae Series 2006-17 TW, 6.000%, 04/20/2036 | | | | | 2,052,975 | | | | | | 0.2 | | |
| 9,140,135 (1) | | | Ginnie Mae Series 2006-26 TB, 0.250%, (-1.000*US0001M + 6.500%), 06/20/2036 | | | | | 87,411 | | | | | | 0.0 | | |
| Voya GNMA Income Fund | as of March 31, 2020 (continued) |
| Principal Amount† | | | Value | | | Percentage of Net Assets | | |||||||||
| COLLATERALIZED MORTGAGE OBLIGATIONS: (continued) | | |||||||||||||||
| 2,882,752 | | | Ginnie Mae Series 2006-7 ZA, 5.500%, 02/20/2036 | | | | $ | 3,342,063 | | | | | | 0.3 | | |
| 1,959,919 (1) | | | Ginnie Mae Series 2007-17 CI, 7.500%, 04/16/2037 | | | | | 512,551 | | | | | | 0.0 | | |
| 36,601 | | | Ginnie Mae Series 2007-37 S, 22.716%, (-3.667*US0001M + 25.300%), 04/16/2037 | | | | | 39,735 | | | | | | 0.0 | | |
| 2,047,956 (3) | | | Ginnie Mae Series 2007-41 OL, 0.000%, 07/20/2037 | | | | | 1,865,095 | | | | | | 0.2 | | |
| 120,449 | | | Ginnie Mae Series 2007-45 PE, 5.500%, 07/16/2037 | | | | | 138,685 | | | | | | 0.0 | | |
| 368,869 | | | Ginnie Mae Series 2007-48 SY, 18.136%, (-3.000*US0001M + 20.250%), 08/16/2037 | | | | | 544,333 | | | | | | 0.0 | | |
| 2,208,882 (1) | | | Ginnie Mae Series 2007-53 SC, 5.727%, (-1.000*US0001M + 6.500%), 09/20/2037 | | | | | 545,244 | | | | | | 0.0 | | |
| 65,210 | | | Ginnie Mae Series 2007-53 SW, 17.886%, (-3.000*US0001M + 20.205%), 09/20/2037 | | | | | 97,558 | | | | | | 0.0 | | |
| 1,222,671 | | | Ginnie Mae Series 2007-60 YZ, 5.500%, 10/20/2037 | | | | | 1,381,648 | | | | | | 0.1 | | |
| 2,932,573 | | | Ginnie Mae Series 2008-20 PZ, 6.000%, 03/20/2038 | | | | | 3,556,196 | | | | | | 0.3 | | |
| 648,609 (1) | | | Ginnie Mae Series 2008-3 SA, 5.777%, (-1.000*US0001M + 6.550%), 01/20/2038 | | | | | 157,367 | | | | | | 0.0 | | |
| 1,284,493 (1) | | | Ginnie Mae Series 2008-40 PS, 5.795%, (-1.000*US0001M + 6.500%), 05/16/2038 | | | | | 267,694 | | | | | | 0.0 | | |
| 2,891,421 (1) | | | Ginnie Mae Series 2008-82 SA, 5.227%, (-1.000*US0001M + 6.000%), 09/20/2038 | | | | | 629,297 | | | | | | 0.1 | | |
| 5,627,237 (1) | | | Ginnie Mae Series 2009-110 SA, 5.645%, (-1.000*US0001M + 6.350%), 04/16/2039 | | | | | 656,802 | | | | | | 0.1 | | |
| 795,315 | | | Ginnie Mae Series 2009-110 ZC, 4.500%, 11/16/2039 | | | | | 956,691 | | | | | | 0.1 | | |
| 1,697,272 | | | Ginnie Mae Series 2009-121 ZQ, 5.500%, 09/20/2039 | | | | | 1,957,927 | | | | | | 0.2 | | |
| Principal Amount† | | | Value | | | Percentage of Net Assets | | |||||||||
| COLLATERALIZED MORTGAGE OBLIGATIONS: (continued) | | |||||||||||||||
| 1,029,000 | | | Ginnie Mae Series 2009-31 BP, 5.000%, 05/20/2039 | | | | $ | 1,250,281 | | | | | | 0.1 | | |
| 3,043,493 | | | Ginnie Mae Series 2009-31 ZL, 4.500%, 05/20/2039 | | | | | 3,492,192 | | | | | | 0.3 | | |
| 2,864,828 | | | Ginnie Mae Series 2009-34 Z, 4.500%, 05/16/2039 | | | | | 3,213,897 | | | | | | 0.3 | | |
| 3,090,732 | | | Ginnie Mae Series 2009-53 ZB, 6.000%, 07/16/2039 | | | | | 3,622,957 | | | | | | 0.3 | | |
| 303,845 (1) | | | Ginnie Mae Series 2009-55 BI, 1.000%, (-25.000*US0001M + 162.500%), 06/16/2037 | | | | | 11,943 | | | | | | 0.0 | | |
| 1,918,733 | | | Ginnie Mae Series 2009-61 EZ, 7.500%, 08/20/2039 | | | | | 2,625,574 | | | | | | 0.2 | | |
| 5,712,159 | | | Ginnie Mae Series 2009-61 PZ, 7.500%, 08/20/2039 | | | | | 8,443,051 | | | | | | 0.7 | | |
| 3,304,781 | | | Ginnie Mae Series 2009-61 ZQ, 6.000%, 08/16/2039 | | | | | 4,390,383 | | | | | | 0.3 | | |
| 1,921,601 (1) | | | Ginnie Mae Series 2009-66 QS, 5.327%, (-1.000*US0001M + 6.100%), 07/20/2039 | | | | | 256,522 | | | | | | 0.0 | | |
| 1,016,935 (1) | | | Ginnie Mae Series 2009-77 SA, 5.445%, (-1.000*US0001M + 6.150%), 09/16/2039 | | | | | 217,893 | | | | | | 0.0 | | |
| 3,558,459 | | | Ginnie Mae Series 2009-77 ZB, 5.500%, 09/16/2039 | | | | | 4,255,724 | | | | | | 0.3 | | |
| 1,002,849 | | | Ginnie Mae Series 2009-87 WZ, 6.000%, 10/20/2039 | | | | | 1,382,828 | | | | | | 0.1 | | |
| 606,810 | | | Ginnie Mae Series 2009-92 DZ, 4.500%, 10/16/2039 | | | | | 726,312 | | | | | | 0.1 | | |
| 1,429,368 | | | Ginnie Mae Series 2009-98 MZ, 5.000%, 10/16/2039 | | | | | 1,787,507 | | | | | | 0.1 | | |
| 2,249,719 (1) | | | Ginnie Mae Series 2010-106 IP, 5.000%, 03/20/2040 | | | | | 273,505 | | | | | | 0.0 | | |
| 10,371,000 | | | Ginnie Mae Series 2010-113 BE, 4.500%, 09/20/2040 | | | | | 12,155,233 | | | | | | 0.9 | | |
| 1,846,270 (1) | | | Ginnie Mae Series 2010-116 NS, 5.945%, (-1.000*US0001M + 6.650%), 09/16/2040 | | | | | 381,346 | | | | | | 0.0 | | |
| 187,225 (1) | | | Ginnie Mae Series 2010-130 KI, 5.500%, 09/16/2040 | | | | | 15,944 | | | | | | 0.0 | | |
| 1,500,000 | | | Ginnie Mae Series 2010-14 B, 4.500%, 02/16/2040 | | | | | 1,740,476 | | | | | | 0.1 | | |
| Voya GNMA Income Fund | as of March 31, 2020 (continued) |
| Principal Amount† | | | Value | | | Percentage of Net Assets | | |||||||||
| COLLATERALIZED MORTGAGE OBLIGATIONS: (continued) | | |||||||||||||||
| 3,483,005 | | | Ginnie Mae Series 2010-146 NL, 4.000%, 10/16/2039 | | | | $ | 3,748,985 | | | | | | 0.3 | | |
| 1,475,393 (1) | | | Ginnie Mae Series 2010-158 SA, 5.277%, (-1.000*US0001M + 6.050%), 12/20/2040 | | | | | 274,904 | | | | | | 0.0 | | |
| 20,065,715 (1) | | | Ginnie Mae Series 2010-166 GS, 5.227%, (-1.000*US0001M + 6.000%), 12/20/2040 | | | | | 3,602,998 | | | | | | 0.3 | | |
| 1,862,755 (1) | | | Ginnie Mae Series 2010-166 NI, 4.500%, 04/20/2039 | | | | | 138,932 | | | | | | 0.0 | | |
| 2,298,391 | | | Ginnie Mae Series 2010-169 AW, 4.500%, 12/20/2040 | | | | | 2,541,525 | | | | | | 0.2 | | |
| 3,776,934 | | | Ginnie Mae Series 2010-169 JZ, 4.000%, 12/20/2040 | | | | | 4,118,489 | | | | | | 0.3 | | |
| 512,740 (1) | | | Ginnie Mae Series 2010-19 LI, 5.000%, 07/16/2039 | | | | | 51,061 | | | | | | 0.0 | | |
| 2,138,000 | | | Ginnie Mae Series 2010-31 BP, 5.000%, 03/20/2040 | | | | | 2,445,509 | | | | | | 0.2 | | |
| 2,123,551 (1) | | | Ginnie Mae Series 2010-4 WI, 6.000%, 01/16/2040 | | | | | 367,379 | | | | | | 0.0 | | |
| 5,392,928 | | | Ginnie Mae Series 2010-42 VZ, 5.500%, 10/20/2039 | | | | | 6,582,190 | | | | | | 0.5 | | |
| 1,727,658 | | | Ginnie Mae Series 2010-59 ZA, 4.500%, 05/20/2040 | | | | | 1,951,516 | | | | | | 0.2 | | |
| 200,363 (1) | | | Ginnie Mae Series 2010-9 SB, 5.727%, (-1.000*US0001M + 6.500%), 09/20/2038 | | | | | 1,972 | | | | | | 0.0 | | |
| 4,804,941 | | | Ginnie Mae Series 2010-H01 FA, 2.433%, (US0001M + 0.820%), 01/20/2060 | | | | | 4,794,949 | | | | | | 0.4 | | |
| 10,754,397 | | | Ginnie Mae Series 2010-H10 FB, 2.613%, (US0001M + 1.000%), 05/20/2060 | | | | | 10,774,606 | | | | | | 0.8 | | |
| 6,819,211 | | | Ginnie Mae Series 2010-H10 FC, 2.613%, (US0001M + 1.000%), 05/20/2060 | | | | | 6,830,569 | | | | | | 0.5 | | |
| 398,556 (1) | | | Ginnie Mae Series 2011-123 QI, 5.000%, 05/20/2041 | | | | | 54,202 | | | | | | 0.0 | | |
| 4,408,987 (1) | | | Ginnie Mae Series 2011-141 PS, 5.995%, (-1.000*US0001M + 6.700%), 06/16/2041 | | | | | 891,743 | | | | | | 0.1 | | |
| 125,009 | | | Ginnie Mae Series 2011-169 BC, 7.000%, 05/16/2032 | | | | | 141,933 | | | | | | 0.0 | | |
| 292,444 (2) | | | Ginnie Mae Series 2011-169 BG, 5.435%, 04/16/2039 | | | | | 335,002 | | | | | | 0.0 | | |
| Principal Amount† | | | Value | | | Percentage of Net Assets | | |||||||||
| COLLATERALIZED MORTGAGE OBLIGATIONS: (continued) | | |||||||||||||||
| 7,181,984 | | | Ginnie Mae Series 2011-25 Z, 4.000%, 02/20/2041 | | | | $ | 7,995,395 | | | | | | 0.6 | | |
| 1,863,394 | | | Ginnie Mae Series 2011-59 QC, 4.000%, 12/20/2040 | | | | | 2,059,933 | | | | | | 0.2 | | |
| 4,983,013 (1) | | | Ginnie Mae Series 2011-73 LS, 5.917%, (-1.000*US0001M + 6.690%), 08/20/2039 | | | | | 413,007 | | | | | | 0.0 | | |
| 4,575,893 | | | Ginnie Mae Series 2011-89 Z, 3.500%, 06/20/2041 | | | | | 5,000,394 | | | | | | 0.4 | | |
| 1,224,221 | | | Ginnie Mae Series 2011-H07 FA, 2.162%, (US0001M + 0.500%), 02/20/2061 | | | | | 1,216,012 | | | | | | 0.1 | | |
| 1,928,572 (1) | | | Ginnie Mae Series 2012-102 TI, 4.000%, 08/20/2039 | | | | | 64,641 | | | | | | 0.0 | | |
| 2,610,529 (1) | | | Ginnie Mae Series 2012-103 IC, 3.500%, 08/16/2040 | | | | | 188,692 | | | | | | 0.0 | | |
| 654,835 (1) | | | Ginnie Mae Series 2012-124 MI, 4.000%, 03/20/2042 | | | | | 47,722 | | | | | | 0.0 | | |
| 7,530,599 (1) | | | Ginnie Mae Series 2012-146 AI, 3.000%, 10/20/2037 | | | | | 416,067 | | | | | | 0.0 | | |
| 582,331 (1) | | | Ginnie Mae Series 2012-34 MS, 5.995%, (-1.000*US0001M + 6.700%), 04/16/2041 | | | | | 89,066 | | | | | | 0.0 | | |
| 90,793 | | | Ginnie Mae Series 2012-43 MA, 4.000%, 10/20/2041 | | | | | 93,068 | | | | | | 0.0 | | |
| 4,775,200 (1) | | | Ginnie Mae Series 2012-48 SA, 5.945%, (-1.000*US0001M + 6.650%), 04/16/2042 | | | | | 1,199,661 | | | | | | 0.1 | | |
| 6,808,873 (1) | | | Ginnie Mae Series 2012-60 SG, 5.395%, (-1.000*US0001M + 6.100%), 05/16/2042 | | | | | 1,584,288 | | | | | | 0.1 | | |
| 1,630,280 (1) | | | Ginnie Mae Series 2012-98 EI, 4.000%, 04/20/2041 | | | | | 188,673 | | | | | | 0.0 | | |
| 2,045,229 | | | Ginnie Mae Series 2012-H11 VA, 2.312%, (US0001M + 0.650%), 05/20/2062 | | | | | 2,026,367 | | | | | | 0.2 | | |
| 21,029,088 | | | Ginnie Mae Series 2012-H12 FB, 2.712%, (US0001M + 1.050%), 02/20/2062 | | | | | 21,086,828 | | | | | | 1.6 | | |
| 3,000,025 | | | Ginnie Mae Series 2012-H20 BA, 2.222%, (US0001M + 0.560%), 09/20/2062 | | | | | 2,979,919 | | | | | | 0.2 | | |
| 7,000,000 | | | Ginnie Mae Series 2013-147 BE, 4.000%, 12/20/2039 | | | | | 8,201,185 | | | | | | 0.6 | | |
| Voya GNMA Income Fund | as of March 31, 2020 (continued) |
| Principal Amount† | | | Value | | | Percentage of Net Assets | | |||||||||
| COLLATERALIZED MORTGAGE OBLIGATIONS: (continued) | | |||||||||||||||
| 1,369,425 | | | Ginnie Mae Series 2013-167 Z, 3.000%, 10/16/2043 | | | | $ | 1,480,838 | | | | | | 0.1 | | |
| 1,900,000 (1) | | | Ginnie Mae Series 2013-186 UI, 2.500%, 11/20/2043 | | | | | 406,904 | | | | | | 0.0 | | |
| 1,295,321 (1) | | | Ginnie Mae Series 2013-186 VI, 4.000%, 12/20/2042 | | | | | 139,451 | | | | | | 0.0 | | |
| 6,375,186 (1) | | | Ginnie Mae Series 2013-20 LI, 4.500%, 12/16/2042 | | | | | 938,713 | | | | | | 0.1 | | |
| 2,828,123 (1) | | | Ginnie Mae Series 2013-41 PI, 3.500%, 04/20/2040 | | | | | 131,891 | | | | | | 0.0 | | |
| 2,641,648 | | | Ginnie Mae Series 2013-H08 BF, 2.062%, (US0001M + 0.400%), 03/20/2063 | | | | | 2,610,412 | | | | | | 0.2 | | |
| 3,569,215 | | | Ginnie Mae Series 2013-H10 FT, 1.950%, (H15T1Y + 0.450%), 04/20/2063 | | | | | 3,545,614 | | | | | | 0.3 | | |
| 5,299,933 | | | Ginnie Mae Series 2013-H14 FC, 2.132%, (US0001M + 0.470%), 06/20/2063 | | | | | 5,251,972 | | | | | | 0.4 | | |
| 952,018 | | | Ginnie Mae Series 2013-H18 BA, 2.262%, (US0001M + 0.600%), 07/20/2063 | | | | | 945,184 | | | | | | 0.1 | | |
| 3,170,800 | | | Ginnie Mae Series 2013-H19 DF, 2.312%, (US0001M + 0.650%), 05/20/2063 | | | | | 3,148,134 | | | | | | 0.3 | | |
| 2,953,654 | | | Ginnie Mae Series 2013-H20 FB, 2.662%, (US0001M + 1.000%), 08/20/2063 | | | | | 2,958,172 | | | | | | 0.2 | | |
| 3,843,874 | | | Ginnie Mae Series 2013-H23 FA, 2.962%, (US0001M + 1.300%), 09/20/2063 | | | | | 3,871,836 | | | | | | 0.3 | | |
| 530,485 | | | Ginnie Mae Series 2013-H24 FB, 2.392%, (US0001M + 0.730%), 09/20/2063 | | | | | 528,774 | | | | | | 0.0 | | |
| 2,793,200 | | | Ginnie Mae Series 2014-115 EM, 4.000%, 08/20/2044 | | | | | 3,307,464 | | | | | | 0.3 | | |
| 12,628,860 | | | Ginnie Mae Series 2014-118 ZP, 4.000%, 08/20/2044 | | | | | 13,697,720 | | | | | | 1.1 | | |
| 2,007,547 (1) | | | Ginnie Mae Series 2014-183 IM, 5.000%, 06/20/2035 | | | | | 349,097 | | | | | | 0.0 | | |
| 3,251,655 (1) | | | Ginnie Mae Series 2014-30 ES, 4.227%, (-1.000*US0001M + 5.000%), 03/20/2040 | | | | | 490,591 | | | | | | 0.0 | | |
| 10,371,041 (2) | | | Ginnie Mae Series 2015-10 Q, 2.315%, 10/20/2044 | | | | | 10,840,532 | | | | | | 0.8 | | |
| 2,364,266 (1) | | | Ginnie Mae Series 2015-141 IX, 1.013%, (-0.714*US0001M + 2.142%), 06/20/2045 | | | | | 225,978 | | | | | | 0.0 | | |
| Principal Amount† | | | Value | | | Percentage of Net Assets | | |||||||||
| COLLATERALIZED MORTGAGE OBLIGATIONS: (continued) | | |||||||||||||||
| 12,125,000 | | | Ginnie Mae Series 2015-143 B, 3.500%, 04/20/2045 | | | | $ | 13,598,923 | | | | | | 1.1 | | |
| 3,023,928 (1) | | | Ginnie Mae Series 2015-157 PI, 4.000%, 03/20/2044 | | | | | 332,039 | | | | | | 0.0 | | |
| 8,914,528 | | | Ginnie Mae Series 2015-27 PB, 3.000%, 08/20/2044 | | | | | 9,502,306 | | | | | | 0.7 | | |
| 3,974,858 | | | Ginnie Mae Series 2015-H31 FT, 2.312%, (US0001M + 0.650%), 11/20/2065 | | | | | 3,995,295 | | | | | | 0.3 | | |
| 13,346,878 (1) | | | Ginnie Mae Series 2016-145 IU, 3.500%, 10/20/2046 | | | | | 1,504,077 | | | | | | 0.1 | | |
| 6,000,070 (2) | | | Ginnie Mae Series 2016-5 AB, 4.678%, 01/20/2046 | | | | | 6,813,728 | | | | | | 0.5 | | |
| 8,841,663 | | | Ginnie Mae Series 2016-H08 FT, 1.619%, (US0001M + 0.720%), 02/20/2066 | | | | | 8,795,458 | | | | | | 0.7 | | |
| 38,872,544 | | | Ginnie Mae Series 2017-H23 FC, 2.112%, (US0001M + 0.450%), 11/20/2067 | | | | | 38,408,235 | | | | | | 3.0 | | |
| 3,406,378 | | | Ginnie Mae Series 2018-112 AL, 3.500%, 08/20/2048 | | | | | 3,614,004 | | | | | | 0.3 | | |
| 2,025,085 | | | Ginnie Mae Series 2019-29 AI, 5.000%, 07/20/2048 | | | | | 329,581 | | | | | | 0.0 | | |
| 1,690,028 | | | Vendee Mortgage Trust 2011-2 DZ, 3.750%, 10/15/2041 | | | | | 1,844,232 | | | | | | 0.2 | | |
| | | | Total Collateralized Mortgage Obligations (Cost $613,163,710) | | | | | 641,373,880 | | | | | | 49.3 | | |
| U.S. GOVERNMENT AGENCY OBLIGATIONS: 75.2% | | |||||||||||||||
| | | | Federal Home Loan Mortgage Corporation: 2.6%(4) | | ||||||||||||
| 6,752,747 | | | 3.500%, 03/01/2048 | | | | | 7,257,024 | | | | | | 0.6 | | |
| 7,784,230 | | | 3.500%,11/01/2048 | | | | | 8,365,424 | | | | | | 0.6 | | |
| 17,281,254 | | | 3.500%-8.000%, 01/01/2030-12/01/2047 | | | | | 18,659,182 | | | | | | 1.4 | | |
| | | | | | | | | 34,281,630 | | | | | | 2.6 | | |
| | | | Federal National Mortgage Association: 1.0%(4) | | ||||||||||||
| 8,326,245 | | | 4.000%, 07/01/2056 | | | | | 9,277,488 | | | | | | 0.7 | | |
| 4,132,849 | | | 5.290%-6.600%, 07/01/2027-05/01/2048 | | | | | 4,464,762 | | | | | | 0.3 | | |
| | | | | | | | | 13,742,250 | | | | | | 1.0 | | |
| | | | Government National Mortgage Association: 65.0% | | ||||||||||||
| 160,796,000 (5) | | | 3.000%, 05/01/2043 | | | | | 169,884,060 | | | | | | 13.1 | | |
| 8,619,840 | | | 3.500%, 04/20/2046 | | | | | 9,195,551 | | | | | | 0.7 | | |
| 9,768,654 | | | 3.500%, 03/20/2047 | | | | | 10,456,007 | | | | | | 0.8 | | |
| Voya GNMA Income Fund | as of March 31, 2020 (continued) |
| Principal Amount† | | | Value | | | Percentage of Net Assets | | |||||||||
| U.S. GOVERNMENT AGENCY OBLIGATIONS: (continued) | | |||||||||||||||
| | | | Government National Mortgage Association (continued) | | ||||||||||||
| 54,438,715 | | | 3.500%,12/20/2047 | | | | $ | 58,383,664 | | | | | | 4.5 | | |
| 16,729,559 | | | 3.500%, 01/20/2048 | | | | | 17,923,250 | | | | | | 1.4 | | |
| 11,742,654 | | | 3.500%, 02/20/2048 | | | | | 12,568,980 | | | | | | 1.0 | | |
| 6,511,395 | | | 3.500%, 02/20/2048 | | | | | 7,035,811 | | | | | | 0.5 | | |
| 23,362,155 | | | 3.500%, 03/20/2048 | | | | | 25,128,567 | | | | | | 1.9 | | |
| 13,918,958 | | | 3.500%, 01/20/2050 | | | | | 14,740,197 | | | | | | 1.1 | | |
| 10,318,141 | | | 4.000%, 08/20/2042 | | | | | 11,266,593 | | | | | | 0.9 | | |
| 9,400,019 | | | 4.000%, 09/20/2047 | | | | | 10,043,782 | | | | | | 0.8 | | |
| 26,206,658 | | | 4.000%, 04/20/2048 | | | | | 28,226,191 | | | | | | 2.2 | | |
| 21,505,884 | | | 4.000%, 11/20/2049 | | | | | 22,905,393 | | | | | | 1.8 | | |
| 27,330,842 | | | 4.000%, 12/20/2049 | | | | | 29,307,714 | | | | | | 2.2 | | |
| 25,819,882 | | | 4.500%, 11/20/2049 | | | | | 27,698,804 | | | | | | 2.1 | | |
| 32,819,105 | | | 4.500%, 12/20/2049 | | | | | 35,100,889 | | | | | | 2.7 | | |
| 107,131,214 | | | 3.000%-7.500%, 01/15/2024-02/20/2050 | | | | | 116,053,704 | | | | | | 8.9 | | |
| 229,500,000 (5) | | | 2.500%,05/01/2050 | | | | | 239,450,978 | | | | | | 18.4 | | |
| | | | | | | | | 845,370,135 | | | | | | 65.0 | | |
| | | | Uniform Mortgage-Backed Securities: 6.6% | | ||||||||||||
| 20,433,246 | | | 3.000%, 10/01/2049 | | | | | 21,465,058 | | | | | | 1.7 | | |
| 9,411,067 | | | 3.500%, 12/01/2047 | | | | | 10,001,412 | | | | | | 0.8 | | |
| 8,548,233 | | | 3.500%, 05/01/2048 | | | | | 9,081,498 | | | | | | 0.7 | | |
| 11,190,884 | | | 4.000%, 05/01/2042 | | | | | 12,200,919 | | | | | | 0.9 | | |
| 8,698,282 | | | 4.000%, 03/01/2049 | | | | | 9,285,687 | | | | | | 0.7 | | |
| 22,205,967 | | | 2.500%-7.500%, 05/01/2028-04/01/2050 | | | | | 23,694,910 | | | | | | 1.8 | | |
| | | | | | | | | 85,729,484 | | | | | | 6.6 | | |
| | | | Total U.S. Government Agency Obligations (Cost $952,752,838) | | | | | 979,123,499 | | | | | | 75.2 | | |
| ASSET-BACKED SECURITIES: 0.2% | | |||||||||||||||
| | | | Other Asset-Backed Securities: 0.2% | | ||||||||||||
| 256,646 (2) | | | Fannie Mae Grantor Trust 2003-T4 2A6, 4.625%, 07/26/2033 | | | | | 281,002 | | | | | | 0.0 | | |
| 97,628 (2) | | | Fannie Mae REMIC Trust 2001-W4 AF6, 5.610%, 01/25/2032 | | | | | 105,578 | | | | | | 0.0 | | |
| 46,522 (2) | | | Fannie Mae REMIC Trust 2002-W12 AF6, 5.066%, 02/25/2033 | | | | | 48,232 | | | | | | 0.0 | | |
| 59,160 (2) | | | Fannie Mae REMIC Trust 2002-W2 AF6, 6.483%, 05/25/2032 | | | | | 63,354 | | | | | | 0.0 | | |
| Principal Amount† | | | Value | | | Percentage of Net Assets | | |||||||||
| ASSET-BACKED SECURITIES (continued) | | |||||||||||||||
| | | | Other Asset-Backed Securities (continued) | | ||||||||||||
| 2,150,205 | | | Fannie Mae Grantor Trust 2001-T9 A1, 1.167%, (US0001M + 0.220%), 09/25/2031 | | | | $ | 2,116,968 | | | | | | 0.2 | | |
| | | | Total Asset-Backed Securities (Cost $2,590,858) | | | | | 2,615,134 | | | | | | 0.2 | | |
| COMMERCIAL MORTGAGE-BACKED SECURITIES: 0.2% | | |||||||||||||||
| 456,250 (2) | | | Ginnie Mae 2004-23 Z, 5.547%, 03/16/2044 | | | | | 501,503 | | | | | | 0.0 | | |
| 6,103,899 (1)(2) | | | Ginnie Mae 2006-67 IO, 0.533%, 11/16/2046 | | | | | 20,030 | | | | | | 0.0 | | |
| 622,506 (2) | | | Ginnie Mae 2007-52 Z, 4.350%, 01/16/2048 | | | | | 675,499 | | | | | | 0.1 | | |
| 652,613 | | | Ginnie Mae 2008-39 Z, 4.500%, 02/16/2048 | | | | | 693,691 | | | | | | 0.1 | | |
| 236,711 (1)(2) | | | Ginnie Mae 2008-45 IO, 0.852%, 02/16/2048 | | | | | 451 | | | | | | 0.0 | | |
| 436,729 (2) | | | Ginnie Mae 2009-115 D, 4.593%, 01/16/2050 | | | | | 457,014 | | | | | | 0.0 | | |
| 2,341,969 (1)(2) | | | Ginnie Mae 2010-122 IO, 0.297%, 02/16/2044 | | | | | 9,531 | | | | | | 0.0 | | |
| 63,497 (1)(2) | | | Ginnie Mae 2010-123 IA, 2.050%, 10/16/2052 | | | | | 859 | | | | | | 0.0 | | |
| 20,811,598 (1)(2) | | | Ginnie Mae 2011-47 IO, 0.081%, 01/16/2051 | | | | | 52,857 | | | | | | 0.0 | | |
| 232,222 (2) | | | Ginnie Mae 2011-53 B, 3.924%, 05/16/2051 | | | | | 238,498 | | | | | | 0.0 | | |
| | | | Total Commercial Mortgage-Backed Securities (Cost $2,893,943) | | | | | 2,649,933 | | | | | | 0.2 | | |
| | | | Total Long-Term Investments (Cost $1,571,401,349) | | | | | 1,625,762,446 | | | | | | 124.9 | | |
| SHORT-TERM INVESTMENTS: 5.0% | | |||||||||||||||
| | | | U.S. Treasury Bills: 5.0% | | ||||||||||||
| 58,000,000 (6) | | | United States Treasury Bill, 0.030%, 04/28/2020 | | | | | 57,998,586 | | | | | | 4.5 | | |
| 6,301,000 (6) | | | United States Treasury Bill, 0.060%, 04/07/2020 | | | | | 6,300,933 | | | | | | 0.5 | | |
| | | | Total U.S. Treasury Bills | | | | | | | | | | | | | |
| | | | Total Short-Term Investments (Cost $64,298,746) | | | | | 64,299,519 | | | | | | 5.0 | | |
| | ||||||||||||||||
| Voya GNMA Income Fund | as of March 31, 2020 (continued) |
| Principal Amount† | | | Value | | | Percentage of Net Assets | | |||||||||
| | | | Total Investments in Securities | | ||||||||||||
| | | | (Cost $1,635,700,095) | | | | $ | 1,690,061,965 | | | | | | 129.9 | | |
| | | | Liabilities in Excess of Other Assets | | | | | (388,638,922) | | | | | | (29.9) | | |
| | | | Net Assets | | | | $ | 1,301,423,043 | | | | | | 100.0 | | |
| | ||||||||||||||||
| | H15T1Y | | | U.S. Treasury 1-Year Constant Maturity | |
| | US0001M | | | 1-month LIBOR | |
| | | | Quoted Prices in Active Markets for Identical Investments (Level 1) | | | Significant Other Observable Inputs (Level 2) | | | Significant Unobservable Inputs (Level 3) | | | Fair Value at March 31, 2020 | | ||||||||||||
| Asset Table | | | | | | | | | | | | | | | | | | | | | | | | | |
| Investments, at fair value | | | | | | | | | | | | | | | | | | | | | | | | | |
| Collateralized Mortgage Obligations | | | | $ | — | | | | | $ | 641,373,880 | | | | | $ | — | | | | | $ | 641,373,880 | | |
| U.S. Government Agency Obligations | | | | | — | | | | | | 979,123,499 | | | | | | — | | | | �� | | 979,123,499 | | |
| Asset-Backed Securities | | | | | — | | | | | | 2,615,134 | | | | | | — | | | | | | 2,615,134 | | |
| Commercial Mortgage-Backed Securities | | | | | — | | | | | | 2,649,933 | | | | | | — | | | | | | 2,649,933 | | |
| Short-Term Investments | | | | | — | | | | | | 64,299,519 | | | | | | — | | | | | | 64,299,519 | | |
| Total Investments, at fair value | | | | $ | — | | | | | $ | 1,690,061,965 | | | | | $ | — | | | | | $ | 1,690,061,965 | | |
| Other Financial Instruments+ | | | | | | | | | | | | | | | | | | | | | | | | | |
| Futures | | | | | 731,587 | | | | | | — | | | | | | — | | | | | | 731,587 | | |
| Total Assets | | | | $ | 731,587 | | | | | $ | 1,690,061,965 | | | | | $ | — | | | | | $ | 1,690,793,552 | | |
| Liabilities Table | | | | | | | | | | | | | | | | | | | | | | | | | |
| Other Financial Instruments+ | | | | | | | | | | | | | | | | | | | | | | | | | |
| Futures | | | | $ | (11,063,481) | | | | | $ | — | | | | | $ | — | | | | | $ | (11,063,481) | | |
| Total Liabilities | | | | $ | (11,063,481) | | | | | $ | — | | | | | $ | — | | | | | $ | (11,063,481) | | |
| Voya GNMA Income Fund | as of March 31, 2020 (continued) |
| Description | | | Number of Contracts | | | Expiration Date | | | Notional Value | | | Unrealized Appreciation/ (Depreciation) | | ||||||||||||
| Long Contracts: | | | | | | | | | | | | | | | | | | | | | | | | | |
| U.S. Treasury Ultra 10-Year Note | | | | | 158 | | | | | | 06/19/20 | | | | | $ | 24,652,938 | | | | | $ | 731,587 | | |
| | | | | | | | | | | | | | | | | $ | 24,652,938 | | | | | $ | 731,587 | | |
| Short Contracts: | | | | | | | | | | | | | | | | | | | | | | | | | |
| U.S. Treasury 10-Year Note | | | | | (1,303) | | | | | | 06/19/20 | | | | | | (180,709,813) | | | | | | (5,946,561) | | |
| U.S. Treasury 2-Year Note | | | | | (202) | | | | | | 06/30/20 | | | | | | (44,517,328) | | | | | | (1,956) | | |
| U.S. Treasury 5-Year Note | | | | | (643) | | | | | | 06/30/20 | | | | | | (80,606,078) | | | | | | (949,063) | | |
| U.S. Treasury Long Bond | | | | | (248) | | | | | | 06/19/20 | | | | | | (44,407,500) | | | | | | (3,307,826) | | |
| U.S. Treasury Ultra Long Bond | | | | | (50) | | | | | | 06/19/20 | | | | | | (11,093,750) | | | | | | (858,075) | | |
| | | | | | | | | | | | | | | | | $ | (361,334,469) | | | | | $ | (11,063,481) | | |
| Derivatives not accounted for as hedging instruments | | | Location on Statement of Assets and Liabilities | | | Fair Value | | |||
| Asset Derivatives | | | | | | | | | | |
| Interest rate contracts | | | Net Assets — Unrealized appreciation* | | | | $ | 731,587 | | |
| Total Asset Derivatives | | | | | | | $ | 731,587 | | |
| Liability Derivatives | | | | | | | | | | |
| Interest rate contracts | | | Net Assets — Unrealized depreciation* | | | | $ | 11,063,481 | | |
| Total Liability Derivatives | | | | | | | $ | 11,063,481 | | |
| | | | Amount of Realized Gain or (Loss) on Derivatives Recognized in Income | | |||
| Derivatives not accounted for as hedging instruments | | | Futures | | |||
| Interest rate contracts | | | | $ | (22,163,857) | | |
| Total | | | | $ | (22,163,857) | | |
| | |||||||
| | | | Change in Unrealized Appreciation or (Depreciation) on Derivatives Recognized in Income | | |||
| Derivatives not accounted for as hedging instruments | | | Futures | | |||
| Interest rate contracts | | | | $ | (7,092,706) | | |
| Total | | | | $ | (7,092,706) | | |
| | Cost for federal income tax purposes was $1,627,227,732. | | | |||||
| | Net unrealized appreciation consisted of: | | | |||||
| | Gross Unrealized Appreciation | | | | $ | 57,375,618 | | |
| | Gross Unrealized Depreciation | | | | | (4,873,279) | | |
| | Net Unrealized Appreciation | | | | $ | 52,502,339 | | |
| Voya High Yield Bond Fund | as of March 31, 2020 |
| Principal Amount† | | | Value | | | Percentage of Net Assets | | |||||||||
| CORPORATE BONDS/NOTES: 92.8% | | |||||||||||||||
| | | | Basic Materials: 5.1% | | ||||||||||||
| 1,510,000 (1) | | | Aruba Investments, Inc., 8.750%, 02/15/2023 | | | | $ | 1,477,905 | | | | | | 0.3 | | |
| 1,760,000 (1) | | | Cleveland-Cliffs, Inc., 6.750%, 03/15/2026 | | | | | 1,565,300 | | | | | | 0.3 | | |
| 1,175,000 (1) | | | Compass Minerals International, Inc., 6.750%, 12/01/2027 | | | | | 1,067,252 | | | | | | 0.2 | | |
| 1,200,000 (1) | | | Constellium SE, 5.750%, 05/15/2024 | | | | | 1,081,614 | | | | | | 0.2 | | |
| 500,000 (1)(2) | | | Constellium SE, 5.875%, 02/15/2026 | | | | | 438,788 | | | | | | 0.1 | | |
| 750,000 (1) | | | Constellium SE, 6.625%, 03/01/2025 | | | | | 680,602 | | | | | | 0.2 | | |
| 1,185,000 (1) | | | First Quantum Minerals Ltd., 6.500%, 03/01/2024 | | | | | 990,962 | | | | | | 0.2 | | |
| 2,600,000 | | | Freeport-McMoRan, Inc., 4.125%, 03/01/2028 | | | | | 2,285,764 | | | | | | 0.5 | | |
| 350,000 | | | Freeport-McMoRan, Inc., 4.250%, 03/01/2030 | | | | | 305,393 | | | | | | 0.0 | | |
| 2,225,000 (1) | | | Novelis Corp., 5.875%, 09/30/2026 | | | | | 2,199,040 | | | | | | 0.5 | | |
| 1,250,000 (1) | | | OCI NV, 5.250%, 11/01/2024 | | | | | 1,093,750 | | | | | | 0.2 | | |
| 2,100,000 (1) | | | OCI NV, 6.625%, 04/15/2023 | | | | | 1,932,000 | | | | | | 0.4 | | |
| 1,950,000 (1) | | | Schweitzer-Mauduit International, Inc., 6.875%, 10/01/2026 | | | | | 1,956,908 | | | | | | 0.4 | | |
| 1,135,000 (1) | | | SPCM SA, 4.875%, 09/15/2025 | | | | | 1,081,053 | | | | | | 0.2 | | |
| 1,875,000 (1)(2) | | | Tronox, Inc., 6.500%, 04/15/2026 | | | | | 1,701,703 | | | | | | 0.3 | | |
| 5,790,000 (3) | | | Other Securities | | | | | 5,305,393 | | | | | | 1.1 | | |
| | | | | | | | | 25,163,427 | | | | | | 5.1 | | |
| | | | Communications: 22.9% | | ||||||||||||
| 1,400,000 (1) | | | Altice France SA/France, 8.125%, 02/01/2027 | | | | | 1,467,270 | | | | | | 0.3 | | |
| 1,375,000 (1)(2) | | | Altice Finco SA, 7.625%, 02/15/2025 | | | | | 1,318,274 | | | | | | 0.3 | | |
| 1,625,000 | | | AMC Networks, Inc., 4.750%, 08/01/2025 | | | | | 1,590,477 | | | | | | 0.3 | | |
| 1,600,000 (1) | | | Block Communications, Inc., 4.875%, 03/01/2028 | | | | | 1,497,000 | | | | | | 0.3 | | |
| 2,275,000 (1) | | | C&W Senior Financing DAC, 7.500%, 10/15/2026 | | | | | 2,099,899 | | | | | | 0.4 | | |
| 2,725,000 (1) | | | CCO Holdings LLC / CCO Holdings Capital Corp., 5.125%, 05/01/2027 | | | | | 2,757,754 | | | | | | 0.6 | | |
| Principal Amount† | | | Value | | | Percentage of Net Assets | | |||||||||
| CORPORATE BONDS/NOTES: (continued) | | |||||||||||||||
| | | | Communications (continued) | | ||||||||||||
| 1,250,000 (1) | | | CCO Holdings LLC / CCO Holdings Capital Corp., 5.000%, 02/01/2028 | | | | $ | 1,261,950 | | | | | | 0.2 | | |
| 1,600,000 (1) | | | CCO Holdings LLC / CCO Holdings Capital Corp., 5.500%, 05/01/2026 | | | | | 1,631,308 | | | | | | 0.3 | | |
| 2,700,000 (1) | | | CCO Holdings LLC / CCO Holdings Capital Corp., 5.750%, 02/15/2026 | | | | | 2,743,065 | | | | | | 0.6 | | |
| 355,000 (1) | | | CCO Holdings LLC / CCO Holdings Capital Corp., 4.500%, 05/01/2032 | | | | | 348,193 | | | | | | 0.1 | | |
| 750,000 (1) | | | CCO Holdings LLC / CCO Holdings Capital Corp., 4.750%, 03/01/2030 | | | | | 752,287 | | | | | | 0.1 | | |
| 2,475,000 | | | CenturyLink, Inc., 5.625%-5.800%, 04/01/2020-04/01/2025 | | | | | 2,492,486 | | | | | | 0.5 | | |
| 1,600,000 (1) | | | Clear Channel Worldwide Holdings, Inc., 9.250%, 02/15/2024 | | | | | 1,386,008 | | | | | | 0.3 | | |
| 2,675,000 (1) | | | CommScope Tech Finance LLC, 6.000%, 06/15/2025 | | | | | 2,468,222 | | | | | | 0.5 | | |
| 300,000 (1) | | | CommScope Technologies LLC, 5.000%, 03/15/2027 | | | | | 262,523 | | | | | | 0.1 | | |
| 2,075,000 (1) | | | Connect Finco SARL / Connect US Finco LLC, 6.750%, 10/01/2026 | | | | | 1,722,250 | | | | | | 0.4 | | |
| 3,275,000 (2) | | | CSC Holdings LLC, 5.250%, 06/01/2024 | | | | | 3,303,640 | | | | | | 0.7 | | |
| 2,245,000 (1) | | | CSC Holdings LLC, 5.500%, 05/15/2026 | | | | | 2,337,758 | | | | | | 0.5 | | |
| 1,195,000 (1) | | | CSC Holdings LLC, 5.750%, 01/15/2030 | | | | | 1,209,591 | | | | | | 0.2 | | |
| 825,000 (1) | | | CSC Holdings LLC, 7.500%, 04/01/2028 | | | | | 884,719 | | | | | | 0.2 | | |
| 1,675,000 (1) | | | Cumulus Media New Holdings, Inc., 6.750%, 07/01/2026 | | | | | 1,508,542 | | | | | | 0.3 | | |
| 900,000 (1) | | | Diamond Sports Group LLC / Diamond Sports Finance Co., 5.375%, 08/15/2026 | | | | | 736,328 | | | | | | 0.1 | | |
| 2,075,000 (1)(2) | | | Diamond Sports Group LLC / Diamond Sports Finance Co., 6.625%, 08/15/2027 | | | | | 1,399,172 | | | | | | 0.3 | | |
| 4,100,000 | | | DISH DBS Corp., 5.000%-5.875%, 07/15/2022-11/15/2024 | | | | | 4,009,038 | | | | | | 0.8 | | |
| Voya High Yield Bond Fund | as of March 31, 2020 (continued) |
| Principal Amount† | | | Value | | | Percentage of Net Assets | | |||||||||
| CORPORATE BONDS/NOTES: (continued) | | |||||||||||||||
| | | | Communications (continued) | | ||||||||||||
| 1,325,000 (1)(2) | | | Entercom Media Corp., 7.250%, 11/01/2024 | | | | $ | 1,117,962 | | | | | | 0.2 | | |
| 2,810,000 (1) | | | Front Range BidCo, Inc., 6.125%, 03/01/2028 | | | | | 2,685,306 | | | | | | 0.6 | | |
| 925,000 (1) | | | Frontier Communications Corp., 8.000%, 04/01/2027 | | | | | 917,443 | | | | | | 0.2 | | |
| 1,900,000 (1)(2) | | | Gray Television, Inc., 5.125%, 10/15/2024 | | | | | 1,847,759 | | | | | | 0.4 | | |
| 1,200,000 (1) | | | Gray Television, Inc., 7.000%, 05/15/2027 | | | | | 1,200,660 | | | | | | 0.2 | | |
| 1,050,000 (1) | | | GTT Communications, Inc., 7.875%, 12/31/2024 | | | | | 685,125 | | | | | | 0.1 | | |
| 525,000 (1) | | | iHeartCommunications, Inc., 5.250%, 08/15/2027 | | | | | 460,399 | | | | | | 0.1 | | |
| 1,915,000 (1)(2) | | | Intelsat Jackson Holdings SA, 8.500%, 10/15/2024 | | | | | 1,217,854 | | | | | | 0.3 | | |
| 935,000 (1) | | | Lamar Media Corp., 3.750%, 02/15/2028 | | | | | 883,463 | | | | | | 0.2 | | |
| 370,000 (1) | | | Lamar Media Corp., 4.000%, 02/15/2030 | | | | | 346,875 | | | | | | 0.1 | | |
| 2,025,000 (1) | | | LCPR Senior Secured Financing DAC, 6.750%, 10/15/2027 | | | | | 2,005,864 | | | | | | 0.4 | | |
| 755,000 (1) | | | Match Group, Inc., 4.125%, 08/01/2030 | | | | | 679,028 | | | | | | 0.1 | | |
| 1,600,000 (1) | | | MDC Partners, Inc., 6.500%, 05/01/2024 | | | | | 1,212,000 | | | | | | 0.3 | | |
| 1,225,000 (1) | | | Midcontinent Communications / Midcontinent Finance Corp., 5.375%, 08/15/2027 | | | | | 1,196,528 | | | | | | 0.2 | | |
| 375,000 (1)(2) | | | Netflix, Inc., 4.875%, 06/15/2030 | | | | | 382,763 | | | | | | 0.1 | | |
| 2,375,000 | | | Netflix, Inc., 5.875%, 11/15/2028 | | | | | 2,554,431 | | | | | | 0.5 | | |
| 1,475,000 (1) | | | Nexstar Broadcasting, Inc., 5.625%, 08/01/2024 | | | | | 1,397,555 | | | | | | 0.3 | | |
| 1,675,000 (1) | | | Nexstar Broadcasting, Inc., 5.625%, 07/15/2027 | | | | | 1,646,609 | | | | | | 0.3 | | |
| 1,650,000 (1) | | | Altice France SA/France, 7.375%, 05/01/2026 | | | | | 1,675,657 | | | | | | 0.3 | | |
| 405,000 (1)(2) | | | Sinclair Television Group, Inc., 5.125%, 02/15/2027 | | | | | 345,685 | | | | | | 0.1 | | |
| 975,000 (1) | | | Sirius XM Radio, Inc., 4.625%, 07/15/2024 | | | | | 995,655 | | | | | | 0.2 | | |
| 2,550,000 (1) | | | Sirius XM Radio, Inc., 5.000%, 08/01/2027 | | | | | 2,602,148 | | | | | | 0.5 | | |
| 1,050,000 (1)(2) | | | Sprint Corp., 7.250%, 02/01/2028 | | | | | 1,059,188 | | | | | | 0.2 | | |
| Principal Amount† | | | Value | | | Percentage of Net Assets | | |||||||||
| CORPORATE BONDS/NOTES: (continued) | | |||||||||||||||
| | | | Communications (continued) | | ||||||||||||
| 2,375,000 | | | Sprint Communications, Inc., 6.000%, 11/15/2022 | | | | $ | 2,484,108 | | | | | | 0.5 | | |
| 5,025,000 | | | Sprint Corp., 7.125%, 06/15/2024 | | | | | 5,552,550 | | | | | | 1.1 | | |
| 2,075,000 | | | Sprint Corp., 7.625%, 03/01/2026 | | | | | 2,360,001 | | | | | | 0.5 | | |
| 750,000 | | | Sprint Nextel Corp., 6.875%, 11/15/2028 | | | | | 860,812 | | | | | | 0.2 | | |
| 355,000 (1) | | | TEGNA, Inc., 4.625%, 03/15/2028 | | | | | 313,953 | | | | | | 0.1 | | |
| 1,575,000 (1) | | | TEGNA, Inc., 5.000%, 09/15/2029 | | | | | 1,423,406 | | | | | | 0.3 | | |
| 2,250,000 | | | Telecom Italia Capital SA, 6.000%-6.375%, 11/15/2033-09/30/2034 | | | | | 2,272,065 | | | | | | 0.5 | | |
| 1,475,000 (1) | | | Telesat Canada / Telesat LLC, 6.500%, 10/15/2027 | | | | | 1,424,186 | | | | | | 0.3 | | |
| 2,075,000 (1) | | | Terrier Media Buyer, Inc., 8.875%, 12/15/2027 | | | | | 1,758,563 | | | | | | 0.4 | | |
| 2,200,000 | | | T-Mobile USA, Inc., 5.125%, 04/15/2025 | | | | | 2,265,868 | | | | | | 0.5 | | |
| 2,650,000 | | | T-Mobile USA, Inc., 5.375%, 04/15/2027 | | | | | 2,747,964 | | | | | | 0.5 | | |
| 1,525,000 (1)(2) | | | Townsquare Media, Inc., 6.500%, 04/01/2023 | | | | | 1,477,336 | | | | | | 0.3 | | |
| 1,675,000 (1) | | | ViaSat, Inc., 5.625%, 09/15/2025 | | | | | 1,576,435 | | | | | | 0.3 | | |
| 400,000 (1)(2) | | | ViaSat, Inc., 5.625%, 04/15/2027 | | | | | 397,220 | | | | | | 0.1 | | |
| 1,350,000 (1) | | | Virgin Media Secured Finance PLC, 5.500%, 05/15/2029 | | | | | 1,357,493 | | | | | | 0.3 | | |
| 950,000 (1)(2) | | | Ziggo Bond Co. BV, 5.125%, 02/28/2030 | | | | | 936,344 | | | | | | 0.2 | | |
| 475,000 (1)(2) | | | Ziggo BV, 4.875%, 01/15/2030 | | | | | 465,929 | | | | | | 0.1 | | |
| 13,750,000 (3) | | | Other Securities | | | | | 11,670,675 | | | | | | 2.4 | | |
| | | | | | | | | 111,648,619 | | | | | | 22.9 | | |
| | | | Consumer, Cyclical: 16.2% | | ||||||||||||
| 3,900,000 (1) | | | 1011778 BC ULC / New Red Finance, Inc., 5.000%, 10/15/2025 | | | | | 3,748,856 | | | | | | 0.8 | | |
| 1,080,000 (1) | | | Adams Homes, Inc., 7.500%, 02/15/2025 | | | | | 1,039,500 | | | | | | 0.2 | | |
| 1,475,000 (1) | | | Adient Global Holdings Ltd., 4.875%, 08/15/2026 | | | | | 1,021,327 | | | | | | 0.2 | | |
| 1,505,000 (1) | | | Allison Transmission, Inc., 5.875%, 06/01/2029 | | | | | 1,485,386 | | | | | | 0.3 | | |
| Voya High Yield Bond Fund | as of March 31, 2020 (continued) |
| Principal Amount† | | | Value | | | Percentage of Net Assets | | |||||||||
| CORPORATE BONDS/NOTES: (continued) | | |||||||||||||||
| | | | Consumer, Cyclical (continued) | | ||||||||||||
| 2,745,000 | | | AMC Entertainment Holdings, Inc., 5.875%, 11/15/2026 | | | | $ | 1,158,301 | | | | | | 0.2 | | |
| 1,450,000 (1) | | | American Builders & Contractors Supply Co., Inc., 4.000%, 01/15/2028 | | | | | 1,327,547 | | | | | | 0.3 | | |
| 900,000 (1) | | | Asbury Automotive Group, Inc., 4.500%, 03/01/2028 | | | | | 771,750 | | | | | | 0.2 | | |
| 1,120,000 (1) | | | Asbury Automotive Group, Inc., 4.750%, 03/01/2030 | | | | | 960,400 | | | | | | 0.2 | | |
| 375,000 (1) | | | Ashton Woods USA LLC / Ashton Woods Finance Co., 6.625%, 01/15/2028 | | | | | 299,062 | | | | | | 0.0 | | |
| 1,000,000 (1) | | | Ashton Woods USA LLC / Ashton Woods Finance Co., 6.750%, 08/01/2025 | | | | | 808,745 | | | | | | 0.2 | | |
| 2,025,000 (1) | | | Caesars Resort Collection LLC / CRC Finco, Inc., 5.250%, 10/15/2025 | | | | | 1,477,642 | | | | | | 0.3 | | |
| 1,215,000 (1) | | | CCM Merger, Inc., 6.000%, 03/15/2022 | | | | | 1,005,412 | | | | | | 0.2 | | |
| 1,405,000 (1)(2) | | | Cedar Fair L.P., 5.250%, 07/15/2029 | | | | | 1,195,023 | | | | | | 0.2 | | |
| 350,000 (1)(4) | | | Core & Main Holdings L.P., 8.625% (PIK Rate 9.375%, Cash Rate 8.625%), 09/15/2024 | | | | | 323,311 | | | | | | 0.1 | | |
| 1,575,000 (1) | | | Core & Main L.P., 6.125%, 08/15/2025 | | | | | 1,476,515 | | | | | | 0.3 | | |
| 2,500,000 | | | Dana, Inc., 5.500%, 12/15/2024 | | | | | 2,203,137 | | | | | | 0.5 | | |
| 1,215,000 (1) | | | Golden Entertainment, Inc., 7.625%, 04/15/2026 | | | | | 810,548 | | | | | | 0.2 | | |
| 2,275,000 (1) | | | Golden Nugget, Inc., 6.750%, 10/15/2024 | | | | | 1,449,994 | | | | | | 0.3 | | |
| 2,600,000 | | | H&E Equipment Services, Inc., 5.625%, 09/01/2025 | | | | | 2,427,763 | | | | | | 0.5 | | |
| 1,125,000 (1) | | | IAA, Inc., 5.500%, 06/15/2027 | | | | | 1,094,681 | | | | | | 0.2 | | |
| 1,500,000 (1) | | | Installed Building Products, Inc., 5.750%, 02/01/2028 | | | | | 1,441,564 | | | | | | 0.3 | | |
| 900,000 (1) | | | International Game Technology PLC, 6.250%, 02/15/2022 | | | | | 832,365 | | | | | | 0.2 | | |
| 1,465,000 (1)(2) | | | International Game Technology PLC, 6.500%, 02/15/2025 | | | | | 1,307,307 | | | | | | 0.2 | | |
| 2,850,000 | | | L Brands, Inc., 6.750%, 07/01/2036 | | | | | 2,074,230 | | | | | | 0.4 | | |
| Principal Amount† | | | Value | | | Percentage of Net Assets | | |||||||||
| CORPORATE BONDS/NOTES: (continued) | | |||||||||||||||
| | | | Consumer, Cyclical (continued) | | ||||||||||||
| 2,465,000 | | | Lennar Corp., 5.250%-5.375%, 10/01/2022-06/01/2026 | | | | $ | 2,486,597 | | | | | | 0.5 | | |
| 1,475,000 (1) | | | Lions Gate Capital Holdings LLC, 5.875%, 11/01/2024 | | | | | 1,269,319 | | | | | | 0.3 | | |
| 1,350,000 (1) | | | M/I Homes, Inc., 4.950%, 02/01/2028 | | | | | 1,155,937 | | | | | | 0.2 | | |
| 250,000 | | | Mattel, Inc., 5.450%, 11/01/2041 | | | | | 200,076 | | | | | | 0.1 | | |
| 2,025,000 (1)(2) | | | Mattel, Inc., 5.875%, 12/15/2027 | | | | | 2,076,739 | | | | | | 0.4 | | |
| 2,450,000 | | | Meritage Homes Corp., 5.125%-7.000%, 04/01/2022-06/06/2027 | | | | | 2,400,293 | | | | | | 0.5 | | |
| 1,350,000 (1)(2) | | | Michaels Stores, Inc., 8.000%, 07/15/2027 | | | | | 1,006,492 | | | | | | 0.2 | | |
| 1,300,000 (1)(2) | | | Motion Bondco DAC, 6.625%, 11/15/2027 | | | | | 942,500 | | | | | | 0.2 | | |
| 1,800,000 | | | Murphy Oil USA, Inc., 4.750%-5.625%, 05/01/2027-09/15/2029 | | | | | 1,717,872 | | | | | | 0.4 | | |
| 1,450,000 (1) | | | Navistar International Corp., 6.625%, 11/01/2025 | | | | | 1,216,195 | | | | | | 0.3 | | |
| 1,475,000 (1)(2) | | | Penn National Gaming, Inc., 5.625%, 01/15/2027 | | | | | 1,106,858 | | | | | | 0.2 | | |
| 1,300,000 (1) | | | Performance Food Group, Inc., 5.500%, 10/15/2027 | | | | | 1,215,598 | | | | | | 0.2 | | |
| 1,075,000 (1) | | | PetSmart, Inc., 5.875%, 06/01/2025 | | | | | 1,066,938 | | | | | | 0.2 | | |
| 2,825,000 (1) | | | PetSmart, Inc., 7.125%, 03/15/2023 | | | | | 2,682,337 | | | | | | 0.6 | | |
| 1,150,000 (1)(2) | | | Scientific Games International, Inc., 5.000%, 10/15/2025 | | | | | 1,009,125 | | | | | | 0.2 | | |
| 750,000 (1) | | | Scientific Games International, Inc., 7.000%, 05/15/2028 | | | | | 465,412 | | | | | | 0.1 | | |
| 800,000 (1) | | | Scientific Games International, Inc., 8.250%, 03/15/2026 | | | | | 516,586 | | | | | | 0.1 | | |
| 800,000 | | | Scientific Games International, Inc., 6.625%, 05/15/2021 | | | | | 645,040 | | | | | | 0.1 | | |
| 965,000 (1) | | | Speedway Motorsports LLC / Speedway Funding II, Inc., 4.875%, 11/01/2027 | | | | | 875,738 | | | | | | 0.2 | | |
| 675,000 (1) | | | Station Casinos LLC, 4.500%, 02/15/2028 | | | | | 551,812 | | | | | | 0.1 | | |
| Voya High Yield Bond Fund | as of March 31, 2020 (continued) |
| Principal Amount† | | | Value | | | Percentage of Net Assets | | |||||||||
| CORPORATE BONDS/NOTES: (continued) | | |||||||||||||||
| | | | Consumer, Cyclical (continued) | | ||||||||||||
| 1,825,000 (1)(2) | | | Station Casinos LLC, 5.000%, 10/01/2025 | | | | $ | 1,533,566 | | | | | | 0.3 | | |
| 1,175,000 (1) | | | Taylor Morrison Communities, Inc., 5.750%, 01/15/2028 | | | | | 1,059,213 | | | | | | 0.2 | | |
| 1,200,000 (1) | | | Univar Solutions USA, Inc./Washington, 5.125%, 12/01/2027 | | | | | 1,098,660 | | | | | | 0.2 | | |
| 1,950,000 (1) | | | Viking Cruises Ltd., 5.875%, 09/15/2027 | | | | | 1,151,787 | | | | | | 0.2 | | |
| 450,000 (1) | | | VOC Escrow Ltd., 5.000%, 02/15/2028 | | | | | 331,515 | | | | | | 0.1 | | |
| 1,400,000 (1) | | | William Carter Co/The, 5.625%, 03/15/2027 | | | | | 1,351,746 | | | | | | 0.3 | | |
| 500,000 (1) | | | WMG Acquisition Corp., 5.000%, 08/01/2023 | | | | | 500,623 | | | | | | 0.1 | | |
| 1,575,000 (1) | | | Wolverine World Wide, Inc., 5.000%, 09/01/2026 | | | | | 1,514,363 | | | | | | 0.3 | | |
| 16,259,000 (3) | | | Other Securities | | | | | 14,352,870 | | | | | | 2.9 | | |
| | | | | | | | | 79,242,173 | | | | | | 16.2 | | |
| | | | Consumer, Non-cyclical: 19.6% | | ||||||||||||
| 725,000 (1) | | | Albertsons Cos, Inc. / Safeway, Inc. / New Albertsons L.P. / Albertsons LLC, 4.875%, 02/15/2030 | | | | | 723,188 | | | | | | 0.1 | | |
| 1,625,000 (1) | | | Albertsons Cos, Inc. / Safeway, Inc. / New Albertsons L.P. / Albertsons LLC, 5.875%, 02/15/2028 | | | | | 1,662,944 | | | | | | 0.3 | | |
| 2,150,000 | | | Albertsons Cos, Inc. / Safeway, Inc. / New Albertsons L.P. / Albertsons LLC, 6.625%, 06/15/2024 | | | | | 2,198,310 | | | | | | 0.5 | | |
| 1,050,000 (1) | | | Allied Universal Holdco LLC / Allied Universal Finance Corp., 6.625%, 07/15/2026 | | | | | 1,033,597 | | | | | | 0.2 | | |
| 1,900,000 (1) | | | Allied Universal Holdco LLC / Allied Universal Finance Corp., 9.750%, 07/15/2027 | | | | | 1,803,798 | | | | | | 0.4 | | |
| 1,400,000 (1) | | | AMN Healthcare, Inc., 4.625%, 10/01/2027 | | | | | 1,338,399 | | | | | | 0.3 | | |
| 3,800,000 (1) | | | Bausch Health Americas, Inc., 8.500%, 01/31/2027 | | | | | 3,992,090 | | | | | | 0.8 | | |
| 1,475,000 (1) | | | Bausch Health Cos, Inc., 5.250%, 01/30/2030 | | | | | 1,390,188 | | | | | | 0.3 | | |
| 375,000 (1) | | | Bausch Health Cos, Inc., 5.500%, 11/01/2025 | | | | | 381,208 | | | | | | 0.1 | | |
| 1,025,000 (1) | | | Bausch Health Cos, Inc., 6.125%, 04/15/2025 | | | | | 1,016,036 | | | | | | 0.2 | | |
| Principal Amount† | | | Value | | | Percentage of Net Assets | | |||||||||
| CORPORATE BONDS/NOTES: (continued) | | |||||||||||||||
| | | | Consumer, Non-cyclical (continued) | | ||||||||||||
| 1,100,000 (1) | | | Bausch Health Cos, Inc., 7.000%, 01/15/2028 | | | | $ | 1,146,805 | | | | | | 0.2 | | |
| 1,375,000 (1) | | | Cardtronics, Inc. / Cardtronics USA, Inc., 5.500%, 05/01/2025 | | | | | 1,318,274 | | | | | | 0.3 | | |
| 1,425,000 (1) | | | Catalent Pharma Solutions, Inc., 5.000%, 07/15/2027 | | | | | 1,390,159 | | | | | | 0.3 | | |
| 350,000 (1) | | | Centene Corp., 3.375%, 02/15/2030 | | | | | 326,813 | | | | | | 0.1 | | |
| 2,400,000 (1) | | | Centene Corp., 4.625%, 12/15/2029 | | | | | 2,425,320 | | | | | | 0.5 | | |
| 925,000 (1) | | | Centene Corp., 4.750%, 01/15/2025 | | | | | 942,348 | | | | | | 0.2 | | |
| 700,000 (1) | | | Centene Corp., 5.375%, 06/01/2026 | | | | | 724,962 | | | | | | 0.1 | | |
| 1,100,000 | | | Centene Corp., 4.750%, 01/15/2025 | | | | | 1,120,630 | | | | | | 0.2 | | |
| 730,000 (1) | | | Chobani LLC / Chobani Finance Corp., Inc., 7.500%, 04/15/2025 | | | | | 669,753 | | | | | | 0.1 | | |
| 1,900,000 (1) | | | CHS/Community Health Systems, Inc., 6.625%, 02/15/2025 | | | | | 1,771,750 | | | | | | 0.4 | | |
| 1,575,000 (1)(2) | | | Cott Holdings, Inc., 5.500%, 04/01/2025 | | | | | 1,537,602 | | | | | | 0.3 | | |
| 1,300,000 (1) | | | Endo Ltd. / Endo Finance LLC / Endo Finco, Inc., 6.000%, 02/01/2025 | | | | | 894,959 | | | | | | 0.2 | | |
| 2,850,000 (1) | | | Garda World Security Corp., 8.750%, 05/15/2025 | | | | | 2,643,290 | | | | | | 0.5 | | |
| 1,910,000 (1) | | | Graham Holdings Co., 5.750%, 06/01/2026 | | | | | 1,888,116 | | | | | | 0.4 | | |
| 4,500,000 | | | HCA, Inc., 5.375%, 02/01/2025 | | | | | 4,606,852 | | | | | | 0.9 | | |
| 1,825,000 | | | HCA, Inc., 3.500%-5.625%, 09/01/2028-09/01/2030 | | | | | 1,779,478 | | | | | | 0.4 | | |
| 760,000 (1) | | | Hertz Corp./The, 6.000%, 01/15/2028 | | | | | 403,218 | | | | | | 0.1 | | |
| 800,000 (1) | | | Hertz Corp./The, 7.125%, 08/01/2026 | | | | | 423,340 | | | | | | 0.1 | | |
| 112,000 (1) | | | Hertz Corp./The, 7.625%, 06/01/2022 | | | | | 91,560 | | | | | | 0.0 | | |
| 1,275,000 (1) | | | Hertz Corp., 5.500%, 10/15/2024 | | | | | 724,895 | | | | | | 0.1 | | |
| 1,250,000 (1) | | | Hill-Rom Holdings, Inc., 4.375%, 09/15/2027 | | | | | 1,241,928 | | | | | | 0.3 | | |
| Voya High Yield Bond Fund | as of March 31, 2020 (continued) |
| Principal Amount† | | | Value | | | Percentage of Net Assets | | |||||||||
| CORPORATE BONDS/NOTES: (continued) | | |||||||||||||||
| | | | Consumer, Non-cyclical (continued) | | ||||||||||||
| 2,125,000 (1) | | | Jaguar Holding Co. II / Pharmaceutical Product Development LLC, 6.375%, 08/01/2023 | | | | $ | 2,178,061 | | | | | | 0.4 | | |
| 1,675,000 (1) | | | JBS USA LUX SA / JBS USA Finance, Inc., 5.875%, 07/15/2024 | | | | | 1,702,219 | | | | | | 0.3 | | |
| 1,200,000 (1)(2) | | | JBS USA LUX SA / JBS USA Finance, Inc., 6.750%, 02/15/2028 | | | | | 1,287,660 | | | | | | 0.3 | | |
| 1,250,000 (1) | | | JBS USA LUX SA / JBS USA Food Co. / JBS USA Finance, Inc., 5.500%, 01/15/2030 | | | | | 1,297,562 | | | | | | 0.3 | | |
| 1,510,000 (1) | | | KeHE Distributors LLC / KeHE Finance Corp., 8.625%, 10/15/2026 | | | | | 1,526,044 | | | | | | 0.3 | | |
| 4,275,000 | | | Kraft Heinz Foods Co., 5.000%, 07/15/2035 | | | | | 4,278,857 | | | | | | 0.9 | | |
| 3,525,000 | | | Kraft Heinz Foods Co., 4.375%-5.000%, 06/04/2042-06/01/2046 | | | | | 3,265,365 | | | | | | 0.6 | | |
| 1,825,000 (1) | | | LifePoint Health, Inc., 4.375%, 02/15/2027 | | | | | 1,732,838 | | | | | | 0.4 | | |
| 2,600,000 (1) | | | MPH Acquisition Holdings LLC, 7.125%, 06/01/2024 | | | | | 2,281,578 | | | | | | 0.5 | | |
| 1,250,000 (1) | | | Par Pharmaceutical, Inc., 7.500%, 04/01/2027 | | | | | 1,253,219 | | | | | | 0.3 | | |
| 1,075,000 (1) | | | Pilgrim’s Pride Corp., 5.750%, 03/15/2025 | | | | | 1,087,099 | | | | | | 0.2 | | |
| 1,100,000 (1) | | | Pilgrim’s Pride Corp., 5.875%, 09/30/2027 | | | | | 1,102,145 | | | | | | 0.2 | | |
650,000 (1)(2)(4) | | | Polaris Intermediate Corp., 8.500% (PIK Rate 9.250%, Cash Rate 8.500%), 12/01/2022 | | | | | 508,612 | | | | | | 0.1 | | |
| 3,675,000 (1) | | | Post Holdings, Inc., 5.625%, 01/15/2028 | | | | | 3,759,709 | | | | | | 0.8 | | |
| 2,200,000 (1) | | | Select Medical Corp., 6.250%, 08/15/2026 | | | | | 2,212,111 | | | | | | 0.4 | | |
| 2,700,000 | | | Tenet Healthcare Corp., 6.750%, 06/15/2023 | | | | | 2,507,638 | | | | | | 0.5 | | |
| 1,875,000 | | | Tenet Healthcare Corp., 5.125%-8.125%, 04/01/2022-05/01/2025 | | | | | 1,784,696 | | | | | | 0.4 | | |
| 4,710,000 | | | United Rentals North America, Inc., 4.875%-6.500%, 07/15/2025-01/15/2030 | | | | | 4,685,368 | | | | | | 1.0 | | |
| Principal Amount† | | | Value | | | Percentage of Net Assets | | |||||||||
| CORPORATE BONDS/NOTES: (continued) | | |||||||||||||||
| | | | Consumer, Non-cyclical (continued) | | ||||||||||||
| 1,325,000 (1) | | | Vizient, Inc., 6.250%, 05/15/2027 | | | | $ | 1,333,556 | | | | | | 0.3 | | |
| 1,600,000 (1) | | | West Street Merger Sub, Inc., 6.375%, 09/01/2025 | | | | | 1,406,672 | | | | | | 0.3 | | |
| 11,145,000 (3) | | | Other Securities | | | | | 10,821,181 | | | | | | 2.2 | | |
| | | | | | | | | 95,624,000 | | | | | | 19.6 | | |
| | | | Energy: 4.1% | | ||||||||||||
| 725,000 (1) | | | Archrock Partners L.P. / Archrock Partners Finance Corp., 6.250%, 04/01/2028 | | | | | 505,688 | | | | | | 0.1 | | |
| 450,000 (1)(2) | | | Archrock Partners L.P. / Archrock Partners Finance Corp., 6.875%, 04/01/2027 | | | | | 322,680 | | | | | | 0.1 | | |
| 1,145,000 (1) | | | Baytex Energy Corp., 8.750%, 04/01/2027 | | | | | 445,405 | | | | | | 0.1 | | |
| 330,550 (1) | | | Calfrac Holdings L.P., 10.875%, 03/15/2026 | | | | | 99,165 | | | | | | 0.0 | | |
| 2,200,000 | | | Delek Logistics Partners L.P. / Delek Logistics Finance Corp., 6.750%, 05/15/2025 | | | | | 2,158,761 | | | | | | 0.4 | | |
| 2,125,000 (1) | | | Enviva Partners L.P. / Enviva Partners Finance Corp., 6.500%, 01/15/2026 | | | | | 2,087,812 | | | | | | 0.4 | | |
| 700,000 (1) | | | Hess Midstream Operations L.P., 5.125%, 06/15/2028 | | | | | 494,585 | | | | | | 0.1 | | |
| 1,153,000 (1) | | | Hess Midstream Operations L.P., 5.625%, 02/15/2026 | | | | | 822,126 | | | | | | 0.2 | | |
| 1,355,000 (1) | | | Magnolia Oil & Gas Operating LLC / Magnolia Oil & Gas Finance Corp., 6.000%, 08/01/2026 | | | | | 846,875 | | | | | | 0.2 | | |
| 1,405,000 (1) | | | Moss Creek Resources Holdings, Inc., 7.500%, 01/15/2026 | | | | | 419,452 | | | | | | 0.1 | | |
| 1,050,000 | | | Murphy Oil Corp., 5.750%, 08/15/2025 | | | | | 568,423 | | | | | | 0.1 | | |
| 525,000 (1) | | | Noble Holding International Ltd., 7.875%, 02/01/2026 | | | | | 130,485 | | | | | | 0.0 | | |
| 500,000 (1) | | | Parsley Energy LLC / Parsley Finance Corp., 5.625%, 10/15/2027 | | | | | 355,275 | | | | | | 0.1 | | |
| 1,550,000 (1) | | | Tallgrass Energy Partners L.P. / Tallgrass Energy Finance Corp., 5.500%, 01/15/2028 | | | | | 816,800 | | | | | | 0.2 | | |
| Voya High Yield Bond Fund | as of March 31, 2020 (continued) |
| Principal Amount† | | | Value | | | Percentage of Net Assets | | |||||||||
| CORPORATE BONDS/NOTES: (continued) | | |||||||||||||||
| | | | Energy (continued) | | ||||||||||||
| 340,000 (1) | | | Targa Resources Partners L.P. / Targa Resources Partners Finance Corp., 5.500%, 03/01/2030 | | | | $ | 265,625 | | | | | | 0.0 | | |
| 1,150,000 (1) | | | Viper Energy Partners L.P., 5.375%, 11/01/2027 | | | | | 972,383 | | | | | | 0.2 | | |
| 16,679,000 (3) | | | Other Securities | | | | | 8,802,021 | | | | | | 1.8 | | |
| | | | | | | | | 20,113,561 | | | | | | 4.1 | | |
| | | | Financial: 5.4% | | ||||||||||||
| 255,000 (1) | | | AG Issuer LLC, 6.250%, 03/01/2028 | | | | | 216,112 | | | | | | 0.1 | | |
| 1,225,000 (1) | | | Altice France Holding SA, 6.000%, 02/15/2028 | | | | | 1,086,796 | | | | | | 0.2 | | |
| 2,375,000 (1) | | | Altice France Holding SA, 10.500%, 05/15/2027 | | | | | 2,517,500 | | | | | | 0.5 | | |
| 1,850,000 (1) | | | ESH Hospitality, Inc., 5.250%, 05/01/2025 | | | | | 1,565,572 | | | | | | 0.3 | | |
| 1,005,000 (1) | | | Freedom Mortgage Corp., 8.250%, 04/15/2025 | | | | | 796,432 | | | | | | 0.2 | | |
| 2,975,000 | | | Icahn Enterprises L.P. / Icahn Enterprises Finance Corp., 6.250%, 05/15/2026 | | | | | 2,828,100 | | | | | | 0.6 | | |
| 1,250,000 (1) | | | LPL Holdings, Inc., 4.625%, 11/15/2027 | | | | | 1,152,650 | | | | | | 0.2 | | |
| 2,750,000 | | | MPT Operating Partnership L.P. / MPT Finance Corp., 4.625%-5.500%, 05/01/2024-08/01/2029 | | | | | 2,652,669 | | | | | | 0.6 | | |
| 1,875,000 (1) | | | Quicken Loans, Inc., 5.250%, 01/15/2028 | | | | | 1,846,439 | | | | | | 0.4 | | |
| 1,200,000 (1) | | | Realogy Group LLC / Realogy Co-Issuer Corp., 5.250%, 12/01/2021 | | | | | 1,124,100 | | | | | | 0.2 | | |
| 1,575,000 (1)(2) | | | SBA Communications Corp., 3.875%, 02/15/2027 | | | | | 1,590,750 | | | | | | 0.3 | | |
| 9,285,000 (3) | | | Other Securities | | | | | 8,825,883 | | | | | | 1.8 | | |
| | | | | | | | | 26,203,003 | | | | | | 5.4 | | |
| | | | Industrial: 12.0% | | ||||||||||||
| 2,030,000 (1) | | | Advanced Disposal Services, Inc., 5.625%, 11/15/2024 | | | | | 2,073,127 | | | | | | 0.4 | | |
| 2,275,000 | | | AECOM, 5.875%, 10/15/2024 | | | | | 2,238,043 | | | | | | 0.5 | | |
| 1,125,000 (1) | | | Amsted Industries, Inc., 5.625%, 07/01/2027 | | | | | 1,104,140 | | | | | | 0.2 | | |
| 2,500,000 (1)(4) | | | ARD Finance SA, 6.500% (PIK Rate 7.250%, Cash Rate 6.500%), 06/30/2027 | | | | | 2,161,125 | | | | | | 0.4 | | |
| 2,225,000 (1)(2) | | | Berry Global, Inc., 5.625%, 07/15/2027 | | | | | 2,315,546 | | | | | | 0.5 | | |
| 1,950,000 (1) | | | Builders FirstSource, Inc., 5.000%, 03/01/2030 | | | | | 1,765,969 | | | | | | 0.4 | | |
| Principal Amount† | | | Value | | | Percentage of Net Assets | | |||||||||
| CORPORATE BONDS/NOTES: (continued) | | |||||||||||||||
| | | | Industrial (continued) | | ||||||||||||
| 1,250,000 (1) | | | Cargo Aircraft Management, Inc., 4.750%, 02/01/2028 | | | | $ | 1,168,750 | | | | | | 0.2 | | |
| 2,000,000 (1) | | | Cascades, Inc./Cascades USA, Inc., 5.375%, 01/15/2028 | | | | | 1,925,000 | | | | | | 0.4 | | |
| 825,000 (1) | | | GFL Environmental, Inc., 7.000%, 06/01/2026 | | | | | 805,577 | | | | | | 0.2 | | |
| 875,000 (1) | | | Granite US Holdings Corp., 11.000%, 10/01/2027 | | | | | 758,150 | | | | | | 0.2 | | |
| 1,800,000 (1)(2) | | | Norbord, Inc., 5.750%, 07/15/2027 | | | | | 1,658,624 | | | | | | 0.3 | | |
| 1,000,000 (1) | | | Sealed Air Corp., 4.000%, 12/01/2027 | | | | | 937,600 | | | | | | 0.2 | | |
| 1,300,000 (1) | | | Silgan Holdings, Inc., 4.125%, 02/01/2028 | | | | | 1,209,000 | | | | | | 0.3 | | |
| 1,625,000 (1) | | | SSL Robotics LLC, 9.750%, 12/31/2023 | | | | | 1,685,938 | | | | | | 0.3 | | |
| 1,215,000 (1) | | | TransDigm, Inc., 5.500%, 11/15/2027 | | | | | 1,097,206 | | | | | | 0.2 | | |
| 1,750,000 (1) | | | ATS Automation Tooling Systems, Inc., 6.500%, 06/15/2023 | | | | | 1,717,179 | | | | | | 0.4 | | |
| 2,075,000 (1) | | | BMC East LLC, 5.500%, 10/01/2024 | | | | | 2,020,521 | | | | | | 0.4 | | |
| 650,000 (1)(2) | | | Bombardier, Inc., 6.000%, 10/15/2022 | | | | | 492,375 | | | | | | 0.1 | | |
| 1,650,000 (1) | | | Bombardier, Inc., 7.875%, 04/15/2027 | | | | | 1,150,999 | | | | | | 0.2 | | |
| 1,675,000 (1) | | | Bombardier, Inc., 8.750%, 12/01/2021 | | | | | 1,401,556 | | | | | | 0.3 | | |
| 1,350,000 (1) | | | Builders FirstSource, Inc., 6.750%, 06/01/2027 | | | | | 1,334,532 | | | | | | 0.3 | | |
| 1,025,000 (1) | | | Clean Harbors, Inc., 4.875%, 07/15/2027 | | | | | 1,009,061 | | | | | | 0.2 | | |
| 475,000 (1) | | | Clean Harbors, Inc., 5.125%, 07/15/2029 | | | | | 445,808 | | | | | | 0.1 | | |
| 930,000 (1) | | | FXI Holdings, Inc., 7.875%, 11/01/2024 | | | | | 635,023 | | | | | | 0.1 | | |
| 810,000 (1) | | | GFL Environmental, Inc., 8.500%, 05/01/2027 | | | | | 818,302 | | | | | | 0.2 | | |
| 2,250,000 (1) | | | Itron, Inc., 5.000%, 01/15/2026 | | | | | 2,156,721 | | | | | | 0.4 | | |
| 2,050,000 (1) | | | James Hardie International Finance DAC, 4.750%, 01/15/2025 | | | | | 1,950,073 | | | | | | 0.4 | | |
| 1,875,000 (1)(2) | | | Koppers, Inc., 6.000%, 02/15/2025 | | | | | 1,514,006 | | | | | | 0.3 | | |
| 1,050,000 (1) | | | Masonite International Corp., 5.375%, 02/01/2028 | | | | | 1,037,768 | | | | | | 0.2 | | |
| Voya High Yield Bond Fund | as of March 31, 2020 (continued) |
| Principal Amount† | | | Value | | | Percentage of Net Assets | | |||||||||
| CORPORATE BONDS/NOTES: (continued) | | |||||||||||||||
| | | | Industrial (continued) | | ||||||||||||
| 1,025,000 (1) | | | Masonite International Corp., 5.750%, 09/15/2026 | | | | $ | 1,013,256 | | | | | | 0.2 | | |
| 930,000 (1)(2) | | | Mauser Packaging Solutions Holding Co., 7.250%, 04/15/2025 | | | | | 711,478 | | | | | | 0.1 | | |
| 525,000 (1)(2) | | | Owens-Brockway Glass Container, Inc., 5.875%, 08/15/2023 | | | | | 517,784 | | | | | | 0.1 | | |
| 1,450,000 (1)(2) | | | Owens-Brockway Glass Container, Inc., 6.375%, 08/15/2025 | | | | | 1,388,375 | | | | | | 0.3 | | |
| 1,850,000 (1) | | | PGT Innovations, Inc., 6.750%, 08/01/2026 | | | | | 1,760,196 | | | | | | 0.4 | | |
| 1,600,000 (1) | | | Reynolds Group Issuer, Inc. / Reynolds Group Issuer LLC / Reynolds Group Issuer Lu, 5.125%, 07/15/2023 | | | | | 1,597,992 | | | | | | 0.3 | | |
| 725,000 (1) | | | Reynolds Group Issuer, Inc. / Reynolds Group Issuer LLC / Reynolds Group Issuer Lu, 7.000%, 07/15/2024 | | | | | 740,859 | | | | | | 0.2 | | |
| 1,125,000 (1) | | | Sealed Air Corp., 5.500%, 09/15/2025 | | �� | | | 1,148,912 | | | | | | 0.2 | | |
| 3,225,000 (1) | | | Standard Industries, Inc./NJ, 6.000%, 10/15/2025 | | | | | 3,193,621 | | | | | | 0.7 | | |
| 1,590,000 (1)(2) | | | Stevens Holding Co., Inc., 6.125%, 10/01/2026 | | | | | 1,584,367 | | | | | | 0.3 | | |
| 600,000 (1) | | | Summit Materials LLC / Summit Materials Finance Corp., 5.125%, 06/01/2025 | | | | | 563,247 | | | | | | 0.1 | | |
| 1,175,000 (1) | | | Summit Materials LLC / Summit Materials Finance Corp., 6.500%, 03/15/2027 | | | | | 1,120,412 | | | | | | 0.2 | | |
| 2,450,000 | | | TransDigm, Inc., 6.375%-6.500%, 05/15/2025-06/15/2026 | | | | | 2,352,338 | | | | | | 0.5 | | |
| 422,000 (1) | | | Zekelman Industries, Inc., 9.875%, 06/15/2023 | | | | | 410,131 | | | | | | 0.1 | | |
| | | | | | | | | 58,690,687 | | | | | | 12.0 | | |
| | | | Technology: 5.2% | | ||||||||||||
| 2,350,000 (1) | | | Ascend Learning LLC, 6.875%, 08/01/2025 | | | | | 2,300,051 | | | | | | 0.5 | | |
| 1,100,000 (1) | | | Castle US Holding Corp., 9.500%, 02/15/2028 | | | | | 1,051,187 | | | | | | 0.2 | | |
| 2,625,000(2) | | | CDW LLC / CDW Finance Corp., 5.000%-5.500%, 12/01/2024-09/01/2025 | | | | | 2,741,040 | | | | | | 0.6 | | |
| Principal Amount† | | | Value | | | Percentage of Net Assets | | |||||||||
| CORPORATE BONDS/NOTES: (continued) | | |||||||||||||||
| | | | Technology (continued) | | ||||||||||||
| 2,725,000 (1) | | | Change Healthcare Holdings LLC / Change Healthcare Finance, Inc., 5.750%, 03/01/2025 | | | | $ | 2,540,981 | | | | | | 0.5 | | |
| 315,000 (1) | | | Dell International LLC / EMC Corp., 5.875%, 06/15/2021 | | | | | 315,000 | | | | | | 0.1 | | |
| 3,575,000 (1)(2) | | | Dell International LLC / EMC Corp., 7.125%, 06/15/2024 | | | | | 3,704,594 | | | | | | 0.7 | | |
| 900,000 (1) | | | MSCI, Inc., 4.000%, 11/15/2029 | | | | | 899,037 | | | | | | 0.2 | | |
| 380,000 (1) | | | MSCI, Inc., 5.750%, 08/15/2025 | | | | | 395,135 | | | | | | 0.1 | | |
| 1,075,000 (1) | | | MTS Systems Corp., 5.750%, 08/15/2027 | | | | | 1,006,246 | | | | | | 0.2 | | |
| 375,000 (1) | | | Open Text Corp., 3.875%, 02/15/2028 | | | | | 354,258 | | | | | | 0.1 | | |
| 650,000 (1) | | | Open Text Corp., 5.875%, 06/01/2026 | | | | | 685,392 | | | | | | 0.1 | | |
| 700,000 (1) | | | Open Text Holdings, Inc., 4.125%, 02/15/2030 | | | | | 662,113 | | | | | | 0.1 | | |
| 1,575,000 (1) | | | RP Crown Parent LLC, 7.375%, 10/15/2024 | | | | | 1,514,433 | | | | | | 0.3 | | |
| 1,405,000 (1) | | | Science Applications International Corp., 4.875%, 04/01/2028 | | | | | 1,356,703 | | | | | | 0.3 | | |
| 2,450,000 (1) | | | Tempo Acquisition LLC / Tempo Acquisition Finance Corp., 6.750%, 06/01/2025 | | | | | 2,260,199 | | | | | | 0.5 | | |
| 2,475,000 (1)(2) | | | Veritas US, Inc. / Veritas Bermuda Ltd.., 10.500%, 02/01/2024 | | | | | 2,106,831 | | | | | | 0.4 | | |
| 1,525,000 (3) | | | Other Securities | | | | | 1,446,836 | | | | | | 0.3 | | |
| | | | | | | | | 25,340,036 | | | | | | 5.2 | | |
| | | | Utilities: 2.3% | | ||||||||||||
| 2,225,000 | | | Calpine Corp., 5.750%, 01/15/2025 | | | | | 2,074,813 | | | | | | 0.4 | | |
| 1,100,000 (1) | | | Clearway Energy Operating LLC, 4.750%, 03/15/2028 | | | | | 1,024,375 | | | | | | 0.2 | | |
| 2,025,000 (1) | | | Drax Finco PLC, 6.625%, 11/01/2025 | | | | | 2,042,729 | | | | | | 0.4 | | |
| 1,850,000 (1) | | | LBC Tank Terminals Holding Netherlands BV, 6.875%, 05/15/2023 | | | | | 1,750,553 | | | | | | 0.4 | | |
| 2,200,000 (2) | | | NRG Energy, Inc., 5.750%-6.625%, 01/15/2027-01/15/2028 | | | | | 2,281,210 | | | | | | 0.5 | | |
| Voya High Yield Bond Fund | as of March 31, 2020 (continued) |
| Principal Amount† | | | Value | | | Percentage of Net Assets | | |||||||||
| CORPORATE BONDS/NOTES: (continued) | | |||||||||||||||
| | | | Utilities (continued) | | ||||||||||||
| 725,000 (1) | | | Vistra Operations Co. LLC, 5.500%, 09/01/2026 | | | | $ | 751,801 | | | | | | 0.1 | | |
| 1,200,000 (1) | | | Vistra Operations Co. LLC, 5.625%, 02/15/2027 | | | | | 1,244,160 | | | | | | 0.3 | | |
| | | | | | | | | 11,169,641 | | | | | | 2.3 | | |
| | | | Total Corporate Bonds/Notes | | | | | | | | | | | | | |
| | | | (Cost $488,004,605) | | | | | 453,195,147 | | | | | | 92.8 | | |
| BANK LOANS: 1.0% | | |||||||||||||||
| | | | Consumer, Non-cyclical: 0.3% | | ||||||||||||
| 1,012,188 | | | Bellring Brands LLC – TL B 1L, 6.000%, (US0001M + 5.000%), 10/10/2024 | | | | | 956,517 | | | | | | 0.2 | | |
| 945,214 | | | Envision Healthcare Corporation 2018 1st Lien Term Loan, 4.739%, (US0003M + 3.750%), 09/28/2025 | | | | | 506,635 | | | | | | 0.1 | | |
| | | | | | | | | 1,463,152 | | | | | | 0.3 | | |
| | | | Containers & Glass Products: 0.2% | | ||||||||||||
| 852,896 | | | Reynolds Group Holdings Inc. USD 2017 Term Loan, 3.739%, (US0001M + 2.750%), 02/05/2023 | | | | | 813,450 | | | | | | 0.2 | | |
| | | | Electronics/Electrical: 0.3% | | ||||||||||||
| 1,922,123 | | | Rackspace Hosting, Inc. 2017 Incremental 1st Lien Term Loan, 4.762%, (US0003M + 3.000%), 11/03/2023 | | | | | 1,725,105 | | | | | | 0.3 | | |
| | | | Health Care: 0.2% | | ||||||||||||
| 845,625 | | | Bausch Health Companies, Inc. 2018 Term Loan B, 3.612%, (US0001M + 3.000%), 06/02/2025 | | | | | 810,390 | | | | | | 0.2 | | |
| | | | Total Bank Loans | | | | | | | | | | | | | |
| | | | (Cost $5,245,790) | | | | | 4,812,097 | | | | | | 1.0 | | |
| CONVERTIBLE BONDS/NOTES: 0.1% | | |||||||||||||||
| | | | Communications: 0.1% | | ||||||||||||
| 625,000 | | | Other Securities | | | | | 508,969 | | | | | | 0.1 | | |
| | | | Total Convertible Bonds/Notes (Cost $619,800) | | | | | 508,969 | | | | | | 0.1 | | |
| | ||||||||||||||||
| Shares | | | Value | | | Percentage of Net Assets | | |||||||||
| COMMON STOCK: 0.2% | | |||||||||||||||
| | | | Consumer Staples: 0.2% | | ||||||||||||
| 27,789 (5)(6) | | | Other Securities | | | | $ | 889,248 | | | | | | 0.2 | | |
| | | | Total Common Stock (Cost $848,084) | | | | | 889,248 | | | | | | 0.2 | | |
| | | | Total Long-Term Investments (Cost $494,718,279) | | | | | 459,405,461 | | | | | | 94.1 | | |
| | ||||||||||||||||
| Principal Amount† | | | Value | | | Percentage of Net Assets | | |||||||||
| SHORT-TERM INVESTMENTS: 12.4% | | |||||||||||||||
| | | | Commercial Paper: 1.4% | | ||||||||||||
| 1,500,000 | | | American Electric Power Co., Inc., 3.190%, 04/13/2020 | | | | | 1,498,300 | | | | | | 0.2 | | |
| 2,000,000 | | | Dominion Resources, Inc., 2.790%, 04/06/2020 | | | | | 1,999,086 | | | | | | 0.4 | | |
| 950,000 (7) | | | Exxon Mobil Corp., 1.600%, 06/03/2020 | | | | | 946,424 | | | | | | 0.2 | | |
| 950,000 (7) | �� | | Federal Republic of Germany, 1.620%, 05/21/2020 | | | | | 948,654 | | | | | | 0.2 | | |
| 950,000 (7) | | | LMA Americas LLC, 1.660%, 04/07/2020 | | | | | 949,797 | | | | | | 0.2 | | |
| 950,000 (7) | | | Pfizer Inc., 1.630%, 06/15/2020 | | | | | 946,410 | | | | | | 0.2 | | |
| | | | Total Commercial Paper | | | | | | | | | | | | | |
| | | | (Cost $7,290,050) | | | | | 7,288,671 | | | | | | 1.4 | | |
| | | | Floating Rate Notes: 3.6% | | ||||||||||||
| 825,000 (7) | | | Australia & New Zealand Banking Group Ltd., 1.220%, 04/09/2020 | | | | | 825,129 | | | | | | 0.2 | | |
| 250,000 (7) | | | Bank of America Corp., 1.200%, 05/07/2020 | | | | | 249,845 | | | | | | 0.0 | | |
| 525,000 (7) | | | Bank of Montreal, 0.210%, 07/13/2020 | | | | | 523,328 | | | | | | 0.1 | | |
| 275,000 (7) | | | Bank of Montreal, 0.980%, 08/26/2020 | | | | | 275,003 | | | | | | 0.1 | | |
| 900,000 (7) | | | Bank of Nova Scotia, 1.240%, 05/08/2020 | | | | | 900,311 | | | | | | 0.2 | | |
| 950,000 (7) | | | Canadian Imperial Bank of Commerce, 0.240%, 08/28/2020 | | | | | 945,010 | | | | | | 0.2 | | |
| 700,000 (7) | | | Commonwealth Bank of Australia, 0.950%, 06/10/2020 | | | | | 699,396 | | | | | | 0.1 | | |
| Voya High Yield Bond Fund | as of March 31, 2020 (continued) |
| Principal Amount† | | | Value | | | Percentage of Net Assets | | |||||||||
| SHORT-TERM INVESTMENTS: (continued) | | |||||||||||||||
| | | | Floating Rate Notes (continued) | | ||||||||||||
| 250,000 (7) | | | Commonwealth Bank of Australia, 1.200%, 07/06/2020 | | | | $ | 249,830 | | | | | | 0.1 | | |
| 700,000 (7) | | | Coöperatieve Rabobank U.A., 0.990%, 04/20/2020 | | | | | 700,176 | | | | | | 0.1 | | |
| 625,000 (7) | | | Crédit Industriel et Commercial, 1.140%, 04/24/2020 | | | | | 625,175 | | | | | | 0.1 | | |
| 775,000 (7) | | | Credit Suisse Group AG, 0.360%, 04/17/2020 | | | | | 774,972 | | | | | | 0.1 | | |
| 700,000 (7) | | | HSBC Bank PLC, 1.520%, 06/03/2020 | | | | | 699,468 | | | | | | 0.1 | | |
| 325,000 (7) | | | J.P. Morgan Securities LLC, 1.190%, 07/08/2020 | | | | | 324,834 | | | | | | 0.1 | | |
| 950,000 (7) | | | Lloyds Bank PLC, 1.080%, 07/31/2020 | | | | | 949,454 | | | | | | 0.2 | | |
| 700,000 (7) | | | Mizuho Financial Group Inc., 1.140%, 05/22/2020 | | | | | 700,216 | | | | | | 0.1 | | |
| 250,000 (7) | | | Mizuho Financial Group Inc., 1.640%, 05/05/2020 | | | | | 250,118 | | | | | | 0.1 | | |
| 700,000 (7) | | | National Bank of Canada, 1.840%, 05/01/2020 | | | | | 699,761 | | | | | | 0.1 | | |
| 950,000 (7) | | | Oversea-Chinese Banking Corp., Ltd., 0.820%, 07/15/2020 | | | | | 949,286 | | | | | | 0.2 | | |
| 800,000 (7) | | | Royal Bank of Canada, 0.960%, 07/17/2020 | | | | | 799,316 | | | | | | 0.2 | | |
| 975,000 (7) | | | Skandinaviska Enskilda Banken AB, 1.780%, 05/11/2020 | | | | | 974,532 | | | | | | 0.2 | | |
| 950,000 (7) | | | Societe Generale, 0.290%, 09/04/2020 | | | | | 946,093 | | | | | | 0.2 | | |
| 300,000 (7) | | | Sumitomo Mitsui Trust Holdings, Inc., 1.190%, 04/24/2020 | | | | | 300,092 | | | | | | 0.1 | | |
| 950,000 (7) | | | Svenska Handelsbanken AB, 1.160%, 07/07/2020 | | | | | 949,597 | | | | | | 0.2 | | |
| 800,000 (7) | | | The Norinchukin Bank, 1.200%, 04/24/2020 | | | | | 800,091 | | | | | | 0.2 | | |
| 475,000 (7) | | | The Sumitomo Mitsui Financial Group, 1.020%, 08/25/2020 | | | | | 474,476 | | | | | | 0.1 | | |
| 450,000 (7) | | | The Sumitomo Mitsui Financial Group, 1.040%, 05/12/2020 | | | | | 450,247 | | | | | | 0.1 | | |
| 400,000 (7) | | | Westpac Banking Corp, 1.520%, 06/03/2020 | | | | | 399,696 | | | | | | 0.1 | | |
| | | | Total Floating Rate Notes | | | | | | | | | | | | | |
| | | | (Cost $17,435,452) | | | | | 17,435,452 | | | | | | 3.6 | | |
| | ||||||||||||||||
| Principal Amount† | | | Value | | | Percentage of Net Assets | | |||||||||
| SHORT-TERM INVESTMENTS: (continued) | | |||||||||||||||
| | | | Repurchase Agreements: 3.3% | | ||||||||||||
| 3,797,254 (7) | | | Cantor Fitzgerald Securities, Repurchase Agreement dated 03/31/20, 0.02%, due 04/01/20 (Repurchase Amount $3,797,256, collateralized by various U.S. Government/U.S. Government Agency Obligations, 0.000%-8.500%, Market Value plus accrued interest $3,873,199, due 05/01/20-02/20/70) | | | | $ | 3,797,254 | | | | | | 0.8 | | |
| 1,635,005 (7) | | | CF Secured LLC, Repurchase Agreement dated 03/31/20, 0.02%, due 04/01/20 (Repurchase Amount $1,635,006, collateralized by various U.S. Government/U.S. Government Agency Obligations, 0.000%-6.500%, Market Value plus accrued interest $1,667,707, due 12/15/21-11/20/66) | | | | | 1,635,005 | | | | | | 0.3 | | |
| 1,250,790 (7) | | | Citadel Securities LLC, Repurchase Agreement dated 03/31/20, 0.09%, due 04/01/20 (Repurchase Amount $1,250,793, collateralized by various U.S. Government Securities, 0.000%-8.125%, Market Value plus accrued interest $1,275,809, due 04/07/20-02/15/50) | | | | | 1,250,790 | | | | | | 0.3 | | |
| 1,362,412 (7) | | | Industrial & Comm. Bank of China, Repurchase Agreement dated 03/31/20, 0.02%, due 04/01/20 (Repurchase Amount $1,362,413, collateralized by various U.S. Government Agency Obligations, 0.000%-9.500%, Market Value plus accrued interest $1,389,660, due 04/02/20-03/01/50) | | | | | 1,362,412 | | | | | | 0.3 | | |
| Voya High Yield Bond Fund | as of March 31, 2020 (continued) |
| Principal Amount† | | | Value | | | Percentage of Net Assets | | |||||||||
| SHORT-TERM INVESTMENTS: (continued) | | |||||||||||||||
| | | | Repurchase Agreements (continued) | | ||||||||||||
| 8,075,752 (7) | | | Royal Bank of Canada (NY), Repurchase Agreement dated 03/31/20, 0.01%, due 04/01/20 (Repurchase Amount $8,075,754, collateralized by various U.S. Government/U.S. Government Agency Obligations, 2.500%-5.000%, Market Value plus accrued interest $8,237,267, due 08/01/23-06/01/51) | | | | $ | 8,075,752 | | | | | | 1.6 | | |
| | | | Total Repurchase Agreements | | | | | | | | | | | | | |
| | | | (Cost $16,121,213) | | | | | 16,121,213 | | | | | | 3.3 | | |
| | | | | | ||||||||||||
| | | | Certificates of Deposit: 0.2% | | ||||||||||||
| 550,000 (7) | | | Landesbank Baden-Wurttemberg, 1.630%, 04/24/2020 | | | | | 550,294 | | | | | | 0.1 | | |
| 400,000 (7) | | | Landesbank Baden-Wurttemberg, 1.640%, 04/21/2020 | | | | | 400,211 | | | | | | 0.1 | | |
| | | | Total Certificates of Deposit | | | | | | | | | | | | | |
| | | | (Cost $950,505) | | | | | 950,505 | | | | | | 0.2 | | |
| | | | | | | | | | | | | | | | | |
| Shares | | | Value | | | Percentage of Net Assets | | |||||||||
| | | | Mutual Funds: 3.9% | | ||||||||||||
| 940,000 (7) | | | Fidelity Investments Money Market Government Portfolio – Institutional Class, 0.380% | | | | | 940,000 | | | | | | 0.2 | | |
| 16,330,000(8) | | | Goldman Sachs Financial Square Government Fund – Institutional Shares, 0.340% | | | | | 16,330,000 | | | | | | 3.3 | | |
| 970,000 (7)(8) | | | Invesco Short-Term Investments Trust Government & Agency Portfolio – Institutional Class, 0.490% | | | | | 970,000 | | | | | | 0.2 | | |
| 768,000(7)(8) | | | Morgan Stanley Institutional Liquidity Funds – Government Portfolio (Institutional Share Class), 0.250% | | | | | 768,000 | | | | | | 0.2 | | |
| Shares | | | Value | | | Percentage of Net Assets | | |||||||||
| SHORT-TERM INVESTMENTS: (continued) | | |||||||||||||||
| | | | Mutual Funds (continued) | | ||||||||||||
| | | | Total Mutual Funds | | | | | | | | | | | | | |
| | | | (Cost $19,008,000) | | | | $ | 19,008,000 | | | | | | 3.9 | | |
| | | | Total Short-Term Investments | | | | | | | | | | | | | |
| | | | (Cost $60,805,220) | | | | | 60,803,841 | | | | | | 12.4 | | |
| | | | Total Investments in Securities | | ||||||||||||
| | | | (Cost $555,523,499) | | | | $ | 520,209,302 | | | | | | 106.5 | | |
| | | | Liabilities in Excess of Other Assets | | | | | (31,886,197) | | | | | | (6.5) | | |
| | | | Net Assets | | | | $ | 488,323,105 | | | | | | 100.0 | | |
| | ||||||||||||||||
| Voya High Yield Bond Fund | as of March 31, 2020 (continued) |
| | | | Quoted Prices in Active Markets for Identical Investments (Level 1) | | | Significant Other Observable Inputs (Level 2) | | | Significant Unobservable Inputs (Level 3) | | | Fair Value at March 31, 2020 | | ||||||||||||
| Asset Table | | | | | | | | | | | | | | | | | | | | | | | | | |
| Investments, at fair value | | | | | | | | | | | | | | | | | | | | | | | | | |
| Common Stock | | | | | | | | | | | | | | | | | | | | | | | | | |
| Consumer Staples | | | | $ | — | | | | | $ | — | | | | | $ | 889,248 | | | | | $ | 889,248 | | |
| Total Common Stock | | | | | — | | | | | | — | | | | | | 889,248 | | | | | | 889,248 | | |
| Corporate Bonds/Notes | | | | | — | | | | | | 453,195,147 | | | | | | — | | | | | | 453,195,147 | | |
| Bank Loans | | | | | — | | | | | | 4,812,097 | | | | | | — | | | | | | 4,812,097 | | |
| Convertible Bonds/Notes | | | | | — | | | | | | 508,969 | | | | | | — | | | | | | 508,969 | | |
| Short-Term Investments | | | | | 16,330,000 | | | | | | 44,473,841 | | | | | | — | | | | | | 60,803,841 | | |
| Total Investments, at fair value | | | | $ | 16,330,000 | | | | | $ | 502,990,054 | | | | | $ | 889,248 | | | | | $ | 520,209,302 | | |
| | Cost for federal income tax purposes was $555,749,997. | | | |||||
| | Net unrealized depreciation consisted of: | | | |||||
| | Gross Unrealized Appreciation | | | | $ | 5,936,677 | | |
| | Gross Unrealized Depreciation | | | | | (41,477,372) | | |
| | Net Unrealized Depreciation | | | | $ | (35,540,695) | | |
| Voya Intermediate Bond Fund | as of March 31, 2020 |
| Principal Amount† | | | Value | | | Percentage of Net Assets | | |||||||||
| CORPORATE BONDS/NOTES: 32.5% | | |||||||||||||||
| | | | Basic Materials: 1.0% | | ||||||||||||
| 1,377,000 (1) | | | Anglo American Capital PLC, 3.625%, 09/11/2024 | | | | $ | 1,298,205 | | | | | | 0.0 | | |
| 2,746,000 (1) | | | Anglo American Capital PLC, 4.875%, 05/14/2025 | | | | | 2,669,217 | | | | | | 0.1 | | |
| 1,846,000 (1) | | | Anglo American Capital PLC, 5.625%, 04/01/2030 | | | | | 1,877,489 | | | | | | 0.0 | | |
| 750,000 (1) | | | Braskem Netherlands Finance BV, 4.500%, 01/31/2030 | | | | | 586,500 | | | | | | 0.0 | | |
| 3,410,000 (1) | | | Chevron Phillips Chemical Co. LLC / Chevron Phillips Chemical Co. L.P., 3.700%, 06/01/2028 | | | | | 3,463,457 | | | | | | 0.0 | | |
| 1,960,000 (1) | | | Georgia-Pacific LLC, 3.163%, 11/15/2021 | | | | | 1,987,912 | | | | | | 0.0 | | |
| 7,120,000 (1) | | | Newcrest Finance Pty Ltd., 4.450%, 11/15/2021 | | | | | 7,305,384 | | | | | | 0.1 | | |
| 4,300,000 (1) | | | Novelis Corp., 4.750%, 01/30/2030 | | | | | 3,851,187 | | | | | | 0.0 | | |
| 7,180,000 (1)(2) | | | Valvoline, Inc., 4.250%, 02/15/2030 | | | | | 6,717,788 | | | | | | 0.1 | | |
| 56,397,000 | | | Other Securities | | | | | 54,442,415 | | | | | | 0.7 | | |
| | | | | | | | | 84,199,554 | | | | | | 1.0 | | |
| | | | Communications: 2.8% | | ||||||||||||
| 27,879,000 (2) | | | AT&T, Inc., 2.950%- 5.150%, 07/15/2026- 02/15/2050 | | | | | 30,914,884 | | | | | | 0.4 | | |
| 26,839,000 (2) | | | Comcast Corp., 2.650%- 4.600%, 10/15/2025- 11/01/2049 | | | | | 30,393,428 | | | | | | 0.4 | | |
| 9,425,000 (1)(2) | | | CommScope Technologies LLC, 5.000%, 03/15/2027 | | | | | 8,247,582 | | | | | | 0.1 | | |
| 8,250,000 (1) | | | CSC Holdings LLC, 5.750%, 01/15/2030 | | | | | 8,350,732 | | | | | | 0.1 | | |
| 1,875,000 (1)(2) | | | Deutsche Telekom AG, 3.625%, 01/21/2050 | | | | | 1,874,551 | | | | | | 0.0 | | |
| 9,075,000 (1) | | | Front Range BidCo, Inc., 4.000%, 03/01/2027 | | | | | 8,734,688 | | | | | | 0.1 | | |
| 8,075,000 (1) | | | Gray Television, Inc., 7.000%, 05/15/2027 | | | | | 8,079,441 | | | | | | 0.1 | | |
| 4,425,000 (1) | | | Match Group, Inc., 4.125%, 08/01/2030 | | | | | 3,979,734 | | | | | | 0.0 | | |
| 9,365,000 (1) | | | NBCUniversal Enterprise, Inc., 5.250%, 12/31/2199 | | | | | 9,366,264 | | | | | | 0.1 | | |
| 3,835,000 (1)(2) | | | Sinclair Television Group, Inc., 5.125%, 02/15/2027 | | | | | 3,273,335 | | | | | | 0.0 | | |
| 3,990,000 (1) | | | Sirius XM Radio, Inc., 5.500%, 07/01/2029 | | | | | 4,091,944 | | | | | | 0.1 | | |
| Principal Amount† | | | Value | | | Percentage of Net Assets | | |||||||||
| CORPORATE BONDS/NOTES: (continued) | | |||||||||||||||
| | | | Communications (continued) | | ||||||||||||
| 3,420,000 (1) | | | Tencent Holdings Ltd., 2.985%, 01/19/2023 | | | | $ | 3,491,800 | | | | | | 0.0 | | |
| 20,200,000 (2) | | | Verizon Communications, Inc., 3.850%-4.812%, 12/03/2029-03/22/2050 | | | | | 23,579,447 | | | | | | 0.3 | | |
| 5,195,000 (1)(2) | | | ViaSat, Inc., 5.625%, 04/15/2027 | | | | | 5,158,895 | | | | | | 0.1 | | |
| 77,671,000 (3) | | | Other Securities | | | | | 80,701,901 | | | | | | 1.0 | | |
| | | | | | | | | 230,238,626 | | | | | | 2.8 | | |
| | | | Consumer, Cyclical: 1.9% | | ||||||||||||
| 6,225,000 (1) | | | 1011778 BC ULC / New Red Finance, Inc., 5.000%, 10/15/2025 | | | | | 5,983,750 | | | | | | 0.1 | | |
| 5,115,000 (1)(2) | | | Asbury Automotive Group, Inc., 4.750%, 03/01/2030 | | | | | 4,386,112 | | | | | | 0.1 | | |
| 4,205,000 (1) | | | BMW US Capital LLC, 3.400%, 08/13/2021 | | | | | 4,200,632 | | | | | | 0.0 | | |
| 4,340,000 (1) | | | BMW US Capital LLC, 3.450%, 04/12/2023 | | | | | 4,316,651 | | | | | | 0.1 | | |
| 5,195,000 (1)(2) | | | Caesars Resort Collection LLC / CRC Finco, Inc., 5.250%, 10/15/2025 | | | | | 3,790,792 | | | | | | 0.0 | | |
| 4,640,000 (1) | | | Daimler Finance North America LLC, 2.125%, 03/10/2025 | | | | | 4,279,127 | | | | | | 0.0 | | |
| 5,659,000 (1) | | | Daimler Finance North America LLC, 2.300%, 02/12/2021 | | | | | 5,517,694 | | | | | | 0.1 | | |
| 6,383,000 (1) | | | Daimler Finance North America LLC, 2.550%, 08/15/2022 | | | | | 6,128,016 | | | | | | 0.1 | | |
| 3,060,000 (1) | | | Dana Financing Luxembourg Sarl, 6.500%, 06/01/2026 | | | | | 2,719,422 | | | | | | 0.0 | | |
| 6,440,000 (1)(2) | | | PetSmart, Inc., 5.875%, 06/01/2025 | | | | | 6,391,700 | | | | | | 0.1 | | |
| 3,080,000 (1)(2) | | | Six Flags Entertainment Corp., 5.500%, 04/15/2027 | | | | | 2,611,994 | | | | | | 0.0 | | |
| 114,921,444 (3) | | | Other Securities | | | | | 107,659,980 | | | | | | 1.3 | | |
| | | | | | | | | 157,985,870 | | | | | | 1.9 | | |
| | | | Consumer, Non-cyclical: 5.6% | | ||||||||||||
| 2,740,000 (1) | | | AbbVie, Inc., 2.300%, 11/21/2022 | | | | | 2,741,312 | | | | | | 0.0 | | |
| 5,636,000 (1) | | | AbbVie, Inc., 2.600%, 11/21/2024 | | | | | 5,737,335 | | | | | | 0.1 | | |
| 3,188,000 (1) | | | AbbVie, Inc., 2.950%, 11/21/2026 | | | | | 3,255,748 | | | | | | 0.0 | | |
| Voya Intermediate Bond Fund | as of March 31, 2020 (continued) |
| Principal Amount† | | | Value | | | Percentage of Net Assets | | |||||||||
| CORPORATE BONDS/NOTES: (continued) | | |||||||||||||||
| | | | Consumer, Non-cyclical (continued) | | ||||||||||||
| 2,763,000 (1) | | | AbbVie, Inc., 3.200%, 11/21/2029 | | | | $ | 2,835,875 | | | | | | 0.0 | | |
| 3,172,000 (1) | | | AbbVie, Inc., 4.050%, 11/21/2039 | | | | | 3,342,194 | | | | | | 0.1 | | |
| 12,150,000 | | | AbbVie, Inc., 2.900%-4.500%, 11/14/2021-05/14/2046 | | | | | 13,057,583 | | | | | | 0.2 | | |
| 3,975,000 (1) | | | Albertsons Cos, Inc. / Safeway, Inc. / New Albertsons L.P. / Albertsons LLC, 4.625%, 01/15/2027 | | | | | 3,977,186 | | | | | | 0.0 | | |
| 4,145,000 (1)(2) | | | Albertsons Cos, Inc. / Safeway, Inc. / New Albertsons L.P. / Albertsons LLC, 5.875%, 02/15/2028 | | | | | 4,241,786 | | | | | | 0.1 | | |
| 3,440,000 (1) | | | Alcon Finance Corp., 3.800%, 09/23/2049 | | | | | 3,464,262 | | | | | | 0.0 | | |
| 16,550,000 | | | Anheuser-Busch Cos LLC / Anheuser-Busch InBev Worldwide, Inc., 4.700%-4.900%, 02/01/2036-02/01/2046 | | | | | 17,965,141 | | | | | | 0.2 | | |
| 4,130,000 | | | Anheuser-Busch InBev Worldwide, Inc., 4.439%-5.450%, 01/23/2039-10/06/2048 | | | | | 4,545,697 | | | | | | 0.1 | | |
| 4,970,000 (1) | | | Bausch Health Cos, Inc., 5.250%, 01/30/2030 | | | | | 4,684,225 | | | | | | 0.1 | | |
| 3,275,000 (1)(2) | | | Bausch Health Cos, Inc., 6.125%, 04/15/2025 | | | | | 3,246,360 | | | | | | 0.0 | | |
| 4,662,000 (1) | | | Bristol-Myers Squibb Co., 3.875%, 08/15/2025 | | | | | 5,067,617 | | | | | | 0.1 | | |
| 2,250,000 (1) | | | Bristol-Myers Squibb Co., 2.550%, 05/14/2021 | | | | | 2,277,044 | | | | | | 0.0 | | |
| 3,421,000 (1) | | | Bristol-Myers Squibb Co., 4.125%, 06/15/2039 | | | | | 4,144,794 | | | | | | 0.1 | | |
| 5,406,000 (1) | | | Bristol-Myers Squibb Co., 4.550%, 02/20/2048 | | | | | 6,881,975 | | | | | | 0.1 | | |
| 5,377,000 (1) | | | Cargill, Inc., 3.875%, 05/23/2049 | | | | | 6,534,099 | | | | | | 0.1 | | |
| 4,450,000 (1) | | | Centene Corp., 3.375%, 02/15/2030 | | | | | 4,155,187 | | | | | | 0.0 | | |
| 6,698,000 (1) | | | Cigna Corp., 3.050%, 11/30/2022 | | | | | 6,875,548 | | | | | | 0.1 | | |
| 3,471,000 (1) | | | Cigna Corp., 3.250%, 04/15/2025 | | | | | 3,549,189 | | | | | | 0.1 | | |
| 25,562,000 | | | Cigna Corp., 3.200%-4.900%, 09/17/2020-03/15/2050 | | | | | 26,653,956 | | | | | | 0.3 | | |
| Principal Amount† | | | Value | | | Percentage of Net Assets | | |||||||||
| CORPORATE BONDS/NOTES: (continued) | | |||||||||||||||
| | | | Consumer, Non-cyclical (continued) | | ||||||||||||
| 19,437,000 (2) | | | CVS Health Corp., 3.700%-5.050%, 03/09/2023-03/25/2048 | | | | $ | 21,284,247 | | | | | | 0.3 | | |
| 7,379,000 (1) | | | Danone SA, 2.947%, 11/02/2026 | | | | | 7,386,050 | | | | | | 0.1 | | |
| 2,290,000 (1) | | | Imperial Brands Finance PLC, 3.750%, 07/21/2022 | | | | | 2,292,034 | | | | | | 0.0 | | |
| 3,849,000 (1) | | | Kraft Heinz Foods Co., 4.875%, 02/15/2025 | | | | | 3,858,139 | | | | | | 0.0 | | |
| 992,000 (1) | | | Mars, Inc., 3.200%, 04/01/2030 | | | | | 1,038,814 | | | | | | 0.0 | | |
| 1,321,000 (1) | | | Mars, Inc., 3.875%, 04/01/2039 | | | | | 1,410,594 | | | | | | 0.0 | | |
| 3,336,000 (1) | | | Mars, Inc., 4.125%, 04/01/2054 | | | | | 3,794,840 | | | | | | 0.1 | | |
| 6,665,000 (1)(2) | | | Pilgrim’s Pride Corp., 5.875%, 09/30/2027 | | | | | 6,677,997 | | | | | | 0.1 | | |
| 8,405,000 (1) | | | Post Holdings, Inc., 5.500%, 12/15/2029 | | | | | 8,765,154 | | | | | | 0.1 | | |
| 2,250,000 (1) | | | SC Johnson & Son, Inc., 4.750%, 10/15/2046 | | | | | 2,680,041 | | | | | | 0.0 | | |
| 8,680,000 (1) | | | Tenet Healthcare Corp., 5.125%, 11/01/2027 | | | | | 8,321,950 | | | | | | 0.1 | | |
| 19,549,000 | | | Unilever Capital Corp., 3.000%-3.250%, 03/07/2022-03/07/2024 | | | | | 20,457,699 | | | | | | 0.2 | | |
| 222,814,000 (3) | | | Other Securities | | | | | 230,531,963 | | | | | | 2.8 | | |
| | | | | | | | | 457,733,635 | | | | | | 5.6 | | |
| | | | Energy: 3.3% | | ||||||||||||
| 4,095,000 (1) | | | Cheniere Corpus Christi Holdings LLC, 3.700%, 11/15/2029 | | | | | 3,079,943 | | | | | | 0.0 | | |
| 5,525,000 (1) | | | Crestwood Midstream Partners L.P. / Crestwood Midstream Finance Corp., 5.625%, 05/01/2027 | | | | | 3,079,000 | | | | | | 0.0 | | |
| 400,000 (1) | | | Empresa Nacional del Petroleo, 3.750%, 08/05/2026 | | | | | 375,726 | | | | | | 0.0 | | |
| 1,575,000 (1) | | | KazMunayGas National Co. JSC, 5.375%, 04/24/2030 | | | | | 1,557,675 | | | | | | 0.0 | | |
| 1,020,000 (1) | | | MPLX L.P., 5.250%, 01/15/2025 | | | | | 899,462 | | | | | | 0.0 | | |
| 10,650,000 (1)(2) | | | Pertamina Persero PT, 3.100%, 01/21/2030 | | | | | 9,477,806 | | | | | | 0.1 | | |
| 4,000,000 (1) | | | Petroleos del Peru SA, 4.750%, 06/19/2032 | | | | | 3,674,210 | | | | | | 0.1 | | |
| 12,600,000 (1) | | | Petroleos Mexicanos, 5.950%, 01/28/2031 | | | | | 8,726,760 | | | | | | 0.1 | | |
| Voya Intermediate Bond Fund | as of March 31, 2020 (continued) |
| Principal Amount† | | | Value | | | Percentage of Net Assets | | |||||||||
| CORPORATE BONDS/NOTES: (continued) | | |||||||||||||||
| | | | Energy (continued) | | ||||||||||||
| 5,190,000 (1) | | | Schlumberger Investment SA, 2.400%, 08/01/2022 | | | | $ | 5,093,153 | | | | | | 0.1 | | |
| 1,656,000 (1) | | | Schlumberger Oilfield UK PLC, 4.200%, 01/15/2021 | | | | | 1,677,750 | | | | | | 0.0 | | |
| 282,899,000 (3) | | | Other Securities | | | | | 234,770,057 | | | | | | 2.9 | | |
| | | | | | | | | 272,411,542 | | | | | | 3.3 | | |
| | | | Financial: 10.3% | | ||||||||||||
| 9,100,000 (1) | | | ABN AMRO Bank NV, 4.750%, 07/28/2025 | | | | | 9,175,892 | | | | | | 0.1 | | |
| 2,465,000 (1)(2) | | | ANZ New Zealand Int’l Ltd./London, 2.550%, 02/13/2030 | | | | | 2,407,055 | | | | | | 0.0 | | |
| 3,420,000 (1) | | | ANZ New Zealand Int’l Ltd./London, 3.400%, 03/19/2024 | | | | | 3,546,776 | | | | | | 0.1 | | |
| 4,600,000 (1)(2) | | | Banco Bradesco SA/ Cayman Islands, 3.200%, 01/27/2025 | | | | | 4,214,796 | | | | | | 0.1 | | |
| 50,645,000 (2)(4) | | | Bank of America Corp., 2.496%-5.125%, 05/17/2022-12/31/2199 | | | | | 52,860,949 | | | | | | 0.6 | | |
| 3,395,000 (1) | | | Banque Federative du Credit Mutuel SA, 2.375%, 11/21/2024 | | | | | 3,330,849 | | | | | | 0.0 | | |
| 2,980,000 (1) | | | Barclays Bank PLC, 10.179%, 06/12/2021 | | | | | 3,168,065 | | | | | | 0.0 | | |
| 9,060,000 (1)(4) | | | BNP Paribas SA, 2.819%, 11/19/2025 | | | | | 8,966,122 | | | | | | 0.1 | | |
| 2,000,000 (1)(4) | | | BNP Paribas SA, 3.052%, 01/13/2031 | | | | | 1,902,302 | | | | | | 0.0 | | |
| 4,499,000 (1) | | | BNP Paribas SA, 3.375%, 01/09/2025 | | | | | 4,477,820 | | | | | | 0.1 | | |
| 8,130,000 (1)(2) | | | BPCE SA, 2.700%, 10/01/2029 | | | | | 7,732,702 | | | | | | 0.1 | | |
| 2,094,000 (1) | | | BPCE SA, 5.150%, 07/21/2024 | | | | | 2,211,627 | | | | | | 0.0 | | |
| 7,020,000 (1) | | | BPCE SA, 5.700%, 10/22/2023 | | | | | 7,225,545 | | | | | | 0.1 | | |
| 25,155,000 (2)(4) | | | Canadian Imperial Bank of Commerce, 2.250%-3.100%, 07/22/2023-01/28/2025 | | | | | 25,252,234 | | | | | | 0.3 | | |
| 5,310,000 | | | Citibank NA, 3.400%, 07/23/2021 | | | | | 5,394,995 | | | | | | 0.1 | | |
| 8,085,000 (4) | | | Citigroup, Inc., 2.876%-5.500%, 07/24/2023-09/13/2025 | | | | | 8,669,397 | | | | | | 0.1 | | |
| Principal Amount† | | | Value | | | Percentage of Net Assets | | |||||||||
| CORPORATE BONDS/NOTES: (continued) | | |||||||||||||||
| | | | Financial (continued) | | ||||||||||||
| 1,147,000 (1)(2) | | | Citizens Financial Group, Inc., 4.150%, 09/28/2022 | | | | $ | 1,175,788 | | | | | | 0.0 | | |
| 1,520,000 (1) | | | Commonwealth Bank of Australia, 3.743%, 09/12/2039 | | | | | 1,289,144 | | | | | | 0.0 | | |
| 4,330,000 (1) | | | Credit Agricole SA/ London, 2.375%, 07/01/2021 | | | | | 4,261,594 | | | | | | 0.1 | | |
| 4,000,000 (1) | | | Credit Agricole SA/ London, 2.375%, 01/22/2025 | | | | | 3,922,556 | | | | | | 0.1 | | |
| 4,068,000 (1) | | | Credit Suisse AG, 6.500%, 08/08/2023 | | | | | 4,158,741 | | | | | | 0.0 | | |
| 6,870,000 (1)(4) | | | Credit Suisse Group AG, 2.997%, 12/14/2023 | | | | | 6,697,187 | | | | | | 0.1 | | |
| 1,170,000 (1)(4) | | | Credit Suisse Group AG, 3.869%, 01/12/2029 | | | | | 1,186,702 | | | | | | 0.0 | | |
| 3,166,000 (1)(4) | | | Credit Suisse Group AG, 4.194%, 04/01/2031 | | | | | 3,249,807 | | | | | | 0.1 | | |
| 1,441,000 (1) | | | Credit Suisse Group AG, 4.282%, 01/09/2028 | | | | | 1,478,702 | | | | | | 0.0 | | |
| 5,660,000 | | | Credit Suisse Group Funding Guernsey Ltd., 3.450%-3.800%, 04/16/2021-09/15/2022 | | | | | 5,733,776 | | | | | | 0.1 | | |
| 8,650,000 (1) | | | Danske Bank A/S, 2.800%, 03/10/2021 | | | | | 8,641,725 | | | | | | 0.1 | | |
| 2,005,000 (1) | | | Danske Bank A/S, 5.000%, 01/12/2022 | | | | | 2,054,423 | | | | | | 0.0 | | |
| 8,775,000 (1)(2) | | | ESH Hospitality, Inc., 4.625%, 10/01/2027 | | | | | 6,893,201 | | | | | | 0.1 | | |
| 2,931,000 (1)(2) | | | Fairfax US, Inc., 4.875%, 08/13/2024 | | | | | 3,090,588 | | | | | | 0.0 | | |
| 4,670,000 (1) | | | Federation des Caisses Desjardins du Quebec, 2.050%, 02/10/2025 | | | | | 4,529,095 | | | | | | 0.0 | | |
| 13,105,000 (1)(2) | | | Federation des Caisses Desjardins du Quebec, 2.250%, 10/30/2020 | | | | | 12,987,563 | | | | | | 0.2 | | |
| 3,135,000 (1)(4) | | | Harborwalk Funding Trust, 5.077%, 02/15/2069 | | | | | 3,709,803 | | | | | | 0.0 | | |
| 4,791,000 (1) | | | HSBC Bank PLC, 4.125%, 08/12/2020 | | | | | 4,805,219 | | | | | | 0.1 | | |
| 24,316,000 (4) | | | HSBC Holdings PLC, 2.633%-6.000%, 05/18/2024-12/31/2199 | | | | | 24,719,210 | | | | | | 0.3 | | |
| Voya Intermediate Bond Fund | as of March 31, 2020 (continued) |
| Principal Amount† | | | Value | | | Percentage of Net Assets | | |||||||||
| CORPORATE BONDS/NOTES: (continued) | | |||||||||||||||
| | | | Financial (continued) | | ||||||||||||
| 2,500,000 (1)(2) | | | Itau Unibanco Holding SA/Cayman Island, 3.250%, 01/24/2025 | | | | $ | 2,343,000 | | | | | | 0.0 | | |
| 49,599,000 (2)(4) | | | JPMorgan Chase & Co., 2.301%-5.000%, 10/29/2020-12/31/2199 | | | | | 51,577,433 | | | | | | 0.6 | | |
| 2,838,000 (1) | | | KKR Group Finance Co. VII LLC, 3.625%, 02/25/2050 | | | | | 2,354,924 | | | | | | 0.0 | | |
| 6,322,000 (1) | | | Liberty Mutual Group, Inc., 3.951%, 10/15/2050 | | | | | 5,894,021 | | | | | | 0.1 | | |
| 3,080,000 (1) | | | Mizuho Financial Group, Inc., 2.632%, 04/12/2021 | | | | | 3,081,448 | | | | | | 0.1 | | |
| 660,000 (1)(2) | | | Mizuho Financial Group, Inc., 3.477%, 04/12/2026 | | | | | 652,438 | | | | | | 0.0 | | |
| 26,071,000 (4) | | | Morgan Stanley, 2.750%-5.597%, 07/28/2021-03/24/2051 | | | | | 28,122,421 | | | | | | 0.3 | | |
| 2,990,000 (1)(4) | | | National Australia Bank Ltd., 3.933%, 08/02/2034 | | | | | 2,950,206 | | | | | | 0.0 | | |
| 5,105,000 (1) | | | Nationwide Building Society, 2.000%, 01/27/2023 | | | | | 5,003,589 | | | | | | 0.1 | | |
| 1,000,000 (1)(2)(4) | | | NBK Tier 1 Financing 2 Ltd., 4.500%, 12/31/2199 | | | | | 945,000 | | | | | | 0.0 | | |
| 3,915,000 (1)(2) | | | New York Life Global Funding, 2.875%, 04/10/2024 | | | | | 4,026,762 | | | | | | 0.1 | | |
| 1,345,000 (1)(2)(4) | | | Nordea Bank ABP, 6.125%, 12/31/2199 | | | | | 1,197,312 | | | | | | 0.0 | | |
| 4,068,000 (1) | | | Northwestern Mutual Life Insurance Co/The, 3.625%, 09/30/2059 | | | | | 3,591,846 | | | | | | 0.0 | | |
| 4,200,000 (1) | | | Quicken Loans, Inc., 5.250%, 01/15/2028 | | | | | 4,136,024 | | | | | | 0.1 | | |
| 4,410,000 | | | Royal Bank of Canada, 2.560%, (US0003M + 0.660%), 10/05/2023 | | | | | 4,371,906 | | | | | | 0.1 | | |
| 5,930,000 (1) | | | Societe Generale SA, 3.000%, 01/22/2030 | | | | | 5,457,357 | | | | | | 0.1 | | |
| 24,960,000 (2) | | | Toronto-Dominion Bank/The, 2.650%- 3.500%, 09/17/2020- 06/12/2024 | | | | | 25,719,351 | | | | | | 0.3 | | |
| 4,125,000 (1) | | | Turkiye Vakiflar Bankasi TAO, 5.250%, 02/05/2025 | | | | | 3,476,550 | | | | | | 0.0 | | |
| 7,760,000 (1) | | | UBS AG/London, 2.450%, 12/01/2020 | | | | | 7,741,229 | | | | | | 0.1 | | |
| 7,779,000 (1)(4) | | | UBS Group AG, 2.859%, 08/15/2023 | | | | | 7,722,130 | | | | | | 0.1 | | |
| Principal Amount† | | | Value | | | Percentage of Net Assets | | |||||||||
| CORPORATE BONDS/NOTES: (continued) | | |||||||||||||||
| | | | Financial (continued) | | ||||||||||||
| 2,565,000 (1)(4) | | | UBS Group AG, 3.126%, 08/13/2030 | | | | $ | 2,507,577 | | | | | | 0.0 | | |
| 33,459,000 (4) | | | Wells Fargo & Co., 2.406%-4.750%, 08/15/2023-12/07/2046 | | | | | 34,254,157 | | | | | | 0.4 | | |
| 381,454,006 (3)(5) | | | Other Securities | | | | | 382,457,558 | | | | | | 4.7 | | |
| | | | | | | | | 844,706,189 | | | | | | 10.3 | | |
| | | | Industrial: 2.0% | | ||||||||||||
| 8,620,000 (1) | | | Airbus Finance BV, 2.700%, 04/17/2023 | | | | | 8,446,989 | | | | | | 0.1 | | |
| 8,465,000 (1) | | | Builders FirstSource, Inc., 5.000%, 03/01/2030 | | | | | 7,666,116 | | | | | | 0.1 | | |
| 2,350,000 (1) | | | Carrier Global Corp., 2.242%, 02/15/2025 | | | | | 2,302,830 | | | | | | 0.0 | | |
| 3,290,000 (1) | | | Carrier Global Corp., 2.493%, 02/15/2027 | | | | | 3,155,593 | | | | | | 0.1 | | |
| 2,965,000 (1) | | | Carrier Global Corp., 2.722%, 02/15/2030 | | | | | 2,745,536 | | | | | | 0.0 | | |
| 3,085,000 (1) | | | Carrier Global Corp., 3.577%, 04/05/2050 | | | | | 2,786,900 | | | | | | 0.0 | | |
| 1,475,000 (1) | | | FXI Holdings, Inc., 7.875%, 11/01/2024 | | | | | 1,007,159 | | | | | | 0.0 | | |
| 3,975,000 (1)(2) | | | Owens-Brockway Glass Container, Inc., 5.875%, 08/15/2023 | | | | | 3,920,364 | | | | | | 0.1 | | |
| 5,565,000 (1)(2) | | | Sealed Air Corp., 4.000%, 12/01/2027 | | | | | 5,217,744 | | | | | | 0.1 | | |
| 2,570,000 (1) | | | SMBC Aviation Capital Finance DAC, 2.650%, 07/15/2021 | | | | | 2,549,307 | | | | | | 0.0 | | |
| 2,540,000 (1)(2) | | | SMBC Aviation Capital Finance DAC, 3.550%, 04/15/2024 | | | | | 2,715,990 | | | | | | 0.1 | | |
| 1,125,000 (1) | | | Standard Industries, Inc./NJ, 4.750%, 01/15/2028 | | | | | 1,043,907 | | | | | | 0.0 | | |
| 2,885,000 (1)(2) | | | Standard Industries, Inc./NJ, 5.000%, 02/15/2027 | | | | | 2,645,451 | | | | | | 0.0 | | |
| 4,150,000 (1) | | | Summit Materials LLC / Summit Materials Finance Corp., 5.125%, 06/01/2025 | | | | | 3,895,792 | | | | | | 0.0 | | |
| 5,745,000 (1) | | | TTX Co., 3.600%, 01/15/2025 | | | | | 6,071,147 | | | | | | 0.1 | | |
| 2,209,000 (1) | | | Vinci SA, 3.750%, 04/10/2029 | | | | | 2,390,498 | | | | | | 0.0 | | |
| 103,823,000 (3) | | | Other Securities | | | | | 107,878,238 | | | | | | 1.3 | | |
| | | | | | | | | 166,439,561 | | | | | | 2.0 | | |
| Voya Intermediate Bond Fund | as of March 31, 2020 (continued) |
| Principal Amount† | | | Value | | | Percentage of Net Assets | | |||||||||
| CORPORATE BONDS/NOTES: (continued) | | |||||||||||||||
| | | | Technology: 1.6% | | ||||||||||||
| 23,353,000 | | | Apple, Inc., 2.400%- 4.450%, 01/13/2023- 11/13/2047 | | | | $ | 26,765,716 | | | | | | 0.3 | | |
| 2,143,000 (1) | | | Dell International LLC / EMC Corp., 6.020%, 06/15/2026 | | | | | 2,284,810 | | | | | | 0.1 | | |
| 22,380,000 | | | Microsoft Corp., 2.400%- 4.450%, 08/08/2026- 08/08/2046 | | | | | 26,556,084 | | | | | | 0.3 | | |
| 70,601,000 (3) | | | Other Securities | | | | | 74,659,664 | | | | | | 0.9 | | |
| | | | | | | | | 130,266,274 | | | | | | 1.6 | | |
| | | | Utilities: 4.0% | | ||||||||||||
| 7,500,000 (1) | | | American Transmission Systems, Inc., 5.000%, 09/01/2044 | | | | | 8,533,098 | | | | | | 0.1 | | |
| 5,385,000 (1) | | | American Transmission Systems, Inc., 5.250%, 01/15/2022 | | | | | 5,731,769 | | | | | | 0.1 | | |
| 6,300,000 (1)(2) | | | Centrais Eletricas Brasileiras SA, 3.625%, 02/04/2025 | | | | | 5,610,213 | | | | | | 0.1 | | |
| 2,166,000 (1) | | | Cleveland Electric Illuminating Co/The, 3.500%, 04/01/2028 | | | | | 2,052,052 | | | | | | 0.0 | | |
| 2,155,000 (4) | | | Duke Energy Corp., 4.875%, 12/31/2199 | | | | | 1,811,698 | | | | | | 0.0 | | |
| 3,030,000 | | | Duke Energy Florida LLC, 4.200%, 07/15/2048 | | | | | 3,469,396 | | | | | | 0.0 | | |
| 3,500,000 | | | Duke Energy Indiana LLC, 3.250%, 10/01/2049 | | | | | 3,553,768 | | | | | | 0.1 | | |
| 10,454,000 (2) | | | Duke Energy Carolinas LLC, 2.950%-4.000%, 12/01/2026-08/15/2049 | | | | | 11,125,416 | | | | | | 0.1 | | |
| 7,400,000 | | | Duke Energy Progress LLC, 3.700%-4.200%, 08/15/2045-10/15/2046 | | | | | 8,259,613 | | | | | | 0.1 | | |
| 3,199,000 (1) | | | Jersey Central Power & Light Co., 4.300%, 01/15/2026 | | | | | 3,426,674 | | | | | | 0.0 | | |
| 3,950,000 (1) | | | Kallpa Generacion SA, 4.125%, 08/16/2027 | | | | | 3,582,857 | | | | | | 0.1 | | |
| 1,950,000 (1) | | | Metropolitan Edison Co., 3.500%, 03/15/2023 | | | | | 2,032,264 | | | | | | 0.0 | | |
| 750,000 (1) | | | Perusahaan Listrik Negara PT, 5.375%, 01/25/2029 | | | | | 786,407 | | | | | | 0.0 | | |
| Principal Amount† | | | Value | | | Percentage of Net Assets | | |||||||||
| CORPORATE BONDS/NOTES: (continued) | | |||||||||||||||
| | | | Utilities (continued) | | ||||||||||||
| 4,500,000 (1) | | | Perusahaan Listrik Negara PT, 5.450%, 05/21/2028 | | | | $ | 4,722,142 | | | | | | 0.1 | | |
| 259,684,000 (3) | | | Other Securities | | | | | 263,974,575 | | | | | | 3.2 | | |
| | | | | | | | | 328,671,942 | | | | | | 4.0 | | |
| | | | Total Corporate Bonds/Notes (Cost $2,735,430,477) | | | | | 2,672,653,193 | | | | | | 32.5 | | |
| COLLATERALIZED MORTGAGE OBLIGATIONS: 20.8% | | |||||||||||||||
| 1,009,817 (1)(4) | | | Agate Bay Mortgage Trust 2014-2 B4, 3.880%, 09/25/2044 | | | | | 952,106 | | | | | | 0.0 | | |
| 2,808,625 | | | Alternative Loan Trust 2004-J7 MI, 1.967%, (US0001M + 1.020%), 10/25/2034 | | | | | 2,572,445 | | | | | | 0.1 | | |
| 2,774,073 | | | Alternative Loan Trust 2005-10CB 1A1, 1.447%, (US0001M + 0.500%), 05/25/2035 | | | | | 2,100,714 | | | | | | 0.1 | | |
| 2,309,395 | | | Alternative Loan Trust 2005-51 3A2A, 3.256%, (12MTA + 1.290%), 11/20/2035 | | | | | 1,913,236 | | | | | | 0.0 | | |
| 1,659,243 | | | Alternative Loan Trust 2005-J2 1A12, 1.347%, (US0001M + 0.400%), 04/25/2035 | | | | | 1,290,796 | | | | | | 0.0 | | |
| 176,465 | | | Alternative Loan Trust 2006-18CB A10, 1.347%, (US0001M + 0.400%), 07/25/2036 | | | | | 81,358 | | | | | | 0.0 | | |
| 1,058,299 | | | Alternative Loan Trust 2006-19CB A28, 1.547%, (US0001M + 0.600%), 08/25/2036 | | | | | 577,435 | | | | | | 0.0 | | |
| 937,939 | | | Alternative Loan Trust 2006-HY11 A1, 1.067%, (US0001M + 0.120%), 06/25/2036 | | | | | 799,309 | | | | | | 0.0 | | |
| 1,142,482 | | | Alternative Loan Trust 2007-23CB A3, 1.447%, (US0001M + 0.500%), 09/25/2037 | | | | | 452,191 | | | | | | 0.0 | | |
| 2,925,053 | | | Alternative Loan Trust 2007-2CB 2A1, 1.547%, (US0001M + 0.600%), 03/25/2037 | | | | | 1,443,026 | | | | | | 0.0 | | |
| Voya Intermediate Bond Fund | as of March 31, 2020 (continued) |
| Principal Amount† | | | Value | | | Percentage of Net Assets | | |||||||||
| COLLATERALIZED MORTGAGE OBLIGATIONS: (continued) | | |||||||||||||||
| 1,084,858 | | | Alternative Loan Trust 2007-8CB A3, 1.447%, (US0001M + 0.500%), 05/25/2037 | | | | $ | 531,262 | | | | | | 0.0 | | |
| 1,955,652 | | | American Home Mortgage Assets Trust 2007-4 A4, 1.237%, (US0001M + 0.290%), 08/25/2037 | | | | | 1,515,851 | | | | | | 0.0 | | |
| 2,473,473 (1)(4) | | | Arroyo Mortgage Trust 2019-3 A3, 3.416%, 10/25/2048 | | | | | 2,361,507 | | | | | | 0.0 | | |
| 1,011,229 | | | Banc of America Funding 2007-2 1A16 Trust, 1.547%, (US0001M + 0.600%), 03/25/2037 | | | | | 722,249 | | | | | | 0.0 | | |
| 1,038,114 (6) | | | Banc of America Mortgage 2007-2 A8 Trust, 6.000%, 05/25/2037 | | | | | 224,577 | | | | | | 0.0 | | |
| 4,530,504 | | | Bear Stearns Mortgage Funding Trust 2006-AR5 2A1, 1.137%, (US0001M + 0.190%), 01/25/2037 | | | | | 3,801,036 | | | | | | 0.1 | | |
| 1,905,745 (1)(4) | | | Chase Mortgage Finance Corp. 2019-1 B2, 3.967%, 03/25/2050 | | | | | 1,543,022 | | | | | | 0.0 | | |
| 2,226,180 (1)(4) | | | Chase Mortgage Finance Corp. 2019-1 B3, 3.967%, 03/25/2050 | | | | | 2,153,804 | | | | | | 0.1 | | |
| 1,369,284 (1)(4) | | | CIM Trust 2019-INV1 A1, 4.000%, 02/25/2049 | | | | | 1,363,594 | | | | | | 0.0 | | |
| 1,302,190 (1)(4) | | | CIM Trust 2019-INV3 A3, 3.500%, 08/25/2049 | | | | | 1,329,424 | | | | | | 0.0 | | |
| 6,446,246 (1)(4) | | | CIM Trust 2019-J1 1A2, 3.500%, 08/25/2049 | | | | | 6,495,930 | | | | | | 0.1 | | |
| 2,973,518 (1)(4) | | | CIM Trust 2019-J2 B2, 3.856%, 10/25/2049 | | | | | 2,417,323 | | | | | | 0.1 | | |
| 991,173 (1)(4) | | | CIM Trust 2019-J2 B3, 3.856%, 10/25/2049 | | | | | 768,378 | | | | | | 0.0 | | |
| 2,600,000 (1)(4) | | | CIM Trust 2019-R5 M2, 3.250%, 09/25/2059 | | | | | 2,333,228 | | | | | | 0.0 | | |
| 1,329,532 | | | Citicorp Mortgage Securities Trust Series 2006-3 1A4, 6.000%, 06/25/2036 | | | | | 1,275,699 | | | | | | 0.0 | | |
| 1,535,698 (4) | | | Citigroup Mortgage Loan Trust 2006-AR9 2A, 4.344%, 11/25/2036 | | | | | 1,162,947 | | | | | | 0.0 | | |
| 627,015 (4) | | | Citigroup Mortgage Loan Trust 2007-10 22AA, 4.128%, 09/25/2037 | | | | | 553,392 | | | | | | 0.0 | | |
| Principal Amount† | | | Value | | | Percentage of Net Assets | | |||||||||
| COLLATERALIZED MORTGAGE OBLIGATIONS: (continued) | | |||||||||||||||
| 1,575,907 (1)(4) | | | Citigroup Mortgage Loan Trust 2015-A B2, 4.500%, 06/25/2058 | | | | $ | 1,507,829 | | | | | | 0.1 | | |
| 1,680,000 (1)(4) | | | COLT 2018-2 M1 Mortgage Loan Trust, 4.189%, 07/27/2048 | | | | | 1,621,315 | | | | | | 0.0 | | |
| 1,550,000 (1)(4) | | | COLT 2018-3 M1 Mortgage Loan Trust, 4.283%, 10/26/2048 | | | | | 1,501,774 | | | | | | 0.0 | | |
| 2,000,000 (1)(4) | | | COLT 2019-1 M1 Mortgage Loan Trust, 4.518%, 03/25/2049 | | | | | 1,850,676 | | | | | | 0.0 | | |
| 1,887,464 (1)(4) | | | COLT 2019-4 A3 Mortgage Loan Trust, 2.988%, 11/25/2049 | | | | | 1,852,027 | | | | | | 0.1 | | |
| 7,550,000 (1) | | | Connecticut Avenue Securities Trust 2020-R02 2M2, 2.947%, (US0001M + 2.000%), 01/25/2040 | | | | | 5,002,444 | | | | | | 0.1 | | |
| 543,897 | | | Countrywide Alternative Loan Trust 2005-53T2 2A6, 1.447%, (US0001M + 0.500%), 11/25/2035 | | | | | 242,990 | | | | | | 0.0 | | |
| 5,912,165 | | | Countrywide Asset-Backed Certificates 2005-IM1 M1, 1.667%, (US0001M + 0.720%), 11/25/2035 | | | | | 5,550,257 | | | | | | 0.1 | | |
| 1,814,939 (1) | | | CSMC Series 2008-2R 1A1, 6.000%, 07/25/2037 | | | | | 1,607,394 | | | | | | 0.0 | | |
| 1,616,914 (1)(4) | | | CSMC Trust 2015-2 B3, 3.922%, 02/25/2045 | | | | | 1,600,823 | | | | | | 0.0 | | |
| 1,800,000 (1)(4) | | | Deephave Residential Mortgage Trust 2019-2A M1, 3.921%, 04/25/2059 | | | | | 1,698,039 | | | | | | 0.0 | | |
| 1,360,000 (1)(4) | | | Deephaven Residential Mortgage Trust 2018-1A M1, 3.939%, 12/25/2057 | | | | | 1,321,474 | | | | | | 0.0 | | |
| 1,000,000 (1)(4) | | | Deephaven Residential Mortgage Trust 2018-2A M1, 4.375%, 04/25/2058 | | | | | 965,474 | | | | | | 0.0 | | |
| 2,300,000 (1)(4) | | | Deephaven Residential Mortgage Trust 2019-1A M1, 4.402%, 08/25/2058 | | | | | 2,188,068 | | | | | | 0.1 | | |
| 1,000,000 (1)(4) | | | Deephaven Residential Mortgage Trust 2019-4 M1, 3.484%, 10/25/2059 | | | | | 859,780 | | | | | | 0.0 | | |
| 3,000,000 (1)(4) | | | Deephaven Residential Mortgage Trust 2020-1 M1, 3.010%, 01/25/2060 | | | | | 2,454,763 | | | | | | 0.0 | | |
| Voya Intermediate Bond Fund | as of March 31, 2020 (continued) |
| Principal Amount† | | | Value | | | Percentage of Net Assets | | |||||||||
| COLLATERALIZED MORTGAGE OBLIGATIONS: (continued) | | |||||||||||||||
| 90,711,977 (4)(6) | | | Deutsche ALT-A Securities, Inc. ALT 07-AB1 X, 0.845%, 04/25/2037 | | | | $ | 4,253,566 | | | | | | 0.1 | | |
| 3,251,458 (1)(4) | | | Ellington Financial Mortgage Trust 2019-2 A3, 3.046%, 11/25/2059 | | | | | 3,151,980 | | | | | | 0.0 | | |
| 4,535,593 (6) | | | Fannie Mae 2008-12 SC, 5.403%, (-1.000*US0001M + 6.350%), 03/25/2038 | | | | | 965,944 | | | | | | 0.0 | | |
| 8,358,699 | | | Fannie Mae 2011-99 CZ, 4.500%, 10/25/2041 | | | | | 9,800,132 | | | | | | 0.1 | | |
| 866,058 | | | Fannie Mae 2012-110 CA, 3.000%, 10/25/2042 | | | | | 922,331 | | | | | | 0.0 | | |
| 5,919,751 | | | Fannie Mae 2012-66 EP, 4.000%, 06/25/2042 | | | | | 7,136,981 | | | | | | 0.1 | | |
| 5,237,793 | | | Fannie Mae 2013-116 UB, 4.000%, 11/25/2043 | | | | | 5,757,126 | | | | | | 0.1 | | |
| 4,084,276 | | | Fannie Mae 2013-20 DL, 4.000%, 03/25/2033 | | | | | 4,600,030 | | | | | | 0.1 | | |
| 27,023,469 (6) | | | Fannie Mae 2016-82 SD, 5.103%, (-1.000*US0001M + 6.050%), 11/25/2046 | | | | | 6,067,028 | | | | | | 0.1 | | |
| 5,704,946 | | | Fannie Mae 2016-88 EA, 3.500%, 01/25/2045 | | | | | 6,161,501 | | | | | | 0.1 | | |
| 16,055,858 (6) | | | Fannie Mae 2018-86 US, 5.643%, (-1.000*US0001M + 6.590%), 09/25/2040 | | | | | 3,932,667 | | | | | | 0.1 | | |
| 21,016,364 | | | Fannie Mae Connecticut Avenue Securities 16-C06 1M2, 5.197%, (US0001M + 4.250%), 04/25/2029 | | | | | 20,455,553 | | | | | | 0.3 | | |
| 7,008,840 | | | Fannie Mae Connecticut Avenue Securities 2015-C02 1M2, 4.947%, (US0001M + 4.000%), 05/25/2025 | | | | | 6,584,888 | | | | | | 0.1 | | |
| 200,324 | | | Fannie Mae Connecticut Avenue Securities 2015-C02 2M2, 4.947%, (US0001M + 4.000%), 05/25/2025 | | | | | 190,908 | | | | | | 0.0 | | |
| 1,388,668 | | | Fannie Mae Connecticut Avenue Securities 2015-C03 2M2, 5.947%, (US0001M + 5.000%), 07/25/2025 | | | | | 1,352,312 | | | | | | 0.0 | | |
| Principal Amount† | | | Value | | | Percentage of Net Assets | | |||||||||
| COLLATERALIZED MORTGAGE OBLIGATIONS: (continued) | | |||||||||||||||
| 10,078,792 | | | Fannie Mae Connecticut Avenue Securities 2015-C04 2M2, 6.497%, (US0001M + 5.550%), 04/25/2028 | | | | $ | 9,435,315 | | | | | | 0.1 | | |
| 3,317,584 | | | Fannie Mae Connecticut Avenue Securities 2015-CO1 1M2, 5.247%, (US0001M + 4.300%), 02/25/2025 | | | | | 3,158,764 | | | | | | 0.0 | | |
| 626,661 | | | Fannie Mae Connecticut Avenue Securities 2016-C01 2M2, 7.897%, (US0001M + 6.950%), 08/25/2028 | | | | | 632,370 | | | | | | 0.0 | | |
| 15,039,496 | | | Fannie Mae Connecticut Avenue Securities 2016-C04 1M2, 5.197%, (US0001M + 4.250%), 01/25/2029 | | | | | 14,300,971 | | | | | | 0.2 | | |
| 18,690,686 | | | Fannie Mae Connecticut Avenue Securities 2016-C05 2M2, 5.397%, (US0001M + 4.450%), 01/25/2029 | | | | | 18,037,927 | | | | | | 0.2 | | |
| 11,342,749 | | | Fannie Mae Connecticut Avenue Securities 2016-C07 2M2, 5.297%, (US0001M + 4.350%), 05/25/2029 | | | | | 10,941,318 | | | | | | 0.1 | | |
| 3,577,926 | | | Fannie Mae Connecticut Avenue Securities 2017-C01 1M2, 4.497%, (US0001M + 3.550%), 07/25/2029 | | | | | 3,312,547 | | | | | | 0.1 | | |
| 16,484,000 | | | Fannie Mae Connecticut Avenue Securities 2017-C02 2M2, 4.597%, (US0001M + 3.650%), 09/25/2029 | | | | | 12,032,354 | | | | | | 0.2 | | |
| 4,750,000 | | | Fannie Mae Connecticut Avenue Securities 2017-C03 1M2, 3.947%, (US0001M + 3.000%), 10/25/2029 | | | | | 4,269,044 | | | | | | 0.1 | | |
| 10,900,000 | | | Fannie Mae Connecticut Avenue Securities 2017-C04 2M2, 3.797%, (US0001M + 2.850%), 11/25/2029 | | | | | 9,646,761 | | | | | | 0.1 | | |
| Voya Intermediate Bond Fund | as of March 31, 2020 (continued) |
| Principal Amount† | | | Value | | | Percentage of Net Assets | | |||||||||
| COLLATERALIZED MORTGAGE OBLIGATIONS: (continued) | | |||||||||||||||
| 13,762,512 | | | Fannie Mae Connecticut Avenue Securities 2017-C05 1M2, 3.147%, (US0001M + 2.200%), 01/25/2030 | | | | $ | 12,311,610 | | | | | | 0.2 | | |
| 1,430,351 | | | Fannie Mae Connecticut Avenue Securities 2017-C06 1M2, 3.597%, (US0001M + 2.650%), 02/25/2030 | | | | | 1,274,661 | | | | | | 0.0 | | |
| 13,855,000 | | | Fannie Mae Connecticut Avenue Securities 2017-C07 1M2, 3.347%, (US0001M + 2.400%), 05/28/2030 | | | | | 12,496,027 | | | | | | 0.2 | | |
| 8,568,497 | | | Fannie Mae Connecticut Avenue Securities 2017-C07 2M2, 3.447%, (US0001M + 2.500%), 05/25/2030 | | | | | 7,497,457 | | | | | | 0.1 | | |
| 10,865,013 | | | Fannie Mae Connecticut Avenue Securities 2017-CO6 2M2, 3.747%, (US0001M + 2.800%), 02/25/2030 | | | | | 9,183,639 | | | | | | 0.1 | | |
| 13,769,786 | | | Fannie Mae Connecticut Avenue Securities 2018-C02 2M2, 3.147%, (US0001M + 2.200%), 08/25/2030 | | | | | 11,531,033 | | | | | | 0.1 | | |
| 5,550,000 | | | Fannie Mae Connecticut Avenue Securities 2018-C03 1M2, 3.097%, (US0001M + 2.150%), 10/25/2030 | | | | | 4,679,096 | | | | | | 0.1 | | |
| 11,529,897 | | | Fannie Mae Connecticut Avenue Securities 2018-C04 2M2, 3.497%, (US0001M + 2.550%), 12/25/2030 | | | | | 9,577,636 | | | | | | 0.1 | | |
| 19,615,000 | | | Fannie Mae Connecticut Avenue Securities 2018-C05 1M2, 3.297%, (US0001M + 2.350%), 01/25/2031 | | | | | 16,709,008 | | | | | | 0.2 | | |
| 13,861,818 | | | Fannie Mae Connecticut Avenue Securities 2018-C06 1M2, 2.947%, (US0001M + 2.000%), 03/25/2031 | | | | | 12,346,103 | | | | | | 0.2 | | |
| Principal Amount† | | | Value | | | Percentage of Net Assets | | |||||||||
| COLLATERALIZED MORTGAGE OBLIGATIONS: (continued) | | |||||||||||||||
| 12,658,696 | | | Fannie Mae Connecticut Avenue Securities 2018-C06 2M2, 3.047%, (US0001M + 2.100%), 03/25/2031 | | | | $ | 10,768,844 | | | | | | 0.1 | | |
| 20,015,652 | | | Fannie Mae Connecticut Avenue Securities 2018-CO1 1M2, 3.197%, (US0001M + 2.250%), 07/25/2030 | | | | | 17,539,434 | | | | | | 0.2 | | |
| 5,297,283 (1) | | | Fannie Mae Connecticut Avenue Securities 2019-R02 1M2, 3.247%, (US0001M + 2.300%), 08/25/2031 | | | | | 4,439,046 | | | | | | 0.1 | | |
| 4,050,000 (1) | | | Fannie Mae Connecticut Avenue Securities 2019-R04 2M2, 3.047%, (US0001M + 2.100%), 06/25/2039 | | | | | 3,340,676 | | | | | | 0.1 | | |
| 11,372,170 (1) | | | Fannie Mae Connecticut Avenue Securities Trust 2018-R07 1M2, 3.347%, (US0001M + 2.400%), 04/25/2031 | | | | | 9,846,772 | | | | | | 0.1 | | |
| 3,300,000 (1) | | | Fannie Mae Connecticut Avenue Securities Trust 2020-R01 1M2, 2.997%, (US0001M + 2.050%), 01/25/2040 | | | | | 2,008,500 | | | | | | 0.0 | | |
| 7,402,991 | | | Fannie Mae Connecticut Avenue Securities, 6.647%, (US0001M + 5.700%), 04/25/2028 | | | | | 7,412,703 | | | | | | 0.1 | | |
| 16,519 | | | Fannie Mae Grantor Trust 1998-T2 A6, 0.108%, (US0001M + 0.550%), 01/25/2032 | | | | | 17,019 | | | | | | 0.0 | | |
| 14,107 (6) | | | Fannie Mae Interest Strip Series 104 2, 9.500%, 10/25/2021 | | | | | 726 | | | | | | 0.0 | | |
| 458,540 (6) | | | Fannie Mae Interest Strip Series 418 20, 3.000%, 05/25/2043 | | | | | 35,314 | | | | | | 0.0 | | |
| 1,306,108 (6) | | | Fannie Mae Interest Strip Series 418 59, 3.000%, 08/25/2028 | | | | | 83,616 | | | | | | 0.0 | | |
| Voya Intermediate Bond Fund | as of March 31, 2020 (continued) |
| Principal Amount† | | | Value | | | Percentage of Net Assets | | |||||||||
| COLLATERALIZED MORTGAGE OBLIGATIONS: (continued) | | |||||||||||||||
| 484 (6) | | | Fannie Mae Interest Strip Series 83 2, 9.500%, 09/25/2020 | | | | $ | 6 | | | | | | 0.0 | | |
| 147,686 | | | Fannie Mae REMIC Trust 1999-33 Z, 6.000%, 07/25/2029 | | | | | 166,265 | | | | | | 0.0 | | |
| 153,831 (6) | | | Fannie Mae REMIC Trust 1999-6 SE, 6.885%, (-1.000*US0001M + 7.685%), 02/17/2029 | | | | | 12,975 | | | | | | 0.0 | | |
| 1,202,523 | | | Fannie Mae REMIC Trust 2003-105 AZ, 5.500%, 10/25/2033 | | | | | 1,396,448 | | | | | | 0.0 | | |
| 424,091 | | | Fannie Mae REMIC Trust 2003-45 FJ, 3.081%, (US0001M + 1.500%), 06/25/2033 | | | | | 436,757 | | | | | | 0.0 | | |
| 1,591,075 (6) | | | Fannie Mae REMIC Trust 2003-66 SA, 6.703%, (-1.000*US0001M + 7.650%), 07/25/2033 | | | | | 397,889 | | | | | | 0.0 | | |
| 287,847 (6) | | | Fannie Mae REMIC Trust 2003-74 IO, 6.000%, 08/25/2033 | | | | | 61,554 | | | | | | 0.0 | | |
| 784,421 | | | Fannie Mae REMIC Trust 2003-84 PZ, 5.000%, 09/25/2033 | | | | | 899,317 | | | | | | 0.0 | | |
| 1,139,787 | | | Fannie Mae REMIC Trust 2004-50 VZ, 5.500%, 07/25/2034 | | | | | 1,300,499 | | | | | | 0.0 | | |
| 23,647 | | | Fannie Mae REMIC Trust 2004-56 FE, 1.397%, (US0001M + 0.450%), 10/25/2033 | | | | | 23,530 | | | | | | 0.0 | | |
| 599,202 | | | Fannie Mae REMIC Trust 2004-7 Z, 5.500%, 02/25/2034 | | | | | 670,675 | | | | | | 0.0 | | |
| 1,222,242 | | | Fannie Mae REMIC Trust 2004-75 ZG, 4.500%, 10/25/2034 | | | | | 1,343,843 | | | | | | 0.0 | | |
| 3,059,543 | | | Fannie Mae REMIC Trust 2005-25 Z, 5.000%, 04/25/2035 | | | | | 3,484,611 | | | | | | 0.1 | | |
| 153,901 | | | Fannie Mae REMIC Trust 2006-104 ES, 28.717%, (-5.000*US0001M + 33.450%), 11/25/2036 | | | | | 296,276 | | | | | | 0.0 | | |
| 2,703,758 (6) | | | Fannie Mae REMIC Trust 2006-12 SD, 5.803%, (-1.000*US0001M + 6.750%), 10/25/2035 | | | | | 556,883 | | | | | | 0.0 | | |
| Principal Amount† | | | Value | | | Percentage of Net Assets | | |||||||||
| COLLATERALIZED MORTGAGE OBLIGATIONS: (continued) | | |||||||||||||||
| 833,604 (6) | | | Fannie Mae REMIC Trust 2006-123 UI, 5.793%, (-1.000*US0001M + 6.740%), 01/25/2037 | | | | $ | 212,296 | | | | | | 0.0 | | |
| 209,699 (6) | | | Fannie Mae REMIC Trust 2006-72 HS, 5.753%, (-1.000*US0001M + 6.700%), 08/25/2026 | | | | | 29,063 | | | | | | 0.0 | | |
| 30,943 | | | Fannie Mae REMIC Trust 2007-10 Z, 6.000%, 02/25/2037 | | | | | 35,762 | | | | | | 0.0 | | |
| 4,439,512 (6) | | | Fannie Mae REMIC Trust 2007-91 AS, 5.453%, (-1.000*US0001M + 6.400%), 10/25/2037 | | | | | 1,152,793 | | | | | | 0.0 | | |
| 1,906,726 | | | Fannie Mae REMIC Trust 2009-19 PW, 4.500%, 10/25/2036 | | | | | 2,147,125 | | | | | | 0.0 | | |
| 9,174,214 (4) | | | Fannie Mae REMIC Trust 2009-50 HZ, 5.544%, 02/25/2049 | | | | | 10,416,910 | | | | | | 0.1 | | |
| 2,146,141 (6) | | | Fannie Mae REMIC Trust 2009-90 TS, 5.203%, (-1.000*US0001M + 6.150%), 11/25/2039 | | | | | 444,965 | | | | | | 0.0 | | |
| 2,561,459 (6) | | | Fannie Mae REMIC Trust 2010-118 GS, 5.003%, (-1.000*US0001M + 5.950%), 10/25/2039 | | | | | 196,925 | | | | | | 0.0 | | |
| 5,790,269 (6) | | | Fannie Mae REMIC Trust 2010-123 SL, 5.123%, (-1.000*US0001M + 6.070%), 11/25/2040 | | | | | 1,103,674 | | | | | | 0.0 | | |
| 6,445,773 (6) | | | Fannie Mae REMIC Trust 2010-41 SB, 5.453%, (-1.000*US0001M + 6.400%), 05/25/2040 | | | | | 1,348,539 | | | | | | 0.0 | | |
| 1,861,021 (6) | | | Fannie Mae REMIC Trust 2010-43 VS, 5.503%, (-1.000*US0001M + 6.450%), 05/25/2040 | | | | | 377,580 | | | | | | 0.0 | | |
| 11,049,000 | | | Fannie Mae REMIC Trust 2010-59 PC, 5.000%, 06/25/2040 | | | | | 12,763,336 | | | | | | 0.2 | | |
| 2,023,823 (6) | | | Fannie Mae REMIC Trust 2011-102 SA, 5.653%, (-1.000*US0001M + 6.600%), 10/25/2041 | | | | | 377,060 | | | | | | 0.0 | | |
| 3,181,332 | | | Fannie Mae REMIC Trust 2011-30 ZA, 5.000%, 04/25/2041 | | | | | 3,585,085 | | | | | | 0.1 | | |
| Voya Intermediate Bond Fund | as of March 31, 2020 (continued) |
| Principal Amount† | | | Value | | | Percentage of Net Assets | | |||||||||
| COLLATERALIZED MORTGAGE OBLIGATIONS: (continued) | | |||||||||||||||
| 2,894,212 (6) | | | Fannie Mae REMIC Trust 2011-93 GS, 5.603%, (-1.000*US0001M + 6.550%), 04/25/2039 | | | | $ | 742,691 | | | | | | 0.0 | | |
| 985,556 (6) | | | Fannie Mae REMIC Trust 2012-103 IT, 4.000%, 04/25/2041 | | | | | 27,466 | | | | | | 0.0 | | |
| 7,695,842 (6) | | | Fannie Mae REMIC Trust 2012-122 SB, 5.203%, (-1.000*US0001M + 6.150%), 11/25/2042 | | | | | 1,406,162 | | | | | | 0.0 | | |
| 3,968,536 (6) | | | Fannie Mae REMIC Trust 2012-128 LI, 3.500%, 06/25/2042 | | | | | 351,242 | | | | | | 0.0 | | |
| 7,329,592 (6) | | | Fannie Mae REMIC Trust 2012-133 AS, 5.253%, (-1.000*US0001M + 6.200%), 10/25/2042 | | | | | 1,470,530 | | | | | | 0.0 | | |
| 1,132,719 (6) | | | Fannie Mae REMIC Trust 2012-149 GI, 3.500%, 06/25/2042 | | | | | 126,109 | | | | | | 0.0 | | |
| 4,798,222 (6) | | | Fannie Mae REMIC Trust 2012-15 SP, 5.673%, (-1.000*US0001M + 6.620%), 06/25/2040 | | | | | 402,110 | | | | | | 0.0 | | |
| 2,584,843 (6) | | | Fannie Mae REMIC Trust 2012-24 HS, 5.603%, (-1.000*US0001M + 6.550%), 09/25/2040 | | | | | 321,433 | | | | | | 0.0 | | |
| 6,152,487 (6) | | | Fannie Mae REMIC Trust 2012-30 QS, 5.653%, (-1.000*US0001M + 6.600%), 04/25/2031 | | | | | 518,468 | | | | | | 0.0 | | |
| 1,663,732 (6) | | | Fannie Mae REMIC Trust 2012-68 YS, 5.753%, (-1.000*US0001M + 6.700%), 07/25/2042 | | | | | 286,605 | | | | | | 0.0 | | |
| 2,707,490 (6) | | | Fannie Mae REMIC Trust 2013-26 JS, 5.253%, (-1.000*US0001M + 6.200%), 10/25/2032 | | | | | 291,684 | | | | | | 0.0 | | |
| 9,495,243 (6) | | | Fannie Mae REMIC Trust 2013-60 DS, 5.253%, (-1.000*US0001M + 6.200%), 06/25/2033 | | | | | 1,392,651 | | | | | | 0.0 | | |
| 8,123,643 (6) | | | Fannie Mae REMIC Trust 2013-9 SM, 5.303%, (-1.000*US0001M + 6.250%), 02/25/2033 | | | | | 1,483,766 | | | | | | 0.0 | | |
| Principal Amount† | | | Value | | | Percentage of Net Assets | | |||||||||
| COLLATERALIZED MORTGAGE OBLIGATIONS: (continued) | | |||||||||||||||
| 5,645,367 (6) | | | Fannie Mae REMIC Trust 2014-17 DS, 5.253%, (-1.000*US0001M + 6.200%), 02/25/2043 | | | | $ | 626,138 | | | | | | 0.0 | | |
| 2,845,877 (6) | | | Fannie Mae REMIC Trust 2014-28 BS, 5.253%, (-1.000*US0001M + 6.200%), 08/25/2043 | | | | | 439,503 | | | | | | 0.0 | | |
| 3,019,000 | | | Fannie Mae REMIC Trust 2015-17 MK, 2.500%, 12/25/2041 | | | | | 3,303,815 | | | | | | 0.0 | | |
| 53,796,685 (6) | | | Fannie Mae REMIC Trust 2015-79 SA, 5.303%, (-1.000*US0001M + 6.250%), 11/25/2045 | | | | | 11,744,204 | | | | | | 0.2 | | |
| 21,970,122 (6) | | | Fannie Mae REMIC Trust 2015-9 IO, 5.500%, 03/25/2045 | | | | | 4,556,184 | | | | | | 0.1 | | |
| 37,766,350 (6) | | | Fannie Mae REMICS 16-60 SB, 5.153%, (-1.000*US0001M + 6.100%), 09/25/2046 | | | | | 7,886,600 | | | | | | 0.1 | | |
| 4 | | | Fannie Mae REMICS 1990-59 K, 1184.190%, 06/25/2020 | | | | | 6 | | | | | | 0.0 | | |
| 147,729 (6) | | | Fannie Mae REMICS 1997-18 SG, 7.300%, (-1.000*US0001M + 8.100%), 03/17/2027 | | | | | 19,788 | | | | | | 0.0 | | |
| 96,610 (6) | | | Fannie Mae REMICS 1997-91 FC, 0.000%, (US0001M + (8.500)%), 11/25/2023 | | | | | — | | | | | | — | | |
| 10,424 (6) | | | Fannie Mae REMICS 1999-57 SC, 8.950%, (-1.000*US0001M + 9.750%), 11/17/2029 | | | | | 274 | | | | | | 0.0 | | |
| 5,199 (6) | | | Fannie Mae REMICS 2000-38 SK, 8.400%, (-1.000*US0001M + 9.200%), 10/17/2030 | | | | | 68 | | | | | | 0.0 | | |
| 323,758 (6) | | | Fannie Mae REMICS 2001-72 SC, 1.000%, (-1.000*US0001M + 8.500%), 12/25/2031 | | | | | 12,002 | | | | | | 0.0 | | |
| 108,840 (6) | | | Fannie Mae REMICS 2001-8 SK, 8.138%, (-1.000*US0001M + 8.750%), 03/18/2031 | | | | | 17,140 | | | | | | 0.0 | | |
| Voya Intermediate Bond Fund | as of March 31, 2020 (continued) |
| Principal Amount† | | | Value | | | Percentage of Net Assets | | |||||||||
| COLLATERALIZED MORTGAGE OBLIGATIONS: (continued) | | |||||||||||||||
| 78 (6) | | | Fannie Mae REMICS 2001-8 SO, 9.027%, (-1.000*US0001M + 9.800%), 02/20/2031 | | | | $ | 2 | | | | | | 0.0 | | |
| 690,504 (6) | | | Fannie Mae REMICS 2003-49 SW, 6.053%, (-1.000*US0001M + 7.000%), 01/25/2033 | | | | | 141,901 | | | | | | 0.0 | | |
| 5,600,642 (6) | | | Fannie Mae REMICS 2004-54 SN, 6.103%, (-1.000*US0001M + 7.050%), 07/25/2034 | | | | | 1,270,540 | | | | | | 0.0 | | |
| 297,538 (6) | | | Fannie Mae REMICS 2004-88 JH, 5.653%, (-1.000*US0001M + 6.600%), 06/25/2033 | | | | | 4,688 | | | | | | 0.0 | | |
| 1,458,912 (6) | | | Fannie Mae REMICS 2005-75 SP, 5.803%, (-1.000*US0001M + 6.750%), 08/25/2035 | | | | | 266,508 | | | | | | 0.0 | | |
| 2,909,309 (6) | | | Fannie Mae REMICS 2006-56 SM, 5.803%, (-1.000*US0001M + 6.750%), 07/25/2036 | | | | | 601,254 | | | | | | 0.0 | | |
| 542,718 (6) | | | Fannie Mae REMICS 2007-21 SB, 5.453%, (-1.000*US0001M + 6.400%), 03/25/2037 | | | | | 68,464 | | | | | | 0.0 | | |
| 1,447,827 (6) | | | Fannie Mae REMICS 2007-52 NS, 5.503%, (-1.000*US0001M + 6.450%), 06/25/2037 | | | | | 305,229 | | | | | | 0.0 | | |
| 1,771,840 (6) | | | Fannie Mae REMICS 2007-85 SM, 5.513%, (-1.000*US0001M + 6.460%), 09/25/2037 | | | | | 365,697 | | | | | | 0.0 | | |
| 517,529 | | | Fannie Mae REMICS 2008-16 Z, 5.500%, 03/25/2038 | | | | | 600,632 | | | | | | 0.0 | | |
| 640 (6) | | | Fannie Mae REMICS 2010-112 SG, 5.413%, (-1.000*US0001M + 6.360%), 06/25/2021 | | | | | 9 | | | | | | 0.0 | | |
| 9,068,550 (6) | | | Fannie Mae REMICS 2010-150 SJ, 5.533%, (-1.000*US0001M + 6.480%), 01/25/2041 | | | | | 2,239,721 | | | | | | 0.0 | | |
| 1,498,014 (6) | | | Fannie Mae REMICS 2010-35 CS, 5.503%, (-1.000*US0001M + 6.450%), 04/25/2050 | | | | | 284,839 | | | | | | 0.0 | | |
| Principal Amount† | | | Value | | | Percentage of Net Assets | | |||||||||
| COLLATERALIZED MORTGAGE OBLIGATIONS: (continued) | | |||||||||||||||
| 2,132,138 | | | Fannie Mae REMICS 2011-10 ZC, 5.000%, 02/25/2041 | | | | $ | 2,468,320 | | | | | | 0.0 | | |
| 6,166,562 | | | Fannie Mae REMICS 2011-101 DB, 4.000%, 10/25/2041 | | | | | 7,241,911 | | | | | | 0.1 | | |
| 670,996 | | | Fannie Mae REMICS 2011-116 ZA, 3.500%, 11/25/2041 | | | | | 744,392 | | | | | | 0.0 | | |
| 132,000 | | | Fannie Mae REMICS 2011-127 UY, 3.500%, 12/25/2041 | | | | | 146,314 | | | | | | 0.0 | | |
| 12,049,455 (6) | | | Fannie Mae REMICS 2011-47 GS, 4.983%, (-1.000*US0001M + 5.930%), 06/25/2041 | | | | | 2,267,241 | | | | | | 0.0 | | |
| 3,266,386 | | | Fannie Mae REMICS 2011-8 ZA, 4.000%, 02/25/2041 | | | | | 3,613,507 | | | | | | 0.1 | | |
| 7,722,506 (6) | | | Fannie Mae REMICS 2012-111 SL, 5.153%, (-1.000*US0001M + 6.100%), 05/25/2041 | | | | | 933,862 | | | | | | 0.0 | | |
| 5,900,546 | | | Fannie Mae REMICS 2012-111 ZK, 3.500%, 10/25/2042 | | | | | 6,602,808 | | | | | | 0.1 | | |
| 10,370,725 (6) | | | Fannie Mae REMICS 2012-120 WI, 3.000%, 11/25/2027 | | | | | 632,658 | | | | | | 0.0 | | |
| 3,000,000 | | | Fannie Mae REMICS 2012-134 KV, 3.000%, 07/25/2031 | | | | | 3,153,658 | | | | | | 0.0 | | |
| 10,219,555 | | | Fannie Mae REMICS 2012-17 QZ, 4.000%, 03/25/2042 | | | | | 11,436,492 | | | | | | 0.1 | | |
| 5,815,272 | | | Fannie Mae REMICS 2012-2 HE, 4.000%, 02/25/2042 | | | | | 6,740,752 | | | | | | 0.1 | | |
| 1,896,253 | | | Fannie Mae REMICS 2012-30 AB, 4.000%, 04/25/2042 | | | | | 2,111,866 | | | | | | 0.0 | | |
| 2,649,113 | | | Fannie Mae REMICS 2012-33 BW, 4.000%, 04/25/2042 | | | | | 3,045,204 | | | | | | 0.0 | | |
| 1,058,948 | | | Fannie Mae REMICS 2012-44 KW, 3.500%, 05/25/2032 | | | | | 1,123,323 | | | | | | 0.0 | | |
| 5,897,347 | | | Fannie Mae REMICS 2012-55 PC, 3.500%, 05/25/2042 | | | | | 6,394,503 | | | | | | 0.1 | | |
| Voya Intermediate Bond Fund | as of March 31, 2020 (continued) |
| Principal Amount† | | | Value | | | Percentage of Net Assets | | |||||||||
| COLLATERALIZED MORTGAGE OBLIGATIONS: (continued) | | |||||||||||||||
| 500,000 | | | Fannie Mae REMICS 2012-80 MY, 3.250%, 08/25/2042 | | | | $ | 570,405 | | | | | | 0.0 | | |
| 2,700,000 | | | Fannie Mae REMICS 2013-111 BA, 3.000%, 11/25/2033 | | | | | 3,000,704 | | | | | | 0.0 | | |
| 1,403,000 | | | Fannie Mae REMICS 2013-13 BE, 4.000%, 03/25/2043 | | | | | 1,779,264 | | | | | | 0.0 | | |
| 1,187,997 | | | Fannie Mae REMICS 2013-16 GD, 3.000%, 03/25/2033 | | | | | 1,243,518 | | | | | | 0.0 | | |
| 10,534,357 (6) | | | Fannie Mae REMICS 2013-40 LS, 5.203%, (-1.000*US0001M + 6.150%), 05/25/2043 | | | | | 1,845,118 | | | | | | 0.0 | | |
| 10,978,302 (6) | | | Fannie Mae REMICS 2013-70 BI, 3.000%, 07/25/2033 | | | | | 852,492 | | | | | | 0.0 | | |
| 12,269,147 (6) | | | Fannie Mae REMICS 2014-15 SB, 5.703%, (-1.000*US0001M + 6.650%), 04/25/2044 | | | | | 3,145,973 | | | | | | 0.0 | | |
| 8,456,293 (6) | | | Fannie Mae REMICS 2014-20 HI, 4.000%, 01/25/2040 | | | | | 209,665 | | | | | | 0.0 | | |
| 970,000 | | | Fannie Mae REMICS 2014-61 PY, 3.500%, 10/25/2044 | | | | | 1,163,166 | | | | | | 0.0 | | |
| 16,528,536 | | | Fannie Mae REMICS 2015-20 EZ, 3.500%, 04/25/2045 | | | | | 19,402,590 | | | | | | 0.2 | | |
| 1,160,327 | | | Fannie Mae REMICS 2015-45 EY, 2.500%, 12/25/2040 | | | | | 1,186,726 | | | | | | 0.0 | | |
| 9,245,261 (6) | | | Fannie Mae REMICS 2015-56 IC, 6.000%, 08/25/2045 | | | | | 1,732,765 | | | | | | 0.0 | | |
| 2,000,000 | | | Fannie Mae REMICS 2015-67 AV, 3.500%, 01/25/2036 | | | | | 2,296,192 | | | | | | 0.0 | | |
| 5,000,000 | | | Fannie Mae REMICS 2015-67 QV, 3.000%, 12/25/2040 | | | | | 5,361,299 | | | | | | 0.1 | | |
| 3,928,140 (6) | | | Fannie Mae REMICS 2015-76 PI, 6.000%, 09/25/2045 | | | | | 625,268 | | | | | | 0.0 | | |
| 9,275,791 (6) | | | Fannie Mae REMICS 2016-52 MI, 4.000%, 12/25/2045 | | | | | 1,388,018 | | | | | | 0.0 | | |
| Principal Amount† | | | Value | | | Percentage of Net Assets | | |||||||||
| COLLATERALIZED MORTGAGE OBLIGATIONS: (continued) | | |||||||||||||||
| 848,247 | | | Fannie Mae REMICS 2016-9 D, 3.000%, 03/25/2046 | | | | $ | 906,783 | | | | | | 0.0 | | |
| 8,946,855 | | | Fannie Mae REMICS 2017-54 D, 3.000%, 07/25/2047 | | | | | 9,501,424 | | | | | | 0.1 | | |
| 52,833,422 (6) | | | Fannie Mae REMICS 2018-15 SC, 5.353%, (-1.000*US0001M + 6.300%), 03/25/2048 | | | | | 11,531,037 | | | | | | 0.1 | | |
| 5,200,952 | | | Fannie Mae REMICS 2018-38 LA, 3.000%, 06/25/2048 | | | | | 5,438,134 | | | | | | 0.1 | | |
| 27,423,526 | | | Fannie Mae REMICS 2018-73 AB, 3.000%, 10/25/2048 | | | | | 29,486,622 | | | | | | 0.4 | | |
| 4,953,640 | | | Fannie Mae REMICS 2018-8 AB, 3.500%, 10/25/2047 | | | | | 5,314,158 | | | | | | 0.1 | | |
| 68,106,715 (6) | | | Fannie Mae REMICS 2018-82 SA, 5.253%, (-1.000*US0001M + 6.200%), 11/25/2048 | | | | | 14,152,126 | | | | | | 0.2 | | |
| 65,902,916 (6) | | | Fannie Mae REMICS 2018-86 SM, 5.253%, (-1.000*US0001M + 6.200%), 12/25/2048 | | | | | 13,595,917 | | | | | | 0.2 | | |
| 57,357,290 (6) | | | Fannie Mae REMICS 2018-91 SB, 5.153%, (-1.000*US0001M + 6.100%), 12/25/2058 | | | | | 9,984,218 | | | | | | 0.1 | | |
| 18,846,832 (6) | | | Fannie Mae REMICS 2019-21 AI, 5.000%, 05/25/2059 | | | | | 3,511,287 | | | | | | 0.1 | | |
| 21,589,297 (6) | | | Fannie Mae REMICS 2019-30 SB, 5.153%, (-1.000*US0001M + 6.100%), 07/25/2049 | | | | | 4,035,672 | | | | | | 0.1 | | |
| 17,274,340 | | | Fannie Mae REMICS 2019-37 CA, 3.000%, 10/25/2047 | | | | | 18,201,913 | | | | | | 0.2 | | |
| 19,930,710 (6) | | | Fannie Mae REMICS 2019-39 SA, 5.153%, (-1.000*US0001M + 6.100%), 08/25/2049 | | | | | 3,397,730 | | | | | | 0.1 | | |
| 104,782,552 (6) | | | Fannie Mae REMICS 2019-41 S, 5.053%, (-1.000*US0001M + 6.000%), 08/25/2059 | | | | | 17,484,247 | | | | | | 0.2 | | |
| Voya Intermediate Bond Fund | as of March 31, 2020 (continued) |
| Principal Amount† | | | Value | | | Percentage of Net Assets | | |||||||||
| COLLATERALIZED MORTGAGE OBLIGATIONS: (continued) | | |||||||||||||||
| 12,803,541 (6) | | | Fannie Mae REMICS 2019-47 SB, 5.153%, (-1.000*US0001M + 6.100%), 05/25/2040 | | | | $ | 2,221,236 | | | | | | 0.0 | | |
| 17 | | | Fannie Mae REMICS G-9 G, 509.000%, 04/25/2021 | | | | | 37 | | | | | | 0.0 | | |
| 6,060 | | | Fannie Mae REMICS G93-35 ZQ, 6.500%, 11/25/2023 | | | | | 6,463 | | | | | | 0.0 | | |
| 4,046,342 | | | Fannie Mae REMICS Trust 2010-53 JZ, 5.000%, 07/25/2040 | | | | | 4,593,036 | | | | | | 0.1 | | |
| 37,175,034 (6) | | | Fannie Mae Series 2013-44 DI, 3.000%, 05/25/2033 | | | | | 3,024,576 | | | | | | 0.0 | | |
| 1,974,286 (6) | | | Fannie Mae Series 2013-72 YS, 5.203%, (-1.000*US0001M + 6.150%), 07/25/2033 | | | | | 290,803 | | | | | | 0.0 | | |
| 800,000 (1) | | | Fannie Mae Connecticut Avenue Securities Trust 2020-SBT1 1M2, 4.513%, (US0001M + 3.650%), 02/25/2040 | | | | | 547,451 | | | | | | 0.0 | | |
| 1,000,000 (1) | | | Fannie Mae Connecticut Avenue Securities Trust 2019-R05 1B1, 5.047%, (US0001M + 4.100%), 07/25/2039 | | | | | 545,150 | | | | | | 0.0 | | |
| 3,550,000 (1) | | | Fannie Mae Connecticut Avenue Securities Trust 2019-R06 2M2, 3.047%, (US0001M + 2.100%), 09/25/2039 | | | | | 2,791,410 | | | | | | 0.0 | | |
| 500,000 (1) | | | Fannie Mae Connecticut Avenue Securities Trust 2020-SBT1 2M2, 4.513%, (US0001M + 3.650%), 02/25/2040 | | | | | 342,157 | | | | | | 0.0 | | |
| 203,265 (6) | | | FHLMC-GNMA 20 S, 7.953%, (-1.000*US0001M + 8.900%), 10/25/2023 | | | | | 22,043 | | | | | | 0.0 | | |
| 1,909,490 (1)(4) | | | Flagstar Mortgage Trust 2018-1 B1, 4.026%, 03/25/2048 | | | | | 1,888,309 | | | | | | 0.0 | | |
| 2,238,878 (1)(4) | | | Flagstar Mortgage Trust 2018-1 B2, 4.026%, 03/25/2048 | | | | | 2,127,954 | | | | | | 0.0 | | |
| Principal Amount† | | | Value | | | Percentage of Net Assets | | |||||||||
| COLLATERALIZED MORTGAGE OBLIGATIONS: (continued) | | |||||||||||||||
| 2,489,976 (1)(4) | | | Flagstar Mortgage Trust 2018-1 B3, 4.026%, 03/25/2048 | | | | $ | 2,289,698 | | | | | | 0.1 | | |
| 1,271,152 (1)(4) | | | Flagstar Mortgage Trust 2018-2 B2, 4.042%, 04/25/2048 | | | | | 1,205,711 | | | | | | 0.0 | | |
| 3,649,614 (1)(4) | | | Flagstar Mortgage Trust 2018-3INV A3, 4.000%, 05/25/2048 | | | | | 3,711,488 | | | | | | 0.1 | | |
| 1,823,764 (1)(4) | | | Flagstar Mortgage Trust 2018-5 B3, 4.536%, 09/25/2048 | | | | | 1,674,115 | | | | | | 0.0 | | |
| 1,513,448 (1)(4) | | | Flagstar Mortgage Trust 2019-2 B1, 4.184%, 12/25/2049 | | | | | 1,337,842 | | | | | | 0.0 | | |
| 1,467,736 (1)(4) | | | Flagstar Mortgage Trust 2019-2 B2, 4.184%, 12/25/2049 | | | | | 1,210,459 | | | | | | 0.0 | | |
| 965,172 (1)(4) | | | Flagstar Mortgage Trust 2018-4 B3, 4.322%, 07/25/2048 | | | | | 889,607 | | | | | | 0.0 | | |
| 2,050,213 (1)(4) | | | Flagstar Mortgage Trust 2020-1NV B1A, 4.356%, 03/25/2050 | | | | | 1,792,295 | | | | | | 0.0 | | |
| 2,481,626 (1)(4) | | | Flagstar Mortgage Trust 2020-1NV B2A, 4.356%, 03/25/2050 | | | | | 2,146,360 | | | | | | 0.0 | | |
| 26,818,050 | | | Freddie Mac 326 350, 3.500%, 03/15/2044 | | | | | 29,627,832 | | | | | | 0.4 | | |
| 10,544,351 (6) | | | Freddie Mac 3510 AS, 5.705%, (-1.000*US0001M + 6.410%), 04/15/2037 | | | | | 2,488,475 | | | | | | 0.0 | | |
| 8,241,370 (6) | | | Freddie Mac 4191 SA, 5.495%, (-1.000*US0001M + 6.200%), 03/15/2043 | | | | | 1,473,390 | | | | | | 0.0 | | |
| 4,248,688 | | | Freddie Mac 4316 XZ, 4.500%, 03/15/2044 | | | | | 5,214,487 | | | | | | 0.1 | | |
| 5,000,000 | | | Freddie Mac 4800 KG, 3.500%, 11/15/2045 | | | | | 5,232,776 | | | | | | 0.1 | | |
| 816,786 | | | Freddie Mac Reference Series R007 ZA, 6.000%, 05/15/2036 | | | | | 972,755 | | | | | | 0.0 | | |
| 395,554 | | | Freddie Mac Reference Series R008 ZA, 6.000%, 07/15/2036 | | | | | 457,409 | | | | | | 0.0 | | |
| Voya Intermediate Bond Fund | as of March 31, 2020 (continued) |
| Principal Amount† | | | Value | | | Percentage of Net Assets | | |||||||||
| COLLATERALIZED MORTGAGE OBLIGATIONS: (continued) | | |||||||||||||||
| 114,292 | | | Freddie Mac REMIC Trust 2110 PG, 6.000%, 01/15/2029 | | | | $ | 129,843 | | | | | | 0.0 | | |
| 105,616 | | | Freddie Mac REMIC Trust 2114 ZM, 6.000%, 01/15/2029 | | | | | 116,955 | | | | | | 0.0 | | |
| 718,032 | | | Freddie Mac REMIC Trust 2143 ZB, 6.000%, 04/15/2029 | | | | | 812,402 | | | | | | 0.0 | | |
| 122,188 | | | Freddie Mac REMIC Trust 2528 KM, 5.500%, 11/15/2022 | | | | | 127,008 | | | | | | 0.0 | | |
| 299,190 | | | Freddie Mac REMIC Trust 2541 NE, 5.500%, 12/15/2032 | | | | | 346,275 | | | | | | 0.0 | | |
| 114,334 (6) | | | Freddie Mac REMIC Trust 2594 IY, 6.000%, 04/15/2033 | | | | | 24,157 | | | | | | 0.0 | | |
| 777,775 | | | Freddie Mac REMIC Trust 2845 QH, 5.000%, 08/15/2034 | | | | | 888,210 | | | | | | 0.0 | | |
| 155,584 | | | Freddie Mac REMIC Trust 2861 Z, 5.500%, 09/15/2034 | | | | | 183,727 | | | | | | 0.0 | | |
| 583,523 (6) | | | Freddie Mac REMIC Trust 2866 GS, 5.895%, (-1.000*US0001M + 6.600%), 09/15/2034 | | | | | 17,725 | | | | | | 0.0 | | |
| 253,798 (6) | | | Freddie Mac REMIC Trust 2883 SD, 5.995%, (-1.000*US0001M + 6.700%), 10/15/2034 | | | | | 10,517 | | | | | | 0.0 | | |
| 225,653 | | | Freddie Mac REMIC Trust 2930 ZL, 5.000%, 02/15/2035 | | | | | 257,601 | | | | | | 0.0 | | |
| 315,412 | | | Freddie Mac REMIC Trust 2931 ZY, 5.000%, 02/15/2035 | | | | | 360,376 | | | | | | 0.0 | | |
| 6,522,054 (6) | | | Freddie Mac REMIC Trust 3045 DI, 6.025%, (-1.000*US0001M + 6.730%), 10/15/2035 | | | | | 1,465,529 | | | | | | 0.0 | | |
| 1,167,835 | | | Freddie Mac REMIC Trust 3117 ZA, 5.500%, 02/15/2036 | | | | | 1,335,139 | | | | | | 0.0 | | |
| 33,656 (7) | | | Freddie Mac REMIC Trust 3139 PO, 0.000%, 01/15/2036 | | | | | 33,612 | | | | | | 0.0 | | |
| Principal Amount† | | | Value | | | Percentage of Net Assets | | |||||||||
| COLLATERALIZED MORTGAGE OBLIGATIONS: (continued) | | |||||||||||||||
| 1,383,444 (6) | | | Freddie Mac REMIC Trust 3171 PS, 5.780%, (-1.000*US0001M + 6.485%), 06/15/2036 | | | | $ | 285,621 | | | | | | 0.0 | | |
| 6,826,290 (6) | | | Freddie Mac REMIC Trust 3199 S, 5.745%, (-1.000*US0001M + 6.450%), 08/15/2036 | | | | | 1,607,468 | | | | | | 0.0 | | |
| 593,752 | | | Freddie Mac REMIC Trust 3351 ZC, 5.500%, 07/15/2037 | | | | | 694,045 | | | | | | 0.0 | | |
| 193,439 | | | Freddie Mac REMIC Trust 3394 ZY, 6.000%, 11/15/2037 | | | | | 221,627 | | | | | | 0.0 | | |
| 316,516 (4)(6) | | | Freddie Mac REMIC Trust 3524 LA, 5.085%, 03/15/2033 | | | | | 359,687 | | | | | | 0.0 | | |
| 32,247 | | | Freddie Mac REMIC Trust 3556 NT, 3.805%, (US0001M + 3.100%), 03/15/2038 | | | | | 32,887 | | | | | | 0.0 | | |
| 6,346,979 | | | Freddie Mac REMIC Trust 3639 ZN, 5.500%, 12/15/2034 | | | | | 7,393,481 | | | | | | 0.1 | | |
| 571,641 | | | Freddie Mac REMIC Trust 3662 ZB, 5.500%, 08/15/2036 | | | | | 670,896 | | | | | | 0.0 | | |
| 329,512 (6) | | | Freddie Mac REMIC Trust 3710 SL, 5.295%, (-1.000*US0001M + 6.000%), 05/15/2036 | | | | | 2,925 | | | | | | 0.0 | | |
| 435,429 | | | Freddie Mac REMIC Trust 3724 CM, 5.500%, 06/15/2037 | | | | | 510,323 | | | | | | 0.0 | | |
| 3,124,734 | | | Freddie Mac REMIC Trust 3747 HW, 4.500%, 05/15/2038 | | | | | 3,132,613 | | | | | | 0.0 | | |
| 997,649 | | | Freddie Mac REMIC Trust 3753 DC, 3.500%, 09/15/2039 | | | | | 1,047,804 | | | | | | 0.0 | | |
| 1,618,055 (6) | | | Freddie Mac REMIC Trust 3856 KS, 5.845%, (-1.000*US0001M + 6.550%), 05/15/2041 | | | | | 303,315 | | | | | | 0.0 | | |
| 1,235,818 (6) | | | Freddie Mac REMIC Trust 3925 SD, 5.345%, (-1.000*US0001M + 6.050%), 07/15/2040 | | | | | 133,109 | | | | | | 0.0 | | |
| Voya Intermediate Bond Fund | as of March 31, 2020 (continued) |
| Principal Amount† | | | Value | | | Percentage of Net Assets | | |||||||||
| COLLATERALIZED MORTGAGE OBLIGATIONS: (continued) | | |||||||||||||||
| 7,732,379 (6) | | | Freddie Mac REMIC Trust 3925 SL, 5.345%, (-1.000*US0001M + 6.050%), 01/15/2041 | | | | $ | 760,312 | | | | | | 0.0 | | |
| 367,535 | | | Freddie Mac REMIC Trust 4000 PA, 4.500%, 01/15/2042 | | | | | 414,569 | | | | | | 0.0 | | |
| 1,729,727 (6) | | | Freddie Mac REMIC Trust 4027 QI, 4.500%, 12/15/2040 | | | | | 94,817 | | | | | | 0.0 | | |
| 2,089,851 (6) | | | Freddie Mac REMIC Trust 4088 CS, 5.295%, (-1.000*US0001M + 6.000%), 08/15/2042 | | | | | 369,467 | | | | | | 0.0 | | |
| 7,495,836 (6) | | | Freddie Mac REMIC Trust 4161 WI, 3.000%, 02/15/2033 | | | | | 698,270 | | | | | | 0.0 | | |
| 3,943,196 (6) | | | Freddie Mac REMIC Trust 4194 GI, 4.000%, 04/15/2043 | | | | | 553,246 | | | | | | 0.0 | | |
| 4,017,818 | | | Freddie Mac REMIC Trust 4203 BN, 3.000%, 04/15/2033 | | | | | 4,325,934 | | | | | | 0.1 | | |
| 1,339,040 | | | Freddie Mac REMIC Trust 4246 ZX, 4.500%, 04/15/2041 | | | | | 1,574,548 | | | | | | 0.0 | | |
| 1,938,333 (6) | | | Freddie Mac REMIC Trust 4293 KI, 4.500%, 08/15/2043 | | | | | 211,137 | | | | | | 0.0 | | |
| 4,961,702 | | | Freddie Mac REMIC Trust 4335 ZX, 4.250%, 05/15/2044 | | | | | 5,842,754 | | | | | | 0.1 | | |
| 6,660,118 | | | Freddie Mac REMIC Trust 435 XZ, 4.250%, 05/15/2044 | | | | | 7,890,665 | | | | | | 0.1 | | |
| 1,916,000 | | | Freddie Mac REMIC Trust 4370 AD, 3.000%, 08/15/2040 | | | | | 2,004,385 | | | | | | 0.0 | | |
| 6,638,211 (6) | | | Freddie Mac REMIC Trust 4386 LS, 5.395%, (-1.000*US0001M + 6.100%), 09/15/2044 | | | | | 1,136,810 | | | | | | 0.0 | | |
| 4 | | | Freddie Mac REMICS 1006 I, 860.000%, 10/15/2020 | | | | | 7 | | | | | | 0.0 | | |
| 19 | | | Freddie Mac REMICS 1023 C, 508.500%, 12/15/2020 | | | | | 36 | | | | | | 0.0 | | |
| 42 | | | Freddie Mac REMICS 1094 L, 1141.844%, 06/15/2021 | | | | | 227 | | | | | | 0.0 | | |
| Principal Amount† | | | Value | | | Percentage of Net Assets | | |||||||||
| COLLATERALIZED MORTGAGE OBLIGATIONS: (continued) | | |||||||||||||||
| 18 | | | Freddie Mac REMICS 1159 D, 1029.473%, 11/15/2021 | | | | $ | 87 | | | | | | 0.0 | | |
| 10 | | | Freddie Mac REMICS 1278 L, 1127.368%, 05/15/2022 | | | | | 53 | | | | | | 0.0 | | |
| 1,120 (6) | | | Freddie Mac REMICS 1368 S, 8.795%, (-1.000*US0001M + 9.500%), 08/15/2022 | | | | | 29 | | | | | | 0.0 | | |
| 63,126 (6) | | | Freddie Mac REMICS 2074 S, 7.900%, (-1.000*US0001M + 8.700%), 07/17/2028 | | | | | 6,504 | | | | | | 0.0 | | |
| 59,687 (6) | | | Freddie Mac REMICS 2232 SA, 7.800%, (-1.000*US0001M + 8.600%), 05/17/2030 | | | | | 4,137 | | | | | | 0.0 | | |
| 22,442 (6) | | | Freddie Mac REMICS 2301 SP, 8.545%, (-1.000*US0001M + 9.250%), 04/15/2031 | | | | | 3,061 | | | | | | 0.0 | | |
| 1,683,221 (6) | | | Freddie Mac REMICS 2953 LS, 5.995%, (-1.000*US0001M + 6.700%), 12/15/2034 | | | | | 109,368 | | | | | | 0.0 | | |
| 1,774,818 (6) | | | Freddie Mac REMICS 2993 GS, 5.445%, (-1.000*US0001M + 6.150%), 06/15/2025 | | | | | 155,493 | | | | | | 0.0 | | |
| 924,637 (6) | | | Freddie Mac REMICS 3006 SI, 6.035%, (-1.000*US0001M + 6.740%), 07/15/2035 | | | | | 189,874 | | | | | | 0.0 | | |
| 1,066,993 (6) | | | Freddie Mac REMICS 3006 YI, 6.035%, (-1.000*US0001M + 6.740%), 07/15/2035 | | | | | 233,300 | | | | | | 0.0 | | |
| 6,321,494 (6) | | | Freddie Mac REMICS 3213 JS, 6.495%, (-1.000*US0001M + 7.200%), 09/15/2036 | | | | | 1,688,974 | | | | | | 0.0 | | |
| 1,404,517 (6) | | | Freddie Mac REMICS 3375 QI, 0.600%, (-10.000*US0001M + 64.600%), 10/15/2037 | | | | | 36,525 | | | | | | 0.0 | | |
| 4,369,517 | | | Freddie Mac REMICS 3736 ZP, 4.000%, 10/15/2040 | | | | | 4,924,926 | ��� | | | | | 0.1 | | |
| Voya Intermediate Bond Fund | as of March 31, 2020 (continued) |
| Principal Amount† | | | Value | | | Percentage of Net Assets | | |||||||||
| COLLATERALIZED MORTGAGE OBLIGATIONS: (continued) | | |||||||||||||||
| 4,662,551 | | | Freddie Mac REMICS 3740 KE, 4.000%, 10/15/2040 | | | | $ | 5,177,679 | | | | | | 0.1 | | |
| 21,290,731 | | | Freddie Mac REMICS 3753 KZ, 4.500%, 11/15/2040 | | | | | 25,012,542 | | | | | | 0.3 | | |
| 6,372,812 | | | Freddie Mac REMICS 3775 GZ, 4.500%, 12/15/2040 | | | | | 7,244,894 | | | | | | 0.1 | | |
| 1,900,000 | | | Freddie Mac REMICS 3820 NC, 4.500%, 03/15/2041 | | | | | 2,264,959 | | | | | | 0.0 | | |
| 708,418 | | | Freddie Mac REMICS 3843 JZ, 5.100%, 04/15/2041 | | | | | 925,122 | | | | | | 0.0 | | |
| 500,000 | | | Freddie Mac REMICS 3848 WX, 5.000%, 04/15/2041 | | | | | 588,626 | | | | | | 0.0 | | |
| 2,650,000 | | | Freddie Mac REMICS 3890 ME, 5.000%, 07/15/2041 | | | | | 3,223,594 | | | | | | 0.0 | | |
| 5,000,000 | | | Freddie Mac REMICS 3893 PU, 4.000%, 07/15/2041 | | | | | 5,658,683 | | | | | | 0.1 | | |
| 7,000,000 | | | Freddie Mac REMICS 3919 BY, 4.000%, 09/15/2041 | | | | | 7,878,620 | | | | | | 0.1 | | |
| 9,344,112 | | | Freddie Mac REMICS 3919 ZB, 4.000%, 09/15/2041 | | | | | 10,725,366 | | | | | | 0.1 | | |
| 3,790,000 | | | Freddie Mac REMICS 3923 GY, 4.000%, 09/15/2041 | | | | | 4,516,472 | | | | | | 0.1 | | |
| 3,000,000 | | | Freddie Mac REMICS 3934 CB, 4.000%, 10/15/2041 | | | | | 3,362,285 | | | | | | 0.0 | | |
| 420,000 | | | Freddie Mac REMICS 3934 KB, 5.000%, 10/15/2041 | | | | | 495,360 | | | | | | 0.0 | | |
| 1,500,000 | | | Freddie Mac REMICS 3997 PB, 4.000%, 02/15/2042 | | | | | 1,708,922 | | | | | | 0.0 | | |
| 2,756,359 | | | Freddie Mac REMICS 4000 ZT, 3.500%, 01/15/2042 | | | | | 3,212,023 | | | | | | 0.0 | | |
| 9,108,799 (6) | | | Freddie Mac REMICS 4057 SN, 5.945%, (-1.000*US0001M + 6.650%), 12/15/2041 | | | | | 1,299,270 | | | | | | 0.0 | | |
| 3,146,604 | | | Freddie Mac REMICS 4057 ZB, 3.500%, 06/15/2042 | | | | | 3,405,636 | | | | | | 0.1 | | |
| Principal Amount† | | | Value | | | Percentage of Net Assets | | |||||||||
| COLLATERALIZED MORTGAGE OBLIGATIONS: (continued) | | |||||||||||||||
| 14,804,327 | | | Freddie Mac REMICS 4084 TZ, 4.000%, 07/15/2042 | | | | $ | 16,657,818 | | | | | | 0.2 | | |
| 2,930,546 (6) | | | Freddie Mac REMICS 4090 SN, 5.995%, (-1.000*US0001M + 6.700%), 08/15/2032 | | | | | 513,605 | | | | | | 0.0 | | |
| 1,620,994 | | | Freddie Mac REMICS 4100 JA, 3.500%, 10/15/2041 | | | | | 1,738,864 | | | | | | 0.0 | | |
| 2,128,000 | | | Freddie Mac REMICS 4193 BP, 4.000%, 04/15/2043 | | | | | 2,692,548 | | | | | | 0.0 | | |
| 10,325,701 | | | Freddie Mac REMICS 4199 BZ, 3.500%, 05/15/2043 | | | | | 11,178,300 | | | | | | 0.1 | | |
| 310,000 | | | Freddie Mac REMICS 4235 QD, 3.000%, 08/15/2033 | | | | | 345,500 | | | | | | 0.0 | | |
| 47,135,510 (6) | | | Freddie Mac REMICS 4301 SD, 5.395%, (-1.000*US0001M + 6.100%), 07/15/2037 | | | | | 9,490,231 | | | | | | 0.1 | | |
| 6,247,838 | | | Freddie Mac REMICS 4310 BZ, 4.000%, 02/15/2044 | | | | | 7,119,283 | | | | | | 0.1 | | |
| 3,102,000 | | | Freddie Mac REMICS 4401 BL, 3.500%, 10/15/2034 | | | | | 3,628,022 | | | | | | 0.1 | | |
| 25,552,588 (6) | | | Freddie Mac REMICS 4461 AS, 4.895%, (-1.000*US0001M + 5.600%), 04/15/2045 | | | | | 5,003,473 | | | | | | 0.1 | | |
| 3,124,000 | | | Freddie Mac REMICS 4492 VB, 3.500%, 05/15/2035 | | | | | 3,603,912 | | | | | | 0.1 | | |
| 946,247 | | | Freddie Mac REMICS 4500 HC, 3.000%, 11/15/2042 | | | | | 995,408 | | | | | | 0.0 | | |
| 2,913,000 | | | Freddie Mac REMICS 4505 PB, 3.000%, 08/15/2045 | | | | | 3,243,296 | | | | | | 0.0 | | |
| 29,277,089 (6) | | | Freddie Mac REMICS 4574 ST, 5.295%, (-1.000*US0001M + 6.000%), 04/15/2046 | | | | | 4,956,008 | | | | | | 0.1 | | |
| 7,313,376 | | | Freddie Mac REMICS 4608 JV, 3.500%, 01/15/2055 | | | | | 7,748,812 | | | | | | 0.1 | | |
| 719,506 | | | Freddie Mac REMICS 4673 WA, 3.500%, 09/15/2043 | | | | | 755,004 | | | | | | 0.0 | | |
| Voya Intermediate Bond Fund | as of March 31, 2020 (continued) |
| Principal Amount† | | | Value | | | Percentage of Net Assets | | |||||||||
| COLLATERALIZED MORTGAGE OBLIGATIONS: (continued) | | |||||||||||||||
| 32,265,802 | | | Freddie Mac REMICS 4771 HZ, 3.500%, 03/15/2048 | | | | $ | 37,006,274 | | | | | | 0.5 | | |
| 2,457,000 | | | Freddie Mac REMICS 4772 VG, 4.500%, 08/15/2036 | | | | | 2,820,871 | | | | | | 0.0 | | |
| 1,350,000 | | | Freddie Mac REMICS 4787 PY, 4.000%, 05/15/2048 | | | | | 1,475,507 | | | | | | 0.0 | | |
| 13,474,764 | | | Freddie Mac REMICS 4795 D, 5.000%, 05/15/2048 | | | | | 16,234,006 | | | | | | 0.2 | | |
| 1,632,872 | | | Freddie Mac REMICS 4904 HB, 3.000%, 08/25/2049 | | | | | 1,751,224 | | | | | | 0.0 | | |
| 606,535 | | | Freddie Mac REMICS 4914 DB, 3.000%, 09/25/2049 | | | | | 676,009 | | | | | | 0.0 | | |
| 11,606,176 | | | Freddie Mac Series 4348 ZX, 4.250%, 06/15/2044 | | | | | 13,665,211 | | | | | | 0.2 | | |
| 9,500,000 (1) | | | Freddie Mac STACR Trust 2018-DNA2 M2, 3.097%, (US0001M + 2.150%), 12/25/2030 | | | | | 7,846,813 | | | | | | 0.1 | | |
| 4,000,000 (1) | | | Freddie Mac STACR Trust 2018-DNA3 M2, 3.047%, (US0001M + 2.100%), 09/25/2048 | | | | | 3,341,904 | | | | | | 0.0 | | |
| 6,000,000 (1) | | | Freddie Mac Stacr Trust 2018-HQA2 M2, 3.247%, (US0001M + 2.300%), 10/25/2048 | | | | | 4,972,423 | | | | | | 0.1 | | |
| 6,892,611 | | | Freddie Mac Strips 277 30, 3.000%, 09/15/2042 | | | | | 7,271,368 | | | | | | 0.1 | | |
| 6,892,641 (6) | | | Freddie Mac Strips 303 C17, 3.500%, 01/15/2043 | | | | | 904,164 | | | | | | 0.0 | | |
| 4,940,000 | | | Freddie Mac Structured Agency Credit Risk Debt Notes 2015-DNA2 M3, 4.847%, (US0001M + 3.900%), 12/25/2027 | | | | | 4,872,321 | | | | | | 0.1 | | |
| 5,750,000 | | | Freddie Mac Structured Agency Credit Risk Debt Notes 2015-DNA3 M3, 5.647%, (US0001M + 4.700%), 04/25/2028 | | | | | 5,349,821 | | | | | | 0.1 | | |
| 2,872,721 | | | Freddie Mac Structured Agency Credit Risk Debt Notes 2015-HQ1 M3, 4.747%, (US0001M + 3.800%), 03/25/2025 | | | | | 2,759,543 | | | | | | 0.0 | | |
| Principal Amount† | | | Value | | | Percentage of Net Assets | | |||||||||
| COLLATERALIZED MORTGAGE OBLIGATIONS: (continued) | | |||||||||||||||
| 14,050,000 | | | Freddie Mac Structured Agency Credit Risk Debt Notes 2016-DNA1 M3, 6.497%, (US0001M + 5.550%), 07/25/2028 | | | | $ | 13,696,249 | | | | | | 0.2 | | |
| 7,300,000 | | | Freddie Mac Structured Agency Credit Risk Debt Notes 2016-HQA2 M3, 6.097%, (US0001M + 5.150%), 11/25/2028 | | | | | 7,006,361 | | | | | | 0.1 | | |
| 750,000 | | | Freddie Mac Structured Agency Credit Risk Debt Notes 2016-HQA3 M3, 4.797%, (US0001M + 3.850%), 03/25/2029 | | | | | 677,869 | | | | | | 0.0 | | |
| 5,600,000 | | | Freddie Mac Structured Agency Credit Risk Debt Notes 2017-DNA2 M2, 4.397%, (US0001M + 3.450%), 10/25/2029 | | | | | 5,064,665 | | | | | | 0.1 | | |
| 8,200,000 | | | Freddie Mac Structured Agency Credit Risk Debt Notes 2017-DNA3 M2, 3.447%, (US0001M + 2.500%), 03/25/2030 | | | | | 7,170,831 | | | | | | 0.1 | | |
| 6,800,000 | | | Freddie Mac Structured Agency Credit Risk Debt Notes 2017-HQA1 M2, 4.497%, (US0001M + 3.550%), 08/25/2029 | | | | | 5,406,174 | | | | | | 0.1 | | |
| 12,300,000 | | | Freddie Mac Structured Agency Credit Risk Debt Notes 2017-HQA2 M2, 3.597%, (US0001M + 2.650%), 12/25/2029 | | | | | 10,800,875 | | | | | | 0.1 | | |
| 11,058,277 | | | Freddie Mac Structured Agency Credit Risk Debt Notes 2017-HQA3 M2, 3.297%, (US0001M + 2.350%), 04/25/2030 | | | | | 9,626,686 | | | | | | 0.1 | | |
| 9,200,000 | | | Freddie Mac Structured Agency Credit Risk Debt Notes 2018-DNA1 M2, 2.747%, (US0001M + 1.800%), 07/25/2030 | | | | | 7,656,906 | | | | | | 0.1 | | |
| 1,787,558 | | | Freddie Mac Structured Agency Credit Risk Debt Notes 2018-HQA1 M2, 3.247%, (US0001M + 2.300%), 09/25/2030 | | | | | 1,526,155 | | | | | | 0.0 | | |
| Voya Intermediate Bond Fund | as of March 31, 2020 (continued) |
| Principal Amount† | | | Value | | | Percentage of Net Assets | | |||||||||
| COLLATERALIZED MORTGAGE OBLIGATIONS: (continued) | | |||||||||||||||
| 6,550,000 (1) | | | Freddie Mac Structured Agency Credit Risk Debt Notes 2019-DNA1 M2, 3.597%, (US0001M + 2.650%), 01/25/2049 | | | | $ | 5,849,109 | | | | | | 0.1 | | |
| 8,169,000 (1) | | | Freddie Mac Structured Agency Credit Risk Debt Notes 2019-HQA2 M2, 2.997%, (US0001M + 2.050%), 04/25/2049 | | | | | 6,859,734 | | | | | | 0.1 | | |
| 1,057,887 (4) | | | Freddie Mac Structured Pass Through Certificates T-48 1A, 4.879%, 07/25/2033 | | | | | 1,180,269 | | | | | | 0.0 | | |
| 60,017,189 (6) | | | Freddie Mac REMICS 4585 AS, 5.395%, (-1.000*US0001M + 6.100%), 05/15/2046 | | | | | 12,227,362 | | | | | | 0.2 | | |
| 21,662,859 | | | Freddie Mac REMICS 4776 AZ, 4.000%, 07/15/2047 | | | | | 24,078,047 | | | | | | 0.3 | | |
| 68,863,637 (6) | | | Freddie Mac REMICS 4879 DS, 5.395%, (-1.000*US0001M + 6.100%), 08/15/2034 | | | | | 13,559,794 | | | | | | 0.2 | | |
| 4,500,000 (1) | | | Freddie Mac STACR Remic Trust 2020-DNA2 M2, 2.797%, (US0001M + 1.850%), 02/25/2050 | | | | | 2,927,503 | | | | | | 0.0 | | |
| 6,900,000 (1) | | | Freddie Mac STACR REMIC Trust 2020-HQA1 M2, 2.847%, (US0001M + 1.900%), 01/25/2050 | | | | | 4,408,700 | | | | | | 0.1 | | |
| 1,700,000 (1) | | | Freddie Mac Stacr Remic Trust 2020-HQA2 M2, 3.911%, (US0001M + 3.100%), 03/25/2050 | | | | | 1,116,794 | | | | | | 0.0 | | |
| 988,522 (1)(4) | | | Galton Funding Mortgage Trust 2017-2 A21, 4.000%, 06/25/2059 | | | | | 972,170 | | | | | | 0.0 | | |
| 3,594,582 (1)(4) | | | Galton Funding Mortgage Trust 2018-1 B1, 3.800%, 11/25/2057 | | | | | 3,380,109 | | | | | | 0.0 | | |
| 3,924,585 (1)(4) | | | Galton Funding Mortgage Trust 2018-2 B2, 4.750%, 10/25/2058 | | | | | 3,770,008 | | | | | | 0.1 | | |
| 2,500,000 (1)(4) | | | Galton Funding Mortgage Trust 2018-2 A51, 4.500%, 10/25/2058 | | | | | 2,471,137 | | | | | | 0.0 | | |
| Principal Amount† | | | Value | | | Percentage of Net Assets | | |||||||||
| COLLATERALIZED MORTGAGE OBLIGATIONS: (continued) | | |||||||||||||||
| 1,975,586 (6) | | | Ginnie Mae 2005-37 SI, 5.377%, (-1.000*US0001M + 6.150%), 05/20/2035 | | | | $ | 362,535 | | | | | | 0.0 | | |
| 2,007,194 (6) | | | Ginnie Mae 2007-23 ST, 5.427%, (-1.000*US0001M + 6.200%), 04/20/2037 | | | | | 330,357 | | | | | | 0.0 | | |
| 2,284,589 (6) | | | Ginnie Mae 2007-40 SE, 5.977%, (-1.000*US0001M + 6.750%), 07/20/2037 | | | | | 530,804 | | | | | | 0.0 | | |
| 1,616,560 (6) | | | Ginnie Mae 2007-7 EI, 5.427%, (-1.000*US0001M + 6.200%), 02/20/2037 | | | | | 342,503 | | | | | | 0.0 | | |
| 5,445,509 (6) | | | Ginnie Mae 2010-11 SA, 5.715%, (-1.000*US0001M + 6.420%), 01/16/2040 | | | | | 1,245,958 | | | | | | 0.0 | | |
| 2,319,094 (6) | | | Ginnie Mae 2010-14 SB, 6.027%, (-1.000*US0001M + 6.800%), 11/20/2035 | | | | | 522,338 | | | | | | 0.0 | | |
| 1,907,535 (6) | | | Ginnie Mae 2010-99 IT, 5.000%, 08/16/2040 | | | | | 333,599 | | | | | | 0.0 | | |
| 913,473 | | | Ginnie Mae 2013-69 KA, 1.250%, 08/20/2042 | | | | | 899,828 | | | | | | 0.0 | | |
| 2,218,616 | | | Ginnie Mae 2015-3 ZD, 4.000%, 01/20/2045 | | | | | 2,560,955 | | | | | | 0.1 | | |
| 57,445,031 (6) | | | Ginnie Mae 2018-167 CS, 5.327%, (-1.000*US0001M + 6.100%), 12/20/2048 | | | | | 7,931,837 | | | | | | 0.1 | | |
| 630,874 (6) | | | Ginnie Mae Series 2005-7 AH, 6.065%, (-1.000*US0001M + 6.770%), 02/16/2035 | | | | | 133,847 | | | | | | 0.0 | | |
| 12,287,739 (6) | | | Ginnie Mae Series 2007-41 SL, 5.927%, (-1.000*US0001M + 6.700%), 07/20/2037 | | | | | 3,046,102 | | | | | | 0.1 | | |
| 1,312,813 (6) | | | Ginnie Mae Series 2008-2 SW, 5.777%, (-1.000*US0001M + 6.550%), 01/20/2038 | | | | | 343,023 | | | | | | 0.0 | | |
| Voya Intermediate Bond Fund | as of March 31, 2020 (continued) |
| Principal Amount† | | | Value | | | Percentage of Net Assets | | |||||||||
| COLLATERALIZED MORTGAGE OBLIGATIONS: (continued) | | |||||||||||||||
| 777,168 (6) | | | Ginnie Mae Series 2008-35 SN, 5.627%, (-1.000*US0001M + 6.400%), 04/20/2038 | | | | $ | 133,626 | | | | | | 0.0 | | |
| 443,694 (6) | | | Ginnie Mae Series 2008-40 PS, 5.795%, (-1.000*US0001M + 6.500%), 05/16/2038 | | | | | 92,468 | | | | | | 0.0 | | |
| 1,096,036 (6) | | | Ginnie Mae Series 2009-25 KS, 5.427%, (-1.000*US0001M + 6.200%), 04/20/2039 | | | | | 241,144 | | | | | | 0.0 | | |
| 865,603 | | | Ginnie Mae Series 2009-29 PB, 4.750%, 05/20/2039 | | | | | 984,590 | | | | | | 0.0 | | |
| 929,956 | | | Ginnie Mae Series 2009-31 ZL, 4.500%, 05/20/2039 | | | | | 1,067,059 | | | | | | 0.0 | | |
| 1,439,104 (6) | | | Ginnie Mae Series 2009-33 SN, 5.527%, (-1.000*US0001M + 6.300%), 05/20/2039 | | | | | 51,207 | | | | | | 0.0 | | |
| 12,083,146 | | | Ginnie Mae Series 2009-33 ZB, 6.000%, 05/20/2039 | | | | | 13,809,624 | | | | | | 0.2 | | |
| 1,909,885 | | | Ginnie Mae Series 2009-34 Z, 4.500%, 05/16/2039 | | | | | 2,142,598 | | | | | | 0.0 | | |
| 192,878 (6) | | | Ginnie Mae Series 2009-43 HS, 5.427%, (-1.000*US0001M + 6.200%), 06/20/2038 | | | | | 5,868 | | | | | | 0.0 | | |
| 2,600,663 | | | Ginnie Mae Series 2009-98 DA, 3.250%, 07/16/2039 | | | | | 2,777,505 | | | | | | 0.1 | | |
| 5,155,446 | | | Ginnie Mae Series 2010-108 WL, 4.000%, 04/16/2040 | | | | | 5,681,101 | | | | | | 0.1 | | |
| 2,087,088 (6) | | | Ginnie Mae Series 2010-116 NS, 5.945%, (-1.000*US0001M + 6.650%), 09/16/2040 | | | | | 431,087 | | | | | | 0.0 | | |
| 5,946,065 (6) | | | Ginnie Mae Series 2010-116 SK, 5.847%, (-1.000*US0001M + 6.620%), 08/20/2040 | | | | | 1,389,573 | | | | | | 0.0 | | |
| Principal Amount† | | | Value | | | Percentage of Net Assets | | |||||||||
| COLLATERALIZED MORTGAGE OBLIGATIONS: (continued) | | |||||||||||||||
| 8,824,633 (6) | | | Ginnie Mae Series 2010-149 HS, 5.395%, (-1.000*US0001M + 6.100%), 05/16/2040 | | | | $ | 1,108,158 | | | | | | 0.0 | | |
| 480,000 | | | Ginnie Mae Series 2010-164 MD, 4.000%, 12/20/2040 | | | | | 554,511 | | | | | | 0.0 | | |
| 1,781,055 (6) | | | Ginnie Mae Series 2010-168 BI, 5.000%, 04/20/2040 | | | | | 421,687 | | | | | | 0.0 | | |
| 1,711,158 (6) | | | Ginnie Mae Series 2010-68 MS, 5.077%, (-1.000*US0001M + 5.850%), 06/20/2040 | | | | | 325,765 | | | | | | 0.0 | | |
| 3,893,620 | | | Ginnie Mae Series 2011-52 PA, 4.250%, 02/16/2041 | | | | | 4,276,402 | | | | | | 0.1 | | |
| 4,656,439 (6) | | | Ginnie Mae Series 2011-72 SA, 4.645%, (-1.000*US0001M + 5.350%), 05/16/2041 | | | | | 779,364 | | | | | | 0.0 | | |
| 4,983,013 (6) | | | Ginnie Mae Series 2011-73 LS, 5.917%, (-1.000*US0001M + 6.690%), 08/20/2039 | | | | | 413,007 | | | | | | 0.0 | | |
| 73,151 | | | Ginnie Mae Series 2012-43 MA, 4.000%, 10/20/2041 | | | | | 74,984 | | | | | | 0.0 | | |
| 1,189,731 (6) | | | Ginnie Mae Series 2012-91 QI, 4.500%, 09/20/2041 | | | | | 93,850 | | | | | | 0.0 | | |
| 1,388,000 | | | Ginnie Mae Series 2013-116 KB, 3.500%, 12/20/2042 | | | | | 1,514,685 | | | | | | 0.0 | | |
| 8,505,246 (6) | | | Ginnie Mae Series 2013-167 PI, 5.500%, 11/20/2043 | | | | | 1,545,852 | | | | | | 0.0 | | |
| 666,693 | | | Ginnie Mae Series 2013-27 KA, 2.250%, 02/20/2043 | | | | | 691,320 | | | | | | 0.0 | | |
| 1,866,766 (6) | | | Ginnie Mae Series 2014-10 GI, 4.500%, 01/16/2029 | | | | | 142,130 | | | | | | 0.0 | | |
| 5,316,013 (6) | | | Ginnie Mae Series 2014-185 SB, 4.827%, (-1.000*US0001M + 5.600%), 12/20/2044 | | | | | 1,032,051 | | | | | | 0.0 | | |
| Voya Intermediate Bond Fund | as of March 31, 2020 (continued) |
| Principal Amount† | | | Value | | | Percentage of Net Assets | | |||||||||
| COLLATERALIZED MORTGAGE OBLIGATIONS: (continued) | | |||||||||||||||
| 5,121,927 (6) | | | Ginnie Mae Series 2014-3 QS, 5.377%, (-1.000*US0001M + 6.150%), 03/20/2043 | | | | $ | 707,594 | | | | | | 0.0 | | |
| 8,930,697 (6) | | | Ginnie Mae Series 2014-3 SU, 5.277%, (-1.000*US0001M + 6.050%), 07/20/2039 | | | | | 1,913,379 | | | | | | 0.0 | | |
| 7,429,758 (6) | | | Ginnie Mae Series 2014-56 SP, 5.495%, (-1.000*US0001M + 6.200%), 12/16/2039 | | | | | 1,099,495 | | | | | | 0.0 | | |
| 12,037,543 (6) | | | Ginnie Mae Series 2014-58 SG, 4.895%, (-1.000*US0001M + 5.600%), 04/16/2044 | | | | | 1,791,634 | | | | | | 0.0 | | |
| 41,411,717 (6) | | | Ginnie Mae Series 2015-110 MS, 4.937%, (-1.000*US0001M + 5.710%), 08/20/2045 | | | | | 6,604,279 | | | | | | 0.1 | | |
| 2,198,621 | | | Ginnie Mae Series 2015-27 PB, 3.000%, 08/20/2044 | | | | | 2,343,587 | | | | | | 0.0 | | |
| 28,739,960 (6) | | | Ginnie Mae Series 2016-160 GS, 5.327%, (-1.000*US0001M + 6.100%), 11/20/2046 | | | | | 5,784,538 | | | | | | 0.1 | | |
| 2,235,042 | | | Ginnie Mae Series 2016-44 JA, 3.500%, 03/20/2046 | | | | | 2,409,913 | | | | | | 0.0 | | |
| 299,760 | | | Ginnie Mae Series 2018-104 HZ, 3.500%, 08/20/2048 | | | | | 331,263 | | | | | | 0.0 | | |
| 6,495,085 | | | Ginnie Mae Series 2018-120 DE, 3.500%, 09/20/2048 | | | | | 6,929,504 | | | | | | 0.1 | | |
| 179,366 | | | Ginnie Mae Series 2018-122 GZ, 3.500%, 09/20/2048 | | | | | 205,555 | | | | | | 0.0 | | |
| 4,977,225 | | | Ginnie Mae Series 2018-126 A, 3.500%, 09/20/2048 | | | | | 5,311,148 | | | | | | 0.1 | | |
| 178,056 | | | Ginnie Mae Series 2018-147 KZ, 3.750%, 10/20/2048 | | | | | 207,915 | | | | | | 0.0 | | |
| 176,532 | | | Ginnie Mae Series 2019-100 JB, 3.000%, 08/20/2049 | | | | | 187,140 | | | | | | 0.0 | | |
| Principal Amount† | | | Value | | | Percentage of Net Assets | | |||||||||
| COLLATERALIZED MORTGAGE OBLIGATIONS: (continued) | | |||||||||||||||
| 532,322 | | | Ginnie Mae Series 2019-100 KB, 3.000%, 08/20/2049 | | | | $ | 564,008 | | | | | | 0.0 | | |
| 1,349,931 | | | Ginnie Mae Series 2019-100 MC, 3.000%, 08/20/2049 | | | | | 1,424,070 | | | | | | 0.0 | | |
| 1,081,376 | | | Ginnie Mae Series 2019-23 NG, 3.500%, 02/20/2049 | | | | | 1,210,605 | | | | | | 0.0 | | |
| 71,326 | | | Ginnie Mae Series 2019-54 AB, 3.000%, 04/20/2049 | | | | | 76,610 | | | | | | 0.0 | | |
| 798,785 | | | Ginnie Mae Series 2019-78 MB, 3.000%, 06/20/2049 | | | | | 846,754 | | | | | | 0.0 | | |
| 416,445 | | | Ginnie Mae Series 2019-89 KB, 3.000%, 07/20/2049 | | | | | 438,244 | | | | | | 0.0 | | |
| 299,424 | | | Ginnie Mae Series 2019-89 WB, 3.000%, 07/20/2049 | | | | | 314,827 | | | | | | 0.0 | | |
| 2,059,629 (1)(4) | | | GS Mortage-Backed Securities Trust 2020-PJ1 A1, 3.500%, 05/01/2050 | | | | | 2,095,530 | | | | | | 0.0 | | |
| 3,303,252 (1)(4) | | | GS Mortage-Backed Securities Trust 2020-PJ1 A4, 3.500%, 05/01/2050 | | | | | 3,346,014 | | | | | | 0.0 | | |
| 2,100,000 (1)(4) | | | GS Mortage-Backed Securities Trust 2020-PJ1 A8, 3.500%, 05/01/2050 | | | | | 1,997,213 | | | | | | 0.0 | | |
| 5,990,521 (1)(4) | | | GS Mortgage-Backed Securities Corp. Trust 2019-PJ2 A1, 4.000%, 11/25/2049 | | | | | 6,081,056 | | | | | | 0.1 | | |
| 2,963,200 (1)(4) | | | GS Mortgage-Backed Securities Corp. Trust 2019-PJ2 B3, 4.496%, 11/25/2049 | | | | | 2,734,940 | | | | | | 0.0 | | |
| 1,190,135 (1)(4) | | | GS Mortgage-Backed Securities Corp. Trust 2019-PJ3 B1, 4.095%, 03/25/2050 | | | | | 1,176,568 | | | | | | 0.0 | | |
| 7,253,939 (1)(4) | | | GS Mortgage-Backed Securities Corp. Trust 2020-PJ2 A4, 3.500%, 07/25/2050 | | | | | 7,276,202 | | | | | | 0.1 | | |
| 3,253 | | | GSR Mortgage Loan Trust 2005-5F 8A1, 1.447%, (US0001M + 0.500%), 06/25/2035 | | | | | 2,959 | | | | | | 0.0 | | |
| Voya Intermediate Bond Fund | as of March 31, 2020 (continued) |
| Principal Amount† | | | Value | | | Percentage of Net Assets | | |||||||||
| COLLATERALIZED MORTGAGE OBLIGATIONS: (continued) | | |||||||||||||||
| 2,662,384 | | | HarborView Mortgage Loan Trust 2007-5 A1A, 0.940%, (US0001M + 0.190%), 09/19/2037 | | | | $ | 2,180,367 | | | | | | 0.0 | | |
| 146,863 | | | HomeBanc Mortgage Trust 2004-1 2A, 1.807%, (US0001M + 0.860%), 08/25/2029 | | | | | 131,884 | | | | | | 0.0 | | |
| 2,000,000 | | | HomeBanc Mortgage Trust 2005-4 M1, 1.417%, (US0001M + 0.470%), 10/25/2035 | | | | | 1,772,422 | | | | | | 0.0 | | |
| 1,940,951 (1)(4) | | | Homeward Opportunities Fund I Trust 2019-2 A3, 3.007%, 09/25/2059 | | | | | 1,878,866 | | | | | | 0.0 | | |
| 1,157,501 | | | Impac CMB Trust Series 2005-1 M1, 1.637%, (US0001M + 0.690%), 04/25/2035 | | | | | 990,969 | | | | | | 0.0 | | |
| 1,705,471 | | | IndyMac INDX Mortgage Loan Trust 2006-AR2 1A1B, 1.157%, (US0001M + 0.210%), 04/25/2046 | | | | | 1,379,438 | | | | | | 0.0 | | |
| 2,498,453 | | | IndyMac INDX Mortgage Loan Trust 2006-AR2 2A1, 1.157%, (US0001M + 0.210%), 02/25/2046 | | | | | 1,838,327 | | | | | | 0.0 | | |
| 2,802,412 (1)(4) | | | JP Morgan Mortgage Trust 2019-6 B1, 4.250%, 12/25/2049 | | | | | 2,567,440 | | | | | | 0.0 | | |
| 5,181,558 (1)(4) | | | JP Morgan Mortgage Trust 2020-1 A15, 3.500%, 06/25/2050 | | | | | 5,240,713 | | | | | | 0.1 | | |
| 2,300,000 (1)(4) | | | JP Morgan Mortgage Trust 2020-1 A7, 3.500%, 06/25/2050 | | | | | 2,219,049 | | | | | | 0.0 | | |
| 6,000,000 (1)(4) | | | JP Morgan Mortgage Trust 2020-LTV1 A5, 3.500%, 06/25/2050 | | | | | 5,864,080 | | | | | | 0.1 | | |
| 965,335 (1)(4) | | | J.P. Morgan Mortgage Trust 2019-2 A3, 4.000%, 08/25/2049 | | | | | 986,627 | | | | | | 0.0 | | |
| 380,969 | | | JP Morgan Alternative Loan Trust 2005-S1 1A1, 5.500%, 12/25/2035 | | | | | 255,096 | | | | | | 0.0 | | |
| 2,519,201 (4) | | | JP Morgan Mortgage Trust 2005-A4 B1, 4.301%, 07/25/2035 | | | | | 2,173,672 | | | | | | 0.0 | | |
| 4,320,587 (1)(4) | | | JP Morgan Mortgage Trust 2016-1 B3, 3.868%, 05/25/2046 | | | | | 4,125,964 | | | | | | 0.1 | | |
| Principal Amount† | | | Value | | | Percentage of Net Assets | | |||||||||
| COLLATERALIZED MORTGAGE OBLIGATIONS: (continued) | | |||||||||||||||
| 1,104,794 (1)(4) | | | JP Morgan Mortgage Trust 2017-1 B4, 3.529%, 01/25/2047 | | | | $ | 1,004,419 | | | | | | 0.0 | | |
| 5,736,713 (1)(4) | | | JP Morgan Mortgage Trust 2017-3 1A13, 3.500%, 08/25/2047 | | | | | 5,653,415 | | | | | | 0.1 | | |
| 3,479,878 (1)(4) | | | JP Morgan Mortgage Trust 2017-3 B1, 3.834%, 08/25/2047 | | | | | 3,295,047 | | | | | | 0.1 | | |
| 1,988,368 (1)(4) | | | JP Morgan Mortgage Trust 2017-3 B2, 3.834%, 08/25/2047 | | | | | 1,856,115 | | | | | | 0.0 | | |
| 1,431,875 (1)(4) | | | JP Morgan Mortgage Trust 2017-6 B3, 3.818%, 12/25/2048 | | | | | 1,341,620 | | | | | | 0.0 | | |
| 954,583 (1)(4) | | | JP Morgan Mortgage Trust 2017-6 B4, 3.818%, 12/25/2048 | | | | | 864,384 | | | | | | 0.0 | | |
| 2,066,124 (1)(4) | | | JP Morgan Mortgage Trust 2018-1 B1, 3.738%, 06/25/2048 | | | | | 2,038,541 | | | | | | 0.0 | | |
| 1,988,823 (1)(4) | | | JP Morgan Mortgage Trust 2018-1 B2, 3.738%, 06/25/2048 | | | | | 1,856,407 | | | | | | 0.0 | | |
| 2,625,361 (1)(4) | | | JP Morgan Mortgage Trust 2018-1 B3, 3.738%, 06/25/2048 | | | | | 2,370,393 | | | | | | 0.0 | | |
| 2,539,243 (1)(4) | | | JP Morgan Mortgage Trust 2018-3 B1, 3.763%, 09/25/2048 | | | | | 2,343,901 | | | | | | 0.0 | | |
| 2,187,402 (1)(4) | | | JP Morgan Mortgage Trust 2018-4 B2, 3.773%, 10/25/2048 | | | | | 1,983,674 | | | | | | 0.0 | | |
| 1,744,795 (1)(4) | | | JP Morgan Mortgage Trust 2018-6C B2, 3.950%, 12/25/2048 | | | | | 1,602,981 | | | | | | 0.0 | | |
| 2,936,710 (1)(4) | | | JP Morgan Mortgage Trust 2018-9 B3, 4.462%, 02/25/2049 | | | | | 2,777,096 | | | | | | 0.0 | | |
| 2,270,756 (1)(4) | | | JP Morgan Mortgage Trust 2019-1 A3, 4.000%, 05/25/2049 | | | | | 2,315,175 | | | | | | 0.0 | | |
| 3,199,066 (1)(4) | | | JP Morgan Mortgage Trust 2019-1 B1, 4.515%, 05/25/2049 | | | | | 3,045,527 | | | | | | 0.0 | | |
| 3,111,748 (1)(4) | | | JP Morgan Mortgage Trust 2019-6 A3, 3.500%, 12/25/2049 | | | | | 3,172,715 | | | | | | 0.1 | | |
| Voya Intermediate Bond Fund | as of March 31, 2020 (continued) |
| Principal Amount† | | | Value | | | Percentage of Net Assets | | |||||||||
| COLLATERALIZED MORTGAGE OBLIGATIONS: (continued) | | |||||||||||||||
| 4,230,821 (1)(4) | | | JP Morgan Mortgage Trust 2019-6 B2, 4.250%, 12/25/2049 | | | | $ | 4,050,566 | | | | | | 0.1 | | |
| 2,615,236 (1)(4) | | | JP Morgan Mortgage Trust 2019-8 A15, 3.500%, 03/25/2050 | | | | | 2,630,443 | | | | | | 0.0 | | |
| 4,509,714 (1)(4) | | | JP Morgan Mortgage Trust 2019-LTV2 A18, 4.000%, 12/25/2049 | | | | | 4,652,986 | | | | | | 0.1 | | |
| 3,604,602 (1)(4) | | | JP Morgan Mortgage Trust 2019-LTV2 B3, 4.824%, 12/25/2049 | | | | | 3,127,237 | | | | | | 0.1 | | |
| 7,617,817,917 (1)(6) | | | L Street Securities 2017-PM1 XIO, 0.000%, 10/25/2048 | | | | | 7,825,023 | | | | | | 0.1 | | |
| 15,717,603 (6) | | | Lehman Mortgage Trust 2006-7 2A4, 5.603%, (-1.000*US0001M + 6.550%), 11/25/2036 | | | | | 4,888,713 | | | | | | 0.1 | | |
| 11,017,563 (6) | | | Lehman Mortgage Trust 2006-9 2A5, 5.673%, (-1.000*US0001M + 6.620%), 01/25/2037 | | | | | 1,008,787 | | | | | | 0.0 | | |
| 1,506,045 | | | Lehman XS Trust Series 2005-5N 1A2, 1.307%, (US0001M + 0.360%), 11/25/2035 | | | | | 1,099,711 | | | | | | 0.0 | | |
| 4,695,654 | | | Morgan Stanley Mortgage Loan Trust 2007-13 6A1, 6.000%, 10/25/2037 | | | | | 3,313,939 | | | | | | 0.0 | | |
| 2,712,237 (1)(4) | | | New Residential Mortgage Loan Trust 2017-3A B2, 4.750%, 04/25/2057 | | | | | 2,655,282 | | | | | | 0.0 | | |
| 2,130,209 (1)(4) | | | OBX 2019-EXP1 1A3 Trust, 4.000%, 01/25/2059 | | | | | 2,128,736 | | | | | | 0.0 | | |
| 1,920,898 (1)(4) | | | OBX 2019-EXP2 1A3 Trust, 4.000%, 07/25/2059 | | | | | 1,936,909 | | | | | | 0.0 | | |
| 2,425,078 (1)(4) | | | OBX 2019-INV2 A25 Trust, 4.000%, 05/27/2049 | | | | | 2,486,065 | | | | | | 0.1 | | |
| 9,826,000 | | | Opteum Mortgage Acceptance Corp. Asset Backed Pass-Through Certificates 2005-4 M2, 1.447%, (US0001M + 0.500%), 11/25/2035 | | | | | 8,008,829 | | | | | | 0.1 | | |
| 985,853 (1)(4) | | | PSMC 2020-1 A1 Trust, 3.500%, 01/25/2050 | | | | | 1,000,758 | | | | | | 0.0 | | |
| 5,539,108 (1)(4) | | | RCKT Mortgage Trust 2019-1 A13, 3.500%, 09/25/2049 | | | | | 5,619,489 | | | | | | 0.1 | | |
| Principal Amount† | | | Value | | | Percentage of Net Assets | | |||||||||
| COLLATERALIZED MORTGAGE OBLIGATIONS: (continued) | | |||||||||||||||
| 2,000,000 (1)(4) | | | RCKT Mortgage Trust 2020-1 A13, 3.000%, 02/25/2050 | | | | $ | 1,979,054 | | | | | | 0.0 | | |
| 1,724,448 (1)(4) | | | Sequoia Mortgage Trust 2014-3 B3, 3.938%, 10/25/2044 | | | | | 1,652,780 | | | | | | 0.0 | | |
| 1,756,845 (1)(4) | | | Sequoia Mortgage Trust 2014-4 B3, 3.865%, 11/25/2044 | | | | | 1,680,817 | | | | | | 0.0 | | |
| 1,817,161 (1)(4) | | | Sequoia Mortgage Trust 2015-2 B3, 3.736%, 05/25/2045 | | | | | 1,712,270 | | | | | | 0.0 | | |
| 1,582,122 (1)(4) | | | Sequoia Mortgage Trust 2015-3 B3, 3.703%, 07/25/2045 | | | | | 1,414,194 | | | | | | 0.0 | | |
| 3,300,000 (1)(4) | | | Sequoia Mortgage Trust 2017-CH2 A13, 4.000%, 12/25/2047 | | | | | 3,268,778 | | | | | | 0.1 | | |
| 1,578,584 (1)(4) | | | Sequoia Mortgage Trust 2018-CH1 A19, 4.000%, 02/25/2048 | | | | | 1,581,194 | | | | | | 0.0 | | |
| 2,601,425 (1)(4) | | | Sequoia Mortgage Trust 2018-CH1 B2B, 4.477%, 02/25/2048 | | | | | 2,475,823 | | | | | | 0.0 | | |
| 1,534,356 (1)(4) | | | Sequoia Mortgage Trust 2019-1 A1, 4.000%, 02/25/2049 | | | | | 1,518,357 | | | | | | 0.0 | | |
| 3,799,750 (1)(4) | | | Sequoia Mortgage Trust 2019-3 A2, 3.500%, 09/25/2049 | | | | | 3,842,919 | | | | | | 0.1 | | |
| 3,765,863 (1)(4) | | | Sequoia Mortgage Trust 2019-4 A19, 3.500%, 11/25/2049 | | | | | 3,809,886 | | | | | | 0.1 | | |
| 1,437,709 (1)(4) | | | Sequoia Mortgage Trust 2019-5 A19, 3.500%, 12/25/2049 | | | | | 1,465,397 | | | | | | 0.0 | | |
| 1,409,971 (1)(4) | | | Sequoia Mortgage Trust 2019-CH1 A1, 4.500%, 03/25/2049 | | | | | 1,409,081 | | | | | | 0.0 | | |
| 4,496,197 (1)(4) | | | Sequoia Mortgage Trust 2019-CH2 A1, 4.500%, 08/25/2049 | | | | | 4,503,227 | | | | | | 0.1 | | |
| 5,278,376 (1)(4) | | | Sequoia Mortgage Trust 2020-1 A19, 3.500%, 02/25/2050 | | | | | 5,391,809 | | | | | | 0.1 | | |
| 5,200,000 (1)(4) | | | Sequoia Mortgage Trust 2020-1 A7, 3.500%, 02/25/2050 | | | | | 4,987,198 | | | | | | 0.1 | | |
| 4,373,811 (1)(4) | | | Sequoia Mortgage Trust 2020-2 A19, 3.500%, 03/25/2050 | | | | | 4,407,575 | | | | | | 0.1 | | |
| Voya Intermediate Bond Fund | as of March 31, 2020 (continued) |
| Principal Amount† | | | Value | | | Percentage of Net Assets | | |||||||||
| COLLATERALIZED MORTGAGE OBLIGATIONS: (continued) | | |||||||||||||||
| 1,996,698 (1)(4) | | | Sequoia Mortgage Trust 2020-2 B2, 3.675%, 03/25/2050 | | | | $ | 1,594,768 | | | | | | 0.0 | | |
| 2,690,000 (1)(4) | | | Sequoia Mortgage Trust 2020-3 B2, 3.442%, 04/25/2050 | | | | | 2,110,337 | | | | | | 0.0 | | |
| 1,893,046 (1)(4) | | | Shellpoint Co-Originator Trust 2017-2 B2, 3.714%, 10/25/2047 | | | | | 1,844,002 | | | | | | 0.0 | | |
| 2,457,097 (1)(4) | | | Starwood Mortgage Residential Trust 2019-1 A3, 3.299%, 06/25/2049 | | | | | 2,455,712 | | | | | | 0.0 | | |
| 1,360,000 (1) | | | Verus Securitization Trust 2017-SG1A B1, 3.615%, 11/25/2047 | | | | | 1,246,702 | | | | | | 0.0 | | |
| 1,773,000 (1)(4) | | | Verus Securitization Trust 2018-1 B1, 3.801%, 01/25/2058 | | | | | 1,613,305 | | | | | | 0.0 | | |
| 1,231,000 (1)(4) | | | Verus Securitization Trust 2018-2 B1, 4.426%, 06/01/2058 | | | | | 1,114,605 | | | | | | 0.0 | | |
| 2,460,159 (1)(8) | | | Verus Securitization Trust 2019-3 A2, 2.938% (Step Rate @ 3.938% on 07/25/2023), 07/25/2059 | | | | | 2,366,210 | | | | | | 0.0 | | |
| 925,174 (1)(8) | | | Verus Securitization Trust 2019-4 A3, 3.000% (Step Rate @ 4.000% on 10/25/2023), 11/25/2059 | | | | | 938,558 | | | | | | 0.0 | | |
| 2,617,962 (1)(4) | | | Verus Securitization Trust 2019-INV2 A2, 3.117%, 07/25/2059 | | | | | 2,589,761 | | | | | | 0.1 | | |
| 382,152 (4) | | | WaMu Mortgage Pass Through Certificates Series 2006-AR12 2A3, 3.206%, 10/25/2036 | | | | | 310,910 | | | | | | 0.0 | | |
| 4,632,449 (4) | | | WaMu Mortgage Pass-Through Certificates Series 2004-AR4 A6 Trust, 4.464%, 06/25/2034 | | | | | 4,132,635 | | | | | | 0.1 | | |
| 2,630,823 | | | WaMu Mortgage Pass-Through Certificates Series 2005-AR11 A1C3, 1.457%, (US0001M + 0.510%), 08/25/2045 | | | | | 2,459,192 | | | | | | 0.1 | | |
| Principal Amount† | | | Value | | | Percentage of Net Assets | | |||||||||
| COLLATERALIZED MORTGAGE OBLIGATIONS: (continued) | | |||||||||||||||
| 81,296,415 (4)(6) | | | WaMu Mortgage Pass-Through Certificates Series 2005-AR11 X, 1.263%, 08/25/2045 | | | | $ | 4,140,134 | | | | | | 0.1 | | |
| 2,061,973 | | | WaMu Mortgage Pass-Through Certificates Series 2005-AR13 A1C3, 1.437%, (US0001M + 0.490%), 10/25/2045 | | | | | 1,815,167 | | | | | | 0.0 | | |
| 395,614 (4) | | | WaMu Mortgage Pass-Through Certificates Series 2006-AR12 1A1, 3.694%, 10/25/2036 | | | | | 348,912 | | | | | | 0.0 | | |
| 878,506 (4) | | | WaMu Mortgage Pass-Through Certificates Series 2006-AR14 1A4, 3.270%, 11/25/2036 | | | | | 739,554 | | | | | | 0.0 | | |
| 1,098,075 (4) | | | WaMu Mortgage Pass-Through Certificates Series 2006-AR16 2A1, 3.333%, 12/25/2036 | | | | | 920,326 | | | | | | 0.0 | | |
| 2,538,631 (4) | | | WaMu Mortgage Pass-Through Certificates Series 2006-AR16 2A3, 3.333%, 12/25/2036 | | | | | 2,127,695 | | | | | | 0.0 | | |
| 1,682,927 (4) | | | WaMu Mortgage Pass-Through Certificates Series 2006-AR16 3A1, 3.523%, 12/25/2036 | | | | | 1,399,177 | | | | | | 0.0 | | |
| 1,363,647 (4) | | | WaMu Mortgage Pass-Through Certificates Series 2006-AR8 1A4, 3.890%, 08/25/2046 | | | | | 1,219,116 | | | | | | 0.0 | | |
| 1,977,200 (4) | | | WaMu Mortgage Pass-Through Certificates Series 2007-HY2 1A1, 3.740%, 12/25/2036 | | | | | 1,711,462 | | | | | | 0.0 | | |
| 505,534 (4) | | | WaMu Mortgage Pass-Through Certificates Series 2007-HY3 1A1, 3.237%, 03/25/2037 | | | | | 408,898 | | | | | | 0.0 | | |
| 1,274,709 (4) | | | WaMu Mortgage Pass-Through Certificates Series 2007-HY4 1A1, 3.428%, 04/25/2037 | | | | | 1,021,122 | | | | | | 0.0 | | |
| Voya Intermediate Bond Fund | as of March 31, 2020 (continued) |
| Principal Amount† | | | Value | | | Percentage of Net Assets | | |||||||||
| COLLATERALIZED MORTGAGE OBLIGATIONS: (continued) | | |||||||||||||||
| 1,691,206 | | | Washington Mutual Mortgage Pass-Through Certificates WMALT Series 2005-10 2A3, 1.847%, (US0001M + 0.900%), 11/25/2035 | | | | $ | 1,287,968 | | | | | | 0.0 | | |
| 1,074,804 | | | Washington Mutual Mortgage Pass-Through Certificates WMALT Series 2005-5 CB3, 5.500%, 07/25/2035 | | | | | 981,317 | | | | | | 0.0 | | |
| 467,226 | | | Washington Mutual Mortgage Pass-Through Certificates WMALT Series 2005-8 1A2, 5.500%, 10/25/2035 | | | | | 432,061 | | | | | | 0.0 | | |
| 4,497,180 | | | Washington Mutual Mortgage Pass-Through Certificates WMALT Series 2006-AR6 2A, 2.926%, (12MTA + 0.960%), 08/25/2046 | | | | | 2,864,881 | | | | | | 0.1 | | |
| 747,143 | | | Washington Mutual Mortgage Pass-Through Certificates WMALT Series 2007-OC1 A3, 1.177%, (US0001M + 0.230%), 01/25/2047 | | | | | 610,334 | | | | | | 0.0 | | |
| 1,547,855 | | | Washington Mutual Mortgage Pass-Through Certificates WMALT Series 2007-OC1 A4, 1.267%, (US0001M + 0.320%), 01/25/2047 | | | | | 1,264,721 | | | | | | 0.0 | | |
| 1,005,212 | | | Wells Fargo Alternative Loan 2007-PA2 2A1, 1.377%, (US0001M + 0.430%), 06/25/2037 | | | | | 757,207 | | | | | | 0.0 | | |
| 1,151,359 | | | Wells Fargo Alternative Loan 2007-PA3 3A1, 6.250%, 07/25/2037 | | | | | 1,064,771 | | | | | | 0.0 | | |
| 359,210 (4) | | | Wells Fargo Mortgage Backed Securities 2006-AR4 2A4, 4.093%, 04/25/2036 | | | | | 346,081 | | | | | | 0.0 | | |
| 2,025,285 (1)(4) | | | Wells Fargo Mortgage Backed Securities 2019-4 B3 Trust, 3.596%, 09/25/2049 | | | | | 1,614,417 | | | | | | 0.1 | | |
| 3,488,320 (1)(4) | | | Wells Fargo Mortgage Backed Securities 2020-1 A17 Trust, 3.000%, 12/25/2049 | | | | | 3,470,845 | | | | | | 0.1 | | |
| Principal Amount† | | | Value | | | Percentage of Net Assets | | |||||||||
| COLLATERALIZED MORTGAGE OBLIGATIONS: (continued) | | |||||||||||||||
| 1,800,800 (1)(4) | | | WinWater Mortgage Loan Trust 2015-5 B4, 3.774%, 08/20/2045 | | | | $ | 1,685,805 | | | | | | 0.0 | | |
| 50,451,167 | | | Other Securities | | | | | 52,169,158 | | | | | | 0.6 | | |
| | | | Total Collateralized Mortgage Obligations | | | | | | | | | | | | | |
| | | | (Cost $1,711,193,594) | | | | | 1,708,802,457 | | | | | | 20.8 | | |
| U.S. TREASURY OBLIGATIONS: 7.0% | | |||||||||||||||
| | | | Treasury Inflation Indexed Protected Securities: 2.3% | | ||||||||||||
| 181,844,231 | | | 0.125%,01/15/2030 | | | | | 187,624,176 | | | | | | 2.3 | | |
| | | | | | ||||||||||||
| | | | U.S. Treasury Bonds: 1.9% | | ||||||||||||
| 46,424,000 | | | 2.375%,11/15/2049 | | | | | 57,981,037 | | | | | | 0.7 | | |
| 67,450,000 | | | 3.500%,02/15/2039 | | | | | 96,047,746 | | | | | | 1.2 | | |
| | | | | | | | | 154,028,783 | | | | | | 1.9 | | |
| | | | U.S. Treasury Notes: 2.8% | | ||||||||||||
| 54,483,000 | | | 0.375%,03/31/2022 | | | | | 54,633,041 | | | | | | 0.7 | | |
| 68,697,000 | | | 0.500%,03/15/2023 | | | | | 69,134,407 | | | | | | 0.8 | | |
| 40,651,000 | | | 0.500%,03/31/2025 | | | | | 40,912,215 | | | | | | 0.5 | | |
| 67,576,000 | | | 0.625%,03/31/2027 | | | | | 67,960,074 | | | | | | 0.8 | | |
| 2,502,000 | | | Other Securities | | | | | 2,697,615 | | | | | | 0.0 | | |
| | | | | | | | | 235,337,352 | | | | | | 2.8 | | |
| | | | Total U.S. Treasury Obligations (Cost $576,279,030) | | | | | 576,990,311 | | | | | | 7.0 | | |
| U.S. GOVERNMENT AGENCY OBLIGATIONS: 16.6% | | |||||||||||||||
| | | | Federal Home Loan Mortgage Corporation: 5.2%(9) | | ||||||||||||
| 20,772,321 | | | 3.000%,10/01/2046 | | | | | 21,964,489 | | | | | | 0.3 | | |
| 26,317,160 | | | 3.000%,08/01/2048 | | | | | 27,742,162 | | | | | | 0.3 | | |
| 22,322,925 | | | 3.500%,12/01/2046 | | | | | 23,835,582 | | | | | | 0.3 | | |
| 35,056,116 | | | 3.500%,01/01/2048 | | | | | 37,288,819 | | | | | | 0.4 | | |
| 59,045,357 | | | 3.500%,03/01/2048 | | | | | 63,454,712 | | | | | | 0.8 | | |
| 39,786,063 | | | 3.500%,11/01/2048 | | | | | 42,756,608 | | | | | | 0.5 | | |
| 28,670,679 | | | 4.000%,11/01/2045 | | | | | 31,076,670 | | | | | | 0.4 | | |
| 17,000,504 | | | 4.000%,11/01/2047 | | | | | 18,251,401 | | | | | | 0.2 | | |
| 3,436 | | | 4.670%, (US0012M + 1.773%),05/01/2037 | | | | | 3,469 | | | | | | 0.0 | | |
| 149,012,191 | | | 2.500%-7.000%, 01/01/ 2024-06/01/2048 | | | | | 159,871,674 | | | | | | 2.0 | | |
| | | | | | | | | 426,245,586 | | | | | | 5.2 | | |
| | | | Federal National Mortgage Association: 0.4%(9) | | ||||||||||||
| 84,046 | | | 4.029%, (US0012M + 1.486%),07/01/2035 | | | | | 85,223 | | | | | | 0.0 | | |
| 15,589,687 | | | 5.000%,08/01/2056 | | | | | 17,948,476 | | | | | | 0.2 | | |
| 14,478,637 | | | 3.500%-6.000%, 05/01/ 2038-12/01/2046 | | | | | 15,763,697 | | | | | | 0.2 | | |
| | | | | | | | | 33,797,396 | | | | | | 0.4 | | |
| Voya Intermediate Bond Fund | as of March 31, 2020 (continued) |
| Principal Amount† | | | Value | | | Percentage of Net Assets | | |||||||||
| U.S. GOVERNMENT AGENCY OBLIGATIONS: (continued) | | |||||||||||||||
| | | | Government National Mortgage Association: 2.4% | | ||||||||||||
| 32,707,017 | | | 3.500%, 03/20/2048 | | | | $ | 35,179,994 | | | | | | 0.4 | | |
| 34,016,976 | | | 4.000%, 09/20/2047 | | | | | 36,725,158 | | | | | | 0.4 | | |
| 19,621,334 | | | 4.000%, 11/20/2049 | | | | | 20,898,205 | | | | | | 0.3 | | |
| 101,431,695 (4) | | | 3.000%-5.500%, 10/15/2039-10/20/2060 | | | | | 109,078,611 | | | | | | 1.3 | | |
| | | | | | | | | 201,881,968 | | | | | | 2.4 | | |
| | | | Uniform Mortgage-Backed Securities: 8.6% | | ||||||||||||
| 29,275,429 | | | 3.500%, 11/01/2047 | | | | | 31,501,603 | | | | | | 0.4 | | |
| 26,055,601 | | | 3.500%, 09/01/2049 | | | | | 27,676,666 | | | | | | 0.3 | | |
| 34,393,913 | | | 4.000%, 04/01/2049 | | | | | 37,094,010 | | | | | | 0.5 | | |
| 32,344,419 | | | 3.000%-4.000%, 11/01/2045-01/01/2050 | | | | | 34,379,437 | | | | | | 0.4 | | |
| 16,785,094 | | | 2.500%, 04/01/2037 | | | | | 17,570,730 | | | | | | 0.2 | | |
| 34,559,682 | | | 3.000%, 01/01/2047 | | | | | 36,488,289 | | | | | | 0.4 | | |
| 32,080,928 | | | 3.000%, 12/01/2049 | | | | | 33,685,605 | | | | | | 0.4 | | |
| 44,310,259 | | | 3.500%, 06/01/2034 | | | | | 47,024,836 | | | | | | 0.6 | | |
| 24,750,188 | | | 3.500%, 08/01/2046 | | | | | 26,595,685 | | | | | | 0.3 | | |
| 17,745,864 | | | 3.500%, 07/01/2048 | | | | | 19,066,095 | | | | | | 0.2 | | |
| 76,337,605 | | | 3.500%, 09/01/2049 | | | | | 80,825,151 | | | | | | 1.0 | | |
| 34,543,325 | | | 3.500%, 02/01/2050 | | | | | 36,569,089 | | | | | | 0.5 | | |
| 15,956,069 | | | 4.000%, 01/01/2045 | | | | | 17,653,144 | | | | | | 0.2 | | |
| 241,792,157 | | | 2.500%-7.500%, 12/01/2027-09/01/2048 | | | | | 259,619,001 | | | | | | 3.2 | | |
| | | | | | | | | 705,749,341 | | | | | | 8.6 | | |
| | | | Total U.S. Government Agency Obligations (Cost $1,303,264,501) | | | | | 1,367,674,291 | | | | | | 16.6 | | |
| COMMERCIAL MORTGAGE-BACKED SECURITIES: 9.1% | | |||||||||||||||
| 10,647,000 (1)(4) | | | BAMLL Re-REMIC Trust 2016-FRR16 B, 0.998%, 05/27/2021 | | | | | 9,954,666 | | | | | | 0.1 | | |
| 4,390,000 (1) | | | Bancorp Commercial Mortgage 2018 CRE4 D Trust, 2.805%, (US0001M + 2.100%), 09/15/2035 | | | | | 3,387,229 | | | | | | 0.0 | | |
| 24,811,172 (4)(6) | | | BANK 2017-BNK4 XA, 1.421%, 05/15/2050 | | | | | 1,724,109 | | | | | | 0.0 | | |
| 167,655,000 (4)(6) | | | BANK 2017-BNK8 XB, 0.175%, 11/15/2050 | | | | | 2,053,204 | | | | | | 0.0 | | |
| 204,729,308 (4)(6) | | | BANK 2018-BNK14 XA, 0.521%, 09/15/2060 | | | | | 6,543,783 | | | | | | 0.1 | | |
19,110,000 (1)(4)(6) | | | BANK 2018-BNK14 XD, 1.602%, 09/15/2060 | | | | | 2,082,143 | | | | | | 0.0 | | |
| 24,696,456 (4)(6) | | | BANK 2019-BNK16 XA, 0.966%, 02/15/2052 | | | | | 1,579,879 | | | | | | 0.0 | | |
| Principal Amount† | | | Value | | | Percentage of Net Assets | | |||||||||
| COMMERCIAL MORTGAGE-BACKED SECURITIES: (continued) | | |||||||||||||||
| 5,210,000 (1) | | | BANK 2019-BNK18 D, 3.000%, 05/15/2062 | | | | $ | 3,269,321 | | | | | | 0.1 | | |
| 6,580,000 (4) | | | Bank 2019-BNK19 C, 4.035%, 08/15/2061 | | | | | 5,519,716 | | | | | | 0.1 | | |
| 100,701,485 (4)(6) | | | Bank 2019-BNK19 XA, 0.964%, 08/15/2061 | | | | | 6,987,535 | | | | | | 0.1 | | |
92,840,000 (1)(4)(6) | | | BBCCRE Trust 2015-GTP XA, 0.597%, 08/10/2033 | | | | | 2,740,089 | | | | | | 0.0 | | |
| 2,400,000 (1) | | | BDS 2018-FL2 D, 3.350%, (US0001M + 2.550%), 08/15/2035 | | | | | 2,048,221 | | | | | | 0.0 | | |
| 2,620,000 (1)(4) | | | BENCHMARK 2018-B3 D Mortgage Trust, 3.057%, 04/10/2051 | | | | | 1,755,712 | | | | | | 0.0 | | |
| 54,451,680 (4)(6) | | | Benchmark 2019-B12 XA Mortgage Trust, 1.068%, 08/15/2052 | | | | | 3,692,259 | | | | | | 0.0 | | |
| 7,470,000 (1) | | | Benchmark 2019-B9 D Mortgage Trust, 3.000%, 03/15/2052 | | | | | 4,760,381 | | | | | | 0.1 | | |
| 36,649,740 (4)(6) | | | Benchmark 2019-B9 XA Mortgage Trust, 1.047%, 03/15/2052 | | | | | 2,644,737 | | | | | | 0.0 | | |
| 6,420,000 (1) | | | Benchmark 2020-B17 D Mortgage Trust, 2.250%, 03/15/2053 | | | | | 4,079,667 | | | | | | 0.0 | | |
| 92,730,000 (4)(6) | | | Benchmark 2020-B17 XA Mortgage Trust, 1.542%, 03/15/2053 | | | | | 8,709,100 | | | | | | 0.1 | | |
| 7,540,000 (1) | | | BHP Trust 2019-BXHP D, 2.476%, (US0001M + 1.771%), 08/15/2036 | | | | | 6,324,507 | | | | | | 0.1 | | |
| 7,570,000 (1) | | | BHP Trust 2019-BXHP E, 3.272%, (US0001M + 2.568%), 08/15/2036 | | | | | 6,145,317 | | | | | | 0.1 | | |
| 8,025,365 (1) | | | BX Commercial Mortgage Trust 2019-XL A, 1.625%, (US0001M + 0.920%), 10/15/2036 | | | | | 7,749,129 | | | | | | 0.1 | | |
| 24,572,902 (1) | | | BX Commercial Mortgage Trust 2019-XL G, 3.005%, (US0001M + 2.300%), 10/15/2036 | | | | | 21,250,768 | | | | | | 0.3 | | |
| 24,572,902 (1) | | | BX Commercial Mortgage Trust 2019-XL J, 3.355%, (US0001M + 2.650%), 10/15/2036 | | | | | 21,280,185 | | | | | | 0.3 | | |
| Voya Intermediate Bond Fund | as of March 31, 2020 (continued) |
| Principal Amount† | | | Value | | | Percentage of Net Assets | | |||||||||
| COMMERCIAL MORTGAGE-BACKED SECURITIES: (continued) | | |||||||||||||||
| 21,390,000 (1) | | | BX Commercial Mortgage Trust 2020-BXLP G, 3.205%, (US0001M + 2.500%), 12/15/2029 | | | | $ | 18,239,364 | | | | | | 0.2 | | |
| 5,150,000 (1) | | | BX Trust 2019-MMP E, 2.605%, (US0001M + 1.900%), 08/15/2036 | | | | | 4,986,387 | | | | | | 0.0 | | |
| 6,000,000 (1) | | | BX Trust 2019-OC11 A, 3.202%, 12/09/2041 | | | | | 5,565,600 | | | | | | 0.1 | | |
| 10,660,000 (1)(4) | | | BX Trust 2019-OC11 E, 4.076%, 12/09/2041 | | | | | 8,201,742 | | | | | | 0.1 | | |
| 93,522,520 (4)(6) | | | CCUBS Commercial Mortgage Trust 2017-C1 XA, 1.012%, 11/15/2050 | | | | | 4,751,720 | | | | | | 0.1 | | |
| 24,835,436 (4)(6) | | | CD 2016-CD1 Mortgage Trust XA, 1.404%, 08/10/2049 | | | | | 1,582,425 | | | | | | 0.0 | | |
| 45,113,000 (1)(4)(6) | | | CD 2016-CD1 Mortgage Trust XB, 0.678%, 08/10/2049 | | | | | 1,755,608 | | | | | | 0.0 | | |
| 33,730,709 (4)(6) | | | CD 2017-CD4 Mortgage Trust XA, 1.306%, 05/10/2050 | | | | | 2,114,558 | | | | | | 0.1 | | |
| 7,453,264 (1)(4) | | | CFCRE Commercial Mortgage Trust 2011-C1 E, 6.089%, 04/15/2044 | | | | | 7,047,710 | | | | | | 0.1 | | |
| 4,139,000 (4) | | | Citigroup Commercial Mortgage Trust 2013-GC17 C, 5.110%, 11/10/2046 | | | | | 3,889,314 | | | | | | 0.1 | | |
| 3,910,000 (1)(4) | | | Citigroup Commercial Mortgage Trust 2014-GC19, 5.092%, 03/10/2047 | | | | | 3,479,049 | | | | | | 0.0 | | |
| 7,745,000 (1) | | | Citigroup Commercial Mortgage Trust 2016-C2 E, 4.594%, 08/10/2049 | | | | | 5,025,195 | | | | | | 0.1 | | |
| 40,776,675 (4)(6) | | | Citigroup Commercial Mortgage Trust 2016-P4 XA, 1.975%, 07/10/2049 | | | | | 3,460,965 | | | | | | 0.0 | | |
| 82,540,015 (4)(6) | | | Citigroup Commercial Mortgage Trust 2017-C4 XA, 1.106%, 10/12/2050 | | | | | 4,510,556 | | | | | | 0.1 | | |
| 3,940,000 (4) | | | Citigroup Commercial Mortgage Trust 2017-P8 C, 4.269%, 09/15/2050 | | | | | 3,219,294 | | | | | | 0.0 | | |
| 40,211,727 (4)(6) | | | Citigroup Commercial Mortgage Trust 2017-P8 XA, 0.914%, 09/15/2050 | | | | | 2,072,195 | | | | | | 0.0 | | |
| Principal Amount† | | | Value | | | Percentage of Net Assets | | |||||||||
| COMMERCIAL MORTGAGE-BACKED SECURITIES: (continued) | | |||||||||||||||
| 88,795,092 (4)(6) | | | Citigroup Commercial Mortgage Trust 2018-C5 XA, 0.599%, 06/10/2051 | | | | $ | 3,788,363 | | | | | | 0.1 | | |
| 9,645,000 (1)(4) | | | COMM 2013-CR10 F Mortgage Trust, 4.789%, 08/10/2046 | | | | | 7,818,257 | | | | | | 0.1 | | |
| 28,378,644 (4)(6) | | | COMM 2012-CR2 XA, 1.633%, 08/15/2045 | | | | | 826,593 | | | | | | 0.0 | | |
| 31,075,230 (4)(6) | | | COMM 2012-CR4 XA, 1.697%, 10/15/2045 | | | | | 1,004,398 | | | | | | 0.0 | | |
| 27,260,000 (1)(4)(6) | | | COMM 2012-CR4 XB, 0.614%, 10/15/2045 | | | | | 415,388 | | | | | | 0.0 | | |
| 48,200,568 (1)(4)(6) | | | COMM 2012-LC4 XA, 2.101%, 12/10/2044 | | | | | 1,390,625 | | | | | | 0.0 | | |
| 4,640,000 (1)(4) | | | COMM 2013-CR10 E Mortgage Trust, 4.789%, 08/10/2046 | | | | | 3,938,649 | | | | | | 0.1 | | |
| 129,372,029 (1)(4)(6) | | | COMM 2015-PC1 XA, 0.660%, 07/10/2050 | | | | | 3,004,886 | | | | | | 0.1 | | |
| 68,703,910 (4)(6) | | | COMM 2016-CR28 XA, 0.693%, 02/10/2049 | | | | | 1,934,269 | | | | | | 0.0 | | |
| 36,126,734 (4)(6) | | | COMM 2017-COR2 XA, 1.171%, 09/10/2050 | | | | | 2,399,032 | | | | | | 0.0 | | |
| 12,420,000 | | | COMM 2018-COR3 A3 Mortgage Trust, 4.228%, 05/10/2051 | | | | | 13,758,439 | | | | | | 0.2 | | |
| 14,010,000 (1)(4) | | | COMM 2020-CBM F Mortgage Trust, 3.633%, 11/13/2039 | | | | | 8,719,148 | | | | | | 0.1 | | |
| 15,420,000 (1) | | | Credit Suisse Mortgage Capital Certificates 2019-ICE4 F, 3.355%, (US0001M + 2.650%), 05/15/2036 | | | | | 11,954,087 | | | | | | 0.1 | | |
| 6,670,000 (4) | | | Csail 2015-C2 C Commercial Mortgage Trust, 4.192%, 06/15/2057 | | | | | 5,804,497 | | | | | | 0.1 | | |
| 4,340,000 (1)(4) | | | CSAIL 2017-CX10 D Commercial Mortgage Trust, 4.111%, 11/15/2050 | | | | | 3,216,942 | | | | | | 0.0 | | |
| 19,066,000 (4) | | | CSAIL 2018-CX11 A5 Commercial Mortgage Trust, 4.033%, 04/15/2051 | | | | | 20,760,659 | | | | | | 0.3 | | |
| 6,407,012 (1) | | | CSWF 2018-TOP E, 2.955%, (US0001M + 2.250%), 08/15/2035 | | | | | 5,286,074 | | | | | | 0.1 | | |
| Voya Intermediate Bond Fund | as of March 31, 2020 (continued) |
| Principal Amount† | | | Value | | | Percentage of Net Assets | | |||||||||
| COMMERCIAL MORTGAGE-BACKED SECURITIES: (continued) | | |||||||||||||||
| 6,056,423 (1) | | | CSWF 2018-TOP F, 3.455%, (US0001M + 2.750%), 08/15/2035 | | | | $ | 4,802,439 | | | | | | 0.0 | | |
| 4,460,000 (1)(4) | | | DBJPM 16-C3 Mortgage Trust, 3.491%, 08/10/2049 | | | | | 3,318,826 | | | | | | 0.0 | | |
| 5,000,000 (1)(4) | | | DBUBS 2011-LC2 E Mortgage Trust, 5.530%, 07/10/2044 | | | | | 4,814,766 | | | | | | 0.1 | | |
| 12,519,000 (1) | | | DBUBS 2011-LC2A F Mortgage Trust, 4.000%, (US0001M + 3.650%), 07/10/2044 | | | | | 11,950,517 | | | | | | 0.1 | | |
| 4,480,000 (1) | | | Exantas Capital Corp. 2019-RSO7 C Ltd., 2.850%, (US0001M + 2.050%), 04/15/2036 | | | | | 3,315,178 | | | | | | 0.0 | | |
| 10,520,000 (1) | | | Fontainebleau Miami Beach Trust 2019-FBLU F, 4.095%, 12/10/2036 | | | | | 7,007,305 | | | | | | 0.1 | | |
| 16,840,000 (4)(6) | | | Freddie Mac Multifamily Structured Pass Through Certificates K008 X3, 5.298%, 08/25/2020 | | | | | 162,769 | | | | | | 0.0 | | |
| 77,599,012 (4)(6) | | | Freddie Mac Multifamily Structured Pass Through Certificates K013 X3, 2.815%, 01/25/2043 | | | | | 1,241,491 | | | | | | 0.0 | | |
| 42,047,111 (4)(6) | | | Freddie Mac Multifamily Structured Pass Through Certificates K020 X3, 1.872%, 05/25/2040 | | | | | 1,526,398 | | | | | | 0.0 | | |
| 31,879,545 (4)(6) | | | Freddie Mac Multifamily Structured Pass Through Certificates K029 X3, 1.592%, 05/25/2041 | | | | | 1,388,692 | | | | | | 0.0 | | |
| 187,773,113 (1)(6) | | | FREMF Mortgage Trust 2012-K17 X2A, 0.100%, 12/25/2044 | | | | | 237,308 | | | | | | 0.0 | | |
| 223,355,545 (4)(6) | | | Freddie Mac Multifamily Structured Pass Through Certificates KHG2 X, 0.406%, 02/25/2030 | | | | | 5,671,690 | | | | | | 0.1 | | |
| 4,580,000 (1) | | | GS Mortgage Securities Corp. II 2018-RIVR E, 2.255%, (US0001M + 1.550%), 07/15/2035 | | | | | 4,358,764 | | | | | | 0.1 | | |
| 4,400,000 (1) | | | GS Mortgage Securities Corp. II 2018-RIVR F, 2.805%, (US0001M + 2.100%), 07/15/2035 | | | | | 4,294,441 | | | | | | 0.1 | | |
| Principal Amount† | | | Value | | | Percentage of Net Assets | | |||||||||
| COMMERCIAL MORTGAGE-BACKED SECURITIES: (continued) | | |||||||||||||||
| 12,770,000 (1) | | | GS Mortgage Securities Corp. Trust 2019-70P E, 2.905%, (US0001M + 2.200%), 10/15/2036 | | | | $ | 10,084,754 | | | | | | 0.1 | | |
| 5,110,000 (1) | | | GS Mortgage Securities Corp. Trust 2019-70P F, 3.355%, (US0001M + 2.650%), 10/15/2036 | | | | | 4,002,374 | | | | | | 0.0 | | |
| 3,400,000 (1)(4) | | | GS Mortgage Securities Trust 2010-C2 D, 5.180%, 12/10/2043 | | | | | 3,332,968 | | | | | | 0.0 | | |
| 8,190,000 (1)(4) | | | GS Mortgage Securities Trust 2010-C2 E, 4.548%, 12/10/2043 | | | | | 7,839,314 | | | | | | 0.1 | | |
| 3,710,000 (1)(4) | | | GS Mortgage Securities Trust 2010-C2 F, 4.548%, 12/10/2043 | | | | | 3,510,603 | | | | | | 0.0 | | |
| 5,340,000 (1)(4) | | | GS Mortgage Securities Trust 2010-C2 G, 4.548%, 12/10/2043 | | | | | 5,097,608 | | | | | | 0.1 | | |
| 6,140,000 (1) | | | GS Mortgage Securities Trust 2013-GC16 G, 3.500%, 11/10/2046 | | | | | 4,689,591 | | | | | | 0.1 | | |
| 46,973,078 (4)(6) | | | GS Mortgage Securities Trust 2013-GC16 XA, 1.032%, 11/10/2046 | | | | | 1,440,331 | | | | | | 0.0 | | |
| 65,288,551 (4)(6) | | | GS Mortgage Securities Trust 2014-GC22 XA, 0.985%, 06/10/2047 | | | | | 1,727,065 | | | | | | 0.0 | | |
| 81,824,745 (4)(6) | | | GS Mortgage Securities Trust 2016-GS4 XA, 0.567%, 11/10/2049 | | | | | 1,987,229 | | | | | | 0.0 | | |
| 69,921,372 (4)(6) | | | GS Mortgage Securities Trust 2017-GS6 XA, 1.041%, 05/10/2050 | | | | | 4,118,949 | | | | | | 0.0 | | |
| 6,310,000 | | | GS Mortgage Securities Trust 2019-GC38 A4, 3.968%, 02/10/2052 | | | | | 6,969,425 | | | | | �� | 0.1 | | |
| 78,390,308 (4)(6) | | | GS Mortgage Securities Trust 2019-GC38 XA, 0.963%, 02/10/2052 | | | | | 5,004,296 | | | | | | 0.1 | | |
| 13,220,000 (1)(4) | | | GS Mortgage Securities Trust 2019-GC40 DBD, 3.550%, 07/10/2052 | | | | | 12,393,312 | | | | | | 0.2 | | |
| 10,120,000 (1)(4) | | | GS Mortgage Securities Trust 2019-GC40 DBE, 3.550%, 07/10/2052 | | | | | 9,281,040 | | | | | | 0.1 | | |
| 11,820,000 | | | GS Mortgage Securities Trust 2019-GSA1 A4, 3.048%, 11/10/2052 | | | | | 12,156,606 | | | | | | 0.1 | | |
| Voya Intermediate Bond Fund | as of March 31, 2020 (continued) |
| Principal Amount† | | | Value | | | Percentage of Net Assets | | |||||||||
| COMMERCIAL MORTGAGE-BACKED SECURITIES: (continued) | | |||||||||||||||
| 7,690,000 (1)(4) | | | Hudson Yards 2019-55HY F Mortgage Trust, 2.943%, 12/10/2041 | | | | $ | 6,574,129 | | | | | | 0.1 | | |
| 14,030,000 (1)(4) | | | Jackson Park Trust 2019-LIC F, 3.242%, 10/14/2039 | | | | | 8,138,326 | | | | | | 0.1 | | |
| 2,400,000 (1)(4) | | | JP Morgan Chase Commercial Mortgage Securities Trust 2011-C4 E, 5.541%, 07/15/2046 | | | | | 2,330,803 | | | | | | 0.0 | | |
| 4,500,000 (1)(4) | | | JP Morgan Chase Commercial Mortgage Securities Trust 2011-C4 G, 3.873%, 07/15/2046 | | | | | 4,248,637 | | | | | | 0.0 | | |
| 73,538,575 (4)(6) | | | JP Morgan Chase Commercial Mortgage Securities Trust 2012-CIBX XA, 1.476%, 06/15/2045 | | | | | 1,382,466 | | | | | | 0.0 | | |
| 5,550,000 (1)(4) | | | JP Morgan Chase Commercial Mortgage Securities Trust 2013-C13 E, 3.986%, 01/15/2046 | | | | | 4,662,278 | | | | | | 0.1 | | |
| 93,754,062 (4)(6) | | | JP Morgan Chase Commercial Mortgage Securities Trust 2016-JP4 XA, 0.729%, 12/15/2049 | | | | | 2,719,046 | | | | | | 0.0 | | |
| 10,720,000 (1) | | | JP Morgan Chase Commercial Mortgage Securities Trust 2020-LOOP E, 3.862%, 12/05/2038 | | | | | 8,453,547 | | | | | | 0.1 | | |
| 6,363,797 (1)(4) | | | JPMBB Commercial Mortgage Securities Trust 2013-C15 D, 5.198%, 11/15/2045 | | | | | 5,738,397 | | | | | | 0.1 | | |
| 7,840,000 (1)(4) | | | JPMBB Commercial Mortgage Securities Trust 2013-C17 D, 4.892%, 01/15/2047 | | | | | 6,942,750 | | | | | | 0.1 | | |
| 6,470,000 (1)(4) | | | JPMBB Commercial Mortgage Securities Trust 2013-C17 F, 3.867%, 01/15/2047 | | | | | 4,698,517 | | | | | | 0.1 | | |
| 10,865,151 (4)(6) | | | JPMBB Commercial Mortgage Securities Trust 2014-C19 XA, 0.750%, 04/15/2047 | | | | | 207,913 | | | | | | 0.0 | | |
| 3,080,000 (1)(4) | | | JPMBB Commercial Mortgage Securities Trust 2014-C26 D, 3.882%, 01/15/2048 | | | | | 2,522,325 | | | | | | 0.0 | | |
| Principal Amount† | | | Value | | | Percentage of Net Assets | | |||||||||
| COMMERCIAL MORTGAGE-BACKED SECURITIES: (continued) | | |||||||||||||||
| 1,416,065 (4)(6) | | | JPMBB Commercial Mortgage Securities Trust 2015-C28 XA, 1.057%, 10/15/2048 | | | | $ | 47,765 | | | | | | 0.0 | | |
| 12,440,000 | | | JPMCC Commercial Mortgage Securities Trust 2019-COR4 A5, 4.029%, 03/10/2052 | | | | | 14,040,603 | | | | | | 0.2 | | |
| 5,000,000 | | | JPMDB Commercial Mortgage Securities Trust 2019-COR6 A4, 3.057%, 11/13/2052 | | | | | 5,311,050 | | | | | | 0.1 | | |
| 2,000,000 (1) | | | KNDL 2019-KNSQ F Mortgage Trust, 2.705%, (US0001M + 2.000%), 05/15/2036 | | | | | 1,502,436 | | | | | | 0.0 | | |
| 4,110,201 (1)(4)(6) | | | LB-UBS Commercial Mortgage Trust 2006-C7 XW, 0.600%, 11/15/2038 | | | | | 13,510 | | | | | | 0.0 | | |
| 46,415,798 (1)(4)(6) | | | LSTAR Commercial Mortgage Trust 2017-5 X, 1.000%, 03/10/2050 | | | | | 1,672,584 | | | | | | 0.0 | | |
| 4,340,000 (1)(4) | | | Morgan Stanley Bank of America Merrill Lynch Trust 2013-C13 D, 4.909%, 11/15/2046 | | | | | 3,859,498 | | | | | | 0.1 | | |
| 74,669,036 (4)(6) | | | Morgan Stanley Bank of America Merrill Lynch Trust 2014 C19 XA, 1.003%, 12/15/2047 | | | | | 2,633,473 | | | | | | 0.0 | | |
| 3,970,000 (1)(4) | | | Morgan Stanley Bank of America Merrill Lynch Trust 2014-C15 D, 4.909%, 04/15/2047 | | | | | 3,485,626 | | | | | | 0.1 | | |
| 10,600,000 (1) | | | Morgan Stanley Bank of America Merrill Lynch Trust 2015-C26 D, 3.060%, 10/15/2048 | | | | | 7,973,994 | | | | | | 0.1 | | |
| 3,090,000 (1)(4) | | | Morgan Stanley Capital I Trust 2011-C1 D, 5.375%, 09/15/2047 | | | | | 2,686,978 | | | | | | 0.0 | | |
| 14,914,000 (1) | | | Morgan Stanley Capital I Trust 2011-C1 J, 4.193%, 09/15/2047 | | | | | 14,522,618 | | | | | | 0.2 | | |
| 7,864,000 (1)(4) | | | Morgan Stanley Capital I Trust 2016-BNK2 E, 3.905%, 11/15/2049 | | | | | 4,838,181 | | | | | | 0.1 | | |
| 7,455,000 | | | Morgan Stanley Capital I Trust 2019-H6 A4, 3.417%, 06/15/2052 | | | | | 8,057,042 | | | | | | 0.1 | | |
| Voya Intermediate Bond Fund | as of March 31, 2020 (continued) |
| Principal Amount† | | | Value | | | Percentage of Net Assets | | |||||||||
| COMMERCIAL MORTGAGE-BACKED SECURITIES: (continued) | | |||||||||||||||
| 490,000 (1) | | | Morgan Stanley Capital I Trust 2019-H7 D, 3.000%, 07/15/2052 | | | | $ | 305,152 | | | | | | 0.0 | | |
| 2,500,000 (1) | | | Morgan Stanley Capital I Trust 2019-PLND E, 2.855%, (US0001M + 2.150%), 05/15/2036 | | | | | 2,008,679 | | | | | | 0.0 | | |
| 4,670,000 | | | Morgan Stanley Capital I, Inc. 2017-HR2 D, 2.730%, 12/15/2050 | | | | | 3,065,878 | | | | | | 0.0 | | |
| 46,534,350 (4)(6) | | | Morgan Stanley Capital I, Inc. 2017-HR2 XA, 0.793%, 12/15/2050 | | | | | 2,151,064 | | | | | | 0.0 | | |
| 6,820,000 (1) | | | MRCD 2019-PARK E Mortgage Trust, 2.718%, 12/15/2036 | | | | | 6,207,103 | | | | | | 0.1 | | |
| 12,790,000 (1) | | | MRCD 2019-PARK F Mortgage Trust, 2.718%, 12/15/2036 | | | | | 11,166,882 | | | | | | 0.1 | | |
| 14,680,000 (1) | | | One Bryant Park Trust 2019-OBP A, 2.516%, 09/13/2049 | | | | | 14,990,388 | | | | | | 0.2 | | |
| 8,262,000 (1) | | | Shelter Growth CRE 2018-FL1 D Issuer Ltd., 3.705%, (US0001M + 3.000%), 01/15/2035 | | | | | 7,451,512 | | | | | | 0.1 | | |
| 5,280,000 (1)(4) | | | UBS-Barclays Commercial Mortgage Trust 2012-C4 D, 4.476%, 12/10/2045 | | | | | 4,818,310 | | | | | | 0.1 | | |
| 9,020,000 (1)(4) | | | UBS-Barclays Commercial Mortgage Trust 2012-C4 E, 4.476%, 12/10/2045 | | | | | 7,501,973 | | | | | | 0.1 | | |
| 6,239,500 (1) | | | Wells Fargo Commercial Mortgage Trust 2010-C1 E, 4.000%, 11/15/2043 | | | | | 6,037,211 | | | | | | 0.1 | | |
| 8,780,000 (1) | | | Wells Fargo Commercial Mortgage Trust 2010-C1 F, 4.000%, 11/15/2043 | | | | | 8,435,388 | | | | | | 0.1 | | |
| 4,830,000 (4) | | | Wells Fargo Commercial Mortgage Trust 2017-C40 C, 4.330%, 10/15/2050 | | | | | 3,957,373 | | | | | | 0.1 | | |
| 8,660,000 | | | Wells Fargo Commercial Mortgage Trust 2018-C44 A5, 4.212%, 05/15/2051 | | | | | 9,808,202 | | | | | | 0.1 | | |
| 1,264,000 (1) | | | Wells Fargo Commercial Mortgage Trust 2019-C49 D, 3.000%, 03/15/2052 | | | | | 802,379 | | | | | | 0.0 | | |
| Principal Amount† | | | Value | | | Percentage of Net Assets | | |||||||||
| COMMERCIAL MORTGAGE-BACKED SECURITIES: (continued) | | |||||||||||||||
| 6,000,000 (1)(7) | | | Wells Fargo Re-REMIC Trust 2013-FRR1 BK26, 0.000%, 01/27/2045 | | | | $ | 4,950,924 | | | | | | 0.1 | | |
| 3,270,000 (1)(4) | | | WFRBS Commercial Mortgage Trust 2011-C5 E, 5.661%, 11/15/2044 | | | | | 3,119,093 | | | | | | 0.0 | | |
| 13,339,543 (1)(4)(6) | | | WFRBS Commercial Mortgage Trust 2012-C8 XA, 1.807%, 08/15/2045 | | | | | 418,089 | | | | | | 0.0 | | |
| 9,610,970 (1)(4)(6) | | | WFRBS Commercial Mortgage Trust 2012-C9 XA, 1.892%, 11/15/2045 | | | | | 371,962 | | | | | | 0.0 | | |
| 3,920,000 (1) | | | WFRBS Commercial Mortgage Trust 2013-C17 E, 3.500%, 12/15/2046 | | | | | 2,985,465 | | | | | | 0.0 | | |
| 81,728,062 (4)(6) | | | WFRBS Commercial Mortgage Trust 2014-C25 XA, 0.816%, 11/15/2047 | | | | | 2,487,295 | | | | | | 0.0 | | |
| 12,946,000 (1)(4) | | | WFRBS Commercial Mortgage Trust 2013-C11 F, 4.258%, 03/15/2045 | | | | | 9,150,070 | | | | | | 0.1 | | |
| 50,973,845 | | | Other Securities | | | | | 48,747,355 | | | | | | 0.6 | | |
| | | | Total Commercial Mortgage-Backed Securities (Cost $833,271,252) | | | | | 750,131,933 | | | | | | 9.1 | | |
| SOVEREIGN BONDS: 2.6% | | |||||||||||||||
BRL 95,000,000 | | | Brazil Notas do Tesouro Nacional Serie F, 10.000%, 01/01/2027 | | | | | 21,176,094 | | | | | | 0.3 | | |
BRL 52,000,000 | | | Brazil Notas do Tesouro Nacional Series F, 10.000%, 01/01/2023 | | | | | 11,363,897 | | | | | | 0.1 | | |
| 7,900,000 (1)(2) | | | Dominican Republic International Bond, 4.500%, 01/30/2030 | | | | | 6,908,550 | | | | | | 0.1 | | |
| 300,000 (1) | | | Dominican Republic International Bond, 5.500%, 01/27/2025 | | | | | 290,624 | | | | | | 0.0 | | |
| 300,000 (1)(2) | | | Dominican Republic International Bond, 6.600%, 01/28/2024 | | | | | 296,626 | | | | | | 0.0 | | |
| 250,000 (1)(2) | | | Egypt Government International Bond, 5.875%, 06/11/2025 | | | | | 225,679 | | | | | | 0.0 | | |
| 1,240,000 (1)(2) | | | Gabon Government International Bond, 6.625%, 02/06/2031 | | | | | 767,356 | | | | | | 0.0 | | |
| Voya Intermediate Bond Fund | as of March 31, 2020 (continued) |
| Principal Amount† | | | Value | | | Percentage of Net Assets | | |||||||||
| SOVEREIGN BONDS: (continued) | | |||||||||||||||
| 12,725,000 (1) | | | Ghana Government International Bond, 6.375%, 02/11/2027 | | | | $ | 9,384,688 | | | | | | 0.1 | | |
| 1,200,000 (1) | | | Kenya Government International Bond, 7.000%, 05/22/2027 | | | | | 1,113,000 | | | | | | 0.0 | | |
| 600,000 (1) | | | Morocco Government International Bond, 4.250%, 12/11/2022 | | | | | 597,311 | | | | | | 0.0 | | |
| 600,000 (1)(2) | | | Paraguay Government International Bond, 4.625%, 01/25/2023 | | | | | 609,006 | | | | | | 0.0 | | |
PEN 14,129,000 (1) | | | Peru Government Bond, 6.150%, 08/12/2032 | | | | | 4,430,843 | | | | | | 0.1 | | |
| 4,000,000 (1) | | | Perusahaan Penerbit SBSN Indonesia III, 4.400%, 03/01/2028 | | | | | 4,052,280 | | | | | | 0.1 | | |
| 2,925,000 (1) | | | Saudi Government International Bond, 4.500%, 04/17/2030 | | | | | 3,159,796 | | | | | | 0.0 | | |
| 22,225,000 | | | Turkey Government International Bond, 4.875%, 10/09/2026 | | | | | 18,850,134 | | | | | | 0.2 | | |
| 6,908,000 | | | Turkey Government International Bond, 5.125%-7.375%, 09/26/2022-10/24/2028 | | | | | 6,546,381 | | | | | | 0.1 | | |
RUB133,625,063,330 (3) | | | Other Securities | | | | | 125,299,503 | | | | | | 1.5 | | |
| | | | Total Sovereign Bonds | | | | | | | | | | | | | |
| | | | (Cost $256,902,262) | | | | | 215,071,768 | | | | | | 2.6 | | |
| ASSET-BACKED SECURITIES: 10.0% | | |||||||||||||||
| | | | Automobile Asset-Backed Securities: 0.9% | | ||||||||||||
| 5,950,000 | | | Americredit Automobile Receivables Trust 2018-2 D, 4.010%, 07/18/2024 | | | | | 4,858,471 | | | | | | 0.1 | | |
| 8,440,000 | | | Americredit Automobile Receivables Trust 2019-1 D, 3.620%, 03/18/2025 | | | | | 8,449,728 | | | | | | 0.1 | | |
| 5,750,000 | | | AmeriCredit Automobile Receivables Trust 2019-3 C, 2.320%, 07/18/2025 | | | | | 5,680,906 | | | | | | 0.1 | | |
| 5,050,000 | | | AmeriCredit Automobile Receivables Trust 2019-3 D, 2.580%, 09/18/2025 | | | | | 4,790,729 | | | | | | 0.0 | | |
| 6,150,000 (1) | | | Oscar US Funding XI LLC 2019-2A A4, 2.680%, 09/10/2026 | | | | | 6,355,623 | | | | | | 0.1 | | |
| 500,000 | | | Santander Drive Auto Receivables Trust 2018-1 D, 3.320%, 03/15/2024 | | | | | 485,312 | | | | | | 0.0 | | |
| Principal Amount† | | | Value | | | Percentage of Net Assets | | |||||||||
| ASSET-BACKED SECURITIES: (continued) | | |||||||||||||||
| | | | Automobile Asset-Backed Securities (continued) | | ||||||||||||
| 9,100,000 | | | Santander Drive Auto Receivables Trust 2018-4 D, 3.980%, 12/15/2025 | | | | $ | 9,127,893 | | | | | | 0.1 | | |
| 2,850,000 | | | Santander Drive Auto Receivables Trust 2019-3 C, 2.490%, 10/15/2025 | | | | | 2,761,467 | | | | | | 0.1 | | |
| 7,550,000 | | | Santander Drive Auto Receivables Trust 2019-3 D, 2.680%, 10/15/2025 | | | | | 7,217,589 | | | | | | 0.1 | | |
| 9,850,000 (1) | | | Santander Retail Auto Lease Trust 2019-C A4, 1.930%, 11/20/2023 | | | | | 9,702,709 | | | | | | 0.1 | | |
| 164,798 (1) | | | Tesla Auto Lease Trust 2018-A D, 3.300%, 05/20/2020 | | | | | 164,155 | | | | | | 0.0 | | |
| 4,150,000 (1) | | | Tesla Auto Lease Trust 2018-B C, 4.360%, 10/20/2021 | | | | | 4,075,418 | | | | | | 0.0 | | |
| 11,150,000 | | | Other Securities | | | | | 10,522,538 | | | | | | 0.1 | | |
| | | | | | | | | 74,192,538 | | | | | | 0.9 | | |
| | | | Credit Card Asset-Backed Securities: 0.0% | | ||||||||||||
| 600,000 | | | Other Securities | | | | | 606,763 | | | | | | 0.0 | | |
| | | | | | ||||||||||||
| | | | Home Equity Asset-Backed Securities: 0.3% | | ||||||||||||
| 3,449,486 (1)(4) | | | ACE Securities Corp. Mortgage Loan Trust Series 2007-D1 A2, 6.336%, 02/25/2038 | | | | | 3,123,558 | | | | | | 0.1 | | |
| 6,826,145 | | | Freddie Mac Structured Pass Through Certificates T-31 A7, 1.072%, (US0001M + 0.250%), 05/25/2031 | | | | | 6,791,067 | | | | | | 0.1 | | |
| 881,685 | | | Nomura Home Equity Loan, Inc. Home Equity Loan Trust Series 2007-1 2A3, 1.267%, (US0001M + 0.160%), 02/25/2037 | | | | | 694,953 | | | | | | 0.0 | | |
| 1,073,159 | | | Nomura Home Equity Loan, Inc. Home Equity Loan Trust Series 2007-1 2A4A, 1.407%, (US0001M + 0.230%), 02/25/2037 | | | | | 855,073 | | | | | | 0.0 | | |
| 12,820,346 | | | Other Securities | | | | | 9,413,402 | | | | | | 0.1 | | |
| | | | | | | | | 20,878,053 | | | | | | 0.3 | | |
| Voya Intermediate Bond Fund | as of March 31, 2020 (continued) |
| Principal Amount† | | | Value | | | Percentage of Net Assets | | |||||||||
| ASSET-BACKED SECURITIES: (continued) | | |||||||||||||||
| | | | Other Asset-Backed Securities: 8.2% | | ||||||||||||
| 2,862,787 (1) | | | Ajax Mortgage Loan Trust 2018-A A, 3.850%, 04/25/2058 | | | | $ | 2,712,487 | | | | | | 0.0 | | |
| 10,000,000 (1) | | | Allegany Park CLO Ltd. 2019-1A A, 3.164%, (US0003M + 1.330%), 01/20/2033 | | | | | 9,362,560 | | | | | | 0.1 | | |
1,073,505 (1)(4)(6)(10) | | | American Homes 4 Rent 2015-SFR1 XS, 0.000%, 04/17/2052 | | | | | — | | | | | | — | | |
| 10,000,000 (1) | | | AMMC CLO 15 Ltd. 2014-15A ARR, 3.091%, (US0003M + 1.260%), 01/15/2032 | | | | | 9,331,510 | | | | | | 0.1 | | |
| 3,900,000 (1) | | | Apidos CLO XII 2013-12A AR, 2.911%, (US0003M + 1.080%), 04/15/2031 | | | | | 3,668,566 | | | | | | 0.1 | | |
| 500,000 (1) | | | Apidos CLO XII 2013-12A CR, 3.631%, (US0003M + 1.800%), 04/15/2031 | | | | | 422,382 | | | | | | 0.0 | | |
| 20,000,000 (1) | | | Apidos CLO XXXII 2019-32A A1, 3.003%, (US0003M + 1.320%), 01/20/2033 | | | | | 18,770,320 | | | | | | 0.2 | | |
| 4,450,000 (1) | | | Applebee’s Funding LLC / IHOP Funding LLC 2019-1A A2I, 4.194%, 06/07/2049 | | | | | 4,052,837 | | | | | | 0.1 | | |
| 2,050,000 (1) | | | Applebee’s Funding LLC / IHOP Funding LLC 2019-1A A2II, 4.723%, 06/07/2049 | | | | | 1,773,086 | | | | | | 0.0 | | |
| 4,659,403 (1) | | | Aqua Finance Trust 2019-A A, 3.140%, 07/16/2040 | | | | | 4,646,346 | | | | | | 0.1 | | |
| 10,000,000 (1) | | | ARES XLVI CLO Ltd. 2017-46A A2, 3.061%, (US0003M + 1.230%), 01/15/2030 | | | | | 9,145,380 | | | | | | 0.1 | | |
| 3,890,000 (1) | | | Babson CLO Ltd. 2017-1A A2, 3.169%, (US0003M + 1.350%), 07/18/2029 | | | | | 3,623,270 | | | | | | 0.0 | | |
| 6,361,000 (1) | | | Babson CLO Ltd. 2018-3A A2, 3.119%, (US0003M + 1.300%), 07/20/2029 | | | | | 5,893,575 | | | | | | 0.1 | | |
| 1,650,000 (1) | | | Bain Capital Credit CLO 2017-1A A2, 3.169%, (US0003M + 1.350%), 07/20/2030 | | | | | 1,538,665 | | | | | | 0.0 | | |
| Principal Amount† | | | Value | | | Percentage of Net Assets | | |||||||||
| ASSET-BACKED SECURITIES: (continued) | | |||||||||||||||
| | | | Other Asset-Backed Securities (continued) | | ||||||||||||
| 3,750,000 (1) | | | Barings Clo Ltd. 2019-4A C, 4.703%, (US0003M + 2.800%), 01/15/2033 | | | | $ | 3,156,870 | | | | | | 0.0 | | |
| 7,500,000 (1) | | | Beechwood Park CLO Ltd. 2019-1A A1, 3.233%, (US0003M + 1.330%), 01/17/2033 | | | | | 7,009,320 | | | | | | 0.1 | | |
| 8,770,000 (1) | | | Benefit Street Partners CLO II Ltd. 2013-IIA A1R, 3.081%, (US0003M + 1.250%), 07/15/2029 | | | | | 8,405,107 | | | | | | 0.1 | | |
| 7,500,000 (1) | | | Benefit Street Partners CLO VIII Ltd. 2015-8A A1BR, 3.019%, (US0003M + 1.200%), 01/20/2031 | | | | | 6,655,642 | | | | | | 0.1 | | |
| 5,000,000 (1) | | | Benefit Street Partners CLO XIV Ltd. 2018-14A A2, 2.969%, (US0003M + 1.150%), 04/20/2031 | | | | | 4,522,170 | | | | | | 0.0 | | |
| 17,350,000 (1) | | | Benefit Street Partners CLO XIX Ltd. 2019-19A A, 3.228%, (US0003M + 1.350%), 01/15/2033 | | | | | 16,073,474 | | | | | | 0.2 | | |
| 4,070,000 (1) | | | BlueMountain CLO 2015-1A BR, 4.348%, (US0003M + 2.500%), 04/13/2027 | | | | | 3,895,849 | | | | | | 0.0 | | |
| 10,000,000 (1) | | | Carbone CLO Ltd. 2017-1A A1, 2.967%, (US0003M + 1.140%), 01/20/2031 | | | | | 9,404,320 | | | | | | 0.1 | | |
| 700,000 (1) | | | Carlyle Global Market Strategies CLO 2014-2RA A1 Ltd., 2.742%, (US0003M + 1.050%), 05/15/2031 | | | | | 658,896 | | | | | | 0.0 | | |
| 3,250,000 (1) | | | Carlyle Global Market Strategies CLO Ltd. 2014-1A A2R2, 2.966%, (US0003M + 1.130%), 04/17/2031 | | | | | 2,935,839 | | | | | | 0.0 | | |
| 3,530,000 (1) | | | Cedar Funding VIII Clo Ltd. 2017-8A A1, 3.086%, (US0003M + 1.250%), 10/17/2030 | | | | | 3,314,885 | | | | | | 0.0 | | |
| Voya Intermediate Bond Fund | as of March 31, 2020 (continued) |
| Principal Amount† | | | Value | | | Percentage of Net Assets | | |||||||||
| ASSET-BACKED SECURITIES: (continued) | | |||||||||||||||
| | | | Other Asset-Backed Securities (continued) | | ||||||||||||
| 37,149 | | | Chase Funding Trust Series 2003-5 2A2, 1.547%, (US0001M + 0.600%), 07/25/2033 | | | | $ | 32,866 | | | | | | 0.0 | | |
| 4,050,000 (1) | | | CIFC Funding 2013-2A A1LR, 3.037%, (US0003M + 1.210%), 10/18/2030 | | | | | 3,864,429 | | | | | | 0.1 | | |
| 2,150,000 (1) | | | CIFC Funding 2017-2A C, 4.169%, (US0003M + 2.350%), 04/20/2030 | | | | | 1,884,914 | | | | | | 0.0 | | |
| 7,400,000 (1) | | | CIFC Funding 2017-4 A1, 3.051%, (US0003M + 1.250%), 10/24/2030 | | | | | 7,009,524 | | | | | | 0.1 | | |
| 3,000,000 (1) | | | CIFC Funding 2017-5A A1, 3.016%, (US0003M + 1.180%), 11/16/2030 | | | | | 2,840,202 | | | | | | 0.1 | | |
| 11,380,000 (1) | | | CIFC Funding 2019-6A A1 Ltd., 3.237%, (US0003M + 1.330%), 01/16/2033 | | | | | 10,691,635 | | | | | | 0.1 | | |
| 3,000,000 (1) | | | CIFC Funding 2019-6A A2 Ltd., 3.657%, (US0003M + 1.750%), 01/16/2033 | | | | | 2,789,127 | | | | | | 0.0 | | |
| 4,675,000 (1) | | | Cole Park CLO Ltd. 2015-1A CR, 3.819%, (US0003M + 2.000%), 10/20/2028 | | | | | 4,219,061 | | | | | | 0.0 | | |
| 7,425,000 | | | Countrywide Asset-Backed Certificates 2005-AB2 M1, 1.652%, (US0001M + 0.705%), 09/25/2035 | | | | | 6,548,324 | | | | | | 0.1 | | |
| 9,874,233 | | | Credit-Based Asset Servicing & Securitization LLC 2006-CB8 A2C, 1.097%, (US0001M + 0.150%), 10/25/2036 | | | | | 7,984,201 | | | | | | 0.1 | | |
| 4,714,375 (1) | | | DB Master Finance LLC 2019-1A A23, 4.352%, 05/20/2049 | | | | | 4,546,904 | | | | | | 0.1 | | |
| 2,431,625 (1) | | | DB Master Finance LLC 2019-1A A2II, 4.021%, 05/20/2049 | | | | | 2,365,181 | | | | | | 0.0 | | |
| 4,200,000 (1) | | | Deer Creek Clo Ltd. 2017-1A A, 2.999%, (US0003M + 1.180%), 10/20/2030 | | | | | 3,972,469 | | | | | | 0.0 | | |
| Principal Amount† | | | Value | | | Percentage of Net Assets | | |||||||||
| ASSET-BACKED SECURITIES: (continued) | | |||||||||||||||
| | | | Other Asset-Backed Securities (continued) | | ||||||||||||
| 7,000,000 (1) | | | Dewolf Park Clo Ltd. 2017-1A A, 3.041%, (US0003M + 1.210%), 10/15/2030 | | | | $ | 6,634,845 | | | | | | 0.1 | | |
| 635,375 (1) | | | Domino’s Pizza Master Issuer LLC 2017-1A A2II, 3.082%, 07/25/2047 | | | | | 622,033 | | | | | | 0.0 | | |
| 6,832,875 (1) | | | Domino’s Pizza Master Issuer LLC 2019-1A A2, 3.668%, 10/25/2049 | | | | | 6,102,235 | | | | | | 0.1 | | |
| 2,610,250 (1) | | | Domino’s Pizza Master Issuer LLC 2018-1A A211, 4.328%, 07/25/2048 | | | | | 2,501,443 | | | | | | 0.0 | | |
| 5,791,500 (1) | | | Driven Brands Funding LLC 2019-1A A2, 4.641%, 04/20/2049 | | | | | 5,547,736 | | | | | | 0.1 | | |
| 2,308,875 (1) | | | Driven Brands Funding, LLC 2018-1A A2, 4.739%, 04/20/2048 | | | | | 2,261,487 | | | | | | 0.0 | | |
| 6,660,000 (1) | | | Dryden Senior Loan Fund 2017-47A A2, 3.181%, (US0003M + 1.350%), 04/15/2028 | | | | | 6,115,372 | | | | | | 0.1 | | |
| 5,565,000 (1) | | | Dryden XXVIII Senior Loan Fund 2013-28A A1LR, 2.892%, (US0003M + 1.200%), 08/15/2030 | | | | | 5,335,649 | | | | | | 0.0 | | |
| 7,000,000 (1) | | | Dryden 78 CLO Ltd. 2020-78A A, 2.447%, (US0003M + 1.180%), 04/17/2033 | | | | | 6,510,000 | | | | | | 0.1 | | |
| 8,000,000 (1) | | | Eaton Vance Clo 2015-1A A2R Ltd., 3.069%, (US0003M + 1.250%), 01/20/2030 | | | | | 7,223,776 | | | | | | 0.1 | | |
| 4,228,050 (1) | | | Five Guys Holdings, Inc. 2017-1A A2, 4.600%, 07/25/2047 | | | | | 4,452,695 | | | | | | 0.1 | | |
| 4,250,000 (1) | | | Galaxy XIX CLO Ltd. 2015-19A A1R, 3.021%, (US0003M + 1.220%), 07/24/2030 | | | | | 4,040,671 | | | | | | 0.1 | | |
| 2,500,000 (1) | | | Galaxy XV CLO Ltd. 2013-15A AR, 3.031%, (US0003M + 1.200%), 10/15/2030 | | | | | 2,361,297 | | | | | | 0.0 | | |
| Voya Intermediate Bond Fund | as of March 31, 2020 (continued) |
| Principal Amount† | | | Value | | | Percentage of Net Assets | | |||||||||
| ASSET-BACKED SECURITIES: (continued) | | |||||||||||||||
| | | | Other Asset-Backed Securities (continued) | | ||||||||||||
| 11,150,000 (1) | | | Galaxy XXI CLO Ltd. 2015-21A AR, 2.839%, (US0003M + 1.020%), 04/20/2031 | | | | $ | 10,411,926 | | | | | | 0.1 | | |
| 2,300,000 (1) | | | Gilbert Park CLO Ltd. 2017-1A A, 3.021%, (US0003M + 1.190%), 10/15/2030 | | | | | 2,179,326 | | | | | | 0.0 | | |
| 7,000,000 (1) | | | Goldentree Loan Management US Clo 2 Ltd. 2017-2A A, 2.969%, (US0003M + 1.150%), 11/28/2030 | | | | | 6,610,996 | | | | | | 0.1 | | |
| 4,727,499 (1) | | | Helios Issuer, LLC 2018-1A A, 4.870%, 07/20/2048 | | | | | 4,289,837 | | | | | | 0.1 | | |
| 1,281,642 (1) | | | HERO Funding Trust 2015-2A A, 3.990%, 09/20/2040 | | | | | 1,343,903 | | | | | | 0.0 | | |
| 1,219,708 (1) | | | HERO Funding Trust 2016-2A A, 3.750%, 09/20/2041 | | | | | 1,255,546 | | | | | | 0.0 | | |
| 3,020,285 (1) | | | HERO Funding Trust 2016-4A A2, 4.290%, 09/20/2047 | | | | | 3,211,499 | | | | | | 0.1 | | |
| 1,250,000 (1) | | | Home Partners of America 2018-1 E Trust, 2.650%, (US0001M + 1.850%), 07/17/2037 | | | | | 1,102,254 | | | | | | 0.0 | | |
| 7,750,000 (1) | | | Jay Park CLO Ltd. 2016-1A BR, 3.819%, (US0003M + 2.000%), 10/20/2027 | | | | | 6,867,817 | | | | | | 0.1 | | |
| 7,300,000 (1) | | | Jersey Mike’s Funding 2019-1A A2, 4.433%, 02/15/2050 | | | | | 6,477,290 | | | | | | 0.1 | | |
| 4,328,213 (1) | | | JG Wentworth XLII LLC 2018-2A A, 3.960%, 10/15/2075 | | | | | 4,436,656 | | | | | | 0.1 | | |
| 3,111,030 (1) | | | JGWPT XXXIII LLC 2014-3A A, 3.500%, 06/15/2077 | | | | | 3,095,083 | | | | | | 0.0 | | |
| 10,050,000 (1) | | | Kayne CLO 6 Ltd. 2019-6A A1, 3.131%, (US0003M + 1.380%), 01/20/2033 | | | | | 9,380,167 | | | | | | 0.1 | | |
| 6,000,000 (1) | | | Kayne CLO 6 Ltd. 2019-6A A2, 3.601%, (US0003M + 1.850%), 01/20/2033 | | | | | 5,560,572 | | | | | | 0.1 | | |
| Principal Amount† | | | Value | | | Percentage of Net Assets | | |||||||||
| ASSET-BACKED SECURITIES: (continued) | | |||||||||||||||
| | | | Other Asset-Backed Securities (continued) | | ||||||||||||
| 4,250,000 (1) | | | Kayne CLO 7 Ltd. 2020-7A A1, 2.651%, (US0003M + 1.200%), 04/17/2033 | | | | $ | 3,591,250 | | | | | | 0.0 | | |
| 6,000,000 (1)(11) | | | KKR CLO 21 A Ltd., 2.831%, (US0003M + 1.000%), 04/15/2031 | | | | | 5,580,216 | | | | | | 0.1 | | |
| 6,000,000 (1) | | | LCM 26A A2 Ltd., 3.069%, (US0003M + 1.250%), 01/20/2031 | | | | | 5,480,364 | | | | | | 0.1 | | |
| 1,867,000 (1) | | | LCM XIV L.P. 14A AR, 2.867%, (US0003M + 1.040%), 07/20/2031 | | | | | 1,741,060 | | | | | | 0.0 | | |
| 5,000,000 (1) | | | LCM XVIII L.P. 18A A2R, 3.039%, (US0003M + 1.220%), 04/20/2031 | | | | | 4,537,885 | | | | | | 0.0 | | |
| 5,400,000 (1) | | | Madison Park Funding XV Ltd. 2014-15A B1R, 3.994%, (US0003M + 2.200%), 01/27/2026 | | | | | 5,123,417 | | | | | | 0.1 | | |
| 3,600,000 (1) | | | Madison Park Funding XXI Ltd. 2016-21A BR, 4.681%, (US0003M + 2.850%), 10/15/2032 | | | | | 2,972,927 | | | | | | 0.0 | | |
| 1,400,000 (1) | | | Madison Park Funding XXVII Ltd. 2018-27A B, 3.619%, (US0003M + 1.800%), 04/20/2030 | | | | | 1,176,028 | | | | | | 0.0 | | |
| 13,150,000 (1) | | | Magnetite XXII Ltd. 2019-22A A2, 3.481%, (US0003M + 1.650%), 04/15/2031 | | | | | 12,219,204 | | | | | | 0.1 | | |
| 3,400,000 (1) | | | Marlette Funding Trust 2018-1A C, 3.690%, 03/15/2028 | | | | | 3,344,691 | | | | | | 0.1 | | |
| 3,488,000 (1) | | | Marlette Funding Trust 2018-4A C, 4.910%, 12/15/2028 | | | | | 3,245,711 | | | | | | 0.0 | | |
| 500,000 (1) | | | Marlette Funding Trust 2019-2 A2A, 3.530%, 07/16/2029 | | | | | 407,377 | | | | | | 0.0 | | |
| 4,200,000 (1) | | | Marlette Funding Trust 2019-2A C, 4.110%, 07/16/2029 | | | | | 3,135,780 | | | | | | 0.0 | | |
| 1,100,000 (1)(4) | | | Mill City Mortgage Loan Trust 2017-1 M2, 3.250%, 11/25/2058 | | | | | 1,079,441 | | | | | | 0.0 | | |
| Voya Intermediate Bond Fund | as of March 31, 2020 (continued) |
| Principal Amount† | | | Value | | | Percentage of Net Assets | | |||||||||
| ASSET-BACKED SECURITIES: (continued) | | |||||||||||||||
| | | | Other Asset-Backed Securities (continued) | | ||||||||||||
| 3,200,000 (1)(4) | | | Mill City Mortgage Loan Trust 2017-2 M2, 3.250%, 07/25/2059 | | | | $ | 3,022,023 | | | | | | 0.1 | | |
| 2,482,000 (1)(4) | | | Mill City Mortgage Trust 2015-2 B2, 3.820%, 09/25/2057 | | | | | 2,065,753 | | | | | | 0.0 | | |
| 1,241,902 (1) | | | Mill City Solar Loan 2019-1A A Ltd., 4.340%, 03/20/2043 | | | | | 1,211,826 | | | | | | 0.0 | | |
| 6,361,877 (1) | | | Mill City Solar Loan 2019-2GS A Ltd., 3.690%, 07/20/2043 | | | | | 6,023,798 | | | | | | 0.1 | | |
| 4,819,560 (1) | | | Mosaic Solar Loan Trust 2018-1A A, 4.010%, 06/22/2043 | | | | | 4,633,576 | | | | | | 0.1 | | |
| 7,924,800 (1) | | | Mosaic Solar Loan Trust 2018-2-GS A, 4.200%, 02/22/2044 | | | | | 8,001,984 | | | | | | 0.1 | | |
| 2,024,885 (1) | | | Mosaic Solar Loan Trust 2018-2-GS B, 4.740%, 02/22/2044 | | | | | 1,856,797 | | | | | | 0.0 | | |
| 7,028,345 (1) | | | Mosaic Solar Loan Trust 2019-2A A, 2.880%, 09/20/2040 | | | | | 6,784,575 | | | | | | 0.1 | | |
| 2,993,822 (1) | | | Mosaic Solar Loans 2017-2A A LLC, 3.820%, 06/22/2043 | | | | | 2,995,769 | | | | | | 0.0 | | |
| 3,250,000 (1) | | | Neuberger Berman Loan Advisers CLO 33 Ltd. 2019-33A C, 4.590%, (US0003M + 2.450%), 10/16/2032 | | | | | 2,691,253 | | | | | | 0.0 | | |
| 12,250,000 (1) | | | Neuberger Berman Loan Advisers CLO 35 Ltd. 2019-35A A1, 3.243%, (US0003M + 1.340%), 01/19/2033 | | | | | 11,599,892 | | | | | | 0.1 | | |
| 2,500,000 (1) | | | OCP CLO 2015-8 Ltd. 2015-8A BR, 3.686%, (US0003M + 1.850%), 04/17/2027 | | | | | 2,315,722 | | | | | | 0.0 | | |
| 9,470,000 (1) | | | Octagon Investment Partners 30 Ltd. 2017-1A A1, 3.139%, (US0003M + 1.320%), 03/17/2030 | | | | | 8,991,869 | | | | | | 0.1 | | |
| 3,000,000 (1) | | | Octagon Investment Partners Ltd. 2017-1A A2, 3.181%, (US0003M + 1.350%), 07/15/2029 | | | | | 2,784,759 | | | | | | 0.0 | | |
| Principal Amount† | | | Value | | | Percentage of Net Assets | | |||||||||
| ASSET-BACKED SECURITIES: (continued) | | |||||||||||||||
| | | | Other Asset-Backed Securities (continued) | | ||||||||||||
| 5,520,000 (1) | | | Octagon Investment Partners XIV Ltd. 2012-1A A1BR, 3.206%, (US0003M + 1.375%), 07/15/2029 | | | | $ | 4,975,088 | | | | | | 0.1 | | |
| 4,060,000 (1) | | | Octagon Investment Partners XV Ltd. 2013-1A A2R, 3.169%, (US0003M + 1.350%), 07/19/2030 | | | | | 3,759,150 | | | | | | 0.1 | | |
| 20,000,000 (1) | | | Octagon Loan Funding Ltd. 2014-1A ARR, 2.872%, (US0003M + 1.180%), 11/18/2031 | | | | | 18,709,280 | | | | | | 0.2 | | |
| 17,700,000 (1) | | | OHA Loan Funding 2015-1A A1R2 Ltd., 3.032%, (US0003M + 1.340%), 11/15/2032 | | | | | 16,602,494 | | | | | | 0.2 | | |
| 3,550,000 (1) | | | Palmer Square CLO 2014-1A A1R2 Ltd., 2.966%, (US0003M + 1.130%), 01/17/2031 | | | | | 3,383,381 | | | | | | 0.1 | | |
| 10,000,000 (1) | | | Palmer Square CLO 2018-1A A1 Ltd., 2.849%, (US0003M + 1.030%), 04/18/2031 | | | | | 9,427,440 | | | | | | 0.1 | | |
| 6,700,000 (1) | | | Palmer Square Loan Funding 2018-1A B Ltd., 3.231%, (US0003M + 1.400%), 04/15/2026 | | | | | 5,833,127 | | | | | | 0.1 | | |
| 4,000,000 (1) | | | Palmer Square Loan Funding 2018-1A C Ltd., 3.681%, (US0003M + 1.850%), 04/15/2026 | | | | | 3,160,048 | | | | | | 0.0 | | |
| 1,000,000 (1)(11) | | | Palmer Square Loan Funding 2018-2A C Ltd., 3.781%, (US0003M + 1.950%), 07/15/2026 | | | | | 772,683 | | | | | | 0.0 | | |
| 6,600,000 (1) | | | Palmer Square CLO 2015-2A A1R2 Ltd., 2.919%, (US0003M + 1.100%), 07/20/2030 | | | | | 6,256,430 | | | | | | 0.1 | | |
| 6,107,000 (1) | | | Planet Fitness Master Issuer LLC 2018-1A A2I, 4.262%, 09/05/2048 | | | | | 5,829,928 | | | | | | 0.1 | | |
| 5,037,375 (1) | | | Primose Funding LLC 2019-1A A2, 4.475%, 07/30/2049 | | | | | 4,651,572 | | | | | | 0.1 | | |
| Voya Intermediate Bond Fund | as of March 31, 2020 (continued) |
| Principal Amount† | | | Value | | | Percentage of Net Assets | | |||||||||
| ASSET-BACKED SECURITIES: (continued) | | |||||||||||||||
| | | | Other Asset-Backed Securities (continued) | | ||||||||||||
| 2,000,000 (1)(4) | | | Sofi Consumer Loan Program 2016-4 C LLC, 5.920%, 11/25/2025 | | | | $ | 1,898,317 | | | | | | 0.0 | | |
| 5,101,000 (1) | | | SoFi Consumer Loan Program 2017-3 B, 3.850%, 05/25/2026 | | | | | 4,588,756 | | | | | | 0.1 | | |
| 1,585,000 (1) | | | Sofi Consumer Loan Program 2017-6 B LLC, 3.520%, 11/25/2026 | | | | | 1,485,066 | | | | | | 0.0 | | |
| 7,000,000 (1) | | | Sofi Consumer Loan Program 2018-1 C Trust, 3.970%, 02/25/2027 | | | | | 5,772,003 | | | | | | 0.1 | | |
| 7,190,000 (1) | | | Sofi Consumer Loan Program 2018-2 B Trust, 3.790%, 04/26/2027 | | | | | 6,871,592 | | | | | | 0.1 | | |
| 3,700,000 (1) | | | Sofi Consumer Loan Program 2018-2 C Trust, 4.250%, 04/26/2027 | | | | | 3,456,547 | | | | | | 0.1 | | |
| 9,950,000 (1) | | | Sofi Consumer Loan Program 2018-3 C Trust, 4.670%, 08/25/2027 | | | | | 8,823,264 | | | | | | 0.1 | | |
| 3,450,000 (1) | | | SoFi Consumer Loan Program 2018-4 B Trust, 3.960%, 11/26/2027 | | | | | 3,238,545 | | | | | | 0.0 | | |
| 2,000,000 (1) | | | SoFi Consumer Loan Program 2019-2 C Trust, 3.460%, 04/25/2028 | | | | | 1,544,610 | | | | | | 0.0 | | |
| 2,000,000 (1) | | | SoFi Consumer Loan Program 2019-2 D Trust, 4.200%, 04/25/2028 | | | | | 1,403,413 | | | | | | 0.0 | | |
| 4,100,000 (1) | | | SoFi Consumer Loan Program 2019-4 C Trust, 2.840%, 08/25/2028 | | | | | 3,353,076 | | | | | | 0.0 | | |
| 1,300,000 (1) | | | SoFi Consumer Loan Program 2019-4 D Trust, 3.480%, 08/25/2028 | | | | | 1,054,221 | | | | | | 0.0 | | |
| 345,333 (1) | | | Sonic Capital LLC 2018-1A A2, 4.026%, 02/20/2048 | | | | | 349,715 | | | | | | 0.0 | | |
| 7,293,917 (1) | | | Sonic Capital LLC 2020-1A A2I, 3.845%, 01/20/2050 | | | | | 7,098,033 | | | | | | 0.1 | | |
| 22,060,000 (1) | | | Sound Point CLO XXV Ltd. 2019-4A A1A, 3.231%, (US0003M + 1.400%), 01/15/2033 | | | | | 20,042,503 | | | | | | 0.2 | | |
| 4,819,982 (1) | | | Sunrun Athena Issuer 2018-1 A LLC, 5.310%, 04/30/2049 | | | | | 4,311,191 | | | | | | 0.1 | | |
| Principal Amount† | | | Value | | | Percentage of Net Assets | | |||||||||
| ASSET-BACKED SECURITIES: (continued) | | |||||||||||||||
| | | | Other Asset-Backed Securities (continued) | | ||||||||||||
| 4,729,670 (1) | | | Sunrun Xanadu Issuer 2019-1A A LLC, 3.980%, 06/30/2054 | | | | $ | 3,646,766 | | | | | | 0.0 | | |
| 6,073,125 (1) | | | Taco Bell Funding LLC 2018-1A A2II, 4.940%, 11/25/2048 | | | | | 5,983,382 | | | | | | 0.1 | | |
| 7,200,000 (1) | | | TES LLC 2017-1A B, 7.740%, 10/20/2047 | | | | | 6,152,972 | | | | | | 0.1 | | |
| 7,000,000 (1) | | | THL Credit Wind River 2013-2A AR CLO Ltd., 3.049%, (US0003M + 1.230%), 10/18/2030 | | | | | 6,582,380 | | | | | | 0.1 | | |
| 12,250,000 (1) | | | THL Credit Wind River 2016-2A A1R CLO Ltd., 2.953%, (US0003M + 1.190%), 11/01/2031 | | | | | 11,448,348 | | | | | | 0.1 | | |
| 7,080,000 (1) | | | THL Credit Wind River 2017-2A A CLO Ltd., 3.049%, (US0003M + 1.230%), 07/20/2030 | | | | | 6,714,735 | | | | | | 0.1 | | |
| 7,500,000 (1) | | | Tiaa Clo III Ltd. 2017-2A A, 2.993%, (US0003M + 1.150%), 01/16/2031 | | | | | 6,935,325 | | | | | | 0.1 | | |
| 1,400,000 (1)(4) | | | Towd Point Mortgage Trust 2015-2 1B1, 3.757%, 11/25/2060 | | | | | 1,282,058 | | | | | | 0.0 | | |
| 2,640,000 (1)(4) | | | Towd Point Mortgage Trust 2015-2 2B2, 4.449%, 11/25/2057 | | | | | 2,537,215 | | | | | | 0.0 | | |
| 4,346,000 (1)(4) | | | Towd Point Mortgage Trust 2016-2 M1, 3.000%, 08/25/2055 | | | | | 4,055,934 | | | | | | 0.1 | | |
| 3,200,000 (1)(4) | | | Towd Point Mortgage Trust 2017-1 M1, 3.750%, 10/25/2056 | | | | | 3,047,983 | | | | | | 0.1 | | |
| 2,200,000 (1)(4) | | | Towd Point Mortgage Trust 2017-3 M1, 3.500%, 07/25/2057 | | | | | 1,983,729 | | | | | | 0.0 | | |
| 3,000,000 (1) | | | Trafigura Securitisation Finance PLC 2018-1A B, 4.290%, 03/15/2022 | | | | | 3,020,350 | | | | | | 0.0 | | |
| 7,250,000 (1) | | | Venture XX CLO Ltd. 2015-20A CR, 3.731%, (US0003M + 1.900%), 04/15/2027 | | | | | 6,234,855 | | | | | | 0.1 | | |
| 1,955,000 (1) | | | Wendys Funding LLC 2018-1A A2I, 3.573%, 03/15/2048 | | | | | 1,786,655 | | | | | | 0.0 | | |
| Voya Intermediate Bond Fund | as of March 31, 2020 (continued) |
| Principal Amount† | | | Value | | | Percentage of Net Assets | | |||||||||
| ASSET-BACKED SECURITIES: (continued) | | |||||||||||||||
| | | | Other Asset-Backed Securities (continued) | | ||||||||||||
| 3,606,975 (1) | | | Wendy’s Funding LLC 2018-1A A2II, 3.884%, 03/15/2048 | | | | $ | 3,269,795 | | | | | | 0.1 | | |
| 572,544 | | | Other Securities | | | | | 558,385 | | | | | | 0.0 | | |
| | | | | | | | | 678,161,591 | | | | | | 8.2 | | |
| | | | Student Loan Asset-Backed Securities: 0.6% | | ||||||||||||
| 831,351 (1) | | | Commonbond Student Loan Trust 2016-B, 4.000%, 10/25/2040 | | | | | 856,751 | | | | | | 0.0 | | |
| 2,300,000 (1) | | | Commonbond Student Loan Trust 2017-BGS B, 3.260%, 09/25/2042 | | | | | 2,360,574 | | | | | | 0.0 | | |
| 240,353 (1) | | | Commonbond Student Loan Trust 2018-A-GS C, 3.820%, 02/25/2044 | | | | | 246,828 | | | | | | 0.0 | | |
| 255,319 (1) | | | Earnest Student Loan Program, LLC 2016-A B, 2.500%, 01/25/2039 | | | | | 252,132 | | | | | | 0.0 | | |
| 327,188 (1)(4) | | | Earnest Student Loan Program, LLC 2016-B B, 4.810%, 09/25/2036 | | | | | 338,549 | | | | | | 0.0 | | |
| 252,967 (1) | | | Earnest Student Loan Program, LLC 2016-C B, 4.460%, 01/26/2037 | | | | | 256,917 | | | | | | 0.0 | | |
| 504,691 (1) | | | Laurel Road Prime Student Loan Trust 2017-B A4, 3.020%, 08/25/2042 | | | | | 492,754 | | | | | | 0.0 | | |
| 2,700,000 (1) | | | SMB Private Education Loan Trust 2014-A C, 4.500%, 09/15/2045 | | | | | 2,642,843 | | | | | | 0.1 | | |
| 1,450,000 (1) | | | SMB Private Education Loan Trust 2017-A B, 3.500%, 06/17/2041 | | | | | 1,505,786 | | | | | | 0.0 | | |
| 4,100,000 (1)(4) | | | SoFi Professional Loan Program 2016-E C, 4.430%, 10/25/2041 | | | | | 4,341,007 | | | | | | 0.1 | | |
| 3,000,000 (1)(4) | | | SoFi Professional Loan Program 2017-C B, 3.560%, 07/25/2040 | | | | | 3,060,552 | | | | | | 0.0 | | |
| 3,900,000 (1) | | | SoFi Professional Loan Program 2017-F BFX LLC, 3.620%, 01/25/2041 | | | | | 3,883,325 | | | | | | 0.1 | | |
| 3,250,000 (1) | | | Sofi Professional Loan Program 2018-A B LLC, 3.610%, 02/25/2042 | | | | | 3,159,921 | | | | | | 0.0 | | |
| 8,000,000 (1) | | | Sofi Professional Loan Program 2018-B BFX Trust, 3.830%, 08/25/2047 | | | | | 7,503,729 | | | | | | 0.1 | | |
| Principal Amount† | | | Value | | | Percentage of Net Assets | | |||||||||
| ASSET-BACKED SECURITIES: (continued) | | |||||||||||||||
| | | | Student Loan Asset-Backed Securities (continued) | | ||||||||||||
| 5,800,000 (1) | | | Sofi Professional Loan Program 2018-C BFX Trust, 4.130%, 01/25/2048 | | | | $ | 5,897,000 | | | | | | 0.1 | | |
| 6,000,000 (1) | | | Sofi Professional Loan Program 2018-D BFX Trust, 4.140%, 02/25/2048 | | | | | 6,192,755 | | | | | | 0.1 | | |
| 3,000,000 (1) | | | Sofi Professional Loan Program 2019-B BFX LLC, 3.730%, 08/17/2048 | | | | | 3,133,155 | | | | | | 0.0 | | |
| | | | | | | | | 46,124,578 | | | | | | 0.6 | | |
| | | | Total Asset-Backed Securities | | | | | | | | | | | | | |
| | | | (Cost $877,196,585) | | | | | 819,963,523 | | | | | | 10.0 | | |
| CONVERTIBLE BONDS/NOTES: 0.0% | | |||||||||||||||
| | | | Financial: 0.0% | | ||||||||||||
| 1,690,000 | | | Other Securities | | | | | 1,693,664 | | | | | | 0.0 | | |
| | | | Total Convertible Bonds/Notes | | | | | | | | | | | | | |
| | | | (Cost $1,679,961) | | | | | 1,693,664 | | | | | | 0.0 | | |
| | ||||||||||||||||
| | | | | | | | Value | | | Percentage of Net Assets | | ||||||
| | PURCHASED OPTIONS(12): 0.1% | | |||||||||||||||
| | | | | Total Purchased Options | | | | | | | | | | | | | |
| | | | | (Cost $896,417) | | | | | 9,754,777 | | | | | | 0.1 | | |
| | | | | Total Long-Term Investments | | | | | | | | | | | | | |
| | | | | (Cost $8,296,114,079) | | | | | 8,122,735,917 | | | | | | 98.7 | | |
| | |||||||||||||||||
| Principal Amount† | | | Value | | | Percentage of Net Assets | | |||||||||
| SHORT-TERM INVESTMENTS: 2.2% | | |||||||||||||||
| | | | Commercial Paper: 0.2% | | ||||||||||||
| 1,825,000 (13) | | | DBS Bank Ltd., 1.700%, 04/03/2020 | | | | | 1,824,954 | | | | | | 0.0 | | |
| 4,670,000 (13) | | | Exxon Mobil Corp., 1.600%, 06/03/2020 | | | | | 4,652,422 | | | | | | 0.1 | | |
| 4,775,000 (13) | | | Federal Republic of Germany, 1.620%, 05/21/2020 | | | | | 4,768,234 | | | | | | 0.1 | | |
| 950,000 (13) | | | Matchpoint Finance PLC, 1.680%, 05/11/2020 | | | | | 948,280 | | | | | | 0.0 | | |
| 4,625,000 (13) | | | Pfizer Inc., 1.630%, 06/15/2020 | | | | | 4,607,522 | | | | | | 0.0 | | |
| | | | Total Commercial Paper | | | | | | | | | | | | | |
| | | | (Cost $16,801,412) | | | | | 16,801,412 | | | | | | 0.2 | | |
| | ||||||||||||||||
| Voya Intermediate Bond Fund | as of March 31, 2020 (continued) |
| Principal Amount† | | | Value | | | Percentage of Net Assets | | |||||||||
| SHORT-TERM INVESTMENTS: (continued) | | |||||||||||||||
| | | | Floating Rate Notes: 1.2% | | ||||||||||||
| 4,600,000 (13) | | | Australia & New Zealand Banking Group Ltd., 0.950%, 05/20/2020 | | | | $ | 4,600,847 | | | | | | 0.1 | | |
| 3,250,000 (13) | | | Australia & New Zealand Banking Group Ltd., 1.220%, 04/09/2020 | | | | | 3,250,510 | | | | | | 0.0 | | |
| 2,900,000 (13) | | | Bank of America Corp., 1.200%, 05/07/2020 | | | | | 2,898,198 | | | | | | 0.0 | | |
| 2,100,000 (13) | | | Bank of Montreal, 0.210%, 07/13/2020 | | | | | 2,093,311 | | | | | | 0.1 | | |
| 1,250,000 (13) | | | Bank of Montreal, 0.980%, 08/26/2020 | | | | | 1,250,012 | | | | | | 0.0 | | |
| 2,100,000 (13) | | | Bank of Nova Scotia, 0.830%, 08/20/2020 | | | | | 2,098,726 | | | | | | 0.0 | | |
| 2,425,000 (13) | | | Bank of Nova Scotia, 1.240%, 05/08/2020 | | | | | 2,425,837 | | | | | | 0.1 | | |
| 2,200,000 (13) | | | Canadian Imperial Bank of Commerce, 0.240%, 08/28/2020 | | | | | 2,188,445 | | | | | | 0.0 | | |
| 3,200,000 (13) | | | Citibank N.A., 1.810%, 05/01/2020 | | | | | 3,198,058 | | | | | | 0.1 | | |
| 2,250,000 (13) | | | Commonwealth Bank of Australia, 0.950%, 06/10/2020 | | | | | 2,248,059 | | | | | | 0.0 | | |
| 3,000,000 (13) | | | Coöperatieve Rabobank U.A., 0.990%, 04/20/2020 | | | | | 3,000,752 | | | | | | 0.0 | | |
| 2,100,000 (13) | | | Crédit Agricole Group, 0.190%, 06/12/2020 | | | | | 2,095,374 | | | | | | 0.0 | | |
| 1,600,000 (13) | | | Crédit Industriel et Commercial, 1.140%, 04/24/2020 | | | | | 1,600,449 | | | | | | 0.0 | | |
| 3,375,000 (13) | | | Credit Suisse Group AG, 0.150%, 08/14/2020 | | | | | 3,360,584 | | | | | | 0.0 | | |
| 3,450,000 (13) | | | Credit Suisse Group AG, 0.360%, 04/17/2020 | | | | | 3,449,874 | | | | | | 0.1 | | |
| 2,925,000 (13) | | | HSBC Bank PLC, 1.520%, 06/03/2020 | | | | | 2,922,779 | | | | | | 0.0 | | |
| 2,925,000 (13) | | | JPMorgan Chase & Co., 1.740%, 08/07/2020 | | | | | 2,920,047 | | | | | | 0.0 | | |
| 450,000 (13) | | | Lloyds Bank PLC, 0.110%, 08/24/2020 | | | | | 448,734 | | | | | | 0.0 | | |
| 875,000 (13) | | | Lloyds Bank PLC, 0.110%, 08/25/2020 | | | | | 872,518 | | | | | | 0.0 | | |
| 925,000 (13) | | | Lloyds Bank PLC, 0.220%, 09/08/2020 | | | | | 922,536 | | | | | | 0.0 | | |
| 950,000 (13) | | | Lloyds Bank PLC, 1.100%, 08/07/2020 | | | | | 949,207 | | | | | | 0.0 | | |
| 1,125,000 (13) | | | Mizuho Financial Group Inc., 0.870%, 08/13/2020 | | | | | 1,124,072 | | | | | | 0.0 | | |
| Principal Amount† | | | Value | | | Percentage of Net Assets | | |||||||||
| SHORT-TERM INVESTMENTS: (continued) | | |||||||||||||||
| | | | Floating Rate Notes (continued) | | ||||||||||||
| 1,800,000 (13) | | | Mizuho Financial Group Inc., 1.140%, 05/22/2020 | | | | $ | 1,800,554 | | | | | | 0.0 | | |
| 3,900,000 (13) | | | Mizuho Financial Group Inc., 1.140%, 05/26/2020 | | | | | 3,901,124 | | | | | | 0.1 | | |
| 2,750,000 (13) | | | National Bank of Canada, 1.840%, 05/01/2020 | | | | | 2,749,060 | | | | | | 0.1 | | |
| 2,700,000 (13) | | | National Bank of Canada, 1.840%, 07/16/2020 | | | | | 2,695,730 | | | | | | 0.0 | | |
| 2,600,000 (13) | | | Royal Bank of Canada, 0.960%, 07/17/2020 | | | | | 2,597,778 | | | | | | 0.0 | | |
| 4,175,000 (13) | | | Skandinaviska Enskilda Banken AB, 1.150%, 05/26/2020 | | | | | 4,176,150 | | | | | | 0.0 | | |
| 4,325,000 (13) | | | Skandinaviska Enskilda Banken AB, 1.780%, 05/11/2020 | | | | | 4,322,924 | | | | | | 0.1 | | |
| 2,325,000 (13) | | | Societe Generale, 0.290%, 09/04/2020 | | | | | 2,315,439 | | | | | | 0.0 | | |
| 825,000 (13) | | | Sumitomo Mitsui Trust Holdings, Inc., 0.760%, 06/15/2020 | | | | | 824,530 | | | | | | 0.0 | | |
| 2,750,000 (13) | | | Sumitomo Mitsui Trust Holdings, Inc., 0.870%, 05/11/2020 | | | | | 2,750,616 | | | | | | 0.1 | | |
| 2,550,000 (13) | | | Sumitomo Mitsui Trust Holdings, Inc., 1.280%, 05/07/2020 | | | | | 2,551,113 | | | | | | 0.0 | | |
| 2,900,000 (13) | | | Svenska Handelsbanken AB, 0.970%, 05/20/2020 | | | | | 2,900,615 | | | | | | 0.0 | | |
| 3,000,000 (13) | | | Svenska Handelsbanken AB, 1.160%, 07/07/2020 | | | | | 2,998,726 | | | | | | 0.1 | | |
| 3,175,000 (13) | | | The Norinchukin Bank, 1.200%, 04/24/2020 | | | | | 3,175,362 | | | | | | 0.0 | | |
| 2,250,000 (13) | | | The Sumitomo Mitsui Financial Group, 1.020%, 08/25/2020 | | | | | 2,247,518 | | | | | | 0.1 | | |
| 2,075,000 (13) | | | The Sumitomo Mitsui Financial Group, 1.040%, 05/12/2020 | | | | | 2,076,140 | | | | | | 0.0 | | |
| 350,000 (13) | | | The Sumitomo Mitsui Financial Group, 1.270%, 05/06/2020 | | | | | 350,145 | | | | | | 0.0 | | |
| 3,200,000 (13) | | | Toronto-Dominion Bank, 1.140%, 04/30/2020 | | | | | 3,200,740 | | | | | | 0.1 | | |
| 1,450,000 (13) | | | Toyota Motor Corp., 1.680%, 04/17/2020 | | | | | 1,449,374 | | | | | | 0.0 | | |
| | | | Total Floating Rate Notes | | | | | | | | | | | | | |
| | | | (Cost $99,002,567) | | | | | 99,002,567 | | | | | | 1.2 | | |
| | ||||||||||||||||
| Voya Intermediate Bond Fund | as of March 31, 2020 (continued) |
| Principal Amount† | | | Value | | | Percentage of Net Assets | | |||||||||
| SHORT-TERM INVESTMENTS: (continued) | | |||||||||||||||
| | | | Repurchase Agreements: 0.5% | | ||||||||||||
| 3,428,319 (13) | | | BNP Paribas S.A., Repurchase Agreement dated 03/31/20, 0.33%, due 04/01/20 (Repurchase Amount $3,428,350, collateralized by various U.S. Government Securities, 2.125%-6.875%, Market Value plus accrued interest $3,599,743, due 06/15/20-03/15/39) | | | | $ | 3,428,319 | | | | | | 0.0 | | |
| 3,907,311 (13) | | | Cantor Fitzgerald Securities, Repurchase Agreement dated 03/31/20, 0.02%, due 04/01/20 (Repurchase Amount $3,907,313, collateralized by various U.S. Government/U.S. Government Agency Obligations, 0.000%-8.500%, Market Value plus accrued interest $3,985,457, due 05/01/20-02/20/70) | | | | | 3,907,311 | | | | | | 0.1 | | |
| 1,682,394 (13) | | | CF Secured LLC, Repurchase Agreement dated 03/31/20, 0.02%, due 04/01/20 (Repurchase Amount $1,682,395, collateralized by various U.S. Government/U.S. Government Agency Obligations, 0.000%-6.500%, Market Value plus accrued interest $1,716,044, due 12/15/21-11/20/66) | | | | | 1,682,394 | | | | | | 0.0 | | |
| 1,203,929 (13) | | | Citadel Securities LLC, Repurchase Agreement dated 03/31/20, 0.09%, due 04/01/20 (Repurchase Amount $1,203,932, collateralized by various U.S. Government Securities, 0.000%-8.125%, Market Value plus accrued interest $1,228,011, due 04/07/20-02/15/50) | | | | | 1,203,929 | | | | | | 0.0 | | |
| Principal Amount† | | | Value | | | Percentage of Net Assets | | |||||||||
| SHORT-TERM INVESTMENTS: (continued) | | |||||||||||||||
| | | | Repurchase Agreements (continued) | | ||||||||||||
| 8,309,810 (13) | | | Citigroup, Inc., Repurchase Agreement dated 03/31/20, 0.01%, due 04/01/20 (Repurchase Amount $8,309,812, collateralized by various U.S. Government Agency Obligations, 0.150%-8.500%, Market Value plus accrued interest $8,476,006, due 04/15/21-09/20/69) | | | | $ | 8,309,810 | | | | | | 0.1 | | |
| 1,401,898 (13) | | | Industrial & Comm. Bank of China, Repurchase Agreement dated 03/31/20, 0.02%, due 04/01/20 (Repurchase Amount $1,401,899, collateralized by various U.S. Government Agency Obligations, 0.000%-9.500%, Market Value plus accrued interest $1,429,936, due 04/02/20-03/01/50) | | | | | 1,401,898 | | | | | | 0.0 | | |
| 12,200,000 (13) | | | MUFG Securities America Inc., Repurchase Agreement dated 03/03/20, 0.35%, due 05/05/20 (Repurchase Amount $12,207,370, collateralized by various U.S. Government Securities, 0.000%-8.500%, Market Value plus accrued interest $12,809,993, due 10/15/20-09/09/49) | | | | | 12,200,000 | | | | | | 0.2 | | |
| 1,511,908 (13) | | | Royal Bank of Canada, Repurchase Agreement dated 03/31/20, 0.38%, due 04/01/20 (Repurchase Amount $1,511,924, collateralized by various U.S. Government Securities, 1.493%-10.200%, Market Value plus accrued interest $1,577,735, due 04/17/20-03/15/40) | | | | | 1,511,908 | | | | | | 0.0 | | |
| Voya Intermediate Bond Fund | as of March 31, 2020 (continued) |
| Principal Amount† | | | Value | | | Percentage of Net Assets | | |||||||||
| SHORT-TERM INVESTMENTS: (continued) | | |||||||||||||||
| | | | Repurchase Agreements (continued) | | ||||||||||||
| 8,176,813 (13) | | | State of Wisconsin Investment Board, Repurchase Agreement dated 03/31/20, 0.16%, due 04/01/20 (Repurchase Amount $8,176,849, collateralized by various U.S. Government Securities, 0.125%-3.875%, Market Value plus accrued interest $8,360,308, due 04/01/20-09/09/49) | | | | $ | 8,176,813 | | | | | | 0.1 | | |
| | | | Total Repurchase Agreements | | | | | | | | | | | | | |
| | | | (Cost $41,822,382) | | | | | 41,822,382 | | | | | | 0.5 | | |
| | | | Certificates of Deposit: 0.1% | | ||||||||||||
| 350,000 (13) | | | Dz Bank Ag Deutsche Zentral-Genossenschaftsbank, 1.640%, 05/12/2020 | | | | | 350,174 | | | | | | 0.0 | | |
| 2,950,000 (13) | | | Group BPCE, 1.790%, 04/13/2020 | | | | | 2,950,646 | | | | | | 0.0 | | |
| 2,525,000 (13) | | | Landesbank Baden-Wurttemberg, 1.630%, 04/24/2020 | | | | | 2,526,351 | | | | | | 0.1 | | |
| 1,900,000 (13) | | | Landesbank Baden-Wurttemberg, 1.640%, 04/21/2020 | | | | | 1,901,003 | | | | | | 0.0 | | |
| 2,850,000 (13) | | | The Norinchukin Bank, 1.650%, 06/18/2020 | | | | | 2,852,841 | | | | | | 0.0 | | |
| | | | Total Certificates of Deposit | | | | | | | | | | | | | |
| | | | (Cost $10,581,015) | | | | | 10,581,015 | | | | | | 0.1 | | |
| | ||||||||||||||||
| Shares | | | Value | | | Percentage of Net Assets | | |||||||||
| | | | Mutual Funds: 0.2% | | ||||||||||||
| 12,049,000 (14) | | | Goldman Sachs Financial Square Government Fund - Institutional Shares, 0.340% | | | | | | | | | | | | | |
| | | | (Cost $12,049,000) | | | | | 12,049,000 | | | | | | 0.2 | | |
| | | | Total Short-Term Investments | | | | | | | | | | | | | |
| | | | (Cost $180,256,376) | | | | | 180,256,376 | | | | | | 2.2 | | |
| | | | Total Investments in Securities | | ||||||||||||
| | | | (Cost $8,476,370,455) | | | | $ | 8,302,992,293 | | | | | | 100.9 | | |
| | | | Liabilities in Excess of Other Assets | | | | | (74,013,594) | | | | | | (0.9) | | |
| | | | Net Assets | | | | $ | 8,228,978,699 | | | | | | 100.0 | | |
| Voya Intermediate Bond Fund | as of March 31, 2020 (continued) |
| | | | Quoted Prices in Active Markets for Identical Investments (Level 1) | | | Significant Other Observable Inputs (Level 2) | | | Significant Unobservable Inputs (Level 3) | | | Fair Value at March 31, 2020 | | ||||||||||||
| Asset Table | | | | | | | | | | | | | | | | | | | | | | | | | |
| Investments, at fair value | | | | | | | | | | | | | | | | | | | | | | | | | |
| Purchased Options | | | | $ | — | | | | | $ | 9,754,777 | | | | | $ | — | | | | | $ | 9,754,777 | | |
| Corporate Bonds/Notes | | | | | — | | | | | | 2,672,653,193 | | | | | | — | | | | | | 2,672,653,193 | | |
| Collateralized Mortgage Obligations | | | | | — | | | | | | 1,708,802,457 | | | | | | — | | | | | | 1,708,802,457 | | |
| Asset-Backed Securities | | | | | — | | | | | | 819,963,523 | | | | | | — | | | | | | 819,963,523 | | |
| Sovereign Bonds | | | | | — | | | | | | 215,071,768 | | | | | | — | | | | | | 215,071,768 | | |
| Commercial Mortgage-Backed Securities | | | | | — | | | | | | 750,131,933 | | | | | | — | | | | | | 750,131,933 | | |
| U.S. Government Agency Obligations | | | | | — | | | | | | 1,367,674,291 | | | | | | — | | | | | | 1,367,674,291 | | |
| Convertible Bonds/Notes | | | | | — | | | | | | 1,693,664 | | | | | | — | | | | | | 1,693,664 | | |
| U.S. Treasury Obligations | | | | | — | | | | | | 576,990,311 | | | | | | — | | | | | | 576,990,311 | | |
| Short-Term Investments | | | | | 12,049,000 | | | | | | 168,207,376 | | | | | | — | | | | | | 180,256,376 | | |
| Total Investments, at fair value | | | | $ | 12,049,000 | | | | | $ | 8,290,943,293 | | | | | $ | — | | | | | $ | 8,302,992,293 | | |
| Other Financial Instruments+ | | | | | | | | | | | | | | | | | | | | | | | | | |
| Centrally Cleared Swaps | | | | | — | | | | | | 15,901,067 | | | | | | — | | | | | | 15,901,067 | | |
| Forward Foreign Currency Contracts | | | | | — | | | | | | 15,088,865 | | | | | | — | | | | | | 15,088,865 | | |
| Futures | | | | | 48,508,193 | | | | | | — | | | | | | — | | | | | | 48,508,193 | | |
| Total Assets | | | | $ | 60,557,193 | | | | | $ | 8,321,933,225 | | | | | $ | — | | | | | $ | 8,382,490,418 | | |
| Liabilities Table | | | | | | | | | | | | | | | | | | | | | | | | | |
| Other Financial Instruments+ | | | | | | | | | | | | | | | | | | | | | | | | | |
| Forward Foreign Currency Contracts | | | | $ | — | | | | | $ | (345,538) | | | | | $ | — | | | | | $ | (345,538) | | |
| Futures | | | | | (19,697,055) | | | | | | — | | | | | | — | | | | | | (19,697,055) | | |
| Written Options | | | | | — | | | | | | (12,115,246) | | | | | | — | | | | | | (12,115,246) | | |
| Total Liabilities | | | | $ | (19,697,055) | | | | | $ | (12,460,784) | | | | | $ | — | | | | | $ | (32,157,839) | | |
| Currency Purchased | | | Currency Sold | | | Counterparty | | | Settlement Date | | | Unrealized Appreciation (Depreciation) | | ||||||
| ZAR 16,118 | | | USD 1,088 | | | Barclays Bank PLC | | | | | 05/15/20 | | | | | $ | (193) | | |
| USD 215 | | | HUF 65,821 | | | Barclays Bank PLC | | | | | 05/15/20 | | | | | | 14 | | |
| IDR 18,513,638,400 | | | USD 1,128,000 | | | Barclays Bank PLC | | | | | 05/15/20 | | | | | | 517 | | |
| ILS 198,126 | | | USD 57,591 | | | Barclays Bank PLC | | | | | 05/15/20 | | | | | | (1,545) | | |
| USD 126,000 | | | RUB 8,051,942 | | | Barclays Bank PLC | | | | | 05/15/20 | | | | | | 23,517 | | |
| USD 9,406 | | | MYR 38,391 | | | Barclays Bank PLC | | | | | 05/15/20 | | | | | | 507 | | |
| USD 282 | | | CZK 6,471 | | | Barclays Bank PLC | | | | | 05/15/20 | | | | | | 22 | | |
| USD 14,313,353 | | | RUB 906,212,723 | | | Barclays Bank PLC | | | | | 05/15/20 | | | | | | 2,779,330 | | |
| USD 1,000 | | | PHP 50,987 | | | Barclays Bank PLC | | | | | 05/15/20 | | | | | | 8 | | |
| USD 40,573,223 | | | BRL 171,400,546 | | | BNP Paribas | | | | | 05/15/20 | | | | | | 7,684,197 | | |
| PLN 386,881 | | | USD 99,669 | | | BNP Paribas | | | | | 05/15/20 | | | | | | (6,173) | | |
| PHP 56,064 | | | USD 1,098 | | | BNP Paribas | | | | | 05/15/20 | | | | | | (7) | | |
| USD 400,000 | | | MXN 7,591,126 | | | BNP Paribas | | | | | 05/15/20 | | | | | | 82,081 | | |
| USD 90,000 | | | PLN 381,252 | | | BNP Paribas | | | | | 05/15/20 | | | | | | (2,136) | | |
| USD 709,000 | | | IDR 9,798,089,310 | | | BNP Paribas | | | | | 05/15/20 | | | | | | 111,748 | | |
| USD 1,000 | | | ZAR 14,930 | | | Citibank N.A. | | | | | 05/15/20 | | | | | | 171 | | |
| Voya Intermediate Bond Fund | as of March 31, 2020 (continued) |
| Currency Purchased | | | Currency Sold | | | Counterparty | | | Settlement Date | | | Unrealized Appreciation (Depreciation) | | ||||||
| USD 255 | | | TRY 1,549 | | | Citibank N.A. | | | | | 05/15/20 | | | | | | 23 | | |
| USD 10,105,443 | | | PEN 33,888,603 | | | Citibank N.A. | | | | | 05/15/20 | | | | | | 249,641 | | |
| USD 212,000 | | | RON 951,414 | | | Citibank N.A. | | | | | 05/15/20 | | | | | | (4,324) | | |
| RUB 88,953,437 | | | USD 1,126,000 | | | Citibank N.A. | | | | | 05/15/20 | | | | | | 6,175 | | |
| RON 962,505 | | | USD 220,862 | | | Citibank N.A. | | | | | 05/15/20 | | | | | | (2,017) | | |
| PEN 3,686,313 | | | USD 1,046,000 | | | Citibank N.A. | | | | | 05/15/20 | | | | | | 26,088 | | |
| MXN 29,483,791 | | | USD 1,200,000 | | | Citibank N.A. | | | | | 05/15/20 | | | | | | 34,792 | | |
| COP 591,511 | | | USD 173 | | | Citibank N.A. | | | | | 05/15/20 | | | | | | (28) | | |
| CLP 840,590 | | | USD 1,000 | | | Citibank N.A. | | | | | 05/15/20 | | | | | | (17) | | |
| USD 9,681,938 | | | MXN 184,309,481 | | | Citibank N.A. | | | | | 05/15/20 | | | | | | 1,962,988 | | |
| USD 680,000 | | | BRL 2,898,364 | | | Credit Suisse International | | | | | 05/15/20 | | | | | | 123,850 | | |
| USD 4,679,950 | | | CLP 3,684,697,887 | | | HSBC Bank USA N.A. | | | | | 05/15/20 | | | | | | 369,697 | | |
| USD 10,145,853 | | | IDR 139,647,523,914 | | | HSBC Bank USA N.A. | | | | | 05/15/20 | | | | | | 1,633,499 | | |
| BRL 14,688,456 | | | USD 2,889,000 | | | JPMorgan Chase Bank N.A. | | | | | 05/15/20 | | | | | | (70,520) | | |
| USD 15,797,000 | | | EUR 14,521,273 | | | JPMorgan Chase Bank N.A. | | | | | 06/05/20 | | | | | | (258,578) | | |
| | | | | | | | | | | | | | | | | $ | 14,743,327 | | |
| | |||||||||||||||||||
| Description | | | Number of Contracts | | | Expiration Date | | | Notional Value | | | Unrealized Appreciation/ (Depreciation) | | ||||||||||||
| Long Contracts: | | | | | | | | | | | | | | | | | | | | | | | | | |
| U.S. Treasury 10-Year Note | | | | | 4,438 | | | | | | 06/19/20 | | | | | $ | 615,495,125 | | | | | $ | 1,670,540 | | |
| U.S. Treasury 2-Year Note | | | | | 1,735 | | | | | | 06/30/20 | | | | | | 382,364,179 | | | | | | 976,966 | | |
| U.S. Treasury 5-Year Note | | | | | 3,345 | | | | | | 06/30/20 | | | | | | 419,327,109 | | | | | | 9,900,099 | | |
| U.S. Treasury Long Bond | | | | | 1,268 | | | | | | 06/19/20 | | | | | | 227,051,250 | | | | | | 9,576,192 | | |
| U.S. Treasury Ultra Long Bond | | | | | 1,893 | | | | | | 06/19/20 | | | | | | 420,009,375 | | | | | | 26,384,396 | | |
| | | | | | | | | | | | | | | | | $ | 2,064,247,038 | | | | | $ | 48,508,193 | | |
| Short Contracts: | | | | | | | | | | | | | | | | | | | | | | | | | |
| U.S. Treasury Ultra 10-Year Note | | | | | (5,695) | | | | | | 06/19/20 | | | | | | (888,597,969) | | | | | | (19,697,055) | | |
| | | | | | | | | | | | | | | | | $ | (888,597,969) | | | | | $ | (19,697,055) | | |
| Reference Entity/Obligation | | | Buy/Sell Protection | | | (Pay)/ Receive Financing Rate (%)(2) | | | Termination Date | | | Notional Amount(3) | | | Fair Value(4) | | | Unrealized Appreciation/ (Depreciation) | | |||||||||||||||
| CDX North American High Yield Index, Series 34, Version 1 | | | Buy | | | | | (5.000) | | | | | | 06/20/25 | | | | | | USD399,755,000 | | | | | $ | 25,664,271 | | | | | $ | 8,248,763 | | |
| iTraxx Cross-over Index, Series 32, Version 1 | | | Buy | | | | | (5.000) | | | | | | 12/20/24 | | | | | | EUR43,939,000 | | | | | | 993,049 | | | | | | 7,652,304 | | |
| | | | | | | | | | | | | | | | | | | | | | | | | | $ | 26,657,320 | | | | | $ | 15,901,067 | | |
| Voya Intermediate Bond Fund | as of March 31, 2020 (continued) |
| Description | | | Counterparty | | | Expiration Date | | | Exercise Price | | | Notional Amount | | | Cost | | | Fair Value | | |||||||||
| Call EUR vs. Put NOK | | | Bank of America N.A. | | | | | 05/11/20 | | | | 10.500 | | | EUR60,048,000 | | | | $ | 180,316 | | | | | $ | 5,916,676 | | |
| Call USD vs. Put AUD | | | Morgan Stanley Capital Services LLC | | | | | 05/11/20 | | | | 0.650 | | | USD 63,878,100 | | | | | 244,604 | | | | | | 3,755,216 | | |
| Put EUR vs. Call NOK | | | Bank of America N.A. | | | | | 05/11/20 | | | | 9.900 | | | EUR 60,048,000 | | | | | 213,429 | | | | | | 41,777 | | |
| Put USD vs. Call AUD | | | Morgan Stanley Capital Services LLC | | | | | 05/11/20 | | | | 0.690 | | | USD 67,809,060 | | | | | 258,068 | | | | | | 41,108 | | |
| | | | | | | | | | | | | | | | | | | | $ | 896,417 | | | | | $ | 9,754,777 | | |
| Description | | | Counterparty | | | Expiration Date | | | Exercise Price | | | Notional Amount | | | Premiums Received | | | Fair Value | | |||||||||
| Call EUR vs. Put NOK | | | Bank of America N.A. | | | | | 05/11/20 | | | | 10.300 | | | EUR 60,048,000 | | | | $ | 419,318 | | | | | $ | (7,016,283) | | |
| Call USD vs. Put AUD | | | Morgan Stanley Capital Services LLC | | | | | 05/11/20 | | | | 0.665 | | | USD 65,352,210 | | | | | 571,562 | | | | | | (5,098,963) | | |
| | | | | | | | | | | | | | | | | | | | $ | 990,880 | | | | | $ | (12,115,246) | | |
| Derivatives not accounted for as hedging instruments | | | Location on Statement of Assets and Liabilities | | | Fair Value | | |||
| Asset Derivatives | | | | | | | | | | |
| Foreign exchange contracts | | | Investments in securities at value* | | | | $ | 9,754,777 | | |
| Foreign exchange contracts | | | Unrealized appreciation on forward foreign currency contracts | | | | | 15,088,865 | | |
| Interest rate contracts | | | Net Assets — Unrealized appreciation** | | | | | 48,508,193 | | |
| Credit contracts | | | Net Assets — Unrealized appreciation*** | | | | | 15,901,067 | | |
| Total Asset Derivatives | | | | | | | $ | 89,252,902 | | |
| Liability Derivatives | | | | | | | | | | |
| Foreign exchange contracts | | | Unrealized depreciation on forward foreign currency contracts | | | | $ | 345,538 | | |
| Interest rate contracts | | | Net Assets — Unrealized depreciation** | | | | | 19,697,055 | | |
| Foreign exchange contracts | | | Written options, at fair value | | | | | 12,115,246 | | |
| Total Liability Derivatives | | | | | | | $ | 32,157,839 | | |
| Voya Intermediate Bond Fund | as of March 31, 2020 (continued) |
| Derivatives not accounted for as hedging instruments | | | Investments* | | | Forward foreign currency contracts | | | Futures | | | Swaps | | | Written options | | | Total | | ||||||||||||||||||
| Credit contracts | | | | $ | — | | | | | $ | — | | | | | $ | — | | | | | $ | 16,060,931 | | | | | $ | — | | | | | $ | 16,060,931 | | |
| Equity contracts | | | | | — | | | | | | — | | | | | | (442,043) | | | | | | — | | | | | | — | | | | | | (442,043) | | |
| Foreign exchange contracts | | | | | — | | | | | | 5,767,026 | | | | | | — | | | | | | (1,306,572) | | | | | | — | | | | | | 4,460,454 | | |
| Interest rate contracts | | | | | 558,890 | | | | | | — | | | | | | 57,836,255 | | | | | | (6,824,690) | | | | | | (12,979,414) | | | | | | 38,591,041 | | |
| Total | | | | $ | 558,890 | | | | | $ | 5,767,026 | | | | | $ | 57,394,212 | | | | | $ | 7,929,669 | | | | | $ | (12,979,414) | | | | | $ | 58,670,383 | | |
| Derivatives not accounted for as hedging instruments | | | Investments* | | | Forward foreign currency contracts | | | Futures | | | Swaps | | | Written options | | | Total | | ||||||||||||||||||
| Credit contracts | | | | $ | — | | | | | $ | — | | | | | $ | — | | | | | $ | 15,899,784 | | | | | $ | — | | | | | $ | 15,899,784 | | |
| Foreign exchange contracts | | | | | 8,858,360 | | | | | | 14,632,990 | | | | | | — | | | | | | — | | | | | | (11,124,366) | | | | | | 12,366,984 | | |
| Interest rate contracts | | | | | 2,782,589 | | | | | | — | | | | | | 23,449,297 | | | | | | 987,924 | | | | | | 10,226,970 | | | | | | 37,446,780 | | |
| Total | | | | $ | 11,640,949 | | | | | $ | 14,632,990 | | | | | $ | 23,449,297 | | | | | $ | 16,887,708 | | | | | $ | (897,396) | | | | | $ | 65,713,548 | | |
| | | | Bank of America N.A. | | | Barclays Bank PLC | | | BNP Paribas | | | Citibank N.A. | | | Credit Suisse International | | | HSBC Bank USA N.A. | | | JPMorgan Chase Bank N.A. | | | Morgan Stanley Capital Services LLC | | | Totals | | |||||||||||||||||||||||||||
| Assets: | | | | | | | | | | | | | | | | | | | | | | | | | | | | | | | | | | | | | | | | | | | | | | | | | | | | | | | |
| Purchased options | | | | $ | 5,958,453 | | | | | $ | — | | | | | $ | — | | | | | $ | — | | | | | $ | — | | | | | $ | — | | | | | $ | — | | | | | $ | 3,796,324 | | | | | $ | 9,754,777 | | |
| Forward foreign currency contracts | | | | | — | | | | | | 2,803,915 | | | | | | 7,878,026 | | | | | | 2,279,878 | | | | | | 123,850 | | | | | | 2,003,196 | | | | | | — | | | | | | — | | | | | | 15,088,865 | | |
| Total Assets | | | | $ | 5,958,453 | | | | | $ | 2,803,915 | | | | | $ | 7,878,026 | | | | | $ | 2,279,878 | | | | | $ | 123,850 | | | | | $ | 2,003,196 | | | | | $ | — | | | | | $ | 3,796,324 | | | | | $ | 24,843,642 | | |
| Liabilities: | | | | | | | | | | | | | | | | | | | | | | | | | | | | | | | | | | | | | | | | | | | | | | | | | | | | | | | |
| Forward foreign currency contracts | | | | $ | — | | | | | $ | 1,738 | | | | | $ | 8,316 | | | | | $ | 6,386 | | | | | $ | — | | | | | $ | — | | | | | $ | 329,098 | | | | | $ | — | | | | | $ | 345,538 | | |
| Written options | | | | | 7,016,283 | | | | | | — | | | | | | — | | | | | | — | | | | | | — | | | | | | — | | | | | | — | | | | | | 5,098,963 | | | | | | 12,115,246 | | |
| Total Liabilities | | | | $ | 7,016,283 | | | | | $ | 1,738 | | | | | $ | 8,316 | | | | | $ | 6,386 | | | | | $ | — | | | | | $ | — | | | | | $ | 329,098 | | | | | $ | 5,098,963 | | | | | $ | 12,460,784 | | |
| Net OTC derivative instruments by counterparty, at fair value | | | | $ | (1,057,830) | | | | | $ | 2,802,177 | | | | | $ | 7,869,710 | | | | | $ | 2,273,492 | | | | | $ | 123,850 | | | | | $ | 2,003,196 | | | | | $ | (329,098) | | | | | $ | (1,302,639) | | | | | $ | 12,382,858 | | |
| Total collateral pledged by the Fund/(Received from counterparty) | | | | $ | 920,000 | | | | | $ | (2,720,000) | | | | | $ | (7,540,000) | | | | | $ | (2,100,000) | | | | | | — | | | | | $ | (1,750,000) | | | | | | — | | | | | $ | 1,190,000 | | | | | $ | (12,000,000) | | |
Net Exposure(1) | | | | $ | (137,830) | | | | | $ | 82,177 | | | | | $ | 329,710 | | | | | $ | 173,492 | | | | | $ | 123,850 | | | | | $ | 253,196 | | | | | $ | (329,098) | | | | | $ | (112,639) | | | | | $ | 382,858 | | |
| | Cost for federal income tax purposes was $8,552,678,437. | | | |||||
| | Net unrealized depreciation consisted of: | | | |||||
| | Gross Unrealized Appreciation | | | | $ | 281,537,083 | | |
| | Gross Unrealized Depreciation | | | | | (468,389,576) | | |
| | Net Unrealized Depreciation | | | | $ | (186,852,493) | | |
| Voya Short Term Bond Fund | as of March 31, 2020 |
| Principal Amount† | | | Value | | | Percentage of Net Assets | | |||||||||
| CORPORATE BONDS/NOTES: 46.3% | | |||||||||||||||
| | | | Basic Materials: 1.8% | | ||||||||||||
| 613,000 (1) | | | Anglo American Capital PLC, 4.125%, 04/15/2021 | | | | $ | 604,241 | | | | | | 0.3 | | |
| 293,000 (1) | | | Cleveland-Cliffs, Inc., 4.875%, 01/15/2024 | | | | | 270,657 | | | | | | 0.2 | | |
| 231,000 (1) | | | Georgia-Pacific LLC, 5.400%, 11/01/2020 | | | | | 233,230 | | | | | | 0.1 | | |
| 300,000 (1) | | | OCI NV, 6.625%, 04/15/2023 | | | | | 276,000 | | | | | | 0.2 | | |
| 300,000 (1) | | | WR Grace & Co-Conn, 5.125%, 10/01/2021 | | | | | 305,790 | | | | | | 0.2 | | |
| 1,395,000 | | | Other Securities | | | | | 1,383,826 | | | | | | 0.8 | | |
| | | | | | | | | 3,073,744 | | | | | | 1.8 | | |
| | | | Communications: 3.4% | | ||||||||||||
| 22,000 (1) | | | CommScope, Inc., 5.000%, 06/15/2021 | | | | | 21,971 | | | | | | 0.0 | | |
| 200,000 (1) | | | CSC Holdings LLC, 5.375%, 07/15/2023 | | | | | 203,251 | | | | | | 0.1 | | |
| 188,000 (1) | | | Fox Corp., 4.030%, 01/25/2024 | | | | | 195,695 | | | | | | 0.1 | | |
| 250,000 (1) | | | Plantronics, Inc., 5.500%, 05/31/2023 | | | | | 183,743 | | | | | | 0.1 | | |
| 250,000 (1) | | | Sirius XM Radio, Inc., 3.875%, 08/01/2022 | | | | | 250,932 | | | | | | 0.1 | | |
| 802,000 | | | Verizon Communications, Inc., 3.125%, 03/16/2022 | | | | | 825,483 | | | | | | 0.5 | | |
| 4,159,000 | | | Other Securities | | | | | 4,222,049 | | | | | | 2.5 | | |
| | | | | | | | | 5,903,124 | | | | | | 3.4 | | |
| | | | Consumer, Cyclical: 4.8% | | ||||||||||||
| 250,000 (1) | | | 1011778 BC ULC / New Red Finance, Inc., 4.250%, 05/15/2024 | | | | | 250,936 | | | | | | 0.1 | | |
| 350,000 (1) | | | Allison Transmission, Inc., 5.000%, 10/01/2024 | | | | | 342,115 | | | | | | 0.2 | | |
| 313,000 (1) | | | BMW US Capital LLC, 3.400%, 08/13/2021 | | | | | 312,675 | | | | | | 0.2 | �� | |
| 514,000 (1) | | | Daimler Finance North America LLC, 3.400%, 02/22/2022 | | | | | 499,925 | | | | | | 0.3 | | |
| 796,000 | | | Ford Motor Credit Co. LLC, 3.157%, 08/04/2020 | | | | | 780,199 | | | | | | 0.5 | | |
| 250,000 (1) | | | Lions Gate Capital Holdings LLC, 6.375%, 02/01/2024 | | | | | 221,868 | | | | | | 0.1 | | |
| 306,000 (1) | | | Nissan Motor Acceptance Corp., 2.150%, 09/28/2020 | | | | | 300,539 | | | | | | 0.2 | | |
| 285,000 (1) | | | Panasonic Corp., 2.536%, 07/19/2022 | | | | | 280,965 | | | | | | 0.2 | | |
| 250,000 (1) | | | Six Flags Entertainment Corp., 4.875%, 07/31/2024 | | | | | 213,439 | | | | | | 0.1 | | |
| Principal Amount† | | | Value | | | Percentage of Net Assets | | |||||||||
| CORPORATE BONDS/NOTES: (continued) | | |||||||||||||||
| | | | Consumer, Cyclical (continued) | | ||||||||||||
| 250,000 (1) | | | Taylor Morrison Communities, Inc. / Taylor Morrison Holdings II, Inc., 5.625%, 03/01/2024 | | | | $ | 237,186 | | | | | | 0.1 | | |
| 200,000 (1) | | | Toyota Industries Corp., 3.110%, 03/12/2022 | | | | | 202,363 | | | | | | 0.1 | | |
| 110,000 | | | Toyota Motor Credit Corp., 2.950%, 04/13/2021 | | | | | 110,450 | | | | | | 0.1 | | |
| 510,000 | | | Toyota Motor Credit Corp., 1.832%, (US0003M + 0.125%), 08/13/2021 | | | | | 487,851 | | | | | | 0.3 | | |
| 250,000 (1) | | | Wynn Las Vegas LLC / Wynn Las Vegas Capital Corp., 4.250%, 05/30/2023 | | | | | 234,368 | | | | | | 0.1 | | |
| 3,921,307 | | | Other Securities | | | | | 3,746,504 | | | | | | 2.2 | | |
| | | | | | | | | 8,221,383 | | | | | | 4.8 | | |
| | | | Consumer, Non-cyclical: 7.3% | | ||||||||||||
| 490,000 (1) | | | AbbVie, Inc., 2.150%, 11/19/2021 | | | | | 488,390 | | | | | | 0.3 | | |
| 245,000 (1) | | | AbbVie, Inc., 2.300%, 11/21/2022 | | | | | 245,117 | | | | | | 0.1 | | |
| 503,000 | | | AbbVie, Inc., 2.500%-3.375%, 05/14/2020-11/06/2022 | | | | | 508,104 | | | | | | 0.3 | | |
| 635,000 | | | CVS Health Corp., 3.700%, 03/09/2023 | | | | | 661,833 | | | | | | 0.4 | | |
| 712,000 | | | General Mills, Inc., 3.150%, 12/15/2021 | | | | | 721,607 | | | | | | 0.4 | | |
| 100,000 (1)(2) | | | Hertz Corp., 5.500%, 10/15/2024 | | | | | 56,855 | | | | | | 0.0 | | |
| 210,000 (1) | | | Imperial Brands Finance PLC, 2.950%, 07/21/2020 | | | | | 209,611 | | | | | | 0.1 | | |
| 200,000 (1) | | | JBS USA LUX SA / JBS USA Finance, Inc., 5.875%, 07/15/2024 | | | | | 203,250 | | | | | | 0.1 | | |
| 890,000 | | | Keurig Dr Pepper, Inc., 3.551%-4.057%, 05/25/2021-05/25/2023 | | | | | 918,854 | | | | | | 0.5 | | |
| 300,000 (1) | | | Nielsen Finance LLC / Nielsen Finance Co., 5.000%, 04/15/2022 | | | | | 278,148 | | | | | | 0.2 | | |
| 300,000 (1) | | | Prestige Brands, Inc., 6.375%, 03/01/2024 | | | | | 309,377 | | | | | | 0.2 | | |
| 507,000 (1) | | | Seven & i Holdings Co. Ltd., 3.350%, 09/17/2021 | | | | | 514,952 | | | | | | 0.3 | | |
| 824,000 | | | Shire Acquisitions Investments Ireland DAC, 2.400%, 09/23/2021 | | | | | 821,566 | | | | | | 0.5 | | |
| Voya Short Term Bond Fund | as of March 31, 2020 (continued) |
| Principal Amount† | | | Value | | | Percentage of Net Assets | | |||||||||
| CORPORATE BONDS/NOTES: (continued) | | |||||||||||||||
| | | | Consumer, Non-cyclical (continued) | | ||||||||||||
| 252,000 (1) | | | Takeda Pharmaceutical Co. Ltd., 2.450%, 01/18/2022 | | | | $ | 256,450 | | | | | | 0.2 | | |
| 250,000 (1) | | | TreeHouse Foods, Inc., 6.000%, 02/15/2024 | | | | | 249,686 | | | | | | 0.1 | | |
| 6,151,000 | | | Other Securities | | | | | 6,203,369 | | | | | | 3.6 | | |
| | | | | | | | | 12,647,169 | | | | | | 7.3 | | |
| | | | Energy: 3.9% | | ||||||||||||
| 125,000 (1) | | | MPLX L.P., 3.500%, 12/01/2022 | | | | | 119,808 | | | | | | 0.1 | | |
| 498,000 (1) | | | NGPL PipeCo LLC, 4.375%, 08/15/2022 | | | | | 475,734 | | | | | | 0.3 | | |
| 170,000 (1) | | | Schlumberger Finance Canada Ltd., 2.200%, 11/20/2020 | | | | | 167,806 | | | | | | 0.1 | | |
| 936,000 | | | Shell International Finance BV, 1.750%, 09/12/2021 | | | | | 932,127 | | | | | | 0.5 | | |
| 355,000 | | | Total Capital International SA, 2.218%, 07/12/2021 | | | | | 356,120 | | | | | | 0.2 | | |
| 5,344,000 (3) | | | Other Securities | | | | | 4,709,576 | | | | | | 2.7 | | |
| | | | | | | | | 6,761,171 | | | | | | 3.9 | | |
| | | | Financial: 16.1% | | ||||||||||||
| 400,000 (1) | | | ABN AMRO Bank NV, 3.400%, 08/27/2021 | | | | | 400,752 | | | | | | 0.2 | | |
| 860,000 | | | American Express Co., 3.375%-3.700%, 05/17/2021-08/03/2023 | | | | | 880,329 | | | | | | 0.5 | | |
| 285,000 (1) | | | Athene Global Funding, 2.750%, 04/20/2020 | | | | | 284,382 | | | | | | 0.2 | | |
| 682,000 (4) | | | Bank of America Corp., 3.004%, 12/20/2023 | | | | | 695,740 | | | | | | 0.4 | | |
| 260,000 (1) | | | Banque Federative du Credit Mutuel SA, 2.125%, 11/21/2022 | | | | | 241,766 | | | | | | 0.2 | | |
| 200,000 (1) | | | Banque Federative du Credit Mutuel SA, 2.200%, 07/20/2020 | | | | | 199,653 | | | | | | 0.1 | | |
| 800,000 (1) | | | BPCE SA, 2.750%, 01/11/2023 | | | | | 789,846 | | | | | | 0.5 | | |
| 878,000 | | | Citigroup, Inc., 2.900%, 12/08/2021 | | | | | 886,668 | | | | | | 0.5 | | |
| 220,000 (1) | | | Danske Bank A/S, 2.000%, 09/08/2021 | | | | | 215,770 | | | | | | 0.1 | | |
| 200,000 (1) | | | Danske Bank A/S, 2.800%, 03/10/2021 | | | | | 199,809 | | | | | | 0.1 | | |
| 305,000 (1)(4) | | | Danske Bank A/S, 3.001%, 09/20/2022 | | | | | 302,189 | | | | | | 0.2 | | |
| 260,000 (1) | | | DNB Bank ASA, 2.150%, 12/02/2022 | | | | | 257,075 | | | | | | 0.2 | | |
| 230,000 (1) | | | Federation des Caisses Desjardins du Quebec, 2.050%, 02/10/2025 | | | | | 223,060 | | | | | | 0.1 | | |
| Principal Amount† | | | Value | | | Percentage of Net Assets | | |||||||||
| CORPORATE BONDS/NOTES: (continued) | | |||||||||||||||
| | | | Financial (continued) | | ||||||||||||
| 698,000 | | | JPMorgan Chase & Co., 3.200%, 01/25/2023 | | | | $ | 719,049 | | | | | | 0.4 | | |
| 670,000 (4) | | | JPMorgan Chase & Co., 2.776%-4.500%, 01/24/2022-04/25/2023 | | | | | 689,031 | | | | | | 0.4 | | |
| 281,000 (1) | | | Lloyds Bank PLC, 6.500%, 09/14/2020 | | | | | 284,689 | | | | | | 0.2 | | |
| 408,000 (1) | | | Metropolitan Life Global Funding I, 3.375%, 01/11/2022 | | | | | 414,542 | | | | | | 0.2 | | |
| 515,000 | | | Mizuho Financial Group, Inc., 2.309%, (US0003M + 0.630%), 05/25/2024 | | | | | 468,102 | | | | | | 0.3 | | |
| 641,000 (1) | | | Mizuho Financial Group, Inc., 2.632%, 04/12/2021 | | | | | 641,301 | | | | | | 0.4 | | |
| 1,156,000 | | | Morgan Stanley, 3.750%-5.500%, 07/28/2021-02/25/2023 | | | | | 1,203,719 | | | | | | 0.7 | | |
| 217,000 (1) | | | Nationwide Financial Services, Inc., 5.375%, 03/25/2021 | | | | | 222,264 | | | | | | 0.1 | | |
| 130,000 (1) | | | New York Life Global Funding, 2.950%, 01/28/2021 | | | | | 132,595 | | | | | | 0.1 | | |
| 200,000 (1) | | | Nordea Bank ABP, 4.875%, 05/13/2021 | | | | | 203,723 | | | | | | 0.1 | | |
| 346,000 (1) | | | Protective Life Global Funding, 2.161%, 09/25/2020 | | | | | 343,763 | | | | | | 0.2 | | |
| 175,000 (1) | | | Realogy Group LLC / Realogy Co-Issuer Corp., 5.250%, 12/01/2021 | | | | | 163,931 | | | | | | 0.1 | | |
| 210,000 | | | Royal Bank of Canada, 2.560%, (US0003M + 0.660%), 10/05/2023 | | | | | 208,186 | | | | | | 0.1 | | |
| 459,000 | | | Royal Bank of Canada, 1.950%-3.700%, 01/17/2023-10/05/2023 | | | | | 467,265 | | | | | | 0.3 | | |
| 560,000 (1) | | | Standard Chartered PLC, 2.250%, 04/17/2020 | | | | | 559,000 | | | | | | 0.3 | | |
| 200,000 (1) | | | UBS AG/London, 2.200%, 06/08/2020 | | | | | 199,852 | | | | | | 0.1 | | |
| 355,000 (1)(4) | | | UBS Group AG, 2.859%, 08/15/2023 | | | | | 352,405 | | | | | | 0.2 | | |
| 236,000 (4) | | | Wells Fargo & Co., 2.406%-4.125%, 08/15/2023-10/30/2025 | | | | | 237,119 | | | | | | 0.1 | | |
| 14,528,000 | | | Other Securities | | | | | 14,612,128 | | | | | | 8.5 | | |
| | | | | | | | | 27,699,703 | | | | | | 16.1 | | |
| Voya Short Term Bond Fund | as of March 31, 2020 (continued) |
| Principal Amount† | | | Value | | | Percentage of Net Assets | | |||||||||
| CORPORATE BONDS/NOTES: (continued) | | |||||||||||||||
| | | | Industrial: 3.5% | | ||||||||||||
| 300,000 (1) | | | BMC East LLC, 5.500%, 10/01/2024 | | | | $ | 292,123 | | | | | | 0.2 | | |
| 250,000 (1) | | | Colfax Corp., 6.000%, 02/15/2024 | | | | | 250,314 | | | | | | 0.1 | | |
| 300,000 (1) | | | Owens-Brockway Glass Container, Inc., 5.000%, 01/15/2022 | | | | | 304,647 | | | | | | 0.2 | | |
| 200,000 (1) | | | Rolls-Royce PLC, 2.375%, 10/14/2020 | | | | | 188,490 | | | | | | 0.1 | | |
| 300,000 (1) | | | Sealed Air Corp., 5.250%, 04/01/2023 | | | | | 310,607 | | | | | | 0.2 | | |
| 484,000 (1) | | | SMBC Aviation Capital Finance DAC, 4.125%, 07/15/2023 | | | | | 523,039 | | | | | | 0.3 | | |
| 72,000 (1) | | | Standard Industries, Inc./NJ, 5.500%, 02/15/2023 | | | | | 70,018 | | | | | | 0.0 | | |
| 4,050,000 | | | Other Securities | | | | | 4,086,059 | | | | | | 2.4 | | |
| | | | | | | | | 6,025,297 | | | | | | 3.5 | | |
| | | | Technology: 1.4% | | ||||||||||||
| 225,000 (1) | | | Dell International LLC / EMC Corp., 4.420%, 06/15/2021 | | | | | 227,489 | | | | | | 0.2 | | |
| 2,077,000 | | | Other Securities | | | | | 2,093,768 | | | | | | 1.2 | | |
| | | | | | | | | 2,321,257 | | | | | | 1.4 | | |
| | | | Utilities: 4.1% | | ||||||||||||
| 300,000 (4)(5) | | | Dominion Energy, Inc., 2.715%, 08/15/2021 | | | | | 296,170 | | | | | | 0.2 | | |
| 449,000 | | | Dominion Energy, Inc., 2.579%, 07/01/2020 | | | | | 448,485 | | | | | | 0.2 | | |
| 120,000 | | | Duke Energy Progress LLC, 3.375%, 09/01/2023 | | | | | 125,064 | | | | | | 0.1 | | |
| 814,000 | | | Duke Energy Corp., 1.800%-2.400%, 09/01/2021-08/15/2022 | | | | | 810,658 | | | | | | 0.5 | | |
| 687,000 | | | National Rural Utilities Cooperative Finance Corp., 2.300%-2.350%, 06/15/2020-09/15/2022 | | | | | 684,030 | | | | | | 0.4 | | |
| 220,000 (1) | | | Niagara Mohawk Power Corp., 2.721%, 11/28/2022 | | | | | 224,446 | | | | | | 0.1 | | |
| 4,525,000 (3) | | | Other Securities | | | | | 4,534,460 | | | | | | 2.6 | | |
| | | | | | | | | 7,123,313 | | | | | | 4.1 | | |
| | | | Total Corporate Bonds/Notes (Cost $81,464,296) | | | | | 79,776,161 | | | | | | 46.3 | | |
| COLLATERALIZED MORTGAGE OBLIGATIONS: 7.5% | | |||||||||||||||
| 380,882 | | | Fannie Mae Connecticut Avenue Securities 2016-C05 2M2, 5.397%, (US0001M + 4.450%), 01/25/2029 | | | | | 367,580 | | | | | | 0.2 | | |
| Principal Amount† | | | Value | | | Percentage of Net Assets | | |||||||||
| COLLATERALIZED MORTGAGE OBLIGATIONS: (continued) | | |||||||||||||||
| 461,164 | | | Fannie Mae Connecticut Avenue Securities 2016-C07 2M2, 5.297%, (US0001M + 4.350%), 05/25/2029 | | | | $ | 444,843 | | | | | | 0.3 | | |
| 600,000 | | | Fannie Mae Connecticut Avenue Securities 2017-C03 1M2, 3.947%, (US0001M + 3.000%), 10/25/2029 | | | | | 539,248 | | | | | | 0.3 | | |
| 600,000 | | | Fannie Mae Connecticut Avenue Securities 2017-C07 1M2, 3.347%, (US0001M + 2.400%), 05/28/2030 | | | | | 541,149 | | | | | | 0.3 | | |
| 599,373 | | | Fannie Mae Connecticut Avenue Securities 2018-C02 2M2, 3.147%, (US0001M + 2.200%), 08/25/2030 | | | | | 501,924 | | | | | | 0.3 | | |
| 880,705 | | | Fannie Mae Connecticut Avenue Securities 2018-C04 2M2, 3.497%, (US0001M + 2.550%), 12/25/2030 | | | | | 731,583 | | | | | | 0.4 | | |
| 292,846 | | | Fannie Mae Connecticut Avenue Securities 2018-C06 2M2, 3.047%, (US0001M + 2.100%), 03/25/2031 | | | | | 249,126 | | | | | | 0.1 | | |
| 190,297 | | | Fannie Mae Interest Strip Series 404 8, 3.000%, 05/25/2040 | | | | | 194,980 | | | | | | 0.1 | | |
| 2,370 | | | Fannie Mae REMIC Trust 2009-49 KB, 5.000%, 07/25/2024 | | | | | 2,378 | | | | | | 0.0 | | |
| 88,739 | | | Fannie Mae REMIC Trust 2010-137 XP, 4.500%, 10/25/2040 | | | | | 96,688 | | | | | | 0.1 | | |
| 22,431 | | | Fannie Mae REMIC Trust 2010-19 PB, 3.000%, 12/25/2039 | | | | | 22,598 | | | | | | 0.0 | | |
| 155,999 | | | Fannie Mae REMIC Trust 2010-54 LC, 3.000%, 04/25/2040 | | | | | 162,141 | | | | | | 0.1 | | |
| 1,087,215 | | | Fannie Mae REMICS 2013-114 NA, 3.000%, 08/25/2032 | | | | | 1,145,333 | | | | | | 0.7 | | |
| 1,897,783 | | | Freddie Mac 3049 XF, 1.055%, (US0001M + 0.350%), 05/15/2033 | | | | | 1,876,302 | | | | | | 1.1 | | |
| 340,400 | | | Freddie Mac REMIC Trust 2103 TE, 6.000%, 12/15/2028 | | | | | 391,235 | | | | | | 0.2 | | |
| Voya Short Term Bond Fund | as of March 31, 2020 (continued) |
| Principal Amount† | | | Value | | | Percentage of Net Assets | | |||||||||
| COLLATERALIZED MORTGAGE OBLIGATIONS: (continued) | | |||||||||||||||
| 807,351 | | | Freddie Mac REMICS 3255 FA, 0.985%, (US0001M + 0.280%), 12/15/2036 | | | | $ | 795,280 | | | | | | 0.5 | | |
| 105,232 | | | Freddie Mac REMICS 3747 FA, 1.205%, (US0001M + 0.500%), 10/15/2040 | | | | | 104,174 | | | | | | 0.0 | | |
| 683,786 | | | Freddie Mac REMICS 3878 FA, 1.055%, (US0001M + 0.350%), 04/15/2041 | | | | | 682,347 | | | | | | 0.4 | | |
| 100,000 (1) | | | Freddie Mac Stacr Trust 2018-HQA2 M2, 3.247%, (US0001M + 2.300%), 10/25/2048 | | | | | 82,874 | | | | | | 0.0 | | |
| 300,000 | | | Freddie Mac Structured Agency Credit Risk Debt Notes 2016-DNA4 M3, 4.747%, (US0001M + 3.800%), 03/25/2029 | | | | | 282,195 | | | | | | 0.2 | | |
| 147,246 | | | Ginnie Mae Series 2012-52 PV, 2.500%, 12/20/2039 | | | | | 150,624 | | | | | | 0.1 | | |
| 826,732 | | | Ginnie Mae Series 2014-3 EP, 2.750%, 02/16/2043 | | | | | 874,024 | | | | | | 0.5 | | |
| 465,110 (4) | | | Ginnie Mae Series 2014-53 JM, 7.110%, 04/20/2039 | | | | | 551,498 | | | | | | 0.3 | | |
| 1,314,079 | | | Ginnie Mae Series 2016-H23 F, 2.412%, (US0001M + 0.750%), 10/20/2066 | | | | | 1,299,407 | | | | | | 0.8 | | |
| 900,968 | | | Ginnie Mae Series 2017-H19 FA, 2.112%, (US0001M + 0.450%), 08/20/2067 | | | | | 892,892 | | | | | | 0.5 | | |
| | | | Total Collateralized Mortgage Obligations (Cost $13,482,674) | | | | | 12,982,423 | | | | | | 7.5 | | |
| U.S. TREASURY OBLIGATIONS: 4.4% | | |||||||||||||||
| | | | U.S. Treasury Notes: 4.4% | | ||||||||||||
| 4,868,000 | | | 0.375%,03/31/2022 | | | | | 4,881,406 | | | | | | 2.8 | | |
| 2,176,000 | | | 0.500%,03/15/2023 | | | | | 2,189,855 | | | | | | 1.3 | | |
| 404,000 | | | 0.500%,03/31/2025 | | | | | 406,596 | | | | | | 0.3 | | |
| | | | Total U.S. Treasury Obligations (Cost $7,456,706) | | | | | 7,477,857 | | | | | | 4.4 | | |
| COMMERCIAL MORTGAGE-BACKED SECURITIES: 20.5% | | |||||||||||||||
| 270,000 (1) | | | Austin Fairmont Hotel Trust 2019-FAIR C, 2.155%, (US0001M + 1.450%), 09/15/2032 | | | | | 220,946 | | | | | | 0.1 | | |
| 560,000 (1) | | | BFLD 2019-DPLO A, 1.795%, (US0001M + 1.090%), 10/15/2034 | | | | | 475,101 | | | | | | 0.3 | | |
| 670,000 (1) | | | BHP Trust 2019-BXHP A, 1.680%, (US0001M + 0.975%), 08/15/2036 | | | | | 572,761 | | | | | | 0.3 | | |
| Principal Amount† | | | Value | | | Percentage of Net Assets | | |||||||||
| COMMERCIAL MORTGAGE-BACKED SECURITIES: (continued) | | |||||||||||||||
| 220,000 (1) | | | BHP Trust 2019-BXHP D, 2.476%, (US0001M + 1.771%), 08/15/2036 | | | | $ | 184,535 | | | | | | 0.1 | | |
| 220,000 (1) | | | BHP Trust 2019-BXHP E, 3.272%, (US0001M + 2.568%), 08/15/2036 | | | | | 178,596 | | | | | | 0.1 | | |
| 360,000 (1) | | | CGDB Commercial Mortgage Trust 2019-MOB F, 3.255%, (US0001M + 2.550%), 11/15/2036 | | | | | 274,671 | | | | | | 0.2 | | |
| 90,000 (4) | | | Citigroup Commercial Mortgage Trust 2013-GC17 C, 5.110%, 11/10/2046 | | | | | 84,571 | | | | | | 0.0 | | |
| 260,525 | | | Citigroup Commercial Mortgage Trust 2015-GC27 AAB, 2.944%, 02/10/2048 | | | | | 266,869 | | | | | | 0.2 | | |
| 293,077 | | | Citigroup/Deutsche Bank Commercial Mortgage Trust 2006-CD3 AM, 5.648%, 10/15/2048 | | | | | 300,899 | | | | | | 0.2 | | |
| 530,000 (1) | | | CLNY Trust 2019-IKPR A, 1.834%, (US0001M + 1.227%), 11/15/2038 | | | | | 485,305 | | | | | | 0.3 | | |
| 990,000 (1)(4) | | | COMM 2013-CR10 D Mortgage Trust, 4.789%, 08/10/2046 | | | | | 887,332 | | | | | | 0.5 | | |
| 178,111 | | | COMM 2012-CCRE1 A3 Mortgage Trust, 3.391%, 05/15/2045 | | | | | 180,962 | | | | | | 0.1 | | |
| 120,000 (1)(4) | | | COMM 2013-CR10 E Mortgage Trust, 4.789%, 08/10/2046 | | | | | 101,862 | | | | | | 0.1 | | |
| 680,000 (1)(4) | | | COMM 2013-SFS A2 Mortgage Trust, 2.987%, 04/12/2035 | | | | | 683,377 | | | | | | 0.4 | | |
| 1,100,000 (1) | | | Credit Suisse Mortgage Capital Certificates 2019-ICE4 B, 1.935%, (US0001M + 1.230%), 05/15/2036 | | | | | 1,039,315 | | | | | | 0.6 | | |
| 210,353 (1) | | | CSWF 2018-TOP C, 2.155%, (US0001M + 1.450%), 08/15/2035 | | | | | 175,014 | | | | | | 0.1 | | |
| 1,120,000 (1)(4) | | | DBRR 2011-LC2 A4B Trust, 4.537%, 07/12/2044 | | | | | 1,131,241 | | | | | | 0.7 | | |
| 793,000 (1)(4) | | | DBUBS 2011-LC1A E, 5.689%, 11/10/2046 | | | | | 763,243 | | | | | | 0.4 | | |
| 530,000 (1)(4) | | | DBUBS 2011-LC2A D, 5.530%, 07/10/2044 | | | | | 516,494 | | | | | | 0.3 | | |
| Voya Short Term Bond Fund | as of March 31, 2020 (continued) |
| Principal Amount† | | | Value | | | Percentage of Net Assets | | |||||||||
| COMMERCIAL MORTGAGE-BACKED SECURITIES: (continued) | | |||||||||||||||
| 1,000,000 (1)(4) | | | DBUBS 2017-BRBK E Mortgage Trust, 3.530%, 10/10/2034 | | | | $ | 796,527 | | | | | | 0.5 | | |
| 1,000,000 (1)(4) | | | DBUBS 2011-LC2 E Mortgage Trust, 5.530%, 07/10/2044 | | | | | 962,953 | | | | | | 0.6 | | |
| 51,089 (4) | | | Ginnie Mae 2011-53 B, 3.924%, 05/16/2051 | | | | | 52,470 | | | | | | 0.0 | | |
| 219,858 | | | Ginnie Mae 2015-183 AC, 2.350%, 07/16/2056 | | | | | 223,822 | | | | | | 0.1 | | |
| 51,011 (4) | | | Ginnie Mae 2015-21 AF, 2.078%, 07/16/2048 | | | | | 51,382 | | | | ��� | | 0.0 | | |
| 174,998 | | | Ginnie Mae 2016-110 AB, 2.000%, 05/16/2049 | | | | | 176,660 | | | | | | 0.1 | | |
| 74,986 | | | Ginnie Mae 2016-86 AB, 2.500%, 09/16/2056 | | | | | 76,094 | | | | | | 0.1 | | |
| 376,451 | | | Ginnie Mae 2017-100 AB, 2.300%, 04/16/2052 | | | | | 380,796 | | | | | | 0.2 | | |
| 183,891 | | | Ginnie Mae 2017-51 AB, 2.350%, 04/16/2057 | | | | | 186,150 | | | | | | 0.1 | | |
| 78,626 | | | Ginnie Mae 2017-69 AB, 2.350%, 05/16/2053 | | | | | 79,635 | | | | | | 0.1 | | |
| 140,545 | | | Ginnie Mae 2017-70 A, 2.500%, 10/16/2057 | | | | | 142,744 | | | | | | 0.1 | | |
| 502,504 | | | Ginnie Mae 2017-86 AB, 2.300%, 11/16/2051 | | | | | 509,111 | | | | | | 0.3 | | |
| 331,760 | | | Ginnie Mae 2017-89 A, 2.500%, 08/16/2057 | | | | | 337,091 | | | | | | 0.2 | | |
| 142,457 | | | Ginnie Mae 2018-41 A, 2.400%, 09/16/2058 | | | | | 144,385 | | | | | | 0.1 | | |
| 250,000 (1)(4) | | | GRACE 2014-GRCE F Mortgage Trust, 3.590%, 06/10/2028 | | | | | 247,938 | | | | | | 0.1 | | |
| 800,000 (1) | | | Great Wolf Trust 2019-WOLF A, 1.739%, (US0001M + 1.034%), 12/15/2029 | | | | | 738,974 | | | | | | 0.4 | | |
| 330,000 (1) | | | GS Mortgage Securities Corp. Trust 2017-GPTX B, 3.104%, 05/10/2034 | | | | | 313,593 | | | | | | 0.2 | | |
| 1,039,000 (1)(4) | | | GS Mortgage Securities Corp. Trust 2017-SLP E, 4.591%, 10/10/2032 | | | | | 905,486 | | | | | | 0.5 | | |
| 1,070,000 (1) | | | GS Mortgage Securities Corp. Trust 2019-70P C, 2.205%, (US0001M + 1.500%), 10/15/2036 | | | | | 952,111 | | | | | | 0.5 | | |
| Principal Amount† | | | Value | | | Percentage of Net Assets | | |||||||||
| COMMERCIAL MORTGAGE-BACKED SECURITIES: (continued) | | |||||||||||||||
| 870,000 (1)(4) | | | GS Mortgage Securities Trust 2011-GC3 D, 5.637%, 03/10/2044 | | | | $ | 861,529 | | | | | | 0.5 | | |
| 290,000 (1)(4) | | | GS Mortgage Securities Trust 2012-GC6 C, 5.651%, 01/10/2045 | | | | | 285,916 | | | | | | 0.2 | | |
| 320,000 (1) | | | GS Mortgage Securities Trust 2018-HART A, 1.795%, (US0001M + 1.090%), 10/15/2031 | | | | | 310,460 | | | | | | 0.2 | | |
| 1,030,000 (1) | | | Hawaii Hotel Trust 2019-MAUI E, 2.864%, (US0001M + 2.350%), 05/15/2038 | | | | | 762,073 | | | | | | 0.4 | | |
| 330,000 (1) | | | Houston Galleria Mall Trust 2015-HGLR A1A2, 3.087%, 03/05/2037 | | | | | 325,662 | | | | | | 0.2 | | |
| 700,000 (1)(4) | | | Irvine Core Office Trust 2013-IRV A2, 3.173%, 05/15/2048 | | | | | 710,417 | | | | | | 0.4 | | |
| 280,906 (1) | | | JP Morgan Chase Commercial Mortgage Securities Corp. 2012-HSBC A, 3.093%, 07/05/2032 | | | | | 282,322 | | | | | | 0.2 | | |
| 730,000 (1)(4) | | | JP Morgan Chase Commercial Mortgage Securities Trust 2010-C2 C, 5.636%, 11/15/2043 | | | | | 643,585 | | | | | | 0.4 | | |
| 1,040,000 (1)(4) | | | JP Morgan Chase Commercial Mortgage Securities Trust 2011-C5 B, 5.419%, 08/15/2046 | | | | | 1,062,002 | | | | | | 0.6 | | |
| 500,000 (4) | | | JP Morgan Chase Commercial Mortgage Securities Trust 2013-C10 B, 3.674%, 12/15/2047 | | | | | 498,658 | | | | | | 0.3 | | |
| 210,000 (4) | | | JP Morgan Chase Commercial Mortgage Securities Trust 2013-C10 C, 4.113%, 12/15/2047 | | | | | 195,022 | | | | | | 0.1 | | |
| 900,000 (1)(4) | | | JP Morgan Chase Commercial Mortgage Securities Trust 2013-C13 E, 3.986%, 01/15/2046 | | | | | 756,045 | | | | | | 0.4 | | |
| Voya Short Term Bond Fund | as of March 31, 2020 (continued) |
| Principal Amount† | | | Value | | | Percentage of Net Assets | | |||||||||
| COMMERCIAL MORTGAGE-BACKED SECURITIES: (continued) | | |||||||||||||||
| 300,000 (1)(4) | | | JP Morgan Chase Commercial Mortgage Securities Trust 2015-UES D, 3.621%, 09/05/2032 | | | | $ | 295,530 | | | | | | 0.2 | | |
| 1,539 | | | JPMBB Commercial Mortgage Securities Trust 2 2014-C19 A2, 3.046%, 04/15/2047 | | | | | 1,550 | | | | | | 0.0 | | |
| 1,100,000 (1)(4) | | | JPMBB Commercial Mortgage Securities Trust 2013-C15 D, 5.198%, 11/15/2045 | | | | | 991,898 | | | | | | 0.6 | | |
| 820,000 (4) | | | JPMBB Commercial Mortgage Securities Trust 2014-C19 C, 4.679%, 04/15/2047 | | | | | 750,706 | | | | | | 0.4 | | |
| 226,104 | | | Morgan Stanley Bank of America Merrill Lynch Trust 2013-C8 ASB, 2.699%, 12/15/2048 | | | | | 227,677 | | | | | | 0.1 | | |
| 97,238 | | | Morgan Stanley Bank of America Merrill Lynch Trust 2014-C14 A3, 3.669%, 02/15/2047 | | | | | 97,908 | | | | | | 0.1 | | |
| 330,000 (4) | | | Morgan Stanley Bank of America Merrill Lynch Trust 2014-C15 C, 4.909%, 04/15/2047 | | | | | 305,289 | | | | | | 0.2 | | |
| 164,598 | | | Morgan Stanley Capital I 2011-C3 A4, 4.118%, 07/15/2049 | | | | | 167,574 | | | | | | 0.1 | | |
| 600,000 (1)(4) | | | Morgan Stanley Capital I Trust 2011-C1 D, 5.375%, 09/15/2047 | | | | | 521,743 | | | | | | 0.3 | | |
| 290,000 (1) | | | Morgan Stanley Capital I Trust 2011-C1 J, 4.193%, 09/15/2047 | | | | | 282,390 | | | | | | 0.2 | | |
| 910,000 | | | Morgan Stanley Capital I Trust 2019-H6 A2, 3.228%, 06/15/2052 | | | | | 951,744 | | | | | | 0.5 | | |
| 720,000 | | | Morgan Stanley Bank of America Merrill Lynch Trust 2013-C7 A4, 2.918%, 02/15/2046 | | | | | 729,233 | | | | | | 0.4 | | |
| 550,000 (1) | | | Morgan Stanley Capital I Trust 2011-C1 G, 4.193%, 09/15/2047 | | | | | 444,632 | | | | | | 0.3 | | |
| 340,000 (1)(4) | | | Wells Fargo Commercial Mortgage Trust 2010-C1 B, 5.276%, 11/15/2043 | | | | | 341,243 | | | | | | 0.2 | | |
| Principal Amount† | | | Value | | | Percentage of Net Assets | | |||||||||
| COMMERCIAL MORTGAGE-BACKED SECURITIES: (continued) | | |||||||||||||||
| 224,000 | | | Wells Fargo Commercial Mortgage Trust 2017-RC1 A2, 3.118%, 01/15/2060 | | | | $ | 228,393 | | | | | | 0.1 | | |
| 1,198,986 | | | WFRBS Commercial Mortgage Trust 2011-C5 A4, 3.667%, 11/15/2044 | | | | | 1,222,156 | | | | | | 0.7 | | |
| 567,391 (1) | | | West Town Mall Trust 2017-KNOX A, 3.823%, 07/05/2030 | | | | | 572,771 | | | | | | 0.3 | | |
| 465,000 (1)(4) | | | WFRBS Commercial Mortgage Trust 2012-C6 D, 5.579%, 04/15/2045 | | | | | 445,711 | | | | | | 0.3 | | |
| 4,095,440 | | | Other Securities | | | | | 4,174,193 | | | | | | 2.4 | | |
| | | | Total Commercial Mortgage- Backed Securities (Cost $37,876,500) | | | | | 35,247,048 | | | | | | 20.5 | | |
| ASSET-BACKED SECURITIES: 19.5% | | |||||||||||||||
| | | | Automobile Asset-Backed Securities: 7.6% | | ||||||||||||
| 700,000 | | | AmeriCredit Automobile Receivables Trust 2020-1 A3, 1.110%, 08/19/2024 | | | | | 686,638 | | | | | | 0.4 | | |
| 450,000 | | | CarMax Auto Owner Trust 2017-3 A4, 2.220%, 11/15/2022 | | | | | 450,320 | | | | | | 0.3 | | |
| 100,000 | | | Carmax Auto Owner Trust 2019-2 A4, 2.770%, 12/16/2024 | | | | | 100,575 | | | | | | 0.0 | | |
| 500,000 | | | Carmax Auto Owner Trust 2019-3 A4, 2.300%, 04/15/2025 | | | | | 497,175 | | | | | | 0.3 | | |
| 550,000 | | | Carmax Auto Owner Trust 2019-4 A4, 2.130%, 07/15/2025 | | | | | 538,673 | | | | | | 0.3 | | |
| 500,000 | | | GM Financial Automobile Leasing Trust 2018-1 B, 2.870%, 12/20/2021 | | | | | 500,211 | | | | | | 0.3 | | |
| 850,000 | | | GM Financial Automobile Leasing Trust 2019-2 A4, 2.720%, 03/20/2023 | | | | | 852,492 | | | | | | 0.5 | | |
| 300,000 | | | GM Financial Automobile Leasing Trust 2019-4 A4, 1.760%, 01/16/2025 | | | | | 296,370 | | | | | | 0.1 | | |
| 300,000 | | | GM Financial Consumer Automobile Receivables Trust 2019-3 A3, 2.180%, 04/16/2024 | | | | | 302,293 | | | | | | 0.2 | | |
| 350,000 (1) | | | Hyundai Auto Lease Securitization Trust 2019-B A4, 2.030%, 06/15/2023 | | | | | 348,926 | | | | | | 0.2 | | |
| Voya Short Term Bond Fund | as of March 31, 2020 (continued) |
| Principal Amount† | | | Value | | | Percentage of Net Assets | | |||||||||
| ASSET-BACKED SECURITIES: (continued) | | |||||||||||||||
| | | | Automobile Asset-Backed Securities (continued) | | ||||||||||||
| 266,655 (1) | | | OSCAR US Funding Trust VII LLC 2017-2A A3, 2.450%, 12/10/2021 | | | | $ | 267,098 | | | | | | 0.2 | | |
| 400,000 | | | Santander Drive Auto Receivables Trust 2019-1 B, 3.210%, 09/15/2023 | | | | | 399,666 | | | | | | 0.2 | | |
| 550,000 | | | Santander Drive Auto Receivables Trust 2019-2 B, 2.790%, 01/16/2024 | | | | | 545,239 | | | | | | 0.3 | | |
| 150,000 (1) | | | Santander Retail Auto Lease Trust 2017-A A4, 2.370%, 01/20/2022 | | | | | 149,913 | | | | | | 0.1 | | |
| 78,140 (1) | | | Santander Retail Auto Lease Trust 2019-A A2, 2.720%, 01/20/2022 | | | | | 78,204 | | | | | | 0.0 | | |
| 300,000 (1) | | | Santander Retail Auto Lease Trust 2019-B A3, 2.300%, 01/20/2023 | | | | | 297,788 | | | | | | 0.2 | | |
| 300,000 (1) | | | Santander Retail Auto Lease Trust 2019-B A4, 2.380%, 08/21/2023 | | | | | 266,534 | | | | | | 0.2 | | |
| 900,000 (1) | | | Santander Retail Auto Lease Trust 2019-C A4, 1.930%, 11/20/2023 | | | | | 886,542 | | | | | | 0.5 | | |
| 165,200 (1) | | | Tesla Auto Lease Trust 2018-B A, 3.710%, 08/20/2021 | | | | | 166,179 | | | | | | 0.1 | | |
| 800,000 | | | Toyota Auto Receivables 2019-B A4 Owner Trust, 2.600%, 11/15/2024 | | | | | 805,853 | | | | | | 0.5 | | |
| 350,000 | | | Toyota Auto Receivables 2019-C A4 Owner Trust, 1.880%, 11/15/2024 | | | | | 347,743 | | | | | | 0.2 | | |
| 4,343,920 | | | Other Securities | | | | | 4,360,741 | | | | | | 2.5 | | |
| | | | | | | | | 13,145,173 | | | | | | 7.6 | | |
| | | | Credit Card Asset-Backed Securities: 1.5% | | ||||||||||||
| 700,000 | | | BA Credit Card Trust 2019-A1 A1, 1.740%, 01/15/2025 | | | | | 710,397 | | | | | | 0.4 | | |
| 800,000 | | | Capital One Multi-Asset Execution Trust 2019-A2 A2, 1.720%, 08/15/2024 | | | | | 811,508 | | | | | | 0.5 | | |
| 600,000 (1) | | | Evergreen Credit Card Trust Series 2018-1 A, 2.950%, 03/15/2023 | | | | | 603,082 | | | | | | 0.3 | | |
| 450,000 | | | Other Securities | | | | | 459,266 | | | | | | 0.3 | | |
| | | | | | | | | 2,584,253 | | | | | | 1.5 | | |
| Principal Amount† | | | Value | | | Percentage of Net Assets | | |||||||||
| ASSET-BACKED SECURITIES: (continued) | | |||||||||||||||
| | | | Home Equity Asset-Backed Securities: 0.0% | | ||||||||||||
| 4,729 | | | Other Securities | | | | $ | 4,740 | | | | | | 0.0 | | |
| | | | | | ||||||||||||
| | | | Other Asset-Backed Securities: 9.6% | | ||||||||||||
| 600,000 (1) | | | Allegany Park CLO Ltd. 2019-1A A, 3.164%, (US0003M + 1.330%), 01/20/2033 | | | | | 561,754 | | | | | | 0.3 | | |
| 700,000 (1) | | | Apidos CLO XXXII 2019-32A A1, 3.003%, (US0003M + 1.320%), 01/20/2033 | | | | | 656,961 | | | | | | 0.4 | | |
| 400,000 (1) | | | Arbor Realty Commercial Real Estate Notes 2019-FL2 A Ltd., 1.905%, (US0001M + 1.200%), 06/15/2034 | | | | | 381,349 | | | | | | 0.2 | | |
| 400,000 (1) | | | ARES XLVI CLO Ltd. 2017-46A A2, 3.061%, (US0003M + 1.230%), 01/15/2030 | | | | | 365,815 | | | | | | 0.2 | | |
| 250,000 (1) | | | Babson CLO Ltd. 2017-1A A2, 3.169%, (US0003M + 1.350%), 07/18/2029 | | | | | 232,858 | | | | | | 0.1 | | |
| 500,000 (1) | | | Barings Clo Ltd. 2019-4A A1, 3.233%, (US0003M + 1.330%), 01/15/2033 | | | | | 466,644 | | | | | | 0.3 | | |
| 600,000 (1) | | | Beechwood Park CLO Ltd. 2019-1A A1, 3.233%, (US0003M + 1.330%), 01/17/2033 | | | | | 560,746 | | | | | | 0.3 | | |
| 250,000 (1) | | | Benefit Street Partners CLO VIII Ltd. 2015-8A A1BR, 3.019%, (US0003M + 1.200%), 01/20/2031 | | | | | 221,855 | | | | | | 0.1 | | |
| 250,000 (1) | | | Cedar Funding VIII Clo Ltd. 2017-8A A1, 3.086%, (US0003M + 1.250%), 10/17/2030 | | | | | 234,765 | | | | | | 0.1 | | |
| 250,000 (1) | | | CIFC Funding 2013-2A A1LR, 3.037%, (US0003M + 1.210%), 10/18/2030 | | | | | 238,545 | | | | | | 0.2 | | |
| 250,000 (1) | | | CIFC Funding 2015-IA ARR Ltd., 2.912%, (US0003M + 1.110%), 01/22/2031 | | | | | 235,674 | | | | | | 0.2 | | |
| 600,000 (1) | | | CIFC Funding 2019-6A A1 Ltd., 3.237%, (US0003M + 1.330%), 01/16/2033 | | | | | 563,707 | | | | | | 0.3 | | |
| Voya Short Term Bond Fund | as of March 31, 2020 (continued) |
| Principal Amount† | | | Value | | | Percentage of Net Assets | | |||||||||
| ASSET-BACKED SECURITIES: (continued) | | |||||||||||||||
| | | | Other Asset-Backed Securities (continued) | | ||||||||||||
| 250,000 (1) | | | CIFC Funding 2019-6A A2 Ltd., 3.657%, (US0003M + 1.750%), 01/16/2033 | | | | $ | 232,427 | | | | | | 0.1 | | |
| 250,000 (1) | | | Deer Creek Clo Ltd. 2017-1A A, 2.999%, (US0003M + 1.180%), 10/20/2030 | | | | | 236,457 | | | | | | 0.1 | | |
| 300,000 (1) | | | Dryden 68 CLO Ltd. 2019-68A A, 3.141%, (US0003M + 1.310%), 07/15/2032 | | | | | 279,017 | | | | | | 0.2 | | |
| 250,000 (1) | | | Dryden Senior Loan Fund 2017-47A A2, 3.181%, (US0003M + 1.350%), 04/15/2028 | | | | | 229,556 | | | | | | 0.1 | | |
| 360,000 (1) | | | Dryden XXVIII Senior Loan Fund 2013-28A A1LR, 2.892%, (US0003M + 1.200%), 08/15/2030 | | | | | 345,163 | | | | | | 0.2 | | |
| 250,000 (1) | | | Eaton Vance Clo 2015-1A A2R Ltd., 3.069%, (US0003M + 1.250%), 01/20/2030 | | | | | 225,743 | | | | | | 0.1 | | |
| 250,000 (1) | | | Galaxy XIX CLO Ltd. 2015-19A A1R, 3.021%, (US0003M + 1.220%), 07/24/2030 | | | | | 237,687 | | | | | | 0.2 | | |
| 500,000 (1) | | | Kayne CLO 6 Ltd. 2019-6A A1, 3.131%, (US0003M + 1.380%), 01/20/2033 | | | | | 466,675 | | | | | | 0.3 | | |
| 500,000 (1) | | | Kayne CLO 7 Ltd. 2020-7A A1, 2.651%, (US0003M + 1.200%), 04/17/2033 | | | | | 422,500 | | | | | | 0.3 | | |
| 310,000 (1) | | | LoanCore 2019-CRE2 A Issuer Ltd., 1.835%, (US0001M + 1.130%), 05/09/2036 | | | | | 290,193 | | | | | | 0.2 | | |
| 600,000 (1) | | | Madison Park Funding XXXVII Ltd. 2019-37A A1, 3.131%, (US0003M + 1.300%), 07/15/2032 | | | | | 563,890 | | | | | | 0.3 | | |
| 250,000 (1) | | | Magnetite XII Ltd. 2015-12A ARR, 2.931%, (US0003M + 1.100%), 10/15/2031 | | | | | 234,467 | | | | | | 0.1 | | |
| 850,000 (1) | | | Marlette Funding Trust 2020-1A B, 2.380%, 03/15/2030 | | | | | 711,229 | | | | | | 0.4 | | |
| 340,000 (1) | | | Neuberger Berman Loan Advisers CLO 35 Ltd. 2019-35A A1, 3.243%, (US0003M + 1.340%), 01/19/2033 | | | | | 321,956 | | | | | | 0.2 | | |
| Principal Amount† | | | Value | | | Percentage of Net Assets | | |||||||||
| ASSET-BACKED SECURITIES: (continued) | | |||||||||||||||
| | | | Other Asset-Backed Securities (continued) | | ||||||||||||
| 700,000 (1) | | | Niagara Park Clo Ltd. 2019-B A4, 3.136%, (US0003M + 1.300%), 07/17/2032 | | | | $ | 654,740 | | | | | | 0.4 | | |
| 250,000 (1) | | | OCP Clo 2019-17A C1 Ltd., 3.577%, (US0003M + 1.750%), 07/20/2032 | | | | | 226,667 | | | | | | 0.1 | | |
| 250,000 (1) | | | Octagon Investment Partners 30 Ltd. 2017-1A A1, 3.139%, (US0003M + 1.320%), 03/17/2030 | | | | | 237,378 | | | | | | 0.2 | | |
| 250,000 (1) | | | Octagon Investment Partners XIV Ltd. 2012-1A A1BR, 3.206%, (US0003M + 1.375%), 07/15/2029 | | | | | 225,321 | | | | | | 0.1 | | |
| 250,000 (1) | | | Octagon Investment Partners XV Ltd. 2013-1A A2R, 3.169%, (US0003M + 1.350%), 07/19/2030 | | | | | 231,475 | | | | | | 0.1 | | |
| 600,000 (1) | | | Octagon Loan Funding Ltd. 2014-1A ARR, 2.872%, (US0003M + 1.180%), 11/18/2031 | | | | | 561,278 | | | | | | 0.3 | | |
| 500,000 (1) | | | OHA Credit Funding 3 Ltd. 2019-3A A1, 3.139%, (US0003M + 1.320%), 07/20/2032 | | | | | 472,475 | | | | | | 0.3 | | |
| 500,000 (1) | | | OHA Loan Funding 2015-1A A1R2 Ltd., 3.032%, (US0003M + 1.340%), 11/15/2032 | | | | | 468,997 | | | | | | 0.3 | | |
| 250,000 (1) | | | Palmer Square CLO 2013-2A AARR Ltd., 3.036%, (US0003M + 1.200%), 10/17/2031 | | | | | 233,935 | | | | | | 0.1 | | |
| 500,000 (1) | | | Palmer Square CLO 2015-2A A1R2 Ltd., 2.919%, (US0003M + 1.100%), 07/20/2030 | | | | | 473,972 | | | | | | 0.3 | | |
| 191,289 (1) | | | SoFi Consumer Loan Program 2019-2 A Trust, 3.010%, 04/25/2028 | | | | | 185,794 | | | | | | 0.1 | | |
| 211,466 (1) | | | SoFi Consumer Loan Program 2019-3 A Trust, 2.900%, 05/25/2028 | | | | | 205,279 | | | | | | 0.1 | | |
| 476,304 (1) | | | SoFi Consumer Loan Program 2020-1 A Trust, 2.020%, 01/25/2029 | | | | | 475,503 | | | | | | 0.3 | | |
| Voya Short Term Bond Fund | as of March 31, 2020 (continued) |
| Principal Amount† | | | Value | | | Percentage of Net Assets | | |||||||||
| ASSET-BACKED SECURITIES: (continued) | | |||||||||||||||
| | | | Other Asset-Backed Securities (continued) | | ||||||||||||
| 590,000 (1) | | | Sound Point CLO XXV Ltd. 2019-4A A1A, 3.231%, (US0003M + 1.400%), 01/15/2033 | | | | $ | 536,042 | | | | | | 0.3 | | |
| 400,000 (1) | | | Symphony CLO XXI Ltd. 2019-21A A, 3.742%, (US0003M + 1.380%), 07/15/2032 | | | | | 375,454 | | | | | | 0.2 | | |
| 250,000 (1) | | | THL Credit Wind River 2017-2A A CLO Ltd., 3.049%, (US0003M + 1.230%), 07/20/2030 | | | | | 237,102 | | | | | | 0.2 | | |
| 400,000 (1) | | | THL Credit Wind River 2019-2A A2 Clo Ltd., 3.501%, (US0003M + 1.650%), 01/15/2033 | | | | | 369,950 | | | | | | 0.2 | | |
| 300,000 (1) | | | Trafigura Securitisation Finance PLC 2018-1A A2, 3.730%, 03/15/2022 | | | | | 302,597 | | | | | | 0.2 | | |
| 100,000 (1) | | | Volvo Financial Equipment LLC Series 2017-1A A4, 2.210%, 11/15/2021 | | | | | 99,661 | | | | | | 0.1 | | |
| 350,000 | | | Other Securities | | | | | 355,201 | | | | | | 0.2 | | |
| | | | | | | | | 16,446,454 | | | | | | 9.6 | | |
| | | | Student Loan Asset-Backed Securities: 0.8% | | ||||||||||||
| 167,817 (1) | | | DRB Prime Student Loan Trust 2017-A A2B, 2.850%, 05/27/2042 | | | | | 171,898 | | | | | | 0.1 | | |
| 384,805 (1) | | | Laurel Road Prime Student Loan Trust 2018-B A2FX, 3.540%, 05/26/2043 | | | | | 378,543 | | | | | | 0.2 | | |
| 300,000 (1) | | | Navient Private Education Loan Trust 2014-AA A3, 2.305%, (US0001M + 1.600%), 10/15/2031 | | | | | 288,503 | | | | | | 0.2 | | |
| 500,000 (1) | | | Navient Private Education Refi Loan Trust 2019-FA A2, 2.600%, 08/15/2068 | | | | | 505,997 | | | | | | 0.3 | | |
| | | | | | | | | 1,344,941 | | | | | | 0.8 | | |
| | | | Total Asset-Backed Securities (Cost $34,741,917) | | | | | 33,525,561 | | | | | | 19.5 | | |
| U.S. GOVERNMENT AGENCY OBLIGATIONS(6): 0.4% | | |||||||||||||||
| | | | Federal Home Loan Mortgage Corporation: 0.3%(6) | | ||||||||||||
| 416,450 | | | 5.500%, 01/01/2037- 02/01/2039 | | | | | 465,959 | | | | | | 0.3 | | |
| | | | | | ||||||||||||
| Principal Amount† | | | Value | | | Percentage of Net Assets | | |||||||||
| U.S. GOVERNMENT AGENCY OBLIGATIONS(6): (continued) | | |||||||||||||||
| | | | Uniform Mortgage-Backed Securities: 0.1% | | ||||||||||||
| 229,898 | | | Other Securities | | | | $ | 249,667 | | | | | | 0.1 | | |
| | | | Total U.S. Government Agency Obligations (Cost $690,845) | | | | | 715,626 | | | | | | 0.4 | | |
| SUPRANATIONAL BONDS: 0.0% | | |||||||||||||||
| 58,000 | | | Other Securities | | | | | 58,073 | | | | | | 0.0 | | |
| | | | Total Supranational Bonds (Cost $57,829) | | | | | 58,073 | | | | | | 0.0 | | |
| | | | Total Long-Term Investments (Cost $175,770,767) | | | | | 169,782,749 | | | | | | 98.6 | | |
| SHORT-TERM INVESTMENTS: 1.1% | | |||||||||||||||
| | | | Repurchase Agreements: 0.1% | | ||||||||||||
| 239,706 (7) | | | Citigroup, Inc., Repurchase Agreement dated 03/31/20, 0.01%, due 04/01/20 (Repurchase Amount $239,706, collateralized by various U.S. Government Agency Obligations, 0.150%-8.500%, Market Value plus accrued interest $244,500, due 04/15/21-09/20/69) (Cost $239,706) | | | | | 239,706 | | | | | | 0.1 | | |
| | Shares | | | Value | | | Percentage of Net Assets | | ||||||||||||
| | | | | | | | Mutual Funds: 1.0% | | ||||||||||||
| | | | 1,641,000 (8 | ) | | Goldman Sachs Financial Square Government Fund Institutional Shares, 0.340% (Cost $1,641,000) | | | | | 1,641,000 | | | | | | 1.0 | | | |
| | | | | | | | Total Short-Term Investments (Cost $1,880,706) | | | | | 1,880,706 | | | | | | 1.1 | | |
| | | | | | | | Total Investments in Securities | | ||||||||||||
| | | | | | | | (Cost $177,651,473) | | | | $ | 171,663,455 | | | | | | 99.7 | | |
| | | | | | | | Assets in Excess of Other Liabilities | | | | | 567,135 | | | | | | 0.3 | | |
| | | | | | | | Net Assets | | | | $ | 172,230,590 | | | | | | 100.0 | | |
| Voya Short Term Bond Fund | as of March 31, 2020 (continued) |
| | | | Quoted Prices in Active Markets for Identical Investments (Level 1) | | | Significant Other Observable Inputs (Level 2) | | | Significant Unobservable Inputs (Level 3) | | | Fair Value at March 31, 2020 | | ||||||||||||
| Asset Table | | | | | | | | | | | | | | | | | | | | | | | | | |
| Investments, at fair value | | | | | | | | | | | | | | | | | | | | | | | | | |
| Corporate Bonds/Notes | | | | $ | — | | | | | $ | 79,776,161 | | | | | $ | — | | | | | $ | 79,776,161 | | |
| Collateralized Mortgage Obligations | | | | | — | | | | | | 12,982,423 | | | | | | — | | | | | | 12,982,423 | | |
| Asset-Backed Securities | | | | | — | | | | | | 33,525,561 | | | | | | — | | | | | | 33,525,561 | | |
| Commercial Mortgage-Backed Securities | | | | | — | | | | | | 35,247,048 | | | | | | — | | | | | | 35,247,048 | | |
| Supranational Bonds | | | | | — | | | | | | 58,073 | | | | | | — | | | | | | 58,073 | | |
| U.S. Government Agency Obligations | | | | | — | | | | | | 715,626 | | | | | | — | | | | | | 715,626 | | |
| U.S. Treasury Obligations | | | | | — | | | | | | 7,477,857 | | | | | | — | | | | | | 7,477,857 | | |
| Short-Term Investments | | | | | 1,641,000 | | | | | | 239,706 | | | | | | — | | | | | | 1,880,706 | | |
| Total Investments, at fair value | | | | $ | 1,641,000 | | | | | $ | 170,022,455 | | | | | $ | — | | | | | $ | 171,663,455 | | |
| Other Financial Instruments+ | | | | | | | | | | | | | | | | | | | | | | | | | |
| Centrally Cleared Swaps | | | | | — | | | | | | 174,506 | | | | | | — | | | | | | 174,506 | | |
| Futures | | | | | 822,137 | | | | | | — | | | | | | — | | | | | | 822,137 | | |
| Total Assets | | | | $ | 2,463,137 | | | | | $ | 170,196,961 | | | | | $ | — | | | | | $ | 172,660,098 | | |
| Liabilities Table | | | | | | | | | | | | | | | | | | | | | | | | | |
| Other Financial Instruments+ | | | | | | | | | | | | | | | | | | | | | | | | | |
| Futures | | | | $ | (556,663) | | | | | $ | — | | | | | $ | — | | | | | $ | (556,663) | | |
| Total Liabilities | | | | $ | (556,663) | | | | | $ | — | | | | | $ | — | | | | | $ | (556,663) | | |
| Voya Short Term Bond Fund | as of March 31, 2020 (continued) |
| Description | | | Number of Contracts | | | Expiration Date | | | Notional Value | | | Unrealized Appreciation/ (Depreciation) | | ||||||
| Long Contracts: | | | | | | | | | | | | | | | | | | | |
| U.S. Treasury 2-Year Note | | | 244 | | | 06/30/20 | | | | $ | 53,773,406 | | | | | $ | 822,137 | | |
| | | | | | | | | | | $ | 53,773,406 | | | | | $ | 822,137 | | |
| Short Contracts: | | | | | | | | | | | | | | | | | | | |
| U.S. Treasury 10-Year Note | | | (52) | | | 06/19/20 | | | | | (7,211,750) | | | | | | (150,975) | | |
| U.S. Treasury 5-Year Note | | | (122) | | | 06/30/20 | | | | | (15,293,844) | | | | | | (405,688) | | |
| | | | | | | | | | | $ | (22,505,594) | | | | | $ | (556,663) | | |
| Reference Entity/Obligation | | | Buy/Sell Protection | | | (Pay)/ Receive Financing Rate (%)(2) | | | Termination Date | | | Notional Amount(3) | | | Fair Value(4) | | | Unrealized Appreciation/ (Depreciation) | | ||||||||||||
| iTraxx Cross-over Index, Series 32, Version 1 | | | Buy | | | | | (5.000) | | | | | | 12/20/24 | | | | EUR1,002,000 | | | | $ | 22,646 | | | | | $ | 174,506 | | |
| | | | | | | | | | | | | | | | | | | | | | | $ | 22,646 | | | | | $ | 174,506 | | |
| Derivatives not accounted for as hedging instruments | | | Location on Statement of Assets and Liabilities | | | Fair Value | | |||
| Asset Derivatives | | | | | | | | | | |
| Interest rate contracts | | | Net Assets — Unrealized appreciation* | | | | $ | 822,137 | | |
| Credit contracts | | | Net Assets — Unrealized appreciation** | | | | | 174,506 | | |
| Total Asset Derivatives | | | | | | | $ | 996,643 | | |
| Liability Derivatives | | | | | | | | | | |
| Interest rate contracts | | | Net Assets — Unrealized depreciation* | | | | $ | 556,663 | | |
| Total Liability Derivatives | | | | | | | $ | 556,663 | | |
| Voya Short Term Bond Fund | as of March 31, 2020 (continued) |
| Derivatives not accounted for as hedging instruments | | | Investments* | | | Futures | | | Swaps | | | Total | | ||||||||||||
| Credit contracts | | | | $ | — | | | | | $ | — | | | | | $ | 347,874 | | | | | $ | 347,874 | | |
| Equity contracts | | | | | — | | | | | | (5,922) | | | | | | — | | | | | | (5,922) | | |
| Interest rate contracts | | | | | 4,551 | | | | | | 122,843 | | | | | | (35,990) | | | | | | 91,404 | | |
| Total | | | | $ | 4,551 | | | | | $ | 116,921 | | | | | $ | 311,884 | | | | | $ | 433,356 | | |
| Derivatives not accounted for as hedging instruments | | | Investments* | | | Futures | | | Swaps | | | Total | | ||||||||||||
| Credit contracts | | | | $ | — | | | | | $ | — | | | | | $ | 174,506 | | | | | $ | 174,506 | | |
| Interest rate contracts | | | | | 7,807 | | | | | | 243,609 | | | | | | — | | | | | | 251,416 | | |
| Total | | | | $ | 7,807 | | | | | $ | 243,609 | | | | | $ | 174,506 | | | | | $ | 425,922 | | |
| | Cost for federal income tax purposes was $177,951,491. | | | | | | | |
| | Net unrealized depreciation consisted of: | | | | | | | |
| | Gross Unrealized Appreciation | | | | $ | 1,388,425 | | |
| | Gross Unrealized Depreciation | | | | | (7,381,822) | | |
| | Net Unrealized Depreciation | | | | $ | (5,993,397) | | |
| Voya Strategic Income | SUMMARY PORTFOLIO OF INVESTMENTS |
| Opportunities Fund | as of March 31, 2020 |
| Principal Amount† | | | Value | | | Percentage of Net Assets | | |||||||||
| CORPORATE BONDS/NOTES: 15.3% | | |||||||||||||||
| | | | Basic Materials: 1.2% | | ||||||||||||
| 1,250,000 (1) | | | Alpek SAB de CV, 4.250%, 09/18/2029 | | | | $ | 1,025,962 | | | | | | 0.0 | | |
| 1,925,000 (1) | | | Anglo American Capital PLC, 3.625%, 09/11/2024 | | | | | 1,814,848 | | | | | | 0.1 | | |
| 800,000 (1) | | | Aruba Investments, Inc., 8.750%, 02/15/2023 | | | | | 782,996 | | | | | | 0.0 | | |
| 250,000 (1) | | | Braskem Netherlands Finance BV, 4.500%, 01/31/2030 | | | | | 195,500 | | | | | | 0.0 | | |
| 1,500,000 (1) | | | Celulosa Arauco y Constitucion SA, 4.250%, 04/30/2029 | | | | | 1,276,564 | | | | | | 0.1 | | |
| 260,000 (1) | | | Cleveland-Cliffs, Inc., 6.750%, 03/15/2026 | | | | | 231,238 | | | | | | 0.0 | | |
| 675,000 (1) | | | Compass Minerals International, Inc., 6.750%, 12/01/2027 | | | | | 613,103 | | | | | | 0.0 | | |
| 250,000 (1) | | | Constellium SE, 5.750%, 05/15/2024 | | | | | 225,336 | | | | | | 0.0 | | |
| 550,000 (1) | | | Constellium SE, 6.625%, 03/01/2025 | | | | | 499,109 | | | | | | 0.0 | | |
| 1,250,000 (1) | | | Evraz PLC, 5.250%, 04/02/2024 | | | | | 1,270,619 | | | | | | 0.1 | | |
| 800,000 (1) | | | First Quantum Minerals Ltd., 6.500%, 03/01/2024 | | | | | 669,004 | | | | | | 0.0 | | |
| 750,000 (1) | | | Gold Fields Orogen Holdings BVI Ltd., 5.125%, 05/15/2024 | | | | | 711,559 | | | | | | 0.0 | | |
| 2,000,000 (1) | | | Inversiones CMPC SA, 3.850%, 01/13/2030 | | | | | 1,810,500 | | | | | | 0.1 | | |
| 1,800,000 (1) | | | MMK International Capital DAC, 4.375%, 06/13/2024 | | | | | 1,787,990 | | | | | | 0.1 | | |
| 1,075,000 (1) | | | Novelis Corp., 5.875%, 09/30/2026 | | | | | 1,062,457 | | | | | | 0.0 | | |
| 700,000 (1) | | | OCI NV, 5.250%, 11/01/2024 | | | | | 612,500 | | | | | | 0.0 | | |
| 1,050,000 (1) | | | OCI NV, 6.625%, 04/15/2023 | | | | | 966,000 | | | | | | 0.1 | | |
| 950,000 (1) | | | Schweitzer-Mauduit International, Inc., 6.875%, 10/01/2026 | | | | | 953,365 | | | | | | 0.0 | | |
| 2,500,000 (1) | | | Severstal OAO Via Steel Capital SA, 3.150%, 09/16/2024 | | | | | 2,407,015 | | | | | | 0.1 | | |
| 620,000 (1) | | | SPCM SA, 4.875%, 09/15/2025 | | | | | 590,531 | | | | | | 0.0 | | |
| Principal Amount† | | | Value | | | Percentage of Net Assets | | |||||||||
| CORPORATE BONDS/NOTES: (continued) | | |||||||||||||||
| | | | Basic Materials (continued) | | ||||||||||||
| 600,000 (1)(2) | | | Tronox, Inc., 6.500%, 04/15/2026 | | | | $ | 544,545 | | | | | | 0.0 | | |
| 12,615,000 (3) | | | Other Securities | | | | | 11,827,004 | | | | | | 0.5 | | |
| | | | | | | | | 31,877,745 | | | | | | 1.2 | | |
| | | | Communications: 2.3% | | ||||||||||||
| 450,000 (1) | | | Altice France SA/France, 8.125%, 02/01/2027 | | | | | 471,622 | | | | | | 0.0 | | |
| 550,000 (1) | | | Altice Finco SA, 7.625%, 02/15/2025 | | | | | 527,310 | | | | | | 0.0 | | |
| 775,000 (1) | | | Block Communications, Inc., 4.875%, 03/01/2028 | | | | | 725,109 | | | | | | 0.0 | | |
| 1,100,000 (1) | | | C&W Senior Financing DAC, 7.500%, 10/15/2026 | | | | | 1,015,336 | | | | | | 0.1 | | |
| 1,300,000 (1) | | | CCO Holdings LLC / CCO Holdings Capital Corp., 5.125%, 05/01/2027 | | | | | 1,315,626 | | | | | | 0.1 | | |
| 600,000 (1) | | | CCO Holdings LLC / CCO Holdings Capital Corp., 5.000%, 02/01/2028 | | | | | 605,736 | | | | | | 0.0 | | |
| 750,000 (1) | | | CCO Holdings LLC / CCO Holdings Capital Corp., 5.500%, 05/01/2026 | | | | | 764,676 | | | | | | 0.0 | | |
| 1,500,000 (1) | | | CCO Holdings LLC / CCO Holdings Capital Corp., 5.750%, 02/15/2026 | | | | | 1,523,925 | | | | | | 0.1 | | |
| 180,000 (1) | | | CCO Holdings LLC / CCO Holdings Capital Corp., 4.500%, 05/01/2032 | | | | | 176,548 | | | | | | 0.0 | | |
| 420,000 (1) | | | CCO Holdings LLC / CCO Holdings Capital Corp., 4.750%, 03/01/2030 | | | | | 421,281 | | | | | | 0.0 | | |
| 950,000 (1) | | | Clear Channel Worldwide Holdings, Inc., 9.250%, 02/15/2024 | | | | | 822,942 | | | | | | 0.0 | | |
| 1,250,000 (1) | | | CommScope Tech Finance LLC, 6.000%, 06/15/2025 | | | | | 1,153,375 | | | | | | 0.1 | | |
| 500,000 (1) | | | CommScope Technologies LLC, 5.000%, 03/15/2027 | | | | | 437,537 | | | | | | 0.0 | | |
| Voya Strategic Income | SUMMARY PORTFOLIO OF INVESTMENTS |
| Opportunities Fund | as of March 31, 2020 (continued) |
| Principal Amount† | | | Value | | | Percentage of Net Assets | | |||||||||
| CORPORATE BONDS/NOTES: (continued) | | |||||||||||||||
| | | | Communications (continued) | | ||||||||||||
| 1,025,000 (1) | | | Connect Finco SARL / Connect US Finco LLC, 6.750%, 10/01/2026 | | | | $ | 850,750 | | | | | | 0.0 | | |
| 1,175,000 (1) | | | CSC Holdings LLC, 5.500%, 05/15/2026 | | | | | 1,223,548 | | | | | | 0.1 | | |
| 600,000 (1) | | | CSC Holdings LLC, 5.750%, 01/15/2030 | | | | | 607,326 | | | | | | 0.0 | | |
| 400,000 (1) | | | CSC Holdings LLC, 7.500%, 04/01/2028 | | | | | 428,955 | | | | | | 0.0 | | |
| 825,000 (1) | | | Cumulus Media New Holdings, Inc., 6.750%, 07/01/2026 | | | | | 743,013 | | | | | | 0.0 | | |
| 550,000 (1) | | | Diamond Sports Group LLC / Diamond Sports Finance Co., 5.375%, 08/15/2026 | | | | | 449,978 | | | | | | 0.0 | | |
| 1,225,000 (1)(2) | | | Diamond Sports Group LLC / Diamond Sports Finance Co., 6.625%, 08/15/2027 | | | | | 826,018 | | | | | | 0.1 | | |
| 750,000 (1)(2) | | | Entercom Media Corp., 7.250%, 11/01/2024 | | | | | 632,809 | | | | | | 0.0 | | |
| 375,000 (1) | | | Frontier Communications Corp., 8.000%, 04/01/2027 | | | | | 371,936 | | | | | | 0.0 | | |
| 900,000 (1) | | | Gray Television, Inc., 5.125%, 10/15/2024 | | | | | 875,255 | | | | | | 0.1 | | |
| 575,000 (1) | | | Gray Television, Inc., 7.000%, 05/15/2027 | | | | | 575,316 | | | | | | 0.0 | | |
| 645,000 (1) | | | GTT Communications, Inc., 7.875%, 12/31/2024 | | | | | 420,862 | | | | | | 0.0 | | |
| 325,000 (1) | | | iHeartCommunications, Inc., 5.250%, 08/15/2027 | | | | | 285,009 | | | | | | 0.0 | | |
| 775,000 (1) | | | Intelsat Jackson Holdings SA, 8.500%, 10/15/2024 | | | | | 492,865 | | | | | | 0.0 | | |
| 500,000 (1) | | | Lamar Media Corp., 3.750%, 02/15/2028 | | | | | 472,440 | | | | | | 0.0 | | |
| 175,000 (1) | | | Lamar Media Corp., 4.000%, 02/15/2030 | | | | | 164,062 | | | | | | 0.0 | | |
| 1,000,000 (1) | | | LCPR Senior Secured Financing DAC, 6.750%, 10/15/2027 | | | | | 990,550 | | | | | | 0.1 | | |
| 425,000 (1) | | | Match Group, Inc., 4.125%, 08/01/2030 | | | | | 382,234 | | | | | | 0.0 | | |
| 950,000 (1) | | | MDC Partners, Inc., 6.500%, 05/01/2024 | | | | | 719,625 | | | | | | 0.0 | | |
| Principal Amount† | | | Value | | | Percentage of Net Assets | | |||||||||
| CORPORATE BONDS/NOTES: (continued) | | |||||||||||||||
| | | | Communications (continued) | | ||||||||||||
| 475,000 (1) | | | Midcontinent Communications / Midcontinent Finance Corp., 5.375%, 08/15/2027 | | | | $ | 463,960 | | | | | | 0.0 | | |
| 225,000 (1) | | | Netflix, Inc., 4.875%, 06/15/2030 | | | | | 229,657 | | | | | | 0.0 | | |
| 875,000 (1) | | | Nexstar Broadcasting, Inc., 5.625%, 08/01/2024 | | | | | 829,058 | | | | | | 0.1 | | |
| 825,000 (1) | | | Nexstar Broadcasting, Inc., 5.625%, 07/15/2027 | | | | | 811,016 | | | | | | 0.0 | | |
| 450,000 (1) | | | Altice France SA/France, 7.375%, 05/01/2026 | | | | | 456,998 | | | | | | 0.0 | | |
| 245,000 (1) | | | Sinclair Television Group, Inc., 5.125%, 02/15/2027 | | | | | 209,118 | | | | | | 0.0 | | |
| 475,000 (1) | | | Sirius XM Radio, Inc., 4.625%, 07/15/2024 | | | | | 485,063 | | | | | | 0.0 | | |
| 1,225,000 (1) | | | Sirius XM Radio, Inc., 5.000%, 08/01/2027 | | | | | 1,250,051 | | | | | | 0.1 | | |
| 385,000 (1) | | | Sprint Corp., 7.250%, 02/01/2028 | | | | | 388,369 | | | | | | 0.0 | | |
| 210,000 (1) | | | TEGNA, Inc., 4.625%, 03/15/2028 | | | | | 185,719 | | | | | | 0.0 | | |
| 775,000 (1) | | | TEGNA, Inc., 5.000%, 09/15/2029 | | | | | 700,406 | | | | | | 0.1 | | |
| 700,000 (1) | | | Telesat Canada / Telesat LLC, 6.500%, 10/15/2027 | | | | | 675,885 | | | | | | 0.0 | | |
| 1,025,000 (1) | | | Terrier Media Buyer, Inc., 8.875%, 12/15/2027 | | | | | 868,688 | | | | | | 0.1 | | |
| 750,000 (1) | | | Townsquare Media, Inc., 6.500%, 04/01/2023 | | | | | 726,559 | | | | | | 0.0 | | |
| 725,000 (1) | | | ViaSat, Inc., 5.625%, 09/15/2025 | | | | | 682,338 | | | | | | 0.1 | | |
| 265,000 (1) | | | ViaSat, Inc., 5.625%, 04/15/2027 | | | | | 263,158 | | | | | | 0.0 | | |
| 600,000 (1) | | | Virgin Media Secured Finance PLC, 5.500%, 05/15/2029 | | | | | 603,330 | | | | | | 0.0 | | |
| 350,000 (1) | | | Ziggo Bond Co. BV, 5.125%, 02/28/2030 | | | | | 344,969 | | | | | | 0.0 | | |
| 200,000 (1) | | | Ziggo BV, 4.875%, 01/15/2030 | | | | | 196,181 | | | | | | 0.0 | | |
| 25,788,000 (3) | | | Other Securities | | | | | 26,626,260 | | | | | | 1.0 | | |
| | | | | | | | | 58,470,357 | | | | | | 2.3 | | |
| Voya Strategic Income | SUMMARY PORTFOLIO OF INVESTMENTS |
| Opportunities Fund | as of March 31, 2020 (continued) |
| Principal Amount† | | | Value | | | Percentage of Net Assets | | |||||||||
| CORPORATE BONDS/NOTES: (continued) | | |||||||||||||||
| | | | Consumer, Cyclical: 1.7% | | ||||||||||||
| 1,750,000 (1) | | | 1011778 BC ULC / New Red Finance, Inc., 5.000%, 10/15/2025 | | | | $ | 1,682,179 | | | | | | 0.1 | | |
| 625,000 (1) | | | Adams Homes, Inc., 7.500%, 02/15/2025 | | | | | 601,562 | | | | | | 0.0 | | |
| 700,000 (1) | | | Adient Global Holdings Ltd., 4.875%, 08/15/2026 | | | | | 484,697 | | | | | | 0.0 | | |
| 725,000 (1) | | | Allison Transmission, Inc., 5.875%, 06/01/2029 | | | | | 715,551 | | | | | | 0.0 | | |
| 450,000 (1) | | | American Builders & Contractors Supply Co., Inc., 4.000%, 01/15/2028 | | | | | 411,997 | | | | | | 0.0 | | |
| 525,000 (1) | | | Asbury Automotive Group, Inc., 4.500%, 03/01/2028 | | | | | 450,187 | | | | | | 0.0 | | |
| 470,000 (1) | | | Asbury Automotive Group, Inc., 4.750%, 03/01/2030 | | | | | 403,025 | | | | | | 0.0 | | |
| 200,000 (1) | | | Ashton Woods USA LLC / Ashton Woods Finance Co., 6.625%, 01/15/2028 | | | | | 159,500 | | | | | | 0.0 | | |
| 600,000 (1) | | | Ashton Woods USA LLC / Ashton Woods Finance Co., 6.750%, 08/01/2025 | | | | | 485,247 | | | | | | 0.0 | | |
| 1,220,000 (1) | | | Caesars Resort Collection LLC / CRC Finco, Inc., 5.250%, 10/15/2025 | | | | | 890,234 | | | | | | 0.1 | | |
| 475,000 (1) | | | CCM Merger, Inc., 6.000%, 03/15/2022 | | | | | 393,062 | | | | | | 0.0 | | |
| 850,000 (1) | | | Cedar Fair L.P., 5.250%, 07/15/2029 | | | | | 722,968 | | | | | | 0.0 | | |
| 225,000 (1)(4) | | | Core & Main Holdings L.P., 8.625% (PIK Rate 9.375%, Cash Rate 8.625%), 09/15/2024 | | | | | 207,843 | | | | | | 0.0 | | |
| 925,000 (1) | | | Core & Main L.P., 6.125%, 08/15/2025 | | | | | 867,160 | | | | | | 0.1 | | |
| 735,000 (1) | | | Golden Entertainment, Inc., 7.625%, 04/15/2026 | | | | | 490,331 | | | | | | 0.0 | | |
| 1,375,000 (1) | | | Golden Nugget, Inc., 6.750%, 10/15/2024 | | | | | 876,370 | | | | | | 0.1 | | |
| 675,000 (1) | | | IAA, Inc., 5.500%, 06/15/2027 | | | | | 656,809 | | | | | | 0.0 | | |
| Principal Amount† | | | Value | | | Percentage of Net Assets | | |||||||||
| CORPORATE BONDS/NOTES: (continued) | | |||||||||||||||
| | | | Consumer, Cyclical (continued) | | ||||||||||||
| 725,000 (1) | | | Installed Building Products, Inc., 5.750%, 02/01/2028 | | | | $ | 696,756 | | | | | | 0.0 | | |
| 600,000 (1) | | | International Game Technology PLC, 6.250%, 02/15/2022 | | | | | 554,910 | | | | | | 0.0 | | |
| 1,000,000 (1) | | | International Game Technology PLC, 6.500%, 02/15/2025 | | | | | 892,360 | | | | | | 0.1 | | |
| 875,000 (1) | | | Lions Gate Capital Holdings LLC, 5.875%, 11/01/2024 | | | | | 752,986 | | | | | | 0.0 | | |
| 625,000 (1) | | | M/I Homes, Inc., 4.950%, 02/01/2028 | | | | | 535,156 | | | | | | 0.0 | | |
| 1,225,000 (1) | | | Mattel, Inc., 5.875%, 12/15/2027 | | | | | 1,256,299 | | | | | | 0.1 | | |
| 800,000 (1)(2) | | | Michaels Stores, Inc., 8.000%, 07/15/2027 | | | | | 596,440 | | | | | | 0.0 | | |
| 650,000 (1) | | | Motion Bondco DAC, 6.625%, 11/15/2027 | | | | | 471,250 | | | | | | 0.0 | | |
| 750,000 (1) | | | Navistar International Corp., 6.625%, 11/01/2025 | | | | | 629,066 | | | | | | 0.0 | | |
| 880,000 (1) | | | Penn National Gaming, Inc., 5.625%, 01/15/2027 | | | | | 660,363 | | | | | | 0.0 | | |
| 675,000 (1) | | | Performance Food Group, Inc., 5.500%, 10/15/2027 | | | | | 631,176 | | | | | | 0.0 | | |
| 495,000 (1) | | | PetSmart, Inc., 5.875%, 06/01/2025 | | | | | 491,287 | | | | | | 0.0 | | |
| 1,000,000 (1) | | | PetSmart, Inc., 7.125%, 03/15/2023 | | | | | 949,500 | | | | | | 0.1 | | |
| 685,000 (1) | | | Scientific Games International, Inc., 5.000%, 10/15/2025 | | | | | 601,088 | | | | | | 0.1 | | |
| 475,000 (1) | | | Scientific Games International, Inc., 7.000%, 05/15/2028 | | | | | 294,761 | | | | | | 0.0 | | |
| 825,000 (1) | | | Scientific Games International, Inc., 8.250%, 03/15/2026 | | | | | 532,729 | | | | | | 0.0 | | |
| 475,000 (1) | | | Speedway Motorsports LLC / Speedway Funding II, Inc., 4.875%, 11/01/2027 | | | | | 431,063 | | | | | | 0.0 | | |
| 415,000 (1) | | | Station Casinos LLC, 4.500%, 02/15/2028 | | | | | 339,263 | | | | | | 0.0 | | |
| Voya Strategic Income | SUMMARY PORTFOLIO OF INVESTMENTS |
| Opportunities Fund | as of March 31, 2020 (continued) |
| Principal Amount† | | | Value | | | Percentage of Net Assets | | |||||||||
| CORPORATE BONDS/NOTES: (continued) | | |||||||||||||||
| | | | Consumer, Cyclical (continued) | | ||||||||||||
| 1,085,000 (1) | | | Station Casinos LLC, 5.000%, 10/01/2025 | | | | $ | 911,736 | | | | | | 0.1 | | |
| 575,000 (1) | | | Taylor Morrison Communities, Inc., 5.750%, 01/15/2028 | | | | | 518,338 | | | | | | 0.0 | | |
| 725,000 (1) | | | Univar Solutions USA, Inc./Washington, 5.125%, 12/01/2027 | | | | | 663,774 | | | | | | 0.0 | | |
| 975,000 (1) | | | Viking Cruises Ltd., 5.875%, 09/15/2027 | | | | | 575,894 | | | | | | 0.0 | | |
| 675,000 (1) | | | William Carter Co/The, 5.625%, 03/15/2027 | | | | | 651,734 | | | | | | 0.0 | | |
| 250,000 (1) | | | WMG Acquisition Corp., 5.000%, 08/01/2023 | | | | | 250,311 | | | | | | 0.0 | | |
| 950,000 (1) | | | Wolverine World Wide, Inc., 5.000%, 09/01/2026 | | | | | 913,425 | | | | | | 0.1 | | |
| 18,848,000 (3) | | | Other Securities | | | | | 16,605,676 | | | | | | 0.7 | | |
| | | | | | | | | 42,906,063 | | | | | | 1.7 | | |
| | | | Consumer, Non-cyclical: 2.2% | | ||||||||||||
| 875,000 (1) | | | Adani Ports & Special Economic Zone Ltd., 4.375%, 07/03/2029 | | | | | 757,026 | | | | | | 0.0 | | |
| 425,000 (1) | | | Albertsons Cos, Inc. / Safeway, Inc. / New Albertsons L.P. / Albertsons LLC, 4.875%, 02/15/2030 | | | | | 423,937 | | | | | | 0.0 | | |
| 725,000 (1) | | | Albertsons Cos, Inc. / Safeway, Inc. / New Albertsons L.P. / Albertsons LLC, 5.875%, 02/15/2028 | | | | | 741,929 | | | | | | 0.0 | | |
| 525,000 (1) | | | Allied Universal Holdco LLC / Allied Universal Finance Corp., 6.625%, 07/15/2026 | | | | | 516,799 | | | | | | 0.0 | | |
| 700,000 (1) | | | Allied Universal Holdco LLC / Allied Universal Finance Corp., 9.750%, 07/15/2027 | | | | | 664,557 | | | | | | 0.1 | | |
| 675,000 (1) | | | AMN Healthcare, Inc., 4.625%, 10/01/2027 | | | | | 645,300 | | | | | | 0.0 | | |
| 1,850,000 (1) | | | Bausch Health Americas, Inc., 8.500%, 01/31/2027 | | | | | 1,943,517 | | | | | | 0.1 | | |
| 530,000 (1) | | | Bausch Health Cos, Inc., 5.250%, 01/30/2030 | | | | | 499,525 | | | | | | 0.0 | | |
| 675,000 (1) | | | Bausch Health Cos, Inc., 5.500%, 11/01/2025 | | | | | 686,175 | | | | | | 0.1 | | |
| Principal Amount† | | | Value | | | Percentage of Net Assets | | |||||||||
| CORPORATE BONDS/NOTES: (continued) | | |||||||||||||||
| | | | Consumer, Non-cyclical (continued) | | ||||||||||||
| 475,000 (1) | | | Bausch Health Cos, Inc., 6.125%, 04/15/2025 | | | | $ | 470,846 | | | | | | 0.0 | | |
| 525,000 (1) | | | Bausch Health Cos, Inc., 7.000%, 01/15/2028 | | | | | 547,339 | | | | | | 0.0 | | |
| 1,200,000 (1) | | | Bristol-Myers Squibb Co., 4.550%, 02/20/2048 | | | | | 1,527,630 | | | | | | 0.1 | | |
| 750,000 (1) | | | Cardtronics, Inc./ Cardtronics USA, Inc., 5.500%, 05/01/2025 | | | | | 719,059 | | | | | | 0.0 | | |
| 415,000 (1) | | | Catalent Pharma Solutions, Inc., 5.000%, 07/15/2027 | | | | | 404,853 | | | | | | 0.0 | | |
| 200,000 (1) | | | Centene Corp., 3.375%, 02/15/2030 | | | | | 186,750 | | | | | | 0.0 | | |
| 625,000 (1) | | | Centene Corp., 4.625%, 12/15/2029 | | | | | 631,594 | | | | | | 0.1 | | |
| 295,000 (1) | | | Centene Corp., 4.750%, 01/15/2025 | | | | | 300,533 | | | | | | 0.0 | | |
| 425,000 (1) | | | Centene Corp., 5.375%, 06/01/2026 | | | | | 440,155 | | | | | | 0.0 | | |
| 950,000 (1) | | | CHS/Community Health Systems, Inc., 6.625%, 02/15/2025 | | | | | 885,875 | | | | | | 0.0 | | |
| 925,000 (1) | | | Cott Holdings, Inc., 5.500%, 04/01/2025 | | | | | 903,036 | | | | | | 0.0 | | |
| 1,325,000 (1) | | | DP World Crescent Ltd., 3.750%, 01/30/2030 | | | | | 1,105,050 | | | | | | 0.1 | | |
| 625,000 (1) | | | Endo Ltd. / Endo Finance LLC / Endo Finco, Inc., 6.000%, 02/01/2025 | | | | | 430,269 | | | | | | 0.0 | | |
| 1,250,000 (1) | | | Garda World Security Corp., 8.750%, 05/15/2025 | | | | | 1,159,338 | | | | | | 0.1 | | |
| 1,075,000 (1) | | | Graham Holdings Co., 5.750%, 06/01/2026 | | | | | 1,062,683 | | | | | | 0.0 | | |
| 475,000 (1) | | | Hertz Corp./The, 6.000%, 01/15/2028 | | | | | 252,011 | | | | | | 0.0 | | |
| 475,000 (1) | | | Hertz Corp./The, 7.125%, 08/01/2026 | | | | | 251,358 | | | | | | 0.0 | | |
| 775,000 (1) | | | Hertz Corp., 5.500%, 10/15/2024 | | | | | 440,623 | | | | | | 0.0 | | |
| 445,000 (1) | | | Hill-Rom Holdings, Inc., 4.375%, 09/15/2027 | | | | | 442,126 | | | | | | 0.0 | | |
| 800,000 (1) | | | JBS USA LUX SA / JBS USA Finance, Inc., 5.875%, 07/15/2024 | | | | | 813,000 | | | | | | 0.1 | | |
| Voya Strategic Income | SUMMARY PORTFOLIO OF INVESTMENTS |
| Opportunities Fund | as of March 31, 2020 (continued) |
| Principal Amount† | | | Value | | | Percentage of Net Assets | | |||||||||
| CORPORATE BONDS/NOTES: (continued) | | |||||||||||||||
| | | | Consumer, Non-cyclical (continued) | | ||||||||||||
| 725,000 (1) | | | JBS USA LUX SA / JBS USA Finance, Inc., 6.750%, 02/15/2028 | | | | $ | 777,961 | | | | | | 0.0 | | |
| 750,000 (1) | | | JBS USA LUX SA / JBS USA Food Co. / JBS USA Finance, Inc., 5.500%, 01/15/2030 | | | | | 778,538 | | | | | | 0.0 | | |
| 500,000 (1) | | | KeHE Distributors LLC / KeHE Finance Corp., 8.625%, 10/15/2026 | | | | | 505,313 | | | | | | 0.0 | | |
| 520,000 (1) | | | LifePoint Health, Inc., 4.375%, 02/15/2027 | | | | | 493,740 | | | | | | 0.0 | | |
| 1,025,000 (1) | | | MPH Acquisition Holdings LLC, 7.125%, 06/01/2024 | | | | | 899,468 | | | | | | 0.0 | | |
| 750,000 (1) | | | Par Pharmaceutical, Inc., 7.500%, 04/01/2027 | | | | | 751,931 | | | | | | 0.0 | | |
| 525,000 (1) | | | Pilgrim’s Pride Corp., 5.750%, 03/15/2025 | | | | | 530,909 | | | | | | 0.0 | | |
| 550,000 (1) | | | Pilgrim’s Pride Corp., 5.875%, 09/30/2027 | | | | | 551,072 | | | | | | 0.1 | | |
| 380,000 (1)(4) | | | Polaris Intermediate Corp., 8.500% (PIK Rate 9.250%, Cash Rate 8.500%), 12/01/2022 | | | | | 297,343 | | | | | | 0.0 | | |
| 1,375,000 (1) | | | Post Holdings, Inc., 5.625%, 01/15/2028 | | | | | 1,406,694 | | | | | | 0.1 | | |
| 1,070,000 (1) | | | Select Medical Corp., 6.250%, 08/15/2026 | | | | | 1,075,890 | | | | | | 0.1 | | |
| 95,000 (1) | | | Tenet Healthcare Corp., 5.125%, 11/01/2027 | | | | | 91,081 | | | | | | 0.0 | | |
| 475,000 (1) | | | Vizient, Inc., 6.250%, 05/15/2027 | | | | | 478,067 | | | | | | 0.0 | | |
| 770,000 (1) | | | West Street Merger Sub, Inc., 6.375%, 09/01/2025 | | | | | 676,961 | | | | | | 0.0 | | |
| 28,417,000 | | | Other Securities | | | | | 28,540,554 | | | | | | 1.1 | | |
| | | | | | | | | 57,708,415 | | | | | | 2.2 | | |
| | | | Energy: 2.5% | | ||||||||||||
| 425,000 (1) | | | Archrock Partners L.P. / Archrock Partners Finance Corp., 6.250%, 04/01/2028 | | | | | 296,437 | | | | | | 0.0 | | |
| 275,000 (1) | | | Archrock Partners L.P. / Archrock Partners Finance Corp., 6.875%, 04/01/2027 | | | | | 197,194 | | | | | | 0.0 | | |
| Principal Amount† | | | Value | | | Percentage of Net Assets | | |||||||||
| CORPORATE BONDS/NOTES: (continued) | | |||||||||||||||
| | | | Energy (continued) | | ||||||||||||
| 605,000 (1) | | | Baytex Energy Corp., 8.750%, 04/01/2027 | | | | $ | 235,345 | | | | | | 0.0 | | |
| 161,700 (1) | | | Calfrac Holdings L.P., 10.875%, 03/15/2026 | | | | | 48,510 | | | | | | 0.0 | | |
| 340,000 (1) | | | Empresa Nacional del Petroleo, 5.250%, 11/06/2029 | | | | | 337,400 | | | | | | 0.0 | | |
| 1,025,000 (1) | | | Enviva Partners L.P. / Enviva Partners Finance Corp., 6.500%, 01/15/2026 | | | | | 1,007,063 | | | | | | 0.1 | | |
| 400,000 (1) | | | Hess Midstream Operations L.P., 5.125%, 06/15/2028 | | | | | 282,620 | | | | | | 0.0 | | |
| 700,000 (1) | | | Hess Midstream Operations L.P., 5.625%, 02/15/2026 | | | | | 499,123 | | | | | | 0.1 | | |
| 300,000 (1) | | | KazMunayGas National Co. JSC, 5.375%, 04/24/2030 | | | | | 296,700 | | | | | | 0.0 | | |
| 595,000 (1) | | | Magnolia Oil & Gas Operating LLC / Magnolia Oil & Gas Finance Corp., 6.000%, 08/01/2026 | | | | | 371,875 | | | | | | 0.0 | | |
| 700,000 (1) | | | Moss Creek Resources Holdings, Inc., 7.500%, 01/15/2026 | | | | | 208,980 | | | | | | 0.0 | | |
| 270,000 (1) | | | Noble Holding International Ltd., 7.875%, 02/01/2026 | | | | | 67,106 | | | | | | 0.0 | | |
| 50,000 (1) | | | Parsley Energy LLC / Parsley Finance Corp., 5.625%, 10/15/2027 | | | | | 35,528 | | | | | | 0.0 | | |
| 3,375,000 (1) | | | Pertamina Persero PT, 3.100%, 01/21/2030 | | | | | 3,003,530 | | | | | | 0.1 | | |
| 750,000 (1)(2) | | | Pertamina Persero PT, 3.100%, 08/25/2030 | | | | | 668,425 | | | | | | 0.1 | | |
| 7,350,000 | | | Petrobras Global Finance BV, 5.750%, 02/01/2029 | | | | | 6,971,842 | | | | | | 0.3 | | |
| 775,000 | | | Petrobras Global Finance BV, 7.375%, 01/17/2027 | | | | | 796,739 | | | | | | 0.0 | | |
| 7,450,000 (1) | | | Petroleos Mexicanos, 5.950%, 01/28/2031 | | | | | 5,159,870 | | | | | | 0.2 | | |
| Voya Strategic Income | SUMMARY PORTFOLIO OF INVESTMENTS |
| Opportunities Fund | as of March 31, 2020 (continued) |
| Principal Amount† | | | Value | | | Percentage of Net Assets | | |||||||||
| CORPORATE BONDS/NOTES: (continued) | | |||||||||||||||
| | | | Energy (continued) | | ||||||||||||
| 925,000 (1) | | | Tallgrass Energy Partners L.P. / Tallgrass Energy Finance Corp., 5.500%, 01/15/2028 | | | | $ | 487,445 | | | | | | 0.0 | | |
| 200,000 (1) | | | Targa Resources Partners L.P. / Targa Resources Partners Finance Corp., 5.500%, 03/01/2030 | | | | | 156,250 | | | | | | 0.0 | | |
| 700,000 (1) | | | Viper Energy Partners L.P., 5.375%, 11/01/2027 | | | | | 591,885 | | | | | | 0.0 | | |
| 51,949,000 (3) | | | Other Securities | | | | | 41,901,783 | | | | | | 1.6 | | |
| | | | | | | | | 63,621,650 | | | | | | 2.5 | | |
| | | | Financial: 1.9% | | ||||||||||||
| 115,000 (1) | | | AG Issuer LLC, 6.250%, 03/01/2028 | | | | | 97,462 | | | | | | 0.0 | | |
| 600,000 (1) | | | Altice France Holding SA, 6.000%, 02/15/2028 | | | | | 532,308 | | | | | | 0.0 | | |
| 1,200,000 (1) | | | Altice France Holding SA, 10.500%, 05/15/2027 | | | | | 1,272,000 | | | | | | 0.1 | | |
| 1,600,000 (1) | | | Banco Bradesco SA/Cayman Islands, 3.200%, 01/27/2025 | | | | | 1,466,016 | | | | | | 0.1 | | |
| 1,550,000 (1) | | | Banco Internacional del Peru SAA Interbank, 3.250%, 10/04/2026 | | | | | 1,375,048 | | | | | | 0.1 | | |
| 1,200,000 (1) | | | Banco Votorantim SA, 4.500%, 09/24/2024 | | | | | 1,083,612 | | | | | | 0.1 | | |
| 327,000 | | | Bank of America Corp., 2.625%, 10/19/2020 | | | | | 327,540 | | | | | | 0.0 | | |
| 409,000 (1) | | | BPCE SA, 4.500%, 03/15/2025 | | | | | 406,640 | | | | | | 0.0 | | |
| 1,000,000 | | | Citigroup, Inc., 4.750%, 05/18/2046 | | | | | 1,150,471 | | | | | | 0.1 | | |
| 1,125,000 (1) | | | ESH Hospitality, Inc., 5.250%, 05/01/2025 | | | | | 952,037 | | | | | | 0.0 | | |
| 550,000 (1) | | | Freedom Mortgage Corp., 8.250%, 04/15/2025 | | | | | 435,858 | | | | | | 0.0 | | |
| 1,500,000 (1) | | | Itau Unibanco Holding SA/Cayman Island, 3.250%, 01/24/2025 | | | | | 1,405,800 | | | | | | 0.1 | | |
| 277,000 | | | JPMorgan Chase & Co., 4.250%, 10/01/2027 | | | | | 305,728 | | | | | | 0.0 | | |
| 6,800,000 (5) | | | JPMorgan Chase & Co., 4.600%, 12/31/2199 | | | | | 5,959,860 | | | | | | 0.2 | | |
| 1,050,000 (1)(5) | | | Kookmin Bank, 4.350%, 12/31/2199 | | | | | 1,010,107 | | | | | | 0.0 | | |
| Principal Amount† | | | Value | | | Percentage of Net Assets | | |||||||||
| CORPORATE BONDS/NOTES: (continued) | | |||||||||||||||
| | | | Financial (continued) | | ||||||||||||
| 740,000 (1) | | | LPL Holdings, Inc., 4.625%, 11/15/2027 | | | | $ | 682,369 | | | | | | 0.0 | | |
| 268,000 | | | Morgan Stanley, 4.000%, 07/23/2025 | | | | | 287,375 | | | | | | 0.0 | | |
| 1,100,000 (1)(5) | | | NBK Tier 1 Financing 2 Ltd., 4.500%, 12/31/2199 | | | | | 1,039,500 | | | | | | 0.0 | | |
| 950,000 (1) | | | QNB Finansbank AS, 6.875%, 09/07/2024 | | | | | 881,305 | | | | | | 0.0 | | |
| 900,000 (1) | | | Quicken Loans, Inc., 5.250%, 01/15/2028 | | | | | 886,291 | | | | | | 0.0 | | |
| 725,000 (1) | | | Realogy Group LLC / Realogy Co-Issuer Corp., 5.250%, 12/01/2021 | | | | | 679,144 | | | | | | 0.0 | | |
| 725,000 (1) | | | SBA Communications Corp., 3.875%, 02/15/2027 | | | | | 732,250 | | | | | | 0.0 | | |
| 2,000,000 (1) | | | Turkiye Vakiflar Bankasi TAO, 5.250%, 02/05/2025 | | | | | 1,685,600 | | | | | | 0.1 | | |
| 550,000 (1) | | | Turkiye Vakiflar Bankasi TAO, 8.125%, 03/28/2024 | | | | | 526,807 | | | | | | 0.0 | | |
| 200,000 (1) | | | UBS Group AG, 2.950%, 09/24/2020 | | | | | 200,353 | | | | | | 0.0 | | |
| 2,019,000 | | | Wells Fargo & Co., 4.300%-4.750%, 07/22/2027-12/07/2046 | | | | | 2,318,371 | | | | | | 0.1 | | |
| 23,084,000 | | | Other Securities | | | | | 22,410,952 | | | | | | 0.9 | | |
| | | | | | | | | 50,110,804 | | | | | | 1.9 | | |
| | | | Industrial: 1.4% | | ||||||||||||
| 520,000 (1) | | | Advanced Disposal Services, Inc., 5.625%, 11/15/2024 | | | | | 531,047 | | | | | | 0.0 | | |
| 650,000 (1) | | | Amsted Industries, Inc., 5.625%, 07/01/2027 | | | | | 637,947 | | | | | | 0.0 | | |
| 1,225,000 (1)(4) | | | ARD Finance SA, 6.500% (PIK Rate 7.250%, Cash Rate 6.500%), 06/30/2027 | | | | | 1,058,951 | | | | | | 0.1 | | |
| 410,000 (1) | | | ATS Automation Tooling Systems, Inc., 6.500%, 06/15/2023 | | | | | 402,311 | | | | | | 0.0 | | |
| 665,000 (1) | | | Berry Global, Inc., 5.625%, 07/15/2027 | | | | | 692,062 | | | | | | 0.0 | | |
| 700,000 (1) | | | BMC East LLC, 5.500%, 10/01/2024 | | | | | 681,622 | | | | | | 0.0 | | |
| 500,000 (1) | | | Bombardier, Inc., 6.000%, 10/15/2022 | | | | | 378,750 | | | | | | 0.0 | | |
| Voya Strategic Income | SUMMARY PORTFOLIO OF INVESTMENTS |
| Opportunities Fund | as of March 31, 2020 (continued) |
| Principal Amount† | | | Value | | | Percentage of Net Assets | | |||||||||
| CORPORATE BONDS/NOTES: (continued) | | |||||||||||||||
| | | | Industrial (continued) | | ||||||||||||
| 275,000 (1) | | | Bombardier, Inc., 7.875%, 04/15/2027 | | | | $ | 191,833 | | | | | | 0.0 | | |
| 900,000 (1) | | | Bombardier, Inc., 8.750%, 12/01/2021 | | | | | 753,075 | | | | | | 0.1 | | |
| 607,000 (1) | | | Builders FirstSource, Inc., 6.750%, 06/01/2027 | | | | | 600,045 | | | | | | 0.0 | | |
| 745,000 (1) | | | Builders FirstSource, Inc., 5.000%, 03/01/2030 | | | | | 674,691 | | | | | | 0.0 | | |
| 725,000 (1) | | | Cargo Aircraft Management, Inc., 4.750%, 02/01/2028 | | | | | 677,875 | | | | | | 0.0 | | |
| 675,000 (1) | | | Cascades, Inc./ Cascades USA, Inc., 5.375%, 01/15/2028 | | | | | 649,688 | | | | | | 0.0 | | |
| 575,000 (1) | | | Clean Harbors, Inc., 4.875%, 07/15/2027 | | | | | 566,059 | | | | | | 0.0 | | |
| 350,000 (1) | | | Clean Harbors, Inc., 5.125%, 07/15/2029 | | | | | 328,490 | | | | | | 0.0 | | |
| 420,000 (1) | | | FXI Holdings, Inc., 7.875%, 11/01/2024 | | | | | 286,784 | | | | | | 0.0 | | |
| 420,000 (1) | | | GFL Environmental, Inc., 8.500%, 05/01/2027 | | | | | 424,305 | | | | | | 0.0 | | |
| 116,000 (1) | | | GFL Environmental, Inc., 7.000%, 06/01/2026 | | | | | 113,269 | | | | | | 0.0 | | |
| 525,000 (1) | | | Granite US Holdings Corp., 11.000%, 10/01/2027 | | | | | 454,890 | | | | | | 0.0 | | |
| 2,775,000 (1) | | | Indian Railway Finance Corp. Ltd., 3.249%, 02/13/2030 | | | | | 2,471,595 | | | | | | 0.1 | | |
| 1,100,000 (1) | | | Itron, Inc., 5.000%, 01/15/2026 | | | | | 1,054,397 | | | | | | 0.1 | | |
| 1,000,000 (1) | | | James Hardie International Finance DAC, 4.750%, 01/15/2025 | | | | | 951,255 | | | | | | 0.1 | | |
| 1,550,000 (1)(2) | | | Klabin Austria GmbH, 5.750%, 04/03/2029 | | | | | 1,414,468 | | | | | | 0.1 | | |
| 900,000 (1) | | | Koppers, Inc., 6.000%, 02/15/2025 | | | | | 726,723 | | | | | | 0.0 | | |
| 520,000 (1) | | | Masonite International Corp., 5.375%, 02/01/2028 | | | | | 513,942 | | | | | | 0.1 | | |
| 500,000 (1) | | | Masonite International Corp., 5.750%, 09/15/2026 | | | | | 494,271 | | | | | | 0.0 | | |
| 545,000 (1) | | | Mauser Packaging Solutions Holding Co., 7.250%, 04/15/2025 | | | | | 416,941 | | | | | | 0.0 | | |
| Principal Amount† | | | Value | | | Percentage of Net Assets | | |||||||||
| CORPORATE BONDS/NOTES: (continued) | | |||||||||||||||
| | | | Industrial (continued) | | ||||||||||||
| 725,000 (1) | | | Norbord, Inc., 5.750%, 07/15/2027 | | | | $ | 668,057 | | | | | | 0.0 | | |
| 650,000 (1) | | | Owens-Brockway Glass Container, Inc., 5.875%, 08/15/2023 | | | | | 641,066 | | | | | | 0.1 | | |
| 325,000 (1) | | | Owens-Brockway Glass Container, Inc., 6.375%, 08/15/2025 | | | | | 311,187 | | | | | | 0.0 | | |
| 885,000 (1) | | | PGT Innovations, Inc., 6.750%, 08/01/2026 | | | | | 842,040 | | | | | | 0.0 | | |
| 725,000 (1) | | | Reynolds Group Issuer, Inc. / Reynolds Group Issuer LLC / Reynolds Group Issuer Lu, 5.125%, 07/15/2023 | | | | | 724,090 | | | | | | 0.0 | | |
| 200,000 (1) | | | Reynolds Group Issuer, Inc. / Reynolds Group Issuer LLC / Reynolds Group Issuer Lu, 7.000%, 07/15/2024 | | | | | 204,375 | | | | | | 0.0 | | |
| 650,000 (1) | | | Sealed Air Corp., 5.500%, 09/15/2025 | | | | | 663,816 | | | | | | 0.0 | | |
| 390,000 (1) | | | Silgan Holdings, Inc., 4.125%, 02/01/2028 | | | | | 362,700 | | | | | | 0.0 | | |
| 725,000 (1) | | | SSL Robotics LLC, 9.750%, 12/31/2023 | | | | | 752,188 | | | | | | 0.0 | | |
| 600,000 (1) | | | Standard Industries, Inc./NJ, 5.000%, 02/15/2027 | | | | | 550,181 | | | | | | 0.0 | | |
| 975,000 (1) | | | Standard Industries, Inc./NJ, 6.000%, 10/15/2025 | | | | | 965,513 | | | | | | 0.1 | | |
| 750,000 (1) | | | Stevens Holding Co., Inc., 6.125%, 10/01/2026 | | | | | 747,343 | | | | | | 0.0 | | |
| 400,000 (1) | | | Summit Materials LLC / Summit Materials Finance Corp., 5.125%, 06/01/2025 | | | | | 375,498 | | | | | | 0.0 | | |
| 690,000 (1) | | | Summit Materials LLC / Summit Materials Finance Corp., 6.500%, 03/15/2027 | | | | | 657,944 | | | | | | 0.1 | | |
| 750,000 (1) | | | TransDigm, Inc., 5.500%, 11/15/2027 | | | | | 677,288 | | | | | | 0.0 | | |
| 181,000 (1) | | | Zekelman Industries, Inc., 9.875%, 06/15/2023 | | | | | 175,909 | | | | | | 0.0 | | |
| 9,334,000 | | | Other Securities | | | | | 9,382,886 | | | | | | 0.4 | | |
| | | | | | | | | 36,849,367 | | | | | | 1.4 | | |
| Voya Strategic Income | SUMMARY PORTFOLIO OF INVESTMENTS |
| Opportunities Fund | as of March 31, 2020 (continued) |
| Principal Amount† | | | Value | | | Percentage of Net Assets | | |||||||||
| CORPORATE BONDS/NOTES: (continued) | | |||||||||||||||
| | | | Technology: 0.5% | | ||||||||||||
| 950,000 (1) | | | Ascend Learning LLC, 6.875%, 08/01/2025 | | | | $ | 929,808 | | | | | | 0.0 | | |
| 650,000 (1) | | | Castle US Holding Corp., 9.500%, 02/15/2028 | | | | | 621,156 | | | | | | 0.0 | | |
| 1,300,000 (1) | | | Change Healthcare Holdings LLC / Change Healthcare Finance, Inc., 5.750%, 03/01/2025 | | | | | 1,212,211 | | | | | | 0.1 | | |
| 345,000 (1) | | | Dell International LLC / EMC Corp., 7.125%, 06/15/2024 | | | | | 357,506 | | | | | | 0.0 | | |
| 1,000,000 (1) | | | Dell International LLC / EMC Corp., 8.350%, 07/15/2046 | | | | | 1,179,118 | | | | | | 0.1 | | |
| 450,000 (1) | | | MSCI, Inc., 5.750%, 08/15/2025 | | | | | 467,923 | | | | | | 0.0 | | |
| 650,000 (1) | | | MTS Systems Corp., 5.750%, 08/15/2027 | | | | | 608,428 | | | | | | 0.0 | | |
| 250,000 (1) | | | Open Text Corp., 3.875%, 02/15/2028 | | | | | 236,172 | | | | | | 0.0 | | |
| 350,000 (1) | | | Open Text Corp., 5.875%, 06/01/2026 | | | | | 369,057 | | | | | | 0.0 | | |
| 425,000 (1) | | | Open Text Holdings, Inc., 4.125%, 02/15/2030 | | | | | 401,997 | | | | | | 0.0 | | |
| 550,000 (1) | | | RP Crown Parent LLC, 7.375%, 10/15/2024 | | | | | 528,850 | | | | | | 0.0 | | |
| 430,000 (1) | | | Science Applications International Corp., 4.875%, 04/01/2028 | | | | | 415,219 | | | | | | 0.0 | | |
| 1,175,000 (1) | | | Tempo Acquisition LLC / Tempo Acquisition Finance Corp., 6.750%, 06/01/2025 | | | | | 1,083,973 | | | | | | 0.1 | | |
| 1,150,000 (1)(2) | | | Veritas US, Inc. / Veritas Bermuda Ltd.., 10.500%, 02/01/2024 | | | | | 978,932 | | | | | | 0.1 | | |
| 3,080,000 | | | Other Securities | | | | | 3,211,129 | | | | | | 0.1 | | |
| | | | | | | | | 12,601,479 | | | | | | 0.5 | | |
| | | | Utilities: 1.6% | | ||||||||||||
| 2,275,000 (1) | | | Centrais Eletricas Brasileiras SA, 3.625%, 02/04/2025 | | | | | 2,025,910 | | | | | | 0.1 | | |
| 550,000 (1) | | | Clearway Energy Operating LLC, 4.750%, 03/15/2028 | | | | | 512,187 | | | | | | 0.0 | | |
| 1,850,000 (1) | | | Colbun SA, 3.150%, 03/06/2030 | | | | | 1,623,375 | | | | | | 0.1 | | |
| 1,050,000 (1) | | | Drax Finco PLC, 6.625%, 11/01/2025 | | | | | 1,059,193 | | | | | | 0.1 | | |
| Principal Amount† | | | Value | | | Percentage of Net Assets | | |||||||||
| CORPORATE BONDS/NOTES: (continued) | | |||||||||||||||
| | | | Utilities (continued) | | ||||||||||||
| 500,000 (1) | | | Israel Electric Corp. Ltd., 4.250%, 08/14/2028 | | | | $ | 512,308 | | | | | | 0.0 | | |
| 575,000 (1) | | | Kallpa Generacion SA, 4.125%, 08/16/2027 | | | | | 521,555 | | | | | | 0.0 | | |
| 650,000 (1) | | | LBC Tank Terminals Holding Netherlands BV, 6.875%, 05/15/2023 | | | | | 615,059 | | | | | | 0.0 | | |
| 2,325,000 (1) | | | Perusahaan Listrik Negara PT, 3.875%, 07/17/2029 | | | | | 2,182,112 | | | | | | 0.1 | | |
| 3,950,000 | | | Perusahaan Listrik Negara PT, 4.125%-5.450%, 05/15/2027-05/21/2028 | | | | | 4,067,784 | | | | | | 0.2 | | |
| 425,000 (1) | | | Vistra Operations Co. LLC, 5.500%, 09/01/2026 | | | | | 440,711 | | | | | | 0.0 | | |
| 575,000 (1) | | | Vistra Operations Co. LLC, 5.625%, 02/15/2027 | | | | | 596,160 | | | | | | 0.0 | | |
| 28,398,000 | | | Other Securities | | | | | 26,185,859 | | | | | | 1.0 | | |
| | | | | | | | | 40,342,213 | | | | | | 1.6 | | |
| | | | Total Corporate Bonds/Notes (Cost $437,559,837) | | | | | 394,488,093 | | | | | | 15.3 | | |
| COLLATERALIZED MORTGAGE OBLIGATIONS: 29.2% | | |||||||||||||||
| 192,890 | | | Adjustable Rate Mortgage Trust 2005-7 7A21, 1.447%, (US0001M + 0.500%), 10/25/2035 | | | | | 190,857 | | | | | | 0.0 | | |
| 1,235,488 (1)(5) | | | Agate Bay Mortgage Trust 2014-1 B4, 3.868%, 07/25/2044 | | | | | 1,183,462 | | | | | | 0.1 | | |
| 4,593,424 (1)(5) | | | Agate Bay Mortgage Trust 2014-2 B2, 3.880%, 09/25/2044 | | | | | 4,407,763 | | | | | | 0.2 | | |
| 1,884,306 (1)(5) | | | Agate Bay Mortgage Trust 2014-2 B4, 3.880%, 09/25/2044 | | | | | 1,776,618 | | | | | | 0.1 | | |
| 2,705,769 (1)(5) | | | Agate Bay Mortgage Trust 2015-2 B3, 3.723%, 03/25/2045 | | | | | 2,578,668 | | | | | | 0.1 | | |
| 1,218,542 (1)(5) | | | Agate Bay Mortgage Trust 2015-4 B3, 3.573%, 06/25/2045 | | | | | 1,117,776 | | | | | | 0.0 | | |
| 2,597,597 (1)(5) | | | Agate Bay Mortgage Trust 2016-1 B3, 3.772%, 12/25/2045 | | | | | 2,423,532 | | | | | | 0.1 | | |
| Voya Strategic Income | SUMMARY PORTFOLIO OF INVESTMENTS |
| Opportunities Fund | as of March 31, 2020 (continued) |
| Principal Amount† | | | Value | | | Percentage of Net Assets | | |||||||||
| COLLATERALIZED MORTGAGE OBLIGATIONS: (continued) | | |||||||||||||||
| 1,000,000 (1)(5) | | | Agate Bay Mortgage Trust 2016-1 B4, 3.772%, 12/25/2045 | | | | $ | 761,337 | | | | | | 0.0 | | |
| 1,137,085 (1)(5) | | | Agate Bay Mortgage Trust 2016-2 B4, 3.795%, 03/25/2046 | | | | | 849,839 | | | | | | 0.0 | | |
| 724,807 | | | Alternative Loan Trust 2004-J7 MI, 1.967%, (US0001M + 1.020%), 10/25/2034 | | | | | 663,857 | | | | | | 0.0 | | |
| 135,461 | | | Alternative Loan Trust 2005-10CB 1A1, 1.447%, (US0001M + 0.500%), 05/25/2035 | | | | | 102,581 | | | | | | 0.0 | | |
| 540,404 | | | Alternative Loan Trust 2005-10CB 1A2, 1.397%, (US0001M + 0.450%), 05/25/2035 | | | | | 408,295 | | | | | | 0.0 | | |
| 568,540 | | | Alternative Loan Trust 2005-23CB A15, 5.500%, 07/25/2035 | | | | | 517,217 | | | | | | 0.0 | | |
| 191,658 | | | Alternative Loan Trust 2005-51 3A2A, 3.256%, (12MTA + 1.290%), 11/20/2035 | | | | | 158,780 | | | | | | 0.0 | | |
| 61,790 | | | Alternative Loan Trust 2005-6CB 1A3, 5.250%, 04/25/2035 | | | | | 56,442 | | | | | | 0.0 | | |
| 289,669 | | | Alternative Loan Trust 2005-J2 1A12, 1.347%, (US0001M + 0.400%), 04/25/2035 | | | | | 225,346 | | | | | | 0.0 | | |
| 38,209 | | | Alternative Loan Trust 2006-13T1 A9, 6.000%, 05/25/2036 | | | | | 26,498 | | | | | | 0.0 | | |
| 705,858 | | | Alternative Loan Trust 2006-18CB A10, 1.347%, (US0001M + 0.400%), 07/25/2036 | | | | | 325,430 | | | | | | 0.0 | | |
| 168,133 | | | Alternative Loan Trust 2006-19CB A12, 1.347%, (US0001M + 0.400%), 08/25/2036 | | | | | 89,537 | | | | | | 0.0 | | |
| 712,005 | | | Alternative Loan Trust 2006-19CB A28, 1.547%, (US0001M + 0.600%), 08/25/2036 | | | | | 388,488 | | | | | | 0.0 | | |
| Principal Amount† | | | Value | | | Percentage of Net Assets | | |||||||||
| COLLATERALIZED MORTGAGE OBLIGATIONS: (continued) | | |||||||||||||||
| 1,194,923 | | | Alternative Loan Trust 2006-27CB A5, 6.000%, 11/25/2036 | | | | $ | 948,335 | | | | | | 0.1 | | |
| 450,985 | | | Alternative Loan Trust 2006-HY11 A1, 1.067%, (US0001M + 0.120%), 06/25/2036 | | | | | 384,328 | | | | | | 0.0 | | |
| 1,250,225 | | | Alternative Loan Trust 2007-15CB A5, 5.750%, 07/25/2037 | | | | | 991,237 | | | | | | 0.1 | | |
| 182,915 | | | Alternative Loan Trust 2007-2CB 2A1, 1.547%, (US0001M + 0.600%), 03/25/2037 | | | | | 90,238 | | | | | | 0.0 | | |
| 321,734 | | | Alternative Loan Trust 2007-HY8C A1, 1.107%, (US0001M + 0.160%), 09/25/2047 | | | | | 269,609 | | | | | | 0.0 | | |
| 908,176 | | | Alternative Loan Trust 2007-OA4 A1, 1.117%, (US0001M + 0.170%), 05/25/2047 | | | | | 750,272 | | | | | | 0.1 | | |
| 1,648,982 (1)(5) | | | Arroyo Mortgage Trust 2019-3 A3, 3.416%, 10/25/2048 | | | | | 1,574,338 | | | | | | 0.1 | | |
| 536,518 | | | Banc of America Funding 2007-2 1A16 Trust, 1.547%, (US0001M + 0.600%), 03/25/2037 | | | | | 383,197 | | | | | | 0.0 | | |
| 2,559,545 | | | Banc of America Funding 2007-C 7A1 Trust, 0.983%, (US0001M + 0.210%), 05/20/2047 | | | | | 2,314,979 | | | | | | 0.1 | | |
| 2,500,000 (1)(5) | | | Chase Home Lending Mortgage Trust 2019-ATR1 A5, 4.000%, 04/25/2049 | | | | | 2,420,553 | | | | | | 0.1 | | |
| 992,059 (1)(5) | | | Chase Mortgage Finance Corp. 2019-1 B2, 3.967%, 03/25/2050 | | | | | 803,239 | | | | | | 0.0 | | |
| 1,289,677 (1)(5) | | | Chase Mortgage Finance Corp. 2019-1 B3, 3.967%, 03/25/2050 | | | | | 1,247,748 | | | | | | 0.1 | | |
| Voya Strategic Income | SUMMARY PORTFOLIO OF INVESTMENTS |
| Opportunities Fund | as of March 31, 2020 (continued) |
| Principal Amount† | | | Value | | | Percentage of Net Assets | | |||||||||
| COLLATERALIZED MORTGAGE OBLIGATIONS: (continued) | | |||||||||||||||
| 686,896 (1)(5) | | | Chase Home Lending Mortgage Trust 2019-ATR2 A3, 3.500%, 07/25/2049 | | | | $ | 696,715 | | | | | | 0.0 | | |
| 565,325 | | | CHL Mortgage Pass-Through Trust 2005-HYB9 2A1, 3.939%, (US0012M + 1.750%), 02/20/2036 | | | | | 493,467 | | | | | | 0.0 | | |
| 1,867,206 (1)(5) | | | CIM Trust 2019-INV1 A1, 4.000%, 02/25/2049 | | | | | 1,859,445 | | | | | | 0.1 | | |
| 1,382,433 (1)(5) | | | CIM Trust 2019-INV2 A3, 4.000%, 05/25/2049 | | | | | 1,384,781 | | | | | | 0.1 | | |
| 868,126 (1)(5) | | | CIM Trust 2019-INV3 A15, 3.500%, 08/25/2049 | | | | | 840,676 | | | | | | 0.0 | | |
| 1,302,190 (1)(5) | | | CIM Trust 2019-INV3 A3, 3.500%, 08/25/2049 | | | | | 1,329,424 | | | | | | 0.0 | | |
| 2,593,318 (1)(5) | | | CIM Trust 2019-J1 1A2, 3.500%, 08/25/2049 | | | | | 2,613,305 | | | | | | 0.1 | | |
| 3,223,294 (1)(5) | | | CIM Trust 2019-J2 B2, 3.856%, 10/25/2049 | | | | | 2,620,378 | | | | | | 0.1 | | |
| 2,023,975 (1)(5) | | | CIM Trust 2019-J2 B3, 3.856%, 10/25/2049 | | | | | 1,569,029 | | | | | | 0.1 | | |
| 1,799,180 (1)(5) | | | CIM Trust 2019-J1 B3, 4.010%, 08/25/2049 | | | | | 1,436,395 | | | | | | 0.1 | | |
| 710,239 | | | Citicorp Mortgage Securities Trust Series 2006-3 1A4, 6.000%, 06/25/2036 | | | | | 681,481 | | | | | | 0.1 | | |
| 114,378 (5) | | | Citigroup Mortgage Loan Trust 2006-AR2 1A1, 3.982%, 03/25/2036 | | | | | 93,976 | | | | | | 0.0 | | |
| 78,633 (5) | | | Citigroup Mortgage Loan Trust 2006-AR9 2A, 4.344%, 11/25/2036 | | | | | 59,547 | | | | | | 0.0 | | |
| 350,202 (1)(5) | | | Citigroup Mortgage Loan Trust 2015-A B2, 4.500%, 06/25/2058 | | | | | 335,073 | | | | | | 0.0 | | |
| 235,154 (5) | | | Citigroup Mortgage Loan Trust, Inc. 2005-4 A, 4.592%, 08/25/2035 | | | | | 219,107 | | | | | | 0.0 | | |
| 644,209 | | | Citigroup Mortgage Loan Trust, Inc. 2005-9 22A2, 6.000%, 11/25/2035 | | | | | 620,207 | | | | | | 0.0 | | |
| 1,000,000 (1)(5) | | | COLT 2019-1 M1 Mortgage Loan Trust, 4.518%, 03/25/2049 | | | | | 925,338 | | | | | | 0.0 | | |
| 4,057,318 (1)(5) | | | COLT 2019-4 A3 Mortgage Loan Trust, 2.988%, 11/25/2049 | | | | | 3,981,142 | | | | | | 0.2 | | |
| Principal Amount† | | | Value | | | Percentage of Net Assets | | |||||||||
| COLLATERALIZED MORTGAGE OBLIGATIONS: (continued) | | |||||||||||||||
| 6,000,000 (1) | | | Connecticut Avenue Securities Trust 2019-R07 1M2, 3.047%, (US0001M + 2.100%), 10/25/2039 | | | | $ | 4,933,070 | | | | | | 0.2 | | |
| 3,000,000 (1) | | | Connecticut Avenue Securities Trust 2020-R02 2M2, 2.947%, (US0001M + 2.000%), 01/25/2040 | | | | | 1,987,726 | | | | | | 0.1 | | |
| 26,377 | | | Countrywide Alternative Loan Trust 2005-53T2 2A6, 1.447%, (US0001M + 0.500%), 11/25/2035 | | | | | 11,784 | | | | | | 0.0 | | |
| 915,432 | | | Countrywide Asset-Backed Certificates 2005-IM1 M1, 1.667%, (US0001M + 0.720%), 11/25/2035 | | | | | 859,395 | | | | | | 0.0 | | |
| 4,022,249 (1)(6) | | | CSMC 2019-AFC1 A3 Trust, 2.877% (Step Rate @ 3.877% on 0), 07/25/2049 | | | | | 3,886,352 | | | | | | 0.2 | | |
| 800,000 (1)(5) | | | CSMC 2017-HL1 A12 Trust, 3.500%, 06/25/2047 | | | | | 763,827 | | | | | | 0.0 | | |
| 1,670,168 (1)(5) | | | CSMC Trust 2013-7 A11, 3.500%, 08/25/2043 | | | | | 1,720,328 | | | | | | 0.1 | | |
| 1,500,000 (1)(5) | | | Deephave Residential Mortgage Trust 2019-2A M1, 3.921%, 04/25/2059 | | | | | 1,415,032 | | | | | | 0.0 | | |
| 1,400,000 (1)(5) | | | Deephaven Residential Mortgage Trust 2018-2A M1, 4.375%, 04/25/2058 | | | | | 1,351,664 | | | | | | 0.0 | | |
| 2,126,000 (1)(5) | | | Deephaven Residential Mortgage Trust 2018-3 M1, 4.357%, 08/25/2058 | | | | | 2,063,740 | | | | | | 0.1 | | |
| 2,000,000 (1)(5) | | | Deephaven Residential Mortgage Trust 2019-1A M1, 4.402%, 08/25/2058 | | | | | 1,902,668 | | | | | | 0.1 | | |
| 2,000,000 (1)(5) | | | Deephaven Residential Mortgage Trust 2019-4 M1, 3.484%, 10/25/2059 | | | | | 1,719,559 | | | | | | 0.1 | | |
| Voya Strategic Income | SUMMARY PORTFOLIO OF INVESTMENTS |
| Opportunities Fund | as of March 31, 2020 (continued) |
| Principal Amount† | | | Value | | | Percentage of Net Assets | | |||||||||
| COLLATERALIZED MORTGAGE OBLIGATIONS: (continued) | | |||||||||||||||
| 2,000,000 (1)(5) | | | Deephaven Residential Mortgage Trust 2020-1 M1, 3.010%, 01/25/2060 | | | | $ | 1,636,509 | | | | | | 0.1 | | |
| 648,499 | | | Deutsche ALT-A Securities, Inc. ALT 2007-AB1 A1, 1.247%, (US0001M + 0.300%), 04/25/2037 | | | | | 397,689 | | | | | | 0.0 | | |
| 144,326 (1)(5) | | | Deutsche Mortgage Securities, Inc. Re-REMIC Trust Certificates Series 2007-WM1 A1, 3.802%, 06/27/2037 | | | | | 127,882 | | | | | | 0.0 | | |
| 2,289,759 (1)(5) | | | Ellington Financial Mortgage Trust 2019-2 A3, 3.046%, 11/25/2059 | | | | | 2,219,705 | | | | | | 0.1 | | |
| 753,365 (7) | | | Fannie Mae 2007-18 BS, 5.653%, (-1.000*US0001M + 6.600%), 06/25/2035 | | | | | 148,370 | | | | | | 0.0 | | |
| 2,193,589 (7) | | | Fannie Mae 2008-94 SI, 4.553%, (-1.000*US0001M + 5.500%), 04/25/2036 | | | | | 564,922 | | | | | | 0.0 | | |
| 723,095 (7) | | | Fannie Mae 2009-95 HI, 6.000%, 12/25/2038 | | | | | 17,946 | | | | | | 0.0 | | |
| 301,270 | | | Fannie Mae 2010-15 FD, 1.687%, (US0001M + 0.740%), 03/25/2040 | | | | | 302,749 | | | | | | 0.0 | | |
| 804,663 | | | Fannie Mae 2011-47 GF, 1.517%, (US0001M + 0.570%), 06/25/2041 | | | | | 802,704 | | | | | | 0.0 | | |
| 225,037 | | | Fannie Mae 2012-10 UF, 1.497%, (US0001M + 0.550%), 02/25/2042 | | | | | 225,219 | | | | | | 0.0 | | |
| 300,951 (7) | | | Fannie Mae 2012-84 KI, 6.000%, (US0001M + 6.000%), 08/25/2042 | | | | | 60,307 | | | | | | 0.0 | | |
| 1,096,703 (7) | | | Fannie Mae 2012-93 IL, 3.000%, 09/25/2027 | | | | | 67,216 | | | | | | 0.0 | | |
| 6,570,135 (7) | | | Fannie Mae 2013-67 AI, 3.000%, 07/25/2028 | | | | | 419,705 | | | | | | 0.0 | | |
| 1,698,350 (7) | | | Fannie Mae 2015-56 DI, 3.000%, 12/25/2032 | | | | | 40,838 | | | | | | 0.0 | | |
| Principal Amount† | | | Value | | | Percentage of Net Assets | | |||||||||
| COLLATERALIZED MORTGAGE OBLIGATIONS: (continued) | | |||||||||||||||
| 36,711,724 (7) | | | Fannie Mae 2018-86 US, 5.253%, (-1.000*US0001M + 6.200%), 12/25/2048 | | | | $ | 7,365,598 | | | | | | 0.3 | | |
| 3,050,000 | | | Fannie Mae Connecticut Avenue Securities 16-C06 1M2, 5.197%, (US0001M + 4.250%), 04/25/2029 | | | | | 2,968,612 | | | | | | 0.1 | | |
| 121,246 | | | Fannie Mae Connecticut Avenue Securities 2014-CO4 1M2, 5.847%, (US0001M + 4.900%), 11/25/2024 | | | | | 116,788 | | | | | | 0.0 | | |
| 2,024,945 | | | Fannie Mae Connecticut Avenue Securities 2015-C02 1M2, 4.947%, (US0001M + 4.000%), 05/25/2025 | | | | | 1,902,459 | | | | | | 0.1 | | |
| 1,542,709 | | | Fannie Mae Connecticut Avenue Securities 2015-C03 2M2, 5.947%, (US0001M + 5.000%), 07/25/2025 | | | | | 1,502,320 | | | | | | 0.1 | | |
| 2,074,450 | | | Fannie Mae Connecticut Avenue Securities 2015-C04 2M2, 6.497%, (US0001M + 5.550%), 04/25/2028 | | | | | 1,942,007 | | | | | | 0.1 | | |
| 4,739,406 | | | Fannie Mae Connecticut Avenue Securities 2015-CO1 1M2, 5.247%, (US0001M + 4.300%), 02/25/2025 | | | | | 4,512,521 | | | | | | 0.2 | | |
| 1,566,653 | | | Fannie Mae Connecticut Avenue Securities 2016-C01 2M2, 7.897%, (US0001M + 6.950%), 08/25/2028 | | | | | 1,580,925 | | | | | | 0.1 | | |
| 4,824,509 | | | Fannie Mae Connecticut Avenue Securities 2016-C04 1M2, 5.197%, (US0001M + 4.250%), 01/25/2029 | | | | | 4,587,598 | | | | | | 0.2 | | |
| Voya Strategic Income | SUMMARY PORTFOLIO OF INVESTMENTS |
| Opportunities Fund | as of March 31, 2020 (continued) |
| Principal Amount† | | | Value | | | Percentage of Net Assets | | |||||||||
| COLLATERALIZED MORTGAGE OBLIGATIONS: (continued) | | |||||||||||||||
| 6,056,023 | | | Fannie Mae Connecticut Avenue Securities 2016-C05 2M2, 5.397%, (US0001M + 4.450%), 01/25/2029 | | | | $ | 5,844,521 | | | | | | 0.2 | | |
| 8,147,224 | | | Fannie Mae Connecticut Avenue Securities 2016-C07 2M2, 5.297%, (US0001M + 4.350%), 05/25/2029 | | | | | 7,858,885 | | | | | | 0.3 | | |
| 2,484,671 | | | Fannie Mae Connecticut Avenue Securities 2017-C01 1M2, 4.497%, (US0001M + 3.550%), 07/25/2029 | | | | | 2,300,380 | | | | | | 0.1 | | |
| 4,900,000 | | | Fannie Mae Connecticut Avenue Securities 2017-C02 2M2, 4.597%, (US0001M + 3.650%), 09/25/2029 | | | | | 3,576,713 | | | | | | 0.1 | | |
| 8,500,000 | | | Fannie Mae Connecticut Avenue Securities 2017-C03 1M2, 3.947%, (US0001M + 3.000%), 10/25/2029 | | | | | 7,639,342 | | | | | | 0.3 | | |
| 1,400,000 | | | Fannie Mae Connecticut Avenue Securities 2017-C04 2M2, 3.797%, (US0001M + 2.850%), 11/25/2029 | | | | | 1,239,033 | | | | | | 0.1 | | |
| 6,210,682 | | | Fannie Mae Connecticut Avenue Securities 2017-C05 1M2, 3.147%, (US0001M + 2.200%), 01/25/2030 | | | | | 5,555,926 | | | | | | 0.2 | | |
| 4,927,295 | | | Fannie Mae Connecticut Avenue Securities 2017-C06 1M2, 3.597%, (US0001M + 2.650%), 02/25/2030 | | | | | 4,390,972 | | | | | | 0.2 | | |
| 4,450,000 | | | Fannie Mae Connecticut Avenue Securities 2017-C07 1M2, 3.347%, (US0001M + 2.400%), 05/28/2030 | | | | | 4,013,520 | | | | | | 0.2 | | |
| 5,762,875 | | | Fannie Mae Connecticut Avenue Securities 2017-C07 2M2, 3.447%, (US0001M + 2.500%), 05/25/2030 | | | | | 5,042,531 | | | | | | 0.2 | | |
| Principal Amount† | | | Value | | | Percentage of Net Assets | | |||||||||
| COLLATERALIZED MORTGAGE OBLIGATIONS: (continued) | | |||||||||||||||
| 5,133,077 | | | Fannie Mae Connecticut Avenue Securities 2017-CO6 2M2, 3.747%, (US0001M + 2.800%), 02/25/2030 | | | | $ | 4,338,727 | | | | | | 0.2 | | |
| 4,010,839 | | | Fannie Mae Connecticut Avenue Securities 2018-C02 2M2, 3.147%, (US0001M + 2.200%), 08/25/2030 | | | | | 3,358,739 | | | | | | 0.1 | | |
| 3,200,000 | | | Fannie Mae Connecticut Avenue Securities 2018-C03 1M2, 3.097%, (US0001M + 2.150%), 10/25/2030 | | | | | 2,697,857 | | | | | | 0.1 | | |
| 7,632,777 | | | Fannie Mae Connecticut Avenue Securities 2018-C04 2M2, 3.497%, (US0001M + 2.550%), 12/25/2030 | | | | | 6,340,383 | | | | | | 0.2 | | |
| 12,200,000 | | | Fannie Mae Connecticut Avenue Securities 2018-C05 1M2, 3.297%, (US0001M + 2.350%), 01/25/2031 | | | | | 10,392,552 | | | | | | 0.4 | | |
| 6,403,855 | | | Fannie Mae Connecticut Avenue Securities 2018-C06 1M2, 2.947%, (US0001M + 2.000%), 03/25/2031 | | | | | 5,703,628 | | | | | | 0.2 | | |
| 4,295,076 | | | Fannie Mae Connecticut Avenue Securities 2018-C06 2M2, 3.047%, (US0001M + 2.100%), 03/25/2031 | | | | | 3,653,852 | | | | | | 0.1 | | |
| 8,540,000 | | | Fannie Mae Connecticut Avenue Securities 2018-CO1 1M2, 3.197%, (US0001M + 2.250%), 07/25/2030 | | | | | 7,483,482 | | | | | | 0.3 | | |
| 6,971,255 (1) | | | Fannie Mae Connecticut Avenue Securities 2019-R02 1M2, 3.247%, (US0001M + 2.300%), 08/25/2031 | | | | | 5,841,811 | | | | | | 0.2 | | |
| 3,000,000 (1) | | | Fannie Mae Connecticut Avenue Securities 2019-R04 2M2, 3.047%, (US0001M + 2.100%), 06/25/2039 | | | | | 2,474,575 | | | | | | 0.1 | | |
| Voya Strategic Income | SUMMARY PORTFOLIO OF INVESTMENTS |
| Opportunities Fund | as of March 31, 2020 (continued) |
| Principal Amount† | | | Value | | | Percentage of Net Assets | | |||||||||
| COLLATERALIZED MORTGAGE OBLIGATIONS: (continued) | | |||||||||||||||
| 2,454,425 (1) | | | Fannie Mae Connecticut Avenue Securities Trust 2018-R07 1M2, 3.347%, (US0001M + 2.400%), 04/25/2031 | | | | $ | 2,125,203 | | | | | | 0.1 | | |
| 5,894,116 (1) | | | Fannie Mae Connecticut Avenue Securities Trust 2019-R01 2M2, 3.397%, (US0001M + 2.450%), 07/25/2031 | | | | | 4,947,212 | | | | | | 0.2 | | |
| 1,500,000 (1) | | | Fannie Mae Connecticut Avenue Securities Trust 2020-R01 1M2, 2.997%, (US0001M + 2.050%), 01/25/2040 | | | | | 912,955 | | | | | | 0.0 | | |
| 5,255,571 | | | Fannie Mae Connecticut Avenue Securities, 6.647%, (US0001M + 5.700%), 04/25/2028 | | | | | 5,262,467 | | | | | | 0.2 | | |
| 4,371,194 | | | Fannie Mae Connecticut Avenue Securities, 6.847%, (US0001M + 5.900%), 10/25/2028 | | | | | 4,308,995 | | | | | | 0.2 | | |
| 173,855 (7) | | | Fannie Mae REMIC Trust 2000-26 SP, 7.553%, (-1.000*US0001M + 8.500%), 08/25/2030 | | | | | 42,851 | | | | | | 0.0 | | |
| 219,633 (7) | | | Fannie Mae REMIC Trust 2002-13 SR, 5.653%, (-1.000*US0001M + 6.600%), 03/25/2032 | | | | | 39,026 | | | | | | 0.0 | | |
| 120,533 (7) | | | Fannie Mae REMIC Trust 2004-64 SW, 6.103%, (-1.000*US0001M + 7.050%), 08/25/2034 | | | | | 26,039 | | | | | | 0.0 | | |
| 85,308 (7) | | | Fannie Mae REMIC Trust 2004-66 SE, 5.553%, (-1.000*US0001M + 6.500%), 09/25/2034 | | | | | 16,765 | | | | | | 0.0 | | |
| 432,621 (7) | | | Fannie Mae REMIC Trust 2009-25 SN, 5.603%, (-1.000*US0001M + 6.550%), 04/25/2039 | | | | | 110,375 | | | | | | 0.0 | | |
| 179,209 (7) | | | Fannie Mae REMIC Trust 2012-146 LI, 4.500%, 10/25/2041 | | | | | 7,484 | | | | | | 0.0 | | |
| 19,508,490 (7) | | | Fannie Mae REMIC Trust 2012-66 IB, 0.050%, (-1.000*US0001M + 6.050%), 06/25/2042 | | | | | 33,112 | | | | | | 0.0 | | |
| Principal Amount† | | | Value | | | Percentage of Net Assets | | |||||||||
| COLLATERALIZED MORTGAGE OBLIGATIONS: (continued) | | |||||||||||||||
| 921,145 (7) | | | Fannie Mae REMIC Trust 2013-116 SC, 5.253%, (-1.000*US0001M + 6.200%), 04/25/2033 | | | | $ | 68,902 | | | | | | 0.0 | | |
| 1,972,566 (7) | | | Fannie Mae REMICS 2004-53 UC, 6.603%, (-1.000*US0001M + 7.550%), 07/25/2034 | | | | | 482,912 | | | | | | 0.0 | | |
| 2,150,893 (7) | | | Fannie Mae REMICS 2005-59 NS, 5.803%, (-1.000*US0001M + 6.750%), 05/25/2035 | | | | | 282,502 | | | | | | 0.0 | | |
| 6,931,902 (7) | | | Fannie Mae REMICS 2007-22 SD, 5.453%, (-1.000*US0001M + 6.400%), 03/25/2037 | | | | | 1,591,252 | | | | | | 0.1 | | |
| 5,233,818 (7) | | | Fannie Mae REMICS 2007-30 IE, 5.793%, (-1.000*US0001M + 6.740%), 04/25/2037 | | | | | 1,448,803 | | | | | | 0.1 | | |
| 3,606,912 (7) | | | Fannie Mae REMICS 2007-55 S, 5.813%, (-1.000*US0001M + 6.760%), 06/25/2037 | | | | | 810,124 | | | | | | 0.0 | | |
| 7,733,501 (7) | | | Fannie Mae REMICS 2011-123 SD, 5.653%, (-1.000*US0001M + 6.600%), 08/25/2039 | | | | | 666,782 | | | | | | 0.0 | | |
| 24,947,450 (7) | | | Fannie Mae REMICS 2012-111 UI, 3.000%, 10/25/2027 | | | | | 1,608,327 | | | | | | 0.1 | | |
| 20,285,178 (7) | | | Fannie Mae REMICS 2012-128 KI, 3.000%, 11/25/2027 | | | | | 1,352,804 | | | | | | 0.1 | | |
| 6,941,173 (7) | | | Fannie Mae REMICS 2012-150 PS, 5.203%, (-1.000*US0001M + 6.150%), 01/25/2043 | | | | | 1,336,209 | | | | | | 0.1 | | |
| 20,653,008 (7) | | | Fannie Mae REMICS 2013-1 LI, 2.500%, 02/25/2028 | | | | | 1,199,894 | | | | | | 0.1 | | |
| 7,931,512 (7) | | | Fannie Mae REMICS 2013-21 KI, 3.000%, 03/25/2028 | | | | | 500,502 | | | | | | 0.0 | | |
| 8,890,495 (7) | | | Fannie Mae REMICS 2013-32 EI, 2.500%, 04/25/2033 | | | | | 648,387 | | | | | | 0.0 | | |
| Voya Strategic Income | SUMMARY PORTFOLIO OF INVESTMENTS |
| Opportunities Fund | as of March 31, 2020 (continued) |
| Principal Amount† | | | Value | | | Percentage of Net Assets | | |||||||||
| COLLATERALIZED MORTGAGE OBLIGATIONS: (continued) | | |||||||||||||||
| 6,013,955 (7) | | | Fannie Mae REMICS 2013-97 JS, 5.203%, (-1.000*US0001M + 6.150%), 04/25/2038 | | | | $ | 1,108,851 | | | | | | 0.0 | | |
| 13,714,612 (7) | | | Fannie Mae REMICS 2019-15 AI, 4.000%, 04/25/2059 | | | | | 2,081,028 | | | | | | 0.1 | | |
| 29,726,133 (7) | | | Fannie Mae REMICS 2019-17 SA, 5.153%, (-1.000*US0001M + 6.100%), 04/25/2049 | | | | | 6,058,364 | | | | | | 0.2 | | |
| 28,913,769 (7) | | | Fannie Mae REMICS 2019-8 SB, 5.153%, (-1.000*US0001M + 6.100%), 03/25/2049 | | | | | 5,664,150 | | | | | | 0.2 | | |
| 609,562 | | | Fannie Mae Series 2006-11 FA, 1.247%, (US0001M + 0.300%), 03/25/2036 | | | | | 602,178 | | | | | | 0.0 | | |
| 1,700,000 (1) | | | Fannie Mae Connecticut Avenue Securities Trust 2020-SBT1 1M2, 4.513%, (US0001M + 3.650%), 02/25/2040 | | | | | 1,163,334 | | | | | | 0.0 | | |
| 1,000,000 (1) | | | Fannie Mae Connecticut Avenue Securities Trust 2019-R05 1B1, 5.047%, (US0001M + 4.100%), 07/25/2039 | | | | | 545,151 | | | | | | 0.0 | | |
| 1,800,000 (1) | | | Fannie Mae Connecticut Avenue Securities Trust 2020-SBT1 2M2, 4.513%, (US0001M + 3.650%), 02/25/2040 | | | | | 1,231,765 | | | | | | 0.1 | | |
| 915,578 (7) | | | Fannie Mae Interest Strip Series 346 6, 5.000%, 10/25/2033 | | | | | 146,883 | | | | | | 0.0 | | |
| 183,586 | | | Fannie Mae REMICS 2006-46 SP, 20.729%, (-3.667*US0001M + 24.200%), 06/25/2036 | | | | | 276,552 | | | | | | 0.0 | | |
| 615,582 (7) | | | Fannie Mae REMICS 2010-102 DI, 4.000%, 06/25/2029 | | | | | 13,809 | | | | | | 0.0 | | |
| 577,888 (7) | | | Fannie Mae REMICS 2011-48 HI, 4.000%, 10/25/2038 | | | | | 20,638 | | | | | | 0.0 | | |
| 2,045,697 (7) | | | Fannie Mae REMICS 2012-121 DI, 2.500%, 11/25/2027 | | | | | 101,219 | | | | | | 0.0 | | |
| Principal Amount† | | | Value | | | Percentage of Net Assets | | |||||||||
| COLLATERALIZED MORTGAGE OBLIGATIONS: (continued) | | |||||||||||||||
| 5,174,247 (7) | | | Fannie Mae REMICS 2012-148 IB, 3.500%, 01/25/2028 | | | | $ | 393,575 | | | | | | 0.0 | | |
| 2,723,443 (7) | | | Fannie Mae REMICS 2013-137 PI, 5.000%, 10/25/2041 | | | | | 383,792 | | | | | | 0.0 | | |
| 20,308,686 (7) | | | Fannie Mae REMICS 2013-19 JS, 5.253%, (-1.000*US0001M + 6.200%), 10/25/2041 | | | | | 2,593,500 | | | | | | 0.1 | | |
| 2,311,886 (7) | | | Fannie Mae REMICS 2013-2 NI, 4.000%, 02/25/2043 | | | | | 325,689 | | | | | | 0.0 | | |
| 2,902,176 (7) | | | Fannie Mae REMICS 2013-41 BI, 3.000%, 05/25/2028 | | | | | 170,116 | | | | | | 0.0 | | |
| 2,684,107 (7) | | | Fannie Mae REMICS 2013-69 PI, 3.000%, 04/25/2033 | | | | | 214,658 | | | | | | 0.0 | | |
| 12,765,220 (7) | | | Fannie Mae REMICS 2016-19 SB, 5.153%, (-1.000*US0001M + 6.100%), 04/25/2046 | | | | | 2,508,405 | | | | | | 0.1 | | |
| 3,641,274 (7) | | | Fannie Mae REMICS 2016-4 BI, 4.000%, 02/25/2046 | | | | | 589,410 | | | | | | 0.0 | | |
| 2,480,974 (7) | | | Fannie Mae REMICS 2016-61 PI, 4.500%, 01/25/2046 | | | | | 405,437 | | | | | | 0.0 | | |
| 800,000 (1)(5) | | | Flagstar Mortgage Trust 2017-2 A7, 3.500%, 10/25/2047 | | | | | 766,695 | | | | | | 0.0 | | |
| 668,322 (1)(5) | | | Flagstar Mortgage Trust 2018-1 B3, 4.026%, 03/25/2048 | | | | | 614,566 | | | | | | 0.0 | | |
| 4,807,685 (1)(5) | | | Flagstar Mortgage Trust 2018-2 B2, 4.042%, 04/25/2048 | | | | | 4,560,178 | | | | | | 0.2 | | |
| 3,721,058 (1)(5) | | | Flagstar Mortgage Trust 2018-3INV A3, 4.000%, 05/25/2048 | | | | | 3,784,143 | | | | | | 0.2 | | |
| 971,120 (1)(5) | | | Flagstar Mortgage Trust 2018-5 B3, 4.536%, 09/25/2048 | | | | | 891,435 | | | | | | 0.0 | | |
| 675,000 (1)(5) | | | Flagstar Mortgage Trust 2018-6RR 1A7, 4.000%, 10/25/2048 | | | | | 690,640 | | | | | | 0.0 | | |
| Voya Strategic Income | SUMMARY PORTFOLIO OF INVESTMENTS |
| Opportunities Fund | as of March 31, 2020 (continued) |
| Principal Amount† | | | Value | | | Percentage of Net Assets | | |||||||||
| COLLATERALIZED MORTGAGE OBLIGATIONS: (continued) | | |||||||||||||||
| 3,674,581 (1)(5) | | | Flagstar Mortgage Trust 2018-6RR B1, 5.004%, 10/25/2048 | | | | $ | 3,254,344 | | | | | | 0.1 | | |
| 1,490,592 (1)(5) | | | Flagstar Mortgage Trust 2019-2 B1, 4.184%, 12/25/2049 | | | | | 1,317,639 | | | | | | 0.1 | | |
| 2,086,829 (1)(5) | | | Flagstar Mortgage Trust 2019-2 B2, 4.184%, 12/25/2049 | | | | | 1,721,032 | | | | | | 0.1 | | |
| 3,860,690 (1)(5) | | | Flagstar Mortgage Trust 2018-4 B3, 4.322%, 07/25/2048 | | | | | 3,558,428 | | | | | | 0.1 | | |
| 3,495,248 (1)(5) | | | Flagstar Mortgage Trust 2020-1NV B2A, 4.356%, 03/25/2050 | | | | | 3,023,043 | | | | | | 0.1 | | |
| 3,000,000 (1)(5) | | | Flagstar Mortgage Trust 2020-1NV B3, 4.356%, 03/25/2050 | | | | | 2,567,231 | | | | | | 0.1 | | |
| 1,645,076 (7) | | | Freddie Mac 2009-70 PS, 5.803%, (-1.000*US0001M + 6.750%), 01/25/2037 | | | | | 416,504 | | | | | | 0.0 | | |
| 260,941 (7) | | | Freddie Mac 2524 SH, 6.795%, (-1.000*US0001M + 7.500%), 11/15/2032 | | | | | 27,537 | | | | | | 0.0 | | |
| 442,042 (7) | | | Freddie Mac 2525 SM, 7.295%, (-1.000*US0001M + 8.000%), 02/15/2032 | | | | | 108,403 | | | | | | 0.0 | | |
| 425,625 (7) | | | Freddie Mac 2981 CS, 6.015%, (-1.000*US0001M + 6.720%), 05/15/2035 | | | | | 82,847 | | | | | | 0.0 | | |
| 236,955 (7) | | | Freddie Mac 2989 HS, 6.445%, (-1.000*US0001M + 7.150%), 08/15/2034 | | | | | 112,562 | | | | | | 0.0 | | |
| 230,684 (7) | | | Freddie Mac 3018 SM, 6.495%, (-1.000*US0001M + 7.200%), 08/15/2035 | | | | | 55,349 | | | | | | 0.0 | | |
| 2,251,728 (7) | | | Freddie Mac 3222 SN, 5.895%, (-1.000*US0001M + 6.600%), 09/15/2036 | | | | | 477,869 | | | | | | 0.0 | | |
| 410,018 (5)(7) | | | Freddie Mac 324 144, 6.000%, 06/15/2039 | | | | | 80,087 | | | | | | 0.0 | | |
| Principal Amount† | | | Value | | | Percentage of Net Assets | | |||||||||
| COLLATERALIZED MORTGAGE OBLIGATIONS: (continued) | | |||||||||||||||
| 828,028 (7) | | | Freddie Mac 3523 SA, 5.295%, (-1.000*US0001M + 6.000%), 09/15/2036 | | | | $ | 171,718 | | | | | | 0.0 | | |
| 707,221 (7) | | | Freddie Mac 3582 MS, 5.445%, (-1.000*US0001M + 6.150%), 10/15/2039 | | | | | 155,342 | | | | | | 0.0 | | |
| 1,108,650 (7) | | | Freddie Mac 3688 BI, 5.000%, 07/15/2040 | | | | | 185,137 | | | | | | 0.0 | | |
| 4,593,134 (7) | | | Freddie Mac 4186 IA, 3.000%, 03/15/2033 | | | | | 356,638 | | | | | | 0.0 | | |
| 171,995 (7) | | | Freddie Mac 4333 AI, 5.500%, 02/15/2044 | | | | | 27,934 | | | | | | 0.0 | | |
| 8,274,433 (7) | | | Freddie Mac 4813 IO, 5.500%, 08/15/2048 | | | | | 1,660,869 | | | | | | 0.1 | | |
| 124,584 (7) | | | Freddie Mac REMIC Trust 2266 S, 7.845%, (-1.000*US0001M + 8.550%), 11/15/2030 | | | | | 24,774 | | | | | | 0.0 | | |
| 205,291 (7) | | | Freddie Mac REMIC Trust 2374 S, 7.395%, (-1.000*US0001M + 8.100%), 06/15/2031 | | | | | 50,819 | | | | | | 0.0 | | |
| 114,261 (7) | | | Freddie Mac REMIC Trust 2417 SY, 7.695%, (-1.000*US0001M + 8.400%), 12/15/2031 | | | | | 30,249 | | | | | | 0.0 | | |
| 227,979 (7) | | | Freddie Mac REMIC Trust 2577 SA, 6.745%, (-1.000*US0001M + 7.450%), 02/15/2033 | | | | | 55,621 | | | | | | 0.0 | | |
| 1,631 | | | Freddie Mac REMIC Trust 2973 SB, 15.750%, (-3.667*US0001M + 18.333%), 05/15/2035 | | | | | 1,642 | | | | | | 0.0 | | |
| 109,965 (7) | | | Freddie Mac REMIC Trust 2981 SU, 7.095%, (-1.000*US0001M + 7.800%), 05/15/2030 | | | | | 25,662 | | | | | | 0.0 | | |
| 167,386 | | | Freddie Mac REMIC Trust 3031 BP, 8.000%, (-6.723*US0001M + 44.975%), 08/15/2035 | | | | | 190,893 | | | | | | 0.0 | | |
| 753,101 (7) | | | Freddie Mac REMIC Trust 3049 PI, 5.945%, (-1.000*US0001M + 6.650%), 10/15/2035 | | | | | 169,564 | | | | | | 0.0 | | |
| Voya Strategic Income | SUMMARY PORTFOLIO OF INVESTMENTS |
| Opportunities Fund | as of March 31, 2020 (continued) |
| Principal Amount† | | | Value | | | Percentage of Net Assets | | |||||||||
| COLLATERALIZED MORTGAGE OBLIGATIONS: (continued) | | |||||||||||||||
| 61,296 | | | Freddie Mac REMIC Trust 3085 SK, 57.544%, (-12.000*US0001M + 66.000%), 12/15/2035 | | | | $ | 200,340 | | | | | | 0.0 | | |
| 84,019 (8) | | | Freddie Mac REMIC Trust 3151 PO, 0.000%, 05/15/2036 | | | | | 78,941 | | | | | | 0.0 | | |
| 115,017 (7) | | | Freddie Mac REMIC Trust 3590 PI, 6.000%, 07/15/2039 | | | | | 3,345 | | | | | | 0.0 | | |
| 211,787 (7) | | | Freddie Mac REMIC Trust 3624 TS, 4.095%, (-1.000*US0001M + 4.800%), 01/15/2040 | | | | | 32,561 | | | | | | 0.0 | | |
| 332,480 (7) | | | Freddie Mac REMIC Trust 4261 ID, 6.500%, 06/15/2032 | | | | | 46,303 | | | | | | 0.0 | | |
| 1,155,590 (7) | | | Freddie Mac REMIC Trust 4287 CI, 4.500%, 07/15/2041 | | | | | 128,703 | | | | | | 0.0 | | |
| 2,025,894 (7) | | | Freddie Mac REMICS 2781 SB, 6.445%, (-1.000*US0001M + 7.150%), 04/15/2034 | | | | | 456,394 | | | | | | 0.0 | | |
| 658,409 | | | Freddie Mac REMICS 2921 PF, 1.055%, (US0001M + 0.350%), 01/15/2035 | | | | | 650,654 | | | | | | 0.0 | | |
| 4,924,872 (7) | | | Freddie Mac REMICS 3128 JI, 5.925%, (-1.000*US0001M + 6.630%), 03/15/2036 | | | | | 1,210,899 | | | | | | 0.1 | | |
| 20,481,376 (7) | | | Freddie Mac REMICS 4120 TI, 2.500%, 10/15/2027 | | | | | 1,095,100 | | | | | | 0.1 | | |
| 10,035,967 (7) | | | Freddie Mac REMICS 4182 IL, 3.000%, 03/15/2028 | | | | | 668,795 | | | | | | 0.0 | | |
| 47,452,501 (7) | | | Freddie Mac REMICS 4273 PS, 5.395%, (-1.000*US0001M + 6.100%), 11/15/2043 | | | | | 9,975,669 | | | | | | 0.4 | | |
| 3,954,947 (7) | | | Freddie Mac REMICS 4290 EI, 5.000%, 12/15/2043 | | | | | 566,289 | | | | | | 0.0 | | |
| 1,260,530 | | | Freddie Mac REMICS Trust 3740 FB, 1.205%, (US0001M + 0.500%), 10/15/2040 | | | | | 1,248,827 | | | | | | 0.1 | | |
| Principal Amount† | | | Value | | | Percentage of Net Assets | | |||||||||
| COLLATERALIZED MORTGAGE OBLIGATIONS: (continued) | | |||||||||||||||
| 3,300,000 (1) | | | Freddie Mac STACR Trust 2018-DNA2 M2, 3.097%, (US0001M + 2.150%), 12/25/2030 | | | | $ | 2,725,735 | | | | | | 0.1 | | |
| 2,200,000 (1) | | | Freddie Mac STACR Trust 2018-DNA3 M2, 3.047%, (US0001M + 2.100%), 09/25/2048 | | | | | 1,838,047 | | | | | | 0.1 | | |
| 2,000,000 (1) | | | Freddie Mac Stacr Trust 2018-HQA2 M2, 3.247%, (US0001M + 2.300%), 10/25/2048 | | | | | 1,657,474 | | | | | | 0.1 | | |
| 1,502,435 (7) | | | Freddie Mac Strips Series 224 IO, 6.000%, 03/01/2033 | | | | | 321,606 | | | | | | 0.0 | | |
| 767,141 (7) | | | Freddie Mac Strips Series 237 S23, 6.395%, (-1.000*US0001M + 7.100%), 05/15/2036 | | | | | 177,737 | | | | | | 0.0 | | |
| 1,126,716 (7) | | | Freddie Mac Strips Series 260 33, 4.000%, 05/15/2039 | | | | | 126,980 | | | | | | 0.0 | | |
| 1,092,445 | | | Freddie Mac Structured Agency Credit Risk Debt Notes 2014-DN3 M3, 4.947%, (US0001M + 4.000%), 08/25/2024 | | | | | 1,048,626 | | | | | | 0.0 | | |
| 1,200,000 | | | Freddie Mac Structured Agency Credit Risk Debt Notes 2015-DNA3 M3, 5.647%, (US0001M + 4.700%), 04/25/2028 | | | | | 1,116,484 | | | | | | 0.1 | | |
| 487,675 | | | Freddie Mac Structured Agency Credit Risk Debt Notes 2015-HQA1 M3, 5.647%, (US0001M + 4.700%), 03/25/2028 | | | | | 466,961 | | | | | | 0.0 | | |
| 6,200,000 | | | Freddie Mac Structured Agency Credit Risk Debt Notes 2016-DNA1 M3, 6.497%, (US0001M + 5.550%), 07/25/2028 | | | | | 6,043,896 | | | | | | 0.2 | | |
| 4,665,000 | | | Freddie Mac Structured Agency Credit Risk Debt Notes 2016-HQA2 M3, 6.097%, (US0001M + 5.150%), 11/25/2028 | | | | | 4,477,353 | | | | | | 0.2 | | |
| Voya Strategic Income | SUMMARY PORTFOLIO OF INVESTMENTS |
| Opportunities Fund | as of March 31, 2020 (continued) |
| Principal Amount† | | | Value | | | Percentage of Net Assets | | |||||||||
| COLLATERALIZED MORTGAGE OBLIGATIONS: (continued) | | |||||||||||||||
| 500,000 | | | Freddie Mac Structured Agency Credit Risk Debt Notes 2016-HQA3 M3, 4.797%, (US0001M + 3.850%), 03/25/2029 | | | | $ | 451,913 | | | | | | 0.0 | | |
| 7,910,000 | | | Freddie Mac Structured Agency Credit Risk Debt Notes 2017-DNA2 M2, 4.397%, (US0001M + 3.450%), 10/25/2029 | | | | | 7,153,839 | | | | | | 0.3 | | |
| 2,750,000 | | | Freddie Mac Structured Agency Credit Risk Debt Notes 2017-DNA3 M2, 3.447%, (US0001M + 2.500%), 03/25/2030 | | | | | 2,404,852 | | | | | | 0.1 | | |
| 8,800,000 | | | Freddie Mac Structured Agency Credit Risk Debt Notes 2017-HQA1 M2, 4.497%, (US0001M + 3.550%), 08/25/2029 | | | | | 6,996,225 | | | | | | 0.3 | | |
| 5,550,000 | | | Freddie Mac Structured Agency Credit Risk Debt Notes 2017-HQA2 M2, 3.597%, (US0001M + 2.650%), 12/25/2029 | | | | | 4,873,565 | | | | | | 0.2 | | |
| 3,592,626 | | | Freddie Mac Structured Agency Credit Risk Debt Notes 2017-HQA3 M2, 3.297%, (US0001M + 2.350%), 04/25/2030 | | | | | 3,127,529 | | | | | | 0.1 | | |
| 1,000,000 | | | Freddie Mac Structured Agency Credit Risk Debt Notes 2018-DNA1 M2, 2.747%, (US0001M + 1.800%), 07/25/2030 | | | | | 832,272 | | | | | | 0.0 | | |
| 3,277,189 | | | Freddie Mac Structured Agency Credit Risk Debt Notes 2018-HQA1 M2, 3.247%, (US0001M + 2.300%), 09/25/2030 | | | | | 2,797,950 | | | | | | 0.1 | | |
| 5,600,000 (1) | | | Freddie Mac Structured Agency Credit Risk Debt Notes 2019-DNA1 M2, 3.597%, (US0001M + 2.650%), 01/25/2049 | | | | | 5,000,765 | | | | | | 0.2 | | |
| 10,100,000 (1) | | | Freddie Mac Structured Agency Credit Risk Debt Notes 2019-HQA2 M2, 2.997%, (US0001M + 2.050%), 04/25/2049 | | | | | 8,481,248 | | | | | | 0.3 | | |
| Principal Amount† | | | Value | | | Percentage of Net Assets | | |||||||||
| COLLATERALIZED MORTGAGE OBLIGATIONS: (continued) | | |||||||||||||||
| 2,346,192 (7) | | | Freddie Mac REMICS 3298 S, 5.405%, (-1.000*US0001M + 6.110%), 04/15/2037 | | | | $ | 501,270 | | | | | | 0.0 | | |
| 95,162 (7) | | | Freddie Mac REMICS 3759 DI, 4.000%, 10/15/2029 | | | | | 1,006 | | | | | | 0.0 | | |
| 268,933 (7) | | | Freddie Mac REMICS 3763 AI, 3.500%, 06/15/2025 | | | | | 6,445 | | | | | | 0.0 | | |
| 2,392,428 (7) | | | Freddie Mac REMICS 3851 PI, 4.000%, 08/15/2038 | | | | | 50,476 | | | | | | 0.0 | | |
| 6,204,047 (7) | | | Freddie Mac REMICS 4097 IC, 2.500%, 08/15/2027 | | | | | 305,636 | | | | | | 0.0 | | |
| 1,558,271 (7) | | | Freddie Mac REMICS 4116 IL, 4.500%, 05/15/2042 | | | | | 245,563 | | | | | | 0.0 | | |
| 2,978,103 (7) | | | Freddie Mac REMICS 4136 QI, 3.000%, 11/15/2032 | | | | | 218,526 | | | | | | 0.0 | | |
| 2,224,229 (7) | | | Freddie Mac REMICS 4143 IK, 4.000%, 10/15/2041 | | | | | 167,111 | | | | | | 0.0 | | |
| 2,225,854 (7) | | | Freddie Mac REMICS 4153 YI, 3.000%, 09/15/2042 | | | | | 110,229 | | | | | | 0.0 | | |
| 3,785,716 (7) | | | Freddie Mac REMICS 4157 IH, 3.500%, 01/15/2043 | | | | | 442,536 | | | | | | 0.0 | | |
| 2,562,484 (7) | | | Freddie Mac REMICS 4162 DI, 2.000%, 02/15/2028 | | | | | 108,876 | | | | | | 0.0 | | |
| 2,009,868 (7) | | | Freddie Mac REMICS 4266 LI, 3.500%, 06/15/2028 | | | | | 103,987 | | | | | | 0.0 | | |
| 1,046,048 | | | Freddie Mac REMICS 4385 LS, 6.170%, (-2.333*US0001M + 9.333%), 07/15/2037 | | | | | 1,435,918 | | | | | | 0.1 | | |
| 4,155,622 (7) | | | Freddie Mac REMICS 4494 LI, 5.000%, 12/15/2043 | | | | | 517,328 | | | | | | 0.0 | | |
| 11,458,428 (7) | | | Freddie Mac REMICS 4618 SA, 5.295%, (-1.000*US0001M + 6.000%), 09/15/2046 | | | | | 2,280,237 | | | | | | 0.1 | | |
| Voya Strategic Income | SUMMARY PORTFOLIO OF INVESTMENTS |
| Opportunities Fund | as of March 31, 2020 (continued) |
| Principal Amount† | | | Value | | | Percentage of Net Assets | | |||||||||
| COLLATERALIZED MORTGAGE OBLIGATIONS: (continued) | | |||||||||||||||
| 4,070,428 (7) | | | Freddie Mac REMICS 4708 KI, 4.500%, 11/15/2046 | | | | $ | 561,471 | | | | | | 0.0 | | |
| 54,616,638 (7) | | | Freddie Mac REMICS 4903 NS, 5.395%, (-1.000*US0001M + 6.100%), 08/25/2049 | | | | | 10,518,449 | | | | | | 0.4 | | |
| 26,985,830 (7) | | | Freddie Mac REMICS 4909 SJ, 5.345%, (-1.000*US0001M + 6.050%), 09/25/2049 | | | | | 4,634,268 | | | | | | 0.2 | | |
| 8,859,663 (7) | | | Freddie Mac REMICS 4910 SD, 5.345%, (-1.000*US0001M + 6.050%), 06/15/2049 | | | | | 1,682,004 | | | | | | 0.1 | | |
| 25,939,171 (7) | | | Freddie Mac REMICS 4910 SH, 5.345%, (-1.000*US0001M + 6.050%), 09/25/2049 | | | | | 5,122,203 | | | | | | 0.2 | | |
| 36,329,521 (7) | | | Freddie Mac REMICS 4924 SY, 5.345%, (-1.000*US0001M + 6.050%), 10/25/2049 | | | | | 6,219,937 | | | | | | 0.2 | | |
| 2,000,000 (1) | | | Freddie Mac STACR Remic Trust 2020-DNA2 M2, 2.797%, (US0001M + 1.850%), 02/25/2050 | | | | | 1,301,113 | | | | | | 0.1 | | |
| 6,000,000 (1) | | | Freddie Mac STACR REMIC Trust 2020-HQA1 M2, 2.847%, (US0001M + 1.900%), 01/25/2050 | | | | | 3,833,652 | | | | | | 0.2 | | |
| 3,069,110 (7) | | | Freddie Mac Strips 287 IO, 3.000%, 10/15/2027 | | | | | 192,848 | | | | | | 0.0 | | |
| 2,840,000 | | | Freddie Mac Structured Agency Credit Risk Debt Notes 2017-DNA1 M2, 4.197%, (US0001M + 3.250%), 07/25/2029 | | | | | 2,536,921 | | | | | | 0.1 | | |
| 2,465,199 (1)(5) | | | Galton Funding Mortgage Trust 2019-1 B1, 4.250%, 02/25/2059 | | | | | 2,235,603 | | | | | | 0.1 | | |
| Principal Amount† | | | Value | | | Percentage of Net Assets | | |||||||||
| COLLATERALIZED MORTGAGE OBLIGATIONS: (continued) | | |||||||||||||||
| 1,972,159 (1)(5) | | | Galton Funding Mortgage Trust 2019-1 B2, 4.500%, 02/25/2059 | | | | $ | 1,853,971 | | | | | | 0.1 | | |
| 659,015 (1)(5) | | | Galton Funding Mortgage Trust 2017-2 A21, 4.000%, 06/25/2059 | | | | | 648,113 | | | | | | 0.0 | | |
| 1,644,892 (1)(5) | | | Galton Funding Mortgage Trust 2018-2 B2, 4.750%, 10/25/2058 | | | | | 1,580,105 | | | | | | 0.1 | | |
| 6,100,682 (7) | | | Ginnie Mae 2007-59 SC, 5.727%, (-1.000*US0001M + 6.500%), 07/20/2037 | | | | | 1,369,462 | | | | | | 0.1 | | |
| 230,824 (7) | | | Ginnie Mae 2011-101 EI, 6.000%, (-19.355*US0001M + 109.161%), 10/16/2039 | | | | | 57,434 | | | | | | 0.0 | | |
| 37,691,753 (7) | | | Ginnie Mae 2013-130 SB, 3.469%, (-1.000*US0001M + 5.050%), 09/16/2043 | | | | | 6,184,101 | | | | | | 0.2 | | |
| 541,603 (7) | | | Ginnie Mae Series 2008-40 SA, 5.695%, (-1.000*US0001M + 6.400%), 05/16/2038 | | | | | 118,000 | | | | | | 0.0 | | |
| 952,224 (7) | | | Ginnie Mae Series 2009-116 SJ, 5.775%, (-1.000*US0001M + 6.480%), 12/16/2039 | | | | | 231,484 | | | | | | 0.0 | | |
| 932,887 (7) | | | Ginnie Mae Series 2010-4 SL, 5.695%, (-1.000*US0001M + 6.400%), 01/16/2040 | | | | | 205,901 | | | | | | 0.0 | | |
| 248,626 (7) | | | Ginnie Mae Series 2010-98 QS, 5.827%, (-1.000*US0001M + 6.600%), 01/20/2040 | | | | | 23,471 | | | | | | 0.0 | | |
| Voya Strategic Income | SUMMARY PORTFOLIO OF INVESTMENTS |
| Opportunities Fund | as of March 31, 2020 (continued) |
| Principal Amount† | | | Value | | | Percentage of Net Assets | | |||||||||
| COLLATERALIZED MORTGAGE OBLIGATIONS: (continued) | | |||||||||||||||
| 2,519,968 (7) | | | Ginnie Mae Series 2011-101 BI, 0.650%, (-1.000*US0001M + 6.650%), 11/20/2037 | | | | $ | 57,668 | | | | | | 0.0 | | |
| 7,687,663 (7) | | | Ginnie Mae Series 2011-25 AS, 5.287%, (-1.000*US0001M + 6.060%), 02/20/2041 | | | | | 1,573,150 | | | | | | 0.1 | | |
| 48,391 (7) | | | Ginnie Mae Series 2012-149 BI, 3.500%, 10/20/2041 | | | | | 3,258 | | | | | | 0.0 | | |
| 3,780,021 (7) | | | Ginnie Mae Series 2013-103 DS, 5.377%, (-1.000*US0001M + 6.150%), 07/20/2043 | | | | | 715,801 | | | | | | 0.0 | | |
| 154,502 (7) | | | Ginnie Mae Series 2013-134 DS, 5.327%, (-1.000*US0001M + 6.100%), 09/20/2043 | | | | | 29,133 | | | | | | 0.0 | | |
| 349,939 (7) | | | Ginnie Mae Series 2013-44 LI, 4.500%, 01/16/2043 | | | | | 54,815 | | | | | | 0.0 | | |
| 31,511,530 (7) | | | Ginnie Mae Series 2015-144 SA, 5.427%, (-1.000*US0001M + 6.200%), 10/20/2045 | | | | | 6,933,898 | | | | | | 0.3 | | |
| 5,661,837 (7) | | | Ginnie Mae Series 2015-69 IL, 0.200%, (-1.000*US0001M + 6.700%), 07/20/2034 | | | | | 41,260 | | | | | | 0.0 | | |
| 311,282 (7) | | | Ginnie Mae Series 2015-98 IU, 4.000%, 08/20/2044 | | | | | 45,638 | | | | | | 0.0 | | |
| 948,371 (7) | | | Ginnie Mae Series 2016-8 PI, 4.000%, 10/20/2044 | | | | | 105,754 | | | | | | 0.0 | | |
| 11,683,186 (7) | | | Ginnie Mae Series 2018-153 SQ, 5.427%, (-1.000*US0001M + 6.200%), 11/20/2048 | | | | | 2,477,154 | | | | | | 0.1 | | |
| Principal Amount† | | | Value | | | Percentage of Net Assets | | |||||||||
| COLLATERALIZED MORTGAGE OBLIGATIONS: (continued) | | |||||||||||||||
| 1,567,310 (7) | | | Ginnie Mae Series 2010-143 JI, 4.000%, 08/16/2039 | | | | $ | 128,212 | | | | | | 0.0 | | |
| 2,025,211 (7) | | | Ginnie Mae Series 2010-143 PI, 4.000%, 11/16/2037 | | | | | 40,859 | | | | | | 0.0 | | |
| 2,466,538 (7) | | | Ginnie Mae Series 2010-4 IP, 5.000%, 01/16/2039 | | | | | 279,100 | | | | | | 0.0 | | |
| 2,750,000 (7) | | | Ginnie Mae Series 2011-124 KI, 4.000%, 08/20/2039 | | | | | 311,184 | | | | | | 0.0 | | |
| 4,216,521 (7) | | | Ginnie Mae Series 2012-148 IP, 3.500%, 04/20/2041 | | | | | 324,597 | | | | | | 0.0 | | |
| 3,802,598 (7) | | | Ginnie Mae Series 2012-39 PI, 4.000%, 03/16/2042 | | | | | 508,499 | | | | | | 0.0 | | |
| 1,931,579 (7) | | | Ginnie Mae Series 2013-81 IO, 4.500%, 01/16/2040 | | | | | 182,267 | | | | | | 0.0 | | |
| 4,851,119 (7) | | | Ginnie Mae Series 2014-84 PI, 4.500%, 04/20/2043 | | | | | 500,032 | | | | | | 0.0 | | |
| 4,863,304 (7) | | | Ginnie Mae Series 2015-132 BI, 4.000%, 11/20/2044 | | | | | 551,544 | | | | | | 0.0 | | |
| 34,439,345 (7) | | | Ginnie Mae Series 2018-93 SJ, 5.427%, (-1.000*US0001M + 6.200%), 07/20/2048 | | | | | 5,376,367 | | | | | | 0.2 | | |
| 896,870 (7) | | | Ginnie Mae Series 2019-111 TI, 5.000%, 09/20/2049 | | | | | 105,257 | | | | | | 0.0 | | |
| 194,549 (7) | | | Ginnie Mae Series 2019-86 GI, 6.500%, 07/20/2049 | | | | | 35,994 | | | | | | 0.0 | �� | |
| 1,365,719 (7) | | | Ginnie Mae Series 2019-86 HI, 5.500%, 07/20/2049 | | | | | 185,029 | | | | | | 0.0 | | |
| 22,660,142 (7) | | | Ginnie Mae Series 2019-89 SC, 5.327%, (-1.000*US0001M + 6.100%), 07/20/2049 | | | | | 4,768,394 | | | | | | 0.2 | | |
| Voya Strategic Income | SUMMARY PORTFOLIO OF INVESTMENTS |
| Opportunities Fund | as of March 31, 2020 (continued) |
| Principal Amount† | | | Value | | | Percentage of Net Assets | | |||||||||
| COLLATERALIZED MORTGAGE OBLIGATIONS: (continued) | | |||||||||||||||
| 1,667,319 (1)(5) | | | GS Mortage-Backed Securities Trust 2020-PJ1 A1, 3.500%, 05/01/2050 | | | | $ | 1,696,381 | | | | | | 0.1 | | |
| 2,648,094 (1)(5) | | | GS Mortage-Backed Securities Trust 2020-PJ1 A4, 3.500%, 05/01/2050 | | | | | 2,682,374 | | | | | | 0.1 | | |
| 1,700,000 (1)(5) | | | GS Mortage-Backed Securities Trust 2020-PJ1 A8, 3.500%, 05/01/2050 | | | | | 1,616,791 | | | | | | 0.1 | | |
| 3,770,367 (1)(5) | | | GS Mortage-Backed Securities Trust 2020-PJ1 B3, 3.694%, 05/01/2050 | | | | | 2,716,577 | | | | | | 0.1 | | |
| 804,775 (1)(5) | | | GS Mortgage-Backed Securities Corp. Trust 2019-PJ1 A1, 4.000%, 08/25/2049 | | | | | 815,328 | | | | | | 0.0 | | |
| 1,803,937 (1)(5) | | | GS Mortgage-Backed Securities Corp. Trust 2019-PJ1 B3, 4.333%, 08/25/2049 | | | | | 1,753,488 | | | | | | 0.1 | | |
| 1,198,104 (1)(5) | | | GS Mortgage-Backed Securities Corp. Trust 2019-PJ2 A1, 4.000%, 11/25/2049 | | | | | 1,216,211 | | | | | | 0.1 | | |
| 3,971,676 (1)(5) | | | GS Mortgage-Backed Securities Corp. Trust 2019-PJ2 B2, 4.496%, 11/25/2049 | | | | | 3,843,416 | | | | | | 0.2 | | |
| 3,950,934 (1)(5) | | | GS Mortgage-Backed Securities Corp. Trust 2019-PJ2 B3, 4.496%, 11/25/2049 | | | | | 3,646,586 | | | | | | 0.1 | | |
| 495,890 (1)(5) | | | GS Mortgage-Backed Securities Corp. Trust 2019-PJ3 B1, 4.095%, 03/25/2050 | | | | | 490,237 | | | | | | 0.0 | | |
| 495,890 (1)(5) | | | GS Mortgage-Backed Securities Corp. Trust 2019-PJ3 B2, 4.095%, 03/25/2050 | | | | | 464,934 | | | | | | 0.0 | | |
| 504,270 | | | HarborView Mortgage Loan Trust 2006-14 2A1A, 0.900%, (US0001M + 0.150%), 01/25/2047 | | | | | 399,544 | | | | | | 0.0 | | |
| Principal Amount† | | | Value | | | Percentage of Net Assets | | |||||||||
| COLLATERALIZED MORTGAGE OBLIGATIONS: (continued) | | |||||||||||||||
| 591,641 | | | HarborView Mortgage Loan Trust 2007-5 A1A, 0.940%, (US0001M + 0.190%), 09/19/2037 | | | | $ | 484,526 | | | | | | 0.0 | | |
| 2,734 | | | HomeBanc Mortgage Trust 2004-1 2A, 1.807%, (US0001M + 0.860%), 08/25/2029 | | | | | 2,455 | | | | | | 0.0 | | |
| 20,236 | | | HomeBanc Mortgage Trust 2005-3 A2, 1.257%, (US0001M + 0.310%), 07/25/2035 | | | | | 19,895 | | | | | | 0.0 | | |
| 1,785,675 (1)(5) | | | Homeward Opportunities Fund I Trust 2019-2 A3, 3.007%, 09/25/2059 | | | | | 1,728,557 | | | | | | 0.1 | | |
| 83,952 | | | IndyMac INDX Mortgage Loan Trust 2006-AR2 1A1B, 1.157%, (US0001M + 0.210%), 04/25/2046 | | | | | 67,903 | | | | | | 0.0 | | |
| 882,517 (1)(5) | | | JP Morgan Mortgage Trust 2014-5 B3, 2.959%, 10/25/2029 | | | | | 740,403 | | | | | | 0.0 | | |
| 2,967,609 (1)(5) | | | JP Morgan Mortgage Trust 2019-6 B1, 4.250%, 12/25/2049 | | | | | 2,718,786 | | | | | | 0.1 | | |
| 1,781,169 (1)(5) | | | JP Morgan Mortgage Trust 2019-7 B2A, 3.220%, 02/25/2050 | | | | | 1,536,142 | | | | | | 0.1 | | |
| 992,061 (1)(5) | | | JP Morgan Mortgage Trust 2019-8 B3A, 3.476%, 03/25/2050 | | | | | 743,425 | | | | | | 0.0 | | |
| 4,188,838 (1)(5) | | | JP Morgan Mortgage Trust 2019-INV3 B3, 4.556%, 05/25/2050 | | | | | 3,508,182 | | | | | | 0.1 | | |
| 3,703,320 (1)(5) | | | JP Morgan Mortgage Trust 2020-LTV1 A15, 3.500%, 06/25/2050 | | | | | 3,760,360 | | | | | | 0.2 | | |
| 4,900,000 (1)(5) | | | JP Morgan Mortgage Trust 2020-LTV1 A5, 3.500%, 06/25/2050 | | | | | 4,788,999 | | | | | | 0.2 | | |
| 1,181,834 (1)(5) | | | JP Morgan Trust 2015-3 B3, 3.664%, 05/25/2045 | | | | | 1,111,775 | | | | | | 0.0 | | |
| 1,316,365 (1)(5) | | | J.P. Morgan Mortgage Trust 2019-2 A3, 4.000%, 08/25/2049 | | | | | 1,345,401 | | | | | | 0.0 | | |
| Voya Strategic Income | SUMMARY PORTFOLIO OF INVESTMENTS |
| Opportunities Fund | as of March 31, 2020 (continued) |
| Principal Amount† | | | Value | | | Percentage of Net Assets | | |||||||||
| COLLATERALIZED MORTGAGE OBLIGATIONS: (continued) | | |||||||||||||||
| 1,114,105 (1)(5) | | | J.P. Morgan Mortgage Trust 2019-2 B1, 4.651%, 08/25/2049 | | | | $ | 1,139,207 | | | | | | 0.0 | | |
| 2,699,374 (1)(5) | | | J.P. Morgan Mortgage Trust 2019-2 B2, 4.651%, 08/25/2049 | | | | | 2,517,042 | | | | | | 0.1 | | |
| 3,210,261 (1)(5) | | | J.P. Morgan Mortgage Trust 2019-LTV1 A3, 4.000%, 06/25/2049 | | | | | 3,289,706 | | | | | | 0.1 | | |
| 2,356,330 (1)(5) | | | J.P. Morgan Mortgage Trust 2019-LTV1 B1, 4.900%, 06/25/2049 | | | | | 2,382,587 | | | | | | 0.1 | | |
| 1,865,428 (1)(5) | | | J.P. Morgan Mortgage Trust 2019-LTV1 B2, 4.900%, 06/25/2049 | | | | | 1,768,881 | | | | | | 0.1 | | |
| 2,130,740 (5) | | | JP Morgan Mortgage Trust 2005-A4 B1, 4.301%, 07/25/2035 | | | | | 1,838,492 | | | | | | 0.1 | | |
| 90,967 | | | JP Morgan Mortgage Trust 2005-S3 1A10, 6.000%, 01/25/2036 | | | | | 63,454 | | | | | | 0.0 | | |
| 218,048 | | | JP Morgan Mortgage Trust 2006-S2 1A18, 6.000%, 07/25/2036 | | | | | 163,923 | | | | | | 0.0 | | |
| 529,187 | | | JP Morgan Mortgage Trust 2006-S3 1A30, 6.500%, 08/25/2036 | | | | | 328,810 | | | | | | 0.0 | | |
| 631,401 (1)(5) | | | JP Morgan Mortgage Trust 2016-1 B3, 3.868%, 05/25/2046 | | | | | 602,959 | | | | | | 0.0 | | |
| 2,095,000 (1)(5) | | | JP Morgan Mortgage Trust 2016-1 B4, 3.868%, 05/25/2046 | | | | | 1,604,730 | | | | | | 0.1 | | |
| 1,916,223 (1)(5) | | | JP Morgan Mortgage Trust 2016-4 A13, 3.500%, 10/25/2046 | | | | | 1,887,707 | | | | | | 0.1 | | |
| 930,744 (1)(5) | | | JP Morgan Mortgage Trust 2017-1 B4, 3.529%, 01/25/2047 | | | | | 846,182 | | | | | | 0.0 | | |
| 3,468,417 (1)(5) | | | JP Morgan Mortgage Trust 2017-3 1A13, 3.500%, 08/25/2047 | | | | | 3,418,054 | | | | | | 0.1 | | |
| 1,515,838 (1)(5) | | | JP Morgan Mortgage Trust 2017-3 B1, 3.834%, 08/25/2047 | | | | | 1,435,326 | | | | | | 0.1 | | |
| 1,122,843 (1)(5) | | | JP Morgan Mortgage Trust 2017-3 B2, 3.834%, 08/25/2047 | | | | | 1,048,159 | | | | | | 0.0 | | |
| 500,000 (1)(5) | | | JP Morgan Mortgage Trust 2017-4 A7, 3.500%, 11/25/2048 | | | | | 474,208 | | | | | | 0.0 | | |
| Principal Amount† | | | Value | | | Percentage of Net Assets | | |||||||||
| COLLATERALIZED MORTGAGE OBLIGATIONS: (continued) | | |||||||||||||||
| 1,944,686 (1)(5) | | | JP Morgan Mortgage Trust 2017-5 B1, 3.147%, 10/26/2048 | | | | $ | 1,692,979 | | | | | | 0.1 | | |
| 572,750 (1)(5) | | | JP Morgan Mortgage Trust 2017-6 B3, 3.818%, 12/25/2048 | | | | | 536,648 | | | | | | 0.0 | | |
| 1,610,382 (1)(5) | | | JP Morgan Mortgage Trust 2017-6 B4, 3.818%, 12/25/2048 | | | | | 1,458,217 | | | | | | 0.1 | | |
| 2,354,332 (1)(5) | | | JP Morgan Mortgage Trust 2018-1 B2, 3.738%, 06/25/2048 | | | | | 2,197,579 | | | | | | 0.1 | | |
| 3,832,820 (1)(5) | | | JP Morgan Mortgage Trust 2018-3 B1, 3.763%, 09/25/2048 | | | | | 3,537,964 | | | | | | 0.1 | | |
| 2,395,513 (1)(5) | | | JP Morgan Mortgage Trust 2018-3 B3, 3.763%, 09/25/2048 | | | | | 2,160,588 | | | | | | 0.1 | | |
| 480,537 (1)(5) | | | JP Morgan Mortgage Trust 2018-4 B1, 3.773%, 10/25/2048 | | | | | 440,898 | | | | | | 0.0 | | |
| 480,537 (1)(5) | | | JP Morgan Mortgage Trust 2018-4 B2, 3.773%, 10/25/2048 | | | | | 435,781 | | | | | | 0.0 | | |
| 1,932,725 (1)(5) | | | JP MORGAN MORTGAGE TRUST 2018-5 A13, 3.500%, 10/25/2048 | | | | | 1,896,089 | | | | | | 0.1 | | |
| 907,975 (1)(5) | | | JP Morgan Mortgage Trust 2018-6 1A10, 3.500%, 12/25/2048 | | | | | 921,977 | | | | | | 0.0 | | |
| 1,920,523 (1)(5) | | | JP Morgan Mortgage Trust 2018-6C B2, 3.950%, 12/25/2048 | | | | | 1,764,426 | | | | | | 0.1 | | |
| 2,431,895 (1)(5) | | | JP Morgan Mortgage Trust 2018-8 A3, 4.000%, 01/25/2049 | | | | | 2,494,740 | | | | | | 0.1 | | |
| 8,330,041 (1)(5) | | | JP Morgan Mortgage Trust 2018-8 B1, 4.202%, 01/25/2049 | | | | | 7,824,601 | | | | | | 0.3 | | |
| 3,882,111 (1)(5) | | | JP Morgan Mortgage Trust 2018-8 B2, 4.202%, 01/25/2049 | | | | | 3,604,569 | | | | | | 0.1 | | |
| 984,730 (1)(5) | | | JP Morgan Mortgage Trust 2018-9 B2, 4.462%, 02/25/2049 | | | | | 947,915 | | | | | | 0.0 | | |
| 1,942,269 (1)(5) | | | JP Morgan Mortgage Trust 2018-9 B3, 4.462%, 02/25/2049 | | | | | 1,836,704 | | | | | | 0.1 | | |
| Voya Strategic Income | SUMMARY PORTFOLIO OF INVESTMENTS |
| Opportunities Fund | as of March 31, 2020 (continued) |
| Principal Amount† | | | Value | | | Percentage of Net Assets | | |||||||||
| COLLATERALIZED MORTGAGE OBLIGATIONS: (continued) | | |||||||||||||||
| 1,527,316 (1)(5) | | | JP Morgan Mortgage Trust 2018-LTV1 B1, 4.773%, 04/25/2049 | | | | $ | 1,533,835 | | | | | | 0.1 | | |
| 2,468,213 (1)(5) | | | JP Morgan Mortgage Trust 2019-1 A3, 4.000%, 05/25/2049 | | | | | 2,516,494 | | | | | | 0.1 | | |
| 1,780,171 (1)(5) | | | JP Morgan Mortgage Trust 2019-3 A3, 4.000%, 09/25/2049 | | | | | 1,809,702 | | | | | | 0.1 | | |
| 6,027,764 (1)(5) | | | JP Morgan Mortgage Trust 2019-5 A3, 4.000%, 11/25/2049 | | | | | 6,185,856 | | | | | | 0.2 | | |
| 2,958,407 (1)(5) | | | JP Morgan Mortgage Trust 2019-5 B1, 4.466%, 11/25/2049 | | | | | 2,981,520 | | | | | | 0.1 | | |
| 4,930,678 (1)(5) | | | JP Morgan Mortgage Trust 2019-5 B2, 4.466%, 11/25/2049 | | | | | 4,688,149 | | | | | | 0.2 | | |
| 1,447,325 (1)(5) | | | JP Morgan Mortgage Trust 2019-6 A3, 3.500%, 12/25/2049 | | | | | 1,475,681 | | | | | | 0.1 | | |
| 6,429,818 (1)(5) | | | JP Morgan Mortgage Trust 2019-6 B2, 4.250%, 12/25/2049 | | | | | 6,155,875 | | | | | | 0.2 | | |
| 989,538 (1)(5) | | | JP Morgan Mortgage Trust 2019-7 B3A, 3.470%, 12/31/2049 | | | | | 853,012 | | | | | | 0.0 | | |
| 4,068,146 (1)(5) | | | JP Morgan Mortgage Trust 2019-8 A15, 3.500%, 03/25/2050 | | | | | 4,091,801 | | | | | | 0.2 | | |
| 3,946,704 (1)(5) | | | JP Morgan Mortgage Trust 2019-INV1 B2, 5.130%, 10/25/2049 | | | | | 3,725,490 | | | | | | 0.1 | | |
| 1,634,963 (1)(5) | | | JP Morgan Mortgage Trust 2019-INV2 A15, 3.500%, 02/25/2050 | | | | | 1,619,177 | | | | | | 0.1 | | |
| 5,035,848 (1)(5) | | | JP Morgan Mortgage Trust 2019-LTV2 A18, 4.000%, 12/25/2049 | | | | | 5,195,835 | | | | | | 0.2 | | |
| 1,950,063 (1)(5) | | | JP Morgan Mortgage Trust 2019-LTV2 B2, 4.824%, 12/25/2049 | | | | | 1,839,226 | | | | | | 0.1 | | |
| 1,976,749 (1)(5) | | | JP Morgan Mortgage Trust 2019-LTV2 B3, 4.824%, 12/25/2049 | | | | | 1,714,964 | | | | | | 0.1 | | |
| 2,773,744 (1)(5) | | | JP Morgan Mortgage Trust 2019-LTV3 B2, 4.571%, 12/31/2049 | | | | | 2,639,122 | | | | | | 0.1 | | |
| 6,456,342 (1)(5) | | | JP Morgan Mortgage Trust 2019-LTV3 B3, 4.571%, 12/31/2049 | | | | | 5,987,955 | | | | | | 0.2 | | |
| Principal Amount† | | | Value | | | Percentage of Net Assets | | |||||||||
| COLLATERALIZED MORTGAGE OBLIGATIONS: (continued) | | |||||||||||||||
| 2,076,342 (1)(5) | | | JP Morgan Trust 2015-3 B4, 3.664%, 05/25/2045 | | | | $ | 1,860,613 | | | | | | 0.1 | | |
| 5,503,234,817 (1)(7) | | | L Street Securities 2017-PM1 XIO, 0.000%, 10/25/2048 | | | | | 5,652,923 | | | | | | 0.2 | | |
| 74,310 | | | Lehman XS Trust Series 2005-5N 1A2, 1.307%, (US0001M + 0.360%), 11/25/2035 | | | | | 54,261 | | | | | | 0.0 | | |
| 706,648 (1)(5) | | | Mello Mortgage Capital Acceptance 2018-MTG2 A1, 4.481%, 10/25/2048 | | | | | 729,500 | | | | | | 0.0 | | |
| 1,091,757 (1)(5) | | | Mello Mortgage Capital Acceptance 2018-MTG2 B1, 4.481%, 10/25/2048 | | | | | 1,108,040 | | | | | | 0.0 | | |
| 655,000 | | | Morgan Stanley Mortgage Loan Trust 2005-5AR 1B1, 2.747%, (US0001M + 1.800%), 09/25/2035 | | | | | 566,265 | | | | | | 0.0 | | |
| 1,264,598 | | | Morgan Stanley Mortgage Loan Trust 2006-9AR A2, 1.097%, (US0001M + 0.150%), 08/25/2036 | | | | | 508,890 | | | | | | 0.0 | | |
| 423,787 (1)(5) | | | New Residential Mortgage Loan Trust 2017-3A B2, 4.750%, 04/25/2057 | | | | | 414,888 | | | | | | 0.0 | | |
| 1,400,000 (1)(5) | | | New Residential Mortgage Loan Trust 2019-NQM2 M1, 4.267%, 04/25/2049 | | | | | 1,317,733 | | | | | | 0.1 | | |
| 922,196 (1)(5) | | | New Residential Mortgage Loan Trust 2019-NQM3 A3, 3.086%, 07/25/2049 | | | | | 906,506 | | | | | | 0.0 | | |
| 1,863,933 (1)(5) | | | OBX 2019-EXP1 1A3 Trust, 4.000%, 01/25/2059 | | | | | 1,862,644 | | | | | | 0.1 | | |
| 768,359 (1)(5) | | | OBX 2019-EXP2 1A3 Trust, 4.000%, 07/25/2059 | | | | | 774,764 | | | | | | 0.0 | | |
| 1,255,832 (1)(5) | | | OBX 2019-EXP3 1A9 Trust, 3.500%, 10/25/2059 | | | | | 1,243,081 | | | | | | 0.0 | | |
| Voya Strategic Income | SUMMARY PORTFOLIO OF INVESTMENTS |
| Opportunities Fund | as of March 31, 2020 (continued) |
| Principal Amount† | | | Value | | | Percentage of Net Assets | | |||||||||
| COLLATERALIZED MORTGAGE OBLIGATIONS: (continued) | | |||||||||||||||
| 2,771,518 (1)(5) | | | OBX 2019-INV2 A25 Trust, 4.000%, 05/27/2049 | | | | $ | 2,841,217 | | | | | | 0.1 | | |
| 1,460,400 (1)(5) | | | OBX 2020-INV1 A21 Trust, 3.500%, 05/25/2049 | | | | | 1,488,012 | | | | | | 0.1 | | |
| 1,000,000 (1)(5) | | | PSMC 2019-3 A12 Trust, 3.500%, 11/25/2049 | | | | | 944,655 | | | | | | 0.0 | | |
| 3,817,424 (1)(5) | | | RCKT Mortgage Trust 2019-1 B1A, 3.929%, 09/25/2049 | | | | | 3,217,797 | | | | | | 0.1 | | |
| 2,478,551 (1)(5) | | | RCKT Mortgage Trust 2019-1 B2A, 3.929%, 09/25/2049 | | | | | 2,034,061 | | | | | | 0.1 | | |
| 3,500,000 (1)(5) | | | RCKT Mortgage Trust 2020-1 A13, 3.000%, 02/25/2050 | | | | | 3,463,345 | | | | | | 0.1 | | |
| 1,648,000 (1)(5) | | | RCKT Mortgage Trust 2020-1 B2A, 3.538%, 02/25/2050 | | | | | 1,292,038 | | | | | | 0.1 | | |
| 2,487,587 (5) | | | Sequoia Mortgage Trust 2013-3 B3, 3.513%, 03/25/2043 | | | | | 2,378,073 | | | | | | 0.1 | | |
| 470,475 (1) | | | Sequoia Mortgage Trust 2013-9 B1, 3.500%, 07/25/2043 | | | | | 452,884 | | | | | | 0.0 | | |
| 2,716,710 (1) | | | Sequoia Mortgage Trust 2013-9 B2, 3.500%, 07/25/2043 | | | | | 2,604,507 | | | | | | 0.1 | | |
| 1,550,157 (1)(5) | | | Sequoia Mortgage Trust 2015-1 B1, 3.875%, 01/25/2045 | | | | | 1,510,540 | | | | | | 0.1 | | |
| 1,202,404 (1)(5) | | | Sequoia Mortgage Trust 2018-6 B1, 4.199%, 07/25/2048 | | | | | 1,148,192 | | | | | | 0.0 | | |
| 767,948 (1)(5) | | | Sequoia Mortgage Trust 2018-CH1 B1B, 4.477%, 02/25/2048 | | | | | 741,600 | | | | | | 0.0 | | |
| 575,961 (1)(5) | | | Sequoia Mortgage Trust 2018-CH1 B2B, 4.477%, 02/25/2048 | | | | | 548,153 | | | | | | 0.0 | | |
| 3,400,000 (1)(5) | | | Sequoia Mortgage Trust 2018-CH4 A13, 4.500%, 10/25/2048 | | | | | 3,341,271 | | | | | | 0.1 | | |
| 1,438,458 (1)(5) | | | Sequoia Mortgage Trust 2019-1 A1, 4.000%, 02/25/2049 | | | | | 1,423,459 | | | | | | 0.0 | | |
| 1,772,197 (1)(5) | | | Sequoia Mortgage Trust 2019-2 B2, 4.246%, 06/25/2049 | | | | | 1,621,940 | | | | | | 0.1 | | |
| Principal Amount† | | | Value | | | Percentage of Net Assets | | |||||||||
| COLLATERALIZED MORTGAGE OBLIGATIONS: (continued) | | |||||||||||||||
| 1,673,307 (1)(5) | | | Sequoia Mortgage Trust 2019-2 B3, 4.246%, 06/25/2049 | | | | $ | 1,470,253 | | | | | | 0.1 | | |
| 4,711,690 (1)(5) | | | Sequoia Mortgage Trust 2019-3 A2, 3.500%, 09/25/2049 | | | | | 4,765,219 | | | | | | 0.2 | | |
| 5,648,795 (1)(5) | | | Sequoia Mortgage Trust 2019-4 A19, 3.500%, 11/25/2049 | | | | | 5,714,830 | | | | | | 0.2 | | |
| 1,916,945 (1)(5) | | | Sequoia Mortgage Trust 2019-5 A19, 3.500%, 12/25/2049 | | | | | 1,953,863 | | | | | | 0.1 | | |
| 2,160,100 (1)(5) | | | Sequoia Mortgage Trust 2019-5 B2, 3.776%, 12/25/2049 | | | | | 1,766,415 | | | | | | 0.1 | | |
| 2,161,093 (1)(5) | | | Sequoia Mortgage Trust 2019-5 B3, 3.776%, 12/25/2049 | | | | | 1,687,069 | | | | | | 0.1 | | |
| 2,654,037 (1)(5) | | | Sequoia Mortgage Trust 2019-CH1 B1B, 5.052%, 03/25/2049 | | | | | 2,522,900 | | | | | | 0.1 | | |
| 981,886 (1)(5) | | | Sequoia Mortgage Trust 2019-CH1 B2B, 5.052%, 03/25/2049 | | | | | 997,097 | | | | | | 0.0 | | |
| 3,166,336 (1)(5) | | | Sequoia Mortgage Trust 2019-CH2 A1, 4.500%, 08/25/2049 | | | | | 3,171,287 | | | | | | 0.1 | | |
| 600,000 (1)(5) | | | Sequoia Mortgage Trust 2019-CH3 A13, 4.000%, 09/25/2049 | | | | | 599,688 | | | | | | 0.0 | | |
| 1,982,564 (1)(5) | | | Sequoia Mortgage Trust 2019-CH3 B1B, 4.534%, 09/25/2049 | | | | | 1,937,732 | | | | | | 0.1 | | |
| 1,598,273 (1)(5) | | | Sequoia Mortgage Trust 2017-1 B2, 3.622%, 02/25/2047 | | | | | 1,507,489 | | | | | | 0.1 | | |
| 959,705 (1)(5) | | | Sequoia Mortgage Trust 2020-1 A1, 3.500%, 02/25/2050 | | | | | 984,412 | | | | | | 0.0 | | |
| 4,318,671 (1)(5) | | | Sequoia Mortgage Trust 2020-1 A19, 3.500%, 02/25/2050 | | | | | 4,411,480 | | | | | | 0.2 | | |
| 1,988,096 (1)(5) | | | Sequoia Mortgage Trust 2020-2 A19, 3.500%, 03/25/2050 | | | | | 2,003,443 | | | | | | 0.1 | | |
| 1,497,524 (1)(5) | | | Sequoia Mortgage Trust 2020-2 B3, 3.675%, 03/25/2050 | | | | | 1,138,003 | | | | | | 0.0 | | |
| Voya Strategic Income | SUMMARY PORTFOLIO OF INVESTMENTS |
| Opportunities Fund | as of March 31, 2020 (continued) |
| Principal Amount† | | | Value | | | Percentage of Net Assets | | |||||||||
| COLLATERALIZED MORTGAGE OBLIGATIONS: (continued) | | |||||||||||||||
| 2,391,864 (1)(5) | | | Shellpoint Co-Originator Trust 2017-2 B2, 3.714%, 10/25/2047 | | | | $ | 2,329,897 | | | | | | 0.1 | | |
| 3,170,852 (1)(5) | | | Shellpoint Co-Originator Trust 2017-2 B3, 3.714%, 10/25/2047 | | | | | 2,921,975 | | | | | | 0.1 | | |
| 3,042,837 (1)(5) | | | Starwood Mortgage Residential Trust 2019-1 A3, 3.299%, 06/25/2049 | | | | | 3,041,122 | | | | | | 0.1 | | |
| 600,000 (1) | | | Verus Securitization Trust 2017-SG1A B1, 3.615%, 11/25/2047 | | | | | 550,016 | | | | | | 0.0 | | |
| 4,000,000 (1)(5) | | | Verus Securitization Trust 2018-1 B1, 3.801%, 01/25/2058 | | | | | 3,639,718 | | | | | | 0.2 | | |
| 2,100,000 (1)(5) | | | Verus Securitization Trust 2018-2 B1, 4.426%, 06/01/2058 | | | | | 1,901,439 | | | | | | 0.1 | | |
| 3,000,000 (1)(5) | | | Verus Securitization Trust 2018-3 M1, 4.595%, 10/25/2058 | | | | | 2,909,971 | | | | | | 0.1 | | |
| 2,489,136 (1)(5) | | | Verus Securitization Trust 2019-1 A2, 3.938%, 02/25/2059 | | | | | 2,418,222 | | | | | | 0.1 | | |
| 3,127,983 (1)(6) | | | Verus Securitization Trust 2019-3 A2, 2.938% (Step Rate @ 3.938% on 0), 07/25/2059 | | | | | 3,008,531 | | | | | | 0.1 | | |
| 3,410,331 (1)(5) | | | Verus Securitization Trust 2019-INV2 A2, 3.117%, 07/25/2059 | | | | | 3,373,595 | | | | | | 0.1 | | |
| 127,745 (5) | | | WaMu Mortgage Pass Through Certificates Series 2006-AR12 2A3, 3.206%, 10/25/2036 | | | | | 103,930 | | | | | | 0.0 | | |
| 261,318 (5) | | | WaMu Mortgage Pass-Through Certificates Series 2004-AR4 A6 Trust, 4.464%, 06/25/2034 | | | | | 233,123 | | | | | | 0.0 | | |
| 1,652,232 (5) | | | WaMu Mortgage Pass-Through Certificates Series 2004-AR7 A6, 4.534%, 07/25/2034 | | | | | 1,547,833 | | | | | | 0.1 | | |
| Principal Amount† | | | Value | | | Percentage of Net Assets | | |||||||||
| COLLATERALIZED MORTGAGE OBLIGATIONS: (continued) | | |||||||||||||||
| 132,866,546 (5) | | | WaMu Mortgage Pass-Through Certificates Series 2005-AR1 X Trust, 1.416%, 01/25/2045 | | | | $ | 4,177,032 | | | | | | 0.2 | | |
| 285,396 (5) | | | WaMu Mortgage Pass-Through Certificates Series 2005-AR10 1A3, 4.121%, 09/25/2035 | | | | | 272,517 | | | | | | 0.0 | | |
| 43,113,306 (5) | | | WaMu Mortgage Pass-Through Certificates Series 2005-AR2 X Trust, 1.394%, 01/25/2045 | | | | | 2,529,807 | | | | | | 0.1 | | |
| 19,502 (5) | | | WaMu Mortgage Pass-Through Certificates Series 2006-AR12 1A1, 3.694%, 10/25/2036 | | | | | 17,200 | | | | | | 0.0 | | |
| 130,360 (5) | | | WaMu Mortgage Pass-Through Certificates Series 2006-AR14 1A3, 3.270%, 11/25/2036 | | | | | 109,741 | | | | | | 0.0 | | |
| 500,986 (5) | | | WaMu Mortgage Pass-Through Certificates Series 2006-AR14 1A4, 3.270%, 11/25/2036 | | | | | 421,746 | | | | | | 0.0 | | |
| 74,838 (5) | | | WaMu Mortgage Pass-Through Certificates Series 2006-AR16 3A1, 3.523%, 12/25/2036 | | | | | 62,220 | | | | | | 0.0 | | |
| 67,677 (5) | | | WaMu Mortgage Pass-Through Certificates Series 2006-AR8 1A4, 3.890%, 08/25/2046 | | | | | 60,504 | | | | | | 0.0 | | |
| 121,588 (5) | | | WaMu Mortgage Pass-Through Certificates Series 2007-HY2 1A1, 3.740%, 12/25/2036 | | | | | 105,246 | | | | | | 0.0 | | |
| Voya Strategic Income | SUMMARY PORTFOLIO OF INVESTMENTS |
| Opportunities Fund | as of March 31, 2020 (continued) |
| Principal Amount† | | | Value | | | Percentage of Net Assets | | |||||||||
| COLLATERALIZED MORTGAGE OBLIGATIONS: (continued) | | |||||||||||||||
| 582,939 (5) | | | WaMu Mortgage Pass-Through Certificates Series 2007-HY3 1A1, 3.237%, 03/25/2037 | | | | $ | 471,507 | | | | | | 0.0 | | |
| 12,470 (5) | | | WaMu Mortgage Pass-Through Certificates Series 2007-HY4 1A1, 3.428%, 04/25/2037 | | | | | 9,989 | | | | | | 0.0 | | |
| 69,346 (5) | | | WaMu Mortgage Pass-Through Certificates Series 2007-HY7 2A2, 3.612%, 07/25/2037 | | | | | 54,610 | | | | | | 0.0 | | |
| 730,293 | | | Washington Mutual Mortgage Pass-Through Certificates WMALT Series 2005-10 2A3, 1.847%, (US0001M + 0.900%), 11/25/2035 | | | | | 556,168 | | | | | | 0.0 | | |
| 774,485 | | | Washington Mutual Mortgage Pass-Through Certificates WMALT Series 2005-10 2A9, 6.000%, 11/25/2035 | | | | | 687,466 | | | | | | 0.0 | | |
| 946,742 | | | Washington Mutual Mortgage Pass-Through Certificates WMALT Series 2005-5 CB3, 5.500%, 07/25/2035 | | | | | 864,394 | | | | | | 0.1 | | |
| 180,288 | | | Washington Mutual Mortgage Pass-Through Certificates WMALT Series 2005-8 1A2, 5.500%, 10/25/2035 | | | | | 166,719 | | | | | | 0.0 | | |
| 868,868 | | | Washington Mutual Mortgage Pass-Through Certificates WMALT Series 2006-5 2CB2, 1.547%, (US0001M + 0.600%), 07/25/2036 | | | | | 437,047 | | | | | | 0.0 | | |
| 2,220,678 | | | Washington Mutual Mortgage Pass-Through Certificates WMALT Series 2006-AR5 3A Trust, 2.906%, (12MTA + 0.940%), 07/25/2046 | | | | | 1,380,368 | | | | | | 0.1 | | |
| Principal Amount† | | | Value | | | Percentage of Net Assets | | |||||||||
| COLLATERALIZED MORTGAGE OBLIGATIONS: (continued) | | |||||||||||||||
| 958,352 | | | Washington Mutual Mortgage Pass-Through Certificates WMALT Series 2006-AR6 2A, 2.926%, (12MTA + 0.960%), 08/25/2046 | | | | $ | 610,508 | | | | | | 0.0 | | |
| 49,640 | | | Wells Fargo Alternative Loan 2007-PA2 2A1, 1.377%, (US0001M + 0.430%), 06/25/2037 | | | | | 37,393 | | | | | | 0.0 | | |
| 1,168,677 (5) | | | Wells Fargo Mortgage Backed Securities 2006-AR12 1A1, 4.715%, 09/25/2036 | | | | | 1,052,965 | | | | | | 0.0 | | |
| 201,494 (5) | | | Wells Fargo Mortgage Backed Securities 2007-AR7 A1, 4.353%, 12/28/2037 | | | | | 184,874 | | | | | | 0.0 | | |
| 3,256,169 (1)(5) | | | Wells Fargo Mortgage Backed Securities 2018-1 B1, 3.691%, 07/25/2047 | | | | | 3,039,202 | | | | | | 0.1 | | |
| 1,444,404 (1)(5) | | | Wells Fargo Mortgage Backed Securities 2018-1 B3, 3.691%, 07/25/2047 | | | | | 1,299,787 | | | | | | 0.1 | | |
| 1,588,459 (1)(5) | | | Wells Fargo Mortgage Backed Securities 2019-4 B3 Trust, 3.596%, 09/25/2049 | | | | | 1,266,209 | | | | | | 0.1 | | |
| 1,996,520 (1)(5) | | | Wells Fargo Mortgage Backed Securities 2020-1 B3 Trust, 3.474%, 12/25/2049 | | | | | 1,734,388 | | | | | | 0.1 | | |
| 720,320 (1)(5) | | | WinWater Mortgage Loan Trust 2015-5 B4, 3.774%, 08/20/2045 | | | | | 674,322 | | | | | | 0.0 | | |
| 11,013,500 | | | Other Securities | | | | | 4,090,769 | | | | | | 0.2 | | |
| | | | Total Collateralized Mortgage Obligations (Cost $806,207,910) | | | | | 753,643,797 | | | | | | 29.2 | | |
| COMMERCIAL MORTGAGE-BACKED SECURITIES: 20.6% | | |||||||||||||||
| 5,000,000 (1) | | | Atrium Hotel Portfolio Trust 2018-ATRM C, 2.355%, (US0001M + 1.650%), 06/15/2035 | | | | | 3,650,435 | | | | | | 0.1 | | |
| Voya Strategic Income | SUMMARY PORTFOLIO OF INVESTMENTS |
| Opportunities Fund | as of March 31, 2020 (continued) |
| Principal Amount† | | | Value | | | Percentage of Net Assets | | |||||||||
| COMMERCIAL MORTGAGE-BACKED SECURITIES: (continued) | | |||||||||||||||
| 5,000,000 (1) | | | Austin Fairmont Hotel Trust 2019-FAIR E, 2.955%, (US0001M + 2.250%), 09/15/2032 | | | | $ | 4,040,421 | | | | | | 0.2 | | |
| 3,670,000 (1)(5) | | | BAMLL Re-REMIC Trust 2016-FRR16 B, 0.998%, 05/27/2021 | | | | | 3,431,354 | | | | | | 0.1 | | |
| 6,700,000 (1) | | | BANK 2017-BNK4 E, 3.357%, 05/15/2050 | | | | | 3,628,092 | | | | | | 0.1 | | |
| 5,320,000 (1)(5)(7) | | | BANK 2017-BNK4 XE, 1.468%, 05/15/2050 | | | | | 464,616 | | | | | | 0.0 | | |
| 1,500,000 (1)(5) | | | BANK 2017-BNK5 D, 3.078%, 06/15/2060 | | | | | 1,037,916 | | | | | | 0.0 | | |
| 1,600,000 (1)(5) | | | BANK 2017-BNK6 E, 2.649%, 07/15/2060 | | | | | 869,806 | | | | | | 0.0 | | |
| 16,600,000 (1)(5)(7) | | | BANK 2017-BNK6 XE, 1.500%, 07/15/2060 | | | | | 1,369,307 | | | | | | 0.1 | | |
| 4,500,000 (1) | | | BANK 2018-BNK14 D, 3.000%, 09/15/2060 | | | | | 2,913,016 | | | | | | 0.1 | | |
| 51,159,818 (5)(7) | | | BANK 2019-BN17 XA, 1.036%, 04/15/2052 | | | | | 3,733,475 | | | | | | 0.2 | | |
| 10,280,248 (5)(7) | | | BANK 2019-BNK16 XA, 0.966%, 02/15/2052 | | | | | 657,647 | | | | | | 0.0 | | |
| 29,395,695 (5)(7) | | | Bank 2019-BNK19 XA, 0.964%, 08/15/2061 | | | | | 2,039,726 | | | | | | 0.1 | | |
| 4,380,000 (1) | | | BANK 2017-BNK6 D, 3.100%, 07/15/2060 | | | | | 3,023,418 | | | | | | 0.1 | | |
| 58,714,626 (5)(7) | | | BANK 2019-BNK22 XA, 0.604%, 11/15/2062 | | | | | 2,687,198 | | | | | | 0.1 | | |
| 4,590,000 (1) | | | BANK 2020-BNK25 D, 2.500%, 01/15/2063 | | | | | 3,086,099 | | | | | | 0.1 | | |
| 3,799,000 (1)(5) | | | BAMLL Commercial Mortgage Securities Trust 2016-FR14 C, 1.321%, 02/27/2048 | | | | | 3,578,047 | | | | | | 0.2 | | |
| 1,000,000 (1)(5) | | | BAMLL RE-Remic Trust 2014-FRR8 A, 2.150%, 11/26/2047 | | | | | 803,296 | | | | | | 0.0 | | |
| 104,415,810 (5)(7) | | | Benchmark 2018-B7 XA Mortgage Trust, 0.445%, 05/15/2053 | | | | | 3,002,967 | | | | | | 0.1 | | |
| 53,257,680 (5)(7) | | | BENCHMARK 2019-B10 XA Mortgage Trust, 1.231%, 03/15/2062 | | | | | 4,330,238 | | | | | | 0.2 | | |
| 42,285,000 (1)(5)(7) | | | BENCHMARK 2019-B10 XB Mortgage Trust, 0.900%, 03/15/2062 | | | | | 2,969,523 | | | | | | 0.1 | | |
| Principal Amount† | | | Value | | | Percentage of Net Assets | | |||||||||
| COMMERCIAL MORTGAGE-BACKED SECURITIES: (continued) | | |||||||||||||||
| 43,898,797 (5)(7) | | | Benchmark 2019-B12 XA Mortgage Trust, 1.068%, 08/15/2052 | | | | $ | 2,976,690 | | | | | | 0.1 | | |
| 3,090,000 (1) | | | Benchmark 2019-B9 D Mortgage Trust, 3.000%, 03/15/2052 | | | | | 1,969,154 | | | | | | 0.1 | | |
| 7,330,000 (1)(5)(7) | | | Benchmark 2019-B9 XD Mortgage Trust, 2.002%, 03/15/2052 | | | | | 1,020,768 | | | | | | 0.0 | | |
| 77,310,347 (5)(7) | | | BMARK 2018-B4 XA, 0.538%, 07/15/2051 | | | | | 2,424,708 | | | | | | 0.1 | | |
| 3,020,000 (1) | | | Benchmark 2019-B14 D Mortgage Trust, 2.500%, 12/15/2061 | | | | | 1,758,381 | | | | | | 0.1 | | |
| 2,420,000 (1) | | | BHP Trust 2019-BXHP D, 2.476%, (US0001M + 1.771%), 08/15/2036 | | | | | 2,029,882 | | | | | | 0.1 | | |
| 6,190,000 (1) | | | BHP Trust 2019-BXHP E, 3.272%, (US0001M + 2.568%), 08/15/2036 | | | | | 5,025,035 | | | | | | 0.2 | | |
| 8,235,553 (1) | | | BX Commercial Mortgage Trust 2019-XL G, 3.005%, (US0001M + 2.300%), 10/15/2036 | | | | | 7,122,147 | | | | | | 0.3 | | |
| 8,235,553 (1) | | | BX Commercial Mortgage Trust 2019-XL J, 3.355%, (US0001M + 2.650%), 10/15/2036 | | | | | 7,132,006 | | | | | | 0.3 | | |
| 7,680,000 (1) | | | BX Commercial Mortgage Trust 2020-BXLP G, 3.205%, (US0001M + 2.500%), 12/15/2029 | | | | | 6,548,776 | | | | | | 0.3 | | |
| 1,650,000 (1) | | | BX Trust 2019-MMP E, 2.605%, (US0001M + 1.900%), 08/15/2036 | | | | | 1,597,580 | | | | | | 0.1 | | |
| 3,710,000 (1)(5) | | | BX Trust 2019-OC11 E, 4.076%, 12/09/2041 | | | | | 2,854,453 | | | | | | 0.1 | | |
| 4,990,000 (1)(5) | | | CALI Mortgage Trust 2019-101C E, 4.324%, 03/10/2039 | | | | | 5,047,568 | | | | | | 0.2 | | |
| Voya Strategic Income | SUMMARY PORTFOLIO OF INVESTMENTS |
| Opportunities Fund | as of March 31, 2020 (continued) |
| Principal Amount† | | | Value | | | Percentage of Net Assets | | |||||||||
| COMMERCIAL MORTGAGE-BACKED SECURITIES: (continued) | | |||||||||||||||
| 92,346,523 (5)(7) | | | Cantor Commercial Real Estate Lending 2019-CF1 XA, 1.144%, 05/15/2052 | | | | $ | 6,708,024 | | | | | | 0.3 | | |
| 40,648,290 (5)(7) | | | Cantor Commercial Real Estate Lending 2019-CF2 XA, 1.376%, 11/15/2052 | | | | | 3,244,262 | | | | | | 0.1 | | |
| 8,122,160 (5)(7) | | | CD 2016-CD1 Mortgage Trust XA, 1.404%, 08/10/2049 | | | | | 517,515 | | | | | | 0.0 | | |
| 14,660,000 (1)(5)(7) | | | CD 2016-CD1 Mortgage Trust XB, 0.678%, 08/10/2049 | | | | | 570,505 | | | | | | 0.0 | | |
| 2,140,256 (1)(5) | | | CFCRE Commercial Mortgage Trust 2011-C1 E, 6.089%, 04/15/2044 | | | | | 2,023,798 | | | | | | 0.1 | | |
| 5,060,000 (1) | | | CGDB Commercial Mortgage Trust 2019-MOB E, 2.705%, (US0001M + 2.000%), 11/15/2036 | | | | | 3,850,762 | | | | | | 0.1 | | |
| 4,640,000 (1) | | | CGDB Commercial Mortgage Trust 2019-MOB F, 3.255%, (US0001M + 2.550%), 11/15/2036 | | | | | 3,540,202 | | | | | | 0.1 | | |
| 1,000,000 (1)(5) | | | Citigroup Commercial Mortgage Trust 2013-GC17 D, 5.110%, 11/10/2046 | | | | | 897,504 | | | | | | 0.0 | | |
| 4,826,000 (1)(5) | | | Citigroup Commercial Mortgage Trust 2014-GC19 E, 4.592%, 03/10/2047 | | | | | 3,895,151 | | | | | | 0.1 | | |
| 6,030,000 (1)(5) | | | Citigroup Commercial Mortgage Trust 2014-GC19 F, 3.665%, 03/10/2047 | | | | | 4,494,990 | | | | | | 0.2 | | |
| 2,130,000 (1) | | | Citigroup Commercial Mortgage Trust 2016-C2 E, 4.594%, 08/10/2049 | | | | | 1,382,010 | | | | | | 0.0 | | |
| 3,080,000 (1) | | | Citigroup Commercial Mortgage Trust 2016-P5 D, 3.000%, 10/10/2049 | | | | | 2,194,643 | | | | | | 0.1 | | |
| Principal Amount† | | | Value | | | Percentage of Net Assets | | |||||||||
| COMMERCIAL MORTGAGE-BACKED SECURITIES: (continued) | | |||||||||||||||
| 27,584,598 (5)(7) | | | Citigroup Commercial Mortgage Trust 2017-C4 XA, 1.106%, 10/12/2050 | | | | $ | 1,507,413 | | | | | | 0.1 | | |
| 34,050,379 (5)(7) | | | Citigroup Commercial Mortgage Trust 2019-C7 XA, 0.881%, 12/15/2072 | | | | | 2,105,985 | | | | | | 0.1 | | |
| 12,040,000 (1)(5) | | | Citigroup Commercial Mortgage Trust 2016-P4 E, 4.723%, 07/10/2049 | | | | | 8,403,798 | | | | | | 0.3 | | |
| 5,790,000 (1)(5) | | | Citigroup Commercial Mortgage Trust 2016-P4 F, 4.723%, 07/10/2049 | | | | | 3,669,542 | | | | | | 0.1 | | |
| 40,945,117 (5)(7) | | | Citigroup Commercial Mortgage Trust 2019-GC41 XA, 1.190%, 08/10/2056 | | | | | 2,819,059 | | | | | | 0.1 | | |
| 3,460,000 (1)(5) | | | COMM 2013-CR10 F Mortgage Trust, 4.789%, 08/10/2046 | | | | | 2,804,683 | | | | | | 0.1 | | |
| 8,380,000 (1)(5) | | | COMM 2013-GAM F, 3.418%, 02/10/2028 | | | | | 7,999,964 | | | | | | 0.3 | | |
| 3,000,000 (5) | | | COMM 2012-CCRE2 C Mortgage Trust, 4.831%, 08/15/2045 | | | | | 2,883,625 | | | | | | 0.1 | | |
| 10,974,289 (5)(7) | | | COMM 2012-CR3 XA, 1.857%, 10/15/2045 | | | | | 381,628 | | | | | | 0.0 | | |
| 863,403 (5)(7) | | | COMM 2012-CR4 XA, 1.697%, 10/15/2045 | | | | | 27,907 | | | | | | 0.0 | | |
| 6,936,612 (1)(5)(7) | | | COMM 2012-LTRT XA, 0.920%, 10/05/2030 | | | | | 117,135 | | | | | | 0.0 | | |
| 1,670,000 (1)(5) | | | COMM 2013-CR10 E Mortgage Trust, 4.789%, 08/10/2046 | | | | | 1,417,574 | | | | | | 0.1 | | |
| 2,200,000 (1)(5) | | | COMM 2013-LC6 D Mortgage Trust, 4.342%, 01/10/2046 | | | | | 1,988,703 | | | | | | 0.1 | | |
| 11,060,000 (1)(5) | | | COMM 2014-LC15 D Mortgage Trust, 4.984%, 04/10/2047 | | | | | 9,775,172 | | | | | | 0.4 | | |
| 11,063,359 (5)(7) | | | COMM 2016-COR1 XA, 1.432%, 10/10/2049 | | | | | 690,567 | | | | | | 0.0 | | |
| 2,806,410 (5)(7) | | | COMM 2016-CR28 XA, 0.693%, 02/10/2049 | | | | | 79,011 | | | | | | 0.0 | | |
| Voya Strategic Income | SUMMARY PORTFOLIO OF INVESTMENTS |
| Opportunities Fund | as of March 31, 2020 (continued) |
| Principal Amount† | | | Value | | | Percentage of Net Assets | | |||||||||
| COMMERCIAL MORTGAGE-BACKED SECURITIES: (continued) | | |||||||||||||||
| 1,000,000 (5) | | | COMM 2017-COR2 C, 4.561%, 09/10/2050 | | | | $ | 835,982 | | | | | | 0.0 | | |
| 21,430,778 (5)(7) | | | COMM 2017-COR2 XA, 1.171%, 09/10/2050 | | | | | 1,423,132 | | | | | | 0.1 | | |
| 5,000,000 (1)(5) | | | COMM 2020-CBM F Mortgage Trust, 3.633%, 11/13/2039 | | | | | 3,111,759 | | | | | | 0.1 | | |
| 3,840,000 (1) | | | Credit Suisse Mortgage Capital Certificates 2019-ICE4 F, 3.355%, (US0001M + 2.650%), 05/15/2036 | | | | | 2,976,893 | | | | | | 0.1 | | |
| 3,023,829 (1) | | | CSWF 2018-TOP F, 3.455%, (US0001M + 2.750%), 08/15/2035 | | | | | 2,397,745 | | | | | | 0.1 | | |
| 2,314,968 (1)(5) | | | DBUBS 2011-LC1A F Mortgage Trust, 5.689%, 11/10/2046 | | | | | 2,198,757 | | | | | | 0.1 | | |
| 5,000,000 (1)(5) | | | DBUBS 2011-LC2A D, 5.530%, 07/10/2044 | | | | | 4,872,585 | | | | | | 0.2 | | |
| 2,300,000 (1)(5) | | | DBUBS 2017-BRBK E Mortgage Trust, 3.530%, 10/10/2034 | | | | | 1,832,013 | | | | | | 0.1 | | |
| 6,080,000 (1)(5) | | | DBUBS 2011-LC2 E Mortgage Trust, 5.530%, 07/10/2044 | | | | | 5,854,755 | | | | | | 0.2 | | |
| 4,500,000 (1) | | | DBUBS 2011-LC2A F Mortgage Trust, 4.000%, (US0001M + 3.650%), 07/10/2044 | | | | | 4,295,657 | | | | | | 0.2 | | |
| 5,000,000 (1) | | | DBWF 2018-GLKS D Mortgage Trust, 3.150%, (US0001M + 2.400%), 11/19/2035 | | | | | 3,881,455 | | | | | | 0.2 | | |
| 4,800,000 (1)(5) | | | DBJPM 16-C3 F Mortgage Trust, 4.241%, 08/10/2049 | | | | | 2,728,381 | | | | | | 0.1 | | |
| 4,160,000 (1) | | | Exantas Capital Corp. 2019-RSO7 D Ltd., 3.500%, (US0001M + 2.700%), 04/15/2036 | | | | | 2,828,755 | | | | | | 0.1 | | |
| 3,680,000 (1) | | | Fontainebleau Miami Beach Trust 2019-FBLU F, 4.095%, 12/10/2036 | | | | | 2,451,224 | | | | | | 0.1 | | |
| 8,937,711 (5)(7) | | | Freddie Mac Multifamily Structured Pass Through Certificates K715 X3, 2.014%, 02/25/2041 | | | | | 146,220 | | | | | | 0.0 | | |
| Principal Amount† | | | Value | | | Percentage of Net Assets | | |||||||||
| COMMERCIAL MORTGAGE-BACKED SECURITIES: (continued) | | |||||||||||||||
| 628,416 (1)(7) | | | FREMF Mortgage Trust 2012-K17 X2A, 0.100%, 12/25/2044 | | | | $ | 794 | | | | | | 0.0 | | |
| 203,197,429 (1)(7) | | | FREMF Mortgage Trust 2014-K714 X2B, 0.100%, 01/25/2047 | | | | | 57,261 | | | | | | 0.0 | | |
| 159,355 (1) | | | GPT 2018-GPP E Mortgage Trust, 3.175%, (US0001M + 2.470%), 06/15/2035 | | | | | 159,910 | | | | | | 0.0 | | |
| 2,000,000 (1) | | | GS Mortgage Securities Corp. II 2018-RIVR F, 2.805%, (US0001M + 2.100%), 07/15/2035 | | | | | 1,952,019 | | | | | | 0.1 | | |
| 3,500,000 (1) | | | GS Mortgage Securities Corp. II 2018-RIVR G, 3.305%, (US0001M + 2.600%), 07/15/2035 | | | | | 2,597,980 | | | | | | 0.1 | | |
| 4,230,000 (1) | | | GS Mortgage Securities Corp. Trust 2019-70P E, 2.905%, (US0001M + 2.200%), 10/15/2036 | | | | | 3,340,525 | | | | | | 0.1 | | |
| 1,690,000 (1) | | | GS Mortgage Securities Corp. Trust 2019-70P F, 3.355%, (US0001M + 2.650%), 10/15/2036 | | | | | 1,323,681 | | | | | | 0.1 | | |
| 1,010,000 (1)(5) | | | GS Mortgage Securities Trust 2010-C2 E, 4.548%, 12/10/2043 | | | | | 966,753 | | | | | | 0.0 | | |
| 3,080,000 (5) | | | GS Mortgage Securities Trust 2012-GCJ7 C, 5.708%, 05/10/2045 | | | | | 3,021,994 | | | | | | 0.1 | | |
| 15,518,000 (1)(5) | | | GS Mortgage Securities Trust 2012-GCJ7 E, 5.000%, 05/10/2045 | | | | | 9,974,750 | | | | | | 0.4 | | |
| 1,330,000 (1) | | | GS Mortgage Securities Trust 2013-GC16 G, 3.500%, 11/10/2046 | | | | | 1,015,824 | | | | | | 0.1 | | |
| 6,670,000 (1)(5) | | | GS Mortgage Securities Trust 2016-GS4 D, 3.233%, 11/10/2049 | | | | | 4,808,187 | | | | | | 0.2 | | |
| 15,420,815 (5)(7) | | | GS Mortgage Securities Trust 2019-GC38 XA, 0.963%, 02/10/2052 | | | | | 984,437 | | | | | | 0.0 | | |
| 4,830,000 (1)(5) | | | GS Mortgage Securities Trust 2019-GC40 DBD, 3.550%, 07/10/2052 | | | | | 4,527,965 | | | | | | 0.2 | | |
| Voya Strategic Income | SUMMARY PORTFOLIO OF INVESTMENTS |
| Opportunities Fund | as of March 31, 2020 (continued) |
| Principal Amount�� | | | Value | | | Percentage of Net Assets | | |||||||||
| COMMERCIAL MORTGAGE-BACKED SECURITIES: (continued) | | |||||||||||||||
| 3,710,000 (1)(5) | | | GS Mortgage Securities Trust 2019-GC40 DBE, 3.550%, 07/10/2052 | | | | $ | 3,402,437 | | | | | | 0.1 | | |
| 41,143,567 (5)(7) | | | GS Mortgage Securities Trust 2019-GC40 XA, 1.093%, 07/10/2052 | | | | | 2,910,636 | | | | | | 0.1 | | |
| 4,460,000 (1)(5) | | | GS Mortgage Securities Trust 2020-GC45 SWC, 3.219%, 12/13/2039 | | | | | 2,520,006 | | | | | | 0.1 | | |
| 84,876,230 (5)(7) | | | GS Mortgage Securities Trust 2019-GSA1 XA, 0.834%, 11/10/2052 | | | | | 5,058,004 | | | | | | 0.2 | | |
| 6,200,000 (1) | | | Hawaii Hotel Trust 2019-MAUI F, 3.455%, (US0001M + 3.000%), 05/15/2038 | | | | | 4,435,791 | | | | | | 0.2 | | |
| 2,670,000 (1)(5) | | | Hudson Yards 2019-55HY F Mortgage Trust, 2.943%, 12/10/2041 | | | | | 2,282,565 | | | | | | 0.1 | | |
| 180,000 (1)(5) | | | IMT Trust 2017-APTS EFX, 3.497%, 06/15/2034 | | | | | 155,025 | | | | | | 0.0 | | |
| 4,860,000 (1)(5) | | | Jackson Park Trust 2019-LIC F, 3.242%, 10/14/2039 | | | | | 2,819,121 | | | | | | 0.1 | | |
| 1,800,000 (1) | | | JP Morgan Chase Commercial Mortgage Securities Corp. 2019-BKWD E, 3.305%, (US0001M + 2.600%), 09/15/2029 | | | | | 1,753,891 | | | | | | 0.1 | | |
| 2,845,000 (1)(5) | | | JP Morgan Chase Commercial Mortgage Securities Trust 2011-C5 D, 5.419%, 08/15/2046 | | | | | 2,754,239 | | | | | | 0.1 | | |
| 3,640,000 (1) | | | JP Morgan Chase Commercial Mortgage Securities Trust 2020-LOOP F, 3.862%, 12/05/2038 | | | | | 2,601,102 | | | | | | 0.1 | | |
| 3,760,000 (1)(5) | | | JPMCC Re-REMIC Trust 2015-FRR2 AK36, 2.195%, 12/27/2046 | | | | | 3,683,317 | | | | | | 0.1 | | |
| 5,910,000 (1) | | | J.P. Morgan Chase Commercial Mortgage Securities Trust 2018-WPT FFX, 5.542%, 07/05/2033 | | | | | 4,553,691 | | | | | | 0.2 | | |
| Principal Amount† | | | Value | | | Percentage of Net Assets | | |||||||||
| COMMERCIAL MORTGAGE-BACKED SECURITIES: (continued) | | |||||||||||||||
| 5,440,000 (1) | | | J.P. Morgan Chase Commercial Mortgage Securities Trust 2019-MFP E, 2.865%, (US0001M + 2.160%), 07/15/2036 | | | | $ | 4,662,002 | | | | | | 0.2 | | |
| 6,150,000 (1)(5) | | | JP Morgan Chase Commercial Mortgage Securities Trust 2011-C4 F, 3.873%, 07/15/2046 | | | | | 5,823,673 | | | | | | 0.2 | | |
| 5,000,000 (1)(5) | | | JP Morgan Chase Commercial Mortgage Securities Trust 2011-C4 G, 3.873%, 07/15/2046 | | | | | 4,720,708 | | | | | | 0.2 | | |
| 5,240,179 (5)(7) | | | JP Morgan Chase Commercial Mortgage Securities Trust 2012-CIBX XA, 1.476%, 06/15/2045 | | | | | 98,511 | | | | | | 0.0 | | |
| 2,000,000 (5) | | | JP Morgan Chase Commercial Mortgage Securities Trust 2013-C10 D, 4.113%, 12/15/2047 | | | | | 1,788,373 | | | | | | 0.1 | | |
| 5,500,000 (1)(5) | | | JP Morgan Chase Commercial Mortgage Securities Trust 2013-C10 E, 3.500%, 12/15/2047 | | | | | 4,426,463 | | | | | | 0.2 | | |
| 3,630,000 (1)(5) | | | JP Morgan Chase Commercial Mortgage Securities Trust 2013-C13 E, 3.986%, 01/15/2046 | | | | | 3,049,382 | | | | | | 0.1 | | |
| 7,470,000 (1)(5) | | | JP Morgan Chase Commercial Mortgage Securities Trust 2013-C13 F, 3.986%, 01/15/2046 | | | | | 5,331,720 | | | | | | 0.2 | | |
| 23,978,037 (5)(7) | | | JP Morgan Chase Commercial Mortgage Securities Trust 2014-C20 XA, 0.945%, 07/15/2047 | | | | | 537,134 | | | | | | 0.0 | | |
| Voya Strategic Income | SUMMARY PORTFOLIO OF INVESTMENTS |
| Opportunities Fund | as of March 31, 2020 (continued) |
| Principal Amount† | | | Value | | | Percentage of Net Assets | | |||||||||
| COMMERCIAL MORTGAGE-BACKED SECURITIES: (continued) | | |||||||||||||||
| 3,810,000 (1) | | | JP Morgan Chase Commercial Mortgage Securities Trust 2020-LOOP E, 3.862%, 12/05/2038 | | | | $ | 3,004,479 | | | | | | 0.1 | | |
| 1,000,000 (1)(5) | | | JPMBB Commercial Mortgage Securities Trust 2013-C15 D, 5.198%, 11/15/2045 | | | | | 901,725 | | | | | | 0.0 | | |
| 2,549,000 (1)(5) | | | JPMBB Commercial Mortgage Securities Trust 2013-C17 D, 4.892%, 01/15/2047 | | | | | 2,257,280 | | | | | | 0.1 | | |
| 9,560,000 (1)(5) | | | JPMBB Commercial Mortgage Securities Trust 2013-C17 E, 3.867%, 01/15/2047 | | | | | 7,524,984 | | | | | | 0.3 | | |
| 2,200,000 (1)(5) | | | JPMBB Commercial Mortgage Securities Trust 2013-C17 F, 3.867%, 01/15/2047 | | | | | 1,597,641 | | | | | | 0.1 | | |
| 1,405,000 (5) | | | JPMBB Commercial Mortgage Securities Trust 2014-C21 C, 4.657%, 08/15/2047 | | | | | 1,276,921 | | | | | | 0.0 | | |
| 2,440,000 (1) | | | JPMBB Commercial Mortgage Securities Trust 2014-C26 E, 4.000%, 01/15/2048 | | | | | 1,716,994 | | | | | | 0.1 | | |
| 50,278,540 (5)(7) | | | JPMBB Commercial Mortgage Securities Trust 2015-C27 XA, 1.169%, 02/15/2048 | | | | | 2,311,883 | | | | | | 0.1 | | |
| 56,139,836 (5)(7) | | | JPMBB Commercial Mortgage Securities Trust 2015-C28 XA, 1.057%, 10/15/2048 | | | | | 1,893,630 | | | | | | 0.1 | | |
| 21,428,263 (5)(7) | | | JPMDB Commercial Mortgage Securities Trust 2017-C7 XA, 0.902%, 10/15/2050 | | | | | 1,020,170 | | | | | | 0.0 | | |
| 12,759,871 (1)(5)(7) | | | LSTAR Commercial Mortgage Trust 2017-5 X, 1.000%, 03/10/2050 | | | | | 459,799 | | | | | | 0.0 | | |
| 6,737,000 (1) | | | Morgan Stanley Bank of America Merrill Lynch Trust 2013-C13 F, 3.707%, 11/15/2046 | | | | | 5,225,070 | | | | | | 0.2 | | |
| Principal Amount† | | | Value | | | Percentage of Net Assets | | |||||||||
| COMMERCIAL MORTGAGE-BACKED SECURITIES: (continued) | | |||||||||||||||
| 11,679,276 (5)(7) | | | Morgan Stanley Bank of America Merrill Lynch Trust 2013-C13 XA, 0.980%, 11/15/2046 | | | | $ | 327,089 | | | | | | 0.0 | | |
| 13,998,453 (5)(7) | | | Morgan Stanley Bank of America Merrill Lynch Trust 2014 C19 XA, 1.003%, 12/15/2047 | | | | | 493,706 | | | | | | 0.0 | | |
| 5,649,000 (1) | | | Morgan Stanley Bank of America Merrill Lynch Trust 2014-C18 D, 3.389%, 10/15/2047 | | | | | 4,552,121 | | | | | | 0.2 | | |
| 1,000,000 (5) | | | Morgan Stanley Bank of America Merrill Lynch Trust 2015-C20 C, 4.462%, 02/15/2048 | | | | | 889,365 | | | | | | 0.0 | | |
| 8,220,000 | | | Morgan Stanley Bank of America Merrill Lynch Trust 2015-C25 D, 3.068%, 10/15/2048 | | | | | 6,213,293 | | | | | | 0.3 | | |
| 4,300,000 (1) | | | Morgan Stanley Bank of America Merrill Lynch Trust 2015-C26 D, 3.060%, 10/15/2048 | | | | | 3,234,733 | | | | | | 0.1 | | |
| 15,697,129 (5)(7) | | | Morgan Stanley Bank of America Merrill Lynch Trust 2017-C34 XA, 0.813%, 11/15/2052 | | | | | 698,050 | | | | | | 0.0 | | |
| 270,000 (1)(5) | | | Morgan Stanley Capital I Trust 2011-C1 D, 5.375%, 09/15/2047 | | | | | 234,784 | | | | | | 0.0 | | |
| 5,970,000 (1) | | | Morgan Stanley Capital I Trust 2011-C1 K, 4.193%, 09/15/2047 | | | | | 5,782,232 | | | | | | 0.2 | | |
| 4,268,000 (1) | | | Morgan Stanley Capital I Trust 2011-C1 L, 4.193%, 09/15/2047 | | | | | 4,047,467 | | | | | | 0.2 | | |
| 4,220,000 (1) | | | Morgan Stanley Capital I Trust 2011-C1 M, 4.193%, 09/15/2047 | | | | | 3,971,202 | | | | | | 0.2 | | |
| 4,841,000 (1)(5) | | | Morgan Stanley Capital I Trust 2016-BNK2 D, 3.000%, 11/15/2049 | | | | | 3,430,201 | | | | | | 0.1 | | |
| 25,660,000 (1)(5)(7) | | | Morgan Stanley Capital I Trust 2018-L1 XD, 1.796%, 10/15/2051 | | | | | 3,062,970 | | | | | | 0.1 | | |
| Voya Strategic Income | SUMMARY PORTFOLIO OF INVESTMENTS |
| Opportunities Fund | as of March 31, 2020 (continued) |
| Principal Amount† | | | Value | | | Percentage of Net Assets | | |||||||||
| COMMERCIAL MORTGAGE-BACKED SECURITIES: (continued) | | |||||||||||||||
| 910,000 | | | Morgan Stanley Capital I, Inc. 2017-HR2 D, 2.730%, 12/15/2050 | | | | $ | 597,419 | | | | | | 0.0 | | |
| 38,427,307 (5)(7) | | | Morgan Stanley Capital I, Inc. 2017-HR2 XA, 0.793%, 12/15/2050 | | | | | 1,776,314 | | | | | | 0.1 | | |
| 2,370,000 (1) | | | MRCD 2019-PARK E Mortgage Trust, 2.718%, 12/15/2036 | | | | | 2,157,014 | | | | | | 0.1 | | |
| 4,450,000 (1) | | | MRCD 2019-PARK F Mortgage Trust, 2.718%, 12/15/2036 | | | | | 3,885,272 | | | | | | 0.2 | | |
| 790,000 (1) | | | Prima Capital CRE Securitization 2019-RK1 CD Ltd., 3.500%, 04/15/2038 | | | | | 718,650 | | | | | | 0.0 | | |
| 10,151,000 (1) | | | Prima Capital CRE Securitization 2019-RK1 DD Ltd., 3.500%, 04/15/2038 | | | | | 9,116,692 | | | | | | 0.4 | | |
| 15,000,000 (1) | | | Prima Capital CRE Securitization 2019-7A D Ltd., 4.250%, 12/25/2050 | | | | | 15,628,551 | | | | | | 0.6 | | |
| 4,470,000 (1)(5) | | | Ready Capital Mortgage Trust 2019-5 D, 5.504%, 02/25/2052 | | | | | 3,012,043 | | | | | | 0.1 | | |
| 5,310,000 (1)(5) | | | ReadyCap Commercial Mortgage Trust 2018-4 D, 5.338%, 02/27/2051 | | | | | 3,680,567 | | | | | | 0.1 | | |
| 2,673,000 (1) | | | Shelter Growth CRE 2018-FL1 D Issuer Ltd., 3.705%, (US0001M + 3.000%), 01/15/2035 | | | | | 2,410,783 | | | | | | 0.1 | | |
| 1,000,000 (1)(5) | | | UBS Commercial Mortgage Trust 2017-C5, 4.316%, 11/15/2050 | | | | | 750,355 | | | | | | 0.0 | | |
| 26,351,798 (5)(7) | | | UBS Commercial Mortgage Trust 2019-C16 XA, 1.561%, 04/15/2052 | | | | | 2,534,832 | | | | | | 0.1 | | |
| 1,900,000 (1)(5) | | | UBS-Barclays Commercial Mortgage Trust 2012-C4 D, 4.476%, 12/10/2045 | | | | | 1,733,862 | | | | | | 0.1 | | |
| 3,240,000 (1)(5) | | | UBS-Barclays Commercial Mortgage Trust 2012-C4 E, 4.476%, 12/10/2045 | | | | | 2,694,722 | | | | | | 0.1 | | |
| Principal Amount† | | | Value | | | Percentage of Net Assets | | |||||||||
| COMMERCIAL MORTGAGE-BACKED SECURITIES: (continued) | | |||||||||||||||
| 1,616,500 (1) | | | Wells Fargo Commercial Mortgage Trust 2010-C1 E, 4.000%, 11/15/2043 | | | | $ | 1,564,092 | | | | | | 0.1 | | |
| 3,448,000 (1) | | | Wells Fargo Commercial Mortgage Trust 2010-C1 F, 4.000%, 11/15/2043 | | | | | 3,312,667 | | | | | | 0.1 | | |
| 8,190,000 (1)(5) | | | Wells Fargo Commercial Mortgage Trust 2015-C30 D, 4.497%, 09/15/2058 | | | | | 6,748,599 | | | | | | 0.3 | | |
| 8,329,649 (1) | | | Wells Fargo Commercial Mortgage Trust 2015-C30 E, 3.250%, 09/15/2058 | | | | | 5,199,059 | | | | | | 0.2 | | |
| 78,780,000 (5)(7) | | | Wells Fargo Commercial Mortgage Trust 2016-NXS6 XB, 0.527%, 11/15/2049 | | | | | 2,397,677 | | | | | | 0.1 | | |
| 20,748,388 (5)(7) | | | Wells Fargo Commercial Mortgage Trust 2017-C40 XA, 0.969%, 10/15/2050 | | | | | 1,041,636 | | | | | | 0.0 | | |
| 2,321,869 (1) | | | Wells Fargo Commercial Mortgage Trust 2018-BXI E, 2.861%, (US0001M + 2.157%), 12/15/2036 | | | | | 1,882,921 | | | | | | 0.1 | | |
| 8,430,000 (1) | | | Wells Fargo Commercial Mortgage Trust 2019-C49 D, 3.000%, 03/15/2052 | | | | | 5,351,308 | | | | | | 0.2 | | |
| 374,852 (1)(5)(7) | | | WFRBS Commercial Mortgage Trust 2012-C8 XA, 1.807%, 08/15/2045 | | | | | 11,749 | | | | | | 0.0 | | |
| 2,894,184 (1)(5)(7) | | | WFRBS Commercial Mortgage Trust 2012-C9 XA, 1.892%, 11/15/2045 | | | | | 112,010 | | | | | | 0.0 | | |
| 9,230,000 (1)(5) | | | WFRBS Commercial Mortgage Trust 2013-C11 E, 4.258%, 03/15/2045 | | | | | 7,555,811 | | | | | | 0.3 | | |
| 10,350,000 (1) | | | WFRBS Commercial Mortgage Trust 2013-C12 E, 3.500%, 03/15/2048 | | | | | 8,178,523 | | | | | | 0.3 | | |
| Voya Strategic Income | SUMMARY PORTFOLIO OF INVESTMENTS |
| Opportunities Fund | as of March 31, 2020 (continued) |
| Principal Amount† | | | Value | | | Percentage of Net Assets | | |||||||||
| COMMERCIAL MORTGAGE-BACKED SECURITIES: (continued) | | |||||||||||||||
| 5,950,000 (1) | | | WFRBS Commercial Mortgage Trust 2013-C12 F, 3.500%, 03/15/2048 | | | | $ | 4,519,165 | | | | | | 0.2 | | |
| 4,691,143 (1)(5)(7) | | | WFRBS Commercial Mortgage Trust 2013-C12 XA, 1.215%, 03/15/2048 | | | | | 130,161 | | | | | | 0.0 | | |
| 9,000,000 (1)(5) | | | WFRBS Commercial Mortgage Trust 2013-C17 D, 5.041%, 12/15/2046 | | | | | 8,050,047 | | | | | | 0.3 | | |
| 760,000 (1) | | | WFRBS Commercial Mortgage Trust 2013-C17 E, 3.500%, 12/15/2046 | | | | | 578,815 | | | | | | 0.0 | | |
| 3,000,000 (1) | | | WFRBS Commercial Mortgage Trust 2013-C17 F, 3.500%, 12/15/2046 | | | | | 2,182,412 | | | | | | 0.1 | | |
| 10,940,000 (1) | | | Wells Fargo Commercial Mortgage Trust 2015-NXS3 D, 3.153%, 09/15/2057 | | | | | 8,308,519 | | | | | | 0.3 | | |
| 39,904,284 (5)(7) | | | Wells Fargo Commercial Mortgage Trust 2019-C52 XA, 1.623%, 08/15/2052 | | | | | 4,035,345 | | | | | | 0.2 | | |
| 7,735,000 (1)(5) | | | West Town Mall Trust 2017-KNOX E, 4.346%, 07/05/2030 | | | | | 6,985,539 | | | | | | 0.3 | | |
| 1,500,000 (1)(5) | | | WFLD 2014-MONT D Mortgage Trust, 3.755%, 08/10/2031 | | | | | 1,286,665 | | | | | | 0.0 | | |
| 960,000 (1)(5) | | | WFRBS Commercial Mortgage Trust 2013-C11 F, 4.258%, 03/15/2045 | | | | | 678,516 | | | | | | 0.0 | | |
| 41,965,049 (5)(7) | | | WFRBS Commercial Mortgage Trust 2013-UBS1 XA, 0.848%, 03/15/2046 | | | | | 825,133 | | | | | | 0.1 | | |
| 7,843,319 | | | Other Securities | | | | | 7,449,812 | | | | | | 0.3 | | |
| | | | Total Commercial Mortgage-Backed Securities (Cost $609,205,464) | | | | | 529,961,107 | | | | | | 20.6 | | |
| | ||||||||||||||||
| Principal Amount† | | | Value | | | Percentage of Net Assets | | |||||||||
| U.S. TREASURY OBLIGATIONS: 0.6% | | |||||||||||||||
| | | | Treasury Inflation Indexed Protected Securities: 0.6% | | ||||||||||||
| 13,897,909 | | | 0.125%, 01/15/2030 | | | | $ | 14,339,655 | | | | | | 0.6 | | |
| | | | | | ||||||||||||
| | | | U.S. Treasury Notes: 0.0% | | ||||||||||||
| 298,000 | | | Other Securities | | | | | 321,299 | | | | | | 0.0 | | |
| | | | Total U.S. Treasury Obligations (Cost $15,031,977) | | | | | 14,660,954 | | | | | | 0.6 | | |
| SOVEREIGN BONDS: 3.2% | | |||||||||||||||
| 2,825,000 (1) | | | Dominican Republic International Bond, 4.500%, 01/30/2030 | | | | | 2,470,462 | | | | | | 0.1 | | |
| 7,800,000 | | | Egypt Government International Bond, 5.875%-7.500%, 06/11/2025-02/21/2028 | | | | | 6,997,463 | | | | | | 0.3 | | |
| 1,400,000 (1) | | | Export-Import Bank of India, 3.250%, 01/15/2030 | | | | | 1,250,362 | | | | | | 0.0 | | |
| 440,000 (1) | | | Gabon Government International Bond, 6.625%, 02/06/2031 | | | | | 272,288 | | | | | | 0.0 | | |
| 4,525,000 (1) | | | Ghana Government International Bond, 6.375%, 02/11/2027 | | | | | 3,337,187 | | | | | | 0.1 | | |
| 1,350,000 (1) | | | Kenya Government International Bond, 7.000%, 05/22/2027 | | | | | 1,252,125 | | | | | | 0.1 | | |
| 500,000 (1) | | | KSA Sukuk Ltd., 3.628%, 04/20/2027 | | | | | 508,319 | | | | | | 0.0 | | |
PEN 9,681,000 (1) | | | Peru Government Bond, 6.150%, 08/12/2032 | | | | | 3,035,954 | | | | | | 0.1 | | |
| 750,000 (1) | | | Perusahaan Penerbit SBSN Indonesia III, 4.150%, 03/29/2027 | | | | | 754,342 | | | | | | 0.0 | | |
| 1,800,000 (1) | | | Perusahaan Penerbit SBSN Indonesia III, 4.450%, 02/20/2029 | | | | | 1,844,285 | | | | | | 0.1 | | |
RUB 557,160,000 | | | Russian Federal Bond - OFZ, 7.250%, 05/10/2034 | | | | | 7,417,343 | | | | | | 0.3 | | |
| 11,475,000 | | | Turkey Government International Bond, 4.875%, 10/09/2026 | | | | | 9,732,521 | | | | | | 0.4 | | |
| Voya Strategic Income | SUMMARY PORTFOLIO OF INVESTMENTS |
| Opportunities Fund | as of March 31, 2020 (continued) |
| Principal Amount† | | | Value | | | Percentage of Net Assets | | |||||||||
| SOVEREIGN BONDS: (continued) | | |||||||||||||||
| 1,975,000 | | | Turkey Government International Bond, 5.600%-7.375%, 12/23/2023-02/05/2025 | | | | $ | 1,873,737 | | | | | | 0.1 | | |
| 32,697,784,875 (3) | | | Other Securities | | | | | 41,276,704 | | | | | | 1.6 | | |
| | | | Total Sovereign Bonds (Cost $94,013,144) | | | | | 82,023,092 | | | | | | 3.2 | | |
| ASSET-BACKED SECURITIES: 12.0% | | |||||||||||||||
| | | | Automobile Asset-Backed Securities: 1.3% | | ||||||||||||
| 1,075,000 | | | Americredit Automobile Receivables Trust 2018-2 D, 4.010%, 07/18/2024 | | | | | 877,791 | | | | | | 0.0 | | |
| 2,000,000 | | | Americredit Automobile Receivables Trust 2019-1 D, 3.620%, 03/18/2025 | | | | | 2,002,305 | | | | | | 0.1 | | |
| 2,800,000 | | | AmeriCredit Automobile Receivables Trust 2019-3 C, 2.320%, 07/18/2025 | | | | | 2,766,354 | | | | | | 0.1 | | |
| 2,450,000 | | | AmeriCredit Automobile Receivables Trust 2019-3 D, 2.580%, 09/18/2025 | | | | | 2,324,216 | | | | | | 0.1 | | |
| 2,500,000 (1) | | | Santander Drive Auto Receivables Trust 2018-1 E, 4.370%, 05/15/2025 | | | | | 2,160,459 | | | | | | 0.1 | | |
| 1,000,000 | | | Santander Drive Auto Receivables Trust 2018-2 D, 3.880%, 02/15/2024 | | | | | 998,406 | | | | | | 0.0 | | |
| 4,450,000 | | | Santander Drive Auto Receivables Trust 2019-2 D, 3.220%, 07/15/2025 | | | | | 4,403,603 | | | | | | 0.2 | | |
| 2,250,000 | | | Santander Drive Auto Receivables Trust 2019-3 C, 2.490%, 10/15/2025 | | | | | 2,180,106 | | | | | | 0.1 | | |
| 6,000,000 | | | Santander Drive Auto Receivables Trust 2019-3 D, 2.680%, 10/15/2025 | | | | | 5,735,832 | | | | | | 0.2 | | |
| 850,000 (1) | | | Tesla Auto Lease Trust 2018-B C, 4.360%, 10/20/2021 | | | | | 834,724 | | | | | | 0.0 | | |
| Principal Amount† | | | Value | | | Percentage of Net Assets | | |||||||||
| ASSET-BACKED SECURITIES: (continued) | | |||||||||||||||
| | | | Automobile Asset-Backed Securities (continued) | | ||||||||||||
| 3,800,000 (1) | | | Tesla Auto Lease Trust 2019-A C, 2.680%, 01/20/2023 | | | | $ | 3,683,662 | | | | | | 0.1 | | |
| 7,400,000 | | | Other Securities | | | | | 7,136,666 | | | | | | 0.3 | | |
| | | | | | | | | 35,104,124 | | | | | | 1.3 | | |
| | | | Home Equity Asset-Backed Securities: 0.3% | | ||||||||||||
| 2,682,934 (1)(5) | | | ACE Securities Corp. Mortgage Loan Trust Series 2007-D1 A2, 6.336%, 02/25/2038 | | | | | 2,429,434 | | | | | | 0.1 | | |
| 463,175 | | | GSAA Home Equity Trust 2006-3 A3, 1.247%, (US0001M + 0.300%), 03/25/2036 | | | | | 296,826 | | | | | | 0.0 | | |
| 1,048,741 | | | GSAA Home Equity Trust 2007-1 1A1, 1.027%, (US0001M + 0.080%), 02/25/2037 | | | | | 418,920 | | | | | | 0.1 | | |
| 1,125,984 (5) | | | Morgan Stanley Mortgage Loan Trust 2007-10XS A2, 6.250%, 02/25/2037 | | | | | 658,339 | | | | | | 0.0 | | |
| 652,046 | | | Nomura Home Equity Loan, Inc. Home Equity Loan Trust Series 2007-1 2A4A, 1.407%, (US0001M + 0.230%), 02/25/2037 | | | | | 519,538 | | | | | | 0.0 | | |
| 4,023,361 | | | Other Securities | | | | | 2,681,032 | | | | | | 0.1 | | |
| | | | | | | | | 7,004,089 | | | | | | 0.3 | | |
| | | | Other Asset-Backed Securities: 9.2% | | ||||||||||||
| 2,806,691 (1) | | | Ajax Mortgage Loan Trust 2018-A A, 3.850%, 04/25/2058 | | | | | 2,659,336 | | | | | | 0.1 | | |
| 3,331,074 (1)(5) | | | Ajax Mortgage Loan Trust 2018-C A, 4.360%, 09/25/2065 | | | | | 3,303,484 | | | | | | 0.1 | | |
| 3,089,000 (1) | | | Ajax Mortgage Loan Trust 2019-D A2, 3.500%, 09/25/2065 | | | | | 2,695,483 | | | | | | 0.1 | | |
| 4,234,000 (1) | | | Ajax Mortgage Loan Trust 2019-F A2, 3.500%, 09/25/2059 | | | | | 3,855,637 | | | | | | 0.2 | | |
| Voya Strategic Income | SUMMARY PORTFOLIO OF INVESTMENTS |
| Opportunities Fund | as of March 31, 2020 (continued) |
| Principal Amount† | | | Value | | | Percentage of Net Assets | | |||||||||
| ASSET-BACKED SECURITIES: (continued) | | |||||||||||||||
| | | | Other Asset-Backed Securities (continued) | | ||||||||||||
| 2,500,000 (1) | | | AMMC CLO 16 Ltd. 2015-16A CR, 4.188%, (US0003M + 2.350%), 04/14/2029 | | | | $ | 2,212,145 | | | | | | 0.1 | | |
| 2,000,000 (1) | | | AMMC CLO XI Ltd. 2012-11A CR2, 3.670%, (US0003M + 1.900%), 04/30/2031 | | | | | 1,639,058 | | | | | | 0.1 | | |
| 4,750,000 (1) | | | Apidos CLO XI 2012-11A CRR, 4.336%, (US0003M + 2.500%), 10/17/2030 | | | | | 4,082,582 | | | | | | 0.2 | | |
| 9,000,000 (1) | | | Apidos CLO XXII 2015-22A BR, 0.340%, (US0003M + 1.950%), 04/20/2031 | | | | | 7,477,983 | | | | | | 0.3 | | |
| 1,650,000 (1) | | | Applebee’s Funding LLC / IHOP Funding LLC 2019-1A A2I, 4.194%, 06/07/2049 | | | | | 1,502,737 | | | | | | 0.1 | | |
| 750,000 (1) | | | Applebee’s Funding LLC / IHOP Funding LLC 2019-1A A2II, 4.723%, 06/07/2049 | | | | | 648,690 | | | | | | 0.0 | | |
| 2,287,343 (1) | | | Aqua Finance Trust 2019-A A, 3.140%, 07/16/2040 | | | | | 2,280,933 | | | | | | 0.1 | | |
| 1,100,000 (1) | | | Ares XLII Clo Ltd. 2017-42A C, 4.002%, (US0003M + 2.200%), 01/22/2028 | | | | | 956,585 | | | | | | 0.0 | | |
| 750,000 (1) | | | Atrium CDO Corp. 12A CR, 3.452%, (US0003M + 1.650%), 04/22/2027 | | | | | 690,442 | | | | | | 0.0 | | |
| 1,250,000 (1) | | | Atrium CDO Corp. 12A DR, 4.602%, (US0003M + 2.800%), 04/22/2027 | | | | | 1,014,759 | | | | | | 0.1 | | |
| 2,000,000 (1) | | | Babson CLO Ltd. 2018-3A C, 3.719%, (US0003M + 1.900%), 07/20/2029 | | | | | 1,757,334 | | | | | | 0.1 | | |
| 5,000,000 (1) | | | Barings CLO Ltd 2018-3A D, 4.719%, (US0003M + 2.900%), 07/20/2029 | | | | | 3,855,745 | | | | | | 0.2 | | |
| Principal Amount† | | | Value | | | Percentage of Net Assets | | |||||||||
| ASSET-BACKED SECURITIES: (continued) | | |||||||||||||||
| | | | Other Asset-Backed Securities (continued) | | ||||||||||||
| 6,000,000 (1) | | | Barings Clo Ltd. 2019-4A C, 4.703%, (US0003M + 2.800%), 01/15/2033 | | | | $ | 5,050,992 | | | | | | 0.2 | | |
| 2,000,000 (1) | | | Benefit Street Partners CLO V-B Ltd. 2018-5BA B, 3.969%, (US0003M + 2.150%), 04/20/2031 | | | | | 1,636,394 | | | | | | 0.1 | | |
| 500,000 (1) | | | Benefit Street Partners CLO VII Ltd. 2015-VIIA CR, 4.219%, (US0003M + 2.400%), 07/18/2027 | | | | | 415,486 | | | | | | 0.0 | | |
| 2,750,000 (1) | | | BlueMountain CLO 2012-2A DR2 Ltd., 4.595%, (US0003M + 2.900%), 11/20/2028 | | | | | 2,168,776 | | | | | | 0.1 | | |
| 1,000,000 (1) | | | BlueMountain CLO 2013-2A CR, 3.752%, (US0003M + 1.950%), 10/22/2030 | | | | | 855,654 | | | | | | 0.0 | | |
| 1,000,000 (1) | | | BlueMountain CLO 2015-4 CR Ltd., 3.719%, (US0003M + 1.900%), 04/20/2030 | | | | | 842,546 | | | | | | 0.0 | | |
| 2,250,000 (1) | | | BlueMountain CLO 2016-1 Ltd. 2016-1A DR, 4.469%, (US0003M + 2.650%), 04/20/2027 | | | | | 1,752,251 | | | | | | 0.1 | | |
| 3,750,000 (1) | | | BlueMountain CLO XXV Ltd. 2019-25A C, 4.281%, (US0003M + 2.450%), 07/15/2032 | | | | | 3,132,041 | | | | | | 0.1 | | |
| 250,000 (1) | | | Bowman Park CLO Ltd. 2014-1A E, 7.083%, (US0003M + 5.400%), 11/23/2025 | | | | | 195,938 | | | | | | 0.0 | | |
| 4,000,000 (1) | | | Bristol Park CLO Ltd. 2016-1A CR, 3.577%, (US0003M + 1.950%), 04/15/2029 | | | | | 3,510,036 | | | | | | 0.1 | | |
| 750,000 (1) | | | Buttermilk Park CLO Ltd. 2018-1A C, 3.931%, (US0003M + 2.100%), 10/15/2031 | | | | | 627,142 | | | | | | 0.0 | | |
| Voya Strategic Income | SUMMARY PORTFOLIO OF INVESTMENTS |
| Opportunities Fund | as of March 31, 2020 (continued) |
| Principal Amount† | | | Value | | | Percentage of Net Assets | | |||||||||
| ASSET-BACKED SECURITIES: (continued) | | |||||||||||||||
| | | | Other Asset-Backed Securities (continued) | | ||||||||||||
| 2,000,000 (1) | | | Carlyle Global Market Strategies CLO 2015-2A CR Ltd., 4.044%, (US0003M + 2.250%), 04/27/2027 | | | | $ | 1,631,220 | | | | | | 0.1 | | |
| 250,000 (1) | | | Carlyle Global Market Strategies CLO 2015-2A DR Ltd., 6.144%, (US0003M + 4.350%), 04/27/2027 | | | | | 175,817 | | | | | | 0.0 | | |
| 1,500,000 (1) | | | Carlyle Global Market Strategies CLO 2015-3A CR Ltd., 4.645%, (US0003M + 2.850%), 07/28/2028 | | | | | 1,204,683 | | | | | | 0.0 | | |
| 1,500,000 (1) | | | Carlyle US CLO 2016-4A BR Ltd., 3.919%, (US0003M + 2.100%), 10/20/2027 | | | | | 1,301,004 | | | | | | 0.1 | | |
| 1,000,000 (1) | | | Cent CLO C17A BR Ltd., 3.620%, (US0003M + 1.850%), 04/30/2031 | | | | | 851,682 | | | | | | 0.0 | | |
| 1,500,000 (1) | | | CIFC Funding 2013-IA BR Ltd., 4.243%, (US0003M + 2.400%), 07/16/2030 | | | | | 1,271,049 | | | | | | 0.0 | | |
| 2,000,000 (1) | | | Cifc Funding 2014-4RA B Ltd., 4.036%, (US0003M + 2.200%), 10/17/2030 | | | | | 1,748,172 | | | | | | 0.1 | | |
| 6,250,000 (1) | | | CIFC Funding 2017-2A C, 4.169%, (US0003M + 2.350%), 04/20/2030 | | | | | 5,479,400 | | | | | | 0.2 | | |
| 1,100,000 | | | Countrywide Asset-Backed Certificates 2005-AB2 M1, 1.652%, (US0001M + 0.705%), 09/25/2035 | | | | | 970,122 | | | | | | 0.0 | | |
| 1,750,000 (1) | | | Cumberland Park CLO Ltd. 2015-2A CR, 3.619%, (US0003M + 1.800%), 07/20/2028 | | | | | 1,590,092 | | | | | | 0.1 | | |
| 500,000 (1) | | | Cumberland Park CLO Ltd. 2015-2A DR, 4.519%, (US0003M + 2.700%), 07/20/2028 | | | | | 407,143 | | | | | | 0.0 | | |
| Principal Amount† | | | Value | | | Percentage of Net Assets | | |||||||||
| ASSET-BACKED SECURITIES: (continued) | | |||||||||||||||
| | | | Other Asset-Backed Securities (continued) | | ||||||||||||
| 843,625 (1) | | | DB Master Finance LLC 2019-1A A23, 4.352%, 05/20/2049 | | | | $ | 813,657 | | | | | | 0.1 | | |
| 446,625 (1) | | | DB Master Finance LLC 2019-1A A2II, 4.021%, 05/20/2049 | | | | | 434,421 | | | | | | 0.0 | | |
| 579,000 (1) | | | Domino’s Pizza Master Issuer LLC 2015-1A A1II, 4.474%, 10/25/2045 | | | | | 562,649 | | | | | | 0.0 | | |
| 1,075,250 (1) | | | Domino’s Pizza Master Issuer LLC 2017-1A A23, 4.118%, 07/25/2047 | | | | | 1,053,936 | | | | | | 0.1 | | |
| 3,079,125 (1) | | | Domino’s Pizza Master Issuer LLC 2017-1A A2II, 3.082%, 07/25/2047 | | | | | 3,014,467 | | | | | | 0.1 | | |
| 2,324,600 (1) | | | Domino’s Pizza Master Issuer LLC 2018-1A A2I, 4.116%, 07/25/2048 | | | | | 2,273,423 | | | | | | 0.1 | | |
| 3,541,125 (1) | | | Domino’s Pizza Master Issuer LLC 2019-1A A2, 3.668%, 10/25/2049 | | | | | 3,162,473 | | | | | | 0.1 | | |
| 2,178,000 (1) | | | Driven Brands Funding LLC 2019-1A A2, 4.641%, 04/20/2049 | | | | | 2,086,328 | | | | | | 0.1 | | |
| 1,228,125 (1) | | | Driven Brands Funding, LLC 2018-1A A2, 4.739%, 04/20/2048 | | | | | 1,202,919 | | | | | | 0.0 | | |
| 2,750,000 (1) | | | Dryden 30 Senior Loan Fund 2013-30A DR, 4.292%, (US0003M + 2.600%), 11/15/2028 | | | | | 2,114,995 | | | | | | 0.1 | | |
| 1,750,000 (1) | | | Dryden 55 CLO Ltd. 2018-55A C, 3.731%, (US0003M + 1.900%), 04/15/2031 | | | | | 1,488,204 | | | | | | 0.1 | | |
| 1,150,000 (1) | | | Dryden XXV Senior Loan Fund 2012-25A DRR, 4.831%, (US0003M + 3.000%), 10/15/2027 | | | | | 940,403 | | | | | | 0.0 | | |
| 3,061,863 (1) | | | Five Guys Holdings, Inc. 2017-1A A2, 4.600%, 07/25/2047 | | | | | 3,224,545 | | | | | | 0.1 | | |
| 750,000 (1) | | | Galaxy XXII CLO Ltd. 2016-22A DR, 4.943%, (US0003M + 3.100%), 07/16/2028 | | | | | 605,749 | | | | | | 0.0 | | |
| Voya Strategic Income | SUMMARY PORTFOLIO OF INVESTMENTS |
| Opportunities Fund | as of March 31, 2020 (continued) |
| Principal Amount† | | | Value | | | Percentage of Net Assets | | |||||||||
| ASSET-BACKED SECURITIES: (continued) | | |||||||||||||||
| | | | Other Asset-Backed Securities (continued) | | ||||||||||||
| 945,500 (1) | | | Helios Issuer, LLC 2018-1A A, 4.870%, 07/20/2048 | | | | $ | 857,967 | | | | | | 0.0 | | |
| 3,553,439 (1) | | | Helios Issuer, LLC 2018-1A B, 7.710%, 07/20/2048 | | | | | 1,969,638 | | | | | | 0.1 | | |
| 1,000,000 (1) | | | Invitation Homes 2018-SFR1 D Trust, 2.250%, (US0001M + 1.450%), 03/17/2037 | | | | | 859,377 | | | | | | 0.0 | | |
| 4,500,000 (1) | | | Jay Park CLO Ltd. 2016-1A BR, 3.819%, (US0003M + 2.000%), 10/20/2027 | | | | | 3,987,765 | | | | | | 0.2 | | |
| 3,750,000 (1) | | | Jersey Mike’s Funding 2019-1A A2, 4.433%, 02/15/2050 | | | | | 3,327,375 | | | | | | 0.1 | | |
| 1,000,000 (1) | | | JG Wentworth XLII LLC 2018-2A B, 4.700%, 10/15/2077 | | | | | 973,103 | | | | | | 0.0 | | |
| 1,350,000 (1) | | | LCM XVIII L.P. 18A CR, 3.669%, (US0003M + 1.850%), 04/20/2031 | | | | | 1,129,946 | | | | | | 0.0 | | |
| 1,000,000 (1) | | | LCM XX L.P. 20A-CR, 3.769%, (US0003M + 1.950%), 10/20/2027 | | | | | 891,771 | | | | | | 0.0 | | |
| 1,500,000 (1) | | | LCM XX L.P. 20A-DR, 4.619%, (US0003M + 2.800%), 10/20/2027 | | | | | 1,194,270 | | | | | | 0.1 | | |
| 2,800,000 (1) | | | LCM XXII Ltd. 22A CR, 4.619%, (US0003M + 2.800%), 10/20/2028 | | | | | 2,121,616 | | | | | | 0.1 | | |
| 944,101 (1) | | | LCSS Financing 2018-A A LLC, 4.700%, 12/15/2062 | | | | | 986,502 | | | | | | 0.0 | | |
| 1,000,000 (1) | | | Madison Park Funding XIII Ltd. 2014-13A CR2, 3.719%, (US0003M + 1.900%), 04/19/2030 | | | | | 880,963 | | | | | | 0.0 | | |
| 6,000,000 (1) | | | Madison Park Funding XXI Ltd. 2016-21A BR, 4.681%, (US0003M + 2.850%), 10/15/2032 | | | | | 4,954,878 | | | | | | 0.2 | | |
| 2,500,000 (1) | | | Madison Park Funding XIX Ltd. 2015-19A B1R2, 2.717%, (US0003M + 1.850%), 01/22/2028 | | | | | 2,263,047 | | | | | | 0.1 | | |
| Principal Amount† | | | Value | | | Percentage of Net Assets | | |||||||||
| ASSET-BACKED SECURITIES: (continued) | | |||||||||||||||
| | | | Other Asset-Backed Securities (continued) | | ||||||||||||
| 1,000,000 (1) | | | Magnetite VIII Ltd. 2014-8A CR2, 3.681%, (US0003M + 1.850%), 04/15/2031 | | | | $ | 875,584 | | | | | | 0.0 | | |
| 1,500,000 (1) | | | Marlette Funding Trust 2018-1A C, 3.690%, 03/15/2028 | | | | | 1,475,599 | | | | | | 0.0 | | |
| 1,700,000 (1) | | | Marlette Funding Trust 2018-4A C, 4.910%, 12/15/2028 | | | | | 1,581,912 | | | | | | 0.1 | | |
| 1,700,000 (1) | | | Marlette Funding Trust 2019-1A B, 3.940%, 04/16/2029 | | | | | 1,539,412 | | | | | | 0.1 | | |
| 2,000,000 (1) | | | Marlette Funding Trust 2019-2A C, 4.110%, 07/16/2029 | | | | | 1,493,229 | | | | | | 0.0 | | |
| 4,050,000 (1) | | | Marlette Funding Trust 2019-3A C, 3.790%, 09/17/2029 | | | | | 2,967,610 | | | | | | 0.1 | | |
| 1,950,000 (1) | | | Marlette Funding Trust 2019-4A B, 2.950%, 12/17/2029 | | | | | 1,717,079 | | | | | | 0.1 | | |
| 1,600,000 (1) | | | Marlette Funding Trust 2020-1A C, 2.800%, 03/15/2030 | | | | | 1,241,776 | | | | | | 0.0 | | |
| 2,797,421 (1) | | | Mill City Solar Loan 2019-2GS A Ltd., 3.690%, 07/20/2043 | | | | | 2,648,762 | | | | | | 0.1 | | |
| 987,750 (1) | | | Mosaic Solar Loan Trust 2018-1A A, 4.010%, 06/22/2043 | | | | | 949,633 | | | | | | 0.0 | | |
| 2,426,756 (1) | | | Mosaic Solar Loan Trust 2018-2-GS B, 4.740%, 02/22/2044 | | | | | 2,225,308 | | | | | | 0.1 | | |
| 2,250,280 (1) | | | Mosaic Solar Loan Trust 2019-1A A, 4.370%, 12/21/2043 | | | | | 2,229,354 | | | | | | 0.1 | | |
| 1,171,391 (1) | | | Mosaic Solar Loan Trust 2019-2A A, 2.880%, 09/20/2040 | | | | | 1,130,763 | | | | | | 0.0 | | |
| 1,796,293 (1) | | | Mosaic Solar Loans 2017-2A A LLC, 3.820%, 06/22/2043 | | | | | 1,797,461 | | | | | | 0.1 | | |
| Voya Strategic Income | SUMMARY PORTFOLIO OF INVESTMENTS |
| Opportunities Fund | as of March 31, 2020 (continued) |
| Principal Amount† | | | Value | | | Percentage of Net Assets | | |||||||||
| ASSET-BACKED SECURITIES: (continued) | | |||||||||||||||
| | | | Other Asset-Backed Securities (continued) | | ||||||||||||
| 3,500,000 (1) | | | Neuberger Berman Loan Advisers CLO 24 Ltd. 2017-24A CR, 3.822%, (US0003M + 1.950%), 04/19/2030 | | | | $ | 3,050,824 | | | | | | 0.1 | | |
| 2,300,000 (1) | | | Neuberger Berman Loan Advisers CLO 33 Ltd. 2019-33A C, 4.590%, (US0003M + 2.450%), 10/16/2032 | | | | | 1,904,579 | | | | | | 0.1 | | |
| 700,000 (1) | | | Ocean Trails CLO IV 2013-4A DR, 4.707%, (US0003M + 3.000%), 08/13/2025 | | | | | 623,860 | | | | | | 0.0 | | |
| 2,450,000 (1) | | | OCP CLO 2015-8 Ltd. 2015-8A BR, 3.686%, (US0003M + 1.850%), 04/17/2027 | | | | | 2,269,408 | | | | | | 0.1 | | |
| 2,000,000 (1) | | | Octagon Investment Partners 31 Ltd. 2017-1A C, 4.219%, (US0003M + 2.400%), 07/20/2030 | | | | | 1,710,704 | | | | | | 0.1 | | |
| 2,250,000 (1) | | | Octagon Investment Partners 32 Ltd. 2017-1A C, 4.081%, (US0003M + 2.250%), 07/15/2029 | | | | | 1,915,533 | | | | | | 0.1 | | |
| 600,000 (1) | | | Octagon Investment Partners 33 Ltd. 2017-1A B, 3.669%, (US0003M + 1.850%), 01/20/2031 | | | | | 501,382 | | | | | | 0.0 | | |
| 1,000,000 (1) | | | Octagon Investment Partners XXIII Ltd. 2015-1A CR, 3.681%, (US0003M + 1.850%), 07/15/2027 | | | | | 903,771 | | | | | | 0.0 | | |
| 1,500,000 (1) | | | OHA Credit Funding 3 Ltd. 2019-3A C, 4.269%, (US0003M + 2.450%), 07/20/2032 | | | | | 1,261,347 | | | | | | 0.0 | | |
| 1,545,000 (1) | | | OHA Credit Partners IX Ltd. 2013-9A DR, 5.119%, (US0003M + 3.300%), 10/20/2025 | | | | | 1,419,702 | | | | | | 0.1 | | |
| 1,500,000 (1) | | | Palmer Square Loan Funding 2018-1A D Ltd., 5.781%, (US0003M + 3.950%), 04/15/2026 | | | | | 996,456 | | | | | | 0.0 | | |
| Principal Amount† | | | Value | | | Percentage of Net Assets | | |||||||||
| ASSET-BACKED SECURITIES: (continued) | | |||||||||||||||
| | | | Other Asset-Backed Securities (continued) | | ||||||||||||
| 1,000,000 (1) | | | Palmer Square Loan Funding 2018-1A E Ltd., 7.731%, (US0003M + 5.900%), 04/15/2026 | | | | $ | 616,228 | | | | | | 0.0 | | |
| 1,500,000 (1)(9) | | | Palmer Square Loan Funding 2018-2A C Ltd., 3.781%, (US0003M + 1.950%), 07/15/2026 | | | | | 1,159,025 | | | | | | 0.1 | | |
| 3,000,000 (1) | | | Palmer Square Loan Funding 2018-4 D Ltd., 5.942%, (US0003M + 4.250%), 11/15/2026 | | | | | 2,015,955 | | | | | | 0.1 | | |
| 1,576,000 (1) | | | Planet Fitness Master Issuer LLC 2018-1A A2I, 4.262%, 09/05/2048 | | | | | 1,504,498 | | | | | | 0.1 | | |
| 2,443,875 (1) | | | Primose Funding LLC 2019-1A A2, 4.475%, 07/30/2049 | | | | | 2,256,703 | | | | | | 0.1 | | |
| 670,000 (1) | | | Recette CLO Ltd. 2015-1A DR, 4.569%, (US0003M + 2.750%), 10/20/2027 | | | | | 560,103 | | | | | | 0.0 | | |
| 3,000,000 (1) | | | Shackleton CLO Ltd. 2019-15A C, 4.703%, (US0003M + 2.800%), 01/15/2030 | | | | | 2,625,537 | | | | | | 0.1 | | |
| 1,985,000 (1) | | | Sofi Consumer Loan Program 2018-1 C Trust, 3.970%, 02/25/2027 | | | | | 1,636,775 | | | | | | 0.1 | | |
| 2,050,000 (1) | | | Sofi Consumer Loan Program 2018-2 C Trust, 4.250%, 04/26/2027 | | | | | 1,915,114 | | | | | | 0.1 | | |
| 3,000,000 (1) | | | SoFi Consumer Loan Program 2018-4 D Trust, 4.760%, 11/26/2027 | | | | | 2,644,437 | | | | | | 0.1 | | |
| 2,750,000 (1) | | | SoFi Consumer Loan Program 2019-1 D Trust, 4.420%, 02/25/2028 | | | | | 2,398,326 | | | | | | 0.1 | | |
| 3,000,000 (1) | | | SoFi Consumer Loan Program 2019-2 D Trust, 4.200%, 04/25/2028 | | | | | 2,105,119 | | | | | | 0.1 | | |
| 4,000,000 (1) | | | SoFi Consumer Loan Program 2019-3 D Trust, 3.890%, 05/25/2028 | | | | | 3,328,853 | | | | | | 0.1 | | |
| Voya Strategic Income | SUMMARY PORTFOLIO OF INVESTMENTS |
| Opportunities Fund | as of March 31, 2020 (continued) |
| Principal Amount† | | | Value | | | Percentage of Net Assets | | |||||||||
| ASSET-BACKED SECURITIES: (continued) | | |||||||||||||||
| | | | Other Asset-Backed Securities (continued) | | ||||||||||||
| 2,000,000 (1) | | | SoFi Consumer Loan Program 2019-4 C Trust, 2.840%, 08/25/2028 | | | | $ | 1,635,647 | | | | | | 0.0 | | |
| 600,000 (1) | | | SoFi Consumer Loan Program 2019-4 D Trust, 3.480%, 08/25/2028 | | | | | 486,563 | | | | | | 0.0 | | |
| 770,000 (1)(5) | | | SoFi Consumer Loan Program 2017-1 B, 4.730%, 01/26/2026 | | | | | 738,216 | | | | | | 0.0 | | |
| 2,100,000 (1) | | | SoFi Consumer Loan Program 2020-1 C Trust, 2.500%, 01/25/2029 | | | | | 1,653,204 | | | | | | 0.1 | | |
| 1,200,000 (1) | | | SoFi Consumer Loan Program 2020-1 D Trust, 2.940%, 01/25/2029 | | | | | 941,112 | | | | | | 0.0 | | |
| 1,948,375 (1) | | | Sonic Capital LLC 2020-1A A2I, 3.845%, 01/20/2050 | | | | | 1,896,050 | | | | | | 0.1 | | |
| 5,150,000 (1) | | | Sunnova Sol Issuer LLC 2020-1A A, 3.350%, 02/01/2055 | | | | | 3,820,878 | | | | | | 0.2 | | |
| 1,927,993 (1) | | | Sunrun Athena Issuer 2018-1 A LLC, 5.310%, 04/30/2049 | | | | | 1,724,477 | | | | | | 0.1 | | |
| 3,826,061 (1) | | | Sunrun Atlas Issuer 2019-2 A LLC, 3.610%, 01/30/2055 | | | | | 3,367,156 | | | | | | 0.1 | | |
| 1,200,000 (1) | | | Symphony Credit Opportunities Fund Ltd. 2015-2A CR, 4.091%, (US0003M + 2.260%), 07/15/2028 | | | | | 1,094,200 | | | | | | 0.0 | | |
| 1,086,250 (1) | | | Taco Bell Funding LLC 2018-1A A2II, 4.940%, 11/25/2048 | | | | | 1,070,198 | | | | | | 0.0 | | |
| 1,000,000 (1) | | | TCI-Flatiron Clo 2017-1A C Ltd., 3.542%, (US0003M + 1.850%), 11/18/2030 | | | | | 849,842 | | | | | | 0.0 | | |
| 4,000,000 (1) | | | TES 2017-2A B LLC, 6.990%, 02/20/2048 | | | | | 2,789,574 | | | | | | 0.1 | | |
| 3,450,000 (1) | | | TES LLC 2017-1A B, 7.740%, 10/20/2047 | | | | | 2,948,299 | | | | | | 0.1 | | |
| 2,000,000 (1) | | | THL Credit Wind River 2014-1 CRR CLO Ltd., 3.769%, (US0003M + 1.950%), 07/18/2031 | | | | | 1,628,234 | | | | | | 0.1 | | |
| Principal Amount† | | | Value | | | Percentage of Net Assets | | |||||||||
| ASSET-BACKED SECURITIES: (continued) | | |||||||||||||||
| | | | Other Asset-Backed Securities (continued) | | ||||||||||||
| 1,000,000 (1) | | | THL Credit Wind River 2016-1A CR CLO Ltd., 3.931%, (US0003M + 2.100%), 07/15/2028 | | | | $ | 890,813 | | | | | | 0.0 | | |
| 2,000,000 (1)(5) | | | Towd Point Mortgage Trust 2015-6 M2, 3.750%, 04/25/2055 | | | | | 1,880,397 | | | | | | 0.1 | | |
| 2,500,000 (1)(5) | | | Towd Point Mortgage Trust 2017-6 A2, 3.000%, 10/25/2057 | | | | | 2,329,428 | | | | | | 0.1 | | |
| 1,500,000 (1) | | | Upland CLO Ltd. 2016-1A BR, 3.669%, (US0003M + 1.850%), 04/20/2031 | | | | | 1,252,982 | | | | | | 0.1 | | |
| 1,795,000 (1) | | | Venture XX CLO Ltd. 2015-20A CR, 3.731%, (US0003M + 1.900%), 04/15/2027 | | | | | 1,543,664 | | | | | | 0.1 | | |
| 2,785,875 (1) | | | Wendys Funding LLC 2018-1A A2I, 3.573%, 03/15/2048 | | | | | 2,545,984 | | | | | | 0.1 | | |
| 977,500 (1) | | | Wendy’s Funding LLC 2018-1A A2II, 3.884%, 03/15/2048 | | | | | 886,123 | | | | | | 0.1 | | |
| 3,357,500 (1) | | | Wendy’s Funding LLC 2019-1A A2I, 3.783%, 06/15/2049 | | | | | 3,198,623 | | | | | | 0.1 | | |
| 2,000,000 (1) | | | West CLO 2014-2A BR Ltd., 3.593%, (US0003M + 1.750%), 01/16/2027 | | | | | 1,858,172 | | | | | | 0.1 | | |
| 550,523 | | | Other Securities | | | | | 536,908 | | | | | | 0.0 | | |
| | | | | | | | | 235,591,425 | | | | | | 9.2 | | |
| | | | Student Loan Asset-Backed Securities: 1.2% | | ||||||||||||
| 551,931 (1) | | | Commonbond Student Loan Trust 2018-CGS C, 4.350%, 02/25/2046 | | | | | 561,262 | | | | | | 0.0 | | |
| 4,779,820 (1) | | | Commonbond Student Loan Trust 2019-A-GS A1, 2.540%, 01/25/2047 | | | | | 4,867,038 | | | | | | 0.2 | | |
| 1,215,411 (1) | | | Laurel Road Prime Student Loan Trust 2018-B BFX, 3.720%, 05/26/2043 | | | | | 1,181,777 | | | | | | 0.0 | | |
| Voya Strategic Income | SUMMARY PORTFOLIO OF INVESTMENTS |
| Opportunities Fund | as of March 31, 2020 (continued) |
| Principal Amount† | | | Value | | | Percentage of Net Assets | | |||||||||
| ASSET-BACKED SECURITIES: (continued) | | |||||||||||||||
| | | | Student Loan Asset-Backed Securities (continued) | | ||||||||||||
| 4,400,000 (1) | | | SoFi Professional Loan Program 2020-B BFX Trust, 2.730%, 05/15/2046 | | | | $ | 4,407,927 | | | | | | 0.2 | | |
| 258,932 (1) | | | Earnest Student Loan Program, LLC 2017-A C, 4.130%, 01/25/2041 | | | | | 258,663 | | | | | | 0.0 | | |
| 1,086,000 (1) | | | ELFI Graduate Loan Program 2018-A B LLC, 4.000%, 08/25/2042 | | | | | 1,112,602 | | | | | | 0.0 | | |
| 2,150,000 (1)(5) | | | ELFI Graduate Loan Program 2019-A B LLC, 2.940%, 03/25/2044 | | | | | 2,179,364 | | | | | | 0.1 | | |
| 4,000,000 (1) | | | SMB Private Education Loan Trust 2014-A C, 4.500%, 09/15/2045 | | | | | 3,915,323 | | | | | | 0.2 | | |
| 1,000,000 (1) | | | SMB Private Education Loan Trust 2017-A B, 3.500%, 06/17/2041 | | | | | 1,038,473 | | | | | | 0.0 | | |
| 2,250,000 (1)(5) | | | SoFi Professional Loan Program 2017-A B LLC, 3.440%, 03/26/2040 | | | | | 2,317,394 | | | | | | 0.1 | | |
| 1,000,000 (1)(5) | | | SoFi Professional Loan Program 2017-A C, 4.430%, 03/26/2040 | | | | | 1,055,861 | | | | | | 0.1 | | |
| 1,000,000 (1)(5) | | | SoFi Professional Loan Program 2017-C C, 4.210%, 07/25/2040 | | | | | 1,046,712 | | | | | | 0.0 | | |
| 1,000,000 (1) | | | SoFi Professional Loan Program 2017-E C LLC, 4.160%, 11/26/2040 | | | | | 1,053,020 | | | | | | 0.1 | | |
| 1,000,000 (1) | | | Sofi Professional Loan Program 2018-D BFX Trust, 4.140%, 02/25/2048 | | | | | 1,032,126 | | | | | | 0.0 | | |
| 2,000,000 (1) | | | Sofi Professional Loan Program 2019-B BFX LLC, 3.730%, 08/17/2048 | | | | | 2,088,770 | | | | | | 0.1 | | |
| 3,000,000 (1) | | | Sofi Professional Loan Program 2019-C BFX LLC, 3.050%, 11/16/2048 | | | | | 3,025,433 | | | | | | 0.1 | | |
| | | | | | | | | 31,141,745 | | | | | | 1.2 | | |
| | | | Total Asset-Backed Securities (Cost $348,224,383) | | | | | 308,841,383 | | | | | | 12.0 | | |
| | ||||||||||||||||
| Principal Amount† | | | Value | | | Percentage of Net Assets | | |||||||||
| BANK LOANS: 13.5% | | |||||||||||||||
| | | | Aerospace & Defense: 0.4% | | ||||||||||||
| 1,324,402 | | | AI Convoy (Luxembourg) S.A.R.L USD Term Loan B, 5.340%, (US0003M + 3.500%), 01/17/2027 | | | | $ | 1,244,937 | | | | | | 0.1 | | |
| 1,395,099 | | | Amentum Government Services Holdings LLC Term Loan B, 4.989%, (US0001M + 4.000%), 02/01/2027 | | | | | 1,318,369 | | | | | | 0.1 | | |
| 2,327,328 | | | American Airlines, Inc. 2018 Term Loan B, 2.709%, (US0001M + 1.750%), 06/27/2025 | | | | | 1,920,046 | | | | | | 0.1 | | |
| 226,136 | | | Dynasty Acquisition Co., Inc. 2020 CAD Term Loan B2, 4.950%, (US0003M + 3.500%), 04/06/2026 | | | | | 178,195 | | | | | | 0.0 | | |
| 420,614 | | | Dynasty Acquisition Co., Inc. 2020 Term Loan B1, 4.950%, (US0003M + 3.500%), 04/06/2026 | | | | | 331,444 | | | | | | 0.0 | | |
| 1,260,817 | | | KBR, Inc. 2020 Term Loan B, 3.739%, (US0001M + 2.750%), 02/05/2027 | | | | | 1,115,823 | | | | | | 0.0 | | |
| 933,068 | | | Maxar Technologies Ltd. Term Loan B, 3.739%, (US0003M + 2.750%), 10/04/2024 | | | | | 807,103 | | | | | | 0.0 | | |
| 655,000 | | | Science Applications International Corporation 2020 Incremental Term Loan B, 3.701%, (US0003M + 2.250%), 03/05/2027 | | | | | 623,887 | | | | | | 0.0 | | |
| 498,750 | | | TransDigm, Inc. 2020 Term Loan E, 3.239%, (US0001M + 2.250%), 05/30/2025 | | | | | 466,331 | | | | | | 0.0 | | |
| 1,286,998 | | | TransDigm, Inc. 2020 Term Loan F, 3.239%, (US0001M + 2.250%), 12/09/2025 | | | | | 1,203,343 | | | | | | 0.0 | | |
| 2,220,289 | | | TransDigm, Inc. 2020 Term Loan G, 3.239%, (US0001M + 2.250%), 08/22/2024 | | | | | 2,075,971 | | | | | | 0.1 | | |
| | | | | | | | | 11,285,449 | | | | | | 0.4 | | |
| Voya Strategic Income | SUMMARY PORTFOLIO OF INVESTMENTS |
| Opportunities Fund | as of March 31, 2020 (continued) |
| Principal Amount† | | | Value | | | Percentage of Net Assets | | |||||||||
| BANK LOANS: (continued) | | |||||||||||||||
| | | | Auto Components: 0.0% | | ||||||||||||
| 1,267,532 | | | Broadstreet Partners, Inc. 2020 Term Loan B, 4.294%, (US0001M + 3.250%), 01/27/2027 | | | | $ | 1,138,402 | | | | | | 0.0 | | |
| | | | | | ||||||||||||
| | | | Automotive: 0.7% | | ||||||||||||
| 3,337,774 | | | American Axle and Manufacturing, Inc. Term Loan B, 3.200%, (US0001M + 2.250%), 04/06/2024 | | | | | 2,828,764 | | | | | | 0.1 | | |
| 337,875 | | | Autokiniton US Holdings, Inc. Term Loan, 6.739%, (US0001M + 5.750%), 05/22/2025 | | | | | 277,902 | | | | | | 0.0 | | |
| 136,020 | | | Belron Finance US LLC 2018 Term Loan B, 3.957%, (US0003M + 2.250%), 11/13/2025 | | | | | 129,219 | | | | | | 0.0 | | |
| 1,136,364 | | | Belron Finance US LLC 2019 USD Term Loan B, 4.270%, (US0003M + 2.500%), 10/30/2026 | | | | | 1,079,545 | | | | | | 0.0 | | |
| 1,610,375 | | | Belron Finance US LLC USD Term Loan B, 3.992%, (US0003M + 2.250%), 11/07/2024 | | | | | 1,529,857 | | | | | | 0.1 | | |
| 492 | | | Bright Bidco B.V. 2018 Term Loan B, 4.573%, (US0006M + 3.500%), 06/30/2024 | | | | | 175 | | | | | | 0.0 | | |
| 1,182,038 | | | Dealer Tire, LLC 2020 Term Loan B, 5.239%, (US0001M + 4.250%), 12/12/2025 | | | | | 981,091 | | | | | | 0.0 | | |
| 3,104,601 | | | Gates Global LLC 2017 USD Repriced Term Loan B, 3.750%, (US0001M + 2.750%), 04/01/2024 | | | | | 2,794,141 | | | | | | 0.1 | | |
| 1,858,092 | | | Hertz Corporation, (The) 2016 Term Loan B, 3.739%, (US0001M + 2.750%), 06/30/2023 | | | | | 1,331,633 | | | | | | 0.1 | | |
| Principal Amount† | | | Value | | | Percentage of Net Assets | | |||||||||
| BANK LOANS: (continued) | | |||||||||||||||
| | | | Automotive (continued) | | ||||||||||||
| 148,500 | | | Holley Purchaser, Inc. Term Loan B, 6.777%, (US0003M + 5.000%), 10/24/2025 | | | | $ | 123,997 | | | | | | 0.0 | | |
| 525,000 | | | Innovative Xcessories & Services LLC 2020 Term Loan B, 6.451%, (US0003M + 5.000%), 02/26/2027 | | | | | 396,375 | | | | | | 0.0 | | |
| 1,761,016 | | | KAR Auction Services, Inc. 2019 Term Loan B6, 3.188%, (US0001M + 2.250%), 09/19/2026 | | | | | 1,637,745 | | | | | | 0.1 | | |
| 57,619 | | | Mister Car Wash Holdings, Inc. 2019 Delayed Draw Term Loan, 3.862%, (US0001M + 3.250%), 05/14/2026 | | | | | 48,304 | | | | | | 0.0 | | |
| 1,143,739 | | | Mister Car Wash Holdings, Inc. 2019 Term Loan B, 3.862%, (US0001M + 3.250%), 05/14/2026 | | | | | 946,444 | | | | | | 0.0 | | |
| 1,756,175 | | | Panther BF Aggregator 2 LP USD Term Loan B, 4.441%, (US0001M + 3.500%), 04/30/2026 | | | | | 1,615,681 | | | | | | 0.1 | | |
| 1,636,966 | | | Truck Hero, Inc. 1st Lien Term Loan, 4.739%, (US0001M + 3.750%), 04/22/2024 | | | | | 1,257,735 | | | | | | 0.1 | | |
| 1,000,000 | | | Wand NewCo 3, Inc. 2020 Term Loan, 4.072%, (US0006M + 3.000%), 02/05/2026 | | | | | 915,000 | | | | | | 0.0 | | |
| | | | | | | | | 17,893,608 | | | | | | 0.7 | | |
| | | | Beverage & Tobacco: 0.1% | | ||||||||||||
| 1,965,250 | | | Sunshine Investments B.V. USD Term Loan B3, 4.954%, (US0002M + 3.250%), 03/28/2025 | | | | | 1,827,682 | | | | | | 0.1 | | |
| Voya Strategic Income | SUMMARY PORTFOLIO OF INVESTMENTS |
| Opportunities Fund | as of March 31, 2020 (continued) |
| Principal Amount† | | | Value | | | Percentage of Net Assets | | |||||||||
| BANK LOANS: (continued) | | |||||||||||||||
| | | | Brokers, Dealers & Investment Houses: 0.1% | | ||||||||||||
| 2,484,874 | | | Brookfield Property REIT Inc. 1st Lien Term Loan B, 3.489%, (US0001M + 2.500%), 08/27/2025 | | | | $ | 1,784,140 | | | | | | 0.1 | | |
| 941,225 | | | Forest City Enterprises, L.P. 2019 Term Loan B, 4.489%, (US0001M + 3.500%), 12/08/2025 | | | | | 809,453 | | | | | | 0.0 | | |
| | | | | | | | | 2,593,593 | | | | | | 0.1 | | |
| | | | Building & Development: 0.4% | | ||||||||||||
| 427,418 | | | Advanced Drainage Systems Inc Term Loan B, 3.813%, (US0001M + 2.250%), 07/31/2026 | | | | | 399,635 | | | | | | 0.0 | | |
| 690,000 | | | Arconic Rolled Products Corporation Term Loan B, 4.213%, (US0003M + 2.750%), 02/04/2027 | | | | | 631,350 | | | | | | 0.0 | | |
| 2,130,826 | | | Core & Main LP 2017 Term Loan B, 4.331%, (US0001M + 2.750%), 08/01/2024 | | | | | 1,885,781 | | | | | | 0.1 | | |
| 1,822,720 | | | GYP Holdings III Corp. 2018 Term Loan B, 3.739%, (US0001M + 2.750%), 06/01/2025 | | | | | 1,658,675 | | | | | | 0.1 | | |
| 989,155 | | | Henry Company LLC Term Loan B, 5.000%, (US0001M + 4.000%), 10/05/2023 | | | | | 849,024 | | | | | | 0.0 | | |
| 147,750 | | | Interior Logic Group Holdings IV LLC 2018 Term Loan B, 4.989%, (US0001M + 4.000%), 05/30/2025 | | | | | 128,543 | | | | | | 0.0 | | |
| 1,879,141 | | | MX Holdings US, Inc. 2018 USD Term Loan B1C, 3.739%, (US0001M + 2.750%), 07/31/2025 | | | | | 1,625,457 | | | | | | 0.1 | | |
| 1,895,250 | | | Quikrete Holdings Inc Term Loan, 3.489%, (US0001M + 2.500%), 02/01/2027 | | | | | 1,648,868 | | | | | | 0.1 | | |
| Principal Amount† | | | Value | | | Percentage of Net Assets | | |||||||||
| BANK LOANS: (continued) | | |||||||||||||||
| | | | Building & Development (continued) | | ||||||||||||
| 644,080 | | | Werner FinCo LP 2017 Term Loan, 5.000%, (US0001M + 4.000%), 07/24/2024 | | | | $ | 570,011 | | | | | | 0.0 | | |
| 1,500,000 | | | Zekelman Industries, Inc. 2020 Term Loan, 3.209%, (US0001M + 2.250%), 01/24/2027 | | | | | 1,402,500 | | | | | | 0.0 | | |
| | | | | | | | | 10,799,844 | | | | | | 0.4 | | |
| | | | Business Equipment & Services: 1.2% | | ||||||||||||
| 442,261 | | | 24-7 Intouch Inc 2018 Term Loan, 5.739%, (US0001M + 4.750%), 08/25/2025 | | | | | 373,711 | | | | | | 0.0 | | |
| 2,561,345 | | | AlixPartners, LLP 2017 Term Loan B, 3.500%, (US0001M + 2.500%), 04/04/2024 | | | | | 2,388,454 | | | | | | 0.1 | | |
| 640,547 | | | Ascend Learning, LLC 2017 Term Loan B, 4.000%, (US0001M + 3.000%), 07/12/2024 | | | | | 580,763 | | | | | | 0.0 | | |
| 215,899 | | | Big Ass Fans, LLC 2018 Term Loan, 5.200%, (US0003M + 3.750%), 05/21/2024 | | | | | 189,991 | | | | | | 0.0 | | |
| 755,000 | | | Castle US Holding Corporation USD Term Loan B, 5.200%, (US0001M + 3.750%), 01/29/2027 | | | | | 657,794 | | | | | | 0.0 | | |
| 584,594 | | | Colorado Buyer Inc Term Loan B, 4.000%, (US0001M + 3.000%), 05/01/2024 | | | | | 397,037 | | | | | | 0.0 | | |
| 1,140,115 | | | Convergint Technologies LLC 2018 1st Lien Term Loan, 3.989%, (US0001M + 3.000%), 02/03/2025 | | | | | 986,200 | | | | | | 0.0 | | |
| 1,911,930 | | | EIG Investors Corp. 2018 1st Lien Term Loan, 5.388%, (US0003M + 3.750%), 02/09/2023 | | | | | 1,567,783 | | | | | | 0.1 | | |
| Voya Strategic Income | SUMMARY PORTFOLIO OF INVESTMENTS |
| Opportunities Fund | as of March 31, 2020 (continued) |
| Principal Amount† | | | Value | | | Percentage of Net Assets | | |||||||||
| BANK LOANS: (continued) | | |||||||||||||||
| | | | Business Equipment & Services (continued) | | ||||||||||||
| 921,610 | | | Ellie Mae, Inc. Term Loan, 5.200%, (US0003M + 3.750%), 04/17/2026 | | | | $ | 810,249 | | | | | | 0.0 | | |
| 787,479 | | | EVO Payments International LLC 2018 1st Lien Term Loan, 4.200%, (US0001M + 3.250%), 12/22/2023 | | | | | 685,107 | | | | | | 0.0 | | |
| 883,744 | | | GreenSky Holdings, LLC 2018 Term Loan B, 4.250%, (US0001M + 3.250%), 03/31/2025 | | | | | 729,089 | | | | | | 0.0 | | |
| 400,871 | | | ION Trading Technologies S.a.r.l. USD Incremental Term Loan B, 5.072%, (US0003M + 4.000%), 11/21/2024 | | | | | 304,662 | | | | | | 0.0 | | |
| 146,512 | | | IQOR US Inc. Term Loan B, 6.909%, (US0003M + 5.000%), 04/01/2021 | | | | | 87,724 | | | | | | 0.0 | | |
| 1,731,401 | | | KUEHG Corp. 2018 Incremental Term Loan, 5.200%, (US0003M + 3.750%), 02/21/2025 | | | | | 1,302,879 | | | | | | 0.1 | | |
| 1,036,434 | | | Learning Care Group, Inc. 2018 1st Lien Term Loan, 4.984%, (US0003M + 3.250%), 03/13/2025 | | | | | 834,329 | | | | | | 0.0 | | |
| 100,000 | | | Learning Care Group, Inc. 2018 2nd Lien Term Loan, 9.294%, (US0003M + 7.500%), 03/13/2026 | | | | | 89,000 | | | | | | 0.0 | | |
| 1,385,054 | | | PI US MergerCo, Inc. USD 2017 1st Lien Term Loan, 4.700%, (US0003M + 3.250%), 01/03/2025 | | | | | 1,187,684 | | | | | | 0.1 | | |
| 1,624,587 | | | Pre-Paid Legal Services, Inc. 2018 1st Lien Term Loan, 4.239%, (US0001M + 3.250%), 05/01/2025 | | | | | 1,389,022 | | | | | | 0.1 | | |
| Principal Amount† | | | Value | | | Percentage of Net Assets | | |||||||||
| BANK LOANS: (continued) | | |||||||||||||||
| | | | Business Equipment & Services (continued) | | ||||||||||||
| 1,489,383 | | | Prometric Holdings, Inc. 1st Lien Term Loan, 4.000%, (US0001M + 3.000%), 01/29/2025 | | | | $ | 1,154,271 | | | | | | 0.1 | | |
| 2,503,476 | | | Red Ventures, LLC 2020 Term Loan B, 3.489%, (US0001M + 2.500%), 11/08/2024 | | | | | 2,111,264 | | | | | | 0.1 | | |
| 641,715 | | | Renaissance Learning, Inc. 2018 Add On Term Loan, 4.239%, (US0001M + 3.250%), 05/30/2025 | | | | | 571,127 | | | | | | 0.0 | | |
| 1,144,074 | | | Research Now Group, Inc. 2017 1st Lien Term Loan, 7.263%, (US0003M + 5.500%), 12/20/2024 | | | | | 1,029,667 | | | | | | 0.1 | | |
| 265,000 | | | Rockwood Service Corporation 2020 Term Loan, 5.700%, (US0003M + 4.250%), 01/23/2027 | | | | | 241,481 | | | | | | 0.0 | | |
| 1,629,213 | | | Solera Holdings, Inc. USD Term Loan B, 4.363%, (US0003M + 2.750%), 03/03/2023 | | | | | 1,527,387 | | | | | | 0.1 | | |
| 261,173 | | | SSH Group Holdings, Inc. 2018 1st Lien Term Loan, 5.700%, (US0003M + 4.250%), 07/30/2025 | | | | | 210,897 | | | | | | 0.0 | | |
| 1,550,794 | | | Staples, Inc. 7 Year Term Loan, 6.515%, (US0001M + 5.000%), 04/16/2026 | | | | | 1,246,450 | | | | | | 0.1 | | |
| 665,000 | | | STG-Fairway Holdings, LLC Term Loan B, 4.572%, (US0006M + 3.500%), 01/31/2027 | | | | | 608,475 | | | | | | 0.0 | | |
| 364,432 | | | SurveyMonkey Inc. 2018 Term Loan B, 4.370%, (US0001W + 3.750%), 10/10/2025 | | | | | 300,657 | | | | | | 0.0 | | |
| Voya Strategic Income | SUMMARY PORTFOLIO OF INVESTMENTS |
| Opportunities Fund | as of March 31, 2020 (continued) |
| Principal Amount† | | | Value | | | Percentage of Net Assets | | |||||||||
| BANK LOANS: (continued) | | |||||||||||||||
| | | | Business Equipment & Services (continued) | | ||||||||||||
| 1,292,406 | | | Verifone Systems, Inc. 2018 1st Lien Term Loan, 5.695%, (US0003M + 4.000%), 08/20/2025 | | | | $ | 857,296 | | | | | | 0.0 | | |
| 1,111,832 | | | Verra Mobility Corporation 2020 Term Loan B, 4.239%, (US0001M + 3.250%), 02/28/2025 | | | | | 1,006,208 | | | | | | 0.0 | | |
| 2,006,981 | | | Verscend Holding Corp. 2018 Term Loan B, 5.489%, (US0001M + 4.500%), 08/27/2025 | | | | | 1,906,632 | | | | | | 0.1 | | |
| 610,000 | | | VS Buyer, LLC Term Loan B, 4.863%, (US0003M + 3.250%), 02/28/2027 | | | | | 588,650 | | | | | | 0.0 | | |
| 1,393,027 | | | West Corporation 2017 Term Loan, 5.450%, (US0003M + 4.000%), 10/10/2024 | | | | | 1,072,631 | | | | | | 0.1 | | |
| 686,550 | | | West Corporation 2018 Term Loan B1, 4.950%, (US0003M + 3.500%), 10/10/2024 | | | | | 516,285 | | | | | | 0.0 | | |
| 630,008 | | | Yak Access, LLC 2018 1st Lien Term Loan B, 6.450%, (US0003M + 5.000%), 07/11/2025 | | | | | 475,656 | | | | | | 0.0 | | |
| 100,000 | | | Yak Access, LLC 2018 2nd Lien Term Loan B, 11.204%, (US0003M + 10.000%), 07/10/2026 | | | | | 62,500 | | | | | | 0.0 | | |
| | | | | | | | | 30,049,012 | | | | | | 1.2 | | |
| | | | Cable & Satellite Television: 0.3% | | ||||||||||||
| 2,038,112 | | | CSC Holdings, LLC 2019 Term Loan B5, 3.112%, (US0001M + 2.500%), 04/15/2027 | | | | | 1,973,572 | | | | | | 0.1 | | |
| 1,477,348 | | | Radiate Holdco, LLC 1st Lien Term Loan, 3.989%, (US0001M + 3.000%), 02/01/2024 | | | | | 1,370,978 | | | | | | 0.0 | | |
| 598,500 | | | Telesat Canada Term Loan B5, 3.740%, (US0001M + 2.750%), 12/07/2026 | | | | | 558,101 | | | | | | 0.0 | | |
| Principal Amount† | | | Value | | | Percentage of Net Assets | | |||||||||
| BANK LOANS: (continued) | | |||||||||||||||
| | | | Cable & Satellite Television (continued) | | ||||||||||||
| 1,110,000 | | | UPC Broadband Holding B.V. 2020 USD Term Loan B, 2.955%, (US0001M + 2.250%), 04/30/2028 | | | | $ | 1,008,250 | | | | | | 0.0 | | |
| 2,149,808 | | | Virgin Media Bristol LLC USD Term Loan N, 3.205%, (US0001M + 2.500%), 01/31/2028 | | | | | 2,047,692 | | | | | | 0.1 | | |
| 1,994,885 | | | WideOpenWest Finance LLC 2017 Term Loan B, 4.250%, (US0001M + 3.250%), 08/18/2023 | | | | | 1,822,826 | | | | | | 0.1 | | |
| | | | | | | | | 8,781,419 | | | | | | 0.3 | | |
| | | | Chemicals & Plastics: 0.4% | | ||||||||||||
| 1,340,206 | | | Alpha 3 B.V. 2017 Term Loan B1, 4.450%, (US0003M + 3.000%), 01/31/2024 | | | | | 1,243,041 | | | | | | 0.1 | | |
| 278,600 | | | Ascend Performance Materials Operations LLC 2019 Term Loan B, 6.700%, (US0003M + 5.250%), 08/27/2026 | | | | | 247,954 | | | | | | 0.0 | | |
| 669,850 | | | Composite Resins Holding B.V. 2018 Term Loan B, 5.255%, (US0001M + 4.250%), 08/01/2025 | | | | | 599,515 | | | | | | 0.0 | | |
| 634,659 | | | Diamond (BC) B.V. USD Term Loan, 4.777%, (US0003M + 3.000%), 09/06/2024 | | | | | 490,274 | | | | | | 0.0 | | |
| 1,553,485 | | | Encapsys, LLC 2020 Term Loan B2, 4.250%, (US0001M + 3.250%), 11/07/2024 | | | | | 1,242,788 | | | | | | 0.1 | | |
| 891,231 | | | Polar US Borrower, LLC 2018 1st Lien Term Loan, 6.609%, (US0003M + 4.750%), 10/15/2025 | | | | | 779,827 | | | | | | 0.0 | | |
| 1,587,859 | | | Starfruit Finco B.V 2018 USD Term Loan B, 3.863%, (US0001M + 3.000%), 10/01/2025 | | | | | 1,452,891 | | | | | | 0.1 | | |
| Voya Strategic Income | SUMMARY PORTFOLIO OF INVESTMENTS |
| Opportunities Fund | as of March 31, 2020 (continued) |
| Principal Amount† | | | Value | | | Percentage of Net Assets | | |||||||||
| BANK LOANS: (continued) | | |||||||||||||||
| | | | Chemicals & Plastics (continued) | | ||||||||||||
| 2,494,013 | | | Tronox Finance LLC Term Loan B, 3.930%, (US0001M + 2.750%), 09/23/2024 | | | | $ | 2,242,534 | | | | | | 0.1 | | |
| 500,000 | | | Univar Inc. 2017 USD Term Loan B, 4.484%, (US0001M + 2.250%), 07/01/2024 | | | | | 468,750 | | | | | | 0.0 | | |
| 443,888 | | | Univar Inc. 2019 USD Term Loan B5, 3.450%, (US0003M + 2.000%), 07/01/2026 | | | | | 406,157 | | | | | | 0.0 | | |
| | | | | | | | | 9,173,731 | | | | | | 0.4 | | |
| | | | Clothing/Textiles: 0.0% | | ||||||||||||
| 1,230,462 | | | Varsity Brands, Inc. 2017 Term Loan B, 4.500%, (US0001M + 3.500%), 12/15/2024 | | | | | 974,116 | | | | | | 0.0 | | |
| | | | | | ||||||||||||
| | | | Consumer, Cyclical: 0.0% | | ||||||||||||
| 973,887 | | | 24 Hour Fitness Worldwide, Inc. 2018 Term Loan B, 4.950%, (US0003M + 3.500%), 05/30/2025 | | | | | 241,848 | | | | | | 0.0 | | |
| 501,601 | | | Harbor Freight Tools USA, Inc. 2018 Term Loan B, 4.299%, (US0001M + 2.500%), 08/19/2023 | | | | | 460,219 | | | | | | 0.0 | | |
| | | | | | | | | 702,067 | | | | | | 0.0 | | |
| | | | Containers & Glass Products: 0.6% | | ||||||||||||
| 890,677 | | | Albea Beauty Holdings S.A 2018 USD Term Loan B2, 4.907%, (US0006M + 3.000%), 04/22/2024 | | | | | 723,675 | | | | | | 0.0 | | |
| 3,143,781 | | | Berry Global, Inc. 2019 Term Loan Y, 2.863%, (US0001M + 2.000%), 07/01/2026 | | | | | 2,977,161 | | | | | | 0.1 | | |
| 1,278,768 | | | Bway Holding Company 2017 Term Loan B, 5.084%, (US0003M + 3.250%), 04/03/2024 | | | | | 1,061,378 | | | | | | 0.0 | | |
| Principal Amount† | | | Value | | | Percentage of Net Assets | | |||||||||
| BANK LOANS: (continued) | | |||||||||||||||
| | | | Containers & Glass Products (continued) | | ||||||||||||
| 1,378,128 | | | Charter NEX US, Inc. Incremental Term Loan, 4.489%, (US0001M + 3.500%), 05/16/2024 | | | | $ | 1,215,050 | | | | | | 0.1 | | |
| 806,699 | | | Flex Acquisition Company, Inc. 1st Lien Term Loan, 4.898%, (US0003M + 3.000%), 12/29/2023 | | | | | 719,307 | | | | | | 0.0 | | |
| 2,018,888 | | | Flex Acquisition Company, Inc. 2018 Incremental Term Loan, 5.159%, (US0003M + 3.250%), 06/29/2025 | | | | | 1,800,176 | | | | | | 0.1 | | |
| 684,715 | | | Plastipak Packaging, Inc. 2018 Term Loan B, 3.490%, (US0001M + 2.500%), 10/14/2024 | | | | | 631,649 | | | | | | 0.0 | | |
| 1,195,000 | | | Reynolds Consumer Products LLC Term Loan, 3.501%, (US0003M + 1.750%), 02/04/2027 | | | | | 1,134,503 | | | | | | 0.1 | | |
| 2,453,084 | | | Reynolds Group Holdings Inc. USD 2017 Term Loan, 3.739%, (US0001M + 2.750%), 02/05/2023 | | | | | 2,339,629 | | | | | | 0.1 | | |
| 888,189 | | | Ring Container Technologies Group, LLC 1st Lien Term Loan, 3.739%, (US0001M + 2.750%), 10/31/2024 | | | | | 777,165 | | | | | | 0.0 | | |
| 1,787,961 | | | TricorBraun Hldgs Inc First Lien Term Loan, 5.202%, (US0003M + 3.750%), 11/30/2023 | | | | | 1,497,417 | | | | | | 0.1 | | |
| | | | | | | | | 14,877,110 | | | | | | 0.6 | | |
| | | | Cosmetics/Toiletries: 0.1% | | ||||||||||||
| 147,375 | | | Anastasia Parent, LLC 2018 Term Loan B, 4.822%, (US0006M + 3.750%), 08/11/2025 | | | | | 88,916 | | | | | | 0.0 | | |
| Voya Strategic Income | SUMMARY PORTFOLIO OF INVESTMENTS |
| Opportunities Fund | as of March 31, 2020 (continued) |
| Principal Amount† | | | Value | | | Percentage of Net Assets | | |||||||||
| BANK LOANS: (continued) | | |||||||||||||||
| | | | Cosmetics/Toiletries (continued) | | ||||||||||||
| 1,720,915 | | | Wellness Merger Sub, Inc. 1st Lien Term Loan, 5.863%, (US0003M + 4.250%), 06/30/2024 | | | | $ | 1,370,996 | | | | | | 0.1 | | |
| | | | | | | | | 1,459,912 | | | | | | 0.1 | | |
| | | | Drugs: 0.0% | | ||||||||||||
| 1,038,362 | | | Horizon Therapeutics USA Inc Term Loan B, 3.313%, (US0001M + 2.250%), 05/22/2026 | | | | | 983,848 | | | | | | 0.0 | | |
| | | | | | ||||||||||||
| | | | Ecological Services & Equipment: 0.0% | | ||||||||||||
| 1,090,466 | | | GFL Environmental Inc. 2018 USD Term Loan B, 3.991%, (US0001M + 3.000%), 05/30/2025 | | | | | 1,063,885 | | | | | | 0.0 | | |
| | | | | | ||||||||||||
| | | | Electronics/Electrical: 2.0% | | ||||||||||||
| 420,084 | | | ABC Financial Services, Inc. 1st Lien Term Loan, 5.250%, (US0001M + 4.250%), 01/02/2025 | | | | | 325,565 | | | | | | 0.0 | | |
| 1,533,405 | | | Barracuda Networks, Inc. 1st Lien Term Loan, 4.517%, (US0003M + 3.250%), 02/12/2025 | | | | | 1,423,511 | | | | | | 0.1 | | |
| 1,191,763 | | | BMC Software Finance, Inc. 2018 USD Term Loan B, 5.239%, (US0001M + 4.250%), 10/02/2025 | | | | | 1,021,341 | | | | | | 0.0 | | |
| 642,085 | | | Brave Parent Holdings, Inc. 1st Lien Term Loan, 5.777%, (US0003M + 4.000%), 04/18/2025 | | | | | 560,754 | | | | | | 0.0 | | |
| 678,447 | | | Cohu, Inc. 2018 Term Loan B, 3.989%, (US0001M + 3.000%), 10/01/2025 | | | | | 508,835 | | | | | | 0.0 | | |
| 1,013,536 | | | Compuware Corporation 2018 Term Loan B, 4.989%, (US0001M + 4.000%), 08/22/2025 | | | | | 983,130 | | | | | | 0.0 | | |
| 148,500 | | | EagleView Technology Corporation 2018 Add On Term Loan B, 5.113%, (US0003M + 3.500%), 08/14/2025 | | | | | 126,225 | | | | | | 0.0 | | |
| Principal Amount† | | | Value | | | Percentage of Net Assets | | |||||||||
| BANK LOANS: (continued) | | |||||||||||||||
| | | | Electronics/Electrical (continued) | | ||||||||||||
| 394,856 | | | Electrical Components International, Inc. 2018 1st Lien Term Loan, 5.239%, (US0003M + 4.250%), 06/26/2025 | | | | $ | 298,116 | | | | | | 0.0 | | |
| 2,120,744 | | | Epicor Software Corporation 1st Lien Term Loan, 4.250%, (US0001M + 3.250%), 06/01/2022 | | | | | 1,966,990 | | | | | | 0.1 | | |
| 406,117 | | | Exact Merger Sub LLC 1st Lien Term Loan, 5.700%, (US0003M + 4.250%), 09/27/2024 | | | | | 364,828 | | | | | | 0.0 | | |
| 890,525 | | | GlobalFoundries Inc USD Term Loan B, 6.200%, (US0003M + 4.750%), 06/05/2026 | | | | | 765,851 | | | | | | 0.0 | | |
| 1,553,612 | | | Greeneden U.S. Holdings II, LLC 2018 USD Term Loan B, 4.239%, (US0001M + 3.250%), 12/01/2023 | | | | | 1,406,019 | | | | | | 0.1 | | |
| 593,513 | | | Helios Software Holdings, Inc. USD Term Loan, 5.322%, (US0006M + 4.250%), 10/24/2025 | | | | | 504,486 | | | | | | 0.0 | | |
| 250,000 | | | Hyland Software, Inc. 2017 2nd Lien Term Loan, 7.989%, (US0001M + 7.000%), 07/07/2025 | | | | | 236,250 | | | | | | 0.0 | | |
| 1,668,170 | | | Hyland Software, Inc. 2018 1st Lien Term Loan, 4.489%, (US0001M + 3.250%), 07/01/2024 | | | | | 1,558,349 | | | | | | 0.1 | | |
| 1,210,850 | | | Imperva, Inc. 1st Lien Term Loan, 5.704%, (US0003M + 4.000%), 01/12/2026 | | | | | 1,008,033 | | | | | | 0.0 | | |
| 110,000 | | | Imperva, Inc. 2nd Lien Term Loan, 9.442%, (US0003M + 7.750%), 01/10/2027 | | | | | 99,000 | | | | | | 0.0 | | |
| Voya Strategic Income | SUMMARY PORTFOLIO OF INVESTMENTS |
| Opportunities Fund | as of March 31, 2020 (continued) |
| Principal Amount† | | | Value | | | Percentage of Net Assets | | |||||||||
| BANK LOANS: (continued) | | |||||||||||||||
| | | | Electronics/Electrical (continued) | | ||||||||||||
| 1,131,980 | | | Infor (US), Inc. Term Loan B6, 3.750%, (US0001M + 2.750%), 02/01/2022 | | | | $ | 1,097,454 | | | | | | 0.0 | | |
| 1,560,000 | | | Informatica LLC 2020 USD Term Loan B, 4.239%, (US0001M + 3.250%), 02/25/2027 | | | | | 1,380,600 | | | | | | 0.1 | | |
| 2,554,359 | | | Kronos Incorporated 2017 Term Loan B, 4.763%, (US0003M + 3.000%), 11/01/2023 | | | | | 2,365,975 | | | | | | 0.1 | | |
| 249,921 | | | MA FinanceCo., LLC USD Term Loan B3, 3.489%, (US0001M + 2.500%), 06/21/2024 | | | | | 227,845 | | | | | | 0.0 | | |
| 3,878,573 | | | McAfee, LLC 2018 USD Term Loan B, 4.691%, (US0001M + 3.750%), 09/30/2024 | | | | | 3,620,000 | | | | | | 0.1 | | |
| 3,367,768 | | | MH Sub I, LLC 2017 1st Lien Term Loan, 4.822%, (US0006M + 3.750%), 09/13/2024 | | | | | 2,929,958 | | | | | | 0.1 | | |
| 400,000 | | | MH Sub I, LLC 2017 2nd Lien Term Loan, 8.572%, (US0006M + 7.500%), 09/15/2025 | | | | | 325,000 | | | | | | 0.0 | | |
| 2,007,793 | | | Project Boost Purchaser, LLC 2019 Term Loan B, 4.489%, (US0001M + 3.500%), 06/01/2026 | | | | | 1,656,429 | | | | | | 0.1 | | |
| 669,044 | | | Project Leopard Holdings, Inc. 2019 Term Loan, 5.700%, (US0003M + 4.250%), 07/07/2023 | | | | | 598,794 | | | | | | 0.0 | | |
| 2,552,850 | | | Quest Software US Holdings Inc. 2018 1st Lien Term Loan, 6.027%, (US0003M + 4.250%), 05/16/2025 | | | | | 1,997,605 | | | | | | 0.1 | | |
| 115,000 | | | Quest Software US Holdings Inc. 2018 2nd Lien Term Loan, 10.027%, (US0003M + 8.250%), 05/18/2026 | | | | | 70,438 | | | | | | 0.0 | | |
| Principal Amount† | | | Value | | | Percentage of Net Assets | | |||||||||
| BANK LOANS: (continued) | | |||||||||||||||
| | | | Electronics/Electrical (continued) | | ||||||||||||
| 2,776,035 | | | Rackspace Hosting, Inc. 2017 Incremental 1st Lien Term Loan, 4.762%, (US0003M + 3.000%), 11/03/2023 | | | | $ | 2,519,252 | | | | | | 0.1 | | |
| 739,436 | | | Riverbed Technology, Inc. 2016 Term Loan, 4.250%, (US0001M + 3.250%), 04/24/2022 | | | | | 487,288 | | | | | | 0.0 | | |
| 90,000 | | | Rocket Software, Inc. 2018 2nd Lien Term Loan, 9.239%, (US0001M + 8.250%), 11/27/2026 | | | | | 60,300 | | | | | | 0.0 | | |
| 1,819,181 | | | Rocket Software, Inc. 2018 Term Loan, 5.239%, (US0001M + 4.250%), 11/28/2025 | | | | | 1,506,888 | | | | | | 0.1 | | |
| 1,877,876 | | | RP Crown Parent LLC Term Loan B, 3.750%, (US0001M + 2.750%), 10/12/2023 | | | | | 1,802,761 | | | | | | 0.1 | | |
| 1,687,778 | | | Seattle Spinco, Inc. USD Term Loan B3, 3.489%, (US0001M + 2.500%), 06/21/2024 | | | | | 1,538,692 | | | | | | 0.1 | | |
| 947,849 | | | Sirius Computer Solutions, Inc. 2020 Term Loan, 4.489%, (US0001M + 3.500%), 07/01/2026 | | | | | 836,477 | | | | | | 0.0 | | |
| 392,735 | | | SkillSoft Corporation 1st Lien Term Loan, 6.527%, (US0003M + 4.750%), 04/28/2021 | | | | | 258,550 | | | | | | 0.0 | | |
| 2,987,265 | | | SolarWinds Holdings, Inc. 2018 Term Loan B, 3.739%, (US0001M + 2.750%), 02/05/2024 | | | | | 2,787,118 | | | | | | 0.1 | | |
| 634,481 | | | SonicWall US Holdings Inc. 1st Lien Term Loan, 5.195%, (US0003M + 3.500%), 05/16/2025 | | | | | 527,677 | | | | | | 0.0 | | |
| 100,000 | | | SonicWall US Holdings Inc. 2nd Lien Term Loan, 9.195%, (US0003M + 7.500%), 05/18/2026 | | | | | 79,250 | | | | | | 0.0 | | |
| Voya Strategic Income | SUMMARY PORTFOLIO OF INVESTMENTS |
| Opportunities Fund | as of March 31, 2020 (continued) |
| Principal Amount† | | | Value | | | Percentage of Net Assets | | |||||||||
| BANK LOANS: (continued) | | |||||||||||||||
| | | | Electronics/Electrical (continued) | | ||||||||||||
| 326,116 | | | SS&C Technologies Holdings Europe S.A.R.L. 2018 Term Loan B4, 2.739%, (US0001M + 1.750%), 04/16/2025 | | | | $ | 310,626 | | | | | | 0.0 | | |
| 457,022 | | | SS&C Technologies Inc. 2018 Term Loan B3, 2.739%, (US0001M + 1.750%), 04/16/2025 | | | | | 435,313 | | | | | | 0.0 | | |
| 1,334,098 | | | Surf Holdings, LLC USD Term Loan, 4.814%, (US0003M + 3.500%), 03/05/2027 | | | | | 1,197,353 | | | | | | 0.1 | | |
| 1,333,278 | | | Travelport Finance (Luxembourg) S.a.r.l. 2019 Term Loan, 6.072%, (US0003M + 5.000%), 05/29/2026 | | | | | 885,519 | | | | | | 0.0 | | |
| 643,500 | | | TriTech Software Systems 2018 Term Loan B, 5.200%, (US0003M + 3.750%), 08/29/2025 | | | | | 501,930 | | | | | | 0.0 | | |
| 1,424,292 | | | TTM Technologies, Inc. 2017 Term Loan, 4.081%, (US0001M + 2.500%), 09/28/2024 | | | | | 1,338,835 | | | | | | 0.1 | | |
| 1,355,681 | | | Ultimate Software Group Inc(The) Term Loan B, 4.739%, (US0001M + 3.750%), 05/04/2026 | | | | | 1,281,119 | | | | | | 0.1 | | |
| 1,649,024 | | | Veritas Bermuda Ltd. USD Repriced Term Loan B, 5.950%, (US0003M + 4.500%), 01/27/2023 | | | | | 1,409,916 | | | | | | 0.1 | | |
| 2,114,711 | | | Vertafore, Inc. 2018 1st Lien Term Loan, 4.239%, (US0001M + 3.250%), 07/02/2025 | | | | | 1,908,527 | | | | | | 0.1 | | |
| 350,000 | | | Vertafore, Inc. 2018 2nd Lien Term Loan, 8.239%, (US0001M + 7.250%), 07/02/2026 | | | | | 310,916 | | | | | | 0.0 | | |
| 73,181 | | | Web.com Group, Inc. 2018 2nd Lien Term Loan, 8.945%, (US0003M + 7.750%), 10/09/2026 | | | | | 56,532 | | | | | | 0.0 | | |
| Principal Amount† | | | Value | | | Percentage of Net Assets | | |||||||||
| BANK LOANS: (continued) | | |||||||||||||||
| | | | Electronics/Electrical (continued) | | ||||||||||||
| 390,845 | | | Web.com Group, Inc. 2018 Term Loan B, 4.945%, (US0003M + 3.750%), 10/10/2025 | | | | $ | 325,378 | | | | | | 0.0 | | |
| 542,466 | | | Xperi Corporation 2018 Term Loan B1, 3.489%, (US0001M + 2.500%), 12/01/2023 | | | | | 504,493 | | | | | | 0.0 | | |
| | | | | | | | | 52,298,091 | | | | | | 2.0 | | |
| | | | Financial: 0.0% | | ||||||||||||
| 1,179,908 | | | Blucora, Inc. 2017 Term Loan B, 4.450%, (US0003M + 3.000%), 05/22/2024 | | | | | 1,079,616 | | | | | | 0.0 | | |
| | | | | | ||||||||||||
| | | | Financial Intermediaries: 0.4% | | ||||||||||||
| 185,250 | | | Advisor Group, Inc. 2019 Term Loan B, 5.989%, (US0001M + 5.000%), 07/31/2026 | | | | | 142,642 | | | | | | 0.0 | | |
| 2,129,143 | | | Blackhawk Network Holdings, Inc 2018 1st Lien Term Loan, 3.989%, (US0001M + 3.000%), 06/15/2025 | | | | | 1,760,092 | | | | | | 0.1 | | |
| 997,245 | | | Blackstone Mortgage Trust, Inc. 2019 Term Loan B, 3.239%, (US0001M + 2.250%), 04/23/2026 | | | | | 872,590 | | | | | | 0.0 | | |
| 940,603 | | | Cushman & Wakefield U.S. Borrower, LLC 2020 Term Loan B, 3.739%, (US0001M + 2.750%), 08/21/2025 | | | | | 846,543 | | | | | | 0.0 | | |
| 770,000 | | | Deerfield Dakota Holding, LLC 2020 USD Term Loan B, 5.201%, (US0003M + 3.750%), 03/05/2027 | | | | | 662,200 | | | | | | 0.0 | | |
| 3,389,056 | | | Edelman Financial Center, LLC 2018 1st Lien Term Loan, 4.179%, (US0001M + 3.250%), 07/21/2025 | | | | | 2,925,884 | | | | | | 0.1 | | |
| 1,266,416 | | | First Eagle Holdings, Inc. 2020 Term Loan B, 3.950%, (US0003M + 2.500%), 02/01/2027 | | | | | 1,074,871 | | | | | | 0.1 | | |
| Voya Strategic Income | SUMMARY PORTFOLIO OF INVESTMENTS |
| Opportunities Fund | as of March 31, 2020 (continued) |
| Principal Amount† | | | Value | | | Percentage of Net Assets | | |||||||||
| BANK LOANS: (continued) | | |||||||||||||||
| | | | Financial Intermediaries (continued) | | ||||||||||||
| 1,275,305 | | | Focus Financial Partners, LLC 2020 Term Loan, 2.989%, (US0001M + 2.000%), 07/03/2024 | | | | $ | 1,173,280 | | | | | | 0.1 | | |
| 253,418 | | | VFH Parent LLC 2019 Term Loan B, 4.005%, (US0001M + 3.000%), 03/01/2026 | | | | | 234,834 | | | | | | 0.0 | | |
| 893,227 | | | Victory Capital Holdings, Inc. 2020 Term Loan B, 4.015%, (US0001M + 2.500%), 07/01/2026 | | | | | 794,972 | | | | | | 0.0 | | |
| | | | | | | | | 10,487,908 | | | | | | 0.4 | | |
| | | | Food Products: 0.3% | | ||||||||||||
| 100,000 | | | 8th Avenue Food & Provisions, Inc. 2018 2nd Lien Term Loan, 8.547%, (US0001M + 7.750%), 10/01/2026 | | | | | 90,000 | | | | | | 0.0 | | |
| 723,845 | | | Atkins Nutritionals Holdings II, Inc. 2017 Term Loan B, 4.750%, (US0001M + 3.750%), 07/07/2024 | | | | | 676,795 | | | | | | 0.0 | | |
| 1,144,508 | | | B&G Foods, Inc. 2019 Term Loan B4, 3.489%, (US0001M + 2.500%), 10/10/2026 | | | | | 1,091,097 | | | | | | 0.0 | | |
| 1,387,280 | | | CHG PPC Parent LLC 2018 Term Loan B, 3.739%, (US0001M + 2.750%), 03/31/2025 | | | | | 1,255,489 | | | | | | 0.1 | | |
| 885,000 | | | Froneri International PLC 2020 USD Term Loan, 3.239%, (US0001M + 2.250%), 01/29/2027 | | | | | 849,600 | | | | | | 0.0 | | |
| 1,796,826 | | | IRB Holding Corp 2020 Term Loan B, 3.751%, (US0001M + 2.750%), 02/05/2025 | | | | | 1,401,524 | | | | | | 0.1 | | |
| 1,412(10) | | | NPC International, Inc. 1st Lien Term Loan, 4.951%, (US0003M + 3.500%), 04/19/2024 | | | | | 600 | | | | | | 0.0 | | |
| Principal Amount† | | | Value | | | Percentage of Net Assets | | |||||||||
| BANK LOANS: (continued) | | |||||||||||||||
| | | | Food Products (continued) | | ||||||||||||
| 1,287,174 | | | Sigma Bidco B.V. 2018 USD Term Loan B, 4.909%, (US0003M + 3.000%), 07/02/2025 | | | | $ | 1,142,367 | | | | | | 0.1 | | |
| | | | | | | | | 6,507,472 | | | | | | 0.3 | | |
| | | | Food Service: 0.3% | | ||||||||||||
| 910,631 | | | Carrols Restaurant Group, Inc. Term Loan B, 4.210%, (US0001M + 3.250%), 04/30/2026 | | | | | 687,526 | | | | | | 0.0 | | |
| 143,883 | | | Fogo De Chao, Inc. 2018 Add On Term Loan, 5.700%, (US0003M + 4.250%), 04/07/2025 | | | | | 100,718 | | | | | | 0.0 | | |
| 2,898,325 | | | Golden Nugget, Inc. 2017 Incremental Term Loan B, 3.584%, (US0001M + 2.500%), 10/04/2023 | | | | | 2,265,525 | | | | | | 0.1 | | |
| 1,903,831 | | | Hearthside Food Solutions, LLC 2018 Term Loan B, 4.677%, (US0001M + 3.688%), 05/23/2025 | | | | | 1,627,775 | | | | | | 0.1 | | |
| 1,284,797 | | | US Foods, Inc. 2019 Term Loan B, 3.072%, (US0006M + 2.000%), 09/13/2026 | | | | | 1,197,003 | | | | | | 0.0 | | |
| 1,500,000 | | | Welbilt, Inc. 2018 Term Loan B, 3.489%, (US0001M + 2.500%), 10/23/2025 | | | | | 1,200,000 | | | | | | 0.1 | | |
| | | | | | | | | 7,078,547 | | | | | | 0.3 | | |
| | | | Food/Drug Retailers: 0.1% | | ||||||||||||
| 1,136,913 | | | EG Finco Limited 2018 USD Term Loan, 5.072%, (US0006M + 4.000%), 02/07/2025 | | | | | 832,788 | | | | | | 0.1 | | |
| 147,000 | | | EG Group Limited 2018 USD Term Loan B, 5.450%, (US0006M + 4.000%), 02/07/2025 | | | | | 107,678 | | | | | | 0.0 | | |
| Voya Strategic Income | SUMMARY PORTFOLIO OF INVESTMENTS |
| Opportunities Fund | as of March 31, 2020 (continued) |
| Principal Amount† | | | Value | | | Percentage of Net Assets | | |||||||||
| BANK LOANS: (continued) | | |||||||||||||||
| | | | Food/Drug Retailers (continued) | | ||||||||||||
| 28,970 | | | Moran Foods LLC 2020 Term Loan, 8.451%, (US0003M + 7.000%), 03/12/2024 | | | | $ | 26,797 | | | | | | 0.0 | | |
| 145,875(10) | | | Moran Foods LLC Term Loan, 7.451%, (US0003M + 6.000%), 12/05/2023 | | | | | 18,234 | | | | | | 0.0 | | |
| 472,625 | | | Portillo Restaurant Group (The) Term Loan, 6.950%, (US0003M + 5.500%), 09/06/2024 | | | | | 429,203 | | | | | | 0.0 | | |
| 981,344 | | | United Natural Foods, Inc. Term Loan B, 5.239%, (US0001M + 4.250%), 10/22/2025 | | | | | 848,862 | | | | | | 0.0 | | |
| | | | | | | | | 2,263,562 | | | | | | 0.1 | | |
| | | | Forest Products: 0.0% | | ||||||||||||
| 1,320,869 | | | LABL, Inc. 2019 USD Term Loan, 5.000%, (US0001M + 4.500%), 07/01/2026 | | | | | 1,119,436 | | | | | | 0.0 | | |
| | | | | | ||||||||||||
| | | | Health Care: 1.4% | | ||||||||||||
| 1,148,500 | | | Accelerated Health Systems, LLC Term Loan B, 4.297%, (US0001M + 3.500%), 10/31/2025 | | | | | 1,036,521 | | | | | | 0.0 | | |
| 1,412,604 | | | ADMI Corp. 2018 Term Loan B, 4.200%, (US0001M + 2.750%), 04/30/2025 | | | | | 1,267,812 | | | | | | 0.1 | | |
| 551,362 | | | Agiliti Health, Inc Term Loan, 4.625%, (US0003M + 3.000%), 01/04/2026 | | | | | 532,065 | | | | | | 0.0 | | |
| 1,143,311 | | | Air Methods Corporation 2017 Term Loan B, 4.950%, (US0003M + 3.500%), 04/22/2024 | | | | | 826,042 | | | | | | 0.0 | | |
| 636,071 | | | ATI Holdings Acquisition, Inc. 2016 Term Loan, 4.570%, (US0001M + 3.500%), 05/10/2023 | | | | | 485,004 | | | | | | 0.0 | | |
| 1,951,543 | | | Auris Luxembourg III S.a.r.l. 2019 USD Term Loan B, 4.739%, (US0001M + 3.750%), 02/27/2026 | | | | | 1,512,446 | | | | | | 0.1 | | |
| Principal Amount† | | | Value | | | Percentage of Net Assets | | |||||||||
| BANK LOANS: (continued) | | |||||||||||||||
| | | | Health Care (continued) | | ||||||||||||
| 3,380,286 | | | Bausch Health Companies, Inc. 2018 Term Loan B, 3.612%, (US0001M + 3.000%), 06/02/2025 | | | | $ | 3,239,440 | | | | | | 0.1 | | |
| 1,076,575 | | | Change Healthcare Holdings LLC 2017 Term Loan B, 3.500%, (US0001M + 2.500%), 03/01/2024 | | | | | 994,037 | | | | | | 0.0 | | |
| 500,159 | | | CHG Healthcare Services Inc. 2017 1st Lien Term Loan B, 4.073%, (US0001M + 3.000%), 06/07/2023 | | | | | 452,644 | | | | | | 0.0 | | |
| 375,000 | | | Da Vinci Purchaser Corp. 2019 Term Loan, 5.872%, (US0003M + 4.000%), 01/08/2027 | | | | | 350,156 | | | | | | 0.0 | | |
| 2,277,588 | | | DaVita, Inc. 2020 Term Loan B, 2.739%, (US0001M + 1.750%), 08/12/2026 | | | | | 2,176,994 | | | | | | 0.1 | | |
| 643,695 | | | DentalCorp Perfect Smile ULC 1st Lien Term Loan, 4.750%, (US0001M + 3.750%), 06/06/2025 | | | | | 511,737 | | | | | | 0.0 | | |
| 477,600 | | | Emerald TopCo Inc Term Loan, 4.489%, (US0001M + 3.500%), 07/24/2026 | | | | | 437,601 | | | | | | 0.0 | | |
| 1,976,806 | | | Envision Healthcare Corporation 2018 1st Lien Term Loan, 4.739%, (US0001M + 3.750%), 10/10/2025 | | | | | 1,059,568 | | | | | | 0.0 | | |
| 1,379,488 | | | ExamWorks Group, Inc. 2017 Term Loan, 4.250%, (US0006M + 3.250%), 07/27/2023 | | | | | 1,251,885 | | | | | | 0.1 | | |
| 542,101 | | | Global Medical Response, Inc. 2017 Term Loan B2, 5.863%, (US0001M + 4.250%), 03/14/2025 | | | | | 489,246 | | | | | | 0.0 | | |
| Voya Strategic Income | SUMMARY PORTFOLIO OF INVESTMENTS |
| Opportunities Fund | as of March 31, 2020 (continued) |
| Principal Amount† | | | Value | | | Percentage of Net Assets | | |||||||||
| BANK LOANS: (continued) | | |||||||||||||||
| | | | Health Care (continued) | | ||||||||||||
| 785,106 | | | Global Medical Response, Inc. 2018 Term Loan B1, 4.932%, (US0002M + 3.250%), 04/28/2022 | | | | $ | 726,224 | | | | | | 0.1 | | |
| 848,624 | | | GoodRx, Inc. 1st Lien Term Loan, 3.739%, (US0001M + 2.750%), 10/10/2025 | | | | | 801,949 | | | | | | 0.0 | | |
| 1,083,511 | | | Inovalon Holdings, Inc. 2020 Term Loan B1, 3.750%, (US0001M + 3.000%), 04/02/2025 | | | | | 1,005,498 | | | | | | 0.0 | | |
| 1,574,843 | | | Jaguar Holding Company II 2018 Term Loan, 3.500%, (US0001M + 2.500%), 08/18/2022 | | | | | 1,518,412 | | | | | | 0.1 | | |
| 1,267,378 | | | Medical Solutions L.L.C. 2017 Term Loan, 5.500%, (US0001M + 4.500%), 06/14/2024 | | | | | 1,127,967 | | | | | | 0.1 | | |
| 4,349,168 | | | MPH Acquisition Holdings LLC 2016 Term Loan B, 4.200%, (US0003M + 2.750%), 06/07/2023 | | | | | 3,957,708 | | | | | | 0.2 | | |
| 2,090,687 | | | Ortho-Clinical Diagnostics SA 2018 Term Loan B, 4.765%, (US0001M + 3.250%), 06/30/2025 | | | | | 1,789,628 | | | | | | 0.1 | | |
| 1,796,000 | | | Phoenix Guarantor Inc 2020 Term Loan B, 4.113%, (US0001M + 3.250%), 03/05/2026 | | | | | 1,652,320 | | | | | | 0.1 | | |
| 728,715 | | | RegionalCare Hospital Partners Holdings, Inc. 2018 Term Loan B, 4.739%, (US0001M + 3.750%), 11/17/2025 | | | | | 683,778 | | | | | | 0.0 | | |
| 1,848,190 | | | Select Medical Corporation 2017 Term Loan B, 3.430%, (US0001M + 2.500%), 03/06/2025 | | | | | 1,765,022 | | | | | | 0.1 | | |
| 1,520,000 | | | Sotera Health Holdings, LLC 2019 Term Loan, 5.500%, (US0001M + 4.500%), 12/11/2026 | | | | | 1,355,334 | | | | | | 0.1 | | |
| Principal Amount† | | | Value | | | Percentage of Net Assets | | |||||||||
| BANK LOANS: (continued) | | |||||||||||||||
| | | | Health Care (continued) | | ||||||||||||
| 462,755 | | | Surgery Center Holdings, Inc. 2017 Term Loan B, 4.250%, (US0001M + 3.250%), 09/03/2024 | | | | $ | 364,882 | | | | | | 0.0 | | |
| 892,048 | | | Tecomet Inc. 2017 Repriced Term Loan, 4.250%, (US0001M + 3.250%), 05/01/2024 | | | | | 762,701 | | | | | | 0.0 | | |
| 636,373 | | | U.S. Anesthesia Partners, Inc. 2017 Term Loan, 4.000%, (US0001M + 3.000%), 06/23/2024 | | | | | 482,053 | | | | | | 0.0 | | |
| 188,100 | | | Vizient, Inc. 2020 Term Loan B6, 2.989%, (US0001M + 2.000%), 05/06/2026 | | | | | 178,695 | | | | | | 0.0 | | |
| 1,283,497 | | | Wink Holdco, Inc 1st Lien Term Loan B, 4.450%, (US0001M + 3.000%), 12/02/2024 | | | | | 1,098,995 | | | | | | 0.0 | | |
| | | | | | | | | 35,894,364 | | | | | | 1.4 | | |
| | | | Home Furnishings: 0.0% | | ||||||||||||
| 860,675 | | | Prime Security Services Borrower, LLC 2019 Term Loan B1, 4.606%, (US0001M + 3.250%), 09/23/2026 | | | | | 783,214 | | | | | | 0.0 | | |
| | | | | | ||||||||||||
| | | | Industrial: 0.1% | | ||||||||||||
| 1,510,269 | | | NCI Building Systems, Inc. 2018 Term Loan, 4.561%, (US0001M + 3.750%), 04/12/2025 | | | | | 1,321,485 | | | | | | 0.1 | | |
| | | | | | ||||||||||||
| | | | Industrial Equipment: 0.3% | | ||||||||||||
| 1,105,000 | | | APi Group DE, Inc. Term Loan B, 3.489%, (US0001M + 2.500%), 10/01/2026 | | | | | 1,016,600 | | | | | | 0.1 | | |
| 395,619 | | | CPM Holdings, Inc. 2018 1st Lien Term Loan, 5.353%, (US0006M + 3.750%), 11/17/2025 | | | | | 327,374 | | | | | | 0.0 | | |
| 630,007 | | | EWT Holdings III Corp. 2020 Term Loan, 3.739%, (US0001M + 2.750%), 12/20/2024 | | | | | 579,607 | | | | | | 0.0 | | |
| Voya Strategic Income | SUMMARY PORTFOLIO OF INVESTMENTS |
| Opportunities Fund | as of March 31, 2020 (continued) |
| Principal Amount† | | | Value | | | Percentage of Net Assets | | |||||||||
| BANK LOANS: (continued) | | |||||||||||||||
| | | | Industrial Equipment (continued) | | ||||||||||||
| 1,709,546 | | | Filtration Group Corporation 2018 1st Lien Term Loan, 3.989%, (US0001M + 3.000%), 03/29/2025 | | | | $ | 1,510,811 | | | | | | 0.1 | | |
| 691,525 | | | Granite Holdings US Acquisition Co. Term Loan B, 6.322%, (US0006M + 5.250%), 09/30/2026 | | | | | 501,356 | | | | | | 0.0 | | |
| 725,000 | | | Ingersoll-Rand Services Company 2020 USD Spinco Term Loan, 3.201%, (US0003M + 1.750%), 02/05/2027 | | | | | 681,500 | | | | | | 0.0 | | |
| 1,498,415 | | | Kenan Advantage Group, Inc. 2015 Term Loan, 4.000%, (US0001M + 3.000%), 07/31/2022 | | | | | 1,273,653 | | | | | | 0.1 | | |
| 367,941 | | | Kenan Advantage Group, Inc. CAD Term Loan B, 4.000%, (US0001M + 3.000%), 07/31/2022 | | | | | 312,750 | | | | | | 0.0 | | |
| 430,000 | | | Star US Bidco LLC Term Loan B, 5.701%, (US0003M + 4.250%), 03/03/2027 | | | | | 384,850 | | | | | | 0.0 | | |
| | | | | | | | | 6,588,501 | | | | | | 0.3 | | |
| | | | Insurance: 0.7% | | ||||||||||||
| 1,141,705 | | | Achilles Acquisition LLC 2018 Term Loan, 5.000%, (US0001M + 4.000%), 10/13/2025 | | | | | 1,021,826 | | | | | | 0.0 | | |
| 3,212,467 | | | Acrisure, LLC 2020 Term Loan B, 5.207%, (US0003M + 3.500%), 02/15/2027 | | | | | 2,730,597 | | | | | | 0.1 | | |
| 395,237 | | | Alera Group Holdings, Inc. 2018 Term Loan B, 4.989%, (US0001M + 4.000%), 08/01/2025 | | | | | 347,809 | | | | | | 0.0 | | |
| 2,043,680 | | | Alliant Holdings Intermediate, LLC 2018 Term Loan B, 3.989%, (US0001M + 3.000%), 05/09/2025 | | | | | 1,898,920 | | | | | | 0.1 | | |
| Principal Amount† | | | Value | | | Percentage of Net Assets | | |||||||||
| BANK LOANS: (continued) | | |||||||||||||||
| | | | Insurance (continued) | | ||||||||||||
| 2,127,064 | | | AmWINS Group, Inc. 2017 Term Loan B, 3.753%, (US0001M + 2.750%), 01/25/2024 | | | | $ | 1,991,464 | | | | | | 0.1 | | |
| 150,000 | | | Applied Systems, Inc. 2017 2nd Lien Term Loan, 8.450%, (US0003M + 7.000%), 09/19/2025 | | | | | 138,750 | | | | | | 0.0 | | |
| 148,125 | | | Aretec Group, Inc. 2018 Term Loan, 5.239%, (US0001M + 4.250%), 10/01/2025 | | | | | 102,206 | | | | | | 0.0 | | |
| 1,833,871 | | | AssuredPartners, Inc. 2020 Term Loan B, 4.489%, (US0001M + 3.500%), 02/12/2027 | | | | | 1,636,730 | | | | | | 0.1 | | |
| 631,304 | | | CCC Information Services, Inc. 2017 1st Lien Term Loan, 3.750%, (US0001M + 2.750%), 04/29/2024 | | | | | 583,280 | | | | | | 0.0 | | |
| 1,450,023 | | | Hub International Limited 2018 Term Loan B, 4.543%, (US0002M + 2.750%), 04/25/2025 | | | | | 1,370,271 | | | | | | 0.0 | | |
| 2,586,895 | | | NFP Corp. 2020 Term Loan, 4.239%, (US0001M + 3.250%), 02/15/2027 | | | | | 2,263,533 | | | | | | 0.1 | | |
| 2,610,341 | | | Sedgwick Claims Management Services, Inc. 2018 Term Loan B, 4.239%, (US0001M + 3.250%), 12/31/2025 | | | | | 2,305,800 | | | | | | 0.1 | | |
| 2,370,927 | | | USI, Inc. 2017 Repriced Term Loan, 3.989%, (US0003M + 3.000%), 05/16/2024 | | | | | 2,163,471 | | | | | | 0.1 | | |
| | | | | | | | | 18,554,657 | | | | | | 0.7 | | |
| | | | Leisure Good/Activities/Movies: 0.6% | | ||||||||||||
| 1,689,191 | | | AMC Entertainment Holdings Inc. 2019 Term Loan B, 4.080%, (US0001M + 3.000%), 04/22/2026 | | | | | 1,272,523 | | | | | | 0.1 | | |
| Voya Strategic Income | SUMMARY PORTFOLIO OF INVESTMENTS |
| Opportunities Fund | as of March 31, 2020 (continued) |
| Principal Amount† | | | Value | | | Percentage of Net Assets | | |||||||||
| BANK LOANS: (continued) | | |||||||||||||||
| | | | Leisure Good/Activities/ Movies (continued) | | ||||||||||||
| 1,251,849 | | | Bombardier Recreational Products, Inc. 2020 Term Loan, 2.989%, (US0001M + 2.000%), 05/24/2027 | | | | $ | 1,057,813 | | | | | | 0.1 | | |
| 1,042,327 | | | ClubCorp Club Operations, Inc. 2017 Incremental Term Loan, 4.200%, (US0003M + 2.750%), 09/18/2024 | | | | | 669,695 | | | | | | 0.0 | | |
| 1,487,505 | | | Crown Finance US, Inc. 2018 USD Term Loan, 3.322%, (US0006M + 2.250%), 02/28/2025 | | | | | 999,603 | | | | | | 0.1 | | |
| 427,850 | | | Crown Finance US, Inc. 2019 Incremental Term Loan, 3.558%, (US0006M + 2.500%), 09/30/2026 | | | | | 283,237 | | | | | | 0.0 | | |
| 2,125,297 | | | Equinox Holdings, Inc. 2017 1st Lien Term Loan, 4.072%, (US0006M + 3.000%), 03/08/2024 | | | | | 1,586,889 | | | | | | 0.1 | | |
| 1,003,941 | | | Fitness International, LLC 2018 Term Loan B, 4.322%, (US0006M + 3.250%), 04/18/2025 | | | | | 761,321 | | | | | | 0.0 | | |
| 711,218 | | | Fluidra S.A. USD Term Loan B, 2.989%, (US0001M + 2.000%), 07/02/2025 | | | | | 647,208 | | | | | | 0.0 | | |
| 539,368 | | | GVC Holdings (Gibraltar) Limited 2020 USD Term Loan B3, 3.308%, (US0006M + 2.250%), 03/29/2024 | | | | | 448,575 | | | | | | 0.0 | | |
| 1,236,723 | | | Intrawest Resorts Holdings, Inc. Term Loan B1, 3.750%, (US0001M + 2.750%), 07/31/2024 | | | | | 1,108,929 | | | | | | 0.1 | | |
| 1,136,469 | | | Kingpin Intermediate Holdings LLC 2018 Term Loan B, 4.500%, (US0001M + 3.500%), 07/03/2024 | | | | | 806,893 | | | | | | 0.0 | | |
| Principal Amount† | | | Value | | | Percentage of Net Assets | | |||||||||
| BANK LOANS: (continued) | | |||||||||||||||
| | | | Leisure Good/Activities/ Movies (continued) | | ||||||||||||
| 1,722,425 | | | Life Time, Inc. 2017 Term Loan B, 4.363%, (US0003M + 2.750%), 06/10/2022 | | | | $ | 1,300,431 | | | | | | 0.1 | | |
| 115,821 | | | Motion Finco Sarl Delayed Draw Term Loan B2, 4.323%, (US0006M + 3.250%), 11/04/2026 | | | | | 94,394 | | | | | | 0.0 | | |
| 843,085 | | | Motion Finco Sarl USD Term Loan B1, 4.209%, (US0006M + 3.250%), 11/13/2026 | | | | | 711,353 | | | | | | 0.0 | | |
| 785,063 | | | Playtika Holding Corp Term Loan B, 7.072%, (US0006M + 6.000%), 12/10/2024 | | | | | 740,575 | | | | | | 0.0 | | |
| 974,709 | | | SRAM, LLC 2018 Term Loan B, 3.787%, (US0001M + 2.750%), 03/15/2024 | | | | | 930,847 | | | | | | 0.0 | | |
| 967,839 | | | Thor Industries, Inc. USD Term Loan B, 5.365%, (US0001M + 3.750%), 02/01/2026 | | | | | 832,342 | | | | | | 0.0 | | |
| 644,356 | | | WeddingWire, Inc. 1st Lien Term Loan, 5.950%, (US0001M + 4.500%), 12/19/2025 | | | | | 563,811 | | | | | | 0.0 | | |
| 100,000 | | | WeddingWire, Inc. 2nd Lien Term Loan, 9.700%, (US0003M + 8.250%), 12/21/2026 | | | | | 92,500 | | | | | | 0.0 | | |
| | | | | | | | | 14,908,939 | | | | | | 0.6 | | |
| | | | Lodging & Casinos: 0.5% | | ||||||||||||
| 1,185,225 | | | Aimbridge Acquisition Co., Inc. 2019 Term Loan B, 5.573%, (US0001M + 3.750%), 02/02/2026 | | | | | 859,288 | | | | | | 0.0 | | |
| 3,042,965 | | | Caesars Resort Collection, LLC 2017 1st Lien Term Loan B, 3.739%, (US0001M + 2.750%), 12/23/2024 | | | | | 2,499,579 | | | | | | 0.1 | | |
| Voya Strategic Income | SUMMARY PORTFOLIO OF INVESTMENTS |
| Opportunities Fund | as of March 31, 2020 (continued) |
| Principal Amount† | | | Value | | | Percentage of Net Assets | | |||||||||
| BANK LOANS: (continued) | | |||||||||||||||
| | | | Lodging & Casinos (continued) | | ||||||||||||
| 126,756 | | | Eldorado Resorts LLC 2017 Term Loan B, 3.250%, (US0006M + 2.250%), 04/17/2024 | | | | $ | 124,221 | | | | | | 0.0 | | |
| 1,421,794 | | | Everi Payments Inc. Term Loan B, 3.822%, (US0003M + 2.750%), 05/09/2024 | | | | | 1,139,805 | | | | | | 0.1 | | |
| 1,380,899 | | | Golden Entertainment, Inc. 2017 1st Lien Term Loan, 3.960%, (US0001M + 3.000%), 10/21/2024 | | | | | 1,056,388 | | | | | | 0.0 | | |
| 2,134,194 | | | PCI Gaming Authority Term Loan, 3.489%, (US0001M + 2.500%), 05/29/2026 | | | | | 1,714,977 | | | | | | 0.1 | | |
| 2,319,749 | | | Scientific Games International, Inc. 2018 Term Loan B5, 4.246%, (US0002M + 2.750%), 08/14/2024 | | | | | 1,884,796 | | | | | | 0.1 | | |
| 3,058,702 | | | Stars Group Holdings B.V. (The) 2018 USD Incremental Term Loan, 4.950%, (US0003M + 3.500%), 07/10/2025 | | | | | 2,932,531 | | | | | | 0.1 | | |
| 963,673 | | | Station Casinos LLC 2020 Term Loan B, 3.240%, (US0001M + 2.250%), 02/08/2027 | | | | | 811,413 | | | | | | 0.0 | | |
| | | | | | | | | 13,022,998 | | | | | | 0.5 | | |
| | | | Machinery-Diversified: 0.0% | | ||||||||||||
| 523,012 | | | Gardner Denver, Inc. 2020 USD Term Loan, 2.739%, (0 + 0.000%), 03/01/2027 | | | | | 494,247 | | | | | | 0.0 | | |
| | | | | | ||||||||||||
| | | | Nonferrous Metals/Minerals: 0.0% | | ||||||||||||
| 1,565,319 | | | Covia Holdings Corporation Term Loan, 5.874%, (US0003M + 4.000%), 06/01/2025 | | | | | 729,830 | | | | | | 0.0 | | |
| 545,228 | | | U.S. Silica Company 2018 Term Loan B, 5.000%, (US0001M + 4.000%), 05/01/2025 | | | | | 269,207 | | | | | | 0.0 | | |
| | | | | | | | | 999,037 | | | | | | 0.0 | | |
| Principal Amount† | | | Value | | | Percentage of Net Assets | | |||||||||
| BANK LOANS: (continued) | | |||||||||||||||
| | | | Oil & Gas: 0.1% | | ||||||||||||
| 390,000 | | | Encino Acquisition Partners Holdings, LLC 2018 2nd Lien Term Loan, 7.750%, (US0001M + 6.750%), 10/29/2025 | | | | $ | 185,250 | | | | | | 0.0 | | |
| 942,875 | | | Lower Cadence Holdings LLC Term Loan B, 4.989%, (US0001M + 4.000%), 05/22/2026 | | | | | 590,869 | | | | | | 0.1 | | |
| 527,350 | | | Lucid Energy Group II LLC Incremental Term Loan B2, 4.000%, (US0001M + 3.000%), 02/19/2025 | | | | | 300,590 | | | | | | 0.0 | | |
| 148,500 | | | Moda Ingleside Energy Center, LLC 2018 Term Loan B, 4.239%, (US0001M + 3.250%), 09/29/2025 | | | | | 115,087 | | | | | | 0.0 | | |
| | | | | | | | | 1,191,796 | | | | | | 0.1 | | |
| | | | Publishing: 0.1% | | ||||||||||||
| 2,164,873 | | | Meredith Corporation 2020 Term Loan B2, 3.489%, (US0001M + 2.500%), 01/31/2025 | | | | | 1,970,034 | | | | | | 0.1 | | |
| | | | | | ||||||||||||
| | | | Radio & Television: 0.7% | | ||||||||||||
| 1,040,516 | | | A-L Parent LLC 2016 1st Lien Term Loan, 4.860%, (US0001M + 3.250%), 12/01/2023 | | | | | 712,753 | | | | | | 0.0 | | |
| 1,330,099 | | | Banijay Entertainment S.A.S USD Term Loan, 5.213%, (US0003M + 3.750%), 03/04/2025 | | | | | 1,197,089 | | | | | | 0.0 | | |
| 1,629,319 | | | Clear Channel Outdoor Holdings, Inc. Term Loan B, 4.489%, (US0001M + 3.500%), 08/21/2026 | | | | | 1,476,570 | | | | | | 0.1 | | |
| 288,550 | | | Cumulus Media New Holdings Inc. Term Loan B, 4.822%, (US0006M + 3.750%), 03/31/2026 | | | | | 234,207 | | | | | | 0.0 | | |
| Voya Strategic Income | SUMMARY PORTFOLIO OF INVESTMENTS |
| Opportunities Fund | as of March 31, 2020 (continued) |
| Principal Amount† | | | Value | | | Percentage of Net Assets | | |||||||||
| BANK LOANS: (continued) | | |||||||||||||||
| | | | Radio & Television (continued) | | ||||||||||||
| 2,403,975 | | | Diamond Sports Group, LLC Term Loan, 4.180%, (US0001M + 3.250%), 08/24/2026 | | | | $ | 1,887,120 | | | | | | 0.1 | | |
| 1,107,128 | | | Entercom Media Corp. 2019 Term Loan, 3.489%, (US0001M + 2.500%), 11/18/2024 | | | | | 996,415 | | | | | | 0.0 | | |
| 1,346,625 | | | iHeartCommunications, Inc. 2020 Term Loan, 3.989%, (US0001M + 3.000%), 05/01/2026 | | | | | 1,153,384 | | | | | | 0.0 | | |
| 2,131,876 | | | NASCAR Holdings, Inc Term Loan B, 3.674%, (US0001M + 2.750%), 10/19/2026 | | | | | 1,884,934 | | | | | | 0.1 | | |
| 2,830,057 | | | Nexstar Broadcasting, Inc. 2019 Term Loan B4, 4.331%, (US0001M + 2.750%), 09/18/2026 | | | | | 2,674,404 | | | | | | 0.1 | | |
| 2,781,052 | | | Sinclair Television Group Inc. Term Loan B2B, 3.210%, (US0001M + 2.500%), 09/30/2026 | | | | | 2,575,950 | | | | | | 0.1 | | |
| 1,534,494 | | | Terrier Media Buyer, Inc. Term Loan B, 5.700%, (US0003M + 4.250%), 12/17/2026 | | | | | 1,330,215 | | | | | | 0.1 | | |
| 1,720,284 | | | Univision Communications Inc. Term Loan C5, 3.750%, (US0001M + 2.750%), 03/15/2024 | | | | | 1,470,843 | | | | | | 0.1 | | |
| | | | | | | | | 17,593,884 | | | | | | 0.7 | | |
| | | | Retailers (Except Food & Drug): 0.2% | | ||||||||||||
| 244,828 | | | Academy, Ltd. 2015 Term Loan B, 5.558%, (US0001M + 4.000%), 07/01/2022 | | | | | 134,859 | | | | | | 0.0 | | |
| 1,034,997 | | | Bass Pro Group, LLC Term Loan B, 5.989%, (US0001M + 5.000%), 09/25/2024 | | | | | 879,748 | | | | | | 0.0 | | |
| 208,294 | | | Belk, Inc. 2019 Term Loan B, 7.750%, (US0006M + 6.750%), 07/31/2025 | | | | | 109,354 | | | | | | 0.0 | | |
| Principal Amount† | | | Value | | | Percentage of Net Assets | | |||||||||
| BANK LOANS: (continued) | | |||||||||||||||
| | | | Retailers (Except Food & Drug) (continued) | | ||||||||||||
| 1,913,455 | | | BJs Wholesale Club, Inc. 2017 1st Lien Term Loan, 3.047%, (US0001M + 2.250%), 02/03/2024 | | | | $ | 1,827,349 | | | | | | 0.1 | | |
| 734,320 | | | Jo-Ann Stores, Inc. 2016 Term Loan, 6.000%, (US0006M + 5.000%), 10/20/2023 | | | | | 304,743 | | | | | | 0.0 | | |
| 2,079,298 | | | Leslies Poolmart, Inc. 2016 Term Loan, 4.500%, (US0001M + 3.500%), 08/16/2023 | | | | | 1,744,012 | | | | | | 0.1 | | |
| 1,367,353 | | | Mens Wearhouse, Inc. (The) 2018 Term Loan, 4.831%, (US0001M + 3.250%), 04/09/2025 | | | | | 546,941 | | | | | | 0.0 | | |
| | | | | | | | | 5,547,006 | | | | | | 0.2 | | |
| | | | Steel: 0.0% | | ||||||||||||
| 882,000 | | | GrafTech Finance, Inc. 2018 Term Loan B, 4.500%, (US0001M + 3.500%), 02/12/2025 | | | | | 771,750 | | | | | | 0.0 | | |
| | | | | | ||||||||||||
| | | | Surface Transport: 0.1% | | ||||||||||||
| 1,385,486 | | | Navistar International Corporation 2017 1st Lien Term Loan B, 4.280%, (US0001M + 3.500%), 11/06/2024 | | | | | 1,216,918 | | | | | | 0.1 | | |
| 1,285,905 | | | PODS, LLC 2018 1st Lien Term Loan, 3.750%, (US0001M + 2.750%), 12/06/2024 | | | | | 1,128,381 | | | | | | 0.0 | | |
| 734,520 | | | Savage Enterprises LLC 2020 Term Loan B, 4.620%, (US0001M + 4.000%), 08/01/2025 | | | | | 653,111 | | | | | | 0.0 | | |
| | | | | | | | | 2,998,410 | | | | | | 0.1 | | |
| | | | Technology: 0.1% | | ||||||||||||
| 2,851,296 | | | Misys (Finastra) – TL B 1L, 5.277%, (US0003M + 3.500%), 06/13/2024 | | | | | 2,480,628 | | | | | | 0.1 | | |
| | | | | | ||||||||||||
| Voya Strategic Income | SUMMARY PORTFOLIO OF INVESTMENTS |
| Opportunities Fund | as of March 31, 2020 (continued) |
| Principal Amount† | | | Value | | | Percentage of Net Assets | | |||||||||
| BANK LOANS: (continued) | | |||||||||||||||
| | | | Telecommunications: 1.0% | | ||||||||||||
| 1,539,472 | | | Altice Financing SA USD 2017 1st Lien Term Loan, 3.674%, (US0001M + 2.750%), 01/31/2026 | | | | $ | 1,416,314 | | | | | | 0.1 | | |
| 3,491,786 | | | Altice France S.A. USD Term Loan B11, 3.739%, (US0001M + 2.750%), 07/31/2025 | | | | | 3,215,352 | | | | | | 0.1 | | |
| 185,000 | | | Asurion LLC 2017 2nd Lien Term Loan, 7.489%, (US0001M + 6.500%), 08/04/2025 | | | | | 172,975 | | | | | | 0.0 | | |
| 598 | | | Asurion LLC 2017 Term Loan B4, 3.989%, (US0001M + 3.000%), 08/04/2022 | | | | | 556 | | | | | | 0.0 | | |
| 1,966,285 | | | Asurion LLC 2018 Term Loan B6, 3.989%, (US0001M + 3.000%), 11/03/2023 | | | | | 1,897,465 | | | | | | 0.1 | | |
| 4,208,517 | | | Asurion LLC 2018 Term Loan B7, 3.989%, (US0001M + 3.000%), 11/03/2024 | | | | | 3,963,022 | | | | | | 0.1 | | |
| 1,850,004 | | | Avaya, Inc. 2018 Term Loan B, 4.955%, (US0001M + 4.250%), 12/15/2024 | | | | | 1,586,378 | | | | | | 0.1 | | |
| 2,379,038 | | | CenturyLink, Inc. 2020 Term Loan B, 3.239%, (US0001M + 2.250%), 03/15/2027 | | | | | 2,211,018 | | | | | | 0.1 | | |
| 1,800,950 | | | CommScope, Inc. 2019 Term Loan B, 4.239%, (US0001M + 3.250%), 04/06/2026 | | | | | 1,710,903 | | | | | | 0.1 | | |
| 720,000 | | | Connect Finco Sarl Term Loan B, 5.490%, (US0001M + 4.500%), 12/11/2026 | | | | | 588,600 | | | | | | 0.0 | | |
| 458,162 | | | Consolidated Communications, Inc. 2016 Term Loan B, 3.959%, (US0001M + 3.000%), 10/04/2023 | | | | | 395,492 | | | | | | 0.0 | | |
| 673,432 | | | Global Tel*Link Corporation 2018 1st Lien Term Loan, 5.700%, (US0003M + 4.250%), 11/29/2025 | | | | | 580,835 | | | | | | 0.0 | | |
| Principal Amount† | | | Value | | | Percentage of Net Assets | | |||||||||
| BANK LOANS: (continued) | | |||||||||||||||
| | | | Telecommunications (continued) | | ||||||||||||
| 120,000 | | | Global Tel*Link Corporation 2018 2nd Lien Term Loan, 9.700%, (US0003M + 8.250%), 11/29/2026 | | | | $ | 100,500 | | | | | | 0.0 | | |
| 1,234,918 | | | GTT Communications, Inc. 2018 USD Term Loan B, 3.740%, (US0001M + 2.750%), 05/31/2025 | | | | | 844,890 | | | | | | 0.0 | | |
| 470,000 | | | Iridium Satellite LLC Term Loan, 4.750%, (US0001M + 3.750%), 11/04/2026 | | | | | 448,850 | | | | | | 0.0 | | |
| 1,631,488 | | | Level 3 Financing Inc. 2019 Term Loan B, 2.739%, (US0001M + 1.750%), 03/01/2027 | | | | | 1,541,756 | | | | | | 0.1 | | |
| 393,468 | | | Securus Technologies Holdings, Inc. 2017 1st Lien Term Loan, 5.500%, (US0006M + 4.500%), 11/01/2024 | | | | | 312,807 | | | | | | 0.0 | | |
| 445,986 | | | Speedcast International Limited Term Loan B, 4.200%, (US0003M + 2.750%), 05/15/2025 | | | | | 112,983 | | | | | | 0.0 | | |
| 805,000 | | | Telenet Financing USD LLC 2020 USD Term Loan AR, 2.705%, (US0001M + 2.000%), 04/30/2028 | | | | | 747,644 | | | | | | 0.0 | | |
| 1,814,739 | | | Zayo Group Holdings, Inc. USD Term Loan, 3.989%, (US0001M + 3.000%), 02/19/2027 | | | | | 1,701,318 | | | | | | 0.1 | | |
| 1,295,000 | | | Ziggo Financing Partnership USD Term Loan I, 3.205%, (US0001M + 2.500%), 04/30/2028 | | | | | 1,209,206 | | | | | | 0.1 | | |
| | | | | | | | | 24,758,864 | | | | | | 1.0 | | |
| | | | Utilities: 0.2% | | ||||||||||||
| 857,153 | | | Calpine Construction Finance Company, L.P. 2017 Term Loan B, 2.989%, (US0001M + 2.000%), 01/15/2025 | | | | | 792,866 | | | | | | 0.1 | | |
| Voya Strategic Income | SUMMARY PORTFOLIO OF INVESTMENTS |
| Opportunities Fund | as of March 31, 2020 (continued) |
| Principal Amount† | | | Value | | | Percentage of Net Assets | | |||||||||
| BANK LOANS: (continued) | | |||||||||||||||
| | | | Utilities (continued) | | ||||||||||||
| 2,239,997 | | | Calpine Corporation 2019 Term Loan B10, 2.989%, (US0001M + 2.000%), 08/12/2026 | | | | $ | 2,111,197 | | | | | | 0.1 | | |
| 364,185 | | | LMBE-MC Holdco II LLC Term Loan B, 5.460%, (US0003M + 4.000%), 12/03/2025 | | | | | 318,662 | | | | | | 0.0 | | |
| 724,075 | | | Nautilus Power, LLC Term Loan B, 5.250%, (US0001M + 4.250%), 05/16/2024 | | | | | 640,807 | | | | | | 0.0 | | |
| 650,088 | | | Sabre Industries, Inc. 2019 Term Loan B, 4.494%, (US0003M + 3.500%), 04/15/2026 | | | | | 599,706 | | | | | | 0.0 | | |
| | | | | | | | | 4,463,238 | | | | | | 0.2 | | |
| | | | Total Bank Loans (Cost $401,208,618) | | | | | 348,781,362 | | | | | | 13.5 | | |
| CONVERTIBLE BONDS/NOTES: 0.0% | | |||||||||||||||
| | | | Communications: 0.0% | | ||||||||||||
| 385,000 | | | Other Securities | | | | | 313,525 | | | | | | 0.0 | | |
| | | | Total Convertible Bonds/Notes (Cost $378,216) | | | | | 313,525 | | | | | | 0.0 | | |
| U.S. GOVERNMENT AGENCY OBLIGATIONS: 0.0% | | |||||||||||||||
| | | | Uniform Mortgage-Backed Securities: 0.0% | | ||||||||||||
| 6,537 | | | Other Securities | | | | | 7,429 | | | | | | 0.0 | | |
| | | | Total U.S. Government Agency Obligations (Cost $7,054) | | | | | 7,429 | | | | | | 0.0 | | |
| | ||||||||||||||||
| | | | Value | | | Percentage of Net Assets | | |||||||||
| PURCHASED OPTIONS (11): 0.2% | | |||||||||||||||
| | | | Total Purchased Options (Cost $3,395,684) | | | | | 4,673,724 | | | | | | 0.2 | | |
| | | | Total Long-Term Investments (Cost $2,715,232,287) | | | | | 2,438,431,969 | | | | | | 94.6 | | |
| | ||||||||||||||||
| Principal Amount† | | | Value | | | Percentage of Net Assets | | |||||||||
| SHORT-TERM INVESTMENTS: 3.0% | | |||||||||||||||
| | | | Repurchase Agreements: 0.4% | | ||||||||||||
| 1,381,827 (12) | | | BNP Paribas S.A., Repurchase Agreement dated 03/31/20, 0.33%, due 04/01/20 (Repurchase Amount $1,381,839, collateralized by various U.S. Government Securities, 2.125%-6.875%, Market Value plus accrued interest $1,450,921, due 06/15/20-03/15/39) | | | | $ | 1,381,827 | | | | | | 0.0 | | |
| 1,762,980 (12) | | | Cantor Fitzgerald Securities, Repurchase Agreement dated 03/31/20, 0.02%, due 04/01/20 (Repurchase Amount $1,762,981, collateralized by various U.S. Government/U.S. Government Agency Obligations, 0.000%-8.500%, Market Value plus accrued interest $1,798,240, due 05/01/20-02/20/70) | | | | | 1,762,980 | | | | | | 0.1 | | |
| 2,513,562 (12) | | | Citibank N.A., Repurchase Agreement dated 03/31/20, 0.02%, due 04/01/20 (Repurchase Amount $2,513,563, collateralized by various U.S. Government/ U.S. Government Agency Obligations, 0.000%-4.500%, Market Value plus accrued interest $2,566,255, due 03/15/22-05/01/48) | | | | | 2,513,562 | | | | | $ | 0.1 | | |
| Voya Strategic Income | SUMMARY PORTFOLIO OF INVESTMENTS |
| Opportunities Fund | as of March 31, 2020 (continued) |
| Principal Amount† | | | Value | | | Percentage of Net Assets | | |||||||||
| SHORT-TERM INVESTMENTS: (continued) | | |||||||||||||||
| | | | Repurchase Agreements (continued) | | ||||||||||||
| 113,898 (12) | | | HSBC Securities USA, Repurchase Agreement dated 03/31/20, 0.01%, due 04/01/20 (Repurchase Amount $113,898, collateralized by various U.S. Government Securities, 0.000%-3.000%, Market Value plus accrued interest $116,176, due 05/15/44-08/15/48) | | | | $ | 113,898 | | | | | | 0.0 | | |
| 2,513,562 (12) | | | RBC Dominion Securities Inc., Repurchase Agreement dated 03/31/20, 0.01%, due 04/01/20 (Repurchase Amount $2,513,563, collateralized by various U.S. Government/U.S. Government Agency Obligations, 0.000%-7.125%, Market Value plus accrued interest $2,563,833, due 07/15/20-02/20/50) | | | | | 2,513,562 | | | | | | 0.1 | | |
| 2,513,562 (12) | | | State of Wisconsin Investment Board, Repurchase Agreement dated 03/31/20, 0.16%, due 04/01/20 (Repurchase Amount $2,513,573, collateralized by various U.S. Government Securities, 0.125%-3.875%, Market Value plus accrued interest $2,569,969, due 04/01/20-09/09/49) | | | | | 2,513,562 | | | | | | 0.1 | | |
| | | | Total Repurchase Agreements (Cost $10,799,391) | | | | | 10,799,391 | | | | | | 0.4 | | |
| | | | | | | | | | | | | | | | | |
| Shares | | | Value | | | Percentage of Net Assets | | |||||||||
| | | | Mutual Funds: 2.6% | | ||||||||||||
| 15,741,134 (13) | | | BlackRock Liquidity Funds, FedFund, Institutional Class, 0.330% | | | | | 15,741,134 | | | | | | 0.6 | | |
| Principal Amount† | | | Value | | | Percentage of Net Assets | | |||||||||
| SHORT-TERM INVESTMENTS: (continued) | | |||||||||||||||
| | | | Mutual Funds (continued) | | ||||||||||||
| 49,886,000 (13) | | | Morgan Stanley Institutional Liquidity Funds - Government Portfolio (Institutional Share Class), 0.250% | | | | $ | 49,886,000 | | | | | | 2.0 | | |
| | | | Total Mutual Funds (Cost $65,627,134) | | | | | 65,627,134 | | | | | | 2.6 | | |
| | | | Total Short-Term Investments (Cost $76,426,525) | | | | | 76,426,525 | | | | | | 3.0 | | |
| | | | Total Investments in Securities (Cost $2,791,658,812) | | | | $ | 2,513,820,991 | | | | | | 97.6 | | |
| | | | Assets in Excess of Other Liabilities | | | | | 63,073,798 | | | | | | 2.4 | | |
| | | | Net Assets | | | | $ | 2,576,894,789 | | | | | | 100.0 | | |
| | ||||||||||||||||
payment rates.
| Voya Strategic Income | SUMMARY PORTFOLIO OF INVESTMENTS |
| Opportunities Fund | as of March 31, 2020 (continued) |
| | | | Quoted Prices in Active Markets for Identical Investments (Level 1) | | | Significant Other Observable Inputs (Level 2) | | | Significant Unobservable Inputs (Level 3) | | | Fair Value at March 31, 2020 | | ||||||||||||
| Asset Table | | | | | | | | | | | | | | | | | | | | | | | | | |
| Investments, at fair value | | | | | | | | | | | | | | | | | | | | | | | | | |
| Purchased Options | | | | $ | — | | | | | $ | 4,673,724 | | | | | $ | — | | | | | $ | 4,673,724 | | |
| Corporate Bonds/Notes | | | | | — | | | | | | 394,488,093 | | | | | | — | | | | | | 394,488,093 | | |
| Collateralized Mortgage Obligations | | | | | — | | | | | | 753,643,797 | | | | | | — | | | | | | 753,643,797 | | |
| Asset-Backed Securities | | | | | — | | | | | | 308,841,383 | | | | | | — | | | | | | 308,841,383 | | |
| Bank Loans | | | | | — | | | | | | 348,781,362 | | | | | | — | | | | | | 348,781,362 | | |
| Sovereign Bonds | | | | | — | | | | | | 82,023,092 | | | | | | — | | | | | | 82,023,092 | | |
| Commercial Mortgage-Backed Securities | | | | | — | | | | | | 529,961,107 | | | | | | — | | | | | | 529,961,107 | | |
| Convertible Bonds/Notes | | | | | — | | | | | | 313,525 | | | | | | — | | | | | | 313,525 | | |
| U.S. Government Agency Obligations | | | | | — | | | | | | 7,429 | | | | | | — | | | | | | 7,429 | | |
| U.S. Treasury Obligations | | | | | — | | | | | | 14,660,954 | | | | | | — | | | | | | 14,660,954 | | |
| Short-Term Investments | | | | | 65,627,134 | | | | | | 10,799,391 | | | | | | — | | | | | | 76,426,525 | | |
| Total Investments, at fair value | | | | $ | 65,627,134 | | | | | $ | 2,448,193,857 | | | | | $ | — | | | | | $ | 2,513,820,991 | | |
| Other Financial Instruments+ | | | | | | | | | | | | | | | | | | | | | | | | | |
| Centrally Cleared Swaps | | | | | — | | | | | | 14,286,381 | | | | | | — | | | | | | 14,286,381 | | |
| Forward Foreign Currency Contracts | | | | | — | | | | | | 19,836,927 | | | | | | — | | | | | | 19,836,927 | | |
| Total Assets | | | | $ | 65,627,134 | | | | | $ | 2,482,317,165 | | | | | $ | — | | | | | $ | 2,547,944,289 | | |
| Liabilities Table | | | | | | | | | | | | | | | | | | | | | | | | | |
| Other Financial Instruments+ | | | | | | | | | | | | | | | | | | | | | | | | | |
| Centrally Cleared Swaps | | | | $ | — | | | | | $ | (2,538,527) | | | | | $ | — | | | | | $ | (2,538,527) | | |
| Forward Foreign Currency Contracts | | | | | — | | | | | | (12,373,218) | | | | | | — | | | | | | (12,373,218) | | |
| Written Options | | | | | — | | | | | | (4,349,549) | | | | | | — | | | | | | (4,349,549) | | |
| Total Liabilities | | | | $ | — | | | | | $ | (19,261,294) | | | | | $ | — | | | | | $ | (19,261,294) | | |
| Voya Strategic Income | SUMMARY PORTFOLIO OF INVESTMENTS |
| Opportunities Fund | as of March 31, 2020 (continued) |
| Currency Purchased | | | Currency Sold | | | Counterparty | | | Settlement Date | | | Unrealized Appreciation (Depreciation) | | ||||||
| HUF 655,795 | | | USD 2,147 | | | Barclays Bank PLC | | | | | 05/15/20 | | | | | $ | (139) | | |
| USD 7,032,932 | | | IDR 96,830,815,700 | | | Barclays Bank PLC | | | | | 05/15/20 | | | | | | 1,130,513 | | |
| PHP 1,478,623 | | | USD 29,000 | | | Barclays Bank PLC | | | | | 05/15/20 | | | | | | (224) | | |
| MYR 131,109 | | | USD 32,123 | | | Barclays Bank PLC | | | | | 05/15/20 | | | | | | (1,733) | | |
| MXN 134,002,849 | | | USD 6,313,543 | | | Barclays Bank PLC | | | | | 05/15/20 | | | | | | (701,453) | | |
| ILS 120,172 | | | USD 34,931 | | | Barclays Bank PLC | | | | | 05/15/20 | | | | | | (938) | | |
| IDR 5,793,718,400 | | | USD 353,000 | | | Barclays Bank PLC | | | | | 05/15/20 | | | | | | 162 | | |
| IDR 63,890,217,755 | | | USD 4,401,820 | | | Barclays Bank PLC | | | | | 05/15/20 | | | | | | (507,328) | | |
| USD 86,000 | | | RUB 5,495,770 | | | Barclays Bank PLC | | | | | 05/15/20 | | | | | | 16,051 | | |
| ZAR 180,127 | | | USD 12,161 | | | Barclays Bank PLC | | | | | 05/15/20 | | | | | | (2,154) | | |
| THB 154,924 | | | USD 5,000 | | | Barclays Bank PLC | | | | | 05/15/20 | | | | | | (278) | | |
| USD 9,771,749 | | | RUB 618,672,890 | | | Barclays Bank PLC | | | | | 05/15/20 | | | | | | 1,897,453 | | |
| CZK 42,445 | | | USD 1,851 | | | Barclays Bank PLC | | | | | 05/15/20 | | | | | | (143) | | |
| NOK 43,472,229 | | | USD 4,151,600 | | | Barclays Bank PLC | | | | | 06/05/20 | | | | | | 390 | | |
| USD 6,293,000 | | | JPY 693,884,933 | | | Barclays Bank PLC | | | | | 06/05/20 | | | | | | (178,396) | | |
| USD 7,623,000 | | | CHF 7,339,479 | | | Barclays Bank PLC | | | | | 06/05/20 | | | | | | 9,202 | | |
| CHF 7,324,714 | | | USD 7,623,000 | | | Barclays Bank PLC | | | | | 06/05/20 | | | | | | (24,520) | | |
| USD 32,466,661 | | | SEK 333,422,217 | | | Barclays Bank PLC | | | | | 06/05/20 | | | | | | (1,285,605) | | |
| NOK 43,513,164 | | | USD 4,151,600 | | | Barclays Bank PLC | | | | | 06/05/20 | | | | | | 4,299 | | |
| CAD 11,763,154 | | | USD 8,412,000 | | | Barclays Bank PLC | | | | | 06/05/20 | | | | | | (48,296) | | |
| USD 397,000 | | | IDR 5,486,377,230 | | | BNP Paribas | | | | | 05/15/20 | | | | | | 62,572 | | |
| USD 29,363 | | | PHP 1,499,125 | | | BNP Paribas | | | | | 05/15/20 | | | | | | 188 | | |
| USD 16,284,002 | | | BRL 68,799,522 | | | BNP Paribas | | | | | 05/15/20 | | | | | | 3,082,472 | | |
| USD 108,130 | | | PLN 419,722 | | | BNP Paribas | | | | | 05/15/20 | | | | | | 6,697 | | |
| USD 68,000 | | | PLN 288,057 | | | BNP Paribas | | | | | 05/15/20 | | | | | | (1,614) | | |
| USD 282,000 | | | MXN 5,351,744 | | | BNP Paribas | | | | | 05/15/20 | | | | | | 57,867 | | |
| NOK 102,006,542 | | | USD 9,072,000 | | | BNP Paribas | | | | | 06/05/20 | | | | | | 742,343 | | |
| USD 5,954,000 | | | JPY 660,892,809 | | | Brown Brothers Harriman & Co. | | | | | 06/05/20 | | | | | | (209,700) | | |
| USD 11,759,000 | | | CAD 17,072,128 | | | Brown Brothers Harriman & Co. | | | | | 06/05/20 | | | | | | (379,431) | | |
| USD 6,919,705 | | | PEN 23,210,076 | | | Citibank N.A. | | | | | 05/15/20 | | | | | | 169,533 | | |
| TRY 74,344 | | | USD 12,215 | | | Citibank N.A. | | | | | 05/15/20 | | | | | | (1,116) | | |
| USD 358,000 | | | BRL 1,526,118 | | | Citibank N.A. | | | | | 05/15/20 | | | | | | 65,162 | | |
| USD 6,832,988 | | | MXN 130,075,655 | | | Citibank N.A. | | | | | 05/15/20 | | | | | | 1,385,371 | | |
| MXN 1,474,190 | | | USD 60,000 | | | Citibank N.A. | | | | | 05/15/20 | | | | | | 1,740 | | |
| RON 4,488 | | | USD 1,000 | | | Citibank N.A. | | | | | 05/15/20 | | | | | | 20 | | |
| PEN 2,523,327 | | | USD 716,000 | | | Citibank N.A. | | | | | 05/15/20 | | | | | | 17,858 | | |
| USD 1,000 | | | ZAR 17,558 | | | Citibank N.A. | | | | | 05/15/20 | | | | | | 25 | | |
| USD 50,000 | | | CLP 42,029,500 | | | Citibank N.A. | | | | | 05/15/20 | | | | | | 835 | | |
| COP 69,540,774 | | | USD 20,359 | | | Citibank N.A. | | | | | 05/15/20 | | | | | | (3,293) | | |
| CLP 44,100,907 | | | USD 56,013 | | | Citibank N.A. | | | | | 05/15/20 | | | | | | (4,425) | | |
| USD 10,000 | | | TRY 61,039 | | | Citibank N.A. | | | | | 05/15/20 | | | | | | 887 | | |
| RUB 60,750,616 | | | USD 769,000 | | | Citibank N.A. | | | | | 05/15/20 | | | | | | 4,217 | | |
| USD 13,000 | | | ZAR 194,093 | | | Citibank N.A. | | | | | 05/15/20 | | | | | | 2,217 | | |
| EUR 115,524,256 | | | USD 124,903,000 | | | Citibank N.A. | | | | | 06/05/20 | | | | | | 2,827,449 | | |
| USD 7,623,000 | | | CHF 7,343,526 | | | Citibank N.A. | | | | | 06/05/20 | | | | | | 5,005 | | |
| NOK 1,229,809 | | | USD 108,519 | | | Deutsche Bank AG | | | | | 06/05/20 | | | | | | 9,805 | | |
| CHF 7,340,212 | | | USD 7,510,935 | | | Deutsche Bank AG | | | | | 06/05/20 | | | | | | 139,264 | | |
| Voya Strategic Income | SUMMARY PORTFOLIO OF INVESTMENTS |
| Opportunities Fund | as of March 31, 2020 (continued) |
| Currency Purchased | | | Currency Sold | | | Counterparty | | | Settlement Date | | | Unrealized Appreciation (Depreciation) | | ||||||
| USD 171 | | | NOK 1,883 | | | Deutsche Bank AG | | | | | 06/05/20 | | | | | | (10) | | |
| BRL 1,133,792 | | | USD 223,000 | | | JPMorgan Chase Bank N.A. | | | | | 05/15/20 | | | | | | (5,443) | | |
| USD 10,856,000 | | | JPY 1,181,932,887 | | | JPMorgan Chase Bank N.A. | | | | | 06/05/20 | | | | | | (167,089) | | |
| USD 472,538 | | | CAD 681,082 | | | JPMorgan Chase Bank N.A. | | | | | 06/05/20 | | | | | | (11,717) | | |
| AUD 34,803,675 | | | USD 20,273,343 | | | JPMorgan Chase Bank N.A. | | | | | 06/05/20 | | | | | | 1,138,673 | | |
| USD 169,279,316 | | | EUR 156,539,520 | | | JPMorgan Chase Bank N.A. | | | | | 06/05/20 | | | | | | (3,800,034) | | |
| EUR 6,330,651 | | | USD 6,886,000 | | | JPMorgan Chase Bank N.A. | | | | | 06/05/20 | | | | | | 113,542 | | |
| USD 37,279,111 | | | NZD 65,291,377 | | | JPMorgan Chase Bank N.A. | | | | | 06/05/20 | | | | | | (1,660,845) | | |
| CAD 17,205,157 | | | USD 12,260,000 | | | JPMorgan Chase Bank N.A. | | | | | 06/05/20 | | | | | | (26,985) | | |
| EUR 5,901,051 | | | USD 6,567,000 | | | JPMorgan Chase Bank N.A. | | | | | 06/05/20 | | | | | | (42,450) | | |
| GBP 4,970,984 | | | USD 5,713,000 | | | JPMorgan Chase Bank N.A. | | | | | 06/05/20 | | | | | | 468,883 | | |
| GBP 29,000,962 | | | USD 33,772,818 | | | JPMorgan Chase Bank N.A. | | | | | 06/05/20 | | | | | | 2,292,588 | | |
| EUR 2,339,253 | | | USD 2,534,000 | | | JPMorgan Chase Bank N.A. | | | | | 06/05/20 | | | | | | 52,417 | | |
| BRL 69,196,636 | | | USD 14,545,971 | | | Morgan Stanley Capital Services LLC | | | | | 05/15/20 | | | | | | (1,268,242) | | |
| USD 17,000 | | | COP 57,691,200 | | | Morgan Stanley Capital Services LLC | | | | | 05/15/20 | | | | | | 2,842 | | |
| NOK 43,528,069 | | | USD 4,151,600 | | | Morgan Stanley Capital Services LLC | | | | | 06/05/20 | | | | | | 5,723 | | |
| NOK 43,509,809 | | | USD 4,151,600 | | | Morgan Stanley Capital Services LLC | | | | | 06/05/20 | | | | | | 3,979 | | |
| SEK 48,606,490 | | | USD 4,906,000 | | | Morgan Stanley Capital Services LLC | | | | | 06/05/20 | | | | | | 14,426 | | |
| NZD 9,670,565 | | | USD 5,780,000 | | | Morgan Stanley Capital Services LLC | | | | | 06/05/20 | | | | | | (12,449) | | |
| USD 6,465,000 | | | AUD 10,601,303 | | | State Street Bank and Trust Co. | | | | | 06/05/20 | | | | | | 20,537 | | |
| USD 5,451,000 | | | EUR 4,956,180 | | | State Street Bank and Trust Co. | | | | | 06/05/20 | | | | | | 11,731 | | |
| EUR 4,940,530 | | | USD 5,451,000 | | | State Street Bank and Trust Co. | | | | | 06/05/20 | | | | | | (28,907) | | |
| NOK 43,498,347 | | | USD 4,151,600 | | | State Street Bank and Trust Co. | | | | | 06/05/20 | | | | | | 2,884 | | |
| USD 5,443,000 | | | AUD 8,832,361 | | | State Street Bank and Trust Co. | | | | | 06/05/20 | | | | | | 9,130 | | |
| EUR 7,023,379 | | | USD 7,775,000 | | | State Street Bank and Trust Co. | | | | | 06/05/20 | | | | | | (9,537) | | |
| USD 7,244,000 | | | CHF 6,890,000 | | | State Street Bank and Trust Co. | | | | | 06/05/20 | | | | | | 63,025 | | |
| USD 11,111,000 | | | GBP 8,932,620 | | | State Street Bank and Trust Co. | | | | | 06/05/20 | | | | | | 2,453 | | |
| USD 12,198,000 | | | GBP 10,038,283 | | | State Street Bank and Trust Co. | | | | | 06/05/20 | | | | | | (285,543) | | |
| USD 6,232,000 | | | CHF 6,073,720 | | | State Street Bank and Trust Co. | | | | | 06/05/20 | | | | | | (98,221) | | |
| JPY 15,668,941,075 | | | USD 142,166,273 | | | State Street Bank and Trust Co. | | | | | 06/05/20 | | | | | | 3,967,348 | | |
| USD 15,914,000 | | | GBP 13,553,369 | | | State Street Bank and Trust Co. | | | | | 06/05/20 | | | | | | (940,881) | | |
| USD 5,451,000 | | | EUR 4,955,639 | | | State Street Bank and Trust Co. | | | | | 06/05/20 | | | | | | 12,324 | | |
| Voya Strategic Income | SUMMARY PORTFOLIO OF INVESTMENTS |
| Opportunities Fund | as of March 31, 2020 (continued) |
| Currency Purchased | | | Currency Sold | | | Counterparty | | | Settlement Date | | | Unrealized Appreciation (Depreciation) | | ||||||
| USD 9,279,000 | | | AUD 16,093,044 | | | State Street Bank and Trust Co. | | | | | 06/05/20 | | | | | | (621,808) | | |
| AUD 10,565,550 | | | USD 6,465,000 | | | State Street Bank and Trust Co. | | | | | 06/05/20 | | | | | | (42,271) | | |
| USD 6,465,000 | | | AUD 10,610,699 | | | State Street Bank and Trust Co. | | | | | 06/05/20 | | | | | | 14,825 | | |
| | | | | | | | | | | | | | | | | $ | 7,463,709 | | |
| | |||||||||||||||||||
| Reference Entity/Obligation | | | Buy/Sell Protection | | | (Pay)/ Receive Financing Rate (%)(2) | | | Termination Date | | | Notional Amount(3) | | | Fair Value(4) | | | Unrealized Appreciation/ (Depreciation) | | ||||||||||||||||||
| CDX North American High Yield Index, Series 34, Version 1 | | | | | Buy | | | | | | (5.000) | | | | | | 06/20/25 | | | | | | USD 243,185,000 | | | | | $ | 15,612,477 | | | | | $ | 5,018,018 | | |
| iTraxx Cross-over Index, Series 32, Version 1 | | | | | Buy | | | | | | (5.000) | | | | | | 12/20/24 | | | | | | EUR 41,009,000 | | | | | | 926,829 | | | | | | 7,213,215 | | |
| | | | | | | | | | | | | | | | | | | | | | | | | | | | | $ | 16,539,306 | | | | | $ | 12,231,233 | | |
| ReferenceEntity/Obligation | | | Buy/Sell Protection | | | (Pay)/ Receive Financing Rate (%)(2) | | | Termination Date | | | Notional Amount(3) | | | Fair Value(4) | | | Unrealized Appreciation/ (Depreciation) | | ||||||||||||||||||
| Prudential Financial Inc. 3.50%, due 05/15/2024 | | | | | Buy | | | | | | (1.000) | | | | | | 12/20/24 | | | | | | USD 15,120,000 | | | | | | (132,088) | | | | | | 269,623 | | |
| | | | | | | | | | | | | | | | | | | | | | | | | | | | | | (132,088) | | | | | $ | 269,623 | | |
| ReferenceEntity/Obligation | | | Buy/Sell Protection | | | (Pay)/ Receive Financing Rate (%)(6) | | | Termination Date | | | Notional Amount(3) | | | Fair Value(4) | | | Unrealized Appreciation/ (Depreciation) | | ||||||||||||||||||
| CDX North American Investment Grade Index, Series 33, Version 1 | | | | | Sell | | | | | | 1.000 | | | | | | 06/20/24 | | | | | | USD 15,120,000 | | | | | | (52,512) | | | | | | (447,940) | | |
| | | | | | | | | | | | | | | | | | | | | | | | | | | | | | (52,512) | | | | | $ | (447,940) | | |
| Voya Strategic Income | SUMMARY PORTFOLIO OF INVESTMENTS |
| Opportunities Fund | as of March 31, 2020 (continued) |
| Pay/Receive Floating Rate | | | Floating Rate Index | | | Floating Rate Index Payment Frequency | | | Fixed Rate | | | Fixed Rate Payment Frequency | | | Maturity Date | | | Notional Amount | | | Fair Value | | | Unrealized Appreciation/ (Depreciation) | | |||||||||||||||
| Pay | | | 3-month USD-LIBOR | | | Quarterly | | | | | 2.596% | | | | Semi-Annual | | | | | 04/11/20 | | | | | | USD 90,000,000 | | | | | $ | 24,293 | | | | | $ | 24,293 | | |
| Pay | | | 3-month USD-LIBOR | | | Quarterly | | | | | 2.026 | | | | Semi-Annual | | | | | 03/12/22 | | | | | | USD 258,000 | | | | | | 8,106 | | | | | | 8,106 | | |
| Pay | | | 3-month USD-LIBOR | | | Quarterly | | | | | 2.246 | | | | Semi-Annual | | | | | 03/12/25 | | | | | | USD 49,000 | | | | | | 4,227 | | | | | | 4,227 | | |
| Pay | | | 3-month USD-LIBOR | | | Quarterly | | | | | 2.238 | | | | Semi-Annual | | | | | 03/09/26 | | | | | | USD 20,892,000 | | | | | | 1,748,899 | | | | | | 1,748,899 | | |
| Receive | | | 3-month USD-LIBOR | | | Quarterly | | | | | 2.620 | | | | Semi-Annual | | | | | 04/13/20 | | | | | | USD 23,800,000 | | | | | | (6,630) | | | | | | (6,630) | | |
| Receive | | | 3-month USD-LIBOR | | | Quarterly | | | | | 1.923 | | | | Semi-Annual | | | | | 03/20/22 | | | | | | USD 575,000 | | | | | | (16,759) | | | | | | (16,759) | | |
| Receive | | | 3-month USD-LIBOR | | | Quarterly | | | | | 2.839 | | | | Semi-Annual | | | | | 04/11/28 | | | | | | USD 12,000,000 | | | | | | (2,067,198) | | | | | | (2,067,198) | | |
| | | | | | | | | | | | | | | | | | | | | | | | | | | | | | | | $ | (305,062) | | | | | $ | (305,062) | | |
| Description | | | Counterparty | | | Expiration Date | | | Exercise Price | | | Notional Amount | | | Cost | | | Fair Value | | |||||||||
| Call EUR vs. Put NOK | | | Bank of America N.A. | | | | | 05/11/20 | | | | 10.500 | | | EUR 21,558,000 | | | | $ | 64,736 | | | | | $ | 2,124,162 | | |
| Call USD vs. Put AUD | | | Morgan Stanley Capital Services LLC | | | | | 05/11/20 | | | | 0.650 | | | USD 22,933,300 | | | | | 87,817 | | | | | | 1,348,185 | | |
| Call USD vs. Put JPY | | | Morgan Stanley Capital Services LLC | | | | | 04/22/20 | | | | 111.500 | | | USD 141,548,000 | | | | | 1,932,979 | | | | | | 239,368 | | |
| Put EUR vs. Call NOK | | | Bank of America N.A. | | | | | 05/11/20 | | | | 9.900 | | | EUR 21,558,000 | | | | | 76,624 | | | | | | 14,999 | | |
| Put USD vs. Call AUD | | | Morgan Stanley Capital Services LLC | | | | | 05/11/20 | | | | 0.690 | | | USD 24,344,580 | | | | | 92,651 | | | | | | 14,758 | | |
| Put USD vs. Call EUR | | | Citibank N.A. | | | | | 04/21/20 | | | | 1.110 | | | USD 141,548,000 | | | | | 1,140,877 | | | | | | 932,252 | | |
| | | | | | | | | | | | | | | | | | | | $ | 3,395,684 | | | | | $ | 4,673,724 | | |
| Description | | | Counterparty | | | Expiration Date | | | Exercise Price | | | Notional Amount | | | Premiums Received | | | Fair Value | | |||||||||
| Call EUR vs. Put NOK | | | Bank of America N.A. | | | | | 05/11/20 | | | | 10.300 | | | EUR 21,558,000 | | | | $ | 150,540 | | | | | $ | (2,518,936) | | |
| Call USD vs. Put AUD | | | Morgan Stanley Capital Services LLC | | | | | 05/11/20 | | | | 0.665 | | | USD 23,462,530 | | | | | 205,200 | | | | | | (1,830,613) | | |
| | | | | | | | | | | | | | | | | | | | $ | 355,740 | | | | | $ | (4,349,549) | | |
| Voya Strategic Income | SUMMARY PORTFOLIO OF INVESTMENTS |
| Opportunities Fund | as of March 31, 2020 (continued) |
| Derivatives not accounted for as hedging instruments | | | Location on Statement of Assets and Liabilities | | | Fair Value | | |||
| Asset Derivatives | | | | | | | | | | |
| Foreign exchange contracts | | | Investments in securities at value* | | | | $ | 4,673,724 | | |
| Foreign exchange contracts | | | Unrealized appreciation on forward foreign currency contracts | | | | | 19,836,927 | | |
| Interest rate contracts | | | Net Assets — Unrealized appreciation** | | | | | 1,785,525 | | |
| Credit contracts | | | Net Assets — Unrealized appreciation** | | | | | 12,500,856 | | |
| Total Asset Derivatives | | | | | | | $ | 38,797,032 | | |
| Liability Derivatives | | | | | | | | | | |
| Foreign exchange contracts | | | Unrealized depreciation on forward foreign currency contracts | | | | $ | 12,373,218 | | |
| Interest rate contracts | | | Net Assets — Unrealized depreciation** | | | | | 2,090,587 | | |
| Credit contracts | | | Net Assets — Unrealized depreciation** | | | | | 447,940 | | |
| Foreign exchange contracts | | | Written options, at fair value | | | | | 4,349,549 | | |
| Total Liability Derivatives | | | | | | | $ | 19,261,294 | | |
| Derivatives not accounted for as hedging instruments | | | Investments* | | | Forward foreign currency contracts | | | Futures | | | Swaps | | | Written options | | | Total | | ||||||||||||||||||
| Credit contracts | | | | $ | — | | | | | $ | — | | | | | $ | — | | | | | $ | 13,254,232 | | | | | $ | — | | | | | $ | 13,254,232 | | |
| Equity contracts | | | | | — | | | | | | — | | | | | | (330,368) | | | | | | — | | | | | | — | | | | | | (330,368) | | |
| Foreign exchange contracts | | | | | (105,530) | | | | | | (1,339,511) | | | | | | — | | | | | | (1,086,217) | | | | | | 292,560 | | | | | | (2,238,698) | | |
| Interest rate contracts | | | | | 1,294,079 | | | | | | — | | | | | | (51,065,482) | | | | | | (1,139,125) | | | | | | (4,636,395) | | | | | | (55,546,923) | | |
| Total | | | | $ | 1,188,549 | | | | | $ | (1,339,511) | | | | | $ | (51,395,850) | | | | | $ | 11,028,890 | | | | | $ | (4,343,835) | | | | | $ | (44,861,757) | | |
| Derivatives not accounted for as hedging instruments | | | Investments* | | | Forward foreign currency contracts | | | Futures | | | Swaps | | | Written options | | | Total | | ||||||||||||||||||
| Credit contracts | | | | $ | — | | | | | $ | — | | | | | $ | — | | | | | $ | 12,052,916 | | | | | $ | — | | | | | $ | 12,052,916 | | |
| Foreign exchange contracts | | | | | 1,278,041 | | | | | | 7,013,752 | | | | | | — | | | | | | — | | | | | | (3,993,809) | | | | | | 4,297,984 | | |
| Interest rate contracts | | | | | 896,378 | | | | | | — | | | | | | 2,272,315 | | | | | | 17,095 | | | | | | 4,155,660 | | | | | | 7,341,448 | | |
| Total | | | | $ | 2,174,419 | | | | | $ | 7,013,752 | | | | | $ | 2,272,315 | | | | | $ | 12,070,011 | | | | | $ | 161,851 | | | | | $ | 23,692,348 | | |
| Voya Strategic Income | SUMMARY PORTFOLIO OF INVESTMENTS |
| Opportunities Fund | as of March 31, 2020 (continued) |
| | | | Bank of America N.A. | | | Barclays Bank PLC | | | BNP Paribas | | | Brown Brothers Harriman & Co. | | | Citibank N.A. | | | Deutsche Bank AG | | | JPMorgan Chase Bank N.A. | | | Morgan Stanley Capital Services LLC | | | State Street Bank and Trust Co. | | | Totals | | ||||||||||||||||||||||||||||||
| Assets: | | | | | | | | | | | | | | | | | | | | | | | | | | | | | | | | | | | | | | | | | | | | | | | | | | | | | | | | | | | | | |
| Purchased options | | | | $ | 2,139,161 | | | | | $ | — | | | | | $ | — | | | | | $ | — | | | | | $ | 932,252 | | | | | $ | — | | | | | $ | — | | | | | $ | 1,602,311 | | | | | $ | — | | | | | $ | 4,673,724 | | |
| Forward foreign currency contracts | | | | | — | | | | | | 3,058,070 | | | | | | 3,952,139 | | | | | | — | | | | | | 4,480,319 | | | | | | 149,069 | | | | | | 4,066,103 | | | | | | 26,970 | | | | | | 4,104,257 | | | | | | 19,836,927 | | |
| Total Assets | | | | $ | 2,139,161 | | | | | $ | 3,058,070 | | | | | $ | 3,952,139 | | | | | $ | — | | | | | $ | 5,412,571 | | | | | $ | 149,069 | | | | | $ | 4,066,103 | | | | | $ | 1,629,281 | | | | | $ | 4,104,257 | | | | | $ | 24,510,651 | | |
| Liabilities: | | | | | | | | | | | | | | | | | | | | | | | | | | | | | | | | | | | | | | | | | | | | | | | | | | | | | | | | | | | | | |
| Forward foreign currency contracts | | | | $ | — | | | | | $ | 2,751,207 | | | | | $ | 1,614 | | | | | $ | 589,131 | | | | | $ | 8,834 | | | | | $ | 10 | | | | | $ | 5,714,563 | | | | | $ | 1,280,691 | | | | | $ | 2,027,168 | | | | | $ | 12,373,218 | | |
| Written options | | | | | 2,518,936 | | | | | | — | | | | | | — | | | | | | — | | | | | | — | | | | | | — | | | | | | — | | | | | | 1,830,613 | | | | | | — | | | | | | 4,349,549 | | |
| Total Liabilities | | | | $ | 2,518,936 | | | | | $ | 2,751,207 | | | | | $ | 1,614 | | | | | $ | 589,131 | | | | | $ | 8,834 | | | | | $ | 10 | | | | | $ | 5,714,563 | | | | | $ | 3,111,304 | | | | | $ | 2,027,168 | | | | | $ | 16,722,767 | | |
| Net OTC derivative instruments by counterparty, at fair value | | | | $ | (379,775) | | | | | $ | 306,863 | | | | | $ | 3,950,525 | | | | | $ | (589,131) | | | | | $ | 5,403,737 | | | | | $ | 149,059 | | | | | $ | (1,648,460) | | | | | $ | (1,482,023) | | | | | $ | 2,077,089 | | | | | $ | 7,787,884 | | |
| Total cash collateral pledged by the Fund/(Received from counterparty) | | | | $ | — | | | | | $ | (306,863) | | | | | $ | (3,640,000) | | | | | $ | — | | | | | $ | (5,403,737) | | | | | $ | — | | | | | $ | — | | | | | $ | — | | | | | $ | — | | | | | $ | (9,350,600) | | |
| Total non-cash collateral pledged by the Fund/(Received from counterparty) | | | | | — | | | | | | — | | | | | | — | | | | | | — | | | | | | — | | | | | | — | | | | | | — | | | | | | — | | | | | | (1,531,259) | | | | | | (1,531,259) | | |
Net Exposure(1)(2)(3) | | | | $ | (379,775) | | | | | $ | — | | | | | $ | 310,525 | | | | | $ | (589,131) | | | | | $ | — | | | | | $ | 149,059 | | | | | $ | (1,648,460) | | | | | $ | (1,482,023) | | | | | $ | 545,830 | | | | | $ | (3,093,975) | | |
| | Cost for federal income tax purposes was $2,815,864,436. | | | |||||
| | Net unrealized depreciation consisted of: | | | |||||
| | Gross Unrealized Appreciation | | | | $ | 51,082,346 | | |
| | Gross Unrealized Depreciation | | | | | (333,249,653) | | |
| | Net Unrealized Depreciation | | | | $ | (282,167,307) | | |
| Fund Name | | | Type | | | Per Share Amount | | |||
| Voya GNMA Income Fund | | |||||||||
| Class A | | | NII | | | | $ | 0.2286 | | |
| Class C | | | NII | | | | $ | 0.1643 | | |
| Class I | | | NII | | | | $ | 0.2545 | | |
| Class W | | | NII | | | | $ | 0.2505 | | |
| Voya High Yield Bond Fund | | |||||||||
| Class A | | | NII | | | | $ | 0.4230 | | |
| Class C | | | NII | | | | $ | 0.3630 | | |
| Class I | | | NII | | | | $ | 0.4500 | | |
| Class P | | | NII | | | | $ | 0.5037 | | |
| Class P3 | | | NII | | | | $ | 0.5085 | | |
| Class R | | | NII | | | | $ | 0.4033 | | |
| Class R6 | | | NII | | | | $ | 0.4561 | | |
| Class W | | | NII | | | | $ | 0.4435 | | |
| Voya Intermediate Bond Fund | | |||||||||
| Class A | | | NII | | | | $ | 0.3347 | | |
| Class C | | | NII | | | | $ | 0.2566 | | |
| Class I | | | NII | | | | $ | 0.3678 | | |
| Class P3 | | | NII | | | | $ | 0.4041 | | |
| Class R | | | NII | | | | $ | 0.3093 | | |
| Class R6 | | | NII | | | | $ | 0.3719 | | |
| Fund Name | | | Type | | | Per Share Amount | | |||
| Voya Intermediate Bond Fund (continued) | | |||||||||
| Class W | | | NII | | | | $ | 0.3605 | | |
| All Classes | | | STCG | | | | $ | 0.0084 | | |
| Voya Short Term Bond Fund | | |||||||||
| Class A | | | NII | | | | $ | 0.2108 | | |
| Class C | | | NII | | | | $ | 0.1366 | | |
| Class I | | | NII | | | | $ | 0.2402 | | |
Class P2(1) | | | NII | | | | $ | 0.1293 | | |
| Class P3 | | | NII | | | | $ | 0.2907 | | |
| Class R | | | NII | | | | $ | 0.1865 | | |
| Class R6 | | | NII | | | | $ | 0.2432 | | |
| Class W | | | NII | | | | $ | 0.2361 | | |
| Voya Strategic Income Opportunities Fund | | |||||||||
| Class A | | | NII | | | | $ | 0.4082 | | |
| Class C | | | NII | | | | $ | 0.3261 | | |
| Class I | | | NII | | | | $ | 0.4462 | | |
| Class P | | | NII | | | | $ | 0.5030 | | |
Class P3(2) | | | NII | | | | $ | 0.2822 | | |
| Class R | | | NII | | | | $ | 0.3794 | | |
| Class R6 | | | NII | | | | $ | 0.4510 | | |
| Class W | | | NII | | | | $ | 0.4328 | | |
| | Voya GNMA Income Fund | | | | | 99.94% | | |
| | Voya High Yield Bond Fund | | | | | 98.18% | | |
| | Voya Intermediate Bond Fund | | | | | 92.68% | | |
| | Voya Short Term Bond Fund | | | | | 96.70% | | |
| | Voya Strategic Income Opportunities Fund | | | | | 85.91% | | |
| | Voya Intermediate Bond Fund | | | | | 100.00% | | |
| Name, Address and Age | | | Position(s) Held with the Trust | | | Term of Office and Length of Time Served(1) | | | Principal Occupation(s) – During the Past 5 Years | | | Number of funds in Fund Complex Overseen by Trustee(2) | | | Other Board Positions Held by Trustee | |
| Independent Trustees: | | | | | | | | | | | | | | | | |
| Colleen D. Baldwin 7337 East Doubletree Ranch Rd. Suite 100 Scottsdale, Arizona 85258 Age: 59 | | | Trustee Chairperson | | | November 2007 – Present January 2020 – Present | | | President, Glantuam Partners, LLC, a business consulting firm (January 2009 – Present). | | | 136 | | | Dentaquest (February 2014 – Present); RSR Partners, Inc. (2016 – Present). | |
| John V. Boyer 7337 East Doubletree Ranch Rd. Suite 100 Scottsdale, Arizona 85258 Age: 66 | | | Trustee | | | January 2005 – Present | | | Retired. Formerly, President and Chief Executive Officer, Bechtler Arts Foundation, an arts and education foundation (January 2008 – December 2019). | | | 136 | | | None. | |
| Patricia W. Chadwick 7337 East Doubletree Ranch Rd. Suite 100 Scottsdale, Arizona 85258 Age: 71 | | | Trustee | | | January 2006 – Present | | | Consultant and President, Ravengate Partners LLC, a consulting firm that provides advice regarding financial markets and the global economy (January 2000 – Present). | | | 136 | | | Wisconsin Energy Corporation (June 2006 – Present); The Royce Funds (22 funds) (December 2009 – Present); and AMICA Mutual Insurance Company (1992 – Present). | |
| Martin J. Gavin 7337 East Doubletree Ranch Rd. Suite 100 Scottsdale, AZ 85258 Age: 70 | | | Trustee | | | August 2015 – Present | | | Retired. Formerly, President and Chief Executive Officer, Connecticut Children’s Medical Center (May 2006 – November 2015). | | | 136 | | | None. | |
| Joseph E. Obermeyer 7337 East Doubletree Ranch Rd. Suite 100 Scottsdale, Arizona 85258 Age: 62 | | | Trustee | | | May 2013 – Present | | | President, Obermeyer & Associates, Inc., a provider of financial and economic consulting services (November 1999 – Present). | | | 136 | | | None. | |
| Sheryl K. Pressler 7337 East Doubletree Ranch Rd. Suite 100 Scottsdale, Arizona 85258 Age: 69 | | | Trustee | | | January 2006 – Present | | | Consultant (May 2001 – Present). | | | 136 | | | None. | |
| Christopher P. Sullivan 7337 East Doubletree Ranch Rd. Suite 100 Scottsdale, Arizona 85258 Age: 66 | | | Trustee | | | October 2015 – Present | | | Retired. | | | 136 | | | None. | |
| Name, Address and Age | | | Position(s) Held with the Trust | | | Term of Office and Length of Time Served(1) | | | Principal Occupation(s) – During the Past 5 Years | | | Number of funds in Fund Complex Overseen by Trustee(2) | | | Other Board Positions Held by Trustee | |
| Trustee who is an “interested person”: | | |||||||||||||||
| Dina Santoro 230 Park Avenue New York, New York 10169 Age: 47 | | | Trustee | | | July 2018 – Present | | | President, Voya Investments, LLC and Voya Capital, LLC (March 2018 – Present); Senior Vice President, Voya Investments Distributor, LLC (April 2018 – Present); Senior Managing Director, Head of Product and Marketing Strategy, Voya Investment Management (September 2017 – Present). Formerly, Managing Director, Quantitative Management Associates, LLC (January 2004 – August 2017). | | | 136 | | | Voya Investments, LLC, Voya Capital, LLC, and Voya Funds Services, LLC (March 2018 – Present); Voya Investments Distributor, LLC (April 2018 – Present). | |
| Name, Address and Age | | | Position(s) Held With the Trust | | | Term of Office and Length of Time Served(1) | | | Principal Occupation(s) – During the Past 5 Years | |
| Michael Bell One Orange Way Windsor, Connecticut 06095 Age: 51 | | | Chief Executive Officer | | | March 2018 – Present | | | Chief Executive Officer and Director, Voya Investments, LLC, Voya Capital, LLC, and Voya Funds Services, LLC (March 2018 – Present); Senior Vice President and Chief Financial Officer, Voya Investments Distributor, LLC (September 2019 – Present); Chief Financial Officer, Voya Investment Management (September 2014 – Present). Formerly, Senior Vice President, Chief Financial Officer and Treasurer, Voya Investments, LLC (November 2015 – March 2018). | |
| Dina Santoro 230 Park Avenue New York, New York 10169 Age: 47 | | | President | | | March 2018 – Present | | | President and Director, Voya Investments, LLC and Voya Capital, LLC (March 2018 – Present); Director, Voya Funds Services, LLC (March 2018 – Present); Director and Senior Vice President, Voya Investments Distributor, LLC (April 2018 – Present); Senior Managing Director, Head of Product and Marketing Strategy, Voya Investment Management (September 2017 – Present). Formerly, Managing Director, Quantitative Management Associates, LLC (January 2004 – August 2017). | |
| Jonathan Nash 230 Park Avenue New York, New York 10169 Age: 52 | | | Executive Vice President Chief Investment Risk Officer | | | March 2020 – Present March 2020 – Present | | | Senior Vice President, Investment Risk Management, Voya Investment Management (March 2017 – Present); Formerly, Consultant, DA Capital LLC (January 2016 – March 2017); Managing Director, Enterprise Risk, American International Group (AIG) (September 2014 – March 2015). | |
| James M. Fink 5780 Powers Ferry Road NW Atlanta, Georgia 30327 Age: 62 | | | Executive Vice President | | | March 2018 – Present | | | Managing Director, Voya Investments, LLC, Voya Capital, LLC, and Voya Funds Services, LLC (March 2018 – Present); Senior Vice President, Voya Investments Distributor, LLC (April 2018 – Present); Chief Administrative Officer, Voya Investment Management (September 2017 – Present). Formerly, Managing Director, Operations, Voya Investment Management (March 1999 – September 2017). | |
| Kevin M. Gleason 7337 East Doubletree Ranch Rd. Suite 100 Scottsdale, Arizona 85258 Age: 53 | | | Chief Compliance Officer | | | February 2012 – Present | | | Senior Vice President, Voya Investment Management and Chief Compliance Officer, Voya Family of Funds (February 2012 – Present). | |
| Todd Modic 7337 East Doubletree Ranch Rd. Suite 100 Scottsdale, Arizona 85258 Age: 52 | | | Senior Vice President, Chief/Principal Financial Officer and Assistant Secretary | | | March 2005 – Present | | | President, Voya Funds Services, LLC (March 2018 – Present) and Senior Vice President, Voya Investments, LLC (April 2005 – Present). | |
| Kimberly A. Anderson 7337 East Doubletree Ranch Rd. Suite 100 Scottsdale, Arizona 85258 Age: 55 | | | Senior Vice President | | | November 2003 – Present | | | Senior Vice President, Voya Investments, LLC (September 2003 – Present). | |
| Robert Terris 5780 Powers Ferry Road NW Atlanta, Georgia 30327 Age: 49 | | | Senior Vice President | | | May 2006 – Present | | | Senior Vice President, Voya Investments Distributor, LLC (April 2018 – Present); Senior Vice President, Head of Division Operations, Voya Investments, LLC (October 2015 – Present) and Voya Funds Services, LLC (March 2006 – Present). | |
| Maria M. Anderson 7337 East Doubletree Ranch Rd. Suite 100 Scottsdale, Arizona 85258 Age: 62 | | | Vice President | | | September 2004 – Present | | | Vice President, Voya Investments, LLC (October 2015 – Present) and Voya Funds Services, LLC (September 2004 – Present). | |
| Name, Address and Age | | | Position(s) Held With the Trust | | | Term of Office and Length of Time Served(1) | | | Principal Occupation(s) – During the Past 5 Years | |
| Fred Bedoya 7337 East Doubletree Ranch Rd. Suite 100 Scottsdale, Arizona 85258 Age: 47 | | | Vice President | | | September 2012 – Present | | | Vice President, Voya Investments, LLC (October 2015 – Present) and Voya Funds Services, LLC (July 2012 – Present). | |
| Sara M. Donaldson 7337 East Doubletree Ranch Rd. Suite 100 Scottsdale, Arizona 85258 Age: 60 | | | Vice President | | | September 2014 – Present | | | Vice President, Voya Investments, LLC (October 2015 – Present). Formerly, Vice President, Voya Funds Services, LLC (April 2014 – October 2015). | |
| Micheline S. Faver 7337 East Doubletree Ranch Rd. Suite 100 Scottsdale, Arizona 85258 Age: 42 | | | Vice President | | | September 2016 – Present | | | Senior Vice President, Head of Fund Compliance and Chief Compliance Office, Voya Investments, LLC (March 2020 – Present). Formerly, Vice President, Head of Fund Compliance and Chief Compliance Officer, Voya Investments, LLC (June 2016 – March 2020); and Vice President, Mutual Fund Compliance (March 2014 – June 2016). | |
| Robyn L. Ichilov 7337 East Doubletree Ranch Rd. Suite 100 Scottsdale, Arizona 85258 Age: 52 | | | Vice President | | | October 2000 – Present | | | Vice President, Voya Funds Services, LLC (November 1995 – Present) and Voya Investments, LLC (August 1997 – Present). | |
| Jason Kadavy 7337 East Doubletree Ranch Rd. Suite 100 Scottsdale, Arizona 85258 Age: 44 | | | Vice President | | | September 2012 – Present | | | Vice President, Voya Investments, LLC (October 2015 – Present) and Voya Funds Services, LLC (July 2007 – Present). | |
| Andrew K. Schlueter 7337 East Doubletree Ranch Rd. Suite 100 Scottsdale, Arizona 85258 Age: 44 | | | Vice President | | | March 2018 – Present | | | Vice President, Voya Investments Distributor, LLC (April 2018 – Present); Vice President, Voya Investments, LLC and Voya Funds Services, LLC (March 2018 – Present); Vice President, Head of Mutual Fund Operations, Voya Investment Management (February 2018 – Present). Formerly, Vice President, Voya Investment Management (March 2014 – February 2018). | |
| Craig Wheeler 7337 East Doubletree Ranch Rd. Suite 100 Scottsdale, Arizona 85258 Age: 51 | | | Vice President | | | May 2013 – Present | | | Vice President – Director of Tax, Voya Investments, LLC (October 2015 – Present). Formerly, Vice President – Director of Tax, Voya Funds Services, LLC (March 2013 – October 2015). | |
| Monia Piacenti One Orange Way Windsor, Connecticut 06095 Age: 43 | | | Anti-Money Laundering Officer | | | June 2018 – Present | | | Anti-Money Laundering Officer, Voya Investments Distributor, LLC, Voya Investment Management and Voya Investment Management Trust Co. (June 2018 – Present); Compliance Consultant, Voya Financial, Inc. (January 2019 – Present). Formerly, Senior Compliance Officer, Voya Investment Management (December 2009 – December 2018). | |
| Theresa K. Kelety 7337 East Doubletree Ranch Rd. Suite 100 Scottsdale, Arizona 85258 Age: 57 | | | Secretary | | | January 2020 – Present | | | Vice President and Senior Counsel, Voya Investment Management – Mutual Fund Legal Department (March 2010 – Present). | |
| Paul A. Caldarelli 7337 East Doubletree Ranch Rd. Suite 100 Scottsdale, Arizona 85258 Age: 68 | | | Assistant Secretary | | | June 2010 – Present | | | Vice President and Senior Counsel, Voya Investment Management – Mutual Fund Legal Department (March 2010 – Present). | |
| Name, Address and Age | | | Position(s) Held With the Trust | | | Term of Office and Length of Time Served(1) | | | Principal Occupation(s) – During the Past 5 Years | |
| Joanne F. Osberg 7337 East Doubletree Ranch Rd. Suite 100 Scottsdale, Arizona 85258 Age: 38 | | | Assistant Secretary | | | January 2020 – Present | | | Vice President and Counsel, Voya Investment Management – Mutual Fund Legal Department (January 2013 – Present). | |
Voya Investments, LLC
7337 East Doubletree Ranch Road, Suite 100
Scottsdale, Arizona 85258
Voya Investments Distributor, LLC
7337 East Doubletree Ranch Road, Suite 100
Scottsdale, Arizona 85258
BNY Mellon Investment Servicing (U.S.) Inc.
301 Bellevue Parkway
Wilmington, Delaware 19809
Ernst & Young LLP
200 Clarendon Street
Boston, MA 02116
The Bank of New York Mellon
225 Liberty Street
New York, New York 10286
Ropes & Gray LLP
Prudential Tower
800 Boylston Street
Boston, Massachusetts 02199
| | | Beginning on January 1, 2021, as permitted by regulations adopted by the U.S. Securities and Exchange Commission, paper copies of the Fund’s annual and semi-annual shareholder reports, like this annual report, will no longer be sent by mail, unless you specifically request paper copies of the reports. Instead, the reports will be made available on the Voya funds’ website (www.voyainvestments.com/literature), and you will be notified by mail each time a report is posted and provided with a website link to access the report. | | |
| | | If you already elected to receive shareholder reports electronically, you will not be affected by this change and you need not take any action. You may elect to receive shareholder reports and other communications from the Fund electronically anytime by contacting your financial intermediary (such as a broker-dealer or bank) or, if you are a direct investor, by calling 1-800-992-0180 or by sending an e-mail request to Voyaim_literature@voya.com. | | |
| | | You may elect to receive all future reports in paper free of charge. If you received this document in the mail, please follow the instructions to elect to continue receiving paper copies of your shareholder reports. If you received this document through a financial intermediary, you can contact your financial intermediary to request that you continue to receive paper copies of your shareholder reports. If you invest directly with us, you can call 1-800-992-0180 or send an email request to Voyaim_literature@voya.com to let the Fund know you wish to continue receiving paper copies of your shareholder reports. Your election to receive reports in paper will apply to all funds held in your account if you invest through your financial intermediary or all funds held with the Voya funds complex if you invest directly with the funds. | | |
| | | This report is submitted for general information to shareholders of the Voya mutual funds. It is not authorized for distribution to prospective shareholders unless accompanied or preceded by a prospectus which includes details regarding the fund’s investment objectives, risks, charges, expenses and other information. This information should be read carefully. | | |
| | | | E-Delivery Sign-up – details inside | |
| | | | | | 1 | | | |
| | | | | | 3 | | | |
| | | | | | 4 | | | |
| | | | | | 5 | | | |
| | | | | | 6 | | | |
| | | | | | 8 | | | |
| | | | | | 9 | | | |
| | | | | | 10 | | | |
| | | | | | 11 | | | |
| | | | | | 19 | | | |
| | | | | | 21 | | | |
| | | | | | 22 | | | |
| | | | | | 26 | | |
| | | | | Go Paperless with E-Delivery! | | | | | ||
| | | Sign up now for on-line prospectuses, fund reports, and proxy statements. In less than five minutes, you can help reduce paper mail and lower fund costs. | | | ||||||
| | | Just go to www.individuals.voya.com/page/e-delivery, follow the directions and complete the quick 5 Steps to Enroll. | | | ||||||
| | | You will be notified by e-mail when these communications become available on the internet. Documents that are not available on the internet will continue to be sent by mail. | | | ||||||
President
Voya Family of Funds
April 2, 2020
| | | Index | | | | Description | | |
| | | MSCI All Country World IndexSM | | | | A free-float adjusted market capitalization index that is designed to measure equity performance in the global developed and emerging markets. | | |
| Portfolio managers’ report | Voya Government Money Market Fund |
| | Investment Type Allocation as of March 31, 2020 (as a percentage of net assets) | | |||
| | | | | | |
| | U.S. Government Agency Debt | | | 40.3% | |
| | U.S. Treasury Repurchase Agreement | | | 33.7% | |
| | Investment Companies | | | 9.6% | |
| | Assets in Excess of Other Liabilities | | | 16.4% | |
| | Net Assets | | | 100.0% | |
| | Portfolio holdings are subject to change daily. | | |||
| | | | Actual Fund Return | | | Hypothetical (5% return before expenses) | | ||||||||||||||||||||||||||||||||||||||||||
| | | | Beginning Account Value October 1, 2019 | | | Ending Account Value March 31, 2020 | | | Annualized Expense Ratio* | | | Expenses Paid During the Period Ended March 31, 2020** | | | Beginning Account Value October 1, 2019 | | | Ending Account Value March 31, 2020 | | | Annualized Expense Ratio* | | | Expenses Paid During the Period Ended March 31, 2020** | | ||||||||||||||||||||||||
| Class A | | | | $ | 1,000.00 | | | | | $ | 1,005.80 | | | | | | 0.41% | | | | | $ | 2.06 | | | | | $ | 1,000.00 | | | | | $ | 1,022.95 | | | | | | 0.41% | | | | | $ | 2.07 | | |
| Class C | | | | | 1,000.00 | | | | | | 1,001.30 | | | | | | 1.41 | | | | | | 7.05 | | | | | | 1,000.00 | | | | | | 1,017.95 | | | | | | 1.41 | | | | | | 7.11 | | |
| Class I | | | | | 1,000.00 | | | | | | 1,006.00 | | | | | | 0.41 | | | | | | 2.06 | | | | | | 1,000.00 | | | | | | 1,022.95 | | | | | | 0.41 | | | | | | 2.07 | | |
| Class W | | | | | 1,000.00 | | | | | | 1,005.80 | | | | | | 0.41 | | | | | | 2.06 | | | | | | 1,000.00 | | | | | | 1,022.95 | | | | | | 0.41 | | | | | | 2.07 | | |
May 26, 2020
| | ASSETS: | | | | | | | |
| | Short-term investments at amortized cost | | | | $ | 104,175,660 | | |
| | Repurchase agreements | | | | | 70,520,000 | | |
| | Cash | | | | | 7,138 | | |
| | Receivables: | | | | | | | |
| | Investment securities sold | | | | | 33,246,811 | | |
| | Fund shares sold | | | | | 1,435,694 | | |
| | Dividends | | | | | 11,746 | | |
| | Interest | | | | | 73,377 | | |
| | Prepaid expenses | | | | | 74,815 | | |
| | Reimbursement due from Investment Adviser | | | | | 67,019 | | |
| | Other assets | | | | | 22,162 | | |
| | Total assets | | | | | 209,634,422 | | |
| | LIABILITIES: | | | | | | | |
| | Payable for fund shares redeemed | | | | | 491,306 | | |
| | Payable for investment management fees | | | | | 41,637 | | |
| | Payable for distribution and shareholder service fees | | | | | 2,022 | | |
| | Payable for trustees fees | | | | | 2,845 | | |
| | Payable to trustees under the deferred compensation plan (Note 5) | | | | | 22,162 | | |
| | Other accrued expenses and liabilities | | | | | 145,959 | | |
| | Total liabilities | | | | | 705,931 | | |
| | NET ASSETS | | | | $ | 208,928,491 | | |
| | NET ASSETS WERE COMPRISED OF: | | | | | | | |
| | Paid-in capital | | | | $ | 208,946,011 | | |
| | Total distributable loss | | | | | (17,520) | | |
| | NET ASSETS | | | | $ | 208,928,491 | | |
| | Class A | | | | | | | |
| | Net assets | | | | $ | 161,828,262 | | |
| | Shares authorized | | | | | unlimited | | |
| | Par value | | | | $ | 0.001 | | |
| | Shares outstanding | | | | | 161,809,974 | | |
| | Net asset value and redemption price per share | | | | $ | 1.00 | | |
| | Class C | | | | | | | |
| | Net assets | | | | $ | 2,869,857 | | |
| | Shares authorized | | | | | unlimited | | |
| | Par value | | | | $ | 0.001 | | |
| | Shares outstanding | | | | | 2,871,048 | | |
| | Net asset value and redemption price per share† | | | | $ | 1.00 | | |
| | Class I | | | | | | | |
| | Net assets | | | | $ | 43,994,040 | | |
| | Shares authorized | | | | | unlimited | | |
| | Par value | | | | $ | 0.001 | | |
| | Shares outstanding | | | | | 43,997,510 | | |
| | Net asset value and redemption price per share | | | | $ | 1.00 | | |
| | Class W | | | | | | | |
| | Net assets | | | | $ | 236,332 | | |
| | Shares authorized | | | | | unlimited | | |
| | Par value | | | | $ | 0.001 | | |
| | Shares outstanding | | | | | 236,312 | | |
| | Net asset value and redemption price per share | | | | $ | 1.00 | | |
| | INVESTMENT INCOME: | | | | | | | |
| | Dividends | | | | $ | 53,144 | | |
| | Interest | | | | | 3,876,317 | | |
| | Total investment income | | | | | 3,929,461 | | |
| | EXPENSES: | | | | | | | |
| | Investment management fees | | | | | 718,069 | | |
| | Distribution and shareholder service fees: | | | | | | | |
| | Class C | | | | | 34,768 | | |
| | Class O(1) | | | | | 2,022 | | |
| | Transfer agent fees: | | | | | | | |
| | Class A | | | | | 246,161 | | |
| | Class C | | | | | 5,151 | | |
| | Class I | | | | | 57,959 | | |
| | Class L(2) | | | | | 914 | | |
| | Class O(1) | | | | | 1,019 | | |
| | Class W | | | | | 365 | | |
| | Shareholder reporting expense | | | | | 27,625 | | |
| | Registration fees | | | | | 115,934 | | |
| | Professional fees | | | | | 42,967 | | |
| | Custody and accounting expense | | | | | 28,479 | | |
| | Trustee fees | | | | | 7,917 | | |
| | Reorganization expense (Note 5) | | | | | 18,786 | | |
| | Miscellaneous expense | | | | | 16,471 | | |
| | Interest expense | | | | | 326 | | |
| | Total expenses | | | | | 1,324,933 | | |
| | Waived and reimbursed fees | | | | | (452,871) | | |
| | Net expenses | | | | | 872,062 | | |
| | Net investment income | | | | | 3,057,399 | | |
| | REALIZED GAIN (LOSS): | | | | | | | |
| | Net realized gain on investments | | | | | 175,153 | | |
| | Increase in net assets resulting from operations | | | | $ | 3,232,552 | | |
| | | | Year Ended March 31, 2020 | | | Year Ended March 31, 2019 | | ||||||
| FROM OPERATIONS: | | | | | | | | | | | | | |
| Net investment income | | | | $ | 3,057,399 | | | | | $ | 3,676,118 | | |
| Net realized gain | | | | | 175,153 | | | | | | 57,460 | | |
| Increase in net assets resulting from operations | | | | | 3,232,552 | | | | | | 3,733,578 | | |
| FROM DISTRIBUTIONS TO SHAREHOLDERS: | | | | | | | | | | | | | |
| Total distributions (excluding return of capital): | | | | | | | | | | | | | |
| Class A | | | | | (2,459,516) | | | | | | (2,922,697) | | |
| Class C | | | | | (23,967) | | | | | | (32,171) | | |
| Class I | | | | | (705,499) | | | | | | (689,776) | | |
Class L(2) | | | | | (12,802) | | | | | | (20,229) | | |
Class O(1) | | | | | (14,204) | | | | | | (60,977) | | |
| Class W | | | | | (3,796) | | | | | | (2,413) | | |
| Total distributions | | | | | (3,219,784) | | | | | | (3,728,263) | | |
| FROM CAPITAL SHARE TRANSACTIONS: | | | | | | | | | | | | | |
| Net proceeds from sale of shares | | | | | 1,084,467,447 | | | | | | 1,078,050,846 | | |
| Reinvestment of distributions | | | | | 3,203,375 | | | | | | 3,666,481 | | |
| | | | | | 1,087,670,822 | | | | | | 1,081,717,327 | | |
| Cost of shares redeemed | | | | | (1,082,433,841) | | | | | | (1,084,718,301) | | |
| Net increase (decrease) in net assets resulting from capital share transactions | | | | | 5,236,981 | | | | | | (3,000,974) | | |
| Net increase (decrease) in net assets | | | | | 5,249,749 | | | | | | (2,995,659) | | |
| NET ASSETS: | | | | | | | | | | | | | |
| Beginning of year or period | | | | | 203,678,742 | | | | | | 206,674,401 | | |
| End of year or period | | | | $ | 208,928,491 | | | | | $ | 203,678,742 | | |
| | | | | | | | | | Income (loss) from investment operations | | | | | | | | | Less Distributions | | | | | | Ratios to average net assets | | | Supplemental Data | | |||||||||||||||||||||||||||||||||||||||||||||||||||||||||||||||||||||||||||
| | | | Net asset value, beginning of year or period | | | Net investment income (loss) | | | Net realized and unrealized gain (loss) | | | Total from investment operations | | | From net investment income | | | From net realized gains | | | From return of capital | | | Total distributions | | | Payment by affiliate | | | Net asset value, end of year or period | | | Total Return(1) | | | Expenses before reductions/additions(2)(3) | | | Expenses net of fee waivers and/or recoupments if any(2)(3) | | | Expenses net of all reductions/additions(2)(3) | | | Net investment income (loss)(2)(3) | | | Net assets, end of year or period | | | Portfolio turnover rate | | |||||||||||||||||||||||||||||||||||||||||||||||||||
| Year or period ended | | | ($) | | | ($) | | | ($) | | | ($) | | | ($) | | | ($) | | | ($) | | | ($) | | | ($) | | | ($) | | | (%) | | | (%) | | | (%) | | | (%) | | | (%) | | | ($000’s) | | | (%) | | |||||||||||||||||||||||||||||||||||||||||||||||||||
| Class A | | | | | | | | | | | | | | | | | | | | | | | | | | | | | | | | | | | | | | | | | | | | | | | | | | | | | | | | | | | | | | | | | | | | | | | | | | | | | | | | | | | | | | | | | | | | | | | | | | | | | | | |
| 03-31-20 | | | | | 1.00 | | | | | | 0.02 | | | | | | 0.00* | | | | | | 0.02 | | | | | | 0.02 | | | | | | 0.00* | | | | | | — | | | | | | 0.02 | | | | | | — | | | | | | 1.00 | | | | | | 1.61 | | | | | | 0.63 | | | | | | 0.41(4) | | | | | | 0.41 | | | | | | 1.49 | | | | | | 161,828 | | | | | | — | | |
| 03-31-19 | | | | | 1.00 | | | | | | 0.02 | | | | | | 0.00* | | | | | | 0.02 | | | | | | 0.02 | | | | | | 0.00* | | | | | | — | | | | | | 0.02 | | | | | | — | | | | | | 1.00 | | | | | | 1.76 | | | | | | 0.57 | | | | | | 0.40 | | | | | | 0.40 | | | | | | 1.75 | | | | | | 157,178 | | | | | | — | | |
| 03-31-18 | | | | | 1.00 | | | | | | 0.01 | | | | | | 0.00* | | | | | | 0.01 | | | | | | 0.01 | | | | | | 0.00* | | | | | | — | | | | | | 0.01 | | | | | | — | | | | | | 1.00 | | | | | | 0.53 | | | | | | 0.69 | | | | | | 0.64 | | | | | | 0.64 | | | | | | 0.50 | | | | | | 155,574 | | | | | | — | | |
| 03-31-17 | | | | | 1.00 | | | | | | 0.00*• | | | | | | 0.00* | | | | | | 0.00* | | | | | | 0.00* | | | | | | 0.00* | | | | | | — | | | | | | 0.00* | | | | | | — | | | | | | 1.00 | | | | | | 0.09 | | | | | | 0.74 | | | | | | 0.46(5) | | | | | | 0.46 | | | | | | 0.00* | | | | | | 138,169 | | | | | | — | | |
| 03-31-16 | | | | | 1.00 | | | | | | (0.00)* | | | | | | 0.00* | | | | | | 0.00* | | | | | | — | | | | | | 0.00* | | | | | | — | | | | | | 0.00* | | | | | | — | | | | | | 1.00 | | | | | | 0.02 | | | | | | 0.71 | | | | | | 0.28(6) | | | | | | 0.28 | | | | | | 0.00* | | | | | | 144,081 | | | | | | — | | |
| Class C | | | | | | | | | | | | | | | | | | | | | | | | | | | | | | | | | | | | | | | | | | | | | | | | | | | | | | | | | | | | | | | | | | | | | | | | | | | ��� | | | | | | | | | | | | | | | | | | | | | | | | | | | | |
| 03-31-20 | | | | | 1.00 | | | | | | 0.01 | | | | | | 0.00* | | | | | | 0.01 | | | | | | 0.01 | | | | | | 0.00* | | | | | | — | | | | | | 0.01 | | | | | | — | | | | | | 1.00 | | | | | | 0.65 | | | | | | 1.63 | | | | | | 1.41(4) | | | | | | 1.41 | | | | | | 0.56 | | | | | | 2,870 | | | | | | — | | |
| 03-31-19 | | | | | 1.00 | | | | | | 0.01 | | | | | | 0.00* | | | | | | 0.01 | | | | | | 0.01 | | | | | | 0.00* | | | | | | — | | | | | | 0.01 | | | | | | — | | | | | | 1.00 | | | | | | 0.75 | | | | | | 1.57 | | | | | | 1.40 | | | | | | 1.40 | | | | | | 0.74 | | | | | | 4,256 | | | | | | — | | |
| 03-31-18 | | | | | 1.00 | | | | | | 0.00* | | | | | | 0.00* | | | | | | 0.00* | | | | | | 0.00* | | | | | | 0.00* | | | | | | — | | | | | | 0.00* | | | | | | — | | | | | | 1.00 | | | | | | 0.06 | | | | | | 1.69 | | | | | | 1.15(7) | | | | | | 1.15 | | | | | | 0.02 | | | | | | 4,054 | | | | | | — | | |
| 03-31-17 | | | | | 1.00 | | | | | | (0.00)* | | | | | | 0.00* | | | | | | 0.00* | | | | | | — | | | | | | 0.00* | | | | | | — | | | | | | 0.00* | | | | | | — | | | | | | 1.00 | | | | | | 0.08 | | | | | | 1.74 | | | | | | 0.46(5) | | | | | | 0.46 | | | | | | (0.00)* | | | | | | 2,410 | | | | | | — | | |
| 03-31-16 | | | | | 1.00 | | | | | | (0.00)*• | | | | | | 0.00* | | | | | | 0.00* | | | | | | — | | | | | | 0.00* | | | | | | — | | | | | | 0.00* | | | | | | — | | | | | | 1.00 | | | | | | 0.02 | | | | | | 1.71 | | | | | | 0.28(6) | | | | | | 0.28 | | | | | | (0.00)* | | | | | | 3,681 | | | | | | — | | |
| Class I | | | | | | | | | | | | | | | | | | | | | | | | | | | | | | | | | | | | | | | | | | | | | | | | | | | | | | | | | | | | | | | | | | | | | | | | | | | | | | | | | | | | | | | | | | | | | | | | | | | | | | | |
| 03-31-20 | | | | | 1.00 | | | | | | 0.02 | | | | | | 0.00* | | | | | | 0.02 | | | | | | 0.02 | | | | | | 0.00* | | | | | | — | | | | | | 0.02 | | | | | | — | | | | | | 1.00 | | | | | | 1.63 | | | | | | 0.61 | | | | | | 0.41(4) | | | | | | 0.41 | | | | | | 1.53 | | | | | | 43,994 | | | | | | — | | |
| 03-31-19 | | | | | 1.00 | | | | | | 0.02 | | | | | | 0.00* | | | | | | 0.02 | | | | | | 0.02 | | | | | | 0.00* | | | | | | — | | | | | | 0.02 | | | | | | — | | | | | | 1.00 | | | | | | 1.76 | | | | | | 0.57 | | | | | | 0.40 | | | | | | 0.40 | | | | | | 1.72 | | | | | | 39,581 | | | | | | — | | |
| 03-31-18 | | | | | 1.00 | | | | | | 0.01 | | | | | | 0.00* | | | | | | 0.01 | | | | | | 0.01 | | | | | | 0.00* | | | | | | — | | | | | | 0.01 | | | | | | — | | | | | | 1.00 | | | | | | 0.53 | | | | | | 0.69 | | | | | | 0.64 | | | | | | 0.64 | | | | | | 0.50 | | | | | | 39,617 | | | | | | — | | |
| 03-31-17 | | | | | 1.00 | | | | | | 0.00*• | | | | | | 0.00* | | | | | | 0.00* | | | | | | 0.00* | | | | | | 0.00* | | | | | | — | | | | | | 0.00* | | | | | | — | | | | | | 1.00 | | | | | | 0.09 | | | | | | 0.74 | | | | | | 0.46(5) | | | | | | 0.46 | | | | | | 0.00* | | | | | | 39,955 | | | | | | — | | |
| 03-31-16 | | | | | 1.00 | | | | | | (0.00)* | | | | | | 0.00* | | | | | | 0.00* | | | | | | — | | | | | | 0.00* | | | | | | — | | | | | | 0.00* | | | | | | — | | | | | | 1.00 | | | | | | 0.02 | | | | | | 0.71 | | | | | | 0.28(6) | | | | | | 0.28 | | | | | | (0.00)* | | | | | | 46,198 | | | | | | — | | |
| Class W | | | | | | | | | | | | | | | | | �� | | | | | | | | | | | | | | | | | | | | | | | | | | | | | | | | | | | | | | | | | | | | | | | | | | | | | | | | | | | | | | | | | | | | | | | | | | | | | | | | | | | | | | |
| 03-31-20 | | | | | 1.00 | | | | | | 0.02 | | | | | | 0.00* | | | | | | 0.02 | | | | | | 0.02 | | | | | | 0.00* | | | | | | — | | | | | | 0.02 | | | | | | — | | | | | | 1.00 | | | | | | 1.61 | | | | | | 0.63 | | | | | | 0.41(4) | | | | | | 0.41 | | | | | | 1.52 | | | | | | 236 | | | | | | — | | |
| 03-31-19 | | | | | 1.00 | | | | | | 0.02 | | | | | | 0.00* | | | | | | 0.02 | | | | | | 0.02 | | | | | | 0.00* | | | | | | — | | | | | | 0.02 | | | | | | — | | | | | | 1.00 | | | | | | 1.76 | | | | | | 0.57 | | | | | | 0.40 | | | | | | 0.40 | | | | | | 1.82 | | | | | | 269 | | | | | | — | | |
| 03-31-18 | | | | | 1.00 | | | | | | 0.01 | | | | | | 0.00* | | | | | | 0.01 | | | | | | 0.01 | | | | | | 0.00* | | | | | | — | | | | | | 0.01 | | | | | | — | | | | | | 1.00 | | | | | | 0.53 | | | | | | 0.69 | | | | | | 0.64 | | | | | | 0.64 | | | | | | 0.48 | | | | | | 64 | | | | | | — | | |
| 03-31-17 | | | | | 1.00 | | | | | | (0.00)*• | | | | | | 0.00* | | | | | | 0.00* | | | | | | 0.00* | | | | | | 0.00* | | | | | | — | | | | | | 0.00* | | | | | | — | | | | | | 1.00 | | | | | | 0.09 | | | | | | 0.74 | | | | | | 0.46(5) | | | | | | 0.46 | | | | | | (0.00)* | | | | | | 99 | | | | | | — | | |
| 03-31-16 | | | | | 1.00 | | | | | | —• | | | | | | 0.00* | | | | | | 0.00 | | | | | | — | | | | | | 0.00* | | | | | | — | | | | | | 0.00* | | | | | | — | | | | | | 1.00 | | | | | | 0.02 | | | | | | 0.71 | | | | | | 0.28(6) | | | | | | 0.28 | | | | | | 0.00 | | | | | | 27 | | | | | | — | | |
| | | | Distribution Fee | | | Shareholder Servicing Fee | | ||||||
| Class C | | | | $ | 270 | | | | | $ | 66 | | |
| | March 31, | | | |||||||||||||||||
| | 2021 | | | 2022 | | | 2023 | | | Total | | |||||||||
| | $ — | | | | $ | — | | | | | $ | 19,696 | | | | | $ | 19,696 | | |
| | | | Class C | | |||
| Contingent Deferred Sales Charges: | | | | $ | 2,995 | | |
| Subsidiary | | | Percentage | | |||
| Voya Institutional Trust Company | | | | | 22.60% | | |
| Voya Investments Distributor, LLC | | | | | 13.98 | | |
| Voya Retirement Insurance and Annuity Company | | | | | 29.02 | | |
| Class A | | | Class C | | | Class I | | | Class W | |
| 0.40% | | | 1.40% | | | 0.40% | | | 0.40% | |
| | March 31, | | | |||||||||||||||||
| | 2021 | | | 2022 | | | 2023 | | | Total | | |||||||||
| | $72,888 | | | | $ | 349,897 | | | | | $ | 392,267 | | | | | $ | 815,052 | | |
| | | | March 31, | | | | | | | | |||||||||||||||
| | | | 2021 | | | 2022 | | | 2023 | | | Total | | ||||||||||||
| Class A | | | | $ | — | | | | | $ | — | | | | | $ | 36,363 | | | | | $ | 36,363 | | |
| Class C | | | | | — | | | | | | — | | | | | | 493 | | | | | | 493 | | |
| Class W | | | | | — | | | | | | — | | | | | | 48 | | | | | | 48 | | |
| | | | Shares sold | | | Shares issued in merger | | | Reinvestment of distributions | | | Shares redeemed | | | Shares converted | | | Net increase (decrease) in shares outstanding | | | Shares sold | | | Proceeds from shares issued in merger | | | Reinvestment of distributions | | | Shares redeemed | | | Shares converted | | | Net increase (decrease) | | ||||||||||||||||||||||||||||||||||||
| Year or period ended | | | # | | | # | | | # | | | # | | | # | | | # | | | ($) | | | ($) | | | ($) | | | ($) | | | $ | | | ($) | | ||||||||||||||||||||||||||||||||||||
| Class A | | | | | | | | | | | | | | | | | | | | | | | | | | | | | | | | | | | | | | | | | | | | | | | | | | | | | | | | | | | | | | | | | | | | | | | | | |
| 3/31/2020 | | | | | 1,063,186,555 | | | | | | — | | | | | | 2,446,503 | | | | | | (1,063,331,277) | | | | | | 2,331,173 | | | | | | 4,632,954 | | | | | | 1,063,186,541 | | | | | | — | | | | | | 2,446,503 | | | | | | (1,063,331,277) | | | | | | 2,331,173 | | | | | | 4,632,940 | | |
| 3/31/2019 | | | | | 1,061,971,521 | | | | | | — | | | | | | 2,902,514 | | | | | | (1,063,274,438) | | | | | | — | | | | | | 1,599,597 | | | | | | 1,061,971,521 | | | | | | — | | | | | | 2,902,514 | | | | | | (1,063,274,438) | | | | | | — | | | | | | 1,599,597 | | |
| Class C | | | | | | | | | | | | | | | | | | | | | | | | | | | | | | | | | | | | | | | | | | | | | | | | | | | | | | | | | | | | | | | | | | | | | | | | | |
| 3/31/2020 | | | | | 3,129,655 | | | | | | — | | | | | | 23,665 | | | | | | (4,538,530) | | | | | | — | | | | | | (1,385,210) | | | | | | 3,129,655 | | | | | | — | | | | | | 23,665 | | | | | | (4,538,530) | | | | | | — | | | | | | (1,385,210) | | |
| 3/31/2019 | | | | | 3,489,162 | | | | | | — | | | | | | 31,098 | | | | | | (3,317,779) | | | | | | — | | | | | | 202,481 | | | | | | 3,489,162 | | | | | | — | | | | | | 31,098 | | | | | | (3,317,779) | | | | | | — | | | | | | 202,481 | | |
| Class I | | | | | | | | | | | | | | | | | | | | | | | | | | | | | | | | | | | | | | | | | | | | | | | | | | | | | | | | | | | | | | | | | | | | | | | | | |
| 3/31/2020 | | | | | 18,110,502 | | | | | | — | | | | | | 702,494 | | | | | | (14,396,676) | | | | | | — | | | | | | 4,416,320 | | | | | | 18,110,502 | | | | | | — | | | | | | 702,494 | | | | | | (14,396,676) | | | | | | — | | | | | | 4,416,320 | | |
| 3/31/2019 | | | | | 11,767,921 | | | | | | — | | | | | | 688,419 | | | | | | (12,493,421) | | | | | | — | | | | | | (37,081) | | | | | | 11,767,921 | | | | | | — | | | | | | 688,419 | | | | | | (12,493,421) | | | | | | — | | | | | | (37,081) | | |
| Class L(2) | | | | | | | | | | | | | | | | | | | | | | | | | | | | | | | | | | | | | | | | | | | | | | | | | | | | | | | | | | | | | | | | | | | | | | | | | |
| 3/31/2020 | | | | | 1 | | | | | | — | | | | | | 12,790 | | | | | | (68,993) | | | | | | (1,090,121) | | | | | | (1,146,323) | | | | | | 1 | | | | | | — | | | | | | 12,790 | | | | | | (68,993) | | | | | | (1,090,121) | | | | | | (1,146,323) | | |
| 3/31/2019 | | | | | 23 | | | | | | — | | | | | | 20,206 | | | | | | (76,736) | | | | | | — | | | | | | (56,507) | | | | | | 23 | | | | | | — | | | | | | 20,206 | | | | | | (76,736) | | | | | | — | | | | | | (56,507) | | |
| Class O(1) | | | | | | �� | | | | | | | | | | | | | | | | | | | | | | | | | | | | | | | | | | | | | | | | | | | | | | | | | | | | | | | | | | | | | | | | | | | |
| 3/31/2020 | | | | | 6,154 | | | | | | — | | | | | | 14,129 | | | | | | (27,005) | | | | | | (1,241,052) | | | | | | (1,247,774) | | | | | | 6,154 | | | | | | — | | | | | | 14,129 | | | | | | (27,005) | | | | | | (1,241,052) | | | | | | (1,247,774) | | |
| 3/31/2019 | | | | | 478,167 | | | | | | — | | | | | | 21,837 | | | | | | (5,414,558) | | | | | | — | | | | | | (4,914,554) | | | | | | 478,167 | | | | | | — | | | | | | 21,837 | | | | | | (5,414,558) | | | | | | — | | | | | | (4,914,554) | | |
| Class W | | | | | | | | | | | | | | | | | | | | | | | | | | | | | | | | | | | | | | | | | | | | | | | | | | | | | | | | | | | | | | | | | | | | | | | | | |
| 3/31/2020 | | | | | 34,594 | | | | | | — | | | | | | 3,794 | | | | | | (71,360) | | | | | | — | | | | | | (32,972) | | | | | | 34,594 | | | | | | — | | | | | | 3,794 | | | | | | (71,360) | | | | | | — | | | | | | (32,972) | | |
| 3/31/2019 | | | | | 344,052 | | | | | | — | | | | | | 2,407 | | | | | | (141,369) | | | | | | — | | | | | | 205,090 | | | | | | 344,052 | | | | | | — | | | | | | 2,407 | | | | | | (141,369) | | | | | | — | | | | | | 205,090 | | |
| | Paid-in Capital | | | Distributable Earnings | | |||
| | $(3,649) | | | | $ | 3,649 | | |
| | Year Ended March 31, 2020 | | | Year Ended March 31, 2019 | | |||
| | Ordinary Income | | | Ordinary Income | | |||
| | $3,219,784 | | | | $ | 3,728,263 | | |
| | Unrealized Appreciation/ (Depreciation) | |
| | $(570) | |
| | | | Type | | | Per Share Amount | | | Payable Date | | | Record Date | |
| Class A | | | NII | | | $0.0001 | | | May 1, 2020 | | | Daily | |
| Class C | | | NII | | | $0.0001 | | | May 1, 2020 | | | Daily | |
| | | | Type | | | Per Share Amount | | | Payable Date | | | Record Date | |
| Class I | | | NII | | | $0.0001 | | | May 1, 2020 | | | Daily | |
| Class W | | | NII | | | $0.0001 | | | May 1, 2020 | | | Daily | |
| All Classes | | | STCG | | | $0.0000* | | | May 1, 2020 | | | April 29, 2020 | |
| Voya Government Money Market Fund | as of March 31, 2020 |
| Principal Amount† | | | Value | | | Percentage of Net Assets | | |||||||||
| U.S. GOVERNMENT AGENCY DEBT: 40.3% | | |||||||||||||||
| 7,250,000 | | | Fannie Mae, 0.050%, (SOFRRATE + 0.040)%, 01/29/2021 | | | | $ | 7,248,163 | | | | | | 3.5 | | |
| 1,750,000 | | | Fannie Mae, 0.085%, (SOFRRATE + 0.075)%, 10/30/2020 | | | | | 1,750,407 | | | | | | 0.8 | | |
| 23,000,000 | | | Fannie Mae, 0.130%, (SOFRRATE + 0.120)%, 03/16/2021 | | | | | 23,000,000 | | | | | | 11.0 | | |
| 2,000,000 | | | Fannie Mae, 0.290%, (SOFRRATE + 0.280)%, 04/26/2021 | | | | | 2,000,000 | | | | | | 1.0 | | |
| 600,000 | | | Federal Farm Credit Banks Funding Corp., 0.750%, (US0001M + 0.000)%, 06/19/2020 | | | | | 600,001 | | | | | | 0.3 | | |
| 1,750,000 | | | Federal Farm Credit Banks, 0.210%, (FEDL01 + 0.120)%, 04/23/2021 | | | | | 1,747,558 | | | | | | 0.8 | | |
| 5,000,000 | | | Federal Farm Credit Banks, 0.894%, (US0001M + (0.030))%, 04/22/2020 | | | | | 4,999,920 | | | | | | 2.4 | | |
| 10,750,000 | | | Federal Farm Credit Banks, 0.925%, (US0001M + 0.000)%, 05/26/2020 | | | | | 10,752,218 | | | | | | 5.1 | | |
| 9,000,000 | | | Federal Farm Credit Banks, 1.003%, (US0001M + 0.010)%, 07/02/2020 | | | | | 9,002,443 | | | | | | 4.3 | | |
| 1,500,000 | | | Federal Farm Credit Banks, 2.710%, 08/10/2020 | | | | | 1,512,550 | | | | | | 0.7 | | |
| 2,500,000 | | | Federal Home Loan Bank Discount Notes, 0.040%, 04/03/2020 | | | | | 2,499,938 | | | | | | 1.2 | | |
| 1,300,000 | | | Federal Home Loan Bank Discount Notes, 0.010%, 04/08/2020 | | | | | 1,299,997 | | | | | | 0.6 | | |
| 250,000 | | | Federal Home Loan Bank Discount Notes, 0.250%, 07/24/2020 | | | | | 249,802 | | | | | | 0.1 | | |
| 2,000,000 | | | Federal Home Loan Banks, 0.045%, (SOFRRATE + 0.035)%, 06/19/2020 | | | | | 1,999,528 | | | | | | 1.0 | | |
| 4,500,000 | | | Federal Home Loan Banks, 0.090%, (SOFRRATE + 0.080)%, 03/04/2021 | | | | | 4,500,000 | | | | | | 2.2 | | |
| 7,000,000 | | | Federal Home Loan Banks, 0.140%, (SOFRRATE + 0.130)%, 10/16/2020 | | | | | 7,000,000 | | | | | | 3.4 | | |
| Principal Amount† | | | Value | | | Percentage of Net Assets | | |||||||||
| U.S. GOVERNMENT AGENCY DEBT: (continued) | | |||||||||||||||
| 2,500,000 | | | Federal Home Loan Banks, 0.170%, (SOFRRATE + 0.160)%, 07/24/2020 | | | | $ | 2,500,000 | | | | | | 1.2 | | |
| 1,500,000 | | | Federal Home Loan Banks, 2.625%, 08/21/2020 | | | | | 1,513,135 | | | | | | 0.7 | | |
| | | | Total U.S. Government Agency Debt (Cost $84,175,660) | | | | | 84,175,660 | | | | | | 40.3 | | |
| U.S. TREASURY REPURCHASE AGREEMENT: 33.7% | | |||||||||||||||
| | | | Repurchase Agreement: 33.7% | | ||||||||||||
| 30,520,000 | | | Deutsche Bank Repurchase Agreement dated 3/31/2020, 0.010%, due 4/1/2020, $30,520,008 to be received upon repurchase (Collateralized by $37,662,084, U.S. Treasury STRIP, 0.000%, Market Value plus accrued interest $31,435,600 due 8/15/2036) | | | | | 30,520,000 | | | | | | 14.6 | | |
| 40,000,000 | | | Deutsche Bank Repurchase Agreement dated 3/31/2020, 0.010%, due 4/1/2020, $40,000,011 to be received upon repurchase (Collateralized by $29,243,500, U.S. Treasury Bond, 3.125%, Market Value plus accrued interest $40,800,044 due 8/15/2044) | | | | | 40,000,000 | | | | | | 19.1 | | |
| | | | Total U.S. Treasury Repurchase Agreement (Cost $70,520,000) | | | | | 70,520,000 | | | | | | 33.7 | | |
| | ||||||||||||||||
| Shares | | | Value | | | Percentage of Net Assets | | |||||||||
| INVESTMENT COMPANIES: 9.6% | | |||||||||||||||
| 9,000,000 (1) | | | BlackRock Liquidity Funds, FedFund, Institutional Class, 0.370%, 04/01/20 | | | | | 9,000,000 | | | | | | 4.3 | | |
| 9,000,000 (1) | | | Goldman Sachs Financial Square Government Fund - Institutional Shares, 0.350%, 04/01/20 | | | | | 9,000,000 | | | | | | 4.3 | | |
| Voya Government Money Market Fund | as of March 31, 2020 (continued) |
| Shares | | | Value | | | Percentage of Net Assets | | |||||||||
| INVESTMENT COMPANIES: (continued) | | |||||||||||||||
| 2,000,000 (1) | | | Morgan Stanley Institutional Liquidity Funds - Government Portfolio (Institutional Share Class), 0.230%, 04/01/20 | | | | $ | 2,000,000 | | | | | | 1.0 | | |
| | | | Total Investment Companies (Cost $20,000,000) | | | | | 20,000,000 | | | | | | 9.6 | | |
| | | | Total Investments in Securities (Cost $174,695,660) | | | | $ | 174,695,660 | | | | | | 83.6 | | |
| | | | Assets in Excess of Other Liabilities | | | | | 34,232,831 | | | | | | 16.4 | | |
| | | | Net Assets | | | | $ | 208,928,491 | | | | | | 100.0 | | |
| | ||||||||||||||||
| | | | Quoted Prices in Active Markets for Identical Investments (Level 1) | | | Significant Other Observable Inputs (Level 2) | | | Significant Unobservable Inputs (Level 3) | | | Fair Value at March 31, 2020 | | ||||||||||||
| Asset Table | | | | | | | | | | | | | | | | | | | | | | | | | |
| Investments, at fair value | | | | | | | | | | | | | | | | | | | | | | | | | |
| Investment Companies | | | | $ | 20,000,000 | | | | | $ | — | | | | | $ | — | | | | | $ | 20,000,000 | | |
| U.S. Government Agency Debt | | | | | — | | | | | | 84,175,660 | | | | | | — | | | | | | 84,175,660 | | |
| U.S. Treasury Repurchase Agreement | | | | | — | | | | | | 70,520,000 | | | | | | — | | | | | | 70,520,000 | | |
| Total Investments, at fair value | | | | $ | 20,000,000 | | | | | $ | 154,695,660 | | | | | $ | — | | | | | $ | 174,695,660 | | |
| Counterparty | | | U.S. Treasury Repurchase Agreement, at fair value | | | Fair Value of Non-Cash Collateral Received Including Accrued Interest(1) | | | Net Amount | | ||||||
| Deutsche Bank | | | $70,520,000 | | | | $ | (70,520,000) | | | | | $ | — | | |
| Totals | | | $70,520,000 | | | | $ | (70,520,000) | | | | | $ | — | | |
| | Gross Unrealized Appreciation | | | | $ | — | | | | ||
| | Gross Unrealized Depreciation | | | | | (570) | | | | | |
| | Net Unrealized Depreciation | | | | $ | (570) | | | | ||
| Fund Name | | | Type | | | Per Share Amount | | |||
| Voya Government Money Market Fund | | |||||||||
| Class A | | | NII | | | | $ | 0.0152 | | |
| Class C | | | NII | | | | $ | 0.0058 | | |
| Class I | | | NII | | | | $ | 0.0154 | | |
| Class W | | | NII | | | | $ | 0.0153 | | |
| All Classes | | | STCG | | | | $ | 0.0008 | | |
| Name, Address and Age | | | Position(s) Held with the Trust | | | Term of Office and Length of Time Served(1) | | | Principal Occupation(s) – During the Past 5 Years | | | Number of funds in Fund Complex Overseen by Trustee(2) | | | Other Board Positions Held by Trustee | |
| Independent Trustees: | | | | | | | | | | | | | | | | |
| Colleen D. Baldwin 7337 East Doubletree Ranch Rd. Suite 100 Scottsdale, Arizona 85258 Age: 59 | | | Trustee Chairperson | | | November 2007 – Present January 2020 – Present | | | President, Glantuam Partners, LLC, a business consulting firm (January 2009 – Present). | | | 136 | | | Dentaquest (February 2014 – Present); RSR Partners, Inc. (2016 – Present). | |
| John V. Boyer 7337 East Doubletree Ranch Rd. Suite 100 Scottsdale, Arizona 85258 Age: 66 | | | Trustee | | | January 2005 – Present | | | Retired. Formerly, President and Chief Executive Officer, Bechtler Arts Foundation, an arts and education foundation (January 2008 – December 2019). | | | 136 | | | None. | |
| Patricia W. Chadwick 7337 East Doubletree Ranch Rd. Suite 100 Scottsdale, Arizona 85258 Age: 71 | | | Trustee | | | January 2006 – Present | | | Consultant and President, Ravengate Partners LLC, a consulting firm that provides advice regarding financial markets and the global economy (January 2000 – Present). | | | 136 | | | Wisconsin Energy Corporation (June 2006 – Present); The Royce Funds (22 funds) (December 2009 – Present); and AMICA Mutual Insurance Company (1992 – Present). | |
| Martin J. Gavin 7337 East Doubletree Ranch Rd. Suite 100 Scottsdale, AZ 85258 Age: 70 | | | Trustee | | | August 2015 – Present | | | Retired. Formerly, President and Chief Executive Officer, Connecticut Children’s Medical Center (May 2006 – November 2015). | | | 136 | | | None. | |
| Joseph E. Obermeyer 7337 East Doubletree Ranch Rd. Suite 100 Scottsdale, Arizona 85258 Age: 62 | | | Trustee | | | May 2013 – Present | | | President, Obermeyer & Associates, Inc., a provider of financial and economic consulting services (November 1999 – Present). | | | 136 | | | None. | |
| Sheryl K. Pressler 7337 East Doubletree Ranch Rd. Suite 100 Scottsdale, Arizona 85258 Age: 69 | | | Trustee | | | January 2006 – Present | | | Consultant (May 2001 – Present). | | | 136 | | | None. | |
| Christopher P. Sullivan 7337 East Doubletree Ranch Rd. Suite 100 Scottsdale, Arizona 85258 Age: 66 | | | Trustee | | | October 2015 – Present | | | Retired. | | | 136 | | | None. | |
| Name, Address and Age | | | Position(s) Held with the Trust | | | Term of Office and Length of Time Served(1) | | | Principal Occupation(s) – During the Past 5 Years | | | Number of funds in Fund Complex Overseen by Trustee(2) | | | Other Board Positions Held by Trustee | |
| Trustee who is an “interested person”: | | |||||||||||||||
| Dina Santoro 230 Park Avenue New York, New York 10169 Age: 47 | | | Trustee | | | July 2018 – Present | | | President, Voya Investments, LLC and Voya Capital, LLC (March 2018 – Present); Senior Vice President, Voya Investments Distributor, LLC (April 2018 – Present); Senior Managing Director, Head of Product and Marketing Strategy, Voya Investment Management (September 2017 – Present). Formerly, Managing Director, Quantitative Management Associates, LLC (January 2004 – August 2017). | | | 136 | | | Voya Investments, LLC, Voya Capital, LLC, and Voya Funds Services, LLC (March 2018 – Present); Voya Investments Distributor, LLC (April 2018 – Present). | |
| Name, Address and Age | | | Position(s) Held With the Trust | | | Term of Office and Length of Time Served(1) | | | Principal Occupation(s) – During the Past 5 Years | |
| Michael Bell One Orange Way Windsor, Connecticut 06095 Age: 51 | | | Chief Executive Officer | | | March 2018 – Present | | | Chief Executive Officer and Director, Voya Investments, LLC, Voya Capital, LLC, and Voya Funds Services, LLC (March 2018 – Present); Senior Vice President and Chief Financial Officer, Voya Investments Distributor, LLC (September 2019 – Present); Chief Financial Officer, Voya Investment Management (September 2014 – Present). Formerly, Senior Vice President, Chief Financial Officer and Treasurer, Voya Investments, LLC (November 2015 – March 2018). | |
| Dina Santoro 230 Park Avenue New York, New York 10169 Age: 47 | | | President | | | March 2018 – Present | | | President and Director, Voya Investments, LLC and Voya Capital, LLC (March 2018-Present); Director, Voya Funds Services, LLC (March 2018 – Present); Director and Senior Vice President, Voya Investments Distributor, LLC (April 2018 – Present); Senior Managing Director, Head of Product and Marketing Strategy, Voya Investment Management (September 2017 – Present). Formerly, Managing Director, Quantitative Management Associates, LLC (January 2004 – August 2017). | |
| Jonathan Nash 230 Park Avenue New York, New York 10169 Age: 52 | | | Executive Vice President Chief Investment Risk Officer | | | March 2020 – Present March 2020 – Present | | | Senior Vice President, Investment Risk Management, Voya Investment Management (March 2017 – Present); Formerly, Consultant, DA Capital LLC (January 2016 – March 2017); Managing Director, Enterprise Risk, American International Group (AIG) (September 2014 – March 2015). | |
| James M. Fink 5780 Powers Ferry Road NW Atlanta, Georgia 30327 Age: 62 | | | Executive Vice President | | | March 2018 – Present | | | Managing Director, Voya Investments, LLC, Voya Capital, LLC, and Voya Funds Services, LLC (March 2018-Present); Senior Vice President, Voya Investments Distributor, LLC (April 2018 – Present); Chief Administrative Officer, Voya Investment Management (September 2017 – Present). Formerly, Managing Director, Operations, Voya Investment Management (March 1999 – September 2017). | |
| Kevin M. Gleason 7337 East Doubletree Ranch Rd. Suite 100 Scottsdale, Arizona 85258 Age: 53 | | | Chief Compliance Officer | | | February 2012 – Present | | | Senior Vice President, Voya Investment Management and Chief Compliance Officer, Voya Family of Funds (February 2012 – Present). | |
| Todd Modic 7337 East Doubletree Ranch Rd. Suite 100 Scottsdale, Arizona 85258 Age: 52 | | | Senior Vice President, Chief/Principal Financial Officer and Assistant Secretary | | | March 2005 – Present | | | President, Voya Funds Services, LLC (March 2018 – Present) and Senior Vice President, Voya Investments, LLC (April 2005 – Present). | |
| Kimberly A. Anderson 7337 East Doubletree Ranch Rd. Suite 100 Scottsdale, Arizona 85258 Age: 55 | | | Senior Vice President | | | November 2003 – Present | | | Senior Vice President, Voya Investments, LLC (September 2003 – Present). | |
| Robert Terris 5780 Powers Ferry Road NW Atlanta, Georgia 30327 Age: 49 | | | Senior Vice President | | | May 2006 – Present | | | Senior Vice President, Voya Investments Distributor, LLC (April 2018 – Present); Senior Vice President, Head of Division Operations, Voya Investments, LLC (October 2015 – Present) and Voya Funds Services, LLC (March 2006 – Present). | |
| Maria M. Anderson 7337 East Doubletree Ranch Rd. Suite 100 Scottsdale, Arizona 85258 Age: 62 | | | Vice President | | | September 2004 – Present | | | Vice President, Voya Investments, LLC (October 2015 – Present) and Voya Funds Services, LLC (September 2004 – Present). | |
| Fred Bedoya 7337 East Doubletree Ranch Rd. Suite 100 Scottsdale, Arizona 85258 Age: 47 | | | Vice President | | | September 2012 – Present | | | Vice President, Voya Investments, LLC (October 2015 – Present) and Voya Funds Services, LLC (July 2012 – Present). | |
| Name, Address and Age | | | Position(s) Held With the Trust | | | Term of Office and Length of Time Served(1) | | | Principal Occupation(s) – During the Past 5 Years | |
| Sara M. Donaldson 7337 East Doubletree Ranch Rd. Suite 100 Scottsdale, Arizona 85258 Age: 60 | | | Vice President | | | September 2014 – Present | | | Vice President, Voya Investments, LLC (October 2015 – Present). Formerly, Vice President, Voya Funds Services, LLC (April 2014 – October 2015). | |
| Micheline S. Faver 7337 East Doubletree Ranch Rd. Suite 100 Scottsdale, Arizona 85258 Age: 42 | | | Vice President | | | September 2016 – Present | | | Senior Vice President, Head of Fund Compliance and Chief Compliance Office, Voya Investments, LLC (March 2020 – Present). Formerly, Vice President, Head of Fund Compliance and Chief Compliance Officer, Voya Investments, LLC (June 2016 – March 2020); and Vice President, Mutual Fund Compliance (March 2014 – June 2016). | |
| Robyn L. Ichilov 7337 East Doubletree Ranch Rd. Suite 100 Scottsdale, Arizona 85258 Age: 52 | | | Vice President | | | October 2000 – Present | | | Vice President, Voya Funds Services, LLC (November 1995 – Present) and Voya Investments, LLC (August 1997 – Present). | |
| Jason Kadavy 7337 East Doubletree Ranch Rd. Suite 100 Scottsdale, Arizona 85258 Age: 44 | | | Vice President | | | September 2012 – Present | | | Vice President, Voya Investments, LLC (October 2015 – Present) and Voya Funds Services, LLC (July 2007 – Present). | |
| Andrew K. Schlueter 7337 East Doubletree Ranch Rd. Suite 100 Scottsdale, Arizona 85258 Age: 44 | | | Vice President | | | March 2018 – Present | | | Vice President, Voya Investments Distributor, LLC (April 2018 – Present); Vice President, Voya Investments, LLC and Voya Funds Services, LLC (March 2018 – Present); Vice President, Head of Mutual Fund Operations, Voya Investment Management (February 2018 – Present). Formerly, Vice President, Voya Investment Management (March 2014 – February 2018). | |
| Craig Wheeler 7337 East Doubletree Ranch Rd. Suite 100 Scottsdale, Arizona 85258 Age: 51 | | | Vice President | | | May 2013 – Present | | | Vice President – Director of Tax, Voya Investments, LLC (October 2015 – Present). Formerly, Vice President – Director of Tax, Voya Funds Services, LLC (March 2013 – October 2015). | |
| Monia Piacenti One Orange Way Windsor, Connecticut 06095 Age: 43 | | | Anti-Money Laundering Officer | | | June 2018 – Present | | | Anti-Money Laundering Officer, Voya Investments Distributor, LLC, Voya Investment Management and Voya Investment Management Trust Co. (June 2018 – Present); Compliance Consultant, Voya Financial, Inc. (January 2019 – Present). Formerly, Senior Compliance Officer, Voya Investment Management (December 2009 – December 2018). | |
| Theresa K. Kelety 7337 East Doubletree Ranch Rd. Suite 100 Scottsdale, Arizona 85258 Age: 57 | | | Secretary | | | January 2020 – Present | | | Vice President and Senior Counsel, Voya Investment Management – Mutual Fund Legal Department (March 2010 – Present). | |
| Paul A. Caldarelli 7337 East Doubletree Ranch Rd. Suite 100 Scottsdale, Arizona 85258 Age: 68 | | | Assistant Secretary | | | June 2010 – Present | | | Vice President and Senior Counsel, Voya Investment Management – Mutual Fund Legal Department (March 2010 – Present). | |
| Joanne F. Osberg 7337 East Doubletree Ranch Rd. Suite 100 Scottsdale, Arizona 85258 Age: 38 | | | Assistant Secretary | | | January 2020 – Present | | | Vice President and Counsel, Voya Investment Management – Mutual Fund Legal Department (January 2013 – Present). | |
Voya Investments, LLC
7337 East Doubletree Ranch Road, Suite 100
Scottsdale, Arizona 85258
Voya Investments Distributor, LLC
7337 East Doubletree Ranch Road, Suite 100
Scottsdale, Arizona 85258
BNY Mellon Investment Servicing (U.S.) Inc.
301 Bellevue Parkway
Wilmington, Delaware 19809
Ernst & Young LLP
200 Clarendon Street
Boston, MA 02116
The Bank of New York Mellon
225 Liberty Street
New York, New York 10286
Ropes & Gray LLP
Prudential Tower
800 Boylston Street
Boston, Massachusetts 02199


Voya Floating Rate Fund
Classes A, C, I, P, P3, R and W
Beginning on January 1, 2021, as permitted by regulations adopted by the U.S. Securities and Exchange Commission, paper copies of the Fund’s annual and semi-annual shareholder reports, like this annual report, will no longer be sent by mail, unless you specifically request paper copies of the reports. Instead, the reports will be made available on the Voya funds’website (www.voyainvestments.com/literature), and you will be notified by mail each time a report is posted and provided with a website link to access the report. |
This report is submitted for general information to shareholders of the Voya mutual funds. It is not authorized for distribution to prospective shareholders unless accompanied or preceded by a prospectus which includes details regarding the fund’s investment objectives, risks, charges, expenses and other information. This information should be read carefully. |
 E-Delivery Sign-up – details inside
INVESTMENT MANAGEMENT |
|
TABLE OF CONTENTS
| 1 | ||
| 3 | ||
| 6 | ||
| 7 | ||
| 8 | ||
| 10 | ||
| 11 | ||
| 12 | ||
| 13 | ||
| 22 | ||
| 35 | ||
| 36 | ||
| 40 |
| Go Paperless with E-Delivery! | |
| Sign up now for on-line prospectuses, fund reports, and proxy statements. In less than five minutes, you can help reduce paper mail and lower fund costs. | ||
| Just go to www.individuals.voya.com/page/e-delivery, follow the directions and complete the quick 5 Steps to Enroll. | ||
| You will be notified by e-mail when these communications become available on the internet. Documents that are not available on the internet will continue to be sent by mail. | ||
PROXY VOTING INFORMATION
QUARTERLY PORTFOLIO HOLDINGS
 | Turbulent Waters Demand Steadfast Navigation Dear Shareholder, After a tumultuous January, stocks staged an impressive recovery until the last week of February, at which point the financial markets fell sharply as fears of the spreading coronavirus darkened the outlook. The tumult has since continued: as of this writing at the end of March, global stock markets, as measured by the MSCI All Country World IndexSM, have spiraled down into a bear market, i.e., a drop of 20% or more. Governments around the world launched massive policy responses to the coronavirus pandemic in March. The U.S. Congress passed a $2 trillion rescue package, the largest single injection of cash into the U.S. economy in history. The U.S. Federal Reserve Board cut interest rates to near zero, expanded its purchases of U.S. Treasury and mortgage-backed securities to include corporate and municipal bonds, coordinated with other central banks to ease strains in the global funding markets and guaranteed support for critical market functions such as credit flows into the private and public sectors. While these measures provided only temporary respite from market tumult, we believe they have helped allay fears of an economic shutdown. |
Until the picture is clearer, however, we expect the market swings to continue. It is our opinion that investors should resist the temptation of the 24-hour “breaking news” cycle; in the end, fundamentals will count most. The most valuable insight we can offer is a reminder that events such as the coronavirus are exactly why investors prepare portfolios for risk. It is also worth remembering that, in our view, portfolios should not be built just to withstand risk; primarily, they should be built to achieve long-term objectives. We believe that even severe market disruptions such as this should not distract investors from focusing on their objectives.
This is an unprecedented time for all of us, and the situation is fast-changing. And while we are humble and realistic in the face of the challenges ahead, we believe we are well prepared for and fully committed to serving our clients without disruption. We appreciate your continued confidence in us, and we look forward to serving your investment needs in the future.

President
Voya Family of Funds
April 2, 2020
BENCHMARK DESCRIPTIONS
| Index | Description | ||
|---|---|---|---|
MSCI All Country World IndexSM | A free-float adjusted market capitalization index that is designed to measure equity performance in the global developed and emerging markets. | ||
| The S&P/LSTA Leveraged Loan Index | An unmanaged total return index that captures accrued interest, repayments, and market value changes. It represents a broad cross section of leveraged loans syndicated in the United States, including dollar-denominated loans to overseas issuers. Standard & Poor’s (“S&P”) and the Loan Syndications and Trading Association (“LSTA”) conceived the index to establish a performance benchmark for the syndicated leveraged loan industry. |
VOYA FLOATING RATE FUND |
| Ratings Distribution as of March 31, 2020 | ||||||
|---|---|---|---|---|---|---|
| Ba | 21.01 | % | ||||
| B | 73.28 | % | ||||
| Caa and below | 5.71 | % | ||||
| Not rated* | 0.00 | % | ||||
| Bond ratings apply to the underlying holdings of the Fund and not the Fund itself. Ratings distribution shows the percentage of the Fund’s loan commitments (excluding cash and foreign cash) that are rated in each ratings category, based upon the categories provided by Moody’s Investors Service, Inc. Ratings distribution is based on Moody’s senior secured facility ratings. Moody’s ratings classification methodology: Aaa rating denotes the least credit risk; C rating denotes the greatest credit risk. Loans rated below Baa by Moody’s are considered to be below investment grade. When a bond is not rated by Moody’s it is designated as “Not Rated”. Ratings can change from time to time, and current ratings may not fully reflect the actual credit condition or risks posed by a loan. | ||||||
| * Not rated includes loans to non-U.S. borrowers (which are typically unrated) and loans for which the rating has been withdrawn. | ||||||
Voya Floating Rate Fund* (the “Fund”) seeks to provide investors with a high level of current income. The Fund is managed by Jeffrey A. Bakalar, Daniel A. Norman, and Charles LeMieux, Portfolio Managers of Voya Investment Management Co. LLC — the Sub-Adviser.
The loan market, as measured by the Index, posted a negative return for the reporting period; secondary trading levels fell to post-crisis lows, with the Index bid price finishing the period at 82.85% of par. From a ratings perspective, BB-rated issues, which lost 6.61% for the period, performed better than riskier credits. Single-B-rated credits trailed the Index, losing 9.50%; CCC-rated credits lost 22.98% during the period and fell far out of favor, given the general “risk-off” dislocation and the virtual buyers’ strike in that area of the market.
| TOP TEN LOAN ISSUERS AS OF MARCH 31, 2020 AS A PERCENTAGE OF: | ||
|---|---|---|
| NET ASSETS | ||
| Asurion, LLC | 1.3% | |
| Maxar Technologies Ltd. | 1.1% | |
| MH Sub I LLC | 0.9% | |
| Panther BF Aggregator 2 LP | 0.8% | |
| Rocket Software, Inc. | 0.8% | |
| Altice France S.A. | 0.8% | |
| Rackspace Hosting | 0.7% | |
| Flex Acquisition Company, Inc. | 0.7% | |
| AmWINS Group, Inc. | 0.7% | |
| Golden Nugget Inc. | 0.7% |
The loan market’s technical equation was mostly in balance during the period before shifting materially amid the volatility. Unsurprisingly, measurable investor demand was put on pause in March. New issues of collateralized loan obligations (“CLOs”) came to a halt, while retail loan funds saw $14 billion of withdrawals. Before that, the CLO space had churned out deals at a healthy clip, and retail fund flows — although still mostly negative — had begun to see weekly inflows earlier in 2020. On the supply side, new issue activity shut down in March, but was generally steady for most of the Fund’s fiscal year.
Fundamental credit risk remained relatively stable during the year, albeit slightly picking up towards the end of the period. The 12-month trailing default rate closed out the fiscal period at 1.84% by principal amount. While this rate remains below the long-term historical average of 2.90%, most market participants don’t expect it to stay there for long. The shuttering of business activity caused by the global virus pandemic will likely have a substantial impact on the abilities of many borrowers to meet their short-term debt obligations.
VOYA FLOATING RATE FUND | PORTFOLIO MANAGERS’ REPORT |
Current Strategy & Outlook: In our view, volatility will remain highly elevated as the contraction in economic activity takes its toll on companies’ earnings. We have seen many borrowers focus on shoring up liquidity in the near term by drawing on revolvers, if available, and cutting costs by shuttering operations or furloughing workers. While we expect that both the U.S. Federal Reserve Board and U.S. Congress will continue to support the economy, we believe that recovery prospects will likely depend on the effectiveness and eventual relaxation of virus containment measures, the reaction of both markets and the public to stimulus packages and the ultimate effects for individual industries and borrowers given an unknown timeline for support liquidity.
While in our opinion downside surprises seem likely, we are generally comfortable with the holdings exposed to material COVID-19 risks, given the individual issuer weights and liquidity profile of those borrowers, e.g., free cash flow generation, balance sheet cash, fixed charges and debt maturity profile, over the next six to nine months. We based our view on certain assumptions about the likely depth of the recession and the shape of the recovery, and will revaluate it as more information becomes available.
The views expressed in this commentary are informed opinions. They should not be considered promises or advice. The views expressed reflect those of the portfolio managers, only through the end of the period as stated on the cover. The portfolio managers’ views are subject to change at any time based on market and other conditions.
Portfolio holdings and characteristics are subject to change and may not be representative of current holdings and characteristics. Fund holdings are subject to change daily. The outlook for this Fund may differ from that presented for other Voya mutual funds. This report contains statements that may be “forward-looking” statements. Actual results may differ materially from those projected in the “forward-looking” statements. The Fund’s performance returns shown reflect applicable fee waivers and/or expense limits in effect during this period. Absent such fee waivers/expense limitations, if any, performance would have been lower. Performance for the different classes of shares will vary based on differences in fees associated with each class. An index has no cash in its portfolio and imposes no sales charges. An investor cannot invest directly in an index.
 |  | |||
Jeffrey A. Bakalar Senior Managing Director Voya Investment Management Co. LLC | Daniel A. Norman Senior Managing Director Voya Investment Management Co. LLC | |||
 | ||||
Charles LeMieux Senior Vice President Voya Investment Management Co. LLC |
* Effective January 31, 2020, Charles LeMieux was added as a portfolio manager to the Fund.
VOYA FLOATING RATE FUND | PORTFOLIO MANAGERS’ REPORT |
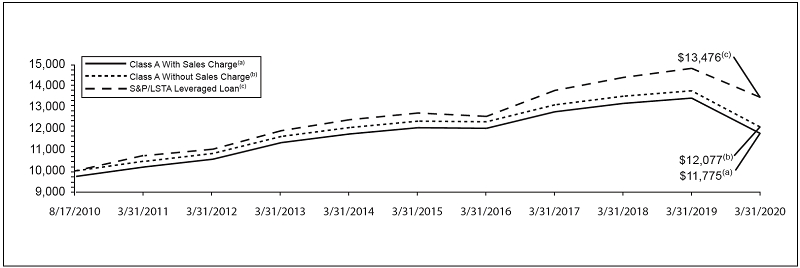
| Average Annual Total Returns for the Periods Ended March 31, 2020 | ||||||||||||||||||||
|---|---|---|---|---|---|---|---|---|---|---|---|---|---|---|---|---|---|---|---|---|
| 1 Year | 5 Year | Since Inception of Classes A, C, I, R and W August 17, 2010 | Since Inception of Class P June 14, 2013 | Since Inception of Class P3 June 1, 2018 | ||||||||||||||||
Including Sales Charge: | ||||||||||||||||||||
Class A(1) | –14.57 | % | –0.94 | % | 1.71 | % | — | — | ||||||||||||
Class C(2) | –13.84 | % | –1.19 | % | 1.23 | % | — | — | ||||||||||||
| Class I | –12.12 | % | –0.18 | % | 2.24 | % | — | — | ||||||||||||
| Class P | –11.52 | % | 0.47 | % | — | 1.40 | % | — | ||||||||||||
| Class P3 | –11.43 | % | — | — | — | –5.26 | % | |||||||||||||
| Class R | –12.57 | % | –0.69 | % | 1.72 | % | — | — | ||||||||||||
| Class W | –12.10 | % | –0.21 | % | 2.25 | % | — | — | ||||||||||||
Excluding Sales Charge: | ||||||||||||||||||||
| Class A | –12.34 | % | –0.44 | % | 1.98 | % | — | — | ||||||||||||
| Class C | –13.00 | % | –1.19 | % | 1.23 | % | — | — | ||||||||||||
| Class I | –12.12 | % | –0.18 | % | 2.24 | % | — | — | ||||||||||||
| Class P | –11.52 | % | 0.47 | % | — | 1.40 | % | — | ||||||||||||
| Class P3 | –11.43 | % | — | — | — | –5.26 | % | |||||||||||||
| Class R | –12.57 | % | –0.69 | % | 1.72 | % | — | — | ||||||||||||
| Class W | –12.10 | % | –0.21 | % | 2.25 | % | — | — | ||||||||||||
| S&P/LSTA Leveraged Loan | –9.16 | % | 1.14 | % | 3.15 | % | 1.76 | % | –3.90 | % | ||||||||||
(1) | Reflects deduction of the maximum Class A sales charge of 2.50%. |
(2) | Reflects deduction of the Class C deferred sales charge of 1% for the 1 year return. |
SHAREHOLDER EXPENSE EXAMPLE (UNAUDITED)
| Actual Fund Return | Hypothetical (5% return before expenses) | |||||||||||||||||||||||||||||||||
|---|---|---|---|---|---|---|---|---|---|---|---|---|---|---|---|---|---|---|---|---|---|---|---|---|---|---|---|---|---|---|---|---|---|---|
| Beginning Account Value October 1, 2019 | Ending Account Value March 31, 2020 | Annualized Expense Ratio | Expenses Paid During the Period Ended March 31, 2020* | Beginning Account Value October 1, 2019 | Ending Account Value March 31, 2020 | Annualized Expense Ratio | Expenses Paid During the Period Ended March 31, 2020* | |||||||||||||||||||||||||||
| Class A | $ | 1,000.00 | $ | 862.90 | 1.10 | % | $ | 5.12 | $ | 1,000.00 | $ | 1,019.50 | 1.10 | % | $ | 5.55 | ||||||||||||||||||
| Class C | 1,000.00 | 859.60 | 1.85 | 8.60 | 1,000.00 | 1,015.75 | 1.85 | 9.32 | ||||||||||||||||||||||||||
| Class I | 1,000.00 | 864.10 | 0.85 | 3.96 | 1,000.00 | 1,020.75 | 0.85 | 4.29 | ||||||||||||||||||||||||||
| Class P | 1,000.00 | 867.00 | 0.20 | 0.93 | 1,000.00 | 1,024.00 | 0.20 | 1.01 | ||||||||||||||||||||||||||
| Class P3 | 1,000.00 | 867.50 | 0.10 | 0.47 | 1,000.00 | 1,024.50 | 0.10 | 0.51 | ||||||||||||||||||||||||||
| Class R | 1,000.00 | 861.70 | 1.35 | 6.28 | 1,000.00 | 1,018.25 | 1.35 | 6.81 | ||||||||||||||||||||||||||
| Class W | 1,000.00 | 864.20 | 0.85 | 3.96 | 1,000.00 | 1,020.75 | 0.85 | 4.29 | ||||||||||||||||||||||||||
| * | Expenses are equal to the Fund’s annualized expense ratios multiplied by the average account value over the period, multiplied by 183/366 to reflect the most recent fiscal half-year. |
REPORT OF INDEPENDENT REGISTERED PUBLIC ACCOUNTING FIRM

May 26, 2020
STATEMENT OF ASSETS AND LIABILITIES AS OF MARCH 31, 2020
ASSETS: | |||||
| Investments in securities at fair value (Cost $834,680,580) | $ | 684,409,916 | |||
| Short-term investments at fair value (Cost $26,494,631) | 26,469,294 | ||||
| Receivables: | |||||
| Investment securities sold | 81,983,427 | ||||
| Fund shares sold | 2,522,752 | ||||
| Dividend | 39,566 | ||||
| Interest | 2,367,848 | ||||
| Prepaid structuring fee (Note 7) | 60,203 | ||||
| Prepaid expenses | 69,340 | ||||
| Reimbursement due from Investment Adviser | 124,767 | ||||
| Other assets | 38,848 | ||||
| Total assets | 798,085,961 | ||||
LIABILITIES: | |||||
| Notes payable | 21,000,000 | ||||
| Payable for investment securities purchased | 11,636,954 | ||||
| Payable for fund shares redeemed | 3,225,486 | ||||
| Income distribution payable | 137,482 | ||||
| Payable for investment management fees | 428,637 | ||||
| Payable for distribution and shareholder service fees | 77,709 | ||||
| Payable to custodian due to bank overdrdaft | 572,068 | ||||
| Accrued trustees fees | 31,368 | ||||
| Payable to trustees under the deferred compensation plan (Note 8) | 38,848 | ||||
| Payable for commitment fees on line of credit (Note 7) | 240,183 | ||||
| Other accrued expenses and liabilities | 604,946 | ||||
| Total liabilities | 37,993,681 | ||||
NET ASSETS | $ | 760,092,280 | |||
NET ASSETS WERE COMPRISED OF: | |||||
| Paid-in capital | 1,023,670,053 | ||||
| Total distributable loss | (263,577,773 | ) | |||
NET ASSETS | $ | 760,092,280 |
STATEMENT OF ASSETS AND LIABILITIES AS OF MARCH 31, 2020 (CONTINUED)
Class A: | ||||
| Net assets | $ | 52,013,627 | ||
| Shares authorized | unlimited | |||
| Par value | $ | 0.001 | ||
| Shares outstanding | 6,500,311 | |||
Net asset value and redemption price per share(2) | $ | 8.00 | ||
Maximum offering price per share (2.50%)(1) | $ | 8.21 | ||
Class C: | ||||
| Net assets | $ | 20,446,413 | ||
| Shares authorized | unlimited | |||
| Par value | $ | 0.001 | ||
| Shares outstanding | 2,555,241 | |||
Net asset value and redemption price per share(2) | $ | 8.00 | ||
Class I: | ||||
| Net assets | $ | 427,503,690 | ||
| Shares authorized | unlimited | |||
| Par value | $ | 0.001 | ||
| Shares outstanding | 53,435,991 | |||
| Net asset value and redemption price per share | $ | 8.00 | ||
Class P: | ||||
| Net assets | $ | 122,015,548 | ||
| Shares authorized | unlimited | |||
| Par value | $ | 0.001 | ||
| Shares outstanding | 15,265,863 | |||
| Net asset value and redemption price per share | $ | 7.99 | ||
Class P3: | ||||
| Net assets | $ | 2,795,455 | ||
| Shares authorized | unlimited | |||
| Par value | $ | 0.001 | ||
| Shares outstanding | 349,418 | |||
| Net asset value and redemption price per share | $ | 8.00 | ||
Class R: | ||||
| Net assets | $ | 99,774,093 | ||
| Shares authorized | unlimited | |||
| Par value | $ | 0.001 | ||
| Shares outstanding | 12,488,835 | |||
| Net asset value and redemption price per share | $ | 7.99 | ||
Class W: | ||||
| Net assets | $ | 35,543,454 | ||
| Shares authorized | unlimited | |||
| Par value | $ | 0.001 | ||
| Shares outstanding | 4,436,587 | |||
| Net asset value and redemption price per share | $ | 8.01 |
| (1) | Maximum offering price is computed at 100/97.50 of net asset value. On purchases of $100,000 or more, the offering price is reduced. |
| (2) | Redemption price per share may be reduced for any applicable contingent deferred sales charge. |
STATEMENT OF OPERATIONS FOR THE YEAR ENDED MARCH 31, 2020
INVESTMENT INCOME: | ||||||
| Interest | $ | 75,261,140 | ||||
| Dividend | 1,437,288 | |||||
| Other | 387,215 | |||||
| Total investment income | 77,085,643 | |||||
EXPENSES: | ||||||
| Investment management fees | 8,417,317 | |||||
| Distribution and service fees: | ||||||
| Class A | 151,345 | |||||
| Class C | 320,245 | |||||
| Class R | 656,615 | |||||
| Transfer agent fees: | ||||||
| Class A | 51,491 | |||||
| Class C | 26,029 | |||||
| Class I | 363,238 | |||||
| Class P | 594 | |||||
| Class P3 | 309 | |||||
| Class R | 109,197 | |||||
| Class W | 39,044 | |||||
| Shareholder reporting expense | 65,880 | |||||
| Custody and accounting expense | 652,420 | |||||
| Registration fees | 142,620 | |||||
| Professional fees | 163,222 | |||||
| Trustees fees | 73,200 | |||||
| Structuring fee (Note 7) | 410,137 | |||||
| Commitment fee | 520,121 | |||||
| Miscellaneous expense | 112,407 | |||||
| Interest expense | 246,671 | |||||
| Total expenses | 12,522,102 | |||||
| Waived and reimbursed fees | (1,339,942 | ) | ||||
| Net expenses | 11,182,160 | |||||
| Net investment income | 65,903,483 | |||||
REALIZED AND UNREALIZED GAIN (LOSS): | ||||||
| Net realized loss on investments | (68,486,658 | ) | ||||
| Net change in unrealized appreciation (depreciation) on investments | (104,110,887 | ) | ||||
| Net realized and unrealized loss | (172,597,545 | ) | ||||
| Decrease in net assets resulting from operations | (106,694,062 | ) |
STATEMENTS OF CHANGES IN NET ASSETS
| Year Ended March 31, 2020 | Year Ended March 31, 2019 | |||||||||
|---|---|---|---|---|---|---|---|---|---|---|
FROM OPERATIONS: | ||||||||||
| Net investment income | $ | 65,903,483 | $ | 99,966,916 | ||||||
| Net realized loss | (68,486,658 | ) | (24,505,646 | ) | ||||||
| Net change in unrealized depreciation | (104,110,887 | ) | (42,113,615 | ) | ||||||
| Net increase (decrease) in net assets resulting from operations | (106,694,062 | ) | 33,347,655 | |||||||
FROM DISTRIBUTIONS TO SHAREHOLDERS: | ||||||||||
| Net investment income: | ||||||||||
| Class A | (2,975,473 | ) | (2,351,716 | ) | ||||||
| Class C | (1,352,004 | ) | (1,726,650 | ) | ||||||
| Class I | (46,817,372 | ) | (75,863,503 | ) | ||||||
| Class P | (7,240,268 | ) | (2,880,917 | ) | ||||||
| Class P3 | (150,956 | ) | (123,564 | ) | ||||||
| Class R | (6,175,696 | ) | (5,934,498 | ) | ||||||
| Class W | (2,461,712 | ) | (10,249,420 | ) | ||||||
| Total distributions | (67,173,481 | ) | (99,130,268 | ) | ||||||
FROM CAPITAL SHARE TRANSACTIONS: | ||||||||||
| Net proceeds from sale of shares | 387,431,929 | 1,188,162,603 | ||||||||
| Reinvestment of distributions | 64,849,161 | 95,062,572 | ||||||||
| 452,281,090 | 1,283,225,175 | |||||||||
| Cost of shares redeemed | (1,025,097,472 | ) | (1,856,840,747 | ) | ||||||
| Net decrease in net assets resulting from capital share transactions | (572,816,382 | ) | (573,615,572 | ) | ||||||
| Net decrease in net assets | (746,683,925 | ) | (639,398,185 | ) | ||||||
NET ASSETS: | ||||||||||
| Beginning of year or period | 1,506,776,205 | 2,146,174,390 | ||||||||
| End of year or period | $ | 760,092,280 | $ | 1,506,776,205 | ||||||
| Income (loss) from investment operations | Less distributions | Ratios to average net assets | Supplemental data | ||||||||||||||||||||||||||||||||||||||||||||||||||||||||||||||
| Net asset value, beginning of year or period | Net investment income (loss) | Net realized and unrealized gain (loss) | Total from investment operations | From net investment income | From net realized gains | From return of capital | Total distributions | Net asset value, end of year or period | TotalReturn(1) | Expenses before reductions/ additions(2)(3) | Expenses, net of fee waivers and/ or recoupments, if any(2)(3) | Expenses, net of all reductions/ additions(2)(3) | Net investment income (loss)(2)(3) | Net assets, end of year or period | Portfolio Turnover rate | ||||||||||||||||||||||||||||||||||||||||||||||||||
| Year or period ended | ($) | ($) | ($) | ($) | ($) | ($) | ($) | ($) | ($) | (%) | (%) | (%) | (%) | (%) | ($000’s) | (%) | |||||||||||||||||||||||||||||||||||||||||||||||||
Class A | |||||||||||||||||||||||||||||||||||||||||||||||||||||||||||||||||
| 03-31-20 | 9.59 | 0.46 | (1.58 | ) | (1.12 | ) | 0.47 | — | — | 0.47 | 8.00 | (12.34 | ) | 1.18 | 1.10 | 1.10 | 4.83 | 52,014 | 52 | ||||||||||||||||||||||||||||||||||||||||||||||
| 03-31-19 | 9.86 | 0.46 | (0.28 | ) | 0.18 | 0.45 | — | — | 0.45 | 9.59 | 1.90 | 1.14 | 1.05 | 1.05 | 4.75 | 59,614 | 58 | ||||||||||||||||||||||||||||||||||||||||||||||||
| 03-31-18 | 9.93 | 0.35 | (0.05 | ) | 0.30 | 0.35 | — | 0.02 | 0.37 | 9.86 | 3.09 | 1.13 | 1.02 | 1.02 | 3.58 | 43,839 | 82 | ||||||||||||||||||||||||||||||||||||||||||||||||
| 03-31-17 | 9.70 | 0.37 | * | 0.25 | 0.62 | 0.39 | — | — | 0.39 | 9.93 | 6.49 | 1.11 | 1.03 | 1.03 | 3.79 | 93,318 | 69 | ||||||||||||||||||||||||||||||||||||||||||||||||
| 03-31-16 | 10.11 | 0.38 | (0.41 | ) | (0.03 | ) | 0.38 | — | — | 0.38 | 9.70 | (0.25 | ) | 1.08 | 1.04 | 1.04 | 3.84 | 39,820 | 46 | ||||||||||||||||||||||||||||||||||||||||||||||
Class C | |||||||||||||||||||||||||||||||||||||||||||||||||||||||||||||||||
| 03-31-20 | 9.59 | 0.38 | (1.58 | ) | (1.20 | ) | 0.39 | — | — | 0.39 | 8.00 | (13.00 | ) | 1.93 | 1.85 | 1.85 | 4.12 | 20,446 | 52 | ||||||||||||||||||||||||||||||||||||||||||||||
| 03-31-19 | 9.87 | 0.38 | * | (0.28 | ) | 0.10 | 0.38 | — | — | 0.38 | 9.59 | 1.04 | 1.89 | 1.80 | 1.80 | 3.93 | 39,455 | 58 | |||||||||||||||||||||||||||||||||||||||||||||||
| 03-31-18 | 9.93 | 0.28 | (0.04 | ) | 0.24 | 0.28 | — | 0.02 | 0.30 | 9.87 | 2.42 | 1.88 | 1.77 | 1.77 | 2.85 | 45,848 | 82 | ||||||||||||||||||||||||||||||||||||||||||||||||
| 03-31-17 | 9.70 | 0.30 | * | 0.25 | 0.55 | 0.32 | — | — | 0.32 | 9.93 | 5.70 | 1.86 | 1.78 | 1.78 | 3.08 | 55,583 | 69 | ||||||||||||||||||||||||||||||||||||||||||||||||
| 03-31-16 | 10.11 | 0.31 | (0.41 | ) | (0.10 | ) | 0.31 | — | — | 0.31 | 9.70 | (1.00 | ) | 1.83 | 1.79 | 1.79 | 3.10 | 50,751 | 46 | ||||||||||||||||||||||||||||||||||||||||||||||
Class I | |||||||||||||||||||||||||||||||||||||||||||||||||||||||||||||||||
| 03-31-20 | 9.59 | 0.48 | (1.58 | ) | (1.10 | ) | 0.49 | — | — | 0.49 | 8.00 | (12.12 | ) | 0.88 | 0.85 | 0.85 | 5.15 | 427,504 | 52 | ||||||||||||||||||||||||||||||||||||||||||||||
| 03-31-19 | 9.87 | 0.48 | (0.28 | ) | 0.20 | 0.48 | — | — | 0.48 | 9.59 | 2.07 | 0.80 | 0.80 | 0.80 | 4.93 | 1,160,464 | 58 | ||||||||||||||||||||||||||||||||||||||||||||||||
| 03-31-18 | 9.93 | 0.38 | * | (0.04 | ) | 0.34 | 0.38 | — | 0.02 | 0.40 | 9.87 | 3.46 | 0.75 | 0.75 | 0.75 | 3.89 | 1,338,826 | 82 | |||||||||||||||||||||||||||||||||||||||||||||||
| 03-31-17 | 9.70 | 0.40 | * | 0.25 | 0.65 | 0.42 | — | — | 0.42 | 9.93 | 6.76 | 0.76 | 0.76 | 0.76 | 4.09 | 1,156,695 | 69 | ||||||||||||||||||||||||||||||||||||||||||||||||
| 03-31-16 | 10.11 | 0.41 | (0.41 | ) | — | 0.41 | — | — | 0.41 | 9.70 | 0.01 | 0.79 | 0.79 | 0.79 | 4.12 | 900,493 | 46 | ||||||||||||||||||||||||||||||||||||||||||||||||
Class P | |||||||||||||||||||||||||||||||||||||||||||||||||||||||||||||||||
| 03-31-20 | 9.58 | 0.53 | * | (1.56 | ) | (1.03 | ) | 0.56 | — | — | 0.56 | 7.99 | (11.52 | ) | 0.85 | 0.20 | 0.20 | 5.70 | 122,016 | 52 | |||||||||||||||||||||||||||||||||||||||||||||
| 03-31-19 | 9.86 | 0.55 | (0.29 | ) | 0.26 | 0.54 | — | — | 0.54 | 9.58 | 2.75 | 0.77 | 0.12 | 0.12 | 5.65 | 53,416 | 58 | ||||||||||||||||||||||||||||||||||||||||||||||||
| 03-31-18 | 9.92 | 0.45 | (0.05 | ) | 0.40 | 0.44 | — | 0.02 | 0.46 | 9.86 | 4.15 | 0.74 | 0.09 | 0.09 | 4.56 | 42,522 | 82 | ||||||||||||||||||||||||||||||||||||||||||||||||
| 03-31-17 | 9.69 | 0.47 | 0.24 | 0.71 | 0.48 | — | — | 0.48 | 9.92 | 7.47 | 0.75 | 0.10 | 0.10 | 4.76 | 36,072 | 69 | |||||||||||||||||||||||||||||||||||||||||||||||||
| 03-31-16 | 10.11 | 0.47 | (0.41 | ) | 0.06 | 0.48 | — | — | 0.48 | 9.69 | 0.58 | 0.77 | 0.12 | 0.12 | 4.76 | 21,608 | 46 | ||||||||||||||||||||||||||||||||||||||||||||||||
Class P3 | |||||||||||||||||||||||||||||||||||||||||||||||||||||||||||||||||
| 03-31-20 | 9.59 | 0.55 | (1.58 | ) | (1.03 | ) | 0.56 | — | — | 0.56 | 8.00 | (11.43 | ) | 0.86 | 0.10 | 0.10 | 5.81 | 2,795 | 52 | ||||||||||||||||||||||||||||||||||||||||||||||
6-1-18(4)–03-31-19 | 9.84 | 0.47 | * | (0.25 | ) | 0.22 | 0.47 | — | — | 0.47 | 9.59 | 2.26 | 0.77 | 0.05 | 0.05 | 5.87 | 2,158 | 58 | |||||||||||||||||||||||||||||||||||||||||||||||
Class R | |||||||||||||||||||||||||||||||||||||||||||||||||||||||||||||||||
| 03-31-20 | 9.58 | 0.43 | (1.58 | ) | (1.15 | ) | 0.44 | — | — | 0.44 | 7.99 | (12.57 | ) | 1.43 | 1.35 | 1.35 | 4.60 | 99,774 | 52 | ||||||||||||||||||||||||||||||||||||||||||||||
| 03-31-19 | �� | 9.85 | 0.44 | * | (0.28 | ) | 0.16 | 0.43 | — | — | 0.43 | 9.58 | 1.65 | 1.39 | 1.30 | 1.30 | 4.48 | 139,026 | 58 | ||||||||||||||||||||||||||||||||||||||||||||||
| 03-31-18 | 9.91 | 0.33 | (0.04 | ) | 0.29 | 0.33 | — | 0.02 | 0.35 | 9.85 | 2.94 | 1.38 | 1.27 | 1.27 | 3.36 | 118,071 | 82 | ||||||||||||||||||||||||||||||||||||||||||||||||
| 03-31-17 | 9.69 | 0.35 | 0.24 | 0.59 | 0.37 | — | — | 0.37 | 9.91 | 6.12 | 1.36 | 1.28 | 1.28 | 3.58 | 119,041 | 69 | |||||||||||||||||||||||||||||||||||||||||||||||||
| 03-31-16 | 10.10 | 0.35 | (0.40 | ) | (0.05 | ) | 0.36 | — | — | 0.36 | 9.69 | (0.50 | ) | 1.33 | 1.29 | 1.29 | 3.60 | 107,927 | 46 | ||||||||||||||||||||||||||||||||||||||||||||||
Class W | |||||||||||||||||||||||||||||||||||||||||||||||||||||||||||||||||
| 03-31-20 | 9.60 | 0.48 | (1.58 | ) | (1.10 | ) | 0.49 | — | — | 0.49 | 8.01 | (12.10 | ) | 0.93 | 0.85 | 0.85 | 5.11 | 35,543 | 52 | ||||||||||||||||||||||||||||||||||||||||||||||
| 03-31-19 | 9.89 | 0.46 | * | (0.27 | ) | 0.19 | 0.48 | — | — | 0.48 | 9.60 | 1.96 | 0.89 | 0.80 | 0.80 | 4.60 | 52,642 | 58 | |||||||||||||||||||||||||||||||||||||||||||||||
| 03-31-18 | 9.95 | 0.38 | * | (0.04 | ) | 0.34 | 0.38 | — | 0.02 | 0.40 | 9.89 | 3.46 | 0.88 | 0.77 | 0.77 | 3.88 | 557,067 | 82 | |||||||||||||||||||||||||||||||||||||||||||||||
| 03-31-17 | 9.72 | 0.39 | * | 0.26 | 0.65 | 0.42 | — | — | 0.42 | 9.95 | 6.75 | 0.86 | 0.78 | 0.78 | 3.96 | 434,100 | 69 | ||||||||||||||||||||||||||||||||||||||||||||||||
| 03-31-16 | 10.13 | 0.41 | (0.41 | ) | — | 0.41 | — | — | 0.41 | 9.72 | 0.01 | 0.83 | 0.79 | 0.79 | 4.10 | 98,241 | 46 | ||||||||||||||||||||||||||||||||||||||||||||||||
(1) | Total return is calculated assuming reinvestment of all dividends, capital gain distributions and return of capital distributions, if any, at net asset value and excluding the deduction of sales charges or contingent deferred sales charges, if applicable. Total return for periods less than one year is not annualized. | |
(2) | Annualized for periods less than one year. | |
(3) | Ratios reflect operating expenses of a Fund. Expenses before reductions/additions do not reflect amounts reimbursed by the Investment Adviser and/or Distributor or reductions from brokerage service arrangements or other expense offset arrangements and do not represent the amount paid by a Fund during periods when reimbursements or reductions occur. Expenses net of fee waivers reflect expenses after reimbursement by an Investment Adviser and/or Distributor but prior to reductions from brokerage service arrangements or other expense offset arrangements. Expenses net of all reductions/additions represent the net expenses paid by a Fund. Net investment income (loss) is net of all such additions or reductions. | |
(4) | Commencement of operations. | |
| * | Calculated using average number of shares outstanding throughout the period. |
NOTES TO FINANCIAL STATEMENTS AS OF MARCH 31, 2020
NOTES TO FINANCIAL STATEMENTS AS OF MARCH 31, 2020 (CONTINUED)
NOTES TO FINANCIAL STATEMENTS AS OF MARCH 31, 2020 (CONTINUED)
| (1) | Market value of investment securities, other assets and liabilities — at the exchange rates prevailing at Market Close. |
| (2) | Purchases and sales of investment securities, income and expenses — at the rates of exchange prevailing on the respective dates of such transactions. |
NOTES TO FINANCIAL STATEMENTS AS OF MARCH 31, 2020 (CONTINUED)
NOTE 2 — SIGNIFICANT ACCOUNTING POLICIES (continued)
changes in the value of assets and liabilities other than investments in securities, resulting from changes in the exchange rate. Foreign security and currency transactions may involve certain considerations and risks not typically associated with investing in U.S. companies and the U.S. government. These risks include, but are not limited to, revaluation of currencies and future adverse political and economic developments which could cause securities and their markets to be less liquid and prices more volatile than those of comparable U.S. companies and U.S. government securities. The foregoing risks are even greater with respect to securities of issuers in emerging markets.
| Class A | Class C | Class R | ||||
|---|---|---|---|---|---|---|
| 0.25% | 1.00% | 0.50% |
The Distributor may also retain the proceeds of the initial sales charge paid by shareholders upon the purchase of Class A shares of the Fund and the contingent deferred sales charge paid by shareholders upon certain redemptions for Class A and Class C shares. For the year ended March 31, 2020, the Distributor retained the following amounts in sales charges:
| Class A | Class C | |||||||||
|---|---|---|---|---|---|---|---|---|---|---|
| Initial Sales Charges | $ | 5,223 | $ | — | ||||||
| Contingent Deferred Sales Charges | 2,065 | 6,094 | ||||||||
NOTES TO FINANCIAL STATEMENTS AS OF MARCH 31, 2020 (CONTINUED)
(as a percentage of average daily net assets)
Class C — 1.75%
Class I — 0.75%
Class P — 0.15%
Class P3 — 0.00%
Class R — 1.25%
Class W — 0.75%
| March 31, | ||||||
|---|---|---|---|---|---|---|
| 2021 | 2022 | 2033 | Total | |||
| $— | $40,723 | $401,550 | $442,273 | |||
| March 31, | ||||||||||||||||||
|---|---|---|---|---|---|---|---|---|---|---|---|---|---|---|---|---|---|---|
| 2021 | 2022 | 2023 | Total | |||||||||||||||
| Class A | $ | 48,160 | $ | 43,691 | $ | 25,765 | $ | 117,616 | ||||||||||
| Class C | 54,440 | 38,985 | 13,630 | 107,055 | ||||||||||||||
| Class R | 125,960 | 117,207 | 55,890 | 299,057 | ||||||||||||||
| Class W | 534,174 | 215,463 | 20,153 | 769,790 | ||||||||||||||
| Days Utilized | Approximate Average Daily Balance For Days Utilized | Approximate Weighted Average Interest Rate For Days Utilized | ||||
|---|---|---|---|---|---|---|
| 106 | $30,858,491 | 2.72% |
| Subsidiary | Percentage | |||||
|---|---|---|---|---|---|---|
| Voya Institutional Trust Company | 13.14 | % | ||||
| Voya Investment Management Co. LLC | 5.28 | |||||
NOTES TO FINANCIAL STATEMENTS AS OF MARCH 31, 2020 (CONTINUED)
NOTE 9 — CAPITAL SHARES
| Shares sold | Reinvestment of distributions | Shares redeemed | Net increase (decrease) in shares outstanding | Shares sold | Reinvestment of distributions | Shares redeemed | Net increase (decrease) | |||||||||||||||||||||||||||
|---|---|---|---|---|---|---|---|---|---|---|---|---|---|---|---|---|---|---|---|---|---|---|---|---|---|---|---|---|---|---|---|---|---|---|
| Year or period ended | # | # | # | # | ($) | ($) | ($) | ($) | ||||||||||||||||||||||||||
Class A | ||||||||||||||||||||||||||||||||||
| 03-31-20 | 5,639,510 | 292,826 | (5,646,601 | ) | 285,735 | 53,778,688 | 2,743,018 | (52,770,320 | ) | 3,751,386 | ||||||||||||||||||||||||
| 03-31-19 | 4,900,915 | 216,844 | (3,347,666 | ) | 1,770,093 | 47,678,722 | 2,103,779 | (32,387,511 | ) | 17,394,990 | ||||||||||||||||||||||||
Class C | ||||||||||||||||||||||||||||||||||
| 03-31-20 | 201,468 | 126,244 | (1,885,559 | ) | (1,557,847 | ) | 1,916,440 | 1,189,893 | (17,736,355 | ) | (14,630,022 | ) | ||||||||||||||||||||||
| 03-31-19 | 859,655 | 160,854 | (1,553,952 | ) | (533,443 | ) | 8,395,213 | 1,563,108 | (15,057,239 | ) | (5,098,918 | ) | ||||||||||||||||||||||
Class I | ||||||||||||||||||||||||||||||||||
| 03-31-20 | 19,938,138 | 4,755,535 | (92,232,126 | ) | (67,538,453 | ) | 185,893,516 | 44,908,640 | (859,301,235 | ) | (628,499,079 | ) | ||||||||||||||||||||||
| 03-31-19 | 103,785,552 | 7,433,338 | (125,923,823 | ) | (14,704,933 | ) | 1,015,694,395 | 72,280,256 | (1,212,479,474 | ) | (124,504,823 | ) | ||||||||||||||||||||||
Class P | ||||||||||||||||||||||||||||||||||
| 03-31-20 | 12,120,922 | 776,328 | (3,204,975 | ) | 9,692,275 | 116,185,715 | 7,240,269 | (30,254,592 | ) | 93,171,392 | ||||||||||||||||||||||||
| 03-31-19 | 2,060,011 | 296,668 | (1,095,999 | ) | 1,260,680 | 20,100,297 | 2,880,910 | (10,621,849 | ) | 12,359,358 | ||||||||||||||||||||||||
Class P3 | ||||||||||||||||||||||||||||||||||
| 03-31-20 | 222,832 | 16,098 | (114,495 | ) | 124,435 | 2,059,802 | 150,356 | (1,075,423 | ) | 1,134,735 | ||||||||||||||||||||||||
06-01-18(1)–03-31-19 | 484,611 | 12,748 | (272,376 | ) | 224,983 | 4,723,442 | 123,525 | (2,622,223 | ) | 2,224,744 | ||||||||||||||||||||||||
Class R | ||||||||||||||||||||||||||||||||||
| 03-31-20 | 1,406,440 | 657,745 | (4,090,945 | ) | (2,026,760 | ) | 13,279,120 | 6,170,305 | (37,621,501 | ) | (18,172,076 | ) | ||||||||||||||||||||||
| 03-31-19 | 4,251,727 | 611,023 | (2,331,421 | ) | 2,531,329 | 41,570,411 | 5,923,293 | (22,534,031 | ) | 24,959,673 | ||||||||||||||||||||||||
Class W | ||||||||||||||||||||||||||||||||||
| 03-31-20 | 1,523,717 | 260,120 | (2,828,336 | ) | (1,044,499 | ) | 14,318,648 | 2,446,680 | (26,338,046 | ) | (9,572,718 | ) | ||||||||||||||||||||||
| 03-31-19 | 5,078,081 | 1,037,432 | (56,963,913 | ) | (50,848,400 | ) | 50,000,123 | 10,187,701 | (561,138,420 | ) | (500,950,596 | ) | ||||||||||||||||||||||
(1) | Commencement of operations. |
| Paid-in Capital | Distributable Earnings | |||
|---|---|---|---|---|
| $(255,888) | $255,888 |
NOTES TO FINANCIAL STATEMENTS AS OF MARCH 31, 2020 (CONTINUED)
| Year Ended March 31, 2020 | Year Ended March 31, 2019 | |||
|---|---|---|---|---|
| Ordinary Income | Ordinary Income | |||
| $67,173,481 | $99,130,268 |
| Capital Loss Carryforwards | ||||||||||
|---|---|---|---|---|---|---|---|---|---|---|
| Unrealized Appreciation/ (Depreciation) | Amount | Character | Expiration | |||||||
| $(150,799,442) | $ | (26,618,372 | ) | Short-term | None | |||||
| (85,994,622 | ) | Long-term | None | |||||||
| $ | (112,612,994 | ) | ||||||||
As of March 31, 2020, no provision for income tax is required in the Fund’s financial statements as a result of tax positions taken on federal and state income tax returns for open tax years. The Fund’s federal and state income and federal excise tax returns for tax years for which the applicable statutes of limitations have not expired are subject to examination by the Internal Revenue Service and state department of revenue. Generally, the earliest tax year that remains subject to examination by these jurisdictions is 2015.
NOTES TO FINANCIAL STATEMENTS AS OF MARCH 31, 2020 (CONTINUED)
NOTES TO FINANCIAL STATEMENTS AS OF MARCH 31, 2020 (CONTINUED)
| Per Share Amount | Payable Date | Record Date | |||||||
|---|---|---|---|---|---|---|---|---|---|
| Class A | $0.0290 | May 1, 2020 | Daily | ||||||
| Class C | $0.0241 | May 1, 2020 | Daily | ||||||
| Class I | $0.0306 | May 1, 2020 | Daily | ||||||
| Class P | $0.0351 | May 1, 2020 | Daily | ||||||
| Class P3 | $0.0345 | May 1, 2020 | Daily | ||||||
| Class R | $0.0274 | May 1, 2020 | Daily | ||||||
| Class W | $0.0306 | May 1, 2020 | Daily |
| VOYA FLOATING RATE FUND | PORTFOLIO OF INVESTMENTS AS OF MARCH 31, 2020 |
| Principal Amount† | Borrower/Tranche Description | Fair Value | Percentage of Net Assets | |||||||
|---|---|---|---|---|---|---|---|---|---|---|
LOANS*: 90.0% | ||||||||||
Aerospace & Defense: 2.8% | ||||||||||
| 1,070,000 | AI Convoy (Luxembourg) S.A.R.L USD Term Loan B, 5.340%, (US0003M + 3.500%), 01/17/27 | $ | 1,005,800 | 0.2 | ||||||
| 1,295,000 | Amentum Government Services Holdings LLC Term Loan B, 4.989%, (US0001M + 4.000%), 02/01/27 | 1,223,775 | 0.2 | |||||||
| 2,037,698 | American Airlines, Inc. 2018 Term Loan B, 2.709%, (US0001M + 1.750%), 06/27/25 | 1,688,233 | 0.2 | |||||||
| 402,019 | Dynasty Acquisition Co., Inc. 2020 CAD Term Loan B2, 4.950%, (US0003M + 3.500%), 04/06/26 | 316,791 | 0.0 | |||||||
| 747,755 | Dynasty Acquisition Co., Inc. 2020 Term Loan B1, 4.950%, (US0003M + 3.500%), 04/06/26 | 589,231 | 0.1 | |||||||
| 1,984,211 | KBR, Inc. 2020 Term Loan B, 3.739%, (US0001M + 2.750%), 02/05/27 | 1,756,026 | 0.2 | |||||||
| 9,633,135 | Maxar Technologies Ltd. Term Loan B, 3.739%, (US0003M + 2.750%), 10/04/24 | 8,332,662 | 1.1 | |||||||
| 1,540,000 | Science Applications International Corporation 2020 Incremental Term Loan B, 3.701%, (US0003M + 2.250%), 03/05/27 | 1,466,850 | 0.2 | |||||||
| 4,987,500 | TransDigm, Inc. 2020 Term Loan E, 3.239%, (US0001M + 2.250%), 05/30/25 | 4,663,313 | 0.6 | |||||||
| 21,042,681 | 2.8 | |||||||||
Auto Components: 0.5% | ||||||||||
| 4,070,752 | Broadstreet Partners, Inc. 2020 Term Loan B, 4.294%, (US0001M + 3.250%), 01/27/27 | 3,656,045 | 0.5 | |||||||
Automotive: 3.7% | ||||||||||
| 1,675,548 | American Axle and Manufacturing, Inc. Term Loan B, 3.200%, (US0001M + 2.250%), 04/06/24 | 1,420,027 | 0.2 | |||||||
| 1,391,250 | Autokiniton US Holdings, Inc. Term Loan, 6.739%, (US0001M + 5.750%), 05/22/25 | 1,144,303 | 0.1 | |||||||
| 814,060 | Belron Finance US LLC 2018 Term Loan B, 3.957%, (US0003M + 2.250%), 11/13/25 | 773,357 | 0.1 | |||||||
| Principal Amount† | Borrower/Tranche Description | Fair Value | Percentage of Net Assets | |||||||
|---|---|---|---|---|---|---|---|---|---|---|
LOANS*: (continued) | ||||||||||
Automotive: (continued) | ||||||||||
| 3,274,974 | Belron Finance US LLC 2019 USD Term Loan B, 4.270%, (US0003M + 2.500%), 10/30/26 | $ | 3,111,225 | 0.4 | ||||||
| 1,307,156 | Belron Finance US LLC USD Term Loan B, 3.992%, (US0003M + 2.250%), 11/07/24 | 1,241,799 | 0.2 | |||||||
| 1,402,597 | Bright Bidco B.V. 2018 Term Loan B, 4.573%, (US0006M + 3.500%), 06/30/24 | 499,324 | 0.1 | |||||||
| 598,500 | Dealer Tire, LLC 2020 Term Loan B, 5.239%, (US0001M + 4.250%), 12/12/25 | 496,755 | 0.1 | |||||||
| 5,530,883 | Gates Global LLC 2017 USD Repriced Term Loan B, 3.750%, (US0001M + 2.750%), 04/01/24 | 4,977,794 | 0.6 | |||||||
| 2,721,488 | Hertz Corporation, (The) 2016 Term Loan B, 3.739%, (US0001M + 2.750%), 06/30/23 | 1,950,401 | 0.3 | |||||||
| 2,434,188 | Holley Purchaser, Inc. Term Loan B, 6.777%, (US0003M + 5.000%), 10/24/25 | 2,032,547 | 0.3 | |||||||
| 1,260,000 | Innovative Xcessories & Services LLC 2020 Term Loan B, 6.451%, (US0003M + 5.000%), 02/26/27 | 951,300 | 0.1 | |||||||
| 1,049,993 | KAR Auction Services, Inc. 2019 Term Loan B6, 3.188%, (US0001M + 2.250%), 09/19/26 | 976,494 | 0.1 | |||||||
| 6,751,075 | Panther BF Aggregator 2 LP USD Term Loan B, 4.441%, (US0001M + 3.500%), 04/30/26 | 6,210,989 | 0.8 | |||||||
| 1,218,784 | Tenneco, Inc. 2018 Term Loan B, 3.989%, (US0003M + 3.000%), 10/01/25 | 859,243 | 0.1 | |||||||
| 1,916,745 | Truck Hero, Inc. 1st Lien Term Loan, 4.739%, (US0001M + 3.750%), 04/22/24 | 1,472,699 | 0.2 | |||||||
| 28,118,257 | 3.7 | |||||||||
Beverage & Tobacco: 0.5% | ||||||||||
| 4,384,309 | Sunshine Investments B.V. USD Term Loan B3, 4.954%, (US0002M + 3.250%), 03/28/25 | 4,077,407 | 0.5 | |||||||
Brokers, Dealers & Investment Houses: 0.6% | ||||||||||
| 5,969,735 | Brookfield Property REIT Inc. 1st Lien Term Loan B, 3.489%, (US0001M + 2.500%), 08/27/25 | 4,286,270 | 0.6 | |||||||
| VOYA FLOATING RATE FUND | PORTFOLIO OF INVESTMENTS AS OF MARCH 31, 2020 (CONTINUED) |
| Principal Amount† | Borrower/Tranche Description | Fair Value | Percentage of Net Assets | |||||||
|---|---|---|---|---|---|---|---|---|---|---|
LOANS*: (continued) | ||||||||||
Building & Development: 2.6% | ||||||||||
| 1,282,253 | Advanced Drainage Systems Inc Term Loan B, 3.813%, (US0001M + 2.250%), 07/31/26 | $ | 1,198,906 | 0.1 | ||||||
| 3,132,484 | Core & Main LP 2017 Term Loan B, 4.331%, (US0001M + 2.750%), 08/01/24 | 2,772,249 | 0.4 | |||||||
| 4,157,610 | GYP Holdings III Corp. 2018 Term Loan B, 3.739%, (US0001M + 2.750%), 06/01/25 | 3,783,425 | 0.5 | |||||||
| 1,862,438 | Henry Company LLC Term Loan B, 5.000%, (US0001M + 4.000%), 10/05/23 | 1,598,592 | 0.2 | |||||||
| 2,280,951 | Interior Logic Group Holdings IV LLC 2018 Term Loan B, 4.989%, (US0001M + 4.000%), 05/30/25 | 1,984,427 | 0.3 | |||||||
| 2,319,267 | MX Holdings US, Inc. 2018 USD Term Loan B1C, 3.739%, (US0001M + 2.750%), 07/31/25 | 2,006,166 | 0.3 | |||||||
| 4,275,282 | Quikrete Holdings Inc Term Loan, 3.489%, (US0001M + 2.500%), 02/01/27 | 3,719,496 | 0.5 | |||||||
| 2,518,767 | Werner FinCo LP 2017 Term Loan, 5.000%, (US0001M + 4.000%), 07/24/24 | 2,229,109 | 0.3 | |||||||
| 470,000 | Zekelman Industries, Inc. 2020 Term Loan, 3.209%, (US0001M + 2.250%), 01/24/27 | 439,450 | 0.0 | |||||||
| 19,731,820 | 2.6 | |||||||||
Business Equipment & Services: 11.7% | ||||||||||
| 1,796,208 | 24-7 Intouch Inc 2018 Term Loan, 5.739%, (US0001M + 4.750%), 08/25/25 | 1,517,795 | 0.2 | |||||||
| 4,687,686 | AlixPartners, LLP 2017 Term Loan B, 3.500%, (US0001M + 2.500%), 04/04/24 | 4,465,021 | 0.6 | |||||||
| 2,895,750 | Ascend Learning, LLC 2017 Term Loan B, 4.000%, (US0001M + 3.000%), 07/12/24 | 2,625,481 | 0.3 | |||||||
| 2,307,716 | Big Ass Fans, LLC 2018 Term Loan, 5.200%, (US0003M + 3.750%), 05/21/24 | 2,030,790 | 0.3 | |||||||
| 2,420,000 | Castle US Holding Corporation USD Term Loan B, 5.200%, (US0001M + 3.750%), 01/29/27 | 2,108,425 | 0.3 | |||||||
| 2,867,667 | Colorado Buyer Inc Term Loan B, 4.000%, (US0001M + 3.000%), 05/01/24 | 1,947,625 | 0.3 | |||||||
| Principal Amount† | Borrower/Tranche Description | Fair Value | Percentage of Net Assets | |||||||
|---|---|---|---|---|---|---|---|---|---|---|
LOANS*: (continued) | ||||||||||
Business Equipment & Services: (continued) | ||||||||||
| 2,398,794 | Convergint Technologies LLC 2018 1st Lien Term Loan, 3.989%, (US0001M + 3.000%), 02/03/25 | $ | 2,074,957 | 0.3 | ||||||
| 5,051,040 | EIG Investors Corp. 2018 1st Lien Term Loan, 5.388%, (US0003M + 3.750%), 02/09/23 | 4,141,853 | 0.5 | |||||||
| 2,676,516 | Ellie Mae, Inc. Term Loan, 5.200%, (US0003M + 3.750%), 04/17/26 | 2,353,105 | 0.3 | |||||||
| 5,111,316 | EVO Payments International LLC 2018 1st Lien Term Loan, 4.200%, (US0001M + 3.250%), 12/22/23 | 4,446,845 | 0.6 | |||||||
| 1,394,076 | Flexential Intermediate Corporation 2nd Lien Term Loan, 8.713%, (US0003M + 7.250%), 08/01/25 | 573,314 | 0.1 | |||||||
| 2,892,744 | GreenSky Holdings, LLC 2018 Term Loan B, 4.250%, (US0001M + 3.250%), 03/31/25 | 2,386,514 | 0.3 | |||||||
| 4,229,284 | ION Trading Technologies S.a.r.l. USD Incremental Term Loan B, 5.072%, (US0003M + 4.000%), 11/21/24 | 3,214,256 | 0.4 | |||||||
| 2,988,454 | IQOR US Inc. 2nd Lien Term Loan, 10.659%, (US0003M + 8.750%), 04/01/22 | 608,898 | 0.1 | |||||||
| 4,688,445 | IQOR US Inc. Term Loan B, 6.909%, (US0003M + 5.000%), 04/01/21 | 2,807,206 | 0.4 | |||||||
| 5,186,710 | KUEHG Corp. 2018 Incremental Term Loan, 5.200%, (US0003M + 3.750%), 02/21/25 | 3,903,000 | 0.5 | |||||||
| 2,306,798 | Learning Care Group, Inc. 2018 1st Lien Term Loan, 4.984%, (US0003M + 3.250%), 03/13/25 | 1,856,972 | 0.2 | |||||||
| 2,305,000 | Learning Care Group, Inc. 2018 2nd Lien Term Loan, 9.294%, (US0003M + 7.500%), 03/13/26 | 2,051,450 | 0.3 | |||||||
| 1,370,000 | Misys (Finastra) USD 2nd Lien Term Loan, 9.027%, (US0003M + 7.250%), 06/13/25 | 1,060,037 | 0.1 | |||||||
| 1,353,262 | NeuStar, Inc. 2018 Term Loan B4, 4.573%, (US0001M + 3.500%), 08/08/24 | 1,047,086 | 0.1 | |||||||
| VOYA FLOATING RATE FUND | PORTFOLIO OF INVESTMENTS AS OF MARCH 31, 2020 (CONTINUED) |
| Principal Amount† | Borrower/Tranche Description | Fair Value | Percentage of Net Assets | |||||||
|---|---|---|---|---|---|---|---|---|---|---|
LOANS*: (continued) | ||||||||||
Business Equipment & Services: (continued) | ||||||||||
| 3,482,046 | PI US MergerCo, Inc. USD 2017 1st Lien Term Loan, 4.700%, (US0003M + 3.250%), 01/03/25 | $ | 2,985,854 | 0.4 | ||||||
| 4,793,133 | Pre-Paid Legal Services, Inc. 2018 1st Lien Term Loan, 4.239%, (US0001M + 3.250%), 05/01/25 | 4,098,129 | 0.5 | |||||||
| 480,000 | Presidio, Inc. 2020 Term Loan B, 5.280%, (US0002M + 3.500%), 01/22/27 | 451,200 | 0.1 | |||||||
| 1,281,654 | Prometric Holdings, Inc. 1st Lien Term Loan, 4.000%, (US0001M + 3.000%), 01/29/25 | 993,282 | 0.1 | |||||||
| 3,077,713 | Red Ventures, LLC 2020 Term Loan B, 3.489%, (US0001M + 2.500%), 11/08/24 | 2,595,537 | 0.3 | |||||||
| 465,000 | Renaissance Holding Corp. 2018 2nd Lien Term Loan, 7.989%, (US0001M + 7.000%), 05/29/26 | 367,350 | 0.0 | |||||||
| 1,616,063 | Renaissance Learning, Inc. 2018 Add On Term Loan, 4.239%, (US0001M + 3.250%), 05/30/25 | 1,438,296 | 0.2 | |||||||
| 2,981,375 | Research Now Group, Inc. 2017 1st Lien Term Loan, 7.263%, (US0003M + 5.500%), 12/20/24 | 2,683,237 | 0.4 | |||||||
| 850,000 | Rockwood Service Corporation 2020 Term Loan, 5.700%, (US0003M + 4.250%), 01/23/27 | 774,562 | 0.1 | |||||||
| 2,299,029 | Solera Holdings, Inc. USD Term Loan B, 4.363%, (US0003M + 2.750%), 03/03/23 | 2,155,340 | 0.3 | |||||||
| 4,225,600 | Staples, Inc. 7 Year Term Loan, 6.515%, (US0001M + 5.000%), 04/16/26 | 3,396,326 | 0.4 | |||||||
| 525,000 | STG-Fairway Holdings, LLC Term Loan B, 4.572%, (US0006M + 3.500%), 01/31/27 | 480,375 | 0.1 | |||||||
| 1,788,858 | SurveyMonkey Inc. 2018 Term Loan B, 4.370%, (US0001W + 3.750%), 10/10/25 | 1,475,808 | 0.2 | |||||||
| 6,744,625 | Verifone Systems, Inc. 2018 1st Lien Term Loan, 5.695%, (US0003M + 4.000%), 08/20/25 | 4,473,932 | 0.6 | |||||||
| Principal Amount† | Borrower/Tranche Description | Fair Value | Percentage of Net Assets | |||||||
|---|---|---|---|---|---|---|---|---|---|---|
LOANS*: (continued) | ||||||||||
Business Equipment & Services: (continued) | ||||||||||
| 5,453,236 | Verra Mobility Corporation 2020 Term Loan B, 4.239%, (US0001M + 3.250%), 02/28/25 | $ | 4,935,179 | 0.7 | ||||||
| 1,188,409 | Verscend Holding Corp. 2018 Term Loan B, 5.489%, (US0001M + 4.500%), 08/27/25 | 1,128,989 | 0.2 | |||||||
| 4,314,428 | West Corporation 2017 Term Loan, 5.450%, (US0003M + 4.000%), 10/10/24 | 3,322,110 | 0.4 | |||||||
| 4,127,750 | Yak Access, LLC 2018 1st Lien Term Loan B, 6.450%, (US0003M + 5.000%), 07/11/25 | 3,116,451 | 0.4 | |||||||
| 970,000 | Yak Access, LLC 2018 2nd Lien Term Loan B, 11.204%, (US0003M + 10.000%), 07/10/26 | 606,250 | 0.1 | |||||||
| 88,698,837 | 11.7 | |||||||||
Cable & Satellite Television: 1.6% | ||||||||||
| 2,664,821 | Radiate Holdco, LLC 1st Lien Term Loan, 3.989%, (US0001M + 3.000%), 02/01/24 | 2,472,954 | 0.3 | |||||||
| 1,446,375 | Telesat Canada Term Loan B5, 3.740%, (US0001M + 2.750%), 12/07/26 | 1,348,745 | 0.2 | |||||||
| 1,970,000 | UPC Broadband Holding B.V. 2020 USD Term Loan B, 2.955%, (US0001M + 2.250%), 04/30/28 | 1,789,416 | 0.2 | |||||||
| 2,998,077 | Virgin Media Bristol LLC USD Term Loan N, 3.205%, (US0001M + 2.500%), 01/31/28 | 2,855,668 | 0.4 | |||||||
| 3,717,705 | WideOpenWest Finance LLC 2017 Term Loan B, 4.250%, (US0001M + 3.250%), 08/18/23 | 3,397,053 | 0.5 | |||||||
| 11,863,836 | 1.6 | |||||||||
Chemicals & Plastics: 2.5% | ||||||||||
| 2,524,933 | Alpha 3 B.V. 2017 Term Loan B1, 4.450%, (US0003M + 3.000%), 01/31/24 | 2,341,875 | 0.3 | |||||||
| 1,203,950 | Ascend Performance Materials Operations LLC 2019 Term Loan B, 6.700%, (US0003M + 5.250%), 08/27/26 | 1,071,516 | 0.1 | |||||||
| 3,462,389 | Composite Resins Holding B.V. 2018 Term Loan B, 5.255%, (US0001M + 4.250%), 08/01/25 | 3,098,838 | 0.4 | |||||||
| 1,116,372 | Diamond (BC) B.V. USD Term Loan, 4.777%, (US0003M + 3.000%), 09/06/24 | 862,398 | 0.1 | |||||||
| VOYA FLOATING RATE FUND | PORTFOLIO OF INVESTMENTS AS OF MARCH 31, 2020 (CONTINUED) |
| Principal Amount† | Borrower/Tranche Description | Fair Value | Percentage of Net Assets | |||||||
|---|---|---|---|---|---|---|---|---|---|---|
LOANS*: (continued) | ||||||||||
Chemicals & Plastics: (continued) | ||||||||||
| 4,045,467 | Encapsys, LLC 2020 Term Loan B2, 4.250%, (US0001M + 3.250%), 11/07/24 | $ | 3,236,373 | 0.4 | ||||||
| 3,214,313 | Polar US Borrower, LLC 2018 1st Lien Term Loan, 6.609%, (US0003M + 4.750%), 10/15/25 | 2,812,523 | 0.4 | |||||||
| 3,832,636 | Starfruit Finco B.V 2018 USD Term Loan B, 3.863%, (US0001M + 3.000%), 10/01/25 | 3,506,862 | 0.5 | |||||||
| 1,475,812 | Tronox Finance LLC Term Loan B, 3.930%, (US0001M + 2.750%), 09/23/24 | 1,327,001 | 0.2 | |||||||
| 593,513 | Univar Inc. 2019 USD Term Loan B5, 3.450%, (US0003M + 2.000%), 07/01/26 | 543,064 | 0.1 | |||||||
| 18,800,450 | 2.5 | |||||||||
Clothing/Textiles: 0.1% | ||||||||||
| 624,795 | Varsity Brands, Inc. 2017 Term Loan B, 4.500%, (US0001M + 3.500%), 12/15/24 | 494,629 | 0.1 | |||||||
Consumer, Cyclical: 0.1% | ||||||||||
| 2,802,115 | 24 Hour Fitness Worldwide, Inc. 2018 Term Loan B, 4.950%, (US0003M + 3.500%), 05/30/25 | 695,858 | 0.1 | |||||||
Containers & Glass Products: 2.5% | ||||||||||
| 1,001,660 | Albea Beauty Holdings S.A 2018 USD Term Loan B2, 4.907%, (US0006M + 3.000%), 04/22/24 | 813,848 | 0.1 | |||||||
| 3,430,162 | Bway Holding Company 2017 Term Loan B, 5.084%, (US0003M + 3.250%), 04/03/24 | 2,847,034 | 0.4 | |||||||
| 3,791,078 | Charter NEX US, Inc. Incremental Term Loan, 4.489%, (US0001M + 3.500%), 05/16/24 | 3,342,469 | 0.5 | |||||||
| 1,674,845 | Flex Acquisition Company, Inc. 1st Lien Term Loan, 4.898%, (US0003M + 3.000%), 12/29/23 | 1,493,404 | 0.2 | |||||||
| 4,669,672 | Flex Acquisition Company, Inc. 2018 Incremental Term Loan, 5.159%, (US0003M + 3.250%), 06/29/25 | 4,163,793 | 0.5 | |||||||
| 386,378 | Pelican Products, Inc. 2018 2nd Lien Term Loan, 8.750%, (US0001M + 7.750%), 05/01/26 | 307,171 | 0.0 | |||||||
| Principal Amount† | Borrower/Tranche Description | Fair Value | Percentage of Net Assets | |||||||
|---|---|---|---|---|---|---|---|---|---|---|
LOANS*: (continued) | ||||||||||
Containers & Glass Products: (continued) | ||||||||||
| 1,695,000 | Plastipak Packaging, Inc. 2018 Term Loan B, 3.490%, (US0001M + 2.500%), 10/14/24 | $ | 1,563,637 | 0.2 | ||||||
| 660,000 | Proampac AC Borrower LLC Second Lien Term Loan, 10.192%, (US0003M + 8.500%), 11/18/24 | 485,100 | 0.1 | |||||||
| 2,523,614 | Reynolds Group Holdings Inc. USD 2017 Term Loan, 3.739%, (US0001M + 2.750%), 02/05/23 | 2,406,897 | 0.3 | |||||||
| 1,648,271 | TricorBraun Hldgs Inc First Lien Term Loan, 5.202%, (US0003M + 3.750%), 11/30/23 | 1,380,427 | 0.2 | |||||||
| 18,803,780 | 2.5 | |||||||||
Cosmetics/Toiletries: 0.6% | ||||||||||
| 2,185,864 | Anastasia Parent, LLC 2018 Term Loan B, 4.822%, (US0006M + 3.750%), 08/11/25 | 1,318,804 | 0.2 | |||||||
| 4,448,196 | Wellness Merger Sub, Inc. 1st Lien Term Loan, 5.863%, (US0003M + 4.250%), 06/30/24 | 3,543,731 | 0.4 | |||||||
| 4,862,535 | 0.6 | |||||||||
Drugs: 0.6% | ||||||||||
| 1,994,872 | Endo Luxembourg Finance Company I S.a r.l. 2017 Term Loan B, 5.250%, (US0003M + 4.250%), 04/29/24 | 1,790,397 | 0.2 | |||||||
| 3,129,064 | Horizon Therapeutics USA Inc Term Loan B, 3.313%, (US0001M + 2.250%), 05/22/26 | 2,964,788 | 0.4 | |||||||
| 4,755,185 | 0.6 | |||||||||
Ecological Services & Equipment: 0.5% | ||||||||||
| 4,070,217 | GFL Environmental Inc. 2018 USD Term Loan B, 3.991%, (US0001M + 3.000%), 05/30/25 | 3,971,006 | 0.5 | |||||||
Electronics/Electrical: 12.1% | ||||||||||
| 3,232,311 | ASG Technologies Group, Inc. 2018 Term Loan, 4.500%, (US0001M + 3.500%), 07/31/24 | 2,650,495 | 0.3 | |||||||
| 1,199,748 | Barracuda Networks, Inc. 1st Lien Term Loan, 4.517%, (US0003M + 3.250%), 02/12/25 | 1,113,766 | 0.1 | |||||||
| 1,648,715 | BMC Software Finance, Inc. 2018 USD Term Loan B, 5.239%, (US0001M + 4.250%), 10/02/25 | 1,412,949 | 0.2 | |||||||
| VOYA FLOATING RATE FUND | PORTFOLIO OF INVESTMENTS AS OF MARCH 31, 2020 (CONTINUED) |
| Principal Amount† | Borrower/Tranche Description | Fair Value | Percentage of Net Assets | |||||||
|---|---|---|---|---|---|---|---|---|---|---|
LOANS*: (continued) | ||||||||||
Electronics/Electrical: (continued) | ||||||||||
| 1,216,429 | Brave Parent Holdings, Inc. 1st Lien Term Loan, 5.777%, (US0003M + 4.000%), 04/18/25 | $ | 1,062,347 | 0.1 | ||||||
| 3,457,350 | Cohu, Inc. 2018 Term Loan B, 3.989%, (US0001M + 3.000%), 10/01/25 | 2,593,013 | 0.3 | |||||||
| 1,465,744 | Dynatrace LLC 2018 1st Lien Term Loan, 3.239%, (US0001M + 2.250%), 08/22/25 | 1,385,128 | 0.2 | |||||||
| 1,470,057 | EagleView Technology Corporation 2018 Add On Term Loan B, 5.113%, (US0003M + 3.500%), 08/14/25 | 1,249,548 | 0.2 | |||||||
| 1,056,188 | Electrical Components International, Inc. 2018 1st Lien Term Loan, 5.239%, (US0003M + 4.250%), 06/26/25 | 797,422 | 0.1 | |||||||
| 2,115,750 | Exact Merger Sub LLC 1st Lien Term Loan, 5.700%, (US0003M + 4.250%), 09/27/24 | 1,900,648 | 0.3 | |||||||
| 3,245,475 | GlobalFoundries Inc USD Term Loan B, 6.200%, (US0003M + 4.750%), 06/05/26 | 2,791,109 | 0.4 | |||||||
| 1,950,113 | Helios Software Holdings, Inc. USD Term Loan, 5.322%, (US0006M + 4.250%), 10/24/25 | 1,657,596 | 0.2 | |||||||
| 2,233,552 | Hyland Software, Inc. 2018 1st Lien Term Loan, 4.489%, (US0001M + 3.250%), 07/01/24 | 2,086,510 | 0.3 | |||||||
| 2,009,763 | Imperva, Inc. 1st Lien Term Loan, 5.704%, (US0003M + 4.000%), 01/12/26 | 1,673,128 | 0.2 | |||||||
| 1,368,871 | Imperva, Inc. 2nd Lien Term Loan, 9.442%, (US0003M + 7.750%), 01/10/27 | 1,231,984 | 0.2 | |||||||
| 984,642 | Infor (US), Inc. Term Loan B6, 3.750%, (US0001M + 2.750%), 02/01/22 | 954,610 | 0.1 | |||||||
| 1,865,000 | Informatica LLC 2020 USD Term Loan B, 4.239%, (US0001M + 3.250%), 02/25/27 | 1,650,525 | 0.2 | |||||||
| 2,782,293 | Kronos Incorporated 2017 Term Loan B, 4.763%, (US0003M + 3.000%), 11/01/23 | 2,577,099 | 0.3 | |||||||
| 386,935 | MA FinanceCo., LLC USD Term Loan B3, 3.489%, (US0001M + 2.500%), 06/21/24 | 352,756 | 0.0 | |||||||
| Principal Amount† | Borrower/Tranche Description | Fair Value | Percentage of Net Assets | |||||||
|---|---|---|---|---|---|---|---|---|---|---|
LOANS*: (continued) | ||||||||||
Electronics/Electrical: (continued) | ||||||||||
| 3,953,925 | McAfee, LLC 2018 USD Term Loan B, 4.691%, (US0001M + 3.750%), 09/30/24 | $ | 3,690,329 | 0.5 | ||||||
| 5,229,161 | MH Sub I, LLC 2017 1st Lien Term Loan, 4.822%, (US0006M + 3.750%), 09/13/24 | 4,549,370 | 0.6 | |||||||
| 2,540,000 | MH Sub I, LLC 2017 2nd Lien Term Loan, 8.572%, (US0006M + 7.500%), 09/15/25 | 2,063,750 | 0.3 | |||||||
| 3,224,224 | Project Boost Purchaser, LLC 2019 Term Loan B, 4.489%, (US0001M + 3.500%), 06/01/26 | 2,659,985 | 0.4 | |||||||
| 2,305,813 | Project Leopard Holdings, Inc. 2019 Term Loan, 5.700%, (US0003M + 4.250%), 07/07/23 | 2,063,702 | 0.3 | |||||||
| 3,747,075 | Quest Software US Holdings Inc. 2018 1st Lien Term Loan, 6.027%, (US0003M + 4.250%), 05/16/25 | 2,932,086 | 0.4 | |||||||
| 3,000,000 | Quest Software US Holdings Inc. 2018 2nd Lien Term Loan, 10.027%, (US0003M + 8.250%), 05/18/26 | 1,837,500 | 0.2 | |||||||
| 6,244,836 | Rackspace Hosting, Inc. 2017 Incremental 1st Lien Term Loan, 4.762%, (US0003M + 3.000%), 11/03/23 | 5,667,189 | 0.7 | |||||||
| 2,399,180 | Riverbed Technology, Inc. 2016 Term Loan, 4.250%, (US0001M + 3.250%), 04/24/22 | 1,581,059 | 0.2 | |||||||
| 1,685,000 | Rocket Software, Inc. 2018 2nd Lien Term Loan, 9.239%, (US0001M + 8.250%), 11/27/26 | 1,128,950 | 0.1 | |||||||
| 6,068,700 | Rocket Software, Inc. 2018 Term Loan, 5.239%, (US0001M + 4.250%), 11/28/25 | 5,026,904 | 0.7 | |||||||
| 2,649,099 | RP Crown Parent LLC Term Loan B, 3.750%, (US0001M + 2.750%), 10/12/23 | 2,543,135 | 0.3 | |||||||
| 2,613,065 | Seattle Spinco, Inc. USD Term Loan B3, 3.489%, (US0001M + 2.500%), 06/21/24 | 2,382,245 | 0.3 | |||||||
| 2,507,717 | Sirius Computer Solutions, Inc. 2020 Term Loan, 4.489%, (US0001M + 3.500%), 07/01/26 | 2,213,060 | 0.3 | |||||||
| VOYA FLOATING RATE FUND | PORTFOLIO OF INVESTMENTS AS OF MARCH 31, 2020 (CONTINUED) |
| Principal Amount† | Borrower/Tranche Description | Fair Value | Percentage of Net Assets | |||||||
|---|---|---|---|---|---|---|---|---|---|---|
LOANS*: (continued) | ||||||||||
Electronics/Electrical: (continued) | ||||||||||
| 5,688,116 | SkillSoft Corporation 1st Lien Term Loan, 6.527%, (US0003M + 4.750%), 04/28/21 | $ | 3,744,674 | 0.5 | ||||||
| 2,131,820 | SolarWinds Holdings, Inc. 2018 Term Loan B, 3.739%, (US0001M + 2.750%), 02/05/24 | 1,988,988 | 0.3 | |||||||
| 1,913,076 | SonicWall US Holdings Inc. 1st Lien Term Loan, 5.195%, (US0003M + 3.500%), 05/16/25 | 1,591,042 | 0.2 | |||||||
| 1,060,000 | SonicWall US Holdings Inc. 2nd Lien Term Loan, 9.195%, (US0003M + 7.500%), 05/18/26 | 840,050 | 0.1 | |||||||
| 1,070,000 | Surf Holdings, LLC USD Term Loan, 4.814%, (US0003M + 3.500%), 03/05/27 | 960,325 | 0.1 | |||||||
| 4,303,329 | Travelport Finance (Luxembourg) S.a.r.l. 2019 Term Loan, 6.072%, (US0003M + 5.000%), 05/29/26 | 2,858,129 | 0.4 | |||||||
| 2,213,850 | Ultimate Software Group Inc(The) Term Loan B, 4.739%, (US0001M + 3.750%), 05/04/26 | 2,092,088 | 0.3 | |||||||
| 4,988,141 | Veritas Bermuda Ltd. USD Repriced Term Loan B, 5.950%, (US0003M + 4.500%), 01/27/23 | 4,264,860 | 0.6 | |||||||
| 2,015,000 | Vertafore, Inc. 2018 2nd Lien Term Loan, 8.239%, (US0001M + 7.250%), 07/02/26 | 1,789,991 | 0.2 | |||||||
| 1,280,666 | Web.com Group, Inc. 2018 2nd Lien Term Loan, 8.945%, (US0003M + 7.750%), 10/09/26 | 989,315 | 0.1 | |||||||
| 2,134,931 | Web.com Group, Inc. 2018 Term Loan B, 4.945%, (US0003M + 3.750%), 10/10/25 | 1,777,330 | 0.3 | |||||||
| 92,376,689 | 12.1 | |||||||||
Financial: 0.2% | ||||||||||
| 1,315,821 | Blucora, Inc. 2017 Term Loan B, 4.450%, (US0003M + 3.000%), 05/22/24 | 1,203,976 | 0.2 | |||||||
Financial Intermediaries: 2.1% | ||||||||||
| 1,371,579 | Blackhawk Network Holdings, Inc 2018 1st Lien Term Loan, 3.989%, (US0001M + 3.000%), 06/15/25 | 1,133,839 | 0.2 | |||||||
| Principal Amount† | Borrower/Tranche Description | Fair Value | Percentage of Net Assets | |||||||
|---|---|---|---|---|---|---|---|---|---|---|
LOANS*: (continued) | ||||||||||
Financial Intermediaries: (continued) | ||||||||||
| 1,176,127 | Blackstone Mortgage Trust, Inc. 2019 Term Loan B, 3.239%, (US0001M + 2.250%), 04/23/26 | $ | 1,029,111 | 0.1 | ||||||
| 4,433,563 | Cushman & Wakefield U.S. Borrower, LLC 2020 Term Loan B, 3.739%, (US0001M + 2.750%), 08/21/25 | 3,990,206 | 0.5 | |||||||
| 1,810,000 | Deerfield Dakota Holding, LLC 2020 USD Term Loan B, 5.201%, (US0003M + 3.750%), 03/05/27 | 1,556,600 | 0.2 | |||||||
| 3,419,916 | Edelman Financial Center, LLC 2018 1st Lien Term Loan, 4.179%, (US0001M + 3.250%), 07/21/25 | 2,952,527 | 0.4 | |||||||
| 857,850 | First Eagle Holdings, Inc. 2020 Term Loan B, 3.950%, (US0003M + 2.500%), 02/01/27 | 728,100 | 0.1 | |||||||
| 1,178,460 | Focus Financial Partners, LLC 2020 Term Loan, 2.989%, (US0001M + 2.000%), 07/03/24 | 1,084,183 | 0.2 | |||||||
| 1,038,038 | VFH Parent LLC 2019 Term Loan B, 4.005%, (US0001M + 3.000%), 03/01/26 | 961,916 | 0.1 | |||||||
| 2,815,118 | Victory Capital Holdings, Inc. 2020 Term Loan B, 4.015%, (US0001M + 2.500%), 07/01/26 | 2,505,455 | 0.3 | |||||||
| 15,941,937 | 2.1 | |||||||||
Food Products: 2.0% | ||||||||||
| 967,451 | 8th Avenue Food & Provisions, Inc. 2018 1st Lien Term Loan, 4.297%, (US0001M + 3.500%), 10/01/25 | 903,357 | 0.1 | |||||||
| 400,000 | 8th Avenue Food & Provisions, Inc. 2018 2nd Lien Term Loan, 8.547%, (US0001M + 7.750%), 10/01/26 | 360,000 | 0.1 | |||||||
| 2,442,506 | Atkins Nutritionals Holdings II, Inc. 2017 Term Loan B, 4.750%, (US0001M + 3.750%), 07/07/24 | 2,283,743 | 0.3 | |||||||
| 1,986,043 | B&G Foods, Inc. 2019 Term Loan B4, 3.489%, (US0001M + 2.500%), 10/10/26 | 1,893,360 | 0.2 | |||||||
| 817,620 | Del Monte Foods, Inc. 1st Lien Term Loan, 4.865%, (US0003M + 3.250%), 02/18/21 | 668,405 | 0.1 | |||||||
| VOYA FLOATING RATE FUND | PORTFOLIO OF INVESTMENTS AS OF MARCH 31, 2020 (CONTINUED) |
| Principal Amount† | Borrower/Tranche Description | Fair Value | Percentage of Net Assets | |||||||
|---|---|---|---|---|---|---|---|---|---|---|
LOANS*: (continued) | ||||||||||
Food Products: (continued) | ||||||||||
| 1,240,000 | Froneri International PLC 2020 USD Term Loan, 3.239%, (US0001M + 2.250%), 01/29/27 | $ | 1,190,400 | 0.2 | ||||||
| 4,299,359 | IRB Holding Corp 2020 Term Loan B, 3.751%, (US0001M + 2.750%), 02/05/25 | 3,353,500 | 0.4 | |||||||
| 1,709 | (1),(2) | NPC International, Inc. 1st Lien Term Loan, 4.951%, (US0003M + 3.500%), 04/19/24 | 726 | 0.0 | ||||||
| 970,000 | (1),(2) | NPC International, Inc. 2nd Lien Term Loan, 8.951%, (US0003M + 7.500%), 04/18/25 | 26,675 | 0.0 | ||||||
| 5,113,913 | Sigma Bidco B.V. 2018 USD Term Loan B, 4.909%, (US0003M + 3.000%), 07/02/25 | 4,538,597 | 0.6 | |||||||
| 15,218,763 | 2.0 | |||||||||
Food Service: 1.3% | ||||||||||
| 1,181,075 | Carrols Restaurant Group, Inc. Term Loan B, 4.210%, (US0001M + 3.250%), 04/30/26 | 891,712 | 0.1 | |||||||
| 1,021,566 | Fogo De Chao, Inc. 2018 Add On Term Loan, 5.700%, (US0003M + 4.250%), 04/07/25 | 715,096 | 0.1 | |||||||
| 6,632,070 | Golden Nugget, Inc. 2017 Incremental Term Loan B, 3.584%, (US0001M + 2.500%), 10/04/23 | 5,184,070 | 0.7 | |||||||
| 3,664,352 | Hearthside Food Solutions, LLC 2018 Term Loan B, 4.677%, (US0001M + 3.688%), 05/23/25 | 3,133,021 | 0.4 | |||||||
| 9,923,899 | 1.3 | |||||||||
Food/Drug Retailers: 1.5% | ||||||||||
| 4,184,420 | EG Finco Limited 2018 USD Term Loan, 5.072%, (US0006M + 4.000%), 02/07/25 | 3,065,088 | 0.4 | |||||||
| 926,100 | EG Group Limited 2018 USD Term Loan B, 5.450%, (US0006M + 4.000%), 02/07/25 | 678,368 | 0.1 | |||||||
| 1,261,161 | Moran Foods LLC 2020 Term Loan, 8.451%, (US0003M + 7.000%), 03/12/24 | 1,166,574 | 0.1 | |||||||
| 6,350,535 | (1),(2) | Moran Foods LLC Term Loan, 7.451%, (US0003M + 6.000%), 12/05/23 | 793,817 | 0.1 | ||||||
| 1,532,300 | Portillo Restaurant Group (The) Term Loan, 6.950%, (US0003M + 5.500%), 09/06/24 | 1,391,520 | 0.2 | |||||||
| Principal Amount† | Borrower/Tranche Description | Fair Value | Percentage of Net Assets | |||||||
|---|---|---|---|---|---|---|---|---|---|---|
LOANS*: (continued) | ||||||||||
Food/Drug Retailers: (continued) | ||||||||||
| 5,021,787 | United Natural Foods, Inc. Term Loan B, 5.239%, (US0001M + 4.250%), 10/22/25 | $ | 4,343,846 | 0.6 | ||||||
| 11,439,213 | 1.5 | |||||||||
Forest Products: 0.2% | ||||||||||
| 1,776,075 | LABL, Inc. 2019 USD Term Loan, 5.000%, (US0001M + 4.500%), 07/01/26 | 1,505,224 | 0.2 | |||||||
Health Care: 7.1% | ||||||||||
| 1,519,650 | Accelerated Health Systems, LLC Term Loan B, 4.297%, (US0001M + 3.500%), 10/31/25 | 1,371,484 | 0.2 | |||||||
| 4,311,606 | ADMI Corp. 2018 Term Loan B, 4.200%, (US0001M + 2.750%), 04/30/25 | 3,869,666 | 0.5 | |||||||
| 2,203,626 | Air Methods Corporation 2017 Term Loan B, 4.950%, (US0003M + 3.500%), 04/22/24 | 1,592,120 | 0.2 | |||||||
| 4,078,472 | Auris Luxembourg III S.a.r.l. 2019 USD Term Loan B, 4.739%, (US0001M + 3.750%), 02/27/26 | 3,160,815 | 0.4 | |||||||
| 1,472,673 | Bausch Health Companies, Inc. 2018 Term Loan B, 3.612%, (US0001M + 3.000%), 06/02/25 | 1,411,311 | 0.2 | |||||||
| 1,022,379 | Change Healthcare Holdings LLC 2017 Term Loan B, 3.500%, (US0001M + 2.500%), 03/01/24 | 943,997 | 0.1 | |||||||
| 1,200,000 | Da Vinci Purchaser Corp. 2019 Term Loan, 5.872%, (US0003M + 4.000%), 01/08/27 | 1,120,500 | 0.2 | |||||||
| 1,216,904 | DentalCorp Perfect Smile ULC 1st Lien Term Loan, 4.750%, (US0001M + 3.750%), 06/06/25 | 967,438 | 0.1 | |||||||
| 2,004,925 | Emerald TopCo Inc Term Loan, 4.489%, (US0001M + 3.500%), 07/24/26 | 1,837,013 | 0.2 | |||||||
| 2,495,339 | Envision Healthcare Corporation 2018 1st Lien Term Loan, 4.739%, (US0001M + 3.750%), 10/10/25 | 1,337,502 | 0.2 | |||||||
| 5,099,528 | ExamWorks Group, Inc. 2017 Term Loan, 4.250%, (US0006M + 3.250%), 07/27/23 | 4,627,822 | 0.6 | |||||||
| VOYA FLOATING RATE FUND | PORTFOLIO OF INVESTMENTS AS OF MARCH 31, 2020 (CONTINUED) |
| Principal Amount† | Borrower/Tranche Description | Fair Value | Percentage of Net Assets | |||||||
|---|---|---|---|---|---|---|---|---|---|---|
LOANS*: (continued) | ||||||||||
Health Care: (continued) | ||||||||||
| 2,861,375 | Global Medical Response, Inc. 2017 Term Loan B2, 5.863%, (US0001M + 4.250%), 03/14/25 | $ | 2,582,391 | 0.3 | ||||||
| 2,114,811 | Global Medical Response, Inc. 2018 Term Loan B1, 4.932%, (US0002M + 3.250%), 04/28/22 | 1,956,200 | 0.3 | |||||||
| 2,910,827 | GoodRx, Inc. 1st Lien Term Loan, 3.739%, (US0001M + 2.750%), 10/10/25 | 2,750,732 | 0.4 | |||||||
| 2,555,159 | Inovalon Holdings, Inc. 2020 Term Loan B1, 3.750%, (US0001M + 3.000%), 04/02/25 | 2,353,941 | 0.3 | |||||||
| 3,152,859 | Jaguar Holding Company II 2018 Term Loan, 3.500%, (US0001M + 2.500%), 08/18/22 | 3,039,883 | 0.4 | |||||||
| 2,372,929 | MPH Acquisition Holdings LLC 2016 Term Loan B, 4.200%, (US0003M + 2.750%), 06/07/23 | 2,159,365 | 0.3 | |||||||
| 1,613,005 | Ortho-Clinical Diagnostics SA 2018 Term Loan B, 4.765%, (US0001M + 3.250%), 06/30/25 | 1,380,732 | 0.2 | |||||||
| 3,860,874 | Phoenix Guarantor Inc 2020 Term Loan B, 4.113%, (US0001M + 3.250%), 03/05/26 | 3,552,004 | 0.5 | |||||||
| 1,824,231 | RegionalCare Hospital Partners Holdings, Inc. 2018 Term Loan B, 4.739%, (US0001M + 3.750%), 11/17/25 | 1,711,736 | 0.2 | |||||||
| 2,580,282 | Select Medical Corporation 2017 Term Loan B, 3.430%, (US0001M + 2.500%), 03/06/25 | 2,464,169 | 0.3 | |||||||
| 1,700,000 | Sotera Health Holdings, LLC 2019 Term Loan, 5.500%, (US0001M + 4.500%), 12/11/26 | 1,515,834 | 0.2 | |||||||
| 1,346,538 | Tecomet Inc. 2017 Repriced Term Loan, 4.250%, (US0001M + 3.250%), 05/01/24 | 1,151,290 | 0.2 | |||||||
| 1,134,595 | U.S. Anesthesia Partners, Inc. 2017 Term Loan, 4.000%, (US0001M + 3.000%), 06/23/24 | 859,456 | 0.1 | |||||||
| 4,308,994 | Vizient, Inc. 2020 Term Loan B6, 2.989%, (US0001M + 2.000%), 05/06/26 | 4,093,544 | 0.5 | |||||||
| 53,810,945 | 7.1 | |||||||||
| Principal Amount† | Borrower/Tranche Description | Fair Value | Percentage of Net Assets | |||||||
|---|---|---|---|---|---|---|---|---|---|---|
LOANS*: (continued) | ||||||||||
Home Furnishings: 0.2% | ||||||||||
| 1,562,138 | Prime Security Services Borrower, LLC 2019 Term Loan B1, 4.606%, (US0001M + 3.250%), 09/23/26 | $ | 1,421,545 | 0.2 | ||||||
Industrial: 0.3% | ||||||||||
| 2,862,779 | NCI Building Systems, Inc. 2018 Term Loan, 4.561%, (US0001M + 3.750%), 04/12/25 | 2,504,931 | 0.3 | |||||||
Industrial Equipment: 1.5% | ||||||||||
| 2,475,000 | APi Group DE, Inc. Term Loan B, 3.489%, (US0001M + 2.500%), 10/01/26 | 2,277,000 | 0.3 | |||||||
| 1,405,695 | CPM Holdings, Inc. 2018 1st Lien Term Loan, 5.353%, (US0006M + 3.750%), 11/17/25 | 1,163,213 | 0.2 | |||||||
| 2,202,603 | EWT Holdings III Corp. 2020 Term Loan, 3.739%, (US0001M + 2.750%), 12/20/24 | 2,026,394 | 0.3 | |||||||
| 2,976,323 | Filtration Group Corporation 2018 1st Lien Term Loan, 3.989%, (US0001M + 3.000%), 03/29/25 | 2,630,326 | 0.3 | |||||||
| 2,855,650 | Granite Holdings US Acquisition Co. Term Loan B, 6.322%, (US0006M + 5.250%), 09/30/26 | 2,070,346 | 0.3 | |||||||
| 1,050,000 | Star US Bidco LLC Term Loan B, 5.701%, (US0003M + 4.250%), 03/03/27 | 939,750 | 0.1 | |||||||
| 11,107,029 | 1.5 | |||||||||
Insurance: 5.1% | ||||||||||
| 1,960,237 | Achilles Acquisition LLC 2018 Term Loan, 5.000%, (US0001M + 4.000%), 10/13/25 | 1,754,412 | 0.2 | |||||||
| 4,275,140 | Acrisure, LLC 2020 Term Loan B, 5.207%, (US0003M + 3.500%), 02/15/27 | 3,633,869 | 0.5 | |||||||
| 2,815,939 | Alera Group Holdings, Inc. 2018 Term Loan B, 4.989%, (US0001M + 4.000%), 08/01/25 | 2,478,027 | 0.3 | |||||||
| 1,115,356 | Alliant Holdings Intermediate, LLC 2018 Term Loan B, 3.989%, (US0001M + 3.000%), 05/09/25 | 1,036,352 | 0.1 | |||||||
| 2,396,888 | Alliant Holdings Intermediate, LLC Term Loan B, 3.862%, (US0001M + 3.250%), 05/09/25 | 2,223,113 | 0.3 | |||||||
| VOYA FLOATING RATE FUND | PORTFOLIO OF INVESTMENTS AS OF MARCH 31, 2020 (CONTINUED) |
| Principal Amount† | Borrower/Tranche Description | Fair Value | Percentage of Net Assets | |||||||
|---|---|---|---|---|---|---|---|---|---|---|
LOANS*: (continued) | ||||||||||
Insurance: (continued) | ||||||||||
| 5,611,424 | AmWINS Group, Inc. 2017 Term Loan B, 3.753%, (US0001M + 2.750%), 01/25/24 | $ | 5,253,696 | 0.7 | ||||||
| 1,120,000 | Applied Systems, Inc. 2017 2nd Lien Term Loan, 8.450%, (US0003M + 7.000%), 09/19/25 | 1,036,000 | 0.1 | |||||||
| 1,802,188 | Aretec Group, Inc. 2018 Term Loan, 5.239%, (US0001M + 4.250%), 10/01/25 | 1,243,509 | 0.2 | |||||||
| 5,342,802 | AssuredPartners, Inc. 2020 Term Loan B, 4.489%, (US0001M + 3.500%), 02/12/27 | 4,768,451 | 0.6 | |||||||
| 2,538,274 | CCC Information Services, Inc. 2017 1st Lien Term Loan, 3.750%, (US0001M + 2.750%), 04/29/24 | 2,345,185 | 0.3 | |||||||
| 1,204,111 | Hub International Limited 2018 Term Loan B, 4.543%, (US0002M + 2.750%), 04/25/25 | 1,137,884 | 0.2 | |||||||
| 5,304,023 | NFP Corp. 2020 Term Loan, 4.239%, (US0001M + 3.250%), 02/15/27 | 4,641,020 | 0.6 | |||||||
| 4,265,701 | Sedgwick Claims Management Services, Inc. 2018 Term Loan B, 4.239%, (US0001M + 3.250%), 12/31/25 | 3,768,034 | 0.5 | |||||||
| 3,285,305 | USI, Inc. 2017 Repriced Term Loan, 3.989%, (US0003M + 3.000%), 05/16/24 | 2,997,841 | 0.4 | |||||||
| 967,575 | USI, Inc. 2019 Incremental Term Loan B, 4.989%, (US0001M + 4.000%), 12/02/26 | 885,331 | 0.1 | |||||||
| 39,202,724 | 5.1 | |||||||||
Leisure Good/Activities/Movies: 4.2% | ||||||||||
| 865,000 | Airxcel, Inc. 2018 2nd Lien Term Loan, 9.739%, (US0001M + 8.750%), 04/27/26 | 681,188 | 0.1 | |||||||
| 1,726,677 | AMC Entertainment Holdings Inc. 2019 Term Loan B, 4.080%, (US0001M + 3.000%), 04/22/26 | 1,300,763 | 0.2 | |||||||
| 4,762,875 | ClubCorp Club Operations, Inc. 2017 Incremental Term Loan, 4.200%, (US0003M + 2.750%), 09/18/24 | 3,060,147 | 0.4 | |||||||
| 2,989,073 | Crown Finance US, Inc. 2018 USD Term Loan, 3.322%, (US0006M + 2.250%), 02/28/25 | 2,008,657 | 0.3 | |||||||
| Principal Amount† | Borrower/Tranche Description | Fair Value | Percentage of Net Assets | |||||||
|---|---|---|---|---|---|---|---|---|---|---|
LOANS*: (continued) | ||||||||||
Leisure Good/Activities/Movies: (continued) | ||||||||||
| 3,815,825 | Crown Finance US, Inc. 2019 Incremental Term Loan, 3.558%, (US0006M + 2.500%), 09/30/26 | $ | 2,526,076 | 0.3 | ||||||
| 2,177,322 | Equinox Holdings, Inc. 2017 1st Lien Term Loan, 4.072%, (US0006M + 3.000%), 03/08/24 | 1,625,734 | 0.2 | |||||||
| 3,058,485 | Fitness International, LLC 2018 Term Loan B, 4.322%, (US0006M + 3.250%), 04/18/25 | 2,319,350 | 0.3 | |||||||
| 2,962,121 | Intrawest Resorts Holdings, Inc. Term Loan B1, 3.750%, (US0001M + 2.750%), 07/31/24 | 2,656,036 | 0.3 | |||||||
| 5,038,661 | Kingpin Intermediate Holdings LLC 2018 Term Loan B, 4.500%, (US0001M + 3.500%), 07/03/24 | 3,577,449 | 0.5 | |||||||
| 5,353,967 | Life Time, Inc. 2017 Term Loan B, 4.363%, (US0003M + 2.750%), 06/10/22 | 4,042,245 | 0.5 | |||||||
| 180,759 | Motion Finco Sarl Delayed Draw Term Loan B2, 4.323%, (US0006M + 3.250%), 11/04/26 | 147,319 | 0.0 | |||||||
| 1,375,341 | Motion Finco Sarl USD Term Loan B1, 4.209%, (US0006M + 3.250%), 11/13/26 | 1,160,444 | 0.2 | |||||||
| 2,562,563 | Playtika Holding Corp Term Loan B, 7.072%, (US0006M + 6.000%), 12/10/24 | 2,417,350 | 0.3 | |||||||
| 2,799,649 | Thor Industries, Inc. USD Term Loan B, 5.365%, (US0001M + 3.750%), 02/01/26 | 2,407,698 | 0.3 | |||||||
| 1,629,375 | WeddingWire, Inc. 1st Lien Term Loan, 5.950%, (US0001M + 4.500%), 12/19/25 | 1,425,703 | 0.2 | |||||||
| 600,000 | WeddingWire, Inc. 2nd Lien Term Loan, 9.700%, (US0003M + 8.250%), 12/21/26 | 555,000 | 0.1 | |||||||
| 31,911,159 | 4.2 | |||||||||
Lodging & Casinos: 3.1% | ||||||||||
| 5,229,984 | Caesars Resort Collection, LLC 2017 1st Lien Term Loan B, 3.739%, (US0001M + 2.750%), 12/23/24 | 4,296,061 | 0.6 | |||||||
| 380,267 | Eldorado Resorts LLC 2017 Term Loan B, 3.250%, (US0006M + 2.250%), 04/17/24 | 372,662 | 0.0 | |||||||
| VOYA FLOATING RATE FUND | PORTFOLIO OF INVESTMENTS AS OF MARCH 31, 2020 (CONTINUED) |
| Principal Amount† | Borrower/Tranche Description | Fair Value | Percentage of Net Assets | |||||||
|---|---|---|---|---|---|---|---|---|---|---|
LOANS*: (continued) | ||||||||||
Lodging & Casinos: (continued) | ||||||||||
| 5,519,656 | Everi Payments Inc. Term Loan B, 3.822%, (US0003M + 2.750%), 05/09/24 | $ | 4,424,926 | 0.6 | ||||||
| 5,031,250 | Golden Entertainment, Inc. 2017 1st Lien Term Loan, 3.960%, (US0001M + 3.000%), 10/21/24 | 3,848,906 | 0.5 | |||||||
| 3,881,950 | PCI Gaming Authority Term Loan, 3.489%, (US0001M + 2.500%), 05/29/26 | 3,119,422 | 0.4 | |||||||
| 2,660,700 | Scientific Games International, Inc. 2018 Term Loan B5, 4.246%, (US0002M + 2.750%), 08/14/24 | 2,161,819 | 0.3 | |||||||
| 2,925,976 | Stars Group Holdings B.V. (The) 2018 USD Incremental Term Loan, 4.950%, (US0003M + 3.500%), 07/10/25 | 2,805,280 | 0.4 | |||||||
| 3,119,520 | Station Casinos LLC 2020 Term Loan B, 3.240%, (US0001M + 2.250%), 02/08/27 | 2,626,635 | 0.3 | |||||||
| 23,655,711 | 3.1 | |||||||||
Nonferrous Metals/Minerals: 0.6% | ||||||||||
| 6,894,811 | Covia Holdings Corporation Term Loan, 5.874%, (US0003M + 4.000%), 06/01/25 | 3,214,705 | 0.4 | |||||||
| 3,490,039 | U.S. Silica Company 2018 Term Loan B, 5.000%, (US0001M + 4.000%), 05/01/25 | 1,723,207 | 0.2 | |||||||
| 4,937,912 | 0.6 | |||||||||
Oil & Gas: 0.9% | ||||||||||
| 2,670,000 | Encino Acquisition Partners Holdings, LLC 2018 2nd Lien Term Loan, 7.750%, (US0001M + 6.750%), 10/29/25 | 1,268,250 | 0.1 | |||||||
| 2,247,249 | Glass Mountain Pipeline Holdings, LLC Term Loan B, 6.280%, (US0003M + 4.500%), 12/23/24 | 1,269,696 | 0.2 | |||||||
| 958,306 | HGIM Corp. 2018 Exit Term Loan, 7.713%, (US0003M + 6.000%), 07/02/23 | 554,220 | 0.1 | |||||||
| 2,525,913 | Lower Cadence Holdings LLC Term Loan B, 4.989%, (US0001M + 4.000%), 05/22/26 | 1,582,906 | 0.2 | |||||||
| 2,987,425 | Lucid Energy Group II LLC Incremental Term Loan B2, 4.000%, (US0001M + 3.000%), 02/19/25 | 1,702,832 | 0.2 | |||||||
| Principal Amount† | Borrower/Tranche Description | Fair Value | Percentage of Net Assets | |||||||
|---|---|---|---|---|---|---|---|---|---|---|
LOANS*: (continued) | ||||||||||
Oil & Gas: (continued) | ||||||||||
| 834,438 | Moda Ingleside Energy Center, LLC 2018 Term Loan B, 4.239%, (US0001M + 3.250%), 09/29/25 | $ | 646,689 | 0.1 | ||||||
| 7,024,593 | 0.9 | |||||||||
Publishing: 0.2% | ||||||||||
| 2,000,000 | Meredith Corporation 2020 Term Loan B2, 3.489%, (US0001M + 2.500%), 01/31/25 | 1,820,000 | 0.2 | |||||||
Radio & Television: 3.8% | ||||||||||
| 4,170,957 | A-L Parent LLC 2016 1st Lien Term Loan, 4.860%, (US0001M + 3.250%), 12/01/23 | 2,857,106 | 0.4 | |||||||
| 1,050,000 | Banijay Entertainment S.A.S USD Term Loan, 5.213%, (US0003M + 3.750%), 03/04/25 | 945,000 | 0.1 | |||||||
| 2,676,550 | Clear Channel Outdoor Holdings, Inc. Term Loan B, 4.489%, (US0001M + 3.500%), 08/21/26 | 2,425,623 | 0.3 | |||||||
| 1,198,975 | Cumulus Media New Holdings Inc. Term Loan B, 4.822%, (US0006M + 3.750%), 03/31/26 | 973,168 | 0.1 | |||||||
| 2,840,700 | Diamond Sports Group, LLC Term Loan, 4.180%, (US0001M + 3.250%), 08/24/26 | 2,229,950 | 0.3 | |||||||
| 3,337,679 | Entercom Media Corp. 2019 Term Loan, 3.489%, (US0001M + 2.500%), 11/18/24 | 3,003,911 | 0.4 | |||||||
| 1,132,163 | iHeartCommunications, Inc. 2020 Term Loan, 3.989%, (US0001M + 3.000%), 05/01/26 | 969,697 | 0.1 | |||||||
| 2,678,014 | NASCAR Holdings, Inc Term Loan B, 3.674%, (US0001M + 2.750%), 10/19/26 | 2,367,812 | 0.3 | |||||||
| 2,072,072 | Nexstar Broadcasting, Inc. 2019 Term Loan B4, 4.331%, (US0001M + 2.750%), 09/18/26 | 1,958,108 | 0.3 | |||||||
| 5,504,984 | Sinclair Television Group Inc. Term Loan B2B, 3.210%, (US0001M + 2.500%), 09/30/26 | 5,098,991 | 0.7 | |||||||
| 3,727,339 | Terrier Media Buyer, Inc. Term Loan B, 5.700%, (US0003M + 4.250%), 12/17/26 | 3,231,137 | 0.4 | |||||||
| VOYA FLOATING RATE FUND | PORTFOLIO OF INVESTMENTS AS OF MARCH 31, 2020 (CONTINUED) |
| Principal Amount† | Borrower/Tranche Description | Fair Value | Percentage of Net Assets | |||||||
|---|---|---|---|---|---|---|---|---|---|---|
LOANS*: (continued) | ||||||||||
Radio & Television: (continued) | ||||||||||
| 2,949,984 | Univision Communications Inc. Term Loan C5, 3.750%, (US0001M + 2.750%), 03/15/24 | $ | 2,522,237 | 0.4 | ||||||
| 28,582,740 | 3.8 | |||||||||
Retailers (Except Food & Drug): 2.7% | ||||||||||
| 2,428,120 | Academy, Ltd. 2015 Term Loan B, 5.558%, (US0001M + 4.000%), 07/01/22 | 1,337,489 | 0.2 | |||||||
| 4,449,091 | Bass Pro Group, LLC Term Loan B, 5.989%, (US0001M + 5.000%), 09/25/24 | 3,781,727 | 0.5 | |||||||
| 3,208,846 | Belk, Inc. 2019 Term Loan B, 7.750%, (US0006M + 6.750%), 07/31/25 | 1,684,644 | 0.2 | |||||||
| 1,370,889 | BJs Wholesale Club, Inc. 2017 1st Lien Term Loan, 3.047%, (US0001M + 2.250%), 02/03/24 | 1,309,199 | 0.2 | |||||||
| 6,843,539 | Jo-Ann Stores, Inc. 2016 Term Loan, 6.000%, (US0006M + 5.000%), 10/20/23 | 2,840,068 | 0.4 | |||||||
| 5,668,720 | Leslies Poolmart, Inc. 2016 Term Loan, 4.500%, (US0001M + 3.500%), 08/16/23 | 4,754,639 | 0.6 | |||||||
| 5,978,563 | Mens Wearhouse, Inc. (The) 2018 Term Loan, 4.831%, (US0001M + 3.250%), 04/09/25 | 2,391,425 | 0.3 | |||||||
| 3,106,417 | Petco Animal Supplies, Inc. 2017 Term Loan B, 5.027%, (US0003M + 3.250%), 01/26/23 | 2,180,705 | 0.3 | |||||||
| 20,279,896 | 2.7 | |||||||||
Steel: 0.3% | ||||||||||
| 2,263,115 | GrafTech Finance, Inc. 2018 Term Loan B, 4.500%, (US0001M + 3.500%), 02/12/25 | 1,980,225 | 0.3 | |||||||
Surface Transport: 1.3% | ||||||||||
| 3,218,027 | Navistar International Corporation 2017 1st Lien Term Loan B, 4.280%, (US0001M + 3.500%), 11/06/24 | 2,826,499 | 0.4 | |||||||
| 3,299,064 | PODS, LLC 2018 1st Lien Term Loan, 3.750%, (US0001M + 2.750%), 12/06/24 | 2,894,929 | 0.4 | |||||||
| 4,602,289 | Savage Enterprises LLC 2020 Term Loan B, 4.620%, (US0001M + 4.000%), 08/01/25 | 4,092,203 | 0.5 | |||||||
| 9,813,631 | 1.3 | |||||||||
| Principal Amount† | Borrower/Tranche Description | Fair Value | Percentage of Net Assets | |||||||
|---|---|---|---|---|---|---|---|---|---|---|
LOANS*: (continued) | ||||||||||
Technology: 0.5% | ||||||||||
| 4,276,198 | Misys (Finastra)—TL B 1L, 5.277%, (US0003M + 3.500%), 06/13/24 | $ | 3,720,292 | 0.5 | ||||||
Telecommunications: 6.6% | ||||||||||
| 1,925,153 | Altice Financing SA 2017 USD Term Loan B, 4.412%, (US0002M + 2.750%), 07/15/25 | 1,771,141 | 0.2 | |||||||
| 1,925,675 | Altice Financing SA USD 2017 1st Lien Term Loan, 3.674%, (US0001M + 2.750%), 01/31/26 | 1,771,621 | 0.3 | |||||||
| 1,653,250 | Altice France S.A. USD Term Loan B11, 3.739%, (US0001M + 2.750%), 07/31/25 | 1,522,367 | 0.2 | |||||||
| 4,832,866 | Altice France S.A. USD Term Loan B12, 4.392%, (US0001M + 3.688%), 01/31/26 | 4,542,894 | 0.6 | |||||||
| 3,600,000 | Asurion LLC 2017 2nd Lien Term Loan, 7.489%, (US0001M + 6.500%), 08/04/25 | 3,366,000 | 0.4 | |||||||
| 4,018,721 | Asurion LLC 2017 Term Loan B4, 3.989%, (US0001M + 3.000%), 08/04/22 | 3,737,411 | 0.5 | |||||||
| 2,980,293 | Asurion LLC 2018 Term Loan B7, 3.989%, (US0001M + 3.000%), 11/03/24 | 2,806,443 | 0.4 | |||||||
| 4,695,256 | Avaya, Inc. 2018 Term Loan B, 4.955%, (US0001M + 4.250%), 12/15/24 | 4,026,182 | 0.5 | |||||||
| 4,089,750 | CenturyLink, Inc. 2020 Term Loan B, 3.239%, (US0001M + 2.250%), 03/15/27 | 3,800,911 | 0.5 | |||||||
| 3,328,250 | CommScope, Inc. 2019 Term Loan B, 4.239%, (US0001M + 3.250%), 04/06/26 | 3,161,838 | 0.4 | |||||||
| 2,435,000 | Connect Finco Sarl Term Loan B, 5.490%, (US0001M + 4.500%), 12/11/26 | 1,990,612 | 0.3 | |||||||
| 1,248,242 | Flexential Intermediate Corporation 2017 1st Lien Term Loan, 4.950%, (US0003M + 3.500%), 08/01/24 | 914,337 | 0.1 | |||||||
| 3,787,571 | Global Tel*Link Corporation 2018 1st Lien Term Loan, 5.700%, (US0003M + 4.250%), 11/29/25 | 3,266,780 | 0.4 | |||||||
| 2,225,000 | Global Tel*Link Corporation 2018 2nd Lien Term Loan, 9.700%, (US0003M + 8.250%), 11/29/26 | 1,863,437 | 0.3 | |||||||
| VOYA FLOATING RATE FUND | PORTFOLIO OF INVESTMENTS AS OF MARCH 31, 2020 (CONTINUED) |
| Principal Amount† | Borrower/Tranche Description | Fair Value | Percentage of Net Assets | |||||||
|---|---|---|---|---|---|---|---|---|---|---|
LOANS*: (continued) | ||||||||||
Telecommunications: (continued) | ||||||||||
| 1,989,873 | GTT Communications, Inc. 2018 USD Term Loan B, 3.740%, (US0001M + 2.750%), 05/31/25 | $ | 1,361,406 | 0.2 | ||||||
| 1,840,000 | Iridium Satellite LLC Term Loan, 4.750%, (US0001M + 3.750%), 11/04/26 | 1,757,200 | 0.2 | |||||||
| 3,761,391 | Securus Technologies Holdings, Inc. 2017 1st Lien Term Loan, 5.500%, (US0006M + 4.500%), 11/01/24 | 2,990,306 | 0.4 | |||||||
| 2,817,836 | Speedcast International Limited Term Loan B, 4.200%, (US0003M + 2.750%), 05/15/25 | 713,851 | 0.1 | |||||||
| 4,484,022 | Zayo Group Holdings, Inc. USD Term Loan, 3.989%, (US0001M + 3.000%), 02/19/27 | 4,203,771 | 0.5 | |||||||
| 940,000 | Ziggo Financing Partnership USD Term Loan I, 3.205%, (US0001M + 2.500%), 04/30/28 | 877,725 | 0.1 | |||||||
| 50,446,233 | 6.6 | |||||||||
Utilities: 1.3% | ||||||||||
| 1,492,167 | Calpine Corporation Term Loan B5, 3.240%, (US0003M + 2.250%), 01/15/24 | 1,441,184 | 0.2 | |||||||
| 2,153,246 | LMBE-MC Holdco II LLC Term Loan B, 5.460%, (US0003M + 4.000%), 12/03/25 | 1,884,090 | 0.2 | |||||||
| 3,192,252 | Longview Power LLC Term Loan B, 7.780%, (US0003M + 6.000%), 04/13/21 | 678,354 | 0.1 | |||||||
| 3,288,356 | Nautilus Power, LLC Term Loan B, 5.250%, (US0001M + 4.250%), 05/16/24 | 2,910,195 | 0.4 | |||||||
| 2,114,050 | Sabre Industries, Inc. 2019 Term Loan B, 4.494%, (US0003M + 3.500%), 04/15/26 | 1,936,121 | 0.2 | |||||||
| 1,720,373 | Southeast PowerGen, LLC Term Loan B, 4.500%, (US0001M + 3.500%), 12/02/21 | 1,413,574 | 0.2 | |||||||
| 10,263,518 | 1.3 | |||||||||
Total Loans (Cost $832,466,780) | 683,951,381 | 90.0 | ||||||||
| Shares | Value | Percentage of Net Assets | ||||||||
|---|---|---|---|---|---|---|---|---|---|---|
EQUITIES AND OTHER ASSETS: 0.0% | ||||||||||
| 69,381 | (3) | Cumulus Media, Inc. Class-A | $ | 376,045 | 0.0 | |||||
| 2,254 | (3) | Harvey Gulf International Marine LLC | 14,274 | 0.0 | ||||||
| 10,072 | (3) | Harvey Gulf International Marine LLC—Warrants | 63,786 | 0.0 | ||||||
| 57,165 | (3) | Millennium Health, LLC | 3,144 | 0.0 | ||||||
| — | (4) | Millennium Health, LLC- Corporate Claims Trust | — | 0.0 | ||||||
| 222 | (3) | Southcross Holdings GP LLC | — | 0.0 | ||||||
| 222 | (3) | Southcross Holdings LP- Class A | — | 0.0 | ||||||
| 42,856 | (3) | The Oneida Group (formerly EveryWare Global, Inc.) | 1,286 | 0.0 | ||||||
Total Equities and Other Assets (Cost $2,213,800) | 458,535 | 0.0 | ||||||||
| Total Long-Term Investments (Cost $834,680,580) | 684,409,916 | 90.0 | ||||||||
SHORT-TERM INVESTMENTS: 3.5% | ||||||||||
Mutual Funds: 3.5% | ||||||||||
| 26,493,138 | (5) | State Street Institutional Liquid Reserves Fund—Premier Class, 0.810% (Cost $26,494,631) | 26,469,294 | 3.5 | ||||||
| Total Short-Term Investments (Cost $26,494,631) | 26,469,294 | 3.5 | ||||||||
Total Investments (Cost $861,175,211) | $ | 710,879,210 | 93.5 | |||||||
Assets in Excess of Other Liabilities | 49,213,070 | 6.5 | ||||||||
Net Assets | $ | 760,092,280 | 100.0 | |||||||
| * | Loans, while exempt from registration under the Securities Act of 1933, as amended, contain certain restrictions on resale and cannot be sold publicly. These loans bear interest (unless otherwise noted) at rates that float periodically at a margin above the London Inter-Bank Offered Rate (“LIBOR”) and other short-term rates. | |
| † | Unless otherwise indicated, principal amount is shown in USD. |
| (1) | Issuer filed for bankruptcy and/or is in default. | |
| (2) | Senior Loan is on non-accrual status at March 31, 2020. | |
| (3) | Non-income producing security. | |
| (4) | For fair value measurement disclosure purposes, security is categorized as Level 3, whose value was determined using significant unobservable inputs. | |
| (5) | Rate shown is the 7-day yield as of March 31, 2020. |
| US0001M | 1-month LIBOR | |
| US0001W | 1-week LIBOR | |
| US0002M | 2-month LIBOR | |
| US0003M | 3-month LIBOR | |
| US0006M | 6-month LIBOR |
| VOYA FLOATING RATE FUND | PORTFOLIO OF INVESTMENTS AS OF MARCH 31, 2020 (CONTINUED) |
| Quoted Prices in Active Markets for Identical Investments (Level 1) | Significant Other Observable Inputs (Level 2) | Significant Unobservable Inputs (Level 3) | Fair Value at March 31, 2020 | ||||||||||||||||
|---|---|---|---|---|---|---|---|---|---|---|---|---|---|---|---|---|---|---|---|
Asset Table | |||||||||||||||||||
Investments, at fair value | |||||||||||||||||||
| Loans | $ | — | $ | 683,951,381 | $ | — | $ | 683,951,381 | |||||||||||
| Equities and Other Assets | 376,045 | 82,490 | — | 458,535 | |||||||||||||||
| Short-Term Investments | 26,469,294 | — | — | 26,469,294 | |||||||||||||||
| Total Investments, at fair value | $ | 26,845,339 | $ | 684,033,871 | $ | — | $ | 710,879,210 | |||||||||||
| ˆ | See Note 2, “Significant Accounting Policies” in the Notes to Financial Statements for additional information. |
| Cost for federal income tax purposes was $861,678,652. | ||||
| Net unrealized depreciation consisted of: | ||||
| Gross Unrealized Appreciation | $ | — | ||
| Gross Unrealized Depreciation | (150,799,442 | ) | ||
| Net Unrealized Depreciation | $ | (150,799,442 | ) |
| Fund Name | Type | Per Share Amount | ||||||
|---|---|---|---|---|---|---|---|---|
| Voya Floating Rate Fund | ||||||||
| Class A | NII | $ | 0.4661 | |||||
| Class C | NII | $ | 0.3945 | |||||
| Class I | NII | $ | 0.4901 | |||||
| Class P | NII | $ | 0.5552 | |||||
| Class P3 | NII | $ | 0.5635 | |||||
| Class R | NII | $ | 0.4423 | |||||
| Class W | NII | $ | 0.4901 | |||||
TRUSTEE AND OFFICER INFORMATION (UNAUDITED)
| Name, Address and Age | Position(s) Held with the Trust | Term of Office and Length of Time Served(1) | Principal Occupation(s) — During the Past 5 Years | Number of Funds in Fund Complex Overseen by Trustee(2) | Other Board Positions Held by Trustee | |||||
|---|---|---|---|---|---|---|---|---|---|---|
Independent Trustees: | ||||||||||
| Colleen D. Baldwin 7337 East Doubletree Ranch Rd. Suite 100 Scottsdale, Arizona 85258 Age: 59 | Trustee Chairperson | November 2007–Present January 2020– Present | President, Glantuam Partners, LLC, a business consulting firm (January 2009– Present). | 136 | Dentaquest (February 2014– Present); RSR Partners, Inc. (2016–Present). | |||||
| John V. Boyer 7337 East Doubletree Ranch Rd. Suite 100 Scottsdale, Arizona 85258 Age: 66 | Trustee | January 2005–Present | Retired. Formerly, President and Chief Executive Officer, Bechtler Arts Foundation, an arts and education foundation (January 2008–December 2019). | 136 | None. | |||||
| Patricia W. Chadwick 7337 East Doubletree Ranch Rd. Suite 100 Scottsdale, Arizona 85258 Age: 71 | Trustee | January 2006–Present | Consultant and President, Ravengate Partners LLC, a consulting firm that provides advice regarding financial markets and the global economy (January 2000–Present). | 136 | Wisconsin Energy Corporation (June 2006–Present); The Royce Funds (22 funds) (December 2009–Present); and AMICA Mutual Insurance Company (1992–Present). | |||||
| Martin J. Gavin 7337 East Doubletree Ranch Rd. Suite 100 Scottsdale, AZ 85258 Age: 70 | Trustee | August 2015–Present | Retired. Formerly, President and Chief Executive Officer, Connecticut Children’s Medical Center (May 2006–November 2015). | 136 | None. | |||||
| Joseph E. Obermeyer 7337 East Doubletree Ranch Rd. Suite 100 Scottsdale, Arizona 85258 Age: 62 | Trustee | May 2013–Present | President, Obermeyer & Associates, Inc., a provider of financial and economic consulting services (November 1999– Present). | 136 | None. | |||||
| Sheryl K. Pressler 7337 East Doubletree Ranch Rd. Suite 100 Scottsdale, Arizona 85258 Age: 69 | Trustee | January 2006–Present | Consultant (May 2001– Present). | 136 | None. | |||||
| Christopher P. Sullivan 7337 East Doubletree Ranch Rd. Suite 100 Scottsdale, Arizona 85258 Age: 66 | Trustee | October 2015–Present | Retired. | 136 | None. |
TRUSTEE AND OFFICER INFORMATION (UNAUDITED) (CONTINUED)
| Name, Address and Age | Position(s) Held with the Trust | Term of Office and Length of Time Served(1) | Principal Occupation(s) — During the Past 5 Years | Number of Funds in Fund Complex Overseen by Trustee(2) | Other Board Positions Held by Trustee | |||||
|---|---|---|---|---|---|---|---|---|---|---|
Trustee who is an “interested person”: | ||||||||||
| Dina Santoro 230 Park Avenue New York, New York 10169 Age: 47 | Trustee | July 2018–Present | President, Voya Investments, LLC and Voya Capital, LLC (March 2018–Present); Senior Vice President, Voya Investments Distributor, LLC (April 2018–Present); Senior Managing Director, Head of Product and Marketing Strategy, Voya Investment Management (September 2017– Present). Formerly, Managing Director, Quantitative Management Associates, LLC (January 2004–August 2017). | 136 | Voya Investments, LLC, Voya Capital, LLC, and Voya Funds Services, LLC (March 2018– Present); Voya Investments Distributor, LLC (April 2018– Present). | |||||
| (1) | Trustees serve until their successors are duly elected and qualified. The tenure of each Trustee who is not an “interested person” as defined in the 1940 Act, of each Fund (“Independent Trustee”) is subject to the Board’s retirement policy which states that each duly elected or appointed Independent Trustee shall retire from and cease to be a member of the Board of Trustees at the close of business on December 31 of the calendar year in which the Independent Trustee attains the age of 75. A majority vote of the Board’s other Independent Trustees may extend the retirement date of an Independent Trustee if the retirement would trigger a requirement to hold a meeting of shareholders of the Trust under applicable law, whether for the purposes of appointing a successor to the Independent Trustee or otherwise comply under applicable law, in which case the extension would apply until such time as the shareholder meeting can be held or is no longer required (as determined by a vote of a majority of the other Independent Trustees). |
| (2) | For the purposes of this table, “Fund Complex” means the Voya family of funds including the following investment companies: Voya Asia Pacific High Dividend Equity Income Fund; Voya Balanced Portfolio, Inc.; Voya Emerging Markets High Dividend Equity Fund; Voya Equity Trust; Voya Funds Trust; Voya Global Advantage and Premium Opportunity Fund; Voya Global Equity Dividend and Premium Opportunity Fund; Voya Government Money Market Portfolio; Voya Infrastructure, Industrials and Materials Fund; Voya Intermediate Bond Portfolio; Voya International High Dividend Equity Income Fund; Voya Investors Trust; Voya Mutual Funds; Voya Natural Resources Equity Income Fund; Voya Partners, Inc.; Voya Prime Rate Trust; Voya Senior Income Fund; Voya Separate Portfolios Trust; Voya Strategic Allocation Portfolios, Inc.; Voya Variable Funds; Voya Variable Insurance Trust; Voya Variable Portfolios, Inc.; and Voya Variable Products Trust. The number of funds in the Fund Complex is as of April 30, 2020. |
TRUSTEE AND OFFICER INFORMATION (UNAUDITED) (CONTINUED)
| Name, Address and Age | Position(s) Held With the Trust | Term of Office and Length of Time Served(1) | Principal Occupation(s) — During the Past 5 Years | |||
|---|---|---|---|---|---|---|
| Michael Bell One Orange Way Windsor, Connecticut 06095 Age: 51 | Chief Executive Officer | March 2018–Present | Chief Executive Officer and Director, Voya Investments, LLC, Voya Capital, LLC, and Voya Funds Services, LLC (March 2018–Present); Senior Vice President and Chief Financial Officer, Voya Investments Distributor, LLC (September 2019–Present); Chief Financial Officer, Voya Investment Management (September 2014–Present). Formerly, Senior Vice President, Chief Financial Officer and Treasurer, Voya Investments, LLC (November 2015–March 2018). | |||
| Dina Santoro 230 Park Avenue New York, New York 10169 Age: 47 | President | March 2018–Present | President and Director, Voya Investments, LLC and Voya Capital, LLC (March 2018–Present); Director, Voya Funds Services, LLC (March 2018-Present); Director and Senior Vice President, Voya Investments Distributor, LLC (April 2018–Present); Senior Managing Director, Head of Product and Marketing Strategy, Voya Investment Management (September 2017–Present). Formerly, Managing Director, Quantitative Management Associates, LLC (January 2004–August 2017). | |||
| Jonathan Nash 230 Park Avenue New York, New York 10169 Age: 52 | Executive Vice President Chief Investment Risk Officer | March 2020–Present March 2020–Present | Senior Vice President, Investment Risk Management, Voya Investment Management (March 2017–Present); Formerly, Consultant, DA Capital LLC (January 2016–March 2017); Managing Director, Enterprise Risk, American International Group (AIG) (September 2014– March 2015). | |||
| James M. Fink 5780 Powers Ferry Road NW Atlanta, Georgia 30327 Age: 62 | Executive Vice President | March 2018–Present | Managing Director, Voya Investments, LLC, Voya Capital, LLC, and Voya Funds Services, LLC (March 2018-Present); Senior Vice President, Voya Investments Distributor, LLC (April 2018–Present); Chief Administrative Officer, Voya Investment Management (September 2017–Present). Formerly, Managing Director, Operations, Voya Investment Management (March 1999–September 2017). | |||
| Kevin M. Gleason 7337 East Doubletree Ranch Rd. Suite 100 Scottsdale, Arizona 85258 Age: 53 | Chief Compliance Officer | February 2012–Present | Senior Vice President, Voya Investment Management and Chief Compliance Officer, Voya Family of Funds (February 2012–Present). | |||
| Todd Modic 7337 East Doubletree Ranch Rd. Suite 100 Scottsdale, Arizona 85258 Age: 52 | Senior Vice President, Chief/Principal Financial Officer and Assistant Secretary | March 2005–Present | President, Voya Funds Services, LLC (March 2018–Present) and Senior Vice President, Voya Investments, LLC (April 2005–Present). | |||
| Kimberly A. Anderson 7337 East Doubletree Ranch Rd. Suite 100 Scottsdale, Arizona 85258 Age: 55 | Senior Vice President | November 2003–Present | Senior Vice President, Voya Investments, LLC (September 2003–Present). | |||
| Robert Terris 5780 Powers Ferry Road NW Atlanta, Georgia 30327 Age: 49 | Senior Vice President | May 2006–Present | Senior Vice President, Voya Investments Distributor, LLC (April 2018–Present); Senior Vice President, Head of Division Operations, Voya Investments, LLC (October 2015–Present) and Voya Funds Services, LLC (March 2006–Present). | |||
| Maria M. Anderson 7337 East Doubletree Ranch Rd. Suite 100 Scottsdale, Arizona 85258 Age: 62 | Vice President | September 2004–Present | Vice President, Voya Investments, LLC (October 2015–Present) and Voya Funds Services, LLC (September 2004–Present). | |||
| Fred Bedoya 7337 East Doubletree Ranch Rd. Suite 100 Scottsdale, Arizona 85258 Age: 47 | Vice President | September 2012–Present | Vice President, Voya Investments, LLC (October 2015–Present) and Voya Funds Services, LLC (July 2012–Present). |
TRUSTEE AND OFFICER INFORMATION (UNAUDITED) (CONTINUED)
| Name, Address and Age | Position(s) Held With the Trust | Term of Office and Length of Time Served(1) | Principal Occupation(s) — During the Past 5 Years | |||
|---|---|---|---|---|---|---|
| Sara M. Donaldson 7337 East Doubletree Ranch Rd. Suite 100 Scottsdale, Arizona 85258 Age: 60 | Vice President | September 2014–Present | Vice President, Voya Investments, LLC (October 2015–Present). Formerly, Vice President, Voya Funds Services, LLC (April 2014–October 2015). | |||
| Micheline S. Faver 7337 East Doubletree Ranch Rd. Suite 100 Scottsdale, Arizona 85258 Age: 42 | Vice President | September 2016–Present | Senior Vice President, Head of Fund Compliance and Chief Compliance Office, Voya Investments, LLC (March 2020–Present). Formerly, Vice President, Head of Fund Compliance and Chief Compliance Officer, Voya Investments, LLC (June 2016–March 2020); and Vice President, Mutual Fund Compliance (March 2014–June 2016). | |||
| Robyn L. Ichilov 7337 East Doubletree Ranch Rd. Suite 100 Scottsdale, Arizona 85258 Age: 52 | Vice President | October 2000–Present | Vice President, Voya Funds Services, LLC (November 1995 Present) and Voya Investments, LLC (August 1997–Present). | |||
| Jason Kadavy 7337 East Doubletree Ranch Rd. Suite 100 Scottsdale, Arizona 85258 Age: 44 | Vice President | September 2012–Present | Vice President, Voya Investments, LLC (October 2015–Present) and Voya Funds Services, LLC (July 2007–Present). | |||
| Andrew K. Schlueter 7337 East Doubletree Ranch Rd. Suite 100 Scottsdale, Arizona 85258 Age: 44 | Vice President | March 2018–Present | Vice President, Voya Investments Distributor, LLC (April 2018–Present); Vice President, Voya Investments, LLC and Voya Funds Services, LLC (March 2018–Present); Vice President, Head of Mutual Fund Operations, Voya Investment Management (February 2018– Present). Formerly, Vice President, Voya Investment Management (March 2014–February 2018). | |||
| Craig Wheeler 7337 East Doubletree Ranch Rd. Suite 100 Scottsdale, Arizona 85258 Age: 51 | Vice President | May 2013–Present | Vice President–Director of Tax, Voya Investments, LLC (October 2015–Present). Formerly, Vice President–Director of Tax, Voya Funds Services, LLC (March 2013–October 2015). | |||
| Monia Piacenti One Orange Way Windsor, Connecticut 06095 Age: 43 | Anti-Money Laundering Officer | June 2018–Present | Anti-Money Laundering Officer, Voya Investments Distributor, LLC, Voya Investment Management and Voya Investment Management Trust Co. (June 2018–Present); Compliance Consultant, Voya Financial, Inc. (January 2019– Present). Formerly, Senior Compliance Officer, Voya Investment Management (December 2009–December 2018). | |||
| Theresa K. Kelety 7337 East Doubletree Ranch Rd. Suite 100 Scottsdale, Arizona 85258 Age: 57 | Secretary | January 2020–Present | Vice President and Senior Counsel, Voya Investment Management–Mutual Fund Legal Department (March 2010–Present). | |||
| Paul A. Caldarelli 7337 East Doubletree Ranch Rd. Suite 100 Scottsdale, Arizona 85258 Age: 68 | Assistant Secretary | June 2010–Present | Vice President and Senior Counsel, Voya Investment Management–Mutual Fund Legal Department (March 2010–Present). | |||
| Joanne F. Osberg 7337 East Doubletree Ranch Rd. Suite 100 Scottsdale, Arizona 85258 Age: 38 | Assistant Secretary | January 2020–Present | Vice President and Counsel, Voya Investment Management–Mutual Fund Legal Department (January 2013–Present). |
(1) | The Officers hold office until the next annual meeting of the Board of Trustees and until their successors shall have been elected and qualified. |
ADVISORY AND SUB-ADVISORY CONTRACT APPROVAL DISCUSSION (UNAUDITED)
ADVISORY AND SUB-ADVISORY CONTRACT APPROVAL DISCUSSION (UNAUDITED) (CONTINUED)
ADVISORY AND SUB-ADVISORY CONTRACT APPROVAL DISCUSSION (UNAUDITED) (CONTINUED)
ADVISORY AND SUB-ADVISORY CONTRACT APPROVAL DISCUSSION (UNAUDITED) (CONTINUED)
Voya Investments, LLC
7337 East Doubletree Ranch Road, Suite 100
Scottsdale, Arizona 85258
Voya Investments Distributor, LLC
7337 East Doubletree Ranch Road, Suite 100
Scottsdale, Arizona 85258
BNY Mellon Investment Servicing (U.S.) Inc.
301 Bellevue Parkway
Wilmington, Delaware 19809
Ernst & Young LLP
200 Clarendon Street
Boston, MA 02116
State Street Bank and Trust Company
801 Pennsylvania Avenue
Kansas City, Missouri 64105
Ropes & Gray LLP
Prudential Tower
800 Boylston Street
Boston, Massachusetts 02199
RETIREMENT | INVESTMENTS | INSURANCE |  |
| 163061 (0320-052120) |
Item 2. Code of Ethics.
As of the end of the period covered by this report, Registrant had adopted a code of ethics, as defined in Item 2 of Form N-CSR, that applies to the Registrant’s principal executive officer and principal financial officer. There were no amendments to the Code during the period covered by the report. The Registrant did not grant any waivers, including implicit waivers, from any provisions of the Code during the period covered by this report. The code of ethics is filed herewith pursuant to Item 10(a)(1), Ex-99.CODE ETH.
Item 3. Audit Committee Financial Expert.
The Board of Trustees has determined that Colleen D. Baldwin, Martin J. Gavin, and Joseph E. Obermeyer are audit committee financial experts, as defined in Item 3 of Form N-CSR. Ms. Baldwin, Mr. Gavin, and Mr. Obermeyer are “independent” for purposes of Item 3 of Form N-CSR.
Item 4. Principal Accountant Fees and Services.
Below are the amount of fees that Ernst & Young LLP (“EY”), the Funds’ current Independent Registered Public Accounting Firm, billed to the Funds during the Funds’ fiscal year ended March 31, 2020 and the amount of fees that KPMG LLP (“KPMG”), the Funds’ prior Independent Registered Public Accounting Firm, billed to the Funds during the Funds’ fiscal year ended March 31, 2019.
| (a) | Audit Fees(1): The aggregate fees billed for each of the last two fiscal years for professional services rendered by EY and KPMG, the principal accountant for each respective audit of the registrant’s annual financial statements or services that are normally provided by the accountant in connection with statutory and regulatory filings or engagements for those fiscal years were $178,200 for the year ended March 31, 2020 and $165,325 for the year ended March 31, 2019. |
| (b) | Audit-Related Fees: The aggregate fees billed in each of the last two fiscal years for assurance and related services by EY and KPMG that are reasonably related to the performance of each respective audit of the registrant’s financial statements and are not reported under paragraph (a) of this Item were $0 for the year ended March 31, 2020 and $16,200 for the year ended March 31, 2019. |
| (c) | Tax Fees(2): The aggregate fees billed in each of the last two fiscal years for professional services rendered by EY and KPMG for tax compliance, tax advice, and tax planning were $15,325 for the year ended March 31, 2020 and $58,121 for the year ended March 31, 2019. Such services included review of excise distribution calculations (if applicable), preparation of the Funds’ federal, state, and excise tax returns, tax services related to mergers and routine consulting. |
| (d) | All Other Fees(3): The aggregate fees billed in each of the last two fiscal years for products and services provided by EY and KPMG,, other than the services reported in paragraphs (a) through (c) of this Item were $0 for the year ended March 31, 2020 and $0 for the year ended March 31, 2019. |
(1)For the year ended March 31, 2020, KPMG billed $9,614 for Audit Fees.
(2)For the year ended March 31, 2020, KPMG billed $63,930 for Tax Fees.
(3)For the year ended March 31, 2020, KPMG billed $3,914 for All Other Fees.
| (e)(1) | Audit Committee Pre-Approval Policies and Procedures |
Appendix A
AUDIT AND NON-AUDIT SERVICES
PRE-APPROVAL POLICY
I. Statement of Principles
Under the Sarbanes-Oxley Act of 2002 (the “Act”), the Audit Committee of the Board of Directors or Trustees (the “Committee”) of the Voya funds (each a “Fund,” collectively, the “Funds”) set out onExhibit A to this Audit and Non-Audit Services Pre-Approval Policy (“Policy”) is responsible for the oversight of the work of the Funds’ independent auditors. As part of its responsibilities, the Committee must pre-approve the audit and non-audit services performed by the auditors in order to assure that the provision of these services does not impair the auditors’ independence from the Funds. The Committee has adopted, and the Board has ratified, this Policy, which sets out the procedures and conditions under which the services of the independent auditors may be pre-approved.
Under Securities and Exchange Commission (“SEC”) rules promulgated in accordance with the Act, the Funds may establish two different approaches to pre-approving audit and non-audit services. The Committee may approve services without consideration of specific case-by-case services (“general pre-approval”) or it may pre-approve specific services (“specific pre-approval”). The Committee believes that the combination of these approaches contemplated in this Policy results in an effective and efficient method for pre-approving audit and non-audit services to be performed by the Funds’ independent auditors. Under this Policy, services that are not of a type that may receive general pre-approval require specific pre-approval by the Committee. Any proposed services that exceed pre-approved cost levels or budgeted amounts will also require the Committee’s specific pre-approval.
For both types of approval, the Committee considers whether the subject services are consistent with the SEC’s rules on auditor independence and that such services are compatible with maintaining the auditors independence. The Committee also considers whether a particular audit firm is in the best position to provide effective and efficient services to the Funds. Reasons that the auditors are in the best position include the auditors’ familiarity with the Funds’ business, personnel, culture, accounting systems, risk profile, and other factors, and whether the services will enhance the Funds’ ability to manage and control risk or improve audit quality. Such factors will be considered as a whole, with no one factor being determinative.
The appendices attached to this Policy describe the audit, audit-related, tax-related, and other services that have the Committee’s general pre-approval. For any service that has been approved through general pre-approval, the general pre-approval will remain in place for a period 12 months from the date of pre-approval, unless the Committee determines that a different period is appropriate. The Committee will annually review and pre-approve the services that may be provided by the independent auditors without specific pre-approval. The Committee will revise the list of services subject to general pre-approval as appropriate. This Policy does not serve as a delegation to Fund management of the Committee’s duty to pre-approve services performed by the Funds’ independent auditors.
II. Audit Services
The annual audit services engagement terms and fees are subject to the Committee’s specific pre-approval. Audit services are those services that are normally provided by auditors in connection with statutory and regulatory filings or engagements or those that generally only independent auditors can reasonably provide. They include the Funds’ annual financial statement audit and procedures that the independent auditors must perform in order to form an opinion on the Funds’ financial statements (e.g., information systems and procedural reviews and testing). The Committee will monitor the audit services engagement and approve any changes in terms, conditions or fees deemed by the Committee to be necessary or appropriate.
The Committee may grant general pre-approval to other audit services, such as statutory audits and services associated with SEC registration statements, periodic reports and other documents filed with the SEC or issued in connection with securities offerings.
The Committee has pre-approved the audit services listed on Appendix A. The Committee must specifically approve all audit services not listed on Appendix A.
III. Audit-related Services
Audit-related services are assurance and related services that are reasonably related to the performance of the audit or the review of the Funds’ financial statements or are traditionally performed by the independent auditors. The Committee believes that the provision of audit-related services will not impair the independent auditors’ independence, and therefore may grant pre-approval to audit-related services. Audit-related services include accounting consultations related to accounting, financial reporting or disclosure matters not classified as “audit services;” assistance with understanding and implementing new accounting and financial reporting guidance from rulemaking authorities; agreed-upon or expanded audit procedures relating to accounting and/or billing records required to respond to or comply with financial, accounting or regulatory reporting matters; and assistance with internal control reporting requirements under Form N-SAR or Form N-CSR.
The Committee has pre-approved the audit-related services listed on Appendix B. The Committee must specifically approve all audit-related services not listed on Appendix B.
IV. Tax Services
The Committee believes the independent auditors can provide tax services to the Funds, including tax compliance, tax planning, and tax advice, without compromising the auditors’ independence. Therefore, the Committee may grant general pre-approval with respect to tax services historically provided by the Funds’ independent auditors that do not, in the Committee’s view, impair auditor independence and that are consistent with the SEC’s rules on auditor independence.
The Committee will not grant pre-approval if the independent auditors initially recommends a transaction the sole business purpose of which is tax avoidance and the tax treatment of which may not be supported in the Internal Revenue Code and related regulations. The Committee may consult outside counsel to determine that tax planning and reporting positions are consistent with this Policy.
The Committee has pre-approved the tax-related services listed on Appendix C. The Committee must specifically approve all tax-related services not listed on Appendix C.
V. Other Services
The Committee believes it may grant approval of non-audit services that are permissible services for independent auditors to a Fund. The Committee has determined to grant general pre-approval to other services that it believes are routine and recurring, do not impair auditor independence, and are consistent with SEC rules on auditor independence.
The Committee has pre-approved the non-audit services listed on Appendix D. The Committee must specifically approve all non-audit services not listed on Appendix D.
A list of the SEC’s prohibited non-audit services is attached to this Policy as Appendix E. The SEC’s rules and relevant guidance should be consulted to determine the precise definitions of these impermissible services and the applicability of exceptions to certain of the SEC’s prohibitions.
VI. Pre-approval of Fee levels and Budgeted Amounts
The Committee will annually establish pre-approval fee levels or budgeted amounts for audit, audit-related, tax and non-audit services to be provided to the Funds by the independent auditors. Any proposed services exceeding these levels or amounts require the Committee’s specific pre-approval. The Committee considers fees for audit and non-audit services when deciding whether to pre-approve services. The Committee may determine, for a pre-approval period of 12 months, the appropriate ratio between the total amount of fees for the Fund’s audit, audit-related, and tax services (including fees for services provided to Fund affiliates that are subject to pre-approval), and the total amount of fees for certain permissible non-audit services for the Fund classified as other services (including any such services provided to Fund affiliates that are subject to pre-approval).
VII. Procedures
Requests or applications for services to be provided by the independent auditors will be submitted to management. If management determines that the services do not fall within those services generally pre-approved by the Committee and set out in the appendices to these procedures, management will submit the services to the Committee or its delagee. Any such submission will include a detailed description of the services to be rendered. Notwithstanding this paragraph, the Committee will, on a quarterly basis, receive from the independent auditors a list of services provided for the previous calendar quarter on a cumulative basis by the auditors during the Pre-Approval Period.
VIII. Delegation
The Committee may delegate pre-approval authority to one or more of the Committee’s members. Any member or members to whom such pre-approval authority is delegated must report any pre-approval decisions, including any pre-approved services, to the Committee at its next scheduled meeting. The Committee will identify any member to whom pre-approval authority is delegated in writing. The member will retain such authority for a period of 12 months from the date of pre-approval unless the Committee determines that a different period is appropriate. The period of delegated authority may be terminated by the Committee or at the option of the member.
IX. Additional Requirements
The Committee will take any measures the Committee deems necessary or appropriate to oversee the work of the independent auditors and to assure the auditors’ independence from the Funds. This may include reviewing a formal written statement from the independent auditors delineating all relationships between the auditors and the Funds, consistent with Independence Standards Board No. 1, and discussing with the auditors their methods and procedures for ensuring independence.
Last Approved: November 21, 2019
Appendix A
Pre-Approved Audit Services for the Pre-Approval Period January 1, 2020 through December 31, 2020
| Service | ||
| The Fund(s) | Fee Range | |
| Statutory audits or financial audits (including tax services associated with audit services) | √ | As presented to Audit Committee1 |
| Services associated with SEC registration statements, periodic reports and other documents filed with the SEC or other documents issued in connection with securities offerings (e.g., consents), and assistance in responding to SEC comment letters. | √ | Not to exceed $9,750 per filing |
| Consultations by Fund management with respect to accounting or disclosure treatment of transactions or events and/or the actual or potential effect of final or proposed rules, standards or interpretations by the SEC, Financial Accounting Standards Board, or other regulatory or standard setting bodies. | √ | Not to exceed $8,000 during the Pre-Approval Period |
| Seed capital audit and related review and issuance of consent on the N-2 registration statement | √ | Not to exceed $14,750 per audit |
| Audit of summary portfolio of investments | √ | Not to exceed $750 per fund |
| 1 | For new Funds launched during the Pre-Approval Period, the fee ranges pre-approved will be the same as those for existing Funds, pro-rated in accordance with inception dates as provided in the auditors’ Proposal or any Engagement Letter covering the period at issue. Fees in the Engagement Letter will be controlling. |
Appendix B
Pre-Approved Audit-Related Services for the Pre-Approval Period January 1, 2020 through December 31, 2020
| Service | |||
| The Fund(s) | Fund Affiliates | Fee Range | |
| Services related to Fund mergers (Excludes tax services - See Appendix C for tax services associated with Fund mergers) | √ | √ | Not to exceed $10,000 per merger |
| Consultations by Fund management with respect to accounting or disclosure treatment of transactions or events and/or the actual or potential effect of final or proposed rules, standards or interpretations by the SEC, Financial Accounting Standards Board, or other regulatory or standard setting bodies. [Note: Under SEC rules some consultations may be “audit” services and others may be “audit-related” services.] | √ | Not to exceed $5,000 per occurrence during the Pre-Approval Period | |
| Review of the Funds’ semi-annual and quarterly financial statements | √ | Not to exceed $2,700 per set of financial statements per fund | |
| Reports to regulatory or government agencies related to the annual engagement | √ | Up to $5,000 per occurrence during the Pre-Approval Period | |
| Regulatory compliance assistance | √ | √ | Not to exceed $5,000 per quarter |
| Training courses | √ | Not to exceed $5,000 per course | |
| For Prime Rate Trust, agreed upon procedures for quarterly reports to rating agencies | √ | Not to exceed $9,450 per quarter | |
Appendix C
Pre-Approved Tax Services for the Pre-Approval Period January 1, 2020 through December 31, 2020
| Service | |||
| The Fund(s) | Fund Affiliates | Fee Range | |
| Preparation of federal and state income tax returns and federal excise tax returns for the Funds including assistance and review with excise tax distributions | √ | As presented to Audit Committee2 | |
| Review of IRC Sections 851(b) and 817(h) diversification testing on a real-time basis | √ | As presented to Audit Committee2 | |
| Tax assistance and advice regarding statutory, regulatory or administrative developments | √ | √ | Not to exceed $5,000 for the Funds or for the Funds’ investment adviser during the Pre-Approval Period |
| 2 | For new Funds launched during the Pre-Approval Period, the fee ranges pre-approved will be the same as those for existing Funds, pro-rated in accordance with inception dates as provided in the auditors’ Proposal or any Engagement Letter covering the period at issue. Fees in the Engagement Letter will be controlling. |
Appendix C,continued
Pre-Approved Tax Services for the Pre-Approval Period January 1, 2020 through December 31, 2020
| Service | |||
| The Fund(s) | Fund Affiliates | Fee Range | |
| Tax and technology training sessions | √ | Not to exceed $5,000 per course during the Pre-Approval Period | |
| Tax services associated with Fund mergers | √ | √ | Not to exceed $4,000 per fund per merger during the Pre-Approval Period |
| Other tax-related assistance and consultation, including, without limitation, assistance in evaluating derivative financial instruments and international tax issues, qualification and distribution issues, year-end reporting for 1099’s, tax compliance services in foreign jurisdictions and similar routine tax consultations as requested. | √ | Not to exceed $300,000 during the Pre-Approval Period | |
Appendix D
Pre-Approved Other Services for the Pre-Approval Period January 1, 2020 through December 31, 2020
| Service | |||
| The Fund(s) | Fund Affiliates | Fee Range | |
| Agreed-upon procedures for Class B share 12b-1 programs | √ | Not to exceed $60,000 during the Pre-Approval Period | |
Security counts performed pursuant to Rule 17f-2 of the 1940 Act (i.e., counts for Funds holding securities with affiliated sub-custodians)
Cost to be borne 50% by the Funds and 50% by Voya Investments, LLC.
| √
| √
| Not to exceed $5,700 per Fund during the Pre-Approval Period |
| Agreed upon procedures for 15 (c) FACT Books | √ | Not to exceed $50,000 during the Pre-Approval Period | |
Appendix E
Prohibited Non-Audit Services
Dated: January 1, 2020 to December 31, 2020
| · | Bookkeeping or other services related to the accounting records or financial statements of the Funds |
| · | Financial information systems design and implementation |
| · | Appraisal or valuation services, fairness opinions, or contribution-in-kind reports |
| · | Actuarial services |
| · | Internal audit outsourcing services |
| · | Management functions |
| · | Human resources |
| · | Broker-dealer, investment adviser, or investment banking services |
| · | Legal services |
| · | Expert services unrelated to the audit |
| · | Any other service that the Public Company Accounting Oversight Board determines, by regulation, is impermissible |
EXHIBIT A
VOYA ASIA PACIFIC HIGH DIVIDEND EQUITY INCOME FUND
VOYA BALANCED PORTFOLIO, INC.
VOYA EMERGING MARKETS HIGH DIVIDEND EQUITY FUND
VOYA EQUITY TRUST
VOYA FUNDS TRUST
VOYA GLOBAL ADVANTAGE AND PREMIUM OPPORTUNITY FUND
VOYA GLOBAL EQUITY DIVIDEND AND PREMIUM OPPORTUNITY FUND
VOYA INFRASTRUCTURE, INDUSTRIALS, AND MATERIALS FUND
VOYA INTERMEDIATE BOND PORTFOLIO
VOYA INTERNATIONAL HIGH DIVIDEND EQUITY INCOME FUND
VOYA INVESTORS TRUST
VOYA GOVERNMENT MONEY MARKET PORTFOLIO
VOYA MUTUAL FUNDS
VOYA PARTNERS, INC.
VOYA PRIME RATE TRUST
VOYA NATURAL RESOURCES EQUITY INCOME FUND
VOYA SENIOR INCOME FUND
VOYA SEPARATE PORTFOLIOS TRUST
VOYA SERIES FUND, INC.
VOYA STRATEGIC ALLOCATIONS PORTFOLIOS, INC.
VOYA VARIABLE FUNDS
VOYA VARIABLE INSURANCE TRUST
VOYA VARIABLE PORTFOLIOS INC,
VOYA VARIABLE PRODUCTS TRUST
| (e)(2) | Percentage of services referred to in 4(b) – (4)(d) that were approved by the audit committee |
100% of the services were approved by the audit committee.
| (f) | Percentage of hours expended attributable to work performed by other than full time employees of EY if greater than 50% |
Not applicable.
| (g) | Non-Audit Fees: The following table presents (i) the aggregate non-audit fees (i.e., fees for audit-related, tax, and other services) billed to each Registrant by the independent registered public accounting firm for each Registrant’s fiscal years ended March 31, 2020 and March 31, 2019; and (ii) the aggregate non-audit fees billed to the investment adviser, or any of its affiliates that provide ongoing services to the registrant, by the independent registered public accounting firm for the same time periods. |
| Registrant/Investment Adviser | 2020(1) | 2019 | ||||||
| Voya Funds Trust | $ | 15,325 | $ | 74,321 | ||||
| Voya Investments, LLC(2) | $ | 13,793,519 | $ | 72,250 | ||||
(1) For the year ended March 31, 2020, KPMG billed the Registrant $67,844 for Non-Audit Fees.
(2) Each Registrant’s investment adviser and any of its affiliates, which are subsidiaries of Voya Financial, Inc.
| (h) | Principal Accountants Independence: The Registrant’s Audit committee has considered whether the provision of non-audit services that were rendered to the registrant’s investment adviser and any entity controlling, controlled by, or under common control with the investment adviser that provides ongoing services to the registrant that were not pre-approved pursuant to Rule 2-01(c)(7)(ii) of Regulation S-X is compatible with maintaining EY’s independence. |
Item 5. Audit Committee of Listed Registrants.
Not applicable.
Item 6. Schedule of Investments.
Complete schedule of investments, as applicable, is included as part of the report to shareholders filed under Item 1 of this Form and filed herein, as applicable.
Report of Independent Registered Public Accounting Firm
To the Shareholders of Voya GNMA Income Fund, Voya High Yield Bond Fund, Voya Intermediate Bond Fund, Voya Short Term Bond Fund and Voya Strategic Income Opportunities Fund and the Board of Trustees of Voya Funds Trust
Opinion on the Financial Statements
We have audited the accompanying statement of assets and liabilities of Voya GNMA Income Fund, Voya High Yield Bond Fund, Voya Intermediate Bond Fund, Voya Short Term Bond Fund and Voya Strategic Income Opportunities Fund (the “Funds”) (five of the funds constituting Voya Funds Trust (the “Trust”)), including the summary portfolio of investments, as of March 31, 2020, and the related statements of operations and changes in net assets and the financial highlights for the year then ended and the related notes (collectively referred to as the “financial statements”) (the financial statements are included in Item 1 of this Form N-CSR)and the portfolio of investments as of March 31, 2020 (included in Item 6 of this Form N-CSR). In our opinion, the financial statements and portfolio of investments present fairly, in all material respects, the financial position of the Funds (five of the funds constituting Voya Funds Trust) at March 31, 2020, the results of their operations, the changes in their net assets and their financial highlights for the year then ended, in conformity with U.S. generally accepted accounting principles.
The statement of changes in net assets for the year ended March 31, 2019, and the financial highlights for each of the periods in the four-year period then ended, were audited by another independent registered public accounting firm whose report, dated May 23, 2019, expressed an unqualified opinion on that statement of changes in net assets and those financial highlights.
Basis for Opinion
These financial statements and portfolio of investments are the responsibility of the Trust’s management. Our responsibility is to express an opinion on the Funds’ financial statements and portfolio of investments based on our audits. We are a public accounting firm registered with the Public Company Accounting Oversight Board (United States) ("PCAOB") and are required to be independent with respect to the Trust in accordance with the U.S. federal securities laws and the applicable rules and regulations of the Securities and Exchange Commission and the PCAOB.
We conducted our audits in accordance with the standards of the PCAOB. Those standards require that we plan and perform the audits to obtain reasonable assurance about whether the financial statements and portfolio of investments are free of material misstatement, whether due to error or fraud. The Trust is not required to have, nor were we engaged to perform, an audit of the Trust’s internal control over financial reporting. As part of our audits, we are required to obtain an understanding of internal control over financial reporting, but not for the purpose of expressing an opinion on the effectiveness of the Trust’s internal control over financial reporting. Accordingly, we express no such opinion.
Our audits included performing procedures to assess the risks of material misstatement of the financial statements and portfolio of investments, whether due to error or fraud, and performing procedures that respond to those risks. Such procedures included examining, on a test basis, evidence regarding the amounts and disclosures in the financial statements and portfolio of investments. Our procedures included confirmation of securities owned as of March 31, 2020, by correspondence with the custodian and others or by other appropriate auditing procedures where replies from others were not received. Our audits also included evaluating the accounting principles used and significant estimates made by management, as well as evaluating the overall presentation of the financial statements and portfolio of investments. We believe that our audits provide a reasonable basis for our opinion.

We have served as the auditor of one or more Voya investment companies since 2019.
Boston, Massachusetts
May 26, 2020
| Voya GNMA Income Fund | PORTFOLIO OF INVESTMENTS |
| as of March31, 2020 |
| Principal Amount† | Value | Percentage of Net Assets | ||
| COLLATERALIZED MORTGAGE OBLIGATIONS: 49.3% | ||||
| 1,654,011 | Fannie Mae 2004-28 PZ, 6.000%, 05/25/2034 | $ 2,278,290 | 0.2 | |
| 2,622,179 | Fannie Mae 2004-88 ZC, 6.500%, 12/25/2034 | 3,314,216 | 0.3 | |
| 7,989,880 | Fannie Mae 2005-17 B, 6.500%, (US0001M + 6.500%), 03/25/2035 | 10,239,309 | 0.8 | |
| 2,459,331 | Fannie Mae 2005-43 PZ, 6.000%, 05/25/2035 | 2,943,807 | 0.2 | |
| 1,223,456 | Fannie Mae 2007-60 ZB, 4.750%, 05/25/2037 | 1,358,718 | 0.1 | |
| 5,418,252 | (1) | Fannie Mae 2010-150 PS, 5.653%, (-1.000*US0001M + 6.600%), 12/25/2039 | 409,869 | 0.0 |
| 6,122,620 | (1) | Fannie Mae 2010-95 SB, 5.653%, (-1.000*US0001M + 6.600%), 09/25/2040 | 1,131,992 | 0.1 |
| 4,923,517 | Fannie Mae 2011-99 CZ, 4.500%, 10/25/2041 | 5,772,563 | 0.5 | |
| 8,719,456 | (1) | Fannie Mae 2012-148 HI, 3.500%, 05/25/2042 | 960,198 | 0.1 |
| 26,956,665 | (1) | Fannie Mae 2012-148 IM, 3.000%, 01/25/2028 | 1,827,309 | 0.1 |
| 260,156 | (2) | Fannie Mae REMIC Trust 2002-W1 3A, 4.033%, 04/25/2042 | 273,687 | 0.0 |
| 1,177,788 | (2) | Fannie Mae REMIC Trust 2002-W6 3A, 4.428%, 01/25/2042 | 1,245,398 | 0.1 |
| 1,360,969 | Fannie Mae REMIC Trust 2003-16 CX, 6.500%, 03/25/2033 | 1,612,199 | 0.1 | |
| 3,113,787 | Fannie Mae REMIC Trust 2003-34 LN, 5.000%, 05/25/2033 | 3,554,344 | 0.3 | |
| 123,814 | Fannie Mae REMIC Trust 2004-61 SH, 20.203%, (-3.998*US0001M + 23.988%), 11/25/2032 | 198,476 | 0.0 | |
| 3,613,358 | (2) | Fannie Mae REMIC Trust 2004-W11 2A, 4.194%, 03/25/2043 | 3,676,037 | 0.3 |
| 3,233,541 | Fannie Mae REMIC Trust 2004-W3 A8, 5.500%, 05/25/2034 | 3,707,161 | 0.3 | |
| 813,063 | (1) | Fannie Mae REMIC Trust 2005-17 ES, 5.803%, (-1.000*US0001M + 6.750%), 03/25/2035 | 113,927 | 0.0 |
| 730,227 | Fannie Mae REMIC Trust 2005-59 NQ, 14.508%, (-2.500*US0001M + 16.875%), 05/25/2035 | 937,070 | 0.1 | |
| 768,484 | Fannie Mae REMIC Trust 2005-88 ZC, 5.000%, 10/25/2035 | 877,499 | 0.1 | |
| 200,467 | Fannie Mae REMIC Trust 2006-115 ES, 22.774%, (-4.000*US0001M + 26.560%), 12/25/2036 | 328,954 | 0.0 | |
| 1,446,301 | (1) | Fannie Mae REMIC Trust 2006-36 SP, 5.753%, (-1.000*US0001M + 6.700%), 05/25/2036 | 265,117 | 0.0 |
| 4,087,781 | (1) | Fannie Mae REMIC Trust 2006-79 SH, 5.503%, (-1.000*US0001M + 6.450%), 08/25/2036 | 1,036,546 | 0.1 |
| 324,954 | (2) | Fannie Mae REMIC Trust 2009-12 LK, 10.079%, 03/25/2039 | 387,128 | 0.0 |
| 1,861,549 | Fannie Mae REMIC Trust 2009-66 XA, 5.500%, 12/25/2035 | 2,399,083 | 0.2 | |
| 5,069,928 | Fannie Mae REMIC Trust 2010-155 JC, 4.000%, 12/25/2039 | 5,423,393 | 0.4 | |
| 5,084,839 | Fannie Mae REMIC Trust 2010-2 LC, 5.000%, 02/25/2040 | 6,076,082 | 0.5 | |
| 1,767,407 | Fannie Mae REMIC Trust 2011-30 ZA, 5.000%, 04/25/2041 | 1,991,714 | 0.2 | |
| 7,287,686 | (1) | Fannie Mae REMIC Trust 2012-128 VS, 5.303%, (-1.000*US0001M + 6.250%), 06/25/2042 | 1,156,662 | 0.1 |
| 5,564,506 | (1) | Fannie Mae REMIC Trust 2012-142 BI, 3.000%, 11/25/2027 | 310,763 | 0.0 |
| 3,472,323 | (1) | Fannie Mae REMIC Trust 2012-154 PI, 4.000%, 05/25/2042 | 407,081 | 0.0 |
| 2,674,096 | (1) | Fannie Mae REMIC Trust 2012-68 SD, 5.753%, (-1.000*US0001M + 6.700%), 06/25/2032 | 518,157 | 0.0 |
| 3,457,000 | Fannie Mae REMIC Trust 2012-97 PC, 3.500%, 09/25/2042 | 4,113,366 | 0.3 | |
| 1,077,355 | (1) | Fannie Mae REMIC Trust 2013-13 PI, 3.500%, 04/25/2042 | 113,728 | 0.0 |
| 3,214,111 | (1) | Fannie Mae REMIC Trust 2013-54 ID, 3.000%, 01/25/2033 | 192,856 | 0.0 |
| 372,631 | Fannie Mae REMICS 2004-89 ES, 11.476%, (-1.850*US0001M + 13.228%), 08/25/2034 | 386,445 | 0.0 | |
| 5,113 | (3) | Fannie Mae REMICS 2006-44 P, 0.000%, 12/25/2033 | 4,816 | 0.0 |
| 1,000,000 | Fannie Mae REMICS 2010-87 PL, 4.000%, 06/25/2040 | 1,152,151 | 0.1 | |
| 2,358,961 | Fannie Mae REMICS 2011-10 ZC, 5.000%, 02/25/2041 | 2,730,907 | 0.2 | |
| 5,228,832 | (1) | Fannie Mae REMICS 2012-137 EI, 3.000%, 12/25/2027 | 329,695 | 0.0 |
| 10,081,177 | Fannie Mae REMICS 2012-17 QZ, 4.000%, 03/25/2042 | 11,281,635 | 0.9 | |
See Accompanying Notes to Financial Statements
| 3 |
| Voya GNMA Income Fund | PORTFOLIO OF INVESTMENTS |
| as of March31, 2020 (Continued) |
| 2,500,000 | Fannie Mae REMICS 2012-40 MY, 3.500%, 04/25/2042 | 2,870,206 | 0.2 | |
| 3,239,952 | (3) | Fannie Mae REMICS 2013-135 PO, 0.000%, 01/25/2044 | 2,997,651 | 0.2 |
| 1,227,211 | Fannie Mae REMICS 2013-55 VZ, 3.000%, 06/25/2043 | 1,279,060 | 0.1 | |
| 18,038,564 | (1) | Fannie Mae REMICS 2019-49 IG, 3.000%, 03/25/2033 | 1,333,080 | 0.1 |
| 5,699,532 | Fannie Mae Series 2016-51 S, 4.973%, (-1.000*US0001M + 5.920%), 10/25/2043 | 6,282,559 | 0.5 | |
| 2,571,308 | (2) | Fannie Mae Trust 2004-W2 3A, 4.165%, 02/25/2044 | 2,700,134 | 0.2 |
| 2,488,326 | (2) | Fannie Mae Trust 2004-W2 4A, 4.139%, 02/25/2044 | 2,606,967 | 0.2 |
| 1,857,332 | Fannie Mae REMICS 2010-26 F, 1.717%, (US0001M + 0.770%), 11/25/2036 | 1,869,014 | 0.2 | |
| 1,994,338 | Fannie Mae REMICS 2010-39 FN, 1.777%, (US0001M + 0.830%), 05/25/2040 | 2,009,486 | 0.2 | |
| 4,845,867 | Fannie Mae REMICS 2017-22 DZ, 4.000%, 04/25/2047 | 5,712,027 | 0.4 | |
| 2,649,939 | Freddie Mac 3770 GA, 4.500%, 10/15/2040 | 3,163,990 | 0.3 | |
| 2,850,574 | Freddie Mac REMIC Trust 2005-S001 2A2, 1.777%, (US0001M + 0.150%), 09/25/2045 | 2,818,009 | 0.2 | |
| 524,640 | Freddie Mac REMIC Trust 2653 SC, 6.122%, (-0.500*US0001M + 6.800%), 07/15/2033 | 599,379 | 0.1 | |
| 1,390,511 | Freddie Mac REMIC Trust 2767 ZW, 6.000%, 03/15/2034 | 1,691,948 | 0.1 | |
| 166,937 | Freddie Mac REMIC Trust 3012 ST, 19.423%, (-3.600*US0001M + 21.960%), 04/15/2035 | 242,621 | 0.0 | |
| 359,887 | Freddie Mac REMIC Trust 3065 DC, 17.746%, (-3.000*US0001M + 19.860%), 03/15/2035 | 513,036 | 0.0 | |
| 671,028 | Freddie Mac REMIC Trust 3158 NE, 5.500%, 05/15/2036 | 784,087 | 0.1 | |
| 4,592,523 | (1) | Freddie Mac REMIC Trust 3181 TA, 0.500%, (-0.794*US0001M + 5.635%), 07/15/2036 | 95,701 | 0.0 |
| 377,804 | (1) | Freddie Mac REMIC Trust 3507 IA, 5.500%, 09/15/2035 | 70,182 | 0.0 |
| 35,913 | (1) | Freddie Mac REMIC Trust 3753 PS, 5.395%, (-1.000*US0001M + 6.100%), 06/15/2040 | 520 | 0.0 |
| 493,624 | Freddie Mac REMIC Trust 3864 NT, 5.500%, (-9.167*US0001M + 60.500%), 03/15/2039 | 534,263 | 0.0 | |
| 2,980,256 | Freddie Mac REMIC Trust 3888 ZG, 4.000%, 07/15/2041 | 3,325,011 | 0.3 | |
| 1,153,151 | (1) | Freddie Mac REMIC Trust 4027 QI, 4.500%, 12/15/2040 | 63,211 | 0.0 |
| 3,135,844 | Freddie Mac REMICS 3196 ZK, 6.500%, 04/15/2032 | 4,368,634 | 0.3 | |
| 1,303,471 | Freddie Mac REMICS 4097 ZA, 3.500%, 08/15/2042 | 1,412,009 | 0.1 | |
| 6,573,000 | Freddie Mac REMICS 4136 LU, 3.000%, 07/15/2032 | 6,921,408 | 0.5 | |
| 1,252,765 | Freddie Mac Series 4040 UZ, 5.000%, 05/15/2042 | 1,684,659 | 0.1 | |
| 1,689,170 | (2) | Freddie Mac Structured Pass-Through Certificates T-54 2A, 4.062%, 07/25/2033 | 1,769,914 | 0.1 |
| 1,101,151 | (2) | Freddie Mac Structured Pass-Through Certificates T-54 4A, 4.122%, 02/25/2043 | 1,172,477 | 0.1 |
| 134,807 | (1) | Freddie Mac-Ginnie Mae Series 21 SA, 7.053%, (-1.000*US0001M + 8.000%), 10/25/2023 | 13,929 | 0.0 |
| 969,345 | Freddie Mac REMICS 3658 CZ, 5.000%, 04/15/2040 | 1,210,787 | 0.1 | |
| 4,369,480 | Freddie Mac REMICS 4249 CS, 3.633%, (-0.750*US0001M + 4.650%), 09/15/2043 | 4,352,639 | 0.3 | |
| 6,648,772 | Freddie Mac REMICS 4480 ZX, 4.000%, 11/15/2044 | 7,419,886 | 0.6 | |
| 9,318,150 | Freddie Mac REMICS 4764 CJ, 4.000%, 06/15/2045 | 9,810,699 | 0.8 | |
| 6,473,979 | Freddie Mac REMICS 4764 DA, 4.000%, 07/15/2045 | 6,806,902 | 0.5 | |
| 1,301,531 | Ginnie Mae 2004-65 ZG, 5.500%, 07/20/2034 | 1,504,681 | 0.1 | |
| 5,342,518 | Ginnie Mae 2009-110 ZA, 5.500%, 11/16/2039 | 6,877,507 | 0.5 | |
| 742,950 | Ginnie Mae 2009-32 QZ, 5.500%, 05/16/2039 | 960,098 | 0.1 | |
| 575,105 | Ginnie Mae 2009-32 YZ, 7.000%, 05/16/2039 | 821,417 | 0.1 | |
| 3,261,044 | Ginnie Mae 2009-50 MZ, 6.000%, 07/16/2039 | 4,036,642 | 0.3 | |
| 725,715 | Ginnie Mae 2009-54 HZ, 5.000%, 07/20/2039 | 835,985 | 0.1 | |
| 1,893,215 | Ginnie Mae 2009-H01 FA, 1.923%, (US0001M + 1.150%), 11/20/2059 | 1,910,773 | 0.2 | |
| 2,000,000 | Ginnie Mae 2010-116 PB, 5.000%, 06/16/2040 | 2,439,678 | 0.2 | |
| 3,984,213 | Ginnie Mae 2010-125 BZ, 4.500%, 09/16/2040 | 4,405,375 | 0.3 |
See Accompanying Notes to Financial Statements
| 4 |
| Voya GNMA Income Fund | PORTFOLIO OF INVESTMENTS |
| as of March31, 2020 (Continued) |
| 5,054,853 | (3) | Ginnie Mae 2011-70 PO, 0.000%, 05/16/2041 | 4,713,795 | 0.4 |
| 3,938,954 | (1) | Ginnie Mae 2014-107 XS, 4.895%, (-1.000*US0001M + 5.600%), 07/16/2044 | 718,510 | 0.1 |
| 1,925,909 | (1) | Ginnie Mae 2014-96 SQ, 4.895%, (-1.000*US0001M + 5.600%), 07/16/2044 | 338,237 | 0.0 |
| 3,385,962 | Ginnie Mae 2015-H13 FG, 2.062%, (US0001M + 0.400%), 04/20/2065 | 3,345,010 | 0.3 | |
| 22,052,580 | (1) | Ginnie Mae 2016-120 IM, 3.500%, 07/20/2046 | 2,657,111 | 0.2 |
| 2,185,344 | (1) | Ginnie Mae 2016-84 IO, 5.000%, 12/20/2040 | 138,999 | 0.0 |
| 19,988,807 | Ginnie Mae 2016-H20 FB, 2.212%, (US0001M + 0.550%), 09/20/2066 | 19,758,764 | 1.5 | |
| 2,890,000 | Ginnie Mae 2017-162 PL, 3.000%, 10/20/2047 | 3,103,138 | 0.2 | |
| 1,567,532 | (1) | Ginnie Mae 2018-78 IC, 4.000%, 02/20/2047 | 200,263 | 0.0 |
| 3,566,566 | Ginnie Mae Series 2003-86 ZC, 4.500%, 10/20/2033 | 3,957,979 | 0.3 | |
| 131,889 | Ginnie Mae Series 2004-16 AE, 5.500%, 02/20/2034 | 151,160 | 0.0 | |
| 1,248,305 | Ginnie Mae Series 2004-17 MZ, 5.500%, 03/16/2034 | 1,417,421 | 0.1 | |
| 840,362 | Ginnie Mae Series 2004-28 CZ, 5.500%, 04/20/2034 | 975,285 | 0.1 | |
| 409,090 | (3) | Ginnie Mae Series 2004-37 OA, 0.000%, 04/17/2034 | 386,502 | 0.0 |
| 3,164,192 | Ginnie Mae Series 2004-4 MG, 5.000%, 01/16/2034 | 3,569,644 | 0.3 | |
| 3,298,420 | Ginnie Mae Series 2004-81 Z, 5.000%, 10/20/2034 | 3,720,057 | 0.3 | |
| 1,276,279 | (1) | Ginnie Mae Series 2004-98 SA, 5.927%, (-1.000*US0001M + 6.700%), 11/20/2034 | 323,818 | 0.0 |
| 1,110,414 | Ginnie Mae Series 2005-21 Z, 5.000%, 03/20/2035 | 1,269,878 | 0.1 | |
| 322,400 | (1) | Ginnie Mae Series 2005-25 SI, 6.000%, (-6.000*US0001M + 43.200%), 01/20/2034 | 50,046 | 0.0 |
| 842,624 | (1) | Ginnie Mae Series 2005-7 AH, 6.065%, (-1.000*US0001M + 6.770%), 02/16/2035 | 178,772 | 0.0 |
| 1,002,557 | (1) | Ginnie Mae Series 2005-73 IM, 5.500%, 09/20/2035 | 186,087 | 0.0 |
| 578,838 | Ginnie Mae Series 2005-80 Z, 5.000%, 10/20/2035 | 657,323 | 0.1 | |
| 281,749 | Ginnie Mae Series 2005-91 UP, 12.891%, (-2.000*US0001M + 14.300%), 09/16/2031 | 356,566 | 0.0 | |
| 8,203,598 | Ginnie Mae Series 2006-10 ZT, 6.000%, 03/20/2036 | 9,596,221 | 0.7 | |
| 1,756,969 | Ginnie Mae Series 2006-17 TW, 6.000%, 04/20/2036 | 2,052,975 | 0.2 | |
| 9,140,135 | (1) | Ginnie Mae Series 2006-26 TB, 0.250%, (-1.000*US0001M + 6.500%), 06/20/2036 | 87,411 | 0.0 |
| 2,882,752 | Ginnie Mae Series 2006-7 ZA, 5.500%, 02/20/2036 | 3,342,063 | 0.3 | |
| 1,959,919 | (1) | Ginnie Mae Series 2007-17 CI, 7.500%, 04/16/2037 | 512,551 | 0.0 |
| 36,601 | Ginnie Mae Series 2007-37 S, 22.716%, (-3.667*US0001M + 25.300%), 04/16/2037 | 39,735 | 0.0 | |
| 2,047,956 | (3) | Ginnie Mae Series 2007-41 OL, 0.000%, 07/20/2037 | 1,865,095 | 0.2 |
| 120,449 | Ginnie Mae Series 2007-45 PE, 5.500%, 07/16/2037 | 138,685 | 0.0 | |
| 368,869 | Ginnie Mae Series 2007-48 SY, 18.136%, (-3.000*US0001M + 20.250%), 08/16/2037 | 544,333 | 0.1 | |
| 2,208,882 | (1) | Ginnie Mae Series 2007-53 SC, 5.727%, (-1.000*US0001M + 6.500%), 09/20/2037 | 545,244 | 0.1 |
| 65,210 | Ginnie Mae Series 2007-53 SW, 17.886%, (-3.000*US0001M + 20.205%), 09/20/2037 | 97,558 | 0.0 | |
| 1,222,671 | Ginnie Mae Series 2007-60 YZ, 5.500%, 10/20/2037 | 1,381,648 | 0.1 | |
| 2,932,573 | Ginnie Mae Series 2008-20 PZ, 6.000%, 03/20/2038 | 3,556,196 | 0.3 | |
| 648,609 | (1) | Ginnie Mae Series 2008-3 SA, 5.777%, (-1.000*US0001M + 6.550%), 01/20/2038 | 157,367 | 0.0 |
| 1,284,493 | (1) | Ginnie Mae Series 2008-40 PS, 5.795%, (-1.000*US0001M + 6.500%), 05/16/2038 | 267,694 | 0.0 |
| 2,891,421 | (1) | Ginnie Mae Series 2008-82 SA, 5.227%, (-1.000*US0001M + 6.000%), 09/20/2038 | 629,297 | 0.1 |
| 5,627,237 | (1) | Ginnie Mae Series 2009-110 SA, 5.645%, (-1.000*US0001M + 6.350%), 04/16/2039 | 656,802 | 0.1 |
| 795,315 | Ginnie Mae Series 2009-110 ZC, 4.500%, 11/16/2039 | 956,691 | 0.1 | |
| 1,697,272 | Ginnie Mae Series 2009-121 ZQ, 5.500%, 09/20/2039 | 1,957,927 | 0.2 | |
| 1,029,000 | Ginnie Mae Series 2009-31 BP, 5.000%, 05/20/2039 | 1,250,281 | 0.1 |
See Accompanying Notes to Financial Statements
| 5 |
| Voya GNMA Income Fund | PORTFOLIO OF INVESTMENTS |
| as of March31, 2020 (Continued) |
| 3,043,493 | Ginnie Mae Series 2009-31 ZL, 4.500%, 05/20/2039 | 3,492,192 | 0.3 | |
| 2,864,828 | Ginnie Mae Series 2009-34 Z, 4.500%, 05/16/2039 | 3,213,897 | 0.3 | |
| 3,090,732 | Ginnie Mae Series 2009-53 ZB, 6.000%, 07/16/2039 | 3,622,957 | 0.3 | |
| 303,845 | (1) | Ginnie Mae Series 2009-55 BI, 1.000%, (-25.000*US0001M + 162.500%), 06/16/2037 | 11,943 | 0.0 |
| 1,918,733 | Ginnie Mae Series 2009-61 EZ, 7.500%, 08/20/2039 | 2,625,574 | 0.2 | |
| 5,712,159 | Ginnie Mae Series 2009-61 PZ, 7.500%, 08/20/2039 | 8,443,051 | 0.7 | |
| 3,304,781 | Ginnie Mae Series 2009-61 ZQ, 6.000%, 08/16/2039 | 4,390,383 | 0.3 | |
| 1,921,601 | (1) | Ginnie Mae Series 2009-66 QS, 5.327%, (-1.000*US0001M + 6.100%), 07/20/2039 | 256,522 | 0.0 |
| 1,016,935 | (1) | Ginnie Mae Series 2009-77 SA, 5.445%, (-1.000*US0001M + 6.150%), 09/16/2039 | 217,893 | 0.0 |
| 3,558,459 | Ginnie Mae Series 2009-77 ZB, 5.500%, 09/16/2039 | 4,255,724 | 0.3 | |
| 1,002,849 | Ginnie Mae Series 2009-87 WZ, 6.000%, 10/20/2039 | 1,382,828 | 0.1 | |
| 606,810 | Ginnie Mae Series 2009-92 DZ, 4.500%, 10/16/2039 | 726,312 | 0.1 | |
| 1,429,368 | Ginnie Mae Series 2009-98 MZ, 5.000%, 10/16/2039 | 1,787,507 | 0.1 | |
| 2,249,719 | (1) | Ginnie Mae Series 2010-106 IP, 5.000%, 03/20/2040 | 273,505 | 0.0 |
| 10,371,000 | Ginnie Mae Series 2010-113 BE, 4.500%, 09/20/2040 | 12,155,233 | 0.9 | |
| 1,846,270 | (1) | Ginnie Mae Series 2010-116 NS, 5.945%, (-1.000*US0001M + 6.650%), 09/16/2040 | 381,346 | 0.0 |
| 187,225 | (1) | Ginnie Mae Series 2010-130 KI, 5.500%, 09/16/2040 | 15,944 | 0.0 |
| 1,500,000 | Ginnie Mae Series 2010-14 B, 4.500%, 02/16/2040 | 1,740,476 | 0.1 | |
| 3,483,005 | Ginnie Mae Series 2010-146 NL, 4.000%, 10/16/2039 | 3,748,985 | 0.3 | |
| 1,475,393 | (1) | Ginnie Mae Series 2010-158 SA, 5.277%, (-1.000*US0001M + 6.050%), 12/20/2040 | 274,904 | 0.0 |
| 20,065,715 | (1) | Ginnie Mae Series 2010-166 GS, 5.227%, (-1.000*US0001M + 6.000%), 12/20/2040 | 3,602,998 | 0.3 |
| 1,862,755 | (1) | Ginnie Mae Series 2010-166 NI, 4.500%, 04/20/2039 | 138,932 | 0.0 |
| 2,298,391 | Ginnie Mae Series 2010-169 AW, 4.500%, 12/20/2040 | 2,541,525 | 0.2 | |
| 3,776,934 | Ginnie Mae Series 2010-169 JZ, 4.000%, 12/20/2040 | 4,118,489 | 0.3 | |
| 512,740 | (1) | Ginnie Mae Series 2010-19 LI, 5.000%, 07/16/2039 | 51,061 | 0.0 |
| 2,138,000 | Ginnie Mae Series 2010-31 BP, 5.000%, 03/20/2040 | 2,445,509 | 0.2 | |
| 2,123,551 | (1) | Ginnie Mae Series 2010-4 WI, 6.000%, 01/16/2040 | 367,379 | 0.0 |
| 5,392,928 | Ginnie Mae Series 2010-42 VZ, 5.500%, 10/20/2039 | 6,582,190 | 0.5 | |
| 1,727,658 | Ginnie Mae Series 2010-59 ZA, 4.500%, 05/20/2040 | 1,951,516 | 0.2 | |
| 200,363 | (1) | Ginnie Mae Series 2010-9 SB, 5.727%, (-1.000*US0001M + 6.500%), 09/20/2038 | 1,972 | 0.0 |
| 4,804,941 | Ginnie Mae Series 2010-H01 FA, 2.433%, (US0001M + 0.820%), 01/20/2060 | 4,794,949 | 0.4 | |
| 10,754,397 | Ginnie Mae Series 2010-H10 FB, 2.613%, (US0001M + 1.000%), 05/20/2060 | 10,774,606 | 0.8 | |
| 6,819,211 | Ginnie Mae Series 2010-H10 FC, 2.613%, (US0001M + 1.000%), 05/20/2060 | 6,830,569 | 0.5 | |
| 398,556 | (1) | Ginnie Mae Series 2011-123 QI, 5.000%, 05/20/2041 | 54,202 | 0.0 |
| 4,408,987 | (1) | Ginnie Mae Series 2011-141 PS, 5.995%, (-1.000*US0001M + 6.700%), 06/16/2041 | 891,743 | 0.1 |
| 125,009 | Ginnie Mae Series 2011-169 BC, 7.000%, 05/16/2032 | 141,933 | 0.0 | |
| 292,444 | (2) | Ginnie Mae Series 2011-169 BG, 5.435%, 04/16/2039 | 335,002 | 0.0 |
| 7,181,984 | Ginnie Mae Series 2011-25 Z, 4.000%, 02/20/2041 | 7,995,395 | 0.6 | |
| 1,863,394 | Ginnie Mae Series 2011-59 QC, 4.000%, 12/20/2040 | 2,059,933 | 0.2 | |
| 4,983,013 | (1) | Ginnie Mae Series 2011-73 LS, 5.917%, (-1.000*US0001M + 6.690%), 08/20/2039 | 413,007 | 0.0 |
| 4,575,893 | Ginnie Mae Series 2011-89 Z, 3.500%, 06/20/2041 | 5,000,394 | 0.4 | |
| 1,224,221 | Ginnie Mae Series 2011-H07 FA, 2.162%, (US0001M + 0.500%), 02/20/2061 | 1,216,012 | 0.1 |
See Accompanying Notes to Financial Statements
| 6 |
| Voya GNMA Income Fund | PORTFOLIO OF INVESTMENTS |
| as of March31, 2020 (Continued) |
| 1,928,572 | (1) | Ginnie Mae Series 2012-102 TI, 4.000%, 08/20/2039 | 64,640 | 0.0 |
| 2,610,529 | (1) | Ginnie Mae Series 2012-103 IC, 3.500%, 08/16/2040 | 188,692 | 0.0 |
| 654,835 | (1) | Ginnie Mae Series 2012-124 MI, 4.000%, 03/20/2042 | 47,722 | 0.0 |
| 7,530,599 | (1) | Ginnie Mae Series 2012-146 AI, 3.000%, 10/20/2037 | 416,067 | 0.0 |
| 582,331 | (1) | Ginnie Mae Series 2012-34 MS, 5.995%, (-1.000*US0001M + 6.700%), 04/16/2041 | 89,066 | 0.0 |
| 90,793 | Ginnie Mae Series 2012-43 MA, 4.000%, 10/20/2041 | 93,068 | 0.0 | |
| 4,775,200 | (1) | Ginnie Mae Series 2012-48 SA, 5.945%, (-1.000*US0001M + 6.650%), 04/16/2042 | 1,199,661 | 0.1 |
| 6,808,873 | (1) | Ginnie Mae Series 2012-60 SG, 5.395%, (-1.000*US0001M + 6.100%), 05/16/2042 | 1,584,288 | 0.1 |
| 1,630,280 | (1) | Ginnie Mae Series 2012-98 EI, 4.000%, 04/20/2041 | 188,673 | 0.0 |
| 2,045,229 | Ginnie Mae Series 2012-H11 VA, 2.312%, (US0001M + 0.650%), 05/20/2062 | 2,026,367 | 0.2 | |
| 21,029,088 | Ginnie Mae Series 2012-H12 FB, 2.712%, (US0001M + 1.050%), 02/20/2062 | 21,086,828 | 1.6 | |
| 3,000,025 | Ginnie Mae Series 2012-H20 BA, 2.222%, (US0001M + 0.560%), 09/20/2062 | 2,979,919 | 0.2 | |
| 7,000,000 | Ginnie Mae Series 2013-147 BE, 4.000%, 12/20/2039 | 8,201,185 | 0.6 | |
| 1,369,425 | Ginnie Mae Series 2013-167 Z, 3.000%, 10/16/2043 | 1,480,838 | 0.1 | |
| 1,900,000 | (1) | Ginnie Mae Series 2013-186 UI, 2.500%, 11/20/2043 | 406,904 | 0.0 |
| 1,295,321 | (1) | Ginnie Mae Series 2013-186 VI, 4.000%, 12/20/2042 | 139,451 | 0.0 |
| 6,375,186 | (1) | Ginnie Mae Series 2013-20 LI, 4.500%, 12/16/2042 | 938,713 | 0.1 |
| 2,828,123 | (1) | Ginnie Mae Series 2013-41 PI, 3.500%, 04/20/2040 | 131,891 | 0.0 |
| 2,641,648 | Ginnie Mae Series 2013-H08 BF, 2.062%, (US0001M + 0.400%), 03/20/2063 | 2,610,412 | 0.2 | |
| 3,569,215 | Ginnie Mae Series 2013-H10 FT, 1.950%, (H15T1Y + 0.450%), 04/20/2063 | 3,545,614 | 0.3 | |
| 5,299,933 | Ginnie Mae Series 2013-H14 FC, 2.132%, (US0001M + 0.470%), 06/20/2063 | 5,251,972 | 0.4 | |
| 952,018 | Ginnie Mae Series 2013-H18 BA, 2.262%, (US0001M + 0.600%), 07/20/2063 | 945,184 | 0.1 | |
| 3,170,800 | Ginnie Mae Series 2013-H19 DF, 2.312%, (US0001M + 0.650%), 05/20/2063 | 3,148,134 | 0.3 | |
| 2,953,654 | Ginnie Mae Series 2013-H20 FB, 2.662%, (US0001M + 1.000%), 08/20/2063 | 2,958,172 | 0.2 | |
| 3,843,874 | Ginnie Mae Series 2013-H23 FA, 2.962%, (US0001M + 1.300%), 09/20/2063 | 3,871,835 | 0.3 | |
| 530,485 | Ginnie Mae Series 2013-H24 FB, 2.392%, (US0001M + 0.730%), 09/20/2063 | 528,774 | 0.0 | |
| 2,793,200 | Ginnie Mae Series 2014-115 EM, 4.000%, 08/20/2044 | 3,307,464 | 0.3 | |
| 12,628,860 | Ginnie Mae Series 2014-118 ZP, 4.000%, 08/20/2044 | 13,697,720 | 1.1 | |
| 2,007,547 | (1) | Ginnie Mae Series 2014-183 IM, 5.000%, 06/20/2035 | 349,097 | 0.0 |
| 3,251,655 | (1) | Ginnie Mae Series 2014-30 ES, 4.227%, (-1.000*US0001M + 5.000%), 03/20/2040 | 490,591 | 0.0 |
| 10,371,041 | (2) | Ginnie Mae Series 2015-10 Q, 2.315%, 10/20/2044 | 10,840,532 | 0.8 |
| 2,364,266 | (1) | Ginnie Mae Series 2015-141 IX, 1.013%, (-0.714*US0001M + 2.142%), 06/20/2045 | 225,978 | 0.0 |
| 12,125,000 | Ginnie Mae Series 2015-143 B, 3.500%, 04/20/2045 | 13,598,923 | 1.1 | |
| 3,023,928 | (1) | Ginnie Mae Series 2015-157 PI, 4.000%, 03/20/2044 | 332,039 | 0.0 |
| 8,914,528 | Ginnie Mae Series 2015-27 PB, 3.000%, 08/20/2044 | 9,502,306 | 0.7 | |
| 3,974,858 | Ginnie Mae Series 2015-H31 FT, 2.312%, (US0001M + 0.650%), 11/20/2065 | 3,995,295 | 0.3 | |
| 13,346,878 | (1) | Ginnie Mae Series 2016-145 IU, 3.500%, 10/20/2046 | 1,504,077 | 0.1 |
| 6,000,070 | (2) | Ginnie Mae Series 2016-5 AB, 4.678%, 01/20/2046 | 6,813,728 | 0.5 |
| 8,841,663 | Ginnie Mae Series 2016-H08 FT, 1.619%, (US0001M + 0.720%), 02/20/2066 | 8,795,458 | 0.7 |
See Accompanying Notes to Financial Statements
| 7 |
| Voya GNMA Income Fund | PORTFOLIO OF INVESTMENTS |
| as of March31, 2020 (Continued) |
| 38,872,544 | Ginnie Mae Series 2017-H23 FC, 2.112%, (US0001M + 0.450%), 11/20/2067 | 38,408,235 | 3.0 | |
| 3,406,378 | Ginnie Mae Series 2018-112 AL, 3.500%, 08/20/2048 | 3,614,004 | 0.3 | |
| 2,025,085 | Ginnie Mae Series 2019-29 AI, 5.000%, 07/20/2048 | 329,581 | 0.0 | |
| 3,268,659 | Ginnie Mae Series 2009-118 XZ, 5.000%, 12/20/2039 | 3,749,328 | 0.3 | |
| 6,832,572 | Ginnie Mae Series 2010-117 ZQ, 4.500%, 09/20/2040 | 8,189,625 | 0.6 | |
| 7,529,368 | Ginnie Mae Series 2011-69 HW, 4.000%, 04/20/2040 | 8,035,011 | 0.6 | |
| 3,023,308 | Ginnie Mae Series 2011-H03 FA, 2.162%, (US0001M + 0.500%), 01/20/2061 | 2,991,144 | 0.2 | |
| 1,410,091 | (1) | Ginnie Mae Series 2012-93 NS, 5.327%, (-1.000*US0001M + 6.100%), 07/20/2042 | 278,014 | 0.0 |
| 4,909,512 | Ginnie Mae Series 2012-H08 FB, 2.262%, (US0001M + 0.600%), 03/20/2062 | 4,878,931 | 0.4 | |
| 2,436,106 | Ginnie Mae Series 2013-119 TZ, 3.000%, 08/20/2043 | 2,632,828 | 0.2 | |
| 1,552,863 | (1) | Ginnie Mae Series 2013-88 AI, 4.269%, (-1.000*US0001M + 5.850%), 06/20/2043 | 297,021 | 0.0 |
| 2,129,273 | (1) | Ginnie Mae Series 2013-99 SK, 4.319%, (-1.000*US0001M + 5.900%), 07/20/2043 | 387,695 | 0.0 |
| 2,443,578 | Ginnie Mae Series 2013-H02 FD, 2.002%, (US0001M + 0.340%), 12/20/2062 | 2,414,511 | 0.2 | |
| 2,773,275 | (1) | Ginnie Mae Series 2014-129 WS, 4.319%, (-1.000*US0001M + 5.900%), 09/20/2044 | 509,433 | 0.0 |
| 2,589,548 | (1) | Ginnie Mae Series 2014-161 WS, 4.319%, (-1.000*US0001M + 5.900%), 11/20/2044 | 456,388 | 0.0 |
| 1,566,095 | Ginnie Mae Series 2014-H21 FA, 2.312%, (US0001M + 0.650%), 10/20/2064 | 1,544,047 | 0.1 | |
| 3,789,570 | Ginnie Mae Series 2015-165 ZA, 3.500%, 07/20/2045 | 4,283,073 | 0.3 | |
| 1,382,892 | Ginnie Mae Series 2015-H26 FA, 2.182%, (US0001M + 0.520%), 10/20/2065 | 1,360,452 | 0.1 | |
| 10,442,727 | (1) | Ginnie Mae Series 2016-20 BS, 5.327%, (-1.000*US0001M + 6.100%), 02/20/2046 | 2,056,838 | 0.2 |
| 1,392,724 | Ginnie Mae Series 2016-H11 FE, 2.512%, (US0001M + 0.850%), 04/20/2066 | 1,382,641 | 0.1 | |
| 583,499 | Ginnie Mae Series 2016-H20 FG, 2.362%, (US0001M + 0.700%), 08/20/2066 | 580,378 | 0.1 | |
| 3,032,447 | Ginnie Mae Series 2017-56 HM, 3.000%, 12/20/2046 | 3,218,456 | 0.3 | |
| 5,590,494 | Ginnie Mae Series 2019-1 Z, 4.000%, 01/20/2049 | 6,148,877 | 0.5 | |
| 5,723,936 | Ginnie Mae Series 2019-H05 FL, 2.142%, (US0001M + 0.480%), 03/20/2069 | 5,732,639 | 0.4 | |
| 1,690,028 | Vendee Mortgage Trust 2011-2 DZ, 3.750%, 10/15/2041 | 1,844,232 | 0.1 | |
| Total Collateralized Mortgage Obligations | ||||
| (Cost $613,163,710) | 641,373,880 | 49.3 | ||
| U.S. GOVERNMENT AGENCY OBLIGATIONS: 75.2% | ||||
| Federal Home Loan Mortgage Corporation: 2.6%(4) | ||||
| 3,383,960 | 3.500%,07/01/2047 | 3,595,730 | 0.3 | |
| 4,457,501 | 3.500%,12/01/2047 | 4,790,867 | 0.4 | |
| 6,752,747 | 3.500%,03/01/2048 | 7,257,024 | 0.6 | |
| 7,784,230 | 3.500%,11/01/2048 | 8,365,423 | 0.7 | |
| 4,410,977 | 4.000%,07/01/2047 | 4,737,788 | 0.4 | |
| 1,491,662 | 4.500%,08/01/2047 | 1,620,110 | 0.1 | |
| 145,801 | 5.290%,10/01/2037 | 158,781 | 0.0 | |
| 26,814 | 5.410%,07/01/2037 | 29,328 | 0.0 | |
| 26,031 | 5.410%,08/01/2037 | 28,463 | 0.0 | |
| 16,815 | 5.410%,08/01/2037 | 18,373 | 0.0 | |
| 63,210 | 5.440%,01/01/2037 | 69,132 | 0.0 | |
| 21,608 | 5.440%,02/01/2037 | 23,637 | 0.0 | |
| 51,301 | 5.440%,04/01/2037 | 56,138 | 0.0 | |
| 31,581 | 5.440%,09/01/2037 | 34,531 | 0.0 | |
| 30,204 | 5.440%,02/01/2038 | 33,047 | 0.0 | |
| 1,095 | 5.440%,06/01/2038 | 1,186 | 0.0 | |
| 139,213 | 5.450%,12/01/2037 | 150,827 | 0.0 | |
| 107,219 | 5.450%,12/01/2037 | 116,654 | 0.0 | |
| 75,869 | 5.460%,05/01/2037 | 83,016 | 0.0 | |
| 35,814 | 5.460%,08/01/2037 | 39,205 | 0.0 | |
| 39,317 | 5.460%,01/01/2038 | 42,780 | 0.0 | |
| 84,229 | 5.480%,08/01/2037 | 92,192 | 0.0 | |
| 76,608 | 5.480%,10/01/2037 | 83,213 | 0.0 | |
| 128,024 | 5.500%,08/01/2037 | 142,431 | 0.0 | |
| 94,628 | 5.500%,11/01/2037 | 103,630 | 0.0 | |
| 28,868 | 5.500%,04/01/2038 | 31,645 | 0.0 | |
| 18,191 | 5.520%,10/01/2037 | 19,965 | 0.0 | |
| 64,714 | 5.620%,12/01/2036 | 71,076 | 0.0 | |
| 98,611 | 5.620%,03/01/2037 | 108,572 | 0.0 | |
| 68,949 | 5.620%,08/01/2037 | 75,732 | 0.0 | |
| 287,137 | 5.625%,12/01/2036 | 317,896 | 0.0 | |
| 201,498 | 5.625%,01/01/2037 | 221,492 | 0.0 | |
| 22,997 | 5.625%,02/01/2037 | 25,276 | 0.0 | |
| 176,032 | 5.625%,03/01/2037 | 193,425 | 0.0 | |
| 95,158 | 5.625%,06/01/2037 | 104,518 | 0.0 | |
| 84,974 | 5.625%,07/01/2037 | 93,392 | 0.0 | |
| 47,096 | 5.625%,02/01/2038 | 51,810 | 0.0 | |
| 742,030 | 5.750%,09/01/2037 | 845,857 | 0.1 | |
| 81,301 | 5.750%,10/01/2037 | 89,656 | 0.0 | |
| 153,703 | 5.750%,11/01/2037 | 169,451 | 0.0 | |
| 54,831 | 5.750%,12/01/2037 | 60,467 | 0.0 | |
See Accompanying Notes to Financial Statements
| 8 |
| Voya GNMA Income Fund | PORTFOLIO OF INVESTMENTS |
| as of March31, 2020 (Continued) |
| 99,462 | 6.090%,12/01/2037 | 110,265 | 0.0 | |
| 7,557 | 7.500%,01/01/2030 | 8,930 | 0.0 | |
| 8,664 | 8.000%,01/01/2030 | 8,699 | 0.0 | |
| 34,281,630 | 2.6 | |||
| Federal National Mortgage Association: 1.0%(4) | ||||
| 8,326,245 | 4.000%,07/01/2056 | 9,277,488 | 0.7 | |
| 380,884 | 5.290%,09/01/2037 | 425,378 | 0.1 | |
| 343,545 | 5.290%,09/01/2037 | 372,048 | 0.1 | |
| 303,910 | 5.290%,11/01/2037 | 335,936 | 0.0 | |
| 84,726 | 5.290%,12/01/2037 | 88,102 | 0.0 | |
| 272,136 | 5.290%,04/01/2038 | 294,057 | 0.0 | |
| 56,544 | 5.350%,04/01/2029 | 62,317 | 0.0 | |
| 40,948 | 5.350%,09/01/2029 | 45,297 | 0.0 | |
| 71,068 | 5.390%,05/01/2038 | 80,720 | 0.0 | |
| 282,710 | 5.440%,08/01/2047 | 305,221 | 0.0 | |
| 168,092 | 5.440%,08/01/2047 | 178,362 | 0.0 | |
| 163,283 | 5.440%,08/01/2047 | 176,391 | 0.0 | |
| 292,451 | 5.440%,08/01/2047 | 310,665 | 0.0 | |
| 179,454 | 5.440%,09/01/2047 | 190,489 | 0.0 | |
| 482,837 | 5.440%,10/01/2047 | 522,630 | 0.1 | |
| 95,746 | 5.440%,05/01/2048 | 103,323 | 0.0 | |
| 108,791 | 5.620%,12/01/2036 | 118,455 | 0.0 | |
| 186,778 | 5.740%,08/01/2037 | 197,989 | 0.0 | |
| 48,495 | 5.875%,06/01/2035 | 50,174 | 0.0 | |
| 151,169 | 5.890%,07/01/2047 | 161,664 | 0.0 | |
| 105,224 | 5.890%,08/01/2047 | 112,527 | 0.0 | |
| 113,616 | 5.890%,10/01/2047 | 122,061 | 0.0 | |
| 24,483 | 5.900%,09/01/2028 | 26,566 | 0.0 | |
| 77,385 | 6.600%,07/01/2027 | 84,023 | 0.0 | |
| 40,430 | 6.600%,09/01/2027 | 41,625 | 0.0 | |
| 31,527 | 6.600%,11/01/2027 | 31,948 | 0.0 | |
| 26,614 | 6.600%,06/01/2028 | 26,794 | 0.0 | |
| 13,742,250 | 1.0 | |||
| Government National Mortgage Association: 65.0% | ||||
| 160,796,000 | (5) | 3.000%,05/01/2043 | 169,884,060 | 13.1 |
| 2,071,571 | 3.000%,04/20/2045 | 2,228,626 | 0.2 | |
| 428,533 | 3.000%,11/20/2045 | 456,378 | 0.1 | |
| 388,601 | 3.000%,12/20/2045 | 412,418 | 0.0 | |
| 340,961 | 3.000%,12/20/2045 | 364,330 | 0.0 | |
| 117,860 | 3.000%,12/20/2045 | 124,987 | 0.0 | |
| 403,277 | 3.000%,01/20/2046 | 430,304 | 0.0 | |
| 2,543,522 | 3.000%,04/20/2046 | 2,725,152 | 0.2 | |
| 3,980,702 | 3.000%,01/20/2050 | 4,225,079 | 0.3 | |
| 3,800,314 | 3.000%,02/20/2050 | 4,030,032 | 0.3 | |
| 2,160,400 | 3.500%,04/20/2043 | 2,313,818 | 0.2 | |
| 2,612,141 | 3.500%,06/20/2045 | 2,809,597 | 0.2 | |
| 8,619,840 | 3.500%,04/20/2046 | 9,195,551 | 0.7 | |
| 9,768,654 | 3.500%,03/20/2047 | 10,456,007 | 0.8 | |
| 1,993,883 | 3.500%,07/20/2047 | 2,148,898 | 0.2 | |
| 2,012,695 | 3.500%,07/20/2047 | 2,144,161 | 0.2 | |
| 54,438,715 | 3.500%,12/20/2047 | 58,383,665 | 4.5 | |
| 16,729,559 | 3.500%,01/20/2048 | 17,923,250 | 1.4 | |
| 11,742,654 | 3.500%,02/20/2048 | 12,568,980 | 1.0 | |
| 6,511,395 | 3.500%,02/20/2048 | 7,035,811 | 0.6 | |
| 23,362,155 | 3.500%,03/20/2048 | 25,128,567 | 1.9 | |
| 13,918,958 | 3.500%,01/20/2050 | 14,740,197 | 1.1 | |
| 4,802,122 | 3.750%,05/20/2042 | 5,167,950 | 0.4 | |
| 4,585,701 | 3.750%,05/20/2042 | 4,941,162 | 0.4 | |
| 108,957 | 4.000%,05/20/2033 | 117,406 | 0.0 | |
| 23,509 | 4.000%,08/15/2033 | 25,019 | 0.0 | |
| 37,609 | 4.000%,01/15/2034 | 40,093 | 0.0 | |
| 22,143 | 4.000%,03/15/2034 | 23,579 | 0.0 | |
| 1,266,708 | 4.000%,05/20/2034 | 1,356,640 | 0.1 | |
| 1,438,989 | 4.000%,07/20/2034 | 1,542,258 | 0.1 | |
| 1,032,414 | 4.000%,07/20/2034 | 1,106,635 | 0.1 | |
| 133,872 | 4.000%,08/20/2035 | 142,735 | 0.0 | |
| 168,224 | 4.000%,05/15/2040 | 179,299 | 0.0 | |
| 2,000,938 | 4.000%,09/20/2040 | 2,159,890 | 0.2 | |
| 2,873,840 | 4.000%,07/20/2041 | 3,200,255 | 0.3 | |
| 10,318,141 | 4.000%,08/20/2042 | 11,266,593 | 0.9 | |
| 453,914 | 4.000%,09/15/2042 | 485,378 | 0.1 | |
| 1,896,856 | 4.000%,10/20/2043 | 2,054,881 | 0.2 | |
| 2,947,336 | 4.000%,12/20/2044 | 3,188,583 | 0.3 | |
| 2,854,262 | 4.000%,01/20/2045 | 3,089,579 | 0.3 | |
| 828,017 | 4.000%,06/20/2045 | 904,058 | 0.1 | |
| 3,717,460 | 4.000%,07/20/2045 | 4,058,834 | 0.3 | |
| 4,505,970 | 4.000%,09/20/2045 | 4,919,362 | 0.4 | |
| 365,768 | 4.000%,12/20/2045 | 391,536 | 0.0 | |
| 713,836 | 4.000%,01/20/2046 | 768,236 | 0.1 | |
| 6,065,313 | 4.000%,01/20/2046 | 6,542,248 | 0.5 | |
| 195,086 | 4.000%,02/20/2046 | 211,916 | 0.0 | |
| 4,666,416 | 4.000%,03/20/2046 | 5,043,207 | 0.4 | |
| 2,426,412 | 4.000%,04/20/2046 | 2,632,977 | 0.2 | |
| 1,060,692 | 4.000%,08/20/2046 | 1,145,322 | 0.1 | |
| 9,400,019 | 4.000%,09/20/2047 | 10,043,782 | 0.8 | |
| 26,206,658 | 4.000%,04/20/2048 | 28,226,191 | 2.2 | |
| 2,406,449 | 4.000%,10/20/2049 | 2,562,165 | 0.2 | |
| 21,505,884 | 4.000%,11/20/2049 | 22,905,393 | 1.8 | |
| 27,330,842 | 4.000%,12/20/2049 | 29,307,714 | 2.3 | |
| 13,197 | 4.500%,07/20/2036 | 14,082 | 0.0 | |
| 11,048 | 4.500%,08/20/2036 | 11,778 | 0.0 | |
| 1,049,059 | 4.500%,10/15/2039 | 1,176,370 | 0.1 | |
| 595,575 | 4.500%,11/15/2039 | 667,648 | 0.1 | |
| 691,221 | 4.500%,11/15/2039 | 775,120 | 0.1 | |
| 208,453 | 4.500%,12/15/2039 | 233,711 | 0.0 | |
| 563,909 | 4.500%,01/15/2040 | 625,599 | 0.1 | |
| 73,975 | 4.500%,01/20/2040 | 79,829 | 0.0 | |
| 2,205,347 | 4.500%,02/15/2040 | 2,445,242 | 0.2 | |
| 494,921 | 4.500%,06/15/2040 | 546,082 | 0.1 | |
| 92,594 | 4.500%,07/20/2040 | 99,873 | 0.0 | |
| 396,822 | 4.500%,08/20/2040 | 427,961 | 0.0 | |
| 1,305,468 | 4.500%,09/20/2041 | 1,440,744 | 0.1 | |
| 25,819,882 | 4.500%,11/20/2049 | 27,698,804 | 2.1 | |
| 32,819,105 | 4.500%,12/20/2049 | 35,100,889 | 2.7 | |
| 754,086 | 4.750%,06/15/2029 | 830,814 | 0.1 | |
| 185,869 | 4.750%,01/15/2030 | 204,503 | 0.0 | |
| 357,220 | 4.750%,09/15/2034 | 393,638 | 0.0 | |
| 26,288 | 5.000%,03/20/2024 | 28,353 | 0.0 | |
| 1,036,666 | 5.000%,04/20/2030 | 1,124,299 | 0.1 | |
| 197,293 | 5.000%,07/15/2033 | 214,184 | 0.0 | |
| 70,390 | 5.000%,03/15/2034 | 77,597 | 0.0 | |
| 62,487 | 5.000%,04/15/2034 | 67,691 | 0.0 | |
| 70,466 | 5.000%,01/15/2035 | 76,252 | 0.0 | |
| 165,616 | 5.000%,03/15/2035 | 179,562 | 0.0 | |
| 19,056 | 5.000%,03/15/2035 | 20,919 | 0.0 | |
| 289,611 | 5.000%,04/15/2035 | 323,500 | 0.0 | |
| 66,060 | 5.000%,04/15/2035 | 73,325 | 0.0 | |
| 51,446 | 5.000%,04/15/2035 | 55,757 | 0.0 | |
| 30,945 | 5.000%,05/15/2035 | 34,782 | 0.0 | |
| 83,029 | 5.000%,05/20/2035 | 92,273 | 0.0 | |
| 418,252 | 5.000%,11/20/2035 | 464,624 | 0.1 | |
| 207,790 | 5.000%,04/20/2036 | 230,966 | 0.0 | |
| 147,159 | 5.000%,02/15/2038 | 159,537 | 0.0 | |
| 44,524 | 5.000%,06/20/2038 | 46,316 | 0.0 | |
| 40,541 | 5.000%,08/20/2038 | 43,409 | 0.0 | |
| 180,544 | 5.000%,10/20/2038 | 190,704 | 0.0 | |
| 32,043 | 5.000%,11/20/2038 | 33,160 | 0.0 | |
| 208,131 | 5.000%,01/20/2039 | 219,363 | 0.0 | |
| 170,385 | 5.000%,02/15/2039 | 184,797 | 0.0 | |
| 227,239 | 5.000%,03/15/2039 | 247,764 | 0.0 | |
| 195,793 | 5.000%,11/15/2039 | 212,433 | 0.0 | |
| 786,354 | 5.000%,11/15/2039 | 892,196 | 0.1 | |
| 897,526 | 5.000%,11/15/2039 | 1,017,881 | 0.1 | |
| 145,400 | 5.000%,04/15/2040 | 160,454 | 0.0 | |
| 872,758 | 5.000%,09/15/2040 | 973,709 | 0.1 | |
| 955,698 | 5.000%,07/20/2041 | 1,058,025 | 0.1 | |
| 28,366 | 5.250%,01/15/2024 | 30,871 | 0.0 | |
See Accompanying Notes to Financial Statements
| 9 |
| Voya GNMA Income Fund | PORTFOLIO OF INVESTMENTS |
| as of March31, 2020 (Continued) |
| 49,892 | 5.250%,06/15/2028 | 54,876 | 0.0 | |
| 76,252 | 5.250%,06/15/2029 | 83,861 | 0.0 | |
| 1,080,868 | 5.250%,01/20/2036 | 1,199,199 | 0.1 | |
| 120,869 | 5.290%,07/20/2037 | 129,941 | 0.0 | |
| 174,762 | 5.290%,08/20/2037 | 187,699 | 0.0 | |
| 138,625 | 5.290%,08/20/2037 | 149,740 | 0.0 | |
| 104,691 | 5.290%,09/20/2037 | 112,548 | 0.0 | |
| 389,551 | 5.290%,09/20/2037 | 419,768 | 0.0 | |
| 121,452 | 5.290%,01/20/2038 | 130,557 | 0.0 | |
| 9,212 | 5.350%,01/15/2029 | 10,006 | 0.0 | |
| 21,015 | 5.350%,01/20/2029 | 22,590 | 0.0 | |
| 3,030 | 5.350%,02/20/2029 | 3,207 | 0.0 | |
| 68,484 | 5.350%,04/20/2029 | 73,633 | 0.0 | |
| 35,135 | 5.350%,06/20/2029 | 37,813 | 0.0 | |
| 43,987 | 5.350%,10/20/2029 | 47,342 | 0.0 | |
| 126,510 | 5.390%,05/15/2038 | 137,781 | 0.0 | |
| 154,607 | 5.390%,08/20/2038 | 171,416 | 0.0 | |
| 162,085 | 5.390%,09/15/2038 | 176,522 | 0.0 | |
| 97,100 | 5.390%,02/15/2040 | 107,962 | 0.0 | |
| 52,519 | 5.500%,08/15/2024 | 55,066 | 0.0 | |
| 23,408 | 5.500%,08/20/2024 | 25,259 | 0.0 | |
| 688 | 5.500%,04/20/2029 | 743 | 0.0 | |
| 283,829 | 5.500%,09/15/2029 | 308,604 | 0.0 | |
| 167,189 | 5.500%,10/15/2029 | 181,790 | 0.0 | |
| 42,744 | 5.500%,12/20/2032 | 48,266 | 0.0 | |
| 146,580 | 5.500%,08/20/2033 | 165,398 | 0.0 | |
| 67,763 | 5.500%,11/20/2033 | 69,342 | 0.0 | |
| 41,287 | 5.500%,12/20/2033 | 46,606 | 0.0 | |
| 68,597 | 5.500%,03/20/2034 | 70,210 | 0.0 | |
| 199,359 | 5.500%,04/20/2034 | 215,664 | 0.0 | |
| 245,448 | 5.500%,04/20/2034 | 277,004 | 0.0 | |
| 181,938 | 5.500%,06/20/2034 | 196,684 | 0.0 | |
| 89,197 | 5.500%,06/20/2034 | 92,068 | 0.0 | |
| 91,297 | 5.500%,07/20/2034 | 98,631 | 0.0 | |
| 111,551 | 5.500%,01/20/2035 | 117,378 | 0.0 | |
| 191,887 | 5.500%,05/15/2035 | 209,106 | 0.0 | |
| 56,316 | 5.500%,05/20/2035 | 60,832 | 0.0 | |
| 45,218 | 5.500%,06/20/2035 | 48,785 | 0.0 | |
| 375,364 | 5.500%,07/15/2035 | 414,456 | 0.0 | |
| 317,568 | 5.500%,08/15/2035 | 350,810 | 0.0 | |
| 222,388 | 5.500%,09/20/2035 | 241,494 | 0.0 | |
| 159,248 | 5.500%,04/15/2036 | 173,585 | 0.0 | |
| 54,963 | 5.500%,06/20/2036 | 61,661 | 0.0 | |
| 13,099 | 5.500%,06/20/2038 | 14,255 | 0.0 | |
| 23,902 | 5.500%,08/20/2038 | 26,017 | 0.0 | |
| 24,129 | 5.500%,09/20/2038 | 26,185 | 0.0 | |
| 2,771 | 5.500%,10/20/2038 | 2,956 | 0.0 | |
| 44,660 | 5.500%,11/20/2038 | 48,661 | 0.0 | |
| 3,753 | 5.500%,12/20/2038 | 4,064 | 0.0 | |
| 90,906 | 5.500%,01/15/2039 | 99,095 | 0.0 | |
| 6,134 | 5.500%,01/20/2039 | 6,528 | 0.0 | |
| 85,302 | 5.500%,03/20/2039 | 91,075 | 0.0 | |
| 30,334 | 5.500%,06/15/2039 | 33,061 | 0.0 | |
| 17,382 | 5.500%,06/20/2039 | 18,576 | 0.0 | |
| 41,417 | 5.500%,10/20/2039 | 46,360 | 0.0 | |
| 263,730 | 5.500%,09/15/2040 | 290,104 | 0.0 | |
| 131,943 | 5.740%,08/20/2037 | 143,415 | 0.0 | |
| 85,884 | 5.740%,09/20/2037 | 93,335 | 0.0 | |
| 351,196 | 5.740%,09/20/2037 | 381,480 | 0.0 | |
| 261,710 | 5.740%,09/20/2037 | 284,410 | 0.0 | |
| 406,610 | 5.740%,10/20/2037 | 451,980 | 0.0 | |
| 97,218 | 5.740%,04/20/2038 | 105,645 | 0.0 | |
| 81,201 | 5.750%,11/15/2024 | 85,628 | 0.0 | |
| 737,249 | 5.750%,07/15/2029 | 799,728 | 0.1 | |
| 541,804 | 5.750%,08/15/2029 | 586,708 | 0.1 | |
| 79,446 | 5.750%,11/15/2029 | 86,080 | 0.0 | |
| 588,607 | 5.750%,11/15/2029 | 638,061 | 0.1 | |
| 12,063 | 5.900%,03/20/2028 | 13,139 | 0.0 | |
| 36,094 | 5.900%,05/20/2028 | 39,361 | 0.0 | |
| 36,934 | 5.900%,09/20/2028 | 40,266 | 0.0 | |
| 1,327,605 | 5.970%,11/15/2031 | 1,325,950 | 0.1 | |
| 18,799 | 6.000%,01/20/2024 | 19,061 | 0.0 | |
| 80,060 | 6.000%,10/15/2025 | 88,845 | 0.0 | |
| 166,844 | 6.000%,04/15/2026 | 180,817 | 0.0 | |
| 41,586 | 6.000%,10/20/2027 | 45,455 | 0.0 | |
| 149,672 | 6.000%,05/15/2029 | 163,845 | 0.0 | |
| 165,152 | 6.000%,07/15/2029 | 180,304 | 0.0 | |
| 76,604 | 6.000%,10/20/2034 | 87,513 | 0.0 | |
| 158,615 | 6.000%,03/15/2037 | 180,516 | 0.0 | |
| 14,541 | 6.000%,05/20/2038 | 15,742 | 0.0 | |
| 111,588 | 6.000%,08/20/2038 | 121,180 | 0.0 | |
| 16,501 | 6.000%,09/20/2038 | 17,907 | 0.0 | |
| 55,834 | 6.000%,10/20/2038 | 66,322 | 0.0 | |
| 75,048 | 6.000%,11/15/2038 | 83,050 | 0.0 | |
| 79,161 | 6.000%,12/15/2038 | 87,605 | 0.0 | |
| 163,074 | 6.000%,12/15/2038 | 180,718 | 0.0 | |
| 360,313 | 6.000%,08/15/2039 | 400,138 | 0.0 | |
| 327,040 | 6.000%,08/15/2039 | 366,704 | 0.0 | |
| 30,915 | 6.490%,01/15/2028 | 34,121 | 0.0 | |
| 27,759 | 6.500%,07/20/2029 | 32,232 | 0.0 | |
| 49,477 | 6.500%,07/20/2032 | 51,123 | 0.0 | |
| 135,384 | 6.500%,02/15/2034 | 148,399 | 0.0 | |
| 421 | 6.500%,09/20/2034 | 452 | 0.0 | |
| 9,379 | 7.500%,08/20/2027 | 10,948 | 0.0 | |
| 229,500,000 | (5) | 2.500%,05/01/2050 | 239,450,978 | 18.4 |
| 845,370,135 | 65.0 | |||
| Uniform Mortgage-Backed Securities: 6.6% | ||||
| 5,294,101 | 2.500%,04/01/2050 | 5,496,562 | 0.4 | |
| 20,433,246 | 3.000%,10/01/2049 | 21,465,058 | 1.7 | |
| 4,135,536 | 3.000%,12/01/2049 | 4,342,394 | 0.4 | |
| 9,411,067 | 3.500%,12/01/2047 | 10,001,412 | 0.8 | |
| 8,548,233 | 3.500%,05/01/2048 | 9,081,498 | 0.7 | |
| 11,190,884 | 4.000%,05/01/2042 | 12,200,919 | 1.0 | |
| 1,286,980 | 4.000%,05/01/2045 | 1,394,148 | 0.1 | |
| 3,930,382 | 4.000%,06/01/2048 | 4,200,524 | 0.3 | |
| 8,698,282 | 4.000%,03/01/2049 | 9,285,687 | 0.7 | |
| 492,994 | 4.250%,08/01/2035 | 533,753 | 0.1 | |
| 259,703 | 4.750%,11/01/2034 | 281,050 | 0.0 | |
| 464,430 | 4.750%,11/01/2034 | 508,590 | 0.1 | |
| 364,657 | 4.750%,02/01/2035 | 398,252 | 0.0 | |
| 630,337 | 4.750%,04/01/2035 | 694,780 | 0.1 | |
| 574,009 | 4.750%,05/01/2035 | 629,482 | 0.1 | |
| 135,285 | 4.750%,07/01/2035 | 145,872 | 0.0 | |
| 823,249 | 4.750%,07/01/2035 | 910,177 | 0.1 | |
| 139,846 | 5.000%,02/01/2033 | 151,363 | 0.0 | |
| 100,353 | 5.000%,07/01/2033 | 108,577 | 0.0 | |
| 87,278 | 5.000%,03/01/2036 | 94,349 | 0.0 | |
| 281,838 | 5.000%,05/01/2036 | 306,736 | 0.0 | |
| 97,130 | 5.030%,05/01/2037 | 105,127 | 0.0 | |
| 150,763 | 5.030%,09/01/2037 | 163,042 | 0.0 | |
| 49,557 | 5.155%,11/01/2036 | 53,846 | 0.0 | |
| 164,692 | 5.155%,01/01/2037 | 178,833 | 0.0 | |
| 146,912 | 5.250%,04/01/2032 | 160,340 | 0.0 | |
| 74,411 | 5.250%,04/01/2032 | 81,059 | 0.0 | |
| 27,987 | 5.280%,11/01/2036 | 30,481 | 0.0 | |
| 130,069 | 5.280%,11/01/2036 | 141,763 | 0.0 | |
| 47,239 | 5.280%,01/01/2037 | 51,432 | 0.0 | |
| 205,017 | 5.290%,08/01/2037 | 223,532 | 0.0 | |
| 334,267 | 5.290%,09/01/2037 | 364,988 | 0.0 | |
| 76,969 | 5.290%,09/01/2037 | 83,931 | 0.0 | |
| 54,192 | 5.300%,09/01/2036 | 59,033 | 0.0 | |
| 22,338 | 5.300%,10/01/2036 | 24,358 | 0.0 | |
| 32,220 | 5.300%,10/01/2036 | 35,101 | 0.0 | |
| 91,540 | 5.300%,12/01/2036 | 99,675 | 0.0 | |
| 125,071 | 5.300%,12/01/2036 | 136,244 | 0.0 | |
| 69,237 | 5.300%,02/01/2037 | 75,446 | 0.0 | |
| 83,372 | 5.300%,05/01/2037 | 90,924 | 0.0 | |
| 336,432 | 5.300%,08/01/2037 | 369,691 | 0.0 | |
| 132,952 | 5.390%,12/01/2037 | 145,201 | 0.0 | |
See Accompanying Notes to Financial Statements
| 10 |
| Voya GNMA Income Fund | PORTFOLIO OF INVESTMENTS |
| as of March31, 2020 (Continued) |
| 267,154 | 5.405%,11/01/2036 | 292,659 | 0.0 | |
| 238,875 | 5.405%,02/01/2037 | 261,288 | 0.0 | |
| 97,204 | 5.740%,07/01/2037 | 107,140 | 0.0 | |
| 133,250 | 5.740%,08/01/2037 | 146,974 | 0.0 | |
| 16,140 | 7.500%,05/01/2028 | 16,193 | 0.0 | |
| 85,729,484 | 6.6 | |||
| Total U.S. Government Agency Obligations | ||||
| (Cost $952,752,838) | 979,123,499 | 75.2 | ||
| ASSET-BACKED SECURITIES: 0.2% | ||||
| Other Asset-Backed Securities: 0.2% | ||||
| 256,646 | (2) | Fannie Mae Grantor Trust 2003-T4 2A6, 4.625%, 07/26/2033 | 281,002 | 0.0 |
| 97,628 | (2) | Fannie Mae REMIC Trust 2001-W4 AF6, 5.610%, 01/25/2032 | 105,578 | 0.0 |
| 46,522 | (2) | Fannie Mae REMIC Trust 2002-W12 AF6, 5.066%, 02/25/2033 | 48,232 | 0.0 |
| 59,160 | (2) | Fannie Mae REMIC Trust 2002-W2 AF6, 6.483%, 05/25/2032 | 63,354 | 0.0 |
| 2,150,205 | Fannie Mae Grantor Trust 2001-T9 A1, 1.167%, (US0001M + 0.220%), 09/25/2031 | 2,116,968 | 0.2 | |
| Total Asset-Backed Securities | ||||
| (Cost $2,590,858) | 2,615,134 | 0.2 | ||
| COMMERCIAL MORTGAGE-BACKED SECURITIES: 0.2% | ||||
| 456,250 | (2) | Ginnie Mae 2004-23 Z, 5.547%, 03/16/2044 | 501,503 | 0.0 |
| 6,103,899 | (1),(2) | Ginnie Mae 2006-67 IO, 0.533%, 11/16/2046 | 20,030 | 0.0 |
| 622,506 | (2) | Ginnie Mae 2007-52 Z, 4.350%, 01/16/2048 | 675,499 | 0.1 |
| 652,613 | Ginnie Mae 2008-39 Z, 4.500%, 02/16/2048 | 693,691 | 0.1 | |
| 236,711 | (1),(2) | Ginnie Mae 2008-45 IO, 0.852%, 02/16/2048 | 451 | 0.0 |
| 436,729 | (2) | Ginnie Mae 2009-115 D, 4.593%, 01/16/2050 | 457,014 | 0.0 |
| 2,341,969 | (1),(2) | Ginnie Mae 2010-122 IO, 0.297%, 02/16/2044 | 9,531 | 0.0 |
| 63,497 | (1),(2) | Ginnie Mae 2010-123 IA, 2.050%, 10/16/2052 | 859 | 0.0 |
| 20,811,598 | (1),(2) | Ginnie Mae 2011-47 IO, 0.081%, 01/16/2051 | 52,857 | 0.0 |
| 232,222 | (2) | Ginnie Mae 2011-53 B, 3.924%, 05/16/2051 | 238,498 | 0.0 |
| Total Commercial Mortgage-Backed Securities | ||||
| (Cost $2,893,943) | 2,649,933 | 0.2 | ||
| Total Long-Term Investments | ||||
| (Cost $1,571,401,349) | 1,625,762,446 | 124.9 | ||
| SHORT-TERM INVESTMENTS: 5.0% | ||||
| U.S. Treasury Bills: 5.0% | ||||
| 58,000,000 | (6) | United States Treasury Bill, 0.030%, 04/28/2020 | 57,998,586 | 4.5 |
| 6,301,000 | (6) | United States Treasury Bill, 0.060%, 04/07/2020 | 6,300,933 | 0.5 |
| Total U.S. Treasury Bills | ||||
| Total Short-Term Investments | ||||
| (Cost $64,298,746) | 64,299,519 | 5.0 | ||
| Total Investments in Securities (Cost $1,635,700,095) | $ 1,690,061,965 | 129.9 | ||
| Liabilities in Excess of Other Assets | (388,638,922) | (29.9) | ||
| Net Assets | $ 1,301,423,043 | 100.0 | ||
| † | Unless otherwise indicated, principal amount is shown in USD. |
| (1) | Interest only securities represent the right to receive the monthly interest payments on an underlying pool of mortgage loans. Principal amount shown represents the notional amount on which current interest is calculated. Payments of principal on the pool reduce the value of the interest only security. |
| (2) | Variable rate security. Rate shown is the rate in effect as of March 31, 2020. |
| (3) | Principal only securities represent the right to receive the monthly principal payments on an underlying pool of mortgage loans. No payments of interest on the pool are passed through the principal only security. |
| (4) | The Federal Housing Finance Agency (“FHFA”) placed the Federal Home Loan Mortgage Corporation and Federal National Mortgage Association into conservatorship with FHFA as the conservator. As such, the FHFA oversees the continuing affairs of these companies. |
| (5) | Settlement is on a when-issued or delayed-delivery basis. |
| (6) | Represents a zero coupon bond. Rate shown reflects the effective yield as of March 31, 2020. |
| Reference Rate Abbreviations: | |
| H15T1Y | U.S. Treasury 1-Year Constant Maturity |
| US0001M | 1-month LIBOR |
See Accompanying Notes to Financial Statements
| 11 |
| Voya High Yield Bond Fund | PORTFOLIO OF INVESTMENTS |
| as of March31, 2020 |
| Principal Amount† | Value | Percentage of Net Assets | ||
| CORPORATE BONDS/NOTES: 92.8% | ||||
| Basic Materials: 5.1% | ||||
| 1,510,000 | (1) | Aruba Investments, Inc., 8.750%, 02/15/2023 | $ 1,477,905 | 0.3 |
| 1,400,000 | CF Industries, Inc., 5.375%, 03/15/2044 | 1,344,462 | 0.3 | |
| 315,000 | (2) | Cleveland-Cliffs, Inc., 5.750%, 03/01/2025 | 245,700 | 0.0 |
| 1,760,000 | (1) | Cleveland-Cliffs, Inc., 6.750%, 03/15/2026 | 1,565,300 | 0.3 |
| 1,175,000 | (1) | Compass Minerals International, Inc., 6.750%, 12/01/2027 | 1,067,252 | 0.2 |
| 1,200,000 | (1) | Constellium SE, 5.750%, 05/15/2024 | 1,081,614 | 0.2 |
| 500,000 | (1),(2) | Constellium SE, 5.875%, 02/15/2026 | 438,787 | 0.1 |
| 750,000 | (1) | Constellium SE, 6.625%, 03/01/2025 | 680,602 | 0.1 |
| 1,185,000 | (1) | First Quantum Minerals Ltd., 6.500%, 03/01/2024 | 990,962 | 0.2 |
| 1,500,000 | Freeport-McMoRan, Inc., 4.550%, 11/14/2024 | 1,425,908 | 0.3 | |
| 2,600,000 | Freeport-McMoRan, Inc., 4.125%, 03/01/2028 | 2,285,764 | 0.5 | |
| 350,000 | Freeport-McMoRan, Inc., 4.250%, 03/01/2030 | 305,393 | 0.1 | |
| 1,475,000 | Hecla Mining Co., 7.250%, 02/15/2028 | 1,298,738 | 0.3 | |
| 2,225,000 | (1) | Novelis Corp., 5.875%, 09/30/2026 | 2,199,040 | 0.5 |
| 1,250,000 | (1) | OCI NV, 5.250%, 11/01/2024 | 1,093,750 | 0.2 |
| 2,100,000 | (1) | OCI NV, 6.625%, 04/15/2023 | 1,932,000 | 0.4 |
| 1,100,000 | Olin Corp., 5.125%, 09/15/2027 | 990,586 | 0.2 | |
| 1,950,000 | (1) | Schweitzer-Mauduit International, Inc., 6.875%, 10/01/2026 | 1,956,908 | 0.4 |
| 1,135,000 | (1) | SPCM SA, 4.875%, 09/15/2025 | 1,081,053 | 0.2 |
| 1,875,000 | (1),(2) | Tronox, Inc., 6.500%, 04/15/2026 | 1,701,703 | 0.3 |
| 25,163,427 | 5.1 | |||
| Communications: 22.9% | ||||
| 1,400,000 | (1) | Altice France SA/France, 8.125%, 02/01/2027 | 1,467,270 | 0.3 |
| 1,375,000 | (1),(2) | Altice Finco SA, 7.625%, 02/15/2025 | 1,318,274 | 0.3 |
| 1,625,000 | AMC Networks, Inc., 4.750%, 08/01/2025 | 1,590,477 | 0.3 | |
| 1,600,000 | (1) | Block Communications, Inc., 4.875%, 03/01/2028 | 1,497,000 | 0.3 |
| 2,275,000 | (1) | C&W Senior Financing DAC, 7.500%, 10/15/2026 | 2,099,899 | 0.4 |
| 1,325,000 | Cablevision Systems Corp., 5.875%, 09/15/2022 | 1,345,325 | 0.3 | |
| 2,725,000 | (1) | CCO Holdings LLC / CCO Holdings Capital Corp., 5.125%, 05/01/2027 | 2,757,754 | 0.6 |
| 1,250,000 | (1) | CCO Holdings LLC / CCO Holdings Capital Corp., 5.000%, 02/01/2028 | 1,261,950 | 0.3 |
| 1,600,000 | (1) | CCO Holdings LLC / CCO Holdings Capital Corp., 5.500%, 05/01/2026 | 1,631,308 | 0.3 |
| 2,700,000 | (1) | CCO Holdings LLC / CCO Holdings Capital Corp., 5.750%, 02/15/2026 | 2,743,065 | 0.6 |
| 355,000 | (1) | CCO Holdings LLC / CCO Holdings Capital Corp., 4.500%, 05/01/2032 | 348,193 | 0.1 |
| 750,000 | (1) | CCO Holdings LLC / CCO Holdings Capital Corp., 4.750%, 03/01/2030 | 752,287 | 0.2 |
| 1,125,000 | CenturyLink, Inc., 5.625%, 04/01/2020 | 1,125,000 | 0.2 | |
| 675,000 | CenturyLink, Inc., 5.625%, 04/01/2025 | 682,590 | 0.1 | |
| 675,000 | CenturyLink, Inc., 5.800%, 03/15/2022 | 684,895 | 0.1 | |
| 1,600,000 | (1) | Clear Channel Worldwide Holdings, Inc., 9.250%, 02/15/2024 | 1,386,008 | 0.3 |
| 2,675,000 | (1) | CommScope Tech Finance LLC, 6.000%, 06/15/2025 | 2,468,222 | 0.5 |
| 300,000 | (1) | CommScope Technologies LLC, 5.000%, 03/15/2027 | 262,522 | 0.1 |
| 2,075,000 | (1) | Connect Finco SARL / Connect US Finco LLC, 6.750%, 10/01/2026 | 1,722,250 | 0.4 |
| 1,775,000 | (2) | Consolidated Communications, Inc., 6.500%, 10/01/2022 | 1,566,437 | 0.3 |
| 3,275,000 | (2) | CSC Holdings LLC, 5.250%, 06/01/2024 | 3,303,640 | 0.7 |
| 2,245,000 | (1) | CSC Holdings LLC, 5.500%, 05/15/2026 | 2,337,758 | 0.5 |
| 1,195,000 | (1) | CSC Holdings LLC, 5.750%, 01/15/2030 | 1,209,591 | 0.2 |
| 825,000 | (1) | CSC Holdings LLC, 7.500%, 04/01/2028 | 884,720 | 0.2 |
| 1,675,000 | (1) | Cumulus Media New Holdings, Inc., 6.750%, 07/01/2026 | 1,508,542 | 0.3 |
| 900,000 | (1) | Diamond Sports Group LLC / Diamond Sports Finance Co., 5.375%, 08/15/2026 | 736,328 | 0.2 |
| 2,075,000 | (1),(2) | Diamond Sports Group LLC / Diamond Sports Finance Co., 6.625%, 08/15/2027 | 1,399,172 | 0.3 |
| 625,000 | DISH DBS Corp., 5.000%, 03/15/2023 | 604,700 | 0.1 | |
| 1,575,000 | DISH DBS Corp., 5.875%, 07/15/2022 | 1,542,177 | 0.3 | |
See Accompanying Notes to Financial Statements
| 12 |
| Voya High Yield Bond Fund | PORTFOLIO OF INVESTMENTS |
| as of March31, 2020 (Continued) |
| 1,900,000 | DISH DBS Corp., 5.875%, 11/15/2024 | 1,862,161 | 0.4 | |
| 1,625,000 | Embarq Corp., 7.995%, 06/01/2036 | 1,617,403 | 0.3 | |
| 1,325,000 | (1),(2) | Entercom Media Corp., 7.250%, 11/01/2024 | 1,117,962 | 0.2 |
| 2,810,000 | (1) | Front Range BidCo, Inc., 6.125%, 03/01/2028 | 2,685,306 | 0.5 |
| 925,000 | (1) | Frontier Communications Corp., 8.000%, 04/01/2027 | 917,443 | 0.2 |
| 1,900,000 | (1),(2) | Gray Television, Inc., 5.125%, 10/15/2024 | 1,847,759 | 0.4 |
| 1,200,000 | (1) | Gray Television, Inc., 7.000%, 05/15/2027 | 1,200,660 | 0.2 |
| 1,050,000 | (1) | GTT Communications, Inc., 7.875%, 12/31/2024 | 685,125 | 0.1 |
| 1,500,000 | (2) | Hughes Satellite Systems Corp., 6.625%, 08/01/2026 | 1,532,186 | 0.3 |
| 525,000 | (1) | iHeartCommunications, Inc., 5.250%, 08/15/2027 | 460,399 | 0.1 |
| 2,075,000 | (2) | iHeartCommunications, Inc., 8.375%, 05/01/2027 | 1,778,171 | 0.4 |
| 1,915,000 | (1),(2) | Intelsat Jackson Holdings SA, 8.500%, 10/15/2024 | 1,217,854 | 0.2 |
| 1,775,000 | Intelsat Luxembourg SA, 8.125%, 06/01/2023 | 377,187 | 0.1 | |
| 935,000 | (1) | Lamar Media Corp., 3.750%, 02/15/2028 | 883,463 | 0.2 |
| 370,000 | (1) | Lamar Media Corp., 4.000%, 02/15/2030 | 346,875 | 0.1 |
| 2,025,000 | (1) | LCPR Senior Secured Financing DAC, 6.750%, 10/15/2027 | 2,005,864 | 0.4 |
| 975,000 | Level 3 Financing, Inc., 5.125%, 05/01/2023 | 964,026 | 0.2 | |
| 1,100,000 | Level 3 Financing, Inc., 5.250%, 03/15/2026 | 1,105,418 | 0.2 | |
| 755,000 | (1) | Match Group, Inc., 4.125%, 08/01/2030 | 679,028 | 0.1 |
| 1,600,000 | (1) | MDC Partners, Inc., 6.500%, 05/01/2024 | 1,212,000 | 0.2 |
| 1,225,000 | (1) | Midcontinent Communications / Midcontinent Finance Corp., 5.375%, 08/15/2027 | 1,196,528 | 0.2 |
| 375,000 | (1),(2) | Netflix, Inc., 4.875%, 06/15/2030 | 382,763 | 0.1 |
| 2,375,000 | Netflix, Inc., 5.875%, 11/15/2028 | 2,554,431 | 0.5 | |
| 1,475,000 | (1) | Nexstar Broadcasting, Inc., 5.625%, 08/01/2024 | 1,397,555 | 0.3 |
| 1,675,000 | (1) | Nexstar Broadcasting, Inc., 5.625%, 07/15/2027 | 1,646,609 | 0.3 |
| 1,650,000 | (1) | Altice France SA/France, 7.375%, 05/01/2026 | 1,675,658 | 0.3 |
| 405,000 | (1),(2) | Sinclair Television Group, Inc., 5.125%, 02/15/2027 | 345,685 | 0.1 |
| 975,000 | (1) | Sirius XM Radio, Inc., 4.625%, 07/15/2024 | 995,655 | 0.2 |
| 2,550,000 | (1) | Sirius XM Radio, Inc., 5.000%, 08/01/2027 | 2,602,148 | 0.5 |
| 1,050,000 | (1),(2) | Sprint Corp., 7.250%, 02/01/2028 | 1,059,188 | 0.2 |
| 2,375,000 | Sprint Communications, Inc., 6.000%, 11/15/2022 | 2,484,108 | 0.5 | |
| 5,025,000 | Sprint Corp., 7.125%, 06/15/2024 | 5,552,550 | 1.1 | |
| 2,075,000 | Sprint Corp., 7.625%, 03/01/2026 | 2,360,001 | 0.5 | |
| 750,000 | Sprint Nextel Corp., 6.875%, 11/15/2028 | 860,813 | 0.2 | |
| 355,000 | (1) | TEGNA, Inc., 4.625%, 03/15/2028 | 313,953 | 0.1 |
| 1,575,000 | (1) | TEGNA, Inc., 5.000%, 09/15/2029 | 1,423,406 | 0.3 |
| 1,025,000 | Telecom Italia Capital SA, 6.000%, 09/30/2034 | 1,021,892 | 0.2 | |
| 1,225,000 | Telecom Italia Capital SA, 6.375%, 11/15/2033 | 1,250,174 | 0.3 | |
| 1,475,000 | (1) | Telesat Canada / Telesat LLC, 6.500%, 10/15/2027 | 1,424,186 | 0.3 |
| 2,075,000 | (1) | Terrier Media Buyer, Inc., 8.875%, 12/15/2027 | 1,758,563 | 0.4 |
| 2,200,000 | T-Mobile USA, Inc., 5.125%, 04/15/2025 | 2,265,868 | 0.5 | |
| 2,650,000 | T-Mobile USA, Inc., 5.375%, 04/15/2027 | 2,747,964 | 0.6 | |
| 1,525,000 | (1),(2) | Townsquare Media, Inc., 6.500%, 04/01/2023 | 1,477,336 | 0.3 |
| 1,600,000 | (2),(3) | ViacomCBS, Inc., 6.250%, 02/28/2057 | 1,384,520 | 0.3 |
| 1,675,000 | (1) | ViaSat, Inc., 5.625%, 09/15/2025 | 1,576,435 | 0.3 |
| 400,000 | (1),(2) | ViaSat, Inc., 5.625%, 04/15/2027 | 397,220 | 0.1 |
| 1,350,000 | (1) | Virgin Media Secured Finance PLC, 5.500%, 05/15/2029 | 1,357,493 | 0.3 |
| 950,000 | (1),(2) | Ziggo Bond Co. BV, 5.125%, 02/28/2030 | 936,344 | 0.2 |
| 475,000 | (1),(2) | Ziggo BV, 4.875%, 01/15/2030 | 465,929 | 0.1 |
| 111,648,619 | 22.9 | |||
| Consumer, Cyclical: 16.2% | ||||
| 3,900,000 | (1) | 1011778 BC ULC / New Red Finance, Inc., 5.000%, 10/15/2025 | 3,748,855 | 0.8 |
| 1,080,000 | (1) | Adams Homes, Inc., 7.500%, 02/15/2025 | 1,039,500 | 0.2 |
| 1,475,000 | (1) | Adient Global Holdings Ltd., 4.875%, 08/15/2026 | 1,021,327 | 0.2 |
| 1,505,000 | (1) | Allison Transmission, Inc., 5.875%, 06/01/2029 | 1,485,386 | 0.3 |
| 2,745,000 | AMC Entertainment Holdings, Inc., 5.875%, 11/15/2026 | 1,158,301 | 0.2 | |
| 1,450,000 | (1) | American Builders & Contractors Supply Co., Inc., 4.000%, 01/15/2028 | 1,327,547 | 0.3 |
| 900,000 | (1) | Asbury Automotive Group, Inc., 4.500%, 03/01/2028 | 771,750 | 0.2 |
| 1,120,000 | (1) | Asbury Automotive Group, Inc., 4.750%, 03/01/2030 | 960,400 | 0.2 |
| 375,000 | (1) | Ashton Woods USA LLC / Ashton Woods Finance Co., 6.625%, 01/15/2028 | 299,062 | 0.1 |
See Accompanying Notes to Financial Statements
| 13 |
| Voya High Yield Bond Fund | PORTFOLIO OF INVESTMENTS |
| as of March31, 2020 (Continued) |
| 1,000,000 | (1) | Ashton Woods USA LLC / Ashton Woods Finance Co., 6.750%, 08/01/2025 | 808,745 | 0.2 |
| 2,025,000 | (1) | Caesars Resort Collection LLC / CRC Finco, Inc., 5.250%, 10/15/2025 | 1,477,642 | 0.3 |
| 1,215,000 | (1) | CCM Merger, Inc., 6.000%, 03/15/2022 | 1,005,412 | 0.2 |
| 1,145,000 | Cedar Fair L.P. / Canada's Wonderland Co. / Magnum Management Corp., 5.375%, 06/01/2024 | 1,040,513 | 0.2 | |
| 1,405,000 | (1),(2) | Cedar Fair L.P., 5.250%, 07/15/2029 | 1,195,023 | 0.2 |
| 2,225,000 | Century Communities, Inc., 5.875%, 07/15/2025 | 1,925,771 | 0.4 | |
| 350,000 | (1),(4) | Core & Main Holdings L.P., 8.625%(PIK Rate 9.375%, Cash Rate 8.625%), 09/15/2024 | 323,311 | 0.1 |
| 1,575,000 | (1) | Core & Main L.P., 6.125%, 08/15/2025 | 1,476,515 | 0.3 |
| 2,500,000 | Dana, Inc., 5.500%, 12/15/2024 | 2,203,137 | 0.4 | |
| 950,000 | Delta Air Lines, Inc., 2.900%, 10/28/2024 | 762,716 | 0.2 | |
| 1,000,000 | Ford Motor Credit Co. LLC, 4.250%, 09/20/2022 | 942,200 | 0.2 | |
| 1,100,000 | Ford Motor Credit Co. LLC, 5.113%, 05/03/2029 | 943,250 | 0.2 | |
| 750,000 | Ford Motor Credit Co. LLC, 4.542%, 08/01/2026 | 660,000 | 0.1 | |
| 1,000,000 | Ford Motor Credit Co. LLC, 5.584%, 03/18/2024 | 932,500 | 0.2 | |
| 1,215,000 | (1) | Golden Entertainment, Inc., 7.625%, 04/15/2026 | 810,548 | 0.2 |
| 2,275,000 | (1) | Golden Nugget, Inc., 6.750%, 10/15/2024 | 1,449,994 | 0.3 |
| 2,600,000 | H&E Equipment Services, Inc., 5.625%, 09/01/2025 | 2,427,763 | 0.5 | |
| 1,125,000 | (1) | IAA, Inc., 5.500%, 06/15/2027 | 1,094,681 | 0.2 |
| 1,500,000 | (1) | Installed Building Products, Inc., 5.750%, 02/01/2028 | 1,441,564 | 0.3 |
| 900,000 | (1) | International Game Technology PLC, 6.250%, 02/15/2022 | 832,365 | 0.2 |
| 1,465,000 | (1),(2) | International Game Technology PLC, 6.500%, 02/15/2025 | 1,307,307 | 0.3 |
| 2,850,000 | L Brands, Inc., 6.750%, 07/01/2036 | 2,074,230 | 0.4 | |
| 425,000 | Lennar Corp., 8.375%, 01/15/2021 | 435,072 | 0.1 | |
| 1,925,000 | Lennar Corp., 5.250%, 06/01/2026 | 1,931,242 | 0.4 | |
| 540,000 | Lennar Corp., 5.375%, 10/01/2022 | 555,355 | 0.1 | |
| 1,475,000 | (1) | Lions Gate Capital Holdings LLC, 5.875%, 11/01/2024 | 1,269,319 | 0.3 |
| 1,350,000 | (1) | M/I Homes, Inc., 4.950%, 02/01/2028 | 1,155,937 | 0.2 |
| 525,000 | M/I Homes, Inc., 5.625%, 08/01/2025 | 474,466 | 0.1 | |
| 250,000 | Mattel, Inc., 5.450%, 11/01/2041 | 200,076 | 0.0 | |
| 2,025,000 | (1),(2) | Mattel, Inc., 5.875%, 12/15/2027 | 2,076,739 | 0.4 |
| 1,175,000 | Meritage Homes Corp., 5.125%, 06/06/2027 | 1,114,537 | 0.2 | |
| 1,275,000 | Meritage Homes Corp., 7.000%, 04/01/2022 | 1,285,756 | 0.3 | |
| 327,000 | (2) | MGM Resorts International, 5.500%, 04/15/2027 | 299,385 | 0.1 |
| 837,000 | (2) | MGM Resorts International, 5.750%, 06/15/2025 | 755,367 | 0.2 |
| 1,175,000 | MGM Resorts International, 6.000%, 03/15/2023 | 1,141,225 | 0.2 | |
| 1,350,000 | (1),(2) | Michaels Stores, Inc., 8.000%, 07/15/2027 | 1,006,492 | 0.2 |
| 1,300,000 | (1),(2) | Motion Bondco DAC, 6.625%, 11/15/2027 | 942,500 | 0.2 |
| 1,350,000 | Murphy Oil USA, Inc., 4.750%, 09/15/2029 | 1,273,117 | 0.3 | |
| 450,000 | Murphy Oil USA, Inc., 5.625%, 05/01/2027 | 444,754 | 0.1 | |
| 1,450,000 | (1) | Navistar International Corp., 6.625%, 11/01/2025 | 1,216,195 | 0.2 |
| 1,475,000 | (1),(2) | Penn National Gaming, Inc., 5.625%, 01/15/2027 | 1,106,858 | 0.2 |
| 1,300,000 | (1) | Performance Food Group, Inc., 5.500%, 10/15/2027 | 1,215,598 | 0.2 |
| 1,075,000 | (1) | PetSmart, Inc., 5.875%, 06/01/2025 | 1,066,938 | 0.2 |
| 2,825,000 | (1) | PetSmart, Inc., 7.125%, 03/15/2023 | 2,682,337 | 0.5 |
| 1,150,000 | (1),(2) | Scientific Games International, Inc., 5.000%, 10/15/2025 | 1,009,125 | 0.2 |
| 800,000 | Scientific Games International, Inc., 6.625%, 05/15/2021 | 645,040 | 0.1 | |
| 750,000 | (1) | Scientific Games International, Inc., 7.000%, 05/15/2028 | 465,413 | 0.1 |
| 800,000 | (1) | Scientific Games International, Inc., 8.250%, 03/15/2026 | 516,586 | 0.1 |
| 2,000,000 | Sonic Automotive, Inc., 6.125%, 03/15/2027 | 1,777,085 | 0.4 | |
| 965,000 | (1) | Speedway Motorsports LLC / Speedway Funding II, Inc., 4.875%, 11/01/2027 | 875,738 | 0.2 |
| 675,000 | (1) | Station Casinos LLC, 4.500%, 02/15/2028 | 551,813 | 0.1 |
| 1,825,000 | (1),(2) | Station Casinos LLC, 5.000%, 10/01/2025 | 1,533,566 | 0.3 |
| 1,175,000 | (1) | Taylor Morrison Communities, Inc., 5.750%, 01/15/2028 | 1,059,213 | 0.2 |
| 1,975,000 | (2) | Tempur Sealy International, Inc., 5.500%, 06/15/2026 | 1,739,383 | 0.4 |
See Accompanying Notes to Financial Statements
| 14 |
| Voya High Yield Bond Fund | PORTFOLIO OF INVESTMENTS |
| as of March31, 2020 (Continued) |
| 825,000 | (2) | Tenneco, Inc., 5.000%, 07/15/2026 | 523,937 | 0.1 |
| 1,200,000 | (1) | Univar Solutions USA, Inc./Washington, 5.125%, 12/01/2027 | 1,098,660 | 0.2 |
| 1,950,000 | (1) | Viking Cruises Ltd., 5.875%, 09/15/2027 | 1,151,787 | 0.2 |
| 450,000 | (1) | VOC Escrow Ltd., 5.000%, 02/15/2028 | 331,515 | 0.1 |
| 1,400,000 | (1) | William Carter Co/The, 5.625%, 03/15/2027 | 1,351,746 | 0.3 |
| 500,000 | (1) | WMG Acquisition Corp., 5.000%, 08/01/2023 | 500,623 | 0.1 |
| 1,575,000 | (1) | Wolverine World Wide, Inc., 5.000%, 09/01/2026 | 1,514,363 | 0.3 |
| 79,242,173 | 16.2 | |||
| Consumer, Non-cyclical: 19.6% | ||||
| 435,000 | Acadia Healthcare Co., Inc., 5.125%, 07/01/2022 | 418,280 | 0.1 | |
| 960,000 | Acadia Healthcare Co., Inc., 5.625%, 02/15/2023 | 910,699 | 0.2 | |
| 200,000 | Acadia Healthcare Co., Inc., 6.500%, 03/01/2024 | 196,251 | 0.0 | |
| 725,000 | (1) | Albertsons Cos, Inc. / Safeway, Inc. / New Albertsons L.P. / Albertsons LLC, 4.875%, 02/15/2030 | 723,187 | 0.1 |
| 1,625,000 | (1) | Albertsons Cos, Inc. / Safeway, Inc. / New Albertsons L.P. / Albertsons LLC, 5.875%, 02/15/2028 | 1,662,944 | 0.3 |
| 2,150,000 | Albertsons Cos, Inc. / Safeway, Inc. / New Albertsons L.P. / Albertsons LLC, 6.625%, 06/15/2024 | 2,198,310 | 0.4 | |
| 1,050,000 | (1) | Allied Universal Holdco LLC / Allied Universal Finance Corp., 6.625%, 07/15/2026 | 1,033,597 | 0.2 |
| 1,900,000 | (1) | Allied Universal Holdco LLC / Allied Universal Finance Corp., 9.750%, 07/15/2027 | 1,803,798 | 0.4 |
| 1,400,000 | (1) | AMN Healthcare, Inc., 4.625%, 10/01/2027 | 1,338,399 | 0.3 |
| 3,800,000 | (1) | Bausch Health Americas, Inc., 8.500%, 01/31/2027 | 3,992,090 | 0.8 |
| 1,475,000 | (1) | Bausch Health Cos, Inc., 5.250%, 01/30/2030 | 1,390,187 | 0.3 |
| 375,000 | (1) | Bausch Health Cos, Inc., 5.500%, 11/01/2025 | 381,208 | 0.1 |
| 1,025,000 | (1) | Bausch Health Cos, Inc., 6.125%, 04/15/2025 | 1,016,036 | 0.2 |
| 1,100,000 | (1) | Bausch Health Cos, Inc., 7.000%, 01/15/2028 | 1,146,805 | 0.2 |
| 1,375,000 | (1) | Cardtronics, Inc. / Cardtronics USA, Inc., 5.500%, 05/01/2025 | 1,318,274 | 0.3 |
| 1,425,000 | (1) | Catalent Pharma Solutions, Inc., 5.000%, 07/15/2027 | 1,390,159 | 0.3 |
| 350,000 | (1) | Centene Corp., 3.375%, 02/15/2030 | 326,812 | 0.1 |
| 2,400,000 | (1) | Centene Corp., 4.625%, 12/15/2029 | 2,425,320 | 0.5 |
| 1,100,000 | Centene Corp., 4.750%, 01/15/2025 | 1,120,630 | 0.2 | |
| 925,000 | (1) | Centene Corp., 4.750%, 01/15/2025 | 942,348 | 0.2 |
| 700,000 | (1) | Centene Corp., 5.375%, 06/01/2026 | 724,962 | 0.1 |
| 730,000 | (1) | Chobani LLC / Chobani Finance Corp., Inc., 7.500%, 04/15/2025 | 669,753 | 0.1 |
| 2,050,000 | CHS/Community Health Systems, Inc., 6.250%, 03/31/2023 | 1,961,594 | 0.4 | |
| 1,900,000 | (1) | CHS/Community Health Systems, Inc., 6.625%, 02/15/2025 | 1,771,750 | 0.4 |
| 1,575,000 | (1),(2) | Cott Holdings, Inc., 5.500%, 04/01/2025 | 1,537,602 | 0.3 |
| 1,250,000 | DaVita, Inc., 5.125%, 07/15/2024 | 1,254,069 | 0.3 | |
| 1,300,000 | (1) | Endo Ltd. / Endo Finance LLC / Endo Finco, Inc., 6.000%, 02/01/2025 | 894,959 | 0.2 |
| 2,850,000 | (1) | Garda World Security Corp., 8.750%, 05/15/2025 | 2,643,289 | 0.5 |
| 1,910,000 | (1) | Graham Holdings Co., 5.750%, 06/01/2026 | 1,888,116 | 0.4 |
| 1,000,000 | HCA, Inc., 3.500%, 09/01/2030 | 911,371 | 0.2 | |
| 4,500,000 | HCA, Inc., 5.375%, 02/01/2025 | 4,606,853 | 0.9 | |
| 825,000 | HCA, Inc., 5.625%, 09/01/2028 | 868,106 | 0.2 | |
| 760,000 | (1) | Hertz Corp./The, 6.000%, 01/15/2028 | 403,218 | 0.1 |
| 800,000 | (1) | Hertz Corp./The, 7.125%, 08/01/2026 | 423,340 | 0.1 |
| 112,000 | (1) | Hertz Corp./The, 7.625%, 06/01/2022 | 91,560 | 0.0 |
| 1,275,000 | (1) | Hertz Corp., 5.500%, 10/15/2024 | 724,895 | 0.1 |
| 1,250,000 | (1) | Hill-Rom Holdings, Inc., 4.375%, 09/15/2027 | 1,241,928 | 0.3 |
| 2,125,000 | (1) | Jaguar Holding Co. II / Pharmaceutical Product Development LLC, 6.375%, 08/01/2023 | 2,178,061 | 0.4 |
| 1,675,000 | (1) | JBS USA LUX SA / JBS USA Finance, Inc., 5.875%, 07/15/2024 | 1,702,219 | 0.3 |
| 1,200,000 | (1),(2) | JBS USA LUX SA / JBS USA Finance, Inc., 6.750%, 02/15/2028 | 1,287,660 | 0.3 |
| 1,250,000 | (1) | JBS USA LUX SA / JBS USA Food Co. / JBS USA Finance, Inc., 5.500%, 01/15/2030 | 1,297,563 | 0.3 |
| 1,510,000 | (1) | KeHE Distributors LLC / KeHE Finance Corp., 8.625%, 10/15/2026 | 1,526,044 | 0.3 |
| 2,000,000 | Kraft Heinz Foods Co., 4.375%, 06/01/2046 | 1,813,248 | 0.4 | |
| 4,275,000 | Kraft Heinz Foods Co., 5.000%, 07/15/2035 | 4,278,857 | 0.9 | |
| 1,525,000 | Kraft Heinz Foods Co., 5.000%, 06/04/2042 | 1,452,117 | 0.3 | |
| 1,825,000 | (1) | LifePoint Health, Inc., 4.375%, 02/15/2027 | 1,732,838 | 0.4 |
See Accompanying Notes to Financial Statements
| 15 |
| Voya High Yield Bond Fund | PORTFOLIO OF INVESTMENTS |
| as of March31, 2020 (Continued) |
| 1,875,000 | Molina Healthcare, Inc., 5.375%, 11/15/2022 | 1,866,263 | 0.4 | |
| 2,600,000 | (1) | MPH Acquisition Holdings LLC, 7.125%, 06/01/2024 | 2,281,578 | 0.5 |
| 1,200,000 | New Albertsons L.P., 7.450%, 08/01/2029 | 1,174,251 | 0.2 | |
| 1,250,000 | (1) | Par Pharmaceutical, Inc., 7.500%, 04/01/2027 | 1,253,219 | 0.3 |
| 1,075,000 | (1) | Pilgrim's Pride Corp., 5.750%, 03/15/2025 | 1,087,099 | 0.2 |
| 1,100,000 | (1) | Pilgrim's Pride Corp., 5.875%, 09/30/2027 | 1,102,145 | 0.2 |
| 650,000 | (1),(2),(4) | Polaris Intermediate Corp., 8.500%(PIK Rate 9.250%, Cash Rate 8.500%), 12/01/2022 | 508,612 | 0.1 |
| 3,675,000 | (1) | Post Holdings, Inc., 5.625%, 01/15/2028 | 3,759,709 | 0.8 |
| 2,200,000 | (1) | Select Medical Corp., 6.250%, 08/15/2026 | 2,212,111 | 0.5 |
| 2,150,000 | Spectrum Brands, Inc., 5.750%, 07/15/2025 | 2,026,311 | 0.4 | |
| 1,300,000 | Tenet Healthcare Corp., 5.125%, 05/01/2025 | 1,238,250 | 0.3 | |
| 2,700,000 | Tenet Healthcare Corp., 6.750%, 06/15/2023 | 2,507,639 | 0.5 | |
| 575,000 | Tenet Healthcare Corp., 8.125%, 04/01/2022 | 546,446 | 0.1 | |
| 1,025,000 | (2) | Teva Pharmaceutical Finance Netherlands III BV, 6.000%, 04/15/2024 | 1,013,464 | 0.2 |
| 1,625,000 | United Rentals North America, Inc., 4.875%, 01/15/2028 | 1,585,269 | 0.3 | |
| 635,000 | United Rentals North America, Inc., 5.250%, 01/15/2030 | 638,334 | 0.1 | |
| 1,125,000 | United Rentals North America, Inc., 5.500%, 07/15/2025 | 1,109,537 | 0.2 | |
| 1,325,000 | United Rentals North America, Inc., 6.500%, 12/15/2026 | 1,352,229 | 0.3 | |
| 1,325,000 | (1) | Vizient, Inc., 6.250%, 05/15/2027 | 1,333,556 | 0.3 |
| 1,600,000 | (1) | West Street Merger Sub, Inc., 6.375%, 09/01/2025 | 1,406,672 | 0.3 |
| 95,624,000 | 19.6 | |||
| Energy: 4.1% | ||||
| 725,000 | (1) | Archrock Partners L.P. / Archrock Partners Finance Corp., 6.250%, 04/01/2028 | 505,687 | 0.1 |
| 450,000 | (1),(2) | Archrock Partners L.P. / Archrock Partners Finance Corp., 6.875%, 04/01/2027 | 322,680 | 0.1 |
| 1,145,000 | (1) | Baytex Energy Corp., 8.750%, 04/01/2027 | 445,405 | 0.1 |
| 330,550 | (1) | Calfrac Holdings L.P., 10.875%, 03/15/2026 | 99,165 | 0.0 |
| 1,700,000 | Callon Petroleum Co., 6.250%, 04/15/2023 | 416,449 | 0.1 | |
| 1,844,000 | (2) | Crestwood Midstream Partners L.P. / Crestwood Midstream Finance Corp., 5.750%, 04/01/2025 | 1,069,575 | 0.2 |
| 825,000 | Crestwood Midstream Partners L.P. / Crestwood Midstream Finance Corp., 6.250%, 04/01/2023 | 467,325 | 0.1 | |
| 2,200,000 | Delek Logistics Partners L.P. / Delek Logistics Finance Corp., 6.750%, 05/15/2025 | 2,158,761 | 0.4 | |
| 950,000 | Diamond Offshore Drilling, Inc., 4.875%, 11/01/2043 | 138,040 | 0.0 | |
| 2,125,000 | (1) | Enviva Partners L.P. / Enviva Partners Finance Corp., 6.500%, 01/15/2026 | 2,087,812 | 0.4 |
| 700,000 | (1) | Hess Midstream Operations L.P., 5.125%, 06/15/2028 | 494,585 | 0.1 |
| 1,153,000 | (1) | Hess Midstream Operations L.P., 5.625%, 02/15/2026 | 822,126 | 0.2 |
| 1,355,000 | (1) | Magnolia Oil & Gas Operating LLC / Magnolia Oil & Gas Finance Corp., 6.000%, 08/01/2026 | 846,875 | 0.2 |
| 1,460,000 | Montage Resources Corp., 8.875%, 07/15/2023 | 996,406 | 0.2 | |
| 1,405,000 | (1) | Moss Creek Resources Holdings, Inc., 7.500%, 01/15/2026 | 419,452 | 0.1 |
| 750,000 | Murphy Oil Corp., 5.875%, 12/01/2027 | 394,913 | 0.1 | |
| 1,050,000 | Murphy Oil Corp., 5.750%, 08/15/2025 | 568,423 | 0.1 | |
| 525,000 | (1) | Noble Holding International Ltd., 7.875%, 02/01/2026 | 130,485 | 0.0 |
| 500,000 | (1) | Parsley Energy LLC / Parsley Finance Corp., 5.625%, 10/15/2027 | 355,275 | 0.1 |
| 2,725,000 | PBF Logistics L.P. / PBF Logistics Finance Corp., 6.875%, 05/15/2023 | 1,699,147 | 0.3 | |
| 500,000 | Sunoco L.P. / Sunoco Finance Corp., 4.875%, 01/15/2023 | 487,208 | 0.1 | |
| 45,000 | Sunoco L.P. / Sunoco Finance Corp., 5.500%, 02/15/2026 | 39,322 | 0.0 | |
| 45,000 | Sunoco L.P. / Sunoco Finance Corp., 5.875%, 03/15/2028 | 37,734 | 0.0 | |
| 1,550,000 | (1) | Tallgrass Energy Partners L.P. / Tallgrass Energy Finance Corp., 5.500%, 01/15/2028 | 816,800 | 0.2 |
| 340,000 | (1) | Targa Resources Partners L.P. / Targa Resources Partners Finance Corp., 5.500%, 03/01/2030 | 265,625 | 0.1 |
See Accompanying Notes to Financial Statements
| 16 |
| Voya High Yield Bond Fund | PORTFOLIO OF INVESTMENTS |
| as of March31, 2020 (Continued) |
| 625,000 | Targa Resources Partners L.P. / Targa Resources Partners Finance Corp., 6.500%, 07/15/2027 | 537,500 | 0.1 | |
| 1,185,000 | Targa Resources Partners L.P. / Targa Resources Partners Finance Corp., 6.875%, 01/15/2029 | 962,813 | 0.2 | |
| 2,125,000 | Transocean, Inc., 6.800%, 03/15/2038 | 505,325 | 0.1 | |
| 1,150,000 | (1) | Viper Energy Partners L.P., 5.375%, 11/01/2027 | 972,383 | 0.2 |
| 600,000 | WPX Energy, Inc., 4.500%, 01/15/2030 | 328,050 | 0.1 | |
| 1,300,000 | WPX Energy, Inc., 5.250%, 10/15/2027 | 722,215 | 0.1 | |
| 20,113,561 | 4.1 | |||
| Financial: 5.4% | ||||
| 255,000 | (1) | AG Issuer LLC, 6.250%, 03/01/2028 | 216,113 | 0.0 |
| 2,025,000 | Ally Financial, Inc., 5.750%, 11/20/2025 | 1,996,043 | 0.4 | |
| 1,225,000 | (1) | Altice France Holding SA, 6.000%, 02/15/2028 | 1,086,796 | 0.2 |
| 2,375,000 | (1) | Altice France Holding SA, 10.500%, 05/15/2027 | 2,517,500 | 0.5 |
| 225,000 | CIT Group, Inc., 5.250%, 03/07/2025 | 220,782 | 0.1 | |
| 775,000 | CIT Group, Inc., 6.125%, 03/09/2028 | 735,120 | 0.2 | |
| 1,850,000 | (1) | ESH Hospitality, Inc., 5.250%, 05/01/2025 | 1,565,572 | 0.3 |
| 1,005,000 | (1) | Freedom Mortgage Corp., 8.250%, 04/15/2025 | 796,432 | 0.2 |
| 2,975,000 | Icahn Enterprises L.P. / Icahn Enterprises Finance Corp., 6.250%, 05/15/2026 | 2,828,100 | 0.6 | |
| 1,585,000 | (3) | JPMorgan Chase & Co., 4.600%, 12/31/2199 | 1,389,173 | 0.3 |
| 1,250,000 | (1) | LPL Holdings, Inc., 4.625%, 11/15/2027 | 1,152,650 | 0.2 |
| 1,775,000 | MGM Growth Properties Operating Partnership L.P. / MGP Finance Co-Issuer, Inc., 5.625%, 05/01/2024 | 1,715,103 | 0.4 | |
| 675,000 | MPT Operating Partnership L.P. / MPT Finance Corp., 4.625%, 08/01/2029 | 624,797 | 0.1 | |
| 1,625,000 | MPT Operating Partnership L.P. / MPT Finance Corp., 5.000%, 10/15/2027 | 1,588,559 | 0.3 | |
| 450,000 | MPT Operating Partnership L.P. / MPT Finance Corp., 5.500%, 05/01/2024 | 439,313 | 0.1 | |
| 600,000 | (2) | Navient Corp., 5.000%, 03/15/2027 | 520,320 | 0.1 |
| 925,000 | Navient Corp., 7.250%, 09/25/2023 | 913,410 | 0.2 | |
| 1,875,000 | (1) | Quicken Loans, Inc., 5.250%, 01/15/2028 | 1,846,439 | 0.4 |
| 1,200,000 | (1) | Realogy Group LLC / Realogy Co-Issuer Corp., 5.250%, 12/01/2021 | 1,124,100 | 0.2 |
| 1,575,000 | (1),(2) | SBA Communications Corp., 3.875%, 02/15/2027 | 1,590,750 | 0.3 |
| 375,000 | Springleaf Finance Corp., 5.375%, 11/15/2029 | 345,401 | 0.1 | |
| 575,000 | Springleaf Finance Corp., 6.125%, 03/15/2024 | 572,171 | 0.1 | |
| 425,000 | Springleaf Finance Corp., 7.125%, 03/15/2026 | 418,359 | 0.1 | |
| 26,203,003 | 5.4 | |||
| Industrial: 12.0% | ||||
| 2,030,000 | (1) | Advanced Disposal Services, Inc., 5.625%, 11/15/2024 | 2,073,127 | 0.4 |
| 2,275,000 | AECOM, 5.875%, 10/15/2024 | 2,238,043 | 0.5 | |
| 1,125,000 | (1) | Amsted Industries, Inc., 5.625%, 07/01/2027 | 1,104,140 | 0.2 |
| 2,500,000 | (1),(4) | ARD Finance SA, 6.500%(PIK Rate 7.250%, Cash Rate 6.500%), 06/30/2027 | 2,161,125 | 0.4 |
| 1,750,000 | (1) | ATS Automation Tooling Systems, Inc., 6.500%, 06/15/2023 | 1,717,179 | 0.4 |
| 2,225,000 | (1),(2) | Berry Global, Inc., 5.625%, 07/15/2027 | 2,315,546 | 0.5 |
| 2,075,000 | (1) | BMC East LLC, 5.500%, 10/01/2024 | 2,020,521 | 0.4 |
| 650,000 | (1),(2) | Bombardier, Inc., 6.000%, 10/15/2022 | 492,375 | 0.1 |
| 1,650,000 | (1) | Bombardier, Inc., 7.875%, 04/15/2027 | 1,150,999 | 0.2 |
| 1,675,000 | (1) | Bombardier, Inc., 8.750%, 12/01/2021 | 1,401,556 | 0.3 |
| 1,350,000 | (1) | Builders FirstSource, Inc., 6.750%, 06/01/2027 | 1,334,532 | 0.3 |
| 1,950,000 | (1) | Builders FirstSource, Inc., 5.000%, 03/01/2030 | 1,765,969 | 0.4 |
| 1,250,000 | (1) | Cargo Aircraft Management, Inc., 4.750%, 02/01/2028 | 1,168,750 | 0.2 |
| 2,000,000 | (1) | Cascades, Inc./Cascades USA, Inc., 5.375%, 01/15/2028 | 1,925,000 | 0.4 |
| 1,025,000 | (1) | Clean Harbors, Inc., 4.875%, 07/15/2027 | 1,009,061 | 0.2 |
| 475,000 | (1) | Clean Harbors, Inc., 5.125%, 07/15/2029 | 445,808 | 0.1 |
| 930,000 | (1) | FXI Holdings, Inc., 7.875%, 11/01/2024 | 635,023 | 0.1 |
| 810,000 | (1) | GFL Environmental, Inc., 8.500%, 05/01/2027 | 818,302 | 0.2 |
| 825,000 | (1) | GFL Environmental, Inc., 7.000%, 06/01/2026 | 805,577 | 0.2 |
| 875,000 | (1) | Granite US Holdings Corp., 11.000%, 10/01/2027 | 758,150 | 0.2 |
See Accompanying Notes to Financial Statements
| 17 |
| Voya High Yield Bond Fund | PORTFOLIO OF INVESTMENTS |
| as of March31, 2020 (Continued) |
| 2,250,000 | (1) | Itron, Inc., 5.000%, 01/15/2026 | 2,156,721 | 0.4 |
| 2,050,000 | (1) | James Hardie International Finance DAC, 4.750%, 01/15/2025 | 1,950,073 | 0.4 |
| 1,875,000 | (1),(2) | Koppers, Inc., 6.000%, 02/15/2025 | 1,514,006 | 0.3 |
| 1,050,000 | (1) | Masonite International Corp., 5.375%, 02/01/2028 | 1,037,768 | 0.2 |
| 1,025,000 | (1) | Masonite International Corp., 5.750%, 09/15/2026 | 1,013,256 | 0.2 |
| 930,000 | (1),(2) | Mauser Packaging Solutions Holding Co., 7.250%, 04/15/2025 | 711,478 | 0.1 |
| 1,800,000 | (1),(2) | Norbord, Inc., 5.750%, 07/15/2027 | 1,658,624 | 0.3 |
| 525,000 | (1),(2) | Owens-Brockway Glass Container, Inc., 5.875%, 08/15/2023 | 517,784 | 0.1 |
| 1,450,000 | (1),(2) | Owens-Brockway Glass Container, Inc., 6.375%, 08/15/2025 | 1,388,375 | 0.3 |
| 1,850,000 | (1) | PGT Innovations, Inc., 6.750%, 08/01/2026 | 1,760,196 | 0.4 |
| 1,600,000 | (1) | Reynolds Group Issuer, Inc. / Reynolds Group Issuer LLC / Reynolds Group Issuer Lu, 5.125%, 07/15/2023 | 1,597,992 | 0.3 |
| 725,000 | (1) | Reynolds Group Issuer, Inc. / Reynolds Group Issuer LLC / Reynolds Group Issuer Lu, 7.000%, 07/15/2024 | 740,859 | 0.2 |
| 1,000,000 | (1) | Sealed Air Corp., 4.000%, 12/01/2027 | 937,600 | 0.2 |
| 1,125,000 | (1) | Sealed Air Corp., 5.500%, 09/15/2025 | 1,148,912 | 0.2 |
| 1,300,000 | (1) | Silgan Holdings, Inc., 4.125%, 02/01/2028 | 1,209,000 | 0.3 |
| 1,625,000 | (1) | SSL Robotics LLC, 9.750%, 12/31/2023 | 1,685,938 | 0.3 |
| 3,225,000 | (1) | Standard Industries, Inc./NJ, 6.000%, 10/15/2025 | 3,193,621 | 0.7 |
| 1,590,000 | (1),(2) | Stevens Holding Co., Inc., 6.125%, 10/01/2026 | 1,584,367 | 0.3 |
| 600,000 | (1) | Summit Materials LLC / Summit Materials Finance Corp., 5.125%, 06/01/2025 | 563,247 | 0.1 |
| 1,175,000 | (1) | Summit Materials LLC / Summit Materials Finance Corp., 6.500%, 03/15/2027 | 1,120,412 | 0.2 |
| 1,215,000 | (1) | TransDigm, Inc., 5.500%, 11/15/2027 | 1,097,206 | 0.2 |
| 1,400,000 | TransDigm, Inc., 6.375%, 06/15/2026 | 1,348,270 | 0.3 | |
| 1,050,000 | TransDigm, Inc., 6.500%, 05/15/2025 | 1,004,068 | 0.2 | |
| 422,000 | (1) | Zekelman Industries, Inc., 9.875%, 06/15/2023 | 410,131 | 0.1 |
| 58,690,687 | 12.0 | |||
| Technology: 5.2% | ||||
| 2,350,000 | (1) | Ascend Learning LLC, 6.875%, 08/01/2025 | 2,300,051 | 0.5 |
| 1,100,000 | (1) | Castle US Holding Corp., 9.500%, 02/15/2028 | 1,051,187 | 0.2 |
| 950,000 | CDW LLC / CDW Finance Corp., 5.000%, 09/01/2025 | 984,727 | 0.2 | |
| 1,675,000 | (2) | CDW LLC / CDW Finance Corp., 5.500%, 12/01/2024 | 1,756,313 | 0.4 |
| 2,725,000 | (1) | Change Healthcare Holdings LLC / Change Healthcare Finance, Inc., 5.750%, 03/01/2025 | 2,540,981 | 0.5 |
| 315,000 | (1) | Dell International LLC / EMC Corp., 5.875%, 06/15/2021 | 315,000 | 0.1 |
| 3,575,000 | (1),(2) | Dell International LLC / EMC Corp., 7.125%, 06/15/2024 | 3,704,594 | 0.7 |
| 1,525,000 | (2) | Donnelley Financial Solutions, Inc., 8.250%, 10/15/2024 | 1,446,836 | 0.3 |
| 900,000 | (1) | MSCI, Inc., 4.000%, 11/15/2029 | 899,037 | 0.2 |
| 380,000 | (1) | MSCI, Inc., 5.750%, 08/15/2025 | 395,135 | 0.1 |
| 1,075,000 | (1) | MTS Systems Corp., 5.750%, 08/15/2027 | 1,006,246 | 0.2 |
| 375,000 | (1) | Open Text Corp., 3.875%, 02/15/2028 | 354,258 | 0.1 |
| 650,000 | (1) | Open Text Corp., 5.875%, 06/01/2026 | 685,392 | 0.1 |
| 700,000 | (1) | Open Text Holdings, Inc., 4.125%, 02/15/2030 | 662,113 | 0.1 |
| 1,575,000 | (1) | RP Crown Parent LLC, 7.375%, 10/15/2024 | 1,514,433 | 0.3 |
| 1,405,000 | (1) | Science Applications International Corp., 4.875%, 04/01/2028 | 1,356,703 | 0.3 |
| 2,450,000 | (1) | Tempo Acquisition LLC / Tempo Acquisition Finance Corp., 6.750%, 06/01/2025 | 2,260,199 | 0.5 |
| 2,475,000 | (1),(2) | Veritas US, Inc. / Veritas Bermuda Ltd.., 10.500%, 02/01/2024 | 2,106,831 | 0.4 |
| 25,340,036 | 5.2 | |||
| Utilities: 2.3% | ||||
| 2,225,000 | Calpine Corp., 5.750%, 01/15/2025 | 2,074,812 | 0.4 | |
| 1,100,000 | (1) | Clearway Energy Operating LLC, 4.750%, 03/15/2028 | 1,024,375 | 0.2 |
| 2,025,000 | (1) | Drax Finco PLC, 6.625%, 11/01/2025 | 2,042,729 | 0.4 |
| 1,850,000 | (1) | LBC Tank Terminals Holding Netherlands BV, 6.875%, 05/15/2023 | 1,750,553 | 0.4 |
| 950,000 | (2) | NRG Energy, Inc., 5.750%, 01/15/2028 | 974,273 | 0.2 |
| 1,250,000 | NRG Energy, Inc., 6.625%, 01/15/2027 | 1,306,938 | 0.3 | |
| 725,000 | (1) | Vistra Operations Co. LLC, 5.500%, 09/01/2026 | 751,801 | 0.1 |
See Accompanying Notes to Financial Statements
| 18 |
| Voya High Yield Bond Fund | PORTFOLIO OF INVESTMENTS |
| as of March31, 2020 (Continued) |
| 1,200,000 | (1) | Vistra Operations Co. LLC, 5.625%, 02/15/2027 | 1,244,160 | 0.3 |
| 11,169,641 | 2.3 | |||
| Total Corporate Bonds/Notes | ||||
| (Cost $488,004,605) | 453,195,147 | 92.8 | ||
| BANK LOANS: 1.0% | ||||
| Consumer, Non-cyclical: 0.3% | ||||
| 1,012,188 | Bellring Brands LLC - TL B 1L, 6.000%, (US0001M + 5.000%), 10/10/2024 | 956,517 | 0.2 | |
| 945,214 | Envision Healthcare Corporation 2018 1st Lien Term Loan, 4.739%, (US0003M + 3.750%), 09/28/2025 | 506,635 | 0.1 | |
| 1,463,152 | 0.3 | |||
| Containers & Glass Products: 0.2% | ||||
| 852,896 | Reynolds Group Holdings Inc. USD 2017 Term Loan, 3.739%, (US0001M + 2.750%), 02/05/2023 | 813,450 | 0.2 | |
| Electronics/Electrical: 0.3% | ||||
| 1,922,123 | Rackspace Hosting, Inc. 2017 Incremental 1st Lien Term Loan, 4.762%, (US0003M + 3.000%), 11/03/2023 | 1,725,105 | 0.3 | |
| Health Care: 0.2% | ||||
| 845,625 | Bausch Health Companies, Inc. 2018 Term Loan B, 3.612%, (US0001M + 3.000%), 06/02/2025 | 810,390 | 0.2 | |
| Total Bank Loans | ||||
| (Cost $5,245,790) | 4,812,097 | 1.0 | ||
| CONVERTIBLE BONDS/NOTES: 0.1% | ||||
| Communications: 0.1% | ||||
| 625,000 | DISH Network Corp., 3.375%, 08/15/2026 | 508,970 | 0.1 | |
| Total Convertible Bonds/Notes | ||||
| (Cost $619,800) | 508,970 | 0.1 | ||
| Shares | Value | Percentage of Net Assets | ||
| COMMON STOCK: 0.2% | ||||
| Consumer Staples: 0.2% | ||||
| 27,789 | (5),(6) | Southeastern Grocers, Inc. | 889,248 | 0.2 |
| Total Common Stock | ||||
| (Cost $848,084) | 889,248 | 0.2 | ||
| Total Long-Term Investments | ||||
| (Cost $494,718,279) | 459,405,462 | 94.1 | ||
| Principal Amount† | Value | Percentage of Net Assets | ||
| SHORT-TERM INVESTMENTS: 12.4% | ||||
| Commercial Paper: 1.4% | ||||
| 1,500,000 | American Electric Power Co., Inc., 3.190%, 04/13/2020 | 1,498,300 | 0.2 | |
| 2,000,000 | Dominion Resources, Inc., 2.790%, 04/06/2020 | 1,999,085 | 0.4 | |
| 950,000 | (7) | Exxon Mobil Corp., 1.600%, 06/03/2020 | 946,424 | 0.2 |
| 950,000 | (7) | Federal Republic of Germany, 1.620%, 05/21/2020 | 948,654 | 0.2 |
| 950,000 | (7) | LMA Americas LLC, 1.660%, 04/07/2020 | 949,797 | 0.2 |
| 950,000 | (7) | Pfizer Inc., 1.630%, 06/15/2020 | 946,410 | 0.2 |
| Total Commercial Paper | ||||
| (Cost $7,290,050) | 7,288,670 | 1.4 | ||
| Floating Rate Notes: 3.6% | ||||
| 825,000 | (7) | Australia & New Zealand Banking Group Ltd., 1.220%, 04/09/2020 | 825,129 | 0.2 |
| 250,000 | (7) | Bank of America Corp., 1.200%, 05/07/2020 | 249,845 | 0.0 |
| 525,000 | (7) | Bank of Montreal, 0.210%, 07/13/2020 | 523,328 | 0.1 |
| 275,000 | (7) | Bank of Montreal, 0.980%, 08/26/2020 | 275,003 | 0.1 |
| 900,000 | (7) | Bank of Nova Scotia, 1.240%, 05/08/2020 | 900,311 | 0.2 |
| 950,000 | (7) | Canadian Imperial Bank of Commerce, 0.240%, 08/28/2020 | 945,010 | 0.2 |
| 700,000 | (7) | Commonwealth Bank of Australia, 0.950%, 06/10/2020 | 699,396 | 0.1 |
| 250,000 | (7) | Commonwealth Bank of Australia, 1.200%, 07/06/2020 | 249,830 | 0.0 |
| 700,000 | (7) | Coöperatieve Rabobank U.A., 0.990%, 04/20/2020 | 700,176 | 0.1 |
| 625,000 | (7) | Crédit Industriel et Commercial, 1.140%, 04/24/2020 | 625,175 | 0.1 |
| 775,000 | (7) | Credit Suisse Group AG, 0.360%, 04/17/2020 | 774,972 | 0.2 |
| 700,000 | (7) | HSBC Bank PLC, 1.520%, 06/03/2020 | 699,468 | 0.1 |
| 325,000 | (7) | J.P. Morgan Securities LLC, 1.190%, 07/08/2020 | 324,834 | 0.1 |
| 950,000 | (7) | Lloyds Bank PLC, 1.080%, 07/31/2020 | 949,454 | 0.2 |
| 700,000 | (7) | Mizuho Financial Group Inc., 1.140%, 05/22/2020 | 700,216 | 0.1 |
| 250,000 | (7) | Mizuho Financial Group Inc., 1.640%, 05/05/2020 | 250,118 | 0.1 |
| 700,000 | (7) | National Bank of Canada, 1.840%, 05/01/2020 | 699,761 | 0.1 |
| 950,000 | (7) | Oversea-Chinese Banking Corp., Ltd., 0.820%, 07/15/2020 | 949,286 | 0.2 |
See Accompanying Notes to Financial Statements
| 19 |
| Voya High Yield Bond Fund | PORTFOLIO OF INVESTMENTS |
| as of March31, 2020 (Continued) |
| 800,000 | (7) | Royal Bank of Canada, 0.960%, 07/17/2020 | 799,316 | 0.2 |
| 975,000 | (7) | Skandinaviska Enskilda Banken AB, 1.780%, 05/11/2020 | 974,532 | 0.2 |
| 950,000 | (7) | Societe Generale, 0.290%, 09/04/2020 | 946,093 | 0.2 |
| 300,000 | (7) | Sumitomo Mitsui Trust Holdings, Inc., 1.190%, 04/24/2020 | 300,092 | 0.1 |
| 950,000 | (7) | Svenska Handelsbanken AB, 1.160%, 07/07/2020 | 949,597 | 0.2 |
| 800,000 | (7) | The Norinchukin Bank, 1.200%, 04/24/2020 | 800,091 | 0.2 |
| 475,000 | (7) | The Sumitomo Mitsui Financial Group, 1.020%, 08/25/2020 | 474,476 | 0.1 |
| 450,000 | (7) | The Sumitomo Mitsui Financial Group, 1.040%, 05/12/2020 | 450,247 | 0.1 |
| 400,000 | (7) | Westpac Banking Corp, 1.520%, 06/03/2020 | 399,696 | 0.1 |
| Total Floating Rate Notes | ||||
| (Cost $17,435,452) | 17,435,452 | 3.6 | ||
| Repurchase Agreements: 3.3% | ||||
| 3,797,254 | (7) | Cantor Fitzgerald Securities, Repurchase Agreement dated 03/31/20, 0.02%, due 04/01/20 (Repurchase Amount $3,797,256, collateralized by various U.S. Government/U.S. Government Agency Obligations, 0.000%-8.500%, Market Value plus accrued interest $3,873,199, due 05/01/20-02/20/70) | 3,797,254 | 0.8 |
| 1,635,005 | (7) | CF Secured LLC, Repurchase Agreement dated 03/31/20, 0.02%, due 04/01/20 (Repurchase Amount $1,635,006, collateralized by various U.S. Government/U.S. Government Agency Obligations, 0.000%-6.500%, Market Value plus accrued interest $1,667,707, due 12/15/21-11/20/66) | 1,635,005 | 0.3 |
| 1,250,790 | (7) | Citadel Securities LLC, Repurchase Agreement dated 03/31/20, 0.09%, due 04/01/20 (Repurchase Amount $1,250,793, collateralized by various U.S. Government Securities, 0.000%-8.125%, Market Value plus accrued interest $1,275,809, due 04/07/20-02/15/50) | 1,250,790 | 0.3 |
| 1,362,412 | (7) | Industrial & Comm. Bank of China, Repurchase Agreement dated 03/31/20, 0.02%, due 04/01/20 (Repurchase Amount $1,362,413, collateralized by various U.S. Government Agency Obligations, 0.000%-9.500%, Market Value plus accrued interest $1,389,660, due 04/02/20-03/01/50) | 1,362,412 | 0.3 |
| 8,075,752 | (7) | Royal Bank of Canada (NY), Repurchase Agreement dated 03/31/20, 0.01%, due 04/01/20 (Repurchase Amount $8,075,754, collateralized by various U.S. Government/U.S. Government Agency Obligations, 2.500%-5.000%, Market Value plus accrued interest $8,237,267, due 08/01/23-06/01/51) | 8,075,752 | 1.6 |
| Total Repurchase Agreements | ||||
| (Cost $16,121,213) | 16,121,213 | 3.3 | ||
| Certificates of Deposit: 0.2% | ||||
| 550,000 | (7) | Landesbank Baden-Wurttemberg, 1.630%, 04/24/2020 | 550,294 | 0.1 |
| 400,000 | (7) | Landesbank Baden-Wurttemberg, 1.640%, 04/21/2020 | 400,211 | 0.1 |
| Total Certificates of Deposit | ||||
| (Cost $950,505) | 950,505 | 0.2 | ||
| Shares | Value | Percentage of Net Assets | ||
| Mutual Funds: 3.9% | ||||
| 940,000 | (7) | Fidelity Investments Money Market Government Portfolio - Institutional Class, 0.380% | 940,000 | 0.2 |
| 16,330,000 | (8) | Goldman Sachs Financial Square Government Fund - Institutional Shares, 0.340% | 16,330,000 | 3.3 |
| 970,000 | (7),(8) | Invesco Short-Term Investments Trust Government & Agency Portfolio - Institutional Class, 0.490% | 970,000 | 0.2 |
See Accompanying Notes to Financial Statements
| 20 |
| Voya High Yield Bond Fund | PORTFOLIO OF INVESTMENTS |
| as of March31, 2020 (Continued) |
| 768,000 | (7),(8) | Morgan Stanley Institutional Liquidity Funds - Government Portfolio (Institutional Share Class), 0.250% | 768,000 | 0.2 |
| Total Mutual Funds | ||||
| (Cost $19,008,000) | 19,008,000 | 3.9 | ||
| Total Short-Term Investments | ||||
| (Cost $60,805,220) | 60,803,840 | 12.4 | ||
| Total Investments in Securities (Cost $555,523,499) | $ 520,209,302 | 106.5 | ||
| Liabilities in Excess of Other Assets | (31,886,197) | (6.5) | ||
| Net Assets | $ 488,323,105 | 100.0 | ||
| † | Unless otherwise indicated, principal amount is shown in USD. |
| (1) | Securities with purchases pursuant to Rule 144A or section 4(a)(2), under the Securities Act of 1933 and may not be resold subject to that rule except to qualified institutional buyers. |
| (2) | Security, or a portion of the security, is on loan. |
| (3) | Variable rate security. Rate shown is the rate in effect as of March 31, 2020. |
| (4) | All or a portion of this security is payment-in-kind ("PIK") which may pay interest or additional principal at the issuer's discretion. Rates shown are the current rate and possible payment rates. |
| (5) | For fair value measurement disclosure purposes, security is categorized as Level 3, whose value was determined using significant unobservable inputs. |
| (6) | Non-income producing security. |
| (7) | All or a portion of the security represents securities purchased with cash collateral received for securities on loan. |
| (8) | Rate shown is the 7-day yield as of March 31, 2020. |
| Reference Rate Abbreviations: | |
| US0001M | 1-month LIBOR |
| US0003M | 3-month LIBOR |
See Accompanying Notes to Financial Statements
| 21 |
| Voya Intermediate Bond Fund | PORTFOLIO OF INVESTMENTS |
| as of March31, 2020 |
| Principal Amount† | Value | Percentage of Net Assets | ||
| CORPORATE BONDS/NOTES: 32.5% | ||||
| Basic Materials: 1.0% | ||||
| 1,377,000 | (1) | Anglo American Capital PLC, 3.625%, 09/11/2024 | $ 1,298,205 | 0.0 |
| 2,746,000 | (1) | Anglo American Capital PLC, 4.875%, 05/14/2025 | 2,669,217 | 0.0 |
| 1,846,000 | (1) | Anglo American Capital PLC, 5.625%, 04/01/2030 | 1,877,489 | 0.0 |
| 750,000 | (1) | Braskem Netherlands Finance BV, 4.500%, 01/31/2030 | 586,500 | 0.0 |
| 4,505,000 | Celulosa Arauco y Constitucion SA, 3.875%, 11/02/2027 | 3,930,804 | 0.1 | |
| 3,410,000 | (1) | Chevron Phillips Chemical Co. LLC / Chevron Phillips Chemical Co. L.P., 3.700%, 06/01/2028 | 3,463,457 | 0.1 |
| 5,485,000 | CNAC HK Finbridge Co. Ltd., 5.125%, 03/14/2028 | 6,082,062 | 0.1 | |
| 3,000,000 | CNAC HK Finbridge Co. Ltd., 3.875%, 06/19/2029 | 3,088,125 | 0.0 | |
| 2,984,000 | Dow Chemical Co/The, 4.250%, 10/01/2034 | 2,948,419 | 0.0 | |
| 1,534,000 | Dow Chemical Co/The, 5.550%, 11/30/2048 | 1,731,089 | 0.0 | |
| 3,104,000 | FMC Corp., 3.200%, 10/01/2026 | 3,131,874 | 0.0 | |
| 1,788,000 | FMC Corp., 3.450%, 10/01/2029 | 1,800,074 | 0.0 | |
| 9,260,000 | Freeport-McMoRan, Inc., 4.250%, 03/01/2030 | 8,079,813 | 0.1 | |
| 1,960,000 | (1) | Georgia-Pacific LLC, 3.163%, 11/15/2021 | 1,987,912 | 0.0 |
| 1,996,000 | International Flavors & Fragrances, Inc., 3.400%, 09/25/2020 | 2,005,133 | 0.0 | |
| 2,280,000 | International Paper Co., 4.400%, 08/15/2047 | 2,302,480 | 0.0 | |
| 4,087,000 | Inversiones CMPC SA, 4.375%, 04/04/2027 | 3,846,082 | 0.1 | |
| 5,352,000 | Mosaic Co/The, 5.450%, 11/15/2033 | 5,203,074 | 0.1 | |
| 7,120,000 | (1) | Newcrest Finance Pty Ltd., 4.450%, 11/15/2021 | 7,305,384 | 0.1 |
| 87,000 | Newmont Corp., 3.700%, 03/15/2023 | 87,506 | 0.0 | |
| 4,300,000 | (1) | Novelis Corp., 4.750%, 01/30/2030 | 3,851,187 | 0.1 |
| 2,000,000 | Nutrien Ltd., 3.625%, 03/15/2024 | 2,019,273 | 0.0 | |
| 4,825,000 | Suzano Austria GmbH, 6.000%, 01/15/2029 | 4,540,530 | 0.1 | |
| 1,750,000 | Teck Resources Ltd., 6.125%, 10/01/2035 | 1,612,211 | 0.0 | |
| 2,360,000 | Teck Resources Ltd., 6.000%, 08/15/2040 | 2,033,866 | 0.0 | |
| 7,180,000 | (1),(2) | Valvoline, Inc., 4.250%, 02/15/2030 | 6,717,788 | 0.1 |
| 84,199,554 | 1.0 | |||
| Communications: 2.8% | ||||
| 2,455,000 | Alibaba Group Holding Ltd., 3.600%, 11/28/2024 | 2,595,774 | 0.0 | |
| 2,130,000 | AT&T, Inc., 2.950%, 07/15/2026 | 2,100,077 | 0.0 | |
| 3,876,000 | AT&T, Inc., 4.300%, 02/15/2030 | 4,180,087 | 0.1 | |
| 3,047,000 | AT&T, Inc., 4.500%, 03/09/2048 | 3,322,889 | 0.0 | |
| 10,276,000 | AT&T, Inc., 4.550%, 03/09/2049 | 11,113,516 | 0.1 | |
| 3,275,000 | AT&T, Inc., 5.150%, 11/15/2046 | 3,869,034 | 0.1 | |
| 5,275,000 | (2) | AT&T, Inc., 5.150%, 02/15/2050 | 6,329,281 | 0.1 |
| 4,725,000 | Charter Communications Operating LLC / Charter Communications Operating Capital, 4.464%, 07/23/2022 | 4,886,445 | 0.1 | |
| 3,860,000 | Charter Communications Operating LLC / Charter Communications Operating Capital, 4.800%, 03/01/2050 | 4,041,170 | 0.1 | |
| 5,882,000 | Charter Communications Operating LLC / Charter Communications Operating Capital, 4.908%, 07/23/2025 | 6,347,958 | 0.1 | |
| 5,000,000 | (2) | Comcast Corp., 2.650%, 02/01/2030 | 5,160,803 | 0.1 |
| 3,288,000 | Comcast Corp., 3.900%, 03/01/2038 | 3,710,524 | 0.0 | |
| 6,289,000 | Comcast Corp., 3.950%, 10/15/2025 | 6,937,666 | 0.1 | |
| 2,932,000 | Comcast Corp., 3.999%, 11/01/2049 | 3,479,261 | 0.0 | |
| 6,080,000 | Comcast Corp., 4.000%, 03/01/2048 | 7,042,937 | 0.1 | |
| 3,250,000 | Comcast Corp., 4.600%, 10/15/2038 | 4,062,237 | 0.1 | |
| 9,425,000 | (1),(2) | CommScope Technologies LLC, 5.000%, 03/15/2027 | 8,247,582 | 0.1 |
| 1,690,000 | Corning, Inc., 5.450%, 11/15/2079 | 1,749,929 | 0.0 | |
| 8,250,000 | (1) | CSC Holdings LLC, 5.750%, 01/15/2030 | 8,350,732 | 0.1 |
| 1,875,000 | (1),(2) | Deutsche Telekom AG, 3.625%, 01/21/2050 | 1,874,551 | 0.0 |
| 5,480,000 | (2) | Discovery Communications LLC, 2.950%, 03/20/2023 | 5,475,346 | 0.1 |
See Accompanying Notes to Financial Statements
| 22 |
| Voya Intermediate Bond Fund | PORTFOLIO OF INVESTMENTS |
| as of March31, 2020 (Continued) |
| 3,750,000 | Discovery Communications LLC, 5.200%, 09/20/2047 | 3,849,557 | 0.0 | |
| 4,340,000 | (2) | DISH DBS Corp., 5.875%, 11/15/2024 | 4,253,569 | 0.1 |
| 3,110,000 | Expedia Group, Inc., 3.250%, 02/15/2030 | 2,550,648 | 0.0 | |
| 826,000 | Fox Corp., 3.500%, 04/08/2030 | 824,340 | 0.0 | |
| 9,075,000 | (1) | Front Range BidCo, Inc., 4.000%, 03/01/2027 | 8,734,688 | 0.1 |
| 8,075,000 | (1) | Gray Television, Inc., 7.000%, 05/15/2027 | 8,079,441 | 0.1 |
| 2,770,000 | Interpublic Group of Cos, Inc./The, 3.750%, 10/01/2021 | 2,798,464 | 0.0 | |
| 4,583,000 | Interpublic Group of Cos, Inc./The, 4.750%, 03/30/2030 | 4,564,422 | 0.1 | |
| 4,425,000 | (1) | Match Group, Inc., 4.125%, 08/01/2030 | 3,979,734 | 0.1 |
| 9,365,000 | (1) | NBCUniversal Enterprise, Inc., 5.250%, 12/31/2199 | 9,366,264 | 0.1 |
| 1,848,000 | Omnicom Group, Inc., 4.200%, 06/01/2030 | 1,909,494 | 0.0 | |
| 3,835,000 | (1),(2) | Sinclair Television Group, Inc., 5.125%, 02/15/2027 | 3,273,335 | 0.0 |
| 3,990,000 | (1) | Sirius XM Radio, Inc., 5.500%, 07/01/2029 | 4,091,945 | 0.1 |
| 3,775,000 | Sprint Nextel Corp., 6.875%, 11/15/2028 | 4,332,756 | 0.1 | |
| 6,075,000 | (2) | Telecom Italia Capital SA, 7.721%, 06/04/2038 | 6,469,936 | 0.1 |
| 3,420,000 | (1) | Tencent Holdings Ltd., 2.985%, 01/19/2023 | 3,491,800 | 0.0 |
| 2,350,000 | Time Warner Cable LLC, 5.500%, 09/01/2041 | 2,468,098 | 0.0 | |
| 2,829,000 | Time Warner Cable LLC, 5.875%, 11/15/2040 | 2,993,569 | 0.0 | |
| 4,610,000 | Verizon Communications, Inc., 3.850%, 11/01/2042 | 5,173,022 | 0.1 | |
| 7,999,000 | Verizon Communications, Inc., 4.016%, 12/03/2029 | 9,072,186 | 0.1 | |
| 1,159,000 | (2) | Verizon Communications, Inc., 4.000%, 03/22/2050 | 1,381,829 | 0.0 |
| 6,432,000 | Verizon Communications, Inc., 4.812%, 03/15/2039 | 7,952,409 | 0.1 | |
| 3,668,000 | ViacomCBS, Inc., 4.375%, 03/15/2043 | 3,270,069 | 0.0 | |
| 3,167,000 | ViacomCBS, Inc., 4.950%, 01/15/2031 | 3,141,426 | 0.0 | |
| 2,090,000 | ViacomCBS, Inc., 5.500%, 05/15/2033 | 2,245,961 | 0.0 | |
| 5,195,000 | (1),(2) | ViaSat, Inc., 5.625%, 04/15/2027 | 5,158,895 | 0.1 |
| 1,093,000 | Walt Disney Co/The, 2.000%, 09/01/2029 | 1,068,975 | 0.0 | |
| 2,075,000 | Walt Disney Co/The, 3.000%, 09/15/2022 | 2,146,779 | 0.0 | |
| 5,230,000 | Walt Disney Co/The, 4.750%, 11/15/2046 | 6,717,216 | 0.1 | |
| 230,238,626 | 2.8 | |||
| Consumer, Cyclical: 1.9% | ||||
| 6,225,000 | (1) | 1011778 BC ULC / New Red Finance, Inc., 5.000%, 10/15/2025 | 5,983,750 | 0.1 |
| 4,750,000 | (2) | AMC Entertainment Holdings, Inc., 5.875%, 11/15/2026 | 2,004,346 | 0.0 |
| 1,437,130 | American Airlines 2015-2 Class B Pass Through Trust, 4.400%, 03/22/2025 | 1,218,794 | 0.0 | |
| 236,633 | American Airlines 2016-1 Class B Pass Through Trust, 5.250%, 07/15/2025 | 238,461 | 0.0 | |
| 4,699,750 | American Airlines 2016-2 Class AA Pass Through Trust, 3.200%, 12/15/2029 | 5,123,055 | 0.1 | |
| 2,052,320 | American Airlines 2016-3 Class B Pass Through Trust, 3.750%, 04/15/2027 | 1,654,514 | 0.0 | |
| 2,601,121 | American Airlines 2019-1 Class B Pass Through Trust, 3.850%, 08/15/2029 | 2,022,666 | 0.0 | |
| 5,115,000 | (1),(2) | Asbury Automotive Group, Inc., 4.750%, 03/01/2030 | 4,386,112 | 0.1 |
| 4,205,000 | (1) | BMW US Capital LLC, 3.400%, 08/13/2021 | 4,200,632 | 0.1 |
| 4,340,000 | (1) | BMW US Capital LLC, 3.450%, 04/12/2023 | 4,316,651 | 0.1 |
| 5,195,000 | (1),(2) | Caesars Resort Collection LLC / CRC Finco, Inc., 5.250%, 10/15/2025 | 3,790,791 | 0.1 |
| 935,108 | Continental Airlines 2012-1 Class A Pass Through Trust, 4.150%, 10/11/2025 | 1,009,306 | 0.0 | |
| 4,640,000 | (1) | Daimler Finance North America LLC, 2.125%, 03/10/2025 | 4,279,127 | 0.1 |
| 5,659,000 | (1) | Daimler Finance North America LLC, 2.300%, 02/12/2021 | 5,517,695 | 0.1 |
| 6,383,000 | (1) | Daimler Finance North America LLC, 2.550%, 08/15/2022 | 6,128,016 | 0.1 |
| 3,060,000 | (1) | Dana Financing Luxembourg Sarl, 6.500%, 06/01/2026 | 2,719,422 | 0.0 |
| 5,460,000 | Delta Air Lines 2020-1 Class A Pass Through Trust, 2.500%, 12/10/2029 | 4,980,761 | 0.1 | |
| 5,534,000 | Delta Air Lines 2020-1 Class AA Pass Through Trust, 2.000%, 12/10/2029 | 5,067,713 | 0.1 | |
See Accompanying Notes to Financial Statements
| 23 |
| Voya Intermediate Bond Fund | PORTFOLIO OF INVESTMENTS |
| as of March31, 2020 (Continued) |
| 1,578,281 | Delta Air Lines 2002-1 Class G-1 Pass Through Trust, 6.718%, 07/02/2024 | 1,578,034 | 0.0 | |
| 1,430,252 | Delta Air Lines 2015-1 Class AA Pass Through Trust, 3.625%, 01/30/2029 | 1,303,965 | 0.0 | |
| 3,970,000 | DR Horton, Inc., 4.750%, 02/15/2023 | 4,000,071 | 0.1 | |
| 1,642,000 | Ford Motor Credit Co. LLC, 3.664%, 09/08/2024 | 1,469,590 | 0.0 | |
| 3,266,000 | Ford Motor Credit Co. LLC, 4.134%, 08/04/2025 | 2,913,272 | 0.0 | |
| 2,200,000 | General Motors Co., 5.400%, 04/01/2048 | 1,610,606 | 0.0 | |
| 3,665,000 | (2) | General Motors Financial Co., Inc., 4.150%, 06/19/2023 | 3,337,808 | 0.0 |
| 1,732,000 | General Motors Financial Co., Inc., 4.350%, 01/17/2027 | 1,433,975 | 0.0 | |
| 1,315,000 | Hasbro, Inc., 2.600%, 11/19/2022 | 1,299,049 | 0.0 | |
| 4,240,000 | Home Depot, Inc./The, 3.300%, 04/15/2040 | 4,357,815 | 0.1 | |
| 3,250,000 | Home Depot, Inc./The, 4.500%, 12/06/2048 | 4,007,720 | 0.1 | |
| 6,500,000 | JetBlue 2019-1 Class AA Pass Through Trust, 2.750%, 11/15/2033 | 5,775,032 | 0.1 | |
| 5,451,000 | Lowe's Cos, Inc., 3.700%, 04/15/2046 | 5,075,444 | 0.1 | |
| 2,495,000 | Lowe's Cos, Inc., 5.000%, 04/15/2040 | 2,832,550 | 0.0 | |
| 2,795,000 | (2) | McDonald's Corp., 3.500%, 07/01/2027 | 2,952,431 | 0.0 |
| 595,000 | McDonald's Corp., 3.625%, 05/01/2043 | 578,578 | 0.0 | |
| 2,325,000 | McDonald's Corp., 3.625%, 09/01/2049 | 2,387,416 | 0.0 | |
| 3,095,000 | McDonald's Corp., 4.450%, 09/01/2048 | 3,457,764 | 0.0 | |
| 2,930,000 | (2) | MGM Resorts International, 4.625%, 09/01/2026 | 2,511,794 | 0.0 |
| 1,399,000 | (2) | NIKE, Inc., 2.750%, 03/27/2027 | 1,463,270 | 0.0 |
| 1,685,000 | NIKE, Inc., 3.250%, 03/27/2040 | 1,763,211 | 0.0 | |
| 6,440,000 | (1),(2) | PetSmart, Inc., 5.875%, 06/01/2025 | 6,391,700 | 0.1 |
| 1,650,000 | SACI Falabella, 3.750%, 10/30/2027 | 1,419,044 | 0.0 | |
| 3,080,000 | (1),(2) | Six Flags Entertainment Corp., 5.500%, 04/15/2027 | 2,611,994 | 0.0 |
| 930,000 | Southwest Airlines Co., 3.450%, 11/16/2027 | 837,544 | 0.0 | |
| 1,756,023 | Spirit Airlines Pass Through Trust 2017-1AA, 3.375%, 08/15/2031 | 1,647,441 | 0.0 | |
| 2,638,000 | TJX Cos, Inc./The, 3.750%, 04/15/2027 | 2,712,946 | 0.0 | |
| 4,238,000 | Toyota Motor Credit Corp., 2.150%, 02/13/2030 | 3,950,576 | 0.1 | |
| 1,582,000 | Toyota Motor Credit Corp., 3.375%, 04/01/2030 | 1,603,910 | 0.0 | |
| 270,689 | United Airlines 2014-2 Class B Pass Through Trust, 4.625%, 03/03/2024 | 253,543 | 0.0 | |
| 3,678,940 | United Airlines 2016-1 Class AA Pass Through Trust, 3.100%, 01/07/2030 | 3,425,497 | 0.0 | |
| 911,574 | United Airlines 2016-1 Class B Pass Through Trust, 3.650%, 07/07/2027 | 745,301 | 0.0 | |
| 4,471,380 | United Airlines 2016-2 Class AA Pass Through Trust, 2.875%, 04/07/2030 | 4,162,748 | 0.1 | |
| 1,155,243 | United Airlines 2016-2 Class B Pass Through Trust, 3.650%, 04/07/2027 | 972,379 | 0.0 | |
| 3,570,000 | Walmart, Inc., 2.350%, 12/15/2022 | 3,686,146 | 0.0 | |
| 2,805,000 | WW Grainger, Inc., 1.850%, 02/15/2025 | 2,813,894 | 0.0 | |
| 157,985,870 | 1.9 | |||
| Consumer, Non-cyclical: 5.6% | ||||
| 1,275,000 | Abbott Laboratories, 2.950%, 03/15/2025 | 1,327,699 | 0.0 | |
| 2,740,000 | (1) | AbbVie, Inc., 2.300%, 11/21/2022 | 2,741,312 | 0.0 |
| 5,636,000 | (1) | AbbVie, Inc., 2.600%, 11/21/2024 | 5,737,335 | 0.1 |
| 2,210,000 | AbbVie, Inc., 2.900%, 11/06/2022 | 2,238,574 | 0.0 | |
| 3,188,000 | (1) | AbbVie, Inc., 2.950%, 11/21/2026 | 3,255,749 | 0.0 |
| 2,763,000 | (1) | AbbVie, Inc., 3.200%, 11/21/2029 | 2,835,875 | 0.0 |
| 1,599,000 | AbbVie, Inc., 3.375%, 11/14/2021 | 1,631,191 | 0.0 | |
| 3,172,000 | (1) | AbbVie, Inc., 4.050%, 11/21/2039 | 3,342,194 | 0.1 |
| 3,810,000 | AbbVie, Inc., 4.300%, 05/14/2036 | 4,176,761 | 0.1 | |
| 2,526,000 | AbbVie, Inc., 4.450%, 05/14/2046 | 2,696,874 | 0.0 | |
| 2,005,000 | AbbVie, Inc., 4.500%, 05/14/2035 | 2,314,184 | 0.0 | |
| 1,849,000 | Aetna, Inc., 2.800%, 06/15/2023 | 1,862,830 | 0.0 | |
| 1,764,000 | Aetna, Inc., 4.500%, 05/15/2042 | 1,893,385 | 0.0 | |
| 3,975,000 | (1) | Albertsons Cos, Inc. / Safeway, Inc. / New Albertsons L.P. / Albertsons LLC, 4.625%, 01/15/2027 | 3,977,186 | 0.1 |
| 4,145,000 | (1),(2) | Albertsons Cos, Inc. / Safeway, Inc. / New Albertsons L.P. / Albertsons LLC, 5.875%, 02/15/2028 | 4,241,786 | 0.1 |
See Accompanying Notes to Financial Statements
| 24 |
| Voya Intermediate Bond Fund | PORTFOLIO OF INVESTMENTS |
| as of March31, 2020 (Continued) |
| 3,440,000 | (1) | Alcon Finance Corp., 3.800%, 09/23/2049 | 3,464,262 | 0.1 |
| 2,298,000 | Allergan Finance LLC, 4.625%, 10/01/2042 | 2,901,063 | 0.0 | |
| 2,895,000 | Altria Group, Inc., 4.800%, 02/14/2029 | 3,035,532 | 0.0 | |
| 1,325,000 | Altria Group, Inc., 5.800%, 02/14/2039 | 1,456,930 | 0.0 | |
| 1,326,000 | (2) | Altria Group, Inc., 5.950%, 02/14/2049 | 1,549,583 | 0.0 |
| 9,003,000 | AmerisourceBergen Corp., 3.400%, 05/15/2024 | 9,209,121 | 0.1 | |
| 2,417,000 | AmerisourceBergen Corp., 3.450%, 12/15/2027 | 2,433,398 | 0.0 | |
| 968,000 | (2) | Amgen, Inc., 1.900%, 02/21/2025 | 977,569 | 0.0 |
| 1,045,000 | Amgen, Inc., 2.450%, 02/21/2030 | 1,043,689 | 0.0 | |
| 3,732,000 | Anheuser-Busch Cos LLC / Anheuser-Busch InBev Worldwide, Inc., 4.700%, 02/01/2036 | 3,911,352 | 0.1 | |
| 12,818,000 | Anheuser-Busch Cos LLC / Anheuser-Busch InBev Worldwide, Inc., 4.900%, 02/01/2046 | 14,053,789 | 0.2 | |
| 1,960,000 | Anheuser-Busch InBev Worldwide, Inc., 4.439%, 10/06/2048 | 2,011,805 | 0.0 | |
| 2,170,000 | Anheuser-Busch InBev Worldwide, Inc., 5.450%, 01/23/2039 | 2,533,891 | 0.0 | |
| 4,460,000 | Anthem, Inc., 3.300%, 01/15/2023 | 4,527,010 | 0.1 | |
| 1,598,000 | Anthem, Inc., 3.500%, 08/15/2024 | 1,642,682 | 0.0 | |
| 1,293,000 | (2) | Anthem, Inc., 3.700%, 09/15/2049 | 1,303,308 | 0.0 |
| 873,000 | Anthem, Inc., 4.101%, 03/01/2028 | 941,713 | 0.0 | |
| 4,159,000 | Anthem, Inc., 5.100%, 01/15/2044 | 4,953,812 | 0.1 | |
| 5,220,000 | AstraZeneca PLC, 2.375%, 11/16/2020 | 5,207,864 | 0.1 | |
| 7,854,000 | AstraZeneca PLC, 3.375%, 11/16/2025 | 8,282,039 | 0.1 | |
| 2,316,000 | Avery Dennison Corp., 2.650%, 04/30/2030 | 2,169,711 | 0.0 | |
| 3,580,000 | BAT Capital Corp., 3.222%, 08/15/2024 | 3,602,796 | 0.1 | |
| 1,005,000 | BAT Capital Corp., 3.215%, 09/06/2026 | 957,828 | 0.0 | |
| 7,473,000 | BAT Capital Corp., 3.557%, 08/15/2027 | 7,054,047 | 0.1 | |
| 4,970,000 | (1) | Bausch Health Cos, Inc., 5.250%, 01/30/2030 | 4,684,225 | 0.1 |
| 3,275,000 | (1),(2) | Bausch Health Cos, Inc., 6.125%, 04/15/2025 | 3,246,360 | 0.0 |
| 6,336,000 | Baxalta, Inc., 4.000%, 06/23/2025 | 6,758,535 | 0.1 | |
| 6,487,000 | Becton Dickinson and Co., 2.894%, 06/06/2022 | 6,497,586 | 0.1 | |
| 2,720,000 | Becton Dickinson and Co., 3.363%, 06/06/2024 | 2,730,966 | 0.0 | |
| 4,662,000 | (1) | Bristol-Myers Squibb Co., 3.875%, 08/15/2025 | 5,067,617 | 0.1 |
| 2,250,000 | (1) | Bristol-Myers Squibb Co., 2.550%, 05/14/2021 | 2,277,045 | 0.0 |
| 3,421,000 | (1) | Bristol-Myers Squibb Co., 4.125%, 06/15/2039 | 4,144,794 | 0.1 |
| 5,406,000 | (1) | Bristol-Myers Squibb Co., 4.550%, 02/20/2048 | 6,881,975 | 0.1 |
| 3,870,000 | Bunge Ltd. Finance Corp., 4.350%, 03/15/2024 | 4,016,228 | 0.1 | |
| 5,377,000 | (1) | Cargill, Inc., 3.875%, 05/23/2049 | 6,534,099 | 0.1 |
| 4,450,000 | (1) | Centene Corp., 3.375%, 02/15/2030 | 4,155,188 | 0.1 |
| 6,698,000 | (1) | Cigna Corp., 3.050%, 11/30/2022 | 6,875,548 | 0.1 |
| 17,370,000 | Cigna Corp., 3.200%, 09/17/2020 | 17,396,447 | 0.2 | |
| 3,471,000 | (1) | Cigna Corp., 3.250%, 04/15/2025 | 3,549,189 | 0.1 |
| 2,145,000 | Cigna Corp., 3.400%, 03/15/2050 | 2,071,498 | 0.0 | |
| 1,882,000 | Cigna Corp., 4.800%, 08/15/2038 | 2,126,885 | 0.0 | |
| 4,165,000 | Cigna Corp., 4.900%, 12/15/2048 | 5,059,126 | 0.1 | |
| 1,840,000 | Coca-Cola Co/The, 4.125%, 03/25/2040 | 2,271,680 | 0.0 | |
| 2,587,000 | (2) | CVS Health Corp., 3.700%, 03/09/2023 | 2,696,318 | 0.0 |
| 2,465,000 | CVS Health Corp., 3.875%, 07/20/2025 | 2,551,610 | 0.0 | |
| 4,783,000 | CVS Health Corp., 4.300%, 03/25/2028 | 5,089,609 | 0.1 | |
| 9,602,000 | CVS Health Corp., 5.050%, 03/25/2048 | 10,946,709 | 0.1 | |
| 7,379,000 | (1) | Danone SA, 2.947%, 11/02/2026 | 7,386,050 | 0.1 |
| 5,872,000 | DH Europe Finance II Sarl, 3.400%, 11/15/2049 | 5,800,765 | 0.1 | |
| 3,460,000 | General Mills, Inc., 3.700%, 10/17/2023 | 3,527,920 | 0.1 | |
| 4,340,000 | General Mills, Inc., 4.000%, 04/17/2025 | 4,685,114 | 0.1 | |
| 7,000,000 | Gilead Sciences, Inc., 4.400%, 12/01/2021 | 7,233,211 | 0.1 | |
| 3,420,000 | GlaxoSmithKline Capital PLC, 2.875%, 06/01/2022 | 3,502,233 | 0.1 | |
| 11,343,000 | Global Payments, Inc., 2.650%, 02/15/2025 | 11,266,346 | 0.1 | |
| 3,076,000 | (2) | HCA, Inc., 4.500%, 02/15/2027 | 3,174,136 | 0.0 |
| 1,449,000 | HCA, Inc., 5.250%, 04/15/2025 | 1,522,957 | 0.0 | |
| 2,194,000 | HCA, Inc., 5.250%, 06/15/2049 | 2,358,120 | 0.0 | |
| 2,657,000 | HCA, Inc., 5.500%, 06/15/2047 | 2,912,465 | 0.0 |
See Accompanying Notes to Financial Statements
| 25 |
| Voya Intermediate Bond Fund | PORTFOLIO OF INVESTMENTS |
| as of March31, 2020 (Continued) |
| 1,671,000 | IHS Markit Ltd., 4.250%, 05/01/2029 | 1,773,365 | 0.0 | |
| 2,290,000 | (1) | Imperial Brands Finance PLC, 3.750%, 07/21/2022 | 2,292,034 | 0.0 |
| 1,140,000 | Johnson & Johnson, 4.375%, 12/05/2033 | 1,496,479 | 0.0 | |
| 5,375,000 | Kaiser Foundation Hospitals, 3.266%, 11/01/2049 | 5,378,689 | 0.1 | |
| 3,200,000 | Keurig Dr Pepper, Inc., 4.057%, 05/25/2023 | 3,336,899 | 0.0 | |
| 1,789,000 | Keurig Dr Pepper, Inc., 4.417%, 05/25/2025 | 1,910,169 | 0.0 | |
| 915,000 | Kimberly-Clark Corp., 2.875%, 02/07/2050 | 896,049 | 0.0 | |
| 3,849,000 | (1) | Kraft Heinz Foods Co., 4.875%, 02/15/2025 | 3,858,139 | 0.1 |
| 1,500,000 | Kroger Co., 3.875%, 10/15/2046 | 1,479,058 | 0.0 | |
| 1,309,000 | (2) | Kroger Co/The, 4.650%, 01/15/2048 | 1,487,177 | 0.0 |
| 251,000 | Kroger Co/The, 5.150%, 08/01/2043 | 297,440 | 0.0 | |
| 2,414,000 | Laboratory Corp. of America Holdings, 3.250%, 09/01/2024 | 2,481,414 | 0.0 | |
| 5,806,000 | Laboratory Corp. of America Holdings, 3.750%, 08/23/2022 | 5,993,566 | 0.1 | |
| 1,280,000 | Laboratory Corp. of America Holdings, 4.700%, 02/01/2045 | 1,461,818 | 0.0 | |
| 992,000 | (1) | Mars, Inc., 3.200%, 04/01/2030 | 1,038,814 | 0.0 |
| 1,321,000 | (1) | Mars, Inc., 3.875%, 04/01/2039 | 1,410,594 | 0.0 |
| 3,336,000 | (1) | Mars, Inc., 4.125%, 04/01/2054 | 3,794,840 | 0.1 |
| 1,484,000 | Medtronic, Inc., 4.375%, 03/15/2035 | 1,854,366 | 0.0 | |
| 960,000 | Moody's Corp., 3.750%, 03/24/2025 | 1,009,677 | 0.0 | |
| 170,000 | Mylan NV, 3.750%, 12/15/2020 | 169,040 | 0.0 | |
| 4,946,000 | Mylan, Inc., 5.200%, 04/15/2048 | 4,458,310 | 0.1 | |
| 7,470,000 | PayPal Holdings, Inc., 2.850%, 10/01/2029 | 7,460,457 | 0.1 | |
| 1,215,000 | PepsiCo, Inc., 3.875%, 03/19/2060 | 1,532,008 | 0.0 | |
| 3,795,000 | Pfizer, Inc., 3.200%, 09/15/2023 | 4,008,808 | 0.1 | |
| 1,689,000 | Philip Morris International, Inc., 3.875%, 08/21/2042 | 1,805,958 | 0.0 | |
| 2,555,000 | Philip Morris International, Inc., 4.375%, 11/15/2041 | 2,929,350 | 0.0 | |
| 6,665,000 | (1),(2) | Pilgrim's Pride Corp., 5.875%, 09/30/2027 | 6,677,997 | 0.1 |
| 8,405,000 | (1) | Post Holdings, Inc., 5.500%, 12/15/2029 | 8,765,154 | 0.1 |
| 6,443,000 | RELX Capital, Inc., 4.000%, 03/18/2029 | 6,671,191 | 0.1 | |
| 1,903,000 | Reynolds American, Inc., 5.850%, 08/15/2045 | 2,056,022 | 0.0 | |
| 818,000 | Reynolds American, Inc., 6.150%, 09/15/2043 | 892,127 | 0.0 | |
| 2,250,000 | (1) | SC Johnson & Son, Inc., 4.750%, 10/15/2046 | 2,680,041 | 0.0 |
| 3,698,000 | Shire Acquisitions Investments Ireland DAC, 2.400%, 09/23/2021 | 3,687,078 | 0.1 | |
| 2,110,000 | Sysco Corp., 5.950%, 04/01/2030 | 2,225,922 | 0.0 | |
| 7,240,000 | Takeda Pharmaceutical Co. Ltd., 4.000%, 11/26/2021 | 7,338,439 | 0.1 | |
| 8,680,000 | (1) | Tenet Healthcare Corp., 5.125%, 11/01/2027 | 8,321,950 | 0.1 |
| 9,510,000 | Unilever Capital Corp., 3.000%, 03/07/2022 | 9,835,267 | 0.1 | |
| 10,039,000 | Unilever Capital Corp., 3.250%, 03/07/2024 | 10,622,432 | 0.1 | |
| 4,500,000 | (2) | United Rentals North America, Inc., 4.000%, 07/15/2030 | 4,044,375 | 0.1 |
| 4,325,000 | United Rentals North America, Inc., 4.875%, 01/15/2028 | 4,219,254 | 0.1 | |
| 848,000 | UnitedHealth Group, Inc., 2.875%, 08/15/2029 | 895,897 | 0.0 | |
| 2,117,000 | UnitedHealth Group, Inc., 3.500%, 08/15/2039 | 2,287,951 | 0.0 | |
| 1,483,000 | UnitedHealth Group, Inc., 3.875%, 08/15/2059 | 1,623,839 | 0.0 | |
| 2,310,000 | UnitedHealth Group, Inc., 4.200%, 01/15/2047 | 2,749,660 | 0.0 | |
| 2,025,000 | Zimmer Biomet Holdings, Inc., 3.550%, 03/20/2030 | 2,028,238 | 0.0 | |
| 457,733,635 | 5.6 | |||
| Energy: 3.3% | ||||
| 2,430,000 | Apache Corp., 4.750%, 04/15/2043 | 1,080,050 | 0.0 | |
| 4,713,000 | Apache Corp., 5.250%, 02/01/2042 | 2,136,555 | 0.0 | |
| 3,266,000 | BP Capital Markets America, Inc., 3.000%, 02/24/2050 | 3,062,794 | 0.0 | |
| 5,828,000 | BP Capital Markets America, Inc., 3.216%, 11/28/2023 | 5,998,902 | 0.1 | |
| 4,856,000 | BP Capital Markets America, Inc., 3.224%, 04/14/2024 | 4,975,847 | 0.1 | |
| 3,280,000 | BP Capital Markets PLC, 4.742%, 03/11/2021 | 3,303,217 | 0.1 | |
| 3,000,000 | Cenovus Energy, Inc., 3.800%, 09/15/2023 | 1,583,646 | 0.0 | |
| 2,725,000 | Cenovus Energy, Inc., 6.750%, 11/15/2039 | 1,323,838 | 0.0 | |
See Accompanying Notes to Financial Statements
| 26 |
| Voya Intermediate Bond Fund | PORTFOLIO OF INVESTMENTS |
| as of March31, 2020 (Continued) |
| 4,095,000 | (1) | Cheniere Corpus Christi Holdings LLC, 3.700%, 11/15/2029 | 3,079,943 | 0.1 |
| 2,150,000 | Cheniere Corpus Christi Holdings LLC, 5.875%, 03/31/2025 | 1,961,959 | 0.0 | |
| 5,664,000 | Cimarex Energy Co., 3.900%, 05/15/2027 | 4,116,825 | 0.1 | |
| 1,680,000 | Cimarex Energy Co., 4.375%, 06/01/2024 | 1,326,506 | 0.0 | |
| 1,609,000 | (2) | Cimarex Energy Co., 4.375%, 03/15/2029 | 1,080,537 | 0.0 |
| 4,032,000 | Continental Resources, Inc./OK, 3.800%, 06/01/2024 | 2,041,254 | 0.0 | |
| 5,525,000 | (1) | Crestwood Midstream Partners L.P. / Crestwood Midstream Finance Corp., 5.625%, 05/01/2027 | 3,079,000 | 0.0 |
| 3,055,000 | (2) | Crestwood Midstream Partners L.P. / Crestwood Midstream Finance Corp., 5.750%, 04/01/2025 | 1,771,992 | 0.0 |
| 3,662,000 | Diamondback Energy, Inc., 2.875%, 12/01/2024 | 2,566,184 | 0.0 | |
| 1,580,000 | Diamondback Energy, Inc., 3.250%, 12/01/2026 | 1,119,760 | 0.0 | |
| 4,650,000 | Diamondback Energy, Inc., 3.500%, 12/01/2029 | 3,298,115 | 0.1 | |
| 7,100,000 | Empresa Nacional del Petroleo, 3.750%, 08/05/2026 | 6,669,144 | 0.1 | |
| 400,000 | (1) | Empresa Nacional del Petroleo, 3.750%, 08/05/2026 | 375,726 | 0.0 |
| 5,582,000 | (2) | Enable Midstream Partners L.P., 4.150%, 09/15/2029 | 2,574,224 | 0.0 |
| 2,960,000 | (3) | Enbridge, Inc., 6.250%, 03/01/2078 | 2,225,165 | 0.0 |
| 1,217,000 | Energy Transfer Operating L.P., 4.650%, 06/01/2021 | 1,185,989 | 0.0 | |
| 645,000 | Energy Transfer Operating L.P., 4.900%, 03/15/2035 | 509,218 | 0.0 | |
| 8,457,000 | Energy Transfer Operating L.P., 5.300%, 04/15/2047 | 6,465,154 | 0.1 | |
| 1,263,000 | Energy Transfer Partners L.P. / Regency Energy Finance Corp., 4.500%, 11/01/2023 | 1,146,091 | 0.0 | |
| 3,140,000 | Enterprise Products Operating LLC, 3.500%, 02/01/2022 | 3,099,982 | 0.1 | |
| 3,220,000 | (2) | Enterprise Products Operating LLC, 3.700%, 01/31/2051 | 2,911,504 | 0.0 |
| 1,389,000 | Enterprise Products Operating LLC, 3.950%, 01/31/2060 | 1,185,115 | 0.0 | |
| 519,000 | Enterprise Products Operating LLC, 4.200%, 01/31/2050 | 492,021 | 0.0 | |
| 3,800,000 | (2),(3) | Enterprise Products Operating LLC, 4.875%, 08/16/2077 | 2,616,471 | 0.0 |
| 2,185,000 | Enterprise Products Operating LLC, 4.900%, 05/15/2046 | 2,112,279 | 0.0 | |
| 1,301,000 | (3) | Enterprise Products Operating LLC, 5.375%, 02/15/2078 | 912,970 | 0.0 |
| 1,510,000 | (2) | Exxon Mobil Corp., 2.726%, 03/01/2023 | 1,560,425 | 0.0 |
| 1,970,000 | Exxon Mobil Corp., 2.995%, 08/16/2039 | 1,982,657 | 0.0 | |
| 3,794,000 | (2) | Exxon Mobil Corp., 3.095%, 08/16/2049 | 3,866,384 | 0.1 |
| 1,850,000 | Exxon Mobil Corp., 4.227%, 03/19/2040 | 2,146,982 | 0.0 | |
| 5,050,000 | Gazprom PJSC Via Gaz Capital SA, 4.950%, 03/23/2027 | 5,258,767 | 0.1 | |
| 3,450,000 | Gazprom PJSC Via Gaz Capital SA, 4.950%, 02/06/2028 | 3,608,000 | 0.1 | |
| 9,050,000 | Gazprom PJSC Via Gaz Finance PLC, 3.250%, 02/25/2030 | 8,380,300 | 0.1 | |
| 163,000 | Halliburton Co., 3.500%, 08/01/2023 | 153,889 | 0.0 | |
| 136,000 | Halliburton Co., 3.800%, 11/15/2025 | 120,943 | 0.0 | |
| 5,735,000 | Halliburton Co., 4.850%, 11/15/2035 | 4,465,021 | 0.1 | |
| 5,775,000 | KazMunayGas National Co. JSC, 4.750%, 04/19/2027 | 5,560,239 | 0.1 | |
| 2,650,000 | KazMunayGas National Co. JSC, 5.375%, 04/24/2030 | 2,620,850 | 0.0 | |
| 1,575,000 | (1) | KazMunayGas National Co. JSC, 5.375%, 04/24/2030 | 1,557,675 | 0.0 |
| 1,295,000 | Kinder Morgan Energy Partners L.P., 4.250%, 09/01/2024 | 1,262,764 | 0.0 | |
| 2,663,000 | Marathon Petroleum Corp., 5.125%, 04/01/2024 | 2,488,347 | 0.0 | |
| 1,443,000 | Marathon Petroleum Corp., 5.000%, 09/15/2054 | 1,110,436 | 0.0 | |
| 1,020,000 | (1) | MPLX L.P., 5.250%, 01/15/2025 | 899,462 | 0.0 |
| 2,833,000 | Newfield Exploration Co., 5.375%, 01/01/2026 | 1,484,764 | 0.0 | |
| 265,000 | Noble Energy, Inc., 3.250%, 10/15/2029 | 155,820 | 0.0 | |
| 4,468,000 | Noble Energy, Inc., 4.200%, 10/15/2049 | 2,433,863 | 0.0 | |
| 2,013,000 | Noble Energy, Inc., 4.950%, 08/15/2047 | 1,222,873 | 0.0 | |
| 4,867,000 | Occidental Petroleum Corp., 2.900%, 08/15/2024 | 2,657,411 | 0.0 |
See Accompanying Notes to Financial Statements
| 27 |
| Voya Intermediate Bond Fund | PORTFOLIO OF INVESTMENTS |
| as of March31, 2020 (Continued) |
| 816,000 | Occidental Petroleum Corp., 3.500%, 08/15/2029 | 384,348 | 0.0 | |
| 803,000 | (2) | Occidental Petroleum Corp., 4.400%, 08/15/2049 | 348,255 | 0.0 |
| 2,023,000 | ONEOK Partners L.P., 3.375%, 10/01/2022 | 1,883,465 | 0.0 | |
| 1,910,000 | ONEOK, Inc., 2.200%, 09/15/2025 | 1,479,418 | 0.0 | |
| 1,754,000 | ONEOK, Inc., 3.100%, 03/15/2030 | 1,326,763 | 0.0 | |
| 796,000 | ONEOK, Inc., 4.500%, 03/15/2050 | 605,794 | 0.0 | |
| 5,585,000 | Pertamina Persero PT, 3.100%, 01/21/2030 | 4,970,286 | 0.1 | |
| 10,650,000 | (1),(2) | Pertamina Persero PT, 3.100%, 01/21/2030 | 9,477,806 | 0.1 |
| 750,000 | Pertamina Persero PT, 5.625%, 05/20/2043 | 764,900 | 0.0 | |
| 10,500,000 | Petrobras Global Finance BV, 5.750%, 02/01/2029 | 9,959,775 | 0.1 | |
| 4,750,000 | Petroleos del Peru SA, 4.750%, 06/19/2032 | 4,363,124 | 0.1 | |
| 4,000,000 | (1) | Petroleos del Peru SA, 4.750%, 06/19/2032 | 3,674,210 | 0.1 |
| 12,600,000 | (1) | Petroleos Mexicanos, 5.950%, 01/28/2031 | 8,726,760 | 0.1 |
| 8,500,000 | Petroleos Mexicanos, 6.500%, 03/13/2027 | 6,363,461 | 0.1 | |
| 2,225,000 | Petroleos Mexicanos, 6.500%, 01/23/2029 | 1,626,570 | 0.0 | |
| 2,225,000 | Petroleos Mexicanos, 6.875%, 08/04/2026 | 1,710,007 | 0.0 | |
| 10,116,000 | Plains All American Pipeline L.P. / PAA Finance Corp., 3.550%, 12/15/2029 | 6,950,942 | 0.1 | |
| 662,000 | Plains All American Pipeline L.P. / PAA Finance Corp., 4.500%, 12/15/2026 | 536,118 | 0.0 | |
| 3,468,000 | Plains All American Pipeline L.P. / PAA Finance Corp., 4.650%, 10/15/2025 | 2,812,185 | 0.0 | |
| 1,890,000 | Sabine Pass Liquefaction LLC, 4.200%, 03/15/2028 | 1,626,863 | 0.0 | |
| 2,203,000 | Sabine Pass Liquefaction LLC, 5.000%, 03/15/2027 | 1,877,559 | 0.0 | |
| 5,205,000 | Sabine Pass Liquefaction LLC, 5.625%, 02/01/2021 | 5,122,370 | 0.1 | |
| 5,190,000 | (1) | Schlumberger Investment SA, 2.400%, 08/01/2022 | 5,093,153 | 0.1 |
| 1,656,000 | (1) | Schlumberger Oilfield UK PLC, 4.200%, 01/15/2021 | 1,677,750 | 0.0 |
| 4,235,000 | Shell International Finance BV, 3.250%, 05/11/2025 | 4,451,750 | 0.1 | |
| 3,245,000 | Shell International Finance BV, 4.125%, 05/11/2035 | 3,732,332 | 0.1 | |
| 4,432,000 | Shell International Finance BV, 4.000%, 05/10/2046 | 4,988,083 | 0.1 | |
| 2,528,000 | Spectra Energy Partners L.P., 5.950%, 09/25/2043 | 2,808,675 | 0.0 | |
| 325,000 | Sunoco Logistics Partners Operations L.P., 4.250%, 04/01/2024 | 287,249 | 0.0 | |
| 1,003,000 | Sunoco Logistics Partners Operations L.P., 5.350%, 05/15/2045 | 791,480 | 0.0 | |
| 4,143,000 | Total Capital Canada Ltd., 2.750%, 07/15/2023 | 4,207,652 | 0.1 | |
| 6,241,000 | Total Capital International SA, 3.461%, 07/12/2049 | 6,400,549 | 0.1 | |
| 10,875,000 | Williams Cos, Inc./The, 4.000%, 09/15/2025 | 9,566,058 | 0.1 | |
| 4,884,000 | Williams Cos, Inc./The, 5.400%, 03/04/2044 | 4,333,155 | 0.1 | |
| 1,846,000 | Williams Partners L.P., 3.600%, 03/15/2022 | 1,790,728 | 0.0 | |
| 2,768,000 | Williams Partners L.P., 3.750%, 06/15/2027 | 2,543,233 | 0.0 | |
| 8,255,000 | (2) | WPX Energy, Inc., 5.750%, 06/01/2026 | 4,762,867 | 0.1 |
| 272,411,542 | 3.3 | |||
| Financial: 10.3% | ||||
| 9,100,000 | (1) | ABN AMRO Bank NV, 4.750%, 07/28/2025 | 9,175,892 | 0.1 |
| 2,109,000 | Aflac, Inc., 3.600%, 04/01/2030 | 2,139,326 | 0.0 | |
| 4,050,000 | American International Group, Inc., 4.500%, 07/16/2044 | 4,157,936 | 0.1 | |
| 3,975,000 | Air Lease Corp., 3.500%, 01/15/2022 | 3,625,264 | 0.1 | |
| 3,795,000 | American Express Co., 3.700%, 08/03/2023 | 3,994,399 | 0.1 | |
| 1,147,000 | American International Group, Inc., 4.375%, 01/15/2055 | 1,121,815 | 0.0 | |
| 1,488,000 | American International Group, Inc., 4.750%, 04/01/2048 | 1,578,526 | 0.0 | |
| 1,897,000 | (3) | American International Group, Inc., 5.750%, 04/01/2048 | 1,666,965 | 0.0 |
| 1,955,000 | American Tower Corp., 2.750%, 01/15/2027 | 1,896,721 | 0.0 | |
| 3,085,000 | American Tower Corp., 3.700%, 10/15/2049 | 2,989,125 | 0.0 | |
| 2,465,000 | (1),(2) | ANZ New Zealand Int'l Ltd./London, 2.550%, 02/13/2030 | 2,407,056 | 0.0 |
| 3,420,000 | (1) | ANZ New Zealand Int'l Ltd./London, 3.400%, 03/19/2024 | 3,546,776 | 0.0 |
| 3,460,000 | Assurant, Inc., 3.700%, 02/22/2030 | 3,401,808 | 0.0 | |
| 4,643,000 | Assurant, Inc., 4.900%, 03/27/2028 | 5,266,585 | 0.1 | |
See Accompanying Notes to Financial Statements
| 28 |
| Voya Intermediate Bond Fund | PORTFOLIO OF INVESTMENTS |
| as of March31, 2020 (Continued) |
| 4,600,000 | (1),(2) | Banco Bradesco SA/Cayman Islands, 3.200%, 01/27/2025 | 4,214,796 | 0.1 |
| 4,250,000 | Banco de Bogota SA, 6.250%, 05/12/2026 | 4,054,319 | 0.1 | |
| 764,000 | Banco Nacional de Comercio Exterior SNC/Cayman Islands, 4.375%, 10/14/2025 | 713,381 | 0.0 | |
| 4,600,000 | Banco Santander SA, 3.125%, 02/23/2023 | 4,566,538 | 0.1 | |
| 4,175,000 | Bancolombia SA, 3.000%, 01/29/2025 | 3,756,498 | 0.1 | |
| 3,615,000 | (2),(3) | Bank of America Corp., 2.496%, 02/13/2031 | 3,481,828 | 0.0 |
| 3,625,000 | (3) | Bank of America Corp., 3.194%, 07/23/2030 | 3,709,172 | 0.1 |
| 2,750,000 | (3) | Bank of America Corp., 3.419%, 12/20/2028 | 2,845,207 | 0.0 |
| 10,041,000 | (3) | Bank of America Corp., 3.499%, 05/17/2022 | 10,163,465 | 0.1 |
| 2,300,000 | (3) | Bank of America Corp., 3.550%, 03/05/2024 | 2,387,486 | 0.0 |
| 1,941,000 | Bank of America Corp., 3.950%, 04/21/2025 | 2,044,910 | 0.0 | |
| 1,718,000 | (3) | Bank of America Corp., 3.970%, 03/05/2029 | 1,858,024 | 0.0 |
| 2,645,000 | (3) | Bank of America Corp., 4.078%, 04/23/2040 | 2,976,755 | 0.0 |
| 7,307,000 | Bank of America Corp., 4.183%, 11/25/2027 | 7,570,007 | 0.1 | |
| 4,495,000 | Bank of America Corp., 4.250%, 10/22/2026 | 4,807,427 | 0.1 | |
| 9,614,000 | (3) | Bank of America Corp., 4.271%, 07/23/2029 | 10,451,954 | 0.1 |
| 594,000 | (3) | Bank of America Corp., 5.125%, 12/31/2199 | 564,713 | 0.0 |
| 1,495,000 | (2),(3) | Bank of America Corp., 2.015%, 02/13/2026 | 1,466,409 | 0.0 |
| 5,000,000 | (3) | Bank of America Corp., 2.884%, 10/22/2030 | 5,003,325 | 0.1 |
| 5,594,000 | (3) | Bank of Montreal, 3.803%, 12/15/2032 | 5,438,039 | 0.1 |
| 2,940,000 | (2) | Bank of Nova Scotia/The, 2.200%, 02/03/2025 | 2,937,591 | 0.0 |
| 2,417,000 | (2) | Bank of Nova Scotia/The, 2.700%, 08/03/2026 | 2,443,241 | 0.0 |
| 7,130,000 | Bank of Nova Scotia/The, 3.125%, 04/20/2021 | 7,207,193 | 0.1 | |
| 3,962,000 | Bank of Nova Scotia, 4.500%, 12/16/2025 | 4,080,600 | 0.1 | |
| 3,395,000 | (1) | Banque Federative du Credit Mutuel SA, 2.375%, 11/21/2024 | 3,330,849 | 0.0 |
| 2,980,000 | (1) | Barclays Bank PLC, 10.179%, 06/12/2021 | 3,168,064 | 0.0 |
| 4,548,000 | (3) | Barclays PLC, 3.932%, 05/07/2025 | 4,371,125 | 0.1 |
| 2,475,000 | (3) | Barclays PLC, 4.610%, 02/15/2023 | 2,520,402 | 0.0 |
| 5,060,000 | Berkshire Hathaway Finance Corp., 4.250%, 01/15/2049 | 6,259,042 | 0.1 | |
| 2,394,000 | Berkshire Hathaway, Inc., 2.750%, 03/15/2023 | 2,494,838 | 0.0 | |
| 3,500,000 | BlackRock, Inc., 2.400%, 04/30/2030 | 3,505,611 | 0.0 | |
| 9,060,000 | (1),(3) | BNP Paribas SA, 2.819%, 11/19/2025 | 8,966,122 | 0.1 |
| 2,000,000 | (1),(3) | BNP Paribas SA, 3.052%, 01/13/2031 | 1,902,302 | 0.0 |
| 4,499,000 | (1) | BNP Paribas SA, 3.375%, 01/09/2025 | 4,477,820 | 0.1 |
| 8,130,000 | (1),(2) | BPCE SA, 2.700%, 10/01/2029 | 7,732,702 | 0.1 |
| 2,094,000 | (1) | BPCE SA, 5.150%, 07/21/2024 | 2,211,627 | 0.0 |
| 7,020,000 | (1) | BPCE SA, 5.700%, 10/22/2023 | 7,225,544 | 0.1 |
| 4,814,000 | Brookfield Finance LLC, 3.450%, 04/15/2050 | 3,882,488 | 0.1 | |
| 11,000,000 | (2) | Canadian Imperial Bank of Commerce, 2.250%, 01/28/2025 | 10,908,720 | 0.1 |
| 12,153,000 | (3) | Canadian Imperial Bank of Commerce, 2.606%, 07/22/2023 | 12,270,281 | 0.2 |
| 2,002,000 | (2) | Canadian Imperial Bank of Commerce, 3.100%, 04/02/2024 | 2,073,233 | 0.0 |
| 2,160,000 | Charles Schwab Corp./The, 3.250%, 05/22/2029 | 2,141,265 | 0.0 | |
| 9,025,000 | (2) | Charles Schwab Corp./The, 3.550%, 02/01/2024 | 9,495,439 | 0.1 |
| 3,245,000 | Chubb INA Holdings, Inc., 2.875%, 11/03/2022 | 3,297,287 | 0.0 | |
| 5,310,000 | Citibank NA, 3.400%, 07/23/2021 | 5,394,996 | 0.1 | |
| 3,170,000 | (3) | Citigroup, Inc., 2.876%, 07/24/2023 | 3,199,124 | 0.0 |
| 4,915,000 | Citigroup, Inc., 5.500%, 09/13/2025 | 5,470,273 | 0.1 | |
| 1,147,000 | (1),(2) | Citizens Financial Group, Inc., 4.150%, 09/28/2022 | 1,175,788 | 0.0 |
| 1,201,000 | Columbia Property Trust Operating Partnership L.P., 3.650%, 08/15/2026 | 1,070,108 | 0.0 | |
| 638,000 | Columbia Property Trust Operating Partnership L.P., 4.150%, 04/01/2025 | 661,649 | 0.0 |
See Accompanying Notes to Financial Statements
| 29 |
| Voya Intermediate Bond Fund | PORTFOLIO OF INVESTMENTS |
| as of March31, 2020 (Continued) |
| 1,520,000 | (1) | Commonwealth Bank of Australia, 3.743%, 09/12/2039 | 1,289,144 | 0.0 |
| 6,000,000 | Cooperatieve Rabobank UA, 3.950%, 11/09/2022 | 6,043,124 | 0.1 | |
| 9,163,000 | Cooperatieve Rabobank UA, 4.375%, 08/04/2025 | 9,404,351 | 0.1 | |
| 1,500,000 | Cooperatieve Rabobank UA, 4.625%, 12/01/2023 | 1,554,027 | 0.0 | |
| 3,150,000 | Corp Financiera de Desarrollo SA, 4.750%, 07/15/2025 | 3,083,078 | 0.0 | |
| 4,330,000 | (1) | Credit Agricole SA/London, 2.375%, 07/01/2021 | 4,261,594 | 0.1 |
| 4,000,000 | (1) | Credit Agricole SA/London, 2.375%, 01/22/2025 | 3,922,556 | 0.1 |
| 4,068,000 | (1) | Credit Suisse AG, 6.500%, 08/08/2023 | 4,158,741 | 0.1 |
| 6,870,000 | (1),(3) | Credit Suisse Group AG, 2.997%, 12/14/2023 | 6,697,187 | 0.1 |
| 1,170,000 | (1),(3) | Credit Suisse Group AG, 3.869%, 01/12/2029 | 1,186,702 | 0.0 |
| 3,166,000 | (1),(3) | Credit Suisse Group AG, 4.194%, 04/01/2031 | 3,249,807 | 0.0 |
| 1,441,000 | (1) | Credit Suisse Group AG, 4.282%, 01/09/2028 | 1,478,702 | 0.0 |
| 2,470,000 | Credit Suisse Group Funding Guernsey Ltd., 3.450%, 04/16/2021 | 2,486,382 | 0.0 | |
| 3,190,000 | Credit Suisse Group Funding Guernsey Ltd., 3.800%, 09/15/2022 | 3,247,395 | 0.0 | |
| 1,033,000 | Crown Castle International Corp., 4.150%, 07/01/2050 | 1,021,637 | 0.0 | |
| 8,650,000 | (1) | Danske Bank A/S, 2.800%, 03/10/2021 | 8,641,725 | 0.1 |
| 2,005,000 | (1) | Danske Bank A/S, 5.000%, 01/12/2022 | 2,054,423 | 0.0 |
| 2,897,000 | Discover Bank, 4.250%, 03/13/2026 | 2,908,705 | 0.0 | |
| 2,404,000 | (3) | Discover Bank, 4.682%, 08/09/2028 | 2,449,736 | 0.0 |
| 805,000 | Discover Financial Services, 3.850%, 11/21/2022 | 822,536 | 0.0 | |
| 6,000,000 | ERP Operating L.P., 2.500%, 02/15/2030 | 5,585,131 | 0.1 | |
| 8,775,000 | (1),(2) | ESH Hospitality, Inc., 4.625%, 10/01/2027 | 6,893,201 | 0.1 |
| 4,085,000 | Essex Portfolio L.P., 3.000%, 01/15/2030 | 3,882,011 | 0.1 | |
| 1,862,000 | (2) | Essex Portfolio L.P., 3.250%, 05/01/2023 | 1,828,613 | 0.0 |
| 7,358,000 | Fairfax Financial Holdings Ltd., 4.850%, 04/17/2028 | 7,956,397 | 0.1 | |
| 2,931,000 | (1),(2) | Fairfax US, Inc., 4.875%, 08/13/2024 | 3,090,588 | 0.0 |
| 4,670,000 | (1) | Federation des Caisses Desjardins du Quebec, 2.050%, 02/10/2025 | 4,529,095 | 0.1 |
| 13,105,000 | (1),(2) | Federation des Caisses Desjardins du Quebec, 2.250%, 10/30/2020 | 12,987,563 | 0.2 |
| 750,000 | Fondo MIVIVIENDA SA, 3.500%, 01/31/2023 | 713,629 | 0.0 | |
| 1,516,000 | GE Capital International Funding Co. Unlimited Co., 2.342%, 11/15/2020 | 1,507,644 | 0.0 | |
| 4,509,000 | GE Capital International Funding Co. Unlimited Co., 4.418%, 11/15/2035 | 4,890,901 | 0.1 | |
| 2,426,000 | Goldman Sachs Group, Inc./The, 2.625%, 04/25/2021 | 2,428,502 | 0.0 | |
| 5,493,000 | Goldman Sachs Group, Inc., 4.250%, 10/21/2025 | 5,786,326 | 0.1 | |
| 1,680,000 | Goldman Sachs Group, Inc., 5.150%, 05/22/2045 | 1,995,462 | 0.0 | |
| 792,000 | Goldman Sachs Group, Inc., 6.750%, 10/01/2037 | 1,068,123 | 0.0 | |
| 3,135,000 | (1),(3) | Harborwalk Funding Trust, 5.077%, 02/15/2069 | 3,709,803 | 0.1 |
| 5,115,000 | (2) | Healthpeak Properties, Inc., 3.000%, 01/15/2030 | 4,811,496 | 0.1 |
| 4,791,000 | (1) | HSBC Bank PLC, 4.125%, 08/12/2020 | 4,805,219 | 0.1 |
| 1,308,000 | (3) | HSBC Holdings PLC, 2.633%, 11/07/2025 | 1,271,272 | 0.0 |
| 3,435,000 | (3) | HSBC Holdings PLC, 3.803%, 03/11/2025 | 3,581,380 | 0.0 |
| 3,140,000 | (3) | HSBC Holdings PLC, 3.950%, 05/18/2024 | 3,221,997 | 0.0 |
| 2,924,000 | (3) | HSBC Holdings PLC, 3.973%, 05/22/2030 | 3,008,756 | 0.0 |
| 4,593,000 | (3) | HSBC Holdings PLC, 4.041%, 03/13/2028 | 4,684,475 | 0.1 |
| 4,085,000 | HSBC Holdings PLC, 4.300%, 03/08/2026 | 4,369,923 | 0.1 | |
| 4,831,000 | (3) | HSBC Holdings PLC, 6.000%, 12/31/2199 | 4,581,406 | 0.1 |
| 1,883,000 | HSBC Holdings PLC, 4.950%, 03/31/2030 | 2,079,131 | 0.0 | |
| 6,599,000 | ING Groep NV, 3.550%, 04/09/2024 | 6,644,165 | 0.1 | |
| 3,818,000 | Intercontinental Exchange, Inc., 4.250%, 09/21/2048 | 4,205,651 | 0.1 | |
| 2,500,000 | (1),(2) | Itau Unibanco Holding SA/Cayman Island, 3.250%, 01/24/2025 | 2,343,000 | 0.0 |
| 5,000,000 | (3) | JPMorgan Chase & Co., 2.301%, 10/15/2025 | 5,009,093 | 0.1 |
See Accompanying Notes to Financial Statements
| 30 |
| Voya Intermediate Bond Fund | PORTFOLIO OF INVESTMENTS |
| as of March31, 2020 (Continued) |
| 3,604,000 | JPMorgan Chase & Co., 2.550%, 10/29/2020 | 3,611,875 | 0.0 | |
| 8,459,000 | (3) | JPMorgan Chase & Co., 3.207%, 04/01/2023 | 8,628,217 | 0.1 |
| 9,040,000 | (3) | JPMorgan Chase & Co., 3.514%, 06/18/2022 | 9,183,331 | 0.1 |
| 10,000 | (2),(3) | JPMorgan Chase & Co., 3.559%, 04/23/2024 | 10,402 | 0.0 |
| 4,270,000 | (3) | JPMorgan Chase & Co., 3.797%, 07/23/2024 | 4,475,259 | 0.1 |
| 3,700,000 | JPMorgan Chase & Co., 3.875%, 09/10/2024 | 3,914,162 | 0.1 | |
| 4,361,000 | (3) | JPMorgan Chase & Co., 3.882%, 07/24/2038 | 4,888,883 | 0.1 |
| 2,774,000 | (3) | JPMorgan Chase & Co., 3.897%, 01/23/2049 | 3,222,084 | 0.0 |
| 4,145,000 | (3) | JPMorgan Chase & Co., 4.452%, 12/05/2029 | 4,659,931 | 0.1 |
| 4,236,000 | (3) | JPMorgan Chase & Co., 5.000%, 12/31/2199 | 3,974,194 | 0.1 |
| 2,200,000 | (3) | JPMorgan Chase & Co., 4.493%, 03/24/2031 | 2,555,604 | 0.0 |
| 11,251,000 | (3) | JPMorgan Chase & Co., 4.600%, 12/31/2199 | 9,860,939 | 0.1 |
| 2,990,000 | Kilroy Realty L.P., 3.450%, 12/15/2024 | 2,939,968 | 0.0 | |
| 3,846,000 | Kimco Realty Corp., 3.700%, 10/01/2049 | 3,151,076 | 0.0 | |
| 2,838,000 | (1) | KKR Group Finance Co. VII LLC, 3.625%, 02/25/2050 | 2,354,924 | 0.0 |
| 6,322,000 | (1) | Liberty Mutual Group, Inc., 3.951%, 10/15/2050 | 5,894,021 | 0.1 |
| 2,545,000 | (3) | Lloyds Banking Group PLC, 2.438%, 02/05/2026 | 2,408,481 | 0.0 |
| 2,849,000 | (3) | Lloyds Banking Group PLC, 2.907%, 11/07/2023 | 2,849,260 | 0.0 |
| 2,495,000 | Mastercard, Inc., 3.300%, 03/26/2027 | 2,715,364 | 0.0 | |
| 4,479,000 | (2) | Mitsubishi UFJ Financial Group, Inc., 2.193%, 02/25/2025 | 4,444,018 | 0.1 |
| 5,494,000 | (2) | Mitsubishi UFJ Financial Group, Inc., 2.559%, 02/25/2030 | 5,300,867 | 0.1 |
| 725,000 | Mitsubishi UFJ Financial Group, Inc., 2.757%, 09/13/2026 | 731,864 | 0.0 | |
| 4,700,000 | (2) | Mitsubishi UFJ Financial Group, Inc., 3.218%, 03/07/2022 | 4,768,705 | 0.1 |
| 5,500,000 | Mizuho Financial Group Cayman 2 Ltd., 4.200%, 07/18/2022 | 5,706,558 | 0.1 | |
| 3,080,000 | (1) | Mizuho Financial Group, Inc., 2.632%, 04/12/2021 | 3,081,448 | 0.0 |
| 660,000 | (1),(2) | Mizuho Financial Group, Inc., 3.477%, 04/12/2026 | 652,438 | 0.0 |
| 6,933,000 | Morgan Stanley, 2.750%, 05/19/2022 | 7,012,243 | 0.1 | |
| 3,840,000 | Morgan Stanley, 3.700%, 10/23/2024 | 4,064,687 | 0.1 | |
| 3,210,000 | Morgan Stanley, 3.875%, 04/29/2024 | 3,374,463 | 0.0 | |
| 3,524,000 | Morgan Stanley, 4.000%, 07/23/2025 | 3,778,772 | 0.1 | |
| 2,439,000 | (3) | Morgan Stanley, 4.457%, 04/22/2039 | 2,781,100 | 0.0 |
| 4,155,000 | Morgan Stanley, 5.500%, 07/28/2021 | 4,316,784 | 0.1 | |
| 1,970,000 | (3) | Morgan Stanley, 5.597%, 03/24/2051 | 2,794,372 | 0.0 |
| 5,540,000 | MUFG Union Bank NA, 3.150%, 04/01/2022 | 5,543,687 | 0.1 | |
| 2,990,000 | (1),(3) | National Australia Bank Ltd., 3.933%, 08/02/2034 | 2,950,206 | 0.0 |
| 5,105,000 | (1) | Nationwide Building Society, 2.000%, 01/27/2023 | 5,003,589 | 0.1 |
| 4,500,000 | (2) | Navient Corp., 5.000%, 03/15/2027 | 3,902,400 | 0.1 |
| 1,000,000 | (1),(2),(3) | NBK Tier 1 Financing 2 Ltd., 4.500%, 12/31/2199 | 945,000 | 0.0 |
| 3,915,000 | (1),(2) | New York Life Global Funding, 2.875%, 04/10/2024 | 4,026,762 | 0.1 |
| 1,345,000 | (1),(2),(3) | Nordea Bank ABP, 6.125%, 12/31/2199 | 1,197,312 | 0.0 |
| DKK 6 | (4) | Nordea Kredit Realkreditaktieselskab, 6.000%, 07/01/2029 | – | – |
| 4,068,000 | (1) | Northwestern Mutual Life Insurance Co/The, 3.625%, 09/30/2059 | 3,591,846 | 0.0 |
| 7,860,000 | ORIX Corp., 3.250%, 12/04/2024 | 8,274,431 | 0.1 | |
| 1,580,000 | Piedmont Operating Partnership L.P., 4.450%, 03/15/2024 | 1,604,664 | 0.0 | |
| 2,000,000 | Power Sector Assets & Liabilities Management Corp., 7.390%, 12/02/2024 | 2,348,697 | 0.0 | |
| 2,626,000 | (2) | Prologis L.P., 2.250%, 04/15/2030 | 2,412,071 | 0.0 |
| 2,335,000 | Prologis L.P., 3.000%, 04/15/2050 | 2,034,776 | 0.0 | |
| 4,200,000 | (1) | Quicken Loans, Inc., 5.250%, 01/15/2028 | 4,136,023 | 0.1 |
| 3,152,000 | Regency Centers L.P., 2.950%, 09/15/2029 | 2,978,800 | 0.0 | |
| 1,250,000 | Retail Opportunity Investments Partnership L.P., 5.000%, 12/15/2023 | 1,321,958 | 0.0 | |
| 9,225,000 | Royal Bank of Canada, 2.250%, 11/01/2024 | 9,335,739 | 0.1 |
See Accompanying Notes to Financial Statements
| 31 |
| Voya Intermediate Bond Fund | PORTFOLIO OF INVESTMENTS |
| as of March31, 2020 (Continued) |
| 4,410,000 | Royal Bank of Canada, 2.560%, (US0003M + 0.660%), 10/05/2023 | 4,371,906 | 0.1 | |
| 5,550,000 | Royal Bank of Canada, 3.700%, 10/05/2023 | 5,853,998 | 0.1 | |
| 9,148,000 | Royal Bank of Scotland Group PLC, 3.875%, 09/12/2023 | 9,258,508 | 0.1 | |
| 459,000 | (3) | Royal Bank of Scotland Group PLC, 4.269%, 03/22/2025 | 472,291 | 0.0 |
| 3,017,000 | (3) | Royal Bank of Scotland Group PLC, 4.519%, 06/25/2024 | 3,042,231 | 0.0 |
| 5,930,000 | (1) | Societe Generale SA, 3.000%, 01/22/2030 | 5,457,357 | 0.1 |
| 6,240,000 | State Street Corp., 2.400%, 01/24/2030 | 6,117,250 | 0.1 | |
| 5,250,000 | (3) | State Street Corp., 3.031%, 11/01/2034 | 5,081,306 | 0.1 |
| 2,217,000 | Sumitomo Mitsui Financial Group, Inc., 2.442%, 10/19/2021 | 2,222,900 | 0.0 | |
| 3,225,000 | Sumitomo Mitsui Financial Group, Inc., 2.448%, 09/27/2024 | 3,221,903 | 0.0 | |
| 300,000 | Sumitomo Mitsui Financial Group, Inc., 3.010%, 10/19/2026 | 312,895 | 0.0 | |
| 2,878,000 | Toronto-Dominion Bank/The, 2.650%, 06/12/2024 | 2,943,717 | 0.0 | |
| 5,920,000 | (2) | Toronto-Dominion Bank/The, 3.150%, 09/17/2020 | 5,948,014 | 0.1 |
| 9,340,000 | Toronto-Dominion Bank/The, 3.250%, 03/11/2024 | 9,779,143 | 0.1 | |
| 6,822,000 | (2) | Toronto-Dominion Bank/The, 3.500%, 07/19/2023 | 7,048,477 | 0.1 |
| 4,600,000 | (2) | Truist Bank, 2.250%, 03/11/2030 | 4,223,282 | 0.1 |
| 3,293,000 | Truist Bank, 3.200%, 04/01/2024 | 3,407,820 | 0.0 | |
| 10,893,000 | (3) | Truist Financial Corp., 4.800%, 12/31/2199 | 9,375,551 | 0.1 |
| 4,125,000 | (1) | Turkiye Vakiflar Bankasi TAO, 5.250%, 02/05/2025 | 3,476,550 | 0.0 |
| 7,760,000 | (1) | UBS AG/London, 2.450%, 12/01/2020 | 7,741,229 | 0.1 |
| 1,470,000 | UBS AG/Stamford CT, 7.625%, 08/17/2022 | 1,514,820 | 0.0 | |
| 3,180,000 | UBS AG, 5.125%, 05/15/2024 | 3,211,800 | 0.0 | |
| 7,779,000 | (1),(3) | UBS Group AG, 2.859%, 08/15/2023 | 7,722,130 | 0.1 |
| 2,565,000 | (1),(3) | UBS Group AG, 3.126%, 08/13/2030 | 2,507,577 | 0.0 |
| 5,000,000 | US Bank NA/Cincinnati OH, 2.050%, 01/21/2025 | 4,984,746 | 0.1 | |
| 9,435,000 | (3) | Wells Fargo & Co., 2.406%, 10/30/2025 | 9,313,037 | 0.1 |
| 10,000,000 | (3) | Wells Fargo & Co., 2.879%, 10/30/2030 | 9,936,917 | 0.1 |
| 6,670,000 | Wells Fargo & Co., 3.750%, 01/24/2024 | 7,074,832 | 0.1 | |
| 4,723,000 | Wells Fargo & Co., 4.125%, 08/15/2023 | 4,878,339 | 0.1 | |
| 2,631,000 | Wells Fargo & Co., 4.750%, 12/07/2046 | 3,051,032 | 0.0 | |
| 2,660,000 | (3) | Wells Fargo & Co., 4.478%, 04/04/2031 | 3,020,016 | 0.0 |
| 3,115,000 | (3) | Wells Fargo & Co., 5.013%, 04/04/2051 | 3,983,438 | 0.1 |
| 4,455,000 | (3) | Wells Fargo Bank NA, 2.082%, 09/09/2022 | 4,437,364 | 0.1 |
| 12,450,000 | Wells Fargo Bank NA, 3.625%, 10/22/2021 | 12,800,518 | 0.2 | |
| 2,270,000 | Westpac Banking Corp., 2.350%, 02/19/2025 | 2,293,701 | 0.0 | |
| 5,180,000 | XLIT Ltd., 4.450%, 03/31/2025 | 5,360,060 | 0.1 | |
| 2,000,000 | XLIT Ltd., 5.250%, 12/15/2043 | 2,277,255 | 0.0 | |
| 2,511,000 | XLIT Ltd., 5.500%, 03/31/2045 | 2,918,748 | 0.0 | |
| 844,706,189 | 10.3 | |||
| Industrial: 2.0% | ||||
| 1,335,000 | 3M Co., 3.700%, 04/15/2050 | 1,498,029 | 0.0 | |
| 4,000,000 | AECOM, 5.125%, 03/15/2027 | 3,634,170 | 0.1 | |
| 8,620,000 | (1) | Airbus Finance BV, 2.700%, 04/17/2023 | 8,446,989 | 0.1 |
| 5,435,000 | Amphenol Corp., 2.800%, 02/15/2030 | 4,979,850 | 0.1 | |
| 2,530,000 | (3) | BNSF Funding Trust I, 6.613%, 12/15/2055 | 2,483,815 | 0.0 |
| 8,465,000 | (1) | Builders FirstSource, Inc., 5.000%, 03/01/2030 | 7,666,116 | 0.1 |
| 4,885,000 | Burlington Northern Santa Fe LLC, 3.900%, 08/01/2046 | 5,508,444 | 0.1 | |
| 1,165,000 | Burlington Northern Santa Fe LLC, 4.450%, 03/15/2043 | 1,384,334 | 0.0 | |
| 2,728,000 | Burlington Northern Santa Fe LLC, 5.150%, 09/01/2043 | 3,559,212 | 0.1 | |
| 2,350,000 | (1) | Carrier Global Corp., 2.242%, 02/15/2025 | 2,302,830 | 0.0 |
| 3,290,000 | (1) | Carrier Global Corp., 2.493%, 02/15/2027 | 3,155,593 | 0.0 |
| 2,965,000 | (1) | Carrier Global Corp., 2.722%, 02/15/2030 | 2,745,536 | 0.0 |
| 3,085,000 | (1) | Carrier Global Corp., 3.577%, 04/05/2050 | 2,786,900 | 0.0 |
| 5,615,000 | Caterpillar Financial Services Corp., 3.150%, 09/07/2021 | 5,718,356 | 0.1 | |
| 3,185,000 | Caterpillar, Inc., 3.250%, 09/19/2049 | 3,219,915 | 0.1 | |
| 200,000 | Cemex SAB de CV, 6.125%, 05/05/2025 | 178,749 | 0.0 | |
| 2,715,000 | CSX Corp., 4.650%, 03/01/2068 | 2,974,146 | 0.0 | |
| 890,000 | CSX Corp., 4.500%, 08/01/2054 | 1,011,695 | 0.0 | |
| 1,957,000 | Deere & Co., 3.750%, 04/15/2050 | 2,287,357 | 0.0 | |
See Accompanying Notes to Financial Statements
| 32 |
| Voya Intermediate Bond Fund | PORTFOLIO OF INVESTMENTS |
| as of March31, 2020 (Continued) |
| 1,428,000 | FedEx Corp., 3.900%, 02/01/2035 | 1,401,847 | 0.0 | |
| 4,000,000 | FedEx Corp., 4.050%, 02/15/2048 | 3,540,007 | 0.1 | |
| 2,647,000 | FedEx Corp., 4.400%, 01/15/2047 | 2,423,621 | 0.0 | |
| 1,475,000 | (1) | FXI Holdings, Inc., 7.875%, 11/01/2024 | 1,007,159 | 0.0 |
| 5,327,000 | General Dynamics Corp., 3.500%, 04/01/2027 | 5,737,832 | 0.1 | |
| 4,250,000 | Keysight Technologies, Inc., 3.000%, 10/30/2029 | 4,039,996 | 0.1 | |
| 4,940,000 | Lockheed Martin Corp., 4.070%, 12/15/2042 | 5,797,939 | 0.1 | |
| 3,379,000 | Norfolk Southern Corp., 3.650%, 08/01/2025 | 3,496,312 | 0.1 | |
| 434,000 | Northrop Grumman Corp., 2.930%, 01/15/2025 | 442,634 | 0.0 | |
| 3,975,000 | (1),(2) | Owens-Brockway Glass Container, Inc., 5.875%, 08/15/2023 | 3,920,364 | 0.1 |
| 2,395,000 | (2) | Packaging Corp. of America, 4.050%, 12/15/2049 | 2,406,684 | 0.0 |
| 2,335,000 | Rockwell Collins, Inc., 3.200%, 03/15/2024 | 2,413,296 | 0.0 | |
| 3,686,000 | Rockwell Collins, Inc., 3.500%, 03/15/2027 | 3,842,729 | 0.0 | |
| 5,565,000 | (1),(2) | Sealed Air Corp., 4.000%, 12/01/2027 | 5,217,744 | 0.1 |
| 2,570,000 | (1) | SMBC Aviation Capital Finance DAC, 2.650%, 07/15/2021 | 2,549,307 | 0.0 |
| 2,540,000 | (1),(2) | SMBC Aviation Capital Finance DAC, 3.550%, 04/15/2024 | 2,715,990 | 0.0 |
| 1,125,000 | (1) | Standard Industries, Inc./NJ, 4.750%, 01/15/2028 | 1,043,907 | 0.0 |
| 2,885,000 | (1),(2) | Standard Industries, Inc./NJ, 5.000%, 02/15/2027 | 2,645,451 | 0.0 |
| 6,290,000 | Stanley Black & Decker, Inc., 2.900%, 11/01/2022 | 6,298,218 | 0.1 | |
| 4,150,000 | (1) | Summit Materials LLC / Summit Materials Finance Corp., 5.125%, 06/01/2025 | 3,895,792 | 0.1 |
| 2,720,000 | Textron, Inc., 3.000%, 06/01/2030 | 2,551,177 | 0.0 | |
| 5,745,000 | (1) | TTX Co., 3.600%, 01/15/2025 | 6,071,147 | 0.1 |
| 1,000,000 | Union Pacific Corp., 2.400%, 02/05/2030 | 979,552 | 0.0 | |
| 2,700,000 | Union Pacific Corp., 3.250%, 02/05/2050 | 2,660,922 | 0.0 | |
| 1,148,000 | Union Pacific Corp., 3.750%, 02/05/2070 | 1,206,728 | 0.0 | |
| 3,920,000 | United Parcel Service, Inc., 2.050%, 04/01/2021 | 3,916,559 | 0.1 | |
| 951,000 | (2) | United Parcel Service, Inc., 2.500%, 04/01/2023 | 994,574 | 0.0 |
| 2,431,000 | (2) | United Parcel Service, Inc., 2.800%, 11/15/2024 | 2,531,278 | 0.0 |
| 3,155,000 | United Parcel Service, Inc., 3.400%, 09/01/2049 | 3,193,408 | 0.0 | |
| 721,000 | United Technologies Corp., 3.650%, 08/16/2023 | 759,490 | 0.0 | |
| 6,000,000 | United Technologies Corp., 4.500%, 06/01/2042 | 6,998,352 | 0.1 | |
| 534,000 | United Technologies Corp., 5.400%, 05/01/2035 | 657,935 | 0.0 | |
| 792,000 | United Technologies Corp., 6.125%, 07/15/2038 | 1,149,076 | 0.0 | |
| 2,209,000 | (1) | Vinci SA, 3.750%, 04/10/2029 | 2,390,498 | 0.0 |
| 166,439,561 | 2.0 | |||
| Technology: 1.6% | ||||
| 562,000 | Analog Devices, Inc., 3.500%, 12/05/2026 | 569,792 | 0.0 | |
| 5,675,000 | Apple, Inc., 2.400%, 01/13/2023 | 5,856,424 | 0.1 | |
| 4,128,000 | Apple, Inc., 3.450%, 02/09/2045 | 4,683,410 | 0.1 | |
| 7,492,000 | Apple, Inc., 3.750%, 09/12/2047 | 8,857,399 | 0.1 | |
| 5,095,000 | Apple, Inc., 3.750%, 11/13/2047 | 6,122,371 | 0.1 | |
| 963,000 | Apple, Inc., 4.450%, 05/06/2044 | 1,246,111 | 0.0 | |
| 3,840,000 | Broadridge Financial Solutions, Inc., 2.900%, 12/01/2029 | 3,618,141 | 0.1 | |
| 2,143,000 | (1) | Dell International LLC / EMC Corp., 6.020%, 06/15/2026 | 2,284,810 | 0.0 |
| 2,695,000 | Fiserv, Inc., 2.750%, 07/01/2024 | 2,684,966 | 0.0 | |
| 8,847,000 | Fiserv, Inc., 3.200%, 07/01/2026 | 9,126,072 | 0.1 | |
| 2,895,000 | (2) | HP, Inc., 4.050%, 09/15/2022 | 3,029,151 | 0.0 |
| 5,885,000 | HP, Inc., 4.300%, 06/01/2021 | 6,132,110 | 0.1 | |
| 2,000,000 | IBM Credit LLC, 3.000%, 02/06/2023 | 2,070,638 | 0.0 | |
| 2,289,000 | (2) | International Business Machines Corp., 2.875%, 11/09/2022 | 2,371,171 | 0.0 |
| 7,595,000 | International Business Machines Corp., 3.300%, 05/15/2026 | 8,163,879 | 0.1 | |
| 1,975,000 | Intel Corp., 3.100%, 02/15/2060 | 2,164,632 | 0.0 | |
| 11,150,000 | Intel Corp., 3.250%, 11/15/2049 | 12,134,439 | 0.2 | |
| 6,701,000 | Microsoft Corp., 2.400%, 08/08/2026 | 7,102,767 | 0.1 | |
| 9,677,000 | Microsoft Corp., 3.700%, 08/08/2046 | 11,529,005 | 0.2 | |
See Accompanying Notes to Financial Statements
| 33 |
| Voya Intermediate Bond Fund | PORTFOLIO OF INVESTMENTS |
| as of March31, 2020 (Continued) |
| 6,002,000 | Microsoft Corp., 4.450%, 11/03/2045 | 7,924,312 | 0.1 | |
| 1,820,000 | NVIDIA Corp., 3.500%, 04/01/2040 | 1,940,329 | 0.0 | |
| 2,425,000 | NVIDIA Corp., 3.500%, 04/01/2050 | 2,654,930 | 0.0 | |
| 1,855,000 | NVIDIA Corp., 3.700%, 04/01/2060 | 2,015,853 | 0.0 | |
| 3,692,000 | Oracle Corp., 3.600%, 04/01/2040 | 3,688,254 | 0.1 | |
| 370,000 | Oracle Corp., 3.850%, 07/15/2036 | 387,721 | 0.0 | |
| 8,841,000 | Oracle Corp., 4.000%, 11/15/2047 | 9,752,561 | 0.1 | |
| 1,865,000 | Texas Instruments, Inc., 3.875%, 03/15/2039 | 2,155,026 | 0.0 | |
| 130,266,274 | 1.6 | |||
| Utilities: 4.0% | ||||
| 1,059,000 | (2) | AEP Texas, Inc., 3.450%, 01/15/2050 | 957,391 | 0.0 |
| 2,639,000 | AEP Transmission Co. LLC, 3.650%, 04/01/2050 | 2,729,546 | 0.0 | |
| 3,770,000 | Alabama Power Co., 3.375%, 10/01/2020 | 3,700,789 | 0.1 | |
| 2,480,000 | (2) | Alabama Power Co., 3.450%, 10/01/2049 | 2,535,239 | 0.0 |
| 1,927,000 | Ameren Corp., 2.700%, 11/15/2020 | 1,921,546 | 0.0 | |
| 1,443,000 | Ameren Corp., 3.500%, 01/15/2031 | 1,439,580 | 0.0 | |
| 3,136,000 | American Electric Power Co., Inc., 3.250%, 03/01/2050 | 2,762,794 | 0.0 | |
| 7,500,000 | (1) | American Transmission Systems, Inc., 5.000%, 09/01/2044 | 8,533,098 | 0.1 |
| 5,385,000 | (1) | American Transmission Systems, Inc., 5.250%, 01/15/2022 | 5,731,769 | 0.1 |
| 2,595,000 | Arizona Public Service Co., 4.200%, 08/15/2048 | 2,665,609 | 0.0 | |
| 4,801,000 | Avangrid, Inc., 3.800%, 06/01/2029 | 4,925,304 | 0.1 | |
| 2,510,000 | (2) | Baltimore Gas & Electric Co., 3.200%, 09/15/2049 | 2,403,404 | 0.0 |
| 1,000,000 | Baltimore Gas & Electric Co., 3.350%, 07/01/2023 | 1,031,233 | 0.0 | |
| 3,250,000 | Black Hills Corp., 3.050%, 10/15/2029 | 3,139,886 | 0.0 | |
| 1,720,000 | Black Hills Corp., 4.250%, 11/30/2023 | 1,807,338 | 0.0 | |
| 2,750,000 | Black Hills Corp., 4.350%, 05/01/2033 | 3,372,290 | 0.1 | |
| 566,000 | CenterPoint Energy Houston Electric LLC, 3.550%, 08/01/2042 | 589,058 | 0.0 | |
| 6,300,000 | (1),(2) | Centrais Eletricas Brasileiras SA, 3.625%, 02/04/2025 | 5,610,213 | 0.1 |
| 2,166,000 | (1) | Cleveland Electric Illuminating Co/The, 3.500%, 04/01/2028 | 2,052,052 | 0.0 |
| 4,990,000 | Commonwealth Edison Co., 3.750%, 08/15/2047 | 5,422,291 | 0.1 | |
| 1,864,000 | Consolidated Edison Co. of New York, Inc., 4.000%, 11/15/2057 | 1,937,636 | 0.0 | |
| 2,591,000 | Consolidated Edison Co. of New York, Inc., 4.625%, 12/01/2054 | 2,915,596 | 0.0 | |
| 831,000 | Consolidated Edison Co. of New York, Inc., 5.300%, 03/01/2035 | 985,842 | 0.0 | |
| 633,000 | Delmarva Power & Light Co., 3.500%, 11/15/2023 | 652,942 | 0.0 | |
| 3,185,000 | Dominion Energy Gas Holdings LLC, 2.500%, 11/15/2024 | 3,100,685 | 0.0 | |
| 4,865,000 | (3) | Dominion Energy, Inc., 4.650%, 12/31/2199 | 4,375,119 | 0.1 |
| 3,860,000 | DTE Electric Co., 2.250%, 03/01/2030 | 3,748,981 | 0.1 | |
| 7,263,000 | (2) | DTE Electric Co., 2.950%, 03/01/2050 | 6,834,485 | 0.1 |
| 1,790,000 | DTE Electric Co., 3.950%, 03/01/2049 | 1,961,608 | 0.0 | |
| 1,210,000 | DTE Electric Co., 4.050%, 05/15/2048 | 1,379,568 | 0.0 | |
| 1,539,000 | Duke Energy Carolinas LLC, 2.950%, 12/01/2026 | 1,612,317 | 0.0 | |
| 4,390,000 | (2) | Duke Energy Carolinas LLC, 3.200%, 08/15/2049 | 4,455,920 | 0.1 |
| 2,340,000 | Duke Energy Carolinas LLC, 3.700%, 12/01/2047 | 2,585,676 | 0.0 | |
| 2,185,000 | Duke Energy Carolinas LLC, 4.000%, 09/30/2042 | 2,471,503 | 0.0 | |
| 2,155,000 | (3) | Duke Energy Corp., 4.875%, 12/31/2199 | 1,811,698 | 0.0 |
| 3,030,000 | Duke Energy Florida LLC, 4.200%, 07/15/2048 | 3,469,397 | 0.1 | |
| 3,500,000 | Duke Energy Indiana LLC, 3.250%, 10/01/2049 | 3,553,768 | 0.1 | |
| 3,723,000 | Duke Energy Progress LLC, 3.700%, 10/15/2046 | 4,034,046 | 0.1 | |
| 3,677,000 | Duke Energy Progress LLC, 4.200%, 08/15/2045 | 4,225,567 | 0.1 | |
| 1,200,000 | Duke Energy Indiana LLC, 3.750%, 05/15/2046 | 1,310,519 | 0.0 | |
| 4,000,000 | Duke Energy Progress LLC, 4.100%, 05/15/2042 | 4,599,773 | 0.1 | |
| 3,323,000 | Entergy Corp., 2.950%, 09/01/2026 | 3,301,398 | 0.0 | |
| 3,860,000 | Entergy Gulf States Louisiana LLC, 3.950%, 10/01/2020 | 3,841,073 | 0.1 | |
See Accompanying Notes to Financial Statements
| 34 |
| Voya Intermediate Bond Fund | PORTFOLIO OF INVESTMENTS |
| as of March31, 2020 (Continued) |
| 7,875,000 | Entergy Louisiana LLC, 4.200%, 04/01/2050 | 9,074,298 | 0.1 | |
| 2,172,000 | Entergy Texas, Inc., 4.000%, 03/30/2029 | 2,375,028 | 0.0 | |
| 1,758,000 | Entergy Louisiana LLC, 2.900%, 03/15/2051 | 1,556,451 | 0.0 | |
| 6,480,000 | Entergy Louisiana LLC, 4.050%, 09/01/2023 | 6,632,480 | 0.1 | |
| 3,038,000 | Entergy Louisiana LLC, 4.200%, 09/01/2048 | 3,464,979 | 0.1 | |
| 2,882,000 | Evergy Kansas Central, Inc., 3.250%, 09/01/2049 | 2,945,913 | 0.0 | |
| 6,159,000 | Eversource Energy, 2.900%, 10/01/2024 | 6,329,023 | 0.1 | |
| 2,871,000 | (2) | Eversource Energy, 3.450%, 01/15/2050 | 2,621,109 | 0.0 |
| 3,617,000 | Exelon Corp., 3.497%, 06/01/2022 | 3,504,166 | 0.1 | |
| 1,060,000 | Exelon Corp., 4.050%, 04/15/2030 | 1,051,949 | 0.0 | |
| 1,585,000 | Exelon Corp., 4.700%, 04/15/2050 | 1,662,327 | 0.0 | |
| 3,475,000 | FirstEnergy Corp., 2.850%, 07/15/2022 | 3,393,089 | 0.1 | |
| 1,519,000 | FirstEnergy Corp., 4.250%, 03/15/2023 | 1,553,212 | 0.0 | |
| 1,725,000 | Fortis, Inc./Canada, 3.055%, 10/04/2026 | 1,656,355 | 0.0 | |
| 3,055,000 | Georgia Power Co., 2.200%, 09/15/2024 | 2,871,579 | 0.0 | |
| 2,124,000 | Georgia Power Co., 5.750%, 04/15/2023 | 2,259,796 | 0.0 | |
| 1,444,000 | Idaho Power Co., 4.200%, 03/01/2048 | 1,682,245 | 0.0 | |
| 6,060,000 | Inkia Energy Ltd., 5.875%, 11/09/2027 | 5,363,100 | 0.1 | |
| 4,400,000 | Interstate Power & Light Co., 3.250%, 12/01/2024 | 4,457,738 | 0.1 | |
| 11,576,000 | IPALCO Enterprises, Inc., 3.450%, 07/15/2020 | 11,575,115 | 0.2 | |
| 3,199,000 | (1) | Jersey Central Power & Light Co., 4.300%, 01/15/2026 | 3,426,674 | 0.1 |
| 3,950,000 | (1) | Kallpa Generacion SA, 4.125%, 08/16/2027 | 3,582,857 | 0.1 |
| 2,862,000 | (2) | LG&E & KU Energy LLC, 3.750%, 11/15/2020 | 2,842,738 | 0.0 |
| 1,950,000 | (1) | Metropolitan Edison Co., 3.500%, 03/15/2023 | 2,032,264 | 0.0 |
| 2,430,000 | MidAmerican Energy Co., 3.150%, 04/15/2050 | 2,475,669 | 0.0 | |
| 1,702,000 | MidAmerican Energy Co., 3.500%, 10/15/2024 | 1,794,650 | 0.0 | |
| 5,027,000 | Mississippi Power Co., 4.250%, 03/15/2042 | 4,841,139 | 0.1 | |
| 375,000 | Mississippi Power Co., 4.750%, 10/15/2041 | 363,121 | 0.0 | |
| 2,880,000 | (3) | National Rural Utilities Cooperative Finance Corp., 4.750%, 04/30/2043 | 2,872,570 | 0.0 |
| 5,049,000 | NextEra Energy Capital Holdings, Inc., 3.150%, 04/01/2024 | 5,176,481 | 0.1 | |
| 1,901,000 | NiSource, Inc., 5.950%, 06/15/2041 | 2,207,604 | 0.0 | |
| 4,760,000 | (2) | NiSource, Inc., 3.650%, 06/15/2023 | 4,880,621 | 0.1 |
| 3,175,000 | (2) | NRG Energy, Inc., 5.750%, 01/15/2028 | 3,256,121 | 0.0 |
| 555,000 | NSTAR Electric Co., 2.375%, 10/15/2022 | 580,354 | 0.0 | |
| 1,137,000 | Ohio Power Co., 5.375%, 10/01/2021 | 1,189,775 | 0.0 | |
| 1,138,000 | PECO Energy Co., 4.150%, 10/01/2044 | 1,279,065 | 0.0 | |
| 750,000 | (1) | Perusahaan Listrik Negara PT, 5.375%, 01/25/2029 | 786,407 | 0.0 |
| 2,675,000 | Perusahaan Listrik Negara PT, 5.450%, 05/21/2028 | 2,807,051 | 0.0 | |
| 4,500,000 | (1) | Perusahaan Listrik Negara PT, 5.450%, 05/21/2028 | 4,722,143 | 0.1 |
| 3,035,000 | Pinnacle West Capital Corp., 2.250%, 11/30/2020 | 3,039,420 | 0.0 | |
| 7,000,000 | PNM Resources, Inc., 3.250%, 03/09/2021 | 7,046,586 | 0.1 | |
| 6,952,000 | Public Service Electric & Gas Co., 3.000%, 05/15/2025 | 7,155,453 | 0.1 | |
| 5,924,000 | Public Service Electric & Gas Co., 3.250%, 09/01/2023 | 6,111,138 | 0.1 | |
| 2,758,000 | (2) | San Diego Gas & Electric Co., 3.000%, 08/15/2021 | 2,780,799 | 0.0 |
| 3,937,000 | Sempra Energy, 3.800%, 02/01/2038 | 3,710,329 | 0.1 | |
| 5,750,000 | (2) | Sierra Pacific Power Co., 2.600%, 05/01/2026 | 5,761,933 | 0.1 |
| 435,000 | Southern California Edison Co., 2.400%, 02/01/2022 | 424,107 | 0.0 | |
| 2,415,000 | (2) | Southern California Edison Co., 3.650%, 02/01/2050 | 2,356,867 | 0.0 |
| 980,000 | (2) | Southern California Edison Co., 3.875%, 06/01/2021 | 971,602 | 0.0 |
| 813,000 | Southern California Edison Co., 4.050%, 03/15/2042 | 851,337 | 0.0 | |
| 1,444,000 | Southern Co. Gas Capital Corp., 4.400%, 05/30/2047 | 1,437,938 | 0.0 | |
| 1,680,000 | Southern Co. Gas Capital Corp., 5.875%, 03/15/2041 | 1,911,582 | 0.0 | |
| 3,690,000 | Tampa Electric Co., 5.400%, 05/15/2021 | 3,790,526 | 0.1 |
See Accompanying Notes to Financial Statements
| 35 |
| Voya Intermediate Bond Fund | PORTFOLIO OF INVESTMENTS |
| as of March31, 2020 (Continued) |
| 1,710,000 | Tucson Electric Power Co., 4.850%, 12/01/2048 | 1,939,100 | 0.0 | |
| 2,500,000 | Union Electric Co., 3.250%, 10/01/2049 | 2,286,369 | 0.0 | |
| 1,945,000 | (2) | Union Electric Co., 3.500%, 03/15/2029 | 2,071,413 | 0.0 |
| 2,260,000 | Union Electric Co., 3.900%, 09/15/2042 | 2,458,802 | 0.0 | |
| 5,165,000 | Virginia Electric & Power Co., 3.800%, 09/15/2047 | 5,544,800 | 0.1 | |
| 1,476,000 | (2) | Virginia Electric & Power Co., 2.875%, 07/15/2029 | 1,472,514 | 0.0 |
| 1,915,000 | Virginia Electric & Power Co., 3.450%, 09/01/2022 | 1,945,641 | 0.0 | |
| 3,485,000 | Washington Gas Light Co., 3.650%, 09/15/2049 | 3,188,323 | 0.0 | |
| 763,000 | WEC Energy Group, Inc., 3.100%, 03/08/2022 | 772,560 | 0.0 | |
| 328,671,942 | 4.0 | |||
| Total Corporate Bonds/Notes | ||||
| (Cost $2,735,430,477) | 2,672,653,193 | 32.5 | ||
| COLLATERALIZED MORTGAGE OBLIGATIONS: 20.8% | ||||
| 1,009,817 | (1),(3) | Agate Bay Mortgage Trust 2014-2 B4, 3.880%, 09/25/2044 | 952,106 | 0.0 |
| 2,808,625 | Alternative Loan Trust 2004-J7 MI, 1.967%, (US0001M + 1.020%), 10/25/2034 | 2,572,445 | 0.0 | |
| 2,774,073 | Alternative Loan Trust 2005-10CB 1A1, 1.447%, (US0001M + 0.500%), 05/25/2035 | 2,100,714 | 0.0 | |
| 2,309,395 | Alternative Loan Trust 2005-51 3A2A, 3.256%, (12MTA + 1.290%), 11/20/2035 | 1,913,236 | 0.0 | |
| 704,090 | Alternative Loan Trust 2005-65CB 2A4, 5.500%, 12/25/2035 | 598,304 | 0.0 | |
| 893,376 | Alternative Loan Trust 2005-6CB 1A3, 5.250%, 04/25/2035 | 816,060 | 0.0 | |
| 1,659,243 | Alternative Loan Trust 2005-J2 1A12, 1.347%, (US0001M + 0.400%), 04/25/2035 | 1,290,796 | 0.0 | |
| 783,274 | Alternative Loan Trust 2006-13T1 A9, 6.000%, 05/25/2036 | 543,207 | 0.0 | |
| 176,465 | Alternative Loan Trust 2006-18CB A10, 1.347%, (US0001M + 0.400%), 07/25/2036 | 81,358 | 0.0 | |
| 1,058,299 | Alternative Loan Trust 2006-19CB A28, 1.547%, (US0001M + 0.600%), 08/25/2036 | 577,435 | 0.0 | |
| 937,939 | Alternative Loan Trust 2006-HY11 A1, 1.067%, (US0001M + 0.120%), 06/25/2036 | 799,309 | 0.0 | |
| 1,142,482 | Alternative Loan Trust 2007-23CB A3, 1.447%, (US0001M + 0.500%), 09/25/2037 | 452,191 | 0.0 | |
| 2,925,053 | Alternative Loan Trust 2007-2CB 2A1, 1.547%, (US0001M + 0.600%), 03/25/2037 | 1,443,026 | 0.0 | |
| 1,117,926 | Alternative Loan Trust 2007-3T1 1A11, 6.000%, 04/25/2037 | 717,808 | 0.0 | |
| 1,084,858 | Alternative Loan Trust 2007-8CB A3, 1.447%, (US0001M + 0.500%), 05/25/2037 | 531,262 | 0.0 | |
| 1,955,652 | American Home Mortgage Assets Trust 2007-4 A4, 1.237%, (US0001M + 0.290%), 08/25/2037 | 1,515,851 | 0.0 | |
| 2,473,473 | (1),(3) | Arroyo Mortgage Trust 2019-3 A3, 3.416%, 10/25/2048 | 2,361,507 | 0.0 |
| 1,011,229 | Banc of America Funding 2007-2 1A16 Trust, 1.547%, (US0001M + 0.600%), 03/25/2037 | 722,249 | 0.0 | |
| 1,038,114 | (5) | Banc of America Mortgage 2007-2 A8 Trust, 6.000%, 05/25/2037 | 224,577 | 0.0 |
| 1,408,823 | (3) | Bear Stearns ALT-A Trust 2005-4 23A1, 3.882%, 05/25/2035 | 1,275,098 | 0.0 |
| 1,851,058 | (3) | Bear Stearns ALT-A Trust 2005-7 21A1, 4.253%, 09/25/2035 | 1,590,728 | 0.0 |
| 4,530,504 | Bear Stearns Mortgage Funding Trust 2006-AR5 2A1, 1.137%, (US0001M + 0.190%), 01/25/2037 | 3,801,036 | 0.1 | |
| 1,905,745 | (1),(3) | Chase Mortgage Finance Corp. 2019-1 B2, 3.967%, 03/25/2050 | 1,543,022 | 0.0 |
| 2,226,180 | (1),(3) | Chase Mortgage Finance Corp. 2019-1 B3, 3.967%, 03/25/2050 | 2,153,804 | 0.0 |
| 1,891,847 | (3) | CHL Mortgage Pass-Through Trust 2004-22 A3, 3.826%, 11/25/2034 | 1,713,430 | 0.0 |
| 691,157 | CHL Mortgage Pass-Through Trust 2007-7 A7, 5.750%, 06/25/2037 | 517,893 | 0.0 | |
| 1,369,284 | (1),(3) | CIM Trust 2019-INV1 A1, 4.000%, 02/25/2049 | 1,363,593 | 0.0 |
| 1,302,190 | (1),(3) | CIM Trust 2019-INV3 A3, 3.500%, 08/25/2049 | 1,329,424 | 0.0 |
See Accompanying Notes to Financial Statements
| 36 |
| Voya Intermediate Bond Fund | PORTFOLIO OF INVESTMENTS |
| as of March31, 2020 (Continued) |
| 6,446,246 | (1),(3) | CIM Trust 2019-J1 1A2, 3.500%, 08/25/2049 | 6,495,930 | 0.1 |
| 2,973,518 | (1),(3) | CIM Trust 2019-J2 B2, 3.856%, 10/25/2049 | 2,417,323 | 0.0 |
| 991,173 | (1),(3) | CIM Trust 2019-J2 B3, 3.856%, 10/25/2049 | 768,378 | 0.0 |
| 2,600,000 | (1),(3) | CIM Trust 2019-R5 M2, 3.250%, 09/25/2059 | 2,333,228 | 0.0 |
| 1,329,532 | Citicorp Mortgage Securities Trust Series 2006-3 1A4, 6.000%, 06/25/2036 | 1,275,699 | 0.0 | |
| 1,535,698 | (3) | Citigroup Mortgage Loan Trust 2006-AR9 2A, 4.344%, 11/25/2036 | 1,162,947 | 0.0 |
| 627,015 | (3) | Citigroup Mortgage Loan Trust 2007-10 22AA, 4.128%, 09/25/2037 | 553,392 | 0.0 |
| 1,575,907 | (1),(3) | Citigroup Mortgage Loan Trust 2015-A B2, 4.500%, 06/25/2058 | 1,507,829 | 0.0 |
| 1,680,000 | (1),(3) | COLT 2018-2 M1 Mortgage Loan Trust, 4.189%, 07/27/2048 | 1,621,315 | 0.0 |
| 1,550,000 | (1),(3) | COLT 2018-3 M1 Mortgage Loan Trust, 4.283%, 10/26/2048 | 1,501,773 | 0.0 |
| 2,000,000 | (1),(3) | COLT 2019-1 M1 Mortgage Loan Trust, 4.518%, 03/25/2049 | 1,850,676 | 0.0 |
| 1,887,464 | (1),(3) | COLT 2019-4 A3 Mortgage Loan Trust, 2.988%, 11/25/2049 | 1,852,027 | 0.0 |
| 7,550,000 | (1) | Connecticut Avenue Securities Trust 2020-R02 2M2, 2.947%, (US0001M + 2.000%), 01/25/2040 | 5,002,444 | 0.1 |
| 543,897 | Countrywide Alternative Loan Trust 2005-53T2 2A6, 1.447%, (US0001M + 0.500%), 11/25/2035 | 242,990 | 0.0 | |
| 5,912,165 | Countrywide Asset-Backed Certificates 2005-IM1 M1, 1.667%, (US0001M + 0.720%), 11/25/2035 | 5,550,257 | 0.1 | |
| 1,814,939 | (1) | CSMC Series 2008-2R 1A1, 6.000%, 07/25/2037 | 1,607,394 | 0.0 |
| 1,616,914 | (1),(3) | CSMC Trust 2015-2 B3, 3.922%, 02/25/2045 | 1,600,823 | 0.0 |
| 1,800,000 | (1),(3) | Deephave Residential Mortgage Trust 2019-2A M1, 3.921%, 04/25/2059 | 1,698,039 | 0.0 |
| 1,360,000 | (1),(3) | Deephaven Residential Mortgage Trust 2018-1A M1, 3.939%, 12/25/2057 | 1,321,474 | 0.0 |
| 1,000,000 | (1),(3) | Deephaven Residential Mortgage Trust 2018-2A M1, 4.375%, 04/25/2058 | 965,474 | 0.0 |
| 2,300,000 | (1),(3) | Deephaven Residential Mortgage Trust 2019-1A M1, 4.402%, 08/25/2058 | 2,188,068 | 0.0 |
| 1,000,000 | (1),(3) | Deephaven Residential Mortgage Trust 2019-4 M1, 3.484%, 10/25/2059 | 859,780 | 0.0 |
| 3,000,000 | (1),(3) | Deephaven Residential Mortgage Trust 2020-1 M1, 3.010%, 01/25/2060 | 2,454,764 | 0.0 |
| 90,711,977 | (3),(5) | Deutsche ALT-A Securities, Inc. ALT 07-AB1 X, 0.845%, 04/25/2037 | 4,253,566 | 0.1 |
| 3,251,458 | (1),(3) | Ellington Financial Mortgage Trust 2019-2 A3, 3.046%, 11/25/2059 | 3,151,980 | 0.1 |
| 4,535,593 | (5) | Fannie Mae 2008-12 SC, 5.403%, (-1.000*US0001M + 6.350%), 03/25/2038 | 965,944 | 0.0 |
| 8,358,699 | Fannie Mae 2011-99 CZ, 4.500%, 10/25/2041 | 9,800,132 | 0.1 | |
| 866,058 | Fannie Mae 2012-110 CA, 3.000%, 10/25/2042 | 922,331 | 0.0 | |
| 5,919,751 | Fannie Mae 2012-66 EP, 4.000%, 06/25/2042 | 7,136,981 | 0.1 | |
| 5,237,793 | Fannie Mae 2013-116 UB, 4.000%, 11/25/2043 | 5,757,126 | 0.1 | |
| 4,084,276 | Fannie Mae 2013-20 DL, 4.000%, 03/25/2033 | 4,600,030 | 0.1 | |
| 27,023,469 | (5) | Fannie Mae 2016-82 SD, 5.103%, (-1.000*US0001M + 6.050%), 11/25/2046 | 6,067,028 | 0.1 |
| 5,704,946 | Fannie Mae 2016-88 EA, 3.500%, 01/25/2045 | 6,161,501 | 0.1 | |
| 16,055,858 | (5) | Fannie Mae 2018-86 US, 5.643%, (-1.000*US0001M + 6.590%), 09/25/2040 | 3,932,667 | 0.1 |
| 21,016,364 | Fannie Mae Connecticut Avenue Securities 16-C06 1M2, 5.197%, (US0001M + 4.250%), 04/25/2029 | 20,455,553 | 0.3 | |
| 7,008,840 | Fannie Mae Connecticut Avenue Securities 2015-C02 1M2, 4.947%, (US0001M + 4.000%), 05/25/2025 | 6,584,888 | 0.1 |
See Accompanying Notes to Financial Statements
| 37 |
| Voya Intermediate Bond Fund | PORTFOLIO OF INVESTMENTS |
| as of March31, 2020 (Continued) |
| 200,324 | Fannie Mae Connecticut Avenue Securities 2015-C02 2M2, 4.947%, (US0001M + 4.000%), 05/25/2025 | 190,908 | 0.0 | |
| 1,388,668 | Fannie Mae Connecticut Avenue Securities 2015-C03 2M2, 5.947%, (US0001M + 5.000%), 07/25/2025 | 1,352,312 | 0.0 | |
| 10,078,792 | Fannie Mae Connecticut Avenue Securities 2015-C04 2M2, 6.497%, (US0001M + 5.550%), 04/25/2028 | 9,435,315 | 0.1 | |
| 3,317,584 | Fannie Mae Connecticut Avenue Securities 2015-CO1 1M2, 5.247%, (US0001M + 4.300%), 02/25/2025 | 3,158,764 | 0.1 | |
| 626,661 | Fannie Mae Connecticut Avenue Securities 2016-C01 2M2, 7.897%, (US0001M + 6.950%), 08/25/2028 | 632,370 | 0.0 | |
| 15,039,496 | Fannie Mae Connecticut Avenue Securities 2016-C04 1M2, 5.197%, (US0001M + 4.250%), 01/25/2029 | 14,300,971 | 0.2 | |
| 18,690,686 | Fannie Mae Connecticut Avenue Securities 2016-C05 2M2, 5.397%, (US0001M + 4.450%), 01/25/2029 | 18,037,927 | 0.2 | |
| 11,342,749 | Fannie Mae Connecticut Avenue Securities 2016-C07 2M2, 5.297%, (US0001M + 4.350%), 05/25/2029 | 10,941,318 | 0.1 | |
| 3,577,926 | Fannie Mae Connecticut Avenue Securities 2017-C01 1M2, 4.497%, (US0001M + 3.550%), 07/25/2029 | 3,312,547 | 0.1 | |
| 16,484,000 | Fannie Mae Connecticut Avenue Securities 2017-C02 2M2, 4.597%, (US0001M + 3.650%), 09/25/2029 | 12,032,354 | 0.2 | |
| 4,750,000 | Fannie Mae Connecticut Avenue Securities 2017-C03 1M2, 3.947%, (US0001M + 3.000%), 10/25/2029 | 4,269,044 | 0.1 | |
| 10,900,000 | Fannie Mae Connecticut Avenue Securities 2017-C04 2M2, 3.797%, (US0001M + 2.850%), 11/25/2029 | 9,646,761 | 0.1 | |
| 13,762,512 | Fannie Mae Connecticut Avenue Securities 2017-C05 1M2, 3.147%, (US0001M + 2.200%), 01/25/2030 | 12,311,610 | 0.2 | |
| 1,430,351 | Fannie Mae Connecticut Avenue Securities 2017-C06 1M2, 3.597%, (US0001M + 2.650%), 02/25/2030 | 1,274,661 | 0.0 | |
| 13,855,000 | Fannie Mae Connecticut Avenue Securities 2017-C07 1M2, 3.347%, (US0001M + 2.400%), 05/28/2030 | 12,496,027 | 0.2 | |
| 8,568,497 | Fannie Mae Connecticut Avenue Securities 2017-C07 2M2, 3.447%, (US0001M + 2.500%), 05/25/2030 | 7,497,457 | 0.1 | |
| 10,865,013 | Fannie Mae Connecticut Avenue Securities 2017-CO6 2M2, 3.747%, (US0001M + 2.800%), 02/25/2030 | 9,183,639 | 0.1 | |
| 13,769,786 | Fannie Mae Connecticut Avenue Securities 2018-C02 2M2, 3.147%, (US0001M + 2.200%), 08/25/2030 | 11,531,033 | 0.2 | |
| 5,550,000 | Fannie Mae Connecticut Avenue Securities 2018-C03 1M2, 3.097%, (US0001M + 2.150%), 10/25/2030 | 4,679,096 | 0.1 | |
| 11,529,897 | Fannie Mae Connecticut Avenue Securities 2018-C04 2M2, 3.497%, (US0001M + 2.550%), 12/25/2030 | 9,577,636 | 0.1 | |
| 19,615,000 | Fannie Mae Connecticut Avenue Securities 2018-C05 1M2, 3.297%, (US0001M + 2.350%), 01/25/2031 | 16,709,008 | 0.2 | |
| 13,861,818 | Fannie Mae Connecticut Avenue Securities 2018-C06 1M2, 2.947%, (US0001M + 2.000%), 03/25/2031 | 12,346,103 | 0.2 |
See Accompanying Notes to Financial Statements
| 38 |
| Voya Intermediate Bond Fund | PORTFOLIO OF INVESTMENTS |
| as of March31, 2020 (Continued) |
| 12,658,696 | Fannie Mae Connecticut Avenue Securities 2018-C06 2M2, 3.047%, (US0001M + 2.100%), 03/25/2031 | 10,768,844 | 0.1 | |
| 20,015,652 | Fannie Mae Connecticut Avenue Securities 2018-CO1 1M2, 3.197%, (US0001M + 2.250%), 07/25/2030 | 17,539,434 | 0.2 | |
| 5,297,283 | (1) | Fannie Mae Connecticut Avenue Securities 2019-R02 1M2, 3.247%, (US0001M + 2.300%), 08/25/2031 | 4,439,046 | 0.1 |
| 4,050,000 | (1) | Fannie Mae Connecticut Avenue Securities 2019-R04 2M2, 3.047%, (US0001M + 2.100%), 06/25/2039 | 3,340,676 | 0.1 |
| 11,372,170 | (1) | Fannie Mae Connecticut Avenue Securities Trust 2018-R07 1M2, 3.347%, (US0001M + 2.400%), 04/25/2031 | 9,846,772 | 0.1 |
| 3,300,000 | (1) | Fannie Mae Connecticut Avenue Securities Trust 2020-R01 1M2, 2.997%, (US0001M + 2.050%), 01/25/2040 | 2,008,500 | 0.0 |
| 7,402,991 | Fannie Mae Connecticut Avenue Securities, 6.647%, (US0001M + 5.700%), 04/25/2028 | 7,412,703 | 0.1 | |
| 16,519 | Fannie Mae Grantor Trust 1998-T2 A6, 0.108%, (US0001M + 0.550%), 01/25/2032 | 17,019 | 0.0 | |
| 14,107 | (5) | Fannie Mae Interest Strip Series 104 2, 9.500%, 10/25/2021 | 726 | 0.0 |
| 458,540 | (5) | Fannie Mae Interest Strip Series 418 20, 3.000%, 05/25/2043 | 35,314 | 0.0 |
| 1,306,108 | (5) | Fannie Mae Interest Strip Series 418 59, 3.000%, 08/25/2028 | 83,616 | 0.0 |
| 484 | (5) | Fannie Mae Interest Strip Series 83 2, 9.500%, 09/25/2020 | 6 | 0.0 |
| 147,686 | Fannie Mae REMIC Trust 1999-33 Z, 6.000%, 07/25/2029 | 166,265 | 0.0 | |
| 153,831 | (5) | Fannie Mae REMIC Trust 1999-6 SE, 6.885%, (-1.000*US0001M + 7.685%), 02/17/2029 | 12,975 | 0.0 |
| 1,202,523 | Fannie Mae REMIC Trust 2003-105 AZ, 5.500%, 10/25/2033 | 1,396,448 | 0.0 | |
| 424,091 | Fannie Mae REMIC Trust 2003-45 FJ, 3.081%, (US0001M + 1.500%), 06/25/2033 | 436,757 | 0.0 | |
| 1,591,075 | (5) | Fannie Mae REMIC Trust 2003-66 SA, 6.703%, (-1.000*US0001M + 7.650%), 07/25/2033 | 397,889 | 0.0 |
| 287,847 | (5) | Fannie Mae REMIC Trust 2003-74 IO, 6.000%, 08/25/2033 | 61,554 | 0.0 |
| 784,421 | Fannie Mae REMIC Trust 2003-84 PZ, 5.000%, 09/25/2033 | 899,317 | 0.0 | |
| 1,139,787 | Fannie Mae REMIC Trust 2004-50 VZ, 5.500%, 07/25/2034 | 1,300,499 | 0.0 | |
| 23,647 | Fannie Mae REMIC Trust 2004-56 FE, 1.397%, (US0001M + 0.450%), 10/25/2033 | 23,530 | 0.0 | |
| 599,202 | Fannie Mae REMIC Trust 2004-7 Z, 5.500%, 02/25/2034 | 670,675 | 0.0 | |
| 1,222,242 | Fannie Mae REMIC Trust 2004-75 ZG, 4.500%, 10/25/2034 | 1,343,843 | 0.0 | |
| 3,059,543 | Fannie Mae REMIC Trust 2005-25 Z, 5.000%, 04/25/2035 | 3,484,611 | 0.1 | |
| 153,901 | Fannie Mae REMIC Trust 2006-104 ES, 28.717%, (-5.000*US0001M + 33.450%), 11/25/2036 | 296,276 | 0.0 | |
| 2,703,758 | (5) | Fannie Mae REMIC Trust 2006-12 SD, 5.803%, (-1.000*US0001M + 6.750%), 10/25/2035 | 556,883 | 0.0 |
| 833,604 | (5) | Fannie Mae REMIC Trust 2006-123 UI, 5.793%, (-1.000*US0001M + 6.740%), 01/25/2037 | 212,296 | 0.0 |
| 209,699 | (5) | Fannie Mae REMIC Trust 2006-72 HS, 5.753%, (-1.000*US0001M + 6.700%), 08/25/2026 | 29,063 | 0.0 |
| 30,943 | Fannie Mae REMIC Trust 2007-10 Z, 6.000%, 02/25/2037 | 35,762 | 0.0 | |
| 4,439,512 | (5) | Fannie Mae REMIC Trust 2007-91 AS, 5.453%, (-1.000*US0001M + 6.400%), 10/25/2037 | 1,152,793 | 0.0 |
| 1,906,726 | Fannie Mae REMIC Trust 2009-19 PW, 4.500%, 10/25/2036 | 2,147,125 | 0.0 | |
| 9,174,214 | (3) | Fannie Mae REMIC Trust 2009-50 HZ, 5.544%, 02/25/2049 | 10,416,910 | 0.1 |
| 2,146,141 | (5) | Fannie Mae REMIC Trust 2009-90 TS, 5.203%, (-1.000*US0001M + 6.150%), 11/25/2039 | 444,965 | 0.0 |
See Accompanying Notes to Financial Statements
| 39 |
| Voya Intermediate Bond Fund | PORTFOLIO OF INVESTMENTS |
| as of March31, 2020 (Continued) |
| 2,561,459 | (5) | Fannie Mae REMIC Trust 2010-118 GS, 5.003%, (-1.000*US0001M + 5.950%), 10/25/2039 | 196,925 | 0.0 |
| 5,790,269 | (5) | Fannie Mae REMIC Trust 2010-123 SL, 5.123%, (-1.000*US0001M + 6.070%), 11/25/2040 | 1,103,674 | 0.0 |
| 6,445,773 | (5) | Fannie Mae REMIC Trust 2010-41 SB, 5.453%, (-1.000*US0001M + 6.400%), 05/25/2040 | 1,348,539 | 0.0 |
| 1,861,021 | (5) | Fannie Mae REMIC Trust 2010-43 VS, 5.503%, (-1.000*US0001M + 6.450%), 05/25/2040 | 377,580 | 0.0 |
| 11,049,000 | Fannie Mae REMIC Trust 2010-59 PC, 5.000%, 06/25/2040 | 12,763,336 | 0.2 | |
| 2,023,823 | (5) | Fannie Mae REMIC Trust 2011-102 SA, 5.653%, (-1.000*US0001M + 6.600%), 10/25/2041 | 377,060 | 0.0 |
| 3,181,332 | Fannie Mae REMIC Trust 2011-30 ZA, 5.000%, 04/25/2041 | 3,585,085 | 0.1 | |
| 2,894,212 | (5) | Fannie Mae REMIC Trust 2011-93 GS, 5.603%, (-1.000*US0001M + 6.550%), 04/25/2039 | 742,691 | 0.0 |
| 985,556 | (5) | Fannie Mae REMIC Trust 2012-103 IT, 4.000%, 04/25/2041 | 27,465 | 0.0 |
| 7,695,842 | (5) | Fannie Mae REMIC Trust 2012-122 SB, 5.203%, (-1.000*US0001M + 6.150%), 11/25/2042 | 1,406,162 | 0.0 |
| 3,968,536 | (5) | Fannie Mae REMIC Trust 2012-128 LI, 3.500%, 06/25/2042 | 351,242 | 0.0 |
| 7,329,592 | (5) | Fannie Mae REMIC Trust 2012-133 AS, 5.253%, (-1.000*US0001M + 6.200%), 10/25/2042 | 1,470,530 | 0.0 |
| 1,132,719 | (5) | Fannie Mae REMIC Trust 2012-149 GI, 3.500%, 06/25/2042 | 126,109 | 0.0 |
| 4,798,222 | (5) | Fannie Mae REMIC Trust 2012-15 SP, 5.673%, (-1.000*US0001M + 6.620%), 06/25/2040 | 402,110 | 0.0 |
| 2,584,843 | (5) | Fannie Mae REMIC Trust 2012-24 HS, 5.603%, (-1.000*US0001M + 6.550%), 09/25/2040 | 321,433 | 0.0 |
| 6,152,487 | (5) | Fannie Mae REMIC Trust 2012-30 QS, 5.653%, (-1.000*US0001M + 6.600%), 04/25/2031 | 518,468 | 0.0 |
| 1,663,732 | (5) | Fannie Mae REMIC Trust 2012-68 YS, 5.753%, (-1.000*US0001M + 6.700%), 07/25/2042 | 286,605 | 0.0 |
| 2,707,490 | (5) | Fannie Mae REMIC Trust 2013-26 JS, 5.253%, (-1.000*US0001M + 6.200%), 10/25/2032 | 291,684 | 0.0 |
| 9,495,243 | (5) | Fannie Mae REMIC Trust 2013-60 DS, 5.253%, (-1.000*US0001M + 6.200%), 06/25/2033 | 1,392,651 | 0.0 |
| 8,123,643 | (5) | Fannie Mae REMIC Trust 2013-9 SM, 5.303%, (-1.000*US0001M + 6.250%), 02/25/2033 | 1,483,766 | 0.0 |
| 5,645,367 | (5) | Fannie Mae REMIC Trust 2014-17 DS, 5.253%, (-1.000*US0001M + 6.200%), 02/25/2043 | 626,138 | 0.0 |
| 2,845,877 | (5) | Fannie Mae REMIC Trust 2014-28 BS, 5.253%, (-1.000*US0001M + 6.200%), 08/25/2043 | 439,503 | 0.0 |
| 3,019,000 | Fannie Mae REMIC Trust 2015-17 MK, 2.500%, 12/25/2041 | 3,303,815 | 0.1 | |
| 53,796,685 | (5) | Fannie Mae REMIC Trust 2015-79 SA, 5.303%, (-1.000*US0001M + 6.250%), 11/25/2045 | 11,744,204 | 0.2 |
| 21,970,122 | (5) | Fannie Mae REMIC Trust 2015-9 IO, 5.500%, 03/25/2045 | 4,556,184 | 0.1 |
| 37,766,350 | (5) | Fannie Mae REMICS 16-60 SB, 5.153%, (-1.000*US0001M + 6.100%), 09/25/2046 | 7,886,600 | 0.1 |
| 4 | Fannie Mae REMICS 1990-59 K, 1184.190%, 06/25/2020 | 6 | 0.0 | |
| 147,729 | (5) | Fannie Mae REMICS 1997-18 SG, 7.300%, (-1.000*US0001M + 8.100%), 03/17/2027 | 19,788 | 0.0 |
| 96,610 | (5) | Fannie Mae REMICS 1997-91 FC, 0.000%, (US0001M + (8.500)%), 11/25/2023 | 0 | – |
| 10,424 | (5) | Fannie Mae REMICS 1999-57 SC, 8.950%, (-1.000*US0001M + 9.750%), 11/17/2029 | 274 | 0.0 |
| 5,199 | (5) | Fannie Mae REMICS 2000-38 SK, 8.400%, (-1.000*US0001M + 9.200%), 10/17/2030 | 68 | 0.0 |
| 323,758 | (5) | Fannie Mae REMICS 2001-72 SC, 1.000%, (-1.000*US0001M + 8.500%), 12/25/2031 | 12,002 | 0.0 |
See Accompanying Notes to Financial Statements
| 40 |
| Voya Intermediate Bond Fund | PORTFOLIO OF INVESTMENTS |
| as of March31, 2020 (Continued) |
| 108,840 | (5) | Fannie Mae REMICS 2001-8 SK, 8.138%, (-1.000*US0001M + 8.750%), 03/18/2031 | 17,140 | 0.0 |
| 78 | (5) | Fannie Mae REMICS 2001-8 SO, 9.027%, (-1.000*US0001M + 9.800%), 02/20/2031 | 2 | 0.0 |
| 690,504 | (5) | Fannie Mae REMICS 2003-49 SW, 6.053%, (-1.000*US0001M + 7.000%), 01/25/2033 | 141,901 | 0.0 |
| 5,600,642 | (5) | Fannie Mae REMICS 2004-54 SN, 6.103%, (-1.000*US0001M + 7.050%), 07/25/2034 | 1,270,540 | 0.0 |
| 297,538 | (5) | Fannie Mae REMICS 2004-88 JH, 5.653%, (-1.000*US0001M + 6.600%), 06/25/2033 | 4,688 | 0.0 |
| 1,458,912 | (5) | Fannie Mae REMICS 2005-75 SP, 5.803%, (-1.000*US0001M + 6.750%), 08/25/2035 | 266,508 | 0.0 |
| 2,909,309 | (5) | Fannie Mae REMICS 2006-56 SM, 5.803%, (-1.000*US0001M + 6.750%), 07/25/2036 | 601,254 | 0.0 |
| 542,718 | (5) | Fannie Mae REMICS 2007-21 SB, 5.453%, (-1.000*US0001M + 6.400%), 03/25/2037 | 68,464 | 0.0 |
| 1,447,827 | (5) | Fannie Mae REMICS 2007-52 NS, 5.503%, (-1.000*US0001M + 6.450%), 06/25/2037 | 305,229 | 0.0 |
| 1,771,840 | (5) | Fannie Mae REMICS 2007-85 SM, 5.513%, (-1.000*US0001M + 6.460%), 09/25/2037 | 365,697 | 0.0 |
| 517,529 | Fannie Mae REMICS 2008-16 Z, 5.500%, 03/25/2038 | 600,632 | 0.0 | |
| 640 | (5) | Fannie Mae REMICS 2010-112 SG, 5.413%, (-1.000*US0001M + 6.360%), 06/25/2021 | 9 | 0.0 |
| 9,068,550 | (5) | Fannie Mae REMICS 2010-150 SJ, 5.533%, (-1.000*US0001M + 6.480%), 01/25/2041 | 2,239,721 | 0.0 |
| 1,498,014 | (5) | Fannie Mae REMICS 2010-35 CS, 5.503%, (-1.000*US0001M + 6.450%), 04/25/2050 | 284,839 | 0.0 |
| 2,132,138 | Fannie Mae REMICS 2011-10 ZC, 5.000%, 02/25/2041 | 2,468,320 | 0.0 | |
| 6,166,562 | Fannie Mae REMICS 2011-101 DB, 4.000%, 10/25/2041 | 7,241,911 | 0.1 | |
| 670,996 | Fannie Mae REMICS 2011-116 ZA, 3.500%, 11/25/2041 | 744,392 | 0.0 | |
| 132,000 | Fannie Mae REMICS 2011-127 UY, 3.500%, 12/25/2041 | 146,314 | 0.0 | |
| 12,049,455 | (5) | Fannie Mae REMICS 2011-47 GS, 4.983%, (-1.000*US0001M + 5.930%), 06/25/2041 | 2,267,241 | 0.0 |
| 3,266,386 | Fannie Mae REMICS 2011-8 ZA, 4.000%, 02/25/2041 | 3,613,507 | 0.1 | |
| 7,722,506 | (5) | Fannie Mae REMICS 2012-111 SL, 5.153%, (-1.000*US0001M + 6.100%), 05/25/2041 | 933,862 | 0.0 |
| 5,900,546 | Fannie Mae REMICS 2012-111 ZK, 3.500%, 10/25/2042 | 6,602,808 | 0.1 | |
| 10,370,725 | (5) | Fannie Mae REMICS 2012-120 WI, 3.000%, 11/25/2027 | 632,658 | 0.0 |
| 3,000,000 | Fannie Mae REMICS 2012-134 KV, 3.000%, 07/25/2031 | 3,153,658 | 0.1 | |
| 10,219,555 | Fannie Mae REMICS 2012-17 QZ, 4.000%, 03/25/2042 | 11,436,492 | 0.2 | |
| 5,815,272 | Fannie Mae REMICS 2012-2 HE, 4.000%, 02/25/2042 | 6,740,752 | 0.1 | |
| 1,896,253 | Fannie Mae REMICS 2012-30 AB, 4.000%, 04/25/2042 | 2,111,866 | 0.0 | |
| 2,649,113 | Fannie Mae REMICS 2012-33 BW, 4.000%, 04/25/2042 | 3,045,204 | 0.0 | |
| 1,058,948 | Fannie Mae REMICS 2012-44 KW, 3.500%, 05/25/2032 | 1,123,323 | 0.0 | |
| 5,897,347 | Fannie Mae REMICS 2012-55 PC, 3.500%, 05/25/2042 | 6,394,503 | 0.1 | |
| 500,000 | Fannie Mae REMICS 2012-80 MY, 3.250%, 08/25/2042 | 570,405 | 0.0 | |
| 2,700,000 | Fannie Mae REMICS 2013-111 BA, 3.000%, 11/25/2033 | 3,000,704 | 0.0 | |
| 1,403,000 | Fannie Mae REMICS 2013-13 BE, 4.000%, 03/25/2043 | 1,779,264 | 0.0 | |
| 1,187,997 | Fannie Mae REMICS 2013-16 GD, 3.000%, 03/25/2033 | 1,243,518 | 0.0 | |
| 10,534,357 | (5) | Fannie Mae REMICS 2013-40 LS, 5.203%, (-1.000*US0001M + 6.150%), 05/25/2043 | 1,845,118 | 0.0 |
| 10,978,302 | (5) | Fannie Mae REMICS 2013-70 BI, 3.000%, 07/25/2033 | 852,492 | 0.0 |
| 12,269,147 | (5) | Fannie Mae REMICS 2014-15 SB, 5.703%, (-1.000*US0001M + 6.650%), 04/25/2044 | 3,145,973 | 0.1 |
| 8,456,293 | (5) | Fannie Mae REMICS 2014-20 HI, 4.000%, 01/25/2040 | 209,665 | 0.0 |
| 970,000 | Fannie Mae REMICS 2014-61 PY, 3.500%, 10/25/2044 | 1,163,166 | 0.0 |
See Accompanying Notes to Financial Statements
| 41 |
| Voya Intermediate Bond Fund | PORTFOLIO OF INVESTMENTS |
| as of March31, 2020 (Continued) |
| 16,528,536 | Fannie Mae REMICS 2015-20 EZ, 3.500%, 04/25/2045 | 19,402,590 | 0.2 | |
| 1,160,327 | Fannie Mae REMICS 2015-45 EY, 2.500%, 12/25/2040 | 1,186,726 | 0.0 | |
| 9,245,261 | (5) | Fannie Mae REMICS 2015-56 IC, 6.000%, 08/25/2045 | 1,732,765 | 0.0 |
| 2,000,000 | Fannie Mae REMICS 2015-67 AV, 3.500%, 01/25/2036 | 2,296,192 | 0.0 | |
| 5,000,000 | Fannie Mae REMICS 2015-67 QV, 3.000%, 12/25/2040 | 5,361,299 | 0.1 | |
| 3,928,140 | (5) | Fannie Mae REMICS 2015-76 PI, 6.000%, 09/25/2045 | 625,268 | 0.0 |
| 9,275,791 | (5) | Fannie Mae REMICS 2016-52 MI, 4.000%, 12/25/2045 | 1,388,018 | 0.0 |
| 848,247 | Fannie Mae REMICS 2016-9 D, 3.000%, 03/25/2046 | 906,783 | 0.0 | |
| 8,946,855 | Fannie Mae REMICS 2017-54 D, 3.000%, 07/25/2047 | 9,501,424 | 0.1 | |
| 52,833,422 | (5) | Fannie Mae REMICS 2018-15 SC, 5.353%, (-1.000*US0001M + 6.300%), 03/25/2048 | 11,531,037 | 0.2 |
| 5,200,952 | Fannie Mae REMICS 2018-38 LA, 3.000%, 06/25/2048 | 5,438,134 | 0.1 | |
| 27,423,526 | Fannie Mae REMICS 2018-73 AB, 3.000%, 10/25/2048 | 29,486,622 | 0.4 | |
| 4,953,640 | Fannie Mae REMICS 2018-8 AB, 3.500%, 10/25/2047 | 5,314,158 | 0.1 | |
| 68,106,715 | (5) | Fannie Mae REMICS 2018-82 SA, 5.253%, (-1.000*US0001M + 6.200%), 11/25/2048 | 14,152,126 | 0.2 |
| 65,902,916 | (5) | Fannie Mae REMICS 2018-86 SM, 5.253%, (-1.000*US0001M + 6.200%), 12/25/2048 | 13,595,917 | 0.2 |
| 57,357,290 | (5) | Fannie Mae REMICS 2018-91 SB, 5.153%, (-1.000*US0001M + 6.100%), 12/25/2058 | 9,984,218 | 0.1 |
| 18,846,832 | (5) | Fannie Mae REMICS 2019-21 AI, 5.000%, 05/25/2059 | 3,511,287 | 0.1 |
| 21,589,297 | (5) | Fannie Mae REMICS 2019-30 SB, 5.153%, (-1.000*US0001M + 6.100%), 07/25/2049 | 4,035,672 | 0.1 |
| 17,274,340 | Fannie Mae REMICS 2019-37 CA, 3.000%, 10/25/2047 | 18,201,913 | 0.2 | |
| 19,930,710 | (5) | Fannie Mae REMICS 2019-39 SA, 5.153%, (-1.000*US0001M + 6.100%), 08/25/2049 | 3,397,730 | 0.1 |
| 104,782,552 | (5) | Fannie Mae REMICS 2019-41 S, 5.053%, (-1.000*US0001M + 6.000%), 08/25/2059 | 17,484,247 | 0.2 |
| 12,803,541 | (5) | Fannie Mae REMICS 2019-47 SB, 5.153%, (-1.000*US0001M + 6.100%), 05/25/2040 | 2,221,236 | 0.0 |
| 17 | Fannie Mae REMICS G-9 G, 509.000%, 04/25/2021 | 37 | 0.0 | |
| 6,060 | Fannie Mae REMICS G93-35 ZQ, 6.500%, 11/25/2023 | 6,463 | 0.0 | |
| 4,046,342 | Fannie Mae REMICS Trust 2010-53 JZ, 5.000%, 07/25/2040 | 4,593,036 | 0.1 | |
| 37,175,034 | (5) | Fannie Mae Series 2013-44 DI, 3.000%, 05/25/2033 | 3,024,576 | 0.0 |
| 1,974,286 | (5) | Fannie Mae Series 2013-72 YS, 5.203%, (-1.000*US0001M + 6.150%), 07/25/2033 | 290,803 | 0.0 |
| 800,000 | (1) | Fannie Mae Connecticut Avenue Securities Trust 2020-SBT1 1M2, 4.513%, (US0001M + 3.650%), 02/25/2040 | 547,451 | 0.0 |
| 1,000,000 | (1) | Fannie Mae Connecticut Avenue Securities Trust 2019-R05 1B1, 5.047%, (US0001M + 4.100%), 07/25/2039 | 545,151 | 0.0 |
| 3,550,000 | (1) | Fannie Mae Connecticut Avenue Securities Trust 2019-R06 2M2, 3.047%, (US0001M + 2.100%), 09/25/2039 | 2,791,410 | 0.0 |
| 500,000 | (1) | Fannie Mae Connecticut Avenue Securities Trust 2020-SBT1 2M2, 4.513%, (US0001M + 3.650%), 02/25/2040 | 342,157 | 0.0 |
| 5,488,529 | Fannie Mae REMICS 2011-136 PZ, 4.000%, 01/25/2042 | 6,496,757 | 0.1 | |
| 9,614,655 | Fannie Mae REMICS 2012-94 LZ, 3.500%, 09/25/2042 | 10,333,370 | 0.1 | |
| 5,273,851 | Fannie Mae REMICS 2017-41 MZ, 4.000%, 06/25/2057 | 6,139,806 | 0.1 | |
| 203,265 | (5) | FHLMC-GNMA 20 S, 7.953%, (-1.000*US0001M + 8.900%), 10/25/2023 | 22,043 | 0.0 |
| 710,655 | First Horizon Alternative Mortgage Securities Trust 2006-FA8 1A11, 6.000%, 02/25/2037 | 464,656 | 0.0 | |
| 1,909,490 | (1),(3) | Flagstar Mortgage Trust 2018-1 B1, 4.026%, 03/25/2048 | 1,888,309 | 0.0 |
| 2,238,878 | (1),(3) | Flagstar Mortgage Trust 2018-1 B2, 4.026%, 03/25/2048 | 2,127,954 | 0.0 |
See Accompanying Notes to Financial Statements
| 42 |
| Voya Intermediate Bond Fund | PORTFOLIO OF INVESTMENTS |
| as of March31, 2020 (Continued) |
| 2,489,976 | (1),(3) | Flagstar Mortgage Trust 2018-1 B3, 4.026%, 03/25/2048 | 2,289,698 | 0.0 |
| 1,271,152 | (1),(3) | Flagstar Mortgage Trust 2018-2 B2, 4.042%, 04/25/2048 | 1,205,711 | 0.0 |
| 3,649,614 | (1),(3) | Flagstar Mortgage Trust 2018-3INV A3, 4.000%, 05/25/2048 | 3,711,488 | 0.1 |
| 1,823,764 | (1),(3) | Flagstar Mortgage Trust 2018-5 B3, 4.536%, 09/25/2048 | 1,674,115 | 0.0 |
| 1,513,448 | (1),(3) | Flagstar Mortgage Trust 2019-2 B1, 4.184%, 12/25/2049 | 1,337,842 | 0.0 |
| 1,467,736 | (1),(3) | Flagstar Mortgage Trust 2019-2 B2, 4.184%, 12/25/2049 | 1,210,459 | 0.0 |
| 965,172 | (1),(3) | Flagstar Mortgage Trust 2018-4 B3, 4.322%, 07/25/2048 | 889,607 | 0.0 |
| 2,050,213 | (1),(3) | Flagstar Mortgage Trust 2020-1NV B1A, 4.356%, 03/25/2050 | 1,792,295 | 0.0 |
| 2,481,626 | (1),(3) | Flagstar Mortgage Trust 2020-1NV B2A, 4.356%, 03/25/2050 | 2,146,360 | 0.0 |
| 26,818,050 | Freddie Mac 326 350, 3.500%, 03/15/2044 | 29,627,832 | 0.4 | |
| 10,544,351 | (5) | Freddie Mac 3510 AS, 5.705%, (-1.000*US0001M + 6.410%), 04/15/2037 | 2,488,475 | 0.0 |
| 8,241,370 | (5) | Freddie Mac 4191 SA, 5.495%, (-1.000*US0001M + 6.200%), 03/15/2043 | 1,473,390 | 0.0 |
| 4,248,688 | Freddie Mac 4316 XZ, 4.500%, 03/15/2044 | 5,214,487 | 0.1 | |
| 5,000,000 | Freddie Mac 4800 KG, 3.500%, 11/15/2045 | 5,232,776 | 0.1 | |
| 816,786 | Freddie Mac Reference Series R007 ZA, 6.000%, 05/15/2036 | 972,755 | 0.0 | |
| 395,554 | Freddie Mac Reference Series R008 ZA, 6.000%, 07/15/2036 | 457,409 | 0.0 | |
| 114,292 | Freddie Mac REMIC Trust 2110 PG, 6.000%, 01/15/2029 | 129,843 | 0.0 | |
| 105,616 | Freddie Mac REMIC Trust 2114 ZM, 6.000%, 01/15/2029 | 116,955 | 0.0 | |
| 718,032 | Freddie Mac REMIC Trust 2143 ZB, 6.000%, 04/15/2029 | 812,402 | 0.0 | |
| 122,188 | Freddie Mac REMIC Trust 2528 KM, 5.500%, 11/15/2022 | 127,008 | 0.0 | |
| 299,190 | Freddie Mac REMIC Trust 2541 NE, 5.500%, 12/15/2032 | 346,275 | 0.0 | |
| 114,334 | (5) | Freddie Mac REMIC Trust 2594 IY, 6.000%, 04/15/2033 | 24,157 | 0.0 |
| 777,775 | Freddie Mac REMIC Trust 2845 QH, 5.000%, 08/15/2034 | 888,210 | 0.0 | |
| 155,584 | Freddie Mac REMIC Trust 2861 Z, 5.500%, 09/15/2034 | 183,727 | 0.0 | |
| 583,523 | (5) | Freddie Mac REMIC Trust 2866 GS, 5.895%, (-1.000*US0001M + 6.600%), 09/15/2034 | 17,725 | 0.0 |
| 253,798 | (5) | Freddie Mac REMIC Trust 2883 SD, 5.995%, (-1.000*US0001M + 6.700%), 10/15/2034 | 10,517 | 0.0 |
| 225,653 | Freddie Mac REMIC Trust 2930 ZL, 5.000%, 02/15/2035 | 257,601 | 0.0 | |
| 315,412 | Freddie Mac REMIC Trust 2931 ZY, 5.000%, 02/15/2035 | 360,376 | 0.0 | |
| 6,522,054 | (5) | Freddie Mac REMIC Trust 3045 DI, 6.025%, (-1.000*US0001M + 6.730%), 10/15/2035 | 1,465,529 | 0.0 |
| 1,167,835 | Freddie Mac REMIC Trust 3117 ZA, 5.500%, 02/15/2036 | 1,335,139 | 0.0 | |
| 33,656 | (6) | Freddie Mac REMIC Trust 3139 PO, 0.000%, 01/15/2036 | 33,612 | 0.0 |
| 1,383,444 | (5) | Freddie Mac REMIC Trust 3171 PS, 5.780%, (-1.000*US0001M + 6.485%), 06/15/2036 | 285,621 | 0.0 |
| 6,826,290 | (5) | Freddie Mac REMIC Trust 3199 S, 5.745%, (-1.000*US0001M + 6.450%), 08/15/2036 | 1,607,468 | 0.0 |
| 593,752 | Freddie Mac REMIC Trust 3351 ZC, 5.500%, 07/15/2037 | 694,045 | 0.0 | |
| 193,439 | Freddie Mac REMIC Trust 3394 ZY, 6.000%, 11/15/2037 | 221,627 | 0.0 | |
| 316,516 | (3),(5) | Freddie Mac REMIC Trust 3524 LA, 5.085%, 03/15/2033 | 359,687 | 0.0 |
| 32,247 | Freddie Mac REMIC Trust 3556 NT, 3.805%, (US0001M + 3.100%), 03/15/2038 | 32,887 | 0.0 | |
| 6,346,979 | Freddie Mac REMIC Trust 3639 ZN, 5.500%, 12/15/2034 | 7,393,481 | 0.1 | |
| 571,641 | Freddie Mac REMIC Trust 3662 ZB, 5.500%, 08/15/2036 | 670,896 | 0.0 | |
| 329,512 | (5) | Freddie Mac REMIC Trust 3710 SL, 5.295%, (-1.000*US0001M + 6.000%), 05/15/2036 | 2,925 | 0.0 |
| 435,429 | Freddie Mac REMIC Trust 3724 CM, 5.500%, 06/15/2037 | 510,323 | 0.0 |
See Accompanying Notes to Financial Statements
| 43 |
| Voya Intermediate Bond Fund | PORTFOLIO OF INVESTMENTS |
| as of March31, 2020 (Continued) |
| 3,124,734 | Freddie Mac REMIC Trust 3747 HW, 4.500%, 05/15/2038 | 3,132,613 | 0.1 | |
| 997,649 | Freddie Mac REMIC Trust 3753 DC, 3.500%, 09/15/2039 | 1,047,804 | 0.0 | |
| 1,618,055 | (5) | Freddie Mac REMIC Trust 3856 KS, 5.845%, (-1.000*US0001M + 6.550%), 05/15/2041 | 303,315 | 0.0 |
| 1,235,818 | (5) | Freddie Mac REMIC Trust 3925 SD, 5.345%, (-1.000*US0001M + 6.050%), 07/15/2040 | 133,109 | 0.0 |
| 7,732,379 | (5) | Freddie Mac REMIC Trust 3925 SL, 5.345%, (-1.000*US0001M + 6.050%), 01/15/2041 | 760,312 | 0.0 |
| 367,535 | Freddie Mac REMIC Trust 4000 PA, 4.500%, 01/15/2042 | 414,569 | 0.0 | |
| 1,729,727 | (5) | Freddie Mac REMIC Trust 4027 QI, 4.500%, 12/15/2040 | 94,817 | 0.0 |
| 2,089,851 | (5) | Freddie Mac REMIC Trust 4088 CS, 5.295%, (-1.000*US0001M + 6.000%), 08/15/2042 | 369,467 | 0.0 |
| 7,495,836 | (5) | Freddie Mac REMIC Trust 4161 WI, 3.000%, 02/15/2033 | 698,270 | 0.0 |
| 3,943,196 | (5) | Freddie Mac REMIC Trust 4194 GI, 4.000%, 04/15/2043 | 553,246 | 0.0 |
| 4,017,818 | Freddie Mac REMIC Trust 4203 BN, 3.000%, 04/15/2033 | 4,325,934 | 0.1 | |
| 1,339,040 | Freddie Mac REMIC Trust 4246 ZX, 4.500%, 04/15/2041 | 1,574,548 | 0.0 | |
| 1,938,333 | (5) | Freddie Mac REMIC Trust 4293 KI, 4.500%, 08/15/2043 | 211,137 | 0.0 |
| 4,961,702 | Freddie Mac REMIC Trust 4335 ZX, 4.250%, 05/15/2044 | 5,842,754 | 0.1 | |
| 6,660,118 | Freddie Mac REMIC Trust 435 XZ, 4.250%, 05/15/2044 | 7,890,665 | 0.1 | |
| 1,916,000 | Freddie Mac REMIC Trust 4370 AD, 3.000%, 08/15/2040 | 2,004,385 | 0.0 | |
| 6,638,211 | (5) | Freddie Mac REMIC Trust 4386 LS, 5.395%, (-1.000*US0001M + 6.100%), 09/15/2044 | 1,136,810 | 0.0 |
| 4 | Freddie Mac REMICS 1006 I, 860.000%, 10/15/2020 | 7 | 0.0 | |
| 19 | Freddie Mac REMICS 1023 C, 508.500%, 12/15/2020 | 36 | 0.0 | |
| 42 | Freddie Mac REMICS 1094 L, 1141.844%, 06/15/2021 | 227 | 0.0 | |
| 18 | Freddie Mac REMICS 1159 D, 1029.473%, 11/15/2021 | 87 | 0.0 | |
| 10 | Freddie Mac REMICS 1278 L, 1127.368%, 05/15/2022 | 53 | 0.0 | |
| 1,120 | (5) | Freddie Mac REMICS 1368 S, 8.795%, (-1.000*US0001M + 9.500%), 08/15/2022 | 29 | 0.0 |
| 63,126 | (5) | Freddie Mac REMICS 2074 S, 7.900%, (-1.000*US0001M + 8.700%), 07/17/2028 | 6,504 | 0.0 |
| 59,687 | (5) | Freddie Mac REMICS 2232 SA, 7.800%, (-1.000*US0001M + 8.600%), 05/17/2030 | 4,137 | 0.0 |
| 22,442 | (5) | Freddie Mac REMICS 2301 SP, 8.545%, (-1.000*US0001M + 9.250%), 04/15/2031 | 3,061 | 0.0 |
| 1,683,221 | (5) | Freddie Mac REMICS 2953 LS, 5.995%, (-1.000*US0001M + 6.700%), 12/15/2034 | 109,368 | 0.0 |
| 1,774,818 | (5) | Freddie Mac REMICS 2993 GS, 5.445%, (-1.000*US0001M + 6.150%), 06/15/2025 | 155,493 | 0.0 |
| 924,637 | (5) | Freddie Mac REMICS 3006 SI, 6.035%, (-1.000*US0001M + 6.740%), 07/15/2035 | 189,874 | 0.0 |
| 1,066,993 | (5) | Freddie Mac REMICS 3006 YI, 6.035%, (-1.000*US0001M + 6.740%), 07/15/2035 | 233,300 | 0.0 |
| 6,321,494 | (5) | Freddie Mac REMICS 3213 JS, 6.495%, (-1.000*US0001M + 7.200%), 09/15/2036 | 1,688,974 | 0.0 |
| 1,404,517 | (5) | Freddie Mac REMICS 3375 QI, 0.600%, (-10.000*US0001M + 64.600%), 10/15/2037 | 36,525 | 0.0 |
| 4,369,517 | Freddie Mac REMICS 3736 ZP, 4.000%, 10/15/2040 | 4,924,926 | 0.1 | |
| 4,662,551 | Freddie Mac REMICS 3740 KE, 4.000%, 10/15/2040 | 5,177,679 | 0.1 | |
| 21,290,731 | Freddie Mac REMICS 3753 KZ, 4.500%, 11/15/2040 | 25,012,542 | 0.3 | |
| 6,372,812 | Freddie Mac REMICS 3775 GZ, 4.500%, 12/15/2040 | 7,244,894 | 0.1 | |
| 1,900,000 | Freddie Mac REMICS 3820 NC, 4.500%, 03/15/2041 | 2,264,959 | 0.0 | |
| 708,418 | Freddie Mac REMICS 3843 JZ, 5.100%, 04/15/2041 | 925,122 | 0.0 | |
| 500,000 | Freddie Mac REMICS 3848 WX, 5.000%, 04/15/2041 | 588,626 | 0.0 |
See Accompanying Notes to Financial Statements
| 44 |
| Voya Intermediate Bond Fund | PORTFOLIO OF INVESTMENTS |
| as of March31, 2020 (Continued) |
| 2,650,000 | Freddie Mac REMICS 3890 ME, 5.000%, 07/15/2041 | 3,223,594 | 0.1 | |
| 5,000,000 | Freddie Mac REMICS 3893 PU, 4.000%, 07/15/2041 | 5,658,683 | 0.1 | |
| 7,000,000 | Freddie Mac REMICS 3919 BY, 4.000%, 09/15/2041 | 7,878,620 | 0.1 | |
| 9,344,112 | Freddie Mac REMICS 3919 ZB, 4.000%, 09/15/2041 | 10,725,366 | 0.1 | |
| 3,790,000 | Freddie Mac REMICS 3923 GY, 4.000%, 09/15/2041 | 4,516,473 | 0.1 | |
| 3,000,000 | Freddie Mac REMICS 3934 CB, 4.000%, 10/15/2041 | 3,362,285 | 0.1 | |
| 420,000 | Freddie Mac REMICS 3934 KB, 5.000%, 10/15/2041 | 495,360 | 0.0 | |
| 1,500,000 | Freddie Mac REMICS 3997 PB, 4.000%, 02/15/2042 | 1,708,922 | 0.0 | |
| 2,756,359 | Freddie Mac REMICS 4000 ZT, 3.500%, 01/15/2042 | 3,212,023 | 0.1 | |
| 9,108,799 | (5) | Freddie Mac REMICS 4057 SN, 5.945%, (-1.000*US0001M + 6.650%), 12/15/2041 | 1,299,270 | 0.0 |
| 3,146,604 | Freddie Mac REMICS 4057 ZB, 3.500%, 06/15/2042 | 3,405,636 | 0.1 | |
| 14,804,327 | Freddie Mac REMICS 4084 TZ, 4.000%, 07/15/2042 | 16,657,818 | 0.2 | |
| 2,930,546 | (5) | Freddie Mac REMICS 4090 SN, 5.995%, (-1.000*US0001M + 6.700%), 08/15/2032 | 513,605 | 0.0 |
| 1,620,994 | Freddie Mac REMICS 4100 JA, 3.500%, 10/15/2041 | 1,738,864 | 0.0 | |
| 2,128,000 | Freddie Mac REMICS 4193 BP, 4.000%, 04/15/2043 | 2,692,548 | 0.0 | |
| 10,325,701 | Freddie Mac REMICS 4199 BZ, 3.500%, 05/15/2043 | 11,178,300 | 0.1 | |
| 310,000 | Freddie Mac REMICS 4235 QD, 3.000%, 08/15/2033 | 345,500 | 0.0 | |
| 47,135,510 | (5) | Freddie Mac REMICS 4301 SD, 5.395%, (-1.000*US0001M + 6.100%), 07/15/2037 | 9,490,231 | 0.1 |
| 6,247,838 | Freddie Mac REMICS 4310 BZ, 4.000%, 02/15/2044 | 7,119,283 | 0.1 | |
| 3,102,000 | Freddie Mac REMICS 4401 BL, 3.500%, 10/15/2034 | 3,628,022 | 0.1 | |
| 25,552,588 | (5) | Freddie Mac REMICS 4461 AS, 4.895%, (-1.000*US0001M + 5.600%), 04/15/2045 | 5,003,473 | 0.1 |
| 3,124,000 | Freddie Mac REMICS 4492 VB, 3.500%, 05/15/2035 | 3,603,912 | 0.1 | |
| 946,247 | Freddie Mac REMICS 4500 HC, 3.000%, 11/15/2042 | 995,408 | 0.0 | |
| 2,913,000 | Freddie Mac REMICS 4505 PB, 3.000%, 08/15/2045 | 3,243,296 | 0.1 | |
| 29,277,089 | (5) | Freddie Mac REMICS 4574 ST, 5.295%, (-1.000*US0001M + 6.000%), 04/15/2046 | 4,956,008 | 0.1 |
| 7,313,376 | Freddie Mac REMICS 4608 JV, 3.500%, 01/15/2055 | 7,748,812 | 0.1 | |
| 719,506 | Freddie Mac REMICS 4673 WA, 3.500%, 09/15/2043 | 755,004 | 0.0 | |
| 32,265,802 | Freddie Mac REMICS 4771 HZ, 3.500%, 03/15/2048 | 37,006,274 | 0.5 | |
| 2,457,000 | Freddie Mac REMICS 4772 VG, 4.500%, 08/15/2036 | 2,820,871 | 0.0 | |
| 1,350,000 | Freddie Mac REMICS 4787 PY, 4.000%, 05/15/2048 | 1,475,507 | 0.0 | |
| 13,474,764 | Freddie Mac REMICS 4795 D, 5.000%, 05/15/2048 | 16,234,006 | 0.2 | |
| 1,632,872 | Freddie Mac REMICS 4904 HB, 3.000%, 08/25/2049 | 1,751,224 | 0.0 | |
| 606,535 | Freddie Mac REMICS 4914 DB, 3.000%, 09/25/2049 | 676,009 | 0.0 | |
| 11,606,176 | Freddie Mac Series 4348 ZX, 4.250%, 06/15/2044 | 13,665,211 | 0.2 | |
| 9,500,000 | (1) | Freddie Mac STACR Trust 2018-DNA2 M2, 3.097%, (US0001M + 2.150%), 12/25/2030 | 7,846,813 | 0.1 |
| 4,000,000 | (1) | Freddie Mac STACR Trust 2018-DNA3 M2, 3.047%, (US0001M + 2.100%), 09/25/2048 | 3,341,904 | 0.1 |
| 6,000,000 | (1) | Freddie Mac Stacr Trust 2018-HQA2 M2, 3.247%, (US0001M + 2.300%), 10/25/2048 | 4,972,423 | 0.1 |
| 6,892,611 | Freddie Mac Strips 277 30, 3.000%, 09/15/2042 | 7,271,368 | 0.1 | |
| 6,892,641 | (5) | Freddie Mac Strips 303 C17, 3.500%, 01/15/2043 | 904,164 | 0.0 |
| 4,940,000 | Freddie Mac Structured Agency Credit Risk Debt Notes 2015-DNA2 M3, 4.847%, (US0001M + 3.900%), 12/25/2027 | 4,872,321 | 0.1 |
See Accompanying Notes to Financial Statements
| 45 |
| Voya Intermediate Bond Fund | PORTFOLIO OF INVESTMENTS |
| as of March31, 2020 (Continued) |
| 5,750,000 | Freddie Mac Structured Agency Credit Risk Debt Notes 2015-DNA3 M3, 5.647%, (US0001M + 4.700%), 04/25/2028 | 5,349,821 | 0.1 | |
| 2,872,721 | Freddie Mac Structured Agency Credit Risk Debt Notes 2015-HQ1 M3, 4.747%, (US0001M + 3.800%), 03/25/2025 | 2,759,543 | 0.0 | |
| 14,050,000 | Freddie Mac Structured Agency Credit Risk Debt Notes 2016-DNA1 M3, 6.497%, (US0001M + 5.550%), 07/25/2028 | 13,696,249 | 0.2 | |
| 7,300,000 | Freddie Mac Structured Agency Credit Risk Debt Notes 2016-HQA2 M3, 6.097%, (US0001M + 5.150%), 11/25/2028 | 7,006,361 | 0.1 | |
| 750,000 | Freddie Mac Structured Agency Credit Risk Debt Notes 2016-HQA3 M3, 4.797%, (US0001M + 3.850%), 03/25/2029 | 677,869 | 0.0 | |
| 5,600,000 | Freddie Mac Structured Agency Credit Risk Debt Notes 2017-DNA2 M2, 4.397%, (US0001M + 3.450%), 10/25/2029 | 5,064,665 | 0.1 | |
| 8,200,000 | Freddie Mac Structured Agency Credit Risk Debt Notes 2017-DNA3 M2, 3.447%, (US0001M + 2.500%), 03/25/2030 | 7,170,831 | 0.1 | |
| 6,800,000 | Freddie Mac Structured Agency Credit Risk Debt Notes 2017-HQA1 M2, 4.497%, (US0001M + 3.550%), 08/25/2029 | 5,406,174 | 0.1 | |
| 12,300,000 | Freddie Mac Structured Agency Credit Risk Debt Notes 2017-HQA2 M2, 3.597%, (US0001M + 2.650%), 12/25/2029 | 10,800,875 | 0.1 | |
| 11,058,277 | Freddie Mac Structured Agency Credit Risk Debt Notes 2017-HQA3 M2, 3.297%, (US0001M + 2.350%), 04/25/2030 | 9,626,686 | 0.1 | |
| 9,200,000 | Freddie Mac Structured Agency Credit Risk Debt Notes 2018-DNA1 M2, 2.747%, (US0001M + 1.800%), 07/25/2030 | 7,656,906 | 0.1 | |
| 1,787,558 | Freddie Mac Structured Agency Credit Risk Debt Notes 2018-HQA1 M2, 3.247%, (US0001M + 2.300%), 09/25/2030 | 1,526,155 | 0.0 | |
| 6,550,000 | (1) | Freddie Mac Structured Agency Credit Risk Debt Notes 2019-DNA1 M2, 3.597%, (US0001M + 2.650%), 01/25/2049 | 5,849,109 | 0.1 |
| 8,169,000 | (1) | Freddie Mac Structured Agency Credit Risk Debt Notes 2019-HQA2 M2, 2.997%, (US0001M + 2.050%), 04/25/2049 | 6,859,734 | 0.1 |
| 1,057,887 | (3) | Freddie Mac Structured Pass Through Certificates T-48 1A, 4.879%, 07/25/2033 | 1,180,269 | 0.0 |
| 60,017,189 | (5) | Freddie Mac REMICS 4585 AS, 5.395%, (-1.000*US0001M + 6.100%), 05/15/2046 | 12,227,362 | 0.2 |
| 1,324,499 | Freddie Mac REMICS 4612 JZ, 3.000%, 09/15/2046 | 1,324,554 | 0.0 | |
| 6,351,283 | Freddie Mac REMICS 4682 HZ, 3.500%, 04/15/2047 | 6,916,832 | 0.1 | |
| 21,662,859 | Freddie Mac REMICS 4776 AZ, 4.000%, 07/15/2047 | 24,078,047 | 0.3 | |
| 68,863,637 | (5) | Freddie Mac REMICS 4879 DS, 5.395%, (-1.000*US0001M + 6.100%), 08/15/2034 | 13,559,794 | 0.2 |
| 4,500,000 | (1) | Freddie Mac STACR Remic Trust 2020-DNA2 M2, 2.797%, (US0001M + 1.850%), 02/25/2050 | 2,927,503 | 0.0 |
| 6,900,000 | (1) | Freddie Mac STACR REMIC Trust 2020-HQA1 M2, 2.847%, (US0001M + 1.900%), 01/25/2050 | 4,408,700 | 0.1 |
| 1,700,000 | (1) | Freddie Mac Stacr Remic Trust 2020-HQA2 M2, 3.911%, (US0001M + 3.100%), 03/25/2050 | 1,116,794 | 0.0 |
| 988,522 | (1),(3) | Galton Funding Mortgage Trust 2017-2 A21, 4.000%, 06/25/2059 | 972,170 | 0.0 |
| 3,594,582 | (1),(3) | Galton Funding Mortgage Trust 2018-1 B1, 3.800%, 11/25/2057 | 3,380,108 | 0.1 |
| 3,924,585 | (1),(3) | Galton Funding Mortgage Trust 2018-2 B2, 4.750%, 10/25/2058 | 3,770,008 | 0.1 |
See Accompanying Notes to Financial Statements
| 46 |
| Voya Intermediate Bond Fund | PORTFOLIO OF INVESTMENTS |
| as of March31, 2020 (Continued) |
| 2,500,000 | (1),(3) | Galton Funding Mortgage Trust 2018-2 A51, 4.500%, 10/25/2058 | 2,471,137 | 0.0 |
| 1,975,586 | (5) | Ginnie Mae 2005-37 SI, 5.377%, (-1.000*US0001M + 6.150%), 05/20/2035 | 362,534 | 0.0 |
| 2,007,194 | (5) | Ginnie Mae 2007-23 ST, 5.427%, (-1.000*US0001M + 6.200%), 04/20/2037 | 330,357 | 0.0 |
| 2,284,589 | (5) | Ginnie Mae 2007-40 SE, 5.977%, (-1.000*US0001M + 6.750%), 07/20/2037 | 530,804 | 0.0 |
| 1,616,560 | (5) | Ginnie Mae 2007-7 EI, 5.427%, (-1.000*US0001M + 6.200%), 02/20/2037 | 342,503 | 0.0 |
| 5,445,509 | (5) | Ginnie Mae 2010-11 SA, 5.715%, (-1.000*US0001M + 6.420%), 01/16/2040 | 1,245,958 | 0.0 |
| 2,319,094 | (5) | Ginnie Mae 2010-14 SB, 6.027%, (-1.000*US0001M + 6.800%), 11/20/2035 | 522,338 | 0.0 |
| 1,907,535 | (5) | Ginnie Mae 2010-99 IT, 5.000%, 08/16/2040 | 333,599 | 0.0 |
| 913,473 | Ginnie Mae 2013-69 KA, 1.250%, 08/20/2042 | 899,828 | 0.0 | |
| 2,218,616 | Ginnie Mae 2015-3 ZD, 4.000%, 01/20/2045 | 2,560,955 | 0.0 | |
| 57,445,031 | (5) | Ginnie Mae 2018-167 CS, 5.327%, (-1.000*US0001M + 6.100%), 12/20/2048 | 7,931,837 | 0.1 |
| 630,874 | (5) | Ginnie Mae Series 2005-7 AH, 6.065%, (-1.000*US0001M + 6.770%), 02/16/2035 | 133,847 | 0.0 |
| 12,287,739 | (5) | Ginnie Mae Series 2007-41 SL, 5.927%, (-1.000*US0001M + 6.700%), 07/20/2037 | 3,046,102 | 0.0 |
| 1,312,813 | (5) | Ginnie Mae Series 2008-2 SW, 5.777%, (-1.000*US0001M + 6.550%), 01/20/2038 | 343,023 | 0.0 |
| 777,168 | (5) | Ginnie Mae Series 2008-35 SN, 5.627%, (-1.000*US0001M + 6.400%), 04/20/2038 | 133,626 | 0.0 |
| 443,694 | (5) | Ginnie Mae Series 2008-40 PS, 5.795%, (-1.000*US0001M + 6.500%), 05/16/2038 | 92,468 | 0.0 |
| 1,096,036 | (5) | Ginnie Mae Series 2009-25 KS, 5.427%, (-1.000*US0001M + 6.200%), 04/20/2039 | 241,144 | 0.0 |
| 865,603 | Ginnie Mae Series 2009-29 PB, 4.750%, 05/20/2039 | 984,590 | 0.0 | |
| 929,956 | Ginnie Mae Series 2009-31 ZL, 4.500%, 05/20/2039 | 1,067,059 | 0.0 | |
| 1,439,104 | (5) | Ginnie Mae Series 2009-33 SN, 5.527%, (-1.000*US0001M + 6.300%), 05/20/2039 | 51,207 | 0.0 |
| 12,083,146 | Ginnie Mae Series 2009-33 ZB, 6.000%, 05/20/2039 | 13,809,624 | 0.2 | |
| 1,909,885 | Ginnie Mae Series 2009-34 Z, 4.500%, 05/16/2039 | 2,142,598 | 0.0 | |
| 192,878 | (5) | Ginnie Mae Series 2009-43 HS, 5.427%, (-1.000*US0001M + 6.200%), 06/20/2038 | 5,868 | 0.0 |
| 2,600,663 | Ginnie Mae Series 2009-98 DA, 3.250%, 07/16/2039 | 2,777,505 | 0.0 | |
| 5,155,446 | Ginnie Mae Series 2010-108 WL, 4.000%, 04/16/2040 | 5,681,101 | 0.1 | |
| 2,087,088 | (5) | Ginnie Mae Series 2010-116 NS, 5.945%, (-1.000*US0001M + 6.650%), 09/16/2040 | 431,087 | 0.0 |
| 5,946,065 | (5) | Ginnie Mae Series 2010-116 SK, 5.847%, (-1.000*US0001M + 6.620%), 08/20/2040 | 1,389,573 | 0.0 |
| 8,824,633 | (5) | Ginnie Mae Series 2010-149 HS, 5.395%, (-1.000*US0001M + 6.100%), 05/16/2040 | 1,108,158 | 0.0 |
| 480,000 | Ginnie Mae Series 2010-164 MD, 4.000%, 12/20/2040 | 554,511 | 0.0 | |
| 1,781,055 | (5) | Ginnie Mae Series 2010-168 BI, 5.000%, 04/20/2040 | 421,687 | 0.0 |
| 1,711,158 | (5) | Ginnie Mae Series 2010-68 MS, 5.077%, (-1.000*US0001M + 5.850%), 06/20/2040 | 325,765 | 0.0 |
| 3,893,620 | Ginnie Mae Series 2011-52 PA, 4.250%, 02/16/2041 | 4,276,402 | 0.1 | |
| 4,656,439 | (5) | Ginnie Mae Series 2011-72 SA, 4.645%, (-1.000*US0001M + 5.350%), 05/16/2041 | 779,364 | 0.0 |
| 4,983,013 | (5) | Ginnie Mae Series 2011-73 LS, 5.917%, (-1.000*US0001M + 6.690%), 08/20/2039 | 413,007 | 0.0 |
| 73,151 | Ginnie Mae Series 2012-43 MA, 4.000%, 10/20/2041 | 74,984 | 0.0 | |
| 1,189,731 | (5) | Ginnie Mae Series 2012-91 QI, 4.500%, 09/20/2041 | 93,850 | 0.0 |
| 1,388,000 | Ginnie Mae Series 2013-116 KB, 3.500%, 12/20/2042 | 1,514,685 | 0.0 | |
| 8,505,246 | (5) | Ginnie Mae Series 2013-167 PI, 5.500%, 11/20/2043 | 1,545,852 | 0.0 |
See Accompanying Notes to Financial Statements
| 47 |
| Voya Intermediate Bond Fund | PORTFOLIO OF INVESTMENTS |
| as of March31, 2020 (Continued) |
| 666,693 | Ginnie Mae Series 2013-27 KA, 2.250%, 02/20/2043 | 691,320 | 0.0 | |
| 1,866,766 | (5) | Ginnie Mae Series 2014-10 GI, 4.500%, 01/16/2029 | 142,130 | 0.0 |
| 5,316,013 | (5) | Ginnie Mae Series 2014-185 SB, 4.827%, (-1.000*US0001M + 5.600%), 12/20/2044 | 1,032,051 | 0.0 |
| 5,121,927 | (5) | Ginnie Mae Series 2014-3 QS, 5.377%, (-1.000*US0001M + 6.150%), 03/20/2043 | 707,594 | 0.0 |
| 8,930,697 | (5) | Ginnie Mae Series 2014-3 SU, 5.277%, (-1.000*US0001M + 6.050%), 07/20/2039 | 1,913,379 | 0.0 |
| 7,429,758 | (5) | Ginnie Mae Series 2014-56 SP, 5.495%, (-1.000*US0001M + 6.200%), 12/16/2039 | 1,099,495 | 0.0 |
| 12,037,543 | (5) | Ginnie Mae Series 2014-58 SG, 4.895%, (-1.000*US0001M + 5.600%), 04/16/2044 | 1,791,634 | 0.0 |
| 41,411,717 | (5) | Ginnie Mae Series 2015-110 MS, 4.937%, (-1.000*US0001M + 5.710%), 08/20/2045 | 6,604,279 | 0.1 |
| 2,198,621 | Ginnie Mae Series 2015-27 PB, 3.000%, 08/20/2044 | 2,343,587 | 0.0 | |
| 28,739,960 | (5) | Ginnie Mae Series 2016-160 GS, 5.327%, (-1.000*US0001M + 6.100%), 11/20/2046 | 5,784,538 | 0.1 |
| 2,235,042 | Ginnie Mae Series 2016-44 JA, 3.500%, 03/20/2046 | 2,409,913 | 0.0 | |
| 299,760 | Ginnie Mae Series 2018-104 HZ, 3.500%, 08/20/2048 | 331,263 | 0.0 | |
| 6,495,085 | Ginnie Mae Series 2018-120 DE, 3.500%, 09/20/2048 | 6,929,504 | 0.1 | |
| 179,366 | Ginnie Mae Series 2018-122 GZ, 3.500%, 09/20/2048 | 205,555 | 0.0 | |
| 4,977,225 | Ginnie Mae Series 2018-126 A, 3.500%, 09/20/2048 | 5,311,148 | 0.1 | |
| 178,056 | Ginnie Mae Series 2018-147 KZ, 3.750%, 10/20/2048 | 207,915 | 0.0 | |
| 176,532 | Ginnie Mae Series 2019-100 JB, 3.000%, 08/20/2049 | 187,140 | 0.0 | |
| 532,322 | Ginnie Mae Series 2019-100 KB, 3.000%, 08/20/2049 | 564,008 | 0.0 | |
| 1,349,931 | Ginnie Mae Series 2019-100 MC, 3.000%, 08/20/2049 | 1,424,070 | 0.0 | |
| 1,081,376 | Ginnie Mae Series 2019-23 NG, 3.500%, 02/20/2049 | 1,210,605 | 0.0 | |
| 71,326 | Ginnie Mae Series 2019-54 AB, 3.000%, 04/20/2049 | 76,610 | 0.0 | |
| 798,785 | Ginnie Mae Series 2019-78 MB, 3.000%, 06/20/2049 | 846,754 | 0.0 | |
| 416,445 | Ginnie Mae Series 2019-89 KB, 3.000%, 07/20/2049 | 438,244 | 0.0 | |
| 299,424 | Ginnie Mae Series 2019-89 WB, 3.000%, 07/20/2049 | 314,827 | 0.0 | |
| 2,059,629 | (1),(3) | GS Mortage-Backed Securities Trust 2020-PJ1 A1, 3.500%, 05/01/2050 | 2,095,530 | 0.0 |
| 3,303,252 | (1),(3) | GS Mortage-Backed Securities Trust 2020-PJ1 A4, 3.500%, 05/01/2050 | 3,346,014 | 0.1 |
| 2,100,000 | (1),(3) | GS Mortage-Backed Securities Trust 2020-PJ1 A8, 3.500%, 05/01/2050 | 1,997,213 | 0.0 |
| 5,990,521 | (1),(3) | GS Mortgage-Backed Securities Corp. Trust 2019-PJ2 A1, 4.000%, 11/25/2049 | 6,081,056 | 0.1 |
| 2,963,200 | (1),(3) | GS Mortgage-Backed Securities Corp. Trust 2019-PJ2 B3, 4.496%, 11/25/2049 | 2,734,940 | 0.0 |
| 1,190,135 | (1),(3) | GS Mortgage-Backed Securities Corp. Trust 2019-PJ3 B1, 4.095%, 03/25/2050 | 1,176,568 | 0.0 |
| 7,253,939 | (1),(3) | GS Mortgage-Backed Securities Corp. Trust 2020-PJ2 A4, 3.500%, 07/25/2050 | 7,276,202 | 0.1 |
| 3,253 | GSR Mortgage Loan Trust 2005-5F 8A1, 1.447%, (US0001M + 0.500%), 06/25/2035 | 2,959 | 0.0 | |
| 213,505 | GSR Mortgage Loan Trust 2007-1F 3A13, 6.000%, 01/25/2037 | 185,296 | 0.0 | |
| 2,662,384 | HarborView Mortgage Loan Trust 2007-5 A1A, 0.940%, (US0001M + 0.190%), 09/19/2037 | 2,180,367 | 0.0 | |
| 146,863 | HomeBanc Mortgage Trust 2004-1 2A, 1.807%, (US0001M + 0.860%), 08/25/2029 | 131,884 | 0.0 | |
| 2,000,000 | HomeBanc Mortgage Trust 2005-4 M1, 1.417%, (US0001M + 0.470%), 10/25/2035 | 1,772,422 | 0.0 | |
| 1,940,951 | (1),(3) | Homeward Opportunities Fund I Trust 2019-2 A3, 3.007%, 09/25/2059 | 1,878,866 | 0.0 |
| 1,157,501 | Impac CMB Trust Series 2005-1 M1, 1.637%, (US0001M + 0.690%), 04/25/2035 | 990,969 | 0.0 |
See Accompanying Notes to Financial Statements
| 48 |
| Voya Intermediate Bond Fund | PORTFOLIO OF INVESTMENTS |
| as of March31, 2020 (Continued) |
| 1,705,471 | IndyMac INDX Mortgage Loan Trust 2006-AR2 1A1B, 1.157%, (US0001M + 0.210%), 04/25/2046 | 1,379,438 | 0.0 | |
| 2,498,453 | IndyMac INDX Mortgage Loan Trust 2006-AR2 2A1, 1.157%, (US0001M + 0.210%), 02/25/2046 | 1,838,327 | 0.0 | |
| 2,802,412 | (1),(3) | JP Morgan Mortgage Trust 2019-6 B1, 4.250%, 12/25/2049 | 2,567,440 | 0.0 |
| 5,181,558 | (1),(3) | JP Morgan Mortgage Trust 2020-1 A15, 3.500%, 06/25/2050 | 5,240,713 | 0.1 |
| 2,300,000 | (1),(3) | JP Morgan Mortgage Trust 2020-1 A7, 3.500%, 06/25/2050 | 2,219,049 | 0.0 |
| 6,000,000 | (1),(3) | JP Morgan Mortgage Trust 2020-LTV1 A5, 3.500%, 06/25/2050 | 5,864,080 | 0.1 |
| 965,335 | (1),(3) | J.P. Morgan Mortgage Trust 2019-2 A3, 4.000%, 08/25/2049 | 986,627 | 0.0 |
| 380,969 | JP Morgan Alternative Loan Trust 2005-S1 1A1, 5.500%, 12/25/2035 | 255,096 | 0.0 | |
| 2,519,201 | (3) | JP Morgan Mortgage Trust 2005-A4 B1, 4.301%, 07/25/2035 | 2,173,672 | 0.0 |
| 4,320,587 | (1),(3) | JP Morgan Mortgage Trust 2016-1 B3, 3.868%, 05/25/2046 | 4,125,964 | 0.1 |
| 1,104,794 | (1),(3) | JP Morgan Mortgage Trust 2017-1 B4, 3.529%, 01/25/2047 | 1,004,419 | 0.0 |
| 5,736,713 | (1),(3) | JP Morgan Mortgage Trust 2017-3 1A13, 3.500%, 08/25/2047 | 5,653,415 | 0.1 |
| 3,479,878 | (1),(3) | JP Morgan Mortgage Trust 2017-3 B1, 3.834%, 08/25/2047 | 3,295,047 | 0.1 |
| 1,988,368 | (1),(3) | JP Morgan Mortgage Trust 2017-3 B2, 3.834%, 08/25/2047 | 1,856,115 | 0.0 |
| 1,431,875 | (1),(3) | JP Morgan Mortgage Trust 2017-6 B3, 3.818%, 12/25/2048 | 1,341,620 | 0.0 |
| 954,583 | (1),(3) | JP Morgan Mortgage Trust 2017-6 B4, 3.818%, 12/25/2048 | 864,384 | 0.0 |
| 2,066,124 | (1),(3) | JP Morgan Mortgage Trust 2018-1 B1, 3.738%, 06/25/2048 | 2,038,541 | 0.0 |
| 1,988,823 | (1),(3) | JP Morgan Mortgage Trust 2018-1 B2, 3.738%, 06/25/2048 | 1,856,407 | 0.0 |
| 2,625,361 | (1),(3) | JP Morgan Mortgage Trust 2018-1 B3, 3.738%, 06/25/2048 | 2,370,393 | 0.0 |
| 2,539,243 | (1),(3) | JP Morgan Mortgage Trust 2018-3 B1, 3.763%, 09/25/2048 | 2,343,901 | 0.0 |
| 2,187,402 | (1),(3) | JP Morgan Mortgage Trust 2018-4 B2, 3.773%, 10/25/2048 | 1,983,675 | 0.0 |
| 1,744,795 | (1),(3) | JP Morgan Mortgage Trust 2018-6C B2, 3.950%, 12/25/2048 | 1,602,981 | 0.0 |
| 2,936,710 | (1),(3) | JP Morgan Mortgage Trust 2018-9 B3, 4.462%, 02/25/2049 | 2,777,096 | 0.0 |
| 2,270,756 | (1),(3) | JP Morgan Mortgage Trust 2019-1 A3, 4.000%, 05/25/2049 | 2,315,175 | 0.0 |
| 3,199,066 | (1),(3) | JP Morgan Mortgage Trust 2019-1 B1, 4.515%, 05/25/2049 | 3,045,527 | 0.0 |
| 3,111,748 | (1),(3) | JP Morgan Mortgage Trust 2019-6 A3, 3.500%, 12/25/2049 | 3,172,715 | 0.1 |
| 4,230,821 | (1),(3) | JP Morgan Mortgage Trust 2019-6 B2, 4.250%, 12/25/2049 | 4,050,566 | 0.1 |
| 2,615,236 | (1),(3) | JP Morgan Mortgage Trust 2019-8 A15, 3.500%, 03/25/2050 | 2,630,444 | 0.0 |
| 4,509,714 | (1),(3) | JP Morgan Mortgage Trust 2019-LTV2 A18, 4.000%, 12/25/2049 | 4,652,986 | 0.1 |
| 3,604,602 | (1),(3) | JP Morgan Mortgage Trust 2019-LTV2 B3, 4.824%, 12/25/2049 | 3,127,237 | 0.1 |
| 7,617,817,917 | (1),(5) | L Street Securities 2017-PM1 XIO, 0.000%, 10/25/2048 | 7,825,023 | 0.1 |
| 15,717,603 | (5) | Lehman Mortgage Trust 2006-7 2A4, 5.603%, (-1.000*US0001M + 6.550%), 11/25/2036 | 4,888,714 | 0.1 |
| 11,017,563 | (5) | Lehman Mortgage Trust 2006-9 2A5, 5.673%, (-1.000*US0001M + 6.620%), 01/25/2037 | 1,008,787 | 0.0 |
| 1,506,045 | Lehman XS Trust Series 2005-5N 1A2, 1.307%, (US0001M + 0.360%), 11/25/2035 | 1,099,711 | 0.0 | |
| 4,695,654 | Morgan Stanley Mortgage Loan Trust 2007-13 6A1, 6.000%, 10/25/2037 | 3,313,939 | 0.1 | |
| 2,712,237 | (1),(3) | New Residential Mortgage Loan Trust 2017-3A B2, 4.750%, 04/25/2057 | 2,655,282 | 0.0 |
| 2,130,209 | (1),(3) | OBX 2019-EXP1 1A3 Trust, 4.000%, 01/25/2059 | 2,128,736 | 0.0 |
| 1,920,898 | (1),(3) | OBX 2019-EXP2 1A3 Trust, 4.000%, 07/25/2059 | 1,936,909 | 0.0 |
| 2,425,078 | (1),(3) | OBX 2019-INV2 A25 Trust, 4.000%, 05/27/2049 | 2,486,065 | 0.0 |
| 9,826,000 | Opteum Mortgage Acceptance Corp. Asset Backed Pass-Through Certificates 2005-4 M2, 1.447%, (US0001M + 0.500%), 11/25/2035 | 8,008,829 | 0.1 |
See Accompanying Notes to Financial Statements
| 49 |
| Voya Intermediate Bond Fund | PORTFOLIO OF INVESTMENTS |
| as of March31, 2020 (Continued) |
| 140,675 | Prime Mortgage Trust 2007-1 A4, 5.500%, 03/25/2037 | 121,295 | 0.0 | |
| 985,853 | (1),(3) | PSMC 2020-1 A1 Trust, 3.500%, 01/25/2050 | 1,000,758 | 0.0 |
| 5,539,108 | (1),(3) | RCKT Mortgage Trust 2019-1 A13, 3.500%, 09/25/2049 | 5,619,489 | 0.1 |
| 2,000,000 | (1),(3) | RCKT Mortgage Trust 2020-1 A13, 3.000%, 02/25/2050 | 1,979,054 | 0.0 |
| 9,338,295 | Seasoned Credit Risk Transfer Trust Series 2018-2 MV, 3.500%, 11/25/2057 | 10,090,298 | 0.1 | |
| 1,724,448 | (1),(3) | Sequoia Mortgage Trust 2014-3 B3, 3.938%, 10/25/2044 | 1,652,780 | 0.0 |
| 1,756,845 | (1),(3) | Sequoia Mortgage Trust 2014-4 B3, 3.865%, 11/25/2044 | 1,680,817 | 0.0 |
| 1,817,161 | (1),(3) | Sequoia Mortgage Trust 2015-2 B3, 3.736%, 05/25/2045 | 1,712,270 | 0.0 |
| 1,582,122 | (1),(3) | Sequoia Mortgage Trust 2015-3 B3, 3.703%, 07/25/2045 | 1,414,194 | 0.0 |
| 3,300,000 | (1),(3) | Sequoia Mortgage Trust 2017-CH2 A13, 4.000%, 12/25/2047 | 3,268,778 | 0.1 |
| 1,578,584 | (1),(3) | Sequoia Mortgage Trust 2018-CH1 A19, 4.000%, 02/25/2048 | 1,581,194 | 0.0 |
| 2,601,425 | (1),(3) | Sequoia Mortgage Trust 2018-CH1 B2B, 4.477%, 02/25/2048 | 2,475,823 | 0.0 |
| 1,534,356 | (1),(3) | Sequoia Mortgage Trust 2019-1 A1, 4.000%, 02/25/2049 | 1,518,357 | 0.0 |
| 3,799,750 | (1),(3) | Sequoia Mortgage Trust 2019-3 A2, 3.500%, 09/25/2049 | 3,842,919 | 0.1 |
| 3,765,863 | (1),(3) | Sequoia Mortgage Trust 2019-4 A19, 3.500%, 11/25/2049 | 3,809,886 | 0.1 |
| 1,437,709 | (1),(3) | Sequoia Mortgage Trust 2019-5 A19, 3.500%, 12/25/2049 | 1,465,397 | 0.0 |
| 1,409,971 | (1),(3) | Sequoia Mortgage Trust 2019-CH1 A1, 4.500%, 03/25/2049 | 1,409,081 | 0.0 |
| 4,496,197 | (1),(3) | Sequoia Mortgage Trust 2019-CH2 A1, 4.500%, 08/25/2049 | 4,503,227 | 0.1 |
| 5,278,376 | (1),(3) | Sequoia Mortgage Trust 2020-1 A19, 3.500%, 02/25/2050 | 5,391,809 | 0.1 |
| 5,200,000 | (1),(3) | Sequoia Mortgage Trust 2020-1 A7, 3.500%, 02/25/2050 | 4,987,198 | 0.1 |
| 4,373,811 | (1),(3) | Sequoia Mortgage Trust 2020-2 A19, 3.500%, 03/25/2050 | 4,407,575 | 0.1 |
| 1,996,698 | (1),(3) | Sequoia Mortgage Trust 2020-2 B2, 3.675%, 03/25/2050 | 1,594,768 | 0.0 |
| 2,690,000 | (1),(3) | Sequoia Mortgage Trust 2020-3 B2, 3.442%, 04/25/2050 | 2,110,337 | 0.0 |
| 1,893,046 | (1),(3) | Shellpoint Co-Originator Trust 2017-2 B2, 3.714%, 10/25/2047 | 1,844,002 | 0.0 |
| 2,457,097 | (1),(3) | Starwood Mortgage Residential Trust 2019-1 A3, 3.299%, 06/25/2049 | 2,455,712 | 0.0 |
| 21,640 | (3) | Structured Adjustable Rate Mortgage Loan Trust 2004-12 7A3, 4.088%, 09/25/2034 | 19,373 | 0.0 |
| 1,360,000 | (1) | Verus Securitization Trust 2017-SG1A B1, 3.615%, 11/25/2047 | 1,246,702 | 0.0 |
| 1,773,000 | (1),(3) | Verus Securitization Trust 2018-1 B1, 3.801%, 01/25/2058 | 1,613,305 | 0.0 |
| 1,231,000 | (1),(3) | Verus Securitization Trust 2018-2 B1, 4.426%, 06/01/2058 | 1,114,605 | 0.0 |
| 2,460,159 | (1),(7) | Verus Securitization Trust 2019-3 A2, 2.938%(Step Rate @ 3.938% on 07/25/2023), 07/25/2059 | 2,366,210 | 0.0 |
| 925,174 | (1),(7) | Verus Securitization Trust 2019-4 A3, 3.000%(Step Rate @ 4.000% on 10/25/2023), 11/25/2059 | 938,558 | 0.0 |
| 2,617,962 | (1),(3) | Verus Securitization Trust 2019-INV2 A2, 3.117%, 07/25/2059 | 2,589,761 | 0.0 |
| 989,346 | (3) | Wachovia Mortgage Loan LLC Series 2005-B 2A1, 4.284%, 10/20/2035 | 887,431 | 0.0 |
| 382,152 | (3) | WaMu Mortgage Pass Through Certificates Series 2006-AR12 2A3, 3.206%, 10/25/2036 | 310,910 | 0.0 |
| 4,632,449 | (3) | WaMu Mortgage Pass-Through Certificates Series 2004-AR4 A6 Trust, 4.464%, 06/25/2034 | 4,132,635 | 0.1 |
| 2,630,823 | WaMu Mortgage Pass-Through Certificates Series 2005-AR11 A1C3, 1.457%, (US0001M + 0.510%), 08/25/2045 | 2,459,192 | 0.0 | |
| 81,296,415 | (3),(5) | WaMu Mortgage Pass-Through Certificates Series 2005-AR11 X, 1.263%, 08/25/2045 | 4,140,134 | 0.1 |
| 2,061,973 | WaMu Mortgage Pass-Through Certificates Series 2005-AR13 A1C3, 1.437%, (US0001M + 0.490%), 10/25/2045 | 1,815,167 | 0.0 |
See Accompanying Notes to Financial Statements
| 50 |
| Voya Intermediate Bond Fund | PORTFOLIO OF INVESTMENTS |
| as of March31, 2020 (Continued) |
| 395,614 | (3) | WaMu Mortgage Pass-Through Certificates Series 2006-AR12 1A1, 3.694%, 10/25/2036 | 348,912 | 0.0 |
| 878,506 | (3) | WaMu Mortgage Pass-Through Certificates Series 2006-AR14 1A4, 3.270%, 11/25/2036 | 739,554 | 0.0 |
| 1,098,075 | (3) | WaMu Mortgage Pass-Through Certificates Series 2006-AR16 2A1, 3.333%, 12/25/2036 | 920,326 | 0.0 |
| 2,538,631 | (3) | WaMu Mortgage Pass-Through Certificates Series 2006-AR16 2A3, 3.333%, 12/25/2036 | 2,127,695 | 0.0 |
| 1,682,927 | (3) | WaMu Mortgage Pass-Through Certificates Series 2006-AR16 3A1, 3.523%, 12/25/2036 | 1,399,177 | 0.0 |
| 1,363,647 | (3) | WaMu Mortgage Pass-Through Certificates Series 2006-AR8 1A4, 3.890%, 08/25/2046 | 1,219,116 | 0.0 |
| 1,977,200 | (3) | WaMu Mortgage Pass-Through Certificates Series 2007-HY2 1A1, 3.740%, 12/25/2036 | 1,711,462 | 0.0 |
| 505,534 | (3) | WaMu Mortgage Pass-Through Certificates Series 2007-HY3 1A1, 3.237%, 03/25/2037 | 408,898 | 0.0 |
| 1,274,709 | (3) | WaMu Mortgage Pass-Through Certificates Series 2007-HY4 1A1, 3.428%, 04/25/2037 | 1,021,122 | 0.0 |
| 1,691,206 | Washington Mutual Mortgage Pass-Through Certificates WMALT Series 2005-10 2A3, 1.847%, (US0001M + 0.900%), 11/25/2035 | 1,287,968 | 0.0 | |
| 1,074,804 | Washington Mutual Mortgage Pass-Through Certificates WMALT Series 2005-5 CB3, 5.500%, 07/25/2035 | 981,317 | 0.0 | |
| 467,226 | Washington Mutual Mortgage Pass-Through Certificates WMALT Series 2005-8 1A2, 5.500%, 10/25/2035 | 432,061 | 0.0 | |
| 4,497,180 | Washington Mutual Mortgage Pass-Through Certificates WMALT Series 2006-AR6 2A, 2.926%, (12MTA + 0.960%), 08/25/2046 | 2,864,881 | 0.0 | |
| 747,143 | Washington Mutual Mortgage Pass-Through Certificates WMALT Series 2007-OC1 A3, 1.177%, (US0001M + 0.230%), 01/25/2047 | 610,334 | 0.0 | |
| 1,547,855 | Washington Mutual Mortgage Pass-Through Certificates WMALT Series 2007-OC1 A4, 1.267%, (US0001M + 0.320%), 01/25/2047 | 1,264,721 | 0.0 | |
| 1,642,683 | Washington Mutual Mortgage Pass-Through Certificates WMALT Series 2005-11 A1, 5.750%, 01/25/2036 | 1,416,961 | 0.0 | |
| 1,005,212 | Wells Fargo Alternative Loan 2007-PA2 2A1, 1.377%, (US0001M + 0.430%), 06/25/2037 | 757,207 | 0.0 | |
| 1,151,359 | Wells Fargo Alternative Loan 2007-PA3 3A1, 6.250%, 07/25/2037 | 1,064,771 | 0.0 | |
| 359,210 | (3) | Wells Fargo Mortgage Backed Securities 2006-AR4 2A4, 4.093%, 04/25/2036 | 346,081 | 0.0 |
| 2,025,285 | (1),(3) | Wells Fargo Mortgage Backed Securities 2019-4 B3 Trust, 3.596%, 09/25/2049 | 1,614,417 | 0.0 |
| 3,488,320 | (1),(3) | Wells Fargo Mortgage Backed Securities 2020-1 A17 Trust, 3.000%, 12/25/2049 | 3,470,845 | 0.1 |
| 1,800,800 | (1),(3) | WinWater Mortgage Loan Trust 2015-5 B4, 3.774%, 08/20/2045 | 1,685,805 | 0.0 |
| Total Collateralized Mortgage Obligations | ||||
| (Cost $1,711,193,594) | 1,708,802,457 | 20.8 | ||
| U.S. TREASURY OBLIGATIONS: 7.0% | ||||
| Treasury Inflation Indexed Protected Securities: 2.3% | ||||
| 181,844,231 | 0.125%,01/15/2030 | 187,624,176 | 2.3 | |
| U.S. Treasury Bonds: 1.9% | ||||
| 46,424,000 | 2.375%,11/15/2049 | 57,981,037 | 0.7 | |
| 67,450,000 | 3.500%,02/15/2039 | 96,047,746 | 1.2 | |
| 154,028,783 | 1.9 | |||
| U.S. Treasury Notes: 2.8% | ||||
| 2,502,000 | 1.500%,02/15/2030 | 2,697,615 | 0.0 | |
| 54,483,000 | 0.375%,03/31/2022 | 54,633,041 | 0.7 | |
| 68,697,000 | 0.500%,03/15/2023 | 69,134,407 | 0.8 | |
| 40,651,000 | 0.500%,03/31/2025 | 40,912,215 | 0.5 | |
See Accompanying Notes to Financial Statements
| 51 |
| Voya Intermediate Bond Fund | PORTFOLIO OF INVESTMENTS |
| as of March31, 2020 (Continued) |
| 67,576,000 | 0.625%,03/31/2027 | 67,960,074 | 0.8 | |
| 235,337,352 | 2.8 | |||
| Total U.S. Treasury Obligations | ||||
| (Cost $576,279,030) | 576,990,311 | 7.0 | ||
| U.S. GOVERNMENT AGENCY OBLIGATIONS: 16.6% | ||||
| Federal Home Loan Mortgage Corporation: 5.2%(8) | ||||
| 675,821 | 2.500%,05/01/2030 | 703,597 | 0.0 | |
| 1,009,554 | 2.500%,05/01/2030 | 1,055,959 | 0.0 | |
| 1,180,479 | 2.500%,06/01/2030 | 1,234,768 | 0.0 | |
| 1,569,278 | 3.000%,11/01/2042 | 1,664,386 | 0.0 | |
| 1,628,344 | 3.000%,02/01/2043 | 1,725,182 | 0.0 | |
| 1,961,076 | 3.000%,03/01/2045 | 2,077,567 | 0.0 | |
| 2,107,084 | 3.000%,03/01/2045 | 2,232,013 | 0.0 | |
| 4,896,773 | 3.000%,04/01/2045 | 5,186,775 | 0.1 | |
| 5,130,369 | 3.000%,04/01/2045 | 5,434,868 | 0.1 | |
| 2,191,361 | 3.000%,10/01/2046 | 2,321,632 | 0.0 | |
| 20,772,321 | 3.000%,10/01/2046 | 21,964,489 | 0.3 | |
| 8,101,210 | 3.000%,03/01/2048 | 8,563,186 | 0.1 | |
| 7,041,651 | 3.000%,03/01/2048 | 7,443,219 | 0.1 | |
| 26,317,160 | 3.000%,08/01/2048 | 27,742,162 | 0.3 | |
| 8,342,382 | 3.500%,01/01/2045 | 8,933,977 | 0.1 | |
| 2,649,939 | 3.500%,03/01/2045 | 2,836,023 | 0.0 | |
| 11,104,790 | 3.500%,12/01/2046 | 11,936,004 | 0.2 | |
| 22,322,925 | 3.500%,12/01/2046 | 23,835,582 | 0.3 | |
| 9,053,290 | 3.500%,04/01/2047 | 9,764,121 | 0.1 | |
| 14,067,432 | 3.500%,07/01/2047 | 14,947,775 | 0.2 | |
| 12,167,816 | 3.500%,10/01/2047 | 12,952,152 | 0.2 | |
| 35,056,116 | 3.500%,01/01/2048 | 37,288,819 | 0.5 | |
| 4,056,367 | 3.500%,03/01/2048 | 4,315,325 | 0.1 | |
| 59,045,357 | 3.500%,03/01/2048 | 63,454,712 | 0.8 | |
| 39,786,063 | 3.500%,11/01/2048 | 42,756,608 | 0.5 | |
| 1,042,716 | 4.000%,10/01/2041 | 1,129,304 | 0.0 | |
| 1,692,218 | 4.000%,12/01/2041 | 1,833,033 | 0.0 | |
| 2,846,094 | 4.000%,08/01/2044 | 3,086,462 | 0.0 | |
| 1,332,380 | 4.000%,07/01/2045 | 1,444,276 | 0.0 | |
| 2,516,746 | 4.000%,09/01/2045 | 2,729,065 | 0.0 | |
| 4,748,072 | 4.000%,09/01/2045 | 5,147,991 | 0.1 | |
| 2,955,235 | 4.000%,09/01/2045 | 3,187,438 | 0.1 | |
| 28,670,679 | 4.000%,11/01/2045 | 31,076,670 | 0.4 | |
| 3,543,133 | 4.000%,05/01/2046 | 3,831,831 | 0.1 | |
| 3,773,118 | 4.000%,05/01/2047 | 4,066,091 | 0.1 | |
| 17,000,504 | 4.000%,11/01/2047 | 18,251,401 | 0.2 | |
| 973,019 | 4.000%,03/01/2048 | 1,043,762 | 0.0 | |
| 8,797,935 | 4.000%,06/01/2048 | 9,666,328 | 0.1 | |
| 873,330 | 4.500%,08/01/2041 | 957,902 | 0.0 | |
| 1,285,504 | 4.500%,09/01/2041 | 1,410,178 | 0.0 | |
| 1,117,969 | 4.500%,10/01/2041 | 1,226,777 | 0.0 | |
| 1,611,994 | 4.500%,03/01/2044 | 1,766,624 | 0.0 | |
| 6,069,435 | 4.500%,02/01/2048 | 6,567,128 | 0.1 | |
| 1,750,097 | 4.500%,06/01/2048 | 1,889,061 | 0.0 | |
| 3,436 | 4.670%, (US0012M + 1.773%),05/01/2037 | 3,469 | 0.0 | |
| 114,194 | 5.000%,01/01/2041 | 126,963 | 0.0 | |
| 968,165 | 5.000%,04/01/2041 | 1,075,862 | 0.0 | |
| 29,258 | 5.500%,07/01/2037 | 33,243 | 0.0 | |
| 1,539,564 | 5.500%,11/01/2038 | 1,750,381 | 0.0 | |
| 1,289 | 6.000%,12/01/2028 | 1,430 | 0.0 | |
| 15,437 | 6.000%,01/01/2029 | 17,111 | 0.0 | |
| 3,805 | 6.500%,01/01/2024 | 4,222 | 0.0 | |
| 4,844 | 6.500%,12/01/2031 | 5,546 | 0.0 | |
| 470,671 | 6.500%,09/01/2034 | 544,123 | 0.0 | |
| 951 | 7.000%,03/01/2032 | 1,013 | 0.0 | |
| 426,245,586 | 5.2 | |||
| Federal National Mortgage Association: 0.4%(8) | ||||
| 5,692,239 | 3.500%,01/01/2044 | 6,092,149 | 0.1 | |
| 8,612,251 | 4.000%,12/01/2046 | 9,473,119 | 0.1 | |
| 84,046 | 4.029%, (US0012M + 1.486%),07/01/2035 | 85,223 | 0.0 | |
| 15,589,687 | 5.000%,08/01/2056 | 17,948,476 | 0.2 | |
| 174,147 | 6.000%,05/01/2038 | 198,429 | 0.0 | |
| 33,797,396 | 0.4 | |||
| Government National Mortgage Association: 2.4% | ||||
| 3,760,379 | 3.000%,04/20/2046 | 4,028,902 | 0.1 | |
| 659,308 | 3.000%,01/20/2047 | 705,943 | 0.0 | |
| 15,274,034 | 3.000%,10/20/2049 | 16,435,176 | 0.2 | |
| 9,061,079 | 3.000%,11/20/2049 | 9,749,892 | 0.1 | |
| 7,970,254 | 3.500%,07/20/2046 | 8,530,537 | 0.1 | |
| 1,251,091 | 3.500%,07/20/2046 | 1,339,099 | 0.0 | |
| 1,795,338 | 3.500%,10/20/2046 | 1,948,809 | 0.0 | |
| 1,091,915 | 3.500%,02/20/2047 | 1,160,192 | 0.0 | |
| 713,451 | 3.500%,03/20/2047 | 761,397 | 0.0 | |
| 1,207,617 | 3.500%,07/20/2047 | 1,286,497 | 0.0 | |
| 1,572,632 | 3.500%,08/20/2047 | 1,683,151 | 0.0 | |
| 3,452,224 | 3.500%,09/20/2047 | 3,691,469 | 0.0 | |
| 16,223,458 | 3.500%,12/20/2047 | 17,399,105 | 0.2 | |
| 8,364,780 | 3.500%,01/20/2048 | 8,961,625 | 0.1 | |
| 6,766,063 | 3.500%,02/20/2048 | 7,242,188 | 0.1 | |
| 13,059,112 | 3.500%,02/20/2048 | 14,110,871 | 0.2 | |
| 1,308,609 | 3.500%,03/20/2048 | 1,399,181 | 0.0 | |
| 32,707,017 | 3.500%,03/20/2048 | 35,179,994 | 0.4 | |
| 295,246 | 4.000%,11/20/2040 | 322,431 | 0.0 | |
| 1,893,770 | 4.000%,03/20/2046 | 2,046,683 | 0.0 | |
| 34,016,976 | 4.000%,09/20/2047 | 36,725,159 | 0.5 | |
| 19,621,334 | 4.000%,11/20/2049 | 20,898,205 | 0.3 | |
| 398,091 | 4.500%,10/15/2039 | 446,402 | 0.0 | |
| 255,440 | 4.500%,11/15/2039 | 286,445 | 0.0 | |
| 252,701 | 4.500%,11/15/2039 | 283,282 | 0.0 | |
| 85,652 | 4.500%,12/15/2039 | 96,031 | 0.0 | |
| 78,506 | 4.500%,08/20/2041 | 86,655 | 0.0 | |
| 4,588,939 | 4.500%,09/15/2047 | 5,023,580 | 0.1 | |
| 35,016 | (3) | 5.140%,10/20/2060 | 35,034 | 0.0 |
| 16,991 | (3) | 5.500%,03/20/2060 | 18,033 | 0.0 |
| 201,881,968 | 2.4 | |||
| Uniform Mortgage-Backed Securities: 8.6% | ||||
| 15,850,985 | 3.000%,01/01/2050 | 16,646,267 | 0.2 | |
| 29,275,429 | 3.500%,11/01/2047 | 31,501,602 | 0.4 | |
| 1,711,033 | 3.500%,12/01/2047 | 1,809,978 | 0.0 | |
| 26,055,601 | 3.500%,09/01/2049 | 27,676,666 | 0.3 | |
| 3,467,069 | 3.500%,10/01/2049 | 3,736,993 | 0.1 | |
| 2,033,278 | 4.000%,11/01/2045 | 2,216,715 | 0.0 | |
| 7,363,638 | 4.000%,08/01/2047 | 7,910,108 | 0.1 | |
| 1,918,416 | 4.000%,08/01/2047 | 2,059,377 | 0.0 | |
| 34,393,913 | 4.000%,04/01/2049 | 37,094,010 | 0.5 | |
| 1,579,505 | 2.500%,05/01/2030 | 1,649,872 | 0.0 | |
| 3,532,960 | 2.500%,06/01/2030 | 3,681,924 | 0.1 | |
| 2,468,734 | 2.500%,06/01/2030 | 2,572,853 | 0.0 | |
| 1,432,979 | 2.500%,07/01/2030 | 1,493,406 | 0.0 | |
| 16,785,094 | 2.500%,04/01/2037 | 17,570,730 | 0.2 | |
| 2,053,656 | 3.000%,08/01/2030 | 2,162,763 | 0.0 | |
| 1,145,085 | 3.000%,09/01/2030 | 1,207,673 | 0.0 | |
| 4,234,296 | 3.000%,04/01/2043 | 4,483,969 | 0.1 | |
| 3,414,448 | 3.000%,07/01/2043 | 3,615,913 | 0.1 | |
| 875,339 | 3.000%,08/01/2043 | 928,775 | 0.0 | |
| 795,063 | 3.000%,09/01/2043 | 842,075 | 0.0 | |
| 10,824,167 | 3.000%,04/01/2045 | 11,464,747 | 0.1 | |
| 2,164,518 | 3.000%,08/01/2046 | 2,291,046 | 0.0 | |
| 5,347,478 | 3.000%,08/01/2046 | 5,657,329 | 0.1 | |
| 1,066,012 | 3.000%,11/01/2046 | 1,131,128 | 0.0 | |
See Accompanying Notes to Financial Statements
| 52 |
| Voya Intermediate Bond Fund | PORTFOLIO OF INVESTMENTS |
| as of March31, 2020 (Continued) |
| 14,165,946 | 3.000%,12/01/2046 | 14,979,223 | 0.2 | |
| 4,310,884 | 3.000%,12/01/2046 | 4,556,213 | 0.1 | |
| 34,559,682 | 3.000%,01/01/2047 | 36,488,289 | 0.5 | |
| 7,824,987 | 3.000%,02/01/2047 | 8,227,626 | 0.1 | |
| 8,411,759 | 3.000%,03/01/2047 | 8,883,108 | 0.1 | |
| 8,639,014 | 3.000%,07/01/2047 | 9,125,392 | 0.1 | |
| 32,080,928 | 3.000%,12/01/2049 | 33,685,605 | 0.4 | |
| 44,310,259 | 3.500%,06/01/2034 | 47,024,836 | 0.6 | |
| 5,455,629 | 3.500%,10/01/2042 | 5,866,577 | 0.1 | |
| 1,818,720 | 3.500%,04/01/2043 | 1,956,679 | 0.0 | |
| 5,365,250 | 3.500%,08/01/2043 | 5,772,250 | 0.1 | |
| 3,394,695 | 3.500%,03/01/2044 | 3,651,836 | 0.1 | |
| 409,251 | 3.500%,01/01/2046 | 439,761 | 0.0 | |
| 620,611 | 3.500%,02/01/2046 | 666,801 | 0.0 | |
| 296,098 | 3.500%,02/01/2046 | 318,175 | 0.0 | |
| 24,750,188 | 3.500%,08/01/2046 | 26,595,685 | 0.3 | |
| 3,009,276 | 3.500%,08/01/2047 | 3,196,216 | 0.0 | |
| 3,971,275 | 3.500%,09/01/2047 | 4,219,069 | 0.1 | |
| 2,758,525 | 3.500%,02/01/2048 | 2,932,232 | 0.0 | |
| 4,158,600 | 3.500%,05/01/2048 | 4,418,026 | 0.1 | |
| 17,745,864 | 3.500%,07/01/2048 | 19,066,095 | 0.2 | |
| 76,337,605 | 3.500%,09/01/2049 | 80,825,151 | 1.0 | |
| 34,543,325 | 3.500%,02/01/2050 | 36,569,089 | 0.5 | |
| 464,992 | 4.000%,03/01/2042 | 504,192 | 0.0 | |
| 1,964,460 | 4.000%,07/01/2042 | 2,129,509 | 0.0 | |
| 2,172,500 | 4.000%,07/01/2042 | 2,355,962 | 0.0 | |
| 371,414 | 4.000%,07/01/2042 | 402,763 | 0.0 | |
| 1,036,149 | 4.000%,09/01/2043 | 1,133,716 | 0.0 | |
| 15,956,069 | 4.000%,01/01/2045 | 17,653,144 | 0.2 | |
| 2,198,845 | 4.000%,01/01/2045 | 2,371,236 | 0.0 | |
| 1,521,857 | 4.000%,03/01/2045 | 1,650,067 | 0.0 | |
| 12,712,732 | 4.000%,05/01/2045 | 13,771,330 | 0.2 | |
| 2,282,941 | 4.000%,06/01/2045 | 2,475,268 | 0.0 | |
| 6,789,455 | 4.000%,02/01/2046 | 7,369,345 | 0.1 | |
| 14,364,144 | 4.000%,07/01/2047 | 15,495,496 | 0.2 | |
| 838,324 | 4.000%,03/01/2048 | 897,699 | 0.0 | |
| 2,518,639 | 4.000%,03/01/2048 | 2,699,272 | 0.0 | |
| 12,274,593 | 4.000%,09/01/2048 | 13,247,179 | 0.2 | |
| 2,232,829 | 4.250%,11/01/2043 | 2,431,895 | 0.0 | |
| 233,474 | 4.500%,11/01/2040 | 256,273 | 0.0 | |
| 446,613 | 4.500%,11/01/2040 | 490,277 | 0.0 | |
| 3,416,591 | 4.500%,11/01/2040 | 3,750,823 | 0.1 | |
| 4,184 | 4.500%,12/01/2040 | 4,593 | 0.0 | |
| 7,246 | 4.500%,12/01/2040 | 7,955 | 0.0 | |
| 7,234 | 4.500%,01/01/2041 | 7,941 | 0.0 | |
| 9,884 | 4.500%,01/01/2041 | 10,849 | 0.0 | |
| 443,795 | 4.500%,10/01/2041 | 483,740 | 0.0 | |
| 549,931 | 4.500%,10/01/2044 | 596,549 | 0.0 | |
| 1,409,359 | 4.500%,12/01/2045 | 1,546,897 | 0.0 | |
| 2,044,909 | 4.500%,04/01/2047 | 2,232,541 | 0.0 | |
| 3,870,340 | 4.500%,04/01/2047 | 4,197,585 | 0.1 | |
| 3,990,916 | 4.500%,04/01/2047 | 4,360,007 | 0.1 | |
| 4,555,517 | 4.500%,04/01/2047 | 4,999,139 | 0.1 | |
| 3,041,352 | 4.500%,04/01/2047 | 3,320,815 | 0.0 | |
| 2,178,862 | 4.500%,05/01/2047 | 2,391,043 | 0.0 | |
| 2,584,943 | 4.500%,05/01/2047 | 2,831,606 | 0.0 | |
| 1,917,216 | 4.500%,05/01/2047 | 2,103,910 | 0.0 | |
| 7,534,803 | 4.500%,05/01/2047 | 8,185,593 | 0.1 | |
| 1,587,196 | 4.500%,05/01/2047 | 1,741,758 | 0.0 | |
| 4,388,054 | 4.500%,06/01/2047 | 4,769,405 | 0.1 | |
| 3,566,343 | 4.500%,06/01/2047 | 3,862,880 | 0.1 | |
| 1,191,740 | 4.500%,06/01/2047 | 1,307,793 | 0.0 | |
| 5,694,102 | 4.500%,07/01/2047 | 6,169,460 | 0.1 | |
| 2,992,118 | 4.500%,08/01/2047 | 3,240,098 | 0.0 | |
| 116,344 | 5.000%,06/01/2033 | 129,230 | 0.0 | |
| 24,009 | 5.000%,09/01/2033 | 26,669 | 0.0 | |
| 69,785 | 5.000%,11/01/2033 | 77,519 | 0.0 | |
| 24,023 | 5.000%,03/01/2034 | 26,682 | 0.0 | |
| 21,324 | 5.000%,03/01/2034 | 23,684 | 0.0 | |
| 162,942 | 5.000%,02/01/2035 | 180,935 | 0.0 | |
| 106,038 | 5.000%,06/01/2035 | 117,774 | 0.0 | |
| 6,106 | 5.000%,06/01/2035 | 6,781 | 0.0 | |
| 61,224 | 5.000%,07/01/2035 | 67,997 | 0.0 | |
| 360,393 | 5.000%,08/01/2035 | 400,631 | 0.0 | |
| 21,718 | 5.000%,10/01/2035 | 23,904 | 0.0 | |
| 524,569 | 5.000%,10/01/2035 | 584,103 | 0.0 | |
| 293,651 | 5.000%,02/01/2036 | 327,707 | 0.0 | |
| 4,292 | 5.000%,03/01/2036 | 4,791 | 0.0 | |
| 54,531 | 5.000%,03/01/2036 | 60,855 | 0.0 | |
| 8,925 | 5.000%,05/01/2036 | 9,962 | 0.0 | |
| 5,676 | 5.000%,06/01/2036 | 6,332 | 0.0 | |
| 223,199 | 5.000%,07/01/2036 | 247,946 | 0.0 | |
| 177,620 | 5.000%,11/01/2040 | 197,250 | 0.0 | |
| 61,442 | 5.000%,05/01/2041 | 68,320 | 0.0 | |
| 397,092 | 5.000%,06/01/2041 | 440,331 | 0.0 | |
| 278,679 | 5.000%,06/01/2041 | 309,875 | 0.0 | |
| 147,025 | 5.500%,03/01/2037 | 167,022 | 0.0 | |
| 149,398 | 5.500%,06/01/2039 | 169,731 | 0.0 | |
| 1,431,318 | 5.500%,10/01/2039 | 1,626,547 | 0.0 | |
| 45,354 | 6.000%,09/01/2036 | 50,299 | 0.0 | |
| 323 | 6.500%,02/01/2028 | 358 | 0.0 | |
| 565 | 6.500%,09/01/2031 | 627 | 0.0 | |
| 147 | 6.500%,09/01/2031 | 164 | 0.0 | |
| 16,057 | 6.500%,11/01/2031 | 18,841 | 0.0 | |
| 7,482 | 6.500%,04/01/2032 | 8,514 | 0.0 | |
| 1,331 | 6.500%,08/01/2032 | 1,534 | 0.0 | |
| 4,303 | 6.500%,08/01/2032 | 4,888 | 0.0 | |
| 6,555 | 7.000%,12/01/2027 | 6,685 | 0.0 | |
| 899 | 7.000%,10/01/2031 | 922 | 0.0 | |
| 2,959 | 7.000%,03/01/2032 | 3,453 | 0.0 | |
| 1,126 | 7.500%,09/01/2030 | 1,335 | 0.0 | |
| 3,684 | 7.500%,09/01/2031 | 4,459 | 0.0 | |
| 14,688 | 7.500%,02/01/2032 | 17,228 | 0.0 | |
| 705,749,341 | 8.6 | |||
| Total U.S. Government Agency Obligations | ||||
| (Cost $1,303,264,501) | 1,367,674,291 | 16.6 | ||
| COMMERCIAL MORTGAGE-BACKED SECURITIES: 9.1% | ||||
| 10,647,000 | (1),(3) | BAMLL Re-REMIC Trust 2016-FRR16 B, 0.998%, 05/27/2021 | 9,954,666 | 0.1 |
| 4,390,000 | (1) | Bancorp Commercial Mortgage 2018 CRE4 D Trust, 2.805%, (US0001M + 2.100%), 09/15/2035 | 3,387,229 | 0.0 |
| 24,811,172 | (3),(5) | BANK 2017-BNK4 XA, 1.421%, 05/15/2050 | 1,724,108 | 0.0 |
| 167,655,000 | (3),(5) | BANK 2017-BNK8 XB, 0.175%, 11/15/2050 | 2,053,204 | 0.0 |
| 204,729,308 | (3),(5) | BANK 2018-BNK14 XA, 0.521%, 09/15/2060 | 6,543,783 | 0.1 |
| 19,110,000 | (1),(3),(5) | BANK 2018-BNK14 XD, 1.602%, 09/15/2060 | 2,082,143 | 0.0 |
| 24,696,456 | (3),(5) | BANK 2019-BNK16 XA, 0.966%, 02/15/2052 | 1,579,879 | 0.0 |
| 5,210,000 | (1) | BANK 2019-BNK18 D, 3.000%, 05/15/2062 | 3,269,321 | 0.0 |
| 6,580,000 | (3) | Bank 2019-BNK19 C, 4.035%, 08/15/2061 | 5,519,716 | 0.1 |
| 100,701,485 | (3),(5) | Bank 2019-BNK19 XA, 0.964%, 08/15/2061 | 6,987,535 | 0.1 |
See Accompanying Notes to Financial Statements
| 53 |
| Voya Intermediate Bond Fund | PORTFOLIO OF INVESTMENTS |
| as of March31, 2020 (Continued) |
| 92,840,000 | (1),(3),(5) | BBCCRE Trust 2015-GTP XA, 0.597%, 08/10/2033 | 2,740,089 | 0.0 |
| 2,400,000 | (1) | BDS 2018-FL2 D, 3.350%, (US0001M + 2.550%), 08/15/2035 | 2,048,221 | 0.0 |
| 2,620,000 | (1),(3) | BENCHMARK 2018-B3 D Mortgage Trust, 3.057%, 04/10/2051 | 1,755,712 | 0.0 |
| 54,451,680 | (3),(5) | Benchmark 2019-B12 XA Mortgage Trust, 1.068%, 08/15/2052 | 3,692,260 | 0.0 |
| 7,470,000 | (1) | Benchmark 2019-B9 D Mortgage Trust, 3.000%, 03/15/2052 | 4,760,381 | 0.1 |
| 36,649,740 | (3),(5) | Benchmark 2019-B9 XA Mortgage Trust, 1.047%, 03/15/2052 | 2,644,737 | 0.0 |
| 6,420,000 | (1) | Benchmark 2020-B17 D Mortgage Trust, 2.250%, 03/15/2053 | 4,079,667 | 0.1 |
| 92,730,000 | (3),(5) | Benchmark 2020-B17 XA Mortgage Trust, 1.542%, 03/15/2053 | 8,709,100 | 0.1 |
| 7,540,000 | (1) | BHP Trust 2019-BXHP D, 2.476%, (US0001M + 1.771%), 08/15/2036 | 6,324,508 | 0.1 |
| 7,570,000 | (1) | BHP Trust 2019-BXHP E, 3.272%, (US0001M + 2.568%), 08/15/2036 | 6,145,317 | 0.1 |
| 5,392,484 | BMD2 2019-FRR1, 2.870%, 05/25/2052 | 5,025,825 | 0.1 | |
| 9,101,360 | BMD2 RE-REMIC TR 2019 3.6, 3.665%, 09/25/2022 | 8,930,157 | 0.1 | |
| 8,025,365 | (1) | BX Commercial Mortgage Trust 2019-XL A, 1.625%, (US0001M + 0.920%), 10/15/2036 | 7,749,129 | 0.1 |
| 24,572,902 | (1) | BX Commercial Mortgage Trust 2019-XL G, 3.005%, (US0001M + 2.300%), 10/15/2036 | 21,250,768 | 0.3 |
| 24,572,902 | (1) | BX Commercial Mortgage Trust 2019-XL J, 3.355%, (US0001M + 2.650%), 10/15/2036 | 21,280,185 | 0.3 |
| 21,390,000 | (1) | BX Commercial Mortgage Trust 2020-BXLP G, 3.205%, (US0001M + 2.500%), 12/15/2029 | 18,239,364 | 0.2 |
| 5,150,000 | (1) | BX Trust 2019-MMP E, 2.605%, (US0001M + 1.900%), 08/15/2036 | 4,986,387 | 0.1 |
| 6,000,000 | (1) | BX Trust 2019-OC11 A, 3.202%, 12/09/2041 | 5,565,600 | 0.1 |
| 10,660,000 | (1),(3) | BX Trust 2019-OC11 E, 4.076%, 12/09/2041 | 8,201,742 | 0.1 |
| 7,290,000 | Cantor Commercial Real Estate Lending 2019-CF2 A5, 2.874%, 11/15/2052 | 7,662,201 | 0.1 | |
| 3,340,000 | (3) | CCUBS Commercial Mortgage Trust 2017-C1 C, 4.393%, 11/15/2050 | 2,741,754 | 0.0 |
| 93,522,520 | (3),(5) | CCUBS Commercial Mortgage Trust 2017-C1 XA, 1.012%, 11/15/2050 | 4,751,720 | 0.1 |
| 24,835,436 | (3),(5) | CD 2016-CD1 Mortgage Trust XA, 1.404%, 08/10/2049 | 1,582,425 | 0.0 |
| 45,113,000 | (1),(3),(5) | CD 2016-CD1 Mortgage Trust XB, 0.678%, 08/10/2049 | 1,755,609 | 0.0 |
| 33,730,709 | (3),(5) | CD 2017-CD4 Mortgage Trust XA, 1.306%, 05/10/2050 | 2,114,558 | 0.0 |
| 4,280,000 | (3) | CD 2017-CD6 Mortgage Trust C, 4.267%, 11/13/2050 | 3,478,625 | 0.0 |
| 7,453,264 | (1),(3) | CFCRE Commercial Mortgage Trust 2011-C1 E, 6.089%, 04/15/2044 | 7,047,710 | 0.1 |
| 4,139,000 | (3) | Citigroup Commercial Mortgage Trust 2013-GC17 C, 5.110%, 11/10/2046 | 3,889,314 | 0.1 |
| 3,910,000 | (1),(3) | Citigroup Commercial Mortgage Trust 2014-GC19, 5.092%, 03/10/2047 | 3,479,049 | 0.0 |
| 7,745,000 | (1) | Citigroup Commercial Mortgage Trust 2016-C2 E, 4.594%, 08/10/2049 | 5,025,195 | 0.1 |
| 40,776,675 | (3),(5) | Citigroup Commercial Mortgage Trust 2016-P4 XA, 1.975%, 07/10/2049 | 3,460,965 | 0.0 |
| 82,540,015 | (3),(5) | Citigroup Commercial Mortgage Trust 2017-C4 XA, 1.106%, 10/12/2050 | 4,510,556 | 0.1 |
| 3,940,000 | (3) | Citigroup Commercial Mortgage Trust 2017-P8 C, 4.269%, 09/15/2050 | 3,219,294 | 0.0 |
| 40,211,727 | (3),(5) | Citigroup Commercial Mortgage Trust 2017-P8 XA, 0.914%, 09/15/2050 | 2,072,195 | 0.0 |
| 88,795,092 | (3),(5) | Citigroup Commercial Mortgage Trust 2018-C5 XA, 0.599%, 06/10/2051 | 3,788,363 | 0.0 |
| 7,480,000 | Citigroup Commercial Mortgage Trust 2019-GC43 A4, 3.038%, 11/10/2052 | 7,687,803 | 0.1 | |
| 9,645,000 | (1),(3) | COMM 2013-CR10 F Mortgage Trust, 4.789%, 08/10/2046 | 7,818,257 | 0.1 |
| 2,180,000 | (3) | Commercial Mortgage Pass Through Certificates 2016-CR28 D, 3.896%, 02/10/2049 | 1,712,462 | 0.0 |
See Accompanying Notes to Financial Statements
| 54 |
| Voya Intermediate Bond Fund | PORTFOLIO OF INVESTMENTS |
| as of March31, 2020 (Continued) |
| 28,378,644 | (3),(5) | COMM 2012-CR2 XA, 1.633%, 08/15/2045 | 826,593 | 0.0 |
| 31,075,230 | (3),(5) | COMM 2012-CR4 XA, 1.697%, 10/15/2045 | 1,004,398 | 0.0 |
| 27,260,000 | (1),(3),(5) | COMM 2012-CR4 XB, 0.614%, 10/15/2045 | 415,388 | 0.0 |
| 48,200,568 | (1),(3),(5) | COMM 2012-LC4 XA, 2.101%, 12/10/2044 | 1,390,625 | 0.0 |
| 4,640,000 | (1),(3) | COMM 2013-CR10 E Mortgage Trust, 4.789%, 08/10/2046 | 3,938,649 | 0.1 |
| 3,310,000 | (3) | COMM 2015-CCRE26 D Mortgage Trust, 3.484%, 10/10/2048 | 2,571,648 | 0.0 |
| 129,372,029 | (1),(3),(5) | COMM 2015-PC1 XA, 0.660%, 07/10/2050 | 3,004,885 | 0.0 |
| 920,000 | (3) | COMM 2016-COR1 C, 4.383%, 10/10/2049 | 776,622 | 0.0 |
| 68,703,910 | (3),(5) | COMM 2016-CR28 XA, 0.693%, 02/10/2049 | 1,934,269 | 0.0 |
| 36,126,734 | (3),(5) | COMM 2017-COR2 XA, 1.171%, 09/10/2050 | 2,399,032 | 0.0 |
| 12,420,000 | COMM 2018-COR3 A3 Mortgage Trust, 4.228%, 05/10/2051 | 13,758,439 | 0.2 | |
| 14,010,000 | (1),(3) | COMM 2020-CBM F Mortgage Trust, 3.633%, 11/13/2039 | 8,719,149 | 0.1 |
| 15,420,000 | (1) | Credit Suisse Mortgage Capital Certificates 2019-ICE4 F, 3.355%, (US0001M + 2.650%), 05/15/2036 | 11,954,087 | 0.1 |
| 6,670,000 | (3) | Csail 2015-C2 C Commercial Mortgage Trust, 4.192%, 06/15/2057 | 5,804,497 | 0.1 |
| 4,340,000 | (1),(3) | CSAIL 2017-CX10 D Commercial Mortgage Trust, 4.111%, 11/15/2050 | 3,216,942 | 0.0 |
| 19,066,000 | (3) | CSAIL 2018-CX11 A5 Commercial Mortgage Trust, 4.033%, 04/15/2051 | 20,760,659 | 0.3 |
| 6,407,012 | (1) | CSWF 2018-TOP E, 2.955%, (US0001M + 2.250%), 08/15/2035 | 5,286,074 | 0.1 |
| 6,056,423 | (1) | CSWF 2018-TOP F, 3.455%, (US0001M + 2.750%), 08/15/2035 | 4,802,439 | 0.1 |
| 4,460,000 | (1),(3) | DBJPM 16-C3 Mortgage Trust, 3.491%, 08/10/2049 | 3,318,826 | 0.0 |
| 5,000,000 | (1),(3) | DBUBS 2011-LC2 E Mortgage Trust, 5.530%, 07/10/2044 | 4,814,766 | 0.1 |
| 12,519,000 | (1) | DBUBS 2011-LC2A F Mortgage Trust, 4.000%, (US0001M + 3.650%), 07/10/2044 | 11,950,517 | 0.1 |
| 4,480,000 | (1) | Exantas Capital Corp. 2019-RSO7 C Ltd., 2.850%, (US0001M + 2.050%), 04/15/2036 | 3,315,178 | 0.0 |
| 10,520,000 | (1) | Fontainebleau Miami Beach Trust 2019-FBLU F, 4.095%, 12/10/2036 | 7,007,305 | 0.1 |
| 16,840,000 | (3),(5) | Freddie Mac Multifamily Structured Pass Through Certificates K008 X3, 5.298%, 08/25/2020 | 162,769 | 0.0 |
| 77,599,012 | (3),(5) | Freddie Mac Multifamily Structured Pass Through Certificates K013 X3, 2.815%, 01/25/2043 | 1,241,491 | 0.0 |
| 42,047,111 | (3),(5) | Freddie Mac Multifamily Structured Pass Through Certificates K020 X3, 1.872%, 05/25/2040 | 1,526,398 | 0.0 |
| 31,879,545 | (3),(5) | Freddie Mac Multifamily Structured Pass Through Certificates K029 X3, 1.592%, 05/25/2041 | 1,388,692 | 0.0 |
| 187,773,113 | (1),(5) | FREMF Mortgage Trust 2012-K17 X2A, 0.100%, 12/25/2044 | 237,308 | 0.0 |
| 223,355,545 | (3),(5) | Freddie Mac Multifamily Structured Pass Through Certificates KHG2 X, 0.406%, 02/25/2030 | 5,671,690 | 0.1 |
| 4,580,000 | (1) | GS Mortgage Securities Corp. II 2018-RIVR E, 2.255%, (US0001M + 1.550%), 07/15/2035 | 4,358,764 | 0.1 |
| 4,400,000 | (1) | GS Mortgage Securities Corp. II 2018-RIVR F, 2.805%, (US0001M + 2.100%), 07/15/2035 | 4,294,441 | 0.1 |
| 12,770,000 | (1) | GS Mortgage Securities Corp. Trust 2019-70P E, 2.905%, (US0001M + 2.200%), 10/15/2036 | 10,084,754 | 0.1 |
| 5,110,000 | (1) | GS Mortgage Securities Corp. Trust 2019-70P F, 3.355%, (US0001M + 2.650%), 10/15/2036 | 4,002,374 | 0.1 |
| 3,400,000 | (1),(3) | GS Mortgage Securities Trust 2010-C2 D, 5.180%, 12/10/2043 | 3,332,968 | 0.0 |
| 8,190,000 | (1),(3) | GS Mortgage Securities Trust 2010-C2 E, 4.548%, 12/10/2043 | 7,839,314 | 0.1 |
| 3,710,000 | (1),(3) | GS Mortgage Securities Trust 2010-C2 F, 4.548%, 12/10/2043 | 3,510,603 | 0.0 |
| 5,340,000 | (1),(3) | GS Mortgage Securities Trust 2010-C2 G, 4.548%, 12/10/2043 | 5,097,608 | 0.1 |
See Accompanying Notes to Financial Statements
| 55 |
| Voya Intermediate Bond Fund | PORTFOLIO OF INVESTMENTS |
| as of March31, 2020 (Continued) |
| 6,140,000 | (1) | GS Mortgage Securities Trust 2013-GC16 G, 3.500%, 11/10/2046 | 4,689,591 | 0.1 |
| 46,973,078 | (3),(5) | GS Mortgage Securities Trust 2013-GC16 XA, 1.032%, 11/10/2046 | 1,440,331 | 0.0 |
| 65,288,551 | (3),(5) | GS Mortgage Securities Trust 2014-GC22 XA, 0.985%, 06/10/2047 | 1,727,065 | 0.0 |
| 81,824,745 | (3),(5) | GS Mortgage Securities Trust 2016-GS4 XA, 0.567%, 11/10/2049 | 1,987,228 | 0.0 |
| 69,921,372 | (3),(5) | GS Mortgage Securities Trust 2017-GS6 XA, 1.041%, 05/10/2050 | 4,118,949 | 0.1 |
| 6,310,000 | GS Mortgage Securities Trust 2019-GC38 A4, 3.968%, 02/10/2052 | 6,969,425 | 0.1 | |
| 78,390,308 | (3),(5) | GS Mortgage Securities Trust 2019-GC38 XA, 0.963%, 02/10/2052 | 5,004,296 | 0.1 |
| 13,220,000 | (1),(3) | GS Mortgage Securities Trust 2019-GC40 DBD, 3.550%, 07/10/2052 | 12,393,312 | 0.2 |
| 10,120,000 | (1),(3) | GS Mortgage Securities Trust 2019-GC40 DBE, 3.550%, 07/10/2052 | 9,281,040 | 0.1 |
| 11,820,000 | GS Mortgage Securities Trust 2019-GSA1 A4, 3.048%, 11/10/2052 | 12,156,606 | 0.2 | |
| 7,690,000 | (1),(3) | Hudson Yards 2019-55HY F Mortgage Trust, 2.943%, 12/10/2041 | 6,574,129 | 0.1 |
| 14,030,000 | (1),(3) | Jackson Park Trust 2019-LIC F, 3.242%, 10/14/2039 | 8,138,326 | 0.1 |
| 2,400,000 | (1),(3) | JP Morgan Chase Commercial Mortgage Securities Trust 2011-C4 E, 5.541%, 07/15/2046 | 2,330,803 | 0.0 |
| 4,500,000 | (1),(3) | JP Morgan Chase Commercial Mortgage Securities Trust 2011-C4 G, 3.873%, 07/15/2046 | 4,248,637 | 0.1 |
| 73,538,575 | (3),(5) | JP Morgan Chase Commercial Mortgage Securities Trust 2012-CIBX XA, 1.476%, 06/15/2045 | 1,382,466 | 0.0 |
| 5,550,000 | (1),(3) | JP Morgan Chase Commercial Mortgage Securities Trust 2013-C13 E, 3.986%, 01/15/2046 | 4,662,278 | 0.1 |
| 93,754,062 | (3),(5) | JP Morgan Chase Commercial Mortgage Securities Trust 2016-JP4 XA, 0.729%, 12/15/2049 | 2,719,046 | 0.0 |
| 10,720,000 | (1) | JP Morgan Chase Commercial Mortgage Securities Trust 2020-LOOP E, 3.862%, 12/05/2038 | 8,453,547 | 0.1 |
| 6,363,797 | (1),(3) | JPMBB Commercial Mortgage Securities Trust 2013-C15 D, 5.198%, 11/15/2045 | 5,738,397 | 0.1 |
| 7,840,000 | (1),(3) | JPMBB Commercial Mortgage Securities Trust 2013-C17 D, 4.892%, 01/15/2047 | 6,942,750 | 0.1 |
| 6,470,000 | (1),(3) | JPMBB Commercial Mortgage Securities Trust 2013-C17 F, 3.867%, 01/15/2047 | 4,698,517 | 0.1 |
| 10,865,151 | (3),(5) | JPMBB Commercial Mortgage Securities Trust 2014-C19 XA, 0.750%, 04/15/2047 | 207,913 | 0.0 |
| 3,080,000 | (1),(3) | JPMBB Commercial Mortgage Securities Trust 2014-C26 D, 3.882%, 01/15/2048 | 2,522,325 | 0.0 |
| 1,416,065 | (3),(5) | JPMBB Commercial Mortgage Securities Trust 2015-C28 XA, 1.057%, 10/15/2048 | 47,765 | 0.0 |
| 12,440,000 | JPMCC Commercial Mortgage Securities Trust 2019-COR4 A5, 4.029%, 03/10/2052 | 14,040,603 | 0.2 | |
| 5,000,000 | JPMDB Commercial Mortgage Securities Trust 2019-COR6 A4, 3.057%, 11/13/2052 | 5,311,050 | 0.1 | |
| 2,000,000 | (1) | KNDL 2019-KNSQ F Mortgage Trust, 2.705%, (US0001M + 2.000%), 05/15/2036 | 1,502,436 | 0.0 |
| 4,110,201 | (1),(3),(5) | LB-UBS Commercial Mortgage Trust 2006-C7 XW, 0.600%, 11/15/2038 | 13,510 | 0.0 |
| 46,415,798 | (1),(3),(5) | LSTAR Commercial Mortgage Trust 2017-5 X, 1.000%, 03/10/2050 | 1,672,584 | 0.0 |
| 4,340,000 | (1),(3) | Morgan Stanley Bank of America Merrill Lynch Trust 2013-C13 D, 4.909%, 11/15/2046 | 3,859,498 | 0.0 |
| 74,669,036 | (3),(5) | Morgan Stanley Bank of America Merrill Lynch Trust 2014 C19 XA, 1.003%, 12/15/2047 | 2,633,472 | 0.0 |
| 3,970,000 | (1),(3) | Morgan Stanley Bank of America Merrill Lynch Trust 2014-C15 D, 4.909%, 04/15/2047 | 3,485,626 | 0.0 |
See Accompanying Notes to Financial Statements
| 56 |
| Voya Intermediate Bond Fund | PORTFOLIO OF INVESTMENTS |
| as of March31, 2020 (Continued) |
| 10,600,000 | (1) | Morgan Stanley Bank of America Merrill Lynch Trust 2015-C26 D, 3.060%, 10/15/2048 | 7,973,994 | 0.1 |
| 3,090,000 | (1),(3) | Morgan Stanley Capital I Trust 2011-C1 D, 5.375%, 09/15/2047 | 2,686,978 | 0.0 |
| 14,914,000 | (1) | Morgan Stanley Capital I Trust 2011-C1 J, 4.193%, 09/15/2047 | 14,522,618 | 0.2 |
| 7,864,000 | (1),(3) | Morgan Stanley Capital I Trust 2016-BNK2 E, 3.905%, 11/15/2049 | 4,838,181 | 0.1 |
| 7,455,000 | Morgan Stanley Capital I Trust 2019-H6 A4, 3.417%, 06/15/2052 | 8,057,042 | 0.1 | |
| 490,000 | (1) | Morgan Stanley Capital I Trust 2019-H7 D, 3.000%, 07/15/2052 | 305,152 | 0.0 |
| 2,500,000 | (1) | Morgan Stanley Capital I Trust 2019-PLND E, 2.855%, (US0001M + 2.150%), 05/15/2036 | 2,008,679 | 0.0 |
| 4,670,000 | Morgan Stanley Capital I, Inc. 2017-HR2 D, 2.730%, 12/15/2050 | 3,065,878 | 0.0 | |
| 46,534,350 | (3),(5) | Morgan Stanley Capital I, Inc. 2017-HR2 XA, 0.793%, 12/15/2050 | 2,151,064 | 0.0 |
| 6,820,000 | (1) | MRCD 2019-PARK E Mortgage Trust, 2.718%, 12/15/2036 | 6,207,103 | 0.1 |
| 12,790,000 | (1) | MRCD 2019-PARK F Mortgage Trust, 2.718%, 12/15/2036 | 11,166,882 | 0.1 |
| 14,680,000 | (1) | One Bryant Park Trust 2019-OBP A, 2.516%, 09/13/2049 | 14,990,388 | 0.2 |
| 8,262,000 | (1) | Shelter Growth CRE 2018-FL1 D Issuer Ltd., 3.705%, (US0001M + 3.000%), 01/15/2035 | 7,451,512 | 0.1 |
| 7,680,000 | UBS Commercial Mortgage Trust 2019-C17 A4, 2.921%, 09/15/2052 | 8,160,257 | 0.1 | |
| 5,280,000 | (1),(3) | UBS-Barclays Commercial Mortgage Trust 2012-C4 D, 4.476%, 12/10/2045 | 4,818,310 | 0.1 |
| 9,020,000 | (1),(3) | UBS-Barclays Commercial Mortgage Trust 2012-C4 E, 4.476%, 12/10/2045 | 7,501,973 | 0.1 |
| 6,239,500 | (1) | Wells Fargo Commercial Mortgage Trust 2010-C1 E, 4.000%, 11/15/2043 | 6,037,211 | 0.1 |
| 8,780,000 | (1) | Wells Fargo Commercial Mortgage Trust 2010-C1 F, 4.000%, 11/15/2043 | 8,435,388 | 0.1 |
| 4,830,000 | (3) | Wells Fargo Commercial Mortgage Trust 2017-C40 C, 4.330%, 10/15/2050 | 3,957,373 | 0.1 |
| 8,660,000 | Wells Fargo Commercial Mortgage Trust 2018-C44 A5, 4.212%, 05/15/2051 | 9,808,202 | 0.1 | |
| 1,264,000 | (1) | Wells Fargo Commercial Mortgage Trust 2019-C49 D, 3.000%, 03/15/2052 | 802,379 | 0.0 |
| 6,000,000 | (1),(6) | Wells Fargo Re-REMIC Trust 2013-FRR1 BK26, 0.000%, 01/27/2045 | 4,950,924 | 0.1 |
| 3,270,000 | (1),(3) | WFRBS Commercial Mortgage Trust 2011-C5 E, 5.661%, 11/15/2044 | 3,119,093 | 0.0 |
| 13,339,543 | (1),(3),(5) | WFRBS Commercial Mortgage Trust 2012-C8 XA, 1.807%, 08/15/2045 | 418,089 | 0.0 |
| 9,610,970 | (1),(3),(5) | WFRBS Commercial Mortgage Trust 2012-C9 XA, 1.892%, 11/15/2045 | 371,962 | 0.0 |
| 3,920,000 | (1) | WFRBS Commercial Mortgage Trust 2013-C17 E, 3.500%, 12/15/2046 | 2,985,465 | 0.0 |
| 81,728,062 | (3),(5) | WFRBS Commercial Mortgage Trust 2014-C25 XA, 0.816%, 11/15/2047 | 2,487,296 | 0.0 |
| 12,946,000 | (1),(3) | WFRBS Commercial Mortgage Trust 2013-C11 F, 4.258%, 03/15/2045 | 9,150,070 | 0.1 |
| Total Commercial Mortgage-Backed Securities | ||||
| (Cost $833,271,252) | 750,131,933 | 9.1 | ||
| SOVEREIGN BONDS: 2.6% | ||||
| 2,750,000 | Argentine Republic Government International Bond, 5.625%, 01/26/2022 | 811,250 | 0.0 | |
| 4,960,000 | Argentine Republic Government International Bond, 6.875%, 04/22/2021 | 1,450,800 | 0.0 | |
| 2,900,000 | (2) | Argentine Republic Government International Bond, 6.875%, 01/26/2027 | 812,029 | 0.0 |
| BRL 95,000,000 | Brazil Notas do Tesouro Nacional Serie F, 10.000%, 01/01/2027 | 21,176,094 | 0.3 | |
See Accompanying Notes to Financial Statements
| 57 |
| Voya Intermediate Bond Fund | PORTFOLIO OF INVESTMENTS |
| as of March31, 2020 (Continued) |
| BRL 52,000,000 | Brazil Notas do Tesouro Nacional Series F, 10.000%, 01/01/2023 | 11,363,897 | 0.2 | |
| 5,900,000 | (2) | Brazilian Government International Bond, 4.625%, 01/13/2028 | 6,307,100 | 0.1 |
| 2,500,000 | Brazilian Government International Bond, 6.000%, 04/07/2026 | 2,848,750 | 0.1 | |
| 3,000,000 | (2) | Colombia Government International Bond, 3.000%, 01/30/2030 | 2,748,000 | 0.0 |
| 5,225,000 | Colombia Government International Bond, 3.875%, 04/25/2027 | 5,206,935 | 0.1 | |
| 2,500,000 | Croatia Government International Bond, 5.500%, 04/04/2023 | 2,627,600 | 0.0 | |
| 272,000 | Croatia Government International Bond, 6.375%, 03/24/2021 | 278,757 | 0.0 | |
| 7,900,000 | (1),(2) | Dominican Republic International Bond, 4.500%, 01/30/2030 | 6,908,550 | 0.1 |
| 300,000 | (1) | Dominican Republic International Bond, 5.500%, 01/27/2025 | 290,623 | 0.0 |
| 270,000 | Dominican Republic International Bond, 5.875%, 04/18/2024 | 268,311 | 0.0 | |
| 900,000 | Dominican Republic International Bond, 5.950%, 01/25/2027 | 858,557 | 0.0 | |
| 300,000 | (1),(2) | Dominican Republic International Bond, 6.600%, 01/28/2024 | 296,626 | 0.0 |
| 4,825,000 | Dominican Republic International Bond, 6.875%, 01/29/2026 | 4,842,093 | 0.1 | |
| 2,675,000 | Egypt Government International Bond, 5.875%, 06/11/2025 | 2,414,768 | 0.0 | |
| 250,000 | (1),(2) | Egypt Government International Bond, 5.875%, 06/11/2025 | 225,679 | 0.0 |
| 1,300,000 | Egypt Government International Bond, 6.588%, 02/21/2028 | 1,113,125 | 0.0 | |
| 9,150,000 | Egypt Government International Bond, 7.500%, 01/31/2027 | 8,356,933 | 0.1 | |
| 1,240,000 | (1),(2) | Gabon Government International Bond, 6.625%, 02/06/2031 | 767,356 | 0.0 |
| 12,725,000 | (1) | Ghana Government International Bond, 6.375%, 02/11/2027 | 9,384,687 | 0.1 |
| IDR 132,518,000,000 | Indonesia Treasury Bond, 8.375%, 04/15/2039 | 8,151,114 | 0.1 | |
| 3,288,330 | (3) | Ivory Coast Government International Bond, 5.750%, 12/31/2032 | 2,980,421 | 0.1 |
| 1,000,000 | Jordan Government International Bond, 6.125%, 01/29/2026 | 915,770 | 0.0 | |
| 1,200,000 | (1) | Kenya Government International Bond, 7.000%, 05/22/2027 | 1,113,000 | 0.0 |
| MXN 170,290,000 | Mexican Bonos, 7.750%, 11/13/2042 | 7,020,923 | 0.1 | |
| 2,250,000 | Morocco Government International Bond, 4.250%, 12/11/2022 | 2,239,918 | 0.0 | |
| 600,000 | (1) | Morocco Government International Bond, 4.250%, 12/11/2022 | 597,311 | 0.0 |
| 850,000 | Namibia International Bonds, 5.500%, 11/03/2021 | 821,011 | 0.0 | |
| 3,400,000 | Oman Government International Bond, 6.000%, 08/01/2029 | 2,454,239 | 0.0 | |
| 693,000 | Panama Government International Bond, 6.700%, 01/26/2036 | 896,787 | 0.0 | |
| 1,000,000 | Panama Government International Bond, 9.375%, 04/01/2029 | 1,426,052 | 0.0 | |
| 600,000 | Paraguay Government International Bond, 4.625%, 01/25/2023 | 609,006 | 0.0 | |
| 600,000 | (1),(2) | Paraguay Government International Bond, 4.625%, 01/25/2023 | 609,006 | 0.0 |
| PEN 14,129,000 | (1) | Peru Government Bond, 6.150%, 08/12/2032 | 4,430,843 | 0.1 |
| PEN 14,130,000 | Peru Government Bond, 6.850%, 02/12/2042 | 4,648,440 | 0.1 | |
| 2,675,000 | Perusahaan Penerbit SBSN Indonesia III, 4.150%, 03/29/2027 | 2,690,488 | 0.0 | |
| 4,000,000 | (1) | Perusahaan Penerbit SBSN Indonesia III, 4.400%, 03/01/2028 | 4,052,280 | 0.1 |
| 4,200,000 | Philippine Government International Bond, 3.750%, 01/14/2029 | 4,683,762 | 0.1 | |
| 3,450,000 | Republic of South Africa Government International Bond, 4.300%, 10/12/2028 | 2,844,546 | 0.0 | |
| 12,300,000 | Republic of South Africa Government International Bond, 4.850%, 09/30/2029 | 10,147,648 | 0.1 | |
| RUB 815,784,000 | Russian Federal Bond - OFZ, 7.250%, 05/10/2034 | 10,860,345 | 0.1 | |
| 3,600,000 | Russian Foreign Bond - Eurobond, 4.250%, 06/23/2027 | 3,781,548 | 0.1 | |
| 2,600,000 | Russian Foreign Bond - Eurobond, 4.750%, 05/27/2026 | 2,767,700 | 0.0 | |
| 2,925,000 | (1) | Saudi Government International Bond, 4.500%, 04/17/2030 | 3,159,796 | 0.1 |
| 1,200,000 | Sri Lanka Government International Bond, 6.350%, 06/28/2024 | 756,000 | 0.0 |
See Accompanying Notes to Financial Statements
| 58 |
| Voya Intermediate Bond Fund | PORTFOLIO OF INVESTMENTS |
| as of March31, 2020 (Continued) |
| 22,225,000 | Turkey Government International Bond, 4.875%, 10/09/2026 | 18,850,134 | 0.2 | |
| 1,000,000 | Turkey Government International Bond, 5.125%, 02/17/2028 | 840,595 | 0.0 | |
| 1,000,000 | Turkey Government International Bond, 6.125%, 10/24/2028 | 882,890 | 0.0 | |
| 200,000 | Turkey Government International Bond, 6.250%, 09/26/2022 | 195,354 | 0.0 | |
| 2,625,000 | Turkey Government International Bond, 7.250%, 12/23/2023 | 2,574,944 | 0.0 | |
| 2,083,000 | Turkey Government International Bond, 7.375%, 02/05/2025 | 2,052,599 | 0.0 | |
| 2,726,000 | Ukraine Government AID Bonds, 1.847%, 05/29/2020 | 2,740,966 | 0.0 | |
| 1,500,000 | Ukraine Government International Bond, 7.750%, 09/01/2023 | 1,412,212 | 0.0 | |
| 10,400,000 | Ukraine Government International Bond, 7.750%, 09/01/2025 | 9,505,600 | 0.1 | |
| Total Sovereign Bonds | ||||
| (Cost $256,902,262) | 215,071,768 | 2.6 | ||
| ASSET-BACKED SECURITIES: 10.0% | ||||
| Automobile Asset-Backed Securities: 0.9% | ||||
| 5,950,000 | Americredit Automobile Receivables Trust 2018-2 D, 4.010%, 07/18/2024 | 4,858,471 | 0.1 | |
| 8,440,000 | Americredit Automobile Receivables Trust 2019-1 D, 3.620%, 03/18/2025 | 8,449,728 | 0.1 | |
| 5,750,000 | AmeriCredit Automobile Receivables Trust 2019-3 C, 2.320%, 07/18/2025 | 5,680,906 | 0.1 | |
| 5,050,000 | AmeriCredit Automobile Receivables Trust 2019-3 D, 2.580%, 09/18/2025 | 4,790,730 | 0.1 | |
| 8,300,000 | AmeriCredit Automobile Receivables Trust 2020-1 D, 1.800%, 12/18/2025 | 7,786,455 | 0.1 | |
| 750,000 | CarMax Auto Owner Trust 2017-4 D, 3.300%, 05/15/2024 | 742,908 | 0.0 | |
| 1,500,000 | Carmax Auto Owner Trust 2018-4 D, 4.150%, 04/15/2025 | 1,392,921 | 0.0 | |
| 600,000 | GM Financial Automobile Leasing Trust 2018-1 B, 2.870%, 12/20/2021 | 600,253 | 0.0 | |
| 6,150,000 | (1) | Oscar US Funding XI LLC 2019-2A A4, 2.680%, 09/10/2026 | 6,355,623 | 0.1 |
| 500,000 | Santander Drive Auto Receivables Trust 2018-1 D, 3.320%, 03/15/2024 | 485,312 | 0.0 | |
| 9,100,000 | Santander Drive Auto Receivables Trust 2018-4 D, 3.980%, 12/15/2025 | 9,127,893 | 0.1 | |
| 2,850,000 | Santander Drive Auto Receivables Trust 2019-3 C, 2.490%, 10/15/2025 | 2,761,467 | 0.0 | |
| 7,550,000 | Santander Drive Auto Receivables Trust 2019-3 D, 2.680%, 10/15/2025 | 7,217,589 | 0.1 | |
| 9,850,000 | (1) | Santander Retail Auto Lease Trust 2019-C A4, 1.930%, 11/20/2023 | 9,702,709 | 0.1 |
| 164,798 | (1) | Tesla Auto Lease Trust 2018-A D, 3.300%, 05/20/2020 | 164,155 | 0.0 |
| 4,150,000 | (1) | Tesla Auto Lease Trust 2018-B C, 4.360%, 10/20/2021 | 4,075,418 | 0.0 |
| 74,192,538 | 0.9 | |||
| Credit Card Asset-Backed Securities: 0.0% | ||||
| 600,000 | Synchrony Credit Card Master Note Trust 2017-2 C, 3.010%, 10/15/2025 | 606,763 | 0.0 | |
| Home Equity Asset-Backed Securities: 0.3% | ||||
| 3,449,486 | (1),(3) | ACE Securities Corp. Mortgage Loan Trust Series 2007-D1 A2, 6.336%, 02/25/2038 | 3,123,558 | 0.1 |
| 6,826,145 | Freddie Mac Structured Pass Through Certificates T-31 A7, 1.072%, (US0001M + 0.250%), 05/25/2031 | 6,791,067 | 0.1 | |
| 5,952,104 | (3) | GSAA Home Equity Trust 2006-4 4A3, 3.729%, 03/25/2036 | 4,251,220 | 0.1 |
| 3,714,586 | (3) | GSAA Trust 2006-7 AF2, 5.995%, 03/25/2046 | 2,030,202 | 0.0 |
| 269,463 | (3) | HSI Asset Loan Obligation Trust 2007-WF1 A6, 4.869%, 12/25/2036 | 206,747 | 0.0 |
| 881,685 | Nomura Home Equity Loan, Inc. Home Equity Loan Trust Series 2007-1 2A3, 1.267%, (US0001M + 0.160%), 02/25/2037 | 694,953 | 0.0 | |
See Accompanying Notes to Financial Statements
| 59 |
| Voya Intermediate Bond Fund | PORTFOLIO OF INVESTMENTS |
| as of March31, 2020 (Continued) |
| 1,073,159 | Nomura Home Equity Loan, Inc. Home Equity Loan Trust Series 2007-1 2A4A, 1.407%, (US0001M + 0.230%), 02/25/2037 | 855,073 | 0.0 | |
| 2,884,193 | (3) | Renaissance Home Equity Loan Trust 2005-3 AF4, 5.140%, 11/25/2035 | 2,925,233 | 0.0 |
| 20,878,053 | 0.3 | |||
| Other Asset-Backed Securities: 8.2% | ||||
| 2,862,787 | (1) | Ajax Mortgage Loan Trust 2018-A A, 3.850%, 04/25/2058 | 2,712,487 | 0.0 |
| 10,000,000 | (1) | Allegany Park CLO Ltd. 2019-1A A, 3.164%, (US0003M + 1.330%), 01/20/2033 | 9,362,560 | 0.1 |
| 1,073,505 | (1),(3),(4),(5) | American Homes 4 Rent 2015-SFR1 XS, 0.000%, 04/17/2052 | – | – |
| 10,000,000 | (1) | AMMC CLO 15 Ltd. 2014-15A ARR, 3.091%, (US0003M + 1.260%), 01/15/2032 | 9,331,510 | 0.1 |
| 3,900,000 | (1) | Apidos CLO XII 2013-12A AR, 2.911%, (US0003M + 1.080%), 04/15/2031 | 3,668,566 | 0.1 |
| 500,000 | (1) | Apidos CLO XII 2013-12A CR, 3.631%, (US0003M + 1.800%), 04/15/2031 | 422,381 | 0.0 |
| 20,000,000 | (1) | Apidos CLO XXXII 2019-32A A1, 3.003%, (US0003M + 1.320%), 01/20/2033 | 18,770,320 | 0.2 |
| 4,450,000 | (1) | Applebee's Funding LLC / IHOP Funding LLC 2019-1A A2I, 4.194%, 06/07/2049 | 4,052,837 | 0.1 |
| 2,050,000 | (1) | Applebee's Funding LLC / IHOP Funding LLC 2019-1A A2II, 4.723%, 06/07/2049 | 1,773,086 | 0.0 |
| 4,659,403 | (1) | Aqua Finance Trust 2019-A A, 3.140%, 07/16/2040 | 4,646,345 | 0.1 |
| 10,000,000 | (1) | ARES XLVI CLO Ltd. 2017-46A A2, 3.061%, (US0003M + 1.230%), 01/15/2030 | 9,145,380 | 0.1 |
| 3,890,000 | (1) | Babson CLO Ltd. 2017-1A A2, 3.169%, (US0003M + 1.350%), 07/18/2029 | 3,623,270 | 0.0 |
| 6,361,000 | (1) | Babson CLO Ltd. 2018-3A A2, 3.119%, (US0003M + 1.300%), 07/20/2029 | 5,893,575 | 0.1 |
| 1,650,000 | (1) | Bain Capital Credit CLO 2017-1A A2, 3.169%, (US0003M + 1.350%), 07/20/2030 | 1,538,665 | 0.0 |
| 3,750,000 | (1) | Barings Clo Ltd. 2019-4A C, 4.703%, (US0003M + 2.800%), 01/15/2033 | 3,156,870 | 0.0 |
| 7,500,000 | (1) | Beechwood Park CLO Ltd. 2019-1A A1, 3.233%, (US0003M + 1.330%), 01/17/2033 | 7,009,320 | 0.1 |
| 8,770,000 | (1) | Benefit Street Partners CLO II Ltd. 2013-IIA A1R, 3.081%, (US0003M + 1.250%), 07/15/2029 | 8,405,107 | 0.1 |
| 7,500,000 | (1) | Benefit Street Partners CLO VIII Ltd. 2015-8A A1BR, 3.019%, (US0003M + 1.200%), 01/20/2031 | 6,655,642 | 0.1 |
| 5,000,000 | (1) | Benefit Street Partners CLO XIV Ltd. 2018-14A A2, 2.969%, (US0003M + 1.150%), 04/20/2031 | 4,522,170 | 0.1 |
| 17,350,000 | (1) | Benefit Street Partners CLO XIX Ltd. 2019-19A A, 3.228%, (US0003M + 1.350%), 01/15/2033 | 16,073,474 | 0.2 |
| 4,070,000 | (1) | BlueMountain CLO 2015-1A BR, 4.348%, (US0003M + 2.500%), 04/13/2027 | 3,895,849 | 0.1 |
| 10,000,000 | (1) | Carbone CLO Ltd. 2017-1A A1, 2.967%, (US0003M + 1.140%), 01/20/2031 | 9,404,320 | 0.1 |
| 700,000 | (1) | Carlyle Global Market Strategies CLO 2014-2RA A1 Ltd., 2.742%, (US0003M + 1.050%), 05/15/2031 | 658,897 | 0.0 |
| 3,250,000 | (1) | Carlyle Global Market Strategies CLO Ltd. 2014-1A A2R2, 2.966%, (US0003M + 1.130%), 04/17/2031 | 2,935,839 | 0.0 |
| 3,530,000 | (1) | Cedar Funding VIII Clo Ltd. 2017-8A A1, 3.086%, (US0003M + 1.250%), 10/17/2030 | 3,314,885 | 0.0 |
| 37,149 | Chase Funding Trust Series 2003-5 2A2, 1.547%, (US0001M + 0.600%), 07/25/2033 | 32,866 | 0.0 | |
| 4,050,000 | (1) | CIFC Funding 2013-2A A1LR, 3.037%, (US0003M + 1.210%), 10/18/2030 | 3,864,429 | 0.1 |
| 2,150,000 | (1) | CIFC Funding 2017-2A C, 4.169%, (US0003M + 2.350%), 04/20/2030 | 1,884,914 | 0.0 |
| 7,400,000 | (1) | CIFC Funding 2017-4 A1, 3.051%, (US0003M + 1.250%), 10/24/2030 | 7,009,524 | 0.1 |
| 3,000,000 | (1) | CIFC Funding 2017-5A A1, 3.016%, (US0003M + 1.180%), 11/16/2030 | 2,840,202 | 0.0 |
See Accompanying Notes to Financial Statements
| 60 |
| Voya Intermediate Bond Fund | PORTFOLIO OF INVESTMENTS |
| as of March31, 2020 (Continued) |
| 11,380,000 | (1) | CIFC Funding 2019-6A A1 Ltd., 3.237%, (US0003M + 1.330%), 01/16/2033 | 10,691,635 | 0.1 |
| 3,000,000 | (1) | CIFC Funding 2019-6A A2 Ltd., 3.657%, (US0003M + 1.750%), 01/16/2033 | 2,789,127 | 0.0 |
| 4,675,000 | (1) | Cole Park CLO Ltd. 2015-1A CR, 3.819%, (US0003M + 2.000%), 10/20/2028 | 4,219,061 | 0.1 |
| 7,425,000 | Countrywide Asset-Backed Certificates 2005-AB2 M1, 1.652%, (US0001M + 0.705%), 09/25/2035 | 6,548,324 | 0.1 | |
| 9,874,233 | Credit-Based Asset Servicing & Securitization LLC 2006-CB8 A2C, 1.097%, (US0001M + 0.150%), 10/25/2036 | 7,984,201 | 0.1 | |
| 4,714,375 | (1) | DB Master Finance LLC 2019-1A A23, 4.352%, 05/20/2049 | 4,546,904 | 0.1 |
| 2,431,625 | (1) | DB Master Finance LLC 2019-1A A2II, 4.021%, 05/20/2049 | 2,365,182 | 0.0 |
| 4,200,000 | (1) | Deer Creek Clo Ltd. 2017-1A A, 2.999%, (US0003M + 1.180%), 10/20/2030 | 3,972,469 | 0.1 |
| 7,000,000 | (1) | Dewolf Park Clo Ltd. 2017-1A A, 3.041%, (US0003M + 1.210%), 10/15/2030 | 6,634,845 | 0.1 |
| 635,375 | (1) | Domino's Pizza Master Issuer LLC 2017-1A A2II, 3.082%, 07/25/2047 | 622,033 | 0.0 |
| 6,832,875 | (1) | Domino's Pizza Master Issuer LLC 2019-1A A2, 3.668%, 10/25/2049 | 6,102,236 | 0.1 |
| 2,610,250 | (1) | Domino's Pizza Master Issuer LLC 2018-1A A211, 4.328%, 07/25/2048 | 2,501,442 | 0.0 |
| 5,791,500 | (1) | Driven Brands Funding LLC 2019-1A A2, 4.641%, 04/20/2049 | 5,547,736 | 0.1 |
| 2,308,875 | (1) | Driven Brands Funding, LLC 2018-1A A2, 4.739%, 04/20/2048 | 2,261,487 | 0.0 |
| 6,660,000 | (1) | Dryden Senior Loan Fund 2017-47A A2, 3.181%, (US0003M + 1.350%), 04/15/2028 | 6,115,372 | 0.1 |
| 5,565,000 | (1) | Dryden XXVIII Senior Loan Fund 2013-28A A1LR, 2.892%, (US0003M + 1.200%), 08/15/2030 | 5,335,650 | 0.1 |
| 7,000,000 | (1) | Dryden 78 CLO Ltd. 2020-78A A, 2.447%, (US0003M + 1.180%), 04/17/2033 | 6,510,000 | 0.1 |
| 8,000,000 | (1) | Eaton Vance Clo 2015-1A A2R Ltd., 3.069%, (US0003M + 1.250%), 01/20/2030 | 7,223,776 | 0.1 |
| 4,228,050 | (1) | Five Guys Holdings, Inc. 2017-1A A2, 4.600%, 07/25/2047 | 4,452,695 | 0.1 |
| 4,250,000 | (1) | Galaxy XIX CLO Ltd. 2015-19A A1R, 3.021%, (US0003M + 1.220%), 07/24/2030 | 4,040,670 | 0.1 |
| 2,500,000 | (1) | Galaxy XV CLO Ltd. 2013-15A AR, 3.031%, (US0003M + 1.200%), 10/15/2030 | 2,361,297 | 0.0 |
| 11,150,000 | (1) | Galaxy XXI CLO Ltd. 2015-21A AR, 2.839%, (US0003M + 1.020%), 04/20/2031 | 10,411,926 | 0.1 |
| 2,300,000 | (1) | Gilbert Park CLO Ltd. 2017-1A A, 3.021%, (US0003M + 1.190%), 10/15/2030 | 2,179,326 | 0.0 |
| 7,000,000 | (1) | Goldentree Loan Management US Clo 2 Ltd. 2017-2A A, 2.969%, (US0003M + 1.150%), 11/28/2030 | 6,610,996 | 0.1 |
| 4,727,499 | (1) | Helios Issuer, LLC 2018-1A A, 4.870%, 07/20/2048 | 4,289,837 | 0.1 |
| 1,281,642 | (1) | HERO Funding Trust 2015-2A A, 3.990%, 09/20/2040 | 1,343,903 | 0.0 |
| 1,219,708 | (1) | HERO Funding Trust 2016-2A A, 3.750%, 09/20/2041 | 1,255,546 | 0.0 |
| 3,020,285 | (1) | HERO Funding Trust 2016-4A A2, 4.290%, 09/20/2047 | 3,211,499 | 0.0 |
| 1,250,000 | (1) | Home Partners of America 2018-1 E Trust, 2.650%, (US0001M + 1.850%), 07/17/2037 | 1,102,254 | 0.0 |
| 7,750,000 | (1) | Jay Park CLO Ltd. 2016-1A BR, 3.819%, (US0003M + 2.000%), 10/20/2027 | 6,867,817 | 0.1 |
| 7,300,000 | (1) | Jersey Mike's Funding 2019-1A A2, 4.433%, 02/15/2050 | 6,477,290 | 0.1 |
| 4,328,213 | (1) | JG Wentworth XLII LLC 2018-2A A, 3.960%, 10/15/2075 | 4,436,656 | 0.1 |
| 3,111,030 | (1) | JGWPT XXXIII LLC 2014-3A A, 3.500%, 06/15/2077 | 3,095,083 | 0.0 |
| 10,050,000 | (1) | Kayne CLO 6 Ltd. 2019-6A A1, 3.131%, (US0003M + 1.380%), 01/20/2033 | 9,380,167 | 0.1 |
| 6,000,000 | (1) | Kayne CLO 6 Ltd. 2019-6A A2, 3.601%, (US0003M + 1.850%), 01/20/2033 | 5,560,572 | 0.1 |
See Accompanying Notes to Financial Statements
| 61 |
| Voya Intermediate Bond Fund | PORTFOLIO OF INVESTMENTS |
| as of March31, 2020 (Continued) |
| 4,250,000 | (1) | Kayne CLO 7 Ltd. 2020-7A A1, 2.651%, (US0003M + 1.200%), 04/17/2033 | 3,591,250 | 0.0 |
| 6,000,000 | (1),(9) | KKR CLO 21 A Ltd., 2.831%, (US0003M + 1.000%), 04/15/2031 | 5,580,216 | 0.1 |
| 6,000,000 | (1) | LCM 26A A2 Ltd., 3.069%, (US0003M + 1.250%), 01/20/2031 | 5,480,364 | 0.1 |
| 1,867,000 | (1) | LCM XIV L.P. 14A AR, 2.867%, (US0003M + 1.040%), 07/20/2031 | 1,741,060 | 0.0 |
| 5,000,000 | (1) | LCM XVIII L.P. 18A A2R, 3.039%, (US0003M + 1.220%), 04/20/2031 | 4,537,885 | 0.1 |
| 5,400,000 | (1) | Madison Park Funding XV Ltd. 2014-15A B1R, 3.994%, (US0003M + 2.200%), 01/27/2026 | 5,123,417 | 0.1 |
| 3,600,000 | (1) | Madison Park Funding XXI Ltd. 2016-21A BR, 4.681%, (US0003M + 2.850%), 10/15/2032 | 2,972,927 | 0.0 |
| 1,400,000 | (1) | Madison Park Funding XXVII Ltd. 2018-27A B, 3.619%, (US0003M + 1.800%), 04/20/2030 | 1,176,028 | 0.0 |
| 13,150,000 | (1) | Magnetite XXII Ltd. 2019-22A A2, 3.481%, (US0003M + 1.650%), 04/15/2031 | 12,219,204 | 0.2 |
| 3,400,000 | (1) | Marlette Funding Trust 2018-1A C, 3.690%, 03/15/2028 | 3,344,691 | 0.0 |
| 3,488,000 | (1) | Marlette Funding Trust 2018-4A C, 4.910%, 12/15/2028 | 3,245,711 | 0.0 |
| 500,000 | (1) | Marlette Funding Trust 2019-2 A2A, 3.530%, 07/16/2029 | 407,377 | 0.0 |
| 4,200,000 | (1) | Marlette Funding Trust 2019-2A C, 4.110%, 07/16/2029 | 3,135,780 | 0.0 |
| 1,100,000 | (1),(3) | Mill City Mortgage Loan Trust 2017-1 M2, 3.250%, 11/25/2058 | 1,079,441 | 0.0 |
| 3,200,000 | (1),(3) | Mill City Mortgage Loan Trust 2017-2 M2, 3.250%, 07/25/2059 | 3,022,023 | 0.0 |
| 2,482,000 | (1),(3) | Mill City Mortgage Trust 2015-2 B2, 3.820%, 09/25/2057 | 2,065,753 | 0.0 |
| 1,241,902 | (1) | Mill City Solar Loan 2019-1A A Ltd., 4.340%, 03/20/2043 | 1,211,825 | 0.0 |
| 6,361,877 | (1) | Mill City Solar Loan 2019-2GS A Ltd., 3.690%, 07/20/2043 | 6,023,798 | 0.1 |
| 4,819,560 | (1) | Mosaic Solar Loan Trust 2018-1A A, 4.010%, 06/22/2043 | 4,633,576 | 0.1 |
| 7,924,800 | (1) | Mosaic Solar Loan Trust 2018-2-GS A, 4.200%, 02/22/2044 | 8,001,984 | 0.1 |
| 2,024,885 | (1) | Mosaic Solar Loan Trust 2018-2-GS B, 4.740%, 02/22/2044 | 1,856,797 | 0.0 |
| 7,028,345 | (1) | Mosaic Solar Loan Trust 2019-2A A, 2.880%, 09/20/2040 | 6,784,575 | 0.1 |
| 2,993,822 | (1) | Mosaic Solar Loans 2017-2A A LLC, 3.820%, 06/22/2043 | 2,995,769 | 0.0 |
| 3,250,000 | (1) | Neuberger Berman Loan Advisers CLO 33 Ltd. 2019-33A C, 4.590%, (US0003M + 2.450%), 10/16/2032 | 2,691,253 | 0.0 |
| 12,250,000 | (1) | Neuberger Berman Loan Advisers CLO 35 Ltd. 2019-35A A1, 3.243%, (US0003M + 1.340%), 01/19/2033 | 11,599,892 | 0.1 |
| 2,500,000 | (1) | OCP CLO 2015-8 Ltd. 2015-8A BR, 3.686%, (US0003M + 1.850%), 04/17/2027 | 2,315,722 | 0.0 |
| 9,470,000 | (1) | Octagon Investment Partners 30 Ltd. 2017-1A A1, 3.139%, (US0003M + 1.320%), 03/17/2030 | 8,991,869 | 0.1 |
| 3,000,000 | (1) | Octagon Investment Partners Ltd. 2017-1A A2, 3.181%, (US0003M + 1.350%), 07/15/2029 | 2,784,759 | 0.0 |
| 5,520,000 | (1) | Octagon Investment Partners XIV Ltd. 2012-1A A1BR, 3.206%, (US0003M + 1.375%), 07/15/2029 | 4,975,088 | 0.1 |
| 4,060,000 | (1) | Octagon Investment Partners XV Ltd. 2013-1A A2R, 3.169%, (US0003M + 1.350%), 07/19/2030 | 3,759,150 | 0.1 |
| 20,000,000 | (1) | Octagon Loan Funding Ltd. 2014-1A ARR, 2.872%, (US0003M + 1.180%), 11/18/2031 | 18,709,280 | 0.2 |
| 17,700,000 | (1) | OHA Loan Funding 2015-1A A1R2 Ltd., 3.032%, (US0003M + 1.340%), 11/15/2032 | 16,602,494 | 0.2 |
| 3,550,000 | (1) | Palmer Square CLO 2014-1A A1R2 Ltd., 2.966%, (US0003M + 1.130%), 01/17/2031 | 3,383,381 | 0.0 |
| 10,000,000 | (1) | Palmer Square CLO 2018-1A A1 Ltd., 2.849%, (US0003M + 1.030%), 04/18/2031 | 9,427,440 | 0.1 |
| 6,700,000 | (1) | Palmer Square Loan Funding 2018-1A B Ltd., 3.231%, (US0003M + 1.400%), 04/15/2026 | 5,833,127 | 0.1 |
| 4,000,000 | (1) | Palmer Square Loan Funding 2018-1A C Ltd., 3.681%, (US0003M + 1.850%), 04/15/2026 | 3,160,048 | 0.0 |
See Accompanying Notes to Financial Statements
| 62 |
| Voya Intermediate Bond Fund | PORTFOLIO OF INVESTMENTS |
| as of March31, 2020 (Continued) |
| 1,000,000 | (1),(9) | Palmer Square Loan Funding 2018-2A C Ltd., 3.781%, (US0003M + 1.950%), 07/15/2026 | 772,683 | 0.0 |
| 6,600,000 | (1) | Palmer Square CLO 2015-2A A1R2 Ltd., 2.919%, (US0003M + 1.100%), 07/20/2030 | 6,256,430 | 0.1 |
| 6,107,000 | (1) | Planet Fitness Master Issuer LLC 2018-1A A2I, 4.262%, 09/05/2048 | 5,829,928 | 0.1 |
| 572,544 | (3) | Popular ABS Mortgage Pass-Through Trust 2005-D A5, 3.741%, 01/25/2036 | 558,385 | 0.0 |
| 5,037,375 | (1) | Primose Funding LLC 2019-1A A2, 4.475%, 07/30/2049 | 4,651,572 | 0.1 |
| 2,000,000 | (1),(3) | Sofi Consumer Loan Program 2016-4 C LLC, 5.920%, 11/25/2025 | 1,898,317 | 0.0 |
| 5,101,000 | (1) | SoFi Consumer Loan Program 2017-3 B, 3.850%, 05/25/2026 | 4,588,757 | 0.1 |
| 1,585,000 | (1) | Sofi Consumer Loan Program 2017-6 B LLC, 3.520%, 11/25/2026 | 1,485,066 | 0.0 |
| 7,000,000 | (1) | Sofi Consumer Loan Program 2018-1 C Trust, 3.970%, 02/25/2027 | 5,772,003 | 0.1 |
| 7,190,000 | (1) | Sofi Consumer Loan Program 2018-2 B Trust, 3.790%, 04/26/2027 | 6,871,592 | 0.1 |
| 3,700,000 | (1) | Sofi Consumer Loan Program 2018-2 C Trust, 4.250%, 04/26/2027 | 3,456,547 | 0.0 |
| 9,950,000 | (1) | Sofi Consumer Loan Program 2018-3 C Trust, 4.670%, 08/25/2027 | 8,823,264 | 0.1 |
| 3,450,000 | (1) | SoFi Consumer Loan Program 2018-4 B Trust, 3.960%, 11/26/2027 | 3,238,545 | 0.0 |
| 2,000,000 | (1) | SoFi Consumer Loan Program 2019-2 C Trust, 3.460%, 04/25/2028 | 1,544,610 | 0.0 |
| 2,000,000 | (1) | SoFi Consumer Loan Program 2019-2 D Trust, 4.200%, 04/25/2028 | 1,403,413 | 0.0 |
| 4,100,000 | (1) | SoFi Consumer Loan Program 2019-4 C Trust, 2.840%, 08/25/2028 | 3,353,076 | 0.0 |
| 1,300,000 | (1) | SoFi Consumer Loan Program 2019-4 D Trust, 3.480%, 08/25/2028 | 1,054,221 | 0.0 |
| 345,333 | (1) | Sonic Capital LLC 2018-1A A2, 4.026%, 02/20/2048 | 349,715 | 0.0 |
| 7,293,917 | (1) | Sonic Capital LLC 2020-1A A2I, 3.845%, 01/20/2050 | 7,098,033 | 0.1 |
| 22,060,000 | (1) | Sound Point CLO XXV Ltd. 2019-4A A1A, 3.231%, (US0003M + 1.400%), 01/15/2033 | 20,042,503 | 0.2 |
| 4,819,982 | (1) | Sunrun Athena Issuer 2018-1 A LLC, 5.310%, 04/30/2049 | 4,311,191 | 0.1 |
| 4,729,670 | (1) | Sunrun Xanadu Issuer 2019-1A A LLC, 3.980%, 06/30/2054 | 3,646,765 | 0.1 |
| 6,073,125 | (1) | Taco Bell Funding LLC 2018-1A A2II, 4.940%, 11/25/2048 | 5,983,382 | 0.1 |
| 7,200,000 | (1) | TES LLC 2017-1A B, 7.740%, 10/20/2047 | 6,152,972 | 0.1 |
| 7,000,000 | (1) | THL Credit Wind River 2013-2A AR CLO Ltd., 3.049%, (US0003M + 1.230%), 10/18/2030 | 6,582,380 | 0.1 |
| 12,250,000 | (1) | THL Credit Wind River 2016-2A A1R CLO Ltd., 2.953%, (US0003M + 1.190%), 11/01/2031 | 11,448,348 | 0.1 |
| 7,080,000 | (1) | THL Credit Wind River 2017-2A A CLO Ltd., 3.049%, (US0003M + 1.230%), 07/20/2030 | 6,714,736 | 0.1 |
| 7,500,000 | (1) | Tiaa Clo III Ltd. 2017-2A A, 2.993%, (US0003M + 1.150%), 01/16/2031 | 6,935,325 | 0.1 |
| 1,400,000 | (1),(3) | Towd Point Mortgage Trust 2015-2 1B1, 3.757%, 11/25/2060 | 1,282,058 | 0.0 |
| 2,640,000 | (1),(3) | Towd Point Mortgage Trust 2015-2 2B2, 4.449%, 11/25/2057 | 2,537,215 | 0.0 |
| 4,346,000 | (1),(3) | Towd Point Mortgage Trust 2016-2 M1, 3.000%, 08/25/2055 | 4,055,934 | 0.1 |
| 3,200,000 | (1),(3) | Towd Point Mortgage Trust 2017-1 M1, 3.750%, 10/25/2056 | 3,047,983 | 0.0 |
| 2,200,000 | (1),(3) | Towd Point Mortgage Trust 2017-3 M1, 3.500%, 07/25/2057 | 1,983,729 | 0.0 |
| 3,000,000 | (1) | Trafigura Securitisation Finance PLC 2018-1A B, 4.290%, 03/15/2022 | 3,020,350 | 0.0 |
| 7,250,000 | (1) | Venture XX CLO Ltd. 2015-20A CR, 3.731%, (US0003M + 1.900%), 04/15/2027 | 6,234,855 | 0.1 |
| 1,955,000 | (1) | Wendys Funding LLC 2018-1A A2I, 3.573%, 03/15/2048 | 1,786,655 | 0.0 |
| 3,606,975 | (1) | Wendy's Funding LLC 2018-1A A2II, 3.884%, 03/15/2048 | 3,269,795 | 0.0 |
| 678,161,591 | 8.2 |
See Accompanying Notes to Financial Statements
| 63 |
| Voya Intermediate Bond Fund | PORTFOLIO OF INVESTMENTS |
| as of March31, 2020 (Continued) |
| Student Loan Asset-Backed Securities: 0.6% | ||||
| 831,351 | (1) | Commonbond Student Loan Trust 2016-B, 4.000%, 10/25/2040 | 856,751 | 0.0 |
| 2,300,000 | (1) | Commonbond Student Loan Trust 2017-BGS B, 3.260%, 09/25/2042 | 2,360,574 | 0.0 |
| 240,353 | (1) | Commonbond Student Loan Trust 2018-A-GS C, 3.820%, 02/25/2044 | 246,828 | 0.0 |
| 255,319 | (1) | Earnest Student Loan Program, LLC 2016-A B, 2.500%, 01/25/2039 | 252,132 | 0.0 |
| 327,188 | (1),(3) | Earnest Student Loan Program, LLC 2016-B B, 4.810%, 09/25/2036 | 338,549 | 0.0 |
| 252,967 | (1) | Earnest Student Loan Program, LLC 2016-C B, 4.460%, 01/26/2037 | 256,917 | 0.0 |
| 504,691 | (1) | Laurel Road Prime Student Loan Trust 2017-B A4, 3.020%, 08/25/2042 | 492,754 | 0.0 |
| 2,700,000 | (1) | SMB Private Education Loan Trust 2014-A C, 4.500%, 09/15/2045 | 2,642,843 | 0.0 |
| 1,450,000 | (1) | SMB Private Education Loan Trust 2017-A B, 3.500%, 06/17/2041 | 1,505,786 | 0.0 |
| 4,100,000 | (1),(3) | SoFi Professional Loan Program 2016-E C, 4.430%, 10/25/2041 | 4,341,007 | 0.1 |
| 3,000,000 | (1),(3) | SoFi Professional Loan Program 2017-C B, 3.560%, 07/25/2040 | 3,060,552 | 0.0 |
| 3,900,000 | (1) | SoFi Professional Loan Program 2017-F BFX LLC, 3.620%, 01/25/2041 | 3,883,325 | 0.1 |
| 3,250,000 | (1) | Sofi Professional Loan Program 2018-A B LLC, 3.610%, 02/25/2042 | 3,159,921 | 0.1 |
| 8,000,000 | (1) | Sofi Professional Loan Program 2018-B BFX Trust, 3.830%, 08/25/2047 | 7,503,729 | 0.1 |
| 5,800,000 | (1) | Sofi Professional Loan Program 2018-C BFX Trust, 4.130%, 01/25/2048 | 5,897,000 | 0.1 |
| 6,000,000 | (1) | Sofi Professional Loan Program 2018-D BFX Trust, 4.140%, 02/25/2048 | 6,192,755 | 0.1 |
| 3,000,000 | (1) | Sofi Professional Loan Program 2019-B BFX LLC, 3.730%, 08/17/2048 | 3,133,155 | 0.0 |
| 46,124,578 | 0.6 | |||
| Total Asset-Backed Securities | ||||
| (Cost $877,196,585) | 819,963,523 | 10.0 | ||
| CONVERTIBLE BONDS/NOTES: 0.0% | ||||
| Financial: 0.0% | ||||
| 1,690,000 | Santander UK PLC, 3.400%, 06/01/2021 | 1,693,664 | 0.0 | |
| Total Convertible Bonds/Notes | ||||
| (Cost $1,679,961) | 1,693,664 | 0.0 | ||
| Value | Percentage of Net Assets | |||
| PURCHASED OPTIONS(10): 0.1% | ||||
| Total Purchased Options | ||||
| (Cost $896,417) | 9,754,777 | 0.1 | ||
| Total Long-Term Investments | ||||
| (Cost $8,296,114,079) | 8,122,735,917 | 98.7 | ||
| Principal Amount† | Value | Percentage of Net Assets | ||
| SHORT-TERM INVESTMENTS: 2.2% | ||||
| Commercial Paper: 0.2% | ||||
| 1,825,000 | (11) | DBS Bank Ltd., 1.700%, 04/03/2020 | 1,824,954 | 0.0 |
| 4,670,000 | (11) | Exxon Mobil Corp., 1.600%, 06/03/2020 | 4,652,422 | 0.1 |
| 4,775,000 | (11) | Federal Republic of Germany, 1.620%, 05/21/2020 | 4,768,234 | 0.1 |
| 950,000 | (11) | Matchpoint Finance PLC, 1.680%, 05/11/2020 | 948,280 | 0.0 |
| 4,625,000 | (11) | Pfizer Inc., 1.630%, 06/15/2020 | 4,607,522 | 0.0 |
| Total Commercial Paper | ||||
| (Cost $16,801,412) | 16,801,412 | 0.2 | ||
| Floating Rate Notes: 1.2% | ||||
| 4,600,000 | (11) | Australia & New Zealand Banking Group Ltd., 0.950%, 05/20/2020 | 4,600,847 | 0.1 |
| 3,250,000 | (11) | Australia & New Zealand Banking Group Ltd., 1.220%, 04/09/2020 | 3,250,510 | 0.1 |
| 2,900,000 | (11) | Bank of America Corp., 1.200%, 05/07/2020 | 2,898,198 | 0.0 |
| 2,100,000 | (11) | Bank of Montreal, 0.210%, 07/13/2020 | 2,093,311 | 0.0 |
| 1,250,000 | (11) | Bank of Montreal, 0.980%, 08/26/2020 | 1,250,012 | 0.0 |
| 2,100,000 | (11) | Bank of Nova Scotia, 0.830%, 08/20/2020 | 2,098,726 | 0.0 |
| 2,425,000 | (11) | Bank of Nova Scotia, 1.240%, 05/08/2020 | 2,425,837 | 0.0 |
| 2,200,000 | (11) | Canadian Imperial Bank of Commerce, 0.240%, 08/28/2020 | 2,188,445 | 0.0 |
| 3,200,000 | (11) | Citibank N.A., 1.810%, 05/01/2020 | 3,198,058 | 0.1 |
| 2,250,000 | (11) | Commonwealth Bank of Australia, 0.950%, 06/10/2020 | 2,248,059 | 0.0 |
See Accompanying Notes to Financial Statements
| 64 |
| Voya Intermediate Bond Fund | PORTFOLIO OF INVESTMENTS |
| as of March31, 2020 (Continued) |
| 3,000,000 | (11) | Coöperatieve Rabobank U.A., 0.990%, 04/20/2020 | 3,000,752 | 0.1 |
| 2,100,000 | (11) | Crédit Agricole Group, 0.190%, 06/12/2020 | 2,095,374 | 0.0 |
| 1,600,000 | (11) | Crédit Industriel et Commercial, 1.140%, 04/24/2020 | 1,600,449 | 0.0 |
| 3,375,000 | (11) | Credit Suisse Group AG, 0.150%, 08/14/2020 | 3,360,584 | 0.1 |
| 3,450,000 | (11) | Credit Suisse Group AG, 0.360%, 04/17/2020 | 3,449,874 | 0.1 |
| 2,925,000 | (11) | HSBC Bank PLC, 1.520%, 06/03/2020 | 2,922,779 | 0.0 |
| 2,925,000 | (11) | JPMorgan Chase & Co., 1.740%, 08/07/2020 | 2,920,047 | 0.0 |
| 450,000 | (11) | Lloyds Bank PLC, 0.110%, 08/24/2020 | 448,734 | 0.0 |
| 875,000 | (11) | Lloyds Bank PLC, 0.110%, 08/25/2020 | 872,518 | 0.0 |
| 925,000 | (11) | Lloyds Bank PLC, 0.220%, 09/08/2020 | 922,536 | 0.0 |
| 950,000 | (11) | Lloyds Bank PLC, 1.100%, 08/07/2020 | 949,207 | 0.0 |
| 1,125,000 | (11) | Mizuho Financial Group Inc., 0.870%, 08/13/2020 | 1,124,072 | 0.0 |
| 1,800,000 | (11) | Mizuho Financial Group Inc., 1.140%, 05/22/2020 | 1,800,554 | 0.0 |
| 3,900,000 | (11) | Mizuho Financial Group Inc., 1.140%, 05/26/2020 | 3,901,124 | 0.1 |
| 2,750,000 | (11) | National Bank of Canada, 1.840%, 05/01/2020 | 2,749,060 | 0.0 |
| 2,700,000 | (11) | National Bank of Canada, 1.840%, 07/16/2020 | 2,695,730 | 0.0 |
| 2,600,000 | (11) | Royal Bank of Canada, 0.960%, 07/17/2020 | 2,597,778 | 0.0 |
| 4,175,000 | (11) | Skandinaviska Enskilda Banken AB, 1.150%, 05/26/2020 | 4,176,150 | 0.1 |
| 4,325,000 | (11) | Skandinaviska Enskilda Banken AB, 1.780%, 05/11/2020 | 4,322,924 | 0.1 |
| 2,325,000 | (11) | Societe Generale, 0.290%, 09/04/2020 | 2,315,439 | 0.0 |
| 825,000 | (11) | Sumitomo Mitsui Trust Holdings, Inc., 0.760%, 06/15/2020 | 824,530 | 0.0 |
| 2,750,000 | (11) | Sumitomo Mitsui Trust Holdings, Inc., 0.870%, 05/11/2020 | 2,750,616 | 0.0 |
| 2,550,000 | (11) | Sumitomo Mitsui Trust Holdings, Inc., 1.280%, 05/07/2020 | 2,551,113 | 0.0 |
| 2,900,000 | (11) | Svenska Handelsbanken AB, 0.970%, 05/20/2020 | 2,900,615 | 0.0 |
| 3,000,000 | (11) | Svenska Handelsbanken AB, 1.160%, 07/07/2020 | 2,998,726 | 0.1 |
| 3,175,000 | (11) | The Norinchukin Bank, 1.200%, 04/24/2020 | 3,175,362 | 0.1 |
| 2,250,000 | (11) | The Sumitomo Mitsui Financial Group, 1.020%, 08/25/2020 | 2,247,518 | 0.0 |
| 2,075,000 | (11) | The Sumitomo Mitsui Financial Group, 1.040%, 05/12/2020 | 2,076,140 | 0.0 |
| 350,000 | (11) | The Sumitomo Mitsui Financial Group, 1.270%, 05/06/2020 | 350,145 | 0.0 |
| 3,200,000 | (11) | Toronto-Dominion Bank, 1.140%, 04/30/2020 | 3,200,740 | 0.1 |
| 1,450,000 | (11) | Toyota Motor Corp., 1.680%, 04/17/2020 | 1,449,374 | 0.0 |
| Total Floating Rate Notes | ||||
| (Cost $99,002,567) | 99,002,567 | 1.2 | ||
| Repurchase Agreements: 0.5% | ||||
| 3,428,319 | (11) | BNP Paribas S.A., Repurchase Agreement dated 03/31/20, 0.33%, due 04/01/20 (Repurchase Amount $3,428,350, collateralized by various U.S. Government Securities, 2.125%-6.875%, Market Value plus accrued interest $3,599,743, due 06/15/20-03/15/39) | 3,428,319 | 0.0 |
| 3,907,311 | (11) | Cantor Fitzgerald Securities, Repurchase Agreement dated 03/31/20, 0.02%, due 04/01/20 (Repurchase Amount $3,907,313, collateralized by various U.S. Government/U.S. Government Agency Obligations, 0.000%-8.500%, Market Value plus accrued interest $3,985,457, due 05/01/20-02/20/70) | 3,907,311 | 0.1 |
| 1,682,394 | (11) | CF Secured LLC, Repurchase Agreement dated 03/31/20, 0.02%, due 04/01/20 (Repurchase Amount $1,682,395, collateralized by various U.S. Government/U.S. Government Agency Obligations, 0.000%-6.500%, Market Value plus accrued interest $1,716,044, due 12/15/21-11/20/66) | 1,682,394 | 0.0 |
See Accompanying Notes to Financial Statements
| 65 |
| Voya Intermediate Bond Fund | PORTFOLIO OF INVESTMENTS |
| as of March31, 2020 (Continued) |
| 1,203,929 | (11) | Citadel Securities LLC, Repurchase Agreement dated 03/31/20, 0.09%, due 04/01/20 (Repurchase Amount $1,203,932, collateralized by various U.S. Government Securities, 0.000%-8.125%, Market Value plus accrued interest $1,228,011, due 04/07/20-02/15/50) | 1,203,929 | 0.0 |
| 8,309,810 | (11) | Citigroup, Inc., Repurchase Agreement dated 03/31/20, 0.01%, due 04/01/20 (Repurchase Amount $8,309,812, collateralized by various U.S. Government Agency Obligations, 0.150%-8.500%, Market Value plus accrued interest $8,476,006, due 04/15/21-09/20/69) | 8,309,810 | 0.1 |
| 1,401,898 | (11) | Industrial & Comm. Bank of China, Repurchase Agreement dated 03/31/20, 0.02%, due 04/01/20 (Repurchase Amount $1,401,899, collateralized by various U.S. Government Agency Obligations, 0.000%-9.500%, Market Value plus accrued interest $1,429,936, due 04/02/20-03/01/50) | 1,401,898 | 0.0 |
| 12,200,000 | (11) | MUFG Securities America Inc., Repurchase Agreement dated 03/03/20, 0.35%, due 05/05/20 (Repurchase Amount $12,207,370, collateralized by various U.S. Government Securities, 0.000%-8.500%, Market Value plus accrued interest $12,809,993, due 10/15/20-09/09/49) | 12,200,000 | 0.2 |
| 1,511,908 | (11) | Royal Bank of Canada, Repurchase Agreement dated 03/31/20, 0.38%, due 04/01/20 (Repurchase Amount $1,511,924, collateralized by various U.S. Government Securities, 1.493%-10.200%, Market Value plus accrued interest $1,577,735, due 04/17/20-03/15/40) | 1,511,908 | 0.0 |
| 8,176,813 | (11) | State of Wisconsin Investment Board, Repurchase Agreement dated 03/31/20, 0.16%, due 04/01/20 (Repurchase Amount $8,176,849, collateralized by various U.S. Government Securities, 0.125%-3.875%, Market Value plus accrued interest $8,360,308, due 04/01/20-09/09/49) | 8,176,813 | 0.1 |
| Total Repurchase Agreements | ||||
| (Cost $41,822,382) | 41,822,382 | 0.5 | ||
| Certificates of Deposit: 0.1% | ||||
| 350,000 | (11) | Dz Bank Ag Deutsche Zentral-Genossenschaftsbank, 1.640%, 05/12/2020 | 350,174 | 0.0 |
| 2,950,000 | (11) | Group BPCE, 1.790%, 04/13/2020 | 2,950,646 | 0.1 |
| 2,525,000 | (11) | Landesbank Baden-Wurttemberg, 1.630%, 04/24/2020 | 2,526,351 | 0.0 |
| 1,900,000 | (11) | Landesbank Baden-Wurttemberg, 1.640%, 04/21/2020 | 1,901,003 | 0.0 |
| 2,850,000 | (11) | The Norinchukin Bank, 1.650%, 06/18/2020 | 2,852,841 | 0.0 |
| Total Certificates of Deposit | ||||
| (Cost $10,581,015) | 10,581,015 | 0.1 | ||
| Shares | Value | Percentage of Net Assets | ||
| Mutual Funds: 0.2% | ||||
| 12,049,000 | (12) | Goldman Sachs Financial Square Government Fund - Institutional Shares, 0.340% | ||
| (Cost $12,049,000) | 12,049,000 | 0.2 | ||
| Total Short-Term Investments | ||||
| (Cost $180,256,376) | 180,256,376 | 2.2 | ||
| Total Investments in Securities (Cost $8,476,370,455) | $ 8,302,992,293 | 100.9 | ||
| Liabilities in Excess of Other Assets | (74,013,594) | (0.9) | ||
| Net Assets | $ 8,228,978,699 | 100.0 | ||
See Accompanying Notes to Financial Statements
| 66 |
| Voya Intermediate Bond Fund | PORTFOLIO OF INVESTMENTS |
| as of March31, 2020 (Continued) |
| † | Unless otherwise indicated, principal amount is shown in USD. |
| (1) | Securities with purchases pursuant to Rule 144A or section 4(a)(2), under the Securities Act of 1933 and may not be resold subject to that rule except to qualified institutional buyers. |
| (2) | Security, or a portion of the security, is on loan. |
| (3) | Variable rate security. Rate shown is the rate in effect as of March 31, 2020. |
| (4) | For fair value measurement disclosure purposes, security is categorized as Level 3, whose value was determined using significant unobservable inputs. |
| (5) | Interest only securities represent the right to receive the monthly interest payments on an underlying pool of mortgage loans. Principal amount shown represents the notional amount on which current interest is calculated. Payments of principal on the pool reduce the value of the interest only security. |
| (6) | Principal only securities represent the right to receive the monthly principal payments on an underlying pool of mortgage loans. No payments of interest on the pool are passed through the principal only security. |
| (7) | Step-up bond that pays an initial coupon rate for the first period and then a higher coupon rate for the following periods. Rates shown reflect the current and next coupon rate as of March 31, 2020. |
| (8) | The Federal Housing Finance Agency (“FHFA”) placed the Federal Home Loan Mortgage Corporation and Federal National Mortgage Association into conservatorship with FHFA as the conservator. As such, the FHFA oversees the continuing affairs of these companies. |
| (9) | Settlement is on a when-issued or delayed-delivery basis. |
| (10) | The tables within the Portfolio of Investments detail open purchased options which are non-income producing securities. |
| (11) | All or a portion of the security represents securities purchased with cash collateral received for securities on loan. |
| (12) | Rate shown is the 7-day yield as of March 31, 2020. |
| Currency Abbreviations: | |
| BRL | Brazilian Real |
| DKK | Danish Krone |
| IDR | Indonesian Rupiah |
| MXN | Mexican Peso |
| PEN | Peruvian Nuevo Sol |
| RUB | Russian Ruble |
| Reference Rate Abbreviations: | |
| 12MTA | 12-month Treasury Average |
| US0001M | 1-month LIBOR |
| US0003M | 3-month LIBOR |
| US0012M | 12-month LIBOR |
See Accompanying Notes to Financial Statements
| 67 |
| Voya Short Term Bond Fund | PORTFOLIO OF INVESTMENTS |
| as of March31, 2020 |
| Principal Amount† | Value | Percentage of Net Assets | ||
| CORPORATE BONDS/NOTES: 46.3% | ||||
| Basic Materials: 1.8% | ||||
| 613,000 | (1) | Anglo American Capital PLC, 4.125%, 04/15/2021 | $ 604,241 | 0.3 |
| 29,000 | Ashland LLC, 4.750%, 08/15/2022 | 28,782 | 0.0 | |
| 300,000 | CF Industries, Inc., 3.450%, 06/01/2023 | 297,012 | 0.2 | |
| 293,000 | (1) | Cleveland-Cliffs, Inc., 4.875%, 01/15/2024 | 270,657 | 0.2 |
| 235,000 | Dow Chemical Co/The, 3.150%, 05/15/2024 | 231,901 | 0.1 | |
| 231,000 | Eastman Chemical Co., 3.500%, 12/01/2021 | 238,020 | 0.1 | |
| 300,000 | Freeport-McMoRan, Inc., 3.875%, 03/15/2023 | 287,626 | 0.2 | |
| 231,000 | (1) | Georgia-Pacific LLC, 5.400%, 11/01/2020 | 233,230 | 0.1 |
| 300,000 | Nutrien Ltd., 3.150%, 10/01/2022 | 300,485 | 0.2 | |
| 300,000 | (1) | OCI NV, 6.625%, 04/15/2023 | 276,000 | 0.2 |
| 300,000 | (1) | WR Grace & Co-Conn, 5.125%, 10/01/2021 | 305,790 | 0.2 |
| 3,073,744 | 1.8 | |||
| Communications: 3.4% | ||||
| 230,000 | Alibaba Group Holding Ltd., 2.800%, 06/06/2023 | 234,176 | 0.1 | |
| 250,000 | AMC Networks, Inc., 5.000%, 04/01/2024 | 241,250 | 0.1 | |
| 210,000 | AT&T, Inc., 4.050%, 12/15/2023 | 221,526 | 0.1 | |
| 285,000 | Baidu, Inc., 3.875%, 09/29/2023 | 295,951 | 0.2 | |
| 200,000 | Cablevision Systems Corp., 5.875%, 09/15/2022 | 203,068 | 0.1 | |
| 150,000 | CCO Holdings LLC / CCO Holdings Capital Corp., 5.250%, 09/30/2022 | 148,176 | 0.1 | |
| 283,000 | Charter Communications Operating LLC / Charter Communications Operating Capital, 3.579%, 07/23/2020 | 282,138 | 0.2 | |
| 22,000 | (1) | CommScope, Inc., 5.000%, 06/15/2021 | 21,971 | 0.0 |
| 200,000 | (1) | CSC Holdings LLC, 5.375%, 07/15/2023 | 203,251 | 0.1 |
| 300,000 | DISH DBS Corp., 5.125%, 05/01/2020 | 298,742 | 0.2 | |
| 121,000 | Fox Corp., 3.050%, 04/07/2025 | 120,806 | 0.1 | |
| 188,000 | (1) | Fox Corp., 4.030%, 01/25/2024 | 195,695 | 0.1 |
| 250,000 | Hughes Satellite Systems Corp., 7.625%, 06/15/2021 | 256,365 | 0.2 | |
| 40,000 | Interpublic Group of Cos, Inc./The, 3.500%, 10/01/2020 | 39,396 | 0.0 | |
| 248,000 | Interpublic Group of Cos, Inc./The, 3.750%, 10/01/2021 | 250,548 | 0.1 | |
| 300,000 | Level 3 Financing, Inc., 5.375%, 01/15/2024 | 302,624 | 0.2 | |
| 250,000 | (1) | Plantronics, Inc., 5.500%, 05/31/2023 | 183,743 | 0.1 |
| 250,000 | (1) | Sirius XM Radio, Inc., 3.875%, 08/01/2022 | 250,932 | 0.1 |
| 300,000 | Sprint Communications, Inc., 6.000%, 11/15/2022 | 313,782 | 0.2 | |
| 250,000 | T-Mobile USA, Inc., 4.000%, 04/15/2022 | 252,495 | 0.2 | |
| 802,000 | Verizon Communications, Inc., 3.125%, 03/16/2022 | 825,483 | 0.5 | |
| 204,000 | ViacomCBS, Inc., 2.500%, 02/15/2023 | 200,721 | 0.1 | |
| 318,000 | ViacomCBS, Inc., 4.250%, 09/01/2023 | 324,787 | 0.2 | |
| 220,000 | Walt Disney Co/The, 4.000%, 10/01/2023 | 235,498 | 0.1 | |
| 5,903,124 | 3.4 | |||
| Consumer, Cyclical: 4.8% | ||||
| 250,000 | (1) | 1011778 BC ULC / New Red Finance, Inc., 4.250%, 05/15/2024 | 250,936 | 0.1 |
| 350,000 | (1) | Allison Transmission, Inc., 5.000%, 10/01/2024 | 342,114 | 0.2 |
| 211,396 | American Airlines 2015-2 Class B Pass Through Trust, 4.400%, 03/22/2025 | 179,280 | 0.1 | |
| 350,000 | American Axle & Manufacturing, Inc., 6.625%, 10/15/2022 | 293,453 | 0.2 | |
| 265,000 | American Honda Finance Corp., 2.050%, 01/10/2023 | 261,319 | 0.1 | |
| 203,000 | AutoZone, Inc., 4.000%, 11/15/2020 | 202,984 | 0.1 | |
| 313,000 | (1) | BMW US Capital LLC, 3.400%, 08/13/2021 | 312,675 | 0.2 |
| 514,000 | (1) | Daimler Finance North America LLC, 3.400%, 02/22/2022 | 499,925 | 0.3 |
| 157,000 | Delta Air Lines 2020-1 Class A Pass Through Trust, 2.500%, 12/10/2029 | 143,220 | 0.1 | |
| 125,000 | Delta Air Lines 2020-1 Class AA Pass Through Trust, 2.000%, 12/10/2029 | 114,468 | 0.1 | |
See Accompanying Notes to Financial Statements
| 68 |
| Voya Short Term Bond Fund | PORTFOLIO OF INVESTMENTS |
| as of March31, 2020 (Continued) |
| 160,000 | Delta Air Lines 2019-1 Class A Pass Through Trust, 3.404%, 10/25/2025 | 154,916 | 0.1 | |
| 300,000 | Fiat Chrysler Automobiles NV, 4.500%, 04/15/2020 | 300,859 | 0.2 | |
| 796,000 | Ford Motor Credit Co. LLC, 3.157%, 08/04/2020 | 780,199 | 0.4 | |
| 300,000 | Goodyear Tire & Rubber Co., 5.125%, 11/15/2023 | 285,834 | 0.2 | |
| 300,000 | KB Home, 7.625%, 05/15/2023 | 304,123 | 0.2 | |
| 300,000 | Lennar Corp., 4.500%, 04/30/2024 | 295,288 | 0.2 | |
| 200,000 | L Brands, Inc., 6.625%, 04/01/2021 | 189,740 | 0.1 | |
| 250,000 | (1) | Lions Gate Capital Holdings LLC, 6.375%, 02/01/2024 | 221,868 | 0.1 |
| 300,000 | MGM Resorts International, 6.000%, 03/15/2023 | 291,377 | 0.2 | |
| 306,000 | (1) | Nissan Motor Acceptance Corp., 2.150%, 09/28/2020 | 300,539 | 0.2 |
| 285,000 | (1) | Panasonic Corp., 2.536%, 07/19/2022 | 280,965 | 0.2 |
| 250,000 | (1) | Six Flags Entertainment Corp., 4.875%, 07/31/2024 | 213,439 | 0.1 |
| 250,000 | (1) | Taylor Morrison Communities, Inc. / Taylor Morrison Holdings II, Inc., 5.625%, 03/01/2024 | 237,186 | 0.1 |
| 250,000 | Tempur Sealy International, Inc., 5.625%, 10/15/2023 | 234,061 | 0.1 | |
| 400,000 | Toll Brothers Finance Corp., 5.875%, 02/15/2022 | 402,000 | 0.2 | |
| 200,000 | (1) | Toyota Industries Corp., 3.110%, 03/12/2022 | 202,363 | 0.1 |
| 110,000 | Toyota Motor Credit Corp., 2.950%, 04/13/2021 | 110,451 | 0.1 | |
| 510,000 | Toyota Motor Credit Corp., 1.832%, (US0003M + 0.125%), 08/13/2021 | 487,851 | 0.3 | |
| 99,911 | United Airlines 2014-2 Class B Pass Through Trust, 4.625%, 03/03/2024 | 93,582 | 0.1 | |
| 250,000 | (1) | Wynn Las Vegas LLC / Wynn Las Vegas Capital Corp., 4.250%, 05/30/2023 | 234,368 | 0.1 |
| 8,221,383 | 4.8 | |||
| Consumer, Non-cyclical: 7.3% | ||||
| 490,000 | (1) | AbbVie, Inc., 2.150%, 11/19/2021 | 488,390 | 0.3 |
| 245,000 | (1) | AbbVie, Inc., 2.300%, 11/21/2022 | 245,117 | 0.1 |
| 220,000 | AbbVie, Inc., 2.500%, 05/14/2020 | 220,019 | 0.1 | |
| 85,000 | AbbVie, Inc., 2.900%, 11/06/2022 | 86,099 | 0.0 | |
| 198,000 | AbbVie, Inc., 3.375%, 11/14/2021 | 201,986 | 0.1 | |
| 250,000 | Acadia Healthcare Co., Inc., 6.500%, 03/01/2024 | 245,314 | 0.1 | |
| 300,000 | Albertsons Cos, Inc. / Safeway, Inc. / New Albertsons L.P. / Albertsons LLC, 6.625%, 06/15/2024 | 306,741 | 0.2 | |
| 285,000 | Altria Group, Inc., 2.850%, 08/09/2022 | 286,700 | 0.2 | |
| 117,000 | Altria Group, Inc., 3.490%, 02/14/2022 | 118,376 | 0.1 | |
| 195,000 | Anthem, Inc., 2.375%, 01/15/2025 | 192,804 | 0.1 | |
| 375,000 | BAT Capital Corp., 3.222%, 08/15/2024 | 377,388 | 0.2 | |
| 550,000 | Becton Dickinson and Co., 2.404%, 06/05/2020 | 548,306 | 0.3 | |
| 300,000 | Centene Corp., 4.750%, 05/15/2022 | 303,102 | 0.2 | |
| 413,000 | Cigna Corp., 3.200%, 09/17/2020 | 413,629 | 0.2 | |
| 635,000 | CVS Health Corp., 3.700%, 03/09/2023 | 661,833 | 0.4 | |
| 490,000 | DH Europe Finance II Sarl, 2.050%, 11/15/2022 | 481,204 | 0.3 | |
| 111,000 | Express Scripts Holding Co., 3.900%, 02/15/2022 | 115,539 | 0.1 | |
| 235,000 | Express Scripts Holding Co., 4.750%, 11/15/2021 | 247,082 | 0.1 | |
| 712,000 | General Mills, Inc., 3.150%, 12/15/2021 | 721,607 | 0.4 | |
| 127,000 | Gilead Sciences, Inc., 2.500%, 09/01/2023 | 127,041 | 0.1 | |
| 146,000 | GlaxoSmithKline Capital PLC, 2.875%, 06/01/2022 | 149,511 | 0.1 | |
| 100,000 | (1),(2) | Hertz Corp., 5.500%, 10/15/2024 | 56,855 | 0.0 |
| 210,000 | (1) | Imperial Brands Finance PLC, 2.950%, 07/21/2020 | 209,611 | 0.1 |
| 200,000 | (1) | JBS USA LUX SA / JBS USA Finance, Inc., 5.875%, 07/15/2024 | 203,250 | 0.1 |
| 304,000 | Keurig Dr Pepper, Inc., 3.551%, 05/25/2021 | 307,784 | 0.2 | |
| 586,000 | Keurig Dr Pepper, Inc., 4.057%, 05/25/2023 | 611,070 | 0.4 | |
| 231,000 | McKesson Corp., 3.650%, 11/30/2020 | 232,696 | 0.1 | |
| 300,000 | Molina Healthcare, Inc., 5.375%, 11/15/2022 | 298,602 | 0.2 | |
| 101,000 | Mylan, Inc., 4.200%, 11/29/2023 | 96,431 | 0.1 | |
| 300,000 | (1) | Nielsen Finance LLC / Nielsen Finance Co., 5.000%, 04/15/2022 | 278,148 | 0.2 |
| 235,000 | PayPal Holdings, Inc., 2.200%, 09/26/2022 | 234,162 | 0.1 | |
| 300,000 | (1) | Prestige Brands, Inc., 6.375%, 03/01/2024 | 309,377 | 0.2 |
See Accompanying Notes to Financial Statements
| 69 |
| Voya Short Term Bond Fund | PORTFOLIO OF INVESTMENTS |
| as of March31, 2020 (Continued) |
| 507,000 | (1) | Seven & i Holdings Co. Ltd., 3.350%, 09/17/2021 | 514,952 | 0.3 |
| 824,000 | Shire Acquisitions Investments Ireland DAC, 2.400%, 09/23/2021 | 821,566 | 0.5 | |
| 252,000 | (1) | Takeda Pharmaceutical Co. Ltd., 2.450%, 01/18/2022 | 256,450 | 0.1 |
| 200,000 | Takeda Pharmaceutical Co. Ltd., 4.000%, 11/26/2021 | 202,719 | 0.1 | |
| 250,000 | (1) | TreeHouse Foods, Inc., 6.000%, 02/15/2024 | 249,686 | 0.1 |
| 291,000 | Unilever Capital Corp., 3.000%, 03/07/2022 | 300,953 | 0.2 | |
| 602,000 | UnitedHealth Group, Inc., 3.350%, 07/15/2022 | 623,815 | 0.4 | |
| 297,000 | Zoetis, Inc., 3.250%, 08/20/2021 | 301,254 | 0.2 | |
| 12,647,169 | 7.3 | |||
| Energy: 3.9% | ||||
| 345,000 | Apache Corp., 3.250%, 04/15/2022 | 265,782 | 0.2 | |
| 54,000 | BP Capital Markets America, Inc., 3.216%, 11/28/2023 | 55,583 | 0.0 | |
| 318,000 | Canadian Natural Resources Ltd., 2.950%, 01/15/2023 | 275,832 | 0.2 | |
| 217,000 | Columbia Pipeline Group, Inc., 3.300%, 06/01/2020 | 216,125 | 0.1 | |
| 250,000 | Crestwood Midstream Partners L.P. / Crestwood Midstream Finance Corp., 6.250%, 04/01/2023 | 141,614 | 0.1 | |
| 300,000 | (2) | DCP Midstream Operating L.P., 3.875%, 03/15/2023 | 242,151 | 0.1 |
| 663,000 | Energy Transfer Partners L.P. / Regency Energy Finance Corp., 5.875%, 03/01/2022 | 623,266 | 0.4 | |
| 491,000 | Enterprise Products Operating LLC, 2.850%, 04/15/2021 | 485,369 | 0.3 | |
| 130,000 | Enterprise Products Operating LLC, 5.200%, 09/01/2020 | 128,733 | 0.1 | |
| 437,000 | Husky Energy, Inc., 3.950%, 04/15/2022 | 395,989 | 0.2 | |
| 434,000 | Kinder Morgan Energy Partners L.P., 5.000%, 10/01/2021 | 425,086 | 0.2 | |
| 290,000 | Marathon Petroleum Corp., 5.125%, 04/01/2024 | 270,980 | 0.2 | |
| 125,000 | (1) | MPLX L.P., 3.500%, 12/01/2022 | 119,808 | 0.1 |
| 498,000 | (1) | NGPL PipeCo LLC, 4.375%, 08/15/2022 | 475,734 | 0.3 |
| 370,000 | Occidental Petroleum Corp., 2.700%, 08/15/2022 | 263,970 | 0.1 | |
| 361,000 | ONEOK Partners L.P., 3.375%, 10/01/2022 | 336,100 | 0.2 | |
| 250,000 | PBF Logistics L.P. / PBF Logistics Finance Corp., 6.875%, 05/15/2023 | 155,885 | 0.1 | |
| 434,000 | Sabine Pass Liquefaction LLC, 5.625%, 02/01/2021 | 427,110 | 0.2 | |
| 170,000 | (1) | Schlumberger Finance Canada Ltd., 2.200%, 11/20/2020 | 167,806 | 0.1 |
| 936,000 | Shell International Finance BV, 1.750%, 09/12/2021 | 932,128 | 0.5 | |
| 355,000 | Total Capital International SA, 2.218%, 07/12/2021 | 356,120 | 0.2 | |
| 6,761,171 | 3.9 | |||
| Financial: 16.1% | ||||
| 400,000 | (1) | ABN AMRO Bank NV, 3.400%, 08/27/2021 | 400,752 | 0.2 |
| 283,000 | American International Group, Inc., 3.300%, 03/01/2021 | 283,290 | 0.2 | |
| 300,000 | Ally Financial, Inc., 3.875%, 05/21/2024 | 271,877 | 0.2 | |
| 506,000 | American Express Co., 3.375%, 05/17/2021 | 512,010 | 0.3 | |
| 209,000 | American Express Co., 3.700%, 11/05/2021 | 215,700 | 0.1 | |
| 145,000 | American Express Co., 3.700%, 08/03/2023 | 152,619 | 0.1 | |
| 50,000 | American International Group, Inc., 6.400%, 12/15/2020 | 51,432 | 0.0 | |
| 176,000 | American Tower Corp., 3.500%, 01/31/2023 | 177,486 | 0.1 | |
| 121,000 | Ameriprise Financial, Inc., 3.000%, 04/02/2025 | 120,536 | 0.1 | |
| 300,000 | Ameriprise Financial, Inc., 4.000%, 10/15/2023 | 319,137 | 0.2 | |
| 377,000 | Aon Corp., 5.000%, 09/30/2020 | 380,827 | 0.2 | |
| 255,000 | Assurant, Inc., 4.200%, 09/27/2023 | 271,400 | 0.2 | |
| 285,000 | (1) | Athene Global Funding, 2.750%, 04/20/2020 | 284,382 | 0.2 |
| 400,000 | Banco Santander SA, 3.500%, 04/11/2022 | 395,956 | 0.2 | |
| 682,000 | (3) | Bank of America Corp., 3.004%, 12/20/2023 | 695,740 | 0.4 |
| 103,000 | Bank of Montreal, 3.300%, 02/05/2024 | 107,768 | 0.1 | |
| 275,000 | Bank of New York Mellon Corp./The, 1.950%, 08/23/2022 | 276,842 | 0.2 | |
| 75,000 | Bank of New York Mellon Corp./The, 2.950%, 01/29/2023 | 76,772 | 0.0 | |
| 140,000 | Bank of Nova Scotia/The, 3.125%, 04/20/2021 | 141,516 | 0.1 | |
| 255,000 | Bank of Nova Scotia/The, 1.950%, 02/01/2023 | 253,844 | 0.2 | |
See Accompanying Notes to Financial Statements
| 70 |
| Voya Short Term Bond Fund | PORTFOLIO OF INVESTMENTS |
| as of March31, 2020 (Continued) |
| 260,000 | (1) | Banque Federative du Credit Mutuel SA, 2.125%, 11/21/2022 | 241,765 | 0.1 |
| 200,000 | (1) | Banque Federative du Credit Mutuel SA, 2.200%, 07/20/2020 | 199,653 | 0.1 |
| 500,000 | BBVA USA, 3.500%, 06/11/2021 | 497,492 | 0.3 | |
| 800,000 | (1) | BPCE SA, 2.750%, 01/11/2023 | 789,846 | 0.5 |
| 215,000 | Brookfield Finance, Inc., 4.000%, 04/01/2024 | 217,682 | 0.1 | |
| 170,000 | (3) | Canadian Imperial Bank of Commerce, 2.606%, 07/22/2023 | 171,641 | 0.1 |
| 490,000 | Capital One Financial Corp., 3.200%, 01/30/2023 | 484,947 | 0.3 | |
| 250,000 | (3) | Capital One Bank USA NA, 2.014%, 01/27/2023 | 244,351 | 0.1 |
| 395,000 | Capital One NA, 2.650%, 08/08/2022 | 391,678 | 0.2 | |
| 345,000 | Chubb INA Holdings, Inc., 2.875%, 11/03/2022 | 350,559 | 0.2 | |
| 300,000 | CIT Group, Inc., 5.000%, 08/15/2022 | 294,756 | 0.2 | |
| 878,000 | Citigroup, Inc., 2.900%, 12/08/2021 | 886,668 | 0.5 | |
| 250,000 | Citizens Bank NA/Providence RI, 3.700%, 03/29/2023 | 256,400 | 0.2 | |
| 500,000 | Cooperatieve Rabobank UA, 3.950%, 11/09/2022 | 503,594 | 0.3 | |
| 220,000 | (1) | Danske Bank A/S, 2.000%, 09/08/2021 | 215,770 | 0.1 |
| 200,000 | (1) | Danske Bank A/S, 2.800%, 03/10/2021 | 199,809 | 0.1 |
| 305,000 | (1),(3) | Danske Bank A/S, 3.001%, 09/20/2022 | 302,189 | 0.2 |
| 260,000 | (1) | DNB Bank ASA, 2.150%, 12/02/2022 | 257,075 | 0.2 |
| 230,000 | (1) | Federation des Caisses Desjardins du Quebec, 2.050%, 02/10/2025 | 223,060 | 0.1 |
| 223,000 | GE Capital International Funding Co. Unlimited Co., 2.342%, 11/15/2020 | 221,771 | 0.1 | |
| 247,000 | Goldman Sachs Group, Inc./The, 2.350%, 11/15/2021 | 246,848 | 0.1 | |
| 200,000 | HSBC Holdings PLC, 5.100%, 04/05/2021 | 204,695 | 0.1 | |
| 200,000 | HSBC USA, Inc., 5.000%, 09/27/2020 | 201,233 | 0.1 | |
| 345,000 | Huntington National Bank/The, 3.550%, 10/06/2023 | 358,213 | 0.2 | |
| 300,000 | Icahn Enterprises L.P. / Icahn Enterprises Finance Corp., 4.750%, 09/15/2024 | 276,375 | 0.2 | |
| 503,000 | ING Groep NV, 3.150%, 03/29/2022 | 505,655 | 0.3 | |
| 510,000 | Intercontinental Exchange, Inc., 3.450%, 09/21/2023 | 539,131 | 0.3 | |
| 355,000 | (3) | JPMorgan Chase & Co., 2.776%, 04/25/2023 | 359,816 | 0.2 |
| 698,000 | JPMorgan Chase & Co., 3.200%, 01/25/2023 | 719,050 | 0.4 | |
| 315,000 | JPMorgan Chase & Co., 4.500%, 01/24/2022 | 329,215 | 0.2 | |
| 200,000 | Lloyds Bank PLC, 2.700%, 08/17/2020 | 197,575 | 0.1 | |
| 281,000 | (1) | Lloyds Bank PLC, 6.500%, 09/14/2020 | 284,689 | 0.2 |
| 145,000 | M&T Bank Corp., 3.550%, 07/26/2023 | 152,887 | 0.1 | |
| 188,000 | Marsh & McLennan Cos, Inc., 3.500%, 12/29/2020 | 189,490 | 0.1 | |
| 290,000 | Marsh & McLennan Cos, Inc., 4.050%, 10/15/2023 | 304,751 | 0.2 | |
| 408,000 | (1) | Metropolitan Life Global Funding I, 3.375%, 01/11/2022 | 414,542 | 0.2 |
| 200,000 | MGM Growth Properties Operating Partnership L.P. / MGP Finance Co-Issuer, Inc., 5.625%, 05/01/2024 | 193,251 | 0.1 | |
| 319,000 | Mitsubishi UFJ Financial Group, Inc., 2.190%, 09/13/2021 | 314,907 | 0.2 | |
| 200,000 | Mitsubishi UFJ Financial Group, Inc., 2.623%, 07/18/2022 | 199,961 | 0.1 | |
| 515,000 | Mizuho Financial Group, Inc., 2.309%, (US0003M + 0.630%), 05/25/2024 | 468,102 | 0.3 | |
| 641,000 | (1) | Mizuho Financial Group, Inc., 2.632%, 04/12/2021 | 641,301 | 0.4 |
| 600,000 | Morgan Stanley, 3.750%, 02/25/2023 | 626,070 | 0.4 | |
| 556,000 | Morgan Stanley, 5.500%, 07/28/2021 | 577,649 | 0.3 | |
| 250,000 | MUFG Union Bank NA, 2.100%, 12/09/2022 | 247,123 | 0.1 | |
| 614,000 | National Australia Bank Ltd./New York, 2.500%, 05/22/2022 | 620,198 | 0.4 | |
| 217,000 | (1) | Nationwide Financial Services, Inc., 5.375%, 03/25/2021 | 222,265 | 0.1 |
| 250,000 | Navient Corp., 5.000%, 10/26/2020 | 247,113 | 0.1 | |
| 130,000 | (1) | New York Life Global Funding, 2.950%, 01/28/2021 | 132,595 | 0.1 |
| 200,000 | (1) | Nordea Bank ABP, 4.875%, 05/13/2021 | 203,723 | 0.1 |
| 250,000 | PNC Bank NA, 2.700%, 11/01/2022 | 253,489 | 0.1 | |
| 346,000 | (1) | Protective Life Global Funding, 2.161%, 09/25/2020 | 343,763 | 0.2 |
| 175,000 | (1) | Realogy Group LLC / Realogy Co-Issuer Corp., 5.250%, 12/01/2021 | 163,931 | 0.1 |
| 265,000 | Royal Bank of Canada, 1.950%, 01/17/2023 | 262,638 | 0.2 | |
| 210,000 | Royal Bank of Canada, 2.560%, (US0003M + 0.660%), 10/05/2023 | 208,186 | 0.1 |
See Accompanying Notes to Financial Statements
| 71 |
| Voya Short Term Bond Fund | PORTFOLIO OF INVESTMENTS |
| as of March31, 2020 (Continued) |
| 194,000 | Royal Bank of Canada, 3.700%, 10/05/2023 | 204,626 | 0.1 | |
| 399,000 | Royal Bank of Scotland Group PLC, 3.875%, 09/12/2023 | 403,820 | 0.2 | |
| 300,000 | Springleaf Finance Corp., 6.125%, 05/15/2022 | 306,660 | 0.2 | |
| 560,000 | (1) | Standard Chartered PLC, 2.250%, 04/17/2020 | 559,000 | 0.3 |
| 245,000 | (3) | State Street Corp., 2.354%, 11/01/2025 | 242,908 | 0.1 |
| 240,000 | Sumitomo Mitsui Financial Group, Inc., 2.348%, 01/15/2025 | 238,832 | 0.1 | |
| 607,000 | Svenska Handelsbanken AB, 3.350%, 05/24/2021 | 614,409 | 0.4 | |
| 286,000 | Truist Bank, 2.150%, 12/06/2024 | 283,865 | 0.2 | |
| 200,000 | (1) | UBS AG/London, 2.200%, 06/08/2020 | 199,852 | 0.1 |
| 355,000 | (1),(3) | UBS Group AG, 2.859%, 08/15/2023 | 352,405 | 0.2 |
| 250,000 | US Bank NA/Cincinnati OH, 3.400%, 07/24/2023 | 263,453 | 0.2 | |
| 145,000 | (3) | Wells Fargo & Co., 2.406%, 10/30/2025 | 143,126 | 0.1 |
| 91,000 | Wells Fargo & Co., 4.125%, 08/15/2023 | 93,993 | 0.1 | |
| 242,000 | Westpac Banking Corp., 2.100%, 05/13/2021 | 241,732 | 0.1 | |
| 27,699,703 | 16.1 | |||
| Industrial: 3.5% | ||||
| 341,000 | 3M Co., 2.000%, 02/14/2025 | 351,662 | 0.2 | |
| 300,000 | AECOM, 5.875%, 10/15/2024 | 295,126 | 0.2 | |
| 324,000 | Amphenol Corp., 2.200%, 04/01/2020 | 324,000 | 0.2 | |
| 300,000 | Ball Corp., 4.000%, 11/15/2023 | 304,491 | 0.2 | |
| 250,000 | Berry Global, Inc., 5.125%, 07/15/2023 | 252,418 | 0.1 | |
| 300,000 | (1) | BMC East LLC, 5.500%, 10/01/2024 | 292,124 | 0.2 |
| 265,000 | Caterpillar Financial Services Corp., 2.850%, 05/17/2024 | 270,881 | 0.2 | |
| 110,000 | Caterpillar Financial Services Corp., 3.150%, 09/07/2021 | 112,025 | 0.1 | |
| 140,000 | Caterpillar Financial Services Corp., 3.650%, 12/07/2023 | 148,593 | 0.1 | |
| 250,000 | (1) | Colfax Corp., 6.000%, 02/15/2024 | 250,314 | 0.1 |
| 250,000 | Crown Americas LLC / Crown Americas Capital Corp. IV, 4.500%, 01/15/2023 | 257,870 | 0.1 | |
| 43,000 | General Electric Co., 3.150%, 09/07/2022 | 43,496 | 0.0 | |
| 250,000 | Howmet Aerospace, Inc., 5.400%, 04/15/2021 | 247,981 | 0.1 | |
| 255,000 | John Deere Capital Corp., 2.050%, 01/09/2025 | 255,135 | 0.1 | |
| 231,000 | John Deere Capital Corp., 2.950%, 04/01/2022 | 236,080 | 0.1 | |
| 300,000 | (1) | Owens-Brockway Glass Container, Inc., 5.000%, 01/15/2022 | 304,647 | 0.2 |
| 93,000 | Rockwell Collins, Inc., 2.800%, 03/15/2022 | 94,029 | 0.1 | |
| 200,000 | (1) | Rolls-Royce PLC, 2.375%, 10/14/2020 | 188,490 | 0.1 |
| 305,000 | Roper Technologies, Inc., 3.125%, 11/15/2022 | 299,697 | 0.2 | |
| 101,000 | Ryder System, Inc., 3.500%, 06/01/2021 | 101,006 | 0.1 | |
| 300,000 | (1) | Sealed Air Corp., 5.250%, 04/01/2023 | 310,607 | 0.2 |
| 484,000 | (1) | SMBC Aviation Capital Finance DAC, 4.125%, 07/15/2023 | 523,039 | 0.3 |
| 72,000 | (1) | Standard Industries, Inc./NJ, 5.500%, 02/15/2023 | 70,018 | 0.0 |
| 492,000 | United Parcel Service, Inc., 2.050%, 04/01/2021 | 491,568 | 0.3 | |
| 6,025,297 | 3.5 | |||
| Technology: 1.4% | ||||
| 379,000 | Activision Blizzard, Inc., 2.600%, 06/15/2022 | 381,977 | 0.2 | |
| 133,000 | Applied Materials, Inc., 2.625%, 10/01/2020 | 133,310 | 0.1 | |
| 225,000 | (1) | Dell International LLC / EMC Corp., 4.420%, 06/15/2021 | 227,489 | 0.1 |
| 290,000 | Fiserv, Inc., 2.750%, 07/01/2024 | 288,920 | 0.2 | |
| 144,000 | Hewlett Packard Enterprise Co., 3.600%, 10/15/2020 | 144,186 | 0.1 | |
| 188,000 | HP, Inc., 4.300%, 06/01/2021 | 195,894 | 0.1 | |
| 300,000 | NCR Corp., 5.000%, 07/15/2022 | 283,125 | 0.2 | |
| 149,000 | Oracle Corp., 2.500%, 04/01/2025 | 152,285 | 0.1 | |
| 494,000 | salesforce.com, Inc., 3.250%, 04/11/2023 | 514,071 | 0.3 | |
| 2,321,257 | 1.4 | |||
| Utilities: 4.1% | ||||
| 188,000 | Ameren Illinois Co., 2.700%, 09/01/2022 | 183,921 | 0.1 | |
| 152,000 | Arizona Public Service Co., 3.350%, 06/15/2024 | 153,590 | 0.1 | |
| 248,000 | Berkshire Hathaway Energy Co., 2.375%, 01/15/2021 | 248,728 | 0.1 | |
| 449,000 | Dominion Energy, Inc., 2.579%, 07/01/2020 | 448,485 | 0.3 | |
| 300,000 | (3),(4) | Dominion Energy, Inc., 2.715%, 08/15/2021 | 296,169 | 0.2 |
| 550,000 | DTE Energy Co., 2.600%, 06/15/2022 | 548,243 | 0.3 | |
See Accompanying Notes to Financial Statements
| 72 |
| Voya Short Term Bond Fund | PORTFOLIO OF INVESTMENTS |
| as of March31, 2020 (Continued) |
| 525,000 | Duke Energy Corp., 1.800%, 09/01/2021 | 521,825 | 0.3 | |
| 289,000 | Duke Energy Corp., 2.400%, 08/15/2022 | 288,833 | 0.2 | |
| 120,000 | Duke Energy Progress LLC, 3.375%, 09/01/2023 | 125,064 | 0.1 | |
| 91,000 | Edison International, 4.950%, 04/15/2025 | 90,790 | 0.1 | |
| 230,000 | Entergy Arkansas LLC, 3.050%, 06/01/2023 | 220,247 | 0.1 | |
| 160,000 | Entergy Louisiana LLC, 4.050%, 09/01/2023 | 163,765 | 0.1 | |
| 165,000 | Evergy, Inc., 4.850%, 06/01/2021 | 166,802 | 0.1 | |
| 245,000 | Eversource Energy, 2.500%, 03/15/2021 | 245,968 | 0.1 | |
| 245,000 | FirstEnergy Corp., 4.250%, 03/15/2023 | 250,518 | 0.2 | |
| 387,000 | National Rural Utilities Cooperative Finance Corp., 2.300%, 09/15/2022 | 384,015 | 0.2 | |
| 300,000 | National Rural Utilities Cooperative Finance Corp., 2.350%, 06/15/2020 | 300,014 | 0.2 | |
| 195,000 | NextEra Energy Capital Holdings, Inc., 2.403%, 09/01/2021 | 194,813 | 0.1 | |
| 140,000 | NextEra Energy Capital Holdings, Inc., 3.150%, 04/01/2024 | 143,535 | 0.1 | |
| 220,000 | (1) | Niagara Mohawk Power Corp., 2.721%, 11/28/2022 | 224,446 | 0.1 |
| 225,000 | Oncor Electric Delivery Co. LLC, 2.750%, 06/01/2024 | 217,705 | 0.1 | |
| 105,000 | Oncor Electric Delivery Co. LLC, 4.100%, 06/01/2022 | 107,042 | 0.1 | |
| 204,000 | PNM Resources, Inc., 3.250%, 03/09/2021 | 205,358 | 0.1 | |
| 180,000 | Public Service Electric & Gas Co., 3.750%, 03/15/2024 | 186,294 | 0.1 | |
| 235,000 | (2) | San Diego Gas & Electric Co., 3.000%, 08/15/2021 | 236,943 | 0.1 |
| 199,000 | Southern California Edison Co., 2.400%, 02/01/2022 | 194,017 | 0.1 | |
| 188,000 | Southern Co. Gas Capital Corp., 2.450%, 10/01/2023 | 190,530 | 0.1 | |
| 300,000 | Vistra Energy Corp., 5.875%, 06/01/2023 | 301,491 | 0.2 | |
| 60,000 | Wisconsin Power & Light Co., 2.250%, 11/15/2022 | 60,573 | 0.0 | |
| 220,000 | Wisconsin Public Service Corp., 3.350%, 11/21/2021 | 223,589 | 0.1 | |
| 7,123,313 | 4.1 | |||
| Total Corporate Bonds/Notes | ||||
| (Cost $81,464,296) | 79,776,161 | 46.3 | ||
| COLLATERALIZED MORTGAGE OBLIGATIONS: 7.5% | ||||
| 380,882 | Fannie Mae Connecticut Avenue Securities 2016-C05 2M2, 5.397%, (US0001M + 4.450%), 01/25/2029 | 367,580 | 0.2 | |
| 461,164 | Fannie Mae Connecticut Avenue Securities 2016-C07 2M2, 5.297%, (US0001M + 4.350%), 05/25/2029 | 444,843 | 0.3 | |
| 600,000 | Fannie Mae Connecticut Avenue Securities 2017-C03 1M2, 3.947%, (US0001M + 3.000%), 10/25/2029 | 539,248 | 0.3 | |
| 600,000 | Fannie Mae Connecticut Avenue Securities 2017-C07 1M2, 3.347%, (US0001M + 2.400%), 05/28/2030 | 541,149 | 0.3 | |
| 599,373 | Fannie Mae Connecticut Avenue Securities 2018-C02 2M2, 3.147%, (US0001M + 2.200%), 08/25/2030 | 501,924 | 0.3 | |
| 880,705 | Fannie Mae Connecticut Avenue Securities 2018-C04 2M2, 3.497%, (US0001M + 2.550%), 12/25/2030 | 731,583 | 0.4 | |
| 292,846 | Fannie Mae Connecticut Avenue Securities 2018-C06 2M2, 3.047%, (US0001M + 2.100%), 03/25/2031 | 249,126 | 0.1 | |
| 190,297 | Fannie Mae Interest Strip Series 404 8, 3.000%, 05/25/2040 | 194,980 | 0.1 | |
| 2,370 | Fannie Mae REMIC Trust 2009-49 KB, 5.000%, 07/25/2024 | 2,378 | 0.0 | |
| 88,739 | Fannie Mae REMIC Trust 2010-137 XP, 4.500%, 10/25/2040 | 96,688 | 0.1 | |
| 22,431 | Fannie Mae REMIC Trust 2010-19 PB, 3.000%, 12/25/2039 | 22,598 | 0.0 | |
| 155,999 | Fannie Mae REMIC Trust 2010-54 LC, 3.000%, 04/25/2040 | 162,141 | 0.1 | |
| 1,087,215 | Fannie Mae REMICS 2013-114 NA, 3.000%, 08/25/2032 | 1,145,333 | 0.7 | |
| 1,897,783 | Freddie Mac 3049 XF, 1.055%, (US0001M + 0.350%), 05/15/2033 | 1,876,302 | 1.1 | |
| 340,400 | Freddie Mac REMIC Trust 2103 TE, 6.000%, 12/15/2028 | 391,235 | 0.2 | |
| 807,351 | Freddie Mac REMICS 3255 FA, 0.985%, (US0001M + 0.280%), 12/15/2036 | 795,280 | 0.5 | |
| 105,232 | Freddie Mac REMICS 3747 FA, 1.205%, (US0001M + 0.500%), 10/15/2040 | 104,174 | 0.1 | |
See Accompanying Notes to Financial Statements
| 73 |
| Voya Short Term Bond Fund | PORTFOLIO OF INVESTMENTS |
| as of March31, 2020 (Continued) |
| 683,786 | Freddie Mac REMICS 3878 FA, 1.055%, (US0001M + 0.350%), 04/15/2041 | 682,347 | 0.4 | |
| 100,000 | (1) | Freddie Mac Stacr Trust 2018-HQA2 M2, 3.247%, (US0001M + 2.300%), 10/25/2048 | 82,874 | 0.0 |
| 300,000 | Freddie Mac Structured Agency Credit Risk Debt Notes 2016-DNA4 M3, 4.747%, (US0001M + 3.800%), 03/25/2029 | 282,195 | 0.2 | |
| 147,246 | Ginnie Mae Series 2012-52 PV, 2.500%, 12/20/2039 | 150,624 | 0.1 | |
| 826,732 | Ginnie Mae Series 2014-3 EP, 2.750%, 02/16/2043 | 874,024 | 0.5 | |
| 465,110 | (3) | Ginnie Mae Series 2014-53 JM, 7.110%, 04/20/2039 | 551,498 | 0.3 |
| 1,314,079 | Ginnie Mae Series 2016-H23 F, 2.412%, (US0001M + 0.750%), 10/20/2066 | 1,299,407 | 0.7 | |
| 900,968 | Ginnie Mae Series 2017-H19 FA, 2.112%, (US0001M + 0.450%), 08/20/2067 | 892,892 | 0.5 | |
| Total Collateralized Mortgage Obligations | ||||
| (Cost $13,482,674) | 12,982,423 | 7.5 | ||
| U.S. TREASURY OBLIGATIONS: 4.4% | ||||
| U.S. Treasury Notes: 4.4% | ||||
| 4,868,000 | 0.375%,03/31/2022 | 4,881,406 | 2.8 | |
| 2,176,000 | 0.500%,03/15/2023 | 2,189,855 | 1.3 | |
| 404,000 | 0.500%,03/31/2025 | 406,596 | 0.3 | |
| Total U.S. Treasury Obligations | ||||
| (Cost $7,456,706) | 7,477,857 | 4.4 | ||
| COMMERCIAL MORTGAGE-BACKED SECURITIES: 20.5% | ||||
| 270,000 | (1) | Austin Fairmont Hotel Trust 2019-FAIR C, 2.155%, (US0001M + 1.450%), 09/15/2032 | 220,946 | 0.1 |
| 66,282 | (3) | Bear Stearns Commercial Mortgage Securities Trust 2005-PWR9 C, 5.055%, 09/11/2042 | 66,127 | 0.0 |
| 560,000 | (1) | BFLD 2019-DPLO A, 1.795%, (US0001M + 1.090%), 10/15/2034 | 475,101 | 0.3 |
| 670,000 | (1) | BHP Trust 2019-BXHP A, 1.680%, (US0001M + 0.975%), 08/15/2036 | 572,762 | 0.3 |
| 220,000 | (1) | BHP Trust 2019-BXHP D, 2.476%, (US0001M + 1.771%), 08/15/2036 | 184,535 | 0.1 |
| 220,000 | (1) | BHP Trust 2019-BXHP E, 3.272%, (US0001M + 2.568%), 08/15/2036 | 178,596 | 0.1 |
| 360,000 | (1) | CGDB Commercial Mortgage Trust 2019-MOB F, 3.255%, (US0001M + 2.550%), 11/15/2036 | 274,671 | 0.2 |
| 90,000 | (3) | Citigroup Commercial Mortgage Trust 2013-GC17 C, 5.110%, 11/10/2046 | 84,571 | 0.0 |
| 260,525 | Citigroup Commercial Mortgage Trust 2015-GC27 AAB, 2.944%, 02/10/2048 | 266,869 | 0.2 | |
| 293,077 | Citigroup/Deutsche Bank Commercial Mortgage Trust 2006-CD3 AM, 5.648%, 10/15/2048 | 300,899 | 0.2 | |
| 530,000 | (1) | CLNY Trust 2019-IKPR A, 1.834%, (US0001M + 1.227%), 11/15/2038 | 485,305 | 0.3 |
| 540,000 | COMM 2012-CR5 A4 Mortgage Trust, 2.771%, 12/10/2045 | 545,005 | 0.3 | |
| 990,000 | (1),(3) | COMM 2013-CR10 D Mortgage Trust, 4.789%, 08/10/2046 | 887,332 | 0.5 |
| 178,111 | COMM 2012-CCRE1 A3 Mortgage Trust, 3.391%, 05/15/2045 | 180,962 | 0.1 | |
| 120,000 | (1),(3) | COMM 2013-CR10 E Mortgage Trust, 4.789%, 08/10/2046 | 101,862 | 0.1 |
| 680,000 | (1),(3) | COMM 2013-SFS A2 Mortgage Trust, 2.987%, 04/12/2035 | 683,377 | 0.4 |
| 1,100,000 | (1) | Credit Suisse Mortgage Capital Certificates 2019-ICE4 B, 1.935%, (US0001M + 1.230%), 05/15/2036 | 1,039,315 | 0.6 |
| 210,353 | (1) | CSWF 2018-TOP C, 2.155%, (US0001M + 1.450%), 08/15/2035 | 175,014 | 0.1 |
| 1,120,000 | (1),(3) | DBRR 2011-LC2 A4B Trust, 4.537%, 07/12/2044 | 1,131,241 | 0.7 |
| 793,000 | (1),(3) | DBUBS 2011-LC1A E, 5.689%, 11/10/2046 | 763,243 | 0.4 |
| 530,000 | (1),(3) | DBUBS 2011-LC2A D, 5.530%, 07/10/2044 | 516,494 | 0.3 |
| 1,000,000 | (1),(3) | DBUBS 2017-BRBK E Mortgage Trust, 3.530%, 10/10/2034 | 796,527 | 0.5 |
| 1,000,000 | (1),(3) | DBUBS 2011-LC2 E Mortgage Trust, 5.530%, 07/10/2044 | 962,953 | 0.6 |
| 51,089 | (3) | Ginnie Mae 2011-53 B, 3.924%, 05/16/2051 | 52,470 | 0.0 |
| 219,858 | Ginnie Mae 2015-183 AC, 2.350%, 07/16/2056 | 223,822 | 0.1 | |
| 51,011 | (3) | Ginnie Mae 2015-21 AF, 2.078%, 07/16/2048 | 51,383 | 0.0 |
| 174,998 | Ginnie Mae 2016-110 AB, 2.000%, 05/16/2049 | 176,660 | 0.1 | |
| 74,986 | Ginnie Mae 2016-86 AB, 2.500%, 09/16/2056 | 76,094 | 0.0 | |
| 376,451 | Ginnie Mae 2017-100 AB, 2.300%, 04/16/2052 | 380,796 | 0.2 | |
See Accompanying Notes to Financial Statements
| 74 |
| Voya Short Term Bond Fund | PORTFOLIO OF INVESTMENTS |
| as of March31, 2020 (Continued) |
| 183,891 | Ginnie Mae 2017-51 AB, 2.350%, 04/16/2057 | 186,150 | 0.1 | |
| 78,626 | Ginnie Mae 2017-69 AB, 2.350%, 05/16/2053 | 79,635 | 0.0 | |
| 140,545 | Ginnie Mae 2017-70 A, 2.500%, 10/16/2057 | 142,744 | 0.1 | |
| 502,504 | Ginnie Mae 2017-86 AB, 2.300%, 11/16/2051 | 509,111 | 0.3 | |
| 331,760 | Ginnie Mae 2017-89 A, 2.500%, 08/16/2057 | 337,091 | 0.2 | |
| 142,457 | Ginnie Mae 2018-41 A, 2.400%, 09/16/2058 | 144,385 | 0.1 | |
| 250,000 | (1),(3) | GRACE 2014-GRCE F Mortgage Trust, 3.590%, 06/10/2028 | 247,938 | 0.1 |
| 800,000 | (1) | Great Wolf Trust 2019-WOLF A, 1.739%, (US0001M + 1.034%), 12/15/2029 | 738,974 | 0.4 |
| 330,000 | (1) | GS Mortgage Securities Corp. Trust 2017-GPTX B, 3.104%, 05/10/2034 | 313,593 | 0.2 |
| 1,039,000 | (1),(3) | GS Mortgage Securities Corp. Trust 2017-SLP E, 4.591%, 10/10/2032 | 905,486 | 0.5 |
| 1,070,000 | (1) | GS Mortgage Securities Corp. Trust 2019-70P C, 2.205%, (US0001M + 1.500%), 10/15/2036 | 952,111 | 0.6 |
| 870,000 | (1),(3) | GS Mortgage Securities Trust 2011-GC3 D, 5.637%, 03/10/2044 | 861,529 | 0.5 |
| 290,000 | (1),(3) | GS Mortgage Securities Trust 2012-GC6 C, 5.651%, 01/10/2045 | 285,916 | 0.2 |
| 320,000 | (1) | GS Mortgage Securities Trust 2018-HART A, 1.795%, (US0001M + 1.090%), 10/15/2031 | 310,460 | 0.2 |
| 464,920 | GS Mortgage Securities Trust 2020-GC45 A1, 2.019%, 02/13/2053 | 464,889 | 0.3 | |
| 1,030,000 | (1) | Hawaii Hotel Trust 2019-MAUI E, 2.864%, (US0001M + 2.350%), 05/15/2038 | 762,073 | 0.4 |
| 330,000 | (1) | Houston Galleria Mall Trust 2015-HGLR A1A2, 3.087%, 03/05/2037 | 325,662 | 0.2 |
| 700,000 | (1),(3) | Irvine Core Office Trust 2013-IRV A2, 3.173%, 05/15/2048 | 710,417 | 0.4 |
| 384,770 | JP Morgan Chase Commercial Mortgage Securities Trust 2012-C8 A3, 2.829%, 10/15/2045 | 391,868 | 0.2 | |
| 370,000 | JPMBB Commercial Mortgage Securities Trust 2015-C32 ASB, 3.358%, 11/15/2048 | 383,048 | 0.2 | |
| 280,906 | (1) | JP Morgan Chase Commercial Mortgage Securities Corp. 2012-HSBC A, 3.093%, 07/05/2032 | 282,322 | 0.2 |
| 730,000 | (1),(3) | JP Morgan Chase Commercial Mortgage Securities Trust 2010-C2 C, 5.636%, 11/15/2043 | 643,585 | 0.4 |
| 1,040,000 | (1),(3) | JP Morgan Chase Commercial Mortgage Securities Trust 2011-C5 B, 5.419%, 08/15/2046 | 1,062,002 | 0.6 |
| 500,000 | (3) | JP Morgan Chase Commercial Mortgage Securities Trust 2013-C10 B, 3.674%, 12/15/2047 | 498,658 | 0.3 |
| 210,000 | (3) | JP Morgan Chase Commercial Mortgage Securities Trust 2013-C10 C, 4.113%, 12/15/2047 | 195,022 | 0.1 |
| 900,000 | (1),(3) | JP Morgan Chase Commercial Mortgage Securities Trust 2013-C13 E, 3.986%, 01/15/2046 | 756,045 | 0.4 |
| 300,000 | (1),(3) | JP Morgan Chase Commercial Mortgage Securities Trust 2015-UES D, 3.621%, 09/05/2032 | 295,530 | 0.2 |
| 1,539 | JPMBB Commercial Mortgage Securities Trust 2 2014-C19 A2, 3.046%, 04/15/2047 | 1,550 | 0.0 | |
| 1,100,000 | (1),(3) | JPMBB Commercial Mortgage Securities Trust 2013-C15 D, 5.198%, 11/15/2045 | 991,898 | 0.6 |
| 820,000 | (3) | JPMBB Commercial Mortgage Securities Trust 2014-C19 C, 4.679%, 04/15/2047 | 750,706 | 0.4 |
| 226,104 | Morgan Stanley Bank of America Merrill Lynch Trust 2013-C8 ASB, 2.699%, 12/15/2048 | 227,677 | 0.1 | |
| 97,238 | Morgan Stanley Bank of America Merrill Lynch Trust 2014-C14 A3, 3.669%, 02/15/2047 | 97,908 | 0.1 | |
| 330,000 | (3) | Morgan Stanley Bank of America Merrill Lynch Trust 2014-C15 C, 4.909%, 04/15/2047 | 305,288 | 0.2 |
| 164,598 | Morgan Stanley Capital I 2011-C3 A4, 4.118%, 07/15/2049 | 167,574 | 0.1 | |
| 600,000 | (1),(3) | Morgan Stanley Capital I Trust 2011-C1 D, 5.375%, 09/15/2047 | 521,743 | 0.3 |
| 290,000 | (1) | Morgan Stanley Capital I Trust 2011-C1 J, 4.193%, 09/15/2047 | 282,390 | 0.2 |
| 910,000 | Morgan Stanley Capital I Trust 2019-H6 A2, 3.228%, 06/15/2052 | 951,744 | 0.6 | |
| 610,000 | Morgan Stanley Bank of America Merrill Lynch Trust 2012-C5 A4, 3.176%, 08/15/2045 | 619,330 | 0.4 | |
| 720,000 | Morgan Stanley Bank of America Merrill Lynch Trust 2013-C7 A4, 2.918%, 02/15/2046 | 729,233 | 0.4 |
See Accompanying Notes to Financial Statements
| 75 |
| Voya Short Term Bond Fund | PORTFOLIO OF INVESTMENTS |
| as of March31, 2020 (Continued) |
| 399,468 | Morgan Stanley Bank of America Merrill Lynch Trust 2014 C19 ASB, 3.326%, 12/15/2047 | 414,644 | 0.2 | |
| 550,000 | (1) | Morgan Stanley Capital I Trust 2011-C1 G, 4.193%, 09/15/2047 | 444,632 | 0.3 |
| 600,000 | Morgan Stanley Capital I Trust 2017-H1 A2, 3.089%, 06/15/2050 | 613,572 | 0.4 | |
| 390,000 | (3) | TIAA Seasoned Commercial Mortgage Trust 2007-C4 C, 5.521%, 08/15/2039 | 389,149 | 0.2 |
| 340,000 | (1),(3) | Wells Fargo Commercial Mortgage Trust 2010-C1 B, 5.276%, 11/15/2043 | 341,243 | 0.2 |
| 224,000 | Wells Fargo Commercial Mortgage Trust 2017-RC1 A2, 3.118%, 01/15/2060 | 228,393 | 0.1 | |
| 1,198,986 | WFRBS Commercial Mortgage Trust 2011-C5 A4, 3.667%, 11/15/2044 | 1,222,156 | 0.7 | |
| 567,391 | (1) | West Town Mall Trust 2017-KNOX A, 3.823%, 07/05/2030 | 572,771 | 0.3 |
| 465,000 | (1),(3) | WFRBS Commercial Mortgage Trust 2012-C6 D, 5.579%, 04/15/2045 | 445,711 | 0.3 |
| 270,000 | (3) | WFRBS Commercial Mortgage Trust 2013-C18 A5, 4.162%, 12/15/2046 | 286,560 | 0.2 |
| Total Commercial Mortgage-Backed Securities | ||||
| (Cost $37,876,500) | 35,247,048 | 20.5 | ||
| ASSET-BACKED SECURITIES: 19.5% | ||||
| Automobile Asset-Backed Securities: 7.6% | ||||
| 200,000 | Ally Auto Receivables Trust 2018-3 A4, 3.120%, 07/17/2023 | 204,134 | 0.1 | |
| 100,000 | Ally Auto Receivables Trust 2019-1 A4, 3.020%, 04/15/2024 | 101,763 | 0.1 | |
| 350,000 | Americredit Automobile Receivables Trust 2019-1 B, 3.130%, 02/18/2025 | 352,032 | 0.2 | |
| 400,000 | AmeriCredit Automobile Receivables Trust 2019-3 B, 2.130%, 07/18/2025 | 410,241 | 0.2 | |
| 700,000 | AmeriCredit Automobile Receivables Trust 2020-1 A3, 1.110%, 08/19/2024 | 686,638 | 0.4 | |
| 400,000 | AmeriCredit Automobile Receivables Trust 2020-1 C, 1.590%, 10/20/2025 | 375,836 | 0.2 | |
| 500,000 | Capital One Prime Auto Receivables Trust 2019-1 A4, 2.560%, 10/15/2024 | 507,233 | 0.3 | |
| 350,000 | Capital One Prime Auto Receivables Trust 2020-1 A4, 1.630%, 08/15/2025 | 346,991 | 0.2 | |
| 450,000 | CarMax Auto Owner Trust 2017-3 A4, 2.220%, 11/15/2022 | 450,320 | 0.3 | |
| 100,000 | Carmax Auto Owner Trust 2019-2 A4, 2.770%, 12/16/2024 | 100,576 | 0.1 | |
| 500,000 | Carmax Auto Owner Trust 2019-3 A4, 2.300%, 04/15/2025 | 497,175 | 0.3 | |
| 550,000 | Carmax Auto Owner Trust 2019-4 A4, 2.130%, 07/15/2025 | 538,673 | 0.3 | |
| 250,000 | Ford Credit Auto Lease Trust 2018-B A4, 3.300%, 02/15/2022 | 252,320 | 0.1 | |
| 250,000 | Ford Credit Auto Lease Trust 2020-A A4, 1.880%, 05/15/2023 | 250,039 | 0.1 | |
| 500,000 | GM Financial Automobile Leasing Trust 2018-1 B, 2.870%, 12/20/2021 | 500,211 | 0.3 | |
| 850,000 | GM Financial Automobile Leasing Trust 2019-2 A4, 2.720%, 03/20/2023 | 852,492 | 0.5 | |
| 300,000 | GM Financial Automobile Leasing Trust 2019-4 A4, 1.760%, 01/16/2025 | 296,370 | 0.2 | |
| 300,000 | GM Financial Consumer Automobile Receivables Trust 2019-3 A3, 2.180%, 04/16/2024 | 302,293 | 0.2 | |
| 200,000 | Honda Auto Receivables 2018-4 A4 Owner Trust, 3.300%, 07/15/2025 | 203,892 | 0.1 | |
| 350,000 | (1) | Hyundai Auto Lease Securitization Trust 2019-B A4, 2.030%, 06/15/2023 | 348,926 | 0.2 |
| 93,920 | Mercedes-Benz Auto Lease Trust 2019-A A2, 3.010%, 02/16/2021 | 94,024 | 0.0 | |
| 150,000 | Mercedes-Benz Auto Lease Trust 2019-A A4, 3.250%, 10/15/2024 | 151,340 | 0.1 | |
| 200,000 | Mercedes-Benz Auto Receivables Trust 2018-1 A4, 3.150%, 10/15/2024 | 203,106 | 0.1 | |
| 300,000 | Mercedes-Benz Auto Lease Trust 2020-A A4, 1.880%, 09/15/2025 | 297,832 | 0.2 | |
| 350,000 | Nissan Auto Receivables 2018-C A4 Owner Trust, 3.270%, 06/16/2025 | 365,368 | 0.2 | |
| 250,000 | Nissan Auto Lease Trust 2020-A A4, 1.880%, 04/15/2025 | 244,590 | 0.1 | |
| 266,655 | (1) | OSCAR US Funding Trust VII LLC 2017-2A A3, 2.450%, 12/10/2021 | 267,098 | 0.2 |
| 400,000 | Santander Drive Auto Receivables Trust 2019-1 B, 3.210%, 09/15/2023 | 399,666 | 0.2 | |
See Accompanying Notes to Financial Statements
| 76 |
| Voya Short Term Bond Fund | PORTFOLIO OF INVESTMENTS |
| as of March31, 2020 (Continued) |
| 550,000 | Santander Drive Auto Receivables Trust 2019-2 B, 2.790%, 01/16/2024 | 545,239 | 0.3 | |
| 150,000 | (1) | Santander Retail Auto Lease Trust 2017-A A4, 2.370%, 01/20/2022 | 149,913 | 0.1 |
| 78,140 | (1) | Santander Retail Auto Lease Trust 2019-A A2, 2.720%, 01/20/2022 | 78,204 | 0.0 |
| 300,000 | (1) | Santander Retail Auto Lease Trust 2019-B A3, 2.300%, 01/20/2023 | 297,787 | 0.2 |
| 300,000 | (1) | Santander Retail Auto Lease Trust 2019-B A4, 2.380%, 08/21/2023 | 266,534 | 0.2 |
| 900,000 | (1) | Santander Retail Auto Lease Trust 2019-C A4, 1.930%, 11/20/2023 | 886,542 | 0.5 |
| 165,200 | (1) | Tesla Auto Lease Trust 2018-B A, 3.710%, 08/20/2021 | 166,179 | 0.1 |
| 800,000 | Toyota Auto Receivables 2019-B A4 Owner Trust, 2.600%, 11/15/2024 | 805,853 | 0.5 | |
| 350,000 | Toyota Auto Receivables 2019-C A4 Owner Trust, 1.880%, 11/15/2024 | 347,743 | 0.2 | |
| 13,145,173 | 7.6 | |||
| Credit Card Asset-Backed Securities: 1.5% | ||||
| 700,000 | BA Credit Card Trust 2019-A1 A1, 1.740%, 01/15/2025 | 710,397 | 0.4 | |
| 800,000 | Capital One Multi-Asset Execution Trust 2019-A2 A2, 1.720%, 08/15/2024 | 811,508 | 0.5 | |
| 450,000 | Discover Card Execution Note Trust 2017-A2 A2, 2.390%, 07/15/2024 | 459,266 | 0.3 | |
| 600,000 | (1) | Evergreen Credit Card Trust Series 2018-1 A, 2.950%, 03/15/2023 | 603,082 | 0.3 |
| 2,584,253 | 1.5 | |||
| Home Equity Asset-Backed Securities: 0.0% | ||||
| 4,729 | Chase Funding Loan Acquisition Trust Series 2003-C2 1A, 4.750%, 05/25/2020 | 4,740 | 0.0 | |
| Other Asset-Backed Securities: 9.6% | ||||
| 600,000 | (1) | Allegany Park CLO Ltd. 2019-1A A, 3.164%, (US0003M + 1.330%), 01/20/2033 | 561,754 | 0.3 |
| 700,000 | (1) | Apidos CLO XXXII 2019-32A A1, 3.003%, (US0003M + 1.320%), 01/20/2033 | 656,961 | 0.4 |
| 400,000 | (1) | Arbor Realty Commercial Real Estate Notes 2019-FL2 A Ltd., 1.905%, (US0001M + 1.200%), 06/15/2034 | 381,349 | 0.2 |
| 400,000 | (1) | ARES XLVI CLO Ltd. 2017-46A A2, 3.061%, (US0003M + 1.230%), 01/15/2030 | 365,815 | 0.2 |
| 250,000 | (1) | Babson CLO Ltd. 2017-1A A2, 3.169%, (US0003M + 1.350%), 07/18/2029 | 232,858 | 0.1 |
| 500,000 | (1) | Barings Clo Ltd. 2019-4A A1, 3.233%, (US0003M + 1.330%), 01/15/2033 | 466,644 | 0.3 |
| 600,000 | (1) | Beechwood Park CLO Ltd. 2019-1A A1, 3.233%, (US0003M + 1.330%), 01/17/2033 | 560,746 | 0.3 |
| 250,000 | (1) | Benefit Street Partners CLO VIII Ltd. 2015-8A A1BR, 3.019%, (US0003M + 1.200%), 01/20/2031 | 221,855 | 0.1 |
| 250,000 | (1) | Cedar Funding VIII Clo Ltd. 2017-8A A1, 3.086%, (US0003M + 1.250%), 10/17/2030 | 234,765 | 0.1 |
| 250,000 | (1) | CIFC Funding 2013-2A A1LR, 3.037%, (US0003M + 1.210%), 10/18/2030 | 238,545 | 0.2 |
| 250,000 | (1) | CIFC Funding 2015-IA ARR Ltd., 2.912%, (US0003M + 1.110%), 01/22/2031 | 235,674 | 0.1 |
| 600,000 | (1) | CIFC Funding 2019-6A A1 Ltd., 3.237%, (US0003M + 1.330%), 01/16/2033 | 563,707 | 0.3 |
| 250,000 | (1) | CIFC Funding 2019-6A A2 Ltd., 3.657%, (US0003M + 1.750%), 01/16/2033 | 232,427 | 0.1 |
| 150,000 | CNH Equipment Trust 2017-B A4, 2.170%, 04/17/2023 | 152,363 | 0.1 | |
| 250,000 | (1) | Deer Creek Clo Ltd. 2017-1A A, 2.999%, (US0003M + 1.180%), 10/20/2030 | 236,457 | 0.2 |
| 300,000 | (1) | Dryden 68 CLO Ltd. 2019-68A A, 3.141%, (US0003M + 1.310%), 07/15/2032 | 279,017 | 0.2 |
| 250,000 | (1) | Dryden Senior Loan Fund 2017-47A A2, 3.181%, (US0003M + 1.350%), 04/15/2028 | 229,556 | 0.1 |
| 360,000 | (1) | Dryden XXVIII Senior Loan Fund 2013-28A A1LR, 2.892%, (US0003M + 1.200%), 08/15/2030 | 345,163 | 0.2 |
| 250,000 | (1) | Eaton Vance Clo 2015-1A A2R Ltd., 3.069%, (US0003M + 1.250%), 01/20/2030 | 225,743 | 0.1 |
| 250,000 | (1) | Galaxy XIX CLO Ltd. 2015-19A A1R, 3.021%, (US0003M + 1.220%), 07/24/2030 | 237,687 | 0.2 |
See Accompanying Notes to Financial Statements
| 77 |
| Voya Short Term Bond Fund | PORTFOLIO OF INVESTMENTS |
| as of March31, 2020 (Continued) |
| 500,000 | (1) | Kayne CLO 6 Ltd. 2019-6A A1, 3.131%, (US0003M + 1.380%), 01/20/2033 | 466,675 | 0.3 |
| 500,000 | (1) | Kayne CLO 7 Ltd. 2020-7A A1, 2.651%, (US0003M + 1.200%), 04/17/2033 | 422,500 | 0.3 |
| 310,000 | (1) | LoanCore 2019-CRE2 A Issuer Ltd., 1.835%, (US0001M + 1.130%), 05/09/2036 | 290,193 | 0.2 |
| 600,000 | (1) | Madison Park Funding XXXVII Ltd. 2019-37A A1, 3.131%, (US0003M + 1.300%), 07/15/2032 | 563,890 | 0.3 |
| 250,000 | (1) | Magnetite XII Ltd. 2015-12A ARR, 2.931%, (US0003M + 1.100%), 10/15/2031 | 234,467 | 0.1 |
| 850,000 | (1) | Marlette Funding Trust 2020-1A B, 2.380%, 03/15/2030 | 711,229 | 0.4 |
| 340,000 | (1) | Neuberger Berman Loan Advisers CLO 35 Ltd. 2019-35A A1, 3.243%, (US0003M + 1.340%), 01/19/2033 | 321,956 | 0.2 |
| 700,000 | (1) | Niagara Park Clo Ltd. 2019-B A4, 3.136%, (US0003M + 1.300%), 07/17/2032 | 654,740 | 0.4 |
| 250,000 | (1) | OCP Clo 2019-17A C1 Ltd., 3.577%, (US0003M + 1.750%), 07/20/2032 | 226,667 | 0.1 |
| 250,000 | (1) | Octagon Investment Partners 30 Ltd. 2017-1A A1, 3.139%, (US0003M + 1.320%), 03/17/2030 | 237,378 | 0.2 |
| 250,000 | (1) | Octagon Investment Partners XIV Ltd. 2012-1A A1BR, 3.206%, (US0003M + 1.375%), 07/15/2029 | 225,321 | 0.1 |
| 250,000 | (1) | Octagon Investment Partners XV Ltd. 2013-1A A2R, 3.169%, (US0003M + 1.350%), 07/19/2030 | 231,475 | 0.1 |
| 600,000 | (1) | Octagon Loan Funding Ltd. 2014-1A ARR, 2.872%, (US0003M + 1.180%), 11/18/2031 | 561,278 | 0.3 |
| 500,000 | (1) | OHA Credit Funding 3 Ltd. 2019-3A A1, 3.139%, (US0003M + 1.320%), 07/20/2032 | 472,475 | 0.3 |
| 500,000 | (1) | OHA Loan Funding 2015-1A A1R2 Ltd., 3.032%, (US0003M + 1.340%), 11/15/2032 | 468,997 | 0.3 |
| 250,000 | (1) | Palmer Square CLO 2013-2A AARR Ltd., 3.036%, (US0003M + 1.200%), 10/17/2031 | 233,935 | 0.1 |
| 500,000 | (1) | Palmer Square CLO 2015-2A A1R2 Ltd., 2.919%, (US0003M + 1.100%), 07/20/2030 | 473,972 | 0.3 |
| 191,289 | (1) | SoFi Consumer Loan Program 2019-2 A Trust, 3.010%, 04/25/2028 | 185,794 | 0.1 |
| 211,466 | (1) | SoFi Consumer Loan Program 2019-3 A Trust, 2.900%, 05/25/2028 | 205,279 | 0.1 |
| 476,304 | (1) | SoFi Consumer Loan Program 2020-1 A Trust, 2.020%, 01/25/2029 | 475,503 | 0.3 |
| 590,000 | (1) | Sound Point CLO XXV Ltd. 2019-4A A1A, 3.231%, (US0003M + 1.400%), 01/15/2033 | 536,042 | 0.3 |
| 400,000 | (1) | Symphony CLO XXI Ltd. 2019-21A A, 3.742%, (US0003M + 1.380%), 07/15/2032 | 375,454 | 0.2 |
| 250,000 | (1) | THL Credit Wind River 2017-2A A CLO Ltd., 3.049%, (US0003M + 1.230%), 07/20/2030 | 237,102 | 0.2 |
| 400,000 | (1) | THL Credit Wind River 2019-2A A2 Clo Ltd., 3.501%, (US0003M + 1.650%), 01/15/2033 | 369,950 | 0.2 |
| 300,000 | (1) | Trafigura Securitisation Finance PLC 2018-1A A2, 3.730%, 03/15/2022 | 302,597 | 0.2 |
| 200,000 | Verizon Owner Trust 2018-A A1A, 3.230%, 04/20/2023 | 202,838 | 0.1 | |
| 100,000 | (1) | Volvo Financial Equipment LLC Series 2017-1A A4, 2.210%, 11/15/2021 | 99,661 | 0.1 |
| 16,446,454 | 9.6 | |||
| Student Loan Asset-Backed Securities: 0.8% | ||||
| 167,817 | (1) | DRB Prime Student Loan Trust 2017-A A2B, 2.850%, 05/27/2042 | 171,898 | 0.1 |
| 384,805 | (1) | Laurel Road Prime Student Loan Trust 2018-B A2FX, 3.540%, 05/26/2043 | 378,543 | 0.2 |
| 300,000 | (1) | Navient Private Education Loan Trust 2014-AA A3, 2.305%, (US0001M + 1.600%), 10/15/2031 | 288,503 | 0.2 |
| 500,000 | (1) | Navient Private Education Refi Loan Trust 2019-FA A2, 2.600%, 08/15/2068 | 505,997 | 0.3 |
| 1,344,941 | 0.8 | |||
| Total Asset-Backed Securities | ||||
| (Cost $34,741,917) | 33,525,561 | 19.5 | ||
| U.S. GOVERNMENT AGENCY OBLIGATIONS: 0.4% | ||||
| Federal Home Loan Mortgage Corporation: 0.3%(5) | ||||
| 35,291 | 5.500%,01/01/2037 | 38,718 | 0.0 | |
| 30,238 | 5.500%,08/01/2038 | 33,169 | 0.0 | |
See Accompanying Notes to Financial Statements
| 78 |
| Voya Short Term Bond Fund | PORTFOLIO OF INVESTMENTS |
| as of March31, 2020 (Continued) |
| 9,663 | 5.500%,10/01/2038 | 10,598 | 0.0 | |
| 5,010 | 5.500%,10/01/2038 | 5,493 | 0.0 | |
| 228,236 | 5.500%,11/01/2038 | 259,489 | 0.2 | |
| 108,011 | 5.500%,02/01/2039 | 118,492 | 0.1 | |
| 465,959 | 0.3 | |||
| Uniform Mortgage-Backed Securities: 0.1% | ||||
| 101,051 | 5.000%,03/01/2027 | 106,555 | 0.0 | |
| 128,847 | 5.000%,07/01/2034 | 143,112 | 0.1 | |
| 249,667 | 0.1 | |||
| Total U.S. Government Agency Obligations | ||||
| (Cost $690,845) | 715,626 | 0.4 | ||
| SUPRANATIONAL BONDS: 0.0% | ||||
| 58,000 | European Investment Bank, 1.750%, 05/15/2020 | 58,073 | 0.0 | |
| Total Supranational Bonds | ||||
| (Cost $57,829) | 58,073 | 0.0 | ||
| Total Long-Term Investments | ||||
| (Cost $175,770,767) | 169,782,749 | 98.6 | ||
| SHORT-TERM INVESTMENTS: 1.1% | ||||
| Repurchase Agreements: 0.1% | ||||
| 239,706 | (6) | Citigroup, Inc., Repurchase Agreement dated 03/31/20, 0.01%, due 04/01/20 (Repurchase Amount $239,706, collateralized by various U.S. Government Agency Obligations, 0.150%-8.500%, Market Value plus accrued interest $244,500, due 04/15/21-09/20/69) | ||
| (Cost $239,706) | 239,706 | 0.1 | ||
| Shares | Value | Percentage of Net Assets | ||
| Mutual Funds: 1.0% | ||||
| 1,641,000 | (7) | Goldman Sachs Financial Square Government Fund - Institutional Shares, 0.340% | ||
| (Cost $1,641,000) | 1,641,000 | 1.0 | ||
| Total Short-Term Investments | ||||
| (Cost $1,880,706) | 1,880,706 | 1.1 | ||
| Total Investments in Securities (Cost $177,651,473) | $ 171,663,455 | 99.7 | ||
| Assets in Excess of Other Liabilities | 567,135 | 0.3 | ||
| Net Assets | $ 172,230,590 | 100.0 | ||
| † | Unless otherwise indicated, principal amount is shown in USD. |
| (1) | Securities with purchases pursuant to Rule 144A or section 4(a)(2), under the Securities Act of 1933 and may not be resold subject to that rule except to qualified institutional buyers. |
| (2) | Security, or a portion of the security, is on loan. |
| (3) | Variable rate security. Rate shown is the rate in effect as of March 31, 2020. |
| (4) | Step-up bond that pays an initial coupon rate for the first period and then a higher coupon rate for the following periods. Rates shown reflect the current and next coupon rate as of March 31, 2020. |
| (5) | The Federal Housing Finance Agency (“FHFA”) placed the Federal Home Loan Mortgage Corporation and Federal National Mortgage Association into conservatorship with FHFA as the conservator. As such, the FHFA oversees the continuing affairs of these companies. |
| (6) | All or a portion of the security represents securities purchased with cash collateral received for securities on loan. |
| (7) | Rate shown is the 7-day yield as of March 31, 2020. |
| Reference Rate Abbreviations: | |
| US0001M | 1-month LIBOR |
| US0003M | 3-month LIBOR |
See Accompanying Notes to Financial Statements
| 79 |
| Voya Strategic Income Opportunities Fund | PORTFOLIO OF INVESTMENTS |
| as of March31, 2020 |
| Principal Amount† | Value | Percentage of Net Assets | ||
| CORPORATE BONDS/NOTES: 15.3% | ||||
| Basic Materials: 1.2% | ||||
| 1,250,000 | (1) | Alpek SAB de CV, 4.250%, 09/18/2029 | $ 1,025,962 | 0.0 |
| 1,925,000 | (1) | Anglo American Capital PLC, 3.625%, 09/11/2024 | 1,814,848 | 0.1 |
| 800,000 | (1) | Aruba Investments, Inc., 8.750%, 02/15/2023 | 782,996 | 0.0 |
| 250,000 | (1) | Braskem Netherlands Finance BV, 4.500%, 01/31/2030 | 195,500 | 0.0 |
| 1,350,000 | Celulosa Arauco y Constitucion SA, 3.875%, 11/02/2027 | 1,177,932 | 0.1 | |
| 1,500,000 | (1) | Celulosa Arauco y Constitucion SA, 4.250%, 04/30/2029 | 1,276,564 | 0.1 |
| 160,000 | (2) | Cleveland-Cliffs, Inc., 5.750%, 03/01/2025 | 124,800 | 0.0 |
| 260,000 | (1) | Cleveland-Cliffs, Inc., 6.750%, 03/15/2026 | 231,237 | 0.0 |
| 1,500,000 | CNAC HK Finbridge Co. Ltd., 5.125%, 03/14/2028 | 1,663,280 | 0.1 | |
| 1,050,000 | CNAC HK Finbridge Co. Ltd., 3.875%, 06/19/2029 | 1,080,844 | 0.1 | |
| 675,000 | (1) | Compass Minerals International, Inc., 6.750%, 12/01/2027 | 613,103 | 0.0 |
| 250,000 | (1) | Constellium SE, 5.750%, 05/15/2024 | 225,336 | 0.0 |
| 550,000 | (1) | Constellium SE, 6.625%, 03/01/2025 | 499,109 | 0.0 |
| 1,250,000 | (1) | Evraz PLC, 5.250%, 04/02/2024 | 1,270,619 | 0.1 |
| 800,000 | (1) | First Quantum Minerals Ltd., 6.500%, 03/01/2024 | 669,004 | 0.0 |
| 750,000 | Freeport-McMoRan, Inc., 4.550%, 11/14/2024 | 712,954 | 0.0 | |
| 1,175,000 | Freeport-McMoRan, Inc., 4.125%, 03/01/2028 | 1,032,990 | 0.0 | |
| 200,000 | Freeport-McMoRan, Inc., 4.250%, 03/01/2030 | 174,510 | 0.0 | |
| 750,000 | (1) | Gold Fields Orogen Holdings BVI Ltd., 5.125%, 05/15/2024 | 711,559 | 0.0 |
| 705,000 | Hecla Mining Co., 7.250%, 02/15/2028 | 620,753 | 0.0 | |
| 1,200,000 | International Paper Co., 4.350%, 08/15/2048 | 1,167,518 | 0.1 | |
| 2,000,000 | (1) | Inversiones CMPC SA, 3.850%, 01/13/2030 | 1,810,500 | 0.1 |
| 400,000 | Inversiones CMPC SA, 4.375%, 04/04/2027 | 376,421 | 0.0 | |
| 1,800,000 | (1) | MMK International Capital DAC, 4.375%, 06/13/2024 | 1,787,990 | 0.1 |
| 1,075,000 | (1) | Novelis Corp., 5.875%, 09/30/2026 | 1,062,457 | 0.1 |
| 700,000 | (1) | OCI NV, 5.250%, 11/01/2024 | 612,500 | 0.0 |
| 1,050,000 | (1) | OCI NV, 6.625%, 04/15/2023 | 966,000 | 0.0 |
| 650,000 | Olin Corp., 5.125%, 09/15/2027 | 585,346 | 0.0 | |
| 950,000 | (1) | Schweitzer-Mauduit International, Inc., 6.875%, 10/01/2026 | 953,365 | 0.0 |
| 2,500,000 | (1) | Severstal OAO Via Steel Capital SA, 3.150%, 09/16/2024 | 2,407,015 | 0.1 |
| 825,000 | Sherwin-Williams Co/The, 3.300%, 05/15/2050 | 784,004 | 0.0 | |
| 350,000 | Southern Copper Corp., 5.875%, 04/23/2045 | 373,169 | 0.0 | |
| 620,000 | (1) | SPCM SA, 4.875%, 09/15/2025 | 590,531 | 0.0 |
| 1,350,000 | Suzano Austria GmbH, 5.000%, 01/15/2030 | 1,195,088 | 0.1 | |
| 200,000 | Suzano Austria GmbH, 6.000%, 01/15/2029 | 188,209 | 0.0 | |
| 750,000 | Teck Resources Ltd., 5.200%, 03/01/2042 | 569,187 | 0.0 | |
| 600,000 | (1),(2) | Tronox, Inc., 6.500%, 04/15/2026 | 544,545 | 0.0 |
| 31,877,745 | 1.2 | |||
| Communications: 2.3% | ||||
| 450,000 | (1) | Altice France SA/France, 8.125%, 02/01/2027 | 471,622 | 0.0 |
| 550,000 | (1) | Altice Finco SA, 7.625%, 02/15/2025 | 527,310 | 0.0 |
| 950,000 | AMC Networks, Inc., 4.750%, 08/01/2025 | 929,817 | 0.1 | |
| 290,000 | AT&T, Inc., 3.400%, 05/15/2025 | 300,485 | 0.0 | |
| 1,068,000 | AT&T, Inc., 4.500%, 03/09/2048 | 1,164,702 | 0.1 | |
| 500,000 | AT&T, Inc., 5.150%, 02/15/2050 | 599,932 | 0.0 | |
| 775,000 | (1) | Block Communications, Inc., 4.875%, 03/01/2028 | 725,109 | 0.0 |
| 1,100,000 | (1) | C&W Senior Financing DAC, 7.500%, 10/15/2026 | 1,015,336 | 0.1 |
| 650,000 | Cablevision Systems Corp., 5.875%, 09/15/2022 | 659,971 | 0.0 | |
| 278,000 | ViacomCBS, Inc., 4.000%, 01/15/2026 | 287,261 | 0.0 | |
| 1,300,000 | (1) | CCO Holdings LLC / CCO Holdings Capital Corp., 5.125%, 05/01/2027 | 1,315,626 | 0.1 |
| 600,000 | (1) | CCO Holdings LLC / CCO Holdings Capital Corp., 5.000%, 02/01/2028 | 605,736 | 0.0 |
See Accompanying Notes to Financial Statements
| 80 |
| Voya Strategic Income Opportunities Fund | PORTFOLIO OF INVESTMENTS |
| as of March31, 2020 (Continued) |
| 750,000 | (1) | CCO Holdings LLC / CCO Holdings Capital Corp., 5.500%, 05/01/2026 | 764,676 | 0.0 |
| 1,500,000 | (1) | CCO Holdings LLC / CCO Holdings Capital Corp., 5.750%, 02/15/2026 | 1,523,925 | 0.1 |
| 180,000 | (1) | CCO Holdings LLC / CCO Holdings Capital Corp., 4.500%, 05/01/2032 | 176,548 | 0.0 |
| 420,000 | (1) | CCO Holdings LLC / CCO Holdings Capital Corp., 4.750%, 03/01/2030 | 421,281 | 0.0 |
| 100,000 | CenturyLink, Inc., 5.625%, 04/01/2020 | 100,000 | 0.0 | |
| 395,000 | CenturyLink, Inc., 5.625%, 04/01/2025 | 399,442 | 0.0 | |
| 385,000 | CenturyLink, Inc., 5.800%, 03/15/2022 | 390,644 | 0.0 | |
| 950,000 | (1) | Clear Channel Worldwide Holdings, Inc., 9.250%, 02/15/2024 | 822,942 | 0.0 |
| 80,000 | Comcast Corp., 4.250%, 01/15/2033 | 94,432 | 0.0 | |
| 1,750,000 | Comcast Corp., 4.700%, 10/15/2048 | 2,272,217 | 0.1 | |
| 60,000 | Comcast Corp., 5.650%, 06/15/2035 | 81,344 | 0.0 | |
| 1,250,000 | (1) | CommScope Tech Finance LLC, 6.000%, 06/15/2025 | 1,153,375 | 0.1 |
| 500,000 | (1) | CommScope Technologies LLC, 5.000%, 03/15/2027 | 437,537 | 0.0 |
| 1,025,000 | (1) | Connect Finco SARL / Connect US Finco LLC, 6.750%, 10/01/2026 | 850,750 | 0.0 |
| 1,650,000 | (2) | CSC Holdings LLC, 5.250%, 06/01/2024 | 1,664,429 | 0.1 |
| 1,175,000 | (1) | CSC Holdings LLC, 5.500%, 05/15/2026 | 1,223,548 | 0.1 |
| 600,000 | (1) | CSC Holdings LLC, 5.750%, 01/15/2030 | 607,326 | 0.0 |
| 400,000 | (1) | CSC Holdings LLC, 7.500%, 04/01/2028 | 428,955 | 0.0 |
| 825,000 | (1) | Cumulus Media New Holdings, Inc., 6.750%, 07/01/2026 | 743,013 | 0.0 |
| 550,000 | (1) | Diamond Sports Group LLC / Diamond Sports Finance Co., 5.375%, 08/15/2026 | 449,978 | 0.0 |
| 1,225,000 | (1),(2) | Diamond Sports Group LLC / Diamond Sports Finance Co., 6.625%, 08/15/2027 | 826,017 | 0.0 |
| 1,282,000 | Discovery Communications LLC, 2.950%, 03/20/2023 | 1,280,911 | 0.1 | |
| 650,000 | DISH DBS Corp., 5.000%, 03/15/2023 | 628,888 | 0.0 | |
| 400,000 | DISH DBS Corp., 5.875%, 07/15/2022 | 391,664 | 0.0 | |
| 1,000,000 | DISH DBS Corp., 5.875%, 11/15/2024 | 980,085 | 0.1 | |
| 800,000 | Embarq Corp., 7.995%, 06/01/2036 | 796,260 | 0.0 | |
| 750,000 | (1),(2) | Entercom Media Corp., 7.250%, 11/01/2024 | 632,809 | 0.0 |
| 375,000 | (1) | Frontier Communications Corp., 8.000%, 04/01/2027 | 371,936 | 0.0 |
| 900,000 | (1) | Gray Television, Inc., 5.125%, 10/15/2024 | 875,254 | 0.1 |
| 575,000 | (1) | Gray Television, Inc., 7.000%, 05/15/2027 | 575,316 | 0.0 |
| 645,000 | (1) | GTT Communications, Inc., 7.875%, 12/31/2024 | 420,862 | 0.0 |
| 900,000 | Hughes Satellite Systems Corp., 6.625%, 08/01/2026 | 919,312 | 0.1 | |
| 325,000 | (1) | iHeartCommunications, Inc., 5.250%, 08/15/2027 | 285,009 | 0.0 |
| 1,000,000 | iHeartCommunications, Inc., 8.375%, 05/01/2027 | 856,950 | 0.0 | |
| 775,000 | (1) | Intelsat Jackson Holdings SA, 8.500%, 10/15/2024 | 492,865 | 0.0 |
| 600,000 | (2) | Intelsat Luxembourg SA, 8.125%, 06/01/2023 | 127,500 | 0.0 |
| 500,000 | (1) | Lamar Media Corp., 3.750%, 02/15/2028 | 472,440 | 0.0 |
| 175,000 | (1) | Lamar Media Corp., 4.000%, 02/15/2030 | 164,063 | 0.0 |
| 1,000,000 | (1) | LCPR Senior Secured Financing DAC, 6.750%, 10/15/2027 | 990,550 | 0.1 |
| 225,000 | Level 3 Financing, Inc., 5.125%, 05/01/2023 | 222,468 | 0.0 | |
| 850,000 | Level 3 Financing, Inc., 5.250%, 03/15/2026 | 854,186 | 0.0 | |
| 425,000 | (1) | Match Group, Inc., 4.125%, 08/01/2030 | 382,234 | 0.0 |
| 950,000 | (1) | MDC Partners, Inc., 6.500%, 05/01/2024 | 719,625 | 0.0 |
| 475,000 | (1) | Midcontinent Communications / Midcontinent Finance Corp., 5.375%, 08/15/2027 | 463,960 | 0.0 |
| 225,000 | (1) | Netflix, Inc., 4.875%, 06/15/2030 | 229,658 | 0.0 |
| 1,150,000 | Netflix, Inc., 5.875%, 11/15/2028 | 1,236,883 | 0.1 | |
| 875,000 | (1) | Nexstar Broadcasting, Inc., 5.625%, 08/01/2024 | 829,058 | 0.0 |
| 825,000 | (1) | Nexstar Broadcasting, Inc., 5.625%, 07/15/2027 | 811,016 | 0.0 |
| 450,000 | (1) | Altice France SA/France, 7.375%, 05/01/2026 | 456,998 | 0.0 |
| 245,000 | (1) | Sinclair Television Group, Inc., 5.125%, 02/15/2027 | 209,118 | 0.0 |
| 475,000 | (1) | Sirius XM Radio, Inc., 4.625%, 07/15/2024 | 485,063 | 0.0 |
| 1,225,000 | (1) | Sirius XM Radio, Inc., 5.000%, 08/01/2027 | 1,250,051 | 0.1 |
See Accompanying Notes to Financial Statements
| 81 |
| Voya Strategic Income Opportunities Fund | PORTFOLIO OF INVESTMENTS |
| as of March31, 2020 (Continued) |
| 385,000 | (1) | Sprint Corp., 7.250%, 02/01/2028 | 388,369 | 0.0 |
| 1,175,000 | Sprint Communications, Inc., 6.000%, 11/15/2022 | 1,228,980 | 0.1 | |
| 1,500,000 | Sprint Corp., 7.125%, 06/15/2024 | 1,657,478 | 0.1 | |
| 800,000 | Sprint Corp., 7.625%, 03/01/2026 | 909,880 | 0.1 | |
| 210,000 | (1) | TEGNA, Inc., 4.625%, 03/15/2028 | 185,719 | 0.0 |
| 775,000 | (1) | TEGNA, Inc., 5.000%, 09/15/2029 | 700,406 | 0.0 |
| 1,300,000 | Telecom Italia Capital SA, 6.375%, 11/15/2033 | 1,326,715 | 0.1 | |
| 700,000 | (1) | Telesat Canada / Telesat LLC, 6.500%, 10/15/2027 | 675,885 | 0.0 |
| 1,025,000 | (1) | Terrier Media Buyer, Inc., 8.875%, 12/15/2027 | 868,688 | 0.1 |
| 1,250,000 | T-Mobile USA, Inc., 5.375%, 04/15/2027 | 1,296,209 | 0.1 | |
| 750,000 | (1) | Townsquare Media, Inc., 6.500%, 04/01/2023 | 726,559 | 0.0 |
| 1,975,000 | Verizon Communications, Inc., 4.125%, 08/15/2046 | 2,296,589 | 0.1 | |
| 775,000 | (3) | ViacomCBS, Inc., 6.250%, 02/28/2057 | 670,627 | 0.0 |
| 725,000 | (1) | ViaSat, Inc., 5.625%, 09/15/2025 | 682,337 | 0.0 |
| 265,000 | (1) | ViaSat, Inc., 5.625%, 04/15/2027 | 263,158 | 0.0 |
| 600,000 | (1) | Virgin Media Secured Finance PLC, 5.500%, 05/15/2029 | 603,330 | 0.0 |
| 350,000 | (1) | Ziggo Bond Co. BV, 5.125%, 02/28/2030 | 344,969 | 0.0 |
| 200,000 | (1) | Ziggo BV, 4.875%, 01/15/2030 | 196,181 | 0.0 |
| 58,470,357 | 2.3 | |||
| Consumer, Cyclical: 1.7% | ||||
| 1,750,000 | (1) | 1011778 BC ULC / New Red Finance, Inc., 5.000%, 10/15/2025 | 1,682,179 | 0.1 |
| 625,000 | (1) | Adams Homes, Inc., 7.500%, 02/15/2025 | 601,562 | 0.0 |
| 700,000 | (1) | Adient Global Holdings Ltd., 4.875%, 08/15/2026 | 484,697 | 0.0 |
| 725,000 | (1) | Allison Transmission, Inc., 5.875%, 06/01/2029 | 715,551 | 0.0 |
| 1,050,000 | AMC Entertainment Holdings, Inc., 5.875%, 11/15/2026 | 443,066 | 0.0 | |
| 450,000 | (1) | American Builders & Contractors Supply Co., Inc., 4.000%, 01/15/2028 | 411,997 | 0.0 |
| 525,000 | (1) | Asbury Automotive Group, Inc., 4.500%, 03/01/2028 | 450,187 | 0.0 |
| 470,000 | (1) | Asbury Automotive Group, Inc., 4.750%, 03/01/2030 | 403,025 | 0.0 |
| 200,000 | (1) | Ashton Woods USA LLC / Ashton Woods Finance Co., 6.625%, 01/15/2028 | 159,500 | 0.0 |
| 600,000 | (1) | Ashton Woods USA LLC / Ashton Woods Finance Co., 6.750%, 08/01/2025 | 485,247 | 0.0 |
| 1,220,000 | (1) | Caesars Resort Collection LLC / CRC Finco, Inc., 5.250%, 10/15/2025 | 890,234 | 0.1 |
| 475,000 | (1) | CCM Merger, Inc., 6.000%, 03/15/2022 | 393,062 | 0.0 |
| 400,000 | Cedar Fair L.P. / Canada's Wonderland Co. / Magnum Management Corp., 5.375%, 06/01/2024 | 363,498 | 0.0 | |
| 850,000 | (1) | Cedar Fair L.P., 5.250%, 07/15/2029 | 722,967 | 0.0 |
| 1,075,000 | Century Communities, Inc., 5.875%, 07/15/2025 | 930,429 | 0.1 | |
| 225,000 | (1),(4) | Core & Main Holdings L.P., 8.625%(PIK Rate 9.375%, Cash Rate 8.625%), 09/15/2024 | 207,843 | 0.0 |
| 925,000 | (1) | Core & Main L.P., 6.125%, 08/15/2025 | 867,160 | 0.1 |
| 1,200,000 | Dana, Inc., 5.500%, 12/15/2024 | 1,057,506 | 0.1 | |
| 735,000 | (1) | Golden Entertainment, Inc., 7.625%, 04/15/2026 | 490,331 | 0.0 |
| 1,375,000 | (1) | Golden Nugget, Inc., 6.750%, 10/15/2024 | 876,370 | 0.1 |
| 1,250,000 | H&E Equipment Services, Inc., 5.625%, 09/01/2025 | 1,167,194 | 0.1 | |
| 800,000 | Home Depot, Inc./The, 3.125%, 12/15/2049 | 810,705 | 0.0 | |
| 675,000 | (1) | IAA, Inc., 5.500%, 06/15/2027 | 656,809 | 0.0 |
| 725,000 | (1) | Installed Building Products, Inc., 5.750%, 02/01/2028 | 696,756 | 0.0 |
| 600,000 | (1) | International Game Technology PLC, 6.250%, 02/15/2022 | 554,910 | 0.0 |
| 1,000,000 | (1) | International Game Technology PLC, 6.500%, 02/15/2025 | 892,360 | 0.1 |
| 1,400,000 | L Brands, Inc., 6.750%, 07/01/2036 | 1,018,920 | 0.1 | |
| 950,000 | Lennar Corp., 5.250%, 06/01/2026 | 953,080 | 0.1 | |
| 575,000 | Lennar Corp., 5.375%, 10/01/2022 | 591,351 | 0.0 | |
| 875,000 | (1) | Lions Gate Capital Holdings LLC, 5.875%, 11/01/2024 | 752,986 | 0.0 |
| 1,714,000 | Lowe's Cos, Inc., 3.700%, 04/15/2046 | 1,595,911 | 0.1 | |
| 625,000 | (1) | M/I Homes, Inc., 4.950%, 02/01/2028 | 535,156 | 0.0 |
See Accompanying Notes to Financial Statements
| 82 |
| Voya Strategic Income Opportunities Fund | PORTFOLIO OF INVESTMENTS |
| as of March31, 2020 (Continued) |
| 325,000 | M/I Homes, Inc., 5.625%, 08/01/2025 | 293,717 | 0.0 | |
| 1,225,000 | (1) | Mattel, Inc., 5.875%, 12/15/2027 | 1,256,299 | 0.1 |
| 675,000 | McDonald's Corp., 3.625%, 05/01/2043 | 656,370 | 0.0 | |
| 825,000 | McDonald's Corp., 3.625%, 09/01/2049 | 847,147 | 0.1 | |
| 600,000 | Meritage Homes Corp., 5.125%, 06/06/2027 | 569,125 | 0.0 | |
| 500,000 | Meritage Homes Corp., 6.000%, 06/01/2025 | 465,622 | 0.0 | |
| 180,000 | (2) | MGM Resorts International, 5.500%, 04/15/2027 | 164,799 | 0.0 |
| 329,000 | (2) | MGM Resorts International, 5.750%, 06/15/2025 | 296,913 | 0.0 |
| 650,000 | MGM Resorts International, 6.000%, 03/15/2023 | 631,316 | 0.0 | |
| 800,000 | (1),(2) | Michaels Stores, Inc., 8.000%, 07/15/2027 | 596,440 | 0.0 |
| 650,000 | (1) | Motion Bondco DAC, 6.625%, 11/15/2027 | 471,250 | 0.0 |
| 775,000 | Murphy Oil USA, Inc., 4.750%, 09/15/2029 | 730,864 | 0.0 | |
| 265,000 | Murphy Oil USA, Inc., 5.625%, 05/01/2027 | 261,911 | 0.0 | |
| 750,000 | (1) | Navistar International Corp., 6.625%, 11/01/2025 | 629,066 | 0.0 |
| 880,000 | (1) | Penn National Gaming, Inc., 5.625%, 01/15/2027 | 660,363 | 0.0 |
| 675,000 | (1) | Performance Food Group, Inc., 5.500%, 10/15/2027 | 631,176 | 0.0 |
| 495,000 | (1) | PetSmart, Inc., 5.875%, 06/01/2025 | 491,288 | 0.0 |
| 1,000,000 | (1) | PetSmart, Inc., 7.125%, 03/15/2023 | 949,500 | 0.1 |
| 600,000 | SACI Falabella, 3.750%, 10/30/2027 | 516,016 | 0.0 | |
| 685,000 | (1) | Scientific Games International, Inc., 5.000%, 10/15/2025 | 601,088 | 0.0 |
| 485,000 | Scientific Games International, Inc., 6.625%, 05/15/2021 | 391,056 | 0.0 | |
| 475,000 | (1) | Scientific Games International, Inc., 7.000%, 05/15/2028 | 294,761 | 0.0 |
| 825,000 | (1) | Scientific Games International, Inc., 8.250%, 03/15/2026 | 532,729 | 0.0 |
| 800,000 | Sonic Automotive, Inc., 6.125%, 03/15/2027 | 710,834 | 0.0 | |
| 475,000 | (1) | Speedway Motorsports LLC / Speedway Funding II, Inc., 4.875%, 11/01/2027 | 431,063 | 0.0 |
| 415,000 | (1) | Station Casinos LLC, 4.500%, 02/15/2028 | 339,263 | 0.0 |
| 1,085,000 | (1) | Station Casinos LLC, 5.000%, 10/01/2025 | 911,736 | 0.1 |
| 575,000 | (1) | Taylor Morrison Communities, Inc., 5.750%, 01/15/2028 | 518,338 | 0.0 |
| 950,000 | Tempur Sealy International, Inc., 5.500%, 06/15/2026 | 836,665 | 0.1 | |
| 475,000 | (2) | Tenneco, Inc., 5.000%, 07/15/2026 | 301,661 | 0.0 |
| 725,000 | (1) | Univar Solutions USA, Inc./Washington, 5.125%, 12/01/2027 | 663,774 | 0.0 |
| 975,000 | (1) | Viking Cruises Ltd., 5.875%, 09/15/2027 | 575,894 | 0.0 |
| 675,000 | (1) | William Carter Co/The, 5.625%, 03/15/2027 | 651,734 | 0.0 |
| 250,000 | (1) | WMG Acquisition Corp., 5.000%, 08/01/2023 | 250,311 | 0.0 |
| 950,000 | (1) | Wolverine World Wide, Inc., 5.000%, 09/01/2026 | 913,425 | 0.1 |
| 42,906,063 | 1.7 | |||
| Consumer, Non-cyclical: 2.2% | ||||
| 1,000,000 | AbbVie, Inc., 4.875%, 11/14/2048 | 1,171,251 | 0.1 | |
| 250,000 | Acadia Healthcare Co., Inc., 5.625%, 02/15/2023 | 237,161 | 0.0 | |
| 675,000 | Acadia Healthcare Co., Inc., 6.500%, 03/01/2024 | 662,347 | 0.0 | |
| 875,000 | (1) | Adani Ports & Special Economic Zone Ltd., 4.375%, 07/03/2029 | 757,026 | 0.0 |
| 425,000 | (1) | Albertsons Cos, Inc. / Safeway, Inc. / New Albertsons L.P. / Albertsons LLC, 4.875%, 02/15/2030 | 423,937 | 0.0 |
| 725,000 | (1) | Albertsons Cos, Inc. / Safeway, Inc. / New Albertsons L.P. / Albertsons LLC, 5.875%, 02/15/2028 | 741,929 | 0.0 |
| 1,050,000 | Albertsons Cos, Inc. / Safeway, Inc. / New Albertsons L.P. / Albertsons LLC, 6.625%, 06/15/2024 | 1,073,594 | 0.1 | |
| 525,000 | (1) | Allied Universal Holdco LLC / Allied Universal Finance Corp., 6.625%, 07/15/2026 | 516,798 | 0.0 |
| 700,000 | (1) | Allied Universal Holdco LLC / Allied Universal Finance Corp., 9.750%, 07/15/2027 | 664,557 | 0.0 |
| 2,000,000 | Altria Group, Inc., 4.500%, 05/02/2043 | 1,904,641 | 0.1 | |
| 140,000 | Amgen, Inc., 3.200%, 11/02/2027 | 151,795 | 0.0 | |
| 675,000 | (1) | AMN Healthcare, Inc., 4.625%, 10/01/2027 | 645,300 | 0.0 |
| 1,200,000 | Anheuser-Busch InBev Worldwide, Inc., 4.600%, 04/15/2048 | 1,277,272 | 0.1 | |
| 750,000 | Anthem, Inc., 3.700%, 09/15/2049 | 755,979 | 0.0 | |
| 1,250,000 | BAT Capital Corp., 4.540%, 08/15/2047 | 1,146,723 | 0.1 | |
See Accompanying Notes to Financial Statements
| 83 |
| Voya Strategic Income Opportunities Fund | PORTFOLIO OF INVESTMENTS |
| as of March31, 2020 (Continued) |
| 1,850,000 | (1) | Bausch Health Americas, Inc., 8.500%, 01/31/2027 | 1,943,518 | 0.1 |
| 530,000 | (1) | Bausch Health Cos, Inc., 5.250%, 01/30/2030 | 499,525 | 0.0 |
| 675,000 | (1) | Bausch Health Cos, Inc., 5.500%, 11/01/2025 | 686,175 | 0.0 |
| 475,000 | (1) | Bausch Health Cos, Inc., 6.125%, 04/15/2025 | 470,846 | 0.0 |
| 525,000 | (1) | Bausch Health Cos, Inc., 7.000%, 01/15/2028 | 547,339 | 0.0 |
| 1,200,000 | (1) | Bristol-Myers Squibb Co., 4.550%, 02/20/2048 | 1,527,630 | 0.1 |
| 750,000 | (1) | Cardtronics, Inc. / Cardtronics USA, Inc., 5.500%, 05/01/2025 | 719,059 | 0.0 |
| 415,000 | (1) | Catalent Pharma Solutions, Inc., 5.000%, 07/15/2027 | 404,853 | 0.0 |
| 200,000 | (1) | Centene Corp., 3.375%, 02/15/2030 | 186,750 | 0.0 |
| 625,000 | (1) | Centene Corp., 4.625%, 12/15/2029 | 631,594 | 0.0 |
| 1,325,000 | Centene Corp., 4.750%, 01/15/2025 | 1,349,850 | 0.1 | |
| 295,000 | (1) | Centene Corp., 4.750%, 01/15/2025 | 300,533 | 0.0 |
| 425,000 | (1) | Centene Corp., 5.375%, 06/01/2026 | 440,156 | 0.0 |
| 950,000 | CHS/Community Health Systems, Inc., 6.250%, 03/31/2023 | 909,031 | 0.1 | |
| 950,000 | (1) | CHS/Community Health Systems, Inc., 6.625%, 02/15/2025 | 885,875 | 0.1 |
| 1,250,000 | Cigna Corp., 4.900%, 12/15/2048 | 1,518,345 | 0.1 | |
| 925,000 | (1) | Cott Holdings, Inc., 5.500%, 04/01/2025 | 903,036 | 0.1 |
| 239,000 | CVS Health Corp., 3.875%, 07/20/2025 | 247,397 | 0.0 | |
| 1,250,000 | CVS Health Corp., 5.050%, 03/25/2048 | 1,425,056 | 0.1 | |
| 600,000 | DaVita, Inc., 5.125%, 07/15/2024 | 601,953 | 0.0 | |
| 1,325,000 | (1) | DP World Crescent Ltd., 3.750%, 01/30/2030 | 1,105,050 | 0.1 |
| 1,050,000 | DP World Crescent Ltd., 3.875%, 07/18/2029 | 885,150 | 0.0 | |
| 625,000 | (1) | Endo Ltd. / Endo Finance LLC / Endo Finco, Inc., 6.000%, 02/01/2025 | 430,269 | 0.0 |
| 1,250,000 | (1) | Garda World Security Corp., 8.750%, 05/15/2025 | 1,159,338 | 0.1 |
| 1,075,000 | (1) | Graham Holdings Co., 5.750%, 06/01/2026 | 1,062,683 | 0.1 |
| 2,775,000 | HCA, Inc., 5.375%, 02/01/2025 | 2,840,892 | 0.1 | |
| 375,000 | HCA, Inc., 5.625%, 09/01/2028 | 394,594 | 0.0 | |
| 475,000 | (1) | Hertz Corp./The, 6.000%, 01/15/2028 | 252,011 | 0.0 |
| 475,000 | (1) | Hertz Corp./The, 7.125%, 08/01/2026 | 251,358 | 0.0 |
| 775,000 | (1) | Hertz Corp., 5.500%, 10/15/2024 | 440,622 | 0.0 |
| 445,000 | (1) | Hill-Rom Holdings, Inc., 4.375%, 09/15/2027 | 442,126 | 0.0 |
| 800,000 | (1) | JBS USA LUX SA / JBS USA Finance, Inc., 5.875%, 07/15/2024 | 813,000 | 0.0 |
| 725,000 | (1) | JBS USA LUX SA / JBS USA Finance, Inc., 6.750%, 02/15/2028 | 777,961 | 0.0 |
| 750,000 | (1) | JBS USA LUX SA / JBS USA Food Co. / JBS USA Finance, Inc., 5.500%, 01/15/2030 | 778,538 | 0.0 |
| 500,000 | (1) | KeHE Distributors LLC / KeHE Finance Corp., 8.625%, 10/15/2026 | 505,313 | 0.0 |
| 35,000 | Kraft Heinz Foods Co., 2.800%, 07/02/2020 | 34,742 | 0.0 | |
| 665,000 | Kraft Heinz Foods Co., 4.375%, 06/01/2046 | 602,905 | 0.0 | |
| 1,440,000 | Kraft Heinz Foods Co., 5.000%, 07/15/2035 | 1,441,299 | 0.1 | |
| 330,000 | Kraft Heinz Foods Co., 5.000%, 06/04/2042 | 314,229 | 0.0 | |
| 520,000 | (1) | LifePoint Health, Inc., 4.375%, 02/15/2027 | 493,740 | 0.0 |
| 850,000 | Molina Healthcare, Inc., 5.375%, 11/15/2022 | 846,039 | 0.0 | |
| 1,025,000 | (1) | MPH Acquisition Holdings LLC, 7.125%, 06/01/2024 | 899,468 | 0.1 |
| 725,000 | New Albertsons L.P., 7.450%, 08/01/2029 | 709,443 | 0.0 | |
| 750,000 | (1) | Par Pharmaceutical, Inc., 7.500%, 04/01/2027 | 751,931 | 0.0 |
| 525,000 | (1) | Pilgrim's Pride Corp., 5.750%, 03/15/2025 | 530,909 | 0.0 |
| 550,000 | (1) | Pilgrim's Pride Corp., 5.875%, 09/30/2027 | 551,073 | 0.0 |
| 380,000 | (1),(4) | Polaris Intermediate Corp., 8.500%(PIK Rate 9.250%, Cash Rate 8.500%), 12/01/2022 | 297,343 | 0.0 |
| 1,375,000 | (1) | Post Holdings, Inc., 5.625%, 01/15/2028 | 1,406,694 | 0.1 |
| 263,000 | Reynolds American, Inc., 4.450%, 06/12/2025 | 268,299 | 0.0 | |
| 1,070,000 | (1) | Select Medical Corp., 6.250%, 08/15/2026 | 1,075,890 | 0.1 |
| 925,000 | Spectrum Brands, Inc., 5.750%, 07/15/2025 | 871,785 | 0.0 | |
| 630,000 | Tenet Healthcare Corp., 5.125%, 05/01/2025 | 600,075 | 0.0 | |
| 95,000 | (1) | Tenet Healthcare Corp., 5.125%, 11/01/2027 | 91,081 | 0.0 |
| 1,300,000 | Tenet Healthcare Corp., 6.750%, 06/15/2023 | 1,207,382 | 0.1 |
See Accompanying Notes to Financial Statements
| 84 |
| Voya Strategic Income Opportunities Fund | PORTFOLIO OF INVESTMENTS |
| as of March31, 2020 (Continued) |
| 350,000 | Tenet Healthcare Corp., 8.125%, 04/01/2022 | 332,619 | 0.0 | |
| 400,000 | Teva Pharmaceutical Finance Netherlands III BV, 6.000%, 04/15/2024 | 395,498 | 0.0 | |
| 800,000 | United Rentals North America, Inc., 4.875%, 01/15/2028 | 780,440 | 0.0 | |
| 375,000 | United Rentals North America, Inc., 5.250%, 01/15/2030 | 376,969 | 0.0 | |
| 550,000 | United Rentals North America, Inc., 5.500%, 07/15/2025 | 542,440 | 0.0 | |
| 650,000 | United Rentals North America, Inc., 6.500%, 12/15/2026 | 663,358 | 0.0 | |
| 475,000 | (1) | Vizient, Inc., 6.250%, 05/15/2027 | 478,067 | 0.0 |
| 770,000 | (1) | West Street Merger Sub, Inc., 6.375%, 09/01/2025 | 676,961 | 0.0 |
| 57,708,415 | 2.2 | |||
| Energy: 2.5% | ||||
| 425,000 | (1) | Archrock Partners L.P. / Archrock Partners Finance Corp., 6.250%, 04/01/2028 | 296,437 | 0.0 |
| 275,000 | (1) | Archrock Partners L.P. / Archrock Partners Finance Corp., 6.875%, 04/01/2027 | 197,194 | 0.0 |
| 605,000 | (1) | Baytex Energy Corp., 8.750%, 04/01/2027 | 235,345 | 0.0 |
| 161,700 | (1) | Calfrac Holdings L.P., 10.875%, 03/15/2026 | 48,510 | 0.0 |
| 1,025,000 | (2) | Callon Petroleum Co., 6.250%, 04/15/2023 | 251,094 | 0.0 |
| 2,000,000 | Cenovus Energy, Inc., 5.250%, 06/15/2037 | 899,382 | 0.1 | |
| 2,550,000 | CNOOC Finance 2013 Ltd., 2.875%, 09/30/2029 | 2,621,385 | 0.1 | |
| 250,000 | Continental Resources, Inc./OK, 4.500%, 04/15/2023 | 137,764 | 0.0 | |
| 975,000 | Crestwood Midstream Partners L.P. / Crestwood Midstream Finance Corp., 5.750%, 04/01/2025 | 565,529 | 0.0 | |
| 500,000 | Crestwood Midstream Partners L.P. / Crestwood Midstream Finance Corp., 6.250%, 04/01/2023 | 283,227 | 0.0 | |
| 850,000 | Delek Logistics Partners L.P. / Delek Logistics Finance Corp., 6.750%, 05/15/2025 | 834,067 | 0.0 | |
| 455,000 | Diamond Offshore Drilling, Inc., 4.875%, 11/01/2043 | 66,114 | 0.0 | |
| 1,800,000 | Ecopetrol SA, 5.375%, 06/26/2026 | 1,764,976 | 0.1 | |
| 500,000 | Empresa Nacional del Petroleo, 3.750%, 08/05/2026 | 469,658 | 0.0 | |
| 1,200,000 | Empresa Nacional del Petroleo, 5.250%, 11/06/2029 | 1,190,824 | 0.1 | |
| 340,000 | (1) | Empresa Nacional del Petroleo, 5.250%, 11/06/2029 | 337,400 | 0.0 |
| 1,075,000 | Energy Transfer Operating L.P., 4.900%, 02/01/2024 | 963,867 | 0.1 | |
| 1,750,000 | Energy Transfer Operating L.P., 6.000%, 06/15/2048 | 1,474,810 | 0.1 | |
| 5,725,000 | (3) | Energy Transfer Operating L.P., 7.125%, 12/31/2199 | 3,452,633 | 0.1 |
| 1,025,000 | (1) | Enviva Partners L.P. / Enviva Partners Finance Corp., 6.500%, 01/15/2026 | 1,007,062 | 0.1 |
| 2,031,000 | (2) | Exxon Mobil Corp., 3.095%, 08/16/2049 | 2,069,748 | 0.1 |
| 3,600,000 | Gazprom PJSC Via Gaz Capital SA, 4.950%, 03/23/2027 | 3,748,824 | 0.2 | |
| 750,000 | Gazprom PJSC Via Gaz Capital SA, 4.950%, 02/06/2028 | 784,348 | 0.0 | |
| 2,700,000 | Gazprom PJSC Via Gaz Finance PLC, 3.250%, 02/25/2030 | 2,500,200 | 0.1 | |
| 400,000 | (1) | Hess Midstream Operations L.P., 5.125%, 06/15/2028 | 282,620 | 0.0 |
| 700,000 | (1) | Hess Midstream Operations L.P., 5.625%, 02/15/2026 | 499,123 | 0.0 |
| 2,625,000 | KazMunayGas National Co. JSC, 4.750%, 04/19/2027 | 2,527,382 | 0.1 | |
| 2,550,000 | KazMunayGas National Co. JSC, 5.375%, 04/24/2030 | 2,521,950 | 0.1 | |
| 300,000 | (1) | KazMunayGas National Co. JSC, 5.375%, 04/24/2030 | 296,700 | 0.0 |
| 1,250,000 | Kinder Morgan, Inc., 5.200%, 03/01/2048 | 1,326,254 | 0.1 | |
| 595,000 | (1) | Magnolia Oil & Gas Operating LLC / Magnolia Oil & Gas Finance Corp., 6.000%, 08/01/2026 | 371,875 | 0.0 |
| 575,000 | Montage Resources Corp., 8.875%, 07/15/2023 | 392,420 | 0.0 | |
| 700,000 | (1) | Moss Creek Resources Holdings, Inc., 7.500%, 01/15/2026 | 208,980 | 0.0 |
| 1,047,000 | MPLX L.P., 3.375%, 03/15/2023 | 969,161 | 0.1 | |
| 450,000 | Murphy Oil Corp., 5.875%, 12/01/2027 | 236,947 | 0.0 | |
| 640,000 | Murphy Oil Corp., 5.750%, 08/15/2025 | 346,467 | 0.0 | |
See Accompanying Notes to Financial Statements
| 85 |
| Voya Strategic Income Opportunities Fund | PORTFOLIO OF INVESTMENTS |
| as of March31, 2020 (Continued) |
| 270,000 | (1) | Noble Holding International Ltd., 7.875%, 02/01/2026 | 67,106 | 0.0 |
| 50,000 | (1) | Parsley Energy LLC / Parsley Finance Corp., 5.625%, 10/15/2027 | 35,528 | 0.0 |
| 1,325,000 | PBF Logistics L.P. / PBF Logistics Finance Corp., 6.875%, 05/15/2023 | 826,191 | 0.0 | |
| 2,100,000 | Pertamina Persero PT, 3.100%, 01/21/2030 | 1,868,863 | 0.1 | |
| 3,375,000 | (1) | Pertamina Persero PT, 3.100%, 01/21/2030 | 3,003,530 | 0.1 |
| 750,000 | (1),(2) | Pertamina Persero PT, 3.100%, 08/25/2030 | 668,425 | 0.0 |
| 7,350,000 | Petrobras Global Finance BV, 5.750%, 02/01/2029 | 6,971,843 | 0.3 | |
| 775,000 | Petrobras Global Finance BV, 7.375%, 01/17/2027 | 796,739 | 0.0 | |
| 1,400,000 | Petroleos del Peru SA, 4.750%, 06/19/2032 | 1,285,974 | 0.1 | |
| 7,450,000 | (1) | Petroleos Mexicanos, 5.950%, 01/28/2031 | 5,159,870 | 0.2 |
| 575,000 | Petroleos Mexicanos, 6.500%, 01/23/2029 | 420,349 | 0.0 | |
| 230,000 | Sunoco L.P. / Sunoco Finance Corp., 4.875%, 01/15/2023 | 224,115 | 0.0 | |
| 10,000 | Sunoco L.P. / Sunoco Finance Corp., 5.500%, 02/15/2026 | 8,738 | 0.0 | |
| 10,000 | Sunoco L.P. / Sunoco Finance Corp., 5.875%, 03/15/2028 | 8,385 | 0.0 | |
| 925,000 | (1) | Tallgrass Energy Partners L.P. / Tallgrass Energy Finance Corp., 5.500%, 01/15/2028 | 487,445 | 0.0 |
| 200,000 | (1) | Targa Resources Partners L.P. / Targa Resources Partners Finance Corp., 5.500%, 03/01/2030 | 156,250 | 0.0 |
| 375,000 | Targa Resources Partners L.P. / Targa Resources Partners Finance Corp., 6.500%, 07/15/2027 | 322,500 | 0.0 | |
| 725,000 | Targa Resources Partners L.P. / Targa Resources Partners Finance Corp., 6.875%, 01/15/2029 | 589,063 | 0.0 | |
| 3,951,000 | (3) | Transcanada Trust, 5.500%, 09/15/2079 | 3,029,410 | 0.1 |
| 1,250,000 | Transocean, Inc., 6.800%, 03/15/2038 | 297,250 | 0.0 | |
| 700,000 | (1) | Viper Energy Partners L.P., 5.375%, 11/01/2027 | 591,885 | 0.0 |
| 350,000 | WPX Energy, Inc., 4.500%, 01/15/2030 | 191,363 | 0.0 | |
| 775,000 | WPX Energy, Inc., 5.250%, 10/15/2027 | 430,551 | 0.0 | |
| 63,621,650 | 2.5 | |||
| Financial: 1.9% | ||||
| 150,000 | AerCap Ireland Capital DAC / AerCap Global Aviation Trust, 4.625%, 10/30/2020 | 145,522 | 0.0 | |
| 115,000 | (1) | AG Issuer LLC, 6.250%, 03/01/2028 | 97,462 | 0.0 |
| 975,000 | Ally Financial, Inc., 5.750%, 11/20/2025 | 961,057 | 0.0 | |
| 600,000 | (1) | Altice France Holding SA, 6.000%, 02/15/2028 | 532,308 | 0.0 |
| 1,200,000 | (1) | Altice France Holding SA, 10.500%, 05/15/2027 | 1,272,000 | 0.1 |
| 1,730,000 | American International Group, Inc., 3.900%, 04/01/2026 | 1,806,226 | 0.1 | |
| 2,730,000 | American International Group, Inc., 4.375%, 01/15/2055 | 2,670,058 | 0.1 | |
| 1,600,000 | (1) | Banco Bradesco SA/Cayman Islands, 3.200%, 01/27/2025 | 1,466,016 | 0.1 |
| 1,550,000 | Banco de Bogota SA, 6.250%, 05/12/2026 | 1,478,634 | 0.1 | |
| 1,550,000 | (1) | Banco Internacional del Peru SAA Interbank, 3.250%, 10/04/2026 | 1,375,048 | 0.1 |
| 1,200,000 | (1) | Banco Votorantim SA, 4.500%, 09/24/2024 | 1,083,612 | 0.1 |
| 1,500,000 | Bancolombia SA, 3.000%, 01/29/2025 | 1,349,640 | 0.1 | |
| 327,000 | Bank of America Corp., 2.625%, 10/19/2020 | 327,540 | 0.0 | |
| 425,000 | BBVA Bancomer SA/Texas, 6.750%, 09/30/2022 | 424,082 | 0.0 | |
| 409,000 | (1) | BPCE SA, 4.500%, 03/15/2025 | 406,640 | 0.0 |
| 1,220,000 | Brookfield Finance LLC, 3.450%, 04/15/2050 | 983,929 | 0.0 | |
| 281,000 | Chubb INA Holdings, Inc., 3.350%, 05/03/2026 | 298,224 | 0.0 | |
| 175,000 | CIT Group, Inc., 5.250%, 03/07/2025 | 171,720 | 0.0 | |
| 475,000 | CIT Group, Inc., 6.125%, 03/09/2028 | 450,558 | 0.0 | |
| 1,000,000 | Citigroup, Inc., 4.750%, 05/18/2046 | 1,150,471 | 0.1 | |
| 1,000,000 | Corp Financiera de Desarrollo SA, 4.750%, 07/15/2025 | 978,755 | 0.0 | |
| 1,125,000 | (1) | ESH Hospitality, Inc., 5.250%, 05/01/2025 | 952,037 | 0.0 |
| 550,000 | (1) | Freedom Mortgage Corp., 8.250%, 04/15/2025 | 435,858 | 0.0 |
| 403,000 | GE Capital International Funding Co. Unlimited Co., 3.373%, 11/15/2025 | 405,913 | 0.0 | |
See Accompanying Notes to Financial Statements
| 86 |
| Voya Strategic Income Opportunities Fund | PORTFOLIO OF INVESTMENTS |
| as of March31, 2020 (Continued) |
| 665,000 | GE Capital International Funding Co. Unlimited Co., 4.418%, 11/15/2035 | 721,324 | 0.0 | |
| 279,000 | Goldman Sachs Group, Inc., 4.250%, 10/21/2025 | 293,899 | 0.0 | |
| 281,000 | Healthpeak Properties, Inc., 4.000%, 06/01/2025 | 287,681 | 0.0 | |
| 1,450,000 | Icahn Enterprises L.P. / Icahn Enterprises Finance Corp., 6.250%, 05/15/2026 | 1,378,402 | 0.1 | |
| 1,500,000 | (1) | Itau Unibanco Holding SA/Cayman Island, 3.250%, 01/24/2025 | 1,405,800 | 0.1 |
| 277,000 | JPMorgan Chase & Co., 4.250%, 10/01/2027 | 305,728 | 0.0 | |
| 6,800,000 | (3) | JPMorgan Chase & Co., 4.600%, 12/31/2199 | 5,959,860 | 0.2 |
| 1,050,000 | (1),(3) | Kookmin Bank, 4.350%, 12/31/2199 | 1,010,107 | 0.1 |
| 400,000 | Lloyds Banking Group PLC, 4.582%, 12/10/2025 | 412,440 | 0.0 | |
| 740,000 | (1) | LPL Holdings, Inc., 4.625%, 11/15/2027 | 682,369 | 0.0 |
| 1,075,000 | MGM Growth Properties Operating Partnership L.P. / MGP Finance Co-Issuer, Inc., 5.625%, 05/01/2024 | 1,038,724 | 0.1 | |
| 268,000 | Morgan Stanley, 4.000%, 07/23/2025 | 287,375 | 0.0 | |
| 400,000 | MPT Operating Partnership L.P. / MPT Finance Corp., 4.625%, 08/01/2029 | 370,250 | 0.0 | |
| 775,000 | MPT Operating Partnership L.P. / MPT Finance Corp., 5.000%, 10/15/2027 | 757,621 | 0.0 | |
| 250,000 | MPT Operating Partnership L.P. / MPT Finance Corp., 5.500%, 05/01/2024 | 244,062 | 0.0 | |
| 475,000 | Navient Corp., 5.000%, 03/15/2027 | 411,920 | 0.0 | |
| 950,000 | Navient Corp., 7.250%, 09/25/2023 | 938,096 | 0.0 | |
| 1,100,000 | (1),(3) | NBK Tier 1 Financing 2 Ltd., 4.500%, 12/31/2199 | 1,039,500 | 0.1 |
| 950,000 | (1) | QNB Finansbank AS, 6.875%, 09/07/2024 | 881,305 | 0.0 |
| 900,000 | (1) | Quicken Loans, Inc., 5.250%, 01/15/2028 | 886,291 | 0.0 |
| 725,000 | (1) | Realogy Group LLC / Realogy Co-Issuer Corp., 5.250%, 12/01/2021 | 679,144 | 0.0 |
| 725,000 | (1) | SBA Communications Corp., 3.875%, 02/15/2027 | 732,250 | 0.0 |
| 970,000 | Simon Property Group L.P., 3.375%, 12/01/2027 | 963,485 | 0.0 | |
| 225,000 | Springleaf Finance Corp., 5.375%, 11/15/2029 | 207,241 | 0.0 | |
| 650,000 | Springleaf Finance Corp., 6.125%, 03/15/2024 | 646,802 | 0.0 | |
| 1,125,000 | Springleaf Finance Corp., 7.125%, 03/15/2026 | 1,107,422 | 0.1 | |
| 2,000,000 | (1) | Turkiye Vakiflar Bankasi TAO, 5.250%, 02/05/2025 | 1,685,600 | 0.1 |
| 550,000 | (1) | Turkiye Vakiflar Bankasi TAO, 8.125%, 03/28/2024 | 526,807 | 0.0 |
| 200,000 | (1) | UBS Group AG, 2.950%, 09/24/2020 | 200,353 | 0.0 |
| 500,000 | Vnesheconombank Via VEB Finance PLC, 6.025%, 07/05/2022 | 507,265 | 0.0 | |
| 269,000 | Wells Fargo & Co., 4.300%, 07/22/2027 | 288,988 | 0.0 | |
| 1,750,000 | Wells Fargo & Co., 4.750%, 12/07/2046 | 2,029,383 | 0.1 | |
| 50,110,804 | 1.9 | |||
| Industrial: 1.4% | ||||
| 520,000 | (1) | Advanced Disposal Services, Inc., 5.625%, 11/15/2024 | 531,047 | 0.0 |
| 1,125,000 | AECOM, 5.875%, 10/15/2024 | 1,106,724 | 0.1 | |
| 650,000 | (1) | Amsted Industries, Inc., 5.625%, 07/01/2027 | 637,947 | 0.0 |
| 1,225,000 | (1),(4) | ARD Finance SA, 6.500%(PIK Rate 7.250%, Cash Rate 6.500%), 06/30/2027 | 1,058,951 | 0.1 |
| 410,000 | (1) | ATS Automation Tooling Systems, Inc., 6.500%, 06/15/2023 | 402,310 | 0.0 |
| 665,000 | (1) | Berry Global, Inc., 5.625%, 07/15/2027 | 692,062 | 0.0 |
| 700,000 | (1) | BMC East LLC, 5.500%, 10/01/2024 | 681,622 | 0.0 |
| 2,796,000 | (3) | BNSF Funding Trust I, 6.613%, 12/15/2055 | 2,744,959 | 0.1 |
| 500,000 | (1) | Bombardier, Inc., 6.000%, 10/15/2022 | 378,750 | 0.0 |
| 275,000 | (1) | Bombardier, Inc., 7.875%, 04/15/2027 | 191,833 | 0.0 |
| 900,000 | (1) | Bombardier, Inc., 8.750%, 12/01/2021 | 753,075 | 0.1 |
| 607,000 | (1) | Builders FirstSource, Inc., 6.750%, 06/01/2027 | 600,045 | 0.0 |
| 745,000 | (1) | Builders FirstSource, Inc., 5.000%, 03/01/2030 | 674,691 | 0.0 |
| 410,000 | Burlington Northern Santa Fe LLC, 4.450%, 03/15/2043 | 487,190 | 0.0 | |
| 725,000 | (1) | Cargo Aircraft Management, Inc., 4.750%, 02/01/2028 | 677,875 | 0.0 |
See Accompanying Notes to Financial Statements
| 87 |
| Voya Strategic Income Opportunities Fund | PORTFOLIO OF INVESTMENTS |
| as of March31, 2020 (Continued) |
| 675,000 | (1) | Cascades, Inc./Cascades USA, Inc., 5.375%, 01/15/2028 | 649,688 | 0.0 |
| 500,000 | Cemex SAB de CV, 6.125%, 05/05/2025 | 446,873 | 0.0 | |
| 575,000 | (1) | Clean Harbors, Inc., 4.875%, 07/15/2027 | 566,059 | 0.0 |
| 350,000 | (1) | Clean Harbors, Inc., 5.125%, 07/15/2029 | 328,490 | 0.0 |
| 1,000,000 | CSX Corp., 4.500%, 08/01/2054 | 1,136,736 | 0.1 | |
| 603,000 | FedEx Corp., 4.000%, 01/15/2024 | 630,411 | 0.0 | |
| 1,000,000 | FedEx Corp., 4.950%, 10/17/2048 | 982,880 | 0.1 | |
| 420,000 | (1) | FXI Holdings, Inc., 7.875%, 11/01/2024 | 286,784 | 0.0 |
| 420,000 | (1) | GFL Environmental, Inc., 8.500%, 05/01/2027 | 424,305 | 0.0 |
| 116,000 | (1) | GFL Environmental, Inc., 7.000%, 06/01/2026 | 113,269 | 0.0 |
| 525,000 | (1) | Granite US Holdings Corp., 11.000%, 10/01/2027 | 454,890 | 0.0 |
| 2,775,000 | (1) | Indian Railway Finance Corp. Ltd., 3.249%, 02/13/2030 | 2,471,595 | 0.1 |
| 1,100,000 | (1) | Itron, Inc., 5.000%, 01/15/2026 | 1,054,397 | 0.1 |
| 1,000,000 | (1) | James Hardie International Finance DAC, 4.750%, 01/15/2025 | 951,255 | 0.1 |
| 1,550,000 | (1),(2) | Klabin Austria GmbH, 5.750%, 04/03/2029 | 1,414,468 | 0.1 |
| 900,000 | (1) | Koppers, Inc., 6.000%, 02/15/2025 | 726,723 | 0.0 |
| 200,000 | Lockheed Martin Corp., 3.550%, 01/15/2026 | 216,723 | 0.0 | |
| 520,000 | (1) | Masonite International Corp., 5.375%, 02/01/2028 | 513,942 | 0.0 |
| 500,000 | (1) | Masonite International Corp., 5.750%, 09/15/2026 | 494,271 | 0.0 |
| 545,000 | (1) | Mauser Packaging Solutions Holding Co., 7.250%, 04/15/2025 | 416,941 | 0.0 |
| 725,000 | (1) | Norbord, Inc., 5.750%, 07/15/2027 | 668,057 | 0.0 |
| 650,000 | (1) | Owens-Brockway Glass Container, Inc., 5.875%, 08/15/2023 | 641,066 | 0.0 |
| 325,000 | (1) | Owens-Brockway Glass Container, Inc., 6.375%, 08/15/2025 | 311,188 | 0.0 |
| 885,000 | (1) | PGT Innovations, Inc., 6.750%, 08/01/2026 | 842,040 | 0.1 |
| 725,000 | (1) | Reynolds Group Issuer, Inc. / Reynolds Group Issuer LLC / Reynolds Group Issuer Lu, 5.125%, 07/15/2023 | 724,090 | 0.0 |
| 200,000 | (1) | Reynolds Group Issuer, Inc. / Reynolds Group Issuer LLC / Reynolds Group Issuer Lu, 7.000%, 07/15/2024 | 204,375 | 0.0 |
| 650,000 | (1) | Sealed Air Corp., 5.500%, 09/15/2025 | 663,816 | 0.0 |
| 390,000 | (1) | Silgan Holdings, Inc., 4.125%, 02/01/2028 | 362,700 | 0.0 |
| 725,000 | (1) | SSL Robotics LLC, 9.750%, 12/31/2023 | 752,188 | 0.1 |
| 600,000 | (1) | Standard Industries, Inc./NJ, 5.000%, 02/15/2027 | 550,181 | 0.0 |
| 975,000 | (1) | Standard Industries, Inc./NJ, 6.000%, 10/15/2025 | 965,513 | 0.1 |
| 750,000 | (1) | Stevens Holding Co., Inc., 6.125%, 10/01/2026 | 747,343 | 0.0 |
| 400,000 | (1) | Summit Materials LLC / Summit Materials Finance Corp., 5.125%, 06/01/2025 | 375,498 | 0.0 |
| 690,000 | (1) | Summit Materials LLC / Summit Materials Finance Corp., 6.500%, 03/15/2027 | 657,944 | 0.0 |
| 750,000 | (1) | TransDigm, Inc., 5.500%, 11/15/2027 | 677,288 | 0.0 |
| 700,000 | TransDigm, Inc., 6.375%, 06/15/2026 | 674,135 | 0.0 | |
| 1,000,000 | TransDigm, Inc., 6.500%, 05/15/2025 | 956,255 | 0.1 | |
| 181,000 | (1) | Zekelman Industries, Inc., 9.875%, 06/15/2023 | 175,909 | 0.0 |
| 36,849,367 | 1.4 | |||
| Technology: 0.5% | ||||
| 950,000 | (1) | Ascend Learning LLC, 6.875%, 08/01/2025 | 929,808 | 0.1 |
| 650,000 | (1) | Castle US Holding Corp., 9.500%, 02/15/2028 | 621,156 | 0.0 |
| 675,000 | CDW LLC / CDW Finance Corp., 5.000%, 09/01/2025 | 699,675 | 0.0 | |
| 650,000 | CDW LLC / CDW Finance Corp., 5.500%, 12/01/2024 | 681,554 | 0.0 | |
| 1,300,000 | (1) | Change Healthcare Holdings LLC / Change Healthcare Finance, Inc., 5.750%, 03/01/2025 | 1,212,211 | 0.1 |
| 345,000 | (1) | Dell International LLC / EMC Corp., 7.125%, 06/15/2024 | 357,506 | 0.0 |
| 1,000,000 | (1) | Dell International LLC / EMC Corp., 8.350%, 07/15/2046 | 1,179,118 | 0.1 |
| 750,000 | Donnelley Financial Solutions, Inc., 8.250%, 10/15/2024 | 711,559 | 0.0 | |
| 450,000 | (1) | MSCI, Inc., 5.750%, 08/15/2025 | 467,923 | 0.0 |
| 650,000 | (1) | MTS Systems Corp., 5.750%, 08/15/2027 | 608,428 | 0.0 |
See Accompanying Notes to Financial Statements
| 88 |
| Voya Strategic Income Opportunities Fund | PORTFOLIO OF INVESTMENTS |
| as of March31, 2020 (Continued) |
| 250,000 | (1) | Open Text Corp., 3.875%, 02/15/2028 | 236,172 | 0.0 |
| 350,000 | (1) | Open Text Corp., 5.875%, 06/01/2026 | 369,057 | 0.0 |
| 425,000 | (1) | Open Text Holdings, Inc., 4.125%, 02/15/2030 | 401,997 | 0.0 |
| 350,000 | Oracle Corp., 3.250%, 11/15/2027 | 361,482 | 0.0 | |
| 550,000 | (1) | RP Crown Parent LLC, 7.375%, 10/15/2024 | 528,850 | 0.0 |
| 430,000 | (1) | Science Applications International Corp., 4.875%, 04/01/2028 | 415,219 | 0.0 |
| 1,175,000 | (1) | Tempo Acquisition LLC / Tempo Acquisition Finance Corp., 6.750%, 06/01/2025 | 1,083,973 | 0.1 |
| 655,000 | Texas Instruments, Inc., 3.875%, 03/15/2039 | 756,859 | 0.0 | |
| 1,150,000 | (1),(2) | Veritas US, Inc. / Veritas Bermuda Ltd.., 10.500%, 02/01/2024 | 978,932 | 0.1 |
| 12,601,479 | 0.5 | |||
| Utilities: 1.6% | ||||
| 1,114,000 | American Electric Power Co., Inc., 3.250%, 03/01/2050 | 981,426 | 0.1 | |
| 1,075,000 | Calpine Corp., 5.750%, 01/15/2025 | 1,002,438 | 0.1 | |
| 2,275,000 | (1) | Centrais Eletricas Brasileiras SA, 3.625%, 02/04/2025 | 2,025,910 | 0.1 |
| 550,000 | (1) | Clearway Energy Operating LLC, 4.750%, 03/15/2028 | 512,188 | 0.0 |
| 1,850,000 | (1) | Colbun SA, 3.150%, 03/06/2030 | 1,623,375 | 0.1 |
| 5,670,000 | (3) | Dominion Energy, Inc., 4.650%, 12/31/2199 | 5,099,059 | 0.2 |
| 1,050,000 | (1) | Drax Finco PLC, 6.625%, 11/01/2025 | 1,059,193 | 0.1 |
| 1,415,000 | Duke Energy Carolinas LLC, 3.200%, 08/15/2049 | 1,436,247 | 0.1 | |
| 3,935,000 | (3) | Duke Energy Corp., 4.875%, 12/31/2199 | 3,308,135 | 0.1 |
| 1,355,000 | Duke Energy Indiana LLC, 3.750%, 05/15/2046 | 1,479,794 | 0.1 | |
| 614,000 | Entergy Louisiana LLC, 2.900%, 03/15/2051 | 543,607 | 0.0 | |
| 3,175,000 | Inkia Energy Ltd., 5.875%, 11/09/2027 | 2,809,875 | 0.1 | |
| 500,000 | (1) | Israel Electric Corp. Ltd., 4.250%, 08/14/2028 | 512,308 | 0.0 |
| 2,500,000 | Kallpa Generacion SA, 4.125%, 08/16/2027 | 2,267,631 | 0.1 | |
| 575,000 | (1) | Kallpa Generacion SA, 4.125%, 08/16/2027 | 521,555 | 0.0 |
| 650,000 | (1) | LBC Tank Terminals Holding Netherlands BV, 6.875%, 05/15/2023 | 615,059 | 0.0 |
| 2,500,000 | Mississippi Power Co., 4.250%, 03/15/2042 | 2,407,569 | 0.1 | |
| 2,875,000 | (3) | NextEra Energy Capital Holdings, Inc., 5.650%, 05/01/2079 | 2,658,564 | 0.1 |
| 925,000 | NRG Energy, Inc., 5.750%, 01/15/2028 | 948,634 | 0.0 | |
| 400,000 | NRG Energy, Inc., 6.625%, 01/15/2027 | 418,220 | 0.0 | |
| 2,325,000 | (1) | Perusahaan Listrik Negara PT, 3.875%, 07/17/2029 | 2,182,111 | 0.1 |
| 1,000,000 | Perusahaan Listrik Negara PT, 4.125%, 05/15/2027 | 972,158 | 0.0 | |
| 2,950,000 | Perusahaan Listrik Negara PT, 5.450%, 05/21/2028 | 3,095,627 | 0.1 | |
| 845,000 | Southern California Edison Co., 3.650%, 02/01/2050 | 824,659 | 0.0 | |
| 425,000 | (1) | Vistra Operations Co. LLC, 5.500%, 09/01/2026 | 440,711 | 0.0 |
| 575,000 | (1) | Vistra Operations Co. LLC, 5.625%, 02/15/2027 | 596,160 | 0.0 |
| 40,342,213 | 1.6 | |||
| Total Corporate Bonds/Notes | ||||
| (Cost $437,559,837) | 394,488,093 | 15.3 | ||
| COLLATERALIZED MORTGAGE OBLIGATIONS: 29.2% | ||||
| 192,890 | Adjustable Rate Mortgage Trust 2005-7 7A21, 1.447%, (US0001M + 0.500%), 10/25/2035 | 190,857 | 0.0 | |
| 366,842 | (3) | Adjustable Rate Mortgage Trust 2006-2 1A1, 4.074%, 05/25/2036 | 319,472 | 0.0 |
| 1,235,488 | (1),(3) | Agate Bay Mortgage Trust 2014-1 B4, 3.868%, 07/25/2044 | 1,183,462 | 0.1 |
| 4,593,424 | (1),(3) | Agate Bay Mortgage Trust 2014-2 B2, 3.880%, 09/25/2044 | 4,407,763 | 0.2 |
| 1,884,306 | (1),(3) | Agate Bay Mortgage Trust 2014-2 B4, 3.880%, 09/25/2044 | 1,776,618 | 0.1 |
| 2,705,769 | (1),(3) | Agate Bay Mortgage Trust 2015-2 B3, 3.723%, 03/25/2045 | 2,578,668 | 0.1 |
| 1,218,542 | (1),(3) | Agate Bay Mortgage Trust 2015-4 B3, 3.573%, 06/25/2045 | 1,117,777 | 0.0 |
| 2,597,597 | (1),(3) | Agate Bay Mortgage Trust 2016-1 B3, 3.772%, 12/25/2045 | 2,423,532 | 0.1 |
| 1,000,000 | (1),(3) | Agate Bay Mortgage Trust 2016-1 B4, 3.772%, 12/25/2045 | 761,337 | 0.0 |
| 1,137,085 | (1),(3) | Agate Bay Mortgage Trust 2016-2 B4, 3.795%, 03/25/2046 | 849,839 | 0.0 |
| 724,807 | Alternative Loan Trust 2004-J7 MI, 1.967%, (US0001M + 1.020%), 10/25/2034 | 663,857 | 0.0 | |
See Accompanying Notes to Financial Statements
| 89 |
| Voya Strategic Income Opportunities Fund | PORTFOLIO OF INVESTMENTS |
| as of March31, 2020 (Continued) |
| 135,461 | Alternative Loan Trust 2005-10CB 1A1, 1.447%, (US0001M + 0.500%), 05/25/2035 | 102,580 | 0.0 | |
| 540,404 | Alternative Loan Trust 2005-10CB 1A2, 1.397%, (US0001M + 0.450%), 05/25/2035 | 408,295 | 0.0 | |
| 568,540 | Alternative Loan Trust 2005-23CB A15, 5.500%, 07/25/2035 | 517,217 | 0.0 | |
| 191,658 | Alternative Loan Trust 2005-51 3A2A, 3.256%, (12MTA + 1.290%), 11/20/2035 | 158,780 | 0.0 | |
| 61,790 | Alternative Loan Trust 2005-6CB 1A3, 5.250%, 04/25/2035 | 56,442 | 0.0 | |
| 289,669 | Alternative Loan Trust 2005-J2 1A12, 1.347%, (US0001M + 0.400%), 04/25/2035 | 225,346 | 0.0 | |
| 38,209 | Alternative Loan Trust 2006-13T1 A9, 6.000%, 05/25/2036 | 26,498 | 0.0 | |
| 705,858 | Alternative Loan Trust 2006-18CB A10, 1.347%, (US0001M + 0.400%), 07/25/2036 | 325,430 | 0.0 | |
| 168,133 | Alternative Loan Trust 2006-19CB A12, 1.347%, (US0001M + 0.400%), 08/25/2036 | 89,537 | 0.0 | |
| 712,005 | Alternative Loan Trust 2006-19CB A28, 1.547%, (US0001M + 0.600%), 08/25/2036 | 388,488 | 0.0 | |
| 1,194,923 | Alternative Loan Trust 2006-27CB A5, 6.000%, 11/25/2036 | 948,335 | 0.0 | |
| 450,985 | Alternative Loan Trust 2006-HY11 A1, 1.067%, (US0001M + 0.120%), 06/25/2036 | 384,328 | 0.0 | |
| 1,250,225 | Alternative Loan Trust 2007-15CB A5, 5.750%, 07/25/2037 | 991,237 | 0.0 | |
| 182,915 | Alternative Loan Trust 2007-2CB 2A1, 1.547%, (US0001M + 0.600%), 03/25/2037 | 90,238 | 0.0 | |
| 321,734 | Alternative Loan Trust 2007-HY8C A1, 1.107%, (US0001M + 0.160%), 09/25/2047 | 269,609 | 0.0 | |
| 908,176 | Alternative Loan Trust 2007-OA4 A1, 1.117%, (US0001M + 0.170%), 05/25/2047 | 750,272 | 0.0 | |
| 1,648,982 | (1),(3) | Arroyo Mortgage Trust 2019-3 A3, 3.416%, 10/25/2048 | 1,574,338 | 0.1 |
| 536,518 | Banc of America Funding 2007-2 1A16 Trust, 1.547%, (US0001M + 0.600%), 03/25/2037 | 383,197 | 0.0 | |
| 2,559,545 | Banc of America Funding 2007-C 7A1 Trust, 0.983%, (US0001M + 0.210%), 05/20/2047 | 2,314,979 | 0.1 | |
| 370,364 | (3) | Bear Stearns ALT-A Trust 2005-3 4A3, 3.568%, 04/25/2035 | 338,164 | 0.0 |
| 634,059 | (3) | Bear Stearns ALT-A Trust 2006-6 31A1, 3.877%, 11/25/2036 | 524,818 | 0.0 |
| 754,316 | (3) | Bear Stearns ALT-A Trust 2006-6 32A1, 3.775%, 11/25/2036 | 568,716 | 0.0 |
| 168,161 | (3) | Bear Stearns Structured Products, Inc. Trust 2007-R6 1A1, 3.726%, 01/26/2036 | 134,783 | 0.0 |
| 2,500,000 | (1),(3) | Chase Home Lending Mortgage Trust 2019-ATR1 A5, 4.000%, 04/25/2049 | 2,420,553 | 0.1 |
| 992,059 | (1),(3) | Chase Mortgage Finance Corp. 2019-1 B2, 3.967%, 03/25/2050 | 803,239 | 0.0 |
| 1,289,677 | (1),(3) | Chase Mortgage Finance Corp. 2019-1 B3, 3.967%, 03/25/2050 | 1,247,748 | 0.1 |
| 580,560 | (3) | Chase Mortgage Finance Trust Series 2006-A1 2A3, 4.300%, 09/25/2036 | 470,293 | 0.0 |
| 686,896 | (1),(3) | Chase Home Lending Mortgage Trust 2019-ATR2 A3, 3.500%, 07/25/2049 | 696,715 | 0.0 |
| 79,020 | (3) | CHL Mortgage Pass-Through Trust 2004-22 A3, 3.826%, 11/25/2034 | 71,567 | 0.0 |
| 565,325 | CHL Mortgage Pass-Through Trust 2005-HYB9 2A1, 3.939%, (US0012M + 1.750%), 02/20/2036 | 493,467 | 0.0 | |
| 1,867,206 | (1),(3) | CIM Trust 2019-INV1 A1, 4.000%, 02/25/2049 | 1,859,446 | 0.1 |
| 1,382,433 | (1),(3) | CIM Trust 2019-INV2 A3, 4.000%, 05/25/2049 | 1,384,781 | 0.1 |
| 868,126 | (1),(3) | CIM Trust 2019-INV3 A15, 3.500%, 08/25/2049 | 840,676 | 0.0 |
| 1,302,190 | (1),(3) | CIM Trust 2019-INV3 A3, 3.500%, 08/25/2049 | 1,329,424 | 0.1 |
| 2,593,318 | (1),(3) | CIM Trust 2019-J1 1A2, 3.500%, 08/25/2049 | 2,613,305 | 0.1 |
| 3,223,294 | (1),(3) | CIM Trust 2019-J2 B2, 3.856%, 10/25/2049 | 2,620,378 | 0.1 |
| 2,023,975 | (1),(3) | CIM Trust 2019-J2 B3, 3.856%, 10/25/2049 | 1,569,029 | 0.1 |
| 1,799,180 | (1),(3) | CIM Trust 2019-J1 B3, 4.010%, 08/25/2049 | 1,436,395 | 0.1 |
See Accompanying Notes to Financial Statements
| 90 |
| Voya Strategic Income Opportunities Fund | PORTFOLIO OF INVESTMENTS |
| as of March31, 2020 (Continued) |
| 710,239 | Citicorp Mortgage Securities Trust Series 2006-3 1A4, 6.000%, 06/25/2036 | 681,481 | 0.0 | |
| 114,378 | (3) | Citigroup Mortgage Loan Trust 2006-AR2 1A1, 3.982%, 03/25/2036 | 93,976 | 0.0 |
| 78,633 | (3) | Citigroup Mortgage Loan Trust 2006-AR9 2A, 4.344%, 11/25/2036 | 59,547 | 0.0 |
| 350,202 | (1),(3) | Citigroup Mortgage Loan Trust 2015-A B2, 4.500%, 06/25/2058 | 335,073 | 0.0 |
| 235,154 | (3) | Citigroup Mortgage Loan Trust, Inc. 2005-4 A, 4.592%, 08/25/2035 | 219,107 | 0.0 |
| 644,209 | Citigroup Mortgage Loan Trust, Inc. 2005-9 22A2, 6.000%, 11/25/2035 | 620,207 | 0.0 | |
| 1,000,000 | (1),(3) | COLT 2019-1 M1 Mortgage Loan Trust, 4.518%, 03/25/2049 | 925,338 | 0.0 |
| 4,057,318 | (1),(3) | COLT 2019-4 A3 Mortgage Loan Trust, 2.988%, 11/25/2049 | 3,981,142 | 0.2 |
| 6,000,000 | (1) | Connecticut Avenue Securities Trust 2019-R07 1M2, 3.047%, (US0001M + 2.100%), 10/25/2039 | 4,933,070 | 0.2 |
| 3,000,000 | (1) | Connecticut Avenue Securities Trust 2020-R02 2M2, 2.947%, (US0001M + 2.000%), 01/25/2040 | 1,987,726 | 0.1 |
| 26,377 | Countrywide Alternative Loan Trust 2005-53T2 2A6, 1.447%, (US0001M + 0.500%), 11/25/2035 | 11,784 | 0.0 | |
| 915,432 | Countrywide Asset-Backed Certificates 2005-IM1 M1, 1.667%, (US0001M + 0.720%), 11/25/2035 | 859,395 | 0.0 | |
| 4,022,249 | (1),(5) | CSMC 2019-AFC1 A3 Trust, 2.877%(Step Rate @ 3.877% on 0), 07/25/2049 | 3,886,352 | 0.2 |
| 800,000 | (1),(3) | CSMC 2017-HL1 A12 Trust, 3.500%, 06/25/2047 | 763,827 | 0.0 |
| 480,089 | CSMC Series 2007-2 3A6, 5.400%, 03/25/2037 | 377,687 | 0.0 | |
| 1,670,168 | (1),(3) | CSMC Trust 2013-7 A11, 3.500%, 08/25/2043 | 1,720,328 | 0.1 |
| 1,500,000 | (1),(3) | Deephave Residential Mortgage Trust 2019-2A M1, 3.921%, 04/25/2059 | 1,415,032 | 0.1 |
| 1,400,000 | (1),(3) | Deephaven Residential Mortgage Trust 2018-2A M1, 4.375%, 04/25/2058 | 1,351,664 | 0.1 |
| 2,126,000 | (1),(3) | Deephaven Residential Mortgage Trust 2018-3 M1, 4.357%, 08/25/2058 | 2,063,739 | 0.1 |
| 2,000,000 | (1),(3) | Deephaven Residential Mortgage Trust 2019-1A M1, 4.402%, 08/25/2058 | 1,902,668 | 0.1 |
| 2,000,000 | (1),(3) | Deephaven Residential Mortgage Trust 2019-4 M1, 3.484%, 10/25/2059 | 1,719,559 | 0.1 |
| 2,000,000 | (1),(3) | Deephaven Residential Mortgage Trust 2020-1 M1, 3.010%, 01/25/2060 | 1,636,509 | 0.1 |
| 648,499 | Deutsche ALT-A Securities, Inc. ALT 2007-AB1 A1, 1.247%, (US0001M + 0.300%), 04/25/2037 | 397,689 | 0.0 | |
| 144,326 | (1),(3) | Deutsche Mortgage Securities, Inc. Re-REMIC Trust Certificates Series 2007-WM1 A1, 3.802%, 06/27/2037 | 127,883 | 0.0 |
| 2,289,759 | (1),(3) | Ellington Financial Mortgage Trust 2019-2 A3, 3.046%, 11/25/2059 | 2,219,705 | 0.1 |
| 753,365 | (6) | Fannie Mae 2007-18 BS, 5.653%, (-1.000*US0001M + 6.600%), 06/25/2035 | 148,370 | 0.0 |
| 2,193,589 | (6) | Fannie Mae 2008-94 SI, 4.553%, (-1.000*US0001M + 5.500%), 04/25/2036 | 564,922 | 0.0 |
| 723,095 | (6) | Fannie Mae 2009-95 HI, 6.000%, 12/25/2038 | 17,946 | 0.0 |
| 301,270 | Fannie Mae 2010-15 FD, 1.687%, (US0001M + 0.740%), 03/25/2040 | 302,749 | 0.0 | |
| 804,663 | Fannie Mae 2011-47 GF, 1.517%, (US0001M + 0.570%), 06/25/2041 | 802,704 | 0.0 | |
| 225,037 | Fannie Mae 2012-10 UF, 1.497%, (US0001M + 0.550%), 02/25/2042 | 225,219 | 0.0 | |
| 300,951 | (6) | Fannie Mae 2012-84 KI, 6.000%, (US0001M + 6.000%), 08/25/2042 | 60,307 | 0.0 |
| 1,096,703 | (6) | Fannie Mae 2012-93 IL, 3.000%, 09/25/2027 | 67,216 | 0.0 |
| 6,570,135 | (6) | Fannie Mae 2013-67 AI, 3.000%, 07/25/2028 | 419,705 | 0.0 |
| 1,698,350 | (6) | Fannie Mae 2015-56 DI, 3.000%, 12/25/2032 | 40,838 | 0.0 |
| 36,711,724 | (6) | Fannie Mae 2018-86 US, 5.253%, (-1.000*US0001M + 6.200%), 12/25/2048 | 7,365,598 | 0.3 |
| 3,050,000 | Fannie Mae Connecticut Avenue Securities 16-C06 1M2, 5.197%, (US0001M + 4.250%), 04/25/2029 | 2,968,612 | 0.1 |
See Accompanying Notes to Financial Statements
| 91 |
| Voya Strategic Income Opportunities Fund | PORTFOLIO OF INVESTMENTS |
| as of March31, 2020 (Continued) |
| 121,246 | Fannie Mae Connecticut Avenue Securities 2014-CO4 1M2, 5.847%, (US0001M + 4.900%), 11/25/2024 | 116,788 | 0.0 | |
| 2,024,945 | Fannie Mae Connecticut Avenue Securities 2015-C02 1M2, 4.947%, (US0001M + 4.000%), 05/25/2025 | 1,902,459 | 0.1 | |
| 1,542,709 | Fannie Mae Connecticut Avenue Securities 2015-C03 2M2, 5.947%, (US0001M + 5.000%), 07/25/2025 | 1,502,321 | 0.1 | |
| 2,074,450 | Fannie Mae Connecticut Avenue Securities 2015-C04 2M2, 6.497%, (US0001M + 5.550%), 04/25/2028 | 1,942,008 | 0.1 | |
| 4,739,406 | Fannie Mae Connecticut Avenue Securities 2015-CO1 1M2, 5.247%, (US0001M + 4.300%), 02/25/2025 | 4,512,521 | 0.2 | |
| 1,566,653 | Fannie Mae Connecticut Avenue Securities 2016-C01 2M2, 7.897%, (US0001M + 6.950%), 08/25/2028 | 1,580,925 | 0.1 | |
| 4,824,509 | Fannie Mae Connecticut Avenue Securities 2016-C04 1M2, 5.197%, (US0001M + 4.250%), 01/25/2029 | 4,587,598 | 0.2 | |
| 6,056,023 | Fannie Mae Connecticut Avenue Securities 2016-C05 2M2, 5.397%, (US0001M + 4.450%), 01/25/2029 | 5,844,521 | 0.2 | |
| 8,147,224 | Fannie Mae Connecticut Avenue Securities 2016-C07 2M2, 5.297%, (US0001M + 4.350%), 05/25/2029 | 7,858,886 | 0.3 | |
| 2,484,671 | Fannie Mae Connecticut Avenue Securities 2017-C01 1M2, 4.497%, (US0001M + 3.550%), 07/25/2029 | 2,300,380 | 0.1 | |
| 4,900,000 | Fannie Mae Connecticut Avenue Securities 2017-C02 2M2, 4.597%, (US0001M + 3.650%), 09/25/2029 | 3,576,713 | 0.1 | |
| 8,500,000 | Fannie Mae Connecticut Avenue Securities 2017-C03 1M2, 3.947%, (US0001M + 3.000%), 10/25/2029 | 7,639,342 | 0.3 | |
| 1,400,000 | Fannie Mae Connecticut Avenue Securities 2017-C04 2M2, 3.797%, (US0001M + 2.850%), 11/25/2029 | 1,239,033 | 0.1 | |
| 6,210,682 | Fannie Mae Connecticut Avenue Securities 2017-C05 1M2, 3.147%, (US0001M + 2.200%), 01/25/2030 | 5,555,926 | 0.2 | |
| 4,927,295 | Fannie Mae Connecticut Avenue Securities 2017-C06 1M2, 3.597%, (US0001M + 2.650%), 02/25/2030 | 4,390,972 | 0.2 | |
| 4,450,000 | Fannie Mae Connecticut Avenue Securities 2017-C07 1M2, 3.347%, (US0001M + 2.400%), 05/28/2030 | 4,013,520 | 0.2 | |
| 5,762,875 | Fannie Mae Connecticut Avenue Securities 2017-C07 2M2, 3.447%, (US0001M + 2.500%), 05/25/2030 | 5,042,531 | 0.2 | |
| 5,133,077 | Fannie Mae Connecticut Avenue Securities 2017-CO6 2M2, 3.747%, (US0001M + 2.800%), 02/25/2030 | 4,338,727 | 0.2 | |
| 4,010,839 | Fannie Mae Connecticut Avenue Securities 2018-C02 2M2, 3.147%, (US0001M + 2.200%), 08/25/2030 | 3,358,739 | 0.1 | |
| 3,200,000 | Fannie Mae Connecticut Avenue Securities 2018-C03 1M2, 3.097%, (US0001M + 2.150%), 10/25/2030 | 2,697,857 | 0.1 | |
| 7,632,777 | Fannie Mae Connecticut Avenue Securities 2018-C04 2M2, 3.497%, (US0001M + 2.550%), 12/25/2030 | 6,340,383 | 0.3 | |
| 12,200,000 | Fannie Mae Connecticut Avenue Securities 2018-C05 1M2, 3.297%, (US0001M + 2.350%), 01/25/2031 | 10,392,552 | 0.4 | |
| 6,403,855 | Fannie Mae Connecticut Avenue Securities 2018-C06 1M2, 2.947%, (US0001M + 2.000%), 03/25/2031 | 5,703,628 | 0.2 | |
| 4,295,076 | Fannie Mae Connecticut Avenue Securities 2018-C06 2M2, 3.047%, (US0001M + 2.100%), 03/25/2031 | 3,653,852 | 0.1 | |
| 8,540,000 | Fannie Mae Connecticut Avenue Securities 2018-CO1 1M2, 3.197%, (US0001M + 2.250%), 07/25/2030 | 7,483,482 | 0.3 | |
| 6,971,255 | (1) | Fannie Mae Connecticut Avenue Securities 2019-R02 1M2, 3.247%, (US0001M + 2.300%), 08/25/2031 | 5,841,811 | 0.2 |
See Accompanying Notes to Financial Statements
| 92 |
| Voya Strategic Income Opportunities Fund | PORTFOLIO OF INVESTMENTS |
| as of March31, 2020 (Continued) |
| 3,000,000 | (1) | Fannie Mae Connecticut Avenue Securities 2019-R04 2M2, 3.047%, (US0001M + 2.100%), 06/25/2039 | 2,474,575 | 0.1 |
| 2,454,425 | (1) | Fannie Mae Connecticut Avenue Securities Trust 2018-R07 1M2, 3.347%, (US0001M + 2.400%), 04/25/2031 | 2,125,203 | 0.1 |
| 5,894,116 | (1) | Fannie Mae Connecticut Avenue Securities Trust 2019-R01 2M2, 3.397%, (US0001M + 2.450%), 07/25/2031 | 4,947,212 | 0.2 |
| 1,500,000 | (1) | Fannie Mae Connecticut Avenue Securities Trust 2020-R01 1M2, 2.997%, (US0001M + 2.050%), 01/25/2040 | 912,955 | 0.0 |
| 5,255,571 | Fannie Mae Connecticut Avenue Securities, 6.647%, (US0001M + 5.700%), 04/25/2028 | 5,262,467 | 0.2 | |
| 4,371,194 | Fannie Mae Connecticut Avenue Securities, 6.847%, (US0001M + 5.900%), 10/25/2028 | 4,308,995 | 0.2 | |
| 173,855 | (6) | Fannie Mae REMIC Trust 2000-26 SP, 7.553%, (-1.000*US0001M + 8.500%), 08/25/2030 | 42,851 | 0.0 |
| 219,633 | (6) | Fannie Mae REMIC Trust 2002-13 SR, 5.653%, (-1.000*US0001M + 6.600%), 03/25/2032 | 39,026 | 0.0 |
| 120,533 | (6) | Fannie Mae REMIC Trust 2004-64 SW, 6.103%, (-1.000*US0001M + 7.050%), 08/25/2034 | 26,039 | 0.0 |
| 85,308 | (6) | Fannie Mae REMIC Trust 2004-66 SE, 5.553%, (-1.000*US0001M + 6.500%), 09/25/2034 | 16,765 | 0.0 |
| 432,621 | (6) | Fannie Mae REMIC Trust 2009-25 SN, 5.603%, (-1.000*US0001M + 6.550%), 04/25/2039 | 110,375 | 0.0 |
| 179,209 | (6) | Fannie Mae REMIC Trust 2012-146 LI, 4.500%, 10/25/2041 | 7,484 | 0.0 |
| 19,508,490 | (6) | Fannie Mae REMIC Trust 2012-66 IB, 0.050%, (-1.000*US0001M + 6.050%), 06/25/2042 | 33,112 | 0.0 |
| 921,145 | (6) | Fannie Mae REMIC Trust 2013-116 SC, 5.253%, (-1.000*US0001M + 6.200%), 04/25/2033 | 68,903 | 0.0 |
| 1,972,566 | (6) | Fannie Mae REMICS 2004-53 UC, 6.603%, (-1.000*US0001M + 7.550%), 07/25/2034 | 482,912 | 0.0 |
| 2,150,893 | (6) | Fannie Mae REMICS 2005-59 NS, 5.803%, (-1.000*US0001M + 6.750%), 05/25/2035 | 282,502 | 0.0 |
| 6,931,902 | (6) | Fannie Mae REMICS 2007-22 SD, 5.453%, (-1.000*US0001M + 6.400%), 03/25/2037 | 1,591,252 | 0.1 |
| 5,233,818 | (6) | Fannie Mae REMICS 2007-30 IE, 5.793%, (-1.000*US0001M + 6.740%), 04/25/2037 | 1,448,803 | 0.1 |
| 3,606,912 | (6) | Fannie Mae REMICS 2007-55 S, 5.813%, (-1.000*US0001M + 6.760%), 06/25/2037 | 810,124 | 0.0 |
| 7,733,501 | (6) | Fannie Mae REMICS 2011-123 SD, 5.653%, (-1.000*US0001M + 6.600%), 08/25/2039 | 666,782 | 0.0 |
| 24,947,450 | (6) | Fannie Mae REMICS 2012-111 UI, 3.000%, 10/25/2027 | 1,608,327 | 0.1 |
| 20,285,178 | (6) | Fannie Mae REMICS 2012-128 KI, 3.000%, 11/25/2027 | 1,352,804 | 0.1 |
| 6,941,173 | (6) | Fannie Mae REMICS 2012-150 PS, 5.203%, (-1.000*US0001M + 6.150%), 01/25/2043 | 1,336,209 | 0.1 |
| 20,653,008 | (6) | Fannie Mae REMICS 2013-1 LI, 2.500%, 02/25/2028 | 1,199,894 | 0.1 |
| 7,931,512 | (6) | Fannie Mae REMICS 2013-21 KI, 3.000%, 03/25/2028 | 500,502 | 0.0 |
| 8,890,495 | (6) | Fannie Mae REMICS 2013-32 EI, 2.500%, 04/25/2033 | 648,387 | 0.0 |
| 6,013,955 | (6) | Fannie Mae REMICS 2013-97 JS, 5.203%, (-1.000*US0001M + 6.150%), 04/25/2038 | 1,108,851 | 0.0 |
| 13,714,612 | (6) | Fannie Mae REMICS 2019-15 AI, 4.000%, 04/25/2059 | 2,081,028 | 0.1 |
| 29,726,133 | (6) | Fannie Mae REMICS 2019-17 SA, 5.153%, (-1.000*US0001M + 6.100%), 04/25/2049 | 6,058,364 | 0.2 |
| 28,913,769 | (6) | Fannie Mae REMICS 2019-8 SB, 5.153%, (-1.000*US0001M + 6.100%), 03/25/2049 | 5,664,150 | 0.2 |
| 609,562 | Fannie Mae Series 2006-11 FA, 1.247%, (US0001M + 0.300%), 03/25/2036 | 602,178 | 0.0 |
See Accompanying Notes to Financial Statements
| 93 |
| Voya Strategic Income Opportunities Fund | PORTFOLIO OF INVESTMENTS |
| as of March31, 2020 (Continued) |
| 1,700,000 | (1) | Fannie Mae Connecticut Avenue Securities Trust 2020-SBT1 1M2, 4.513%, (US0001M + 3.650%), 02/25/2040 | 1,163,334 | 0.1 |
| 1,000,000 | (1) | Fannie Mae Connecticut Avenue Securities Trust 2019-R05 1B1, 5.047%, (US0001M + 4.100%), 07/25/2039 | 545,151 | 0.0 |
| 1,800,000 | (1) | Fannie Mae Connecticut Avenue Securities Trust 2020-SBT1 2M2, 4.513%, (US0001M + 3.650%), 02/25/2040 | 1,231,765 | 0.1 |
| 915,578 | (6) | Fannie Mae Interest Strip Series 346 6, 5.000%, 10/25/2033 | 146,883 | 0.0 |
| 183,586 | Fannie Mae REMICS 2006-46 SP, 20.729%, (-3.667*US0001M + 24.200%), 06/25/2036 | 276,552 | 0.0 | |
| 615,582 | (6) | Fannie Mae REMICS 2010-102 DI, 4.000%, 06/25/2029 | 13,809 | 0.0 |
| 577,888 | (6) | Fannie Mae REMICS 2011-48 HI, 4.000%, 10/25/2038 | 20,638 | 0.0 |
| 2,045,697 | (6) | Fannie Mae REMICS 2012-121 DI, 2.500%, 11/25/2027 | 101,219 | 0.0 |
| 5,174,247 | (6) | Fannie Mae REMICS 2012-148 IB, 3.500%, 01/25/2028 | 393,575 | 0.0 |
| 2,723,443 | (6) | Fannie Mae REMICS 2013-137 PI, 5.000%, 10/25/2041 | 383,792 | 0.0 |
| 20,308,686 | (6) | Fannie Mae REMICS 2013-19 JS, 5.253%, (-1.000*US0001M + 6.200%), 10/25/2041 | 2,593,500 | 0.1 |
| 2,311,886 | (6) | Fannie Mae REMICS 2013-2 NI, 4.000%, 02/25/2043 | 325,689 | 0.0 |
| 2,902,176 | (6) | Fannie Mae REMICS 2013-41 BI, 3.000%, 05/25/2028 | 170,116 | 0.0 |
| 2,684,107 | (6) | Fannie Mae REMICS 2013-69 PI, 3.000%, 04/25/2033 | 214,658 | 0.0 |
| 12,765,220 | (6) | Fannie Mae REMICS 2016-19 SB, 5.153%, (-1.000*US0001M + 6.100%), 04/25/2046 | 2,508,405 | 0.1 |
| 3,641,274 | (6) | Fannie Mae REMICS 2016-4 BI, 4.000%, 02/25/2046 | 589,410 | 0.0 |
| 2,480,974 | (6) | Fannie Mae REMICS 2016-61 PI, 4.500%, 01/25/2046 | 405,437 | 0.0 |
| 86,116 | First Horizon Alternative Mortgage Securities Trust 2006-FA8 1A7, 6.000%, 02/25/2037 | 56,307 | 0.0 | |
| 800,000 | (1),(3) | Flagstar Mortgage Trust 2017-2 A7, 3.500%, 10/25/2047 | 766,695 | 0.0 |
| 668,322 | (1),(3) | Flagstar Mortgage Trust 2018-1 B3, 4.026%, 03/25/2048 | 614,566 | 0.0 |
| 4,807,685 | (1),(3) | Flagstar Mortgage Trust 2018-2 B2, 4.042%, 04/25/2048 | 4,560,178 | 0.2 |
| 3,721,058 | (1),(3) | Flagstar Mortgage Trust 2018-3INV A3, 4.000%, 05/25/2048 | 3,784,143 | 0.2 |
| 971,120 | (1),(3) | Flagstar Mortgage Trust 2018-5 B3, 4.536%, 09/25/2048 | 891,435 | 0.0 |
| 675,000 | (1),(3) | Flagstar Mortgage Trust 2018-6RR 1A7, 4.000%, 10/25/2048 | 690,640 | 0.0 |
| 3,674,581 | (1),(3) | Flagstar Mortgage Trust 2018-6RR B1, 5.004%, 10/25/2048 | 3,254,343 | 0.1 |
| 1,490,592 | (1),(3) | Flagstar Mortgage Trust 2019-2 B1, 4.184%, 12/25/2049 | 1,317,639 | 0.1 |
| 2,086,829 | (1),(3) | Flagstar Mortgage Trust 2019-2 B2, 4.184%, 12/25/2049 | 1,721,032 | 0.1 |
| 3,860,690 | (1),(3) | Flagstar Mortgage Trust 2018-4 B3, 4.322%, 07/25/2048 | 3,558,428 | 0.1 |
| 3,495,248 | (1),(3) | Flagstar Mortgage Trust 2020-1NV B2A, 4.356%, 03/25/2050 | 3,023,043 | 0.1 |
| 3,000,000 | (1),(3) | Flagstar Mortgage Trust 2020-1NV B3, 4.356%, 03/25/2050 | 2,567,231 | 0.1 |
| 1,645,076 | (6) | Freddie Mac 2009-70 PS, 5.803%, (-1.000*US0001M + 6.750%), 01/25/2037 | 416,504 | 0.0 |
| 260,941 | (6) | Freddie Mac 2524 SH, 6.795%, (-1.000*US0001M + 7.500%), 11/15/2032 | 27,537 | 0.0 |
| 442,042 | (6) | Freddie Mac 2525 SM, 7.295%, (-1.000*US0001M + 8.000%), 02/15/2032 | 108,403 | 0.0 |
| 425,625 | (6) | Freddie Mac 2981 CS, 6.015%, (-1.000*US0001M + 6.720%), 05/15/2035 | 82,847 | 0.0 |
| 236,955 | (6) | Freddie Mac 2989 HS, 6.445%, (-1.000*US0001M + 7.150%), 08/15/2034 | 112,562 | 0.0 |
| 230,684 | (6) | Freddie Mac 3018 SM, 6.495%, (-1.000*US0001M + 7.200%), 08/15/2035 | 55,349 | 0.0 |
| 2,251,728 | (6) | Freddie Mac 3222 SN, 5.895%, (-1.000*US0001M + 6.600%), 09/15/2036 | 477,869 | 0.0 |
| 410,018 | (3),(6) | Freddie Mac 324 144, 6.000%, 06/15/2039 | 80,087 | 0.0 |
| 828,028 | (6) | Freddie Mac 3523 SA, 5.295%, (-1.000*US0001M + 6.000%), 09/15/2036 | 171,718 | 0.0 |
See Accompanying Notes to Financial Statements
| 94 |
| Voya Strategic Income Opportunities Fund | PORTFOLIO OF INVESTMENTS |
| as of March31, 2020 (Continued) |
| 707,221 | (6) | Freddie Mac 3582 MS, 5.445%, (-1.000*US0001M + 6.150%), 10/15/2039 | 155,342 | 0.0 |
| 1,108,650 | (6) | Freddie Mac 3688 BI, 5.000%, 07/15/2040 | 185,137 | 0.0 |
| 4,593,134 | (6) | Freddie Mac 4186 IA, 3.000%, 03/15/2033 | 356,638 | 0.0 |
| 171,995 | (6) | Freddie Mac 4333 AI, 5.500%, 02/15/2044 | 27,934 | 0.0 |
| 8,274,433 | (6) | Freddie Mac 4813 IO, 5.500%, 08/15/2048 | 1,660,869 | 0.1 |
| 124,584 | (6) | Freddie Mac REMIC Trust 2266 S, 7.845%, (-1.000*US0001M + 8.550%), 11/15/2030 | 24,774 | 0.0 |
| 205,291 | (6) | Freddie Mac REMIC Trust 2374 S, 7.395%, (-1.000*US0001M + 8.100%), 06/15/2031 | 50,819 | 0.0 |
| 114,261 | (6) | Freddie Mac REMIC Trust 2417 SY, 7.695%, (-1.000*US0001M + 8.400%), 12/15/2031 | 30,249 | 0.0 |
| 227,979 | (6) | Freddie Mac REMIC Trust 2577 SA, 6.745%, (-1.000*US0001M + 7.450%), 02/15/2033 | 55,621 | 0.0 |
| 1,631 | Freddie Mac REMIC Trust 2973 SB, 15.750%, (-3.667*US0001M + 18.333%), 05/15/2035 | 1,642 | 0.0 | |
| 109,965 | (6) | Freddie Mac REMIC Trust 2981 SU, 7.095%, (-1.000*US0001M + 7.800%), 05/15/2030 | 25,662 | 0.0 |
| 167,386 | Freddie Mac REMIC Trust 3031 BP, 8.000%, (-6.723*US0001M + 44.975%), 08/15/2035 | 190,893 | 0.0 | |
| 753,101 | (6) | Freddie Mac REMIC Trust 3049 PI, 5.945%, (-1.000*US0001M + 6.650%), 10/15/2035 | 169,564 | 0.0 |
| 61,296 | Freddie Mac REMIC Trust 3085 SK, 57.544%, (-12.000*US0001M + 66.000%), 12/15/2035 | 200,340 | 0.0 | |
| 84,019 | (7) | Freddie Mac REMIC Trust 3151 PO, 0.000%, 05/15/2036 | 78,941 | 0.0 |
| 115,017 | (6) | Freddie Mac REMIC Trust 3590 PI, 6.000%, 07/15/2039 | 3,345 | 0.0 |
| 211,787 | (6) | Freddie Mac REMIC Trust 3624 TS, 4.095%, (-1.000*US0001M + 4.800%), 01/15/2040 | 32,561 | 0.0 |
| 332,480 | (6) | Freddie Mac REMIC Trust 4261 ID, 6.500%, 06/15/2032 | 46,303 | 0.0 |
| 1,155,590 | (6) | Freddie Mac REMIC Trust 4287 CI, 4.500%, 07/15/2041 | 128,702 | 0.0 |
| 2,025,894 | (6) | Freddie Mac REMICS 2781 SB, 6.445%, (-1.000*US0001M + 7.150%), 04/15/2034 | 456,394 | 0.0 |
| 658,409 | Freddie Mac REMICS 2921 PF, 1.055%, (US0001M + 0.350%), 01/15/2035 | 650,654 | 0.0 | |
| 4,924,872 | (6) | Freddie Mac REMICS 3128 JI, 5.925%, (-1.000*US0001M + 6.630%), 03/15/2036 | 1,210,899 | 0.1 |
| 20,481,376 | (6) | Freddie Mac REMICS 4120 TI, 2.500%, 10/15/2027 | 1,095,100 | 0.0 |
| 10,035,967 | (6) | Freddie Mac REMICS 4182 IL, 3.000%, 03/15/2028 | 668,795 | 0.0 |
| 47,452,501 | (6) | Freddie Mac REMICS 4273 PS, 5.395%, (-1.000*US0001M + 6.100%), 11/15/2043 | 9,975,669 | 0.4 |
| 3,954,947 | (6) | Freddie Mac REMICS 4290 EI, 5.000%, 12/15/2043 | 566,289 | 0.0 |
| 1,260,530 | Freddie Mac REMICS Trust 3740 FB, 1.205%, (US0001M + 0.500%), 10/15/2040 | 1,248,827 | 0.1 | |
| 3,300,000 | (1) | Freddie Mac STACR Trust 2018-DNA2 M2, 3.097%, (US0001M + 2.150%), 12/25/2030 | 2,725,735 | 0.1 |
| 2,200,000 | (1) | Freddie Mac STACR Trust 2018-DNA3 M2, 3.047%, (US0001M + 2.100%), 09/25/2048 | 1,838,047 | 0.1 |
| 2,000,000 | (1) | Freddie Mac Stacr Trust 2018-HQA2 M2, 3.247%, (US0001M + 2.300%), 10/25/2048 | 1,657,474 | 0.1 |
| 1,502,435 | (6) | Freddie Mac Strips Series 224 IO, 6.000%, 03/01/2033 | 321,606 | 0.0 |
| 767,141 | (6) | Freddie Mac Strips Series 237 S23, 6.395%, (-1.000*US0001M + 7.100%), 05/15/2036 | 177,737 | 0.0 |
| 1,126,716 | (6) | Freddie Mac Strips Series 260 33, 4.000%, 05/15/2039 | 126,980 | 0.0 |
| 1,092,445 | Freddie Mac Structured Agency Credit Risk Debt Notes 2014-DN3 M3, 4.947%, (US0001M + 4.000%), 08/25/2024 | 1,048,626 | 0.0 | |
| 1,200,000 | Freddie Mac Structured Agency Credit Risk Debt Notes 2015-DNA3 M3, 5.647%, (US0001M + 4.700%), 04/25/2028 | 1,116,484 | 0.0 | |
| 487,675 | Freddie Mac Structured Agency Credit Risk Debt Notes 2015-HQA1 M3, 5.647%, (US0001M + 4.700%), 03/25/2028 | 466,961 | 0.0 |
See Accompanying Notes to Financial Statements
| 95 |
| Voya Strategic Income Opportunities Fund | PORTFOLIO OF INVESTMENTS |
| as of March31, 2020 (Continued) |
| 6,200,000 | Freddie Mac Structured Agency Credit Risk Debt Notes 2016-DNA1 M3, 6.497%, (US0001M + 5.550%), 07/25/2028 | 6,043,896 | 0.2 | |
| 4,665,000 | Freddie Mac Structured Agency Credit Risk Debt Notes 2016-HQA2 M3, 6.097%, (US0001M + 5.150%), 11/25/2028 | 4,477,353 | 0.2 | |
| 500,000 | Freddie Mac Structured Agency Credit Risk Debt Notes 2016-HQA3 M3, 4.797%, (US0001M + 3.850%), 03/25/2029 | 451,913 | 0.0 | |
| 7,910,000 | Freddie Mac Structured Agency Credit Risk Debt Notes 2017-DNA2 M2, 4.397%, (US0001M + 3.450%), 10/25/2029 | 7,153,839 | 0.3 | |
| 2,750,000 | Freddie Mac Structured Agency Credit Risk Debt Notes 2017-DNA3 M2, 3.447%, (US0001M + 2.500%), 03/25/2030 | 2,404,852 | 0.1 | |
| 8,800,000 | Freddie Mac Structured Agency Credit Risk Debt Notes 2017-HQA1 M2, 4.497%, (US0001M + 3.550%), 08/25/2029 | 6,996,225 | 0.3 | |
| 5,550,000 | Freddie Mac Structured Agency Credit Risk Debt Notes 2017-HQA2 M2, 3.597%, (US0001M + 2.650%), 12/25/2029 | 4,873,565 | 0.2 | |
| 3,592,626 | Freddie Mac Structured Agency Credit Risk Debt Notes 2017-HQA3 M2, 3.297%, (US0001M + 2.350%), 04/25/2030 | 3,127,529 | 0.1 | |
| 1,000,000 | Freddie Mac Structured Agency Credit Risk Debt Notes 2018-DNA1 M2, 2.747%, (US0001M + 1.800%), 07/25/2030 | 832,272 | 0.0 | |
| 3,277,189 | Freddie Mac Structured Agency Credit Risk Debt Notes 2018-HQA1 M2, 3.247%, (US0001M + 2.300%), 09/25/2030 | 2,797,950 | 0.1 | |
| 5,600,000 | (1) | Freddie Mac Structured Agency Credit Risk Debt Notes 2019-DNA1 M2, 3.597%, (US0001M + 2.650%), 01/25/2049 | 5,000,765 | 0.2 |
| 10,100,000 | (1) | Freddie Mac Structured Agency Credit Risk Debt Notes 2019-HQA2 M2, 2.997%, (US0001M + 2.050%), 04/25/2049 | 8,481,248 | 0.3 |
| 2,346,192 | (6) | Freddie Mac REMICS 3298 S, 5.405%, (-1.000*US0001M + 6.110%), 04/15/2037 | 501,270 | 0.0 |
| 95,162 | (6) | Freddie Mac REMICS 3759 DI, 4.000%, 10/15/2029 | 1,006 | 0.0 |
| 268,933 | (6) | Freddie Mac REMICS 3763 AI, 3.500%, 06/15/2025 | 6,445 | 0.0 |
| 2,392,428 | (6) | Freddie Mac REMICS 3851 PI, 4.000%, 08/15/2038 | 50,476 | 0.0 |
| 6,204,047 | (6) | Freddie Mac REMICS 4097 IC, 2.500%, 08/15/2027 | 305,636 | 0.0 |
| 1,558,271 | (6) | Freddie Mac REMICS 4116 IL, 4.500%, 05/15/2042 | 245,563 | 0.0 |
| 2,978,103 | (6) | Freddie Mac REMICS 4136 QI, 3.000%, 11/15/2032 | 218,526 | 0.0 |
| 2,224,229 | (6) | Freddie Mac REMICS 4143 IK, 4.000%, 10/15/2041 | 167,111 | 0.0 |
| 2,225,854 | (6) | Freddie Mac REMICS 4153 YI, 3.000%, 09/15/2042 | 110,229 | 0.0 |
| 3,785,716 | (6) | Freddie Mac REMICS 4157 IH, 3.500%, 01/15/2043 | 442,536 | 0.0 |
| 2,562,484 | (6) | Freddie Mac REMICS 4162 DI, 2.000%, 02/15/2028 | 108,876 | 0.0 |
| 2,009,868 | (6) | Freddie Mac REMICS 4266 LI, 3.500%, 06/15/2028 | 103,987 | 0.0 |
| 1,046,048 | Freddie Mac REMICS 4385 LS, 6.170%, (-2.333*US0001M + 9.333%), 07/15/2037 | 1,435,918 | 0.1 | |
| 4,155,622 | (6) | Freddie Mac REMICS 4494 LI, 5.000%, 12/15/2043 | 517,328 | 0.0 |
| 11,458,428 | (6) | Freddie Mac REMICS 4618 SA, 5.295%, (-1.000*US0001M + 6.000%), 09/15/2046 | 2,280,237 | 0.1 |
| 5,506,476 | Freddie Mac REMICS 4625 BI, 3.500%, 06/15/2046 | 457,048 | 0.0 | |
| 4,070,428 | (6) | Freddie Mac REMICS 4708 KI, 4.500%, 11/15/2046 | 561,471 | 0.0 |
| 54,616,638 | (6) | Freddie Mac REMICS 4903 NS, 5.395%, (-1.000*US0001M + 6.100%), 08/25/2049 | 10,518,449 | 0.4 |
| 26,985,830 | (6) | Freddie Mac REMICS 4909 SJ, 5.345%, (-1.000*US0001M + 6.050%), 09/25/2049 | 4,634,268 | 0.2 |
| 8,859,663 | (6) | Freddie Mac REMICS 4910 SD, 5.345%, (-1.000*US0001M + 6.050%), 06/15/2049 | 1,682,004 | 0.1 |
| 25,939,171 | (6) | Freddie Mac REMICS 4910 SH, 5.345%, (-1.000*US0001M + 6.050%), 09/25/2049 | 5,122,203 | 0.2 |
| 36,329,521 | (6) | Freddie Mac REMICS 4924 SY, 5.345%, (-1.000*US0001M + 6.050%), 10/25/2049 | 6,219,937 | 0.2 |
See Accompanying Notes to Financial Statements
| 96 |
| Voya Strategic Income Opportunities Fund | PORTFOLIO OF INVESTMENTS |
| as of March31, 2020 (Continued) |
| 2,000,000 | (1) | Freddie Mac STACR Remic Trust 2020-DNA2 M2, 2.797%, (US0001M + 1.850%), 02/25/2050 | 1,301,113 | 0.1 |
| 6,000,000 | (1) | Freddie Mac STACR REMIC Trust 2020-HQA1 M2, 2.847%, (US0001M + 1.900%), 01/25/2050 | 3,833,652 | 0.2 |
| 3,069,110 | (6) | Freddie Mac Strips 287 IO, 3.000%, 10/15/2027 | 192,848 | 0.0 |
| 2,840,000 | Freddie Mac Structured Agency Credit Risk Debt Notes 2017-DNA1 M2, 4.197%, (US0001M + 3.250%), 07/25/2029 | 2,536,921 | 0.1 | |
| 2,465,199 | (1),(3) | Galton Funding Mortgage Trust 2019-1 B1, 4.250%, 02/25/2059 | 2,235,603 | 0.1 |
| 1,972,159 | (1),(3) | Galton Funding Mortgage Trust 2019-1 B2, 4.500%, 02/25/2059 | 1,853,971 | 0.1 |
| 659,015 | (1),(3) | Galton Funding Mortgage Trust 2017-2 A21, 4.000%, 06/25/2059 | 648,113 | 0.0 |
| 1,644,892 | (1),(3) | Galton Funding Mortgage Trust 2018-2 B2, 4.750%, 10/25/2058 | 1,580,105 | 0.1 |
| 6,100,682 | (6) | Ginnie Mae 2007-59 SC, 5.727%, (-1.000*US0001M + 6.500%), 07/20/2037 | 1,369,462 | 0.1 |
| 230,824 | (6) | Ginnie Mae 2011-101 EI, 6.000%, (-19.355*US0001M + 109.161%), 10/16/2039 | 57,434 | 0.0 |
| 37,691,753 | (6) | Ginnie Mae 2013-130 SB, 3.469%, (-1.000*US0001M + 5.050%), 09/16/2043 | 6,184,101 | 0.2 |
| 541,603 | (6) | Ginnie Mae Series 2008-40 SA, 5.695%, (-1.000*US0001M + 6.400%), 05/16/2038 | 118,000 | 0.0 |
| 952,224 | (6) | Ginnie Mae Series 2009-116 SJ, 5.775%, (-1.000*US0001M + 6.480%), 12/16/2039 | 231,484 | 0.0 |
| 932,887 | (6) | Ginnie Mae Series 2010-4 SL, 5.695%, (-1.000*US0001M + 6.400%), 01/16/2040 | 205,901 | 0.0 |
| 248,626 | (6) | Ginnie Mae Series 2010-98 QS, 5.827%, (-1.000*US0001M + 6.600%), 01/20/2040 | 23,471 | 0.0 |
| 2,519,968 | (6) | Ginnie Mae Series 2011-101 BI, 0.650%, (-1.000*US0001M + 6.650%), 11/20/2037 | 57,668 | 0.0 |
| 7,687,663 | (6) | Ginnie Mae Series 2011-25 AS, 5.287%, (-1.000*US0001M + 6.060%), 02/20/2041 | 1,573,149 | 0.1 |
| 48,391 | (6) | Ginnie Mae Series 2012-149 BI, 3.500%, 10/20/2041 | 3,258 | 0.0 |
| 3,780,021 | (6) | Ginnie Mae Series 2013-103 DS, 5.377%, (-1.000*US0001M + 6.150%), 07/20/2043 | 715,801 | 0.0 |
| 154,502 | (6) | Ginnie Mae Series 2013-134 DS, 5.327%, (-1.000*US0001M + 6.100%), 09/20/2043 | 29,133 | 0.0 |
| 349,939 | (6) | Ginnie Mae Series 2013-44 LI, 4.500%, 01/16/2043 | 54,815 | 0.0 |
| 31,511,530 | (6) | Ginnie Mae Series 2015-144 SA, 5.427%, (-1.000*US0001M + 6.200%), 10/20/2045 | 6,933,898 | 0.3 |
| 5,661,837 | (6) | Ginnie Mae Series 2015-69 IL, 0.200%, (-1.000*US0001M + 6.700%), 07/20/2034 | 41,260 | 0.0 |
| 311,282 | (6) | Ginnie Mae Series 2015-98 IU, 4.000%, 08/20/2044 | 45,638 | 0.0 |
| 948,371 | (6) | Ginnie Mae Series 2016-8 PI, 4.000%, 10/20/2044 | 105,754 | 0.0 |
| 11,683,186 | (6) | Ginnie Mae Series 2018-153 SQ, 5.427%, (-1.000*US0001M + 6.200%), 11/20/2048 | 2,477,154 | 0.1 |
| 1,567,310 | (6) | Ginnie Mae Series 2010-143 JI, 4.000%, 08/16/2039 | 128,212 | 0.0 |
| 2,025,211 | (6) | Ginnie Mae Series 2010-143 PI, 4.000%, 11/16/2037 | 40,859 | 0.0 |
| 2,466,538 | (6) | Ginnie Mae Series 2010-4 IP, 5.000%, 01/16/2039 | 279,100 | 0.0 |
| 2,750,000 | (6) | Ginnie Mae Series 2011-124 KI, 4.000%, 08/20/2039 | 311,184 | 0.0 |
| 1,131,859 | Ginnie Mae Series 2011-159 CI, 5.000%, 06/16/2040 | 28,420 | 0.0 | |
| 4,216,521 | (6) | Ginnie Mae Series 2012-148 IP, 3.500%, 04/20/2041 | 324,597 | 0.0 |
| 3,802,598 | (6) | Ginnie Mae Series 2012-39 PI, 4.000%, 03/16/2042 | 508,499 | 0.0 |
| 1,931,579 | (6) | Ginnie Mae Series 2013-81 IO, 4.500%, 01/16/2040 | 182,267 | 0.0 |
| 4,851,119 | (6) | Ginnie Mae Series 2014-84 PI, 4.500%, 04/20/2043 | 500,032 | 0.0 |
| 4,863,304 | (6) | Ginnie Mae Series 2015-132 BI, 4.000%, 11/20/2044 | 551,544 | 0.0 |
| 34,439,345 | (6) | Ginnie Mae Series 2018-93 SJ, 5.427%, (-1.000*US0001M + 6.200%), 07/20/2048 | 5,376,367 | 0.2 |
| 896,870 | (6) | Ginnie Mae Series 2019-111 TI, 5.000%, 09/20/2049 | 105,257 | 0.0 |
See Accompanying Notes to Financial Statements
| 97 |
| Voya Strategic Income Opportunities Fund | PORTFOLIO OF INVESTMENTS |
| as of March31, 2020 (Continued) |
| 194,549 | (6) | Ginnie Mae Series 2019-86 GI, 6.500%, 07/20/2049 | 35,994 | 0.0 |
| 1,365,719 | (6) | Ginnie Mae Series 2019-86 HI, 5.500%, 07/20/2049 | 185,029 | 0.0 |
| 22,660,142 | (6) | Ginnie Mae Series 2019-89 SC, 5.327%, (-1.000*US0001M + 6.100%), 07/20/2049 | 4,768,394 | 0.2 |
| 1,667,319 | (1),(3) | GS Mortage-Backed Securities Trust 2020-PJ1 A1, 3.500%, 05/01/2050 | 1,696,381 | 0.1 |
| 2,648,094 | (1),(3) | GS Mortage-Backed Securities Trust 2020-PJ1 A4, 3.500%, 05/01/2050 | 2,682,374 | 0.1 |
| 1,700,000 | (1),(3) | GS Mortage-Backed Securities Trust 2020-PJ1 A8, 3.500%, 05/01/2050 | 1,616,791 | 0.1 |
| 3,770,367 | (1),(3) | GS Mortage-Backed Securities Trust 2020-PJ1 B3, 3.694%, 05/01/2050 | 2,716,577 | 0.1 |
| 804,775 | (1),(3) | GS Mortgage-Backed Securities Corp. Trust 2019-PJ1 A1, 4.000%, 08/25/2049 | 815,328 | 0.0 |
| 1,803,937 | (1),(3) | GS Mortgage-Backed Securities Corp. Trust 2019-PJ1 B3, 4.333%, 08/25/2049 | 1,753,488 | 0.1 |
| 1,198,104 | (1),(3) | GS Mortgage-Backed Securities Corp. Trust 2019-PJ2 A1, 4.000%, 11/25/2049 | 1,216,211 | 0.1 |
| 3,971,676 | (1),(3) | GS Mortgage-Backed Securities Corp. Trust 2019-PJ2 B2, 4.496%, 11/25/2049 | 3,843,416 | 0.2 |
| 3,950,934 | (1),(3) | GS Mortgage-Backed Securities Corp. Trust 2019-PJ2 B3, 4.496%, 11/25/2049 | 3,646,586 | 0.1 |
| 495,890 | (1),(3) | GS Mortgage-Backed Securities Corp. Trust 2019-PJ3 B1, 4.095%, 03/25/2050 | 490,237 | 0.0 |
| 495,890 | (1),(3) | GS Mortgage-Backed Securities Corp. Trust 2019-PJ3 B2, 4.095%, 03/25/2050 | 464,934 | 0.0 |
| 504,270 | HarborView Mortgage Loan Trust 2006-14 2A1A, 0.900%, (US0001M + 0.150%), 01/25/2047 | 399,544 | 0.0 | |
| 591,641 | HarborView Mortgage Loan Trust 2007-5 A1A, 0.940%, (US0001M + 0.190%), 09/19/2037 | 484,526 | 0.0 | |
| 2,734 | HomeBanc Mortgage Trust 2004-1 2A, 1.807%, (US0001M + 0.860%), 08/25/2029 | 2,455 | 0.0 | |
| 20,236 | HomeBanc Mortgage Trust 2005-3 A2, 1.257%, (US0001M + 0.310%), 07/25/2035 | 19,895 | 0.0 | |
| 1,785,675 | (1),(3) | Homeward Opportunities Fund I Trust 2019-2 A3, 3.007%, 09/25/2059 | 1,728,557 | 0.1 |
| 83,952 | IndyMac INDX Mortgage Loan Trust 2006-AR2 1A1B, 1.157%, (US0001M + 0.210%), 04/25/2046 | 67,903 | 0.0 | |
| 882,517 | (1),(3) | JP Morgan Mortgage Trust 2014-5 B3, 2.959%, 10/25/2029 | 740,403 | 0.0 |
| 2,967,609 | (1),(3) | JP Morgan Mortgage Trust 2019-6 B1, 4.250%, 12/25/2049 | 2,718,786 | 0.1 |
| 1,781,169 | (1),(3) | JP Morgan Mortgage Trust 2019-7 B2A, 3.220%, 02/25/2050 | 1,536,142 | 0.1 |
| 992,061 | (1),(3) | JP Morgan Mortgage Trust 2019-8 B3A, 3.476%, 03/25/2050 | 743,425 | 0.0 |
| 4,188,838 | (1),(3) | JP Morgan Mortgage Trust 2019-INV3 B3, 4.556%, 05/25/2050 | 3,508,182 | 0.1 |
| 3,703,320 | (1),(3) | JP Morgan Mortgage Trust 2020-LTV1 A15, 3.500%, 06/25/2050 | 3,760,360 | 0.2 |
| 4,900,000 | (1),(3) | JP Morgan Mortgage Trust 2020-LTV1 A5, 3.500%, 06/25/2050 | 4,788,999 | 0.2 |
| 1,181,834 | (1),(3) | JP Morgan Trust 2015-3 B3, 3.664%, 05/25/2045 | 1,111,775 | 0.0 |
| 1,316,365 | (1),(3) | J.P. Morgan Mortgage Trust 2019-2 A3, 4.000%, 08/25/2049 | 1,345,401 | 0.1 |
| 1,114,105 | (1),(3) | J.P. Morgan Mortgage Trust 2019-2 B1, 4.651%, 08/25/2049 | 1,139,207 | 0.0 |
| 2,699,374 | (1),(3) | J.P. Morgan Mortgage Trust 2019-2 B2, 4.651%, 08/25/2049 | 2,517,043 | 0.1 |
| 3,210,261 | (1),(3) | J.P. Morgan Mortgage Trust 2019-LTV1 A3, 4.000%, 06/25/2049 | 3,289,706 | 0.1 |
| 2,356,330 | (1),(3) | J.P. Morgan Mortgage Trust 2019-LTV1 B1, 4.900%, 06/25/2049 | 2,382,587 | 0.1 |
| 1,865,428 | (1),(3) | J.P. Morgan Mortgage Trust 2019-LTV1 B2, 4.900%, 06/25/2049 | 1,768,881 | 0.1 |
| 2,130,740 | (3) | JP Morgan Mortgage Trust 2005-A4 B1, 4.301%, 07/25/2035 | 1,838,492 | 0.1 |
| 90,967 | JP Morgan Mortgage Trust 2005-S3 1A10, 6.000%, 01/25/2036 | 63,454 | 0.0 | |
| 218,048 | JP Morgan Mortgage Trust 2006-S2 1A18, 6.000%, 07/25/2036 | 163,923 | 0.0 | |
| 529,187 | JP Morgan Mortgage Trust 2006-S3 1A30, 6.500%, 08/25/2036 | 328,810 | 0.0 |
See Accompanying Notes to Financial Statements
| 98 |
| Voya Strategic Income Opportunities Fund | PORTFOLIO OF INVESTMENTS |
| as of March31, 2020 (Continued) |
| 631,401 | (1),(3) | JP Morgan Mortgage Trust 2016-1 B3, 3.868%, 05/25/2046 | 602,959 | 0.0 |
| 2,095,000 | (1),(3) | JP Morgan Mortgage Trust 2016-1 B4, 3.868%, 05/25/2046 | 1,604,730 | 0.1 |
| 1,916,223 | (1),(3) | JP Morgan Mortgage Trust 2016-4 A13, 3.500%, 10/25/2046 | 1,887,707 | 0.1 |
| 930,744 | (1),(3) | JP Morgan Mortgage Trust 2017-1 B4, 3.529%, 01/25/2047 | 846,183 | 0.0 |
| 3,468,417 | (1),(3) | JP Morgan Mortgage Trust 2017-3 1A13, 3.500%, 08/25/2047 | 3,418,054 | 0.1 |
| 1,515,838 | (1),(3) | JP Morgan Mortgage Trust 2017-3 B1, 3.834%, 08/25/2047 | 1,435,326 | 0.1 |
| 1,122,843 | (1),(3) | JP Morgan Mortgage Trust 2017-3 B2, 3.834%, 08/25/2047 | 1,048,159 | 0.0 |
| 500,000 | (1),(3) | JP Morgan Mortgage Trust 2017-4 A7, 3.500%, 11/25/2048 | 474,208 | 0.0 |
| 1,944,686 | (1),(3) | JP Morgan Mortgage Trust 2017-5 B1, 3.147%, 10/26/2048 | 1,692,979 | 0.1 |
| 572,750 | (1),(3) | JP Morgan Mortgage Trust 2017-6 B3, 3.818%, 12/25/2048 | 536,648 | 0.0 |
| 1,610,382 | (1),(3) | JP Morgan Mortgage Trust 2017-6 B4, 3.818%, 12/25/2048 | 1,458,217 | 0.1 |
| 2,354,332 | (1),(3) | JP Morgan Mortgage Trust 2018-1 B2, 3.738%, 06/25/2048 | 2,197,579 | 0.1 |
| 3,832,820 | (1),(3) | JP Morgan Mortgage Trust 2018-3 B1, 3.763%, 09/25/2048 | 3,537,964 | 0.1 |
| 2,395,513 | (1),(3) | JP Morgan Mortgage Trust 2018-3 B3, 3.763%, 09/25/2048 | 2,160,588 | 0.1 |
| 480,537 | (1),(3) | JP Morgan Mortgage Trust 2018-4 B1, 3.773%, 10/25/2048 | 440,898 | 0.0 |
| 480,537 | (1),(3) | JP Morgan Mortgage Trust 2018-4 B2, 3.773%, 10/25/2048 | 435,781 | 0.0 |
| 1,932,725 | (1),(3) | JP MORGAN MORTGAGE TRUST 2018-5 A13, 3.500%, 10/25/2048 | 1,896,089 | 0.1 |
| 907,975 | (1),(3) | JP Morgan Mortgage Trust 2018-6 1A10, 3.500%, 12/25/2048 | 921,977 | 0.0 |
| 1,920,523 | (1),(3) | JP Morgan Mortgage Trust 2018-6C B2, 3.950%, 12/25/2048 | 1,764,426 | 0.1 |
| 2,431,895 | (1),(3) | JP Morgan Mortgage Trust 2018-8 A3, 4.000%, 01/25/2049 | 2,494,740 | 0.1 |
| 8,330,041 | (1),(3) | JP Morgan Mortgage Trust 2018-8 B1, 4.202%, 01/25/2049 | 7,824,601 | 0.3 |
| 3,882,111 | (1),(3) | JP Morgan Mortgage Trust 2018-8 B2, 4.202%, 01/25/2049 | 3,604,569 | 0.1 |
| 984,730 | (1),(3) | JP Morgan Mortgage Trust 2018-9 B2, 4.462%, 02/25/2049 | 947,915 | 0.0 |
| 1,942,269 | (1),(3) | JP Morgan Mortgage Trust 2018-9 B3, 4.462%, 02/25/2049 | 1,836,704 | 0.1 |
| 1,527,316 | (1),(3) | JP Morgan Mortgage Trust 2018-LTV1 B1, 4.773%, 04/25/2049 | 1,533,835 | 0.1 |
| 2,468,213 | (1),(3) | JP Morgan Mortgage Trust 2019-1 A3, 4.000%, 05/25/2049 | 2,516,494 | 0.1 |
| 1,780,171 | (1),(3) | JP Morgan Mortgage Trust 2019-3 A3, 4.000%, 09/25/2049 | 1,809,702 | 0.1 |
| 6,027,764 | (1),(3) | JP Morgan Mortgage Trust 2019-5 A3, 4.000%, 11/25/2049 | 6,185,856 | 0.2 |
| 2,958,407 | (1),(3) | JP Morgan Mortgage Trust 2019-5 B1, 4.466%, 11/25/2049 | 2,981,520 | 0.1 |
| 4,930,678 | (1),(3) | JP Morgan Mortgage Trust 2019-5 B2, 4.466%, 11/25/2049 | 4,688,149 | 0.2 |
| 1,447,325 | (1),(3) | JP Morgan Mortgage Trust 2019-6 A3, 3.500%, 12/25/2049 | 1,475,681 | 0.1 |
| 6,429,818 | (1),(3) | JP Morgan Mortgage Trust 2019-6 B2, 4.250%, 12/25/2049 | 6,155,875 | 0.2 |
| 989,538 | (1),(3) | JP Morgan Mortgage Trust 2019-7 B3A, 3.470%, 12/31/2049 | 853,012 | 0.0 |
| 4,068,146 | (1),(3) | JP Morgan Mortgage Trust 2019-8 A15, 3.500%, 03/25/2050 | 4,091,801 | 0.2 |
| 3,946,704 | (1),(3) | JP Morgan Mortgage Trust 2019-INV1 B2, 5.130%, 10/25/2049 | 3,725,490 | 0.2 |
| 1,634,963 | (1),(3) | JP Morgan Mortgage Trust 2019-INV2 A15, 3.500%, 02/25/2050 | 1,619,177 | 0.1 |
| 5,035,848 | (1),(3) | JP Morgan Mortgage Trust 2019-LTV2 A18, 4.000%, 12/25/2049 | 5,195,835 | 0.2 |
| 1,950,063 | (1),(3) | JP Morgan Mortgage Trust 2019-LTV2 B2, 4.824%, 12/25/2049 | 1,839,226 | 0.1 |
| 1,976,749 | (1),(3) | JP Morgan Mortgage Trust 2019-LTV2 B3, 4.824%, 12/25/2049 | 1,714,964 | 0.1 |
| 2,773,744 | (1),(3) | JP Morgan Mortgage Trust 2019-LTV3 B2, 4.571%, 12/31/2049 | 2,639,122 | 0.1 |
| 6,456,342 | (1),(3) | JP Morgan Mortgage Trust 2019-LTV3 B3, 4.571%, 12/31/2049 | 5,987,955 | 0.2 |
| 2,076,342 | (1),(3) | JP Morgan Trust 2015-3 B4, 3.664%, 05/25/2045 | 1,860,613 | 0.1 |
| 5,503,234,817 | (1),(6) | L Street Securities 2017-PM1 XIO, 0.000%, 10/25/2048 | 5,652,923 | 0.2 |
| 74,310 | Lehman XS Trust Series 2005-5N 1A2, 1.307%, (US0001M + 0.360%), 11/25/2035 | 54,261 | 0.0 |
See Accompanying Notes to Financial Statements
| 99 |
| Voya Strategic Income Opportunities Fund | PORTFOLIO OF INVESTMENTS |
| as of March31, 2020 (Continued) |
| 706,648 | (1),(3) | Mello Mortgage Capital Acceptance 2018-MTG2 A1, 4.481%, 10/25/2048 | 729,500 | 0.0 |
| 1,091,757 | (1),(3) | Mello Mortgage Capital Acceptance 2018-MTG2 B1, 4.481%, 10/25/2048 | 1,108,040 | 0.0 |
| 655,000 | Morgan Stanley Mortgage Loan Trust 2005-5AR 1B1, 2.747%, (US0001M + 1.800%), 09/25/2035 | 566,265 | 0.0 | |
| 1,264,598 | Morgan Stanley Mortgage Loan Trust 2006-9AR A2, 1.097%, (US0001M + 0.150%), 08/25/2036 | 508,890 | 0.0 | |
| 423,787 | (1),(3) | New Residential Mortgage Loan Trust 2017-3A B2, 4.750%, 04/25/2057 | 414,888 | 0.0 |
| 1,400,000 | (1),(3) | New Residential Mortgage Loan Trust 2019-NQM2 M1, 4.267%, 04/25/2049 | 1,317,733 | 0.1 |
| 922,196 | (1),(3) | New Residential Mortgage Loan Trust 2019-NQM3 A3, 3.086%, 07/25/2049 | 906,506 | 0.0 |
| 1,863,933 | (1),(3) | OBX 2019-EXP1 1A3 Trust, 4.000%, 01/25/2059 | 1,862,644 | 0.1 |
| 768,359 | (1),(3) | OBX 2019-EXP2 1A3 Trust, 4.000%, 07/25/2059 | 774,763 | 0.0 |
| 1,255,832 | (1),(3) | OBX 2019-EXP3 1A9 Trust, 3.500%, 10/25/2059 | 1,243,081 | 0.1 |
| 2,771,518 | (1),(3) | OBX 2019-INV2 A25 Trust, 4.000%, 05/27/2049 | 2,841,217 | 0.1 |
| 1,460,400 | (1),(3) | OBX 2020-INV1 A21 Trust, 3.500%, 05/25/2049 | 1,488,012 | 0.1 |
| 34,164 | Prime Mortgage Trust 2007-1 A4, 5.500%, 03/25/2037 | 29,457 | 0.0 | |
| 1,000,000 | (1),(3) | PSMC 2019-3 A12 Trust, 3.500%, 11/25/2049 | 944,655 | 0.0 |
| 3,817,424 | (1),(3) | RCKT Mortgage Trust 2019-1 B1A, 3.929%, 09/25/2049 | 3,217,797 | 0.1 |
| 2,478,551 | (1),(3) | RCKT Mortgage Trust 2019-1 B2A, 3.929%, 09/25/2049 | 2,034,061 | 0.1 |
| 3,500,000 | (1),(3) | RCKT Mortgage Trust 2020-1 A13, 3.000%, 02/25/2050 | 3,463,345 | 0.1 |
| 1,648,000 | (1),(3) | RCKT Mortgage Trust 2020-1 B2A, 3.538%, 02/25/2050 | 1,292,038 | 0.1 |
| 2,487,587 | (3) | Sequoia Mortgage Trust 2013-3 B3, 3.513%, 03/25/2043 | 2,378,073 | 0.1 |
| 470,475 | (1) | Sequoia Mortgage Trust 2013-9 B1, 3.500%, 07/25/2043 | 452,884 | 0.0 |
| 2,716,710 | (1) | Sequoia Mortgage Trust 2013-9 B2, 3.500%, 07/25/2043 | 2,604,507 | 0.1 |
| 1,550,157 | (1),(3) | Sequoia Mortgage Trust 2015-1 B1, 3.875%, 01/25/2045 | 1,510,540 | 0.1 |
| 1,202,404 | (1),(3) | Sequoia Mortgage Trust 2018-6 B1, 4.199%, 07/25/2048 | 1,148,192 | 0.1 |
| 767,948 | (1),(3) | Sequoia Mortgage Trust 2018-CH1 B1B, 4.477%, 02/25/2048 | 741,600 | 0.0 |
| 575,961 | (1),(3) | Sequoia Mortgage Trust 2018-CH1 B2B, 4.477%, 02/25/2048 | 548,153 | 0.0 |
| 3,400,000 | (1),(3) | Sequoia Mortgage Trust 2018-CH4 A13, 4.500%, 10/25/2048 | 3,341,271 | 0.1 |
| 1,438,458 | (1),(3) | Sequoia Mortgage Trust 2019-1 A1, 4.000%, 02/25/2049 | 1,423,459 | 0.1 |
| 1,772,197 | (1),(3) | Sequoia Mortgage Trust 2019-2 B2, 4.246%, 06/25/2049 | 1,621,940 | 0.1 |
| 1,673,307 | (1),(3) | Sequoia Mortgage Trust 2019-2 B3, 4.246%, 06/25/2049 | 1,470,253 | 0.1 |
| 4,711,690 | (1),(3) | Sequoia Mortgage Trust 2019-3 A2, 3.500%, 09/25/2049 | 4,765,219 | 0.2 |
| 5,648,795 | (1),(3) | Sequoia Mortgage Trust 2019-4 A19, 3.500%, 11/25/2049 | 5,714,829 | 0.2 |
| 1,916,945 | (1),(3) | Sequoia Mortgage Trust 2019-5 A19, 3.500%, 12/25/2049 | 1,953,863 | 0.1 |
| 2,160,100 | (1),(3) | Sequoia Mortgage Trust 2019-5 B2, 3.776%, 12/25/2049 | 1,766,415 | 0.1 |
| 2,161,093 | (1),(3) | Sequoia Mortgage Trust 2019-5 B3, 3.776%, 12/25/2049 | 1,687,069 | 0.1 |
| 2,654,037 | (1),(3) | Sequoia Mortgage Trust 2019-CH1 B1B, 5.052%, 03/25/2049 | 2,522,900 | 0.1 |
| 981,886 | (1),(3) | Sequoia Mortgage Trust 2019-CH1 B2B, 5.052%, 03/25/2049 | 997,097 | 0.0 |
| 3,166,336 | (1),(3) | Sequoia Mortgage Trust 2019-CH2 A1, 4.500%, 08/25/2049 | 3,171,287 | 0.1 |
| 600,000 | (1),(3) | Sequoia Mortgage Trust 2019-CH3 A13, 4.000%, 09/25/2049 | 599,688 | 0.0 |
| 1,982,564 | (1),(3) | Sequoia Mortgage Trust 2019-CH3 B1B, 4.534%, 09/25/2049 | 1,937,732 | 0.1 |
| 1,598,273 | (1),(3) | Sequoia Mortgage Trust 2017-1 B2, 3.622%, 02/25/2047 | 1,507,489 | 0.1 |
| 959,705 | (1),(3) | Sequoia Mortgage Trust 2020-1 A1, 3.500%, 02/25/2050 | 984,412 | 0.0 |
| 4,318,671 | (1),(3) | Sequoia Mortgage Trust 2020-1 A19, 3.500%, 02/25/2050 | 4,411,480 | 0.2 |
| 1,988,096 | (1),(3) | Sequoia Mortgage Trust 2020-2 A19, 3.500%, 03/25/2050 | 2,003,443 | 0.1 |
See Accompanying Notes to Financial Statements
| 100 |
| Voya Strategic Income Opportunities Fund | PORTFOLIO OF INVESTMENTS |
| as of March31, 2020 (Continued) |
| 1,497,524 | (1),(3) | Sequoia Mortgage Trust 2020-2 B3, 3.675%, 03/25/2050 | 1,138,003 | 0.0 |
| 2,391,864 | (1),(3) | Shellpoint Co-Originator Trust 2017-2 B2, 3.714%, 10/25/2047 | 2,329,897 | 0.1 |
| 3,170,852 | (1),(3) | Shellpoint Co-Originator Trust 2017-2 B3, 3.714%, 10/25/2047 | 2,921,975 | 0.1 |
| 3,042,837 | (1),(3) | Starwood Mortgage Residential Trust 2019-1 A3, 3.299%, 06/25/2049 | 3,041,122 | 0.1 |
| 66,853 | (3) | Structured Adjustable Rate Mortgage Loan Trust 2005-4 3A1, 3.960%, 03/25/2035 | 63,107 | 0.0 |
| 600,000 | (1) | Verus Securitization Trust 2017-SG1A B1, 3.615%, 11/25/2047 | 550,016 | 0.0 |
| 4,000,000 | (1),(3) | Verus Securitization Trust 2018-1 B1, 3.801%, 01/25/2058 | 3,639,718 | 0.1 |
| 2,100,000 | (1),(3) | Verus Securitization Trust 2018-2 B1, 4.426%, 06/01/2058 | 1,901,439 | 0.1 |
| 3,000,000 | (1),(3) | Verus Securitization Trust 2018-3 M1, 4.595%, 10/25/2058 | 2,909,971 | 0.1 |
| 2,489,136 | (1),(3) | Verus Securitization Trust 2019-1 A2, 3.938%, 02/25/2059 | 2,418,222 | 0.1 |
| 3,127,983 | (1),(5) | Verus Securitization Trust 2019-3 A2, 2.938%(Step Rate @ 3.938% on 0), 07/25/2059 | 3,008,531 | 0.1 |
| 3,410,331 | (1),(3) | Verus Securitization Trust 2019-INV2 A2, 3.117%, 07/25/2059 | 3,373,595 | 0.1 |
| 127,745 | (3) | WaMu Mortgage Pass Through Certificates Series 2006-AR12 2A3, 3.206%, 10/25/2036 | 103,930 | 0.0 |
| 261,318 | (3) | WaMu Mortgage Pass-Through Certificates Series 2004-AR4 A6 Trust, 4.464%, 06/25/2034 | 233,123 | 0.0 |
| 1,652,232 | (3) | WaMu Mortgage Pass-Through Certificates Series 2004-AR7 A6, 4.534%, 07/25/2034 | 1,547,833 | 0.1 |
| 132,866,546 | (3) | WaMu Mortgage Pass-Through Certificates Series 2005-AR1 X Trust, 1.416%, 01/25/2045 | 4,177,032 | 0.2 |
| 285,396 | (3) | WaMu Mortgage Pass-Through Certificates Series 2005-AR10 1A3, 4.121%, 09/25/2035 | 272,517 | 0.0 |
| 43,113,306 | (3) | WaMu Mortgage Pass-Through Certificates Series 2005-AR2 X Trust, 1.394%, 01/25/2045 | 2,529,807 | 0.1 |
| 19,502 | (3) | WaMu Mortgage Pass-Through Certificates Series 2006-AR12 1A1, 3.694%, 10/25/2036 | 17,200 | 0.0 |
| 130,360 | (3) | WaMu Mortgage Pass-Through Certificates Series 2006-AR14 1A3, 3.270%, 11/25/2036 | 109,741 | 0.0 |
| 500,986 | (3) | WaMu Mortgage Pass-Through Certificates Series 2006-AR14 1A4, 3.270%, 11/25/2036 | 421,746 | 0.0 |
| 74,838 | (3) | WaMu Mortgage Pass-Through Certificates Series 2006-AR16 3A1, 3.523%, 12/25/2036 | 62,220 | 0.0 |
| 67,677 | (3) | WaMu Mortgage Pass-Through Certificates Series 2006-AR8 1A4, 3.890%, 08/25/2046 | 60,504 | 0.0 |
| 121,588 | (3) | WaMu Mortgage Pass-Through Certificates Series 2007-HY2 1A1, 3.740%, 12/25/2036 | 105,246 | 0.0 |
| 582,939 | (3) | WaMu Mortgage Pass-Through Certificates Series 2007-HY3 1A1, 3.237%, 03/25/2037 | 471,507 | 0.0 |
| 12,470 | (3) | WaMu Mortgage Pass-Through Certificates Series 2007-HY4 1A1, 3.428%, 04/25/2037 | 9,989 | 0.0 |
| 69,346 | (3) | WaMu Mortgage Pass-Through Certificates Series 2007-HY7 2A2, 3.612%, 07/25/2037 | 54,610 | 0.0 |
| 730,293 | Washington Mutual Mortgage Pass-Through Certificates WMALT Series 2005-10 2A3, 1.847%, (US0001M + 0.900%), 11/25/2035 | 556,168 | 0.0 | |
| 774,485 | Washington Mutual Mortgage Pass-Through Certificates WMALT Series 2005-10 2A9, 6.000%, 11/25/2035 | 687,466 | 0.0 | |
| 946,742 | Washington Mutual Mortgage Pass-Through Certificates WMALT Series 2005-5 CB3, 5.500%, 07/25/2035 | 864,394 | 0.0 | |
| 180,288 | Washington Mutual Mortgage Pass-Through Certificates WMALT Series 2005-8 1A2, 5.500%, 10/25/2035 | 166,719 | 0.0 | |
| 868,868 | Washington Mutual Mortgage Pass-Through Certificates WMALT Series 2006-5 2CB2, 1.547%, (US0001M + 0.600%), 07/25/2036 | 437,047 | 0.0 |
See Accompanying Notes to Financial Statements
| 101 |
| Voya Strategic Income Opportunities Fund | PORTFOLIO OF INVESTMENTS |
| as of March31, 2020 (Continued) |
| 2,220,678 | Washington Mutual Mortgage Pass-Through Certificates WMALT Series 2006-AR5 3A Trust, 2.906%, (12MTA + 0.940%), 07/25/2046 | 1,380,368 | 0.1 | |
| 958,352 | Washington Mutual Mortgage Pass-Through Certificates WMALT Series 2006-AR6 2A, 2.926%, (12MTA + 0.960%), 08/25/2046 | 610,508 | 0.0 | |
| 754,620 | Washington Mutual Mortgage Pass-Through Certificates WMALT Series 2005-11 A1, 5.750%, 01/25/2036 | 650,928 | 0.0 | |
| 49,640 | Wells Fargo Alternative Loan 2007-PA2 2A1, 1.377%, (US0001M + 0.430%), 06/25/2037 | 37,393 | 0.0 | |
| 1,168,677 | (3) | Wells Fargo Mortgage Backed Securities 2006-AR12 1A1, 4.715%, 09/25/2036 | 1,052,965 | 0.0 |
| 201,494 | (3) | Wells Fargo Mortgage Backed Securities 2007-AR7 A1, 4.353%, 12/28/2037 | 184,874 | 0.0 |
| 3,256,169 | (1),(3) | Wells Fargo Mortgage Backed Securities 2018-1 B1, 3.691%, 07/25/2047 | 3,039,202 | 0.1 |
| 1,444,404 | (1),(3) | Wells Fargo Mortgage Backed Securities 2018-1 B3, 3.691%, 07/25/2047 | 1,299,787 | 0.1 |
| 1,588,459 | (1),(3) | Wells Fargo Mortgage Backed Securities 2019-4 B3 Trust, 3.596%, 09/25/2049 | 1,266,209 | 0.1 |
| 1,996,520 | (1),(3) | Wells Fargo Mortgage Backed Securities 2020-1 B3 Trust, 3.474%, 12/25/2049 | 1,734,388 | 0.1 |
| 720,320 | (1),(3) | WinWater Mortgage Loan Trust 2015-5 B4, 3.774%, 08/20/2045 | 674,322 | 0.0 |
| Total Collateralized Mortgage Obligations | ||||
| (Cost $806,207,910) | 753,643,797 | 29.2 | ||
| COMMERCIAL MORTGAGE-BACKED SECURITIES: 20.6% | ||||
| 5,000,000 | (1) | Atrium Hotel Portfolio Trust 2018-ATRM C, 2.355%, (US0001M + 1.650%), 06/15/2035 | 3,650,435 | 0.1 |
| 5,000,000 | (1) | Austin Fairmont Hotel Trust 2019-FAIR E, 2.955%, (US0001M + 2.250%), 09/15/2032 | 4,040,421 | 0.2 |
| 3,670,000 | (1),(3) | BAMLL Re-REMIC Trust 2016-FRR16 B, 0.998%, 05/27/2021 | 3,431,354 | 0.1 |
| 6,700,000 | (1) | BANK 2017-BNK4 E, 3.357%, 05/15/2050 | 3,628,092 | 0.1 |
| 5,320,000 | (1),(3),(6) | BANK 2017-BNK4 XE, 1.468%, 05/15/2050 | 464,616 | 0.0 |
| 1,500,000 | (1),(3) | BANK 2017-BNK5 D, 3.078%, 06/15/2060 | 1,037,916 | 0.0 |
| 1,600,000 | (1),(3) | BANK 2017-BNK6 E, 2.649%, 07/15/2060 | 869,806 | 0.0 |
| 16,600,000 | (1),(3),(6) | BANK 2017-BNK6 XE, 1.500%, 07/15/2060 | 1,369,307 | 0.1 |
| 4,500,000 | (1) | BANK 2018-BNK14 D, 3.000%, 09/15/2060 | 2,913,016 | 0.1 |
| 51,159,818 | (3),(6) | BANK 2019-BN17 XA, 1.036%, 04/15/2052 | 3,733,475 | 0.1 |
| 10,280,248 | (3),(6) | BANK 2019-BNK16 XA, 0.966%, 02/15/2052 | 657,647 | 0.0 |
| 29,395,695 | (3),(6) | Bank 2019-BNK19 XA, 0.964%, 08/15/2061 | 2,039,726 | 0.1 |
| 4,380,000 | (1) | BANK 2017-BNK6 D, 3.100%, 07/15/2060 | 3,023,419 | 0.1 |
| 58,714,626 | (3),(6) | BANK 2019-BNK22 XA, 0.604%, 11/15/2062 | 2,687,198 | 0.1 |
| 4,590,000 | (1) | BANK 2020-BNK25 D, 2.500%, 01/15/2063 | 3,086,099 | 0.1 |
| 3,799,000 | (1),(3) | BAMLL Commercial Mortgage Securities Trust 2016-FR14 C, 1.321%, 02/27/2048 | 3,578,047 | 0.1 |
| 1,000,000 | (1),(3) | BAMLL RE-Remic Trust 2014-FRR8 A, 2.150%, 11/26/2047 | 803,296 | 0.0 |
| 104,415,810 | (3),(6) | Benchmark 2018-B7 XA Mortgage Trust, 0.445%, 05/15/2053 | 3,002,967 | 0.1 |
| 53,257,680 | (3),(6) | BENCHMARK 2019-B10 XA Mortgage Trust, 1.231%, 03/15/2062 | 4,330,238 | 0.2 |
| 42,285,000 | (1),(3),(6) | BENCHMARK 2019-B10 XB Mortgage Trust, 0.900%, 03/15/2062 | 2,969,523 | 0.1 |
| 43,898,797 | (3),(6) | Benchmark 2019-B12 XA Mortgage Trust, 1.068%, 08/15/2052 | 2,976,690 | 0.1 |
| 3,090,000 | (1) | Benchmark 2019-B9 D Mortgage Trust, 3.000%, 03/15/2052 | 1,969,154 | 0.1 |
| 7,330,000 | (1),(3),(6) | Benchmark 2019-B9 XD Mortgage Trust, 2.002%, 03/15/2052 | 1,020,768 | 0.0 |
| 77,310,347 | (3),(6) | BMARK 2018-B4 XA, 0.538%, 07/15/2051 | 2,424,708 | 0.1 |
| 3,020,000 | (1) | Benchmark 2019-B14 D Mortgage Trust, 2.500%, 12/15/2061 | 1,758,381 | 0.1 |
| 2,420,000 | (1) | BHP Trust 2019-BXHP D, 2.476%, (US0001M + 1.771%), 08/15/2036 | 2,029,882 | 0.1 |
| 6,190,000 | (1) | BHP Trust 2019-BXHP E, 3.272%, (US0001M + 2.568%), 08/15/2036 | 5,025,035 | 0.2 |
| 1,933,155 | BMD2 2019-FRR1, 2.870%, 05/25/2052 | 1,801,711 | 0.1 | |
| 3,565,159 | BMD2 RE-REMIC TR 2019 3.6, 3.665%, 09/25/2022 | 3,498,096 | 0.1 | |
See Accompanying Notes to Financial Statements
| 102 |
| Voya Strategic Income Opportunities Fund | PORTFOLIO OF INVESTMENTS |
| as of March31, 2020 (Continued) |
| 8,235,553 | (1) | BX Commercial Mortgage Trust 2019-XL G, 3.005%, (US0001M + 2.300%), 10/15/2036 | 7,122,147 | 0.3 |
| 8,235,553 | (1) | BX Commercial Mortgage Trust 2019-XL J, 3.355%, (US0001M + 2.650%), 10/15/2036 | 7,132,006 | 0.3 |
| 7,680,000 | (1) | BX Commercial Mortgage Trust 2020-BXLP G, 3.205%, (US0001M + 2.500%), 12/15/2029 | 6,548,776 | 0.3 |
| 1,650,000 | (1) | BX Trust 2019-MMP E, 2.605%, (US0001M + 1.900%), 08/15/2036 | 1,597,580 | 0.1 |
| 3,710,000 | (1),(3) | BX Trust 2019-OC11 E, 4.076%, 12/09/2041 | 2,854,452 | 0.1 |
| 4,990,000 | (1),(3) | CALI Mortgage Trust 2019-101C E, 4.324%, 03/10/2039 | 5,047,568 | 0.2 |
| 92,346,523 | (3),(6) | Cantor Commercial Real Estate Lending 2019-CF1 XA, 1.144%, 05/15/2052 | 6,708,024 | 0.3 |
| 40,648,290 | (3),(6) | Cantor Commercial Real Estate Lending 2019-CF2 XA, 1.376%, 11/15/2052 | 3,244,262 | 0.1 |
| 8,122,160 | (3),(6) | CD 2016-CD1 Mortgage Trust XA, 1.404%, 08/10/2049 | 517,515 | 0.0 |
| 14,660,000 | (1),(3),(6) | CD 2016-CD1 Mortgage Trust XB, 0.678%, 08/10/2049 | 570,506 | 0.0 |
| 2,140,256 | (1),(3) | CFCRE Commercial Mortgage Trust 2011-C1 E, 6.089%, 04/15/2044 | 2,023,798 | 0.1 |
| 5,060,000 | (1) | CGDB Commercial Mortgage Trust 2019-MOB E, 2.705%, (US0001M + 2.000%), 11/15/2036 | 3,850,762 | 0.2 |
| 4,640,000 | (1) | CGDB Commercial Mortgage Trust 2019-MOB F, 3.255%, (US0001M + 2.550%), 11/15/2036 | 3,540,202 | 0.1 |
| 1,000,000 | (1),(3) | Citigroup Commercial Mortgage Trust 2013-GC17 D, 5.110%, 11/10/2046 | 897,504 | 0.0 |
| 4,826,000 | (1),(3) | Citigroup Commercial Mortgage Trust 2014-GC19 E, 4.592%, 03/10/2047 | 3,895,151 | 0.2 |
| 6,030,000 | (1),(3) | Citigroup Commercial Mortgage Trust 2014-GC19 F, 3.665%, 03/10/2047 | 4,494,991 | 0.2 |
| 2,130,000 | (1) | Citigroup Commercial Mortgage Trust 2016-C2 E, 4.594%, 08/10/2049 | 1,382,010 | 0.1 |
| 3,080,000 | (1) | Citigroup Commercial Mortgage Trust 2016-P5 D, 3.000%, 10/10/2049 | 2,194,643 | 0.1 |
| 27,584,598 | (3),(6) | Citigroup Commercial Mortgage Trust 2017-C4 XA, 1.106%, 10/12/2050 | 1,507,413 | 0.1 |
| 34,050,379 | (3),(6) | Citigroup Commercial Mortgage Trust 2019-C7 XA, 0.881%, 12/15/2072 | 2,105,985 | 0.1 |
| 12,040,000 | (1),(3) | Citigroup Commercial Mortgage Trust 2016-P4 E, 4.723%, 07/10/2049 | 8,403,798 | 0.3 |
| 5,790,000 | (1),(3) | Citigroup Commercial Mortgage Trust 2016-P4 F, 4.723%, 07/10/2049 | 3,669,542 | 0.1 |
| 40,945,117 | (3),(6) | Citigroup Commercial Mortgage Trust 2019-GC41 XA, 1.190%, 08/10/2056 | 2,819,059 | 0.1 |
| 3,460,000 | (1),(3) | COMM 2013-CR10 F Mortgage Trust, 4.789%, 08/10/2046 | 2,804,683 | 0.1 |
| 8,380,000 | (1),(3) | COMM 2013-GAM F, 3.418%, 02/10/2028 | 7,999,965 | 0.3 |
| 3,000,000 | (3) | COMM 2012-CCRE2 C Mortgage Trust, 4.831%, 08/15/2045 | 2,883,625 | 0.1 |
| 10,974,289 | (3),(6) | COMM 2012-CR3 XA, 1.857%, 10/15/2045 | 381,628 | 0.0 |
| 863,403 | (3),(6) | COMM 2012-CR4 XA, 1.697%, 10/15/2045 | 27,906 | 0.0 |
| 6,936,612 | (1),(3),(6) | COMM 2012-LTRT XA, 0.920%, 10/05/2030 | 117,135 | 0.0 |
| 1,670,000 | (1),(3) | COMM 2013-CR10 E Mortgage Trust, 4.789%, 08/10/2046 | 1,417,574 | 0.1 |
| 2,200,000 | (1),(3) | COMM 2013-LC6 D Mortgage Trust, 4.342%, 01/10/2046 | 1,988,703 | 0.1 |
| 11,060,000 | (1),(3) | COMM 2014-LC15 D Mortgage Trust, 4.984%, 04/10/2047 | 9,775,172 | 0.4 |
| 11,063,359 | (3),(6) | COMM 2016-COR1 XA, 1.432%, 10/10/2049 | 690,567 | 0.0 |
| 2,806,410 | (3),(6) | COMM 2016-CR28 XA, 0.693%, 02/10/2049 | 79,011 | 0.0 |
| 1,000,000 | (3) | COMM 2017-COR2 C, 4.561%, 09/10/2050 | 835,982 | 0.0 |
| 21,430,778 | (3),(6) | COMM 2017-COR2 XA, 1.171%, 09/10/2050 | 1,423,132 | 0.1 |
| 5,000,000 | (1),(3) | COMM 2020-CBM F Mortgage Trust, 3.633%, 11/13/2039 | 3,111,759 | 0.1 |
| 3,840,000 | (1) | Credit Suisse Mortgage Capital Certificates 2019-ICE4 F, 3.355%, (US0001M + 2.650%), 05/15/2036 | 2,976,893 | 0.1 |
| 1,430,000 | (3) | Csail 2015-C2 C Commercial Mortgage Trust, 4.192%, 06/15/2057 | 1,244,442 | 0.1 |
See Accompanying Notes to Financial Statements
| 103 |
| Voya Strategic Income Opportunities Fund | PORTFOLIO OF INVESTMENTS |
| as of March31, 2020 (Continued) |
| 3,023,829 | (1) | CSWF 2018-TOP F, 3.455%, (US0001M + 2.750%), 08/15/2035 | 2,397,745 | 0.1 |
| 2,314,968 | (1),(3) | DBUBS 2011-LC1A F Mortgage Trust, 5.689%, 11/10/2046 | 2,198,757 | 0.1 |
| 5,000,000 | (1),(3) | DBUBS 2011-LC2A D, 5.530%, 07/10/2044 | 4,872,586 | 0.2 |
| 2,300,000 | (1),(3) | DBUBS 2017-BRBK E Mortgage Trust, 3.530%, 10/10/2034 | 1,832,013 | 0.1 |
| 6,080,000 | (1),(3) | DBUBS 2011-LC2 E Mortgage Trust, 5.530%, 07/10/2044 | 5,854,755 | 0.2 |
| 4,500,000 | (1) | DBUBS 2011-LC2A F Mortgage Trust, 4.000%, (US0001M + 3.650%), 07/10/2044 | 4,295,657 | 0.2 |
| 5,000,000 | (1) | DBWF 2018-GLKS D Mortgage Trust, 3.150%, (US0001M + 2.400%), 11/19/2035 | 3,881,456 | 0.2 |
| 4,800,000 | (1),(3) | DBJPM 16-C3 F Mortgage Trust, 4.241%, 08/10/2049 | 2,728,381 | 0.1 |
| 4,160,000 | (1) | Exantas Capital Corp. 2019-RSO7 D Ltd., 3.500%, (US0001M + 2.700%), 04/15/2036 | 2,828,755 | 0.1 |
| 3,680,000 | (1) | Fontainebleau Miami Beach Trust 2019-FBLU F, 4.095%, 12/10/2036 | 2,451,224 | 0.1 |
| 8,937,711 | (3),(6) | Freddie Mac Multifamily Structured Pass Through Certificates K715 X3, 2.014%, 02/25/2041 | 146,220 | 0.0 |
| 628,416 | (1),(6) | FREMF Mortgage Trust 2012-K17 X2A, 0.100%, 12/25/2044 | 794 | 0.0 |
| 203,197,429 | (1),(6) | FREMF Mortgage Trust 2014-K714 X2B, 0.100%, 01/25/2047 | 57,261 | 0.0 |
| 159,355 | (1) | GPT 2018-GPP E Mortgage Trust, 3.175%, (US0001M + 2.470%), 06/15/2035 | 159,910 | 0.0 |
| 2,000,000 | (1) | GS Mortgage Securities Corp. II 2018-RIVR F, 2.805%, (US0001M + 2.100%), 07/15/2035 | 1,952,019 | 0.1 |
| 3,500,000 | (1) | GS Mortgage Securities Corp. II 2018-RIVR G, 3.305%, (US0001M + 2.600%), 07/15/2035 | 2,597,980 | 0.1 |
| 4,230,000 | (1) | GS Mortgage Securities Corp. Trust 2019-70P E, 2.905%, (US0001M + 2.200%), 10/15/2036 | 3,340,525 | 0.1 |
| 1,690,000 | (1) | GS Mortgage Securities Corp. Trust 2019-70P F, 3.355%, (US0001M + 2.650%), 10/15/2036 | 1,323,681 | 0.1 |
| 1,010,000 | (1),(3) | GS Mortgage Securities Trust 2010-C2 E, 4.548%, 12/10/2043 | 966,753 | 0.0 |
| 3,080,000 | (3) | GS Mortgage Securities Trust 2012-GCJ7 C, 5.708%, 05/10/2045 | 3,021,994 | 0.1 |
| 15,518,000 | (1),(3) | GS Mortgage Securities Trust 2012-GCJ7 E, 5.000%, 05/10/2045 | 9,974,750 | 0.4 |
| 1,330,000 | (1) | GS Mortgage Securities Trust 2013-GC16 G, 3.500%, 11/10/2046 | 1,015,824 | 0.0 |
| 6,670,000 | (1),(3) | GS Mortgage Securities Trust 2016-GS4 D, 3.233%, 11/10/2049 | 4,808,187 | 0.2 |
| 15,420,815 | (3),(6) | GS Mortgage Securities Trust 2019-GC38 XA, 0.963%, 02/10/2052 | 984,437 | 0.0 |
| 4,830,000 | (1),(3) | GS Mortgage Securities Trust 2019-GC40 DBD, 3.550%, 07/10/2052 | 4,527,965 | 0.2 |
| 3,710,000 | (1),(3) | GS Mortgage Securities Trust 2019-GC40 DBE, 3.550%, 07/10/2052 | 3,402,437 | 0.1 |
| 41,143,567 | (3),(6) | GS Mortgage Securities Trust 2019-GC40 XA, 1.093%, 07/10/2052 | 2,910,636 | 0.1 |
| 4,460,000 | (1),(3) | GS Mortgage Securities Trust 2020-GC45 SWC, 3.219%, 12/13/2039 | 2,520,006 | 0.1 |
| 84,876,230 | (3),(6) | GS Mortgage Securities Trust 2019-GSA1 XA, 0.834%, 11/10/2052 | 5,058,004 | 0.2 |
| 6,200,000 | (1) | Hawaii Hotel Trust 2019-MAUI F, 3.455%, (US0001M + 3.000%), 05/15/2038 | 4,435,791 | 0.2 |
| 2,670,000 | (1),(3) | Hudson Yards 2019-55HY F Mortgage Trust, 2.943%, 12/10/2041 | 2,282,565 | 0.1 |
| 180,000 | (1),(3) | IMT Trust 2017-APTS EFX, 3.497%, 06/15/2034 | 155,025 | 0.0 |
| 4,860,000 | (1),(3) | Jackson Park Trust 2019-LIC F, 3.242%, 10/14/2039 | 2,819,121 | 0.1 |
| 1,800,000 | (1) | JP Morgan Chase Commercial Mortgage Securities Corp. 2019-BKWD E, 3.305%, (US0001M + 2.600%), 09/15/2029 | 1,753,891 | 0.1 |
| 2,845,000 | (1),(3) | JP Morgan Chase Commercial Mortgage Securities Trust 2011-C5 D, 5.419%, 08/15/2046 | 2,754,239 | 0.1 |
See Accompanying Notes to Financial Statements
| 104 |
| Voya Strategic Income Opportunities Fund | PORTFOLIO OF INVESTMENTS |
| as of March31, 2020 (Continued) |
| 3,640,000 | (1) | JP Morgan Chase Commercial Mortgage Securities Trust 2020-LOOP F, 3.862%, 12/05/2038 | 2,601,102 | 0.1 |
| 3,760,000 | (1),(3) | JPMCC Re-REMIC Trust 2015-FRR2 AK36, 2.195%, 12/27/2046 | 3,683,317 | 0.1 |
| 5,910,000 | (1) | J.P. Morgan Chase Commercial Mortgage Securities Trust 2018-WPT FFX, 5.542%, 07/05/2033 | 4,553,691 | 0.2 |
| 5,440,000 | (1) | J.P. Morgan Chase Commercial Mortgage Securities Trust 2019-MFP E, 2.865%, (US0001M + 2.160%), 07/15/2036 | 4,662,002 | 0.2 |
| 6,150,000 | (1),(3) | JP Morgan Chase Commercial Mortgage Securities Trust 2011-C4 F, 3.873%, 07/15/2046 | 5,823,673 | 0.2 |
| 5,000,000 | (1),(3) | JP Morgan Chase Commercial Mortgage Securities Trust 2011-C4 G, 3.873%, 07/15/2046 | 4,720,708 | 0.2 |
| 5,240,179 | (3),(6) | JP Morgan Chase Commercial Mortgage Securities Trust 2012-CIBX XA, 1.476%, 06/15/2045 | 98,511 | 0.0 |
| 2,000,000 | (3) | JP Morgan Chase Commercial Mortgage Securities Trust 2013-C10 D, 4.113%, 12/15/2047 | 1,788,373 | 0.1 |
| 5,500,000 | (1),(3) | JP Morgan Chase Commercial Mortgage Securities Trust 2013-C10 E, 3.500%, 12/15/2047 | 4,426,463 | 0.2 |
| 3,630,000 | (1),(3) | JP Morgan Chase Commercial Mortgage Securities Trust 2013-C13 E, 3.986%, 01/15/2046 | 3,049,382 | 0.1 |
| 7,470,000 | (1),(3) | JP Morgan Chase Commercial Mortgage Securities Trust 2013-C13 F, 3.986%, 01/15/2046 | 5,331,720 | 0.2 |
| 23,978,037 | (3),(6) | JP Morgan Chase Commercial Mortgage Securities Trust 2014-C20 XA, 0.945%, 07/15/2047 | 537,134 | 0.0 |
| 3,810,000 | (1) | JP Morgan Chase Commercial Mortgage Securities Trust 2020-LOOP E, 3.862%, 12/05/2038 | 3,004,479 | 0.1 |
| 1,000,000 | (1),(3) | JPMBB Commercial Mortgage Securities Trust 2013-C15 D, 5.198%, 11/15/2045 | 901,725 | 0.0 |
| 2,549,000 | (1),(3) | JPMBB Commercial Mortgage Securities Trust 2013-C17 D, 4.892%, 01/15/2047 | 2,257,279 | 0.1 |
| 9,560,000 | (1),(3) | JPMBB Commercial Mortgage Securities Trust 2013-C17 E, 3.867%, 01/15/2047 | 7,524,984 | 0.3 |
| 2,200,000 | (1),(3) | JPMBB Commercial Mortgage Securities Trust 2013-C17 F, 3.867%, 01/15/2047 | 1,597,641 | 0.1 |
| 1,405,000 | (3) | JPMBB Commercial Mortgage Securities Trust 2014-C21 C, 4.657%, 08/15/2047 | 1,276,920 | 0.1 |
| 2,440,000 | (1) | JPMBB Commercial Mortgage Securities Trust 2014-C26 E, 4.000%, 01/15/2048 | 1,716,994 | 0.1 |
| 50,278,540 | (3),(6) | JPMBB Commercial Mortgage Securities Trust 2015-C27 XA, 1.169%, 02/15/2048 | 2,311,883 | 0.1 |
| 56,139,836 | (3),(6) | JPMBB Commercial Mortgage Securities Trust 2015-C28 XA, 1.057%, 10/15/2048 | 1,893,630 | 0.1 |
| 21,428,263 | (3),(6) | JPMDB Commercial Mortgage Securities Trust 2017-C7 XA, 0.902%, 10/15/2050 | 1,020,170 | 0.0 |
| 915,005 | (3) | LB-UBS Commercial Mortgage Trust 2005-C3 F, 5.013%, 07/15/2040 | 905,562 | 0.0 |
| 12,759,871 | (1),(3),(6) | LSTAR Commercial Mortgage Trust 2017-5 X, 1.000%, 03/10/2050 | 459,799 | 0.0 |
| 6,737,000 | (1) | Morgan Stanley Bank of America Merrill Lynch Trust 2013-C13 F, 3.707%, 11/15/2046 | 5,225,070 | 0.2 |
| 11,679,276 | (3),(6) | Morgan Stanley Bank of America Merrill Lynch Trust 2013-C13 XA, 0.980%, 11/15/2046 | 327,089 | 0.0 |
| 13,998,453 | (3),(6) | Morgan Stanley Bank of America Merrill Lynch Trust 2014 C19 XA, 1.003%, 12/15/2047 | 493,706 | 0.0 |
| 5,649,000 | (1) | Morgan Stanley Bank of America Merrill Lynch Trust 2014-C18 D, 3.389%, 10/15/2047 | 4,552,121 | 0.2 |
| 1,000,000 | (3) | Morgan Stanley Bank of America Merrill Lynch Trust 2015-C20 C, 4.462%, 02/15/2048 | 889,365 | 0.0 |
| 8,220,000 | Morgan Stanley Bank of America Merrill Lynch Trust 2015-C25 D, 3.068%, 10/15/2048 | 6,213,293 | 0.2 | |
| 4,300,000 | (1) | Morgan Stanley Bank of America Merrill Lynch Trust 2015-C26 D, 3.060%, 10/15/2048 | 3,234,733 | 0.1 |
See Accompanying Notes to Financial Statements
| 105 |
| Voya Strategic Income Opportunities Fund | PORTFOLIO OF INVESTMENTS |
| as of March31, 2020 (Continued) |
| 15,697,129 | (3),(6) | Morgan Stanley Bank of America Merrill Lynch Trust 2017-C34 XA, 0.813%, 11/15/2052 | 698,050 | 0.0 |
| 270,000 | (1),(3) | Morgan Stanley Capital I Trust 2011-C1 D, 5.375%, 09/15/2047 | 234,784 | 0.0 |
| 5,970,000 | (1) | Morgan Stanley Capital I Trust 2011-C1 K, 4.193%, 09/15/2047 | 5,782,232 | 0.2 |
| 4,268,000 | (1) | Morgan Stanley Capital I Trust 2011-C1 L, 4.193%, 09/15/2047 | 4,047,467 | 0.2 |
| 4,220,000 | (1) | Morgan Stanley Capital I Trust 2011-C1 M, 4.193%, 09/15/2047 | 3,971,202 | 0.2 |
| 4,841,000 | (1),(3) | Morgan Stanley Capital I Trust 2016-BNK2 D, 3.000%, 11/15/2049 | 3,430,201 | 0.1 |
| 25,660,000 | (1),(3),(6) | Morgan Stanley Capital I Trust 2018-L1 XD, 1.796%, 10/15/2051 | 3,062,970 | 0.1 |
| 910,000 | Morgan Stanley Capital I, Inc. 2017-HR2 D, 2.730%, 12/15/2050 | 597,419 | 0.0 | |
| 38,427,307 | (3),(6) | Morgan Stanley Capital I, Inc. 2017-HR2 XA, 0.793%, 12/15/2050 | 1,776,314 | 0.1 |
| 2,370,000 | (1) | MRCD 2019-PARK E Mortgage Trust, 2.718%, 12/15/2036 | 2,157,014 | 0.1 |
| 4,450,000 | (1) | MRCD 2019-PARK F Mortgage Trust, 2.718%, 12/15/2036 | 3,885,272 | 0.2 |
| 790,000 | (1) | Prima Capital CRE Securitization 2019-RK1 CD Ltd., 3.500%, 04/15/2038 | 718,650 | 0.0 |
| 10,151,000 | (1) | Prima Capital CRE Securitization 2019-RK1 DD Ltd., 3.500%, 04/15/2038 | 9,116,692 | 0.4 |
| 15,000,000 | (1) | Prima Capital CRE Securitization 2019-7A D Ltd., 4.250%, 12/25/2050 | 15,628,551 | 0.6 |
| 4,470,000 | (1),(3) | Ready Capital Mortgage Trust 2019-5 D, 5.504%, 02/25/2052 | 3,012,043 | 0.1 |
| 5,310,000 | (1),(3) | ReadyCap Commercial Mortgage Trust 2018-4 D, 5.338%, 02/27/2051 | 3,680,567 | 0.1 |
| 2,673,000 | (1) | Shelter Growth CRE 2018-FL1 D Issuer Ltd., 3.705%, (US0001M + 3.000%), 01/15/2035 | 2,410,783 | 0.1 |
| 1,000,000 | (1),(3) | UBS Commercial Mortgage Trust 2017-C5, 4.316%, 11/15/2050 | 750,354 | 0.0 |
| 26,351,798 | (3),(6) | UBS Commercial Mortgage Trust 2019-C16 XA, 1.561%, 04/15/2052 | 2,534,832 | 0.1 |
| 1,900,000 | (1),(3) | UBS-Barclays Commercial Mortgage Trust 2012-C4 D, 4.476%, 12/10/2045 | 1,733,862 | 0.1 |
| 3,240,000 | (1),(3) | UBS-Barclays Commercial Mortgage Trust 2012-C4 E, 4.476%, 12/10/2045 | 2,694,722 | 0.1 |
| 1,616,500 | (1) | Wells Fargo Commercial Mortgage Trust 2010-C1 E, 4.000%, 11/15/2043 | 1,564,092 | 0.1 |
| 3,448,000 | (1) | Wells Fargo Commercial Mortgage Trust 2010-C1 F, 4.000%, 11/15/2043 | 3,312,667 | 0.1 |
| 8,190,000 | (1),(3) | Wells Fargo Commercial Mortgage Trust 2015-C30 D, 4.497%, 09/15/2058 | 6,748,599 | 0.3 |
| 8,329,649 | (1) | Wells Fargo Commercial Mortgage Trust 2015-C30 E, 3.250%, 09/15/2058 | 5,199,059 | 0.2 |
| 78,780,000 | (3),(6) | Wells Fargo Commercial Mortgage Trust 2016-NXS6 XB, 0.527%, 11/15/2049 | 2,397,677 | 0.1 |
| 20,748,388 | (3),(6) | Wells Fargo Commercial Mortgage Trust 2017-C40 XA, 0.969%, 10/15/2050 | 1,041,635 | 0.0 |
| 2,321,869 | (1) | Wells Fargo Commercial Mortgage Trust 2018-BXI E, 2.861%, (US0001M + 2.157%), 12/15/2036 | 1,882,921 | 0.1 |
| 8,430,000 | (1) | Wells Fargo Commercial Mortgage Trust 2019-C49 D, 3.000%, 03/15/2052 | 5,351,308 | 0.2 |
| 374,852 | (1),(3),(6) | WFRBS Commercial Mortgage Trust 2012-C8 XA, 1.807%, 08/15/2045 | 11,749 | 0.0 |
| 2,894,184 | (1),(3),(6) | WFRBS Commercial Mortgage Trust 2012-C9 XA, 1.892%, 11/15/2045 | 112,010 | 0.0 |
| 9,230,000 | (1),(3) | WFRBS Commercial Mortgage Trust 2013-C11 E, 4.258%, 03/15/2045 | 7,555,811 | 0.3 |
| 10,350,000 | (1) | WFRBS Commercial Mortgage Trust 2013-C12 E, 3.500%, 03/15/2048 | 8,178,523 | 0.3 |
| 5,950,000 | (1) | WFRBS Commercial Mortgage Trust 2013-C12 F, 3.500%, 03/15/2048 | 4,519,165 | 0.2 |
| 4,691,143 | (1),(3),(6) | WFRBS Commercial Mortgage Trust 2013-C12 XA, 1.215%, 03/15/2048 | 130,161 | 0.0 |
| 9,000,000 | (1),(3) | WFRBS Commercial Mortgage Trust 2013-C17 D, 5.041%, 12/15/2046 | 8,050,047 | 0.3 |
| 760,000 | (1) | WFRBS Commercial Mortgage Trust 2013-C17 E, 3.500%, 12/15/2046 | 578,815 | 0.0 |
See Accompanying Notes to Financial Statements
| 106 |
| Voya Strategic Income Opportunities Fund | PORTFOLIO OF INVESTMENTS |
| as of March31, 2020 (Continued) |
| 3,000,000 | (1) | WFRBS Commercial Mortgage Trust 2013-C17 F, 3.500%, 12/15/2046 | 2,182,412 | 0.1 |
| 10,940,000 | (1) | Wells Fargo Commercial Mortgage Trust 2015-NXS3 D, 3.153%, 09/15/2057 | 8,308,519 | 0.3 |
| 39,904,284 | (3),(6) | Wells Fargo Commercial Mortgage Trust 2019-C52 XA, 1.623%, 08/15/2052 | 4,035,345 | 0.2 |
| 7,735,000 | (1),(3) | West Town Mall Trust 2017-KNOX E, 4.346%, 07/05/2030 | 6,985,539 | 0.3 |
| 1,500,000 | (1),(3) | WFLD 2014-MONT D Mortgage Trust, 3.755%, 08/10/2031 | 1,286,665 | 0.1 |
| 960,000 | (1),(3) | WFRBS Commercial Mortgage Trust 2013-C11 F, 4.258%, 03/15/2045 | 678,516 | 0.0 |
| 41,965,049 | (3),(6) | WFRBS Commercial Mortgage Trust 2013-UBS1 XA, 0.848%, 03/15/2046 | 825,134 | 0.0 |
| Total Commercial Mortgage-Backed Securities | ||||
| (Cost $609,205,464) | 529,961,107 | 20.6 | ||
| U.S. TREASURY OBLIGATIONS: 0.6% | ||||
| Treasury Inflation Indexed Protected Securities: 0.6% | ||||
| 13,897,909 | 0.125%,01/15/2030 | 14,339,655 | 0.6 | |
| U.S. Treasury Notes: 0.0% | ||||
| 298,000 | 1.500%,02/15/2030 | 321,299 | 0.0 | |
| Total U.S. Treasury Obligations | ||||
| (Cost $15,031,977) | 14,660,954 | 0.6 | ||
| SOVEREIGN BONDS: 3.2% | ||||
| 1,075,000 | Argentine Republic Government International Bond, 6.875%, 01/26/2027 | 301,011 | 0.0 | |
| 1,500,000 | Brazilian Government International Bond, 6.000%, 04/07/2026 | 1,709,250 | 0.1 | |
| 1,650,000 | Colombia Government International Bond, 3.000%, 01/30/2030 | 1,511,400 | 0.1 | |
| 2,700,000 | Colombia Government International Bond, 3.875%, 04/25/2027 | 2,690,665 | 0.1 | |
| EUR 1,875,000 | Croatia Government International Bond, 1.125%, 06/19/2029 | 1,897,933 | 0.1 | |
| 800,000 | Croatia Government International Bond, 5.500%, 04/04/2023 | 840,832 | 0.0 | |
| 2,825,000 | (1) | Dominican Republic International Bond, 4.500%, 01/30/2030 | 2,470,462 | 0.1 |
| 500,000 | Dominican Republic International Bond, 6.000%, 07/19/2028 | 478,196 | 0.0 | |
| 1,725,000 | Dominican Republic International Bond, 6.875%, 01/29/2026 | 1,731,111 | 0.1 | |
| 300,000 | (2) | Ecuador Government International Bond, 7.875%, 01/23/2028 | 84,966 | 0.0 |
| 1,700,000 | (2) | Egypt Government International Bond, 5.875%, 06/11/2025 | 1,534,619 | 0.1 |
| 1,900,000 | Egypt Government International Bond, 6.588%, 02/21/2028 | 1,626,875 | 0.1 | |
| 4,200,000 | Egypt Government International Bond, 7.500%, 01/31/2027 | 3,835,969 | 0.2 | |
| 1,400,000 | (1) | Export-Import Bank of India, 3.250%, 01/15/2030 | 1,250,362 | 0.1 |
| 440,000 | (1) | Gabon Government International Bond, 6.625%, 02/06/2031 | 272,288 | 0.0 |
| 4,525,000 | (1) | Ghana Government International Bond, 6.375%, 02/11/2027 | 3,337,187 | 0.1 |
| 2,100,000 | (2) | Indonesia Government International Bond, 2.850%, 02/14/2030 | 2,047,032 | 0.1 |
| IDR 32,649,000,000 | Indonesia Treasury Bond, 8.375%, 04/15/2039 | 2,008,223 | 0.1 | |
| 1,303,875 | Ivory Coast Government International Bond, 5.750%, 12/31/2032 | 1,181,784 | 0.0 | |
| 650,000 | Jordan Government International Bond, 6.125%, 01/29/2026 | 595,251 | 0.0 | |
| 1,350,000 | (1) | Kenya Government International Bond, 7.000%, 05/22/2027 | 1,252,125 | 0.1 |
| 500,000 | (1) | KSA Sukuk Ltd., 3.628%, 04/20/2027 | 508,319 | 0.0 |
| 1,200,000 | Mexico Government International Bond, 3.250%, 04/16/2030 | 1,127,700 | 0.0 | |
| 1,600,000 | Mexico Government International Bond, 4.500%, 04/22/2029 | 1,647,216 | 0.1 | |
| 600,000 | Oman Government International Bond, 6.000%, 08/01/2029 | 433,101 | 0.0 | |
| 600,000 | Panama Government International Bond, 3.160%, 01/23/2030 | 602,706 | 0.0 | |
| 500,000 | Panama Government International Bond, 9.375%, 04/01/2029 | 713,026 | 0.0 | |
| PEN 9,681,000 | (1) | Peru Government Bond, 6.150%, 08/12/2032 | 3,035,954 | 0.1 |
| PEN 9,681,000 | Peru Government Bond, 6.850%, 02/12/2042 | 3,184,823 | 0.1 | |
| 750,000 | (1) | Perusahaan Penerbit SBSN Indonesia III, 4.150%, 03/29/2027 | 754,343 | 0.0 |
See Accompanying Notes to Financial Statements
| 107 |
| Voya Strategic Income Opportunities Fund | PORTFOLIO OF INVESTMENTS |
| as of March31, 2020 (Continued) |
| 1,800,000 | (1) | Perusahaan Penerbit SBSN Indonesia III, 4.450%, 02/20/2029 | 1,844,285 | 0.1 |
| 450,000 | Nigeria Government International Bond, 6.500%, 11/28/2027 | 314,924 | 0.0 | |
| 700,000 | Republic of South Africa Government International Bond, 4.300%, 10/12/2028 | 577,154 | 0.0 | |
| 5,750,000 | Republic of South Africa Government International Bond, 4.850%, 09/30/2029 | 4,743,819 | 0.2 | |
| RUB 557,160,000 | Russian Federal Bond - OFZ, 7.250%, 05/10/2034 | 7,417,343 | 0.3 | |
| 800,000 | Russian Foreign Bond - Eurobond, 4.375%, 03/21/2029 | 857,950 | 0.0 | |
| 500,000 | Saudi Government International Bond, 3.625%, 03/04/2028 | 510,000 | 0.0 | |
| 2,000,000 | Saudi Government International Bond, 4.500%, 04/17/2030 | 2,150,000 | 0.1 | |
| 1,300,000 | South Africa Government International Bond, 5.875%, 09/16/2025 | 1,253,961 | 0.1 | |
| 950,000 | Sri Lanka Government International Bond, 6.350%, 06/28/2024 | 598,500 | 0.0 | |
| 11,475,000 | Turkey Government International Bond, 4.875%, 10/09/2026 | 9,732,521 | 0.4 | |
| 1,100,000 | Turkey Government International Bond, 5.600%, 11/14/2024 | 1,012,961 | 0.0 | |
| 325,000 | Turkey Government International Bond, 7.250%, 12/23/2023 | 318,803 | 0.0 | |
| 550,000 | Turkey Government International Bond, 7.375%, 02/05/2025 | 541,973 | 0.0 | |
| 450,000 | Ukraine Government International Bond, 7.375%, 09/25/2032 | 407,531 | 0.0 | |
| 975,000 | Ukraine Government International Bond, 7.750%, 09/01/2023 | 917,938 | 0.0 | |
| 4,550,000 | Ukraine Government International Bond, 7.750%, 09/01/2025 | 4,158,700 | 0.2 | |
| Total Sovereign Bonds | ||||
| (Cost $94,013,144) | 82,023,092 | 3.2 | ||
| ASSET-BACKED SECURITIES: 12.0% | ||||
| Automobile Asset-Backed Securities: 1.3% | ||||
| 1,075,000 | Americredit Automobile Receivables Trust 2018-2 D, 4.010%, 07/18/2024 | 877,791 | 0.0 | |
| 2,000,000 | Americredit Automobile Receivables Trust 2019-1 D, 3.620%, 03/18/2025 | 2,002,305 | 0.1 | |
| 2,800,000 | AmeriCredit Automobile Receivables Trust 2019-3 C, 2.320%, 07/18/2025 | 2,766,354 | 0.1 | |
| 2,450,000 | AmeriCredit Automobile Receivables Trust 2019-3 D, 2.580%, 09/18/2025 | 2,324,215 | 0.1 | |
| 4,400,000 | AmeriCredit Automobile Receivables Trust 2020-1 D, 1.800%, 12/18/2025 | 4,127,759 | 0.2 | |
| 3,000,000 | Carmax Auto Owner Trust 2019-2 D, 3.410%, 10/15/2025 | 3,008,907 | 0.1 | |
| 2,500,000 | (1) | Santander Drive Auto Receivables Trust 2018-1 E, 4.370%, 05/15/2025 | 2,160,459 | 0.1 |
| 1,000,000 | Santander Drive Auto Receivables Trust 2018-2 D, 3.880%, 02/15/2024 | 998,406 | 0.0 | |
| 4,450,000 | Santander Drive Auto Receivables Trust 2019-2 D, 3.220%, 07/15/2025 | 4,403,604 | 0.2 | |
| 2,250,000 | Santander Drive Auto Receivables Trust 2019-3 C, 2.490%, 10/15/2025 | 2,180,106 | 0.1 | |
| 6,000,000 | Santander Drive Auto Receivables Trust 2019-3 D, 2.680%, 10/15/2025 | 5,735,832 | 0.2 | |
| 850,000 | (1) | Tesla Auto Lease Trust 2018-B C, 4.360%, 10/20/2021 | 834,724 | 0.0 |
| 3,800,000 | (1) | Tesla Auto Lease Trust 2019-A C, 2.680%, 01/20/2023 | 3,683,662 | 0.1 |
| 35,104,124 | 1.3 | |||
| Home Equity Asset-Backed Securities: 0.3% | ||||
| 2,682,934 | (1),(3) | ACE Securities Corp. Mortgage Loan Trust Series 2007-D1 A2, 6.336%, 02/25/2038 | 2,429,434 | 0.1 |
| 463,175 | GSAA Home Equity Trust 2006-3 A3, 1.247%, (US0001M + 0.300%), 03/25/2036 | 296,826 | 0.0 | |
| 2,874,772 | (3) | GSAA Home Equity Trust 2006-4 4A3, 3.729%, 03/25/2036 | 2,053,272 | 0.1 |
| 1,048,741 | GSAA Home Equity Trust 2007-1 1A1, 1.027%, (US0001M + 0.080%), 02/25/2037 | 418,921 | 0.0 | |
| 1,148,589 | (3) | GSAA Trust 2006-7 AF2, 5.995%, 03/25/2046 | 627,760 | 0.0 |
| 1,125,984 | (3) | Morgan Stanley Mortgage Loan Trust 2007-10XS A2, 6.250%, 02/25/2037 | 658,338 | 0.1 |
See Accompanying Notes to Financial Statements
| 108 |
| Voya Strategic Income Opportunities Fund | PORTFOLIO OF INVESTMENTS |
| as of March31, 2020 (Continued) |
| 652,046 | Nomura Home Equity Loan, Inc. Home Equity Loan Trust Series 2007-1 2A4A, 1.407%, (US0001M + 0.230%), 02/25/2037 | 519,538 | 0.0 | |
| 7,004,089 | 0.3 | |||
| Other Asset-Backed Securities: 9.2% | ||||
| 2,806,691 | (1) | Ajax Mortgage Loan Trust 2018-A A, 3.850%, 04/25/2058 | 2,659,336 | 0.1 |
| 3,331,074 | (1),(3) | Ajax Mortgage Loan Trust 2018-C A, 4.360%, 09/25/2065 | 3,303,484 | 0.1 |
| 3,089,000 | (1) | Ajax Mortgage Loan Trust 2019-D A2, 3.500%, 09/25/2065 | 2,695,483 | 0.1 |
| 4,234,000 | (1) | Ajax Mortgage Loan Trust 2019-F A2, 3.500%, 09/25/2059 | 3,855,637 | 0.2 |
| 2,500,000 | (1) | AMMC CLO 16 Ltd. 2015-16A CR, 4.188%, (US0003M + 2.350%), 04/14/2029 | 2,212,145 | 0.1 |
| 2,000,000 | (1) | AMMC CLO XI Ltd. 2012-11A CR2, 3.670%, (US0003M + 1.900%), 04/30/2031 | 1,639,058 | 0.1 |
| 4,750,000 | (1) | Apidos CLO XI 2012-11A CRR, 4.336%, (US0003M + 2.500%), 10/17/2030 | 4,082,582 | 0.2 |
| 9,000,000 | (1) | Apidos CLO XXII 2015-22A BR, 0.340%, (US0003M + 1.950%), 04/20/2031 | 7,477,983 | 0.3 |
| 1,650,000 | (1) | Applebee's Funding LLC / IHOP Funding LLC 2019-1A A2I, 4.194%, 06/07/2049 | 1,502,737 | 0.1 |
| 750,000 | (1) | Applebee's Funding LLC / IHOP Funding LLC 2019-1A A2II, 4.723%, 06/07/2049 | 648,690 | 0.0 |
| 2,287,343 | (1) | Aqua Finance Trust 2019-A A, 3.140%, 07/16/2040 | 2,280,933 | 0.1 |
| 1,100,000 | (1) | Ares XLII Clo Ltd. 2017-42A C, 4.002%, (US0003M + 2.200%), 01/22/2028 | 956,585 | 0.0 |
| 750,000 | (1) | Atrium CDO Corp. 12A CR, 3.452%, (US0003M + 1.650%), 04/22/2027 | 690,442 | 0.0 |
| 1,250,000 | (1) | Atrium CDO Corp. 12A DR, 4.602%, (US0003M + 2.800%), 04/22/2027 | 1,014,759 | 0.0 |
| 2,000,000 | (1) | Babson CLO Ltd. 2018-3A C, 3.719%, (US0003M + 1.900%), 07/20/2029 | 1,757,334 | 0.1 |
| 5,000,000 | (1) | Barings CLO Ltd 2018-3A D, 4.719%, (US0003M + 2.900%), 07/20/2029 | 3,855,745 | 0.2 |
| 6,000,000 | (1) | Barings Clo Ltd. 2019-4A C, 4.703%, (US0003M + 2.800%), 01/15/2033 | 5,050,992 | 0.2 |
| 2,000,000 | (1) | Benefit Street Partners CLO V-B Ltd. 2018-5BA B, 3.969%, (US0003M + 2.150%), 04/20/2031 | 1,636,394 | 0.1 |
| 500,000 | (1) | Benefit Street Partners CLO VII Ltd. 2015-VIIA CR, 4.219%, (US0003M + 2.400%), 07/18/2027 | 415,486 | 0.0 |
| 2,750,000 | (1) | BlueMountain CLO 2012-2A DR2 Ltd., 4.595%, (US0003M + 2.900%), 11/20/2028 | 2,168,776 | 0.1 |
| 1,000,000 | (1) | BlueMountain CLO 2013-2A CR, 3.752%, (US0003M + 1.950%), 10/22/2030 | 855,654 | 0.0 |
| 1,000,000 | (1) | BlueMountain CLO 2015-4 CR Ltd., 3.719%, (US0003M + 1.900%), 04/20/2030 | 842,546 | 0.0 |
| 2,250,000 | (1) | BlueMountain CLO 2016-1 Ltd. 2016-1A DR, 4.469%, (US0003M + 2.650%), 04/20/2027 | 1,752,251 | 0.1 |
| 3,750,000 | (1) | BlueMountain CLO XXV Ltd. 2019-25A C, 4.281%, (US0003M + 2.450%), 07/15/2032 | 3,132,041 | 0.1 |
| 250,000 | (1) | Bowman Park CLO Ltd. 2014-1A E, 7.083%, (US0003M + 5.400%), 11/23/2025 | 195,938 | 0.0 |
| 4,000,000 | (1) | Bristol Park CLO Ltd. 2016-1A CR, 3.577%, (US0003M + 1.950%), 04/15/2029 | 3,510,036 | 0.1 |
| 750,000 | (1) | Buttermilk Park CLO Ltd. 2018-1A C, 3.931%, (US0003M + 2.100%), 10/15/2031 | 627,143 | 0.0 |
| 2,000,000 | (1) | Carlyle Global Market Strategies CLO 2015-2A CR Ltd., 4.044%, (US0003M + 2.250%), 04/27/2027 | 1,631,220 | 0.1 |
| 250,000 | (1) | Carlyle Global Market Strategies CLO 2015-2A DR Ltd., 6.144%, (US0003M + 4.350%), 04/27/2027 | 175,817 | 0.0 |
| 1,500,000 | (1) | Carlyle Global Market Strategies CLO 2015-3A CR Ltd., 4.645%, (US0003M + 2.850%), 07/28/2028 | 1,204,683 | 0.1 |
| 1,500,000 | (1) | Carlyle US CLO 2016-4A BR Ltd., 3.919%, (US0003M + 2.100%), 10/20/2027 | 1,301,004 | 0.1 |
| 1,000,000 | (1) | Cent CLO C17A BR Ltd., 3.620%, (US0003M + 1.850%), 04/30/2031 | 851,682 | 0.0 |
See Accompanying Notes to Financial Statements
| 109 |
| Voya Strategic Income Opportunities Fund | PORTFOLIO OF INVESTMENTS |
| as of March31, 2020 (Continued) |
| 1,500,000 | (1) | CIFC Funding 2013-IA BR Ltd., 4.243%, (US0003M + 2.400%), 07/16/2030 | 1,271,049 | 0.1 |
| 2,000,000 | (1) | Cifc Funding 2014-4RA B Ltd., 4.036%, (US0003M + 2.200%), 10/17/2030 | 1,748,172 | 0.1 |
| 6,250,000 | (1) | CIFC Funding 2017-2A C, 4.169%, (US0003M + 2.350%), 04/20/2030 | 5,479,400 | 0.2 |
| 1,100,000 | Countrywide Asset-Backed Certificates 2005-AB2 M1, 1.652%, (US0001M + 0.705%), 09/25/2035 | 970,122 | 0.0 | |
| 1,750,000 | (1) | Cumberland Park CLO Ltd. 2015-2A CR, 3.619%, (US0003M + 1.800%), 07/20/2028 | 1,590,092 | 0.1 |
| 500,000 | (1) | Cumberland Park CLO Ltd. 2015-2A DR, 4.519%, (US0003M + 2.700%), 07/20/2028 | 407,143 | 0.0 |
| 843,625 | (1) | DB Master Finance LLC 2019-1A A23, 4.352%, 05/20/2049 | 813,656 | 0.0 |
| 446,625 | (1) | DB Master Finance LLC 2019-1A A2II, 4.021%, 05/20/2049 | 434,421 | 0.0 |
| 579,000 | (1) | Domino's Pizza Master Issuer LLC 2015-1A A1II, 4.474%, 10/25/2045 | 562,649 | 0.0 |
| 1,075,250 | (1) | Domino's Pizza Master Issuer LLC 2017-1A A23, 4.118%, 07/25/2047 | 1,053,936 | 0.0 |
| 3,079,125 | (1) | Domino's Pizza Master Issuer LLC 2017-1A A2II, 3.082%, 07/25/2047 | 3,014,467 | 0.1 |
| 2,324,600 | (1) | Domino's Pizza Master Issuer LLC 2018-1A A2I, 4.116%, 07/25/2048 | 2,273,423 | 0.1 |
| 3,541,125 | (1) | Domino's Pizza Master Issuer LLC 2019-1A A2, 3.668%, 10/25/2049 | 3,162,473 | 0.1 |
| 2,178,000 | (1) | Driven Brands Funding LLC 2019-1A A2, 4.641%, 04/20/2049 | 2,086,328 | 0.1 |
| 1,228,125 | (1) | Driven Brands Funding, LLC 2018-1A A2, 4.739%, 04/20/2048 | 1,202,919 | 0.0 |
| 2,750,000 | (1) | Dryden 30 Senior Loan Fund 2013-30A DR, 4.292%, (US0003M + 2.600%), 11/15/2028 | 2,114,995 | 0.1 |
| 1,750,000 | (1) | Dryden 55 CLO Ltd. 2018-55A C, 3.731%, (US0003M + 1.900%), 04/15/2031 | 1,488,204 | 0.1 |
| 1,150,000 | (1) | Dryden XXV Senior Loan Fund 2012-25A DRR, 4.831%, (US0003M + 3.000%), 10/15/2027 | 940,403 | 0.0 |
| 3,061,863 | (1) | Five Guys Holdings, Inc. 2017-1A A2, 4.600%, 07/25/2047 | 3,224,545 | 0.1 |
| 750,000 | (1) | Galaxy XXII CLO Ltd. 2016-22A DR, 4.943%, (US0003M + 3.100%), 07/16/2028 | 605,750 | 0.0 |
| 945,500 | (1) | Helios Issuer, LLC 2018-1A A, 4.870%, 07/20/2048 | 857,967 | 0.0 |
| 3,553,439 | (1) | Helios Issuer, LLC 2018-1A B, 7.710%, 07/20/2048 | 1,969,638 | 0.1 |
| 1,000,000 | (1) | Invitation Homes 2018-SFR1 D Trust, 2.250%, (US0001M + 1.450%), 03/17/2037 | 859,377 | 0.0 |
| 4,500,000 | (1) | Jay Park CLO Ltd. 2016-1A BR, 3.819%, (US0003M + 2.000%), 10/20/2027 | 3,987,765 | 0.2 |
| 3,750,000 | (1) | Jersey Mike's Funding 2019-1A A2, 4.433%, 02/15/2050 | 3,327,375 | 0.1 |
| 1,000,000 | (1) | JG Wentworth XLII LLC 2018-2A B, 4.700%, 10/15/2077 | 973,103 | 0.0 |
| 1,350,000 | (1) | LCM XVIII L.P. 18A CR, 3.669%, (US0003M + 1.850%), 04/20/2031 | 1,129,946 | 0.0 |
| 1,000,000 | (1) | LCM XX L.P. 20A-CR, 3.769%, (US0003M + 1.950%), 10/20/2027 | 891,771 | 0.0 |
| 1,500,000 | (1) | LCM XX L.P. 20A-DR, 4.619%, (US0003M + 2.800%), 10/20/2027 | 1,194,270 | 0.0 |
| 2,800,000 | (1) | LCM XXII Ltd. 22A CR, 4.619%, (US0003M + 2.800%), 10/20/2028 | 2,121,616 | 0.1 |
| 944,101 | (1) | LCSS Financing 2018-A A LLC, 4.700%, 12/15/2062 | 986,502 | 0.0 |
| 1,000,000 | (1) | Madison Park Funding XIII Ltd. 2014-13A CR2, 3.719%, (US0003M + 1.900%), 04/19/2030 | 880,963 | 0.0 |
| 6,000,000 | (1) | Madison Park Funding XXI Ltd. 2016-21A BR, 4.681%, (US0003M + 2.850%), 10/15/2032 | 4,954,878 | 0.2 |
| 2,500,000 | (1) | Madison Park Funding XIX Ltd. 2015-19A B1R2, 2.717%, (US0003M + 1.850%), 01/22/2028 | 2,263,048 | 0.1 |
| 1,000,000 | (1) | Magnetite VIII Ltd. 2014-8A CR2, 3.681%, (US0003M + 1.850%), 04/15/2031 | 875,584 | 0.0 |
| 1,500,000 | (1) | Marlette Funding Trust 2018-1A C, 3.690%, 03/15/2028 | 1,475,599 | 0.1 |
| 1,700,000 | (1) | Marlette Funding Trust 2018-4A C, 4.910%, 12/15/2028 | 1,581,912 | 0.1 |
| 1,700,000 | (1) | Marlette Funding Trust 2019-1A B, 3.940%, 04/16/2029 | 1,539,412 | 0.1 |
See Accompanying Notes to Financial Statements
| 110 |
| Voya Strategic Income Opportunities Fund | PORTFOLIO OF INVESTMENTS |
| as of March31, 2020 (Continued) |
| 2,000,000 | (1) | Marlette Funding Trust 2019-2A C, 4.110%, 07/16/2029 | 1,493,228 | 0.1 |
| 4,050,000 | (1) | Marlette Funding Trust 2019-3A C, 3.790%, 09/17/2029 | 2,967,610 | 0.1 |
| 1,950,000 | (1) | Marlette Funding Trust 2019-4A B, 2.950%, 12/17/2029 | 1,717,079 | 0.1 |
| 1,600,000 | (1) | Marlette Funding Trust 2020-1A C, 2.800%, 03/15/2030 | 1,241,776 | 0.0 |
| 2,797,421 | (1) | Mill City Solar Loan 2019-2GS A Ltd., 3.690%, 07/20/2043 | 2,648,762 | 0.1 |
| 987,750 | (1) | Mosaic Solar Loan Trust 2018-1A A, 4.010%, 06/22/2043 | 949,633 | 0.0 |
| 2,426,756 | (1) | Mosaic Solar Loan Trust 2018-2-GS B, 4.740%, 02/22/2044 | 2,225,308 | 0.1 |
| 2,250,280 | (1) | Mosaic Solar Loan Trust 2019-1A A, 4.370%, 12/21/2043 | 2,229,353 | 0.1 |
| 1,171,391 | (1) | Mosaic Solar Loan Trust 2019-2A A, 2.880%, 09/20/2040 | 1,130,763 | 0.0 |
| 1,796,293 | (1) | Mosaic Solar Loans 2017-2A A LLC, 3.820%, 06/22/2043 | 1,797,461 | 0.1 |
| 3,500,000 | (1) | Neuberger Berman Loan Advisers CLO 24 Ltd. 2017-24A CR, 3.822%, (US0003M + 1.950%), 04/19/2030 | 3,050,824 | 0.1 |
| 2,300,000 | (1) | Neuberger Berman Loan Advisers CLO 33 Ltd. 2019-33A C, 4.590%, (US0003M + 2.450%), 10/16/2032 | 1,904,579 | 0.1 |
| 700,000 | (1) | Ocean Trails CLO IV 2013-4A DR, 4.707%, (US0003M + 3.000%), 08/13/2025 | 623,860 | 0.0 |
| 2,450,000 | (1) | OCP CLO 2015-8 Ltd. 2015-8A BR, 3.686%, (US0003M + 1.850%), 04/17/2027 | 2,269,408 | 0.1 |
| 2,000,000 | (1) | Octagon Investment Partners 31 Ltd. 2017-1A C, 4.219%, (US0003M + 2.400%), 07/20/2030 | 1,710,704 | 0.1 |
| 2,250,000 | (1) | Octagon Investment Partners 32 Ltd. 2017-1A C, 4.081%, (US0003M + 2.250%), 07/15/2029 | 1,915,533 | 0.1 |
| 600,000 | (1) | Octagon Investment Partners 33 Ltd. 2017-1A B, 3.669%, (US0003M + 1.850%), 01/20/2031 | 501,382 | 0.0 |
| 1,000,000 | (1) | Octagon Investment Partners XXIII Ltd. 2015-1A CR, 3.681%, (US0003M + 1.850%), 07/15/2027 | 903,771 | 0.0 |
| 1,500,000 | (1) | OHA Credit Funding 3 Ltd. 2019-3A C, 4.269%, (US0003M + 2.450%), 07/20/2032 | 1,261,347 | 0.1 |
| 1,545,000 | (1) | OHA Credit Partners IX Ltd. 2013-9A DR, 5.119%, (US0003M + 3.300%), 10/20/2025 | 1,419,702 | 0.1 |
| 1,500,000 | (1) | Palmer Square Loan Funding 2018-1A D Ltd., 5.781%, (US0003M + 3.950%), 04/15/2026 | 996,456 | 0.0 |
| 1,000,000 | (1) | Palmer Square Loan Funding 2018-1A E Ltd., 7.731%, (US0003M + 5.900%), 04/15/2026 | 616,228 | 0.0 |
| 1,500,000 | (1),(8) | Palmer Square Loan Funding 2018-2A C Ltd., 3.781%, (US0003M + 1.950%), 07/15/2026 | 1,159,025 | 0.0 |
| 3,000,000 | (1) | Palmer Square Loan Funding 2018-4 D Ltd., 5.942%, (US0003M + 4.250%), 11/15/2026 | 2,015,955 | 0.1 |
| 1,576,000 | (1) | Planet Fitness Master Issuer LLC 2018-1A A2I, 4.262%, 09/05/2048 | 1,504,498 | 0.1 |
| 550,523 | (3) | Popular ABS Mortgage Pass-Through Trust 2005-D A5, 3.741%, 01/25/2036 | 536,908 | 0.0 |
| 2,443,875 | (1) | Primose Funding LLC 2019-1A A2, 4.475%, 07/30/2049 | 2,256,703 | 0.1 |
| 670,000 | (1) | Recette CLO Ltd. 2015-1A DR, 4.569%, (US0003M + 2.750%), 10/20/2027 | 560,103 | 0.0 |
| 3,000,000 | (1) | Shackleton CLO Ltd. 2019-15A C, 4.703%, (US0003M + 2.800%), 01/15/2030 | 2,625,537 | 0.1 |
| 1,985,000 | (1) | Sofi Consumer Loan Program 2018-1 C Trust, 3.970%, 02/25/2027 | 1,636,775 | 0.1 |
| 2,050,000 | (1) | Sofi Consumer Loan Program 2018-2 C Trust, 4.250%, 04/26/2027 | 1,915,114 | 0.1 |
| 3,000,000 | (1) | SoFi Consumer Loan Program 2018-4 D Trust, 4.760%, 11/26/2027 | 2,644,437 | 0.1 |
| 2,750,000 | (1) | SoFi Consumer Loan Program 2019-1 D Trust, 4.420%, 02/25/2028 | 2,398,326 | 0.1 |
| 3,000,000 | (1) | SoFi Consumer Loan Program 2019-2 D Trust, 4.200%, 04/25/2028 | 2,105,119 | 0.1 |
| 4,000,000 | (1) | SoFi Consumer Loan Program 2019-3 D Trust, 3.890%, 05/25/2028 | 3,328,853 | 0.1 |
See Accompanying Notes to Financial Statements
| 111 |
| Voya Strategic Income Opportunities Fund | PORTFOLIO OF INVESTMENTS |
| as of March31, 2020 (Continued) |
| 2,000,000 | (1) | SoFi Consumer Loan Program 2019-4 C Trust, 2.840%, 08/25/2028 | 1,635,647 | 0.1 |
| 600,000 | (1) | SoFi Consumer Loan Program 2019-4 D Trust, 3.480%, 08/25/2028 | 486,563 | 0.0 |
| 770,000 | (1),(3) | SoFi Consumer Loan Program 2017-1 B, 4.730%, 01/26/2026 | 738,216 | 0.0 |
| 2,100,000 | (1) | SoFi Consumer Loan Program 2020-1 C Trust, 2.500%, 01/25/2029 | 1,653,204 | 0.1 |
| 1,200,000 | (1) | SoFi Consumer Loan Program 2020-1 D Trust, 2.940%, 01/25/2029 | 941,112 | 0.0 |
| 1,948,375 | (1) | Sonic Capital LLC 2020-1A A2I, 3.845%, 01/20/2050 | 1,896,050 | 0.1 |
| 5,150,000 | (1) | Sunnova Sol Issuer LLC 2020-1A A, 3.350%, 02/01/2055 | 3,820,878 | 0.2 |
| 1,927,993 | (1) | Sunrun Athena Issuer 2018-1 A LLC, 5.310%, 04/30/2049 | 1,724,477 | 0.1 |
| 3,826,061 | (1) | Sunrun Atlas Issuer 2019-2 A LLC, 3.610%, 01/30/2055 | 3,367,156 | 0.1 |
| 1,200,000 | (1) | Symphony Credit Opportunities Fund Ltd. 2015-2A CR, 4.091%, (US0003M + 2.260%), 07/15/2028 | 1,094,200 | 0.0 |
| 1,086,250 | (1) | Taco Bell Funding LLC 2018-1A A2II, 4.940%, 11/25/2048 | 1,070,198 | 0.0 |
| 1,000,000 | (1) | TCI-Flatiron Clo 2017-1A C Ltd., 3.542%, (US0003M + 1.850%), 11/18/2030 | 849,842 | 0.0 |
| 4,000,000 | (1) | TES 2017-2A B LLC, 6.990%, 02/20/2048 | 2,789,574 | 0.1 |
| 3,450,000 | (1) | TES LLC 2017-1A B, 7.740%, 10/20/2047 | 2,948,299 | 0.1 |
| 2,000,000 | (1) | THL Credit Wind River 2014-1 CRR CLO Ltd., 3.769%, (US0003M + 1.950%), 07/18/2031 | 1,628,234 | 0.1 |
| 1,000,000 | (1) | THL Credit Wind River 2016-1A CR CLO Ltd., 3.931%, (US0003M + 2.100%), 07/15/2028 | 890,813 | 0.0 |
| 2,000,000 | (1),(3) | Towd Point Mortgage Trust 2015-6 M2, 3.750%, 04/25/2055 | 1,880,397 | 0.1 |
| 2,500,000 | (1),(3) | Towd Point Mortgage Trust 2017-6 A2, 3.000%, 10/25/2057 | 2,329,429 | 0.1 |
| 1,500,000 | (1) | Upland CLO Ltd. 2016-1A BR, 3.669%, (US0003M + 1.850%), 04/20/2031 | 1,252,982 | 0.1 |
| 1,795,000 | (1) | Venture XX CLO Ltd. 2015-20A CR, 3.731%, (US0003M + 1.900%), 04/15/2027 | 1,543,664 | 0.1 |
| 2,785,875 | (1) | Wendys Funding LLC 2018-1A A2I, 3.573%, 03/15/2048 | 2,545,983 | 0.1 |
| 977,500 | (1) | Wendy's Funding LLC 2018-1A A2II, 3.884%, 03/15/2048 | 886,123 | 0.0 |
| 3,357,500 | (1) | Wendy's Funding LLC 2019-1A A2I, 3.783%, 06/15/2049 | 3,198,623 | 0.1 |
| 2,000,000 | (1) | West CLO 2014-2A BR Ltd., 3.593%, (US0003M + 1.750%), 01/16/2027 | 1,858,172 | 0.1 |
| 235,591,425 | 9.2 | |||
| Student Loan Asset-Backed Securities: 1.2% | ||||
| 551,931 | (1) | Commonbond Student Loan Trust 2018-CGS C, 4.350%, 02/25/2046 | 561,262 | 0.0 |
| 4,779,820 | (1) | Commonbond Student Loan Trust 2019-A-GS A1, 2.540%, 01/25/2047 | 4,867,038 | 0.2 |
| 258,932 | (1) | Earnest Student Loan Program, LLC 2017-A C, 4.130%, 01/25/2041 | 258,663 | 0.0 |
| 1,086,000 | (1) | ELFI Graduate Loan Program 2018-A B LLC, 4.000%, 08/25/2042 | 1,112,601 | 0.1 |
| 2,150,000 | (1),(3) | ELFI Graduate Loan Program 2019-A B LLC, 2.940%, 03/25/2044 | 2,179,364 | 0.1 |
| 1,215,411 | (1) | Laurel Road Prime Student Loan Trust 2018-B BFX, 3.720%, 05/26/2043 | 1,181,778 | 0.1 |
| 4,000,000 | (1) | SMB Private Education Loan Trust 2014-A C, 4.500%, 09/15/2045 | 3,915,323 | 0.2 |
| 1,000,000 | (1) | SMB Private Education Loan Trust 2017-A B, 3.500%, 06/17/2041 | 1,038,473 | 0.0 |
| 2,250,000 | (1),(3) | SoFi Professional Loan Program 2017-A B LLC, 3.440%, 03/26/2040 | 2,317,394 | 0.1 |
| 1,000,000 | (1),(3) | SoFi Professional Loan Program 2017-A C, 4.430%, 03/26/2040 | 1,055,861 | 0.0 |
| 1,000,000 | (1),(3) | SoFi Professional Loan Program 2017-C C, 4.210%, 07/25/2040 | 1,046,712 | 0.0 |
| 1,000,000 | (1) | SoFi Professional Loan Program 2017-E C LLC, 4.160%, 11/26/2040 | 1,053,020 | 0.0 |
| 1,000,000 | (1) | Sofi Professional Loan Program 2018-D BFX Trust, 4.140%, 02/25/2048 | 1,032,126 | 0.0 |
| 2,000,000 | (1) | Sofi Professional Loan Program 2019-B BFX LLC, 3.730%, 08/17/2048 | 2,088,770 | 0.1 |
| 3,000,000 | (1) | Sofi Professional Loan Program 2019-C BFX LLC, 3.050%, 11/16/2048 | 3,025,433 | 0.1 |
See Accompanying Notes to Financial Statements
| 112 |
| Voya Strategic Income Opportunities Fund | PORTFOLIO OF INVESTMENTS |
| as of March31, 2020 (Continued) |
| 4,400,000 | (1) | SoFi Professional Loan Program 2020-B BFX Trust, 2.730%, 05/15/2046 | 4,407,927 | 0.2 |
| 31,141,745 | 1.2 | |||
| Total Asset-Backed Securities | ||||
| (Cost $348,224,383) | 308,841,383 | 12.0 | ||
| BANK LOANS: 13.5% | ||||
| Aerospace & Defense: 0.4% | ||||
| 1,324,402 | AI Convoy (Luxembourg) S.A.R.L USD Term Loan B, 5.340%, (US0003M + 3.500%), 01/17/2027 | 1,244,937 | 0.1 | |
| 1,395,099 | Amentum Government Services Holdings LLC Term Loan B, 4.989%, (US0001M + 4.000%), 02/01/2027 | 1,318,369 | 0.1 | |
| 2,327,328 | American Airlines, Inc. 2018 Term Loan B, 2.709%, (US0001M + 1.750%), 06/27/2025 | 1,920,046 | 0.1 | |
| 226,136 | Dynasty Acquisition Co., Inc. 2020 CAD Term Loan B2, 4.950%, (US0003M + 3.500%), 04/06/2026 | 178,195 | 0.0 | |
| 420,614 | Dynasty Acquisition Co., Inc. 2020 Term Loan B1, 4.950%, (US0003M + 3.500%), 04/06/2026 | 331,444 | 0.0 | |
| 1,260,817 | KBR, Inc. 2020 Term Loan B, 3.739%, (US0001M + 2.750%), 02/05/2027 | 1,115,823 | 0.0 | |
| 933,068 | Maxar Technologies Ltd. Term Loan B, 3.739%, (US0003M + 2.750%), 10/04/2024 | 807,104 | 0.0 | |
| 655,000 | Science Applications International Corporation 2020 Incremental Term Loan B, 3.701%, (US0003M + 2.250%), 03/05/2027 | 623,887 | 0.0 | |
| 498,750 | TransDigm, Inc. 2020 Term Loan E, 3.239%, (US0001M + 2.250%), 05/30/2025 | 466,331 | 0.0 | |
| 1,286,998 | TransDigm, Inc. 2020 Term Loan F, 3.239%, (US0001M + 2.250%), 12/09/2025 | 1,203,343 | 0.0 | |
| 2,220,289 | TransDigm, Inc. 2020 Term Loan G, 3.239%, (US0001M + 2.250%), 08/22/2024 | 2,075,970 | 0.1 | |
| 11,285,449 | 0.4 | |||
| Auto Components: 0.0% | ||||
| 1,267,532 | Broadstreet Partners, Inc. 2020 Term Loan B, 4.294%, (US0001M + 3.250%), 01/27/2027 | 1,138,402 | 0.0 | |
| Automotive: 0.7% | ||||
| 3,337,774 | American Axle and Manufacturing, Inc. Term Loan B, 3.200%, (US0001M + 2.250%), 04/06/2024 | 2,828,764 | 0.1 | |
| 337,875 | Autokiniton US Holdings, Inc. Term Loan, 6.739%, (US0001M + 5.750%), 05/22/2025 | 277,902 | 0.0 | |
| 136,020 | Belron Finance US LLC 2018 Term Loan B, 3.957%, (US0003M + 2.250%), 11/13/2025 | 129,219 | 0.0 | |
| 1,136,364 | Belron Finance US LLC 2019 USD Term Loan B, 4.270%, (US0003M + 2.500%), 10/30/2026 | 1,079,545 | 0.0 | |
| 1,610,375 | Belron Finance US LLC USD Term Loan B, 3.992%, (US0003M + 2.250%), 11/07/2024 | 1,529,857 | 0.1 | |
| 492 | Bright Bidco B.V. 2018 Term Loan B, 4.573%, (US0006M + 3.500%), 06/30/2024 | 175 | 0.0 | |
| 1,182,038 | Dealer Tire, LLC 2020 Term Loan B, 5.239%, (US0001M + 4.250%), 12/12/2025 | 981,091 | 0.0 | |
| 3,104,601 | Gates Global LLC 2017 USD Repriced Term Loan B, 3.750%, (US0001M + 2.750%), 04/01/2024 | 2,794,141 | 0.1 | |
| 1,858,092 | Hertz Corporation, (The) 2016 Term Loan B, 3.739%, (US0001M + 2.750%), 06/30/2023 | 1,331,633 | 0.1 | |
| 148,500 | Holley Purchaser, Inc. Term Loan B, 6.777%, (US0003M + 5.000%), 10/24/2025 | 123,997 | 0.0 | |
| 525,000 | Innovative Xcessories & Services LLC 2020 Term Loan B, 6.451%, (US0003M + 5.000%), 02/26/2027 | 396,375 | 0.0 | |
| 1,761,016 | KAR Auction Services, Inc. 2019 Term Loan B6, 3.188%, (US0001M + 2.250%), 09/19/2026 | 1,637,745 | 0.1 | |
| 57,619 | Mister Car Wash Holdings, Inc. 2019 Delayed Draw Term Loan, 3.862%, (US0001M + 3.250%), 05/14/2026 | 48,304 | 0.0 | |
See Accompanying Notes to Financial Statements
| 113 |
| Voya Strategic Income Opportunities Fund | PORTFOLIO OF INVESTMENTS |
| as of March31, 2020 (Continued) |
| 1,143,739 | Mister Car Wash Holdings, Inc. 2019 Term Loan B, 3.862%, (US0001M + 3.250%), 05/14/2026 | 946,444 | 0.0 | |
| 1,756,175 | Panther BF Aggregator 2 LP USD Term Loan B, 4.441%, (US0001M + 3.500%), 04/30/2026 | 1,615,681 | 0.1 | |
| 1,636,966 | Truck Hero, Inc. 1st Lien Term Loan, 4.739%, (US0001M + 3.750%), 04/22/2024 | 1,257,735 | 0.1 | |
| 1,000,000 | Wand NewCo 3, Inc. 2020 Term Loan, 4.072%, (US0006M + 3.000%), 02/05/2026 | 915,000 | 0.0 | |
| 17,893,608 | 0.7 | |||
| Beverage & Tobacco: 0.1% | ||||
| 1,965,250 | Sunshine Investments B.V. USD Term Loan B3, 4.954%, (US0002M + 3.250%), 03/28/2025 | 1,827,682 | 0.1 | |
| Brokers, Dealers & Investment Houses: 0.1% | ||||
| 2,484,874 | Brookfield Property REIT Inc. 1st Lien Term Loan B, 3.489%, (US0001M + 2.500%), 08/27/2025 | 1,784,140 | 0.1 | |
| 941,225 | Forest City Enterprises, L.P. 2019 Term Loan B, 4.489%, (US0001M + 3.500%), 12/08/2025 | 809,453 | 0.0 | |
| 2,593,593 | 0.1 | |||
| Building & Development: 0.4% | ||||
| 427,418 | Advanced Drainage Systems Inc Term Loan B, 3.813%, (US0001M + 2.250%), 07/31/2026 | 399,635 | 0.0 | |
| 690,000 | Arconic Rolled Products Corporation Term Loan B, 4.213%, (US0003M + 2.750%), 02/04/2027 | 631,350 | 0.0 | |
| 2,130,826 | Core & Main LP 2017 Term Loan B, 4.331%, (US0001M + 2.750%), 08/01/2024 | 1,885,781 | 0.1 | |
| 1,822,720 | GYP Holdings III Corp. 2018 Term Loan B, 3.739%, (US0001M + 2.750%), 06/01/2025 | 1,658,675 | 0.1 | |
| 989,155 | Henry Company LLC Term Loan B, 5.000%, (US0001M + 4.000%), 10/05/2023 | 849,024 | 0.0 | |
| 147,750 | Interior Logic Group Holdings IV LLC 2018 Term Loan B, 4.989%, (US0001M + 4.000%), 05/30/2025 | 128,543 | 0.0 | |
| 1,879,141 | MX Holdings US, Inc. 2018 USD Term Loan B1C, 3.739%, (US0001M + 2.750%), 07/31/2025 | 1,625,457 | 0.1 | |
| 1,895,250 | Quikrete Holdings Inc Term Loan, 3.489%, (US0001M + 2.500%), 02/01/2027 | 1,648,868 | 0.1 | |
| 644,080 | Werner FinCo LP 2017 Term Loan, 5.000%, (US0001M + 4.000%), 07/24/2024 | 570,011 | 0.0 | |
| 1,500,000 | Zekelman Industries, Inc. 2020 Term Loan, 3.209%, (US0001M + 2.250%), 01/24/2027 | 1,402,500 | 0.0 | |
| 10,799,844 | 0.4 | |||
| Business Equipment & Services: 1.2% | ||||
| 442,261 | 24-7 Intouch Inc 2018 Term Loan, 5.739%, (US0001M + 4.750%), 08/25/2025 | 373,711 | 0.0 | |
| 2,561,345 | AlixPartners, LLP 2017 Term Loan B, 3.500%, (US0001M + 2.500%), 04/04/2024 | 2,388,454 | 0.1 | |
| 640,547 | Ascend Learning, LLC 2017 Term Loan B, 4.000%, (US0001M + 3.000%), 07/12/2024 | 580,763 | 0.0 | |
| 215,899 | Big Ass Fans, LLC 2018 Term Loan, 5.200%, (US0003M + 3.750%), 05/21/2024 | 189,991 | 0.0 | |
| 755,000 | Castle US Holding Corporation USD Term Loan B, 5.200%, (US0001M + 3.750%), 01/29/2027 | 657,794 | 0.0 | |
| 584,594 | Colorado Buyer Inc Term Loan B, 4.000%, (US0001M + 3.000%), 05/01/2024 | 397,037 | 0.0 | |
| 1,140,115 | Convergint Technologies LLC 2018 1st Lien Term Loan, 3.989%, (US0001M + 3.000%), 02/03/2025 | 986,200 | 0.0 | |
| 1,911,930 | EIG Investors Corp. 2018 1st Lien Term Loan, 5.388%, (US0003M + 3.750%), 02/09/2023 | 1,567,783 | 0.1 | |
| 921,610 | Ellie Mae, Inc. Term Loan, 5.200%, (US0003M + 3.750%), 04/17/2026 | 810,249 | 0.0 | |
| 787,479 | EVO Payments International LLC 2018 1st Lien Term Loan, 4.200%, (US0001M + 3.250%), 12/22/2023 | 685,107 | 0.0 | |
| 883,744 | GreenSky Holdings, LLC 2018 Term Loan B, 4.250%, (US0001M + 3.250%), 03/31/2025 | 729,089 | 0.0 | |
| 400,871 | ION Trading Technologies S.a.r.l. USD Incremental Term Loan B, 5.072%, (US0003M + 4.000%), 11/21/2024 | 304,662 | 0.0 | |
See Accompanying Notes to Financial Statements
| 114 |
| Voya Strategic Income Opportunities Fund | PORTFOLIO OF INVESTMENTS |
| as of March31, 2020 (Continued) |
| 146,512 | IQOR US Inc. Term Loan B, 6.909%, (US0003M + 5.000%), 04/01/2021 | 87,724 | 0.0 | |
| 1,731,401 | KUEHG Corp. 2018 Incremental Term Loan, 5.200%, (US0003M + 3.750%), 02/21/2025 | 1,302,879 | 0.1 | |
| 1,036,434 | Learning Care Group, Inc. 2018 1st Lien Term Loan, 4.984%, (US0003M + 3.250%), 03/13/2025 | 834,329 | 0.0 | |
| 100,000 | Learning Care Group, Inc. 2018 2nd Lien Term Loan, 9.294%, (US0003M + 7.500%), 03/13/2026 | 89,000 | 0.0 | |
| 1,385,054 | PI US MergerCo, Inc. USD 2017 1st Lien Term Loan, 4.700%, (US0003M + 3.250%), 01/03/2025 | 1,187,684 | 0.1 | |
| 1,624,587 | Pre-Paid Legal Services, Inc. 2018 1st Lien Term Loan, 4.239%, (US0001M + 3.250%), 05/01/2025 | 1,389,022 | 0.1 | |
| 1,489,383 | Prometric Holdings, Inc. 1st Lien Term Loan, 4.000%, (US0001M + 3.000%), 01/29/2025 | 1,154,271 | 0.1 | |
| 2,503,476 | Red Ventures, LLC 2020 Term Loan B, 3.489%, (US0001M + 2.500%), 11/08/2024 | 2,111,264 | 0.1 | |
| 641,715 | Renaissance Learning, Inc. 2018 Add On Term Loan, 4.239%, (US0001M + 3.250%), 05/30/2025 | 571,127 | 0.0 | |
| 1,144,074 | Research Now Group, Inc. 2017 1st Lien Term Loan, 7.263%, (US0003M + 5.500%), 12/20/2024 | 1,029,667 | 0.1 | |
| 265,000 | Rockwood Service Corporation 2020 Term Loan, 5.700%, (US0003M + 4.250%), 01/23/2027 | 241,481 | 0.0 | |
| 1,629,213 | Solera Holdings, Inc. USD Term Loan B, 4.363%, (US0003M + 2.750%), 03/03/2023 | 1,527,387 | 0.1 | |
| 261,173 | SSH Group Holdings, Inc. 2018 1st Lien Term Loan, 5.700%, (US0003M + 4.250%), 07/30/2025 | 210,897 | 0.0 | |
| 1,550,794 | Staples, Inc. 7 Year Term Loan, 6.515%, (US0001M + 5.000%), 04/16/2026 | 1,246,450 | 0.1 | |
| 665,000 | STG-Fairway Holdings, LLC Term Loan B, 4.572%, (US0006M + 3.500%), 01/31/2027 | 608,475 | 0.0 | |
| 364,432 | SurveyMonkey Inc. 2018 Term Loan B, 4.370%, (US0001W + 3.750%), 10/10/2025 | 300,657 | 0.0 | |
| 1,292,406 | Verifone Systems, Inc. 2018 1st Lien Term Loan, 5.695%, (US0003M + 4.000%), 08/20/2025 | 857,296 | 0.0 | |
| 1,111,832 | Verra Mobility Corporation 2020 Term Loan B, 4.239%, (US0001M + 3.250%), 02/28/2025 | 1,006,208 | 0.0 | |
| 2,006,981 | Verscend Holding Corp. 2018 Term Loan B, 5.489%, (US0001M + 4.500%), 08/27/2025 | 1,906,632 | 0.1 | |
| 610,000 | VS Buyer, LLC Term Loan B, 4.863%, (US0003M + 3.250%), 02/28/2027 | 588,650 | 0.0 | |
| 1,393,027 | West Corporation 2017 Term Loan, 5.450%, (US0003M + 4.000%), 10/10/2024 | 1,072,631 | 0.1 | |
| 686,550 | West Corporation 2018 Term Loan B1, 4.950%, (US0003M + 3.500%), 10/10/2024 | 516,285 | 0.0 | |
| 630,008 | Yak Access, LLC 2018 1st Lien Term Loan B, 6.450%, (US0003M + 5.000%), 07/11/2025 | 475,656 | 0.0 | |
| 100,000 | Yak Access, LLC 2018 2nd Lien Term Loan B, 11.204%, (US0003M + 10.000%), 07/10/2026 | 62,500 | 0.0 | |
| 30,049,012 | 1.2 | |||
| Cable & Satellite Television: 0.3% | ||||
| 2,038,112 | CSC Holdings, LLC 2019 Term Loan B5, 3.112%, (US0001M + 2.500%), 04/15/2027 | 1,973,572 | 0.1 | |
| 1,477,348 | Radiate Holdco, LLC 1st Lien Term Loan, 3.989%, (US0001M + 3.000%), 02/01/2024 | 1,370,978 | 0.0 | |
| 598,500 | Telesat Canada Term Loan B5, 3.740%, (US0001M + 2.750%), 12/07/2026 | 558,101 | 0.0 | |
| 1,110,000 | UPC Broadband Holding B.V. 2020 USD Term Loan B, 2.955%, (US0001M + 2.250%), 04/30/2028 | 1,008,250 | 0.0 | |
| 2,149,808 | Virgin Media Bristol LLC USD Term Loan N, 3.205%, (US0001M + 2.500%), 01/31/2028 | 2,047,692 | 0.1 | |
See Accompanying Notes to Financial Statements
| 115 |
| Voya Strategic Income Opportunities Fund | PORTFOLIO OF INVESTMENTS |
| as of March31, 2020 (Continued) |
| 1,994,885 | WideOpenWest Finance LLC 2017 Term Loan B, 4.250%, (US0001M + 3.250%), 08/18/2023 | 1,822,826 | 0.1 | |
| 8,781,419 | 0.3 | |||
| Chemicals & Plastics: 0.4% | ||||
| 1,340,206 | Alpha 3 B.V. 2017 Term Loan B1, 4.450%, (US0003M + 3.000%), 01/31/2024 | 1,243,041 | 0.1 | |
| 278,600 | Ascend Performance Materials Operations LLC 2019 Term Loan B, 6.700%, (US0003M + 5.250%), 08/27/2026 | 247,954 | 0.0 | |
| 669,850 | Composite Resins Holding B.V. 2018 Term Loan B, 5.255%, (US0001M + 4.250%), 08/01/2025 | 599,515 | 0.0 | |
| 634,659 | Diamond (BC) B.V. USD Term Loan, 4.777%, (US0003M + 3.000%), 09/06/2024 | 490,274 | 0.0 | |
| 1,553,485 | Encapsys, LLC 2020 Term Loan B2, 4.250%, (US0001M + 3.250%), 11/07/2024 | 1,242,788 | 0.1 | |
| 891,231 | Polar US Borrower, LLC 2018 1st Lien Term Loan, 6.609%, (US0003M + 4.750%), 10/15/2025 | 779,827 | 0.0 | |
| 1,587,859 | Starfruit Finco B.V 2018 USD Term Loan B, 3.863%, (US0001M + 3.000%), 10/01/2025 | 1,452,891 | 0.1 | |
| 2,494,013 | Tronox Finance LLC Term Loan B, 3.930%, (US0001M + 2.750%), 09/23/2024 | 2,242,534 | 0.1 | |
| 500,000 | Univar Inc. 2017 USD Term Loan B, 4.484%, (US0001M + 2.250%), 07/01/2024 | 468,750 | 0.0 | |
| 443,888 | Univar Inc. 2019 USD Term Loan B5, 3.450%, (US0003M + 2.000%), 07/01/2026 | 406,157 | 0.0 | |
| 9,173,731 | 0.4 | |||
| Clothing/Textiles: 0.0% | ||||
| 1,230,462 | Varsity Brands, Inc. 2017 Term Loan B, 4.500%, (US0001M + 3.500%), 12/15/2024 | 974,116 | 0.0 | |
| Consumer, Cyclical: 0.0% | ||||
| 973,887 | 24 Hour Fitness Worldwide, Inc. 2018 Term Loan B, 4.950%, (US0003M + 3.500%), 05/30/2025 | 241,848 | 0.0 | |
| 501,601 | Harbor Freight Tools USA, Inc. 2018 Term Loan B, 4.299%, (US0001M + 2.500%), 08/19/2023 | 460,219 | 0.0 | |
| 702,067 | 0.0 | |||
| Containers & Glass Products: 0.6% | ||||
| 890,677 | Albea Beauty Holdings S.A 2018 USD Term Loan B2, 4.907%, (US0006M + 3.000%), 04/22/2024 | 723,675 | 0.0 | |
| 3,143,781 | Berry Global, Inc. 2019 Term Loan Y, 2.863%, (US0001M + 2.000%), 07/01/2026 | 2,977,161 | 0.1 | |
| 1,278,768 | Bway Holding Company 2017 Term Loan B, 5.084%, (US0003M + 3.250%), 04/03/2024 | 1,061,378 | 0.0 | |
| 1,378,128 | Charter NEX US, Inc. Incremental Term Loan, 4.489%, (US0001M + 3.500%), 05/16/2024 | 1,215,050 | 0.1 | |
| 806,699 | Flex Acquisition Company, Inc. 1st Lien Term Loan, 4.898%, (US0003M + 3.000%), 12/29/2023 | 719,307 | 0.0 | |
| 2,018,888 | Flex Acquisition Company, Inc. 2018 Incremental Term Loan, 5.159%, (US0003M + 3.250%), 06/29/2025 | 1,800,176 | 0.1 | |
| 684,715 | Plastipak Packaging, Inc. 2018 Term Loan B, 3.490%, (US0001M + 2.500%), 10/14/2024 | 631,649 | 0.0 | |
| 1,195,000 | Reynolds Consumer Products LLC Term Loan, 3.501%, (US0003M + 1.750%), 02/04/2027 | 1,134,503 | 0.1 | |
| 2,453,084 | Reynolds Group Holdings Inc. USD 2017 Term Loan, 3.739%, (US0001M + 2.750%), 02/05/2023 | 2,339,629 | 0.1 | |
| 888,189 | Ring Container Technologies Group, LLC 1st Lien Term Loan, 3.739%, (US0001M + 2.750%), 10/31/2024 | 777,165 | 0.0 | |
| 1,787,961 | TricorBraun Hldgs Inc First Lien Term Loan, 5.202%, (US0003M + 3.750%), 11/30/2023 | 1,497,417 | 0.1 | |
| 14,877,110 | 0.6 | |||
| Cosmetics/Toiletries: 0.1% | ||||
| 147,375 | Anastasia Parent, LLC 2018 Term Loan B, 4.822%, (US0006M + 3.750%), 08/11/2025 | 88,916 | 0.0 | |
See Accompanying Notes to Financial Statements
| 116 |
| Voya Strategic Income Opportunities Fund | PORTFOLIO OF INVESTMENTS |
| as of March31, 2020 (Continued) |
| 1,720,915 | Wellness Merger Sub, Inc. 1st Lien Term Loan, 5.863%, (US0003M + 4.250%), 06/30/2024 | 1,370,996 | 0.1 | |
| 1,459,912 | 0.1 | |||
| Drugs: 0.0% | ||||
| 1,038,362 | Horizon Therapeutics USA Inc Term Loan B, 3.313%, (US0001M + 2.250%), 05/22/2026 | 983,848 | 0.0 | |
| Ecological Services & Equipment: 0.0% | ||||
| 1,090,466 | GFL Environmental Inc. 2018 USD Term Loan B, 3.991%, (US0001M + 3.000%), 05/30/2025 | 1,063,885 | 0.0 | |
| Electronics/Electrical: 2.0% | ||||
| 420,084 | ABC Financial Services, Inc. 1st Lien Term Loan, 5.250%, (US0001M + 4.250%), 01/02/2025 | 325,565 | 0.0 | |
| 1,533,405 | Barracuda Networks, Inc. 1st Lien Term Loan, 4.517%, (US0003M + 3.250%), 02/12/2025 | 1,423,511 | 0.1 | |
| 1,191,763 | BMC Software Finance, Inc. 2018 USD Term Loan B, 5.239%, (US0001M + 4.250%), 10/02/2025 | 1,021,341 | 0.0 | |
| 642,085 | Brave Parent Holdings, Inc. 1st Lien Term Loan, 5.777%, (US0003M + 4.000%), 04/18/2025 | 560,754 | 0.0 | |
| 678,447 | Cohu, Inc. 2018 Term Loan B, 3.989%, (US0001M + 3.000%), 10/01/2025 | 508,835 | 0.0 | |
| 1,013,536 | Compuware Corporation 2018 Term Loan B, 4.989%, (US0001M + 4.000%), 08/22/2025 | 983,130 | 0.0 | |
| 148,500 | EagleView Technology Corporation 2018 Add On Term Loan B, 5.113%, (US0003M + 3.500%), 08/14/2025 | 126,225 | 0.0 | |
| 394,856 | Electrical Components International, Inc. 2018 1st Lien Term Loan, 5.239%, (US0003M + 4.250%), 06/26/2025 | 298,116 | 0.0 | |
| 2,120,744 | Epicor Software Corporation 1st Lien Term Loan, 4.250%, (US0001M + 3.250%), 06/01/2022 | 1,966,990 | 0.1 | |
| 406,117 | Exact Merger Sub LLC 1st Lien Term Loan, 5.700%, (US0003M + 4.250%), 09/27/2024 | 364,828 | 0.0 | |
| 890,525 | GlobalFoundries Inc USD Term Loan B, 6.200%, (US0003M + 4.750%), 06/05/2026 | 765,851 | 0.0 | |
| 1,553,612 | Greeneden U.S. Holdings II, LLC 2018 USD Term Loan B, 4.239%, (US0001M + 3.250%), 12/01/2023 | 1,406,019 | 0.1 | |
| 593,513 | Helios Software Holdings, Inc. USD Term Loan, 5.322%, (US0006M + 4.250%), 10/24/2025 | 504,486 | 0.0 | |
| 250,000 | Hyland Software, Inc. 2017 2nd Lien Term Loan, 7.989%, (US0001M + 7.000%), 07/07/2025 | 236,250 | 0.0 | |
| 1,668,170 | Hyland Software, Inc. 2018 1st Lien Term Loan, 4.489%, (US0001M + 3.250%), 07/01/2024 | 1,558,349 | 0.1 | |
| 1,210,850 | Imperva, Inc. 1st Lien Term Loan, 5.704%, (US0003M + 4.000%), 01/12/2026 | 1,008,033 | 0.0 | |
| 110,000 | Imperva, Inc. 2nd Lien Term Loan, 9.442%, (US0003M + 7.750%), 01/10/2027 | 99,000 | 0.0 | |
| 1,131,980 | Infor (US), Inc. Term Loan B6, 3.750%, (US0001M + 2.750%), 02/01/2022 | 1,097,454 | 0.0 | |
| 1,560,000 | Informatica LLC 2020 USD Term Loan B, 4.239%, (US0001M + 3.250%), 02/25/2027 | 1,380,600 | 0.1 | |
| 2,554,359 | Kronos Incorporated 2017 Term Loan B, 4.763%, (US0003M + 3.000%), 11/01/2023 | 2,365,975 | 0.1 | |
| 249,921 | MA FinanceCo., LLC USD Term Loan B3, 3.489%, (US0001M + 2.500%), 06/21/2024 | 227,845 | 0.0 | |
| 3,878,573 | McAfee, LLC 2018 USD Term Loan B, 4.691%, (US0001M + 3.750%), 09/30/2024 | 3,620,000 | 0.1 | |
| 3,367,768 | MH Sub I, LLC 2017 1st Lien Term Loan, 4.822%, (US0006M + 3.750%), 09/13/2024 | 2,929,958 | 0.1 | |
| 400,000 | MH Sub I, LLC 2017 2nd Lien Term Loan, 8.572%, (US0006M + 7.500%), 09/15/2025 | 325,000 | 0.0 | |
| 2,007,793 | Project Boost Purchaser, LLC 2019 Term Loan B, 4.489%, (US0001M + 3.500%), 06/01/2026 | 1,656,429 | 0.1 | |
See Accompanying Notes to Financial Statements
| 117 |
| Voya Strategic Income Opportunities Fund | PORTFOLIO OF INVESTMENTS |
| as of March31, 2020 (Continued) |
| 669,044 | Project Leopard Holdings, Inc. 2019 Term Loan, 5.700%, (US0003M + 4.250%), 07/07/2023 | 598,794 | 0.0 | |
| 2,552,850 | Quest Software US Holdings Inc. 2018 1st Lien Term Loan, 6.027%, (US0003M + 4.250%), 05/16/2025 | 1,997,605 | 0.1 | |
| 115,000 | Quest Software US Holdings Inc. 2018 2nd Lien Term Loan, 10.027%, (US0003M + 8.250%), 05/18/2026 | 70,437 | 0.0 | |
| 2,776,035 | Rackspace Hosting, Inc. 2017 Incremental 1st Lien Term Loan, 4.762%, (US0003M + 3.000%), 11/03/2023 | 2,519,252 | 0.1 | |
| 739,436 | Riverbed Technology, Inc. 2016 Term Loan, 4.250%, (US0001M + 3.250%), 04/24/2022 | 487,288 | 0.0 | |
| 90,000 | Rocket Software, Inc. 2018 2nd Lien Term Loan, 9.239%, (US0001M + 8.250%), 11/27/2026 | 60,300 | 0.0 | |
| 1,819,181 | Rocket Software, Inc. 2018 Term Loan, 5.239%, (US0001M + 4.250%), 11/28/2025 | 1,506,888 | 0.1 | |
| 1,877,876 | RP Crown Parent LLC Term Loan B, 3.750%, (US0001M + 2.750%), 10/12/2023 | 1,802,761 | 0.1 | |
| 1,687,778 | Seattle Spinco, Inc. USD Term Loan B3, 3.489%, (US0001M + 2.500%), 06/21/2024 | 1,538,692 | 0.1 | |
| 947,849 | Sirius Computer Solutions, Inc. 2020 Term Loan, 4.489%, (US0001M + 3.500%), 07/01/2026 | 836,477 | 0.0 | |
| 392,735 | SkillSoft Corporation 1st Lien Term Loan, 6.527%, (US0003M + 4.750%), 04/28/2021 | 258,550 | 0.0 | |
| 2,987,265 | SolarWinds Holdings, Inc. 2018 Term Loan B, 3.739%, (US0001M + 2.750%), 02/05/2024 | 2,787,118 | 0.1 | |
| 634,481 | SonicWall US Holdings Inc. 1st Lien Term Loan, 5.195%, (US0003M + 3.500%), 05/16/2025 | 527,677 | 0.0 | |
| 100,000 | SonicWall US Holdings Inc. 2nd Lien Term Loan, 9.195%, (US0003M + 7.500%), 05/18/2026 | 79,250 | 0.0 | |
| 326,116 | SS&C Technologies Holdings Europe S.A.R.L. 2018 Term Loan B4, 2.739%, (US0001M + 1.750%), 04/16/2025 | 310,626 | 0.0 | |
| 457,022 | SS&C Technologies Inc. 2018 Term Loan B3, 2.739%, (US0001M + 1.750%), 04/16/2025 | 435,313 | 0.0 | |
| 1,334,098 | Surf Holdings, LLC USD Term Loan, 4.814%, (US0003M + 3.500%), 03/05/2027 | 1,197,353 | 0.1 | |
| 1,333,278 | Travelport Finance (Luxembourg) S.a.r.l. 2019 Term Loan, 6.072%, (US0003M + 5.000%), 05/29/2026 | 885,519 | 0.0 | |
| 643,500 | TriTech Software Systems 2018 Term Loan B, 5.200%, (US0003M + 3.750%), 08/29/2025 | 501,930 | 0.0 | |
| 1,424,292 | TTM Technologies, Inc. 2017 Term Loan, 4.081%, (US0001M + 2.500%), 09/28/2024 | 1,338,835 | 0.1 | |
| 1,355,681 | Ultimate Software Group Inc(The) Term Loan B, 4.739%, (US0001M + 3.750%), 05/04/2026 | 1,281,119 | 0.1 | |
| 1,649,024 | Veritas Bermuda Ltd. USD Repriced Term Loan B, 5.950%, (US0003M + 4.500%), 01/27/2023 | 1,409,916 | 0.1 | |
| 2,114,711 | Vertafore, Inc. 2018 1st Lien Term Loan, 4.239%, (US0001M + 3.250%), 07/02/2025 | 1,908,527 | 0.1 | |
| 350,000 | Vertafore, Inc. 2018 2nd Lien Term Loan, 8.239%, (US0001M + 7.250%), 07/02/2026 | 310,917 | 0.0 | |
| 73,181 | Web.com Group, Inc. 2018 2nd Lien Term Loan, 8.945%, (US0003M + 7.750%), 10/09/2026 | 56,532 | 0.0 | |
| 390,845 | Web.com Group, Inc. 2018 Term Loan B, 4.945%, (US0003M + 3.750%), 10/10/2025 | 325,378 | 0.0 | |
| 542,466 | Xperi Corporation 2018 Term Loan B1, 3.489%, (US0001M + 2.500%), 12/01/2023 | 504,493 | 0.0 | |
| 52,298,091 | 2.0 | |||
| Financial: 0.0% | ||||
| 1,179,908 | Blucora, Inc. 2017 Term Loan B, 4.450%, (US0003M + 3.000%), 05/22/2024 | 1,079,616 | 0.0 | |
See Accompanying Notes to Financial Statements
| 118 |
| Voya Strategic Income Opportunities Fund | PORTFOLIO OF INVESTMENTS |
| as of March31, 2020 (Continued) |
| Financial Intermediaries: 0.4% | ||||
| 185,250 | Advisor Group, Inc. 2019 Term Loan B, 5.989%, (US0001M + 5.000%), 07/31/2026 | 142,642 | 0.0 | |
| 2,129,143 | Blackhawk Network Holdings, Inc 2018 1st Lien Term Loan, 3.989%, (US0001M + 3.000%), 06/15/2025 | 1,760,092 | 0.1 | |
| 997,245 | Blackstone Mortgage Trust, Inc. 2019 Term Loan B, 3.239%, (US0001M + 2.250%), 04/23/2026 | 872,590 | 0.0 | |
| 940,603 | Cushman & Wakefield U.S. Borrower, LLC 2020 Term Loan B, 3.739%, (US0001M + 2.750%), 08/21/2025 | 846,543 | 0.0 | |
| 770,000 | Deerfield Dakota Holding, LLC 2020 USD Term Loan B, 5.201%, (US0003M + 3.750%), 03/05/2027 | 662,200 | 0.0 | |
| 3,389,056 | Edelman Financial Center, LLC 2018 1st Lien Term Loan, 4.179%, (US0001M + 3.250%), 07/21/2025 | 2,925,884 | 0.1 | |
| 1,266,416 | First Eagle Holdings, Inc. 2020 Term Loan B, 3.950%, (US0003M + 2.500%), 02/01/2027 | 1,074,871 | 0.1 | |
| 1,275,305 | Focus Financial Partners, LLC 2020 Term Loan, 2.989%, (US0001M + 2.000%), 07/03/2024 | 1,173,280 | 0.1 | |
| 253,418 | VFH Parent LLC 2019 Term Loan B, 4.005%, (US0001M + 3.000%), 03/01/2026 | 234,834 | 0.0 | |
| 893,227 | Victory Capital Holdings, Inc. 2020 Term Loan B, 4.015%, (US0001M + 2.500%), 07/01/2026 | 794,972 | 0.0 | |
| 10,487,908 | 0.4 | |||
| Food Products: 0.3% | ||||
| 100,000 | 8th Avenue Food & Provisions, Inc. 2018 2nd Lien Term Loan, 8.547%, (US0001M + 7.750%), 10/01/2026 | 90,000 | 0.0 | |
| 723,845 | Atkins Nutritionals Holdings II, Inc. 2017 Term Loan B, 4.750%, (US0001M + 3.750%), 07/07/2024 | 676,795 | 0.0 | |
| 1,144,508 | B&G Foods, Inc. 2019 Term Loan B4, 3.489%, (US0001M + 2.500%), 10/10/2026 | 1,091,097 | 0.0 | |
| 1,387,280 | CHG PPC Parent LLC 2018 Term Loan B, 3.739%, (US0001M + 2.750%), 03/31/2025 | 1,255,489 | 0.1 | |
| 885,000 | Froneri International PLC 2020 USD Term Loan, 3.239%, (US0001M + 2.250%), 01/29/2027 | 849,600 | 0.0 | |
| 1,796,826 | IRB Holding Corp 2020 Term Loan B, 3.751%, (US0001M + 2.750%), 02/05/2025 | 1,401,524 | 0.1 | |
| 1,412 | (9) | NPC International, Inc. 1st Lien Term Loan, 4.951%, (US0003M + 3.500%), 04/19/2024 | 600 | 0.0 |
| 1,287,174 | Sigma Bidco B.V. 2018 USD Term Loan B, 4.909%, (US0003M + 3.000%), 07/02/2025 | 1,142,367 | 0.1 | |
| 6,507,472 | 0.3 | |||
| Food Service: 0.3% | ||||
| 910,631 | Carrols Restaurant Group, Inc. Term Loan B, 4.210%, (US0001M + 3.250%), 04/30/2026 | 687,526 | 0.0 | |
| 143,883 | Fogo De Chao, Inc. 2018 Add On Term Loan, 5.700%, (US0003M + 4.250%), 04/07/2025 | 100,718 | 0.0 | |
| 2,898,325 | Golden Nugget, Inc. 2017 Incremental Term Loan B, 3.584%, (US0001M + 2.500%), 10/04/2023 | 2,265,525 | 0.1 | |
| 1,903,831 | Hearthside Food Solutions, LLC 2018 Term Loan B, 4.677%, (US0001M + 3.688%), 05/23/2025 | 1,627,775 | 0.1 | |
| 1,284,797 | US Foods, Inc. 2019 Term Loan B, 3.072%, (US0006M + 2.000%), 09/13/2026 | 1,197,003 | 0.0 | |
| 1,500,000 | Welbilt, Inc. 2018 Term Loan B, 3.489%, (US0001M + 2.500%), 10/23/2025 | 1,200,000 | 0.1 | |
| 7,078,547 | 0.3 | |||
| Food/Drug Retailers: 0.1% | ||||
| 1,136,913 | EG Finco Limited 2018 USD Term Loan, 5.072%, (US0006M + 4.000%), 02/07/2025 | 832,788 | 0.0 | |
| 147,000 | EG Group Limited 2018 USD Term Loan B, 5.450%, (US0006M + 4.000%), 02/07/2025 | 107,678 | 0.0 | |
| 28,970 | Moran Foods LLC 2020 Term Loan, 8.451%, (US0003M + 7.000%), 03/12/2024 | 26,797 | 0.0 | |
| 145,875 | (9) | Moran Foods LLC Term Loan, 7.451%, (US0003M + 6.000%), 12/05/2023 | 18,234 | 0.0 |
See Accompanying Notes to Financial Statements
| 119 |
| Voya Strategic Income Opportunities Fund | PORTFOLIO OF INVESTMENTS |
| as of March31, 2020 (Continued) |
| 472,625 | Portillo Restaurant Group (The) Term Loan, 6.950%, (US0003M + 5.500%), 09/06/2024 | 429,203 | 0.0 | |
| 981,344 | United Natural Foods, Inc. Term Loan B, 5.239%, (US0001M + 4.250%), 10/22/2025 | 848,862 | 0.1 | |
| 2,263,562 | 0.1 | |||
| Forest Products: 0.0% | ||||
| 1,320,869 | LABL, Inc. 2019 USD Term Loan, 5.000%, (US0001M + 4.500%), 07/01/2026 | 1,119,436 | 0.0 | |
| Health Care: 1.4% | ||||
| 1,148,500 | Accelerated Health Systems, LLC Term Loan B, 4.297%, (US0001M + 3.500%), 10/31/2025 | 1,036,521 | 0.0 | |
| 1,412,604 | ADMI Corp. 2018 Term Loan B, 4.200%, (US0001M + 2.750%), 04/30/2025 | 1,267,812 | 0.1 | |
| 551,362 | Agiliti Health, Inc Term Loan, 4.625%, (US0003M + 3.000%), 01/04/2026 | 532,065 | 0.0 | |
| 1,143,311 | Air Methods Corporation 2017 Term Loan B, 4.950%, (US0003M + 3.500%), 04/22/2024 | 826,042 | 0.0 | |
| 636,071 | ATI Holdings Acquisition, Inc. 2016 Term Loan, 4.570%, (US0001M + 3.500%), 05/10/2023 | 485,004 | 0.0 | |
| 1,951,543 | Auris Luxembourg III S.a.r.l. 2019 USD Term Loan B, 4.739%, (US0001M + 3.750%), 02/27/2026 | 1,512,446 | 0.1 | |
| 3,380,286 | Bausch Health Companies, Inc. 2018 Term Loan B, 3.612%, (US0001M + 3.000%), 06/02/2025 | 3,239,440 | 0.1 | |
| 1,076,575 | Change Healthcare Holdings LLC 2017 Term Loan B, 3.500%, (US0001M + 2.500%), 03/01/2024 | 994,037 | 0.0 | |
| 500,159 | CHG Healthcare Services Inc. 2017 1st Lien Term Loan B, 4.073%, (US0001M + 3.000%), 06/07/2023 | 452,644 | 0.0 | |
| 375,000 | Da Vinci Purchaser Corp. 2019 Term Loan, 5.872%, (US0003M + 4.000%), 01/08/2027 | 350,156 | 0.0 | |
| 2,277,588 | DaVita, Inc. 2020 Term Loan B, 2.739%, (US0001M + 1.750%), 08/12/2026 | 2,176,994 | 0.1 | |
| 643,695 | DentalCorp Perfect Smile ULC 1st Lien Term Loan, 4.750%, (US0001M + 3.750%), 06/06/2025 | 511,737 | 0.0 | |
| 477,600 | Emerald TopCo Inc Term Loan, 4.489%, (US0001M + 3.500%), 07/24/2026 | 437,601 | 0.0 | |
| 1,976,806 | Envision Healthcare Corporation 2018 1st Lien Term Loan, 4.739%, (US0001M + 3.750%), 10/10/2025 | 1,059,568 | 0.0 | |
| 1,379,488 | ExamWorks Group, Inc. 2017 Term Loan, 4.250%, (US0006M + 3.250%), 07/27/2023 | 1,251,886 | 0.1 | |
| 542,101 | Global Medical Response, Inc. 2017 Term Loan B2, 5.863%, (US0001M + 4.250%), 03/14/2025 | 489,246 | 0.0 | |
| 785,106 | Global Medical Response, Inc. 2018 Term Loan B1, 4.932%, (US0002M + 3.250%), 04/28/2022 | 726,223 | 0.0 | |
| 848,624 | GoodRx, Inc. 1st Lien Term Loan, 3.739%, (US0001M + 2.750%), 10/10/2025 | 801,949 | 0.0 | |
| 1,083,511 | Inovalon Holdings, Inc. 2020 Term Loan B1, 3.750%, (US0001M + 3.000%), 04/02/2025 | 1,005,498 | 0.0 | |
| 1,574,843 | Jaguar Holding Company II 2018 Term Loan, 3.500%, (US0001M + 2.500%), 08/18/2022 | 1,518,412 | 0.1 | |
| 1,267,378 | Medical Solutions L.L.C. 2017 Term Loan, 5.500%, (US0001M + 4.500%), 06/14/2024 | 1,127,967 | 0.1 | |
| 4,349,168 | MPH Acquisition Holdings LLC 2016 Term Loan B, 4.200%, (US0003M + 2.750%), 06/07/2023 | 3,957,708 | 0.2 | |
| 2,090,687 | Ortho-Clinical Diagnostics SA 2018 Term Loan B, 4.765%, (US0001M + 3.250%), 06/30/2025 | 1,789,628 | 0.1 | |
| 1,796,000 | Phoenix Guarantor Inc 2020 Term Loan B, 4.113%, (US0001M + 3.250%), 03/05/2026 | 1,652,320 | 0.1 | |
| 728,715 | RegionalCare Hospital Partners Holdings, Inc. 2018 Term Loan B, 4.739%, (US0001M + 3.750%), 11/17/2025 | 683,778 | 0.0 | |
| 1,848,190 | Select Medical Corporation 2017 Term Loan B, 3.430%, (US0001M + 2.500%), 03/06/2025 | 1,765,022 | 0.1 | |
See Accompanying Notes to Financial Statements
| 120 |
| Voya Strategic Income Opportunities Fund | PORTFOLIO OF INVESTMENTS |
| as of March31, 2020 (Continued) |
| 1,520,000 | Sotera Health Holdings, LLC 2019 Term Loan, 5.500%, (US0001M + 4.500%), 12/11/2026 | 1,355,334 | 0.1 | |
| 462,755 | Surgery Center Holdings, Inc. 2017 Term Loan B, 4.250%, (US0001M + 3.250%), 09/03/2024 | 364,882 | 0.0 | |
| 892,048 | Tecomet Inc. 2017 Repriced Term Loan, 4.250%, (US0001M + 3.250%), 05/01/2024 | 762,701 | 0.0 | |
| 636,373 | U.S. Anesthesia Partners, Inc. 2017 Term Loan, 4.000%, (US0001M + 3.000%), 06/23/2024 | 482,053 | 0.0 | |
| 188,100 | Vizient, Inc. 2020 Term Loan B6, 2.989%, (US0001M + 2.000%), 05/06/2026 | 178,695 | 0.0 | |
| 1,283,497 | Wink Holdco, Inc 1st Lien Term Loan B, 4.450%, (US0001M + 3.000%), 12/02/2024 | 1,098,995 | 0.1 | |
| 35,894,364 | 1.4 | |||
| Home Furnishings: 0.0% | ||||
| 860,675 | Prime Security Services Borrower, LLC 2019 Term Loan B1, 4.606%, (US0001M + 3.250%), 09/23/2026 | 783,214 | 0.0 | |
| Industrial: 0.1% | ||||
| 1,510,269 | NCI Building Systems, Inc. 2018 Term Loan, 4.561%, (US0001M + 3.750%), 04/12/2025 | 1,321,485 | 0.1 | |
| Industrial Equipment: 0.3% | ||||
| 1,105,000 | APi Group DE, Inc. Term Loan B, 3.489%, (US0001M + 2.500%), 10/01/2026 | 1,016,600 | 0.1 | |
| 395,619 | CPM Holdings, Inc. 2018 1st Lien Term Loan, 5.353%, (US0006M + 3.750%), 11/17/2025 | 327,374 | 0.0 | |
| 630,007 | EWT Holdings III Corp. 2020 Term Loan, 3.739%, (US0001M + 2.750%), 12/20/2024 | 579,607 | 0.0 | |
| 1,709,546 | Filtration Group Corporation 2018 1st Lien Term Loan, 3.989%, (US0001M + 3.000%), 03/29/2025 | 1,510,811 | 0.1 | |
| 691,525 | Granite Holdings US Acquisition Co. Term Loan B, 6.322%, (US0006M + 5.250%), 09/30/2026 | 501,356 | 0.0 | |
| 725,000 | Ingersoll-Rand Services Company 2020 USD Spinco Term Loan, 3.201%, (US0003M + 1.750%), 02/05/2027 | 681,500 | 0.0 | |
| 1,498,415 | Kenan Advantage Group, Inc. 2015 Term Loan, 4.000%, (US0001M + 3.000%), 07/31/2022 | 1,273,653 | 0.1 | |
| 367,941 | Kenan Advantage Group, Inc. CAD Term Loan B, 4.000%, (US0001M + 3.000%), 07/31/2022 | 312,750 | 0.0 | |
| 430,000 | Star US Bidco LLC Term Loan B, 5.701%, (US0003M + 4.250%), 03/03/2027 | 384,850 | 0.0 | |
| 6,588,501 | 0.3 | |||
| Insurance: 0.7% | ||||
| 1,141,705 | Achilles Acquisition LLC 2018 Term Loan, 5.000%, (US0001M + 4.000%), 10/13/2025 | 1,021,826 | 0.0 | |
| 3,212,467 | Acrisure, LLC 2020 Term Loan B, 5.207%, (US0003M + 3.500%), 02/15/2027 | 2,730,597 | 0.1 | |
| 395,237 | Alera Group Holdings, Inc. 2018 Term Loan B, 4.989%, (US0001M + 4.000%), 08/01/2025 | 347,809 | 0.0 | |
| 2,043,680 | Alliant Holdings Intermediate, LLC 2018 Term Loan B, 3.989%, (US0001M + 3.000%), 05/09/2025 | 1,898,920 | 0.1 | |
| 2,127,064 | AmWINS Group, Inc. 2017 Term Loan B, 3.753%, (US0001M + 2.750%), 01/25/2024 | 1,991,464 | 0.1 | |
| 150,000 | Applied Systems, Inc. 2017 2nd Lien Term Loan, 8.450%, (US0003M + 7.000%), 09/19/2025 | 138,750 | 0.0 | |
| 148,125 | Aretec Group, Inc. 2018 Term Loan, 5.239%, (US0001M + 4.250%), 10/01/2025 | 102,206 | 0.0 | |
| 1,833,871 | AssuredPartners, Inc. 2020 Term Loan B, 4.489%, (US0001M + 3.500%), 02/12/2027 | 1,636,730 | 0.1 | |
| 631,304 | CCC Information Services, Inc. 2017 1st Lien Term Loan, 3.750%, (US0001M + 2.750%), 04/29/2024 | 583,280 | 0.0 | |
| 1,450,023 | Hub International Limited 2018 Term Loan B, 4.543%, (US0002M + 2.750%), 04/25/2025 | 1,370,271 | 0.0 | |
See Accompanying Notes to Financial Statements
| 121 |
| Voya Strategic Income Opportunities Fund | PORTFOLIO OF INVESTMENTS |
| as of March31, 2020 (Continued) |
| 2,586,895 | NFP Corp. 2020 Term Loan, 4.239%, (US0001M + 3.250%), 02/15/2027 | 2,263,533 | 0.1 | |
| 2,610,341 | Sedgwick Claims Management Services, Inc. 2018 Term Loan B, 4.239%, (US0001M + 3.250%), 12/31/2025 | 2,305,800 | 0.1 | |
| 2,370,927 | USI, Inc. 2017 Repriced Term Loan, 3.989%, (US0003M + 3.000%), 05/16/2024 | 2,163,471 | 0.1 | |
| 18,554,657 | 0.7 | |||
| Leisure Good/Activities/Movies: 0.6% | ||||
| 1,689,191 | AMC Entertainment Holdings Inc. 2019 Term Loan B, 4.080%, (US0001M + 3.000%), 04/22/2026 | 1,272,523 | 0.1 | |
| 1,251,849 | Bombardier Recreational Products, Inc. 2020 Term Loan, 2.989%, (US0001M + 2.000%), 05/24/2027 | 1,057,813 | 0.1 | |
| 1,042,327 | ClubCorp Club Operations, Inc. 2017 Incremental Term Loan, 4.200%, (US0003M + 2.750%), 09/18/2024 | 669,695 | 0.0 | |
| 1,487,505 | Crown Finance US, Inc. 2018 USD Term Loan, 3.322%, (US0006M + 2.250%), 02/28/2025 | 999,603 | 0.1 | |
| 427,850 | Crown Finance US, Inc. 2019 Incremental Term Loan, 3.558%, (US0006M + 2.500%), 09/30/2026 | 283,237 | 0.0 | |
| 2,125,297 | Equinox Holdings, Inc. 2017 1st Lien Term Loan, 4.072%, (US0006M + 3.000%), 03/08/2024 | 1,586,889 | 0.1 | |
| 1,003,941 | Fitness International, LLC 2018 Term Loan B, 4.322%, (US0006M + 3.250%), 04/18/2025 | 761,321 | 0.0 | |
| 711,218 | Fluidra S.A. USD Term Loan B, 2.989%, (US0001M + 2.000%), 07/02/2025 | 647,208 | 0.0 | |
| 539,368 | GVC Holdings (Gibraltar) Limited 2020 USD Term Loan B3, 3.308%, (US0006M + 2.250%), 03/29/2024 | 448,575 | 0.0 | |
| 1,236,723 | Intrawest Resorts Holdings, Inc. Term Loan B1, 3.750%, (US0001M + 2.750%), 07/31/2024 | 1,108,929 | 0.1 | |
| 1,136,469 | Kingpin Intermediate Holdings LLC 2018 Term Loan B, 4.500%, (US0001M + 3.500%), 07/03/2024 | 806,893 | 0.0 | |
| 1,722,425 | Life Time, Inc. 2017 Term Loan B, 4.363%, (US0003M + 2.750%), 06/10/2022 | 1,300,431 | 0.1 | |
| 115,821 | Motion Finco Sarl Delayed Draw Term Loan B2, 4.323%, (US0006M + 3.250%), 11/04/2026 | 94,394 | 0.0 | |
| 843,085 | Motion Finco Sarl USD Term Loan B1, 4.209%, (US0006M + 3.250%), 11/13/2026 | 711,353 | 0.0 | |
| 785,063 | Playtika Holding Corp Term Loan B, 7.072%, (US0006M + 6.000%), 12/10/2024 | 740,575 | 0.0 | |
| 974,709 | SRAM, LLC 2018 Term Loan B, 3.787%, (US0001M + 2.750%), 03/15/2024 | 930,847 | 0.0 | |
| 967,839 | Thor Industries, Inc. USD Term Loan B, 5.365%, (US0001M + 3.750%), 02/01/2026 | 832,342 | 0.0 | |
| 644,356 | WeddingWire, Inc. 1st Lien Term Loan, 5.950%, (US0001M + 4.500%), 12/19/2025 | 563,811 | 0.0 | |
| 100,000 | WeddingWire, Inc. 2nd Lien Term Loan, 9.700%, (US0003M + 8.250%), 12/21/2026 | 92,500 | 0.0 | |
| 14,908,939 | 0.6 | |||
| Lodging & Casinos: 0.5% | ||||
| 1,185,225 | Aimbridge Acquisition Co., Inc. 2019 Term Loan B, 5.573%, (US0001M + 3.750%), 02/02/2026 | 859,288 | 0.0 | |
| 3,042,965 | Caesars Resort Collection, LLC 2017 1st Lien Term Loan B, 3.739%, (US0001M + 2.750%), 12/23/2024 | 2,499,579 | 0.1 | |
| 126,756 | Eldorado Resorts LLC 2017 Term Loan B, 3.250%, (US0006M + 2.250%), 04/17/2024 | 124,221 | 0.0 | |
| 1,421,794 | Everi Payments Inc. Term Loan B, 3.822%, (US0003M + 2.750%), 05/09/2024 | 1,139,805 | 0.1 | |
| 1,380,899 | Golden Entertainment, Inc. 2017 1st Lien Term Loan, 3.960%, (US0001M + 3.000%), 10/21/2024 | 1,056,388 | 0.0 | |
| 2,134,194 | PCI Gaming Authority Term Loan, 3.489%, (US0001M + 2.500%), 05/29/2026 | 1,714,977 | 0.1 | |
| 2,319,749 | Scientific Games International, Inc. 2018 Term Loan B5, 4.246%, (US0002M + 2.750%), 08/14/2024 | 1,884,796 | 0.1 | |
See Accompanying Notes to Financial Statements
| 122 |
| Voya Strategic Income Opportunities Fund | PORTFOLIO OF INVESTMENTS |
| as of March31, 2020 (Continued) |
| 3,058,702 | Stars Group Holdings B.V. (The) 2018 USD Incremental Term Loan, 4.950%, (US0003M + 3.500%), 07/10/2025 | 2,932,531 | 0.1 | |
| 963,673 | Station Casinos LLC 2020 Term Loan B, 3.240%, (US0001M + 2.250%), 02/08/2027 | 811,413 | 0.0 | |
| 13,022,998 | 0.5 | |||
| Machinery-Diversified: 0.0% | ||||
| 523,012 | Gardner Denver, Inc. 2020 USD Term Loan, 2.739%, (0 + 0.000%), 03/01/2027 | 494,247 | 0.0 | |
| Nonferrous Metals/Minerals: 0.0% | ||||
| 1,565,319 | Covia Holdings Corporation Term Loan, 5.874%, (US0003M + 4.000%), 06/01/2025 | 729,830 | 0.0 | |
| 545,228 | U.S. Silica Company 2018 Term Loan B, 5.000%, (US0001M + 4.000%), 05/01/2025 | 269,207 | 0.0 | |
| 999,037 | 0.0 | |||
| Oil & Gas: 0.1% | ||||
| 390,000 | Encino Acquisition Partners Holdings, LLC 2018 2nd Lien Term Loan, 7.750%, (US0001M + 6.750%), 10/29/2025 | 185,250 | 0.0 | |
| 942,875 | Lower Cadence Holdings LLC Term Loan B, 4.989%, (US0001M + 4.000%), 05/22/2026 | 590,869 | 0.1 | |
| 527,350 | Lucid Energy Group II LLC Incremental Term Loan B2, 4.000%, (US0001M + 3.000%), 02/19/2025 | 300,590 | 0.0 | |
| 148,500 | Moda Ingleside Energy Center, LLC 2018 Term Loan B, 4.239%, (US0001M + 3.250%), 09/29/2025 | 115,087 | 0.0 | |
| 1,191,796 | 0.1 | |||
| Publishing: 0.1% | ||||
| 2,164,873 | Meredith Corporation 2020 Term Loan B2, 3.489%, (US0001M + 2.500%), 01/31/2025 | 1,970,034 | 0.1 | |
| Radio & Television: 0.7% | ||||
| 1,040,516 | A-L Parent LLC 2016 1st Lien Term Loan, 4.860%, (US0001M + 3.250%), 12/01/2023 | 712,753 | 0.0 | |
| 1,330,099 | Banijay Entertainment S.A.S USD Term Loan, 5.213%, (US0003M + 3.750%), 03/04/2025 | 1,197,089 | 0.0 | |
| 1,629,319 | Clear Channel Outdoor Holdings, Inc. Term Loan B, 4.489%, (US0001M + 3.500%), 08/21/2026 | 1,476,570 | 0.1 | |
| 288,550 | Cumulus Media New Holdings Inc. Term Loan B, 4.822%, (US0006M + 3.750%), 03/31/2026 | 234,207 | 0.0 | |
| 2,403,975 | Diamond Sports Group, LLC Term Loan, 4.180%, (US0001M + 3.250%), 08/24/2026 | 1,887,120 | 0.1 | |
| 1,107,128 | Entercom Media Corp. 2019 Term Loan, 3.489%, (US0001M + 2.500%), 11/18/2024 | 996,415 | 0.0 | |
| 1,346,625 | iHeartCommunications, Inc. 2020 Term Loan, 3.989%, (US0001M + 3.000%), 05/01/2026 | 1,153,384 | 0.0 | |
| 2,131,876 | NASCAR Holdings, Inc Term Loan B, 3.674%, (US0001M + 2.750%), 10/19/2026 | 1,884,934 | 0.1 | |
| 2,830,057 | Nexstar Broadcasting, Inc. 2019 Term Loan B4, 4.331%, (US0001M + 2.750%), 09/18/2026 | 2,674,404 | 0.1 | |
| 2,781,052 | Sinclair Television Group Inc. Term Loan B2B, 3.210%, (US0001M + 2.500%), 09/30/2026 | 2,575,950 | 0.1 | |
| 1,534,494 | Terrier Media Buyer, Inc. Term Loan B, 5.700%, (US0003M + 4.250%), 12/17/2026 | 1,330,215 | 0.1 | |
| 1,720,284 | Univision Communications Inc. Term Loan C5, 3.750%, (US0001M + 2.750%), 03/15/2024 | 1,470,843 | 0.1 | |
| 17,593,884 | 0.7 | |||
| Retailers (Except Food & Drug): 0.2% | ||||
| 244,828 | Academy, Ltd. 2015 Term Loan B, 5.558%, (US0001M + 4.000%), 07/01/2022 | 134,859 | 0.0 | |
| 1,034,997 | Bass Pro Group, LLC Term Loan B, 5.989%, (US0001M + 5.000%), 09/25/2024 | 879,748 | 0.0 | |
| 208,294 | Belk, Inc. 2019 Term Loan B, 7.750%, (US0006M + 6.750%), 07/31/2025 | 109,354 | 0.0 | |
| 1,913,455 | BJs Wholesale Club, Inc. 2017 1st Lien Term Loan, 3.047%, (US0001M + 2.250%), 02/03/2024 | 1,827,349 | 0.1 | |
See Accompanying Notes to Financial Statements
| 123 |
| Voya Strategic Income Opportunities Fund | PORTFOLIO OF INVESTMENTS |
| as of March31, 2020 (Continued) |
| 734,320 | Jo-Ann Stores, Inc. 2016 Term Loan, 6.000%, (US0006M + 5.000%), 10/20/2023 | 304,743 | 0.0 | |
| 2,079,298 | Leslies Poolmart, Inc. 2016 Term Loan, 4.500%, (US0001M + 3.500%), 08/16/2023 | 1,744,012 | 0.1 | |
| 1,367,353 | Mens Wearhouse, Inc. (The) 2018 Term Loan, 4.831%, (US0001M + 3.250%), 04/09/2025 | 546,941 | 0.0 | |
| 5,547,006 | 0.2 | |||
| Steel: 0.0% | ||||
| 882,000 | GrafTech Finance, Inc. 2018 Term Loan B, 4.500%, (US0001M + 3.500%), 02/12/2025 | 771,750 | 0.0 | |
| Surface Transport: 0.1% | ||||
| 1,385,486 | Navistar International Corporation 2017 1st Lien Term Loan B, 4.280%, (US0001M + 3.500%), 11/06/2024 | 1,216,918 | 0.1 | |
| 1,285,905 | PODS, LLC 2018 1st Lien Term Loan, 3.750%, (US0001M + 2.750%), 12/06/2024 | 1,128,381 | 0.0 | |
| 734,520 | Savage Enterprises LLC 2020 Term Loan B, 4.620%, (US0001M + 4.000%), 08/01/2025 | 653,111 | 0.0 | |
| 2,998,410 | 0.1 | |||
| Technology: 0.1% | ||||
| 2,851,296 | Misys (Finastra) - TL B 1L, 5.277%, (US0003M + 3.500%), 06/13/2024 | 2,480,628 | 0.1 | |
| Telecommunications: 1.0% | ||||
| 1,539,472 | Altice Financing SA USD 2017 1st Lien Term Loan, 3.674%, (US0001M + 2.750%), 01/31/2026 | 1,416,314 | 0.1 | |
| 3,491,786 | Altice France S.A. USD Term Loan B11, 3.739%, (US0001M + 2.750%), 07/31/2025 | 3,215,352 | 0.1 | |
| 185,000 | Asurion LLC 2017 2nd Lien Term Loan, 7.489%, (US0001M + 6.500%), 08/04/2025 | 172,975 | 0.0 | |
| 598 | Asurion LLC 2017 Term Loan B4, 3.989%, (US0001M + 3.000%), 08/04/2022 | 556 | 0.0 | |
| 1,966,285 | Asurion LLC 2018 Term Loan B6, 3.989%, (US0001M + 3.000%), 11/03/2023 | 1,897,465 | 0.1 | |
| 4,208,517 | Asurion LLC 2018 Term Loan B7, 3.989%, (US0001M + 3.000%), 11/03/2024 | 3,963,022 | 0.2 | |
| 1,850,004 | Avaya, Inc. 2018 Term Loan B, 4.955%, (US0001M + 4.250%), 12/15/2024 | 1,586,378 | 0.1 | |
| 2,379,038 | CenturyLink, Inc. 2020 Term Loan B, 3.239%, (US0001M + 2.250%), 03/15/2027 | 2,211,018 | 0.1 | |
| 1,800,950 | CommScope, Inc. 2019 Term Loan B, 4.239%, (US0001M + 3.250%), 04/06/2026 | 1,710,903 | 0.1 | |
| 720,000 | Connect Finco Sarl Term Loan B, 5.490%, (US0001M + 4.500%), 12/11/2026 | 588,600 | 0.0 | |
| 458,162 | Consolidated Communications, Inc. 2016 Term Loan B, 3.959%, (US0001M + 3.000%), 10/04/2023 | 395,492 | 0.0 | |
| 673,432 | Global Tel*Link Corporation 2018 1st Lien Term Loan, 5.700%, (US0003M + 4.250%), 11/29/2025 | 580,835 | 0.0 | |
| 120,000 | Global Tel*Link Corporation 2018 2nd Lien Term Loan, 9.700%, (US0003M + 8.250%), 11/29/2026 | 100,500 | 0.0 | |
| 1,234,918 | GTT Communications, Inc. 2018 USD Term Loan B, 3.740%, (US0001M + 2.750%), 05/31/2025 | 844,890 | 0.0 | |
| 470,000 | Iridium Satellite LLC Term Loan, 4.750%, (US0001M + 3.750%), 11/04/2026 | 448,850 | 0.0 | |
| 1,631,488 | Level 3 Financing Inc. 2019 Term Loan B, 2.739%, (US0001M + 1.750%), 03/01/2027 | 1,541,756 | 0.1 | |
| 393,468 | Securus Technologies Holdings, Inc. 2017 1st Lien Term Loan, 5.500%, (US0006M + 4.500%), 11/01/2024 | 312,807 | 0.0 | |
| 445,986 | Speedcast International Limited Term Loan B, 4.200%, (US0003M + 2.750%), 05/15/2025 | 112,983 | 0.0 | |
| 805,000 | Telenet Financing USD LLC 2020 USD Term Loan AR, 2.705%, (US0001M + 2.000%), 04/30/2028 | 747,644 | 0.0 | |
| 1,814,739 | Zayo Group Holdings, Inc. USD Term Loan, 3.989%, (US0001M + 3.000%), 02/19/2027 | 1,701,318 | 0.1 | |
| 1,295,000 | Ziggo Financing Partnership USD Term Loan I, 3.205%, (US0001M + 2.500%), 04/30/2028 | 1,209,206 | 0.0 | |
| 24,758,864 | 1.0 | |||
See Accompanying Notes to Financial Statements
| 124 |
| Voya Strategic Income Opportunities Fund | PORTFOLIO OF INVESTMENTS |
| as of March31, 2020 (Continued) |
| Utilities: 0.2% | ||||
| 857,153 | Calpine Construction Finance Company, L.P. 2017 Term Loan B, 2.989%, (US0001M + 2.000%), 01/15/2025 | 792,866 | 0.1 | |
| 2,239,997 | Calpine Corporation 2019 Term Loan B10, 2.989%, (US0001M + 2.000%), 08/12/2026 | 2,111,197 | 0.1 | |
| 364,185 | LMBE-MC Holdco II LLC Term Loan B, 5.460%, (US0003M + 4.000%), 12/03/2025 | 318,662 | 0.0 | |
| 724,075 | Nautilus Power, LLC Term Loan B, 5.250%, (US0001M + 4.250%), 05/16/2024 | 640,807 | 0.0 | |
| 650,088 | Sabre Industries, Inc. 2019 Term Loan B, 4.494%, (US0003M + 3.500%), 04/15/2026 | 599,706 | 0.0 | |
| 4,463,238 | 0.2 | |||
| Total Bank Loans | ||||
| (Cost $401,208,619) | 348,781,362 | 13.5 | ||
| CONVERTIBLE BONDS/NOTES: 0.0% | ||||
| Communications: 0.0% | ||||
| 385,000 | DISH Network Corp., 3.375%, 08/15/2026 | 313,525 | 0.0 | |
| Total Convertible Bonds/Notes | ||||
| (Cost $378,216) | 313,525 | 0.0 | ||
| U.S. GOVERNMENT AGENCY OBLIGATIONS: 0.0% | ||||
| Uniform Mortgage-Backed Securities: 0.0% | ||||
| 6,537 | 5.500%,10/01/2039 | 7,429 | 0.0 | |
| Total U.S. Government Agency Obligations | ||||
| (Cost $7,054) | 7,429 | 0.0 | ||
| Value | Percentage of Net Assets | |||
| PURCHASED OPTIONS(10): 0.2% | ||||
| Total Purchased Options | ||||
| (Cost $3,395,683) | 4,673,724 | 0.2 | ||
| Total Long-Term Investments | ||||
| (Cost $2,715,232,287) | 2,438,431,969 | 94.6 | ||
| Principal Amount† | Value | Percentage of Net Assets | ||
| SHORT-TERM INVESTMENTS: 3.0% | ||||
| Repurchase Agreements: 0.4% | ||||
| 1,381,827 | (11) | BNP Paribas S.A., Repurchase Agreement dated 03/31/20, 0.33%, due 04/01/20 (Repurchase Amount $1,381,839, collateralized by various U.S. Government Securities, 2.125%-6.875%, Market Value plus accrued interest $1,450,921, due 06/15/20-03/15/39) | 1,381,827 | 0.0 |
| 1,762,980 | (11) | Cantor Fitzgerald Securities, Repurchase Agreement dated 03/31/20, 0.02%, due 04/01/20 (Repurchase Amount $1,762,981, collateralized by various U.S. Government/U.S. Government Agency Obligations, 0.000%-8.500%, Market Value plus accrued interest $1,798,240, due 05/01/20-02/20/70) | 1,762,980 | 0.1 |
| 2,513,562 | (11) | Citibank N.A., Repurchase Agreement dated 03/31/20, 0.02%, due 04/01/20 (Repurchase Amount $2,513,563, collateralized by various U.S. Government/U.S. Government Agency Obligations, 0.000%-4.500%, Market Value plus accrued interest $2,566,255, due 03/15/22-05/01/48) | 2,513,562 | 0.1 |
| 113,898 | (11) | HSBC Securities USA, Repurchase Agreement dated 03/31/20, 0.01%, due 04/01/20 (Repurchase Amount $113,898, collateralized by various U.S. Government Securities, 0.000%-3.000%, Market Value plus accrued interest $116,176, due 05/15/44-08/15/48) | 113,898 | 0.0 |
See Accompanying Notes to Financial Statements
| 125 |
| Voya Strategic Income Opportunities Fund | PORTFOLIO OF INVESTMENTS |
| as of March31, 2020 (Continued) |
| 2,513,562 | (11) | RBC Dominion Securities Inc., Repurchase Agreement dated 03/31/20, 0.01%, due 04/01/20 (Repurchase Amount $2,513,563, collateralized by various U.S. Government/U.S. Government Agency Obligations, 0.000%-7.125%, Market Value plus accrued interest $2,563,833, due 07/15/20-02/20/50) | 2,513,562 | 0.1 |
| 2,513,562 | (11) | State of Wisconsin Investment Board, Repurchase Agreement dated 03/31/20, 0.16%, due 04/01/20 (Repurchase Amount $2,513,573, collateralized by various U.S. Government Securities, 0.125%-3.875%, Market Value plus accrued interest $2,569,969, due 04/01/20-09/09/49) | 2,513,562 | 0.1 |
| Total Repurchase Agreements | ||||
| (Cost $10,799,391) | 10,799,391 | 0.4 | ||
| Shares | Value | Percentage of Net Assets | ||
| Mutual Funds: 2.6% | ||||
| 15,741,134 | (12) | BlackRock Liquidity Funds, FedFund, Institutional Class, 0.330% | 15,741,134 | 0.6 |
| 49,886,000 | (12) | Morgan Stanley Institutional Liquidity Funds - Government Portfolio (Institutional Share Class), 0.250% | 49,886,000 | 2.0 |
| Total Mutual Funds | ||||
| (Cost $65,627,134) | 65,627,134 | 2.6 | ||
| Total Short-Term Investments | ||||
| (Cost $76,426,525) | 76,426,525 | 3.0 | ||
| Total Investments in Securities (Cost $2,791,658,812) | $ 2,513,820,991 | 97.6 | ||
| Assets in Excess of Other Liabilities | 63,073,798 | 2.4 | ||
| Net Assets | $ 2,576,894,789 | 100.0 | ||
| † | Unless otherwise indicated, principal amount is shown in USD. |
| (1) | Securities with purchases pursuant to Rule 144A or section 4(a)(2), under the Securities Act of 1933 and may not be resold subject to that rule except to qualified institutional buyers. |
| (2) | Security, or a portion of the security, is on loan. |
| (3) | Variable rate security. Rate shown is the rate in effect as of March 31, 2020. |
| (4) | All or a portion of this security is payment-in-kind ("PIK") which may pay interest or additional principal at the issuer's discretion. Rates shown are the current rate and possible payment rates. |
| (5) | Step-up bond that pays an initial coupon rate for the first period and then a higher coupon rate for the following periods. Rates shown reflect the current and next coupon rate as of March 31, 2020. |
| (6) | Interest only securities represent the right to receive the monthly interest payments on an underlying pool of mortgage loans. Principal amount shown represents the notional amount on which current interest is calculated. Payments of principal on the pool reduce the value of the interest only security. |
| (7) | Principal only securities represent the right to receive the monthly principal payments on an underlying pool of mortgage loans. No payments of interest on the pool are passed through the principal only security. |
| (8) | Settlement is on a when-issued or delayed-delivery basis. |
| (9) | Security is a Master Limited Partnership. |
| (10) | The tables within the Portfolio of Investments detail open purchased options which are non-income producing securities. |
| (11) | All or a portion of the security represents securities purchased with cash collateral received for securities on loan. |
| (12) | Rate shown is the 7-day yield as of March 31, 2020. |
| Currency Abbreviations: | |
| EUR | EU Euro |
| IDR | Indonesian Rupiah |
| PEN | Peruvian Nuevo Sol |
| RUB | Russian Ruble |
| Reference Rate Abbreviations: | |
| 12MTA | 12-month Treasury Average |
| US0001M | 1-month LIBOR |
| US0001W | 1-week LIBOR |
| US0002M | 2-month LIBOR |
| US0003M | 3-month LIBOR |
| US0006M | 6-month LIBOR |
| US0012M | 12-month LIBOR |
See Accompanying Notes to Financial Statements
| 126 |
Item 7. Disclosure of Proxy Voting Policies and Procedures for Closed-End Management Investment Companies.
Not applicable.
Item 8. Portfolio Managers of Closed-End Management Investment Companies.
Not applicable.
Item 9. Purchases of Equity Securities by Closed-End Management Investment Company and Affiliated Purchasers.
Not applicable.
Item 10. Submission of Matters to a Vote of Security Holders.
Not applicable.
Item 11. Controls and Procedures.
| (a) | Based on our evaluation conducted within 90 days of the filing date, hereof, the design and operation of the registrant’s disclosure controls and procedures are effective to ensure that material information relating to the registrant is made known to the certifying officers by others within the appropriate entities, particularly during the period in which Forms N-CSR are being prepared, and the registrant’s disclosure controls and procedures allow timely preparation and review of the information for the registrant’s Form N-CSR and the officer certifications of such Form N-CSR. |
| (b) | There were no significant changes in the registrant’s internal controls that occurred during the second fiscal quarter of the period covered by this report that has materially affected, or is reasonably likely to materially affect, the registrant’s internal control over financial reporting. |
Item 12. Disclosure of Securities Lending Activities for Closed-End Management Investment Companies.
Not applicable.
Item 13. Exhibits.
| (a)(1) | The Code of Ethics pursuant to Item 2 of Form N-CSR is filed and attached hereto as EX-99.CODE ETH. |
| (a)(3) | Not applicable. |
| (b) | The officer certifications required by Section 906 of the Sarbanes-Oxley Act of 2002 are attached hereto as EX-99.906CERT. |
SIGNATURES
Pursuant to the requirements of the Securities Exchange Act of 1934 and the Investment Company Act of 1940, the registrant has duly caused this report to be signed on its behalf by the undersigned, thereunto duly authorized.
(Registrant): Voya Funds Trust
| By | /s/ Michael Bell | |
| Michael Bell | ||
| Chief Executive Officer |
Date: June 8, 2020
Pursuant to the requirements of the Securities Exchange Act of 1934 and the Investment Company Act of 1940, this report has been signed below by the following persons on behalf of the registrant and in the capacities and on the dates indicated.
| By | /s/ Michael Bell | |
| Michael Bell | ||
| Chief Executive Officer |
Date: June 8, 2020
| By | /s/ Todd Modic | |
| Todd Modic | ||
| Senior Vice President and Chief Financial Officer | ||
Date: June 8, 2020