UNITED STATES
SECURITIES AND EXCHANGE COMMISSION
Washington, D.C. 20549
Form N-CSR
CERTIFIED SHAREHOLDER REPORT OF
REGISTERED MANAGEMENT INVESTMENT COMPANIES
Investment Company Act file number: 811-08895
Voya Funds Trust
(Exact name of registrant as specified in charter)
| 7337 East Doubletree Ranch Road, Suite 100, Scottsdale, AZ | 85258 |
| (Address of principal executive offices) | (Zip code) |
The Corporation Trust Company, 1209 Orange Street, Wilmington, DE 19801
(Name and address of agent for service)
Registrant’s telephone number, including area code: 1-800-992-0180
| Date of fiscal year end: | March 31 |
| Date of reporting period: | March 31, 2017 |
Item 1. Reports to Stockholders.
The following is a copy of the report transmitted to stockholders pursuant to Rule 30e-1 under the Act (17 CFR 270.30e-1):
![[MISSING IMAGE: ing_cov.jpg]](https://capedge.com/proxy/N-CSR/0001571049-17-005775/ing_cov.jpg)
| | | | E-Delivery Sign-up – details inside | |
| | | This report is submitted for general information to shareholders of the Voya mutual funds. It is not authorized for distribution to prospective shareholders unless accompanied or preceded by a prospectus which includes details regarding the funds’ investment objectives, risks, charges, expenses and other information. This information should be read carefully. | | |
![[MISSING IMAGE: voya_covinvmgt.jpg]](https://capedge.com/proxy/N-CSR/0001571049-17-005775/voya_covinvmgt.jpg)
| | | | | | 1 | |
| | | | | | 2 | |
| | | | | | 4 | |
| | | | | | 16 | |
| | | | | | 18 | |
| | | | | | 19 | |
| | | | | | 23 | |
| | | | | | 25 | |
| | | | | | 28 | |
| | | | | | 34 | |
| | | | | | 53 | |
| | | | | | 129 | |
| | | | | | 130 | |
| | | | | | 131 | |
| | | | | | 135 |
| | | | | Go Paperless with E-Delivery! | | | | | ||
| | | Sign up now for on-line prospectuses, fund reports, and proxy statements. In less than five minutes, you can help reduce paper mail and lower fund costs. | | | ||||||
| | | Just go to www.voyainvestments.com, click on the E-Delivery icon from the home page, follow the directions and complete the quick 5 Steps to Enroll. | | | ||||||
| | | You will be notified by e-mail when these communications become available on the internet. Documents that are not available on the internet will continue to be sent by mail. | | | ||||||
![[MISSING IMAGE: ph_shaun-mathews.jpg]](https://capedge.com/proxy/N-CSR/0001571049-17-005775/ph_shaun-mathews.jpg)
![[MISSING IMAGE: sg_shaun-mathews.jpg]](https://capedge.com/proxy/N-CSR/0001571049-17-005775/sg_shaun-mathews.jpg)
President and Chief Executive Officer
Voya Family of Funds
April 25, 2017
| | | Index | | | | Description | | |
| | | Bank of America Merrill Lynch U.S. Dollar Three-Month LIBOR Constant Maturity Index | | | | The Index is designed to track the performance of a synthetic asset paying LIBOR to a stated maturity. The index is based on the assumed purchase at par of a synthetic instrument having exactly its stated maturity and with a coupon equal to that day’s fixing rate. That issue is assumed to be sold the following business day (priced at a yield equal to the current day rate) and rolled into a new instrument. | | |
| | | Bloomberg Barclays GNMA Index | | | | An index comprised of all fixed security mortgage pools sponsored by GNMA, including GNMA Graduated Payment Mortgages. | | |
| | | Bloomberg Barclays High Yield Bond — 2% Issuer Constrained Composite Index | | | | An index that includes all fixed income securities having a maximum quality rating of Ba1, a minimum amount outstanding of $150 million, and at least one year to maturity. | | |
| | | Bloomberg Barclays U.S. 1-3 Year Government/Credit Bond Index | | | | A widely recognized index of publicly issued fixed rate, investment grade debt securities, including Treasuries, Agencies and credit securities with a maturity of one to three years. | | |
| | | Bloomberg Barclays U.S. Aggregate Bond Index | | | | An index of publicly issued investment grade U.S. Government, mortgage-backed, asset-backed and corporate debt securities. | | |
| | | Bloomberg Barclays U.S. Corporate Investment Grade Bond Index | | | | An index consisting of publicly issued, fixed rate, nonconvertible, investment grade debt securities. | | |
| | | Bloomberg Barclays U.S. Treasury Bond Index | | | | A market capitalization-weighted index that measures the performance of public obligations of the U.S. Treasury that have a remaining maturity of one year or more. | | |
| | | MSCI Europe ex UK® Index | | | | A free float-adjusted market capitalization index that is designed to measure developed market equity performance in Europe, excluding the UK. | | |
| | | MSCI Japan® Index | | | | A free float-adjusted market capitalization index that is designed to measure developed market equity performance in Japan. | | |
| | | MSCI UK® Index | | | | A free float-adjusted market capitalization index that is designed to measure developed market equity performance in the UK. | | |
| | | MSCI World IndexSM | | | | An index that measures the performance of over 1,400 securities listed on exchanges in the U.S., Europe, Canada, Australia, New Zealand and the Far East. | | |
| | | S&P 500® Index | | | | An index that measures the performance of securities of approximately 500 large-capitalization companies whose securities are traded on major U.S. stock markets. | | |
| Voya GNMA Income Fund | Portfolio Managers’ Report |
| | Investment Type Allocation as of March 31, 2017 (as a percentage of net assets) | | |||
| | | | | | |
| | U.S. Government Agency Obligations | | | 70.7% | |
| | Collateralized Mortgage Obligations | | | 54.6% | |
| | Commercial Mortgage-Backed Securities | | | 1.6% | |
| | Asset-Backed Securities | | | 0.9% | |
| | Liabilities in Excess of Other Assets | | | (27.8)% | |
| | Net Assets | | | 100.0% | |
| | Portfolio holdings are subject to change daily. | | |||
| Portfolio Managers’ Report | Voya GNMA Income Fund |
| | | ![[MISSING IMAGE: t1701325_chrt-gnma.jpg]](https://capedge.com/proxy/N-CSR/0001571049-17-005775/t1701325_chrt-gnma.jpg) | | |
| | | Average Annual Total Returns for the Periods Ended March 31, 2017 | | | ||||||||||||||||||
| | | | | | 1 Year | | | 5 Year | | | 10 Year | | | |||||||||
| | | Including Sales Charge: | | | | | ||||||||||||||||
| | | Class A(1) | | | | | -2.06% | | | | | | 1.32% | | | | | | 3.68% | | | |
| | | Class B(2) | | | | | -5.16% | | | | | | 0.69% | | | | | | 3.16% | | | |
| | | Class C(3) | | | | | -1.35% | | | | | | 1.06% | | | | | | 3.16% | | | |
| | | Class I | | | | | 0.76% | | | | | | 2.12% | | | | | | 4.24% | | | |
| | | Class W(4) | | | | | 0.72% | | | | | | 2.09% | | | | | | 4.19% | | | |
| | | Excluding Sales Charge: | | | | | ||||||||||||||||
| | | Class A | | | | | 0.44% | | | | | | 1.83% | | | | | | 3.93% | | | |
| | | Class B | | | | | -0.26% | | | | | | 1.05% | | | | | | 3.16% | | | |
| | | Class C | | | | | -0.37% | | | | | | 1.06% | | | | | | 3.16% | | | |
| | | Class I | | | | | 0.76% | | | | | | 2.12% | | | | | | 4.24% | | | |
| | | Class W(4) | | | | | 0.72% | | | | | | 2.09% | | | | | | 4.19% | | | |
| | | Bloomberg Barclays GNMA | | | | | 0.09% | | | | | | 1.79% | | | | | | 4.23% | | | |
| | | | | | ||||||||||||||||||
| Voya High Yield Bond Fund | Portfolio Managers’ Report |
| | Sector Diversification as of March 31, 2017 (as a percentage of net assets) | | |||
| | | | | | |
| | Communications | | | 19.0% | |
| | Consumer, Non-cyclical | | | 18.9% | |
| | Consumer, Cyclical | | | 15.9% | |
| | Energy | | | 11.9% | |
| | Industrials | | | 10.5% | |
| | Basic Materials | | | 8.0% | |
| | Technology | | | 5.8% | |
| | Financials | | | 5.5% | |
| | Utilities | | | 1.4% | |
| | Steel** | | | 0.0% | |
| | Consumer Discretionary | | | — | |
| | Assets in Excess of Other Liabilities* | | | 3.1% | |
| | Net Assets | | | 100.0% | |
| | * Includes short-term investments. | | |||
| | ** Amount less than 0.005% | | |||
| | Portfolio holdings are subject to change daily. | | |||
| | Top Ten Holdings as of March 31, 2017* (as a percentage of net assets) | | |||
| | | | | | |
| | Sprint Corp., 7.125%, 06/15/24 | | | 0.9% | |
| | HCA, Inc., 5.375%, 02/01/25 | | | 0.7% | |
| | First Data Corp., 7.000%, 12/01/23 | | | 0.7% | |
| | HCA Holdings, Inc., 6.250%, 02/15/21 | | | 0.6% | |
| | Valeant Pharmaceuticals International, 6.750%, 08/15/21 | | | 0.6% | |
| | Sprint Corp., 7.250%, 09/15/21 | | | 0.5% | |
| | Targa Resources Partners L.P. / Targa Resources Partners Finance Corp., 5.250%, 05/01/23 | | | 0.5% | |
| | WPX Energy, Inc., 6.000%, 01/15/22 | | | 0.5% | |
| | MPH Acquisition Holdings LLC, 7.125%, 06/01/24 | | | 0.5% | |
| | Sprint Communications, Inc., 6.000%, 11/15/22 | | | 0.5% | |
| | * Excludes short-term investments. | | |||
| | Portfolio holdings are subject to change daily. | | |||
| Portfolio Managers’ Report | Voya High Yield Bond Fund |
| | | ![[MISSING IMAGE: t1701325_chrt-hybf.jpg]](https://capedge.com/proxy/N-CSR/0001571049-17-005775/t1701325_chrt-hybf.jpg) | | |
| | | Average Annual Total Returns for the Periods Ended March 31, 2017 | | | ||||||||||||||||||||||||||||||||||||||||||
| | | | | | 1 Year | | | 5 Year | | | 10 Year | | | Since Inception of Class I July 31, 2008 | | | Since Inception of Class P June 14, 2013 | | | Since Inception of Class R January 30, 2014 | | | Since Inception of Class R6 August 3, 2016 | | | |||||||||||||||||||||
| | | Including Sales Charge: | | | | | | | | | ||||||||||||||||||||||||||||||||||||
| | | Class A(1) | | | | | 9.26% | | | | | | 5.88% | | | | | | 5.79% | | | | | | — | | | | | | — | | | | | | — | | | | | | — | | | |
| | | Class B(2) | | | | | 6.31% | | | | | | 5.30% | | | | | | 5.25% | | | | | | — | | | | | | — | | | | | | — | | | | | | — | | | |
| | | Class C(3) | | | | | 10.45% | | | | | | 5.62% | | | | | | 5.26% | | | | | | — | | | | | | — | | | | | | — | | | | | | — | | | |
| | | Class I | | | | | 12.54% | | | | | | 6.79% | | | | | | — | | | | | | 8.40% | | | | | | — | | | | | | — | | | | | | — | | | |
| | | Class P | | | | | 13.36% | | | | | | — | | | | | | — | | | | | | — | | | | | | 6.01% | | | | | | — | | | | | | — | | | |
| | | Class R | | | | | 11.85% | | | | | | — | | | | | | — | | | | | | — | | | | | | — | | | | | | 4.03% | | | | | | — | | | |
| | | Class R6(4) | | | | | 12.66% | | | | | | 6.81% | | | | | | — | | | | | | — | | | | | | — | | | | | | — | | | | | | 8.41% | | | |
| | | Class W(5) | | | | | 12.40% | | | | | | 6.72% | | | | | | 6.35% | | | | | | — | | | | | | — | | | | | | — | | | | | | — | | | |
| | | Excluding Sales Charge: | | | | | | | | | ||||||||||||||||||||||||||||||||||||
| | | Class A | | | | | 12.13% | | | | | | 6.42% | | | | | | 6.06% | | | | | | — | | | | | | — | | | | | | — | | | | | | — | | | |
| | | Class B | | | | | 11.31% | | | | | | 5.62% | | | | | | 5.25% | | | | | | — | | | | | | — | | | | | | — | | | | | | — | | | |
| | | Class C | | | | | 11.45% | | | | | | 5.62% | | | | | | 5.26% | | | | | | — | | | | | | — | | | | | | — | | | | | | — | | | |
| | | Class I | | | | | 12.54% | | | | | | 6.79% | | | | | | — | | | | | | 8.40% | | | | | | — | | | | | | — | | | | | | — | | | |
| | | Class P | | | | | 13.36% | | | | | | — | | | | | | — | | | | | | — | | | | | | 6.01% | | | | | | — | | | | | | — | | | |
| | | Class R | | | | | 11.85% | | | | | | — | | | | | | — | | | | | | — | | | | | | — | | | | | | 4.03% | | | | | | — | | | |
| | | Class R6(4) | | | | | 12.66% | | | | | | 6.81% | | | | | | — | | | | | | — | | | | | | — | | | | | | — | | | | | | 8.41% | | | |
| | | Class W(5) | | | | | 12.40% | | | | | | 6.72% | | | | | | 6.35% | | | | | | — | | | | | | — | | | | | | — | | | | | | — | | | |
| | | Bloomberg Barclays High Yield Bond – 2% Issuer Constrained Composite | | | | | 16.39% | | | | | | 6.82% | | | | | | 7.54% | | | | | | 9.11% | | | | | | 5.62% | | | | | | 5.05% | | | | | | 9.11% | | | |
| | | | | | ||||||||||||||||||||||||||||||||||||||||||
| Voya Intermediate Bond Fund | Portfolio Managers’ Report |
| | Investment Type Allocation as of March 31, 2017 (as a percentage of net assets) | | |||
| | | | | | |
| | Corporate Bonds/Notes | | | 30.4% | |
| | U.S. Treasury Obligations | | | 23.8% | |
| | Collateralized Mortgage Obligations | | | 13.5% | |
| | U.S. Government Agency Obligations | | | 11.8% | |
| | Asset-Backed Securities | | | 11.4% | |
| | Commercial Mortgage-Backed Securities | | | 5.6% | |
| | Foreign Government Bonds | | | 4.2% | |
| | Purchased Options** | | | 0.0% | |
| | Liabilities in Excess of Other Assets* | | | (0.7)% | |
| | Net Assets | | | 100.0% | |
| | * Includes short-term investments. | | |||
| | ** Amount less than 0.005% | | |||
| | Portfolio holdings are subject to change daily. | | |||
| | Top Ten Holdings as of March 31, 2017* (as a percentage of net assets) | | |||
| | | | | | |
| | United States Treasury Note, 1.250%, 03/31/19 | | | 4.6% | |
| | United States Treasury Note, 1.625%, 03/15/20 | | | 4.5% | |
| | United States Treasury Bond, 2.875%, 11/15/46 | | | 3.8% | |
| | United States Treasury Note, 2.250%, 02/15/27 | | | 3.6% | |
| | United States Treasury Note, 1.875%, 03/31/22 | | | 2.9% | |
| | United States Treasury Inflation Indexed Bonds, 0.375%, 01/15/27 | | | 2.5% | |
| | Freddie Mac, 4.000%, 05/01/47 | | | 1.0% | |
| | United States Treasury Note, 1.875%, 02/28/22 | | | 0.9% | |
| | United States Treasury Note, 2.125%, 02/29/24 | | | 0.7% | |
| | Fannie Mae, 4.000%, 01/01/45 | | | 0.7% | |
| | * Excludes short-term investments. | | |||
| | Portfolio holdings are subject to change daily. | | |||
| Portfolio Managers’ Report | Voya Intermediate Bond Fund |
| Voya Intermediate Bond Fund | Portfolio Managers’ Report |
| | | ![[MISSING IMAGE: t1701325_chrt-ibf.jpg]](https://capedge.com/proxy/N-CSR/0001571049-17-005775/t1701325_chrt-ibf.jpg) | | |
| | | Average Annual Total Returns for the Periods Ended March 31, 2017 | | | ||||||||||||||||||
| | | | | | 1 Year | | | 5 Year | | | 10 Year | | | |||||||||
| | | Including Sales Charge: | | | | | ||||||||||||||||
| | | Class A(1) | | | | | -0.38% | | | | | | 2.92% | | | | | | 3.96% | | | |
| | | Class B(2) | | | | | -3.44% | | | | | | 2.31% | | | | | | 3.44% | | | |
| | | Class C(3) | | | | | 0.53% | | | | | | 2.67% | | | | | | 3.45% | | | |
| | | Class I | | | | | 2.63% | | | | | | 3.78% | | | | | | 4.56% | | | |
| | | Class O | | | | | 2.19% | | | | | | 3.44% | | | | | | 4.22% | | | |
| | | Class R | | | | | 1.93% | | | | | | 3.18% | | | | | | 3.96% | | | |
| | | Class R6(4) | | | | | 2.54% | | | | | | 3.77% | | | | | | 4.56% | | | |
| | | Class W(5) | | | | | 2.54% | | | | | | 3.71% | | | | | | 4.71% | | | |
| | | Excluding Sales Charge: | | | | | ||||||||||||||||
| | | Class A | | | | | 2.19% | | | | | | 3.44% | | | | | | 4.22% | | | |
| | | Class B | | | | | 1.52% | | | | | | 2.67% | | | | | | 3.44% | | | |
| | | Class C | | | | | 1.53% | | | | | | 2.67% | | | | | | 3.45% | | | |
| | | Class I | | | | | 2.63% | | | | | | 3.78% | | | | | | 4.56% | | | |
| | | Class O | | | | | 2.19% | | | | | | 3.44% | | | | | | 4.22% | | | |
| | | Class R | | | | | 1.93% | | | | | | 3.18% | | | | | | 3.96% | | | |
| | | Class R6(4) | | | | | 2.54% | | | | | | 3.77% | | | | | | 4.56% | | | |
| | | Class W(5) | | | | | 2.54% | | | | | | 3.71% | | | | | | 4.71% | | | |
| | | Bloomberg Barclays U.S. Aggregate Bond | | | | | 0.44% | | | | | | 2.34% | | | | | | 4.27% | | | |
| | | | | | ||||||||||||||||||
| Portfolio Managers’ Report | Voya Short Term Bond Fund |
| | Investment Type Allocation as of March 31, 2017 (as a percentage of net assets) | | |||
| | | | | | |
| | Corporate Bonds/Notes | | | 49.0% | |
| | Asset-Backed Securities | | | 16.5% | |
| | Commercial Mortgage-Backed Securities | | | 8.4% | |
| | Collateralized Mortgage Obligations | | | 5.8% | |
| | U.S. Treasury Obligations | | | 4.7% | |
| | U.S. Government Agency Obligations | | | 2.0% | |
| | Foreign Government Bonds** | | | 0.0% | |
| | Assets in Excess of Other Liabilities* | | | 13.6% | |
| | Net Assets | | | 100.0% | |
| | * Includes short-term investments. | | |||
| | ** Amount less than 0.005% | | |||
| | Portfolio holdings are subject to change daily. | | |||
| | Top Ten Holdings as of March 31, 2017* (as a percentage of net assets) | | |||
| | | | | | |
| | United States Treasury Note, 0.625%, 06/30/18 | | | 2.0% | |
| | Ginnie Mae Series 2014-53 JM, 7.124%, 04/20/39 | | | 1.0% | |
| | Bank of America Corp., 2.600%, 01/15/19 | | | 1.0% | |
| | United States Treasury Note, 2.125%, 02/29/24 | | | 1.0% | |
| | United States Treasury Note, 2.125%, 03/31/24 | | | 0.9% | |
| | Fannie Mae REMIC Trust 2009-49 KB, 5.000%, 07/25/24 | | | 0.8% | |
| | Freddie Mac REMIC Trust 2103 TE, 6.000%, 12/15/28 | | | 0.8% | |
| | JP Morgan Chase Commercial Mortgage Securities Trust 2007-LDP12, 5.882%, 02/15/51 | | | 0.8% | |
| | Freddie Mac REMIC Trust 3597 L, 5.000%, 07/15/39 | | | 0.7% | |
| | Ginnie Mae Series 2015-H31 FT, 1.430%, 11/20/65 | | | 0.6% | |
| | * Excludes short-term investments. | | |||
| | Portfolio holdings are subject to change daily. | | |||
| Voya Short Term Bond Fund | Portfolio Managers’ Report |
| | | ![[MISSING IMAGE: t1701325_chrt-stbf.jpg]](https://capedge.com/proxy/N-CSR/0001571049-17-005775/t1701325_chrt-stbf.jpg) | | |
| | | Average Annual Total Returns for the Periods Ended March 31, 2017 | | | ||||||||||||||||||||||||
| | | | | | 1 Year | | | Since Inception of Classes A, C, I, and W December 19, 2012 | | | Since Inception of Class R6 July 31, 2013 | | | Since Inception of Class R July 31, 2014 | | | ||||||||||||
| | | Including Sales Charge: | | | | | | |||||||||||||||||||||
| | | Class A(1) | | | | | -1.34% | | | | | | 0.47% | | | | | | — | | | | | | — | | | |
| | | Class C(2) | | | | | -0.59% | | | | | | 0.30% | | | | | | — | | | | | | — | | | |
| | | Class I | | | | | 1.46% | | | | | | 1.35% | | | | | | — | | | | | | — | | | |
| | | Class R | | | | | 0.89% | | | | | | — | | | | | | — | | | | | | 0.76% | | | |
| | | Class R6(3) | | | | | 1.39% | | | | | | — | | | | | | 1.37% | | | | | | — | | | |
| | | Class W | | | | | 1.41% | | | | | | 1.31% | | | | | | — | | | | | | — | | | |
| | | Excluding Sales Charge: | | | | | | |||||||||||||||||||||
| | | Class A | | | | | 1.16% | | | | | | 1.07% | | | | | | — | | | | | | — | | | |
| | | Class C | | | | | 0.40% | | | | | | 0.30% | | | | | | — | | | | | | — | | | |
| | | Class I | | | | | 1.46% | | | | | | 1.35% | | | | | | — | | | | | | — | | | |
| | | Class R | | | | | 0.89% | | | | | | — | | | | | | — | | | | | | 0.76% | | | |
| | | Class R6(3) | | | | | 1.39% | | | | | | — | | | | | | 1.37% | | | | | | — | | | |
| | | Class W | | | | | 1.41% | | | | | | 1.31% | | | | | | — | | | | | | — | | | |
| | | Bloomberg Barclays U.S. 1-3 Year Government/Credit Bond | | | | | 0.71% | | | | | | 0.89% | | | | | | 0.89% | | | | | | 0.98% | | | |
| | | | | | ||||||||||||||||||||||||
| Portfolio Managers’ Report | Voya Strategic Income Opportunities Fund |
| | Investment Type Allocation as of March 31, 2017 (as a percentage of net assets) | | |||
| | | | | | |
| | Collateralized Mortgage Obligations | | | 26.5% | |
| | Bank Loans | | | 20.5% | |
| | Corporate Bonds/Notes | | | 14.8% | |
| | Foreign Government Bonds | | | 12.4% | |
| | Asset-Backed Securities | | | 11.8% | |
| | Commercial Mortgage-Backed Securities | | | 11.1% | |
| | U.S. Treasury Obligations | | | 0.1% | |
| | Purchased Options** | | | 0.0% | |
| | U.S. Government Agency Obligations** | | | 0.0% | |
| | Assets in Excess of Other Liabilities* | | | 2.8% | |
| | Net Assets | | | 100.0% | |
| | * Includes short-term investments. | | |||
| | ** Amount less than 0.005% | | |||
| | Portfolio holdings are subject to change daily. | | |||
| | Top Ten Holdings as of March 31, 2017* (as a percentage of net assets) | | |||
| | | | | | |
| | Russian Federal Bond - OFZ, 7.600%, 07/20/22 | | | 1.6% | |
| | Brazil Notas do Tesouro Nacional Series F, 10.000%, 01/01/23 | | | 1.6% | |
| | Republic of Poland Government Bond, 3.250%, 07/25/25 | | | 1.1% | |
| | Russian Federal Bond - OFZ, 7.000%, 08/16/23 | | | 1.1% | |
| | Babson CLO Ltd. 2013-IIA C, 4.274%, 01/18/25 | | | 0.9% | |
| | Russian Federal Bond - OFZ, 7.500%, 08/18/21 | | | 0.9% | |
| | Fannie Mae 2011-47 GF, 1.552%, 06/25/41 | | | 0.8% | |
| | Wells Fargo Mortgage Backed Securities 2006-AR12 Trust 1A1, 3.235%, 09/25/36 | | | 0.8% | |
| | Brazil Notas do Tesouro Nacional Series F, 10.000%, 01/01/19 | | | 0.7% | |
| | Wells Fargo Mortgage Backed Securities 2006-8 A18 Trust, 6.000%, 07/25/36 | | | 0.7% | |
| | * Excludes short-term investments. | | |||
| | Portfolio holdings are subject to change daily. | | |||
| Voya Strategic Income Opportunities Fund | Portfolio Managers’ Report |
| Portfolio Managers’ Report | Voya Strategic Income Opportunities Fund |
| | | ![[MISSING IMAGE: t1701325_chrt-siof.jpg]](https://capedge.com/proxy/N-CSR/0001571049-17-005775/t1701325_chrt-siof.jpg) | | |
| | | Average Annual Total Returns for the Periods Ended March 31, 2017 | | | ||||||||||||||||||
| | | | | | 1 Year | | | Since Inception of Classes A, C, I, R, and W November 2, 2012 | | | Since Inception of Class R6 October 23, 2015 | | | |||||||||
| | | Including Sales Charge: | | | | | ||||||||||||||||
| | | Class A(1) | | | | | 4.19% | | | | | | 2.88% | | | | | | — | | | |
| | | Class C(2) | | | | | 5.05% | | | | | | 2.65% | | | | | | — | | | |
| | | Class I | | | | | 7.38% | | | | | | 3.88% | | | | | | — | | | |
| | | Class R | | | | | 6.57% | | | | | | 3.17% | | | | | | — | | | |
| | | Class R6(3) | | | | | 7.21% | | | | | | — | | | | | | 3.84% | | | |
| | | Class W | | | | | 7.19% | | | | | | 3.53% | | | | | | — | | | |
| | | Excluding Sales Charge: | | | | | ||||||||||||||||
| | | Class A | | | | | 6.82% | | | | | | 3.49% | | | | | | — | | | |
| | | Class C | | | | | 6.05% | | | | | | 2.65% | | | | | | — | | | |
| | | Class I | | | | | 7.38% | | | | | | 3.88% | | | | | | — | | | |
| | | Class R | | | | | 6.57% | | | | | | 3.17% | | | | | | — | | | |
| | | Class R6(3) | | | | | 7.21% | | | | | | — | | | | | | 3.84% | | | |
| | | Class W | | | | | 7.19% | | | | | | 3.53% | | | | | | — | | | |
| | | Bank of America Merrill Lynch U.S. Dollar Three-Month LIBOR Constant Maturity | | | | | 0.74% | | | | | | 0.38% | | | | | | 0.38% | | | |
| | | | | | ||||||||||||||||||
| | | | Actual Fund Return | | | Hypothetical (5% return before expenses) | | ||||||||||||||||||||||||||||||||||||||||||
| | | | Beginning Account Value October 1, 2016 | | | Ending Account Value March 31, 2017 | | | Annualized Expense Ratio | | | Expenses Paid During the Period Ended March 31, 2017* | | | Beginning Account Value October 1, 2016 | | | Ending Account Value March 31, 2017 | | | Annualized Expense Ratio | | | Expenses Paid During the Period Ended March 31, 2017* | | ||||||||||||||||||||||||
| Voya GNMA Income Fund | | ||||||||||||||||||||||||||||||||||||||||||||||||
| Class A | | | | $ | 1,000.00 | | | | | $ | 990.60 | | | | | | 0.93% | | | | | $ | 4.62 | | | | | $ | 1,000.00 | | | | | $ | 1,020.29 | | | | | | 0.93% | | | | | $ | 4.68 | | |
| Class B | | | | | 1,000.00 | | | | | | 986.80 | | | | | | 1.68 | | | | | | 8.32 | | | | | | 1,000.00 | | | | | | 1,016.55 | | | | | | 1.68 | | | | | | 8.45 | | |
| Class C | | | | | 1,000.00 | | | | | | 985.60 | | | | | | 1.68 | | | | | | 8.32 | | | | | | 1,000.00 | | | | | | 1,016.55 | | | | | | 1.68 | | | | | | 8.45 | | |
| Class I | | | | | 1,000.00 | | | | | | 992.10 | | | | | | 0.64 | | | | | | 3.18 | | | | | | 1,000.00 | | | | | | 1,021.74 | | | | | | 0.64 | | | | | | 3.23 | | |
| Class W | | | | | 1,000.00 | | | | | | 991.90 | | | | | | 0.68 | | | | | | 3.38 | | | | | | 1,000.00 | | | | | | 1,021.54 | | | | | | 0.68 | | | | | | 3.43 | | |
| Voya High Yield Bond Fund | | ||||||||||||||||||||||||||||||||||||||||||||||||
| Class A | | | | $ | 1,000.00 | | | | | $ | 1,034.30 | | | | | | 1.06% | | | | | $ | 5.38 | | | | | $ | 1,000.00 | | | | | $ | 1,019.65 | | | | | | 1.06% | | | | | $ | 5.34 | | |
| Class B | | | | | 1,000.00 | | | | | | 1,029.20 | | | | | | 1.81 | | | | | | 9.16 | | | | | | 1,000.00 | | | | | | 1,015.91 | | | | | | 1.81 | | | | | | 9.10 | | |
| Class C | | | | | 1,000.00 | | | | | | 1,030.50 | | | | | | 1.81 | | | | | | 9.16 | | | | | | 1,000.00 | | | | | | 1,015.91 | | | | | | 1.81 | | | | | | 9.10 | | |
| Class I | | | | | 1,000.00 | | | | | | 1,036.10 | | | | | | 0.71 | | | | | | 3.60 | | | | | | 1,000.00 | | | | | | 1,021.39 | | | | | | 0.71 | | | | | | 3.58 | | |
| Class P | | | | | 1,000.00 | | | | | | 1,039.30 | | | | | | 0.07 | | | | | | 0.36 | | | | | | 1,000.00 | | | | | | 1,024.58 | | | | | | 0.07 | | | | | | 0.35 | | |
| Class R | | | | | 1,000.00 | | | | | | 1,031.80 | | | | | | 1.31 | | | | | | 6.64 | | | | | | 1,000.00 | | | | | | 1,018.40 | | | | | | 1.31 | | | | | | 6.59 | | |
| Class R6 | | | | | 1,000.00 | | | | | | 1,036.00 | | | �� | | | 0.66 | | | | | | 3.35 | | | | | | 1,000.00 | | | | | | 1,021.64 | | | | | | 0.66 | | | | | | 3.33 | | |
| Class W | | | | | 1,000.00 | | | | | | 1,035.60 | | | | | | 0.81 | | | | | | 4.11 | | | | | | 1,000.00 | | | | | | 1,020.89 | | | | | | 0.81 | | | | | | 4.08 | | |
| | | | Actual Fund Return | | | Hypothetical (5% return before expenses) | | ||||||||||||||||||||||||||||||||||||||||||
| | | | Beginning Account Value October 1, 2016 | | | Ending Account Value March 31, 2017 | | | Annualized Expense Ratio | | | Expenses Paid During the Period Ended March 31, 2017* | | | Beginning Account Value October 1, 2016 | | | Ending Account Value March 31, 2017 | | | Annualized Expense Ratio | | | Expenses Paid During the Period Ended March 31, 2017* | | ||||||||||||||||||||||||
| Voya Intermediate Bond Fund | | ||||||||||||||||||||||||||||||||||||||||||||||||
| Class A | | | | $ | 1,000.00 | | | | | $ | 985.80 | | | | | | 0.65% | | | | | $ | 3.22 | | | | | $ | 1,000.00 | | | | | $ | 1,021.69 | | | | | | 0.65% | | | | | $ | 3.28 | | |
| Class B | | | | | 1,000.00 | | | | | | 983.00 | | | | | | 1.40 | | | | | | 6.92 | | | | | | 1,000.00 | | | | | | 1,017.95 | | | | | | 1.40 | | | | | | 7.04 | | |
| Class C | | | | | 1,000.00 | | | | | | 983.00 | | | | | | 1.40 | | | | | | 6.92 | | | | | | 1,000.00 | | | | | | 1,017.95 | | | | | | 1.40 | | | | | | 7.04 | | |
| Class I | | | | | 1,000.00 | | | | | | 988.40 | | | | | | 0.33 | | | | | | 1.64 | | | | | | 1,000.00 | | | | | | 1,023.29 | | | | | | 0.33 | | | | | | 1.66 | | |
| Class O | | | | | 1,000.00 | | | | | | 985.80 | | | | | | 0.65 | | | | | | 3.22 | | | | | | 1,000.00 | | | | | | 1,021.69 | | | | | | 0.65 | | | | | | 3.28 | | |
| Class R | | | | | 1,000.00 | | | | | | 984.60 | | | | | | 0.90 | | | | | | 4.45 | | | | | | 1,000.00 | | | | | | 1,020.44 | | | | | | 0.90 | | | | | | 4.53 | | |
| Class R6 | | | | | 1,000.00 | | | | | | 987.50 | | | | | | 0.31 | | | | | | 1.54 | | | | | | 1,000.00 | | | | | | 1,023.39 | | | | | | 0.31 | | | | | | 1.56 | | |
| Class W | | | | | 1,000.00 | | | | | | 987.90 | | | | | | 0.40 | | | | | | 1.98 | | | | | | 1,000.00 | | | | | | 1,022.94 | | | | | | 0.40 | | | | | | 2.02 | | |
| Voya Short Term Bond Fund | | ||||||||||||||||||||||||||||||||||||||||||||||||
| Class A | | | | $ | 1,000.00 | | | | | $ | 1,002.50 | | | | | | 0.76% | | | | | $ | 3.79 | | | | | $ | 1,000.00 | | | | | $ | 1,021.14 | | | | | | 0.76% | | | | | $ | 3.83 | | |
| Class C | | | | | 1,000.00 | | | | | | 998.80 | | | | | | 1.51 | | | | | | 7.52 | | | | | | 1,000.00 | | | | | | 1,017.40 | | | | | | 1.51 | | | | | | 7.59 | | |
| Class I | | | | | 1,000.00 | | | | | | 1,004.00 | | | | | | 0.50 | | | | | | 2.50 | | | | | | 1,000.00 | | | | | | 1,022.44 | | | | | | 0.50 | | | | | | 2.52 | | |
| Class R | | | | | 1,000.00 | | | | | | 1,001.30 | | | | | | 1.01 | | | | | | 5.04 | | | | | | 1,000.00 | | | | | | 1,019.90 | | | | | | 1.01 | | | | | | 5.09 | | |
| Class R6 | | | | | 1,000.00 | | | | | | 1,003.10 | | | | | | 0.47 | | | | | | 2.35 | | | | | | 1,000.00 | | | | | | 1,022.59 | | | | | | 0.47 | | | | | | 2.37 | | |
| Class W | | | | | 1,000.00 | | | | | | 1,003.70 | | | | | | 0.51 | | | | | | 2.55 | | | | | | 1,000.00 | | | | | | 1,022.39 | | | | | | 0.51 | | | | | | 2.57 | | |
| Voya Strategic Income Opportunities Fund | | ||||||||||||||||||||||||||||||||||||||||||||||||
| Class A | | | | $ | 1,000.00 | | | | | $ | 1,030.80 | | | | | | 1.06% | | | | | $ | 5.37 | | | | | $ | 1,000.00 | | | | | $ | 1,019.65 | | | | | | 1.06% | | | | | $ | 5.34 | | |
| Class C | | | | | 1,000.00 | | | | | | 1,027.10 | | | | | | 1.81 | | | | | | 9.15 | | | | | | 1,000.00 | | | | | | 1,015.91 | | | | | | 1.81 | | | | | | 9.10 | | |
| Class I | | | | | 1,000.00 | | | | | | 1,034.00 | | | | | | 0.69 | | | | | | 3.50 | | | | | | 1,000.00 | | | | | | 1,021.49 | | | | | | 0.69 | | | | | | 3.48 | | |
| Class R | | | | | 1,000.00 | | | | | | 1,029.50 | | | | | | 1.31 | | | | | | 6.63 | | | | | | 1,000.00 | | | | | | 1,018.40 | | | | | | 1.31 | | | | | | 6.59 | | |
| Class R6 | | | | | 1,000.00 | | | | | | 1,032.20 | | | | | | 0.67 | | | | | | 3.39 | | | | | | 1,000.00 | | | | | | 1,021.59 | | | | | | 0.67 | | | | | | 3.38 | | |
| Class W | | | | | 1,000.00 | | | | | | 1,032.10 | | | | | | 0.81 | | | | | | 4.10 | | | | | | 1,000.00 | | | | | | 1,020.89 | | | | | | 0.81 | | | | | | 4.08 | | |
Voya Funds Trust
May 26, 2017
| | | | Voya GNMA Income Fund | | | Voya High Yield Bond Fund | | | Voya Intermediate Bond Fund | | |||||||||
| ASSETS: | | | | | |||||||||||||||
| Investments in securities at fair value+* | | | | $ | 1,568,121,568 | | | | | $ | 620,042,346 | | | | | $ | 3,757,792,006 | | |
| Short-term investments at fair value** | | | | | — | | | | | | 50,692,164 | | | | | | 293,137,183 | | |
| Total investments at fair value | | | | $ | 1,568,121,568 | | | | | $ | 670,734,510 | | | | | $ | 4,050,929,189 | | |
| Cash | | | | | 75,659,737 | | | | | | 63,918 | | | | | | 77,845 | | |
| Cash collateral for futures | | | | | 2,824,843 | | | | | | — | | | | | | 5,501,601 | | |
| Cash pledged for centrally cleared swaps (Note 2) | | | | | — | | | | | | — | | | | | | 1,550,000 | | |
| Cash pledged as collateral for OTC derivatives (Note 2) | | | | | — | | | | | | — | | | | | | 1,210,000 | | |
| Foreign currencies at value*** | | | | | — | | | | | | — | | | | | | 234,945 | | |
| Receivables: | | | | | |||||||||||||||
| Investment securities sold | | | | | 29,946,013 | | | | | | 1,670,625 | | | | | | 27,925,193 | | |
| Investment securities sold on a delayed-delivery or when-issued basis | | | | | 342,972,728 | | | | | | — | | | | | | 75,218,171 | | |
| Fund shares sold | | | | | 3,038,628 | | | | | | 918,283 | | | | | | 6,577,440 | | |
| Dividends | | | | | — | | | | | | 2,578 | | | | | | 59,331 | | |
| Interest | | | | | 3,484,298 | | | | | | 10,649,124 | | | | | | 23,076,207 | | |
| Unrealized appreciation on forward foreign currency contracts | | | | | — | | | | | | — | | | | | | 258,714 | | |
| Prepaid expenses | | | | | 48,232 | | | | | | 47,980 | | | | | | 75,986 | | |
| Other assets | | | | | 31,490 | | | | | | 11,165 | | | | | | 61,226 | | |
| Total assets | | | | | 2,026,127,537 | | | | | | 684,098,183 | | | | | | 4,192,755,848 | | |
| LIABILITIES: | | | | | |||||||||||||||
| Income distribution payable | | | | | 369,657 | | | | | | 84,030 | | | | | | 659,357 | | |
| Payable for investment securities purchased | | | | | 13,564,306 | | | | | | 7,068,500 | | | | | | 85,281,412 | | |
| Payable for investment securities purchased on a delayed-delivery or when-issued basis | | | | | 776,457,535 | | | | | | — | | | | | | 202,296,785 | | |
| Payable for fund shares redeemed | | | | | 3,347,646 | | | | | | 778,995 | | | | | | 5,006,124 | | |
| Payable for foreign cash collateral for futures**** | | | | | — | | | | | | — | | | | | | 1,081,002 | | |
| Payable upon receipt of securities loaned | | | | | — | | | | | | 35,457,175 | | | | | | 164,524,818 | | |
| Unrealized depreciation on forward foreign currency contracts | | | | | — | | | | | | — | | | | | | 1,724,386 | | |
| Variation margin payable on centrally cleared swaps | | | | | — | | | | | | — | | | | | | 86,503 | | |
| Cash received as collateral for OTC derivatives (Note 2) | | | | | — | | | | | | — | | | | | | 310,000 | | |
| Cash received as collateral for delayed-delivery or when-issued securities (Note 2) | | | | | 4,130,000 | | | | | | — | | | | | | — | | |
| Payable for investment management fees | | | | | 584,192 | | | | | | 252,327 | | | | | | 842,001 | | |
| Payable for distribution and shareholder service fees | | | | | 208,599 | | | | | | 24,319 | | | | | | 194,804 | | |
| Payable to trustees under the deferred compensation plan (Note 6) | | | | | 31,490 | | | | | | 11,165 | | | | | | 61,226 | | |
| Payable for trustee fees | | | | | 7,096 | | | | | | 3,605 | | | | | | 16,844 | | |
| Other accrued expenses and liabilities | | | | | 102,079 | | | | | | 141,175 | | | | | | 634,097 | | |
| Written options, at fair value^ | | | | | — | | | | | | — | | | | | | 287,863 | | |
| Total liabilities | | | | | 798,802,600 | | | | | | 43,821,291 | | | | | | 463,007,222 | | |
| NET ASSETS | | | | $ | 1,227,324,937 | | | | | $ | 640,276,892 | | | | | $ | 3,729,748,626 | | |
| NET ASSETS WERE COMPRISED OF: | | | | | |||||||||||||||
| Paid-in capital | | | | $ | 1,240,631,262 | | | | | $ | 651,778,491 | | | | | $ | 3,846,213,841 | | |
| Undistributed (distributions in excess of) net investment income or accumulated net investment loss | | | | | (2,042,161) | | | | | | 11,313 | | | | | | (1,140,786) | | |
| Accumulated net realized loss | | | | | (15,412,802) | | | | | | (28,960,138) | | | | | | (139,802,292) | | |
| Net unrealized appreciation | | | | | 4,148,638 | | | | | | 17,447,226 | | | | | | 24,477,863 | | |
| NET ASSETS | | | | $ | 1,227,324,937 | | | | | $ | 640,276,892 | | | | | $ | 3,729,748,626 | | |
+ Including securities loaned at value | | | | $ | — | | | | | $ | 34,600,224 | | | | | $ | 160,888,836 | | |
* Cost of investments in securities | | | | $ | 1,563,770,595 | | | | | $ | 602,536,054 | | | | | $ | 3,738,263,829 | | |
** Cost of short-term investments | | | | $ | — | | | | | $ | 50,751,230 | | | | | $ | 293,096,069 | | |
*** Cost of foreign currencies | | | | $ | — | | | | | $ | — | | | | | $ | 224,612 | | |
**** Cost of payable for foreign cash collateral for futures | | | | $ | — | | | | | $ | — | | | | | $ | 1,081,002 | | |
^ Premiums received on written options | | | | $ | — | | | | | $ | — | | | | | $ | 32,349 | | |
| | | | Voya GNMA Income Fund | | | Voya High Yield Bond Fund | | | Voya Intermediate Bond Fund | | |||||||||
| Class A | | | | | |||||||||||||||
| Net assets | | | | $ | 513,222,517 | | | | | $ | 60,926,664 | | | | | $ | 436,937,768 | | |
| Shares authorized | | | | | unlimited | | | | | | unlimited | | | | | | unlimited | | |
| Par value | | | | $ | 0.001 | | | | | $ | 0.001 | | | | | $ | 0.001 | | |
| Shares outstanding | | | | | 60,841,111 | | | | | | 7,512,515 | | | | | | 43,647,625 | | |
| Net asset value and redemption price per share† | | | | $ | 8.44 | | | | | $ | 8.11 | | | | | $ | 10.01 | | |
Maximum offering price per share (2.50%)(1) | | | | $ | 8.66 | | | | | $ | 8.32 | | | | | $ | 10.27 | | |
| Class B | | | | | |||||||||||||||
| Net assets | | | | $ | 70,140 | | | | | $ | 63,985 | | | | | $ | 187,916 | | |
| Shares authorized | | | | | unlimited | | | | | | unlimited | | | | | | unlimited | | |
| Par value | | | | $ | 0.001 | | | | | $ | 0.001 | | | | | $ | 0.001 | | |
| Shares outstanding | | | | | 8,363 | | | | | | 7,896 | | | | | | 18,819 | | |
| Net asset value and redemption price per share† | | | | $ | 8.39 | | | | | $ | 8.10 | | | | | $ | 9.99 | | |
| Class C | | | | | |||||||||||||||
| Net assets | | | | $ | 111,102,638 | | | | | $ | 13,112,777 | | | | | $ | 28,270,240 | | |
| Shares authorized | | | | | unlimited | | | | | | unlimited | | | | | | unlimited | | |
| Par value | | | | $ | 0.001 | | | | | $ | 0.001 | | | | | $ | 0.001 | | |
| Shares outstanding | | | | | 13,238,319 | | | | | | 1,617,327 | | | | | | 2,828,356 | | |
| Net asset value and redemption price per share† | | | | $ | 8.39 | | | | | $ | 8.11 | | | | | $ | 10.00 | | |
| Class I | | | | | |||||||||||||||
| Net assets | | | | $ | 461,076,268 | | | | | $ | 204,817,916 | | | | | $ | 1,578,844,331 | | |
| Shares authorized | | | | | unlimited | | | | | | unlimited | | | | | | unlimited | | |
| Par value | | | | $ | 0.001 | | | | | $ | 0.001 | | | | | $ | 0.001 | | |
| Shares outstanding | | | | | 54,587,337 | | | | | | 25,297,285 | | | | | | 157,789,626 | | |
| Net asset value and redemption price per share | | | | $ | 8.45 | | | | | $ | 8.10 | | | | | $ | 10.01 | | |
| Class O | | | | | |||||||||||||||
| Net assets | | | | | n/a | | | | | | n/a | | | | | $ | 32,404,423 | | |
| Shares authorized | | | | | n/a | | | | | | n/a | | | | | | unlimited | | |
| Par value | | | | | n/a | | | | | | n/a | | | | | $ | 0.001 | | |
| Shares outstanding | | | | | n/a | | | | | | n/a | | | | | | 3,237,137 | | |
| Net asset value and redemption price per share | | | | | n/a | | | | | | n/a | | | | | $ | 10.01 | | |
| Class P | | | | | |||||||||||||||
| Net assets | | | | | n/a | | | | | $ | 149,605,989 | | | | | | n/a | | |
| Shares authorized | | | | | n/a | | | | | | unlimited | | | | | | n/a | | |
| Par value | | | | | n/a | | | | | $ | 0.001 | | | | | | n/a | | |
| Shares outstanding | | | | | n/a | | | | | | 18,453,086 | | | | | | n/a | | |
| Net asset value and redemption price per share | | | | | n/a | | | | | $ | 8.11 | | | | | | n/a | | |
| Class R | | | | | |||||||||||||||
| Net assets | | | | | n/a | | | | | $ | 267,218 | | | | | $ | 166,267,581 | | |
| Shares authorized | | | | | n/a | | | | | | unlimited | | | | | | unlimited | | |
| Par value | | | | | n/a | | | | | $ | 0.001 | | | | | $ | 0.001 | | |
| Shares outstanding | | | | | n/a | | | | | | 32,933 | | | | | | 16,588,886 | | |
| Net asset value and redemption price per share | | | | | n/a | | | | | $ | 8.11 | | | | | $ | 10.02 | | |
| Class R6 | | | | | |||||||||||||||
| Net assets | | | | | n/a | | | | | $ | 120,604,573 | | | | | $ | 832,462,101 | | |
| Shares authorized | | | | | n/a | | | | | | unlimited | | | | | | unlimited | | |
| Par value | | | | | n/a | | | | | $ | 0.001 | | | | | $ | 0.001 | | |
| Shares outstanding | | | | | n/a | | | | | | 14,888,322 | | | | | | 83,226,497 | | |
| Net asset value and redemption price per share | | | | | n/a | | | | | $ | 8.10 | | | | | $ | 10.00 | | |
| Class W | | | | | |||||||||||||||
| Net assets | | | | $ | 141,853,374 | | | | | $ | 90,877,770 | | | | | $ | 654,374,266 | | |
| Shares authorized | | | | | unlimited | | | | | | unlimited | | | | | | unlimited | | |
| Par value | | | | $ | 0.001 | | | | | $ | 0.001 | | | | | $ | 0.001 | | |
| Shares outstanding | | | | | 16,773,626 | | | | | | 11,191,480 | | | | | | 65,457,922 | | |
| Net asset value and redemption price per share | | | | $ | 8.46 | | | | | $ | 8.12 | | | | | $ | 10.00 | | |
| | | | Voya Short Term Bond Fund | | | Voya Strategic Income Opportunities Fund | | ||||||
| ASSETS: | | | | ||||||||||
| Investments in securities at fair value+* | | | | $ | 80,512,972 | | | | | $ | 155,661,440 | | |
| Short-term investments at fair value** | | | | | 13,733,803 | | | | | | 9,457,863 | | |
| Total investments at fair value | | | | $ | 94,246,775 | | | | | $ | 165,119,303 | | |
| Cash | | | | | 963 | | | | | | 111,171 | | |
| Cash collateral for futures | | | | | 204,540 | | | | | | 1,183,977 | | |
| Cash pledged for centrally cleared swaps (Note 2) | | | | | — | | | | | | 1,191,000 | | |
| Foreign currencies at value*** | | | | | 49,105 | | | | | | 135,598 | | |
| Receivables: | | | | ||||||||||
| Investment securities sold | | | | | 827,207 | | | | | | 1,379,686 | | |
| Fund shares sold | | | | | 10,728 | | | | | | 629,286 | | |
| Dividends | | | | | 1,013 | | | | | | 4,094 | | |
| Interest | | | | | 468,751 | | | | | | 1,110,924 | | |
| Unrealized appreciation on forward foreign currency contracts | | | | | — | | | | | | 1,264,143 | | |
| Prepaid expenses | | | | | 38,304 | | | | | | 37,737 | | |
| Reimbursement due from manager | | | | | 11,473 | | | | | | 23,860 | | |
| Other assets | | | | | 2,379 | | | | | | 1,224 | | |
| Total assets | | | | | 95,861,238 | | | | | | 172,192,003 | | |
| LIABILITIES: | | | | ||||||||||
| Income distribution payable | | | | | 948 | | | | | | 365,420 | | |
| Payable for investment securities purchased | | | | | 1,567,992 | | | | | | 8,901,482 | | |
| Payable for fund shares redeemed | | | | | 69,969 | | | | | | 26,945 | | |
| Payable for variation margin | | | | | — | | | | | | 18,437 | | |
| Payable for foreign cash collateral for futures**** | | | | | — | | | | | | 103,800 | | |
| Payable upon receipt of securities loaned | | | | | 983,395 | | | | | | 996,954 | | |
| Unrealized depreciation on forward foreign currency contracts | | | | | — | | | | | | 1,392,286 | | |
| Payable for investment management fees | | | | | 36,365 | | | | | | 84,546 | | |
| Payable for distribution and shareholder service fees | | | | | 2,355 | | | | | | 5,017 | | |
| Payable to trustees under the deferred compensation plan (Note 6) | | | | | 2,379 | | | | | | 1,224 | | |
| Payable for trustee fees | | | | | 600 | | | | | | 660 | | |
| Unfunded loan commitments (Note 11) | | | | | — | | | | | | 111,739 | | |
| Other accrued expenses and liabilities | | | | | 36,074 | | | | | | 27,696 | | |
| Written options, at fair value^ | | | | | — | | | | | | 22,677 | | |
| Total liabilities | | | | | 2,700,077 | | | | | | 12,058,883 | | |
| NET ASSETS | | | | $ | 93,161,161 | | | | | $ | 160,133,120 | | |
| NET ASSETS WERE COMPRISED OF: | | | | ||||||||||
| Paid-in capital | | | | $ | 95,335,868 | | | | | $ | 158,259,037 | | |
| Undistributed (distributions in excess of) net investment income or accumulated net investment loss | | | | | 87,638 | | | | | | (188,060) | | |
| Accumulated net realized loss | | | | | (2,324,500) | | | | | | (799,953) | | |
| Net unrealized appreciation | | | | | 62,155 | | | | | | 2,862,096 | | |
| NET ASSETS | | | | $ | 93,161,161 | | | | | $ | 160,133,120 | | |
+ Including securities loaned at value | | | | $ | 961,526 | | | | | $ | 975,485 | | |
* Cost of investments in securities | | | | $ | 80,481,196 | | | | | $ | 152,492,737 | | |
** Cost of short-term investments | | | | $ | 13,706,711 | | | | | $ | 9,457,663 | | |
*** Cost of foreign currencies | | | | $ | 55,805 | | | | | $ | 132,718 | | |
**** Cost of payable for foreign cash collateral for futures | | | | $ | — | | | | | $ | 103,800 | | |
^ Premiums received on written options | | | | $ | — | | | | | $ | 57,990 | | |
| | | | Voya Short Term Bond Fund | | | Voya Strategic Income Opportunities Fund | | ||||||
| Class A | | | | ||||||||||
| Net assets | | | | $ | 4,893,833 | | | | | $ | 11,255,233 | | |
| Shares authorized | | | | | unlimited | | | | | | unlimited | | |
| Par value | | | | $ | 0.001 | | | | | $ | 0.001 | | |
| Shares outstanding | | | | | 497,322 | | | | | | 1,112,165 | | |
| Net asset value and redemption price per share† | | | | $ | 9.84 | | | | | $ | 10.12 | | |
Maximum offering price per share (2.50%)(1) | | | | $ | 10.09 | | | | | $ | 10.38 | | |
| Class C | | | | ||||||||||
| Net assets | | | | $ | 1,078,744 | | | | | $ | 1,893,198 | | |
| Shares authorized | | | | | unlimited | | | | | | unlimited | | |
| Par value | | | | $ | 0.001 | | | | | $ | 0.001 | | |
| Shares outstanding | | | | | 109,602 | | | | | | 190,013 | | |
| Net asset value and redemption price per share† | | | | $ | 9.84 | | | | | $ | 9.96 | | |
| Class I | | | | ||||||||||
| Net assets | | | | $ | 12,921,383 | | | | | $ | 27,338,803 | | |
| Shares authorized | | | | | unlimited | | | | | | unlimited | | |
| Par value | | | | $ | 0.001 | | | | | $ | 0.001 | | |
| Shares outstanding | | | | | 1,313,263 | | | | | | 2,686,804 | | |
| Net asset value and redemption price per share | | | | $ | 9.84 | | | | | $ | 10.18 | | |
| Class R | | | | ||||||||||
| Net assets | | | | $ | 3,072 | | | | | $ | 3,955,078 | | |
| Shares authorized | | | | | unlimited | | | | | | unlimited | | |
| Par value | | | | $ | 0.001 | | | | | $ | 0.001 | | |
| Shares outstanding | | | | | 312 | | | | | | 393,915 | | |
| Net asset value and redemption price per share | | | | $ | 9.84 | | | | | $ | 10.04 | | |
| Class R6 | | | | ||||||||||
| Net assets | | | | $ | 73,870,880 | | | | | $ | 111,530,090 | | |
| Shares authorized | | | | | unlimited | | | | | | unlimited | | |
| Par value | | | | $ | 0.001 | | | | | $ | 0.001 | | |
| Shares outstanding | | | | | 7,505,278 | | | | | | 10,976,827 | | |
| Net asset value and redemption price per share | | | | $ | 9.84 | | | | | $ | 10.16 | | |
| Class W | | | | ||||||||||
| Net assets | | | | $ | 393,249 | | | | | $ | 4,160,718 | | |
| Shares authorized | | | | | unlimited | | | | | | unlimited | | |
| Par value | | | | $ | 0.001 | | | | | $ | 0.001 | | |
| Shares outstanding | | | | | 39,922 | | | | | | 412,426 | | |
| Net asset value and redemption price per share | | | | $ | 9.85 | | | | | $ | 10.09 | | |
| | | | Voya GNMA Income Fund | | | Voya High Yield Bond Fund | | | Voya Intermediate Bond Fund | | |||||||||
| INVESTMENT INCOME: | | | | | |||||||||||||||
| Dividends | | | | $ | — | | | | | $ | 18,196 | | | | | $ | 395,781 | | |
| Interest, net of foreign taxes withheld* | | | | | 27,437,350 | | | | | | 42,602,215 | | | | | | 110,348,054 | | |
| Securities lending income, net | | | | | — | | | | | | 49,145 | | | | | | 1,075,616 | | |
| Total investment income | | | | | 27,437,350 | | | | | | 42,669,556 | | | | | | 111,819,451 | | |
| EXPENSES: | | | | | |||||||||||||||
| Investment management fees | | | | | 7,795,285 | | | | | | 4,027,646 | | | | | | 9,095,413 | | |
| Distribution and shareholder service fees: | | | | | |||||||||||||||
| Class A | | | | | 1,511,164 | | | | | | 174,214 | | | | | | 1,195,056 | | |
| Class B | | | | | 772 | | | | | | 1,107 | | | | | | 1,857 | | |
| Class C | | | | | 1,224,405 | | | | | | 132,306 | | | | | | 318,224 | | |
| Class O | | | | | — | | | | | | — | | | | | | 83,687 | | |
| Class R | | | | | — | | | | | | 1,311 | | | | | | 791,188 | | |
| Transfer agent fees: | | | | | |||||||||||||||
| Class A | | | | | 456,197 | | | | | | 110,044 | | | | | | 445,181 | | |
| Class B | | | | | 59 | | | | | | 178 | | | | | | 172 | | |
| Class C | | | | | 92,380 | | | | | | 20,687 | | | | | | 29,501 | | |
| Class I | | | | | 206,331 | | | | | | 160,552 | | | | | | 305,936 | | |
| Class O | | | | | — | | | | | | — | | | | | | 31,050 | | |
| Class P | | | | | — | | | | | | 3,764 | | | | | | — | | |
| Class R | | | | | — | | | | | | 410 | | | | | | 146,360 | | |
| Class R6 | | | | | — | | | | | | 1,810 | | | | | | 3,805 | | |
| Class W | | | | | 103,574 | | | | | | 166,707 | | | | | | 586,652 | | |
| Shareholder reporting expense | | | | | 154,465 | | | | | | 41,975 | | | | | | 175,500 | | |
| Registration fees | | | | | 187,824 | | | | | | 112,095 | | | | | | 201,958 | | |
| Professional fees | | | | | 67,218 | | | | | | 48,040 | | | | | | 172,322 | | |
| Custody and accounting expense | | | | | 160,940 | | | | | | 109,865 | | | | | | 369,380 | | |
| Trustee fees | | | | | 42,572 | | | | | | 21,630 | | | | | | 101,060 | | |
| Miscellaneous expense | | | | | 85,090 | | | | | | 47,677 | | | | | | 242,713 | | |
| Interest expense | | | | | — | | | | | | — | | | | | | 4,582 | | |
| Total expenses | | | | | 12,088,276 | | | | | | 5,182,018 | | | | | | 14,301,597 | | |
| Waived and reimbursed fees | | | | | — | | | | | | (730,683) | | | | | | — | | |
| Net expenses | | | | | 12,088,276 | | | | | | 4,451,335 | | | | | | 14,301,597 | | |
| Net investment income | | | | | 15,349,074 | | | | | | 38,218,221 | | | | | | 97,517,854 | | |
| REALIZED AND UNREALIZED GAIN (LOSS): | | | | | |||||||||||||||
| Net realized gain (loss) on: | | | | | |||||||||||||||
| Investments | | | | | (2,563,981) | | | | | | 1,999,664 | | | | | | (17,243,346) | | |
| Foreign currency related transactions | | | | | — | | | | | | 53 | | | | | | (2,057,429) | | |
| Futures | | | | | 8,464,707 | | | | | | — | | | | | | 5,855,546 | | |
| Swaps | | | | | — | | | | | | 2,334 | | | | | | (9,281,303) | | |
| Written options | | | | | — | | | | | | — | | | | | | 1,784,289 | | |
| Net realized gain (loss) | | | | | 5,900,726 | | | | | | 2,002,051 | | | | | | (20,942,243) | | |
| Net change in unrealized appreciation (depreciation) on: | | | | | |||||||||||||||
| Investments | | | | | (15,585,911) | | | | | | 40,898,528 | | | | | | (10,077,825) | | |
| Foreign currency related transactions | | | | | — | | | | | | — | | | | | | (1,429,226) | | |
| Futures | | | | | (695,098) | | | | | | — | | | | | | (1,375,327) | | |
| Swaps | | | | | — | | | | | | — | | | | | | 15,322,419 | | |
| Written options | | | | | — | | | | | | — | | | | | | (255,514) | | |
| Net change in unrealized appreciation (depreciation) | | | | | (16,281,009) | | | | | | 40,898,528 | | | | | | 2,184,527 | | |
| Net realized and unrealized gain (loss) | | | | | (10,380,283) | | | | | | 42,900,579 | | | | | | (18,757,716) | | |
| Increase in net assets resulting from operations | | | | $ | 4,968,791 | | | | | $ | 81,118,800 | | | | | $ | 78,760,138 | | |
* Foreign taxes withheld | | | | $ | — | | | | | $ | 11,238 | | | | | $ | 92,936 | | |
| | | | Voya Short Term Bond Fund | | | Voya Strategic Income Opportunities Fund | | ||||||
| INVESTMENT INCOME: | | | | ||||||||||
| Dividends | | | | $ | 14,251 | | | | | $ | 52,662 | | |
| Interest, net of foreign taxes withheld* | | | | | 2,299,251 | | | | | | 6,734,642 | | |
| Securities lending income, net | | | | | 14,683 | | | | | | 4,913 | | |
| Total investment income | | | | | 2,328,185 | | | | | | 6,792,217 | | |
| EXPENSES: | | | | ||||||||||
| Investment management fees | | | | | 540,005 | | | | | | 858,413 | | |
| Distribution and shareholder service fees: | | | | ||||||||||
| Class A | | | | | 24,676 | | | | | | 9,928 | | |
| Class C | | | | | 11,635 | | | | | | 8,308 | | |
| Class R | | | | | 14 | | | | | | 18,689 | | |
| Transfer agent fees: | | | | ||||||||||
| Class A | | | | | 3,041 | | | | | | 5,413 | | |
| Class C | | | | | 329 | | | | | | 1,159 | | |
| Class I | | | | | 12,423 | | | | | | 2,113 | | |
| Class R | | | | | 1 | | | | | | 5,429 | | |
| Class R6 | | | | | 309 | | | | | | 428 | | |
| Class W | | | | | 204 | | | | | | 2,521 | | |
| Shareholder reporting expense | | | | | 2,373 | | | | | | 8,072 | | |
| Registration fees | | | | | 67,476 | | | | | | 95,633 | | |
| Professional fees | | | | | 14,959 | | | | | | 22,969 | | |
| Custody and accounting expense | | | | | 27,065 | | | | | | 66,225 | | |
| Trustee fees | | | | | 3,600 | | | | | | 3,962 | | |
| Proxy and solicitation costs (Note 6) | | | | | — | | | | | | 17,875 | | |
| Miscellaneous expense | | | | | 20,694 | | | | | | 20,731 | | |
| Interest expense | | | | | — | | | | | | 571 | | |
| Total expenses | | | | | 728,804 | | | | | | 1,148,439 | | |
| Waived and reimbursed fees | | | | | (118,256) | | | | | | (205,624) | | |
| Net expenses | | | | | 610,548 | | | | | | 942,815 | | |
| Net investment income | | | | | 1,717,637 | | | | | | 5,849,402 | | |
| REALIZED AND UNREALIZED GAIN (LOSS): | | | | ||||||||||
| Net realized gain (loss) on: | | | | ||||||||||
| Investments | | | | | 100,599 | | | | | | 318,193 | | |
| Foreign currency related transactions | | | | | — | | | | | | (648,342) | | |
| Futures | | | | | 61,998 | | | | | | 937,404 | | |
| Swaps | | | | | (298,758) | | | | | | (200,668) | | |
| Written options | | | | | — | | | | | | 132,852 | | |
| Net realized gain (loss) | | | | | (136,161) | | | | | | 539,439 | | |
| Net change in unrealized appreciation (depreciation) on: | | | | ||||||||||
| Investments | | | | | (140,567) | | | | | | 3,034,318 | | |
| Foreign currency related transactions | | | | | (3,273) | | | | | | (121,577) | | |
| Futures | | | | | 17,840 | | | | | | (290,025) | | |
| Swaps | | | | | 277,368 | | | | | | 115,563 | | |
| Written options | | | | | — | | | | | | 35,313 | | |
| Net change in unrealized appreciation (depreciation) | | | | | 151,368 | | | | | | 2,773,592 | | |
| Net realized and unrealized gain | | | | | 15,207 | | | | | | 3,313,031 | | |
| Increase in net assets resulting from operations | | | | $ | 1,732,844 | | | | | $ | 9,162,433 | | |
* Foreign taxes withheld | | | | $ | — | | | | | $ | 6,612 | | |
| | | | Voya GNMA Income Fund | | | Voya High Yield Bond Fund | | ||||||||||||||||||
| | | | Year Ended March 31, 2017 | | | Year Ended March 31, 2016 | | | Year Ended March 31, 2017 | | | Year Ended March 31, 2016 | | ||||||||||||
| FROM OPERATIONS: | | | | | | ||||||||||||||||||||
| Net investment income | | | | $ | 15,349,074 | | | | | $ | 14,536,625 | | | | | $ | 38,218,221 | | | | | $ | 30,579,727 | | |
| Net realized gain (loss) | | | | | 5,900,726 | | | | | | 8,038,023 | | | | | | 2,002,051 | | | | | | (11,178,355) | | |
| Net change in unrealized appreciation (depreciation) | | | | | (16,281,009) | | | | | | 1,582,920 | | | | | | 40,898,528 | | | | | | (22,601,052) | | |
| Increase (decrease) in net assets resulting from operations | | | | | 4,968,791 | | | | | | 24,157,568 | | | | | | 81,118,800 | | | | | | (3,199,680) | | |
| FROM DISTRIBUTIONS TO SHAREHOLDERS: | | | | | | ||||||||||||||||||||
| Net investment income: | | | | | | ||||||||||||||||||||
| Class A | | | | | (9,371,652) | | | | | | (10,261,642) | | | | | | (3,664,076) | | | | | | (3,699,919) | | |
| Class B | | | | | (567) | | | | | | (3,247) | | | | | | (5,053) | | | | | | (12,886) | | |
| Class C | | | | | (904,359) | | | | | | (1,020,443) | | | | | | (594,565) | | | | | | (584,981) | | |
| Class I | | | | | (10,228,852) | | | | | | (6,159,476) | | | | | | (15,804,366) | | | | | | (14,525,380) | | |
| Class P | | | | | — | | | | | | — | | | | | | (7,518,324) | | | | | | (8,274,354) | | |
| Class R | | | | | — | | | | | | — | | | | | | (13,089) | | | | | | (17,340) | | |
| Class R6 | | | | | — | | | | | | — | | | | | | (4,655,554) | | | | | | — | | |
| Class W | | | | | (2,442,732) | | | | | | (1,403,938) | | | | | | (5,832,510) | | | | | | (3,343,723) | | |
| Net realized gains: | | | | | | ||||||||||||||||||||
| Class A | | | | | (593,935) | | | | | | — | | | | | | — | | | | | | — | | |
| Class B | | | | | (76) | | | | | | — | | | | | | — | | | | | | — | | |
| Class C | | | | | (116,092) | | | | | | — | | | | | | — | | | | | | — | | |
| Class I | | | | | (542,881) | | | | | | — | | | | | | — | | | | | | — | | |
| Class W | | | | | (132,715) | | | | | | — | | | | | | — | | | | | | — | | |
| Return of capital: | | | | | | ||||||||||||||||||||
| Class A | | | | | (6,278,979) | | | | | | (5,747,286) | | | | | | — | | | | | | — | | |
| Class B | | | | | (813) | | | | | | (1,202) | | | | | | — | | | | | | — | | |
| Class C | | | | | (1,248,578) | | | | | | (1,002,493) | | | | | | — | | | | | | — | | |
| Class I | | | | | (5,716,429) | | | | | | (3,826,237) | | | | | | — | | | | | | — | | |
| Class W | | | | | (1,418,914) | | | | | | (981,071) | | | | | | — | | | | | | — | | |
| Total distributions | | | | | (38,997,574) | | | | | | (30,407,035) | | | | | | (38,087,537) | | | | | | (30,458,583) | | |
| FROM CAPITAL SHARE TRANSACTIONS: | | | | | | ||||||||||||||||||||
| Net proceeds from sale of shares | | | | | 610,508,428 | | | | | | 727,335,904 | | | | | | 454,059,893 | | | | | | 332,231,556 | | |
| Reinvestment of distributions | | | | | 33,457,640 | | | | | | 25,773,065 | | | | | | 36,954,030 | | | | | | 29,341,215 | | |
| | | | | | 643,966,068 | | | | | | 753,108,969 | | | | | | 491,013,923 | | | | | | 361,572,771 | | |
| Cost of shares redeemed | | | | | (746,448,713) | | | | | | (262,149,692) | | | | | | (524,312,053) | | | | | | (214,313,353) | | |
| Net increase (decrease) in net assets resulting from capital share transactions | | | | | (102,482,645) | | | | | | 490,959,277 | | | | | | (33,298,130) | | | | | | 147,259,418 | | |
| Net increase (decrease) in net assets | | | | | (136,511,428) | | | | | | 484,709,810 | | | | | | 9,733,133 | | | | | | 113,601,155 | | |
| NET ASSETS: | | | | | | ||||||||||||||||||||
| Beginning of year or period | | | | | 1,363,836,365 | | | | | | 879,126,555 | | | | | | 630,543,759 | | | | | | 516,942,604 | | |
| End of year or period | | | | $ | 1,227,324,937 | | | | | $ | 1,363,836,365 | | | | | $ | 640,276,892 | | | | | $ | 630,543,759 | | |
| Undistributed (distributions in excess of) net investment income or accumulated net investment loss at end of year or period | | | | $ | (2,042,161) | | | | | $ | (1,508,575) | | | | | $ | 11,313 | | | | | $ | (133,655) | | |
| | |||||||||||||||||||||||||
| | | | Voya Intermediate Bond Fund | | | Voya Short Term Bond Fund | ||||||||||||||||||
| | | | Year Ended March 31, 2017 | | | Year Ended March 31, 2016 | | | Year Ended March 31, 2017 | | | Year Ended March 31, 2016 | ||||||||||||
| FROM OPERATIONS: | | | | | | |||||||||||||||||||
| Net investment income | | | | $ | 97,517,854 | | | | | $ | 78,918,416 | | | | | $ | 1,717,637 | | | | | $ | 2,063,227 | |
| Net realized loss | | | | | (20,942,243) | | | | | | (8,714,395) | | | | | | (136,161) | | | | | | (483,365) | |
| Net change in unrealized appreciation (depreciation) | | | | | 2,184,527 | | | | | | (28,509,608) | | | | | | 151,368 | | | | | | (378,110) | |
| Increase in net assets resulting from operations | | | | | 78,760,138 | | | | | | 41,694,413 | | | | | | 1,732,844 | | | | | | 1,201,752 | |
| FROM DISTRIBUTIONS TO SHAREHOLDERS: | | | | | | |||||||||||||||||||
| Net investment income: | | | | | | |||||||||||||||||||
| Class A | | | | | (14,128,199) | | | | | | (12,642,432) | | | | | | (154,091) | | | | | | (59,522) | |
| Class B | | | | | (4,128) | | | | | | (4,057) | | | | | | — | | | | | | — | |
| Class C | | | | | (704,341) | | | | | | (555,671) | | | | | | (9,364) | | | | | | (4,284) | |
| Class I | | | | | (43,585,570) | | | | | | (32,378,317) | | | | | | (220,901) | | | | | | (158,586) | |
| Class O | | | | | (992,005) | | | | | | (861,161) | | | | | | — | | | | | | — | |
| Class R | | | | | (4,302,360) | | | | | | (2,987,626) | | | | | | (40) | | | | | | (40) | |
| Class R6 | | | | | (23,703,605) | | | | | | (13,739,455) | | | | | | (1,824,297) | | | | | | (2,283,486) | |
| Class W | | | | | (20,376,785) | | | | | | (13,158,830) | | | | | | (11,826) | | | | | | (2,136) | |
| Total distributions | | | | | (107,796,993) | | | | | | (76,327,549) | | | | | | (2,220,519) | | | | | | (2,508,054) | |
| FROM CAPITAL SHARE TRANSACTIONS: | | | | | | |||||||||||||||||||
| Net proceeds from sale of shares | | | | | 1,696,290,275 | | | | | | 1,829,190,140 | | | | | | 37,611,066 | | | | | | 33,965,425 | |
| Reinvestment of distributions | | | | | 100,764,579 | | | | | | 71,748,402 | | | | | | 2,203,439 | | | | | | 2,504,562 | |
| | | | | | 1,797,054,854 | | | | | | 1,900,938,542 | | | | | | 39,814,505 | | | | | | 36,469,987 | |
| Cost of shares redeemed | | | | | (1,072,345,653) | | | | | | (1,465,843,603) | | | | | | (77,729,767) | | | | | | (44,766,024) | |
| Net increase (decrease) in net assets resulting from capital share transactions | | | | | 724,709,201 | | | | | | 435,094,939 | | | | | | (37,915,262) | | | | | | (8,296,037) | |
| Net increase (decrease) in net assets | | | | | 695,672,346 | | | | | | 400,461,803 | | | | | | (38,402,937) | | | | | | (9,602,339) | |
| NET ASSETS: | | | | | | |||||||||||||||||||
| Beginning of year or period | | | | | 3,034,076,280 | | | | | | 2,633,614,477 | | | | | | 131,564,098 | | | | | | 141,166,437 | |
| End of year or period | | | | $ | 3,729,748,626 | | | | | $ | 3,034,076,280 | | | | | $ | 93,161,161 | | | | | $ | 131,564,098 | |
| Undistributed (distributions in excess of) net investment income or accumulated net investment loss at end of year or period | | | | $ | (1,140,786) | | | | | $ | 4,877,593 | | | | | $ | 87,638 | | | | | $ | 98,259 | |
| | ||||||||||||||||||||||||
| | | | Voya Strategic Income Opportunities Fund | | |||||||||
| | | | Year Ended March 31, 2017 | | | Year Ended March 31, 2016 | | ||||||
| FROM OPERATIONS: | | | | ||||||||||
| Net investment income | | | | $ | 5,849,402 | | | | | $ | 2,015,493 | | |
| Net realized gain (loss) | | | | | 539,439 | | | | | | (1,482,961) | | |
| Net change in unrealized appreciation (depreciation) | | | | | 2,773,592 | | | | | | 36,525 | | |
| Increase in net assets resulting from operations | | | | | 9,162,433 | | | | | | 569,057 | | |
| FROM DISTRIBUTIONS TO SHAREHOLDERS: | | | | ||||||||||
| Net investment income: | | | | ||||||||||
| Class A | | | | | (190,623) | | | | | | (3,114) | | |
| Class C | | | | | (33,353) | | | | | | (363) | | |
| Class I | | | | | (564,732) | | | | | | (44,465) | | |
| Class R | | | | | (170,700) | | | | | | (13,777) | | |
| Class R6 | | | | | (5,854,425) | | | | | | (887,689) | | |
| Class W | | | | | (95,217) | | | | | | (107) | | |
| Total distributions | | | | | (6,909,050) | | | | | | (949,515) | | |
| FROM CAPITAL SHARE TRANSACTIONS: | | | | ||||||||||
| Net proceeds from sale of shares | | | | | 41,508,190 | | | | | | 140,663,405 | | |
| Reinvestment of distributions | | | | | 1,034,135 | | | | | | 61,077 | | |
| | | | | | 42,542,325 | | | | | | 140,724,482 | | |
| Cost of shares redeemed | | | | | (5,703,070) | | | | | | (25,697,045) | | |
| Net increase in net assets resulting from capital share transactions | | | | | 36,839,255 | | | | | | 115,027,437 | | |
| Net increase in net assets | | | | | 39,092,638 | | | | | | 114,646,979 | | |
| NET ASSETS: | | | | ||||||||||
| Beginning of year or period | | | | | 121,040,482 | | | | | | 6,393,503 | | |
| End of year or period | | | | $ | 160,133,120 | | | | | $ | 121,040,482 | | |
| Undistributed (distributions in excess of) net investment income or accumulated net investment loss at end of year or period | | | | $ | (188,060) | | | | | $ | 1,107,125 | | |
| | |||||||||||||
| | | | | | | | | | Income (loss) from investment operations | | | | | | | | | Less Distributions | | | | | | Ratios to average net assets | | | Supplemental Data | | |||||||||||||||||||||||||||||||||||||||||||||||||||||||||||||||||||||||||||
| | | | Net asset value, beginning of year or period | | | Net investment income (loss) | | | Net realized and unrealized gain (loss) | | | Total from investment operations | | | From net investment income | | | From net realized gains | | | From return of capital | | | Total distributions | | | Payment by affiliate | | | Net asset value, end of year or period | | | Total Return(1) | | | Expenses before reductions/additions(2)(3) | | | Expenses net of fee waivers and/or recoupments if any(2)(3) | | | Expenses net of all reductions/additions(2)(3) | | | Net investment income (loss)(2)(3) | | | Net assets, end of year or period | | | Portfolio turnover rate | | |||||||||||||||||||||||||||||||||||||||||||||||||||
| Year or period ended | | | ($) | | | ($) | | | ($) | | | ($) | | | ($) | | | ($) | | | ($) | | | ($) | | | ($) | | | ($) | | | (%) | | | (%) | | | (%) | | | (%) | | | (%) | | | ($000’s) | | | (%) | | |||||||||||||||||||||||||||||||||||||||||||||||||||
| Voya GNMA Income Fund | | | | | | | | | | | | | | | | | | | | | | | | | | | | | | | | | | | | | | | | | | | | | | | | | | | | | | | | | | | | | | | | | | | | | | | | | | | | | | | | | | | | | | | | | | | | | | | | | | | | | | | |
| Class A | | | | | | | | | | | | | | | | | | | | | | | | | | | | | | | | | | | | | | | | | | | | | | | | | | | | | | | | | | | | | | | | | | | | | | | | | | | | | | | | | | | | | | | | | | | | | | | | | | | | | | | |
| 03-31-17 | | | | | 8.63 | | | | | | 0.08 | | | | | | (0.04) | | | | | | 0.04 | | | | | | 0.13 | | | | | | 0.01 | | | | | | 0.09 | | | | | | 0.23 | | | | | | — | | | | | | 8.44 | | | | | | 0.44 | | | | | | 0.93 | | | | | | 0.93 | | | | | | 0.93 | | | | | | 1.02 | | | | | | 513,223 | | | | | | 580 | | |
| 03-31-16 | | | | | 8.70 | | | | | | 0.13 | | | | | | 0.06 | | | | | | 0.19 | | | | | | 0.17 | | | | | | — | | | | | | 0.09 | | | | | | 0.26 | | | | | | — | | | | | | 8.63 | | | | | | 2.21 | | | | | | 0.93 | | | | | | 0.93 | | | | | | 0.93 | | | | | | 1.39 | | | | | | 630,448 | | | | | | 508 | | |
| 03-31-15 | | | | | 8.62 | | | | | | 0.16 | | | | | | 0.22 | | | | | | 0.38 | | | | | | 0.26 | | | | | | — | | | | | | 0.04 | | | | | | 0.30 | | | | | | — | | | | | | 8.70 | | | | | | 4.40 | | | | | | 0.92 | | | | | | 0.92 | | | | | | 0.92 | | | | | | 1.85 | | | | | | 521,226 | | | | | | 511 | | |
| 03-31-14 | | | | | 8.95 | | | | | | 0.24• | | | | | | (0.27) | | | | | | (0.03) | | | | | | 0.30 | | | | | | — | | | | | | — | | | | | | 0.30 | | | | | | — | | | | | | 8.62 | | | | | | (0.35) | | | | | | 0.94 | | | | | | 0.94 | | | | | | 0.94 | | | | | | 2.74 | | | | | | 558,520 | | | | | | 302 | | |
| 03-31-13 | | | | | 9.09 | | | | | | 0.22 | | | | | | 0.00* | | | | | | 0.22 | | | | | | 0.29 | | | | | | 0.05 | | | | | | 0.02 | | | | | | 0.36 | | | | | | — | | | | | | 8.95 | | | | | | 2.51 | | | | | | 0.90 | | | | | | 0.90 | | | | | | 0.90 | | | | | | 2.38 | | | | | | 727,058 | | | | | | 352 | | |
| Class B | | | | | | | | | | | | | | | | | | | | | | | | | | | | | | | | | | | | | | | | | | | | | | | | | | | | | | | | | | | | | | | | | | | | | | | | | | | | | | | | | | | | | | | | | | | | | | | | | | | | | | | |
| 03-31-17 | | | | | 8.57 | | | | | | 0.02 | | | | | | (0.04) | | | | | | (0.02) | | | | | | 0.06 | | | | | | 0.01 | | | | | | 0.09 | | | | | | 0.16 | | | | | | — | | | | | | 8.39 | | | | | | (0.26) | | | | | | 1.68 | | | | | | 1.68 | | | | | | 1.68 | | | | | | 0.26 | | | | | | 70 | | | | | | 580 | | |
| 03-31-16 | | | | | 8.65 | | | | | | 0.06• | | | | | | 0.05 | | | | | | 0.11 | | | | | | 0.10 | | | | | | — | | | | | | 0.09 | | | | | | 0.19 | | | | | | — | | | | | | 8.57 | | | | | | 1.32 | | | | | | 1.68 | | | | | | 1.68 | | | | | | 1.68 | | | | | | 0.72 | | | | | | 88 | | | | | | 508 | | |
| 03-31-15 | | | | | 8.57 | | | | | | 0.10• | | | | | | 0.21 | | | | | | 0.31 | | | | | | 0.19 | | | | | | — | | | | | | 0.04 | | | | | | 0.23 | | | | | | — | | | | | | 8.65 | | | | | | 3.62 | | | | | | 1.67 | | | | | | 1.67 | | | | | | 1.67 | | | | | | 1.21 | | | | | | 333 | | | | | | 511 | | |
| 03-31-14 | | | | | 8.90 | | | | | | 0.17• | | | | | | (0.27) | | | | | | (0.10) | | | | | | 0.23 | | | | | | — | | | | | | — | | | | | | 0.23 | | | | | | — | | | | | | 8.57 | | | | | | (1.11) | | | | | | 1.69 | | | | | | 1.69 | | | | | | 1.69 | | | | | | 1.97 | | | | | | 622 | | | | | | 302 | | |
| 03-31-13 | | | | | 9.04 | | | | | | 0.14• | | | | | | 0.01 | | | | | | 0.15 | | | | | | 0.22 | | | | | | 0.05 | | | | | | 0.02 | | | | | | 0.29 | | | | | | — | | | | | | 8.90 | | | | | | 1.74 | | | | | | 1.65 | | | | | | 1.65 | | | | | | 1.65 | | | | | | 1.59 | | | | | | 1,430 | | | | | | 352 | | |
| Class C | | | | | | | | | | | | | | | | | | | | | | | | | | | | | | | | | | | | | | | | | | | | | | | | | | | | | | | | | | | | | | | | | | | | | | | | | | | | | | | | | | | | | | | | | | | | | | | | | | | | | | | |
| 03-31-17 | | | | | 8.58 | | | | | | 0.02 | | | | | | (0.05) | | | | | | (0.03) | | | | | | 0.06 | | | | | | 0.01 | | | | | | 0.09 | | | | | | 0.16 | | | | | | — | | | | | | 8.39 | | | | | | (0.37) | | | | | | 1.68 | | | | | | 1.68 | | | | | | 1.68 | | | | | | 0.27 | | | | | | 111,103 | | | | | | 580 | | |
| 03-31-16 | | | | | 8.65 | | | | | | 0.05• | | | | | | 0.07 | | | | | | 0.12 | | | | | | 0.10 | | | | | | — | | | | | | 0.09 | | | | | | 0.19 | | | | | | — | | | | | | 8.58 | | | | | | 1.46 | | | | | | 1.68 | | | | | | 1.68 | | | | | | 1.68 | | | | | | 0.64 | | | | | | 108,278 | | | | | | 508 | | |
| 03-31-15 | | | | | 8.57 | | | | | | 0.09 | | | | | | 0.22 | | | | | | 0.31 | | | | | | 0.19 | | | | | | — | | | | | | 0.04 | | | | | | 0.23 | | | | | | — | | | | | | 8.65 | | | | | | 3.62 | | | | | | 1.67 | | | | | | 1.67 | | | | | | 1.67 | | | | | | 1.11 | | | | | | 83,809 | | | | | | 511 | | |
| 03-31-14 | | | | | 8.90 | | | | | | 0.17• | | | | | | (0.27) | | | | | | (0.10) | | | | | | 0.23 | | | | | | — | | | | | | — | | | | | | 0.23 | | | | | | — | | | | | | 8.57 | | | | | | (1.12) | | | | | | 1.69 | | | | | | 1.69 | | | | | | 1.69 | | | | | | 1.97 | | | | | | 95,602 | | | | | | 302 | | |
| 03-31-13 | | | | | 9.04 | | | | | | 0.16 | | | | | | 0.00* | | | | | | 0.16 | | | | | | 0.23 | | | | | | 0.05 | | | | | | 0.02 | | | | | | 0.30 | | | | | | — | | | | | | 8.90 | | | | | | 1.78 | | | | | | 1.65 | | | | | | 1.65 | | | | | | 1.65 | | | | | | 1.63 | | | | | | 177,823 | | | | | | 352 | | |
| Class I | | | | | | | | | | | | | | | | | | | | | | | | | | | | | | | | | | | | | | | | | | | | | | | | | | | | | | | | | | | | | | | | | | | | | | | | | | | | | | | | | | | | | | | | | | | | | | | | | | | | | | | |
| 03-31-17 | | | | | 8.64 | | | | | | 0.10 | | | | | | (0.03) | | | | | | 0.07 | | | | | | 0.16 | | | | | | 0.01 | | | | | | 0.09 | | | | | | 0.26 | | | | | | — | | | | | | 8.45 | | | | | | 0.76 | | | | | | 0.64 | | | | | | 0.64 | | | | | | 0.64 | | | | | | 1.29 | | | | | | 461,076 | | | | | | 580 | | |
| 03-31-16 | | | | | 8.71 | | | | | | 0.14• | | | | | | 0.07 | | | | | | 0.21 | | | | | | 0.19 | | | | | | — | | | | | | 0.09 | | | | | | 0.28 | | | | | | — | | | | | | 8.64 | | | | | | 2.50 | | | | | | 0.64 | | | | | | 0.64 | | | | | | 0.64 | | | | | | 1.65 | | | | | | 506,384 | | | | | | 508 | | |
| 03-31-15 | | | | | 8.63 | | | | | | 0.17• | | | | | | 0.23 | | | | | | 0.40 | | | | | | 0.28 | | | | | | — | | | | | | 0.04 | | | | | | 0.32 | | | | | | — | | | | | | 8.71 | | | | | | 4.70 | | | | | | 0.65 | | | | | | 0.65 | | | | | | 0.65 | | | | | | 1.94 | | | | | | 223,920 | | | | | | 511 | | |
| 03-31-14 | | | | | 8.96 | | | | | | 0.26• | | | | | | (0.27) | | | | | | (0.01) | | | | | | 0.32 | | | | | | — | | | | | | — | | | | | | 0.32 | | | | | | — | | | | | | 8.63 | | | | | | (0.09) | | | | | | 0.66 | | | | | | 0.66 | | | | | | 0.66 | | | | | | 3.00 | | | | | | 130,878 | | | | | | 302 | | |
| 03-31-13 | | | | | 9.10 | | | | | | 0.25 | | | | | | 0.00* | | | | | | 0.25 | | | | | | 0.32 | | | | | | 0.05 | | | | | | 0.02 | | | | | | 0.39 | | | | | | — | | | | | | 8.96 | | | | | | 2.79 | | | | | | 0.63 | | | | | | 0.63 | | | | | | 0.63 | | | | | | 2.64 | | | | | | 206,100 | | | | | | 352 | | |
| Class W | | | | | | | | | | | | | | | | | | | | | | | | | | | | | | | | | | | | | | | | | | | | | | | | | | | | | | | | | | | | | | | | | | | | | | | | | | | | | | | | | | | | | | | | | | | | | | | | | | | | | | | |
| 03-31-17 | | | | | 8.65 | | | | | | 0.12 | | | | | | (0.05) | | | | | | 0.07 | | | | | | 0.16 | | | | | | 0.01 | | | | | | 0.09 | | | | | | 0.26 | | | | | | — | | | | | | 8.46 | | | | | | 0.72 | | | | | | 0.68 | | | | | | 0.68 | | | | | | 0.68 | | | | | | 1.26 | | | | | | 141,853 | | | | | | 580 | | |
| 03-31-16 | | | | | 8.72 | | | | | | 0.14• | | | | | | 0.07 | | | | | | 0.21 | | | | | | 0.19 | | | | | | — | | | | | | 0.09 | | | | | | 0.28 | | | | | | — | | | | | | 8.65 | | | | | | 2.46 | | | | | | 0.68 | | | | | | 0.68 | | | | | | 0.68 | | | | | | 1.60 | | | | | | 118,638 | | | | | | 508 | | |
| 03-31-15 | | | | | 8.64 | | | | | | 0.17• | | | | | | 0.23 | | | | | | 0.40 | | | | | | 0.28 | | | | | | — | | | | | | 0.04 | | | | | | 0.32 | | | | | | — | | | | | | 8.72 | | | | | | 4.66 | | | | | | 0.67 | | | | | | 0.67 | | | | | | 0.67 | | | | | | 2.00 | | | | | | 49,838 | | | | | | 511 | | |
| 03-31-14 | | | | | 8.97 | | | | | | 0.26 | | | | | | (0.27) | | | | | | (0.01) | | | | | | 0.32 | | | | | | — | | | | | | — | | | | | | 0.32 | | | | | | — | | | | | | 8.64 | | | | | | (0.09) | | | | | | 0.69 | | | | | | 0.69 | | | | | | 0.69 | | | | | | 3.00 | | | | | | 33,180 | | | | | | 302 | | |
| 03-31-13 | | | | | 9.11 | | | | | | 0.25• | | | | | | (0.01) | | | | | | 0.24 | | | | | | 0.31 | | | | | | 0.05 | | | | | | 0.02 | | | | | | 0.38 | | | | | | — | | | | | | 8.97 | | | | | | 2.76 | | | | | | 0.65 | | | | | | 0.65 | | | | | | 0.65 | | | | | | 2.72 | | | | | | 37,682 | | | | | | 352 | | |
| Voya High Yield Bond Fund | | | | | | | | | | | | | | | | | | | | | | | | | | | | | | | | | | | | | | | | | | | | | | | | | | | | | | | | | | | | | | | | | | | | | | | | | | | | | | | | | | | | | | | | | | | | | | | | | | | | | | | |
| Class A | | | | | | | | | | | | | | | | | | | | | | | | | | | | | | | | | | | | | | | | | | | | | | | | | | | | | | | | | | | | | | | | | | | | | | | | | | | | | | | | | | | | | | | | | | | | | | | | | | | | | | | |
| 03-31-17 | | | | | 7.62 | | | | | | 0.41 | | | | | | 0.50 | | | | | | 0.91 | | | | | | 0.42 | | | | | | — | | | | | | — | | | | | | 0.42 | | | | | | — | | | | | | 8.11 | | | | | | 12.13 | | | | | | 1.06 | | | | | | 1.06 | | | | | | 1.06 | | | | | | 5.23 | | | | | | 60,927 | | | | | | 41 | | |
| 03-31-16 | | | | | 8.14 | | | | | | 0.41 | | | | | | (0.52) | | | | | | (0.11) | | | | | | 0.41 | | | | | | — | | | | | | — | | | | | | 0.41 | | | | | | — | | | | | | 7.62 | | | | | | (1.36) | | | | | | 1.07 | | | | | | 1.07 | | | | | | 1.07 | | | | | | 5.23 | | | | | | 78,352 | | | | | | 22 | | |
| 03-31-15 | | | | | 8.49 | | | | | | 0.42 | | | | | | (0.34) | | | | | | 0.08 | | | | | | 0.43 | | | | | | — | | | | | | — | | | | | | 0.43 | | | | | | — | | | | | | 8.14 | | | | | | 0.98 | | | | | | 1.09 | | | | | | 1.10 | | | | | | 1.10 | | | | | | 5.10 | | | | | | 75,588 | | | | | | 37 | | |
| 03-31-14 | | | | | 8.34 | | | | | | 0.44 | | | | | | 0.16 | | | | | | 0.60 | | | | | | 0.45 | | | | | | — | | | | | | — | | | | | | 0.45 | | | | | | — | | | | | | 8.49 | | | | | | 7.49 | | | | | | 1.08 | | | | | | 1.10 | | | | | | 1.10 | | | | | | 5.34 | | | | | | 79,309 | | | | | | 47 | | |
| 03-31-13 | | | | | 7.80 | | | | | | 0.49 | | | | | | 0.54 | | | | | | 1.03 | | | | | | 0.49 | | | | | | — | | | | | | — | | | | | | 0.49 | | | | | | — | | | | | | 8.34 | | | | | | 13.69 | | | | | | 1.06 | | | | | | 1.10 | | | | | | 1.10 | | | | | | 6.20 | | | | | | 85,429 | | | | | | 109 | | |
| | | | | | | | | | Income (loss) from investment operations | | | | | | | | | Less Distributions | | | | | | Ratios to average net assets | | | Supplemental Data | | |||||||||||||||||||||||||||||||||||||||||||||||||||||||||||||||||||||||||||
| | | | Net asset value, beginning of year or period | | | Net investment income (loss) | | | Net realized and unrealized gain (loss) | | | Total from investment operations | | | From net investment income | | | From net realized gains | | | From return of capital | | | Total distributions | | | Payment by affiliate | | | Net asset value, end of year or period | | | Total Return(1) | | | Expenses before reductions/additions(2)(3) | | | Expenses net of fee waivers and/or recoupments if any(2)(3) | | | Expenses net of all reductions/additions(2)(3) | | | Net investment income (loss)(2)(3) | | | Net assets, end of year or period | | | Portfolio turnover rate | | |||||||||||||||||||||||||||||||||||||||||||||||||||
| Year or period ended | | | ($) | | | ($) | | | ($) | | | ($) | | | ($) | | | ($) | | | ($) | | | ($) | | | ($) | | | ($) | | | (%) | | | (%) | | | (%) | | | (%) | | | (%) | | | ($000’s) | | | (%) | | |||||||||||||||||||||||||||||||||||||||||||||||||||
| Voya High Yield Bond Fund (continued) | | | | | | | | | | | | | | | | | | | | | | | | | | | | | | | | | | | | | | | | | | | | | | | | | | | | | | | | | | | | | | | | | | | | | | | | | | | | | | | | | | | | | | | | | | | | | | | | | | | | | | | |
| Class B | | | | | | | | | | | | | | | | | | | | | | | | | | | | | | | | | | | | | | | | | | | | | | | | | | | | | | | | | | | | | | | | | | | | | | | | | | | | | | | | | | | | | | | | | | | | | | | | | | | | | | | |
| 03-31-17 | | | | | 7.61 | | | | | | 0.34 | | | | | | 0.51 | | | | | | 0.85 | | | | | | 0.36 | | | | | | — | | | | | | — | | | | | | 0.36 | | | | | | — | | | | | | 8.10 | | | | | | 11.31 | | | | | | 1.81 | | | | | | 1.81 | | | | | | 1.81 | | | | | | 4.45 | | | | | | 64 | | | | | | 41 | | |
| 03-31-16 | | | | | 8.14 | | | | | | 0.34 | | | | | | (0.52) | | | | | | (0.18) | | | | | | 0.35 | | | | | | — | | | | | | — | | | | | | 0.35 | | | | | | — | | | | | | 7.61 | | | | | | (2.22) | | | | | | 1.82 | | | | | | 1.82 | | | | | | 1.82 | | | | | | 4.43 | | | | | | 151 | | | | | | 22 | | |
| 03-31-15 | | | | | 8.48 | | | | | | 0.36 | | | | | | (0.33) | | | | | | 0.03 | | | | | | 0.37 | | | | | | — | | | | | | — | | | | | | 0.37 | | | | | | — | | | | | | 8.14 | | | | | | 0.31 | | | | | | 1.84 | | | | | | 1.85 | | | | | | 1.85 | | | | | | 4.33 | | | | | | 473 | | | | | | 37 | | |
| 03-31-14 | | | | | 8.33 | | | | | | 0.38 | | | | | | 0.16 | | | | | | 0.54 | | | | | | 0.39 | | | | | | — | | | | | | — | | | | | | 0.39 | | | | | | — | | | | | | 8.48 | | | | | | 6.69 | | | | | | 1.83 | | | | | | 1.85 | | | | | | 1.85 | | | | | | 4.58 | | | | | | 1,086 | | | | | | 47 | | |
| 03-31-13 | | | | | 7.79 | | | | | | 0.43 | | | | | | 0.54 | | | | | | 0.97 | | | | | | 0.43 | | | | | | — | | | | | | — | | | | | | 0.43 | | | | | | — | | | | | | 8.33 | | | | | | 12.85 | | | | | | 1.81 | | | | | | 1.85 | | | | | | 1.85 | | | | | | 5.47 | | | | | | 1,629 | | | | | | 109 | | |
| Class C | | | | | | | | | | | | | | | | | | | | | | | | | | | | | | | | | | | | | | | | | | | | | | | | | | | | | | | | | | | | | | | | | | | | | | | | | | | | | | | | | | | | | | | | | | | | | | | | | | | | | | | |
| 03-31-17 | | | | | 7.61 | | | | | | 0.36 | | | | | | 0.50 | | | | | | 0.86 | | | | | | 0.36 | | | | | | — | | | | | | — | | | | | | 0.36 | | | | | | — | | | | | | 8.11 | | | | | | 11.45 | | | | | | 1.81 | | | | | | 1.81 | | | | | | 1.81 | | | | | | 4.49 | | | | | | 13,113 | | | | | | 41 | | |
| 03-31-16 | | | | | 8.14 | | | | | | 0.35 | | | | | | (0.53) | | | | | | (0.18) | | | | | | 0.35 | | | | | | — | | | | | | — | | | | | | 0.35 | | | | | | — | | | | | | 7.61 | | | | | | (2.24) | | | | | | 1.82 | | | | | | 1.82 | | | | | | 1.82 | | | | | | 4.48 | | | | | | 12,677 | | | | | | 22 | | |
| 03-31-15 | | | | | 8.49 | | | | | | 0.36 | | | | | | (0.34) | | | | | | 0.02 | | | | | | 0.37 | | | | | | — | | | | | | — | | | | | | 0.37 | | | | | | — | | | | | | 8.14 | | | | | | 0.21 | | | | | | 1.84 | | | | | | 1.85 | | | | | | 1.85 | | | | | | 4.35 | | | | | | 13,568 | | | | | | 37 | | |
| 03-31-14 | | | | | 8.34 | | | | | | 0.38 | | | | | | 0.16 | | | | | | 0.54 | | | | | | 0.39 | | | | | | — | | | | | | — | | | | | | 0.39 | | | | | | — | | | | | | 8.49 | | | | | | 6.69 | | | | | | 1.83 | | | | | | 1.85 | | | | | | 1.85 | | | | | | 4.59 | | | | | | 15,051 | | | | | | 47 | | |
| 03-31-13 | | | | | 7.80 | | | | | | 0.44 | | | | | | 0.53 | | | | | | 0.97 | | | | | | 0.43 | | | | | | — | | | | | | — | | | | | | 0.43 | | | | | | — | | | | | | 8.34 | | | | | | 12.85 | | | | | | 1.81 | | | | | | 1.85 | | | | | | 1.85 | | | | | | 5.43 | | | | | | 14,354 | | | | | | 109 | | |
| Class I | | | | | | | | | | | | | | | | | | | | | | | | | | | | | | | | | | | | | | | | | | | | | | | | | | | | | | | | | | | | | | | | | | | | | | | | | | | | | | | | | | | | | | | | | | | | | | | | | | | | | | | |
| 03-31-17 | | | | | 7.61 | | | | | | 0.44 | | | | | | 0.49 | | | | | | 0.93 | | | | | | 0.44 | | | | | | — | | | | | | — | | | | | | 0.44 | | | | | | — | | | | | | 8.10 | | | | | | 12.54 | | | | | | 0.71 | | | | | | 0.71 | | | | | | 0.71 | | | | | | 5.56 | | | | | | 204,818 | | | | | | 41 | | |
| 03-31-16 | | | | | 8.14 | | | | | | 0.44 | | | | | | (0.53) | | | | | | (0.09) | | | | | | 0.44 | | | | | | — | | | | | | — | | | | | | 0.44 | | | | | | — | | | | | | 7.61 | | | | | | (1.12) | | | | | | 0.69 | | | | | | 0.69 | | | | | | 0.69 | | | | | | 5.63 | | | | | | 352,052 | | | | | | 22 | | |
| 03-31-15 | | | | | 8.48 | | | | | | 0.46 | | | | | | (0.34) | | | | | | 0.12 | | | | | | 0.46 | | | | | | — | | | | | | — | | | | | | 0.46 | | | | | | — | | | | | | 8.14 | | | | | | 1.48 | | | | | | 0.68 | | | | | | 0.69 | | | | | | 0.69 | | | | | | 5.51 | | | | | | 233,374 | | | | | | 37 | | |
| 03-31-14 | | | | | 8.33 | | | | | | 0.48 | | | | | | 0.15 | | | | | | 0.63 | | | | | | 0.48 | | | | | | — | | | | | | — | | | | | | 0.48 | | | | | | — | | | | | | 8.48 | | | | | | 7.89 | | | | | | 0.68 | | | | | | 0.70 | | | | | | 0.70 | | | | | | 5.74 | | | | | | 223,686 | | | | | | 47 | | |
| 03-31-13 | | | | | 7.80 | | | | | | 0.52• | | | | | | 0.53 | | | | | | 1.05 | | | | | | 0.52 | | | | | | — | | | | | | — | | | | | | 0.52 | | | | | | — | | | | | | 8.33 | | | | | | 13.98 | | | | | | 0.71 | | | | | | 0.75 | | | | | | 0.75 | | | | | | 6.40 | | | | | | 101,387 | | | | | | 109 | | |
| Class P | | | | | | | | | | | | | | | | | | | | | | | | | | | | | | | | | | | | | | | | | | | | | | | | | | | | | | | | | | | | | | | | | | | | | | | | | | | | | | | | | | | | | | | | | | | | | | | | | | | | | | | |
| 03-31-17 | | | | | 7.61 | | | | | | 0.50 | | | | | | 0.49 | | | | | | 0.99 | | | | | | 0.49 | | | | | | — | | | | | | — | | | | | | 0.49 | | | | | | — | | | | | | 8.11 | | | | | | 13.36 | | | | | | 0.66 | | | | | | 0.07 | | | | | | 0.07 | | | | | | 6.25 | | | | | | 149,606 | | | | | | 41 | | |
| 03-31-16 | | | | | 8.14 | | | | | | 0.49 | | | | | | (0.53) | | | | | | (0.04) | | | | | | 0.49 | | | | | | — | | | | | | — | | | | | | 0.49 | | | | | | — | | | | | | 7.61 | | | | | | (0.51) | | | | | | 0.67 | | | | | | 0.06 | | | | | | 0.06 | | | | | | 6.23 | | | | | | 104,009 | | | | | | 22 | | |
| 03-31-15 | | | | | 8.48 | | | | | | 0.51 | | | | | | (0.34) | | | | | | 0.17 | | | | | | 0.51 | | | | | | — | | | | | | — | | | | | | 0.51 | | | | | | — | | | | | | 8.14 | | | | | | 2.09 | | | | | | 0.68 | | | | | | 0.07 | | | | | | 0.07 | | | | | | 6.13 | | | | | | 145,332 | | | | | | 37 | | |
| 06-14-13(4) - 03-31-14 | | | | | 8.23 | | | | | | 0.42• | | | | | | 0.25 | | | | | | 0.67 | | | | | | 0.42 | | | | | | — | | | | | | — | | | | | | 0.42 | | | | | | — | | | | | | 8.48 | | | | | | 8.40 | | | | | | 0.68 | | | | | | 0.07 | | | | | | 0.07 | | | | | | 6.35 | | | | | | 81,146 | | | | | | 47 | | |
| Class R | | | | | | | | | | | | | | | | | | | | | | | | | | | | | | | | | | | | | | | | | | | | | | | | | | | | | | | | | | | | | | | | | | | | | | | | | | | | | | | | | | | | | | | | | | | | | | | | | | | | | | | |
| 03-31-17 | | | | | 7.62 | | | | | | 0.40 | | | | | | 0.49 | | | | | | 0.89 | | | | | | 0.40 | | | | | | — | | | | | | — | | | | | | 0.40 | | | | | | — | | | | | | 8.11 | | | | | | 11.85 | | | | | | 1.31 | | | | | | 1.31 | | | | | | 1.31 | | | | | | 4.99 | | | | | | 267 | | | | | | 41 | | |
| 03-31-16 | | | | | 8.15 | | | | | | 0.39 | | | | | | (0.53) | | | | | | (0.14) | | | | | | 0.39 | | | | | | — | | | | | | — | | | | | | 0.39 | | | | | | — | | | | | | 7.62 | | | | | | (1.71) | | | | | | 1.32 | | | | | | 1.32 | | | | | | 1.32 | | | | | | 5.00 | | | | | | 323 | | | | | | 22 | | |
| 03-31-15 | | | | | 8.49 | | | | | | 0.42 | | | | | | (0.34) | | | | | | 0.08 | | | | | | 0.42 | | | | | | — | | | | | | — | | | | | | 0.42 | | | | | | — | | | | | | 8.15 | | | | | | 0.91 | | | | | | 1.34 | | | | | | 1.34 | | | | | | 1.34 | | | | | | 4.93 | | | | | | 181 | | | | | | 37 | | |
| 01-30-14(4) - 03-31-14 | | | | | 8.38 | | | | | | 0.08 | | | | | | 0.10 | | | | | | 0.18 | | | | | | 0.07 | | | | | | — | | | | | | — | | | | | | 0.07 | | | | | | — | | | | | | 8.49 | | | | | | 2.17 | | | | | | 1.33 | | | | | | 1.33 | | | | | | 1.33 | | | | | | 5.50 | | | | | | 3 | | | | | | 47 | | |
| Class R6 | | | | | | | | | | | | | | | | | | | | | | | | | | | | | | | | | | | | | | | | | | | | | | | | | | | | | | | | | | | | | | | | | | | | | | | | | | | | | | | | | | | | | | | | | | | | | | | | | | | | | | | |
| 08-03-16(4) - 03-31-17 | | | | | 7.89 | | | | | | 0.30• | | | | | | 0.20 | | | | | | 0.50 | | | | | | 0.29 | | | | | | — | | | | | | — | | | | | | 0.29 | | | | | | — | | | | | | 8.10 | | | | | | 6.39 | | | | | | 0.66 | | | | | | 0.66 | | | | | | 0.66 | | | | | | 5.74 | | | | | | 120,605 | | | | | | 41 | | |
| Class W | | | | | | | | | | | | | | | | | | | | | | | | | | | | | | | | | | | | | | | | | | | | | | | | | | | | | | | | | | | | | | | | | | | | | | | | | | | | | | | | | | | | | | | | | | | | | | | | | | | | | | | |
| 03-31-17 | | | | | 7.63 | | | | | | 0.44 | | | | | | 0.49 | | | | | | 0.93 | | | | | | 0.44 | | | | | | — | | | | | | — | | | | | | 0.44 | | | | | | — | | | | | | 8.12 | | | | | | 12.40 | | | | | | 0.81 | | | | | | 0.81 | | | | | | 0.81 | | | | | | 5.49 | | | | | | 90,878 | | | | | | 41 | | |
| 03-31-16 | | | | | 8.15 | | | | | | 0.43 | | | | | | (0.52) | | | | | | (0.09) | | | | | | 0.43 | | | | | | — | | | | | | — | | | | | | 0.43 | | | | | | — | | | | | | 7.63 | | | | | | (1.08) | | | | | | 0.82 | | | | | | 0.82 | | | | | | 0.82 | | | | | | 5.51 | | | | | | 82,981 | | | | | | 22 | | |
| 03-31-15 | | | | | 8.50 | | | | | | 0.45 | | | | | | (0.35) | | | | | | 0.10 | | | | | | 0.45 | | | | | | — | | | | | | — | | | | | | 0.45 | | | | | | — | | | | | | 8.15 | | | | | | 1.26 | | | | | | 0.84 | | | | | | 0.85 | | | | | | 0.85 | | | | | | 5.37 | | | | | | 48,426 | | | | | | 37 | | |
| 03-31-14 | | | | | 8.35 | | | | | | 0.47 | | | | | | 0.16 | | | | | | 0.63 | | | | | | 0.48 | | | | | | — | | | | | | — | | | | | | 0.48 | | | | | | — | | | | | | 8.50 | | | | | | 7.78 | | | | | | 0.83 | | | | | | 0.85 | | | | | | 0.85 | | | | | | 5.60 | | | | | | 20,090 | | | | | | 47 | | |
| 03-31-13 | | | | | 7.81 | | | | | | 0.51• | | | | | | 0.55 | | | | | | 1.06 | | | | | | 0.52 | | | | | | — | | | | | | — | | | | | | 0.52 | | | | | | — | | | | | | 8.35 | | | | | | 14.11 | | | | | | 0.81 | | | | | | 0.85 | | | | | | 0.85 | | | | | | 6.30 | | | | | | 14,703 | | | | | | 109 | | |
| | | | | | | | | | Income (loss) from investment operations | | | | | | | | | Less Distributions | | | | | | Ratios to average net assets | | | Supplemental Data | | |||||||||||||||||||||||||||||||||||||||||||||||||||||||||||||||||||||||||||
| | | | Net asset value, beginning of year or period | | | Net investment income (loss) | | | Net realized and unrealized gain (loss) | | | Total from investment operations | | | From net investment income | | | From net realized gains | | | From return of capital | | | Total distributions | | | Payment by affiliate | | | Net asset value, end of year or period | | | Total Return(1) | | | Expenses before reductions/additions(2)(3) | | | Expenses net of fee waivers and/or recoupments if any(2)(3) | | | Expenses net of all reductions/additions(2)(3) | | | Net investment income (loss)(2)(3) | | | Net assets, end of year or period | | | Portfolio turnover rate | | |||||||||||||||||||||||||||||||||||||||||||||||||||
| Year or period ended | | | ($) | | | ($) | | | ($) | | | ($) | | | ($) | | | ($) | | | ($) | | | ($) | | | ($) | | | ($) | | | (%) | | | (%) | | | (%) | | | (%) | | | (%) | | | ($000’s) | | | (%) | | |||||||||||||||||||||||||||||||||||||||||||||||||||
| Voya Intermediate Bond Fund | | | | | | | | | | | | | | | | | | | | | | | | | | | | | | | | | | | | | | | | | | | | | | | | | | | | | | | | | | | | | | | | | | | | | | | | | | | | | | | | | | | | | | | | | | | | | | | | | | | | | | | |
| Class A | | | | | | | | | | | | | | | | | | | | | | | | | | | | | | | | | | | | | | | | | | | | | | | | | | | | | | | | | | | | | | | | | | | | | | | | | | | | | | | | | | | | | | | | | | | | | | | | | | | | | | | |
| 03-31-17 | | | | | 10.09 | | | | | | 0.27 | | | | | | (0.05) | | | | | | 0.22 | | | | | | 0.30 | | | | | | — | | | | | | — | | | | | | 0.30 | | | | | | — | | | | | | 10.01 | | | | | | 2.19 | | | | | | 0.65 | | | | | | 0.65 | | | | | | 0.65 | | | | | | 2.65 | | | | | | 436,938 | | | | | | 403†† | | |
| 03-31-16 | | | | | 10.23 | | | | | | 0.26 | | | | | | (0.15) | | | | | | 0.11 | | | | | | 0.25 | | | | | | — | | | | | | — | | | | | | 0.25 | | | | | | — | | | | | | 10.09 | | | | | | 1.12 | | | | | | 0.65 | | | | | | 0.65 | | | | | | 0.65 | | | | | | 2.57 | | | | | | 490,902 | | | | | | 465†† | | |
| 03-31-15 | | | | | 9.91 | | | | | | 0.24 | | | | | | 0.36 | | | | | | 0.60 | | | | | | 0.28 | | | | | | — | | | | | | — | | | | | | 0.28 | | | | | | — | | | | | | 10.23 | | | | | | 6.09 | | | | | | 0.66 | | | | | | 0.66 | | | | | | 0.66 | | | | | | 2.41 | | | | | | 995,117 | | | | | | 587†† | | |
| 03-31-14 | | | | | 10.09 | | | | | | 0.31• | | | | | | (0.20) | | | | | | 0.11 | | | | | | 0.29 | | | | | | — | | | | | | — | | | | | | 0.29 | | | | | | — | | | | | | 9.91 | | | | | | 1.11 | | | | | | 0.70 | | | | | | 0.70 | | | | | | 0.70 | | | | | | 3.16 | | | | | | 535,194 | | | | | | 525†† | | |
| 03-31-13 | | | | | 9.90 | | | | | | 0.34 | | | | | | 0.33 | | | | | | 0.67 | | | | | | 0.48 | | | | | | — | | | | | | — | | | | | | 0.48 | | | | | | — | | | | | | 10.09 | | | | | | 6.83 | | | | | | 0.70 | | | | | | 0.70 | | | | | | 0.70 | | | | | | 3.38 | | | | | | 301,544 | | | | | | 490†† | | |
| Class B | | | | | | | | | | | | | | | | | | | | | | | | | | | | | | | | | | | | | | | | | | | | | | | | | | | | | | | | | | | | | | | | | | | | | | | | | | | | | | | | | | | | | | | | | | | | | | | | | | | | | | | |
| 03-31-17 | | | | | 10.06 | | | | | | 0.19 | | | | | | (0.04) | | | | | | 0.15 | | | | | | 0.22 | | | | | | — | | | | | | — | | | | | | 0.22 | | | | | | — | | | | | | 9.99 | | | | | | 1.52 | | | | | | 1.40 | | | | | | 1.40 | | | | | | 1.40 | | | | | | 1.91 | | | | | | 188 | | | | | | 403†† | | |
| 03-31-16 | | | | | 10.20 | | | | | | 0.19 | | | | | | (0.16) | | | | | | 0.03 | | | | | | 0.17 | | | | | | — | | | | | | — | | | | | | 0.17 | | | | | | — | | | | | | 10.06 | | | | | | 0.33 | | | | | | 1.40 | | | | | | 1.40 | | | | | | 1.40 | | | | | | 1.76 | | | | | | 145 | | | | | | 465†† | | |
| 03-31-15 | | | | | 9.90 | | | | | | 0.18 | | | | | | 0.33 | | | | | | 0.51 | | | | | | 0.21 | | | | | | — | | | | | | — | | | | | | 0.21 | | | | | | — | | | | | | 10.20 | | | | | | 5.17 | | | | | | 1.41 | | | | | | 1.41 | | | | | | 1.41 | | | | | | 1.69 | | | | | | 447 | | | | | | 587†† | | |
| 03-31-14 | | | | | 10.07 | | | | | | 0.22• | | | | | | (0.18) | | | | | | 0.04 | | | | | | 0.21 | | | | | | — | | | | | | — | | | | | | 0.21 | | | | | | — | | | | | | 9.90 | | | | | | 0.43 | | | | | | 1.45 | | | | | | 1.45 | | | | | | 1.45 | | | | | | 2.27 | | | | | | 727 | | | | | | 525†† | | |
| 03-31-13 | | | | | 9.88 | | | | | | 0.27• | | | | | | 0.32 | | | | | | 0.59 | | | | | | 0.40 | | | | | | — | | | | | | — | | | | | | 0.40 | | | | | | — | | | | | | 10.07 | | | | | | 6.02 | | | | | | 1.45 | | | | | | 1.45 | | | | | | 1.45 | | | | | | 2.63 | | | | | | 1,928 | | | | | | 490†† | | |
| Class C | | | | | | | | | | | | | | | | | | | | | | | | | | | | | | | | | | | | | | | | | | | | | | | | | | | | | | | | | | | | | | | | | | | | | | | | | | | | | | | | | | | | | | | | | | | | | | | | | | | | | | | |
| 03-31-17 | | | | | 10.07 | | | | | | 0.19 | | | | | | (0.04) | | | | | | 0.15 | | | | | | 0.22 | | | | | | — | | | | | | — | | | | | | 0.22 | | | | | | — | | | | | | 10.00 | | | | | | 1.53 | | | | | | 1.40 | | | | | | 1.40 | | | | | | 1.40 | | | | | | 1.91 | | | | | | 28,270 | | | | | | 403†† | | |
| 03-31-16 | | | | | 10.21 | | | | | | 0.18 | | | | | | (0.14) | | | | | | 0.04 | | | | | | 0.18 | | | | | | — | | | | | | — | | | | | | 0.18 | | | | | | — | | | | | | 10.07 | | | | | | 0.37 | | | | | | 1.40 | | | | | | 1.40 | | | | | | 1.40 | | | | | | 1.85 | | | | | | 31,945 | | | | | | 465†† | | |
| 03-31-15 | | | | | 9.90 | | | | | | 0.17 | | | | | | 0.34 | | | | | | 0.51 | | | | | | 0.20 | | | | | | — | | | | | | — | | | | | | 0.20 | | | | | | — | | | | | | 10.21 | | | | | | 5.21 | | | | | | 1.41 | | | | | | 1.41 | | | | | | 1.41 | | | | | | 1.68 | | | | | | 32,593 | | | | | | 587†† | | |
| 03-31-14 | | | | | 10.07 | | | | | | 0.24 | | | | | | (0.20) | | | | | | 0.04 | | | | | | 0.21 | | | | | | — | | | | | | — | | | | | | 0.21 | | | | | | — | | | | | | 9.90 | | | | | | 0.44 | | | | | | 1.45 | | | | | | 1.45 | | | | | | 1.45 | | | | | | 2.32 | | | | | | 26,604 | | | | | | 525†† | | |
| 03-31-13 | | | | | 9.89 | | | | | | 0.27 | | | | | | 0.31 | | | | | | 0.58 | | | | | | 0.40 | | | | | | — | | | | | | — | | | | | | 0.40 | | | | | | — | | | | | | 10.07 | | | | | | 5.93 | | | | | | 1.45 | | | | | | 1.45 | | | | | | 1.45 | | | | | | 2.63 | | | | | | 35,308 | | | | | | 490†† | | |
| Class I | | | | | | | | | | | | | | | | | | | | | | | | | | | | | | | | | | | | | | | | | | | | | | | | | | | | | | | | | | | | | | | | | | | | | | | | | | | | | | | | | | | | | | | | | | | | | | | | | | | | | | | |
| 03-31-17 | | | | | 10.08 | | | | | | 0.30 | | | | | | (0.04) | | | | | | 0.26 | | | | | | 0.33 | | | | | | — | | | | | | — | | | | | | 0.33 | | | | | | — | | | | | | 10.01 | | | | | | 2.63 | | | | | | 0.33 | | | | | | 0.33 | | | | | | 0.33 | | | | | | 3.00 | | | | | | 1,578,844 | | | | | | 403†† | | |
| 03-31-16 | | | | | 10.23 | | | | | | 0.29 | | | | | | (0.16) | | | | | | 0.13 | | | | | | 0.28 | | | | | | — | | | | | | — | | | | | | 0.28 | | | | | | — | | | | | | 10.08 | | | | | | 1.36 | | | | | | 0.32 | | | | | | 0.32 | | | | | | 0.32 | | | | | | 2.93 | | | | | | 1,137,655 | | | | | | 465†† | | |
| 03-31-15 | | | | | 9.91 | | | | | | 0.28 | | | | | | 0.35 | | | | | | 0.63 | | | | | | 0.31 | | | | | | — | | | | | | — | | | | | | 0.31 | | | | | | — | | | | | | 10.23 | | | | | | 6.46 | | | | | | 0.32 | | | | | | 0.32 | | | | | | 0.32 | | | | | | 2.76 | | | | | | 613,643 | | | | | | 587†† | | |
| 03-31-14 | | | | | 10.08 | | | | | | 0.35 | | | | | | (0.20) | | | | | | 0.15 | | | | | | 0.32 | | | | | | — | | | | | | — | | | | | | 0.32 | | | | | | — | | | | | | 9.91 | | | | | | 1.56 | | | | | | 0.33 | | | | | | 0.33 | | | | | | 0.33 | | | | | | 3.48 | | | | | | 408,114 | | | | | | 525†† | | |
| 03-31-13 | | | | | 9.90 | | | | | | 0.37• | | | | | | 0.32 | | | | | | 0.69 | | | | | | 0.51 | | | | | | — | | | | | | — | | | | | | 0.51 | | | | | | — | | | | | | 10.08 | | | | | | 7.04 | | | | | | 0.42 | | | | | | 0.42 | | | | | | 0.42 | | | | | | 3.64 | | | | | | 531,681 | | | | | | 490†† | | |
| Class O | | | | | | | | | | | | | | | | | | | | | | | | | | | | | | | | | | | | | | | | | | | | | | | | | | | | | | | | | | | | | | | | | | | | | | | | | | | | | | | | | | | | | | | | | | | | | | | | | | | | | | | |
| 03-31-17 | | | | | 10.09 | | | | | | 0.27 | | | | | | (0.05) | | | | | | 0.22 | | | | | | 0.30 | | | | | | — | | | | | | — | | | | | | 0.30 | | | | | | — | | | | | | 10.01 | | | | | | 2.19 | | | | | | 0.65 | | | | | | 0.65 | | | | | | 0.65 | | | | | | 2.66 | | | | | | 32,404 | | | | | | 403†† | | |
| 03-31-16 | | | | | 10.23 | | | | | | 0.26 | | | | | | (0.15) | | | | | | 0.11 | | | | | | 0.25 | | | | | | — | | | | | | — | | | | | | 0.25 | | | | | | — | | | | | | 10.09 | | | | | | 1.12 | | | | | | 0.65 | | | | | | 0.65 | | | | | | 0.65 | | | | | | 2.59 | | | | | | 33,928 | | | | | | 465†† | | |
| 03-31-15 | | | | | 9.92 | | | | | | 0.25 | | | | | | 0.34 | | | | | | 0.59 | | | | | | 0.28 | | | | | | — | | | | | | — | | | | | | 0.28 | | | | | | — | | | | | | 10.23 | | | | | | 6.01 | | | | | | 0.66 | | | | | | 0.66 | | | | | | 0.66 | | | | | | 2.43 | | | | | | 36,329 | | | | | | 587†† | | |
| 03-31-14 | | | | | 10.09 | | | | | | 0.31 | | | | | | (0.19) | | | | | | 0.12 | | | | | | 0.29 | | | | | | — | | | | | | — | | | | | | 0.29 | | | | | | — | | | | | | 9.92 | | | | | | 1.21 | | | | | | 0.70 | | | | | | 0.70 | | | | | | 0.70 | | | | | | 3.09 | | | | | | 37,673 | | | | | | 525†† | | |
| 03-31-13 | | | | | 9.90 | | | | | | 0.34• | | | | | | 0.33 | | | | | | 0.67 | | | | | | 0.48 | | | | | | — | | | | | | — | | | | | | 0.48 | | | | | | — | | | | | | 10.09 | | | | | | 6.83 | | | | | | 0.70 | | | | | | 0.70 | | | | | | 0.70 | | | | | | 3.38 | | | | | | 41,596 | | | | | | 490†† | | |
| Class R | | | | | | | | | | | | | | | | | | | | | | | | | | | | | | | | | | | | | | | | | | | | | | | | | | | | | | | | | | | | | | | | | | | | | | | | | | | | | | | | | | | | | | | | | | | | | | | | | | | | | | | |
| 03-31-17 | | | | | 10.10 | | | | | | 0.24 | | | | | | (0.04) | | | | | | 0.20 | | | | | | 0.28 | | | | | | — | | | | | | — | | | | | | 0.28 | | | | | | — | | | | | | 10.02 | | | | | | 1.93 | | | | | | 0.90 | | | | | | 0.90 | | | | | | 0.90 | | | | | | 2.42 | | | | | | 166,268 | | | | | | 403†† | | |
| 03-31-16 | | | | | 10.24 | | | | | | 0.23 | | | | | | (0.14) | | | | | | 0.09 | | | | | | 0.23 | | | | | | — | | | | | | — | | | | | | 0.23 | | | | | | — | | | | | | 10.10 | | | | | | 0.88 | | | | | | 0.90 | | | | | | 0.90 | | | | | | 0.90 | | | | | | 2.36 | | | | | | 145,437 | | | | | | 465†† | | |
| 03-31-15 | | | | | 9.93 | | | | | | 0.22 | | | | | | 0.34 | | | | | | 0.56 | | | | | | 0.25 | | | | | | — | | | | | | — | | | | | | 0.25 | | | | | | — | | | | | | 10.24 | | | | | | 5.71 | | | | | | 0.91 | | | | | | 0.91 | | | | | | 0.91 | | | | | | 2.08 | | | | | | 121,657 | | | | | | 587†† | | |
| 03-31-14 | | | | | 10.10 | | | | | | 0.30 | | | | | | (0.20) | | | | | | 0.10 | | | | | | 0.27 | | | | | | — | | | | | | — | | | | | | 0.27 | | | | | | — | | | | | | 9.93 | | | | | | 0.96 | | | | | | 0.95 | | | | | | 0.95 | | | | | | 0.95 | | | | | | 2.82 | | | | | | 11,139 | | | | | | 525†† | | |
| 03-31-13 | | | | | 9.91 | | | | | | 0.30 | | | | | | 0.35 | | | | | | 0.65 | | | | | | 0.46 | | | | | | — | | | | | | — | | | | | | 0.46 | | | | | | — | | | | | | 10.10 | | | | | | 6.57 | | | | | | 0.95 | | | | | | 0.95 | | | | | | 0.95 | | | | | | 3.14 | | | | | | 14,401 | | | | | | 490†† | | |
| | | | | | | | | | Income (loss) from investment operations | | | | | | | | | Less Distributions | | | | | | Ratios to average net assets | | | Supplemental Data | | |||||||||||||||||||||||||||||||||||||||||||||||||||||||||||||||||||||||||||
| | | | Net asset value, beginning of year or period | | | Net investment income (loss) | | | Net realized and unrealized gain (loss) | | | Total from investment operations | | | From net investment income | | | From net realized gains | | | From return of capital | | | Total distributions | | | Payment by affiliate | | | Net asset value, end of year or period | | | Total Return(1) | | | Expenses before reductions/additions(2)(3) | | | Expenses net of fee waivers and/or recoupments if any(2)(3) | | | Expenses net of all reductions/additions(2)(3) | | | Net investment income (loss)(2)(3) | | | Net assets, end of year or period | | | Portfolio turnover rate | | |||||||||||||||||||||||||||||||||||||||||||||||||||
| Year or period ended | | | ($) | | | ($) | | | ($) | | | ($) | | | ($) | | | ($) | | | ($) | | | ($) | | | ($) | | | ($) | | | (%) | | | (%) | | | (%) | | | (%) | | | (%) | | | ($000’s) | | | (%) | | |||||||||||||||||||||||||||||||||||||||||||||||||||
| Voya Intermediate Bond Fund (continued) | | | | | | | | | | | | | | | | | | | | | | | | | | | | | | | | | | | | | | | | | | | | | | | | | | | | | | | | | | | | | | | | | | | | | | | | | | | | | | | | | | | | | | | | | | | | | | | | | | | | | | | |
| Class R6 | | | | | | | | | | | | | | | | | | | | | | | | | | | | | | | | | | | | | | | | | | | | | | | | | | | | | | | | | | | | | | | | | | | | | | | | | | | | | | | | | | | | | | | | | | | | | | | | | | | | | | | |
| 03-31-17 | | | | | 10.08 | | | | | | 0.30 | | | | | | (0.04) | | | | | | 0.26 | | | | | | 0.34 | | | | | | — | | | | | | — | | | | | | 0.34 | | | | | | — | | | | | | 10.00 | | | | | | 2.54 | | | | | | 0.31 | | | | | | 0.31 | | | | | | 0.31 | | | | | | 3.01 | | | | | | 832,462 | | | | | | 403†† | | |
| 03-31-16 | | | | | 10.22 | | | | | | 0.29 | | | | | | (0.15) | | | | | | 0.14 | | | | | | 0.28 | | | | | | — | | | | | | — | | | | | | 0.28 | | | | | | — | | | | | | 10.08 | | | | | | 1.47 | | | | | | 0.31 | | | | | | 0.31 | | | | | | 0.31 | | | | | | 2.97 | | | | | | 605,884 | | | | | | 465†† | | |
| 03-31-15 | | | | | 9.91 | | | | | | 0.28 | | | | | | 0.34 | | | | | | 0.62 | | | | | | 0.31 | | | | | | — | | | | | | — | | | | | | 0.31 | | | | | | — | | | | | | 10.22 | | | | | | 6.38 | | | | | | 0.31 | | | | | | 0.31 | | | | | | 0.31 | | | | | | 2.77 | | | | | | 371,049 | | | | | | 587†† | | |
| 05-31-13(4) - 03-31-14 | | | | | 10.02 | | | | | | 0.29• | | | | | | (0.13) | | | | | | 0.16 | | | | | | 0.27 | | | | | | — | | | | | | — | | | | | | 0.27 | | | | | | — | | | | | | 9.91 | | | | | | 1.67 | | | | | | 0.33 | | | | | | 0.33 | | | | | | 0.33 | | | | | | 3.52 | | | | | | 241,001 | | | | | | 525†† | | |
| Class W | | | | | | | | | | | | | | | | | | | | | | | | | | | | | | | | | | | | | | | | | | | | | | | | | | | | | | | | | | | | | | | | | | | | | | | | | | | | | | | | | | | | | | | | | | | | | | | | | | | | | | | |
| 03-31-17 | | | | | 10.07 | | | | | | 0.29 | | | | | | (0.03) | | | | | | 0.26 | | | | | | 0.33 | | | | | | — | | | | | | — | | | | | | 0.33 | | | | | | — | | | | | | 10.00 | | | | | | 2.54 | | | | | | 0.40 | | | | | | 0.40 | | | | | | 0.40 | | | | | | 2.92 | | | | | | 654,374 | | | | | | 403†† | | |
| 03-31-16 | | | | | 10.22 | | | | | | 0.28 | | | | | | (0.15) | | | | | | 0.13 | | | | | | 0.28 | | | | | | — | | | | | | — | | | | | | 0.28 | | | | | | — | | | | | | 10.07 | | | | | | 1.28 | | | | | | 0.40 | | | | | | 0.40 | | | | | | 0.40 | | | | | | 2.87 | | | | | | 588,181 | | | | | | 465†† | | |
| 03-31-15 | | | | | 9.90 | | | | | | 0.27 | | | | | | 0.35 | | | | | | 0.62 | | | | | | 0.30 | | | | | | — | | | | | | — | | | | | | 0.30 | | | | | | — | | | | | | 10.22 | | | | | | 6.36 | | | | | | 0.41 | | | | | | 0.41 | | | | | | 0.41 | | | | | | 2.67 | | | | | | 462,779 | | | | | | 587†† | | |
| 03-31-14 | | | | | 10.07 | | | | | | 0.33• | | | | | | (0.19) | | | | | | 0.14 | | | | | | 0.31 | | | | | | — | | | | | | — | | | | | | 0.31 | | | | | | — | | | | | | 9.90 | | | | | | 1.46 | | | | | | 0.45 | | | | | | 0.45 | | | | | | 0.45 | | | | | | 3.39 | | | | | | 354,894 | | | | | | 525†† | | |
| 03-31-13 | | | | | 9.89 | | | | | | 0.37• | | | | | | 0.32 | | | | | | 0.69 | | | | | | 0.51 | | | | | | — | | | | | | — | | | | | | 0.51 | | | | | | — | | | | | | 10.07 | | | | | | 7.04 | | | | | | 0.45 | | | | | | 0.45 | | | | | | 0.45 | | | | | | 3.64 | | | | | | 225,738 | | | | | | 490†† | | |
| Voya Short Term Bond Fund | | | | | | | | | | | | | | | | | | | | | | | | | | | | | | | | | | | | | | | | | | | | | | | | | | | | | | | | | | | | | | | | | | | | | | | | | | | | | | | | | | | | | | | | | | | | | | | | | | | | | | | |
| Class A | | | | | | | | | | | | | | | | | | | | | | | | | | | | | | | | | | | | | | | | | | | | | | | | | | | | | | | | | | | | | | | | | | | | | | | | | | | | | | | | | | | | | | | | | | | | | | | | | | | | | | | |
| 03-31-17 | | | | | 9.88 | | | | | | 0.12• | | | | | | (0.01) | | | | | | 0.11 | | | | | | 0.15 | | | | | | — | | | | | | — | | | | | | 0.15 | | | | | | — | | | | | | 9.84 | | | | | | 1.16 | | | | | | 0.85 | | | | | | 0.76 | | | | | | 0.76 | | | | | | 1.18 | | | | | | 4,894 | | | | | | 227 | | |
| 03-31-16 | | | | | 9.97 | | | | | | 0.13• | | | | | | (0.06) | | | | | | 0.07 | | | | | | 0.16 | | | | | | — | | | | | | — | | | | | | 0.16 | | | | | | — | | | | | | 9.88 | | | | | | 0.67 | | | | | | 0.96 | | | | | | 0.80 | | | | | | 0.80 | | | | | | 1.28 | | | | | | 9,658 | | | | | | 109 | | |
| 03-31-15 | | | | | 10.01 | | | | | | 0.13 | | | | | | (0.01) | | | | | | 0.12 | | | | | | 0.16 | | | | | | — | | | | | | — | | | | | | 0.16 | | | | | | — | | | | | | 9.97 | | | | | | 1.20 | | | | | | 0.89 | | | | | | 0.80 | | | | | | 0.80 | | | | | | 1.31 | | | | | | 303 | | | | | | 95 | | |
| 03-31-14 | | | | | 10.01 | | | | | | 0.11• | | | | | | 0.03 | | | | | | 0.14 | | | | | | 0.14 | | | | | | — | | | | | | — | | | | | | 0.14 | | | | | | — | | | | | | 10.01 | | | | | | 1.43 | | | | | | 0.91 | | | | | | 0.80 | | | | | | 0.80 | | | | | | 1.12 | | | | | | 173 | | | | | | 116 | | |
| 12-19-12(4) - 03-31-13 | | | | | 10.00 | | | | | | 0.02 | | | | | | (0.01) | | | | | | 0.01 | | | | | | 0.00* | | | | | | — | | | | | | — | | | | | | 0.00* | | | | | | — | | | | | | 10.01 | | | | | | 0.13 | | | | | | 2.39 | | | | | | 0.80 | | | | | | 0.80 | | | | | | 0.63 | | | | | | 4 | | | | | | 85 | | |
| Class C | | | | | | | | | | | | | | | | | | | | | | | | | | | | | | | | | | | | | | | | | | | | | | | | | | | | | | | | | | | | | | | | | | | | | | | | | | | | | | | | | | | | | | | | | | | | | | | | | | | | | | | |
| 03-31-17 | | | | | 9.88 | | | | | | 0.04 | | | | | | 0.00* | | | | | | 0.04 | | | | | | 0.08 | | | | | | — | | | | | | — | | | | | | 0.08 | | | | | | — | | | | | | 9.84 | | | | | | 0.40 | | | | | | 1.60 | | | | | | 1.51 | | | | | | 1.51 | | | | | | 0.45 | | | | | | 1,079 | | | | | | 227 | | |
| 03-31-16 | | | | | 9.98 | | | | | | 0.06 | | | | | | (0.08) | | | | | | (0.02) | | | | | | 0.08 | | | | | | — | | | | | | — | | | | | | 0.08 | | | | | | — | | | | | | 9.88 | | | | | | (0.19) | | | | | | 1.71 | | | | | | 1.55 | | | | | | 1.55 | | | | | | 0.51 | | | | | | 898 | | | | | | 109 | | |
| 03-31-15 | | | | | 10.02 | | | | | | 0.05 | | | | | | (0.01) | | | | | | 0.04 | | | | | | 0.08 | | | | | | — | | | | | | — | | | | | | 0.08 | | | | | | — | | | | | | 9.98 | | | | | | 0.44 | | | | | | 1.64 | | | | | | 1.55 | | | | | | 1.55 | | | | | | 0.56 | | | | | | 344 | | | | | | 95 | | |
| 03-31-14 | | | | | 9.99 | | | | | | 0.03 | | | | | | 0.04 | | | | | | 0.07 | | | | | | 0.04 | | | | | | — | | | | | | — | | | | | | 0.04 | | | | | | — | | | | | | 10.02 | | | | | | 0.73 | | | | | | 1.66 | | | | | | 1.55 | | | | | | 1.55 | | | | | | 0.35 | | | | | | 352 | | | | | | 116 | | |
| 12-19-12(4) - 03-31-13 | | | | | 10.00 | | | | | | (0.01) | | | | | | 0.00* | | | | | | (0.01) | | | | | | — | | | | | | — | | | | | | — | | | | | | — | | | | | | — | | | | | | 9.99 | | | | | | (0.10) | | | | | | 3.14 | | | | | | 1.55 | | | | | | 1.55 | | | | | | (0.39) | | | | | | 3 | | | | | | 85 | | |
| Class I | | | | | | | | | | | | | | | | | | | | | | | | | | | | | | | | | | | | | | | | | | | | | | | | | | | | | | | | | | | | | | | | | | | | | | | | | | | | | | | | | | | | | | | | | | | | | | | | | | | | | | | |
| 03-31-17 | | | | | 9.88 | | | | | | 0.15 | | | | | | (0.01) | | | | | | 0.14 | | | | | | 0.18 | | | | | | — | | | | | | — | | | | | | 0.18 | | | | | | — | | | | | | 9.84 | | | | | | 1.46 | | | | | | 0.67 | | | | | | 0.50 | | | | | | 0.50 | | | | | | 1.46 | | | | | | 12,921 | | | | | | 227 | | |
| 03-31-16 | | | | | 9.98 | | | | | | 0.16 | | | | | | (0.08) | | | | | | 0.08 | | | | | | 0.18 | | | | | | — | | | | | | — | | | | | | 0.18 | | | | | | — | | | | | | 9.88 | | | | | | 0.85 | | | | | | 0.63 | | | | | | 0.50 | | | | | | 0.50 | | | | | | 1.53 | | | | | | 9,954 | | | | | | 109 | | |
| 03-31-15 | | | | | 10.02 | | | | | | 0.17 | | | | | | (0.02) | | | | | | 0.15 | | | | | | 0.19 | | | | | | — | | | | | | — | | | | | | 0.19 | | | | | | — | | | | | | 9.98 | | | | | | 1.50 | | | | | | 0.59 | | | | | | 0.50 | | | | | | 0.50 | | | | | | 1.63 | | | | | | 7,416 | | | | | | 95 | | |
| 03-31-14 | | | | | 10.00 | | | | | | 0.11• | | | | | | 0.06 | | | | | | 0.17 | | | | | | 0.15 | | | | | | — | | | | | | — | | | | | | 0.15 | | | | | | — | | | | | | 10.02 | | | | | | 1.74 | | | | | | 0.61 | | | | | | 0.50 | | | | | | 0.50 | | | | | | 1.13 | | | | | | 4,419 | | | | | | 116 | | |
| 12-19-12(4) - 03-31-13 | | | | | 10.00 | | | | | | 0.02 | | | | | | 0.00* | | | | | | 0.02 | | | | | | 0.02 | | | | | | — | | | | | | — | | | | | | 0.02 | | | | | | — | | | | | | 10.00 | | | | | | 0.22 | | | | | | 0.61 | | | | | | 0.50 | | | | | | 0.50 | | | | | | 0.84 | | | | | | 177,653 | | | | | | 85 | | |
| Class R | | | | | | | | | | | | | | | | | | | | | | | | | | | | | | | | | | | | | | | | | | | | | | | | | | | | | | | | | | | | | | | | | | | | | | | | | | | | | | | | | | | | | | | | | | | | | | | | | | | | | | | |
| 03-31-17 | | | | | 9.88 | | | | | | 0.09 | | | | | | 0.00* | | | | | | 0.09 | | | | | | 0.13 | | | | | | — | | | | | | — | | | | | | 0.13 | | | | | | — | | | | | | 9.84 | | | | | | 0.89 | | | | | | 1.10 | | | | | | 1.01 | | | | | | 1.01 | | | | | | 0.93 | | | | | | 3 | | | | | | 227 | | |
| 03-31-16 | | | | | 9.97 | | | | | | 0.10 | | | | | | (0.06) | | | | | | 0.04 | | | | | | 0.13 | | | | | | — | | | | | | — | | | | | | 0.13 | | | | | | — | | | | | | 9.88 | | | | | | 0.40 | | | | | | 1.21 | | | | | | 1.05 | | | | | | 1.05 | | | | | | 0.97 | | | | | | 3 | | | | | | 109 | | |
| 07-31-14(4) - 03-31-15 | | | | | 9.99 | | | | | | 0.07• | | | | | | 0.00* | | | | | | 0.07 | | | | | | 0.09 | | | | | | — | | | | | | — | | | | | | 0.09 | | | | | | — | | | | | | 9.97 | | | | | | 0.72 | | | | | | 1.14 | | | | | | 1.05 | | | | | | 1.05 | | | | | | 1.00 | | | | | | 3 | | | | | | 95 | | |
| | | | | | | | | | Income (loss) from investment operations | | | | | | | | | Less Distributions | | | | | | Ratios to average net assets | | | Supplemental Data | | |||||||||||||||||||||||||||||||||||||||||||||||||||||||||||||||||||||||||||
| | | | Net asset value, beginning of year or period | | | Net investment income (loss) | | | Net realized and unrealized gain (loss) | | | Total from investment operations | | | From net investment income | | | From net realized gains | | | From return of capital | | | Total distributions | | | Payment by affiliate | | | Net asset value, end of year or period | | | Total Return(1) | | | Expenses before reductions/additions(2)(3) | | | Expenses net of fee waivers and/or recoupments if any(2)(3) | | | Expenses net of all reductions/additions(2)(3) | | | Net investment income (loss)(2)(3) | | | Net assets, end of year or period | | | Portfolio turnover rate | | |||||||||||||||||||||||||||||||||||||||||||||||||||
| Year or period ended | | | ($) | | | ($) | | | ($) | | | ($) | | | ($) | | | ($) | | | ($) | | | ($) | | | ($) | | | ($) | | | (%) | | | (%) | | | (%) | | | (%) | | | (%) | | | ($000’s) | | | (%) | | |||||||||||||||||||||||||||||||||||||||||||||||||||
| Voya Short Term Bond Fund (continued) | | | | | | | | | | | | | | | | | | | | | | | | | | | | | | | | | | | | | | | | | | | | | | | | | | | | | | | | | | | | | | | | | | | | | | | | | | | | | | | | | | | | | | | | | | | | | | | | | | | | | | | |
| Class R6 | | | | | | | | | | | | | | | | | | | | | | | | | | | | | | | | | | | | | | | | | | | | | | | | | | | | | | | | | | | | | | | | | | | | | | | | | | | | | | | | | | | | | | | | | | | | | | | | | | | | | | | |
| 03-31-17 | | | | | 9.89 | | | | | | 0.14 | | | | | | 0.00* | | | | | | 0.14 | | | | | | 0.19 | | | | | | — | | | | | | — | | | | | | 0.19 | | | | | | — | | | | | | 9.84 | | | | | | 1.39 | | | | | | 0.56 | | | | | | 0.47 | | | | | | 0.47 | | | | | | 1.47 | | | | | | 73,871 | | | | | | 227 | | |
| 03-31-16 | | | | | 9.98 | | | | | | 0.15 | | | | | | (0.05) | | | | | | 0.10 | | | | | | 0.19 | | | | | | — | | | | | | — | | | | | | 0.19 | | | | | | — | | | | | | 9.89 | | | | | | 0.98 | | | | | | 0.55 | | | | | | 0.47 | | | | | | 0.47 | | | | | | 1.55 | | | | | | 110,520 | | | | | | 109 | | |
| 03-31-15 | | | | | 10.02 | | | | | | 0.16 | | | | | | (0.01) | | | | | | 0.15 | | | | | | 0.19 | | | | | | — | | | | | | — | | | | | | 0.19 | | | | | | — | | | | | | 9.98 | | | | | | 1.53 | | | | | | 0.54 | | | | | | 0.47 | | | | | | 0.47 | | | | | | 1.63 | | | | | | 133,098 | | | | | | 95 | | |
| 07-31-13(4) - 03-31-14 | | | | | 9.98 | | | | | | 0.09• | | | | | | 0.06 | | | | | | 0.15 | | | | | | 0.11 | | | | | | — | | | | | | — | | | | | | 0.11 | | | | | | — | | | | | | 10.02 | | | | | | 1.49 | | | | | | 0.55 | | | | | | 0.47 | | | | | | 0.47 | | | | | | 1.31 | | | | | | 169,497 | | | | | | 116 | | |
| Class W | | | | | | | | | | | | | | | | | | | | | | | | | | | | | | | | | | | | | | | | | | | | | | | | | | | | | | | | | | | | | | | | | | | | | | | | | | | | | | | | | | | | | | | | | | | | | | | | | | | | | | | |
| 03-31-17 | | | | | 9.89 | | | | | | 0.14• | | | | | | 0.00* | | | | | | 0.14 | | | | | | 0.18 | | | | | | — | | | | | | — | | | | | | 0.18 | | | | | | — | | | | | | 9.85 | | | | | | 1.41 | | | | | | 0.60 | | | | | | 0.51 | | | | | | 0.51 | | | | | | 1.42 | | | | | | 393 | | | | | | 227 | | |
| 03-31-16 | | | | | 9.98 | | | | | | 0.17 | | | | | | (0.08) | | | | | | 0.09 | | | | | | 0.18 | | | | | | — | | | | | | — | | | | | | 0.18 | | | | | | — | | | | | | 9.89 | | | | | | 0.91 | | | | | | 0.71 | | | | | | 0.55 | | | | | | 0.55 | | | �� | | | 1.61 | | | | | | 531 | | | | | | 109 | | |
| 03-31-15 | | | | | 10.02 | | | | | | 0.15• | | | | | | (0.01) | | | | | | 0.14 | | | | | | 0.18 | | | | | | — | | | | | | — | | | | | | 0.18 | | | | | | — | | | | | | 9.98 | | | | | | 1.41 | | | | | | 0.64 | | | | | | 0.55 | | | | | | 0.55 | | | | | | 1.46 | | | | | | 3 | | | | | | 95 | | |
| 03-31-14 | | | | | 10.01 | | | | | | 0.12 | | | | | | 0.05 | | | | | | 0.17 | | | | | | 0.16 | | | | | | — | | | | | | — | | | | | | 0.16 | | | | | | — | | | | | | 10.02 | | | | | | 1.70 | | | | | | 0.66 | | | | | | 0.55 | | | | | | 0.55 | | | | | | 1.24 | | | | | | 3 | | | | | | 116 | | |
| 12-19-12(4) - 03-31-13 | | | | | 10.00 | | | | | | 0.02 | | | | | | 0.00* | | | | | | 0.02 | | | | | | 0.01 | | | | | | — | | | | | | — | | | | | | 0.01 | | | | | | — | | | | | | 10.01 | | | | | | 0.17 | | | | | | 2.14 | | | | | | 0.55 | | | | | | 0.55 | | | | | | 0.59 | | | | | | 3 | | | | | | 85 | | |
| Voya Strategic Income Opportunities Fund | | | | | | | | | | | | | | | | | | | | | | | | | | | | | | | | | | | | | | | | | | | | | | | | | | | | | | | | | | | | | | | | | | | | | | | | | | | | | | | | | | | | | | | | | | | | | | | | | | | | | | | |
| Class A | | | | | | | | | | | | | | | | | | | | | | | | | | | | | | | | | | | | | | | | | | | | | | | | | | | | | | | | | | | | | | | | | | | | | | | | | | | | | | | | | | | | | | | | | | | | | | | | | | | | | | | |
| 03-31-17 | | | | | 9.94 | | | | | | 0.42• | | | | | | 0.24 | | | | | | 0.66 | | | | | | 0.48 | | | | | | — | | | | | | — | | | | | | 0.48 | | | | | | — | | | | | | 10.12 | | | | | | 6.82 | | | | | | 1.22 | | | | | | 1.06 | | | | | | 1.06 | | | | | | 4.17 | | | | | | 11,255 | | | | | | 68 | | |
| 03-31-16 | | | | | 9.97 | | | | | | 0.30• | | | | | | (0.27) | | | | | | 0.03 | | | | | | 0.06 | | | | | | — | | | | | | — | | | | | | 0.06 | | | | | | — | | | | | | 9.94 | | | | | | 0.25 | | | | | | 1.25 | | | | | | 1.01 | | | | | | 1.01 | | | | | | 2.99 | | | | | | 1,492 | | | | | | 83 | | |
| 03-31-15 | | | | | 9.93 | | | | | | 0.34• | | | | | | 0.05 | | | | | | 0.39 | | | | | | 0.35 | | | | | | — | | | | | | — | | | | | | 0.35 | | | | | | — | | | | | | 9.97 | | | | | | 3.97 | | | | | | 2.75 | | | | | | 1.03 | | | | | | 1.03 | | | | | | 3.40 | | | | | | 438 | | | | | | 158 | | |
| 03-31-14 | | | | | 10.16 | | | | | | 0.50• | | | | | | (0.29) | | | | | | 0.21 | | | | | | 0.44 | | | | | | — | | | | | | — | | | | | | 0.44 | | | | | | — | | | | | | 9.93 | | | | | | 2.21 | | | | | | 4.23 | | | | | | 0.87 | | | | | | 0.87 | | | | | | 5.11 | | | | | | 309 | | | | | | 338 | | |
| 11-02-12(4) - 03-31-13 | | | | | 10.00 | | | | | | 0.12 | | | | | | 0.10 | | | | | | 0.22 | | | | | | 0.06 | | | | | | — | | | | | | — | | | | | | 0.06 | | | | | | — | | | | | | 10.16 | | | | | | 2.21 | | | | | | 3.78 | | | | | | 0.83 | | | | | | 0.83 | | | | | | 3.26 | | | | | | 4 | | | | | | 193 | | |
| Class C | | | | | | | | | | | | | | | | | | | | | | | | | | | | | | | | | | | | | | | | | | | | | | | | | | | | | | | | | | | | | | | | | | | | | | | | | | | | | | | | | | | | | | | | | | | | | | | | | | | | | | | |
| 03-31-17 | | | | | 9.78 | | | | | | 0.33• | | | | | | 0.25 | | | | | | 0.58 | | | | | | 0.40 | | | | | | — | | | | | | — | | | | | | 0.40 | | | | | | — | | | | | | 9.96 | | | | | | 6.05 | | | | | | 1.97 | | | | | | 1.81 | | | | | | 1.81 | | | | | | 3.38 | | | | | | 1,893 | | | | | | 68 | | |
| 03-31-16 | | | | | 9.85 | | | | | | 0.22• | | | | | | (0.28) | | | | | | (0.06) | | | | | | 0.01 | | | | | | — | | | | | | — | | | | | | 0.01 | | | | | | — | | | | | | 9.78 | | | | | | (0.57) | | | | | | 2.00 | | | | | | 1.76 | | | | | | 1.76 | | | | | | 2.25 | | | | | | 421 | | | | | | 83 | | |
| 03-31-15 | | | | | 9.86 | | | | | | 0.26• | | | | | | 0.05 | | | | | | 0.31 | | | | | | 0.32 | | | | | | — | | | | | | — | | | | | | 0.32 | | | | | | — | | | | | | 9.85 | | | | | | 3.22 | | | | | | 3.50 | | | | | | 1.78 | | | | | | 1.78 | | | | | | 2.61 | | | | | | 170 | | | | | | 158 | | |
| 03-31-14 | | | | | 10.14 | | | | | | 0.36• | | | | | | (0.25) | | | | | | 0.11 | | | | | | 0.39 | | | | | | — | | | | | | — | | | | | | 0.39 | | | | | | — | | | | | | 9.86 | | | | | | 1.18 | | | | | | 4.98 | | | | | | 1.62 | | | | | | 1.62 | | | | | | 3.63 | | | | | | 48 | | | | | | 338 | | |
| 11-02-12(4) - 03-31-13 | | | | | 10.00 | | | | | | 0.11 | | | | | | 0.08 | | | | | | 0.19 | | | | | | 0.05 | | | | | | — | | | | | | — | | | | | | 0.05 | | | | | | — | | | | | | 10.14 | | | | | | 1.91 | | | | | | 4.53 | | | | | | 1.58 | | | | | | 1.58 | | | | | | 2.69 | | | | | | 3 | | | | | | 193 | | |
| Class I | | | | | | | | | | | | | | | | | | | | | | | | | | | | | | | | | | | | | | | | | | | | | | | | | | | | | | | | | | | | | | | | | | | | | | | | | | | | | | | | | | | | | | | | | | | | | | | | | | | | | | | |
| 03-31-17 | | | | | 9.99 | | | | | | 0.45• | | | | | | 0.27 | | | | | | 0.72 | | | | | | 0.53 | | | | | | — | | | | | | — | | | | | | 0.53 | | | | | | — | | | | | | 10.18 | | | | | | 7.38 | | | | | | 0.85 | | | | | | 0.69 | | | | | | 0.69 | | | | | | 4.51 | | | | | | 27,339 | | | | | | 68 | | |
| 03-31-16 | | | | | 9.98 | | | | | | 0.38• | | | | | | (0.29) | | | | | | 0.09 | | | | | | 0.08 | | | | | | — | | | | | | — | | | | | | 0.08 | | | | | | — | | | | | | 9.99 | | | | | | 0.91 | | | | | | 0.87 | | | | | | 0.63 | | | | | | 0.63 | | | | | | 3.77 | | | | | | 6,046 | | | | | | 83 | | |
| 03-31-15 | | | | | 9.94 | | | | | | 0.38 | | | | | | 0.04 | | | | | | 0.42 | | | | | | 0.38 | | | | | | — | | | | | | — | | | | | | 0.38 | | | | | | — | | | | | | 9.98 | | | | | | 4.29 | | | | | | 2.36 | | | | | | 0.64 | | | | | | 0.64 | | | | | | 3.78 | | | | | | 5,453 | | | | | | 158 | | |
| 03-31-14 | | | | | 10.17 | | | | | | 0.44 | | | | | | (0.22) | | | | | | 0.22 | | | | | | 0.45 | | | | | | — | | | | | | — | | | | | | 0.45 | | | | | | — | | | | | | 9.94 | | | | | | 2.26 | | | | | | 3.84 | | | | | | 0.48 | | | | | | 0.48 | | | | | | 4.42 | | | | | | 5,264 | | | | | | 338 | | |
| 11-02-12(4) - 03-31-13 | | | | | 10.00 | | | | | | 0.16 | | | | | | 0.08 | | | | | | 0.24 | | | | | | 0.07 | | | | | | — | | | | | | — | | | | | | 0.07 | | | | | | — | | | | | | 10.17 | | | | | | 2.36 | | | | | | 3.33 | | | | | | 0.38 | | | | | | 0.38 | | | | | | 3.87 | | | | | | 5,107 | | | | | | 193 | | |
| Class R | | | | | | | | | | | | | | | | | | | | | | | | | | | | | | | | | | | | | | | | | | | | | | | | | | | | | | | | | | | | | | | | | | | | | | | | | | | | | | | | | | | | | | | | | | | | | | | | | | | | | | | |
| 03-31-17 | | | | | 9.86 | | | | | | 0.37 | | | | | | 0.26 | | | | | | 0.63 | | | | | | 0.45 | | | | | | — | | | | | | — | | | | | | 0.45 | | | | | | — | | | | | | 10.04 | | | | | | 6.57 | | | | | | 1.47 | | | | | | 1.31 | | | | | | 1.31 | | | | | | 3.82 | | | | | | 3,955 | | | | | | 68 | | |
| 03-31-16 | | | | | 9.90 | | | | | | 0.30• | | | | | | (0.28) | | | | | | 0.02 | | | | | | 0.06 | | | | | | — | | | | | | — | | | | | | 0.06 | | | | | | — | | | | | | 9.86 | | | | | | 0.17 | | | | | | 1.50 | | | | | | 1.26 | | | | | | 1.26 | | | | | | 3.05 | | | | | | 3,397 | | | | | | 83 | | |
| 03-31-15 | | | | | 9.91 | | | | | | 0.31• | | | | | | 0.05 | | | | | | 0.36 | | | | | | 0.37 | | | | | | — | | | | | | — | | | | | | 0.37 | | | | | | — | | | | | | 9.90 | | | | | | 3.70 | | | | | | 3.00 | | | | | | 1.28 | | | | | | 1.28 | | | | | | 3.12 | | | | | | 330 | | | | | | 158 | | |
| 03-31-14 | | | | | 10.15 | | | | | | 0.38 | | | | | | (0.23) | | | | | | 0.15 | | | | | | 0.39 | | | | | | — | | | | | | — | | | | | | 0.39 | | | | | | — | | | | | | 9.91 | | | | | | 1.57 | | | | | | 4.48 | | | | | | 1.12 | | | | | | 1.12 | | | | | | 3.77 | | | | | | 3 | | | | | | 338 | | |
| 11-02-12(4) - 03-31-13 | | | | | 10.00 | | | | | | 0.13 | | | | | | 0.08 | | | | | | 0.21 | | | | | | 0.06 | | | | | | — | | | | | | — | | | | | | 0.06 | | | | | | — | | | | | | 10.15 | | | | | | 2.08 | | | | | | 4.03 | | | | | | 1.08 | | | | | | 1.08 | | | | | | 3.20 | | | | | | 3 | | | | | | 193 | | |
| | | | | | | | | | Income (loss) from investment operations | | | | | | | | | Less Distributions | | | | | | Ratios to average net assets | | | Supplemental Data | | |||||||||||||||||||||||||||||||||||||||||||||||||||||||||||||||||||||||||||
| | | | Net asset value, beginning of year or period | | | Net investment income (loss) | | | Net realized and unrealized gain (loss) | | | Total from investment operations | | | From net investment income | | | From net realized gains | | | From return of capital | | | Total distributions | | | Payment by affiliate | | | Net asset value, end of year or period | | | Total Return(1) | | | Expenses before reductions/additions(2)(3) | | | Expenses net of fee waivers and/or recoupments if any(2)(3) | | | Expenses net of all reductions/additions(2)(3) | | | Net investment income (loss)(2)(3) | | | Net assets, end of year or period | | | Portfolio turnover rate | | |||||||||||||||||||||||||||||||||||||||||||||||||||
| Year or period ended | | | ($) | | | ($) | | | ($) | | | ($) | | | ($) | | | ($) | | | ($) | | | ($) | | | ($) | | | ($) | | | (%) | | | (%) | | | (%) | | | (%) | | | (%) | | | ($000’s) | | | (%) | | |||||||||||||||||||||||||||||||||||||||||||||||||||
| Voya Strategic Income Opportunities Fund (continued) | | | | | | | | | | | | | | | | | | | | | | | | | | | | | | | | | | | | | | | | | | | | | | | | | | | | | | | | | | | | | | | | | | | | | | | | | | | | | | | | | | | | | | | | | | | | | | | | | | | | | | | |
| Class R6 | | | | | | | | | | | | | | | | | | | | | | | | | | | | | | | | | | | | | | | | | | | | | | | | | | | | | | | | | | | | | | | | | | | | | | | | | | | | | | | | | | | | | | | | | | | | | | | | | | | | | | | |
| 03-31-17 | | | | | 9.99 | | | | | | 0.45 | | | | | | 0.25 | | | | | | 0.70 | | | | | | 0.53 | | | | | | — | | | | | | — | | | | | | 0.53 | | | | | | — | | | | | | 10.16 | | | | | | 7.21 | | | | | | 0.83 | | | | | | 0.67 | | | | | | 0.67 | | | | | | 4.46 | | | | | | 111,530 | | | | | | 68 | | |
| 10-23-15(4) - 03-31-16 | | | | | 10.05 | | | | | | 0.16• | | | | | | (0.14) | | | | | | 0.02 | | | | | | 0.08 | | | | | | — | | | | | | — | | | | | | 0.08 | | | | | | — | | | | | | 9.99 | | | | | | 0.21 | | | | | | 0.87 | | | | | | 0.63 | | | | | | 0.63 | | | | | | 3.70 | | | | | | 109,630 | | | | | | 83 | | |
| Class W | | | | | | | | | | | | | | | | | | | | | | | | | | | | | | | | | | | | | | | | | | | | | | | | | | | | | | | | | | | | | | | | | | | | | | | | | | | | | | | | | | | | | | | | | | | | | | | | | | | | | | | |
| 03-31-17 | | | | | 9.90 | | | | | | 0.44• | | | | | | 0.26 | | | | | | 0.70 | | | | | | 0.51 | | | | | | — | | | | | | — | | | | | | 0.51 | | | | | | — | | | | | | 10.09 | | | | | | 7.19 | | | | | | 0.97 | | | | | | 0.81 | | | | | | 0.81 | | | | | | 4.38 | | | | | | 4,161 | | | | | | 68 | | |
| 03-31-16 | | | | | 9.96 | | | | | | 0.33• | | | | | | (0.31) | | | | | | 0.02 | | | | | | 0.08 | | | | | | — | | | | | | — | | | | | | 0.08 | | | | | | — | | | | | | 9.90 | | | | | | 0.17 | | | | | | 1.00 | | | | | | 0.76 | | | | | | 0.76 | | | | | | 3.33 | | | | | | 54 | | | | | | 83 | | |
| 03-31-15 | | | | | 9.89 | | | | | | 0.36 | | | | | | 0.05 | | | | | | 0.41 | | | | | | 0.34 | | | | | | — | | | | | | — | | | | | | 0.34 | | | | | | — | | | | | | 9.96 | | | | | | 4.24 | | | | | | 2.50 | | | | | | 0.78 | | | | | | 0.78 | | | | | | 3.60 | | | | | | 3 | | | | | | 158 | | |
| 03-31-14 | | | | | 10.17 | | | | | | 0.43• | | | | | | (0.26) | | | | | | 0.17 | | | | | | 0.45 | | | | | | — | | | | | | — | | | | | | 0.45 | | | | | | — | | | | | | 9.89 | | | | | | 1.72 | | | | | | 3.98 | | | | | | 0.62 | | | | | | 0.62 | | | | | | 4.29 | | | | | | 3 | | | | | | 338 | | |
| 11-02-12(4) - 03-31-13 | | | | | 10.00 | | | | | | 0.15 | | | | | | 0.09 | | | | | | 0.24 | | | | | | 0.07 | | | | | | — | | | | | | — | | | | | | 0.07 | | | | | | — | | | | | | 10.17 | | | | | | 2.36 | | | | | | 3.53 | | | | | | 0.58 | | | | | | 0.58 | | | | | | 3.68 | | | | | | 3 | | | | | | 193 | | |
| | | | Buy | | | Sell | | ||||||
| Intermediate Bond | | | | $ | 9,748,367 | | | | | $ | 72,088,762 | | |
| Strategic Income Opportunities | | | | | 56,046,957 | | | | | | 61,637,148 | | |
| | | | Purchased | | | Sold | | ||||||
| GNMA Income | | | | $ | — | | | | | $ | 264,789,063 | | |
| Intermediate Bond | | | | | 221,224,805 | | | | | | 180,117,236 | | |
| Short Term Bond | | | | | 31,566,478 | | | | | | 6,320,730 | | |
| Strategic Income Opportunities | | | | | 12,236,548 | | | | | | 36,152,369 | | |
| | | | Sell Protection | | |||
| High Yield | | | | $ | 6,000,000 | | |
| Intermediate Bond | | | | | 101,900,000 | | |
| Short Term Bond | | | | | 1,000,000 | | |
| Strategic Income Opportunities | | | | | 12,935,000 | | |
| | | | Purchases | | | Sales | | ||||||
| GNMA Income | | | | $ | 61,261,095 | | | | | $ | 15,740,257 | | |
| High Yield Bond | | | | | 267,170,106 | | | | | | 276,204,778 | | |
| Intermediate Bond | | | | | 1,903,219,476 | | | | | | 1,385,988,389 | | |
| Short Term Bond | | | | | 56,710,776 | | | | | | 83,339,972 | | |
| Strategic Income Opportunities | | | | | 118,288,545 | | | | | | 73,832,037 | | |
| | | | Purchases | | | Sales | | ||||||
| GNMA Income | | | | $ | 10,016,210,459 | | | | | $ | 10,085,643,803 | | |
| Intermediate Bond | | | | | 12,656,176,354 | | | | | | 12,693,155,405 | | |
| Short Term Bond | | | | | 206,351,462 | | | | | | 215,593,557 | | |
| Strategic Income Opportunities | | | | | 8,729,774 | | | | | | 5,967,646 | | |
| Fund | | | Fee | |
| GNMA Income | | | 0.57% on first $1 billion, 0.50% on next $4 billion and 0.45% on assets thereafter | |
| High Yield Bond | | | 0.61% on first $500 million, 0.55% on next $4.5 billion and 0.50% on assets thereafter | |
| Intermediate Bond | | | 0.27% on all assets | |
| Short Term Bond | | | 0.45% on all assets | |
| Strategic Income Opportunities | | | 0.65% on all assets | |
| | | | Class A | | | Class B | | | Class C | | | Class O | | | Class R | | |||||||||||||||
| GNMA Income | | | | | 0.25% | | | | | | 1.00% | | | | | | 1.00% | | | | | | N/A | | | | | | N/A | | |
| High Yield Bond | | | | | 0.25% | | | | | | 1.00% | | | | | | 1.00% | | | | | | N/A | | | | | | 0.50% | | |
| Intermediate Bond | | | | | 0.25% | | | | | | 1.00% | | | | | | 1.00% | | | | | | 0.25% | | | | | | 0.50% | | |
| Short Term Bond | | | | | 0.25% | | | | | | N/A | | | | | | 1.00% | | | | | | N/A | | | | | | 0.50% | | |
| Strategic Income Opportunities | | | | | 0.25% | | | | | | N/A | | | | | | 1.00% | | | | | | N/A | | | | | | 0.50% | | |
| | | | Class A | | | Class C | | ||||||
| Initial Sales Charges: | | | | ||||||||||
| GNMA Income | | | | $ | 50,469 | | | | | $ | — | | |
| High Yield Bond | | | | | 5,170 | | | | | | — | | |
| Intermediate Bond | | | | | 10,362 | | | | | | — | | |
| Short Term Bond | | | | | 603 | | | | | | — | | |
| Strategic Income Opportunities | | | | | 1,463 | | | | | | — | | |
| Contingent Deferred Sales Charges: | | | | ||||||||||
| GNMA Income | | | | $ | 2,609 | | | | | $ | 37,092 | | |
| High Yield Bond | | | | | 4,680 | | | | | | 1,069 | | |
| Intermediate Bond | | | | | 1,443 | | | | | | 1,943 | | |
| Short Term Bond | | | | | 10,050 | | | | | | 125 | | |
| Strategic Income Opportunities | | | | | — | | | | | | 769 | | |
| Subsidiary/Affiliated Investment Company | | | Fund | | | Percentage | | |||
| Voya Institutional Trust Company | | | GNMA Income | | | | | 19.19% | | |
| Voya Intermediate Bond Portfolio | | | High Yield Bond | | | | | 20.24 | | |
| Voya Retirement Insurance and Annuity Company | | | GNMA Income | | | | | 5.77 | | |
| | Intermediate Bond | | | | | 17.40 | | | ||
| Voya Solution 2025 Portfolio | | | Short Term Bond | | | | | 21.93 | | |
| Voya Solution Income Portfolio | | | Short Term Bond | | | | | 35.48 | | |
| Fund | | | Class A | | | Class B | | | Class C | | | Class I | | | Class O | | | Class P | | | Class R | | | Class R6 | | | Class W | | |||||||||||||||||||||||||||
| GNMA Income | | | | | 0.95% | | | | | | 1.70% | | | | | | 1.70% | | | | | | 0.65% | | | | | | N/A | | | | | | N/A | | | | | | N/A | | | | | | N/A | | | | | | 0.70% | | |
| High Yield Bond | | | | | 1.10% | | | | | | 1.85% | | | | | | 1.85% | | | | | | 0.85% | | | | | | N/A | | | | | | 0.15% | | | | | | 1.35% | | | | | | 0.83% | | | | | | 0.85% | | |
| Intermediate Bond | | | | | 0.75% | | | | | | 1.50% | | | | | | 1.50% | | | | | | 0.50% | | | | | | 0.75% | | | | | | N/A | | | | | | 1.00% | | | | | | 0.50% | | | | | | 0.50% | | |
| Short Term Bond | | | | | 0.80% | | | | | | N/A | | | | | | 1.55% | | | | | | 0.50% | | | | | | N/A | | | | | | N/A | | | | | | 1.05% | | | | | | 0.47% | | | | | | 0.55% | | |
| Strategic Income Opportunities(1)(2)(3) | | | | | 1.15% | | | | | | N/A | | | | | | 1.90% | | | | | | 0.72% | | | | | | N/A | | | | | | N/A | | | | | | 1.40% | | | | | | 0.67% | | | | | | 0.90% | | |
| | | | March 31, | | | ||||||||||||||||||||
| | | | 2018 | | | 2019 | | | 2020 | | | Total | | ||||||||||||
| Short Term Bond | | | | $ | 104,644 | | | | | $ | 107,869 | | | | | $ | 107,375 | | | | | $ | 319,888 | | |
| | | | March 31, | | | ||||||||||||||||||||
| | | | 2018 | | | 2019 | | | 2020 | | | Total | | ||||||||||||
| Short Term Bond | | | | | | ||||||||||||||||||||
| Class A | | | | $ | 66 | | | | | $ | 2,936 | | | | | $ | — | | | | | $ | 3,002 | | |
| Class C | | | | | 88 | | | | | | 400 | | | | | | — | | | | | | 488 | | |
| Class I | | | | | 1,041 | | | | | | 4,399 | | | | | | 9,680 | | | | | | 15,120 | | |
| Class R | | | | | 1 | | | | | | 2 | | | | | | — | | | | | | 3 | | |
| Class W | | | | | 28 | | | | | | 88 | | | | | | — | | | | | | 116 | | |
| Fund | | | Days Utilized | | | Approximate Average Daily Balance For Days Utilized | | | Approximate Weighted Average Interest Rate For Days Utilized | | |||||||||
| Intermediate Bond | | | | | 28 | | | | | $ | 4,177,250 | | | | | | 1.43% | | |
| Strategic Income Opportunities | | | | | 6 | | | | | | 2,093,333 | | | | | | 1.66 | | |
| | | | Notional Amount | | | Cost | | ||||||
| Balance at 03/31/2016 | | | | | — | | | | | $ | — | | |
| Options Purchased | | | | | 679,330,000 | | | | | | 1,834,150 | | |
| Options Expired | | | | | (523,800,000) | | | | | | (1,806,114) | | |
| Balance at 03/31/2017 | | | | | 155,530,000 | | | | | $ | 28,036 | | |
| | |||||||||||||
| | | | Notional Amount | | | Cost | | ||||||
| Balance at 03/31/2016 | | | | | — | | | | | $ | — | | |
| Options Purchased | | | | | 182,000,000 | | | | | | 227,500 | | |
| Options Expired | | | | | (182,000,000) | | | | | | (227,500) | | |
| Balance at 03/31/2017 | | | | | — | | | | | $ | — | | |
| | |||||||||||||
| | | | Notional Amount | | | Premiums Received | | ||||||
| Balance at 03/31/2016 | | | | | — | | | | | $ | — | | |
| Options Written | | | | | 679,330,000 | | | | | | 1,816,638 | | |
| Options Expired | | | | | (523,800,000) | | | | | | (1,784,289) | | |
| Balance at 03/31/2017 | | | | | 155,530,000 | | | | | $ | 32,349 | | |
| | |||||||||||||
| | | | Notional Amount | | | Cost | | ||||||
| Balance at 03/31/2016 | | | | | — | | | | | $ | — | | |
| Options Purchased | | | | | 48,400,000 | | | | | | 192,200 | | |
| Options Expired | | | | | (39,000,000) | | | | | | (134,477) | | |
| Balance at 03/31/2017 | | | | | 9,400,000 | | | | | $ | 57,723 | | |
| | |||||||||||||
| | | | Notional Amount | | | Cost | | ||||||
| Balance at 03/31/2016 | | | | | — | | | | | $ | — | | |
| Options Purchased | | | | | 5,500,000 | | | | | | 6,875 | | |
| Options Expired | | | | | (5,500,000) | | | | | | (6,875) | | |
| Balance at 03/31/2017 | | | | | — | | | | | $ | — | | |
| | |||||||||||||
| | | | Number of Contracts | | | Premiums Received | | ||||||
| Balance at 03/31/2016 | | | | | — | | | | | $ | — | | |
| Options Written | | | | | 48,400,000 | | | | | | 190,842 | | |
| Options Expired | | | | | (39,000,000) | | | | | | (132,852) | | |
| Balance at 03/31/2017 | | | | | 9,400,000 | | | | | $ | 57,990 | | |
| | |||||||||||||
| | | | Shares sold | | | Shares issued in merger | | | Reinvestment of distributions | | | Shares redeemed | | | Net increase (decrease) in shares outstanding | | | Shares sold | | | Proceeds from shares issued in merger | | | Reinvestment of distributions | | | Shares redeemed | | | Net increase (decrease) | | ||||||||||||||||||||||||||||||
| Year or period ended | | | # | | | # | | | # | | | # | | | # | | | ($) | | | ($) | | | ($) | | | ($) | | | ($) | | ||||||||||||||||||||||||||||||
| GNMA Income | | ||||||||||||||||||||||||||||||||||||||||||||||||||||||||||||
| Class A | | ||||||||||||||||||||||||||||||||||||||||||||||||||||||||||||
| 3/31/2017 | | | | | 14,487,331 | | | | | | — | | | | | | 1,718,632 | | | | | | (28,417,745) | | | | | | (12,211,782) | | | | | | 124,311,113 | | | | | | — | | | | | | 14,707,229 | | | | | | (242,297,317) | | | | | | (103,278,975) | | |
| 3/31/2016 | | | | | 23,264,301 | | | | | | — | | | | | | 1,672,007 | | | | | | (11,777,971) | | | | | | 13,158,337 | | | | | | 200,380,806 | | | | | | — | | | | | | 14,398,678 | | | | | | (101,448,034) | | | | | | 113,331,450 | | |
| Class B | | | | | | | | | | | | ||||||||||||||||||||||||||||||||||||||||||||||||||
| 3/31/2017 | | | | | 26 | | | | | | — | | | | | | 170 | | | | | | (2,062) | | | | | | (1,866) | | | | | | 225 | | | | | | — | | | | | | 1,445 | | | | | | (17,539) | | | | | | (15,869) | | |
| 3/31/2016 | | | | | 2,814 | | | | | | — | | | | | | 518 | | | | | | (31,565) | | | | | | (28,233) | | | | | | 24,115 | | | | | | — | | | | | | 4,444 | | | | | | (270,927) | | | | | | (242,368) | | |
| Class C | | ||||||||||||||||||||||||||||||||||||||||||||||||||||||||||||
| 3/31/2017 | | | | | 4,807,149 | | | | | | — | | | | | | 220,761 | | | | | | (4,406,958) | | | | | | 620,952 | | | | | | 41,128,424 | | | | | | — | | | | | | 1,878,700 | | | | | | (37,282,818) | | | | | | 5,724,306 | | |
| 3/31/2016 | | | | | 4,925,127 | | | | | | — | | | | | | 191,559 | | | | | | (2,182,940) | | | | | | 2,933,746 | | | | | | 42,194,660 | | | | | | — | | | | | | 1,641,438 | | | | | | (18,708,112) | | | | | | 25,127,986 | | |
| Class I | | ||||||||||||||||||||||||||||||||||||||||||||||||||||||||||||
| 3/31/2017 | | | | | 38,493,787 | | | | | | — | | | | | | 1,517,791 | | | | | | (44,013,436) | | | | | | (4,001,858) | | | | | | 330,624,396 | | | | | | — | | | | | | 13,002,173 | | | | | | (375,145,828) | | | | | | (31,519,259) | | |
| 3/31/2016 | | | | | 45,866,725 | | | | | | — | | | | | | 852,569 | | | | | | (13,824,593) | | | | | | 32,894,701 | | | | | | 395,508,088 | | | | | | — | | | | | | 7,346,325 | | | | | | (119,166,997) | | | | | | 283,687,416 | | |
| Class W | | ||||||||||||||||||||||||||||||||||||||||||||||||||||||||||||
| 3/31/2017 | | | | | 13,405,385 | | | | | | — | | | | | | 451,019 | | | | | | (10,794,006) | | | | | | 3,062,398 | | | | | | 114,444,270 | | | | | | — | | | | | | 3,868,093 | | | | | | (91,705,211) | | | | | | 26,607,152 | | |
| 3/31/2016 | | | | | 10,337,826 | | | | | | — | | | | | | 276,204 | | | | | | (2,615,763) | | | | | | 7,998,267 | | | | | | 89,228,235 | | | | | | — | | | | | | 2,382,180 | | | | | | (22,555,622) | | | | | | 69,054,793 | | |
| High Yield Bond | | ||||||||||||||||||||||||||||||||||||||||||||||||||||||||||||
| Class A | | ||||||||||||||||||||||||||||||||||||||||||||||||||||||||||||
| 3/31/2017 | | | | | 3,743,314 | | | | | | — | | | | | | 396,948 | | | | | | (6,916,839) | | | | | | (2,776,577) | | | | | | 29,651,120 | | | | | | — | | | | | | 3,157,662 | | | | | | (54,572,876) | | | | | | (21,764,094) | | |
| 3/31/2016 | | | | | 5,288,902 | | | | | | — | | | | | | 397,306 | | | | | | (4,677,950) | | | | | | 1,008,258 | | | | | | 40,526,566 | | | | | | — | | | | | | 3,101,999 | | | | | | (36,140,923) | | | | | | 7,487,642 | | |
| Class B | | ||||||||||||||||||||||||||||||||||||||||||||||||||||||||||||
| 3/31/2017 | | | | | 1,154 | | | | | | — | | | | | | 621 | | | | | | (13,677) | | | | | | (11,902) | | | | | | 8,926 | | | | | | — | | | | | | 4,919 | | | | | | (109,307) | | | | | | (95,462) | | |
| 3/31/2016 | | | | | 170 | | | | | | — | | | | | | 1,428 | | | | | | (39,927) | | | | | | (38,329) | | | | | | 1,339 | | | | | | — | | | | | | 11,274 | | | | | | (315,181) | | | | | | (302,568) | | |
| Class C | | ||||||||||||||||||||||||||||||||||||||||||||||||||||||||||||
| 3/31/2017 | | | | | 307,596 | | | | | | — | | | | | | 52,592 | | | | | | (407,918) | | | | | | (47,730) | | | | | | 2,440,539 | | | | | | — | | | | | | 419,057 | | | | | | (3,246,513) | | | | | | (386,917) | | |
| 3/31/2016 | | | | | 335,964 | | | | | | — | | | | | | 50,924 | | | | | | (388,220) | | | | | | (1,332) | | | | | | 2,627,846 | | | | | | — | | | | | | 397,092 | | | | | | (3,018,036) | | | | | | 6,902 | | |
| | | | Shares sold | | | Shares issued in merger | | | Reinvestment of distributions | | | Shares redeemed | | | Net increase (decrease) in shares outstanding | | | Shares sold | | | Proceeds from shares issued in merger | | | Reinvestment of distributions | | | Shares redeemed | | | Net increase (decrease) | | ||||||||||||||||||||||||||||||
| Year or period ended | | | # | | | # | | | # | | | # | | | # | | | ($) | | | ($) | | | ($) | | | ($) | | | ($) | | ||||||||||||||||||||||||||||||
| High Yield Bond (continued) | | ||||||||||||||||||||||||||||||||||||||||||||||||||||||||||||
| Class I | | ||||||||||||||||||||||||||||||||||||||||||||||||||||||||||||
| 3/31/2017 | | | | | 18,512,857 | | | | | | — | | | | | | 1,936,883 | | | | | | (41,429,697) | | | | | | (20,979,957) | | | | | | 146,391,373 | | | | | | — | | | | | | 15,356,624 | | | | | | (328,931,184) | | | | | | (167,183,187) | | |
| 3/31/2016 | | | | | 28,674,313 | | | | | | — | | | | | | 1,832,946 | | | | | | (12,915,018) | | | | | | 17,592,241 | | | | | | 219,179,594 | | | | | | — | | | | | | 14,229,608 | | | | | | (99,504,418) | | | | | | 133,904,784 | | |
| Class P | | ||||||||||||||||||||||||||||||||||||||||||||||||||||||||||||
| 3/31/2017 | | | | | 4,118,240 | | | | | | — | | | | | | 942,682 | | | | | | (274,828) | | | | | | 4,786,094 | | | | | | 33,147,703 | | | | | | — | | | | | | 7,518,324 | | | | | | (2,191,612) | | | | | | 38,474,415 | | |
| 3/31/2016 | | | | | 591,547 | | | | | | — | | | | | | 1,055,798 | | | | | | (5,836,892) | | | | | | (4,189,547) | | | | | | 4,712,792 | | | | | | — | | | | | | 8,245,701 | | | | | | (44,685,476) | | | | | | (31,726,983) | | |
| Class R | | ||||||||||||||||||||||||||||||||||||||||||||||||||||||||||||
| 3/31/2017 | | | | | 4,764 | | | | | | — | | | | | | 1,642 | | | | | | (15,840) | | | | | | (9,434) | | | | | | 37,561 | | | | | | — | | | | | | 13,089 | | | | | | (123,228) | | | | | | (72,578) | | |
| 3/31/2016 | | | | | 30,091 | | | | | | — | | | | | | 2,198 | | | | | | (12,194) | | | | | | 20,095 | | | | | | 244,801 | | | | | | — | | | | | | 17,092 | | | | | | (90,023) | | | | | | 171,870 | | |
| Class R6 | | ||||||||||||||||||||||||||||||||||||||||||||||||||||||||||||
| 8/3/2016(1) - 3/31/2017 | | | | | 22,268,088 | | | | | | — | | | | | | 578,783 | | | | | | (7,958,549) | | | | | | 14,888,322 | | | | | | 175,818,441 | | | | | | — | | | | | | 4,655,554 | | | | | | (63,892,215) | | | | | | 116,581,780 | | |
| Class W | | ||||||||||||||||||||||||||||||||||||||||||||||||||||||||||||
| 3/31/2017 | | | | | 8,419,529 | | | | | | — | | | | | | 729,916 | | | | | | (8,840,680) | | | | | | 308,765 | | | | | | 66,564,230 | | | | | | — | | | | | | 5,828,801 | | | | | | (71,245,118) | | | | | | 1,147,913 | | |
| 3/31/2016 | | | | | 8,415,767 | | | | | | — | | | | | | 430,241 | | | | | | (3,903,305) | | | | | | 4,942,703 | | | | | | 64,938,618 | | | | | | — | | | | | | 3,338,449 | | | | | | (30,559,296) | | | | | | 37,717,771 | | |
| Intermediate Bond | | ||||||||||||||||||||||||||||||||||||||||||||||||||||||||||||
| Class A | | ||||||||||||||||||||||||||||||||||||||||||||||||||||||||||||
| 3/31/2017 | | | | | 23,298,637 | | | | | | — | | | | | | 1,191,301 | | | | | | (29,509,986) | | | | | | (5,020,048) | | | | | | 235,356,710 | | | | | | — | | | | | | 12,091,532 | | | | | | (299,960,495) | | | | | | (52,512,253) | | |
| 3/31/2016 | | | | | 18,513,121 | | | | | | — | | | | | | 1,162,591 | | | | | | (68,307,177) | | | | | | (48,631,465) | | | | | | 185,244,858 | | | | | | — | | | | | | 11,659,582 | | | | | | (692,474,068) | | | | | | (495,569,628) | | |
| Class B | | ||||||||||||||||||||||||||||||||||||||||||||||||||||||||||||
| 3/31/2017 | | | | | 6,010 | | | | | | — | | | | | | 196 | | | | | | (1,748) | | | | | | 4,458 | | | | | | 61,055 | | | | | | — | | | | | | 1,978 | | | | | | (17,612) | | | | | | 45,421 | | |
| 3/31/2016 | | | | | 66 | | | | | | — | | | | | | 323 | | | | | | (29,849) | | | | | | (29,460) | | | | | | 665 | | | | | | — | | | | | | 3,234 | | | | | | (298,986) | | | | | | (295,087) | | |
| Class C | | ||||||||||||||||||||||||||||||||||||||||||||||||||||||||||||
| 3/31/2017 | | | | | 612,068 | | | | | | — | | | | | | 50,989 | | | | | | (1,006,474) | | | | | | (343,417) | | | | | | 6,208,788 | | | | | | — | | | | | | 515,970 | | | | | | (10,122,013) | | | | | | (3,397,255) | | |
| 3/31/2016 | | | | | 530,238 | | | | | | — | | | | | | 41,579 | | | | | | (590,971) | | | | | | (19,154) | | | | | | 5,301,174 | | | | | | — | | | | | | 415,820 | | | | | | (5,903,513) | | | | | | (186,519) | | |
| Class I | | ||||||||||||||||||||||||||||||||||||||||||||||||||||||||||||
| 3/31/2017 | | | | | 77,008,539 | | | | | | — | | | | | | 3,936,779 | | | | | | (35,979,963) | | | | | | 44,965,355 | | | | | | 777,949,764 | | | | | | — | | | | | | 39,840,263 | | | | | | (364,480,859) | | | | | | 453,309,168 | | |
| 3/31/2016 | | | | | 97,857,532 | | | | | | — | | | | | | 2,978,834 | | | | | | (48,015,575) | | | | | | 52,820,791 | | | | | | 987,623,508 | | | | | | — | | | | | | 29,792,829 | | | | | | (477,916,541) | | | | | | 539,499,796 | | |
| Class O | | ||||||||||||||||||||||||||||||||||||||||||||||||||||||||||||
| 3/31/2017 | | | | | 215,176 | | | | | | — | | | | | | 9,046 | | | | | | (350,705) | | | | | | (126,483) | | | | | | 2,181,893 | | | | | | — | | | | | | 91,673 | | | | | | (3,544,971) | | | | | | (1,271,405) | | |
| 3/31/2016 | | | | | 180,894 | | | | | | — | | | | | | 7,906 | | | | | | (376,682) | | | | | | (187,882) | | | | | | 1,811,541 | | | | | | — | | | | | | 79,176 | | | | | | (3,773,826) | | | | | | (1,883,109) | | |
| Class R | | ||||||||||||||||||||||||||||||||||||||||||||||||||||||||||||
| 3/31/2017 | | | | | 4,796,756 | | | | | | — | | | | | | 412,042 | | | | | | (3,020,505) | | | | | | 2,188,293 | | | | | | 48,656,408 | | | | | | — | | | | | | 4,178,688 | | | | | | (30,553,815) | | | | | | 22,281,281 | | |
| 3/31/2016 | | | | | 4,610,139 | | | | | | — | | | | | | 294,280 | | | | | | (2,381,746) | | | | | | 2,522,673 | | | | | | 46,247,482 | | | | | | — | | | | | | 2,950,492 | | | | | | (23,844,475) | | | | | | 25,353,499 | | |
| Class R6 | | ||||||||||||||||||||||||||||||||||||||||||||||||||||||||||||
| 3/31/2017 | | | | | 39,986,409 | | | | | | — | | | | | | 2,342,376 | | | | | | (19,216,304) | | | | | | 23,112,481 | | | | | | 404,651,139 | | | | | | — | | | | | | 23,703,003 | | | | | | (194,185,226) | | | | | | 234,168,916 | | |
| 3/31/2016 | | | | | 35,505,404 | | | | | | — | | | | | | 1,373,344 | | | | | | (13,068,201) | | | | | | 23,810,547 | | | | | | 355,109,182 | | | | | | — | | | | | | 13,736,047 | | | | | | (130,933,258) | | | | | | 237,911,971 | | |
| Class W | | ||||||||||||||||||||||||||||||||||||||||||||||||||||||||||||
| 3/31/2017 | | | | | 21,887,585 | | | | | | — | | | | | | 2,010,273 | | | | | | (16,832,263) | | | | | | 7,065,595 | | | | | | 221,224,518 | | | | | | — | | | | | | 20,341,472 | | | | | | (169,480,662) | | | | | | 72,085,328 | | |
| 3/31/2016 | | | | | 24,831,944 | | | | | | — | | | | | | 1,311,108 | | | | | | (13,052,252) | | | | | | 13,090,800 | | | | | | 247,851,730 | | | | | | — | | | | | | 13,111,222 | | | | | | (130,698,936) | | | | | | 130,264,016 | | |
| Short Term Bond | | ||||||||||||||||||||||||||||||||||||||||||||||||||||||||||||
| Class A | | ||||||||||||||||||||||||||||||||||||||||||||||||||||||||||||
| 3/31/2017 | | | | | 264,513 | | | | | | — | | | | | | 15,493 | | | | | | (760,041) | | | | | | (480,035) | | | | | | 2,610,005 | | | | | | — | | | | | | 152,959 | | | | | | (7,476,802) | | | | | | (4,713,838) | | |
| 3/31/2016 | | | | | 950,873 | | | | | | — | | | | | | 5,991 | | | | | | (9,904) | | | | | | 946,960 | | | | | | 9,404,344 | | | | | | — | | | | | | 59,130 | | | | | | (97,971) | | | | | | 9,365,503 | | |
| Class C | | ||||||||||||||||||||||||||||||||||||||||||||||||||||||||||||
| 3/31/2017 | | | | | 73,026 | | | | | | — | | | | | | 844 | | | | | | (55,103) | | | | | | 18,767 | | | | | | 722,242 | | | | | | — | | | | | | 8,333 | | | | | | (543,634) | | | | | | 186,941 | | |
| 3/31/2016 | | | | | 73,082 | | | | | | — | | | | | | 431 | | | | | | (17,111) | | | | | | 56,402 | | | | | | 721,169 | | | | | | — | | | | | | 4,266 | | | | | | (168,522) | | | | | | 556,913 | | |
| Class I | | ||||||||||||||||||||||||||||||||||||||||||||||||||||||||||||
| 3/31/2017 | | | | | 576,330 | | | | | | — | | | | | | 21,212 | | | | | | (291,359) | | | | | | 306,183 | | | | | | 5,694,681 | | | | | | — | | | | | | 209,343 | | | | | | (2,871,360) | | | | | | 3,032,664 | | |
| 3/31/2016 | | | | | 666,325 | | | | | | — | | | | | | 15,699 | | | | | | (418,225) | | | | | | 263,799 | | | | | | 6,587,417 | | | | | | — | | | | | | 155,504 | | | | | | (4,128,957) | | | | | | 2,613,964 | | |
| Class R | | ||||||||||||||||||||||||||||||||||||||||||||||||||||||||||||
| 3/31/2017 | | | | | — | | | | | | — | | | | | | 4 | | | | | | — | | | | | | 4 | | | | | | — | | | | | | — | | | | | | 39 | | | | | | — | | | | | | 39 | | |
| 3/31/2016 | | | | | — | | | | | | — | | | | | | 4 | | | | | | — | | | | | | 4 | | | | | | — | | | | | | — | | | | | | 40 | | | | | | — | | | | | | 40 | | |
| Class R6 | | ||||||||||||||||||||||||||||||||||||||||||||||||||||||||||||
| 3/31/2017 | | | | | 2,838,368 | | | | | | — | | | | | | 184,314 | | | | | | (6,695,037) | | | | | | (3,672,355) | | | | | | 28,058,950 | | | | | | — | | | | | | 1,820,939 | | | | | | (66,167,289) | | | | | | (36,287,400) | | |
| 3/31/2016 | | | | | 1,686,518 | | | | | | — | | | | | | 230,322 | | | | | | (4,074,843) | | | | | | (2,158,003) | | | | | | 16,717,168 | | | | | | — | | | | | | 2,283,486 | | | | | | (40,359,706) | | | | | | (21,359,052) | | |
| | | | Shares sold | | | Shares issued in merger | | | Reinvestment of distributions | | | Shares redeemed | | | Net increase (decrease) in shares outstanding | | | Shares sold | | | Proceeds from shares issued in merger | | | Reinvestment of distributions | | | Shares redeemed | | | Net increase (decrease) | | ||||||||||||||||||||||||||||||
| Year or period ended | | | # | | | # | | | # | | | # | | | # | | | ($) | | | ($) | | | ($) | | | ($) | | | ($) | | ||||||||||||||||||||||||||||||
| Short Term Bond (continued) | | ||||||||||||||||||||||||||||||||||||||||||||||||||||||||||||
| Class W | | ||||||||||||||||||||||||||||||||||||||||||||||||||||||||||||
| 3/31/2017 | | | | | 53,147 | | | | | | — | | | | | | 1,197 | | | | | | (68,093) | | | | | | (13,749) | | | | | | 525,188 | | | | | | — | | | | | | 11,826 | | | | | | (670,682) | | | | | | (133,668) | | |
| 3/31/2016 | | | | | 54,249 | | | | | | — | | | | | | 216 | | | | | | (1,104) | | | | | | 53,361 | | | | | | 535,327 | | | | | | — | | | | | | 2,136 | | | | | | (10,868) | | | | | | 526,595 | | |
| Strategic Income Opportunities | | ||||||||||||||||||||||||||||||||||||||||||||||||||||||||||||
| Class A | | ||||||||||||||||||||||||||||||||||||||||||||||||||||||||||||
| 3/31/2017 | | | | | 1,202,045 | | | | | | — | | | | | | 17,815 | | | | | | (257,871) | | | | | | 961,989 | | | | | | 12,099,209 | | | | | | — | | | | | | 179,349 | | | | | | (2,592,262) | | | | | | 9,686,296 | | |
| 3/31/2016 | | | | | 116,610 | | | | | | — | | | | | | 239 | | | | | | (10,629) | | | | | | 106,220 | | | | | | 1,238,252 | | | | | | — | | | | | | 2,365 | | | | | | (191,058) | | | | | | 1,049,559 | | |
| Class C | | ||||||||||||||||||||||||||||||||||||||||||||||||||||||||||||
| 3/31/2017 | | | | | 167,393 | | | | | | — | | | | | | 3,242 | | | | | | (23,659) | | | | | | 146,976 | | | | | | 1,658,329 | | | | | | — | | | | | | 32,112 | | | | | | (233,790) | | | | | | 1,456,651 | | |
| 3/31/2016 | | | | | 26,077 | | | | | | — | | | | | | 37 | | | | | | (294) | | | | | | 25,820 | | | | | | 283,650 | | | | | | — | | | | | | 363 | | | | | | (31,489) | | | | | | 252,524 | | |
| Class I | | ||||||||||||||||||||||||||||||||||||||||||||||||||||||||||||
| 3/31/2017 | | | | | 2,104,498 | | | | | | — | | | | | | 54,998 | | | | | | (77,600) | | | | | | 2,081,896 | | | | | | 21,321,867 | | | | | | — | | | | | | 556,395 | | | | | | (785,931) | | | | | | 21,092,331 | | |
| 3/31/2016 | | | | | 2,539,064 | | | | | | — | | | | | | 4,460 | | | | | | (2,484,896) | | | | | | 58,628 | | | | | | 25,593,263 | | | | | | — | | | | | | 44,465 | | | | | | (24,969,762) | | | | | | 667,966 | | |
| Class R | | ||||||||||||||||||||||||||||||||||||||||||||||||||||||||||||
| 3/31/2017 | | | | | 144,950 | | | | | | — | | | | | | 17,103 | | | | | | (112,508) | | | | | | 49,545 | | | | | | 1,444,671 | | | | | | — | | | | | | 170,612 | | | | | | (1,121,930) | | | | | | 493,353 | | |
| 3/31/2016 | | | | | 350,316 | | | | | | — | | | | | | 1,398 | | | | | | (40,623) | | | | | | 311,091 | | | | | | 3,559,386 | | | | | | — | | | | | | 13,777 | | | | | | (496,078) | | | | | | 3,077,085 | | |
| Class R6 | | ||||||||||||||||||||||||||||||||||||||||||||||||||||||||||||
| 3/31/2017 | | | | | 4,090 | | | | | | — | | | | | | 73 | | | | | | (5) | | | | | | 4,158 | | | | | | 41,229 | | | | | | — | | | | | | 736 | | | | | | (50) | | | | | | 41,915 | | |
| 10/23/2015(1) - 3/31/2016 | | | | | 10,972,669 | | | | | | — | | | | | | — | | | | | | — | | | | | | 10,972,669 | | | | | | 109,938,197 | | | | | | — | | | | | | — | | | | | | (8,658) | | | | | | 109,929,539 | | |
| Class W | | ||||||||||||||||||||||||||||||||||||||||||||||||||||||||||||
| 3/31/2017 | | | | | 493,869 | | | | | | — | | | | | | 9,461 | | | | | | (96,378) | | | | | | 406,952 | | | | | �� | 4,942,885 | | | | | | — | | | | | | 94,931 | | | | | | (969,107) | | | | | | 4,068,709 | | |
| 3/31/2016 | | | | | 5,136 | | | | | | — | | | | | | 11 | | | | | | — | | | | | | 5,147 | | | | | | 50,657 | | | | | | — | | | | | | 107 | | | | | | — | | | | | | 50,764 | | |
| Loan | | | Unfunded Commitments | | | Unrealized Appreciation at 3/31/17* | | ||||||
| Acrisure, LLC | | | | $ | 5,476 | | | | | $ | 91 | | |
| Oberthur Technologies S.A. | | | | | 92,763 | | | | | | 348 | | |
| TricorBraun Holdings, Inc. | | | | | 13,500 | | | | | | 307 | | |
| | | | | $ | 111,739 | | | | | $ | 746 | | |
| | |||||||||||||
| Counterparty | | | Securities Loaned at Value | | | Cash Collateral Received(1) | | | Net Amount | | |||||||||
| BNP Paribas Prime Brokerage Intl Ltd | | | | $ | 2,585,627 | | | | | $ | (2,585,627) | | | | | $ | — | | |
| Citadel Clearing LLC | | | | | 4,120,080 | | | | | | (4,120,080) | | | | | | — | | |
| Citigroup Global Markets Inc. | | | | | 8,679,093 | | | | | | (8,679,093) | | | | | | — | | |
| Credit Suisse Securities (USA) LLC | | | | | 1,764,528 | | | | | | (1,764,528) | | | | | | — | | |
| Goldman, Sachs & Co. | | | | | 7,877,598 | | | | | | (7,877,598) | | | | | | — | | |
| HSBC Securities (USA) Inc. | | | | | 2,128,548 | | | | | | (2,128,548) | | | | | | — | | |
| J.P. Morgan Securities LLC | | | | | 6,460,523 | | | | | | (6,460,523) | | | | | | — | | |
| Janney Montgomery Scott LLC | | | | | 202,410 | | | | | | (202,410) | | | | | | — | | |
| Jefferies LLC | | | | | 239,024 | | | | | | (239,024) | | | | | | — | | |
| Morgan Stanley & Co. LLC | | | | | 268,417 | | | | | | (268,417) | | | | | | — | | |
| Wells Fargo Securities LLC | | | | | 274,376 | | | | | | (274,376) | | | | | | — | | |
| | | | | $ | 34,600,224 | | | | | $ | (34,600,224) | | | | | $ | — | | |
| | |||||||||||||||||||
| Counterparty | | | Securities Loaned at Value | | | Cash Collateral Received(1) | | | Net Amount | | |||||||||
| Barclays Capital Inc. | | | | $ | 9,556,745 | | | | | $ | (9,556,745) | | | | | $ | — | | |
| BNP Paribas Prime Brokerage Intl Ltd | | | | | 10,033,265 | | | | | | (10,033,265) | | | | | | — | | |
| Citadel Clearing LLC | | | | | 21,091 | | | | | | (21,091) | | | | | | — | | |
| Citigroup Global Markets Inc. | | | | | 2,712,147 | | | | | | (2,712,147) | | | | | | — | | |
| Daiwa Capital Markets America Inc. | | | | | 736,373 | | | | | | (736,373) | | | | | | — | | |
| Deutsche Bank Securities Inc. | | | | | 539,274 | | | | | | (539,274) | | | | | | — | | |
| Counterparty | | | Securities Loaned at Value | | | Cash Collateral Received(1) | | | Net Amount | | |||||||||
| Goldman, Sachs & Co. | | | | | 119,536,223 | | | | | | (119,536,223) | | | | | | — | | |
| HSBC Securities (USA) Inc. | | | | | 633,335 | | | | | | (633,335) | | | | | | — | | |
| J.P. Morgan Securities LLC | | | | | 8,228,934 | | | | | | (8,228,934) | | | | | | — | | |
| Jefferies LLC | | | | | 559,444 | | | | | | (559,444) | | | | | | — | | |
| Merrill Lynch, Pierce, Fenner & Smith Inc. | | | | | 875,346 | | | | | | (875,346) | | | | | | — | | |
| Morgan Stanley & Co. LLC | | | | | 402,782 | | | | | | (402,782) | | | | | | — | | |
| Nomura Securities International, Inc. | | | | | 1,662,376 | | | | | | (1,662,376) | | | | | | — | | |
| RBC Capital Markets, LLC | | | | | 2,944,733 | | | | | | (2,944,733) | | | | | | — | | |
| Scotia Capital (USA) INC | | | | | 1,421,745 | | | | | | (1,421,745) | | | | | | — | | |
| UBS Securities LLC. | | | | | 313,759 | | | | | | (313,759) | | | | | | — | | |
| Wells Fargo Securities LLC | | | | | 711,264 | | | | | | (711,264) | | | | | | — | | |
| | | | | $ | 160,888,836 | | | | | $ | (160,888,836) | | | | | $ | — | | |
| | |||||||||||||||||||
| Counterparty | | | Securities Loaned at Value | | | Cash Collateral Received(1) | | | Net Amount | | |||||||||
| Goldman, Sachs & Co. | | | | $ | 694,538 | | | | | $ | (694,538) | | | | | $ | — | | |
| Morgan Stanley & Co. LLC | | | | | 49,554 | | | | | | (49,554) | | | | | | — | | |
| RBC Capital Markets, LLC | | | | | 217,434 | | | | | | (217,434) | | | | | | — | | |
| Total | | | | $ | 961,526 | | | | | $ | (961,526) | | | | | $ | — | | |
| | |||||||||||||||||||
| Counterparty | | | Securities Loaned at Value | | | Cash Collateral Received(1) | | | Net Amount | | |||||||||
| Barclays Capital Inc. | | | | $ | 152,148 | | | | | $ | (152,148) | | | | | | — | | |
| Citadel Clearing LLC | | | | | 79,453 | | | | | | (79,453) | | | | | | — | | |
| Credit Suisse Securities (Europe) Limited | | | | | 452,802 | | | | | | (452,802) | | | | | | — | | |
| Goldman, Sachs & Co. | | | | | 150,169 | | | | | | (150,169) | | | | | | — | | |
| RBC Capital Markets, LLC | | | | | 140,913 | | | | | | (140,913) | | | | | | — | | |
| Total | | | | $ | 975,485 | | | | | $ | (975,485) | | | | | $ | — | | |
| | |||||||||||||||||||
| | | | Paid-in Capital | | | Undistributed Net Investment Income | | | Accumulated Net Realized Gains/(Losses) | | |||||||||
| GNMA Income | | | | $ | — | | | | | $ | 7,065,502 | | | | | $ | (7,065,502) | | |
| High Yield Bond | | | | | (9,006,267) | | | | | | 14,284 | | | | | | 8,991,983 | | |
| Intermediate Bond | | | | | — | | | | | | 4,260,760 | | | | | | (4,260,760) | | |
| Short Term Bond | | | | | — | | | | | | 492,261 | | | | | | (492,261) | | |
| Strategic Income Opportunities | | | | | — | | | | | | (235,537) | | | | | | 235,537 | | |
| | | | Year Ended March 31, 2017 | | | Year Ended March 31, 2016 | | ||||||||||||||||||
| | | | Ordinary Income | | | Return of Capital | | | Ordinary Income | | | Return of Capital | | ||||||||||||
| GNMA Income | | | | $ | 24,333,861 | | | | | $ | 14,663,713 | | | | | $ | 18,848,746 | | | | | $ | 11,558,289 | | |
| High Yield Bond | | | | | 38,087,537 | | | | | | — | | | | | | 30,458,583 | | | | | | — | | |
| Intermediate Bond | | | | | 107,796,993 | | | | | | — | | | | | | 76,327,549 | | | | | | — | | |
| Short Term Bond | | | | | 2,220,519 | | | | | | — | | | | | | 2,508,054 | | | | | | — | | |
| Strategic Income Opportunities | | | | | 6,909,050 | | | | | | — | | | | | | 949,515 | | | | | | — | | |
| | | | Undistributed Ordinary Income | | | Late Year Ordinary Losses Deferred | | | Post-October Capital Losses Deferred | | | Unrealized Appreciation/ (Depreciation) | | | Capital Loss Carryforwards | | |||||||||||||||||||||||||||
| | Amount | | | Character | | | Expiration | | |||||||||||||||||||||||||||||||||||
| GNMA Income | | | | $ | — | | | | | $ | — | | | | | $ | (15,614,934) | | | | | $ | 2,703,591 | | | | | $ | — | | | | | | — | | | | | | — | | |
| High Yield Bond | | | | | 104,039 | | | | | | — | | | | | | — | | | | | | 17,414,455 | | | | | | (14,980,165) | | | | | | Short-term | | | | | | 2018 | | |
| | | | | | | | | | | | | | | | | | | | | | | | | | | | | | (13,947,202) | | | | | | Long-term | | | | | | None | | |
| | | | | | | | | | | | | | | | | | | | | | | | | | | | | $ | (28,927,367) | | | | | ||||||||||
| Intermediate Bond | | | | | 3,335,839 | | | | | | (4,046,300) | | | | | | (54,992,025) | | | | | | 25,570,569 | | | | | | (85,625,747) | | | | | | Short-term | | | | | | 2018 | | |
| Short Term Bond | | | | | 90,419 | | | | | | — | | | | | | (308,803) | | | | | | 50,596 | | | | | | (736,049) | | | | | | Short-term | | | | | | None | | |
| | | | | | | | | | | | | | | | | | | | | | | | | | | | | | (1,268,089) | | | | | | Long-term | | | | | | None | | |
| | | | | | | | | | | | | | | | | | | | | | | | | | | | | $ | (2,004,138) | | | | | ||||||||||
| Strategic Income Opportunities | | | | | 174,463 | | | | | | — | | | | | | — | | | | | | 2,710,091 | | | | | | (819,574) | | | | | | Short-term | | | | | | None | | |
| | | | | | | | | | | | | | | | | | | | | | | | | | | | | | (190,089) | | | | | | Long-term | | | | | | None | | |
| | | | | | | | | | | | | | | | | | | | | | | | | | | | | $ | (1,009,663) | | | | | ||||||||||
| | |||||||||||||||||||||||||||||||||||||||||||
| | | | Per Share Amount | | | Payable Date | | | Record Date | | |||
| GNMA Income | | ||||||||||||
| Class A | | | | $ | 0.0165 | | | | May 1, 2017 | | | Daily | |
| Class B | | | | $ | 0.0112 | | | | May 1, 2017 | | | Daily | |
| Class C | | | | $ | 0.0112 | | | | May 1, 2017 | | | Daily | |
| Class I | | | | $ | 0.0185 | | | | May 1, 2017 | | | Daily | |
| Class W | | | | $ | 0.0183 | | | | May 1, 2017 | | | Daily | |
| High Yield Bond | | ||||||||||||
| Class A | | | | $ | 0.0349 | | | | May 1, 2017 | | | Daily | |
| Class B | | | | $ | 0.0299 | | | | May 1, 2017 | | | Daily | |
| Class C | | | | $ | 0.0299 | | | | May 1, 2017 | | | Daily | |
| Class I | | | | $ | 0.0372 | | | | May 1, 2017 | | | Daily | |
| Class P | | | | $ | 0.0413 | | | | May 1, 2017 | | | Daily | |
| Class R | | | | $ | 0.0333 | | | | May 1, 2017 | | | Daily | |
| Class R6 | | | | $ | 0.0370 | | | | May 1, 2017 | | | Daily | |
| Class W | | | | $ | 0.0366 | | | | May 1, 2017 | | | Daily | |
| Intermediate Bond | | ||||||||||||
| Class A | | | | $ | 0.0233 | | | | May 1, 2017 | | | Daily | |
| Class B | | | | $ | 0.0171 | | | | May 1, 2017 | | | Daily | |
| Class C | | | | $ | 0.0171 | | | | May 1, 2017 | | | Daily | |
| | | | Per Share Amount | | | Payable Date | | | Record Date | | |||
| Class I | | | | $ | 0.0261 | | | | May 1, 2017 | | | Daily | |
| Class O | | | | $ | 0.0233 | | | | May 1, 2017 | | | Daily | |
| Class R | | | | $ | 0.0213 | | | | May 1, 2017 | | | Daily | |
| Class R6 | | | | $ | 0.0262 | | | | May 1, 2017 | | | Daily | |
| Class W | | | | $ | 0.0254 | | | | May 1, 2017 | | | Daily | |
| Short Term Bond | | ||||||||||||
| Class A | | | | $ | 0.0121 | | | | May 1, 2017 | | | Daily | |
| Class C | | | | $ | 0.0061 | | | | May 1, 2017 | | | Daily | |
| Class I | | | | $ | 0.0146 | | | | May 1, 2017 | | | Daily | |
| Class R | | | | $ | 0.0104 | | | | May 1, 2017 | | | Daily | |
| Class R6 | | | | $ | 0.0148 | | | | May 1, 2017 | | | Daily | |
| Class W | | | | $ | 0.0142 | | | | May 1, 2017 | | | Daily | |
| Strategic Income Opportunities | | ||||||||||||
| Class A | | | | $ | 0.0279 | | | | May 1, 2017 | | | Daily | |
| Class C | | | | $ | 0.0213 | | | | May 1, 2017 | | | Daily | |
| Class I | | | | $ | 0.0318 | | | | May 1, 2017 | | | Daily | |
| Class R | | | | $ | 0.0256 | | | | May 1, 2017 | | | Daily | |
| Class R6 | | | | $ | 0.0320 | | | | May 1, 2017 | | | Daily | |
| Class W | | | | $ | 0.0299 | | | | May 1, 2017 | | | Daily | |
| Voya GNMA Income Fund | as of March 31, 2017 |
| Principal Amount† | | | Value | | | Percentage of Net Assets | | ||||||||||||
| COLLATERALIZED MORTGAGE OBLIGATIONS: 54.6% | | ||||||||||||||||||
| | | 2,238,481 | | | | Fannie Mae 2005-43 PZ, 6.000%, 05/25/35 | | | | $ | 2,647,642 | | | | | | 0.2 | | |
| | | 1,061,264 | | | | Fannie Mae 2007-60 ZB, 4.750%, 05/25/37 | | | | | 1,180,011 | | | | | | 0.1 | | |
| | | 4,302,842 | | | | Fannie Mae 2011-99 CZ, 4.500%, 10/25/41 | | | | | 4,785,367 | | | | | | 0.4 | | |
| | | 15,328,461 ^ | | | | Fannie Mae 2012-148 HI, 3.500%, 05/25/42 | | | | | 2,243,225 | | | | | | 0.2 | | |
| | | 335,501 | | | | Fannie Mae Grantor Trust 2004-T1 1A1, 6.000%, 01/25/44 | | | | | 379,755 | | | | | | 0.0 | | |
| | | 1,959,903 | | | | Fannie Mae REMIC Trust 2003-16 CX, 6.500%, 03/25/33 | | | | | 2,291,374 | | | | | | 0.2 | | |
| | | 3,575,202 | | | | Fannie Mae REMIC Trust 2003-34 LN, 5.000%, 05/25/33 | | | | | 3,771,710 | | | | | | 0.3 | | |
| | | 6,002,195 | | | | Fannie Mae REMIC Trust 2003-76 EZ, 5.000%, 08/25/33 | | | | | 6,805,427 | | | | | | 0.5 | | |
| | | 892,382 | | | | Fannie Mae REMIC Trust 2004-W3 A8, 5.500%, 05/25/34 | | | | | 966,420 | | | | | | 0.1 | | |
| | | 2,035,936 ^ | | | | Fannie Mae REMIC Trust 2005-17 ES, 5.768%, 03/25/35 | | | | | 269,697 | | | | | | 0.0 | | |
| | | 1,479,507 | | | | Fannie Mae REMIC Trust 2005-59 NQ, 14.421%, 05/25/35 | | | | | 1,903,428 | | | | | | 0.1 | | |
| | | 1,374,109 | | | | Fannie Mae REMIC Trust 2005-88 ZC, 5.000%, 10/25/35 | | | | | 1,492,552 | | | | | | 0.1 | | |
| | | 499,480 | | | | Fannie Mae REMIC Trust 2006-115 ES, 22.633%, 12/25/36 | | | | | 726,762 | | | | | | 0.1 | | |
| | | 3,751,543 ^ | | | | Fannie Mae REMIC Trust 2006-36 SP, 5.718%, 05/25/36 | | | | | 520,923 | | | | | | 0.0 | | |
| | | 6,806,315 ^ | | | | Fannie Mae REMIC Trust 2006-79 SH, 5.468%, 08/25/36 | | | | | 1,328,479 | | | | | | 0.1 | | |
| | | 180,385 | | | | Fannie Mae REMIC Trust 2007-114 A6, 1.182%, 10/27/37 | | | | | 180,263 | | | | | | 0.0 | | |
| | | 792,597 | | | | Fannie Mae REMIC Trust 2009-12 LK, 7.853%, 03/25/39 | | | | | 862,370 | | | | | | 0.1 | | |
| | | 1,861,549 | | | | Fannie Mae REMIC Trust 2009-66 XA, 5.500%, 12/25/35 | | | | | 2,093,293 | | | | | | 0.2 | | |
| Principal Amount† | | | Value | | | Percentage of Net Assets | | ||||||||||||
| COLLATERALIZED MORTGAGE OBLIGATIONS: (continued) | | ||||||||||||||||||
| | | 6,000,000 | | | | Fannie Mae REMIC Trust 2010-155 JC, 4.000%, 12/25/39 | | | | $ | 6,385,018 | | | | | | 0.5 | | |
| | | 5,084,839 | | | | Fannie Mae REMIC Trust 2010-2 LC, 5.000%, 02/25/40 | | | | | 5,715,144 | | | | | | 0.5 | | |
| | | 2,478,438 | | | | Fannie Mae REMIC Trust 2011-30 ZA, 5.000%, 04/25/41 | | | | | 2,616,300 | | | | | | 0.2 | | |
| | | 4,957,622 ^ | | | | Fannie Mae REMIC Trust 2012-128 VS, 5.268%, 06/25/42 | | | | | 768,619 | | | | | | 0.1 | | |
| | | 12,269,726 ^ | | | | Fannie Mae REMIC Trust 2012-142 BI, 3.000%, 11/25/27 | | | | | 1,221,762 | | | | | | 0.1 | | |
| | | 5,592,798 ^ | | | | Fannie Mae REMIC Trust 2012-154 PI, 4.000%, 05/25/42 | | | | | 969,866 | | | | | | 0.1 | | |
| | | 5,087,814 ^ | | | | Fannie Mae REMIC Trust 2012-68 SD, 5.718%, 06/25/32 | | | | | 932,315 | | | | | | 0.1 | | |
| | | 3,457,000 | | | | Fannie Mae REMIC Trust 2012-97 PC, 3.500%, 09/25/42 | | | | | 3,353,283 | | | | | | 0.3 | | |
| | | 1,884,226 ^ | | | | Fannie Mae REMIC Trust 2013-13 PI, 3.500%, 04/25/42 | | | | | 252,415 | | | | | | 0.0 | | |
| | | 5,245,027 ^ | | | | Fannie Mae REMIC Trust 2013-54 ID, 3.000%, 01/25/33 | | | | | 646,909 | | | | | | 0.0 | | |
| | | 8,285,906 | | | | Fannie Mae Series 2016-51 S, 4.938%, 10/25/43 | | | | | 8,255,900 | | | | | | 0.7 | | |
| | | 2,892,648 | | | | Freddie Mac 3770 GA, 4.500%, 10/15/40 | | | | | 3,170,081 | | | | | | 0.3 | | |
| | | 4,894,445 | | | | Freddie Mac REMIC Trust 2005-S001 2A2, 1.132%, 09/25/45 | | | | | 4,831,171 | | | | | | 0.4 | | |
| | | 748,563 | | | | Freddie Mac REMIC Trust 2653 SC, 6.309%, 07/15/33 | | | | | 820,293 | | | | | | 0.1 | | |
| | | 1,088,336 | | | | Freddie Mac REMIC Trust 2767 ZW, 6.000%, 03/15/34 | | | | | 1,142,090 | | | | | | 0.1 | | |
| | | 344,288 | | | | Freddie Mac REMIC Trust 3012 ST, 18.676%, 04/15/35 | | | | | 487,907 | | | | | | 0.0 | | |
| | | 637,507 | | | | Freddie Mac REMIC Trust 3065 DC, 17.123%, 03/15/35 | | | | | 899,413 | | | | | | 0.1 | | |
| Voya GNMA Income Fund | as of March 31, 2017 (continued) |
| Principal Amount† | | | Value | | | Percentage of Net Assets | | ||||||||||||
| COLLATERALIZED MORTGAGE OBLIGATIONS: (continued) | | ||||||||||||||||||
| | | 1,241,894 | | | | Freddie Mac REMIC Trust 3158 NE, 5.500%, 05/15/36 | | | | $ | 1,379,872 | | | | | | 0.1 | | |
| | | 7,735,144 ^ | | | | Freddie Mac REMIC Trust 3181 TA, 0.500%, 07/15/36 | | | | | 167,469 | | | | | | 0.0 | | |
| | | 783,569 ^ | | | | Freddie Mac REMIC Trust 3507 IA, 5.500%, 09/15/35 | | | | | 149,514 | | | | | | 0.0 | | |
| | | 506,532 ^ | | | | Freddie Mac REMIC Trust 3753 PS, 5.188%, 06/15/40 | | | | | 32,349 | | | | | | 0.0 | | |
| | | 4,695,320 ^ | | | | Freddie Mac REMIC Trust 3795 PI, 4.500%, 10/15/35 | | | | | 104,297 | | | | | | 0.0 | | |
| | | 883,873 | | | | Freddie Mac REMIC Trust 3864 NT, 5.500%, 03/15/39 | | | | | 933,025 | | | | | | 0.1 | | |
| | | 4,626,891 | | | | Freddie Mac REMIC Trust 3888 ZG, 4.000%, 07/15/41 | | | | | 4,903,241 | | | | | | 0.4 | | |
| | | 2,633,194 ^ | | | | Freddie Mac REMIC Trust 4027 QI, 4.500%, 12/15/40 | | | | | 342,649 | | | | | | 0.0 | | |
| | | 1,078,601 | | | | Freddie Mac Series 4040 UZ, 5.000%, 05/15/42 | | | | | 1,259,820 | | | | | | 0.1 | | |
| | | 368,495 ^ | | | | Freddie Mac-Ginnie Mae Series 21 SA, 7.018%, 10/25/23 | | | | | 55,080 | | | | | | 0.0 | | |
| | | 1,994,717 | | | | Ginnie Mae 2004-65 ZG, 5.500%, 07/20/34 | | | | | 2,237,257 | | | | | | 0.2 | | |
| | | 4,531,596 | | | | Ginnie Mae 2009-110 ZA, 5.500%, 11/16/39 | | | | | 5,525,737 | | | | | | 0.5 | | |
| | | 1,335,558 | | | | Ginnie Mae 2009-54 HZ, 5.000%, 07/20/39 | | | | | 1,475,022 | | | | | | 0.1 | | |
| | | 3,965,022 | | | | Ginnie Mae 2009-H01 FA, 2.128%, 11/20/59 | | | | | 4,010,094 | | | | | | 0.3 | | |
| | | 2,000,000 | | | | Ginnie Mae 2010-116 PB, 5.000%, 06/16/40 | | | | | 2,301,113 | | | | | | 0.2 | | |
| | | 2,645,050 | | | | Ginnie Mae 2010-125 BZ, 4.500%, 09/16/40 | | | | | 2,929,216 | | | | | | 0.2 | | |
| | | 8,556,112 ^^ | | | | Ginnie Mae 2011-70 PO, 05/16/41 | | | | | 7,188,199 | | | | | | 0.6 | | |
| | | 5,791,114 | | | | Ginnie Mae 2012-H14 FK, 1.360%, 07/20/62 | | | | | 5,789,014 | | | | | | 0.5 | | |
| | | 7,097,666 ^ | | | | Ginnie Mae 2014-107 XS, 4.672%, 07/16/44 | | | | | 932,222 | | | | | | 0.1 | | |
| Principal Amount† | | | Value | | | Percentage of Net Assets | | ||||||||||||
| COLLATERALIZED MORTGAGE OBLIGATIONS: (continued) | | ||||||||||||||||||
| | | 3,619,880 ^ | | | | Ginnie Mae 2014-96 SQ, 4.672%, 07/16/44 | | | | $ | 483,430 | | | | | | 0.0 | | |
| | | 4,599,246 | | | | Ginnie Mae 2015-H13 FG, 1.180%, 04/20/65 | | | | | 4,569,252 | | | | | | 0.4 | | |
| | | 32,157,395 ^ | | | | Ginnie Mae 2016-120 IM, 3.500%, 07/20/46 | | | | | 5,293,631 | | | | | | 0.4 | | |
| | | 5,946,346 ^ | | | | Ginnie Mae 2016-84 IO, 5.000%, 12/20/40 | | | | | 680,994 | | | | | | 0.1 | | |
| | | 27,444,033 | | | | Ginnie Mae 2016-H20 FB, 1.330%, 09/20/66 | | | | | 27,390,182 | | | | | | 2.2 | | |
| | | 24,987,486 | | | | Ginnie Mae 2016-H23 F, 1.530%, 10/20/66 | | | | | 24,968,895 | | | | | | 2.0 | | |
| | | 241,389 | | | | Ginnie Mae Series 2002-11 TS, 18.215%, 02/16/32 | | | | | 314,983 | | | | | | 0.0 | | |
| | | 40,242 | | | | Ginnie Mae Series 2002-15 SX, 14.043%, 01/20/32 | | | | | 52,911 | | | | | | 0.0 | | |
| | | 945,230 ^ | | | | Ginnie Mae Series 2002-76 SG, 6.672%, 10/16/29 | | | | | 185,767 | | | | | | 0.0 | | |
| | | 6,267,916 | | | | Ginnie Mae Series 2003-86 ZC, 4.500%, 10/20/33 | | | | | 6,743,826 | | | | | | 0.6 | | |
| | | 229,262 | | | | Ginnie Mae Series 2004-16 AE, 5.500%, 02/20/34 | | | | | 257,438 | | | | | | 0.0 | | |
| | | 1,059,507 | | | | Ginnie Mae Series 2004-17 MZ, 5.500%, 03/16/34 | | | | | 1,185,569 | | | | | | 0.1 | | |
| | | 1,234,099 | | | | Ginnie Mae Series 2004-28 CZ, 5.500%, 04/20/34 | | | | | 1,375,701 | | | | | | 0.1 | | |
| | | 4,564 | | | | Ginnie Mae Series 2004-28 SV, 8.022%, 04/20/34 | | | | | 4,586 | | | | | | 0.0 | | |
| | | 5,539,897 | | | | Ginnie Mae Series 2004-81 Z, 5.000%, 10/20/34 | | | | | 6,126,523 | | | | | | 0.5 | | |
| | | 312,973 | | | | Ginnie Mae Series 2004-87 SB, 6.585%, 03/17/33 | | | | | 325,972 | | | | | | 0.0 | | |
| | | 2,088,989 ^ | | | | Ginnie Mae Series 2004-98 SA, 5.722%, 11/20/34 | | | | | 428,236 | | | | | | 0.0 | | |
| | | 1,939,016 | | | | Ginnie Mae Series 2005-21 Z, 5.000%, 03/20/35 | | | | | 2,132,129 | | | | | | 0.2 | | |
| Voya GNMA Income Fund | as of March 31, 2017 (continued) |
| Principal Amount† | | | Value | | | Percentage of Net Assets | | ||||||||||||
| COLLATERALIZED MORTGAGE OBLIGATIONS: (continued) | | ||||||||||||||||||
| | | 604,775 ^ | | | | Ginnie Mae Series 2005-25 SI, 6.000%, 01/20/34 | | | | $ | 116,488 | | | | | | 0.0 | | |
| | | 1,753,645 ^ | | | | Ginnie Mae Series 2005-7 AH, 5.842%, 02/16/35 | | | | | 295,214 | | | | | | 0.0 | | |
| | | 1,261,909 ^ | | | | Ginnie Mae Series 2005-73 IM, 5.500%, 09/20/35 | | | | | 343,777 | | | | | | 0.0 | | |
| | | 996,917 | | | | Ginnie Mae Series 2005-80 Z, 5.000%, 10/20/35 | | | | | 1,107,787 | | | | | | 0.1 | | |
| | | 722,862 | | | | Ginnie Mae Series 2005-91 UP, 12.443%, 09/16/31 | | | | | 871,214 | | | | | | 0.1 | | |
| | | 1,800,000 | | | | Ginnie Mae Series 2005-92 PB, 6.000%, 12/20/35 | | | | | 2,086,406 | | | | | | 0.2 | | |
| | | 8,998,764 | | | | Ginnie Mae Series 2005-96 Z, 5.500%, 12/16/35 | | | | | 10,034,731 | | | | | | 0.8 | | |
| | | 10,567,856 | | | | Ginnie Mae Series 2006-10 ZT, 6.000%, 03/20/36 | | | | | 12,683,912 | | | | | | 1.0 | | |
| | | 1,687,928 | | | | Ginnie Mae Series 2006-17 TW, 6.000%, 04/20/36 | | | | | 1,969,286 | | | | | | 0.2 | | |
| | | 16,123,731 ^ | | | | Ginnie Mae Series 2006-26 TB, 0.250%, 06/20/36 | | | | | 157,351 | | | | | | 0.0 | | |
| | | 3,123,077 | | | | Ginnie Mae Series 2006-7 ZA, 5.500%, 02/20/36 | | | | | 3,533,445 | | | | | | 0.3 | | |
| | | 3,181,165 ^ | | | | Ginnie Mae Series 2007-17 CI, 7.500%, 04/16/37 | | | | | 920,114 | | | | | | 0.1 | | |
| | | 168,816 | | | | Ginnie Mae Series 2007-37 S, 21.896%, 04/16/37 | | | | | 206,812 | | | | | | 0.0 | | |
| | | 200,000 | | | | Ginnie Mae Series 2007-45 PE, 5.500%, 07/16/37 | | | | | 220,444 | | | | | | 0.0 | | |
| | | 268,814 | | | | Ginnie Mae Series 2007-5 MT, 1.198%, 02/20/34 | | | | | 268,163 | | | | | | 0.0 | | |
| | | 4,205,562 ^ | | | | Ginnie Mae Series 2007-53 SC, 5.522%, 09/20/37 | | | | | 758,979 | | | | | | 0.1 | | |
| | | 99,551 | | | | Ginnie Mae Series 2007-53 SW, 17.270%, 09/20/37 | | | | | 142,675 | | | | | | 0.0 | | |
| Principal Amount† | | | Value | | | Percentage of Net Assets | | ||||||||||||
| COLLATERALIZED MORTGAGE OBLIGATIONS: (continued) | | ||||||||||||||||||
| | | 2,111,724 | | | | Ginnie Mae Series 2007-60 YZ, 5.500%, 10/20/37 | | | | $ | 2,354,920 | | | | | | 0.2 | | |
| | | 3,917,319 | | | | Ginnie Mae Series 2007-63 Z, 6.000%, 10/20/37 | | | | | 4,479,894 | | | | | | 0.4 | | |
| | | 2,450,590 | | | | Ginnie Mae Series 2008-20 PZ, 6.000%, 03/20/38 | | | | | 2,987,260 | | | | | | 0.2 | | |
| | | 1,101,603 ^ | | | | Ginnie Mae Series 2008-3 SA, 5.572%, 01/20/38 | | | | | 190,677 | | | | | | 0.0 | | |
| | | 2,242,082 ^ | | | | Ginnie Mae Series 2008-40 PS, 5.572%, 05/16/38 | | | | | 384,262 | | | | | | 0.0 | | |
| | | 4,973,944 ^ | | | | Ginnie Mae Series 2008-82 SA, 5.022%, 09/20/38 | | | | | 750,992 | | | | | | 0.1 | | |
| | | 8,160,734 ^ | | | | Ginnie Mae Series 2009-110 SA, 5.422%, 04/16/39 | | | | | 958,419 | | | | | | 0.1 | | |
| | | 695,055 | | | | Ginnie Mae Series 2009-110 ZC, 4.500%, 11/16/39 | | | | | 759,827 | | | | | | 0.1 | | |
| | | 2,084,046 | | | | Ginnie Mae Series 2009-121 ZQ, 5.500%, 09/20/39 | | | | | 2,375,628 | | | | | | 0.2 | | |
| | | 1,029,000 | | | | Ginnie Mae Series 2009-31 BP, 5.000%, 05/20/39 | | | | | 1,148,562 | | | | | | 0.1 | | |
| | | 5,527,150 | | | | Ginnie Mae Series 2009-31 ZL, 4.500%, 05/20/39 | | | | | 6,031,118 | | | | | | 0.5 | | |
| | | 5,008,976 | | | | Ginnie Mae Series 2009-34 Z, 4.500%, 05/16/39 | | | | | 5,347,658 | | | | | | 0.4 | | |
| | | 2,582,755 | | | | Ginnie Mae Series 2009-53 ZB, 6.000%, 07/16/39 | | | | | 3,095,903 | | | | | | 0.3 | | |
| | | 514,172 ^ | | | | Ginnie Mae Series 2009-55 BI, 1.000%, 06/16/37 | | | | | 19,250 | | | | | | 0.0 | | |
| | | 1,533,212 | | | | Ginnie Mae Series 2009-61 EZ, 7.500%, 08/20/39 | | | | | 1,826,401 | | | | | | 0.2 | | |
| | | 1,523,176 | | | | Ginnie Mae Series 2009-61 PZ, 7.500%, 08/20/39 | | | | | 2,348,186 | | | | | | 0.2 | | |
| | | 715,566 | | | | Ginnie Mae Series 2009-61 ZQ, 6.000%, 08/16/39 | | | | | 930,913 | | | | | | 0.1 | | |
| Voya GNMA Income Fund | as of March 31, 2017 (continued) |
| Principal Amount† | | | Value | | | Percentage of Net Assets | | ||||||||||||
| COLLATERALIZED MORTGAGE OBLIGATIONS: (continued) | | ||||||||||||||||||
| | | 1,934,660 ^ | | | | Ginnie Mae Series 2009-66 QS, 5.122%, 05/20/32 | | | | $ | 242,627 | | | | | | 0.0 | | |
| | | 2,770,922 | | | | Ginnie Mae Series 2009-67 NZ, 6.000%, 08/16/39 | | | | | 3,232,627 | | | | | | 0.3 | | |
| | | 3,783 | | | | Ginnie Mae Series 2009-68 KA, 5.000%, 09/20/37 | | | | | 3,785 | | | | | | 0.0 | | |
| | | 1,827,210 ^ | | | | Ginnie Mae Series 2009-77 SA, 5.222%, 09/16/39 | | | | | 275,421 | | | | | | 0.0 | | |
| | | 3,018,333 | | | | Ginnie Mae Series 2009-77 ZB, 5.500%, 09/16/39 | | | | | 3,525,948 | | | | | | 0.3 | | |
| | | 838,026 | | | | Ginnie Mae Series 2009-87 WZ, 6.000%, 10/20/39 | | | | | 1,077,744 | | | | | | 0.1 | | |
| | | 530,313 | | | | Ginnie Mae Series 2009-92 DZ, 4.500%, 10/16/39 | | | | | 569,961 | | | | | | 0.1 | | |
| | | 4,944,382 ^ | | | | Ginnie Mae Series 2010-106 IP, 5.000%, 03/20/40 | | | | | 746,369 | | | | | | 0.1 | | |
| | | 3,672,460 ^ | | | | Ginnie Mae Series 2010-116 NS, 5.722%, 09/16/40 | | | | | 608,789 | | | | | | 0.1 | | |
| | | 441,492 ^ | | | | Ginnie Mae Series 2010-130 KI, 5.500%, 09/16/40 | | | | | 63,769 | | | | | | 0.0 | | |
| | | 1,000,000 | | | | Ginnie Mae Series 2010-14 B, 4.500%, 02/16/40 | | | | | 1,104,950 | | | | | | 0.1 | | |
| | | 2,629,292 ^ | | | | Ginnie Mae Series 2010-158 SA, 5.072%, 12/20/40 | | | | | 429,232 | | | | | | 0.0 | | |
| | | 1,630,253 ^ | | | | Ginnie Mae Series 2010-165 IP, 4.000%, 04/20/38 | | | | | 92,386 | | | | | | 0.0 | | |
| | | 7,149,621 ^ | | | | Ginnie Mae Series 2010-166 GS, 5.022%, 12/20/40 | | | | | 1,106,061 | | | | | | 0.1 | | |
| | | 3,889,939 ^ | | | | Ginnie Mae Series 2010-166 NI, 4.500%, 04/20/39 | | | | | 489,699 | | | | | | 0.0 | | |
| | | 3,125,000 | | | | Ginnie Mae Series 2010-169 AW, 4.500%, 12/20/40 | | | | | 3,385,299 | | | | | | 0.3 | | |
| | | 6,531,689 | | | | Ginnie Mae Series 2010-169 JZ, 4.000%, 12/20/40 | | | | | 6,774,924 | | | | | | 0.6 | | |
| Principal Amount† | | | Value | | | Percentage of Net Assets | | ||||||||||||
| COLLATERALIZED MORTGAGE OBLIGATIONS: (continued) | | ||||||||||||||||||
| | | 1,215,343 ^ | | | | Ginnie Mae Series 2010-19 LI, 5.000%, 07/16/39 | | | | $ | 164,151 | | | | | | 0.0 | | |
| | | 1,600,000 | | | | Ginnie Mae Series 2010-31 BP, 5.000%, 03/20/40 | | | | | 1,766,112 | | | | | | 0.1 | | |
| | | 2,123,551 ^ | | | | Ginnie Mae Series 2010-4 WI, 6.000%, 01/16/40 | | | | | 730,383 | | | | | | 0.1 | | |
| | | 5,512,764 | | | | Ginnie Mae Series 2010-42 VZ, 5.500%, 10/20/39 | | | | | 6,273,943 | | | | | | 0.5 | | |
| | | 2,718,478 | | | | Ginnie Mae Series 2010-59 ZA, 4.500%, 05/20/40 | | | | | 2,947,685 | | | | | | 0.2 | | |
| | | 37,077,994 | | | | Ginnie Mae Series 2010-61 EZ, 5.000%, 05/20/40 | | | | | 40,363,004 | | | | | | 3.3 | | |
| | | 4,761,000 | | | | Ginnie Mae Series 2010-67 JD, 4.500%, 05/20/39 | | | | | 4,997,113 | | | | | | 0.4 | | |
| | | 1,705,308 ^ | | | | Ginnie Mae Series 2010-85 NI, 5.000%, 01/20/38 | | | | | 92,914 | | | | | | 0.0 | | |
| | | 70,879 ^ | | | | Ginnie Mae Series 2010-89 KI, 4.500%, 12/20/37 | | | | | 1,692 | | | | | | 0.0 | | |
| | | 2,558,958 ^ | | | | Ginnie Mae Series 2010-9 SB, 5.522%, 09/20/38 | | | | | 191,493 | | | | | | 0.0 | | |
| | | 8,415,106 | | | | Ginnie Mae Series 2010-H01 FA, 1.601%, 01/20/60 | | | | | 8,459,739 | | | | | | 0.7 | | |
| | | 10,040,829 | | | | Ginnie Mae Series 2010-H10 FB, 1.781%, 05/20/60 | | | | | 10,167,661 | | | | | | 0.8 | | |
| | | 10,802,451 | | | | Ginnie Mae Series 2010-H10 FC, 1.781%, 05/20/60 | | | | | 10,920,360 | | | | | | 0.9 | | |
| | | 11,272,895 | | | | Ginnie Mae Series 2010-H20 AF, 1.110%, 10/20/60 | | | | | 11,170,636 | | | | | | 0.9 | | |
| | | 790,427 ^ | | | | Ginnie Mae Series 2011-123 QI, 5.000%, 05/20/41 | | | | | 143,199 | | | | | | 0.0 | | |
| | | 276,498 | | | | Ginnie Mae Series 2011-169 BC, 7.000%, 05/16/32 | | | | | 309,968 | | | | | | 0.0 | | |
| | | 715,107 | | | | Ginnie Mae Series 2011-169 BG, 5.409%, 04/16/39 | | | | | 780,008 | | | | | | 0.1 | | |
| Voya GNMA Income Fund | as of March 31, 2017 (continued) |
| Principal Amount† | | | Value | | | Percentage of Net Assets | | ||||||||||||
| COLLATERALIZED MORTGAGE OBLIGATIONS: (continued) | | ||||||||||||||||||
| | | 6,371,120 | | | | Ginnie Mae Series 2011-25 Z, 4.000%, 02/20/41 | | | | $ | 6,864,165 | | | | | | 0.6 | | |
| | | 1,720,056 | | | | Ginnie Mae Series 2011-59 QC, 4.000%, 12/20/40 | | | | | 1,844,147 | | | | | | 0.2 | | |
| | | 12,795,151 ^ | | | | Ginnie Mae Series 2011-73 LS, 5.712%, 08/20/39 | | | | | 1,581,447 | | | | | | 0.1 | | |
| | | 2,819,000 | | | | Ginnie Mae Series 2011-85 LC, 4.000%, 10/20/40 | | | | | 2,962,809 | | | | | | 0.2 | | |
| | | 1,552,897 | | | | Ginnie Mae Series 2011-H07 FA, 1.280%, 02/20/61 | | | | | 1,548,336 | | | | | | 0.1 | | |
| | | 3,038,615 ^ | | | | Ginnie Mae Series 2012-102 TI, 4.000%, 08/20/39 | | | | | 569,216 | | | | | | 0.0 | | |
| | | 4,452,407 ^ | | | | Ginnie Mae Series 2012-103 IC, 3.500%, 08/16/40 | | | | | 484,392 | | | | | | 0.0 | | |
| | | 1,266,577 ^ | | | | Ginnie Mae Series 2012-124 MI, 4.000%, 03/20/42 | | | | | 203,794 | | | | | | 0.0 | | |
| | | 14,324,074 ^ | | | | Ginnie Mae Series 2012-146 AI, 3.000%, 10/20/37 | | | | | 1,717,103 | | | | | | 0.1 | | |
| | | 856,437 ^ | | | | Ginnie Mae Series 2012-34 MS, 5.772%, 04/16/41 | | | | | 154,149 | | | | | | 0.0 | | |
| | | 414,570 | | | | Ginnie Mae Series 2012-43 MA, 4.000%, 10/20/41 | | | | | 429,401 | | | | | | 0.0 | | |
| | | 4,103,237 | | | | Ginnie Mae Series 2012-43 MB, 4.000%, 04/20/42 | | | | | 4,575,491 | | | | | | 0.4 | | |
| | | 7,831,035 ^ | | | | Ginnie Mae Series 2012-48 SA, 5.722%, 04/16/42 | | | | | 1,675,322 | | | | | | 0.1 | | |
| | | 10,618,199 ^ | | | | Ginnie Mae Series 2012-60 SG, 5.172%, 05/16/42 | | | | | 1,823,470 | | | | | | 0.2 | | |
| | | 2,931,747 ^ | | | | Ginnie Mae Series 2012-98 EI, 4.000%, 04/20/41 | | | | | 427,861 | | | | | | 0.0 | | |
| | | 27,624 ^ | | | | Ginnie Mae Series 2012-98 WI, 4.500%, 02/20/38 | | | | | 764 | | | | | | 0.0 | | |
| | | 2,837,410 | | | | Ginnie Mae Series 2012-H11 VA, 1.430%, 05/20/62 | | | | | 2,843,429 | | | | | | 0.2 | | |
| Principal Amount† | | | Value | | | Percentage of Net Assets | | ||||||||||||
| COLLATERALIZED MORTGAGE OBLIGATIONS: (continued) | | ||||||||||||||||||
| | | 33,043,446 | | | | Ginnie Mae Series 2012-H12 FB, 1.830%, 02/20/62 | | | | $ | 33,496,451 | | | | | | 2.7 | | |
| | | 2,067,594 | | | | Ginnie Mae Series 2012-H20 BA, 1.340%, 09/20/62 | | | | | 2,064,729 | | | | | | 0.2 | | |
| | | 4,643,860 | | | | Ginnie Mae Series 2012-H29 SA, 1.295%, 10/20/62 | | | | | 4,628,122 | | | | | | 0.4 | | |
| | | 3,000,000 | | | | Ginnie Mae Series 2013-147 BE, 4.000%, 12/20/39 | | | | | 3,126,290 | | | | | | 0.3 | | |
| | | 2,790,436 | | | | Ginnie Mae Series 2013-148 YA, 4.500%, 09/20/40 | | | | | 2,917,355 | | | | | | 0.2 | | |
| | | 1,251,701 | | | | Ginnie Mae Series 2013-167 Z, 3.000%, 10/16/43 | | | | | 1,195,829 | | | | | | 0.1 | | |
| | | 1,900,000 ^ | | | | Ginnie Mae Series 2013-186 UI, 2.500%, 11/20/43 | | | | | 649,882 | | | | | | 0.1 | | |
| | | 2,243,535 ^ | | | | Ginnie Mae Series 2013-186 VI, 4.000%, 12/20/42 | | | | | 365,138 | | | | | | 0.0 | | |
| | | 11,637,440 ^ | | | | Ginnie Mae Series 2013-20 LI, 4.500%, 12/16/42 | | | | | 1,916,994 | | | | | | 0.2 | | |
| | | 6,588,318 ^ | | | | Ginnie Mae Series 2013-41 PI, 3.500%, 04/20/40 | | | | | 649,704 | | | | | | 0.1 | | |
| | | 2,823,838 | | | | Ginnie Mae Series 2013-H08 BF, 1.180%, 03/20/63 | | | | | 2,802,623 | | | | | | 0.2 | | |
| | | 6,285,397 | | | | Ginnie Mae Series 2013-H10 FT, 1.260%, 04/20/63 | | | | | 6,302,724 | | | | | | 0.5 | | |
| | | 4,544,035 | | | | Ginnie Mae Series 2013-H14 FC, 1.250%, 06/20/63 | | | | | 4,523,980 | | | | | | 0.4 | | |
| | | 1,614,501 | | | | Ginnie Mae Series 2013-H18 BA, 1.380%, 07/20/63 | | | | | 1,614,272 | | | | | | 0.1 | | |
| | | 4,792,574 | | | | Ginnie Mae Series 2013-H19 DF, 1.430%, 05/20/63 | | | | | 4,796,397 | | | | | | 0.4 | | |
| | | 10,938,242 | | | | Ginnie Mae Series 2013-H19 FC, 1.380%, 08/20/63 | | | | | 10,936,258 | | | | | | 0.9 | | |
| | | 3,750,427 | | | | Ginnie Mae Series 2013-H20 FB, 1.780%, 08/20/63 | | | | | 3,798,188 | | | | | | 0.3 | | |
| Voya GNMA Income Fund | as of March 31, 2017 (continued) |
| Principal Amount† | | | Value | | | Percentage of Net Assets | | ||||||||||||
| COLLATERALIZED MORTGAGE OBLIGATIONS: (continued) | | ||||||||||||||||||
| | | 4,656,631 | | | | Ginnie Mae Series 2013-H23 FA, 2.080%, 09/20/63 | | | | $ | 4,762,626 | | | | | | 0.4 | | |
| | | 9,999,640 | | | | Ginnie Mae Series 2013-H23 TA, 1.500%, 09/20/63 | | | | | 10,039,801 | | | | | | 0.8 | | |
| | | 2,793,200 | | | | Ginnie Mae Series 2014-115 EM, 4.000%, 08/20/44 | | | | | 2,960,443 | | | | | | 0.2 | | |
| | | 1,485,618 | | | | Ginnie Mae Series 2014-118 ZP, 4.000%, 08/20/44 | | | | | 1,576,397 | | | | | | 0.1 | | |
| | | 5,917,154 ^ | | | | Ginnie Mae Series 2014-30 ES, 4.022%, 03/20/40 | | | | | 727,338 | | | | | | 0.1 | | |
| | | 12,862,576 | | | | Ginnie Mae Series 2015-10 Q, 2.254%, 10/20/44 | | | | | 12,267,039 | | | | | | 1.0 | | |
| | | 12,125,000 | | | | Ginnie Mae Series 2015-143 B, 3.500%, 04/20/45 | | | | | 12,502,873 | | | | | | 1.0 | | |
| | | 4,572,831 ^ | | | | Ginnie Mae Series 2015-157 PI, 4.000%, 03/20/44 | | | | | 850,901 | | | | | | 0.1 | | |
| | | 13,347,340 | | | | Ginnie Mae Series 2015-27 PB, 3.000%, 08/20/44 | | | | | 13,443,569 | | | | | | 1.1 | | |
| | | 50,678,403 | | | | Ginnie Mae Series 2015-H31 FT, 1.430%, 11/20/65 | | | | | 50,864,530 | | | | | | 4.1 | | |
| | | 19,181,911 ^ | | | | Ginnie Mae Series 2016-145 IU, 3.500%, 10/20/46 | | | | | 3,783,080 | | | | | | 0.3 | | |
| | | 10,313,855 | | | | Ginnie Mae Series 2016-5 AB, 4.684%, 01/20/46 | | | | | 11,129,147 | | | | | | 0.9 | | |
| | | 32,449,828 | | | | Ginnie Mae Series 2016-H08 FT, 1.500%, 02/20/66 | | | | | 32,628,971 | | | | | | 2.7 | | |
| | | 1,126,850 | | | | Vendee Mortgage Trust 2011-2 DZ, 3.750%, 10/15/41 | | | | | 1,157,468 | | | | | | 0.1 | | |
| | | | | | | Total Collateralized Mortgage Obligations (Cost $668,480,846) | | | | | 670,253,134 | | | | | | 54.6 | | |
| COMMERCIAL MORTGAGE-BACKED SECURITIES:1.6% | | ||||||||||||||||||
| | | 874,895 | | | | Ginnie Mae Series 2004-23 Z, 5.480%, 03/16/44 | | | | | 928,115 | | | | | | 0.1 | | |
| Principal Amount† | | | Value | | | Percentage of Net Assets | | ||||||||||||
| COMMERCIAL MORTGAGE-BACKED SECURITIES: (continued) | | ||||||||||||||||||
| | | 12,799,274 ^ | | | | Ginnie Mae Series 2006-67 IO, 0.378%, 11/16/46 | | | | $ | 86,733 | | | | | | 0.0 | | |
| | | 2,084,596 | | | | Ginnie Mae Series 2007-52 Z, 4.350%, 01/16/48 | | | | | 2,215,579 | | | | | | 0.2 | | |
| | | 1,973,669 | | | | Ginnie Mae Series 2008-39 Z, 4.500%, 02/16/48 | | | | | 2,154,057 | | | | | | 0.2 | | |
| | | 587,352 ^ | | | | Ginnie Mae Series 2008-45 IO, 0.669%, 02/16/48 | | | | | 4,483 | | | | | | 0.0 | | |
| | | 1,529,326 | | | | Ginnie Mae Series 2008-48 Z, 4.865%, 04/16/48 | | | | | 1,571,812 | | | | | | 0.1 | | |
| | | 911,733 | | | | Ginnie Mae Series 2009-115 D, 4.677%, 01/16/50 | | | | | 965,244 | | | | | | 0.1 | | |
| | | 5,800,107 | | | | Ginnie Mae Series 2009-60 Z, 4.910%, 06/16/49 | | | | | 6,069,899 | | | | | | 0.5 | | |
| | | 8,186,011 ^ | | | | Ginnie Mae Series 2010-122 IO, 0.257%, 02/16/44 | | | | | 216,326 | | | | | | 0.0 | | |
| | | 112,115 ^ | | | | Ginnie Mae Series 2010-123 IA, 1.943%, 10/16/52 | | | | | 5,105 | | | | | | 0.0 | | |
| | | 33,826,021 ^ | | | | Ginnie Mae Series 2011-47 IO, 0.007%, 01/16/51 | | | | | 407,786 | | | | | | 0.0 | | |
| | | 1,382,090 | | | | Ginnie Mae Series 2011-53 B, 4.397%, 05/16/51 | | | | | 1,464,450 | | | | | | 0.1 | | |
| | | 4,000,000 | | | | Ginnie Mae Series 2011-95 C, 3.526%, 01/16/40 | | | | | 4,116,931 | | | | | | 0.3 | | |
| | | | | | | Total Commercial Mortgage-Backed Securities (Cost $20,217,812) | | | | | 20,206,520 | | | | | | 1.6 | | |
| ASSET-BACKED SECURITIES: 0.9% | | ||||||||||||||||||
| | | | | | | Other Asset-Backed Securities: 0.9% | | ||||||||||||
| | | 1,741,054 | | | | Fannie Mae Grantor Trust 2003-T4 2A6, 4.761%, 07/26/33 | | | | | 1,843,899 | | | | | | 0.2 | | |
| | | 197,238 | | | | Fannie Mae REMIC Trust 2001-W4 AF6, 5.610%, 01/25/32 | | | | | 211,646 | | | | | | 0.0 | | |
| Voya GNMA Income Fund | as of March 31, 2017 (continued) |
| Principal Amount† | | | Value | | | Percentage of Net Assets | | ||||||||||||
| ASSET-BACKED SECURITIES: (continued) | | ||||||||||||||||||
| | | | | | | Other Asset-Backed Securities (continued) | | ||||||||||||
| | | 292,611 | | | | Fannie Mae REMIC Trust 2002-W12 AF6, 5.066%, 02/25/33 | | | | $ | 299,711 | | | | | | 0.0 | | |
| | | 363,396 | | | | Fannie Mae REMIC Trust 2002-W2 AF6, 6.496%, 05/25/32 | | | | | 376,867 | | | | | | 0.0 | | |
| | | 7,633,492 | | | | Fannie Mae REMIC Trust 2003-W16 AF5, 4.566%, 11/25/33 | | | | | 7,741,106 | | | | | | 0.7 | | |
| | | | | | | Total Asset-Backed Securities (Cost $10,370,577) | | | | | 10,473,229 | | | | | | 0.9 | | |
| U.S. GOVERNMENT AGENCY OBLIGATIONS: 70.7% | | ||||||||||||||||||
| | | | | | | Federal Home Loan Mortgage Corporation: 3.4%## | | ||||||||||||
| | | 31,240,000 | W | | 4.000%, due 05/01/47 | | | | | 32,699,492 | | | | | | 2.7 | | | |
| | | 8,598,084 | | | | 4.000%-9.500%, due 07/01/20-11/01/45 | | | | | 9,257,810 | | | | | | 0.7 | | |
| | | | | | | | | | | | 41,957,302 | | | | | | 3.4 | | |
| | | | | | | Federal National Mortgage Association: 8.2%## | | ||||||||||||
| | | 9,700,000 | W | | 3.000%, due 05/01/43 | | | | | 9,597,695 | | | | | | 0.8 | | | |
| | | 30,770,691 | | | | 3.500%, due 01/01/44 | | | | | 31,587,459 | | | | | | 2.6 | | |
| | | 9,874,263 | | | | 3.500%, due 03/01/46 | | | | | 10,175,212 | | | | | | 0.8 | | |
| | | 16,596,184 | | | | 4.000%, due 05/01/42 | | | | | 17,541,927 | | | | | | 1.4 | | |
| | | 9,882,403 | | | | 4.000%, due 01/01/45 | | | | | 10,509,944 | | | | | | 0.9 | | |
| | | 19,992,931 | | | | 3.000%-7.500%, due 07/01/27-05/01/45 | | | | | 21,191,171 | | | | | | 1.7 | | |
| | | | | | | | | | | | 100,603,408 | | | | | | 8.2 | | |
| | | | | | | Government National Mortgage Association: 59.1% | | ||||||||||||
| | | 184,332,000 | W | | 3.000%, due 04/01/44 | | | | | 185,959,307 | | | | | | 15.2 | | | |
| | | 75,000,000 | W | | 3.500%, due 12/20/41 | | | | | 77,636,718 | | | | | | 6.3 | | | |
| | | 37,248,273 | | | | 3.500%, due 06/20/46 | | | | | 38,677,076 | | | | | | 3.2 | | |
| | | 46,283,834 | | | | 3.500%, due 07/20/46 | | | | | 48,059,230 | | | | | | 3.9 | | |
| | | 9,611,627 | | | | 3.500%, due 08/20/46 | | | | | 9,990,951 | | | | | | 0.8 | | |
| | | 53,343,710 | | | | 3.500%, due 09/20/46 | | | | | 55,389,916 | | | | | | 4.5 | | |
| | | 25,956,579 | | | | 3.500%, due 12/20/46 | | | | | 26,952,245 | | | | | | 2.2 | | |
| | | 9,373,760 | | | | 3.750%, due 05/20/42 | | | | | 9,820,471 | | | | | | 0.8 | | |
| | | 7,336,395 | | | | 3.750%, due 05/20/42 | | | | | 7,685,553 | | | | | | 0.6 | | |
| | | 126,047,000 | W | | 4.000%, due 11/20/41 | | | | | 132,898,348 | | | | | | 10.8 | | | |
| | | 8,470,776 | | | | 4.000%, due 01/20/46 | | | | | 8,987,047 | | | | | | 0.7 | | |
| Principal Amount† | | | Value | | | Percentage of Net Assets | | ||||||||||||
| U.S. GOVERNMENT AGENCY OBLIGATIONS: (continued) | | ||||||||||||||||||
| | | | | | | Government National Mortgage Association (continued) | | ||||||||||||
| | | 7,423,879 | | | | 4.000%, due 03/20/46 | | | | $ | 7,870,242 | | | | | | 0.7 | | |
| | | 8,785,062 | | | | 4.631%, due 09/20/61 | | | | | 9,463,119 | | | | | | 0.8 | | |
| | | 97,836,186 | | | | 2.936%-7.500%, due 05/15/18-10/20/63 | | | | | 105,237,752 | | | | | | 8.6 | | |
| | | | | | | | | | | | 724,627,975 | | | | | | 59.1 | | |
| | | | | | | Total U.S. Government Agency Obligations (Cost $864,701,360) | | | | | 867,188,685 | | | | | | 70.7 | | |
| | | | | | | Total Investments in Securities (Cost $1,563,770,595) | | | | $ | 1,568,121,568 | | | | | | 127.8 | | |
| | | | | | | Liabilities in Excess of Other Assets | | | | | (340,796,631) | | | | | | (27.8) | | |
| | | | | | | Net Assets | | | | $ | 1,227,324,937 | | | | | | 100.0 | | |
| | |||||||||||||||||||
| | Gross Unrealized Appreciation | | | | $ | 15,319,126 | | |
| | Gross Unrealized Depreciation | | | | | (12,615,535) | | |
| | Net Unrealized Appreciation | | | | $ | 2,703,591 | | |
| | ||||||||
| Voya GNMA Income Fund | as of March 31, 2017 (continued) |
| | | | Quoted Prices in Active Markets for Identical Investments (Level 1) | | | Significant Other Observable Inputs (Level 2) | | | Significant Unobservable Inputs (Level 3) | | | Fair Value at March 31, 2017 | | ||||||||||||
| Asset Table | | | | | | ||||||||||||||||||||
| Investments, at fair value | | | | | | ||||||||||||||||||||
| Collateralized Mortgage Obligations | | | | $ | — | | | | | $ | 670,253,134 | | | | | $ | — | | | | | $ | 670,253,134 | | |
| Commercial Mortgage-Backed Securities | | | | | — | | | | | | 20,206,520 | | | | | | — | | | | | | 20,206,520 | | |
| Asset-Backed Securities | | | | | — | | | | | | 10,473,229 | | | | | | — | | | | | | 10,473,229 | | |
| U.S. Government Agency Obligations | | | | | — | | | | | | 867,188,685 | | | | | | — | | | | | | 867,188,685 | | |
| Total Investments, at fair value | | | | $ | — | | | | | $ | 1,568,121,568 | | | | | $ | — | | | | | $ | 1,568,121,568 | | |
| Liabilities Table | | | | | | ||||||||||||||||||||
| Other Financial Instruments+ | | | | | | ||||||||||||||||||||
| Futures | | | | $ | (202,335) | | | | | $ | — | | | | | $ | — | | | | | $ | (202,335) | | |
| Total Liabilities | | | | $ | (202,335) | | | | | $ | — | | | | | $ | — | | | | | $ | (202,335) | | |
| | |||||||||||||||||||||||||
| Contract Description | | | Number of Contracts | | | Expiration Date | | | Notional Value | | | Unrealized Appreciation/ (Depreciation) | | ||||||||||||
| Short Contracts | | | | | | | | | | | | | | | | | | | | | | | | | |
| U.S. Treasury 10-Year Note | | | | | (456) | | | | | | 06/21/17 | | | | | $ | (56,800,500) | | | | | $ | (41,310) | | |
| U.S. Treasury 2-Year Note | | | | | (261) | | | | | | 06/30/17 | | | | | | (56,494,264) | | | | | | (53,500) | | |
| U.S. Treasury 5-Year Note | | | | | (434) | | | | | | 06/30/17 | | | | | | (51,093,327) | | | | | | (75,487) | | |
| U.S. Treasury Long Bond | | | | | (217) | | | | | | 06/20/17 | | | | | | (32,733,094) | | | | | | (32,038) | | |
| | | | | | | | | | | | | | | | | $ | (197,121,185) | | | | | $ | (202,335) | | |
| | |||||||||||||||||||||||||
| Derivatives not accounted for as hedging instruments | | | Location on Statement of Assets and Liabilities | | | Fair Value | | |||
| Liability Derivatives | | | | | | | | | | |
| Interest rate contracts | | | Net Assets — Unrealized depreciation* | | | | $ | 202,335 | | |
| Total Liability Derivatives | | | | | | | $ | 202,335 | | |
| | ||||||||||
| Voya GNMA Income Fund | as of March 31, 2017 (continued) |
| | | | Amount of Realized Gain or (Loss) on Derivatives Recognized in Income | | |||
| Derivatives not accounted for as hedging instruments | | | Futures | | |||
| Interest rate contracts | | | | $ | 8,464,707 | | |
| Total | | | | $ | 8,464,707 | | |
| | |||||||
| | | | Change in Unrealized Appreciation or (Depreciation) on Derivatives Recognized in Income | | |||
| Derivatives not accounted for as hedging instruments | | | | | Futures | | |
| Interest rate contracts | | | | $ | (695,098) | | |
| Total | | | | $ | (695,098) | | |
| | |||||||
| Voya High Yield Bond Fund | as of March 31, 2017 |
| | Principal Amount† | | | Value | | | Percentage of Net Assets | | ||||||||||||
| | CORPORATE BONDS/NOTES:96.3% | | ||||||||||||||||||
| | | | | | | | Basic Materials: 8.0% | | ||||||||||||
| | | | 2,225,000 | # | | Alpha 3 BV / Alpha US Bidco, Inc., 6.250%, 02/01/25 | | | | $ | 2,258,375 | | | | | | 0.4 | | | |
| | | | 2,740,000 | L | | ArcelorMittal, 6.125%-6.250%, 03/01/21-06/01/25 | | | | | 3,010,100 | | | | | | 0.5 | | | |
| | | | 1,635,000 | # | | Aruba Investments, Inc., 8.750%, 02/15/23 | | | | | 1,692,225 | | | | | | 0.3 | | | |
| | | | 2,120,000 | # | | Axalta Coating Systems LLC, 4.875%, 08/15/24 | | | | | 2,178,300 | | | | | | 0.3 | | | |
| | | | 1,470,000 | # | | Cascades, Inc., 5.500%, 07/15/22 | | | | | 1,473,675 | | | | | | 0.2 | | | |
| | | | 245,000 | #,L | | Cliffs Natural Resources, Inc., 5.750%, 03/01/25 | | | | | 238,262 | | | | | | 0.0 | | | |
| | | | 920,000 | # | | Constellium NV, 5.750%, 05/15/24 | | | | | 855,600 | | | | | | 0.1 | | | |
| | | | 500,000 | # | | Constellium NV, 7.875%, 04/01/21 | | | | | 535,625 | | | | | | 0.1 | | | |
| | | | 940,000 | # | | Ferroglobe PLC / Globe Specialty Metals, Inc., 9.375%, 03/01/22 | | | | | 984,650 | | | | | | 0.2 | | | |
| | | | 4,200,000 | L | | Freeport-McMoRan, Inc., 4.550%-5.450%, 11/14/24-03/15/43 | | | | | 3,752,000 | | | | | | 0.6 | | | |
| | | | 975,000 | # | | Hexion, Inc., 10.375%, 02/01/22 | | | | | 975,000 | | | | | | 0.2 | | | |
| | | | 240,000 | # | | Hexion, Inc., 13.750%, 02/01/22 | | | | | 231,000 | | | | | | 0.0 | | | |
| | | | 250,000 | # | | Hudbay Minerals, Inc., 7.250%, 01/15/23 | | | | | 266,250 | | | | | | 0.0 | | | |
| | | | 250,000 | # | | Hudbay Minerals, Inc., 7.625%, 01/15/25 | | | | | 272,500 | | | | | | 0.1 | | | |
| | | | 2,425,000 | # | | IAMGOLD Corp., 7.000%, 04/15/25 | | | | | 2,406,813 | | | | | | 0.4 | | | |
| | | | 2,800,000 | #,L | | INEOS Group Holdings SA, 5.625%, 08/01/24 | | | | | 2,814,000 | | | | | | 0.4 | | | |
| | | | 2,100,000 | # | | Kraton Polymers LLC / Kraton Polymers Capital Corp., 10.500%, 04/15/23 | | | | | 2,420,250 | | | | | | 0.4 | | | |
| | | | 485,000 | # | | PQ Corp., 6.750%, 11/15/22 | | | | | 517,738 | | | | | | 0.1 | | | |
| | | | 2,320,000 | # | | Rayonier AM Products, Inc., 5.500%, 06/01/24 | | | | | 2,099,600 | | | | | | 0.3 | | | |
| | | | 1,860,000 | # | | SPCM SA, 6.000%, 01/15/22 | | | | | 1,929,750 | | | | | | 0.3 | | | |
| | | | 3,515,000 | | | | Teck Resources Ltd., 4.750%-5.200%, 01/15/22-03/01/42 | | | | | 3,426,206 | | | | | | 0.5 | | |
| | | | 1,700,000 | #,L | | Tronox Finance LLC, 7.500%, 03/15/22 | | | | | 1,759,500 | | | | | | 0.3 | | | |
| | Principal Amount† | | | Value | | | Percentage of Net Assets | | ||||||||||||
| | CORPORATE BONDS/NOTES: (continued) | | ||||||||||||||||||
| | | | | | | | Basic Materials (continued) | | ||||||||||||
| | | | 1,500,000 | # | | Unifrax I LLC / Unifrax Holding Co., 7.500%, 02/15/19 | | | | $ | 1,496,250 | | | | | | 0.2 | | | |
| | | | 1,120,000 | # | | Valvoline, Inc., 5.500%, 07/15/24 | | | | | 1,178,800 | | | | | | 0.2 | | | |
| | | | 1,605,000 | # | | WR Grace & Co-Conn, 5.125%, 10/01/21 | | | | | 1,689,262 | | | | | | 0.3 | | | |
| | | | 555,000 | # | | WR Grace & Co-Conn, 5.625%, 10/01/24 | | | | | 586,913 | | | | | | 0.1 | | | |
| | | | 11,830,000 | | | | Other Securities(a) | | | | | 9,895,656 | | | | | | 1.5 | | |
| | | | | | | | | | | | | 50,944,300 | | | | | | 8.0 | | |
| | | | | | | | Communications: 18.6% | | ||||||||||||
| | | | 1,860,000 | #,L | | Acosta, Inc., 7.750%, 10/01/22 | | | | | 1,588,440 | | | | | | 0.2 | | | |
| | | | 600,000 | # | | Altice Financing SA, 6.500%, 01/15/22 | | | | | 630,294 | | | | | | 0.1 | | | |
| | | | 1,000,000 | #,L | | Altice Finco SA, 8.125%, 01/15/24 | | | | | 1,075,000 | | | | | | 0.1 | | | |
| | | | 2,470,000 | #,L | | Altice Luxembourg SA, 7.625%, 02/15/25 | | | | | 2,619,744 | | | | | | 0.4 | | | |
| | | | 2,170,000 | # | | Altice Luxembourg SA, 7.750%, 05/15/22 | | | | | 2,308,337 | | | | | | 0.4 | | | |
| | | | 1,215,000 | # | | Block Communications, Inc., 6.875%, 02/15/25 | | | | | 1,290,937 | | | | | | 0.2 | | | |
| | | | 1,115,000 | # | | CCO Holdings LLC / CCO Holdings Capital Corp., 5.125%, 05/01/23 | | | | | 1,151,237 | | | | | | 0.2 | | | |
| | | | 485,000 | # | | CCO Holdings LLC / CCO Holdings Capital Corp., 5.125%, 05/01/27 | | | | | 489,547 | | | | | | 0.1 | | | |
| | | | 1,120,000 | # | | CCO Holdings LLC / CCO Holdings Capital Corp., 5.500%, 05/01/26 | | | | | 1,162,000 | | | | | | 0.2 | | | |
| | | | 2,895,000 | # | | CCO Holdings LLC / CCO Holdings Capital Corp., 5.750%, 02/15/26 | | | | | 3,046,988 | | | | | | 0.5 | | | |
| | | | 1,500,000 | # | | CCO Holdings LLC / CCO Holdings Capital Corp., 5.875%, 04/01/24 | | | | | 1,586,250 | | | | | | 0.2 | | | |
| | | | 3,725,000 | L | | CenturyLink, Inc., 5.625%-7.500%, 04/01/20-04/01/24 | | | | | 3,906,518 | | | | | | 0.6 | | | |
| | | | 955,000 | # | | Cequel Communications Holdings I LLC / Cequel Capital Corp., 5.125%, 12/15/21 | | | | | 974,100 | | | | | | 0.1 | | | |
| Voya High Yield Bond Fund | as of March 31, 2017 (continued) |
| | Principal Amount† | | | Value | | | Percentage of Net Assets | | ||||||||||||
| | CORPORATE BONDS/NOTES: (continued) | | ||||||||||||||||||
| | | | | | | | Communications (continued) | | ||||||||||||
| | | | 3,135,000 | | | | Clear Channel Worldwide Holdings, Inc., 6.500%-7.625%, 03/15/20-11/15/22 | | | | $ | 3,196,990 | | | | | | 0.5 | | |
| | | | 1,740,000 | # | | CommScope Tech Finance LLC, 6.000%, 06/15/25 | | | | | 1,831,350 | | | | | | 0.3 | | | |
| | | | 2,585,000 | | | | CSC Holdings LLC, 5.250%, 06/01/24 | | | | | 2,581,769 | | | | | | 0.4 | | |
| | | | 1,375,000 | # | | CSC Holdings LLC, 6.625%, 10/15/25 | | | | | 1,498,750 | | | | | | 0.2 | | | |
| | | | 2,530,000 | # | | CSC Holdings LLC, 10.875%, 10/15/25 | | | | | 3,048,650 | | | | | | 0.5 | | | |
| | | | 6,700,000 | | | | DISH DBS Corp., 5.000%-7.750%, 06/01/21-07/01/26 | | | | | 7,212,612 | | | | | | 1.1 | | |
| | | | 5,165,000 | | | | Frontier Communications Corp., 7.625%-11.000%, 09/15/20-09/15/25 | | | | | 5,043,550 | | | | | | 0.8 | | |
| | | | 1,685,000 | # | | Gray Television, Inc., 5.125%, 10/15/24 | | | | | 1,668,150 | | | | | | 0.3 | | | |
| | | | 4,495,000 | | | | Level 3 Financing, Inc., 5.125%-5.375%, 05/01/23-03/15/26 | | | | | 4,585,250 | | | | | | 0.7 | | |
| | | | 2,598,000 | | | | Mediacom Broadband LLC / Mediacom Broadband Corp., 6.375%, 04/01/23 | | | | | 2,734,395 | | | | | | 0.4 | | |
| | | | 1,000,000 | # | | Midcontinent Communications / Midcontinent Finance Corp., 6.875%, 08/15/23 | | | | | 1,068,750 | | | | | | 0.2 | | | |
| | | | 1,750,000 | # | | s, 6.250%, 08/01/21 | | | | | 1,828,750 | | | | | | 0.3 | | | |
| | | | 1,600,000 | # | | Nexstar Escrow Corp., 5.625%, 08/01/24 | | | | | 1,628,000 | | | | | | 0.3 | | | |
| | | | 575,000 | # | | Nielsen Finance LLC / Nielsen Finance Co., 5.000%, 04/15/22 | | | | | 589,375 | | | | | | 0.1 | | | |
| | | | 1,750,000 | # | | SFR Group SA, 6.000%, 05/15/22 | | | | | 1,820,000 | | | | | | 0.3 | | | |
| | | | 2,925,000 | # | | SFR Group SA, 6.250%, 05/15/24 | | | | | 2,954,250 | | | | | | 0.4 | | | |
| | | | 1,800,000 | # | | SFR Group SA, 7.375%, 05/01/26 | | | | | 1,860,750 | | | | | | 0.3 | | | |
| | | | 2,230,000 | # | | Plantronics, Inc., 5.500%, 05/31/23 | | | | | 2,255,087 | | | | | | 0.4 | | | |
| | | | 500,000 | # | | Sirius XM Radio, Inc., 5.375%, 07/15/26 | | | | | 512,500 | | | | | | 0.1 | | | |
| | | | 1,660,000 | # | | Sirius XM Radio, Inc., 6.000%, 07/15/24 | | | | | 1,784,500 | | | | | | 0.3 | | | |
| | Principal Amount† | | | Value | | | Percentage of Net Assets | | ||||||||||||
| | CORPORATE BONDS/NOTES: (continued) | | ||||||||||||||||||
| | | | | | | | Communications (continued) | | ||||||||||||
| | | | 3,000,000 | | | | Sprint Communications, Inc., 6.000%, 11/15/22 | | | | $ | 3,075,000 | | | | | | 0.5 | | |
| | | | 5,110,000 | | | | Sprint Corp., 7.125%, 06/15/24 | | | | | 5,467,700 | | | | | | 0.9 | | |
| | | | 3,250,000 | | | | Sprint Corp., 7.250%, 09/15/21 | | | | | 3,517,118 | | | | | | 0.5 | | |
| | | | 1,400,000 | | | | Sprint Nextel Corp., 6.875%, 11/15/28 | | | | | 1,482,250 | | | | | | 0.2 | | |
| | | | 1,320,000 | # | | Telesat Canada / Telesat LLC, 8.875%, 11/15/24 | | | | | 1,452,000 | | | | | | 0.2 | | | |
| | | | 6,530,000 | | | | T-Mobile USA, Inc., 5.125%-6.836%, 04/01/21-01/15/26 | | | | | 6,952,153 | | | | | | 1.1 | | |
| | | | 2,500,000 | # | | Univision Communications, Inc., 5.125%, 05/15/23 | | | | | 2,500,000 | | | | | | 0.4 | | | |
| | | | 250,000 | # | | Univision Communications, Inc., 5.125%, 02/15/25 | | | | | 246,875 | | | | | | 0.0 | | | |
| | | | 2,360,000 | # | | West Corp., 5.375%, 07/15/22 | | | | | 2,327,550 | | | | | | 0.4 | | | |
| | | | 1,200,000 | # | | Wind Acquisition Finance SA, 4.750%, 07/15/20 | | | | | 1,225,500 | | | | | | 0.2 | | | |
| | | | 1,310,000 | # | | Wind Acquisition Finance SA, 7.375%, 04/23/21 | | | | | 1,365,675 | | | | | | 0.2 | | | |
| | | | 3,045,000 | | | | Windstream Services LLC, 7.500%-7.750%, 10/15/20-04/01/23 | | | | | 2,950,025 | | | | | | 0.5 | | |
| | | | 2,640,000 | | | | Zayo Group LLC / Zayo Capital, Inc., 6.000%-6.375%, 04/01/23-05/15/25 | | | | | 2,812,635 | | | | | | 0.4 | | |
| | | | 245,000 | # | | Zayo Group LLC / Zayo Capital, Inc., 5.750%, 01/15/27 | | | | | 259,039 | | | | | | 0.0 | | | |
| | | | 12,060,000 | | | | Other Securities | | | | | 11,888,760 | | | | | | 1.9 | | |
| | | | | | | | | | | | | 119,055,100 | | | | | | 18.6 | | |
| | | | | | | | Consumer, Cyclical: 15.9% | | ||||||||||||
| | | | 1,750,000 | # | | Adient Global Holdings Ltd., 4.875%, 08/15/26 | | | | | 1,721,562 | | | | | | 0.3 | | | |
| | | | 2,000,000 | # | | AdvancePierre Foods Holdings, Inc., 5.500%, 12/15/24 | | | | | 2,027,500 | | | | | | 0.3 | | | |
| | | | 1,705,000 | # | | American Greetings Corp., 7.875%, 02/15/25 | | | | | 1,794,512 | | | | | | 0.3 | | | |
| | | | 2,050,000 | # | | American Tire Distributors, Inc., 10.250%, 03/01/22 | | | | | 2,096,125 | | | | | | 0.3 | | | |
| | | | 2,345,000 | | | | Asbury Automotive Group, Inc., 6.000%, 12/15/24 | | | | | 2,432,937 | | | | | | 0.4 | | |
| Voya High Yield Bond Fund | as of March 31, 2017 (continued) |
| | Principal Amount† | | | Value | | | Percentage of Net Assets | | ||||||||||||
| | CORPORATE BONDS/NOTES: (continued) | | ||||||||||||||||||
| | | | | | | | Consumer, Cyclical (continued) | | ||||||||||||
| | | | 2,070,000 | # | | Ashton Woods USA LLC / Ashton Woods Finance Co., 6.875%, 02/15/21 | | | | $ | 2,080,350 | | | | | | 0.3 | | | |
| | | | 2,670,000 | | | | Caesars Entertainment Resort Properties LLC / Caesars Entertainment Resort Prope, 8.000%, 10/01/20 | | | | | 2,793,487 | | | | | | 0.4 | | |
| | | | 495,000 | # | | Carlson Travel, Inc., 6.750%, 12/15/23 | | | | | 516,037 | | | | | | 0.1 | | | |
| | | | 490,000 | # | | Carlson Travel, Inc., 9.500%, 12/15/24 | | | | | 514,500 | | | | | | 0.1 | | | |
| | | | 1,300,000 | # | | Carmike Cinemas, Inc., 6.000%, 06/15/23 | | | | | 1,378,000 | | | | | | 0.2 | | | |
| | | | 1,940,000 | # | | CCM Merger, Inc., 6.000%, 03/15/22 | | | | | 1,983,650 | | | | | | 0.3 | | | |
| | | | 750,000 | # | | Century Communities, Inc., 6.875%, 05/15/22 | | | | | 783,750 | | | | | | 0.1 | | | |
| | | | 1,975,000 | # | | Cooper-Standard Automotive, Inc., 5.625%, 11/15/26 | | | | | 1,979,937 | | | | | | 0.3 | | | |
| | | | 1,080,000 | # | | DBP Holding Corp., 7.750%, 10/15/20 | | | | | 734,400 | | | | | | 0.1 | | | |
| | | | 2,585,000 | | | | Dollar Tree, Inc., 5.750%, 03/01/23 | | | | | 2,765,950 | | | | | | 0.4 | | |
| | | | 485,000 | # | | Eagle II Acquisition Co. LLC, 6.000%, 04/01/25 | | | | | 501,369 | | | | | | 0.1 | | | |
| | | | 2,095,000 | # | | EMI Music Publishing Group North America Holdings, Inc., 7.625%, 06/15/24 | | | | | 2,294,025 | | | | | | 0.4 | | | |
| | | | 825,000 | # | | Guitar Center, Inc., 6.500%, 04/15/19 | | | | | 697,125 | | | | | | 0.1 | | | |
| | | | 900,000 | # | | Guitar Center, Inc., 9.625%, 04/15/20 | | | | | 623,250 | | | | | | 0.1 | | | |
| | | | 1,400,000 | # | | HD Supply, Inc., 5.250%, 12/15/21 | | | | | 1,477,000 | | | | | | 0.2 | | | |
| | | | 375,000 | # | | HD Supply, Inc., 5.750%, 04/15/24 | | | | | 395,363 | | | | | | 0.1 | | | |
| | | | 970,000 | # | | Hilton Worldwide Finance LLC / Hilton Worldwide Finance Corp., 4.625%, 04/01/25 | | | | | 982,125 | | | | | | 0.2 | | | |
| | | | 1,455,000 | # | | Hilton Worldwide Finance LLC / Hilton Worldwide Finance Corp., 4.875%, 04/01/27 | | | | | 1,473,188 | | | | | | 0.2 | | | |
| | | | 2,690,000 | # | | Hot Topic, Inc., 9.250%, 06/15/21 | | | | | 2,622,750 | | | | | | 0.4 | | | |
| | Principal Amount† | | | Value | | | Percentage of Net Assets | | ||||||||||||
| | CORPORATE BONDS/NOTES: (continued) | | ||||||||||||||||||
| | | | | | | | Consumer, Cyclical (continued) | | ||||||||||||
| | | | 860,000 | # | | International Game Technology PLC, 5.625%, 02/15/20 | | | | $ | 903,000 | | | | | | 0.1 | | | |
| | | | 900,000 | # | | International Game Technology PLC, 6.250%, 02/15/22 | | | | | 965,250 | | | | | | 0.2 | | | |
| | | | 865,000 | # | | International Game Technology PLC, 6.500%, 02/15/25 | | | | | 925,550 | | | | | | 0.1 | | | |
| | | | 1,040,000 | # | | KFC Holding Co/Pizza Hut Holdings LLC/Taco Bell of America LLC, 5.000%, 06/01/24 | | | | | 1,064,700 | | | | | | 0.2 | | | |
| | | | 1,040,000 | # | | KFC Holding Co/Pizza Hut Holdings LLC/Taco Bell of America LLC, 5.250%, 06/01/26 | | | | | 1,060,800 | | | | | | 0.1 | | | |
| | | | 475,000 | # | | Landry’s, Inc., 6.750%, 10/15/24 | | | | | 494,000 | | | | | | 0.1 | | | |
| | | | 2,115,000 | # | | Lions Gate Entertainment Corp., 5.875%, 11/01/24 | | | | | 2,204,888 | | | | | | 0.3 | | | |
| | | | 1,000,000 | # | | MCE Finance Ltd., 5.000%, 02/15/21 | | | | | 1,017,000 | | | | | | 0.2 | | | |
| | | | 3,500,000 | | | | MGM Resorts International, 6.000%-7.750%, 03/15/22-03/15/23 | | | | | 3,890,938 | | | | | | 0.6 | | |
| | | | 250,000 | #,L | | Neiman Marcus Group Ltd., Inc., 8.000%, 10/15/21 | | | | | 151,780 | | | | | | 0.0 | | | |
| | | | 1,750,000 | #,&,L | | Neiman Marcus Group Ltd., Inc., 8.750%, 10/15/21 | | | | | 993,125 | | | | | | 0.2 | | | |
| | | | 3,095,000 | # | | PetSmart, Inc., 7.125%, 03/15/23 | | | | | 2,947,987 | | | | | | 0.5 | | | |
| | | | 2,085,000 | #,L | | Rite Aid Corp., 6.125%, 04/01/23 | | | | | 2,074,575 | | | | | | 0.3 | | | |
| | | | 240,000 | # | | Rite Aid Corp., 6.875%, 12/15/28 | | | | | 256,800 | | | | | | 0.1 | | | |
| | | | 1,908,000 | # | | Rivers Pittsburgh Borrower L.P./Rivers Pittsburgh Finance Corp., 6.125%, 08/15/21 | | | | | 1,946,160 | | | | | | 0.3 | | | |
| | | | 790,000 | # | | Scientific Games International, Inc., 7.000%, 01/01/22 | | | | | 846,288 | | | | | | 0.1 | | | |
| | | | 1,705,000 | # | | Silversea Cruise Finance Ltd., 7.250%, 02/01/25 | | | | | 1,803,038 | | | | | | 0.3 | | | |
| | | | 790,000 | # | | Six Flags Entertainment Corp., 4.875%, 07/31/24 | | | | | 781,606 | | | | | | 0.2 | | | |
| | | | 1,585,000 | # | | Six Flags Entertainment Corp., 5.500%, 04/15/27 | | | | | 1,585,000 | | | | | | 0.2 | | | |
| Voya High Yield Bond Fund | as of March 31, 2017 (continued) |
| | Principal Amount† | | | Value | | | Percentage of Net Assets | | ||||||||||||
| | CORPORATE BONDS/NOTES: (continued) | | ||||||||||||||||||
| | | | | | | | Consumer, Cyclical (continued) | | ||||||||||||
| | | | 725,000 | # | | Sonic Automotive, Inc., 6.125%, 03/15/27 | | | | $ | 727,719 | | | | | | 0.1 | | | |
| | | | 1,450,000 | # | | Tops Holding LLC / Tops Markets II Corp., 8.000%, 06/15/22 | | | | | 1,196,250 | | | | | | 0.2 | | | |
| | | | 1,830,000 | # | | Viking Cruises Ltd., 8.500%, 10/15/22 | | | | | 1,905,488 | | | | | | 0.3 | | | |
| | | | 657,000 | # | | WMG Acquisition Corp., 5.625%, 04/15/22 | | | | | 682,459 | | | | | | 0.1 | | | |
| | | | 1,960,000 | # | | WMG Acquisition Corp., 6.750%, 04/15/22 | | | | | 2,067,800 | | | | | | 0.3 | | | |
| | | | 1,120,000 | # | | Wolverine World Wide, Inc., 5.000%, 09/01/26 | | | | | 1,055,600 | | | | | | 0.2 | | | |
| | | | 30,277,000 | | | | Other Securities | | | | | 31,559,334 | | | | | | 4.9 | | |
| | | | | | | | | | | | | 101,776,027 | | | | | | 15.9 | | |
| | | | | | | | Consumer, Non-cyclical: 18.7% | | ||||||||||||
| | | | 2,615,000 | # | | Albertsons Cos LLC / Safeway, Inc. / New Albertson’s, Inc. / Albertson’s LLC, 6.625%, 06/15/24 | | | | | 2,680,375 | | | | | | 0.4 | | | |
| | | | 830,000 | # | | Alere, Inc., 6.375%, 07/01/23 | | | | | 847,637 | | | | | | 0.1 | | | |
| | | | 1,500,000 | # | | Ashtead Capital, Inc., 6.500%, 07/15/22 | | | | | 1,567,500 | | | | | | 0.3 | | | |
| | | | 1,320,000 | #,& | | BI-LO LLC / BI-LO Finance Corp., 8.625%, 09/15/18 | | | | | 666,600 | | | | | | 0.1 | | | |
| | | | 1,335,000 | # | | BI-LO LLC / BI-LO Finance Corp., 9.250%, 02/15/19 | | | | | 1,159,781 | | | | | | 0.2 | | | |
| | | | 2,250,000 | # | | Brand Energy & Infrastructure Services, Inc., 8.500%, 12/01/21 | | | | | 2,379,375 | | | | | | 0.4 | | | |
| | | | 1,930,000 | # | | C&S Group Enterprises LLC, 5.375%, 07/15/22 | | | | | 1,915,525 | | | | | | 0.3 | | | |
| | | | 1,875,000 | #,& | | Capsugel SA, 7.000%, 05/15/19 | | | | | 1,870,781 | | | | | | 0.3 | | | |
| | | | 1,245,000 | # | | Cardtronics, Inc. / Cardtronics USA, 5.500%, 05/01/25 | | | | | 1,263,675 | | | | | | 0.2 | | | |
| | | | 3,470,000 | | | | Centene Corp., 4.750%-6.125%, 02/15/21-01/15/25 | | | | | 3,651,314 | | | | | | 0.6 | | |
| | | | 1,455,000 | # | | Cott Holdings, Inc., 5.500%, 04/01/25 | | | | | 1,484,537 | | | | | | 0.2 | | | |
| | | | 1,190,000 | # | | Endo Finance LLC / Endo Finco, Inc., 5.375%, 01/15/23 | | | | | 1,033,063 | | | | | | 0.1 | | | |
| | Principal Amount† | | | Value | | | Percentage of Net Assets | | ||||||||||||
| | CORPORATE BONDS/NOTES: (continued) | | ||||||||||||||||||
| | | | | | | | Consumer, Non-cyclical (continued) | | ||||||||||||
| | | | 515,000 | # | | Endo Ltd. / Endo Finance LLC / Endo Finco, Inc., 6.000%, 02/01/25 | | | | $ | 441,612 | | | | | | 0.1 | | | |
| | | | 840,000 | # | | Envision Healthcare Corp., 5.125%, 07/01/22 | | | | | 859,160 | | | | | | 0.1 | | | |
| | | | 2,000,000 | # | | FAGE International SA/ FAGE USA Dairy Industry, Inc., 5.625%, 08/15/26 | | | | | 2,010,000 | | | | | | 0.3 | | | |
| | | | 485,000 | # | | Gartner, Inc., 5.125%, 04/01/25 | | | | | 495,306 | | | | | | 0.1 | | | |
| | | | 3,620,000 | | | | HCA Holdings, Inc., 6.250%, 02/15/21 | | | | | 3,916,388 | | | | | | 0.6 | | |
| | | | 4,315,000 | | | | HCA, Inc., 5.375%, 02/01/25 | | | | | 4,498,387 | | | | | | 0.7 | | |
| | | | 1,800,000 | | | | HCA, Inc., 7.500%, 02/15/22 | | | | | 2,063,250 | | | | | | 0.3 | | |
| | | | 468,000 | # | | Herc Rentals, Inc., 7.500%, 06/01/22 | | | | | 499,590 | | | | | | 0.1 | | | |
| | | | 454,000 | # | | Herc Rentals, Inc., 7.750%, 06/01/24 | | | | | 485,780 | | | | | | 0.1 | | | |
| | | | 835,000 | #,L | | Hertz Corp., 5.500%, 10/15/24 | | | | | 729,581 | | | | | | 0.1 | | | |
| | | | 880,000 | # | | High Ridge Brands Co., 8.875%, 03/15/25 | | | | | 899,800 | | | | | | 0.1 | | | |
| | | | 2,305,000 | # | | Hill-Rom Holdings, Inc., 5.750%, 09/01/23 | | | | | 2,400,081 | | | | | | 0.4 | | | |
| | | | 2,095,000 | # | | Jaguar Holding Co. II / Pharmaceutical Product Development LLC, 6.375%, 08/01/23 | | | | | 2,194,513 | | | | | | 0.4 | | | |
| | | | 1,150,000 | # | | JBS USA LLC/JBS USA Finance, Inc., 7.250%, 06/01/21 | | | | | 1,187,375 | | | | | | 0.2 | | | |
| | | | 830,000 | # | | JBS USA LUX SA / JBS USA Finance, Inc., 5.750%, 06/15/25 | | | | | 842,450 | | | | | | 0.1 | | | |
| | | | 1,250,000 | # | | JBS USA LUX SA / JBS USA Finance, Inc., 5.875%, 07/15/24 | | | | | 1,293,750 | | | | | | 0.2 | | | |
| | | | 2,700,000 | # | | KeHE Distributors LLC / KeHE Finance Corp., 7.625%, 08/15/21 | | | | | 2,727,000 | | | | | | 0.4 | | | |
| | | | 990,000 | # | | Lamb Weston Holdings, Inc., 4.625%, 11/01/24 | | | | | 1,012,275 | | | | | | 0.1 | | | |
| | | | 990,000 | # | | Lamb Weston Holdings, Inc., 4.875%, 11/01/26 | | | | | 1,012,275 | | | | | | 0.2 | | | |
| | | | 1,960,000 | # | | Live Nation Entertainment, Inc., 5.375%, 06/15/22 | | | | | 2,048,200 | | | | | | 0.3 | | | |
| Voya High Yield Bond Fund | as of March 31, 2017 (continued) |
| | Principal Amount† | | | Value | | | Percentage of Net Assets | | ||||||||||||
| | CORPORATE BONDS/NOTES: (continued) | | ||||||||||||||||||
| | | | | | | | Consumer, Non-cyclical (continued) | | ||||||||||||
| | | | 2,080,000 | # | | Midas Intermediate Holdco II LLC / Midas Intermediate Holdco II Finance, Inc., 7.875%, 10/01/22 | | | | $ | 2,158,000 | | | | | | 0.3 | | | |
| | | | 2,900,000 | # | | MPH Acquisition Holdings LLC, 7.125%, 06/01/24 | | | | | 3,125,113 | | | | | | 0.5 | | | |
| | | | 785,000 | # | | Nature’s Bounty Co., 7.625%, 05/15/21 | | | | | 828,175 | | | | | | 0.1 | | | |
| | | | 779,000 | # | | Nielsen Co. Luxembourg SARL., 5.500%, 10/01/21 | | | | | 811,134 | | | | | | 0.1 | | | |
| | | | 600,000 | # | | Post Holdings, Inc., 5.000%, 08/15/26 | | | | | 576,000 | | | | | | 0.1 | | | |
| | | | 1,400,000 | # | | Post Holdings, Inc., 7.750%, 03/15/24 | | | | | 1,550,794 | | | | | | 0.2 | | | |
| | | | 1,150,000 | # | | Post Holdings, Inc., 8.000%, 07/15/25 | | | | | 1,296,625 | | | | | | 0.2 | | | |
| | | | 1,800,000 | #,L | | Quorum Health Corp., 11.625%, 04/15/23 | | | | | 1,577,250 | | | | | | 0.3 | | | |
| | | | 1,050,000 | # | | Shearers Foods LLC / Chip Fin Corp., 9.000%, 11/01/19 | | | | | 1,095,938 | | | | | | 0.2 | | | |
| | | | 1,975,000 | # | | Southern Graphics, Inc., 8.375%, 10/15/20 | | | | | 2,014,500 | | | | | | 0.3 | | | |
| | | | 2,040,000 | # | | Sterigenics-Nordion Holdings LLC, 6.500%, 05/15/23 | | | | | 2,091,000 | | | | | | 0.3 | | | |
| | | | 1,230,000 | #,& | | Sterigenics-Nordion Topco LLC, 8.125%, 11/01/21 | | | | | 1,263,825 | | | | | | 0.2 | | | |
| | | | 2,860,000 | L | | Tenet Healthcare Corp., 6.750%, 06/15/23 | | | | | 2,817,100 | | | | | | 0.4 | | | |
| | | | 195,000 | #,L | | Tenet Healthcare Corp., 7.500%, 01/01/22 | | | | | 211,087 | | | | | | 0.0 | | | |
| | | | 3,975,000 | | | | Tenet Healthcare Corp., 6.000%-8.125%, 02/01/20-04/01/22 | | | | | 4,117,063 | | | | | | 0.7 | | |
| | | | 1,575,000 | # | | US Foods, Inc., 5.875%, 06/15/24 | | | | | 1,641,938 | | | | | | 0.3 | | | |
| | | | 1,620,000 | #,L | | Valeant Pharmaceuticals International, Inc., 5.375%, 03/15/20 | | | | | 1,455,975 | | | | | | 0.2 | | | |
| | | | 1,750,000 | # | | Valeant Pharmaceuticals International, Inc., 5.500%, 03/01/23 | | | | | 1,356,250 | | | | | | 0.2 | | | |
| | | | 420,000 | # | | Valeant Pharmaceuticals International, Inc., 6.125%, 04/15/25 | | | | | 324,975 | | | | | | 0.1 | | | |
| | | | 360,000 | # | | Valeant Pharmaceuticals International, Inc., 6.500%, 03/15/22 | | | | | 371,250 | | | | | | 0.1 | | | |
| | Principal Amount† | | | Value | | | Percentage of Net Assets | | ||||||||||||
| | CORPORATE BONDS/NOTES: (continued) | | ||||||||||||||||||
| | | | | | | | Consumer, Non-cyclical (continued) | | ||||||||||||
| | | | 485,000 | # | | Valeant Pharmaceuticals International, Inc., 7.000%, 03/15/24 | | | | $ | 498,944 | | | | | | 0.1 | | | |
| | | | 990,000 | #,L | | Valeant Pharmaceuticals International, 6.375%, 10/15/20 | | | | | 900,900 | | | | | | 0.1 | | | |
| | | | 4,315,000 | # | | Valeant Pharmaceuticals International, 6.750%, 08/15/21 | | | | | 3,743,262 | | | | | | 0.6 | | | |
| | | | 2,575,000 | # | | Vizient, Inc., 10.375%, 03/01/24 | | | | | 2,945,156 | | | | | | 0.5 | | | |
| | | | 27,803,000 | | | | Other Securities(b) | | | | | 28,486,243 | | | | | | 4.5 | | |
| | | | | | | | | | | | | 119,395,433 | | | | | | 18.7 | | |
| | | | | | | | Energy: 11.9% | | ||||||||||||
| | | | 960,000 | # | | Antero Midstream Partners L.P. / Antero Midstream Finance Corp., 5.375%, 09/15/24 | | | | | 979,200 | | | | | | 0.2 | | | |
| | | | 2,750,000 | | | | Antero Resources Corp., 5.125%, 12/01/22 | | | | | 2,799,844 | | | | | | 0.4 | | |
| | | | 900,000 | # | | Antero Resources Corp., 5.000%, 03/01/25 | | | | | 886,500 | | | | | | 0.1 | | | |
| | | | 1,460,000 | # | | California Resources Corp., 8.000%, 12/15/22 | | | | | 1,195,375 | | | | | | 0.2 | | | |
| | | | 1,235,000 | # | | Cheniere Corpus Christi Holdings LLC, 5.875%, 03/31/25 | | | | | 1,292,119 | | | | | | 0.2 | | | |
| | | | 2,295,000 | #,L | | Chesapeake Energy Corp., 8.000%, 01/15/25 | | | | | 2,303,606 | | | | | | 0.4 | | | |
| | | | 2,220,000 | L | | Chesapeake Energy Corp., 6.125%-6.625%, 08/15/20-02/15/21 | | | | | 2,184,625 | | | | | | 0.3 | | | |
| | | | 2,900,000 | | | | Continental Resources, Inc./OK, 4.500%-5.000%, 09/15/22-04/15/23 | | | | | 2,892,625 | | | | | | 0.5 | | |
| | | | 500,000 | # | | Crestwood Midstream Partners L.P. / Crestwood Midstream Finance Corp., 5.750%, 04/01/25 | | | | | 511,875 | | | | | | 0.1 | | | |
| | | | 1,485,000 | # | | Diamondback Energy, Inc., 4.750%, 11/01/24 | | | | | 1,501,186 | | | | | | 0.2 | | | |
| | | | 1,470,000 | # | | Enviva Partners L.P. / Enviva Partners Finance Corp., 8.500%, 11/01/21 | | | | | 1,563,712 | | | | | | 0.2 | | | |
| | | | 1,465,000 | # | | Gulfport Energy Corp., 6.000%, 10/15/24 | | | | | 1,428,375 | | | | | | 0.2 | | | |
| | | | 495,000 | # | | Gulfport Energy Corp., 6.375%, 05/15/25 | | | | | 487,575 | | | | | | 0.1 | | | |
| Voya High Yield Bond Fund | as of March 31, 2017 (continued) |
| | Principal Amount† | | | Value | | | Percentage of Net Assets | | ||||||||||||
| | CORPORATE BONDS/NOTES: (continued) | | ||||||||||||||||||
| | | | | | | | Energy (continued) | | ||||||||||||
| | | | 1,750,000 | # | | Hilcorp Energy I L.P. / Hilcorp Finance Co., 5.000%, 12/01/24 | | | | $ | 1,649,375 | | | | | | 0.3 | | | |
| | | | 1,120,000 | # | | Holly Energy Partners L.P. / Holly Energy Finance Corp., 6.000%, 08/01/24 | | | | | 1,178,800 | | | | | | 0.2 | | | |
| | | | 1,135,000 | # | | Lonestar Resources America, Inc., 8.750%, 04/15/19 | | | | | 964,750 | | | | | | 0.1 | | | |
| | | | 1,910,000 | | | | Murphy Oil USA, Inc., 6.000%, 08/15/23 | | | | | 2,010,275 | | | | | | 0.3 | | |
| | | | 2,515,000 | | | | Murphy Oil Corp., 4.700%-6.875%, 12/01/22-08/15/24 | | | | | 2,493,537 | | | | | | 0.4 | | |
| | | | 1,470,000 | # | | Murray Energy Corp., 11.250%, 04/15/21 | | | | | 1,142,925 | | | | | | 0.2 | | | |
| | | | 2,285,000 | L | | PBF Logistics L.P. / PBF Logistics Finance Corp., 6.875%, 05/15/23 | | | | | 2,324,988 | | | | | | 0.4 | | | |
| | | | 480,000 | # | | PDC Energy, Inc., 6.125%, 09/15/24 | | | | | 494,400 | | | | | | 0.1 | | | |
| | | | 1,050,000 | # | | Range Resources Corp., 5.875%, 07/01/22 | | | | | 1,086,750 | | | | | | 0.2 | | | |
| | | | 1,950,000 | # | | Rockies Express Pipeline, LLC, 5.625%, 04/15/20 | | | | | 2,062,125 | | | | | | 0.3 | | | |
| | | | 520,000 | # | | SunCoke Energy Partners L.P. / SunCoke Energy Partners Finance Corp., 7.375%, 02/01/20 | | | | | 527,800 | | | | | | 0.1 | | | |
| | | | 500,000 | # | | SunCoke Energy Partners L.P. / SunCoke Energy Partners Finance Corp., 7.375%, 02/01/20 | | | | | 507,500 | | | | | | 0.1 | | | |
| | | | 405,000 | # | | SunCoke Energy Partners L.P. / SunCoke Energy Partners Finance Corp., 7.375%, 02/01/20 | | | | | 411,075 | | | | | | 0.0 | | | |
| | | | 3,250,000 | | | | Targa Resources Partners L.P. / Targa Resources Partners Finance Corp., 5.250%, 05/01/23 | | | | | 3,339,375 | | | | | | 0.5 | | |
| | | | 545,000 | | | | Targa Resources Partners L.P. / Targa Resources Partners Finance Corp., 6.750%, 03/15/24 | | | | | 594,050 | | | | | | 0.1 | | |
| | | | 3,190,000 | | | | Tesoro Logistics L.P. / Tesoro Logistics Finance Corp., 5.250%-6.375%, 10/15/21-01/15/25 | | | | | 3,382,025 | | | | | | 0.5 | | |
| | Principal Amount† | | | Value | | | Percentage of Net Assets | | ||||||||||||
| | CORPORATE BONDS/NOTES: (continued) | | ||||||||||||||||||
| | | | | | | | Energy (continued) | | ||||||||||||
| | | | 2,367,000 | | | | Unit Corp., 6.625%, 05/15/21 | | | | $ | 2,343,330 | | | | | | 0.4 | | |
| | | | 970,000 | # | | Vermilion Energy, Inc., 5.625%, 03/15/25 | | | | | 965,150 | | | | | | 0.2 | | | |
| | | | 1,465,000 | # | | WildHorse Resource Development Corp., 6.875%, 02/01/25 | | | | | 1,402,738 | | | | | | 0.2 | | | |
| | | | 3,240,000 | | | | WPX Energy, Inc., 6.000%, 01/15/22 | | | | | 3,321,000 | | | | | | 0.5 | | |
| | | | 24,642,000 | | | | Other Securities(b) | | | | | 23,711,249 | | | | | | 3.7 | | |
| | | | | | | | | | | | | 75,939,834 | | | | | | 11.9 | | |
| | | | | | | | Financial: 5.5% | | ||||||||||||
| | | | 2,600,000 | | | | Ally Financial, Inc., 5.750%, 11/20/25 | | | | | 2,671,500 | | | | | | 0.4 | | |
| | | | 2,235,000 | | | | Ally Financial, Inc., 7.500%-8.000%, 03/15/20-09/15/20 | | | | | 2,515,312 | | | | | | 0.4 | | |
| | | | 290,000 | # | | CIT Group, Inc., 6.625%, 04/01/18 | | | | | 302,687 | | | | | | 0.0 | | | |
| | | | 1,150,000 | # | | CNG Holdings, Inc., 9.375%, 05/15/20 | | | | | 1,055,125 | | | | | | 0.2 | | | |
| | | | 2,850,000 | # | | ESH Hospitality, Inc., 5.250%, 05/01/25 | | | | | 2,880,267 | | | | | | 0.5 | | | |
| | | | 1,120,000 | # | | FBM Finance, Inc., 8.250%, 08/15/21 | | | | | 1,192,800 | | | | | | 0.2 | | | |
| | | | 435,000 | # | | Iron Mountain, Inc., 6.000%, 10/01/20 | | | | | 456,750 | | | | | | 0.1 | | | |
| | | | 2,380,000 | | | | Navient Corp., 7.250%, 09/25/23 | | | | | 2,403,800 | | | | | | 0.4 | | |
| | | | 3,775,000 | | | | Navient Corp., 5.875%-6.625%, 07/26/21-10/25/24 | | | | | 3,620,063 | | | | | | 0.5 | | |
| | | | 2,040,000 | # | | Realogy Group LLC / Realogy Co-Issuer Corp., 5.250%, 12/01/21 | | | | | 2,131,800 | | | | | | 0.3 | | | |
| | | | 2,800,000 | | | | Royal Bank of Scotland Group PLC, 8.625%, 12/29/49 | | | | | 2,926,000 | | | | | | 0.5 | | |
| | | | 1,725,000 | | | | Uniti Group, Inc. / CSL Capital LLC, 8.250%, 10/15/23 | | | | | 1,828,500 | | | | | | 0.3 | | |
| | | | 990,000 | # | | Uniti Group, Inc. / CSL Capital LLC, 7.125%, 12/15/24 | | | | | 1,007,325 | | | | | | 0.1 | | | |
| | | | 9,795,000 | | | | Other Securities | | | | | 10,226,746 | | | | | | 1.6 | | |
| | | | | | | | | | | | | 35,218,675 | | | | | | 5.5 | | |
| Voya High Yield Bond Fund | as of March 31, 2017 (continued) |
| | Principal Amount† | | | Value | | | Percentage of Net Assets | | ||||||||||||
| | CORPORATE BONDS/NOTES: (continued) | | ||||||||||||||||||
| | | | | | | | Industrial: 10.5% | | ||||||||||||
| | | | 1,975,000 | # | | Advanced Disposal Services, Inc., 5.625%, 11/15/24 | | | | $ | 1,999,687 | | | | | | 0.3 | | | |
| | | | 2,250,000 | # | | Albea Beauty Holdings SA, 8.375%, 11/01/19 | | | | | 2,354,062 | | | | | | 0.4 | | | |
| | | | 2,425,000 | #,& | | ARD Finance SA, 7.125%, 09/15/23 | | | | | 2,503,812 | | | | | | 0.4 | | | |
| | | | 508,000 | # | | Ardagh Packaging Finance PLC / Ardagh Holdings USA, Inc., 6.000%, 02/15/25 | | | | | 514,985 | | | | | | 0.1 | | | |
| | | | 1,425,000 | # | | Ardagh Packaging Finance PLC / Ardagh Holdings USA, Inc., 7.250%, 05/15/24 | | | | | 1,530,094 | | | | | | 0.2 | | | |
| | | | 1,580,000 | # | | ATS Automation Tooling Systems, Inc., 6.500%, 06/15/23 | | | | | 1,655,050 | | | | | | 0.3 | | | |
| | | | 1,034,000 | # | | BMC East LLC, 5.500%, 10/01/24 | | | | | 1,054,680 | | | | | | 0.2 | | | |
| | | | 2,435,000 | # | | Bombardier, Inc., 8.750%, 12/01/21 | | | | | 2,672,413 | | | | | | 0.4 | | | |
| | | | 400,000 | # | | Builders FirstSource, Inc., 5.625%, 09/01/24 | | | | | 407,500 | | | | | | 0.1 | | | |
| | | | 2,500,000 | # | | Builders FirstSource, Inc., 10.750%, 08/15/23 | | | | | 2,918,750 | | | | | | 0.4 | | | |
| | | | 1,250,000 | # | | BWAY Holding Co., 7.250%, 04/15/25 | | | | | 1,253,125 | | | | | | 0.2 | | | |
| | | | 1,500,000 | # | | Cleaver-Brooks, Inc., 8.750%, 12/15/19 | | | | | 1,546,875 | | | | | | 0.2 | | | |
| | | | 1,250,000 | # | | Gardner Denver, Inc., 6.875%, 08/15/21 | | | | | 1,296,875 | | | | | | 0.2 | | | |
| | | | 1,720,000 | # | | Gates Global LLC / Gates Global Co., 6.000%, 07/15/22 | | | | | 1,758,700 | | | | | | 0.3 | | | |
| | | | 2,440,000 | # | | James Hardie International Finance Ltd., 5.875%, 02/15/23 | | | | | 2,531,500 | | | | | | 0.4 | | | |
| | | | 1,355,000 | # | | Koppers, Inc., 6.000%, 02/15/25 | | | | | 1,402,425 | | | | | | 0.2 | | | |
| | | | 1,265,000 | # | | Masonite International Corp., 5.625%, 03/15/23 | | | | | 1,297,244 | | | | | | 0.2 | | | |
| | | | 2,325,000 | # | | Multi-Color Corp., 6.125%, 12/01/22 | | | | | 2,435,438 | | | | | | 0.4 | | | |
| | | | 1,440,000 | # | | Novelis Corp., 5.875%, 09/30/26 | | | | | 1,472,400 | | | | | | 0.2 | | | |
| | | | 600,000 | # | | Novelis Corp., 6.250%, 08/15/24 | | | | | 627,000 | | | | | | 0.1 | | | |
| | Principal Amount† | | | Value | | | Percentage of Net Assets | | ||||||||||||
| | CORPORATE BONDS/NOTES: (continued) | | ||||||||||||||||||
| | | | | | | | Industrial (continued) | | ||||||||||||
| | | | 725,000 | # | | Owens-Brockway Glass Container, Inc., 5.875%, 08/15/23 | | | | $ | 768,500 | | | | | | 0.1 | | | |
| | | | 1,975,000 | # | | Owens-Brockway Glass Container, Inc., 6.375%, 08/15/25 | | | | | 2,114,484 | | | | | | 0.3 | | | |
| | | | 2,120,000 | # | | PaperWorks Industries, Inc., 9.500%, 08/15/19 | | | | | 1,706,600 | | | | | | 0.3 | | | |
| | | | 2,000,000 | # | | Plastipak Holdings, Inc., 6.500%, 10/01/21 | | | | | 2,060,000 | | | | | | 0.3 | | | |
| | | | 1,030,000 | # | | Reynolds Group Issuer, Inc. / Reynolds Group Issuer LLC / Reynolds Group Issuer Lu, 5.125%, 07/15/23 | | | | | 1,059,612 | | | | | | 0.2 | | | |
| | | | 135,000 | # | | Reynolds Group Issuer, Inc. / Reynolds Group Issuer LLC / Reynolds Group Issuer Lu, 7.000%, 07/15/24 | | | | | 144,788 | | | | | | 0.0 | | | |
| | | | 2,435,000 | # | | RSI Home Products, Inc., 6.500%, 03/15/23 | | | | | 2,520,225 | | | | | | 0.4 | | | |
| | | | 500,000 | # | | Sealed Air Corp., 4.875%, 12/01/22 | | | | | 522,810 | | | | | | 0.1 | | | |
| | | | 1,000,000 | # | | Sealed Air Corp., 5.125%, 12/01/24 | | | | | 1,043,750 | | | | | | 0.1 | | | |
| | | | 500,000 | # | | Sealed Air Corp., 5.500%, 09/15/25 | | | | | 531,250 | | | | | | 0.1 | | | |
| | | | 2,485,000 | # | | Shape Technologies Group, Inc., 7.625%, 02/01/20 | | | | | 2,559,550 | | | | | | 0.4 | | | |
| | | | 2,765,000 | # | | Standard Industries, Inc./NJ, 6.000%, 10/15/25 | | | | | 2,868,688 | | | | | | 0.4 | | | |
| | | | 3,020,000 | | | | TransDigm, Inc., 6.375%-6.500%, 07/15/24-06/15/26 | | | | | 3,047,933 | | | | | | 0.5 | | |
| | | | 1,620,000 | # | | Zekelman Industries, Inc., 9.875%, 06/15/23 | | | | | 1,814,400 | | | | | | 0.3 | | | |
| | | | 10,860,000 | | | | Other Securities | | | | | 11,477,619 | | | | | | 1.8 | | |
| | | | | | | | | | | | | 67,472,824 | | | | | | 10.5 | | |
| | | | | | | | Technology: 5.8% | | ||||||||||||
| | | | 2,550,000 | # | | BMC Software Finance, Inc., 8.125%, 07/15/21 | | | | | 2,581,875 | | | | | | 0.4 | | | |
| | | | 1,400,000 | #,& | | Boxer Parent Co., Inc., 9.000%, 10/15/19 | | | | | 1,403,500 | | | | | | 0.2 | | | |
| | | | 475,000 | # | | Camelot Finance SA, 7.875%, 10/15/24 | | | | | 504,683 | | | | | | 0.1 | | | |
| Voya High Yield Bond Fund | as of March 31, 2017 (continued) |
| | Principal Amount† | | | Value | | | Percentage of Net Assets | | ||||||||||||
| | CORPORATE BONDS/NOTES: (continued) | | ||||||||||||||||||
| | | | | | | | Technology (continued) | | ||||||||||||
| | | | 2,905,000 | | | | CDW LLC / CDW Finance Corp., 5.000%-6.000%, 08/15/22-09/01/25 | | | | $ | 3,046,062 | | | | | | 0.5 | | |
| | | | 970,000 | # | | Change Healthcare Holdings LLC / Change Healthcare Finance, Inc., 5.750%, 03/01/25 | | | | | 997,887 | | | | | | 0.1 | | | |
| | | | 1,200,000 | # | | Diamond 1 Finance Corp. / Diamond 2 Finance Corp., 5.450%, 06/15/23 | | | | | 1,296,238 | | | | | | 0.2 | | | |
| | | | 540,000 | # | | Diamond 1 Finance Corp. / Diamond 2 Finance Corp., 5.875%, 06/15/21 | | | | | 567,866 | | | | | | 0.1 | | | |
| | | | 1,200,000 | # | | Diamond 1 Finance Corp. / Diamond 2 Finance Corp., 6.020%, 06/15/26 | | | | | 1,312,957 | | | | | | 0.2 | | | |
| | | | 540,000 | # | | Diamond 1 Finance Corp. / Diamond 2 Finance Corp., 7.125%, 06/15/24 | | | | | 597,246 | | | | | | 0.1 | | | |
| | | | 1,445,000 | # | | Donnelley Financial Solutions, Inc., 8.250%, 10/15/24 | | | | | 1,495,575 | | | | | | 0.2 | | | |
| | | | 1,895,000 | # | | Entegris, Inc., 6.000%, 04/01/22 | | | | | 1,985,013 | | | | | | 0.3 | | | |
| | | | 500,000 | # | | First Data Corp., 5.000%, 01/15/24 | | | | | 510,625 | | | | | | 0.1 | | | |
| | | | 500,000 | # | | First Data Corp., 5.375%, 08/15/23 | | | | | 521,875 | | | | | | 0.1 | | | |
| | | | 1,000,000 | # | | First Data Corp., 5.750%, 01/15/24 | | | | | 1,035,250 | | | | | | 0.1 | | | |
| | | | 4,000,000 | # | | First Data Corp., 7.000%, 12/01/23 | | | | | 4,300,000 | | | | | | 0.7 | | | |
| | | | 1,890,000 | #,& | | Infor Software Parent LLC / Infor Software Parent, Inc., 7.125%, 05/01/21 | | | | | 1,941,975 | | | | | | 0.3 | | | |
| | | | 1,955,000 | # | | Micron Technology, Inc., 5.250%, 01/15/24 | | | | | 2,017,931 | | | | | | 0.3 | | | |
| | | | 590,000 | # | | MSCI, Inc., 5.250%, 11/15/24 | | | | | 623,925 | | | | | | 0.1 | | | |
| | | | 1,125,000 | # | | MSCI, Inc., 5.750%, 08/15/25 | | | | | 1,200,938 | | | | | | 0.2 | | | |
| | | | 1,720,000 | # | | Open Text Corp., 5.625%, 01/15/23 | | | | | 1,797,400 | | | | | | 0.3 | | | |
| | | | 800,000 | # | | Open Text Corp., 5.875%, 06/01/26 | | | | | 840,000 | | | | | | 0.1 | | | |
| | | | 1,000,000 | # | | Quintiles IMS, Inc., 5.000%, 10/15/26 | | | | | 1,006,250 | | | | | | 0.2 | | | |
| | | | 1,425,000 | # | | RP Crown Parent LLC, 7.375%, 10/15/24 | | | | | 1,489,125 | | | | | | 0.2 | | | |
| | Principal Amount† | | | Value | | | Percentage of Net Assets | | ||||||||||||
| | CORPORATE BONDS/NOTES: (continued) | | ||||||||||||||||||
| | | | | | | | Technology (continued) | | ||||||||||||
| | | | 600,000 | # | | Veritas US, Inc. / Veritas Bermuda Ltd., 7.500%, 02/01/23 | | | | $ | 634,500 | | | | | | 0.1 | | | |
| | | | 3,430,000 | | | | Other Securities | | | | | 3,631,450 | | | | | | 0.6 | | |
| | | | | | | | | | | | | 37,340,146 | | | | | | 5.8 | | |
| | | | | | | | Utilities: 1.4% | | ||||||||||||
| | | | 2,950,000 | L | | Calpine Corp., 5.375%-5.750%, 01/15/23-01/15/25 | | | | | 2,966,918 | | | | | | 0.5 | | | |
| | | | 1,500,000 | # | | LBC Tank Terminals Holding Netherlands BV, 6.875%, 05/15/23 | | | | | 1,563,930 | | | | | | 0.2 | | | |
| | | | 1,700,000 | # | | NRG Energy, Inc., 6.625%, 01/15/27 | | | | | 1,704,250 | | | | | | 0.3 | | | |
| | | | 1,602,000 | | | | NRG Energy, Inc., 6.250%-7.875%, 05/15/21-05/15/26 | | | | | 1,650,253 | | | | | | 0.2 | | |
| | | | 1,000,000 | | | | Other Securities | | | | | 1,068,700 | | | | | | 0.2 | | |
| | | | | | | | | | | | | 8,954,051 | | | | | | 1.4 | | |
| | | | | | | | Total Corporate Bonds/Notes (Cost $598,702,246) | | | | | 616,096,390 | | | | | | 96.3 | | |
| | BANK LOANS: 0.6% | | ||||||||||||||||||
| | | | | | | | Communications: 0.4% | | ||||||||||||
| | | | 2,750,000 | | | | Clear Channel Communications, Inc. Term Loan D, 7.732%, 01/30/19 | | | | | 2,374,166 | | | | | | 0.4 | | |
| | | | | | | | Consumer, Non-cyclical: 0.2% | | ||||||||||||
| | | | 1,229,782 | | | | Other Securities | | | | | 1,238,222 | | | | | | 0.2 | | |
| | | | | | | | Steel: 0.0% | | ||||||||||||
| | | | 331,373 | | | | Other Securities | | | | | 333,568 | | | | | | 0.0 | | |
| | | | | | | | Total Bank Loans (Cost $3,825,851) | | | | | 3,945,956 | | | | | | 0.6 | | |
| | ||||||||||||||||||||
| | Shares | | | Value | | | Percentage of Net Assets | | ||||||||||||
| | COMMON STOCK: —% | | ||||||||||||||||||
| | | | | | | | Consumer Discretionary: —% | | ||||||||||||
| | | | 195 | | | | Other Securities | | | | | — | | | | | | — | | |
| | | | | | | | Total Common Stock (Cost $7,957) | | | | | — | | | | | | — | | |
| | | | | | | | Total Long-Term Investments (Cost $602,536,054) | | | | | 620,042,346 | | | | | | 96.9 | | |
| | ||||||||||||||||||||
| Voya High Yield Bond Fund | as of March 31, 2017 (continued) |
| | Principal Amount† | | | Value | | | Percentage of Net Assets | | ||||||||||||
| | SHORT-TERM INVESTMENTS: 7.9% | | ||||||||||||||||||
| | | | | | | | Corporate Bonds/Notes: 0.3% | | ||||||||||||
| | | | 1,536,000 | # | | Bumble Bee Holdings, Inc., 9.000%, 12/15/17 | | | | $ | 1,501,440 | | | | | | 0.3 | | | |
| | | | 200,000 | L | | Frontier Communications Corp., 8.250%, 04/15/17 | | | | | 200,375 | | | | | | 0.0 | | | |
| | | | | | | | | | | | | 1,701,815 | | | | | | 0.3 | | |
| | | | | | | | Commercial Paper: 1.4% | | ||||||||||||
| | | | 4,000,000 | | | | CVS, 1.200%, 04/03/17 | | | | | 3,999,633 | | | | | | 0.6 | | |
| | | | 5,000,000 | | | | Kroger Co., 1.120%, 04/03/17 | | | | | 4,999,541 | | | | | | 0.8 | | |
| | | | | | | | | | | | | 8,999,174 | | | | | | 1.4 | | |
| | | | | | | | Securities Lending Collateralcc: 5.5% | | ||||||||||||
| | | | 8,421,251 | | | | Citigroup, Inc., Repurchase Agreement dated 03/31/17, 0.81%, due 04/03/17 (Repurchase Amount $8,421,812, collateralized by various U.S. Government/U.S. Government Agency Obligations, 0.000%-11.500%, Market Value plus accrued interest $8,589,676, due 04/01/17-06/01/52) | | | | | 8,421,251 | | | | | | 1.3 | | |
| | | | 8,421,251 | | | | HSBC Securities USA, Repurchase Agreement dated 03/31/17, 0.78%, due 04/03/17 (Repurchase Amount $8,421,791, collateralized by various U.S. Government Agency Obligations, 2.500%-6.500%, Market Value plus accrued interest $8,589,684, due 09/01/23-11/01/46) | | | | | 8,421,251 | | | | | | 1.3 | | |
| | | | 8,421,251 | | | | Merrill Lynch & Co., Inc., Repurchase Agreement dated 03/31/17, 0.83%, due 04/03/17 (Repurchase Amount $8,421,825, collateralized by various U.S. Government Agency Obligations, 1.840%-7.000%, Market Value plus accrued interest $8,589,676, due 05/01/17-12/01/46) | | | | | 8,421,251 | | | | | | 1.3 | | |
| | Principal Amount† | | | Value | | | Percentage of Net Assets | | ||||||||||||
| | SHORT-TERM INVESTMENTS (continued) | | ||||||||||||||||||
| | | | | | | | Securities Lending Collateralcc (continued) | | ||||||||||||
| | | | 8,421,251 | | | | Mizuho Securities USA Inc., Repurchase Agreement dated 03/31/17, 0.81%, due 04/03/17 (Repurchase Amount $8,421,812, collateralized by various U.S. Government Agency Obligations, 3.000%-4.000%, Market Value plus accrued interest $8,589,676, due 09/01/31-02/20/47) | | | | $ | 8,421,251 | | | | | | 1.3 | | |
| | | | 1,772,171 | | | | Royal Bank of Scotland PLC, Repurchase Agreement dated 03/31/17, 0.78%, due 04/03/17 (Repurchase Amount $1,772,285, collateralized by various U.S. Government Securities, 0.394%-2.250%, Market Value plus accrued interest $1,807,631, due 04/30/17-07/31/18) | | | | | 1,772,171 | | | | | | 0.3 | | |
| | | | | | | | | | | | | 35,457,175 | | | | | | 5.5 | | |
| | Shares | | | Value | | | Percentage of Net Assets | | ||||||||||||
| | | | | | | | Mutual Funds: 0.7% | | ||||||||||||
| | | | 4,534,000 | | | | BlackRock Liquidity Funds, FedFund, Institutional Class, 0.600%†† (Cost $4,534,000) | | | | | 4,534,000 | | | | | | 0.7 | | |
| | | | | | | | Total Short-Term Investments (Cost $50,751,230) | | | | | 50,692,164 | | | | | | 7.9 | | |
| | | | | | | | Total Investments in Securities (Cost $653,287,284) | | | | $ | 670,734,510 | | | | | | 104.8 | | |
| | | | | | | | Liabilities in Excess of Other Assets | | | | | (30,457,618) | | | | | | (4.8) | | |
| | | | | | | | Net Assets | | | | $ | 640,276,892 | | | | | | 100.0 | | |
| | ||||||||||||||||||||
| Voya High Yield Bond Fund | as of March 31, 2017 (continued) |
| | Gross Unrealized Appreciation | | | | $ | 24,891,472 | | |
| | Gross Unrealized Depreciation | | | | | (7,477,017) | | |
| | Net Unrealized Appreciation | | | | $ | 17,414,455 | | |
| | | | | |||||
| | | | Quoted Prices in Active Markets for Identical Investments (Level 1) | | | Significant Other Observable Inputs (Level 2) | | | Significant Unobservable Inputs (Level 3) | | | Fair Value at March 31, 2017 | | ||||||||||||
| Asset Table | | | | | | ||||||||||||||||||||
| Investments, at fair value | | | | | | ||||||||||||||||||||
| Common Stock | | | | | | ||||||||||||||||||||
| Consumer Discretionary | | | | $ | — | | | | | $ | — | | | | | $ | — | | | | | $ | — | | |
| Total Common Stock | | | | | — | | | | | | — | | | | | | — | | | | | | — | | |
| Corporate Bonds/Notes | | | | | — | | | | | | 616,096,390 | | | | | | — | | | | | | 616,096,390 | | |
| Short-Term Investments | | | | | 4,534,000 | | | | | | 46,158,164 | | | | | | — | | | | | | 50,692,164 | | |
| Bank Loans | | | | | — | | | | | | 3,945,956 | | | | | | — | | | | | | 3,945,956 | | |
| Total Investments, at fair value | | | | $ | 4,534,000 | | | | | $ | 666,200,510 | | | | | $ | — | | | | | $ | 670,734,510 | | |
| | |||||||||||||||||||||||||
| | | | Amount of Realized Gain or (Loss) on Derivatives Recognized in Income | | |||
| Derivatives not accounted for as hedging instruments | | | Swaps | | |||
| Credit contracts | | | | $ | 2,334 | | |
| Total | | | | $ | 2,334 | | |
| | |||||||
| Voya Intermediate Bond Fund | as of March 31, 2017 |
| | Principal Amount† | | | Value | | | Percentage of Net Assets | | ||||||||||||
| | CORPORATE BONDS/NOTES: 30.4% | | ||||||||||||||||||
| | | | | | | | Basic Materials: 0.8% | | ||||||||||||
| | | | 4,465,000 | # | | Chevron Phillips Chemical Co. LLC / Chevron Phillips Chemical Co. L.P., 3.400%, 12/01/26 | | | | $ | 4,474,475 | | | | | | 0.1 | | | |
| | | | 1,200,000 | # | | Corp Nacional del Cobre de Chile, 4.500%, 09/16/25 | | | | | 1,266,456 | | | | | | 0.0 | | | |
| | | | 1,861,000 | # | | Georgia-Pacific LLC, 2.539%, 11/15/19 | | | | | 1,876,845 | | | | | | 0.0 | | | |
| | | | 1,960,000 | # | | Georgia-Pacific LLC, 3.163%, 11/15/21 | | | | | 1,993,884 | | | | | | 0.1 | | | |
| | | | 1,334,000 | # | | Georgia-Pacific LLC, 3.734%, 07/15/23 | | | | | 1,389,656 | | | | | | 0.0 | | | |
| | | | 1,770,000 | # | | Mexichem SAB de CV, 4.875%, 09/19/22 | | | | | 1,871,775 | | | | | | 0.1 | | | |
| | | | 17,052,000 | | | | Other Securities | | | | | 17,507,195 | | | | | | 0.5 | | |
| | | | | | | | | | | | | 30,380,286 | | | | | | 0.8 | | |
| | | | | | | | Communications: 4.0% | | ||||||||||||
| | | | 800,000 | # | | Altice Financing SA, 6.625%, 02/15/23 | | | | | 834,000 | | | | | ��� | 0.0 | | | |
| | | | 31,833,000 | | | | AT&T, Inc., 2.800%-5.450%, 02/17/21-03/09/49 | | | | | 31,609,979 | | | | | | 0.8 | | |
| | | | 1,969,000 | # | | Charter Communications Operating LLC / Charter Communications Operating Capital, 5.375%, 05/01/47 | | | | | 1,984,758 | | | | | | 0.1 | | | |
| | | | 2,900,000 | # | | CommScope Technologies LLC, 5.000%, 03/15/27 | | | | | 2,902,755 | | | | | | 0.1 | | | |
| | | | 707,000 | # | | Digicel Ltd., 6.750%, 03/01/23 | | | | | 634,533 | | | | | | 0.0 | | | |
| | | | 1,380,000 | # | | Millicom International Cellular SA, 4.750%, 05/22/20 | | | | | 1,413,313 | | | | | | 0.0 | | | |
| | | | 2,000,000 | # | | Millicom International Cellular SA, 6.625%, 10/15/21 | | | | | 2,102,400 | | | | | | 0.1 | | | |
| | | | 2,985,000 | # | | Nielsen Finance LLC / Nielsen Finance Co., 5.000%, 04/15/22 | | | | | 3,059,625 | | | | | | 0.1 | | | |
| | | | 3,000,000 | # | | Sinclair Television Group, Inc., 5.625%, 08/01/24 | | | | | 3,045,000 | | | | | | 0.1 | | | |
| | | | 2,880,000 | # | | Sirius XM Radio, Inc., 5.375%, 04/15/25 | | | | | 2,954,880 | | | | | | 0.1 | | | |
| | | | 2,600,000 | # | | Telefonica Chile SA, 3.875%, 10/12/22 | | | | | 2,652,044 | | | | | | 0.1 | | | |
| | Principal Amount† | | | Value | | | Percentage of Net Assets | | ||||||||||||
| | CORPORATE BONDS/NOTES: (continued) | | ||||||||||||||||||
| | | | | | | | Communications (continued) | | ||||||||||||
| | | | 1,881,000 | | | | Time Warner Cable, Inc., 5.350%, 12/15/43 | | | | $ | 1,936,480 | | | | | | 0.1 | | |
| | | | 4,697,000 | | | | Time Warner Cable LLC, 5.500%-5.875%, 11/15/40-09/01/41 | | | | | 4,917,407 | | | | | | 0.1 | | |
| | | | 7,700,000 | | | | Time Warner, Inc., 4.050%-6.500%, 12/15/23-07/15/45 | | | | | 7,959,055 | | | | | | 0.2 | | |
| | | | 5,630,000 | # | | Univision Communications, Inc., 5.125%, 02/15/25 | | | | | 5,559,625 | | | | | | 0.1 | | | |
| | | | 2,350,000 | # | | UPCB Finance IV Ltd., 5.375%, 01/15/25 | | | | | 2,376,438 | | | | | | 0.1 | | | |
| | | | 5,386,000 | # | | Verizon Communications, Inc., 4.812%, 03/15/39 | | | | | 5,262,084 | | | | | | 0.1 | | | |
| | | | 25,082,000 | | | | Verizon Communications, Inc., 3.000%-5.050%, 11/01/21-08/21/54 | | | | | 25,154,219 | | | | | | 0.7 | | |
| | | | 42,677,000 | | | | Other Securities | | | | | 42,828,178 | | | | | | 1.1 | | |
| | | | | | | | | | | | | 149,186,773 | | | | | | 4.0 | | |
| | | | | | | | Consumer, Cyclical: 1.8% | | ||||||||||||
| | | | 1,490,000 | # | | AMC Entertainment Holdings, Inc., 5.875%, 11/15/26 | | | | | 1,510,487 | | | | | | 0.1 | | | |
| | | | 1,445,000 | # | | Nemak SA de CV, 5.500%, 02/28/23 | | | | | 1,508,219 | | | | | | 0.0 | | | |
| | | | 1,605,000 | # | | Six Flags Entertainment Corp., 4.875%, 07/31/24 | | | | | 1,587,947 | | | | | | 0.0 | | | |
| | | | 3,210,000 | # | | Six Flags Entertainment Corp., 5.500%, 04/15/27 | | | | | 3,210,000 | | | | | | 0.1 | | | |
| | | | 58,908,000 | | | | Other Securities | | | | | 59,441,195 | | | | | | 1.6 | | |
| | | | | | | | | | | | | 67,257,848 | | | | | | 1.8 | | |
| | | | | | | | Consumer, Non-cyclical: 4.5% | | ||||||||||||
| | | | 13,858,000 | | | | Abbott Laboratories, 2.800%-4.900%, 09/15/20-11/30/46 | | | | | 14,255,173 | | | | | | 0.4 | | |
| | | | 13,290,000 | | | | AbbVie, Inc., 3.200%-4.450%, 11/06/22-05/14/46 | | | | | 12,931,952 | | | | | | 0.3 | | |
| | | | 12,564,000 | | | | Anheuser-Busch InBev Finance, Inc., 3.650%, 02/01/26 | | | | | 12,726,716 | | | | | | 0.4 | | |
| | | | 4,161,000 | | | | Anheuser-Busch InBev Finance, Inc., 4.700%, 02/01/36 | | | | | 4,418,762 | | | | | | 0.1 | | |
| | | | 2,506,000 | # | | Bayer US Finance LLC, 3.000%, 10/08/21 | | | | | 2,537,052 | | | | | | 0.1 | | | |
| Voya Intermediate Bond Fund | as of March 31, 2017 (continued) |
| | Principal Amount† | | | Value | | | Percentage of Net Assets | | ||||||||||||
| | CORPORATE BONDS/NOTES: (continued) | | ||||||||||||||||||
| | | | | | | | Consumer, Non-cyclical (continued) | | ||||||||||||
| | | | 1,790,000 | # | | Hill-Rom Holdings, Inc., 5.000%, 02/15/25 | | | | $ | 1,792,237 | | | | | | 0.0 | | | |
| | | | 3,430,000 | # | | Imperial Brands Finance PLC, 2.950%, 07/21/20 | | | | | 3,475,996 | | | | | | 0.1 | | | |
| | | | 2,290,000 | # | | Imperial Brands Finance PLC, 3.750%, 07/21/22 | | | | | 2,354,402 | | | | | | 0.1 | | | |
| | | | 1,300,000 | # | | JBS USA LUX SA / JBS USA Finance, Inc., 5.750%, 06/15/25 | | | | | 1,319,500 | | | | | | 0.0 | | | |
| | | | 6,230,000 | # | | Post Holdings, Inc., 5.000%, 08/15/26 | | | | | 5,980,800 | | | | | | 0.2 | | | |
| | | | 3,000,000 | # | | Universal Health Services, Inc., 4.750%, 08/01/22 | | | | | 3,097,500 | | | | | | 0.1 | | | |
| | | | 1,000,000 | # | | Valeant Pharmaceuticals International, Inc., 5.625%, 12/01/21 | | | | | 810,000 | | | | | | 0.0 | | | |
| | | | 1,000,000 | #,L | | Valeant Pharmaceuticals International, 6.375%, 10/15/20 | | | | | 910,000 | | | | | | 0.1 | | | |
| | | | 915,000 | # | | Valeant Pharmaceuticals International, 7.250%, 07/15/22 | | | | | 784,613 | | | | | | 0.0 | | | |
| | | | 1,753,000 | # | | Wm Wrigley Jr Co., 2.400%, 10/21/18 | | | | | 1,767,752 | | | | | | 0.0 | | | |
| | | | 98,064,000 | | | | Other Securities(a) | | | | | 98,186,249 | | | | | | 2.6 | | |
| | | | | | | | | | | | | 167,348,704 | | | | | | 4.5 | | |
| | | | | | | | Energy: 3.8% | | ||||||||||||
| | | | 400,000 | # | | Empresa Nacional del Petroleo, 3.750%, 08/05/26 | | | | | 387,734 | | | | | | 0.0 | | | |
| | | | 1,070,000 | | | | Energy Transfer Equity L.P., 7.500%, 10/15/20 | | | | | 1,198,400 | | | | | | 0.0 | | |
| | | | 11,012,000 | | | | Energy Transfer Partners L.P., 4.200%-9.700%, 03/15/19-04/15/47 | | | | | 11,041,796 | | | | | | 0.3 | | |
| | | | 285,000 | # | | Hilcorp Energy I L.P. / Hilcorp Finance Co., 5.000%, 12/01/24 | | | | | 268,612 | | | | | | 0.0 | | | |
| | | | 1,250,000 | # | | Petroleos Mexicanos, 6.500%, 03/13/27 | | | | | 1,346,250 | | | | | | 0.0 | | | |
| | | | 4,633,000 | # | | Sabine Pass Liquefaction LLC, 4.200%, 03/15/28 | | | | | 4,572,637 | | | | | | 0.1 | | | |
| | | | 13,264,000 | | | | Shell International Finance BV, 3.250%-4.375%, 05/11/25-05/10/46 | | | | | 13,072,696 | | | | | | 0.4 | | |
| | | | 3,250,000 | # | | YPF SA, 8.500%, 03/23/21 | | | | | 3,570,157 | | | | | | 0.1 | | | |
| | Principal Amount† | | | Value | | | Percentage of Net Assets | | ||||||||||||
| | CORPORATE BONDS/NOTES: (continued) | | ||||||||||||||||||
| | | | | | | | Energy (continued) | | ||||||||||||
| | | | 2,600,000 | # | | YPF SA, 8.875%, 12/19/18 | | | | $ | 2,835,300 | | | | | | 0.1 | | | |
| | | | 100,624,667 | | | | Other Securities(a) | | | | | 102,373,402 | | | | | | 2.8 | | |
| | | | | | | | | | | | | 140,666,984 | | | | | | 3.8 | | |
| | | | | | | | Financial: 10.1% | | ||||||||||||
| | | | 3,270,000 | #,L | | ABN AMRO Bank NV, 4.800%, 04/18/26 | | | | | 3,395,800 | | | | | | 0.1 | | | |
| | | | 5,270,000 | # | | Athene Global Funding, 2.875%, 10/23/18 | | | | | 5,301,709 | | | | | | 0.1 | | | |
| | | | 5,840,000 | # | | Athene Global Funding, 4.000%, 01/25/22 | | | | | 5,942,025 | | | | | | 0.2 | | | |
| | | | 400,000 | # | | Banco de Reservas de la Republica Dominicana, 7.000%, 02/01/23 | | | | | 408,264 | | | | | | 0.0 | | | |
| | | | 28,641,000 | | | | Bank of America Corp., 2.503%-4.750%, 10/19/20-04/21/45 | | | | | 28,874,017 | | | | | | 0.8 | | |
| | | | 12,532,000 | | | | Barclays PLC, 3.250%-4.337%, 01/12/21-01/10/28 | | | | | 12,594,029 | | | | | | 0.3 | | |
| | | | 2,045,000 | # | | BNP Paribas SA, 3.800%, 01/10/24 | | | | | 2,036,395 | | | | | | 0.1 | | | |
| | | | 5,145,000 | # | | BPCE SA, 5.150%, 07/21/24 | | | | | 5,291,766 | | | | | | 0.1 | | | |
| | | | 19,782,000 | | | | Citigroup, Inc., 3.200%-5.500%, 09/13/25-05/18/46 | | | | | 20,136,384 | | | | | | 0.5 | | |
| | | | 1,147,000 | # | | Citizens Financial Group, Inc., 4.150%, 09/28/22 | | | | | 1,180,124 | | | | | | 0.0 | | | |
| | | | 559,000 | #,L | | Commonwealth Bank of Australia, 2.750%, 03/10/22 | | | | | 560,702 | | | | | | 0.0 | | | |
| | | | 2,160,000 | # | | Commonwealth Bank of Australia, 2.850%, 05/18/26 | | | | | 2,089,530 | | | | | | 0.1 | | | |
| | | | 1,660,000 | # | | Cooperatieve Centrale Raiffeisen-Boerenleenbank BA/Netherlands, 11.000%, 12/29/49 | | | | | 1,944,275 | | | | | | 0.1 | | | |
| | | | 2,620,000 | # | | Credit Agricole SA/ London, 4.125%, 01/10/27 | | | | | 2,604,036 | | | | | | 0.1 | | | |
| | | | 2,776,000 | # | | Credit Suisse AG, 6.500%, 08/08/23 | | | | | 3,054,505 | | | | | | 0.1 | | | |
| | | | 4,400,000 | # | | Credit Suisse Group AG, 3.574%, 01/09/23 | | | | | 4,396,832 | | | | | | 0.1 | | | |
| | | | 2,565,000 | # | | Credit Suisse Group AG, 4.282%, 01/09/28 | | | | | 2,557,874 | | | | | | 0.1 | | | |
| Voya Intermediate Bond Fund | as of March 31, 2017 (continued) |
| | Principal Amount† | | | Value | | | Percentage of Net Assets | | ||||||||||||
| | CORPORATE BONDS/NOTES: (continued) | | ||||||||||||||||||
| | | | | | | | Financial: (continued) | | ||||||||||||
| | | | 5,410,000 | | | | Credit Suisse Group Funding Guernsey Ltd., 3.450%-3.800%, 04/16/21-09/15/22 | | | | $ | 5,490,657 | | | | | | 0.1 | | |
| | | | 2,115,000 | # | | Dana Financing Luxembourg Sarl, 5.750%, 04/15/25 | | | | | 2,138,794 | | | | | | 0.1 | | | |
| | | | 2,385,000 | # | | ESH Hospitality, Inc., 5.250%, 05/01/25 | | | | | 2,410,329 | | | | | | 0.1 | | | |
| | | | 17,869,000 | | | | Goldman Sachs Group, Inc., 2.600%-6.750%, 04/23/20-05/22/45 | | | | | 18,217,225 | | | | | | 0.5 | | |
| | | | 1,763,000 | # | | HBOS PLC, 6.750%, 05/21/18 | | | | | 1,846,665 | | | | | | 0.0 | | | |
| | | | 2,010,000 | # | | ING Bank NV, 2.000%, 11/26/18 | | | | | 2,009,107 | | | | | | 0.1 | | | |
| | | | 1,037,000 | # | | International Lease Finance Corp., 7.125%, 09/01/18 | | | | | 1,108,604 | | | | | | 0.0 | | | |
| | | | 8,393,000 | | | | JPMorgan Chase & Co., 4.125%, 12/15/26 | | | | | 8,567,768 | | | | | | 0.2 | | |
| | | | 16,851,000 | | | | JPMorgan Chase & Co., 2.550%-6.125%, 10/29/20-12/29/49 | | | | | 17,160,007 | | | | | | 0.5 | | |
| | | | 3,048,000 | # | | Liberty Mutual Group, Inc., 4.850%, 08/01/44 | | | | | 3,101,471 | | | | | | 0.1 | | | |
| | | | 200,000 | #,L | | Mizuho Financial Group, Inc., 3.477%, 04/12/26 | | | | | 199,349 | | | | | | 0.0 | | | |
| | | | 14,506,000 | | | | Morgan Stanley, 2.125%-4.000%, 04/25/18-04/23/27 | | | | | 14,515,740 | | | | | | 0.4 | | |
| | | | 1,345,000 | #,L | | Nordea Bank AB, 6.125%, 12/29/49 | | | | | 1,363,494 | | | | | | 0.0 | | | |
| | | | 3,280,000 | # | | Ontario Teachers’ Cadillac Fairview Properties Trust, 3.875%, 03/20/27 | | | | | 3,331,306 | | | | | | 0.1 | | | |
| | | | 2,763,000 | | | | Santander UK Group Holdings PLC, 3.571%, 01/10/23 | | | | | 2,766,152 | | | | | | 0.1 | | |
| | | | 3,769,000 | # | | Santander UK Group Holdings PLC, 5.625%, 09/15/45 | | | | | 3,869,391 | | | | | | 0.1 | | | |
| | | | 3,112,000 | | | | Santander UK PLC, 2.375%, 03/16/20 | | | | | 3,121,084 | | | | | | 0.1 | | |
| | | | 1,680,000 | # | | Santander UK PLC, 5.000%, 11/07/23 | | | | | 1,756,205 | | | | | | 0.0 | | | |
| | Principal Amount† | | | Value | | | Percentage of Net Assets | | ||||||||||||
| | CORPORATE BONDS/NOTES: (continued) | | ||||||||||||||||||
| | | | | | | | Financial: (continued) | | ||||||||||||
| | | | 7,350,000 # | | | | Scentre Group Trust 1 / Scentre Group Trust 2, 3.750%, 03/23/27 | | | | $ | 7,411,042 | | | | | | 0.2 | | |
| | | | 4,845,000 | #,L | | Societe Generale SA, 4.000%, 01/12/27 | | | | | 4,744,655 | | | | | | 0.1 | | | |
| | | | 5,370,000 | #,L | | Standard Chartered PLC, 4.300%, 02/19/27 | | | | | 5,290,411 | | | | | | 0.1 | | | |
| | | | 1,470,000 | | | | UBS AG/Stamford CT, 7.625%, 08/17/22 | | | | | 1,703,289 | | | | | | 0.0 | | |
| | | | 3,719,000 | # | | UBS Group Funding Jersey Ltd., 4.125%, 09/24/25 | | | | | 3,788,289 | | | | | | 0.1 | | | |
| | | | 6,041,000 | # | | UBS Group Funding Jersey Ltd., 4.125%, 04/15/26 | | | | | 6,151,937 | | | | | | 0.2 | | | |
| | | | 3,871,000 | | | | Wells Fargo & Co., 3.000%-4.100%, 06/03/26-10/23/26 | | | | | 3,877,476 | | | | | | 0.1 | | |
| | | | 149,016,010 | | | | Other Securities(a) | | | | | 150,425,397 | | | | | | 4.0 | | |
| | | | | | | | | | | | | 378,734,111 | | | | | | 10.1 | | |
| | | | | | | | Industrial: 1.3% | | ||||||||||||
| | | | 2,518,000 | # | | Builders FirstSource, Inc., 5.625%, 09/01/24 | | | | | 2,565,212 | | | | | | 0.1 | | | |
| | | | 2,449,000 | #,L | | Cemex SAB de CV, 6.125%, 05/05/25 | | | | | 2,619,695 | | | | | | 0.1 | | | |
| | | | 1,000,000 | # | | Empresa de Transporte de Pasajeros Metro SA, 5.000%, 01/25/47 | | | | | 1,049,150 | | | | | | 0.0 | | | |
| | | | 600,000 | # | | Kazakhstan Temir Zholy Finance BV, 6.950%, 07/10/42 | | | | | 632,631 | | | | | | 0.0 | | | |
| | | | 2,900,000 | # | | Novelis Corp., 5.875%, 09/30/26 | | | | | 2,965,250 | | | | | | 0.1 | | | |
| | | | 1,220,000 | # | | Owens-Brockway Glass Container, Inc., 5.875%, 08/15/23 | | | | | 1,293,200 | | | | | | 0.0 | | | |
| | | | 2,712,000 | # | | Siemens Financieringsmaatschappij NV, 3.300%, 09/15/46 | | | | | 2,365,295 | | | | | | 0.1 | | | |
| | | | 2,280,000 | # | | Siemens Financieringsmaatschappij NV, 3.400%, 03/16/27 | | | | | 2,302,862 | | | | | | 0.0 | | | |
| | | | 3,042,000 | # | | Siemens Financieringsmaatschappij NV, 4.200%, 03/16/47 | | | | | 3,092,369 | | | | | | 0.1 | | | |
| | | | 3,855,000 | # | | Standard Industries, Inc./NJ, 5.000%, 02/15/27 | | | | | 3,787,538 | | | | | | 0.1 | | | |
| Voya Intermediate Bond Fund | as of March 31, 2017 (continued) |
| | Principal Amount† | | | Value | | | Percentage of Net Assets | | ||||||||||||
| | CORPORATE BONDS/NOTES: (continued) | | ||||||||||||||||||
| | | | | | | | Industrial (continued) | | ||||||||||||
| | | | 1,000,000 | # | | Transnet SOC Ltd., 4.000%, 07/26/22 | | | | $ | 960,634 | | | | | | 0.0 | | | |
| | | | 24,486,000 | | | | Other Securities | | | | | 24,866,363 | | | | | | 0.7 | | |
| | | | | | | | | | | | | 48,500,199 | | | | | | 1.3 | | |
| | | | | | | | Mortgage Securities: 0.1% | | ||||||||||||
| | | | 57,060,000 | #,^ | | LSTAR Commercial Mortgage Trust 2017-5, 1.393%, 03/10/50 | | | | | 3,329,029 | | | | | | 0.1 | | | |
| | | | | | | | Technology: 2.4% | | ||||||||||||
| | | | 15,052,000 | | | | Apple, Inc., 2.450%-4.650%, 02/09/24-02/23/46 | | | | | 15,217,434 | | | | | | 0.4 | | |
| | | | 2,820,000 | # | | Broadcom Corp. / Broadcom Cayman Finance Ltd., 3.625%, 01/15/24 | | | | | 2,844,320 | | | | | | 0.1 | | | |
| | | | 4,120,000 | # | | Diamond 1 Finance Corp./ Diamond 2 Finance Corp., 4.420%, 06/15/21 | | | | | 4,312,103 | | | | | | 0.1 | | | |
| | | | 4,358,000 | # | | Diamond 1 Finance Corp./ Diamond 2 Finance Corp., 5.450%, 06/15/23 | | | | | 4,707,503 | | | | | | 0.2 | | | |
| | | | 4,040,000 | # | | Diamond 1 Finance Corp./ Diamond 2 Finance Corp., 6.020%, 06/15/26 | | | | | 4,420,289 | | | | | | 0.1 | | | |
| | | | 2,320,000 | # | | Everett Spinco, Inc., 4.250%, 04/15/24 | | | | | 2,362,340 | | | | | | 0.0 | | | |
| | | | 3,290,000 | # | | Everett Spinco, Inc., 4.750%, 04/15/27 | | | | | 3,361,133 | | | | | | 0.1 | | | |
| | | | 3,255,000 | # | | First Data Corp., 5.750%, 01/15/24 | | | | | 3,369,739 | | | | | | 0.1 | | | |
| | | | 18,569,000 | | | | Microsoft Corp., 2.875%-4.450%, 02/06/24-02/06/47 | | | | | 18,937,521 | | | | | | 0.5 | | |
| | | | 2,840,000 | # | | Seagate HDD Cayman, 4.875%, 03/01/24 | | | | | 2,793,884 | | | | | | 0.1 | | | |
| | | | 26,356,000 | | | | Other Securities | | | | | 26,674,199 | | | | | | 0.7 | | |
| | | | | | | | | | | | | 89,000,465 | | | | | | 2.4 | | |
| | | | | | | | Utilities: 1.6% | | ||||||||||||
| | | | 1,400,000 | # | | Comision Federal de Electricidad, 4.750%, 02/23/27 | | | | | 1,407,000 | | | | | | 0.0 | | | |
| | | | 873,000 | # | | Empresa de Energia de Bogota SA ESP, 6.125%, 11/10/21 | | | | | 901,372 | | | | | | 0.0 | | | |
| | Principal Amount† | | | Value | | | Percentage of Net Assets | | ||||||||||||
| | CORPORATE BONDS/NOTES: (continued) | | ||||||||||||||||||
| | | | | | | | Utilities (continued) | | ||||||||||||
| | | | 4,199,000 | # | | Jersey Central Power & Light Co., 4.300%, 01/15/26 | | | | $ | 4,375,669 | | | | | | 0.1 | | | |
| | | | 1,982,000 | # | | New York State Electric & Gas Corp., 3.250%, 12/01/26 | | | | | 1,973,872 | | | | | | 0.1 | | | |
| | | | 50,489,000 | | | | Other Securities(a) | | | | | 50,535,723 | | | | | | 1.4 | | |
| | | | | | | | | | | | | 59,193,636 | | | | | | 1.6 | | |
| | | | | | | | Total Corporate Bonds/Notes (Cost $1,128,648,923) | | | | | 1,133,598,035 | | | | | | 30.4 | | |
| | COLLATERALIZED MORTGAGE OBLIGATIONS: 13.5% | | ||||||||||||||||||
| | | | 2,808,625 | | | | Alternative Loan Trust 2004-J7 MI, 2.002%, 10/25/34 | | | | | 2,363,562 | | | | | | 0.1 | | |
| | | | 4,631,714 | | | | Alternative Loan Trust 2005-10CB 1A1, 1.482%, 05/25/35 | | | | | 3,686,801 | | | | | | 0.1 | | |
| | | | 3,795,758 | | | | Alternative Loan Trust 2005-51 3A2A, 1.928%, 11/20/35 | | | | | 3,335,719 | | | | | | 0.1 | | |
| | | | 1,208,672 | | | | Alternative Loan Trust 2005-65CB 2A4, 5.500%, 12/25/35 | | | | | 1,082,482 | | | | | | 0.0 | | |
| | | | 1,483,044 | | | | Alternative Loan Trust 2005-6CB 1A3, 5.250%, 04/25/35 | | | | | 1,426,617 | | | | | | 0.1 | | |
| | | | 2,701,609 | | | | Alternative Loan Trust 2005-J2 1A12, 1.382%, 04/25/35 | | | | | 2,173,594 | | | | | | 0.1 | | |
| | | | 1,156,251 | | | | Alternative Loan Trust 2006-13T1 A9, 6.000%, 05/25/36 | | | | | 903,849 | | | | | | 0.0 | | |
| | | | 272,976 | | | | Alternative Loan Trust 2006-18CB A10, 1.382%, 07/25/36 | | | | | 161,390 | | | | | | 0.0 | | |
| | | | 1,698,920 | | | | Alternative Loan Trust 2006-19CB A28, 1.582%, 08/25/36 | | | | | 1,160,536 | | | | | | 0.0 | | |
| | | | 1,767,538 | | | | Alternative Loan Trust 2006-HY11 A1, 1.102%, 06/25/36 | | | | | 1,487,100 | | | | | | 0.1 | | |
| | | | 1,774,693 | | | | Alternative Loan Trust 2007-23CB A3, 1.482%, 09/25/37 | | | | | 1,125,915 | | | | | | 0.0 | | |
| | | | 4,511,142 | | | | Alternative Loan Trust 2007-2CB 2A1, 1.582%, 03/25/37 | | | | | 2,954,585 | | | | | | 0.1 | | |
| Voya Intermediate Bond Fund | as of March 31, 2017 (continued) |
| | Principal Amount† | | | Value | | | Percentage of Net Assets | | ||||||||||||
| | COLLATERALIZED MORTGAGE OBLIGATIONS: (continued) | | ||||||||||||||||||
| | | | 1,795,238 | | | | Alternative Loan Trust 2007-3T1 1A11, 6.000%, 04/25/37 | | | | $ | 1,373,332 | | | | | | 0.0 | | |
| | | | 1,620,459 | | | | Alternative Loan Trust 2007-8CB A3, 1.482%, 05/25/37 | | | | | 1,074,042 | | | | | | 0.0 | | |
| | | | 529,542 | # | | Angel Oak Mortgage Trust LLC 2015-1 A, 4.500%, 11/25/45 | | | | | 532,830 | | | | | | 0.0 | | | |
| | | | 458,430 | | | | Banc of America Mortgage 2005-J Trust 2A4, 3.426%, 11/25/35 | | | | | 426,559 | | | | | | 0.0 | | |
| | | | 1,857,491 ^ | | | | Banc of America Mortgage 2007-2 A8 Trust, 6.000%, 05/25/37 | | | | | 355,974 | | | | | | 0.0 | | |
| | | | 2,774,533 | | | | Bear Stearns ALT-A Trust 2005-4 23A1, 3.404%, 05/25/35 | | | | | 2,686,453 | | | | | | 0.1 | | |
| | | | 3,881,585 | | | | Bear Stearns ALT-A Trust 2005-7 21A1, 3.301%, 09/25/35 | | | | | 3,629,467 | | | | | | 0.1 | | |
| | | | 1,351,585 | # | | Bellemeade Re Ltd. 2015-1A M2, 5.282%, 07/25/25 | | | | | 1,359,839 | | | | | | 0.0 | | | |
| | | | 2,437,080 | | | | Citicorp Mortgage Securities Trust Series 2006-3 1A4, 6.000%, 06/25/36 | | | | | 2,407,576 | | | | | | 0.0 | | |
| | | | 3,036,184 | | | | Citigroup Mortgage Loan Trust 2006-AR9 2A, 3.229%, 11/25/36 | | | | | 2,498,438 | | | | | | 0.1 | | |
| | | | 1,218,335 | | | | Citigroup Mortgage Loan Trust 2007-10 22AA, 3.365%, 09/25/37 | | | | | 1,049,399 | | | | | | 0.0 | | |
| | | | 2,811,000 | # | | Citigroup Mortgage Loan Trust 2010-7 3A5, 5.500%, 12/25/35 | | | | | 2,837,837 | | | | | | 0.1 | | | |
| | | | 3,361,394 | # | | CSMC Series 2008-2R 1A1, 6.000%, 07/25/37 | | | | | 3,096,917 | | | | | | 0.1 | | | |
| | | | 135,897,179 ^ | | | | Deutsche ALT-A Securities, Inc. ALT 07-AB1 X, 1.094%, 04/25/37 | | | | | 5,280,258 | | | | | | 0.1 | | |
| | | | 7,816,509 ^ | | | | Fannie Mae 2008-12 SC, 5.368%, 03/25/38 | | | | | 1,340,049 | | | | | | 0.0 | | |
| | | | 7,304,973 | | | | Fannie Mae 2011-99 CZ, 4.500%, 10/25/41 | | | | | 8,124,160 | | | | | | 0.2 | | |
| | | | 4,919,751 | | | | Fannie Mae 2012-66 EP, 4.000%, 06/25/42 | | | | | 5,247,637 | | | | | | 0.1 | | |
| | Principal Amount† | | | Value | | | Percentage of Net Assets | | ||||||||||||
| | COLLATERALIZED MORTGAGE OBLIGATIONS: (continued) | | ||||||||||||||||||
| | | | 6,534,000 | | | | Fannie Mae 2013-116 UB, 4.000%, 11/25/43 | | | | $ | 6,863,153 | | | | | | 0.2 | | |
| | | | 46,303,740 ^ | | | | Fannie Mae 2016-82 SD, 5.068%, 11/25/46 | | | | | 8,215,159 | | | | | | 0.2 | | |
| | | | 4,600,000 | | | | Fannie Mae Connecticut Avenue Securities 16-C06 1M2, 5.232%, 04/25/29 | | | | | 4,877,706 | | | | | | 0.1 | | |
| | | | 1,400,000 | | | | Fannie Mae Connecticut Avenue Securities 2014-C01 M2, 5.382%, 01/25/24 | | | | | 1,550,223 | | | | | | 0.0 | | |
| | | | 2,920,000 | | | | Fannie Mae Connecticut Avenue Securities 2014-C03 2M2, 3.882%, 07/25/24 | | | | | 3,005,461 | | | | | | 0.1 | | |
| | | | 6,700,000 | | | | Fannie Mae Connecticut Avenue Securities 2014-CO3 1M2, 3.982%, 07/25/24 | | | | | 6,917,525 | | | | | | 0.2 | | |
| | | | 4,043,321 | | | | Fannie Mae Connecticut Avenue Securities 2015-C02 1M2, 4.982%, 05/25/25 | | | | | 4,259,899 | | | | | | 0.1 | | |
| | | | 5,400,000 | | | | Fannie Mae Connecticut Avenue Securities 2015-C03 1M2, 5.982%, 07/25/25 | | | | | 5,945,158 | | | | | | 0.2 | | |
| | | | 700,000 | | | | Fannie Mae Connecticut Avenue Securities 2015-C03 2M2, 5.982%, 07/25/25 | | | | | 766,809 | | | | | | 0.0 | | |
| | | | 1,899,438 | | | | Fannie Mae Connecticut Avenue Securities 2015-CO1 1M2, 5.282%, 02/25/25 | | | | | 2,017,685 | | | | | | 0.1 | | |
| | | | 3,000,000 | | | | Fannie Mae Connecticut Avenue Securities 2017-C01 1M2, 4.532%, 07/25/29 | | | | | 3,039,982 | | | | | | 0.1 | | |
| | | | 3,100,000 | | | | Fannie Mae Connecticut Avenue Securities 2017-C02 2M2, 4.627%, 09/25/29 | | | | | 3,119,986 | | | | | | 0.1 | | |
| | | | 54,944 | | | | Fannie Mae Grantor Trust 1998-T2 A6, 0.532%, 01/25/32 | | | | | 56,384 | | | | | | 0.0 | | |
| | | | 86,691 ^ | | | | Fannie Mae Interest Strip Series 343 22, 4.000%, 11/25/18 | | | | | 1,903 | | | | | | 0.0 | | |
| Voya Intermediate Bond Fund | as of March 31, 2017 (continued) |
| | Principal Amount† | | | Value | | | Percentage of Net Assets | | ||||||||||||
| | COLLATERALIZED MORTGAGE OBLIGATIONS: (continued) | | ||||||||||||||||||
| | | | 622,680 ^ | | | | Fannie Mae Interest Strip Series 418 20, 3.000%, 05/25/43 | | | | $ | 93,150 | | | | | | 0.0 | | |
| | | | 2,574,067 ^ | | | | Fannie Mae Interest Strip Series 418 59, 3.000%, 08/25/28 | | | | | 247,810 | | | | | | 0.0 | | |
| | | | 272,148 | | | | Fannie Mae REMIC Trust 1999-33 Z, 6.000%, 07/25/29 | | | | | 301,795 | | | | | | 0.0 | | |
| | | | 409,167 ^ | | | | Fannie Mae REMIC Trust 1999-6 SE, 6.743%, 02/17/29 | | | | | 54,621 | | | | | | 0.0 | | |
| | | | 212,557 | | | | Fannie Mae REMIC Trust 2001-15 Z, 6.000%, 04/25/31 | | | | | 235,477 | | | | | | 0.0 | | |
| | | | 2,130,934 | | | | Fannie Mae REMIC Trust 2003-105 AZ, 5.500%, 10/25/33 | | | | | 2,376,101 | | | | | | 0.1 | | |
| | | | 624,713 | | | | Fannie Mae REMIC Trust 2003-45 FJ, 2.483%, 06/25/33 | | | | | 653,495 | | | | | | 0.0 | | |
| | | | 2,739,158 ^ | | | | Fannie Mae REMIC Trust 2003-66 SA, 6.668%, 07/25/33 | | | | | 565,681 | | | | | | 0.0 | | |
| | | | 435,380 ^ | | | | Fannie Mae REMIC Trust 2003-74 IO, 6.000%, 08/25/33 | | | | | 102,623 | | | | | | 0.0 | | |
| | | | 1,470,341 | | | | Fannie Mae REMIC Trust 2003-84 PZ, 5.000%, 09/25/33 | | | | | 1,605,373 | | | | | | 0.1 | | |
| | | | 31,448 | | | | Fannie Mae REMIC Trust 2004-10 SC, 24.673%, 02/25/34 | | | | | 37,446 | | | | | | 0.0 | | |
| | | | 2,119,149 | | | | Fannie Mae REMIC Trust 2004-50 VZ, 5.500%, 07/25/34 | | | | | 2,322,862 | | | | | | 0.1 | | |
| | | | 43,349 | | | | Fannie Mae REMIC Trust 2004-56 FE, 1.432%, 10/25/33 | | | | | 43,451 | | | | | | 0.0 | | |
| | | | 1,004,556 | | | | Fannie Mae REMIC Trust 2004-7 Z, 5.500%, 02/25/34 | | | | | 1,129,222 | | | | | | 0.0 | | |
| | | | 2,181,544 | | | | Fannie Mae REMIC Trust 2004-75 ZG, 4.500%, 10/25/34 | | | | | 2,340,670 | | | | | | 0.1 | | |
| | | | 481,192 | | | | Fannie Mae REMIC Trust 2004-79 S, 17.100%, 08/25/32 | | | | | 546,033 | | | | | | 0.0 | | |
| | Principal Amount† | | | Value | | | Percentage of Net Assets | | ||||||||||||
| | COLLATERALIZED MORTGAGE OBLIGATIONS: (continued) | | ||||||||||||||||||
| | | | 219,249 | | | | Fannie Mae REMIC Trust 2004-W10 A5, 5.500%, 08/25/34 | | | | $ | 224,092 | | | | | | 0.0 | | |
| | | | 5,593,503 | | | | Fannie Mae REMIC Trust 2005-25 Z, 5.000%, 04/25/35 | | | | | 6,125,360 | | | | | | 0.2 | | |
| | | | 204,986 | | | | Fannie Mae REMIC Trust 2005-74 NP, 19.279%, 01/25/35 | | | | | 235,476 | | | | | | 0.0 | | |
| | | | 313,623 | | | | Fannie Mae REMIC Trust 2006-104 ES, 28.542%, 11/25/36 | | | | | 553,094 | | | | | | 0.0 | | |
| | | | 5,629,561 ^ | | | | Fannie Mae REMIC Trust 2006-12 SD, 5.768%, 10/25/35 | | | | | 926,105 | | | | | | 0.0 | | |
| | | | 1,510,795 ^ | | | | Fannie Mae REMIC Trust 2006-123 UI, 5.758%, 01/25/37 | | | | | 305,087 | | | | | | 0.0 | | |
| | | | 420,453 ^ | | | | Fannie Mae REMIC Trust 2006-72 HS, 5.718%, 08/25/26 | | | | | 63,397 | | | | | | 0.0 | | |
| | | | 102,267 | | | | Fannie Mae REMIC Trust 2007-10 Z, 6.000%, 02/25/37 | | | | | 112,672 | | | | | | 0.0 | | |
| | | | 7,449,387 ^ | | | | Fannie Mae REMIC Trust 2007-91 AS, 5.418%, 10/25/37 | | | | | 1,386,613 | | | | | | 0.0 | | |
| | | | 3,467,676 | | | | Fannie Mae REMIC Trust 2009-19 PW, 4.500%, 10/25/36 | | | | | 3,724,977 | | | | | | 0.1 | | |
| | | | 18,154,241 | | | | Fannie Mae REMIC Trust 2009-50 HZ, 5.578%, 02/25/49 | | | | | 19,705,343 | | | | | | 0.5 | | |
| | | | 4,418,590 ^ | | | | Fannie Mae REMIC Trust 2009-90 TS, 5.168%, 11/25/39 | | | | | 723,131 | | | | | | 0.0 | | |
| | | | 7,288,335 ^ | | | | Fannie Mae REMIC Trust 2010-118 GS, 4.968%, 10/25/39 | | | | | 748,478 | | | | | | 0.0 | | |
| | | | 10,900,077 ^ | | | | Fannie Mae REMIC Trust 2010-123 SL, 5.088%, 11/25/40 | | | | | 1,751,816 | | | | | | 0.1 | | |
| | | | 11,243,801 ^ | | | | Fannie Mae REMIC Trust 2010-41 SB, 5.418%, 05/25/40 | | | | | 1,951,136 | | | | | | 0.1 | | |
| | | | 3,309,134 ^ | | | | Fannie Mae REMIC Trust 2010-43 VS, 5.468%, 05/25/40 | | | | | 578,483 | | | | | | 0.0 | | |
| Voya Intermediate Bond Fund | as of March 31, 2017 (continued) |
| | Principal Amount† | | | Value | | | Percentage of Net Assets | | ||||||||||||
| | COLLATERALIZED MORTGAGE OBLIGATIONS: (continued) | | ||||||||||||||||||
| | | | 11,049,000 | | | | Fannie Mae REMIC Trust 2010-59 PC, 5.000%, 06/25/40 | | | | $ | 12,371,091 | | | | | | 0.3 | | |
| | | | 3,744,306 ^ | | | | Fannie Mae REMIC Trust 2011-102 SA, 5.618%, 10/25/41 | | | | | 691,299 | | | | | | 0.0 | | |
| | | | 4,461,188 | | | | Fannie Mae REMIC Trust 2011-30 ZA, 5.000%, 04/25/41 | | | | | 4,709,341 | | | | | | 0.1 | | |
| | | | 4,920,808 ^ | | | | Fannie Mae REMIC Trust 2011-93 GS, 5.568%, 04/25/39 | | | | | 963,984 | | | | | | 0.0 | | |
| | | | 2,963,677 ^ | | | | Fannie Mae REMIC Trust 2012-103 IT, 4.000%, 04/25/41 | | | | | 417,602 | | | | | | 0.0 | | |
| | | | 12,766,768 ^ | | | | Fannie Mae REMIC Trust 2012-122 SB, 5.168%, 11/25/42 | | | | | 2,750,501 | | | | | | 0.1 | | |
| | | | 7,720,533 ^ | | | | Fannie Mae REMIC Trust 2012-128 LI, 3.500%, 06/25/42 | | | | | 873,896 | | | | | | 0.0 | | |
| | | | 12,468,037 ^ | | | | Fannie Mae REMIC Trust 2012-133 AS, 5.218%, 10/25/42 | | | | | 2,230,706 | | | | | | 0.1 | | |
| | | | 2,019,750 ^ | | | | Fannie Mae REMIC Trust 2012-149 GI, 3.500%, 06/25/42 | | | | | 261,141 | | | | | | 0.0 | | |
| | | | 10,305,479 ^ | | | | Fannie Mae REMIC Trust 2012-15 SP, 5.638%, 06/25/40 | | | | | 1,430,982 | | | | | | 0.0 | | |
| | | | 5,065,426 ^ | | | | Fannie Mae REMIC Trust 2012-24 HS, 5.568%, 09/25/40 | | | | | 800,830 | | | | | | 0.0 | | |
| | | | 11,664,437 ^ | | | | Fannie Mae REMIC Trust 2012-30 QS, 5.618%, 04/25/31 | | | | | 1,661,033 | | | | | | 0.1 | | |
| | | | 3,161,921 ^ | | | | Fannie Mae REMIC Trust 2012-68 YS, 5.718%, 07/25/42 | | | | | 594,328 | | | | | | 0.0 | | |
| | | | 4,394,804 ^ | | | | Fannie Mae REMIC Trust 2013-26 JS, 5.218%, 10/25/32 | | | | | 773,504 | | | | | | 0.0 | | |
| | | | 14,909,573 ^ | | | | Fannie Mae REMIC Trust 2013-60 DS, 5.218%, 06/25/33 | | | | | 2,805,853 | | | | | | 0.1 | | |
| | | | 14,401,565 ^ | | | | Fannie Mae REMIC Trust 2013-9 SM, 5.268%, 02/25/33 | | | | | 2,483,090 | | | | | | 0.1 | | |
| | Principal Amount† | | | Value | | | Percentage of Net Assets | | ||||||||||||
| | COLLATERALIZED MORTGAGE OBLIGATIONS: (continued) | | ||||||||||||||||||
| | | | 11,053,424 ^ | | | | Fannie Mae REMIC Trust 2014-17 DS, 5.218%, 02/25/43 | | | | $ | 1,654,616 | | | | | | 0.1 | | |
| | | | 5,174,627 ^ | | | | Fannie Mae REMIC Trust 2014-28 BS, 5.218%, 08/25/43 | | | | | 884,162 | | | | | | 0.0 | | |
| | | | 3,019,000 | | | | Fannie Mae REMIC Trust 2015-17 MK, 2.500%, 12/25/41 | | | | | 2,657,607 | | | | | | 0.1 | | |
| | | | 40,728,820 ^ | | | | Fannie Mae REMIC Trust 2015-9 IO, 5.500%, 03/25/45 | | | | | 9,258,471 | | | | | | 0.3 | | |
| | | | 2,569,776 ^ | | | | Fannie Mae Series 2013-72 YS, 5.168%, 07/25/33 | | | | | 521,951 | | | | | | 0.0 | | |
| | | | 963,996 ^ | | | | First Horizon Alternative Mortgage Securities Trust 2006-FA7 A9, 5.718%, 12/25/36 | | | | | 245,386 | | | | | | 0.0 | | |
| | | | 18,063,648 ^ | | | | Freddie Mac 3510 AS, 5.498%, 04/15/37 | | | | | 3,466,250 | | | | | | 0.1 | | |
| | | | 14,810,664 ^ | | | | Freddie Mac 4191 SA, 5.288%, 03/15/43 | | | | | 2,617,637 | | | | | | 0.1 | | |
| | | | 1,270,069 | | | | Freddie Mac Reference Series R007 ZA, 6.000%, 05/15/36 | | | | | 1,428,938 | | | | | | 0.0 | | |
| | | | 727,604 | | | | Freddie Mac Reference Series R008 ZA, 6.000%, 07/15/36 | | | | | 830,203 | | | | | | 0.0 | | |
| | | | 220,409 | | | | Freddie Mac REMIC Trust 2110 PG, 6.000%, 01/15/29 | | | | | 250,885 | | | | | | 0.0 | | |
| | | | 204,012 | | | | Freddie Mac REMIC Trust 2114 ZM, 6.000%, 01/15/29 | | | | | 233,444 | | | | | | 0.0 | | |
| | | | 1,398,003 | | | | Freddie Mac REMIC Trust 2143 ZB, 6.000%, 04/15/29 | | | | | 1,597,956 | | | | | | 0.1 | | |
| | | | 248,340 | | | | Freddie Mac REMIC Trust 2472 ZC, 6.000%, 07/15/32 | | | | | 282,948 | | | | | | 0.0 | | |
| | | | 417,439 | | | | Freddie Mac REMIC Trust 2528 KM, 5.500%, 11/15/22 | | | | | 446,637 | | | | | | 0.0 | | |
| | | | 541,210 | | | | Freddie Mac REMIC Trust 2541 NE, 5.500%, 12/15/32 | | | | | 606,678 | | | | | | 0.0 | | |
| | | | 211,944 ^ | | | | Freddie Mac REMIC Trust 2594 IY, 6.000%, 04/15/33 | | | | | 50,960 | | | | | | 0.0 | | |
| Voya Intermediate Bond Fund | as of March 31, 2017 (continued) |
| | Principal Amount† | | | Value | | | Percentage of Net Assets | | ||||||||||||
| | COLLATERALIZED MORTGAGE OBLIGATIONS: (continued) | | ||||||||||||||||||
| | | | 1,616,416 | | | | Freddie Mac REMIC Trust 2845 QH, 5.000%, 08/15/34 | | | | $ | 1,759,200 | | | | | | 0.1 | | |
| | | | 282,739 | | | | Freddie Mac REMIC Trust 2861 Z, 5.500%, 09/15/34 | | | | | 315,834 | | | | | | 0.0 | | |
| | | | 3,703,334 ^ | | | | Freddie Mac REMIC Trust 2866 GS, 5.688%, 09/15/34 | | | | | 292,426 | | | | | | 0.0 | | |
| | | | 1,289,742 ^ | | | | Freddie Mac REMIC Trust 2883 SD, 5.788%, 10/15/34 | | | | | 108,448 | | | | | | 0.0 | | |
| | | | 441,401 | | | | Freddie Mac REMIC Trust 2930 ZL, 5.000%, 02/15/35 | | | | | 483,584 | | | | | | 0.0 | | |
| | | | 585,862 | | | | Freddie Mac REMIC Trust 2931 ZY, 5.000%, 02/15/35 | | | | | 641,713 | | | | | | 0.0 | | |
| | | | 11,175,619 ^ | | | | Freddie Mac REMIC Trust 3045 DI, 5.818%, 10/15/35 | | | | | 1,997,503 | | | | | | 0.1 | | |
| | | | 109,663 | | | | Freddie Mac REMIC Trust 3049 NA, 5.000%, 02/15/35 | | | | | 113,200 | | | | | | 0.0 | | |
| | | | 2,212,792 | | | | Freddie Mac REMIC Trust 3117 ZA, 5.500%, 02/15/36 | | | | | 2,465,074 | | | | | | 0.1 | | |
| | | | 853,596 ^^ | | | | Freddie Mac REMIC Trust 3139 PO, 4.000%, 01/15/36 | | | | | 824,677 | | | | | | 0.0 | | |
| | | | 3,150,137 ^ | | | | Freddie Mac REMIC Trust 3171 PS, 5.573%, 06/15/36 | | | | | 474,642 | | | | | | 0.0 | | |
| | | | 5,667,021 ^ | | | | Freddie Mac REMIC Trust 3199 S, 5.538%, 08/15/36 | | | | | 1,077,604 | | | | | | 0.0 | | |
| | | | 1,082,204 | | | | Freddie Mac REMIC Trust 3351 ZC, 5.500%, 07/15/37 | | | | | 1,209,461 | | | | | | 0.0 | | |
| | | | 641,125 | | | | Freddie Mac REMIC Trust 3394 ZY, 6.000%, 11/15/37 | | | | | 700,538 | | | | | | 0.0 | | |
| | | | 549,296 ^ | | | | Freddie Mac REMIC Trust 3524 LA, 5.322%, 03/15/33 | | | | | 599,648 | | | | | | 0.0 | | |
| | | | 106,816 | | | | Freddie Mac REMIC Trust 3556 NT, 4.012%, 03/15/38 | | | | | 109,927 | | | | | | 0.0 | | |
| | | | 10,325,364 | | | | Freddie Mac REMIC Trust 3639 ZN, 5.500%, 12/15/34 | | | | | 11,619,299 | | | | | | 0.3 | | |
| | Principal Amount† | | | Value | | | Percentage of Net Assets | | ||||||||||||
| | COLLATERALIZED MORTGAGE OBLIGATIONS: (continued) | | ||||||||||||||||||
| | | | 1,054,134 | | | | Freddie Mac REMIC Trust 3662 ZB, 5.500%, 08/15/36 | | | | $ | 1,175,125 | | | | | | 0.0 | | |
| | | | 4,709,237 ^ | | | | Freddie Mac REMIC Trust 3710 SL, 5.088%, 05/15/36 | | | | | 316,381 | | | | | | 0.0 | | |
| | | | 811,178 | | | | Freddie Mac REMIC Trust 3724 CM, 5.500%, 06/15/37 | | �� | | | 902,899 | | | | | | 0.0 | | |
| | | | 25,000,000 | | | | Freddie Mac REMIC Trust 3747 HW, 4.500%, 05/15/38 | | | | | 25,986,405 | | | | | | 0.7 | | |
| | | | 1,000,000 | | | | Freddie Mac REMIC Trust 3753 DC, 3.500%, 09/15/39 | | | | | 1,039,357 | | | | | | 0.0 | | |
| | | | 914,966 | | | | Freddie Mac REMIC Trust 3819 ZY, 6.000%, 10/15/37 | | | | | 997,603 | | | | | | 0.0 | | |
| | | | 2,712,213 ^ | | | | Freddie Mac REMIC Trust 3856 KS, 5.638%, 05/15/41 | | | | | 505,939 | | | | | | 0.0 | | |
| | | | 2,515,633 ^ | | | | Freddie Mac REMIC Trust 3925 SD, 5.138%, 07/15/40 | | | | | 332,730 | | | | | | 0.0 | | |
| | | | 15,880,254 ^ | | | | Freddie Mac REMIC Trust 3925 SL, 5.138%, 01/15/41 | | | | | 2,175,858 | | | | | | 0.1 | | |
| | | | 655,901 | | | | Freddie Mac REMIC Trust 4000 PA, 4.500%, 01/15/42 | | | | | 705,300 | | | | | | 0.0 | | |
| | | | 3,949,791 ^ | | | | Freddie Mac REMIC Trust 4027 QI, 4.500%, 12/15/40 | | | | | 513,974 | | | | | | 0.0 | | |
| | | | 3,352,307 ^ | | | | Freddie Mac REMIC Trust 4088 CS, 5.088%, 08/15/42 | | | | | 631,435 | | | | | | 0.0 | | |
| | | | 12,617,205 ^ | | | | Freddie Mac REMIC Trust 4161 WI, 3.000%, 02/15/ 33 | | | | | 1,624,908 | | | | | | 0.1 | | |
| | | | 6,362,708 ^ | | | | Freddie Mac REMIC Trust 4194 GI, 4.000%, 04/15/43 | | | | | 1,146,826 | | | | | | 0.0 | | |
| | | | 4,601,688 | | | | Freddie Mac REMIC Trust 4203 BN, 3.000%, 04/15/33 | | | | | 4,652,804 | | | | | | 0.1 | | |
| | | | 3,395,324 ^ | | | | Freddie Mac REMIC Trust 4293 KI, 4.500%, 08/15/43 | | | | | 569,274 | | | | | | 0.0 | | |
| | | | 4,368,738 | | | | Freddie Mac REMIC Trust 4335 ZX, 4.250%, 05/15/44 | | | | | 4,825,616 | | | | | | 0.1 | | |
| Voya Intermediate Bond Fund | as of March 31, 2017 (continued) |
| | Principal Amount† | | | Value | | | Percentage of Net Assets | | ||||||||||||
| | COLLATERALIZED MORTGAGE OBLIGATIONS: (continued) | | ||||||||||||||||||
| | | | 5,864,179 | | | | Freddie Mac REMIC Trust 435 XZ, 4.250%, 05/15/44 | | | | $ | 6,372,097 | | | | | | 0.2 | | |
| | | | 1,916,000 | | | | Freddie Mac REMIC Trust 4370 AD, 3.000%, 08/15/40 | | | | | 1,887,249 | | | | | | 0.1 | | |
| | | | 10,911,691 ^ | | | | Freddie Mac REMIC Trust 4386 LS, 5.188%, 09/15/44 | | | | | 2,023,984 | | | | | | 0.1 | | |
| | | | 10,219,142 | | | | Freddie Mac Series 4348 ZX, 4.250%, 06/15/44 | | | | | 10,863,647 | | | | | | 0.3 | | |
| | | | 880,000 | | | | Freddie Mac Structured Agency Credit Risk Debt Notes 2013-DN2 M2, 5.232%, 11/25/23 | | | | | 955,048 | | | | | | 0.0 | | |
| | | | 6,130,000 | | | | Freddie Mac Structured Agency Credit Risk Debt Notes 2014-DN2 M3, 4.582%, 04/25/24 | | | | | 6,576,587 | | | | | | 0.2 | | |
| | | | 5,600,000 | | | | Freddie Mac Structured Agency Credit Risk Debt Notes 2014-DN3 M3, 4.982%, 08/25/24 | | | | | 5,987,975 | | | | | | 0.2 | | |
| | | | 2,350,000 | | | | Freddie Mac Structured Agency Credit Risk Debt Notes 2014-DN4 M3, 5.532%, 10/25/24 | | | | | 2,535,503 | | | | | | 0.1 | | |
| | | | 1,100,000 | | | | Freddie Mac Structured Agency Credit Risk Debt Notes 2014-HQ1 M3, 5.082%, 08/25/24 | | | | | 1,183,547 | | | | | | 0.0 | | |
| | | | 1,730,000 | | | | Freddie Mac Structured Agency Credit Risk Debt Notes 2014-HQ3 M3, 5.732%, 10/25/24 | | | | | 1,910,737 | | | | | | 0.1 | | |
| | | | 4,200,000 | | | | Freddie Mac Structured Agency Credit Risk Debt Notes 2015-DNA3 M3, 5.682%, 04/25/28 | | | | | 4,634,982 | | | | | | 0.1 | | |
| | | | 2,840,000 | | | | Freddie Mac Structured Agency Credit Risk Debt Notes 2015-HQ2 M3, 4.232%, 05/25/25 | | | | | 3,008,916 | | | | | | 0.1 | | |
| | | | 5,365,000 | | | | Freddie Mac Structured Agency Credit Risk Debt Notes 2015-HQA2 M3, 5.782%, 05/25/28 | | | | | 5,923,779 | | | | | | 0.2 | | |
| | | | 2,100,000 | | | | Freddie Mac Structured Agency Credit Risk Debt Notes 2016-DNA1 M3, 6.532%, 07/25/28 | | | | | 2,383,119 | | | | | | 0.1 | | |
| | Principal Amount† | | | Value | | | Percentage of Net Assets | | ||||||||||||
| | COLLATERALIZED MORTGAGE OBLIGATIONS: (continued) | | ||||||||||||||||||
| | | | 6,500,000 | | | | Freddie Mac Structured Agency Credit Risk Debt Notes 2016-DNA4 M3, 4.782%, 03/25/29 | | | | $ | 6,720,696 | | | | | | 0.2 | | |
| | | | 3,500,000 | | | | Freddie Mac Structured Agency Credit Risk Debt Notes 2017-HQA1 M2, 4.532%, 08/25/29 | | | | | 3,506,225 | | | | | | 0.1 | | |
| | | | 1,062,609 | | | | Freddie Mac Structured Pass Through Certificates T-48 1A, 5.217%, 07/25/33 | | | | | 1,217,677 | | | | | | 0.0 | | |
| | | | 19,546 ^ | | | | Ginnie Mae Series 2001-28 SV, 7.322%, 06/16/31 | | | | | 1,629 | | | | | | 0.0 | | |
| | | | 1,312,956 ^ | | | | Ginnie Mae Series 2005-7 AH, 5.842%, 02/16/35 | | | | | 221,027 | | | | | | 0.0 | | |
| | | | 19,838,188 ^ | | | | Ginnie Mae Series 2007-41 SL, 5.722%, 07/20/37 | | | | | 4,039,743 | | | | | | 0.1 | | |
| | | | 2,080,573 ^ | | | | Ginnie Mae Series 2008-2 SW, 5.572%, 01/20/38 | | | | | 379,921 | | | | | | 0.0 | | |
| | | | 1,435,782 ^ | | | | Ginnie Mae Series 2008-35 SN, 5.422%, 04/20/38 | | | | | 215,620 | | | | | | 0.0 | | |
| | | | 774,467 ^ | | | | Ginnie Mae Series 2008-40 PS, 5.572%, 05/16/38 | | | | | 132,733 | | | | | | 0.0 | | |
| | | | 2,004,351 ^ | | | | Ginnie Mae Series 2009-25 KS, 5.222%, 04/20/39 | | | | | 332,309 | | | | | | 0.0 | | |
| | | | 1,623,446 | | | | Ginnie Mae Series 2009-29 PB, 4.750%, 05/20/39 | | | | | 1,763,805 | | | | | | 0.1 | | |
| | | | 1,688,851 | | | | Ginnie Mae Series 2009-31 ZL, 4.500%, 05/20/39 | | | | | 1,842,842 | | | | | | 0.1 | | |
| | | | 6,012,536 ^ | | | | Ginnie Mae Series 2009-33 SN, 5.322%, 05/20/39 | | | | | 455,643 | | | | | | 0.0 | | |
| | | | 10,097,220 | | | | Ginnie Mae Series 2009-33 ZB, 6.000%, 05/20/39 | | | | | 12,445,327 | | | | | | 0.3 | | |
| | | | 3,339,318 | | | | Ginnie Mae Series 2009-34 Z, 4.500%, 05/16/39 | | | | | 3,565,106 | | | | | | 0.1 | | |
| | | | 854,417 ^ | | | | Ginnie Mae Series 2009-43 HS, 5.222%, 06/20/38 | | | | | 64,143 | | | | | | 0.0 | | |
| Voya Intermediate Bond Fund | as of March 31, 2017 (continued) |
| | Principal Amount† | | | Value | | | Percentage of Net Assets | | ||||||||||||
| | COLLATERALIZED MORTGAGE OBLIGATIONS: (continued) | | ||||||||||||||||||
| | | | 4,151,476 ^ | | | | Ginnie Mae Series 2010-116 NS, 5.722%, 09/16/40 | | | | $ | 688,197 | | | | | | 0.0 | | |
| | | | 10,374,310 ^ | | | | Ginnie Mae Series 2010-116 SK, 5.642%, 08/20/40 | | | | | 1,994,410 | | | | | | 0.1 | | |
| | | | 20,197,758 ^ | | | | Ginnie Mae Series 2010-149 HS, 5.172%, 05/16/40 | | | | | 2,427,952 | | | | | | 0.1 | | |
| | | | 1,839,956 ^ | | | | Ginnie Mae Series 2010-168 BI, 5.000%, 04/20/40 | | | | | 682,506 | | | | | | 0.0 | | |
| | | | 3,163,104 ^ | | | | Ginnie Mae Series 2010-68 MS, 4.872%, 06/20/40 | | | | | 488,636 | | | | | | 0.0 | | |
| | | | 8,015,187 ^ | | | | Ginnie Mae Series 2011-72 SA, 4.422%, 05/16/41 | | | | | 1,123,262 | | | | | | 0.0 | | |
| | | | 12,795,151 ^ | | | | Ginnie Mae Series 2011-73 LS, 5.712%, 08/20/39 | | | | | 1,581,447 | | | | | | 0.0 | | |
| | | | 334,013 | | | | Ginnie Mae Series 2012-43 MA, 4.000%, 10/20/41 | | | | | 345,963 | | | | | | 0.0 | | |
| | | | 2,142,514 ^ | | | | Ginnie Mae Series 2012-91 QI, 4.500%, 09/20/41 | | | | | 358,441 | | | | | | 0.0 | | |
| | | | 15,253,352 ^ | | | | Ginnie Mae Series 2013-167 PI, 5.500%, 11/20/43 | | | | | 3,094,801 | | | | | | 0.1 | | |
| | | | 4,506,556 ^ | | | | Ginnie Mae Series 2014-10 GI, 4.500%, 01/16/29 | | | | | 522,720 | | | | | | 0.0 | | |
| | | | 9,427,406 ^ | | | | Ginnie Mae Series 2014-185 SB, 4.622%, 12/20/44 | | | | | 1,290,350 | | | | | | 0.0 | | |
| | | | 16,539,059 ^ | | | | Ginnie Mae Series 2014-3 SU, 5.072%, 07/20/39 | | | | | 2,504,498 | | | | | | 0.1 | | |
| | | | 15,156,116 ^ | | | | Ginnie Mae Series 2014-56 SP, 5.272%, 12/16/39 | | | | | 2,268,060 | | | | | | 0.1 | | |
| | | | 15,972,562 ^ | | | | Ginnie Mae Series 2014-58 SG, 4.672%, 04/16/44 | | | | | 2,415,566 | | | | | | 0.1 | | |
| | | | 669,197 | # | | Jefferies Resecuritization Trust 2009-R6 1A2, 3.034%, 03/26/36 | | | | | 652,475 | | | | | | 0.0 | | | |
| | | | 566,503 | | | | JP Morgan Alternative Loan Trust 2005-S1 1A1, 5.500%, 12/25/35 | | | | | 472,430 | | | | | | 0.0 | | |
| | Principal Amount† | | | Value | | | Percentage of Net Assets | | ||||||||||||
| | COLLATERALIZED MORTGAGE OBLIGATIONS: (continued) | | ||||||||||||||||||
| | | | 2,974,674 | | | | JP Morgan Mortgage Trust 2005-A4 B1, 3.115%, 07/25/35 | | | | $ | 2,548,589 | | | | | | 0.1 | | |
| | | | 19,857,366 ^ | | | | Lehman Mortgage Trust 2006-7, 5.568%, 11/25/36 | | | | | 4,013,859 | | | | | | 0.1 | | |
| | | | 14,449,153 ^ | | | | Lehman Mortgage Trust 2006-9, 5.638%, 01/25/37 | | | | | 2,888,838 | | | | | | 0.1 | | |
| | | | 6,611,572 | | | | Morgan Stanley Mortgage Loan Trust 2007-13 6A1, 6.000%, 10/25/37 | | | | | 5,563,591 | | | | | | 0.2 | | |
| | | | 664,347 | | | | WaMu Mortgage Pass Through Certificates Series 2006-AR12 2A3, 2.318%, 10/25/36 | | | | | 568,371 | | | | | | 0.0 | | |
| | | | 5,120,667 | | | | WaMu Mortgage Pass-Through Certificates Series 2005-AR11 A1C3, 1.492%, 08/25/45 | | | | | 4,851,608 | | | | | | 0.1 | | |
| | | | 137,991,370 ^ | | | | WaMu Mortgage Pass-Through Certificates Series 2005-AR11 X, 1.371%, 08/25/45 | | | | | 5,108,620 | | | | | | 0.1 | | |
| | | | 724,431 | | | | WaMu Mortgage Pass-Through Certificates Series 2006-AR12 1A1, 2.877%, 10/25/36 | | | | | 679,937 | | | | | | 0.0 | | |
| | | | 1,675,469 | | | | WaMu Mortgage Pass-Through Certificates Series 2006-AR14 Trust 1A4, 2.662%, 11/25/36 | | | | | 1,505,496 | | | | | | 0.0 | | |
| | | | 1,945,825 | | | | WaMu Mortgage Pass-Through Certificates Series 2006-AR16 2A1, 2.771%, 12/25/36 | | | | | 1,685,386 | | | | | | 0.0 | | |
| | | | 4,498,538 | | | | WaMu Mortgage Pass-Through Certificates Series 2006-AR16 Trust 2A3, 2.771%, 12/25/36 | | | | | 3,882,740 | | | | | | 0.1 | | |
| | | | 2,571,963 | | | | WaMu Mortgage Pass-Through Certificates Series 2006-AR16 Trust 3A1, 2.705%, 12/25/36 | | | | | 2,383,592 | | | | | | 0.1 | | |
| | | | 1,234,369 | | | | WaMu Mortgage Pass-Through Certificates Series 2006-AR6 2A3, 2.872%, 08/25/36 | | | | | 1,118,447 | | | | | | 0.0 | | |
| | | | 2,814,774 | | | | WaMu Mortgage Pass-Through Certificates Series 2006-AR8 1A4, 2.858%, 08/25/46 | | | | | 2,567,635 | | | | | | 0.1 | | |
| Voya Intermediate Bond Fund | as of March 31, 2017 (continued) |
| | Principal Amount† | | | Value | | | Percentage of Net Assets | | ||||||||||||
| | COLLATERALIZED MORTGAGE OBLIGATIONS: (continued) | | ||||||||||||||||||
| | | | 3,523,013 | | | | WaMu Mortgage Pass-Through Certificates Series 2007-HY2 1A1, 2.770%, 12/25/36 | | | | $ | 3,342,188 | | | | | | 0.1 | | |
| | | | 832,360 | | | | WaMu Mortgage Pass-Through Certificates Series 2007-HY3 1A1, 2.736%, 03/25/37 | | | | | 742,625 | | | | | | 0.0 | | |
| | | | 2,325,758 | | | | WaMu Mortgage Pass-Through Certificates Series 2007-HY4 1A1, 2.456%, 04/25/37 | | | | | 2,043,434 | | | | | | 0.1 | | |
| | | | 2,682,681 | | | | Washington Mutual Mortgage Pass-Through Certificates WMALT Series 2005-10 2A3, 1.882%, 11/25/35 | | | | | 2,045,561 | | | | | | 0.1 | | |
| | | | 2,418,530 | | | | Washington Mutual Mortgage Pass-Through Certificates WMALT Series 2005-11 A1, 5.750%, 01/25/36 | | | | | 2,119,167 | | | | | | 0.1 | | |
| | | | 1,815,604 | | | | Washington Mutual Mortgage Pass-Through Certificates WMALT Series 2005-5 CB3, 5.500%, 07/25/35 | | | | | 1,690,391 | | | | | | 0.0 | | |
| | | | 784,493 | | | | Washington Mutual Mortgage Pass-Through Certificates WMALT Series 2005-8 1A2, 5.500%, 10/25/35 | | | | | 734,439 | | | | | | 0.0 | | |
| | | | 2,417,852 | | | | Washington Mutual Mortgage Pass-Through Certificates WMALT Series 2006-AR5 4A, 1.628%, 06/25/46 | | | | | 1,884,689 | | | | | | 0.1 | | |
| | | | 6,282,164 | | | | Washington Mutual Mortgage Pass-Through Certificates WMALT Series 2006-AR6 2A, 1.598%, 08/25/46 | | | | | 4,551,095 | | | | | | 0.1 | | |
| | | | 1,111,427 | | | | Washington Mutual Mortgage Pass-Through Certificates WMALT Series 2007-OC1 A3, 1.212%, 01/25/47 | | | | | 924,350 | | | | | | 0.0 | | |
| | Principal Amount† | | | Value | | | Percentage of Net Assets | | ||||||||||||
| | COLLATERALIZED MORTGAGE OBLIGATIONS: (continued) | | ||||||||||||||||||
| | | | 2,302,541 | | | | Washington Mutual Mortgage Pass-Through Certificates WMALT Series 2007-OC1 A4, 1.302%, 01/25/47 | | | | $ | 1,931,716 | | | | | | 0.1 | | |
| | | | 1,912,911 | | | | Wells Fargo Alternative Loan 2007-PA2 2A1, 1.412%, 06/25/37 | | | | | 1,414,932 | | | | | | 0.0 | | |
| | | | 2,132,396 | | | | Wells Fargo Alternative Loan 2007-PA3 Trust 3A1, 6.250%, 07/25/37 | | | | | 2,020,590 | | | | | | 0.1 | | |
| | | | 980,577 | | | | Wells Fargo Mortgage Backed Securities 2006-AR4 Trust 2A4, 3.338%, 04/25/36 | | | | | 902,404 | | | | | | 0.0 | | |
| | | | 23,501,038 | | | | Other Securities | | | | | 19,822,964 | | | | | | 0.5 | | |
| | | | | | | | Total Collateralized Mortgage Obligations (Cost $498,989,371) | | | | | 504,940,726 | | | | | | 13.5 | | |
| | FOREIGN GOVERNMENT BONDS: 4.2% | | ||||||||||||||||||
| | | | 5,935,000 | # | | Argentine Republic Government International Bond, 6.875%, 04/22/21 | | | | | 6,380,125 | | | | | | 0.2 | | | |
| | | | 4,975,000 | # | | Argentine Republic Government International Bond, 6.875%, 01/26/27 | | | | | 5,040,919 | | | | | | 0.1 | | | |
| | | | BRL23,892,000 | | | | Brazil Notas do Tesouro Nacional Series F, 10.000%, 01/01/21 | | | | | 7,872,935 | | | | | | 0.2 | | |
| | | | BRL26,035,000 | | | | Brazil Notas do Tesouro Nacional Series F, 10.000%, 01/01/23 | | | | | 8,550,900 | | | | | | 0.3 | | |
| | | | BRL10,240,000 | | | | Brazil Notas do Tesouro Nacional Series F, 10.000%, 01/01/19 | | | | | 3,380,355 | | | | | | 0.1 | | |
| | | | 4,468,000 | | | | Brazilian Government International Bond, 2.625%-6.000%, 01/05/23-04/07/26 | | | | | 4,553,990 | | | | | | 0.1 | | |
| | | | COP21,119,500,000 | | | | Colombian TES, 11.000%, 07/24/20 | | | | | 8,450,378 | | | | | | 0.2 | | |
| | | | 3,322,000 | L | | Colombia Government International Bond, 2.625%-8.125%, 03/15/23-04/25/27 | | | | | 3,490,088 | | | | | | 0.1 | | | |
| | | | 350,000 | # | | Costa Rica Government International Bond, 4.250%, 01/26/23 | | | | | 339,937 | | | | | | 0.0 | | | |
| Voya Intermediate Bond Fund | as of March 31, 2017 (continued) |
| | Principal Amount† | | | Value | | | Percentage of Net Assets | | ||||||||||||
| | FOREIGN GOVERNMENT BONDS: (continued) | | ||||||||||||||||||
| | | | 300,000 | # | | Dominican Republic International Bond, 6.600%, 01/28/24 | | | | $ | 326,625 | | | | | | 0.0 | | | |
| | | | 300,000 | # | | Dominican Republic International Bond, 5.500%, 01/27/25 | | | | | 306,375 | | | | | | 0.0 | | | |
| | | | 250,000 | # | | Egypt Government International Bond, 5.875%, 06/11/25 | | | | | 245,162 | | | | | | 0.0 | | | |
| | | | 232,000 | # | | El Salvador Government International Bond, 5.875%, 01/30/25 | | | | | 208,429 | | | | | | 0.0 | | | |
| | | | 290,380 | # | | Gabonese Republic, 6.375%, 12/12/24 | | | | | 281,850 | | | | | | 0.0 | | | |
| | | | HUF2,820,500,000 | | | | Hungary Government Bond, 7.500%, 11/12/20 | | | | | 11,939,018 | | | | | | 0.3 | | |
| | | | 2,922,000 | | | | Hungary Government International Bond, 5.375%-7.625%, 02/21/23-03/29/41 | | | | | 3,369,287 | | | | | | 0.1 | | |
| | | | 600,000 | # | | Indonesia Government International Bond, 4.125%, 01/15/25 | | | | | 617,394 | | | | | | 0.0 | | | |
| | | | 2,750,000 | # | | Indonesia Government International Bond, 4.350%, 01/08/27 | | | | | 2,848,882 | | | | | | 0.1 | | | |
| | | | 600,000 | # | | KazAgro National Management Holding JSC, 4.625%, 05/24/23 | | | | | 589,170 | | | | | | 0.0 | | | |
| | | | 1,000,000 | # | | Kazakhstan Government International Bond, 5.125%, 07/21/25 | | | | | 1,088,850 | | | | | | 0.1 | | | |
| | | | 600,000 | # | | Morocco Government International Bond, 4.250%, 12/11/22 | | | | | 622,500 | | | | | | 0.0 | | | |
| | | | 3,875,000 | # | | Oman Government International Bond, 5.375%, 03/08/27 | | | | | 4,058,210 | | | | | | 0.1 | | | |
| | | | 600,000 | # | | Republic of Paraguay, 4.625%, 01/25/23 | | | | | 627,000 | | | | | | 0.0 | | | |
| | | | 136,000 | # | | Romanian Government International Bond, 4.375%, 08/22/23 | | | | | 143,753 | | | | | | 0.0 | | | |
| | | | 6,400,000 | | | | Russian Federal Bond - OFZ, 4.750%, 05/27/26 | | | | | 6,686,016 | | | | | | 0.2 | | |
| | | | RUB1,138,730,000 | | | | Russian Federal Bond - OFZ, 6.400%-7.500%, 05/27/20-08/16/23 | | | | | 19,678,257 | | | | | | 0.5 | | |
| | Principal Amount† | | | Value | | | Percentage of Net Assets | | ||||||||||||
| | FOREIGN GOVERNMENT BONDS: (continued) | | ||||||||||||||||||
| | | | 1,100,000 | # | | Sri Lanka Government International Bond, 6.825%, 07/18/26 | | | | $ | 1,139,723 | | | | | | 0.1 | | | |
| | | | 300,000 | # | | Zambia Government International Bond, 5.375%, 09/20/22 | | | | | 275,250 | | | | | | 0.0 | | | |
| | | | CLP31,217,588,945 | | | | Other Securities(a) | | | | | 52,277,284 | | | | | | 1.4 | | |
| | | | | | | | Total Foreign Government Bonds (Cost $149,467,328) | | | | | 155,388,662 | | | | | | 4.2 | | |
| | COMMERCIAL MORTGAGE-BACKED SECURITIES: 5.6% | | ||||||||||||||||||
| | | | 4,460,000 | # | | BAMLL Re-REMIC Trust 2014-FRR5 A502, 1.219%, 03/27/45 | | | | | 4,392,320 | | | | | | 0.1 | | | |
| | | | 6,244,000 | # | | BAMLL Re-REMIC Trust 2015-FRR11 AK25, 2.787%, 09/27/45 | | | | | 5,488,251 | | | | | | 0.1 | | | |
| | | | 1,990,000 | | | | Banc of America Commercial Mortgage Trust 2007-3 B, 5.761%, 06/10/49 | | | | | 1,995,038 | | | | | | 0.1 | | |
| | | | 1,240,000 | # | | Banc of America Commercial Mortgage Trust 2007-4 B, 5.961%, 02/10/51 | | | | | 1,236,539 | | | | | | 0.0 | | | |
| | | | 92,840,000 | #,^ | | BBCCRE Trust 2015-GTP XA, 0.597%, 08/10/33 | | | | | 4,075,128 | | | | | | 0.1 | | | |
| | | | 2,320,000 | # | | Bear Stearns Commercial Mortgage Securities Trust 2004-PWR4 G, 6.015%, 06/11/41 | | | | | 2,473,143 | | | | | | 0.1 | | | |
| | | | 760,000 | # | | Bear Stearns Commercial Mortgage Securities Trust 2004-TOP14 L, 5.405%, 01/12/41 | | | | | 767,074 | | | | | | 0.0 | | | |
| | | | 760,000 | # | | Bear Stearns Commercial Mortgage Securities Trust 2004-TOP14 M, 5.405%, 01/12/41 | | | | | 762,548 | | | | | | 0.0 | | | |
| | | | 760,000 | # | | Bear Stearns Commercial Mortgage Securities Trust 2004-TOP14 N, 5.405%, 01/12/41 | | | | | 745,955 | | | | | | 0.0 | | | |
| | | | 3,520,000 | # | | Bear Stearns Commercial Mortgage Securities Trust 2005-TOP18 F, 5.805%, 02/13/42 | | | | | 3,551,981 | | | | | | 0.1 | | | |
| Voya Intermediate Bond Fund | as of March 31, 2017 (continued) |
| | Principal Amount† | | | Value | | | Percentage of Net Assets | | ||||||||||||
| | COMMERCIAL MORTGAGE-BACKED SECURITIES: (continued) | | ||||||||||||||||||
| | | | 2,000,000 | # | | Bear Stearns Commercial Mortgage Securities Trust 2005-TOP18 G, 5.805%, 02/13/42 | | | | $ | 1,980,550 | | | | | | 0.1 | | | |
| | | | 191,153 | | | | Bear Stearns Commercial Mortgage Securities Trust 2005-TOP20 C, 5.118%, 10/12/42 | | | | | 190,903 | | | | | | 0.0 | | |
| | | | 633,801 | # | | Bear Stearns Commercial Mortgage Securities Trust 2006-TOP22 B, 5.716%, 04/12/38 | | | | | 643,972 | | | | | | 0.0 | | | |
| | | | 2,259,669 | # | | Beckman Coulter, Inc. 2000-A A, 7.498%, 12/15/18 | | | | | 2,295,945 | | | | | | 0.1 | | | |
| | | | 25,581,391 ^ | | | | CD 2016-CD1 Mortgage Trust, 1.444%, 08/10/49 | | | | | 2,539,703 | | | | | | 0.0 | | |
| | | | 45,113,000 | #,^ | | CD 2016-CD1 Mortgage Trust, 0.685%, 08/10/49 | | | | | 2,598,012 | | | | | | 0.1 | | | |
| | | | 41,927,654 ^ | | | | Citigroup Commercial Mortgage Trust 2016-P4 XA, 2.015%, 07/10/49 | | | | | 5,614,499 | | | | | | 0.2 | | |
| | | | 18,820,723 ^ | | | | Citigroup Commercial Mortgage Trust 2016-P6 XA, 0.841%, 12/10/49 | | | | | 981,557 | | | | | | 0.0 | | |
| | | | 5,218,204 ^ | | | | COMM 2012-CR1 XA, 1.910%, 05/15/45 | | | | | 405,653 | | | | | | 0.0 | | |
| | | | 31,121,664 ^ | | | | COMM 2012-CR2 XA, 1.723%, 08/15/45 | | | | | 2,258,533 | | | | | | 0.1 | | |
| | | | 39,771,154 ^ | | | | COMM 2012-CR4 XA, 1.895%, 10/15/45 | | | | | 2,712,472 | | | | | | 0.1 | | |
| | | | 27,260,000 | #,^ | | COMM 2012-CR4 XB, 0.592%, 10/15/45 | | | | | 869,343 | | | | | | 0.0 | | | |
| | | | 13,766,867 | #,^ | | COMM 2012-LC4 XA, 2.234%, 12/10/44 | | | | | 1,092,650 | | | | | | 0.0 | | | |
| | | | 4,240,000 | # | | COMM 2013-CCRE10 C Mortgage Trust, 4.789%, 08/10/46 | | | | | 4,354,494 | | | | | | 0.1 | | | |
| | | | 35,316,332 ^ | | | | COMM 2013-LC13 XA, 1.346%, 08/10/46 | | | | | 1,674,789 | | | | | | 0.0 | | |
| | | | 13,450,708 ^ | | | | COMM 2013-LC6 XA, 1.673%, 01/10/46 | | | | | 712,001 | | | | | | 0.0 | | |
| | | | 141,330,565 | #,^ | | COMM 2015-PC1 XA, 0.769%, 07/10/50 | | | | | 5,724,354 | | | | | | 0.2 | | | |
| | | | 920,000 | | | | COMM 2016-COR1 C Mortgage Trust, 4.396%, 10/10/49 | | | | | 910,424 | | | | | | 0.0 | | |
| | Principal Amount† | | | Value | | | Percentage of Net Assets | | ||||||||||||
| | COMMERCIAL MORTGAGE-BACKED SECURITIES: (continued) | | ||||||||||||||||||
| | | | 70,192,108 ^ | | | | Commercial Mortgage Pass Through Certificates 2016-CR28 XA, 0.325%, 02/10/49 | | | | $ | 2,899,082 | | | | | | 0.1 | | |
| | | | 37,785 | # | | Credit Suisse First Boston Mortgage Securities Corp. 2003-C4 J, 5.322%, 08/15/36 | | | | | 37,692 | | | | | | 0.0 | | | |
| | | | 642,500 | # | | Credit Suisse First Boston Mortgage Securities Corp. 2004-C2 E, 5.736%, 05/15/36 | | | | | 655,842 | | | | | | 0.0 | | | |
| | | | 900,000 | # | | Credit Suisse First Boston Mortgage Securities Corp. 2004-C2 F, 6.284%, 05/15/36 | | | | | 951,115 | | | | | | 0.0 | | | |
| | | | 1,000,000 | | | | Credit Suisse First Boston Mortgage Securities Corp. 2005-C3 C, 4.952%, 07/15/37 | | | | | 998,686 | | | | | | 0.1 | | |
| | | | 4,460,000 | # | | DBJPM 16-C3 Mortgage Trust, 3.495%, 09/10/49 | | | | | 3,482,447 | | | | | | 0.1 | | | |
| | | | 2,840,000 | # | | DBUBS 2011-LC2A D, 5.727%, 07/10/44 | | | | | 2,989,477 | | | | | | 0.1 | | | |
| | | | 8,190,000 | # | | EQTY 2014-INNS Mortgage Trust, 4.297%, 05/08/31 | | | | | 8,155,357 | | | | | | 0.2 | | | |
| | | | 16,840,000 ^ | | | | Freddie Mac Multifamily Structured Pass Through Certificates K008 X3, 5.251%, 08/25/20 | | | | | 2,677,658 | | | | | | 0.1 | | |
| | | | 27,973,945 ^ | | | | Freddie Mac Multifamily Structured Pass Through Certificates K010 X3, 4.632%, 11/25/44 | | | | | 4,210,079 | | | | | | 0.1 | | |
| | | | 20,890,903 ^ | | | | Freddie Mac Multifamily Structured Pass Through Certificates K021 X3, 1.969%, 07/25/40 | | | | | 1,896,449 | | | | | | 0.1 | | |
| | | | 20,918,411 ^ | | | | Freddie Mac Multifamily Structured Pass Through Certificates KS06 X, 1.084%, 08/25/26 | | | | | 1,530,928 | | | | | | 0.0 | | |
| | | | 25,000,000 ^ | | | | Freddie Mac Multifamily Structured Pass Through CertificatesK015 X3, 2.801%, 08/25/39 | | | | | 2,706,060 | | | | | | 0.1 | | |
| Voya Intermediate Bond Fund | as of March 31, 2017 (continued) |
| | Principal Amount† | | | Value | | | Percentage of Net Assets | | ||||||||||||
| | COMMERCIAL MORTGAGE-BACKED SECURITIES: (continued) | | ||||||||||||||||||
| | | | 219,101,451 | #,^ | | FREMF Mortgage Trust 2012-K17 X2A, 0.100%, 12/25/44 | | | | $ | 816,503 | | | | | | 0.0 | | | |
| | | | 3,400,000 | # | | GS Mortgage Securities Trust 2010-C2 D, 5.184%, 12/10/43 | | | | | 3,410,115 | | | | | | 0.1 | | | |
| | | | 3,000,000 | # | | GS Mortgage Securities Trust 2010-C2 E, 4.548%, 12/10/43 | | | | | 2,840,421 | | | | | | 0.1 | | | |
| | | | 2,710,000 | # | | GS Mortgage Securities Trust 2010-C2 F, 4.548%, 12/10/43 | | | | | 2,369,413 | | | | | | 0.1 | | | |
| | | | 27,897,299 ^ | | | | GS Mortgage Securities Trust 2012-GCJ7 XA, 2.319%, 05/10/45 | | | | | 2,065,962 | | | | | | 0.0 | | |
| | | | 69,131,969 ^ | | | | GS Mortgage Securities Trust 2013-GC16 XA, 1.419%, 11/10/46 | | | | | 3,453,252 | | | | | | 0.1 | | |
| | | | 83,613,165 ^ | | | | GS Mortgage Securities Trust 2016-GS4, 0.603%, 11/10/49 | | | | | 3,363,013 | | | | | | 0.1 | | |
| | | | 630,000 | # | | JP Morgan Chase Commercial Mortgage Securities Corp. 2004-C2 H, 5.763%, 05/15/41 | | | | | 634,883 | | | | | | 0.0 | | | |
| | | | 1,810,000 | # | | JP Morgan Chase Commercial Mortgage Securities Corp. 2004-CB8 J, 4.733%, 01/12/39 | | | | | 1,735,068 | | | | | | 0.1 | | | |
| | | | 5,699,000 | # | | JP Morgan Chase Commercial Mortgage Securities Corp. 2004-CB8 K, 4.733%, 01/12/39 | | | | | 5,275,932 | | | | | | 0.1 | | | |
| | | | 17,385,000 | #,^ | | JP Morgan Chase Commercial Mortgage Securities Corp. 2012-LC9 XB, 0.352%, 12/15/47 | | | | | 306,440 | | | | | | 0.0 | | | |
| | | | 2,490,000 | # | | JP Morgan Chase Commercial Mortgage Securities Trust 2003-CB6 H, 5.379%, 07/12/37 | | | | | 2,455,297 | | | | | | 0.1 | | | |
| | | | 452,491 | # | | JP Morgan Chase Commercial Mortgage Securities Trust 2003-LN1 H, 5.575%, 10/15/37 | | | | | 451,411 | | | | | | 0.0 | | | |
| | | | 1,960,000 | | | | JP Morgan Chase Commercial Mortgage Securities Trust 2004-CBX C, 5.066%, 01/12/37 | | | | | 2,003,108 | | | | | | 0.1 | | |
| | Principal Amount† | | | Value | | | Percentage of Net Assets | | ||||||||||||
| | COMMERCIAL MORTGAGE-BACKED SECURITIES: (continued) | | ||||||||||||||||||
| | | | 1,410,000 | | | | JP Morgan Chase Commercial Mortgage Securities Trust 2004-CBX D, 5.097%, 01/12/37 | | | | $ | 1,433,739 | | | | | | 0.0 | | |
| | | | 1,320,000 | | | | JP Morgan Chase Commercial Mortgage Securities Trust 2004-CIBC9 E, 5.379%, 06/12/41 | | | | | 1,269,913 | | | | | | 0.0 | | |
| | | | 4,950,000 | | | | JP Morgan Chase Commercial Mortgage Securities Trust 2005-LDP2 F, 5.010%, 07/15/42 | | | | | 4,993,313 | | | | | | 0.1 | | |
| | | | 2,400,000 | # | | JP Morgan Chase Commercial Mortgage Securities Trust 2011-C4 E, 5.535%, 07/15/46 | | | | | 2,447,718 | | | | | | 0.1 | | | |
| | | | 1,335,888 | # | | JP Morgan Chase Commercial Mortgage Securities Trust 2011-C4 TAC1, 7.990%, 07/15/46 | | | | | 1,338,977 | | | | | | 0.0 | | | |
| | | | 35,351,216 ^ | | | | JP Morgan Chase Commercial Mortgage Securities Trust 2012-CIBX XA, 1.657%, 06/15/45 | | | | | 1,980,976 | | | | | | 0.1 | | |
| | | | 36,118,891 ^ | | | | JPMBB Commercial Mortgage Securities Trust 2013-C12, 0.697%, 07/15/45 | | | | | 874,752 | | | | | | 0.0 | | |
| | | | 20,852,134 ^ | | | | JPMBB Commercial Mortgage Securities Trust 2014-C19 XA, 1.186%, 04/15/47 | | | | | 725,869 | | | | | | 0.0 | | |
| | | | 1,671,320 ^ | | | | JPMBB Commercial Mortgage Securities Trust 2015-C28 XA, 1.192%, 10/15/48 | | | | | 99,464 | | | | | | 0.0 | | |
| | | | 16,915,593 | #,^ | | LB-UBS Commercial Mortgage Trust 2004-C1 XST, 1.000%, 01/15/36 | | | | | 16,921 | | | | | | 0.0 | | | |
| | | | 751,974 | # | | LB-UBS Commercial Mortgage Trust 2005-C1 G, 5.657%, 02/15/40 | | | | | 751,064 | | | | | | 0.0 | | | |
| | | | 1,860,000 | # | | LB-UBS Commercial Mortgage Trust 2005-C1 H, 5.757%, 02/15/40 | | | | | 1,837,295 | | | | | | 0.1 | | | |
| | | | 150,436 | | | | LB-UBS Commercial Mortgage Trust 2005-C3 D, 4.954%, 07/15/40 | | | | | 155,218 | | | | | | 0.0 | | |
| Voya Intermediate Bond Fund | as of March 31, 2017 (continued) |
| | Principal Amount† | | | Value | | | Percentage of Net Assets | | ||||||||||||
| | COMMERCIAL MORTGAGE-BACKED SECURITIES: (continued) | | ||||||||||||||||||
| | | | 1,730,000 | | | | LB-UBS Commercial Mortgage Trust 2005-C3 E, 4.983%, 07/15/40 | | | | $ | 1,729,750 | | | | | | 0.0 | | |
| | | | 1,130,000 | # | | LB-UBS Commercial Mortgage Trust 2005-C5 G, 5.350%, 09/15/40 | | | | | 1,123,632 | | | | | | 0.0 | | | |
| | | | 2,000,000 | # | | LB-UBS Commercial Mortgage Trust 2005-C5 H, 5.350%, 09/15/40 | | | | | 1,963,037 | | | | | | 0.1 | | | |
| | | | 5,000,000 | | | | LB-UBS Commercial Mortgage Trust 2005-C7 E, 5.350%, 11/15/40 | | | | | 5,066,861 | | | | | | 0.1 | | |
| | | | 756,000 | | | | LB-UBS Commercial Mortgage Trust 2006-C4 D, 5.864%, 06/15/38 | | | | | 756,083 | | | | | | 0.0 | | |
| | | | 5,240,691 | #,^ | | LB-UBS Commercial Mortgage Trust 2006-C7 XW, 0.491%, 11/15/38 | | | | | 15,835 | | | | | | 0.0 | | | |
| | | | 1,550,000 | # | | Morgan Stanley Bank of America Merrill Lynch Trust 2012-C5 D, 4.645%, 08/15/45 | | | | | 1,535,115 | | | | | | 0.0 | | | |
| | | | 53,708,403 ^ | | | | Morgan Stanley Bank of America Merrill Lynch Trust 2014 C19, 1.144%, 12/15/47 | | | | | 2,917,118 | | | | | | 0.1 | | |
| | | | 5,530,000 | # | | Morgan Stanley Bank of America Merrill Lynch Trust 2014-C18 D, 3.389%, 10/15/47 | | | | | 3,811,103 | | | | | | 0.1 | | | |
| | | | 6,610,000 | # | | Morgan Stanley Bank of America Merrill Lynch Trust 2015-C21 D, 4.162%, 03/15/48 | | | | | 5,419,344 | | | | | | 0.2 | | | |
| | | | 4,251,000 | | | | Morgan Stanley Capital I Trust 2006-IQ11, 6.303%, 10/15/42 | | | | | 4,147,167 | | | | | | 0.1 | | |
| | | | 2,800,000 | # | | Morgan Stanley Capital I Trust 2008-T29 D, 6.301%, 01/11/43 | | | | | 2,781,777 | | | | | | 0.1 | | | |
| | | | 3,090,000 | # | | Morgan Stanley Capital I Trust 2011-C1 D, 5.433%, 09/15/47 | | | | | 3,297,459 | | | | | | 0.1 | | | |
| | | | 1,300,000 | # | | Morgan Stanley Capital I Trust 2011-C1 E, 5.433%, 09/15/47 | | | | | 1,377,264 | | | | | | 0.0 | | | |
| | | | 71,638 | # | | Morgan Stanley Capital I, Inc. 1999-WF1 M, 5.910%, 11/15/31 | | | | | 71,496 | | | | | | 0.0 | | | |
| | Principal Amount† | | | Value | | | Percentage of Net Assets | | ||||||||||||
| | COMMERCIAL MORTGAGE-BACKED SECURITIES: (continued) | | ||||||||||||||||||
| | | | 442,266 | # | | Morgan Stanley Dean Witter Capital I Trust 2001-TOP3 E, 7.571%, 07/15/33 | | | | $ | 460,943 | | | | | | 0.0 | | | |
| | | | 2,890,000 | # | | Morgan Stanley Reremic Trust 2012-XA B, 0.250%, 07/27/49 | | | | | 2,794,530 | | | | | | 0.1 | | | |
| | | | 28,856,666 | #,^ | | Wells Fargo Commercial Mortgage Trust 2012-LC5 XA, 2.007%, 10/15/45 | | | | | 1,983,601 | | | | | | 0.1 | | | |
| | | | 56,033,782 ^ | | | | Wells Fargo Commercial Mortgage Trust 2014-LC16 XA, 1.396%, 08/15/50 | | | | | 3,428,674 | | | | | | 0.1 | | |
| | | | 21,525,646 ^ | | | | Wells Fargo Commercial Mortgage Trust 2016-C33 XA, 1.809%, 03/15/59 | | | | | 2,370,736 | | | | | | 0.1 | | |
| | | | 42,409,797 ^ | | | | Wells Fargo Commercial Mortgage Trust 2016-C35 XA, 2.007%, 07/15/48 | | | | | 5,697,358 | | | | | | 0.1 | | |
| | | | 16,529,811 | #,^ | | WFRBS Commercial Mortgage Trust 2012-C8 XA, 1.983%, 08/15/45 | | | | | 1,187,802 | | | | | | 0.0 | | | |
| | | | 13,487,132 | #,^ | | WFRBS Commercial Mortgage Trust 2012-C9 XA, 2.087%, 11/15/45 | | | | | 994,997 | | | | | | 0.0 | | | |
| | | | 49,391,517 | #,^ | | WFRBS Commercial Mortgage Trust 2013-C12 XA, 1.376%, 03/15/48 | | | | | 2,662,173 | | | | | | 0.1 | | | |
| | | | 6,431,071 | | | | Other Securities | | | | | 6,345,753 | | | | | | 0.2 | | |
| | | | | | | | Total Commercial Mortgage-Backed Securities (Cost $209,324,029) | | | | | 209,284,348 | | | | | | 5.6 | | |
| | ASSET-BACKED SECURITIES: 11.4% | | ||||||||||||||||||
| | | | | | | | Automobile Asset-Backed Securities: 0.6% | | ||||||||||||
| | | | 820,000 | # | | MMCA Auto Owner Trust 2014-A C, 2.260%, 10/15/20 | | | | | 823,244 | | | | | | 0.0 | | | |
| | | | 3,240,000 | # | | Oscar US Funding Trust 2014-1 A4, 2.550%, 12/15/21 | | | | | 3,220,748 | | | | | | 0.1 | | | |
| | | | 1,450,000 | # | | Oscar US Funding Trust VI LLC 2017-1A A3, 2.820%, 06/10/21 | | | | | 1,452,007 | | | | | | 0.0 | | | |
| | | | 2,270,000 | # | | Santander Drive Auto Receivables Trust 2013-A E, 4.710%, 01/15/21 | | | | | 2,315,424 | | | | | | 0.1 | | | |
| Voya Intermediate Bond Fund | as of March 31, 2017 (continued) |
| | Principal Amount† | | | Value | | | Percentage of Net Assets | | ||||||||||||
| | ASSET-BACKED SECURITIES: (continued) | | ||||||||||||||||||
| | | | | | | | Automobile Asset-Backed Securities (continued) | | ||||||||||||
| | | | 5,130,000 | | | | Santander Drive Auto Receivables Trust 2014-3 D, 2.650%, 08/17/20 | | | | $ | 5,171,038 | | | | | | 0.1 | | |
| | | | 1,940,000 | # | | SunTrust Auto Receivables Trust 2015-1A B, 2.200%, 02/15/21 | | | | | 1,933,486 | | | | | | 0.1 | | | |
| | | | 7,130,000 | | | | Other Securities | | | | | 7,176,902 | | | | | | 0.2 | | |
| | | | | | | | | | | | | 22,092,849 | | | | | | 0.6 | | |
| | | | | | | | Home Equity Asset-Backed Securities: 0.7% | | ||||||||||||
| | | | 8,807,953 | | | | Freddie Mac Structured Pass Through Certificates T-31 A7, 1.232%, 05/25/31 | | | | | 8,726,050 | | | | | | 0.2 | | |
| | | | 20,236,542 | | | | Other Securities | | | | | 16,579,236 | | | | | | 0.5 | | |
| | | | | | | | | | | | | 25,305,286 | | | | | | 0.7 | | |
| | | | | | | | Other Asset-Backed Securities: 9.7% | | ||||||||||||
| | | | 2,000,000 | # | | 1776 CLO Ltd. 2006-1A D, 2.788%, 05/08/20 | | | | | 2,011,192 | | | | | | 0.1 | | | |
| | | | 3,611,559 | # | | Ajax Mortgage Loan Trust 2016-C, 4.000%, 10/25/57 | | | | | 3,603,793 | | | | | | 0.1 | | | |
| | | | 7,600,000 | # | | ALM VII Ltd. 2012-7A A1R, 2.503%, 10/15/28 | | | | | 7,656,468 | | | | | | 0.2 | | | |
| | | | 5,100,000 | # | | ALM VII R-2 Ltd. 2013-7R2A A2R, 3.023%, 10/15/27 | | | | | 5,138,479 | | | | | | 0.1 | | | |
| | | | 2,930,000 | # | | ALM VIII Ltd. 2013-8A A1R, 2.513%, 10/15/28 | | | | | 2,941,518 | | | | | | 0.1 | | | |
| | | | 1,000,000 | # | | American Homes 4 Rent 2015-SFR1 E, 5.639%, 04/17/52 | | | | | 1,054,540 | | | | | | 0.0 | | | |
| | | | 1,108,107 | #,^ | | American Homes 4 Rent 2015-SFR1 XS, 04/17/52 | | | | | — | | | | | | — | | | |
| | | | 1,076,000 | # | | American Homes 4 Rent 2015-SFR2 C, 4.691%, 10/17/45 | | | | | 1,123,779 | | | | | | 0.0 | | | |
| | | | 1,250,000 | # | | American Homes 4 Rent 2015-SFR2 D, 5.036%, 10/17/45 | | | | | 1,318,125 | | | | | | 0.1 | | | |
| | | | 6,997,917 | #,^ | | American Homes 4 Rent 2015-SFR2 XS, 10/17/45 | | | | | — | | | | | | — | | | |
| | | | 7,380,000 | # | | Apidos CLO XI 2012-11A AR, 2.463%, 01/17/28 | | | | | 7,404,635 | | | | | | 0.2 | | | |
| | | | 3,440,000 | # | | Apidos CLO XI 2012-11A BR, 2.973%, 01/17/28 | | | | | 3,452,989 | | | | | | 0.1 | | | |
| | | | 1,170,000 | # | | Apidos CLO XIV 2013-14A D, 4.523%, 04/15/25 | | | | | 1,165,249 | | | | | | 0.0 | | | |
| | Principal Amount† | | | Value | | | Percentage of Net Assets | | ||||||||||||
| | ASSET-BACKED SECURITIES: (continued) | | ||||||||||||||||||
| | | | | | | | Other Asset-Backed Securities (continued) | | ||||||||||||
| | | | 3,130,000 | # | | Apidos CLO XVII 2014-17A A2R, 2.873%, 04/17/26 | | | | $ | 3,130,191 | | | | | | 0.1 | | | |
| | | | 5,420,000 | # | | Apidos CLO XVII 2014-17A BR, 3.523%, 04/17/26 | | | | | 5,419,951 | | | | | | 0.2 | | | |
| | | | 3,860,000 | # | | Apidos Clo XXV 2016-25A A1, 2.203%, 10/20/28 | | | | | 3,870,507 | | | | | | 0.1 | | | |
| | | | 4,350,000 | # | | Ares XXIX CLO Ltd. 2014-1A BR, 3.330%, 04/17/26 | | | | | 4,349,696 | | | | | | 0.1 | | | |
| | | | 4,410,000 | # | | Ares XXXII CLO Ltd. 2014-32A BR, 3.289%, 11/15/25 | | | | | 4,409,925 | | | | | | 0.1 | | | |
| | | | 146,648 | # | | AVANT Loans Funding Trust 2015-A A, 4.000%, 08/16/21 | | | | | 147,133 | | | | | | 0.0 | | | |
| | | | 3,970,000 | # | | Avery Point IV CLO Ltd., 3.510%, 04/25/26 | | | | | 3,970,000 | | | | | | 0.1 | | | |
| | | | 7,600,000 | # | | Babson CLO Ltd. 2014-3A AR, 2.299%, 01/15/26 | | | | | 7,615,170 | | | | | | 0.2 | | | |
| | | | 2,640,000 | # | | Babson CLO Ltd. 2014-3A C1R, 3.699%, 01/15/26 | | | | | 2,641,845 | | | | | | 0.1 | | | |
| | | | 3,620,000 | # | | Babson CLO Ltd. 2014-IA BR, 3.230%, 07/20/25 | | | | | 3,620,069 | | | | | | 0.1 | | | |
| | | | 9,710,000 | # | | Benefit Street Partners CLO IV Ltd. 2014-IVA A1R, 2.515%, 01/20/29 | | | | | 9,740,946 | | | | | | 0.2 | | | |
| | | | 3,190,000 | # | | Benefit Street Partners CLO X Ltd. 2016-10A A1, 2.233%, 01/15/29 | | | | | 3,200,597 | | | | | | 0.1 | | | |
| | | | 2,450,000 | # | | Birchwood Park CLO Ltd. 2014-1A C1R, 3.273%, 07/15/26 | | | | | 2,450,250 | | | | | | 0.1 | | | |
| | | | 6,270,000 | # | | Blue Hill CLO Ltd. 2013-1A C1R, 3.420%, 01/15/26 | | | | | 6,269,611 | | | | | | 0.2 | | | |
| | | | 3,550,000 | # | | BlueMountain CLO 2013-1A A1R, 2.430%, 01/20/29 | | | | | 3,562,588 | | | | | | 0.1 | | | |
| | | | 4,080,000 | # | | BlueMountain CLO 2013-1A A2R, 2.930%, 01/20/29 | | | | | 4,094,386 | | | | | | 0.1 | | | |
| | | | 4,350,000 | # | | BlueMountain CLO 2014-4A CR, 3.604%, 11/30/26 | | | | | 4,353,323 | | | | | | 0.1 | | | |
| Voya Intermediate Bond Fund | as of March 31, 2017 (continued) |
| | Principal Amount† | | | Value | | | Percentage of Net Assets | | ||||||||||||
| | ASSET-BACKED SECURITIES: (continued) | | ||||||||||||||||||
| | | | | | | | Other Asset-Backed Securities (continued) | | ||||||||||||
| | | | 4,070,000 | # | | BlueMountain CLO 2015-1A BR, 3.522%, 04/13/27 | | | | $ | 4,108,051 | | | | | | 0.1 | | | |
| | | | 7,100,000 | # | | BlueMountain CLO Ltd. 2012-2A AR, 2.472%, 11/20/28 | | | | | 7,122,791 | | | | | | 0.2 | | | |
| | | | 3,270,000 | # | | Burnham Park Clo Ltd. 2016-1A A, 2.318%, 10/20/29 | | | | | 3,296,729 | | | | | | 0.1 | | | |
| | | | 1,377,919 | # | | Callidus Debt Partners Clo Fund VI Ltd. 6A A1T, 1.301%, 10/23/21 | | | | | 1,377,559 | | | | | | 0.0 | | | |
| | | | 3,480,000 | # | | Carlyle Global Market Strategies CLO 2014-3A BR Ltd., 3.187%, 07/27/26 | | | | | 3,486,522 | | | | | | 0.1 | | | |
| | | | 3,040,000 | # | | Carlyle Global Market Strategies CLO Ltd. 2012-4A AR, 2.480%, 01/20/29 | | | | | 3,053,479 | | | | | | 0.1 | | | |
| | | | 6,380,000 | # | | Carlyle US CLO 2017-1A A1A Ltd., 2.460%, 04/20/31 | | | | | 6,406,298 | | | | | | 0.1 | | | |
| | | | 9,680,000 | # | | Cedar Funding VI CLO Ltd. 2016-6A A1, 2.344%, 10/20/28 | | | | | 9,690,251 | | | | | | 0.3 | | | |
| | | | 4,700,000 | # | | Cent CLO 2014-22A A2AR, 2.984%, 11/07/26 | | | | | 4,700,799 | | | | | | 0.1 | | | |
| | | | 2,150,000 | # | | CIFC Funding 2017-2A C Ltd., 04/20/30 | | | | | 2,150,000 | | | | | | 0.1 | | | |
| | | | 2,750,000 | # | | CIFC Funding Ltd. 2014-4A C1R, 2.377%, 10/17/26 | | | | | 2,749,972 | | | | | | 0.1 | | | |
| | | | 3,660,000 | # | | CIFC Funding Ltd. 2016-1A A, 2.445%, 10/21/28 | | | | | 3,674,172 | | | | | | 0.1 | | | |
| | | | 11,950,000 | # | | CIFC Funding Ltd. 2017-1A A, 2.243%, 04/23/29 | | | | | 11,949,845 | | | | | | 0.3 | | | |
| | | | 11,130,000 | # | | Dryden 33 Senior Loan Fund 2014-33A AR, 2.453%, 10/15/28 | | | | | 11,163,323 | | | | | | 0.3 | | | |
| | | | 2,960,000 | # | | Dryden Senior Loan Fund 2014-31A CR, 3.256%, 04/18/26 | | | | | 2,946,739 | | | | | | 0.1 | | | |
| | | | 2,100,000 | # | | Dryden Senior Loan Fund 2014-34A CR, 3.172%, 10/15/26 | | | | | 2,100,000 | | | | | | 0.1 | | | |
| | Principal Amount† | | | Value | | | Percentage of Net Assets | | ||||||||||||
| | ASSET-BACKED SECURITIES: (continued) | | ||||||||||||||||||
| | | | | | | | Other Asset-Backed Securities (continued) | | ||||||||||||
| | | | 6,660,000 | # | | Dryden Senior Loan Fund 2017-47A A2, 2.745%, 04/15/28 | | | | $ | 6,660,000 | | | | | | 0.2 | | | |
| | | | 6,410,000 | # | | Dryden Senior Loan Fund 2017-47A C, 3.595%, 04/15/28 | | | | | 6,406,795 | | | | | | 0.1 | | | |
| | | | 3,000,000 | # | | Flatiron CLO Ltd. 2013-1A A2R, 2.580%, 01/17/26 | | | | | 2,999,850 | | | | | | 0.1 | | | |
| | | | 3,920,000 | # | | Flatiron CLO Ltd. 2013-1A BR, 3.380%, 01/17/26 | | | | | 3,919,796 | | | | | | 0.1 | | | |
| | | | 1,500,000 | # | | Gale Force 3 CLO Ltd. 2007-3A D, 2.425%, 04/19/21 | | | | | 1,498,579 | | | | | | 0.0 | | | |
| | | | 2,125,000 | # | | GoldenTree Loan Opportunities III Ltd. 2007-3A C, 2.284%, 05/01/22 | | | | | 2,125,888 | | | | | | 0.1 | | | |
| | | | 2,963,407 | # | | HERO Funding Trust 2015-2A A, 3.990%, 09/20/40 | | | | | 3,037,492 | | | | | | 0.1 | | | |
| | | | 3,278,790 | # | | HERO Funding Trust 2015-3A A, 4.280%, 09/20/41 | | | | | 3,336,169 | | | | | | 0.1 | | | |
| | | | 2,759,343 | # | | HERO Funding Trust 2016-2A A, 3.750%, 09/20/41 | | | | | 2,808,638 | | | | | | 0.0 | | | |
| | | | 2,500,000 | # | | Invitation Homes Trust 2014-SFR2 E, 4.093%, 06/17/32 | | | | | 2,524,103 | | | | | | 0.1 | | | |
| | | | 5,400,000 | # | | LCM XXIII Ltd. 23A A1, 2.506%, 10/20/29 | | | | | 5,443,151 | | | | | | 0.1 | | | |
| | | | 1,495,350 | # | | Madison Park Funding IV Ltd. 2007-4A E, 4.756%, 03/22/21 | | | | | 1,518,578 | | | | | | 0.0 | | | |
| | | | 1,500,000 | # | | Madison Park Funding Ltd. 2007-6A D, 4.282%, 07/26/21 | | | | | 1,501,511 | | | | | | 0.0 | | | |
| | | | 3,250,000 | # | | Madison Park Funding Ltd. 2007-6A E, 6.282%, 07/26/21 | | | | | 3,255,791 | | | | | | 0.1 | | | |
| | | | 1,250,000 | # | | Madison Park Funding V Ltd. 2007-5A D, 4.552%, 02/26/21 | | | | | 1,251,113 | | | | | | 0.0 | | | |
| | | | 2,900,000 | # | | Madison Park Funding XIII Ltd. 2014-13A CR, 3.028%, 01/19/25 | | | | | 2,900,145 | | | | | | 0.1 | | | |
| Voya Intermediate Bond Fund | as of March 31, 2017 (continued) |
| | Principal Amount† | | | Value | | | Percentage of Net Assets | | ||||||||||||
| | ASSET-BACKED SECURITIES: (continued) | | ||||||||||||||||||
| | | | | | | | Other Asset-Backed Securities (continued) | | ||||||||||||
| | | | 5,400,000 | # | | Madison Park Funding XV Ltd. 2014-15A B1R, 3.242%, 01/27/26 | | | | $ | 5,400,119 | | | | | | 0.2 | | | |
| | | | 9,550,000 | # | | Magnetite CLO Ltd. 2016-18A A, 2.253%, 11/15/28 | | | | | 9,571,354 | | | | | | 0.3 | | | |
| | | | 347,059 | # | | Marketplace Loan Trust Series 2015-AV1 A, 4.000%, 09/15/21 | | | | | 348,447 | | | | | | 0.0 | | | |
| | | | 927,356 | # | | Marketplace Loan Trust Series 2015-AV2 A, 4.000%, 10/15/21 | | | | | 931,322 | | | | | | 0.0 | | | |
| | | | 1,600,000 | # | | Oaktree EIF II Series B1 Ltd. 2015-B1A A, 2.589%, 02/15/26 | | | | | 1,600,339 | | | | | | 0.0 | | | |
| | | | 9,470,000 | # | | Octagon Investment Partners 30 Ltd. 2017-1A A1, 2.355%, 03/17/30 | | | | | 9,480,872 | | | | | | 0.3 | | | |
| | | | 1,570,000 | # | | Octagon Investment Partners XIX Ltd. 2014-1A CR, 3.069%, 04/15/26 | | | | | 1,577,850 | | | | | | 0.0 | | | |
| | | | 5,660,000 | # | | OHA Loan Funding Ltd. 2015-1A AR, 2.449%, 08/15/29 | | | | | 5,697,390 | | | | | | 0.1 | | | |
| | | | 5,980,000 | # | | OHA Loan Funding Ltd. 2015-1A BR, 2.839%, 08/15/29 | | | | | 5,986,650 | | | | | | 0.2 | | | |
| | | | 6,000,000 | # | | Palmer Square CLO 2013-2A BR Ltd., 3.408%, 10/17/27 | | | | | 6,000,000 | | | | | | 0.2 | | | |
| | | | 4,000,000 | # | | Progress Residential 2015-SFR2 E, 4.427%, 06/12/32 | | | | | 4,003,377 | | | | | | 0.1 | | | |
| | | | 4,000,000 | # | | Progress Residential 2015-SFR3 C, 4.327%, 11/12/32 | | | | | 4,087,311 | | | | | | 0.1 | | | |
| | | | 7,830,000 | # | | Shackleton CLO Ltd. 2016-9A A, 2.364%, 10/20/28 | | | | | 7,852,989 | | | | | | 0.2 | | | |
| | | | 2,008,245 | # | | SoFi Consumer Loan Program 2016-1A A, 3.260%, 08/25/25 | | | | | 2,007,041 | | | | | | 0.1 | | | |
| | | | 1,500,000 | # | | SoFi Consumer Loan Program 2016-2A B, 4.770%, 10/27/25 | | | | | 1,531,956 | | | | | | 0.0 | | | |
| | Principal Amount† | | | Value | | | Percentage of Net Assets | | ||||||||||||
| | ASSET-BACKED SECURITIES: (continued) | | ||||||||||||||||||
| | | | | | | | Other Asset-Backed Securities (continued) | | ||||||||||||
| | | | 4,364,879 | # | | Sofi Consumer Loan Program 2017-1 A LLC, 3.280%, 01/26/26 | | | | $ | 4,391,726 | | | | | | 0.1 | | | |
| | | | 5,345,000 | # | | Springleaf Funding Trust 2015-A A, 3.160%, 11/15/24 | | | | | 5,397,695 | | | | | | 0.1 | | | |
| | | | 7,320,000 | # | | Symphony CLO Ltd. 2012-9A AR, 2.472%, 10/16/28 | | | | | 7,402,848 | | | | | | 0.2 | | | |
| | | | 3,120,000 | # | | Symphony CLO Ltd. 2016-18A B, 2.746%, 01/23/28 | | | | | 3,123,236 | | | | | | 0.1 | | | |
| | | | 3,080,000 | # | | Symphony CLO XIV Ltd. 2014-14A C1R, 3.505%, 07/14/26 | | | | | 3,079,978 | | | | | | 0.1 | | | |
| | | | 3,432,750 | # | | Taco Bell Funding 2016-1A A2I, 3.832%, 05/25/46 | | | | | 3,482,646 | | | | | | 0.1 | | | |
| | | | 550,000 | # | | Telos CLO 2007-2A D, 3.223%, 04/15/22 | | | | | 560,110 | | | | | | 0.0 | | | |
| | | | 2,580,000 | # | | Thacher Park CLO Ltd. 2014-1A CR, 3.857%, 10/20/26 | | | | | 2,579,755 | | | | | | 0.1 | | | |
| | | | 11,090,000 | # | | THL Credit Wind River CLO Ltd. 2017-1A A, 2.374%, 04/18/29 | | | | | 11,100,968 | | | | | | 0.3 | | | |
| | | | 6,000,000 | # | | THL Credit Wind River CLO Ltd. 2017-1A C, 3.334%, 04/18/29 | | | | | 5,999,886 | | | | | | 0.2 | | | |
| | | | 9,030,000 | # | | Wind River CLO Ltd. 2016-2A A, 2.386%, 11/01/28 | | | | | 9,057,984 | | | | | | 0.2 | | | |
| | | | 1,077,149 | | | | Other Securities | | | | | 1,073,570 | | | | | | 0.0 | | |
| | | | | | | | | | | | | 364,208,503 | | | | | | 9.7 | | |
| | | | | | | | Student Loan Asset-Backed Securities: 0.4% | | ||||||||||||
| | | | 1,714,117 | # | | DRB Prime Student Loan Trust 2015-B A2, 3.170%, 07/25/31 | | | | | 1,727,126 | | | | | | 0.0 | | | |
| | | | 2,236,498 | # | | DRB Prime Student Loan Trust 2015-D A2, 3.200%, 01/25/40 | | | | | 2,255,623 | | | | | | 0.1 | | | |
| | | | 1,280,717 | # | | Earnest Student Loan Program 2016-A B LLC, 2.500%, 01/25/39 | | | | | 1,239,032 | | | | | | 0.0 | | | |
| Voya Intermediate Bond Fund | as of March 31, 2017 (continued) |
| | Principal Amount† | | | Value | | | Percentage of Net Assets | | ||||||||||||
| | ASSET-BACKED SECURITIES: (continued) | | ||||||||||||||||||
| | | | | | | | Student Loan Asset-Backed Securities (continued) | | ||||||||||||
| | | | 1,550,000 | # | | Earnest Student Loan Program 2016-B B, 4.810%, 09/25/36 | | | | $ | 1,552,280 | | | | | | 0.1 | | | |
| | | | 1,150,000 | # | | Earnest Student Loan Program 2016-C B, 4.460%, 01/26/37 | | | | | 1,131,740 | | | | | | 0.0 | | | |
| | | | 1,200,000 | # | | SMB Private Education Loan Trust 2017-A, 3.500%, 06/17/41 | | | | | 1,162,908 | | | | | | 0.0 | | | |
| | | | 2,191,222 | # | | SoFi Professional Loan Program 2015-C A2, 2.510%, 08/25/33 | | | | | 2,188,548 | | | | | | 0.1 | | | |
| | | | 4,100,000 | # | | Sofi Professional Loan Program 2016-E LLC, 4.430%, 10/25/41 | | | | | 4,131,539 | | | | | | 0.1 | | | |
| | | | | | | | | | | | | 15,388,796 | | | | | | 0.4 | | |
| | | | | | | | Total Asset-Backed Securities (Cost $424,863,048) | | | | | 426,995,434 | | | | | | 11.4 | | |
| | U.S. GOVERNMENT AGENCY OBLIGATIONS: 11.8% | | ||||||||||||||||||
| | | | | | | | Federal Home Loan Mortgage Corporation: 4.8%## | | ||||||||||||
| | | | 11,794,000 | W | | 3.000%, due 11/15/26 | | | | | 12,080,558 | | | | | | 0.3 | | | |
| | | | 24,502,000 | W | | 3.000%, due 04/01/44 | | | | | 24,278,035 | | | | | | 0.7 | | | |
| | | | 7,849,245 | | | | 3.000%, due 04/01/45 | | | | | 7,802,156 | | | | | | 0.2 | | |
| | | | 11,606,229 | | | | 3.500%, due 01/01/45 | | | | | 11,905,831 | | | | | | 0.3 | | |
| | | | 8,540,383 | | | | 4.000%, due 09/01/45 | | | | | 8,969,062 | | | | | | 0.2 | | |
| | | | 35,960,000 | W | | 4.000%, due 05/01/47 | | | | | 37,640,004 | | | | | | 1.0 | | | |
| | | | 74,575,786 | W | | 2.500%-7.000%, due 01/01/24-05/01/46 | | | | | 77,626,341 | | | | | | 2.1 | | | |
| | | | | | | | | | | | | 180,301,987 | | | | | | 4.8 | | |
| | | | | | | | Federal National Mortgage Association: 5.1%## | | ||||||||||||
| | | | 18,700,000 | W | | 2.500%, due 12/25/26 | | | | | 18,710,227 | | | | | | 0.5 | | | |
| | | | 12,470,000 | W | | 3.000%, due 05/01/43 | | | | | 12,338,480 | | | | | | 0.3 | | | |
| | | | 16,056,146 | | | | 3.000%, due 04/01/45 | | | | | 15,979,673 | | | | | | 0.4 | | |
| | | | 8,456,358 | | | | 3.500%, due 10/01/42 | | | | | 8,694,067 | | | | | | 0.3 | | |
| | Principal Amount† | | | Value | | | Percentage of Net Assets | | ||||||||||||
| | U.S. GOVERNMENT AGENCY OBLIGATIONS: (continued) | | ||||||||||||||||||
| | | | | | | | Federal National Mortgage Association (continued) | | ||||||||||||
| | | | 24,701,873 | | | | 4.000%, due 01/01/45 | | | | | 26,270,464 | | | | | | 0.7 | | |
| | | | 24,963,093 | | | | 4.000%, due 05/01/45 | | | | | 26,205,194 | | | | | | 0.7 | | |
| | | | 76,556,489 | W | | 2.500%-7.500%, due 10/01/18-11/01/46 | | | | | 79,811,921 | | | | | | 2.2 | | | |
| | | | | | | | | | | | | 188,010,026 | | | | | | 5.1 | | |
| | | | | | | | Government National Mortgage Association: 1.9% | | ||||||||||||
| | | | 13,213,000 | W | | 3.000%, due 04/01/44 | | | | $ | 13,329,646 | | | | | | 0.4 | | | |
| | | | 23,141,917 | | | | 3.500%, due 07/20/46 | | | | | 24,029,615 | | | | | | 0.6 | | |
| | | | 23,143,755 | | | | 3.500%, due 09/20/46 | | | | | 24,031,524 | | | | | | 0.6 | | |
| | | | 8,773,455 | W | | 4.000%-5.500%, due 10/15/39-10/20/60 | | | | | 9,305,336 | | | | | | 0.3 | | | |
| | | | | | | | | | | | | 70,696,121 | | | | | | 1.9 | | |
| | | | | | | | Total U.S. Government Agency Obligations (Cost $441,072,282) | | | | | 439,008,134 | | | | | | 11.8 | | |
| | U.S. TREASURY OBLIGATIONS: 23.8% | | ||||||||||||||||||
| | | | | | | | Treasury Inflation Indexed Protected Securities: 2.5% | | ||||||||||||
| | | | 91,924,632 | | | | 0.375%, due 01/15/27 | | | | | 91,600,506 | | | | | | 2.5 | | |
| | | | | | | | U.S. Treasury Bonds: 3.8% | | ||||||||||||
| | | | 146,448,000 | | | | 2.875%, due 11/15/46 | | | | | 142,074,623 | | | | | | 3.8 | | |
| | | | | | | | U.S. Treasury Notes: 17.5% | | ||||||||||||
| | | | 247,000 | | | | 0.625%, due 06/30/18 | | | | | 245,456 | | | | | | 0.0 | | |
| | | | 170,756,000 | | | | 1.250%, due 03/31/19 | | | | | 170,719,287 | | | | | | 4.6 | | |
| | | | 167,712,000 | L | | 1.625%, due 03/15/20 | | | | | 168,311,403 | | | | | | 4.5 | | | |
| | | | 35,168,000 | | | | 1.875%, due 02/28/22 | | | | | 35,093,127 | | | | | | 0.9 | | |
| | | | 108,452,000 | | | | 1.875%, due 03/31/22 | | | | | 108,166,012 | | | | | | 2.9 | | |
| | | | 27,273,000 | | | | 2.125%, due 02/29/24 | | | | | 27,123,326 | | | | | | 0.7 | | |
| | | | 9,440,000 | | | | 2.125%, due 03/31/24 | | | | | 9,382,473 | | | | | | 0.3 | | |
| | | | 137,413,000 | | | | 2.250%, due 02/15/27 | | | | | 135,660,435 | | | | | | 3.6 | | |
| | | | | | | | | | | | | 654,701,519 | | | | | | 17.5 | | |
| | | | | | | | Total U.S. Treasury Obligations (Cost $885,870,812) | | | | | 888,376,648 | | | | | | 23.8 | | |
| | ||||||||||||||||||||
| Voya Intermediate Bond Fund | as of March 31, 2017 (continued) |
| | # of Contracts | | | Value | | | Percentage of Net Assets | |||||||||||
| | PURCHASED OPTIONS: 0.0% | |||||||||||||||||
| | | | | | | | OTC Interest Rate Swaptions: 0.0% | |||||||||||
| | | | 155,530,000 | @ | | Put on 10-Year Interest Rate Swap, Receive a floating rate based on the 3-month USD-LIBOR-BBA and pay a fixed rate equal to 2.688%, Exp. 05/16/17 Counterparty: Morgan Stanley Capital Services LLC | | | | $ | 200,019 | | | | | | 0.0 | |
| | | | | | | | Total Purchased Options (Cost $28,036) | | | | | 200,019 | | | | | | 0.0 |
| | | | | | | | Total Long-Term Investments (Cost $3,738,263,829) | | | | | 3,757,792,006 | | | | | | 100.7 |
| | ||||||||||||||||||
| | Principal Amount† | | | Value | | | Percentage of Net Assets | | ||||||||||||
| | SHORT-TERM INVESTMENTS: 7.9% | | ||||||||||||||||||
| | | | | | | | Corporate Bonds/Notes: 0.4% | | ||||||||||||
| | | | 3,158,000 | # | | Barclays Bank PLC, 6.050%, 12/04/17 | | | | | 3,241,598 | | | | | | 0.1 | | | |
| | | | 4,567,000 | | | | Discover Bank, 2.000%, 02/21/18 | | | | | 4,571,878 | | | | | | 0.1 | | |
| | | | 367,000 | | | | Discover Financial Services, 6.450%, 06/12/17 | | | | | 370,135 | | | | | | 0.0 | | |
| | | | 1,019,000 | | | | FirstEnergy Corp., 2.750%, 03/15/18 | | | | | 1,022,947 | | | | | | 0.0 | | |
| | | | 2,911,000 | | | | Hewlett Packard Enterprise Co., 2.450%, 10/05/17 | | | | | 2,919,884 | | | | | | 0.1 | | |
| | | | 1,267,000 | | | | Zoetis, Inc., 1.875%, 02/01/18 | | | | | 1,267,991 | | | | | | 0.1 | | |
| | | | | | | | | | | | | 13,394,433 | | | | | | 0.4 | | |
| | | | | | | | U.S. Government Agency Obligations: 0.0% | | ||||||||||||
| | | | 3,415 | | | | Fannie Mae, 5.500%, 02/01/18 | | | | | 3,448 | | | | | | 0.0 | | |
| | | | 124 | | | | Fannie Mae, 6.000%, 11/01/17 | | | | | 124 | | | | | | 0.0 | | |
| | | | 5,230 | | | | Fannie Mae, 6.000%, 09/01/17 | | | | | 5,246 | | | | | | 0.0 | | |
| | | | | | | | | | | | | 8,818 | | | | | | 0.0 | | |
| | Principal Amount† | | | Value | | | Percentage of Net Assets | | ||||||||||||
| | SHORT-TERM INVESTMENTS: (continued) | | ||||||||||||||||||
| | | | | | | | Securities Lending Collateralcc: 4.4% | | ||||||||||||
| | | | 39,079,068 | | | | Cantor Fitzgerald, Repurchase Agreement dated 03/31/17, 0.81%, due 04/03/17 (Repurchase Amount $39,081,670, collateralized by various U.S. Government/U.S. Government Agency Obligations, 0.000%-10.000%, Market Value plus accrued interest $39,860,660, due 04/01/17-02/20/67) | | | | $ | 39,079,068 | | | | | | 1.1 | | |
| | | | 8,187,614 | | | | Daiwa Capital Markets, Repurchase Agreement dated 03/31/17, 0.82%, due 04/03/17 (Repurchase Amount $8,188,166, collateralized by various U.S. Government/U.S. Government Agency Obligations, 0.000%-6.500%, Market Value plus accrued interest $8,351,367, due 05/11/17-12/01/51) | | | | | 8,187,614 | | | | | | 0.2 | | |
| | | | 39,079,068 | | | | Millenium Fixed Income Ltd., Repurchase Agreement dated 03/31/17, 0.84%, due 04/03/17 (Repurchase Amount $39,081,766, collateralized by various U.S. Government Securities, 3.125%-3.625%, Market Value plus accrued interest $39,860,656, due 02/15/43-02/15/44) | | | | | 39,079,068 | | | | | | 1.0 | | |
| Voya Intermediate Bond Fund | as of March 31, 2017 (continued) |
| | Principal Amount† | | | Value | | | Percentage of Net Assets | | ||||||||||||
| | SHORT-TERM INVESTMENTS: (continued) | | ||||||||||||||||||
| | | | | | | | Securities Lending Collateralcc (continued) | | ||||||||||||
| | | | 39,079,068 | | | | NBC Global Finance Ltd., Repurchase Agreement dated 03/31/17, 0.90%, due 04/03/17 (Repurchase Amount $39,081,959, collateralized by various U.S. Government Securities, 1.250%-4.625%, Market Value plus accrued interest $39,860,649, due 08/15/21-09/09/49) | | | | $ | 39,079,068 | | | | | | 1.0 | | |
| | | | 39,100,000 | | | | State of Wisconsin Investment Board, Repurchase Agreement dated 03/31/17, 0.90%, due 04/03/17 (Repurchase Amount $39,102,892, collateralized by various U.S. Government Securities, 0.125%-3.875%, Market Value plus accrued interest $39,882,042, due 01/15/19-02/15/46) | | | | | 39,100,000 | | | | | | 1.1 | | |
| | | | | | | | | | | | | 164,524,818 | | | | | | 4.4 | | |
| | | | | | | | Collateralized Mortgage Obligations: 0.0% | | ||||||||||||
| | | | 44,373 | | | | Freddie Mac REMIC Trust 2543 AN, 5.000%, 12/15/17 (Cost $43,893) | | | | | 44,720 | | | | | | 0.0 | | |
| | | | | | | | Foreign Government Bonds: 0.0% | | ||||||||||||
| | | | 200,000 | | | | Pakistan Government International Bond, 6.875%, 06/01/17 | | | | | 201,100 | | | | | | 0.0 | | |
| | | | 630,000 | # | | Serbia International Bond, 5.250%, 11/21/17 | | | | | 643,294 | | | | | | 0.0 | | | |
| | | | | | | | | | | | | 844,394 | | | | | | 0.0 | | |
| | Shares | | | Value | | | Percentage of Net Assets | | ||||||||||||
| | SHORT-TERM INVESTMENTS: (continued) | | ||||||||||||||||||
| | | | | | | | Mutual Funds: 3.1% | | ||||||||||||
| | | | 114,320,000 | | | | BlackRock Liquidity Funds, FedFund, Institutional Class, 0.600%†† (Cost $114,320,000) | | | | $ | 114,320,000 | | | | | | 3.1 | | |
| | | | | | | | Total Short-Term Investments (Cost $293,096,069) | | | | | 293,137,183 | | | | | | 7.9 | | |
| | | | | | | | Total Investments in Securities (Cost $4,031,359,898) | | | | $ | 4,050,929,189 | | | | | | 108.6 | | |
| | | | | | | | Liabilities in Excess of Other Assets | | | | | (321,180,563) | | | | | | (8.6) | | |
| | | | | | | | Net Assets | | | | $ | 3,729,748,626 | | | | | | 100.0 | | |
| | ||||||||||||||||||||
| Voya Intermediate Bond Fund | as of March 31, 2017 (continued) |
| | Gross Unrealized Appreciation | | | | $ | 50,195,192 | | |
| | Gross Unrealized Depreciation | | | | | (32,798,388) | | |
| | Net Unrealized Appreciation | | | | $ | 17,396,804 | | |
| | | | | |||||
| | | | Quoted Prices in Active Markets for Identical Investments (Level 1) | | | Significant Other Observable Inputs (Level 2) | | | Significant Unobservable Inputs (Level 3) | | | Fair Value at March 31, 2017 | | ||||||||||||
| Asset Table | | | | | | | | | | | | | | | | | | | | | | | | | |
| Investments, at fair value | | | | | | | | | | | | | | | | | | | | | | | | | |
| Purchased Options | | | | $ | — | | | | | $ | 200,019 | | | | | $ | — | | | | | $ | 200,019 | | |
| Corporate Bonds/Notes | | | | | — | | | | | | 1,133,598,035 | | | | | | — | | | | | | 1,133,598,035 | | |
| Collateralized Mortgage Obligations | | | | | — | | | | | | 504,940,726 | | | | | | — | | | | | | 504,940,726 | | |
| Short-Term Investments | | | | | 114,320,000 | | | | | | 178,817,183 | | | | | | — | | | | | | 293,137,183 | | |
| Foreign Government Bonds | | | | | — | | | | | | 155,388,662 | | | | | | — | | | | | | 155,388,662 | | |
| U.S. Treasury Obligations | | | | | — | | | | | | 888,376,648 | | | | | | — | | | | | | 888,376,648 | | |
| U.S. Government Agency Obligations | | | | | — | | | | | | 439,008,134 | | | | | | — | | | | | | 439,008,134 | | |
| Asset-Backed Securities | | | | | — | | | | | | 402,492,470 | | | | | | 24,502,964 | | | | | | 426,995,434 | | |
| Commercial Mortgage-Backed Securities | | | | | — | | | | | | 209,284,348 | | | | | | — | | | | | | 209,284,348 | | |
| Total Investments, at fair value | | | | $ | 114,320,000 | | | | | $ | 3,912,106,225 | | | | | $ | 24,502,964 | | | | | $ | 4,050,929,189 | | |
| Other Financial Instruments+ | | | | | | ||||||||||||||||||||
| Centrally Cleared Swaps | | | | | — | | | | | | 17,212,915 | | | | | | — | | | | | | 17,212,915 | | |
| Forward Foreign Currency Contracts | | | | | — | | | | | | 258,714 | | | | | | — | | | | | | 258,714 | | |
| Futures | | | | | 603,581 | | | | | | — | | | | | | — | | | | | | 603,581 | | |
| Total Assets | | | | $ | 114,923,581 | | | | | $ | 3,929,577,854 | | | | | $ | 24,502,964 | | | | | $ | 4,069,004,399 | | |
| Liabilities Table | | | | | | | | | | | | | | | | | | | | | | | | | |
| Other Financial Instruments+ | | | | | | | | | | | | | | | | | | | | | | | | | |
| Centrally Cleared Swaps | | | | $ | — | | | | | $ | (8,625,194) | | | | | $ | — | | | | | $ | (8,625,194) | | |
| Forward Foreign Currency Contracts | | | | | — | | | | | | (1,724,386) | | | | | | — | | | | | | (1,724,386) | | |
| Futures | | | | | (2,597,991) | | | | | | — | | | | | | — | | | | | | (2,597,991) | | |
| Written Options | | | | | — | | | | | | (287,863) | | | | | | — | | | | | | (287,863) | | |
| Total Liabilities | | | | $ | (2,597,991) | | | | | $ | (10,637,443) | | | | | $ | — | | | | | $ | (13,235,434) | | |
| | |||||||||||||||||||||||||
| Voya Intermediate Bond Fund | as of March 31, 2017 (continued) |
| Counterparty | | | Currency | | | Contract Amount | | | Buy/Sell | | | Settlement Date | | | In Exchange For | | | Fair Value | | | Unrealized Appreciation (Depreciation) | | ||||||||||||||||||
| The Bank of New York Mellon | | | Indonesian Rupiah | | | | | 30,298,073,021 | | | | | | Buy | | | | | | 06/16/17 | | | | | $ | 2,261,050 | | | | | $ | 2,262,084 | | | | | $ | 1,034 | | |
| Citibank N.A. | | | Russian Ruble | | | | | 5,079,181 | | | | | | Buy | | | | | | 04/07/17 | | | | | | 90,276 | | | | | | 90,190 | | | | | | (86) | | |
| HSBC Bank USA N.A. | | | Hungarian Forint | | | | | 1,930,917,578 | | | | | | Buy | | | | | | 04/07/17 | | | | | �� | 6,709,115 | | | | | | 6,675,350 | | | | | | (33,765) | | |
| JPMorgan Chase Bank N.A. | | | Russian Ruble | | | | | 39,988,988 | | | | | | Buy | | | | | | 04/07/17 | | | | | | 687,926 | | | | | | 710,072 | | | | | | 22,146 | | |
| | | | | | | | | | | | | | | | | | | | | | | | | | | | | | | | | | | | | | $ | (10,671) | | |
| Barclays Bank PLC | | | Brazilian Real | | | | | 4,222,650 | | | | | | Sell | | | | | | 05/19/17 | | | | | $ | 1,351,032 | | | | | $ | 1,334,748 | | | | | $ | 16,284 | | |
| Barclays Bank PLC | | | Brazilian Real | | | | | 55,428,116 | | | | | | Sell | | | | | | 05/19/17 | | | | | | 17,292,106 | | | | | | 17,520,404 | | | | | | (228,298) | | |
| BNP Paribas | | | Indonesian Rupiah | | | | | 59,651,665,989 | | | | | | Sell | | | | | | 06/16/17 | | | | | | 4,396,497 | | | | | | 4,453,653 | | | | | | (57,156) | | |
| Citibank N.A. | | | Russian Ruble | | | | | 16,658,918 | | | | | | Sell | | | | | | 04/07/17 | | | | | | 272,692 | | | | | | 295,807 | | | | | | (23,115) | | |
| Citibank N.A. | | | Brazilian Real | | | | | 2,627,962 | | | | | | Sell | | | | | | 05/19/17 | | | | | | 831,502 | | | | | | 830,679 | | | | | | 823 | | |
| Citibank N.A. | | | Chilean Peso | | | | | 2,748,956,795 | | | | | | Sell | | | | | | 05/19/17 | | | | | | 4,229,164 | | | | | | 4,156,728 | | | | | | 72,436 | | |
| HSBC Bank USA N.A. | | | Russian Ruble | | | | | 1,145,758,623 | | | | | | Sell | | | | | | 04/07/17 | | | | | | 19,030,133 | | | | | | 20,344,894 | | | | | | (1,314,761) | | |
| HSBC Bank USA N.A. | | | Romanian New Leu | | | | | 10,430,012 | | | | | | Sell | | | | | | 04/07/17 | | | | | | 2,494,226 | | | | | | 2,443,541 | | | | | | 50,685 | | |
| JPMorgan Chase Bank N.A. | | | Colombian Peso | | | | | 24,886,564,247 | | | | | | Sell | | | | | | 05/19/17 | | | | | | 8,534,487 | | | | | | 8,601,692 | | | | | | (67,205) | | |
| Morgan Stanley | | | Hungarian Forint | | | | | 5,432,239,440 | | | | | | Sell | | | | | | 04/07/17 | | | | | | 18,875,030 | | | | | | 18,779,724 | | | | | | 95,306 | | |
| | | | | | | | | | | | | | | | | | | | | | | | | | | | | | | | | | | | | | $ | (1,455,001) | | |
| | ||||||||||||||||||||||||||||||||||||||||
| Contract Description | | | Number of Contracts | | | Expiration Date | | | Notional Value | | | Unrealized Appreciation/ (Depreciation) | | ||||||||||||
| Long Contracts | | | | | | ||||||||||||||||||||
| U.S. Treasury 10-Year Note | | | | | 561 | | | | | | 06/21/17 | | | | | $ | 69,879,562 | | | | | $ | (28,041) | | |
| U.S. Treasury 2-Year Note | | | | | 260 | | | | | | 06/30/17 | | | | | | 56,277,811 | | | | | | 36,499 | | |
| U.S. Treasury 5-Year Note | | | | | 1,640 | | | | | | 06/30/17 | | | | | | 193,071,558 | | | | | | 389,770 | | |
| U.S. Treasury Long Bond | | | | | 53 | | | | | | 06/20/17 | | | | | | 7,994,719 | | | | | | 5,116 | | |
| U.S. Treasury Ultra Long Bond | | | | | 418 | | | | | | 06/21/17 | | | | | | 67,141,250 | | | | | | 172,196 | | |
| | | | | | | | | | | | | | | | | $ | 394,364,900 | | | | | $ | 575,540 | | |
| Short Contracts | | | | | | ||||||||||||||||||||
| Euro-Bund | | | | | (729) | | | | | | 06/08/17 | | | | | | (125,536,261) | | | | | | (1,268,947) | | |
| U.S. Treasury Ultra 10-Year Note | | | | | (1,661) | | | | | | 06/21/17 | | | | | | (222,392,336) | | | | | | (1,301,003) | | |
| | | | | | | | | | | | | | | | | $ | (347,928,597) | | | | | $ | (2,569,950) | | |
| | | | | | | ||||||||||||||||||||
| Voya Intermediate Bond Fund | as of March 31, 2017 (continued) |
| | | | Clearinghouse | | | Termination Date | | | Notional Amount | | | Fair Value | | | Unrealized Appreciation/ (Depreciation) | | ||||||||||||||||||
| Receive a fixed rate equal to 2.372% and pay a floating rate based on the 3-month USD-LIBOR-BBA | | | Chicago Mercantile Exchange | | | | | 10/13/30 | | | | | | USD | | | | | | 38,344,000 | | | | | $ | (778,769) | | | | | $ | (778,769) | | |
| Receive a fixed rate equal to 2.510% and pay a floating rate based on the 3-month USD-LIBOR-BBA | | | Chicago Mercantile Exchange | | | | | 10/13/35 | | | | | | USD | | | | | | 31,365,000 | | | | | | (623,274) | | | | | | (623,274) | | |
| Receive a fixed rate equal to 2.593% and pay a floating rate based on the 3-month USD-LIBOR-BBA | | | Chicago Mercantile Exchange | | | | | 10/13/40 | | | | | | USD | | | | | | 24,606,000 | | | | | | (387,639) | | | | | | (387,639) | | |
| Receive a floating rate based on the 3-month USD-LIBOR-BBA and pay a fixed rate equal to 2.619% | | | Chicago Mercantile Exchange | | | | | 10/13/45 | | | | | | USD | | | | | | 45,865,000 | | | | | | 696,929 | | | | | | 696,929 | | |
| Receive a floating rate based on the 3-month USD-LIBOR-BBA and pay a fixed rate equal to 1.036% | | | Chicago Mercantile Exchange | | | | | 10/13/18 | | | | | | USD | | | | | | 42,083,000 | | | | | | 306,774 | | | | | | 306,774 | | |
| Receive a fixed rate equal to 1.036% and pay a floating rate based on the 3-month USD-LIBOR-BBA | | | Chicago Mercantile Exchange | | | | | 10/13/18 | | | | | | USD | | | | | | 42,311,000 | | | | | | (308,758) | | | | | | (308,758) | | |
| Receive a floating rate based on the 3-month USD-LIBOR-BBA and pay a fixed rate equal to 1.668% | | | Chicago Mercantile Exchange | | | | | 10/30/19 | | | | | | USD | | | | | | 162,439,000 | | | | | | 274,344 | | | | | | 274,344 | | |
| Receive a fixed rate equal to 1.460% and pay a floating rate based on the 3-month USD-LIBOR-BBA | | | Chicago Mercantile Exchange | | | | | 10/13/20 | ��� | | | | | USD | | | | | | 151,804,000 | | | | | | (2,247,823) | | | | | | (2,247,823) | | |
| Receive a floating rate based on the 3-month USD-LIBOR-BBA and pay a fixed rate equal to 1.780% | | | Chicago Mercantile Exchange | | | | | 10/13/22 | | | | | | USD | | | | | | 45,684,000 | | | | | | 810,672 | | | | | | 810,672 | | |
| Receive a fixed rate equal to 2.126% and pay a floating rate based on the 3-month USD-LIBOR-BBA | | | Chicago Mercantile Exchange | | | | | 03/10/26 | | | | | | USD | | | | | | 97,984,000 | | | | | | (2,543,437) | | | | | | (2,543,437) | | |
| Receive a floating rate based on the 3-month USD-LIBOR-BBA and pay a fixed rate equal to 1.646% | | | Chicago Mercantile Exchange | | | | | 06/27/26 | | | | | | USD | | | | | | 14,380,000 | | | | | | 886,776 | | | | | | 886,776 | | |
| Receive a floating rate based on the 3-month USD-LIBOR-BBA and pay a fixed rate equal to 1.619% | | | Chicago Mercantile Exchange | | | | | 06/27/26 | | | | | | USD | | | | | | 14,380,000 | | | | | | 920,234 | | | | | | 920,234 | | |
| Receive a floating rate based on the 3-month USD-LIBOR-BBA and pay a fixed rate equal to 1.622% | | | Chicago Mercantile Exchange | | | | | 06/27/26 | | | | | | USD | | | | | | 14,380,000 | | | | | | 916,584 | | | | | | 916,584 | | |
| Receive a floating rate based on the 3-month USD-LIBOR-BBA and pay a fixed rate equal to 1.621% | | | Chicago Mercantile Exchange | | | | | 06/27/26 | | | | | | USD | | | | | | 14,380,000 | | | | | | 917,801 | | | | | | 917,801 | | |
| Receive a floating rate based on the 3-month USD-LIBOR-BBA and pay a fixed rate equal to 1.625% | | | Chicago Mercantile Exchange | | | | | 06/27/26 | | | | | | USD | | | | | | 8,455,000 | | | | | | 536,706 | | | | | | 536,706 | | |
| Receive a floating rate based on the 3-month USD-LIBOR-BBA and pay a fixed rate equal to 1.902% | | | Chicago Mercantile Exchange | | | | | 06/28/26 | | | | | | USD | | | | | | 97,984,000 | | | | | | 3,595,724 | | | | | | 3,595,724 | | |
| Voya Intermediate Bond Fund | as of March 31, 2017 (continued) |
| | | | Clearinghouse | | | Termination Date | | | Notional Amount | | | Fair Value | | | Unrealized Appreciation/ (Depreciation) | | ||||||||||||||||||
| Receive a floating rate based on the 3-month USD-LIBOR-BBA and pay a fixed rate equal to 1.538% | | | Chicago Mercantile Exchange | | | | | 09/22/26 | | | | | | USD | | | | | | 3,367,452 | | | | | | 247,374 | | | | | | 247,374 | | |
| Receive a floating rate based on the 3-month USD-LIBOR-BBA and pay a fixed rate equal to 1.539% | | | Chicago Mercantile Exchange | | | | | 09/22/26 | | | | | | USD | | | | | | 22,754,000 | | | | | | 1,670,335 | | | | | | 1,670,335 | | |
| Receive a floating rate based on the 3-month USD-LIBOR-BBA and pay a fixed rate equal to 1.546% | | | Chicago Mercantile Exchange | | | | | 09/22/26 | | | | | | USD | | | | | | 4,489,000 | | | | | | 327,007 | | | | | | 327,007 | | |
| Receive a floating rate based on the 3-month USD-LIBOR-BBA and pay a fixed rate equal to 1.558% | | | Chicago Mercantile Exchange | | | | | 09/22/26 | | | | | | USD | | | | | | 22,434,000 | | | | | | 1,610,945 | | | | | | 1,610,945 | | |
| Receive a floating rate based on the 3-month USD-LIBOR-BBA and pay a fixed rate equal to 1.558% | | | Chicago Mercantile Exchange | | | | | 09/22/26 | | | | | | USD | | | | | | 22,438,000 | | | | | | 1,610,262 | | | | | | 1,610,262 | | |
| Receive a floating rate based on the 3-month USD-LIBOR-BBA and pay a fixed rate equal to 1.562% | | | Chicago Mercantile Exchange | | | | | 09/22/26 | | | | | | USD | | | | | | 25,493,548 | | | | | | 1,821,604 | | | | | | 1,821,604 | | |
| Receive a fixed rate equal to 2.312% and pay a floating rate based on the 3-month USD-LIBOR-BBA | | | Chicago Mercantile Exchange | | | | | 12/05/26 | | | | | | USD | | | | | | 93,230,000 | | | | | | (705,974) | | | | | | (705,974) | | |
| Receive a fixed rate equal to 2.255% and pay a floating rate based on the 3-month USD-LIBOR-BBA | | | Chicago Mercantile Exchange | | | | | 12/06/26 | | | | | | USD | | | | | | 73,721,000 | | | | | | (925,272) | | | | | | (925,272) | | |
| Receive a floating rate based on the 3-month USD-LIBOR-BBA and pay a fixed rate equal to 2.387% | | | Chicago Mercantile Exchange | | | | | 01/15/27 | | | | | | USD | | | | | | 24,456,000 | | | | | | 35,021 | | | | | | 62,844 | | |
| Receive a floating rate based on the 3-month USD-LIBOR-BBA and pay a fixed rate equal to 2.440% | | | Chicago Mercantile Exchange | | | | | 01/15/27 | | | | | | USD | | | | | | 20,788,000 | | | | | | (68,342) | | | | | | (43,774) | | |
| Receive a floating rate based on the 3-month USD-LIBOR-BBA and pay a fixed rate equal to 2.429% | | | Chicago Mercantile Exchange | | | | | 01/15/27 | | | | | | USD | | | | | | 27,941,000 | | | | | | (64,489) | | | | | | (31,723) | | |
| Receive a floating rate based on the 3-month USD-LIBOR-BBA and pay a fixed rate equal to 2.431% | | | Chicago Mercantile Exchange | | | | | 01/15/27 | | | | | | USD | | | | | | 22,369,000 | | | | | | (55,015) | | | | | | (28,751) | | |
| | | | | | | | | | | | | | | | | | | | | | | | | | $ | 8,476,300 | | | | | $ | 8,587,721 | | |
| | ||||||||||||||||||||||||||||||||||
| Description | | | Counterparty | | | Exercise Rate | | | Pay/ Receive Exercise Rate | | | Floating Rate Index | | | Expiration Date | | | Notional Amount | | | Premiums Received | | | Fair Value | |||||||||||||||||
| Call on 10-Year Interest Rate Swap | | | Morgan Stanley Capital Services LLC | | | | | 2.188% | | | | | | Pay | | | | 3-month USD-LIBOR-BBA | | | | | 05/16/17 | | | | | | USD155,530,000 | | | | | $ | 32,349 | | | | | $ | (287,863) |
| | | | | | | | | | | | | | | | | | | | | | | | | | | | Total Written Swaptions | | | | $ | 32,349 | | | | | $ | (287,863) | |||
| | |||||||||||||||||||||||||||||||||||||||||
| Voya Intermediate Bond Fund | as of March 31, 2017 (continued) |
| Derivatives not accounted for as hedging instruments | | | Location on Statement of Assets and Liabilities | | | Fair Value | | |||
| Asset Derivatives | | | | |||||||
| Interest rate contracts | | | Investments in securities at value* | | | | $ | 200,019 | | |
| Foreign exchange contracts | | | Unrealized appreciation on forward foreign currency contracts | | | | | 258,714 | | |
| Interest rate contracts | | | Net Assets — Unrealized appreciation** | | | | | 603,581 | | |
| Interest rate contracts | | | Net Assets — Unrealized appreciation*** | | | | | 17,212,915 | | |
| Total Asset Derivatives | | | | | | | $ | 18,275,229 | | |
| Liability Derivatives | | | | | | |||||
| Foreign exchange contracts | | | Unrealized depreciation on forward foreign currency contracts | | | | $ | 1,724,386 | | |
| Interest rate contracts | | | Net Assets — Unrealized depreciation** | | | | | 2,597,991 | | |
| Interest rate contracts | | | Net Assets — Unrealized depreciation*** | | | | | 8,625,194 | | |
| Interest rate contracts | | | Written options, at fair value | | | | | 287,863 | | |
| Total Liability Derivatives | | | | | | | $ | 13,235,434 | | |
| | ||||||||||
| Derivatives not accounted for as hedging instruments | | | Investments* | | | Foreign currency related transactions** | | | Futures | | | Swaps | | | Written options | | | Total | | ||||||||||||||||||
| Credit contracts | | | | $ | (227,500) | | | | | $ | — | | | | | $ | — | | | | | $ | 2,168,777 | | | | | $ | — | | | | | $ | 1,941,277 | | |
| Equity contracts | | | | | — | | | | | | — | | | | | | 472,439 | | | | | | — | | | | | | — | | | | | | 472,439 | | |
| Foreign exchange contracts | | | | | — | | | | | | (2,153,996) | | | | | | — | | | | | | (540,456) | | | | | | — | | | | | | (2,694,452) | | |
| Interest rate contracts | | | | | (1,806,114) | | | | | | — | | | | | | 5,383,107 | | | | | | (10,909,624) | | | | | | 1,784,289 | | | | | | (5,548,342) | | |
| Total | | | | $ | (2,033,614) | | | | | $ | (2,153,996) | | | | | $ | 5,855,546 | | | | | $ | (9,281,303) | | | | | $ | 1,784,289 | | | | | $ | (5,829,078) | | |
| | |||||||||||||||||||||||||||||||||||||
| Derivatives not accounted for as hedging instruments | | | Investments* | | | Foreign currency related transactions** | | | Futures | | | Swaps | | | Written options | | | Total | | ||||||||||||||||||
| Credit contracts | | | | $ | — | | | | | $ | — | | | | | $ | — | | | | | $ | — | | | | | $ | — | | | | | $ | — | | |
| Equity contracts | | | | | — | | | | | | — | | | | | | 24,727 | | | | | | — | | | | | | — | | | | | | 24,727 | | |
| Foreign exchange contracts | | | | | — | | | | | | (1,465,672) | | | | | | — | | | | | | — | | | | | | — | | | | | | (1,465,672) | | |
| Interest rate contracts | | | | | 171,983 | | | | | | — | | | | | | (1,400,054) | | | | | | 15,322,419 | | | | | | (255,514) | | | | | | 13,838,834 | | |
| Total | | | | $ | 171,983 | | | | | $ | (1,465,672) | | | | | $ | (1,375,327) | | | | | $ | 15,322,419 | | | | | $ | (255,514) | | | | | $ | 12,397,889 | | |
| | |||||||||||||||||||||||||||||||||||||
| Voya Intermediate Bond Fund | as of March 31, 2017 (continued) |
| | | | Barclays Bank PLC | | | BNP Paribas | | | Citibank N.A. | | | HSBC Bank USA N.A. | | | JPMorgan Chase Bank N.A. | | | JPMorgan Chase & Co. | | | Morgan Stanley | | | Morgan Stanley Capital Services LLC | | | The Bank of New York Mellon | | | Totals | | ||||||||||||||||||||||||||||||
| Assets: | | | | | | | | | | | | ||||||||||||||||||||||||||||||||||||||||||||||||||
| Purchased options | | | | $ | — | | | | | $ | — | | | | | $ | — | | | | | $ | — | | | | | $ | — | | | | | $ | — | | | | | $ | — | | | | | $ | 200,019 | | | | | $ | — | | | | | $ | 200,019 | | |
| Forward foreign currency contracts | | | | | 16,284 | | | | | | — | | | | | | 73,259 | | | | | | 50,685 | | | | | | 22,146 | | | | | | — | | | | | | 95,306 | | | | | | — | | | | | | 1,034 | | | | | | 258,714 | | |
| Total Assets | | | | $ | 16,284 | | | | | $ | — | | | | | $ | 73,259 | | | | | $ | 50,685 | | | | | $ | 22,146 | | | | | $ | — | | | | | $ | 95,306 | | | | | $ | 200,019 | | | | | $ | 1,034 | | | | | $ | 458,733 | | |
| Liabilities: | | | | | | | | | | | | ||||||||||||||||||||||||||||||||||||||||||||||||||
| Forward foreign currency contracts | | | | $ | 228,298 | | | | | $ | 57,156 | | | | | $ | 23,201 | | | | | $ | 1,348,526 | | | | | $ | 67,205 | | | | | $ | — | | | | | $ | — | | | | | $ | — | | | | | $ | — | | | | | $ | 1,724,386 | | |
| Written options | | | | | | | | | | | | | | | | | — | | | | | | | | | | | | — | | | | | | — | | | | | | — | | | | | | 287,863 | | | | | | — | | | | | | 287,863 | | |
| Total Liabilities | | | | $ | 228,298 | | | | | $ | 57,156 | | | | | $ | 23,201 | | | | | $ | 1,348,526 | | | | | $ | 67,205 | | | | | $ | — | | | | | $ | — | | | | | $ | 287,863 | | | | | $ | — | | | | | $ | 2,012,249 | | |
| Net OTC derivative instruments by counterparty, at fair value | | | | $ | (212,014) | | | | | $ | (57,156) | | | | | $ | 50,058 | | | | | $ | (1,297,841) | | | | | $ | (45,059) | | | | | $ | — | | | | | $ | 95,306 | | | | | $ | (87,844) | | | | | $ | 1,034 | | | | | $ | (1,553,516) | | |
| Total collateral pledged by the Fund/(Received from counterparty) | | | | $ | — | | | | | $ | — | | | | | $ | — | | | | | $ | 1,100,000 | | | | | $ | 45,059 | | | | | $ | — | | | | | $ | (10,000) | | | | | $ | — | | | | | $ | — | | | | | $ | 1,135,059 | | |
Net Exposure(1)(2) | | | | $ | (212,014) | | | | | $ | (57,156) | | | | | $ | 50,058 | | | | | $ | (197,841) | | | | | $ | — | | | | | $ | — | | | | | $ | 85,306 | | | | | $ | (87,844) | | | | | $ | 1,034 | | | | | $ | (418,457) | | |
| | |||||||||||||||||||||||||||||||||||||||||||||||||||||||||||||
| Voya Short Term Bond Fund | as of March 31, 2017 |
| | Principal Amount† | | | Value | | | Percentage of Net Assets | | ||||||||||||
| | CORPORATE BONDS/NOTES: 49.0% | | ||||||||||||||||||
| | | | | | | | Basic Materials: 1.1% | | ||||||||||||
| | | | 135,000 | # | | Chevron Phillips Chemical Co. LLC / Chevron Phillips Chemical Co. L.P., 1.700%, 05/01/18 | | | | $ | 135,051 | | | | | | 0.2 | | | |
| | | | 300,000 | # | | WR Grace & Co-Conn, 5.125%, 10/01/21 | | | | | 315,750 | | | | | | 0.3 | | | |
| | | | 578,000 | | | | Other Securities | | | | | 594,787 | | | | | | 0.6 | | |
| | | | | | | | | | | | | 1,045,588 | | | | | | 1.1 | | |
| | | | | | | | Communications: 3.3% | | ||||||||||||
| | | | 414,000 | | | | AT&T, Inc., 2.300%, 03/11/19 | | | | | 416,176 | | | | | | 0.4 | | |
| | | | 300,000 | # | | Nielsen Finance LLC / Nielsen Finance Co., 5.000%, 04/15/22 | | | | | 307,500 | | | | | | 0.3 | | | |
| | | | 300,000 | # | | SFR Group SA, 6.000%, 05/15/22 | | | | | 312,000 | | | | | | 0.3 | | | |
| | | | 200,000 | # | | Sky PLC, 2.625%, 09/16/19 | | | | | 201,272 | | | | | | 0.2 | | | |
| | | | 147,000 | # | | Verizon Communications, Inc., 2.946%, 03/15/22 | | | | | 146,524 | | | | | | 0.2 | | | |
| | | | 1,720,000 | | | | Other Securities | | | | | 1,747,609 | | | | | | 1.9 | | |
| | | | | | | | | | | | | 3,131,081 | | | | | | 3.3 | | |
| | | | | | | | Consumer, Cyclical: 5.2% | | ||||||||||||
| | | | 150,000 | | | | American Honda Finance Corp., 2.000%, 02/14/20 | | | | | 150,528 | | | | | | 0.2 | | |
| | | | 410,000 | | | | American Honda Finance Corp., 2.250%, 08/15/19 | | | | | 413,687 | | | | | | 0.4 | | |
| | | | 165,000 | # | | BMW US Capital LLC, 1.450%, 09/13/19 | | | | | 163,118 | | | | | | 0.2 | | | |
| | | | 260,000 | # | | Daimler Finance North America LLC, 1.500%, 07/05/19 | | | | | 256,389 | | | | | | 0.3 | | | |
| | | | 320,000 | # | | Daimler Finance North America LLC, 2.300%, 01/06/20 | | | | | 320,818 | | | | | | 0.3 | | | |
| | | | 600,000 | | | | Ford Motor Credit Co. LLC, 1.897%-3.157%, 08/12/19-08/04/20 | | | | | 603,681 | | | | | | 0.7 | | |
| | | | 405,000 | | | | Southwest Airlines Co., 2.650%, 11/05/20 | | | | | 409,343 | | | | | | 0.4 | | |
| | | | 265,000 | | | | Southwest Airlines Co., 2.750%, 11/06/19 | | | | | 269,520 | | | | | | 0.3 | | |
| | | | 2,242,614 | | | | Other Securities | | | | | 2,261,666 | | | | | | 2.4 | | |
| | | | | | | | | | | | | 4,848,750 | | | | | | 5.2 | | |
| | | | | | | | Consumer, Non-cyclical: 8.1% | | ||||||||||||
| | | | 509,000 | | | | Abbott Laboratories, 2.350%-2.800%, 11/22/19-09/15/20 | | | | | 512,463 | | | | | | 0.5 | | |
| | Principal Amount† | | | Value | | | Percentage of Net Assets | | ||||||||||||
| | CORPORATE BONDS/NOTES: (continued) | | ||||||||||||||||||
| | | | | | | | Consumer, Non-cyclical (continued) | | ||||||||||||
| | | | 481,000 | | | | Anheuser-Busch InBev Finance, Inc., 1.900%, 02/01/19 | | | | $ | 481,876 | | | | | | 0.5 | | |
| | | | 431,000 | | | | AstraZeneca PLC, 1.750%-1.950%, 11/16/18-09/18/19 | | | | | 430,930 | | | | | | 0.5 | | |
| | | | 240,000 | # | | Danone SA, 1.691%, 10/30/19 | | | | | 236,923 | | | | | | 0.3 | | | |
| | | | 439,000 | | | | Kraft Heinz Foods Co., 2.000%, 07/02/18 | | | | | 440,179 | | | | | | 0.5 | | |
| | | | 464,000 | | | | Sanofi, 1.250%, 04/10/18 | | | | | 463,471 | | | | | | 0.5 | | |
| | | | 4,943,000 | | | | Other Securities(a) | | | | | 4,960,816 | | | | | | 5.3 | | |
| | | | | | | | | | | | | 7,526,658 | | | | | | 8.1 | | |
| | | | | | | | Energy: 3.2% | | ||||||||||||
| | | | 407,000 | | | | BP Capital Markets PLC, 2.315%-2.521%, 01/15/20-02/13/20 | | | | | 411,536 | | | | | | 0.5 | | |
| | | | 882,000 | | | | Shell International Finance BV, 1.375%-2.125%, 11/10/18-09/12/21 | | | | | 874,082 | | | | | | 0.9 | | |
| | | | 1,660,000 | | | | Other Securities | | | | | 1,669,333 | | | | | | 1.8 | | |
| | | | | | | | | | | | | 2,954,951 | | | | | | 3.2 | | |
| | | | | | | | Financial: 18.7% | | ||||||||||||
| | | | 210,000 | # | | ABN AMRO Bank NV, 2.450%, 06/04/20 | | | | | 210,221 | | | | | | 0.2 | | | |
| | | | 480,000 | | | | Australia & New Zealand Banking Group Ltd./New York NY, 2.050%-2.250%, 06/13/19-09/23/19 | | | | | 481,435 | | | | | | 0.5 | | |
| | | | 928,000 | | | | Bank of America Corp., 2.600%, 01/15/19 | | | | | 938,001 | | | | | | 1.0 | | |
| | | | 381,000 | | | | Bank of America Corp., 1.950%-2.151%, 05/12/18-11/09/20 | | | | | 380,200 | | | | | | 0.4 | | |
| | | | 520,000 | | | | Capital One NA/Mclean VA, 1.850%-2.350%, 08/17/18-09/13/19 | | | | | 519,271 | | | | | | 0.6 | | |
| | | | 500,000 | # | | CIT Group, Inc., 5.000%, 05/15/18 | | | | | 504,000 | | | | | | 0.5 | | | |
| | | | 433,000 | | | | Citigroup, Inc., 2.050%, 12/07/18 | | | | | 433,938 | | | | | | 0.5 | | |
| | | | 160,000 | # | | Commonwealth Bank of Australia, 2.250%, 03/10/20 | | | | | 160,158 | | | | | | 0.2 | | | |
| | | | 360,000 | | | | Credit Suisse AG/New York NY, 1.700%, 04/27/18 | | | | | 359,565 | | | | | | 0.4 | | |
| | | | 200,000 | | | | Credit Suisse AG, 5.300%, 08/13/19 | | | | | 214,511 | | | | | | 0.2 | | |
| Voya Short Term Bond Fund | as of March 31, 2017 (continued) |
| | Principal Amount† | | | Value | | | Percentage of Net Assets | | ||||||||||||
| | CORPORATE BONDS/NOTES: (continued) | | ||||||||||||||||||
| | | | | | | | Financial (continued) | | ||||||||||||
| | | | 425,000 | | | | Goldman Sachs Group, Inc., 2.550%, 10/23/19 | | | | $ | 429,097 | | | | | | 0.5 | | |
| | | | 250,000 | | | | Huntington National Bank/ The, 2.375%, 03/10/20 | | | | | 251,021 | | | | | | 0.2 | | |
| | | | 250,000 | | | | Huntington National Bank, 2.200%, 11/06/18 | | | | | 251,137 | | | | | | 0.3 | | |
| | | | 260,000 | # | | ING Bank NV, 1.650%, 08/15/19 | | | | | 256,830 | | | | | | 0.3 | | | |
| | | | 442,000 | | | | JPMorgan Chase & Co., 1.625%, 05/15/18 | | | | | 441,942 | | | | | | 0.5 | | |
| | | | 30,000 | | | | Morgan Stanley, 2.200%, 12/07/18 | | | | | 30,133 | | | | | | 0.0 | | |
| | | | 127,000 | # | | New York Life Global Funding, 1.550%, 11/02/18 | | | | | 126,806 | | | | | | 0.1 | | | |
| | | | 310,000 | | | | PNC Bank NA, 1.450%, 07/29/19 | | | | | 306,502 | | | | | | 0.4 | | |
| | | | 580,000 | | | | PNC Bank NA, 2.400%, 10/18/19 | | | | | 585,048 | | | | | | 0.6 | | |
| | | | 175,000 | # | | Realogy Group LLC / Realogy Co-Issuer Corp., 5.250%, 12/01/21 | | | | | 182,875 | | | | | | 0.2 | | | |
| | | | 495,000 | | | | Royal Bank of Canada, 1.800%-2.125%, 07/30/18-03/02/20 | | | | | 495,612 | | | | | | 0.5 | | |
| | | | 363,000 | # | | Scentre Group Trust 1 / Scentre Group Trust 2, 2.375%, 11/05/19 | | | | | 364,242 | | | | | | 0.4 | | | |
| | | | 265,000 | # | | Standard Chartered PLC, 2.100%, 08/19/19 | | | | | 262,948 | | | | | | 0.3 | | | |
| | | | 260,000 | # | | Swedbank AB, 2.800%, 03/14/22 | | | | | 260,598 | | | | | | 0.3 | | | |
| | | | 500,000 | | | | Toronto-Dominion Bank, 2.250%, 11/05/19 | | | | | 503,463 | | | | | | 0.5 | | |
| | | | 200,000 | # | | UBS Group Funding Jersey Ltd., 2.950%, 09/24/20 | | | | | 201,471 | | | | | | 0.2 | | | |
| | | | 460,000 | | | | Wells Fargo Bank NA, 2.150%, 12/06/19 | | | | | 461,844 | | | | | | 0.5 | | |
| | | | 7,690,000 | | | | Other Securities | | | | | 7,796,944 | | | | | | 8.4 | | |
| | | | | | | | | | | | | 17,409,813 | | | | | | 18.7 | | |
| | | | | | | | Industrial: 3.2% | | ||||||||||||
| | | | 300,000 | # | | Ardagh Packaging Finance PLC / Ardagh Holdings USA, Inc., 4.625%, 05/15/23 | | | | | 303,375 | | | | | | 0.3 | | | |
| | | | 300,000 | # | | Owens-Brockway Glass Container, Inc., 5.000%, 01/15/22 | | | | | 309,750 | | | | | | 0.4 | | | |
| | Principal Amount† | | | Value | | | Percentage of Net Assets | | ||||||||||||
| | CORPORATE BONDS/NOTES: (continued) | | ||||||||||||||||||
| | | | | | | | Industrial (continued) | | ||||||||||||
| | | | 200,000 | # | | Rolls-Royce PLC, 2.375%, 10/14/20 | | | | $ | 199,430 | | | | | | 0.2 | | | |
| | | | 370,000 | # | | Siemens Financieringsmaatschappij NV, 1.450%, 05/25/18 | | | | | 369,695 | | | | | | 0.4 | | | |
| | | | 1,770,000 | | | | Other Securities | | | | | 1,779,224 | | | | | | 1.9 | | |
| | | | | | | | | | | | | 2,961,474 | | | | | | 3.2 | | |
| | | | | | | | Technology: 3.4% | | ||||||||||||
| | | | 490,000 | | | | Apple, Inc., 1.900%, 02/07/20 | | | | | 491,495 | | | | | | 0.5 | | |
| | | | 185,000 | # | | Broadcom Corp. / Broadcom Cayman Finance Ltd., 2.375%, 01/15/20 | | | | | 185,081 | | | | | | 0.2 | | | |
| | | | 564,000 | # | | Diamond 1 Finance Corp. / Diamond 2 Finance Corp., 3.480%, 06/01/19 | | | | | 578,491 | | | | | | 0.6 | | | |
| | | | 300,000 | # | | First Data Corp., 5.375%, 08/15/23 | | | | | 313,125 | | | | | | 0.4 | | | |
| | | | 370,000 | | | | International Business Machines Corp., 1.900%, 01/27/20 | | | | | 371,447 | | | | | | 0.4 | | |
| | | | 300,000 | # | | Quintiles IMS, Inc., 4.875%, 05/15/23 | | | | | 305,625 | | | | | | 0.3 | | | |
| | | | 901,000 | | | | Other Securities | | | | | 899,501 | | | | | | 1.0 | | |
| | | | | | | | | | | | | 3,144,765 | | | | | | 3.4 | | |
| | | | | | | | Utilities: 2.8% | | ||||||||||||
| | | | 405,000 | | | | Duke Energy Corp., 1.800%, 09/01/21 | | | | | 391,575 | | | | | | 0.4 | | |
| | | | 2,209,000 | | | | Other Securities | | | | | 2,233,470 | | | | | | 2.4 | | |
| | | | | | | | | | | | | 2,625,045 | | | | | | 2.8 | | |
| | | | | | | | Total Corporate Bonds/Notes (Cost $45,595,333) | | | | | 45,648,125 | | | | | | 49.0 | | |
| | COLLATERALIZED MORTGAGE OBLIGATIONS: 5.8% | | ||||||||||||||||||
| | | | 339,092 | | | | Fannie Mae Interest Strip Series 404 8, 3.000%, 05/25/40 | | | | | 340,144 | | | | | | 0.4 | | |
| | | | 770,928 | | | | Fannie Mae REMIC Trust 2009-49 KB, 5.000%, 07/25/24 | | | | | 790,843 | | | | | | 0.8 | | |
| | | | 200,244 | | | | Fannie Mae REMIC Trust 2010-137 XP, 4.500%, 10/25/40 | | | | | 211,080 | | | | | | 0.2 | | |
| | | | 106,956 | | | | Fannie Mae REMIC Trust 2010-19 PB, 3.000%, 12/25/39 | | | | | 107,843 | | | | | | 0.1 | | |
| Voya Short Term Bond Fund | as of March 31, 2017 (continued) |
| | Principal Amount† | | | Value | | | Percentage of Net Assets | | ||||||||||||
| | COLLATERALIZED MORTGAGE OBLIGATIONS: (continued) | | ||||||||||||||||||
| | | | 297,833 | | | | Fannie Mae REMIC Trust 2010-54 LC, 3.000%, 04/25/40 | | | | $ | 303,092 | | | | | | 0.3 | | |
| | | | 52,522 | | | | Fannie Mae REMIC Trust 2011-100 QM, 4.000%, 10/25/50 | | | | | 52,972 | | | | | | 0.1 | | |
| | | | 643,970 | | | | Freddie Mac REMIC Trust 2103 TE, 6.000%, 12/15/28 | | | | | 735,404 | | | | | | 0.8 | | |
| | | | 572,351 | | | | Freddie Mac REMIC Trust 3597 L, 5.000%, 07/15/39 | | | | | 612,852 | | | | | | 0.7 | | |
| | | | 423,904 | | | | Ginnie Mae Series 2012-52 PV, 2.500%, 12/20/39 | | | | | 431,882 | | | | | | 0.5 | | |
| | | | 818,944 | | | | Ginnie Mae Series 2014-53 JM, 7.124%, 04/20/39 | | | | | 940,562 | | | | | | 1.0 | | |
| | | | 609,004 | | | | Ginnie Mae Series 2015-H31 FT, 1.430%, 11/20/65 | | | | | 611,241 | | | | | | 0.6 | | |
| | | | 251,088 | | | | Wells Fargo Mortgage Backed Securities 2005-AR16 Trust 2A1, 3.182%, 02/25/34 | | | | | 255,887 | | | | | | 0.3 | | |
| | | | | | | | Total Collateralized Mortgage Obligations (Cost $5,388,043) | | | | | 5,393,802 | | | | | | 5.8 | | |
| | U.S. GOVERNMENT AGENCY OBLIGATIONS: 2.0% | | ||||||||||||||||||
| | | | | | | | Federal Home Loan Mortgage Corporation: 1.3%## | | ||||||||||||
| | | | 421,313 | | | | 5.500%, due 11/01/38 | | | | | 474,225 | | | | | | 0.5 | | |
| | | | 362,899 | | | | 5.500%, due 02/01/39 | | | | | 404,084 | | | | | | 0.5 | | |
| | | | 276,205 | | | | 5.500%, due 01/01/37-10/01/38 | | | | | 310,253 | | | | | | 0.3 | | |
| | | | | | | | | | | | | 1,188,562 | | | | | | 1.3 | | |
| | | | | | | | Federal National Mortgage Association: 0.7%## | | ||||||||||||
| | | | 372,230 | | | | 5.000%, due 01/01/23 | | | | | 397,896 | | | | | | 0.4 | | |
| | | | 236,105 | | | | 5.000%, due 07/01/34 | | | | | 259,098 | | | | | | 0.3 | | |
| | | | | | | | | | | | | 656,994 | | | | | | 0.7 | | |
| | | | | | | | Total U.S. Government Agency Obligations (Cost $1,798,132) | | | | | 1,845,556 | | | | | | 2.0 | | |
| | FOREIGN GOVERNMENT BONDS: 0.0% | | ||||||||||||||||||
| | | | 58,000 | | | | Other Securities | | | | | 57,953 | | | | | | 0.0 | | |
| | | | | | | | Total Foreign Government Bonds (Cost $57,829) | | | | | 57,953 | | | | | | 0.0 | | |
| | ||||||||||||||||||||
| | Principal Amount† | | | Value | | | Percentage of Net Assets | | ||||||||||||
| | ASSET-BACKED SECURITIES: 16.5% | | ||||||||||||||||||
| | | | | | | | Automobile Asset-Backed Securities: 6.0% | | ||||||||||||
| | | | 250,000 | | | | CarMax Auto Owner Trust 2014-4 A4, 1.810%, 07/15/20 | | | | $ | 250,437 | | | | | | 0.3 | | |
| | | | 100,000 | | | | CarMax Auto Owner Trust 2016-2 A3, 1.520%, 02/16/21 | | | | | 99,684 | | | | | | 0.1 | | |
| | | | 225,000 | | | | CarMax Auto Owner Trust 2016-4, 1.600%, 06/15/22 | | | | | 221,578 | | | | | | 0.2 | | |
| | | | 250,000 | | | | CarMax Auto Owner Trust 2017-1 A4, 2.270%, 09/15/22 | | | | | 250,862 | | | | | | 0.3 | | |
| | | | 600,000 | # | | Chrysler Capital Auto Receivables Trust 2016-B, 1.870%, 02/15/22 | | | | | 594,214 | | | | | | 0.6 | | | |
| | | | 190,000 | | | | GM Financial Automobile Leasing Trust 2015-3 A4, 1.810%, 11/20/19 | | | | | 190,355 | | | | | | 0.2 | | |
| | | | 250,000 | | | | GM Financial Automobile Leasing Trust 2016-2 A4, 1.760%, 03/20/20 | | | | | 249,707 | | | | | | 0.3 | | |
| | | | 100,000 | | | | GM Financial Automobile Leasing Trust 2017-1 A4, 2.260%, 08/20/20 | | | | | 100,199 | | | | | | 0.1 | | |
| | | | 480,000 | | | | Harley-Davidson Motorcycle Trust 2015-1 A4, 1.670%, 08/15/22 | | | | | 479,413 | | | | | | 0.5 | | |
| | | | 300,000 | # | | Hyundai Auto Lease Securitization Trust 2016-B A4, 1.680%, 04/15/20 | | | | | 299,919 | | | | | | 0.3 | | | |
| | | | 150,000 | # | | Hyundai Auto Lease Securitization Trust 2016-C, 1.650%, 07/15/20 | | | | | 149,624 | | | | | | 0.2 | | | |
| | | | 450,000 | # | | Hyundai Auto Lease Securitization Trust 2017-A A4, 2.130%, 04/15/21 | | | | | 452,421 | | | | | | 0.5 | | | |
| | | | 200,000 | | | | Nissan Auto Lease Trust 2016-A A4, 1.650%, 10/15/21 | | | | | 200,121 | | | | | | 0.2 | | |
| | | | 100,000 | | | | Nissan Auto Lease Trust 2016-B A4, 1.610%, 01/18/22 | | | | | 99,669 | | | | | | 0.1 | | |
| | | | 540,000 | | | | Nissan Auto Receivables 2016-B A4, 1.540%, 10/17/22 | | | | | 534,396 | | | | | | 0.6 | | |
| | | | 200,000 | # | | Oscar US Funding Trust VI LLC 2017-1A A3, 2.820%, 06/10/21 | | | | | 200,277 | | | | | | 0.2 | | | |
| Voya Short Term Bond Fund | as of March 31, 2017 (continued) |
| | Principal Amount† | | | Value | | | Percentage of Net Assets | | ||||||||||||
| | ASSET-BACKED SECURITIES: (continued) | | ||||||||||||||||||
| | | | | | | | Automobile Asset-Backed Securities (continued) | | ||||||||||||
| | | | 110,000 | | | | World Omni Auto Receivables Trust 2015-B A4, 1.840%, 01/17/22 | | | | $ | 109,822 | | | | | | 0.1 | | |
| | | | 250,000 | | | | World Omni Auto Receivables Trust 2016-B A4, 1.480%, 11/15/22 | | | | | 244,450 | | | | | | 0.3 | | |
| | | | 100,000 | | | | World Omni Automobile Lease Securitization Trust 2017-A A4, 2.320%, 08/15/22 | | | | | 100,387 | | | | | | 0.1 | | |
| | | | 810,000 | | | | Other Securities | | | | | 807,885 | | | | | | 0.8 | | |
| | | | | | | | | | | | | 5,635,420 | | | | | | 6.0 | | |
| | | | | | | | Credit Card Asset-Backed Securities: 4.5% | | ||||||||||||
| | | | 450,000 | | | | Cabela’s Credit Card Master Note Trust 2016-1 A1, 1.780%, 06/15/22 | | | | | 449,279 | | | | | | 0.5 | | |
| | | | 450,000 | | | | Capital One Multi-Asset Execution Trust 2016-A4 A4, 1.330%, 06/15/22 | | | | | 445,399 | | | | | | 0.5 | | |
| | | | 600,000 | | | | Capital One Multi-Asset Execution Trust, 1.820%, 09/15/22 | | | | | 599,983 | | | | | | 0.6 | | |
| | | | 300,000 | | | | Chase Issuance Trust 2016-A2 A, 1.370%, 06/15/21 | | | | | 298,075 | | | | | | 0.3 | | |
| | | | 200,000 | | | | Chase Issuance Trust 2016-A5 A5, 1.270%, 07/15/21 | | | | | 197,945 | | | | | | 0.2 | | |
| | | | 210,000 | | | | Citibank Credit Card Issuance Trust 2014-A6 A6, 2.150%, 07/15/21 | | | | | 211,905 | | | | | | 0.3 | | |
| | | | 300,000 | | | | Citibank Credit Card Issuance Trust 2016-A1 A1, 1.750%, 11/19/21 | | | | | 299,627 | | | | | | 0.3 | | |
| | | | 170,000 | | | | Discover Card Execution Note Trust 2014-A1 A1, 1.342%, 07/15/21 | | | | | 170,961 | | | | | | 0.2 | | |
| | | | 230,000 | | | | Discover Card Execution Note Trust 2014-A4 A4, 2.120%, 12/15/21 | | | | | 232,025 | | | | | | 0.2 | | |
| | | | 200,000 | | | | Discover Card Execution Note Trust 2015-A3 A, 1.450%, 03/15/21 | | | | | 199,794 | | | | | | 0.2 | | |
| | | | 450,000 | | | | Discover Card Execution Note Trust 2017-A2 A2, 2.390%, 07/15/24 | | | | | 452,759 | | | | | | 0.5 | | |
| | Principal Amount† | | | Value | | | Percentage of Net Assets | | ||||||||||||
| | ASSET-BACKED SECURITIES: (continued) | | ||||||||||||||||||
| | | | | | | | Credit Card Asset-Backed Securities (continued) | | ||||||||||||
| | | | 630,000 | | | | Other Securities | | | | $ | 628,253 | | | | | | 0.7 | | |
| | | | | | | | | | | | | 4,186,005 | | | | | | 4.5 | | |
| | | | | | | | Home Equity Asset-Backed Securities: 0.1% | | ||||||||||||
| | | | 57,251 | | | | Chase Funding Loan Acquisition Trust Series 2003-C2 1A, 4.750%, 12/25/19 | | | | | 57,688 | | | | | | 0.1 | | |
| | | | | | | | Other Asset-Backed Securities: 5.9% | | ||||||||||||
| | | | 240,000 | # | | Apidos CLO XI 2012-11A AR, 2.463%, 01/17/28 | | | | | 240,801 | | | | | | 0.3 | | | |
| | | | 330,000 | # | | Babson CLO Ltd. 2014-3A AR, 2.299%, 01/15/26 | | | | | 330,658 | | | | | | 0.3 | | | |
| | | | 280,000 | # | | Benefit Street Partners CLO IV Ltd. 2014-IVA A1R, 2.515%, 01/20/29 | | | | | 280,893 | | | | | | 0.3 | | | |
| | | | 560,000 | # | | Benefit Street Partners CLO X Ltd. 2016-10A A1, 2.233%, 01/15/29 | | | | | 561,860 | | | | | | 0.6 | | | |
| | | | 310,000 | # | | BlueMountain CLO 2013-1A A1R, 2.430%, 01/20/29 | | | | | 311,099 | | | | | | 0.3 | | | |
| | | | 350,000 | # | | BlueMountain CLO Ltd. 2012-2A AR, 2.472%, 11/20/28 | | | | | 351,124 | | | | | | 0.4 | | | |
| | | | 410,000 | # | | Carlyle US CLO 2017-1A A1A Ltd., 2.460%, 04/20/31 | | | | | 411,690 | | | | | | 0.4 | | | |
| | | | 250,000 | # | | CIFC Funding Ltd. 2016-1A A, 2.445%, 10/21/28 | | | | | 250,968 | | | | | | 0.3 | | | |
| | | | 250,000 | # | | CIFC Funding Ltd. 2017-1A A, 2.243%, 04/23/29 | | | | | 249,997 | | | | | | 0.2 | | | |
| | | | 360,000 | # | | Dryden 33 Senior Loan Fund 2014-33A AR, 2.453%, 10/15/28 | | | | | 361,078 | | | | | | 0.4 | | | |
| | | | 250,000 | # | | Dryden Senior Loan Fund 2017-47A A2, 2.745%, 04/15/28 | | | | | 250,000 | | | | | | 0.3 | | | |
| | | | 46,298 | # | | GSAMP Trust 2005-SEA2 A1, 1.332%, 01/25/45 | | | | | 46,112 | | | | | | 0.0 | | | |
| | | | 330,000 | # | | LCM XXIII Ltd. 23A A1, 2.506%, 10/20/29 | | | | | 332,637 | | | | | | 0.4 | | | |
| | | | 250,000 | # | | Madison Park Funding Ltd. 2007-6A E, 6.282%, 07/26/21 | | | | | 250,445 | | | | | | 0.3 | | | |
| | | | 390,000 | # | | Oaktree EIF II Series B1 Ltd. 2015-B1A A, 2.589%, 02/15/26 | | | | | 390,083 | | | | | | 0.4 | | | |
| Voya Short Term Bond Fund | as of March 31, 2017 (continued) |
| | Principal Amount† | | | Value | | | Percentage of Net Assets | | ||||||||||||
| | ASSET-BACKED SECURITIES: (continued) | | ||||||||||||||||||
| | | | | | | | Other Asset-Backed Securities (continued) | | ||||||||||||
| | | | 250,000 | # | | Octagon Investment Partners 30 Ltd. 2017-1A A1, 2.355%, 03/17/30 | | | | $ | 250,287 | | | | | | 0.3 | | | |
| | | | 260,000 | # | | OHA Loan Funding Ltd. 2015-1A AR, 2.449%, 08/15/29 | | | | | 261,717 | | | | | | 0.3 | | | |
| | | | 300,000 | # | | THL Credit Wind River CLO Ltd. 2017-1A A, 2.374%, 04/18/29 | | | | | 300,297 | | | | | | 0.3 | | | |
| | | | 100,000 | # | | Volvo Financial Equipment LLC Series 2017-1A A4, 2.210%, 11/15/21 | | | | | 99,836 | | | | | | 0.1 | | | |
| | | | | | | | | | | | | 5,531,582 | | | | | | 5.9 | | |
| | | | | | | | Total Asset-Backed Securities (Cost $15,407,634) | | | | | 15,410,695 | | | | | | 16.5 | | |
| | U.S. TREASURY OBLIGATIONS: 4.7% | | ||||||||||||||||||
| | | | | | | | U.S. Treasury Notes: 4.7% | | ||||||||||||
| | | | 1,835,000 | | | | 0.625%, due 06/30/18 | | | | | 1,823,531 | | | | | | 2.0 | | |
| | | | 562,000 | L | | 1.625%, due 03/15/20 | | | | | 564,009 | | | | | | 0.6 | | | |
| | | | 933,000 | | | | 2.125%, due 02/29/24 | | | | | 927,880 | | | | | | 1.0 | | |
| | | | 826,000 | | | | 2.125%, due 03/31/24 | | | | | 820,966 | | | | | | 0.9 | | |
| | | | 212,000 | | | | 1.125%-1.875%, due 02/28/19-02/28/22 | | | | | 211,539 | | | | | | 0.2 | | |
| | | | | | | | Total U.S. Treasury Obligations (Cost $4,346,488) | | | | | 4,347,925 | | | | | | 4.7 | | |
| | COMMERCIAL MORTGAGE-BACKED SECURITIES: 8.4% | | ||||||||||||||||||
| | | | 226,578 | # | | Americold LLC 2010 Trust ARTA A2FL, 2.391%, 01/14/29 | | | | | 227,440 | | | | | | 0.3 | | | |
| | | | 20,384 | # | | Banc of America Re-REMIC Trust 2009-UBER2 A4AA, 5.858%, 02/24/51 | | | | | 20,354 | | | | | | 0.0 | | | |
| | | | 230,000 | | | | CD 2007-CD5 Mortgage Trust AJA, 6.159%, 11/15/44 | | | | | 233,932 | | | | | | 0.2 | | |
| | | | 430,000 | | | | CD 2007-CD5 Mortgage Trust AJ, 6.843%, 11/15/44 | | | | | 436,399 | | | | | | 0.5 | | |
| | | | 275,249 | | | | Citigroup Commercial Mortgage Trust 2007-6 A4, 5.779%, 12/10/49 | | | | | 275,577 | | | | | | 0.3 | | |
| | | | 502,589 | | | | Citigroup/Deutsche Bank Commercial Mortgage Trust 2006-CD3 AM, 5.648%, 10/15/48 | | | | | 513,237 | | | | | | 0.6 | | |
| | Principal Amount† | | | Value | | | Percentage of Net Assets | | ||||||||||||
| | COMMERCIAL MORTGAGE-BACKED SECURITIES: (continued) | | ||||||||||||||||||
| | | | 128,393 | # | | Commercial Mortgage Trust 2004-GG1 F, 6.311%, 06/10/36 | | | | $ | 127,853 | | | | | | 0.1 | | | |
| | | | 5,106 | # | | Credit Suisse First Boston Mortgage Securities Corp. 2003-C4 J, 5.322%, 08/15/36 | | | | | 5,094 | | | | | | 0.0 | | | |
| | | | 79,452 | # | | DBRR 2011-C32 A3A, 8.200%, 06/17/49 | | | | | 79,325 | | | | | | 0.1 | | | |
| | | | 203,076 | # | | EQTY 2014-INNS Mortgage Trust, 4.297%, 05/08/31 | | | | | 202,217 | | | | | | 0.2 | | | |
| | | | 106,782 | | | | Ginnie Mae 2012-19 AB, 1.450%, 03/16/34 | | | | | 106,722 | | | | | | 0.1 | | |
| | | | 87,817 | | | | Ginnie Mae 2015-21 AF, 2.069%, 07/16/48 | | | | | 86,479 | | | | | | 0.1 | | |
| | | | 207,751 | | | | Ginnie Mae 2016-110 AB, 2.000%, 05/16/49 | | | | | 203,562 | | | | | | 0.2 | | |
| | | | 90,994 | | | | Ginnie Mae 2016-86 AB, 2.500%, 09/16/56 | | | | | 90,620 | | | | | | 0.1 | | |
| | | | 304,060 | | | | Ginnie Mae Series 2011-53 B, 4.397%, 05/16/51 | | | | | 322,179 | | | | | | 0.4 | | |
| | | | 250,000 | # | | JP Morgan Chase Commercial Mortgage Securities Trust 2003-CB6 H, 5.379%, 07/12/37 | | | | | 246,516 | | | | | | 0.3 | | | |
| | | | 135,000 | | | | JP Morgan Chase Commercial Mortgage Securities Trust 2004-CBX C, 5.066%, 01/12/37 | | | | | 137,969 | | | | | | 0.1 | | |
| | | | 429,721 | | | | JP Morgan Chase Commercial Mortgage Securities Trust 2004-CIBC10 B, 5.021%, 01/12/37 | | | | | 438,147 | | | | | | 0.5 | | |
| | | | 722,257 | | | | JP Morgan Chase Commercial Mortgage Securities Trust 2007-LDP12, 5.882%, 02/15/51 | | | | | 725,962 | | | | | | 0.8 | | |
| | | | 380,000 | # | | JP Morgan Chase Commercial Mortgage Securities Trust 2014-BXH D, 3.162%, 04/15/27 | | | | | 374,843 | | | | | | 0.4 | | | |
| | | | 138,654 | # | | JPMorgan Commercial Mortgage-Backed Securities Trust 2009-RR1 A4B2, 1.000%, 03/18/51 | | | | | 137,989 | | | | | | 0.1 | | | |
| Voya Short Term Bond Fund | as of March 31, 2017 (continued) |
| | Principal Amount† | | | Value | | | Percentage of Net Assets | | ||||||||||||
| | COMMERCIAL MORTGAGE-BACKED SECURITIES: (continued) | | ||||||||||||||||||
| | | | 333,598 | | | | Morgan Stanley Capital I Trust 2007-IQ16, 5.809%, 12/12/49 | | | | $ | 335,613 | | | | | | 0.4 | | |
| | | | 254,547 | | | | Morgan Stanley Capital I Trust 2008-TOP29, 6.301%, 01/11/43 | | | | | 260,818 | | | | | | 0.3 | | |
| | | | 44,732 | # | | Morgan Stanley Re-REMIC Trust 2009-GG10 A4A, 5.949%, 08/12/45 | | | | | 44,697 | | | | | | 0.0 | | | |
| | | | 81,652 | # | | Morgan Stanley Re-REMIC Trust 2010-GG10 A4A, 5.949%, 08/15/45 | | | | | 81,543 | | | | | | 0.1 | | | |
| | | | 390,000 | | | | TIAA Seasoned Commercial Mortgage Trust 2007-C4 C, 5.474%, 08/15/39 | | | | | 392,731 | | | | | | 0.4 | | |
| | | | 1,683,140 | | | | Other Securities | | | | | 1,701,098 | | | | | | 1.8 | | |
| | | | | | | | Total Commercial Mortgage-Backed Securities (Cost $7,887,737) | | | | | 7,808,916 | | | | | | 8.4 | | |
| | | | | | | | Total Long-Term Investments (Cost $80,481,196) | | | | | 80,512,972 | | | | | | 86.4 | | |
| | SHORT-TERM INVESTMENTS: 14.8% | | ||||||||||||||||||
| | | | | | | | Corporate Bonds/Notes: 12.6% | | ||||||||||||
| | | | 291,000 | | | | Actavis Funding SCS, 2.350%, 03/12/18 | | | | | 292,325 | | | | | | 0.3 | | |
| | | | 502,000 | | | | Aetna, Inc., 1.500%, 11/15/17 | | | | | 501,985 | | | | | | 0.5 | | |
| | | | 301,000 | | | | Air Lease Corp., 2.125%, 01/15/18 | | | | | 301,625 | | | | | | 0.3 | | |
| | | | 395,000 | | | | Alibaba Group Holding Ltd., 1.625%, 11/28/17 | | | | | 395,005 | | | | | | 0.4 | | |
| | | | 235,000 | | | | AT&T, Inc., 1.400%, 12/01/17 | | | | | 234,850 | | | | | | 0.3 | | |
| | | | 135,000 | | | | BP Capital Markets PLC, 1.674%, 02/13/18 | | | | | 135,103 | | | | | | 0.1 | | |
| | | | 257,000 | | | | British Telecommunications PLC, 5.950%, 01/15/18 | | | | | 265,511 | | | | | | 0.3 | | |
| | | | 500,000 | | | | Cablevision Systems Corp., 8.625%, 09/15/17 | | | | | 514,375 | | | | | | 0.6 | | |
| | | | 325,000 | | | | Charles Schwab Corp., 1.500%, 03/10/18 | | | | | 324,983 | | | | | | 0.4 | | |
| | | | 329,000 | | | | Chevron Corp., 1.365%, 03/02/18 | | | | | 328,857 | | | | | | 0.4 | | |
| | Principal Amount† | | | Value | | | Percentage of Net Assets | | ||||||||||||
| | SHORT-TERM INVESTMENTS: (continued) | | ||||||||||||||||||
| | | | | | | | Corporate Bonds/Notes (continued) | | ||||||||||||
| | | | 258,000 | | | | Citizens Bank NA/ Providence RI, 1.600%, 12/04/17 | | | | $ | 257,906 | | | | | | 0.3 | | |
| | | | 352,000 | | | | Diageo Capital PLC, 1.500%, 05/11/17 | | | | | 352,019 | | | | | | 0.4 | | |
| | | | 75,000 | | | | eBay, Inc., 1.350%, 07/15/17 | | | | | 74,972 | | | | | | 0.1 | | |
| | | | 140,000 | | | | eBay, Inc., 2.500%, 03/09/18 | | | | | 141,098 | | | | | | 0.1 | | |
| | | | 165,000 | | | | Eli Lilly & Co., 1.250%, 03/01/18 | | | | | 164,831 | | | | | | 0.2 | | |
| | | | 371,000 | | | | JM Smucker Co., 1.750%, 03/15/18 | | | | | 371,480 | | | | | | 0.4 | | |
| | | | 365,000 | | | | JPMorgan Chase & Co., 1.700%, 03/01/18 | | | | | 365,129 | | | | | | 0.4 | | |
| | | | 301,000 | | | | Kinder Morgan, Inc./DE, 2.000%, 12/01/17 | | | | | 301,272 | | | | | | 0.3 | | |
| | | | 204,000 | | | | Kroger Co., 6.400%, 08/15/17 | | | | | 207,634 | | | | | | 0.2 | | |
| | | | 500,000 | | | | Lennar Corp., 4.750%, 12/15/17 | | | | | 508,125 | | | | | | 0.5 | | |
| | | | 500,000 | | | | Manufacturers & Traders Trust Co., 1.450%, 03/07/18 | | | | | 499,354 | | | | | | 0.5 | | |
| | | | 323,000 | | | | Morgan Stanley, 1.875%, 01/05/18 | | | | | 323,561 | | | | | | 0.4 | | |
| | | | 316,000 | | | | NetApp, Inc., 2.000%, 12/15/17 | | | | | 316,770 | | | | | | 0.3 | | |
| | | | 177,000 | | | | PACCAR Financial Corp., 1.450%, 03/09/18 | | | | | 177,151 | | | | | | 0.2 | | |
| | | | 390,000 | | | | Philip Morris International, Inc., 1.250%, 11/09/17 | | | | | 389,813 | | | | | | 0.4 | | |
| | | | 318,000 | | | | Realty Income Corp., 2.000%, 01/31/18 | | | | | 318,600 | | | | | | 0.3 | | |
| | | | 264,000 | | | | Statoil ASA, 1.250%, 11/09/17 | | | | | 263,704 | | | | | | 0.3 | | |
| | | | 500,000 | | | | Tesoro Corp., 4.250%, 10/01/17 | | | | | 505,000 | | | | | | 0.5 | | |
| | | | 211,000 | | | | Total Capital International SA, 1.550%, 06/28/17 | | | | | 211,162 | | | | | | 0.2 | | |
| | | | 181,000 | | | | TransCanada PipeLines Ltd., 1.875%, 01/12/18 | | | | | 181,208 | | | | | | 0.2 | | |
| | | | 342,000 | | | | UBS AG/Stamford CT, 1.375%, 08/14/17 | | | | | 342,114 | | | | | | 0.4 | | |
| | | | 256,000 | | | | UnitedHealth Group, Inc., 1.400%, 12/15/17 | | | | | 256,030 | | | | | | 0.3 | | |
| | | | 250,000 | | | | US Bank NA/Cincinnati OH, 1.375%, 09/11/17 | | | | | 250,124 | | | | | | 0.3 | | |
| Voya Short Term Bond Fund | as of March 31, 2017 (continued) |
| | Principal Amount† | | | Value | | | Percentage of Net Assets | | ||||||||||||
| | SHORT-TERM INVESTMENTS: (continued) | | ||||||||||||||||||
| | | | | | | | Corporate Bonds/Notes (continued) | | ||||||||||||
| | | | 159,000 | | | | Valspar Corp., 6.050%, 05/01/17 | | | | $ | 159,480 | | | | | | 0.2 | | |
| | | | 498,000 | | | | Visa, Inc., 1.200%, 12/14/17 | | | | | 497,591 | | | | | | 0.5 | | |
| | | | 422,000 | | | | Wells Fargo & Co., 1.500%, 01/16/18 | | | | | 421,293 | | | | | | 0.5 | | |
| | | | 252,000 | | | | Welltower, Inc., 2.250%, 03/15/18 | | | | | 253,150 | | | | | | 0.3 | | |
| | | | 279,000 | | | | Zoetis, Inc., 1.875%, 02/01/18 | | | | | 279,218 | | | | | | 0.3 | | |
| | | | | | | | | | | | | 11,684,408 | | | | | | 12.6 | | |
| | | | | | | | Securities Lending Collateralcc: 1.1% | | ||||||||||||
| | | | 983,395 | | | | Cantor Fitzgerald, Repurchase Agreement dated 03/31/17, 0.81%, due 04/03/17 (Repurchase Amount $983,460, collateralized by various U.S. Government and U.S. Government Agency Obligations, 0.000%- 10.000%, Market Value plus accrued interest $1,003,063, due 04/01/17-02/20/67) (Cost $983,395) | | | | | 983,395 | | | | | | 1.1 | | |
| | Shares | | | Value | | | Percentage of Net Assets | | ||||||||||||
| | | | | | | | Mutual Funds: 1.1% | | ||||||||||||
| | | | 1,066,000 | | | | BlackRock Liquidity Funds, FedFund, Institutional Class, 0.600%†† (Cost $1,066,000) | | | | | 1,066,000 | | | | | | 1.1 | | |
| | | | | | | | Total Short-Term Investments (Cost $13,706,711) | | | | | 13,733,803 | | | | | | 14.8 | | |
| | ||||||||||||||||||||
| Shares | | | Value | | | Percentage of Net Assets | | |||||||||
| | | | Total Investments in Securities (Cost $94,187,907) | | | | $ | 94,246,775 | | | | | | 101.2 | | |
| | | | Liabilities in Excess of Other Assets | | | | | (1,085,614) | | | | | | (1.2) | | |
| | | | Net Assets | | | | $ | 93,161,161 | | | | | | 100.0 | | |
| | ||||||||||||||||
| | Gross Unrealized Appreciation | | | | $ | 342,892 | | |
| | Gross Unrealized Depreciation | | | | | (285,596) | | |
| | Net Unrealized Appreciation | | | | $ | 57,296 | | |
| | ||||||||
| Voya Short Term Bond Fund | as of March 31, 2017 (continued) |
| | | | Quoted Prices in Active Markets for Identical Investments (Level 1) | | | Significant Other Observable Inputs (Level 2) | | | Significant Unobservable Inputs (Level 3) | | | Fair Value at March 31, 2017 | | ||||||||||||
| Asset Table | | | | | | ||||||||||||||||||||
| Investments, at fair value | | | | | | ||||||||||||||||||||
| Corporate Bonds/Notes | | | | $ | — | | | | | $ | 45,648,125 | | | | | $ | — | | | | | $ | 45,648,125 | | |
| Collateralized Mortgage Obligations | | | | | — | | | | | | 5,393,802 | | | | | | — | | | | | | 5,393,802 | | |
| Short-Term Investments | | | | | 1,066,000 | | | | | | 12,667,803 | | | | | | — | | | | | | 13,733,803 | | |
| U.S. Government Agency Obligations | | | | | — | | | | | | 1,845,556 | | | | | | — | | | | | | 1,845,556 | | |
| U.S. Treasury Obligations | | | | | — | | | | | | 4,347,925 | | | | | | — | | | | | | 4,347,925 | | |
| Asset-Backed Securities | | | | | — | | | | | | 15,160,695 | | | | | | 250,000 | | | | | | 15,410,695 | | |
| Commercial Mortgage-Backed Securities | | | | | — | | | | | | 7,808,916 | | | | | | — | | | | | | 7,808,916 | | |
| Foreign Government Bonds | | | | | — | | | | | | 57,953 | | | | | | — | | | | | | 57,953 | | |
| Total Investments, at fair value | | | | $ | 1,066,000 | | | | | $ | 92,930,775 | | | | | $ | 250,000 | | | | | $ | 94,246,775 | | |
| Other Financial Instruments+ | | | | | | ||||||||||||||||||||
| Futures | | | | | 17,757 | | | | | | — | | | | | | — | | | | | | 17,757 | | |
| Total Assets | | | | $ | 1,083,757 | | | | | $ | 92,930,775 | | | | | $ | 250,000 | | | | | $ | 94,264,532 | | |
| Liabilities Table | | | | | | ||||||||||||||||||||
| Other Financial Instruments+ | | | | | | ||||||||||||||||||||
| Futures | | | | $ | (7,770) | | | | | $ | — | | | | | $ | — | | | | | $ | (7,770) | | |
| Total Liabilities | | | | $ | (7,770) | | | | | $ | — | | | | | $ | — | | | | | $ | (7,770) | | |
| | |||||||||||||||||||||||||
| Contract Description | | | Number of Contracts | | | Expiration Date | | | Notional Value | | | Unrealized Appreciation/ (Depreciation) | | ||||||||||||
| Long Contracts | | | | | | ||||||||||||||||||||
| U.S. Treasury 2-Year Note | | | | | 105 | | | | | | 06/30/17 | | | | | $ | 22,727,578 | | | | | $ | 17,757 | | |
| | | | | | | | | | | | | | | | | $ | 22,727,578 | | | | | $ | 17,757 | | |
| Short Contracts | | | | | | ||||||||||||||||||||
| U.S. Treasury 10-Year Note | | | | | (33) | | | | | | 06/21/17 | | | | | | (4,110,562) | | | | | | (4,061) | | |
| U.S. Treasury 5-Year Note | | | | | (51) | | | | | | 06/30/17 | | | | | | (6,004,055) | | | | | | (3,709) | | |
| | | | | | | | | | | | | | | | | $ | (10,114,617) | | | | | $ | (7,770) | | |
| | |||||||||||||||||||||||||
| Voya Short Term Bond Fund | as of March 31, 2017 (continued) |
| Derivatives not accounted for as hedging instruments | | | Location on Statement of Assets and Liabilities | | | Fair Value | | |||
| Asset Derivatives | | | | |||||||
| Interest rate contracts | | | Net Assets — Unrealized appreciation* | | | | $ | 17,757 | | |
| Total Asset Derivatives | | | | | | | $ | 17,757 | | |
| Liability Derivatives | | | | |||||||
| Interest rate contracts | | | Net Assets — Unrealized depreciation* | | | | $ | 7,770 | | |
| Total Liability Derivatives | | | | | | | $ | 7,770 | | |
| | ||||||||||
| Derivatives not accounted for as hedging instruments | | | Futures | | | Swaps | | | Total | | |||||||||
| Credit contracts | | | | $ | — | | | | | $ | 21,283 | | | | | $ | 21,283 | | |
| Equity contracts | | | | | 7,150 | | | | | | — | | | | | | 7,150 | | |
| Foreign exchange contracts | | | | | — | | | | | | (8,352) | | | | | | (8,352) | | |
| Interest rate contracts | | | | | 54,848 | | | | | | (311,689) | | | | | | (256,841) | | |
| Total | | | | $ | 61,998 | | | | | $ | (298,758) | | | | | $ | (236,760) | | |
| | |||||||||||||||||||
| Derivatives not accounted for as hedging instruments | | | Futures | | | Swaps | | | Total | | |||||||||
| Equity contracts | | | | $ | 393 | | | | | $ | — | | | | | $ | 393 | | |
| Foreign exchange contracts | | | | | — | | | | | | — | | | | | | — | | |
| Interest rate contracts | | | | | 17,447 | | | | | | 277,368 | | | | | | 294,815 | | |
| Total | | | | $ | 17,840 | | | | | $ | 277,368 | | | | | $ | 295,208 | | |
| | |||||||||||||||||||
| Voya Strategic Income | SUMMARY PORTFOLIO OF INVESTMENTS |
| Opportunities Fund | as of March 31, 2017 |
| | Principal Amount† | | | Value | | | Percentage of Net Assets | | ||||||||||||
| | CORPORATE BONDS/NOTES: 14.8% | | ||||||||||||||||||
| | | | | | | | Basic Materials: 1.0% | | ||||||||||||
| | | | 285,000 | # | | Vedanta Resources PLC, 6.375%, 07/30/22 | | | | $ | 287,707 | | | | | | 0.2 | | | |
| | | | 250,000 | # | | WR Grace & Co-Conn, 5.625%, 10/01/24 | | | | | 264,375 | | | | | | 0.1 | | | |
| | | | 1,100,000 | | | | Other Securities | | | | | 1,133,613 | | | | | | 0.7 | | |
| | | | | | | | | | | | | 1,685,695 | | | | | | 1.0 | | |
| | | | | | | | Communications: 2.5% | | ||||||||||||
| | | | 150,000 | # | | CCO Holdings LLC/ CCO Holdings Capital Corp., 5.750%, 02/15/26 | | | | | 157,875 | | | | | | 0.1 | | | |
| | | | 150,000 | # | | Nielsen Finance LLC/ Nielsen Finance Co., 5.000%, 04/15/22 | | | | | 153,750 | | | | | | 0.1 | | | |
| | | | 200,000 | # | | SFR Group SA, 6.250%, 05/15/24 | | | | | 202,000 | | | | | | 0.1 | | | |
| | | | 250,000 | # | | Sirius XM Radio, Inc., 6.000%, 07/15/24 | | | | | 268,750 | | | | | | 0.2 | | | |
| | | | 250,000 | # | | Univision Communications, Inc., 5.125%, 02/15/25 | | | | | 246,875 | | | | | | 0.1 | | | |
| | | | 278,000 | # | | Verizon Communications, Inc., 4.812%, 03/15/39 | | | | | 271,604 | | | | | | 0.2 | | | |
| | | | 2,650,000 | | | | Other Securities | | | | | 2,693,745 | | | | | | 1.7 | | |
| | | | | | | | | | | | | 3,994,599 | | | | | | 2.5 | | |
| | | | | | | | Consumer, Cyclical: 1.7% | | ||||||||||||
| | | | 55,000 | # | | American Tire Distributors, Inc., 10.250%, 03/01/22 | | | | | 56,237 | | | | | | 0.0 | | | |
| | | | 250,000 | # | | HD Supply, Inc., 5.750%, 04/15/24 | | | | | 263,575 | | | | | | 0.2 | | | |
| | | | 125,000 | ��# | | Hilton Worldwide Finance LLC / Hilton Worldwide Finance Corp., 4.625%, 04/01/25 | | | | | 126,562 | | | | | | 0.1 | | | |
| | | | 150,000 | # | | Hot Topic, Inc., 9.250%, 06/15/21 | | | | | 146,250 | | | | | | 0.1 | | | |
| | | | 150,000 | #,L | | Michaels Stores, Inc., 5.875%, 12/15/20 | | | | | 154,409 | | | | | | 0.1 | | | |
| | | | 150,000 | #,L | | PetSmart, Inc., 7.125%, 03/15/23 | | | | | 142,875 | | | | | | 0.1 | | | |
| | | | 150,000 | # | | Silversea Cruise Finance Ltd., 7.250%, 02/01/25 | | | | | 158,625 | | | | | | 0.1 | | | |
| | | | 55,000 | # | | Six Flags Entertainment Corp., 4.875%, 07/31/24 | | | | | 54,416 | | | | | | 0.0 | | | |
| | | | 110,000 | # | | Six Flags Entertainment Corp., 5.500%, 04/15/27 | | | | | 110,000 | | | | | | 0.1 | | | |
| | | | 1,414,000 | | | | Other Securities | | | | | 1,466,667 | | | | | | 0.9 | | |
| | | | | | | | | | | | | 2,679,616 | | | | | | 1.7 | | |
| | Principal Amount† | | | Value | | | Percentage of Net Assets | | ||||||||||||
| | CORPORATE BONDS/NOTES: (continued) | | ||||||||||||||||||
| | | | | | | | Consumer, Non-cyclical: 2.3% | | ||||||||||||
| | | | 125,000 | # | | Cardtronics, Inc./ Cardtronics USA, 5.500%, 05/01/25 | | | | $ | 126,875 | | | | | | 0.1 | | | |
| | | | 250,000 | # | | Cott Holdings, Inc., 5.500%, 04/01/25 | | | | | 255,075 | | | | | | 0.1 | | | |
| | | | 150,000 | # | | Jaguar Holding Co. II/ Pharmaceutical Product Development LLC, 6.375%, 08/01/23 | | | | | 157,125 | | | | | | 0.1 | | | |
| | | | 125,000 | # | | Post Holdings, Inc., 5.000%, 08/15/26 | | | | | 120,000 | | | | | | 0.1 | | | |
| | | | 150,000 | # | | Post Holdings, Inc., 8.000%, 07/15/25 | | | | | 169,125 | | | | | | 0.1 | | | |
| | | | 150,000 | # | | Valeant Pharmaceuticals International, Inc., 5.500%, 03/01/23 | | | | | 116,250 | | | | | | 0.1 | | | |
| | | | 2,628,000 | | | | Other Securities(a) | | | | | 2,691,107 | | | | | | 1.7 | | |
| | | | | | | | | | | | | 3,635,557 | | | | | | 2.3 | | |
| | | | | | | | Energy: 0.8% | | ||||||||||||
| | | | 700,000 | | | | Petrobras Global Finance BV, 7.375%, 01/17/27 | | | | | 741,790 | | | | | | 0.4 | | |
| | | | 425,000 | | | | YPF SA, 8.500%, 03/23/21 | | | | | 466,867 | | | | | | 0.3 | | |
| | | | 150,000 | | | | Other Securities | | | | | 157,312 | | | | | | 0.1 | | |
| | | | | | | | | | | | | 1,365,969 | | | | | | 0.8 | | |
| | | | | | | | Financial: 4.5% | | ||||||||||||
| | | | 150,000 | # | | Alliance Data Systems Corp., 5.375%, 08/01/22 | | | | | 151,875 | | | | | | 0.1 | | | |
| | | | 425,000 | | | | BBVA Bancomer SA/Texas, 6.750%, 09/30/22 | | | | | 477,062 | | | | | | 0.3 | | |
| | | | 409,000 | # | | BPCE SA, 4.500%, 03/15/25 | | | | | 402,986 | | | | | | 0.2 | | | |
| | | | 280,000 | | | | Citigroup, Inc., 2.650%, 10/26/20 | | | | | 282,013 | | | | | | 0.2 | | |
| | | | 425,000 | # | | Credit Bank of Moscow Via CBOM Finance PLC, 5.875%, 11/07/21 | | | | | 440,442 | | | | | | 0.3 | | | |
| | | | 100,000 | # | | Dana Financing Luxembourg Sarl, 5.750%, 04/15/25 | | | | | 101,125 | | | | | | 0.1 | | | |
| | | | 150,000 | # | | ESH Hospitality, Inc., 5.250%, 05/01/25 | | | | | 151,593 | | | | | | 0.1 | | | |
| | | | 461,000 | | | | JPMorgan Chase & Co., 4.250%-6.125%, 10/01/27-12/29/49 | | | | | 480,138 | | | | | | 0.3 | | |
| | | | 268,000 | | | | Morgan Stanley, 4.000%, 07/23/25 | | | | | 276,941 | | | | | | 0.2 | | |
| Voya Strategic Income | SUMMARY PORTFOLIO OF INVESTMENTS |
| Opportunities Fund | as of March 31, 2017 (continued) |
| | Principal Amount† | | | Value | | | Percentage of Net Assets | | ||||||||||||
| | CORPORATE BONDS/NOTES: (continued) | | ||||||||||||||||||
| | | | | | | | Financial (continued) | | ||||||||||||
| | | | 200,000 | # | | UBS Group Funding Jersey Ltd., 2.950%, 09/24/20 | | | | $ | 201,471 | | | | | | 0.1 | | | |
| | | | 89,000 | | | | Wells Fargo & Co., 5.900%, 12/29/49 | | | | | 93,036 | | | | | | 0.1 | | |
| | | | 250,000 | # | | Yapi ve Kredi Bankasi AS, 5.750%, 02/24/22 | | | | | 249,084 | | | | | | 0.1 | | | |
| | | | 3,751,000 | | | | Other Securities | | | | | 3,865,664 | | | | | | 2.4 | | |
| | | | | | | | | | | | | 7,173,430 | | | | | | 4.5 | | |
| | | | | | | | Industrial: 1.6% | | ||||||||||||
| | | | 250,000 | # | | Advanced Disposal Services, Inc., 5.625%, 11/15/24 | | | | | 253,125 | | | | | | 0.2 | | | |
| | | | 250,000 | # | | Bombardier, Inc., 8.750%, 12/01/21 | | | | | 274,375 | | | | | | 0.2 | | | |
| | | | 130,000 | # | | Builders FirstSource, Inc., 5.625%, 09/01/24 | | | | | 132,437 | | | | | | 0.1 | | | |
| | | | 500,000 | L | | Cemex SAB de CV, 6.125%, 05/05/25 | | | | | 534,850 | | | | | | 0.3 | | | |
| | | | 150,000 | # | | Multi-Color Corp., 6.125%, 12/01/22 | | | | | 157,125 | | | | | | 0.1 | | | |
| | | | 150,000 | # | | Sealed Air Corp., 5.500%, 09/15/25 | | | | | 159,375 | | | | | | 0.1 | | | |
| | | | 125,000 | # | | Standard Industries, Inc./NJ, 5.000%, 02/15/27 | | | | | 122,813 | | | | | | 0.1 | | | |
| | | | 150,000 | # | | Standard Industries, Inc./NJ, 6.000%, 10/15/25 | | | | | 155,625 | | | | | | 0.1 | | | |
| | | | 700,000 | | | | Other Securities | | | | | 723,076 | | | | | | 0.4 | | |
| | | | | | | | | | | | | 2,512,801 | | | | | | 1.6 | | |
| | | | | | | | Mortgage Securities: 0.1% | | ||||||||||||
| | | | 2,360,000 | #,^ | | LSTAR Commercial Mortgage Trust 2017-5, 1.393%, 03/10/50 | | | | | 137,689 | | | | | | 0.1 | | | |
| | | | | | | | Technology: 0.2% | | ||||||||||||
| | | | 150,000 | # | | First Data Corp., 7.000%, 12/01/23 | | | | | 161,250 | | | | | | 0.1 | | | |
| | | | 210,000 | | | | Other Securities | | | | | 219,525 | | | ��� | | | 0.1 | | |
| | | | | | | | | | | | | 380,775 | | | | | | 0.2 | | |
| | | | | | | | Utilities: 0.1% | | ||||||||||||
| | | | 150,000 | | | | Other Securities | | | | | 154,125 | | | | | | 0.1 | | |
| | | | | | | | Total Corporate Bonds/Notes (Cost $23,319,725) | | | | | 23,720,256 | | | | | | 14.8 | | |
| | COLLATERALIZED MORTGAGE OBLIGATIONS: 26.5% | | ||||||||||||||||||
| | | | 785,572 | | | | Adjustable Rate Mortgage Trust 2006-2 1A1, 3.296%, 05/25/36 | | | | | 733,018 | | | | | | 0.5 | | |
| | Principal Amount† | | | Value | | | Percentage of Net Assets | | ||||||||||||
| | COLLATERALIZED MORTGAGE OBLIGATIONS: (continued) | | ||||||||||||||||||
| | | | 226,172 | | | | Alternative Loan Trust 2005-10CB 1A1, 1.482%, 05/25/35 | | | | $ | 180,031 | | | | | | 0.1 | | |
| | | | 902,282 | | | | Alternative Loan Trust 2005-10CB 1A2, 1.432%, 05/25/35 | | | | | 716,010 | | | | | | 0.5 | | |
| | | | 926,470 | | | | Alternative Loan Trust 2005-23CB A15, 5.500%, 07/25/35 | | | | | 874,892 | | | | | | 0.5 | | |
| | | | 315,011 | | | | Alternative Loan Trust 2005-51 3A2A, 1.928%, 11/20/35 | | | | | 276,833 | | | | | | 0.2 | | |
| | | | 102,574 | | | | Alternative Loan Trust 2005-6CB 1A3, 5.250%, 04/25/35 | | | | | 98,671 | | | | | | 0.1 | | |
| | | | 471,644 | | | | Alternative Loan Trust 2005-J2 1A12, 1.382%, 04/25/35 | | | | | 379,464 | | | | | | 0.2 | | |
| | | | 56,403 | | | | Alternative Loan Trust 2006-13T1 A9, 6.000%, 05/25/36 | | | | | 44,090 | | | | | | 0.0 | | |
| | | | 1,091,906 | | | | Alternative Loan Trust 2006-18CB A10, 1.382%, 07/25/36 | | | | | 645,560 | | | | | | 0.4 | | |
| | | | 269,909 | | | | Alternative Loan Trust 2006-19CB A12, 1.382%, 08/25/36 | | | | | 180,132 | | | | | | 0.1 | | |
| | | | 1,143,004 | | | | Alternative Loan Trust 2006-19CB A28, 1.582%, 08/25/36 | | | | | 780,789 | | | | | | 0.5 | | |
| | | | 849,878 | | | | Alternative Loan Trust 2006-HY11 A1, 1.102%, 06/25/36 | | | | | 715,036 | | | | | | 0.5 | | |
| | | | 282,100 | | | | Alternative Loan Trust 2007-2CB 2A1, 1.582%, 03/25/37 | | | | | 184,762 | | | | | | 0.1 | | |
| | | | 561,924 | | | | Alternative Loan Trust 2007-HY8C A1, 1.142%, 09/25/47 | | | | | 526,408 | | | | | | 0.3 | | |
| | | | 750,084 | | | | Alternative Loan Trust 2007-OA4, 1.152%, 05/25/47 | | | | | 657,424 | | | | | | 0.4 | | |
| | | | 135,780 | # | | Angel Oak Mortgage Trust LLC 2015-1 A, 4.500%, 11/25/45 | | | | | 136,623 | | | | | | 0.1 | | | |
| | | | 400,074 | | | | Bear Stearns ALT-A Trust 2006-6 31A1, 3.176%, 11/25/36 | | | | | 358,503 | | | | | | 0.2 | | |
| | | | 1,102,229 | | | | Bear Stearns ALT-A Trust 2006-6 32A1, 3.135%, 11/25/36 | | | | | 900,107 | | | | | | 0.6 | | |
| Voya Strategic Income | SUMMARY PORTFOLIO OF INVESTMENTS |
| Opportunities Fund | as of March 31, 2017 (continued) |
| | Principal Amount† | | | Value | | | Percentage of Net Assets | | ||||||||||||
| | COLLATERALIZED MORTGAGE OBLIGATIONS: (continued) | | ||||||||||||||||||
| | | | 335,874 | | | | Bear Stearns Structured Products, Inc. Trust 2007-R6 1A1, 3.504%, 01/26/36 | | | | $ | 305,655 | | | | | | 0.2 | | |
| | | | 63,926 | # | | Bellemeade Re Ltd. 2015-1A M2, 5.282%, 07/25/25 | | | | | 64,317 | | | | | | 0.0 | | | |
| | | | 284,392 | | | | Citigroup Mortgage Loan Trust 2006-AR2 1A1, 3.497%, 03/25/36 | | | | | 252,501 | | | | | | 0.2 | | |
| | | | 155,463 | | | | Citigroup Mortgage Loan Trust 2006-AR9 2A, 3.229%, 11/25/36 | | | | | 127,928 | | | | | | 0.1 | | |
| | | | 204,935 | | | | Citigroup Mortgage Loan Trust, Inc. 2005-3 2A2, 3.067%, 08/25/35 | | | | | 199,878 | | | | | | 0.1 | | |
| | | | 802,015 | | | | CSMC Mortgage-Backed Trust 2007-2 3A6, 5.400%, 03/25/37 | | | | | 732,061 | | | | | | 0.5 | | |
| | | | 971,184 | | | | Deutsche ALT-A Securities, Inc. Alternate Loan Trust 2007-AB1 A1, 1.282%, 04/25/37 | | | | | 590,331 | | | | | | 0.4 | | |
| | | | 249,333 | # | | Deutsche Mortgage Securities, Inc. Re-REMIC Trust Certificates Series 2007-WM1 A1, 4.035%, 06/27/37 | | | | | 251,929 | | | | | | 0.1 | | | |
| | | | 1,345,484 ^ | | | | Fannie Mae 2007-18 BS, 5.618%, 06/25/35 | | | | | 241,045 | | | | | | 0.2 | | |
| | | | 2,528,084 ^ | | | | Fannie Mae 2008-94 SI, 4.518%, 04/25/36 | | | | | 535,791 | | | | | | 0.3 | | |
| | | | 3,337,788 ^ | | | | Fannie Mae 2009-95 HI, 6.000%, 12/25/38 | | | | | 333,533 | | | | | | 0.2 | | |
| | | | 540,870 | | | | Fannie Mae 2010-15 FD, 1.722%, 03/25/40 | | | | | 548,497 | | | | | | 0.3 | | |
| | | | 1,331,188 | | | | Fannie Mae 2011-47 GF, 1.552%, 06/25/41 | | | | | 1,343,465 | | | | | | 0.8 | | |
| | | | 565,883 | | | | Fannie Mae 2012-10 UF, 1.532%, 02/25/42 | | | | | 567,147 | | | | | | 0.4 | | |
| | | | 547,933 ^ | | | | Fannie Mae 2012-84 KI, 6.000%, 08/25/42 | | | | | 120,185 | | | | | | 0.1 | | |
| | | | 2,092,287 ^ | | | | Fannie Mae 2012-93 IL, 3.000%, 09/25/27 | | | | | 199,562 | | | | | | 0.1 | | |
| | | | 3,197,602 ^ | | | | Fannie Mae 2015-56 DI, 3.000%, 12/25/32 | | | | | 290,375 | | | | | | 0.2 | | |
| | | | 60,000 | | | | Fannie Mae Connecticut Avenue Securities 2014-C03 2M2, 3.882%, 07/25/24 | | | | | 61,756 | | | | | | 0.0 | | |
| | Principal Amount† | | | Value | | | Percentage of Net Assets | | ||||||||||||
| | COLLATERALIZED MORTGAGE OBLIGATIONS: (continued) | | ||||||||||||||||||
| | | | 190,000 | | | | Fannie Mae Connecticut Avenue Securities 2014-CO4 1M2, 5.882%, 11/25/24 | | | | $ | 213,357 | | | | | | 0.1 | | |
| | | | 121,674 | | | | Fannie Mae Connecticut Avenue Securities 2015-C02 1M2, 4.982%, 05/25/25 | | | | | 128,191 | | | | | | 0.1 | | |
| | | | 108,539 | | | | Fannie Mae Connecticut Avenue Securities 2015-CO1 1M2, 5.282%, 02/25/25 | | | | | 115,296 | | | | | | 0.1 | | |
| | | | 1,100,000 | | | | Fannie Mae Connecticut Avenue Securities 2017-C02 2M2, 4.627%, 09/25/29 | | | | | 1,107,092 | | | | | | 0.7 | | |
| | | | 270,773 ^ | | | | Fannie Mae REMIC Trust 2000-26 SP, 7.518%, 08/25/30 | | | | | 56,737 | | | | | | 0.0 | | |
| | | | 458,492 ^ | | | | Fannie Mae REMIC Trust 2002-13 SR, 5.618%, 03/25/32 | | | | | 70,665 | | | | | | 0.1 | | |
| | | | 219,282 ^ | | | | Fannie Mae REMIC Trust 2004-64 SW, 6.068%, 08/25/34 | | | | | 40,686 | | | | | | 0.0 | | |
| | | | 159,572 ^ | | | | Fannie Mae REMIC Trust 2004-66 SE, 5.518%, 09/25/34 | | | | | 26,599 | | | | | | 0.0 | | |
| | | | 664,873 ^ | | | | Fannie Mae REMIC Trust 2008-47 PS, 5.518%, 06/25/38 | | | | | 30,560 | | | | | | 0.0 | | |
| | | | 913,300 ^ | | | | Fannie Mae REMIC Trust 2009-25 SN, 5.568%, 04/25/39 | | | | | 162,790 | | | | | | 0.1 | | |
| | | | 495,128 ^ | | | | Fannie Mae REMIC Trust 2012-146 LI, 4.500%, 10/25/41 | | | | | 67,451 | | | | | | 0.0 | | |
| | | | 36,829,129 ^ | | | | Fannie Mae REMIC Trust 2012-66 IB, 0.050%, 06/25/42 | | | | | 82,125 | | | | | | 0.1 | | |
| | | | 1,590,904 ^ | | | | Fannie Mae REMIC Trust 2013-116 SC, 5.218%, 04/25/33 | | | | | 235,580 | | | | | | 0.2 | | |
| | | | 128,591 | | | | First Horizon Alternative Mortgage Securities Trust 2006-FA8 1A7, 6.000%, 02/25/37 | | | | | 100,530 | | | | | | 0.0 | | |
| | | | 675,788 | | | | First Horizon Mortgage Pass-Through Trust 2006-AR4 1A2, 3.034%, 01/25/37 | | | | | 604,250 | | | | | | 0.4 | | |
| Voya Strategic Income | SUMMARY PORTFOLIO OF INVESTMENTS |
| Opportunities Fund | as of March 31, 2017 (continued) |
| | Principal Amount† | | | Value | | | Percentage of Net Assets | | ||||||||||||
| | COLLATERALIZED MORTGAGE OBLIGATIONS: (continued) | | ||||||||||||||||||
| | | | 3,058,491 ^ | | | | Freddie Mac 2009-70 PS, 5.768%, 01/25/37 | | | | $ | 598,285 | | | | | | 0.4 | | |
| | | | 490,652 ^ | | | | Freddie Mac 2524 SH, 6.588%, 11/15/32 | | | | | 52,721 | | | | | | 0.0 | | |
| | | | 768,734 ^ | | | | Freddie Mac 2525 SM, 7.088%, 02/15/32 | | | | | 162,384 | | | | | | 0.1 | | |
| | | | 745,902 ^ | | | | Freddie Mac 2981 CS, 5.808%, 05/15/35 | | | | | 116,187 | | | | | | 0.1 | | |
| | | | 236,955 ^ | | | | Freddie Mac 2989 HS, 6.238%, 08/15/34 | | | | | 97,745 | | | | | | 0.1 | | |
| | | | 424,560 ^ | | | | Freddie Mac 3018 SM, 6.288%, 08/15/35 | | | | | 88,861 | | | | | | 0.1 | | |
| | | | 702,754 ^ | | | | Freddie Mac 324 144, 5.805%, 06/15/39 | | | | | 145,679 | | | | | | 0.1 | | |
| | | | 1,492,885 ^ | | | | Freddie Mac 3523 SA, 5.088%, 09/15/36 | | | | | 230,019 | | | | | | 0.1 | | |
| | | | 1,302,040 ^ | | | | Freddie Mac 3582 MS, 5.238%, 10/15/39 | | | | | 200,908 | | | | | | 0.1 | | |
| | | | 1,982,107 ^ | | | | Freddie Mac 3688 BI, 5.000%, 07/15/40 | | | | | 404,458 | | | | | | 0.3 | | |
| | | | 7,184,208 ^ | | | | Freddie Mac 4186 IA, 3.000%, 03/15/33 | | | | | 976,827 | | | | | | 0.6 | | |
| | | | 335,243 ^ | | | | Freddie Mac 4333 AI, 5.500%, 02/15/44 | | | | | 61,848 | | | | | | 0.0 | | |
| | | | 278,174 ^ | | | | Freddie Mac REMIC Trust 2266 S, 7.638%, 11/15/30 | | | | | 53,111 | | | | | | 0.0 | | |
| | | | 350,048 ^ | | | | Freddie Mac REMIC Trust 2374 S, 7.188%, 06/15/31 | | | | | 75,383 | | | | | | 0.1 | | |
| | | | 205,286 ^ | | | | Freddie Mac REMIC Trust 2417 SY, 7.488%, 12/15/31 | | | | | 46,157 | | | | | | 0.0 | | |
| | | | 440,473 ^ | | | | Freddie Mac REMIC Trust 2577 SA, 6.538%, 02/15/33 | | | | | 86,415 | | | | | | 0.1 | | |
| | | | 32,715 | | | | Freddie Mac REMIC Trust 2973 SB, 14.989%, 05/15/35 | | | | | 37,272 | | | | | | 0.0 | | |
| | | | 110,243 ^ | | | | Freddie Mac REMIC Trust 2981 SU, 6.888%, 05/15/30 | | | | | 22,101 | | | | | | 0.0 | | |
| | | | 206,957 ^ | | | | Freddie Mac REMIC Trust 2993 PS, 5.788%, 05/15/35 | | | | | 9,325 | | | | | | 0.0 | | |
| | | | 58,493 | | | | Freddie Mac REMIC Trust 3031 BP, 8.000%, 08/15/35 | | | | | 70,851 | | | | | | 0.0 | | |
| | | | 1,203,122 ^ | | | | Freddie Mac REMIC Trust 3049 PI, 5.738%, 10/15/35 | | | | | 223,968 | | | | | | 0.1 | | |
| | Principal Amount† | | | Value | | | Percentage of Net Assets | | ||||||||||||
| | COLLATERALIZED MORTGAGE OBLIGATIONS: (continued) | | ||||||||||||||||||
| | | | 72,170 | | | | Freddie Mac REMIC Trust 3085 SK, 55.053%, 12/15/35 | | | | $ | 197,309 | | | | | | 0.1 | | |
| | | | 129,603 | ^^,Z | | Freddie Mac REMIC Trust 3151 PO, 05/15/36 | | | | | 111,118 | | | | | | 0.1 | | | |
| | | | 543,439 ^ | | | | Freddie Mac REMIC Trust 3590 PI, 6.000%, 07/15/39 | | | | | 52,929 | | | | | | 0.0 | | |
| | | | 418,967 ^ | | | | Freddie Mac REMIC Trust 3624 TS, 3.888%, 01/15/40 | | | | | 47,042 | | | | | | 0.0 | | |
| | | | 673,000 ^ | | | | Freddie Mac REMIC Trust 4261 ID, 6.500%, 06/15/32 | | | | | 122,301 | | | | | | 0.1 | | |
| | | | 2,040,644 ^ | | | | Freddie Mac REMIC Trust 4287 CI, 4.500%, 07/15/41 | | | | | 391,268 | | | | | | 0.3 | | |
| | | | 2,677,489 ^ | | | | Freddie Mac Strips Series 224 IO, 6.000%, 03/01/33 | | | | | 635,700 | | | | | | 0.4 | | |
| | | | 1,436,195 ^ | | | | Freddie Mac Strips Series 237 S23, 6.188%, 05/15/36 | | | | | 274,134 | | | | | | 0.2 | | |
| | | | 1,773,241 ^ | | | | Freddie Mac Strips Series 260 33, 4.000%, 05/15/39 | | | | | 307,131 | | | | | | 0.2 | | |
| | | | 120,000 | | | | Freddie Mac Structured Agency Credit Risk Debt Notes 2014-DN2 M3, 4.582%, 04/25/24 | | | | | 128,742 | | | | | | 0.1 | | |
| | | | 100,000 | | | | Freddie Mac Structured Agency Credit Risk Debt Notes 2014-HQ3 M3, 5.732%, 10/25/24 | | | | | 110,447 | | | | | | 0.1 | | |
| | | | 500,000 | | | | Freddie Mac Structured Agency Credit Risk Debt Notes 2015-HQA1 M3, 5.682%, 03/25/28 | | | | | 550,309 | | | | | | 0.3 | | |
| | | | 100,000 | | | | Freddie Mac Structured Agency Credit Risk Debt Notes 2016-DNA4 M3, 4.782%, 03/25/29 | | | | | 103,395 | | | | | | 0.1 | | |
| | | | 700,000 | | | | Freddie Mac Structured Agency Credit Risk Debt Notes 2017-HQA1 M2, 4.532%, 08/25/29 | | | | | 701,245 | | | | | | 0.4 | | |
| Voya Strategic Income | SUMMARY PORTFOLIO OF INVESTMENTS |
| Opportunities Fund | as of March 31, 2017 (continued) |
| | Principal Amount† | | | Value | | | Percentage of Net Assets | | ||||||||||||
| | COLLATERALIZED MORTGAGE OBLIGATIONS: (continued) | | ||||||||||||||||||
| | | | 430,506 ^ | | | | Ginnie Mae 2011-101 EI, 6.000%, 10/16/39 | | | | $ | 80,475 | | | | | | 0.0 | | |
| | | | 893,348 ^ | | | | Ginnie Mae Series 2008-40 SA, 5.472%, 05/16/38 | | | | | 162,923 | | | | | | 0.1 | | |
| | | | 1,706,903 ^ | | | | Ginnie Mae Series 2009-116 SJ, 5.552%, 12/16/39 | | | | | 276,599 | | | | | | 0.2 | | |
| | | | 1,588,441 ^ | | | | Ginnie Mae Series 2010-4 SL, 5.472%, 01/16/40 | | | | | 293,663 | | | | | | 0.2 | | |
| | | | 584,369 ^ | | | | Ginnie Mae Series 2010-98 QS, 5.622%, 01/20/40 | | | | | 81,856 | | | | | | 0.0 | | |
| | | | 4,280,161 ^ | | | | Ginnie Mae Series 2011-101 BI, 0.650%, 11/20/37 | | | | | 94,909 | | | | | | 0.1 | | |
| | | | 88,860 ^ | | | | Ginnie Mae Series 2012-149 BI, 3.500%, 10/20/41 | | | | | 15,501 | | | | | | 0.0 | | |
| | | | 388,386 ^ | | | | Ginnie Mae Series 2013-103 DS, 5.172%, 07/20/43 | | | | | 64,121 | | | | | | 0.0 | | |
| | | | 285,467 ^ | | | | Ginnie Mae Series 2013-134 DS, 5.122%, 09/20/43 | | | | | 47,448 | | | | | | 0.0 | | |
| | | | 605,272 ^ | | | | Ginnie Mae Series 2013-44 LI, 4.500%, 01/16/43 | | | | | 105,524 | | | | | | 0.1 | | |
| | | | 9,716,241 ^ | | | | Ginnie Mae Series 2015-69 IL, 0.200%, 07/20/34 | | | | | 75,887 | | | | | | 0.0 | | |
| | | | 480,320 ^ | | | | Ginnie Mae Series 2015-98 IU, 4.000%, 08/20/44 | | | | | 85,462 | | | | | | 0.1 | | |
| | | | 18,998 ^ | | | | Ginnie Mae Series 2016-12 JI, 4.000%, 04/20/40 | | | | | 108 | | | | | | 0.0 | | |
| | | | 168,519 ^ | | | | Ginnie Mae Series 2016-12 MI, 5.000%, 04/20/39 | | | | | 2,993 | | | | | | 0.0 | | |
| | | | 1,466,650 ^ | | | | Ginnie Mae Series 2016-8 PI, 4.000%, 10/20/44 | | | | | 245,714 | | | | | | 0.2 | | |
| | | | 728,875 | | | | HarborView Mortgage Loan Trust 2006-14, 1.128%, 01/25/47 | | | | | 627,247 | | | | | | 0.4 | | |
| | | | 31,277 | | | | JP Morgan Alternative Loan Trust 2006-S1 3A2, 1.252%, 03/25/36 | | | | | 51,329 | | | | | | 0.0 | | |
| | Principal Amount† | | | Value | | | Percentage of Net Assets | | ||||||||||||
| | COLLATERALIZED MORTGAGE OBLIGATIONS: (continued) | | ||||||||||||||||||
| | | | 137,598 | | | | JP Morgan Mortgage Trust 2005-S3 1A10, 6.000%, 01/25/36 | | | | $ | 115,742 | | | | | | 0.1 | | |
| | | | 391,960 | | | | JP Morgan Mortgage Trust 2006-S2 1A18, 6.000%, 07/25/36 | | | | | 344,980 | | | | | | 0.2 | | |
| | | | 819,558 | | | | JP Morgan Mortgage Trust 2006-S3 1A30, 6.500%, 08/25/36 | | | | | 677,979 | | | | | | 0.4 | | |
| | | | 1,632,147 | | | | Morgan Stanley Mortgage Loan Trust 2006-9AR A2, 1.132%, 08/25/36 | | | | | 809,411 | | | | | | 0.5 | | |
| | | | 193,846 | | | | WaMu Mortgage Pass Through Certificates Series 2006-AR12 2A3, 2.318%, 10/25/36 | | | | | 165,842 | | | | | | 0.1 | | |
| | | | 643,933 | | | | WaMu Mortgage Pass-Through Certificates Series 2005-AR10 Trust, 2.784%, 09/25/35 | | | | | 638,486 | | | | | | 0.4 | | |
| | | | 207,676 | | | | WaMu Mortgage Pass-Through Certificates Series 2006-AR10 1A1, 2.880%, 09/25/36 | | | | | 195,715 | | | | | | 0.1 | | |
| | | | 35,711 | | | | WaMu Mortgage Pass-Through Certificates Series 2006-AR12 1A1, 2.877%, 10/25/36 | | | | | 33,518 | | | | | | 0.0 | | |
| | | | 248,620 | | | | WaMu Mortgage Pass-Through Certificates Series 2006-AR14 1A3, 2.662%, 11/25/36 | | | | | 223,398 | | | | | | 0.1 | | |
| | | | 905,659 | | | | WaMu Mortgage Pass-Through Certificates Series 2006-AR14 Trust 1A4, 2.662%, 11/25/36 | | | | | 813,782 | | | | | | 0.5 | | |
| | | | 114,372 | | | | WaMu Mortgage Pass-Through Certificates Series 2006-AR16 Trust 3A1, 2.705%, 12/25/36 | | | | | 105,995 | | | | | | 0.1 | | |
| | | | 40,806 | | | | WaMu Mortgage Pass-Through Certificates Series 2006-AR6 2A3, 2.872%, 08/25/36 | | | | | 36,974 | | | | | | 0.0 | | |
| Voya Strategic Income | SUMMARY PORTFOLIO OF INVESTMENTS |
| Opportunities Fund | as of March 31, 2017 (continued) |
| | Principal Amount† | | | Value | | | Percentage of Net Assets | | ||||||||||||
| | COLLATERALIZED MORTGAGE OBLIGATIONS: (continued) | | ||||||||||||||||||
| | | | 139,696 | | | | WaMu Mortgage Pass-Through Certificates Series 2006-AR8 1A4, 2.858%, 08/25/46 | | | | $ | 127,431 | | | | | | 0.1 | | |
| | | | 216,648 | | | | WaMu Mortgage Pass-Through Certificates Series 2007-HY2 1A1, 2.770%, 12/25/36 | | | | | 205,528 | | | | | | 0.1 | | |
| | | | 22,752 | | | | WaMu Mortgage Pass-Through Certificates Series 2007-HY4 1A1, 2.456%, 04/25/37 | | | | | 19,990 | | | | | | 0.0 | | |
| | | | 121,808 | | | | WaMu Mortgage Pass-Through Certificates Series 2007-HY7 2A2, 2.678%, 07/25/37 | | | | | 100,521 | | | | | | 0.1 | | |
| | | | 1,158,430 | | | | Washington Mutual Mortgage Pass-Through Certificates WMALT Series 2005-10 2A3, 1.882%, 11/25/35 | | | | | 883,310 | | | | | | 0.6 | | |
| | | | 214,485 | | | | Washington Mutual Mortgage Pass-Through Certificates WMALT Series 2005-11 A1, 5.750%, 01/25/36 | | | | | 187,936 | | | | | | 0.1 | | |
| | | | 302,712 | | | | Washington Mutual Mortgage Pass-Through Certificates WMALT Series 2005-8 1A2, 5.500%, 10/25/35 | | | | | 283,398 | | | | | | 0.2 | | |
| | | | 1,374,322 | | | | Washington Mutual Mortgage Pass-Through Certificates WMALT Series 2006-5 2CB2, 1.582%, 07/25/36 | | | | | 792,618 | | | | | | 0.5 | | |
| | | | 1,341,970 | | | | Washington Mutual Mortgage Pass-Through Certificates WMALT Series 2006-AR6 2A, 1.598%, 08/25/46 | | | | | 972,186 | | | | | | 0.6 | | |
| | | | 94,465 | | | | Wells Fargo Alternative Loan 2007-PA2 2A1, 1.412%, 06/25/37 | | | | | 69,873 | | | | | | 0.1 | | |
| | | | 882,214 | | | | Wells Fargo Mortgage Backed Securities 2006-8 A15 Trust, 6.000%, 07/25/36 | | | | | 890,848 | | | | | | 0.6 | | |
| | Principal Amount† | | | Value | | | Percentage of Net Assets | | ||||||||||||
| | COLLATERALIZED MORTGAGE OBLIGATIONS: (continued) | | ||||||||||||||||||
| | | | 1,135,300 | | | | Wells Fargo Mortgage Backed Securities 2006-8 A18 Trust, 6.000%, 07/25/36 | | | | $ | 1,146,411 | | | | | | 0.7 | | |
| | | | 1,373,956 | | | | Wells Fargo Mortgage Backed Securities 2006-AR12 Trust 1A1, 3.235%, 09/25/36 | | | | | 1,301,693 | | | | | | 0.8 | | |
| | | | 918,647 | | | | Wells Fargo Mortgage Backed Securities 2006-AR17 Trust A1, 3.045%, 10/25/36 | | | | | 880,186 | | | | | | 0.6 | | |
| | | | 56,632 | | | | Wells Fargo Mortgage Backed Securities 2006-AR6 Trust 3A1, 3.170%, 03/25/36 | | | | | 54,174 | | | | | | 0.0 | | |
| | | | 162,601 | | | | Wells Fargo Mortgage Backed Securities 2006-AR7 Trust 2A1, 3.101%, 05/25/36 | | | | | 155,464 | | | | | | 0.1 | | |
| | | | 172,810 | | | | Wells Fargo Mortgage Backed Securities 2006-AR7 Trust 2A4, 3.101%, 05/25/36 | | | | | 165,224 | | | | | | 0.1 | | |
| | | | 827,355 | | | | Wells Fargo Mortgage Backed Securities 2007-3 AE, 0.985%, 04/25/37 | | | | | 679,204 | | | | | | 0.4 | | |
| | | | 550,041 | | | | Wells Fargo Mortgage Backed Securities 2007-AR7 Trust A1, 3.150%, 12/28/37 | | | | | 510,717 | | | | | | 0.3 | | |
| | | | 876,228 | | | | Other Securities | | | | | 794,781 | | | | | | 0.5 | | |
| | | | | | | | Total Collateralized Mortgage Obligations (Cost $40,793,762) | | | | | 42,384,867 | | | | | | 26.5 | | |
| | U.S. GOVERNMENT AGENCY OBLIGATIONS: 0.0% | | ||||||||||||||||||
| | | | | | | | Federal National Mortgage Association: 0.0%## | | ||||||||||||
| | | | 12,152 | | | | 5.500%, due 10/01/39 | | | | | 13,572 | | | | | | 0.0 | | |
| | | | | | | | Total U.S. Government Agency Obligations (Cost $13,196) | | | | | 13,572 | | | | | | 0.0 | | |
| | U.S. TREASURY OBLIGATIONS: 0.1% | | ||||||||||||||||||
| | | | | | | | U.S. Treasury Bonds: 0.1% | | ||||||||||||
| | | | 140,000 | | | | Other Securities | | | | | 135,819 | | | | | | 0.1 | | |
| | | | | | | | U.S. Treasury Notes: 0.0% | | ||||||||||||
| | | | 92,000 | | | | Other Securities | | | | | 90,930 | | | | | | 0.0 | | |
| | | | | | | | Total U.S. Treasury Obligations (Cost $225,537) | | | | | 226,749 | | | | | | 0.1 | | |
| | ||||||||||||||||||||
| Voya Strategic Income | SUMMARY PORTFOLIO OF INVESTMENTS |
| Opportunities Fund | as of March 31, 2017 (continued) |
| | Principal Amount† | | | Value | | | Percentage of Net Assets | | ||||||||||||
| | BANK LOANS: 20.5% | | ||||||||||||||||||
| | | | | | | | Aerospace & Defense: 0.2% | | ||||||||||||
| | | | 340,000 | | | | Other Securities | | | | $ | 343,533 | | | | | | 0.2 | | |
| | | | | | | | Automotive: 0.8% | | ||||||||||||
| | | | 1,301,061 | | | | Other Securities | | | | | 1,305,451 | | | | | | 0.8 | | |
| | | | | | | | Basic Materials: 0.3% | | ||||||||||||
| | | | 494,995 | | | | Other Securities | | | | | 501,490 | | | | | | 0.3 | | |
| | | | | | | | Building & Development: 0.6% | | ||||||||||||
| | | | 994,938 | | | | Other Securities | | | | | 1,004,633 | | | | | | 0.6 | | |
| | | | | | | | Business Equipment & Services: 1.6% | | ||||||||||||
| | | | 2,525,341 | | | | Other Securities | | | | | 2,541,046 | | | | | | 1.6 | | |
| | | | | | | | Cable & Satellite Television: 1.1% | | ||||||||||||
| | | | 1,745,728 | | | | Other Securities | | | | | 1,753,282 | | | | | | 1.1 | | |
| | | | | | | | Chemicals & Plastics: 1.0% | | ||||||||||||
| | | | 1,631,171 | | | | Other Securities | | | | | 1,643,668 | | | | | | 1.0 | | |
| | | | | | | | Clothing/Textiles: 0.2% | | ||||||||||||
| | | | 246,851 | | | | Other Securities | | | | | 250,631 | | | | | | 0.2 | | |
| | | | | | | | Conglomerates: 0.1% | | ||||||||||||
| | | | 149,625 | | | | Other Securities | | | | | 151,246 | | | | | | 0.1 | | |
| | | | | | | | Consumer, Cyclical: 0.3% | | ||||||||||||
| | | | 468,192 | | | | Other Securities | | | | | 470,611 | | | | | | 0.3 | | |
| | | | | | | | Consumer, Non-cyclical: 0.2% | | ||||||||||||
| | | | 349,488 | | | | Other Securities | | | | | 352,971 | | | | ��� | | 0.2 | | |
| | | | | | | | Containers & Glass Products: 0.7% | | ||||||||||||
| | | | 1,049,266 | | | | Other Securities | | | | | 1,056,362 | | | | | | 0.7 | | |
| | | | | | | | Cosmetics/Toiletries: 0.1% | | ||||||||||||
| | | | 149,625 | | | | Other Securities | | | | | 149,937 | | | | | | 0.1 | | |
| | | | | | | | Drugs: 0.2% | | ||||||||||||
| | | | 360,000 | | | | Other Securities | | | | | 361,381 | | | | | | 0.2 | | |
| | | | | | | | Ecological Services & Equipment: 0.1% | | ||||||||||||
| | | | 150,000 | | | | Other Securities | | | | | 151,406 | | | | | | 0.1 | | |
| | | | | | | | Electronics/Electrical: 2.0% | | ||||||||||||
| | | | 3,117,260 | | | | Other Securities | | | | | 3,138,781 | | | | | | 2.0 | | |
| | | | | | | | Financial: 0.3% | | ||||||||||||
| | | | 397,508 | | | | Other Securities | | | | | 402,110 | | | | | | 0.3 | | |
| | | | | | | | Financial Intermediaries: 0.2% | | ||||||||||||
| | | | 247,500 | | | | Other Securities | | | | | 249,124 | | | | | | 0.2 | | |
| | | | | | | | Food Products: 0.3% | | ||||||||||||
| | | | 563,628 | | | | Other Securities | | | | | 508,855 | | | | | | 0.3 | | |
| | | | | | | | Food Service: 0.3% | | ||||||||||||
| | | | 510,788 | | | | Other Securities | | | | | 516,161 | | | | | | 0.3 | | |
| | | | | | | | Food/Drug Retailers: 0.2% | | ||||||||||||
| | | | 389,479 | | | | Other Securities | | | | | 391,081 | | | | | | 0.2 | | |
| | | | | | | | Forest Products: 0.2% | | ||||||||||||
| | | | 248,750 | | | | Other Securities | | | | | 251,237 | | | | | | 0.2 | | |
| | | | | | | | Health Care: 2.0% | | ||||||||||||
| | | | 3,172,783 | | | | Other Securities | | | | | 3,182,818 | | | | | | 2.0 | | |
| | | | | | | | Home Furnishings: 0.2% | | ||||||||||||
| | | | 339,250 | | | | Other Securities | | | | | 341,915 | | | | | | 0.2 | | |
| | | | | | | | Industrial: 0.6% | | ||||||||||||
| | | | 932,457 | | | | Other Securities | | | | | 940,280 | | | | | | 0.6 | | |
| | Principal Amount† | | | Value | | | Percentage of Net Assets | | ||||||||||||
| | BANK LOANS: (continued) | | ||||||||||||||||||
| | | | | | | | Industrial Equipment: 0.7% | | ||||||||||||
| | | | 1,029,660 | | | | Other Securities | | | | $ | 1,038,045 | | | | | | 0.7 | | |
| | | | | | | | Insurance: 0.8% | | ||||||||||||
| | | | 1,320,753 | | | | Other Securities | | | | | 1,331,139 | | | | | | 0.8 | | |
| | | | | | | | Leisure Good/Activities/Movies: 0.8% | | ||||||||||||
| | | | 1,291,907 | | | | Other Securities | | | | | 1,301,418 | | | | | | 0.8 | | |
| | | | | | | | Lodging & Casinos: 0.5% | | ||||||||||||
| | | | 742,333 | | | | Other Securities | | | | | 749,396 | | | | | | 0.5 | | |
| | | | | | | | Oil & Gas: 0.3% | | ||||||||||||
| | | | 548,092 | | | | Other Securities | | | | | 525,845 | | | | | | 0.3 | | |
| | | | | | | | Publishing: 0.1% | | ||||||||||||
| | | | 149,250 | | | | Other Securities | | | | | 147,913 | | | | | | 0.1 | | |
| | | | | | | | Radio & Television: 0.5% | | ||||||||||||
| | | | 818,778 | | | | Other Securities | | | | | 822,269 | | | | | | 0.5 | | |
| | | | | | | | Retailers (Except Food & Drug): 1.0% | | ||||||||||||
| | | | 1,753,530 | | | | Other Securities | | | | | 1,669,446 | | | | | | 1.0 | | |
| | | | | | | | Surface Transport: 0.5% | | ||||||||||||
| | | | 830,772 | | | | Other Securities | | | | | 834,647 | | | | | | 0.5 | | |
| | | | | | | | Technology: 0.3% | | ||||||||||||
| | | | 422,116 | | | | Other Securities | | | | | 426,898 | | | | | | 0.3 | | |
| | | | | | | | Telecommunications: 0.7% | | ||||||||||||
| | | | 1,188,288 | | | | Other Securities | | | | | 1,195,137 | | | | | | 0.7 | | |
| | | | | | | | Utilities: 0.5% | | ||||||||||||
| | | | 760,042 | | | | Other Securities | | | | | 764,458 | | | | | | 0.5 | | |
| | | | | | | | Total Bank Loans (Cost $32,332,452) | | | | | 32,766,621 | | | | | | 20.5 | | |
| | FOREIGN GOVERNMENT BONDS: 12.4% | | ||||||||||||||||||
| | | | 1,075,000 | # | | Argentine Republic Government International Bond, 6.875%, 01/26/27 | | | | | 1,089,244 | | | | | | 0.7 | | | |
| | | | CLP355,000,000 | | | | Bonos Tesoreria Pesos, 4.500%, 02/28/21 | | | | | 559,419 | | | | | | 0.3 | | |
| | | | BRL3,590,000 | | | | Brazil Notas do Tesouro Nacional Series F, 10.000%, 01/01/19 | | | | | 1,156,436 | | | | | | 0.7 | | |
| | | | BRL1,115,000 | | | | Brazil Notas do Tesouro Nacional Series F, 10.000%, 01/01/21 | | | | | 358,513 | | | | | | 0.2 | | |
| | | | BRL7,838,000 | | | | Brazil Notas do Tesouro Nacional Series F, 10.000%, 01/01/23 | | | | | 2,511,710 | | | | | | 1.6 | | |
| | | | BRL2,500,000 | | | | Brazil Notas do Tesouro Nacional Series F, 10.000%, 01/01/25 | | | | | 798,421 | | | | | | 0.5 | | |
| | | | 1,000,000 | | | | Brazilian Government International Bond, 6.000%, 04/07/26 | | | | | 1,089,500 | | | | | | 0.7 | | |
| | | | COP1,291,400,000 | | | | Colombian TES, 11.000%, 07/24/20 | | | | | 516,718 | | | | | | 0.3 | | |
| Voya Strategic Income | SUMMARY PORTFOLIO OF INVESTMENTS |
| Opportunities Fund | as of March 31, 2017 (continued) |
| | Principal Amount† | | | Value | | | Percentage of Net Assets | | ||||||||||||
| | FOREIGN GOVERNMENT BONDS: (continued) | | ||||||||||||||||||
| | | | HUF107,170,000 | | | | Hungary Government Bond, 7.500%, 11/12/20 | | | | $ | 453,645 | | | | | | 0.3 | | |
| | | | 425,000 | # | | Oman Government International Bond, 5.375%, 03/08/27 | | | | | 445,094 | | | | | | 0.3 | | | |
| | | | 750,000 | # | | Perusahaan Penerbit SBSN Indonesia III, 4.150%, 03/29/27 | | | | | 754,087 | | | | | | 0.5 | | | |
| | | | PLN7,313,000 | | | | Republic of Poland Government Bond, 3.250%, 07/25/25 | | | | | 1,840,651 | | | | | | 1.1 | | |
| | | | ARS9,100,000 | | | | Republic of Argentina, 18.200%-21.200%, 09/19/18-10/03/21 | | | | | 622,130 | | | | | | 0.4 | | |
| | | | ZAR10,600,000 | | | | Republic of South Africa Government Bond, 8.500%, 01/31/37 | | | | | 709,061 | | | | | | 0.4 | | |
| | | | RUB45,350,000 | | | | Russian Federal Bond - OFZ, 6.400%, 05/27/20 | | | | | 773,595 | | | | | | 0.5 | | |
| | | | RUB10,510,000 | | | | Russian Federal Bond - OFZ, 7.000%, 01/25/23 | | | | | 180,729 | | | | | | 0.1 | | |
| | | | RUB102,540,000 | | | | Russian Federal Bond - OFZ, 7.000%, 08/16/23 | | | | | 1,747,266 | | | | | | 1.1 | | |
| | | | RUB84,770,000 | | | | Russian Federal Bond - OFZ, 7.500%, 08/18/21 | | | | | 1,489,611 | | | | | | 0.9 | | |
| | | | RUB142,790,000 | | | | Russian Federal Bond - OFZ, 7.600%, 07/20/22 | | | | | 2,524,055 | | | | | | 1.6 | | |
| | | | IDR2,232,300,000 | | | | Other Securities | | | | | 276,653 | | | | | | 0.2 | | |
| | | | | | | | Total Foreign Government Bonds (Cost $19,280,812) | | | | | 19,896,538 | | | | | | 12.4 | | |
| | ASSET-BACKED SECURITIES: 11.8% | | ||||||||||||||||||
| | | | | | | | Automobile Asset-Backed Securities: 0.1% | | ||||||||||||
| | | | 166,000 | | | | Other Securities | | | | | 168,308 | | | | | | 0.1 | | |
| | | | | | | | Home Equity Asset-Backed Securities: 2.2% | | ||||||||||||
| | | | 718,752 | | | | GSAA Home Equity Trust 2006-3 A3, 1.282%, 03/25/36 | | | | | 511,238 | | | | | | 0.3 | | |
| | | | 994,000 | | | | GSAA Home Equity Trust 2006-4 4A3, 3.428%, 03/25/36 | | | | | 793,166 | | | | | | 0.5 | | |
| | | | 1,603,551 | | | | GSAA Trust 2006-7 AF2, 5.995%, 03/25/46 | | | | | 1,140,839 | | | | | | 0.7 | | |
| | Principal Amount† | | | Value | | | Percentage of Net Assets | | ||||||||||||
| | ASSET-BACKED SECURITIES: (continued) | | ||||||||||||||||||
| | | | | | | | Home Equity Asset-Backed Securities (continued) | | ||||||||||||
| | | | 1,263,969 | | | | Nomura Home Equity Loan, Inc. Home Equity Loan Trust Series 2007-1 2A4A, 1.212%, 02/25/37 | | | | $ | 1,093,613 | | | | | | 0.7 | | |
| | | | | | | | | | | | | 3,538,856 | | | | | | 2.2 | | |
| | | | | | | | Other Asset-Backed Securities: 7.7% | | ||||||||||||
| | | | 190,000 | # | | ALM VII R-2 Ltd. 2013-7R2A A2R, 3.023%, 10/15/27 | | | | | 191,434 | | | | | | 0.1 | | | |
| | | | 140,000 | # | | American Homes 4 Rent 2015-SFR2 C, 4.691%, 10/17/45 | | | | | 146,217 | | | | | | 0.1 | | | |
| | | | 130,000 | # | | Apidos CLO XI 2012-11A BR, 2.973%, 01/17/28 | | | | | 130,491 | | | | | | 0.1 | | | |
| | | | 120,000 | # | | Apidos CLO XVII 2014-17A A2R, 2.873%, 04/17/26 | | | | | 120,007 | | | | | | 0.1 | | | |
| | | | 200,000 | # | | Apidos CLO XVII 2014-17A BR, 3.523%, 04/17/26 | | | | | 199,998 | | | | | | 0.1 | | | |
| | | | 500,000 | # | | Ares XXIX CLO Ltd. 2014-1A BR, 3.330%, 04/17/26 | | | | | 499,965 | | | | | | 0.3 | | | |
| | | | 350,000 | # | | Ares XXVII CLO Ltd. 2013-2A B, 2.839%, 07/28/25 | | | | | 349,997 | | | | | | 0.2 | | | |
| | | | 250,000 | # | | Avery Point IV CLO Ltd., 3.510%, 04/25/26 | | | | | 250,000 | | | | | | 0.2 | | | |
| | | | 1,500,000 | # | | Babson CLO Ltd. 2013-IIA C, 4.274%, 01/18/25 | | | | | 1,495,515 | | | | | | 0.9 | | | |
| | | | 250,000 | # | | Babson CLO Ltd. 2014-IA BR, 3.230%, 07/20/25 | | | | | 250,005 | | | | | | 0.2 | | | |
| | | | 280,000 | # | | BlueMountain CLO 2012-2A BR, 2.952%, 11/20/28 | | | | | 280,894 | | | | | | 0.2 | | | |
| | | | 180,000 | # | | BlueMountain CLO 2014-4A B1R, 2.904%, 11/30/26 | | | | | 180,234 | | | | | | 0.1 | | | |
| | | | 160,000 | # | | BlueMountain CLO 2014-4A CR, 3.604%, 11/30/26 | | | | | 160,122 | | | | | | 0.1 | | | |
| | | | 350,000 | # | | Bristol Park CLO Ltd. 2016-1A B, 2.784%, 04/15/29 | | | | | 351,932 | | | | | | 0.2 | | | |
| | | | 250,000 | # | | Carlyle Global Market Strategies CLO 2014-3A BR Ltd., 3.187%, 07/27/26 | | | | | 250,469 | | | | | | 0.1 | | | |
| | | | 100,000 | # | | Carlyle Global Market Strategies CLO Ltd. 2012-4A AR, 2.480%, 01/20/29 | | | | | 100,443 | | | | | | 0.1 | | | |
| | | | 150,000 | # | | Carlyle Global Market Strategies CLO Ltd. 2012-4A BR, 2.930%, 01/20/29 | | | | | 150,529 | | | | | | 0.1 | | | |
| Voya Strategic Income | SUMMARY PORTFOLIO OF INVESTMENTS |
| Opportunities Fund | as of March 31, 2017 (continued) |
| | Principal Amount† | | | Value | | | Percentage of Net Assets | | ||||||||||||
| | ASSET-BACKED SECURITIES: (continued) | | ||||||||||||||||||
| | | | | | | | Other Asset-Backed Securities (continued) | | ||||||||||||
| | | | 250,000 | # | | CIFC Funding 2017-2A C Ltd., 04/20/30 | | | | $ | 250,000 | | | | | | 0.2 | | | |
| | | | 280,000 | # | | Dryden 33 Senior Loan Fund 2014-33A BR, 2.873%, 10/15/28 | | | | | 280,978 | | | | | | 0.2 | | | |
| | | | 250,000 | # | | Dryden Senior Loan Fund 2014-31A CR, 3.256%, 04/18/26 | | | | | 248,880 | | | | | | 0.1 | | | |
| | | | 250,000 | # | | Dryden Senior Loan Fund 2014-34A CR, 3.172%, 10/15/26 | | | | | 250,000 | | | | | | 0.2 | | | |
| | | | 250,000 | # | | Dryden Senior Loan Fund 2017-47A C, 3.595%, 04/15/28 | | | | | 249,875 | | | | | | 0.2 | | | |
| | | | 1,000,000 | # | | Dryden XXV Senior Loan Fund 2012-25A D, 5.023%, 01/15/25 | | | | | 1,000,857 | | | | | | 0.6 | | | |
| | | | 500,000 | # | | Emerson Park CLO Ltd. 2013-1A D, 4.773%, 07/15/25 | | | | | 498,612 | | | | | | 0.3 | | | |
| | | | 250,000 | # | | Flatiron CLO Ltd. 2013-1A A2R, 2.580%, 01/17/26 | | | | | 249,987 | | | | | | 0.1 | | | |
| | | | 250,000 | # | | Flatiron CLO Ltd. 2013-1A BR, 3.380%, 01/17/26 | | | | | 249,987 | | | | | | 0.2 | | | |
| | | | 100,000 | # | | Invitation Homes Trust 2014-SFR2 E, 4.093%, 06/17/32 | | | | | 100,964 | | | | | | 0.1 | | | |
| | | | 250,000 | # | | Madison Park Funding XIII Ltd. 2014-13A CR, 3.028%, 01/19/25 | | | | | 250,012 | | | | | | 0.2 | | | |
| | | | 250,000 | # | | Octagon Investment Partners XIX Ltd. 2014-1A CR, 3.069%, 04/15/26 | | | | | 251,250 | | | | | | 0.2 | | | |
| | | | 500,000 | # | | Octagon Investment Partners XVI Ltd. 2013-1A D, 4.373%, 07/17/25 | | | | | 493,689 | | | | | | 0.3 | | | |
| | | | 340,000 | # | | OHA Loan Funding Ltd. 2016-1A B1, 2.686%, 01/20/28 | | | | | 340,914 | | | | | | 0.2 | | | |
| | | | 300,000 | # | | Palmer Square CLO 2013-2A BR Ltd., 3.408%, 10/17/27 | | | | | 300,000 | | | | | | 0.2 | | | |
| | | | 400,000 | # | | Progress Residential 2015-SFR2 E, 4.427%, 06/12/32 | | | | | 400,338 | | | | | | 0.2 | | | |
| | | | 220,000 | # | | Shackleton CLO Ltd. 2016-9A A, 2.364%, 10/20/28 | | | | | 220,646 | | | | | | 0.1 | | | |
| | Principal Amount† | | | Value | | | Percentage of Net Assets | | ||||||||||||
| | ASSET-BACKED SECURITIES: (continued) | | ||||||||||||||||||
| | | | | | | | Other Asset-Backed Securities (continued) | | ||||||||||||
| | | | 120,000 | # | | Symphony CLO Ltd. 2016-18A B, 2.746%, 01/23/28 | | | | $ | 120,124 | | | | | | 0.1 | | | |
| | | | 750,000 | # | | Telos CLO 2007-2A D, 3.223%, 04/15/22 | | | | | 763,787 | | | | | | 0.5 | | | |
| | | | 250,000 | # | | Thacher Park CLO Ltd. 2014-1A CR, 3.857%, 10/20/26 | | | | | 249,976 | | | | | | 0.1 | | | |
| | | | 350,000 | # | | THL Credit Wind River CLO Ltd. 2017-1A C, 3.334%, 04/18/29 | | | | | 349,993 | | | | | | 0.2 | | | |
| | | | | | | | | | | | | 12,229,121 | | | | | | 7.7 | | |
| | | | | | | | Student Loan Asset-Backed Securities: 1.8% | | ||||||||||||
| | | | 1,000,000 | # | | SMB Private Education Loan Trust 2014-A, 4.500%, 09/15/45 | | | | | 910,979 | | | | | | 0.6 | | | |
| | | | 1,000,000 | # | | SMB Private Education Loan Trust 2017-A, 3.500%, 06/17/41 | | | | | 969,090 | | | | | | 0.6 | | | |
| | | | 1,000,000 | # | | SoFi Professional Loan Program 2017-A LLC, 4.430%, 03/26/40 | | | | | 1,008,031 | | | | | | 0.6 | | | |
| | | | | | | | | | | | | 2,888,100 | | | | | | 1.8 | | |
| | | | | | | | Total Asset-Backed Securities (Cost $18,658,402) | | | | | 18,824,385 | | | | | | 11.8 | | |
| | COMMERCIAL MORTGAGE-BACKED SECURITIES: 11.1% | | ||||||||||||||||||
| | | | 47,049 | # | | Banc of America Re-REMIC Trust 2010-UBER5 A4A, 5.901%, 02/17/51 | | | | | 47,130 | | | | | | 0.0 | | | |
| | | | 8,366,116 ^ | | | | CD 2016-CD1 Mortgage Trust, 1.444%, 08/10/49 | | | | | 830,582 | | | | | | 0.5 | | |
| | | | 14,660,000 | #,^ | | CD 2016-CD1 Mortgage Trust, 0.685%, 08/10/49 | | | | | 844,255 | | | | | | 0.6 | | | |
| | | | 7,664,126 | #,^ | | COMM 2012 - LTRT XA, 1.162%, 10/05/30 | | | | | 324,413 | | | | | | 0.2 | | | |
| | | | 10,344,641 ^ | | | | COMM 2012-CR3 XA, 2.072%, 10/15/45 | | | | | 761,259 | | | | | | 0.5 | | |
| | | | 7,229,554 ^ | | | | COMM 2016-COR1 XA, 1.490%, 10/10/49 | | | | | 711,621 | | | | | | 0.4 | | |
| | | | 4,249,109 ^ | | | | COMM 2012-CR1 XA, 1.910%, 05/15/45 | | | | | 330,317 | | | | | | 0.2 | | |
| | | | 1,105,012 ^ | | | | COMM 2012-CR4 XA, 1.895%, 10/15/45 | | | | | 75,364 | | | | | | 0.0 | | |
| | | | 2,268,018 ^ | | | | COMM 2013-LC6 XA, 1.673%, 01/10/46 | | | | | 120,056 | | | | | | 0.1 | | |
| Voya Strategic Income | SUMMARY PORTFOLIO OF INVESTMENTS |
| Opportunities Fund | as of March 31, 2017 (continued) |
| | Principal Amount† | | | Value | | | Percentage of Net Assets | | ||||||||||||
| | COMMERCIAL MORTGAGE-BACKED SECURITIES: (continued) | | ||||||||||||||||||
| | | | 2,867,199 ^ | | | | Commercial Mortgage Pass Through Certificates 2016-CR28 XA, 0.325%, 02/10/49 | | | | $ | 118,421 | | | | | | 0.1 | | |
| | | | 10,000 | # | | Credit Suisse First Boston Mortgage Securities Corp. 2004-C2 E, 5.736%, 05/15/36 | | | | | 10,208 | | | | | | 0.0 | | | |
| | | | 10,000 | | | | Credit Suisse First Boston Mortgage Securities Corp. 2005-C3 C, 4.952%, 07/15/37 | | | | | 9,987 | | | | | | 0.0 | | |
| | | | 1,000,000 | | | | Credit Suisse First Boston Mortgage Securities Corp. 2005-C5 F, 5.100%, 08/15/38 | | | | | 992,262 | | | | | | 0.6 | | |
| | | | 1,000,000 | # | | EQTY 2014-INNS Mortgage Trust, 4.297%, 05/08/31 | | | | | 995,770 | | | | | | 0.6 | | | |
| | | | 203,197,429 | #,^ | | Freddie Mac 2014-K714 X2B, 0.100%, 01/25/47 | | | | | 636,272 | | | | | | 0.4 | | | |
| | | | 6,669,157 ^ | | | | Freddie Mac Multifamily Structured Pass Through Certificates K006 BX1, 5.375%, 02/25/20 | | | | | 927,612 | | | | | | 0.6 | | |
| | | | 11,116,342 ^ | | | | Freddie Mac Multifamily Structured Pass Through Certificates K019 X1, 1.690%, 03/25/22 | | | | | 759,667 | | | | | | 0.5 | | |
| | | | 2,799,777 ^ | | | | Freddie Mac Multifamily Structured Pass Through Certificates K704 X1, 1.964%, 08/25/18 | | | | | 54,299 | | | | | | 0.0 | | |
| | | | 8,937,711 ^ | | | | Freddie Mac Multifamily Structured Pass Through Certificates K715 X3, 2.018%, 02/25/41 | | | | | 637,347 | | | | | | 0.4 | | |
| | | | 100,000 ^ | | | | Freddie Mac Multifamily Structured Pass Through CertificatesK015 X3, 2.801%, 08/25/39 | | | | | 10,824 | | | | | | 0.0 | | |
| | | | 731,821 | #,^ | | FREMF Mortgage Trust 2012-K17 X2A, 0.100%, 12/25/44 | | | | | 2,727 | | | | | | 0.0 | | | |
| | | | 8,490,000 | #,^ | | JP Morgan Chase Commercial Mortgage Securities Corp. 2012-LC9 XB, 0.352%, 12/15/47 | | | | | 149,651 | | | | | | 0.1 | | | |
| | | | 140,000 | | | | JP Morgan Chase Commercial Mortgage Securities Trust 2004-CIBC9 E, 5.379%, 06/12/41 | | | | | 134,688 | | | | | | 0.1 | | |
| | Principal Amount† | | | Value | | | Percentage of Net Assets | | ||||||||||||
| | COMMERCIAL MORTGAGE-BACKED SECURITIES: (continued) | | ||||||||||||||||||
| | | | 1,000,000 | | | | JP Morgan Chase Commercial Mortgage Securities Trust 2005-LDP2 F, 5.010%, 07/15/42 | | | | $ | 1,008,750 | | | | | | 0.6 | | |
| | | | 666,438 | | | | JP Morgan Chase Commercial Mortgage Securities Trust 2005-LDP4 B, 5.129%, 10/15/42 | | | | | 664,717 | | | | | | 0.4 | | |
| | | | 500,000 | # | | JP Morgan Chase Commercial Mortgage Securities Trust 2011-C4 C, 5.397%, 07/15/46 | | | | | 537,296 | | | | | | 0.4 | | | |
| | | | 6,615,494 ^ | | | | JP Morgan Chase Commercial Mortgage Securities Trust 2012-CIBX XA, 1.657%, 06/15/45 | | | | | 370,712 | | | | | | 0.2 | | |
| | | | 184,872 | # | | JPMorgan Commercial Mortgage-Backed Securities Trust 2009-RR1 A4B2, 1.000%, 03/18/51 | | | | | 183,985 | | | | | | 0.1 | | | |
| | | | 11,722 | | | | LB-UBS Commercial Mortgage Trust 2005-C3 D, 4.954%, 07/15/40 | | | | | 12,095 | | | | | | 0.0 | | |
| | | | 1,000,000 | | | | LB-UBS Commercial Mortgage Trust 2005-C3 F, 5.013%, 07/15/40 | | | | | 955,319 | | | | | | 0.6 | | |
| | | | 760,000 | # | | LB-UBS Commercial Mortgage Trust 2005-C5 G, 5.350%, 09/15/40 | | | | | 755,717 | | | | | | 0.5 | | | |
| | | | 1,000,000 | # | | LB-UBS Commercial Mortgage Trust 2005-C5 H, 5.350%, 09/15/40 | | | | | 981,519 | | | | | | 0.6 | | | |
| | | | 1,000,000 | # | | Merrill Lynch Mortgage Trust 2004-BPC1 E, 5.167%, 10/12/41 | | | | | 998,505 | | | | | | 0.6 | | | |
| | | | 14,770,058 ^ | | | | Morgan Stanley Bank of America Merrill Lynch Trust 2014 C19, 1.144%, 12/15/47 | | | | | 802,221 | | | | | | 0.5 | | |
| | | | 50,000 | # | | Morgan Stanley Capital I Trust 2008-T29 D, 6.301%, 01/11/43 | | | | | 49,675 | | | | | | 0.0 | | | |
| | | | 270,000 | # | | Morgan Stanley Capital I Trust 2011-C1 D, 5.433%, 09/15/47 | | | | | 288,127 | | | | | | 0.2 | | | |
| | | | 464,501 | #,^ | | WFRBS Commercial Mortgage Trust 2012-C8 XA, 1.983%, 08/15/45 | | | | | 33,378 | | | | | | 0.0 | | | |
| | | | 4,061,425 | #,^ | | WFRBS Commercial Mortgage Trust 2012-C9 XA, 2.087%, 11/15/45 | | | | | 299,627 | | | | | | 0.2 | | | |
| Voya Strategic Income | SUMMARY PORTFOLIO OF INVESTMENTS |
| Opportunities Fund | as of March 31, 2017 (continued) |
| | Principal Amount† | | | Value | | | Percentage of Net Assets | | ||||||||||||
| | COMMERCIAL MORTGAGE-BACKED SECURITIES: (continued) | | ||||||||||||||||||
| | | | 7,193,272 | #,^ | | WFRBS Commercial Mortgage Trust 2013-C12 XA, 1.376%, 03/15/48 | | | | $ | 387,713 | | | | | | 0.3 | | | |
| | | | | | | | Total Commercial Mortgage-Backed Securities (Cost $17,811,128) | | | | | 17,814,088 | | | | | | 11.1 | | |
| | ||||||||||||||||||||
| # of Contracts | | | Value | | | Percentage of Net Assets | | |||||||||
| PURCHASED OPTIONS: 0.0% | | |||||||||||||||
| | | | OTC Interest Rate Swaptions: 0.0% | | ||||||||||||
| 9,400,000 @ | | | Put on 10-Year Interest Rate Swap, Receive a floating rate based on the 3-month USD-LIBOR-BBA and pay a fixed rate equal to 2.700%, Exp. 05/22/17 Counterparty: Goldman Sachs International | | | | | 14,364 | | | | | | 0.0 | | |
| | | | Total Purchased Options (Cost $57,723) | | | | | 14,364 | | | | | | 0.0 | | |
| | | | Total Long-Term Investments (Cost $152,492,737) | | | | | 155,661,440 | | | | | | 97.2 | | |
| | ||||||||||||||||
| Principal Amount† | | | Value | | | Percentage of Net Assets | | |||||||||
| SHORT-TERM INVESTMENTS: 5.9% | | |||||||||||||||
| | | | Corporate Bonds/Notes: 0.1% | | ||||||||||||
| 150,000 | | | Energy Future Intermediate Holdings Term Loan, 4.400%, 06/30/17 (Cost $149,925) | | | | | 150,125 | | | | | | 0.1 | | |
| | | | Securities Lending Collateralcc: 0.6% | | ||||||||||||
| 996,954 | | | Cantor Fitzgerald, Repurchase Agreement dated 03/31/17, 0.81%, due 04/03/17 (Repurchase Amount $997,020, collateralized by various U.S. Government and U.S. Government Agency Obligations, 0.000%- 10.000%, Market Value plus accrued interest $1,016,893, due 04/01/17-02/20/67) (Cost $996,954) | | | | | 996,954 | | | | | | 0.6 | | |
| Shares | | | Value | | | Percentage of Net Assets | | |||||||||
| SHORT-TERM INVESTMENTS: (continued) | | |||||||||||||||
| | | | Mutual Funds: 5.2% | | ||||||||||||
| 8,310,784 | | | BlackRock Liquidity Funds, FedFund, Institutional Class, 0.600%†† (Cost $8,310,784) | | | | $ | 8,310,784 | | | | | | 5.2 | | |
| | | | Total Short-Term Investments (Cost $9,457,663) | | | | | 9,457,863 | | | | | | 5.9 | | |
| | | | Total Investments in Securities (Cost $161,950,400) | | | | $ | 165,119,303 | | | | | | 103.1 | | |
| | | | Liabilities in Excess of Other Assets | | | | | (4,986,183) | | | | | | (3.1) | | |
| | | | Net Assets | | | | $ | 160,133,120 | | | | | | 100.0 | | |
| | ||||||||||||||||
| Voya Strategic Income | SUMMARY PORTFOLIO OF INVESTMENTS |
| Opportunities Fund | as of March 31, 2017 (continued) |
| | Gross Unrealized Appreciation | | | | $ | 3,819,320 | | |
| | Gross Unrealized Depreciation | | | | | (710,306) | | |
| | Net Unrealized Appreciation | | | | $ | 3,109,014 | | |
| | ||||||||
| | | | Quoted Prices in Active Markets for Identical Investments (Level 1) | | | Significant Other Observable Inputs (Level 2) | | | Significant Unobservable Inputs (Level 3) | | | Fair Value at March 31, 2017 | | ||||||||||||
| Asset Table | | | | | | ||||||||||||||||||||
| Investments, at fair value | | | | | | ||||||||||||||||||||
| Purchased Options | | | | $ | – | | | | | $ | 14,364 | | | | | $ | – | | | | | $ | 14,364 | | |
| Corporate Bonds/Notes | | | | | – | | | | | | 23,720,256 | | | | | | – | | | | | | 23,720,256 | | |
| Collateralized Mortgage Obligations | | | | | – | | | | | | 42,384,867 | | | | | | – | | | | | | 42,384,867 | | |
| Short-Term Investments | | | | | 8,310,784 | | | | | | 1,147,079 | | | | | | – | | | | | | 9,457,863 | | |
| Bank Loans | | | | | – | | | | | | 32,766,621 | | | | | | – | | | | | | 32,766,621 | | |
| U.S. Government Agency Obligations | | | | | – | | | | | | 13,572 | | | | | | – | | | | | | 13,572 | | |
| U.S. Treasury Obligations | | | | | – | | | | | | 226,749 | | | | | | – | | | | | | 226,749 | | |
| Asset-Backed Securities | | | | | – | | | | | | 18,024,510 | | | | | | 799,875 | | | | | | 18,824,385 | | |
| Foreign Government Bonds | | | | | – | | | | | | 19,896,538 | | | | | | – | | | | | | 19,896,538 | | |
| Commercial Mortgage-Backed Securities | | | | | – | | | | | | 17,814,088 | | | | | | – | | | | | | 17,814,088 | | |
| Total Investments, at fair value | | | | $ | 8,310,784 | | | | | $ | 156,008,644 | | | | | $ | 799,875 | | | | | $ | 165,119,303 | | |
| Other Financial Instruments+ | | | | | | ||||||||||||||||||||
| Centrally Cleared Swaps | | | | | – | | | | | | 430,812 | | | | | | – | | | | | | 430,812 | | |
| Forward Foreign Currency Contracts | | | | | – | | | | | | 1,264,143 | | | | | | – | | | | | | 1,264,143 | | |
| Futures | | | | | 63,736 | | | | | | – | | | | | | – | | | | | | 63,736 | | |
| Total Assets | | | | $ | 8,374,520 | | | | | $ | 157,703,599 | | | | | $ | 799,875 | | | | | $ | 166,877,994 | | |
| Liabilities Table | | | | | | ||||||||||||||||||||
| Other Financial Instruments+ | | | | | | ||||||||||||||||||||
| Centrally Cleared Swaps | | | | $ | — | | | | | $ | (440,162) | | | | | $ | — | | | | | $ | (440,162) | | |
| Forward Foreign Currency Contracts | | | | | — | | | | | | (1,392,286) | | | | | | — | | | | | | (1,392,286) | | |
| Futures | | | | | (274,929) | | | | | | — | | | | | | — | | | | | | (274,929) | | |
| Written Options | | | | | — | | | | | | (22,677) | | | | | | — | | | | | | (22,677) | | |
| Total Liabilities | | | | $ | (274,929) | | | | | $ | (1,855,125) | | | | | $ | — | | | | | $ | (2,130,054) | | |
| | |||||||||||||||||||||||||
| Voya Strategic Income | SUMMARY PORTFOLIO OF INVESTMENTS |
| Opportunities Fund | as of March 31, 2017 (continued) |
| Counterparty | | | Currency | | | Contract Amount | | | Buy/Sell | | | Settlement Date | | | In Exchange For | | | Fair Value | | | Unrealized Appreciation (Depreciation) | | ||||||||||||||||||
| The Bank of New York Mellon | | | Indonesian Rupiah | | | | | 145,500,216 | | | | | | Buy | | | | | | 06/16/17 | | | | | $ | 10,858 | | | | | $ | 10,863 | | | | | $ | 5 | | |
| Barclays Bank PLC | | | Norwegian Krone | | | | | 4,536,646 | | | | | | Buy | | | | | | 04/07/17 | | | | | | 530,000 | | | | | | 528,381 | | | | | | (1,619) | | |
| Barclays Bank PLC | | | British Pound | | | | | 255,510 | | | | | | Buy | | | | | | 04/07/17 | | | | | | 318,000 | | | | | | 320,150 | | | | | | 2,150 | | |
| Barclays Bank PLC | | | Canadian Dollar | | | | | 1,154,612 | | | | | | Buy | | | | | | 04/07/17 | | | | | | 863,000 | | | | | | 868,265 | | | | | | 5,265 | | |
| Barclays Bank PLC | | | Australian Dollar | | | | | 551,118 | | | | | | Buy | | | | | | 04/07/17 | | | | | | 420,000 | | | | | | 421,032 | | | | | | 1,032 | | |
| Barclays Bank PLC | | | Swedish Krona | | | | | 8,115,709 | | | | | | Buy | | | | | | 04/07/17 | | | | | | 920,000 | | | | | | 905,832 | | | | | | (14,168) | | |
| Barclays Bank PLC | | | Norwegian Krone | | | | | 6,694,403 | | | | | | Buy | | | | | | 04/07/17 | | | | | | 791,000 | | | | | | 779,695 | | | | | | (11,305) | | |
| Barclays Bank PLC | | | Canadian Dollar | | | | | 274,638 | | | | | | Buy | | | | | | 04/07/17 | | | | | | 206,000 | | | | | | 206,527 | | | | | | 527 | | |
| Barclays Bank PLC | | | Swiss Franc | | | | | 278,770 | | | | | | Buy | | | | | | 04/07/17 | | | | | | 276,000 | | | | | | 278,359 | | | | | | 2,359 | | |
| Barclays Bank PLC | | | Japanese Yen | | | | | 37,646,159 | | | | | | Buy | | | | | | 04/07/17 | | | | | | 331,000 | | | | | | 338,191 | | | | | | 7,191 | | |
| Barclays Bank PLC | | | New Zealand Dollar | | | | | 659,173 | | | | | | Buy | | | | | | 04/07/17 | | | | | | 476,000 | | | | | | 462,046 | | | | | | (13,954) | | |
| Barclays Bank PLC | | | Norwegian Krone | | | | | 11,478,123 | | | | | | Buy | | | | | | 04/07/17 | | | | | | 1,377,000 | | | | | | 1,336,853 | | | | | | (40,147) | | |
| Barclays Bank PLC | | | New Zealand Dollar | | | | | 214,330 | | | | | | Buy | | | | | | 04/07/17 | | | | | | 154,000 | | | | | | 150,234 | | | | | | (3,766) | | |
| Barclays Bank PLC | | | Australian Dollar | | | | | 911,647 | | | | | | Buy | | | | | | 04/07/17 | | | | | | 702,000 | | | | | | 696,462 | | | | | | (5,538) | | |
| Barclays Bank PLC | | | New Zealand Dollar | | | | | 212,436 | | | | | | Buy | | | | | | 04/07/17 | | | | | | 152,000 | | | | | | 148,907 | | | | | | (3,093) | | |
| Barclays Bank PLC | | | Swiss Franc | | | | | 368,014 | | | | | | Buy | | | | | | 04/07/17 | | | | | | 367,000 | | | | | | 367,471 | | | | | | 471 | | |
| Barclays Bank PLC | | | Norwegian Krone | | | | | 3,203,189 | | | | | | Buy | | | | | | 04/07/17 | | | | | | 382,000 | | | | | | 373,074 | | | | | | (8,926) | | |
| Barclays Bank PLC | | | Norwegian Krone | | | | | 2,550,554 | | | | | | Buy | | | | | | 04/07/17 | | | | | | 306,000 | | | | | | 297,062 | | | | | | (8,938) | | |
| Barclays Bank PLC | | | New Zealand Dollar | | | | | 519,304 | | | | | | Buy | | | | | | 04/07/17 | | | | | | 377,000 | | | | | | 364,005 | | | | | | (12,995) | | |
| Barclays Bank PLC | | | Norwegian Krone | | | | | 2,668,815 | | | | | | Buy | | | | | | 04/07/17 | | | | | | 321,000 | | | | | | 310,836 | | | | | | (10,164) | | |
| Barclays Bank PLC | | | Canadian Dollar | | | | | 259,203 | | | | | | Buy | | | | | | 04/07/17 | | | | | | 197,000 | | | | | | 194,920 | | | | | | (2,080) | | |
| Barclays Bank PLC | | | Norwegian Krone | | | | | 3,030,486 | | | | | | Buy | | | | | | 04/07/17 | | | | | | 365,000 | | | | | | 352,959 | | | | | | (12,041) | | |
| Barclays Bank PLC | | | Swedish Krona | | | | | 4,590,547 | | | | | | Buy | | | | | | 04/07/17 | | | | | | 522,000 | | | | | | 512,372 | | | | | | (9,628) | | |
| Barclays Bank PLC | | | Japanese Yen | | | | | 42,161,501 | | | | | | Buy | | | | | | 04/07/17 | | | | | | 375,000 | | | | | | 378,754 | | | | | | 3,754 | | |
| Barclays Bank PLC | | | Swedish Krona | | | | | 3,482,312 | | | | | | Buy | | | | | | 04/07/17 | | | | | | 399,000 | | | | | | 388,677 | | | | | | (10,323) | | |
| Barclays Bank PLC | | | Australian Dollar | | | | | 1,211,661 | | | | | | Buy | | | | | | 04/07/17 | | | | | | 913,000 | | | | | | 925,660 | | | | | | 12,660 | | |
| Barclays Bank PLC | | | Japanese Yen | | | | | 11,864,122 | | | | | | Buy | | | | | | 04/07/17 | | | | | | 104,000 | | | | | | 106,580 | | | | | | 2,580 | | |
| Barclays Bank PLC | | | Australian Dollar | | | | | 538,439 | | | | | | Buy | | | | | | 04/07/17 | | | | | | 407,000 | | | | | | 411,346 | | | | | | 4,346 | | |
| Barclays Bank PLC | | | Australian Dollar | | | | | 717,285 | | | | | | Buy | | | | | | 04/07/17 | | | | | | 543,000 | | | | | | 547,977 | | | | | | 4,977 | | |
| Barclays Bank PLC | | | British Pound | | | | | 136,382 | | | | | | Buy | | | | | | 04/07/17 | | | | | | 171,000 | | | | | | 170,885 | | | | | | (115) | | |
| Barclays Bank PLC | | | Japanese Yen | | | | | 153,776,292 | | | | | | Buy | | | | | | 04/07/17 | | | | | | 1,368,000 | | | | | | 1,381,434 | | | | | | 13,434 | | |
| Barclays Bank PLC | | | British Pound | | | | | 195,705 | | | | | | Buy | | | | | | 04/07/17 | | | | | | 242,000 | | | | | | 245,216 | | | | | | 3,216 | | |
| Barclays Bank PLC | | | EU Euro | | | | | 1,122,433 | | | | | | Buy | | | | | | 04/07/17 | | | | | | 1,199,000 | | | | | | 1,197,577 | | | | | | (1,423) | | |
| Barclays Bank PLC | | | Japanese Yen | | | | | 22,817,784 | | | | | | Buy | | | | | | 04/07/17 | | | | | | 200,000 | | | | | | 204,981 | | | | | | 4,981 | | |
| Barclays Bank PLC | | | New Zealand Dollar | | | | | 1,013,033 | | | | | | Buy | | | | | | 04/07/17 | | | | | | 713,000 | | | | | | 710,085 | | | | | | (2,915) | | |
| Barclays Bank PLC | | | Norwegian Krone | | | | | 6,902,367 | | | | | | Buy | | | | | | 04/07/17 | | | | | | 803,000 | | | | | | 803,916 | | | | | | 916 | | |
| Barclays Bank PLC | | | Swedish Krona | | | | | 1,734,208 | | | | | | Buy | | | | | | 04/07/17 | | | | | | 192,190 | | | | | | 193,563 | | | | | | 1,373 | | |
| BNP Paribas | | | EU Euro | | | | | 18,570 | | | | | | Buy | | | | | | 04/07/17 | | | | | | 20,000 | | | | | | 19,813 | | | | | | (187) | | |
| BNP Paribas | | | Australian Dollar | | | | | 495,980 | | | | | | Buy | | | | | | 04/07/17 | | | | | | 381,000 | | | | | | 378,909 | | | | | | (2,091) | | |
| BNP Paribas | | | Japanese Yen | | | | | 32,569,000 | | | | | | Buy | | | | | | 04/07/17 | | | | | | 289,000 | | | | | | 292,580 | | | | | | 3,580 | | |
| BNP Paribas | | | Swiss Franc | | | | | 195,778 | | | | | | Buy | | | | | | 04/07/17 | | | | | | 194,000 | | | | | | 195,489 | | | | | | 1,489 | | |
| BNP Paribas | | | Australian Dollar | | | | | 6,466,437 | | | | | | Buy | | | | | | 04/07/17 | | | | | | 4,736,309 | | | | | | 4,940,099 | | | | | | 203,790 | | |
| BNP Paribas | | | EU Euro | | | | | 3,195,739 | | | | | | Buy | | | | | | 06/21/17 | | | | | | 3,398,000 | | | | | | 3,422,165 | | | | | | 24,165 | | |
| Citibank N.A. | | | Canadian Dollar | | | | | 250,075 | | | | | | Buy | | | | | | 04/07/17 | | | | | | 188,000 | | | | | | 188,056 | | | | | | 56 | | |
| Voya Strategic Income | SUMMARY PORTFOLIO OF INVESTMENTS |
| Opportunities Fund | as of March 31, 2017 (continued) |
| Counterparty | | | Currency | | | Contract Amount | | | Buy/Sell | | | Settlement Date | | | In Exchange For | | | Fair Value | | | Unrealized Appreciation (Depreciation) | | ||||||||||||||||||
| Citibank N.A. | | | Swedish Krona | | | | | 2,877,446 | | | | | | Buy | | | | | | 04/07/17 | | | | | | 330,000 | | | | | | 321,165 | | | | | | (8,835) | | |
| Citibank N.A. | | | Canadian Dollar | | | | | 965,452 | | | | | | Buy | | | | | | 04/07/17 | | | | | | 724,000 | | | | | | 726,018 | | | | | | 2,018 | | |
| Citibank N.A. | | | Australian Dollar | | | | | 1,077,970 | | | | | | Buy | | | | | | 04/07/17 | | | | | | 827,000 | | | | | | 823,526 | | | | | | (3,474) | | |
| Citibank N.A. | | | Canadian Dollar | | | | | 960,941 | | | | | | Buy | | | | | | 04/07/17 | | | | | | 721,000 | | | | | | 722,625 | | | | | | 1,625 | | |
| Citibank N.A. | | | Australian Dollar | | | | | 1,269,726 | | | | | | Buy | | | | | | 04/07/17 | | | | | | 969,000 | | | | | | 970,020 | | | | | | 1,020 | | |
| Citibank N.A. | | | Canadian Dollar | | | | | 718,133 | | | | | | Buy | | | | | | 04/07/17 | | | | | | 537,000 | | | | | | 540,034 | | | | | | 3,034 | | |
| Citibank N.A. | | | Norwegian Krone | | | | | 1,653,518 | | | | | | Buy | | | | | | 04/07/17 | | | | | | 195,000 | | | | | | 192,585 | | | | | | (2,415) | | |
| Citibank N.A. | | | British Pound | | | | | 497,922 | | | | | | Buy | | | | | | 04/07/17 | | | | | | 622,000 | | | | | | 623,889 | | | | | | 1,889 | | |
| Citibank N.A. | | | Canadian Dollar | | | | | 579,531 | | | | | | Buy | | | | | | 04/07/17 | | | | | | 435,000 | | | | | | 435,805 | | | | | | 805 | | |
| Citibank N.A. | | | Canadian Dollar | | | | | 596,754 | | | | | | Buy | | | | | | 04/07/17 | | | | | | 447,000 | | | | | | 448,758 | | | | | | 1,758 | | |
| Citibank N.A. | | | Canadian Dollar | | | | | 432,845 | | | | | | Buy | | | | | | 04/07/17 | | | | | | 324,000 | | | | | | 325,498 | | | | | | 1,498 | | |
| Citibank N.A. | | | Swiss Franc | | | | | 304,293 | | | | | | Buy | | | | | | 04/07/17 | | | | | | 305,000 | | | | | | 303,844 | | | | | | (1,156) | | |
| Citibank N.A. | | | Norwegian Krone | | | | | 10,374,263 | | | | | | Buy | | | | | | 04/07/17 | | | | | | 1,224,000 | | | | | | 1,208,286 | | | | | | (15,714) | | |
| Citibank N.A. | | | Norwegian Krone | | | | | 5,078,016 | | | | | | Buy | | | | | | 04/07/17 | | | | | | 597,000 | | | | | | 591,435 | | | | | | (5,565) | | |
| Citibank N.A. | | | EU Euro | | | | | 72,009 | | | | | | Buy | | | | | | 04/07/17 | | | | | | 77,000 | | | | | | 76,830 | | | | | | (170) | | |
| Citibank N.A. | | | Canadian Dollar | | | | | 358,958 | | | | | | Buy | | | | | | 04/07/17 | | | | | | 268,000 | | | | | | 269,935 | | | | | | 1,935 | | |
| Citibank N.A. | | | Australian Dollar | | | | | 1,181,221 | | | | | | Buy | | | | | | 04/07/17 | | | | | | 906,000 | | | | | | 902,405 | | | | | | (3,595) | | |
| Citibank N.A. | | | Australian Dollar | | | | | 1,015,643 | | | | | | Buy | | | | | | 04/07/17 | | | | | | 779,000 | | | | | | 775,910 | | | | | | (3,090) | | |
| Citibank N.A. | | | British Pound | | | | | 261,951 | | | | | | Buy | | | | | | 04/07/17 | | | | | | 327,000 | | | | | | 328,221 | | | | | | 1,221 | | |
| Citibank N.A. | | | EU Euro | | | | | 9,414 | | | | | | Buy | | | | | | 04/07/17 | | | | | | 10,000 | | | | | | 10,044 | | | | | | 44 | | |
| Citibank N.A. | | | EU Euro | | | | | 156,694 | | | | | | Buy | | | | | | 04/07/17 | | | | | | 167,000 | | | | | | 167,184 | | | | | | 184 | | |
| Citibank N.A. | | | New Zealand Dollar | | | | | 1,053,622 | | | | | | Buy | | | | | | 04/07/17 | | | | | | 768,000 | | | | | | 738,535 | | | | | | (29,465) | | |
| Citibank N.A. | | | Swedish Krona | | | | | 4,658,888 | | | | | | Buy | | | | | | 04/07/17 | | | | | | 532,000 | | | | | | 520,000 | | | | | | (12,000) | | |
| Citibank N.A. | | | Swedish Krona | | | | | 2,284,234 | | | | | | Buy | | | | | | 04/07/17 | | | | | | 262,000 | | | | | | 254,954 | | | | | | (7,046) | | |
| Citibank N.A. | | | Canadian Dollar | | | | | 587,376 | | | | | | Buy | | | | | | 04/07/17 | | | | | | 449,000 | | | | | | 441,705 | | | | | | (7,295) | | |
| Citibank N.A. | | | Australian Dollar | | | | | 422,796 | | | | | | Buy | | | | | | 04/07/17 | | | | | | 319,000 | | | | | | 322,999 | | | | | | 3,999 | | |
| Citibank N.A. | | | Swiss Franc | | | | | 515,248 | | | | | | Buy | | | | | | 04/07/17 | | | | | | 513,000 | | | | | | 514,488 | | | | | | 1,488 | | |
| Citibank N.A. | | | New Zealand Dollar | | | | | 1,406,709 | | | | | | Buy | | | | | | 04/07/17 | | | | | | 999,000 | | | | | | 986,031 | | | | | | (12,969) | | |
| Citibank N.A. | | | New Zealand Dollar | | | | | 1,467,052 | | | | | | Buy | | | | | | 06/21/17 | | | | | | 1,069,000 | | | | | | 1,026,321 | | | | | | (42,679) | | |
| Citibank N.A. | | | Canadian Dollar | | | | | 2,747,183 | | | | | | Buy | | | | | | 06/21/17 | | | | | | 2,083,000 | | | | | | 2,068,058 | | | | | | (14,942) | | |
| Citibank N.A. | | | Japanese Yen | | | | | 113,904,571 | | | | | | Buy | | | | | | 09/20/17 | | | | | | 1,016,554 | | | | | | 1,030,821 | | | | | | 14,267 | | |
| Citibank N.A. | | | Japanese Yen | | | | | 444,160,000 | | | | | | Buy | | | | | | 09/20/17 | | | | | | 3,963,955 | | | | | | 4,019,586 | | | | | | 55,631 | | |
| Citibank N.A. | | | Japanese Yen | | | | | 218,658,000 | | | | | | Buy | | | | | | 09/20/17 | | | | | | 1,951,438 | | | | | | 1,978,825 | | | | | | 27,387 | | |
| Deutsche Bank AG | | | New Zealand Dollar | | | | | 1,208,721 | | | | | | Buy | | | | | | 04/07/17 | | | | | | 845,000 | | | | | | 847,251 | | | | | | 2,251 | | |
| Deutsche Bank AG | | | Swiss Franc | | | | | 325,018 | | | | | | Buy | | | | | | 04/07/17 | | | | | | 322,000 | | | | | | 324,539 | | | | | | 2,539 | | |
| Deutsche Bank AG | | | New Zealand Dollar | | | | | 780,033 | | | �� | | | Buy | | | | | | 04/07/17 | | | | | | 546,000 | | | | | | 546,763 | | | | | | 763 | | |
| Deutsche Bank AG | | | Swiss Franc | | | | | 175,213 | | | | | | Buy | | | | | | 04/07/17 | | | | | | 177,000 | | | | | | 174,955 | | | | | | (2,045) | | |
| Deutsche Bank AG | | | Australian Dollar | | | | | 1,447,153 | | | | | | Buy | | | | | | 04/07/17 | | | | | | 1,107,000 | | | | | | 1,105,567 | | | | | | (1,433) | | |
| Deutsche Bank AG | | | Australian Dollar | | | | | 389,073 | | | | | | Buy | | | | | | 04/07/17 | | | | | | 300,000 | | | | | | 297,236 | | | | | | (2,764) | | |
| Deutsche Bank AG | | | Australian Dollar | | | | | 284,827 | | | | | | Buy | | | | | | 04/07/17 | | | | | | 218,000 | | | | | | 217,597 | | | | | | (403) | | |
| Deutsche Bank AG | | | New Zealand Dollar | | | | | 788,068 | | | | | | Buy | | | | | | 04/07/17 | | | | | | 576,000 | | | | | | 552,396 | | | | | | (23,604) | | |
| Deutsche Bank AG | | | Australian Dollar | | | | | 798,467 | | | | | | Buy | | | | | | 04/07/17 | | | | | | 602,000 | | | | | | 609,997 | | | | | | 7,997 | | |
| Deutsche Bank AG | | | New Zealand Dollar | | | | | 582,525 | | | | | | Buy | | | | | | 04/07/17 | | | | | | 419,000 | | | | | | 408,320 | | | | | | (10,680) | | |
| Deutsche Bank AG | | | Norwegian Krone | | | | | 10,901,941 | | | | | | Buy | | | | | | 04/07/17 | | | | | | 1,276,000 | | | | | | 1,269,745 | | | | | | (6,255) | | |
| Goldman Sachs International | | | EU Euro | | | | | 438,783 | | | | | | Buy | | | | | | 04/07/17 | | | | | | 474,000 | | | | | | 468,158 | | | | | | (5,842) | | |
| Goldman Sachs International | | | British Pound | | | | | 305,864 | | | | | | Buy | | | | | | 04/07/17 | | | | | | 381,000 | | | | | | 383,243 | | | | | | 2,243 | | |
| Voya Strategic Income | SUMMARY PORTFOLIO OF INVESTMENTS |
| Opportunities Fund | as of March 31, 2017 (continued) |
| Counterparty | | | Currency | | | Contract Amount | | | Buy/Sell | | | Settlement Date | | | In Exchange For | | | Fair Value | | | Unrealized Appreciation (Depreciation) | | ||||||||||||||||||
| Goldman Sachs International | | | Canadian Dollar | | | | | 366,748 | | | | | | Buy | | | | | | 04/07/17 | | | | | | 272,000 | | | | | | 275,793 | | | | | | 3,793 | | |
| Goldman Sachs International | | | Japanese Yen | | | | | 30,844,055 | | | | | | Buy | | | | | | 04/07/17 | | | | | | 271,000 | | | | | | 277,084 | | | | | | 6,084 | | |
| Goldman Sachs International | | | Norwegian Krone | | | | | 4,265,657 | | | | | | Buy | | | | | | 04/07/17 | | | | | | 505,000 | | | | | | 496,819 | | | | | | (8,181) | | |
| Goldman Sachs International | | | Canadian Dollar | | | | | 232,443 | | | | | | Buy | | | | | | 04/07/17 | | | | | | 177,000 | | | | | | 174,796 | | | | | | (2,204) | | |
| Goldman Sachs International | | | Australian Dollar | | | | | 1,019,860 | | | | | | Buy | | | | | | 04/07/17 | | | | | | 769,000 | | | | | | 779,132 | | | | | | 10,132 | | |
| Goldman Sachs International | | | EU Euro | | | | | 1,703,132 | | | | | | Buy | | | | | | 04/07/17 | | | | | | 1,805,411 | | | | | | 1,817,151 | | | | | | 11,740 | | |
| HSBC Bank USA N.A. | | | Norwegian Krone | | | | | 7,436,125 | | | | | | Buy | | | | | | 04/07/17 | | | | | | 872,000 | | | | | | 866,083 | | | | | | (5,917) | | |
| HSBC Bank USA N.A. | | | Hungarian Forint | | | | | 73,360,915 | | | | | | Buy | | | | | | 04/07/17 | | | | | | 254,898 | | | | | | 253,615 | | | | | | (1,283) | | |
| HSBC Bank USA N.A. | | | EU Euro | | | | | 257,006 | | | | | | Buy | | | | | | 04/07/17 | | | | | | 273,000 | | | | | | 274,212 | | | | | | 1,212 | | |
| HSBC Bank USA N.A. | | | Japanese Yen | | | | | 39,987,120 | | | | | | Buy | | | | | | 04/07/17 | | | | | | 351,000 | | | | | | 359,220 | | | | | | 8,220 | | |
| JPMorgan Chase Bank N.A. | | | New Zealand Dollar | | | | | 503,734 | | | | | | Buy | | | | | | 04/07/17 | | | | | | 350,000 | | | | | | 353,092 | | | | | | 3,092 | | |
| JPMorgan Chase Bank N.A. | | | Australian Dollar | | | | | 403,843 | | | | | | Buy | | | | | | 04/07/17 | | | | | | 308,000 | | | | | | 308,520 | | | | | | 520 | | |
| JPMorgan Chase Bank N.A. | | | Swiss Franc | | | | | 638,783 | | | | | | Buy | | | | | | 04/07/17 | | | | | | 644,000 | | | | | | 637,841 | | | | | | (6,159) | | |
| JPMorgan Chase Bank N.A. | | | British Pound | | | | | 557,909 | | | | | | Buy | | | | | | 04/07/17 | | | | | | 699,000 | | | | | | 699,052 | | | | | | 52 | | |
| JPMorgan Chase Bank N.A. | | | Swiss Franc | | | | | 458,614 | | | | | | Buy | | | | | | 04/07/17 | | | | | | 463,000 | | | | | | 457,938 | | | | | | (5,062) | | |
| JPMorgan Chase Bank N.A. | | | Swiss Franc | | | | | 311,740 | | | | | | Buy | | | | | | 04/07/17 | | | | | | 314,000 | | | | | | 311,280 | | | | | | (2,720) | | |
| JPMorgan Chase Bank N.A. | | | Russian Ruble | | | | | 7,931,276 | | | | | | Buy | | | | | | 04/07/17 | | | | | | 136,441 | | | | | | 140,833 | | | | | | 4,392 | | |
| JPMorgan Chase Bank N.A. | | | Canadian Dollar | | | | | 278,857 | | | | | | Buy | | | | | | 04/07/17 | | | | | | 209,000 | | | | | | 209,699 | | | | | | 699 | | |
| JPMorgan Chase Bank N.A. | | | Swiss Franc | | | | | 326,598 | | | | | | Buy | | | | | | 04/07/17 | | | | | | 327,000 | | | | | | 326,117 | | | | | | (883) | | |
| JPMorgan Chase Bank N.A. | | | Swiss Franc | | | | | 572,896 | | | | | | Buy | | | | | | 04/07/17 | | | | | | 568,000 | | | | | | 572,051 | | | | | | 4,051 | | |
| JPMorgan Chase Bank N.A. | | | EU Euro | | | | | 816,133 | | | | | | Buy | | | | | | 04/07/17 | | | | | | 865,000 | | | | | | 870,770 | | | | | | 5,770 | | |
| JPMorgan Chase Bank N.A. | | | British Pound | | | | | 270,709 | | | | | | Buy | | | | | | 04/07/17 | | | | | | 333,000 | | | | | | 339,195 | | | | | | 6,195 | | |
| JPMorgan Chase Bank N.A. | | | Japanese Yen | | | | | 45,056,730 | | | | | | Buy | | | | | | 04/07/17 | | | | | | 396,000 | | | | | | 404,763 | | | | | | 8,763 | | |
| JPMorgan Chase Bank N.A. | | | New Zealand Dollar | | | | | 393,670 | | | | | | Buy | | | | | | 04/07/17 | | | | | | 277,000 | | | | | | 275,943 | | | | | | (1,057) | | |
| JPMorgan Chase Bank N.A. | | | Japanese Yen | | | | | 57,132,790 | | | | | | Buy | | | | | | 04/07/17 | | | | | | 500,000 | | | | | | 513,247 | | | | | | 13,247 | | |
| JPMorgan Chase Bank N.A. | | | Japanese Yen | | | | | 55,484,698 | | | | | | Buy | | | | | | 04/07/17 | | | | | | 489,000 | | | | | | 498,441 | | | | | | 9,441 | | |
| JPMorgan Chase Bank N.A. | | | Swiss Franc | | | | | 422,694 | | | | | | Buy | | | | | | 04/07/17 | | | | | | 421,000 | | | | | | 422,070 | | | | | | 1,070 | | |
| JPMorgan Chase Bank N.A. | | | New Zealand Dollar | | | | | 537,285 | | | | | | Buy | | | | | | 04/07/17 | | | | | | 392,000 | | | | | | 376,609 | | | | | | (15,391) | | |
| JPMorgan Chase Bank N.A. | | | Canadian Dollar | | | | | 213,089 | | | | | | Buy | | | | | | 04/07/17 | | | | | | 163,000 | | | | | | 160,243 | | | | | | (2,757) | | |
| JPMorgan Chase Bank N.A. | | | New Zealand Dollar | | | | | 1,071,769 | | | | | | Buy | | | | | | 04/07/17 | | | | | | 780,000 | | | | | | 751,255 | | | | | | (28,745) | | |
| JPMorgan Chase Bank N.A. | | | EU Euro | | | | | 963,622 | | | | | | Buy | | | | | | 04/07/17 | | | | | | 1,034,000 | | | | | | 1,028,133 | | | | | | (5,867) | | |
| JPMorgan Chase Bank N.A. | | | Australian Dollar | | | | | 435,647 | | | | | | Buy | | | | | | 04/07/17 | | | | | | 330,000 | | | | | | 332,817 | | | | | | 2,817 | | |
| JPMorgan Chase Bank N.A. | | | EU Euro | | | | | 400,060 | | | | | | Buy | | | | | | 04/07/17 | | | | | | 430,000 | | | | | | 426,843 | | | | | | (3,157) | | |
| Morgan Stanley | | | New Zealand Dollar | | | | | 659,898 | | | | | | Buy | | | | | | 04/07/17 | | | | | | 456,000 | | | | | | 462,555 | | | | | | 6,555 | | |
| Morgan Stanley | | | Australian Dollar | | | | | 337,346 | | | | | | Buy | | | | | | 04/07/17 | | | | | | 258,000 | | | | | | 257,719 | | | | | | (281) | | |
| Morgan Stanley | | | British Pound | | | | | 286,905 | | | | | | Buy | | | | | | 04/07/17 | | | | | | 353,000 | | | | | | 359,488 | | | | | | 6,488 | | |
| Morgan Stanley | | | Norwegian Krone | | | | | 3,831,254 | | | | | | Buy | | | | | | 04/07/17 | | | | | | 460,000 | | | | | | 446,225 | | | | | | (13,775) | | |
| Morgan Stanley | | | Japanese Yen | | | | | 155,196,372 | | | | | | Buy | | | | | | 04/07/17 | | | | | | 1,368,000 | | | | | | 1,394,191 | | | | | | 26,191 | | |
| Morgan Stanley | | | Japanese Yen | | | | | 32,207,001 | | | | | | Buy | | | | | | 04/07/17 | | | | | | 285,000 | | | | | | 289,328 | | | | | | 4,328 | | |
| Morgan Stanley | | | Japanese Yen | | | | | 53,234,642 | | | | | | Buy | | | | | | 04/07/17 | | | | | | 467,000 | | | | | | 478,228 | | | | | | 11,228 | | |
| Morgan Stanley | | | Japanese Yen | | | | | 38,224,687 | | | | | | Buy | | | | | | 04/07/17 | | | | | | 337,000 | | | | | | 343,388 | | | | | | 6,388 | | |
| Morgan Stanley | | | Norwegian Krone | | | | | 3,044,614 | | | | | | Buy | | | | | | 04/07/17 | | | | | | 363,000 | | | | | | 354,605 | | | | | | (8,395) | | |
| Morgan Stanley | | | EU Euro | | | | | 450,369 | | | | | | Buy | | | | | | 04/07/17 | | | | | | 486,000 | | | | | | 480,520 | | | | | | (5,480) | | |
| Morgan Stanley | | | EU Euro | | | | | 25,136 | | | | | | Buy | | | | | | 04/07/17 | | | | | | 27,000 | | | | | | 26,818 | | | | | | (182) | | |
| Morgan Stanley | | | EU Euro | | | | | 181,646 | | | | | | Buy | | | | | | 04/07/17 | | | | | | 194,000 | | | | | | 193,807 | | | | | | (193) | | |
| Morgan Stanley | | | British Pound | | | | | 279,847 | | | | | | Buy | | | | | | 04/07/17 | | | | | | 344,000 | | | | | | 350,644 | | | | | | 6,644 | | |
| Voya Strategic Income | SUMMARY PORTFOLIO OF INVESTMENTS |
| Opportunities Fund | as of March 31, 2017 (continued) |
| Counterparty | | | Currency | | | Contract Amount | | | Buy/Sell | | | Settlement Date | | | In Exchange For | | | Fair Value | | | Unrealized Appreciation (Depreciation) | | ||||||||||||||||||
| Morgan Stanley | | | British Pound | | | | | 192,253 | | | | | | Buy | | | | | | 04/07/17 | | | | | | 239,000 | | | | | | 240,890 | | | | | | 1,890 | | |
| Morgan Stanley | | | New Zealand Dollar | | | | | 2,972,682 | | | | | | Buy | | | | | | 06/21/17 | | | | | | 2,088,000 | | | | | | 2,079,631 | | | | | | (8,369) | | |
| | | | | | | | | | | | | | | | | | | | | | | | | | | | | | | | | | | | | | $ | 86,005 | | |
| Barclays Bank PLC | | | Polish Zloty | | | | | 186,624 | | | | | | Sell | | | | | | 04/07/17 | | | | | $ | 47,509 | | | | | $ | 47,058 | | | | | $ | 451 | | |
| Barclays Bank PLC | | | New Zealand Dollar | | | | | 1,380,041 | | | | | | Sell | | | | | | 04/07/17 | | | | | | 969,000 | | | | | | 967,338 | | | | | | 1,662 | | |
| Barclays Bank PLC | | | EU Euro | | | | | 325,666 | | | | | | Sell | | | | | | 04/07/17 | | | | | | 351,000 | | | | | | 347,468 | | | | | | 3,532 | | |
| Barclays Bank PLC | | | Swiss Franc | | | | | 1,474,515 | | | | | | Sell | | | | | | 04/07/17 | | | | | | 1,487,000 | | | | | | 1,472,340 | | | | | | 14,660 | | |
| Barclays Bank PLC | | | British Pound | | | | | 607,033 | | | | | | Sell | | | | | | 04/07/17 | | | | | | 763,000 | | | | | | 760,603 | | | | | | 2,397 | | |
| Barclays Bank PLC | | | Canadian Dollar | | | | | 280,854 | | | | | | Sell | | | | | | 04/07/17 | | | | | | 210,000 | | | | | | 211,202 | | | | | | (1,202) | | |
| Barclays Bank PLC | | | Norwegian Krone | | | | | 6,554,006 | | | | | | Sell | | | | | | 04/07/17 | | | | | | 772,000 | | | | | | 763,342 | | | | | | 8,658 | | |
| Barclays Bank PLC | | | EU Euro | | | | | 171,166 | | | | | | Sell | | | | | | 04/07/17 | | | | | | 185,000 | | | | | | 182,625 | | | | | | 2,375 | | |
| Barclays Bank PLC | | | South African Rand | | | | | 10,060,593 | | | | | | Sell | | | | | | 04/07/17 | | | | | | 791,929 | | | | | | 749,494 | | | | | | 42,435 | | |
| Barclays Bank PLC | | | Swiss Franc | | | | | 304,696 | | | | | | Sell | | | | | | 04/07/17 | | | | | | 306,000 | | | | | | 304,247 | | | | | | 1,753 | | |
| Barclays Bank PLC | | | Australian Dollar | | | | | 961,454 | | | ��� | | | Sell | | | | | | 04/07/17 | | | | | | 729,000 | | | | | | 734,513 | | | | | | (5,513) | | |
| Barclays Bank PLC | | | Russian Ruble | | | | | 140,928,018 | | | | | | Sell | | | | | | 04/07/17 | | | | | | 2,408,795 | | | | | | 2,502,416 | | | | | | (93,621) | | |
| Barclays Bank PLC | | | British Pound | | | | | 145,345 | | | | | | Sell | | | | | | 04/07/17 | | | | | | 178,000 | | | | | | 182,115 | | | | | | (4,115) | | |
| Barclays Bank PLC | | | Norwegian Krone | | | | | 4,379,383 | | | | | | Sell | | | | | | 04/07/17 | | | | | | 516,000 | | | | | | 510,065 | | | | | | 5,935 | | |
| Barclays Bank PLC | | | Canadian Dollar | | | | | 663,313 | | | | | | Sell | | | | | | 04/07/17 | | | | | | 495,000 | | | | | | 498,809 | | | | | | (3,809) | | |
| Barclays Bank PLC | | | British Pound | | | | | 185,332 | | | | | | Sell | | | | | | 04/07/17 | | | | | | 230,000 | | | | | | 232,218 | | | | | | (2,218) | | |
| Barclays Bank PLC | | | Japanese Yen | | | | | 55,486,874 | | | | | | Sell | | | | | | 04/07/17 | | | | | | 493,000 | | | | | | 498,461 | | | | | | (5,461) | | |
| Barclays Bank PLC | | | Canadian Dollar | | | | | 15,719 | | | | | | Sell | | | | | | 04/07/17 | | | | | | 12,000 | | | | | | 11,821 | | | | | | 179 | | |
| Barclays Bank PLC | | | Norwegian Krone | | | | | 3,446,672 | | | | | | Sell | | | | | | 04/07/17 | | | | | | 416,000 | | | | | | 401,433 | | | | | | 14,567 | | |
| Barclays Bank PLC | | | Swiss Franc | | | | | 259,534 | | | | | | Sell | | | | | | 04/07/17 | | | | | | 261,000 | | | | | | 259,151 | | | | | | 1,849 | | |
| Barclays Bank PLC | | | Canadian Dollar | | | | | 256,173 | | | | | | Sell | | | | | | 04/07/17 | | | | | | 196,000 | | | | | | 192,641 | | | | | | 3,359 | | |
| Barclays Bank PLC | | | Australian Dollar | | | | | 1,122,309 | | | | | | Sell | | | | | | 04/07/17 | | | | | | 857,000 | | | | | | 857,399 | | | | | | (399) | | |
| Barclays Bank PLC | | | British Pound | | | | | 274,876 | | | | | | Sell | | | | | | 04/07/17 | | | | | | 345,000 | | | | | | 344,416 | | | | | | 584 | | |
| Barclays Bank PLC | | | Australian Dollar | | | | | 482,730 | | | | | | Sell | | | | | | 04/07/17 | | | | | | 368,000 | | | | | | 368,786 | | | | | | (786) | | |
| Barclays Bank PLC | | | Australian Dollar | | | | | 433,929 | | | | | | Sell | | | | | | 04/07/17 | | | | | | 332,000 | | | | | | 331,505 | | | | | | 495 | | |
| Barclays Bank PLC | | | British Pound | | | | | 352,384 | | | | | | Sell | | | | | | 04/07/17 | | | | | | 440,000 | | | | | | 441,532 | | | | | | (1,532) | | |
| Barclays Bank PLC | | | Australian Dollar | | | | | 861,825 | | | | | | Sell | | | | | | 04/07/17 | | | | | | 660,000 | | | | | | 658,400 | | | | | | 1,600 | | |
| Barclays Bank PLC | | | Norwegian Krone | | | | | 2,654,050 | | | | | | Sell | | | | | | 04/07/17 | | | | | | 318,000 | | | | | | 309,116 | | | | | | 8,884 | | |
| Barclays Bank PLC | | | Swedish Krona | | | | | 5,490,454 | | | | | | Sell | | | | | | 04/07/17 | | | | | | 620,000 | | | | | | 612,815 | | | | | | 7,185 | | |
| Barclays Bank PLC | | | Canadian Dollar | | | | | 591,992 | | | | | | Sell | | | | | | 04/07/17 | | | | | | 451,000 | | | | | | 445,177 | | | | | | 5,823 | | |
| Barclays Bank PLC | | | Canadian Dollar | | | | | 211,965 | | | | | | Sell | | | | | | 04/07/17 | | | | | | 161,000 | | | | | | 159,397 | | | | | | 1,603 | | |
| Barclays Bank PLC | | | British Pound | | | | | 810,330 | | | | | | Sell | | | | | | 04/07/17 | | | | | | 986,726 | | | | | | 1,015,331 | | | | | | (28,605) | | |
| Barclays Bank PLC | | | Canadian Dollar | | | | | 198,358 | | | | | | Sell | | | | | | 04/07/17 | | | | | | 150,305 | | | | | | 149,165 | | | | | | 1,140 | | |
| Barclays Bank PLC | | | Brazilian Real | | | | | 8,148,988 | | | | | | Sell | | | | | | 05/19/17 | | | | | | 2,542,269 | | | | | | 2,575,833 | | | | | | (33,564) | | |
| Barclays Bank PLC | | | Japanese Yen | | | | | 222,080,000 | | | | | | Sell | | | | | | 09/20/17 | | | | | | 1,997,403 | | | | | | 2,009,794 | | | | | | (12,391) | | |
| Barclays Bank PLC | | | Japanese Yen | | | | | 2,032,164 | | | | | | Sell | | | | | | 09/20/17 | | | | | | 18,277 | | | | | | 18,390 | | | | | | (113) | | |
| Barclays Bank PLC | | | Japanese Yen | | | | | 109,329,000 | | | | | | Sell | | | | | | 09/20/17 | | | | | | 983,312 | | | | | | 989,412 | | | | | | (6,100) | | |
| BNP Paribas | | | Australian Dollar | | | | | 914,174 | | | | | | Sell | | | | | | 04/07/17 | | | | | | 671,000 | | | | | | 698,392 | | | | | | (27,392) | | |
| BNP Paribas | | | Canadian Dollar | | | | | 417,366 | | | | | | Sell | | | | | | 04/07/17 | | | | | | 316,000 | | | | | | 313,858 | | | | | | 2,142 | | |
| BNP Paribas | | | EU Euro | | | | | 186,138 | | | | | | Sell | | | | | | 04/07/17 | | | | | | 200,000 | | | | | | 198,599 | | | | | | 1,401 | | |
| BNP Paribas | | | British Pound | | | | | 187,846 | | | | | | Sell | | | | | | 04/07/17 | | | | | | 233,000 | | | | | | 235,369 | | | | | | (2,369) | | |
| BNP Paribas | | | EU Euro | | | | | 183,004 | | | | | | Sell | | | | | | 04/07/17 | | | | | | 193,000 | | | | | | 195,255 | | | | | | (2,255) | | |
| BNP Paribas | | | New Zealand Dollar | | | | | 827,341 | | | | | | Sell | | | | | | 04/07/17 | | | | | | 594,000 | | | | | | 579,923 | | | | | | 14,077 | | |
| Voya Strategic Income | SUMMARY PORTFOLIO OF INVESTMENTS |
| Opportunities Fund | as of March 31, 2017 (continued) |
| Counterparty | | | Currency | | | Contract Amount | | | Buy/Sell | | | Settlement Date | | | In Exchange For | | | Fair Value | | | Unrealized Appreciation (Depreciation) | | ||||||||||||||||||
| BNP Paribas | | | EU Euro | | | | | 832,326 | | | | | | Sell | | | | | | 04/07/17 | | | | | | 892,000 | | | | | | 888,047 | | | | | | 3,953 | | |
| BNP Paribas | | | Russian Ruble | | | | | 78,100,190 | | | | | | Sell | | | | | | 04/07/17 | | | | | | 1,304,238 | | | | | | 1,386,802 | | | | | | (82,564) | | |
| BNP Paribas | | | New Zealand Dollar | | | | | 1,069,217 | | | | | | Sell | | | | | | 04/07/17 | | | | | | 777,000 | | | | | | 749,466 | | | | | | 27,534 | | |
| BNP Paribas | | | Australian Dollar | | | | | 368,322 | | | | | | Sell | | | | | | 04/07/17 | | | | | | 278,000 | | | | | | 281,383 | | | | | | (3,383) | | |
| BNP Paribas | | | Australian Dollar | | | | | 421,863 | | | | | | Sell | | | | | | 04/07/17 | | | | | | 310,000 | | | | | | 322,287 | | | | | | (12,287) | | |
| BNP Paribas | | | New Zealand Dollar | | | | | 387,542 | | | | | | Sell | | | | | | 04/07/17 | | | | | | 270,555 | | | | | | 271,647 | | | | | | (1,092) | | |
| BNP Paribas | | | Indonesian Rupiah | | | | | 4,971,899,945 | | | | | | Sell | | | | | | 06/16/17 | | | | | | 366,443 | | | | | | 371,207 | | | | | | (4,764) | | |
| Citibank N.A. | | | New Zealand Dollar | | | | | 2,200,084 | | | | | | Sell | | | | | | 04/07/17 | | | | | | 1,598,000 | | | | | | 1,542,146 | | | | | | 55,854 | | |
| Citibank N.A. | | | Russian Ruble | | | | | 4,153,714 | | | | | | Sell | | | | | | 04/07/17 | | | | | | 73,827 | | | | | | 73,756 | | | | | | 71 | | |
| Citibank N.A. | | | New Zealand Dollar | | | | | 1,118,074 | | | | | | Sell | | | | | | 04/07/17 | �� | | | | | 786,000 | | | | | | 783,713 | | | | | | 2,287 | | |
| Citibank N.A. | | | Swedish Krona | | | | | 7,715,736 | | | | | | Sell | | | | | | 04/07/17 | | | | | | 871,000 | | | | | | 861,189 | | | | | | 9,811 | | |
| Citibank N.A. | | | Swedish Krona | | | | | 3,350,174 | | | | | | Sell | | | | | | 04/07/17 | | | | | | 378,000 | | | | | | 373,928 | | | | | | 4,072 | | |
| Citibank N.A. | | | New Zealand Dollar | | | | | 295,568 | | | | | | Sell | | | | | | 04/07/17 | | | | | | 208,000 | | | | | | 207,178 | | | | | | 822 | | |
| Citibank N.A. | | | Canadian Dollar | | | | | 399,362 | | | | | | Sell | | | | | | 04/07/17 | | | | | | 300,000 | | | | | | 300,319 | | | | | | (319) | | |
| Citibank N.A. | | | Canadian Dollar | | | | | 465,810 | | | | | | Sell | | | | | | 04/07/17 | | | | | | 346,000 | | | | | | 350,288 | | | | | | (4,288) | | |
| Citibank N.A. | | | Swiss Franc | | | | | 286,597 | | | | | | Sell | | | | | | 04/07/17 | | | | | | 283,000 | | | | | | 286,175 | | | | | | (3,175) | | |
| Citibank N.A. | | | Australian Dollar | | | | | 707,093 | | | | | | Sell | | | | | | 04/07/17 | | | | | | 535,000 | | | | | | 540,191 | | | | | | (5,191) | | |
| Citibank N.A. | | | Japanese Yen | | | | | 56,923,932 | | | | | | Sell | | | | | | 04/07/17 | | | | | | 506,000 | | | | | | 511,370 | | | | | | (5,370) | | |
| Citibank N.A. | | | Japanese Yen | | | | | 44,249,429 | | | | | | Sell | | | | | | 04/07/17 | | | | | | 395,000 | | | | | | 397,510 | | | | | | (2,510) | | |
| Citibank N.A. | | | Canadian Dollar | | | | | 590,770 | | | | | | Sell | | | | | | 04/07/17 | | | | | | 451,000 | | | | | | 444,258 | | | | | | 6,742 | | |
| Citibank N.A. | | | Japanese Yen | | | | | 24,746,381 | | | | | | Sell | | | | | | 04/07/17 | | | | | | 220,000 | | | | | | 222,307 | | | | | | (2,307) | | |
| Citibank N.A. | | | Japanese Yen | | | | | 31,594,828 | | | | | | Sell | | | | | | 04/07/17 | | | | | | 280,000 | | | | | | 283,829 | | | | | | (3,829) | | |
| Citibank N.A. | | | Norwegian Krone | | | | | 3,367,467 | | | | | | Sell | | | | | | 04/07/17 | | | | | | 403,000 | | | | | | 392,208 | | | | | | 10,792 | | |
| Citibank N.A. | | | Australian Dollar | | | | | 526,748 | | | | | | Sell | | | | | | 04/07/17 | | | | | | 402,000 | | | | | | 402,414 | | | | | | (414) | | |
| Citibank N.A. | | | Polish Zloty | | | | | 4,956,100 | | | | | | Sell | | | | | | 04/07/17 | | | | | | 1,230,495 | | | | | | 1,249,702 | | | | | | (19,207) | | |
| Citibank N.A. | | | Russian Ruble | | | | | 1,562,942 | | | | | | Sell | | | | | | 04/07/17 | | | | | | 25,584 | | | | | | 27,753 | | | | | | (2,169) | | |
| Citibank N.A. | | | New Zealand Dollar | | | | | 953,284 | | | | | | Sell | | | | | | 04/07/17 | | | | | | 691,000 | | | | | | 668,203 | | | | | | 22,797 | | |
| Citibank N.A. | | | New Zealand Dollar | | | | | 913,734 | | | | | | Sell | | | | | | 04/07/17 | | | | | | 661,000 | | | | | | 640,481 | | | | | | 20,519 | | |
| Citibank N.A. | | | Brazilian Real | | | | | 669,220 | | | | | | Sell | | | | | | 05/19/17 | | | | | | 211,745 | | | | | | 211,535 | | | | | | 210 | | |
| Citibank N.A. | | | Australian Dollar | | | | | 1,376,009 | | | | | | Sell | | | | | | 04/07/17 | | | | | | 1,039,000 | | | | | | 1,051,216 | | | | | | (12,216) | | |
| Citibank N.A. | | | Norwegian Krone | | | | | 6,107,581 | | | | | | Sell | | | | | | 04/07/17 | | | | | | 719,000 | | | | | | 711,348 | | | | | | 7,652 | | |
| Citibank N.A. | | | Australian Dollar | | | | | 910,901 | | | | | | Sell | | | | | | 04/07/17 | | | | | | 677,000 | | | | | | 695,892 | | | | | | (18,892) | | |
| Citibank N.A. | | | EU Euro | | | | | 1,249,872 | | | | | | Sell | | | | | | 04/07/17 | | | | | | 1,328,000 | | | | | | 1,333,547 | | | | | | (5,547) | | |
| Citibank N.A. | | | EU Euro | | | | | 731,962 | | | | | | Sell | | | | | | 04/07/17 | | | | | | 776,000 | | | | | | 780,965 | | | | | | (4,965) | | |
| Citibank N.A. | | | Norwegian Krone | | | | | 20,205,008 | | | | | | Sell | | | | | | 04/07/17 | | | | | | 2,363,262 | | | | | | 2,353,270 | | | | | | 9,992 | | |
| Citibank N.A. | | | Chilean Peso | | | | | 371,056,906 | | | | | | Sell | | | | | | 05/19/17 | | | | | | 570,857 | | | | | | 561,079 | | | | | | 9,778 | | |
| Deutsche Bank AG | | | EU Euro | | | | | 352,262 | | | | | | Sell | | | | | | 04/07/17 | | | | | | 381,000 | | | | | | 375,845 | | | | | | 5,155 | | |
| Deutsche Bank AG | | | Australian Dollar | | | | | 643,062 | | | | | | Sell | | | | | | 04/07/17 | | | | | | 493,000 | | | | | | 491,273 | | | | | | 1,727 | | |
| Deutsche Bank AG | | | Norwegian Krone | | | | | 1,418,547 | | | | | | Sell | | | | | | 04/07/17 | | | | | | 165,000 | | | | | | 165,218 | | | | | | (218) | | |
| Deutsche Bank AG | | | Norwegian Krone | | | | | 2,508,250 | | | | | | Sell | | | | | | 04/07/17 | | | | | | 292,000 | | | | | | 292,135 | | | | | | (135) | | |
| Deutsche Bank AG | | | Norwegian Krone | | | | | 4,056,891 | | | | | | Sell | | | | | | 04/07/17 | | | | | | 478,000 | | | | | | 472,504 | | | | | | 5,496 | | |
| Deutsche Bank AG | | | Australian Dollar | | | | | 675,979 | | | | | | Sell | | | | | | 04/07/17 | | | | | | 513,000 | | | | | | 516,421 | | | | | | (3,421) | | |
| Deutsche Bank AG | | | British Pound | | | | | 883,354 | | | | | | Sell | | | | | | 04/07/17 | | | | | | 1,110,000 | | | | | | 1,106,829 | | | | | | 3,171 | | |
| Deutsche Bank AG | | | Norwegian Krone | | | | | 6,721,704 | | | | | | Sell | | | | | | 04/07/17 | | | | | | 805,000 | | | | | | 782,874 | | | | | | 22,126 | | |
| Deutsche Bank AG | | | Australian Dollar | | | | | 1,046,525 | | | | | | Sell | | | | | | 04/07/17 | | | | | | 806,000 | | | | | | 799,503 | | | | | | 6,497 | | |
| Deutsche Bank AG | | | Swedish Krona | | | | | 11,343,757 | | | | | | Sell | | | | | | 04/07/17 | | | | | | 1,278,000 | | | | | | 1,266,129 | | | | | | 11,871 | | |
| Voya Strategic Income | SUMMARY PORTFOLIO OF INVESTMENTS |
| Opportunities Fund | as of March 31, 2017 (continued) |
| Counterparty | | | Currency | | | Contract Amount | | | Buy/Sell | | | Settlement Date | | | In Exchange For | | | Fair Value | | | Unrealized Appreciation (Depreciation) | | ||||||||||||||||||
| Deutsche Bank AG | | | Norwegian Krone | | | | | 2,687,483 | | | | | | Sell | | | | | | 04/07/17 | | | | | | 322,000 | | | | | | 313,010 | | | | | | 8,990 | | |
| Deutsche Bank AG | | | Swiss Franc | | | | | 1,178,447 | | | | | | Sell | | | | | | 04/07/17 | | | | | | 1,165,326 | | | | | | 1,176,709 | | | | | | (11,383) | | |
| Deutsche Bank AG | | | New Zealand Dollar | | | | | 1,548,604 | | | | | | Sell | | | | | | 06/21/17 | | | | | | 1,069,000 | | | | | | 1,083,374 | | | | | | (14,374) | | |
| Deutsche Bank AG | | | New Zealand Dollar | | | | | 3,024,776 | | | | | | Sell | | | | | | 06/21/17 | | | | | | 2,088,000 | | | | | | 2,116,075 | | | | | | (28,075) | | |
| Goldman Sachs International | | | EU Euro | | | | | 1,119,671 | | | | | | Sell | | | | | | 04/07/17 | | | | | | 1,189,000 | | | | | | 1,194,629 | | | | | | (5,629) | | |
| Goldman Sachs International | | | Japanese Yen | | | | | 1,331,294 | | | | | | Sell | | | | | | 04/07/17 | | | | | | 12,000 | | | | | | 11,960 | | | | | | 40 | | |
| Goldman Sachs International | | | Swiss Franc | | | | | 272,802 | | | | | | Sell | | | | | | 04/07/17 | | | | | | 271,000 | | | | | | 272,400 | | | | | | (1,400) | | |
| Goldman Sachs International | | | Polish Zloty | | | | | 2,291,697 | | | | | | Sell | | | | | | 04/07/17 | | | | | | 564,641 | | | | | | 577,861 | | | | | | (13,220) | | |
| Goldman Sachs International | | | Swiss Franc | | | | | 374,290 | | | | | | Sell | | | | | | 04/07/17 | | | | | | 376,000 | | | | | | 373,738 | | | | | | 2,262 | | |
| Goldman Sachs International | | | EU Euro | | | | | 13,891 | | | | | | Sell | | | | | | 04/07/17 | | | | | | 15,000 | | | | | | 14,821 | | | | | | 179 | | |
| Goldman Sachs International | | | Japanese Yen | | | | | 250,357,238 | | | | | | Sell | | | | | | 04/07/17 | | | | | | 2,157,188 | | | | | | 2,249,059 | | | | | | (91,871) | | |
| HSBC Bank USA N.A. | | | Russian Ruble | | | | | 98,854,597 | | | | | | Sell | | | | | | 04/07/17 | | | | | | 1,641,896 | | | | | | 1,755,332 | | | | | | (113,436) | | |
| HSBC Bank USA N.A. | | | Romanian New Leu | | | | | 364,731 | | | | | | Sell | | | | | | 04/07/17 | | | | | | 87,221 | | | | | | 85,449 | | | | | | 1,772 | | |
| JPMorgan Chase Bank N.A. | | | Brazilian Real | | | | | 6,853,040 | | | | | | Sell | | | | | | 05/19/17 | | | | | | 2,138,568 | | | | | | 2,166,194 | | | | | | (27,626) | | |
| JPMorgan Chase Bank N.A. | | | New Zealand Dollar | | | | | 1,226,143 | | | | | | Sell | | | | | | 04/07/17 | | | | | | 858,000 | | | | | | 859,463 | | | | | | (1,463) | | |
| JPMorgan Chase Bank N.A. | | | Swiss Franc | | | | | 720,511 | | | | | | Sell | | | | | | 04/07/17 | | | | | | 720,000 | | | | | | 719,449 | | | | | | 551 | | |
| JPMorgan Chase Bank N.A. | | | Swiss Franc | | | | | 1,179,787 | | | | | | Sell | | | | | | 04/07/17 | | | | | | 1,185,000 | | | | | | 1,178,047 | | | | | | 6,953 | | |
| JPMorgan Chase Bank N.A. | | | EU Euro | | | | | 153,598 | | | | | | Sell | | | | | | 04/07/17 | | | | | | 167,000 | | | | | | 163,881 | | | | | | 3,119 | | |
| JPMorgan Chase Bank N.A. | | | New Zealand Dollar | | | | | 356,913 | | | | | | Sell | | | | | | 04/07/17 | | | | | | 251,000 | | | | | | 250,178 | | | | | | 822 | | |
| JPMorgan Chase Bank N.A. | | | Australian Dollar | | | | | 676,053 | | | | | | Sell | | | | | | 04/07/17 | | | | | | 519,000 | | | | | | 516,477 | | | | | | 2,523 | | |
| JPMorgan Chase Bank N.A. | | | British Pound | | | | | 385,909 | | | | | | Sell | | | | | | 04/07/17 | | | | | | 482,000 | | | | | | 483,538 | | | | | | (1,538) | | |
| JPMorgan Chase Bank N.A. | | | EU Euro | | | | | 481,403 | | | | | | Sell | | | | | | 04/07/17 | | | | | | 521,000 | | | | | | 513,631 | | | | | | 7,369 | | |
| JPMorgan Chase Bank N.A. | | | Australian Dollar | | | | | 1,299,850 | | | | | | Sell | | | | | | 04/07/17 | | | | | | 1,004,000 | | | | | | 993,033 | | | | | | 10,967 | | |
| JPMorgan Chase Bank N.A. | | | British Pound | | | | | 271,127 | | | | | | Sell | | | | | | 04/07/17 | | | | | | 335,000 | | | | | | 339,719 | | | | | | (4,719) | | |
| JPMorgan Chase Bank N.A. | | | British Pound | | | | | 154,503 | | | | | | Sell | | | | | | 04/07/17 | | | | | | 191,000 | | | | | | 193,590 | | | | | | (2,590) | | |
| JPMorgan Chase Bank N.A. | | | British Pound | | | | | 326,738 | | | | | | Sell | | | | | | 04/07/17 | | | | | | 398,000 | | | | | | 409,398 | | | | | | (11,398) | | |
| JPMorgan Chase Bank N.A. | | | Australian Dollar | | | | | 870,859 | | | | | | Sell | | | | | | 04/07/17 | | | | | | 660,000 | | | | | | 665,301 | | | | | | (5,301) | | |
| JPMorgan Chase Bank N.A. | | | New Zealand Dollar | | | | | 514,300 | | | | | | Sell | | | | | | 04/07/17 | | | | | | 368,000 | | | | | | 360,498 | | | | | | 7,502 | | |
| JPMorgan Chase Bank N.A. | | | Swiss Franc | | | | | 296,408 | | | | | | Sell | | | | | | 04/07/17 | | | | | | 293,000 | | | | | | 295,971 | | | | | | (2,971) | | |
| JPMorgan Chase Bank N.A. | | | EU Euro | | | | | 413,519 | | | | | | Sell | | | | | | 04/07/17 | | | | | | 437,000 | | | | | | 441,203 | | | | | | (4,203) | | |
| JPMorgan Chase Bank N.A. | | | New Zealand Dollar | | | | | 503,675 | | | | | | Sell | | | | | | 04/07/17 | | | | | | 362,000 | | | | | | 353,050 | | | | | | 8,950 | | |
| JPMorgan Chase Bank N.A. | | | New Zealand Dollar | | | | | 662,976 | | | | | | Sell | | | | | | 04/07/17 | | | | | | 477,000 | | | | | | 464,712 | | | | | | 12,288 | | |
| JPMorgan Chase Bank N.A. | | | EU Euro | | | | | 1,073,640 | | | | | | Sell | | | | | | 04/07/17 | | | | | | 1,138,000 | | | | | | 1,145,517 | | | | | | (7,517) | | |
| JPMorgan Chase Bank N.A. | | | Russian Ruble | | | | | 65,810,232 | | | | | | Sell | | | | | | 04/07/17 | | | | | | 1,136,247 | | | | | | 1,168,573 | | | | | | (32,326) | | |
| JPMorgan Chase Bank N.A. | | | Australian Dollar | | | | | 596,299 | | | | | | Sell | | | | | | 04/07/17 | | | | | | 456,000 | | | | | | 455,549 | | | | | | 451 | | |
| JPMorgan Chase Bank N.A. | | | Australian Dollar | | | | | 380,955 | | | | | | Sell | | | | | | 04/07/17 | | | | | | 292,000 | | | | | | 291,034 | | | | | | 966 | | |
| JPMorgan Chase Bank N.A. | | | New Zealand Dollar | | | | | 633,662 | | | | | | Sell | | | | | | 04/07/17 | | | | | | 455,000 | | | | | | 444,165 | | | | | | 10,835 | | |
| JPMorgan Chase Bank N.A. | | | British Pound | | | | | 169,664 | | | | | | Sell | | | | | | 04/07/17 | | | | | | 212,000 | | | | | | 212,587 | | | | | | (587) | | |
| JPMorgan Chase Bank N.A. | | | Australian Dollar | | | | | 818,106 | | | | | | Sell | | | | | | 04/07/17 | | | | | | 626,000 | | | | | | 625,000 | | | | | | 1,000 | | |
| JPMorgan Chase Bank N.A. | | | New Zealand Dollar | | | | | 574,385 | | | | | | Sell | | | | | | 04/07/17 | | | | | | 417,000 | | | | | | 402,615 | | | | | | 14,385 | | |
| JPMorgan Chase Bank N.A. | | | New Zealand Dollar | | | | | 589,315 | | | | | | Sell | | | | | | 04/07/17 | | | | | | 426,000 | | | | | | 413,080 | | | | | | 12,920 | | |
| JPMorgan Chase Bank N.A. | | | Australian Dollar | | | | | 1,803,849 | | | | | | Sell | | | | | | 04/07/17 | | | | | | 1,349,000 | | | | | | 1,378,068 | | | | | | (29,068) | | |
| JPMorgan Chase Bank N.A. | | | Colombian Peso | | | | | 1,521,672,799 | | | | | | Sell | | | | | | 05/19/17 | | | | | | 521,836 | | | | | | 525,945 | | | | | | (4,109) | | |
| Morgan Stanley | | | Swedish Krona | | | | | 6,396,240 | | | | | | Sell | | | | | | 04/07/17 | | | | | | 727,000 | | | | | | 713,914 | | | | | | 13,086 | | |
| Morgan Stanley | | | Norwegian Krone | | | | | 3,256,310 | | | | | | Sell | | | | | | 04/07/17 | | | | | | 390,000 | | | | | | 379,261 | | | | | | 10,739 | | |
| Morgan Stanley | | | Canadian Dollar | | | | | 239,192 | | | | | | Sell | | | | | | 04/07/17 | | | | | | 183,000 | | | | | | 179,871 | | | | | | 3,129 | | |
| Voya Strategic Income | SUMMARY PORTFOLIO OF INVESTMENTS |
| Opportunities Fund | as of March 31, 2017 (continued) |
| Counterparty | | | Currency | | | Contract Amount | | | Buy/Sell | | | Settlement Date | | | In Exchange For | | | Fair Value | | | Unrealized Appreciation (Depreciation) | | ||||||||||||||||||
| Morgan Stanley | | | British Pound | | | | | 418,886 | | | | | | Sell | | | | | | 04/07/17 | | | | | | 525,000 | | | | | | 524,858 | | | | | | 142 | | |
| Morgan Stanley | | | Norwegian Krone | | | | | 11,567,971 | | | | | | Sell | | | | | | 04/07/17 | | | | | | 1,388,000 | | | | | | 1,347,317 | | | | | | 40,683 | | |
| Morgan Stanley | | | Japanese Yen | | | | | 158,896,815 | | | | | | Sell | | | | | | 04/07/17 | | | | | | 1,407,000 | | | | | | 1,427,434 | | | | | | (20,434) | | |
| Morgan Stanley | | | Hungarian Forint | | | | | 206,399,820 | | | | | | Sell | | | | | | 04/07/17 | | | | | | 717,163 | | | | | | 713,542 | | | | | | 3,621 | | |
| Morgan Stanley | | | Norwegian Krone | | | | | 2,728,355 | | | | | | Sell | | | | | | 04/07/17 | | | | | | 325,000 | | | | | | 317,770 | | | | | | 7,230 | | |
| Morgan Stanley | | | Norwegian Krone | | | | | 5,273,444 | | | | | | Sell | | | | | | 04/07/17 | | | | | | 621,000 | | | | | | 614,196 | | | | | | 6,804 | | |
| Morgan Stanley | | | Swedish Krona | | | | | 2,770,113 | | | | | | Sell | | | | | | 04/07/17 | | | | | | 311,000 | | | | | | 309,185 | | | | | | 1,815 | | |
| Morgan Stanley | | | Canadian Dollar | | | | | 2,747,185 | | | | | | Sell | | | | | | 06/21/17 | | | | | | 2,088,136 | | | | | | 2,068,059 | | | | | | 20,077 | | |
| Morgan Stanley | | | Japanese Yen | | | | | 111,872,408 | | | | | | Sell | | | | | | 09/20/17 | | | | | | 1,010,000 | | | | | | 1,012,430 | | | | | | (2,430) | | |
| Morgan Stanley | | | Japanese Yen | | | | | 222,080,000 | | | | | | Sell | | | | | | 09/20/17 | | | | | | 2,032,164 | | | | | | 2,009,794 | | | | | | 22,370 | | |
| Morgan Stanley | | | Japanese Yen | | | | | 109,329,000 | | | | | | Sell | | | | | | 09/20/17 | | | | | | 1,000,425 | | | | | | 989,412 | | | | | | 11,013 | | |
| | | | | | | | | | | | | | | | | | | | | | | | | | | | | | | | | | | | | | $ | (214,148) | | |
| | ||||||||||||||||||||||||||||||||||||||||
| Contract Description | | | Number of Contracts | | | Expiration Date | | | Notional Value | | | Unrealized Appreciation/ (Depreciation) | | ||||||||||||
| Long Contracts | | | | | | ||||||||||||||||||||
| U.S. Treasury 2-Year Note | | | | | 49 | | | | | | 06/30/17 | | | | | $ | 10,606,203 | | | | | $ | 16,924 | | |
| U.S. Treasury 5-Year Note | | | | | 129 | | | | | | 06/30/17 | | | | | | 15,186,726 | | | | | | 27,086 | | |
| U.S. Treasury Long Bond | | | | | 10 | | | | | | 06/20/17 | | | | | | 1,508,438 | | | | | | 8,795 | | |
| U.S. Treasury Ultra Long Bond | | | | | 7 | | | | | | 06/21/17 | | | | | | 1,124,375 | | | | | | 10,931 | | |
| | | | | | | | | | | | | | | | | $ | 28,425,742 | | | | | $ | 63,736 | | |
| Short Contracts | | | | | | ||||||||||||||||||||
| Euro-Bund | | | | | (70) | | | | | | 06/08/17 | | | | | | (12,054,236) | | | | | | (108,663) | | |
| U.S. Treasury 10-Year Note | | | | | (138) | | | | | | 06/21/17 | | | | | | (17,189,625) | | | | | | (16,533) | | |
| U.S. Treasury Ultra 10-Year Note | | | | | (162) | | | | | | 06/21/17 | | | | | | (21,690,282) | | | | | | (149,733) | | |
| | | | | | | | | | | | | | | | | $ | (50,934,143) | | | | | $ | (274,929) | | |
| | | | | | | ||||||||||||||||||||
| Reference Entity/ Obligation | | | Buy/Sell Protection | | | (Pay)/ Receive Fixed Rate (%) | | | Clearinghouse | | | Termination Date | | | Notional Amount(2) | | | Fair Value(3) | | | Unrealized Appreciation/ (Depreciation) | | ||||||||||||||||||
| CDX North American High Yield Index, Series 27, Version 1 | | | | | Sell | | | | | | 5.000 | | | | Intercontinental Exchange | | | | | 12/20/21 | | | | | | USD12,870,000 | | | | | $ | 1,012,200 | | | | | $ | 426,982 | | |
| | | | | | | | | | | | | | | | | | | | | | | | | | | | | | | | $ | 1,012,200 | | | | | $ | 426,982 | | |
| | ||||||||||||||||||||||||||||||||||||||||
| Voya Strategic Income | SUMMARY PORTFOLIO OF INVESTMENTS |
| Opportunities Fund | as of March 31, 2017 (continued) |
| | | | Clearinghouse | | | Termination Date | | | Notional Amount | | | Fair Value | | | Unrealized Appreciation/ (Depreciation) | | ||||||||||||
| Receive a fixed rate equal to 2.026% and pay a floating rate equal to the 3-month USD-LIBOR-BBA | | | Chicago Mercantile Exchange | | | | | 03/12/22 | | | | | | USD258,000 | | | | | $ | (410) | | | | | $ | (410) | | |
| Receive a floating rate based on the 3-month USD-LIBOR-BBA and pay a fixed rate equal to 1.923% | | | Chicago Mercantile Exchange | | | | | 03/20/22 | | | | | | USD575,000 | | | | | | 3,830 | | | | | | 3,830 | | |
| Receive a fixed rate equal to 2.246% and pay a floating rate equal to the 3-month USD-LIBOR-BBA | | | Chicago Mercantile Exchange | | | | | 03/12/25 | | | | | | USD49,000 | | | | | | (191) | | | | | | (191) | | |
| Receive a fixed rate equal to 2.238% and pay a floating rate based on the 3-month USD-LIBOR-BBA | | | Chicago Mercantile Exchange | | | | | 03/09/26 | | | | | | USD20,892,000 | | | | | | (439,561) | | | | | | (439,561) | | |
| | | | | | | | | | | | | | | | | | | | $ | (436,332) | | | | | $ | (436,332) | | |
| | ||||||||||||||||||||||||||||
| Description | | | Counter party | | | Exercise Rate | | | Pay/ Receive Exercise Rate | | | Floating Rate Index | | | Expiration Date | | | Notional Amount | | | Premiums Received | | | Fair Value | | ||||||||||||||||||
| Call on 10-year Interest Rate Swap | | | Goldman Sachs International | | | | | 2.200% | | | | | | Pay | | | | 3-month USD- LIBOR-BBA | | | | | 05/22/17 | | | | | | USD9,400,000 | | | | | $ | 57,990 | | | | | $ | (22,677) | | |
| | | | | | | | | | | | | | | | | | | | | | Total Written Swaptions | | | | $ | 57,990 | | | | | $ | (22,677) | | | |||||||||
| | |||||||||||||||||||||||||||||||||||||||||||
| Derivatives not accounted for as hedging instruments | | | Location on Statement of Assets and Liabilities | | | Fair Value | | |||
| Asset Derivatives | | | | |||||||
| Interest rate contracts | | | Investments in securities at value* | | | | $ | 14,364 | | |
| Foreign exchange contracts | | | Unrealized appreciation on forward foreign currency contracts | | | | | 1,264,143 | | |
| Interest rate contracts | | | Net Assets — Unrealized appreciation** | | | | | 63,736 | | |
| Credit contracts | | | Net Assets — Unrealized appreciation*** | | | | | 426,982 | | |
| Interest rate contracts | | | Net Assets — Unrealized appreciation*** | | | | | 3,830 | | |
| Total Asset Derivatives | | | | | | | $ | 1,773,055 | | |
| Liability Derivatives | | | | |||||||
| Foreign exchange contracts | | | Unrealized depreciation on forward foreign currency contracts | | | | $ | 1,392,286 | | |
| Interest rate contracts | | | Net Assets — Unrealized depreciation** | | | | | 274,929 | | |
| Interest rate contracts | | | Net Assets — Unrealized depreciation*** | | | | | 440,162 | | |
| Interest rate contracts | | | Written options, at fair value | | | | | 22,677 | | |
| Total Liability Derivatives | | | | | | | $ | 2,130,054 | | |
| | ||||||||||
| Voya Strategic Income | SUMMARY PORTFOLIO OF INVESTMENTS |
| Opportunities Fund | as of March 31, 2017 (continued) |
| Derivatives not accounted for as hedging instruments | | | Investments* | | | Foreign currency related transactions** | | | Futures | | | Swaps | | | Written options | | | Total | | ||||||||||||||||||
| Credit contracts | | | | $ | (6,875) | | | | | $ | — | | | | | $ | — | | | | | $ | 51,282 | | | | | $ | — | | | | | $ | 44,407 | | |
| Equity contracts | | | | | — | | | | | | — | | | | | | 30,688 | | | | | | — | | | | | | — | | | | | | 30,688 | | |
| Foreign exchange contracts | | | | | — | | | | | | (681,759) | | | | | | — | | | | | | (41,050) | | | | | | — | | | | | | (722,809) | | |
| Interest rate contracts | | | | | (134,477) | | | | | | — | | | | | | 906,716 | | | | | | (210,900) | | | | | | 132,852 | | | | | | 694,191 | | |
| Total | | | | $ | (141,352) | | | | | $ | (681,759) | | | | | $ | 937,404 | | | | | $ | (200,668) | | | | | $ | 132,852 | | | | | $ | 46,477 | | |
| | |||||||||||||||||||||||||||||||||||||
| Derivatives not accounted for as hedging instruments | | | Investments* | | | Foreign currency related transactions** | | | Futures | | | Swaps | | | Written options | | | Total | | ||||||||||||||||||
| Credit contracts | | | | $ | — | | | | | $ | — | | | | | $ | — | | | | | $ | 426,982 | | | | | $ | — | | | | | $ | 426,982 | | |
| Equity contracts | | | | | — | | | | | | — | | | | | | 2,966 | | | | | | — | | | | | | — | | | | | | 2,966 | | |
| Foreign exchange contracts | | | | | — | | | | | | (128,143) | | | | | | — | | | | | | — | | | | | | — | | | | | | (128,143) | | |
| Interest rate contracts | | | | | (43,359) | | | | | | — | | | | | | (292,991) | | | | | | (311,419) | | | | | | 35,313 | | | | | | (612,456) | | |
| Total | | | | $ | (43,359) | | | | | $ | (128,143) | | | | | $ | (290,025) | | | | | $ | 115,563 | | | | | $ | 35,313 | | | | | $ | (310,651) | | |
| | |||||||||||||||||||||||||||||||||||||
| | | | Barclays Bank PLC | | | BNP Paribas | | | Citibank N.A. | | | Deutsche Bank AG | | | Goldman Sachs International | | | HSBC Bank USA N.A. | | | JPMorgan Chase Bank N.A. | | | Morgan Stanley | | | The Bank of New York Mellon | | | Totals | | ||||||||||||||||||||||||||||||
| Assets: | | | | | | | | | | | | ||||||||||||||||||||||||||||||||||||||||||||||||||
| Purchased options | | | | $ | — | | | | | $ | — | | | | | $ | — | | | | | $ | — | | | | | $ | 14,364 | | | | | $ | — | | | | | $ | — | | | | | $ | — | | | | | $ | — | | | | | $ | 14,364 | | |
| Forward foreign currency contracts | | | | | 202,358 | | | | | | 282,131 | | | | | | 281,258 | | | | | | 78,583 | | | | | | 36,473 | | | | | | 11,204 | | | | | | 161,710 | | | | | | 210,421 | | | | | | 5 | | | | | | 1,264,143 | | |
| Total Assets | | | | $ | 202,358 | | | | | $ | 282,131 | | | | | $ | 281,258 | | | | | $ | 78,583 | | | | | $ | 50,837 | | | | | $ | 11,204 | | | | | $ | 161,710 | | | | | $ | 210,421 | | | | | $ | 5 | | | | | $ | 1,278,507 | | |
| Liabilities: | | | | | | | | | | | | ||||||||||||||||||||||||||||||||||||||||||||||||||
| Forward foreign currency contracts | | | | $ | 372,567 | | | | | $ | 138,384 | | | | | $ | 260,809 | | | | | $ | 104,790 | | | | | $ | 128,347 | | | | | $ | 120,636 | | | | | $ | 207,214 | | | | | $ | 59,539 | | | | | $ | — | | | | | $ | 1,392,286 | | |
| Written options | | | | | | | | | | | | | | | | | | | | | | | — | | | | | | 22,677 | | | | | | — | | | | | | — | | | | | | — | | | | | | — | | | | | | 22,677 | | |
| Total Liabilities | | | | $ | 372,567 | | | | | $ | 138,384 | | | | | $ | 260,809 | | | | | $ | 104,790 | | | | | $ | 151,024 | | | | | $ | 120,636 | | | | | $ | 207,214 | | | | | $ | 59,539 | | | | | $ | — | | | | | $ | 1,414,963 | | |
| Net OTC derivative instruments by counterparty, at fair value | | | | $ | (170,209) | | | | | $ | 143,747 | | | | | $ | 20,449 | | | | | $ | (26,207) | | | | | $ | (100,187) | | | | | $ | (109,432) | | | | | $ | (45,504) | | | | | $ | 150,882 | | | | | $ | 5 | | | | | $ | (136,456) | | |
| Total collateral pledged by the Fund/(Received from counterparty) | | | | $ | — | | | | | $ | — | | | | | $ | — | | | | | $ | — | | | | | $ | — | | | | | $ | — | | | | | $ | — | | | | | $ | — | | | | | $ | — | | | | | $ | — | | |
Net Exposure(1) | | | | $ | (170,209) | | | | | $ | 143,747 | | | | | $ | 20,449 | | | | | $ | (26,207) | | | | | $ | (100,187) | | | | | $ | (109,432) | | | | | $ | (45,504) | | | | | $ | 150,882 | | | | | $ | 5 | | | | | $ | (136,456) | | |
| | |||||||||||||||||||||||||||||||||||||||||||||||||||||||||||||
| Fund Name | | | Type | | | Per Share Amount | | |||
| Voya GNMA Income Fund | | |||||||||
| Class A | | | NII | | | | $ | 0.1330 | | |
| Class B | | | NII | | | | $ | 0.0629 | | |
| Class C | | | NII | | | | $ | 0.0639 | | |
| Class I | | | NII | | | | $ | 0.1599 | | |
| Class W | | | NII | | | | $ | 0.1566 | | |
| All Classes | | | STCG | | | | $ | 0.0081 | | |
| All Classes | | | ROC | | | | $ | 0.0873 | | |
| Voya High Yield Bond Fund | | |||||||||
| Class A | | | NII | | | | $ | 0.4167 | | |
| Class B | | | NII | | | | $ | 0.3570 | | |
| Class C | | | NII | | | | $ | 0.3571 | | |
| Class I | | | NII | | | | $ | 0.4444 | | |
| Class P | | | NII | | | | $ | 0.4930 | | |
| Class R | | | NII | | | | $ | 0.3970 | | |
Class R6(1) | | | NII | | | | $ | 0.2887 | | |
| Class W | | | NII | | | | $ | 0.4371 | | |
| Voya Intermediate Bond Fund | | |||||||||
| Class A | | | NII | | | | $ | 0.3003 | | |
| Class B | | | NII | | | | $ | 0.2237 | | |
| Class C | | | NII | | | | $ | 0.2240 | | |
| Fund Name | | | Type | | | Per Share Amount | | |||
| Voya Intermediate Bond Fund (continued) | | |||||||||
| Class I | | | NII | | | | $ | 0.3342 | | |
| Class O | | | NII | | | | $ | 0.3003 | | |
| Class R | | | NII | | | | $ | 0.2753 | | |
| Class R6 | | | NII | | | | $ | 0.3351 | | |
| Class W | | | NII | | | | $ | 0.3251 | | |
| Voya Short Term Bond Fund | | |||||||||
| Class A | | | NII | | | | $ | 0.1536 | | |
| Class C | | | NII | | | | $ | 0.0797 | | |
| Class I | | | NII | | | | $ | 0.1832 | | |
| Class R | | | NII | | | | $ | 0.1275 | | |
| Class R6 | | | NII | | | | $ | 0.1862 | | |
| Class W | | | NII | | | | $ | 0.1783 | | |
| Voya Strategic Income Opportunities Fund | | |||||||||
| Class A | | | NII | | | | $ | 0.4831 | | |
| Class C | | | NII | | | | $ | 0.4018 | | |
| Class I | | | NII | | | | $ | 0.5308 | | |
| Class R | | | NII | | | | $ | 0.4547 | | |
| Class R6 | | | NII | | | | $ | 0.5335 | | |
| Class W | | | NII | | | | $ | 0.5065 | | |
| | Voya GNMA Income Fund | | | | | 100.00% | | |
| | Voya High Yield Bond Fund | | | | | 99.91% | | |
| | Voya Intermediate Bond Fund | | | | | 82.57% | | |
| | Voya Short Term Bond Fund | | | | | 100.00% | | |
| | | | Proposal | | | Shares voted for | | | Shares voted against or withheld | | | Shares abstained | | | Broker non-vote | | | Total Shares Voted | | ||||||||||||||||||
| Voya Strategic Income Opportunities Fund | | | | | 1* | | | | | | 10,827,949.495 | | | | | | 0.000 | | | | | | 254,559.525 | | | | | | 0.000 | | | | | | 11,082,509.020 | | |
| Name, Address and Age | | | Position(s) Held with the Trust | | | Term of Office and Length of Time Served(1) | | | Principal Occupation(s) – During the Past 5 Years | | | Number of funds in Fund Complex Overseen by Trustee(2) | | | Other Board Positions Held by Trustee | |
| Independent Trustees: | | | | | | | ||||||||||
| Colleen D. Baldwin 7337 East Doubletree Ranch Rd. Suite 100 Scottsdale, Arizona 85258 Age: 56 | | | Trustee | | | November 2007 – Present | | | President, Glantuam Partners, LLC, a business consulting firm (January 2009 – Present). | | | 151 | | | DSM/Dentaquest, Boston, MA (February 2014 – Present). | |
| John V. Boyer 7337 East Doubletree Ranch Rd. Suite 100 Scottsdale, Arizona 85258 Age: 63 | | | Chairperson Trustee | | | January 2014 – Present January 2005 – Present | | | President and Chief Executive Officer, Bechtler Arts Foundation, an arts and education foundation (January 2008 – Present). | | | 151 | | | None. | |
| Patricia W. Chadwick 7337 East Doubletree Ranch Rd. Suite 100 Scottsdale, Arizona 85258 Age: 68 | | | Trustee | | | January 2006 – Present | | | Consultant and President, Ravengate Partners LLC, a consulting firm that provides advice regarding financial markets and the global economy (January 2000 – Present). | | | 151 | | | Wisconsin Energy Corporation (June 2006 – Present); The Royce Funds (23 funds) (December 2009 – Present); and AMICA Mutual Insurance Company (1992 – Present). | |
| Peter S. Drotch 7337 East Doubletree Ranch Rd. Suite 100 Scottsdale, Arizona 85258 Age: 75 | | | Trustee | | | November 2007 – Present | | | Retired. | | | 151 | | | None. | |
| Martin J. Gavin 7337 East Doubletree Ranch Rd. Suite 100 Scottsdale, AZ 85258-2034 Age: 67 | | | Trustee | | | August 2015 – Present | | | Retired. Formerly, President and Chief Executive Officer, Connecticut Children’s Medical Center (May 2006 – November 2015). | | | 151 | | | None. | |
| Russell H. Jones 7337 East Doubletree Ranch Rd. Suite 100 Scottsdale, Arizona 85258 Age: 73 | | | Trustee | | | May 2013 – Present | | | Retired. | | | 151 | | | None. | |
| Patrick W. Kenny 7337 East Doubletree Ranch Rd. Suite 100 Scottsdale, Arizona 85258 Age: 74 | | | Trustee | | | January 2005 – Present | | | Retired. | | | 151 | | | Assured Guaranty Ltd. (April 2004 – Present). | |
| Joseph E. Obermeyer 7337 East Doubletree Ranch Rd. Suite 100 Scottsdale, Arizona 85258 Age: 59 | | | Trustee | | | May 2013 – Present | | | President, Obermeyer & Associates, Inc., a provider of financial and economic consulting services (November 1999 – Present). | | | 151 | | | None. | |
| Name, Address and Age | | | Position(s) Held with the Trust | | | Term of Office and Length of Time Served(1) | | | Principal Occupation(s) – During the Past 5 Years | | | Number of funds in Fund Complex Overseen by Trustee(2) | | | Other Board Positions Held by Trustee | |
| Sheryl K. Pressler 7337 East Doubletree Ranch Rd. Suite 100 Scottsdale, Arizona 85258 Age: 66 | | | Trustee | | | January 2006 – Present | | | Consultant (May 2001 – Present). | | | 151 | | | None. | |
| Christopher P. Sullivan 7337 East Doubletree Ranch Rd. Suite 100 Scottsdale, Arizona 85258 Age: 63 | | | Trustee | | | October 2015 – Present | | | Retired. Formerly, President, Bond Division, Fidelity Management and Research (June 2009 – September 2012). | | | 151 | | | None. | |
| Roger B. Vincent 7337 East Doubletree Ranch Rd. Suite 100 Scottsdale, Arizona 85258 Age: 71 | | | Trustee | | | February 2002 – Present | | | Retired. | | | 151 | | | UGI Corporation (February 2006 – Present) and UGI Utilities, Inc. (February 2006 – Present). | |
| Trustee who is an “interested person”: | | | | | ||||||||||||
| Shaun P. Mathews(3) 7337 East Doubletree Ranch Rd. Suite 100 Scottsdale, Arizona 85258 Age: 61 | | | Trustee | | | November 2007 – Present | | | President and Chief Executive Officer, Voya Investments, LLC (December 2006 – Present). | | | 151 | | | Voya Capital Corporation, LLC and Voya Investments Distributor, LLC (December 2005 – Present); Voya Funds Services, LLC, Voya Investments, LLC and Voya Investment Management (March 2006 – Present); and Voya Investment Trust Co. (April 2009 – Present). | |
| Name, Address and Age | | | Position(s) Held With the Trust | | | Term of Office and Length of Time Served(1) | | | Principal Occupation(s) – During the Past 5 Years | |
| Shaun P. Mathews 7337 East Doubletree Ranch Rd. Suite 100 Scottsdale, Arizona 85258 Age: 61 | | | President and Chief Executive Officer | | | November 2006 – Present | | | President and Chief Executive Officer, Voya Investments, LLC (December 2006 – Present). | |
| Michael J. Roland 7337 East Doubletree Ranch Rd. Suite 100 Scottsdale, Arizona 85258 Age: 59 | | | Executive Vice President | | | February 2002 – Present | | | Managing Director and Chief Operating Officer, Voya Investments, LLC and Voya Funds Services, LLC (March 2012 – Present). Formerly, Chief Compliance Officer, Directed Services LLC and Voya Investments, LLC (March 2011 – December 2013); Executive Vice President and Chief Operating Officer, Voya Investments, LLC and Voya Funds Services, LLC (January 2007 – April 2012) and Chief Compliance Officer, Voya Family of Funds (March 2011 – February 2012). | |
| Stanley D. Vyner 230 Park Avenue New York, New York 10169 Age: 67 | | | Executive Vice President Chief Investment Risk Officer | | | October 2000 – Present September 2009 – Present | | | Executive Vice President, Voya Investments, LLC (July 2000 – Present) and Chief Investment Risk Officer, Voya Investments, LLC (January 2003 – Present). | |
| Kevin M. Gleason 7337 East Doubletree Ranch Rd Suite 100 Scottsdale, Arizona 85258 Age: 50 | | | Chief Compliance Officer | | | February 2012 – Present | | | Senior Vice President, Voya Investment Management and Chief Compliance Officer, Voya Family of Funds (February 2012 – Present). Formerly, Assistant General Counsel and Assistant Secretary, The Northwestern Mutual Life Insurance Company (June 2004 – January 2012). | |
| Todd Modic 7337 East Doubletree Ranch Rd. Suite 100 Scottsdale, Arizona 85258 Age: 49 | | | Senior Vice President, Chief/Principal Financial Officer and Assistant Secretary | | | March 2005 – Present | | | Senior Vice President, Voya Investments, LLC and Voya Funds Services, LLC (April 2005 – Present). | |
| Kimberly A. Anderson 7337 East Doubletree Ranch Rd. Suite 100 Scottsdale, Arizona 85258 Age: 52 | | | Senior Vice President | | | November 2003 – Present | | | Senior Vice President, Voya Investments, LLC (September 2003 – Present). | |
| Robert Terris 7337 East Doubletree Ranch Rd. Suite 100 Scottsdale, Arizona 85258 Age: 46 | | | Senior Vice President | | | May 2006 – Present | | | Senior Vice President, Head of Division Operations, Voya Investments, LLC (October 2015 – Present) and Voya Funds Services, LLC (March 2006 – Present). | |
| Fred Bedoya 7337 East Doubletree Ranch Rd. Suite 100 Scottsdale, Arizona 85258 Age: 44 | | | Vice President and Treasurer | | | September 2012 – Present | | | Vice President, Voya Investments, LLC (October 2015 – Present) and Voya Funds Services, LLC (July 2012 – Present). Formerly, Assistant Vice President – Director, Voya Funds Services, LLC (March 2003 – March 2012). | |
| Maria M. Anderson 7337 East Doubletree Ranch Rd. Suite 100 Scottsdale, Arizona 85258 Age: 59 | | | Vice President | | | September 2004 – Present | | | Vice President, Voya Investments, LLC (October 2015 – Present) and Voya Funds Services, LLC (September 2004 – Present). | |
| Lauren D. Bensinger 7337 East Doubletree Ranch Rd. Suite 100 Scottsdale, Arizona 85258 Age: 63 | | | Vice President | | | February 2003 – Present | | | Vice President, Voya Funds Services, LLC (February 1996 – Present) and Voya Investments, LLC (October 2004 – Present); Vice President and Money Laundering Reporting Officer, Voya Investments Distributor, LLC (April 2010 – Present). Anti-Money Laundering Compliance Officer, Voya Financial, Inc. (January 2013 – Present); and Money Laundering Reporting Officer, Voya Investment Management Trust Co. (October 2012 – Present). | |
| Name, Address and Age | | | Position(s) Held With the Trust | | | Term of Office and Length of Time Served(1) | | | Principal Occupation(s) – During the Past 5 Years | |
| Sara M. Donaldson 7337 East Doubletree Ranch Rd. Suite 100 Scottsdale, Arizona 85258 Age: 57 | | | Vice President | | | September 2014 – Present | | | Vice President, Voya Investments, LLC (October 2015 – Present). Formerly, Vice President, Voya Funds Services, LLC (April 2014 – October 2015). Formerly, Director, Compliance, AXA Rosenberg Global Services, LLC (September 1997 – March 2014). | |
| Micheline S. Faver 7337 East Doubletree Ranch Rd. Suite 100 Scottsdale, Arizona 85258 Age: 39 | | | Vice President | | | September 2016 – Present | | | Vice President, Head of Fund Compliance, Voya Investments LLC, and Chief Compliance Officer for Voya Investments, LLC and Directed Services, LLC (June 2016 – Present). Formerly, Vice President, Mutual Fund Compliance (March 2014 – June 2016); Assistant Vice President, Mutual Fund Compliance (May 2013 – March 2014); Assistant Vice President, Senior Project Manager (May 2008 – May 2013). | |
| Robyn L. Ichilov 7337 East Doubletree Ranch Rd. Suite 100 Scottsdale, Arizona 85258 Age: 49 | | | Vice President | | | October 2000 – Present | | | Vice President, Voya Funds Services, LLC (November 1995 – Present) and Voya Investments, LLC (August 1997 – Present). Formerly, Treasurer, Voya Family of Funds (November 1999 – February 2012). | |
| Jason Kadavy 7337 East Doubletree Ranch Rd. Suite 100 Scottsdale, Arizona 85258 Age: 41 | | | Vice President | | | September 2012 – Present | | | Vice President, Voya Investments, LLC (October 2015 – Present) and Voya Funds Services, LLC (July 2007 – Present). | |
| Kimberly K. Springer 7337 East Doubletree Ranch Rd. Suite 100 Scottsdale, Arizona 85258 Age: 60 | | | Vice President | | | March 2006 – Present | | | Vice President – Mutual Fund Product Development, Voya Investments, LLC (July 2012 – Present); Vice President, Voya Family of Funds (March 2010 – Present) and Vice President, Voya Funds Services, LLC (March 2006 – Present). Formerly Managing Paralegal, Registration Statements (June 2003 – July 2012). | |
| Craig Wheeler 7337 East Doubletree Ranch Rd. Suite 100 Scottsdale, Arizona 85258 Age: 48 | | | Vice President | | | May 2013 – Present | | | Vice President – Director of Tax, Voya Investments, LLC (October 2015 – Present). Formerly, Vice President – Director of Tax, Voya Funds Services, LLC (March 2013 – October 2015). Formerly, Assistant Vice President – Director of Tax, Voya Funds Services, LLC (March 2008 – February 2013). | |
| Huey P. Falgout, Jr. 7337 East Doubletree Ranch Rd. Suite 100 Scottsdale, Arizona 85258 Age: 53 | | | Secretary | | | August 2003 – Present | | | Senior Vice President and Chief Counsel, Voya Investment Management – Mutual Fund Legal Department (March 2010 – Present). | |
| Paul A. Caldarelli 7337 East Doubletree Ranch Rd. Suite 100 Scottsdale, Arizona 85258 Age: 65 | | | Assistant Secretary | | | June 2010 – Present | | | Vice President and Senior Counsel, Voya Investment Management – Mutual Fund Legal Department (March 2010 – Present). | |
| Theresa K. Kelety 7337 East Doubletree Ranch Rd. Suite 100 Scottsdale, Arizona 85258 Age: 54 | | | Assistant Secretary | | | August 2003 – Present | | | Vice President and Senior Counsel, Voya Investment Management – Mutual Fund Legal Department (March 2010 – Present). | |
Voya Investments, LLC
7337 East Doubletree Ranch Road, Suite 100
Scottsdale, Arizona 85258
Voya Investments Distributor, LLC
7337 East Doubletree Ranch Road, Suite 100
Scottsdale, Arizona 85258
BNY Mellon Investment Servicing (U.S.) Inc.
301 Bellevue Parkway
Wilmington, Delaware 19809
KPMG LLP
Two Financial Center
60 South Street
Boston, Massachusetts 02111
The Bank of New York Mellon
225 Liberty Street
New York, New York 10286
Ropes & Gray LLP
Prudential Tower
800 Boylston Street
Boston, Massachusetts 02199


 E-Delivery Sign-up – details inside
This report is submitted for general information to shareholders of the Voya mutual funds. It is not authorized for distribution to prospective shareholders unless accompanied or preceded by a prospectus which includes details regarding the fund’s investment objectives, risks, charges, expenses and other information. This information should be read carefully. |
| INVESTMENT MANAGEMENT |  |
| voyainvestments.com |
| President’s Letter | 1 | |||||
| Market Perspective | 2 | |||||
| Portfolio Managers’ Report | 4 | |||||
| Shareholder Expense Example | 7 | |||||
| Report of Independent Registered Public Accounting Firm | 8 | |||||
| Statement of Assets and Liabilities | 9 | |||||
| Statement of Operations | 11 | |||||
| Statements of Changes in Net Assets | 12 | |||||
| Financial Highlights | 13 | |||||
| Notes to Financial Statements | 14 | |||||
| Portfolio of Investments | 21 | |||||
| Tax Information | 33 | |||||
| Trustee and Officer Information | 34 | |||||
| Advisory and Sub-Advisory Contract Approval Discussion | 38 |
| Go Paperless with E-Delivery! | | |||||||||
| Sign up now for on-line prospectuses, fund reports, and proxy statements. In less than five minutes, you can help reduce paper mail and lower fund costs. | |||||||||||
| Just go to www.voyainvestments.com, click on the E-Delivery icon from the home page, follow the directions and complete the quick 5 Steps to Enroll. | |||||||||||
| You will be notified by e-mail when these communications become available on the internet. Documents that are not available on the internet will continue to be sent by mail. | |||||||||||
 Waves of Expectations
President and Chief Executive Officer
Voya Family of Funds
April 25, 2017
The views expressed in the President’s Letter reflect those of the President as of the date of the letter. Any such views are subject to change at any time based upon market or other conditions and the Voya mutual funds disclaim any responsibility to update such views. These views may not be relied on as investment advice and, because investment decisions for a Voya mutual fund are based on numerous factors, may not be relied on as an indication of investment intent on behalf of any Voya mutual fund. Reference to specific company securities should not be construed as recommendations or investment advice.
BENCHMARK DESCRIPTIONS
| Index | Description |
|---|---|
| Bloomberg Barclays High Yield Bond — 2% Issuer Constrained Composite Index | An unmanaged index that includes all fixed income securities having a maximum quality rating of Ba1, a minimum amount outstanding of $150 million, and at least one year to maturity. |
| Bloomberg Barclays U.S. Aggregate Bond Index | An unmanaged index of publicly issued investment grade U.S. Government, mortgage-backed, asset-backed and corporate debt securities. |
| Bloomberg Barclays U.S. Corporate Investment Grade Bond Index | An unmanaged index consisting of publicly issued, fixed rate, nonconvertible, investment grade debt securities. |
| Bloomberg Barclays U.S. Treasury Bond Index | A market capitalization-weighted index that measures the performance of public obligations of the U.S. Treasury that have a remaining maturity of one year or more. |
| MSCI Europe ex UK® Index | A free float-adjusted market capitalization index that is designed to measure developed market equity performance in Europe, excluding the UK. |
| MSCI Japan® Index | A free float-adjusted market capitalization index that is designed to measure developed market equity performance in Japan. |
| MSCI UK® Index | A free float-adjusted market capitalization index that is designed to measure developed market equity performance in the UK. |
MSCI World IndexSM | An unmanaged index that measures the performance of over 1,400 securities listed on exchanges in the U.S., Europe, Canada, Australia, New Zealand and the Far East. |
| S&P 500® Index | An unmanaged index that measures the performance of securities of approximately 500 large-capitalization companies whose securities are traded on major U.S. stock markets. |
| The S&P/LSTA Leveraged Loan Index | An unmanaged total return index that captures accrued interest, repayments, and market value changes. It represents a broad cross section of leveraged loans syndicated in the United States, including dollar-denominated loans to overseas issuers. Standard & Poor’s (“S&P”) and the Loan Syndications and Trading Association (“LSTA”) conceived the index to establish a performance benchmark for the syndicated leveraged loan industry. |
| VOYA FLOATING RATE FUND | PORTFOLIO MANAGERS’ REPORT |
| Ratings Distribution as of March 31, 2017 | |||||||||
|---|---|---|---|---|---|---|---|---|---|
| Ba | 38.89 | % | |||||||
| B | 58.42 | % | |||||||
| Caa and below | 2.69 | % | |||||||
| Not rated* | 0.0 | % | |||||||
| Bond ratings apply to the underlying holdings of the Fund and not the Fund itself. Ratings distribution shows the percentage of the Fund’s loan commitments (excluding cash and foreign cash) that are rated in each ratings category, based upon the categories provided by Moody’s Investors Service, Inc. Ratings distribution is based on Moody’s senior secured facility ratings. Moody’s ratings classification methodology: Aaa rating denotes the least credit risk; C rating denotes the greatest credit risk. Loans rated below Baa by Moody’s are considered to be below investment grade. When a bond is not rated by Moody’s it is designated as “Not Rated”. Ratings can change from time to time, and current ratings may not fully reflect the actual credit condition or risks posed by a loan. | |||||||||
| * Not rated includes loans to non-U.S. borrowers (which are typically unrated) and loans for which the rating has been withdrawn. | |||||||||
| TOP TEN LOAN ISSUERS AS OF MARCH 31, 2017 AS A PERCENTAGE OF: | ||||||||
| NET ASSETS | ||||||||
| Dell International LLC | 1.1% | |||||||
| Asurion, LLC | 1.1% | |||||||
| Avolon Holdings Limited | 0.9% | |||||||
| Grifols S.A. | 0.8% | |||||||
| Univision Communications, Inc. | 0.8% | |||||||
| Advantage Sales & Marketing, Inc. | 0.8% | |||||||
| PetSmart, Inc. | 0.7% | |||||||
| Amaya Gaming Group Inc. | 0.7% | |||||||
| First Data Corporation | 0.7% | |||||||
| Reynolds Group Holdings Inc | 0.7% |
(1) | The London Interbank Offered Rate is the average interest rate estimated by leading banks in London that they would be charged if borrowing from other banks. |
| VOYA FLOATING RATE FUND | PORTFOLIO MANAGERS’ REPORT |
 |  | |||||
Jeffrey A. Bakalar Managing Director Voya Investment Management Co. LLC | Daniel A. Norman Managing Director Voya Investment Management Co. LLC | |||||
 |  | |||||
| Voya Floating Rate Fund April 25, 2017 | ||||||
| VOYA FLOATING RATE FUND | PORTFOLIO MANAGERS’ REPORT |
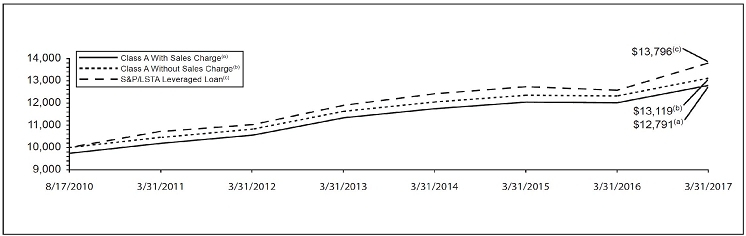
| Average Annual Total Returns for the Periods Ended March 31, 2017 | ||||||||||||||||||
|---|---|---|---|---|---|---|---|---|---|---|---|---|---|---|---|---|---|---|
| 1 Year | 5 Year | Since Inception of Class A, C, I, R and W August 17, 2010 | Since Inception of Class P June 14, 2013 | |||||||||||||||
Including Sales Charge: | ||||||||||||||||||
Class A(1) | 3.81 | % | 3.38 | % | 3.78 | % | — | |||||||||||
Class C(2) | 4.70 | % | 3.13 | % | 3.41 | % | — | |||||||||||
| Class I | 6.76 | % | 4.17 | % | 4.45 | % | — | |||||||||||
| Class P | 7.47 | % | — | — | 4.00 | % | ||||||||||||
| Class R | 6.12 | % | 3.63 | % | 3.90 | % | — | |||||||||||
| Class W | 6.75 | % | 4.16 | % | 4.47 | % | — | |||||||||||
Excluding Sales Charge: | ||||||||||||||||||
| Class A | 6.49 | % | 3.91 | % | 4.19 | % | — | |||||||||||
| Class C | 5.70 | % | 3.13 | % | 3.41 | % | — | |||||||||||
| Class I | 6.76 | % | 4.17 | % | 4.45 | % | — | |||||||||||
| Class P | 7.47 | % | — | — | 4.00 | % | ||||||||||||
| Class R | 6.12 | % | 3.63 | % | 3.90 | % | — | |||||||||||
| Class W | 6.75 | % | 4.16 | % | 4.47 | % | — | |||||||||||
| S&P/LSTA Leveraged Loan | 9.72 | % | 4.58 | % | 4.98 | % | 3.81 | % | ||||||||||
(1) | Reflects deduction of the maximum Class A sales charge of 2.50%. |
(2) | Reflects deduction of the Class C deferred sales charge of 1% for the 1 year return. |
| Actual Fund Return | Hypothetical (5% return before expenses) | ||||||||||||||||||||||||||||||||||
|---|---|---|---|---|---|---|---|---|---|---|---|---|---|---|---|---|---|---|---|---|---|---|---|---|---|---|---|---|---|---|---|---|---|---|---|
| Beginning Account Value October 1, 2016 | Ending Account Value March 31, 2017 | Annualized Expense Ratio | Expenses Paid During the Period Ended March 31, 2017* | Beginning Account Value October 1, 2016 | Ending Account Value March 31, 2017 | Annualized Expense Ratio | Expenses Paid During the Period Ended March 31, 2017* | ||||||||||||||||||||||||||||
| Class A | $ | 1,000.00 | $ | 1,022.80 | 1.03 | % | $ | 5.19 | $ | 1,000.00 | $ | 1,019.80 | 1.03 | % | $ | 5.19 | |||||||||||||||||||
| Class C | 1,000.00 | 1,019.00 | 1.78 | 8.96 | 1,000.00 | 1,016.06 | 1.78 | 8.95 | |||||||||||||||||||||||||||
| Class I | 1,000.00 | 1,024.20 | 0.76 | 3.84 | 1,000.00 | 1,021.14 | 0.76 | 3.83 | |||||||||||||||||||||||||||
| Class P | 1,000.00 | 1,027.50 | 0.10 | 0.51 | 1,000.00 | 1,024.43 | 0.10 | 0.50 | |||||||||||||||||||||||||||
| Class R | 1,000.00 | 1,020.50 | 1.28 | 6.45 | 1,000.00 | 1,018.55 | 1.28 | 6.44 | |||||||||||||||||||||||||||
| Class W | 1,000.00 | 1,024.10 | 0.78 | 3.94 | 1,000.00 | 1,021.04 | 0.78 | 3.93 | |||||||||||||||||||||||||||
| * | Expenses are equal to the Fund’s annualized expense ratios multiplied by the average account value over the period, multiplied by 182/365 to reflect the most recent fiscal half-year. |
Voya Funds Trust
May 26, 2017
ASSETS: | ||||||
| Investments in securities at fair value (Cost $1,764,167,605) | $ | 1,763,244,035 | ||||
| Short-term investments at fair value (Cost $221,141,776) | 221,140,621 | |||||
| Total Investments at fair value | 1,984,384,656 | |||||
| Cash | 2,709,355 | |||||
| Receivables: | ||||||
| Investment securities sold | 15,390,097 | |||||
| Fund shares sold | 5,256,050 | |||||
| Interest | 4,241,040 | |||||
| Prepaid expenses | 74,016 | |||||
| Reimbursement due from manager | 172,804 | |||||
| Other assets | 19,417 | |||||
| Total assets | 2,012,247,435 | |||||
LIABILITIES: | ||||||
| Payable for investment securities purchased | 104,877,600 | |||||
| Payable for fund shares redeemed | 1,866,702 | |||||
| Income distribution payable | 1,265,296 | |||||
| Payable for investment management fees | 1,008,102 | |||||
| Payable for distribution and shareholder service fees | 114,553 | |||||
| Accrued trustees fees | 22,879 | |||||
| Payable to trustees under the deferred compensation plan (Note 8) | 19,417 | |||||
| Unfunded loan commitments (Note 9) | 7,746,472 | |||||
| Other accrued expenses and liabilities | 516,620 | |||||
| Total liabilities | 117,437,641 | |||||
NET ASSETS | $ | 1,894,809,794 | ||||
NET ASSETS WERE COMPRISED OF: | ||||||
| Paid-in capital | 1,911,073,550 | |||||
| Distributions in excess of net investment income or accumulated net investment loss | (1,279,543 | ) | ||||
| Accumulated net realized loss | (14,059,488 | ) | ||||
| Net unrealized depreciation | (924,725 | ) | ||||
NET ASSETS | $ | 1,894,809,794 |
Class A: | ||||||
| Net assets | $ | 93,318,491 | ||||
| Shares authorized | unlimited | |||||
| Par value | $ | 0.001 | ||||
| Shares outstanding | 9,402,288 | |||||
Net asset value and redemption price per share(2) | $ | 9.93 | ||||
Maximum offering price per share (2.50%)(1) | $ | 10.18 | ||||
Class C: | ||||||
| Net assets | $ | 55,583,422 | ||||
| Shares authorized | unlimited | |||||
| Par value | $ | 0.001 | ||||
| Shares outstanding | 5,599,803 | |||||
Net asset value and redemption price per share(2) | $ | 9.93 | ||||
Class I: | ||||||
| Net assets | $ | 1,156,695,154 | ||||
| Shares authorized | unlimited | |||||
| Par value | $ | 0.001 | ||||
| Shares outstanding | 116,541,970 | |||||
Net asset value and redemption price per share(2) | $ | 9.93 | ||||
Class P: | ||||||
| Net assets | $ | 36,071,799 | ||||
| Shares authorized | unlimited | |||||
| Par value | $ | 0.001 | ||||
| Shares outstanding | 3,637,076 | |||||
| Net asset value and redemption price per share | $ | 9.92 | ||||
Class R: | ||||||
| Net assets | $ | 119,041,108 | ||||
| Shares authorized | unlimited | |||||
| Par value | $ | 0.001 | ||||
| Shares outstanding | 12,010,880 | |||||
| Net asset value and redemption price per share | $ | 9.91 | ||||
Class W: | ||||||
| Net assets | $ | 434,099,820 | ||||
| Shares authorized | unlimited | |||||
| Par value | $ | 0.001 | ||||
| Shares outstanding | 43,636,167 | |||||
| Net asset value and redemption price per share | $ | 9.95 |
| (1) | Maximum offering price is computed at 100/97.50 of net asset value. On purchases of $100,000 or more, the offering price is reduced. |
| (2) | Redemption price per share may be reduced for any applicable contingent deferred sales charge. |
INVESTMENT INCOME: | ||||||
| Interest | $ | 68,968,460 | ||||
| Other | 2,858,027 | |||||
| Total investment income | 71,826,487 | |||||
EXPENSES: | ||||||
| Investment management fees | 9,648,089 | |||||
| Distribution and service fees: | ||||||
| Class A | 144,101 | |||||
| Class C | 510,535 | |||||
| Class R | 551,388 | |||||
| Transfer agent fees: | ||||||
| Class A | 62,304 | |||||
| Class C | 54,370 | |||||
| Class I | 115,623 | |||||
| Class P | 135 | |||||
| Class R | 117,452 | |||||
| Class W | 250,541 | |||||
| Shareholder reporting expense | 56,964 | |||||
| Custody and accounting expense | 606,451 | |||||
| Registration fees | 160,086 | |||||
| Professional fees | 91,709 | |||||
| Trustees fees | 60,760 | |||||
| Commitment fee | 405,555 | |||||
| Miscellaneous expense | 108,626 | |||||
| Total expenses | 12,944,689 | |||||
| Waived and reimbursed fees | (594,451 | ) | ||||
| Net expenses | 12,350,238 | |||||
| Net investment income | 59,476,249 | |||||
REALIZED AND UNREALIZED GAIN (LOSS): | ||||||
| Net realized loss on investments | (2,640,244 | ) | ||||
| Net change in unrealized appreciation (depreciation) on: | ||||||
| Investments | 33,296,850 | |||||
| Unfunded commitments | 1,627 | |||||
| Net change in unrealized appreciation (depreciation) | 33,298,477 | |||||
| Net realized and unrealized gain | 30,658,233 | |||||
| Increase in net assets resulting from operations | $ | 90,134,482 |
| Year Ended March 31, 2017 | Year Ended March 31, 2016 | |||||||||
|---|---|---|---|---|---|---|---|---|---|---|
FROM OPERATIONS: | ||||||||||
| Net investment income | $ | 59,476,249 | $ | 41,502,347 | ||||||
| Net realized loss | (2,640,244 | ) | (7,929,133 | ) | ||||||
| Net change in unrealized appreciation (depreciation) | 33,298,477 | (31,753,056 | ) | |||||||
| Net increase in net assets resulting from operations | 90,134,482 | 1,820,158 | ||||||||
FROM DISTRIBUTIONS TO SHAREHOLDERS: | ||||||||||
| Net investment income: | ||||||||||
| Class A | (2,262,634 | ) | (1,638,206 | ) | ||||||
| Class C | (1,634,741 | ) | (1,757,234 | ) | ||||||
| Class I | (42,195,694 | ) | (28,633,949 | ) | ||||||
| Class P | (1,672,622 | ) | (1,223,832 | ) | ||||||
| Class R | (4,089,428 | ) | (3,944,651 | ) | ||||||
| Class W | (9,539,350 | ) | (4,466,780 | ) | ||||||
| Total distributions | (61,394,469 | ) | (41,664,652 | ) | ||||||
FROM CAPITAL SHARE TRANSACTIONS: | ||||||||||
| Net proceeds from sale of shares | 916,209,247 | 786,315,877 | ||||||||
| Reinvestment of distributions | 54,367,405 | 40,294,550 | ||||||||
| 970,576,652 | 826,610,427 | |||||||||
| Cost of shares redeemed | (323,346,078 | ) | (524,352,955 | ) | ||||||
| Net increase in net assets resulting from capital share transactions | 647,230,574 | 302,257,472 | ||||||||
| Net increase in net assets | 675,970,587 | 262,412,978 | ||||||||
NET ASSETS: | �� | |||||||||
| Beginning of year or period | 1,218,839,207 | 956,426,229 | ||||||||
| End of year or period | $ | 1,894,809,794 | $ | 1,218,839,207 | ||||||
| Undistributed (distribution in excess of) net investment income or accumulated net investment loss | $ | (1,279,543 | ) | $ | 3,383 | |||||
| Income (loss) from investment operations | Less distributions | Ratios to average net assets | Supplemental data | |||||||||||||||||||||||||||||||||||||||||||||||||||||||||||||
|---|---|---|---|---|---|---|---|---|---|---|---|---|---|---|---|---|---|---|---|---|---|---|---|---|---|---|---|---|---|---|---|---|---|---|---|---|---|---|---|---|---|---|---|---|---|---|---|---|---|---|---|---|---|---|---|---|---|---|---|---|---|---|---|---|
| Net asset value, beginning of year or period | Net investment income (loss) | Net realized and unrealized gain (loss) | Total from investment operations | From net investment income | From net realized gains | From return of capital | Total distributions | Net asset value, end of year or period | Total Return(1) | Expenses before reductions/ additions(2)(3) | Expenses, net of fee waivers and/ or recoupments, if any(2)(3) | Expenses, net of all reductions/ additions(2)(3) | Net investment income (loss)(2)(3) | Net assets, end of year or period | Portfolio Turnover rate | |||||||||||||||||||||||||||||||||||||||||||||||||
| Year or period ended | ($) | ($) | ($) | ($) | ($) | ($) | ($) | ($) | ($) | (%) | (%) | (%) | (%) | (%) | ($000’s) | (%) | ||||||||||||||||||||||||||||||||||||||||||||||||
Class A | ||||||||||||||||||||||||||||||||||||||||||||||||||||||||||||||||
| 03-31-17 | 9.70 | 0.37 | * | 0.25 | 0.62 | 0.39 | — | — | 0.39 | 9.93 | 6.49 | 1.11 | 1.03 | 1.03 | 3.79 | 93,318 | 69 | |||||||||||||||||||||||||||||||||||||||||||||||
| 03-31-16 | 10.11 | 0.38 | (0.41 | ) | (0.03 | ) | 0.38 | — | — | 0.38 | 9.70 | (0.25 | ) | 1.08 | 1.04 | 1.04 | 3.84 | 39,820 | 46 | |||||||||||||||||||||||||||||||||||||||||||||
| 03-31-15 | 10.22 | 0.36 | (0.11 | ) | 0.25 | 0.36 | — | — | 0.36 | 10.11 | 2.49 | 1.09 | 1.02 | 1.02 | 3.53 | 46,566 | 60 | |||||||||||||||||||||||||||||||||||||||||||||||
| 03-31-14 | 10.28 | 0.38 | * | (0.02 | ) | 0.36 | 0.40 | 0.01 | 0.01 | 0.42 | 10.22 | 3.58 | 1.08 | 1.01 | 1.01 | 3.71 | 98,669 | 124 | ||||||||||||||||||||||||||||||||||||||||||||||
| 03-31-13 | 10.10 | 0.52 | * | 0.21 | 0.73 | 0.53 | 0.02 | — | 0.55 | 10.28 | 7.41 | 1.11 | 1.01 | 1.01 | 5.08 | 35,918 | 101 | |||||||||||||||||||||||||||||||||||||||||||||||
Class C | ||||||||||||||||||||||||||||||||||||||||||||||||||||||||||||||||
| 03-31-17 | 9.70 | 0.30 | * | 0.25 | 0.55 | 0.32 | — | — | 0.32 | 9.93 | 5.70 | 1.86 | 1.78 | 1.78 | 3.08 | 55,583 | 69 | |||||||||||||||||||||||||||||||||||||||||||||||
| 03-31-16 | 10.11 | 0.31 | (0.41 | ) | (0.10 | ) | 0.31 | — | — | 0.31 | 9.70 | (1.00 | ) | 1.83 | 1.79 | 1.79 | 3.10 | 50,751 | 46 | |||||||||||||||||||||||||||||||||||||||||||||
| 03-31-15 | 10.22 | 0.28 | (0.11 | ) | 0.17 | 0.28 | — | — | 0.28 | 10.11 | 1.72 | 1.84 | 1.77 | 1.77 | 2.81 | 63,818 | 60 | |||||||||||||||||||||||||||||||||||||||||||||||
| 03-31-14 | 10.28 | 0.30 | * | (0.02 | ) | 0.28 | 0.32 | 0.01 | 0.01 | 0.34 | 10.22 | 2.81 | 1.83 | 1.76 | 1.76 | 2.97 | 84,619 | 124 | ||||||||||||||||||||||||||||||||||||||||||||||
| 03-31-13 | 10.10 | 0.44 | * | 0.21 | 0.65 | 0.45 | 0.02 | — | 0.47 | 10.28 | 6.61 | 1.86 | 1.76 | 1.76 | 4.33 | 26,367 | 101 | |||||||||||||||||||||||||||||||||||||||||||||||
Class I | ||||||||||||||||||||||||||||||||||||||||||||||||||||||||||||||||
| 03-31-17 | 9.70 | 0.40 | * | 0.25 | 0.65 | 0.42 | — | — | 0.42 | 9.93 | 6.76 | 0.76 | 0.76 | 0.76 | 4.09 | 1,156,695 | 69 | |||||||||||||||||||||||||||||||||||||||||||||||
| 03-31-16 | 10.11 | 0.41 | (0.41 | ) | — | 0.41 | — | — | 0.41 | 9.70 | 0.01 | 0.79 | 0.79 | 0.79 | 4.12 | 900,493 | 46 | |||||||||||||||||||||||||||||||||||||||||||||||
| 03-31-15 | 10.21 | 0.39 | (0.11 | ) | 0.28 | 0.38 | — | — | 0.38 | 10.11 | 2.85 | 0.78 | 0.77 | 0.77 | 3.86 | 590,583 | 60 | |||||||||||||||||||||||||||||||||||||||||||||||
| 03-31-14 | 10.28 | 0.41 | * | (0.03 | ) | 0.38 | 0.43 | 0.01 | 0.01 | 0.45 | 10.21 | 3.74 | 0.76 | 0.76 | 0.76 | 3.99 | 327,896 | 124 | ||||||||||||||||||||||||||||||||||||||||||||||
| 03-31-13 | 10.10 | 0.54 | * | 0.21 | 0.75 | 0.55 | 0.02 | — | 0.57 | 10.28 | 7.67 | 0.86 | 0.76 | 0.76 | 5.33 | 165,936 | 101 | |||||||||||||||||||||||||||||||||||||||||||||||
Class P | ||||||||||||||||||||||||||||||||||||||||||||||||||||||||||||||||
| 03-31-17 | 9.69 | 0.47 | 0.24 | 0.71 | 0.48 | — | — | 0.48 | 9.92 | 7.47 | 0.75 | 0.10 | 0.10 | 4.76 | 36,072 | 69 | ||||||||||||||||||||||||||||||||||||||||||||||||
| 03-31-16 | 10.11 | 0.47 | (0.41 | ) | 0.06 | 0.48 | — | — | 0.48 | 9.69 | 0.58 | 0.77 | 0.12 | 0.12 | 4.76 | 21,608 | 46 | |||||||||||||||||||||||||||||||||||||||||||||||
| 03-31-15 | 10.21 | 0.45 | * | (0.10 | ) | 0.35 | 0.45 | — | — | 0.45 | 10.11 | 3.53 | 0.77 | 0.11 | 0.11 | 4.40 | 23,302 | 60 | ||||||||||||||||||||||||||||||||||||||||||||||
06-14-13(4)–03-31-14 | 10.22 | 0.37 | — | 0.37 | 0.36 | 0.01 | 0.01 | 0.38 | 10.21 | 3.71 | 0.75 | 0.10 | 0.10 | 4.58 | 86,265 | 124 | ||||||||||||||||||||||||||||||||||||||||||||||||
Class R | ||||||||||||||||||||||||||||||||||||||||||||||||||||||||||||||||
| 03-31-17 | 9.69 | 0.35 | 0.24 | 0.59 | 0.37 | — | — | 0.37 | 9.91 | 6.12 | 1.36 | 1.28 | 1.28 | 3.58 | 119,041 | 69 | ||||||||||||||||||||||||||||||||||||||||||||||||
| 03-31-16 | 10.10 | 0.35 | (0.40 | ) | (0.05 | ) | 0.36 | — | — | 0.36 | 9.69 | (0.50 | ) | 1.33 | 1.29 | 1.29 | 3.60 | 107,927 | 46 | |||||||||||||||||||||||||||||||||||||||||||||
| 03-31-15 | 10.20 | 0.34 | (0.11 | ) | 0.23 | 0.33 | — | — | 0.33 | 10.10 | 2.34 | 1.34 | 1.27 | 1.27 | 3.33 | 99,783 | 60 | |||||||||||||||||||||||||||||||||||||||||||||||
| 03-31-14 | 10.27 | 0.35 | * | (0.03 | ) | 0.32 | 0.37 | 0.01 | 0.01 | 0.39 | 10.20 | 3.23 | 1.33 | 1.26 | 1.26 | 3.47 | 98,457 | 124 | ||||||||||||||||||||||||||||||||||||||||||||||
| 03-31-13 | 10.09 | 0.49 | * | 0.21 | 0.70 | 0.50 | 0.02 | — | 0.52 | 10.27 | 7.15 | 1.36 | 1.26 | 1.26 | 4.84 | 32,371 | 101 | |||||||||||||||||||||||||||||||||||||||||||||||
Class W | ||||||||||||||||||||||||||||||||||||||||||||||||||||||||||||||||
| 03-31-17 | 9.72 | 0.39 | * | 0.26 | 0.65 | 0.42 | — | — | 0.42 | 9.95 | 6.75 | 0.86 | 0.78 | 0.78 | 3.96 | 434,100 | 69 | |||||||||||||||||||||||||||||||||||||||||||||||
| 03-31-16 | 10.13 | 0.41 | (0.41 | ) | — | 0.41 | — | — | 0.41 | 9.72 | 0.01 | 0.83 | 0.79 | 0.79 | 4.10 | 98,241 | 46 | |||||||||||||||||||||||||||||||||||||||||||||||
| 03-31-15 | 10.24 | 0.38 | * | (0.11 | ) | 0.27 | 0.38 | — | — | 0.38 | 10.13 | 2.74 | 0.84 | 0.77 | 0.77 | 3.82 | 132,375 | 60 | ||||||||||||||||||||||||||||||||||||||||||||||
| 03-31-14 | 10.30 | 0.41 | * | (0.02 | ) | 0.39 | 0.43 | 0.01 | 0.01 | 0.45 | 10.24 | 3.83 | 0.83 | 0.76 | 0.76 | 3.98 | 153,532 | 124 | ||||||||||||||||||||||||||||||||||||||||||||||
| 03-31-13 | 10.12 | 0.54 | * | 0.21 | 0.75 | 0.55 | 0.02 | — | 0.57 | 10.30 | 7.66 | 0.86 | 0.76 | 0.76 | 5.34 | 86,844 | 101 | |||||||||||||||||||||||||||||||||||||||||||||||
(1) | Total return is calculated assuming reinvestment of all dividends, capital gain distributions and return of capital distributions, if any, at net asset value and excluding the deduction of sales charges or contingent deferred sales charges, if applicable. Total return for periods less than one year is not annualized. |
(2) | Annualized for periods less than one year. |
(3) | Ratios reflect operating expenses of a Fund. Expenses before reductions/additions do not reflect amounts reimbursed by the Investment Adviser and/or Distributor or reductions from brokerage service arrangements or other expense offset arrangements and do not represent the amount paid by a Fund during periods when reimbursements or reductions occur. Expenses net of fee waivers reflect expenses after reimbursement by an Investment Adviser and/or Distributor but prior to reductions from brokerage service arrangements or other expense offset arrangements. Expenses net of all reductions/additions represent the net expenses paid by a Fund. Net investment income (loss) is net of all such additions or reductions. |
(4) | Commencement of operations. |
| * | Calculated using average number of shares outstanding throughout the period. |
• | Amount is less than $0.005 or 0.005% or more than $(0.005) or (0.005)% |
| * | Patent Pending |
agreements are valued using a price provided by the central counterparty clearinghouse; (f) Over-the-counter swap agreements are valued using a price provided by an independent pricing service; (g) Forward foreign currency exchange contracts are valued utilizing current and forward rates obtained from an independent pricing service. Such prices from the third party pricing service are for specific settlement periods and the Fund’s forward foreign currency exchange contracts are valued at an interpolated rate between the closest preceding and subsequent period reported by the independent pricing service and (h) Securities for which market prices are not provided by any of the above methods may be valued based upon quotes furnished by brokers.
an indication that the borrower may be unable to meet payments as they become due. If determined to be uncollectible, unpaid accrued interest is also written off. Cash collections on non-accrual loans are generally applied as a reduction to the recorded investment of the loan. Loans are generally returned to accrual status only after all past due amounts have been received and the borrower has demonstrated sustained performance. Loan premiums and discounts are amortized and/or accreted for financial reporting purposes. Arrangement fees received on revolving credit facilities, which represent non-refundable fees or purchase discounts associated with the acquisition of loans, are deferred and recognized using the effective yield for financial reporting purposes. No such fees are recognized on loans which have been placed on non-accrual status. Arrangement fees associated with all other loans, except revolving credit facilities, are treated as discounts and are accreted as described above. Dividend income is recorded on the ex-dividend date. Amendment fees are earned as compensation for evaluating and accepting changes to an original loan agreement and are recognized when received. Amendment fees and other fees earned are reported on the Statement of Operations.
| (1) | Market value of investment securities, other assets and liabilities — at the exchange rates prevailing at Market Close. |
| (2) | Purchases and sales of investment securities, income and expenses — at the rates of exchange prevailing on the respective dates of such transactions. |
changes in the value of assets and liabilities other than investments in securities, resulting from changes in the exchange rate. Foreign security and currency transactions may involve certain considerations and risks not typically associated with investing in U.S. companies and the U.S. government. These risks include, but are not limited to, revaluation of currencies and future adverse political and economic developments which could cause securities and their markets to be less liquid and prices more volatile than those of comparable U.S. companies and U.S. government securities. The foregoing risks are even greater with respect to securities of issuers in emerging markets.
| Class A | Class C | Class R | ||
|---|---|---|---|---|
| 0.25% | 1.00% | 0.50% |
| Class A | Class C | |||||||||
|---|---|---|---|---|---|---|---|---|---|---|
| Initial Sales Charges | $ | 18,253 | $ | — | ||||||
| Contingent Deferred Sales Charge | 1 | 10,815 | ||||||||
(as a percentage of average daily net assets)
Class C — 1.75%
Class I — 0.75%
Class P — 0.15%
Class R — 1.25%
Class W — 0.75%
| March 31 | ||||||
|---|---|---|---|---|---|---|
| 2018 | 2019 | 2020 | Total | |||
| $73,436 | $— | $— | $73,436 | |||
| March 31, | ||||||||||||||||||
|---|---|---|---|---|---|---|---|---|---|---|---|---|---|---|---|---|---|---|
| 2018 | 2019 | 2020 | Total | |||||||||||||||
| Class A | $ | 42,325 | $ | 18,714 | $ | 45,576 | $ | 106,615 | ||||||||||
| Class C | 48,425 | 25,047 | 39,339 | 112,811 | ||||||||||||||
| Class R | 64,840 | 48,519 | 84,746 | 198,105 | ||||||||||||||
| Class W | 90,613 | 48,421 | 181,571 | 320,605 | ||||||||||||||
| Subsidiary | Percentage | |||||
|---|---|---|---|---|---|---|
| Voya Institutional Trust Company | 6.19 | % | ||||
| Unfunded Commitment | ||||||
|---|---|---|---|---|---|---|
| Acrisure, LLC | $ | 315,064 | ||||
| Go Daddy Operating Company, LLC | 5,848,347 | |||||
| Oberthur Technologies S.A. | 1,286,316 | |||||
| TircorBraun Holdings, Inc. | 296,745 | |||||
| Shares sold | Reinvestment of distributions | Shares redeemed | Net increase (decrease) in shares outstanding | Shares sold | Reinvestment of distributions | Shares redeemed | Net increase (decrease) | |||||||||||||||||||||||||||
|---|---|---|---|---|---|---|---|---|---|---|---|---|---|---|---|---|---|---|---|---|---|---|---|---|---|---|---|---|---|---|---|---|---|---|
| Year or period ended | # | # | # | # | ($) | ($) | ($) | ($) | ||||||||||||||||||||||||||
Class A | ||||||||||||||||||||||||||||||||||
| 03-31-17 | 9,472,554 | 212,171 | (4,387,495 | ) | 5,297,230 | 93,765,808 | 2,100,130 | (43,388,017 | ) | 52,477,921 | ||||||||||||||||||||||||
| 03-31-16 | 1,902,023 | 153,022 | (2,555,525 | ) | (500,480 | ) | 18,766,580 | 1,509,664 | (25,275,490 | ) | (4,999,246 | ) | ||||||||||||||||||||||
Class C | ||||||||||||||||||||||||||||||||||
| 03-31-17 | 1,734,624 | 143,279 | (1,508,988 | ) | 368,915 | 17,186,533 | 1,416,723 | (14,904,761 | ) | 3,698,495 | ||||||||||||||||||||||||
| 03-31-16 | 972,623 | 150,691 | (2,203,097 | ) | (1,079,783 | ) | 9,579,816 | 1,486,663 | (21,780,910 | ) | (10,714,431 | ) | ||||||||||||||||||||||
Class I | ||||||||||||||||||||||||||||||||||
| 03-31-17 | 37,719,628 | 4,140,365 | (18,153,370 | ) | 23,706,623 | 373,467,735 | 40,941,905 | (179,449,889 | ) | 234,959,751 | ||||||||||||||||||||||||
| 03-31-16 | 72,680,247 | 2,819,373 | (41,090,933 | ) | 34,408,687 | 707,805,580 | 27,701,764 | (400,155,407 | ) | 335,351,937 | ||||||||||||||||||||||||
Class P | ||||||||||||||||||||||||||||||||||
| 03-31-17 | 1,365,526 | 169,248 | (126,961 | ) | 1,407,813 | 13,372,277 | 1,672,622 | (1,254,404 | ) | 13,790,495 | ||||||||||||||||||||||||
| 03-31-16 | 774,571 | 123,136 | (974,333 | ) | (76,626 | ) | 7,785,000 | 1,213,451 | (9,460,460 | ) | (462,009 | ) | ||||||||||||||||||||||
Class R | ||||||||||||||||||||||||||||||||||
| 03-31-17 | 2,149,929 | 410,746 | (1,689,884 | ) | 870,791 | 21,264,917 | 4,055,070 | (16,636,054 | ) | 8,683,933 | ||||||||||||||||||||||||
| 03-31-16 | 2,787,213 | 399,347 | (1,927,198 | ) | 1,259,362 | 27,692,709 | 3,926,797 | (18,800,464 | ) | 12,819,042 | ||||||||||||||||||||||||
Class W | ||||||||||||||||||||||||||||||||||
| 03-31-17 | 39,934,427 | 421,896 | (6,826,853 | ) | 33,529,470 | 397,151,977 | 4,180,955 | (67,712,953 | ) | 333,619,979 | ||||||||||||||||||||||||
| 03-31-16 | 1,483,214 | 450,615 | (4,893,867 | ) | (2,960,038 | ) | 14,686,192 | 4,456,211 | (48,880,224 | ) | (29,737,821 | ) | ||||||||||||||||||||||
| Paid-in Capital | Undistributed Net Investment Income | |||||
|---|---|---|---|---|---|---|
| $(635,294) | $635,294 | |||||
| Year Ended March 31, 2017 | Year Ended March 31, 2016 | |||||
|---|---|---|---|---|---|---|
| Ordinary Income | Ordinary Income | |||||
| $61,394,469 | $41,664,652 | |||||
| Capital Loss Carryforwards | ||||||||||
| Post-October Capital Losses Deferred | Unrealized Appreciation/ (Depreciation) | Amount | Character | Expiration | ||||||
| $(671,169) | $(1,151,083) | $ (861,769) | Short-term | None | ||||||
| (12,300,192) | Long-term | None | ||||||||
| $(13,161,961) | ||||||||||
| Per Share Amount | Payable Date | Record Date | ||||||
|---|---|---|---|---|---|---|---|---|
| Class A | $0.0320 | May 1, 2017 | Daily | |||||
| Class C | $0.0259 | May 1, 2017 | Daily | |||||
| Class I | $0.0342 | May 1, 2017 | Daily | |||||
| Class P | $0.0396 | May 1, 2017 | Daily | |||||
| Class R | $0.0300 | May 1, 2017 | Daily | |||||
| Class W | $0.0342 | May 1, 2017 | Daily |
| VOYA FLOATING RATE FUND | PORTFOLIO OF INVESTMENTS ASOF MARCH 31, 2017 |
| Principal Amount† | | | Borrower/Tranche Description | | Fair Value | | Percentage of Net Assets | ||||||||||||
|---|---|---|---|---|---|---|---|---|---|---|---|---|---|---|---|---|---|---|---|
LOANS*: 93.0% | |||||||||||||||||||
Aerospace & Defense: 1.6% | |||||||||||||||||||
| 17,215,000 | (1) | Avolon Holdings Limited, TL B-2, 3.900%, 01/20/22 | $ | 17,475,618 | 0.9 | ||||||||||||||
| 4,019,925 | DigitalGlobe Inc., Term Loan B, 3.900%, 01/15/24 | 4,038,348 | 0.2 | ||||||||||||||||
| 2,385,000 | (1) | GEO, Term Loan B, 3.400%, 03/21/24 | 2,395,435 | 0.1 | |||||||||||||||
| 3,420,002 | Transdigm, Inc., Term Loan F (Rolled), 4.150%, 06/09/23 | 3,408,247 | 0.2 | ||||||||||||||||
| 3,000,000 | US Airways Group, Inc., Term Loan B1, 3.650%, 12/09/23 | 3,007,500 | 0.2 | ||||||||||||||||
| 30,325,148 | 1.6 | ||||||||||||||||||
Automotive: 3.3% | |||||||||||||||||||
| 4,890,000 | (1) | American Axle & Manufacturing, Inc., Term Loan B, 3.400%, 03/08/24 | 4,904,264 | 0.3 | |||||||||||||||
| 1,979,962 | BBB Industries US Holdings, Inc., First Lien Term Loan, 6.150%, 11/03/21 | 1,996,643 | 0.1 | ||||||||||||||||
| 105,000 | (1) | Caliber Collision, Delayed Draw TL, 4.150%, 01/31/24 | 105,897 | 0.0 | |||||||||||||||
| 1,050,000 | (1) | Caliber Collision, First Lien Term Loan, 4.150%, 01/31/24 | 1,058,969 | 0.0 | |||||||||||||||
| 2,941,469 | Dealer Tire, LLC, Term Loan B, 4.900%, 12/22/21 | 2,977,625 | 0.2 | ||||||||||||||||
| 2,100,000 | (1) | Dynacast International LLC, 2017 First Lien Term Loan, 4.400%, 01/28/22 | 2,109,198 | 0.1 | |||||||||||||||
| 4,547,305 | Dynacast International LLC, First Lien Term Loan, 4.650%, 01/28/22 | 4,518,771 | 0.2 | ||||||||||||||||
| 1,640,557 | Federal-Mogul Corporation, Term Loan C, 4.900%, 04/15/21 | 1,637,481 | 0.1 | ||||||||||||||||
| 10,812,281 | Gates Global LLC, First Lien Secured Term Loan, 4.400%, 07/05/21 | 10,846,070 | 0.6 | ||||||||||||||||
| 3,623,400 | KAR Auction Services, Inc., Term Loan B-3, 4.650%, 03/09/23 | 3,671,522 | 0.2 | ||||||||||||||||
| 1,437,248 | Key Safety Systems, Inc., First Lien Term Loan, 5.650%, 08/29/21 | 1,455,214 | 0.1 | ||||||||||||||||
| 3,650,000 | (1) | Lumileds, Term Loan B, 5.650%, 04/15/24 | 3,695,625 | 0.2 | |||||||||||||||
| 4,942,331 | Metaldyne Performance Group, Term Loan B, 3.900%, 10/20/21 | 4,957,775 | 0.3 | ||||||||||||||||
| 3,776,622 | NN, Inc., Upsized Term Loan B, 5.400%, 10/19/22 | 3,783,114 | 0.2 | ||||||||||||||||
| 5,651,885 | Midas Intermediate Holdco II, LLC, 3.900%, 08/18/21 | 5,683,677 | 0.3 | ||||||||||||||||
| 8,365,517 | TI Group Automotive Systems, L.L.C., Term Loan B, 3.900%, 06/30/22 | 8,423,029 | 0.4 | ||||||||||||||||
| 61,824,874 | 3.3 | ||||||||||||||||||
LOANS*: (continued) | ||||||||||||||||||||
Building & Development: 2.6% | ||||||||||||||||||||
| 9,625,000 | American Builders & Contractors Supply Co., Inc., Term Loan B, 3.900%, 10/31/23 | $ | 9,679,141 | 0.5 | ||||||||||||||||
| 6,872,780 | Doosan Infracore Bobcat Holdings Co., Ltd., Term Loan B, 4.650%, 05/28/21 | 6,958,689 | 0.4 | |||||||||||||||||
| 7,564,494 | Forterra Finance, LLC, First Lien Term Loan, 4.650%, 10/31/23 | 7,635,411 | 0.4 | |||||||||||||||||
| 1,920,188 | Henry Company LLC, Term Loan B, 5.650%, 10/05/23 | 1,947,790 | 0.1 | |||||||||||||||||
| 2,048,022 | Minimax Viking GmbH, Facility B1B Loan, 3.900%, 08/16/23 | 2,071,063 | 0.1 | |||||||||||||||||
| 2,266,854 | NCI Building Systems, Inc., Term Loan, 4.400%, 06/24/19 | 2,271,671 | 0.1 | |||||||||||||||||
| 2,039,872 | Ply Gem Industries, Inc., Term Loan, 4.150%, 02/01/21 | 2,052,303 | 0.1 | |||||||||||||||||
| 7,730,625 | Quikrete Holdings, Upsized Term Loan B, 4.400%, 11/15/23 | 7,820,818 | 0.4 | |||||||||||||||||
| 669,977 | Ventia Service (fka Leighton), Upsized Term Loan B, 5.150%, 05/21/22 | 675,002 | 0.1 | |||||||||||||||||
| 3,865,313 | Wilsonart LLC, Term Loan B, 4.650%, 12/19/23 | 3,897,321 | 0.2 | |||||||||||||||||
| 4,024,651 | Zekelman Industries, Inc. (fka JMC Steel), Term Loan B, 4.900%, 06/14/21 | 4,085,020 | 0.2 | |||||||||||||||||
| 49,094,229 | 2.6 | |||||||||||||||||||
Business Equipment & Services: 6.3% | ||||||||||||||||||||
| 6,656,902 | Acosta, Inc., New Term Loan B, 4.400%, 09/26/21 | 6,260,816 | 0.3 | |||||||||||||||||
| 12,397,641 | Advantage Sales & Marketing, Inc., First Lien Term Loan, 4.400%, 07/23/21 | 12,287,612 | 0.6 | |||||||||||||||||
| 2,000,000 | Advantage Sales & Marketing, Inc., Second Lien Term Loan, 7.650%, 07/25/22 | 1,950,000 | 0.1 | |||||||||||||||||
| 10,513,757 | AlixPartners LLP, Term Loan B, 4.150%, 07/28/22 | 10,596,364 | 0.6 | |||||||||||||||||
| 4,563,639 | Allflex Holdings III, Inc., First Lien Term Loan, 4.400%, 07/17/20 | 4,597,866 | 0.2 | |||||||||||||||||
| 2,300,000 | Array Canada Inc., Senior Secured Term Loan, 6.150%, 02/06/23 | 2,278,438 | 0.1 | |||||||||||||||||
| 2,161,500 | Boyd Corporation, First Lien Term Loan, 5.400%, 04/15/22 | 2,156,096 | 0.1 | |||||||||||||||||
| VOYA FLOATING RATE FUND | PORTFOLIO OF INVESTMENTS ASOF MARCH 31, 2017 (CONTINUED) |
| Principal Amount† | | | Borrower/Tranche Description | | Fair Value | | Percentage of Net Assets | ||||||||||||
|---|---|---|---|---|---|---|---|---|---|---|---|---|---|---|---|---|---|---|---|
LOANS*: (continued) | |||||||||||||||||||
Business Equipment & Services: (continued) | |||||||||||||||||||
| 2,238,750 | Thomson Reuters Intellectual Property & Science, First Lien Term Loan, 4.900%, 10/03/23 | $ | 2,248,824 | 0.1 | |||||||||||||||
| 7,789,374 | Coinmach Service Corp., Feb 2014 Upsized Term Loan, 4.400%, 11/14/19 | 7,802,359 | 0.4 | ||||||||||||||||
| 2,000,000 | (1) | Cyxtera Technologies, Inc., First Lien Term Loan, 4.150%, 05/15/24 | 2,015,490 | 0.1 | |||||||||||||||
| 2,960,125 | Document Technologies, Inc., Term Loan B, 6.400%, 10/01/23 | 2,919,423 | 0.2 | ||||||||||||||||
| 2,455,000 | EVO Payments, First Lien, 6.150%, 12/22/23 | 2,483,770 | 0.1 | ||||||||||||||||
| 4,011,700 | First Data Corporation, New 2022 First Lien, 4.150%, 07/10/22 | 4,048,752 | 0.2 | ||||||||||||||||
| 3,575,348 | First Data Corporation, Term Loan 2021 USD, 4.150%, 03/24/21 | 3,606,632 | 0.2 | ||||||||||||||||
| 4,999,306 | First Data Corporation, Term Loan A, 3.150%, 06/02/20 | 5,022,072 | 0.3 | ||||||||||||||||
| 4,132,030 | ION Trading Technologies Limited, Term Loan B USD 2016 refi, 4.150%, 08/11/23 | 4,130,740 | 0.2 | ||||||||||||||||
| 2,839,405 | iQor, First Lien Term Loan, 6.150%, 04/01/21 | 2,766,054 | 0.1 | ||||||||||||||||
| 1,000,000 | iQor, Second Lien Term Loan, 9.900%, 04/01/22 | 890,000 | 0.1 | ||||||||||||||||
| 8,614,735 | KinderCare Education, LLC (fka Knowledge Universe Education, LLC), Incremental First Lien Term Loan, 5.400%, 08/13/22 | 8,688,322 | 0.5 | ||||||||||||||||
| 2,877,229 | Legal Shield, First Lien Term Loan, 6.500%, 07/01/19 | 2,907,201 | 0.2 | ||||||||||||||||
| 1,000,000 | Legal Shield, Second Lien Term Loan, 10.250%, 07/01/20 | 1,007,500 | 0.1 | ||||||||||||||||
| 625,000 | (1) | Neustar, Inc., 2nd Lien Term Loan, 9.150%, 04/01/25 | 632,422 | 0.0 | |||||||||||||||
| 3,400,000 | (1) | Neustar, Inc., Term Loan B-2, 4.900%, 04/01/24 | 3,448,875 | 0.2 | |||||||||||||||
| 1,000,000 | Nielsen Company, TLB-3 USD, 3.650%, 10/04/23 | 1,008,611 | 0.1 | ||||||||||||||||
| 2,588,625 | Onsite Rental Group Operations Pty Ltd., Senior Secured Term Loan, 5.650%, 07/30/21 | 1,902,639 | 0.1 | ||||||||||||||||
| 3,647,975 | Solera Management, USD Term Loan B, 4.400%, 03/03/23 | 3,671,031 | 0.2 | ||||||||||||||||
| 3,652,188 | SourceHOV, First Lien Term Loan, 7.900%, 10/31/19 | 3,563,925 | 0.2 | ||||||||||||||||
LOANS*: (continued) | |||||||||||||||||||
Business Equipment & Services: (continued) | |||||||||||||||||||
| 1,155,000 | SourceHOV, Second Lien Term Loan, 11.650%, 04/30/20 | $ | 1,111,688 | 0.1 | |||||||||||||||
| 4,624,812 | SurveyMonkey.com, LLC, Term Loan B, 6.250%, 02/07/19 | 4,627,587 | 0.2 | ||||||||||||||||
| 110,096 | Wash Multi-Family Services, CAD First Lien Term Loan, 4.400%, 05/26/22 | 110,165 | 0.0 | ||||||||||||||||
| 628,653 | Wash Multi-Family Services, USD First Lien Term Loan, 4.400%, 05/26/22 | 629,046 | 0.0 | ||||||||||||||||
| 7,371,893 | West Corp, Term Loan B-12, 3.650%, 06/17/23 | 7,398,616 | 0.4 | ||||||||||||||||
| 118,768,936 | 6.3 | ||||||||||||||||||
Cable & Satellite Television: 4.0% | |||||||||||||||||||
| 5,957,393 | Charter Communications Operating, LLC, TLI, 3.400%, 01/15/24 | 5,994,216 | 0.3 | ||||||||||||||||
| 7,297,500 | CSC Holdings, Inc. (Cablevision), Term Loan B, 4.150%, 10/11/24 | 7,294,457 | 0.4 | ||||||||||||||||
| 5,841,526 | Liberty Cablevision of Puerto Rico LLC., First Lien Term Facility, 4.650%, 01/07/22 | 5,837,875 | 0.3 | ||||||||||||||||
| 250,000 | Liberty Cablevision of Puerto Rico LLC., Second Lien Facility, 7.900%, 07/07/23 | 247,083 | 0.0 | ||||||||||||||||
| 2,314,025 | New Wave Communications, Including Add on Term Loan B, 4.900%, 04/30/20 | 2,331,380 | 0.1 | ||||||||||||||||
| 4,395,000 | RCN Grande Cable, Term Loan B, 4.150%, 12/16/23 | 4,422,860 | 0.2 | ||||||||||||||||
| 6,413,925 | SFR Group SA (Numericable), Term Loan B10 USD, 4.400%, 01/14/25 | 6,429,960 | 0.4 | ||||||||||||||||
| 1,700,000 | (1) | SFR Group SA (Numericable), USD TL B11, 3.900%, 07/30/25 | 1,696,175 | 0.1 | |||||||||||||||
| 700,000 | (1) | Suddenlink Communications (aka Cequel Communications, LLC), New Term Loan B, 3.400%, 01/25/25 | 700,438 | 0.0 | |||||||||||||||
| 1,995,000 | Suddenlink Communications (aka Cequel Communications, LLC), New Term Loan B, 4.150%, 01/15/25 | 2,002,481 | 0.1 | ||||||||||||||||
| 5,715,000 | Telenet Group Holding NV, Term Loan AF, 4.150%, 01/31/25 | 5,748,484 | 0.3 | ||||||||||||||||
| 2,552,191 | Telesat Canada, Term Loan B, 4.150%, 11/17/23 | 2,576,437 | 0.1 | ||||||||||||||||
| VOYA FLOATING RATE FUND | PORTFOLIO OF INVESTMENTS ASOF MARCH 31, 2017 (CONTINUED) |
| Principal Amount† | | | Borrower/Tranche Description | | Fair Value | | Percentage of Net Assets | ||||||||||||
|---|---|---|---|---|---|---|---|---|---|---|---|---|---|---|---|---|---|---|---|
LOANS*: (continued) | |||||||||||||||||||
Cable & Satellite Television: (continued) | |||||||||||||||||||
| 4,280,000 | UPC Financing Partnership, Term Loan AP, 3.900%, 05/30/25 | $ | 4,298,725 | 0.2 | |||||||||||||||
| 5,175,000 | Virgin Media Investment Holdings Limited, Term Loan I, 3.900%, 01/31/25 | 5,194,406 | 0.3 | ||||||||||||||||
| 984,907 | WaveDivision Holdings LLC, New Term Loan B, 3.900%, 10/15/19 | 990,816 | 0.1 | ||||||||||||||||
| 11,972,500 | Wideopenwest Finance, LLC, 2016 Term Loan, 4.650%, 08/18/23 | 12,056,307 | 0.6 | ||||||||||||||||
| 8,430,000 | Ziggo N.V., USD TLE, 3.650%, 04/15/25 | 8,439,029 | 0.5 | ||||||||||||||||
| 76,261,129 | 4.0 | ||||||||||||||||||
Chemicals & Plastics: 4.6% | |||||||||||||||||||
| 1,491,411 | A. Schulman, Inc., US Term Loan B, 4.400%, 06/01/22 | 1,495,140 | 0.1 | ||||||||||||||||
| 1,884,699 | (1) | Allnex S.a.r.l. (Monarch), Term B-2 Facility, 4.400%, 09/13/23 | 1,897,657 | 0.1 | |||||||||||||||
| 1,419,914 | (1) | Allnex S.a.r.l. (Monarch), Term B-3 Facility, 4.400%, 09/13/23 | 1,429,676 | 0.1 | |||||||||||||||
| 1,195,000 | Atotech, TL B-1 USD, 4.150%, 01/31/24 | 1,202,469 | 0.1 | ||||||||||||||||
| 375,758 | (1) | Avantor Performance Materials, Delayed Draw 1L TL, 5.150%, 03/11/24 | 378,928 | 0.0 | |||||||||||||||
| 24,211 | (1) | Avantor Performance Materials, Delayed Draw 2L TL, 9.400%, 03/11/25 | 24,392 | 0.0 | |||||||||||||||
| 8,924,242 | (1) | Avantor Performance Materials, First Lien Term Loan, 5.150%, 03/10/24 | 8,999,545 | 0.5 | |||||||||||||||
| 550,789 | (1) | Avantor Performance Materials, Second Lien Term Loan, 9.400%, 03/10/25 | 554,921 | 0.0 | |||||||||||||||
| 2,992,500 | Axalta Coating Systems (fka DuPont Performance Coatings), 2014 Specified Refinancing Term B Loan, 3.650%, 02/01/23 | 3,022,192 | 0.2 | ||||||||||||||||
| 8,012,625 | Emerald Performance Materials LLC, First Lien Term Loan, 4.650%, 08/01/21 | 8,076,726 | 0.4 | ||||||||||||||||
| 750,000 | Emerald Performance Materials LLC, Second Lien Term Loan, 8.900%, 08/01/22 | 751,250 | 0.1 | ||||||||||||||||
| 589,138 | Flint Group Holdings S.A.R.L., Second Lien, 8.400%, 09/05/22 | 581,774 | 0.0 | ||||||||||||||||
| 4,033,761 | Flint Group Holdings S.A.R.L., USD Term Loan B2, 4.150%, 09/07/21 | 4,048,888 | 0.2 | ||||||||||||||||
LOANS*: (continued) | |||||||||||||||||||
Chemicals & Plastics: (continued) | |||||||||||||||||||
| 666,828 | Flint Group Holdings S.A.R.L., USD Term Loan C, 4.650%, 09/07/21 | $ | 668,495 | 0.0 | |||||||||||||||
| 5,519,762 | Huntsman International LLC, 2016 Term Loan B, 4.150%, 04/01/23 | 5,581,859 | 0.3 | ||||||||||||||||
| 8,879,629 | Ineos US Finance LLC, TLB USD ‘22, 3.900%, 03/31/22 | 8,933,742 | 0.5 | ||||||||||||||||
| 5,199,531 | Kraton Polymers LLC, Term Loan Facility, 5.150%, 01/06/22 | 5,257,432 | 0.3 | ||||||||||||||||
| 3,722,411 | (1) | MacDermid, Inc. (a.k.a Platform Specialty Products Corp), USD Term Loan B4, 5.150%, 06/07/23 | 3,758,474 | 0.2 | |||||||||||||||
| 1,057,737 | Orion Engineered Carbons, Term Loan B USD, 4.150%, 07/25/21 | 1,068,095 | 0.0 | ||||||||||||||||
| 1,422,171 | PQ Corporation, Dollar Term Loan, 5.400%, 11/04/22 | 1,438,933 | 0.1 | ||||||||||||||||
| 4,826,866 | Royal Adhesives & Sealants, First Lien Term Loan, 4.400%, 06/19/22 | 4,872,117 | 0.2 | ||||||||||||||||
| 137,931 | Royal Adhesives & Sealants, Second Lien Term Loan, 8.650%, 06/19/23 | 138,448 | 0.0 | ||||||||||||||||
| 7,175,116 | Solenis International, L.P., USD First Lien Term Loan, 4.400%, 07/31/21 | 7,208,186 | 0.4 | ||||||||||||||||
| 8,599,626 | Styrolution Group GmbH, New USD facility, 4.900%, 09/30/21 | 8,630,111 | 0.4 | ||||||||||||||||
| 4,966,468 | Tronox Pigments (Netherlands) BV, Term Loan, 4.650%, 03/19/20 | 5,003,240 | 0.3 | ||||||||||||||||
| 2,984,943 | Univar Inc., Dollar Term B2 Loan, 3.900%, 07/01/22 | 2,992,405 | 0.1 | ||||||||||||||||
| 88,015,095 | 4.6 | ||||||||||||||||||
Clothing/Textiles: 0.4% | |||||||||||||||||||
| 6,712,778 | Herff Jones, Inc., First Lien Term Loan, 5.150%, 12/10/21 | 6,815,571 | 0.4 | ||||||||||||||||
| 212,078 | Vince, LLC, Term Loan, 6.150%, 11/27/19 | 201,474 | 0.0 | ||||||||||||||||
| 7,017,045 | 0.4 | ||||||||||||||||||
Conglomerates: 0.2% | |||||||||||||||||||
| 1,518,146 | Jason Incorporated, First Lien Term Loan, 5.650%, 06/30/21 | 1,348,303 | 0.1 | ||||||||||||||||
| 400,000 | Jason Incorporated, Second Lien Term Loan, 9.150%, 06/30/22 | 272,000 | 0.0 | ||||||||||||||||
| 1,842,738 | Waterpik, First Lien, 5.900%, 07/08/20 | 1,853,103 | 0.1 | ||||||||||||||||
| 3,473,406 | 0.2 | ||||||||||||||||||
| VOYA FLOATING RATE FUND | PORTFOLIO OF INVESTMENTS ASOF MARCH 31, 2017 (CONTINUED) |
| Principal Amount† | | | Borrower/Tranche Description | | Fair Value | | Percentage of Net Assets | ||||||||||||
|---|---|---|---|---|---|---|---|---|---|---|---|---|---|---|---|---|---|---|---|
LOANS*: (continued) | |||||||||||||||||||
Containers & Glass Products: 3.2% | |||||||||||||||||||
| 8,208,843 | Berlin Packaging, LLC, First Lien Term Loan, 4.650%, 10/01/21 | $ | 8,266,559 | 0.4 | |||||||||||||||
| 450,000 | Berlin Packaging, LLC, Second Lien Term Facility, 7.900%, 09/30/22 | 455,063 | 0.0 | ||||||||||||||||
| 6,381,645 | Berry Plastics Corporation, Term I Loan, 3.650%, 10/01/22 | 6,437,982 | 0.3 | ||||||||||||||||
| 1,000,000 | Berry Plastics Corporation, Term L Loan, 3.400%, 01/06/21 | 1,005,313 | 0.1 | ||||||||||||||||
| 4,805,673 | Husky Injection Molding Systems, Ltd, Incremental Term Loan, 4.400%, 06/30/21 | 4,838,414 | 0.3 | ||||||||||||||||
| 3,062,325 | (1) | Milacron LLC, Term Loan, 4.150%, 09/28/23 | 3,081,465 | 0.2 | |||||||||||||||
| 3,964,000 | Novolex (aka Flex Acquisition Company, Inc), First Lien Term Loan, 4.400%, 12/29/23 | 3,997,448 | 0.2 | ||||||||||||||||
| 4,150,000 | Proampac Intermediate Inc (f.k.a Prolampac Inc), First Lien Term Loan, 5.150%, 11/18/23 | 4,193,575 | 0.2 | ||||||||||||||||
| 660,000 | Proampac Intermediate Inc (f.k.a Prolampac Inc), Second Lien Term Loan, 9.650%, 11/18/24 | 669,075 | 0.0 | ||||||||||||||||
| 12,557,497 | Reynolds Group Holdings Inc, USD Term Loan, 4.150%, 02/04/23 | 12,624,215 | 0.7 | ||||||||||||||||
| 8,515,019 | SIG Combibloc Group AG, USD Term Loan, 4.150%, 03/10/22 | 8,574,147 | 0.4 | ||||||||||||||||
| 3,979,747 | Tekni-Plex, Inc., Upsized First Lien Term Loan, 4.650%, 06/01/22 | 3,987,706 | 0.2 | ||||||||||||||||
| 296,745 | (2) | TricorBraun, Delayed Draw Term Loan, 3.750%, 11/30/23 | 300,454 | 0.0 | |||||||||||||||
| 2,967,445 | TricorBraun, First Lien Term Loan, 4.900%, 11/30/23 | 3,004,538 | 0.2 | ||||||||||||||||
| 61,435,954 | 3.2 | ||||||||||||||||||
Cosmetics/Toiletries: 0.6% | |||||||||||||||||||
| 10,663,919 | Revlon Consumer Products Corporation, Term Loan B 2016, 4.650%, 09/07/23 | 10,686,132 | 0.6 | ||||||||||||||||
Diversified Insurance: 4.2% | |||||||||||||||||||
| 8,630,000 | (2) | Acrisure, LLC, Term Loan, 5.900%, 11/15/23 | 8,772,939 | 0.5 | |||||||||||||||
| 9,857,280 | Alliant Holdings, I, LLC, Term Loan B, 4.400%, 08/12/22 | 9,938,395 | 0.5 | ||||||||||||||||
| 5,785,500 | AmWINS Group, Inc., 1st Lien Term Loan, 3.900%, 01/25/24 | 5,807,797 | 0.3 | ||||||||||||||||
LOANS*: (continued) | |||||||||||||||||||
Diversified Insurance: (continued) | |||||||||||||||||||
| 10,492,758 | Applied Systems Inc., First Lien Term Loan, 4.400%, 01/25/21 | $ | 10,556,155 | 0.5 | |||||||||||||||
| 1,630,224 | Applied Systems Inc., Second Lien Term Loan, 7.650%, 01/24/22 | 1,643,808 | 0.1 | ||||||||||||||||
| 5,616,083 | AssuredPartners, Inc., First Lien Term Loan, 5.400%, 10/21/22 | 5,667,857 | 0.3 | ||||||||||||||||
| 9,568,746 | Hub International Limited, Term Loan B, 4.150%, 10/02/20 | 9,620,331 | 0.5 | ||||||||||||||||
| 6,783,000 | National Financial Partners Corp., Term Loan, 4.650%, 01/08/24 | 6,860,157 | 0.4 | ||||||||||||||||
| 5,946,447 | Sedgwick Holdings, Inc., First Lien Term Loan, 3.900%, 03/01/21 | 5,969,984 | 0.3 | ||||||||||||||||
| 1,000,000 | Sedgwick Holdings, Inc., Incremental Second Lien Term Loan, 6.900%, 02/28/22 | 1,003,333 | 0.1 | ||||||||||||||||
| 1,500,000 | Sedgwick Holdings, Inc., Second Lien Term Loan, 6.900%, 02/28/22 | 1,507,500 | 0.1 | ||||||||||||||||
| 7,790,505 | USI, Inc., Term Loan, 4.400%, 12/27/19 | 7,811,601 | 0.4 | ||||||||||||||||
| 4,629,244 | Vertafore, Inc., Term Loan B, 4.400%, 06/30/23 | 4,660,658 | 0.2 | ||||||||||||||||
| 79,820,515 | 4.2 | ||||||||||||||||||
Drugs: 0.4% | |||||||||||||||||||
| 3,883,862 | Alvogen Pharma U.S., Term Loan B, 6.150%, 03/31/22 | 3,881,435 | 0.2 | ||||||||||||||||
| 1,265,000 | Horizon Pharma, Inc., Incremental Term Loan, 5.650%, 05/07/21 | 1,269,744 | 0.1 | ||||||||||||||||
| 175,000 | (1) | Horizon Pharma, Inc., Term B, 4.900%, 03/23/24 | 175,547 | 0.0 | |||||||||||||||
| 1,510,806 | Prestige Brands, B-4, 3.900%, 01/26/24 | 1,526,228 | 0.1 | ||||||||||||||||
| 6,852,954 | 0.4 | ||||||||||||||||||
Ecological Services & Equipment: 0.8% | |||||||||||||||||||
| 5,404,248 | 4L Holdings Inc., Term Loan B, 5.650%, 05/08/20 | 5,228,610 | 0.3 | ||||||||||||||||
| 9,295,508 | Advanced Disposal Services, Inc. (fka ADS Waste Holdings, Inc.), Term Loan B, 3.900%, 11/10/23 | 9,374,519 | 0.5 | ||||||||||||||||
| 14,603,129 | 0.8 | ||||||||||||||||||
Electronics/Electrical: 12.6% | |||||||||||||||||||
| 3,100,000 | (1) | Aptean Holdings, Inc., First Lien Term Loan, 6.150%, 12/20/22 | 3,141,658 | 0.2 | |||||||||||||||
| 6,103,000 | (1) | Avast Software B.V., Term Loan USD, 5.150%, 09/30/22 | 6,154,015 | 0.3 | |||||||||||||||
| VOYA FLOATING RATE FUND | PORTFOLIO OF INVESTMENTS ASOF MARCH 31, 2017 (CONTINUED) |
| Principal Amount† | | | Borrower/Tranche Description | | Fair Value | | Percentage of Net Assets | ||||||||||||
|---|---|---|---|---|---|---|---|---|---|---|---|---|---|---|---|---|---|---|---|
LOANS*: (continued) | |||||||||||||||||||
Electronics/Electrical: (continued) | |||||||||||||||||||
| 11,649,426 | BMC Software, Inc., U.S. Term Loan, 5.150%, 09/10/20 | $ | 11,676,465 | 0.6 | |||||||||||||||
| 3,064,753 | Cavium, Inc., Term Loan B, 4.150%, 08/16/22 | 3,072,415 | 0.2 | ||||||||||||||||
| 6,694,571 | Compuware Corporation, Term Loan B-3, 5.400%, 12/15/21 | 6,716,328 | 0.4 | ||||||||||||||||
| 21,356,475 | Dell International LLC, Term Loan B, 3.650%, 09/07/23 | 21,485,105 | 1.1 | ||||||||||||||||
| 6,262,096 | Dell Software Group, Term Loan B, 7.150%, 10/31/22 | 6,357,988 | 0.3 | ||||||||||||||||
| 3,379,142 | ECI, Term Loan B, 5.900%, 05/28/21 | 3,406,598 | 0.2 | ||||||||||||||||
| 1,641,899 | Epicor Software Corporation, 08/16 Incremental Term Loan B, 5.150%, 06/01/22 | 1,648,056 | 0.1 | ||||||||||||||||
| 7,828,516 | Epicor Software Corporation, Term Loan B, 4.900%, 06/01/22 | 7,856,895 | 0.4 | ||||||||||||||||
| 2,222,282 | Eze Castle Software, Inc., 1st Lien Term Loan, 4.150%, 04/04/20 | 2,230,615 | 0.1 | ||||||||||||||||
| 1,428,261 | Eze Castle Software, Inc., Second Lien Term Loan, 7.650%, 04/05/21 | 1,413,978 | 0.1 | ||||||||||||||||
| 5,848,348 | (2) | Go Daddy Operating Company LLC, Delayed Draw Term Loan, 0.000%, 02/15/24 | 5,861,507 | 0.3 | |||||||||||||||
| 4,401,652 | Go Daddy Operating Company, LLC, Term Loan, 3.650%, 02/15/24 | 4,411,555 | 0.2 | ||||||||||||||||
| 4,870,000 | Greeneden U.S. Holdings II, L.L.C., USD Term Loan, 5.150%, 12/01/23 | 4,909,569 | 0.3 | ||||||||||||||||
| 7,553,394 | Hyland Software, Inc., 1st Lien Term Loan, 4.400%, 07/01/22 | 7,630,816 | 0.4 | ||||||||||||||||
| 1,230,000 | (1) | Infor (US), Inc., USD Term Loan B, 3.900%, 02/01/22 | 1,230,989 | 0.1 | |||||||||||||||
| 7,687,851 | Informatica Corporation, Term Loan B, 4.650%, 08/05/22 | 7,660,397 | 0.4 | ||||||||||||||||
| 7,880,250 | JDA Software (f.k.a RedPrairie Corporation), Term Loan B, 4.650%, 10/12/23 | 7,936,397 | 0.4 | ||||||||||||||||
| 10,064,775 | Kronos Incorporated, First Lien Term Loan, 5.150%, 11/01/23 | 10,133,970 | 0.5 | ||||||||||||||||
| 2,962,500 | Linxens, TL B-3 USD, 4.650%, 10/14/22 | 2,976,388 | 0.2 | ||||||||||||||||
| 4,335,050 | M/A-COM Technology Solutions Holdings, Inc., Term Loan B, 4.900%, 05/08/21 | 4,408,204 | 0.2 | ||||||||||||||||
LOANS*: (continued) | |||||||||||||||||||
Electronics/Electrical: (continued) | |||||||||||||||||||
| 1,463,938 | Micron Technology, Inc., Term Loan B, 4.900%, 04/26/22 | $ | 1,481,093 | 0.1 | |||||||||||||||
| 3,301,945 | Microsemi Corporation, Term Loan B, 3.400%, 01/15/23 | 3,323,269 | 0.2 | ||||||||||||||||
| 2,050,000 | (1) | Navico Inc., First Lien Term Loan, 6.900%, 03/15/23 | 2,014,125 | 0.1 | |||||||||||||||
| 793,684 | Oberthur Technologies, Term Loan B1 USD, 4.900%, 12/14/23 | 796,661 | 0.0 | ||||||||||||||||
| 1,286,316 | (2) | Oberthur Technologies, Term Loan B2, 3.750% 12/15/23 | 1,291,139 | 0.1 | |||||||||||||||
| 550,000 | Omnitracs Inc., Upsized Second Lien Term Loan, 8.900%, 05/25/21 | 553,896 | 0.0 | ||||||||||||||||
| 3,992,231 | ON Semiconductor Corporation, Term Loan B, 4.400%, 03/31/23 | 4,018,607 | 0.2 | ||||||||||||||||
| 1,960,000 | Optiv Security, Inc. (f.k.a. Accuvant Inc.), 1st Lien Term Loan, 4.400%, 01/13/24 | 1,973,067 | 0.1 | ||||||||||||||||
| 8,478,750 | Rackspace Hosting, Term Loan B, 4.650%, 11/03/23 | 8,553,821 | 0.5 | ||||||||||||||||
| 8,018,628 | Riverbed Technology, Inc., First Lien Term Loan, 4.400%, 04/24/22 | 8,023,639 | 0.4 | ||||||||||||||||
| 3,970,788 | Rovi Solutions Corporation, Term Loan B, 3.650%, 07/02/21 | 3,989,816 | 0.2 | ||||||||||||||||
| 1,845,375 | (1) | Sabre Inc., Term B Facility, 3.900%, 02/16/24 | 1,860,830 | 0.1 | |||||||||||||||
| 6,402,084 | Skillsoft Corp., First Lien Term Loan, 5.900%, 04/28/21 | 5,901,921 | 0.3 | ||||||||||||||||
| 10,485,957 | SolarWinds Holdings, Inc., Term Loan, 4.650%, 02/05/23 | 10,510,211 | 0.6 | ||||||||||||||||
| 6,353,117 | SS&C Technologies Inc., TLB-1, 3.400%, 07/08/22 | 6,399,063 | 0.3 | ||||||||||||||||
| 543,093 | SS&C Technologies Inc., TLB-2, 3.400%, 07/08/22 | 547,020 | 0.0 | ||||||||||||||||
| 7,392,150 | Synchronoss Technologies, Inc., 1st Lien Term Loan, 3.900%, 01/23/24 | 7,379,214 | 0.4 | ||||||||||||||||
| 3,491,250 | Tessera Technologies, Term Loan B, 4.400%, 12/01/23 | 3,534,164 | 0.2 | ||||||||||||||||
| 6,251,952 | TTM Technologies, Term Loan B, 5.400%, 05/31/21 | 6,361,362 | 0.3 | ||||||||||||||||
| 6,318,731 | Veritas Technologies Corporation, USD Term Loan B-1, 6.775%, 01/27/23 | 6,290,430 | 0.3 | ||||||||||||||||
| VOYA FLOATING RATE FUND | PORTFOLIO OF INVESTMENTS ASOF MARCH 31, 2017 (CONTINUED) |
| Principal Amount† | | | Borrower/Tranche Description | | Fair Value | | Percentage of Net Assets | ||||||||||||
|---|---|---|---|---|---|---|---|---|---|---|---|---|---|---|---|---|---|---|---|
LOANS*: (continued) | |||||||||||||||||||
Electronics/Electrical: (continued) | |||||||||||||||||||
| 12,513,120 | Western Digital, USD Term Loan B-2, 3.900%, 04/29/23 | $ | 12,616,741 | 0.7 | |||||||||||||||
| 9,629,505 | Zebra Technologies, Term Loan B, 3.650%, 10/27/21 | 9,722,796 | 0.5 | ||||||||||||||||
| 239,462,793 | 12.6 | ||||||||||||||||||
Equity REITs and REOCs: 0.2% | |||||||||||||||||||
| 3,572,072 | ESH Hospitality, Inc., TLB, 3.650%, 08/30/23 | 3,593,123 | 0.2 | ||||||||||||||||
Financial Intermediaries: 1.3% | |||||||||||||||||||
| 4,664,564 | Duff & Phelps, Add-on Term Loan, 4.900%, 04/23/20 | 4,702,463 | 0.2 | ||||||||||||||||
| 6,912,500 | First Eagle Investment Management, Inc., Term Loan B, 5.150%, 12/01/22 | 6,957,867 | 0.4 | ||||||||||||||||
| 7,650,000 | (1) | LPL Holdings, Inc., Term Loan B, 3.900%, 03/15/24 | 7,696,221 | 0.4 | |||||||||||||||
| 5,938,999 | Trans Union LLC, Term Loan B, 3.650%, 04/09/23 | 5,992,450 | 0.3 | ||||||||||||||||
| 25,349,001 | 1.3 | ||||||||||||||||||
Food Products: 2.2% | |||||||||||||||||||
| 7,320,386 | Advance Pierre Foods, First Lien Term Loan, 4.150%, 06/02/23 | 7,412,653 | 0.4 | ||||||||||||||||
| 1,109,325 | Atkins Nutritionals Holdings II, Inc., First Lien Term Loan, 6.250%, 01/02/19 | 1,116,258 | 0.1 | ||||||||||||||||
| 3,590,837 | Atrium Innovations, Inc., USD First Lien Term Loan, 4.650%, 02/15/21 | 3,616,648 | 0.2 | ||||||||||||||||
| 7,650,431 | CSM Bakery Supplies, First Lien Term Loan, 5.150%, 07/03/20 | 7,224,875 | 0.4 | ||||||||||||||||
| 3,652,146 | Del Monte Foods Consumer Products, Inc., First Lien, 4.400%, 02/18/21 | 3,037,369 | 0.2 | ||||||||||||||||
| 450,000 | Del Monte Foods Consumer Products, Inc., Second Lien, 8.400%, 08/18/21 | 302,062 | 0.0 | ||||||||||||||||
| 2,490,000 | (1) | Dole Food Company, Inc., Term Loan B, 4.150%, 04/04/24 | 2,508,675 | 0.1 | |||||||||||||||
| 6,335,085 | Hostess, Term Loan, 4.150%, 08/03/22 | 6,405,563 | 0.3 | ||||||||||||||||
| 9,000,000 | JBS USA, Inc. (FKA Swift), Term Loan B, 3.650%, 10/30/22 | 9,032,814 | 0.5 | ||||||||||||||||
| 795,873 | NPC International, Term Loan, 4.900%, 12/28/18 | 802,340 | 0.0 | ||||||||||||||||
| 41,459,257 | 2.2 | ||||||||||||||||||
LOANS*: (continued) | |||||||||||||||||||
Food Service: 1.5% | |||||||||||||||||||
| 5,677,966 | CEC Entertainment, Inc., First Lien Term Loan, 4.150%, 02/14/21 | $ | 5,649,576 | 0.3 | |||||||||||||||
| 2,150,000 | Landry’s Restaurants, Term Loan, 4.400%, 10/04/23 | 2,171,309 | 0.1 | ||||||||||||||||
| 1,988,462 | Manitowoc Foodservice, Inc., Term Loan B, 4.150%, 03/03/23 | 2,010,832 | 0.1 | ||||||||||||||||
| 1,712,263 | P.F. Chang’s China Bistro, Inc., Term Loan, 4.400%, 06/30/19 | 1,690,860 | 0.1 | ||||||||||||||||
| 9,711,632 | Restaurant Brands International (F.K.A. Burger King Corporation), TL B, 3.400%, 02/16/24 | 9,745,020 | 0.5 | ||||||||||||||||
| 6,659,712 | US Foods, Inc., Term Loan B, 3.900%, 06/27/23 | 6,726,902 | 0.4 | ||||||||||||||||
| 27,994,499 | 1.5 | ||||||||||||||||||
Food/Drug Retailers: 1.5% | |||||||||||||||||||
| 10,207,478 | Albertsons LLC, TL-B4, 4.150%, 08/15/21 | 10,269,152 | 0.5 | ||||||||||||||||
| 2,394,000 | (1) | NBTY, Inc., USD Term Loan B, 4.650%, 05/05/23 | 2,408,215 | 0.1 | |||||||||||||||
| 2,437,500 | Portillo Restaurant Group (The), First Lien Term Loan, 5.650%, 08/04/21 | 2,457,305 | 0.1 | ||||||||||||||||
| 4,515,000 | Save-A-Lot, Term Loan B, 7.150%, 12/05/23 | 4,511,474 | 0.3 | ||||||||||||||||
| 6,100,000 | Smart & Final Stores, Extended Term Loan B, 4.650%, 11/15/22 | 6,025,659 | 0.3 | ||||||||||||||||
| 3,420,970 | Supervalu, Term Loan, 5.650%, 03/21/19 | 3,452,566 | 0.2 | ||||||||||||||||
| 29,124,371 | 1.5 | ||||||||||||||||||
Forest Products: 0.1% | |||||||||||||||||||
| 2,763,619 | Blount International, Inc., Term Loan B USD, 7.400%, 04/12/23 | 2,791,255 | 0.1 | ||||||||||||||||
Health Care: 10.8% | |||||||||||||||||||
| 8,305,161 | Acadia, New Term Loan B, 4.150%, 02/16/23 | 8,382,333 | 0.5 | ||||||||||||||||
| 1,226,240 | Aegis Sciences, First Lien Term Loan, 5.650%, 02/24/21 | 1,216,022 | 0.1 | ||||||||||||||||
| 9,326,002 | Air Medical Group Holdings, Inc., Term Loan B, 4.400%, 04/28/22 | 9,333,771 | 0.5 | ||||||||||||||||
| 1,541,079 | Aspen Dental Management, Inc., Term Loan B, 4.900%, 04/30/22 | 1,560,342 | 0.1 | ||||||||||||||||
| 1,091,750 | ATI Physical Therapy, First Lien Term Loan, 4.650%, 05/10/23 | 1,104,942 | 0.1 | ||||||||||||||||
| 3,980,000 | BioClinica, First Lien Term Loan, 5.400%, 10/20/23 | 4,024,775 | 0.2 | ||||||||||||||||
| VOYA FLOATING RATE FUND | PORTFOLIO OF INVESTMENTS ASOF MARCH 31, 2017 (CONTINUED) |
| Principal Amount† | | | Borrower/Tranche Description | | Fair Value | | Percentage of Net Assets | ||||||||||||
|---|---|---|---|---|---|---|---|---|---|---|---|---|---|---|---|---|---|---|---|
LOANS*: (continued) | |||||||||||||||||||
Health Care: (continued) | |||||||||||||||||||
| 2,605,279 | CareCore National, LLC, Term Loan B, 5.650%, 03/05/21 | $ | 2,618,305 | 0.1 | |||||||||||||||
| 3,310,099 | Catalent Pharma Solutions, Inc. , USD Term Loan, 3.900%, 05/20/21 | 3,350,095 | 0.2 | ||||||||||||||||
| 11,500,000 | (1) | Change Healthcare, Inc., Term B, 3.900%, 02/28/24 | 11,533,545 | 0.6 | |||||||||||||||
| 8,240,394 | CHG Medical Staffing, Inc., First Lien Term Loan, 4.900%, 06/07/23 | 8,331,813 | 0.4 | ||||||||||||||||
| 8,388,621 | CHS/Community Health Systems, Inc., Term Loan H, 4.150%, 01/27/21 | 8,279,392 | 0.4 | ||||||||||||||||
| 1,258,254 | Concentra Inc, Term Loan B, 4.150%, 06/01/22 | 1,266,904 | 0.1 | ||||||||||||||||
| 2,243,722 | Correct Care Solutions, First Lien Term Loan, 5.150%, 07/22/21 | 1,862,289 | 0.1 | ||||||||||||||||
| 5,146,975 | Connolly / iHealth Technologies, New First Lien Term Loan B, 3.900%, 09/28/23 | 5,179,144 | 0.3 | ||||||||||||||||
| 6,683,685 | DJO Finance LLC, First Lien Term Loan, 4.400%, 06/08/20 | 6,492,920 | 0.3 | ||||||||||||||||
| 5,785,500 | Envision Healthcare Corporation, Tranche C, 4.150%, 12/01/23 | 5,850,587 | 0.3 | ||||||||||||||||
| 4,303,402 | ExamWorks Group, Inc., Term B, 4.400%, 07/27/23 | 4,335,678 | 0.2 | ||||||||||||||||
| 1,980,316 | Greenway Health LLC, Term B, 5.900%, 02/17/24 | 1,996,406 | 0.1 | ||||||||||||||||
| 15,290,000 | Grifols S.A, TL B, 3.400%, 01/31/25 | 15,346,007 | 0.8 | ||||||||||||||||
| 2,840,887 | Healogics, Inc., First Lien Term Loan, 5.400%, 07/01/21 | 2,655,638 | 0.1 | ||||||||||||||||
| 1,250,000 | Healogics, Inc., Second Lien Term Loan, 9.150%, 07/01/22 | 872,916 | 0.1 | ||||||||||||||||
| 7,430,315 | Iasis Healthcare LLC, Term Loan B-2, 4.500%, 05/03/18 | 7,430,976 | 0.4 | ||||||||||||||||
| 2,603,475 | inVentiv Health Inc., Term loan B, 4.900%, 11/09/23 | 2,616,261 | 0.1 | ||||||||||||||||
| 7,995,000 | Kinetic Concepts, Inc., USD Term B, 4.400%, 02/03/24 | 7,999,165 | 0.4 | ||||||||||||||||
| 5,275,026 | Multiplan, Inc, First Lien Term Loan, 5.150%, 06/07/23 | 5,348,106 | 0.3 | ||||||||||||||||
| 767,650 | NAPA, First Lien Term Loan, 6.150%, 04/19/23 | 772,808 | 0.0 | ||||||||||||||||
| 2,856,858 | Precyse, First Lien Term Loan, 6.650%, 10/20/22 | 2,883,641 | 0.2 | ||||||||||||||||
| 4,853,921 | NVA Holdings, Inc., TLB-2, 4.650%, 08/14/21 | 4,906,503 | 0.3 | ||||||||||||||||
LOANS*: (continued) | |||||||||||||||||||
Health Care: (continued) | |||||||||||||||||||
| 4,500,000 | Patterson Medical Holdings, Inc., Upsized First Lien Term Loan, 5.900%, 08/28/22 | $ | 4,533,750 | 0.2 | |||||||||||||||
| 7,343,216 | Pharmaceutical Product Development, Inc., Term B, 4.400%, 08/18/22 | 7,376,261 | 0.4 | ||||||||||||||||
| 2,274,300 | Press Ganey, First Lien Term Loan, 4.400%, 10/01/23 | 2,283,540 | 0.1 | ||||||||||||||||
| 225,000 | Press Ganey, Second Lien Term Loan, 8.400%, 10/01/24 | 230,344 | 0.0 | ||||||||||||||||
| 4,479,994 | Prospect Medical Holdings, Inc., Term Loan B, 7.150%, 06/30/22 | 4,544,394 | 0.2 | ||||||||||||||||
| 3,302,219 | Schumacher Group, First Lien Term Loan, 5.150%, 07/31/22 | 3,321,480 | 0.2 | ||||||||||||||||
| 5,225,000 | Select Medical Corporation, Term B, 4.650%, 03/06/24 | 5,280,516 | 0.3 | ||||||||||||||||
| 5,899,968 | Sivantos (Siemens Audiology), TL B USD, 4.150%, 01/17/22 | 5,964,502 | 0.3 | ||||||||||||||||
| 6,911,022 | Sterigenics International LLC, Term Loan B, 4.400%, 05/15/22 | 6,936,938 | 0.4 | ||||||||||||||||
| 8,006,160 | Surgery Center Holdings, Inc., First Lien Term Loan, 4.900%, 11/03/20 | 8,088,727 | 0.4 | ||||||||||||||||
| 4,800,000 | Team Health, Inc., Term B, 3.900%, 01/25/24 | 4,787,400 | 0.3 | ||||||||||||||||
| 7,656,847 | U.S. Renal Care, Inc., First Lien Term Loan, 5.400%, 12/30/22 | 7,197,436 | 0.4 | ||||||||||||||||
| 2,245,064 | Valeant Pharmaceuticals International, Inc., First Lien Term Loan, 5.900%, 04/01/22 | 2,253,795 | 0.1 | ||||||||||||||||
| 4,058,856 | Vizient, Inc., Term Loan B-2, 5.150%, 02/13/23 | 4,102,825 | 0.2 | ||||||||||||||||
| 204,453,192 | 10.8 | ||||||||||||||||||
Home Furnishings: 1.1% | |||||||||||||||||||
| 7,044,875 | ADT fka Protection One, Inc., Upsized Term Loan B, 4.400%, 05/02/22 | 7,117,839 | 0.4 | ||||||||||||||||
| 3,674,147 | Hillman Group (The), Inc., Term Loan B, 4.650%, 06/30/21 | 3,707,060 | 0.2 | ||||||||||||||||
| 10,000,000 | Serta Simmons Bedding, LLC, First Lien Term Loan, 4.650%, 11/08/23 | 10,058,930 | 0.5 | ||||||||||||||||
| 20,883,829 | 1.1 | ||||||||||||||||||
Industrial Equipment: 2.8% | |||||||||||||||||||
| 2,275,273 | Accudyne Industries LLC, Term Loan, 4.150%, 12/13/19 | 2,151,271 | 0.1 | ||||||||||||||||
| VOYA FLOATING RATE FUND | PORTFOLIO OF INVESTMENTS ASOF MARCH 31, 2017 (CONTINUED) |
| Principal Amount† | | | Borrower/Tranche Description | | Fair Value | | Percentage of Net Assets | ||||||||||||
|---|---|---|---|---|---|---|---|---|---|---|---|---|---|---|---|---|---|---|---|
LOANS*: (continued) | |||||||||||||||||||
Industrial Equipment: (continued) | |||||||||||||||||||
| 5,611,049 | Apex Tool Group, Term Loan B, 4.500%, 01/31/20 | $ | 5,575,980 | 0.3 | |||||||||||||||
| 1,775,442 | CeramTec GmbH, Dollar Term B-1 Loan, 4.400%, 08/30/20 | 1,787,094 | 0.1 | ||||||||||||||||
| 207,172 | CeramTec GmbH, Dollar Term B-2 Loan, 4.400%, 08/30/20 | 208,532 | 0.0 | ||||||||||||||||
| 541,950 | CeramTec GmbH, Dollar Term B-3 Loan, 4.400%, 08/30/20 | 545,507 | 0.0 | ||||||||||||||||
| 3,984,831 | Columbus McKinnon Corporation, 1st Lien Term Loan, 4.150%, 01/31/24 | 4,024,680 | 0.2 | ||||||||||||||||
| 3,967,128 | Doncasters Group Limited, First Lien Term Loan USD, 4.650%, 04/09/20 | 3,942,333 | 0.2 | ||||||||||||||||
| 2,865,913 | WTG Holdings III Corp., First Lien Term Loan, 4.900%, 01/15/21 | 2,887,407 | 0.2 | ||||||||||||||||
| 5,379,306 | Filtration Group Corporation, First Lien Term Loan, 4.400%, 11/30/20 | 5,433,099 | 0.3 | ||||||||||||||||
| 6,543,608 | Gardner Denver, Inc., Term Loan B USD, 4.400%, 07/30/20 | 6,538,497 | 0.3 | ||||||||||||||||
| 1,343,250 | Global Brass and Copper, Inc., Term Loan B, 5.400%, 07/18/23 | 1,362,559 | 0.1 | ||||||||||||||||
| 2,466,042 | Kenan Advantage Group, Inc., Term Loan B, 4.150%, 07/31/22 | 2,470,358 | 0.1 | ||||||||||||||||
| 749,881 | Kenan Advantage Group, Inc., Term Loan Canada Borrower, 4.150%, 07/31/22 | 751,193 | 0.0 | ||||||||||||||||
| 829,376 | MKS Instruments, Term Loan B, 3.900%, 05/01/23 | 840,132 | 0.0 | ||||||||||||||||
| 7,725,622 | Rexnord Corporation / RBS Global, Inc., First Lien Term Loan, 3.900%, 08/21/23 | 7,763,718 | 0.4 | ||||||||||||||||
| 1,060,000 | Terex Corporation, Term Loan, 3.650%, 01/31/24 | 1,065,520 | 0.1 | ||||||||||||||||
| 6,637,265 | Vertiv, Term Loan B, 6.150%, 11/30/23 | 6,709,864 | 0.4 | ||||||||||||||||
| 54,057,744 | 2.8 | ||||||||||||||||||
Leisure Goods/Activities/Movies: 2.9% | |||||||||||||||||||
| 8,298,250 | 24 Hour Fitness Worldwide, Inc, Term Loan B, 4.900%, 05/28/21 | 8,303,229 | 0.4 | ||||||||||||||||
| 7,110,779 | Delta2 Sarl Luxembourg (Formula One World Championship), Facility B3, 4.400%, 02/01/24 | 7,116,496 | 0.4 | ||||||||||||||||
| 700,000 | Delta2 Sarl Luxembourg (Formula One World Championship), Second Lien Facility, 7.900%, 08/08/22 | 703,587 | 0.0 | ||||||||||||||||
LOANS*: (continued) | |||||||||||||||||||
Leisure Goods/Activities/Movies: (continued) | |||||||||||||||||||
| 6,400,000 | (1) | Equinox Holdings, Inc., First Lien TL-B, 4.400%, 03/10/24 | $ | 6,456,000 | 0.4 | ||||||||||||||
| 530,000 | Equinox Holdings, Inc., Second Lien TL-B, 8.150%, 09/06/24 | 539,165 | 0.0 | ||||||||||||||||
| 8,958,481 | Fitness International, LLC., Term Loan B, 6.150%, 07/01/20 | 9,042,467 | 0.5 | ||||||||||||||||
| 6,263,888 | Life Time Fitness, Upsized Term Loan B, 4.150%, 06/10/22 | 6,292,971 | 0.3 | ||||||||||||||||
| 2,082,857 | NEP/NCP Holdco, Inc, Second Lien, 10.000%, 07/22/20 | 2,115,835 | 0.1 | ||||||||||||||||
| 5,093,858 | NEP/NCP Holdco, Inc, Term Loan B with Add on, 4.500%, 01/22/20 | 5,117,203 | 0.3 | ||||||||||||||||
| 3,928,414 | SRAM, LLC, First Lien Term Loan, 7.500%, 03/13/24 | 3,948,056 | 0.2 | ||||||||||||||||
| 2,912,869 | UFC Holdings (fka Zuffa), First Lien Term Loan, 4.400%, 08/18/23 | 2,933,416 | 0.2 | ||||||||||||||||
| 1,782,000 | Winnebago, Term Loan B, 5.650%, 11/08/23 | 1,808,730 | 0.1 | ||||||||||||||||
| 54,377,155 | 2.9 | ||||||||||||||||||
Lodging & Casinos: 4.0% | |||||||||||||||||||
| 13,191,938 | Amaya Gaming Group Inc., USD Term Loan, 4.650%, 08/01/21 | 13,239,046 | 0.7 | ||||||||||||||||
| 1,739,838 | American Casino and Entertainment Properties LLC, Term Loan, 4.400%, 07/07/22 | 1,751,799 | 0.1 | ||||||||||||||||
| 11,009,907 | Aristocrat Leisure Limited, Term Loan B, 3.400%, 10/20/21 | 11,091,622 | 0.6 | ||||||||||||||||
| 9,814,572 | CityCenter Holdings, LLC, Term Loan, 3.900%, 10/16/20 | 9,939,707 | 0.5 | ||||||||||||||||
| 714,125 | Eldorado Resorts, Inc., Term Loan B, 4.400%, 07/23/22 | 715,232 | 0.0 | ||||||||||||||||
| 3,785,000 | (1) | Eldorado Resorts, Inc., TLB, 3.400%, 03/15/24 | 3,799,194 | 0.2 | |||||||||||||||
| 1,526,112 | Global Cash Access, Inc., Term Loan B, 6.400%, 12/18/20 | 1,540,420 | 0.1 | ||||||||||||||||
| 1,219,891 | Golden Nugget, Inc., Delayed Draw Term Loan, 4.650%, 11/21/19 | 1,238,952 | 0.1 | ||||||||||||||||
| 2,806,435 | Golden Nugget, Inc., Term Loan, 4.650%, 11/21/19 | 2,850,285 | 0.2 | ||||||||||||||||
| 345,625 | Horseshoe Baltimore, Funded Term Loan B, 8.250%, 07/02/20 | 346,921 | 0.0 | ||||||||||||||||
| 3,977,405 | La Quinta, First Lien Term Loan, 3.900%, 04/14/21 | 4,008,429 | 0.2 | ||||||||||||||||
| VOYA FLOATING RATE FUND | PORTFOLIO OF INVESTMENTS ASOF MARCH 31, 2017 (CONTINUED) |
| Principal Amount† | | | Borrower/Tranche Description | | Fair Value | | Percentage of Net Assets | ||||||||||||
|---|---|---|---|---|---|---|---|---|---|---|---|---|---|---|---|---|---|---|---|
LOANS*: (continued) | |||||||||||||||||||
Lodging & Casinos: (continued) | |||||||||||||||||||
| 9,658,550 | Scientific Games International, Inc., Term Loan B-3, 5.150%, 10/01/21 | $ | 9,790,351 | 0.5 | |||||||||||||||
| 11,159,498 | Station Casinos LLC, Term Loan, 3.650%, 06/08/23 | 11,213,901 | 0.6 | ||||||||||||||||
| 3,891,837 | Twin River Management Group, Inc., Term Loan B, 4.650%, 07/10/20 | 3,940,485 | 0.2 | ||||||||||||||||
| 75,466,344 | 4.0 | ||||||||||||||||||
Nonferrous Metals/Minerals: 0.2% | |||||||||||||||||||
| 3,493,366 | Fairmount Minerals, Ltd., Tranche B-2 Term Loan, 4.650%, 09/05/19 | 3,433,688 | 0.2 | ||||||||||||||||
Oil & Gas: 1.2% | |||||||||||||||||||
| 3,248,824 | Energy Transfer Equity, L.P., New Term Loan, 3.900%, 02/02/24 | 3,245,344 | 0.2 | ||||||||||||||||
| 4,761,034 | FTS International, Inc. (fka FracTech), Term Loan, 5.900%, 04/16/21 | 4,174,832 | 0.2 | ||||||||||||||||
| 3,362,063 | Harvey Gulf International Marine, LLC, Upsized Term Loan B, 5.650%, 06/18/20 | 2,412,280 | 0.1 | ||||||||||||||||
| 2,800,000 | Limetree Bay Terminals, Term Loan, 6.150%, 01/30/24 | 2,842,000 | 0.1 | ||||||||||||||||
| 5,197,311 | MEG Energy Corp., Term Loan, 4.650%, 12/31/23 | 5,207,056 | 0.3 | ||||||||||||||||
| 1,965,678 | Seventy Seven Energy Inc., Term Loan, 4.150%, 06/25/20 | 1,957,079 | 0.1 | ||||||||||||||||
| 2,666,538 | Southcross Energy Partners, L.P., Term Loan, 5.400%, 08/04/21 | 2,370,997 | 0.1 | ||||||||||||||||
| 206,782 | Southcross Holdings L.P., Exit Term Loan, 1.150%, 04/13/23 | 186,103 | 0.0 | ||||||||||||||||
| 1,125,000 | Summit Midstream Partners, Term Loan, 7.150%, 05/15/22 | 1,147,500 | 0.1 | ||||||||||||||||
| 23,543,191 | 1.2 | ||||||||||||||||||
Property & Casualty Insurance: 0.2% | |||||||||||||||||||
| 2,892,750 | BroadStreet Partners, Inc., Term Loan B, 5.400%, 11/08/23 | 2,937,498 | 0.2 | ||||||||||||||||
Publishing: 0.9% | |||||||||||||||||||
| 1,627,650 | Cengage Learning Acquisition, Inc., Term Loan-B, 5.400%, 06/07/23 | 1,558,766 | 0.1 | ||||||||||||||||
| 9,143,437 | McGraw Hill Global Education, Term Loan B, 5.150%, 05/04/22 | 9,061,530 | 0.5 | ||||||||||||||||
| 2,682,136 | Merrill Communications, LLC, New First Lien Term Loan, 6.400%, 06/01/22 | 2,688,842 | 0.1 | ||||||||||||||||
LOANS*: (continued) | |||||||||||||||||||
Publishing: (continued) | |||||||||||||||||||
| 244,215 | Tribune Company, Term Loan B, 4.150%, 12/27/20 | $ | 246,811 | 0.0 | |||||||||||||||
| 3,051,456 | Tribune Company, Term Loan C, 4.150%, 01/27/24 | 3,080,064 | 0.2 | ||||||||||||||||
| 16,636,013 | 0.9 | ||||||||||||||||||
Radio & Television: 2.3% | |||||||||||||||||||
| 5,427,475 | CBS Radio, Inc., Term Loan B, 4.650%, 10/17/23 | 5,485,820 | 0.3 | ||||||||||||||||
| 8,181,947 | (1) | Cumulus Media Holdings Inc., Term Loan, 4.400%, 12/23/20 | 6,138,506 | 0.3 | |||||||||||||||
| 4,957,575 | Learfield Communications, Inc, First Lien Term Loan, 4.400%, 12/01/23 | 5,016,446 | 0.3 | ||||||||||||||||
| 6,048,000 | Lions Gate Entertainment Corp, New Term Loan B, 4.150%, 12/08/23 | 6,088,794 | 0.3 | ||||||||||||||||
| 443,753 | Nexstar Broadcasting, Inc., New Term Loan B — Mission, 4.150%, 01/17/24 | 446,711 | 0.0 | ||||||||||||||||
| 4,577,156 | Nexstar Broadcasting, Inc., New Term Loan B — Nexstar, 4.150%, 01/17/24 | 4,607,672 | 0.2 | ||||||||||||||||
| 1,566,429 | Salem Communications Corporation, Term Loan B, 4.650%, 03/13/20 | 1,540,974 | 0.1 | ||||||||||||||||
| 14,404,412 | (1) | Univision Communications, Inc., TL-C5, 3.900%, 03/15/24 | 14,321,141 | 0.8 | |||||||||||||||
| 43,646,064 | 2.3 | ||||||||||||||||||
Retailers (Except Food & Drug): 5.6% | |||||||||||||||||||
| 1,341,250 | Abercrombie & Fitch Management Co., Term Loan B, 4.900%, 08/09/21 | 1,294,306 | 0.1 | ||||||||||||||||
| 2,564,331 | Academy Ltd., Term Loan, 5.150%, 07/01/22 | 1,916,304 | 0.1 | ||||||||||||||||
| 8,545,922 | Ascena Retail Group, Inc., Term Loan B, 5.650%, 08/21/22 | 7,744,742 | 0.4 | ||||||||||||||||
| 2,120,000 | Bass Pro Group, LLC, Asset Sale Facility, 5.900%, 06/08/18 | 2,127,950 | 0.1 | ||||||||||||||||
| 5,949,950 | Belk, First Lien Term Loan, 5.900%, 12/12/22 | 5,078,532 | 0.3 | ||||||||||||||||
| 9,400,000 | BJs Wholesale Club, 1L TL-B, 4.900%, 01/31/24 | 9,212,000 | 0.5 | ||||||||||||||||
| 1,285,000 | BJs Wholesale Club, 2L TL-B, 8.650%, 01/31/25 | 1,257,694 | 0.1 | ||||||||||||||||
| 7,137,950 | FullBeauty Brands (F.K.A. OneStopPlus), First Lien Term Loan, 5.900%, 10/14/22 | 6,029,341 | 0.3 | ||||||||||||||||
| 3,996,118 | General Nutrition Centers, Inc., Term Loan B, 3.650%, 03/04/19 | 3,411,686 | 0.2 | ||||||||||||||||
| VOYA FLOATING RATE FUND | PORTFOLIO OF INVESTMENTS ASOF MARCH 31, 2017 (CONTINUED) |
| Principal Amount† | | | Borrower/Tranche Description | | Fair Value | | Percentage of Net Assets | ||||||||||||
|---|---|---|---|---|---|---|---|---|---|---|---|---|---|---|---|---|---|---|---|
LOANS*: (continued) | |||||||||||||||||||
Retailers (Except Food & Drug): (continued) | |||||||||||||||||||
| 9,465,093 | Harbor Freight Tools USA, Inc., Term Loan B, 4.150%, 08/15/23 | $ | 9,472,978 | 0.5 | |||||||||||||||
| 6,229,388 | Jo-Ann Stores, Inc., Term Loan B, 6.150%, 10/15/23 | 6,146,331 | 0.3 | ||||||||||||||||
| 3,179,626 | Lands’ End, Inc., Term Loan B, 4.400%, 04/04/21 | 2,575,497 | 0.1 | ||||||||||||||||
| 5,999,850 | Leslies Poolmart, Inc., Term Loan B, 5.400%, 08/16/23 | 6,032,351 | 0.3 | ||||||||||||||||
| 7,964,217 | Men’s Wearhouse, Term Loan, 4.650%, 06/18/21 | 7,652,282 | 0.4 | ||||||||||||||||
| 1,095,000 | National Vision, Inc., First Lien Term Loan, 4.150%, 03/13/21 | 1,096,141 | 0.1 | ||||||||||||||||
| 3,516,393 | Neiman Marcus Group, Inc, Term Loan, 4.400%, 10/25/20 | 2,838,391 | 0.2 | ||||||||||||||||
| 6,442,374 | Party City Holdings Inc, Term Loan-B, 4.150%, 08/19/22 | 6,436,047 | 0.3 | ||||||||||||||||
| 7,833,431 | Petco Animal Supplies, Inc., TLB-1, 4.400%, 01/26/23 | 7,407,488 | 0.4 | ||||||||||||||||
| 14,605,709 | PetSmart, Inc., Term Loan-B, 4.150%, 03/11/22 | 14,006,875 | 0.7 | ||||||||||||||||
| 4,541,976 | Savers, Term Loan B, 5.000%, 07/09/19 | 4,038,575 | 0.2 | ||||||||||||||||
| 105,775,511 | 5.6 | ||||||||||||||||||
Surface Transport: 1.1% | |||||||||||||||||||
| 2,440,076 | Goodpack Ltd., First Lien Term Loan, 4.900%, 09/09/21 | 2,396,357 | 0.1 | ||||||||||||||||
| 5,125,000 | Navistar Inc., Term Loan B, 5.150%, 08/07/20 | 5,191,199 | 0.3 | ||||||||||||||||
| 4,302,840 | OSG Bulk Ships, Inc., First Lien Term Loan, 5.400%, 08/05/19 | 4,256,228 | 0.2 | ||||||||||||||||
| 1,471,275 | Quality Distribution, First Lien Term Loan, 5.900%, 08/18/22 | 1,427,137 | 0.1 | ||||||||||||||||
| 1,110,000 | V.Group, TL B, 4.150%, 01/27/24 | 1,112,429 | 0.0 | ||||||||||||||||
| 6,775,649 | XPO Logistics, Term Loan B, 4.400%, 10/31/21 | 6,812,068 | 0.4 | ||||||||||||||||
| 21,195,418 | 1.1 | ||||||||||||||||||
Telecommunications: 5.5% | |||||||||||||||||||
| 3,000,000 | (1) | Altice International S.A., USD TLB, 3.900%, 07/30/25 | 2,998,125 | 0.2 | |||||||||||||||
| 5,272,822 | Aricent Group, First Lien Term Loan, 5.650%, 04/14/21 | 5,290,396 | 0.3 | ||||||||||||||||
| 8,036,307 | Asurion, LLC, Incremental Tranche B-5 Term Loan, 4.900%, 11/01/23 | 8,116,670 | 0.4 | ||||||||||||||||
| 760,244 | Asurion, LLC, Replacement B-2 Term Loan, 4.400%, 07/08/20 | 766,658 | 0.0 | ||||||||||||||||
LOANS*: (continued) | |||||||||||||||||||
Telecommunications: (continued) | |||||||||||||||||||
| 11,194,155 | Asurion, LLC, Replacement B-4 Term Loan, 4.400%, 08/04/22 | $ | 11,269,951 | 0.6 | |||||||||||||||
| 1,150,000 | Asurion, LLC, Second Lien Term Loan, 8.650%, 03/03/21 | 1,163,656 | 0.1 | ||||||||||||||||
| 4,330,167 | CommScope, Inc., Tranche 5 Term Loan, 3.650%, 12/29/22 | 4,362,608 | 0.2 | ||||||||||||||||
| 12,066,291 | Communications Sales & Leasing, Inc., Term Loan B, 4.150%, 10/24/22 | 12,058,690 | 0.6 | ||||||||||||||||
| 4,400,000 | (1) | Consolidated Communications, Inc., Incremental Term Loan, 4.150%, 10/05/23 | 4,426,950 | 0.2 | |||||||||||||||
| 6,430,194 | Consolidated Communications, Inc., Term Loan B, 4.150%, 10/05/23 | 6,476,813 | 0.4 | ||||||||||||||||
| 1,169,443 | Encompass Digital Media, Inc., First Lien, 5.650%, 06/05/21 | 1,127,051 | 0.1 | ||||||||||||||||
| 525,000 | Encompass Digital Media, Inc., Second Lien, 8.900%, 06/05/22 | 485,625 | 0.0 | ||||||||||||||||
| 1,268,929 | Global Tel*Link Corporation, First Lien Term Loan, 5.000%, 05/23/20 | 1,267,541 | 0.1 | ||||||||||||||||
| 850,000 | Global Tel*Link Corporation, Second Lien Term Loan, 9.000%, 11/23/20 | 848,938 | 0.1 | ||||||||||||||||
| 2,907,826 | Hawaiian Telcom Communications, Inc., Term Loan B, 5.400%, 06/06/19 | 2,918,428 | 0.2 | ||||||||||||||||
| 6,000,000 | Level 3 Financing, Inc, Term Loan B, 3.400%, 02/17/24 | 6,013,500 | 0.3 | ||||||||||||||||
| 4,521,774 | Lightower Fiber Networks, First Lien Term Loan, 4.400%, 04/13/20 | 4,561,317 | 0.2 | ||||||||||||||||
| 7,680,000 | Sprint Communications, Term Loan B, 3.650%, 01/31/24 | 7,691,197 | 0.4 | ||||||||||||||||
| 6,934,494 | Syniverse Holdings, Inc., Initial Term Loan, 4.150%, 04/23/19 | 6,414,407 | 0.3 | ||||||||||||||||
| 332,929 | Syniverse Holdings, Inc., Tranche B Term Loan, 4.150%, 04/23/19 | 307,959 | 0.0 | ||||||||||||||||
| 5,140,845 | U.S. Telepacific Corp, Term Loan B, 6.150%, 11/25/20 | 5,183,257 | 0.3 | ||||||||||||||||
| 7,971,516 | Windstream Corporation, Upsized Term Loan B-6, 5.150%, 03/29/21 | 8,059,538 | 0.4 | ||||||||||||||||
| VOYA FLOATING RATE FUND | PORTFOLIO OF INVESTMENTS ASOF MARCH 31, 2017 (CONTINUED) |
| Principal Amount† | | | Borrower/Tranche Description | | Fair Value | | Percentage of Net Assets | ||||||||||||
|---|---|---|---|---|---|---|---|---|---|---|---|---|---|---|---|---|---|---|---|
LOANS*: (continued) | |||||||||||||||||||
Telecommunications: (continued) | |||||||||||||||||||
| 2,525,000 | Zayo Group, LLC, Term Loan B-2, 3.650%, 01/19/24 | $ | 2,542,359 | 0.1 | |||||||||||||||
| 104,351,634 | 5.5 | ||||||||||||||||||
Utilities: 2.8% | |||||||||||||||||||
| 2,169,563 | Aclara Technologies LLC, Term Loan, 6.900%, 08/15/23 | 2,212,954 | 0.1 | ||||||||||||||||
| 6,942,209 | Calpine Corp, Term Loan B-5, 3.900%, 01/15/24 | 6,980,176 | 0.4 | ||||||||||||||||
| 4,939,975 | Calpine Corp, Term Loan B-6, 3.900%, 01/15/23 | 4,968,790 | 0.2 | ||||||||||||||||
| 3,035,393 | Dayton Power and Light Company, Term Loan, 4.400%, 08/30/22 | 3,056,237 | 0.1 | ||||||||||||||||
| 8,875,000 | Dynegy Inc., Term Loan C, 4.400%, 06/30/23 | 8,921,043 | 0.5 | ||||||||||||||||
| 4,531,441 | TPF II Power, LLC, Term Loan, 5.150%, 10/02/21 | 4,570,620 | 0.2 | ||||||||||||||||
| 3,600,000 | (1) | Helix Gen LLC, Term Loan, 4.900%, 03/01/24 | 3,655,127 | 0.2 | |||||||||||||||
| 4,184,889 | Linden Power Complex, Term Loan, 4.650%, 06/28/23 | 4,228,831 | 0.2 | ||||||||||||||||
| 1,965,000 | Longview Power, LLC, Term Loan, 7.150%, 04/13/21 | 1,660,425 | 0.1 | ||||||||||||||||
| 2,553,600 | MRP Generation Holdings, LLC (fka TPF Generation Holdings, LLC), Term Loan, 8.150%, 09/30/22 | 2,579,136 | 0.1 | ||||||||||||||||
| 1,386,000 | RISEC, Term Loan, 5.900%, 12/19/22 | 1,392,930 | 0.1 | ||||||||||||||||
| 1,386,500 | Southeast PowerGen, LLC, Term Loan B, 4.650%, 12/02/21 | 1,376,679 | 0.1 | ||||||||||||||||
| 6,896,003 | Vistra Operations Company LLC (fka TCEH), Term Loan B, 3.900%, 08/04/23 | 6,887,382 | 0.4 | ||||||||||||||||
| 1,576,714 | Vistra Operations Company LLC (fka TCEH), Term Loan C, 3.900%, 08/04/23 | 1,574,743 | 0.1 | ||||||||||||||||
| 54,065,073 | 2.8 | ||||||||||||||||||
Total Loans (Cost $1,763,223,824) | 1,762,775,199 | 93.0 | |||||||||||||||||
| Shares | | | | Value | | Percentage of Net Assets | |||||||||||||
|---|---|---|---|---|---|---|---|---|---|---|---|---|---|---|---|---|---|---|---|
EQUITIES AND OTHER ASSETS: 0.0% | |||||||||||||||||||
| 42,798 | EveryWhere Global | 320,985 | 0.0 | ||||||||||||||||
| 57,165 | Millennium Health, LLC | 59,051 | 0.0 | ||||||||||||||||
| — | Millennium Health, LLC — Corporate Claim Trust | — | 0.0 | ||||||||||||||||
EQUITIES AND OTHER ASSETS: (continued) | |||||||||||||||||||
| 222 | Southcross Holdings GP LLC | $ | — | 0.0 | |||||||||||||||
| 222 | Southcross Holdings L.P. — Class A | 88,800 | 0.0 | ||||||||||||||||
Total Equities and Other Assets (Cost $943,781) | 468,836 | 0.0 | |||||||||||||||||
| Total Long-Term Investments (Cost $1,764,167,605) | 1,763,244,035 | 93.0 | |||||||||||||||||
| Principal Amount† | | | | Value | | Percentage of Net Assets | |||||||||||||
|---|---|---|---|---|---|---|---|---|---|---|---|---|---|---|---|---|---|---|---|
SHORT-TERM INVESTMENTS: 11.7% | |||||||||||||||||||
Loans: 0.0% | |||||||||||||||||||
| 625,000 | Energy Future Intermediate Holding Company LLC, First Lien DIP, 4.400%, 06/30/17 (Cost $625,926) | 625,521 | 0.0 | ||||||||||||||||
| Shares | | | | Value | | Percentage of Net Assets | ||||||||||||
|---|---|---|---|---|---|---|---|---|---|---|---|---|---|---|---|---|---|---|
Mutual Funds: 11.7% | ||||||||||||||||||
| 220,493,051 | State Street Institutional Liquid Reserves Fund — Premier Class, 0.91%†† (Cost $220,515,850) | 220,515,100 | 11.7 | |||||||||||||||
| Total Short-Term Investments (Cost $221,141,776) | 221,140,621 | 11.7 | ||||||||||||||||
Total Investments (Cost $1,985,309,381) | $ | 1,984,384,656 | 104.7 | |||||||||||||||
Liabilities in Excess of Other Assets | (89,574,862 | ) | (4.7 | ) | ||||||||||||||
Net Assets | $ | 1,894,809,794 | 100.0 | |||||||||||||||
| * | Loans, while exempt from registration under the Securities Act of 1933, as amended, contain certain restrictions on resale and cannot be sold publicly. These loans bear interest (unless otherwise noted) at rates that float periodically at a margin above the London Inter-Bank Offered Rate (“LIBOR”) and other short-term rates. |
| † | Unless otherwise indicated, principal amount is shown in USD. |
| †† | Rate shown is the 7-day yield as of March 31, 2017. |
| (1) | Loans purchased on a when-issued or delayed-delivery basis. Contract rates that are not disclosed do not take effect until settlement date and have yet to be determined. |
| (2) | All or a portion of this holding is subject to unfunded loan commitments. Please refer to Note 9 for additional details. |
| Cost for federal income tax purposes is $1,985,535,739. |
| Net unrealized depreciation consists of: | ||||||
| Gross Unrealized Appreciation | $ | 13,091,662 | ||||
| Gross Unrealized Depreciation | (14,242,745 | ) | ||||
| Net Unrealized Depreciation | $ | (1,151,083 | ) |
| VOYA FLOATING RATE FUND | PORTFOLIO OF INVESTMENTS ASOF MARCH 31, 2017 (CONTINUED) |
| Quoted Prices in Active Markets for Identical Investments (Level 1) | Significant Other Observable Inputs (Level 2) | Significant Unobservable Inputs (Level 3) | Fair Value at March 31, 2017 | |||||||||||||||
|---|---|---|---|---|---|---|---|---|---|---|---|---|---|---|---|---|---|---|
Asset Table | ||||||||||||||||||
Investments, at fair value | ||||||||||||||||||
| Loans | $ | — | $ | 1,762,775,199 | $ | — | $ | 1,762,775,199 | ||||||||||
| Equities and Other Assets | — | 468,836 | — | 468,836 | ||||||||||||||
| Short-Term Investments | 220,515,100 | 625,521 | — | 221,140,621 | ||||||||||||||
| Total Investments, at fair value | $ | 220,515,100 | $ | 1,763,869,556 | $ | — | $ | 1,984,384,656 | ||||||||||
| ˆ | See Note 2, “Significant Accounting Policies” in the Notes to Financial Statements for additional information. |
| Fund Name | Type | Per Share Amount | ||||||||
|---|---|---|---|---|---|---|---|---|---|---|
| Voya Floating Rate Fund | ||||||||||
| Class A | NII | $ | 0.3902 | |||||||
| Class C | NII | $ | 0.3164 | |||||||
| Class I | NII | $ | 0.4161 | |||||||
| Class P | NII | $ | 0.4812 | |||||||
| Class R | NII | $ | 0.3657 | |||||||
| Class W | NII | $ | 0.4161 | |||||||
| Name, Address and Age | Position(s) Held with the Trust | Term of Office and Length of Time Served(1) | Principal Occupation(s) — During the Past 5 Years | Number of Funds in Fund Complex Overseen by Trustee(2) | Other Board Positions Held by Trustee | |||||||||||||||||
|---|---|---|---|---|---|---|---|---|---|---|---|---|---|---|---|---|---|---|---|---|---|---|
Independent Trustees: | ||||||||||||||||||||||
| Colleen D. Baldwin 7337 East Doubletree Ranch Rd. Suite 100 Scottsdale, Arizona 85258 Age: 56 | Trustee | November 2007–Present | President, Glantuam Partners, LLC, a business consulting firm (January 2009–Present). | 151 | DSM/Dentaquest, Boston, MA (February 2014–Present). | |||||||||||||||||
| John V. Boyer 7337 East Doubletree Ranch Rd. Suite 100 Scottsdale, Arizona 85258 Age: 63 | Chairperson Trustee | January 2014–Present January 2005–Present | President and Chief Executive Officer, Bechtler Arts Foundation, an arts and education foundation (January 2008–Present). | 151 | None. | |||||||||||||||||
| Patricia W. Chadwick 7337 East Doubletree Ranch Rd. Suite 100 Scottsdale, Arizona 85258 Age: 68 | Trustee | January 2006–Present | Consultant and President, Ravengate Partners LLC, a consulting firm that provides advice regarding financial markets and the global economy (January 2000–Present). | 151 | Wisconsin Energy Corporation (June 2006–Present); The Royce Funds (23 funds) (December 2009–Present); and AMICA Mutual Insurance Company (1992–Present). | |||||||||||||||||
| Peter S. Drotch 7337 East Doubletree Ranch Rd. Suite 100 Scottsdale, Arizona 85258 Age: 75 | Trustee | November 2007–Present | Retired. | 151 | None. | |||||||||||||||||
| Martin J. Gavin 7337 East Doubletree Ranch Rd. Suite 100 Scottsdale, AZ 85258-2034 Age: 67 | Trustee | August 2015–Present | Retired. Formerly, President and Chief Executive Officer, Connecticut Children’s Medical Center (May 2006–November 2015). | 151 | None. | |||||||||||||||||
| Russell H. Jones 7337 East Doubletree Ranch Rd. Suite 100 Scottsdale, Arizona 85258 Age: 73 | Trustee | May 2013–Present | Retired. | 151 | None. | |||||||||||||||||
| Patrick W. Kenny 7337 East Doubletree Ranch Rd. Suite 100 Scottsdale, Arizona 85258 Age: 74 | Trustee | January 2005–Present | Retired. | 151 | Assured Guaranty Ltd. (April 2004–Present). | |||||||||||||||||
| Joseph E. Obermeyer 7337 East Doubletree Ranch Rd. Suite 100 Scottsdale, Arizona 85258 Age: 59 | Trustee | May 2013–Present | President, Obermeyer & Associates, Inc., a provider of financial and economic consulting services (November 1999– Present). | 151 | None. | |||||||||||||||||
| Sheryl K. Pressler 7337 East Doubletree Ranch Rd. Suite 100 Scottsdale, Arizona 85258 Age: 66 | Trustee | January 2006–Present | Consultant (May 2001–Present). | 151 | None. | |||||||||||||||||
| Name, Address and Age | Position(s) Held with the Trust | Term of Office and Length of Time Served(1) | Principal Occupation(s) — During the Past 5 Years | Number of Funds in Fund Complex Overseen by Trustee(2) | Other Board Positions Held by Trustee | |||||||||||||||||
|---|---|---|---|---|---|---|---|---|---|---|---|---|---|---|---|---|---|---|---|---|---|---|
| Christopher P. Sullivan 7337 East Doubletree Ranch Rd. Suite 100 Scottsdale, Arizona 85258 Age: 63 | Trustee | October 2015–Present | Retired. Formerly, President, Bond Division, Fidelity Management and Research (June 2009–September 2012). | 151 | None. | |||||||||||||||||
| Roger B. Vincent 7337 East Doubletree Ranch Rd. Suite 100 Scottsdale, Arizona 85258 Age: 71 | Trustee | February 2002–Present | Retired. | 151 | UGI Corporation (February 2006–Present) and UGI Utilities, Inc. (February 2006–Present). | |||||||||||||||||
Trustee who is an “interested person”: | ||||||||||||||||||||||
Shaun P. Mathews (3) 7337 East Doubletree Ranch Rd. Suite 100 Scottsdale, Arizona 85258 Age: 61 | Trustee | November 2007–Present | President and Chief Executive Officer, Voya Investments, LLC (December 2006– Present). | 151 | Voya Capital Corporation, LLC and Voya Investments Distributor, LLC (December 2005–Present); Voya Funds Services, LLC, Voya Investments, LLC and Voya Investment Management (March 2006–Present); and Voya Investment Trust Co. (April 2009–Present). | |||||||||||||||||
(1) | Trustees serve until their successors are duly elected and qualified. The tenure of each Trustee who is not an “interested person” as defined in the 1940 Act, of each Fund (“Independent Trustee”) is subject to the Board’s retirement policy which states that each duly elected or appointed Independent Trustee shall retire from and cease to be a member of the Board of Trustees at the close of business on December 31 of the calendar year in which the Independent Trustee attains the age of 75. A majority vote of the Board’s other Independent Trustees may extend the retirement date of an Independent Trustee if the retirement would trigger a requirement to hold a meeting of shareholders of the Trust under applicable law, whether for the purposes of appointing a successor to the Independent Trustee or otherwise comply under applicable law, in which case the extension would apply until such time as the shareholder meeting can be held or is no longer required (as determined by a vote of a majority of the other Independent Trustees). | |
(2) | For the purposes of this table, “Fund Complex” means the Voya family of funds including the following investment companies: Voya Asia Pacific High Dividend Equity Income Fund; Voya Balanced Portfolio, Inc.; Voya Emerging Markets High Dividend Equity Fund; Voya Equity Trust; Voya Funds Trust; Voya Global Advantage and Premium Opportunity Fund; Voya Global Equity Dividend and Premium Opportunity Fund; Voya Government Money Market Portfolio; Voya Infrastructure, Industrials and Materials Fund; Voya Intermediate Bond Portfolio; Voya International High Dividend Equity Income Fund; Voya Investors Trust; Voya Mutual Funds; Voya Natural Resources Equity Income Fund; Voya Partners, Inc.; Voya Prime Rate Trust; Voya Senior Income Fund; Voya Separate Portfolios Trust; Voya Series Fund, Inc.; Voya Strategic Allocation Portfolios, Inc.; Voya Variable Funds; Voya Variable Insurance Trust; Voya Variable Portfolios, Inc.; and Voya Variable Products Trust. The number of funds in the Fund Complex is as of April 30, 2017. | |
(3) | Mr. Mathews is deemed to be an “interested person” of the Trust as defined in the 1940 Act, because of his current affiliation with the Voya funds, Voya Financial, Inc. or Voya Financial, Inc.’s affiliates. |
| Name, Address and Age | Position(s) Held With the Trust | Term of Office and Length of Time Served(1) | Principal Occupation(s) — During the Past 5 Years | |||||
|---|---|---|---|---|---|---|---|---|
| Shaun P. Mathews 7337 East Doubletree Ranch Rd. Suite 100 Scottsdale, Arizona 85258 Age: 61 | President and Chief Executive Officer | November 2006–Present | President and Chief Executive Officer, Voya Investments, LLC (December 2006–Present). | |||||
| Michael J. Roland 7337 East Doubletree Ranch Rd. Suite 100 Scottsdale, Arizona 85258 Age: 59 | Executive Vice President | February 2002–Present | Managing Director and Chief Operating Officer, Voya Investments, LLC and Voya Funds Services, LLC (March 2012–Present). Formerly, Chief Compliance Officer, Directed Services LLC and Voya Investments, LLC (March 2011–December 2013); Executive Vice President and Chief Operating Officer, Voya Investments, LLC and Voya Funds Services, LLC (January 2007–April 2012) and Chief Compliance Officer, Voya Family of Funds (March 2011–February 2012). | |||||
| Stanley D. Vyner 230 Park Avenue New York, New York 10169 Age: 67 | Executive Vice President Chief Investment Risk Officer | October 2000–Present September 2009–Present | Executive Vice President, Voya Investments, LLC (July 2000–Present) and Chief Investment Risk Officer, Voya Investments, LLC (January 2003–Present). | |||||
| Kevin M. Gleason 7337 East Doubletree Ranch Rd. Suite 100 Scottsdale, Arizona 85258 Age: 50 | Chief Compliance Officer | February 2012–Present | Senior Vice President, Voya Investment Management and Chief Compliance Officer, Voya Family of Funds (February 2012–Present). Formerly, Assistant General Counsel and Assistant Secretary, The Northwestern Mutual Life Insurance Company (June 2004–January 2012). | |||||
| Todd Modic 7337 East Doubletree Ranch Rd. Suite 100 Scottsdale, Arizona 85258 Age: 49 | Senior Vice President, Chief/Principal Financial Officer and Assistant Secretary | March 2005–Present | Senior Vice President, Voya Investments, LLC and Voya Funds Services, LLC (April 2005– Present). | |||||
| Kimberly A. Anderson 7337 East Doubletree Ranch Rd. Suite 100 Scottsdale, Arizona 85258 Age: 52 | Senior Vice President | November 2003–Present | Senior Vice President, Voya Investments, LLC (September 2003–Present). | |||||
| Robert Terris 7337 East Doubletree Ranch Rd. Suite 100 Scottsdale, Arizona 85258 Age: 46 | Senior Vice President | May 2006–Present | Senior Vice President, Head of Division Operations, Voya Investments, LLC (October 2015–Present) and Voya Funds Services, LLC (March 2006–Present). | |||||
| Fred Bedoya 7337 East Doubletree Ranch Rd. Suite 100 Scottsdale, Arizona 85258 Age: 44 | Vice President and Treasurer | September 2012–Present | Vice President, Voya Investments, LLC (October 2015–Present) and Voya Funds Services, LLC (July 2012–Present). Formerly, Assistant Vice President–Director, Voya Funds Services, LLC (March 2003–March 2012). | |||||
| Maria M. Anderson 7337 East Doubletree Ranch Rd. Suite 100 Scottsdale, Arizona 85258 Age: 59 | Vice President | September 2004–Present | Vice President, Voya Investments, LLC (October 2015–Present) and Voya Funds Services, LLC (September 2004–Present). | |||||
| Lauren D. Bensinger 7337 East Doubletree Ranch Rd. Suite 100 Scottsdale, Arizona 85258 Age: 63 | Vice President | February 2003–Present | Vice President, Voya Funds Services, LLC (February 1996–Present) and Voya Investments, LLC (October 2004–Present); Vice President and Money Laundering Reporting Officer, Voya Investments Distributor, LLC (April 2010–Present). Anti-Money Laundering Compliance Officer, Voya Financial, Inc. (January 2013–Present); and Money Laundering Reporting Officer, Voya Investment Management Trust Co. (October 2012–Present). | |||||
| Sara M. Donaldson 7337 East Doubletree Ranch Rd. Suite 100 Scottsdale, Arizona 85258 Age: 57 | Vice President | September 2014–Present | Vice President, Voya Investments, LLC (October 2015–Present). Formerly, Vice President, Voya Funds Services, LLC (April 2014–October 2015). Formerly, Director, Compliance, AXA Rosenberg Global Services, LLC (September 1997–March 2014). |
| Name, Address and Age | Position(s) Held With the Trust | Term of Office and Length of Time Served(1) | Principal Occupation(s) — During the Past 5 Years | |||||
|---|---|---|---|---|---|---|---|---|
| Micheline S. Faver 7337 East Doubletree Ranch Rd. Suite 100 Scottsdale, Arizona 85258 Age: 39 | Vice President | September 2016–Present | Vice President, Head of Fund Compliance, Voya Investments LLC, and Chief Compliance Officer for Voya Investments, LLC and Directed Services, LLC (June 2016–Present). Formerly, Vice President, Mutual Fund Compliance (March 2014–June 2016); Assistant Vice President, Mutual Fund Compliance (May 2013–March 2014); Assistant Vice President, Senior Project Manager (May 2008–May 2013). | |||||
| Robyn L. Ichilov 7337 East Doubletree Ranch Rd. Suite 100 Scottsdale, Arizona 85258 Age: 49 | Vice President | October 2000–Present | Vice President, Voya Funds Services, LLC (November 1995–Present) and Voya Investments, LLC (August 1997–Present). Formerly, Treasurer, Voya Family of Funds (November 1999–February 2012). | |||||
| Jason Kadavy 7337 East Doubletree Ranch Rd. Suite 100 Scottsdale, Arizona 85258 Age: 41 | Vice President | September 2012–Present | Vice President, Voya Investments, LLC (October 2015–Present) and Voya Funds Services, LLC (July 2007–Present). | |||||
| Kimberly K. Springer 7337 East Doubletree Ranch Rd. Suite 100 Scottsdale, Arizona 85258 Age: 60 | Vice President | March 2006–Present | Vice President — Mutual Fund Product Development, Voya Investments, LLC (July 2012–Present); Vice President, Voya Family of Funds (March 2010–Present) and Vice President, Voya Funds Services, LLC (March 2006–Present). Formerly Managing Paralegal, Registration Statements (June 2003–July 2012). | |||||
| Craig Wheeler 7337 East Doubletree Ranch Rd. Suite 100 Scottsdale, Arizona 85258 Age: 48 | Vice President | May 2013–Present | Vice President — Director of Tax, Voya Investments, LLC (October 2015–Present). Formerly, Vice President — Director of Tax, Voya Funds Services, LLC (March 2013–October 2015). Formerly, Assistant Vice President — Director of Tax, Voya Funds Services, LLC (March 2008–February 2013). | |||||
| Huey P. Falgout, Jr. 7337 East Doubletree Ranch Rd. Suite 100 Scottsdale, Arizona 85258 Age: 53 | Secretary | August 2003–Present | Senior Vice President and Chief Counsel, Voya Investment Management — Mutual Fund Legal Department (March 2010–Present). | |||||
| Paul A. Caldarelli 7337 East Doubletree Ranch Rd. Suite 100 Scottsdale, Arizona 85258 Age: 65 | Assistant Secretary | June 2010–Present | Vice President and Senior Counsel, Voya Investment Management — Mutual Fund Legal Department (March 2010–Present). | |||||
| Theresa K. Kelety 7337 East Doubletree Ranch Rd. Suite 100 Scottsdale, Arizona 85258 Age: 54 | Assistant Secretary | August 2003–Present | Vice President and Senior Counsel, Voya Investment Management — Mutual Fund Legal Department (March 2010–Present). |
(1) | The Officers hold office until the next annual meeting of the Board of Trustees and until their successors shall have been elected and qualified. |
contracts renewal and approval process, and the Fund is assigned to an IRC, which provides ongoing oversight regarding, among other matters, the investment performance of the Adviser and the Sub-Adviser, as well as the oversight by the Adviser of the performance of the Sub-Adviser. The IRCs will typically apply a heightened level of scrutiny in cases where performance has lagged the Fund’s relevant benchmark and/or Morningstar, Inc. (“Morningstar”) category average, as applicable. The Board and/or IRCs may also apply a heightened level of scrutiny in cases where the Fund’s performance has lagged its Selected Peer Group (defined below).
the Forms ADV for the Adviser and the Sub-Adviser; (7) financial statements for the Adviser and the Sub-Adviser; (8) a draft of a narrative summary addressing key factors the Board customarily considers in evaluating the Management and Sub-Advisory Contracts for the Voya funds’ (including the Fund’s) investment management and sub-advisory contracts, including a written analysis for the Fund of how performance, fees and expenses compare to its Selected Peer Group and/or designated benchmark(s); (9) independent analyses of Fund performance by the Trust’s Chief Investment Risk Officer, who leads the Adviser’s Investment Risk Management Department (“IRMD”); (10) information regarding net asset flows into and out of the Fund; and (11) other information relevant to the Board’s evaluations.
included, among others: reductions in fee rates or adjustments to expense limitation and waiver arrangements; changes in the sub-adviser or portfolio managers; and strategy modifications.
Voya Investments, LLC
7337 East Doubletree Ranch Road, Suite 100
Scottsdale, Arizona 85258
Voya Investments Distributor, LLC
7337 East Doubletree Ranch Road, Suite 100
Scottsdale, Arizona 85258
BNY Mellon Investment Servicing (U.S.) Inc.
301 Bellevue Parkway
Wilmington, Delaware 19809
KPMG LLP
Two Financial Center
60 South Street
Boston, Massachusetts 02111
State Street Bank and Trust Company
801 Pennsylvania Avenue
Kansas City, Missouri 64105
Ropes & Gray LLP
Prudential Tower
800 Boylston Street
Boston, Massachusetts 02199
Call us from 9:00 a.m. to 7:00 p.m. Eastern time on any business day for account or other information, at (800) 992-0180
RETIREMENT | INVESTMENTS | INSURANCE | |
| voyainvestments.com | 163061 (0317-052417) |
Item 2. Code of Ethics.
As of the end of the period covered by this report, Registrant had adopted a code of ethics, as defined in Item 2 of Form N-CSR, that applies to the Registrant’s principal executive officer and principal financial officer. There were no amendments to the Code during the period covered by the report. The Registrant did not grant any waivers, including implicit waivers, from any provisions of the Code during the period covered by this report. The code of ethics is filed herewith pursuant to Item 10(a)(1), Ex-99.CODE ETH.
Item 3. Audit Committee Financial Expert.
The Board of Trustees has determined that Colleen D. Baldwin, Peter S. Drotch, Martin J. Gavin, Patrick W. Kenny, Joseph E. Obermeyer, and Roger B. Vincent are audit committee financial experts, as defined in Item 3 of Form N-CSR. Ms. Baldwin, Mr. Drotch, Mr. Gavin, Mr. Kenny, Mr. Obermeyer and Mr. Vincent are “independent” for purposes of Item 3 of Form N-CSR.
Item 4. Principal Accountant Fees and Services.
| (a) | Audit Fees: The aggregate fees billed for each of the last two fiscal years for professional services rendered by KPMG LLP (“KPMG”), the principal accountant for the audit of the registrant’s annual financial statements or services that are normally provided by the accountant in connection with statutory and regulatory filings or engagements for those fiscal years were $165,325 for the year ended March 31, 2017 and $148,000 for the year ended March 31, 2016. |
| (b) | Audit-Related Fees: The aggregate fees billed in each of the last two fiscal years for assurance and related services by KPMG that are reasonably related to the performance of the audit of the registrant’s financial statements and are not reported under paragraph (a) of this Item were $15,150 for the year ended March 31, 2017 and $15,150 for the year ended March 31, 2016. |
| (c) | Tax Fees: The aggregate fees billed in each of the last two fiscal years for professional services rendered by KPMG for tax compliance, tax advice, and tax planning were $53,767 for the year ended March 31, 2017 and $43,890 for the year ended March 31, 2016. Such services included review of excise distribution calculations (if applicable), preparation of the Funds’ federal, state, and excise tax returns, tax services related to mergers and routine consulting. |
| (d) | All Other Fees: The aggregate fees billed in each of the last two fiscal years for products and services provided by KPMG, other than the services reported in paragraphs (a) through (c) of this Item were $0 for the year ended March 31, 2017 and $0 for the year ended March 31, 2016. |
| (e)(1) | Audit Committee Pre-Approval Policies and Procedures |
AUDIT AND NON-AUDIT SERVICES
PRE-APPROVAL POLICY
| I. | Statement of Principles |
Under the Sarbanes-Oxley Act of 2002 (the “Act”), the Audit Committee of the Board of Directors or Trustees (the “Committee”) of the Voya funds (each a “Fund,” collectively, the “Funds”) set out on Exhibit A to this Audit and Non-Audit Services Pre-Approval Policy (“Policy”) is responsible for the oversight of the work of the Funds’ independent auditors. As part of its responsibilities, the Committee must pre-approve the audit and non-audit services performed by the auditors in order to assure that the provision of these services does not impair the auditors’ independence from the Funds. The Committee has adopted, and the Board has ratified, this Policy, which sets out the procedures and conditions under which the services of the independent auditors may be pre-approved.
Under Securities and Exchange Commission (“SEC”) rules promulgated in accordance with the Act, the Funds may establish two different approaches to pre-approving audit and non-audit services. The Committee may approve services without consideration of specific case-by-case services (“general pre-approval”) or it may pre-approve specific services (“specific pre-approval”). The Committee believes that the combination of these approaches contemplated in this Policy results in an effective and efficient method for pre-approving audit and non-audit services to be performed by the Funds’ independent auditors. Under this Policy, services that are not of a type that may receive general pre-approval require specific pre-approval by the Committee. Any proposed services that exceed pre-approved cost levels or budgeted amounts will also require the Committee’s specific pre-approval.
For both types of approval, the Committee considers whether the subject services are consistent with the SEC’s rules on auditor independence and that such services are compatible with maintaining the auditors independence. The Committee also considers whether a particular audit firm is in the best position to provide effective and efficient services to the Funds. Reasons that the auditors are in the best position include the auditors’ familiarity with the Funds’ business, personnel, culture, accounting systems, risk profile, and other factors, and whether the services will enhance the Funds’ ability to manage and control risk or improve audit quality. Such factors will be considered as a whole, with no one factor being determinative.
The appendices attached to this Policy describe the audit, audit-related, tax-related, and other services that have the Committee’s general pre-approval. For any service that has been approved through general pre-approval, the general pre-approval will remain in place for a period 12 months from the date of pre-approval, unless the Committee determines that a different period is appropriate. The Committee will annually review and pre-approve the services that may be provided by the independent auditors without specific pre-approval. The Committee will revise the list of services subject to general pre-approval as appropriate. This Policy does not serve as a delegation to Fund management of the Committee’s duty to pre-approve services performed by the Funds’ independent auditors.
| II. | Audit Services |
The annual audit services engagement terms and fees are subject to the Committee’s specific pre-approval. Audit services are those services that are normally provided by auditors in connection with statutory and regulatory filings or engagements or those that generally only independent auditors can reasonably provide. They include the Funds’ annual financial statement audit and procedures that the independent auditors must perform in order to form an opinion on the Funds’ financial statements (e.g., information systems and procedural reviews and testing). The Committee will monitor the audit services engagement and approve any changes in terms, conditions or fees deemed by the Committee to be necessary or appropriate.
The Committee may grant general pre-approval to other audit services, such as statutory audits and services associated with SEC registration statements, periodic reports and other documents filed with the SEC or issued in connection with securities offerings.
The Committee has pre-approved the audit services listed on Appendix A. The Committee must specifically approve all audit services not listed on Appendix A.
| III. | Audit-related Services |
Audit-related services are assurance and related services that are reasonably related to the performance of the audit or the review of the Funds’ financial statements or are traditionally performed by the independent auditors. The Committee believes that the provision of audit-related services will not impair the independent auditors’ independence, and therefore may grant pre-approval to audit-related services. Audit-related services include accounting consultations related to accounting, financial reporting or disclosure matters not classified as “audit services;” assistance with understanding and implementing new accounting and financial reporting guidance from rulemaking authorities; agreed-upon or expanded audit procedures relating to accounting and/or billing records required to respond to or comply with financial, accounting or regulatory reporting matters; and assistance with internal control reporting requirements under Form N-SAR or Form N-CSR.
The Committee has pre-approved the audit-related services listed on Appendix B. The Committee must specifically approve all audit-related services not listed on Appendix B.
| IV. | Tax Services |
The Committee believes the independent auditors can provide tax services to the Funds, including tax compliance, tax planning, and tax advice, without compromising the auditors’ independence. Therefore, the Committee may grant general pre-approval with respect to tax services historically provided by the Funds’ independent auditors that do not, in the Committee’s view, impair auditor independence and that are consistent with the SEC’s rules on auditor independence.
The Committee will not grant pre-approval if the independent auditors initially recommends a transaction the sole business purpose of which is tax avoidance and the tax treatment of which may not be supported in the Internal Revenue Code and related regulations.
The Committee may consult outside counsel to determine that tax planning and reporting positions are consistent with this Policy.
The Committee has pre-approved the tax-related services listed on Appendix C. The Committee must specifically approve all tax-related services not listed on Appendix C.
| V. | Other Services |
The Committee believes it may grant approval of non-audit services that are permissible services for independent auditors to a Fund. The Committee has determined to grant general pre-approval to other services that it believes are routine and recurring, do not impair auditor independence, and are consistent with SEC rules on auditor independence.
The Committee has pre-approved the non-audit services listed on Appendix D. The Committee must specifically approve all non-audit services not listed on Appendix D.
A list of the SEC’s prohibited non-audit services is attached to this Policy as Appendix E. The SEC’s rules and relevant guidance should be consulted to determine the precise definitions of these impermissible services and the applicability of exceptions to certain of the SEC’s prohibitions.
| VI. | Pre-approval of Fee levels and Budgeted Amounts |
The Committee will annually establish pre-approval fee levels or budgeted amounts for audit, audit-related, tax and non-audit services to be provided to the Funds by the independent auditors. Any proposed services exceeding these levels or amounts require the Committee’s specific pre-approval. The Committee considers fees for audit and non-audit services when deciding whether to pre-approve services. The Committee may determine, for a pre-approval period of 12 months, the appropriate ratio between the total amount of fees for the Fund’s audit, audit-related, and tax services (including fees for services provided to Fund affiliates that are subject to pre-approval), and the total amount of fees for certain permissible non-audit services for the Fund classified as other services (including any such services provided to Fund affiliates that are subject to pre-approval).
| VII. | Procedures |
Requests or applications for services to be provided by the independent auditors will be submitted to management. If management determines that the services do not fall within those services generally pre-approved by the Committee and set out in the appendices to these procedures, management will submit the services to the Committee or its delagee. Any such submission will include a detailed description of the services to be rendered. Notwithstanding this paragraph, the Committee will, on a quarterly basis, receive from the independent auditors a list of services provided for the previous calendar quarter on a cumulative basis by the auditors during the Pre-Approval Period.
| VIII. | Delegation |
The Committee may delegate pre-approval authority to one or more of the Committee’s members. Any member or members to whom such pre-approval authority is delegated must report any pre-approval decisions, including any pre-approved services, to the Committee at its next scheduled meeting. The Committee will identify any member to whom pre-approval authority is delegated in writing. The member will retain such authority for a period of 12 months from the date of pre-approval unless the Committee determines that a different period is appropriate. The period of delegated authority may be terminated by the Committee or at the option of the member.
| IX. | Additional Requirements |
The Committee will take any measures the Committee deems necessary or appropriate to oversee the work of the independent auditors and to assure the auditors’ independence from the Funds. This may include reviewing a formal written statement from the independent auditors delineating all relationships between the auditors and the Funds, consistent with Independence Standards Board No. 1, and discussing with the auditors their methods and procedures for ensuring independence.
Part of KPMG’s performance of an audit in accordance with standards of the Public Company Accounting Oversight Board (US) includes their responsibility to maintain and monitor auditor independence with respect to the Voya funds. Using a proprietary system called Sentinel, the audit team is able to identify and manage potential conflicts of interest across the member firms of the KPMG International Network and prevent the provision of prohibited services to the Voya entities that would impair KPMG independence with the respect to the Voya funds. KPMG requests pre-approval from the Voya funds Audit Committee for services provided to the Voya funds and for services to affiliated entities that relate to the financial reporting or nature of operations of the Voya Funds. Additionally, KPMG provides an annual summary of the fees for services that have commenced for Voya funds and Affiliates.
Last Approved: November 11, 2016
Appendix A
Pre-Approved Audit Services for the Pre-Approval Period January 1, 2017 through December 31, 2017
| Service | The Fund(s) | Fee Range |
| Statutory audits or financial audits (including tax services associated with audit services) | √ | As presented to Audit Committee1 |
| Services associated with SEC registration statements, periodic reports and other documents filed with the SEC or other documents issued in connection with securities offerings (e.g., consents), and assistance in responding to SEC comment letters. | √ | Not to exceed $9,750 per filing |
| Consultations by Fund management with respect to accounting or disclosure treatment of transactions or events and/or the actual or potential effect of final or proposed rules, standards or interpretations by the SEC, Financial Accounting Standards Board, or other regulatory or standard setting bodies. | √ | Not to exceed $8,000 during the Pre-Approval Period |
| Seed capital audit and related review and issuance of consent on the N-2 registration statement | √ | Not to exceed $14,750 per audit |
| Audit of summary portfolio of investments | √ | Not to exceed $565 per fund |
| 1 | For new Funds launched during the Pre-Approval Period, the fee ranges pre-approved will be the same as those for existing Funds, pro-rated in accordance with inception dates as provided in the auditors’ Proposal or any Engagement Letter covering the period at issue. Fees in the Engagement Letter will be controlling. |
Appendix B
Pre-Approved Audit-Related Services for the Pre-Approval Period January 1, 2017 through December 31, 2017
| Service | The Fund(s) | Fund Affiliates | Fee Range |
| Services related to Fund mergers (Excludes tax services - See Appendix C for tax services associated with Fund mergers) | √ | √ | Not to exceed $10,000 per merger |
| Consultations by Fund management with respect to accounting or disclosure treatment of transactions or events and/or the actual or potential effect of final or proposed rules, standards or interpretations by the SEC, Financial Accounting Standards Board, or other regulatory or standard setting bodies. [Note: Under SEC rules some consultations may be “audit” services and others may be “audit-related” services.] | √ | Not to exceed $5,000 per occurrence during the Pre-Approval Period | |
| Review of the Funds’ semi-annual and quarterly financial statements | √ | Not to exceed $2,700 per set of financial statements per fund | |
| Reports to regulatory or government agencies related to the annual engagement | √ | Up to $5,000 per occurrence during the Pre-Approval Period | |
| Regulatory compliance assistance | √ | √ | Not to exceed $5,000 per quarter |
| Training courses | √ | Not to exceed $5,000 per course | |
| For Prime Rate Trust, agreed upon procedures for quarterly reports to rating agencies | √ | Not to exceed $9,450 per quarter |
Appendix C
Pre-Approved Tax Services for the Pre-Approval Period January 1, 2017 through December 31, 2017
| Service | The Fund(s) | Fund Affiliates | Fee Range |
| Preparation of federal and state income tax returns and federal excise tax returns for the Funds including assistance and review with excise tax distributions | √ | As presented to Audit Committee2 | |
| Review of IRC Sections 851(b) and 817(h) diversification testing on a real-time basis | √ | As presented to Audit Committee2 | |
| Assistance and advice regarding year-end reporting for 1099’s, as requested | √ | As presented to Audit Committee2 | |
| Tax assistance and advice regarding statutory, regulatory or administrative developments | √ | √ | Not to exceed $5,000 for the Funds or for the Funds’ investment adviser during the Pre-Approval Period |
| 2 | For new Funds launched during the Pre-Approval Period, the fee ranges pre-approved will be the same as those for existing Funds, pro-rated in accordance with inception dates as provided in the auditors’ Proposal or any Engagement Letter covering the period at issue. Fees in the Engagement Letter will be controlling. |
Appendix C, continued
Pre-Approved Tax Services for the Pre-Approval Period January 1, 2017 through December 31, 2017
| Service | The Fund(s) | Fund Affiliates | Fee Range |
| Tax training courses | √ | Not to exceed $5,000 per course during the Pre-Approval Period | |
| Tax services associated with Fund mergers | √ | √ | Not to exceed $4,000 per fund per merger during the Pre-Approval Period |
| Other tax-related assistance and consultation, including, without limitation, assistance in evaluating derivative financial instruments and international tax issues, qualification and distribution issues, and similar routine tax consultations. | √ | Not to exceed $120,000 during the Pre-Approval Period |
Appendix D
Pre-Approved Other Services for the Pre-Approval Period January 1, 2017 through December 31, 2017
| Service | The Fund(s) | Fund Affiliates | Fee Range |
| Agreed-upon procedures for Class B share 12b-1 programs | √ | Not to exceed $60,000 during the Pre-Approval Period | |
Security counts performed pursuant to Rule 17f-2 of the 1940 Act (i.e., counts for Funds holding securities with affiliated sub-custodians)
Cost to be borne 50% by the Funds and 50% by Voya Investments, LLC. | √ | √ | Not to exceed $5,700 per Fund during the Pre-Approval Period |
| Agreed upon procedures for 15 (c) FACT Books | √ | Not to exceed $50,000 during the Pre-Approval Period |
Appendix E
Prohibited Non-Audit Services
Dated: January 1, 2017 to December 31, 2017
| · | Bookkeeping or other services related to the accounting records or financial statements of the Funds |
| · | Financial information systems design and implementation |
| · | Appraisal or valuation services, fairness opinions, or contribution-in-kind reports |
| · | Actuarial services |
| · | Internal audit outsourcing services |
| · | Management functions |
| · | Human resources |
| · | Broker-dealer, investment adviser, or investment banking services |
| · | Legal services |
| · | Expert services unrelated to the audit |
| · | Any other service that the Public Company Accounting Oversight Board determines, by regulation, is impermissible |
EXHIBIT A
VOYA ASIA PACIFIC HIGH DIVIDEND EQUITY INCOME FUND
VOYA BALANCED PORTFOLIO, INC.
VOYA EMERGING MARKETS HIGH DIVIDEND EQUITY FUND
VOYA EQUITY TRUST
VOYA FUNDS TRUST
VOYA GLOBAL ADVANTAGE AND PREMIUM OPPORTUNITY FUND
VOYA GLOBAL EQUITY DIVIDEND AND PREMIUM OPPORTUNITY FUND
VOYA GOVERNMENT MONEY MARKET PORTFOLIO
VOYA INFRASTRUCTURE, INDUSTRIALS, AND MATERIALS FUND
VOYA INTERMEDIATE BOND PORTFOLIO
VOYA INTERNATIONAL HIGH DIVIDEND EQUITY INCOME FUND
VOYA INVESTORS TRUST
VOYA MUTUAL FUNDS
VOYA PARTNERS, INC.
VOYA PRIME RATE TRUST
VOYA NATURAL RESOURCES EQUITY INCOME FUND
VOYA SENIOR INCOME FUND
VOYA SEPARATE PORTFOLIOS TRUST
VOYA SERIES FUND, INC.
VOYA STRATEGIC ALLOCATIONS PORTFOLIOS, INC.
VOYA VARIABLE FUNDS
VOYA VARIABLE INSURANCE TRUST
VOYA VARIABLE PORTFOLIOS INC,
VOYA VARIABLE PRODUCTS TRUST
| (e)(2) | Percentage of services referred to in 4(b) – (4)(d) that were approved by the audit committee |
100% of the services were approved by the audit committee.
| (f) | Percentage of hours expended attributable to work performed by other than full time employees of KPMG if greater than 50% |
Not applicable.
| (g) | Non-Audit Fees: The following table presents (i) the aggregate non-audit fees (i.e., fees for audit-related, tax, and other services) billed to each Registrant by the independent registered public accounting firm for each Registrant’s fiscal years ended March 31, 2017 and March 31, 2016; and (ii) the aggregate non-audit fees billed to the investment adviser, or any of its affiliates that provide ongoing services to the registrant, by the independent registered public accounting firm for the same time periods. |
| Registrant/Investment Adviser | 2017 | 2016 | ||||||
| Voya Funds Trust | $ | 68,917 | $ | 59,040 | ||||
| Voya Investments, LLC (1) | $ | 93,000 | $ | 178,050 | ||||
(1) Each Registrant’s investment adviser and any of its affiliates, which are subsidiaries of Voya Financial, Inc.
| (h) | Principal Accountants Independence: The Registrant’s Audit committee has considered whether the provision of non-audit services that were rendered to the registrant’s investment adviser and any entity controlling, controlled by, or under common control with the investment adviser that provides ongoing services to the registrant that were not pre-approved pursuant to Rule 2-01(c)(7)(ii) of Regulation S-X is compatible with maintaining KPMG’s independence. |
Item 5. Audit Committee of Listed Registrants.
Not applicable.
Item 6. Schedule of Investments.
Complete schedule of investments, as applicable, is included as part of the report to shareholders filed under Item 1 of this Form and filed herein, as applicable.
Report of Independent Registered Public Accounting Firm
The Shareholders and Board of Trustees
Voya Funds Trust
We have audited the accompanying statements of assets and liabilities, including the summary portfolios of investments, of Voya GNMA Income Fund, Voya High Yield Bond Fund, Voya Intermediate Bond Fund, Voya Short Term Bond Fund, and Voya Strategic Income Opportunities Fund, and including the portfolio of investments of Voya Floating Rate Fund, each a series of Voya Funds Trust, as of March 31, 2017, and the related statements of operations for the year then ended, the statements of changes in net assets for each of the years in the two-year period then ended (collectively, the "financial statements"), and the financial highlights for each of the years or periods in the five-year period then ended (the financial statements and financial highlights are included in Item 1 of this Form N-CSR), and the portfolios of investments of Voya GNMA Income Fund, Voya High Yield Bond Fund, Voya Intermediate Bond Fund, Voya Short Term Bond Fund, and Voya Strategic Income Opportunities Fund, as of March 31, 2017 (included in Item 6 of this Form N-CSR). These financial statements, financial highlights, and portfolios of investments are the responsibility of management. Our responsibility is to express an opinion on these financial statements, financial highlights, and portfolios of investments based on our audits.
We conducted our audits in accordance with the standards of the Public Company Accounting Oversight Board (United States). Those standards require that we plan and perform the audit to obtain reasonable assurance about whether the financial statements, financial highlights, and portfolios of investments are free of material misstatement. An audit includes examining, on a test basis, evidence supporting the amounts and disclosures in the financial statements and portfolios of investments. Our procedures included confirmation of securities owned as of March 31, 2017, by correspondence with the custodian, transfer agent, and brokers, or by other appropriate auditing procedures when replies from brokers were not received. An audit also includes assessing the accounting principles used and significant estimates made by management, as well as evaluating the overall financial statement presentation. We believe that our audits provide a reasonable basis for our opinion.
In our opinion, the financial statements, financial highlights, and portfolios of investments referred to above present fairly, in all material respects, the financial position of the aforementioned funds of Voya Funds Trust as of March 31, 2017, and the results of their operations for the year then ended, the changes in their net assets for each of the years in the two-year period then ended, and the financial highlights for each of the years or periods in the five-year period then ended, in conformity with U.S. generally accepted accounting principles.

Boston, Massachusetts
May 26, 2017
| Voya GNMA Income Fund | PORTFOLIO OF INVESTMENTS as of March 31, 2017 |
| Principal Amount† | Value | Percentage of Net Assets | ||||||||||||
| COLLATERALIZED MORTGAGE OBLIGATIONS: 54.6% | ||||||||||||||
| 2,238,481 | Fannie Mae 2005-43 PZ, 6.000%, 05/25/35 | 2,647,642 | 0.2 | |||||||||||
| 1,061,264 | Fannie Mae 2007-60 ZB, 4.750%, 05/25/37 | 1,180,011 | 0.1 | |||||||||||
| 4,302,842 | Fannie Mae 2011-99 CZ, 4.500%, 10/25/41 | 4,785,366 | 0.4 | |||||||||||
| 15,328,461 | ^ | Fannie Mae 2012-148 HI, 3.500%, 05/25/42 | 2,243,225 | 0.2 | ||||||||||
| 335,501 | Fannie Mae Grantor Trust 2004-T1 1A1, 6.000%, 01/25/44 | 379,755 | 0.0 | |||||||||||
| 1,959,903 | Fannie Mae REMIC Trust 2003-16 CX, 6.500%, 03/25/33 | 2,291,374 | 0.2 | |||||||||||
| 3,575,202 | Fannie Mae REMIC Trust 2003-34 LN, 5.000%, 05/25/33 | 3,771,710 | 0.3 | |||||||||||
| 6,002,195 | Fannie Mae REMIC Trust 2003-76 EZ, 5.000%, 08/25/33 | 6,805,427 | 0.6 | |||||||||||
| 892,382 | Fannie Mae REMIC Trust 2004-W3 A8, 5.500%, 05/25/34 | 966,420 | 0.1 | |||||||||||
| 2,035,936 | ^ | Fannie Mae REMIC Trust 2005-17 ES, 5.768%, 03/25/35 | 269,697 | 0.0 | ||||||||||
| 1,479,507 | Fannie Mae REMIC Trust 2005-59 NQ, 14.421%, 05/25/35 | 1,903,428 | 0.2 | |||||||||||
| 1,374,109 | Fannie Mae REMIC Trust 2005-88 ZC, 5.000%, 10/25/35 | 1,492,552 | 0.1 | |||||||||||
| 499,480 | Fannie Mae REMIC Trust 2006-115 ES, 22.633%, 12/25/36 | 726,762 | 0.1 | |||||||||||
| 3,751,543 | ^ | Fannie Mae REMIC Trust 2006-36 SP, 5.718%, 05/25/36 | 520,923 | 0.0 | ||||||||||
| 6,806,315 | ^ | Fannie Mae REMIC Trust 2006-79 SH, 5.468%, 08/25/36 | 1,328,479 | 0.1 | ||||||||||
| 180,385 | Fannie Mae REMIC Trust 2007-114 A6, 1.182%, 10/27/37 | 180,263 | 0.0 | |||||||||||
| 792,597 | Fannie Mae REMIC Trust 2009-12 LK, 7.853%, 03/25/39 | 862,370 | 0.1 | |||||||||||
| 1,861,549 | Fannie Mae REMIC Trust 2009-66 XA, 5.500%, 12/25/35 | 2,093,293 | 0.2 | |||||||||||
| 6,000,000 | Fannie Mae REMIC Trust 2010-155 JC, 4.000%, 12/25/39 | 6,385,018 | 0.5 | |||||||||||
| 5,084,839 | Fannie Mae REMIC Trust 2010-2 LC, 5.000%, 02/25/40 | 5,715,144 | 0.5 | |||||||||||
| 2,478,438 | Fannie Mae REMIC Trust 2011-30 ZA, 5.000%, 04/25/41 | 2,616,300 | 0.2 | |||||||||||
| 4,957,622 | ^ | Fannie Mae REMIC Trust 2012-128 VS, 5.268%, 06/25/42 | 768,619 | 0.1 | ||||||||||
| 12,269,726 | ^ | Fannie Mae REMIC Trust 2012-142 BI, 3.000%, 11/25/27 | 1,221,762 | 0.1 | ||||||||||
| 5,592,798 | ^ | Fannie Mae REMIC Trust 2012-154 PI, 4.000%, 05/25/42 | 969,866 | 0.1 | ||||||||||
| 5,087,814 | ^ | Fannie Mae REMIC Trust 2012-68 SD, 5.718%, 06/25/32 | 932,315 | 0.1 | ||||||||||
| 3,457,000 | Fannie Mae REMIC Trust 2012-97 PC, 3.500%, 09/25/42 | 3,353,283 | 0.3 | |||||||||||
| 1,884,226 | ^ | Fannie Mae REMIC Trust 2013-13 PI, 3.500%, 04/25/42 | 252,415 | 0.0 | ||||||||||
| 5,245,027 | ^ | Fannie Mae REMIC Trust 2013-54 ID, 3.000%, 01/25/33 | 646,909 | 0.1 | ||||||||||
| 8,285,906 | Fannie Mae Series 2016-51 S, 4.938%, 10/25/43 | 8,255,900 | 0.7 | |||||||||||
| 2,892,648 | Freddie Mac 3770 GA, 4.500%, 10/15/40 | 3,170,081 | 0.3 | |||||||||||
| 4,894,445 | Freddie Mac REMIC Trust 2005-S001 2A2, 1.132%, 09/25/45 | 4,831,171 | 0.4 | |||||||||||
| 748,563 | Freddie Mac REMIC Trust 2653 SC, 6.309%, 07/15/33 | 820,293 | 0.1 | |||||||||||
| 1,088,336 | Freddie Mac REMIC Trust 2767 ZW, 6.000%, 03/15/34 | 1,142,090 | 0.1 | |||||||||||
| 344,288 | Freddie Mac REMIC Trust 3012 ST, 18.676%, 04/15/35 | 487,907 | 0.0 | |||||||||||
| 637,507 | Freddie Mac REMIC Trust 3065 DC, 17.123%, 03/15/35 | 899,413 | 0.1 | |||||||||||
| 1,241,894 | Freddie Mac REMIC Trust 3158 NE, 5.500%, 05/15/36 | 1,379,872 | 0.1 | |||||||||||
| 7,735,144 | ^ | Freddie Mac REMIC Trust 3181 TA, 0.500%, 07/15/36 | 167,469 | 0.0 | ||||||||||
| 783,569 | ^ | Freddie Mac REMIC Trust 3507 IA, 5.500%, 09/15/35 | 149,514 | 0.0 | ||||||||||
| 506,532 | ^ | Freddie Mac REMIC Trust 3753 PS, 5.188%, 06/15/40 | 32,349 | 0.0 | ||||||||||
| 4,695,320 | ^ | Freddie Mac REMIC Trust 3795 PI, 4.500%, 10/15/35 | 104,297 | 0.0 | ||||||||||
| 883,873 | Freddie Mac REMIC Trust 3864 NT, 5.500%, 03/15/39 | 933,025 | 0.1 | |||||||||||
| 4,626,891 | Freddie Mac REMIC Trust 3888 ZG, 4.000%, 07/15/41 | 4,903,241 | 0.4 | |||||||||||
| 2,633,194 | ^ | Freddie Mac REMIC Trust 4027 QI, 4.500%, 12/15/40 | 342,649 | 0.0 | ||||||||||
| 1,078,601 | Freddie Mac Series 4040 UZ, 5.000%, 05/15/42 | 1,259,820 | 0.1 | |||||||||||
See Accompanying Notes to Financial Statements
| Voya GNMA Income Fund | PORTFOLIO OF INVESTMENTS as of March 31, 2017 (continued) |
| Principal Amount† | Value | Percentage of Net Assets | ||||||||||||
| COLLATERALIZED MORTGAGE OBLIGATIONS: (continued) | ||||||||||||||
| 368,495 | ^ | Freddie Mac-Ginnie Mae Series 21 SA, 7.018%, 10/25/23 | 55,080 | 0.0 | ||||||||||
| 1,994,717 | Ginnie Mae 2004-65 ZG, 5.500%, 07/20/34 | 2,237,257 | 0.2 | |||||||||||
| 4,531,596 | Ginnie Mae 2009-110 ZA, 5.500%, 11/16/39 | 5,525,737 | 0.5 | |||||||||||
| 1,335,558 | Ginnie Mae 2009-54 HZ, 5.000%, 07/20/39 | 1,475,022 | 0.1 | |||||||||||
| 3,965,022 | Ginnie Mae 2009-H01 FA, 2.128%, 11/20/59 | 4,010,094 | 0.3 | |||||||||||
| 2,000,000 | Ginnie Mae 2010-116 PB, 5.000%, 06/16/40 | 2,301,113 | 0.2 | |||||||||||
| 2,645,050 | Ginnie Mae 2010-125 BZ, 4.500%, 09/16/40 | 2,929,216 | 0.2 | |||||||||||
| 8,556,112 | ^^ | Ginnie Mae 2011-70 PO, 05/16/41 | 7,188,199 | 0.6 | ||||||||||
| 5,791,114 | Ginnie Mae 2012-H14 FK, 1.360%, 07/20/62 | 5,789,014 | 0.5 | |||||||||||
| 7,097,666 | ^ | Ginnie Mae 2014-107 XS, 4.672%, 07/16/44 | 932,222 | 0.1 | ||||||||||
| 3,619,880 | ^ | Ginnie Mae 2014-96 SQ, 4.672%, 07/16/44 | 483,430 | 0.0 | ||||||||||
| 4,599,246 | Ginnie Mae 2015-H13 FG, 1.180%, 04/20/65 | 4,569,252 | 0.4 | |||||||||||
| 32,157,395 | ^ | Ginnie Mae 2016-120 IM, 3.500%, 07/20/46 | 5,293,631 | 0.4 | ||||||||||
| 5,946,346 | ^ | Ginnie Mae 2016-84 IO, 5.000%, 12/20/40 | 680,994 | 0.1 | ||||||||||
| 27,444,033 | Ginnie Mae 2016-H20 FB, 1.330%, 09/20/66 | 27,390,182 | 2.2 | |||||||||||
| 24,987,486 | Ginnie Mae 2016-H23 F, 1.530%, 10/20/66 | 24,968,895 | 2.0 | |||||||||||
| 241,389 | Ginnie Mae Series 2002-11 TS, 18.215%, 02/16/32 | 314,983 | 0.0 | |||||||||||
| 40,242 | Ginnie Mae Series 2002-15 SX, 14.043%, 01/20/32 | 52,911 | 0.0 | |||||||||||
| 945,230 | ^ | Ginnie Mae Series 2002-76 SG, 6.672%, 10/16/29 | 185,767 | 0.0 | ||||||||||
| 6,267,916 | Ginnie Mae Series 2003-86 ZC, 4.500%, 10/20/33 | 6,743,826 | 0.6 | |||||||||||
| 229,262 | Ginnie Mae Series 2004-16 AE, 5.500%, 02/20/34 | 257,438 | 0.0 | |||||||||||
| 1,059,507 | Ginnie Mae Series 2004-17 MZ, 5.500%, 03/16/34 | 1,185,569 | 0.1 | |||||||||||
| 1,234,099 | Ginnie Mae Series 2004-28 CZ, 5.500%, 04/20/34 | 1,375,701 | 0.1 | |||||||||||
| 4,564 | Ginnie Mae Series 2004-28 SV, 8.022%, 04/20/34 | 4,586 | 0.0 | |||||||||||
| 5,539,897 | Ginnie Mae Series 2004-81 Z, 5.000%, 10/20/34 | 6,126,523 | 0.5 | |||||||||||
| 312,973 | Ginnie Mae Series 2004-87 SB, 6.585%, 03/17/33 | 325,972 | 0.0 | |||||||||||
| 2,088,989 | ^ | Ginnie Mae Series 2004-98 SA, 5.722%, 11/20/34 | 428,236 | 0.0 | ||||||||||
| 1,939,016 | Ginnie Mae Series 2005-21 Z, 5.000%, 03/20/35 | 2,132,129 | 0.2 | |||||||||||
| 604,775 | ^ | Ginnie Mae Series 2005-25 SI, 6.000%, 01/20/34 | 116,488 | 0.0 | ||||||||||
| 1,753,645 | ^ | Ginnie Mae Series 2005-7 AH, 5.842%, 02/16/35 | 295,214 | 0.0 | ||||||||||
| 1,261,909 | ^ | Ginnie Mae Series 2005-73 IM, 5.500%, 09/20/35 | 343,777 | 0.0 | ||||||||||
| 996,917 | Ginnie Mae Series 2005-80 Z, 5.000%, 10/20/35 | 1,107,787 | 0.1 | |||||||||||
| 722,862 | Ginnie Mae Series 2005-91 UP, 12.443%, 09/16/31 | 871,214 | 0.1 | |||||||||||
| 1,800,000 | Ginnie Mae Series 2005-92 PB, 6.000%, 12/20/35 | 2,086,406 | 0.2 | |||||||||||
| 8,998,764 | Ginnie Mae Series 2005-96 Z, 5.500%, 12/16/35 | 10,034,731 | 0.8 | |||||||||||
| 10,567,856 | Ginnie Mae Series 2006-10 ZT, 6.000%, 03/20/36 | 12,683,912 | 1.0 | |||||||||||
| 1,687,928 | Ginnie Mae Series 2006-17 TW, 6.000%, 04/20/36 | 1,969,286 | 0.2 | |||||||||||
| 16,123,731 | ^ | Ginnie Mae Series 2006-26 TB, 0.250%, 06/20/36 | 157,351 | 0.0 | ||||||||||
| 3,123,077 | Ginnie Mae Series 2006-7 ZA, 5.500%, 02/20/36 | 3,533,445 | 0.3 | |||||||||||
| 3,181,165 | ^ | Ginnie Mae Series 2007-17 CI, 7.500%, 04/16/37 | 920,115 | 0.1 | ||||||||||
| 168,816 | Ginnie Mae Series 2007-37 S, 21.896%, 04/16/37 | 206,812 | 0.0 | |||||||||||
| 200,000 | Ginnie Mae Series 2007-45 PE, 5.500%, 07/16/37 | 220,444 | 0.0 | |||||||||||
| 268,814 | Ginnie Mae Series 2007-5 MT, 1.198%, 02/20/34 | 268,163 | 0.0 | |||||||||||
| 4,205,562 | ^ | Ginnie Mae Series 2007-53 SC, 5.522%, 09/20/37 | 758,979 | 0.1 | ||||||||||
| 99,551 | Ginnie Mae Series 2007-53 SW, 17.270%, 09/20/37 | 142,675 | 0.0 | |||||||||||
| 2,111,724 | Ginnie Mae Series 2007-60 YZ, 5.500%, 10/20/37 | 2,354,920 | 0.2 | |||||||||||
| 3,917,319 | Ginnie Mae Series 2007-63 Z, 6.000%, 10/20/37 | 4,479,894 | 0.4 | |||||||||||
| 2,450,590 | Ginnie Mae Series 2008-20 PZ, 6.000%, 03/20/38 | 2,987,260 | 0.2 | |||||||||||
| 1,101,603 | ^ | Ginnie Mae Series 2008-3 SA, 5.572%, 01/20/38 | 190,677 | 0.0 | ||||||||||
| 2,242,082 | ^ | Ginnie Mae Series 2008-40 PS, 5.572%, 05/16/38 | 384,262 | 0.0 | ||||||||||
| 4,973,944 | ^ | Ginnie Mae Series 2008-82 SA, 5.022%, 09/20/38 | 750,992 | 0.1 | ||||||||||
See Accompanying Notes to Financial Statements
| Voya GNMA Income Fund | PORTFOLIO OF INVESTMENTS as of March 31, 2017 (continued) |
| Principal Amount† | Value | Percentage of Net Assets | ||||||||||||
| COLLATERALIZED MORTGAGE OBLIGATIONS: (continued) | ||||||||||||||
| 8,160,734 | ^ | Ginnie Mae Series 2009-110 SA, 5.422%, 04/16/39 | 958,419 | 0.1 | ||||||||||
| 695,055 | Ginnie Mae Series 2009-110 ZC, 4.500%, 11/16/39 | 759,827 | 0.1 | |||||||||||
| 2,084,046 | Ginnie Mae Series 2009-121 ZQ, 5.500%, 09/20/39 | 2,375,628 | 0.2 | |||||||||||
| 1,029,000 | Ginnie Mae Series 2009-31 BP, 5.000%, 05/20/39 | 1,148,562 | 0.1 | |||||||||||
| 5,527,150 | Ginnie Mae Series 2009-31 ZL, 4.500%, 05/20/39 | 6,031,118 | 0.5 | |||||||||||
| 5,008,976 | Ginnie Mae Series 2009-34 Z, 4.500%, 05/16/39 | 5,347,658 | 0.4 | |||||||||||
| 2,582,755 | Ginnie Mae Series 2009-53 ZB, 6.000%, 07/16/39 | 3,095,903 | 0.3 | |||||||||||
| 514,172 | ^ | Ginnie Mae Series 2009-55 BI, 1.000%, 06/16/37 | 19,250 | 0.0 | ||||||||||
| 1,533,212 | Ginnie Mae Series 2009-61 EZ, 7.500%, 08/20/39 | 1,826,401 | 0.1 | |||||||||||
| 1,523,176 | Ginnie Mae Series 2009-61 PZ, 7.500%, 08/20/39 | 2,348,186 | 0.2 | |||||||||||
| 715,566 | Ginnie Mae Series 2009-61 ZQ, 6.000%, 08/16/39 | 930,913 | 0.1 | |||||||||||
| 1,934,660 | ^ | Ginnie Mae Series 2009-66 QS, 5.122%, 05/20/32 | 242,627 | 0.0 | ||||||||||
| 2,770,922 | Ginnie Mae Series 2009-67 NZ, 6.000%, 08/16/39 | 3,232,627 | 0.3 | |||||||||||
| 3,783 | Ginnie Mae Series 2009-68 KA, 5.000%, 09/20/37 | 3,785 | 0.0 | |||||||||||
| 1,827,210 | ^ | Ginnie Mae Series 2009-77 SA, 5.222%, 09/16/39 | 275,421 | 0.0 | ||||||||||
| 3,018,333 | Ginnie Mae Series 2009-77 ZB, 5.500%, 09/16/39 | 3,525,948 | 0.3 | |||||||||||
| 838,026 | Ginnie Mae Series 2009-87 WZ, 6.000%, 10/20/39 | 1,077,744 | 0.1 | |||||||||||
| 530,313 | Ginnie Mae Series 2009-92 DZ, 4.500%, 10/16/39 | 569,961 | 0.0 | |||||||||||
| 4,944,382 | ^ | Ginnie Mae Series 2010-106 IP, 5.000%, 03/20/40 | 746,369 | 0.1 | ||||||||||
| 3,672,460 | ^ | Ginnie Mae Series 2010-116 NS, 5.722%, 09/16/40 | 608,789 | 0.1 | ||||||||||
| 441,492 | ^ | Ginnie Mae Series 2010-130 KI, 5.500%, 09/16/40 | 63,769 | 0.0 | ||||||||||
| 1,000,000 | Ginnie Mae Series 2010-14 B, 4.500%, 02/16/40 | 1,104,950 | 0.1 | |||||||||||
| 2,629,292 | ^ | Ginnie Mae Series 2010-158 SA, 5.072%, 12/20/40 | 429,232 | 0.0 | ||||||||||
| 1,630,253 | ^ | Ginnie Mae Series 2010-165 IP, 4.000%, 04/20/38 | 92,386 | 0.0 | ||||||||||
| 7,149,621 | ^ | Ginnie Mae Series 2010-166 GS, 5.022%, 12/20/40 | 1,106,061 | 0.1 | ||||||||||
| 3,889,939 | ^ | Ginnie Mae Series 2010-166 NI, 4.500%, 04/20/39 | 489,699 | 0.0 | ||||||||||
| 3,125,000 | Ginnie Mae Series 2010-169 AW, 4.500%, 12/20/40 | 3,385,299 | 0.3 | |||||||||||
| 6,531,689 | Ginnie Mae Series 2010-169 JZ, 4.000%, 12/20/40 | 6,774,924 | 0.6 | |||||||||||
| 1,215,343 | ^ | Ginnie Mae Series 2010-19 LI, 5.000%, 07/16/39 | 164,151 | 0.0 | ||||||||||
| 1,600,000 | Ginnie Mae Series 2010-31 BP, 5.000%, 03/20/40 | 1,766,112 | 0.1 | |||||||||||
| 2,123,551 | ^ | Ginnie Mae Series 2010-4 WI, 6.000%, 01/16/40 | 730,383 | 0.1 | ||||||||||
| 5,512,764 | Ginnie Mae Series 2010-42 VZ, 5.500%, 10/20/39 | 6,273,943 | 0.5 | |||||||||||
| 2,718,478 | Ginnie Mae Series 2010-59 ZA, 4.500%, 05/20/40 | 2,947,685 | 0.2 | |||||||||||
| 37,077,994 | Ginnie Mae Series 2010-61 EZ, 5.000%, 05/20/40 | 40,363,004 | 3.3 | |||||||||||
| 4,761,000 | Ginnie Mae Series 2010-67 JD, 4.500%, 05/20/39 | 4,997,113 | 0.4 | |||||||||||
| 1,705,308 | ^ | Ginnie Mae Series 2010-85 NI, 5.000%, 01/20/38 | 92,914 | 0.0 | ||||||||||
| 70,879 | ^ | Ginnie Mae Series 2010-89 KI, 4.500%, 12/20/37 | 1,692 | 0.0 | ||||||||||
| 2,558,958 | ^ | Ginnie Mae Series 2010-9 SB, 5.522%, 09/20/38 | 191,493 | 0.0 | ||||||||||
| 8,415,106 | Ginnie Mae Series 2010-H01 FA, 1.601%, 01/20/60 | 8,459,739 | 0.7 | |||||||||||
| 10,040,829 | Ginnie Mae Series 2010-H10 FB, 1.781%, 05/20/60 | 10,167,661 | 0.8 | |||||||||||
| 10,802,451 | Ginnie Mae Series 2010-H10 FC, 1.781%, 05/20/60 | 10,920,360 | 0.9 | |||||||||||
| 11,272,895 | Ginnie Mae Series 2010-H20 AF, 1.110%, 10/20/60 | 11,170,636 | 0.9 | |||||||||||
| 790,427 | ^ | Ginnie Mae Series 2011-123 QI, 5.000%, 05/20/41 | 143,199 | 0.0 | ||||||||||
| 276,498 | Ginnie Mae Series 2011-169 BC, 7.000%, 05/16/32 | 309,968 | 0.0 | |||||||||||
| 715,107 | Ginnie Mae Series 2011-169 BG, 5.409%, 04/16/39 | 780,008 | 0.1 | |||||||||||
| 6,371,120 | Ginnie Mae Series 2011-25 Z, 4.000%, 02/20/41 | 6,864,165 | 0.6 | |||||||||||
See Accompanying Notes to Financial Statements
| Voya GNMA Income Fund | PORTFOLIO OF INVESTMENTS as of March 31, 2017 (continued) |
| Principal Amount† | Value | Percentage of Net Assets | ||||||||||||
| COLLATERALIZED MORTGAGE OBLIGATIONS: (continued) | ||||||||||||||
| 1,720,056 | Ginnie Mae Series 2011-59 QC, 4.000%, 12/20/40 | 1,844,147 | 0.2 | |||||||||||
| 12,795,151 | ^ | Ginnie Mae Series 2011-73 LS, 5.712%, 08/20/39 | 1,581,447 | 0.1 | ||||||||||
| 2,819,000 | Ginnie Mae Series 2011-85 LC, 4.000%, 10/20/40 | 2,962,809 | 0.2 | |||||||||||
| 1,552,897 | Ginnie Mae Series 2011-H07 FA, 1.280%, 02/20/61 | 1,548,336 | 0.1 | |||||||||||
| 3,038,615 | ^ | Ginnie Mae Series 2012-102 TI, 4.000%, 08/20/39 | 569,216 | 0.0 | ||||||||||
| 4,452,407 | ^ | Ginnie Mae Series 2012-103 IC, 3.500%, 08/16/40 | 484,392 | 0.0 | ||||||||||
| 1,266,577 | ^ | Ginnie Mae Series 2012-124 MI, 4.000%, 03/20/42 | 203,794 | 0.0 | ||||||||||
| 14,324,074 | ^ | Ginnie Mae Series 2012-146 AI, 3.000%, 10/20/37 | 1,717,103 | 0.1 | ||||||||||
| 856,437 | ^ | Ginnie Mae Series 2012-34 MS, 5.772%, 04/16/41 | 154,149 | 0.0 | ||||||||||
| 414,570 | Ginnie Mae Series 2012-43 MA, 4.000%, 10/20/41 | 429,401 | 0.0 | |||||||||||
| 4,103,237 | Ginnie Mae Series 2012-43 MB, 4.000%, 04/20/42 | 4,575,491 | 0.4 | |||||||||||
| 7,831,035 | ^ | Ginnie Mae Series 2012-48 SA, 5.722%, 04/16/42 | 1,675,322 | 0.1 | ||||||||||
| 10,618,199 | ^ | Ginnie Mae Series 2012-60 SG, 5.172%, 05/16/42 | 1,823,470 | 0.1 | ||||||||||
| 2,931,747 | ^ | Ginnie Mae Series 2012-98 EI, 4.000%, 04/20/41 | 427,861 | 0.0 | ||||||||||
| 27,624 | ^ | Ginnie Mae Series 2012-98 WI, 4.500%, 02/20/38 | 764 | 0.0 | ||||||||||
| 2,837,410 | Ginnie Mae Series 2012-H11 VA, 1.430%, 05/20/62 | 2,843,429 | 0.2 | |||||||||||
| 33,043,446 | Ginnie Mae Series 2012-H12 FB, 1.830%, 02/20/62 | 33,496,451 | 2.7 | |||||||||||
| 2,067,594 | Ginnie Mae Series 2012-H20 BA, 1.340%, 09/20/62 | 2,064,729 | 0.2 | |||||||||||
| 4,643,860 | Ginnie Mae Series 2012-H29 SA, 1.295%, 10/20/62 | 4,628,122 | 0.4 | |||||||||||
| 3,000,000 | Ginnie Mae Series 2013-147 BE, 4.000%, 12/20/39 | 3,126,290 | 0.3 | |||||||||||
| 2,790,436 | Ginnie Mae Series 2013-148 YA, 4.500%, 09/20/40 | 2,917,355 | 0.2 | |||||||||||
| 1,251,701 | Ginnie Mae Series 2013-167 Z, 3.000%, 10/16/43 | 1,195,829 | 0.1 | |||||||||||
| 1,900,000 | ^ | Ginnie Mae Series 2013-186 UI, 2.500%, 11/20/43 | 649,882 | 0.1 | ||||||||||
| 2,243,535 | ^ | Ginnie Mae Series 2013-186 VI, 4.000%, 12/20/42 | 365,138 | 0.0 | ||||||||||
| 11,637,440 | ^ | Ginnie Mae Series 2013-20 LI, 4.500%, 12/16/42 | 1,916,994 | 0.2 | ||||||||||
| 6,588,318 | ^ | Ginnie Mae Series 2013-41 PI, 3.500%, 04/20/40 | 649,704 | 0.1 | ||||||||||
| 2,823,838 | Ginnie Mae Series 2013-H08 BF, 1.180%, 03/20/63 | 2,802,623 | 0.2 | |||||||||||
| 6,285,397 | Ginnie Mae Series 2013-H10 FT, 1.260%, 04/20/63 | 6,302,724 | 0.5 | |||||||||||
| 4,544,035 | Ginnie Mae Series 2013-H14 FC, 1.250%, 06/20/63 | 4,523,980 | 0.4 | |||||||||||
| 1,614,501 | Ginnie Mae Series 2013-H18 BA, 1.380%, 07/20/63 | 1,614,272 | 0.1 | |||||||||||
| 4,792,574 | Ginnie Mae Series 2013-H19 DF, 1.430%, 05/20/63 | 4,796,397 | 0.4 | |||||||||||
| 10,938,242 | Ginnie Mae Series 2013-H19 FC, 1.380%, 08/20/63 | 10,936,258 | 0.9 | |||||||||||
| 3,750,427 | Ginnie Mae Series 2013-H20 FB, 1.780%, 08/20/63 | 3,798,188 | 0.3 | |||||||||||
| 4,656,631 | Ginnie Mae Series 2013-H23 FA, 2.080%, 09/20/63 | 4,762,626 | 0.4 | |||||||||||
| 9,999,640 | Ginnie Mae Series 2013-H23 TA, 1.500%, 09/20/63 | 10,039,801 | 0.8 | |||||||||||
| 2,793,200 | Ginnie Mae Series 2014-115 EM, 4.000%, 08/20/44 | 2,960,443 | 0.2 | |||||||||||
| 1,485,618 | Ginnie Mae Series 2014-118 ZP, 4.000%, 08/20/44 | 1,576,397 | 0.1 | |||||||||||
| 5,917,154 | ^ | Ginnie Mae Series 2014-30 ES, 4.022%, 03/20/40 | 727,338 | 0.1 | ||||||||||
| 12,862,576 | Ginnie Mae Series 2015-10 Q, 2.254%, 10/20/44 | 12,267,039 | 1.0 | |||||||||||
| 12,125,000 | Ginnie Mae Series 2015-143 B, 3.500%, 04/20/45 | 12,502,873 | 1.0 | |||||||||||
| 4,572,831 | ^ | Ginnie Mae Series 2015-157 PI, 4.000%, 03/20/44 | 850,901 | 0.1 | ||||||||||
| 13,347,340 | Ginnie Mae Series 2015-27 PB, 3.000%, 08/20/44 | 13,443,569 | 1.1 | |||||||||||
| 50,678,403 | Ginnie Mae Series 2015-H31 FT, 1.430%, 11/20/65 | 50,864,530 | 4.1 | |||||||||||
| 19,181,911 | ^ | Ginnie Mae Series 2016-145 IU, 3.500%, 10/20/46 | 3,783,080 | 0.3 | ||||||||||
| 10,313,855 | Ginnie Mae Series 2016-5 AB, 4.684%, 01/20/46 | 11,129,147 | 0.9 | |||||||||||
| 32,449,828 | Ginnie Mae Series 2016-H08 FT, 1.500%, 02/20/66 | 32,628,971 | 2.7 | |||||||||||
See Accompanying Notes to Financial Statements
| Voya GNMA Income Fund | PORTFOLIO OF INVESTMENTS as of March 31, 2017 (continued) |
| Principal Amount† | Value | Percentage of Net Assets | ||||||||||||
| COLLATERALIZED MORTGAGE OBLIGATIONS: (continued) | ||||||||||||||
| 1,126,850 | Vendee Mortgage Trust 2011-2 DZ, 3.750%, 10/15/41 | 1,157,468 | 0.1 | |||||||||||
| Total Collateralized Mortgage Obligations (Cost $668,480,846) | 670,253,134 | 54.6 | ||||||||||||
| COMMERCIAL MORTGAGE-BACKED SECURITIES: 1.6% | ||||||||||||||
| 874,895 | Ginnie Mae Series 2004-23 Z, 5.480%, 03/16/44 | 928,115 | 0.1 | |||||||||||
| 12,799,274 | ^ | Ginnie Mae Series 2006-67 IO, 0.378%, 11/16/46 | 86,733 | 0.0 | ||||||||||
| 2,084,596 | Ginnie Mae Series 2007-52 Z, 4.350%, 01/16/48 | 2,215,579 | 0.2 | |||||||||||
| 1,973,669 | Ginnie Mae Series 2008-39 Z, 4.500%, 02/16/48 | 2,154,057 | 0.2 | |||||||||||
| 587,352 | ^ | Ginnie Mae Series 2008-45 IO, 0.669%, 02/16/48 | 4,483 | 0.0 | ||||||||||
| 1,529,326 | Ginnie Mae Series 2008-48 Z, 4.865%, 04/16/48 | 1,571,812 | 0.1 | |||||||||||
| 911,733 | Ginnie Mae Series 2009-115 D, 4.677%, 01/16/50 | 965,244 | 0.1 | |||||||||||
| 5,800,107 | Ginnie Mae Series 2009-60 Z, 4.910%, 06/16/49 | 6,069,899 | 0.5 | |||||||||||
| 8,186,011 | ^ | Ginnie Mae Series 2010-122 IO, 0.257%, 02/16/44 | 216,326 | 0.0 | ||||||||||
| 112,115 | ^ | Ginnie Mae Series 2010-123 IA, 1.943%, 10/16/52 | 5,105 | 0.0 | ||||||||||
| 33,826,021 | ^ | Ginnie Mae Series 2011-47 IO, 0.007%, 01/16/51 | 407,786 | 0.0 | ||||||||||
| 1,382,090 | Ginnie Mae Series 2011-53 B, 4.397%, 05/16/51 | 1,464,450 | 0.1 | |||||||||||
| 4,000,000 | Ginnie Mae Series 2011-95 C, 3.526%, 01/16/40 | 4,116,931 | 0.3 | |||||||||||
| Total Commercial Mortgage-Backed Securities (Cost $20,217,812) | 20,206,520 | 1.6 | ||||||||||||
| ASSET-BACKED SECURITIES: 0.9% | ||||||||||||||
| Other Asset-Backed Securities: 0.9% | ||||||||||||||
| 1,741,054 | Fannie Mae Grantor Trust 2003-T4 2A6, 4.761%, 07/26/33 | 1,843,899 | 0.2 | |||||||||||
| 197,238 | Fannie Mae REMIC Trust 2001-W4 AF6, 5.610%, 01/25/32 | 211,646 | 0.0 | |||||||||||
| 292,611 | Fannie Mae REMIC Trust 2002-W12 AF6, 5.066%, 02/25/33 | 299,711 | 0.0 | |||||||||||
| 363,396 | Fannie Mae REMIC Trust 2002-W2 AF6, 6.496%, 05/25/32 | 376,867 | 0.0 | |||||||||||
| 7,633,492 | Fannie Mae REMIC Trust 2003-W16 AF5, 4.566%, 11/25/33 | 7,741,106 | 0.7 | |||||||||||
| Total Asset-Backed Securities (Cost $10,370,577) | 10,473,229 | 0.9 | ||||||||||||
| U.S. GOVERNMENT AGENCY OBLIGATIONS: 70.7% | ||||||||||||||
| Federal Home Loan Mortgage Corporation: 3.4%## | ||||||||||||||
| 4,756,725 | 4.000%, due 11/01/45 | 4,995,486 | 0.4 | |||||||||||
| 31,240,000 | W | 4.000%, due 05/01/47 | 32,699,492 | 2.7 | ||||||||||
| 29,283 | 5.410%, due 07/01/37 | 32,344 | 0.0 | |||||||||||
| 64,744 | 5.410%, due 08/01/37 | 71,485 | 0.0 | |||||||||||
| 22,270 | 5.410%, due 08/01/37 | 24,590 | 0.0 | |||||||||||
| 69,534 | 5.440%, due 01/01/37 | 76,867 | 0.0 | |||||||||||
| 25,766 | 5.440%, due 02/01/37 | 28,497 | 0.0 | |||||||||||
| 56,487 | 5.440%, due 04/01/37 | 62,459 | 0.0 | |||||||||||
| 36,553 | 5.440%, due 07/01/37 | 40,420 | 0.0 | |||||||||||
| 46,035 | 5.440%, due 08/01/37 | 50,874 | 0.0 | |||||||||||
| 62,299 | 5.440%, due 09/01/37 | 68,871 | 0.0 | |||||||||||
| 50,227 | 5.440%, due 02/01/38 | 55,539 | 0.0 | |||||||||||
| 10,494 | 5.440%, due 06/01/38 | 11,600 | 0.0 | |||||||||||
| 116,600 | 5.450%, due 12/01/37 | 128,286 | 0.0 | |||||||||||
| 151,492 | 5.450%, due 12/01/37 | 165,991 | 0.0 | |||||||||||
| 169,810 | 5.460%, due 05/01/37 | 187,223 | 0.0 | |||||||||||
| 33,790 | 5.460%, due 07/01/37 | 37,170 | 0.0 | |||||||||||
| 77,863 | 5.460%, due 08/01/37 | 86,128 | 0.0 | |||||||||||
| 42,725 | 5.460%, due 01/01/38 | 47,002 | 0.0 | |||||||||||
| 92,038 | 5.480%, due 08/01/37 | 101,883 | 0.0 | |||||||||||
| 118,604 | 5.480%, due 10/01/37 | 130,316 | 0.0 | |||||||||||
| 244,287 | 5.500%, due 08/01/37 | 270,662 | 0.1 | |||||||||||
| 103,192 | 5.500%, due 11/01/37 | 114,311 | 0.0 | |||||||||||
| 31,299 | 5.500%, due 04/01/38 | 34,693 | 0.0 | |||||||||||
| 42,481 | 5.520%, due 09/01/37 | 47,111 | 0.0 | |||||||||||
| 19,795 | 5.520%, due 10/01/37 | 21,953 | 0.0 | |||||||||||
| 34,499 | 5.520%, due 01/01/38 | 38,264 | 0.0 | |||||||||||
| 71,634 | 5.620%, due 12/01/36 | 79,671 | 0.0 | |||||||||||
| 110,932 | 5.620%, due 03/01/37 | 123,393 | 0.0 | |||||||||||
| 75,852 | 5.620%, due 08/01/37 | 84,402 | 0.0 | |||||||||||
| 55,764 | 5.620%, due 12/01/37 | 62,046 | 0.0 | |||||||||||
| 385,903 | 5.625%, due 12/01/36 | 431,472 | 0.1 | |||||||||||
| 41,570 | 5.625%, due 01/01/37 | 46,259 | 0.0 | |||||||||||
| 303,355 | 5.625%, due 01/01/37 | 339,010 | 0.1 | |||||||||||
| 32,952 | 5.625%, due 02/01/37 | 36,663 | 0.0 | |||||||||||
| 193,122 | 5.625%, due 03/01/37 | 214,946 | 0.0 | |||||||||||
| 73,151 | 5.625%, due 03/01/37 | 81,402 | 0.0 | |||||||||||
| 103,699 | 5.625%, due 06/01/37 | 115,396 | 0.0 | |||||||||||
| 93,709 | 5.625%, due 07/01/37 | 104,305 | 0.0 | |||||||||||
| 131,552 | 5.625%, due 07/01/37 | 146,427 | 0.0 | |||||||||||
| 123,220 | 5.625%, due 02/01/38 | 137,176 | 0.0 | |||||||||||
| 150,507 | 5.700%, due 12/01/37 | 166,965 | 0.0 | |||||||||||
| 107,650 | 6.090%, due 12/01/37 | 121,081 | 0.0 | |||||||||||
| 14,037 | 7.500%, due 01/01/30 | 16,421 | 0.0 | |||||||||||
| 10,150 | 8.000%, due 01/01/30 | 10,185 | 0.0 | |||||||||||
| 10,432 | 9.500%, due 07/01/20 | 10,565 | 0.0 | |||||||||||
| 41,957,302 | 3.4 | |||||||||||||
| Federal National Mortgage Association: 8.2%## | ||||||||||||||
| 5,664,865 | 3.000%, due 12/01/42 | 5,649,084 | 0.5 | |||||||||||
| 9,700,000 | W | 3.000%, due 05/01/43 | 9,597,695 | 0.8 | ||||||||||
| 30,770,691 | 3.500%, due 01/01/44 | 31,587,459 | 2.6 | |||||||||||
| 9,874,263 | 3.500%, due 03/01/46 | 10,175,212 | 0.8 | |||||||||||
| 16,596,184 | 4.000%, due 05/01/42 | 17,541,927 | 1.4 | |||||||||||
| 9,882,403 | 4.000%, due 01/01/45 | 10,509,944 | 0.9 | |||||||||||
| 2,527,152 | 4.000%, due 05/01/45 | 2,652,897 | 0.2 | |||||||||||
| 1,011,351 | 4.250%, due 08/01/35 | 1,079,318 | 0.1 | |||||||||||
| 403,041 | 4.750%, due 11/01/34 | 437,973 | 0.0 | |||||||||||
| 861,491 | 4.750%, due 11/01/34 | 940,942 | 0.1 | |||||||||||
See Accompanying Notes to Financial Statements
| Voya GNMA Income Fund | PORTFOLIO OF INVESTMENTS as of March 31, 2017 (continued) |
| Principal Amount† | Value | Percentage of Net Assets | ||||||||||||
| U.S. GOVERNMENT AGENCY OBLIGATIONS:(continued) | ||||||||||||||
| Federal National Mortgage Association: (continued) | ||||||||||||||
| 804,039 | 4.750%, due 02/01/35 | 870,973 | 0.1 | |||||||||||
| 923,200 | 4.750%, due 04/01/35 | 1,009,218 | 0.1 | |||||||||||
| 970,708 | 4.750%, due 05/01/35 | 1,060,318 | 0.1 | |||||||||||
| 186,688 | 4.750%, due 07/01/35 | 201,853 | 0.0 | |||||||||||
| 1,036,973 | 4.750%, due 07/01/35 | 1,132,508 | 0.1 | |||||||||||
| 180,495 | 5.000%, due 02/01/33 | 197,120 | 0.0 | |||||||||||
| 221,010 | 5.000%, due 07/01/33 | 241,475 | 0.0 | |||||||||||
| 96,899 | 5.000%, due 03/01/36 | 105,825 | 0.0 | |||||||||||
| 421,948 | 5.000%, due 05/01/36 | 463,353 | 0.1 | |||||||||||
| 172,051 | 5.030%, due 05/01/37 | 187,913 | 0.0 | |||||||||||
| 311,755 | 5.030%, due 09/01/37 | 341,333 | 0.0 | |||||||||||
| 54,449 | 5.155%, due 11/01/36 | 59,731 | 0.0 | |||||||||||
| 459,282 | 5.155%, due 01/01/37 | 507,056 | 0.1 | |||||||||||
| 13,538 | 5.250%, due 06/01/29 | 14,880 | 0.0 | |||||||||||
| 181,227 | 5.250%, due 04/01/32 | 199,590 | 0.0 | |||||||||||
| 92,779 | 5.250%, due 04/01/32 | 102,178 | 0.0 | |||||||||||
| 30,805 | 5.280%, due 11/01/36 | 33,913 | 0.0 | |||||||||||
| 218,783 | 5.280%, due 11/01/36 | 241,013 | 0.0 | |||||||||||
| 138,326 | 5.280%, due 01/01/37 | 152,352 | 0.0 | |||||||||||
| 60,065 | 5.300%, due 09/01/36 | 66,170 | 0.0 | |||||||||||
| 48,210 | 5.300%, due 10/01/36 | 53,099 | 0.0 | |||||||||||
| 28,421 | 5.300%, due 10/01/36 | 31,332 | 0.0 | |||||||||||
| 213,368 | 5.300%, due 12/01/36 | 235,166 | 0.0 | |||||||||||
| 140,029 | 5.300%, due 12/01/36 | 154,225 | 0.0 | |||||||||||
| 76,001 | 5.300%, due 02/01/37 | 83,739 | 0.0 | |||||||||||
| 158,516 | 5.300%, due 05/01/37 | 174,775 | 0.0 | |||||||||||
| 440,994 | 5.300%, due 08/01/37 | 485,363 | 0.1 | |||||||||||
| 69,991 | 5.350%, due 04/01/29 | 77,615 | 0.0 | |||||||||||
| 49,931 | 5.350%, due 09/01/29 | 55,455 | 0.0 | |||||||||||
| 312,353 | 5.390%, due 12/01/37 | 345,570 | 0.0 | |||||||||||
| 77,728 | 5.390%, due 05/01/38 | 87,466 | 0.0 | |||||||||||
| 295,777 | 5.405%, due 11/01/36 | 327,100 | 0.0 | |||||||||||
| 435,431 | 5.405%, due 02/01/37 | 484,369 | 0.1 | |||||||||||
| 119,350 | 5.620%, due 12/01/36 | 127,908 | 0.0 | |||||||||||
| 54,961 | 5.875%, due 06/01/35 | 57,447 | 0.0 | |||||||||||
| 59,070 | 5.900%, due 09/01/28 | 66,568 | 0.0 | |||||||||||
| 142,597 | 6.600%, due 07/01/27 | 154,830 | 0.0 | |||||||||||
| 83,481 | 6.600%, due 09/01/27 | 90,391 | 0.0 | |||||||||||
| 40,490 | 6.600%, due 11/01/27 | 41,829 | 0.0 | |||||||||||
| 81,833 | 6.600%, due 06/01/28 | 86,239 | 0.0 | |||||||||||
| 21,478 | 7.500%, due 05/01/28 | 21,699 | 0.0 | |||||||||||
| 100,603,408 | 8.2 | |||||||||||||
| Government National Mortgage Association: 59.1% | ||||||||||||||
| 5,378,856 | 2.936%, due 10/20/63 | 5,791,720 | 0.5 | |||||||||||
| 184,332,000 | W | 3.000%, due 04/01/44 | 185,959,307 | 15.2 | ||||||||||
| 765,678 | 3.000%, due 11/20/45 | 773,330 | 0.1 | |||||||||||
| 365,847 | 3.000%, due 12/20/45 | 369,598 | 0.0 | |||||||||||
| 526,686 | 3.000%, due 12/20/45 | 532,224 | 0.1 | |||||||||||
| 127,143 | 3.000%, due 12/20/45 | 128,414 | 0.0 | |||||||||||
| 565,707 | 3.000%, due 01/20/46 | 571,685 | 0.1 | |||||||||||
| 75,000,000 | W | 3.500%, due 12/20/41 | 77,636,718 | 6.3 | ||||||||||
| 37,248,273 | 3.500%, due 06/20/46 | 38,677,076 | 3.2 | |||||||||||
| 46,283,834 | 3.500%, due 07/20/46 | 48,059,230 | 3.9 | |||||||||||
| 9,611,627 | 3.500%, due 08/20/46 | 9,990,951 | 0.8 | |||||||||||
| 53,343,710 | 3.500%, due 09/20/46 | 55,389,916 | 4.5 | |||||||||||
| 25,956,579 | 3.500%, due 12/20/46 | 26,952,245 | 2.2 | |||||||||||
| 7,336,395 | 3.750%, due 05/20/42 | 7,685,553 | 0.6 | |||||||||||
| 9,373,760 | 3.750%, due 05/20/42 | 9,820,471 | 0.8 | |||||||||||
| 175,141 | 4.000%, due 05/20/33 | 187,305 | 0.0 | |||||||||||
| 218,707 | 4.000%, due 08/15/33 | 231,220 | 0.0 | |||||||||||
| 55,295 | 4.000%, due 01/15/34 | 58,444 | 0.0 | |||||||||||
| 179,376 | 4.000%, due 03/15/34 | 189,571 | 0.0 | |||||||||||
| 2,089,849 | 4.000%, due 05/20/34 | 2,221,731 | 0.2 | |||||||||||
| 1,466,235 | 4.000%, due 07/20/34 | 1,550,358 | 0.1 | |||||||||||
| 2,077,426 | 4.000%, due 07/20/34 | 2,195,574 | 0.2 | |||||||||||
| 167,057 | 4.000%, due 08/20/35 | 176,679 | 0.0 | |||||||||||
| 444,947 | 4.000%, due 05/15/40 | 470,320 | 0.1 | |||||||||||
| 3,363,477 | 4.000%, due 09/20/40 | 3,519,471 | 0.3 | |||||||||||
| 5,085,674 | 4.000%, due 07/20/41 | 5,311,808 | 0.4 | |||||||||||
| 126,047,000 | W | 4.000%, due 11/20/41 | 132,898,348 | 10.8 | ||||||||||
| 948,752 | 4.000%, due 09/15/42 | 1,003,622 | 0.1 | |||||||||||
| 3,805,869 | 4.000%, due 10/20/43 | 4,032,304 | 0.3 | |||||||||||
| 5,004,928 | 4.000%, due 12/20/44 | 5,317,628 | 0.5 | |||||||||||
| 5,091,252 | 4.000%, due 01/20/45 | 5,409,156 | 0.5 | |||||||||||
| 522,000 | 4.000%, due 12/20/45 | 553,340 | 0.1 | |||||||||||
| 1,447,206 | 4.000%, due 01/20/46 | 1,537,147 | 0.1 | |||||||||||
| 8,470,776 | 4.000%, due 01/20/46 | 8,987,047 | 0.7 | |||||||||||
| 7,423,879 | 4.000%, due 03/20/46 | 7,870,242 | 0.7 | |||||||||||
| 22,069 | 4.500%, due 07/20/36 | 23,606 | 0.0 | |||||||||||
| 12,352 | 4.500%, due 08/20/36 | 13,210 | 0.0 | |||||||||||
| 1,647,821 | 4.500%, due 10/15/39 | 1,781,406 | 0.2 | |||||||||||
| 1,013,992 | 4.500%, due 11/15/39 | 1,093,042 | 0.1 | |||||||||||
| 1,239,560 | 4.500%, due 11/15/39 | 1,337,508 | 0.1 | |||||||||||
| 357,663 | 4.500%, due 12/15/39 | 386,689 | 0.0 | |||||||||||
| 987,961 | 4.500%, due 01/15/40 | 1,058,606 | 0.1 | |||||||||||
| 118,240 | 4.500%, due 01/20/40 | 123,237 | 0.0 | |||||||||||
| 3,640,303 | 4.500%, due 02/15/40 | 3,900,609 | 0.3 | |||||||||||
| 537,204 | 4.500%, due 06/15/40 | 575,346 | 0.1 | |||||||||||
| 172,893 | 4.500%, due 07/20/40 | 180,098 | 0.0 | |||||||||||
| 722,259 | 4.500%, due 08/20/40 | 752,023 | 0.1 | |||||||||||
| 2,339,661 | 4.500%, due 09/20/41 | 2,527,220 | 0.2 | |||||||||||
| 1,443,717 | 4.531%, due 07/20/62 | 1,538,378 | 0.1 | |||||||||||
| 8,785,062 | 4.631%, due 09/20/61 | 9,463,119 | 0.8 | |||||||||||
| 949,010 | 4.700%, due 08/20/62 | 1,010,774 | 0.1 | |||||||||||
| 1,243,725 | 4.750%, due 06/15/29 | 1,355,985 | 0.1 | |||||||||||
| 259,476 | 4.750%, due 01/15/30 | 282,458 | 0.0 | |||||||||||
| 449,690 | 4.750%, due 09/15/34 | 490,318 | 0.1 | |||||||||||
| 3,389,348 | 4.872%, due 06/20/61 | 3,491,102 | 0.3 | |||||||||||
| 17,580 | 5.000%, due 05/15/18 | 18,041 | 0.0 | |||||||||||
| 76,424 | 5.000%, due 03/20/24 | 82,586 | 0.0 | |||||||||||
| 244,103 | 5.000%, due 04/15/29 | 266,853 | 0.0 | |||||||||||
| 311,736 | 5.000%, due 04/15/30 | 342,216 | 0.0 | |||||||||||
| 1,694,130 | 5.000%, due 04/20/30 | 1,796,538 | 0.2 | |||||||||||
| 331,560 | 5.000%, due 10/15/30 | 364,004 | 0.0 | |||||||||||
| 376,200 | 5.000%, due 07/15/33 | 413,150 | 0.1 | |||||||||||
| 92,809 | 5.000%, due 03/15/34 | 103,202 | 0.0 | |||||||||||
| 320,713 | 5.000%, due 04/15/34 | 350,660 | 0.0 | |||||||||||
| 84,434 | 5.000%, due 04/15/34 | 92,335 | 0.0 | |||||||||||
| 79,484 | 5.000%, due 01/15/35 | 86,949 | 0.0 | |||||||||||
| 38,330 | 5.000%, due 03/15/35 | 42,331 | 0.0 | |||||||||||
| 386,051 | 5.000%, due 03/15/35 | 423,139 | 0.1 | |||||||||||
| 159,031 | 5.000%, due 04/15/35 | 173,989 | 0.0 | |||||||||||
| 97,022 | 5.000%, due 04/15/35 | 106,932 | 0.0 | |||||||||||
| 557,973 | 5.000%, due 04/15/35 | 621,443 | 0.1 | |||||||||||
| 169,689 | 5.000%, due 04/15/35 | 185,667 | 0.0 | |||||||||||
| 45,450 | 5.000%, due 05/15/35 | 50,827 | 0.0 | |||||||||||
| 144,673 | 5.000%, due 05/20/35 | 161,042 | 0.0 | |||||||||||
| 87,175 | 5.000%, due 06/15/35 | 95,333 | 0.0 | |||||||||||
| 74,063 | 5.000%, due 09/15/35 | 81,001 | 0.0 | |||||||||||
| 731,611 | 5.000%, due 11/20/35 | 806,326 | 0.1 | |||||||||||
| 376,064 | 5.000%, due 04/20/36 | 414,135 | 0.1 | |||||||||||
| 160,582 | 5.000%, due 02/15/38 | 175,756 | 0.0 | |||||||||||
| 84,418 | 5.000%, due 06/20/38 | 87,475 | 0.0 | |||||||||||
| 44,781 | 5.000%, due 08/20/38 | 46,398 | 0.0 | |||||||||||
| 196,056 | 5.000%, due 10/20/38 | 203,158 | 0.0 | |||||||||||
| 146,622 | 5.000%, due 11/20/38 | 151,925 | 0.0 | |||||||||||
| 390,198 | 5.000%, due 01/20/39 | 404,284 | 0.0 | |||||||||||
| 261,093 | 5.000%, due 02/15/39 | 286,045 | 0.0 | |||||||||||
| 323,460 | 5.000%, due 03/15/39 | 355,741 | 0.0 | |||||||||||
| 1,213,569 | 5.000%, due 11/15/39 | 1,356,173 | 0.1 | |||||||||||
| 445,800 | 5.000%, due 11/15/39 | 492,522 | 0.1 | |||||||||||
| 1,457,807 | 5.000%, due 11/15/39 | 1,597,256 | 0.1 | |||||||||||
| 400,870 | 5.000%, due 04/15/40 | 443,798 | 0.1 | |||||||||||
| 1,638,189 | 5.000%, due 05/15/40 | 1,825,919 | 0.2 | |||||||||||
| 1,271,637 | 5.000%, due 09/15/40 | 1,399,720 | 0.1 | |||||||||||
| 1,810,941 | 5.000%, due 07/20/41 | 1,987,887 | 0.2 | |||||||||||
| 100,511 | 5.250%, due 01/15/24 | 111,736 | 0.0 | |||||||||||
| 194,421 | 5.250%, due 06/15/28 | 216,007 | 0.0 | |||||||||||
See Accompanying Notes to Financial Statements
| Voya GNMA Income Fund | PORTFOLIO OF INVESTMENTS as of March 31, 2017 (continued) |
| Principal Amount† | Value | Percentage of Net Assets | ||||||||||||
| U.S. GOVERNMENT AGENCY OBLIGATIONS: (continued) | ||||||||||||||
| Government National Mortgage Association: (continued) | ||||||||||||||
| 136,180 | 5.250%, due 06/15/29 | 151,288 | 0.0 | |||||||||||
| 1,828,294 | 5.250%, due 01/20/36 | 2,032,302 | 0.2 | |||||||||||
| 15,057 | 5.350%, due 01/15/29 | 16,662 | 0.0 | |||||||||||
| 87,629 | 5.350%, due 01/20/29 | 95,285 | 0.0 | |||||||||||
| 57,603 | 5.350%, due 02/20/29 | 62,646 | 0.0 | |||||||||||
| 173,297 | 5.350%, due 04/20/29 | 188,493 | 0.0 | |||||||||||
| 69,103 | 5.350%, due 06/20/29 | 75,152 | 0.0 | |||||||||||
| 51,457 | 5.350%, due 08/20/29 | 55,975 | 0.0 | |||||||||||
| 105,226 | 5.350%, due 10/20/29 | 114,459 | 0.0 | |||||||||||
| 41,279 | 5.350%, due 11/20/29 | 44,842 | 0.0 | |||||||||||
| 137,597 | 5.390%, due 05/15/38 | 152,826 | 0.0 | |||||||||||
| 337,848 | 5.390%, due 08/20/38 | 377,227 | 0.0 | |||||||||||
| 179,970 | 5.390%, due 09/15/38 | 199,889 | 0.0 | |||||||||||
| 83,563 | 5.390%, due 07/15/39 | 93,303 | 0.0 | |||||||||||
| 64,972 | 5.390%, due 08/15/39 | 72,019 | 0.0 | |||||||||||
| 104,166 | 5.390%, due 02/15/40 | 116,307 | 0.0 | |||||||||||
| 27,866 | 5.480%, due 09/20/37 | 30,459 | 0.0 | |||||||||||
| 178,900 | 5.500%, due 08/15/24 | 189,513 | 0.0 | |||||||||||
| 103,091 | 5.500%, due 08/20/24 | 112,681 | 0.0 | |||||||||||
| 2,176 | 5.500%, due 04/20/29 | 2,379 | 0.0 | |||||||||||
| 450,276 | 5.500%, due 09/15/29 | 505,192 | 0.1 | |||||||||||
| 251,279 | 5.500%, due 10/15/29 | 282,084 | 0.0 | |||||||||||
| 71,468 | 5.500%, due 12/20/32 | 80,324 | 0.0 | |||||||||||
| 247,510 | 5.500%, due 08/20/33 | 277,647 | 0.0 | |||||||||||
| 78,754 | 5.500%, due 11/20/33 | 80,780 | 0.0 | |||||||||||
| 71,065 | 5.500%, due 12/20/33 | 79,691 | 0.0 | |||||||||||
| 77,211 | 5.500%, due 03/20/34 | 79,212 | 0.0 | |||||||||||
| 421,708 | 5.500%, due 04/20/34 | 472,948 | 0.1 | |||||||||||
| 7,712 | 5.500%, due 04/20/34 | 8,426 | 0.0 | |||||||||||
| 464,572 | 5.500%, due 04/20/34 | 502,610 | 0.1 | |||||||||||
| 99,957 | 5.500%, due 06/20/34 | 102,551 | 0.0 | |||||||||||
| 316,027 | 5.500%, due 06/20/34 | 347,040 | 0.0 | |||||||||||
| 121,374 | 5.500%, due 07/20/34 | 132,727 | 0.0 | |||||||||||
| 203,147 | 5.500%, due 07/20/34 | 222,165 | 0.0 | |||||||||||
| 124,170 | 5.500%, due 01/20/35 | 129,275 | 0.0 | |||||||||||
| 343,592 | 5.500%, due 05/15/35 | 383,018 | 0.0 | |||||||||||
| 176,442 | 5.500%, due 05/20/35 | 192,940 | 0.0 | |||||||||||
| 148,503 | 5.500%, due 06/20/35 | 162,398 | 0.0 | |||||||||||
| 711,111 | 5.500%, due 07/15/35 | 807,389 | 0.1 | |||||||||||
| 605,698 | 5.500%, due 08/15/35 | 682,462 | 0.1 | |||||||||||
| 316,106 | 5.500%, due 09/20/35 | 347,155 | 0.0 | |||||||||||
| 175,420 | 5.500%, due 04/15/36 | 195,548 | 0.0 | |||||||||||
| 100,854 | 5.500%, due 06/20/36 | 111,885 | 0.0 | |||||||||||
| 16,881 | 5.500%, due 06/20/38 | 17,777 | 0.0 | |||||||||||
| 44,956 | 5.500%, due 08/20/38 | 47,347 | 0.0 | |||||||||||
| 73,422 | 5.500%, due 09/20/38 | 77,321 | 0.0 | |||||||||||
| 10,351 | 5.500%, due 10/20/38 | 10,906 | 0.0 | |||||||||||
| 91,219 | 5.500%, due 11/20/38 | 96,063 | 0.0 | |||||||||||
| 11,296 | 5.500%, due 12/20/38 | 11,896 | 0.0 | |||||||||||
| 98,349 | 5.500%, due 01/15/39 | 109,690 | 0.0 | |||||||||||
| 17,523 | 5.500%, due 01/20/39 | 18,462 | 0.0 | |||||||||||
| 257,012 | 5.500%, due 03/20/39 | 270,782 | 0.0 | |||||||||||
| 32,654 | 5.500%, due 06/15/39 | 36,400 | 0.0 | |||||||||||
| 20,352 | 5.500%, due 06/20/39 | 21,440 | 0.0 | |||||||||||
| 74,018 | 5.500%, due 10/20/39 | 81,910 | 0.0 | |||||||||||
| 285,431 | 5.500%, due 09/15/40 | 318,357 | 0.0 | |||||||||||
| 217,266 | 5.750%, due 11/15/24 | 230,899 | 0.0 | |||||||||||
| 1,276,135 | 5.750%, due 07/15/29 | 1,415,511 | 0.1 | |||||||||||
| 973,421 | 5.750%, due 08/15/29 | 1,077,078 | 0.1 | |||||||||||
| 238,307 | 5.750%, due 11/15/29 | 264,067 | 0.0 | |||||||||||
| 1,097,686 | 5.750%, due 11/15/29 | 1,218,185 | 0.1 | |||||||||||
| 21,142 | 5.900%, due 03/20/28 | 23,521 | 0.0 | |||||||||||
| 77,808 | 5.900%, due 05/20/28 | 86,585 | 0.0 | |||||||||||
| 46,640 | 5.900%, due 07/20/28 | 51,898 | 0.0 | |||||||||||
| 29,230 | 5.900%, due 08/20/28 | 32,505 | 0.0 | |||||||||||
| 51,807 | 5.900%, due 09/20/28 | 57,636 | 0.0 | |||||||||||
| 1,539,855 | 5.970%, due 11/15/31 | 1,560,051 | 0.1 | |||||||||||
| 56,028 | 6.000%, due 01/20/24 | 58,659 | 0.0 | |||||||||||
| 177,457 | 6.000%, due 10/15/25 | 200,900 | 0.0 | |||||||||||
| 430,167 | 6.000%, due 04/15/26 | 490,806 | 0.1 | |||||||||||
| 53,682 | 6.000%, due 10/20/27 | 60,013 | 0.0 | |||||||||||
| 204,917 | 6.000%, due 05/15/29 | 223,171 | 0.0 | |||||||||||
| 212,085 | 6.000%, due 07/15/29 | 238,383 | 0.0 | |||||||||||
| 127,927 | 6.000%, due 10/20/34 | 147,777 | 0.0 | |||||||||||
| 280,110 | 6.000%, due 03/15/37 | 317,375 | 0.0 | |||||||||||
| 53,806 | 6.000%, due 09/20/37 | 60,056 | 0.0 | |||||||||||
| 29,523 | 6.000%, due 05/20/38 | 32,615 | 0.0 | |||||||||||
| 234,244 | 6.000%, due 08/20/38 | 253,040 | 0.0 | |||||||||||
| 72,936 | 6.000%, due 09/20/38 | 78,788 | 0.0 | |||||||||||
| 100,446 | 6.000%, due 10/20/38 | 108,568 | 0.0 | |||||||||||
| 234,553 | 6.000%, due 11/15/38 | 265,999 | 0.0 | |||||||||||
| 301,841 | 6.000%, due 12/15/38 | 344,124 | 0.0 | |||||||||||
| 306,616 | 6.000%, due 12/15/38 | 347,726 | 0.0 | |||||||||||
| 782,881 | 6.000%, due 08/15/39 | 918,894 | 0.1 | |||||||||||
| 634,929 | 6.000%, due 08/15/39 | 743,033 | 0.1 | |||||||||||
| 15,857 | 6.250%, due 09/15/20 | 17,736 | 0.0 | |||||||||||
| 130,959 | 6.490%, due 01/15/28 | 148,287 | 0.0 | |||||||||||
| 47,926 | 6.500%, due 07/20/29 | 55,702 | 0.0 | |||||||||||
| 57,523 | 6.500%, due 07/20/32 | 59,187 | 0.0 | |||||||||||
| 241,320 | 6.500%, due 02/15/34 | 264,196 | 0.0 | |||||||||||
| 2,349 | 6.500%, due 09/20/34 | 2,606 | 0.0 | |||||||||||
| 16,815 | 7.500%, due 08/20/27 | 19,887 | 0.0 | |||||||||||
| 724,627,975 | 59.1 | |||||||||||||
| Total U.S. Government Agency Obligations (Cost $864,701,360) | 867,188,685 | 70.7 | ||||||||||||
| Total Investments in Securities (Cost $1,563,770,595) | $ | 1,568,121,568 | 127.8 | |||||||||||
| Liabilities in Excess of Other Assets | (340,796,631 | ) | (27.8 | ) | ||||||||||
| Net Assets | $ | 1,227,324,937 | 100.0 | |||||||||||
| † | Unless otherwise indicated, principal amount is shown in USD. |
| ## | The Federal Housing Finance Agency (“FHFA”) placed the Federal Home Loan Mortgage Corporation and Federal National Mortgage Association into conservatorship with FHFA as the conservator. As such, the FHFA oversees the continuing affairs of these companies. |
| W | Settlement is on a when-issued or delayed-delivery basis. |
| ^ | Interest only securities represent the right to receive the monthly interest payments on an underlying pool of mortgage loans. Principal amount shown represents the notional amount on which current interest is calculated. Payments of principal on the pool reduce the value of the interest only security. |
| ^^ | Principal only securities represent the right to receive the monthly principal payments on an underlying pool of mortgage loans. No payments of interest on the pool are passed through the principal only security. |
Cost for federal income tax purposes is $1,565,417,977.
Net unrealized appreciation consists of:
| Gross Unrealized Appreciation | $ | 15,319,126 | ||
| Gross Unrealized Depreciation | (12,615,535 | ) | ||
| Net Unrealized Appreciation | $ | 2,703,591 |
See Accompanying Notes to Financial Statements
| Voya High Yield Bond Fund | PORTFOLIO OF INVESTMENTS as of March 31, 2017 |
| Principal Amount† | Value | Percentage of Net Assets | ||||||||||||
| CORPORATE BONDS/NOTES: 96.3% | ||||||||||||||
| Basic Materials: 8.0% | ||||||||||||||
| 650,000 | Aleris International, Inc., 7.875%, 11/01/20 | 645,125 | 0.1 | |||||||||||
| 2,225,000 | # | Alpha 3 BV / Alpha US Bidco, Inc., 6.250%, 02/01/25 | 2,258,375 | 0.4 | ||||||||||
| 1,240,000 | L | ArcelorMittal, 6.125%, 06/01/25 | 1,382,600 | 0.2 | ||||||||||
| 1,500,000 | ArcelorMittal, 6.250%, 03/01/21 | 1,627,500 | 0.3 | |||||||||||
| 1,635,000 | # | Aruba Investments, Inc., 8.750%, 02/15/23 | 1,692,225 | 0.3 | ||||||||||
| 2,120,000 | # | Axalta Coating Systems LLC, 4.875%, 08/15/24 | 2,178,300 | 0.3 | ||||||||||
| 1,470,000 | # | Cascades, Inc., 5.500%, 07/15/22 | 1,473,675 | 0.2 | ||||||||||
| 245,000 | #,L | Cliffs Natural Resources, Inc., 5.750%, 03/01/25 | 238,262 | 0.0 | ||||||||||
| 920,000 | # | Constellium NV, 5.750%, 05/15/24 | 855,600 | 0.1 | ||||||||||
| 500,000 | # | Constellium NV, 7.875%, 04/01/21 | 535,625 | 0.1 | ||||||||||
| 940,000 | # | Ferroglobe PLC / Globe Specialty Metals, Inc., 9.375%, 03/01/22 | 984,650 | 0.2 | ||||||||||
| 2,200,000 | L | Freeport-McMoRan, Inc., 4.550%, 11/14/24 | 2,057,000 | 0.3 | ||||||||||
| 2,000,000 | Freeport-McMoRan, Inc., 5.450%, 03/15/43 | 1,695,000 | 0.3 | |||||||||||
| 1,450,000 | Hexion, Inc., 6.625%, 04/15/20 | 1,337,625 | 0.2 | |||||||||||
| 975,000 | # | Hexion, Inc., 10.375%, 02/01/22 | 975,000 | 0.2 | ||||||||||
| 240,000 | # | Hexion, Inc., 13.750%, 02/01/22 | 231,000 | 0.0 | ||||||||||
| 250,000 | # | Hudbay Minerals, Inc., 7.250%, 01/15/23 | 266,250 | 0.0 | ||||||||||
| 250,000 | # | Hudbay Minerals, Inc., 7.625%, 01/15/25 | 272,500 | 0.0 | ||||||||||
| 550,000 | Huntsman International LLC, 4.875%, 11/15/20 | 576,125 | 0.1 | |||||||||||
| 1,080,000 | Huntsman International LLC, 5.125%, 11/15/22 | 1,134,000 | 0.2 | |||||||||||
| 2,425,000 | # | IAMGOLD Corp., 7.000%, 04/15/25 | 2,406,813 | 0.4 | ||||||||||
| 2,800,000 | #,L | INEOS Group Holdings SA, 5.625%, 08/01/24 | 2,814,000 | 0.4 | ||||||||||
| 2,100,000 | # | Kraton Polymers LLC / Kraton Polymers Capital Corp., 10.500%, 04/15/23 | 2,420,250 | 0.4 | ||||||||||
| 2,000,000 | ± | Momentive Performance Materials, Inc. Escrow, 8.875%, 10/15/20 | – | – | ||||||||||
| 1,500,000 | Momentive Performance Materials, Inc., 3.880%, 10/24/21 | 1,483,125 | 0.2 | |||||||||||
| 1,500,000 | PolyOne Corp., 5.250%, 03/15/23 | 1,518,750 | 0.2 | |||||||||||
| 485,000 | # | PQ Corp., 6.750%, 11/15/22 | 517,738 | 0.1 | ||||||||||
| 2,320,000 | # | Rayonier AM Products, Inc., 5.500%, 06/01/24 | 2,099,600 | 0.3 | ||||||||||
| 1,860,000 | # | SPCM SA, 6.000%, 01/15/22 | 1,929,750 | 0.3 | ||||||||||
| 675,000 | Steel Dynamics, Inc., 5.125%, 10/01/21 | 699,469 | 0.1 | |||||||||||
| 1,425,000 | Steel Dynamics, Inc., 5.500%, 10/01/24 | 1,492,688 | 0.2 | |||||||||||
| 1,115,000 | Teck Resources Ltd., 4.750%, 01/15/22 | 1,158,206 | 0.2 | |||||||||||
| 2,400,000 | Teck Resources Ltd., 5.200%, 03/01/42 | 2,268,000 | 0.4 | |||||||||||
| 1,000,000 | Tronox Finance LLC, 6.375%, 08/15/20 | 1,008,750 | 0.2 | |||||||||||
| 1,700,000 | #,L | Tronox Finance LLC, 7.500%, 03/15/22 | 1,759,500 | 0.3 | ||||||||||
| 1,500,000 | # | Unifrax I LLC / Unifrax Holding Co., 7.500%, 02/15/19 | 1,496,250 | 0.2 | ||||||||||
| 1,120,000 | # | Valvoline, Inc., 5.500%, 07/15/24 | 1,178,800 | 0.2 | ||||||||||
| 1,605,000 | # | WR Grace & Co-Conn, 5.125%, 10/01/21 | 1,689,262 | 0.3 | ||||||||||
| 555,000 | # | WR Grace & Co-Conn, 5.625%, 10/01/24 | 586,912 | 0.1 | ||||||||||
| 50,944,300 | 8.0 | |||||||||||||
| Communications: 18.6% | ||||||||||||||
| 1,860,000 | #,L | Acosta, Inc., 7.750%, 10/01/22 | 1,588,440 | 0.2 | ||||||||||
| 600,000 | # | Altice Financing SA, 6.500%, 01/15/22 | 630,294 | 0.1 | ||||||||||
| 1,000,000 | #,L | Altice Finco SA, 8.125%, 01/15/24 | 1,075,000 | 0.2 | ||||||||||
| 2,470,000 | #,L | Altice Luxembourg SA, 7.625%, 02/15/25 | 2,619,744 | 0.4 | ||||||||||
| 2,170,000 | # | Altice Luxembourg SA, 7.750%, 05/15/22 | 2,308,337 | 0.4 | ||||||||||
| 1,215,000 | # | Block Communications, Inc., 6.875%, 02/15/25 | 1,290,937 | 0.2 | ||||||||||
| 1,040,000 | Cablevision Systems Corp., 5.875%, 09/15/22 | 1,051,700 | 0.2 | |||||||||||
| 1,115,000 | # | CCO Holdings LLC / CCO Holdings Capital Corp., 5.125%, 05/01/23 | 1,151,237 | 0.2 | ||||||||||
| 485,000 | # | CCO Holdings LLC / CCO Holdings Capital Corp., 5.125%, 05/01/27 | 489,547 | 0.1 | ||||||||||
| 1,120,000 | # | CCO Holdings LLC / CCO Holdings Capital Corp., 5.500%, 05/01/26 | 1,162,000 | 0.2 | ||||||||||
| 2,895,000 | # | CCO Holdings LLC / CCO Holdings Capital Corp., 5.750%, 02/15/26 | 3,046,987 | 0.5 | ||||||||||
| 1,500,000 | # | CCO Holdings LLC / CCO Holdings Capital Corp., 5.875%, 04/01/24 | 1,586,250 | 0.2 | ||||||||||
| 2,050,000 | CenturyLink, Inc., 5.625%, 04/01/20 | 2,156,907 | 0.3 | |||||||||||
| 1,000,000 | CenturyLink, Inc., 5.800%, 03/15/22 | 1,034,320 | 0.2 | |||||||||||
| 675,000 | L | CenturyLink, Inc., 7.500%, 04/01/24 | 715,291 | 0.1 | ||||||||||
| 955,000 | # | Cequel Communications Holdings I LLC / Cequel Capital Corp., 5.125%, 12/15/21 | 974,100 | 0.1 | ||||||||||
See Accompanying Notes to Financial Statements
| Voya High Yield Bond Fund | PORTFOLIO OF INVESTMENTS as of March 31, 2017 (continued) |
| Principal Amount† | Value | Percentage of Net Assets | ||||||||||||
| CORPORATE BONDS/NOTES: (continued) | ||||||||||||||
| Communications: (continued) | ||||||||||||||
| 270,000 | Clear Channel Worldwide Holdings, Inc., 6.500%, 11/15/22 | 275,400 | 0.0 | |||||||||||
| 730,000 | Clear Channel Worldwide Holdings, Inc., 6.500%, 11/15/22 | 761,478 | 0.1 | |||||||||||
| 105,000 | Clear Channel Worldwide Holdings, Inc., 7.625%, 03/15/20 | 104,737 | 0.0 | |||||||||||
| 2,030,000 | Clear Channel Worldwide Holdings, Inc., 7.625%, 03/15/20 | 2,055,375 | 0.3 | |||||||||||
| 1,740,000 | # | CommScope Tech Finance LLC, 6.000%, 06/15/25 | 1,831,350 | 0.3 | ||||||||||
| 2,585,000 | CSC Holdings LLC, 5.250%, 06/01/24 | 2,581,769 | 0.4 | |||||||||||
| 1,375,000 | # | CSC Holdings LLC, 6.625%, 10/15/25 | 1,498,750 | 0.2 | ||||||||||
| 2,530,000 | # | CSC Holdings LLC, 10.875%, 10/15/25 | 3,048,650 | 0.5 | ||||||||||
| 1,070,000 | DISH DBS Corp., 5.000%, 03/15/23 | 1,077,490 | 0.2 | |||||||||||
| 1,200,000 | DISH DBS Corp., 5.875%, 11/15/24 | 1,264,500 | 0.2 | |||||||||||
| 1,800,000 | DISH DBS Corp., 5.875%, 07/15/22 | 1,895,616 | 0.3 | |||||||||||
| 1,070,000 | DISH DBS Corp., 6.750%, 06/01/21 | 1,157,606 | 0.2 | |||||||||||
| 1,560,000 | DISH DBS Corp., 7.750%, 07/01/26 | 1,817,400 | 0.3 | |||||||||||
| 1,000,000 | Frontier Communications Corp., 7.625%, 04/15/24 | 864,500 | 0.1 | |||||||||||
| 560,000 | Frontier Communications Corp., 8.875%, 09/15/20 | 592,900 | 0.1 | |||||||||||
| 1,705,000 | Frontier Communications Corp., 10.500%, 09/15/22 | 1,734,837 | 0.3 | |||||||||||
| 1,900,000 | Frontier Communications Corp., 11.000%, 09/15/25 | 1,851,313 | 0.3 | |||||||||||
| 1,685,000 | # | Gray Television, Inc., 5.125%, 10/15/24 | 1,668,150 | 0.3 | ||||||||||
| 500,000 | Intelsat Jackson Holdings SA, 5.500%, 08/01/23 | 413,125 | 0.1 | |||||||||||
| 500,000 | Intelsat Jackson Holdings SA, 7.250%, 10/15/20 | 458,125 | 0.1 | |||||||||||
| 940,000 | Intelsat Jackson Holdings SA, 7.500%, 04/01/21 | 851,875 | 0.1 | |||||||||||
| 1,000,000 | Intelsat Luxembourg SA, 8.125%, 06/01/23 | 609,375 | 0.1 | |||||||||||
| 80,000 | Lamar Media Corp., 5.750%, 02/01/26 | 85,900 | 0.0 | |||||||||||
| 1,000,000 | Lamar Media Corp., 5.875%, 02/01/22 | 1,035,800 | 0.2 | |||||||||||
| 1,195,000 | Level 3 Financing, Inc., 5.125%, 05/01/23 | 1,224,875 | 0.2 | |||||||||||
| 1,500,000 | Level 3 Financing, Inc., 5.250%, 03/15/26 | 1,513,125 | 0.2 | |||||||||||
| 1,800,000 | Level 3 Financing, Inc., 5.375%, 01/15/24 | 1,847,250 | 0.3 | |||||||||||
| 780,000 | LIN Television Corp., 5.875%, 11/15/22 | 811,200 | 0.1 | |||||||||||
| 520,000 | Match Group, Inc., 6.375%, 06/01/24 | 564,522 | 0.1 | |||||||||||
| 2,598,000 | Mediacom Broadband LLC / Mediacom Broadband Corp., 6.375%, 04/01/23 | 2,734,395 | 0.4 | |||||||||||
| 1,000,000 | # | Midcontinent Communications / Midcontinent Finance Corp., 6.875%, 08/15/23 | 1,068,750 | 0.2 | ||||||||||
| 1,750,000 | # | s, 6.250%, 08/01/21 | 1,828,750 | 0.3 | ||||||||||
| 1,000,000 | Netflix, Inc., 5.750%, 03/01/24 | 1,071,200 | 0.2 | |||||||||||
| 1,300,000 | Netflix, Inc., 5.875%, 02/15/25 | 1,400,750 | 0.2 | |||||||||||
| 1,600,000 | # | Nexstar Escrow Corp., 5.625%, 08/01/24 | 1,628,000 | 0.3 | ||||||||||
| 1,250,000 | Nielsen Finance LLC / Nielsen Finance Co., 4.500%, 10/01/20 | 1,275,000 | 0.2 | |||||||||||
| 575,000 | # | Nielsen Finance LLC / Nielsen Finance Co., 5.000%, 04/15/22 | 589,375 | 0.1 | ||||||||||
| 2,925,000 | # | SFR Group SA, 6.250%, 05/15/24 | 2,954,250 | 0.5 | ||||||||||
| 1,750,000 | # | SFR Group SA, 6.000%, 05/15/22 | 1,820,000 | 0.3 | ||||||||||
| 1,800,000 | # | SFR Group SA, 7.375%, 05/01/26 | 1,860,750 | 0.3 | ||||||||||
| 2,230,000 | # | Plantronics, Inc., 5.500%, 05/31/23 | 2,255,088 | 0.3 | ||||||||||
| 2,150,000 | Sinclair Television Group, Inc., 6.125%, 10/01/22 | 2,260,188 | 0.3 | |||||||||||
| 500,000 | # | Sirius XM Radio, Inc., 5.375%, 07/15/26 | 512,500 | 0.1 | ||||||||||
| 1,660,000 | # | Sirius XM Radio, Inc., 6.000%, 07/15/24 | 1,784,500 | 0.3 | ||||||||||
| 3,000,000 | Sprint Communications, Inc., 6.000%, 11/15/22 | 3,075,000 | 0.5 | |||||||||||
| 5,110,000 | Sprint Corp., 7.125%, 06/15/24 | 5,467,700 | 0.8 | |||||||||||
| 3,250,000 | Sprint Corp., 7.250%, 09/15/21 | 3,517,118 | 0.5 | |||||||||||
| 1,400,000 | Sprint Nextel Corp., 6.875%, 11/15/28 | 1,482,250 | 0.2 | |||||||||||
| 1,320,000 | # | Telesat Canada / Telesat LLC, 8.875%, 11/15/24 | 1,452,000 | 0.2 | ||||||||||
| 150,000 | T-Mobile USA, Inc., 5.125%, 04/15/25 | 155,625 | 0.0 | |||||||||||
| 1,250,000 | T-Mobile USA, Inc., 6.125%, 01/15/22 | 1,323,438 | 0.2 | |||||||||||
| 780,000 | T-Mobile USA, Inc., 6.250%, 04/01/21 | 804,375 | 0.1 | |||||||||||
| 1,000,000 | T-Mobile USA, Inc., 6.000%, 03/01/23 | 1,070,300 | 0.2 | |||||||||||
| 1,300,000 | T-Mobile USA, Inc., 6.500%, 01/15/26 | 1,426,750 | 0.2 | |||||||||||
| 800,000 | T-Mobile USA, Inc., 6.731%, 04/28/22 | 831,040 | 0.1 | |||||||||||
| 1,250,000 | T-Mobile USA, Inc., 6.836%, 04/28/23 | 1,340,625 | 0.2 | |||||||||||
| 250,000 | # | Univision Communications, Inc., 5.125%, 02/15/25 | 246,875 | 0.0 | ||||||||||
| 2,500,000 | # | Univision Communications, Inc., 5.125%, 05/15/23 | 2,500,000 | 0.4 | ||||||||||
See Accompanying Notes to Financial Statements
| Voya High Yield Bond Fund | PORTFOLIO OF INVESTMENTS as of March 31, 2017 (continued) |
| Principal Amount† | Value | Percentage of Net Assets | ||||||||||||
| CORPORATE BONDS/NOTES: (continued) | ||||||||||||||
| Communications: (continued) | ||||||||||||||
| 2,360,000 | # | West Corp., 5.375%, 07/15/22 | 2,327,550 | 0.4 | ||||||||||
| 1,200,000 | # | Wind Acquisition Finance SA, 4.750%, 07/15/20 | 1,225,500 | 0.2 | ||||||||||
| 1,310,000 | # | Wind Acquisition Finance SA, 7.375%, 04/23/21 | 1,365,675 | 0.2 | ||||||||||
| 2,045,000 | Windstream Services LLC, 7.500%, 04/01/23 | 1,932,525 | 0.3 | |||||||||||
| 1,000,000 | Windstream Services LLC, 7.750%, 10/15/20 | 1,017,500 | 0.2 | |||||||||||
| 500,000 | Zayo Group LLC / Zayo Capital, Inc., 6.375%, 05/15/25 | 541,560 | 0.1 | |||||||||||
| 2,140,000 | Zayo Group LLC / Zayo Capital, Inc., 6.000%, 04/01/23 | 2,271,075 | 0.4 | |||||||||||
| 245,000 | # | Zayo Group LLC / Zayo Capital, Inc., 5.750%, 01/15/27 | 259,039 | 0.0 | ||||||||||
| 119,055,100 | 18.6 | |||||||||||||
| Consumer, Cyclical: 15.9% | ||||||||||||||
| 1,750,000 | # | Adient Global Holdings Ltd., 4.875%, 08/15/26 | 1,721,562 | 0.3 | ||||||||||
| 2,000,000 | # | AdvancePierre Foods Holdings, Inc., 5.500%, 12/15/24 | 2,027,500 | 0.3 | ||||||||||
| 1,500,000 | AMC Entertainment Holdings, Inc., 5.750%, 06/15/25 | 1,541,250 | 0.2 | |||||||||||
| 500,000 | AMC Entertainment Holdings, Inc., 5.875%, 02/15/22 | 523,125 | 0.1 | |||||||||||
| 1,705,000 | # | American Greetings Corp., 7.875%, 02/15/25 | 1,794,512 | 0.3 | ||||||||||
| 2,050,000 | # | American Tire Distributors, Inc., 10.250%, 03/01/22 | 2,096,125 | 0.3 | ||||||||||
| 2,345,000 | Asbury Automotive Group, Inc., 6.000%, 12/15/24 | 2,432,937 | 0.4 | |||||||||||
| 2,070,000 | # | Ashton Woods USA LLC / Ashton Woods Finance Co., 6.875%, 02/15/21 | 2,080,350 | 0.3 | ||||||||||
| 2,670,000 | Caesars Entertainment Resort Properties LLC / Caesars Entertainment Resort Prope, 8.000%, 10/01/20 | 2,793,487 | 0.4 | |||||||||||
| 1,465,000 | Caesars Growth Properties Holdings LLC / Caesars Growth Properties Finance, Inc., 9.375%, 05/01/22 | 1,578,537 | 0.3 | |||||||||||
| 1,700,000 | CalAtlantic Group, Inc., 5.250%, 06/01/26 | 1,700,000 | 0.3 | |||||||||||
| 2,000,000 | Caleres, Inc., 6.250%, 08/15/23 | 2,095,000 | 0.3 | |||||||||||
| 495,000 | # | Carlson Travel, Inc., 6.750%, 12/15/23 | 516,037 | 0.1 | ||||||||||
| 490,000 | # | Carlson Travel, Inc., 9.500%, 12/15/24 | 514,500 | 0.1 | ||||||||||
| 1,300,000 | # | Carmike Cinemas, Inc., 6.000%, 06/15/23 | 1,378,000 | 0.2 | ||||||||||
| 1,940,000 | # | CCM Merger, Inc., 6.000%, 03/15/22 | 1,983,650 | 0.3 | ||||||||||
| 2,115,000 | Cedar Fair L.P. / Canada's Wonderland Co. / Magnum Management Corp., 5.375%, 06/01/24 | 2,178,450 | 0.3 | |||||||||||
| 1,315,000 | Century Communities, Inc., 6.875%, 05/15/22 | 1,374,175 | 0.2 | |||||||||||
| 750,000 | # | Century Communities, Inc., 6.875%, 05/15/22 | 783,750 | 0.1 | ||||||||||
| 1,975,000 | # | Cooper-Standard Automotive, Inc., 5.625%, 11/15/26 | 1,979,938 | 0.3 | ||||||||||
| 1,960,000 | Dana, Inc., 5.500%, 12/15/24 | 1,994,300 | 0.3 | |||||||||||
| 1,080,000 | # | DBP Holding Corp., 7.750%, 10/15/20 | 734,400 | 0.1 | ||||||||||
| 2,585,000 | Dollar Tree, Inc., 5.750%, 03/01/23 | 2,765,950 | 0.4 | |||||||||||
| 485,000 | # | Eagle II Acquisition Co. LLC, 6.000%, 04/01/25 | 501,369 | 0.1 | ||||||||||
| 2,095,000 | # | EMI Music Publishing Group North America Holdings, Inc., 7.625%, 06/15/24 | 2,294,025 | 0.4 | ||||||||||
| 820,000 | Fiat Chrysler Automobiles NV, 5.250%, 04/15/23 | 847,470 | 0.1 | |||||||||||
| 520,000 | GLP Capital L.P. / GLP Financing II, Inc., 4.375%, 04/15/21 | 535,600 | 0.1 | |||||||||||
| 1,040,000 | GLP Capital L.P. / GLP Financing II, Inc., 5.375%, 04/15/26 | 1,076,400 | 0.2 | |||||||||||
| 1,970,000 | Goodyear Tire & Rubber Co., 5.125%, 11/15/23 | 2,054,956 | 0.3 | |||||||||||
| 825,000 | # | Guitar Center, Inc., 6.500%, 04/15/19 | 697,125 | 0.1 | ||||||||||
| 900,000 | # | Guitar Center, Inc., 9.625%, 04/15/20 | 623,250 | 0.1 | ||||||||||
| 1,400,000 | # | HD Supply, Inc., 5.250%, 12/15/21 | 1,477,000 | 0.2 | ||||||||||
| 375,000 | # | HD Supply, Inc., 5.750%, 04/15/24 | 395,363 | 0.1 | ||||||||||
| 970,000 | # | Hilton Worldwide Finance LLC / Hilton Worldwide Finance Corp., 4.625%, 04/01/25 | 982,125 | 0.2 | ||||||||||
| 1,455,000 | # | Hilton Worldwide Finance LLC / Hilton Worldwide Finance Corp., 4.875%, 04/01/27 | 1,473,188 | 0.2 | ||||||||||
| 2,690,000 | # | Hot Topic, Inc., 9.250%, 06/15/21 | 2,622,750 | 0.4 | ||||||||||
| 860,000 | # | International Game Technology PLC, 5.625%, 02/15/20 | 903,000 | 0.1 | ||||||||||
| 900,000 | # | International Game Technology PLC, 6.250%, 02/15/22 | 965,250 | 0.2 | ||||||||||
| 865,000 | # | International Game Technology PLC, 6.500%, 02/15/25 | 925,550 | 0.2 | ||||||||||
| 1,040,000 | # | KFC Holding Co/Pizza Hut Holdings LLC/Taco Bell of America LLC, 5.250%, 06/01/26 | 1,060,800 | 0.2 | ||||||||||
See Accompanying Notes to Financial Statements
| Voya High Yield Bond Fund | PORTFOLIO OF INVESTMENTS as of March 31, 2017 (continued) |
| Principal Amount† | Value | Percentage of Net Assets | ||||||||||||
| CORPORATE BONDS/NOTES: (continued) | ||||||||||||||
| Consumer, Cyclical: (continued) | ||||||||||||||
| 1,040,000 | # | KFC Holding Co/Pizza Hut Holdings LLC/Taco Bell of America LLC, 5.000%, 06/01/24 | 1,064,700 | 0.2 | ||||||||||
| 2,145,000 | L Brands, Inc., 6.750%, 07/01/36 | 2,054,481 | 0.3 | |||||||||||
| 475,000 | # | Landry's, Inc., 6.750%, 10/15/24 | 494,000 | 0.1 | ||||||||||
| 2,115,000 | # | Lions Gate Entertainment Corp., 5.875%, 11/01/24 | 2,204,888 | 0.3 | ||||||||||
| 1,700,000 | M/I Homes, Inc., 6.750%, 01/15/21 | 1,788,298 | 0.3 | |||||||||||
| 1,000,000 | # | MCE Finance Ltd., 5.000%, 02/15/21 | 1,017,000 | 0.2 | ||||||||||
| 1,000,000 | Meritage Homes Corp., 7.150%, 04/15/20 | 1,098,630 | 0.2 | |||||||||||
| 1,466,000 | Meritage Homes Corp., 7.000%, 04/01/22 | 1,649,250 | 0.3 | |||||||||||
| 2,000,000 | MGM Resorts International, 6.000%, 03/15/23 | 2,157,500 | 0.3 | |||||||||||
| 1,500,000 | MGM Resorts International, 7.750%, 03/15/22 | 1,733,438 | 0.3 | |||||||||||
| 250,000 | #,L | Neiman Marcus Group Ltd., Inc., 8.000%, 10/15/21 | 151,780 | 0.0 | ||||||||||
| 1,750,000 | #,&,L | Neiman Marcus Group Ltd., Inc., 8.750%, 10/15/21 | 993,125 | 0.2 | ||||||||||
| 3,095,000 | # | PetSmart, Inc., 7.125%, 03/15/23 | 2,947,987 | 0.5 | ||||||||||
| 800,000 | PulteGroup, Inc., 5.500%, 03/01/26 | 831,000 | 0.1 | |||||||||||
| 2,085,000 | #,L | Rite Aid Corp., 6.125%, 04/01/23 | 2,074,575 | 0.3 | ||||||||||
| 240,000 | # | Rite Aid Corp., 6.875%, 12/15/28 | 256,800 | 0.0 | ||||||||||
| 1,908,000 | # | Rivers Pittsburgh Borrower L.P./Rivers Pittsburgh Finance Corp., 6.125%, 08/15/21 | 1,946,160 | 0.3 | ||||||||||
| 600,000 | CalAtlantic Group, Inc., 5.375%, 10/01/22 | 629,250 | 0.1 | |||||||||||
| 790,000 | # | Scientific Games International, Inc., 7.000%, 01/01/22 | 846,288 | 0.1 | ||||||||||
| 1,685,000 | Scientific Games International, Inc., 10.000%, 12/01/22 | 1,802,950 | 0.3 | |||||||||||
| 1,705,000 | # | Silversea Cruise Finance Ltd., 7.250%, 02/01/25 | 1,803,038 | 0.3 | ||||||||||
| 790,000 | # | Six Flags Entertainment Corp., 4.875%, 07/31/24 | 781,606 | 0.1 | ||||||||||
| 1,585,000 | # | Six Flags Entertainment Corp., 5.500%, 04/15/27 | 1,585,000 | 0.2 | ||||||||||
| 780,000 | Sonic Automotive, Inc., 5.000%, 05/15/23 | 761,966 | 0.1 | |||||||||||
| 725,000 | # | Sonic Automotive, Inc., 6.125%, 03/15/27 | 727,719 | 0.1 | ||||||||||
| 2,096,000 | Springs Industries, Inc., 6.250%, 06/01/21 | 2,164,120 | 0.3 | |||||||||||
| 1,100,000 | CalAtlantic Group, Inc., 8.375%, 01/15/21 | 1,280,125 | 0.2 | |||||||||||
| 1,450,000 | # | Tops Holding LLC / Tops Markets II Corp., 8.000%, 06/15/22 | 1,196,250 | 0.2 | ||||||||||
| 1,830,000 | # | Viking Cruises Ltd., 8.500%, 10/15/22 | 1,905,488 | 0.3 | ||||||||||
| 657,000 | # | WMG Acquisition Corp., 5.625%, 04/15/22 | 682,459 | 0.1 | ||||||||||
| 1,960,000 | # | WMG Acquisition Corp., 6.750%, 04/15/22 | 2,067,800 | 0.3 | ||||||||||
| 1,120,000 | # | Wolverine World Wide, Inc., 5.000%, 09/01/26 | 1,055,600 | 0.2 | ||||||||||
| 101,776,027 | 15.9 | |||||||||||||
| Consumer, Non-cyclical: 18.7% | ||||||||||||||
| 1,160,000 | Acadia Healthcare Co., Inc., 5.125%, 07/01/22 | 1,177,400 | 0.2 | |||||||||||
| 1,000,000 | Acadia Healthcare Co., Inc., 5.625%, 02/15/23 | 1,040,620 | 0.2 | |||||||||||
| 110,000 | Acadia Healthcare Co., Inc., 6.500%, 03/01/24 | 116,050 | 0.0 | |||||||||||
| 2,615,000 | # | Albertsons Cos LLC / Safeway, Inc. / New Albertson's, Inc. / Albertson's LLC, 6.625%, 06/15/24 | 2,680,375 | 0.4 | ||||||||||
| 830,000 | # | Alere, Inc., 6.375%, 07/01/23 | 847,637 | 0.1 | ||||||||||
| 1,500,000 | # | Ashtead Capital, Inc., 6.500%, 07/15/22 | 1,567,500 | 0.2 | ||||||||||
| 1,320,000 | #,& | BI-LO LLC / BI-LO Finance Corp., 8.625%, 09/15/18 | 666,600 | 0.1 | ||||||||||
| 1,335,000 | # | BI-LO LLC / BI-LO Finance Corp., 9.250%, 02/15/19 | 1,159,781 | 0.2 | ||||||||||
| 2,250,000 | # | Brand Energy & Infrastructure Services, Inc., 8.500%, 12/01/21 | 2,379,375 | 0.4 | ||||||||||
| 1,930,000 | # | C&S Group Enterprises LLC, 5.375%, 07/15/22 | 1,915,525 | 0.3 | ||||||||||
| 1,875,000 | #,& | Capsugel SA, 7.000%, 05/15/19 | 1,870,781 | 0.3 | ||||||||||
| 1,245,000 | # | Cardtronics, Inc. / Cardtronics USA, 5.500%, 05/01/25 | 1,263,675 | 0.2 | ||||||||||
| 515,000 | Centene Corp., 4.750%, 01/15/25 | 519,187 | 0.1 | |||||||||||
| 1,775,000 | Centene Corp., 5.625%, 02/15/21 | 1,862,152 | 0.3 | |||||||||||
| 1,180,000 | Centene Corp., 6.125%, 02/15/24 | 1,269,975 | 0.2 | |||||||||||
| 2,085,000 | Central Garden & Pet Co., 6.125%, 11/15/23 | 2,210,100 | 0.3 | |||||||||||
| 970,000 | CHS/Community Health Systems, Inc., 6.250%, 03/31/23 | 993,037 | 0.2 | |||||||||||
| 190,000 | CHS/Community Health Systems, Inc., 7.125%, 07/15/20 | 174,800 | 0.0 | |||||||||||
| 1,525,000 | L | CHS/Community Health Systems, Inc., 8.000%, 11/15/19 | 1,500,219 | 0.2 | ||||||||||
| 1,250,000 | Cott Beverages, Inc., 5.375%, 07/01/22 | 1,279,687 | 0.2 | |||||||||||
| 1,455,000 | # | Cott Holdings, Inc., 5.500%, 04/01/25 | 1,484,536 | 0.2 | ||||||||||
| 1,340,000 | DaVita, Inc., 5.125%, 07/15/24 | 1,355,912 | 0.2 | |||||||||||
| 1,190,000 | # | Endo Finance LLC / Endo Finco, Inc., 5.375%, 01/15/23 | 1,033,063 | 0.2 | ||||||||||
See Accompanying Notes to Financial Statements
| Voya High Yield Bond Fund | PORTFOLIO OF INVESTMENTS as of March 31, 2017 (continued) |
| Principal Amount† | Value | Percentage of Net Assets | ||||||||||||
| CORPORATE BONDS/NOTES: (continued) | ||||||||||||||
| Consumer, Non-cyclical: (continued) | ||||||||||||||
| 515,000 | # | Endo Ltd. / Endo Finance LLC / Endo Finco, Inc., 6.000%, 02/01/25 | 441,612 | 0.1 | ||||||||||
| 840,000 | # | Envision Healthcare Corp., 5.125%, 07/01/22 | 859,160 | 0.1 | ||||||||||
| 1,805,000 | Envision Healthcare Corp., 5.625%, 07/15/22 | 1,856,894 | 0.3 | |||||||||||
| 2,000,000 | # | FAGE International SA/ FAGE USA Dairy Industry, Inc., 5.625%, 08/15/26 | 2,010,000 | 0.3 | ||||||||||
| 485,000 | # | Gartner, Inc., 5.125%, 04/01/25 | 495,306 | 0.1 | ||||||||||
| 3,620,000 | HCA Holdings, Inc., 6.250%, 02/15/21 | 3,916,387 | 0.6 | |||||||||||
| 4,315,000 | HCA, Inc., 5.375%, 02/01/25 | 4,498,387 | 0.7 | |||||||||||
| 1,800,000 | HCA, Inc., 7.500%, 02/15/22 | 2,063,250 | 0.3 | |||||||||||
| 850,000 | HealthSouth Corp., 5.750%, 11/01/24 | 860,625 | 0.1 | |||||||||||
| 468,000 | # | Herc Rentals, Inc., 7.500%, 06/01/22 | 499,590 | 0.1 | ||||||||||
| 454,000 | # | Herc Rentals, Inc., 7.750%, 06/01/24 | 485,780 | 0.1 | ||||||||||
| 835,000 | #,L | Hertz Corp., 5.500%, 10/15/24 | 729,581 | 0.1 | ||||||||||
| 480,000 | L | Hertz Corp., 6.750%, 04/15/19 | 481,200 | 0.1 | ||||||||||
| 1,000,000 | L | Hertz Corp., 7.375%, 01/15/21 | 1,001,875 | 0.2 | ||||||||||
| 880,000 | # | High Ridge Brands Co., 8.875%, 03/15/25 | 899,800 | 0.1 | ||||||||||
| 2,305,000 | # | Hill-Rom Holdings, Inc., 5.750%, 09/01/23 | 2,400,081 | 0.4 | ||||||||||
| 2,095,000 | # | Jaguar Holding Co. II / Pharmaceutical Product Development LLC, 6.375%, 08/01/23 | 2,194,513 | 0.3 | ||||||||||
| 1,150,000 | # | JBS USA LLC/JBS USA Finance, Inc., 7.250%, 06/01/21 | 1,187,375 | 0.2 | ||||||||||
| 830,000 | # | JBS USA LUX SA / JBS USA Finance, Inc., 5.750%, 06/15/25 | 842,450 | 0.1 | ||||||||||
| 1,250,000 | # | JBS USA LUX SA / JBS USA Finance, Inc., 5.875%, 07/15/24 | 1,293,750 | 0.2 | ||||||||||
| 2,700,000 | # | KeHE Distributors LLC / KeHE Finance Corp., 7.625%, 08/15/21 | 2,727,000 | 0.4 | ||||||||||
| 990,000 | # | Lamb Weston Holdings, Inc., 4.625%, 11/01/24 | 1,012,275 | 0.2 | ||||||||||
| 990,000 | # | Lamb Weston Holdings, Inc., 4.875%, 11/01/26 | 1,012,275 | 0.2 | ||||||||||
| 1,960,000 | # | Live Nation Entertainment, Inc., 5.375%, 06/15/22 | 2,048,200 | 0.3 | ||||||||||
| 2,080,000 | # | Midas Intermediate Holdco II LLC / Midas Intermediate Holdco II Finance, Inc., 7.875%, 10/01/22 | 2,158,000 | 0.3 | ||||||||||
| 1,815,000 | Molina Healthcare, Inc., 5.375%, 11/15/22 | 1,886,475 | 0.3 | |||||||||||
| 2,900,000 | # | MPH Acquisition Holdings LLC, 7.125%, 06/01/24 | 3,125,113 | 0.5 | ||||||||||
| 785,000 | # | Nature's Bounty Co., 7.625%, 05/15/21 | 828,175 | 0.1 | ||||||||||
| 779,000 | # | Nielsen Co. Luxembourg SARL., 5.500%, 10/01/21 | 811,134 | 0.1 | ||||||||||
| 1,965,000 | Pinnacle Foods Finance LLC / Pinnacle Foods Finance Corp., 5.875%, 01/15/24 | 2,058,338 | 0.3 | |||||||||||
| 600,000 | # | Post Holdings, Inc., 5.000%, 08/15/26 | 576,000 | 0.1 | ||||||||||
| 1,400,000 | # | Post Holdings, Inc., 7.750%, 03/15/24 | 1,550,794 | 0.2 | ||||||||||
| 1,150,000 | # | Post Holdings, Inc., 8.000%, 07/15/25 | 1,296,625 | 0.2 | ||||||||||
| 1,635,000 | Quad/Graphics, Inc., 7.000%, 05/01/22 | 1,643,175 | 0.3 | |||||||||||
| 1,800,000 | #,L | Quorum Health Corp., 11.625%, 04/15/23 | 1,577,250 | 0.3 | ||||||||||
| 1,960,000 | Revlon Consumer Products Corp., 6.250%, 08/01/24 | 1,960,000 | 0.3 | |||||||||||
| 585,000 | L | RR Donnelley & Sons Co., 6.000%, 04/01/24 | 547,706 | 0.1 | ||||||||||
| 500,000 | RR Donnelley & Sons Co., 7.000%, 02/15/22 | 510,000 | 0.1 | |||||||||||
| 420,000 | ServiceMaster Co. LLC, 7.450%, 08/15/27 | 460,950 | 0.1 | |||||||||||
| 1,050,000 | # | Shearers Foods LLC / Chip Fin Corp., 9.000%, 11/01/19 | 1,095,938 | 0.2 | ||||||||||
| 1,975,000 | # | Southern Graphics, Inc., 8.375%, 10/15/20 | 2,014,500 | 0.3 | ||||||||||
| 1,355,000 | Spectrum Brands, Inc., 5.750%, 07/15/25 | 1,439,688 | 0.2 | |||||||||||
| 2,040,000 | # | Sterigenics-Nordion Holdings LLC, 6.500%, 05/15/23 | 2,091,000 | 0.3 | ||||||||||
| 1,230,000 | #,& | Sterigenics-Nordion Topco LLC, 8.125%, 11/01/21 | 1,263,825 | 0.2 | ||||||||||
| 1,580,000 | Teleflex, Inc., 5.250%, 06/15/24 | 1,619,500 | 0.3 | |||||||||||
| 1,000,000 | Tenet Healthcare Corp., 6.000%, 10/01/20 | 1,060,000 | 0.2 | |||||||||||
| 1,975,000 | Tenet Healthcare Corp., 6.750%, 02/01/20 | 2,009,563 | 0.3 | |||||||||||
| 2,860,000 | L | Tenet Healthcare Corp., 6.750%, 06/15/23 | 2,817,100 | 0.4 | ||||||||||
| 195,000 | #,L | Tenet Healthcare Corp., 7.500%, 01/01/22 | 211,088 | 0.0 | ||||||||||
| 1,000,000 | Tenet Healthcare Corp., 8.125%, 04/01/22 | 1,047,500 | 0.2 | |||||||||||
| 500,000 | United Rentals North America, Inc., 5.500%, 05/15/27 | 506,250 | 0.1 | |||||||||||
| 1,500,000 | United Rentals North America, Inc., 6.125%, 06/15/23 | 1,573,125 | 0.2 | |||||||||||
| 223,000 | United Rentals North America, Inc., 7.625%, 04/15/22 | 232,617 | 0.0 | |||||||||||
| 1,575,000 | # | US Foods, Inc., 5.875%, 06/15/24 | 1,641,938 | 0.3 | ||||||||||
| 1,620,000 | #,L | Valeant Pharmaceuticals International, Inc., 5.375%, 03/15/20 | 1,455,975 | 0.2 | ||||||||||
See Accompanying Notes to Financial Statements
| Voya High Yield Bond Fund | PORTFOLIO OF INVESTMENTS as of March 31, 2017 (continued) |
| Principal Amount† | Value | Percentage of Net Assets | ||||||||||||
| CORPORATE BONDS/NOTES: (continued) | ||||||||||||||
| Consumer, Non-cyclical: (continued) | ||||||||||||||
| 1,750,000 | # | Valeant Pharmaceuticals International, Inc., 5.500%, 03/01/23 | 1,356,250 | 0.2 | ||||||||||
| 420,000 | # | Valeant Pharmaceuticals International, Inc., 6.125%, 04/15/25 | 324,975 | 0.1 | ||||||||||
| 360,000 | # | Valeant Pharmaceuticals International, Inc., 6.500%, 03/15/22 | 371,250 | 0.1 | ||||||||||
| 485,000 | # | Valeant Pharmaceuticals International, Inc., 7.000%, 03/15/24 | 498,944 | 0.1 | ||||||||||
| 990,000 | #,L | Valeant Pharmaceuticals International, 6.375%, 10/15/20 | 900,900 | 0.1 | ||||||||||
| 4,315,000 | # | Valeant Pharmaceuticals International, 6.750%, 08/15/21 | 3,743,263 | 0.6 | ||||||||||
| 2,575,000 | # | Vizient, Inc., 10.375%, 03/01/24 | 2,945,156 | 0.5 | ||||||||||
| 119,395,433 | 18.7 | |||||||||||||
| Energy: 11.9% | ||||||||||||||
| 960,000 | # | Antero Midstream Partners L.P. / Antero Midstream Finance Corp., 5.375%, 09/15/24 | 979,200 | 0.2 | ||||||||||
| 2,750,000 | Antero Resources Corp., 5.125%, 12/01/22 | 2,799,844 | 0.4 | |||||||||||
| 900,000 | # | Antero Resources Corp., 5.000%, 03/01/25 | 886,500 | 0.1 | ||||||||||
| 1,460,000 | # | California Resources Corp., 8.000%, 12/15/22 | 1,195,375 | 0.2 | ||||||||||
| 1,250,000 | Calumet Specialty Products Partners L.P. / Calumet Finance Corp., 7.750%, 04/15/23 | 1,056,250 | 0.2 | |||||||||||
| 2,000,000 | Cenovus Energy, Inc., 3.800%, 09/15/23 | 2,022,866 | 0.3 | |||||||||||
| 1,235,000 | # | Cheniere Corpus Christi Holdings LLC, 5.875%, 03/31/25 | 1,292,119 | 0.2 | ||||||||||
| 1,520,000 | L | Chesapeake Energy Corp., 6.125%, 02/15/21 | 1,482,000 | 0.2 | ||||||||||
| 700,000 | L | Chesapeake Energy Corp., 6.625%, 08/15/20 | 702,625 | 0.1 | ||||||||||
| 2,295,000 | #,L | Chesapeake Energy Corp., 8.000%, 01/15/25 | 2,303,606 | 0.4 | ||||||||||
| 2,015,000 | CONSOL Energy, Inc., 5.875%, 04/15/22 | 2,002,406 | 0.3 | |||||||||||
| 1,400,000 | Continental Resources, Inc./OK, 4.500%, 04/15/23 | 1,372,000 | 0.2 | |||||||||||
| 1,500,000 | Continental Resources, Inc./OK, 5.000%, 09/15/22 | 1,520,625 | 0.2 | |||||||||||
| 500,000 | # | Crestwood Midstream Partners L.P. / Crestwood Midstream Finance Corp., 5.750%, 04/01/25 | 511,875 | 0.1 | ||||||||||
| 1,000,000 | Crestwood Midstream Partners L.P. / Crestwood Midstream Finance Corp., 6.250%, 04/01/23 | 1,042,500 | 0.2 | |||||||||||
| 1,485,000 | # | Diamondback Energy, Inc., 4.750%, 11/01/24 | 1,501,186 | 0.2 | ||||||||||
| 2,045,000 | Eclipse Resources Corp., 8.875%, 07/15/23 | 2,096,125 | 0.3 | |||||||||||
| 1,200,000 | Energy Transfer Equity L.P., 7.500%, 10/15/20 | 1,344,000 | 0.2 | |||||||||||
| 1,750,000 | L | Ensco PLC, 5.200%, 03/15/25 | 1,526,875 | 0.2 | ||||||||||
| 800,000 | Ensco PLC, 5.750%, 10/01/44 | 604,000 | 0.1 | |||||||||||
| 1,470,000 | # | Enviva Partners L.P. / Enviva Partners Finance Corp., 8.500%, 11/01/21 | 1,563,712 | 0.2 | ||||||||||
| 1,465,000 | # | Gulfport Energy Corp., 6.000%, 10/15/24 | 1,428,375 | 0.2 | ||||||||||
| 495,000 | # | Gulfport Energy Corp., 6.375%, 05/15/25 | 487,575 | 0.1 | ||||||||||
| 1,750,000 | # | Hilcorp Energy I L.P. / Hilcorp Finance Co., 5.000%, 12/01/24 | 1,649,375 | 0.3 | ||||||||||
| 1,120,000 | # | Holly Energy Partners L.P. / Holly Energy Finance Corp., 6.000%, 08/01/24 | 1,178,800 | 0.2 | ||||||||||
| 1,135,000 | # | Lonestar Resources America, Inc., 8.750%, 04/15/19 | 964,750 | 0.1 | ||||||||||
| 1,985,000 | Murphy Oil Corp., 4.700%, 12/01/22 | 1,930,412 | 0.3 | |||||||||||
| 530,000 | Murphy Oil Corp., 6.875%, 08/15/24 | 563,125 | 0.1 | |||||||||||
| 1,910,000 | Murphy Oil USA, Inc., 6.000%, 08/15/23 | 2,010,275 | 0.3 | |||||||||||
| 1,470,000 | # | Murray Energy Corp., 11.250%, 04/15/21 | 1,142,925 | 0.2 | ||||||||||
| 1,800,000 | Newfield Exploration Co., 5.625%, 07/01/24 | 1,905,750 | 0.3 | |||||||||||
| 495,000 | L | Noble Holding International Ltd., 7.750%, 01/15/24 | 477,675 | 0.1 | ||||||||||
| 825,000 | Northern Oil And Gas, Inc., 8.000%, 06/01/20 | 705,375 | 0.1 | |||||||||||
| 2,285,000 | L | PBF Logistics L.P. / PBF Logistics Finance Corp., 6.875%, 05/15/23 | 2,324,988 | 0.4 | ||||||||||
| 480,000 | # | PDC Energy, Inc., 6.125%, 09/15/24 | 494,400 | 0.1 | ||||||||||
| 1,050,000 | # | Range Resources Corp., 5.875%, 07/01/22 | 1,086,750 | 0.2 | ||||||||||
| 1,950,000 | # | Rockies Express Pipeline, LLC, 5.625%, 04/15/20 | 2,062,125 | 0.3 | ||||||||||
| 1,985,000 | Rowan Cos, Inc., 5.400%, 12/01/42 | 1,498,675 | 0.2 | |||||||||||
| 400,000 | Sanchez Energy Corp., 7.750%, 06/15/21 | 397,000 | 0.1 | |||||||||||
| 360,000 | SemGroup Corp. / Rose Rock Finance Corp., 5.625%, 07/15/22 | 357,527 | 0.1 | |||||||||||
| 625,000 | Summit Midstream Holdings LLC / Summit Midstream Finance Corp., 5.500%, 08/15/22 | 628,125 | 0.1 | |||||||||||
See Accompanying Notes to Financial Statements
| Voya High Yield Bond Fund | PORTFOLIO OF INVESTMENTS as of March 31, 2017 (continued) |
| Principal Amount† | Value | Percentage of Net Assets | ||||||||||||
| CORPORATE BONDS/NOTES: (continued) | ||||||||||||||
| Energy: (continued) | ||||||||||||||
| 1,215,000 | Summit Midstream Holdings LLC / Summit Midstream Finance Corp., 5.750%, 04/15/25 | 1,215,000 | 0.2 | |||||||||||
| 405,000 | # | SunCoke Energy Partners L.P. / SunCoke Energy Partners Finance Corp., 7.375%, 02/01/20 | 411,075 | 0.1 | ||||||||||
| 500,000 | # | SunCoke Energy Partners L.P. / SunCoke Energy Partners Finance Corp., 7.375%, 02/01/20 | 507,500 | 0.1 | ||||||||||
| 520,000 | # | SunCoke Energy Partners L.P. / SunCoke Energy Partners Finance Corp., 7.375%, 02/01/20 | 527,800 | 0.1 | ||||||||||
| 102,000 | SunCoke Energy, Inc., 7.625%, 08/01/19 | 100,725 | �� | 0.0 | ||||||||||
| 2,225,000 | Sunoco L.P. / Sunoco Finance Corp., 6.375%, 04/01/23 | 2,269,500 | 0.4 | |||||||||||
| 3,250,000 | Targa Resources Partners L.P. / Targa Resources Partners Finance Corp., 5.250%, 05/01/23 | 3,339,375 | 0.5 | |||||||||||
| 545,000 | Targa Resources Partners L.P. / Targa Resources Partners Finance Corp., 6.750%, 03/15/24 | 594,050 | 0.1 | |||||||||||
| 240,000 | Tesoro Logistics L.P. / Tesoro Logistics Finance Corp., 5.250%, 01/15/25 | 251,400 | 0.0 | |||||||||||
| 2,000,000 | Tesoro Logistics L.P. / Tesoro Logistics Finance Corp., 6.125%, 10/15/21 | 2,097,500 | 0.3 | |||||||||||
| 950,000 | Tesoro Logistics L.P. / Tesoro Logistics Finance Corp., 6.375%, 05/01/24 | 1,033,125 | 0.2 | |||||||||||
| 2,367,000 | Unit Corp., 6.625%, 05/15/21 | 2,343,330 | 0.4 | |||||||||||
| 970,000 | # | Vermilion Energy, Inc., 5.625%, 03/15/25 | 965,150 | 0.1 | ||||||||||
| 1,300,000 | Weatherford International LLC, 6.800%, 06/15/37 | 1,257,750 | 0.2 | |||||||||||
| 1,250,000 | L | Weatherford International Ltd., 4.500%, 04/15/22 | 1,203,125 | 0.2 | ||||||||||
| 1,465,000 | # | WildHorse Resource Development Corp., 6.875%, 02/01/25 | 1,402,738 | 0.2 | ||||||||||
| 3,240,000 | WPX Energy, Inc., 6.000%, 01/15/22 | 3,321,000 | 0.5 | |||||||||||
| 75,939,834 | 11.9 | |||||||||||||
| Financial: 5.5% | ||||||||||||||
| 2,600,000 | Ally Financial, Inc., 5.750%, 11/20/25 | 2,671,500 | 0.4 | |||||||||||
| 1,500,000 | Ally Financial, Inc., 7.500%, 09/15/20 | 1,688,437 | 0.3 | |||||||||||
| 735,000 | Ally Financial, Inc., 8.000%, 03/15/20 | 826,875 | 0.1 | |||||||||||
| 250,000 | CIT Group, Inc., 5.375%, 05/15/20 | 267,033 | 0.0 | |||||||||||
| 1,060,000 | CIT Group, Inc., 5.000%, 08/15/22 | 1,112,332 | 0.2 | |||||||||||
| 290,000 | # | CIT Group, Inc., 6.625%, 04/01/18 | 302,687 | 0.0 | ||||||||||
| 1,150,000 | # | CNG Holdings, Inc., 9.375%, 05/15/20 | 1,055,125 | 0.2 | ||||||||||
| 965,000 | Equinix, Inc., 5.375%, 04/01/23 | 1,009,631 | 0.2 | |||||||||||
| 1,300,000 | Equinix, Inc., 5.750%, 01/01/25 | 1,381,250 | 0.2 | |||||||||||
| 2,850,000 | # | ESH Hospitality, Inc., 5.250%, 05/01/25 | 2,880,267 | 0.4 | ||||||||||
| 1,120,000 | # | FBM Finance, Inc., 8.250%, 08/15/21 | 1,192,800 | 0.2 | ||||||||||
| 1,000,000 | Icahn Enterprises L.P. / Icahn Enterprises Finance Corp., 6.000%, 08/01/20 | 1,035,000 | 0.2 | |||||||||||
| 1,400,000 | Iron Mountain, Inc., 5.750%, 08/15/24 | 1,435,000 | 0.2 | |||||||||||
| 435,000 | # | Iron Mountain, Inc., 6.000%, 10/01/20 | 456,750 | 0.1 | ||||||||||
| 1,100,000 | MGM Growth Properties Operating Partnership L.P. / MGP Finance Co-Issuer, Inc., 5.625%, 05/01/24 | 1,166,000 | 0.2 | |||||||||||
| 200,000 | MPT Operating Partnership L.P. / MPT Finance Corp., 5.250%, 08/01/26 | 198,000 | 0.0 | |||||||||||
| 1,000,000 | MPT Operating Partnership L.P. / MPT Finance Corp., 5.500%, 05/01/24 | 1,022,500 | 0.2 | |||||||||||
| 1,000,000 | MPT Operating Partnership L.P. / MPT Finance Corp., 6.375%, 03/01/24 | 1,080,000 | 0.2 | |||||||||||
| 1,965,000 | Navient Corp., 5.875%, 10/25/24 | 1,842,188 | 0.3 | |||||||||||
| 1,250,000 | Navient Corp., 6.125%, 03/25/24 | 1,196,875 | 0.2 | |||||||||||
| 560,000 | Navient Corp., 6.625%, 07/26/21 | 581,000 | 0.1 | |||||||||||
| 2,380,000 | Navient Corp., 7.250%, 09/25/23 | 2,403,800 | 0.4 | |||||||||||
| 2,040,000 | # | Realogy Group LLC / Realogy Co-Issuer Corp., 5.250%, 12/01/21 | 2,131,800 | 0.3 | ||||||||||
| 2,800,000 | Royal Bank of Scotland Group PLC, 8.625%, 12/29/49 | 2,926,000 | 0.4 | |||||||||||
| 520,000 | SLM Corp., 5.125%, 04/05/22 | 520,000 | 0.1 | |||||||||||
| 990,000 | # | Uniti Group, Inc. / CSL Capital LLC, 7.125%, 12/15/24 | 1,007,325 | 0.1 | ||||||||||
| 1,725,000 | Uniti Group, Inc. / CSL Capital LLC, 8.250%, 10/15/23 | 1,828,500 | 0.3 | |||||||||||
| 35,218,675 | 5.5 | |||||||||||||
See Accompanying Notes to Financial Statements
| Voya High Yield Bond Fund | PORTFOLIO OF INVESTMENTS as of March 31, 2017 (continued) |
| Principal Amount† | Value | Percentage of Net Assets | ||||||||||||
| CORPORATE BONDS/NOTES: (continued) | ||||||||||||||
| Industrial: 10.5% | ||||||||||||||
| 1,975,000 | # | Advanced Disposal Services, Inc., 5.625%, 11/15/24 | 1,999,687 | 0.3 | ||||||||||
| 370,000 | AECOM, 5.750%, 10/15/22 | 389,887 | 0.1 | |||||||||||
| 2,120,000 | AECOM, 5.875%, 10/15/24 | 2,263,100 | 0.3 | |||||||||||
| 2,250,000 | # | Albea Beauty Holdings SA, 8.375%, 11/01/19 | 2,354,062 | 0.4 | ||||||||||
| 125,000 | Allegion PLC, 5.875%, 09/15/23 | 134,063 | 0.0 | |||||||||||
| 1,070,000 | Allegion US Holding Co., Inc., 5.750%, 10/01/21 | 1,119,487 | 0.2 | |||||||||||
| 2,425,000 | #,& | ARD Finance SA, 7.125%, 09/15/23 | 2,503,812 | 0.4 | ||||||||||
| 508,000 | # | Ardagh Packaging Finance PLC / Ardagh Holdings USA, Inc., 6.000%, 02/15/25 | 514,985 | 0.1 | ||||||||||
| 1,425,000 | # | Ardagh Packaging Finance PLC / Ardagh Holdings USA, Inc., 7.250%, 05/15/24 | 1,530,094 | 0.2 | ||||||||||
| 1,580,000 | # | ATS Automation Tooling Systems, Inc., 6.500%, 06/15/23 | 1,655,050 | 0.3 | ||||||||||
| 1,034,000 | # | BMC East LLC, 5.500%, 10/01/24 | 1,054,680 | 0.2 | ||||||||||
| 2,435,000 | # | Bombardier, Inc., 8.750%, 12/01/21 | 2,672,413 | 0.4 | ||||||||||
| 400,000 | # | Builders FirstSource, Inc., 5.625%, 09/01/24 | 407,500 | 0.1 | ||||||||||
| 2,500,000 | # | Builders FirstSource, Inc., 10.750%, 08/15/23 | 2,918,750 | 0.4 | ||||||||||
| 1,250,000 | # | BWAY Holding Co., 7.250%, 04/15/25 | 1,253,125 | 0.2 | ||||||||||
| 1,500,000 | # | Cleaver-Brooks, Inc., 8.750%, 12/15/19 | 1,546,875 | 0.2 | ||||||||||
| 1,250,000 | # | Gardner Denver, Inc., 6.875%, 08/15/21 | 1,296,875 | 0.2 | ||||||||||
| 1,720,000 | # | Gates Global LLC / Gates Global Co., 6.000%, 07/15/22 | 1,758,700 | 0.3 | ||||||||||
| 2,440,000 | # | James Hardie International Finance Ltd., 5.875%, 02/15/23 | 2,531,500 | 0.4 | ||||||||||
| 1,355,000 | # | Koppers, Inc., 6.000%, 02/15/25 | 1,402,425 | 0.2 | ||||||||||
| 1,265,000 | # | Masonite International Corp., 5.625%, 03/15/23 | 1,297,244 | 0.2 | ||||||||||
| 2,325,000 | # | Multi-Color Corp., 6.125%, 12/01/22 | 2,435,438 | 0.4 | ||||||||||
| 1,440,000 | # | Novelis Corp., 5.875%, 09/30/26 | 1,472,400 | 0.2 | ||||||||||
| 600,000 | # | Novelis Corp., 6.250%, 08/15/24 | 627,000 | 0.1 | ||||||||||
| 1,630,000 | Orbital ATK, Inc., 5.500%, 10/01/23 | 1,687,050 | 0.3 | |||||||||||
| 1,545,000 | Oshkosh Corp., 5.375%, 03/01/22 | 1,608,731 | 0.2 | |||||||||||
| 725,000 | # | Owens-Brockway Glass Container, Inc., 5.875%, 08/15/23 | 768,500 | 0.1 | ||||||||||
| 1,975,000 | # | Owens-Brockway Glass Container, Inc., 6.375%, 08/15/25 | 2,114,484 | 0.3 | ||||||||||
| 2,120,000 | # | PaperWorks Industries, Inc., 9.500%, 08/15/19 | 1,706,600 | 0.3 | ||||||||||
| 2,000,000 | # | Plastipak Holdings, Inc., 6.500%, 10/01/21 | 2,060,000 | 0.3 | ||||||||||
| 1,030,000 | # | Reynolds Group Issuer, Inc. / Reynolds Group Issuer LLC / Reynolds Group Issuer Lu, 5.125%, 07/15/23 | 1,059,613 | 0.2 | ||||||||||
| 135,000 | # | Reynolds Group Issuer, Inc. / Reynolds Group Issuer LLC / Reynolds Group Issuer Lu, 7.000%, 07/15/24 | 144,788 | 0.0 | ||||||||||
| 2,435,000 | # | RSI Home Products, Inc., 6.500%, 03/15/23 | 2,520,225 | 0.4 | ||||||||||
| 500,000 | # | Sealed Air Corp., 4.875%, 12/01/22 | 522,810 | 0.1 | ||||||||||
| 1,000,000 | # | Sealed Air Corp., 5.125%, 12/01/24 | 1,043,750 | 0.2 | ||||||||||
| 500,000 | # | Sealed Air Corp., 5.500%, 09/15/25 | 531,250 | 0.1 | ||||||||||
| 2,485,000 | # | Shape Technologies Group, Inc., 7.625%, 02/01/20 | 2,559,550 | 0.4 | ||||||||||
| 2,765,000 | # | Standard Industries, Inc./NJ, 6.000%, 10/15/25 | 2,868,688 | 0.4 | ||||||||||
| 440,000 | Summit Materials LLC / Summit Materials Finance Corp., 6.125%, 07/15/23 | 451,000 | 0.1 | |||||||||||
| 2,000,000 | Summit Materials LLC / Summit Materials Finance Corp., 8.500%, 04/15/22 | 2,217,500 | 0.3 | |||||||||||
| 1,200,000 | TransDigm, Inc., 6.375%, 06/15/26 | 1,203,708 | 0.2 | |||||||||||
| 820,000 | TransDigm, Inc., 6.500%, 05/15/25 | 829,225 | 0.1 | |||||||||||
| 1,000,000 | TransDigm, Inc., 6.500%, 07/15/24 | 1,015,000 | 0.2 | |||||||||||
| 1,560,000 | WESCO Distribution, Inc., 5.375%, 06/15/24 | 1,606,800 | 0.2 | |||||||||||
| 1,620,000 | # | Zekelman Industries, Inc., 9.875%, 06/15/23 | 1,814,400 | 0.3 | ||||||||||
| 67,472,824 | 10.5 | |||||||||||||
| Technology: 5.8% | ||||||||||||||
| 2,550,000 | # | BMC Software Finance, Inc., 8.125%, 07/15/21 | 2,581,875 | 0.4 | ||||||||||
| 1,400,000 | #,& | Boxer Parent Co., Inc., 9.000%, 10/15/19 | 1,403,500 | 0.2 | ||||||||||
| 475,000 | # | Camelot Finance SA, 7.875%, 10/15/24 | 504,683 | 0.1 | ||||||||||
| 1,500,000 | CDW LLC / CDW Finance Corp., 5.500%, 12/01/24 | 1,578,750 | 0.2 | |||||||||||
| 605,000 | CDW LLC / CDW Finance Corp., 5.000%, 09/01/25 | 617,856 | 0.1 | |||||||||||
| 800,000 | CDW LLC / CDW Finance Corp., 6.000%, 08/15/22 | 849,456 | 0.1 | |||||||||||
| 970,000 | # | Change Healthcare Holdings LLC / Change Healthcare Finance, Inc., 5.750%, 03/01/25 | 997,887 | 0.1 | ||||||||||
See Accompanying Notes to Financial Statements
| Voya High Yield Bond Fund | PORTFOLIO OF INVESTMENTS as of March 31, 2017 (continued) |
| Principal Amount† | Value | Percentage of Net Assets | ||||||||||||
| CORPORATE BONDS/NOTES: (continued) | ||||||||||||||
| Technology: (continued) | ||||||||||||||
| 1,200,000 | # | Diamond 1 Finance Corp. / Diamond 2 Finance Corp., 5.450%, 06/15/23 | 1,296,238 | 0.2 | ||||||||||
| 540,000 | # | Diamond 1 Finance Corp. / Diamond 2 Finance Corp., 5.875%, 06/15/21 | 567,866 | 0.1 | ||||||||||
| 1,200,000 | # | Diamond 1 Finance Corp. / Diamond 2 Finance Corp., 6.020%, 06/15/26 | 1,312,957 | 0.2 | ||||||||||
| 540,000 | # | Diamond 1 Finance Corp. / Diamond 2 Finance Corp., 7.125%, 06/15/24 | 597,246 | 0.1 | ||||||||||
| 1,445,000 | # | Donnelley Financial Solutions, Inc., 8.250%, 10/15/24 | 1,495,575 | 0.2 | ||||||||||
| 1,895,000 | # | Entegris, Inc., 6.000%, 04/01/22 | 1,985,013 | 0.3 | ||||||||||
| 500,000 | # | First Data Corp., 5.000%, 01/15/24 | 510,625 | 0.1 | ||||||||||
| 500,000 | # | First Data Corp., 5.375%, 08/15/23 | 521,875 | 0.1 | ||||||||||
| 1,000,000 | # | First Data Corp., 5.750%, 01/15/24 | 1,035,250 | 0.2 | ||||||||||
| 4,000,000 | # | First Data Corp., 7.000%, 12/01/23 | 4,300,000 | 0.7 | ||||||||||
| 1,890,000 | #,& | Infor Software Parent LLC / Infor Software Parent, Inc., 7.125%, 05/01/21 | 1,941,975 | 0.3 | ||||||||||
| 1,955,000 | # | Micron Technology, Inc., 5.250%, 01/15/24 | 2,017,931 | 0.3 | ||||||||||
| 590,000 | # | MSCI, Inc., 5.250%, 11/15/24 | 623,925 | 0.1 | ||||||||||
| 1,125,000 | # | MSCI, Inc., 5.750%, 08/15/25 | 1,200,938 | 0.2 | ||||||||||
| 750,000 | NCR Corp., 5.000%, 07/15/22 | 765,000 | 0.1 | |||||||||||
| 1,800,000 | NCR Corp., 6.375%, 12/15/23 | 1,899,000 | 0.3 | |||||||||||
| 1,720,000 | # | Open Text Corp., 5.625%, 01/15/23 | 1,797,400 | 0.3 | ||||||||||
| 800,000 | # | Open Text Corp., 5.875%, 06/01/26 | 840,000 | 0.1 | ||||||||||
| 440,000 | Qorvo, Inc., 6.750%, 12/01/23 | 479,050 | 0.1 | |||||||||||
| 440,000 | Qorvo, Inc., 7.000%, 12/01/25 | 488,400 | 0.1 | |||||||||||
| 1,000,000 | # | Quintiles IMS, Inc., 5.000%, 10/15/26 | 1,006,250 | 0.2 | ||||||||||
| 1,425,000 | # | RP Crown Parent LLC, 7.375%, 10/15/24 | 1,489,125 | 0.2 | ||||||||||
| 600,000 | # | Veritas US, Inc. / Veritas Bermuda Ltd., 7.500%, 02/01/23 | 634,500 | 0.1 | ||||||||||
| 37,340,146 | 5.8 | |||||||||||||
| Utilities: 1.4% | ||||||||||||||
| 1,225,000 | L | Calpine Corp., 5.375%, 01/15/23 | 1,246,437 | 0.2 | ||||||||||
| 1,725,000 | Calpine Corp., 5.750%, 01/15/25 | 1,720,481 | 0.3 | |||||||||||
| 1,000,000 | DPL, Inc., 7.250%, 10/15/21 | 1,068,700 | 0.2 | |||||||||||
| 1,500,000 | # | LBC Tank Terminals Holding Netherlands BV, 6.875%, 05/15/23 | 1,563,930 | 0.2 | ||||||||||
| 1,000,000 | NRG Energy, Inc., 6.250%, 07/15/22 | 1,027,500 | 0.1 | |||||||||||
| 1,700,000 | # | NRG Energy, Inc., 6.625%, 01/15/27 | 1,704,250 | 0.3 | ||||||||||
| 475,000 | NRG Energy, Inc., 7.250%, 05/15/26 | 491,625 | 0.1 | |||||||||||
| 127,000 | NRG Energy, Inc., 7.875%, 05/15/21 | 131,128 | 0.0 | |||||||||||
| 8,954,051 | 1.4 | |||||||||||||
| Total Corporate Bonds/Notes (Cost $598,702,246) | 616,096,390 | 96.3 | ||||||||||||
| BANK LOANS: 0.6% | ||||||||||||||
| Communications: 0.4% | ||||||||||||||
| 2,750,000 | Clear Channel Communications, Inc. Term Loan D, 7.732%, 01/30/19 | 2,374,166 | 0.4 | |||||||||||
| Consumer, Non-cyclical: 0.2% | ||||||||||||||
| 1,229,782 | Kindred Healthcare, Inc., 4.310%, 04/09/21 | 1,238,222 | 0.2 | |||||||||||
| Steel: 0.0% | ||||||||||||||
| 331,373 | FMG Resources (August 2006) Pty Ltd. Term Loan B, 2.750%, 06/28/19 | 333,568 | 0.0 | |||||||||||
| Total Bank Loans (Cost $3,825,851) | 3,945,956 | 0.6 | ||||||||||||
| Shares | Value | Percentage of Net Assets | ||||||||||||
| COMMON STOCK: –% | ||||||||||||||
| Consumer Discretionary: –% | ||||||||||||||
| 195 | @ | American Media, Inc. | – | – | ||||||||||
| Total Common Stock (Cost $7,957) | – | – | ||||||||||||
| Total Long-Term Investments (Cost $602,536,054) | 620,042,346 | 96.9 | ||||||||||||
| Principal Amount† | Value | Percentage of Net Assets | ||||||||||||
| SHORT-TERM INVESTMENTS: 7.9% | ||||||||||||||
| Corporate Bonds/Notes: 0.3% | ||||||||||||||
| 1,536,000 | # | Bumble Bee Holdings, Inc., 9.000%, 12/15/17 | 1,501,440 | 0.3 | ||||||||||
| 200,000 | L | Frontier Communications Corp., 8.250%, 04/15/17 | 200,375 | 0.0 | ||||||||||
| 1,701,815 | 0.3 | |||||||||||||
| Commercial Paper: 1.4% | ||||||||||||||
| 4,000,000 | CVS, 1.200%, 04/03/17 | 3,999,633 | 0.6 | |||||||||||
| 5,000,000 | Kroger Co., 1.120%, 04/03/17 | 4,999,541 | 0.8 | |||||||||||
| 8,999,174 | 1.4 | |||||||||||||
See Accompanying Notes to Financial Statements
| Voya High Yield Bond Fund | PORTFOLIO OF INVESTMENTS as of March 31, 2017 (continued) |
| Principal Amount† | Value | Percentage of Net Assets | ||||||||||||
| SHORT-TERM INVESTMENTS: (continued) | ||||||||||||||
| Securities Lending Collateralcc: 5.5% | ||||||||||||||
| 8,421,251 | Citigroup, Inc., Repurchase Agreement dated 03/31/17, 0.81%, due 04/03/17 (Repurchase Amount $8,421,812, collateralized by various U.S. Government/U.S. Government Agency Obligations, 0.000%-11.500%, Market Value plus accrued interest $8,589,676, due 04/01/17-06/01/52) | 8,421,251 | 1.3 | |||||||||||
| 8,421,251 | HSBC Securities USA, Repurchase Agreement dated 03/31/17, 0.78%, due 04/03/17 (Repurchase Amount $8,421,791, collateralized by various U.S. Government Agency Obligations, 2.500%-6.500%, Market Value plus accrued interest $8,589,684, due 09/01/23-11/01/46) | 8,421,251 | 1.3 | |||||||||||
| 8,421,251 | Merrill Lynch & Co., Inc., Repurchase Agreement dated 03/31/17, 0.83%, due 04/03/17 (Repurchase Amount $8,421,825, collateralized by various U.S. Government Agency Obligations, 1.840%-7.000%, Market Value plus accrued interest $8,589,676, due 05/01/17-12/01/46) | 8,421,251 | 1.3 | |||||||||||
| 8,421,251 | Mizuho Securities USA Inc., Repurchase Agreement dated 03/31/17, 0.81%, due 04/03/17 (Repurchase Amount $8,421,812, collateralized by various U.S. Government Agency Obligations, 3.000%-4.000%, Market Value plus accrued interest $8,589,676, due 09/01/31-02/20/47) | 8,421,251 | 1.3 | |||||||||||
| 1,772,171 | Royal Bank of Scotland PLC, Repurchase Agreement dated 03/31/17, 0.78%, due 04/03/17 (Repurchase Amount $1,772,285, collateralized by various U.S. Government Securities, 0.394%-2.250%, Market Value plus accrued interest $1,807,631, due 04/30/17-07/31/18) | 1,772,171 | 0.3 | |||||||||||
| 35,457,175 | 5.5 | |||||||||||||
| Shares | Value | Percentage of Net Assets | ||||||||||||
| Mutual Funds: 0.7% | ||||||||||||||
| 4,534,000 | BlackRock Liquidity Funds, FedFund, Institutional Class, 0.600%†† | |||||||||||||
| (Cost $4,534,000) | 4,534,000 | 0.7 | ||||||||||||
| Total Short-Term Investments (Cost $50,751,230) | 50,692,164 | 7.9 | ||||||||||||
| Total Investments in Securities (Cost $653,287,284) | $ | 670,734,510 | 104.8 | |||||||||||
| Liabilities in Excess of Other Assets | (30,457,618 | ) | (4.8 | ) | ||||||||||
| Net Assets | $ | 640,276,892 | 100.0 | |||||||||||
| † | Unless otherwise indicated, principal amount is shown in USD. |
| †† | Rate shown is the 7-day yield as of March 31, 2017. |
| # | Securities with purchases pursuant to Rule 144A or section 4(a)(2), under the Securities Act of 1933 and may not be resold subject to that rule except to qualified institutional buyers. |
| @ | Non-income producing security. |
| & | Payment-in-kind |
| cc | Represents securities purchased with cash collateral received for securities on loan. |
| L | Loaned security, a portion or all of the security is on loan at March 31, 2017. |
| ± | Defaulted security |
Cost for federal income tax purposes is $653,320,055.
Net unrealized appreciation consists of:
| Gross Unrealized Appreciation | $ | 24,891,472 | ||
| Gross Unrealized Depreciation | (7,477,017 | ) | ||
| Net Unrealized Appreciation | $ | 17,414,455 |
See Accompanying Notes to Financial Statements
Voya Intermediate Bond Fund | PORTFOLIO OF INVESTMENTS as of March 31, 2017 |
| Principal Amount† | Value | Percentage of Net Assets | ||||||||||||
| CORPORATE BONDS/NOTES: 30.4% | ||||||||||||||
| Basic Materials: 0.8% | ||||||||||||||
| 2,000,000 | ArcelorMittal, 6.250%, 03/01/21 | 2,170,000 | 0.1 | |||||||||||
| 431,000 | Barrick Gold Corp., 4.100%, 05/01/23 | 462,690 | 0.0 | |||||||||||
| 4,465,000 | # | Chevron Phillips Chemical Co. LLC / Chevron Phillips Chemical Co. L.P., 3.400%, 12/01/26 | 4,474,475 | 0.1 | ||||||||||
| 2,250,000 | Corp Nacional del Cobre de Chile, 4.500%, 09/16/25 | 2,374,606 | 0.1 | |||||||||||
| 1,200,000 | # | Corp Nacional del Cobre de Chile, 4.500%, 09/16/25 | 1,266,456 | 0.0 | ||||||||||
| 3,255,000 | Dow Chemical Co., 4.625%, 10/01/44 | 3,350,280 | 0.1 | |||||||||||
| 2,020,000 | Eastman Chemical Co., 2.700%, 01/15/20 | 2,048,433 | 0.1 | |||||||||||
| 1,861,000 | # | Georgia-Pacific LLC, 2.539%, 11/15/19 | 1,876,845 | 0.0 | ||||||||||
| 1,960,000 | # | Georgia-Pacific LLC, 3.163%, 11/15/21 | 1,993,884 | 0.1 | ||||||||||
| 1,334,000 | # | Georgia-Pacific LLC, 3.734%, 07/15/23 | 1,389,656 | 0.0 | ||||||||||
| 1,126,000 | Goldcorp, Inc., 3.700%, 03/15/23 | 1,148,871 | 0.0 | |||||||||||
| 3,160,000 | LYB International Finance II BV, 3.500%, 03/02/27 | 3,107,190 | 0.1 | |||||||||||
| 1,770,000 | # | Mexichem SAB de CV, 4.875%, 09/19/22 | 1,871,775 | 0.0 | ||||||||||
| 2,810,000 | PolyOne Corp., 5.250%, 03/15/23 | 2,845,125 | 0.1 | |||||||||||
| 30,380,286 | 0.8 | |||||||||||||
| Communications: 4.0% | ||||||||||||||
| 3,132,000 | 21st Century Fox America, Inc., 3.000%, 09/15/22 | 3,136,532 | 0.1 | |||||||||||
| 2,455,000 | Alibaba Group Holding Ltd., 3.600%, 11/28/24 | 2,476,776 | 0.1 | |||||||||||
| 800,000 | # | Altice Financing SA, 6.625%, 02/15/23 | 834,000 | 0.0 | ||||||||||
| 3,627,000 | AT&T, Inc., 2.800%, 02/17/21 | 3,640,696 | 0.1 | |||||||||||
| 1,274,000 | AT&T, Inc., 3.600%, 02/17/23 | 1,291,795 | 0.0 | |||||||||||
| 4,854,000 | AT&T, Inc., 3.800%, 03/15/22 | 5,025,890 | 0.1 | |||||||||||
| 3,672,000 | AT&T, Inc., 4.125%, 02/17/26 | 3,730,124 | 0.1 | |||||||||||
| 2,790,000 | AT&T, Inc., 4.250%, 03/01/27 | 2,836,175 | 0.1 | |||||||||||
| 2,457,000 | AT&T, Inc., 4.550%, 03/09/49 | 2,212,106 | 0.1 | |||||||||||
| 6,554,000 | AT&T, Inc., 4.800%, 06/15/44 | 6,162,320 | 0.2 | |||||||||||
| 1,500,000 | AT&T, Inc., 5.150%, 03/15/42 | 1,493,041 | 0.0 | |||||||||||
| 104,000 | AT&T, Inc., 5.350%, 09/01/40 | 107,191 | 0.0 | |||||||||||
| 5,001,000 | AT&T, Inc., 5.450%, 03/01/47 | 5,110,642 | 0.1 | |||||||||||
| 2,092,000 | CBS Corp., 2.900%, 01/15/27 | 1,952,311 | 0.1 | |||||||||||
| 3,552,000 | CBS Corp., 4.600%, 01/15/45 | 3,478,381 | 0.1 | |||||||||||
| 1,000,000 | CCO Holdings LLC / CCO Holdings Capital Corp., 5.125%, 02/15/23 | 1,032,390 | 0.0 | |||||||||||
| 475,000 | CCO Holdings LLC / CCO Holdings Capital Corp., 5.750%, 09/01/23 | 495,188 | 0.0 | |||||||||||
| 920,000 | CenturyLink, Inc., 6.750%, 12/01/23 | 962,550 | 0.0 | |||||||||||
| 2,459,000 | Charter Communications Operating LLC / Charter Communications Operating Capital, 4.464%, 07/23/22 | 2,592,541 | 0.1 | |||||||||||
| 4,885,000 | Charter Communications Operating LLC / Charter Communications Operating Capital, 4.908%, 07/23/25 | 5,166,796 | 0.1 | |||||||||||
| 1,969,000 | # | Charter Communications Operating LLC / Charter Communications Operating Capital, 5.375%, 05/01/47 | 1,984,758 | 0.1 | ||||||||||
| 2,900,000 | # | CommScope Technologies LLC, 5.000%, 03/15/27 | 2,902,755 | 0.1 | ||||||||||
| 2,000,000 | CSC Holdings LLC, 5.250%, 06/01/24 | 1,997,500 | 0.1 | |||||||||||
| 1,683,000 | Digicel Ltd., 6.000%, 04/15/21 | 1,537,841 | 0.0 | |||||||||||
| 707,000 | # | Digicel Ltd., 6.750%, 03/01/23 | 634,533 | 0.0 | ||||||||||
| 1,500,000 | DISH DBS Corp., 5.875%, 07/15/22 | 1,579,680 | 0.0 | |||||||||||
| 3,809,000 | eBay, Inc., 4.000%, 07/15/42 | 3,249,572 | 0.1 | |||||||||||
| 5,455,000 | Level 3 Communications, Inc., 5.750%, 12/01/22 | 5,659,563 | 0.1 | |||||||||||
| 1,380,000 | # | Millicom International Cellular SA, 4.750%, 05/22/20 | 1,413,313 | 0.0 | ||||||||||
| 2,000,000 | # | Millicom International Cellular SA, 6.625%, 10/15/21 | 2,102,400 | 0.1 | ||||||||||
| 1,525,000 | Netflix, Inc., 5.750%, 03/01/24 | 1,633,580 | 0.0 | |||||||||||
| 2,985,000 | # | Nielsen Finance LLC / Nielsen Finance Co., 5.000%, 04/15/22 | 3,059,625 | 0.1 | ||||||||||
| 860,000 | Scripps Networks Interactive, Inc., 2.750%, 11/15/19 | 870,715 | 0.0 | |||||||||||
| 3,000,000 | # | Sinclair Television Group, Inc., 5.625%, 08/01/24 | 3,045,000 | 0.1 | ||||||||||
| 2,880,000 | # | Sirius XM Radio, Inc., 5.375%, 04/15/25 | 2,954,880 | 0.1 | ||||||||||
| 2,035,000 | TEGNA, Inc., 6.375%, 10/15/23 | 2,159,644 | 0.1 | |||||||||||
| 625,000 | Telefonica Emisiones SAU, 3.192%, 04/27/18 | 633,260 | 0.0 | |||||||||||
| 2,600,000 | # | Telefonica Chile SA, 3.875%, 10/12/22 | 2,652,044 | 0.1 | ||||||||||
| 2,131,000 | Time Warner Cable LLC, 5.500%, 09/01/41 | 2,185,300 | 0.1 | |||||||||||
See Accompanying Notes to Financial Statements
Voya Intermediate Bond Fund | PORTFOLIO OF INVESTMENTS as of March 31, 2017 (continued) |
| Principal Amount† | Value | Percentage of Net Assets | ||||||||||||
| CORPORATE BONDS/NOTES: (continued) | ||||||||||||||
| Communications: (continued) | ||||||||||||||
| 2,566,000 | Time Warner Cable LLC, 5.875%, 11/15/40 | 2,732,107 | 0.1 | |||||||||||
| 2,812,000 | Time Warner, Inc., 4.050%, 12/15/23 | 2,918,333 | 0.1 | |||||||||||
| 3,637,000 | Time Warner, Inc., 4.850%, 07/15/45 | 3,549,668 | 0.1 | |||||||||||
| 1,881,000 | Time Warner, Inc., 5.350%, 12/15/43 | 1,936,480 | 0.1 | |||||||||||
| 1,251,000 | Time Warner, Inc., 6.500%, 11/15/36 | 1,491,053 | 0.0 | |||||||||||
| 1,435,000 | T-Mobile USA, Inc., 6.625%, 04/01/23 | 1,534,991 | 0.0 | |||||||||||
| 5,630,000 | # | Univision Communications, Inc., 5.125%, 02/15/25 | 5,559,625 | 0.1 | ||||||||||
| 2,350,000 | # | UPCB Finance IV Ltd., 5.375%, 01/15/25 | 2,376,438 | 0.1 | ||||||||||
| 4,701,000 | Verizon Communications, Inc., 3.000%, 11/01/21 | 4,724,336 | 0.1 | |||||||||||
| 3,285,000 | Verizon Communications, Inc., 3.500%, 11/01/24 | 3,262,478 | 0.1 | |||||||||||
| 7,358,000 | Verizon Communications, Inc., 4.150%, 03/15/24 | 7,644,292 | 0.2 | |||||||||||
| 5,386,000 | # | Verizon Communications, Inc., 4.812%, 03/15/39 | 5,262,084 | 0.1 | ||||||||||
| 2,126,000 | Verizon Communications, Inc., 4.862%, 08/21/46 | 2,052,340 | 0.1 | |||||||||||
| 4,715,000 | Verizon Communications, Inc., 5.012%, 08/21/54 | 4,519,285 | 0.1 | |||||||||||
| 2,897,000 | Verizon Communications, Inc., 5.050%, 03/15/34 | 2,951,487 | 0.1 | |||||||||||
| 780,000 | Viacom, Inc., 4.375%, 03/15/43 | 678,368 | 0.0 | |||||||||||
| 149,186,773 | 4.0 | |||||||||||||
| Consumer, Cyclical: 1.8% | ||||||||||||||
| 1,490,000 | # | AMC Entertainment Holdings, Inc., 5.875%, 11/15/26 | 1,510,487 | 0.0 | ||||||||||
| 2,460,000 | American Airlines 2016-2 Class AA Pass Through Trust, 3.200%, 12/15/29 | 2,406,323 | 0.1 | |||||||||||
| 2,585,000 | American Airlines 2017-1 Class AA Pass Through Trust, 3.650%, 08/15/30 | 2,598,700 | 0.1 | |||||||||||
| 500,000 | Cedar Fair L.P. / Canada's Wonderland Co. / Magnum Management Corp., 5.375%, 06/01/24 | 515,000 | 0.0 | |||||||||||
| 3,709,000 | CVS Health Corp., 5.125%, 07/20/45 | 4,101,123 | 0.1 | |||||||||||
| 1,466,000 | Ford Motor Co., 4.750%, 01/15/43 | 1,381,878 | 0.0 | |||||||||||
| 2,150,000 | Ford Motor Co., 5.291%, 12/08/46 | 2,160,806 | 0.1 | |||||||||||
| 3,020,000 | Ford Motor Credit Co. LLC, 4.134%, 08/04/25 | 3,039,754 | 0.1 | |||||||||||
| 1,065,000 | Ford Motor Credit Co. LLC, 8.125%, 01/15/20 | 1,224,555 | 0.0 | |||||||||||
| 1,335,000 | General Motors Co., 4.875%, 10/02/23 | 1,426,115 | 0.0 | |||||||||||
| 2,837,000 | General Motors Financial Co., Inc., 4.000%, 10/06/26 | 2,801,106 | 0.1 | |||||||||||
| 1,570,000 | General Motors Financial Co., Inc., 4.350%, 01/17/27 | 1,585,928 | 0.0 | |||||||||||
| 2,666,000 | General Motors Financial Co., Inc., 4.300%, 07/13/25 | 2,711,815 | 0.1 | |||||||||||
| 540,000 | Goodyear Tire & Rubber Co/The, 4.875%, 03/15/27 | 541,350 | 0.0 | |||||||||||
| 576,000 | Kohl's Corp., 5.550%, 07/17/45 | 522,658 | 0.0 | |||||||||||
| 3,560,000 | Lowe's Cos, Inc., 3.700%, 04/15/46 | 3,312,619 | 0.1 | |||||||||||
| 4,051,000 | McDonald's Corp., 4.875%, 12/09/45 | 4,324,305 | 0.1 | |||||||||||
| 2,292,000 | MDC Holdings, Inc., 6.000%, 01/15/43 | 2,048,704 | 0.1 | |||||||||||
| 2,390,000 | MGM Resorts International, 4.625%, 09/01/26 | 2,330,250 | 0.1 | |||||||||||
| 1,445,000 | # | Nemak SA de CV, 5.500%, 02/28/23 | 1,508,219 | 0.0 | ||||||||||
| 3,343,000 | Newell Brands, Inc., 5.500%, 04/01/46 | 3,807,115 | 0.1 | |||||||||||
| 2,240,000 | Nordstrom, Inc., 4.000%, 03/15/27 | 2,235,312 | 0.1 | |||||||||||
| 3,773,000 | NVR, Inc., 3.950%, 09/15/22 | 3,908,138 | 0.1 | |||||||||||
| 1,605,000 | # | Six Flags Entertainment Corp., 4.875%, 07/31/24 | 1,587,947 | 0.0 | ||||||||||
| 3,210,000 | # | Six Flags Entertainment Corp., 5.500%, 04/15/27 | 3,210,000 | 0.1 | ||||||||||
| 2,230,000 | United Airlines 2016-1 Class AA Pass Through Trust, 3.100%, 01/07/30 | 2,196,550 | 0.1 | |||||||||||
| 2,620,000 | United Airlines 2016-2 Class A Pass Through Trust, 3.100%, 04/07/30 | 2,523,401 | 0.1 | |||||||||||
| 5,930,000 | United Airlines 2016-2 Class AA Pass Through Trust, 2.875%, 04/07/30 | 5,737,690 | 0.1 | |||||||||||
| 67,257,848 | 1.8 | |||||||||||||
| Consumer, Non-cyclical: 4.5% | ||||||||||||||
| 2,232,000 | Abbott Laboratories, 2.800%, 09/15/20 | 2,256,879 | 0.1 | |||||||||||
| 2,050,000 | Abbott Laboratories, 3.750%, 11/30/26 | 2,051,316 | 0.1 | |||||||||||
| 2,986,000 | Abbott Laboratories, 4.750%, 11/30/36 | 3,087,440 | 0.1 | |||||||||||
| 6,590,000 | Abbott Laboratories, 4.900%, 11/30/46 | 6,859,538 | 0.2 | |||||||||||
| 1,510,000 | AbbVie, Inc., 3.200%, 11/06/22 | 1,528,688 | 0.0 | |||||||||||
| 3,348,000 | AbbVie, Inc., 3.200%, 05/14/26 | 3,224,301 | 0.1 | |||||||||||
| 1,960,000 | AbbVie, Inc., 3.600%, 05/14/25 | 1,963,610 | 0.1 | |||||||||||
| 6,472,000 | AbbVie, Inc., 4.450%, 05/14/46 | 6,215,353 | 0.2 | |||||||||||
| 770,000 | Actavis Funding SCS, 3.450%, 03/15/22 | 785,474 | 0.0 | |||||||||||
| 2,416,000 | Aetna, Inc., 2.800%, 06/15/23 | 2,399,189 | 0.1 | |||||||||||
| 12,564,000 | Anheuser-Busch InBev Finance, Inc., 3.650%, 02/01/26 | 12,726,716 | 0.3 | |||||||||||
| 4,161,000 | Anheuser-Busch InBev Finance, Inc., 4.700%, 02/01/36 | 4,418,761 | 0.1 | |||||||||||
| 2,506,000 | # | Bayer US Finance LLC, 3.000%, 10/08/21 | 2,537,052 | 0.1 | ||||||||||
See Accompanying Notes to Financial Statements
Voya Intermediate Bond Fund | PORTFOLIO OF INVESTMENTS as of March 31, 2017 (continued) |
| Principal Amount† | Value | Percentage of Net Assets | ||||||||||||
| CORPORATE BONDS/NOTES: (continued) | ||||||||||||||
| Consumer, Non-cyclical: (continued) | ||||||||||||||
| 3,463,000 | Celgene Corp., 2.250%, 05/15/19 | 3,483,120 | 0.1 | |||||||||||
| 3,165,000 | CHS/Community Health Systems, Inc., 5.125%, 08/01/21 | 3,141,262 | 0.1 | |||||||||||
| 1,401,000 | Envision Healthcare Corp., 5.625%, 07/15/22 | 1,441,279 | 0.0 | |||||||||||
| 4,690,000 | Estee Lauder Cos, Inc./The, 3.150%, 03/15/27 | 4,677,844 | 0.1 | |||||||||||
| 1,680,000 | Express Scripts Holding Co., 3.400%, 03/01/27 | 1,585,398 | 0.0 | |||||||||||
| 2,430,000 | Express Scripts Holding Co., 3.000%, 07/15/23 | 2,351,684 | 0.1 | |||||||||||
| 1,005,000 | HCA, Inc., 5.250%, 04/15/25 | 1,070,325 | 0.0 | |||||||||||
| 1,500,000 | HCA, Inc., 5.875%, 03/15/22 | 1,653,750 | 0.0 | |||||||||||
| 2,695,000 | HealthSouth Corp., 5.125%, 03/15/23 | 2,708,475 | 0.1 | |||||||||||
| 1,790,000 | # | Hill-Rom Holdings, Inc., 5.000%, 02/15/25 | 1,792,237 | 0.1 | ||||||||||
| 1,153,000 | Humana, Inc., 3.150%, 12/01/22 | 1,159,356 | 0.0 | |||||||||||
| 3,430,000 | # | Imperial Brands Finance PLC, 2.950%, 07/21/20 | 3,475,996 | 0.1 | ||||||||||
| 2,290,000 | # | Imperial Brands Finance PLC, 3.750%, 07/21/22 | 2,354,402 | 0.1 | ||||||||||
| 1,300,000 | # | JBS USA LUX SA / JBS USA Finance, Inc., 5.750%, 06/15/25 | 1,319,500 | 0.0 | ||||||||||
| 3,432,000 | Kraft Heinz Foods Co., 4.375%, 06/01/46 | 3,219,909 | 0.1 | |||||||||||
| 6,850,000 | Kroger Co., 4.450%, 02/01/47 | 6,743,208 | 0.2 | |||||||||||
| 1,155,000 | Medtronic, Inc., 3.625%, 03/15/24 | 1,199,116 | 0.0 | |||||||||||
| 3,094,000 | Medtronic, Inc., 4.375%, 03/15/35 | 3,244,672 | �� | 0.1 | ||||||||||
| 1,626,000 | Medtronic, Inc., 4.625%, 03/15/45 | 1,750,695 | 0.0 | |||||||||||
| 4,156,000 | Mylan NV, 3.150%, 06/15/21 | 4,177,370 | 0.1 | |||||||||||
| 1,690,000 | Mylan NV, 3.750%, 12/15/20 | 1,734,903 | 0.0 | |||||||||||
| 2,578,000 | Mylan NV, 3.950%, 06/15/26 | 2,527,961 | 0.1 | |||||||||||
| 4,940,000 | PepsiCo, Inc., 4.450%, 04/14/46 | 5,267,532 | 0.1 | |||||||||||
| 3,414,000 | Pfizer, Inc., 4.400%, 05/15/44 | 3,572,256 | 0.1 | |||||||||||
| 2,637,000 | Philip Morris International, Inc., 4.250%, 11/10/44 | 2,616,073 | 0.1 | |||||||||||
| 6,230,000 | # | Post Holdings, Inc., 5.000%, 08/15/26 | 5,980,800 | 0.2 | ||||||||||
| 2,784,000 | Reynolds American, Inc., 5.850%, 08/15/45 | 3,283,987 | 0.1 | |||||||||||
| 1,369,000 | RR Donnelley & Sons Co., 6.500%, 11/15/23 | 1,334,775 | 0.0 | |||||||||||
| 7,690,000 | Shire Acquisitions Investments Ireland DAC, 2.875%, 09/23/23 | 7,471,073 | 0.2 | |||||||||||
| 1,360,000 | Sysco Corp., 2.500%, 07/15/21 | 1,356,692 | 0.0 | |||||||||||
| 2,070,000 | Teva Pharmaceutical Finance Netherlands III BV, 2.800%, 07/21/23 | 1,967,111 | 0.1 | |||||||||||
| 6,980,000 | L | Teva Pharmaceutical Finance Netherlands III BV, 3.150%, 10/01/26 | 6,444,418 | 0.2 | ||||||||||
| 2,680,000 | Thermo Fisher Scientific, Inc., 2.950%, 09/19/26 | 2,556,597 | 0.1 | |||||||||||
| 1,490,000 | United Rentals North America, Inc., 5.500%, 07/15/25 | 1,540,288 | 0.0 | |||||||||||
| 961,000 | UnitedHealth Group, Inc., 4.250%, 04/15/47 | 984,889 | 0.0 | |||||||||||
| 3,060,000 | UnitedHealth Group, Inc., 4.200%, 01/15/47 | 3,109,961 | 0.1 | |||||||||||
| 3,000,000 | # | Universal Health Services, Inc., 4.750%, 08/01/22 | 3,097,500 | 0.1 | ||||||||||
| 1,000,000 | # | Valeant Pharmaceuticals International, Inc., 5.625%, 12/01/21 | 810,000 | 0.0 | ||||||||||
| 1,000,000 | #,L | Valeant Pharmaceuticals International, 6.375%, 10/15/20 | 910,000 | 0.0 | ||||||||||
| 915,000 | # | Valeant Pharmaceuticals International, 7.250%, 07/15/22 | 784,613 | 0.0 | ||||||||||
| 1,753,000 | # | Wm Wrigley Jr Co., 2.400%, 10/21/18 | 1,767,752 | 0.0 | ||||||||||
| 5,680,000 | Zimmer Biomet Holdings, Inc., 3.550%, 04/01/25 | 5,625,608 | 0.2 | |||||||||||
| 167,348,704 | 4.5 | |||||||||||||
| Energy: 3.8% | ||||||||||||||
| 2,020,000 | L | Anadarko Petroleum Corp., 5.550%, 03/15/26 | 2,245,460 | 0.1 | ||||||||||
| 2,470,000 | Anadarko Petroleum Corp., 4.850%, 03/15/21 | 2,644,387 | 0.1 | |||||||||||
| 870,000 | Antero Resources Corp., 5.375%, 11/01/21 | 896,831 | 0.0 | |||||||||||
| 850,000 | Antero Resources Corp., 5.625%, 06/01/23 | 873,375 | 0.0 | |||||||||||
| 1,637,000 | Apache Corp., 5.100%, 09/01/40 | 1,689,744 | 0.1 | |||||||||||
| 5,049,000 | Boardwalk Pipelines L.P., 5.950%, 06/01/26 | 5,600,568 | 0.2 | |||||||||||
| 1,876,000 | BP Capital Markets PLC, 3.062%, 03/17/22 | 1,902,947 | 0.1 | |||||||||||
| 2,220,000 | BP Capital Markets PLC, 3.119%, 05/04/26 | 2,174,823 | 0.1 | |||||||||||
| 5,310,000 | BP Capital Markets PLC, 3.224%, 04/14/24 | 5,316,680 | 0.1 | |||||||||||
| 5,268,000 | Cenovus Energy, Inc., 3.800%, 09/15/23 | 5,328,229 | 0.1 | |||||||||||
| 2,120,000 | Columbia Pipeline Group, Inc., 4.500%, 06/01/25 | 2,224,601 | 0.1 | |||||||||||
| 400,000 | # | Empresa Nacional del Petroleo, 3.750%, 08/05/26 | 387,734 | 0.0 | ||||||||||
| 1,652,000 | Enable Midstream Partners L.P., 3.900%, 05/15/24 | 1,614,566 | 0.0 | |||||||||||
| 1,523,000 | Enbridge Energy Partners L.P., 9.875%, 03/01/19 | 1,732,993 | 0.1 | |||||||||||
| 891,000 | Enbridge, Inc., 3.500%, 06/10/24 | 876,004 | 0.0 | |||||||||||
| 1,070,000 | Energy Transfer Equity L.P., 7.500%, 10/15/20 | 1,198,400 | 0.0 | |||||||||||
| 4,040,000 | Energy Transfer Partners L.P., 4.200%, 04/15/27 | 3,999,123 | 0.1 | |||||||||||
| 1,217,000 | Energy Transfer Partners L.P., 4.650%, 06/01/21 | 1,281,524 | 0.0 | |||||||||||
See Accompanying Notes to Financial Statements
Voya Intermediate Bond Fund | PORTFOLIO OF INVESTMENTS as of March 31, 2017 (continued) |
| Principal Amount† | Value | Percentage of Net Assets | ||||||||||||
| CORPORATE BONDS/NOTES: (continued) | ||||||||||||||
| Energy: (continued) | ||||||||||||||
| 4,511,000 | Energy Transfer Partners L.P., 5.300%, 04/15/47 | 4,346,037 | 0.1 | |||||||||||
| 1,244,000 | Energy Transfer Partners L.P., 9.700%, 03/15/19 | 1,415,111 | 0.0 | |||||||||||
| 2,170,000 | Enterprise Products Operating LLC, 3.700%, 02/15/26 | 2,174,440 | 0.1 | |||||||||||
| 1,270,000 | Enterprise Products Operating LLC, 3.750%, 02/15/25 | 1,279,232 | 0.0 | |||||||||||
| 2,020,000 | Enterprise Products Operating LLC, 4.900%, 05/15/46 | 2,071,001 | 0.1 | |||||||||||
| 2,120,000 | Exxon Mobil Corp., 2.726%, 03/01/23 | 2,128,111 | 0.1 | |||||||||||
| 2,513,000 | Exxon Mobil Corp., 3.043%, 03/01/26 | 2,515,375 | 0.1 | |||||||||||
| 3,000,000 | Hess Corp., 4.300%, 04/01/27 | 2,959,734 | 0.1 | |||||||||||
| 4,314,000 | Hess Corp., 5.800%, 04/01/47 | 4,499,985 | 0.1 | |||||||||||
| 285,000 | # | Hilcorp Energy I L.P. / Hilcorp Finance Co., 5.000%, 12/01/24 | 268,612 | 0.0 | ||||||||||
| 1,270,000 | Kinder Morgan Energy Partners L.P., 4.250%, 09/01/24 | 1,287,823 | 0.0 | |||||||||||
| 624,000 | L | Kinder Morgan Energy Partners L.P., 4.300%, 05/01/24 | 635,168 | 0.0 | ||||||||||
| 1,766,000 | Kinder Morgan Energy Partners L.P., 5.400%, 09/01/44 | 1,751,990 | 0.1 | |||||||||||
| 3,848,000 | L | Kinder Morgan, Inc./DE, 4.300%, 06/01/25 | 3,937,351 | 0.1 | ||||||||||
| 1,308,000 | Marathon Petroleum Corp., 5.000%, 09/15/54 | 1,144,376 | 0.0 | |||||||||||
| 6,260,000 | MPLX L.P., 4.125%, 03/01/27 | 6,236,644 | 0.2 | |||||||||||
| 3,118,000 | Occidental Petroleum Corp., 3.500%, 06/15/25 | 3,149,941 | 0.1 | |||||||||||
| 3,260,000 | Occidental Petroleum Corp., 4.625%, 06/15/45 | 3,414,971 | 0.1 | |||||||||||
| 400,000 | Pertamina Persero PT, 4.300%, 05/20/23 | 413,146 | 0.0 | |||||||||||
| 750,000 | Pertamina Persero PT, 5.625%, 05/20/43 | 771,802 | 0.0 | |||||||||||
| 2,225,000 | L | Petrobras Global Finance BV, 8.750%, 05/23/26 | 2,581,000 | 0.1 | ||||||||||
| 853,000 | Petroleos de Venezuela SA, 9.000%, 11/17/21 | 409,440 | 0.0 | |||||||||||
| 550,000 | L | Petroleos Mexicanos, 4.500%, 01/23/26 | 528,550 | 0.0 | ||||||||||
| 330,000 | Petroleos Mexicanos, 4.875%, 01/18/24 | 333,795 | 0.0 | |||||||||||
| 1,370,000 | Petroleos Mexicanos, 5.500%, 06/27/44 | 1,215,943 | 0.0 | |||||||||||
| 1,250,000 | # | Petroleos Mexicanos, 6.500%, 03/13/27 | 1,346,250 | 0.0 | ||||||||||
| 2,500,000 | Petroleos Mexicanos, 6.875%, 08/04/26 | 2,781,250 | 0.1 | |||||||||||
| 806,667 | Petroleum Co. of Trinidad & Tobago Ltd., 6.000%, 05/08/22 | 798,488 | 0.0 | |||||||||||
| 2,709,000 | Phillips 66 Partners L.P., 3.550%, 10/01/26 | 2,592,364 | 0.1 | |||||||||||
| 1,145,000 | Regency Energy Partners L.P. / Regency Energy Finance Corp., 4.500%, 11/01/23 | 1,176,355 | 0.0 | |||||||||||
| 1,005,000 | Regency Energy Partners L.P. / Regency Energy Finance Corp., 5.500%, 04/15/23 | 1,048,969 | 0.0 | |||||||||||
| 4,633,000 | # | Sabine Pass Liquefaction LLC, 4.200%, 03/15/28 | 4,572,637 | 0.1 | ||||||||||
| 3,840,000 | Shell International Finance BV, 3.250%, 05/11/25 | 3,881,023 | 0.1 | |||||||||||
| 2,042,000 | Shell International Finance BV, 4.375%, 05/11/45 | 2,077,226 | 0.1 | |||||||||||
| 7,382,000 | Shell International Finance BV, 4.000%, 05/10/46 | 7,114,447 | 0.2 | |||||||||||
| 2,945,000 | Spectra Energy Partners L.P., 3.375%, 10/15/26 | 2,808,726 | 0.1 | |||||||||||
| 850,000 | Sunoco Logistics Partners Operations L.P., 4.250%, 04/01/24 | 866,490 | 0.0 | |||||||||||
| 910,000 | Sunoco Logistics Partners Operations L.P., 5.350%, 05/15/45 | 890,369 | 0.0 | |||||||||||
| 1,020,000 | Tesoro Logistics L.P. / Tesoro Logistics Finance Corp., 5.250%, 01/15/25 | 1,068,450 | 0.0 | |||||||||||
| 4,626,000 | Williams Partners L.P., 3.600%, 03/15/22 | 4,697,120 | 0.1 | |||||||||||
| 3,013,000 | Williams Partners L.P., 5.400%, 03/04/44 | 3,083,796 | 0.1 | |||||||||||
| 3,250,000 | # | YPF SA, 8.500%, 03/23/21 | 3,570,157 | 0.1 | ||||||||||
| 2,600,000 | # | YPF SA, 8.875%, 12/19/18 | 2,835,300 | 0.1 | ||||||||||
| 140,666,984 | 3.8 | |||||||||||||
| Financial: 10.1% | ||||||||||||||
| 3,270,000 | #,L | ABN AMRO Bank NV, 4.800%, 04/18/26 | 3,395,800 | 0.1 | ||||||||||
| 470,000 | Aegon NV, 2.290%, 07/29/49 | 392,215 | 0.0 | |||||||||||
| 3,299,000 | American International Group, Inc., 4.500%, 07/16/44 | 3,156,655 | 0.1 | |||||||||||
| 88,000 | American International Group, Inc., 8.175%, 05/15/58 | 114,620 | 0.0 | |||||||||||
| 3,179,000 | Air Lease Corp., 3.625%, 04/01/27 | 3,095,879 | 0.1 | |||||||||||
| 3,630,000 | Air Lease Corp., 3.000%, 09/15/23 | 3,551,904 | 0.1 | |||||||||||
| 4,646,000 | American Tower Corp., 3.500%, 01/31/23 | 4,678,973 | 0.1 | |||||||||||
| 3,538,000 | Aon PLC, 4.750%, 05/15/45 | 3,546,682 | 0.1 | |||||||||||
| 5,270,000 | # | Athene Global Funding, 2.875%, 10/23/18 | 5,301,710 | 0.1 | ||||||||||
| 5,840,000 | # | Athene Global Funding, 4.000%, 01/25/22 | 5,942,025 | 0.2 | ||||||||||
| 400,000 | # | Banco de Reservas de la Republica Dominicana, 7.000%, 02/01/23 | 408,264 | 0.0 | ||||||||||
| 764,000 | Banco Nacional de Comercio Exterior SNC, 4.375%, 10/14/25 | 778,325 | 0.0 | |||||||||||
See Accompanying Notes to Financial Statements
Voya Intermediate Bond Fund | PORTFOLIO OF INVESTMENTS as of March 31, 2017 (continued) |
| Principal Amount† | Value | Percentage of Net Assets | ||||||||||||
| CORPORATE BONDS/NOTES: (continued) | ||||||||||||||
| Financial: (continued) | ||||||||||||||
| 375,000 | Banco Nacional de Desenvolvimento Economico e Social, 5.750%, 09/26/23 | 397,155 | 0.0 | |||||||||||
| 3,880,000 | Bank of America Corp., 2.503%, 10/21/22 | 3,783,885 | 0.1 | |||||||||||
| 1,741,000 | Bank of America Corp., 2.625%, 10/19/20 | 1,747,318 | 0.0 | |||||||||||
| 6,425,000 | Bank of America Corp., 3.824%, 01/20/28 | 6,451,130 | 0.2 | |||||||||||
| 4,370,000 | Bank of America Corp., 3.875%, 08/01/25 | 4,454,922 | 0.1 | |||||||||||
| 1,760,000 | Bank of America Corp., 3.950%, 04/21/25 | 1,755,208 | 0.0 | |||||||||||
| 4,076,000 | Bank of America Corp., 4.250%, 10/22/26 | 4,146,503 | 0.1 | |||||||||||
| 3,564,000 | Bank of America Corp., 4.200%, 08/26/24 | 3,634,710 | 0.1 | |||||||||||
| 1,725,000 | Bank of America Corp., 4.000%, 04/01/24 | 1,791,050 | 0.0 | |||||||||||
| 1,100,000 | Bank of America Corp., 4.750%, 04/21/45 | 1,109,292 | 0.0 | |||||||||||
| 2,863,000 | Bank of New York Mellon Corp., 4.625%, 12/29/49 | 2,755,637 | 0.1 | |||||||||||
| 7,393,000 | Barclays PLC, 3.250%, 01/12/21 | 7,454,813 | 0.2 | |||||||||||
| 5,139,000 | Barclays PLC, 4.337%, 01/10/28 | 5,139,216 | 0.1 | |||||||||||
| 2,045,000 | # | BNP Paribas SA, 3.800%, 01/10/24 | 2,036,395 | 0.1 | ||||||||||
| 5,549,000 | Boston Properties L.P., 2.750%, 10/01/26 | 5,117,393 | 0.1 | |||||||||||
| 1,333,000 | BPCE SA, 2.500%, 12/10/18 | 1,342,250 | 0.0 | |||||||||||
| 5,145,000 | # | BPCE SA, 5.150%, 07/21/24 | 5,291,766 | 0.1 | ||||||||||
| 2,521,000 | Brixmor Operating Partnership LP, 3.875%, 08/15/22 | 2,584,028 | 0.1 | |||||||||||
| 3,080,000 | Brookfield Finance LLC, 4.000%, 04/01/24 | 3,102,158 | 0.1 | |||||||||||
| 3,610,000 | Capital One Financial Corp., 3.750%, 03/09/27 | 3,595,192 | 0.1 | |||||||||||
| 5,170,000 | L | CBL & Associates L.P., 5.950%, 12/15/26 | 4,996,753 | 0.1 | ||||||||||
| 3,064,000 | Citigroup, Inc., 3.200%, 10/21/26 | 2,930,357 | 0.1 | |||||||||||
| 5,630,000 | Citigroup, Inc., 3.887%, 01/10/28 | 5,665,897 | 0.2 | |||||||||||
| 3,491,000 | Citigroup, Inc., 4.450%, 09/29/27 | 3,549,795 | 0.1 | |||||||||||
| 3,140,000 | Citigroup, Inc., 4.750%, 05/18/46 | 3,109,821 | 0.1 | |||||||||||
| 4,457,000 | Citigroup, Inc., 5.500%, 09/13/25 | 4,880,513 | 0.1 | |||||||||||
| 1,147,000 | # | Citizens Financial Group, Inc., 4.150%, 09/28/22 | 1,180,124 | 0.0 | ||||||||||
| 559,000 | #,L | Commonwealth Bank of Australia, 2.750%, 03/10/22 | 560,702 | 0.0 | ||||||||||
| 2,160,000 | # | Commonwealth Bank of Australia, 2.850%, 05/18/26 | 2,089,530 | 0.1 | ||||||||||
| 1,660,000 | # | Cooperatieve Centrale Raiffeisen-Boerenleenbank BA/Netherlands, 11.000%, 12/29/49 | 1,944,275 | 0.1 | ||||||||||
| 3,282,000 | Cooperatieve Rabobank UA, 4.375%, 08/04/25 | 3,371,897 | 0.1 | |||||||||||
| 2,620,000 | # | Credit Agricole SA/London, 4.125%, 01/10/27 | 2,604,036 | 0.1 | ||||||||||
| 2,776,000 | # | Credit Suisse AG, 6.500%, 08/08/23 | 3,054,505 | 0.1 | ||||||||||
| 4,400,000 | # | Credit Suisse Group AG, 3.574%, 01/09/23 | 4,396,832 | 0.1 | ||||||||||
| 2,565,000 | # | Credit Suisse Group AG, 4.282%, 01/09/28 | 2,557,874 | 0.1 | ||||||||||
| 2,220,000 | Credit Suisse Group Funding Guernsey Ltd., 3.450%, 04/16/21 | 2,251,275 | 0.1 | |||||||||||
| 3,190,000 | Credit Suisse Group Funding Guernsey Ltd., 3.800%, 09/15/22 | 3,239,381 | 0.1 | |||||||||||
| 2,115,000 | # | Dana Financing Luxembourg Sarl, 5.750%, 04/15/25 | 2,138,794 | 0.1 | ||||||||||
| 4,683,000 | Discover Financial Services, 4.100%, 02/09/27 | 4,693,490 | 0.1 | |||||||||||
| 1,990,000 | Discover Financial Services, 5.200%, 04/27/22 | 2,149,091 | 0.1 | |||||||||||
| 805,000 | Discover Financial Services, 3.850%, 11/21/22 | 821,796 | 0.0 | |||||||||||
| 2,230,000 | E*TRADE Financial Corp., 4.625%, 09/15/23 | 2,286,684 | 0.1 | |||||||||||
| 2,463,000 | Equinix, Inc., 5.375%, 04/01/23 | 2,576,914 | 0.1 | |||||||||||
| 2,325,000 | Equity One, Inc., 3.750%, 11/15/22 | 2,394,034 | 0.1 | |||||||||||
| 2,385,000 | # | ESH Hospitality, Inc., 5.250%, 05/01/25 | 2,410,329 | 0.1 | ||||||||||
| 750,000 | Fondo MIVIVIENDA SA, 3.500%, 01/31/23 | 757,500 | 0.0 | |||||||||||
| 1,516,000 | GE Capital International Funding Co. Unlimited Co., 2.342%, 11/15/20 | 1,522,637 | 0.0 | |||||||||||
| 2,200,000 | Goldman Sachs Group, Inc., 2.625%, 04/25/21 | 2,195,864 | 0.1 | |||||||||||
| 3,405,000 | Goldman Sachs Group, Inc., 2.600%, 04/23/20 | 3,426,217 | 0.1 | |||||||||||
| 4,763,000 | Goldman Sachs Group, Inc., 3.500%, 11/16/26 | 4,672,360 | 0.1 | |||||||||||
| 4,980,000 | Goldman Sachs Group, Inc., 4.250%, 10/21/25 | 5,084,724 | 0.1 | |||||||||||
| 1,523,000 | Goldman Sachs Group, Inc., 5.150%, 05/22/45 | 1,603,155 | 0.0 | |||||||||||
| 998,000 | Goldman Sachs Group, Inc., 6.750%, 10/01/37 | 1,234,904 | 0.0 | |||||||||||
| 898,000 | Hartford Financial Services Group, Inc., 6.625%, 03/30/40 | 1,146,892 | 0.0 | |||||||||||
| 1,980,000 | Hartford Financial Services Group, Inc., 8.125%, 06/15/68 | 2,113,650 | 0.1 | |||||||||||
| 1,763,000 | # | HBOS PLC, 6.750%, 05/21/18 | 1,846,665 | 0.1 | ||||||||||
| 3,158,000 | HCP, Inc., 3.875%, 08/15/24 | 3,180,264 | 0.1 | |||||||||||
| 1,324,000 | HCP, Inc., 4.000%, 12/01/22 | 1,367,233 | 0.0 | |||||||||||
| 2,980,000 | HSBC Holdings PLC, 4.041%, 03/13/28 | 3,015,596 | 0.1 | |||||||||||
See Accompanying Notes to Financial Statements
Voya Intermediate Bond Fund | PORTFOLIO OF INVESTMENTS as of March 31, 2017 (continued) |
| Principal Amount† | Value | Percentage of Net Assets | ||||||||||||
| CORPORATE BONDS/NOTES: (continued) | ||||||||||||||
| Financial: (continued) | ||||||||||||||
| 3,121,000 | Huntington Bancshares, Inc./OH, 2.600%, 08/02/18 | 3,149,588 | 0.1 | |||||||||||
| 2,010,000 | # | ING Bank NV, 2.000%, 11/26/18 | 2,009,108 | 0.1 | ||||||||||
| 2,330,000 | ING Groep NV, 3.150%, 03/29/22 | 2,338,642 | 0.1 | |||||||||||
| 4,876,000 | ING Groep NV, 3.950%, 03/29/27 | 4,889,375 | 0.1 | |||||||||||
| 1,037,000 | # | International Lease Finance Corp., 7.125%, 09/01/18 | 1,108,604 | 0.0 | ||||||||||
| 1,366,000 | Intesa Sanpaolo SpA, 3.875%, 01/15/19 | 1,398,901 | 0.0 | |||||||||||
| 3,268,000 | JPMorgan Chase & Co., 2.550%, 10/29/20 | 3,283,752 | 0.1 | |||||||||||
| 2,860,000 | JPMorgan Chase & Co., 2.550%, 03/01/21 | 2,862,382 | 0.1 | |||||||||||
| 2,867,000 | JPMorgan Chase & Co., 3.625%, 12/01/27 | 2,795,219 | 0.1 | |||||||||||
| 3,256,000 | JPMorgan Chase & Co., 3.900%, 07/15/25 | 3,368,814 | 0.1 | |||||||||||
| 8,393,000 | JPMorgan Chase & Co., 4.125%, 12/15/26 | 8,567,767 | 0.2 | |||||||||||
| 1,755,000 | JPMorgan Chase & Co., 6.100%, 10/29/49 | 1,856,790 | 0.1 | |||||||||||
| 1,643,000 | JPMorgan Chase & Co., 6.000%, 12/29/49 | 1,717,428 | 0.0 | |||||||||||
| 1,202,000 | JPMorgan Chase & Co., 6.125%, 12/29/49 | 1,275,622 | 0.0 | |||||||||||
| 3,167,000 | Kite Realty Group L.P., 4.000%, 10/01/26 | 3,040,504 | 0.1 | |||||||||||
| 3,048,000 | # | Liberty Mutual Group, Inc., 4.850%, 08/01/44 | 3,101,471 | 0.1 | ||||||||||
| 2,876,000 | Manufacturers & Traders Trust Co., 2.100%, 02/06/20 | 2,870,955 | 0.1 | |||||||||||
| 4,084,000 | Metlife, Inc., 6.400%, 12/15/66 | 4,492,400 | 0.1 | |||||||||||
| 3,294,000 | MetLife, Inc., 4.875%, 11/13/43 | 3,598,659 | 0.1 | |||||||||||
| 1,375,000 | Mitsubishi UFJ Financial Group, Inc., 2.950%, 03/01/21 | 1,388,028 | 0.0 | |||||||||||
| 3,971,000 | Mizuho Financial Group, Inc., 2.273%, 09/13/21 | 3,882,637 | 0.1 | |||||||||||
| 200,000 | #,L | Mizuho Financial Group, Inc., 3.477%, 04/12/26 | 199,349 | 0.0 | ||||||||||
| 1,353,000 | Morgan Stanley, 2.125%, 04/25/18 | 1,358,535 | 0.0 | |||||||||||
| 4,297,000 | Morgan Stanley, 3.125%, 07/27/26 | 4,112,861 | 0.1 | |||||||||||
| 2,240,000 | Morgan Stanley, 3.875%, 01/27/26 | 2,273,781 | 0.1 | |||||||||||
| 1,607,000 | Morgan Stanley, 3.950%, 04/23/27 | 1,594,448 | 0.0 | |||||||||||
| 5,009,000 | Morgan Stanley, 4.000%, 07/23/25 | 5,176,115 | 0.1 | |||||||||||
| 435,000 | MPT Operating Partnership L.P. / MPT Finance Corp., 6.375%, 02/15/22 | 450,225 | 0.0 | |||||||||||
| 2,760,000 | MUFG Americas Holdings Corp., 2.250%, 02/10/20 | 2,758,394 | 0.1 | |||||||||||
| 1,345,000 | #,L | Nordea Bank AB, 6.125%, 12/29/49 | 1,363,494 | 0.0 | ||||||||||
| DKK | 10 | Nordea Kredit Realkreditaktieselskab, 6.000%, 07/01/29 | – | – | ||||||||||
| 1,885,000 | Old Republic International Corp., 3.875%, 08/26/26 | 1,862,465 | 0.1 | |||||||||||
| 3,280,000 | # | Ontario Teachers' Cadillac Fairview Properties Trust, 3.875%, 03/20/27 | 3,331,306 | 0.1 | ||||||||||
| 1,593,000 | PNC Bank NA, 2.250%, 07/02/19 | 1,605,027 | 0.0 | |||||||||||
| 2,000,000 | Power Sector Assets & Liabilities Management Corp., 7.390%, 12/02/24 | 2,558,682 | 0.1 | |||||||||||
| 2,680,000 | Principal Financial Group, Inc., 3.400%, 05/15/25 | 2,676,746 | 0.1 | |||||||||||
| 4,829,000 | Royal Bank of Scotland Group PLC, 3.875%, 09/12/23 | 4,765,305 | 0.1 | |||||||||||
| 2,763,000 | Santander UK Group Holdings PLC, 3.571%, 01/10/23 | 2,766,153 | 0.1 | |||||||||||
| 3,769,000 | # | Santander UK Group Holdings PLC, 5.625%, 09/15/45 | 3,869,391 | 0.1 | ||||||||||
| 3,112,000 | Santander UK PLC, 2.375%, 03/16/20 | 3,121,084 | 0.1 | |||||||||||
| 1,680,000 | # | Santander UK PLC, 5.000%, 11/07/23 | 1,756,205 | 0.0 | ||||||||||
| 7,350,000 | # | Scentre Group Trust 1 / Scentre Group Trust 2, 3.750%, 03/23/27 | 7,411,042 | 0.2 | ||||||||||
| 3,077,000 | Select Income REIT, 4.150%, 02/01/22 | 3,108,330 | 0.1 | |||||||||||
| 4,118,000 | Senior Housing Properties Trust, 3.250%, 05/01/19 | 4,138,030 | 0.1 | |||||||||||
| 3,010,000 | Simon Property Group L.P., 4.250%, 11/30/46 | 2,918,731 | 0.1 | |||||||||||
| 4,845,000 | #,L | Societe Generale SA, 4.000%, 01/12/27 | 4,744,655 | 0.1 | ||||||||||
| 5,370,000 | #,L | Standard Chartered PLC, 4.300%, 02/19/27 | 5,290,411 | 0.1 | ||||||||||
| 5,429,000 | Sumitomo Mitsui Banking Corp., 2.450%, 01/16/20 | 5,452,339 | 0.1 | |||||||||||
| 2,050,000 | L | Sumitomo Mitsui Financial Group, Inc., 2.442%, 10/19/21 | 2,027,464 | 0.1 | ||||||||||
| 272,000 | Sumitomo Mitsui Financial Group, Inc., 3.010%, 10/19/26 | 260,578 | 0.0 | |||||||||||
| 1,041,000 | Toronto-Dominion Bank, 3.625%, 09/15/31 | 1,021,101 | 0.0 | |||||||||||
| 3,494,000 | Trinity Acquisition PLC, 6.125%, 08/15/43 | 3,760,051 | 0.1 | |||||||||||
| 1,470,000 | UBS AG/Stamford CT, 7.625%, 08/17/22 | 1,703,289 | 0.0 | |||||||||||
| 6,041,000 | # | UBS Group Funding Jersey Ltd., 4.125%, 04/15/26 | 6,151,937 | 0.2 | ||||||||||
| 3,719,000 | # | UBS Group Funding Jersey Ltd., 4.125%, 09/24/25 | 3,788,289 | 0.1 | ||||||||||
| 3,354,000 | Washington Real Estate Investment Trust, 3.950%, 10/15/22 | 3,373,410 | 0.1 | |||||||||||
| 1,331,000 | Wells Fargo & Co., 3.000%, 10/23/26 | 1,275,797 | 0.0 | |||||||||||
| 2,540,000 | Wells Fargo & Co., 4.100%, 06/03/26 | 2,601,679 | 0.1 | |||||||||||
| 2,030,000 | XLIT Ltd., 5.500%, 03/31/45 | 2,035,333 | 0.1 | |||||||||||
| 378,734,111 | 10.1 | |||||||||||||
See Accompanying Notes to Financial Statements
Voya Intermediate Bond Fund | PORTFOLIO OF INVESTMENTS as of March 31, 2017 (continued) |
| Principal Amount† | Value | Percentage of Net Assets | ||||||||||||
| CORPORATE BONDS/NOTES: (continued) | ||||||||||||||
| Industrial: 1.3% | ||||||||||||||
| 1,868,000 | Amphenol Corp., 3.200%, 04/01/24 | 1,873,238 | 0.0 | |||||||||||
| 2,530,000 | BNSF Funding Trust I, 6.613%, 12/15/55 | 2,915,825 | 0.1 | |||||||||||
| 2,518,000 | # | Builders FirstSource, Inc., 5.625%, 09/01/24 | 2,565,213 | 0.1 | ||||||||||
| 2,449,000 | #,L | Cemex SAB de CV, 6.125%, 05/05/25 | 2,619,695 | 0.1 | ||||||||||
| 1,000,000 | # | Empresa de Transporte de Pasajeros Metro SA, 5.000%, 01/25/47 | 1,049,150 | 0.0 | ||||||||||
| 6,801,000 | FedEx Corp., 4.400%, 01/15/47 | 6,645,862 | 0.2 | |||||||||||
| 3,519,000 | General Electric Co., 5.000%, 12/29/49 | 3,712,545 | 0.1 | |||||||||||
| 600,000 | # | Kazakhstan Temir Zholy Finance BV, 6.950%, 07/10/42 | 632,631 | 0.0 | ||||||||||
| 2,900,000 | # | Novelis Corp., 5.875%, 09/30/26 | 2,965,250 | 0.1 | ||||||||||
| 1,220,000 | # | Owens-Brockway Glass Container, Inc., 5.875%, 08/15/23 | 1,293,200 | 0.0 | ||||||||||
| 2,290,000 | Rockwell Collins, Inc., 3.200%, 03/15/24 | 2,288,546 | 0.1 | |||||||||||
| 1,310,000 | Rockwell Collins, Inc., 3.500%, 03/15/27 | 1,313,141 | 0.0 | |||||||||||
| 2,010,000 | Roper Technologies, Inc., 2.800%, 12/15/21 | 2,014,213 | 0.0 | |||||||||||
| 2,712,000 | # | Siemens Financieringsmaatschappij NV, 3.300%, 09/15/46 | 2,365,295 | 0.1 | ||||||||||
| 2,280,000 | # | Siemens Financieringsmaatschappij NV, 3.400%, 03/16/27 | 2,302,862 | 0.1 | ||||||||||
| 3,042,000 | # | Siemens Financieringsmaatschappij NV, 4.200%, 03/16/47 | 3,092,369 | 0.1 | ||||||||||
| 3,855,000 | # | Standard Industries, Inc./NJ, 5.000%, 02/15/27 | 3,787,538 | 0.1 | ||||||||||
| 3,158,000 | Textron, Inc., 3.650%, 03/15/27 | 3,142,358 | 0.1 | |||||||||||
| 1,000,000 | Transnet SOC Ltd., 4.000%, 07/26/22 | 960,634 | 0.0 | |||||||||||
| 1,000,000 | # | Transnet SOC Ltd., 4.000%, 07/26/22 | 960,634 | 0.0 | ||||||||||
| 48,500,199 | 1.3 | |||||||||||||
| Mortgage Securities: 0.1% | ||||||||||||||
| 57,060,000 | #,^ | LSTAR Commercial Mortgage Trust 2017-5, 1.393%, 03/10/50 | 3,329,029 | 0.1 | ||||||||||
| Technology: 2.4% | ||||||||||||||
| 3,000,000 | Analog Devices, Inc., 3.125%, 12/05/23 | 2,989,308 | 0.1 | |||||||||||
| 1,860,000 | Analog Devices, Inc., 3.500%, 12/05/26 | 1,845,643 | 0.1 | |||||||||||
| 2,640,000 | Apple, Inc., 2.450%, 08/04/26 | 2,500,109 | 0.1 | |||||||||||
| 2,870,000 | Apple, Inc., 3.000%, 02/09/24 | 2,896,625 | 0.1 | |||||||||||
| 6,210,000 | Apple, Inc., 3.350%, 02/09/27 | 6,275,652 | 0.2 | |||||||||||
| 945,000 | Apple, Inc., 4.450%, 05/06/44 | 979,273 | 0.0 | |||||||||||
| 2,387,000 | Apple, Inc., 4.650%, 02/23/46 | 2,565,774 | 0.1 | |||||||||||
| 1,000,000 | Applied Materials, Inc., 2.625%, 10/01/20 | 1,015,890 | 0.0 | |||||||||||
| 1,630,000 | Applied Materials, Inc., 3.300%, 04/01/27 | 1,633,961 | 0.0 | |||||||||||
| 2,110,000 | Applied Materials, Inc., 3.900%, 10/01/25 | 2,228,118 | 0.1 | |||||||||||
| 2,820,000 | # | Broadcom Corp. / Broadcom Cayman Finance Ltd., 3.625%, 01/15/24 | 2,844,320 | 0.1 | ||||||||||
| 1,205,000 | CDW LLC / CDW Finance Corp., 5.000%, 09/01/25 | 1,230,606 | 0.0 | |||||||||||
| 4,120,000 | # | Diamond 1 Finance Corp. / Diamond 2 Finance Corp., 4.420%, 06/15/21 | 4,312,103 | 0.1 | ||||||||||
| 4,358,000 | # | Diamond 1 Finance Corp. / Diamond 2 Finance Corp., 5.450%, 06/15/23 | 4,707,503 | 0.1 | ||||||||||
| 4,040,000 | # | Diamond 1 Finance Corp. / Diamond 2 Finance Corp., 6.020%, 06/15/26 | 4,420,289 | 0.1 | ||||||||||
| 2,320,000 | # | Everett Spinco, Inc., 4.250%, 04/15/24 | 2,362,340 | 0.1 | ||||||||||
| 3,290,000 | # | Everett Spinco, Inc., 4.750%, 04/15/27 | 3,361,133 | 0.1 | ||||||||||
| 3,255,000 | # | First Data Corp., 5.750%, 01/15/24 | 3,369,739 | 0.1 | ||||||||||
| 1,400,000 | Hewlett Packard Enterprise Co., 4.400%, 10/15/22 | 1,467,725 | 0.0 | |||||||||||
| 1,685,000 | Infor US, Inc., 6.500%, 05/15/22 | 1,739,931 | 0.0 | |||||||||||
| 2,022,000 | International Business Machines Corp., 2.875%, 11/09/22 | 2,046,854 | 0.1 | |||||||||||
| 1,241,000 | KLA-Tencor Corp., 4.125%, 11/01/21 | 1,300,455 | 0.0 | |||||||||||
| 1,830,000 | Microsoft Corp., 2.875%, 02/06/24 | 1,842,947 | 0.0 | |||||||||||
| 2,940,000 | Microsoft Corp., 3.300%, 02/06/27 | 2,991,071 | 0.1 | |||||||||||
| 2,900,000 | Microsoft Corp., 3.700%, 08/08/46 | 2,723,593 | 0.1 | |||||||||||
| 2,767,000 | Microsoft Corp., 4.200%, 11/03/35 | 2,905,837 | 0.1 | |||||||||||
| 4,310,000 | Microsoft Corp., 4.250%, 02/06/47 | 4,427,775 | 0.1 | |||||||||||
| 3,822,000 | Microsoft Corp., 4.450%, 11/03/45 | 4,046,298 | 0.1 | |||||||||||
| 1,870,000 | Oracle Corp., 3.850%, 07/15/36 | 1,834,663 | 0.0 | |||||||||||
| 4,396,000 | Oracle Corp., 4.125%, 05/15/45 | 4,285,929 | 0.1 | |||||||||||
| 2,937,000 | Oracle Corp., 4.300%, 07/08/34 | 3,055,117 | 0.1 | |||||||||||
| 2,840,000 | # | Seagate HDD Cayman, 4.875%, 03/01/24 | 2,793,884 | 0.1 | ||||||||||
| 89,000,465 | 2.4 | |||||||||||||
| Utilities: 1.6% | ||||||||||||||
| 2,945,000 | AES Corp., 5.500%, 04/15/25 | 2,996,538 | 0.1 | |||||||||||
| 566,000 | CenterPoint Energy Houston Electric LLC, 3.550%, 08/01/42 | 537,247 | 0.0 | |||||||||||
| 1,750,000 | Comision Federal de Electricidad, 4.750%, 02/23/27 | 1,758,750 | 0.0 | |||||||||||
See Accompanying Notes to Financial Statements
Voya Intermediate Bond Fund | PORTFOLIO OF INVESTMENTS as of March 31, 2017 (continued) |
| Principal Amount† | Value | Percentage of Net Assets | ||||||||||||
| CORPORATE BONDS/NOTES: (continued) | ||||||||||||||
| Utilities: (continued) | ||||||||||||||
| 1,400,000 | # | Comision Federal de Electricidad, 4.750%, 02/23/27 | 1,407,000 | 0.0 | ||||||||||
| 1,970,000 | Consolidated Edison Co. of New York, Inc., 2.900%, 12/01/26 | 1,918,616 | 0.1 | |||||||||||
| 1,509,000 | Duke Energy Carolinas LLC, 2.950%, 12/01/26 | 1,486,167 | 0.0 | |||||||||||
| 2,973,000 | Duke Energy Carolinas LLC, 3.875%, 03/15/46 | 2,913,406 | 0.1 | |||||||||||
| 1,760,000 | Duke Energy Corp., 2.100%, 06/15/18 | 1,767,239 | 0.0 | |||||||||||
| 873,000 | # | Empresa de Energia de Bogota SA ESP, 6.125%, 11/10/21 | 901,373 | 0.0 | ||||||||||
| 2,850,000 | Entergy Corp., 2.950%, 09/01/26 | 2,709,732 | 0.1 | |||||||||||
| 782,000 | Entergy Texas, Inc., 7.125%, 02/01/19 | 850,191 | 0.0 | |||||||||||
| 3,050,000 | Exelon Corp., 3.400%, 04/15/26 | 3,005,220 | 0.1 | |||||||||||
| 3,280,000 | Exelon Corp., 3.497%, 06/01/22 | 3,313,718 | 0.1 | |||||||||||
| 1,519,000 | FirstEnergy Corp., 4.250%, 03/15/23 | 1,571,443 | 0.0 | |||||||||||
| 3,210,000 | Great Plains Energy, Inc., 3.900%, 04/01/27 | 3,242,909 | 0.1 | |||||||||||
| 4,199,000 | # | Jersey Central Power & Light Co., 4.300%, 01/15/26 | 4,375,669 | 0.1 | ||||||||||
| 618,000 | Metropolitan Edison Co., 7.700%, 01/15/19 | 674,300 | 0.0 | |||||||||||
| 2,237,000 | Mississippi Power Co., 4.250%, 03/15/42 | 1,922,138 | 0.1 | |||||||||||
| 709,000 | Nevada Power Co., 7.125%, 03/15/19 | 781,722 | 0.0 | |||||||||||
| 1,982,000 | # | New York State Electric & Gas Corp., 3.250%, 12/01/26 | 1,973,872 | 0.1 | ||||||||||
| 1,402,000 | NextEra Energy Capital Holdings, Inc., 3.625%, 06/15/23 | 1,422,647 | 0.0 | |||||||||||
| 1,861,000 | NiSource Finance Corp., 5.950%, 06/15/41 | 2,234,910 | 0.1 | |||||||||||
| 2,000,000 | L | NRG Energy, Inc., 6.250%, 05/01/24 | 2,003,750 | 0.1 | ||||||||||
| 980,000 | Oncor Electric Delivery Co. LLC, 6.800%, 09/01/18 | 1,048,134 | 0.0 | |||||||||||
| 800,000 | Perusahaan Listrik Negara PT, 5.500%, 11/22/21 | 871,040 | 0.0 | |||||||||||
| 2,173,000 | PSEG Power LLC, 2.450%, 11/15/18 | 2,187,092 | 0.1 | |||||||||||
| 3,535,000 | Southwestern Electric Power Co., 2.750%, 10/01/26 | 3,349,911 | 0.1 | |||||||||||
| 1,030,000 | TransAlta Corp., 4.500%, 11/15/22 | 1,036,438 | 0.0 | |||||||||||
| 1,970,000 | Virginia Electric & Power Co., 2.950%, 11/15/26 | 1,926,615 | 0.1 | |||||||||||
| 3,010,000 | Wisconsin Public Service Corp., 1.650%, 12/04/18 | 3,005,849 | 0.1 | |||||||||||
| 59,193,636 | 1.6 | |||||||||||||
| Total Corporate Bonds/Notes (Cost $1,128,648,923) | 1,133,598,035 | 30.4 | ||||||||||||
| COLLATERALIZED MORTGAGE OBLIGATIONS: 13.5% | ||||||||||||||
| 2,808,625 | Alternative Loan Trust 2004-J7 MI, 2.002%, 10/25/34 | 2,363,563 | 0.1 | |||||||||||
| 4,631,714 | Alternative Loan Trust 2005-10CB 1A1, 1.482%, 05/25/35 | 3,686,801 | 0.1 | |||||||||||
| 3,795,758 | Alternative Loan Trust 2005-51 3A2A, 1.928%, 11/20/35 | 3,335,719 | 0.1 | |||||||||||
| 1,208,672 | Alternative Loan Trust 2005-65CB 2A4, 5.500%, 12/25/35 | 1,082,482 | 0.0 | |||||||||||
| 1,483,044 | Alternative Loan Trust 2005-6CB 1A3, 5.250%, 04/25/35 | 1,426,617 | 0.0 | |||||||||||
| 2,701,609 | Alternative Loan Trust 2005-J2 1A12, 1.382%, 04/25/35 | 2,173,594 | 0.1 | |||||||||||
| 1,156,251 | Alternative Loan Trust 2006-13T1 A9, 6.000%, 05/25/36 | 903,849 | 0.0 | |||||||||||
| 272,976 | Alternative Loan Trust 2006-18CB A10, 1.382%, 07/25/36 | 161,390 | 0.0 | |||||||||||
| 1,698,920 | Alternative Loan Trust 2006-19CB A28, 1.582%, 08/25/36 | 1,160,536 | 0.0 | |||||||||||
| 1,767,538 | Alternative Loan Trust 2006-HY11 A1, 1.102%, 06/25/36 | 1,487,100 | 0.0 | |||||||||||
| 1,774,693 | Alternative Loan Trust 2007-23CB A3, 1.482%, 09/25/37 | 1,125,915 | 0.0 | |||||||||||
| 4,511,142 | Alternative Loan Trust 2007-2CB 2A1, 1.582%, 03/25/37 | 2,954,585 | 0.1 | |||||||||||
| 1,795,238 | Alternative Loan Trust 2007-3T1 1A11, 6.000%, 04/25/37 | 1,373,332 | 0.0 | |||||||||||
| 1,620,459 | Alternative Loan Trust 2007-8CB A3, 1.482%, 05/25/37 | 1,074,043 | 0.0 | |||||||||||
| 529,542 | # | Angel Oak Mortgage Trust LLC 2015-1 A, 4.500%, 11/25/45 | 532,830 | 0.0 | ||||||||||
| 458,430 | Banc of America Mortgage 2005-J Trust 2A4, 3.426%, 11/25/35 | 426,559 | 0.0 | |||||||||||
| 1,857,491 | ^ | Banc of America Mortgage 2007-2 A8 Trust, 6.000%, 05/25/37 | 355,974 | 0.0 | ||||||||||
| 2,774,533 | Bear Stearns ALT-A Trust 2005-4 23A1, 3.404%, 05/25/35 | 2,686,453 | 0.1 | |||||||||||
| 3,881,585 | Bear Stearns ALT-A Trust 2005-7 21A1, 3.301%, 09/25/35 | 3,629,467 | 0.1 | |||||||||||
| 1,351,585 | # | Bellemeade Re Ltd. 2015-1A M2, 5.282%, 07/25/25 | 1,359,839 | 0.0 | ||||||||||
| 3,768,268 | CHL Mortgage Pass-Through Trust 2004-22 A3, 3.097%, 11/25/34 | 3,704,929 | 0.1 | |||||||||||
| 1,227,506 | CHL Mortgage Pass-Through Trust 2007-7 A7, 5.750%, 06/25/37 | 1,112,740 | 0.0 | |||||||||||
| 2,437,080 | Citicorp Mortgage Securities Trust Series 2006-3 1A4, 6.000%, 06/25/36 | 2,407,576 | 0.1 | |||||||||||
See Accompanying Notes to Financial Statements
Voya Intermediate Bond Fund | PORTFOLIO OF INVESTMENTS as of March 31, 2017 (continued) |
| Principal Amount† | Value | Percentage of Net Assets | ||||||||||||
| COLLATERALIZED MORTGAGE OBLIGATIONS: (continued) | ||||||||||||||
| 3,036,184 | Citigroup Mortgage Loan Trust 2006-AR9 2A, 3.229%, 11/25/36 | 2,498,438 | 0.1 | |||||||||||
| 1,218,335 | Citigroup Mortgage Loan Trust 2007-10 22AA, 3.365%, 09/25/37 | 1,049,399 | 0.0 | |||||||||||
| 2,811,000 | # | Citigroup Mortgage Loan Trust 2010-7 3A5, 5.500%, 12/25/35 | 2,837,836 | 0.1 | ||||||||||
| 851,942 | Countrywide Alternative Loan Trust 2005-53T2 2A6, 1.482%, 11/25/35 | 542,666 | 0.0 | |||||||||||
| 3,361,394 | # | CSMC Series 2008-2R 1A1, 6.000%, 07/25/37 | 3,096,918 | 0.1 | ||||||||||
| 135,897,179 | ^ | Deutsche ALT-A Securities, Inc. ALT 07-AB1 X, 1.094%, 04/25/37 | 5,280,258 | 0.1 | ||||||||||
| 3,311,011 | DSLA Mortgage Loan Trust 2005-AR4 2A1B, 1.258%, 08/19/45 | 2,737,949 | 0.1 | |||||||||||
| 7,816,509 | ^ | Fannie Mae 2008-12 SC, 5.368%, 03/25/38 | 1,340,049 | 0.0 | ||||||||||
| 7,304,973 | Fannie Mae 2011-99 CZ, 4.500%, 10/25/41 | 8,124,160 | 0.2 | |||||||||||
| 4,919,751 | Fannie Mae 2012-66 EP, 4.000%, 06/25/42 | 5,247,637 | 0.1 | |||||||||||
| 6,534,000 | Fannie Mae 2013-116 UB, 4.000%, 11/25/43 | 6,863,153 | 0.2 | |||||||||||
| 46,303,740 | ^ | Fannie Mae 2016-82 SD, 5.068%, 11/25/46 | 8,215,159 | 0.2 | ||||||||||
| 4,600,000 | Fannie Mae Connecticut Avenue Securities 16-C06 1M2, 5.232%, 04/25/29 | 4,877,706 | 0.1 | |||||||||||
| 1,400,000 | Fannie Mae Connecticut Avenue Securities 2014-C01 M2, 5.382%, 01/25/24 | 1,550,223 | 0.0 | |||||||||||
| 2,920,000 | Fannie Mae Connecticut Avenue Securities 2014-C03 2M2, 3.882%, 07/25/24 | 3,005,461 | 0.1 | |||||||||||
| 6,700,000 | Fannie Mae Connecticut Avenue Securities 2014-CO3 1M2, 3.982%, 07/25/24 | 6,917,525 | 0.2 | |||||||||||
| 4,043,321 | Fannie Mae Connecticut Avenue Securities 2015-C02 1M2, 4.982%, 05/25/25 | 4,259,899 | 0.1 | |||||||||||
| 5,400,000 | Fannie Mae Connecticut Avenue Securities 2015-C03 1M2, 5.982%, 07/25/25 | 5,945,158 | 0.2 | |||||||||||
| 700,000 | Fannie Mae Connecticut Avenue Securities 2015-C03 2M2, 5.982%, 07/25/25 | 766,809 | 0.0 | |||||||||||
| 1,899,438 | Fannie Mae Connecticut Avenue Securities 2015-CO1 1M2, 5.282%, 02/25/25 | 2,017,685 | 0.1 | |||||||||||
| 3,000,000 | Fannie Mae Connecticut Avenue Securities 2017-C01 1M2, 4.532%, 07/25/29 | 3,039,982 | 0.1 | |||||||||||
| 3,100,000 | Fannie Mae Connecticut Avenue Securities 2017-C02 2M2, 4.627%, 09/25/29 | 3,119,986 | 0.1 | |||||||||||
| 54,944 | Fannie Mae Grantor Trust 1998-T2 A6, 0.532%, 01/25/32 | 56,384 | 0.0 | |||||||||||
| 86,691 | ^ | Fannie Mae Interest Strip Series 343 22, 4.000%, 11/25/18 | 1,903 | 0.0 | ||||||||||
| 622,680 | ^ | Fannie Mae Interest Strip Series 418 20, 3.000%, 05/25/43 | 93,150 | 0.0 | ||||||||||
| 2,574,067 | ^ | Fannie Mae Interest Strip Series 418 59, 3.000%, 08/25/28 | 247,810 | 0.0 | ||||||||||
| 272,148 | Fannie Mae REMIC Trust 1999-33 Z, 6.000%, 07/25/29 | 301,795 | 0.0 | |||||||||||
| 409,167 | ^ | Fannie Mae REMIC Trust 1999-6 SE, 6.743%, 02/17/29 | 54,621 | 0.0 | ||||||||||
| 212,557 | Fannie Mae REMIC Trust 2001-15 Z, 6.000%, 04/25/31 | 235,477 | 0.0 | |||||||||||
| 2,130,934 | Fannie Mae REMIC Trust 2003-105 AZ, 5.500%, 10/25/33 | 2,376,101 | 0.1 | |||||||||||
| 624,713 | Fannie Mae REMIC Trust 2003-45 FJ, 2.483%, 06/25/33 | 653,495 | 0.0 | |||||||||||
| 2,739,158 | ^ | Fannie Mae REMIC Trust 2003-66 SA, 6.668%, 07/25/33 | 565,681 | 0.0 | ||||||||||
| 435,380 | ^ | Fannie Mae REMIC Trust 2003-74 IO, 6.000%, 08/25/33 | 102,623 | 0.0 | ||||||||||
| 1,470,341 | Fannie Mae REMIC Trust 2003-84 PZ, 5.000%, 09/25/33 | 1,605,373 | 0.1 | |||||||||||
| 31,448 | Fannie Mae REMIC Trust 2004-10 SC, 24.673%, 02/25/34 | 37,446 | 0.0 | |||||||||||
| 2,119,149 | Fannie Mae REMIC Trust 2004-50 VZ, 5.500%, 07/25/34 | 2,322,862 | 0.1 | |||||||||||
| 43,349 | Fannie Mae REMIC Trust 2004-56 FE, 1.432%, 10/25/33 | 43,451 | 0.0 | |||||||||||
| 1,004,556 | Fannie Mae REMIC Trust 2004-7 Z, 5.500%, 02/25/34 | 1,129,222 | 0.0 | |||||||||||
| 2,181,544 | Fannie Mae REMIC Trust 2004-75 ZG, 4.500%, 10/25/34 | 2,340,670 | 0.1 | |||||||||||
| 481,192 | Fannie Mae REMIC Trust 2004-79 S, 17.100%, 08/25/32 | 546,033 | 0.0 | |||||||||||
| 219,249 | Fannie Mae REMIC Trust 2004-W10 A5, 5.500%, 08/25/34 | 224,092 | 0.0 | |||||||||||
| 5,593,503 | Fannie Mae REMIC Trust 2005-25 Z, 5.000%, 04/25/35 | 6,125,360 | 0.2 | |||||||||||
| 204,986 | Fannie Mae REMIC Trust 2005-74 NP, 19.279%, 01/25/35 | 235,476 | 0.0 | |||||||||||
| 313,623 | Fannie Mae REMIC Trust 2006-104 ES, 28.542%, 11/25/36 | 553,094 | 0.0 | |||||||||||
| 5,629,561 | ^ | Fannie Mae REMIC Trust 2006-12 SD, 5.768%, 10/25/35 | 926,105 | 0.0 | ||||||||||
See Accompanying Notes to Financial Statements
Voya Intermediate Bond Fund | PORTFOLIO OF INVESTMENTS as of March 31, 2017 (continued) |
| Principal Amount† | Value | Percentage of Net Assets | ||||||||||||
| COLLATERALIZED MORTGAGE OBLIGATIONS: (continued) | ||||||||||||||
| 1,510,795 | ^ | Fannie Mae REMIC Trust 2006-123 UI, 5.758%, 01/25/37 | 305,087 | 0.0 | ||||||||||
| 420,453 | ^ | Fannie Mae REMIC Trust 2006-72 HS, 5.718%, 08/25/26 | 63,397 | 0.0 | ||||||||||
| 102,267 | Fannie Mae REMIC Trust 2007-10 Z, 6.000%, 02/25/37 | 112,672 | 0.0 | |||||||||||
| 7,449,387 | ^ | Fannie Mae REMIC Trust 2007-91 AS, 5.418%, 10/25/37 | 1,386,613 | 0.0 | ||||||||||
| 3,467,676 | Fannie Mae REMIC Trust 2009-19 PW, 4.500%, 10/25/36 | 3,724,977 | 0.1 | |||||||||||
| 18,154,241 | Fannie Mae REMIC Trust 2009-50 HZ, 5.578%, 02/25/49 | 19,705,343 | 0.5 | |||||||||||
| 4,418,590 | ^ | Fannie Mae REMIC Trust 2009-90 TS, 5.168%, 11/25/39 | 723,130 | 0.0 | ||||||||||
| 7,288,335 | ^ | Fannie Mae REMIC Trust 2010-118 GS, 4.968%, 10/25/39 | 748,478 | 0.0 | ||||||||||
| 10,900,077 | ^ | Fannie Mae REMIC Trust 2010-123 SL, 5.088%, 11/25/40 | 1,751,816 | 0.1 | ||||||||||
| 11,243,801 | ^ | Fannie Mae REMIC Trust 2010-41 SB, 5.418%, 05/25/40 | 1,951,136 | 0.1 | ||||||||||
| 3,309,134 | ^ | Fannie Mae REMIC Trust 2010-43 VS, 5.468%, 05/25/40 | 578,483 | 0.0 | ||||||||||
| 11,049,000 | Fannie Mae REMIC Trust 2010-59 PC, 5.000%, 06/25/40 | 12,371,091 | 0.3 | |||||||||||
| 3,744,306 | ^ | Fannie Mae REMIC Trust 2011-102 SA, 5.618%, 10/25/41 | 691,299 | 0.0 | ||||||||||
| 4,461,188 | Fannie Mae REMIC Trust 2011-30 ZA, 5.000%, 04/25/41 | 4,709,341 | 0.1 | |||||||||||
| 4,920,808 | ^ | Fannie Mae REMIC Trust 2011-93 GS, 5.568%, 04/25/39 | 963,984 | 0.0 | ||||||||||
| 2,963,677 | ^ | Fannie Mae REMIC Trust 2012-103 IT, 4.000%, 04/25/41 | 417,602 | 0.0 | ||||||||||
| 12,766,768 | ^ | Fannie Mae REMIC Trust 2012-122 SB, 5.168%, 11/25/42 | 2,750,501 | 0.1 | ||||||||||
| 7,720,533 | ^ | Fannie Mae REMIC Trust 2012-128 LI, 3.500%, 06/25/42 | 873,896 | 0.0 | ||||||||||
| 12,468,037 | ^ | Fannie Mae REMIC Trust 2012-133 AS, 5.218%, 10/25/42 | 2,230,706 | 0.1 | ||||||||||
| 2,019,750 | ^ | Fannie Mae REMIC Trust 2012-149 GI, 3.500%, 06/25/42 | 261,141 | 0.0 | ||||||||||
| 10,305,479 | ^ | Fannie Mae REMIC Trust 2012-15 SP, 5.638%, 06/25/40 | 1,430,982 | 0.0 | ||||||||||
| 5,065,426 | ^ | Fannie Mae REMIC Trust 2012-24 HS, 5.568%, 09/25/40 | 800,830 | 0.0 | ||||||||||
| 11,664,437 | ^ | Fannie Mae REMIC Trust 2012-30 QS, 5.618%, 04/25/31 | 1,661,033 | 0.1 | ||||||||||
| 3,161,921 | ^ | Fannie Mae REMIC Trust 2012-68 YS, 5.718%, 07/25/42 | 594,328 | 0.0 | ||||||||||
| 4,394,804 | ^ | Fannie Mae REMIC Trust 2013-26 JS, 5.218%, 10/25/32 | 773,504 | 0.0 | ||||||||||
| 14,909,573 | ^ | Fannie Mae REMIC Trust 2013-60 DS, 5.218%, 06/25/33 | 2,805,853 | 0.1 | ||||||||||
| 14,401,565 | ^ | Fannie Mae REMIC Trust 2013-9 SM, 5.268%, 02/25/33 | 2,483,090 | 0.1 | ||||||||||
| 11,053,424 | ^ | Fannie Mae REMIC Trust 2014-17 DS, 5.218%, 02/25/43 | 1,654,616 | 0.1 | ||||||||||
| 5,174,627 | ^ | Fannie Mae REMIC Trust 2014-28 BS, 5.218%, 08/25/43 | 884,162 | 0.0 | ||||||||||
| 3,019,000 | Fannie Mae REMIC Trust 2015-17 MK, 2.500%, 12/25/41 | 2,657,607 | 0.1 | |||||||||||
| 40,728,820 | ^ | Fannie Mae REMIC Trust 2015-9 IO, 5.500%, 03/25/45 | 9,258,471 | 0.3 | ||||||||||
| 2,569,776 | ^ | Fannie Mae Series 2013-72 YS, 5.168%, 07/25/33 | 521,951 | 0.0 | ||||||||||
| 963,996 | First Horizon Alternative Mortgage Securities Trust 2006-FA7 A5, 1.282%, 12/25/36 | 546,447 | 0.0 | |||||||||||
| 963,996 | ^ | First Horizon Alternative Mortgage Securities Trust 2006-FA7 A9, 5.718%, 12/25/36 | 245,386 | 0.0 | ||||||||||
| 1,061,166 | First Horizon Alternative Mortgage Securities Trust 2006-FA8 1A11, 6.000%, 02/25/37 | 829,600 | 0.0 | |||||||||||
| 18,063,648 | ^ | Freddie Mac 3510 AS, 5.498%, 04/15/37 | 3,466,250 | 0.1 | ||||||||||
| 14,810,664 | ^ | Freddie Mac 4191 SA, 5.288%, 03/15/43 | 2,617,637 | 0.1 | ||||||||||
| 1,270,069 | Freddie Mac Reference Series R007 ZA, 6.000%, 05/15/36 | 1,428,938 | 0.0 | |||||||||||
| 727,604 | Freddie Mac Reference Series R008 ZA, 6.000%, 07/15/36 | 830,203 | 0.0 | |||||||||||
| 220,409 | Freddie Mac REMIC Trust 2110 PG, 6.000%, 01/15/29 | 250,885 | 0.0 | |||||||||||
| 204,012 | Freddie Mac REMIC Trust 2114 ZM, 6.000%, 01/15/29 | 233,444 | 0.0 | |||||||||||
| 1,398,003 | Freddie Mac REMIC Trust 2143 ZB, 6.000%, 04/15/29 | 1,597,955 | 0.0 | |||||||||||
| 248,340 | Freddie Mac REMIC Trust 2472 ZC, 6.000%, 07/15/32 | 282,948 | 0.0 | |||||||||||
| 417,439 | Freddie Mac REMIC Trust 2528 KM, 5.500%, 11/15/22 | 446,637 | 0.0 | |||||||||||
| 541,210 | Freddie Mac REMIC Trust 2541 NE, 5.500%, 12/15/32 | 606,678 | 0.0 | |||||||||||
| 211,944 | ^ | Freddie Mac REMIC Trust 2594 IY, 6.000%, 04/15/33 | 50,960 | 0.0 | ||||||||||
See Accompanying Notes to Financial Statements
Voya Intermediate Bond Fund | PORTFOLIO OF INVESTMENTS as of March 31, 2017 (continued) |
| Principal Amount† | Value | Percentage of Net Assets | ||||||||||||
| COLLATERALIZED MORTGAGE OBLIGATIONS: (continued) | ||||||||||||||
| 1,616,416 | Freddie Mac REMIC Trust 2845 QH, 5.000%, 08/15/34 | 1,759,200 | 0.1 | |||||||||||
| 282,739 | Freddie Mac REMIC Trust 2861 Z, 5.500%, 09/15/34 | 315,834 | 0.0 | |||||||||||
| 3,703,334 | ^ | Freddie Mac REMIC Trust 2866 GS, 5.688%, 09/15/34 | 292,426 | 0.0 | ||||||||||
| 1,289,742 | ^ | Freddie Mac REMIC Trust 2883 SD, 5.788%, 10/15/34 | 108,448 | 0.0 | ||||||||||
| 441,401 | Freddie Mac REMIC Trust 2930 ZL, 5.000%, 02/15/35 | 483,584 | 0.0 | |||||||||||
| 585,862 | Freddie Mac REMIC Trust 2931 ZY, 5.000%, 02/15/35 | 641,713 | 0.0 | |||||||||||
| 11,175,619 | ^ | Freddie Mac REMIC Trust 3045 DI, 5.818%, 10/15/35 | 1,997,503 | 0.1 | ||||||||||
| 109,663 | Freddie Mac REMIC Trust 3049 NA, 5.000%, 02/15/35 | 113,200 | 0.0 | |||||||||||
| 2,212,792 | Freddie Mac REMIC Trust 3117 ZA, 5.500%, 02/15/36 | 2,465,074 | 0.1 | |||||||||||
| 853,596 | ^^ | Freddie Mac REMIC Trust 3139 PO, 4.000%, 01/15/36 | 824,677 | 0.0 | ||||||||||
| 3,150,137 | ^ | Freddie Mac REMIC Trust 3171 PS, 5.573%, 06/15/36 | 474,642 | 0.0 | ||||||||||
| 5,667,021 | ^ | Freddie Mac REMIC Trust 3199 S, 5.538%, 08/15/36 | 1,077,604 | 0.0 | ||||||||||
| 1,082,204 | Freddie Mac REMIC Trust 3351 ZC, 5.500%, 07/15/37 | 1,209,461 | 0.0 | |||||||||||
| 641,125 | Freddie Mac REMIC Trust 3394 ZY, 6.000%, 11/15/37 | 700,538 | 0.0 | |||||||||||
| 549,296 | ^ | Freddie Mac REMIC Trust 3524 LA, 5.322%, 03/15/33 | 599,648 | 0.0 | ||||||||||
| 106,816 | Freddie Mac REMIC Trust 3556 NT, 4.012%, 03/15/38 | 109,927 | 0.0 | |||||||||||
| 10,325,364 | Freddie Mac REMIC Trust 3639 ZN, 5.500%, 12/15/34 | 11,619,299 | 0.3 | |||||||||||
| 1,054,134 | Freddie Mac REMIC Trust 3662 ZB, 5.500%, 08/15/36 | 1,175,125 | 0.0 | |||||||||||
| 4,709,237 | ^ | Freddie Mac REMIC Trust 3710 SL, 5.088%, 05/15/36 | 316,381 | 0.0 | ||||||||||
| 811,178 | Freddie Mac REMIC Trust 3724 CM, 5.500%, 06/15/37 | 902,899 | 0.0 | |||||||||||
| 25,000,000 | Freddie Mac REMIC Trust 3747 HW, 4.500%, 05/15/38 | 25,986,405 | 0.7 | |||||||||||
| 1,000,000 | Freddie Mac REMIC Trust 3753 DC, 3.500%, 09/15/39 | 1,039,357 | 0.0 | |||||||||||
| 914,966 | Freddie Mac REMIC Trust 3819 ZY, 6.000%, 10/15/37 | 997,603 | 0.0 | |||||||||||
| 2,712,213 | ^ | Freddie Mac REMIC Trust 3856 KS, 5.638%, 05/15/41 | 505,939 | 0.0 | ||||||||||
| 2,515,633 | ^ | Freddie Mac REMIC Trust 3925 SD, 5.138%, 07/15/40 | 332,730 | 0.0 | ||||||||||
| 15,880,254 | ^ | Freddie Mac REMIC Trust 3925 SL, 5.138%, 01/15/41 | 2,175,858 | 0.1 | ||||||||||
| 655,901 | Freddie Mac REMIC Trust 4000 PA, 4.500%, 01/15/42 | 705,300 | 0.0 | |||||||||||
| 3,949,791 | ^ | Freddie Mac REMIC Trust 4027 QI, 4.500%, 12/15/40 | 513,974 | 0.0 | ||||||||||
| 3,352,307 | ^ | Freddie Mac REMIC Trust 4088 CS, 5.088%, 08/15/42 | 631,435 | 0.0 | ||||||||||
| 12,617,205 | ^ | Freddie Mac REMIC Trust 4161 WI, 3.000%, 02/15/33 | 1,624,908 | 0.1 | ||||||||||
| 6,362,708 | ^ | Freddie Mac REMIC Trust 4194 GI, 4.000%, 04/15/43 | 1,146,826 | 0.0 | ||||||||||
| 4,601,688 | Freddie Mac REMIC Trust 4203 BN, 3.000%, 04/15/33 | 4,652,804 | 0.1 | |||||||||||
| 3,395,324 | ^ | Freddie Mac REMIC Trust 4293 KI, 4.500%, 08/15/43 | 569,274 | 0.0 | ||||||||||
| 4,368,738 | Freddie Mac REMIC Trust 4335 ZX, 4.250%, 05/15/44 | 4,825,616 | 0.1 | |||||||||||
| 5,864,179 | Freddie Mac REMIC Trust 435 XZ, 4.250%, 05/15/44 | 6,372,097 | 0.2 | |||||||||||
| 1,916,000 | Freddie Mac REMIC Trust 4370 AD, 3.000%, 08/15/40 | 1,887,249 | 0.1 | |||||||||||
| 10,911,691 | ^ | Freddie Mac REMIC Trust 4386 LS, 5.188%, 09/15/44 | 2,023,984 | 0.1 | ||||||||||
| 10,219,142 | Freddie Mac Series 4348 ZX, 4.250%, 06/15/44 | 10,863,647 | 0.3 | |||||||||||
| 880,000 | Freddie Mac Structured Agency Credit Risk Debt Notes 2013-DN2 M2, 5.232%, 11/25/23 | 955,048 | 0.0 | |||||||||||
| 6,130,000 | Freddie Mac Structured Agency Credit Risk Debt Notes 2014-DN2 M3, 4.582%, 04/25/24 | 6,576,587 | 0.2 | |||||||||||
| 5,600,000 | Freddie Mac Structured Agency Credit Risk Debt Notes 2014-DN3 M3, 4.982%, 08/25/24 | 5,987,975 | 0.2 | |||||||||||
| 2,350,000 | Freddie Mac Structured Agency Credit Risk Debt Notes 2014-DN4 M3, 5.532%, 10/25/24 | 2,535,503 | 0.1 | |||||||||||
| 1,100,000 | Freddie Mac Structured Agency Credit Risk Debt Notes 2014-HQ1 M3, 5.082%, 08/25/24 | 1,183,547 | 0.0 | |||||||||||
| 1,730,000 | Freddie Mac Structured Agency Credit Risk Debt Notes 2014-HQ3 M3, 5.732%, 10/25/24 | 1,910,737 | 0.1 | |||||||||||
| 4,200,000 | Freddie Mac Structured Agency Credit Risk Debt Notes 2015-DNA3 M3, 5.682%, 04/25/28 | 4,634,982 | 0.1 | |||||||||||
See Accompanying Notes to Financial Statements
Voya Intermediate Bond Fund | PORTFOLIO OF INVESTMENTS as of March 31, 2017 (continued) |
| Principal Amount† | Value | Percentage of Net Assets | ||||||||||||
| COLLATERALIZED MORTGAGE OBLIGATIONS: (continued) | ||||||||||||||
| 2,840,000 | Freddie Mac Structured Agency Credit Risk Debt Notes 2015-HQ2 M3, 4.232%, 05/25/25 | 3,008,916 | 0.1 | |||||||||||
| 5,365,000 | Freddie Mac Structured Agency Credit Risk Debt Notes 2015-HQA2 M3, 5.782%, 05/25/28 | 5,923,779 | 0.2 | |||||||||||
| 2,100,000 | Freddie Mac Structured Agency Credit Risk Debt Notes 2016-DNA1 M3, 6.532%, 07/25/28 | 2,383,119 | 0.1 | |||||||||||
| 6,500,000 | Freddie Mac Structured Agency Credit Risk Debt Notes 2016-DNA4 M3, 4.782%, 03/25/29 | 6,720,696 | 0.2 | |||||||||||
| 3,500,000 | Freddie Mac Structured Agency Credit Risk Debt Notes 2017-HQA1 M2, 4.532%, 08/25/29 | 3,506,225 | 0.1 | |||||||||||
| 1,062,609 | Freddie Mac Structured Pass Through Certificates T-48 1A, 5.217%, 07/25/33 | 1,217,677 | 0.0 | |||||||||||
| 19,546 | ^ | Ginnie Mae Series 2001-28 SV, 7.322%, 06/16/31 | 1,629 | 0.0 | ||||||||||
| 1,312,956 | ^ | Ginnie Mae Series 2005-7 AH, 5.842%, 02/16/35 | 221,027 | 0.0 | ||||||||||
| 19,838,188 | ^ | Ginnie Mae Series 2007-41 SL, 5.722%, 07/20/37 | 4,039,743 | 0.1 | ||||||||||
| 2,080,573 | ^ | Ginnie Mae Series 2008-2 SW, 5.572%, 01/20/38 | 379,921 | 0.0 | ||||||||||
| 1,435,782 | ^ | Ginnie Mae Series 2008-35 SN, 5.422%, 04/20/38 | 215,620 | 0.0 | ||||||||||
| 774,467 | ^ | Ginnie Mae Series 2008-40 PS, 5.572%, 05/16/38 | 132,733 | 0.0 | ||||||||||
| 2,004,351 | ^ | Ginnie Mae Series 2009-25 KS, 5.222%, 04/20/39 | 332,309 | 0.0 | ||||||||||
| 1,623,446 | Ginnie Mae Series 2009-29 PB, 4.750%, 05/20/39 | 1,763,805 | 0.1 | |||||||||||
| 1,688,851 | Ginnie Mae Series 2009-31 ZL, 4.500%, 05/20/39 | 1,842,842 | 0.1 | |||||||||||
| 6,012,536 | ^ | Ginnie Mae Series 2009-33 SN, 5.322%, 05/20/39 | 455,643 | 0.0 | ||||||||||
| 10,097,220 | Ginnie Mae Series 2009-33 ZB, 6.000%, 05/20/39 | 12,445,327 | 0.3 | |||||||||||
| 3,339,318 | Ginnie Mae Series 2009-34 Z, 4.500%, 05/16/39 | 3,565,106 | 0.1 | |||||||||||
| 854,417 | ^ | Ginnie Mae Series 2009-43 HS, 5.222%, 06/20/38 | 64,143 | 0.0 | ||||||||||
| 4,151,476 | ^ | Ginnie Mae Series 2010-116 NS, 5.722%, 09/16/40 | 688,197 | 0.0 | ||||||||||
| 10,374,310 | ^ | Ginnie Mae Series 2010-116 SK, 5.642%, 08/20/40 | 1,994,410 | 0.1 | ||||||||||
| 20,197,758 | ^ | Ginnie Mae Series 2010-149 HS, 5.172%, 05/16/40 | 2,427,952 | 0.1 | ||||||||||
| 1,839,956 | ^ | Ginnie Mae Series 2010-168 BI, 5.000%, 04/20/40 | 682,506 | 0.0 | ||||||||||
| 3,163,104 | ^ | Ginnie Mae Series 2010-68 MS, 4.872%, 06/20/40 | 488,636 | 0.0 | ||||||||||
| 8,015,187 | ^ | Ginnie Mae Series 2011-72 SA, 4.422%, 05/16/41 | 1,123,262 | 0.0 | ||||||||||
| 12,795,151 | ^ | Ginnie Mae Series 2011-73 LS, 5.712%, 08/20/39 | 1,581,447 | 0.0 | ||||||||||
| 334,013 | Ginnie Mae Series 2012-43 MA, 4.000%, 10/20/41 | 345,963 | 0.0 | |||||||||||
| 2,142,514 | ^ | Ginnie Mae Series 2012-91 QI, 4.500%, 09/20/41 | 358,441 | 0.0 | ||||||||||
| 15,253,352 | ^ | Ginnie Mae Series 2013-167 PI, 5.500%, 11/20/43 | 3,094,801 | 0.1 | ||||||||||
| 4,506,556 | ^ | Ginnie Mae Series 2014-10 GI, 4.500%, 01/16/29 | 522,720 | 0.0 | ||||||||||
| 9,427,406 | ^ | Ginnie Mae Series 2014-185 SB, 4.622%, 12/20/44 | 1,290,350 | 0.0 | ||||||||||
| 16,539,059 | ^ | Ginnie Mae Series 2014-3 SU, 5.072%, 07/20/39 | 2,504,498 | 0.1 | ||||||||||
| 15,156,116 | ^ | Ginnie Mae Series 2014-56 SP, 5.272%, 12/16/39 | 2,268,060 | 0.1 | ||||||||||
| 15,972,562 | ^ | Ginnie Mae Series 2014-58 SG, 4.672%, 04/16/44 | 2,415,566 | 0.1 | ||||||||||
| 6,784 | GSR Mortgage Loan Trust 2005-5F 8A1, 1.482%, 06/25/35 | 6,492 | 0.0 | |||||||||||
| 398,029 | GSR Mortgage Loan Trust 2007-1F 3A13, 6.000%, 01/25/37 | 375,863 | 0.0 | |||||||||||
| 308,080 | HomeBanc Mortgage Trust 2004-1 2A, 1.842%, 08/25/29 | 287,311 | 0.0 | |||||||||||
| 2,522,721 | IndyMac INDX Mortgage Loan Trust 2006-AR2 1A1B, 1.192%, 04/25/46 | 2,100,067 | 0.1 | |||||||||||
| 3,920,326 | IndyMac INDX Mortgage Loan Trust 2006-AR2 2A1, 1.192%, 02/25/46 | 3,137,160 | 0.1 | |||||||||||
| 669,197 | # | Jefferies Resecuritization Trust 2009-R6 1A2, 3.034%, 03/26/36 | 652,476 | 0.0 | ||||||||||
| 566,503 | JP Morgan Alternative Loan Trust 2005-S1 1A1, 5.500%, 12/25/35 | 472,430 | 0.0 | |||||||||||
| 2,974,674 | JP Morgan Mortgage Trust 2005-A4 B1, 3.115%, 07/25/35 | 2,548,589 | 0.1 | |||||||||||
| 19,857,366 | ^ | Lehman Mortgage Trust 2006-7, 5.568%, 11/25/36 | 4,013,859 | 0.1 | ||||||||||
| 14,449,153 | ^ | Lehman Mortgage Trust 2006-9, 5.638%, 01/25/37 | 2,888,838 | 0.1 | ||||||||||
| 1,984,287 | Lehman XS Trust Series 2005-5N 1A2, 1.342%, 11/25/35 | 1,536,923 | 0.0 | |||||||||||
| 6,611,572 | Morgan Stanley Mortgage Loan Trust 2007-13 6A1, 6.000%, 10/25/37 | 5,563,591 | 0.2 | |||||||||||
| 303,999 | Prime Mortgage Trust 2007-1 A4, 5.500%, 03/25/37 | 274,669 | 0.0 | |||||||||||
| 139,898 | Structured Adjustable Rate Mortgage Loan Trust 2004-12 7A3, 3.310%, 09/25/34 | 140,853 | 0.0 | |||||||||||
| 2,733,024 | Wachovia Mortgage Loan Trust LLC Series 2005-B Trust 2A1, 3.226%, 10/20/35 | 2,489,295 | 0.1 | |||||||||||
| 664,347 | WaMu Mortgage Pass Through Certificates Series 2006-AR12 2A3, 2.318%, 10/25/36 | 568,371 | 0.0 | |||||||||||
| 5,120,667 | WaMu Mortgage Pass-Through Certificates Series 2005-AR11 A1C3, 1.492%, 08/25/45 | 4,851,608 | 0.1 | |||||||||||
| 137,991,370 | ^ | WaMu Mortgage Pass-Through Certificates Series 2005-AR11 X, 1.371%, 08/25/45 | 5,108,620 | 0.1 | ||||||||||
See Accompanying Notes to Financial Statements
Voya Intermediate Bond Fund | PORTFOLIO OF INVESTMENTS as of March 31, 2017 (continued) |
| Principal Amount† | Value | Percentage of Net Assets | ||||||||||||
| COLLATERALIZED MORTGAGE OBLIGATIONS: (continued) | ||||||||||||||
| 724,431 | WaMu Mortgage Pass-Through Certificates Series 2006-AR12 1A1, 2.877%, 10/25/36 | 679,937 | 0.0 | |||||||||||
| 1,675,469 | WaMu Mortgage Pass-Through Certificates Series 2006-AR14 Trust 1A4, 2.662%, 11/25/36 | 1,505,496 | 0.0 | |||||||||||
| 1,945,825 | WaMu Mortgage Pass-Through Certificates Series 2006-AR16 2A1, 2.771%, 12/25/36 | 1,685,386 | 0.1 | |||||||||||
| 4,498,538 | WaMu Mortgage Pass-Through Certificates Series 2006-AR16 Trust 2A3, 2.771%, 12/25/36 | 3,882,740 | 0.1 | |||||||||||
| 2,571,963 | WaMu Mortgage Pass-Through Certificates Series 2006-AR16 Trust 3A1, 2.705%, 12/25/36 | 2,383,592 | 0.1 | |||||||||||
| 1,234,369 | WaMu Mortgage Pass-Through Certificates Series 2006-AR6 2A3, 2.872%, 08/25/36 | 1,118,447 | 0.0 | |||||||||||
| 2,814,774 | WaMu Mortgage Pass-Through Certificates Series 2006-AR8 1A4, 2.858%, 08/25/46 | 2,567,635 | 0.1 | |||||||||||
| 3,523,013 | WaMu Mortgage Pass-Through Certificates Series 2007-HY2 1A1, 2.770%, 12/25/36 | 3,342,188 | 0.1 | |||||||||||
| 832,360 | WaMu Mortgage Pass-Through Certificates Series 2007-HY3 1A1, 2.736%, 03/25/37 | 742,624 | 0.0 | |||||||||||
| 2,325,758 | WaMu Mortgage Pass-Through Certificates Series 2007-HY4 1A1, 2.456%, 04/25/37 | 2,043,434 | 0.1 | |||||||||||
| 2,682,681 | Washington Mutual Mortgage Pass-Through Certificates WMALT Series 2005-10 2A3, 1.882%, 11/25/35 | 2,045,561 | 0.1 | |||||||||||
| 2,418,530 | Washington Mutual Mortgage Pass-Through Certificates WMALT Series 2005-11 A1, 5.750%, 01/25/36 | 2,119,167 | 0.1 | |||||||||||
| 1,815,604 | Washington Mutual Mortgage Pass-Through Certificates WMALT Series 2005-5 CB3, 5.500%, 07/25/35 | 1,690,391 | 0.1 | |||||||||||
| 784,493 | Washington Mutual Mortgage Pass-Through Certificates WMALT Series 2005-8 1A2, 5.500%, 10/25/35 | 734,439 | 0.0 | |||||||||||
| 2,417,852 | Washington Mutual Mortgage Pass-Through Certificates WMALT Series 2006-AR5 4A, 1.628%, 06/25/46 | 1,884,689 | 0.1 | |||||||||||
| 6,282,164 | Washington Mutual Mortgage Pass-Through Certificates WMALT Series 2006-AR6 2A, 1.598%, 08/25/46 | 4,551,095 | 0.1 | |||||||||||
| 1,111,427 | Washington Mutual Mortgage Pass-Through Certificates WMALT Series 2007-OC1 A3, 1.212%, 01/25/47 | 924,350 | 0.0 | |||||||||||
| 2,302,541 | Washington Mutual Mortgage Pass-Through Certificates WMALT Series 2007-OC1 A4, 1.302%, 01/25/47 | 1,931,716 | 0.1 | |||||||||||
| 1,912,911 | Wells Fargo Alternative Loan 2007-PA2 2A1, 1.412%, 06/25/37 | 1,414,932 | 0.0 | |||||||||||
| 2,132,396 | Wells Fargo Alternative Loan 2007-PA3 Trust 3A1, 6.250%, 07/25/37 | 2,020,590 | 0.1 | |||||||||||
| 980,577 | Wells Fargo Mortgage Backed Securities 2006-AR4 Trust 2A4, 3.338%, 04/25/36 | 902,404 | 0.0 | |||||||||||
| Total Collateralized Mortgage Obligations (Cost $498,989,371) | 504,940,726 | 13.5 | ||||||||||||
| FOREIGN GOVERNMENT BONDS: 4.2% | ||||||||||||||
| 4,975,000 | # | Argentine Republic Government International Bond, 6.875%, 01/26/27 | 5,040,919 | 0.1 | ||||||||||
| 5,935,000 | # | Argentine Republic Government International Bond, 6.875%, 04/22/21 | 6,380,125 | 0.2 | ||||||||||
| CLP | 2,630,000,000 | Bonos Tesoreria Pesos, 4.500%, 02/28/21 | 4,144,430 | 0.1 | ||||||||||
| BRL | 23,892,000 | Brazil Notas do Tesouro Nacional Series F, 10.000%, 01/01/21 | 7,872,935 | 0.2 | ||||||||||
| BRL | 26,035,000 | Brazil Notas do Tesouro Nacional Series F, 10.000%, 01/01/23 | 8,550,900 | 0.2 | ||||||||||
| BRL | 10,240,000 | Brazil Notas do Tesouro Nacional Series F, 10.000%, 01/01/19 | 3,380,355 | 0.1 | ||||||||||
| 1,968,000 | Brazilian Government International Bond, 2.625%, 01/05/23 | 1,830,240 | 0.1 | |||||||||||
| 2,500,000 | Brazilian Government International Bond, 6.000%, 04/07/26 | 2,723,750 | 0.1 | |||||||||||
| 1,062,000 | Colombia Government International Bond, 2.625%, 03/15/23 | 1,023,503 | 0.0 | |||||||||||
| 1,500,000 | L | Colombia Government International Bond, 3.875%, 04/25/27 | 1,495,875 | 0.1 | ||||||||||
| 760,000 | L | Colombia Government International Bond, 8.125%, 05/21/24 | 970,710 | 0.0 | ||||||||||
| COP | 21,119,500,000 | Colombian TES, 11.000%, 07/24/20 | 8,450,378 | 0.2 | ||||||||||
| 350,000 | # | Costa Rica Government International Bond, 4.250%, 01/26/23 | 339,937 | 0.0 | ||||||||||
| 400,000 | Costa Rica Government International Bond, 9.995%, 08/01/20 | 470,720 | 0.0 | |||||||||||
| 2,500,000 | Croatia Government International Bond, 5.500%, 04/04/23 | 2,698,325 | 0.1 | |||||||||||
See Accompanying Notes to Financial Statements
Voya Intermediate Bond Fund | PORTFOLIO OF INVESTMENTS as of March 31, 2017 (continued) |
| Principal Amount† | Value | Percentage of Net Assets | ||||||||||||
| FOREIGN GOVERNMENT BONDS: (continued) | ||||||||||||||
| 272,000 | Croatia Government International Bond, 6.375%, 03/24/21 | 301,131 | 0.0 | |||||||||||
| 270,000 | Dominican Republic International Bond, 5.875%, 04/18/24 | 283,163 | 0.0 | |||||||||||
| 300,000 | # | Dominican Republic International Bond, 6.600%, 01/28/24 | 326,625 | 0.0 | ||||||||||
| 2,150,000 | Dominican Republic International Bond, 6.875%, 01/29/26 | 2,365,000 | 0.1 | |||||||||||
| 300,000 | # | Dominican Republic International Bond, 5.500%, 01/27/25 | 306,375 | 0.0 | ||||||||||
| 250,000 | # | Egypt Government International Bond, 5.875%, 06/11/25 | 245,162 | 0.0 | ||||||||||
| 232,000 | # | El Salvador Government International Bond, 5.875%, 01/30/25 | 208,429 | 0.0 | ||||||||||
| 290,380 | # | Gabonese Republic, 6.375%, 12/12/24 | 281,850 | 0.0 | ||||||||||
| 323,000 | Guatemala Government Bond, 8.125%, 10/06/34 | 416,347 | 0.0 | |||||||||||
| HUF | 2,820,500,000 | Hungary Government Bond, 7.500%, 11/12/20 | 11,939,018 | 0.3 | ||||||||||
| 2,506,000 | Hungary Government International Bond, 5.375%, 02/21/23 | 2,764,030 | 0.1 | |||||||||||
| 416,000 | Hungary Government International Bond, 7.625%, 03/29/41 | 605,257 | 0.0 | |||||||||||
| 1,500,000 | Indonesia Government International Bond, 4.125%, 01/15/25 | 1,543,485 | 0.1 | |||||||||||
| 600,000 | # | Indonesia Government International Bond, 4.125%, 01/15/25 | 617,394 | 0.0 | ||||||||||
| 2,750,000 | # | Indonesia Government International Bond, 4.350%, 01/08/27 | 2,848,882 | 0.1 | ||||||||||
| IDR | 28,498,000,000 | Indonesia Treasury Bond, 8.375%, 09/15/26 | 2,327,873 | 0.1 | ||||||||||
| 2,715,580 | Ivory Coast Government International Bond, 5.750%, 12/31/32 | 2,529,536 | 0.1 | |||||||||||
| 600,000 | # | KazAgro National Management Holding JSC, 4.625%, 05/24/23 | 589,170 | 0.0 | ||||||||||
| 2,100,000 | Kazakhstan Government International Bond, 5.125%, 07/21/25 | 2,286,585 | 0.1 | |||||||||||
| 1,000,000 | # | Kazakhstan Government International Bond, 5.125%, 07/21/25 | 1,088,850 | 0.0 | ||||||||||
| 955,000 | Lebanon Government International Bond, 6.000%, 01/27/23 | 971,273 | 0.0 | |||||||||||
| 1,150,000 | Lebanon Government International Bond, 6.100%, 10/04/22 | 1,180,008 | 0.0 | |||||||||||
| 400,000 | Mexico Government International Bond, 4.000%, 10/02/23 | 413,000 | 0.0 | |||||||||||
| 2,250,000 | Morocco Government International Bond, 4.250%, 12/11/22 | 2,334,375 | 0.1 | |||||||||||
| 600,000 | # | Morocco Government International Bond, 4.250%, 12/11/22 | 622,500 | 0.0 | ||||||||||
| 850,000 | Namibia International Bonds, 5.500%, 11/03/21 | 905,526 | 0.0 | |||||||||||
| 3,875,000 | # | Oman Government International Bond, 5.375%, 03/08/27 | 4,058,210 | 0.1 | ||||||||||
| 1,325,000 | Panama Government International Bond, 3.875%, 03/17/28 | 1,349,844 | 0.0 | |||||||||||
| 693,000 | Panama Government International Bond, 6.700%, 01/26/36 | 876,645 | 0.0 | |||||||||||
| 1,900,000 | L | Peruvian Government International Bond, 4.125%, 08/25/27 | 2,052,000 | 0.1 | ||||||||||
| 1,380,000 | Republic of Poland Government International Bond, 3.250%, 04/06/26 | 1,371,106 | 0.0 | |||||||||||
| 1,500,000 | Republic of Poland Government International Bond, 4.000%, 01/22/24 | 1,577,345 | 0.1 | |||||||||||
| 593,750 | Republic of Angola Via Northern Lights III BV, 7.000%, 08/17/19 | 613,047 | 0.0 | |||||||||||
| ARS | 21,200,000 | Republic of Argentina, 18.200%, 10/03/21 | 1,480,376 | 0.1 | ||||||||||
| ARS | 21,200,000 | Republic of Argentina, 21.200%, 09/19/18 | 1,440,622 | 0.0 | ||||||||||
| 600,000 | Republic of Paraguay, 4.625%, 01/25/23 | 627,000 | 0.0 | |||||||||||
| 600,000 | # | Republic of Paraguay, 4.625%, 01/25/23 | 627,000 | 0.0 | ||||||||||
| RON | 8,600,000 | Romania Government Bond, 5.850%, 04/26/23 | 2,311,657 | 0.1 | ||||||||||
| 1,602,000 | Romanian Government International Bond, 4.375%, 08/22/23 | 1,693,324 | 0.1 | |||||||||||
| 136,000 | # | Romanian Government International Bond, 4.375%, 08/22/23 | 143,753 | 0.0 | ||||||||||
| 6,400,000 | Russian Federal Bond - OFZ, 4.750%, 05/27/26 | 6,686,016 | 0.2 | |||||||||||
| RUB | 272,530,000 | Russian Federal Bond - OFZ, 6.400%, 05/27/20 | 4,648,906 | 0.1 | ||||||||||
| RUB | 276,740,000 | Russian Federal Bond - OFZ, 7.000%, 01/25/23 | 4,758,782 | 0.1 | ||||||||||
| RUB | 424,870,000 | Russian Federal Bond - OFZ, 7.500%, 08/18/21 | 7,465,980 | 0.2 | ||||||||||
| RUB | 164,590,000 | Russian Federal Bond - OFZ, 7.000%, 08/16/23 | 2,804,588 | 0.1 | ||||||||||
| 1,250,000 | South Africa Government International Bond, 4.300%, 10/12/28 | 1,176,282 | 0.0 | |||||||||||
| 350,000 | Sri Lanka Government International Bond, 5.875%, 07/25/22 | 359,988 | 0.0 | |||||||||||
| 1,100,000 | # | Sri Lanka Government International Bond, 6.825%, 07/18/26 | 1,139,723 | 0.0 | ||||||||||
| 380,002 | Tanzania Government International Bond, 7.421%, 03/09/20 | 402,490 | 0.0 | |||||||||||
| 800,000 | Turkey Government International Bond, 4.875%, 10/09/26 | 772,162 | 0.0 | |||||||||||
See Accompanying Notes to Financial Statements
Voya Intermediate Bond Fund | PORTFOLIO OF INVESTMENTS as of March 31, 2017 (continued) |
| Principal Amount† | Value | Percentage of Net Assets | ||||||||||||
| FOREIGN GOVERNMENT BONDS: (continued) | ||||||||||||||
| 200,000 | Turkey Government International Bond, 6.250%, 09/26/22 | 214,030 | 0.0 | |||||||||||
| 2,083,000 | Turkey Government International Bond, 7.375%, 02/05/25 | 2,367,069 | 0.1 | |||||||||||
| 2,726,000 | Ukraine Government AID Bonds, 1.847%, 05/29/20 | 2,740,104 | 0.1 | |||||||||||
| 2,300,000 | Uruguay Government International Bond, 4.375%, 10/27/27 | 2,412,700 | 0.1 | |||||||||||
| 253,970 | Uruguay Government International Bond, 7.625%, 03/21/36 | 330,999 | 0.0 | |||||||||||
| 341,643 | Uruguay Government International Bond, 8.000%, 11/18/22 | 417,232 | 0.0 | |||||||||||
| 475,000 | Vietnam Government International Bond, 6.750%, 01/29/20 | 520,486 | 0.0 | |||||||||||
| 300,000 | # | Zambia Government International Bond, 5.375%, 09/20/22 | 275,250 | 0.0 | ||||||||||
| Total Foreign Government Bonds (Cost $149,467,328) | 155,388,662 | 4.2 | ||||||||||||
| COMMERCIAL MORTGAGE-BACKED SECURITIES: 5.6% | ||||||||||||||
| 4,460,000 | # | BAMLL Re-REMIC Trust 2014-FRR5 A502, 1.219%, 03/27/45 | 4,392,319 | 0.1 | ||||||||||
| 6,244,000 | # | BAMLL Re-REMIC Trust 2015-FRR11 AK25, 2.787%, 09/27/45 | 5,488,251 | 0.1 | ||||||||||
| 1,990,000 | Banc of America Commercial Mortgage Trust 2007-3 B, 5.761%, 06/10/49 | 1,995,038 | 0.1 | |||||||||||
| 1,240,000 | # | Banc of America Commercial Mortgage Trust 2007-4 B, 5.961%, 02/10/51 | 1,236,539 | 0.0 | ||||||||||
| 92,840,000 | #,^ | BBCCRE Trust 2015-GTP XA, 0.597%, 08/10/33 | 4,075,128 | 0.1 | ||||||||||
| 2,320,000 | # | Bear Stearns Commercial Mortgage Securities Trust 2004-PWR4 G, 6.015%, 06/11/41 | 2,473,143 | 0.1 | ||||||||||
| 760,000 | # | Bear Stearns Commercial Mortgage Securities Trust 2004-TOP14 L, 5.405%, 01/12/41 | 767,075 | 0.0 | ||||||||||
| 760,000 | # | Bear Stearns Commercial Mortgage Securities Trust 2004-TOP14 M, 5.405%, 01/12/41 | 762,548 | 0.0 | ||||||||||
| 760,000 | # | Bear Stearns Commercial Mortgage Securities Trust 2004-TOP14 N, 5.405%, 01/12/41 | 745,955 | 0.0 | ||||||||||
| 3,520,000 | # | Bear Stearns Commercial Mortgage Securities Trust 2005-TOP18 F, 5.805%, 02/13/42 | 3,551,981 | 0.1 | ||||||||||
| 2,000,000 | # | Bear Stearns Commercial Mortgage Securities Trust 2005-TOP18 G, 5.805%, 02/13/42 | 1,980,550 | 0.1 | ||||||||||
| 191,153 | Bear Stearns Commercial Mortgage Securities Trust 2005-TOP20 C, 5.118%, 10/12/42 | 190,904 | 0.0 | |||||||||||
| 633,801 | # | Bear Stearns Commercial Mortgage Securities Trust 2006-TOP22 B, 5.716%, 04/12/38 | 643,972 | 0.0 | ||||||||||
| 2,259,669 | # | Beckman Coulter, Inc. 2000-A A, 7.498%, 12/15/18 | 2,295,945 | 0.1 | ||||||||||
| 45,113,000 | #,^ | CD 2016-CD1 Mortgage Trust, 0.685%, 08/10/49 | 2,598,013 | 0.1 | ||||||||||
| 25,581,391 | ^ | CD 2016-CD1 Mortgage Trust, 1.444%, 08/10/49 | 2,539,703 | 0.1 | ||||||||||
| 3,040,000 | Citigroup Commercial Mortgage Trust 2016-P4 A4, 2.902%, 07/10/49 | 2,960,500 | 0.1 | |||||||||||
| 41,927,654 | ^ | Citigroup Commercial Mortgage Trust 2016-P4 XA, 2.015%, 07/10/49 | 5,614,499 | 0.2 | ||||||||||
| 18,820,723 | ^ | Citigroup Commercial Mortgage Trust 2016-P6 XA, 0.841%, 12/10/49 | 981,557 | 0.0 | ||||||||||
| 5,218,204 | ^ | COMM 2012-CR1 XA, 1.910%, 05/15/45 | 405,653 | 0.0 | ||||||||||
| 31,121,664 | ^ | COMM 2012-CR2 XA, 1.723%, 08/15/45 | 2,258,533 | 0.1 | ||||||||||
| 39,771,154 | ^ | COMM 2012-CR4 XA, 1.895%, 10/15/45 | 2,712,472 | 0.1 | ||||||||||
| 27,260,000 | #,^ | COMM 2012-CR4 XB, 0.592%, 10/15/45 | 869,343 | 0.0 | ||||||||||
| 13,766,867 | #,^ | COMM 2012-LC4 XA, 2.234%, 12/10/44 | 1,092,650 | 0.0 | ||||||||||
| 4,240,000 | # | COMM 2013-CCRE10 C Mortgage Trust, 4.789%, 08/10/46 | 4,354,494 | 0.1 | ||||||||||
| 35,316,332 | ^ | COMM 2013-LC13 XA, 1.346%, 08/10/46 | 1,674,789 | 0.0 | ||||||||||
| 13,450,708 | ^ | COMM 2013-LC6 XA, 1.673%, 01/10/46 | 712,001 | 0.0 | ||||||||||
| 141,330,565 | #,^ | COMM 2015-PC1 XA, 0.769%, 07/10/50 | 5,724,354 | 0.2 | ||||||||||
| 920,000 | COMM 2016-COR1 C Mortgage Trust, 4.396%, 10/10/49 | 910,424 | 0.0 | |||||||||||
| 70,192,108 | ^ | Commercial Mortgage Pass Through Certificates 2016-CR28 XA, 0.325%, 02/10/49 | 2,899,081 | 0.1 | ||||||||||
| 37,785 | # | Credit Suisse First Boston Mortgage Securities Corp. 2003-C4 J, 5.322%, 08/15/36 | 37,692 | 0.0 | ||||||||||
| 642,500 | # | Credit Suisse First Boston Mortgage Securities Corp. 2004-C2 E, 5.736%, 05/15/36 | 655,842 | 0.0 | ||||||||||
| 900,000 | # | Credit Suisse First Boston Mortgage Securities Corp. 2004-C2 F, 6.284%, 05/15/36 | 951,115 | 0.0 | ||||||||||
| 1,000,000 | Credit Suisse First Boston Mortgage Securities Corp. 2005-C3 C, 4.952%, 07/15/37 | 998,686 | 0.0 | |||||||||||
| 4,460,000 | # | DBJPM 16-C3 Mortgage Trust, 3.495%, 09/10/49 | 3,482,446 | 0.1 | ||||||||||
| 2,840,000 | # | DBUBS 2011-LC2A D, 5.727%, 07/10/44 | 2,989,477 | 0.1 | ||||||||||
See Accompanying Notes to Financial Statements
Voya Intermediate Bond Fund | PORTFOLIO OF INVESTMENTS as of March 31, 2017 (continued) |
| Principal Amount† | Value | Percentage of Net Assets | ||||||||||||
| COMMERCIAL MORTGAGE-BACKED SECURITIES: (continued) | ||||||||||||||
| 8,190,000 | # | EQTY 2014-INNS Mortgage Trust, 4.297%, 05/08/31 | 8,155,357 | 0.2 | ||||||||||
| 16,840,000 | ^ | Freddie Mac Multifamily Structured Pass Through Certificates K008 X3, 5.251%, 08/25/20 | 2,677,658 | 0.1 | ||||||||||
| 27,973,945 | ^ | Freddie Mac Multifamily Structured Pass Through Certificates K010 X3, 4.632%, 11/25/44 | 4,210,079 | 0.1 | ||||||||||
| 20,890,903 | ^ | Freddie Mac Multifamily Structured Pass Through Certificates K021 X3, 1.969%, 07/25/40 | 1,896,449 | 0.1 | ||||||||||
| 20,918,411 | ^ | Freddie Mac Multifamily Structured Pass Through Certificates KS06 X, 1.084%, 08/25/26 | 1,530,929 | 0.0 | ||||||||||
| 25,000,000 | ^ | Freddie Mac Multifamily Structured Pass Through CertificatesK015 X3, 2.801%, 08/25/39 | 2,706,060 | 0.1 | ||||||||||
| 219,101,451 | #,^ | FREMF Mortgage Trust 2012-K17 X2A, 0.100%, 12/25/44 | 816,503 | 0.0 | ||||||||||
| 3,400,000 | # | GS Mortgage Securities Trust 2010-C2 D, 5.184%, 12/10/43 | 3,410,115 | 0.1 | ||||||||||
| 3,000,000 | # | GS Mortgage Securities Trust 2010-C2 E, 4.548%, 12/10/43 | 2,840,421 | 0.1 | ||||||||||
| 2,710,000 | # | GS Mortgage Securities Trust 2010-C2 F, 4.548%, 12/10/43 | 2,369,413 | 0.1 | ||||||||||
| 27,897,299 | ^ | GS Mortgage Securities Trust 2012-GCJ7 XA, 2.319%, 05/10/45 | 2,065,962 | 0.1 | ||||||||||
| 69,131,969 | ^ | GS Mortgage Securities Trust 2013-GC16 XA, 1.419%, 11/10/46 | 3,453,252 | 0.1 | ||||||||||
| 83,613,165 | ^ | GS Mortgage Securities Trust 2016-GS4, 0.603%, 11/10/49 | 3,363,013 | 0.1 | ||||||||||
| 630,000 | # | JP Morgan Chase Commercial Mortgage Securities Corp. 2004-C2 H, 5.763%, 05/15/41 | 634,883 | 0.0 | ||||||||||
| 1,810,000 | # | JP Morgan Chase Commercial Mortgage Securities Corp. 2004-CB8 J, 4.733%, 01/12/39 | 1,735,068 | 0.0 | ||||||||||
| 5,699,000 | # | JP Morgan Chase Commercial Mortgage Securities Corp. 2004-CB8 K, 4.733%, 01/12/39 | 5,275,932 | 0.1 | ||||||||||
| 17,385,000 | #,^ | JP Morgan Chase Commercial Mortgage Securities Corp. 2012-LC9 XB, 0.352%, 12/15/47 | 306,440 | 0.0 | ||||||||||
| 2,490,000 | # | JP Morgan Chase Commercial Mortgage Securities Trust 2003-CB6 H, 5.379%, 07/12/37 | 2,455,297 | 0.1 | ||||||||||
| 452,491 | # | JP Morgan Chase Commercial Mortgage Securities Trust 2003-LN1 H, 5.575%, 10/15/37 | 451,411 | 0.0 | ||||||||||
| 1,960,000 | JP Morgan Chase Commercial Mortgage Securities Trust 2004-CBX C, 5.066%, 01/12/37 | 2,003,108 | 0.1 | |||||||||||
| 1,410,000 | JP Morgan Chase Commercial Mortgage Securities Trust 2004-CBX D, 5.097%, 01/12/37 | 1,433,739 | 0.0 | |||||||||||
| 1,320,000 | JP Morgan Chase Commercial Mortgage Securities Trust 2004-CIBC9 E, 5.379%, 06/12/41 | 1,269,913 | 0.0 | |||||||||||
| 4,950,000 | JP Morgan Chase Commercial Mortgage Securities Trust 2005-LDP2 F, 5.010%, 07/15/42 | 4,993,313 | 0.1 | |||||||||||
| 2,400,000 | # | JP Morgan Chase Commercial Mortgage Securities Trust 2011-C4 E, 5.535%, 07/15/46 | 2,447,718 | 0.1 | ||||||||||
| 1,335,888 | # | JP Morgan Chase Commercial Mortgage Securities Trust 2011-C4 TAC1, 7.990%, 07/15/46 | 1,338,977 | 0.0 | ||||||||||
| 35,351,216 | ^ | JP Morgan Chase Commercial Mortgage Securities Trust 2012-CIBX XA, 1.657%, 06/15/45 | 1,980,976 | 0.1 | ||||||||||
| 36,118,891 | ^ | JPMBB Commercial Mortgage Securities Trust 2013-C12, 0.697%, 07/15/45 | 874,753 | 0.0 | ||||||||||
| 20,852,134 | ^ | JPMBB Commercial Mortgage Securities Trust 2014-C19 XA, 1.186%, 04/15/47 | 725,869 | 0.0 | ||||||||||
| 1,671,320 | ^ | JPMBB Commercial Mortgage Securities Trust 2015-C28 XA, 1.192%, 10/15/48 | 99,464 | 0.0 | ||||||||||
| 16,915,593 | #,^ | LB-UBS Commercial Mortgage Trust 2004-C1 XST, 1.000%, 01/15/36 | 16,921 | 0.0 | ||||||||||
| 751,974 | # | LB-UBS Commercial Mortgage Trust 2005-C1 G, 5.657%, 02/15/40 | 751,064 | 0.0 | ||||||||||
| 1,860,000 | # | LB-UBS Commercial Mortgage Trust 2005-C1 H, 5.757%, 02/15/40 | 1,837,295 | 0.1 | ||||||||||
| 150,436 | LB-UBS Commercial Mortgage Trust 2005-C3 D, 4.954%, 07/15/40 | 155,218 | 0.0 | |||||||||||
| 1,730,000 | LB-UBS Commercial Mortgage Trust 2005-C3 E, 4.983%, 07/15/40 | 1,729,750 | 0.0 | |||||||||||
| 1,130,000 | # | LB-UBS Commercial Mortgage Trust 2005-C5 G, 5.350%, 09/15/40 | 1,123,632 | 0.0 | ||||||||||
| 2,000,000 | # | LB-UBS Commercial Mortgage Trust 2005-C5 H, 5.350%, 09/15/40 | 1,963,037 | 0.1 | ||||||||||
| 5,000,000 | LB-UBS Commercial Mortgage Trust 2005-C7 E, 5.350%, 11/15/40 | 5,066,861 | 0.1 | |||||||||||
| 756,000 | LB-UBS Commercial Mortgage Trust 2006-C4 D, 5.864%, 06/15/38 | 756,083 | 0.0 | |||||||||||
See Accompanying Notes to Financial Statements
Voya Intermediate Bond Fund | PORTFOLIO OF INVESTMENTS as of March 31, 2017 (continued) |
| Principal Amount† | Value | Percentage of Net Assets | ||||||||||||
| COMMERCIAL MORTGAGE-BACKED SECURITIES: (continued) | ||||||||||||||
| 5,240,691 | #,^ | LB-UBS Commercial Mortgage Trust 2006-C7 XW, 0.491%, 11/15/38 | 15,835 | 0.0 | ||||||||||
| 89,009 | Merrill Lynch Mortgage Investors Trust Series 1997-C2 F, 6.250%, 12/10/29 | 88,798 | 0.0 | |||||||||||
| 1,550,000 | # | Morgan Stanley Bank of America Merrill Lynch Trust 2012-C5 D, 4.645%, 08/15/45 | 1,535,115 | 0.0 | ||||||||||
| 53,708,403 | ^ | Morgan Stanley Bank of America Merrill Lynch Trust 2014 C19, 1.144%, 12/15/47 | 2,917,118 | 0.1 | ||||||||||
| 5,530,000 | # | Morgan Stanley Bank of America Merrill Lynch Trust 2014-C18 D, 3.389%, 10/15/47 | 3,811,102 | 0.1 | ||||||||||
| 6,610,000 | # | Morgan Stanley Bank of America Merrill Lynch Trust 2015-C21 D, 4.162%, 03/15/48 | 5,419,344 | 0.1 | ||||||||||
| 4,251,000 | Morgan Stanley Capital I Trust 2006-IQ11, 6.303%, 10/15/42 | 4,147,167 | 0.1 | |||||||||||
| 2,800,000 | # | Morgan Stanley Capital I Trust 2008-T29 D, 6.301%, 01/11/43 | 2,781,777 | 0.1 | ||||||||||
| 3,090,000 | # | Morgan Stanley Capital I Trust 2011-C1 D, 5.433%, 09/15/47 | 3,297,459 | 0.1 | ||||||||||
| 1,300,000 | # | Morgan Stanley Capital I Trust 2011-C1 E, 5.433%, 09/15/47 | 1,377,264 | 0.0 | ||||||||||
| 71,638 | # | Morgan Stanley Capital I, Inc. 1999-WF1 M, 5.910%, 11/15/31 | 71,496 | 0.0 | ||||||||||
| 442,266 | # | Morgan Stanley Dean Witter Capital I Trust 2001-TOP3 E, 7.571%, 07/15/33 | 460,942 | 0.0 | ||||||||||
| 2,890,000 | # | Morgan Stanley Reremic Trust 2012-XA B, 0.250%, 07/27/49 | 2,794,530 | 0.1 | ||||||||||
| 3,302,061 | Wachovia Bank Commercial Mortgage Trust Series 2006-C25 D, 5.880%, 05/15/43 | 3,296,455 | 0.1 | |||||||||||
| 28,856,666 | #,^ | Wells Fargo Commercial Mortgage Trust 2012-LC5 XA, 2.007%, 10/15/45 | 1,983,601 | 0.1 | ||||||||||
| 56,033,782 | ^ | Wells Fargo Commercial Mortgage Trust 2014-LC16 XA, 1.396%, 08/15/50 | 3,428,674 | 0.1 | ||||||||||
| 21,525,646 | ^ | Wells Fargo Commercial Mortgage Trust 2016-C33 XA, 1.809%, 03/15/59 | 2,370,736 | 0.1 | ||||||||||
| 42,409,797 | ^ | Wells Fargo Commercial Mortgage Trust 2016-C35 XA, 2.007%, 07/15/48 | 5,697,358 | 0.2 | ||||||||||
| 16,529,811 | #,^ | WFRBS Commercial Mortgage Trust 2012-C8 XA, 1.983%, 08/15/45 | 1,187,802 | 0.0 | ||||||||||
| 13,487,132 | #,^ | WFRBS Commercial Mortgage Trust 2012-C9 XA, 2.087%, 11/15/45 | 994,997 | 0.0 | ||||||||||
| 49,391,517 | #,^ | WFRBS Commercial Mortgage Trust 2013-C12 XA, 1.376%, 03/15/48 | 2,662,173 | 0.1 | ||||||||||
| Total Commercial Mortgage-Backed Securities (Cost $209,324,029) | 209,284,348 | 5.6 | ||||||||||||
| ASSET-BACKED SECURITIES: 11.4% | ||||||||||||||
| Automobile Asset-Backed Securities: 0.6% | ||||||||||||||
| 1,600,000 | Capital Auto Receivables Asset Trust 2015-2 B, 2.290%, 05/20/20 | 1,609,259 | 0.0 | |||||||||||
| 1,280,000 | Capital Auto Receivables Asset Trust 2015-2 C, 2.670%, 08/20/20 | 1,286,405 | 0.0 | |||||||||||
| 400,000 | CarMax Auto Owner Trust 2015-2 C, 2.390%, 03/15/21 | 401,461 | 0.0 | |||||||||||
| 1,960,000 | GM Financial Automobile Leasing Trust 2015-2 B, 2.420%, 07/22/19 | 1,970,889 | 0.1 | |||||||||||
| 1,890,000 | GM Financial Automobile Leasing Trust 2015-2 C, 2.990%, 07/22/19 | 1,908,888 | 0.1 | |||||||||||
| 820,000 | # | MMCA Auto Owner Trust 2014-A C, 2.260%, 10/15/20 | 823,244 | 0.0 | ||||||||||
| 3,240,000 | # | Oscar US Funding Trust 2014-1 A4, 2.550%, 12/15/21 | 3,220,748 | 0.1 | ||||||||||
| 1,450,000 | # | Oscar US Funding Trust VI LLC 2017-1A A3, 2.820%, 06/10/21 | 1,452,007 | 0.0 | ||||||||||
| 2,270,000 | # | Santander Drive Auto Receivables Trust 2013-A E, 4.710%, 01/15/21 | 2,315,424 | 0.1 | ||||||||||
| 5,130,000 | Santander Drive Auto Receivables Trust 2014-3 D, 2.650%, 08/17/20 | 5,171,038 | 0.1 | |||||||||||
| 1,940,000 | # | SunTrust Auto Receivables Trust 2015-1A B, 2.200%, 02/15/21 | 1,933,486 | 0.1 | ||||||||||
| 22,092,849 | 0.6 | |||||||||||||
| Home Equity Asset-Backed Securities: 0.7% | ||||||||||||||
| 8,807,953 | Freddie Mac Structured Pass Through Certificates T-31 A7, 1.232%, 05/25/31 | 8,726,050 | 0.2 | |||||||||||
| 4,942,167 | GSAA Home Equity Trust 2006-4 4A3, 3.428%, 03/25/36 | 3,943,620 | 0.1 | |||||||||||
| 5,185,952 | GSAA Trust 2006-7 AF2, 5.995%, 03/25/46 | 3,689,524 | 0.1 | |||||||||||
| 532,433 | + | HSI Asset Loan Obligation Trust 2007-WF1 A6, 4.960%, 12/25/36 | 444,205 | 0.0 | ||||||||||
| 2,252,012 | Morgan Stanley Home Equity Loan Trust 2006-3 A3, 1.142%, 04/25/36 | 1,670,819 | 0.1 | |||||||||||
| 1,708,647 | Nomura Home Equity Loan, Inc. Home Equity Loan Trust Series 2007-1 2A3, 1.142%, 02/25/37 | 1,465,899 | 0.0 | |||||||||||
See Accompanying Notes to Financial Statements
Voya Intermediate Bond Fund | PORTFOLIO OF INVESTMENTS as of March 31, 2017 (continued) |
| Principal Amount† | Value | Percentage of Net Assets | ||||||||||||
| ASSET-BACKED SECURITIES: (continued) | ||||||||||||||
| Home Equity Asset-Backed Securities: (continued) | ||||||||||||||
| 2,080,283 | Nomura Home Equity Loan, Inc. Home Equity Loan Trust Series 2007-1 2A4A, 1.212%, 02/25/37 | 1,799,905 | 0.1 | |||||||||||
| 3,500,000 | Renaissance Home Equity Loan Trust 2005-3 AF4, 5.140%, 11/25/35 | 3,535,909 | 0.1 | |||||||||||
| 35,048 | RASC Series Trust 2002-KS1 AIIB, 1.582%, 06/25/32 | 29,355 | 0.0 | |||||||||||
| 25,305,286 | 0.7 | |||||||||||||
| Other Asset-Backed Securities: 9.7% | ||||||||||||||
| 2,000,000 | # | 1776 CLO Ltd. 2006-1A D, 2.788%, 05/08/20 | 2,011,192 | 0.1 | ||||||||||
| 3,611,559 | # | Ajax Mortgage Loan Trust 2016-C, 4.000%, 10/25/57 | 3,603,793 | 0.1 | ||||||||||
| 7,600,000 | # | ALM VII Ltd. 2012-7A A1R, 2.503%, 10/15/28 | 7,656,468 | 0.2 | ||||||||||
| 5,100,000 | # | ALM VII R-2 Ltd. 2013-7R2A A2R, 3.023%, 10/15/27 | 5,138,479 | 0.1 | ||||||||||
| 2,930,000 | # | ALM VIII Ltd. 2013-8A A1R, 2.513%, 10/15/28 | 2,941,518 | 0.1 | ||||||||||
| 1,000,000 | # | American Homes 4 Rent 2015-SFR1 E, 5.639%, 04/17/52 | 1,054,540 | 0.0 | ||||||||||
| 1,108,107 | #,^ | American Homes 4 Rent 2015-SFR1 XS, 04/17/52 | – | – | ||||||||||
| 1,076,000 | # | American Homes 4 Rent 2015-SFR2 C, 4.691%, 10/17/45 | 1,123,780 | 0.0 | ||||||||||
| 1,250,000 | # | American Homes 4 Rent 2015-SFR2 D, 5.036%, 10/17/45 | 1,318,125 | 0.0 | ||||||||||
| 6,997,917 | #,^ | American Homes 4 Rent 2015-SFR2 XS, 10/17/45 | – | – | ||||||||||
| 7,380,000 | # | Apidos CLO XI 2012-11A AR, 2.463%, 01/17/28 | 7,404,634 | 0.2 | ||||||||||
| 3,440,000 | # | Apidos CLO XI 2012-11A BR, 2.973%, 01/17/28 | 3,452,989 | 0.1 | ||||||||||
| 1,170,000 | # | Apidos CLO XIV 2013-14A D, 4.523%, 04/15/25 | 1,165,249 | 0.0 | ||||||||||
| 3,130,000 | # | Apidos CLO XVII 2014-17A A2R, 2.873%, 04/17/26 | 3,130,191 | 0.1 | ||||||||||
| 5,420,000 | # | Apidos CLO XVII 2014-17A BR, 3.523%, 04/17/26 | 5,419,951 | 0.1 | ||||||||||
| 3,860,000 | # | Apidos Clo XXV 2016-25A A1, 2.203%, 10/20/28 | 3,870,507 | 0.1 | ||||||||||
| 4,350,000 | # | Ares XXIX CLO Ltd. 2014-1A BR, 3.330%, 04/17/26 | 4,349,695 | 0.1 | ||||||||||
| 4,410,000 | # | Ares XXXII CLO Ltd. 2014-32A BR, 3.289%, 11/15/25 | 4,409,925 | 0.1 | ||||||||||
| 146,648 | # | AVANT Loans Funding Trust 2015-A A, 4.000%, 08/16/21 | 147,133 | 0.0 | ||||||||||
| 3,970,000 | # | Avery Point IV CLO Ltd., 3.510%, 04/25/26 | 3,970,000 | 0.1 | ||||||||||
| 7,600,000 | # | Babson CLO Ltd. 2014-3A AR, 2.299%, 01/15/26 | 7,615,170 | 0.2 | ||||||||||
| 2,640,000 | # | Babson CLO Ltd. 2014-3A C1R, 3.699%, 01/15/26 | 2,641,845 | 0.1 | ||||||||||
| 3,620,000 | # | Babson CLO Ltd. 2014-IA BR, 3.230%, 07/20/25 | 3,620,069 | 0.1 | ||||||||||
| 9,710,000 | # | Benefit Street Partners CLO IV Ltd. 2014-IVA A1R, 2.515%, 01/20/29 | 9,740,946 | 0.3 | ||||||||||
| 3,190,000 | # | Benefit Street Partners CLO X Ltd. 2016-10A A1, 2.233%, 01/15/29 | 3,200,597 | 0.1 | ||||||||||
| 2,450,000 | # | Birchwood Park CLO Ltd. 2014-1A C1R, 3.273%, 07/15/26 | 2,450,250 | 0.1 | ||||||||||
| 6,270,000 | # | Blue Hill CLO Ltd. 2013-1A C1R, 3.420%, 01/15/26 | 6,269,611 | 0.2 | ||||||||||
| 3,550,000 | # | BlueMountain CLO 2013-1A A1R, 2.430%, 01/20/29 | 3,562,588 | 0.1 | ||||||||||
| 4,080,000 | # | BlueMountain CLO 2013-1A A2R, 2.930%, 01/20/29 | 4,094,386 | 0.1 | ||||||||||
| 4,350,000 | # | BlueMountain CLO 2014-4A CR, 3.604%, 11/30/26 | 4,353,323 | 0.1 | ||||||||||
| 4,070,000 | # | BlueMountain CLO 2015-1A BR, 3.522%, 04/13/27 | 4,108,050 | 0.1 | ||||||||||
| 7,100,000 | # | BlueMountain CLO Ltd. 2012-2A AR, 2.472%, 11/20/28 | 7,122,791 | 0.2 | ||||||||||
| 3,270,000 | # | Burnham Park Clo Ltd. 2016-1A A, 2.318%, 10/20/29 | 3,296,729 | 0.1 | ||||||||||
| 1,377,919 | # | Callidus Debt Partners Clo Fund VI Ltd. 6A A1T, 1.301%, 10/23/21 | 1,377,559 | 0.0 | ||||||||||
| 3,480,000 | # | Carlyle Global Market Strategies CLO 2014-3A BR Ltd., 3.187%, 07/27/26 | 3,486,522 | 0.1 | ||||||||||
| 3,040,000 | # | Carlyle Global Market Strategies CLO Ltd. 2012-4A AR, 2.480%, 01/20/29 | 3,053,479 | 0.1 | ||||||||||
| 6,380,000 | # | Carlyle US CLO 2017-1A A1A Ltd., 2.460%, 04/20/31 | 6,406,298 | 0.2 | ||||||||||
| 9,680,000 | # | Cedar Funding VI CLO Ltd. 2016-6A A1, 2.344%, 10/20/28 | 9,690,251 | 0.3 | ||||||||||
| 4,700,000 | # | Cent CLO 2014-22A A2AR, 2.984%, 11/07/26 | 4,700,799 | 0.1 | ||||||||||
| 37,149 | Chase Funding Trust Series 2003-5 2A2, 1.582%, 07/25/33 | 36,019 | 0.0 | |||||||||||
| 2,150,000 | # | CIFC Funding 2017-2A C Ltd., 04/20/30 | 2,150,000 | 0.1 | ||||||||||
| 2,750,000 | # | CIFC Funding Ltd. 2014-4A C1R, 2.377%, 10/17/26 | 2,749,972 | 0.1 | ||||||||||
| 3,660,000 | # | CIFC Funding Ltd. 2016-1A A, 2.445%, 10/21/28 | 3,674,172 | 0.1 | ||||||||||
| 11,950,000 | # | CIFC Funding Ltd. 2017-1A A, 2.243%, 04/23/29 | 11,949,845 | 0.3 | ||||||||||
| 11,130,000 | # | Dryden 33 Senior Loan Fund 2014-33A AR, 2.453%, 10/15/28 | 11,163,323 | 0.3 | ||||||||||
| 2,960,000 | # | Dryden Senior Loan Fund 2014-31A CR, 3.256%, 04/18/26 | 2,946,739 | 0.1 | ||||||||||
| 2,100,000 | # | Dryden Senior Loan Fund 2014-34A CR, 3.172%, 10/15/26 | 2,100,000 | 0.1 | ||||||||||
| 6,660,000 | # | Dryden Senior Loan Fund 2017-47A A2, 2.745%, 04/15/28 | 6,660,000 | 0.2 | ||||||||||
| 6,410,000 | # | Dryden Senior Loan Fund 2017-47A C, 3.595%, 04/15/28 | 6,406,795 | 0.1 | ||||||||||
| 3,000,000 | # | Flatiron CLO Ltd. 2013-1A A2R, 2.580%, 01/17/26 | 2,999,850 | 0.1 | ||||||||||
See Accompanying Notes to Financial Statements
Voya Intermediate Bond Fund | PORTFOLIO OF INVESTMENTS as of March 31, 2017 (continued) |
| Principal Amount† | Value | Percentage of Net Assets | ||||||||||||
| ASSET-BACKED SECURITIES: (continued) | ||||||||||||||
| Other Asset-Backed Securities: (continued) | ||||||||||||||
| 3,920,000 | # | Flatiron CLO Ltd. 2013-1A BR, 3.380%, 01/17/26 | 3,919,796 | 0.1 | ||||||||||
| 1,500,000 | # | Gale Force 3 CLO Ltd. 2007-3A D, 2.425%, 04/19/21 | 1,498,579 | 0.0 | ||||||||||
| 2,125,000 | # | GoldenTree Loan Opportunities III Ltd. 2007-3A C, 2.284%, 05/01/22 | 2,125,888 | 0.1 | ||||||||||
| 2,963,407 | # | HERO Funding Trust 2015-2A A, 3.990%, 09/20/40 | 3,037,493 | 0.1 | ||||||||||
| 3,278,790 | # | HERO Funding Trust 2015-3A A, 4.280%, 09/20/41 | 3,336,169 | 0.0 | ||||||||||
| 2,759,343 | # | HERO Funding Trust 2016-2A A, 3.750%, 09/20/41 | 2,808,638 | 0.1 | ||||||||||
| 2,500,000 | # | Invitation Homes Trust 2014-SFR2 E, 4.093%, 06/17/32 | 2,524,102 | 0.1 | ||||||||||
| 5,400,000 | # | LCM XXIII Ltd. 23A A1, 2.506%, 10/20/29 | 5,443,151 | 0.1 | ||||||||||
| 1,495,350 | # | Madison Park Funding IV Ltd. 2007-4A E, 4.756%, 03/22/21 | 1,518,578 | 0.0 | ||||||||||
| 1,500,000 | # | Madison Park Funding Ltd. 2007-6A D, 4.282%, 07/26/21 | 1,501,511 | 0.0 | ||||||||||
| 3,250,000 | # | Madison Park Funding Ltd. 2007-6A E, 6.282%, 07/26/21 | 3,255,792 | 0.1 | ||||||||||
| 1,250,000 | # | Madison Park Funding V Ltd. 2007-5A D, 4.552%, 02/26/21 | 1,251,113 | 0.0 | ||||||||||
| 2,900,000 | # | Madison Park Funding XIII Ltd. 2014-13A CR, 3.028%, 01/19/25 | 2,900,145 | 0.1 | ||||||||||
| 5,400,000 | # | Madison Park Funding XV Ltd. 2014-15A B1R, 3.242%, 01/27/26 | 5,400,119 | 0.1 | ||||||||||
| 9,550,000 | # | Magnetite CLO Ltd. 2016-18A A, 2.253%, 11/15/28 | 9,571,354 | 0.3 | ||||||||||
| 347,059 | # | Marketplace Loan Trust Series 2015-AV1 A, 4.000%, 09/15/21 | 348,448 | 0.0 | ||||||||||
| 927,356 | # | Marketplace Loan Trust Series 2015-AV2 A, 4.000%, 10/15/21 | 931,322 | 0.0 | ||||||||||
| 1,600,000 | # | Oaktree EIF II Series B1 Ltd. 2015-B1A A, 2.589%, 02/15/26 | 1,600,339 | 0.0 | ||||||||||
| 9,470,000 | # | Octagon Investment Partners 30 Ltd. 2017-1A A1, 2.355%, 03/17/30 | 9,480,872 | 0.3 | ||||||||||
| 1,570,000 | # | Octagon Investment Partners XIX Ltd. 2014-1A CR, 3.069%, 04/15/26 | 1,577,850 | 0.0 | ||||||||||
| 5,660,000 | # | OHA Loan Funding Ltd. 2015-1A AR, 2.449%, 08/15/29 | 5,697,390 | 0.2 | ||||||||||
| 5,980,000 | # | OHA Loan Funding Ltd. 2015-1A BR, 2.839%, 08/15/29 | 5,986,650 | 0.2 | ||||||||||
| 6,000,000 | # | Palmer Square CLO 2013-2A BR Ltd., 3.408%, 10/17/27 | 6,000,000 | 0.2 | ||||||||||
| 1,040,000 | Popular ABS Mortgage Pass-Through Trust 2005-D A5, 4.182%, 01/25/36 | 1,037,551 | 0.0 | |||||||||||
| 4,000,000 | # | Progress Residential 2015-SFR2 E, 4.427%, 06/12/32 | 4,003,377 | 0.1 | ||||||||||
| 4,000,000 | # | Progress Residential 2015-SFR3 C, 4.327%, 11/12/32 | 4,087,311 | 0.1 | ||||||||||
| 7,830,000 | # | Shackleton CLO Ltd. 2016-9A A, 2.364%, 10/20/28 | 7,852,989 | 0.2 | ||||||||||
| 2,008,245 | # | SoFi Consumer Loan Program 2016-1A A, 3.260%, 08/25/25 | 2,007,042 | 0.1 | ||||||||||
| 1,500,000 | # | SoFi Consumer Loan Program 2016-2A B, 4.770%, 10/27/25 | 1,531,956 | 0.0 | ||||||||||
| 4,364,879 | # | Sofi Consumer Loan Program 2017-1 A LLC, 3.280%, 01/26/26 | 4,391,726 | 0.1 | ||||||||||
| 5,345,000 | # | Springleaf Funding Trust 2015-A A, 3.160%, 11/15/24 | 5,397,695 | 0.1 | ||||||||||
| 7,320,000 | # | Symphony CLO Ltd. 2012-9A AR, 2.472%, 10/16/28 | 7,402,848 | 0.2 | ||||||||||
| 3,120,000 | # | Symphony CLO Ltd. 2016-18A B, 2.746%, 01/23/28 | 3,123,235 | 0.1 | ||||||||||
| 3,080,000 | # | Symphony CLO XIV Ltd. 2014-14A C1R, 3.505%, 07/14/26 | 3,079,978 | 0.1 | ||||||||||
| 3,432,750 | # | Taco Bell Funding 2016-1A A2I, 3.832%, 05/25/46 | 3,482,646 | 0.1 | ||||||||||
| 550,000 | # | Telos CLO 2007-2A D, 3.223%, 04/15/22 | 560,110 | 0.0 | ||||||||||
| 2,580,000 | # | Thacher Park CLO Ltd. 2014-1A CR, 3.857%, 10/20/26 | 2,579,755 | 0.1 | ||||||||||
| 11,090,000 | # | THL Credit Wind River CLO Ltd. 2017-1A A, 2.374%, 04/18/29 | 11,100,968 | 0.3 | ||||||||||
| 6,000,000 | # | THL Credit Wind River CLO Ltd. 2017-1A C, 3.334%, 04/18/29 | 5,999,886 | 0.2 | ||||||||||
| 9,030,000 | # | Wind River CLO Ltd. 2016-2A A, 2.386%, 11/01/28 | 9,057,984 | 0.2 | ||||||||||
| 364,208,503 | 9.7 | |||||||||||||
| Student Loan Asset-Backed Securities: 0.4% | ||||||||||||||
| 1,714,117 | # | DRB Prime Student Loan Trust 2015-B A2, 3.170%, 07/25/31 | 1,727,127 | 0.1 | ||||||||||
| 2,236,498 | # | DRB Prime Student Loan Trust 2015-D A2, 3.200%, 01/25/40 | 2,255,623 | 0.1 | ||||||||||
| 1,280,717 | # | Earnest Student Loan Program 2016-A B LLC, 2.500%, 01/25/39 | 1,239,032 | 0.0 | ||||||||||
| 1,550,000 | # | Earnest Student Loan Program 2016-B B, 4.810%, 09/25/36 | 1,552,280 | 0.0 | ||||||||||
| 1,150,000 | # | Earnest Student Loan Program 2016-C B, 4.460%, 01/26/37 | 1,131,740 | 0.0 | ||||||||||
| 1,200,000 | # | SMB Private Education Loan Trust 2017-A, 3.500%, 06/17/41 | 1,162,908 | 0.0 | ||||||||||
| 2,191,222 | # | SoFi Professional Loan Program 2015-C A2, 2.510%, 08/25/33 | 2,188,548 | 0.1 | ||||||||||
See Accompanying Notes to Financial Statements
Voya Intermediate Bond Fund | PORTFOLIO OF INVESTMENTS as of March 31, 2017 (continued) |
| Principal Amount† | Value | Percentage of Net Assets | ||||||||||||
| ASSET-BACKED SECURITIES: (continued) | ||||||||||||||
| Student Loan Asset-Backed Securities: (continued) | ||||||||||||||
| 4,100,000 | # | Sofi Professional Loan Program 2016-E LLC, 4.430%, 10/25/41 | 4,131,538 | 0.1 | ||||||||||
| 15,388,796 | 0.4 | |||||||||||||
| Total Asset-Backed Securities (Cost $424,863,048) | 426,995,434 | 11.4 | ||||||||||||
| U.S. GOVERNMENT AGENCY OBLIGATIONS: 11.8% | ||||||||||||||
| Federal Home Loan Mortgage Corporation: 4.8%## | ||||||||||||||
| 1,385,538 | 2.500%, due 05/01/30 | 1,389,697 | 0.0 | |||||||||||
| 1,664,827 | 2.500%, due 05/01/30 | 1,668,830 | 0.0 | |||||||||||
| 2,153,590 | 2.500%, due 06/01/30 | 2,158,735 | 0.1 | |||||||||||
| 11,794,000 | W | 3.000%, due 11/15/26 | 12,080,557 | 0.3 | ||||||||||
| 24,502,000 | W | 3.000%, due 04/01/44 | 24,278,035 | 0.7 | ||||||||||
| 3,187,528 | 3.000%, due 03/01/45 | 3,168,408 | 0.1 | |||||||||||
| 2,946,967 | 3.000%, due 03/01/45 | 2,934,597 | 0.1 | |||||||||||
| 7,849,245 | 3.000%, due 04/01/45 | 7,802,156 | 0.2 | |||||||||||
| 7,629,628 | 3.000%, due 04/01/45 | 7,597,602 | 0.2 | |||||||||||
| 11,347 | 3.023%, due 05/01/37 | 12,045 | 0.0 | |||||||||||
| 6,823,000 | W | 3.500%, due 08/15/41 | 6,963,991 | 0.2 | ||||||||||
| 11,606,229 | 3.500%, due 01/01/45 | 11,905,831 | 0.3 | |||||||||||
| 4,341,588 | 3.500%, due 03/01/45 | 4,459,389 | 0.1 | |||||||||||
| 1,718,852 | 4.000%, due 10/01/41 | 1,811,390 | 0.0 | |||||||||||
| 2,723,618 | 4.000%, due 12/01/41 | 2,870,235 | 0.1 | |||||||||||
| 3,511,480 | 4.000%, due 08/01/44 | 3,687,736 | 0.1 | |||||||||||
| 2,438,418 | 4.000%, due 07/01/45 | 2,560,813 | 0.1 | |||||||||||
| 8,540,383 | 4.000%, due 09/01/45 | 8,969,062 | 0.2 | |||||||||||
| 2,974,947 | 4.000%, due 09/01/45 | 3,124,272 | 0.1 | |||||||||||
| 5,932,774 | 4.000%, due 09/01/45 | 6,230,566 | 0.2 | |||||||||||
| 4,789,583 | 4.000%, due 09/01/45 | 5,029,993 | 0.1 | |||||||||||
| 915,939 | 4.000%, due 11/01/45 | 961,914 | 0.0 | |||||||||||
| 6,340,556 | 4.000%, due 05/01/46 | 6,658,816 | 0.2 | |||||||||||
| 35,960,000 | W | 4.000%, due 05/01/47 | 37,640,004 | 1.0 | ||||||||||
| 1,381,460 | 4.500%, due 08/01/41 | 1,486,525 | 0.0 | |||||||||||
| 1,738,794 | 4.500%, due 09/01/41 | 1,869,730 | 0.1 | |||||||||||
| 1,607,469 | 4.500%, due 10/01/41 | 1,728,326 | 0.0 | |||||||||||
| 2,126,306 | 4.500%, due 03/01/44 | 2,293,213 | 0.1 | |||||||||||
| 185,777 | 5.000%, due 01/01/41 | 202,926 | 0.0 | |||||||||||
| 2,219,057 | 5.000%, due 04/01/41 | 2,448,633 | 0.1 | |||||||||||
| 52,617 | 5.500%, due 07/01/37 | 59,279 | 0.0 | |||||||||||
| 2,841,970 | 5.500%, due 11/01/38 | 3,198,880 | 0.1 | |||||||||||
| 5,047 | 6.000%, due 12/01/28 | 5,701 | 0.0 | |||||||||||
| 19,055 | 6.000%, due 01/01/29 | 21,524 | 0.0 | |||||||||||
| 9,775 | 6.500%, due 01/01/24 | 10,880 | 0.0 | |||||||||||
| 9,283 | 6.500%, due 12/01/31 | 10,383 | 0.0 | |||||||||||
| 882,632 | 6.500%, due 09/01/34 | 993,985 | 0.0 | |||||||||||
| 6,366 | 7.000%, due 03/01/32 | 7,328 | 0.0 | |||||||||||
| 180,301,987 | 4.8 | |||||||||||||
| Federal National Mortgage Association: 5.1%## | ||||||||||||||
| 18,700,000 | W | 2.500%, due 12/25/26 | 18,710,227 | 0.5 | ||||||||||
| 2,692,625 | 2.500%, due 05/01/30 | 2,708,152 | 0.1 | |||||||||||
| 4,109,331 | 2.500%, due 06/01/30 | 4,133,062 | 0.1 | |||||||||||
| 6,103,146 | 2.500%, due 06/01/30 | 6,138,390 | 0.2 | |||||||||||
| 2,517,599 | 2.500%, due 07/01/30 | 2,532,144 | 0.1 | |||||||||||
| 205,431 | 2.733%, due 07/01/35 | 217,648 | 0.0 | |||||||||||
| 3,579,278 | 3.000%, due 08/01/30 | 3,674,967 | 0.1 | |||||||||||
| 2,168,506 | 3.000%, due 09/01/30 | 2,227,884 | 0.1 | |||||||||||
| 12,470,000 | W | 3.000%, due 05/01/43 | 12,338,481 | 0.3 | ||||||||||
| 4,770,923 | 3.000%, due 07/01/43 | 4,756,695 | 0.1 | |||||||||||
| 1,150,817 | 3.000%, due 09/01/43 | 1,147,552 | 0.0 | |||||||||||
| 16,056,146 | 3.000%, due 04/01/45 | 15,979,673 | 0.4 | |||||||||||
| 3,053,998 | 3.000%, due 08/01/46 | 3,039,566 | 0.1 | |||||||||||
| 1,553,708 | 3.000%, due 11/01/46 | 1,546,366 | 0.1 | |||||||||||
| 8,456,358 | 3.500%, due 10/01/42 | 8,694,067 | 0.3 | |||||||||||
| 603,153 | 3.500%, due 01/01/46 | 619,928 | 0.0 | |||||||||||
| 441,790 | 3.500%, due 02/01/46 | 454,085 | 0.0 | |||||||||||
| 887,441 | 3.500%, due 02/01/46 | 912,137 | 0.0 | |||||||||||
| 1,510,000 | W | 4.000%, due 02/25/39 | 1,580,899 | 0.1 | ||||||||||
| 882,916 | 4.000%, due 03/01/42 | 929,935 | 0.0 | |||||||||||
| 2,973,683 | 4.000%, due 07/01/42 | 3,129,404 | 0.1 | |||||||||||
| 3,078,318 | 4.000%, due 07/01/42 | 3,241,659 | 0.1 | |||||||||||
| 500,982 | 4.000%, due 07/01/42 | 527,674 | 0.0 | |||||||||||
| 1,738,297 | 4.000%, due 09/01/43 | 1,840,271 | 0.1 | |||||||||||
| 3,113,160 | 4.000%, due 01/01/45 | 3,268,035 | 0.1 | |||||||||||
| 24,701,873 | 4.000%, due 01/01/45 | 26,270,464 | 0.7 | |||||||||||
| 2,943,469 | 4.000%, due 03/01/45 | 3,089,719 | 0.1 | |||||||||||
| 24,963,093 | 4.000%, due 05/01/45 | 26,205,194 | 0.7 | |||||||||||
| 3,979,545 | 4.000%, due 06/01/45 | 4,193,132 | 0.1 | |||||||||||
| 3,357,360 | 4.250%, due 11/01/43 | 3,581,512 | 0.1 | |||||||||||
| 388,295 | 4.500%, due 11/01/40 | 418,223 | 0.0 | |||||||||||
| 6,190,143 | 4.500%, due 11/01/40 | 6,666,054 | 0.2 | |||||||||||
| 717,433 | 4.500%, due 11/01/40 | 772,894 | 0.0 | |||||||||||
| 6,313 | 4.500%, due 12/01/40 | 6,794 | 0.0 | |||||||||||
| 11,809 | 4.500%, due 12/01/40 | 12,722 | 0.0 | |||||||||||
| 13,391 | 4.500%, due 01/01/41 | 14,421 | 0.0 | |||||||||||
| 10,721 | 4.500%, due 01/01/41 | 11,511 | 0.0 | |||||||||||
| 1,073,481 | 4.500%, due 10/01/41 | 1,156,159 | 0.1 | |||||||||||
| 212,153 | 5.000%, due 06/01/33 | 232,812 | 0.0 | |||||||||||
| 34,733 | 5.000%, due 09/01/33 | 38,102 | 0.0 | |||||||||||
| 126,001 | 5.000%, due 11/01/33 | 138,247 | 0.0 | |||||||||||
| 26,725 | 5.000%, due 03/01/34 | 29,314 | 0.0 | |||||||||||
| 42,994 | 5.000%, due 03/01/34 | 47,025 | 0.0 | |||||||||||
| 281,391 | 5.000%, due 02/01/35 | 308,475 | 0.0 | |||||||||||
| 11,015 | 5.000%, due 06/01/35 | 12,059 | 0.0 | |||||||||||
| 194,498 | 5.000%, due 06/01/35 | 212,413 | 0.0 | |||||||||||
| 453,980 | 5.000%, due 07/01/35 | 497,471 | 0.0 | |||||||||||
| 110,189 | 5.000%, due 07/01/35 | 120,629 | 0.0 | |||||||||||
| 694,709 | 5.000%, due 08/01/35 | 760,692 | 0.0 | |||||||||||
| 42,856 | 5.000%, due 10/01/35 | 46,804 | 0.0 | |||||||||||
| 996,951 | 5.000%, due 10/01/35 | 1,091,421 | 0.0 | |||||||||||
| 515,377 | 5.000%, due 02/01/36 | 564,164 | 0.0 | |||||||||||
| 7,762 | 5.000%, due 03/01/36 | 8,498 | 0.0 | |||||||||||
| 100,402 | 5.000%, due 03/01/36 | 109,908 | 0.0 | |||||||||||
| 17,137 | 5.000%, due 05/01/36 | 18,732 | 0.0 | |||||||||||
| 10,795 | 5.000%, due 06/01/36 | 11,817 | 0.0 | |||||||||||
| 383,445 | 5.000%, due 07/01/36 | 420,338 | 0.0 | |||||||||||
| 525,200 | 5.000%, due 07/01/37 | 576,398 | 0.0 | |||||||||||
| 315,010 | 5.000%, due 11/01/40 | 345,540 | 0.0 | |||||||||||
| 128,969 | 5.000%, due 05/01/41 | 141,127 | 0.0 | |||||||||||
| 396,460 | 5.000%, due 06/01/41 | 434,156 | 0.0 | |||||||||||
| 640,729 | 5.000%, due 06/01/41 | 701,300 | 0.0 | |||||||||||
| 275,883 | 5.500%, due 03/01/37 | 308,469 | 0.0 | |||||||||||
| 280,393 | 5.500%, due 06/01/39 | 314,490 | 0.0 | |||||||||||
| 2,660,764 | 5.500%, due 10/01/39 | 2,971,799 | 0.1 | |||||||||||
| 2,819 | 6.000%, due 10/01/18 | 2,870 | 0.0 | |||||||||||
| 91,961 | 6.000%, due 09/01/36 | 103,894 | 0.0 | |||||||||||
| 541,649 | 6.000%, due 05/01/38 | 574,414 | 0.0 | |||||||||||
| 2,851 | 6.500%, due 02/01/28 | 3,172 | 0.0 | |||||||||||
| 662 | 6.500%, due 09/01/31 | 736 | 0.0 | |||||||||||
| 212 | 6.500%, due 09/01/31 | 236 | 0.0 | |||||||||||
| 21,787 | 6.500%, due 11/01/31 | 24,851 | 0.0 | |||||||||||
| 8,628 | 6.500%, due 04/01/32 | 9,600 | 0.0 | |||||||||||
| 4,924 | 6.500%, due 08/01/32 | 5,479 | 0.0 | |||||||||||
| 2,105 | 6.500%, due 08/01/32 | 2,354 | 0.0 | |||||||||||
| 16,681 | 6.500%, due 02/01/33 | 18,553 | 0.0 | |||||||||||
| 12,726 | 7.000%, due 12/01/27 | 13,295 | 0.0 | |||||||||||
| 3,492 | 7.000%, due 10/01/31 | 3,866 | 0.0 | |||||||||||
| 4,501 | 7.000%, due 03/01/32 | 5,074 | 0.0 | |||||||||||
| 2,058 | 7.500%, due 09/01/30 | 2,472 | 0.0 | |||||||||||
| 1,694 | 7.500%, due 10/01/30 | 1,698 | 0.0 | |||||||||||
| 5,900 | 7.500%, due 09/01/31 | 6,888 | 0.0 | |||||||||||
| 18,255 | 7.500%, due 02/01/32 | 20,674 | 0.0 | |||||||||||
| 188,010,026 | 5.1 | |||||||||||||
See Accompanying Notes to Financial Statements
Voya Intermediate Bond Fund | PORTFOLIO OF INVESTMENTS as of March 31, 2017 (continued) |
| Principal Amount† | Value | Percentage of Net Assets | ||||||||||||
| U.S. GOVERNMENT AGENCY OBLIGATIONS: (continued) | ||||||||||||||
| Government National Mortgage Association: 1.9% | ||||||||||||||
| 13,213,000 | W | 3.000%, due 04/01/44 | 13,329,646 | 0.4 | ||||||||||
| 23,141,917 | 3.500%, due 07/20/46 | 24,029,615 | 0.7 | |||||||||||
| 23,143,755 | 3.500%, due 09/20/46 | 24,031,524 | 0.7 | |||||||||||
| 523,759 | 4.000%, due 11/20/40 | 560,869 | 0.0 | |||||||||||
| 1,030,000 | W | 4.000%, due 11/20/41 | 1,085,986 | 0.0 | ||||||||||
| 3,012,830 | 4.000%, due 03/20/46 | 3,193,977 | 0.1 | |||||||||||
| 625,305 | 4.500%, due 10/15/39 | 675,998 | 0.0 | |||||||||||
| 430,235 | 4.500%, due 11/15/39 | 463,776 | 0.0 | |||||||||||
| 458,078 | 4.500%, due 11/15/39 | 494,275 | 0.0 | |||||||||||
| 146,962 | 4.500%, due 12/15/39 | 158,889 | 0.0 | |||||||||||
| 142,389 | 4.500%, due 08/20/41 | 153,792 | 0.0 | |||||||||||
| 730,104 | 5.140%, due 10/20/60 | 765,540 | 0.0 | |||||||||||
| 1,140,075 | 5.274%, due 10/20/60 | 1,191,731 | 0.0 | |||||||||||
| 533,718 | 5.500%, due 03/20/60 | 560,503 | 0.0 | |||||||||||
| 70,696,121 | 1.9 | |||||||||||||
| Total U.S. Government Agency Obligations (Cost $441,072,282) | 439,008,134 | 11.8 | ||||||||||||
| U.S. TREASURY OBLIGATIONS: 23.8% | ||||||||||||||
| Treasury Inflation Indexed Protected Securities: 2.5% | ||||||||||||||
| 91,924,632 | 0.375%, due 01/15/27 | 91,600,506 | 2.5 | |||||||||||
| U.S. Treasury Bonds: 3.8% | ||||||||||||||
| 146,448,000 | 2.875%, due 11/15/46 | 142,074,623 | 3.8 | |||||||||||
| U.S. Treasury Notes: 17.5% | ||||||||||||||
| 247,000 | 0.625%, due 06/30/18 | 245,456 | 0.0 | |||||||||||
| 170,756,000 | 1.250%, due 03/31/19 | 170,719,287 | 4.6 | |||||||||||
| 167,712,000 | L | 1.625%, due 03/15/20 | 168,311,403 | 4.5 | ||||||||||
| 35,168,000 | 1.875%, due 02/28/22 | 35,093,127 | 0.9 | |||||||||||
| 108,452,000 | 1.875%, due 03/31/22 | 108,166,012 | 2.9 | |||||||||||
| 27,273,000 | 2.125%, due 02/29/24 | 27,123,326 | 0.7 | |||||||||||
| 9,440,000 | 2.125%, due 03/31/24 | 9,382,473 | 0.3 | |||||||||||
| 137,413,000 | 2.250%, due 02/15/27 | 135,660,435 | 3.6 | |||||||||||
| 654,701,519 | 17.5 | |||||||||||||
| Total U.S. Treasury Obligations (Cost $885,870,812) | 888,376,648 | 23.8 | ||||||||||||
| # of Contracts | Value | Percentage of Net Assets | ||||||||||||
| PURCHASED OPTIONS: 0.0% | ||||||||||||||
| OTC Interest Rate Swaptions: 0.0% | ||||||||||||||
| 155,530,000 | @ | Put on 10-Year Interest Rate Swap, Receive a floating rate based on the 3-month USD-LIBOR-BBA and pay a fixed rate equal to 2.688%, Exp. 05/16/17 Counterparty: Morgan Stanley Capital Services LLC | 200,019 | 0.0 | ||||||||||
| Total Purchased Options (Cost $28,036) | 200,019 | 0.0 | ||||||||||||
| Total Long-Term Investments (Cost $3,738,263,829) | 3,757,792,006 | 100.7 | ||||||||||||
| Principal Amount† | Value | Percentage of Net Assets | ||||||||||||
| SHORT-TERM INVESTMENTS: 7.9% | ||||||||||||||
| Corporate Bonds/Notes: 0.4% | ||||||||||||||
| 3,158,000 | # | Barclays Bank PLC, 6.050%, 12/04/17 | 3,241,599 | 0.1 | ||||||||||
| 4,567,000 | Discover Bank, 2.000%, 02/21/18 | 4,571,877 | 0.1 | |||||||||||
| 367,000 | Discover Financial Services, 6.450%, 06/12/17 | 370,135 | 0.0 | |||||||||||
| 1,019,000 | FirstEnergy Corp., 2.750%, 03/15/18 | 1,022,947 | 0.0 | |||||||||||
| 2,911,000 | Hewlett Packard Enterprise Co., 2.450%, 10/05/17 | 2,919,884 | 0.1 | |||||||||||
| 1,267,000 | Zoetis, Inc., 1.875%, 02/01/18 | 1,267,991 | 0.1 | |||||||||||
| 13,394,433 | 0.4 | |||||||||||||
| U.S. Government Agency Obligations: 0.0% | ||||||||||||||
| 3,415 | Fannie Mae, 5.500%, 02/01/18 | 3,448 | 0.0 | |||||||||||
| 124 | Fannie Mae, 6.000%, 11/01/17 | 124 | 0.0 | |||||||||||
| 5,230 | Fannie Mae, 6.000%, 09/01/17 | 5,246 | 0.0 | |||||||||||
| 8,818 | 0.0 | |||||||||||||
| Securities Lending Collateralcc: 4.4% | ||||||||||||||
| 39,079,068 | Cantor Fitzgerald, Repurchase Agreement dated 03/31/17, 0.81%, due 04/03/17 (Repurchase Amount $39,081,670, collateralized by various U.S. Government/U.S. Government Agency Obligations, 0.000%-10.000%, Market Value plus accrued interest $39,860,660, due 04/01/17-02/20/67) | 39,079,068 | 1.1 | |||||||||||
| 8,187,614 | Daiwa Capital Markets, Repurchase Agreement dated 03/31/17, 0.82%, due 04/03/17 (Repurchase Amount $8,188,166, collateralized by various U.S. Government/U.S. Government Agency Obligations, 0.000%-6.500%, Market Value plus accrued interest $8,351,367, due 05/11/17-12/01/51) | 8,187,614 | 0.2 | |||||||||||
See Accompanying Notes to Financial Statements
Voya Intermediate Bond Fund | PORTFOLIO OF INVESTMENTS as of March 31, 2017 (continued) |
| Principal Amount† | Value | Percentage of Net Assets | ||||||||||||
| SHORT-TERM INVESTMENTS: (continued) | ||||||||||||||
| Securities Lending Collateralcc: (continued) | ||||||||||||||
| 39,079,068 | Millenium Fixed Income Ltd., Repurchase Agreement dated 03/31/17, 0.84%, due 04/03/17 (Repurchase Amount $39,081,766, collateralized by various U.S. Government Securities, 3.125%-3.625%, Market Value plus accrued interest $39,860,656, due 02/15/43-02/15/44) | 39,079,068 | 1.0 | |||||||||||
| 39,079,068 | NBC Global Finance Ltd., Repurchase Agreement dated 03/31/17, 0.90%, due 04/03/17 (Repurchase Amount $39,081,959, collateralized by various U.S. Government Securities, 1.250%-4.625%, Market Value plus accrued interest $39,860,649, due 08/15/21-09/09/49) | 39,079,068 | 1.0 | |||||||||||
| 39,100,000 | State of Wisconsin Investment Board, Repurchase Agreement dated 03/31/17, 0.90%, due 04/03/17 (Repurchase Amount $39,102,892, collateralized by various U.S. Government Securities, 0.125%-3.875%, Market Value plus accrued interest $39,882,042, due 01/15/19-02/15/46) | 39,100,000 | 1.1 | |||||||||||
| 164,524,818 | 4.4 | |||||||||||||
| Collateralized Mortgage Obligations: 0.0% | ||||||||||||||
| 44,373 | Freddie Mac REMIC Trust 2543 AN, 5.000%, 12/15/17 | |||||||||||||
| (Cost $43,893) | 44,720 | 0.0 | ||||||||||||
| Foreign Government Bonds: 0.0% | ||||||||||||||
| 200,000 | Pakistan Government International Bond, 6.875%, 06/01/17 | 201,100 | 0.0 | |||||||||||
| 630,000 | # | Serbia International Bond, 5.250%, 11/21/17 | 643,294 | 0.0 | ||||||||||
| 844,394 | 0.0 | |||||||||||||
| Shares | Value | Percentage of Net Assets | ||||||||||||
| Mutual Funds: 3.1% | ||||||||||||||
| 114,320,000 | BlackRock Liquidity Funds, FedFund, Institutional Class, 0.600%†† | |||||||||||||
| (Cost $114,320,000) | 114,320,000 | 3.1 | ||||||||||||
| Total Short-Term Investments (Cost $293,096,069) | 293,137,183 | 7.9 | ||||||||||||
| Total Investments in Securities (Cost $4,031,359,898) | $ | 4,050,929,189 | 108.6 | |||||||||||
| Liabilities in Excess of Other Assets | (321,180,563 | ) | (8.6 | ) | ||||||||||
| Net Assets | $ | 3,729,748,626 | 100.0 | |||||||||||
| † | Unless otherwise indicated, principal amount is shown in USD. |
| †† | Rate shown is the 7-day yield as of March 31, 2017. |
| # | Securities with purchases pursuant to Rule 144A or section 4(a)(2), under the Securities Act of 1933 and may not be resold subject to that rule except to qualified institutional buyers. |
| ## | The Federal Housing Finance Agency (“FHFA”) placed the Federal Home Loan Mortgage Corporation and Federal National Mortgage Association into conservatorship with FHFA as the conservator. As such, the FHFA oversees the continuing affairs of these companies. |
| @ | Non-income producing security. |
| + | Step-up basis bonds. Interest rates shown reflect current and next coupon rates. |
| cc | Represents securities purchased with cash collateral received for securities on loan. |
| W | Settlement is on a when-issued or delayed-delivery basis. |
| L | Loaned security, a portion or all of the security is on loan at March 31, 2017. |
| ^ | Interest only securities represent the right to receive the monthly interest payments on an underlying pool of mortgage loans. Principal amount shown represents the notional amount on which current interest is calculated. Payments of principal on the pool reduce the value of the interest only security. |
| ^^ | Principal only securities represent the right to receive the monthly principal payments on an underlying pool of mortgage loans. No payments of interest on the pool are passed through the principal only security. |
| ARS | Argentine Peso |
| BRL | Brazilian Real |
| CLP | Chilean Peso |
| COP | Colombian Peso |
| DKK | Danish Krone |
| HUF | Hungarian Forint |
| IDR | Indonesian Rupiah |
| RON | Romanian New Leu |
| RUB | Russian Ruble |
Cost for federal income tax purposes is $4,033,532,385.
Net unrealized appreciation consists of:
| Gross Unrealized Appreciation | $ | 50,195,192 | ||
| Gross Unrealized Depreciation | (32,798,388 | ) | ||
| Net Unrealized Appreciation | $ | 17,396,804 |
See Accompanying Notes to Financial Statements
| Voya Short Term Bond Fund | PORTFOLIO OF INVESTMENTS as of March 31, 2017 |
| Principal Amount† | Value | Percentage of Net Assets | ||||||||||||
| CORPORATE BONDS/NOTES: 49.0% | ||||||||||||||
| Basic Materials: 1.1% | ||||||||||||||
| 135,000 | # | Chevron Phillips Chemical Co. LLC / Chevron Phillips Chemical Co. L.P., 1.700%, 05/01/18 | 135,051 | 0.2 | ||||||||||
| 300,000 | Huntsman International LLC, 4.875%, 11/15/20 | 314,250 | 0.3 | |||||||||||
| 278,000 | PPG Industries, Inc., 2.300%, 11/15/19 | 280,537 | 0.3 | |||||||||||
| 300,000 | # | WR Grace & Co-Conn, 5.125%, 10/01/21 | 315,750 | 0.3 | ||||||||||
| 1,045,588 | 1.1 | |||||||||||||
| Communications: 3.3% | ||||||||||||||
| 414,000 | AT&T, Inc., 2.300%, 03/11/19 | 416,176 | 0.5 | |||||||||||
| 150,000 | Charter Communications Operating LLC / Charter Communications Operating Capital, 3.579%, 07/23/20 | 154,485 | 0.2 | |||||||||||
| 118,000 | Cisco Systems, Inc., 1.650%, 06/15/18 | 118,385 | 0.1 | |||||||||||
| 182,000 | Cisco Systems, Inc., 2.450%, 06/15/20 | 184,996 | 0.2 | |||||||||||
| 300,000 | DISH DBS Corp., 5.125%, 05/01/20 | 313,500 | 0.3 | |||||||||||
| 300,000 | # | Nielsen Finance LLC / Nielsen Finance Co., 5.000%, 04/15/22 | 307,500 | 0.3 | ||||||||||
| 300,000 | # | SFR Group SA, 6.000%, 05/15/22 | 312,000 | 0.3 | ||||||||||
| 300,000 | Orange SA, 1.625%, 11/03/19 | 295,917 | 0.3 | |||||||||||
| 190,000 | Scripps Networks Interactive, Inc., 2.750%, 11/15/19 | 192,367 | 0.2 | |||||||||||
| 200,000 | # | Sky PLC, 2.625%, 09/16/19 | 201,272 | 0.2 | ||||||||||
| 300,000 | Sprint Communications, Inc., 6.000%, 11/15/22 | 307,500 | 0.3 | |||||||||||
| 147,000 | # | Verizon Communications, Inc., 2.946%, 03/15/22 | 146,524 | 0.2 | ||||||||||
| 180,000 | Walt Disney Co/The, 1.950%, 03/04/20 | 180,459 | 0.2 | |||||||||||
| 3,131,081 | 3.3 | |||||||||||||
| Consumer, Cyclical: 5.2% | ||||||||||||||
| 150,000 | American Honda Finance Corp., 2.000%, 02/14/20 | 150,528 | 0.2 | |||||||||||
| 410,000 | American Honda Finance Corp., 2.250%, 08/15/19 | 413,687 | 0.4 | |||||||||||
| 84,000 | AutoZone, Inc., 1.625%, 04/21/19 | 83,199 | 0.1 | |||||||||||
| 165,000 | # | BMW US Capital LLC, 1.450%, 09/13/19 | 163,118 | 0.2 | ||||||||||
| 160,000 | CVS Health Corp., 2.250%, 08/12/19 | 161,153 | 0.2 | |||||||||||
| 260,000 | # | Daimler Finance North America LLC, 1.500%, 07/05/19 | 256,389 | 0.3 | ||||||||||
| 320,000 | # | Daimler Finance North America LLC, 2.300%, 01/06/20 | 320,818 | 0.3 | ||||||||||
| 220,000 | Delta Air Lines, Inc., 2.875%, 03/13/20 | 221,950 | 0.2 | |||||||||||
| 300,000 | Fiat Chrysler Automobiles NV, 4.500%, 04/15/20 | 307,125 | 0.3 | |||||||||||
| 250,000 | Ford Motor Credit Co. LLC, 1.897%, 08/12/19 | 247,736 | 0.3 | |||||||||||
| 350,000 | Ford Motor Credit Co. LLC, 3.157%, 08/04/20 | 355,945 | 0.4 | |||||||||||
| 144,000 | General Motors Financial Co., Inc., 2.350%, 10/04/19 | 144,255 | 0.2 | |||||||||||
| 220,000 | General Motors Financial Co., Inc., 2.400%, 05/09/19 | 220,567 | 0.2 | |||||||||||
| 39,614 | Newell Brands, Inc., 2.600%, 03/29/19 | 40,119 | 0.0 | |||||||||||
| 211,000 | PACCAR Financial Corp., 1.750%, 08/14/18 | 211,576 | 0.2 | |||||||||||
| 160,000 | Ralph Lauren Corp., 2.625%, 08/18/20 | 161,439 | 0.2 | |||||||||||
| 405,000 | Southwest Airlines Co., 2.650%, 11/05/20 | 409,343 | 0.4 | |||||||||||
| 265,000 | Southwest Airlines Co., 2.750%, 11/06/19 | 269,519 | 0.3 | |||||||||||
| 244,000 | Toyota Motor Credit Corp., 1.550%, 10/18/19 | 242,079 | 0.3 | |||||||||||
| 160,000 | Toyota Motor Credit Corp., 1.700%, 01/09/19 | 160,330 | 0.2 | |||||||||||
| 300,000 | Wynn Las Vegas LLC / Wynn Las Vegas Capital Corp., 5.375%, 03/15/22 | 307,875 | 0.3 | |||||||||||
| 4,848,750 | 5.2 | |||||||||||||
| Consumer, Non-cyclical: 8.1% | ||||||||||||||
| 340,000 | Abbott Laboratories, 2.350%, 11/22/19 | 341,579 | 0.4 | |||||||||||
| 169,000 | Abbott Laboratories, 2.800%, 09/15/20 | 170,884 | 0.2 | |||||||||||
| 278,000 | AbbVie, Inc., 1.800%, 05/14/18 | 278,376 | 0.3 | |||||||||||
| 481,000 | Anheuser-Busch InBev Finance, Inc., 1.900%, 02/01/19 | 481,876 | 0.5 | |||||||||||
| 211,000 | AstraZeneca PLC, 1.750%, 11/16/18 | 211,109 | 0.2 | |||||||||||
| 220,000 | AstraZeneca PLC, 1.950%, 09/18/19 | 219,822 | 0.2 | |||||||||||
| 228,000 | Baxalta, Inc., 2.000%, 06/22/18 | 228,441 | 0.3 | |||||||||||
| 151,000 | Cardinal Health, Inc., 1.950%, 06/15/18 | 151,499 | 0.2 | |||||||||||
| 220,000 | Celgene Corp., 2.125%, 08/15/18 | 221,106 | 0.2 | |||||||||||
| 300,000 | Centene Corp., 4.750%, 05/15/22 | 309,750 | 0.3 | |||||||||||
| 240,000 | # | Danone SA, 1.691%, 10/30/19 | 236,923 | 0.3 | ||||||||||
| 287,000 | L | Gilead Sciences, Inc., 1.950%, 03/01/22 | 278,011 | 0.3 | ||||||||||
See Accompanying Notes to Financial Statements
| Voya Short Term Bond Fund | PORTFOLIO OF INVESTMENTS as of March 31, 2017 (continued) |
| Principal Amount† | Value | Percentage of Net Assets | ||||||||||||
| CORPORATE BONDS/NOTES: (continued) | ||||||||||||||
| Consumer, Non-cyclical: (continued) | ||||||||||||||
| 116,000 | L | Hertz Corp., 6.750%, 04/15/19 | 116,290 | 0.1 | ||||||||||
| 439,000 | Kraft Heinz Foods Co., 2.000%, 07/02/18 | 440,179 | 0.5 | |||||||||||
| 180,000 | Kroger Co., 2.000%, 01/15/19 | 180,409 | 0.2 | |||||||||||
| 290,000 | Medtronic Global Holdings SCA, 1.700%, 03/28/19 | 289,942 | 0.3 | |||||||||||
| 188,000 | Medtronic, Inc., 2.500%, 03/15/20 | 190,713 | 0.2 | |||||||||||
| 220,000 | Molson Coors Brewing Co., 1.450%, 07/15/19 | 217,254 | 0.2 | |||||||||||
| 200,000 | Moody's Corp., 2.750%, 12/15/21 | 200,088 | 0.2 | |||||||||||
| 267,000 | Mylan NV, 2.500%, 06/07/19 | 268,338 | 0.3 | |||||||||||
| 186,000 | PepsiCo, Inc., 1.250%, 04/30/18 | 185,919 | 0.2 | |||||||||||
| 202,000 | Reynolds American, Inc., 2.300%, 06/12/18 | 203,262 | 0.2 | |||||||||||
| 464,000 | Sanofi, 1.250%, 04/10/18 | 463,471 | 0.5 | |||||||||||
| 262,000 | Shire Acquisitions Investments Ireland DAC, 1.900%, 09/23/19 | 260,066 | 0.3 | |||||||||||
| 95,000 | Shire Acquisitions Investments Ireland DAC, 2.400%, 09/23/21 | 93,130 | 0.1 | |||||||||||
| 198,000 | Stryker Corp., 2.000%, 03/08/19 | 198,606 | 0.2 | |||||||||||
| 300,000 | Tenet Healthcare Corp., 6.250%, 11/01/18 | 316,312 | 0.3 | |||||||||||
| 295,000 | Teva Pharmaceutical Finance Netherlands III BV, 1.700%, 07/19/19 | 291,773 | 0.3 | |||||||||||
| 138,000 | Thermo Fisher Scientific, Inc., 2.150%, 12/14/18 | 138,533 | 0.2 | |||||||||||
| 135,000 | UnitedHealth Group, Inc., 1.900%, 07/16/18 | 135,607 | 0.2 | |||||||||||
| 207,000 | Zimmer Biomet Holdings, Inc., 2.000%, 04/01/18 | 207,390 | 0.2 | |||||||||||
| 7,526,658 | 8.1 | |||||||||||||
| Energy: 3.2% | ||||||||||||||
| 300,000 | Antero Resources Corp., 5.125%, 12/01/22 | 305,437 | 0.3 | |||||||||||
| 180,000 | BP Capital Markets PLC, 2.315%, 02/13/20 | 181,558 | 0.2 | |||||||||||
| 227,000 | BP Capital Markets PLC, 2.521%, 01/15/20 | 229,978 | 0.2 | |||||||||||
| 195,000 | Chevron Corp., 1.790%, 11/16/18 | 195,596 | 0.2 | |||||||||||
| 144,000 | Energy Transfer Partners L.P., 2.500%, 06/15/18 | 144,745 | 0.2 | |||||||||||
| 278,000 | Enterprise Products Operating LLC, 1.650%, 05/07/18 | 277,765 | 0.3 | |||||||||||
| 313,000 | Exxon Mobil Corp., 1.708%, 03/01/19 | 313,602 | 0.3 | |||||||||||
| 313,000 | Shell International Finance BV, 1.375%, 05/10/19 | 310,293 | 0.3 | |||||||||||
| 84,000 | Shell International Finance BV, 1.375%, 09/12/19 | 83,017 | 0.1 | |||||||||||
| 185,000 | Shell International Finance BV, 1.625%, 11/10/18 | 184,842 | 0.2 | |||||||||||
| 156,000 | Shell International Finance BV, 1.750%, 09/12/21 | 151,719 | 0.2 | |||||||||||
| 144,000 | Shell International Finance BV, 2.125%, 05/11/20 | 144,211 | 0.2 | |||||||||||
| 170,000 | Statoil ASA, 1.950%, 11/08/18 | 170,688 | 0.2 | |||||||||||
| 260,000 | Total Capital International SA, 2.100%, 06/19/19 | 261,500 | 0.3 | |||||||||||
| 2,954,951 | 3.2 | |||||||||||||
| Financial: 18.7% | ||||||||||||||
| 210,000 | # | ABN AMRO Bank NV, 2.450%, 06/04/20 | 210,221 | 0.2 | ||||||||||
| 313,000 | American Express Credit Corp., 1.800%, 07/31/18 | 313,365 | 0.3 | |||||||||||
| 260,000 | Aon Corp., 5.000%, 09/30/20 | 281,419 | 0.3 | |||||||||||
| 250,000 | Australia & New Zealand Banking Group Ltd./New York NY, 2.050%, 09/23/19 | 250,005 | 0.3 | |||||||||||
| 230,000 | Australia & New Zealand Banking Group Ltd./New York NY, 2.250%, 06/13/19 | 231,430 | 0.2 | |||||||||||
| 220,000 | Bank of America Corp., 1.950%, 05/12/18 | 220,538 | 0.2 | |||||||||||
| 161,000 | Bank of America Corp., 2.151%, 11/09/20 | 159,662 | 0.2 | |||||||||||
| 928,000 | Bank of America Corp., 2.600%, 01/15/19 | 938,001 | 1.0 | |||||||||||
| 220,000 | Bank of Montreal, 1.800%, 07/31/18 | 220,464 | 0.2 | |||||||||||
| 160,000 | Bank of Montreal, 2.100%, 12/12/19 | 160,774 | 0.2 | |||||||||||
| 192,000 | Bank of New York Mellon Corp., 2.600%, 08/17/20 | 194,540 | 0.2 | |||||||||||
| 194,000 | Bank of Nova Scotia, 1.650%, 06/14/19 | 192,814 | 0.2 | |||||||||||
| 118,000 | Berkshire Hathaway Finance Corp., 1.700%, 03/15/19 | 118,229 | 0.1 | |||||||||||
| 250,000 | Branch Banking & Trust Co., 2.100%, 01/15/20 | 250,391 | 0.3 | |||||||||||
| 270,000 | Capital One NA/Mclean VA, 1.850%, 09/13/19 | 267,630 | 0.3 | |||||||||||
| 250,000 | Capital One NA/Mclean VA, 2.350%, 08/17/18 | 251,641 | 0.3 | |||||||||||
| 500,000 | # | CIT Group, Inc., 5.000%, 05/15/18 | 504,000 | 0.5 | ||||||||||
| 250,000 | Citibank NA, 2.000%, 03/20/19 | 250,910 | 0.3 | |||||||||||
| 433,000 | Citigroup, Inc., 2.050%, 12/07/18 | 433,938 | 0.5 | |||||||||||
| 240,000 | Citizens Financial Group, Inc., 5.158%, 06/29/23 | 246,574 | 0.3 | |||||||||||
| 266,000 | Comerica, Inc., 2.125%, 05/23/19 | 265,795 | 0.3 | |||||||||||
| 160,000 | # | Commonwealth Bank of Australia, 2.250%, 03/10/20 | 160,158 | 0.2 | ||||||||||
| 340,000 | Cooperatieve Rabobank UA/NY, 2.250%, 01/14/19 | 342,290 | 0.4 | |||||||||||
| 360,000 | Credit Suisse AG/New York NY, 1.700%, 04/27/18 | 359,565 | 0.4 | |||||||||||
| 200,000 | Credit Suisse AG, 5.300%, 08/13/19 | 214,511 | 0.2 | |||||||||||
| 150,000 | Discover Bank, 2.600%, 11/13/18 | 151,445 | 0.2 | |||||||||||
| 220,000 | Fifth Third Bank/Cincinnati OH, 1.625%, 09/27/19 | 217,366 | 0.2 | |||||||||||
See Accompanying Notes to Financial Statements
| Voya Short Term Bond Fund | PORTFOLIO OF INVESTMENTS as of March 31, 2017 (continued) |
| Principal Amount† | Value | Percentage of Net Assets | ||||||||||||
| CORPORATE BONDS/NOTES: (continued) | ||||||||||||||
| Financial: (continued) | ||||||||||||||
| 223,000 | GE Capital International Funding Co. Unlimited Co., 2.342%, 11/15/20 | 223,976 | 0.2 | |||||||||||
| 425,000 | Goldman Sachs Group, Inc., 2.550%, 10/23/19 | 429,097 | 0.5 | |||||||||||
| 320,000 | Hartford Financial Services Group, Inc., 8.125%, 06/15/68 | 341,600 | 0.4 | |||||||||||
| 300,000 | HSBC Bank USA NA, 4.875%, 08/24/20 | 321,419 | 0.3 | |||||||||||
| 250,000 | Huntington National Bank/The, 2.375%, 03/10/20 | 251,022 | 0.3 | |||||||||||
| 250,000 | Huntington National Bank, 2.200%, 11/06/18 | 251,137 | 0.3 | |||||||||||
| 260,000 | # | ING Bank NV, 1.650%, 08/15/19 | 256,830 | 0.3 | ||||||||||
| 442,000 | JPMorgan Chase & Co., 1.625%, 05/15/18 | 441,942 | 0.5 | |||||||||||
| 250,000 | KeyBank NA/Cleveland OH, 2.350%, 03/08/19 | 252,014 | 0.3 | |||||||||||
| 264,000 | KeyCorp, 2.300%, 12/13/18 | 265,619 | 0.3 | |||||||||||
| 87,000 | Kilroy Realty L.P., 4.800%, 07/15/18 | 89,571 | 0.1 | |||||||||||
| 365,000 | Mitsubishi UFJ Financial Group, Inc., 2.190%, 09/13/21 | 357,248 | 0.4 | |||||||||||
| 30,000 | Morgan Stanley, 2.200%, 12/07/18 | 30,133 | 0.0 | |||||||||||
| 250,000 | National Australia Bank Ltd./New York, 2.250%, 01/10/20 | 250,383 | 0.3 | |||||||||||
| 240,000 | National Rural Utilities Cooperative Finance Corp., 1.500%, 11/01/19 | 237,952 | 0.3 | |||||||||||
| 127,000 | # | New York Life Global Funding, 1.550%, 11/02/18 | 126,806 | 0.1 | ||||||||||
| 310,000 | PNC Bank NA, 1.450%, 07/29/19 | 306,502 | 0.3 | |||||||||||
| 580,000 | PNC Bank NA, 2.400%, 10/18/19 | 585,048 | 0.6 | |||||||||||
| 175,000 | # | Realogy Group LLC / Realogy Co-Issuer Corp., 5.250%, 12/01/21 | 182,875 | 0.2 | ||||||||||
| 320,000 | Regions Bank/Birmingham AL, 2.250%, 09/14/18 | 321,075 | 0.3 | |||||||||||
| 295,000 | Royal Bank of Canada, 1.800%, 07/30/18 | 295,463 | 0.3 | |||||||||||
| 200,000 | Royal Bank of Canada, 2.125%, 03/02/20 | 200,149 | 0.2 | |||||||||||
| 300,000 | Royal Bank of Scotland Group PLC, 6.400%, 10/21/19 | 327,052 | 0.3 | |||||||||||
| 362,000 | Santander Holdings USA, Inc., 2.700%, 05/24/19 | 363,864 | 0.4 | |||||||||||
| 363,000 | # | Scentre Group Trust 1 / Scentre Group Trust 2, 2.375%, 11/05/19 | 364,242 | 0.4 | ||||||||||
| 250,000 | Skandinaviska Enskilda Banken AB, 2.300%, 03/11/20 | 250,682 | 0.3 | |||||||||||
| 265,000 | # | Standard Chartered PLC, 2.100%, 08/19/19 | 262,948 | 0.3 | ||||||||||
| 144,000 | Sumitomo Mitsui Financial Group, Inc., 2.934%, 03/09/21 | 145,275 | 0.2 | |||||||||||
| 280,000 | Sumitomo Mitsui Banking Corp., 1.966%, 01/11/19 | 280,124 | 0.3 | |||||||||||
| 140,000 | SunTrust Bank/Atlanta GA, 2.250%, 01/31/20 | 140,532 | 0.1 | |||||||||||
| 188,000 | SunTrust Banks, Inc., 2.500%, 05/01/19 | 190,031 | 0.2 | |||||||||||
| 260,000 | # | Swedbank AB, 2.800%, 03/14/22 | 260,598 | 0.3 | ||||||||||
| 500,000 | Toronto-Dominion Bank, 2.250%, 11/05/19 | 503,463 | 0.5 | |||||||||||
| 200,000 | # | UBS Group Funding Jersey Ltd., 2.950%, 09/24/20 | 201,471 | 0.2 | ||||||||||
| 40,000 | Visa, Inc., 2.200%, 12/14/20 | 40,173 | 0.0 | |||||||||||
| 460,000 | Wells Fargo Bank NA, 2.150%, 12/06/19 | 461,844 | 0.5 | |||||||||||
| 194,000 | Westpac Banking Corp., 1.600%, 08/19/19 | 191,977 | 0.2 | |||||||||||
| 17,409,813 | 18.7 | |||||||||||||
| Industrial: 3.2% | ||||||||||||||
| 250,000 | Amphenol Corp., 2.200%, 04/01/20 | 250,231 | 0.3 | |||||||||||
| 300,000 | # | Ardagh Packaging Finance PLC / Ardagh Holdings USA, Inc., 4.625%, 05/15/23 | 303,375 | 0.3 | ||||||||||
| 355,000 | Caterpillar Financial Services Corp., 2.250%, 12/01/19 | 357,865 | 0.4 | |||||||||||
| 220,000 | Corning, Inc., 1.500%, 05/08/18 | 219,715 | 0.2 | |||||||||||
| 74,000 | General Electric Co., 2.200%, 01/09/20 | 74,820 | 0.1 | |||||||||||
| 281,000 | Ingersoll-Rand Global Holding Co. Ltd., 2.875%, 01/15/19 | 285,718 | 0.3 | |||||||||||
| 228,000 | Lockheed Martin Corp., 1.850%, 11/23/18 | 228,695 | 0.3 | |||||||||||
| 300,000 | # | Owens-Brockway Glass Container, Inc., 5.000%, 01/15/22 | 309,750 | 0.3 | ||||||||||
| 160,000 | Rockwell Collins, Inc., 1.950%, 07/15/19 | 160,192 | 0.2 | |||||||||||
| 200,000 | # | Rolls-Royce PLC, 2.375%, 10/14/20 | 199,430 | 0.2 | ||||||||||
| 370,000 | # | Siemens Financieringsmaatschappij NV, 1.450%, 05/25/18 | 369,695 | 0.4 | ||||||||||
| 202,000 | United Technologies Corp., 1.778%, 05/04/18 | 201,988 | 0.2 | |||||||||||
| 2,961,474 | 3.2 | |||||||||||||
| Technology: 3.4% | ||||||||||||||
| 490,000 | Apple, Inc., 1.900%, 02/07/20 | 491,495 | 0.5 | |||||||||||
| 71,000 | Applied Materials, Inc., 2.625%, 10/01/20 | 72,128 | 0.1 | |||||||||||
| 185,000 | # | Broadcom Corp. / Broadcom Cayman Finance Ltd., 2.375%, 01/15/20 | 185,081 | 0.2 | ||||||||||
| 564,000 | # | Diamond 1 Finance Corp. / Diamond 2 Finance Corp., 3.480%, 06/01/19 | 578,491 | 0.6 | ||||||||||
| 300,000 | # | First Data Corp., 5.375%, 08/15/23 | 313,125 | 0.3 | ||||||||||
See Accompanying Notes to Financial Statements
| Voya Short Term Bond Fund | PORTFOLIO OF INVESTMENTS as of March 31, 2017 (continued) |
| Principal Amount† | Value | Percentage of Net Assets | ||||||||||||
| CORPORATE BONDS/NOTES: (continued) | ||||||||||||||
| Technology: (continued) | ||||||||||||||
| 86,000 | Hewlett Packard Enterprise Co., 2.850%, 10/05/18 | 87,052 | 0.1 | |||||||||||
| 260,000 | Intel Corp., 2.450%, 07/29/20 | 264,273 | 0.3 | |||||||||||
| 370,000 | International Business Machines Corp., 1.900%, 01/27/20 | 371,447 | 0.4 | |||||||||||
| 324,000 | Microsoft Corp., 1.550%, 08/08/21 | 316,077 | 0.4 | |||||||||||
| 160,000 | QUALCOMM, Inc., 1.400%, 05/18/18 | 159,971 | 0.2 | |||||||||||
| 300,000 | # | Quintiles IMS, Inc., 4.875%, 05/15/23 | 305,625 | 0.3 | ||||||||||
| 3,144,765 | 3.4 | |||||||||||||
| Utilities: 2.8% | ||||||||||||||
| 346,000 | Black Hills Corp., 2.500%, 01/11/19 | 347,835 | 0.4 | |||||||||||
| 76,000 | Dominion Resources, Inc./VA, 1.600%, 08/15/19 | 75,085 | 0.1 | |||||||||||
| 405,000 | Duke Energy Corp., 1.800%, 09/01/21 | 391,575 | 0.4 | |||||||||||
| 110,000 | Edison International, 2.125%, 04/15/20 | 110,194 | 0.1 | |||||||||||
| 110,000 | Exelon Generation Co. LLC, 2.950%, 01/15/20 | 111,572 | 0.1 | |||||||||||
| 190,000 | Georgia Power Co., 2.000%, 03/30/20 | 188,817 | 0.2 | |||||||||||
| 160,000 | Great Plains Energy, Inc., 2.500%, 03/09/20 | 161,006 | 0.2 | |||||||||||
| 109,000 | NextEra Energy Capital Holdings, Inc., 1.649%, 09/01/18 | 108,708 | 0.1 | |||||||||||
| 160,000 | NextEra Energy Capital Holdings, Inc., 2.300%, 04/01/19 | 161,040 | 0.2 | |||||||||||
| 250,000 | Oklahoma Gas & Electric Co., 8.250%, 01/15/19 | 276,317 | 0.3 | |||||||||||
| 250,000 | Public Service Enterprise Group, Inc., 1.600%, 11/15/19 | 247,476 | 0.3 | |||||||||||
| 228,000 | Sempra Energy, 1.625%, 10/07/19 | 225,842 | 0.2 | |||||||||||
| 220,000 | Southern Power Co., 1.500%, 06/01/18 | 219,578 | 0.2 | |||||||||||
| 2,625,045 | 2.8 | |||||||||||||
| Total Corporate Bonds/Notes (Cost $45,595,333) | 45,648,125 | 49.0 | ||||||||||||
| COLLATERALIZED MORTGAGE OBLIGATIONS: 5.8% | ||||||||||||||
| 339,092 | Fannie Mae Interest Strip Series 404 8, 3.000%, 05/25/40 | 340,144 | 0.4 | |||||||||||
| 770,928 | Fannie Mae REMIC Trust 2009-49 KB, 5.000%, 07/25/24 | 790,843 | 0.8 | |||||||||||
| 200,244 | Fannie Mae REMIC Trust 2010-137 XP, 4.500%, 10/25/40 | 211,081 | 0.2 | |||||||||||
| 106,956 | Fannie Mae REMIC Trust 2010-19 PB, 3.000%, 12/25/39 | 107,843 | 0.1 | |||||||||||
| 297,833 | Fannie Mae REMIC Trust 2010-54 LC, 3.000%, 04/25/40 | 303,092 | 0.3 | |||||||||||
| 52,522 | Fannie Mae REMIC Trust 2011-100 QM, 4.000%, 10/25/50 | 52,972 | 0.1 | |||||||||||
| 643,970 | Freddie Mac REMIC Trust 2103 TE, 6.000%, 12/15/28 | 735,404 | 0.8 | |||||||||||
| 572,351 | Freddie Mac REMIC Trust 3597 L, 5.000%, 07/15/39 | 612,852 | 0.7 | |||||||||||
| 423,904 | Ginnie Mae Series 2012-52 PV, 2.500%, 12/20/39 | 431,881 | 0.5 | |||||||||||
| 818,944 | Ginnie Mae Series 2014-53 JM, 7.124%, 04/20/39 | 940,562 | 1.0 | |||||||||||
| 609,004 | Ginnie Mae Series 2015-H31 FT, 1.430%, 11/20/65 | 611,241 | 0.6 | |||||||||||
| 251,088 | Wells Fargo Mortgage Backed Securities 2005-AR16 Trust 2A1, 3.182%, 02/25/34 | 255,887 | 0.3 | |||||||||||
| Total Collateralized Mortgage Obligations (Cost $5,388,043) | 5,393,802 | 5.8 | ||||||||||||
| U.S. GOVERNMENT AGENCY OBLIGATIONS: 2.0% | ||||||||||||||
| Federal Home Loan Mortgage Corporation: 1.3%## | ||||||||||||||
| 51,794 | 5.500%, due 01/01/37 | 57,432 | 0.1 | |||||||||||
| 181,843 | 5.500%, due 08/01/38 | 205,528 | 0.2 | |||||||||||
| 18,011 | 5.500%, due 10/01/38 | 19,963 | 0.0 | |||||||||||
| 24,556 | 5.500%, due 10/01/38 | 27,331 | 0.0 | |||||||||||
| 421,313 | 5.500%, due 11/01/38 | 474,224 | 0.5 | |||||||||||
| 362,899 | 5.500%, due 02/01/39 | 404,084 | 0.5 | |||||||||||
| 1,188,562 | 1.3 | |||||||||||||
| Federal National Mortgage Association: 0.7%## | ||||||||||||||
| 372,230 | 5.000%, due 01/01/23 | 397,896 | 0.4 | |||||||||||
| 236,105 | 5.000%, due 07/01/34 | 259,098 | 0.3 | |||||||||||
| 656,994 | 0.7 | |||||||||||||
| Total U.S. Government Agency Obligations (Cost $1,798,132) | 1,845,556 | 2.0 | ||||||||||||
| FOREIGN GOVERNMENT BONDS: 0.1% | ||||||||||||||
| 58,000 | European Investment Bank, 1.750%, 05/15/20 | 57,953 | 0.1 | |||||||||||
| Total Foreign Government Bonds (Cost $57,829) | 57,953 | 0.1 | ||||||||||||
| ASSET-BACKED SECURITIES: 16.5% | ||||||||||||||
| Automobile Asset-Backed Securities: 6.0% | ||||||||||||||
| 100,000 | Ally Auto Receivables Trust 2016-2 A4, 1.600%, 01/15/21 | 99,599 | 0.1 | |||||||||||
| 150,000 | Ally Auto Receivables Trust 2017-2 A4, 2.100%, 03/15/22 | 149,992 | 0.2 | |||||||||||
| 250,000 | CarMax Auto Owner Trust 2014-4 A4, 1.810%, 07/15/20 | 250,437 | 0.3 | |||||||||||
| 100,000 | CarMax Auto Owner Trust 2016-2 A3, 1.520%, 02/16/21 | 99,684 | 0.1 | |||||||||||
| 225,000 | CarMax Auto Owner Trust 2016-4, 1.600%, 06/15/22 | 221,578 | 0.2 | |||||||||||
See Accompanying Notes to Financial Statements
| Voya Short Term Bond Fund | PORTFOLIO OF INVESTMENTS as of March 31, 2017 (continued) |
| Principal Amount† | Value | Percentage of Net Assets | ||||||||||||
| ASSET-BACKED SECURITIES: (continued) | ||||||||||||||
| Automobile Asset-Backed Securities: (continued) | ||||||||||||||
| 250,000 | CarMax Auto Owner Trust 2017-1 A4, 2.270%, 09/15/22 | 250,862 | 0.3 | |||||||||||
| 600,000 | # | Chrysler Capital Auto Receivables Trust 2016-B, 1.870%, 02/15/22 | 594,214 | 0.6 | ||||||||||
| 190,000 | GM Financial Automobile Leasing Trust 2015-3 A4, 1.810%, 11/20/19 | 190,356 | 0.2 | |||||||||||
| 250,000 | GM Financial Automobile Leasing Trust 2016-2 A4, 1.760%, 03/20/20 | 249,707 | 0.3 | |||||||||||
| 100,000 | GM Financial Automobile Leasing Trust 2017-1 A4, 2.260%, 08/20/20 | 100,199 | 0.1 | |||||||||||
| 480,000 | Harley-Davidson Motorcycle Trust 2015-1 A4, 1.670%, 08/15/22 | 479,412 | 0.5 | |||||||||||
| 300,000 | # | Hyundai Auto Lease Securitization Trust 2016-B A4, 1.680%, 04/15/20 | 299,919 | 0.3 | ||||||||||
| 150,000 | # | Hyundai Auto Lease Securitization Trust 2016-C, 1.650%, 07/15/20 | 149,624 | 0.1 | ||||||||||
| 450,000 | # | Hyundai Auto Lease Securitization Trust 2017-A A4, 2.130%, 04/15/21 | 452,421 | 0.5 | ||||||||||
| 100,000 | Hyundai Auto Receivables Trust 2017-A A4, 2.090%, 04/17/23 | 99,987 | 0.1 | |||||||||||
| 200,000 | Mercedes-Benz Auto Lease Trust 2016-B, 1.520%, 06/15/22 | 199,313 | 0.2 | |||||||||||
| 200,000 | Nissan Auto Lease Trust 2016-A A4, 1.650%, 10/15/21 | 200,121 | 0.2 | |||||||||||
| 100,000 | Nissan Auto Lease Trust 2016-B A4, 1.610%, 01/18/22 | 99,669 | 0.1 | |||||||||||
| 540,000 | Nissan Auto Receivables 2016-B A4, 1.540%, 10/17/22 | 534,396 | 0.6 | |||||||||||
| 200,000 | # | Oscar US Funding Trust VI LLC 2017-1A A3, 2.820%, 06/10/21 | 200,277 | 0.2 | ||||||||||
| 160,000 | Toyota Auto Receivables 2016-A Owner Trust A4, 1.470%, 09/15/21 | 159,004 | 0.2 | |||||||||||
| 100,000 | USAA Auto Owner Trust 2015-1 A4, 1.540%, 11/16/20 | 99,990 | 0.1 | |||||||||||
| 110,000 | World Omni Auto Receivables Trust 2015-B A4, 1.840%, 01/17/22 | 109,822 | 0.1 | |||||||||||
| 250,000 | World Omni Auto Receivables Trust 2016-B A4, 1.480%, 11/15/22 | 244,450 | 0.3 | |||||||||||
| 100,000 | World Omni Automobile Lease Securitization Trust 2017-A A4, 2.320%, 08/15/22 | 100,387 | 0.1 | |||||||||||
| 5,635,420 | 6.0 | |||||||||||||
| Credit Card Asset-Backed Securities: 4.5% | ||||||||||||||
| 350,000 | Barclays Dryrock Issuance Trust 2016-1 A, 1.520%, 05/16/22 | 347,105 | 0.4 | |||||||||||
| 450,000 | Cabela's Credit Card Master Note Trust 2016-1 A1, 1.780%, 06/15/22 | 449,279 | 0.5 | |||||||||||
| 450,000 | Capital One Multi-Asset Execution Trust 2016-A4 A4, 1.330%, 06/15/22 | 445,399 | 0.5 | |||||||||||
| 600,000 | Capital One Multi-Asset Execution Trust, 1.820%, 09/15/22 | 599,983 | 0.6 | |||||||||||
| 300,000 | Chase Issuance Trust 2016-A2 A, 1.370%, 06/15/21 | 298,075 | 0.3 | |||||||||||
| 200,000 | Chase Issuance Trust 2016-A5 A5, 1.270%, 07/15/21 | 197,945 | 0.2 | |||||||||||
| 210,000 | Citibank Credit Card Issuance Trust 2014-A6 A6, 2.150%, 07/15/21 | 211,905 | 0.2 | |||||||||||
| 300,000 | Citibank Credit Card Issuance Trust 2016-A1 A1, 1.750%, 11/19/21 | 299,627 | 0.3 | |||||||||||
| 170,000 | Discover Card Execution Note Trust 2014-A1 A1, 1.342%, 07/15/21 | 170,961 | 0.2 | |||||||||||
| 230,000 | Discover Card Execution Note Trust 2014-A4 A4, 2.120%, 12/15/21 | 232,025 | 0.3 | |||||||||||
| 200,000 | Discover Card Execution Note Trust 2015-A3 A, 1.450%, 03/15/21 | 199,794 | 0.2 | |||||||||||
| 450,000 | Discover Card Execution Note Trust 2017-A2 A2, 2.390%, 07/15/24 | 452,759 | 0.5 | |||||||||||
| 280,000 | Synchrony Credit Card Master Note Trust 2016-1 A, 2.040%, 03/15/22 | 281,148 | 0.3 | |||||||||||
| 4,186,005 | 4.5 | |||||||||||||
| Home Equity Asset-Backed Securities: 0.1% | ||||||||||||||
| 57,251 | Chase Funding Loan Acquisition Trust Series 2003-C2 1A, 4.750%, 12/25/19 | 57,688 | 0.1 | |||||||||||
| Other Asset-Backed Securities: 5.9% | ||||||||||||||
| 240,000 | # | Apidos CLO XI 2012-11A AR, 2.463%, 01/17/28 | 240,801 | 0.3 | ||||||||||
| 330,000 | # | Babson CLO Ltd. 2014-3A AR, 2.299%, 01/15/26 | 330,659 | 0.3 | ||||||||||
| 280,000 | # | Benefit Street Partners CLO IV Ltd. 2014-IVA A1R, 2.515%, 01/20/29 | 280,892 | 0.3 | ||||||||||
| 560,000 | # | Benefit Street Partners CLO X Ltd. 2016-10A A1, 2.233%, 01/15/29 | 561,860 | 0.6 | ||||||||||
| 310,000 | # | BlueMountain CLO 2013-1A A1R, 2.430%, 01/20/29 | 311,099 | 0.3 | ||||||||||
| 350,000 | # | BlueMountain CLO Ltd. 2012-2A AR, 2.472%, 11/20/28 | 351,123 | 0.4 | ||||||||||
| 410,000 | # | Carlyle US CLO 2017-1A A1A Ltd., 2.460%, 04/20/31 | 411,690 | 0.4 | ||||||||||
| 250,000 | # | CIFC Funding Ltd. 2016-1A A, 2.445%, 10/21/28 | 250,968 | 0.3 | ||||||||||
| 250,000 | # | CIFC Funding Ltd. 2017-1A A, 2.243%, 04/23/29 | 249,997 | 0.3 | ||||||||||
See Accompanying Notes to Financial Statements
| Voya Short Term Bond Fund | PORTFOLIO OF INVESTMENTS as of March 31, 2017 (continued) |
| Principal Amount† | Value | Percentage of Net Assets | ||||||||||||
| ASSET-BACKED SECURITIES: (continued) | ||||||||||||||
| Other Asset-Backed Securities: (continued) | ||||||||||||||
| 360,000 | # | Dryden 33 Senior Loan Fund 2014-33A AR, 2.453%, 10/15/28 | 361,078 | 0.4 | ||||||||||
| 250,000 | # | Dryden Senior Loan Fund 2017-47A A2, 2.745%, 04/15/28 | 250,000 | 0.3 | ||||||||||
| 46,298 | # | GSAMP Trust 2005-SEA2 A1, 1.332%, 01/25/45 | 46,112 | 0.0 | ||||||||||
| 330,000 | # | LCM XXIII Ltd. 23A A1, 2.506%, 10/20/29 | 332,637 | 0.3 | ||||||||||
| 250,000 | # | Madison Park Funding Ltd. 2007-6A E, 6.282%, 07/26/21 | 250,445 | 0.3 | ||||||||||
| 390,000 | # | Oaktree EIF II Series B1 Ltd. 2015-B1A A, 2.589%, 02/15/26 | 390,083 | 0.4 | ||||||||||
| 250,000 | # | Octagon Investment Partners 30 Ltd. 2017-1A A1, 2.355%, 03/17/30 | 250,287 | 0.3 | ||||||||||
| 260,000 | # | OHA Loan Funding Ltd. 2015-1A AR, 2.449%, 08/15/29 | 261,718 | 0.3 | ||||||||||
| 300,000 | # | THL Credit Wind River CLO Ltd. 2017-1A A, 2.374%, 04/18/29 | 300,297 | 0.3 | ||||||||||
| 100,000 | # | Volvo Financial Equipment LLC Series 2017-1A A4, 2.210%, 11/15/21 | 99,836 | 0.1 | ||||||||||
| 5,531,582 | 5.9 | |||||||||||||
| Total Asset-Backed Securities (Cost $15,407,634) | 15,410,695 | 16.5 | ||||||||||||
| U.S. TREASURY OBLIGATIONS: 4.7% | ||||||||||||||
| U.S. Treasury Notes: 4.7% | ||||||||||||||
| 1,835,000 | 0.625%, due 06/30/18 | 1,823,531 | 2.0 | |||||||||||
| 103,000 | 1.125%, due 02/28/19 | 102,771 | 0.1 | |||||||||||
| 562,000 | L | 1.625%, due 03/15/20 | 564,009 | 0.6 | ||||||||||
| 109,000 | 1.875%, due 02/28/22 | 108,768 | 0.1 | |||||||||||
| 933,000 | 2.125%, due 02/29/24 | 927,880 | 1.0 | |||||||||||
| 826,000 | 2.125%, due 03/31/24 | 820,966 | 0.9 | |||||||||||
| Total U.S. Treasury Obligations (Cost $4,346,488) | 4,347,925 | 4.7 | ||||||||||||
| COMMERCIAL MORTGAGE-BACKED SECURITIES: 8.4% | ||||||||||||||
| 226,578 | # | Americold LLC 2010 Trust ARTA A2FL, 2.391%, 01/14/29 | 227,439 | 0.2 | ||||||||||
| 38,967 | Banc of America Commercial Mortgage Trust 2007-4 A4, 5.894%, 02/10/51 | 39,221 | 0.0 | |||||||||||
| 20,384 | # | Banc of America Re-REMIC Trust 2009-UBER2 A4AA, 5.858%, 02/24/51 | 20,354 | 0.0 | ||||||||||
| 340,115 | Bear Stearns Commercial Mortgage Securities Trust 2005-PWR9 C, 5.055%, 09/11/42 | 340,612 | 0.4 | |||||||||||
| 430,000 | CD 2007-CD5 Mortgage Trust AJ, 6.843%, 11/15/44 | 436,399 | 0.5 | |||||||||||
| 230,000 | CD 2007-CD5 Mortgage Trust AJA, 6.159%, 11/15/44 | 233,932 | 0.3 | |||||||||||
| 275,249 | Citigroup Commercial Mortgage Trust 2007-6 A4, 5.779%, 12/10/49 | 275,577 | 0.3 | |||||||||||
| 502,589 | Citigroup/Deutsche Bank Commercial Mortgage Trust 2006-CD3 AM, 5.648%, 10/15/48 | 513,237 | 0.6 | |||||||||||
| 13,877 | COBALT CMBS Commercial Mortgage Trust 2007-C2 A3, 5.484%, 04/15/47 | 13,860 | 0.0 | |||||||||||
| 87,361 | COMM 2012-CR4 A2, 1.801%, 10/15/45 | 87,858 | 0.1 | |||||||||||
| 190,000 | COMM 2014-UBS6 A2 Mortgage Trust, 2.935%, 12/10/47 | 192,980 | 0.2 | |||||||||||
| 110,000 | Commercial Mortgage Pass Through Certificates 2014-CR14 A2, 3.147%, 02/10/47 | 111,445 | 0.1 | |||||||||||
| 128,393 | # | Commercial Mortgage Trust 2004-GG1 F, 6.311%, 06/10/36 | 127,853 | 0.1 | ||||||||||
| 5,106 | # | Credit Suisse First Boston Mortgage Securities Corp. 2003-C4 J, 5.322%, 08/15/36 | 5,094 | 0.0 | ||||||||||
| 79,452 | # | DBRR 2011-C32 A3A, 8.200%, 06/17/49 | 79,325 | 0.1 | ||||||||||
| 203,076 | # | EQTY 2014-INNS Mortgage Trust, 4.297%, 05/08/31 | 202,217 | 0.2 | ||||||||||
| 106,782 | Ginnie Mae 2012-19 AB, 1.450%, 03/16/34 | 106,722 | 0.1 | |||||||||||
| 87,817 | Ginnie Mae 2015-21 AF, 2.069%, 07/16/48 | 86,479 | 0.1 | |||||||||||
| 207,751 | Ginnie Mae 2016-110 AB, 2.000%, 05/16/49 | 203,563 | 0.2 | |||||||||||
| 90,994 | Ginnie Mae 2016-86 AB, 2.500%, 09/16/56 | 90,620 | 0.1 | |||||||||||
| 304,060 | Ginnie Mae Series 2011-53 B, 4.397%, 05/16/51 | 322,179 | 0.3 | |||||||||||
| 96,507 | GMAC Commercial Mortgage Securities, Inc. Series 2004-C3 Trust B, 4.965%, 12/10/41 | 98,038 | 0.1 | |||||||||||
| 285,868 | GS Mortgage Securities Trust 2012-GCJ9, 1.762%, 11/10/45 | 286,256 | 0.3 | |||||||||||
| 170,000 | JPMBB Commercial Mortgage Securities Trust 2 2014-C19 A2, 3.046%, 04/15/47 | 173,471 | 0.2 | |||||||||||
| 250,000 | # | JP Morgan Chase Commercial Mortgage Securities Trust 2003-CB6 H, 5.379%, 07/12/37 | 246,516 | 0.3 | ||||||||||
| 135,000 | JP Morgan Chase Commercial Mortgage Securities Trust 2004-CBX C, 5.066%, 01/12/37 | 137,969 | 0.1 | |||||||||||
| 429,721 | JP Morgan Chase Commercial Mortgage Securities Trust 2004-CIBC10 B, 5.021%, 01/12/37 | 438,147 | 0.5 | |||||||||||
See Accompanying Notes to Financial Statements
| Voya Short Term Bond Fund | PORTFOLIO OF INVESTMENTS as of March 31, 2017 (continued) |
| Principal Amount† | Value | Percentage of Net Assets | ||||||||||||
| COMMERCIAL MORTGAGE-BACKED SECURITIES: (continued) | ||||||||||||||
| 722,257 | JP Morgan Chase Commercial Mortgage Securities Trust 2007-LDP12, 5.882%, 02/15/51 | 725,962 | 0.8 | |||||||||||
| 380,000 | # | JP Morgan Chase Commercial Mortgage Securities Trust 2014-BXH D, 3.162%, 04/15/27 | 374,843 | 0.4 | ||||||||||
| 138,654 | # | JPMorgan Commercial Mortgage-Backed Securities Trust 2009-RR1 A4B2, 1.000%, 03/18/51 | 137,989 | 0.2 | ||||||||||
| 193,339 | LB-UBS Commercial Mortgage Trust 2008-C1 A2, 6.127%, 04/15/41 | 198,796 | 0.2 | |||||||||||
| 157,106 | ML-CFC Commercial Mortgage Trust 2007-9 A4, 5.700%, 09/12/49 | 158,561 | 0.2 | |||||||||||
| 333,598 | Morgan Stanley Capital I Trust 2007-IQ16, 5.809%, 12/12/49 | 335,613 | 0.4 | |||||||||||
| 254,547 | Morgan Stanley Capital I Trust 2008-TOP29, 6.301%, 01/11/43 | 260,818 | 0.3 | |||||||||||
| 44,732 | # | Morgan Stanley Re-REMIC Trust 2009-GG10 A4A, 5.949%, 08/12/45 | 44,697 | 0.0 | ||||||||||
| 81,652 | # | Morgan Stanley Re-REMIC Trust 2010-GG10 A4A, 5.949%, 08/15/45 | 81,543 | 0.1 | ||||||||||
| 390,000 | TIAA Seasoned Commercial Mortgage Trust 2007-C4 C, 5.474%, 08/15/39 | 392,731 | 0.4 | |||||||||||
| Total Commercial Mortgage-Backed Securities (Cost $7,887,737) | 7,808,916 | 8.4 | ||||||||||||
| Total Long-Term Investments (Cost $80,481,196) | 80,512,972 | 86.5 | ||||||||||||
| SHORT-TERM INVESTMENTS: 14.7% | ||||||||||||||
| Corporate Bonds/Notes: 12.5% | ||||||||||||||
| 291,000 | Actavis Funding SCS, 2.350%, 03/12/18 | 292,325 | 0.3 | |||||||||||
| 502,000 | Aetna, Inc., 1.500%, 11/15/17 | 501,985 | 0.5 | |||||||||||
| 301,000 | Air Lease Corp., 2.125%, 01/15/18 | 301,625 | 0.3 | |||||||||||
| 395,000 | Alibaba Group Holding Ltd., 1.625%, 11/28/17 | 395,005 | 0.4 | |||||||||||
| 235,000 | AT&T, Inc., 1.400%, 12/01/17 | 234,850 | 0.3 | |||||||||||
| 135,000 | BP Capital Markets PLC, 1.674%, 02/13/18 | 135,103 | 0.1 | |||||||||||
| 257,000 | British Telecommunications PLC, 5.950%, 01/15/18 | 265,511 | 0.3 | |||||||||||
| 500,000 | Cablevision Systems Corp., 8.625%, 09/15/17 | 514,375 | 0.6 | |||||||||||
| 325,000 | Charles Schwab Corp., 1.500%, 03/10/18 | 324,983 | 0.3 | |||||||||||
| 329,000 | Chevron Corp., 1.365%, 03/02/18 | 328,857 | 0.4 | |||||||||||
| 258,000 | Citizens Bank NA/Providence RI, 1.600%, 12/04/17 | 257,906 | 0.3 | |||||||||||
| 352,000 | Diageo Capital PLC, 1.500%, 05/11/17 | 352,019 | 0.4 | |||||||||||
| 75,000 | eBay, Inc., 1.350%, 07/15/17 | 74,972 | 0.1 | |||||||||||
| 140,000 | eBay, Inc., 2.500%, 03/09/18 | 141,098 | 0.2 | |||||||||||
| 165,000 | Eli Lilly & Co., 1.250%, 03/01/18 | 164,831 | 0.2 | |||||||||||
| 371,000 | JM Smucker Co., 1.750%, 03/15/18 | 371,480 | 0.4 | |||||||||||
| 365,000 | JPMorgan Chase & Co., 1.700%, 03/01/18 | 365,129 | 0.4 | |||||||||||
| 301,000 | Kinder Morgan, Inc./DE, 2.000%, 12/01/17 | 301,272 | 0.3 | |||||||||||
| 204,000 | Kroger Co., 6.400%, 08/15/17 | 207,634 | 0.2 | |||||||||||
| 500,000 | Lennar Corp., 4.750%, 12/15/17 | 508,125 | 0.5 | |||||||||||
| 500,000 | Manufacturers & Traders Trust Co., 1.450%, 03/07/18 | 499,354 | 0.5 | |||||||||||
| 323,000 | Morgan Stanley, 1.875%, 01/05/18 | 323,561 | 0.3 | |||||||||||
| 316,000 | NetApp, Inc., 2.000%, 12/15/17 | 316,770 | 0.3 | |||||||||||
| 177,000 | PACCAR Financial Corp., 1.450%, 03/09/18 | 177,151 | 0.2 | |||||||||||
| 390,000 | Philip Morris International, Inc., 1.250%, 11/09/17 | 389,813 | 0.4 | |||||||||||
| 318,000 | Realty Income Corp., 2.000%, 01/31/18 | 318,600 | 0.3 | |||||||||||
| 264,000 | Statoil ASA, 1.250%, 11/09/17 | 263,704 | 0.3 | |||||||||||
| 500,000 | Tesoro Corp., 4.250%, 10/01/17 | 505,000 | 0.5 | |||||||||||
| 211,000 | Total Capital International SA, 1.550%, 06/28/17 | 211,162 | 0.2 | |||||||||||
| 181,000 | TransCanada PipeLines Ltd., 1.875%, 01/12/18 | 181,208 | 0.2 | |||||||||||
| 342,000 | UBS AG/Stamford CT, 1.375%, 08/14/17 | 342,114 | 0.4 | |||||||||||
| 256,000 | UnitedHealth Group, Inc., 1.400%, 12/15/17 | 256,030 | 0.3 | |||||||||||
| 250,000 | US Bank NA/Cincinnati OH, 1.375%, 09/11/17 | 250,124 | 0.3 | |||||||||||
| 159,000 | Valspar Corp., 6.050%, 05/01/17 | 159,480 | 0.2 | |||||||||||
| 498,000 | Visa, Inc., 1.200%, 12/14/17 | 497,591 | 0.5 | |||||||||||
| 422,000 | Wells Fargo & Co., 1.500%, 01/16/18 | 421,293 | 0.5 | |||||||||||
| 252,000 | Welltower, Inc., 2.250%, 03/15/18 | 253,150 | 0.3 | |||||||||||
| 279,000 | Zoetis, Inc., 1.875%, 02/01/18 | 279,218 | 0.3 | |||||||||||
| 11,684,408 | 12.5 | |||||||||||||
See Accompanying Notes to Financial Statements
| Voya Short Term Bond Fund | PORTFOLIO OF INVESTMENTS as of March 31, 2017 (continued) |
| Principal Amount† | Value | Percentage of Net Assets | ||||||||||||
| SHORT-TERM INVESTMENTS: (continued) | ||||||||||||||
| Securities Lending Collateralcc: 1.1% | ||||||||||||||
| 983,395 | Cantor Fitzgerald, Repurchase Agreement dated 03/31/17, 0.81%, due 04/03/17 (Repurchase Amount $983,460, collateralized by various U.S. Government and U.S. Government Agency Obligations, 0.000%-10.000%, Market Value plus accrued interest $1,003,063, due 04/01/17-02/20/67) | |||||||||||||
| (Cost $983,395) | 983,395 | 1.1 | ||||||||||||
| Shares | Value | Percentage of Net Assets | ||||||||||||
| Mutual Funds: 1.1% | ||||||||||||||
| 1,066,000 | BlackRock Liquidity Funds, FedFund, Institutional Class, 0.600%†† | |||||||||||||
| (Cost $1,066,000) | 1,066,000 | 1.1 | ||||||||||||
| Total Short-Term Investments (Cost $13,706,711) | 13,733,803 | 14.8 | ||||||||||||
| Total Investments in Securities (Cost $94,187,907) | $ | 94,246,775 | 101.2 | |||||||||||
| Liabilities in Excess of Other Assets | (1,085,614 | ) | (1.2 | ) | ||||||||||
| Net Assets | $ | 93,161,161 | 100.0 | |||||||||||
| † | Unless otherwise indicated, principal amount is shown in USD. |
| †† | Rate shown is the 7-day yield as of March 31, 2017. |
| # | Securities with purchases pursuant to Rule 144A or section 4(a)(2), under the Securities Act of 1933 and may not be resold subject to that rule except to qualified institutional buyers. |
| ## | The Federal Housing Finance Agency (“FHFA”) placed the Federal Home Loan Mortgage Corporation and Federal National Mortgage Association into conservatorship with FHFA as the conservator. As such, the FHFA oversees the continuing affairs of these companies. |
| cc | Represents securities purchased with cash collateral received for securities on loan. |
| L | Loaned security, a portion or all of the security is on loan at March 31, 2017. |
Cost for federal income tax purposes is $94,189,479.
Net unrealized appreciation consists of:
| Gross Unrealized Appreciation | $ | 342,892 | ||
| Gross Unrealized Depreciation | (285,596 | ) | ||
| Net Unrealized Appreciation | $ | 57,296 |
See Accompanying Notes to Financial Statements
| Voya Strategic Income Opportunities Fund | PORTFOLIO OF INVESTMENTS as of March 31, 2017 |
| Principal Amount† | Value | Percentage of Net Assets | ||||||||||||
| CORPORATE BONDS/NOTES: 14.8% | ||||||||||||||
| Basic Materials: 1.0% | ||||||||||||||
| 250,000 | PolyOne Corp., 5.250%, 03/15/23 | 253,125 | 0.2 | |||||||||||
| 350,000 | Southern Copper Corp., 5.875%, 04/23/45 | 366,425 | 0.2 | |||||||||||
| 250,000 | Steel Dynamics, Inc., 5.500%, 10/01/24 | 261,875 | 0.1 | |||||||||||
| 250,000 | Tronox Finance LLC, 6.375%, 08/15/20 | 252,187 | 0.1 | |||||||||||
| 285,000 | # | Vedanta Resources PLC, 6.375%, 07/30/22 | 287,708 | 0.2 | ||||||||||
| 250,000 | # | WR Grace & Co-Conn, 5.625%, 10/01/24 | 264,375 | 0.2 | ||||||||||
| 1,685,695 | 1.0 | |||||||||||||
| Communications: 2.5% | ||||||||||||||
| 290,000 | AT&T, Inc., 3.400%, 05/15/25 | 281,101 | 0.2 | |||||||||||
| 150,000 | Cablevision Systems Corp., 5.875%, 09/15/22 | 151,687 | 0.1 | |||||||||||
| 278,000 | CBS Corp., 4.000%, 01/15/26 | 285,133 | 0.2 | |||||||||||
| 150,000 | # | CCO Holdings LLC / CCO Holdings Capital Corp., 5.750%, 02/15/26 | 157,875 | 0.1 | ||||||||||
| 273,000 | Charter Communications Operating LLC / Charter Communications Operating Capital, 4.464%, 07/23/22 | 287,826 | 0.2 | |||||||||||
| 350,000 | Digicel Ltd., 6.000%, 04/15/21 | 319,813 | 0.2 | |||||||||||
| 200,000 | DISH DBS Corp., 5.000%, 03/15/23 | 201,400 | 0.1 | |||||||||||
| 150,000 | Lamar Media Corp., 5.375%, 01/15/24 | 155,625 | 0.1 | |||||||||||
| 250,000 | Level 3 Financing, Inc., 5.250%, 03/15/26 | 252,188 | 0.1 | |||||||||||
| 150,000 | Netflix, Inc., 5.875%, 02/15/25 | 161,625 | 0.1 | |||||||||||
| 150,000 | # | Nielsen Finance LLC / Nielsen Finance Co., 5.000%, 04/15/22 | 153,750 | 0.1 | ||||||||||
| 200,000 | # | SFR Group SA, 6.250%, 05/15/24 | 202,000 | 0.1 | ||||||||||
| 250,000 | # | Sirius XM Radio, Inc., 6.000%, 07/15/24 | 268,750 | 0.2 | ||||||||||
| 150,000 | Sprint Corp., 7.125%, 06/15/24 | 160,500 | 0.1 | |||||||||||
| 259,000 | Time Warner Cable LLC, 5.000%, 02/01/20 | 275,972 | 0.2 | |||||||||||
| 150,000 | T-Mobile USA, Inc., 6.836%, 04/28/23 | 160,875 | 0.1 | |||||||||||
| 250,000 | # | Univision Communications, Inc., 5.125%, 02/15/25 | 246,875 | 0.1 | ||||||||||
| 278,000 | # | Verizon Communications, Inc., 4.812%, 03/15/39 | 271,604 | 0.2 | ||||||||||
| 3,994,599 | 2.5 | |||||||||||||
| Consumer, Cyclical: 1.7% | ||||||||||||||
| 150,000 | AMC Entertainment Holdings, Inc., 5.750%, 06/15/25 | 154,125 | 0.1 | |||||||||||
| 55,000 | # | American Tire Distributors, Inc., 10.250%, 03/01/22 | 56,237 | 0.0 | ||||||||||
| 200,000 | CalAtlantic Group, Inc., 5.250%, 06/01/26 | 200,000 | 0.1 | |||||||||||
| 150,000 | Cedar Fair L.P. / Canada's Wonderland Co. / Magnum Management Corp., 5.375%, 06/01/24 | 154,500 | 0.1 | |||||||||||
| 239,000 | CVS Health Corp., 3.875%, 07/20/25 | 246,654 | 0.2 | |||||||||||
| 150,000 | Dollar Tree, Inc., 5.750%, 03/01/23 | 160,500 | 0.1 | |||||||||||
| 200,000 | Fiat Chrysler Automobiles NV, 5.250%, 04/15/23 | 206,700 | 0.1 | |||||||||||
| 25,000 | Goodyear Tire & Rubber Co/The, 4.875%, 03/15/27 | 25,062 | 0.0 | |||||||||||
| 250,000 | # | HD Supply, Inc., 5.750%, 04/15/24 | 263,575 | 0.2 | ||||||||||
| 125,000 | # | Hilton Worldwide Finance LLC / Hilton Worldwide Finance Corp., 4.625%, 04/01/25 | 126,562 | 0.1 | ||||||||||
| 150,000 | # | Hot Topic, Inc., 9.250%, 06/15/21 | 146,250 | 0.1 | ||||||||||
| 150,000 | MGM Resorts International, 6.000%, 03/15/23 | 161,813 | 0.1 | |||||||||||
| 150,000 | #,L | Michaels Stores, Inc., 5.875%, 12/15/20 | 154,409 | 0.1 | ||||||||||
| 150,000 | #,L | PetSmart, Inc., 7.125%, 03/15/23 | 142,875 | 0.1 | ||||||||||
| 150,000 | CalAtlantic Group, Inc., 5.375%, 10/01/22 | 157,313 | 0.1 | |||||||||||
| 150,000 | # | Silversea Cruise Finance Ltd., 7.250%, 02/01/25 | 158,625 | 0.1 | ||||||||||
| 55,000 | # | Six Flags Entertainment Corp., 4.875%, 07/31/24 | 54,416 | 0.0 | ||||||||||
| 110,000 | # | Six Flags Entertainment Corp., 5.500%, 04/15/27 | 110,000 | 0.1 | ||||||||||
| 2,679,616 | 1.7 | |||||||||||||
| Consumer, Non-cyclical: 2.3% | ||||||||||||||
| 277,000 | Actavis Funding SCS, 3.000%, 03/12/20 | 281,741 | 0.2 | |||||||||||
| 125,000 | # | Cardtronics, Inc. / Cardtronics USA, 5.500%, 05/01/25 | 126,875 | 0.1 | ||||||||||
See Accompanying Notes to Financial Statements
| Voya Strategic Income Opportunities Fund | PORTFOLIO OF INVESTMENTS as of March 31, 2017 (continued) |
| Principal Amount† | Value | Percentage of Net Assets | ||||||||||||
| CORPORATE BONDS/NOTES: (continued) | ||||||||||||||
| Consumer, Non-cyclical: (continued) | ||||||||||||||
| 280,000 | Celgene Corp., 3.250%, 08/15/22 | 284,651 | 0.2 | |||||||||||
| 200,000 | Central Garden & Pet Co., 6.125%, 11/15/23 | 212,000 | 0.1 | |||||||||||
| 105,000 | CHS/Community Health Systems, Inc., 5.125%, 08/01/21 | 104,212 | 0.1 | |||||||||||
| 250,000 | # | Cott Holdings, Inc., 5.500%, 04/01/25 | 255,075 | 0.1 | ||||||||||
| 250,000 | HCA, Inc., 5.375%, 02/01/25 | 260,625 | 0.1 | |||||||||||
| 150,000 | HealthSouth Corp., 5.750%, 11/01/24 | 151,875 | 0.1 | |||||||||||
| 150,000 | L | Hertz Corp., 7.375%, 01/15/21 | 150,281 | 0.1 | ||||||||||
| 150,000 | # | Jaguar Holding Co. II / Pharmaceutical Product Development LLC, 6.375%, 08/01/23 | 157,125 | 0.1 | ||||||||||
| 275,000 | Kraft Heinz Foods Co., 2.800%, 07/02/20 | 278,886 | 0.2 | |||||||||||
| 278,000 | Laboratory Corp. of America Holdings, 2.625%, 02/01/20 | 279,624 | 0.2 | |||||||||||
| 125,000 | # | Post Holdings, Inc., 5.000%, 08/15/26 | 120,000 | 0.1 | ||||||||||
| 150,000 | # | Post Holdings, Inc., 8.000%, 07/15/25 | 169,125 | 0.1 | ||||||||||
| 263,000 | Reynolds American, Inc., 4.450%, 06/12/25 | 277,274 | 0.2 | |||||||||||
| 150,000 | L | Tenet Healthcare Corp., 6.750%, 06/15/23 | 147,750 | 0.1 | ||||||||||
| 250,000 | United Rentals North America, Inc., 6.125%, 06/15/23 | 262,188 | 0.1 | |||||||||||
| 150,000 | # | Valeant Pharmaceuticals International, Inc., 5.500%, 03/01/23 | 116,250 | 0.1 | ||||||||||
| 3,635,557 | 2.3 | |||||||||||||
| Energy: 0.8% | ||||||||||||||
| 700,000 | Petrobras Global Finance BV, 7.375%, 01/17/27 | 741,790 | 0.4 | |||||||||||
| 150,000 | Tesoro Logistics L.P. / Tesoro Logistics Finance Corp., 6.125%, 10/15/21 | 157,312 | 0.1 | |||||||||||
| 425,000 | YPF SA, 8.500%, 03/23/21 | 466,867 | 0.3 | |||||||||||
| 1,365,969 | 0.8 | |||||||||||||
| Financial: 4.5% | ||||||||||||||
| 150,000 | AerCap Ireland Capital Ltd. / AerCap Global Aviation Trust, 4.625%, 10/30/20 | 158,639 | 0.1 | |||||||||||
| 150,000 | # | Alliance Data Systems Corp., 5.375%, 08/01/22 | 151,875 | 0.1 | ||||||||||
| 425,000 | Banco de Bogota SA, 6.250%, 05/12/26 | 444,656 | 0.3 | |||||||||||
| 275,000 | Banco do Brasil SA/Cayman, 9.250%, 10/31/49 | 291,844 | 0.2 | |||||||||||
| 327,000 | Bank of America Corp., 2.625%, 10/19/20 | 328,187 | 0.2 | |||||||||||
| 425,000 | BBVA Bancomer SA/Texas, 6.750%, 09/30/22 | 477,063 | 0.3 | |||||||||||
| 409,000 | # | BPCE SA, 4.500%, 03/15/25 | 402,986 | 0.2 | ||||||||||
| 281,000 | Chubb INA Holdings, Inc., 3.350%, 05/03/26 | 284,545 | 0.2 | |||||||||||
| 150,000 | CIT Group, Inc., 5.000%, 08/15/22 | 157,405 | 0.1 | |||||||||||
| 280,000 | Citigroup, Inc., 2.650%, 10/26/20 | 282,013 | 0.2 | |||||||||||
| 425,000 | # | Credit Bank of Moscow Via CBOM Finance PLC, 5.875%, 11/07/21 | 440,442 | 0.3 | ||||||||||
| 100,000 | # | Dana Financing Luxembourg Sarl, 5.750%, 04/15/25 | 101,125 | 0.1 | ||||||||||
| 150,000 | Equinix, Inc., 5.750%, 01/01/25 | 159,375 | 0.1 | |||||||||||
| 150,000 | # | ESH Hospitality, Inc., 5.250%, 05/01/25 | 151,593 | 0.1 | ||||||||||
| 403,000 | GE Capital International Funding Co. Unlimited Co., 3.373%, 11/15/25 | 414,003 | 0.2 | |||||||||||
| 279,000 | Goldman Sachs Group, Inc., 4.250%, 10/21/25 | 284,867 | 0.2 | |||||||||||
| 281,000 | HCP, Inc., 4.000%, 06/01/25 | 282,955 | 0.2 | |||||||||||
| 150,000 | Iron Mountain, Inc., 5.750%, 08/15/24 | 153,750 | 0.1 | |||||||||||
| 277,000 | JPMorgan Chase & Co., 4.250%, 10/01/27 | 284,868 | 0.2 | |||||||||||
| 184,000 | JPMorgan Chase & Co., 6.125%, 12/29/49 | 195,270 | 0.1 | |||||||||||
| 400,000 | Lloyds Banking Group PLC, 4.582%, 12/10/25 | 406,850 | 0.2 | |||||||||||
| 86,000 | M&T Bank Corp., 6.450%, 12/29/49 | 93,740 | 0.1 | |||||||||||
| 268,000 | Morgan Stanley, 4.000%, 07/23/25 | 276,941 | 0.2 | |||||||||||
| 125,000 | SLM Corp., 5.125%, 04/05/22 | 125,000 | 0.1 | |||||||||||
| 200,000 | # | UBS Group Funding Jersey Ltd., 2.950%, 09/24/20 | 201,471 | 0.1 | ||||||||||
| 89,000 | Wells Fargo & Co., 5.900%, 12/29/49 | 93,036 | 0.0 | |||||||||||
| 269,000 | Wells Fargo & Co., 4.300%, 07/22/27 | 279,847 | 0.2 | |||||||||||
| 250,000 | # | Yapi ve Kredi Bankasi AS, 5.750%, 02/24/22 | 249,084 | 0.1 | ||||||||||
| 7,173,430 | 4.5 | |||||||||||||
| Industrial: 1.6% | ||||||||||||||
| 250,000 | # | Advanced Disposal Services, Inc., 5.625%, 11/15/24 | 253,125 | 0.2 | ||||||||||
| 250,000 | AECOM, 5.875%, 10/15/24 | 266,875 | 0.2 | |||||||||||
| 250,000 | # | Bombardier, Inc., 8.750%, 12/01/21 | 274,375 | 0.2 | ||||||||||
| 130,000 | # | Builders FirstSource, Inc., 5.625%, 09/01/24 | 132,437 | 0.1 | ||||||||||
| 500,000 | L | Cemex SAB de CV, 6.125%, 05/05/25 | 534,850 | 0.3 | ||||||||||
See Accompanying Notes to Financial Statements
| Voya Strategic Income Opportunities Fund | PORTFOLIO OF INVESTMENTS as of March 31, 2017 (continued) |
| Principal Amount† | Value | Percentage of Net Assets | ||||||||||||
| CORPORATE BONDS/NOTES: (continued) | ||||||||||||||
| Industrial: (continued) | ||||||||||||||
| 200,000 | Lockheed Martin Corp., 3.550%, 01/15/26 | 203,389 | 0.1 | |||||||||||
| 150,000 | # | Multi-Color Corp., 6.125%, 12/01/22 | 157,125 | 0.1 | ||||||||||
| 150,000 | # | Sealed Air Corp., 5.500%, 09/15/25 | 159,375 | 0.1 | ||||||||||
| 125,000 | # | Standard Industries, Inc./NJ, 5.000%, 02/15/27 | 122,812 | 0.1 | ||||||||||
| 150,000 | # | Standard Industries, Inc./NJ, 6.000%, 10/15/25 | 155,625 | 0.1 | ||||||||||
| 250,000 | TransDigm, Inc., 6.500%, 05/15/25 | 252,813 | 0.1 | |||||||||||
| 2,512,801 | 1.6 | |||||||||||||
| Mortgage Securities: 0.1% | ||||||||||||||
| 2,360,000 | #,^ | LSTAR Commercial Mortgage Trust 2017-5, 1.393%, 03/10/50 | 137,689 | 0.1 | ||||||||||
| Technology: 0.2% | ||||||||||||||
| 60,000 | CDW LLC / CDW Finance Corp., 5.000%, 09/01/25 | 61,275 | 0.0 | |||||||||||
| 150,000 | # | First Data Corp., 7.000%, 12/01/23 | 161,250 | 0.1 | ||||||||||
| 150,000 | NCR Corp., 6.375%, 12/15/23 | 158,250 | 0.1 | |||||||||||
| 380,775 | 0.2 | |||||||||||||
| Utilities: 0.1% | ||||||||||||||
| 150,000 | NRG Energy, Inc., 6.250%, 07/15/22 | 154,125 | 0.1 | |||||||||||
| Total Corporate Bonds/Notes (Cost $23,319,725) | 23,720,256 | 14.8 | ||||||||||||
| COLLATERALIZED MORTGAGE OBLIGATIONS: 26.5% | ||||||||||||||
| 785,572 | Adjustable Rate Mortgage Trust 2006-2 1A1, 3.296%, 05/25/36 | 733,018 | 0.5 | |||||||||||
| 226,172 | Alternative Loan Trust 2005-10CB 1A1, 1.482%, 05/25/35 | 180,031 | 0.1 | |||||||||||
| 902,282 | Alternative Loan Trust 2005-10CB 1A2, 1.432%, 05/25/35 | 716,010 | 0.5 | |||||||||||
| 926,470 | Alternative Loan Trust 2005-23CB A15, 5.500%, 07/25/35 | 874,892 | 0.5 | |||||||||||
| 315,011 | Alternative Loan Trust 2005-51 3A2A, 1.928%, 11/20/35 | 276,833 | 0.2 | |||||||||||
| 102,574 | Alternative Loan Trust 2005-6CB 1A3, 5.250%, 04/25/35 | 98,671 | 0.1 | |||||||||||
| 471,644 | Alternative Loan Trust 2005-J2 1A12, 1.382%, 04/25/35 | 379,464 | 0.2 | |||||||||||
| 56,403 | Alternative Loan Trust 2006-13T1 A9, 6.000%, 05/25/36 | 44,090 | 0.0 | |||||||||||
| 1,091,906 | Alternative Loan Trust 2006-18CB A10, 1.382%, 07/25/36 | 645,560 | 0.4 | |||||||||||
| 269,909 | Alternative Loan Trust 2006-19CB A12, 1.382%, 08/25/36 | 180,132 | 0.1 | |||||||||||
| 1,143,004 | Alternative Loan Trust 2006-19CB A28, 1.582%, 08/25/36 | 780,789 | 0.5 | |||||||||||
| 849,878 | Alternative Loan Trust 2006-HY11 A1, 1.102%, 06/25/36 | 715,036 | 0.4 | |||||||||||
| 282,100 | Alternative Loan Trust 2007-2CB 2A1, 1.582%, 03/25/37 | 184,762 | 0.1 | |||||||||||
| 561,924 | Alternative Loan Trust 2007-HY8C A1, 1.142%, 09/25/47 | 526,408 | 0.3 | |||||||||||
| 750,084 | Alternative Loan Trust 2007-OA4, 1.152%, 05/25/47 | 657,424 | 0.4 | |||||||||||
| 135,780 | # | Angel Oak Mortgage Trust LLC 2015-1 A, 4.500%, 11/25/45 | 136,623 | 0.1 | ||||||||||
| 16,979 | Banc of America Mortgage 2005-J Trust 2A4, 3.426%, 11/25/35 | 15,799 | 0.0 | |||||||||||
| 400,074 | Bear Stearns ALT-A Trust 2006-6 31A1, 3.176%, 11/25/36 | 358,503 | 0.2 | |||||||||||
| 1,102,229 | Bear Stearns ALT-A Trust 2006-6 32A1, 3.135%, 11/25/36 | 900,107 | 0.6 | |||||||||||
| 335,874 | Bear Stearns Structured Products, Inc. Trust 2007-R6 1A1, 3.504%, 01/26/36 | 305,655 | 0.2 | |||||||||||
| 63,926 | # | Bellemeade Re Ltd. 2015-1A M2, 5.282%, 07/25/25 | 64,317 | 0.0 | ||||||||||
| 73,539 | Chase Mortgage Finance Trust Series 2006-A1 2A3, 3.156%, 09/25/36 | 66,721 | 0.0 | |||||||||||
| 157,395 | CHL Mortgage Pass-Through Trust 2004-22 A3, 3.097%, 11/25/34 | 154,749 | 0.1 | |||||||||||
| 284,392 | Citigroup Mortgage Loan Trust 2006-AR2 1A1, 3.497%, 03/25/36 | 252,501 | 0.2 | |||||||||||
| 155,463 | Citigroup Mortgage Loan Trust 2006-AR9 2A, 3.229%, 11/25/36 | 127,928 | 0.1 | |||||||||||
| 204,935 | Citigroup Mortgage Loan Trust, Inc. 2005-3 2A2, 3.067%, 08/25/35 | 199,877 | 0.1 | |||||||||||
| 41,316 | Countrywide Alternative Loan Trust 2005-53T2 2A6, 1.482%, 11/25/35 | 26,318 | 0.0 | |||||||||||
| 802,015 | CSMC Mortgage-Backed Trust 2007-2 3A6, 5.400%, 03/25/37 | 732,061 | 0.5 | |||||||||||
| 971,184 | Deutsche ALT-A Securities, Inc. Alternate Loan Trust 2007-AB1 A1, 1.282%, 04/25/37 | 590,331 | 0.4 | |||||||||||
See Accompanying Notes to Financial Statements
| Voya Strategic Income Opportunities Fund | PORTFOLIO OF INVESTMENTS as of March 31, 2017 (continued) |
| Principal Amount† | Value | Percentage of Net Assets | ||||||||||||
| COLLATERALIZED MORTGAGE OBLIGATIONS: (continued) | ||||||||||||||
| 249,333 | # | Deutsche Mortgage Securities, Inc. Re-REMIC Trust Certificates Series 2007-WM1 A1, 4.035%, 06/27/37 | 251,929 | 0.2 | ||||||||||
| 1,345,484 | ^ | Fannie Mae 2007-18 BS, 5.618%, 06/25/35 | 241,044 | 0.2 | ||||||||||
| 2,528,084 | ^ | Fannie Mae 2008-94 SI, 4.518%, 04/25/36 | 535,790 | 0.3 | ||||||||||
| 3,337,788 | ^ | Fannie Mae 2009-95 HI, 6.000%, 12/25/38 | 333,533 | 0.2 | ||||||||||
| 540,870 | Fannie Mae 2010-15 FD, 1.722%, 03/25/40 | 548,497 | 0.3 | |||||||||||
| 1,331,188 | Fannie Mae 2011-47 GF, 1.552%, 06/25/41 | 1,343,465 | 0.8 | |||||||||||
| 565,883 | Fannie Mae 2012-10 UF, 1.532%, 02/25/42 | 567,147 | 0.4 | |||||||||||
| 547,933 | ^ | Fannie Mae 2012-84 KI, 6.000%, 08/25/42 | 120,185 | 0.1 | ||||||||||
| 2,092,287 | ^ | Fannie Mae 2012-93 IL, 3.000%, 09/25/27 | 199,562 | 0.1 | ||||||||||
| 3,197,602 | ^ | Fannie Mae 2015-56 DI, 3.000%, 12/25/32 | 290,375 | 0.2 | ||||||||||
| 60,000 | Fannie Mae Connecticut Avenue Securities 2014-C03 2M2, 3.882%, 07/25/24 | 61,756 | 0.0 | |||||||||||
| 190,000 | Fannie Mae Connecticut Avenue Securities 2014-CO4 1M2, 5.882%, 11/25/24 | 213,357 | 0.1 | |||||||||||
| 121,674 | Fannie Mae Connecticut Avenue Securities 2015-C02 1M2, 4.982%, 05/25/25 | 128,191 | 0.1 | |||||||||||
| 108,539 | Fannie Mae Connecticut Avenue Securities 2015-CO1 1M2, 5.282%, 02/25/25 | 115,296 | 0.1 | |||||||||||
| 1,100,000 | Fannie Mae Connecticut Avenue Securities 2017-C02 2M2, 4.627%, 09/25/29 | 1,107,092 | 0.7 | |||||||||||
| 270,773 | ^ | Fannie Mae REMIC Trust 2000-26 SP, 7.518%, 08/25/30 | 56,737 | 0.0 | ||||||||||
| 458,492 | ^ | Fannie Mae REMIC Trust 2002-13 SR, 5.618%, 03/25/32 | 70,665 | 0.0 | ||||||||||
| 219,282 | ^ | Fannie Mae REMIC Trust 2004-64 SW, 6.068%, 08/25/34 | 40,686 | 0.0 | ||||||||||
| 159,572 | ^ | Fannie Mae REMIC Trust 2004-66 SE, 5.518%, 09/25/34 | 26,599 | 0.0 | ||||||||||
| 664,873 | ^ | Fannie Mae REMIC Trust 2008-47 PS, 5.518%, 06/25/38 | 30,560 | 0.0 | ||||||||||
| 913,300 | ^ | Fannie Mae REMIC Trust 2009-25 SN, 5.568%, 04/25/39 | 162,790 | 0.1 | ||||||||||
| 495,128 | ^ | Fannie Mae REMIC Trust 2012-146 LI, 4.500%, 10/25/41 | 67,451 | 0.0 | ||||||||||
| 36,829,129 | ^ | Fannie Mae REMIC Trust 2012-66 IB, 0.050%, 06/25/42 | 82,125 | 0.1 | ||||||||||
| 1,590,904 | ^ | Fannie Mae REMIC Trust 2013-116 SC, 5.218%, 04/25/33 | 235,580 | 0.2 | ||||||||||
| 128,591 | First Horizon Alternative Mortgage Securities Trust 2006-FA8 1A7, 6.000%, 02/25/37 | 100,530 | 0.1 | |||||||||||
| 675,788 | First Horizon Mortgage Pass-Through Trust 2006-AR4 1A2, 3.034%, 01/25/37 | 604,251 | 0.4 | |||||||||||
| 3,058,491 | ^ | Freddie Mac 2009-70 PS, 5.768%, 01/25/37 | 598,285 | 0.4 | ||||||||||
| 490,652 | ^ | Freddie Mac 2524 SH, 6.588%, 11/15/32 | 52,721 | 0.0 | ||||||||||
| 768,734 | ^ | Freddie Mac 2525 SM, 7.088%, 02/15/32 | 162,384 | 0.1 | ||||||||||
| 745,902 | ^ | Freddie Mac 2981 CS, 5.808%, 05/15/35 | 116,187 | 0.1 | ||||||||||
| 236,955 | ^ | Freddie Mac 2989 HS, 6.238%, 08/15/34 | 97,745 | 0.1 | ||||||||||
| 424,560 | ^ | Freddie Mac 3018 SM, 6.288%, 08/15/35 | 88,861 | 0.1 | ||||||||||
| 702,754 | ^ | Freddie Mac 324 144, 5.805%, 06/15/39 | 145,679 | 0.1 | ||||||||||
| 1,492,885 | ^ | Freddie Mac 3523 SA, 5.088%, 09/15/36 | 230,019 | 0.1 | ||||||||||
| 1,302,040 | ^ | Freddie Mac 3582 MS, 5.238%, 10/15/39 | 200,908 | 0.1 | ||||||||||
| 1,982,107 | ^ | Freddie Mac 3688 BI, 5.000%, 07/15/40 | 404,457 | 0.3 | ||||||||||
| 7,184,208 | ^ | Freddie Mac 4186 IA, 3.000%, 03/15/33 | 976,827 | 0.6 | ||||||||||
| 335,243 | ^ | Freddie Mac 4333 AI, 5.500%, 02/15/44 | 61,848 | 0.0 | ||||||||||
| 278,174 | ^ | Freddie Mac REMIC Trust 2266 S, 7.638%, 11/15/30 | 53,111 | 0.0 | ||||||||||
| 350,048 | ^ | Freddie Mac REMIC Trust 2374 S, 7.188%, 06/15/31 | 75,383 | 0.0 | ||||||||||
| 205,286 | ^ | Freddie Mac REMIC Trust 2417 SY, 7.488%, 12/15/31 | 46,157 | 0.0 | ||||||||||
| 440,473 | ^ | Freddie Mac REMIC Trust 2577 SA, 6.538%, 02/15/33 | 86,415 | 0.1 | ||||||||||
| 32,715 | Freddie Mac REMIC Trust 2973 SB, 14.989%, 05/15/35 | 37,272 | 0.0 | |||||||||||
| 110,243 | ^ | Freddie Mac REMIC Trust 2981 SU, 6.888%, 05/15/30 | 22,101 | 0.0 | ||||||||||
| 206,957 | ^ | Freddie Mac REMIC Trust 2993 PS, 5.788%, 05/15/35 | 9,325 | 0.0 | ||||||||||
| 58,493 | Freddie Mac REMIC Trust 3031 BP, 8.000%, 08/15/35 | 70,851 | 0.0 | |||||||||||
| 1,203,122 | ^ | Freddie Mac REMIC Trust 3049 PI, 5.738%, 10/15/35 | 223,968 | 0.1 | ||||||||||
| 72,170 | Freddie Mac REMIC Trust 3085 SK, 55.053%, 12/15/35 | 197,309 | 0.1 | |||||||||||
| 129,603 | ^^,Z | Freddie Mac REMIC Trust 3151 PO, 05/15/36 | 111,118 | 0.1 | ||||||||||
See Accompanying Notes to Financial Statements
| Voya Strategic Income Opportunities Fund | PORTFOLIO OF INVESTMENTS as of March 31, 2017 (continued) |
| Principal Amount† | Value | Percentage of Net Assets | ||||||||||||
| COLLATERALIZED MORTGAGE OBLIGATIONS: (continued) | ||||||||||||||
| 543,439 | ^ | Freddie Mac REMIC Trust 3590 PI, 6.000%, 07/15/39 | 52,929 | 0.0 | ||||||||||
| 418,967 | ^ | Freddie Mac REMIC Trust 3624 TS, 3.888%, 01/15/40 | 47,042 | 0.0 | ||||||||||
| 673,000 | ^ | Freddie Mac REMIC Trust 4261 ID, 6.500%, 06/15/32 | 122,301 | 0.1 | ||||||||||
| 2,040,644 | ^ | Freddie Mac REMIC Trust 4287 CI, 4.500%, 07/15/41 | 391,268 | 0.2 | ||||||||||
| 2,677,489 | ^ | Freddie Mac Strips Series 224 IO, 6.000%, 03/01/33 | 635,700 | 0.4 | ||||||||||
| 1,436,195 | ^ | Freddie Mac Strips Series 237 S23, 6.188%, 05/15/36 | 274,134 | 0.2 | ||||||||||
| 1,773,241 | ^ | Freddie Mac Strips Series 260 33, 4.000%, 05/15/39 | 307,131 | 0.2 | ||||||||||
| 120,000 | Freddie Mac Structured Agency Credit Risk Debt Notes 2014-DN2 M3, 4.582%, 04/25/24 | 128,742 | 0.1 | |||||||||||
| 100,000 | Freddie Mac Structured Agency Credit Risk Debt Notes 2014-HQ3 M3, 5.732%, 10/25/24 | 110,447 | 0.1 | |||||||||||
| 500,000 | Freddie Mac Structured Agency Credit Risk Debt Notes 2015-HQA1 M3, 5.682%, 03/25/28 | 550,309 | 0.3 | |||||||||||
| 100,000 | Freddie Mac Structured Agency Credit Risk Debt Notes 2016-DNA4 M3, 4.782%, 03/25/29 | 103,395 | 0.1 | |||||||||||
| 700,000 | Freddie Mac Structured Agency Credit Risk Debt Notes 2017-HQA1 M2, 4.532%, 08/25/29 | 701,245 | 0.4 | |||||||||||
| 430,506 | ^ | Ginnie Mae 2011-101 EI, 6.000%, 10/16/39 | 80,475 | 0.1 | ||||||||||
| 893,348 | ^ | Ginnie Mae Series 2008-40 SA, 5.472%, 05/16/38 | 162,923 | 0.1 | ||||||||||
| 1,706,903 | ^ | Ginnie Mae Series 2009-116 SJ, 5.552%, 12/16/39 | 276,599 | 0.2 | ||||||||||
| 1,588,441 | ^ | Ginnie Mae Series 2010-4 SL, 5.472%, 01/16/40 | 293,663 | 0.2 | ||||||||||
| 584,369 | ^ | Ginnie Mae Series 2010-98 QS, 5.622%, 01/20/40 | 81,856 | 0.1 | ||||||||||
| 4,280,161 | ^ | Ginnie Mae Series 2011-101 BI, 0.650%, 11/20/37 | 94,910 | 0.1 | ||||||||||
| 88,860 | ^ | Ginnie Mae Series 2012-149 BI, 3.500%, 10/20/41 | 15,502 | 0.0 | ||||||||||
| 388,386 | ^ | Ginnie Mae Series 2013-103 DS, 5.172%, 07/20/43 | 64,121 | 0.0 | ||||||||||
| 285,467 | ^ | Ginnie Mae Series 2013-134 DS, 5.122%, 09/20/43 | 47,448 | 0.0 | ||||||||||
| 605,272 | ^ | Ginnie Mae Series 2013-44 LI, 4.500%, 01/16/43 | 105,524 | 0.1 | ||||||||||
| 9,716,241 | ^ | Ginnie Mae Series 2015-69 IL, 0.200%, 07/20/34 | 75,887 | 0.1 | ||||||||||
| 480,320 | ^ | Ginnie Mae Series 2015-98 IU, 4.000%, 08/20/44 | 85,462 | 0.1 | ||||||||||
| 18,998 | ^ | Ginnie Mae Series 2016-12 JI, 4.000%, 04/20/40 | 108 | 0.0 | ||||||||||
| 168,519 | ^ | Ginnie Mae Series 2016-12 MI, 5.000%, 04/20/39 | 2,993 | 0.0 | ||||||||||
| 1,466,650 | ^ | Ginnie Mae Series 2016-8 PI, 4.000%, 10/20/44 | 245,714 | 0.2 | ||||||||||
| 728,875 | HarborView Mortgage Loan Trust 2006-14, 1.128%, 01/25/47 | 627,247 | 0.4 | |||||||||||
| 5,734 | HomeBanc Mortgage Trust 2004-1 2A, 1.842%, 08/25/29 | 5,348 | 0.0 | |||||||||||
| 87,718 | HomeBanc Mortgage Trust 2005-3 A2, 1.292%, 07/25/35 | 87,072 | 0.1 | |||||||||||
| 124,181 | IndyMac INDX Mortgage Loan Trust 2006-AR2 1A1B, 1.192%, 04/25/46 | 103,376 | 0.1 | |||||||||||
| 31,277 | JP Morgan Alternative Loan Trust 2006-S1 3A2, 1.252%, 03/25/36 | 51,329 | 0.0 | |||||||||||
| 137,598 | JP Morgan Mortgage Trust 2005-S3 1A10, 6.000%, 01/25/36 | 115,742 | 0.1 | |||||||||||
| 391,960 | JP Morgan Mortgage Trust 2006-S2 1A18, 6.000%, 07/25/36 | 344,980 | 0.2 | |||||||||||
| 819,558 | JP Morgan Mortgage Trust 2006-S3 1A30, 6.500%, 08/25/36 | 677,979 | 0.4 | |||||||||||
| 97,907 | Lehman XS Trust Series 2005-5N 1A2, 1.342%, 11/25/35 | 75,834 | 0.1 | |||||||||||
| 1,632,147 | Morgan Stanley Mortgage Loan Trust 2006-9AR A2, 1.132%, 08/25/36 | 809,411 | 0.5 | |||||||||||
| 73,828 | Prime Mortgage Trust 2007-1 A4, 5.500%, 03/25/37 | 66,706 | 0.0 | |||||||||||
| 197,630 | Structured Adjustable Rate Mortgage Loan Trust 2005-4 3A1, 3.408%, 03/25/35 | 192,860 | 0.1 | |||||||||||
| 193,846 | WaMu Mortgage Pass Through Certificates Series 2006-AR12 2A3, 2.318%, 10/25/36 | 165,842 | 0.1 | |||||||||||
| 643,933 | WaMu Mortgage Pass-Through Certificates Series 2005-AR10 Trust, 2.784%, 09/25/35 | 638,486 | 0.4 | |||||||||||
| 207,676 | WaMu Mortgage Pass-Through Certificates Series 2006-AR10 1A1, 2.880%, 09/25/36 | 195,715 | 0.1 | |||||||||||
See Accompanying Notes to Financial Statements
| Voya Strategic Income Opportunities Fund | PORTFOLIO OF INVESTMENTS as of March 31, 2017 (continued) |
| Principal Amount† | Value | Percentage of Net Assets | ||||||||||||
| COLLATERALIZED MORTGAGE OBLIGATIONS: (continued) | ||||||||||||||
| 35,711 | WaMu Mortgage Pass-Through Certificates Series 2006-AR12 1A1, 2.877%, 10/25/36 | 33,518 | 0.0 | |||||||||||
| 248,620 | WaMu Mortgage Pass-Through Certificates Series 2006-AR14 1A3, 2.662%, 11/25/36 | 223,398 | 0.1 | |||||||||||
| 905,659 | WaMu Mortgage Pass-Through Certificates Series 2006-AR14 Trust 1A4, 2.662%, 11/25/36 | 813,781 | 0.5 | |||||||||||
| 114,372 | WaMu Mortgage Pass-Through Certificates Series 2006-AR16 Trust 3A1, 2.705%, 12/25/36 | 105,995 | 0.1 | |||||||||||
| 40,806 | WaMu Mortgage Pass-Through Certificates Series 2006-AR6 2A3, 2.872%, 08/25/36 | 36,974 | 0.0 | |||||||||||
| 139,696 | WaMu Mortgage Pass-Through Certificates Series 2006-AR8 1A4, 2.858%, 08/25/46 | 127,431 | 0.1 | |||||||||||
| 216,648 | WaMu Mortgage Pass-Through Certificates Series 2007-HY2 1A1, 2.770%, 12/25/36 | 205,528 | 0.1 | |||||||||||
| 22,752 | WaMu Mortgage Pass-Through Certificates Series 2007-HY4 1A1, 2.456%, 04/25/37 | 19,990 | 0.0 | |||||||||||
| 121,808 | WaMu Mortgage Pass-Through Certificates Series 2007-HY7 2A2, 2.678%, 07/25/37 | 100,521 | 0.1 | |||||||||||
| 1,158,430 | Washington Mutual Mortgage Pass-Through Certificates WMALT Series 2005-10 2A3, 1.882%, 11/25/35 | 883,310 | 0.6 | |||||||||||
| 214,485 | Washington Mutual Mortgage Pass-Through Certificates WMALT Series 2005-11 A1, 5.750%, 01/25/36 | 187,936 | 0.1 | |||||||||||
| 302,712 | Washington Mutual Mortgage Pass-Through Certificates WMALT Series 2005-8 1A2, 5.500%, 10/25/35 | 283,398 | 0.2 | |||||||||||
| 1,374,322 | Washington Mutual Mortgage Pass-Through Certificates WMALT Series 2006-5 2CB2, 1.582%, 07/25/36 | 792,618 | 0.5 | |||||||||||
| 1,341,970 | Washington Mutual Mortgage Pass-Through Certificates WMALT Series 2006-AR6 2A, 1.598%, 08/25/46 | 972,186 | 0.6 | |||||||||||
| 94,465 | Wells Fargo Alternative Loan 2007-PA2 2A1, 1.412%, 06/25/37 | 69,873 | 0.0 | |||||||||||
| 882,214 | Wells Fargo Mortgage Backed Securities 2006-8 A15 Trust, 6.000%, 07/25/36 | 890,848 | 0.6 | |||||||||||
| 1,135,300 | Wells Fargo Mortgage Backed Securities 2006-8 A18 Trust, 6.000%, 07/25/36 | 1,146,411 | 0.7 | |||||||||||
| 1,373,956 | Wells Fargo Mortgage Backed Securities 2006-AR12 Trust 1A1, 3.235%, 09/25/36 | 1,301,693 | 0.8 | |||||||||||
| 918,647 | Wells Fargo Mortgage Backed Securities 2006-AR17 Trust A1, 3.045%, 10/25/36 | 880,186 | 0.6 | |||||||||||
| 56,632 | Wells Fargo Mortgage Backed Securities 2006-AR6 Trust 3A1, 3.170%, 03/25/36 | 54,174 | 0.0 | |||||||||||
| 162,601 | Wells Fargo Mortgage Backed Securities 2006-AR7 Trust 2A1, 3.101%, 05/25/36 | 155,464 | 0.1 | |||||||||||
| 172,810 | Wells Fargo Mortgage Backed Securities 2006-AR7 Trust 2A4, 3.101%, 05/25/36 | 165,224 | 0.1 | |||||||||||
| 827,355 | Wells Fargo Mortgage Backed Securities 2007-3 AE, 0.985%, 04/25/37 | 679,204 | 0.4 | |||||||||||
| 550,041 | Wells Fargo Mortgage Backed Securities 2007-AR7 Trust A1, 3.150%, 12/28/37 | 510,717 | 0.3 | |||||||||||
| Total Collateralized Mortgage Obligations (Cost $40,793,762) | 42,384,867 | 26.5 | ||||||||||||
| U.S. GOVERNMENT AGENCY OBLIGATIONS: 0.0% | ||||||||||||||
| Federal National Mortgage Association: 0.0%## | ||||||||||||||
| 12,152 | 5.500%, due 10/01/39 | 13,572 | 0.0 | |||||||||||
| Total U.S. Government Agency Obligations (Cost $13,196) | 13,572 | 0.0 | ||||||||||||
| U.S. TREASURY OBLIGATIONS: 0.1% | ||||||||||||||
| U.S. Treasury Bonds: 0.1% | ||||||||||||||
| 140,000 | 2.875%, due 11/15/46 | 135,819 | 0.1 | |||||||||||
| U.S. Treasury Notes: 0.0% | ||||||||||||||
| 3,000 | 1.250%, due 03/31/19 | 2,999 | 0.0 | |||||||||||
| 9,000 | 2.125%, due 02/29/24 | 8,951 | 0.0 | |||||||||||
| 80,000 | 2.250%, due 02/15/27 | 78,980 | 0.0 | |||||||||||
| 90,930 | 0.0 | |||||||||||||
| Total U.S. Treasury Obligations (Cost $225,537) | 226,749 | 0.1 | ||||||||||||
See Accompanying Notes to Financial Statements
| Voya Strategic Income Opportunities Fund | PORTFOLIO OF INVESTMENTS as of March 31, 2017 (continued) |
| Principal Amount† | Value | Percentage of Net Assets | ||||||||||||
| BANK LOANS: 20.5% | ||||||||||||||
| Aerospace & Defense: 0.2% | ||||||||||||||
| 190,000 | Avolon TLB Borrower 1 (Luxembourg) S.a.r.l. Term Loan B2, 3.900%, 01/20/22 | 192,877 | 0.1 | |||||||||||
| 150,000 | Geo Group, Inc. (The) 2017 Term Loan B, 3.400%, 03/21/24 | 150,656 | 0.1 | |||||||||||
| 343,533 | 0.2 | |||||||||||||
| Automotive: 0.8% | ||||||||||||||
| 150,000 | American Axle and Manufacturing, Inc. Term Loan B, 3.400%, 03/08/24 | 150,438 | 0.1 | |||||||||||
| 13,636 | CH Hold Corp. Delayed Draw Term Loan B, 4.200%, 01/31/24 | 13,753 | 0.0 | |||||||||||
| 246,859 | Dynacast International LLC - Term Loan B, 4.700%, 01/28/22 | 245,310 | 0.1 | |||||||||||
| 150,000 | Lumileds Holding B.V. Term Loan B, 5.700%, 04/15/24 | 151,875 | 0.1 | |||||||||||
| 246,843 | Midas Intermediate Holdco II, LLC - Incremental Term Loan B, 3.900%, 08/18/21 | 248,232 | 0.2 | |||||||||||
| 246,847 | NN, Inc. 2016 Term Loan B, 5.400%, 10/19/22 | 247,271 | 0.1 | |||||||||||
| 246,875 | TI Group Automotive Systems, L.L.C. - 2015 USD Term Loan, 3.900%, 06/30/22 | 248,572 | 0.2 | |||||||||||
| 1,305,451 | 0.8 | |||||||||||||
| Basic Materials: 0.3% | ||||||||||||||
| 248,128 | Huntsman International LLC Term Loan B, 4.200%, 04/01/23 | 250,920 | 0.2 | |||||||||||
| 246,867 | ZEP Inc. 1st Lien, 5.200%, 06/27/22 | 250,570 | 0.1 | |||||||||||
| 501,490 | 0.3 | |||||||||||||
| Building & Development: 0.6% | ||||||||||||||
| 150,000 | American Builders & Contractors Supply Co. Term Loan B, 3.900%, 10/31/23 | 150,844 | 0.1 | |||||||||||
| 200,106 | Doosan Infracore International, Inc. - Term Loan B, 4.700%, 05/28/21 | 202,607 | 0.1 | |||||||||||
| 149,625 | Forterra Finance, LLC Term Loan B, 4.700%, 10/31/23 | 151,027 | 0.1 | |||||||||||
| 196,330 | Ventia Service (fka Leighton), Upsized Term Loan B, 5.200%, 05/21/22 | 197,803 | 0.1 | |||||||||||
| 150,000 | Wilsonart LLC 2016 Term Loan, 4.700%, 12/19/23 | 151,242 | 0.1 | |||||||||||
| 148,877 | Zekelman Industries, Inc. (fka JMC Steel), Term Loan B, 4.900%, 06/14/21 | 151,110 | 0.1 | |||||||||||
| 1,004,633 | 0.6 | |||||||||||||
| Business Equipment & Services: 1.6% | ||||||||||||||
| 244,869 | AlixPartners, LLP 2016 Term Loan B, 4.200%, 07/28/22 | 246,793 | 0.1 | |||||||||||
| 150,000 | Array Canada Inc. Term Loan B, 6.200%, 02/06/23 | 148,594 | 0.1 | |||||||||||
| 149,625 | Camelot UK Holdco Limited Term Loan B, 4.900%, 10/03/23 | 150,298 | 0.1 | |||||||||||
| 150,000 | Colorado Buyer Inc Term Loan B, 4.200%, 05/15/24 | 151,162 | 0.1 | |||||||||||
| 149,625 | DTI Holdco, Inc. 2016 Term Loan B, 6.400%, 10/01/23 | 147,568 | 0.1 | |||||||||||
| 150,000 | EVO Payments International Term Loan B, 6.200%, 12/22/23 | 151,758 | 0.1 | |||||||||||
| 150,000 | Gartner, Inc. Term Loan B, 3.200%, 04/12/24 | 151,031 | 0.1 | |||||||||||
| 246,881 | KUEHG Corp. 2016 1st Lien Term Loan, 5.400%, 08/13/22 | 248,990 | 0.2 | |||||||||||
| 242,247 | Learning Care Group (US) No. 2 Inc. - New Term Loan, 5.200%, 05/05/21 | 246,183 | 0.1 | |||||||||||
| 100,000 | NeuStar, Inc. 2nd Lien Term Loan, 9.200%, 04/01/25 | 101,188 | 0.1 | |||||||||||
| 150,000 | NeuStar, Inc. Term Loan B2, 4.900%, 04/01/24 | 152,156 | 0.1 | |||||||||||
| 147,173 | Pre-Paid Legal Services, Inc. 1st Lien Term Loan, 6.500%, 07/01/19 | 148,706 | 0.1 | |||||||||||
| 248,125 | Solera Management, USD Term Loan B, 4.400%, 03/03/23 | 249,676 | 0.2 | |||||||||||
| 246,795 | SurveyMonkey Inc. - Term Loan B, 6.300%, 02/07/19 | 246,943 | 0.1 | |||||||||||
| 2,541,046 | 1.6 | |||||||||||||
| Cable & Satellite Television: 1.1% | ||||||||||||||
| 249,375 | CSC Holdings, LLC 2016 Term Loan, 4.200%, 10/11/24 | 249,271 | 0.1 | |||||||||||
| 250,000 | Liberty Cablevision of Puerto Rico LLC - 1st Lien Term Loan, 4.700%, 01/07/22 | 249,844 | 0.2 | |||||||||||
| 248,125 | Numericable (YPSO France SAS), Term Loan B7 USD, 5.400%, 01/15/24 | 249,707 | 0.1 | |||||||||||
| 150,000 | RCN Grande 1st Lien Term Loan, 4.200%, 12/16/23 | 150,951 | 0.1 | |||||||||||
See Accompanying Notes to Financial Statements
| Voya Strategic Income Opportunities Fund | PORTFOLIO OF INVESTMENTS as of March 31, 2017 (continued) |
| Principal Amount† | Value | Percentage of Net Assets | ||||||||||||
| BANK LOANS: (continued) | ||||||||||||||
| Cable & Satellite Television: (continued) | ||||||||||||||
| 149,625 | Telesat Canada Term Loan B4, 4.200%, 11/17/23 | 151,046 | 0.1 | |||||||||||
| 150,000 | UPC Financing Partnership USD Term Loan AP, 3.900%, 05/30/25 | 150,656 | 0.1 | |||||||||||
| 150,000 | Virgin Media Investment Holdings Limited USD Term Loan I, 3.900%, 01/31/25 | 150,562 | 0.1 | |||||||||||
| 149,228 | WaveDivision Holdings, LLC Term Loan B, 3.900%, 10/15/19 | 150,124 | 0.1 | |||||||||||
| 249,375 | Wideopenwest Finance, LLC, 2016 Term Loan B, 4.700%, 08/18/23 | 251,121 | 0.2 | |||||||||||
| 1,753,282 | 1.1 | |||||||||||||
| Chemicals & Plastics: 1.0% | ||||||||||||||
| 85,335 | Allnex S.a.r.l. (Monarch), Term B-2 Facility, 4.400%, 09/13/23 | 85,921 | 0.1 | |||||||||||
| 64,290 | Allnex S.a.r.l. (Monarch), Term B-3 Facility, 4.400%, 09/13/23 | 64,732 | 0.0 | |||||||||||
| 150,000 | Alpha 3 B.V. 2017 Term Loan B1, 4.200%, 01/31/24 | 150,938 | 0.1 | |||||||||||
| 167,929 | Avantor Performance Materials Holdings, LLC 2017 1st Lien Term Loan, 5.200%, 03/10/24 | 169,346 | 0.1 | |||||||||||
| 7,071 | Avantor Performance Materials Holdings, LLC 2017 Delayed Draw Term Loan, 5.200%, 03/11/24 | 7,130 | 0.0 | |||||||||||
| 242,806 | Emerald Performance Materials, LLC - New 1st Lien Term Loan, 4.700%, 08/01/21 | 244,748 | 0.1 | |||||||||||
| 35,017 | Flint Group GmbH - USD Term Loan C, 4.700%, 09/07/21 | 35,149 | 0.0 | |||||||||||
| 211,826 | Flint Group US LLC - USD 1st Lien Term Loan B2, 4.200%, 09/07/21 | 213,636 | 0.1 | |||||||||||
| 122,365 | INEOS Styrolution Group GmbH 2016 USD Term Loan B, 4.900%, 09/30/21 | 123,181 | 0.1 | |||||||||||
| 246,858 | Ineos US Finance LLC 2022 USD Term Loan, 3.900%, 03/31/22 | 248,362 | 0.2 | |||||||||||
| 173,318 | Kraton Polymers, LLC 2016 Term Loan B, 5.200%, 01/06/22 | 175,248 | 0.1 | |||||||||||
| 124,356 | Tronox Pigments (Netherlands) BV, Term Loan, 4.700%, 03/19/20 | 125,277 | 0.1 | |||||||||||
| 1,643,668 | 1.0 | |||||||||||||
| Clothing/Textiles: 0.2% | ||||||||||||||
| 246,851 | Varsity Brands, Inc. - 1st Lien Term Loan, 5.200%, 12/10/21 | 250,631 | 0.2 | |||||||||||
| Conglomerates: 0.1% | ||||||||||||||
| 149,625 | WireCo WorldGroup, Inc. 1st Lien Term Loan, 6.700%, 09/29/23 | 151,246 | 0.1 | |||||||||||
| Consumer, Cyclical: 0.3% | ||||||||||||||
| 246,867 | Amaya Holdings BV, 4.700%, 08/01/21 | 247,749 | 0.2 | |||||||||||
| 191,644 | American Casino & Entertainment Properties Term Loan, 4.400%, 07/07/22 | 192,962 | 0.1 | |||||||||||
| 29,680 | Aristocrat International Pty Ltd, 3.400%, 10/20/21 | 29,900 | 0.0 | |||||||||||
| 470,611 | 0.3 | |||||||||||||
| Consumer, Non-cyclical: 0.2% | ||||||||||||||
| 150,000 | Envision Healthcare Corp Term Loan B, 4.200%, 12/01/23 | 151,688 | 0.1 | |||||||||||
| 199,488 | TransUnion, LLC - Term Loan B2, 3.700%, 04/09/23 | 201,283 | 0.1 | |||||||||||
| 352,971 | 0.2 | |||||||||||||
| Containers & Glass Products: 0.7% | ||||||||||||||
| 246,949 | Berlin Packaging LLC - 2014 1st Lien Term Loan, 4.700%, 10/01/21 | 248,685 | 0.2 | |||||||||||
| 150,000 | Flex Acquisition Company, Inc. 1st Lien Term Loan, 4.400%, 12/29/23 | 151,265 | 0.1 | |||||||||||
| 149,625 | Milacron LLC Term Loan B, 4.200%, 09/28/23 | 150,560 | 0.1 | |||||||||||
| 249,375 | Reynolds Group Holdings Inc. USD 2017 Term Loan, 4.200%, 02/04/23 | 250,700 | 0.2 | |||||||||||
| 239,681 | SIG Combibloc US Acquisition Inc - USD Term Loan, 4.200%, 03/10/22 | 241,345 | 0.1 | |||||||||||
| 13,636 | TricorBraun, Inc. 1st Lien Delayed Draw Term Loan, 4.900%, 11/30/23 | 13,807 | 0.0 | |||||||||||
| 1,056,362 | 0.7 | |||||||||||||
| Cosmetics/Toiletries: 0.1% | ||||||||||||||
| 149,625 | Revlon Consumer Products Corporation, Term Loan B 2016, 4.700%, 09/07/23 | 149,937 | 0.1 | |||||||||||
| Drugs: 0.2% | ||||||||||||||
| 60,000 | Horizon Pharma, Inc. Incremental Term Loan B, 5.700%, 05/07/21 | 60,225 | 0.0 | |||||||||||
| 150,000 | Prestige Brands, Inc. Term Loan B4, 3.900%, 01/26/24 | 151,531 | 0.1 | |||||||||||
See Accompanying Notes to Financial Statements
| Voya Strategic Income Opportunities Fund | PORTFOLIO OF INVESTMENTS as of March 31, 2017 (continued) |
| Principal Amount† | Value | Percentage of Net Assets | ||||||||||||
| BANK LOANS: (continued) | ||||||||||||||
| Drugs: (continued) | ||||||||||||||
| 150,000 | RPI Finance Trust Term Loan B6, 2.000%, 03/07/23 | 149,625 | 0.1 | |||||||||||
| 361,381 | 0.2 | |||||||||||||
| Ecological Services & Equipment: 0.1% | ||||||||||||||
| 150,000 | Casella Waste Systems, Inc. Term Loan B, 4.200%, 10/17/23 | 151,406 | 0.1 | |||||||||||
| Electronics/Electrical: 2.0% | ||||||||||||||
| 150,000 | Aptean, Inc. 2016 1st Term Loan, 6.200%, 12/20/22 | 152,016 | 0.1 | |||||||||||
| 148,125 | Avast Software B.V. USD Term Loan B, 5.200%, 09/30/22 | 149,363 | 0.1 | |||||||||||
| 99,910 | Compuware Corporation Term Loan B3, 5.400%, 12/15/21 | 100,234 | 0.1 | |||||||||||
| 127,813 | Epicor Software Corporation 1st Lien Term Loan, 4.900%, 06/01/22 | 128,276 | 0.1 | |||||||||||
| 113,065 | Epicor Software Corporation 2016 Term Loan, 5.200%, 06/01/22 | 113,489 | 0.1 | |||||||||||
| 149,250 | Eze Castle Software Inc. 2017 1st Lien Term Loan, 4.200%, 04/04/20 | 149,810 | 0.1 | |||||||||||
| 150,000 | Greeneden U.S. Holdings II, LLC 2017 Term Loan B, 5.200%, 12/01/23 | 151,219 | 0.1 | |||||||||||
| 150,000 | Infor (US), Inc. Term Loan B6, 3.900%, 02/01/22 | 150,121 | 0.1 | |||||||||||
| 170,000 | Kronos Incorporated New 1st Lien Term Loan, 5.200%, 11/01/23 | 171,169 | 0.1 | |||||||||||
| 149,250 | Micron Technology, Inc., Term Loan B, 4.900%, 04/26/22 | 150,999 | 0.1 | |||||||||||
| 92,763 | Oberthur Technologies S.A. 2016 USD Term Loan B2, 3.750%, 12/15/23 | 93,111 | 0.1 | |||||||||||
| 57,237 | Oberthur Technologies S.A. 2016 USD Term Loan, 4.900%, 12/14/23 | 57,451 | 0.0 | |||||||||||
| 189,115 | ON Semiconductor Corporation Incremental Term Loan, 4.400%, 03/31/23 | 190,365 | 0.1 | |||||||||||
| 150,000 | Optiv Security, Inc. 1st Lien Term Loan, 4.400%, 01/13/24 | 151,000 | 0.1 | |||||||||||
| 150,000 | Optiv Security, Inc. 2nd Lien Term Loan, 8.400%, 02/01/25 | 151,875 | 0.1 | |||||||||||
| 150,000 | Rackspace Hosting, Inc. 1st Lien Term Loan, 4.700%, 11/03/23 | 151,328 | 0.1 | |||||||||||
| 149,625 | Sabre GLBL Inc. Term Loan B, 3.900%, 02/16/24 | 150,878 | 0.1 | |||||||||||
| 248,750 | SolarWinds Holdings, Inc. 2017 Term Loan, 4.700%, 02/05/23 | 249,325 | 0.1 | |||||||||||
| 184,672 | TTM Technologies, Term Loan B, 5.400%, 05/31/21 | 187,904 | 0.1 | |||||||||||
| 148,875 | Veritas Technologies Corporation, USD Term Loan B-1, 6.800%, 01/27/23 | 148,208 | 0.1 | |||||||||||
| 188,810 | Zebra Technologies Corporation 2016 Term Loan B, 3.700%, 10/27/21 | 190,640 | 0.1 | |||||||||||
| 3,138,781 | 2.0 | |||||||||||||
| Financial: 0.3% | ||||||||||||||
| 247,508 | Assuredpartners, Inc. 1st Lien, 5.400%, 10/21/22 | 249,790 | 0.2 | |||||||||||
| 150,000 | Broadstreet Partners Inc. Term Loan, 5.400%, 11/08/23 | 152,320 | 0.1 | |||||||||||
| 402,110 | 0.3 | |||||||||||||
| Financial Intermediaries: 0.2% | ||||||||||||||
| 247,500 | First Eagle Investment Management, LLC - Term Loan, 5.200%, 12/01/22 | 249,124 | 0.2 | |||||||||||
| Food Products: 0.3% | ||||||||||||||
| 70,000 | Atrium Innovations Inc. USD Term Loan, 4.700%, 02/15/21 | 70,503 | 0.0 | |||||||||||
| 246,809 | CSM Bakery Solutions LLC - 1st Lien Term Loan, 5.200%, 07/03/20 | 233,080 | 0.2 | |||||||||||
| 246,819 | Del Monte Foods, Inc. - 1st Lien Term Loan, 4.400%, 02/18/21 | 205,272 | 0.1 | |||||||||||
| 508,855 | 0.3 | |||||||||||||
| Food Service: 0.3% | ||||||||||||||
| 150,000 | Landrys, Inc. 2016 Term Loan B, 4.400%, 10/04/23 | 151,487 | 0.1 | |||||||||||
| 211,538 | Manitowoc Foodservice, Inc., Term Loan B, 4.200%, 03/03/23 | 213,918 | 0.1 | |||||||||||
| 149,250 | US Foods, Inc., Term Loan B, 3.900%, 06/27/23 | 150,756 | 0.1 | |||||||||||
| 516,161 | 0.3 | |||||||||||||
| Food/Drug Retailers: 0.2% | ||||||||||||||
| 150,000 | Moran Foods LLC Term Loan, 7.200%, 12/05/23 | 149,883 | 0.1 | |||||||||||
| 149,625 | NBTY, Inc., USD Term Loan B, 4.700%, 05/05/23 | 150,514 | 0.1 | |||||||||||
| 89,854 | Supervalu Inc. - Refi Term Loan B, 5.700%, 03/21/19 | 90,684 | 0.0 | |||||||||||
| �� | 391,081 | 0.2 | ||||||||||||
See Accompanying Notes to Financial Statements
| Voya Strategic Income Opportunities Fund | PORTFOLIO OF INVESTMENTS as of March 31, 2017 (continued) |
| Principal Amount† | Value | Percentage of Net Assets | ||||||||||||
| BANK LOANS: (continued) | ||||||||||||||
| Forest Products: 0.2% | ||||||||||||||
| 248,750 | Blount International, Inc., Term Loan B USD, 7.400%, 04/12/23 | 251,237 | 0.2 | |||||||||||
| Health Care: 2.0% | ||||||||||||||
| 154,250 | Acadia Healthcare Company, Inc. - Term Loan B2, 4.200%, 02/16/23 | 155,683 | 0.1 | |||||||||||
| 150,000 | ADMI Corp. - 2015 Term Loan B, 4.900%, 04/30/22 | 151,875 | 0.1 | |||||||||||
| 149,250 | Air Medical Group Holdings, Inc., Incremental Term Loan B-1, 5.200%, 04/28/22 | 149,374 | 0.1 | |||||||||||
| 149,250 | ATI Physical Therapy, First Lien Term Loan, 4.700%, 05/10/23 | 151,053 | 0.1 | |||||||||||
| 150,000 | BioClinica, Inc. 1st Lien Term Loan, 5.400%, 10/20/23 | 151,688 | 0.1 | |||||||||||
| 149,625 | ExamWorks Group, Inc. 2017 Term Loan, 4.400%, 07/27/23 | 150,747 | 0.1 | |||||||||||
| 150,000 | Greenway Health, LLC 2017 1st Lien Term Loan, 5.900%, 02/17/24 | 151,219 | 0.1 | |||||||||||
| 125,000 | inVentiv Health, Inc. 2016 Term Loan B, 4.900%, 11/09/23 | 125,614 | 0.1 | |||||||||||
| 150,000 | Kinetic Concepts, Inc. 2017 USD Term Loan B, 4.400%, 02/03/24 | 150,078 | 0.1 | |||||||||||
| 138,112 | Multiplan, Inc, First Lien Term Loan, 5.200%, 06/07/23 | 140,026 | 0.1 | |||||||||||
| 225,779 | NAPA, Upsized First Lien Term Loan, 6.200%, 04/19/23 | 227,297 | 0.1 | |||||||||||
| 157,443 | NVA Holdings, Inc. USD 1st Lien Term Loan B2, 4.700%, 08/14/21 | 159,149 | 0.1 | |||||||||||
| 149,250 | Precyse Acquisition Corp., First Lien Term Loan, 6.700%, 10/20/22 | 150,649 | 0.1 | |||||||||||
| 149,250 | Prospect Medical Holdings, Inc. Term Loan, 7.200%, 06/30/22 | 151,395 | 0.1 | |||||||||||
| 160,000 | Select Medical Corporation 2017 Term Loan B, 4.700%, 03/06/24 | 161,700 | 0.1 | |||||||||||
| 248,110 | Surgery Center Holdings, Inc. New 1st Lien Term Loan, 4.900%, 11/03/20 | 250,669 | 0.2 | |||||||||||
| 150,000 | Team Health Holdings, Inc. 1st Lien Term Loan, 3.900%, 01/25/24 | 149,606 | 0.1 | |||||||||||
| 247,500 | U.S. Renal Care, Inc. - 2015 Term Loan B, 5.400%, 12/30/22 | 232,650 | 0.1 | |||||||||||
| 219,963 | Vizient, Inc. 2016 Term Loan B, 5.200%, 02/13/23 | 222,346 | 0.1 | |||||||||||
| 3,182,818 | 2.0 | |||||||||||||
| Home Furnishings: 0.2% | ||||||||||||||
| 149,250 | Prime Security Services Borrower, LLC 2016 1st Lien Term Loan, 4.400%, 05/02/22 | 150,796 | 0.1 | |||||||||||
| 190,000 | Serta Simmons Bedding, LLC 1st Lien Term Loan, 4.700%, 11/08/23 | 191,119 | 0.1 | |||||||||||
| 341,915 | 0.2 | |||||||||||||
| Industrial: 0.6% | ||||||||||||||
| 128,267 | ADS Waste Holdings Term Loan, 3.900%, 11/10/23 | 129,357 | 0.1 | |||||||||||
| 120,959 | Cortes NP Acquisition Corp Term Loan, 6.200%, 11/30/23 | 122,169 | 0.1 | |||||||||||
| 150,000 | Proampac PG Borrower LLC 1st Lien Term Loan, 5.200%, 11/18/23 | 151,575 | 0.1 | |||||||||||
| 150,000 | Quikrete Holdings Inc. Term Loan, 4.400%, 11/15/23 | 151,750 | 0.1 | |||||||||||
| 246,867 | Tekni-Plex, Inc. - 2015 USD Term Loan B, 4.700%, 06/01/22 | 247,361 | 0.1 | |||||||||||
| 136,364 | Tricorbraun Holdings Inc. 1st Lien Term Loan, 4.900%, 11/30/23 | 138,068 | 0.1 | |||||||||||
| 940,280 | 0.6 | |||||||||||||
| Industrial Equipment: 0.7% | ||||||||||||||
| 150,000 | Columbus McKinnon Corporation Term Loan B, 4.200%, 01/31/24 | 151,500 | 0.1 | |||||||||||
| 246,819 | EWT Holdings III Corp. - 1st Lien Term Loan, 4.900%, 01/15/21 | 248,670 | 0.2 | |||||||||||
| 246,951 | Filtration Group Corporation - 1st Lien Term Loan, 4.400%, 11/30/20 | 249,421 | 0.2 | |||||||||||
| 149,625 | Global Brass and Copper, Inc., Term Loan B, 5.400%, 07/18/23 | 151,776 | 0.1 | |||||||||||
| 181,170 | Kenan Advantage Group, Inc., Term Loan B, 4.200%, 07/31/22 | 181,487 | 0.1 | |||||||||||
| 55,094 | Kenan Advantage Group, Inc., Term Loan Canada Borrower, 4.200%, 07/31/22 | 55,191 | 0.0 | |||||||||||
| 1,038,045 | 0.7 | |||||||||||||
| Insurance: 0.8% | ||||||||||||||
| 150,000 | Acrisure, LLC 2016 Term Loan B, 5.900%, 11/15/23 | 152,484 | 0.1 | |||||||||||
| 246,867 | Alliant Holdings I, Inc. - 2015 Term Loan B, 4.400%, 08/12/22 | 248,899 | 0.2 | |||||||||||
See Accompanying Notes to Financial Statements
| Voya Strategic Income Opportunities Fund | PORTFOLIO OF INVESTMENTS as of March 31, 2017 (continued) |
| Principal Amount† | Value | Percentage of Net Assets | ||||||||||||
| BANK LOANS: (continued) | ||||||||||||||
| Insurance: (continued) | ||||||||||||||
| 136,364 | CH Hold Corp. 1st Lien Term Loan, 4.200%, 01/31/24 | 137,529 | 0.1 | |||||||||||
| 246,827 | Hub International Limited - Term Loan B, 4.200%, 10/02/20 | 248,158 | 0.1 | |||||||||||
| 150,000 | NFP Corp. Term Loan B, 4.700%, 01/08/24 | 151,706 | 0.1 | |||||||||||
| 241,070 | USI, Inc. - Term Loan B, 4.400%, 12/27/19 | 241,723 | 0.1 | |||||||||||
| 149,625 | VF Holding Corp Reprice Term Loan, 4.400%, 06/30/23 | 150,640 | 0.1 | |||||||||||
| 1,331,139 | 0.8 | |||||||||||||
| Leisure Good/Activities/Movies: 0.8% | ||||||||||||||
| 150,000 | Equinox Holdings, Inc. 2017 Term Loan B, 4.400%, 03/10/24 | 151,313 | 0.1 | |||||||||||
| 199,500 | Fitness International, LLC., Upsized Term Loan B, 6.200%, 07/01/20 | 201,370 | 0.1 | |||||||||||
| 246,867 | LTF Merger Sub, Inc. 2017 Term Loan B, 4.200%, 06/10/22 | 248,013 | 0.2 | |||||||||||
| 246,835 | NEP/NCP Holdco, Inc. - Incremental Term Loan, 4.500%, 01/22/20 | 247,967 | 0.1 | |||||||||||
| 149,079 | SRAM, LLC 2017 Term Loan, 4.700%, 03/13/24 | 149,824 | 0.1 | |||||||||||
| 149,625 | UFC Holdings (fka Zuffa), First Lien Term Loan, 4.400%, 08/18/23 | 150,681 | 0.1 | |||||||||||
| 150,000 | Winnebago Industries, Inc. Term Loan, 5.700%, 11/08/23 | 152,250 | 0.1 | |||||||||||
| 1,301,418 | 0.8 | |||||||||||||
| Lodging & Casinos: 0.5% | ||||||||||||||
| 200,833 | CityCenter Holdings, LLC - Term Loan B, 3.900%, 10/16/20 | 203,394 | 0.2 | |||||||||||
| 150,000 | Eldorado Resorts LLC 2017 Term Loan B, 3.400%, 03/15/24 | 150,562 | 0.1 | |||||||||||
| 41,500 | Pinnacle Entertainment, Inc., Term Loan B, 4.200%, 04/28/23 | 41,980 | 0.0 | |||||||||||
| 200,000 | Scientific Games International, Inc. 2017 Term Loan B3, 5.200%, 10/01/21 | 202,729 | 0.1 | |||||||||||
| 150,000 | Station Casinos LLC, Term Loan, 3.700%, 06/08/23 | 150,731 | 0.1 | |||||||||||
| 749,396 | 0.5 | |||||||||||||
| Oil & Gas: 0.3% | ||||||||||||||
| 150,000 | Limetree Bay Terminals, LLC 2017 Term Loan B, 6.200%, 01/30/24 | 152,250 | 0.1 | |||||||||||
| 248,092 | Southcross Energy Partners, L.P., Term Loan, 5.400%, 08/04/21 | 220,595 | 0.1 | |||||||||||
| 150,000 | Summit Midstream Holdings, LLC Term Loan B, 7.200%, 05/15/22 | 153,000 | 0.1 | |||||||||||
| 525,845 | 0.3 | |||||||||||||
| Publishing: 0.1% | ||||||||||||||
| 149,250 | McGraw Hill Global Education, Term Loan B, 5.200%, 05/04/22 | 147,913 | 0.1 | |||||||||||
| Radio & Television: 0.5% | ||||||||||||||
| 135,849 | CBS Radio Inc. Term Loan B, 4.700%, 10/17/23 | 137,310 | 0.1 | |||||||||||
| 144,375 | Entercom Radio, LLC 2016 Term Loan, 4.700%, 11/01/23 | 145,368 | 0.1 | |||||||||||
| 150,000 | LEARFIELD COMMUNICATIONS INC. 2016 1ST LIEN TERM LOAN, 4.400%, 12/01/23 | 151,781 | 0.1 | |||||||||||
| 120,000 | Lions Gate Entertainment Corp. 2016 1st Lien Term Loan, 4.200%, 12/08/23 | 120,809 | 0.1 | |||||||||||
| 268,554 | Univision Communications Inc. Term Loan C5, 3.900%, 03/15/24 | 267,001 | 0.1 | |||||||||||
| 822,269 | 0.5 | |||||||||||||
| Retailers (Except Food & Drug): 1.0% | ||||||||||||||
| 150,000 | Bass Pro Group, LLC Asset Sale Term Loan, 5.900%, 06/08/18 | 147,938 | 0.1 | |||||||||||
| 175,000 | BJs Wholesale Club, Inc. 2017 1st Lien Term Loan, 4.900%, 01/31/24 | 171,500 | 0.1 | |||||||||||
| 248,125 | FullBeauty Brands (F.K.A. OneStopPlus), 1st Lien Term Loan, 5.900%, 10/14/22 | 209,588 | 0.1 | |||||||||||
| 125,000 | General Nutrition Centers, Inc. New Term Loan, 3.700%, 03/04/19 | 106,719 | 0.1 | |||||||||||
| 124,688 | Jo-Ann Stores, Inc. 2016 Term Loan, 6.200%, 10/15/23 | 123,025 | 0.1 | |||||||||||
| 149,625 | Leslies Poolmart, Inc., Term Loan B, 5.400%, 08/16/23 | 150,436 | 0.1 | |||||||||||
| 233,968 | Men's Wearhouse, Inc. (The) - Term Loan B, 4.700%, 06/18/21 | 224,804 | 0.1 | |||||||||||
| 150,000 | National Vision, Inc. 1st Lien Term Loan, 4.200%, 03/13/21 | 150,156 | 0.1 | |||||||||||
| 149,625 | Outerwall Inc. 1st Lien Term Loan, 5.400%, 09/27/23 | 151,238 | 0.1 | |||||||||||
| 247,500 | Petco Animal Supplies, Inc. 2017 Term Loan B, 4.400%, 01/26/23 | 234,042 | 0.1 | |||||||||||
| 1,669,446 | 1.0 | |||||||||||||
See Accompanying Notes to Financial Statements
| Voya Strategic Income Opportunities Fund | PORTFOLIO OF INVESTMENTS as of March 31, 2017 (continued) |
| Principal Amount† | Value | Percentage of Net Assets | ||||||||||||
| BANK LOANS: (continued) | ||||||||||||||
| Surface Transport: 0.5% | ||||||||||||||
| 150,000 | Navistar International Corporation 2017 Term Loan B, 5.200%, 08/07/20 | 151,938 | 0.1 | |||||||||||
| 200,252 | OSG Bulk Ships, Inc - OBS Term Loan, 5.400%, 08/05/19 | 200,085 | 0.1 | |||||||||||
| 150,000 | Vouvray US Finance LLC 2017 Term Loan B, 4.200%, 01/27/24 | 150,328 | 0.1 | |||||||||||
| 330,520 | XPO Logistics, Term Loan B, 4.400%, 10/31/21 | 332,296 | 0.2 | |||||||||||
| 834,647 | 0.5 | |||||||||||||
| Technology: 0.3% | ||||||||||||||
| 122,116 | QUEST Software US Holdings Inc. 1st Lien Term Loan, 7.200%, 10/31/22 | 123,985 | 0.1 | |||||||||||
| 150,000 | RP Crown Parent LLC Term Loan B, 4.700%, 10/12/23 | 151,069 | 0.1 | |||||||||||
| 150,000 | Tessera Holding Corp. Term Loan B, 4.400%, 12/01/23 | 151,844 | 0.1 | |||||||||||
| 426,898 | 0.3 | |||||||||||||
| Telecommunications: 0.7% | ||||||||||||||
| 244,048 | Asurion LLC New Term Loan B4, 4.400%, 08/04/22 | 245,700 | 0.1 | |||||||||||
| 246,875 | Communications Sales & Leasing, Inc. 2017 Term Loan B, 4.200%, 10/24/22 | 246,719 | 0.1 | |||||||||||
| 149,625 | Consolidated Communications, Inc. 2016 Term Loan B, 4.200%, 10/05/23 | 150,710 | 0.1 | |||||||||||
| 149,612 | LTS Buyer LLC 1st Lien Term Loan, 4.400%, 04/13/20 | 150,921 | 0.1 | |||||||||||
| 150,000 | Sprint Communications, Inc. 1st Lien Term Loan B, 3.700%, 01/31/24 | 150,219 | 0.1 | |||||||||||
| 248,128 | Windstream Corporation Repriced Term Loan B6, 5.200%, 03/29/21 | 250,868 | 0.2 | |||||||||||
| 1,195,137 | 0.7 | |||||||||||||
| Utilities: 0.5% | ||||||||||||||
| 150,000 | Dayton Power and Light Company, Term Loan, 4.400%, 08/30/22 | 151,030 | 0.1 | |||||||||||
| 145,204 | Dynegy Inc. 2017 Term Loan C, 4.400%, 06/30/23 | 145,957 | 0.1 | |||||||||||
| 150,000 | Helix Gen Fund 03/01/2024, 4.900%, 03/01/24 | 152,297 | 0.1 | |||||||||||
| 64,838 | Middle River Power LLC Term Loan B, 8.200%, 09/30/22 | 65,486 | 0.1 | |||||||||||
| 203,571 | TEX Operations Co. LLC Exit Term Loan B, 3.900%, 08/04/23 | 203,317 | 0.1 | |||||||||||
| 46,429 | TEX Operations Co. LLC Exit Term Loan C, 3.900%, 08/04/23 | 46,371 | 0.0 | |||||||||||
| 764,458 | 0.5 | |||||||||||||
| Total Bank Loans (Cost $32,332,452) | 32,766,621 | 20.5 | ||||||||||||
| FOREIGN GOVERNMENT BONDS: 12.4% | ||||||||||||||
| 1,075,000 | # | Argentine Republic Government International Bond, 6.875%, 01/26/27 | 1,089,244 | 0.7 | ||||||||||
| CLP | 355,000,000 | Bonos Tesoreria Pesos, 4.500%, 02/28/21 | 559,419 | 0.3 | ||||||||||
| BRL | 7,838,000 | Brazil Notas do Tesouro Nacional Series F, 10.000%, 01/01/23 | 2,511,710 | 1.6 | ||||||||||
| BRL | 2,500,000 | Brazil Notas do Tesouro Nacional Series F, 10.000%, 01/01/25 | 798,421 | 0.5 | ||||||||||
| BRL | 3,590,000 | Brazil Notas do Tesouro Nacional Series F, 10.000%, 01/01/19 | 1,156,436 | 0.7 | ||||||||||
| BRL | 1,115,000 | Brazil Notas do Tesouro Nacional Series F, 10.000%, 01/01/21 | 358,513 | 0.2 | ||||||||||
| 1,000,000 | Brazilian Government International Bond, 6.000%, 04/07/26 | 1,089,500 | 0.7 | |||||||||||
| COP | 1,291,400,000 | Colombian TES, 11.000%, 07/24/20 | 516,718 | 0.3 | ||||||||||
| HUF | 107,170,000 | Hungary Government Bond, 7.500%, 11/12/20 | 453,645 | 0.3 | ||||||||||
| IDR | 1,079,000,000 | Indonesia Treasury Bond, 8.375%, 09/15/26 | 88,139 | 0.1 | ||||||||||
| IDR | 1,153,000,000 | Indonesia Treasury Bond, 11.000%, 09/15/25 | 107,875 | 0.1 | ||||||||||
| 425,000 | # | Oman Government International Bond, 5.375%, 03/08/27 | 445,094 | 0.3 | ||||||||||
| 750,000 | # | Perusahaan Penerbit SBSN Indonesia III, 4.150%, 03/29/27 | 754,088 | 0.5 | ||||||||||
| PLN | 7,313,000 | Republic of Poland Government Bond, 3.250%, 07/25/25 | 1,840,651 | 1.1 | ||||||||||
| ARS | 2,000,000 | Republic of Argentina, 18.200%, 10/03/21 | 139,658 | 0.1 | ||||||||||
| ARS | 7,100,000 | Republic of Argentina, 21.200%, 09/19/18 | 482,472 | 0.3 | ||||||||||
| ZAR | 10,600,000 | Republic of South Africa Government Bond, 8.500%, 01/31/37 | 709,061 | 0.4 | ||||||||||
| RON | 300,000 | Romania Government Bond, 5.850%, 04/26/23 | 80,639 | 0.0 | ||||||||||
| RUB | 45,350,000 | Russian Federal Bond - OFZ, 6.400%, 05/27/20 | 773,595 | 0.5 | ||||||||||
See Accompanying Notes to Financial Statements
| Voya Strategic Income Opportunities Fund | PORTFOLIO OF INVESTMENTS as of March 31, 2017 (continued) |
| Principal Amount† | Value | Percentage of Net Assets | ||||||||||||
| FOREIGN GOVERNMENT BONDS: (continued) | ||||||||||||||
| RUB | 10,510,000 | Russian Federal Bond - OFZ, 7.000%, 01/25/23 | 180,728 | 0.1 | ||||||||||
| RUB | 84,770,000 | Russian Federal Bond - OFZ, 7.500%, 08/18/21 | 1,489,611 | 0.9 | ||||||||||
| RUB | 142,790,000 | Russian Federal Bond - OFZ, 7.600%, 07/20/22 | 2,524,055 | 1.6 | ||||||||||
| RUB | 102,540,000 | Russian Federal Bond - OFZ, 7.000%, 08/16/23 | 1,747,266 | 1.1 | ||||||||||
| Total Foreign Government Bonds (Cost $19,280,812) | 19,896,538 | 12.4 | ||||||||||||
| ASSET-BACKED SECURITIES: 11.8% | ||||||||||||||
| Automobile Asset-Backed Securities: 0.1% | ||||||||||||||
| 166,000 | Santander Drive Auto Receivables Trust 2015-1 D, 3.240%, 04/15/21 | 168,308 | 0.1 | |||||||||||
| Home Equity Asset-Backed Securities: 2.2% | ||||||||||||||
| 718,752 | GSAA Home Equity Trust 2006-3 A3, 1.282%, 03/25/36 | 511,238 | 0.3 | |||||||||||
| 994,000 | GSAA Home Equity Trust 2006-4 4A3, 3.428%, 03/25/36 | 793,166 | 0.5 | |||||||||||
| 1,603,551 | GSAA Trust 2006-7 AF2, 5.995%, 03/25/46 | 1,140,839 | 0.7 | |||||||||||
| 1,263,969 | Nomura Home Equity Loan, Inc. Home Equity Loan Trust Series 2007-1 2A4A, 1.212%, 02/25/37 | 1,093,613 | 0.7 | |||||||||||
| 3,538,856 | 2.2 | |||||||||||||
| Other Asset-Backed Securities: 7.7% | ||||||||||||||
| 190,000 | # | ALM VII R-2 Ltd. 2013-7R2A A2R, 3.023%, 10/15/27 | 191,434 | 0.1 | ||||||||||
| 140,000 | # | American Homes 4 Rent 2015-SFR2 C, 4.691%, 10/17/45 | 146,217 | 0.1 | ||||||||||
| 130,000 | # | Apidos CLO XI 2012-11A BR, 2.973%, 01/17/28 | 130,491 | 0.1 | ||||||||||
| 120,000 | # | Apidos CLO XVII 2014-17A A2R, 2.873%, 04/17/26 | 120,007 | 0.1 | ||||||||||
| 200,000 | # | Apidos CLO XVII 2014-17A BR, 3.523%, 04/17/26 | 199,998 | 0.1 | ||||||||||
| 500,000 | # | Ares XXIX CLO Ltd. 2014-1A BR, 3.330%, 04/17/26 | 499,965 | 0.3 | ||||||||||
| 350,000 | # | Ares XXVII CLO Ltd. 2013-2A B, 2.839%, 07/28/25 | 349,997 | 0.2 | ||||||||||
| 250,000 | # | Avery Point IV CLO Ltd., 3.510%, 04/25/26 | 250,000 | 0.2 | ||||||||||
| 1,500,000 | # | Babson CLO Ltd. 2013-IIA C, 4.274%, 01/18/25 | 1,495,515 | 0.9 | ||||||||||
| 250,000 | # | Babson CLO Ltd. 2014-IA BR, 3.230%, 07/20/25 | 250,005 | 0.2 | ||||||||||
| 280,000 | # | BlueMountain CLO 2012-2A BR, 2.952%, 11/20/28 | 280,894 | 0.2 | ||||||||||
| 180,000 | # | BlueMountain CLO 2014-4A B1R, 2.904%, 11/30/26 | 180,234 | 0.1 | ||||||||||
| 160,000 | # | BlueMountain CLO 2014-4A CR, 3.604%, 11/30/26 | 160,122 | 0.1 | ||||||||||
| 350,000 | # | Bristol Park CLO Ltd. 2016-1A B, 2.784%, 04/15/29 | 351,932 | 0.2 | ||||||||||
| 250,000 | # | Carlyle Global Market Strategies CLO 2014-3A BR Ltd., 3.187%, 07/27/26 | 250,468 | 0.2 | ||||||||||
| 100,000 | # | Carlyle Global Market Strategies CLO Ltd. 2012-4A AR, 2.480%, 01/20/29 | 100,443 | 0.1 | ||||||||||
| 150,000 | # | Carlyle Global Market Strategies CLO Ltd. 2012-4A BR, 2.930%, 01/20/29 | 150,529 | 0.1 | ||||||||||
| 250,000 | # | CIFC Funding 2017-2A C Ltd., 04/20/30 | 250,000 | 0.2 | ||||||||||
| 280,000 | # | Dryden 33 Senior Loan Fund 2014-33A BR, 2.873%, 10/15/28 | 280,978 | 0.2 | ||||||||||
| 250,000 | # | Dryden Senior Loan Fund 2014-31A CR, 3.256%, 04/18/26 | 248,880 | 0.1 | ||||||||||
| 250,000 | # | Dryden Senior Loan Fund 2014-34A CR, 3.172%, 10/15/26 | 250,000 | 0.2 | ||||||||||
| 250,000 | # | Dryden Senior Loan Fund 2017-47A C, 3.595%, 04/15/28 | 249,875 | 0.1 | ||||||||||
| 1,000,000 | # | Dryden XXV Senior Loan Fund 2012-25A D, 5.023%, 01/15/25 | 1,000,857 | 0.6 | ||||||||||
| 500,000 | # | Emerson Park CLO Ltd. 2013-1A D, 4.773%, 07/15/25 | 498,612 | 0.3 | ||||||||||
| 250,000 | # | Flatiron CLO Ltd. 2013-1A A2R, 2.580%, 01/17/26 | 249,987 | 0.1 | ||||||||||
| 250,000 | # | Flatiron CLO Ltd. 2013-1A BR, 3.380%, 01/17/26 | 249,987 | 0.2 | ||||||||||
| 100,000 | # | Invitation Homes Trust 2014-SFR2 E, 4.093%, 06/17/32 | 100,964 | 0.1 | ||||||||||
| 250,000 | # | Madison Park Funding XIII Ltd. 2014-13A CR, 3.028%, 01/19/25 | 250,012 | 0.2 | ||||||||||
| 250,000 | # | Octagon Investment Partners XIX Ltd. 2014-1A CR, 3.069%, 04/15/26 | 251,250 | 0.2 | ||||||||||
| 500,000 | # | Octagon Investment Partners XVI Ltd. 2013-1A D, 4.373%, 07/17/25 | 493,690 | 0.3 | ||||||||||
| 340,000 | # | OHA Loan Funding Ltd. 2016-1A B1, 2.686%, 01/20/28 | 340,914 | 0.2 | ||||||||||
| 300,000 | # | Palmer Square CLO 2013-2A BR Ltd., 3.408%, 10/17/27 | 300,000 | 0.2 | ||||||||||
| 400,000 | # | Progress Residential 2015-SFR2 E, 4.427%, 06/12/32 | 400,338 | 0.2 | ||||||||||
See Accompanying Notes to Financial Statements
| Voya Strategic Income Opportunities Fund | PORTFOLIO OF INVESTMENTS as of March 31, 2017 (continued) |
| Principal Amount† | Value | Percentage of Net Assets | ||||||||||||
| ASSET-BACKED SECURITIES: (continued) | ||||||||||||||
| Other Asset-Backed Securities: (continued) | ||||||||||||||
| 220,000 | # | Shackleton CLO Ltd. 2016-9A A, 2.364%, 10/20/28 | 220,646 | 0.1 | ||||||||||
| 120,000 | # | Symphony CLO Ltd. 2016-18A B, 2.746%, 01/23/28 | 120,124 | 0.1 | ||||||||||
| 750,000 | # | Telos CLO 2007-2A D, 3.223%, 04/15/22 | 763,787 | 0.5 | ||||||||||
| 250,000 | # | Thacher Park CLO Ltd. 2014-1A CR, 3.857%, 10/20/26 | 249,976 | 0.1 | ||||||||||
| 350,000 | # | THL Credit Wind River CLO Ltd. 2017-1A C, 3.334%, 04/18/29 | 349,993 | 0.2 | ||||||||||
| 12,229,121 | 7.7 | |||||||||||||
| Student Loan Asset-Backed Securities: 1.8% | ||||||||||||||
| 1,000,000 | # | SMB Private Education Loan Trust 2014-A, 4.500%, 09/15/45 | 910,979 | 0.6 | ||||||||||
| 1,000,000 | # | SMB Private Education Loan Trust 2017-A, 3.500%, 06/17/41 | 969,090 | 0.6 | ||||||||||
| 1,000,000 | # | SoFi Professional Loan Program 2017-A LLC, 4.430%, 03/26/40 | 1,008,031 | 0.6 | ||||||||||
| 2,888,100 | 1.8 | |||||||||||||
| Total Asset-Backed Securities (Cost $18,658,402) | 18,824,385 | 11.8 | ||||||||||||
| COMMERCIAL MORTGAGE-BACKED SECURITIES: 11.1% | ||||||||||||||
| 47,049 | # | Banc of America Re-REMIC Trust 2010-UBER5 A4A, 5.901%, 02/17/51 | 47,130 | 0.0 | ||||||||||
| 14,660,000 | #,^ | CD 2016-CD1 Mortgage Trust, 0.685%, 08/10/49 | 844,255 | 0.5 | ||||||||||
| 8,366,116 | ^ | CD 2016-CD1 Mortgage Trust, 1.444%, 08/10/49 | 830,582 | 0.5 | ||||||||||
| 7,664,126 | #,^ | COMM 2012 - LTRT XA, 1.162%, 10/05/30 | 324,413 | 0.2 | ||||||||||
| 10,344,641 | ^ | COMM 2012-CR3 XA, 2.072%, 10/15/45 | 761,259 | 0.5 | ||||||||||
| 7,229,554 | ^ | COMM 2016-COR1 XA, 1.490%, 10/10/49 | 711,621 | 0.5 | ||||||||||
| 4,249,109 | ^ | COMM 2012-CR1 XA, 1.910%, 05/15/45 | 330,317 | 0.2 | ||||||||||
| 1,105,012 | ^ | COMM 2012-CR4 XA, 1.895%, 10/15/45 | 75,364 | 0.1 | ||||||||||
| 2,268,018 | ^ | COMM 2013-LC6 XA, 1.673%, 01/10/46 | 120,056 | 0.1 | ||||||||||
| 2,867,199 | ^ | Commercial Mortgage Pass Through Certificates 2016-CR28 XA, 0.325%, 02/10/49 | 118,421 | 0.1 | ||||||||||
| 10,000 | # | Credit Suisse First Boston Mortgage Securities Corp. 2004-C2 E, 5.736%, 05/15/36 | 10,208 | 0.0 | ||||||||||
| 10,000 | Credit Suisse First Boston Mortgage Securities Corp. 2005-C3 C, 4.952%, 07/15/37 | 9,987 | 0.0 | |||||||||||
| 1,000,000 | Credit Suisse First Boston Mortgage Securities Corp. 2005-C5 F, 5.100%, 08/15/38 | 992,263 | 0.6 | |||||||||||
| 1,000,000 | # | EQTY 2014-INNS Mortgage Trust, 4.297%, 05/08/31 | 995,770 | 0.6 | ||||||||||
| 203,197,429 | #,^ | Freddie Mac 2014-K714 X2B, 0.100%, 01/25/47 | 636,272 | 0.4 | ||||||||||
| 6,669,157 | ^ | Freddie Mac Multifamily Structured Pass Through Certificates K006 BX1, 5.375%, 02/25/20 | 927,612 | 0.6 | ||||||||||
| 11,116,342 | ^ | Freddie Mac Multifamily Structured Pass Through Certificates K019 X1, 1.690%, 03/25/22 | 759,666 | 0.5 | ||||||||||
| 2,799,777 | ^ | Freddie Mac Multifamily Structured Pass Through Certificates K704 X1, 1.964%, 08/25/18 | 54,299 | 0.0 | ||||||||||
| 8,937,711 | ^ | Freddie Mac Multifamily Structured Pass Through Certificates K715 X3, 2.018%, 02/25/41 | 637,347 | 0.4 | ||||||||||
| 100,000 | ^ | Freddie Mac Multifamily Structured Pass Through CertificatesK015 X3, 2.801%, 08/25/39 | 10,824 | 0.0 | ||||||||||
| 731,821 | #,^ | FREMF Mortgage Trust 2012-K17 X2A, 0.100%, 12/25/44 | 2,727 | 0.0 | ||||||||||
| 8,490,000 | #,^ | JP Morgan Chase Commercial Mortgage Securities Corp. 2012-LC9 XB, 0.352%, 12/15/47 | 149,651 | 0.1 | ||||||||||
| 140,000 | JP Morgan Chase Commercial Mortgage Securities Trust 2004-CIBC9 E, 5.379%, 06/12/41 | 134,688 | 0.1 | |||||||||||
| 1,000,000 | JP Morgan Chase Commercial Mortgage Securities Trust 2005-LDP2 F, 5.010%, 07/15/42 | 1,008,750 | 0.6 | |||||||||||
| 666,438 | JP Morgan Chase Commercial Mortgage Securities Trust 2005-LDP4 B, 5.129%, 10/15/42 | 664,717 | 0.4 | |||||||||||
| 500,000 | # | JP Morgan Chase Commercial Mortgage Securities Trust 2011-C4 C, 5.397%, 07/15/46 | 537,296 | 0.3 | ||||||||||
| 6,615,494 | ^ | JP Morgan Chase Commercial Mortgage Securities Trust 2012-CIBX XA, 1.657%, 06/15/45 | 370,712 | 0.2 | ||||||||||
See Accompanying Notes to Financial Statements
| Voya Strategic Income Opportunities Fund | PORTFOLIO OF INVESTMENTS as of March 31, 2017 (continued) |
| Principal Amount† | Value | Percentage of Net Assets | ||||||||||||
| COMMERCIAL MORTGAGE-BACKED SECURITIES: (continued) | ||||||||||||||
| 184,872 | # | JPMorgan Commercial Mortgage-Backed Securities Trust 2009-RR1 A4B2, 1.000%, 03/18/51 | 183,985 | 0.1 | ||||||||||
| 11,722 | LB-UBS Commercial Mortgage Trust 2005-C3 D, 4.954%, 07/15/40 | 12,095 | 0.0 | |||||||||||
| 1,000,000 | LB-UBS Commercial Mortgage Trust 2005-C3 F, 5.013%, 07/15/40 | 955,319 | 0.6 | |||||||||||
| 760,000 | # | LB-UBS Commercial Mortgage Trust 2005-C5 G, 5.350%, 09/15/40 | 755,717 | 0.5 | ||||||||||
| 1,000,000 | # | LB-UBS Commercial Mortgage Trust 2005-C5 H, 5.350%, 09/15/40 | 981,518 | 0.6 | ||||||||||
| 1,000,000 | # | Merrill Lynch Mortgage Trust 2004-BPC1 E, 5.167%, 10/12/41 | 998,505 | 0.6 | ||||||||||
| 14,770,058 | ^ | Morgan Stanley Bank of America Merrill Lynch Trust 2014 C19, 1.144%, 12/15/47 | 802,221 | 0.5 | ||||||||||
| 50,000 | # | Morgan Stanley Capital I Trust 2008-T29 D, 6.301%, 01/11/43 | 49,675 | 0.0 | ||||||||||
| 270,000 | # | Morgan Stanley Capital I Trust 2011-C1 D, 5.433%, 09/15/47 | 288,128 | 0.2 | ||||||||||
| 464,501 | #,^ | WFRBS Commercial Mortgage Trust 2012-C8 XA, 1.983%, 08/15/45 | 33,378 | 0.0 | ||||||||||
| 4,061,425 | #,^ | WFRBS Commercial Mortgage Trust 2012-C9 XA, 2.087%, 11/15/45 | 299,627 | 0.2 | ||||||||||
| 7,193,272 | #,^ | WFRBS Commercial Mortgage Trust 2013-C12 XA, 1.376%, 03/15/48 | 387,713 | 0.3 | ||||||||||
| Total Commercial Mortgage-Backed Securities (Cost $17,811,128) | 17,814,088 | 11.1 | ||||||||||||
| # of Contracts | Value | Percentage of Net Assets | ||||||||||||
| PURCHASED OPTIONS: 0.0% | ||||||||||||||
| OTC Interest Rate Swaptions: 0.0% | ||||||||||||||
| 9,400,000 | @ | Put on 10-Year Interest Rate Swap, Receive a floating rate based on the 3-month USD-LIBOR-BBA and pay a fixed rate equal to 2.700%, Exp. 05/22/17 Counterparty: Goldman Sachs International | 14,364 | 0.0 | ||||||||||
| Total Purchased Options (Cost $57,723) | 14,364 | 0.0 | ||||||||||||
| Total Long-Term Investments (Cost $152,492,737) | 155,661,440 | 97.2 | ||||||||||||
| Principal Amount† | Value | Percentage of Net Assets | ||||||||||||
| SHORT-TERM INVESTMENTS: 5.9% | ||||||||||||||
| Corporate Bonds/Notes: 0.1% | ||||||||||||||
| 150,000 | Energy Future Intermediate Holdings Term Loan, 4.400%, 06/30/17 | |||||||||||||
| (Cost $149,925) | 150,125 | 0.1 | ||||||||||||
| Securities Lending Collateralcc: 0.6% | ||||||||||||||
| 996,954 | Cantor Fitzgerald, Repurchase Agreement dated 03/31/17, 0.81%, due 04/03/17 (Repurchase Amount $997,020, collateralized by various U.S. Government and U.S. Government Agency Obligations, 0.000%-10.000%, Market Value plus accrued interest $1,016,893, due 04/01/17-02/20/67) | |||||||||||||
| (Cost $996,954) | 996,954 | 0.6 | ||||||||||||
See Accompanying Notes to Financial Statements
| Voya Strategic Income Opportunities Fund | PORTFOLIO OF INVESTMENTS as of March 31, 2017 (continued) |
| Shares | Value | Percentage of Net Assets | ||||||||||||
| Mutual Funds: 5.2% | ||||||||||||||
| 8,310,784 | BlackRock Liquidity Funds, FedFund, Institutional Class, 0.600%†† | |||||||||||||
| (Cost $8,310,784) | 8,310,784 | 5.2 | ||||||||||||
| Total Short-Term Investments (Cost $9,457,663) | 9,457,863 | 5.9 | ||||||||||||
| Total Investments in Securities (Cost $161,950,400) | $ | 165,119,303 | 103.1 | |||||||||||
| Liabilities in Excess of Other Assets | (4,986,183 | ) | (3.1 | ) | ||||||||||
| Net Assets | $ | 160,133,120 | 100.0 | |||||||||||
| † | Unless otherwise indicated, principal amount is shown in USD. |
| †† | Rate shown is the 7-day yield as of March 31, 2017. |
| # | Securities with purchases pursuant to Rule 144A or section 4(a)(2), under the Securities Act of 1933 and may not be resold subject to that rule except to qualified institutional buyers. |
| ## | The Federal Housing Finance Agency (“FHFA”) placed the Federal Home Loan Mortgage Corporation and Federal National Mortgage Association into conservatorship with FHFA as the conservator. As such, the FHFA oversees the continuing affairs of these companies. |
| @ | Non-income producing security. |
| cc | Represents securities purchased with cash collateral received for securities on loan. |
| L | Loaned security, a portion or all of the security is on loan at March 31, 2017. |
| ^ | Interest only securities represent the right to receive the monthly interest payments on an underlying pool of mortgage loans. Principal amount shown represents the notional amount on which current interest is calculated. Payments of principal on the pool reduce the value of the interest only security. |
| ^^ | Principal only securities represent the right to receive the monthly principal payments on an underlying pool of mortgage loans. No payments of interest on the pool are passed through the principal only security. |
| Z | Indicates Zero Coupon Bond; rate shown reflects current effective yield. |
| ARS | Argentine Peso |
| BRL | Brazilian Real |
| CLP | Chilean Peso |
| COP | Colombian Peso |
| HUF | Hungarian Forint |
| IDR | Indonesian Rupiah |
| PLN | Polish Zloty |
| RON | Romanian New Leu |
| RUB | Russian Ruble |
| ZAR | South African Rand |
Cost for federal income tax purposes is $162,010,289.
Net unrealized appreciation consists of:
| Gross Unrealized Appreciation | $ | 3,819,320 | ||
| Gross Unrealized Depreciation | (710,306 | ) | ||
| Net Unrealized Appreciation | $ | 3,109,014 |
See Accompanying Notes to Financial Statements
Item 7. Disclosure of Proxy Voting Policies and Procedures for Closed-End Management Investment Companies.
Not applicable.
Item 8. Portfolio Managers of Closed-End Management Investment Companies.
Not applicable.
Item 9. Purchases of Equity Securities by Closed-End Management Investment Company and Affiliated Purchasers.
Not applicable.
Item 10. Submission of Matters to a Vote of Security Holders.
Not applicable.
Item 11. Controls and Procedures.
| (a) | Based on our evaluation conducted within 90 days of the filing date, hereof, the design and operation of the registrant’s disclosure controls and procedures are effective to ensure that material information relating to the registrant is made known to the certifying officers by others within the appropriate entities, particularly during the period in which Forms N-CSR are being prepared, and the registrant’s disclosure controls and procedures allow timely preparation and review of the information for the registrant’s Form N-CSR and the officer certifications of such Form N-CSR. |
| (b) | There were no significant changes in the registrant’s internal controls that occurred during the second fiscal quarter of the period covered by this report that has materially affected, or is reasonably likely to materially affect, the registrant’s internal control over financial reporting. |
Item 12. Exhibits.
| (a)(1) | The Code of Ethics pursuant to Item 2 of Form N-CSR is filed and attached hereto as EX-99.CODE ETH. |
| (a)(2) | A separate certification for each principal executive officer and principal financial officer of the registrant as required by Rule 30a-2(a) under the Act (17 CFR 270.30a-2(a)) is attached hereto as EX-99.CERT. |
| (a)(3) | Not applicable. |
| (b) | The officer certifications required by Section 906 of the Sarbanes-Oxley Act of 2002 are attached hereto as EX-99.906CERT. |
SIGNATURES
Pursuant to the requirements of the Securities Exchange Act of 1934 and the Investment Company Act of 1940, the registrant has duly caused this report to be signed on its behalf by the undersigned, thereunto duly authorized.
(Registrant): Voya Funds Trust
| By | /s/ Shaun P. Mathews | |
| Shaun P. Mathews | ||
| President and Chief Executive Officer |
Date: June 7, 2017
Pursuant to the requirements of the Securities Exchange Act of 1934 and the Investment Company Act of 1940, this report has been signed below by the following persons on behalf of the registrant and in the capacities and on the dates indicated.
| By | /s/ Shaun P. Mathews | |
| Shaun P. Mathews | ||
| President and Chief Executive Officer |
Date: June 7, 2017
| By | /s/ Todd Modic | |
| Todd Modic | ||
| Senior Vice President and Chief Financial Officer |
Date: June 7, 2017