UNITED STATES
SECURITIES AND EXCHANGE COMMISSION
Washington, D.C. 20549
Form N-CSR
CERTIFIED SHAREHOLDER REPORT OF
REGISTERED MANAGEMENT INVESTMENT COMPANIES
Investment Company Act file number: 811-08895
Voya Funds Trust
(Exact name of registrant as specified in charter)
| 7337 East Doubletree Ranch Road, Suite 100, Scottsdale, AZ | 85258 |
| (Address of principal executive offices) | (Zip code) |
The Corporation Trust Company, 1209 Orange Street, Wilmington, DE 19801
(Name and address of agent for service)
Registrant’s telephone number, including area code: 1-800-992-0180
Date of fiscal year end: March 31
Date of reporting period: March 31, 2023
Item 1. Reports to Stockholders.
(a) The following is a copy of the report transmitted to stockholders pursuant to Rule 30e-1 under the Act (17 CFR 270.30e-1):
Annual Report
March 31, 2023
Classes A, C, I, R, R6 and W
Fixed-Income Funds
■
Voya GNMA Income Fund
■
Voya High Yield Bond Fund
■
Voya Intermediate Bond Fund
■
Voya Short Duration High Income Fund
■
Voya Short Term Bond Fund
■
Voya Strategic Income Opportunities Fund
| | | As permitted by regulations adopted by the U.S. Securities and Exchange Commission, paper copies of each fund’s annual and semi-annual shareholder reports, like this annual report, are not sent by mail, unless you specifically request paper copies of the reports. Instead, the reports will be made available on the Voya funds’ website (https://individuals.voya.com/literature), and you will be notified by mail each time a report is posted and provided with a website link to access the report. | | |
| | | If you already elected to receive shareholder reports electronically, you need not take any action. You may elect to receive shareholder reports and other communications from each fund electronically anytime by contacting your financial intermediary (such as a broker-dealer or bank) or, if you are a direct investor, by calling 1-800-992-0180 or by sending an e-mail request to Voyaim_literature@voya.com. | | |
| | | You may elect to receive all future reports in paper free of charge. If you received this document in the mail, please follow the instructions to elect to continue receiving paper copies of your shareholder reports. If you received this document through a financial intermediary, you can contact your financial intermediary to request that you continue to receive paper copies of your shareholder reports. If you invest directly with us, you can call 1-800-992-0180 or send an email request to Voyaim_literature@voya.com to let each fund know you wish to continue receiving paper copies of your shareholder reports. Your election to receive reports in paper will apply to all funds held in your account if you invest through your financial intermediary or all funds held with the Voya funds complex if you invest directly with the funds. | | |
| | | This report is submitted for general information to shareholders of the Voya mutual funds. It is not authorized for distribution to prospective shareholders unless accompanied or preceded by a prospectus which includes details regarding the funds’ investment objectives, risks, charges, expenses and other information. This information should be read carefully. | | |
| | | | | E-Delivery Sign-up – details inside | |
| | | | | | Go Paperless with E-Delivery! | | | | | |
| | | Sign up now for on-line prospectuses, fund reports, and proxy statements. | | |
| | | Just go to individuals.voya.com/page/e-delivery, follow the directions and complete the quick 5 Steps to Enroll. | | |
| | | You will be notified by e-mail when these communications become available on the internet. | | |
PROXY VOTING INFORMATION
A description of the policies and procedures that the Funds use to determine how to vote proxies related to portfolio securities is available: (1) without charge, upon request, by calling Shareholder Services toll-free at (800) 992-0180; (2) on the Funds’ website at www.voyainvestments.com; and (3) on the U.S. Securities and Exchange Commission’s (“SEC’s”) website at www.sec.gov. Information regarding how the Funds voted proxies related to portfolio securities during the most recent 12-month period ended June 30 is available without charge on the Funds’ website at www.voyainvestments.com and on the SEC’s website at www.sec.gov.
QUARTERLY PORTFOLIO HOLDINGS
The Funds file their complete schedule of portfolio holdings with the SEC for the first and third quarters of each fiscal year on Form NPORT-P. The Funds’ Forms NPORT-P are available on the SEC’s website at www.sec.gov. Each Fund’s complete schedule of portfolio holdings is available at: www.voyainvestments.com and without charge upon request from the Fund by calling Shareholder Services toll-free at (800) 992-0180.
[This Page Intentionally Left Blank]
| | | Index | | | | Description | | |
| | | ICE BofAML U.S. Dollar 3-Month Deposit Offered Rate Constant Maturity Index | | | | The index is designed to track the performance of a synthetic asset paying London Interbank Offered Rate (“LIBOR”) to a stated maturity. The index is based on the assumed purchase at par of a synthetic instrument having exactly its stated maturity and with a coupon equal to that day’s fixing rate. That issue is assumed to be sold the following business day (priced at a yield equal to the current day rate) and rolled into a new instrument. | | |
| | | ICE BofA 1-3 Year U..S. Treasury Index | | | | The index is an unmanaged index that tracks the performance of the direct sovereign debt of the U.S. Government having a maturity of at least one year and less than three years. | | |
| | | ICE BofA 1-3 Year BB U.S. Cash Pay High Yield Index | | | | The index is a subset of ICE BofA U.S. Cash Pay High Yield Index including all securities with a remaining term to final maturity of less than 3 years and rated BB1 through BB3, inclusive. The index tracks the performance of US dollar denominated below investment grade corporate debt, currently in a coupon paying period, that is publicly issued in US domestic market. | | |
| | | Bloomberg GNMA Index | | | | An index comprised of all fixed security mortgage pools sponsored by GNMA, including GNMA Graduated Payment Mortgages. | | |
| | | Bloomberg High Yield Bond — 2% Issuer
Constrained Composite Index | | | | An index that includes all fixed income securities having a maximum quality rating of Ba1, a minimum amount outstanding of $150 million, and at least one year to maturity. | | |
| | | Bloomberg U.S. 1-3 Year Government/Credit Bond Index | | | | A widely recognized index of publicly issued fixed rate, investment grade debt securities, including Treasuries, Agencies and credit securities with a maturity of one to three years. | | |
| | | Bloomberg U.S. Aggregate Bond Index | | | | An index of publicly issued investment grade U.S. government, mortgage-backed, asset-backed and corporate debt securities. | | |
| | | Bloomberg U.S. Universal Bond Index | | | | The index represents the union of the U.S. Aggregate Index, U.S. Corporate High Yield Index, Investment Grade 144A Index, Eurodollar Index, U.S. Emerging Markets Index, and the non-ERISA eligible portion of the CMBS Index. The index covers USD-denominated, taxable bonds that are rated either investment grade or high-yield. | | |
| Portfolio Managers’ Report | Voya GNMA Income Fund |
| | Investment Type Allocation
as of March 31, 2023
(as a percentage of net assets) | |
| | | | | | |
| | U.S. Government Agency Obligations | | | 67.6% | |
| | Collateralized Mortgage Obligations | | | 50.3% | |
| | Commercial Mortgage-Backed Securities | | | 3.1% | |
| | Asset-Backed Securities | | | 0.1% | |
| | Liabilities in Excess of Other Assets* | | | (21.1)% | |
| | Net Assets | | | 100.0% | |
| | *
Includes short-term investments. | |
| | Portfolio holdings are subject to change daily. | |
Securities issued by the U.S. Treasury are backed by the full faith and credit of the federal government. Securities issued by individual agencies and organizations may be backed by the full faith and credit of the federal government as to principal or interest but are not direct obligations of the U.S. Treasury. Securities of some agencies and organizations are backed solely by the entity’s own resources or by the ability of the entity to borrow from the U.S. Treasury. Government securities also include certain mortgage-related securities that are sponsored by a U.S. government agency or organization and are not direct obligations of the U.S. government.
Performance: For the year ended March 31, 2023, the Fund’s Class A shares, excluding sales charges, provided a total return of -4.53%, compared to the Bloomberg GNMA Index (the “Index” or “Bloomberg GNMA”), which returned -4.48%, for the same period.
Portfolio Specifics: Monetary policy backdrop has changed drastically from the previous year as the US Federal Reserve has embarked on a policy tightening campaign aimed at reducing inflation, most likely, at the expense of the labor market. Since March of last year, the Fed has increased the Fed Funds rate by 4.75% resulting in an inverted 2-10s yield curve for the majority of the period. As of March 31, 2023, the difference between 2-year and 10-year rate stands at 56 basis points (“bp”), inverted. Additionally, although the bulk of Fed tightening is behind us, the market currently expects another 25 bp rate hike in May. Afterwards, there will be a divergence between market expectation and Fed guidance when it comes to the rate path going into next year.
Excess performance of the Fund was largely driven by off-benchmark collateralized mortgage obligation (“CMO”) holdings. Additional contribution came in the form of duration and curve exposure.
The Fund’s net asset value decreased greater than 7%, primarily driven by price depreciation into the massive rate sell-off.
The Fund uses Treasury futures to hedge exposure to interest rate risk. A mild short position in duration and a flattening bias across key rate durations detracted for the fiscal year.
Current Strategy & Outlook: The landscape for agency mortgage-backed securities (“MBS”) and the US housing market has materially evolved since early 2022. Due to Fed’s aggressive rate hike schedule, currently around 99% of the mortgage universe does not have an economic rate incentive to refinance according to Morgan Stanley’s Total Refinance-able Index. On a national level, home price appreciated by 3% from March 2022 to June 2022 and have been steadily declining since then resulting in home prices remaining flat year-over-year. As a result of stable, if not falling, home prices keeping home-owner equity elevated, cash-out refinancings for newly originated mortgages will remain muted, in our opinion. Additionally, the combination of worsening housing affordability and declining housing inventory has led to lower turnover speeds. These factors combined have caused historically low prepayment speeds and very low organic net supply.
Going forward, as the Fed approaches the end of their rate hiking cycle and pauses to learn the efficacy of the rate increases thus far, treasury and mortgage rates in our view, should stabilize, and rate volatility should decline. As a result of the banking crisis in Spring 2023, banks could start tightening their credit box in the near term. In the long run, bank demand will remain an interesting debate, with the market balancing the odds of increased bank demand stemming from an expansion of BASEL guidelines to regional banks, versus the odds of lower bank demand resulting from additional restrictions imposed on duration and convexity exposures. Given the influences mentioned above, among others, we will continue to monitor changing trends in purchases and refinancings and analyze how borrowers react in the current environment.
The views expressed in this commentary are informed opinions. They should not be considered promises or advice. The views expressed reflect those of the portfolio managers, only through the end of the period as stated on the cover. The portfolio managers’ views are subject to change at any time based on market and other conditions.
Portfolio holdings and characteristics are subject to change and may not be representative of current holdings and characteristics. Fund holdings are subject to change daily. The outlook for this Fund may differ from that presented for other Voya mutual funds. The Fund’s performance returns shown reflect applicable fee waivers and/or expense limits in effect during this period. This report contains statements that may be “forward-looking” statements. Actual results may differ materially from those projected in the “forward-looking” statement. Absent such fee waivers/expense limitations, if any, performance would have been lower. Performance for the different classes of shares will vary based on differences in fees associated with each class.
| Voya GNMA Income Fund | Portfolio Managers’ Report |
| | | Average Annual Total Returns for the Periods Ended March 31, 2023 | | |
| | | | | | 1 Year | | | 5 Year | | | 10 Year | | |
| | | Including Sales Charge: | | |
| | | Class A(1) | | | | | -6.97% | | | | | | -0.29% | | | | | | 0.52% | | | |
| | | Class C(2) | | | | | -6.21% | | | | | | -0.55% | | | | | | 0.02% | | | |
| | | Class I | | | | | -4.11% | | | | | | 0.54% | | | | | | 1.08% | | | |
| | | Class R6(3) | | | | | -4.21% | | | | | | 0.54% | | | | | | 1.08% | | | |
| | | Class W | | | | | -4.15% | | | | | | 0.49% | | | | | | 1.05% | | | |
| | | Excluding Sales Charge: | | |
| | | Class A | | | | | -4.53% | | | | | | 0.21% | | | | | | 0.77% | | | |
| | | Class C | | | | | -5.28% | | | | | | -0.55% | | | | | | 0.02% | | | |
| | | Class I | | | | | -4.11% | | | | | | 0.54% | | | | | | 1.08% | | | |
| | | Class R6(3) | | | | | -4.21% | | | | | | 0.54% | | | | | | 1.08% | | | |
| | | Class W | | | | | -4.15% | | | | | | 0.49% | | | | | | 1.05% | | | |
| | | Bloomberg GNMA | | | | | -4.48% | | | | | | 0.26% | | | | | | 0.87% | | | |
| | | | | |
Based on a $10,000 initial investment, the graph and table above illustrate the total return of Voya GNMA Income Fund against the index indicated. The index is unmanaged, has no cash in its portfolio and imposes no sales charges. An investor cannot invest directly in an index.
The Fund’s performance is shown both with and without the imposition of sales charges.
The performance graph and table do not reflect the deduction of taxes that a shareholder will pay on Fund distributions or the redemption of Fund shares.
The performance shown includes, if applicable, the effect of fee waivers and/or expense reimbursements by the Investment Adviser and/or other service providers, which have the effect of increasing total net return. Had all fees and expenses been considered, the total net returns would have been lower.
Performance data represents past performance and is no assurance of future results. Investment return and principal
value of an investment in the Fund will fluctuate. Shares, when sold, may be worth more or less than their original cost. The Fund’s current performance may be lower or higher than the performance data shown. Please log on to www.voyainvestments.com or call (800) 992-0180 to get performance through the most recent month end.
Fund holdings are subject to change daily.
(1)
Reflects deduction of the maximum Class A sales charge of 2.50%.
(2)
Reflects deduction of the Class C deferred sales charge of 1% for the 1 year return.
(3)
R6 incepted on July 31, 2020. Class R6 shares performance shown for the period prior to their inception date is the performance of Class I shares without adjustment for any differences in the expenses between the two classes. If adjusted for such differences, returns would be different.
| Portfolio Managers’ Report | Voya High Yield Bond Fund |
| | Investment Type Allocation
as of March 31, 2023
(as a percentage of net assets) | |
| | | | | | |
| | Corporate Bonds/Notes | | | 92.9% | |
| | Bank Loans | | | 0.8% | |
| | Common Stock | | | 0.3% | |
| | Convertible Bonds/Notes | | | 0.0% | |
| | Assets in Excess of Other Liabilities* | | | 6.0% | |
| | Net Assets | | | 100.0% | |
| | *
Includes short-term investments. | |
| | Portfolio holdings are subject to change daily. | |
Performance: For the year ended March 31, 2023, the Fund’s Class A shares, excluding sales charges, provided a total return of -5.07%, compared to the Bloomberg High Yield Bond — 2% Issuer Constrained Composite Index (the “Index” or “Bloomberg High Yield Bond — 2% Issuer Constrained Composite”), which returned -3.35%, for the same period.
Portfolio Specifics: Inflationary pressures remained top of mind, forcing the U.S. Federal Reserve to aggressively raise interest rates further into restrictive territory. This led to periodic rate volatility and higher overall yields, dampening bond market returns during the trailing 12-month period. Spreads for the high yield (“HY”) bond market ended the period 130 basis points (“bp”) wider on an option-adjusted basis (“OAS”) at 455 bp, as the prospects for a recession quickly grew, and the fundamental health of HY issuers came into focus.
Within the Fund, security selection in media and entertainment, cable and satellite and technology detracted from performance. In contrast, relative benefits included security selection in retailers, an underweight allocation to healthcare and pharma, and the portfolio’s cash position, which provided a positive effect due to the negative total returns experienced in the overall HY bond market.
Current Strategy & Outlook: In our opinion, strains in parts of the financial system are likely to cause the Fed to trim its tightening plans. We believe quick action by regulators has largely addressed concerns of systemic risk in the banking system. In our view, bank balance sheets are generally healthy, and the lack of fundamental consumer and corporate imbalances should limit the severity of any sort of| | Top Ten Holdings
as of March 31, 2023*
(as a percentage of net assets) | |
| | | | | | |
| | Royal Caribbean Cruises Ltd., 5.375%,
07/15/27 | | | 0.7% | |
| | Sirius XM Radio, Inc., 5.000%, 08/01/27 | | | 0.6% | |
| | Sprint Corp., 7.125%, 06/15/24 | | | 0.6% | |
| | Ford Motor Credit Co. LLC, 4.125%, 08/17/27 | | | 0.6% | |
| | American Airlines, Inc./AAdvantage Loyalty IP Ltd., 5.750%, 04/20/29 | | | 0.6% | |
| | Carnival Corp., 6.000%, 05/01/29 | | | 0.5% | |
| | Univision Communications, Inc., 6.625%,
06/01/27 | | | 0.5% | |
| | EnLink Midstream LLC, 5.375%, 06/01/29 | | | 0.5% | |
| | PetSmart, Inc. / PetSmart Finance Corp., 7.750%, 02/15/29 | | | 0.5% | |
| | International Game Technology PLC, 5.250%, 01/15/29 | | | 0.5% | |
| | *
Excludes short-term investments. | |
| | Portfolio holdings are subject to change daily. | |
The long game still needs to play out: a higher cost of capital for banks will tighten lending conditions and raise borrowing costs for companies and consumers, increasing the potential for at least a mild recession, in our view. Since the challenges to the banking system are likely to be disinflationary, further Fed rate hikes may be limited. In our opinion, the focus may soon shift to when the Fed might begin lowering rates. For that to happen, we believe labor markets and economic growth would need to weaken substantially from current levels. Employment data remain solid despite an uptick in the unemployment rate, and the economy has remained remarkably resilient, supported by strong consumer spending.
We believe the HY market would be able to reasonably navigate a mild recessionary outcome with no broad contagion risk from the banking fallout. In terms of sector positioning, we remain positive on the energy sector and are looking to add some exposure after trimming exposure early in the year on tight valuations. Our view is shaped by a positive surprise from Organization of the Petroleum Exporting Countries to support prices in the near term and ongoing structural tailwinds given capital discipline of energy companies and underinvestment in the sector. Additionally, we also remain overweight building materials due to favorable supply and demand dynamics in the housing sector, despite the increase in mortgage rates. With the widening in spreads in March, valuations appear more attractive, and the fundamental health of HY issuers remains generally adequate. Nonetheless, we expect dispersion in performance among borrowers to continue and pockets of stress to emerge as the cycle matures. As such, our focus will be on security selection and finding pockets of value in an increasingly dispersed market.
*
Effective May 1, 2023, Mohamed Basma, CFA was added as a portfolio manager for the Fund and Richard Cumberledge, CFA was removed as a portfolio manager for the Fund.
The views expressed in this commentary are informed opinions. They should not be considered promises or advice. The views expressed reflect those of the portfolio managers, only through the end of the period as stated on the cover. The portfolio managers’ views are subject to change at any time based on market and other conditions.
Portfolio holdings and characteristics are subject to change and may not be representative of current holdings and characteristics. Fund holdings are subject to change daily. The outlook for this Fund may differ from that presented for other Voya mutual funds. The Fund’s performance returns shown reflect applicable fee waivers and/or expense limits in effect during this period. This report contains statements that may be “forward-looking” statements. Actual results may differ materially from those projected in the “forward-looking” statement. Absent such fee waivers/expense limitations, if any, performance would have been lower. Performance for the different classes of shares will vary based on differences in fees associated with each class.
| Voya High Yield Bond Fund | Portfolio Managers’ Report |
| | | Average Annual Total Returns for the Periods Ended March 31, 2023 | | |
| | | | | | 1 Year | | | 5 Year | | | 10 Year | | | Since Inception
of Class R
January 30, 2014 | | |
| | | Including Sales Charge: | | |
| | | Class A(1) | | | | | -7.40% | | | | | | 1.75% | | | | | | 2.99% | | | | | | — | | | |
| | | Class C(2) | | | | | -6.75% | | | | | | 1.48% | | | | | | 2.46% | | | | | | — | | | |
| | | Class I | | | | | -4.83% | | | | | | 2.59% | | | | | | 3.60% | | | | | | — | | | |
| | | Class R | | | | | -5.38% | | | | | | 1.99% | | | | | | — | | | | | | 2.74% | | | |
| | | Class R6(3) | | | | | -4.74% | | | | | | 2.68% | | | | | | 3.52% | | | | | | — | | | |
| | | Class W | | | | | -4.88% | | | | | | 2.53% | | | | | | 3.52% | | | | | | — | | | |
| | | Excluding Sales Charge: | | |
| | | Class A | | | | | -5.07% | | | | | | 2.26% | | | | | | 3.24% | | | | | | — | | | |
| | | Class C | | | | | -5.87% | | | | | | 1.48% | | | | | | 2.46% | | | | | | — | | | |
| | | Class I | | | | | -4.83% | | | | | | 2.59% | | | | | | 3.60% | | | | | | — | | | |
| | | Class R | | | | | -5.38% | | | | | | 1.99% | | | | | | — | | | | | | 2.74% | | | |
| | | Class R6(3) | | | | | -4.74% | | | | | | 2.68% | | | | | | 3.52% | | | | | | — | | | |
| | | Class W | | | | | -4.88% | | | | | | 2.53% | | | | | | 3.52% | | | | | | — | | | |
| | | Bloomberg High Yield Bond – 2% Issuer Constrained Composite | | | | | -3.35% | | | | | | 3.19% | | | | | | 4.09% | | | | | | 3.90% | | | |
| | | | | |
Based on a $10,000 initial investment, the graph and table above illustrate the total return of Voya High Yield Bond Fund against the index indicated. The index is unmanaged, has no cash in its portfolio and imposes no sales charges. An investor cannot invest directly in an index.
The Fund’s performance is shown both with and without the imposition of sales charges.
The performance graph and table do not reflect the deduction of taxes that a shareholder will pay on Fund distributions or the redemption of Fund shares.
The performance shown includes, if applicable, the effect of fee waivers and/or expense reimbursements by the Investment Adviser and/or other service providers, which have the effect of increasing total net return. Had all fees and expenses been considered, the total net returns would have been lower.
Performance data represents past performance and is no assurance of future results. Investment return and principal value of an
investment in the Fund will fluctuate. Shares, when sold, may be worth more or less than their original cost. The Fund’s current performance may be lower or higher than the performance data shown. Please log on to www.voyainvestments.com or call (800) 992-0180 to get performance through the most recent month end.
Fund holdings are subject to change daily.
(1)
Reflects deduction of the maximum Class A sales charge of 2.50%.
(2)
Reflects deduction of the Class C deferred sales charge of 1% for the 1 year return.
(3)
Class R6 incepted on August 3, 2016. The Class R6 shares performance shown for the period prior to their inception date is the performance of Class A shares without adjustment for any differences in the expenses between the two classes. If adjusted for such differences, returns would be different.
| Portfolio Managers’ Report | Voya Intermediate Bond Fund |
| | Investment Type Allocation
as of March 31, 2023
(as a percentage of net assets) | |
| | | | | | |
| | Corporate Bonds/Notes | | | 30.2% | |
| | U.S. Government Agency Obligations | | | 20.1% | |
| | Collateralized Mortgage Obligations | | | 16.1% | |
| | U.S. Treasury Obligations | | | 14.7% | |
| | Asset-Backed Securities | | | 11.5% | |
| | Commercial Mortgage-Backed Securities | | | 6.0% | |
| | Sovereign Bonds | | | 0.4% | |
| | Purchased Options | | | 0.0% | |
| | Assets in Excess of Other Liabilities* | | | 1.0% | |
| | Net Assets | | | 100.0% | |
| | *
Includes short-term investments. | |
| | Portfolio holdings are subject to change daily. | |
Performance: For the year ended March 31, 2023, the Fund’s Class A shares, excluding sales charges, provided a total return of -5.82% compared to the Bloomberg U.S. Aggregate Bond Index (the “Index” or “Bloomberg U.S. Aggregate Bond”), which returned -4.78% for the same period.
Portfolio Specifics: Bond markets continued to struggle against the backdrop of interest rate hikes from the U.S. Federal Reserve. Trailing 12-month performance for bonds, as measured by the Bloomberg Aggregate remained negative. On the heels of one of the most difficult calendar years for bonds, returns recovered in the second half of the reporting period. The first six months of negative performance reflected persistent inflation pressures and a determined hawkish Fed, with the 10-year Treasury yield reaching nearly 4.25% during the fall. As inflation peaked, yields eased and bond markets staged a recovery rally to erase some of the earlier losses. The rally was tempered after a gangbuster employment report for the month of January 2023 and continued comments from Fed officials to raise interest rates further. The rally was then reignited with challenges in some US regional banks as well as the takeover of Credit Suisse by Swiss rival UBS. Higher interest rates and higher bond volatility remained a challenge and non-government sectors struggled and broadly trailed the US Treasury market for the trailing 12 months.
Sector allocations for the entire period detracted from performance, with overweights detracting from performance the most in the first 3-months. Early in the period, credit markets struggled as investors grew weary of the economic risks — including a recession — as a result of the Fed’s aggressive tightening program. Overweights across corporate and securitized sectors weighed performance during this time. Markets then proved more resilient as the economy continued to show signs of growth and inflation showed signs of peaking in the fall of 2022. This combination fueled a rally across| | Top Ten Holdings
as of March 31, 2023
(as a percentage of net assets) | |
| | | | | | |
| | United States Treasury Note, 3.625%,
03/31/28 | | | 2.7% | |
| | United States Treasury Bond, 3.875%,
02/15/43 | | | 2.6% | |
| | United States Treasury Note, 4.625%,
03/15/26 | | | 2.4% | |
| | United States Treasury Note, 3.875%,
03/31/25 | | | 1.6% | |
| | United States Treasury Bond, 4.000%,
11/15/52 | | | 1.3% | |
| | United States Treasury Note, 2.750%,
05/15/25 | | | 0.6% | |
| | United States Treasury Note, 3.500%,
02/15/33 | | | 0.6% | |
| | Uniform Mortgage-Backed Securities, 3.000%, 05/01/52 | | | 0.6% | |
| | United States Treasury Note, 4.000%,
02/29/28 | | | 0.6% | |
| | Uniform Mortgage-Backed Securities, 3.000%, 01/01/52 | | | 0.6% | |
| | Portfolio holdings are subject to change daily. | |
Security selection, in aggregate, added to performance over the period. The most notable contributions came from agency residential mortgage-backed (“RMBS”) securities that included collateralized mortgage obligations and other non-standard pools. As well as, investment grade (“IG”) where our preference for BBB rated bonds and limited exposure to regional banks supported performance. Detractions arose within asset-backed security which captures our investments in higher yielding collateralized loan obligations, as well as commercial mortgage-backed securities (“CMBS”) were our more credit sensitive investment trailed the broader market.
Duration and yield curve positioning detracted from performance. The Fund’s yield curve positioning and the convexity profile weighed on performance as rate volatility remained elevated throughout the reporting period.
The Fund primarily used futures and swaps for cash management purposes. As a result, derivatives had a negative impact on performance during the reporting period.
Current Strategy & Outlook: High levels of rate volatility illustrate the lack of certainty regarding the direction of the Fed, the economy and markets. On the one hand, we believe the left tail risk of reaccelerating inflation has diminished, on the other, a new scenario of a more widespread banking crisis has taken its place. While the likelihood of either of these scenarios materializing, in our opinion, remains slim, so does the likelihood of a soft landing. All of this adds to the challenges of navigating this environment.
We remain relatively defensive, with a preference for higher quality spread sectors such as IG corporates and agency mortgages. We are comfortable with our mortgage credit exposure, non-agency RMBS and credit risk transfer securities. We believe commerical real estate will likely face difficult refinancing conditions going forward, testing the CMBS market. However, in a departure from the previous, long-standing paradigm of “location, location, location”, it is our opinion that property type has emerged as the key dimension that will likely drive future credit performance. In CMBS, our preference is tilted toward multi-family properties, and away from office. With a bias towards liquidity, tactical trades will most likely take place in the corporate arena.
The views expressed in this commentary are informed opinions. They should not be considered promises or advice. The views expressed reflect those of the portfolio managers, only through the end of the period as stated on the cover. The portfolio managers’ views are subject to change at any time based on market and other conditions.
Portfolio holdings and characteristics are subject to change and may not be representative of current holdings and characteristics. Fund holdings are subject to change daily. The outlook for this Fund may differ from that presented for other Voya mutual funds. The Fund’s performance returns shown reflect applicable fee waivers and/or expense limits in effect during this period. This report contains statements that may be “forward-looking” statements. Actual results may differ materially from those projected in the “forward-looking” statement. Absent such fee waivers/expense limitations, if any, performance would have been lower. Performance for the different classes of shares will vary based on differences in fees associated with each class.
| Voya Intermediate Bond Fund | Portfolio Managers’ Report |
| | | Average Annual Total Returns for the Periods Ended March 31, 2023 | | |
| | | | | | 1 Year | | | 5 Year | | | 10 Year | | |
| | | Including Sales Charge: | | |
| | | Class A(1) | | | | | -8.13% | | | | | | 0.21% | | | | | | 1.31% | | | |
| | | Class C(2) | | | | | -7.46% | | | | | | -0.07% | | | | | | 0.81% | | | |
| | | Class I | | | | | -5.51% | | | | | | 1.04% | | | | | | 1.92% | | | |
| | | Class R | | | | | -6.04% | | | | | | 0.44% | | | | | | 1.32% | | | |
| | | Class R6(3) | | | | | -5.46% | | | | | | 1.10% | | | | | | 1.95% | | | |
| | | Class W | | | | | -5.59% | | | | | | 0.96% | | | | | | 1.83% | | | |
| | | Excluding Sales Charge: | | |
| | | Class A | | | | | -5.82% | | | | | | 0.71% | | | | | | 1.57% | | | |
| | | Class C | | | | | -6.54% | | | | | | -0.07% | | | | | | 0.81% | | | |
| | | Class I | | | | | -5.51% | | | | | | 1.04% | | | | | | 1.92% | | | |
| | | Class R | | | | | -6.04% | | | | | | 0.44% | | | | | | 1.32% | | | |
| | | Class R6(3) | | | | | -5.46% | | | | | | 1.10% | | | | | | 1.95% | | | |
| | | Class W | | | | | -5.59% | | | | | | 0.96% | | | | | | 1.83% | | | |
| | | Bloomberg U.S. Aggregate Bond | | | | | -4.78% | | | | | | 0.91% | | | | | | 1.36% | | | |
| | | | | |
Based on a $10,000 initial investment, the graph and table above illustrate the total return of Voya Intermediate Bond Fund against the index indicated. The index is unmanaged, has no cash in its portfolio and imposes no sales charges. An investor cannot invest directly in an index.
The Fund’s performance is shown both with and without the imposition of sales charges.
The performance graph and table do not reflect the deduction of taxes that a shareholder will pay on Fund distributions or the redemption of Fund shares.
The performance shown includes, if applicable, the effect of fee waivers and/or expense reimbursements by the Investment Adviser and/or other service providers, which have the effect of increasing total net return. Had all fees and expenses been considered, the total net returns would have been lower.
Performance data represents past performance and is no assurance of future results. Investment return and principal value of an
investment in the Fund will fluctuate. Shares, when sold, may be worth more or less than their original cost. The Fund’s current performance may be lower or higher than the performance data shown. Please log on to www.voyainvestments.com or call (800) 992-0180 to get performance through the most recent month end.
Fund holdings are subject to change daily.
(1)
Reflects deduction of the maximum Class A sales charge of 2.50%.
(2)
Reflects deduction of the Class C deferred sales charge of 1% for the 1 year return.
(3)
Class R6 incepted on May 31, 2013. The Class R6 shares performance shown for the period prior to their inception date is the performance of Class I shares without adjustment for any differences in the expenses between the two classes. If adjusted for such differences, returns would be different.
| Portfolio Managers’ Report | Voya Short Duration High Income Fund |
| | Investment Type Allocation
as of March 31, 2023
(as a percentage of net assets) | |
| | | | | | |
| | Corporate Bonds/Notes | | | 97.5% | |
| | Assets in Excess of Other Liabilities* | | | 2.5% | |
| | Net Assets | | | 100.0% | |
| | *
Includes short-term investments. | |
| | Portfolio holdings are subject to change daily. | |
Performance: For the period since inception on February 9, 2023, through March 31, 2023, the Fund’s Class A shares, excluding sales charges, provided a total return of -0.21% compared to the ICE BofA 1 – 3 year U.S. Treasury Index and ICE BofA 1 – 3 year BB U.S. Cash Pay High Index, which returned 1.27% and 0.36%, respectively, for the same period.
Portfolio Specifics: The broad high-yield bond market was volatile, with March ushering in the two largest U.S. bank failures since 2008 and the collapse of Credit Suisse in Europe. Headlines rattled markets initially. But U.S. investor confidence was quickly restored as the Federal Reserve and U.S. government responded decisively and with unprecedented speed to tackle the issues facing regional banks; and UBS stepped in to purchase Credit Suisse.
For the reporting period, the Fund’s exposures to financial services, healthcare and media detracted from performance. By contrast, Fund performance benefited from industry weightings and a consistent credit selection framework. Industries contributing the most to performance were technology, support-services, and air transportation.
Current Strategy & Outlook: In our view, the Fund’s short duration high income strategy remains an attractive fixed income solution in an environment of tighter monetary conditions and slowing economic growth. As investors seek to adjust to higher interest rates without taking excess credit risk, the Fund’s shorter maturity profile emphasizes securities that are likely to be repaid the soonest. In our opinion, this potentially lessens the price volatility that may be highly amplified in passively managed, indexed strategies.
While the current period has been compared to the financial crisis of 2008, there are key differences. Most important, the financial crisis of 2008 was a credit crisis. Today, banks are better capitalized — leverage is lower and liquidity is higher. Rather than being a challenge to the entire industry, problems| | Top Ten Holdings
as of March 31, 2023
(as a percentage of net assets) | |
| | | | | | |
| | Connect Finco SARL / Connect US Finco LLC, 6.750%, 10/01/26 | | | 3.7% | |
| | Mileage Plus Holdings LLC / Mileage Plus Intellectual Property Assets Ltd., 6.500%, 06/20/27 | | | 3.3% | |
| | DISH DBS Corp., 5.250%, 12/01/26 | | | 3.1% | |
| | SeaWorld Parks & Entertainment, Inc., 8.750%, 05/01/25 | | | 2.8% | |
| | Martin Midstream Partners L.P. / Martin Midstream Finance Corp., 11.500%,
02/15/28 | | | 2.4% | |
| | Millennium Escrow Corp., 6.625%, 08/01/26 | | | 2.3% | |
| | RP Escrow Issuer LLC, 5.250%, 12/15/25 | | | 2.2% | |
| | LD Holdings Group LLC, 6.500%, 11/01/25 | | | 2.2% | |
| | Goodyear Tire & Rubber Co/The, 9.500%, 05/31/25 | | | 2.0% | |
| | Delta Air Lines, Inc., 7.000%, 05/01/25 | | | 2.0% | |
| | Portfolio holdings are subject to change daily. | |
Until the extent of bank stress spillover is well understood, it is difficult to estimate the impact on the overall economy. Credit accessibility — a potential downstream effect — could impact spending and hiring, potentially curbing growth. Lagged effects of policy tightening and the durability of household balance sheets are additional risks.
Tightening credit conditions have the same effect as rate increases and therefore can serve as a substitute, allowing the Fed to be less hawkish. The most recent Federal Open Market Committee (“FOMC”) policy statement reinforces this view, with the Fed softening its rate guidance language. In light of this, it’s notable that the two-year U.S. Treasury yield — historically, a directional indicator of the Fed funds rate — has dropped sharply from its peak. Finally, inflation continues to recede, in our view also aligning with a less aggressive Fed in the future.
In our view, U.S. high yield’s risk/reward opportunity is compelling. We believe the asset class enjoys a favorable technical backdrop, due to robust “rising star” volume and a less active primary market in 2022, following record new issuance in 2020 and 2021. Credit statistics and fundamentals are healthy, near-term refinancing obligations remain low and managements continue to prioritize debt reduction. As a result, defaults are expected to normalize but not significantly exceed historical averages. A supportive commodity price backdrop also substantiates this view. With the market trading at a deep discount to face value, we believe high-yield bonds offer attractive total return potential and higher spreads that compensate for the risks.
Longer duration issues are the most likely to be impacted by rising interest rates, but in our view, the overall high-yield market should have a dampened response due to its larger coupon relative to other fixed income alternatives. As a result, we believe U.S. high yield bonds offer investors compelling opportunities for diversification and performance potential, through attractive yields with lower rate sensitivity.
The views expressed in this commentary are informed opinions. They should not be considered promises or advice. The views expressed reflect those of the portfolio managers, only through the end of the period as stated on the cover. The portfolio managers’ views are subject to change at any time based on market and other conditions.
Portfolio holdings and characteristics are subject to change and may not be representative of current holdings and characteristics. Fund holdings are subject to change daily. The outlook for this Fund may differ from that presented for other Voya mutual funds. This report contains statements that may be “forward-looking” statements. Actual results may differ materially from those projected in the “forward-looking” statements. The Fund’s performance returns shown reflect applicable fee waivers and/or expense limits in effect during this period. Absent such fee waivers/expense limitations, if any, performance would have been lower. Performance for the different classes of shares will vary based on differences in fees associated with each class. An index has no cash in its portfolio and imposes no sales charges. An investor cannot invest directly in an index.
| Voya Short Duration High Income Fund | Portfolio Managers’ Report |
| | | Cumulative Total Returns for the Period Ended March 31, 2023 | | |
| | | | | | Since Inception
of Class A, I and R6
Febraury 9, 2023 | | |
| | | Including Sales Charge: | | |
| | | Class A(1) | | | | | -2.73% | | | |
| | | Class I | | | | | -0.17% | | | |
| | | Class R6 | | | | | -0.17% | | | |
| | | Excluding Sales Charge: | | |
| | | Class A | | | | | -0.21% | | | |
| | | Class I | | | | | -0.17% | | | |
| | | Class R6 | | | | | -0.17% | | | |
| | | ICE BofA 1-3 year U.S. Treasury Index(2) | | | | | 1.27% | | | |
| | | ICE BofA 1-3 year BB U.S. Cash Pay High Yield Index(2) | | | | | 0.36% | | | |
| | | | | |
Based on a $10,000 initial investment, the graph and table above illustrate the total return of Voya Short Duration High Income Fund against the indices indicated. An index is unmanaged, has no cash in its portfolio and imposes no sales charges. An investor cannot invest directly in an index.
The Fund’s performance is shown both with and without the imposition of sales charges.
The performance graph and table do not reflect the deduction of taxes that a shareholder will pay on Fund distributions or the redemption of Fund shares.
The performance shown includes, if applicable, the effect of fee waivers and/or expense reimbursements by the Investment Adviser and/or other service providers, which have the effect of increasing total net return. Had all fees and expenses been considered, the total net returns would have been lower.
It is important to note that the Fund has a limited operating history. Performance over a longer period of time may be more meaningful than short-term performance.
Performance data represents past performance and is no assurance of future results. Investment return and principal value of an investment in the Fund will fluctuate. Shares, when sold, may be worth more or less than their original cost. The Fund’s current performance may be lower or higher than the performance data shown. Please log on to www.voyainvestments.com or call (800) 992-0180 to get performance through the most recent month end.
Fund holdings are subject to change daily.
(1)
Reflects deduction of the maximum Class A sales charge of 2.50%.
(2)
Since inception performance for the index is shown as of February 9, 2023.
| Portfolio Managers’ Report | Voya Short Term Bond Fund |
| | Investment Type Allocation
as of March 31, 2023
(as a percentage of net assets) | |
| | | | | | |
| | Corporate Bonds/Notes | | | 38.0% | |
| | U.S. Treasury Obligations | | | 25.4% | |
| | Asset-Backed Securities | | | 18.6% | |
| | Commercial Mortgage-Backed Securities | | | 7.6% | |
| | Collateralized Mortgage Obligations | | | 6.1% | |
| | U.S. Government Agency Obligations | | | 0.1% | |
| | Assets in Excess of Other Liabilities* | | | 4.2% | |
| | Net Assets | | | 100.0% | |
| | *
Includes short-term investments. | |
| | Portfolio holdings are subject to change daily. | |
Performance: For the year ended March 31, 2023, the Fund’s Class A shares, excluding sales charges, provided a total return of -0.83% compared to the Bloomberg U.S. 1-3 Year Government/Credit Bond Index (the “Index” or “Bloomberg U.S. 1-3 Year Government/Credit Bond”), which returned 0.26%, for the same period.
Portfolio Specifics: On the heels of one of the most difficult calendar years for bonds, returns recovered in the second half of the reporting period. The first six months of negative performance reflected persistent inflation pressures and a determined hawkish Fed, with the 10-year Treasury yield reaching nearly 4.25% during the fall. As inflation peaked, yields eased and bond markets staged a recovery rally to erase some of the earlier losses. The rally was tempered after a gangbuster employment report for the month of January 2023 and continued comments from U.S. Federal Reserve officials to raise interest rates further. The rally was then reignited with challenges in some U.S. regional banks as well as the takeover of Credit Suisse by Swiss rival UBS. Higher interest rates and higher bond volatility remained a challenge and non-government sectors struggled and broadly trailed the U.S. Treasury market for the trailing 12 months.
Duration positioning detracted most for the period, followed by sector allocation. Security selection contributed. Rate volatility driven by Fed hawkishness and mixed data prints contributed to the negative print from duration. Sector allocation detraction was led by commercial mortgage-backed securities (“CMBS”), as the sector struggled to locate financing, particularly within office properties, and commercial real estate (“CRE”) investments by regional banks had knock on effects on the sector amid the regional banking crisis in March. Positive security selection was driven by selection within investment grade corporates where we focus on financials and industrials, and we are| | Top Ten Holdings
as of March 31, 2023*
(as a percentage of net assets) | |
| | | | | | |
| | United States Treasury Note, 4.625%,
03/15/26 | | | 16.4% | |
| | United States Treasury Note, 0.125%,
01/15/24 | | | 6.9% | |
| | United States Treasury Note, 3.875%,
03/31/25 | | | 1.2% | |
| | UBS-Barclays Commercial Mortgage Trust 2013-C6 C, 4.102%, 04/10/46 | | | 1.2% | |
| | Ginnie Mae 2015-H32 FH, 5.226%,
12/20/65 | | | 1.0% | |
| | BRSP 2021-FL1 B Ltd., 6.661%, 08/19/38 | | | 1.0% | |
| | Ginnie Mae Series 2016-H16 FE, 3.155%, 06/20/66 | | | 1.0% | |
| | OHA Credit Partners XIII Ltd. 2016-13A AR, 5.985%, 10/25/34 | | | 0.9% | |
| | BBCMS Trust 2021-AGW E, 7.834%,
06/15/36 | | | 0.9% | |
| | OHA Credit Partners XVI 2021-16A A, 5.945%, 10/18/34 | | | 0.7% | |
| | *
Excludes short-term investments. | |
| | Portfolio holdings are subject to change daily. | |
During the reporting period, the Fund used futures primarily for cash management purposes, as well as some Credit Default Swap Index (“CDX”) as hedges. As a result, derivatives had a negative impact on performance, as we used the CDX to hedge overall fund risk as opposed to using them for natural duration hedging.
Current Strategy & Outlook: Looking forward, we believe the left tail risk of reaccelerating inflation has diminished, however a new scenario of a more widespread banking crisis has taken its place. While, in our opinion, the likelihood of either of these scenarios materializing remains slim, so does the likelihood of a soft landing. Services inflation remains too hot for comfort and will limit the Fed’s ability to ease in response to further signs of stress. As a result, we remain relatively defensive, with a preference for higher quality spread sectors. Sticking with our preference of consumer related risk over corporate risk, we are comfortable with our asset-backed security exposure, however, in an effort to remain liquid, tactical trades will most likely take place in the corporate arena. And finally, as alluded to above, we believe CRE will likely face difficult refinancing conditions going forward. However, in a departure from the previous, long-standing paradigm of “location, location, location”, in our opinion, property type has emerged as the key dimension that will likely drive future credit performance. In CMBS, our bias is tilted toward multi-family properties, and away from office.
The views expressed in this commentary are informed opinions. They should not be considered promises or advice. The views expressed reflect those of the portfolio managers, only through the end of the period as stated on the cover. The portfolio managers’ views are subject to change at any time based on market and other conditions.
Portfolio holdings and characteristics are subject to change and may not be representative of current holdings and characteristics. Fund holdings are subject to change daily. The outlook for this Fund may differ from that presented for other Voya mutual funds. The Fund’s performance returns shown reflect applicable fee waivers and/or expense limits in effect during this period. This report contains statements that may be “forward-looking” statements. Actual results may differ materially from those projected in the “forward-looking” statement. Absent such fee waivers/expense limitations, if any, performance would have been lower. Performance for the different classes of shares will vary based on differences in fees associated with each class.
| Voya Short Term Bond Fund | Portfolio Managers’ Report |
| | | Average Annual Total Returns for the Periods Ended March 31, 2023 | | |
| | | | | | 1 Year | | | 5 Year | | | 10 year | | | Since Inception
of Class R
July 31, 2014 | | |
| | | Including Sales Charge: | | |
| | | Class A(1) | | | | | -3.35% | | | | | | 0.55% | | | | | | 0.75% | | | | | | — | | | |
| | | Class C(2) | | | | | -2.44% | | | | | | 0.33% | | | | | | 0.26% | | | | | | — | | | |
| | | Class I | | | | | -0.54% | | | | | | 1.36% | | | | | | 1.29% | | | | | | — | | | |
| | | Class R | | | | | -0.96% | | | | | | 0.89% | | | | | | — | | | | | | 0.76% | | | |
| | | Class R6(3) | | | | | -0.50% | | | | | | 1.39% | | | | | | 1.33% | | | | | | — | | | |
| | | Class W | | | | | -0.47% | | | | | | 1.38% | | | | | | 1.28% | | | | | | — | | | |
| | | Excluding Sales Charge: | | |
| | | Class A | | | | | -0.83% | | | | | | 1.06% | | | | | | 1.01% | | | | | | — | | | |
| | | Class C | | | | | -1.47% | | | | | | 0.33% | | | | | | 0.26% | | | | | | — | | | |
| | | Class I | | | | | -0.54% | | | | | | 1.36% | | | | | | 1.29% | | | | | | — | | | |
| | | Class R | | | | | -0.96% | | | | | | 0.89% | | | | | | — | | | | | | 0.76% | | | |
| | | Class R6(3) | | | | | -0.50% | | | | | | 1.39% | | | | | | 1.33% | | | | | | — | | | |
| | | Class W | | | | | -0.47% | | | | | | 1.38% | | | | | | 1.28% | | | | | | — | | | |
| | | Bloomberg U.S. 1-3 Year Government/Credit Bond | | | | | 0.26% | | | | | | 1.26% | | | | | | 1.01% | | | | | | 1.06% | | | |
| | | | | |
Based on a $10,000 initial investment, the graph and table above illustrate the total return of Voya Short Term Bond Fund against the index indicated. The index is unmanaged, has no cash in its portfolio and imposes no sales charges. An investor cannot invest directly in an index.
The Fund’s performance is shown both with and without the imposition of sales charges.
The performance graph and table do not reflect the deduction of taxes that a shareholder will pay on Fund distributions or the redemption of Fund shares.
The performance shown includes, if applicable, the effect of fee waivers and/or expense reimbursements by the Investment Adviser and/or other service providers, which have the effect of increasing total net return. Had all fees and expenses been considered, the total net returns would have been lower.
Performance data represents past performance and is no assurance of future results. Investment return and principal value of an
investment in the Fund will fluctuate. Shares, when sold, may be worth more or less than their original cost. The Fund’s current performance may be lower or higher than the performance data shown. Please log on to www.voyainvestments.com or call (800) 992-0180 to get performance through the most recent month end.
Fund holdings are subject to change daily.
(1)
Reflects deduction of the maximum Class A sales charge of 2.50%.
(2)
Reflects deduction of the Class C deferred sales charge of 1% for the 1 year return.
(3)
Class R6 incepted on July 31, 2013. The Class R6 shares performance shown for the period prior to their inception date is the performance of Class I shares without adjustment for any differences in the expenses between the two classes. If adjusted for such differences, returns would be different.
| Portfolio Managers’ Report | Voya Strategic Income Opportunities Fund |
| | Investment Type Allocation
as of March 31, 2023
(as a percentage of net assets) | |
| | | | | | |
| | Collateralized Mortgage Obligations | | | 26.1% | |
| | Corporate Bonds/Notes | | | 21.9% | |
| | Commercial Mortgage-Backed Securities | | | 18.7% | |
| | Asset-Backed Securities | | | 14.8% | |
| | Bank Loans | | | 8.2% | |
| | Sovereign Bonds | | | 3.6% | |
| | U.S. Treasury Obligations | | | 1.7% | |
| | Purchased Options | | | 0.0% | |
| | Convertible Bonds/Notes | | | 0.0% | |
| | U.S. Government Agency Obligations | | | 0.0% | |
| | Common Stock | | | 0.0% | |
| | Preferred Stock | | | 0.0% | |
| | Assets in Excess of Other Liabilities* | | | 5.0% | |
| | Net Assets | | | 100.0% | |
| | *
Includes short-term investments. | |
| | Portfolio holdings are subject to change daily. | |
Performance: For the year ended March 31, 2023, the Fund’s Class A shares, excluding sales charges, provided a total return of -2.94% compared to the ICE BofA U.S. Dollar 3-Month Deposit Offered Rate Constant Maturity Index and the Bloomberg U.S. Universal Bond Index, which returned 2.39% and -4.61% respectively, for the same period.
Portfolio Specifics: The Fund underperformed the ICE BofA U.S. Dollar 3-Month Deposit Offered Rate Constant Maturity Index. Duration and yield curve decisions detracted the most, as interest rates continued to rise, and bond prices fell over the period. Sector allocation also detracted, reflecting concerns on the impact of the economy from continued US Federal Reserve rate hikes, while security selection was a modest contributor over the period.
Bond markets continued to struggle against the backdrop of interest rate hikes from the Fed. On the heels of one of the most difficult calendar years for bonds, returns recovered in the second half of the reporting period. The first six months of negative performance reflected persistent inflation pressures and a determined hawkish Fed, with the 10-year Treasury yield reaching nearly 4.25% during the fall. As inflation peaked, yields eased, and bond markets staged a recovery rally to erase some of the| | Top Ten Holdings
as of March 31, 2023*
(as a percentage of net assets) | |
| | | | | | |
| | Mexican Bonos, 7.750%, 05/29/31 | | | 1.1% | |
| | Republic of South Africa Government Bond, 8.875%, 02/28/35 | | | 0.8% | |
| | Prima Capital CRE Securitization 2019-7A D Ltd., 4.250%, 12/25/50 | | | 0.6% | |
| | GS Mortgage Securities Corp. II 2021-ARDN B, 6.334%, 11/15/36 | | | 0.5% | |
| | Bank of America Corp., 3.384%, 04/02/26 | | | 0.5% | |
| | Med Trust 2021-MDLN D, 6.685%, 11/15/38 | | | 0.5% | |
| | Morgan Stanley, 2.188%, 04/28/26 | | | 0.5% | |
| | JPMorgan Chase & Co., 2.083%, 04/22/26 | | | 0.5% | |
| | Morgan Stanley, 0.985%, 12/10/26 | | | 0.5% | |
| | Morgan Stanley, 4.679%, 07/17/26 | | | 0.5% | |
| | *
Excludes short-term investments. | |
| | Portfolio holdings are subject to change daily. | |
Duration and yield curve positioning detracted from performance. Even with a low duration profile, the significantly greater than expected rate hiking from the Fed weighed on performance. Sector allocation also weighed on performance, as rate volatility and concerns on the economic impact the Fed’s aggressive actions were challenges to performance. Allocations to commercial mortgage-backed securities (“CMBS”) and high yield (“HY”) had the greatest impact on performance, with CMBS reflecting concerns on the commercial real estate market and HY performance tied to the cyclicality of the United State economy. Offsetting some of this was positive contributions from asset-backed securities allocations, underscoring the lower risk profile of the sector and emerging market allocations which rebounded in response to decision by the Chinese officials to step away from their zero Covid policies. Security selection was mixed and in aggregate modestly added to results over the period. Contributions from CMBS were supported by more credit-sensitive investments as well as the selection of our US Treasuries.
The Fund primarily used futures, swaps and forward contracts for efficient portfolio and cash management purposes. As a result, derivatives had a negative impact on performance during the reporting period.
Current Strategy & Outlook: High levels of rate volatility illustrate the lack of certainty regarding the direction of the Fed, the economy and markets. On the one hand, we believe the left tail risk of reaccelerating inflation has diminished, on the other a new scenario of a more widespread banking crisis has taken its place. While, in our opinion, the likelihood of either of these scenarios materializing remains slim, so does the likelihood of a soft landing. All of this adds to the challenges of navigating this environment.
| Voya Strategic Income Opportunities Fund | Portfolio Managers’ Report |
We remain relatively defensive, with a preference for higher quality spread sectors such as investment grade corporates and agency mortgages. We are comfortable with our mortgage credit exposure, non-agency residential mortgage-backed securities and credit risk transfer securities. We believe commercial real estate will likely face difficult refinancing conditions going forward, testing the CMBS market. However, in a departure from the previous, long-standing paradigm of “location, location, location”, in our opinion property type has emerged as the key dimension that will likely drive future credit performance. In CMBS, our preference is tilted toward multi-family properties, and away from office. With a bias towards liquidity, tactical trades will most likely take place in the corporate arena.
The views expressed in this commentary are informed opinions. They should not be considered promises or advice. The views expressed reflect those of the portfolio managers, only through the end of the period as stated on the cover. The portfolio managers’ views are subject to change at any time based on market and other conditions.
Portfolio holdings and characteristics are subject to change and may not be representative of current holdings and characteristics. Fund holdings are subject to change daily. The outlook for this Fund may differ from that presented for other Voya mutual funds. The Fund’s performance returns shown reflect applicable fee waivers and/or expense limits in effect during this period. This report contains statements that may be “forward-looking” statements. Actual results may differ materially from those projected in the “forward-looking” statement. Absent such fee waivers/expense limitations, if any, performance would have been lower. Performance for the different classes of shares will vary based on differences in fees associated with each class.
| Portfolio Managers’ Report | Voya Strategic Income Opportunities Fund |
| | | Average Annual Total Returns for the Periods Ended March 31, 2023 | | |
| | | | | | 1 Year | | | 5 Years | | | 10 year | | |
| | | Including Sales Charge: | | |
| | | Class A(1) | | | | | -5.41% | | | | | | 0.63% | | | | | | 2.02% | | | |
| | | Class C(2) | | | | | -4.71% | | | | | | 0.39% | | | | | | 1.49% | | | |
| | | Class I | | | | | -2.84% | | | | | | 1.40% | | | | | | 2.61% | | | |
| | | Class R | | | | | -3.25% | | | | | | 0.87% | | | | | | 1.99% | | | |
| | | Class R6(3) | | | | | -2.69% | | | | | | 1.46% | | | | | | 2.62% | | | |
| | | Class W | | | | | -2.83% | | | | | | 1.39% | | | | | | 3.16% | | | |
| | | Excluding Sales Charge: | | |
| | | Class A | | | | | -2.94% | | | | | | 1.14% | | | | | | 2.28% | | | |
| | | Class C | | | | | -3.78% | | | | | | 0.39% | | | | | | 1.49% | | | |
| | | Class I | | | | | -2.84% | | | | | | 1.40% | | | | | | 2.61% | | | |
| | | Class R | | | | | -3.25% | | | | | | 0.87% | | | | | | 1.99% | | | |
| | | Class R6(3) | | | | | -2.69% | | | | | | 1.46% | | | | | | 2.62% | | | |
| | | Class W | | | | | -2.83% | | | | | | 1.39% | | | | | | 2.43% | | | |
| | | ICE BofA U.S. Dollar 3-Month Deposit Offered Rate Constant Maturity Index | | | | | 2.39% | | | | | | 1.58% | | | | | | 1.07% | | | |
| | | Bloomberg U.S. Universal Bond Index | | | | | -4.61% | | | | | | 1.05% | | | | | | 1.62% | | | |
| | | | | |
Based on a $10,000 initial investment, the graph and table above illustrate the total return of Voya Strategic Income Opportunities Fund against the indices indicated. An index is unmanaged, has no cash in its portfolio and imposes no sales charges. An investor cannot invest directly in an index.
The Fund’s performance is shown both with and without the imposition of sales charges.
The performance graph and table do not reflect the deduction of taxes that a shareholder will pay on Fund distributions or the redemption of Fund shares.
The performance shown includes, if applicable, the effect of fee waivers and/or expense reimbursements by the Investment Adviser and/or other service providers, which have the effect of increasing total net return. Had all fees and expenses been considered, the total net returns would have been lower.
Performance data represents past performance and is no assurance of future results. Investment return and principal value of an
investment in the Fund will fluctuate. Shares, when sold, may be worth more or less than their original cost. The Fund’s current performance may be lower or higher than the performance data shown. Please log on to www.voyainvestments.com or call (800) 992-0180 to get performance through the most recent month end.
Fund holdings are subject to change daily.
(1)
Reflects deduction of the maximum Class A sales charge of 2.50%.
(2)
Reflects deduction of the Class C deferred sales charge of 1% for the 1 year return.
(3)
Class R6 incepted on October 23, 2015. The Class R6 shares performance shown for the period prior to their inception date is the performance of Class I shares without adjustment for any differences in the expenses between the two classes. If adjusted for such differences, returns would be different.
shareholder expense examples (Unaudited)
As a shareholder of a Fund, you incur two types of costs: (1) transaction costs, including sales charges (loads) on purchase payments, redemption fees, and exchange fees, and (2) ongoing costs, including management fees, distribution and/or service (12b-1) fees, and other Fund expenses. These Examples are intended to help you understand your ongoing costs (in dollars) of investing in a Fund and to compare these costs with the ongoing costs of investing in other mutual funds.
The Examples are based on an investment of $1,000 invested at the beginning of the period and held for the entire period from October 1, 2022 to March 31, 2023. The Funds’ expenses are shown without the imposition of any sales charges or fees. Expenses would have been higher if such charges were included.
Actual Expenses
The left section of the table shown below, “Actual Fund Return,” provides information about actual account values and actual expenses. You may use the information in this section, together with the amount you invested, to estimate the expenses that you paid over the period. Simply divide your account value by $1,000 (for example, an $8,600 account value divided by $1,000 = 8.6), then multiply the result by the number in the first section under the heading entitled “Expenses Paid During the Period” to estimate the expenses you paid on your account during this period.
Hypothetical Example for Comparison Purposes
The right section of the table shown below, “Hypothetical (5% return before expenses)” provides information about hypothetical account values and hypothetical expenses based on a Fund’s actual expense ratio and an assumed rate of return of 5% per year before expenses, which is not the Fund’s actual return. The hypothetical account values and expenses may not be used to estimate the actual ending account balance or expenses you paid for the period. You may use this information to compare the ongoing costs of investing in each Fund and other mutual funds. To do so, compare this 5% hypothetical example with the 5% hypothetical examples that appear in the shareholder reports of the other mutual funds.
Please note that the expenses shown in the table are meant to highlight your ongoing costs only and do not reflect any transactional costs, such as sales charges (loads), redemption fees, or exchange fees. Therefore, the hypothetical section of the table is useful in comparing ongoing costs only, and will not help you determine the relative total costs of owning different mutual funds. In addition, if these transactional costs were included, your costs would have been higher.
| | | | Actual Fund Return | | | Hypothetical (5% return before expenses) | |
| | | | Beginning
Account
Value
October 1,
2022 | | | Ending
Account
Value
March 31,
2023 | | | Annualized
Expense
Ratio | | | Expenses Paid
During the
Period Ended
March 31,
2023* | | | Beginning
Account
Value
October 1,
2022 | | | Ending
Account
Value
March 31,
2023 | | | Annualized
Expense
Ratio | | | Expenses Paid
During the
Period Ended
March 31,
2023* | |
| Voya GNMA Income Fund | |
| Class A | | | | $ | 1,000.00 | | | | | $ | 1,038.50 | | | | | | 0.84% | | | | | $ | 4.27 | | | | | $ | 1,000.00 | | | | | $ | 1,020.74 | | | | | | 0.84% | | | | | $ | 4.23 | | |
| Class C | | | | | 1,000.00 | | | | | | 1,033.40 | | | | | | 1.59 | | | | | | 8.06 | | | | | | 1,000.00 | | | | | | 1,017.00 | | | | | | 1.59 | | | | | | 8.00 | | |
| Class I | | | | | 1,000.00 | | | | | | 1,040.00 | | | | | | 0.54 | | | | | | 2.75 | | | | | | 1,000.00 | | | | | | 1,022.24 | | | | | | 0.54 | | | | | | 2.72 | | |
| Class R6 | | | | | 1,000.00 | | | | | | 1,040.10 | | | | | | 0.49 | | | | | | 2.49 | | | | | | 1,000.00 | | | | | | 1,022.49 | | | | | | 0.49 | | | | | | 2.47 | | |
| Class W | | | | | 1,000.00 | | | | | | 1,039.70 | | | | | | 0.59 | | | | | | 3.00 | | | | | | 1,000.00 | | | | | | 1,021.99 | | | | | | 0.59 | | | | | | 2.97 | | |
| Voya High Yield Bond Fund | |
| Class A | | | | $ | 1,000.00 | | | | | $ | 1,078.80 | | | | | | 1.07% | | | | | $ | 5.55 | | | | | $ | 1,000.00 | | | | | $ | 1,019.60 | | | | | | 1.07% | | | | | $ | 5.39 | | |
| Class C | | | | | 1,000.00 | | | | | | 1,073.50 | | | | | | 1.82 | | | | | | 9.41 | | | | | | 1,000.00 | | | | | | 1,015.86 | | | | | | 1.82 | | | | | | 9.15 | | |
| Class I | | | | | 1,000.00 | | | | | | 1,079.40 | | | | | | 0.72 | | | | | | 3.73 | | | | | | 1,000.00 | | | | | | 1,021.34 | | | | | | 0.72 | | | | | | 3.63 | | |
| Class R | | | | | 1,000.00 | | | | | | 1,076.10 | | | | | | 1.32 | | | | | | 6.83 | | | | | | 1,000.00 | | | | | | 1,018.35 | | | | | | 1.32 | | | | | | 6.64 | | |
| Class R6 | | | | | 1,000.00 | | | | | | 1,079.60 | | | | | | 0.66 | | | | | | 3.42 | | | | | | 1,000.00 | | | | | | 1,021.64 | | | | | | 0.66 | | | | | | 3.33 | | |
| Class W | | | | | 1,000.00 | | | | | | 1,080.30 | | | | | | 0.82 | | | | | | 4.25 | | | | | | 1,000.00 | | | | | | 1,020.84 | | | | | | 0.82 | | | | | | 4.13 | | |
shareholder expense examples (Unaudited) (continued)
| | | | Actual Fund Return | | | Hypothetical (5% return before expenses) | |
| | | | Beginning
Account
Value
October 1,
2022 | | | Ending
Account
Value
March 31,
2023 | | | Annualized
Expense
Ratio | | | Expenses Paid
During the
Period Ended
March 31,
2023* | | | Beginning
Account
Value
October 1,
2022 | | | Ending
Account
Value
March 31,
2023 | | | Annualized
Expense
Ratio | | | Expenses Paid
During the
Period Ended
March 31,
2023* | |
| Voya Intermediate Bond Fund | |
| Class A | | | | $ | 1,000.00 | | | | | $ | 1,047.40 | | | | | | 0.72% | | | | | $ | 3.68 | | | | | $ | 1,000.00 | | | | | $ | 1,021.34 | | | | | | 0.72% | | | | | $ | 3.63 | | |
| Class C | | | | | 1,000.00 | | | | | | 1,042.40 | | | | | | 1.47 | | | | | | 7.49 | | | | | | 1,000.00 | | | | | | 1,017.60 | | | | | | 1.47 | �� | | | | | 7.39 | | |
| Class I | | | | | 1,000.00 | | | | | | 1,049.10 | | | | | | 0.36 | | | | | | 1.84 | | | | | | 1,000.00 | | | | | | 1,023.14 | | | | | | 0.36 | | | | | | 1.82 | | |
| Class R | | | | | 1,000.00 | | | | | | 1,046.10 | | | | | | 0.97 | | | | | | 4.95 | | | | | | 1,000.00 | | | | | | 1,020.09 | | | | | | 0.97 | | | | | | 4.89 | | |
| Class R6 | | | | | 1,000.00 | | | | | | 1,049.30 | | | | | | 0.30 | | | | | | 1.53 | | | | | | 1,000.00 | | | | | | 1,023.44 | | | | | | 0.30 | | | | | | 1.51 | | |
| Class W | | | | | 1,000.00 | | | | | | 1,048.70 | | | | | | 0.47 | | | | | | 2.40 | | | | | | 1,000.00 | | | | | | 1,022.59 | | | | | | 0.47 | | | | | | 2.37 | | |
| Voya Short Duration High Income Fund | |
| Class A** | | | | $ | 1,000.00 | | | | | $ | 997.90 | | | | | | 0.85% | | | | | $ | 1.19 | | | | | $ | 1,000.00 | | | | | $ | 1,020.69 | | | | | | 0.85% | | | | | $ | 4.28 | | |
| Class I** | | | | | 1,000.00 | | | | | | 998.30 | | | | | | 0.60 | | | | | | 0.84 | | | | | | 1,000.00 | | | | | | 1,021.94 | | | | | | 0.60 | | | | | | 3.02 | | |
| Class R6** | | | | | 1,000.00 | | | | | | 998.30 | | | | | | 0.60 | | | | | | 0.84 | | | | | | 1,000.00 | | | | | | 1,021.94 | | | | | | 0.60 | | | | | | 3.02 | | |
| Voya Short Term Bond Fund | |
| Class A | | | | $ | 1,000.00 | | | | | $ | 1,024.20 | | | | | | 0.62% | | | | | $ | 3.13 | | | | | $ | 1,000.00 | | | | | $ | 1,021.84 | | | | | | 0.62% | | | | | $ | 3.13 | | |
| Class C | | | | | 1,000.00 | | | | | | 1,020.40 | | | | | | 1.37 | | | | | | 6.90 | | | | | | 1,000.00 | | | | | | 1,018.10 | | | | | | 1.37 | | | | | | 6.89 | | |
| Class I | | | | | 1,000.00 | | | | | | 1,025.70 | | | | | | 0.35 | | | | | | 1.77 | | | | | | 1,000.00 | | | | | | 1,023.19 | | | | | | 0.35 | | | | | | 1.77 | | |
| Class R | | | | | 1,000.00 | | | | | | 1,022.90 | | | | | | 0.87 | | | | | | 4.39 | | | | | | 1,000.00 | | | | | | 1,020.59 | | | | | | 0.87 | | | | | | 4.38 | | |
| Class R6 | | | | | 1,000.00 | | | | | | 1,025.90 | | | | | | 0.30 | | | | | | 1.52 | | | | | | 1,000.00 | | | | | | 1,023.44 | | | | | | 0.30 | | | | | | 1.51 | | |
| Class W | | | | | 1,000.00 | | | | | | 1,025.50 | | | | | | 0.37 | | | | | | 1.87 | | | | | | 1,000.00 | | | | | | 1,023.09 | | | | | | 0.37 | | | | | | 1.87 | | |
| Voya Strategic Income Opportunities Fund | |
| Class A | | | | $ | 1,000.00 | | | | | $ | 1,021.80 | | | | | | 0.85% | | | | | $ | 4.28 | | | | | $ | 1,000.00 | | | | | $ | 1,020.69 | | | | | | 0.85% | | | | | $ | 4.28 | | |
| Class C | | | | | 1,000.00 | | | | | | 1,016.80 | | | | | | 1.60 | | | | | | 8.05 | | | | | | 1,000.00 | | | | | | 1,016.95 | | | | | | 1.60 | | | | | | 8.05 | | |
| Class I | | | | | 1,000.00 | | | | | | 1,022.00 | | | | | | 0.61 | | | | | | 3.08 | | | | | | 1,000.00 | | | | | | 1,021.89 | | | | | | 0.61 | | | | | | 3.07 | | |
| Class R | | | | | 1,000.00 | | | | | | 1,019.30 | | | | | | 1.10 | | | | | | 5.54 | | | | | | 1,000.00 | | | | | | 1,019.45 | | | | | | 1.10 | | | | | | 5.54 | | |
| Class R6 | | | | | 1,000.00 | | | | | | 1,023.50 | | | | | | 0.54 | | | | | | 2.72 | | | | | | 1,000.00 | | | | | | 1,022.24 | | | | | | 0.54 | | | | | | 2.72 | | |
| Class W | | | | | 1,000.00 | | | | | | 1,021.80 | | | | | | 0.60 | | | | | | 3.02 | | | | | | 1,000.00 | | | | | | 1,021.94 | | | | | | 0.60 | | | | | | 3.02 | | |
*
Expenses are equal to each Fund's respective annualized expense ratios multiplied by the average account value over the period, multiplied by 182/365 to reflect the most recent fiscal half-year.
**
Commencement of operations was February 9, 2023. Expenses paid for the actual Fund's return reflect the 51-day period ended March 31, 2023
report of independent registered public accounting firm
To the Shareholders of Voya GNMA Income Fund, Voya High Yield Bond Fund, Voya Intermediate Bond Fund, Voya Short Duration High Income Fund, Voya Short Term Bond Fund and Voya Strategic Income Opportunities Fund and the Board of Trustees of Voya Funds Trust
Opinion on the Financial Statements
We have audited the accompanying statements of assets and liabilities of Voya GNMA Income Fund, Voya High Yield Bond Fund, Voya Intermediate Bond Fund, Voya Short Duration High Income Fund, Voya Short Term Bond Fund and Voya Strategic Income Opportunities Fund (collectively referred to as the “Funds”) (six of the funds constituting Voya Funds Trust (the “Trust”)), including the portfolios of investments, as of March 31, 2023, and the related statements of operations and changes in net assets and the financial highlights for each of the periods indicated in the table below and the related notes (collectively referred to as the “financial statements”). In our opinion, the financial statements present fairly, in all material respects, the financial position of each of the Funds (six of the funds constituting Voya Funds Trust) at March 31, 2023, and the results of their operations, changes in net assets and financial highlights for each of the periods indicated in the table below, in conformity with U.S. generally accepted accounting principles.
Individual fund constituting
Voya Funds Trust | | | Statement of Operations | | | Statements of changes in
net assets | | | Financial highlights | | | |
| Voya GNMA Income Fund | | | For the year ended March 31, 2023 | | | For each of the two years in the period ended March 31, 2023 | | | For each of the four years in the period ended March 31, 2023 | | | |
| Voya High Yield Bond Fund | | | For the year ended March 31, 2023 | | | For each of the two years in the period ended March 31, 2023 | | | For each of the four years in the period ended March 31, 2023 | | | |
| Voya Intermediate Bond Fund | | | For the year ended March 31, 2023 | | | For each of the two years in the period ended March 31, 2023 | | | For each of the four years in the period ended March 31, 2023 | | | |
| Voya Short Duration High Income Fund | | | For the period from February 9, 2023 (commencement of operations) through March 31, 2023 | | | | | | | |
| Voya Short Term Bond Fund | | | For the year ended March 31, 2023 | | | For each of the two years in the period ended March 31, 2023 | | | For each of the four years in the period ended March 31, 2023 | | | |
| Voya Strategic Income Opportunities Fund | | | For the year ended March 31, 2023 | | | For each of the two years in the period ended March 31, 2023 | | | For each of the four years in the period ended March 31, 2023 | | | |
The financial highlights for the year ended March 31, 2019 were audited by another independent registered public accounting firm whose report, dated May 23, 2019, expressed an unqualified opinion on those financial highlights.
Basis for Opinion
These financial statements are the responsibility of the Trust’s management. Our responsibility is to express an opinion on each of the Funds’ financial statements based on our audits. We are a public accounting firm registered with the Public Company Accounting Oversight Board (United States) (“PCAOB”) and are required to be independent with respect to the Trust in accordance with the U.S. federal securities laws and the applicable rules and regulations of the Securities and Exchange Commission and the PCAOB.
We conducted our audits in accordance with the standards of the PCAOB. Those standards require that we plan and perform the audit to obtain reasonable assurance about whether the financial statements are free of material misstatement, whether due to error or fraud. The Trust is not required to have, nor were we engaged to perform, an audit of the Trust’s internal control over financial reporting. As part of our audits, we are required to obtain an understanding of internal control over financial reporting, but not for the purpose of expressing an opinion on the effectiveness of the Trust’s internal control over financial reporting. Accordingly, we express no such opinion.
Our audits included performing procedures to assess the risks of material misstatement of the financial statements, whether due to error or fraud, and performing procedures that respond to those risks. Such procedures included examining, on a test basis, evidence regarding the amounts and disclosures in the financial statements. Our procedures included confirmation of securities owned as of March 31, 2023, by correspondence with the custodian, brokers and others; when
report of independent registered public accounting firm
replies were not received from brokers and others, we performed other auditing procedures. Our audits also included evaluating the accounting principles used and significant estimates made by management, as well as evaluating the overall presentation of the financial statements. We believe that our audits provide a reasonable basis for our opinion.
We have served as the auditor of one or more Voya investment companies since 2019.
Boston, Massachusetts
May 30, 2023
STATEMENTS OF ASSETS AND LIABILITIES as of March 31, 2023
| | | | Voya GNMA
Income Fund | | | Voya High Yield
Bond Fund | | | Voya Intermediate
Bond Fund | | | | |
| ASSETS: | | | | | | | | | | | | | | | | | | | | | | |
| Investments in securities at fair value+* | | | | $ | 1,607,349,239 | | | | | $ | 361,321,675 | | | | | $ | 7,597,112,153 | | | | | |
| Short-term investments at fair value† | | | | | 68,378,849 | | | | | | 24,158,647 | | | | | | 124,239,186 | | | | | |
| Cash | | | | | 1,635,017 | | | | | | 24,949 | | | | | | 6,783,233 | | | | | |
| Cash collateral for futures contracts | | | | | 2,893,685 | | | | | | — | | | | | | 13,528,920 | | | | | |
| Cash pledged for centrally cleared swaps (Note 2) | | | | | — | | | | | | — | | | | | | 16,600,000 | | | | | |
| Cash pledged as collateral for OTC derivatives (Note 2) | | | | | — | | | | | | — | | | | | | 39,240,000 | | | | | | | | | | | |
| Cash pledged as collateral for delayed-delivery or when-issued securities (Note 2) | | | | | 315,000 | | | | | | — | | | | | | 413,000 | | | | | |
| Receivables: | | | | | | | | | | | | | | | | | | | | | | |
| Investment securities sold | | | | | — | | | | | | — | | | | | | 60,102,482 | | | | | |
| Investment securities sold on a delayed-delivery or when-issued basis | | | | | 12,595,709 | | | | | | — | | | | | | — | | | | | |
| Fund shares sold | | | | | 13,212,817 | | | | | | 3,275,856 | | | | | | 8,813,662 | | | | | |
| Dividends | | | | | — | | | | | | 10,107 | | | | | | 37,209 | | | | | |
| Interest | | | | | 4,331,191 | | | | | | 6,343,926 | | | | | | 50,313,782 | | | | | |
| Foreign tax reclaims | | | | | — | | | | | | — | | | | | | 62,729 | | | | | |
| Variation margin on futures contracts | | | | | — | | | | | | — | | | | | | 2,477,893 | | | | | |
| Variation margin on centrally cleared swaps | | | | | — | | | | | | — | | | | | | 1,221,021 | | | | | |
| Unrealized appreciation on forward premium swaptions | | | | | — | | | | | | — | | | | | | 1,251,890 | | | | | |
| Prepaid expenses | | | | | 46,697 | | | | | | 58,922 | | | | | | 138,487 | | | | | |
| Other assets | | | | | 39,808 | | | | | | 17,512 | | | | | | 161,738 | | | | | |
| Total assets | | | | | 1,710,798,012 | | | | | | 395,211,594 | | | | | | 7,922,497,384 | | | | | |
| LIABILITIES: | | | | | | | | | | | | | | | | | | | | | | |
| Income distribution payable | | | | | 706,339 | | | | | | 108,310 | | | | | | 2,757,726 | | | | | |
| Payable for investment securities purchased | | | | | 9,552,985 | | | | | | 1,577,545 | | | | | | 75,080,813 | | | | | |
| Payable for investment securities purchased on a delayed-delivery or when-issued basis | | | | | 370,158,199 | | | | | | — | | | | | | 42,142,242 | | | | | |
| Payable for fund shares redeemed | | | | | 1,851,433 | | | | | | 472,767 | | | | | | 7,668,492 | | | | | |
| Payable upon receipt of securities loaned | | | | | — | | | | | | 8,175,410 | | | | | | 80,033,894 | | | | | |
| Unrealized depreciation on forward foreign currency contracts | | | | | — | | | | | | — | | | | | | 53,555 | | | | | |
| Variation margin payable on futures contracts | | | | | 190,110 | | | | | | — | | | | | | — | | | | | |
| Cash received as collateral for OTC derivatives (Note 2) | | | | | — | | | | | | — | | | | | | 290,000 | | | | | |
| Cash received as collateral for delayed-delivery or when-issued securities (Note 2) | | | | | 410,163 | | | | | | — | | | | | | 343,000 | | | | | |
| Payable for investment management fees | | | | | 473,792 | | | | | | 178,646 | | | | | | 1,741,352 | | | | | |
| Payable for distribution and shareholder service fees | | | | | 97,031 | | | | | | 13,440 | | | | | | 109,298 | | | | | |
| Payable to trustees under the deferred compensation plan (Note 6) | | | | | 39,808 | | | | | | 17,512 | | | | | | 161,738 | | | | | |
| Payable for trustee fees | | | | | 3,206 | | | | | | 1,257 | | | | | | 20,270 | | | | | |
| Other accrued expenses and liabilities | | | | | 691,861 | | | | | | 217,345 | | | | | | 2,467,192 | | | | | |
| Written options, at fair value^ | | | | | — | | | | | | — | | | | | | 35,857,987 | | | | | |
| Total liabilities | | | | | 384,174,927 | | | | | | 10,762,232 | | | | | | 248,727,559 | | | | | |
| NET ASSETS | | | | $ | 1,326,623,085 | | | | | $ | 384,449,362 | | | | | $ | 7,673,769,825 | | | | | |
| NET ASSETS WERE COMPRISED OF: | | | | | | | | | | | | | | | | | | | | | | |
| Paid-in capital | | | | $ | 1,521,851,523 | | | | | $ | 447,372,448 | | | | | $ | 9,093,178,474 | | | | | |
| Total distributable loss | | | | | (195,228,438) | | | | | | (62,923,086) | | | | | | (1,419,408,649) | | | | | |
| NET ASSETS | | | | $ | 1,326,623,085 | | | | | $ | 384,449,362 | | | | | $ | 7,673,769,825 | | | | | |
+
Including securities loaned at value | | | | $ | — | | | | | $ | 7,926,733 | | | | | $ | 77,644,175 | | | | | |
*
Cost of investments in securities | | | | $ | 1,706,878,990 | | | | | $ | 398,790,786 | | | | | $ | 8,183,804,905 | | | | | |
†
Cost of short-term investments | | | | $ | 68,360,366 | | | | | $ | 24,159,226 | | | | | $ | 124,247,394 | | | | | |
^
Premiums received on written options | | | | $ | — | | | | | $ | — | | | | | $ | 36,402,924 | | | | | |
See Accompanying Notes to Financial Statements
STATEMENTS OF ASSETS AND LIABILITIES as of March 31, 2023 (continued)
| | | | Voya GNMA
Income Fund | | | Voya High Yield
Bond Fund | | | Voya Intermediate
Bond Fund | |
| Class A | | | | | | | | | | | | | | | | | | | |
| Net assets | | | | $ | 389,828,714 | | | | | $ | 38,547,279 | | | | | $ | 245,360,834 | | |
| Shares authorized | | | | | unlimited | | | | | | unlimited | | | | | | unlimited | | |
| Par value | | | | $ | 0.001 | | | | | $ | 0.001 | | | | | $ | 0.001 | | |
| Shares outstanding | | | | | 52,171,746 | | | | | | 5,728,698 | | | | | | 28,085,431 | | |
| Net asset value and redemption price per share† | | | | $ | 7.47 | | | | | $ | 6.73 | | | | | $ | 8.74 | | |
Maximum offering price per share (2.50%)(1) | | | | $ | 7.66 | | | | | $ | 6.90 | | | | | $ | 8.96 | | |
| Class C | | | | | | | | | | | | | | | | | | | |
| Net assets | | | | $ | 17,679,340 | | | | | $ | 6,561,813 | | | | | $ | 9,686,381 | | |
| Shares authorized | | | | | unlimited | | | | | | unlimited | | | | | | unlimited | | |
| Par value | | | | $ | 0.001 | | | | | $ | 0.001 | | | | | $ | 0.001 | | |
| Shares outstanding | | | | | 2,378,012 | | | | | | 976,115 | | | | | | 1,110,311 | | |
| Net asset value and redemption price per share† | | | | $ | 7.43 | | | | | $ | 6.72 | | | | | $ | 8.72 | | |
| Class I | | | | | | | | | | | | | | | | | | | |
| Net assets | | | | $ | 822,845,811 | | | | | $ | 188,744,246 | | | | | $ | 4,937,511,804 | | |
| Shares authorized | | | | | unlimited | | | | | | unlimited | | | | | | unlimited | | |
| Par value | | | | $ | 0.001 | | | | | $ | 0.001 | | | | | $ | 0.001 | | |
| Shares outstanding | | | | | 109,907,324 | | | | | | 28,115,969 | | | | | | 564,846,329 | | |
| Net asset value and redemption price per share | | | | $ | 7.49 | | | | | $ | 6.71 | | | | | $ | 8.74 | | |
| Class R | | | | | | | | | | | | | | | | | | | |
| Net assets | | | | | n/a | | | | | $ | 255,794 | | | | | $ | 115,626,522 | | |
| Shares authorized | | | | | n/a | | | | | | unlimited | | | | | | unlimited | | |
| Par value | | | | | n/a | | | | | $ | 0.001 | | | | | $ | 0.001 | | |
| Shares outstanding | | | | | n/a | | | | | | 38,017 | | | | | | 13,217,531 | | |
| Net asset value and redemption price per share | | | | | n/a | | | | | $ | 6.73 | | | | | $ | 8.75 | | |
| Class R6 | | | | | | | | | | | | | | | | | | | |
| Net assets | | | | $ | 29,707,106 | | | | | $ | 93,178,871 | | | | | $ | 2,302,753,687 | | |
| Shares authorized | | | | | unlimited | | | | | | unlimited | | | | | | unlimited | | |
| Par value | | | | $ | 0.001 | | | | | $ | 0.001 | | | | | $ | 0.001 | | |
| Shares outstanding | | | | | 3,964,419 | | | | | | 13,847,835 | | | | | | 263,237,351 | | |
| Net asset value and redemption price per share | | | | $ | 7.49 | | | | | $ | 6.73 | | | | | $ | 8.75 | | |
| Class W | | | | | | | | | | | | | | | | | | | |
| Net assets | | | | $ | 66,562,114 | | | | | $ | 57,161,359 | | | | | $ | 62,830,597 | | |
| Shares authorized | | | | | unlimited | | | | | | unlimited | | | | | | unlimited | | |
| Par value | | | | $ | 0.001 | | | | | $ | 0.001 | | | | | $ | 0.001 | | |
| Shares outstanding | | | | | 8,880,706 | | | | | | 8,483,442 | | | | | | 7,198,209 | | |
| Net asset value and redemption price per share | | | | $ | 7.50 | | | | | $ | 6.74 | | | | | $ | 8.73 | | |
(1)
Maximum offering price is computed at 100/97.50 of net asset value. On purchases of $100,000 or more, the offering price is reduced.
†
Redemption price per share may be reduced for any applicable contingent deferred sales charges.
See Accompanying Notes to Financial Statements
STATEMENTS OF ASSETS AND LIABILITIES as of March 31, 2023
| | | | Voya Short
Duration
High Income
Fund | | | Voya Short Term
Bond Fund | | | Voya Strategic
Income
Opportunities
Fund | |
| ASSETS: | | | | | | | | | | | | | | | | | | | |
| Investments in securities at fair value+* | | | | $ | 25,075,660 | | | | | $ | 374,570,911 | | | | | $ | 1,766,630,024 | | |
| Short-term investments at fair value† | | | | | 138,488 | | | | | | 29,936,565 | | | | | | 69,846,890 | | |
| Cash | | | | | — | | | | | | 635,364 | | | | | | 8,176,196 | | |
| Cash collateral for futures contracts | | | | | — | | | | | | 1,005,508 | | | | | | 8,809,700 | | |
| Cash pledged for centrally cleared swaps (Note 2) | | | | | — | | | | | | — | | | | | | 12,296,846 | | |
| Cash pledged as collateral for OTC derivatives (Note 2) | | | | | — | | | | | | — | | | | | | 24,580,000 | | |
| Cash pledged as collateral for delayed-delivery or when-issued securities (Note 2) | | | | | — | | | | | | — | | | | | | 393,892 | | |
| Foreign currencies at value‡ | | | | | — | | | | | | — | | | | | | 1,087,950 | | |
| Receivables: | | | | | | | | | | | | | | | | | | | |
| Investment securities sold | | | | | — | | | | | | 357,684 | | | | | | 32,214,590 | | |
| Fund shares sold | | | | | 25,000 | | | | | | 908,236 | | | | | | 6,007,861 | | |
| Dividends | | | | | 1,255 | | | | | | 23,172 | | | | | | 63,034 | | |
| Interest | | | | | 447,823 | | | | | | 1,996,072 | | | | | | 15,819,942 | | |
| Variation margin on futures contracts | | | | | — | | | | | | 47,980 | | | | | | — | | |
| Variation margin on centrally cleared swaps | | | | | — | | | | | | — | | | | | | 833,621 | | |
| Unrealized appreciation on forward foreign currency contracts | | | | | — | | | | | | — | | | | | | 2,732,415 | | |
| Unrealized appreciation on forward premium swaptions | | | | | — | | | | | | — | | | | | | 519,018 | | |
| Prepaid expenses | | | | | 2,975 | | | | | | 55,062 | | | | | | 88,031 | | |
| Prepaid offering expense | | | | | 84,759 | | | | | | — | | | | | | — | | |
| Reimbursement due from Investment Adviser | | | | | 7,948 | | | | | | 6,089 | | | | | | — | | |
| Other assets | | | | | 8 | | | | | | 4,827 | | | | | | 26,965 | | |
| Total assets | | | | | 25,783,916 | | | | | | 409,547,470 | | | | | | 1,950,126,975 | | |
| LIABILITIES: | | | | | | | | | | | | | | | | | | | |
| Income distribution payable | | | | | 302 | | | | | | 733 | | | | | | 667,241 | | |
| Payable for investment securities purchased | | | | | — | | | | | | 9,310,175 | | | | | | 34,503,551 | | |
| Payable for fund shares redeemed | | | | | — | | | | | | 3,793,374 | | | | | | 6,489,982 | | |
| Payable upon receipt of securities loaned | | | | | — | | | | | | 4,942,012 | | | | | | 19,957,719 | | |
| Unrealized depreciation on forward foreign currency contracts | | | | | — | | | | | | — | | | | | | 3,679,059 | | |
| Unrealized depreciation on OTC swap agreements | | | | | — | | | | | | — | | | | | | 263 | | |
| Variation margin payable on futures contracts | | | | | — | | | | | | — | | | | | | 1,295,615 | | |
| Cash received as collateral for OTC derivatives (Note 2) | | | | | — | | | | | | — | | | | | | 420,000 | | |
| Payable for investment management fees | | | | | 10,572 | | | | | | 82,714 | | | | | | 776,880 | | |
| Payable for distribution and shareholder service fees | | | | | 1,825 | | | | | | 2,247 | | | | | | 52,723 | | |
| Payable to trustees under the deferred compensation plan (Note 6) | | | | | 8 | | | | | | 4,827 | | | | | | 26,965 | | |
| Payable for trustee fees | | | | | 61 | | | | | | 1,025 | | | | | | 5,238 | | |
| Unfunded loan commitments (Note 10) | | | | | — | | | | | | — | | | | | | 161,999 | | |
| Other accrued expenses and liabilities | | | | | 39,963 | | | | | | 76,837 | | | | | | 735,385 | | |
| Written options, at fair value^ | | | | | — | | | | | | — | | | | | | 21,851,529 | | |
| Total liabilities | | | | | 52,731 | | | | | | 18,213,944 | | | | | | 90,624,149 | | |
| NET ASSETS | | | | $ | 25,731,185 | | | | | $ | 391,333,526 | | | | | $ | 1,859,502,826 | | |
| NET ASSETS WERE COMPRISED OF: | | | | | | | | | | | | | | | | | | | |
| Paid-in capital | | | | $ | 26,021,336 | | | | | $ | 423,813,407 | | | | | $ | 2,183,399,851 | | |
| Total distributable loss | | | | | (290,151) | | | | | | (32,479,881) | | | | | | (323,897,025) | | |
| NET ASSETS | | | | $ | 25,731,185 | | | | | $ | 391,333,526 | | | | | $ | 1,859,502,826 | | |
+
Including securities loaned at value | | | | $ | — | | | | | $ | 4,812,380 | | | | | $ | 19,365,435 | | |
*
Cost of investments in securities | | | | $ | 25,366,797 | | | | | $ | 385,265,880 | | | | | $ | 1,956,355,377 | | |
†
Cost of short-term investments | | | | $ | 138,488 | | | | | $ | 29,937,984 | | | | | $ | 69,847,855 | | |
‡
Cost of foreign currencies | | | | $ | — | | | | | $ | — | | | | | $ | 1,039,578 | | |
^
Premiums received on written options | | | | $ | — | | | | | $ | — | | | | | $ | 22,630,012 | | |
See Accompanying Notes to Financial Statements
STATEMENTS OF ASSETS AND LIABILITIES as of March 31, 2023 (continued)
| | | | Voya Short
Duration
High Income
Fund | | | Voya Short Term
Bond Fund | | | Voya Strategic
Income
Opportunities
Fund | |
| Class A | | | | | | | | | | | | | | | | | | | |
| Net assets | | | | $ | 8,604,552 | | | | | $ | 9,054,438 | | | | | $ | 72,345,756 | | |
| Shares authorized | | | | | unlimited | | | | | | unlimited | | | | | | unlimited | | |
| Par value | | | | | — | | | | | $ | 0.001 | | | | | $ | 0.001 | | |
| Shares outstanding | | | | | 870,629 | | | | | | 974,470 | | | | | | 8,060,269 | | |
| Net asset value and redemption price per share† | | | | $ | 9.88 | | | | | $ | 9.29 | | | | | $ | 8.98 | | |
Maximum offering price per share (2.50%)(1) | | | | $ | 10.13 | | | | | $ | 9.53 | | | | | $ | 9.21 | | |
| Class C | | | | | | | | | | | | | | | | | | | |
| Net assets | | | | | n/a | | | | | $ | 148,884 | | | | | $ | 36,696,309 | | |
| Shares authorized | | | | | n/a | | | | | | unlimited | | | | | | unlimited | | |
| Par value | | | | | n/a | | | | | $ | 0.001 | | | | | $ | 0.001 | | |
| Shares outstanding | | | | | n/a | | | | | | 16,009 | | | | | | 4,150,610 | | |
| Net asset value and redemption price per share† | | | | | n/a | | | | | $ | 9.30 | | | | | $ | 8.84 | | |
| Class I | | | | | | | | | | | | | | | | | | | |
| Net assets | | | | $ | 8,805,163 | | | | | $ | 31,010,833 | | | | | $ | 1,545,679,778 | | |
| Shares authorized | | | | | unlimited | | | | | | unlimited | | | | | | unlimited | | |
| Par value | | | | | — | | | | | $ | 0.001 | | | | | $ | 0.001 | | |
| Shares outstanding | | | | | 890,931 | | | | | | 3,341,330 | | | | | | 172,092,274 | | |
| Net asset value and redemption price per share | | | | $ | 9.88 | | | | | $ | 9.28 | | | | | $ | 8.98 | | |
| Class R | | | | | | | | | | | | | | | | | | | |
| Net assets | | | | | n/a | | | | | $ | 22,877 | | | | | $ | 18,601,226 | | |
| Shares authorized | | | | | n/a | | | | | | unlimited | | | | | | unlimited | | |
| Par value | | | | | n/a | | | | | $ | 0.001 | | | | | $ | 0.001 | | |
| Shares outstanding | | | | | n/a | | | | | | 2,453 | | | | | | 2,089,753 | | |
| Net asset value and redemption price per share | | | | | n/a | | | | | $ | 9.33 | | | | | $ | 8.90 | | |
| Class R6 | | | | | | | | | | | | | | | | | | | |
| Net assets | | | | $ | 8,321,470 | | | | | $ | 338,436,721 | | | | | $ | 167,205,753 | | |
| Shares authorized | | | | | unlimited | | | | | | unlimited | | | | | | unlimited | | |
| Par value | | | | | — | | | | | $ | 0.001 | | | | | $ | 0.001 | | |
| Shares outstanding | | | | | 841,991 | | | | | | 36,419,125 | | | | | | 18,671,766 | | |
| Net asset value and redemption price per share | | | | $ | 9.88 | | | | | $ | 9.29 | | | | | $ | 8.96 | | |
| Class W | | | | | | | | | | | | | | | | | | | |
| Net assets | | | | | n/a | | | | | $ | 12,659,773 | | | | | $ | 18,974,004 | | |
| Shares authorized | | | | | n/a | | | | | | unlimited | | | | | | unlimited | | |
| Par value | | | | | n/a | | | | | $ | 0.001 | | | | | $ | 0.001 | | |
| Shares outstanding | | | | | n/a | | | | | | 1,358,521 | | | | | | 2,119,548 | | |
| Net asset value and redemption price per share | | | | | n/a | | | | | $ | 9.32 | | | | | $ | 8.95 | | |
(1)
Maximum offering price is computed at 100/97.50 of net asset value. On purchases of $100,000 or more, the offering price is reduced.
†
Redemption price per share may be reduced for any applicable contingent deferred sales charges.
See Accompanying Notes to Financial Statements
STATEMENTS OF OPERATIONS for the year ended March 31, 2023
| | | | Voya GNMA
Income Fund | | | Voya High Yield
Bond Fund | | | Voya Intermediate
Bond Fund | |
| INVESTMENT INCOME: | | | | | | | | | | | | | | | | | | | |
| Dividends | | | | $ | — | | | | | $ | 151,153 | | | | | $ | 457,071 | | |
| Interest, net of foreign taxes withheld* | | | | | 38,688,562 | | | | | | 32,170,765 | | | | | | 294,146,994 | | |
| Securities lending income, net | | | | | — | | | | | | 372,090 | | | | | | 2,096,148 | | |
| Total investment income | | | | | 38,688,562 | | | | | | 32,694,008 | | | | | | 296,700,213 | | |
| EXPENSES: | | | | | | | | | | | | | | | | | | | |
| Investment management fees | | | | | 5,698,650 | | | | | | 3,047,899 | | | | | | 21,892,634 | | |
| Distribution and shareholder service fees: | | | | | | | | | | | | | | | | | | | |
| Class A | | | | | 1,027,923 | | | | | | 96,979 | | | | | | 725,124 | | |
| Class C | | | | | 209,868 | | | | | | 78,974 | | | | | | 118,219 | | |
| Class R | | | | | — | | | | | | 1,122 | | | | | | 611,342 | | |
| Transfer agent fees: | | | | | | | | | | | | | | | | | | | |
| Class A | | | | | 352,996 | | | | | | 61,285 | | | | | | 490,168 | | |
| Class C | | | | | 18,034 | | | | | | 12,476 | | | | | | 19,948 | | |
| Class I | | | | | 517,426 | | | | | | 120,335 | | | | | | 3,349,321 | | |
Class P(1)(3) | | | | | 760 | | | | | | 629 | | | | | | — | | |
Class P3(2)(4) | | | | | — | | | | | | 17 | | | | | | 330 | | |
| Class R | | | | | — | | | | | | 352 | | | | | | 207,030 | | |
| Class R6 | | | | | 104 | | | | | | 285 | | | | | | 28,902 | | |
| Class W | | | | | 69,377 | | | | | | 109,611 | | | | | | 143,980 | | |
| Shareholder reporting expense | | | | | 125,960 | | | | | | 23,635 | | | | | | 190,165 | | |
| Registration fees | | | | | 117,997 | | | | | | 141,591 | | | | | | 269,065 | | |
| Professional fees | | | | | 65,160 | | | | | | 17,830 | | | | | | 322,437 | | |
| Custody and accounting expense | | | | | 169,360 | | | | | | 92,940 | | | | | | 945,715 | | |
| Trustee fees | | | | | 32,062 | | | | | | 12,572 | | | | | | 202,705 | | |
| Miscellaneous expense | | | | | 71,766 | | | | | | 29,938 | | | | | | 350,400 | | |
| Interest expense | | | | | 948 | | | | | | 530 | | | | | | 1,260 | | |
| Total expenses | | | | | 8,478,391 | | | | | | 3,849,000 | | | | | | 29,868,745 | | |
| Waived and reimbursed fees | | | | | (42,183) | | | | | | (1,012,920) | | | | | | (190,878) | | |
| Net expenses | | | | | 8,436,208 | | | | | | 2,836,080 | | | | | | 29,677,867 | | |
| Net investment income | | | | | 30,252,354 | | | | | | 29,857,928 | | | | | | 267,022,346 | | |
| REALIZED AND UNREALIZED GAIN (LOSS): | | | | | | | | | | | | | | | | | | | |
| Net realized gain (loss) on: | | | | | | | | | | | | | | | | | | | |
| Investments | | | | | (50,533,900) | | | | | | (39,906,407) | | | | | | (551,455,037) | | |
| Forward foreign currency contracts | | | | | — | | | | | | — | | | | | | 443,072 | | |
| Foreign currency related transactions | | | | | — | | | | | | — | | | | | | 23,286 | | |
| Futures | | | | | 18,106,207 | | | | | | — | | | | | | (129,755,749) | | |
| Swaps | | | | | — | | | | | | — | | | | | | (18,542,697) | | |
| Written options | | | | | — | | | | | | — | | | | | | 15,983,500 | | |
| Net realized loss | | | | | (32,427,693) | | | | | | (39,906,407) | | | | | | (683,303,625) | | |
| Net change in unrealized appreciation (depreciation) on: | | | | | | | | | | | | | | | | | | | |
| Investments | | | | | (53,838,632) | | | | | | (23,857,257) | | | | | | (144,112,550) | | |
| Forward foreign currency contracts | | | | | — | | | | | | — | | | | | | (199,744) | | |
| Foreign currency related transactions | | | | | — | | | | | | — | | | | | | 3,674 | | |
| Futures | | | | | (7,095,755) | | | | | | — | | | | | | 15,007,298 | | |
| Swaps | | | | | — | | | | | | — | | | | | | (2,636,430) | | |
| Written options | | | | | — | | | | | | — | | | | | | (657,502) | | |
| Net change in unrealized appreciation (depreciation) | | | | | (60,934,387) | | | | | | (23,857,257) | | | | | | (132,595,254) | | |
| Net realized and unrealized loss | | | | | (93,362,080) | | | | | | (63,763,664) | | | | | | (815,898,879) | | |
| Decrease in net assets resulting from operations | | | | $ | (63,109,726) | | | | | $ | (33,905,736) | | | | | $ | (548,876,533) | | |
*
Foreign taxes withheld | | | | $ | — | | | | | $ | — | | | | | $ | 27,429 | | |
(1)
Class P of Voya High Yield Bond Fund was fully redeemed on close of business February 24, 2023
(2)
Class P3 of Voya High Yield Bond Fund was fully redeemed on close of business February 22, 2023
(3)
Class P of Voya GNMA Income Fund was full redeemed on close of business March 24, 2023
(4)
Class P3 of Voya Intermediate Bond Fund was fully redeemed on close of business March 30, 2023
See Accompanying Notes to Financial Statements
STATEMENTS OF OPERATIONS for the year ended March 31, 2023
| | | | Voya Short
Duration
High Income
Fund | | | Voya Short Term
Bond Fund | | | Voya Strategic
Income
Opportunities
Fund | |
| | | | February 9, 2023(1)
to March 31, 2023 | | | | | | | | | | | | | |
| INVESTMENT INCOME: | | | | | | | | | | | | | | | | | | | |
| Dividends | | | | $ | 19,010 | | | | | $ | 94,216 | | | | | $ | 3,398,042 | | |
| Interest | | | | | 262,269 | | | | | | 11,768,089 | | | | | | 93,965,448 | | |
| Securities lending income, net | | | | | — | | | | | | 66,538 | | | | | | 316,968 | | |
| Total investment income | | | | | 281,279 | | | | | | 11,928,843 | | | | | | 97,680,458 | | |
| EXPENSES: | | | | | | | | | | | | | | | | | | | |
| Investment management fees | | | | | 16,481 | | | | | | 1,025,486 | | | | | | 10,455,533 | | |
| Distribution and shareholder service fees: | | | | | | | | | | | | | | | | | | | |
| Class A | | | | | 2,844 | | | | | | 33,988 | | | | | | 217,197 | | |
| Class C | | | | | — | | | | | | 2,433 | | | | | | 426,050 | | |
| Class R | | | | | — | | | | | | 95 | | | | | | 94,166 | | |
| Transfer agent fees: | | | | | | | | | | | | | | | | | | | |
| Class A | | | | | 7 | | | | | | 9,946 | | | | | | 49,405 | | |
| Class C | | | | | — | | | | | | 177 | | | | | | 24,136 | | |
| Class I | | | | | 7 | | | | | | 25,473 | | | | | | 1,175,474 | | |
Class P2(2) | | | | | — | | | | | | 22 | | | | | | — | | |
Class P3(2) | | | | | — | | | | | | 113 | | | | | | — | | |
| Class R | | | | | — | | | | | | 13 | | | | | | 10,745 | | |
| Class R6 | | | | | 6 | | | | | | 724 | | | | | | 4,074 | | |
| Class W | | | | | — | | | | | | 11,350 | | | | | | 14,175 | | |
| Shareholder reporting expense | | | | | 147 | | | | | | 5,113 | | | | | | 96,770 | | |
| Registration fees | | | | | 25 | | | | | | 113,039 | | | | | | 145,814 | | |
| Professional fees | | | | | 1,470 | | | | | | 20,445 | | | | | | 88,550 | | |
| Custody and accounting expense | | | | | 1,150 | | | | | | 91,275 | | | | | | 391,925 | | |
| Trustee fees | | | | | 614 | | | | | | 10,255 | | | | | | 52,375 | | |
| Offering expense | | | | | 13,185 | | | | | | — | | | | | | — | | |
| Miscellaneous expense | | | | | — | | | | | | 27,947 | | | | | | 127,929 | | |
| Interest expense | | | | | — | | | | | | 692 | | | | | | 429 | | |
| Total expenses | | | | | 35,936 | | | | | | 1,378,586 | | | | | | 13,374,747 | | |
| Waived and reimbursed fees | | | | | (12,498) | | | | | | (102,964) | | | | | | (5) | | |
| Net expenses | | | | | 23,438 | | | | | | 1,275,622 | | | | | | 13,374,742 | | |
| Net investment income | | | | | 257,841 | | | | | | 10,653,221 | | | | | | 84,305,716 | | |
| REALIZED AND UNREALIZED GAIN (LOSS): | | | | | | | | | | | | | | | | | | | |
| Net realized gain (loss) on: | | | | | | | | | | | | | | | | | | | |
| Investments | | | | | 1,108 | | | | | | (10,519,617) | | | | | | (72,320,226) | | |
| Forward foreign currency contracts | | | | | — | | | | | | — | | | | | | (7,229,584) | | |
| Foreign currency related transactions | | | | | — | | | | | | — | | | | | | (339,373) | | |
| Futures | | | | | — | | | | | | (6,104,822) | | | | | | 28,181,745 | | |
| Swaps | | | | | — | | | | | | (130,992) | | | | | | (17,290,408) | | |
| Written options | | | | | — | | | | | | — | | | | | | 16,902,000 | | |
| Net realized gain (loss) | | | | | 1,108 | | | | | | (16,755,431) | | | | | | (52,095,846) | | |
| Net change in unrealized appreciation (depreciation) on: | | | | | | | | | | | | | | | | | | | |
| Investments | | | | | (291,137) | | | | | | 515,118 | | | | | | (89,201,196) | | |
| Forward foreign currency contracts | | | | | — | | | | | | — | | | | | | 442,762 | | |
| Foreign currency related transactions | | | | | — | | | | | | — | | | | | | 60,688 | | |
| Futures | | | | | — | | | | | | 2,375,076 | | | | | | (11,726,093) | | |
| Swaps | | | | | — | | | | | | — | | | | | | (3,889,098) | | |
| Written options | | | | | — | | | | | | — | | | | | | 104,273 | | |
| Net change in unrealized appreciation (depreciation) | | | | | (291,137) | | | | | | 2,890,194 | | | | | | (104,208,664) | | |
| Net realized and unrealized loss | | | | | (290,029) | | | | | | (13,865,237) | | | | | | (156,304,510) | | |
| Decrease in net assets resulting from operations | | | | $ | (32,188) | | | | | $ | (3,212,016) | | | | | $ | (71,998,794) | | |
(1)
Commencement of Operations
(2)
Class P2 and Class P3 of Voya Short Term Bond Fund were fully redeemed on close of business November 29, 2022 and November 3, 2022, respectively.
See Accompanying Notes to Financial Statements
STATEMENTS OF CHANGES IN NET ASSETS
| | | | Voya GNMA Income Fund | | | Voya High Yield Bond Fund | |
| | | | Year Ended
March 31, 2023 | | | Year Ended
March 31, 2022 | | | Year Ended
March 31, 2023 | | | Year Ended
March 31, 2022 | |
| FROM OPERATIONS: | | | | | | | | | | | | | | | | | | | | | | | | | |
| Net investment income | | | | $ | 30,252,354 | | | | | $ | 10,730,126 | | | | | $ | 29,857,928 | | | | | $ | 45,652,290 | | |
| Net realized gain (loss) | | | | | (32,427,693) | | | | | | (8,988,897) | | | | | | (39,906,407) | | | | | | 22,024,852 | | |
| Net change in unrealized appreciation (depreciation) | | | | | (60,934,387) | | | | | | (69,342,529) | | | | | | (23,857,257) | | | | | | (61,579,754) | | |
| Increase (decrease) in net assets resulting from operations | | | | | (63,109,726) | | | | | | (67,601,300) | | | | | | (33,905,736) | | | | | | 6,097,388 | | |
| FROM DISTRIBUTIONS TO SHAREHOLDERS: | | | | | | | | | | | | | | | | | | | | | | | | | |
| Total distributions (excluding return of capital): | | | | | | | | | | | | | | | | | | | | | | | | | |
| Class A | | | | | (10,491,150) | | | | | | (6,296,795) | | | | | | (2,554,975) | | | | | | (2,339,943) | | |
| Class C | | | | | (368,292) | | | | | | (170,951) | | | | | | (467,388) | | | | | | (394,886) | | |
| Class I | | | | | (21,238,171) | | | | | | (14,433,811) | | | | | | (13,144,289) | | | | | | (10,110,459) | | |
Class P(1)(3) | | | | | (13,469) | | | | | | (648) | | | | | | (11,487,958) | | | | | | (17,710,462) | | |
Class P3(2) | | | | | — | | | | | | — | | | | | | (64,348) | | | | | | (553,963) | | |
| Class R | | | | | — | | | | | | — | | | | | | (14,866) | | | | | | (14,342) | | |
| Class R6 | | | | | (828,986) | | | | | | (367,322) | | | | | | (3,023,188) | | | | | | (10,925,724) | | |
| Class W | | | | | (2,192,176) | | | | | | (1,773,989) | | | | | | (4,839,822) | | | | | | (4,683,936) | | |
| Return of capital: | | | | | | | | | | | | | | | | | | | | | | | | | |
| Class A | | | | | — | | | | | | (394,744) | | | | | | — | | | | | | — | | |
| Class C | | | | | — | | | | | | (23,585) | | | | | | — | | | | | | — | | |
| Class I | | | | | — | | | | | | (714,563) | | | | | | — | | | | | | — | | |
Class P(1)(3) | | | | | — | | | | | | (27) | | | | | | — | | | | | | — | | |
| Class R6 | | | | | — | | | | | | (19,980) | | | | | | — | | | | | | — | | |
| Class W | | | | | — | | | | | | (93,830) | | | | | | — | | | | | | — | | |
| Total distributions | | | | | (35,132,244) | | | | | | (24,290,245) | | | | | | (35,596,834) | | | | | | (46,733,715) | | |
| FROM CAPITAL SHARE TRANSACTIONS: | | | | | | | | | | | | | | | | | | | | | | | | | |
| Net proceeds from sale of shares | | | | | 649,321,039 | | | | | | 610,998,074 | | | | | | 186,065,536 | | | | | | 327,195,769 | | |
| Reinvestment of distributions | | | | | 28,796,975 | | | | | | 20,272,704 | | | | | | 33,440,427 | | | | | | 45,439,824 | | |
| | | | | | 678,118,014 | | | | | | 631,270,778 | | | | | | 219,505,963 | | | | | | 372,635,593 | | |
| Cost of shares redeemed | | | | | (714,135,201) | | | | | | (908,840,569) | | | | | | (416,193,851) | | | | | | (623,750,985) | | |
| Net decrease in net assets resulting from capital share transactions | | | | | (36,017,187) | | | | | | (277,569,791) | | | | | | (196,687,888) | | | | | | (251,115,392) | | |
| Net decrease in net assets | | | | | (134,259,157) | | | | | | (369,461,336) | | | | | | (266,190,458) | | | | | | (291,751,719) | | |
| NET ASSETS: | | | | | | | | | | | | | | | | | | | | | | | | | |
| Beginning of year or period | | | | | 1,460,882,242 | | | | | | 1,830,343,578 | | | | | | 650,639,820 | | | | | | 942,391,539 | | |
| End of year or period | | | | $ | 1,326,623,085 | | | | | $ | 1,460,882,242 | | | | | $ | 384,449,362 | | | | | $ | 650,639,820 | | |
(1)
Class P of Voya High Yield Bond Fund was fully redeemed on close of business February 24, 2023
(2)
Class P3 of Voya High Yield Bond Fund was fully redeemed on close of business February 22, 2023
(3)
Class P of Voya GNMA Income Fund was fully redeemed on close of business March 24, 2023
See Accompanying Notes to Financial Statements
STATEMENTS OF CHANGES IN NET ASSETS
| | | | Voya Intermediate Bond Fund | | | Voya Short
Duration High
Income Fund | |
| | | | Year Ended
March 31, 2023 | | | Year Ended
March 31, 2022 | | | February 9, 2023(1)
to March 31, 2023 | |
| FROM OPERATIONS: | | | | | | | | | | | | | | | | | | | |
| Net investment income | | | | $ | 267,022,346 | | | | | $ | 230,619,465 | | | | | $ | 257,841 | | |
| Net realized gain (loss) | | | | | (683,303,625) | | | | | | (55,720,438) | | | | | | 1,108 | | |
| Net change in unrealized appreciation (depreciation) | | | | | (132,595,254) | | | | | | (606,969,252) | | | | | | (291,137) | | |
| Decrease in net assets resulting from operations | | | | | (548,876,533) | | | | | | (432,070,225) | | | | | | (32,188) | | |
| FROM DISTRIBUTIONS TO SHAREHOLDERS: | | | | | — | | | | | | — | | | | | | — | | |
| Total distributions (excluding return of capital): | | | | | | | | | | | | | | | | | | | |
| Class A | | | | | (8,237,422) | | | | | | (9,143,624) | | | | | | (83,538) | | |
| Class C | | | | | (245,934) | | | | | | (282,354) | | | | | | — | | |
| Class I | | | | | (165,463,655) | | | | | | (154,758,798) | | | | | | (88,802) | | |
Class P3(2) | | | | | (2,228,466) | | | | | | (1,438,907) | | | | | | — | | |
| Class R | | | | | (3,178,526) | | | | | | (3,083,013) | | | | | | — | | |
| Class R6 | | | | | (74,737,088) | | | | | | (68,083,038) | | | | | | (85,623) | | |
| Class W | | | | | (2,588,610) | | | | | | (4,830,730) | | | | | | — | | |
| Return of capital: | | | | | | | | | | | | | | | | | | | |
| Class A | | | | | — | | | | | | (615,654) | | | | | | — | | |
| Class C | | | | | — | | | | | | (27,387) | | | | | | — | | |
| Class I | | | | | — | | | | | | (10,216,623) | | | | | | — | | |
Class P3(2) | | | | | — | | | | | | (116,882) | | | | | | — | | |
| Class R | | | | | — | | | | | | (241,500) | | | | | | — | | |
| Class R6 | | | | | — | | | | | | (4,247,795) | | | | | | — | | |
| Class W | | | | | — | | | | | | (293,532) | | | | | | — | | |
| Total distributions | | | | | (256,679,701) | | | | | | (257,379,837) | | | | | | (257,963) | | |
| FROM CAPITAL SHARE TRANSACTIONS: | | | | | | | | | | | | | | | | | | | |
| Net proceeds from sale of shares | | | | | 3,059,416,633 | | | | | | 3,464,507,865 | | | | | | 25,763,674 | | |
| Reinvestment of distributions | | | | | 225,244,907 | | | | | | 227,363,588 | | | | | | 257,662 | | |
| | | | | | 3,284,661,540 | | | | | | 3,691,871,453 | | | | | | 26,021,336 | | |
| Cost of shares redeemed | | | | | (4,234,385,573) | | | | | | (3,574,389,538) | | | | | | — | | |
| Net increase (decrease) in net assets resulting from capital share transactions | | | | | (949,724,033) | | | | | | 117,481,915 | | | | | | 26,021,336 | | |
| Net increase (decrease) in net assets | | | | | (1,755,280,267) | | | | | | (571,968,147) | | | | | | 25,731,185 | | |
| NET ASSETS: | | | | | | | | | | | | | | | | | | | |
| Beginning of year or period | | | | | 9,429,050,092 | | | | | | 10,001,018,239 | | | | | | — | | |
| End of year or period | | | | $ | 7,673,769,825 | | | | | $ | 9,429,050,092 | | | | | $ | 25,731,185 | | |
(1)
Commencement of operations.
(2)
Class P3 of Voya Intermediate Bond Fund was fully redeemed on close of business March 30, 2023
See Accompanying Notes to Financial Statements
STATEMENTS OF CHANGES IN NET ASSETS
| | | | Voya Short Term Bond Fund | | | Voya Strategic Income Opportunities Fund | |
| | | | Year Ended
March 31, 2023 | | | Year Ended
March 31, 2022 | | | Year Ended
March 31, 2023 | | | Year Ended
March 31, 2022 | |
| FROM OPERATIONS: | | | | | | | | | | | | | | | | | | | | | | | | | |
| Net investment income | | | | $ | 10,653,221 | | | | | $ | 4,969,512 | | | | | $ | 84,305,716 | | | | | $ | 76,624,284 | | |
| Net realized loss | | | | | (16,755,431) | | | | | | (3,428,043) | | | | | | (52,095,846) | | | | | | (13,543,027) | | |
| Net change in unrealized appreciation (depreciation) | | | | | 2,890,194 | | | | | | (14,139,271) | | | | | | (104,208,664) | | | | | | (121,380,216) | | |
| Decrease in net assets resulting from operations | | | | | (3,212,016) | | | | | | (12,597,802) | | | | | | (71,998,794) | | | | | | (58,298,959) | | |
| FROM DISTRIBUTIONS TO SHAREHOLDERS: | | | | | | | | | | | | | | | | | | | | | | | | | |
| Total distributions (excluding return of capital): | | | | | | | | | | | | | | | | | | | | | | | | | |
| Class A | | | | | (294,688) | | | | | | (189,601) | | | | | | (3,067,098) | | | | | | (3,060,993) | | |
| Class C | | | | | (3,065) | | | | | | (1,343) | | | | | | (1,177,474) | | | | | | (811,189) | | |
| Class I | | | | | (793,011) | | | | | | (295,881) | | | | | | (67,551,126) | | | | | | (55,102,083) | | |
Class P(1) | | | | | — | | | | | | — | | | | | | (54) | | | | | | (107) | | |
Class P2(2) | | | | | (296,816) | | | | | | (1,393,182) | | | | | | — | | | | | | — | | |
Class P3(2) | | | | | (136,892) | | | | | | (66,502) | | | | | | — | | | | | | — | | |
| Class R | | | | | (387) | | | | | | (63) | | | | | | (622,070) | | | | | | (457,854) | | |
| Class R6 | | | | | (8,453,611) | | | | | | (3,123,798) | | | | | | (6,248,389) | | | | | | (4,473,785) | | |
| Class W | | | | | (369,048) | | | | | | (257,675) | | | | | | (916,333) | | | | | | (1,173,982) | | |
| Return of capital: | | | | | | | | | | | | | | | | | | | | | | | | | |
| Class A | | | | | — | | | | | | (49,663) | | | | | | — | | | | | | (681,504) | | |
| Class C | | | | | — | | | | | | (1,053) | | | | | | — | | | | | | (315,718) | | |
| Class I | | | | | — | | | | | | (87,449) | | | | | | — | | | | | | (12,906,476) | | |
Class P(1) | | | | | — | | | | | | — | | | | | | — | | | | | | (20) | | |
Class P2(2) | | | | | — | | | | | | (52,614) | | | | | | — | | | | | | — | | |
Class P3(2) | | | | | — | | | | | | (14,140) | | | | | | — | | | | | | — | | |
| Class R | | | | | — | | | | | | (45) | | | | | | — | | | | | | (132,830) | | |
| Class R6 | | | | | — | | | | | | (1,037,071) | | | | | | — | | | | | | (989,355) | | |
| Class W | | | | | — | | | | | | (55,355) | | | | | | — | | | | | | (232,114) | | |
| Total distributions | | | | | (10,347,518) | | | | | | (6,625,435) | | | | | | (79,582,544) | | | | | | (80,338,010) | | |
| FROM CAPITAL SHARE TRANSACTIONS: | | | | | | | | | | | | | | | | | | | | | | | | | |
| Net proceeds from sale of shares | | | | | 185,484,275 | | | | | | 464,474,302 | | | | | | 654,401,823 | | | | | | 936,075,526 | | |
| Reinvestment of distributions | | | | | 10,302,316 | | | | | | 6,602,660 | | | | | | 72,052,949 | | | | | | 71,575,250 | | |
| | | | | | 195,786,591 | | | | | | 471,076,962 | | | | | | 726,454,772 | | | | | | 1,007,650,776 | | |
| Cost of shares redeemed | | | | | (263,424,042) | | | | | | (187,837,124) | | | | | | (1,182,478,619) | | | | | | (858,047,976) | | |
| Net increase (decrease) in net assets resulting from capital share transactions | | | | | (67,637,451) | | | | | | 283,239,838 | | | | | | (456,023,847) | | | | | | 149,602,800 | | |
| Net increase (decrease) in net assets | | | | | (81,196,985) | | | | | | 264,016,601 | | | | | | (607,605,185) | | | | | | 10,965,831 | | |
| NET ASSETS: | | | | | | | | | | | | | | | | | | | | | | | | | |
| Beginning of year or period | | | | | 472,530,511 | | | | | | 208,513,910 | | | | | | 2,467,108,011 | | | | | | 2,456,142,180 | | |
| End of year or period | | | | $ | 391,333,526 | | | | | $ | 472,530,511 | | | | | $ | 1,859,502,826 | | | | | $ | 2,467,108,011 | | |
(1)
Class P of Voya Strategic Income Opportunities Fund was fully redeemed on close of business September 8, 2022.
(2)
Class P2 and Class P3 of Voya Short Term Bond Fund were fully redeemed on close of business November 29, 2022 and November 3, 2022, respectively.
See Accompanying Notes to Financial Statements
Selected data for a share of beneficial interest outstanding throughout each year or period.
| | | | | | | | | | Income (loss)
from
investment
operations | | | | | | | | | Less Distributions | | | | | | Ratios to average net assets | | | Supplemental
Data | |
| | | | Net asset value, beginning of year
or period | | | Net investment income (loss) | | | Net realized and unrealized
gain (loss) | | | Total from investment operations | | | From net investment income | | | From net realized gains | | | From return of capital | | | Total distributions | | | Payment by affiliate | | | Net asset value, end of year
or period | | | Total Return(1) | | | Expenses before
reductions/additions(2)(3) | | | Expenses net of fee waivers
and/or recoupments if any(2)(3) | | | Expenses net of all
reductions/additions(2)(3) | | | Net investment income (loss)(2)(3) | | | Net assets, end of year or period | | | Portfolio turnover rate | |
Year or
period ended | | | ($) | | | ($) | | | ($) | | | ($) | | | ($) | | | ($) | | | ($) | | | ($) | | | ($) | | | ($) | | | (%) | | | (%) | | | (%) | | | (%) | | | (%) | | | ($000’s) | | | (%) | |
| Voya GNMA Income Fund | | | | | | | | | | | | | | | | | | | | | | | | | | | | | | | | | | | | | | | | | | | | | | | | | | | | | | | | | | | | | | | | | | | | | | | | | | | | | | | | | | | | | | | | | | | | | | |
| Class A | | | | | | | | | | | | | | | | | | | | | | | | | | | | | | | | | | | | | | | | | | | | | | | | | | | | | | | | | | | | | | | | | | | | | | | | | | | | | | | | | | | | | | | | | | | | | | |
| 03-31-23 | | | | | 8.03 | | | | | | 0.16• | | | | | | (0.53) | | | | | | (0.37) | | | | | | 0.19 | | | | | | — | | | | | | — | | | | | | 0.19 | | | | | | — | | | | | | 7.47 | | | | | | (4.53) | | | | | | 0.83 | | | | 0.84 | | | 0.84 | | | 2.17 | | | | | 389,829 | | | | | | 353 | | |
| 03-31-22 | | | | | 8.50 | | | | | | 0.04• | | | | | | (0.40) | | | | | | (0.36) | | | | | | 0.10 | | | | | | — | | | | | | 0.01 | | | | | | 0.11 | | | | | | — | | | | | | 8.03 | | | | | | (4.36) | | | | | | 0.84 | | | | 0.84 | | | 0.84 | | | 0.45 | | | | | 464,615 | | | | | | 539 | | |
| 03-31-21 | | | | | 8.58 | | | | | | 0.07• | | | | | | 0.02 | | | | | | 0.09 | | | | | | 0.14 | | | | | | — | | | | | | 0.03 | | | | | | 0.17 | | | | | | — | | | | | | 8.50 | | | | | | 1.08 | | | | | | 0.85 | | | | 0.84 | | | 0.84 | | | 0.82 | | | | | 591,762 | | | | | | 419 | | |
| 03-31-20 | | | | | 8.36 | | | | | | 0.18• | | | | | | 0.27 | | | | | | 0.45 | | | | | | 0.23 | | | | | | — | | | | | | — | | | | | | 0.23 | | | | | | — | | | | | | 8.58 | | | | | | 5.43 | | | | | | 0.93 | | | | 0.92 | | | 0.92 | | | 2.12 | | | | | 493,737 | | | | | | 421 | | |
| 03-31-19 | | | | | 8.25 | | | | | | 0.18 | | | | | | 0.13 | | | | | | 0.31 | | | | | | 0.20 | | | | | | — | | | | | | — | | | | | | 0.20 | | | | | | — | | | | | | 8.36 | | | | | | 3.85 | | | | | | 0.97 | | | | 0.95 | | | 0.95 | | | 2.25 | | | | | 394,763 | | | | | | 398 | | |
| Class C | | | | | | | | | | | | | | | | | | | | | | | | | | | | | | | | | | | | | | | | | | | | | | | | | | | | | | | | | | | | | | | | | | | | | | | | | | | | | | | | | | | | | | | | | | | | | | |
| 03-31-23 | | | | | 7.99 | | | | | | 0.10• | | | | | | (0.52) | | | | | | (0.42) | | | | | | 0.14 | | | | | | — | | | | | | — | | | | | | 0.14 | | | | | | — | | | | | | 7.43 | | | | | | (5.28) | | | | | | 1.58 | | | | 1.59 | | | 1.59 | | | 1.39 | | | | | 17,679 | | | | | | 353 | | |
| 03-31-22 | | | | | 8.46 | | | | | | (0.03)• | | | | | | (0.40) | | | | | | (0.43) | | | | | | 0.03 | | | | | | — | | | | | | 0.01 | | | | | | 0.04 | | | | | | — | | | | | | 7.99 | | | | | | (5.10) | | | | | | 1.59 | | | | 1.59 | | | 1.59 | | | (0.32) | | | | | 26,837 | | | | | | 539 | | |
| 03-31-21 | | | | | 8.53 | | | | | | 0.01• | | | | | | 0.03 | | | | | | 0.04 | | | | | | 0.08 | | | | | | — | | | | | | 0.03 | | | | | | 0.11 | | | | | | — | | | | | | 8.46 | | | | | | 0.44 | | | | | | 1.60 | | | | 1.59 | | | 1.59 | | | 0.09 | | | | | 48,911 | | | | | | 419 | | |
| 03-31-20 | | | | | 8.31 | | | | | | 0.12• | | | | | | 0.26 | | | | | | 0.38 | | | | | | 0.16 | | | | | | — | | | | | | — | | | | | | 0.16 | | | | | | — | | | | | | 8.53 | | | | | | 4.66 | | | | | | 1.68 | | | | 1.67 | | | 1.67 | | | 1.37 | | | | | 47,577 | | | | | | 421 | | |
| 03-31-19 | | | | | 8.21 | | | | | | 0.12 | | | | | | 0.12 | | | | | | 0.24 | | | | | | 0.14 | | | | | | — | | | | | | — | | | | | | 0.14 | | | | | | — | | | | | | 8.31 | | | | | | 2.96 | | | | | | 1.72 | | | | 1.70 | | | 1.70 | | | 1.49 | | | | | 62,769 | | | | | | 398 | | |
| Class I | | | | | | | | | | | | | | | | | | | | | | | | | | | | | | | | | | | | | | | | | | | | | | | | | | | | | | | | | | | | | | | | | | | | | | | | | | | | | | | | | | | | | | | | | | | | | | |
| 03-31-23 | | | | | 8.04 | | | | | | 0.19• | | | | | | (0.52) | | | | | | (0.33) | | | | | | 0.22 | | | | | | — | | | | | | — | | | | | | 0.22 | | | | | | — | | | | | | 7.49 | | | | | | (4.11) | | | | | | 0.56 | | | | 0.54 | | | 0.54 | | | 2.48 | | | | | 822,846 | | | | | | 353 | | |
| 03-31-22 | | | | | 8.52 | | | | | | 0.06• | | | | | | (0.41) | | | | | | (0.35) | | | | | | 0.12 | | | | | | — | | | | | | 0.01 | | | | | | 0.13 | | | | | | — | | | | | | 8.04 | | | | | | (4.18) | | | | | | 0.56 | | | | 0.54 | | | 0.54 | | | 0.74 | | | | | 834,623 | | | | | | 539 | | |
| 03-31-21 | | | | | 8.59 | | | | | | 0.09• | | | | | | 0.04 | | | | | | 0.13 | | | | | | 0.17 | | | | | | — | | | | | | 0.03 | | | | | | 0.20 | | | | | | — | | | | | | 8.52 | | | | | | 1.50 | | | | | | 0.57 | | | | 0.54 | | | 0.54 | | | 1.10 | | | | | 968,367 | | | | | | 419 | | |
| 03-31-20 | | | | | 8.37 | | | | | | 0.21• | | | | | | 0.26 | | | | | | 0.47 | | | | | | 0.25 | | | | | | — | | | | | | — | | | | | | 0.25 | | | | | | — | | | | | | 8.59 | | | | | | 5.75 | | | | | | 0.67 | | | | 0.62 | | | 0.62 | | | 2.42 | | | | | 604,194 | | | | | | 421 | | |
| 03-31-19 | | | | | 8.26 | | | | | | 0.21 | | | | | | 0.13 | | | | | | 0.34 | | | | | | 0.23 | | | | | | — | | | | | | — | | | | | | 0.23 | | | | | | — | | | | | | 8.37 | | | | | | 4.16 | | | | | | 0.71 | | | | 0.65 | | | 0.65 | | | 2.55 | | | | | 387,607 | | | | | | 398 | | |
| Class R6 | | | | | | | | | | | | | | | | | | | | | | | | | | | | | | | | | | | | | | | | | | | | | | | | | | | | | | | | | | | | | | | | | | | | | | | | | | | | | | | | | | | | | | | | | | | | | | |
| 03-31-23 | | | | | 8.05 | | | | | | 0.19• | | | | | | (0.53) | | | | | | (0.34) | | | | | | 0.22 | | | | | | — | | | | | | — | | | | | | 0.22 | | | | | | — | | | | | | 7.49 | | | | | | (4.21) | | | | | | 0.49 | | | | 0.49 | | | 0.49 | | | 2.57 | | | | | 29,707 | | | | | | 353 | | |
| 03-31-22 | | | | | 8.52 | | | | | | 0.07• | | | | | | (0.41) | | | | | | (0.34) | | | | | | 0.12 | | | | | | — | | | | | | 0.01 | | | | | | 0.13 | | | | | | — | | | | | | 8.05 | | | | | | (4.06) | | | | | | 0.48 | | | | 0.48 | | | 0.48 | | | 0.81 | | | | | 23,951 | | | | | | 539 | | |
07-31-20(4) -
03-31-21 | | | | | 8.58 | | | | | | 0.04• | | | | | | 0.02 | | | | | | 0.06 | | | | | | 0.09 | | | | | | — | | | | | | 0.03 | | | | | | 0.11 | | | | | | — | | | | | | 8.52 | | | | | | 0.64 | | | | | | 0.48 | | | | 0.48 | | | 0.48 | | | 0.62 | | | | | 41,739 | | | | | | 419 | | |
| Class W | | | | | | | | | | | | | | | | | | | | | | | | | | | | | | | | | | | | | | | | | | | | | | | | | | | | | | | | | | | | | | | | | | | | | | | | | | | | | | | | | | | | | | | | | | | | | | |
| 03-31-23 | | | | | 8.05 | | | | | | 0.18• | | | | | | (0.52) | | | | | | (0.34) | | | | | | 0.21 | | | | | | — | | | | | | — | | | | | | 0.21 | | | | | | — | | | | | | 7.50 | | | | | | (4.15) | | | | | | 0.58 | | | | 0.59 | | | 0.59 | | | 2.36 | | | | | 66,562 | | | | | | 353 | | |
| 03-31-22 | | | | | 8.53 | | | | | | 0.06• | | | | | | (0.41) | | | | | | (0.35) | | | | | | 0.12 | | | | | | — | | | | | | 0.01 | | | | | | 0.13 | | | | | | — | | | | | | 8.05 | | | | | | (4.22) | | | | | | 0.59 | | | | 0.59 | | | 0.59 | | | 0.70 | | | | | 110,824 | | | | | | 539 | | |
| 03-31-21 | | | | | 8.60 | | | | | | 0.09• | | | | | | 0.04 | | | | | | 0.13 | | | | | | 0.17 | | | | | | — | | | | | | 0.03 | | | | | | 0.20 | | | | | | — | | | | | | 8.53 | | | | | | 1.45 | | | | | | 0.60 | | | | 0.59 | | | 0.59 | | | 1.02 | | | | | 179,530 | | | | | | 419 | | |
| 03-31-20 | | | | | 8.38 | | | | | | 0.20• | | | | | | 0.27 | | | | | | 0.47 | | | | | | 0.25 | | | | | | — | | | | | | — | | | | | | 0.25 | | | | | | — | | | | | | 8.60 | | | | | | 5.69 | | | | | | 0.68 | | | | 0.67 | | | 0.67 | | | 2.38 | | | | | 155,915 | | | | | | 421 | | |
| 03-31-19 | | | | | 8.27 | | | | | | 0.20• | | | | | | 0.13 | | | | | | 0.33 | | | | | | 0.22 | | | | | | — | | | | | | — | | | | | | 0.22 | | | | | | — | | | | | | 8.38 | | | | | | 4.11 | | | | | | 0.72 | | | | 0.70 | | | 0.70 | | | 2.47 | | | | | 91,383 | | | | | | 398 | | |
| Voya High Yield Bond Fund | | | | | | | | | | | | | | | | | | | | | | | | | | | | | | | | | | | | | | | | | | | | | | | | | | | | | | | | | | | | | | | | | | | | | | | | | | | | | | | | | | | | | | | | | | | | | | |
| Class A | | | | | | | | | | | | | | | | | | | | | | | | | | | | | | | | | | | | | | | | | | | | | | | | | | | | | | | | | | | | | | | | | | | | | | | | | | | | | | | | | | | | | | | | | | | | | | |
| 03-31-23 | | | | | 7.58 | | | | | | 0.37• | | | | | | (0.77) | | | | | | (0.40) | | | | | | 0.36 | | | | | | 0.09 | | | | | | — | | | | | | 0.45 | | | | | | — | | | | | | 6.73 | | | | | | (5.07) | | | | | | 1.08 | | | | 1.07 | | | 1.07 | | | 5.46 | | | | | 38,546 | | | | | | 70 | | |
| 03-31-22 | | | | | 7.99 | | | | | | 0.36• | | | | | | (0.40) | | | | | | (0.04) | | | | | | 0.37 | | | | | | 0.00* | | | | | | — | | | | | | 0.37 | | | | | | — | | | | | | 7.58 | | | | | | (0.62) | | | | | | 1.04 | | | | 1.04 | | | 1.04 | | | 4.55 | | | | | 45,842 | | | | | | 63 | | |
| 03-31-21 | | | | | 7.02 | | | | | | 0.38• | | | | | | 0.99 | | | | | | 1.37 | | | | | | 0.38 | | | | | | — | | | | | | 0.02 | | | | | | 0.40 | | | | | | — | | | | | | 7.99 | | | | | | 19.76 | | | | | | 1.04 | | | | 1.04 | | | 1.04 | | | 4.86 | | | | | 49,805 | | | | | | 78 | | |
| 03-31-20 | | | | | 7.86 | | | | | | 0.39• | | | | | | (0.81) | | | | | | (0.42) | | | | | | 0.42 | | | | | | — | | | | | | — | | | | | | 0.42 | | | | | | — | | | | | | 7.02 | | | | | | (5.76) | | | | | | 1.10 | | | | 1.10 | | | 1.10 | | | 4.97 | | | | | 44,060 | | | | | | 57 | | |
| 03-31-19 | | | | | 7.89 | | | | | | 0.43 | | | | | | (0.05) | | | | | | 0.38 | | | | | | 0.41 | | | | | | — | | | | | | — | | | | | | 0.41 | | | | | | — | | | | | | 7.86 | | | | | | 5.03 | | | | | | 1.10 | | | | 1.10 | | | 1.10 | | | 5.49 | | | | | 60,390 | | | | | | 33 | | |
See Accompanying Notes to Financial Statements
Financial Highlights (continued)
| | | | | | | | | | Income (loss)
from
investment
operations | | | | | | | | | Less Distributions | | | | | | Ratios to average net assets | | | Supplemental
Data | |
| | | | Net asset value, beginning of year
or period | | | Net investment income (loss) | | | Net realized and unrealized
gain (loss) | | | Total from investment operations | | | From net investment income | | | From net realized gains | | | From return of capital | | | Total distributions | | | Payment by affiliate | | | Net asset value, end of year
or period | | | Total Return(1) | | | Expenses before
reductions/additions(2)(3) | | | Expenses net of fee waivers
and/or recoupments if any(2)(3) | | | Expenses net of all
reductions/additions(2)(3) | | | Net investment income (loss)(2)(3) | | | Net assets, end of year or period | | | Portfolio turnover rate | |
Year or
period ended | | | ($) | | | ($) | | | ($) | | | ($) | | | ($) | | | ($) | | | ($) | | | ($) | | | ($) | | | ($) | | | (%) | | | (%) | | | (%) | | | (%) | | | (%) | | | ($000’s) | | | (%) | |
| Voya High Yield Bond Fund (continued) | | | | | | | | | | | | | | | | | | | | | | | | | | | | | | | | | | | | | | | | | | | | | | | | | | | | | | | | | | | | | | | | | | | | | | | | | | | | | | | | | | | | | | | | | | | | | | |
| Class C | | | | | | | | | | | | | | | | | | | | | | | | | | | | | | | | | | | | | | | | | | | | | | | | | | | | | | | | | | | | | | | | | | | | | | | | | | | | | | | | | | | | | | | | | | | | | | |
| 03-31-23 | | | | | 7.58 | | | | | | 0.32• | | | | | | (0.77) | | | | | | (0.45) | | | | | | 0.32 | | | | | | 0.09 | | | | | | — | | | | | | 0.41 | | | | | | — | | | | | | 6.72 | | | | | | (5.87) | | | | | | 1.83 | | | | 1.82 | | | 1.82 | | | 4.69 | | | | | 6,562 | | | | | | 70 | | |
| 03-31-22 | | | | | 7.99 | | | | | | 0.30• | | | | | | (0.40) | | | | | | (0.10) | | | | | | 0.31 | | | | | | 0.00* | | | | | | — | | | | | | 0.31 | | | | | | — | | | | | | 7.58 | | | | | | (1.37) | | | | | | 1.79 | | | | 1.79 | | | 1.79 | | | 3.80 | | | | | 9,496 | | | | | | 63 | | |
| 03-31-21 | | | | | 7.02 | | | | | | 0.32• | | | | | | 0.99 | | | | | | 1.31 | | | | | | 0.32 | | | | | | — | | | | | | 0.02 | | | | | | 0.34 | | | | | | — | | | | | | 7.99 | | | | | | 18.88 | | | | | | 1.79 | | | | 1.79 | | | 1.79 | | | 4.12 | | | | | 10,150 | | | | | | 78 | | |
| 03-31-20 | | | | | 7.86 | | | | | | 0.34• | | | | | | (0.82) | | | | | | (0.48) | | | | | | 0.36 | | | | | | — | | | | | | — | | | | | | 0.36 | | | | | | — | | | | | | 7.02 | | | | | | (6.47) | | | | | | 1.85 | | | | 1.85 | | | 1.85 | | | 4.23 | | | | | 11,215 | | | | | | 57 | | |
| 03-31-19 | | | | | 7.89 | | | | | | 0.37 | | | | | | (0.05) | | | | | | 0.32 | | | | | | 0.35 | | | | | | — | | | | | | — | | | | | | 0.35 | | | | | | — | | | | | | 7.86 | | | | | | 4.24 | | | | | | 1.85 | | | | 1.85 | | | 1.85 | | | 4.77 | | | | | 15,945 | | | | | | 33 | | |
| Class I | | | | | | | | | | | | | | | | | | | | | | | | | | | | | | | | | | | | | | | | | | | | | | | | | | | | | | | | | | | | | | | | | | | | | | | | | | | | | | | | | | | | | | | | | | | | | | |
| 03-31-23 | | | | | 7.57 | | | | | | 0.40• | | | | | | (0.78) | | | | | | (0.38) | | | | | | 0.39 | | | | | | 0.09 | | | | | | — | | | | | | 0.48 | | | | | | — | | | | | | 6.71 | | | | | | (4.83) | | | | | | 0.73 | | | | 0.72 | | | 0.72 | | | 5.82 | | | | | 188,736 | | | | | | 70 | | |
| 03-31-22 | | | | | 7.98 | | | | | | 0.39• | | | | | | (0.40) | | | | | | (0.01) | | | | | | 0.40 | | | | | | 0.00* | | | | | | — | | | | | | 0.40 | | | | | | — | | | | | | 7.57 | | | | | | (0.28) | | | | | | 0.69 | | | | 0.69 | | | 0.69 | | | 4.90 | | | | | 193,357 | | | | | | 63 | | |
| 03-31-21 | | | | | 7.01 | | | | | | 0.40• | | | | | | 0.99 | | | | | | 1.39 | | | | | | 0.40 | | | | | | — | | | | | | 0.02 | | | | | | 0.42 | | | | | | — | | | | | | 7.98 | | | | | | 20.19 | | | | | | 0.69 | | | | 0.69 | | | 0.69 | | | 5.18 | | | | | 171,058 | | | | | | 78 | | |
| 03-31-20 | | | | | 7.85 | | | | | | 0.42• | | | | | | (0.81) | | | | | | (0.39) | | | | | | 0.45 | | | | | | — | | | | | | — | | | | | | 0.45 | | | | | | — | | | | | | 7.01 | | | | | | (5.45) | | | | | | 0.75 | | | | 0.75 | | | 0.75 | | | 5.32 | | | | | 68,214 | | | | | | 57 | | |
| 03-31-19 | | | | | 7.88 | | | | | | 0.47 | | | | | | (0.06) | | | | | | 0.41 | | | | | | 0.44 | | | | | | — | | | | | | — | | | | | | 0.44 | | | | | | — | | | | | | 7.85 | | | | | | 5.39 | | | | | | 0.75 | | | | 0.75 | | | 0.75 | | | 5.82 | | | | | 81,121 | | | | | | 33 | | |
| Class R | | | | | | | | | | | | | | | | | | | | | | | | | | | | | | | | | | | | | | | | | | | | | | | | | | | | | | | | | | | | | | | | | | | | | | | | | | | | | | | | | | | | | | | | | | | | | | |
| 03-31-23 | | | | | 7.59 | | | | | | 0.36• | | | | | | (0.78) | | | | | | (0.42) | | | | | | 0.35 | | | | | | 0.09 | | | | | | — | | | | | | 0.44 | | | | | | — | | | | | | 6.73 | | | | | | (5.38) | | | | | | 1.33 | | | | 1.32 | | | 1.32 | | | 5.26 | | | | | 256 | | | | | | 70 | | |
| 03-31-22 | | | | | 8.00 | | | | | | 0.34• | | | | | | (0.40) | | | | | | (0.06) | | | | | | 0.35 | | | | | | 0.00* | | | | | | — | | | | | | 0.35 | | | | | | — | | | | | | 7.59 | | | | | | (0.87) | | | | | | 1.29 | | | | 1.29 | | | 1.29 | | | 4.29 | | | | | 182 | | | | | | 63 | | |
| 03-31-21 | | | | | 7.03 | | | | | | 0.36• | | | | | | 0.99 | | | | | | 1.35 | | | | | | 0.36 | | | | | | — | | | | | | 0.02 | | | | | | 0.38 | | | | | | — | | | | | | 8.00 | | | | | | 19.44 | | | | | | 1.29 | | | | 1.29 | | | 1.29 | | | 4.61 | | | | | 547 | | | | | | 78 | | |
| 03-31-20 | | | | | 7.87 | | | | | | 0.37• | | | | | | (0.81) | | | | | | (0.44) | | | | | | 0.40 | | | | | | — | | | | | | — | | | | | | 0.40 | | | | | | — | | | | | | 7.03 | | | | | | (5.99) | | | | | | 1.35 | | | | 1.35 | | | 1.35 | | | 4.72 | | | | | 684 | | | | | | 57 | | |
| 03-31-19 | | | | | 7.90 | | | | | | 0.41 | | | | | | (0.05) | | | | | | 0.36 | | | | | | 0.39 | | | | | | — | | | | | | — | | | | | | 0.39 | | | | | | — | | | | | | 7.87 | | | | | | 4.76 | | | | | | 1.35 | | | | 1.35 | | | 1.35 | | | 5.25 | | | | | 1,185 | | | | | | 33 | | |
| Class R6 | | | | | | | | | | | | | | | | | | | | | | | | | | | | | | | | | | | | | | | | | | | | | | | | | | | | | | | | | | | | | | | | | | | | | | | | | | | | | | | | | | | | | | | | | | | | | | |
| 03-31-23 | | | | | 7.59 | | | | | | 0.40• | | | | | | (0.77) | | | | | | (0.37) | | | | | | 0.40 | | | | | | 0.09 | | | | | | — | | | | | | 0.49 | | | | | | — | | | | | | 6.73 | | | | | | (4.74) | | | | | | 0.67 | | | | 0.66 | | | 0.66 | | | 5.94 | | | | | 93,175 | | | | | | 70 | | |
| 03-31-22 | | | | | 8.00 | | | | | | 0.40• | | | | | | (0.41) | | | | | | (0.01) | | | | | | 0.40 | | | | | | 0.00* | | | | | | — | | | | | | 0.40 | | | | | | — | | | | | | 7.59 | | | | | | (0.21) | | | | | | 0.63 | | | | 0.63 | | | 0.63 | | | 4.91 | | | | | 44,338 | | | | | | 63 | | |
| 03-31-21 | | | | | 7.02 | | | | | | 0.41• | | | | | | 1.00 | | | | | | 1.41 | | | | | | 0.41 | | | | | | — | | | | | | 0.02 | | | | | | 0.43 | | | | | | — | | | | | | 8.00 | | | | | | 20.39 | | | | | | 0.63 | | | | 0.63 | | | 0.63 | | | 5.26 | | | | | 242,749 | | | | | | 78 | | |
| 03-31-20 | | | | | 7.87 | | | | | | 0.43• | | | | | | (0.82) | | | | | | (0.39) | | | | | | 0.46 | | | | | | — | | | | | | — | | | | | | 0.46 | | | | | | — | | | | | | 7.02 | | | | | | (5.49) | | | | | | 0.69 | | | | 0.69 | | | 0.69 | | | 5.44 | | | | | 125,036 | | | | | | 57 | | |
| 03-31-19 | | | | | 7.89 | | | | | | 0.45• | | | | | | (0.03) | | | | | | 0.42 | | | | | | 0.44 | | | | | | — | ��� | | | | | — | | | | | | 0.44 | | | | | | — | | | | | | 7.87 | | | | | | 5.52 | | | | | | 0.69 | | | | 0.69 | | | 0.69 | | | 5.72 | | | | | 10,002 | | | | | | 33 | | |
| Class W | | | | | | | | | | | | | | | | | | | | | | | | | | | | | | | | | | | | | | | | | | | | | | | | | | | | | | | | | | | | | | | | | | | | | | | | | | | | | | | | | | | | | | | | | | | | | | |
| 03-31-23 | | | | | 7.60 | | | | | | 0.39• | | | | | | (0.77) | | | | | | (0.38) | | | | | | 0.39 | | | | | | 0.09 | | | | | | — | | | | | | 0.48 | | | | | | — | | | | | | 6.74 | | | | | | (4.88) | | | | | | 0.83 | | | | 0.82 | | | 0.82 | | | 5.70 | | | | | 57,159 | | | | | | 70 | | |
| 03-31-22 | | | | | 8.00 | | | | | | 0.38• | | | | | | (0.39) | | | | | | (0.01) | | | | | | 0.39 | | | | | | 0.00* | | | | | | — | | | | | | 0.39 | | | | | | — | | | | | | 7.60 | | | | | | (0.24) | | | | | | 0.79 | | | | 0.79 | | | 0.79 | | | 4.79 | | | | | 84,428 | | | | | | 63 | | |
| 03-31-21 | | | | | 7.03 | | | | | | 0.40• | | | | | | 0.99 | | | | | | 1.39 | | | | | | 0.40 | | | | | | — | | | | | | 0.02 | | | | | | 0.42 | | | | | | — | | | | | | 8.00 | | | | | | 20.03 | | | | | | 0.79 | | | | 0.79 | | | 0.79 | | | 5.09 | | | | | 145,963 | | | | | | 78 | | |
| 03-31-20 | | | | | 7.87 | | | | | | 0.41• | | | | | | (0.81) | | | | | | (0.40) | | | | | | 0.44 | | | | | | — | | | | | | — | | | | | | 0.44 | | | | | | — | | | | | | 7.03 | | | | | | (5.51) | | | | | | 0.85 | | | | 0.85 | | | 0.85 | | | 5.22 | | | | | 138,971 | | | | | | 57 | | |
| 03-31-19 | | | | | 7.90 | | | | | | 0.45 | | | | | | (0.05) | | | | | | 0.40 | | | | | | 0.43 | | | | | | — | | | | | | — | | | | | | 0.43 | | | | | | — | | | | | | 7.87 | | | | | | 5.29 | | | | | | 0.85 | | | | 0.85 | | | 0.85 | | | 5.74 | | | | | 98,192 | | | | | | 33 | | |
| Voya Intermediate Bond Fund | | | | | | | | | | | | | | | | | | | | | | | | | | | | | | | | | | | | | | | | | | | | | | | | | | | | | | | | | | | | | | | | | | | | | | | | | | | | | | | | | | | | | | | | | | | | | | |
| Class A | | | | | | | | | | | | | | | | | | | | | | | | | | | | | | | | | | | | | | | | | | | | | | | | | | | | | | | | | | | | | | | | | | | | | | | | | | | | | | | | | | | | | | | | | | | | | | |
| 03-31-23 | | | | | 9.55 | | | | | | 0.26• | | | | | | (0.82) | | | | | | (0.56) | | | | | | 0.25 | | | | | | — | | | | | | — | | | | | | 0.25 | | | | | | — | | | | | | 8.74 | | | | | | (5.82) | | | | | | 0.72 | | | | 0.72 | | | 0.72 | | | 2.93 | | | | | 245,387 | | | | | | 247†† | | |
| 03-31-22 | | | | | 10.25 | | | | | | 0.20• | | | | | | (0.66) | | | | | | (0.46) | | | | | | 0.22 | | | | | | — | | | | | | 0.02 | | | | | | 0.24 | | | | | | — | | | | | | 9.55 | | | | | | (4.70) | | | | | | 0.69 | | | | 0.69 | | | 0.69 | | | 1.97 | | | | | 364,121 | | | | | | 222†† | | |
| 03-31-21 | | | | | 10.11 | | | | | | 0.25• | | | | | | 0.38 | | | | | | 0.63 | | | | | | 0.29 | | | | | | 0.17 | | | | | | 0.03 | | | | | | 0.49 | | | | | | — | | | | | | 10.25 | | | | | | 6.12 | | | | | | 0.70 | | | | 0.70 | | | 0.70 | | | 2.35 | | | | | 459,960 | | | | | | 159†† | | |
| 03-31-20 | | | | | 10.02 | | | | | | 0.30 | | | | | | 0.13 | | | | | | 0.43 | | | | | | 0.33 | | | | | | 0.01 | | | | | | — | | | | | | 0.34 | | | | | | — | | | | | | 10.11 | | | | | | 4.29 | | | | | | 0.69 | | | | 0.69 | | | 0.69 | | | 2.88 | | | | | 451,338 | | | | | | 253†† | | |
| 03-31-19 | | | | | 9.90 | | | | | | 0.30 | | | | | | 0.11 | | | | | | 0.41 | | | | | | 0.29 | | | | | | — | | | | | | — | | | ��� | | | 0.29 | | | | | | — | | | | | | 10.02 | | | | | | 4.28 | | | | | | 0.70 | | | | 0.70 | | | 0.70 | | | 3.06 | | | | | 431,210 | | | | | | 329†† | | |
| Class C | | | | | | | | | | | | | | | | | | | | | | | | | | | | | | | | | | | | | | | | | | | | | | | | | | | | | | | | | | | | | | | | | | | | | | | | | | | | | | | | | | | | | | | | | | | | | | |
| 03-31-23 | | | | | 9.53 | | | | | | 0.19• | | | | | | (0.81) | | | | | | (0.62) | | | | | | 0.19 | | | | | | — | | | | | | — | | | | | | 0.19 | | | | | | — | | | | | | 8.72 | | | | | | (6.54) | | | | | | 1.47 | | | | 1.47 | | | 1.47 | | | 2.17 | | | | | 9,687 | | | | | | 247†† | | |
| 03-31-22 | | | | | 10.23 | | | | | | 0.12• | | | | | | (0.66) | | | | | | (0.54) | | | | | | 0.14 | | | | | | — | | | | | | 0.02 | | | | | | 0.16 | | | | | | — | | | | | | 9.53 | | | | | | (5.43) | | | | | | 1.44 | | | | 1.44 | | | 1.44 | | | 1.22 | | | | | 15,564 | | | | | | 222†† | | |
| 03-31-21 | | | | | 10.09 | | | | | | 0.17• | | | | | | 0.38 | | | | | | 0.55 | | | | | | 0.21 | | | | | | 0.17 | | | | | | 0.03 | | | | | | 0.41 | | | | | | — | | | | | | 10.23 | | | | | | 5.34 | | | | | | 1.45 | | | | 1.45 | | | 1.45 | | | 1.62 | | | | | 22,702 | | | | | | 159†† | | |
| 03-31-20 | | | | | 10.01 | | | | | | 0.21 | | | | | | 0.14 | | | | | | 0.35 | | | | | | 0.26 | | | | | | 0.01 | | | | | | — | | | | | | 0.27 | | | | | | — | | | | | | 10.09 | | | | | | 3.41 | | | | | | 1.44 | | | | 1.44 | | | 1.44 | | | 2.06 | | | | | 25,556 | | | | | | 253†† | | |
| 03-31-19 | | | | | 9.89 | | | | | | 0.23 | | | | | | 0.11 | | | | | | 0.34 | | | | | | 0.22 | | | | | | — | | | | | | — | | | | | | 0.22 | | | | | | — | | | | | | 10.01 | | | | | | 3.51 | | | | | | 1.45 | | | | 1.45 | | | 1.45 | | | 2.31 | | | | | 28,657 | | | | | | 329†† | | |
See Accompanying Notes to Financial Statements
Financial Highlights (continued)
| | | | | | | | | | Income (loss)
from
investment
operations | | | | | | | | | Less Distributions | | | | | | Ratios to average net assets | | | Supplemental
Data | |
| | | | Net asset value, beginning of year
or period | | | Net investment income (loss) | | | Net realized and unrealized
gain (loss) | | | Total from investment operations | | | From net investment income | | | From net realized gains | | | From return of capital | | | Total distributions | | | Payment by affiliate | | | Net asset value, end of year
or period | | | Total Return(1) | | | Expenses before
reductions/additions(2)(3) | | | Expenses net of fee waivers
and/or recoupments if any(2)(3) | | | Expenses net of all
reductions/additions(2)(3) | | | Net investment income (loss)(2)(3) | | | Net assets, end of year or period | | | Portfolio turnover rate | |
Year or
period ended | | | ($) | | | ($) | | | ($) | | | ($) | | | ($) | | | ($) | | | ($) | | | ($) | | | ($) | | | ($) | | | (%) | | | (%) | | | (%) | | | (%) | | | (%) | | | ($000’s) | | | (%) | |
| Voya Intermediate Bond Fund (continued) | | | | | | | | | | | | | | | | | | | | | | | | | | | | | | | | | | | | | | | | | | | | | | | | | | | | | | | | | | | | | | | | | | | | | | | | | | | | | | | | | | | | | | | | | | | | | | |
| Class I | | | | | | | | | | | | | | | | | | | | | | | | | | | | | | | | | | | | | | | | | | | | | | | | | | | | | | | | | | | | | | | | | | | | | | | | | | | | | | | | | | | | | | | | | | | | | | |
| 03-31-23 | | | | | 9.55 | | | | | | 0.29• | | | | | | (0.82) | | | | | | (0.53) | | | | | | 0.28 | | | | | | — | | | | | | — | | | | | | 0.28 | | | | | | — | | | | | | 8.74 | | | | | | (5.51) | | | | | | 0.36 | | | | 0.36 | | | 0.36 | | | 3.29 | | | | | 4,938,036 | | | | | | 247†† | | |
| 03-31-22 | | | | | 10.25 | | | | | | 0.24• | | | | | | (0.67) | | | | | | (0.43) | | | | | | 0.25 | | | | | | — | | | | | | 0.02 | | | | | | 0.27 | | | | | | — | | | | | | 9.55 | | | | | | (4.39) | | | | | | 0.35 | | | | 0.35 | | | 0.35 | | | 2.32 | | | | | 6,092,396 | | | | | | 222†† | | |
| 03-31-21 | | | | | 10.10 | | | | | | 0.29• | | | | | | 0.38 | | | | | | 0.67 | | | | | | 0.32 | | | | | | 0.17 | | | | | | 0.03 | | | | | | 0.52 | | | | | | — | | | | | | 10.25 | | | | | | 6.57 | | | | | | 0.34 | | | | 0.34 | | | 0.34 | | | 2.70 | | | | | 6,175,479 | | | | | | 159†† | | |
| 03-31-20 | | | | | 10.02 | | | | | | 0.32 | | | | | | 0.14 | | | | | | 0.46 | | | | | | 0.37 | | | | | | 0.01 | | | | | | — | | | | | | 0.38 | | | | | | — | | | | | | 10.10 | | | | | | 4.53 | | | | | | 0.36 | | | | 0.36 | | | 0.36 | | | 3.13 | | | | | 4,988,317 | | | | | | 253†† | | |
| 03-31-19 | | | | | 9.90 | | | | | | 0.33 | | | | | | 0.12 | | | | | | 0.45 | | | | | | 0.33 | | | | | | — | | | | | | — | | | | | | 0.33 | | | | | | — | | | | | | 10.02 | | | | | | 4.63 | | | | | | 0.36 | | | | 0.36 | | | 0.36 | | | 3.41 | | | | | 4,142,382 | | | | | | 329†† | | |
| Class R | | | | | | | | | | | | | | | | | | | | | | | | | | | | | | | | | | | | | | | | | | | | | | | | | | | | | | | | | | | | | | | | | | | | | | | | | | | | | | | | | | | | | | | | | | | | | | |
| 03-31-23 | | | | | 9.56 | | | | | | 0.24• | | | | | | (0.82) | | | | | | (0.58) | | | | | | 0.23 | | | | | | — | | | | | | — | | | | | | 0.23 | | | | | | — | | | | | | 8.75 | | | | | | (6.04) | | | | | | 0.97 | | | | 0.97 | | | 0.97 | | | 2.70 | | | | | 115,639 | | | | | | 247†† | | |
| 03-31-22 | | | | | 10.26 | | | | | | 0.18• | | | | | | (0.67) | | | | | | (0.49) | | | | | | 0.19 | | | | | | — | | | | | | 0.02 | | | | | | 0.21 | | | | | | — | | | | | | 9.56 | | | | | | (4.93) | | | | | | 0.94 | | | | 0.94 | | | 0.94 | | | 1.72 | | | | | 143,085 | | | | | | 222†† | | |
| 03-31-21 | | | | | 10.12 | | | | | | 0.22• | | | | | | 0.38 | | | | | | 0.60 | | | | | | 0.26 | | | | | | 0.17 | | | | | | 0.03 | | | | | | 0.46 | | | | | | — | | | | | | 10.26 | | | | | | 5.86 | | | | | | 0.95 | | | | 0.95 | | | 0.95 | | | 2.11 | | | | | 175,289 | | | | | | 159†† | | |
| 03-31-20 | | | | | 10.03 | | | | | | 0.26 | | | | | | 0.15 | | | | | | 0.41 | | | | | | 0.31 | | | | | | 0.01 | | | | | | — | | | | | | 0.32 | | | | | | — | | | | | | 10.12 | | | | | | 4.03 | | | | | | 0.94 | | | | 0.94 | | | 0.94 | | | 2.56 | | | | | 186,915 | | | | | | 253†† | | |
| 03-31-19 | | | | | 9.92 | | | | | | 0.28 | | | | | | 0.10 | | | | | | 0.38 | | | | | | 0.27 | | | | | | — | | | | | | — | | | | | | 0.27 | | | | | | — | | | | | | 10.03 | | | | | | 3.92 | | | | | | 0.95 | | | | 0.95 | | | 0.95 | | | 2.81 | | | | | 170,236 | | | | | | 329†† | | |
| Class R6 | | | | | | | | | | | | | | | | | | | | | | | | | | | | | | | | | | | | | | | | | | | | | | | | | | | | | | | | | | | | | | | | | | | | | | | | | | | | | | | | | | | | | | | | | | | | | | |
| 03-31-23 | | | | | 9.56 | | | | | | 0.30• | | | | | | (0.83) | | | | | | (0.53) | | | | | | 0.28 | | | | | | — | | | | | | — | | | | | | 0.28 | | | | | | — | | | | | | 8.75 | | | | | | (5.46) | | | | | | 0.30 | | | | 0.30 | | | 0.30 | | | 3.37 | | | | | 2,302,998 | | | | | | 247†† | | |
| 03-31-22 | | | | | 10.25 | | | | | | 0.24• | | | | | | (0.66) | | | | | | (0.42) | | | | | | 0.25 | | | | | | — | | | | | | 0.02 | | | | | | 0.27 | | | | | | — | | | | | | 9.56 | | | | | | (4.25) | | | | | | 0.29 | | | | 0.29 | | | 0.29 | | | 2.37 | | | | | 2,563,038 | | | | | | 222†† | | |
| 03-31-21 | | | | | 10.11 | | | | | | 0.29• | | | | | | 0.38 | | | | | | 0.67 | | | | | | 0.33 | | | | | | 0.17 | | | | | | 0.03 | | | | | | 0.53 | | | | | | — | | | | | | 10.25 | | | | | | 6.50 | | | | | | 0.30 | | | | 0.30 | | | 0.30 | | | 2.74 | | | | | 2,861,963 | | | | | | 159†† | | |
| 03-31-20 | | | | | 10.02 | | | | | | 0.33 | | | | | | 0.14 | | | | | | 0.47 | | | | | | 0.37 | | | | | | 0.01 | | | | | | — | | | | | | 0.38 | | | | | | — | | | | | | 10.11 | | | | | | 4.67 | | | | | | 0.30 | | | | 0.30 | | | 0.30 | | | 3.19 | | | | | 2,306,857 | | | | | | 253†† | | |
| 03-31-19 | | | | | 9.90 | | | | | | 0.34 | | | | | | 0.11 | | | | | | 0.45 | | | | | | 0.33 | | | | | | — | | | | | | — | | | | | | 0.33 | | | | | | — | | | | | | 10.02 | | | | | | 4.65 | | | | | | 0.31 | | | | 0.31 | | | 0.31 | | | 3.46 | | | | | 1,851,627 | | | | | | 329†† | | |
| Class W | | | | | | | | | | | | | | | | | | | | | | | | | | | | | | | | | | | | | | | | | | | | | | | | | | | | | | | | | | | | | | | | | | | | | | | | | | | | | | | | | | | | | | | | | | | | | | |
| 03-31-23 | | | | | 9.54 | | | | | | 0.28• | | | | | | (0.82) | | | | | | (0.54) | | | | | | 0.27 | | | | | | — | | | | | | — | | | | | | 0.27 | | | | | | — | | | | | | 8.73 | | | | | | (5.59) | | | | | | 0.47 | | | | 0.47 | | | 0.47 | | | 3.11 | | | | | 62,837 | | | | | | 247†† | | |
| 03-31-22 | | | | | 10.24 | | | | | | 0.23• | | | | | | (0.67) | | | | | | (0.44) | | | | | | 0.24 | | | | | | — | | | | | | 0.02 | | | | | | 0.26 | | | | | | — | | | | | | 9.54 | | | | | | (4.47) | | | | | | 0.44 | | | | 0.44 | | | 0.44 | | | 2.22 | | | | | 174,769 | | | | | | 222†† | | |
| 03-31-21 | | | | | 10.10 | | | | | | 0.27• | | | | | | 0.38 | | | | | | 0.65 | | | | | | 0.31 | | | | | | 0.17 | | | | | | 0.03 | | | | | | 0.51 | | | | | | — | | | | | | 10.24 | | | | | | 6.39 | | | | | | 0.45 | | | | 0.45 | | | 0.45 | | | 2.59 | | | | | 268,634 | | | | | | 159†† | | |
| 03-31-20 | | | | | 10.01 | | | | | | 0.32 | | | | | | 0.14 | | | | | | 0.46 | | | | | | 0.36 | | | | | | 0.01 | | | | | | — | | | | | | 0.37 | | | | | | — | | | | | | 10.10 | | | | | | 4.56 | | | | | | 0.44 | | | | 0.44 | | | 0.44 | | | 3.05 | | | | | 249,060 | | | | | | 253†† | | |
| 03-31-19 | | | | | 9.89 | | | | | | 0.32• | | | | | | 0.12 | | | | | | 0.44 | | | | | | 0.32 | | | | | | — | | | | | | — | | | | | | 0.32 | | | | | | — | | | | | | 10.01 | | | | | | 4.55 | | | | | | 0.45 | | | | 0.45 | | | 0.45 | | | 3.25 | | | | | 174,570 | | | | | | 329†† | | |
| Voya Short Duration High Income Fund | | | | | | | | | | | | | | | | | | | | | | | | | | | | | | | | | | | | | | | | | | | | | | | | | | | | | | | | | | | | | | | | | | | | | | | | | | | | | | | | | | | | | | | | | | | | | | |
| Class A | | | | | | | | | | | | | | | | | | | | | | | | | | | | | | | | | | | | | | | | | | | | | | | | | | | | | | | | | | | | | | | | | | | | | | | | | | | | | | | | | | | | | | | | | | | | | | |
02-09-23(4) -
03-31-23 | | | | | 10.00 | | | | | | 0.10• | | | | | | (0.12) | | | | | | (0.02) | | | | | | 0.10 | | | | | | — | | | | | | — | | | | | | 0.10 | | | | | | — | | | | | | 9.88 | | | | | | (0.21) | | | | | | 1.22 | | | | 0.85 | | | 0.85 | | | 7.35 | | | | | 8,605 | | | | | | 1 | | |
| Class I | | | | | | | | | | | | | | | | | | | | | | | | | | | | | | | | | | | | | | | | | | | | | | | | | | | | | | | | | | | | | | | | | | | | | | | | | | | | | | | | | | | | | | | | | | | | | | |
02-09-23(4) -
03-31-23 | | | | | 10.00 | | | | | | 0.10• | | | | | | (0.12) | | | | | | (0.02) | | | | | | 0.10 | | | | | | — | | | | | | — | | | | | | 0.10 | | | | | | — | | | | | | 9.88 | | | | | | (0.17) | | | | | | 0.97 | | | | 0.60 | | | 0.60 | | | 7.61 | | | | | 8,805 | | | | | | 1 | | |
| Class R6 | | | | | | | | | | | | | | | | | | | | | | | | | | | | | | | | | | | | | | | | | | | | | | | | | | | | | | | | | | | | | | | | | | | | | | | | | | | | | | | | | | | | | | | | | | | | | | |
02-09-23(4) -
03-31-23 | | | | | 10.00 | | | | | | 0.10• | | | | | | (0.12) | | | | | | (0.02) | | | | | | 0.10 | | | | | | — | | | | | | — | | | | | | 0.10 | | | | | | — | | | | | | 9.88 | | | | | | (0.17) | | | | | | 0.97 | | | | 0.60 | | | 0.60 | | | 7.59 | | | | | 8,321 | | | | | | 1 | | |
| Voya Short Term Bond Fund | | | | | | | | | | | | | | | | | | | | | | | | | | | | | | | | | | | | | | | | | | | | | | | | | | | | | | | | | | | | | | | | | | | | | | | | | | | | | | | | | | | | | | | | | | | | | | |
| Class A | | | | | | | | | | | | | | | | | | | | | | | | | | | | | | | | | | | | | | | | | | | | | | | | | | | | | | | | | | | | | | | | | | | | | | | | | | | | | | | | | | | | | | | | | | | | | | |
| 03-31-23 | | | | | 9.58 | | | | | | 0.21• | | | | | | (0.29) | | | | | | (0.08) | | | | | | 0.21 | | | | | | — | | | | | | — | | | | | | 0.21 | | | | | | — | | | | | | 9.29 | | | | | | (0.83) | | | | | | 0.64 | | | | 0.62 | | | 0.62 | | | 2.26 | | | | | 9,054 | | | | | | 225 | | |
| 03-31-22 | | | | | 9.98 | | | | | | 0.09• | | | | | | (0.36) | | | | | | (0.27) | | | | | | 0.10 | | | | | | — | | | | | | 0.03 | | | | | | 0.13 | | | | | | — | | | | | | 9.58 | | | | | | (2.81) | | | | | | 0.64 | | | | 0.63 | | | 0.63 | | | 0.93 | | | | | 15,351 | | | | | | 250 | | |
| 03-31-21 | | | | | 9.55 | | | | | | 0.16• | | | | | | 0.46 | | | | | | 0.62 | | | | | | 0.17 | | | | | | — | | | | | | 0.02 | | | | | | 0.19 | | | | | | — | | | | | | 9.98 | | | | | | 6.48 | | | | | | 0.68 | | | | 0.60 | | | 0.60 | | | 1.62 | | | | | 19,499 | | | | | | 145 | | |
| 03-31-20 | | | | | 9.77 | | | | | | 0.22• | | | | | | (0.23) | | | | | | (0.01) | | | | | | 0.21 | | | | | | — | | | | | | — | | | | | | 0.21 | | | | | | — | | | | | | 9.55 | | | | | | (0.14) | | | | | | 0.72 | | | | 0.65 | | | 0.65 | | | 2.19 | | | | | 6,907 | | | | | | 192 | | |
| 03-31-19 | | | | | 9.72 | | | | | | 0.21• | | | | | | 0.06 | | | | | | 0.27 | | | | | | 0.22 | | | | | | — | | | | | | — | | | | | | 0.22 | | | | | | — | | | | | | 9.77 | | | | | | 2.85 | | | | | | 0.93 | | | | 0.77 | | | 0.77 | | | 2.14 | | | | | 14,247 | | | | | | 137 | | |
See Accompanying Notes to Financial Statements
Financial Highlights (continued)
| | | | | | | | | | Income (loss)
from
investment
operations | | | | | | | | | Less Distributions | | | | | | Ratios to average net assets | | | Supplemental
Data | |
| | | | Net asset value, beginning of year
or period | | | Net investment income (loss) | | | Net realized and unrealized
gain (loss) | | | Total from investment operations | | | From net investment income | | | From net realized gains | | | From return of capital | | | Total distributions | | | Payment by affiliate | | | Net asset value, end of year
or period | | | Total Return(1) | | | Expenses before
reductions/additions(2)(3) | | | Expenses net of fee waivers
and/or recoupments if any(2)(3) | | | Expenses net of all
reductions/additions(2)(3) | | | Net investment income (loss)(2)(3) | | | Net assets, end of year or period | | | Portfolio turnover rate | |
Year or
period ended | | | ($) | | | ($) | | | ($) | | | ($) | | | ($) | | | ($) | | | ($) | | | ($) | | | ($) | | | ($) | | | (%) | | | (%) | | | (%) | | | (%) | | | (%) | | | ($000’s) | | | (%) | |
| Voya Short Term Bond Fund (continued) | | | | | | | | | | | | | | | | | | | | | | | | | | | | | | | | | | | | | | | | | | | | | | | | | | | | | | | | | | | | | | | | | | | | | | | | | | | | | | | | | | | | | | | | | | | | | | |
| Class C | | | | | | | | | | | | | | | | | | | | | | | | | | | | | | | | | | | | | | | | | | | | | | | | | | | | | | | | | | | | | | | | | | | | | | | | | | | | | | | | | | | | | | | | | | | | | | |
| 03-31-23 | | | | | 9.58 | | | | | | 0.13• | | | | | | (0.27) | | | | | | (0.14) | | | | | | 0.14 | | | | | | — | | | | | | — | | | | | | 0.14 | | | | | | — | | | | | | 9.30 | | | | | | (1.47) | | | | | | 1.39 | | | | 1.37 | | | 1.37 | | | 1.34 | | | | | 149 | | | | | | 225 | | |
| 03-31-22 | | | | | 9.98 | | | | | | 0.02• | | | | | | (0.37) | | | | | | (0.35) | | | | | | 0.02 | | | | | | — | | | | | | 0.03 | | | | | | 0.05 | | | | | | — | | | | | | 9.58 | | | | | | (3.54) | | | | | | 1.39 | | | | 1.38 | | | 1.38 | | | 0.18 | | | | | 442 | | | | | | 250 | | |
| 03-31-21 | | | | | 9.55 | | | | | | 0.09• | | | | | | 0.45 | | | | | | 0.54 | | | | | | 0.09 | | | | | | — | | | | | | 0.02 | | | | | | 0.11 | | | | | | — | | | | | | 9.98 | | | | | | 5.69 | | | | | | 1.43 | | | | 1.35 | | | 1.35 | | | 0.89 | | | | | 548 | | | | | | 145 | | |
| 03-31-20 | | | | | 9.76 | | | | | | 0.14• | | | | | | (0.21) | | | | | | (0.07) | | | | | | 0.14 | | | | | | — | | | | | | — | | | | | | 0.14 | | | | | | — | | | | | | 9.55 | | | | | | (0.78) | | | | | | 1.47 | | | | 1.40 | | | 1.40 | | | 1.41 | | | | | 335 | | | | | | 192 | | |
| 03-31-19 | | | | | 9.72 | | | | | | 0.12 | | | | | | 0.07 | | | | | | 0.19 | | | | | | 0.15 | | | | | | — | | | | | | — | | | | | | 0.15 | | | | | | — | | | | | | 9.76 | | | | | | 1.97 | | | | | | 1.68 | | | | 1.52 | | | 1.52 | | | 1.38 | | | | | 1,038 | | | | | | 137 | | |
| Class I | | | | | | | | | | | | | | | | | | | | | | | | | | | | | | | | | | | | | | | | | | | | | | | | | | | | | | | | | | | | | | | | | | | | | | | | | | | | | | | | | | | | | | | | | | | | | | |
| 03-31-23 | | | | | 9.57 | | | | | | 0.25• | | | | | | (0.30) | | | | | | (0.05) | | | | | | 0.24 | | | | | | — | | | | | | — | | | | | | 0.24 | | | | | | — | | | | | | 9.28 | | | | | | (0.54) | | | | | | 0.40 | | | | 0.35 | | | 0.35 | | | 2.67 | | | | | 31,011 | | | | | | 225 | | |
| 03-31-22 | | | | | 9.97 | | | | | | 0.12• | | | | | | (0.36) | | | | | | (0.24) | | | | | | 0.13 | | | | | | — | | | | | | 0.03 | | | | | | 0.16 | | | | | | — | | | | | | 9.57 | | | | | | (2.52) | | | | | | 0.40 | | | | 0.35 | | | 0.35 | | | 1.19 | | | | | 31,691 | | | | | | 250 | | |
| 03-31-21 | | | | | 9.54 | | | | | | 0.19• | | | | | | 0.46 | | | | | | 0.65 | | | | | | 0.20 | | | | | | — | | | | | | 0.02 | | | | | | 0.22 | | | | | | — | | | | | | 9.97 | | | | | | 6.81 | | | | | | 0.48 | | | | 0.35 | | | 0.35 | | | 1.91 | | | | | 16,762 | | | | | | 145 | | |
| 03-31-20 | | | | | 9.76 | | | | | | 0.24• | | | | | | (0.22) | | | | | | 0.02 | | | | | | 0.24 | | | | | | — | | | | | | — | | | | | | 0.24 | | | | | | — | | | | | | 9.54 | | | | | | 0.16 | | | | | | 0.57 | | | | 0.40 | | | 0.40 | | | 2.43 | | | | | 11,925 | | | | | | 192 | | |
| 03-31-19 | | | | | 9.71 | | | | | | 0.23 | | | | | | 0.07 | | | | | | 0.30 | | | | | | 0.25 | | | | | | — | | | | | | — | | | | | | 0.25 | | | | | | — | | | | | | 9.76 | | | | | | 3.15 | | | | | | 0.78 | | | | 0.50 | | | 0.50 | | | 2.37 | | | | | 9,283 | | | | | | 137 | | |
| Class R | | | | | | | | | | | | | | | | | | | | | | | | | | | | | | | | | | | | | | | | | | | | | | | | | | | | | | | | | | | | | | | | | | | | | | | | | | | | | | | | | | | | | | | | | | | | | | |
| 03-31-23 | | | | | 9.61 | | | | | | 0.20• | | | | | | (0.29) | | | | | | (0.09) | | | | | | 0.19 | | | | | | — | | | | | | — | | | | | | 0.19 | | | | | | — | | | | | | 9.33 | | | | | | (0.96) | | | | | | 0.89 | | | | 0.87 | | | 0.87 | | | 2.14 | | | | | 23 | | | | | | 225 | | |
| 03-31-22 | | | | | 10.01 | | | | | | 0.07• | | | | | | (0.37) | | | | | | (0.30) | | | | | | 0.07 | | | | | | — | | | | | | 0.03 | | | | | | 0.10 | | | | | | — | | | | | | 9.61 | | | | | | (3.04) | | | | | | 0.89 | | | | 0.88 | | | 0.88 | | | 0.66 | | | | | 17 | | | | | | 250 | | |
| 03-31-21 | | | | | 9.57 | | | | | | 0.14• | | | | | | 0.46 | | | | | | 0.60 | | | | | | 0.14 | | | | | | — | | | | | | 0.02 | | | | | | 0.16 | | | | | | — | | | | | | 10.01 | | | | | | 6.32 | | | | | | 0.93 | | | | 0.85 | | | 0.85 | | | 1.39 | | | | | 8 | | | | | | 145 | | |
| 03-31-20 | | | | | 9.77 | | | | | | 0.19• | | | | | | (0.20) | | | | | | (0.01) | | | | | | 0.19 | | | | | | — | | | | | | — | | | | | | 0.19 | | | | | | — | | | | | | 9.57 | | | | | | (0.18) | | | | | | 0.97 | | | | 0.90 | | | 0.90 | | | 1.93 | | | | | 3 | | | | | | 192 | | |
| 03-31-19 | | | | | 9.72 | | | | | | 0.18 | | | | | | 0.07 | | | | | | 0.25 | | | | | | 0.20 | | | | | | — | | | | | | — | | | | | | 0.20 | | | | | | — | | | | | | 9.77 | | | | | | 2.60 | | | | | | 1.18 | | | | 1.02 | | | 1.02 | | | 1.85 | | | | | 3 | | | | | | 137 | | |
| Class R6 | | | | | | | | | | | | | | | | | | | | | | | | | | | | | | | | | | | | | | | | | | | | | | | | | | | | | | | | | | | | | | | | | | | | | | | | | | | | | | | | | | | | | | | | | | | | | | |
| 03-31-23 | | | | | 9.58 | | | | | | 0.25• | | | | | | (0.30) | | | | | | (0.05) | | | | | | 0.24 | | | | | | — | | | | | | — | | | | | | 0.24 | | | | | | — | | | | | | 9.29 | | | | | | (0.50) | | | | | | 0.32 | | | | 0.30 | | | 0.30 | | | 2.63 | | | | | 338,437 | | | | | | 225 | | |
| 03-31-22 | | | | | 9.98 | | | | | | 0.12• | | | | | | (0.36) | | | | | | (0.24) | | | | | | 0.13 | | | | | | — | | | | | | 0.03 | | | | | | 0.16 | | | | | | — | | | | | | 9.58 | | | | | | (2.49) | | | | | | 0.31 | | | | 0.30 | | | 0.30 | | | 1.18 | | | | | 372,853 | | | | | | 250 | | |
| 03-31-21 | | | | | 9.55 | | | | | | 0.20• | | | | | | 0.45 | | | | | | 0.65 | | | | | | 0.20 | | | | | | — | | | | | | 0.02 | | | | | | 0.22 | | | | | | — | | | | | | 9.98 | | | | | | 6.83 | | | | | | 0.38 | | | | 0.30 | | | 0.30 | | | 2.01 | | | | | 51,298 | | | | | | 145 | | |
| 03-31-20 | | | | | 9.76 | | | | | | 0.24• | | | | | | (0.21) | | | | | | 0.03 | | | | | | 0.24 | | | | | | — | | | | | | — | | | | | | 0.24 | | | | | | — | | | | | | 9.55 | | | | | | 0.29 | | | | | | 0.42 | | | | 0.35 | | | 0.35 | | | 2.47 | | | | | 98,380 | | | | | | 192 | | |
| 03-31-19 | | | | | 9.72 | | | | | | 0.23 | | | | | | 0.06 | | | | | | 0.29 | | | | | | 0.25 | | | | | | — | | | | | | — | | | | | | 0.25 | | | | | | — | | | | | | 9.76 | | | | | | 3.08 | | | | | | 0.63 | | | | 0.47 | | | 0.47 | | | 2.40 | | | | | 86,628 | | | | | | 137 | | |
| Class W | | | | | | | | | | | | | | | | | | | | | | | | | | | | | | | | | | | | | | | | | | | | | | | | | | | | | | | | | | | | | | | | | | | | | | | | | | | | | | | | | | | | | | | | | | | | | | |
| 03-31-23 | | | | | 9.60 | | | | | | 0.23• | | | | | | (0.28) | | | | | | (0.05) | | | | | | 0.23 | | | | | | — | | | | | | — | | | | | | 0.23 | | | | | | — | | | | | | 9.32 | | | | | | (0.47) | | | | | | 0.39 | | | | 0.37 | | | 0.37 | | | 2.47 | | | | | 12,660 | | | | | | 225 | | |
| 03-31-22 | | | | | 10.01 | | | | | | 0.12• | | | | | | (0.38) | | | | | | (0.26) | | | | | | 0.12 | | | | | | — | | | | | | 0.03 | | | | | | 0.15 | | | | | | — | | | | | | 9.60 | | | | | | (2.65) | | | | | | 0.39 | | | | 0.38 | | | 0.38 | | | 1.18 | | | | | 19,721 | | | | | | 250 | | |
| 03-31-21 | | | | | 9.57 | | | | | | 0.18• | | | | | | 0.47 | �� | | | | | 0.65 | | | | | | 0.19 | | | | | | — | | | | | | 0.02 | | | | | | 0.21 | | | | | | — | | | | | | 10.01 | | | | | | 6.84 | | | | | | 0.43 | | | | 0.35 | | | 0.35 | | | 1.85 | | | | | 21,981 | | | | | | 145 | | |
| 03-31-20 | | | | | 9.79 | | | | | | 0.24• | | | | | | (0.22) | | | | | | 0.02 | | | | | | 0.24 | | | | | | — | | | | | | — | | | | | | 0.24 | | | | | | — | | | | | | 9.57 | | | | | | 0.12 | | | | | | 0.47 | | | | 0.40 | | | 0.40 | | | 2.41 | | | | | 97 | | | | | | 192 | | |
| 03-31-19 | | | | | 9.72 | | | | | | 0.22 | | | | | | 0.10 | | | | | | 0.32 | | | | | | 0.25 | | | | | | — | | | | | | — | | | | | | 0.25 | | | | | | — | | | | | | 9.79 | | | | | | 3.31 | | | | | | 0.68 | | | | 0.52 | | | 0.52 | | | 2.38 | | | | | 523 | | | | | | 137 | | |
| Voya Strategic Income Opportunities Fund | | | | | | | | | | | | | | | | | | | | | | | | | | | | | | | | | | | | | | | | | | | | | | | | | | | | | | | | | | | | | | | | | | | | | | | | | | | | | | | | | | | | | | | | | | | | | | |
| Class A | | | | | | | | | | | | | | | | | | | | | | | | | | | | | | | | | | | | | | | | | | | | | | | | | | | | | | | | | | | | | | | | | | | | | | | | | | | | | | | | | | | | | | | | | | | | | | |
| 03-31-23 | | | | | 9.59 | | | | | | 0.35• | | | | | | (0.63) | | | | | | (0.28) | | | | | | 0.33 | | | | | | — | | | | | | — | | | | | | 0.33 | | | | | | — | | | | | | 8.98 | | | | | | (2.94) | | | | | | 0.85 | | | | 0.85 | | | 0.85 | | | 3.81 | | | | | 72,353 | | | | | | 110 | | |
| 03-31-22 | | | | | 10.12 | | | | | | 0.28• | | | | | | (0.52) | | | | | | (0.24) | | | | | | 0.23 | | | | | | — | | | | | | 0.06 | | | | | | 0.29 | | | | | | — | | | | | | 9.59 | | | | | | (2.47) | | | | | | 0.85 | | | | 0.85 | | | 0.85 | | | 2.81 | | | | | 104,975 | | | | | | 76 | | |
| 03-31-21 | | | | | 9.12 | | | | | | 0.32• | | | | | | 1.03 | | | | | | 1.35 | | | | | | 0.30 | | | | | | — | | | | | | 0.05 | | | | | | 0.35 | | | | | | — | | | | | | 10.12 | | | | | | 14.99 | | | | | | 0.88 | | | | 0.88 | | | 0.88 | | | 3.26 | | | | | 147,463 | | | | | | 45 | | |
| 03-31-20 | | | | | 10.15 | | | | | | 0.35• | | | | | | (0.97) | | | | | | (0.62) | | | | | | 0.41 | | | | | | — | | | | | | — | | | | | | 0.41 | | | | | | — | | | | | | 9.12 | | | | | | (6.48) | | | | | | 0.86 | | | | 0.86 | | | 0.86 | | | 3.45 | | | | | 146,080 | | | | | | 167 | | |
| 03-31-19 | | | | | 10.16 | | | | | | 0.37 | | | | | | 0.03 | | | | | | 0.40 | | | | | | 0.41 | | | | | | — | | | | | | — | | | | | | 0.41 | | | | | | — | | | | | | 10.15 | | | | | | 3.99 | | | | | | 0.94 | | | | 0.94 | | | 0.94 | | | 3.63 | | | | | 128,224 | | | | | | 155 | | |
| Class C | | | | | | | | | | | | | | | | | | | | | | | | | | | | | | | | | | | | | | | | | | | | | | | | | | | | | | | | | | | | | | | | | | | | | | | | | | | | | | | | | | | | | | | | | | | | | | |
| 03-31-23 | | | | | 9.45 | | | | | | 0.28• | | | | | | (0.64) | | | | | | (0.36) | | | | | | 0.25 | | | | | | — | | | | | | — | | | | | | 0.25 | | | | | | — | | | | | | 8.84 | | | | | | (3.78) | | | | | | 1.60 | | | | 1.60 | | | 1.60 | | | 3.06 | | | | | 36,708 | | | | | | 110 | | |
| 03-31-22 | | | | | 9.97 | | | | | | 0.20• | | | | | | (0.51) | | | | | | (0.31) | | | | | | 0.15 | | | | | | — | | | | | | 0.06 | | | | | | 0.21 | | | | | | — | | | | | | 9.45 | | | | | | (3.18) | | | | | | 1.60 | | | | 1.60 | | | 1.60 | | | 2.07 | | | | | 49,839 | | | | | | 76 | | |
| 03-31-21 | | | | | 8.98 | | | | | | 0.24• | | | | | | 1.02 | | | | | | 1.26 | | | | | | 0.22 | | | | | | — | | | | | | 0.05 | | | | | | 0.27 | | | | | | — | | | | | | 9.97 | | | | | | 14.20 | | | | | | 1.63 | | | | 1.63 | | | 1.63 | | | 2.51 | | | | | 53,646 | | | | | | 45 | | |
| 03-31-20 | | | | | 10.00 | | | | | | 0.27• | | | | | | (0.96) | | | | | | (0.69) | | | | | | 0.33 | | | | | | — | | | | | | — | | | | | | 0.33 | | | | | | — | | | | | | 8.98 | | | | | | (7.24) | | | | | | 1.61 | | | | 1.61 | | | 1.61 | | | 2.68 | | | | | 53,333 | | | | | | 167 | | |
| 03-31-19 | | | | | 10.00 | | | | | | 0.29 | | | | | | 0.04 | | | | | | 0.33 | | | | | | 0.33 | | | | | | — | | | | | | — | | | | | | 0.33 | | | | | | — | | | | | | 10.00 | | | | | | 3.32 | | | | | | 1.69 | | | | 1.69 | | | 1.69 | | | 2.87 | | | | | 25,999 | | | | | | 155 | | |
See Accompanying Notes to Financial Statements
Financial Highlights (continued)
| | | | | | | | | | Income (loss)
from
investment
operations | | | | | | | | | Less Distributions | | | | | | Ratios to average net assets | | | Supplemental
Data | |
| | | | Net asset value, beginning of year
or period | | | Net investment income (loss) | | | Net realized and unrealized
gain (loss) | | | Total from investment operations | | | From net investment income | | | From net realized gains | | | From return of capital | | | Total distributions | | | Payment by affiliate | | | Net asset value, end of year
or period | | | Total Return(1) | | | Expenses before
reductions/additions(2)(3) | | | Expenses net of fee waivers
and/or recoupments if any(2)(3) | | | Expenses net of all
reductions/additions(2)(3) | | | Net investment income (loss)(2)(3) | | | Net assets, end of year or period | | | Portfolio turnover rate | |
Year or
period ended | | | ($) | | | ($) | | | ($) | | | ($) | | | ($) | | | ($) | | | ($) | | | ($) | | | ($) | | | ($) | | | (%) | | | (%) | | | (%) | | | (%) | | | (%) | | | ($000’s) | | | (%) | |
| Voya Strategic Income Opportunities Fund (continued) | | | | | | | | | | | | | | | | | | | | | | | | | | | | | | | | | | | | | | | | | | | | | | | | | | | | | | | | | | | | | | | | | | | | | | | | | | | | | | | | | | | | | | | | | | | | | | |
| Class I | | | | | | | | | | | | | | | | | | | | | | | | | | | | | | | | | | | | | | | | | | | | | | | | | | | | | | | | | | | | | | | | | | | | | | | | | | | | | | | | | | | | | | | | | | | | | | |
| 03-31-23 | | | | | 9.61 | | | | | | 0.37• | | | | | | (0.65) | | | | | | (0.28) | | | | | | 0.35 | | | | | | — | | | | | | — | | | | | | 0.35 | | | | | | — | | | | | | 8.98 | | | | | | (2.84) | | | | | | 0.61 | | | | 0.61 | | | 0.61 | | | 4.05 | | | | | 1,546,189 | | | | | | 110 | | |
| 03-31-22 | | | | | 10.15 | | | | | | 0.31• | | | | | | (0.53) | | | | | | (0.22) | | | | | | 0.26 | | | | | | — | | | | | | 0.06 | | | | | | 0.32 | | | | | | — | | | | | | 9.61 | | | | | | (2.22) | | | | | | 0.62 | | | | 0.62 | | | 0.62 | | | 3.06 | | | | | 2,096,038 | | | | | | 76 | | |
| 03-31-21 | | | | | 9.15 | | | | | | 0.34• | | | | | | 1.04 | | | | | | 1.38 | | | | | | 0.33 | | | | | | — | | | | | | 0.05 | | | | | | 0.38 | | | | | | — | | | | | | 10.15 | | | | | | 15.35 | | | | | | 0.63 | | | | 0.63 | | | 0.63 | | | 3.51 | | | | | 2,029,154 | | | | | | 45 | | |
| 03-31-20 | | | | | 10.20 | | | | | | 0.38• | | | | | | (0.98) | | | | | | (0.60) | | | | | | 0.45 | | | | | | — | | | | | | — | | | | | | 0.45 | | | | | | — | | | | | | 9.15 | | | | | | (6.30) | | | | | | 0.60 | | | | 0.60 | | | 0.60 | | | 3.68 | | | | | 2,046,289 | | | | | | 167 | | |
| 03-31-19 | | | | | 10.21 | | | | | | 0.42 | | | | | | 0.02 | | | | | | 0.44 | | | | | | 0.45 | | | | | | — | | | | | | — | | | | | | 0.45 | | | | | | — | | | | | | 10.20 | | | | | | 4.42 | | | | | | 0.61 | | | | 0.61 | | | 0.61 | | | 3.99 | | | | | 1,151,236 | | | | | | 155 | | |
| Class R | | | | | | | | | | | | | | | | | | | | | | | | | | | | | | | | | | | | | | | | | | | | | | | | | | | | | | | | | | | | | | | | | | | | | | | | | | | | | | | | | | | | | | | | | | | | | | |
| 03-31-23 | | | | | 9.51 | | | | | | 0.33• | | | | | | (0.64) | | | | | | (0.31) | | | | | | 0.30 | | | | | | — | | | | | | — | | | | | | 0.30 | | | | | | — | | | | | | 8.90 | | | | | | (3.25) | | | | | | 1.10 | | | | 1.10 | | | 1.10 | | | 3.59 | | | | | 18,607 | | | | | | 110 | | |
| 03-31-22 | | | | | 10.04 | | | | | | 0.26• | | | | | | (0.53) | | | | | | (0.27) | | | | | | 0.20 | | | | | | — | | | | | | 0.06 | | | | | | 0.26 | | | | | | — | | | | | | 9.51 | | | | | | (2.76) | | | | | | 1.10 | | | | 1.10 | | | 1.10 | | | 2.58 | | | | | 20,854 | | | | | | 76 | | |
| 03-31-21 | | | | | 9.04 | | | | | | 0.29• | | | | | | 1.03 | | | | | | 1.32 | | | | | | 0.27 | | | | | | — | | | | | | 0.05 | | | | | | 0.32 | | | | | | — | | | | | | 10.04 | | | | | | 14.81 | | | | | | 1.13 | | | | 1.13 | | | 1.13 | | | 3.00 | | | | | 22,403 | | | | | | 45 | | |
| 03-31-20 | | | | | 10.07 | | | | | | 0.32• | | | | | | (0.97) | | | | | | (0.65) | | | | | | 0.38 | | | | | | — | | | | | | — | | | | | | 0.38 | | | | | | — | | | | | | 9.04 | | | | | | (6.80) | | | | | | 1.11 | | | | 1.11 | | | 1.11 | | | 3.20 | | | | | 18,459 | | | | | | 167 | | |
| 03-31-19 | | | | | 10.08 | | | | | | 0.34 | | | | | | 0.03 | | | | | | 0.37 | | | | | | 0.38 | | | | | | — | | | | | | — | | | | | | 0.38 | | | | | | — | | | | | | 10.07 | | | | | | 3.73 | | | | | | 1.19 | | | | 1.19 | | | 1.19 | | | 3.37 | | | | | 12,425 | | | | | | 155 | | |
| Class R6 | | | | | | | | | | | | | | | | | | | | | | | | | | | | | | | | | | | | | | | | | | | | | | | | | | | | | | | | | | | | | | | | | | | | | | | | | | | | | | | | | | | | | | | | | | | | | | |
| 03-31-23 | | | | | 9.58 | | | | | | 0.38• | | | | | | (0.64) | | | | | | (0.26) | | | | | | 0.36 | | | | | | — | | | | | | — | | | | | | 0.36 | | | | | | — | | | | | | 8.96 | | | | | | (2.69) | | | | | | 0.54 | | | | 0.54 | | | 0.54 | | | 4.19 | | | | | 167,243 | | | | | | 110 | | |
| 03-31-22 | | | | | 10.12 | | | | | | 0.31• | | | | | | (0.52) | | | | | | (0.21) | | | | | | 0.27 | | | | | | — | | | | | | 0.06 | | | | | | 0.33 | | | | | | — | | | | | | 9.58 | | | | | | (2.17) | | | | | | 0.54 | | | | 0.54 | | | 0.54 | | | 3.14 | | | | | 159,175 | | | | | | 76 | | |
| 03-31-21 | | | | | 9.12 | | | | | | 0.35• | | | | | | 1.04 | | | | | | 1.39 | | | | | | 0.34 | | | | | | — | | | | | | 0.05 | | | | | | 0.39 | | | | | | — | | | | | | 10.12 | | | | | | 15.46 | | | | | | 0.57 | | | | 0.57 | | | 0.57 | | | 3.59 | | | | | 154,515 | | | | | | 45 | | |
| 03-31-20 | | | | | 10.17 | | | | | | 0.38• | | | | | | (0.98) | | | | | | (0.60) | | | | | | 0.45 | | | | | | — | | | | | | — | | | | | | 0.45 | | | | | | — | | | | | | 9.12 | | | | | | (6.28) | | | | | | 0.55 | | | | 0.55 | | | 0.55 | | | 3.75 | | | | | 229,913 | | | | | | 167 | | |
| 03-31-19 | | | | | 10.19 | | | | | | 0.39 | | | | | | 0.04 | | | | | | 0.43 | | | | | | 0.45 | | | | | | — | | | | | | — | | | | | | 0.45 | | | | | | — | | | | | | 10.17 | | | | | | 4.36 | | | | | | 0.58 | | | | 0.58 | | | 0.58 | | | 3.82 | | | | | 47,004 | | | | | | 155 | | |
| Class W | | | | | | | | | | | | | | | | | | | | | | | | | | | | | | | | | | | | | | | | | | | | | | | | | | | | | | | | | | | | | | | | | | | | | | | | | | | | | | | | | | | | | | | | | | | | | | |
| 03-31-23 | | | | | 9.57 | | | | | | 0.37• | | | | | | (0.64) | | | | | | (0.27) | | | | | | 0.35 | | | | | | — | | | | | | — | | | | | | 0.35 | | | | | | — | | | | | | 8.95 | | | | | | (2.83) | | | | | | 0.60 | | | | 0.60 | | | 0.60 | | | 3.99 | | | | | 18,980 | | | | | | 110 | | |
| 03-31-22 | | | | | 10.10 | | | | | | 0.31• | | | | | | (0.53) | | | | | | (0.22) | | | | | | 0.25 | | | | | | — | | | | | | 0.06 | | | | | | 0.31 | | | | | | — | | | | | | 9.57 | | | | | | (2.24) | | | | | | 0.60 | | | | 0.60 | | | 0.60 | | | 3.06 | | | | | 36,224 | | | | | | 76 | | |
| 03-31-21 | | | | | 9.09 | | | | | | 0.34• | | | | | | 1.04 | | | | | | 1.38 | | | | | | 0.32 | | | | | | — | | | | | | 0.05 | | | | | | 0.37 | | | | | | — | | | | | | 10.10 | | | | | | 15.42 | | | | | | 0.63 | | | | 0.63 | | | 0.63 | | | 3.53 | | | | | 48,958 | | | | | | 45 | | |
| 03-31-20 | | | | | 10.13 | | | | | | 0.38• | | | | | | (0.99) | | | | | | (0.61) | | | | | | 0.43 | | | | | | — | | | | | | — | | | | | | 0.43 | | | | | | — | | | | | | 9.09 | | | | | | (6.37) | | | | | | 0.61 | | | | 0.61 | | | 0.61 | | | 3.69 | | | | | 69,522 | | | | | | 167 | | |
| 03-31-19 | | | | | 10.13 | | | | | | 0.39 | | | | | | 0.04 | | | | | | 0.43 | | | | | | 0.43 | | | | | | — | | | | | | — | | | | | | 0.43 | | | | | | — | | | | | | 10.13 | | | | | | 4.35 | | | | | | 0.69 | | | | 0.69 | | | 0.69 | | | 3.75 | | | | | 48,251 | | | | | | 155 | | |
(1)
Total return is calculated assuming reinvestment of all dividends, capital gain distributions and return of capital distributions, if any, at net asset value and excluding the deduction of sales charges or contingent deferred sales charges, if applicable. Total return for periods less than one year is not annualized.
(2)
Annualized for periods less than one year.
(3)
Ratios reflect operating expenses of a Fund. Expenses before reductions/additions do not reflect amounts reimbursed or recouped by the Investment Adviser and/or Distributor or reductions from brokerage service arrangements or other expense offset arrangements and do not represent the amount paid by a Fund during periods when reimbursements or reductions occur. Expenses net of fee waivers reflect expenses after reimbursement by the Investment Adviser and/or Distributor or recoupment of previously reimbursed fees by the Investment Adviser, but prior to reductions from brokerage service arrangements or other expense offset arrangements. Expenses net of all reductions/additions represent the net expenses paid by a Fund. Net investment income (loss) is net of all such additions or reductions.
(4)
Commencement of operations.
•
Calculated using average number of shares outstanding throughout the year or period.
*
Amount is less than $0.005 or 0.005% or more than $(0.005) or (0.005)%.
††
The Fund’s use of treasury securities and “to be announced” (TBA) securities contribute significantly to the portfolio turnover rate. Excluding all purchase and sale transactions involving treasury securities and TBAs, the Fund’s portfolio turnover rate was 36% for the year ended March 31, 2023 and 33%, 39%, 40% and 35% for the fiscal years ended March 31, 2022, 2021, 2020, and 2019, respectively. The Fund’s strategies involving treasury securities and TBA securities are employed to increase liquidity and to manage interest rate risk while not changing the economic exposure to treasury and mortgage backed securities. The Fund invests in treasury securities and may purchase and sell treasury securities to manage the
See Accompanying Notes to Financial Statements
Financial Highlights (continued)
duration of the Fund and for hedging purposes when selling or buying corporate bonds. In addition, the Fund commonly employs an investment strategy involving the purchase of the most recently issued treasury security with a particular time to maturity while selling its position in a previously issued treasury security with a substantially similar time to maturity. This strategy is employed in order for the Fund to own the most liquid treasury security available for a given time to maturity. The Fund also invests in TBA securities whereby the actual identity of the securities to be delivered at settlement is not specified, but rather the general characteristics of the securities are agreed to (i.e. issuer, mortgage type, maturity, coupon and month of settlement). The Fund may engage in rolling strategies with TBAs whereby the Fund seeks to extend the expiration or maturity of a TBA position by closing out the position before expiration and simultaneously opening a new position that has substantially similar terms except for a later expiration date. Such rolls enable the Fund to maintain continuous investment exposure to an underlying asset beyond the expiration of the initial position without delivery of the underlying asset.
See Accompanying Notes to Financial Statements
NOTES TO FINANCIAL STATEMENTS as of March 31, 2023
NOTE 1 — ORGANIZATION
Voya Funds Trust (the “Trust”) is a Delaware statutory trust and is registered as an open-end management investment company under the Investment Company Act of 1940, as amended (“1940 Act”). The Trust was organized on August 6, 1998 and was established under a Trust Instrument dated July 30, 1998. It consists of nine separately managed series. This report is for: Voya GNMA Income Fund (“GNMA Income”), Voya High Yield Bond Fund (“High Yield Bond”), Voya Intermediate Bond Fund (“Intermediate Bond”),Voya Short Duration High Income Fund (“Short Duration High Income”), Voya Short Term Bond Fund (“Short Term Bond”) and Voya Strategic Income Opportunities Fund (“Strategic Income Opportunities”) (each, a “Fund” and collectively, the “Funds”). Each Fund is a diversified series of the Trust.
Each Fund offers at least three or more of the following classes of shares: Class A, Class C, Class I, Class R, Class R6 and Class W. The separate classes of shares differ principally in the applicable sales charges (if any), transfer agent fees, distribution fees and shareholder servicing fees, as well as differences in the amount of waiver fees and reimbursement of expenses, if any. Generally, shareholders of each class also bear certain expenses that pertain to that particular class. All shareholders are allocated the common expenses of a fund and earn income and realized gains/losses from a fund pro rata based on the daily ending net assets of each class, without discrimination between share classes. Expenses that are specific to a fund or a class are charged directly to that fund or class. Other operating expenses shared by several funds are generally allocated among those funds based on average net assets. Dividends are determined separately for each class based on income and expenses allocated to each class. Realized gain distributions are allocated to each class pro rata based on the shares outstanding of each class on the date of the distribution. Differences in per share dividend rates generally result from the differences in separate class expenses, including distribution, and shareholder servicing fees, if applicable, as well as differences in the amount of waiver of fees and reimbursement of expenses between the share classes, if any.
Class C shares, along with their pro rata reinvested dividend shares, automatically convert to Class A shares 8 years after purchase.
Voya Investments, LLC (“Voya Investments” or the “Investment Adviser”), an Arizona limited liability company, serves as the Investment Adviser to the Funds. Voya Investment Management Co. LLC (“Voya IM”), a Delaware limited liability company, serves as the sub-adviser to the Funds. Voya Investments Distributor, LLC (“VID” or the
“Distributor”), a Delaware limited liability company, serves as the principal underwriter to the Funds.
NOTE 2 — SIGNIFICANT ACCOUNTING POLICIES
The following significant accounting policies are consistently followed by the Funds in the preparation of their financial statements. Each Fund is considered an investment company under U.S. generally accepted accounting principles (“GAAP”) and follows the accounting and reporting guidance applicable to investment companies.
A. Security Valuation. Each Fund is open for business every day the New York Stock Exchange (“NYSE”) opens for regular trading (each such day, a “Business Day”). The net asset value (“NAV”) per share for each class of each Fund is determined each Business Day as of the close of the regular trading session (“Market Close”), as determined by the Consolidated Tape Association (“CTA”), the central distributor of transaction prices for exchange-traded securities (normally 4:00 p.m. Eastern time unless otherwise designated by the CTA). The NAV per share of each class of each Fund is calculated by taking the value of the Fund’s assets attributable to that class, subtracting the Fund’s liabilities attributable to that class, and dividing by the number of shares of that class that are outstanding. On days when a Fund is closed for business, Fund shares will not be priced and a Fund does not transact purchase and redemption orders. To the extent a Fund’s assets are traded in other markets on days when a Fund does not price its shares, the value of a Fund’s assets will likely change and you will not be able to purchase or redeem shares of a Fund.
Portfolio securities for which market quotations are readily available are valued at market value. Investments in open-end registered investment companies that do not trade on an exchange are valued at the end of day NAV per share. The prospectuses of the open-end registered investment companies in which each Fund may invest explain the circumstances under which they will use fair value pricing and the effects of using fair value pricing. Foreign securities’ prices are converted into U.S. dollar amounts using the applicable exchange rates as of Market Close.
When a market quotation for a portfolio security is not readily available or is deemed unreliable (for example when trading has been halted or there are unexpected market closures or other material events that would suggest that the market quotation is unreliable) and for purposes of determining the value of other Fund assets, the asset is priced at its fair value. The Board has designated the Investment Adviser, as the valuation designee, to make fair value determinations in good faith.
NOTES TO FINANCIAL STATEMENTS as of March 31, 2023 (continued)
NOTE 2 — SIGNIFICANT ACCOUNTING POLICIES (continued)
In determining the fair value of each Fund’s assets, the Investment Adviser, pursuant to its fair valuation policy, may consider inputs from pricing service providers, broker-dealers, or each Fund’s sub-adviser(s). Issuer specific events, transaction price, position size, nature and duration of restrictions on disposition of the security, market trends, bid/ask quotes of brokers and other market data may be reviewed in the course of making a good faith determination of an asset’s fair value. Because trading hours for certain foreign securities end before Market Close, closing market quotations may become unreliable. The prices of foreign securities will generally be adjusted based on inputs from an independent pricing service that are intended to reflect valuation changes through the NYSE close. Because of the inherent uncertainties of fair valuation, the values used to determine each Fund’s NAV may materially differ from the value received upon actual sale of those investments. Thus, fair valuation may have an unintended dilutive or accretive effect on the value of shareholders’ investments in each Fund.
The Funds’ financial instruments are valued at the close of the NYSE and are reported at fair value, which GAAP defines as the price that would be received to sell an asset or paid to transfer a liability in an orderly transaction between market participants at the measurement date.
Various valuation techniques and inputs are used to determine the fair value of financial instruments. GAAP establishes the following fair value hierarchy that categorizes the inputs used to measure fair value:
Level 1 — quoted prices (unadjusted) in active markets for identical financial instruments that the fund can access at the reporting date.
Level 2 — inputs other than Level 1 quoted prices that are observable, either directly or indirectly (including, but not limited to, quoted prices for similar financial instruments in active markets, quoted prices for identical or similar financial instruments in inactive markets, interest rates and yield curves, implied volatilities, and credit spreads).
Level 3 — unobservable inputs (including the fund’s own assumptions in determining fair value).
Observable inputs are developed using market data, such as publicly available information about actual events or transactions, and reflect the assumptions that market participants would use to price the financial instrument. Unobservable inputs are those for which market data are not available and are developed using the best information available about the assumptions that market participants would use to price the financial instrument. GAAP requires valuation techniques to maximize the use of relevant
observable inputs and minimize the use of unobservable inputs. When multiple inputs are used to derive fair value, the financial instrument is assigned to the level within the fair value hierarchy based on the lowest-level input that is significant to the fair value of the financial instrument. Input levels are not necessarily an indication of the risk or liquidity associated with financial instruments at that level but rather the degree of judgment used in determining those values.
A table summarizing each Fund’s investments under these levels of classification is included within each Portfolio of Investments.
Each investment asset or liability of the Funds is assigned a level at measurement date based on the significance and source of the inputs to its valuation. Quoted prices in active markets for identical securities are classified as “Level 1,” inputs other than quoted prices for an asset or liability that are observable are classified as “Level 2” and significant unobservable inputs, including the sub-adviser’s or Pricing Committee’s judgment about the assumptions that a market participant would use in pricing an asset or liability are classified as “Level 3”. The inputs used for valuing securities are not necessarily an indication of the risks associated with investing in those securities. Short-term securities of sufficient credit quality are generally considered to be Level 2 securities under applicable accounting rules. A table summarizing each Fund’s investments under these levels of classification is included within the Portfolios of Investments.
GAAP requires a reconciliation of the beginning to ending balances for reported fair values that presents changes attributable to total realized and unrealized gains or losses, purchases and sales, and transfers in or out of the Level 3 category during the period. A reconciliation of Level 3 investments within the Portfolio of Investments is presented only when a Fund has a significant amount of Level 3 investments.
B. Securities Transactions and Revenue Recognition. Securities transactions are accounted for on the trade date. Realized gains and losses are reported on the basis of identified cost of securities sold. Interest income is recorded on an accrual basis. Dividend income is recorded on the ex-dividend date, or for certain foreign securities, when the information becomes available to the Funds. Premium amortization and discount accretion are determined by the effective yield method.
C. Foreign Currency Translation. The books and records of the Funds are maintained in U.S. dollars. Any foreign currency amounts are translated into U.S. dollars on the following basis:
NOTES TO FINANCIAL STATEMENTS as of March 31, 2023 (continued)
NOTE 2 — SIGNIFICANT ACCOUNTING POLICIES (continued)
(1)
Market value of investment securities, other assets and liabilities — at the exchange rates prevailing at Market Close.
(2)
Purchases and sales of investment securities, income and expenses — at the rates of exchange prevailing on the respective dates of such transactions.
Although the net assets and the market values are presented at the foreign exchange rates at Market Close, the Funds do not isolate the portion of the results of operations resulting from changes in foreign exchange rates on investments from the fluctuations arising from changes in market prices of securities held. Such fluctuations are included with the net realized and unrealized gains or losses from investments. For securities that are subject to foreign withholding tax upon disposition, liabilities are recorded on the Statements of Assets and Liabilities for the estimated tax withholding based on the securities’ current market values. Upon disposition, realized gains or losses on such securities are recorded net of foreign withholding tax.
Reported net realized foreign exchange gains or losses arise from sales of foreign currencies, currency gains or losses realized between the trade and settlement dates on securities transactions, the difference between the amounts of dividends, interest, and foreign withholding taxes recorded on the Funds’ books, and the U.S. dollar equivalent of the amounts actually received or paid. Net unrealized foreign exchange gains and losses arise from changes in the value of assets and liabilities other than investments in securities, resulting from changes in the exchange rate. Foreign security and currency transactions may involve certain considerations and risks not typically associated with investing in U.S. companies and U.S. government securities. These risks include, but are not limited to revaluation of currencies and future adverse political and economic developments which could cause securities and their markets to be less liquid and prices more volatile than those of comparable U.S. companies and U.S. government securities. The foregoing risks are even greater with respect to securities of issuers in emerging markets.
D. Risk Exposures and the Use of Derivative Instruments. The Funds’ investment objectives permit them to enter into various types of derivatives contracts, including, but not limited to, forward foreign currency exchange contracts, futures, purchased options, written options, and swaps. In doing so, the Funds will employ strategies in differing combinations to permit them to increase or decrease the level of risk, or change the level
or types of exposure to risk factors. This may allow the Funds to pursue their objectives more quickly, and efficiently than if they were to make direct purchases or sales of securities capable of affecting a similar response to market or credit factors.
In pursuit of their investment objectives, the Funds may seek to increase or decrease their exposure to the following market or credit risk factors:
Credit Risk. The price of a bond or other debt instrument is likely to fall if the issuer’s actual or perceived financial health deteriorates, whether because of broad economic or issuer-specific reasons. In certain cases, the issuer could be late in paying interest or principal, or could fail to pay its financial obligations altogether.
Equity Risk. Stock prices may be volatile or have reduced liquidity in response to real or perceived impacts of factors including, but not limited to, economic conditions, changes in market interest rates, and political events. Stock markets tend to be cyclical, with periods when stock prices generally rise and periods when stock prices generally decline. Any given stock market segment may remain out of favor with investors for a short or long period of time, and stocks as an asset class may underperform bonds or other asset classes during some periods. Additionally, legislative, regulatory or tax policies or developments in these areas may adversely impact the investment techniques available to a manager, add to costs and impair the ability of a Fund to achieve its investment objectives.
Foreign Exchange Rate Risk. To the extent that a Fund invests directly in foreign (non-U.S.) currencies or in securities denominated in, or that trade in, foreign (non-U.S.) currencies, it is subject to the risk that those foreign (non-U.S.) currencies will decline in value relative to the U.S. dollar or, in the case of hedging positions, that the U.S. dollar will decline in value relative to the currency being hedged by a Fund through foreign currency exchange transactions.
Currency rates may fluctuate significantly over short periods of time. Currency rates may be affected by changes in market interest rates, intervention (or the failure to intervene) by U.S. or foreign governments, central banks or supranational entities such as the International Monetary Fund, by the imposition of currency controls, or other political or economic developments in the United States or abroad.
Interest Rate Risk. With bonds and other fixed rate debt instruments, a rise in market interest rates generally causes values to fall; conversely, values generally rise as market interest rates fall. The higher the credit quality of the instrument, and the longer its maturity or duration, the more sensitive it is likely to be to interest rate risk. As of the
NOTES TO FINANCIAL STATEMENTS as of March 31, 2023 (continued)
NOTE 2 — SIGNIFICANT ACCOUNTING POLICIES (continued)
date of this report, the United States experiences a rising market interest rate environment, which may increase a Fund’s exposure to risks associated with rising market interest rates. Rising market interest rates have unpredictable effects on the markets and may expose fixed-income and related markets to heightened volatility. For a fund that invests in fixed-income securities, an increase in market interest rates may lead to increased redemptions and increased portfolio turnover, which could reduce liquidity for certain investments, adversely affect values, and increase costs. If dealer capacity in fixed-income markets is insufficient for market conditions, it may further inhibit liquidity and increase volatility in the fixed-income markets. Further, recent and potential changes in government policy may affect interest rates.
Risks of Investing in Derivatives. The Funds’ use of derivatives can result in losses due to unanticipated changes in the market or credit risk factors and the overall market. In instances where the Funds are using derivatives to decrease, or hedge, exposures to market or credit risk factors for securities held by a Fund, there are also risks that those derivatives may not perform as expected resulting in losses for the combined or hedged positions.
Derivative instruments are subject to a number of risks, including the risk of changes in the market price of the underlying securities, credit risk with respect to the counterparty, risk of loss due to changes in market interest rates and liquidity and volatility risk. The amounts required to purchase certain derivatives may be small relative to the magnitude of exposure assumed by a Fund. Therefore, the purchase of certain derivatives may have an economic leveraging effect on a Fund and exaggerate any increase or decrease in the NAV. Derivatives may not perform as expected, so a Fund may not realize the intended benefits. When used for hedging purposes, the change in value of a derivative may not correlate as expected with the currency, security or other risk being hedged. When used as an alternative or substitute for direct cash investments, the return provided by the derivative may not provide the same return as direct cash investment. In addition, given their complexity, derivatives expose a Fund to the risk of improper valuation.
Generally, derivatives are sophisticated financial instruments whose performance is derived, at least in part, from the performance of an underlying asset or assets. Derivatives include, among other things, swap agreements, options, forwards and futures. Investments in derivatives are generally negotiated OTC with a single counterparty and as a result are subject to credit risks related to the counterparty’s ability or willingness to
perform its obligations; any deterioration in the counterparty’s creditworthiness could adversely affect the value of the derivative. In addition, derivatives and their underlying securities may experience periods of illiquidity which could cause a Fund to hold a security it might otherwise sell, or to sell a security it otherwise might hold at inopportune times or at an unanticipated price. A manager might imperfectly judge the direction of the market. For instance, if a derivative is used as a hedge to offset investment risk in another security, the hedge might not correlate to the market’s movements and may have unexpected or undesired results such as a loss or a reduction in gains.
Counterparty Credit Risk and Credit Related Contingent Features. Certain derivative positions are subject to counterparty credit risk, which is the risk that the counterparty will not fulfill its obligation to the Funds. The Funds’ derivative counterparties are financial institutions who are subject to market conditions that may weaken their financial position. The Funds intend to enter into financial transactions with counterparties that they believe to be creditworthy at the time of the transaction. To reduce this risk, the Funds generally enter into master netting arrangements, established within the Funds’ International Swap and Derivatives Association, Inc. (“ISDA”) Master Agreements (“Master Agreements”). These agreements are with select counterparties and they govern transactions, including certain OTC derivative and forward foreign currency contracts, entered into by the Funds and the counterparty. The Master Agreements maintain provisions for general obligations, representations, agreements, collateral, and events of default or termination. The occurrence of a specified event of termination may give a counterparty the right to terminate all of its contracts and affect settlement of all outstanding transactions under the applicable Master Agreement.
The Funds may also enter into collateral agreements with certain counterparties to further mitigate credit risk associated with OTC derivative and forward foreign currency contracts. Subject to established minimum levels, collateral is generally determined based on the net aggregate unrealized gain or loss on contracts with a certain counterparty. Collateral pledged to or from the Funds is held in a segregated account by a third-party agent and can be in the form of cash or debt securities issued by the U.S. government or related agencies.
As of March 31, 2023, the maximum amount of loss that Intermediate Bond and Strategic Income Opportunities would incur if the counterparties to their derivative transactions failed to perform would be $1,559,130 and $4,139,226, respectively, which represents the gross payments to be received by the Funds on OTC purchased
NOTES TO FINANCIAL STATEMENTS as of March 31, 2023 (continued)
NOTE 2 — SIGNIFICANT ACCOUNTING POLICIES (continued)
options, forward premium swaptions and open forward foreign currency contracts were they to be unwound as of March 31, 2023. To reduce the amount of potential loss to Intermediate Bond and Strategic Income Opportunities, the Funds received $290,000 and $420,000, respectively, in cash collateral from certain counterparties at March 31, 2023.
The Funds’ Master Agreements with derivative counterparties have credit related contingent features that if triggered would allow their derivatives counterparties to close out and demand payment or additional collateral to cover their exposure from the Funds. Credit related contingent features are established between the Funds and their derivatives counterparties to reduce the risk that the Funds will not fulfill their payment obligations to their counterparties. These triggering features include, but are not limited to, a percentage decrease in the Funds’ net assets and or a percentage decrease in the Funds’ NAV, which could cause the Funds to accelerate payment of any net liability owed to the counterparty. The contingent features are established within the Funds’ Master Agreements.
As of March 31, 2023, Intermediate Bond and Strategic Income Opportunities had a liability position of $35,911,542 and $25,530,851, respectively, on open forward foreign currency contracts, forward premium swaptions, OTC volatility swaps and OTC written options with credit related contingent features. If a contingent feature would have been triggered as of March 31, 2023, the Funds could have been required to pay this amount in cash to their counterparties. At March 31, 2023, Intermediate Bond and Strategic Income Opportunities had pledged $39,240,000 and $24,580,000, respectively, in cash collateral to certain counterparties for open OTC derivatives.
E. Foreign Currency Transactions and Futures Contracts. Certain Funds may enter into foreign currency exchange transactions to convert to and from different foreign currencies and to and from the U.S. dollar in connection with the planned purchases or sales of securities. The Funds either enter into these transactions on a spot basis at the spot rate prevailing in the foreign currency exchange market or use forward foreign currency contracts to purchase or sell foreign currencies. When the contract is fulfilled or closed, gains or losses are realized. Until then, the gain or loss is included in unrealized appreciation or depreciation. Risks may arise upon entering into forward contracts from the potential inability of
counterparties to meet the terms of their forward contracts and from unanticipated movements in the value of foreign currencies relative to the U.S. dollar.
For the year ended March 31, 2023, Intermediate Bond and Strategic Income Opportunities entered into forward foreign currency contracts with the obligation to buy and sell specified foreign currencies in the future at a currently negotiated forward rate in order to increase or decrease exposure to foreign exchange rate risk. The Funds used forward foreign currency contracts primarily to protect any non-U.S. dollar-denominated holdings from adverse currency movements.
During the year ended March 31, 2023, Intermediate Bond and Strategic Income Opportunities had average contract amounts on forward foreign currency contracts to buy and sell as disclosed below. Please refer to the tables within the Portfolio of Investments for open forward foreign currency contracts at March 31, 2023.
| | | | Buy | | | Sell | |
| Intermediate Bond | | | | $ | 2,332,610 | | | | | $ | 3,912,819 | | |
| Strategic Income Opportunities | | | | | 950,802,190 | | | | | | 967,203,828 | | |
Each Fund may enter into futures contracts involving foreign currency, interest rates, securities and securities indices. Each Fund intends to limit its use of futures contracts and futures options to “bona fide hedging” transactions, as such term is defined in applicable regulations, interpretations and practice. A futures contract obligates the seller of the contract to deliver and the purchaser of the contract to take delivery of the type of foreign currency, financial instrument or security called for in the contract at a specified future time for a specified price.
Upon entering into a futures contract, the Funds are required to deposit either cash or securities (initial margin) in an amount equal to a certain percentage of the contract value. Subsequent payments (variation margin) are made or received by the Funds each day. The variation margin payments are equal to the daily changes in the contract value and are recorded as unrealized gains and losses and, if any, shown as variation margin receivable or payable on futures contracts on the Statement of Assets and Liabilities.Open futures contracts, if any, are reported on a table within each Fund’s Portfolio of Investments. Securities held in collateralized accounts to cover initial margin requirements, if any, on open futures contracts are footnoted in the Portfolio of Investments. Cash collateral held by the broker to cover initial margin requirements on open futures contracts are noted in each Fund’s Statement of Assets and Liabilities. The net change in unrealized appreciation and depreciation is reported in each Fund’s
NOTES TO FINANCIAL STATEMENTS as of March 31, 2023 (continued)
NOTE 2 — SIGNIFICANT ACCOUNTING POLICIES (continued)
Statement of Operations. Realized gains (losses) are reported in each Fund’s Statement of Operations at the closing or expiration of futures contracts.
Futures contracts are exposed to the market risk factor of the underlying financial instrument. During the year ended March 31, 2023, GNMA Income, Intermediate Bond, Short Term Bond and Strategic Income Opportunities have purchased and sold futures contracts on various bonds and notes to manage duration and yield curve exposure. Intermediate Bond, Short Term and Strategic Income Opportunities also entered into equity futures to gain exposure market volatility. Additional associated risks of entering into futures contracts include the possibility that there may be an illiquid market where a Fund is unable to liquidate the contract or enter into an offsetting position and, if used for hedging purposes, the risk that the price of the contract will correlate imperfectly with the prices of the Fund’s securities. With futures, there is minimal counterparty credit risk to a Fund since futures are exchange traded and the exchange’s clearinghouse, as counterparty to all exchange traded futures, guarantees the futures against default.
During the year ended March 31, 2023, the following Funds had an average notional value on futures contracts purchased and sold as disclosed below. Please refer to the tables within each respective Portfolio of Investments for open futures contracts at March 31, 2023.
| | | | Purchased | | | Sold | |
| GNMA Income | | | | $ | 23,198,388 | | | | | $ | 263,995,319 | | |
| Intermediate Bond | | | | | 427,887,669 | | | | | | 452,161,228 | | |
| Short Term Bond | | | | | 154,761,500 | | | | | | 25,960,686 | | |
| Strategic Income Opportunities | | | | | 425,229,603 | | | | | | 578,323,409 | | |
F. Distributions to Shareholders. The Funds record distributions to their shareholders on the ex-dividend date. Each Fund distributes capital gains, if any, annually. All Funds declare dividends daily and pay dividends monthly. The characteristics of income and gains to be distributed are determined in accordance with income tax regulations, which may differ from GAAP for investment companies.
G. Federal Income Taxes. It is the policy of each Fund to comply with the requirements of subchapter M of the Internal Revenue Code that are applicable to regulated investment companies and to distribute substantially all of its net investment income and any net realized capital gains to its shareholders. Therefore, a federal income tax or excise tax provision is not required. Management has considered the sustainability of the Funds’ tax positions taken on federal income tax returns for all open tax years in
making this determination. No capital gain distributions shall be made until the capital loss carryforwards have been fully utilized.
The Funds may utilize equalization accounting for tax purposes, whereby a portion of redemption payments are treated as distributions of income or gain.
H. Use of Estimates. The preparation of financial statements in conformity with GAAP requires management to make estimates and assumptions that affect the reported amounts of assets and liabilities and disclosure of contingent assets and liabilities at the date of the financial statements and the reported amounts of increases and decreases in net assets from operations during the reporting period. Actual results could differ from those estimates.
I. Repurchase Agreements. Each Fund may invest in repurchase agreements only with government securities dealers recognized by the Board of Governors of the Federal Reserve System. Under such agreements, the seller of the security agrees to repurchase it at a mutually agreed upon time and price. The resale price is in excess of the purchase price and reflects an agreed upon interest rate for the period of time the agreement is outstanding. The period of the repurchase agreements is generally short, from possibly overnight to one week, (although it may extend over a number of months) while the underlying securities generally have longer maturities. Each Fund will receive as collateral securities acceptable to it whose market value is equal to at least 100% of the carrying amount of the repurchase agreements, plus accrued interest, being invested by a Fund. The underlying collateral is valued daily on a mark to market basis to assure that the value, including accrued interest is at least equal to the repurchase price. There would be potential loss to a Fund in the event a Fund is delayed or prevented from exercising its right to dispose of the collateral, and it may incur disposition costs in liquidating the collateral. Please refer to the Portfolio of Investments for Intermediate Bond for open repurchase agreements at March 31, 2023.
J. Securities Lending. Each Fund has the option to temporarily loan up to 331∕3% of its total assets to brokers, dealers or other financial institutions in exchange for a negotiated lender’s fee. Securities lending involves two primary risks: “investment risk” and “borrower default risk.” When lending securities, the Funds will receive cash or U.S. government securities as collateral. Investment risk is the risk that the Funds will lose money from the investment of the cash collateral received from the borrower. Borrower default risk is the risk that the Funds will lose money due to the failure of a borrower to return a borrowed security.
NOTES TO FINANCIAL STATEMENTS as of March 31, 2023 (continued)
NOTE 2 — SIGNIFICANT ACCOUNTING POLICIES (continued)
Loans are subject to termination at the option of the borrower or the Funds. Securities lending may result in leverage. The use of leverage may exaggerate any increase or decrease in the NAV, causing the Funds to be more volatile. The use of leverage may increase expenses and increase the impact of the Funds’ other risks.
K. Restricted Securities. Each Fund may invest in restricted securities which include those sold under Rule 144A of the Securities Act of 1933, as amended (“1933 Act”) or securities offered pursuant to Section 4(a)(2) of the 1933 Act, and/or are subject to legal or contractual restrictions on resale and may not be publicly sold without registration under the 1933 Act. Restricted securities are fair valued using market quotations when readily available. In the absence of market quotations, the securities are valued based upon their fair value determined in good faith under procedures approved by the Board.
Securities that are not registered for sale to the public under the 1933 Act are referred to as “restricted securities.” These securities may be sold in private placement transactions between issuers and their purchasers and may be neither listed on an exchange nor traded in other established markets. Many times these securities are subject to legal or contractual restrictions on resale. As a result of the absence of a public trading market, the prices of these securities may be more volatile, less liquid and more difficult to value than publicly traded securities. The price realized from the sale of these securities could be less than the amount originally paid or less than their fair value if they are resold in privately negotiated transactions. In addition, these securities may not be subject to disclosure and other investment protection requirements that are afforded to publicly traded securities. Certain investments may include investment in smaller, less seasoned issuers, which may involve greater risk.
L. Delayed-Delivery or When-Issued Transactions. The Funds may purchase or sell securities on a when-issued or a delayed-delivery basis. Each Fund may enter into forward commitments. The price of the underlying securities and date when the securities will be delivered and paid for are fixed at the time the transaction is negotiated. The market value of such is identified in the Funds’ Portfolio of investments. Losses may arise due to changes in the market value of the securities or from the inability of counterparties to meet the terms of the contract. In connection with such purchases, the Funds are required to segregate liquid assets with the Funds’ custodian sufficient to cover the purchase price.
To mitigate counterparty risk, the Funds have entered into Master Securities Forward Transaction Agreements (“MSFTA”) with their respective counterparties that provide for collateral and the right to offset amounts due to or from those counterparties under specified conditions. Subject to minimum transfer amounts, collateral requirements are determined and transfers made based on the net aggregate unrealized gain or loss on all the when-issued or delayed-delivery transactions with a particular counterparty. Cash collateral, if any, is presented on the Statement of Assets and Liabilities as an asset (Cash pledged as collateral for delayed-delivery or when-issued securities) and a liability (Cash received as collateral for delayed-delivery or when-issued securities).
At March 31, 2023, GNMA Income, Intermediate Bond and Strategic Income Opportunities had pledged $315,000, 413,000 and $393,892, respectively in cash collateral with certain counterparties for open delayed-delivery or when-issued transactions.
At March 31, 2023, GNMA Income and Intermediate Bond had received $410,163 and $343,000, respectively, in cash collateral with certain counterparties for open delayed-delivery or when-issued transactions.
M. Mortgage Dollar Roll Transactions. Each Fund may engage in dollar roll transactions with respect to mortgage-backed securities issued or to be issued by Government National Mortgage Association, Federal National Mortgage Association and Federal Home Loan Mortgage Corp. In a dollar roll transaction, a Fund sells a mortgage-backed security to a financial institution, such as a bank or broker/dealer, and simultaneously agrees to repurchase a substantially similar (i.e., same type, coupon, and maturity) security from the institution on a delayed delivery basis at an agreed upon price. The mortgage-backed securities that are repurchased will bear the same interest rate as those sold, but generally will be collateralized by different pools of mortgages with different prepayment histories. The Funds account for dollar roll transactions as purchases and sales.
N. Options Contracts. The Funds may write call and put options on futures, swap options (“swaptions”), securities, commodity or currencies they own or in which they may invest. Writing put options tends to increase the Funds exposure to the underlying instrument. Writing call options tends to decrease the Funds exposure to the underlying instrument. When a Fund writes a call or put option, an amount equal to the premium received is recorded as a liability and subsequently marked to market to reflect the current value of the option written. These liabilities are reflected as written options outstanding on the Statements of Assets and Liabilities. Certain options may be written with premiums to be determined on a future date. Forward
NOTES TO FINANCIAL STATEMENTS as of March 31, 2023 (continued)
NOTE 2 — SIGNIFICANT ACCOUNTING POLICIES (continued)
premium swaptions include premiums that have extended settlement dates. The delayed settlement of the premiums is factored into the daily valuation of the option contracts. Premiums received from writing options which expire are treated as realized gains. Premiums received from writing options which are exercised or closed are added to the proceeds or offset against amounts paid on the underlying futures, swap, security or currency transaction to determine the realized gain or loss. Each Fund as a writer of an option has no control over whether the underlying instrument may be sold (call) or purchased (put) and as a result bears the market risk of an unfavorable change in the price of the instrument underlying the written option. There is the risk the Funds may not be able to enter into a closing transaction because of an illiquid market.
The Funds may also purchase put and call options. Purchasing call options tends to increase the Funds exposure to the underlying instrument. Purchasing put options tends to decrease the Funds’ exposure to the underlying instrument. The Funds pay a premium which is included on the Statements of Assets and Liabilities as an investment and subsequently marked to market to reflect the current value of the option. Premiums paid for purchasing options which expire are treated as realized losses. Certain options may be purchased with premiums to be determined on a future date. The premiums for these options are based upon implied volatility parameters at specified terms. The risk associated with purchasing put and call options is limited to the premium paid. Premiums paid for purchasing options which are exercised or closed are added to the amounts paid or offset against the proceeds on the underlying investment transaction to determine the realized gain or loss.
During the year ended March 31, 2023, Intermediate Bond and Strategic Income Opportunities had written interest rate swaptions to generate income with an average notional value of $1,086,040,000 and $482,449,240, respectively. Please refer to the table within the Portfolio of Investments for open written interest rate swaptions contracts for Intermediate Bond and Strategic Income Opportunities at March 31, 2023.
During the year ended March 31, 2023, Intermediate Bond and Strategic Income Opportunities had purchased foreign currency options to manage their foreign exchange exposure with average notional values of $359,660,800 and $234,718,230, respectively. Please refer to the tables within the Portfolio of Investments for open purchased options on foreign currencies for Intermediate Bond and Strategic Income Opportunities at March 31, 2023.
During the year ended March 31, 2023, Intermediate Bond and Strategic Income Opportunities had written foreign currency options to generate income with an average notional value of $263,433,000 and $152,810,153, respectively. Please refer to the tables within the Portfolio of Investments for open written options on foreign currency contracts for Strategic Income Opportunities at March 31, 2023. There were no written options on foreign currency contracts for Intermediate Bond at March 31, 2023.
During the year ended March 31, 2023, Intermediate Bond and Strategic Income Opportunities had purchased forward premium swaptions with average notional values of $214,136,400 and $125,910,650, respectively, to manage duration and yield curve exposures. Please refer to the tables within the Portfolio of Investments for open purchased forward premium swaptions for Intermediate Bond and Strategic Income Opportunities at March 31, 2023.
During the year ended March 31, 2023, Intermediate Bond and Strategic Income Opportunities had written forward premium swaptions with average notional values of $130,998,000 and $411,285,467, respectively, to generate income. Please refer to the tables within the Portfolio of Investments for open written forward premium swaptions for Intermediate Bond and Strategic Income Opportunities at March 31, 2023.
O. Swap Agreements. Certain Funds may enter into swap agreements. A swap is an agreement between two parties pursuant to which each party agrees to make one or more payments to the other at specified future intervals based on the return of an asset (such as a stock, bond or currency) or non-asset reference (such as an interest rate or index). The swap agreement will specify the “notional” amount of the asset or non-asset reference to which the contract relates. Subsequent changes in fair value, if any, are calculated based upon changes in the performance of the asset or non-asset reference multiplied by the notional value of the contract. A Fund may enter into credit default, interest rate, total return and currency swaps to manage its exposure to credit, currency and interest rate risk. All outstanding swap agreements are reported within each Fund’s Portfolio of Investments.
Swaps are marked to market daily using quotations primarily from third party pricing services, counterparties or brokers. The fair value of the swap contract is recorded on each Fund’s Statement of Assets and Liabilities. During the term of the swap, changes in the fair value of the swap, if any, are recorded as unrealized gains or losses on the Statement of Operations. Upfront payments paid or received by a Fund when entering into the agreements are reported on the Statement of Assets and Liabilities and as a component of the changes in unrealized gains or losses
NOTES TO FINANCIAL STATEMENTS as of March 31, 2023 (continued)
NOTE 2 — SIGNIFICANT ACCOUNTING POLICIES (continued)
on the Statement of Operations. These upfront payments represent the amounts paid or received when initially entering into the swap agreement to compensate for differences between the stated terms of the swap agreement and the prevailing market conditions. The upfront payments are included as a component in the realized gains or losses on each Fund’s Statement of Operations upon termination or maturity of the swap. A Fund also records net periodic payments paid or received on the swap contract as a realized gain or loss on the Statement of Operations.
Entering into swap agreements involves the risk that the maximum potential loss of an investment exceeds the current value of the investment as reported on each Fund’s Statement of Assets and Liabilities. Other risks involve the possibility that the counterparty to the agreements may default on its obligation to perform, that there will be no liquid market for these investments and that unfavorable changes in the market will have a negative impact on the value of the index or securities underlying the respective swap agreement.
Credit Default Swap Contracts. A credit default swap is a bilateral agreement between counterparties in which the buyer of the protection agrees to make a stream of periodic payments to the seller of protection in exchange for the right to receive a specified return in the event of a default or other credit event for a referenced entity, obligation or index. As a seller of protection on credit default swaps, a Fund will generally receive from the buyer a fixed payment stream based on the notional amount of the swap contract. This fixed payment stream will continue until the swap contract expires or a defined credit event occurs.
A Fund is subject to credit risk in the normal course of pursuing its investment objectives. As a seller of protection in a credit default swap, a Fund may execute these contracts to manage its exposure to the market or certain sectors of the market. A Fund may also enter into credit default swaps to speculate on changes in an issuer’s credit quality, to take advantage of perceived spread advantages, or to offset an existing short equivalent (i.e. buying protection on an equivalent reference entity).
Certain Funds may sell credit default swaps which expose these Funds to the risk of loss from credit risk- related events specified in the contract. Although contract specific, credit events are generally defined as bankruptcy, failure to pay, restructuring, obligation acceleration, obligation default or repudiation/moratorium. If a Fund is a seller of protection, and a credit event occurs, as defined under the terms of that particular swap agreement, a Fund will
generally either (i) pay to the buyer an amount equal to the notional amount of the swap and take delivery of the referenced obligation, other deliverable obligations, or underlying securities comprising a referenced index or (ii) pay a net settlement amount in the form of cash or securities equal to the notional amount of the swap less the recovery value of the referenced obligation or underlying securities comprising a referenced index. If a Fund is a buyer of protection and a credit event occurs, as defined under the terms of that particular swap agreement, a Fund will either (i) receive from the seller of protection an amount equal to the notional amount of the swap and deliver the referenced obligation, other deliverable obligations or underlying securities comprising the referenced index or (ii) receive a net settlement amount in the form of cash or securities equal to the notional amount of the swap less the recovery value of the referenced obligation or underlying securities comprising the referenced index. Recovery values are assumed by market makers considering either industry standard recovery rates or entity specific factors and considerations until a credit event occurs. If a credit event has occurred, the recovery value is determined by a facilitated auction whereby a minimum number of allowable broker bids, together with a specified valuation method, are used to calculate the settlement value.
Implied credit spreads, represented in absolute terms, utilized in determining the fair value of credit default swap agreements on corporate issues or sovereign issues are disclosed in each Fund’s Portfolio of Investments and serve as an indicator of the current status of the payment/performance risk and represent the likelihood or risk of default for the credit derivative. The implied credit spread of a particular referenced entity reflects the cost of buying/selling protection and may include upfront payments required to be made to enter into the agreement. For credit default swaps on asset-backed securities or credit indices, the quoted market prices and resulting fair values serve as the indicator of the current status of the payment/performance risk. Wider credit spreads and increasing fair values, in absolute terms when compared to the notional amount of the swap, represent a deterioration of the referenced entity’s credit soundness and a greater likelihood or risk of default or other credit event occurring as defined under the terms of the agreement.
The maximum amount of future payments (undiscounted) that a Fund as seller of protection could be required to make under a credit default swap agreement would be an amount equal to the notional amount of the agreement. Notional amounts of all credit default swap agreements outstanding as of March 31, 2023, if any, for which a Fund is seller of protection, are disclosed in each Fund’s Portfolio of Investments. These potential amounts would
NOTES TO FINANCIAL STATEMENTS as of March 31, 2023 (continued)
NOTE 2 — SIGNIFICANT ACCOUNTING POLICIES (continued)
be partially offset by any recovery values of the respective referenced obligations, upfront payments received upon entering into the agreements, or net amounts received from the settlement of buy protection credit default swap agreements entered into by a Fund for the same referenced entity or entities.
For the year ended March 31, 2023, Intermediate Bond, Short Term Bond and Strategic Income Opportunities had bought and sold credit protection on credit default swap indices (“CDX”). A CDX is a basket of credit instruments or exposures designed to be representative of some part of the credit market as a whole. The Funds enter into CDX swap contracts to gain additional exposure within various credit sectors and to hedge the credit risk associated within various sectors with the credit markets. In addition, for the year ended March 31, 2023,Strategic Income Opportunities had bought credit protection on single name issuers (Corporate or Sovereign) to gain additional exposure to the credit market.
During the year ended March 31, 2023, Intermediate Bond, Short Term Bond and Strategic Income Opportunities had an average notional value on credit default swaps to buy protection of $175,591,087, $4,010,482 and $35,880,321, respectively. Please refer to the tables within the Portfolio of Investments for open credit default swaps to buy protection for Strategic Income Opportunities at March 31, 2023. There were no credit default swaps to buy protection for Intermediate Bond and Short Term Bond at March 31, 2023.
During the year ended March 31, 2023, Intermediate Bond and Strategic Income Opportunities had an average notional value on credit default swaps to sell protection of $136,125,996 and $150,591,428, respectively. There were no credit default swaps to sell protection for Intermediate Bond and Strategic Income Opportunities at March 31, 2023.
Interest Rate Swap Contracts. An interest rate swap involves the agreement between counterparties to exchange periodic payments based on interest rates. One payment will be based on a floating rate of a specified interest rate while the other will be a fixed rate. Risks involve the future fluctuations of interest rates in which a Fund may make payments that are greater than what a Fund received from the counterparty. Other risks include credit, liquidity and market risk.
For the year ended March 31, 2023, Intermediate Bond and Strategic Income Opportunities had entered into interest rate swaps in which they pay a floating interest rate and receive a fixed interest rate (“Long interest rate swap”)
in order to increase exposure to interest rate risk. The average notional amount on long interest rate swaps for Intermediate Bond and Strategic Income Opportunities was $363,757,913 and $266,265,066, respectively.
For the year ended March 31, 2023, Intermediate Bond and Strategic Income Opportunities had entered into interest rate swaps in which they pay a fixed interest rate and receive a floating interest rate (“Short interest rate swap”) in order to decrease exposure to interest rate risk. The average notional amount on short interest rate swaps for Intermediate Bond and Strategic Income Opportunities was $266,553,875 and $154,295,075, respectively.
Please refer to the tables within the Portfolio of Investments for open interest rate swap contracts for Intermediate Bond and Strategic Income Opportunities at March 31, 2023.
At March 31, 2023, Intermediate Bond and Strategic Income Opportunities had pledged $16,600,000 and $12,296,846 as cash collateral for open centrally cleared swaps, respectively.
Volatility Swap Contracts. Certain Funds may enter into volatility swaps. Volatility swaps are agreements in which the counterparties agree to make payments in connection with changes in the volatility (i.e., the magnitude of change over a specified period of time) of an underlying referenced instrument, such as a currency, rate, index, security or other financial instrument. Volatility swaps permit the parties to attempt to hedge volatility risk and/or take positions on the projected future volatility of an underlying referenced instrument. As a receiver of the realized price volatility, a Fund would receive the payoff amount when the realized price volatility of the referenced instrument is greater than the strike and would owe the payoff amount when the volatility is less than the strike. As a payer of the realized price volatility, a Fund would owe the payoff amount when the realized price volatility of the referenced instrument is greater than the strike and would receive the payoff amount when the volatility is less than the strike.
For the year ended March 31, 2023, Strategic Income Opportunities had an average notional amount of $44,252,000 on foreign currency volatility swaps (receiver). Please refer to the tables within the Portfolio of Investments for open volatility swaps at March 31, 2023.
P. Offering Costs. Costs incurred with the offering of Short Duration High Income are deferred and amortized over a twelve month period on a straight-line basis starting at the commencement of operations on February 9, 2023.
Q. Indemnifications. In the normal course of business, the Trust may enter into contracts that provide certain
NOTES TO FINANCIAL STATEMENTS as of March 31, 2023 (continued)
NOTE 2 — SIGNIFICANT ACCOUNTING POLICIES (continued)
indemnifications. The Trust’s maximum exposure under these arrangements is dependent on future claims that may be made against the Funds and, therefore, cannot be estimated; however, based on experience, management considers risk of loss from such claims remote.
NOTE 3 — INVESTMENT TRANSACTIONS
For the year ended March 31, 2023, the cost of purchases and the proceeds from the sales of securities excluding short-term and U.S. government securities, were as follows:
| | | | Purchases | | | Sales | |
| GNMA Income | | | | $ | 11,358,669 | | | | | $ | 4,007,464 | | |
| High Yield Bond | | | | | 776,555,454 | | | | | | 337,218,179 | | |
| Intermediate Bond | | | | | 2,875,950,283 | | | | | | 4,296,014,674 | | |
| Short Duration High Income | | | | | 25,110,877 | | | | | | 293,750 | | |
| Short Term Bond | | | | | 416,203,026 | | | | | | 140,489,506 | | |
| Strategic Income Opportunities | | | | | 674,652,081 | | | | | | 866,629,505 | | |
U.S. government securities not included above were as follows:
| | | | Purchases | | | Sales | |
| GNMA Income | | | | $ | 5,851,092,132 | | | | | $ | 5,978,746,427 | | |
| Intermediate Bond | | | | | 17,504,388,963 | | | | | | 17,151,173,357 | | |
| Short Term Bond | | | | | 866,437,044 | | | | | | 741,811,151 | | |
| Strategic Income Opportunities | | | | | 1,456,311,070 | | | | | | 1,526,975,366 | | |
NOTE 4 — INVESTMENT MANAGEMENT FEES
The Funds have entered into an investment management agreement (“Management Agreement”) with the Investment Adviser. The Investment Adviser has overall responsibility for the management of the Funds. The Investment Adviser oversees all investment advisory and portfolio management services for the Funds and assists in managing and supervising all aspects of the general day-to-day business activities and operations of the Funds, including custodial, transfer agency, dividend disbursing, accounting, auditing, compliance and related services. This Management Agreement compensates the Investment Adviser with a management fee, computed daily and payable monthly, based on the average daily net assets of each Fund, at the following annual rates:
| Fund | | | Fee | |
| GNMA Income | | | 0.45% on the first $1 billion,
0.43% on the next $500 million and
0.41% on assets thereafter | |
| High Yield Bond(1) | | | 0.61% on the first $500 million, 0.55% on the next $4.5 billion and 0.50% on assets thereafter | |
| Intermediate Bond | | | 0.27% on all assets | |
| Short Duration High Income | | | 0.48% on all assets | |
| Short Term Bond | | | 0.25% on all assets | |
| Strategic Income Opportunities | | | 0.50% on all assets | |
(1)
Effective January 1, 2023, the Investment Adviser has agreed to waive 0.05% of the management fee through August 1, 2024. Any fees waived or reimbursed in relation to this waiver are not eligible for recoupment. Termination or modification of this waiver requires approval by the Board.
The Investment Adviser has entered into a sub-advisory agreement with Voya IM with respect to each Fund. Voya IM provides investment advice for the Funds and is paid by the Investment Adviser based on the average daily net assets of each respective Fund. Subject to such policies as the Board or the Investment Adviser may determine, Voya IM manages the Funds’ assets in accordance with the Funds’ investment objectives, policies, and limitations.
NOTE 5 — DISTRIBUTION AND SERVICE FEES
Class A, Class C and Class R of the respective Funds each has a distribution and/or service and distribution plan (the “Plan”), whereby the Distributor is compensated by certain of the Funds for expenses incurred in the distribution and/or shareholder servicing of each Fund’s shares (“Distribution and/or Service Fees”). Pursuant to the Plan, the Distributor is entitled to payment each month for expenses incurred in the distribution and promotion of certain of each Fund’s shares, including expenses incurred in printing prospectuses and reports used for sales purposes, expenses incurred in preparing and printing sales literature and other such distribution related expenses, including any Distribution and/or Service Fees paid to securities dealers who have executed a distribution agreement with the Distributor. In addition, High Yield Bond, Intermediate Bond, Short Term Bond and Strategic Income Opportunities have a shareholder service plan for Class A and Class C shares (together with the Plan referenced above, the “Plans”). Under the Plans, each class of shares of each Fund pays the Distributor a Distribution and/or Service Fee based on average daily net assets at the following annual rates:
| Fund | | | Class A | | | Class C | | | Class R | |
| GNMA Income | | | | | 0.25% | | | | | | 1.00% | | | | | | N/A | | |
| High Yield Bond | | | | | 0.25% | | | | | | 1.00% | | | | | | 0.50% | | |
| Intermediate Bond | | | | | 0.25% | | | | | | 1.00% | | | | | | 0.50% | | |
| Short Duration High Income | | | | | 0.25% | | | | | | N/A | | | | | | N/A | | |
| Short Term Bond | | | | | 0.25% | | | | | | 1.00% | | | | | | 0.50% | | |
| Strategic Income Opportunities | | | | | 0.25% | | | | | | 1.00% | | | | | | 0.50% | | |
The Distributor may also retain the proceeds of the initial sales charge paid by shareholders upon the purchase of Class A shares of the Funds and the contingent deferred sales charge paid by shareholders upon certain redemptions for Class A and Class C shares. For the year ended March 31, 2023, the Distributor retained the following amounts in sales charges:
NOTES TO FINANCIAL STATEMENTS as of March 31, 2023 (continued)
NOTE 5 — DISTRIBUTION AND SERVICE FEES (continued)
| | | | Class A | | | Class C | |
| Initial Sales Charges: | | | | | | | | | | | | | |
| GNMA Income | | | | $ | 8,168 | | | | | $ | — | | |
| High Yield Bond | | | | | 731 | | | | | | — | | |
| Intermediate Bond | | | | | 2,023 | | | | | | — | | |
| Short Term Bond | | | | | 53 | | | | | | — | | |
| Strategic Income Opportunities | | | | | 1,978 | | | | | | — | | |
| Contingent Deferred Sales Charges: | | | | | | | | | | | | | |
| GNMA Income | | | | $ | 9,431 | | | | | $ | 2,911 | | |
| High Yield Bond | | | | | — | | | | | | 173 | | |
| Intermediate Bond | | | | | 1,307 | | | | | | 158 | | |
| Strategic Income Opportunities | | | | | 11,957 | | | | | | 5,409 | | |
NOTE 6 — OTHER TRANSACTIONS WITH AFFILIATES AND RELATED PARTIES
At March 31, 2023, the following direct or indirect, wholly-owned subsidiaries of Voya Financial, Inc. or affiliated investment companies owned more than 5% of the following Funds:
Subsidiary/Affiliated Investment
Company | | | Fund | | | Percentage | |
| Voya Index Solution Income Portfolio | | | Short Term Bond | | | | | 8.73% | | |
| Voya Institutional Trust Company | | | GNMA Income | | | | | 14.93 | | |
| Voya Investments, LLC | | | Short Duration
High Income | | | | | 97.01 | | |
| Voya Retirement Conservative Portfolio | | | Short Term Bond | | | | | 9.66 | | |
| Voya Retirement Growth Portfolio | | | Short Term Bond | | | | | 18.96 | | |
| Voya Retirement Insurance and Annuity Company | | | Intermediate Bond | | | | | 9.36 | | |
| Voya Retirement Moderate Growth Portfolio | | | Short Term Bond | | | | | 16.33 | | |
| Voya Retirement Moderate Portfolio | | | Short Term Bond | | | | | 16.82 | | |
The Funds have adopted a deferred compensation plan (the “DC Plan”), which allows eligible independent trustees, as described in the DC Plan, to defer the receipt of all or a portion of the trustees’ fees that they are entitled to receive from the Funds. For purposes of determining the amount owed to the trustee under the DC Plan, the amounts deferred are invested in shares of the funds selected by the trustee (the “Notional Funds”). When the Funds purchase shares of the Notional Funds, which are all advised by Voya Investments, in amounts equal to the trustees’ deferred fees, this results in a Fund asset equal to the deferred compensation liability. Such assets, if applicable, are included as a component of “Other assets” on the accompanying Statements of Assets and Liabilities. Deferral of trustees’ fees under the DC Plan will not affect net assets of the Funds, and will not materially affect the
Funds’ assets, liabilities or net investment income per share. Amounts will be deferred until distributed in accordance with the DC Plan.
The Funds may pay per account fees to affiliates of Voya Investments for recordkeeping services provided on certain assets. For the year ended March 31, 2023, the per account fees for affiliated recordkeeping services paid by each Fund were as follows:
| Fund | | | Amount | |
| GNMA Income | | | | $ | 266,727 | | |
| High Yield Bond | | | | | 5,576 | | |
| Intermediate Bond | | | | | 316,331 | | |
| Short Duration High Income | | | | | — | | |
| Short Term Bond | | | | | 16 | | |
| Strategic Income Opportunities | | | | | 22,519 | | |
The Funds may engage in purchase and sale transactions with funds that have a common investment adviser (or affiliated investment adviser), a common sub-adviser and/or common officers or trustees. For the year ended March 31, 2023, High Yield Bond engaged in such transactions amounting to $117,543,432 of in-kind sales, resulting in a net realized loss of $(15,156,682).
NOTE 7 — EXPENSE LIMITATION AGREEMENTS
Pursuant to a written expense limitation agreement (“Expense Limitation Agreement”) between the Investment Adviser and the Trust, on behalf of the Funds, the Investment Adviser has agreed to limit expenses of each Fund, excluding interest, taxes, investment-related costs, leverage expenses, extraordinary expenses, and acquired fund fees and expenses, as applicable, to the levels listed below:
| Fund | | | Class
A | | | Class
C | | | Class
I | | | Class
R | | | Class
R6 | | | Class
W | |
| GNMA Income | | | | | 0.84% | | | | | | 1.59% | | | | | | 0.54% | | | | | | N/A | | | | | | 0.54% | | | | | | 0.59% | | |
| High Yield Bond | | | | | 1.10% | | | | | | 1.85% | | | | | | 0.85% | | | | | | 1.35% | | | | | | 0.83% | | | | | | 0.85% | | |
| Intermediate Bond | | | | | 0.75% | | | | | | 1.50% | | | | | | 0.50% | | | | | | 1.00% | | | | | | 0.50% | | | | | | 0.50% | | |
Short Duration
High Income | | | | | 0.85% | | | | | | N/A | | | | | | 0.60% | | | | | | N/A | | | | | | 0.60% | | | | | | N/A | | |
| Short Term Bond | | | | | 0.65% | | | | | | 1.40% | | | | | | 0.35% | | | | | | 0.90% | | | | | | 0.30% | | | | | | 0.40% | | |
Strategic Income
Opportunities | | | | | 1.15% | | | | | | 1.90% | | | | | | 0.72% | | | | | | 1.40% | | | | | | 0.60% | | | | | | 0.90% | | |
With the exception of Strategic Income Opportunities and the non-recoupable management fee waiver for High Yield Bond, the Investment Adviser may at a later date recoup from a Fund for fees waived and/or other expenses reimbursed by the Investment Adviser during the previous 36 months, but only if, after such recoupment, a Fund’s expense ratio does not exceed the percentage described above. Waived and reimbursed fees net of any recoupment by the Investment Adviser of such waived and reimbursed fees are reflected on the accompanying Statements of
NOTES TO FINANCIAL STATEMENTS as of March 31, 2023 (continued)
NOTE 7 — EXPENSE LIMITATION AGREEMENTS (continued)
Operations. Amounts payable by the Investment Adviser are reflected on the accompanying Statements of Assets and Liabilities.
As of March 31, 2023 the amounts of waived and/or reimbursed fees that are subject to possible recoupment by the Investment Adviser and the related expiration dates are as follows:
| | | | March 31, | | | Total | |
| | | | 2024 | | | 2025 | | | 2026 | |
| Short Duration High Income | | | | $ | — | | | | | $ | — | | | | | $ | 12,491 | | | | | $ | 12,491 | | |
| Short Term Bond | | | | | 275,697 | | | | | | 120,887 | | | | | | 56,303 | | | | | | 452,887 | | |
In addition to the above waived and/or reimbursed fees, the amount of class specific fees waived or reimbursed that are subject to possible recoupment by the Investment Adviser, and the related expiration dates, as of March 31, 2023, are as follows:
| | | | March 31, | | | Total | |
| | | | 2024 | | | 2025 | | | 2026 | |
| GNMA Income | | | | | | | | | | | | | | | | | | | | | | | | | |
| Class I | | | | $ | 220,385 | | | | | $ | 169,548 | | | | | $ | 126,505 | | | | | $ | 516,438 | | |
| Short Duration High Income | | | | | | | | | | | | | | | | | | | | | | | | | |
| Class I | | | | | — | | | | | | — | | | | | | 7 | | | | | | 7 | | |
| Short Term Bond | | | | | | | | | | | | | | | | | | | | | | | | | |
| Class I | | | | | 8,563 | | | | | | 8,770 | | | | | | 10,349 | | | | | | 27,682 | | |
The Expense Limitation Agreement is contractual through August 1, 2023, except Short Duration High Income which is through August 1, 2024, and shall renew automatically for one-year terms. Termination or modification of this obligation requires approval by the Board.
NOTE 8 — LINE OF CREDIT
Effective June 13, 2022, the Funds, in addition to certain other funds managed by the Investment Adviser, entered
into a 364-day unsecured committed revolving line of credit agreement (the “Credit Agreement”) with The Bank of New York Mellon (“BNY”) for an aggregate amount of $400,000,000 through June 12, 2023. The proceeds may be used only to finance temporarily: (1) the purchase or sale of investment securities; or (2) the repurchase or redemption of shares of the Fund or certain other funds managed by the Investment Adviser. The funds to which the line of credit is available pay a commitment fee equal to 0.15% per annum on the daily unused portion of the committed line amount payable quarterly in arrears. Prior to June 13, 2022, the predecessor line of credit was for an aggregate amount of $400,000,000 and the funds to which the line of credit was available paid a commitment fee equal to 0.15% per annum on the daily unused portion of the committed line amount through June 13, 2022.
Borrowings under the Credit Agreement accrue interest at the federal funds rate plus a specified margin. Repayments generally must be made within 60 days after the date of a revolving credit advance. The following Funds utilized the line of credit during the year ended March 31, 2023:
| Fund | | | Days
Utilized | | | Approximate
Average Daily
Balance For
Days Utilized | | | Approximate
Weighted
Average Interest
Rate For Days
Utilized | |
| GNMA Income | | | | | 4 | | | | | $ | 4,024,250 | | | | | | 2.12% | | |
| High Yield Bond | | | | | 2 | | | | | | 1,986,500 | | | | | | 4.80 | | |
| Intermediate Bond | | | | | 5 | | | | | | 2,349,400 | | | | | | 3.86 | | |
| Short Term Bond | | | | | 1 | | | | | | 4,271,000 | | | | | | 5.83 | | |
| Strategic Income Opportunities | | | | | 1 | | | | | | 2,900,000 | | | | | | 5.33 | | |
NOTE 9 — CAPITAL SHARES
Transactions in capital shares and dollars were as follows:
| | | | Shares
sold | | | Shares
issued
in
merger | | | Reinvestment
of
distributions | | | Shares
redeemed | | | Shares
converted | | | Net increase
(decrease)
in shares
outstanding | | | Shares
sold | | | Proceeds
from
shares
issued in
merger | | | Reinvestment
of
distributions | | | Shares
redeemed | | | Shares
converted | | | Net
increase
(decrease) | |
Year or
period ended | | | # | | | # | | | # | | | # | | | # | | | # | | | ($) | | | ($) | | | ($) | | | ($) | | | ($) | | | ($) | |
| GNMA Income | |
| Class A | | | | | | | | | | | | | | | | | | | | | | | | | | | | | | | | | | | | | | | | | | | | | | | | | | | | | | | | | | | | | | | | | | | | | | | | | |
| 3/31/2023 | | | | | 8,662,434 | | | | | | — | | | | | | 1,260,960 | | | | | | (15,637,748) | | | | | | — | | | | | | (5,714,354) | | | | | | 65,480,777 | | | | | | — | | | | | | 9,458,438 | | | | | | (118,547,474) | | | | | | — | | | | | | (43,608,259) | | |
| 3/31/2022 | | | | | 11,277,527 | | | | | | — | | | | | | 720,684 | | | | | | (23,725,800) | | | | | | — | | | | | | (11,727,589) | | | | | | 95,005,028 | | | | | | — | | | | | | 6,054,296 | | | | | | (199,441,916) | | | | | | — | | | | | | (98,382,592) | | |
| Class C | | | | | | | | | | | | | | | | | | | | | | | | | | | | | | | | | | | | | | | | | | | | | | | | | | | | | | | | | | | | | | | | | | | | | | | | | |
| 3/31/2023 | | | | | 426,198 | | | | | | — | | | | | | 45,979 | | | | | | (1,454,599) | | | | | | — | | | | | | (982,422) | | | | | | 3,208,894 | | | | | | — | | | | | | 342,488 | | | | | | (10,976,750) | | | | | | — | | | | | | (7,425,368) | | |
| 3/31/2022 | | | | | 434,519 | | | | | | — | | | | | | 21,361 | | | | | | (2,878,820) | | | | | | — | | | | | | (2,422,940) | | | | | | 3,655,918 | | | | | | — | | | | | | 179,138 | | | | | | (24,082,916) | | | | | | — | | | | | | (20,247,860) | | |
| Class I | | | | | | | | | | | | | | | | | | | | | | | | | | | | | | | | | | | | | | | | | | | | | | | | | | | | | | | | | | | | | | | | | | | | | | | | | |
| 3/31/2023 | | | | | 73,733,932 | | | | | | — | | | | | | 2,129,572 | | | | | | (69,747,779) | | | | | | — | | | | | | 6,115,725 | | | | | | 556,500,667 | | | | | | — | | | | | | 16,020,098 | | | | | | (527,669,156) | | | | | | — | | | | | | 44,851,609 | | |
| 3/31/2022 | | | | | 57,283,966 | | | | | | — | | | | | | 1,410,379 | | | | | | (68,604,093) | | | | | | — | | | | | | (9,909,748) | | | | | | 482,886,816 | | | | | | — | | | | | | 11,867,348 | | | | | | (575,307,247) | | | | | | — | | | | | | (80,553,083) | | |
| Class P(2) | | | | | | | | | | | | | | | | | | | | | | | | | | | | | | | | | | | | | | | | | | | | | | | | | | | | | | | | | | | | | | | | | | | | | | | | | |
| 3/31/2023 | | | | | 150,796 | | | | | | — | | | | | | 1,514 | | | | | | (156,307) | | | | | | — | | | | | | (3,997) | | | | | | 1,141,188 | | | | | | — | | | | | | 11,243 | | | | | | (1,174,037) | | | | | | — | | | | | | (21,606) | | |
| 3/31/2022 | | | | | — | | | | | | — | | | | | | 80 | | | | | | — | | | | | | — | | | | | | 80 | | | | | | — | | | | | | — | | | | | | 675 | | | | | | — | | | | | | — | | | | | | 675 | | |
NOTES TO FINANCIAL STATEMENTS as of March 31, 2023 (continued)
NOTE 9 — CAPITAL SHARES (continued)
| | | | Shares
sold | | | Shares
issued
in
merger | | | Reinvestment
of
distributions | | | Shares
redeemed | | | Shares
converted | | | Net increase
(decrease)
in shares
outstanding | | | Shares
sold | | | Proceeds
from
shares
issued in
merger | | | Reinvestment
of
distributions | | | Shares
redeemed | | | Shares
converted | | | Net
increase
(decrease) | |
Year or
period ended | | | # | | | # | | | # | | | # | | | # | | | # | | | ($) | | | ($) | | | ($) | | | ($) | | | ($) | | | ($) | |
| GNMA Income (continued) | |
| Class R6 | | | | | | | | | | | | | | | | | | | | | | | | | | | | | | | | | | | | | | | | | | | | | | | | | | | | | | | | | | | | | | | | | | | | | | | | | |
| 3/31/2023 | | | | | 1,857,031 | | | | | | — | | | | | | 110,352 | | | | | | (979,878) | | | | | | — | | | | | | 987,505 | | | | | | 14,212,219 | | | | | | — | | | | | | 828,986 | | | | | | (7,503,872) | | | | | | — | | | | | | 7,537,333 | | |
| 3/31/2022 | | | | | 759,585 | | | | | | — | | | | | | 46,034 | | | | | | (2,729,091) | | | | | | — | | | | | | (1,923,472) | | | | | | 6,415,735 | | | | | | — | | | | | | 387,301 | | | | | | (23,219,105) | | | | | | — | | | | | | (16,416,069) | | |
| Class W | | | | | | | | | | | | | | | | | | | | | | | | | | | | | | | | | | | | | | | | | | | | | | | | | | | | | | | | | | | | | | | | | | | | | | | | | |
| 3/31/2023 | | | | | 1,154,980 | | | | | | — | | | | | | 283,020 | | | | | | (6,322,696) | | | | | | — | | | | | | (4,884,696) | | | | | | 8,777,294 | | | | | | — | | | | | | 2,135,722 | | | | | | (48,263,912) | | | | | | — | | | | | | (37,350,896) | | |
| 3/31/2022 | | | | | 2,733,426 | | | | | | — | | | | | | 211,783 | | | | | | (10,233,228) | | | | | | — | | | | | | (7,288,019) | | | | | | 23,034,577 | | | | | | — | | | | | | 1,783,946 | | | | | | (86,789,385) | | | | | | — | | | | | | (61,970,862) | | |
| High Yield Bond | |
| Class A | | | | | | | | | | | | | | | | | | | | | | | | | | | | | | | | | | | | | | | | | | | | | | | | | | | | | | | | | | | | | | | | | | | | | | | | | |
| 3/31/2023 | | | | | 537,141 | | | | | | — | | | | | | 335,012 | | | | | | (1,187,397) | | | | | | — | | | | | | (315,244) | | | | | | 3,630,499 | | | | | | — | | | | | | 2,269,789 | | | | | | (8,164,961) | | | | | | — | | | | | | (2,264,673) | | |
| 3/31/2022 | | | | | 649,906 | | | | | | — | | | | | | 259,104 | | | | | | (1,099,273) | | | | | | — | | | | | | (190,263) | | | | | | 5,218,071 | | | | | | — | | | | | | 2,063,621 | | | | | | (8,762,057) | | | | | | — | | | | | | (1,480,365) | | |
| Class C | | | | | | | | | | | | | | | | | | | | | | | | | | | | | | | | | | | | | | | | | | | | | | | | | | | | | | | | | | | | | | | | | | | | | | | | | |
| 3/31/2023 | | | | | 15,650 | | | | | | — | | | | | | 68,923 | | | | | | (360,897) | | | | | | — | | | | | | (276,324) | | | | | | 108,101 | | | | | | — | | | | | | 466,638 | | | | | | (2,470,810) | | | | | | — | | | | | | (1,896,071) | | |
| 3/31/2022 | | | | | 164,725 | | | | | | — | | | | | | 49,194 | | | | | | (232,402) | | | | | | — | | | | | | (18,483) | | | | | | 1,325,876 | | | | | | — | | | | | | 391,638 | | | | | | (1,848,988) | | | | | | — | | | | | | (131,474) | | |
| Class I | | | | | | | | | | | | | | | | | | | | | | | | | | | | | | | | | | | | | | | | | | | | | | | | | | | | | | | | | | | | | | | | | | | | | | | | | |
| 3/31/2023 | | | | | 13,288,597 | | | | | | — | | | | | | 1,772,476 | | | | | | (12,478,237) | | | | | | — | | | | | | 2,582,836 | | | | | | 91,566,913 | | | | | | — | | | | | | 11,976,296 | | | | | | (85,981,809) | | | | | | — | | | | | | 17,561,400 | | |
| 3/31/2022 | | | | | 14,248,586 | | | | | | — | | | | | | 1,180,689 | | | | | | (11,341,157) | | | | | | — | | | | | | 4,088,118 | | | | | | 114,040,363 | | | | | | — | | | | | | 9,385,111 | | | | | | (90,093,198) | | | | | | — | | | | | | 33,332,276 | | |
| Class P(3) | | | | | | | | | | | | | | | | | | | | | | | | | | | | | | | | | | | | | | | | | | | | | | | | | | | | | | | | | | | | | | | | | | | | | | | | | |
| 3/31/2023 | | | | | 86,486 | | | | | | — | | | | | | 1,582,416 | | | | | | (37,547,356) | | | | | | — | | | | | | (35,878,454) | | | | | | 594,949 | | | | | | — | | | | | | 10,805,849 | | | | | | (255,926,038) | | | | | | — | | | | | | (244,525,240) | | |
| 3/31/2022 | | | | | 16,740,632 | | | | | | — | | | | | | 2,200,106 | | | | | | (22,270,858) | | | | | | — | | | | | | (3,330,120) | | | | | | 131,212,122 | | | | | | — | | | | | | 17,529,964 | | | | | | (175,094,969) | | | | | | — | | | | | | (26,352,883) | | |
| Class P3(4) | | | | | | | | | | | | | | | | | | | | | | | | | | | | | | | | | | | | | | | | | | | | | | | | | | | | | | | | | | | | | | | | | | | | | | | | | |
| 3/31/2023 | | | | | 43,956 | | | | | | — | | | | | | 9,136 | | | | | | (171,175) | | | | | | — | | | | | | (118,083) | | | | | | 304,315 | | | | | | — | | | | | | 62,023 | | | | | | (1,158,263) | | | | | | — | | | | | | (791,925) | | |
| 3/31/2022 | | | | | 891,755 | | | | | | — | | | | | | 68,009 | | | | | | (1,943,676) | | | | | | — | | | | | | (983,912) | | | | | | 7,142,828 | | | | | | — | | | | | | 545,174 | | | | | | (15,234,842) | | | | | | — | | | | | | (7,546,840) | | |
| Class R | | | | | | | | | | | | | | | | | | | | | | | | | | | | | | | | | | | | | | | | | | | | | | | | | | | | | | | | | | | | | | | | | | | | | | | | | |
| 3/31/2023 | | | | | 18,190 | | | | | | — | | | | | | 2,198 | | | | | | (6,368) | | | | | | — | | | | | | 14,020 | | | | | | 125,231 | | | | | | — | | | | | | 14,848 | | | | | | (43,427) | | | | | | — | | | | | | 96,652 | | |
| 3/31/2022 | | | | | 5,116 | | | | | | — | | | | | | 1,691 | | | | | | (51,173) | | | | | | — | | | | | | (44,366) | | | | | | 40,858 | | | | | | — | | | | | | 13,528 | | | | | | (411,270) | | | | | | — | | | | | | (356,884) | | |
| Class R6 | | | | | | | | | | | | | | | | | | | | | | | | | | | | | | | | | | | | | | | | | | | | | | | | | | | | | | | | | | | | | | | | | | | | | | | | | |
| 3/31/2023 | | | | | 9,147,216 | | | | | | — | | | | | | 446,194 | | | | | | (1,584,744) | | | | | | — | | | | | | 8,008,666 | | | | | | 60,873,882 | | | | | | — | | | | | | 3,023,148 | | | | | | (10,845,929) | | | | | | — | | | | | | 53,051,101 | | |
| 3/31/2022 | | | | | 4,066,896 | | | | | | — | | | | | | 1,352,792 | | | | | | (29,933,291) | | | | | | — | | | | | | (24,513,603) | | | | | | 32,690,991 | | | | | | — | | | | | | 10,846,577 | | | | | | (235,228,704) | | | | | | — | | | | | | (191,691,136) | | |
| Class W | | | | | | | | | | | | | | | | | | | | | | | | | | | | | | | | | | | | | | | | | | | | | | | | | | | | | | | | | | | | | | | | | | | | | | | | | |
| 3/31/2023 | | | | | 4,246,913 | | | | | | — | | | | | | 710,179 | | | | | | (7,582,561) | | | | | | — | | | | | | (2,625,469) | | | | | | 28,861,646 | | | | | | — | | | | | | 4,821,836 | | | | | | (51,602,614) | | | | | | — | | | | | | (17,919,132) | | |
| 3/31/2022 | | | | | 4,432,494 | | | | | | — | | | | | | 584,438 | | | | | | (12,143,760) | | | | | | — | | | | | | (7,126,828) | | | | | | 35,524,660 | | | | | | — | | | | | | 4,664,211 | | | | | | (97,076,957) | | | | | | — | | | | | | (56,888,086) | | |
| Intermediate Bond | |
| Class A | | | | | | | | | | | | | | | | | | | | | | | | | | | | | | | | | | | | | | | | | | | | | | | | | | | | | | | | | | | | | | | | | | | | | | | | | |
| 3/31/2023 | | | | | 6,039,145 | | | | | | — | | | | | | 675,124 | | | | | | (16,764,116) | | | | | | — | | | | | | (10,049,847) | | | | | | 52,739,875 | | | | | | — | | | | | | 5,922,666 | | | | | | (147,691,741) | | | | | | — | | | | | | (89,029,200) | | |
| 3/31/2022 | | | | | 7,936,708 | | | | | | — | | | | | | 687,990 | | | | | | (15,367,870) | | | | | | — | | | | | | (6,743,172) | | | | | | 81,104,507 | | | | | | — | | | | | | 7,040,999 | | | | | | (157,102,969) | | | | | | — | | | | | | (68,957,463) | | |
| Class C | | | | | | | | | | | | | | | | | | | | | | | | | | | | | | | | | | | | | | | | | | | | | | | | | | | | | | | | | | | | | | | | | | | | | | | | | |
| 3/31/2023 | | | | | 112,160 | | | | | | — | | | | | | 21,933 | | | | | | (656,114) | | | | | | — | | | | | | (522,021) | | | | | | 973,316 | | | | | | — | | | | | | 192,151 | | | | | | (5,773,250) | | | | | | — | | | | | | (4,607,783) | | |
| 3/31/2022 | | | | | 172,368 | | | | | | — | | | | | | 23,132 | | | | | | (781,431) | | | | | | — | | | | | | (585,931) | | | | | | 1,768,576 | | | | | | — | | | | | | 236,689 | | | | | | (7,948,052) | | | | | | — | | | | | | (5,942,787) | | |
| Class I | | | | | | | | | | | | | | | | | | | | | | | | | | | | | | | | | | | | | | | | | | | | | | | | | | | | | | | | | | | | | | | | | | | | | | | | | |
| 3/31/2023 | | | | | 255,795,385 | | | | | | — | | | | | | 16,085,857 | | | | | | (344,956,757) | | | | | | — | | | | | | (73,075,515) | | | | | | 2,273,838,015 | | | | | | — | | | | | | 141,151,475 | | | | | | (3,044,798,908) | | | | | | — | | | | | | (629,809,418) | | |
| 3/31/2022 | | | | | 241,997,846 | | | | | | — | | | | | | 14,032,171 | | | | | | (220,648,390) | | | | | | — | | | | | | 35,381,627 | | | | | | 2,453,548,509 | | | | | | — | | | | | | 143,362,404 | | | | | | (2,226,904,558) | | | | | | — | | | | | | 370,006,355 | | |
| Class P3(5) | | | | | | | | | | | | | | | | | | | | | | | | | | | | | | | | | | | | | | | | | | | | | | | | | | | | | | | | | | | | | | | | | | | | | | | | | |
| 3/31/2023 | | | | | 5,830,640 | | | | | | — | | | | | | 243,852 | | | | | | (14,037,512) | | | | | | — | | | | | | (7,963,020) | | | | | | 51,797,195 | | | | | | — | | | | | | 2,141,635 | | | | | | (122,473,358) | | | | | | — | | | | | | (68,534,528) | | |
| 3/31/2022 | | | | | 6,732,245 | | | | | | — | | | | | | 152,870 | | | | | | (2,529,951) | | | | | | — | | | | | | 4,355,164 | | | | | | 67,863,845 | | | | | | — | | | | | | 1,554,909 | | | | | | (25,314,324) | | | | | | — | | | | | | 44,104,430 | | |
| Class R | | | | | | | | | | | | | | | | | | | | | | | | | | | | | | | | | | | | | | | | | | | | | | | | | | | | | | | | | | | | | | | | | | | | | | | | | |
| 3/31/2023 | | | | | 1,941,190 | | | | | | — | | | | | | 359,089 | | | | | | (4,048,634) | | | | | | — | | | | | | (1,748,355) | | | | | | 17,098,433 | | | | | | — | | | | | | 3,152,853 | | | | | | (35,936,191) | | | | | | — | | | | | | (15,684,905) | | |
| 3/31/2022 | | | | | 1,952,651 | | | | | | — | | | | | | 321,947 | | | | | | (4,389,254) | | | | | | — | | | | | | (2,114,656) | | | | | | 19,998,676 | | | | | | — | | | | | | 3,298,237 | | | | | | (44,929,985) | | | | | | — | | | | | | (21,633,072) | | |
| Class R6 | | | | | | | | | | | | | | | | | | | | | | | | | | | | | | | | | | | | | | | | | | | | | | | | | | | | | | | | | | | | | | | | | | | | | | | | | |
| 3/31/2023 | | | | | 73,110,166 | | | | | | — | | | | | | 8,024,827 | | | | | | (86,107,680) | | | | | | — | | | | | | (4,972,687) | | | | | | 646,791,761 | | | | | | — | | | | | | 70,443,640 | | | | | | (758,883,993) | | | | | | — | | | | | | (41,648,592) | | |
| 3/31/2022 | | | | | 79,215,568 | | | | | | — | | | | | | 6,563,347 | | | | | | (96,696,703) | | | | | | — | | | | | | (10,917,788) | | | | | | 808,317,892 | | | | | | — | | | | | | 67,098,886 | | | | | | (994,110,333) | | | | | | — | | | | | | (118,693,555) | | |
| Class W | | | | | | | | | | | | | | | | | | | | | | | | | | | | | | | | | | | | | | | | | | | | | | | | | | | | | | | | | | | | | | | | | | | | | | | | | |
| 3/31/2023 | | | | | 1,815,263 | | | | | | — | | | | | | 253,869 | | | | | | (13,186,402) | | | | | | — | | | | | | (11,117,270) | | | | | | 16,178,038 | | | | | | — | | | | | | 2,240,487 | | | | | | (118,828,132) | | | | | | — | | | | | | (100,409,607) | | |
| 3/31/2022 | | | | | 3,124,623 | | | | | | — | | | | | | 466,739 | | | | | | (11,502,032) | | | | | | — | | | | | | (7,910,670) | | | | | | 31,905,860 | | | | | | — | | | | | | 4,771,464 | | | | | | (118,079,317) | | | | | | — | | | | | | (81,401,993) | | |
| Short Duration High Income | |
| Class A | | | | | | | | | | | | | | | | | | | | | | | | | | | | | | | | | | | | | | | | | | | | | | | | | | | | | | | | | | | | | | | | | | | | | | | | | |
2/9/2023(1) -
3/31/2023 | | | | | 862,214 | | | | | | — | | | | | | 8,416 | | | | | | — | | | | | | — | | | | | | 870,630 | | | | | | 8,617,007 | | | | | | — | | | | | | 83,236 | | | | | | — | | | | | | — | | | | | | 8,700,243 | | |
| Class I | | | | | | | | | | | | | | | | | | | | | | | | | | | | | | | | | | | | | | | | | | | | | | | | | | | | | | | | | | | | | | | | | | | | | | | | | |
2/9/2023(1) -
3/31/2023 | | | | | 881,952 | | | | | | — | | | | | | 8,979 | | | | | | — | | | | | | — | | | | | | 890,931 | | | | | | 8,813,333 | | | | | | — | | | | | | 88,803 | | | | | | — | | | | | | — | | | | | | 8,902,136 | | |
| Class R6 | | | | | | | | | | | | | | | | | | | | | | | | | | | | | | | | | | | | | | | | | | | | | | | | | | | | | | | | | | | | | | | | | | | | | | | | | |
2/9/2023(1) -
3/31/2023 | | | | | 833,333 | | | | | | — | | | | | | 8,657 | | | | | | — | | | | | | — | | | | | | 841,990 | | | | | | 8,333,334 | | | | | | — | | | | | | 85,623 | | | | | | — | | | | | | — | | | | | | 8,418,957 | | |
| Short Term Bond | |
| Class A | | | | | | | | | | | | | | | | | | | | | | | | | | | | | | | | | | | | | | | | | | | | | | | | | | | | | | | | | | | | | | | | | | | | | | | | | |
| 3/31/2023 | | | | | 110,007 | | | | | | — | | | | | | 31,688 | | | | | | (770,084) | | | | | | — | | | | | | (628,389) | | | | | | 1,028,426 | | | | | | — | | | | | | 294,501 | | | | | | (7,126,977) | | | | | | — | | | | | | (5,804,050) | | |
| 3/31/2022 | | | | | 225,939 | | | | | | — | | | | | | 24,149 | | | | | | (601,354) | | | | | | — | | | | | | (351,266) | | | | | | 2,248,805 | | | | | | — | | | | | | 239,174 | | | | | | (5,901,999) | | | | | | — | | | | | | (3,414,020) | | |
| Class C | | | | | | | | | | | | | | | | | | | | | | | | | | | | | | | | | | | | | | | | | | | | | | | | | | | | | | | | | | | | | | | | | | | | | | | | | |
| 3/31/2023 | | | | | 2,890 | | | | | | — | | | | | | 322 | | | | | | (33,367) | | | | | | — | | | | | | (30,155) | | | | | | 26,785 | | | | | | — | | | | | | 2,997 | | | | | | (312,357) | | | | | | — | | | | | | (282,575) | | |
| 3/31/2022 | | | | | 13,819 | | | | | | — | | | | | | 241 | | | | | | (22,792) | | | | | | — | | | | | | (8,732) | | | | | | 134,109 | | | | | | — | | | | | | 2,396 | | | | | | (225,983) | | | | | | — | | | | | | (89,478) | | |
NOTES TO FINANCIAL STATEMENTS as of March 31, 2023 (continued)
NOTE 9 — CAPITAL SHARES (continued)
| | | | Shares
sold | | | Shares
issued
in
merger | | | Reinvestment
of
distributions | | | Shares
redeemed | �� | | Shares
converted | | | Net increase
(decrease)
in shares
outstanding | | | Shares
sold | | | Proceeds
from
shares
issued in
merger | | | Reinvestment
of
distributions | | | Shares
redeemed | | | Shares
converted | | | Net
increase
(decrease) | |
Year or
period ended | | | # | | | # | | | # | | | # | | | # | | | # | | | ($) | | | ($) | | | ($) | | | ($) | | | ($) | | | ($) | |
| Short Term Bond (continued) | |
| Class I | | | | | | | | | | | | | | | | | | | | | | | | | | | | | | | | | | | | | | | | | | | | | | | | | | | | | | | | | | | | | | | | | | | | | | | | | |
| 3/31/2023 | | | | | 3,028,561 | | | | | | — | | | | | | 84,847 | | | | | | (3,084,170) | | | | | | — | | | | | | 29,238 | | | | | | 27,898,398 | | | | | | — | | | | | | 786,797 | | | | | | (28,724,920) | | | | | | — | | | | | | (39,725) | | |
| 3/31/2022 | | | | | 2,346,060 | | | | | | — | | | | | | 38,184 | | | | | | (753,122) | | | | | | — | | | | | | 1,631,122 | | | | | | 23,155,647 | | | | | | — | | | | | | 376,908 | | | | | | (7,420,186) | | | | | | — | | | | | | 16,112,369 | | |
| Class P2(6) | | | | | | | | | | | | | | | | | | | | | | | | | | | | | | | | | | | | | | | | | | | | | | | | | | | | | | | | | | | | | | | | | | | | | | | | | |
| 3/31/2023 | | | | | 249,092 | | | | | | — | | | | | | 30,934 | | | | | | (3,094,620) | | | | | | — | | | | | | (2,814,594) | | | | | | 2,319,764 | | | | | | — | | | | | | 287,230 | | | | | | (28,457,191) | | | | | | — | | | | | | (25,850,197) | | |
| 3/31/2022 | | | | | 3,710,644 | | | | | | — | | | | | | 144,599 | | | | | | (10,608,845) | | | | | | — | | | | | | (6,753,602) | | | | | | 35,617,003 | | | | | | — | | | | | | 1,429,581 | | | | | | (104,288,052) | | | | | | — | | | | | | (67,241,468) | | |
| Class P3(8) | | | | | | | | | | | | | | | | | | | | | | | | | | | | | | | | | | | | | | | | | | | | | | | | | | | | | | | | | | | | | | | | | | | | | | | | | |
| 3/31/2023 | | | | | 1,135,277 | | | | | | — | | | | | | 13,935 | | | | | | (1,758,058) | | | | | | — | | | | | | (608,846) | | | | | | 10,600,984 | | | | | | — | | | | | | 129,696 | | | | | | (16,137,633) | | | | | | — | | | | | | (5,406,953) | | |
| 3/31/2022 | | | | | 389,625 | | | | | | — | | | | | | 8,196 | | | | | | (123,016) | | | | | | — | | | | | | 274,805 | | | | | | 3,793,284 | | | | | | — | | | | | | 80,642 | | | | | | (1,203,965) | | | | | | — | | | | | | 2,669,961 | | |
| Class R | | | | | | | | | | | | | | | | | | | | | | | | | | | | | | | | | | | | | | | | | | | | | | | | | | | | | | | | | | | | | | | | | | | | | | | | | |
| 3/31/2023 | | | | | 1,036 | | | | | | — | | | | | | 41 | | | | | | (377) | | | | | | — | | | | | | 700 | | | | | | 9,722 | | | | | | — | | | | | | 384 | | | | | | (3,543) | | | | | | — | | | | | | 6,563 | | |
| 3/31/2022 | | | | | 1,087 | | | | | | — | | | | | | 11 | | | | | | (191) | | | | | | — | | | | | | 907 | | | | | | 10,787 | | | | | | — | | | | | | 108 | | | | | | (1,897) | | | | | | — | | | | | | 8,998 | | |
| Class R6 | | | | | | | | | | | | | | | | | | | | | | | | | | | | | | | | | | | | | | | | | | | | | | | | | | | | | | | | | | | | | | | | | | | | | | | | | |
| 3/31/2023 | | | | | 15,171,571 | | | | | | — | | | | | | 906,987 | | | | | | (18,584,103) | | | | | | — | | | | | | (2,505,545) | | | | | | 141,319,801 | | | | | | — | | | | | | 8,431,735 | | | | | | (173,522,880) | | | | | | — | | | | | | (23,771,344) | | |
| 3/31/2022 | | | | | 39,456,260 | | | | | | — | | | | | | 422,058 | | | | | | (6,095,498) | | | | | | — | | | | | | 33,782,820 | | | | | | 392,726,125 | | | | | | — | | | | | | 4,160,869 | | | | | | (60,250,814) | | | | | | — | | | | | | 336,636,180 | | |
| Class W | | | | | | | | | | | | | | | | | | | | | | | | | | | | | | | | | | | | | | | | | | | | | | | | | | | | | | | | | | | | | | | | | | | | | | | | | |
| 3/31/2023 | | | | | 242,070 | | | | | | — | | | | | | 39,541 | | | | | | (976,562) | | | | | | — | | | | | | (694,951) | | | | | | 2,280,395 | | | | | | — | | | | | | 368,976 | | | | | | (9,138,541) | | | | | | — | | | | | | (6,489,170) | | |
| 3/31/2022 | | | | | 683,926 | | | | | | — | | | | | | 31,532 | | | | | | (858,904) | | | | | | — | | | | | | (143,446) | | | | | | 6,788,542 | | | | | | — | | | | | | 312,982 | | | | | | (8,544,228) | | | | | | — | | | | | | (1,442,704) | | |
| Strategic Income Opportunities | |
| Class A | | | | | | | | | | | | | | | | | | | | | | | | | | | | | | | | | | | | | | | | | | | | | | | | | | | | | | | | | | | | | | | | | | | | | | | | | |
| 3/31/2023 | | | | | 2,161,239 | | | | | | — | | | | | | 308,066 | | | | | | (5,353,583) | | | | | | — | | | | | | (2,884,278) | | | | | | 19,705,733 | | | | | | — | | | | | | 2,800,165 | | | | | | (48,903,213) | | | | | | — | | | | | | (26,397,315) | | |
| 3/31/2022 | | | | | 3,051,116 | | | | | | — | | | | | | 339,546 | | | | | | (7,012,470) | | | | | | — | | | | | | (3,621,808) | | | | | | 30,535,738 | | | | | | — | | | | | | 3,392,473 | | | | | | (70,001,927) | | | | | | — | | | | | | (36,073,716) | | |
| Class C | | | | | | | | | | | | | | | | | | | | | | | | | | | | | | | | | | | | | | | | | | | | | | | | | | | | | | | | | | | | | | | | | | | | | | | | | |
| 3/31/2023 | | | | | 528,190 | | | | | | — | | | | | | 119,786 | | | | | | (1,772,262) | | | | | | — | | | | | | (1,124,286) | | | | | | 4,781,253 | | | | | | — | | | | | | 1,071,657 | | | | | | (15,912,261) | | | | | | — | | | | | | (10,059,351) | | |
| 3/31/2022 | | | | | 1,305,996 | | | | | | — | | | | | | 102,460 | | | | | | (1,513,122) | | | | | | — | | | | | | (104,666) | | | | | | 12,857,088 | | | | | | — | | | | | | 1,007,742 | | | | | | (14,880,582) | | | | | | — | | | | | | (1,015,752) | | |
| Class I | | | | | | | | | | | | | | | | | | | | | | | | | | | | | | | | | | | | | | | | | | | | | | | | | | | | | | | | | | | | | | | | | | | | | | | | | |
| 3/31/2023 | | | | | 65,354,991 | | | | | | — | | | | | | 6,665,654 | | | | | | (118,116,153) | | | | | | — | | | | | | (46,095,508) | | | | | | 597,442,459 | | | | | | — | | | | | | 60,676,878 | | | | | | (1,079,721,182) | | | | | | — | | | | | | (421,601,845) | | |
| 3/31/2022 | | | | | 85,696,320 | | | | | | — | | | | | | 6,007,076 | | | | | | (73,414,564) | | | | | | — | | | | | | 18,288,832 | | | | | | 856,763,572 | | | | | | — | | | | | | 60,036,542 | | | | | | (732,917,242) | | | | | | — | | | | | | 183,882,872 | | |
| Class P(7) | | | | | | | | | | | | | | | | | | | | | | | | | | | | | | | | | | | | | | | | | | | | | | | | | | | | | | | | | | | | | | | | | | | | | | | | | |
| 3/31/2023 | | | | | — | | | | | | — | | | | | | 6 | | | | | | (346) | | | | | | — | | | | | | (340) | | | | | | — | | | | | | — | | | | | | 51 | | | | | | (3,182) | | | | | | — | | | | | | (3,131) | | |
| 3/31/2022 | | | | | — | | | | | | — | | | | | | 13 | | | | | | — | | | | | | — | | | | | | 13 | | | | | | — | | | | | | — | | | | | | 127 | | | | | | — | | | | | | — | | | | | | 127 | | |
| Class R | | | | | | | | | | | | | | | | | | | | | | | | | | | | | | | | | | | | | | | | | | | | | | | | | | | | | | | | | | | | | | | | | | | | | | | | | |
| 3/31/2023 | | | | | 205,455 | | | | | | — | | | | | | 69,029 | | | | | | (376,994) | | | | | | — | | | | | | (102,510) | | | | | | 1,843,645 | | | | | | — | | | | | | 621,828 | | | | | | (3,419,516) | | | | | | — | | | | | | (954,043) | | |
| 3/31/2022 | | | | | 257,601 | | | | | | — | | | | | | 59,664 | | | | | | (356,374) | | | | | | — | | | | | | (39,109) | | | | | | 2,565,310 | | | | | | — | | | | | | 590,684 | | | | | | (3,516,584) | | | | | | — | | | | | | (360,590) | | |
| Class R6 | | | | | | | | | | | | | | | | | | | | | | | | | | | | | | | | | | | | | | | | | | | | | | | | | | | | | | | | | | | | | | | | | | | | | | | | | |
| 3/31/2023 | | | | | 2,464,303 | | | | | | — | | | | | | 689,623 | | | | | | (1,102,354) | | | | | | — | | | | | | 2,051,572 | | | | | | 22,125,558 | | | | | | — | | | | | | 6,248,297 | | | | | | (10,112,323) | | | | | | — | | | | | | 18,261,532 | | |
| 3/31/2022 | | | | | 2,340,912 | | | | | | — | | | | | | 548,112 | | | | | | (1,538,747) | | | | | | — | | | | | | 1,350,277 | | | | | | 23,553,792 | | | | | | — | | | | | | 5,463,117 | | | | | | (15,322,706) | | | | | | — | | | | | | 13,694,203 | | |
| Class W | | | | | | | | | | | | | | | | | | | | | | | | | | | | | | | | | | | | | | | | | | | | | | | | | | | | | | | | | | | | | | | | | | | | | | | | | |
| 3/31/2023 | | | | | 932,532 | | | | | | — | | | | | | 69,702 | | | | | | (2,669,069) | | | | | | — | | | | | | (1,666,835) | | | | | | 8,503,175 | | | | | | — | | | | | | 634,073 | | | | | | (24,406,942) | | | | | | — | | | | | | (15,269,694) | | |
| 3/31/2022 | | | | | 980,152 | | | | | | — | | | | | | 108,854 | | | | | | (2,151,161) | | | | | | — | | | | | | (1,062,155) | | | | | | 9,800,026 | | | | | | — | | | | | | 1,084,565 | | | | | | (21,408,935) | | | | | | — | | | | | | (10,524,344) | | |
(1)
Commencement of operations
(2)
Class P was fully redeemed on close of business March 24, 2023
(3)
Class P was fully redeemed on close of business February 24, 2023
(4)
Class P3 was fully redeemed on close of business February 22, 2023
(5)
Class P3 was fully redeemed on close of business March 30, 2023
(6)
Class P2 was fully redeemed on close of business November 29, 2022
(7)
Class P was fully redeemed on close of business September 8, 2022
(8)
Class P3 was fully redeemed on close of business November 3, 2022
NOTE 10 — UNFUNDED LOAN COMMITMENTS
Certain Funds may enter into credit agreements, all or a portion of which may be unfunded. The Funds are obligated to fund these loan commitments at the borrower’s discretion. Funded and unfunded portions of the credit agreements are presented in the Portfolio of Investments. At March 31, 2023, Strategic Income Opportunities had the following unfunded loan commitments:
| Loan | | | Unfunded
Loan
Commitment | |
| Athenahealth, Inc. 2022 Delayed Draw Term Loan | | | | $ | 119,903 | | |
| IPS Corporation 2021 Delayed Draw Term Loan | | | | | 42,096 | | |
| | | | | $ | 161,999 | | |
*
The unrealized appreciation/(depreciation) on these commitments as of March 31, 2023 is included in the Investments in securities at fair value on the Statement of Assets and Liabilities.
NOTES TO FINANCIAL STATEMENTS as of March 31, 2023 (continued)
NOTE 11 — SECURITIES LENDING
Under a Master Securities Lending Agreement (the “Agreement”) with BNY, the Funds can lend their securities to approved brokers, dealers and other financial institutions. Loans are collateralized by cash and U.S. government securities. The collateral is equal to at least 105% of the market value of non-U.S. securities loaned and 102% of the market value of U.S. securities loaned. The market value of the loaned securities is determined at the Market Close of the Funds at their last sale price or official closing price on the principal exchange or system on which they are traded and any additional collateral is delivered to the Funds on the next business day. The cash collateral received is invested in approved investments as defined in the Securities Lending Agreement with BNY (the “Agreement”). The Funds bear the risk of loss with respect to the investment of collateral with the following exception: BNY provides the Funds indemnification from loss with respect to the investment of collateral to the extent the cash collateral is invested in overnight repurchase agreements.
Cash collateral received in connection with securities lending is invested in cash equivalents, money market funds, repurchase agreements with maturities of not more than 99 days that are collateralized with U.S. Government securities, or certain short-term investments that have a remaining maturity of 190 days or less (“Permitted Investments”). Short-term investments include: securities, units, shares or other participations in short-term investment funds, pools or trusts; commercial paper, notes, bonds or other debt obligations, certificates of deposit, time deposits and other bank obligations and asset-backed commercial paper backed by diversified receivables and repurchase-backed programs. Permitted Investments are subject to certain guidelines established by the Adviser regarding liquidity, diversification, credit quality and average credit life/duration requirements. The securities purchased with cash collateral received are reflected in the Portfolio of Investments under Short-Term Investments.
Generally, in the event of counterparty default, the Funds have the right to use the collateral to offset losses incurred. The Agreement contains certain guarantees by BNY in the event of counterparty default and/or a borrower’s failure to return a loaned security; however, there would be a potential loss to the Funds in the event the Funds are delayed or prevented from exercising its right to dispose of the collateral. Engaging in securities lending could have a leveraging effect, which may intensify the credit, market and other risks associated with investing in a fund.
The following tables represent a summary of each respective Fund’s securities lending agreements by counterparty which are subject to offset under the Agreement as of March 31, 2023:
High Yield Bond
| Counterparty | | | Securities
Loaned
at Value | | | Cash
Collateral
Received(1) | | | Net
Amount | |
| Barclays Capital Inc. | | | | $ | 1,016,416 | | | | | $ | (1,016,416) | | | | | $ | — | | |
| BNP Paribas | | | | | 1,473,744 | | | | | | (1,473,744) | | | | | | — | | |
| BNP Paribas Prime Brokerage Intl Ltd | | | | | 1,237,602 | | | | | | (1,237,602) | | | | | | — | | |
| Goldman, Sachs & Co. LLC | | | | | 1,034,129 | | | | | | (1,034,129) | | | | | | — | | |
| J.P. Morgan Securities LLC | | | | | 1,424,237 | | | | | | (1,424,237) | | | | | | — | | |
| Morgan Stanley & Co. LLC | | | | | 561,521 | | | | | | (561,521) | | | | | | — | | |
| Scotia Capital (USA) INC | | | | | 472,262 | | | | | | (472,262) | | | | | | — | | |
| State Street Bank and Trust Company | | | | | 58,082 | | | | | | (58,082) | | | | | | — | | |
| TD Prime Services LLC | | | | | 240,838 | | | | | | (240,838) | | | | | | — | | |
| TD Securities INC | | | | | 358,468 | | | | | | (358,468) | | | | | | — | | |
| UBS AG | | | | | 33,324 | | | | | | (33,324) | | | | | | — | | |
| Wells Fargo Securities LLC | | | | | 16,110 | | | | | | (16,110) | | | | | | — | | |
| | | | | $ | 7,926,733 | | | | | $ | (7,926,733) | | | | | $ | — | | |
(1)
Cash collateral with a fair value of $8,175,410 has been received in connection with the above securities lending transactions. Excess cash collateral received from the individual counterparty is not shown for financial reporting purposes.
Intermediate Bond
| Counterparty | | | Securities
Loaned
at Value | | | Cash
Collateral
Received(1) | | | Net
Amount | |
| Barclays Bank PLC | | | | $ | 5,739,535 | | | | | $ | (5,739,535) | | | | | $ | — | | |
| Barclays Capital Inc. | | | | | 19,928,495 | | | | | | (19,928,495) | | | | | | — | | |
| BNP Paribas | | | | | 4,285,100 | | | | | | (4,285,100) | | | | | | — | | |
| BNP Paribas Prime Brokerage Intl Ltd | | | | | 1,012,117 | | | | | | (1,012,117) | | | | | | — | | |
| BofA Securities Inc | | | | | 7,781,292 | | | | | | (7,781,292) | | | | | | — | | |
| Citigroup Global Markets Inc. | | | | | 38,967 | | | | | | (38,967) | | | | | | — | | |
| Deutsche Bank, AG | | | | | 356,577 | | | | | | (356,577) | | | | | | — | | |
| Goldman Sachs International | | | | | 581,445 | | | | | | (581,445) | | | | | | — | | |
| Goldman, Sachs & Co. LLC | | | | | 8,119,369 | | | | | | (8,119,369) | | | | | | — | | |
| HSBC Securities (USA) Inc. | | | | | 3,275,260 | | | | | | (3,275,260) | | | | | | — | | |
| J.P. Morgan Securities LLC | | | | | 6,101,212 | | | | | | (6,101,212) | | | | | | — | | |
| Morgan Stanley & Co. LLC | | | | | 1,275,764 | | | | | | (1,275,764) | | | | | | — | | |
| Nomura International PLC | | | | | 678,353 | | | | | | (678,353) | | | | | | — | | |
| Nomura Securities International, Inc. | | | | | 4,928,899 | | | | | | (4,928,899) | | | | | | — | | |
| RBC Capital Markets, LLC | | | | | 1,735,638 | | | | | | (1,735,638) | | | | | | — | | |
| RBC Dominion Securities Inc | | | | | 252,475 | | | | | | (252,475) | | | | | | — | | |
| Scotia Capital (USA) INC | | | | | 672,748 | | | | | | (672,748) | | | | | | — | | |
| Societe Generale | | | | | 2,056,783 | | | | | | (2,056,783) | | | | | | — | | |
| TD Prime Services LLC | | | | | 4,195,767 | | | | | | (4,195,767) | | | | | | — | | |
| Truist Securities INC | | | | | 76,405 | | | | | | (76,405) | | | | | | — | | |
| UBS AG | | | | | 2,619,327 | | | | | | (2,619,327) | | | | | | — | | |
| US Bancorp Investments | | | | | 28,253 | | | | | | (28,253) | | | | | | — | | |
| Wells Fargo Bank NA | | | | | 1,904,394 | | | | | | (1,904,394) | | | | | | — | | |
| | | | | $ | 77,644,175 | | | | | $ | (77,644,175) | | | | | $ | — | | |
(1)
Cash collateral with a fair value of $80,033,894 has been received in connection with the above securities lending transactions. Excess cash collateral received from the individual counterparty is not shown for financial reporting purposes.
NOTES TO FINANCIAL STATEMENTS as of March 31, 2023 (continued)
NOTE 11 — SECURITIES LENDING (continued)
Short Term Bond
| Counterparty | | | Securities
Loaned
at Value | | | Cash
Collateral
Received(1) | | | Net
Amount | |
| Barclays Capital Inc. | | | | $ | 691,105 | | | | | $ | (691,105) | | | | | $ | — | | |
| BNP Paribas Prime Brokerage Intl Ltd | | | | | 328,270 | | | | | | (328,270) | | | | | | — | | |
| BofA Securities Inc | | | | | 411,694 | | | | | | (411,694) | | | | | | — | | |
| Deutsche Bank Securities Inc. | | | | | 437,779 | | | | | | (437,779) | | | | | | — | | |
| Mizuho Securities USA LLC. | | | | | 486,610 | | | | | | (486,610) | | | | | | — | | |
| Morgan Stanley & Co. LLC | | | | | 1,050,442 | | | | | | (1,050,442) | | | | | | — | | |
| Nomura Securities International, Inc. | | | | | 357,427 | | | | | | (357,427) | | | | | | — | | |
| RBC Capital Markets, LLC | | | | | 162,444 | | | | | | (162,444) | | | | | | — | | |
| Societe Generale | | | | | 11,881 | | | | | | (11,881) | | | | | | — | | |
| TD Prime Services LLC | | | | | 650,984 | | | | | | (650,984) | | | | | | — | | |
| Wells Fargo Clearing Services, LLC | | | | | 223,744 | | | | | | (223,744) | | | | | | — | | |
| | | | | $ | 4,812,380 | | | | | $ | (4,812,380) | | | | | $ | — | | |
(1)
Cash collateral with a fair value of $4,942,012 has been received in connection with the above securities lending transactions. Excess cash collateral received from the individual counterparty is not shown for financial reporting purposes.
Strategic Income Opportunities
| Counterparty | | | Securities
Loaned
at Value | | | Cash
Collateral
Received(1) | | | Net
Amount | |
| Barclays Capital Inc. | | | | $ | 1,276,838 | | | | | $ | (1,276,838) | | | | | $ | — | | |
| BNP Paribas | | | | | 997,266 | | | | | | (997,266) | | | | | | — | | |
| BNP Paribas Prime Brokerage Intl Ltd | | | | | 4,458,279 | | | | | | (4,458,279) | | | | | | — | | |
| BNP Paribas Securities Corp. | | | | | 116,282 | | | | | | (116,282) | | | | | | — | | |
| BofA Securities Inc | | | | | 70,822 | | | | | | (70,822) | | | | | | — | | |
| Citadel Clearing LLC | | | | | 1,024,151 | | | | | | (1,024,151) | | | | | | — | | |
| Citigroup Global Markets Inc. | | | | | 311,402 | | | | | | (311,402) | | | | | | — | | |
| Goldman, Sachs & Co. LLC | | | | | 1,541,351 | | | | | | (1,541,351) | | | | | | — | | |
| J.P. Morgan Securities LLC | | | | | 2,380,021 | | | | | | (2,380,021) | | | | | | — | | |
| Morgan Stanley & Co. LLC | | | | | 965,268 | | | | | | (965,268) | | | | | | — | | |
| Nomura Securities International, Inc. | | | | | 1,537,141 | | | | | | (1,537,141) | | | | | | — | | |
| RBC Capital Markets, LLC | | | | | 2,699,100 | | | | | | (2,699,100) | | | | | | — | | |
| RBC Dominion Securities Inc | | | | | 27,197 | | | | | | (27,197) | | | | | | — | | |
| Scotia Capital (USA) INC | | | | | 6,179 | | | | | | (6,179) | | | | | | — | | |
| TD Prime Services LLC | | | | | 155,186 | | | | | | (155,186) | | | | | | — | | |
| TD Securities (USA) Inc. | | | | | 309,097 | | | | | | (309,097) | | | | | | — | | |
| Truist Securities INC | | | | | 86,723 | | | | | | (86,723) | | | | | | — | | |
| UBS AG | | | | | 14,543 | | | | | | (14,543) | | | | | | — | | |
| Wells Fargo Bank NA | | | | | 1,132,091 | | | | | | (1,132,091) | | | | | | — | | |
| Wells Fargo Securities LLC | | | | | 256,498 | | | | | | (256,498) | | | | | | — | | |
| Total | | | | $ | 19,365,435 | | | | | $ | (19,365,435) | | | | | $ | — | | |
(1)
Cash collateral with a fair value of $19,957,719 has been received in connection with the above securities lending transactions. Excess cash collateral received from the individual counterparty is not shown for financial reporting purposes.
NOTE 12 — FEDERAL INCOME TAXES
The amount of distributions from net investment income and net realized capital gains are determined in accordance with federal income tax regulations, which may differ from GAAP for investment companies. These book/tax differences may be either temporary or permanent. Permanent differences are reclassified within the capital accounts based on their federal tax-basis treatment; temporary differences are not reclassified. Key differences include the treatment of foreign currency transactions, futures contracts, paydowns, swaps, capital loss carryforwards, straddle loss deferrals, income from passive foreign investment companies (PFICs) and wash sale deferrals. Distributions in excess of net investment income and/or net realized capital gains for tax purposes are reported as return of capital.
The following permanent tax differences have been reclassified as of March 31, 2023:
| | | | Paid-in
Capital | | | Distributable
Earnings | |
| High Yield Bond | | | | $ | (15,224,252 | )(1) | | | $ | 15,224,252 | | |
(1)
Amount is comprised of in-kind sales and related wash sales.
Dividends paid by the Funds from net investment income and distributions of net realized short-term capital gains are, for federal income tax purposes, taxable as ordinary income to shareholders.
The tax composition of dividends and distributions to shareholders was as follows:
| | | | Year Ended March 31, 2023 | | | Year Ended March 31, 2022 | |
| | | | Ordinary
Income | | | Long-term
Capital Gains | | | Ordinary
Income | | | Return of
Capital | |
| GNMA Income | | | | $ | 35,132,244 | | | | | $ | — | | | | | $ | 23,043,516 | | | | | $ | 1,246,729 | | |
| High Yield Bond | | | | | 32,145,490 | | | | | | 3,451,344 | | | | | | 46,733,715 | | | | | | — | | |
| Intermediate Bond | | | | | 256,679,701 | | | | | | — | | | | | | 241,620,464 | | | | | | 15,759,373 | | |
| Short Duration High Income | | | | | 257,963 | | | | | | — | | | | | | — | | | | | | — | | |
| Short Term Bond | | | | | 10,347,518 | | | | | | — | | | | | | 5,328,045 | | | | | | 1,297,390 | | |
| Strategic Income Opportunities | | | | | 79,582,543 | | | | | | — | | | | | | 65,079,993 | | | | | | 15,258,017 | | |
NOTES TO FINANCIAL STATEMENTS as of March 31, 2023 (continued)
NOTE 12 — FEDERAL INCOME TAXES (continued)
The tax-basis components of distributable earnings and the capital loss carryforwards which may be used to offset future realized capital gains for federal income tax purposes as of March 31, 2023 were:
| | | | Undistributed
Ordinary
Income | | | Unrealized
Appreciation/
(Depreciation) | | | Capital Loss Carryforwards | | | Other | | | Total
Distributable
Earnings/(Loss) | |
| | Amount | | | Character | | | Expiration | |
| GNMA Income | | | | $ | 157,275 | | | | | $ | (102,323,363) | | | | | $ | (70,598,959) | | | | | | Short-term | | | | | | None | | | | | $ | (706,339) | | | | | $ | (195,228,438) | | |
| | | | | | | | | | | | | | | | | | (21,757,052) | | | | | | Long-term | | | | | | None | | | | | | | | | | | | | | |
| | | | | | | | | | | | | | | | | $ | (92,356,011) | | | | | | | | | | | | | | | | | | | | | | | | | | |
| High Yield Bond | | | | | 622,458 | | | | | | (38,783,152) | | | | | | (6,648,860) | | | | | | Short-term | | | | | | None | | | | | | (108,310) | | | | | | (62,923,086) | | |
| | | | | | | | | | | | | | | | | | (18,005,222) | | | | | | Long-term | | | | | | None | | | | | | | | | | | | | | |
| | | | | | | | | | | | | | | | | $ | (24,654,082) | | | | | | | | | | | | | | | | | | | | | | | | | | |
| Intermediate Bond | | | | | 21,448,775 | | | | | | (633,772,459) | | | | | | (336,656,658) | | | | | | Short-term | | | | | | None | | | | | | (2,757,726) | | | | | | (1,419,408,649) | | |
| | | | | | | | | | | | | | | | | | (467,670,581) | | | | | | Long-term | | | | | | None | | | | | | | | | | | | | | |
| | | | | | | | | | | | | | | | | $ | (804,327,239) | | | | | | | | | | | | | | | | | | | | | | | | | | |
| Short Duration High Income | | | | | 1,288 | | | | | | (291,137) | | | | | | — | | | | | | — | | | | | | — | | | | | | (302) | | | | | | (290,151) | | |
| Short Term Bond | | | | | 236,858 | | | | | | (11,218,560) | | | | | | (9,222,164) | | | | | | Short-term | | | | | | None | | | | | | (733) | | | | | | (32,479,881) | | |
| | | | | | | | | | | | | | | | | | (12,275,282) | | | | | | Long-term | | | | | | None | | | | | | | | | | | | | | |
| | | | | | | | | | | | | | | | | $ | (21,497,446) | | | | | | | | | | | | | | | | | | | | | | | | | | |
| Strategic Income Opportunities | | | | | 6,766,129 | | | | | | (195,916,660) | | | | | | (38,840,366) | | | | | | Short-term | | | | | | None | | | | | | (667,241) | | | | | | (323,897,025) | | |
| | | | | | | | | | | | | | | | | | (95,238,887) | | | | | | Long-term | | | | | | None | | | | | | | | | | | | | | |
| | | | | | | | | | | | | | | | | $ | (134,079,253) | | | | | | | | | | | | | | | | | | | | | | | | | | |
The Funds’ major tax jurisdictions are U.S. federal and Arizona state.
As of March 31, 2023, no provision for income tax is required in the Funds’ financial statements as a result of tax positions taken on federal and state income tax returns for open tax years. The Funds’ federal and state income and federal excise tax returns for tax years for which the applicable statutes of limitations have not expired are subject to examination by the Internal Revenue Service and state department of revenue. Generally, the preceding four tax years remain subject to examination by these jurisdictions.
NOTE 13 — LONDON INTERBANK OFFERED RATE (“LIBOR”)
In 2017, the UK Financial Conduct Authority announced its intention to cease compelling banks to provide the quotations needed to sustain LIBOR after 2021. On March 5, 2021, ICE Benchmark Administration, the administrator of LIBOR, stated that non-U.S. dollar LIBOR reference rates and the one-week and two-month LIBOR reference rates ceased to be provided or no longer be representative immediately after December 31, 2021 and the remaining more commonly used LIBOR settings ceased to be provided or no longer be representative immediately after June 30, 2023. In addition, global regulators have announced that, with limited exceptions, no new LIBOR-based contracts should be entered into after 2021. Actions by regulators have resulted in the establishment of alternative reference rates to LIBOR in most major currencies (e.g., the Secured Overnight Financing Rate for U.S. Dollar LIBOR and the Sterling Overnight Interbank Average Rate for Sterling LIBOR).
Discontinuance of LIBOR and adoption/implementation of alternative rates pose a number of risks, including among others whether any substitute rate will experience the market participation and liquidity necessary to provide a
workable substitute for LIBOR; the effect on parties’ existing contractual arrangements, hedging transactions, and investment strategies generally from a conversion from LIBOR to alternative rates; the effect on a Fund’s existing investments (including, for example, fixed-income investments, senior loans, CLOs and CDOs, and derivatives transactions), including the possibility that some of those investments may terminate or their terms may be adjusted to the disadvantage of a Fund; and the risk of general market disruption during the period of the conversion. It is difficult to predict at this time the likely impact of the transition away from LIBOR on a Fund.
NOTE 14 — LIQUIDITY
Consistent with Rule 22e-4 under the 1940 Act, the Funds have established a liquidity risk management program to govern their approach to managing liquidity risk (the “Program”). The Board has approved the designation of the Funds’ Investment Adviser, Voya Investments, as the program administrator (the “Program Administrator”). The Program Administrator is responsible for implementing and monitoring the Program and has formed a Liquidity Risk Management Committee (the “Committee”) to assess and review, on an ongoing basis, each Fund’s liquidity risk.
NOTES TO FINANCIAL STATEMENTS as of March 31, 2023 (continued)
NOTE 14 — LIQUIDITY (continued)
The Program includes a number of elements that support the management and assessment of liquidity risk, including an annual assessment of liquidity risk factors and the periodic classification (or re- classification, as necessary) of a Fund’s investments into buckets (highly liquid, moderately liquid, less liquid and illiquid) that reflect the Committee’s assessment of the investments’ liquidity under current market conditions. The Committee also utilizes Fund-specific data, including information regarding a Fund’s shareholder base, characteristics of its investments, access to borrowing arrangements and historical redemptions to determine whether a Fund will be able to meet its redemption obligations in a timely manner.
During the period covered by the annual assessment, January 1, 2022 through December 31, 2022, the Program supported the Funds’ (with the exception of Short Duration High Income which had not commenced operations during annual assessment period) ability to honor redemption requests in a timely manner and the Program Administrator’s management of each Fund’s liquidity risk, including during any periods of market volatility and net redemptions.
There can be no assurance that the Program will achieve its objectives under all circumstances in the future. Please refer to each Fund’s prospectus for more information regarding each Fund’s exposure to liquidity risk and other risks.
NOTE 15 — MARKET DISRUPTION
A Fund is subject to the risk that geopolitical events will disrupt securities markets and adversely affect global economies and markets. Due to the increasing interdependence among global economies and markets, conditions in one country, market, or region might adversely impact markets, issuers and/or foreign exchange rates in other countries, including the United States. Wars, terrorism, global health crises and pandemics, and other geopolitical events that have led, and in the future may continue to lead, to increased market volatility and may have adverse short- or long-term effects on U.S. and global economies and markets generally. For example, the COVID-19 pandemic has resulted, and may continue to result, in significant market volatility, exchange suspensions and closures, declines in global financial markets, higher default rates, supply chain disruptions, and a substantial economic downturn in economies throughout the world. Natural and environmental disasters and systemic market dislocations are also highly disruptive to economies and markets. In addition, military action by Russia in Ukraine has, and may continue to, adversely affect global energy and financial markets and therefore
could affect the value of a Fund’s investments, including beyond a Fund’s direct exposure to Russian issuers or nearby geographic regions. The extent and duration of the military action, sanctions and resulting market disruptions are impossible to predict and could be substantial. Those events as well as other changes in foreign (non-U.S.) and domestic economic, social, and political conditions also could adversely affect individual issuers or related groups of issuers, securities markets, interest rates, credit ratings, inflation, investor sentiment, and other factors affecting the Fund’s investments. Any of these occurrences could disrupt the operations of a Fund and of the Fund’s service providers.
NOTE 16 — OTHER ACCOUNTING PRONOUNCEMENTS
In June 2022, the FASB issued Accounting Standards Update (ASU), ASU 2022-03, Fair Value Measurement (Topic 820) — Fair Value Measurement of Equity Securities Subject to Contractual Sale Restrictions, which clarifies that a contractual restriction on the sale of an equity security is not considered part of the unit of account of the equity security and, therefore, is not considered in measuring fair value. The amendments under this ASU are effective for fiscal years beginning after December 15, 2023; however, early adoption is permitted. Management expects that the adoption of the guidance will not have a material impact on the Funds' financial statements.
NOTE 17 — SUBSEQUENT EVENTS
Dividends. Subsequent to March 31, 2023, the Funds declared dividends from net investment income of:
| | | | Per Share
Amount | | | Payable
Date | | | Record
Date | |
| GNMA Income | | | | | | | | | | | | | | | | |
| Class A | | | | $ | 0.0197 | | | | May 1, 2023 | | | | | Daily | | |
| Class C | | | | $ | 0.0151 | | | | May 1, 2023 | | | | | Daily | | |
| Class I | | | | $ | 0.0216 | | | | May 1, 2023 | | | | | Daily | | |
| Class R6 | | | | $ | 0.0220 | | | | May 1, 2023 | | | | | Daily | | |
| Class W | | | | $ | 0.0213 | | | | May 1, 2023 | | | | | Daily | | |
| High Yield Bond | | | | | | | | | | | | | | | | |
| Class A | | | | $ | 0.0317 | | | | May 1, 2023 | | | | | Daily | | |
| Class C | | | | $ | 0.0276 | | | | May 1, 2023 | | | | | Daily | | |
| Class I | | | | $ | 0.0335 | | | | May 1, 2023 | | | | | Daily | | |
| Class R | | | | $ | 0.0304 | | | | May 1, 2023 | | | | | Daily | | |
| Class R6 | | | | $ | 0.0340 | | | | May 1, 2023 | | | | | Daily | | |
| Class W | | | | $ | 0.0332 | | | | May 1, 2023 | | | | | Daily | | |
| Intermediate Bond | | | | | | | | | | | | | | | | |
| Class A | | | | $ | 0.0240 | | | | May 1, 2023 | | | | | Daily | | |
| Class C | | | | $ | 0.0187 | | | | May 1, 2023 | | | | | Daily | | |
| Class I | | | | $ | 0.0264 | | | | May 1, 2023 | | | | | Daily | | |
| Class R | | | | $ | 0.0223 | | | | May 1, 2023 | | | | | Daily | | |
| Class R6 | | | | $ | 0.0269 | | | | May 1, 2023 | | | | | Daily | | |
| Class W | | | | $ | 0.0257 | | | | May 1, 2023 | | | | | Daily | | |
NOTES TO FINANCIAL STATEMENTS as of March 31, 2023 (continued)
NOTE 17 — SUBSEQUENT EVENTS (continued)
| | | | Per Share
Amount | | | Payable
Date | | | Record
Date | |
| Short Duration High Income | | | | | | | | | | | | | | | | |
| Class A | | | | $ | 0.0609 | | | | May 1, 2023 | | | | | Daily | | |
| Class I | | | | $ | 0.0626 | | | | May 1, 2023 | | | | | Daily | | |
| Class R6 | | | | $ | 0.0626 | | | | May 1, 2023 | | | | | Daily | | |
| Short Term Bond | | | | | | | | | | | | | | | | |
| Class A | | | | $ | 0.0240 | | | | May 1, 2023 | | | | | Daily | | |
| Class C | | | | $ | 0.0183 | | | | May 1, 2023 | | | | | Daily | | |
| Class I | | | | $ | 0.0261 | | | | May 1, 2023 | | | | | Daily | | |
| Class R | | | | $ | 0.0222 | | | | May 1, 2023 | | | | | Daily | | |
| Class R6 | | | | $ | 0.0265 | | | | May 1, 2023 | | | | | Daily | | |
| Class W | | | | $ | 0.0260 | | | | May 1, 2023 | | | | | Daily | | |
| Strategic Income Opportunities | | | | | | | | | | | | | | | | |
| Class A | | | | $ | 0.0316 | | | | May 1, 2023 | | | | | Daily | | |
| Class C | | | | $ | 0.0257 | | | | May 1, 2023 | | | | | Daily | | |
| Class I | | | | $ | 0.0333 | | | | May 1, 2023 | | | | | Daily | | |
| Class R | | | | $ | 0.0295 | | | | May 1, 2023 | | | | | Daily | | |
| Class R6 | | | | $ | 0.0338 | | | | May 1, 2023 | | | | | Daily | | |
| Class W | | | | $ | 0.0333 | | | | May 1, 2023 | | | | | Daily | | |
Line of Credit Renewal: Effective June 13, 2023, the funds to which the Credit Agreement is available will enter into a renewed Credit Agreement with BNY for an aggregate amount of $400,000,000 and will continue to pay a commitment fee equal to 0.15% per annum on the daily unused portion of the committed line amount payable quarterly in arrears.
The Funds have evaluated events occurring after the Statements of Assets and Liabilities date through the date that the financial statements were issued (“subsequent events”) to determine whether any subsequent events necessitated adjustment to or disclosure in the financial statements. Other than the above, no such subsequent events were identified.
PORTFOLIO OF INVESTMENTS
| Voya GNMA Income Fund | as of March 31, 2023 |
Principal
Amount† | | | Value | | | Percentage
of Net
Assets | |
| COLLATERALIZED MORTGAGE OBLIGATIONS: 50.3% | |
| 1,979,323 | | | Fannie Mae 2004-28 PZ,
6.000%, 05/25/2034 | | | | $ | 2,098,059 | | | | | | 0.2 | | |
| 1,818,929 | | | Fannie Mae 2004-88 ZC,
6.500%, 12/25/2034 | | | | | 1,964,461 | | | | | | 0.2 | | |
| 4,934,654 | | | Fannie Mae 2005-17 B,
6.500%, (US0001M +
6.500%), 03/25/2035 | | | | | 5,176,740 | | | | | | 0.4 | | |
| 1,316,360 | | | Fannie Mae 2005-43 PZ,
6.000%, 05/25/2035 | | | | | 1,391,354 | | | | | | 0.1 | | |
| 720,980 | | | Fannie Mae 2007-60 ZB,
4.750%, 05/25/2037 | | | | | 717,984 | | | | | | 0.1 | | |
| 2,426,682 (1) | | | Fannie Mae 2010-95 SB,
1.755%,
(-1.000*US0001M +
6.600%), 09/25/2040 | | | | | 180,455 | | | | | | 0.0 | | |
| 6,013,754 | | | Fannie Mae 2011-99 CZ,
4.500%, 10/25/2041 | | | | | 6,015,373 | | | | | | 0.5 | | |
| 4,551,020 (1) | | | Fannie Mae 2012-148 HI,
3.500%, 05/25/2042 | | | | | 506,166 | | | | | | 0.0 | | |
| 9,068,756 (1) | | | Fannie Mae 2012-148 IM,
3.000%, 01/25/2028 | | | | | 411,655 | | | | | | 0.0 | | |
| 144,653 (2) | | | Fannie Mae REMIC Trust
2002-W1 3A, 3.486%,
04/25/2042 | | | | | 134,975 | | | | | | 0.0 | | |
| 703,979 (2) | | | Fannie Mae REMIC Trust
2002-W6 3A, 4.242%,
01/25/2042 | | | | | 660,961 | | | | | | 0.1 | | |
| 3,983,310 | | | Fannie Mae REMIC Trust
2002-W9 A4, 6.000%,
08/25/2042 | | | | | 4,070,270 | | | | | | 0.3 | | |
| 740,166 | | | Fannie Mae REMIC Trust
2003-16 CX, 6.500%,
03/25/2033 | | | | | 776,768 | | | | | | 0.1 | | |
| 1,925,491 | | | Fannie Mae REMIC Trust
2003-34 LN, 5.000%,
05/25/2033 | | | | | 1,960,555 | | | | | | 0.2 | | |
| 3,042,898 | | | Fannie Mae REMIC Trust
2003-W15 2A7, 5.550%,
08/25/2043 | | | | | 3,072,611 | | | | | | 0.2 | | |
| 79,679 | | | Fannie Mae REMIC Trust
2004-61 SH, 4.617%,
(-3.998*US0001M +
23.988%), 11/25/2032 | | | | | 85,471 | | | | | | 0.0 | | |
| 2,183,969 (2) | | | Fannie Mae REMIC Trust
2004-W11 2A, 3.887%,
03/25/2043 | | | | | 2,066,638 | | | | | | 0.2 | | |
| 1,978,597 | | | Fannie Mae REMIC Trust
2004-W3 A8, 5.500%,
05/25/2034 | | | | | 1,984,168 | | | | | | 0.2 | | |
Principal
Amount† | | | Value | | | Percentage
of Net
Assets | |
| COLLATERALIZED MORTGAGE OBLIGATIONS: (continued) | |
| 252,774 (1) | | | Fannie Mae REMIC Trust
2005-17 ES, 1.905%,
(-1.000*US0001M +
6.750%), 03/25/2035 | | | | $ | 7,683 | | | | | | 0.0 | | |
| 245,701 | | | Fannie Mae REMIC Trust
2005-59 NQ, 4.762%,
(-2.500*US0001M +
16.875%), 05/25/2035 | | | | | 249,934 | | | | | | 0.0 | | |
| 402,402 | | | Fannie Mae REMIC Trust
2005-88 ZC, 5.000%,
10/25/2035 | | | | | 404,121 | | | | | | 0.0 | | |
| 77,835 | | | Fannie Mae REMIC Trust
2006-115 ES, 7.179%,
(-4.000*US0001M +
26.560%), 12/25/2036 | | | | | 91,558 | | | | | | 0.0 | | |
| 539,174 (1) | | | Fannie Mae REMIC Trust
2006-36 SP, 1.855%,
(-1.000*US0001M +
6.700%), 05/25/2036 | | | | | 35,547 | | | | | | 0.0 | | |
| 2,184,129 (1) | | | Fannie Mae REMIC Trust
2006-79 SH, 1.605%,
(-1.000*US0001M +
6.450%), 08/25/2036 | | | | | 224,917 | | | | | | 0.0 | | |
| 122,960 (2) | | | Fannie Mae REMIC Trust
2009-12 LK, 13.171%,
03/25/2039 | | | | | 137,136 | | | | | | 0.0 | | |
| 1,861,549 | | | Fannie Mae REMIC Trust
2009-66 XA, 5.500%,
12/25/2035 | | | | | 1,955,818 | | | | | | 0.2 | | |
| 6,058,525 | | | Fannie Mae REMIC Trust
2010-2 LC, 5.000%,
02/25/2040 | | | | | 6,181,621 | | | | | | 0.5 | | |
| 1,136,660 | | | Fannie Mae REMIC Trust
2011-30 ZA, 5.000%,
04/25/2041 | | | | | 1,136,292 | | | | | | 0.1 | | |
| 3,071,438 (1) | | | Fannie Mae REMIC Trust
2012-128 VS, 1.405%,
(-1.000*US0001M +
6.250%), 06/25/2042 | | | | | 167,146 | | | | | | 0.0 | | |
| 1,549,473 (1) | | | Fannie Mae REMIC Trust
2012-142 BI, 3.000%,
11/25/2027 | | | | | 51,499 | | | | | | 0.0 | | |
| 1,592,072 (1) | | | Fannie Mae REMIC Trust
2012-154 PI, 4.000%,
05/25/2042 | | | | | 200,376 | | | | | | 0.0 | | |
| 1,268,732 (1) | | | Fannie Mae REMIC Trust
2012-68 SD, 1.855%,
(-1.000*US0001M +
6.700%), 06/25/2032 | | | | | 85,108 | | | | | | 0.0 | | |
See Accompanying Notes to Financial Statements
PORTFOLIO OF INVESTMENTS
| Voya GNMA Income Fund | as of March 31, 2023 (continued) |
Principal
Amount† | | | Value | | | Percentage
of Net
Assets | |
| COLLATERALIZED MORTGAGE OBLIGATIONS: (continued) | |
| 3,457,000 | | | Fannie Mae REMIC Trust
2012-97 PC, 3.500%,
09/25/2042 | | | | $ | 3,082,684 | | | | | | 0.2 | | |
| 529,289 (1) | | | Fannie Mae REMIC Trust
2013-13 PI, 3.500%,
04/25/2042 | | | | | 42,088 | | | | | | 0.0 | | |
| 1,243,448 (1) | | | Fannie Mae REMIC Trust
2013-54 ID, 3.000%,
01/25/2033 | | | | | 83,309 | | | | | | 0.0 | | |
| 315,453 | | | Fannie Mae REMICS
2005-122 SE, 6.142%,
(-3.500*US0001M +
23.100%), 11/25/2035 | | | | | 326,564 | | | | | | 0.0 | | |
| 2,200,863 (1) | | | Fannie Mae REMICS
2005-17 SA, 1.855%,
(-1.000*US0001M +
6.700%), 03/25/2035 | | | | | 225,190 | | | | | | 0.0 | | |
| 311,184 | | | Fannie Mae REMICS
2005-75 GS, 5.714%,
(-3.000*US0001M +
20.250%), 08/25/2035 | | | | | 349,757 | | | | | | 0.0 | | |
| 2,804 (3) | | | Fannie Mae REMICS
2006-44 P, 0.000%,
12/25/2033 | | | | | 2,333 | | | | | | 0.0 | | |
| 4,463,108 (1) | | | Fannie Mae REMICS
2006-8 HL, 1.855%,
(-1.000*US0001M +
6.700%), 03/25/2036 | | | | | 429,349 | | | | | | 0.0 | | |
| 580,446 | | | Fannie Mae REMICS
2007-1 NR, 10.676%,
(-7.600*US0001M +
47.500%), 02/25/2037 | | | | | 974,683 | | | | | | 0.1 | | |
| 6,108,148 (1) | | | Fannie Mae REMICS
2010-147 LS, 1.605%,
(-1.000*US0001M +
6.450%), 01/25/2041 | | | | | 759,529 | | | | | | 0.1 | | |
| 995,584 | | | Fannie Mae REMICS
2010-26 F, 5.615%,
(US0001M + 0.770%),
11/25/2036 | | | | | 997,109 | | | | | | 0.1 | | |
| 947,911 | | | Fannie Mae REMICS
2010-39 FN, 5.675%,
(US0001M + 0.830%),
05/25/2040 | | | | | 949,186 | | | | | | 0.1 | | |
| 755,697 | | | Fannie Mae REMICS
2010-80 PZ, 5.000%,
07/25/2040 | | | | | 760,756 | | | | | | 0.1 | | |
| 1,000,000 | | | Fannie Mae REMICS
2010-87 PL, 4.000%,
06/25/2040 | | | | | 977,683 | | | | | | 0.1 | | |
Principal
Amount† | | | Value | | | Percentage
of Net
Assets | |
| COLLATERALIZED MORTGAGE OBLIGATIONS: (continued) | |
| 1,051,033 | | | Fannie Mae REMICS
2011-10 ZC, 5.000%,
02/25/2041 | | | | $ | 1,062,387 | | | | | | 0.1 | | |
| 750,000 | | | Fannie Mae REMICS
2011-105 MB, 4.000%,
10/25/2041 | | | | | 693,887 | | | | | | 0.1 | | |
| 1,304,737 | | | Fannie Mae REMICS
2011-4 CS, 3.209%,
(-2.000*US0001M +
12.900%), 05/25/2040 | | | | | 1,284,355 | | | | | | 0.1 | | |
| 1,829,169 (1) | | | Fannie Mae REMICS
2012-137 EI, 3.000%,
12/25/2027 | | | | | 73,973 | | | | | | 0.0 | | |
| 1,883,573 | | | Fannie Mae REMICS
2012-148 KH, 3.000%,
03/25/2042 | | | | | 1,777,378 | | | | | | 0.1 | | |
| 4,217,885 | | | Fannie Mae REMICS
2012-17 QZ, 4.000%,
03/25/2042 | | | | | 4,088,673 | | | | | | 0.3 | | |
| 2,675,908 | | | Fannie Mae REMICS
2012-27 EZ, 4.250%,
03/25/2042 | | | | | 2,621,673 | | | | | | 0.2 | | |
| 2,500,000 | | | Fannie Mae REMICS
2012-40 MY, 3.500%,
04/25/2042 | | | | | 2,300,664 | | | | | | 0.2 | | |
| 777,215 | | | Fannie Mae REMICS
2013-125 AZ, 4.000%,
11/25/2039 | | | | | 691,124 | | | | | | 0.1 | | |
| 1,243,922 (3) | | | Fannie Mae REMICS
2013-135 PO, 0.000%,
01/25/2044 | | | | | 946,155 | | | | | | 0.1 | | |
| 2,316,562 (1) | | | Fannie Mae REMICS
2013-25 BI, 3.000%,
03/25/2033 | | | | | 170,582 | | | | | | 0.0 | | |
| 1,342,632 | | | Fannie Mae REMICS
2013-55 VZ, 3.000%,
06/25/2043 | | | | | 1,232,329 | | | | | | 0.1 | | |
| 1,778,535 (1) | | | Fannie Mae REMICS
2013-62 AI, 3.000%,
06/25/2033 | | | | | 154,372 | | | | | | 0.0 | | |
| 1,401,927 | | | Fannie Mae REMICS
2015-22 DY, 3.000%,
04/25/2045 | | | | | 1,122,330 | | | | | | 0.1 | | |
| 1,342,493 | | | Fannie Mae REMICS
2015-26 UZ, 3.000%,
05/25/2045 | | | | | 1,073,347 | | | | | | 0.1 | | |
| 711,932 | | | Fannie Mae REMICS
2015-68 JW, 3.500%,
09/25/2030 | | | | | 672,236 | | | | | | 0.1 | | |
See Accompanying Notes to Financial Statements
PORTFOLIO OF INVESTMENTS
| Voya GNMA Income Fund | as of March 31, 2023 (continued) |
Principal
Amount† | | | Value | | | Percentage
of Net
Assets | |
| COLLATERALIZED MORTGAGE OBLIGATIONS: (continued) | |
| 2,630,000 | | | Fannie Mae REMICS
2016-103 PB, 3.000%,
01/25/2047 | | | | $ | 2,314,801 | | | | | | 0.2 | | |
| 4,563,560 (1) | | | Fannie Mae REMICS
2016-4 DS, 1.255%,
(-1.000*US0001M +
6.100%), 02/25/2046 | | | | | 558,408 | | | | | | 0.0 | | |
| 4,283,554 | | | Fannie Mae REMICS
2016-64 LD, 3.500%,
09/25/2046 | | | | | 3,973,594 | | | | | | 0.3 | | |
| 5,462,609 | | | Fannie Mae REMICS
2017-22 DZ, 4.000%,
04/25/2047 | | | | | 5,255,455 | | | | | | 0.4 | | |
| 7,510,000 | | | Fannie Mae REMICS
2018-16 TV, 3.000%,
05/25/2041 | | | | | 6,803,175 | | | | | | 0.5 | | |
| 443,764 | | | Fannie Mae REMICS
2018-25 AL, 3.500%,
04/25/2048 | | | | | 399,073 | | | | | | 0.0 | | |
| 545,804 | | | Fannie Mae REMICS
2018-37 DZ, 4.000%,
06/25/2048 | | | | | 525,788 | | | | | | 0.0 | | |
| 6,229,345 (1) | | | Fannie Mae REMICS
2019-49 IG, 3.000%,
03/25/2033 | | | | | 463,342 | | | | | | 0.0 | | |
| 1,671,495 | | | Fannie Mae REMICS
2019-6 GZ, 4.000%,
03/25/2059 | | | | | 1,544,261 | | | | | | 0.1 | | |
| 28,238,188 (1) | | | Fannie Mae REMICS
2020-34 AI, 3.500%,
06/25/2035 | | | | | 2,634,824 | | | | | | 0.2 | | |
| 4,101,913 (1) | | | Fannie Mae REMICS
2020-44 TI, 5.500%,
12/25/2035 | | | | | 658,483 | | | | | | 0.1 | | |
| 2,702,894 | | | Fannie Mae Series
2016-51 S, 1.075%,
(-1.000*US0001M +
5.920%), 10/25/2043 | | | | | 2,446,380 | | | | | | 0.2 | | |
| 1,314,622 (2) | | | Fannie Mae Trust
2004-W2 3A, 3.608%,
02/25/2044 | | | | | 1,267,045 | | | | | | 0.1 | | |
| 1,122,675 (2) | | | Fannie Mae Trust
2004-W2 4A, 3.556%,
02/25/2044 | | | | | 1,085,880 | | | | | | 0.1 | | |
| 3,069,970 | | | Freddie Mac 3770 GA,
4.500%, 10/15/2040 | | | | | 3,079,599 | | | | | | 0.2 | | |
| 1,605,519 | | | Freddie Mac REMIC Trust
2005-S001 2A2, 4.995%,
(US0001M + 0.150%),
09/25/2045 | | | | | 1,501,366 | | | | | | 0.1 | | |
Principal
Amount† | | | Value | | | Percentage
of Net
Assets | |
| COLLATERALIZED MORTGAGE OBLIGATIONS: (continued) | |
| 288,501 | | | Freddie Mac REMIC Trust
2653 SC, 4.469%,
(-0.500*US0001M +
6.800%), 07/15/2033 | | | | $ | 278,582 | | | | | | 0.0 | | |
| 655,280 | | | Freddie Mac REMIC Trust
2767 ZW, 6.000%,
03/15/2034 | | | | | 687,382 | | | | | | 0.1 | | |
| 65,712 | | | Freddie Mac REMIC Trust
3012 ST, 5.096%,
(-3.600*US0001M +
21.960%), 04/15/2035 | | | | | 67,157 | | | | | | 0.0 | | |
| 198,186 | | | Freddie Mac REMIC Trust
3065 DC, 5.807%,
(-3.000*US0001M +
19.860%), 03/15/2035 | | | | | 204,512 | | | | | | 0.0 | | |
| 285,453 | | | Freddie Mac REMIC Trust
3158 NE, 5.500%,
05/15/2036 | | | | | 295,891 | | | | | | 0.0 | | |
| 2,639,252 (1) | | | Freddie Mac REMIC Trust
3181 TA, 0.500%,
(-0.794*US0001M +
5.635%), 07/15/2036 | | | | | 48,418 | | | | | | 0.0 | | |
| 170,451 (1) | | | Freddie Mac REMIC Trust
3507 IA, 5.500%,
09/15/2035 | | | | | 20,952 | | | | | | 0.0 | | |
| 241,857 | | | Freddie Mac REMIC Trust
3864 NT, 5.500%,
(-9.167*US0001M +
60.500%), 03/15/2039 | | | | | 240,153 | | | | | | 0.0 | | |
| 1,149,739 | | | Freddie Mac REMIC Trust
3888 ZG, 4.000%,
07/15/2041 | | | | | 1,098,940 | | | | | | 0.1 | | |
| 6,115,350 (1) | | | Freddie Mac REMIC Trust
4176 IA, 2.500%,
03/15/2028 | | | | | 236,949 | | | | | | 0.0 | | |
| 115,582 (3) | | | Freddie Mac REMICS
2974 KO, 0.000%,
05/15/2035 | | | | | 92,968 | | | | | | 0.0 | | |
| 3,809,020 | | | Freddie Mac REMICS
3196 ZK, 6.500%,
04/15/2032 | | | | | 4,167,077 | | | | | | 0.3 | | |
| 1,125,867 | | | Freddie Mac REMICS
3658 CZ, 5.000%,
04/15/2040 | | | | | 1,150,215 | | | | | | 0.1 | | |
| 4,349,283 (1) | | | Freddie Mac REMICS
3960 SG, 1.316%,
(-1.000*US0001M +
6.000%), 11/15/2041 | | | | | 456,576 | | | | | | 0.0 | | |
See Accompanying Notes to Financial Statements
PORTFOLIO OF INVESTMENTS
| Voya GNMA Income Fund | as of March 31, 2023 (continued) |
Principal
Amount† | | | Value | | | Percentage
of Net
Assets | |
| COLLATERALIZED MORTGAGE OBLIGATIONS: (continued) | |
| 5,075,000 | | | Freddie Mac REMICS
4059 DY, 3.500%,
06/15/2042 | | | | $ | 4,843,338 | | | | | | 0.4 | | |
| 1,307,721 | | | Freddie Mac REMICS
4097 ZA, 3.500%,
08/15/2042 | | | | | 1,233,612 | | | | | | 0.1 | | |
| 4,088,693 | | | Freddie Mac REMICS
4136 ZG, 3.000%,
11/15/2042 | | | | | 3,731,942 | | | | | | 0.3 | | |
| 9,641,019 | | | Freddie Mac REMICS
4159 LZ, 3.500%,
01/15/2043 | | | | | 9,062,645 | | | | | | 0.7 | | |
| 1,871,677 | | | Freddie Mac REMICS
4249 CS, 1.154%,
(-0.750*US0001M +
4.650%), 09/15/2043 | | | | | 1,426,210 | | | | | | 0.1 | | |
| 2,856,693 | | | Freddie Mac REMICS
4274 US, 1.166%,
(-1.000*US0001M +
5.850%), 10/15/2035 | | | | | 2,375,029 | | | | | | 0.2 | | |
| 10,628,571 | | | Freddie Mac REMICS
4367 MZ, 4.000%,
07/15/2044 | | | | | 10,349,351 | | | | | | 0.8 | | |
| 2,666,803 | | | Freddie Mac REMICS
4372 Z, 3.000%,
08/15/2044 | | | | | 2,432,348 | | | | | | 0.2 | | |
| 7,702,551 (1) | | | Freddie Mac REMICS
4438 AS, 1.516%,
(-1.000*US0001M +
6.200%), 02/15/2045 | | | | | 780,992 | | | | | | 0.1 | | |
| 5,974,239 | | | Freddie Mac REMICS
4480 ZX, 4.000%,
11/15/2044 | | | | | 5,780,339 | | | | | | 0.4 | | |
| 4,127,405 | | | Freddie Mac REMICS
4631 CZ, 3.500%,
11/15/2046 | | | | | 3,864,254 | | | | | | 0.3 | | |
| 2,484,509 | | | Freddie Mac REMICS
4818 GZ, 4.000%,
08/15/2048 | | | | | 2,385,428 | | | | | | 0.2 | | |
| 2,597,868 | | | Freddie Mac REMICS
5000 DC, 2.500%,
03/25/2040 | | | | | 2,287,715 | | | | | | 0.2 | | |
| 23,259,378 (1) | | | Freddie Mac REMICS
5013 QI, 3.500%,
09/25/2050 | | | | | 4,199,504 | | | | | | 0.3 | | |
| 1,455,052 | | | Freddie Mac Series
4040 UZ, 5.000%,
05/15/2042 | | | | | 1,482,389 | | | | | | 0.1 | | |
Principal
Amount† | | | Value | | | Percentage
of Net
Assets | |
| COLLATERALIZED MORTGAGE OBLIGATIONS: (continued) | |
| 999,254 (2) | | | Freddie Mac Structured
Pass-Through Certificates
T-54 2A, 3.830%,
07/25/2033 | | | | $ | 930,266 | | | | | | 0.1 | | |
| 533,184 (2) | | | Freddie Mac Structured
Pass-Through Certificates
T-54 4A, 3.936%,
02/25/2043 | | | | | 491,553 | | | | | | 0.0 | | |
| 5,321,957 | | | Freddie Mac Whole Loan
Securities Trust
2017-SC02 1A2, 3.000%,
05/25/2047 | | | | | 4,740,463 | | | | | | 0.4 | | |
| 7,612 (1) | | | Freddie Mac-Ginnie Mae
Series 21 SA, 3.155%,
(-1.000*US0001M +
8.000%), 10/25/2023 | | | | | 55 | | | | | | 0.0 | | |
| 641,059 | | | Ginnie Mae 2004-65 ZG,
5.500%, 07/20/2034 | | | | | 653,443 | | | | | | 0.1 | | |
| 6,298,555 | | | Ginnie Mae 2009-110 ZA,
5.500%, 11/16/2039 | | | | | 6,485,158 | | | | | | 0.5 | | |
| 875,900 | | | Ginnie Mae 2009-32 QZ,
5.500%, 05/16/2039 | | | | | 902,446 | | | | | | 0.1 | | |
| 709,061 | | | Ginnie Mae 2009-32 YZ,
7.000%, 05/16/2039 | | | | | 766,891 | | | | | | 0.1 | | |
| 4,194,924 | | | Ginnie Mae 2009-50 MZ,
6.000%, 07/16/2039 | | | | | 4,350,490 | | | | | | 0.3 | | |
| 332,916 | | | Ginnie Mae 2009-54 HZ,
5.000%, 07/20/2039 | | | | | 335,637 | | | | | | 0.0 | | |
| 1,213,893 | | | Ginnie Mae 2009-79 PZ,
6.000%, 09/20/2039 | | | | | 1,325,400 | | | | | | 0.1 | | |
| 559,881 | | | Ginnie Mae 2009-H01 FA,
5.911%, (US0001M +
1.150%), 11/20/2059 | | | | | 560,302 | | | | | | 0.0 | | |
| 2,000,000 | | | Ginnie Mae 2010-116 PB,
5.000%, 06/16/2040 | | | | | 2,053,563 | | | | | | 0.2 | | |
| 2,330,195 | | | Ginnie Mae 2010-125 BZ,
4.500%, 09/16/2040 | | | | | 2,309,085 | | | | | | 0.2 | | |
| 2,197,154 (3) | | | Ginnie Mae 2011-70 PO,
0.000%, 05/16/2041 | | | | | 1,699,867 | | | | | | 0.1 | | |
| 1,820,985 (1) | | | Ginnie Mae 2014-107 XS,
0.872%,
(-1.000*US0001M +
5.600%), 07/16/2044 | | | | | 151,017 | | | | | | 0.0 | | |
| 1,850,316 | | | Ginnie Mae 2014-149 KL,
4.000%, 10/16/2044 | | | | | 1,753,811 | | | | | | 0.1 | | |
See Accompanying Notes to Financial Statements
PORTFOLIO OF INVESTMENTS
| Voya GNMA Income Fund | as of March 31, 2023 (continued) |
Principal
Amount† | | | Value | | | Percentage
of Net
Assets | |
| COLLATERALIZED MORTGAGE OBLIGATIONS: (continued) | |
| 904,089 (1) | | | Ginnie Mae 2014-96 SQ,
0.872%,
(-1.000*US0001M +
5.600%), 07/16/2044 | | | | $ | 75,971 | | | | | | 0.0 | | |
| 130,000 | | | Ginnie Mae 2015-123 GY,
3.000%, 09/20/2045 | | | | | 107,227 | | | | | | 0.0 | | |
| 4,773,586 | | | Ginnie Mae 2015-H13 FG,
4.966%, (US0001M +
0.400%), 04/20/2065 | | | | | 4,744,653 | | | | | | 0.4 | | |
| 12,536,933 (1) | | | Ginnie Mae 2016-120 IM,
3.500%, 07/20/2046 | | | | | 1,457,371 | | | | | | 0.1 | | |
| 311,512 (1) | | | Ginnie Mae 2016-84 IO,
5.000%, 12/20/2040 | | | | | 7,316 | | | | | | 0.0 | | |
| 10,274,309 | | | Ginnie Mae 2016-H20 FB,
5.116%, (US0001M +
0.550%), 09/20/2066 | | | | | 10,218,859 | | | | | | 0.8 | | |
| 1,000,000 | | | Ginnie Mae 2017-117 BE,
2.500%, 08/20/2047 | | | | | 847,479 | | | | | | 0.1 | | |
| 1,000,000 | | | Ginnie Mae 2017-117 NG,
2.500%, 08/20/2047 | | | | | 840,217 | | | | | | 0.1 | | |
| 750,000 | | | Ginnie Mae 2017-163 YA,
2.500%, 11/20/2047 | | | | | 626,098 | | | | | | 0.0 | | |
| 10,000,000 | | | Ginnie Mae 2017-180 QB,
2.500%, 12/20/2047 | | | | | 8,717,746 | | | | | | 0.7 | | |
| 4,718,571 | | | Ginnie Mae 2018-64 ZH,
2.500%, 05/16/2045 | | | | | 4,138,094 | | | | | | 0.3 | | |
| 754,297 (1) | | | Ginnie Mae 2018-78 IC,
4.000%, 02/20/2047 | | | | | 102,007 | | | | | | 0.0 | | |
| 1,000,000 | | | Ginnie Mae 2018-91 JN,
3.000%, 07/20/2048 | | | | | 895,846 | | | | | | 0.1 | | |
| 109,899 | | | Ginnie Mae 2019-71 EN,
4.000%, 06/20/2049 | | | | | 99,933 | | | | | | 0.0 | | |
| 6,354,449 (1) | | | Ginnie Mae 2021-74 KI,
3.000%, 04/20/2051 | | | | | 936,500 | | | | | | 0.1 | | |
| 10,655,235 | | | Ginnie Mae 2022-205 ZG,
5.500%, 12/20/2052 | | | | | 10,851,458 | | | | | | 0.8 | | |
| 2,346,452 | | | Ginnie Mae 2022-47 EB,
3.000%, 03/20/2037 | | | | | 2,009,282 | | | | | | 0.2 | | |
| 66,362 | | | Ginnie Mae Series
2004-16 AE, 5.500%,
02/20/2034 | | | | | 67,401 | | | | | | 0.0 | | |
| 624,985 | | | Ginnie Mae Series
2004-17 MZ, 5.500%,
03/16/2034 | | | | | 628,305 | | | | | | 0.0 | | |
| 431,025 | | | Ginnie Mae Series
2004-28 CZ, 5.500%,
04/20/2034 | | | | | 439,595 | | | | | | 0.0 | | |
Principal
Amount† | | | Value | | | Percentage
of Net
Assets | |
| COLLATERALIZED MORTGAGE OBLIGATIONS: (continued) | |
| 218,724 (3) | | | Ginnie Mae Series
2004-37 OA, 0.000%,
04/17/2034 | | | | $ | 184,534 | | | | | | 0.0 | | |
| 1,584,166 | | | Ginnie Mae Series
2004-81 Z, 5.000%,
10/20/2034 | | | | | 1,590,955 | | | | | | 0.1 | | |
| 659,346 (1) | | | Ginnie Mae Series
2004-98 SA, 1.939%,
(-1.000*US0001M +
6.700%), 11/20/2034 | | | | | 76,076 | | | | | | 0.0 | | |
| 547,560 | | | Ginnie Mae Series
2005-21 Z, 5.000%,
03/20/2035 | | | | | 553,926 | | | | | | 0.0 | | |
| 116,129 (1) | | | Ginnie Mae Series
2005-25 SI, 6.000%,
(-6.000*US0001M +
43.200%), 01/20/2034 | | | | | 14,495 | | | | | | 0.0 | | |
| 398,051 (1) | | | Ginnie Mae Series
2005-7 AH, 2.042%,
(-1.000*US0001M +
6.770%), 02/16/2035 | | | | | 34,998 | | | | | | 0.0 | | |
| 489,628 (1) | | | Ginnie Mae Series
2005-73 IM, 5.500%,
09/20/2035 | | | | | 86,569 | | | | | | 0.0 | | |
| 958,912 | | | Ginnie Mae Series
2005-80 Z, 5.000%,
10/20/2035 | | | | | 969,737 | | | | | | 0.1 | | |
| 89,229 | | | Ginnie Mae Series
2005-91 UP, 4.845%,
(-2.000*US0001M +
14.300%), 09/16/2031 | | | | | 90,360 | | | | | | 0.0 | | |
| 5,158,250 | | | Ginnie Mae Series
2006-10 ZT, 6.000%,
03/20/2036 | | | | | 5,308,587 | | | | | | 0.4 | | |
| 1,575,575 | | | Ginnie Mae Series
2006-17 TW, 6.000%,
04/20/2036 | | | | | 1,616,324 | | | | | | 0.1 | | |
| 4,741,816 (1) | | | Ginnie Mae Series
2006-26 TB, 0.250%,
(-1.000*US0001M +
6.500%), 06/20/2036 | | | | | 44,966 | | | | | | 0.0 | | |
| 1,425,848 | | | Ginnie Mae Series
2006-7 ZA, 5.500%,
02/20/2036 | | | | | 1,460,655 | | | | | | 0.1 | | |
| 1,060,397 (1) | | | Ginnie Mae Series
2007-17 CI, 7.500%,
04/16/2037 | | | | | 201,433 | | | | | | 0.0 | | |
See Accompanying Notes to Financial Statements
PORTFOLIO OF INVESTMENTS
| Voya GNMA Income Fund | as of March 31, 2023 (continued) |
Principal
Amount† | | | Value | | | Percentage
of Net
Assets | |
| COLLATERALIZED MORTGAGE OBLIGATIONS: (continued) | |
| 1,077,794 (3) | | | Ginnie Mae Series
2007-41 OL, 0.000%,
07/20/2037 | | | | $ | 872,697 | | | | | | 0.1 | | |
| 63,841 | | | Ginnie Mae Series
2007-45 PE, 5.500%,
07/16/2037 | | | | | 65,204 | | | | | | 0.0 | | |
| 222,314 | | | Ginnie Mae
Series 2007-48 SY,
6.067%,
(-3.000*US0001M +
20.250%), 08/16/2037 | | | | | 226,886 | | | | | | 0.0 | | |
| 1,237,345 (1) | | | Ginnie Mae
Series 2007-53 SC,
1.739%,
(-1.000*US0001M +
6.500%), 09/20/2037 | | | | | 141,030 | | | | | | 0.0 | | |
| 37,179 | | | Ginnie Mae
Series 2007-53 SW,
5.921%,
(-3.000*US0001M +
20.205%), 09/20/2037 | | | | | 39,002 | | | | | | 0.0 | | |
| 640,037 | | | Ginnie Mae
Series 2007-60 YZ,
5.500%, 10/20/2037 | | | | | 645,567 | | | | | | 0.1 | | |
| 2,813,506 | | | Ginnie Mae
Series 2008-20 PZ,
6.000%, 03/20/2038 | | | | | 2,880,400 | | | | | | 0.2 | | |
| 354,599 (1) | | | Ginnie Mae Series 2008-3
SA, 1.789%,
(-1.000*US0001M +
6.550%), 01/20/2038 | | | | | 46,370 | | | | | | 0.0 | | |
| 602,418 (1) | | | Ginnie Mae
Series 2008-40 PS,
1.772%,
(-1.000*US0001M +
6.500%), 05/16/2038 | | | | | 51,764 | | | | | | 0.0 | | |
| 806,795 (1) | | | Ginnie Mae
Series 2008-51 GS,
1.502%,
(-1.000*US0001M +
6.230%), 06/16/2038 | | | | | 85,573 | | | | | | 0.0 | | |
| 1,528,462 (1) | | | Ginnie Mae
Series 2008-82 SA,
1.239%,
(-1.000*US0001M +
6.000%), 09/20/2038 | | | | | 165,895 | | | | | | 0.0 | | |
| 1,428,806 (1) | | | Ginnie Mae
Series 2009-110 SA,
1.622%,
(-1.000*US0001M +
6.350%), 04/16/2039 | | | | | 26,833 | | | | | | 0.0 | | |
Principal
Amount† | | | Value | | | Percentage
of Net
Assets | |
| COLLATERALIZED MORTGAGE OBLIGATIONS: (continued) | |
| 910,038 | | | Ginnie Mae
Series 2009-110 ZC,
4.500%, 11/16/2039 | | | | $ | 902,872 | | | | | | 0.1 | | |
| 2,083,794 | | | Ginnie Mae
Series 2009-118 XZ,
5.000%, 12/20/2039 | | | | | 2,104,825 | | | | | | 0.2 | | |
| 925,720 | | | Ginnie Mae
Series 2009-121 ZQ,
5.500%, 09/20/2039 | | | | | 948,379 | | | | | | 0.1 | | |
| 866,844 | | | Ginnie Mae
Series 2009-31 BP,
5.000%, 05/20/2039 | | | | | 875,521 | | | | | | 0.1 | | |
| 1,264,501 | | | Ginnie Mae
Series 2009-31 ZL,
4.500%, 05/20/2039 | | | | | 1,266,612 | | | | | | 0.1 | | |
| 1,232,446 | | | Ginnie Mae
Series 2009-34 Z,
4.500%, 05/16/2039 | | | | | 1,233,138 | | | | | | 0.1 | | |
| 1,671,015 | | | Ginnie Mae
Series 2009-53 ZB,
6.000%, 07/16/2039 | | | | | 1,725,544 | | | | | | 0.1 | | |
| 157,536 (1) | | | Ginnie Mae
Series 2009-55 BI,
1.000%,
(-25.000*US0001M +
162.500%), 06/16/2037 | | | | | 5,929 | | | | | | 0.0 | | |
| 2,299,664 | | | Ginnie Mae
Series 2009-61 EZ,
7.500%, 08/20/2039 | | | | | 2,478,645 | | | | | | 0.2 | | |
| 7,148,459 | | | Ginnie Mae
Series 2009-61 PZ,
7.500%, 08/20/2039 | | | | | 8,022,767 | | | | | | 0.6 | | |
| 3,954,767 | | | Ginnie Mae
Series 2009-61 ZQ,
6.000%, 08/16/2039 | | | | | 4,227,491 | | | | | | 0.3 | | |
| 681,926 (1) | | | Ginnie Mae
Series 2009-66 QS,
1.339%,
(-1.000*US0001M +
6.100%), 07/20/2039 | | | | | 29,485 | | | | | | 0.0 | | |
| 3,033,579 | | | Ginnie Mae
Series 2009-68 ZC,
5.500%, 08/16/2039 | | | | | 3,120,887 | | | | | | 0.2 | | |
| 476,684 (1) | | | Ginnie Mae
Series 2009-77 SA,
1.422%,
(-1.000*US0001M +
6.150%), 09/16/2039 | | | | | 50,431 | | | | | | 0.0 | | |
See Accompanying Notes to Financial Statements
PORTFOLIO OF INVESTMENTS
| Voya GNMA Income Fund | as of March 31, 2023 (continued) |
Principal
Amount† | | | Value | | | Percentage
of Net
Assets | |
| COLLATERALIZED MORTGAGE OBLIGATIONS: (continued) | |
| 3,140,413 | | | Ginnie Mae
Series 2009-77 ZB,
5.500%, 09/16/2039 | | | | $ | 3,250,685 | | | | | | 0.2 | | |
| 2,410,791 | | | Ginnie Mae
Series 2009-87 WZ,
6.000%, 10/20/2039 | | | | | 2,611,108 | | | | | | 0.2 | | |
| 694,340 | | | Ginnie Mae
Series 2009-92 DZ,
4.500%, 10/16/2039 | | | | | 683,500 | | | | | | 0.1 | | |
| 1,660,171 | | | Ginnie Mae
Series 2009-98 MZ,
5.000%, 10/16/2039 | | | | | 1,677,934 | | | | | | 0.1 | | |
| 911,680 (1) | | | Ginnie Mae
Series 2010-106 IP,
5.000%, 03/20/2040 | | | | | 74,857 | | | | | | 0.0 | | |
| 6,990,011 | | | Ginnie Mae
Series 2010-113 BE,
4.500%, 09/20/2040 | | | | | 6,989,492 | | | | | | 0.5 | | |
| 892,265 (1) | | | Ginnie Mae
Series 2010-116 NS,
1.922%,
(-1.000*US0001M +
6.650%), 09/16/2040 | | | | | 74,475 | | | | | | 0.0 | | |
| 3,896,616 | | | Ginnie Mae
Series 2010-117 ZQ,
4.500%, 09/20/2040 | | | | | 3,935,031 | | | | | | 0.3 | | |
| 918,000 | | | Ginnie Mae
Series 2010-121 TB,
4.000%, 09/20/2040 | | | | | 892,171 | | | | | | 0.1 | | |
| 23,174 (1) | | | Ginnie Mae
Series 2010-130 KI,
5.500%, 09/16/2040 | | | | | 844 | | | | | | 0.0 | | |
| 1,500,000 | | | Ginnie Mae
Series 2010-14 B,
4.500%, 02/16/2040 | | | | | 1,496,019 | | | | | | 0.1 | | |
| 638,260 (1) | | | Ginnie Mae
Series 2010-158 SA,
1.289%,
(-1.000*US0001M +
6.050%), 12/20/2040 | | | | | 71,557 | | | | | | 0.0 | | |
| 893,059 | | | Ginnie Mae
Series 2010-162 ZE,
4.000%, 12/16/2040 | | | | | 878,123 | | | | | | 0.1 | | |
| 8,736,545 (1) | | | Ginnie Mae
Series 2010-166 GS,
1.239%,
(-1.000*US0001M +
6.000%), 12/20/2040 | | | | | 800,711 | | | | | | 0.1 | | |
| 403,600 (1) | | | Ginnie Mae
Series 2010-166 NI,
4.500%, 04/20/2039 | | | | | 12,065 | | | | | | 0.0 | | |
Principal
Amount† | | | Value | | | Percentage
of Net
Assets | |
| COLLATERALIZED MORTGAGE OBLIGATIONS: (continued) | |
| 871,078 | | | Ginnie Mae
Series 2010-169 AW,
4.500%, 12/20/2040 | | | | $ | 864,148 | | | | | | 0.1 | | |
| 908,029 | | | Ginnie Mae
Series 2010-169 JZ,
4.000%, 12/20/2040 | | | | | 869,401 | | | | | | 0.1 | | |
| 152,529 (1) | | | Ginnie Mae
Series 2010-19 LI,
5.000%, 07/16/2039 | | | | | 6,723 | | | | | | 0.0 | | |
| 913,496 | | | Ginnie Mae
Series 2010-31 BP,
5.000%, 03/20/2040 | | | | | 908,717 | | | | | | 0.1 | | |
| 813,669 (1) | | | Ginnie Mae Series 2010-4
WI, 6.000%, 01/16/2040 | | | | | 110,745 | | | | | | 0.0 | | |
| 4,496,836 | | | Ginnie Mae
Series 2010-42 VZ,
5.500%, 10/20/2039 | | | | | 4,624,358 | | | | | | 0.4 | | |
| 706,908 | | | Ginnie Mae
Series 2010-59 ZA,
4.500%, 05/20/2040 | | | | | 701,969 | | | | | | 0.1 | | |
| 6,040,969 | | | Ginnie Mae
Series 2010-H10 FB,
5.635%, (US0001M +
1.000%), 05/20/2060 | | | | | 6,055,755 | | | | | | 0.5 | | |
| 3,145,807 | | | Ginnie Mae
Series 2010-H10 FC,
5.635%, (US0001M +
1.000%), 05/20/2060 | | | | | 3,152,186 | | | | | | 0.2 | | |
| 1,210,245 | | | Ginnie Mae
Series 2010-H20 AF,
4.896%, (US0001M +
0.330%), 10/20/2060 | | | | | 1,201,396 | | | | | | 0.1 | | |
| 177,188 | | | Ginnie Mae
Series 2010-H26 LF,
4.916%, (US0001M +
0.350%), 08/20/2058 | | | | | 175,955 | | | | | | 0.0 | | |
| 272,420 | | | Ginnie Mae
Series 2011-116 CI,
4.000%, 05/16/2026 | | | | | 8,463 | | | | | | 0.0 | | |
| 162,989 (1) | | | Ginnie Mae
Series 2011-123 QI,
5.000%, 05/20/2041 | | | | | 15,002 | | | | | | 0.0 | | |
| 427,231 | | | Ginnie Mae
Series 2011-128 TF,
5.178%, (US0001M +
0.450%), 05/16/2041 | | | | | 421,640 | | | | | | 0.0 | | |
| 2,062,835 (1) | | | Ginnie Mae
Series 2011-141 PS,
1.972%,
(-1.000*US0001M +
6.700%), 06/16/2041 | | | | | 146,338 | | | | | | 0.0 | | |
See Accompanying Notes to Financial Statements
PORTFOLIO OF INVESTMENTS
| Voya GNMA Income Fund | as of March 31, 2023 (continued) |
Principal
Amount† | | | Value | | | Percentage
of Net
Assets | |
| COLLATERALIZED MORTGAGE OBLIGATIONS: (continued) | |
| 1,684,614 (1) | | | Ginnie Mae
Series 2011-146 EI,
5.000%, 11/16/2041 | | | | $ | 304,017 | | | | | | 0.0 | | |
| 945,000 | | | Ginnie Mae
Series 2011-151 PY,
3.000%, 11/20/2041 | | | | | 851,511 | | | | | | 0.1 | | |
| 36,860 | | | Ginnie Mae
Series 2011-169 BC,
7.000%, 05/16/2032 | | | | | 37,713 | | | | | | 0.0 | | |
| 116,161 (2) | | | Ginnie Mae
Series 2011-169 BG,
5.450%, 04/16/2039 | | | | | 116,655 | | | | | | 0.0 | | |
| 5,700,328 | | | Ginnie Mae
Series 2011-25 Z,
4.000%, 02/20/2041 | | | | | 5,573,107 | | | | | | 0.4 | | |
| 1,218,723 | | | Ginnie Mae
Series 2011-59 QC,
4.000%, 12/20/2040 | | | | | 1,192,019 | | | | | | 0.1 | | |
| 1,031,833 | | | Ginnie Mae
Series 2011-69 HW,
4.000%, 04/20/2040 | | | | | 1,020,066 | | | | | | 0.1 | | |
| 228,454 (1) | | | Ginnie Mae
Series 2011-73 LS,
1.929%,
(-1.000*US0001M +
6.690%), 08/20/2039 | | | | | 648 | | | | | | 0.0 | | |
| 1,986,562 | | | Ginnie Mae
Series 2011-89 Z,
3.500%, 06/20/2041 | | | | | 1,900,861 | | | | | | 0.1 | | |
| 1,190,997 | | | Ginnie Mae
Series 2011-H01 AF,
5.016%, (US0001M +
0.450%), 11/20/2060 | | | | | 1,185,537 | | | | | | 0.1 | | |
| 1,613,510 | | | Ginnie Mae
Series 2011-H03 FA,
5.066%, (US0001M +
0.500%), 01/20/2061 | | | | | 1,605,724 | | | | | | 0.1 | | |
| 304,047 | | | Ginnie Mae
Series 2011-H07 FA,
5.066%, (US0001M +
0.500%), 02/20/2061 | | | | | 302,424 | | | | | | 0.0 | | |
| 170,481 | | | Ginnie Mae
Series 2011-H08 FD,
5.066%, (US0001M +
0.500%), 02/20/2061 | | | | | 169,630 | | | | | | 0.0 | | |
| 384,327 | | | Ginnie Mae
Series 2011-H09 AF,
5.066%, (US0001M +
0.500%), 03/20/2061 | | | | | 382,533 | | | | | | 0.0 | | |
Principal
Amount† | | | Value | | | Percentage
of Net
Assets | |
| COLLATERALIZED MORTGAGE OBLIGATIONS: (continued) | |
| 377,860 | | | Ginnie Mae
Series 2011-H11 FB,
5.066%, (US0001M +
0.500%), 04/20/2061 | | | | $ | 376,103 | | | | | | 0.0 | | |
| 450,704 | | | Ginnie Mae
Series 2011-H19 FA,
5.036%, (US0001M +
0.470%), 08/20/2061 | | | | | 448,400 | | | | | | 0.0 | | |
| 1,117,005 | | | Ginnie Mae
Series 2011-H20 FA,
5.116%, (US0001M +
0.550%), 09/20/2061 | | | | | 1,112,257 | | | | | | 0.1 | | |
| 232,053 | | | Ginnie Mae
Series 2011-H21 FT,
5.390%, (H15T1Y +
0.700%), 10/20/2061 | | | | | 231,651 | | | | | | 0.0 | | |
| 919,904 (1) | | | Ginnie Mae
Series 2012-103 IC,
3.500%, 08/16/2040 | | | | | 38,714 | | | | | | 0.0 | | |
| 229,987 (1) | | | Ginnie Mae
Series 2012-124 MI,
4.000%, 03/20/2042 | | | | | 19,275 | | | | | | 0.0 | | |
| 12,433,435 (1) | | | Ginnie Mae
Series 2012-136 BI,
3.500%, 11/20/2042 | | | | | 1,851,746 | | | | | | 0.1 | | |
| 2,075,515 (1) | | | Ginnie Mae
Series 2012-146 AI,
3.000%, 10/20/2037 | | | | | 56,008 | | | | | | 0.0 | | |
| 251,187 (1) | | | Ginnie Mae
Series 2012-34 MS,
1.972%,
(-1.000*US0001M +
6.700%), 04/16/2041 | | | | | 14,799 | | | | | | 0.0 | | |
| 2,559,342 (1) | | | Ginnie Mae
Series 2012-48 SA,
1.922%,
(-1.000*US0001M +
6.650%), 04/16/2042 | | | | | 334,877 | | | | | | 0.0 | | |
| 3,235,726 (1) | | | Ginnie Mae
Series 2012-60 SG,
1.372%,
(-1.000*US0001M +
6.100%), 05/16/2042 | | | | | 327,881 | | | | | | 0.0 | | |
| 3,603,443 | | | Ginnie Mae
Series 2012-77 FE,
5.118%, (US0001M +
0.390%), 05/16/2041 | | | | | 3,574,740 | | | | | | 0.3 | | |
See Accompanying Notes to Financial Statements
PORTFOLIO OF INVESTMENTS
| Voya GNMA Income Fund | as of March 31, 2023 (continued) |
Principal
Amount† | | | Value | | | Percentage
of Net
Assets | |
| COLLATERALIZED MORTGAGE OBLIGATIONS: (continued) | |
| 694,821 (1) | | | Ginnie Mae
Series 2012-93 NS,
1.339%,
(-1.000*US0001M +
6.100%), 07/20/2042 | | | | $ | 65,974 | | | | | | 0.0 | | |
| 756,367 (1) | | | Ginnie Mae
Series 2012-98 EI,
4.000%, 04/20/2041 | | | | | 75,958 | | | | | | 0.0 | | |
| 2,129,101 | | | Ginnie Mae
Series 2012-H06 FS,
5.266%, (US0001M +
0.700%), 03/20/2062 | | | | | 2,123,465 | | | | | | 0.2 | | |
| 4,721,681 | | | Ginnie Mae
Series 2012-H08 FA,
5.166%, (US0001M +
0.600%), 01/20/2062 | | | | | 4,702,921 | | | | | | 0.4 | | |
| 1,601,513 | | | Ginnie Mae
Series 2012-H08 FB,
5.166%, (US0001M +
0.600%), 03/20/2062 | | | | | 1,596,196 | | | | | | 0.1 | | |
| 283,551 | | | Ginnie Mae
Series 2012-H11 FA,
5.266%, (US0001M +
0.700%), 02/20/2062 | | | | | 282,879 | | | | | | 0.0 | | |
| 401,379 | | | Ginnie Mae
Series 2012-H11 GA,
5.146%, (US0001M +
0.580%), 05/20/2062 | | | | | 399,792 | | | | | | 0.0 | | |
| 1,065,523 | | | Ginnie Mae
Series 2012-H11 VA,
5.216%, (US0001M +
0.650%), 05/20/2062 | | | | | 1,061,456 | | | | | | 0.1 | | |
| 1,329,701 | | | Ginnie Mae
Series 2012-H12 FA,
5.116%, (US0001M +
0.550%), 04/20/2062 | | | | | 1,323,883 | | | | | | 0.1 | | |
| 7,614,569 | | | Ginnie Mae
Series 2012-H12 FB,
5.616%, (US0001M +
1.050%), 02/20/2062 | | | | | 7,636,147 | | | | | | 0.6 | | |
| 367,371 | | | Ginnie Mae
Series 2012-H14 FK,
5.146%, (US0001M +
0.580%), 07/20/2062 | | | | | 365,785 | | | | | | 0.0 | | |
| 2,297,230 | | | Ginnie Mae
Series 2012-H20 BA,
5.126%, (US0001M +
0.560%), 09/20/2062 | | | | | 2,286,873 | | | | | | 0.2 | | |
Principal
Amount† | | | Value | | | Percentage
of Net
Assets | |
| COLLATERALIZED MORTGAGE OBLIGATIONS: (continued) | |
| 1,566,731 | | | Ginnie Mae
Series 2012-H20 PT,
5.468%, (US0001M +
3.500%), 07/20/2062 | | | | $ | 1,561,594 | | | | | | 0.1 | | |
| 1,631,228 | | | Ginnie Mae
Series 2012-H26 BA,
4.916%, (US0001M +
0.350%), 10/20/2062 | | | | | 1,619,569 | | | | | | 0.1 | | |
| 389,843 | | | Ginnie Mae
Series 2012-H29 FA,
5.081%, (US0001M +
0.515%), 10/20/2062 | | | | | 388,065 | | | | | | 0.0 | | |
| 833,616 | | | Ginnie Mae
Series 2012-H30 GA,
4.916%, (US0001M +
0.350%), 12/20/2062 | | | | | 827,749 | | | | | | 0.1 | | |
| 1,251,221 | | | Ginnie Mae
Series 2012-H31 FD,
4.906%, (US0001M +
0.340%), 12/20/2062 | | | | | 1,241,141 | | | | | | 0.1 | | |
| 1,148,486 | | | Ginnie Mae
Series 2013-119 TZ,
3.000%, 08/20/2043 | | | | | 1,050,675 | | | | | | 0.1 | | |
| 7,000,000 | | | Ginnie Mae
Series 2013-147 BE,
4.000%, 12/20/2039 | | | | | 6,812,193 | | | | | | 0.5 | | |
| 1,498,221 | | | Ginnie Mae
Series 2013-167 Z,
3.000%, 10/16/2043 | | | | | 1,359,692 | | | | | | 0.1 | | |
| 1,900,000 (1) | | | Ginnie Mae
Series 2013-186 UI,
2.500%, 11/20/2043 | | | | | 343,036 | | | | | | 0.0 | | |
| 501,152 (1) | | | Ginnie Mae
Series 2013-186 VI,
4.000%, 12/20/2042 | | | | | 70,263 | | | | | | 0.0 | | |
| 377,961 | | | Ginnie Mae
Series 2013-186 ZE,
2.500%, 12/16/2043 | | | | | 336,568 | | | | | | 0.0 | | |
| 2,962,184 (1) | | | Ginnie Mae
Series 2013-20 LI,
4.500%, 12/16/2042 | | | | | 342,873 | | | | | | 0.0 | | |
| 1,679,334 (1) | | | Ginnie Mae
Series 2013-23 IO,
3.500%, 02/20/2043 | | | | | 269,585 | | | | | | 0.0 | | |
| 201,670 (1) | | | Ginnie Mae
Series 2013-41 PI,
3.500%, 04/20/2040 | | | | | 1,553 | | | | | | 0.0 | | |
See Accompanying Notes to Financial Statements
PORTFOLIO OF INVESTMENTS
| Voya GNMA Income Fund | as of March 31, 2023 (continued) |
Principal
Amount† | | | Value | | | Percentage
of Net
Assets | |
| COLLATERALIZED MORTGAGE OBLIGATIONS: (continued) | |
| 740,420 (1) | | | Ginnie Mae
Series 2013-88 AI,
1.188%,
(-1.000*US0001M +
5.850%), 06/20/2043 | | | | $ | 67,554 | | | | | | 0.0 | | |
| 1,267,982 (1) | | | Ginnie Mae
Series 2013-99 SK,
1.238%,
(-1.000*US0001M +
5.900%), 07/20/2043 | | | | | 98,581 | | | | | | 0.0 | | |
| 1,114,088 | | | Ginnie Mae
Series 2013-H02 FD,
4.906%, (US0001M +
0.340%), 12/20/2062 | | | | | 1,105,159 | | | | | | 0.1 | | |
| 209,879 | | | Ginnie Mae
Series 2013-H07 HA,
4.976%, (US0001M +
0.410%), 03/20/2063 | | | | | 208,490 | | | | | | 0.0 | | |
| 1,635,028 | | | Ginnie Mae
Series 2013-H08 BF,
4.966%, (US0001M +
0.400%), 03/20/2063 | | | | | 1,618,872 | | | | | | 0.1 | | |
| 1,544,593 | | | Ginnie Mae
Series 2013-H10 FT,
5.140%, (H15T1Y +
0.450%), 04/20/2063 | | | | | 1,538,203 | | | | | | 0.1 | | |
| 1,449,472 | | | Ginnie Mae
Series 2013-H13 FS,
5.566%, (US0001M +
1.000%), 06/20/2063 | | | | | 1,453,756 | | | | | | 0.1 | | |
| 1,519,004 | | | Ginnie Mae
Series 2013-H14 FC,
5.036%, (US0001M +
0.470%), 06/20/2063 | | | | | 1,510,867 | | | | | | 0.1 | | |
| 549,483 | | | Ginnie Mae
Series 2013-H14 FD,
5.036%, (US0001M +
0.470%), 06/20/2063 | | | | | 546,343 | | | | | | 0.0 | | |
| 514,169 | | | Ginnie Mae
Series 2013-H14 FG,
5.036%, (US0001M +
0.470%), 05/20/2063 | | | | | 511,211 | | | | | | 0.0 | | |
| 370,537 | | | Ginnie Mae
Series 2013-H15 FA,
5.106%, (US0001M +
0.540%), 06/20/2063 | | | | | 368,981 | | | | | | 0.0 | | |
| 731,802 | | | Ginnie Mae
Series 2013-H17 FA,
5.116%, (US0001M +
0.550%), 07/20/2063 | | | | | 729,264 | | | | | | 0.1 | | |
Principal
Amount† | | | Value | | | Percentage
of Net
Assets | |
| COLLATERALIZED MORTGAGE OBLIGATIONS: (continued) | |
| 394,395 | | | Ginnie Mae
Series 2013-H18 BA,
5.166%, (US0001M +
0.600%), 07/20/2063 | | | | $ | 392,981 | | | | | | 0.0 | | |
| 467,760 | | | Ginnie Mae
Series 2013-H18 EA,
5.066%, (US0001M +
0.500%), 07/20/2063 | | | | | 466,180 | | | | | | 0.0 | | |
| 1,340,358 | | | Ginnie Mae
Series 2013-H18 FA,
5.066%, (US0001M +
0.500%), 06/20/2063 | | | | | 1,333,663 | | | | | | 0.1 | | |
| 1,297,681 | | | Ginnie Mae
Series 2013-H19 DF,
5.216%, (US0001M +
0.650%), 05/20/2063 | | | | | 1,289,659 | | | | | | 0.1 | | |
| 429,600 | | | Ginnie Mae
Series 2013-H20 FB,
5.566%, (US0001M +
1.000%), 08/20/2063 | | | | | 430,370 | | | | | | 0.0 | | |
| 448,495 | | | Ginnie Mae
Series 2013-H21 FB,
5.266%, (US0001M +
0.700%), 09/20/2063 | | | | | 447,783 | | | | | | 0.0 | | |
| 738,499 | | | Ginnie Mae
Series 2013-H22 FB,
5.266%, (US0001M +
0.700%), 08/20/2063 | | | | | 737,024 | | | | | | 0.1 | | |
| 1,250,838 | | | Ginnie Mae
Series 2013-H22 FT,
5.340%, (H15T1Y +
0.650%), 04/20/2063 | | | | | 1,248,911 | | | | | | 0.1 | | |
| 879,397 | | | Ginnie Mae
Series 2013-H23 FA,
5.866%, (US0001M +
1.300%), 09/20/2063 | | | | | 883,306 | | | | | | 0.1 | | |
| 82,458 | | | Ginnie Mae
Series 2013-H24 FB,
5.296%, (US0001M +
0.730%), 09/20/2063 | | | | | 82,346 | | | | | | 0.0 | | |
| 2,793,200 | | | Ginnie Mae
Series 2014-115 EM,
4.000%, 08/20/2044 | | | | | 2,720,161 | | | | | | 0.2 | | |
| 2,715,782 | | | Ginnie Mae
Series 2014-118 ZP,
4.000%, 08/20/2044 | | | | | 2,618,751 | | | | | | 0.2 | | |
See Accompanying Notes to Financial Statements
PORTFOLIO OF INVESTMENTS
| Voya GNMA Income Fund | as of March 31, 2023 (continued) |
Principal
Amount† | | | Value | | | Percentage
of Net
Assets | |
| COLLATERALIZED MORTGAGE OBLIGATIONS: (continued) | |
| 1,215,792 (1) | | | Ginnie Mae
Series 2014-129 WS,
1.238%,
(-1.000*US0001M +
5.900%), 09/20/2044 | | | | $ | 106,750 | | | | | | 0.0 | | |
| 1,036,371 (1) | | | Ginnie Mae
Series 2014-161 WS,
1.238%,
(-1.000*US0001M +
5.900%), 11/20/2044 | | | | | 86,834 | | | | | | 0.0 | | |
| 1,115,472 (1) | | | Ginnie Mae
Series 2014-183 IM,
5.000%, 06/20/2035 | | | | | 174,070 | | | | | | 0.0 | | |
| 1,294,151 (1) | | | Ginnie Mae
Series 2014-30 ES,
0.239%,
(-1.000*US0001M +
5.000%), 03/20/2040 | | | | | 87,846 | | | | | | 0.0 | | |
| 1,992,008 (1) | | | Ginnie Mae
Series 2014-99 IO,
4.500%, 06/20/2044 | | | | | 386,319 | | | | | | 0.0 | | |
| 7,735,456 | | | Ginnie Mae
Series 2014-H03 FS,
5.216%, (US0001M +
0.650%), 02/20/2064 | | | | | 7,705,726 | | | | | | 0.6 | | |
| 1,981,174 | | | Ginnie Mae
Series 2014-H04 FB,
5.216%, (US0001M +
0.650%), 02/20/2064 | | | | | 1,976,873 | | | | | | 0.2 | | |
| 3,413,996 | | | Ginnie Mae
Series 2014-H05 FB,
5.166%, (US0001M +
0.600%), 12/20/2063 | | | | | 3,406,181 | | | | | | 0.3 | | |
| 840,954 | | | Ginnie Mae
Series 2014-H06 FA,
5.136%, (US0001M +
0.570%), 03/20/2064 | | | | | 837,613 | | | | | | 0.1 | | |
| 375,797 | | | Ginnie Mae
Series 2014-H06 HB,
5.216%, (US0001M +
0.650%), 03/20/2064 | | | | | 374,718 | | | | | | 0.0 | | |
| 2,471,017 | | | Ginnie Mae
Series 2014-H11 VA,
5.066%, (US0001M +
0.500%), 06/20/2064 | | | | | 2,452,765 | | | | | | 0.2 | | |
| 3,021,847 | | | Ginnie Mae
Series 2014-H15 FA,
5.066%, (US0001M +
0.500%), 07/20/2064 | | | | | 2,999,993 | | | | | | 0.2 | | |
Principal
Amount† | | | Value | | | Percentage
of Net
Assets | |
| COLLATERALIZED MORTGAGE OBLIGATIONS: (continued) | |
| 1,477,672 | | | Ginnie Mae
Series 2014-H21 FA,
5.216%, (US0001M +
0.650%), 10/20/2064 | | | | $ | 1,458,106 | | | | | | 0.1 | | |
| 8,265,829 (2) | | | Ginnie Mae
Series 2015-10 Q,
2.397%, 10/20/2044 | | | | | 6,748,073 | | | | | | 0.5 | | |
| 2,364,266 (1) | | | Ginnie Mae
Series 2015-141 IX,
7.000%,
(-0.714*US0001M +
2.142%), 06/20/2045 | | | | | 51,228 | | | | | | 0.0 | | |
| 15,125,000 | | | Ginnie Mae
Series 2015-143 B,
3.500%, 04/20/2045 | | | | | 14,106,286 | | | | | | 1.1 | | |
| 2,071,519 (1) | | | Ginnie Mae
Series 2015-149 IL,
4.500%, 10/20/2045 | | | | | 411,342 | | | | | | 0.0 | | |
| 1,227,175 (1) | | | Ginnie Mae
Series 2015-157 PI,
4.000%, 03/20/2044 | | | | | 124,440 | | | | | | 0.0 | | |
| 2,607,528 | | | Ginnie Mae
Series 2015-165 ZA,
3.500%, 07/20/2045 | | | | | 2,485,190 | | | | | | 0.2 | | |
| 1,439,009 | | | Ginnie Mae
Series 2015-H03 FA,
5.066%, (US0001M +
0.500%), 12/20/2064 | | | | | 1,432,562 | | | | | | 0.1 | | |
| 2,614,778 | | | Ginnie Mae
Series 2015-H05 FC,
5.046%, (US0001M +
0.480%), 02/20/2065 | | | | | 2,586,257 | | | | | | 0.2 | | |
| 1,135,102 | | | Ginnie Mae
Series 2015-H06 FA,
5.046%, (US0001M +
0.480%), 02/20/2065 | | | | | 1,127,800 | | | | | | 0.1 | | |
| 2,126,873 | | | Ginnie Mae
Series 2015-H08 FB,
5.196%, (US0001M +
0.630%), 03/20/2065 | | | | | 2,100,252 | | | | | | 0.2 | | |
| 1,834,835 | | | Ginnie Mae
Series 2015-H08 FC,
5.046%, (US0001M +
0.480%), 03/20/2065 | | | | | 1,823,366 | | | | | | 0.1 | | |
| 2,941,446 | | | Ginnie Mae
Series 2015-H09 FA,
5.186%, (US0001M +
0.620%), 04/20/2065 | | | | | 2,902,571 | | | | | | 0.2 | | |
See Accompanying Notes to Financial Statements
PORTFOLIO OF INVESTMENTS
| Voya GNMA Income Fund | as of March 31, 2023 (continued) |
Principal
Amount† | | | Value | | | Percentage
of Net
Assets | |
| COLLATERALIZED MORTGAGE OBLIGATIONS: (continued) | |
| 4,911,065 | | | Ginnie Mae
Series 2015-H10 FA,
5.166%, (US0001M +
0.600%), 04/20/2065 | | | | $ | 4,863,331 | | | | | | 0.4 | | |
| 1,560,654 | | | Ginnie Mae
Series 2015-H10 FH,
5.166%, (US0001M +
0.600%), 04/20/2065 | | | | | 1,544,155 | | | | | | 0.1 | | |
| 190,027 | | | Ginnie Mae
Series 2015-H12 FA,
5.046%, (US0001M +
0.480%), 05/20/2065 | | | | | 188,799 | | | | | | 0.0 | | |
| 1,165,456 | | | Ginnie Mae
Series 2015-H12 FL,
4.796%, (US0001M +
0.230%), 05/20/2065 | | | | | 1,155,949 | | | | | | 0.1 | | |
| 566,371 | | | Ginnie Mae
Series 2015-H14 FB,
4.996%, (US0001M +
0.430%), 05/20/2065 | | | | | 563,829 | | | | | | 0.0 | | |
| 991,313 | | | Ginnie Mae
Series 2015-H18 FB,
5.166%, (US0001M +
0.600%), 07/20/2065 | | | | | 981,587 | | | | | | 0.1 | | |
| 955,071 | | | Ginnie Mae
Series 2015-H20 FB,
5.166%, (US0001M +
0.600%), 08/20/2065 | | | | | 944,452 | | | | | | 0.1 | | |
| 1,438,862 | | | Ginnie Mae
Series 2015-H22 FC,
5.166%, (US0001M +
0.600%), 09/20/2065 | | | | | 1,422,157 | | | | | | 0.1 | | |
| 1,784,972 | | | Ginnie Mae
Series 2015-H23 FB,
5.086%, (US0001M +
0.520%), 09/20/2065 | | | | | 1,773,646 | | | | | | 0.1 | | |
| 1,194,693 | | | Ginnie Mae
Series 2015-H26 FA,
5.086%, (US0001M +
0.520%), 10/20/2065 | | | | | 1,186,511 | | | | | | 0.1 | | |
| 1,407,832 | | | Ginnie Mae
Series 2015-H26 FC,
5.166%, (US0001M +
0.600%), 08/20/2065 | | | | | 1,404,023 | | | | | | 0.1 | | |
| 1,016,843 | | | Ginnie Mae
Series 2015-H26 FG,
5.086%, (US0001M +
0.520%), 10/20/2065 | | | | | 1,005,852 | | | | | | 0.1 | | |
Principal
Amount† | | | Value | | | Percentage
of Net
Assets | |
| COLLATERALIZED MORTGAGE OBLIGATIONS: (continued) | |
| 1,633,773 | | | Ginnie Mae
Series 2015-H27 FA,
5.316%, (US0001M +
0.750%), 09/20/2065 | | | | $ | 1,618,416 | | | | | | 0.1 | | |
| 3,404,686 | | | Ginnie Mae
Series 2015-H29 FL,
5.166%, (US0001M +
0.600%), 11/20/2065 | | | | | 3,375,163 | | | | | | 0.3 | | |
| 25,215,370 | | | Ginnie Mae
Series 2015-H30 FC,
5.226%, (US0001M +
0.660%), 11/20/2065 | | | | | 24,883,498 | | | | | | 1.9 | | |
| 2,748,203 | | | Ginnie Mae
Series 2015-H30 FE,
5.166%, (US0001M +
0.600%), 11/20/2065 | | | | | 2,734,445 | | | | | | 0.2 | | |
| 1,347,676 | | | Ginnie Mae
Series 2015-H31 FT,
5.216%, (US0001M +
0.650%), 11/20/2065 | | | | | 1,343,539 | | | | | | 0.1 | | |
| 5,221,982 (1) | | | Ginnie Mae
Series 2016-145 IU,
3.500%, 10/20/2046 | | | | | 836,036 | | | | | | 0.1 | | |
| 4,668,612 (1) | | | Ginnie Mae
Series 2016-20 BS,
1.339%,
(-1.000*US0001M +
6.100%), 02/20/2046 | | | | | 554,730 | | | | | | 0.0 | | |
| 3,010,433 (2) | | | Ginnie Mae Series
2016-5 AB, 4.690%,
01/20/2046 | | | | | 3,007,637 | | | | | | 0.2 | | |
| 4,587,765 | | | Ginnie Mae
Series 2016-69 B,
3.000%, 05/20/2046 | | | | | 4,200,466 | | | | | | 0.3 | | |
| 331,806 | | | Ginnie Mae
Series 2016-H01 FL,
5.216%, (US0001M +
0.650%), 12/20/2065 | | | | | 330,977 | | | | | | 0.0 | | |
| 1,372,529 | | | Ginnie Mae
Series 2016-H02 FH,
5.566%, (US0001M +
1.000%), 01/20/2066 | | | | | 1,361,976 | | | | | | 0.1 | | |
| 346,893 | | | Ginnie Mae
Series 2016-H03 FB,
5.216%, (US0001M +
0.650%), 01/20/2066 | | | | | 344,280 | | | | | | 0.0 | | |
See Accompanying Notes to Financial Statements
PORTFOLIO OF INVESTMENTS
| Voya GNMA Income Fund | as of March 31, 2023 (continued) |
Principal
Amount† | | | Value | | | Percentage
of Net
Assets | |
| COLLATERALIZED MORTGAGE OBLIGATIONS: (continued) | |
| 2,143,984 | | | Ginnie Mae
Series 2016-H04 FK,
5.616%, (US0001M +
1.050%), 02/20/2066 | | | | $ | 2,130,339 | | | | | | 0.2 | | |
| 284,673 | | | Ginnie Mae
Series 2016-H07 FK,
5.566%, (US0001M +
1.000%), 03/20/2066 | | | | | 282,699 | | | | | | 0.0 | | |
| 972,649 | | | Ginnie Mae
Series 2016-H09 FB,
5.466%, (US0001M +
0.900%), 04/20/2066 | | | | | 968,180 | | | | | | 0.1 | | |
| 1,971,230 | | | Ginnie Mae
Series 2016-H11 F,
5.366%, (US0001M +
0.800%), 05/20/2066 | | | | | 1,959,482 | | | | | | 0.2 | | |
| 877,181 | | | Ginnie Mae
Series 2016-H11 FE,
5.416%, (US0001M +
0.850%), 04/20/2066 | | | | | 872,481 | | | | | | 0.1 | | |
| 1,911,579 | | | Ginnie Mae
Series 2016-H13 FD,
5.140%, (H15T1Y +
0.450%), 05/20/2066 | | | | | 1,899,454 | | | | | | 0.1 | | |
| 438,824 | | | Ginnie Mae
Series 2016-H13 FT,
5.146%, (US0001M +
0.580%), 05/20/2066 | | | | | 437,607 | | | | | | 0.0 | | |
| 204,186 | | | Ginnie Mae
Series 2016-H20 FG,
5.266%, (US0001M +
0.700%), 08/20/2066 | | | | | 203,514 | | | | | | 0.0 | | |
| 1,774,987 | | | Ginnie Mae
Series 2016-H21 FH,
5.416%, (US0001M +
0.850%), 09/20/2066 | | | | | 1,763,900 | | | | | | 0.1 | | |
| 4,271,944 | | | Ginnie Mae
Series 2016-H23 F,
5.316%, (US0001M +
0.750%), 10/20/2066 | | | | | 4,266,075 | | | | | | 0.3 | | |
| 3,788,907 | | | Ginnie Mae
Series 2017-107 QZ,
3.000%, 08/20/2045 | | | | | 3,202,830 | | | | | | 0.2 | | |
| 1,672,669 | | | Ginnie Mae
Series 2017-122 CZ,
3.000%, 08/20/2047 | | | | | 1,381,091 | | | | | | 0.1 | | |
| 2,112,059 (1) | | | Ginnie Mae
Series 2017-123 IO,
5.000%, 08/16/2047 | | | | | 444,436 | | | | | | 0.0 | | |
Principal
Amount† | | | Value | | | Percentage
of Net
Assets | |
| COLLATERALIZED MORTGAGE OBLIGATIONS: (continued) | |
| 2,890,000 | | | Ginnie Mae
Series 2017-162 PL,
3.000%, 10/20/2047 | | | | $ | 2,397,812 | | | | | | 0.2 | | |
| 1,311,511 | | | Ginnie Mae
Series 2017-56 HM,
3.000%, 12/20/2046 | | | | | 1,223,889 | | | | | | 0.1 | | |
| 5,045,179 | | | Ginnie Mae
Series 2017-56 JZ,
3.000%, 04/20/2047 | | | | | 4,352,588 | | | | | | 0.3 | | |
| 23,244,204 | | | Ginnie Mae
Series 2017-H05 FC,
5.316%, (US0001M +
0.750%), 02/20/2067 | | | | | 23,033,423 | | | | | | 1.7 | | |
| 849,721 | | | Ginnie Mae
Series 2017-H07 FG,
5.026%, (US0001M +
0.460%), 02/20/2067 | | | | | 844,867 | | | | | | 0.1 | | |
| 679,902 | | | Ginnie Mae
Series 2017-H14 FD,
5.036%, (US0001M +
0.470%), 06/20/2067 | | | | | 672,929 | | | | | | 0.1 | | |
| 1,196,986 | | | Ginnie Mae
Series 2017-H14 FV,
5.066%, (US0001M +
0.500%), 06/20/2067 | | | | | 1,188,488 | | | | | | 0.1 | | |
| 1,542,713 | | | Ginnie Mae
Series 2017-H17 FG,
5.066%, (US0001M +
0.500%), 08/20/2067 | | | | | 1,534,248 | | | | | | 0.1 | | |
| 679,749 | | | Ginnie Mae
Series 2017-H19 FA,
5.016%, (US0001M +
0.450%), 08/20/2067 | | | | | 676,371 | | | | | | 0.1 | | |
| 1,499,104 | | | Ginnie Mae
Series 2018-112 AL,
3.500%, 08/20/2048 | | | | | 1,406,858 | | | | | | 0.1 | | |
| 342,561 | | | Ginnie Mae
Series 2018-163 DZ,
4.500%, 11/20/2048 | | | | | 332,806 | | | | | | 0.0 | | |
| 1,943,661 | | | Ginnie Mae
Series 2018-H04 FM,
4.866%, (US0001M +
0.300%), 03/20/2068 | | | | | 1,924,758 | | | | | | 0.1 | | |
| 346,104 | | | Ginnie Mae
Series 2018-H07 FE,
4.916%, (US0001M +
0.350%), 02/20/2068 | | | | | 344,248 | | | | | | 0.0 | | |
See Accompanying Notes to Financial Statements
PORTFOLIO OF INVESTMENTS
| Voya GNMA Income Fund | as of March 31, 2023 (continued) |
Principal
Amount† | | | Value | | | Percentage
of Net
Assets | |
| COLLATERALIZED MORTGAGE OBLIGATIONS: (continued) | |
| 4,577,314 | | | Ginnie Mae
Series 2018-H14 FG,
4.916%, (US0001M +
0.350%), 09/20/2068 | | | | $ | 4,539,485 | | | | | | 0.3 | | |
| 4,267,595 | | | Ginnie Mae
Series 2018-H18 FC,
4.916%, (US0001M +
0.350%), 08/20/2065 | | | | | 4,243,559 | | | | | | 0.3 | | |
| 9,627,521 | | | Ginnie Mae Series 2019-1
LZ, 3.500%, 01/20/2049 | | | | | 8,498,790 | | | | | | 0.6 | | |
| 1,454,010 | | | Ginnie Mae Series 2019-1
Z, 4.000%, 01/20/2049 | | | | | 1,404,791 | | | | | | 0.1 | | |
| 3,134,740 | | | Ginnie Mae
Series 2019-100 FD,
5.161%, (US0001M +
0.400%), 08/20/2049 | | | | | 3,063,000 | | | | | | 0.2 | | |
| 863,776 | | | Ginnie Mae
Series 2019-29 AI,
5.000%, 07/20/2048 | | | | | 169,712 | | | | | | 0.0 | | |
| 12,000,000 (1) | | | Ginnie Mae
Series 2019-56 YI,
5.000%, 05/20/2049 | | | | | 3,083,557 | | | | | | 0.2 | | |
| 528,077 | | | Ginnie Mae
Series 2019-H01 FJ,
4.866%, (US0001M +
0.300%), 09/20/2068 | | | | | 525,031 | | | | | | 0.0 | | |
| 1,078,445 | | | Ginnie Mae
Series 2019-H01 FL,
5.016%, (US0001M +
0.450%), 12/20/2068 | | | | | 1,074,553 | | | | | | 0.1 | | |
| 2,699,104 | | | Ginnie Mae
Series 2019-H05 FL,
5.046%, (US0001M +
0.480%), 03/20/2069 | | | | | 2,674,063 | | | | | | 0.2 | | |
| 534,519 | | | Ginnie Mae
Series 2019-H10 FM,
4.966%, (US0001M +
0.400%), 05/20/2069 | | | | | 527,200 | | | | | | 0.0 | | |
| 1,970,836 | | | Ginnie Mae
Series 2019-H19 FB,
5.016%, (US0001M +
0.450%), 11/20/2069 | | | | | 1,959,216 | | | | | | 0.2 | | |
| 21,231,522 (1) | | | Ginnie Mae
Series 2020-47 LI,
3.500%, 04/20/2050 | | | | | 3,595,875 | | | | | | 0.3 | | |
Principal
Amount† | | | Value | | | Percentage
of Net
Assets | |
| COLLATERALIZED MORTGAGE OBLIGATIONS: (continued) | |
| 883,733 | | | Ginnie Mae
Series 2020-H01 FT,
5.190%, (H15T1Y +
0.500%), 01/20/2070 | | | | $ | 879,835 | | | | | | 0.1 | | |
| 4,893,574 | | | Ginnie Mae
Series 2020-H10 FD,
4.966%, (US0001M +
0.400%), 05/20/2070 | | | | | 4,867,437 | | | | | | 0.4 | | |
| 9,010,840 (1) | | | Ginnie Mae
Series 2021-58 SB,
1.539%,
(-1.000*US0001M +
6.300%), 04/20/2051 | | | | | 1,051,918 | | | | | | 0.1 | | |
| 15,800,933 (1) | | | Ginnie Mae
Series 2021-77 SK,
8.158%,
(-1.000*US0001M +
3.300%), 05/20/2051 | | | | | 360,005 | | | | | | 0.0 | | |
| 105,363 (2) | | | Ginnie Mae
Series 2021-H09 Z,
3.076%, 10/20/2066 | | | | | 98,864 | | | | | | 0.0 | | |
| 679,843 | | | Seasoned Credit Risk
Transfer Trust
Series 2017-2 MA,
3.000%, 08/25/2056 | | | | | 639,801 | | | | | | 0.1 | | |
| 478,988 (2) | | | Seasoned Credit Risk
Transfer Trust
Series 2018-2 HA,
3.000%, 11/25/2057 | | | | | 452,160 | | | | | | 0.0 | | |
| 4,338,088 | | | Seasoned Credit Risk
Transfer Trust
Series 2019-1 M55D,
4.000%, 07/25/2058 | | | | | 4,158,113 | | | | | | 0.3 | | |
| 1,706,898 | | | Seasoned Credit Risk
Transfer Trust
Series 2019-3 M55D,
4.000%, 10/25/2058 | | | | | 1,636,701 | | | | | | 0.1 | | |
| 7,265,000 | | | Seasoned Loans
Structured Transaction
Series 2019-1 A2,
3.500%, 05/25/2029 | | | | | 6,804,203 | | | | | | 0.5 | | |
| 3,395,428 | | | Seasoned Loans
Structured Transaction
Trust Series 2019-2 A1C,
2.750%, 09/25/2029 | | | | | 3,142,826 | | | | | | 0.2 | | |
See Accompanying Notes to Financial Statements
PORTFOLIO OF INVESTMENTS
| Voya GNMA Income Fund | as of March 31, 2023 (continued) |
Principal
Amount† | | | Value | | | Percentage
of Net
Assets | |
| COLLATERALIZED MORTGAGE OBLIGATIONS: (continued) | |
| 5,875,000 | | | Seasoned Loans
Structured Transaction
Trust Series 2019-3 A2C,
2.750%, 11/25/2029 | | | | $ | 5,216,889 | | | | | | 0.4 | | |
| 1,045,310 | | | Vendee Mortgage Trust
2011-2 DZ, 3.750%,
10/15/2041 | | | | | 986,453 | | | | | | 0.1 | | |
| 23,317,349 (1)(2) | | | Vendee Mortgage Trust
2011-2 IO, 0.356%,
10/15/2041 | | | | | 342,152 | | | | | | 0.0 | | |
| | | | Total Collateralized
Mortgage Obligations
(Cost $718,655,353) | | | | | 667,330,356 | | | | | | 50.3 | | |
| | | | | |
| U.S. GOVERNMENT AGENCY OBLIGATIONS: 67.6% | |
| | | | Federal Home Loan Mortgage
Corporation: 1.1%(4) | |
| 712,897 | | | 3.500%, 07/01/2047 | | | | | 674,445 | | | | | | 0.1 | | |
| 1,603,626 | | | 3.500%, 12/01/2047 | | | | | 1,517,620 | | | | | | 0.1 | | |
| 3,038,577 | | | 3.500%, 03/01/2048 | | | | | 2,878,487 | | | | | | 0.2 | | |
| 3,444,445 | | | 3.500%, 11/01/2048 | | | | | 3,259,703 | | | | | | 0.3 | | |
| 970,918 | | | 4.000%, 07/01/2047 | | | | | 947,223 | | | | | | 0.1 | | |
| 389,725 | | | 4.500%, 08/01/2047 | | | | | 389,238 | | | | | | 0.0 | | |
| 434,301 | | | 5.000%, 11/01/2035 | | | | | 440,097 | | | | | | 0.0 | | |
| 21,747 | | | 5.000%, 12/01/2035 | | | | | 22,254 | | | | | | 0.0 | | |
| 10,834 | | | 5.000%, 01/01/2038 | | | | | 11,087 | | | | | | 0.0 | | |
| 10,939 | | | 5.000%, 03/01/2038 | | | | | 11,194 | | | | | | 0.0 | | |
| 38,518 | | | 5.000%, 03/01/2038 | | | | | 39,417 | | | | | | 0.0 | | |
| 99,546 | | | 5.000%, 02/01/2039 | | | | | 100,493 | | | | | | 0.0 | | |
| 405,381 | | | 5.000%, 07/01/2039 | | | | | 413,876 | | | | | | 0.0 | | |
| 135,650 | | | 5.000%, 01/01/2040 | | | | | 138,824 | | | | | | 0.0 | | |
| 443,510 | | | 5.000%, 04/01/2040 | | | | | 448,743 | | | | | | 0.1 | | |
| 1,464,634 | | | 5.000%, 10/01/2040 | | | | | 1,498,854 | | | | | | 0.1 | | |
| 151,587 | | | 5.000%, 05/01/2041 | | | | | 153,122 | | | | | | 0.0 | | |
| 129,489 | | | 5.290%, 10/01/2037 | | | | | 131,903 | | | | | | 0.0 | | |
| 23,871 | | | 5.410%, 07/01/2037 | | | | | 24,339 | | | | | | 0.0 | | |
| 10,518 | | | 5.410%, 08/01/2037 | | | | | 10,678 | | | | | | 0.0 | | |
| 34,550 | | | 5.440%, 01/01/2037 | | | | | 35,336 | | | | | | 0.0 | | |
| 45,073 | | | 5.440%, 04/01/2037 | | | | | 46,129 | | | | | | 0.0 | | |
| 28,206 | | | 5.440%, 09/01/2037 | | | | | 28,834 | | | | | | 0.0 | | |
| 26,744 | | | 5.440%, 02/01/2038 | | | | | 27,352 | | | | | | 0.0 | | |
| 124,186 | | | 5.450%, 12/01/2037 | | | | | 125,998 | | | | | | 0.0 | | |
| 96,027 | | | 5.450%, 12/01/2037 | | | | | 97,430 | | | | | | 0.0 | | |
| 36,859 | | | 5.460%, 05/01/2037 | | | | | 37,717 | | | | | | 0.0 | | |
| 31,905 | | | 5.460%, 08/01/2037 | | | | | 32,649 | | | | | | 0.0 | | |
| 35,253 | | | 5.460%, 01/01/2038 | | | | | 35,841 | | | | | | 0.0 | | |
Principal
Amount† | | | Value | | | Percentage
of Net
Assets | |
| U.S. GOVERNMENT AGENCY OBLIGATIONS: (continued) | |
| | | | Federal Home Loan Mortgage
Corporation (continued) | |
| 51,900 | | | 5.500%, 08/01/2037 | | | | $ | 52,798 | | | | | | 0.0 | | |
| 84,379 | | | 5.500%, 11/01/2037 | | | | | 85,739 | | | | | | 0.0 | | |
| 16,273 | | | 5.520%, 10/01/2037 | | | | | 16,482 | | | | | | 0.0 | | |
| 35,216 | | | 5.620%, 12/01/2036 | | | | | 35,760 | | | | | | 0.0 | | |
| 57,429 | | | 5.620%, 03/01/2037 | | | | | 58,316 | | | | | | 0.0 | | |
| 60,262 | | | 5.620%, 08/01/2037 | | | | | 61,203 | | | | | | 0.0 | | |
| 69,780 | | | 5.625%, 12/01/2036 | | | | | 70,843 | | | | | | 0.0 | | |
| 100,472 | | | 5.625%, 01/01/2037 | | | | | 102,041 | | | | | | 0.0 | | |
| 90,674 | | | 5.625%, 03/01/2037 | | | | | 92,054 | | | | | | 0.0 | | |
| 84,860 | | | 5.625%, 06/01/2037 | | | | | 86,101 | | | | | | 0.0 | | |
| 74,491 | | | 5.625%, 07/01/2037 | | | | | 75,624 | | | | | | 0.0 | | |
| 41,109 | | | 5.625%, 02/01/2038 | | | | | 41,735 | | | | | | 0.0 | | |
| 434,152 | | | 5.750%, 09/01/2037 | | | | | 447,203 | | | | | | 0.1 | | |
| 72,857 | | | 5.750%, 10/01/2037 | | | | | 74,175 | | | | | | 0.0 | | |
| 88,423 | | | 6.090%, 12/01/2037 | | | | | 90,566 | | | | | | 0.0 | | |
| 4,033 | | | 7.500%, 01/01/2030 | | | | | 4,233 | | | | | | 0.0 | | |
| 4,445 | | | 8.000%, 01/01/2030 | | | | | 4,434 | | | | | | 0.0 | | |
| | | | | | | | | 14,978,190 | | | | | | 1.1 | | |
| | | | Federal National Mortgage
Association: 0.9%(4) | |
| 62,372 | | | 3.125%, 11/01/2041 | | | | | 59,874 | | | | | | 0.0 | | |
| 26,428 | | | 3.250%, 04/01/2041 | | | | | 25,630 | | | | | | 0.0 | | |
| 94,398 | | | 3.475%, 10/01/2041 | | | | | 91,615 | | | | | | 0.0 | | |
| 84,429 | | | 3.750%, 09/01/2041 | | | | | 82,875 | | | | | | 0.0 | | |
| 60,609 | | | 3.750%, 10/01/2041 | | | | | 59,493 | | | | | | 0.0 | | |
| 4,619,493 | | | 4.000%, 07/01/2056 | | | | | 4,515,200 | | | | | | 0.4 | | |
| 711,789 | | | 4.500%, 09/01/2047 | | | | | 733,638 | | | | | | 0.1 | | |
| 86,405 | | | 5.290%, 09/01/2037 | | | | | 85,921 | | | | | | 0.0 | | |
| 260,113 | | | 5.290%, 11/01/2037 | | | | | 260,988 | | | | | | 0.0 | | |
| 75,474 | | | 5.290%, 12/01/2037 | | | | | 74,372 | | | | | | 0.0 | | |
| 116,738 | | | 5.290%, 04/01/2038 | | | | | 116,067 | | | | | | 0.0 | | |
| 40,524 | | | 5.350%, 04/01/2029 | | | | | 41,100 | | | | | | 0.0 | | |
| 62,878 | | | 5.390%, 05/01/2038 | | | | | 65,506 | | | | | | 0.0 | | |
| 112,372 | | | 5.440%, 08/01/2047 | | | | | 112,519 | | | | | | 0.0 | | |
| 159,890 | | | 5.440%, 08/01/2047 | | | | | 160,320 | | | | | | 0.0 | | |
| 169,883 | | | 5.440%, 08/01/2047 | | | | | 170,389 | | | | | | 0.0 | | |
| 170,942 | | | 5.440%, 09/01/2047 | | | | | 171,456 | | | | | | 0.0 | | |
| 267,713 | | | 5.440%, 10/01/2047 | | | | | 269,176 | | | | | | 0.0 | | |
| 60,159 | | | 5.620%, 12/01/2036 | | | | | 60,458 | | | | | | 0.0 | | |
| 99,968 | | | 5.890%, 08/01/2047 | | | | | 99,990 | | | | | | 0.0 | | |
| 107,752 | | | 5.890%, 10/01/2047 | | | | | 108,013 | | | | | | 0.0 | | |
| 6,409 | | | 5.900%, 09/01/2028 | | | | | 6,413 | | | | | | 0.0 | | |
See Accompanying Notes to Financial Statements
PORTFOLIO OF INVESTMENTS
| Voya GNMA Income Fund | as of March 31, 2023 (continued) |
Principal
Amount† | | | Value | | | Percentage
of Net
Assets | |
| U.S. GOVERNMENT AGENCY OBLIGATIONS: (continued) | |
| | | | Federal National Mortgage
Association (continued) | |
| 4,400,000 (5) | | | 6.000%, 04/15/2053 | | | | $ | 4,491,266 | | | | | | 0.4 | | |
| 7,536 | | | 6.600%, 07/01/2027 | | | | | 7,512 | | | | | | 0.0 | | |
| 14,082 | | | 6.600%, 09/01/2027 | | | | | 14,015 | | | | | | 0.0 | | |
| 20,443 | | | 6.600%, 11/01/2027 | | | | | 20,381 | | | | | | 0.0 | | |
| 18,305 | | | 6.600%, 06/01/2028 | | | | | 18,245 | | | | | | 0.0 | | |
| | | | | | | | | 11,922,432 | | | | | | 0.9 | | |
| | | | Government National Mortgage
Association: 61.3% | |
| 35,973,623 | | | 2.000%, 12/20/2050 | | | | | 30,791,296 | | | | | | 2.3 | | |
| 20,035,484 | | | 2.000%, 01/20/2051 | | | | | 17,132,437 | | | | | | 1.3 | | |
| 14,480,402 | | | 2.000%, 02/20/2051 | | | | | 12,372,438 | | | | | | 0.9 | | |
| 7,748,870 | | | 2.000%, 06/20/2051 | | | | | 6,621,978 | | | | | | 0.5 | | |
| 3,902,095 | | | 2.000%, 10/20/2051 | | | | | 3,327,400 | | | | | | 0.3 | | |
| 2,723,569 | | | 2.000%, 11/20/2051 | | | | | 2,321,842 | | | | | | 0.2 | | |
| 17,929,000 (5) | | | 2.000%, 04/15/2053 | | | | | 15,232,854 | | | | | | 1.2 | | |
| 10,424,795 | | | 2.500%, 12/20/2050 | | | | | 8,875,557 | | | | | | 0.7 | | |
| 16,558,460 | | | 2.500%, 03/20/2051 | | | | | 14,594,779 | | | | | | 1.1 | | |
| 18,795,778 | | | 2.500%, 04/20/2051 | | | | | 16,639,207 | | | | | | 1.3 | | |
| 18,613,002 | | | 2.500%, 05/20/2051 | | | | | 16,447,401 | | | | | | 1.3 | | |
| 4,275,200 | | | 2.500%, 08/20/2051 | | | | | 3,768,053 | | | | | | 0.3 | | |
| 31,350,086 | | | 2.500%, 09/20/2051 | | | | | 27,624,902 | | | | | | 2.1 | | |
| 44,174,703 | | | 2.500%, 10/20/2051 | | | | | 38,934,380 | | | | | | 2.9 | | |
| 29,554,697 | | | 2.500%, 11/20/2051 | | | | | 26,048,743 | | | | | | 2.0 | | |
| 4,248,239 | | | 2.500%, 12/20/2051 | | | | | 3,743,206 | | | | | | 0.3 | | |
| 18,764,603 | | | 2.500%, 03/20/2052 | | | | | 16,527,300 | | | | | | 1.3 | | |
| 108,670,000 (5) | | | 2.500%, 04/15/2053 | | | | | 95,642,335 | | | | | | 7.2 | | |
| 163,294 | | | 3.000%, 12/15/2041 | | | | | 154,332 | | | | | | 0.0 | | |
| 169,796 | | | 3.000%, 01/15/2042 | | | | | 160,693 | | | | | | 0.0 | | |
| 169,499 | | | 3.000%, 01/15/2042 | | | | | 160,590 | | | | | | 0.0 | | |
| 123,044 | | | 3.000%, 01/15/2042 | | | | | 116,570 | | | | | | 0.0 | | |
| 537,233 | | | 3.000%, 02/15/2042 | | | | | 501,947 | | | | | | 0.1 | | |
| 166,986 | | | 3.000%, 03/15/2042 | | | | | 156,018 | | | | | | 0.0 | | |
| 138,357 | | | 3.000%, 04/15/2042 | | | | | 131,085 | | | | | | 0.0 | | |
| 57,246 | | | 3.000%, 05/15/2042 | | | | | 54,235 | | | | | | 0.0 | | |
| 44,786 | | | 3.000%, 06/15/2042 | | | | | 42,460 | | | | | | 0.0 | | |
| 620,970 | | | 3.000%, 04/20/2045 | | | | | 578,905 | | | | | | 0.1 | | |
| 335,493 | | | 3.000%, 11/20/2045 | | | | | 307,472 | | | | | | 0.0 | | |
| 123,930 | | | 3.000%, 12/20/2045 | | | | | 113,867 | | | | | | 0.0 | | |
| 103,148 | | | 3.000%, 12/20/2045 | | | | | 94,633 | | | | | | 0.0 | | |
| 91,488 | | | 3.000%, 12/20/2045 | | | | | 84,016 | | | | | | 0.0 | | |
| 60,437 | | | 3.000%, 01/20/2046 | | | | | 55,380 | | | | | | 0.0 | | |
| 2,253,170 | | | 3.000%, 02/20/2050 | | | | | 1,998,960 | | | | | | 0.2 | | |
| 2,991,072 | | | 3.000%, 10/20/2051 | | | | | 2,736,522 | | | | | | 0.2 | | |
Principal
Amount† | | | Value | | | Percentage
of Net
Assets | |
| U.S. GOVERNMENT AGENCY OBLIGATIONS: (continued) | |
| | | | Government National Mortgage
Association (continued) | |
| 23,801,190 | | | 3.000%, 10/20/2051 | | | | $ | 21,980,741 | | | | | | 1.7 | | |
| 19,107,164 | | | 3.000%, 11/20/2051 | | | | | 17,645,699 | | | | | | 1.3 | | |
| 1,610,922 | | | 3.000%, 01/20/2052 | | | | | 1,471,552 | | | | | | 0.1 | | |
| 8,897,959 | | | 3.000%, 03/20/2052 | | | | | 8,085,690 | | | | | | 0.6 | | |
| 4,132,141 | | | 3.000%, 04/20/2052 | | | | | 3,771,433 | | | | | | 0.3 | | |
| 83,340,000 (5) | | | 3.000%, 04/15/2053 | | | | | 75,917,027 | | | | | | 5.7 | | |
| 49,292 | | | 3.250%, 03/15/2041 | | | | | 47,004 | | | | | | 0.0 | | |
| 343,256 | | | 3.250%, 04/15/2041 | | | | | 327,164 | | | | | | 0.0 | | |
| 75,324 | | | 3.250%, 05/15/2041 | | | | | 71,340 | | | | | | 0.0 | | |
| 347,939 | | | 3.250%, 06/15/2041 | | | | | 331,752 | | | | | | 0.0 | | |
| 413,374 | | | 3.250%, 07/15/2041 | | | | | 394,180 | | | | | | 0.0 | | |
| 58,461 | | | 3.250%, 07/15/2041 | | | | | 55,746 | | | | | | 0.0 | | |
| 619,642 | | | 3.250%, 08/15/2041 | | | | | 590,873 | | | | | | 0.1 | | |
| 263,401 | | | 3.250%, 09/15/2041 | | | | | 251,016 | | | | | | 0.0 | | |
| 198,841 | | | 3.250%, 09/15/2041 | | | | | 189,491 | | | | | | 0.0 | | |
| 173,740 | | | 3.250%, 11/15/2041 | | | | | 165,665 | | | | | | 0.0 | | |
| 40,889 | | | 3.250%, 11/15/2041 | | | | | 38,990 | | | | | | 0.0 | | |
| 65,431 | | | 3.250%, 12/15/2041 | | | | | 62,387 | | | | | | 0.0 | | |
| 37,956 | | | 3.250%, 04/15/2042 | | | | | 36,193 | | | | | | 0.0 | | |
| 77,796 | | | 3.250%, 06/15/2042 | | | | | 74,183 | | | | | | 0.0 | | |
| 30,479 | | | 3.250%, 06/15/2042 | | | | | 28,871 | | | | | | 0.0 | | |
| 917,514 | | | 3.500%, 04/20/2043 | | | | | 867,692 | | | | | | 0.1 | | |
| 1,070,976 | | | 3.500%, 06/20/2045 | �� | | | | 1,019,913 | | | | | | 0.1 | | |
| 2,670,191 | | | 3.500%, 04/20/2046 | | | | | 2,541,902 | | | | | | 0.2 | | |
| 4,232,705 | | | 3.500%, 03/20/2047 | | | | | 4,092,394 | | | | | | 0.3 | | |
| 512,050 | | | 3.500%, 07/20/2047 | | | | | 487,522 | | | | | | 0.1 | | |
| 880,704 | | | 3.500%, 07/20/2047 | | | | | 837,455 | | | | | | 0.1 | | |
| 21,499,503 | | | 3.500%, 12/20/2047 | | | | | 20,439,933 | | | | | | 1.6 | | |
| 7,693,435 | | | 3.500%, 01/20/2048 | | | | | 7,314,251 | | | | | | 0.6 | | |
| 5,756,007 | | | 3.500%, 02/20/2048 | | | | | 5,472,474 | | | | | | 0.4 | | |
| 2,919,091 | | | 3.500%, 02/20/2048 | | | | | 2,775,305 | | | | | | 0.2 | | |
| 11,051,245 | | | 3.500%, 03/20/2048 | | | | | 10,506,136 | | | | | | 0.8 | | |
| 29,488,293 | | | 3.500%, 03/20/2052 | | | | | 27,667,944 | | | | | | 2.1 | | |
| 7,000,000 (5) | | | 3.500%, 04/15/2053 | | | | | 6,562,773 | | | | | | 0.5 | | |
| 51,642 | | | 3.650%, 12/15/2040 | | | | | 50,173 | | | | | | 0.0 | | |
| 15,715 | | | 3.750%, 09/15/2041 | | | | | 15,065 | | | | | | 0.0 | | |
| 298,574 | | | 3.750%, 09/15/2041 | | | | | 289,143 | | | | | | 0.0 | | |
| 128,846 | | | 3.750%, 10/15/2041 | | | | | 125,079 | | | | | | 0.0 | | |
| 112,739 | | | 3.750%, 10/15/2041 | | | | | 109,444 | | | | | | 0.0 | | |
| 2,606,226 | | | 3.750%, 05/20/2042 | | | | | 2,478,501 | | | | | | 0.2 | | |
| 1,944,922 | | | 3.750%, 05/20/2042 | | | | | 1,856,809 | | | | | | 0.2 | | |
| 127,512 | | | 3.900%, 10/15/2041 | | | | | 123,631 | | | | | | 0.0 | | |
See Accompanying Notes to Financial Statements
PORTFOLIO OF INVESTMENTS
| Voya GNMA Income Fund | as of March 31, 2023 (continued) |
Principal
Amount† | | | Value | | | Percentage
of Net
Assets | |
| U.S. GOVERNMENT AGENCY OBLIGATIONS: (continued) | |
| | | | Government National Mortgage
Association (continued) | |
| 60,513 | | | 4.000%, 05/20/2033 | | | | $ | 58,821 | | | | | | 0.0 | | |
| 681 | | | 4.000%, 08/15/2033 | | | | | 677 | | | | | | 0.0 | | |
| 29,394 | | | 4.000%, 01/15/2034 | | | | | 28,214 | | | | | | 0.0 | | |
| 383,385 | | | 4.000%, 05/20/2034 | | | | | 372,308 | | | | | | 0.0 | | |
| 344,710 | | | 4.000%, 07/20/2034 | | | | | 334,747 | | | | | | 0.0 | | |
| 752,202 | | | 4.000%, 07/20/2034 | | | | | 730,728 | | | | | | 0.1 | | |
| 74,836 | | | 4.000%, 08/20/2035 | | | | | 73,816 | | | | | | 0.0 | | |
| 623,719 | | | 4.000%, 09/20/2040 | | | | | 604,300 | | | | | | 0.1 | | |
| 1,108,678 | | | 4.000%, 07/20/2041 | | | | | 1,074,295 | | | | | | 0.1 | | |
| 4,581,711 | | | 4.000%, 08/20/2042 | | | | | 4,528,177 | | | | | | 0.4 | | |
| 136,160 | | | 4.000%, 09/15/2042 | | | | | 131,555 | | | | | | 0.0 | | |
| 815,539 | | | 4.000%, 10/20/2043 | | | | | 812,568 | | | | | | 0.1 | | |
| 1,350,036 | | | 4.000%, 12/20/2044 | | | | | 1,314,257 | | | | | | 0.1 | | |
| 1,253,649 | | | 4.000%, 01/20/2045 | | | | | 1,220,631 | | | | | | 0.1 | | |
| 315,199 | | | 4.000%, 06/20/2045 | | | | | 309,078 | | | | | | 0.0 | | |
| 1,307,823 | | | 4.000%, 07/20/2045 | | | | | 1,280,425 | | | | | | 0.1 | | |
| 1,432,083 | | | 4.000%, 09/20/2045 | | | | | 1,404,194 | | | | | | 0.1 | | |
| 102,549 | | | 4.000%, 12/20/2045 | | | | | 101,000 | | | | | | 0.0 | | |
| 3,093,177 | | | 4.000%, 01/20/2046 | | | | | 3,042,072 | | | | | | 0.2 | | |
| 366,557 | | | 4.000%, 01/20/2046 | | | | | 361,023 | | | | | | 0.0 | | |
| 66,741 | | | 4.000%, 02/20/2046 | | | | | 65,342 | | | | | | 0.0 | | |
| 1,691,315 | | | 4.000%, 03/20/2046 | | | | | 1,654,806 | | | | | | 0.1 | | |
| 799,272 | | | 4.000%, 04/20/2046 | | | | | 782,518 | | | | | | 0.1 | | |
| 345,199 | | | 4.000%, 08/20/2046 | | | | | 336,895 | | | | | | 0.0 | | |
| 1,387,266 | | | 4.000%, 09/20/2047 | | | | | 1,350,057 | | | | | | 0.1 | | |
| 13,009,502 | | | 4.000%, 02/20/2050 | | | | | 12,678,620 | | | | | | 1.0 | | |
| 949,968 (2) | | | 4.242%, 10/20/2064 | | | | | 941,775 | | | | | | 0.1 | | |
| 5,297 (2) | | | 4.329%, 09/20/2062 | | | | | 5,107 | | | | | | 0.0 | | |
| 20,336 (2) | | | 4.398%, 02/20/2068 | | | | | 20,073 | | | | | | 0.0 | | |
| 8,589 (2) | | | 4.414%, 04/20/2065 | | | | | 8,480 | | | | | | 0.0 | | |
| 110,033 | | | 4.450%, 07/15/2040 | | | | | 107,487 | | | | | | 0.0 | | |
| 61,530 | | | 4.450%, 09/15/2040 | | | | | 59,729 | | | | | | 0.0 | | |
| 59,962 | | | 4.450%, 10/15/2040 | | | | | 58,207 | | | | | | 0.0 | | |
| 587,718 (2) | | | 4.472%, 01/20/2065 | | | | | 582,985 | | | | | | 0.1 | | |
| 10,836 (2) | | | 4.480%, 10/20/2067 | | | | | 10,704 | | | | | | 0.0 | | |
| 4,933 | | | 4.500%, 07/20/2036 | | | | | 4,950 | | | | | | 0.0 | | |
| 390,438 | | | 4.500%, 10/15/2039 | | | | | 394,304 | | | | | | 0.0 | | |
| 283,111 | | | 4.500%, 11/15/2039 | | | | | 286,176 | | | | | | 0.0 | | |
| 292,450 | | | 4.500%, 11/15/2039 | | | | | 295,616 | | | | | | 0.0 | | |
| 94,083 | | | 4.500%, 12/15/2039 | | | | | 95,014 | | | | | | 0.0 | | |
| 227,618 | | | 4.500%, 01/15/2040 | | | | | 229,520 | | | | | | 0.0 | | |
| 24,127 | | | 4.500%, 01/20/2040 | | | | | 23,941 | | | | | | 0.0 | | |
| 1,053,072 | | | 4.500%, 02/15/2040 | | | | | 1,054,729 | | | | | | 0.1 | | |
Principal
Amount† | | | Value | | | Percentage
of Net
Assets | ��� |
| U.S. GOVERNMENT AGENCY OBLIGATIONS: (continued) | |
| | | | Government National Mortgage
Association (continued) | |
| 50,585 | | | 4.500%, 06/15/2040 | | | | $ | 50,472 | | | | | | 0.0 | | |
| 22,657 | | | 4.500%, 07/20/2040 | | | | | 22,483 | | | | | | 0.0 | | |
| 79,971 | | | 4.500%, 08/20/2040 | | | | | 79,367 | | | | | | 0.0 | | |
| 593,313 | | | 4.500%, 09/20/2041 | | | | | 601,376 | | | | | | 0.1 | | |
| 213,929 | | | 4.500%, 10/20/2048 | | | | | 213,406 | | | | | | 0.0 | | |
| 99,829 | | | 4.500%, 11/20/2048 | | | | | 99,585 | | | | | | 0.0 | | |
| 3,071,413 | | | 4.500%, 12/20/2048 | | | | | 3,027,936 | | | | | | 0.2 | | |
| 74,867 | | | 4.500%, 01/20/2049 | | | | | 74,639 | | | | | | 0.0 | | |
| 261,478 | | | 4.500%, 03/20/2049 | | | | | 260,678 | | | | | | 0.0 | | |
| 43,004 | | | 4.500%, 05/20/2049 | | | | | 42,778 | | | | | | 0.0 | | |
| 4,792,999 | | | 4.500%, 11/20/2049 | | | | | 4,727,531 | | | | | | 0.4 | | |
| 5,936,524 | | | 4.500%, 12/20/2049 | | | | | 5,884,371 | | | | | | 0.5 | | |
| 120,000,000 (5) | | | 4.500%, 04/15/2053 | | | | | 118,203,623 | | | | | | 8.9 | | |
| 1,281,686 (2) | | | 4.505%, 01/20/2065 | | | | | 1,271,465 | | | | | | 0.1 | | |
| 17,727 (2) | | | 4.523%, 04/20/2066 | | | | | 17,513 | | | | | | 0.0 | | |
| 1,541,973 (2) | | | 4.539%, 02/20/2065 | | | | | 1,530,213 | | | | | | 0.1 | | |
| 26,442 | | | 4.580%, 01/20/2034 | | | | | 26,308 | | | | | | 0.0 | | |
| 40,725 | | | 4.580%, 03/20/2034 | | | | | 40,519 | | | | | | 0.0 | | |
| 31,854 | | | 4.580%, 04/20/2034 | | | | | 31,692 | | | | | | 0.0 | | |
| 41,349 | | | 4.580%, 04/20/2034 | | | | | 41,139 | | | | | | 0.0 | | |
| 40,335 | | | 4.580%, 06/20/2034 | | | | | 40,131 | | | | | | 0.0 | | |
| 113,946 (2) | | | 4.657%, 09/20/2064 | | | | | 113,402 | | | | | | 0.0 | | |
| 276,499 (2) | | | 4.679%, 10/20/2064 | | | | | 274,752 | | | | | | 0.0 | | |
| 146,915 (2) | | | 4.694%, 09/20/2064 | | | | | 145,988 | | | | | | 0.0 | | |
| 438 (2) | | | 4.700%, 06/20/2061 | | | | | 440 | | | | | | 0.0 | | |
| 4,052 (2) | | | 4.700%, 08/20/2061 | | | | | 4,023 | | | | | | 0.0 | | |
| 401,698 | | | 4.750%, 06/15/2029 | | | | | 403,287 | | | | | | 0.0 | | |
| 101,782 | | | 4.750%, 01/15/2030 | | | | | 101,851 | | | | | | 0.0 | | |
| 49,124 | | | 4.750%, 06/20/2033 | | | | | 48,732 | | | | | | 0.0 | | |
| 21,045 | | | 4.750%, 07/20/2033 | | | | | 21,070 | | | | | | 0.0 | | |
| 44,392 | | | 4.750%, 07/20/2033 | | | | | 44,037 | | | | | | 0.0 | | |
| 35,338 | | | 4.750%, 07/20/2033 | | | | | 35,355 | | | | | | 0.0 | | |
| 57,163 | | | 4.750%, 08/20/2033 | | | | | 57,190 | | | | | | 0.0 | | |
| 24,536 | | | 4.750%, 08/20/2033 | | | | | 24,293 | | | | | | 0.0 | | |
| 20,592 | | | 4.750%, 09/20/2033 | | | | | 20,387 | | | | | | 0.0 | | |
| 28,435 | | | 4.750%, 10/20/2033 | | | | | 28,449 | | | | | | 0.0 | | |
| 22,860 | | | 4.750%, 11/20/2033 | | | | | 22,633 | | | | | | 0.0 | | |
| 20,391 | | | 4.750%, 12/20/2033 | | | | | 20,180 | | | | | | 0.0 | | |
| 186,021 | | | 4.750%, 09/15/2034 | | | | | 190,708 | | | | | | 0.0 | | |
| 21,329 | | | 4.920%, 04/20/2033 | | | | | 21,208 | | | | | | 0.0 | | |
| 42,365 | | | 4.920%, 04/20/2033 | | | | | 42,168 | | | | | | 0.0 | | |
| 27,862 | | | 4.920%, 05/20/2033 | | | | | 27,698 | | | | | | 0.0 | | |
| 25,279 | | | 4.920%, 05/20/2033 | | | | | 25,130 | | | | | | 0.0 | | |
See Accompanying Notes to Financial Statements
PORTFOLIO OF INVESTMENTS
| Voya GNMA Income Fund | as of March 31, 2023 (continued) |
Principal
Amount† | | | Value | | | Percentage
of Net
Assets | |
| U.S. GOVERNMENT AGENCY OBLIGATIONS: (continued) | |
| | | | Government National Mortgage
Association (continued) | |
| 27,077 | | | 4.920%, 05/20/2033 | | | | $ | 27,002 | | | | | | 0.0 | | |
| 2,808 | | | 5.000%, 03/20/2024 | | | | | 2,823 | | | | | | 0.0 | | |
| 455,311 | | | 5.000%, 04/20/2030 | | | | | 464,125 | | | | | | 0.1 | | |
| 145,760 | | | 5.000%, 07/15/2033 | | | | | 148,741 | | | | | | 0.0 | | |
| 40,431 | | | 5.000%, 03/15/2034 | | | | | 41,480 | | | | | | 0.0 | | |
| 59,744 | | | 5.000%, 01/15/2035 | | | | | 61,094 | | | | | | 0.0 | | |
| 81,033 | | | 5.000%, 03/15/2035 | | | | | 82,958 | | | | | | 0.0 | | |
| 7,734 | | | 5.000%, 03/15/2035 | | | | | 7,926 | | | | | | 0.0 | | |
| 187,017 | | | 5.000%, 04/15/2035 | | | | | 193,158 | | | | | | 0.0 | | |
| 27,566 | | | 5.000%, 04/15/2035 | | | | | 28,198 | | | | | | 0.0 | | |
| 14,306 | | | 5.000%, 05/15/2035 | | | | | 14,711 | | | | | | 0.0 | | |
| 40,117 | | | 5.000%, 05/20/2035 | | | | | 41,389 | | | | | | 0.0 | | |
| 212,783 | | | 5.000%, 11/20/2035 | | | | | 219,529 | | | | | | 0.0 | | |
| 103,505 | | | 5.000%, 04/20/2036 | | | | | 106,790 | | | | | | 0.0 | | |
| 39,840 | | | 5.000%, 06/20/2038 | | | | | 39,464 | | | | | | 0.0 | | |
| 14,249 | | | 5.000%, 08/20/2038 | | | | | 14,435 | | | | | | 0.0 | | |
| 162,257 | | | 5.000%, 10/20/2038 | | | | | 163,414 | | | | | | 0.0 | | |
| 28,797 | | | 5.000%, 11/20/2038 | | | | | 28,468 | | | | | | 0.0 | | |
| 108,500 | | | 5.000%, 01/20/2039 | | | | | 109,891 | | | | | | 0.0 | | |
| 35,332 | | | 5.000%, 02/15/2039 | | | | | 36,082 | | | | | | 0.0 | | |
| 150,798 | | | 5.000%, 03/15/2039 | | | | | 154,607 | | | | | | 0.0 | | |
| 57,426 | | | 5.000%, 11/15/2039 | | | | | 58,598 | | | | | | 0.0 | | |
| 561,938 | | | 5.000%, 11/15/2039 | | | | | 577,053 | | | | | | 0.1 | | |
| 516,913 | | | 5.000%, 11/15/2039 | | | | | 528,946 | | | | | | 0.1 | | |
| 70,018 | | | 5.000%, 04/15/2040 | | | | | 71,925 | | | | | | 0.0 | | |
| 593,298 | | | 5.000%, 09/15/2040 | | | | | 607,114 | | | | | | 0.1 | | |
| 445,237 | | | 5.000%, 07/20/2041 | | | | | 457,748 | | | | | | 0.0 | | |
| 30,000,000 (5) | | | 5.000%, 04/15/2053 | | | | | 30,039,844 | | | | | | 2.3 | | |
| 3,014 | | | 5.250%, 01/15/2024 | | | | | 3,036 | | | | | | 0.0 | | |
| 32,402 | | | 5.250%, 06/15/2028 | | | | | 32,938 | | | | | | 0.0 | | |
| 51,466 | | | 5.250%, 06/15/2029 | | | | | 52,568 | | | | | | 0.0 | | |
| 798,081 | | | 5.250%, 01/20/2036 | | | | | 817,458 | | | | | | 0.1 | | |
| 107,585 | | | 5.290%, 07/20/2037 | | | | | 110,373 | | | | | | 0.0 | | |
| 76,737 | | | 5.290%, 08/20/2037 | | | | | 78,450 | | | | | | 0.0 | | |
| 116,038 | | | 5.290%, 09/20/2037 | | | | | 119,045 | | | | | | 0.0 | | |
| 93,272 | | | 5.290%, 09/20/2037 | | | | | 95,355 | | | | | | 0.0 | | |
| 108,163 | | | 5.290%, 01/20/2038 | | | | | 110,966 | | | | | | 0.0 | | |
| 2,233 | | | 5.350%, 01/15/2029 | | | | | 2,277 | | | | | | 0.0 | | |
| 3,763 | | | 5.350%, 01/20/2029 | | | | | 3,802 | | | | | | 0.0 | | |
| 25,382 | | | 5.350%, 04/20/2029 | | | | | 25,749 | | | | | | 0.0 | | |
| 24,248 | | | 5.350%, 06/20/2029 | | | | | 24,598 | | | | | | 0.0 | | |
| 28,659 | | | 5.350%, 10/20/2029 | | | | | 29,051 | | | | | | 0.0 | | |
| 70,698 | | | 5.350%, 07/20/2033 | | | | | 72,318 | | | | | | 0.0 | | |
Principal
Amount† | | | Value | | | Percentage
of Net
Assets | |
| U.S. GOVERNMENT AGENCY OBLIGATIONS: (continued) | |
| | | | Government National Mortgage
Association (continued) | |
| 12,308 | | | 5.350%, 08/20/2033 | | | | $ | 12,487 | | | | | | 0.0 | | |
| 138,279 | | | 5.390%, 08/20/2038 | | | | | 136,405 | | | | | | 0.0 | | |
| 69,479 | | | 5.390%, 09/15/2038 | | | | | 71,445 | | | | | | 0.0 | | |
| 23,701 | | | 5.490%, 08/20/2033 | | | | | 24,114 | | | | | | 0.0 | | |
| 175,174 | | | 5.490%, 09/20/2033 | | | | | 178,334 | | | | | | 0.0 | | |
| 40,572 | | | 5.490%, 09/20/2033 | | | | | 41,205 | | | | | | 0.0 | | |
| 42,325 | | | 5.490%, 09/20/2033 | | | | | 43,062 | | | | | | 0.0 | | |
| 176,923 | | | 5.490%, 10/20/2033 | | | | | 180,111 | | | | | | 0.0 | | |
| 261,348 | | | 5.490%, 10/20/2033 | | | | | 266,394 | | | | | | 0.0 | | |
| 131,530 | | | 5.490%, 11/20/2033 | | | | | 133,998 | | | | | | 0.0 | | |
| 247,333 | | | 5.490%, 11/20/2033 | | | | | 252,471 | | | | | | 0.0 | | |
| 155,917 | | | 5.490%, 12/20/2033 | | | | | 159,017 | | | | | | 0.0 | | |
| 208,046 | | | 5.490%, 12/20/2033 | | | | | 211,426 | | | | | | 0.0 | | |
| 124,737 | | | 5.490%, 12/20/2033 | | | | | 127,078 | | | | | | 0.0 | | |
| 42,483 | | | 5.490%, 01/20/2034 | | | | | 43,223 | | | | | | 0.0 | | |
| 89,726 | | | 5.490%, 03/20/2034 | | | | | 90,937 | | | | | | 0.0 | | |
| 36,144 | | | 5.490%, 03/20/2034 | | | | | 36,771 | | | | | | 0.0 | | |
| 36,490 | | | 5.490%, 06/20/2034 | | | | | 37,126 | | | | | | 0.0 | | |
| 8,772 | | | 5.500%, 08/15/2024 | | | | | 8,756 | | | | | | 0.0 | | |
| 6,964 | | | 5.500%, 08/20/2024 | | | | | 7,044 | | | | | | 0.0 | | |
| 377 | | | 5.500%, 04/20/2029 | | | | | 382 | | | | | | 0.0 | | |
| 110,478 | | | 5.500%, 09/15/2029 | | | | | 113,910 | | | | | | 0.0 | | |
| 77,035 | | | 5.500%, 10/15/2029 | | | | | 79,147 | | | | | | 0.0 | | |
| 23,253 | | | 5.500%, 12/20/2032 | | | | | 23,996 | | | | | | 0.0 | | |
| 71,270 | | | 5.500%, 08/20/2033 | | | | | 73,547 | | | | | | 0.0 | | |
| 54,270 | | | 5.500%, 11/20/2033 | | | | | 53,926 | | | | | | 0.0 | | |
| 20,479 | | | 5.500%, 12/20/2033 | | | | | 21,229 | | | | | | 0.0 | | |
| 58,288 | | | 5.500%, 03/20/2034 | | | | | 57,918 | | | | | | 0.0 | | |
| 104,802 | | | 5.500%, 04/20/2034 | | | | | 104,534 | | | | | | 0.0 | | |
| 119,439 | | | 5.500%, 04/20/2034 | | | | | 124,286 | | | | | | 0.0 | | |
| 151,124 | | | 5.500%, 06/20/2034 | | | | | 153,237 | | | | | | 0.0 | | |
| 76,273 | | | 5.500%, 06/20/2034 | | | | | 75,768 | | | | | | 0.0 | | |
| 66,218 | | | 5.500%, 07/20/2034 | | | | | 67,036 | | | | | | 0.0 | | |
| 96,338 | | | 5.500%, 01/20/2035 | | | | | 95,700 | | | | | | 0.0 | | |
| 65,967 | | | 5.500%, 05/15/2035 | | | | | 67,323 | | | | | | 0.0 | | |
| 12,376 | | | 5.500%, 06/20/2035 | | | | | 12,524 | | | | | | 0.0 | | |
| 152,291 | | | 5.500%, 07/15/2035 | | | | | 155,483 | | | | | | 0.0 | | |
| 79,695 | | | 5.500%, 08/15/2035 | | | | | 81,332 | | | | | | 0.0 | | |
| 77,898 | | | 5.500%, 09/20/2035 | | | | | 78,860 | | | | | | 0.0 | | |
| 139,895 | | | 5.500%, 04/15/2036 | | | | | 142,850 | | | | | | 0.0 | | |
| 27,097 | | | 5.500%, 06/20/2036 | | | | | 28,366 | | | | | | 0.0 | | |
| 2,406 | | | 5.500%, 06/20/2038 | | | | | 2,445 | | | | | | 0.0 | | |
| 11,289 | | | 5.500%, 08/20/2038 | | | | | 11,486 | | | | | | 0.0 | | |
See Accompanying Notes to Financial Statements
PORTFOLIO OF INVESTMENTS
| Voya GNMA Income Fund | as of March 31, 2023 (continued) |
Principal
Amount† | | | Value | | | Percentage
of Net
Assets | |
| U.S. GOVERNMENT AGENCY OBLIGATIONS: (continued) | |
| | | | Government National Mortgage
Association (continued) | |
| 7,305 | | | 5.500%, 09/20/2038 | | | | $ | 7,411 | | | | | | 0.0 | | |
| 1,442 | | | 5.500%, 10/20/2038 | | | | | 1,439 | | | | | | 0.0 | | |
| 14,727 | | | 5.500%, 11/20/2038 | | | | | 14,964 | | | | | | 0.0 | | |
| 735 | | | 5.500%, 12/20/2038 | | | | | 745 | | | | | | 0.0 | | |
| 45,940 | | | 5.500%, 01/15/2039 | | | | | 46,886 | | | | | | 0.0 | | |
| 5,563 | | | 5.500%, 01/20/2039 | | | | | 5,530 | | | | | | 0.0 | | |
| 25,033 | | | 5.500%, 06/15/2039 | | | | | 25,546 | | | | | | 0.0 | | |
| 15,690 | | | 5.500%, 06/20/2039 | | | | | 15,677 | | | | | | 0.0 | | |
| 20,515 | | | 5.500%, 10/20/2039 | | | | | 21,468 | | | | | | 0.0 | | |
| 162,121 | | | 5.500%, 09/15/2040 | | | | | 165,699 | | | | | | 0.0 | | |
| 66,627 | | | 5.580%, 12/20/2033 | | | | | 67,457 | | | | | | 0.0 | | |
| 35,928 | | | 5.580%, 12/20/2033 | | | | | 36,749 | | | | | | 0.0 | | |
| 125,514 | | | 5.580%, 01/20/2034 | | | | | 127,387 | | | | | | 0.0 | | |
| 45,606 | | | 5.580%, 02/20/2034 | | | | | 46,223 | | | | | | 0.0 | | |
| 37,374 | | | 5.580%, 03/20/2034 | | | | | 37,880 | | | | | | 0.0 | | |
| 59,169 | | | 5.580%, 04/20/2034 | | | | | 60,691 | | | | | | 0.0 | | |
| 118,636 | | | 5.580%, 04/20/2034 | | | | | 120,502 | | | | | | 0.0 | | |
| 43,632 | | | 5.580%, 04/20/2034 | | | | | 44,648 | | | | | | 0.0 | | |
| 32,745 | | | 5.580%, 06/20/2034 | | | | | 33,588 | | | | | | 0.0 | | |
| 51,277 | | | 5.580%, 09/20/2034 | | | | | 52,471 | | | | | | 0.0 | | |
| 189,218 | | | 5.590%, 06/20/2033 | | | | | 192,138 | | | | | | 0.0 | | |
| 13,103 | | | 5.590%, 07/20/2033 | | | | | 13,282 | | | | | | 0.0 | | |
| 28,940 | | | 5.590%, 07/20/2033 | | | | | 29,677 | | | | | | 0.0 | | |
| 86,686 | | | 5.590%, 07/20/2033 | | | | | 87,872 | | | | | | 0.0 | | |
| 145,895 | | | 5.590%, 07/20/2033 | | | | | 148,146 | | | | | | 0.0 | | |
| 84,996 | | | 5.590%, 08/20/2033 | | | | | 86,143 | | | | | | 0.0 | | |
| 22,133 | | | 5.590%, 09/20/2033 | | | | | 22,654 | | | | | | 0.0 | | |
| 38,491 | | | 5.590%, 09/20/2033 | | | | | 39,471 | | | | | | 0.0 | | |
| 151,483 | | | 5.590%, 09/20/2033 | | | | | 153,822 | | | | | | 0.0 | | |
| 58,635 | | | 5.590%, 10/20/2033 | | | | | 60,128 | | | | | | 0.0 | | |
| 24,521 | | | 5.590%, 11/20/2033 | | | | | 25,085 | | | | | | 0.0 | | |
| 42,949 | | | 5.590%, 11/20/2033 | | | | | 44,039 | | | | | | 0.0 | | |
| 44,895 | | | 5.590%, 11/20/2033 | | | | | 46,042 | | | | | | 0.0 | | |
| 70,878 | | | 5.590%, 12/20/2033 | | | | | 72,513 | | | | | | 0.0 | | |
| 76,522 | | | 5.740%, 09/20/2037 | | | | | 77,743 | | | | | | 0.0 | | |
| 234,040 | | | 5.740%, 09/20/2037 | | | | | 238,197 | | | | | | 0.0 | | |
| 80,195 | | | 5.740%, 10/20/2037 | | | | | 81,474 | | | | | | 0.0 | | |
| 83,447 | | | 5.740%, 04/20/2038 | | | | | 84,777 | | | | | | 0.0 | | |
| 5,667 | | | 5.750%, 11/15/2024 | | | | | 5,654 | | | | | | 0.0 | | |
| 350,712 | | | 5.750%, 07/15/2029 | | | | | 353,562 | | | | | | 0.0 | | |
| 262,684 | | | 5.750%, 08/15/2029 | | | | | 264,484 | | | | | | 0.0 | | |
| 37,635 | | | 5.750%, 11/15/2029 | | | | | 37,894 | | | | | | 0.0 | | |
| 322,676 | | | 5.750%, 11/15/2029 | | | | | 325,266 | | | | | | 0.0 | | |
Principal
Amount† | | | Value | | | Percentage
of Net
Assets | |
| U.S. GOVERNMENT AGENCY OBLIGATIONS: (continued) | |
| | | | Government National Mortgage
Association (continued) | |
| 132,905 | | | 5.770%, 03/20/2033 | | | | $ | 135,267 | | | | | | 0.0 | | |
| 36,606 | | | 5.770%, 03/20/2033 | | | | | 37,205 | | | | | | 0.0 | | |
| 66,823 | | | 5.770%, 04/20/2033 | | | | | 67,916 | | | | | | 0.0 | | |
| 32,664 | | | 5.770%, 04/20/2033 | | | | | 33,198 | | | | | | 0.0 | | |
| 82,787 | | | 5.770%, 05/20/2033 | | | | | 84,141 | | | | | | 0.0 | | |
| 32,173 | | | 5.770%, 05/20/2033 | | | | | 32,700 | | | | | | 0.0 | | |
| 74,921 | | | 5.770%, 05/20/2033 | | | | | 76,148 | | | | | | 0.0 | | |
| 60,386 | | | 5.770%, 07/20/2033 | | | | | 61,369 | | | | | | 0.0 | | |
| 56,937 | | | 5.770%, 07/20/2033 | | | | | 57,869 | | | | | | 0.0 | | |
| 24,958 | | | 5.900%, 05/20/2028 | | | | | 25,411 | | | | | | 0.0 | | |
| 1,071,937 | | | 5.970%, 11/15/2031 | | | | | 1,069,553 | | | | | | 0.1 | | |
| 11,975 | | | 6.000%, 10/15/2025 | | | | | 12,230 | | | | | | 0.0 | | |
| 53,263 | | | 6.000%, 04/15/2026 | | | | | 52,980 | | | | | | 0.0 | | |
| 25,225 | | | 6.000%, 10/20/2027 | | | | | 25,718 | | | | | | 0.0 | | |
| 68,758 | | | 6.000%, 05/15/2029 | | | | | 69,276 | | | | | | 0.0 | | |
| 53,549 | | | 6.000%, 07/15/2029 | | | | | 53,190 | | | | | | 0.0 | | |
| 40,744 | | | 6.000%, 10/20/2034 | | | | | 43,155 | | | | | | 0.0 | | |
| 102,360 | | | 6.000%, 03/15/2037 | | | | | 107,830 | | | | | | 0.0 | | |
| 57,789 | | | 6.000%, 08/20/2038 | | | | | 60,101 | | | | | | 0.0 | | |
| 11,549 | | | 6.000%, 09/20/2038 | | | | | 11,657 | | | | | | 0.0 | | |
| 16,553 | | | 6.000%, 10/20/2038 | | | | | 17,150 | | | | | | 0.0 | | |
| 67,292 | | | 6.000%, 11/15/2038 | | | | | 68,608 | | | | | | 0.0 | | |
| 71,941 | | | 6.000%, 12/15/2038 | | | | | 73,346 | | | | | | 0.0 | | |
| 162,879 | | | 6.000%, 08/15/2039 | | | | | 166,254 | | | | | | 0.0 | | |
| 219,591 | | | 6.000%, 08/15/2039 | | | | | 224,529 | | | | | | 0.0 | | |
| 14,621 | | | 6.500%, 07/20/2029 | | | | | 14,879 | | | | | | 0.0 | | |
| 39,346 | | | 6.500%, 07/20/2032 | | | | | 39,437 | | | | | | 0.0 | | |
| 65,637 | | | 6.500%, 02/15/2034 | | | | | 65,642 | | | | | | 0.0 | | |
| 169 | | | 6.500%, 09/20/2034 | | | | | 168 | | | | | | 0.0 | | |
| 3,656 | | | 7.500%, 08/20/2027 | | | | | 3,751 | | | | | | 0.0 | | |
| | | | | | | | | 813,860,344 | | | | | | 61.3 | | |
| | | | Uniform Mortgage-Backed Securities: 4.3% | |
| 2,789,218 | | | 2.000%, 12/01/2051 | | | | | 2,313,065 | | | | | | 0.2 | | |
| 2,738,841 | | | 2.500%, 12/01/2051 | | | | | 2,365,635 | | | | | | 0.2 | | |
| 1,825,898 | | | 2.500%, 02/01/2052 | | | | | 1,593,323 | | | | | | 0.1 | | |
| 3,000,000 (5) | | | 2.500%, 04/15/2053 | | | | | 2,585,976 | | | | | | 0.2 | | |
| 2,584,758 | | | 3.000%, 11/01/2051 | | | | | 2,326,193 | | | | | | 0.2 | | |
| 1,814,567 | | | 3.000%, 01/01/2052 | | | | | 1,650,473 | | | | | | 0.1 | | |
| 1,776,278 | | | 3.500%, 02/01/2052 | | | | | 1,663,382 | | | | | | 0.1 | | |
| 5,422,343 | | | 3.500%, 03/01/2052 | | | | | 5,096,235 | | | | | | 0.4 | | |
| 3,400,000 (5) | | | 3.500%, 04/15/2053 | | | | | 3,159,476 | | | | | | 0.3 | | |
| 5,740,170 | | | 4.000%, 05/01/2042 | | | | | 5,643,214 | | | | | | 0.4 | | |
See Accompanying Notes to Financial Statements
PORTFOLIO OF INVESTMENTS
| Voya GNMA Income Fund | as of March 31, 2023 (continued) |
Principal
Amount† | | | Value | | | Percentage
of Net
Assets | |
| U.S. GOVERNMENT AGENCY OBLIGATIONS: (continued) | |
| | | | Uniform Mortgage-Backed
Securities (continued) | |
| 323,124 | | | 4.000%, 05/01/2045 | | | | $ | 315,436 | | | | | | 0.0 | | |
| 364,999 | | | 4.000%, 08/01/2046 | | | | | 356,126 | | | | | | 0.0 | | |
| 4,520,000 (5) | | | 4.000%, 04/15/2053 | | | | | 4,323,327 | | | | | | 0.3 | | |
| 305,205 | | | 4.250%, 08/01/2035 | | | | | 303,959 | | | | | | 0.0 | | |
| 4,481,500 | | | 4.500%, 07/01/2052 | | | | | 4,395,166 | | | | | | 0.4 | | |
| 3,000,000 (5) | | | 4.500%, 04/15/2053 | | | | | 2,939,622 | | | | | | 0.2 | | |
| 48,215 | | | 4.750%, 11/01/2034 | | | | | 48,271 | | | | | | 0.0 | | |
| 283,092 | | | 4.750%, 11/01/2034 | | | | | 285,138 | | | | | | 0.0 | | |
| 242,138 | | | 4.750%, 02/01/2035 | | | | | 243,889 | | | | | | 0.0 | | |
| 331,448 | | | 4.750%, 04/01/2035 | | | | | 333,999 | | | | | | 0.0 | | |
| 378,380 | | | 4.750%, 05/01/2035 | | | | | 381,322 | | | | | | 0.1 | | |
| 67,421 | | | 4.750%, 07/01/2035 | | | | | 67,130 | | | | | | 0.0 | | |
| 457,060 | | | 4.750%, 07/01/2035 | | | | | 462,712 | | | | | | 0.1 | | |
| 5,677,148 | | | 5.000%, 08/01/2052 | | | | | 5,668,723 | | | | | | 0.5 | | |
| 35,921 | | | 5.030%, 05/01/2037 | | | | | 36,217 | | | | | | 0.0 | | |
| 91,858 | | | 5.030%, 09/01/2037 | | | | | 92,565 | | | | | | 0.0 | | |
| 144,086 | | | 5.155%, 01/01/2037 | | | | | 146,038 | | | | | | 0.0 | | |
| 34,463 | | | 5.250%, 04/01/2032 | | | | | 34,917 | | | | | | 0.0 | | |
| 78,207 | | | 5.250%, 04/01/2032 | | | | | 79,276 | | | | | | 0.0 | | |
| 24,651 | | | 5.280%, 11/01/2036 | | | | | 25,008 | | | | | | 0.0 | | |
| 91,248 | | | 5.280%, 11/01/2036 | | | | | 92,481 | | | | | | 0.0 | | |
| 41,669 | | | 5.280%, 01/01/2037 | | | | | 42,272 | | | | | | 0.0 | | |
| 85,084 | | | 5.290%, 08/01/2037 | | | | | 86,384 | | | | | | 0.0 | | |
| 66,250 | | | 5.290%, 09/01/2037 | | | | | 67,179 | | | | | | 0.0 | | |
| 60,272 | | | 5.290%, 09/01/2037 | | | | | 61,193 | | | | | | 0.0 | | |
| 15,125 | | | 5.300%, 10/01/2036 | | | | | 15,329 | | | | | | 0.0 | | |
| 70,366 | | | 5.300%, 12/01/2036 | | | | | 71,285 | | | | | | 0.0 | | |
| 47,223 | | | 5.300%, 05/01/2037 | | | | | 47,957 | | | | | | 0.0 | | |
| 199,102 | | | 5.300%, 08/01/2037 | | | | | 201,109 | | | | | | 0.0 | | |
| 108,599 | | | 5.390%, 12/01/2037 | | | | | 110,576 | | | | | | 0.0 | | |
| 156,181 | | | 5.405%, 11/01/2036 | | | | | 159,430 | | | | | | 0.0 | | |
| 201,332 | | | 5.405%, 02/01/2037 | | | | | 206,242 | | | | | | 0.0 | | |
| 6,460,317 | | | 5.500%, 12/01/2052 | | | | | 6,531,331 | | | | | | 0.5 | | |
| 67,975 | | | 5.740%, 07/01/2037 | | | | | 69,053 | | | | | | 0.0 | | |
| | | | | | | | | 56,697,634 | | | | | | 4.3 | | |
| | | | Total U.S. Government
Agency Obligations (Cost $934,438,177) | | | | | 897,458,600 | | | | | | 67.6 | | |
| |
Principal
Amount† | | | Value | | | Percentage
of Net
Assets | |
| COMMERCIAL MORTGAGE-BACKED SECURITIES: 3.1% | |
| 9,255,323 (1)(2) | | | Freddie Mac Multifamily
Structured Pass Through
Certificates K106 X1,
1.354%, 01/25/2030 | | | | $ | 678,834 | | | | | | 0.1 | | |
| 28,099,698 (1)(2) | | | Freddie Mac Multifamily
Structured Pass Through
Certificates K107 X1,
1.691%, 03/25/2030 | | | | | 2,619,610 | | | | | | 0.2 | | |
| 19,417,115 (1)(2) | | | Freddie Mac Multifamily
Structured Pass Through
Certificates K110 X1,
1.697%, 04/25/2030 | | | | | 1,763,900 | | | | | | 0.1 | | |
| 2,982,631 (1)(2) | | | Freddie Mac Multifamily
Structured Pass Through
Certificates K119 X1,
0.930%, 09/25/2030 | | | | | 160,802 | | | | | | 0.0 | | |
| 16,484,870 (1)(2) | | | Freddie Mac Multifamily
Structured Pass Through
Certificates K-1516 X1,
1.511%, 05/25/2035 | | | | | 1,946,050 | | | | | | 0.1 | | |
| 14,675,357 (1)(2) | | | Freddie Mac Multifamily
Structured Pass Through
Certificates K-1517 X1,
1.324%, 07/25/2035 | | | | | 1,539,466 | | | | | | 0.1 | | |
| 34,180,835 (1)(2) | | | Freddie Mac Multifamily
Structured Pass Through
Certificates K-1519 X1,
0.598%, 12/25/2035 | | | | | 1,689,249 | | | | | | 0.1 | | |
| 24,714,509 (1)(2) | | | Freddie Mac Multifamily
Structured Pass Through
Certificates K740 X1,
0.749%, 09/25/2027 | | | | | 676,020 | | | | | | 0.1 | | |
| 31,466,000 (1)(2) | | | Freddie Mac Multifamily
Structured Pass Through
Certificates KL06 XFX,
1.364%, 12/25/2029 | | | | | 2,185,712 | | | | | | 0.2 | | |
| 34,749,650 (1)(2) | | | Freddie Mac Multifamily
Structured Pass Through
Certificates KLU3 X1,
1.937%, 01/25/2031 | | | | | 3,778,517 | | | | | | 0.3 | | |
| 259,941 (2) | | | Ginnie Mae 2004-23 Z,
5.758%, 03/16/2044 | | | | | 257,168 | | | | | | 0.0 | | |
| 3,935,742 (1)(2) | | | Ginnie Mae 2006-67 IO,
0.545%, 11/16/2046 | | | | | 29,251 | | | | | | 0.0 | | |
See Accompanying Notes to Financial Statements
PORTFOLIO OF INVESTMENTS
| Voya GNMA Income Fund | as of March 31, 2023 (continued) |
Principal
Amount† | | | Value | | | Percentage
of Net
Assets | |
| COMMERCIAL MORTGAGE-BACKED SECURITIES: (continued) | |
| 44,800 (2) | | | Ginnie Mae 2007-52 Z,
4.350%, 01/16/2048 | | | | $ | 44,663 | | | | | | 0.0 | | |
| 479,995 | | | Ginnie Mae 2008-39 Z,
4.500%, 02/16/2048 | | | | | 478,532 | | | | | | 0.0 | | |
| 224,077 (1)(2) | | | Ginnie Mae 2008-45 IO,
0.858%, 02/16/2048 | | | | | 258 | | | | | | 0.0 | | |
| 58,899 (2) | | | Ginnie Mae 2009-115 D,
4.824%, 01/16/2050 | | | | | 58,280 | | | | | | 0.0 | | |
| 57,538 (1)(2) | | | Ginnie Mae 2010-123 IA,
2.050%, 10/16/2052 | | | | | 805 | | | | | | 0.0 | | |
| 8,240,660 (1)(2) | | | Ginnie Mae 2011-47 IO,
0.200%, 01/16/2051 | | | | | 22,559 | | | | | | 0.0 | | |
| 1,946,738 (2) | | | Ginnie Mae 2018-114 Z,
3.100%, 04/16/2060 | | | | | 1,511,724 | | | | | | 0.1 | | |
| 10,994,694 | | | Ginnie Mae 2018-116 Z,
3.000%, 06/16/2058 | | | | | 9,148,501 | | | | | | 0.7 | | |
| 1,962,669 | | | Ginnie Mae 2018-169 Z,
3.000%, 04/16/2061 | | | | | 1,391,000 | | | | | | 0.1 | | |
| 1,952,441 | | | Ginnie Mae 2019-17 Z,
3.000%, 12/16/2060 | | | | | 1,399,422 | | | | | | 0.1 | | |
| 2,586,414 (2) | | | Ginnie Mae 2019-19 Z,
3.200%, 11/16/2060 | | | | | 2,129,496 | | | | | | 0.2 | | |
| 3,376,924 | | | Ginnie Mae 2019-53 Z,
3.000%, 06/16/2061 | | | | | 2,646,311 | | | | | | 0.2 | | |
| 5,162,897 | | | Ginnie Mae 2021-79,
1.750%, 08/16/2063 | | | | | 2,631,468 | | | | | | 0.2 | | |
| 2,569,660 | | | Ginnie Mae 2021-80 Z,
1.500%, 12/16/2062 | | | | | 1,331,958 | | | | | | 0.1 | | |
| 2,333,712 | | | Ginnie Mae 2021-90 B,
1.750%, 05/16/2061 | | | | | 1,224,432 | | | | | | 0.1 | | |
| | | | Total Commercial
Mortgage-Backed
Securities
(Cost $52,564,994) | | | | | 41,343,988 | | | | | | 3.1 | | |
| | |
| ASSET-BACKED SECURITIES: 0.1% | |
| | | | Other Asset-Backed Securities: 0.1% | |
| 1,108,336 | | | Fannie Mae Grantor Trust
2001-T9 A1, 4.955%,
(US0001M + 0.220%),
09/25/2031 | | | | | 1,095,654 | | | | | | 0.1 | | |
| 96,360 (2) | | | Fannie Mae Grantor Trust
2003-T4 2A6, 4.439%,
07/26/2033 | | | | | 94,207 | | | | | | 0.0 | | |
| 11,112 (2) | | | Fannie Mae REMIC Trust
2001-W4 AF6, 5.110%,
01/25/2032 | | | | | 11,037 | | | | | | 0.0 | | |
| 8,055 (2) | | | Fannie Mae REMIC Trust
2002-W12 AF6, 5.066%,
02/25/2033 | | | | | 7,539 | | | | | | 0.0 | | |
Principal
Amount† | | | Value | | | Percentage
of Net
Assets | |
| ASSET-BACKED SECURITIES: (continued) | |
| | | | Other Asset-Backed Securities (continued) | |
| 8,028 (2) | | | Fannie Mae REMIC Trust
2002-W2 AF6, 6.000%,
05/25/2032 | | | | $ | 7,858 | | | | | | 0.0 | | |
| | | | Total Asset-Backed
Securities
(Cost $1,220,466) | | | | | 1,216,295 | | | | | | 0.1 | | |
| | | | Total Long-Term
Investments
(Cost $1,706,878,990) | | | | | 1,607,349,239 | | | | | | 121.1 | | |
| SHORT-TERM INVESTMENTS: 5.2% | |
| | | | U.S. Government Agency Obligations: 2.4% | |
| 400,000 (6) | | | Federal Home Loan Bank
Discount Notes, 1.820%,
04/05/2023 | | | | | 399,900 | | | | | | 0.0 | | |
| 12,000,000 (6) | | | Federal Home Loan Bank
Discount Notes, 4.000%,
04/21/2023 | | | | | 11,972,457 | | | | | | 0.9 | | |
| 9,525,000 (6) | | | Federal Home Loan Bank
Discount Notes, 4.550%,
06/06/2023 | | | | | 9,446,037 | | | | | | 0.7 | | |
| 10,000,000 | | | Federal Home Loan
Banks, 4.860%,
05/03/2023 | | | | | 9,999,984 | | | | | | 0.8 | | |
| | | | Total U.S. Government
Agency Obligations | | | | | | | | | | | | | |
| | | | (Cost $31,808,737) | | | | | 31,818,378 | | | | | | 2.4 | | |
| | | | | |
| | | | U.S. Treasury Bills: 0.1% | |
| 1,625,000 (6) | | | United States Treasury
Bill, 2.340%, 04/06/2023
(Cost $1,623,972) | | | | | 1,624,375 | | | | | | 0.1 | | |
| Shares | | | Value | | | Percentage
of Net
Assets | |
| | | | U.S. Cash Management Bills: 2.7% | |
| 35,000,000 (6) | | | United States Cash
Management Bill”“ | | | | | | | | | | | | | |
| | | | (Cost $34,927,657) | | | | | 34,936,096 | | | | | | 2.7 | | |
| | | | Total Short-Term
Investments | | | | | | | | | | | | | |
| | | | (Cost $68,360,366) | | | | | 68,378,849 | | | | | | 5.2 | | |
| | | | Total Investments in
Securities
(Cost $1,775,239,356) | | | | $ | 1,675,728,088 | | | | | | 126.3 | | |
| | | | Liabilities in Excess of
Other Assets | | | | | (349,105,003) | | | | | | (26.3) | | |
| | | | Net Assets | | | | $ | 1,326,623,085 | | | | | | 100.0 | | |
†
Unless otherwise indicated, principal amount is shown in USD.
See Accompanying Notes to Financial Statements
PORTFOLIO OF INVESTMENTS
| Voya GNMA Income Fund | as of March 31, 2023 (continued) |
(1)
Interest only securities represent the right to receive the monthly interest payments on an underlying pool of mortgage loans. Principal amount shown represents the notional amount on which current interest is calculated. Payments of principal on the pool reduce the value of the interest only security.
(2)
Variable rate security. Rate shown is the rate in effect as of March 31, 2023.
(3)
Principal only securities represent the right to receive the monthly principal payments on an underlying pool of mortgage loans. No payments of interest on the pool are passed through the principal only security.
(4)
The Federal Housing Finance Agency (“FHFA”) placed the Federal Home Loan Mortgage Corporation and Federal National Mortgage Association into conservatorship with FHFA as the conservator. As such, the FHFA oversees the continuing affairs of these companies.
(5)
Represents or includes a TBA transaction.
(6)
Represents a zero coupon bond. Rate shown reflects the effective yield as of March 31, 2023.
Reference Rate Abbreviations:
| | H15T1Y | | | U.S. Treasury 1-Year Constant Maturity | |
| | SOFRRATE | | | 1-day Secured Overnight Financing Rate | |
| | US0001M | | | 1-month LIBOR | |
Fair Value Measurements^
The following is a summary of the fair valuations according to the inputs used as of March 31, 2023 in valuing the assets and liabilities:
| | | | Quoted Prices
in Active Markets
for Identical
Investments
(Level 1) | | | Significant
Other
Observable
Inputs
(Level 2) | | | Significant
Unobservable
Inputs
(Level 3) | | | Fair Value
at
March 31, 2023 | |
| Asset Table | | | | | | | | | | | | | | | | | | | | | | | | | |
| Investments, at fair value | | | | | | | | | | | | | | | | | | | | | | | | | |
| Collateralized Mortgage Obligations | | | | $ | — | | | | | $ | 667,330,356 | | | | | $ | — | | | | | $ | 667,330,356 | | |
| U.S. Government Agency Obligations | | | | | — | | | | | | 897,458,600 | | | | | | — | | | | | | 897,458,600 | | |
| Commercial Mortgage-Backed Securities | | | | | — | | | | | | 41,343,988 | | | | | | — | | | | | | 41,343,988 | | |
| Asset-Backed Securities | | | | | — | | | | | | 1,216,295 | | | | | | — | | | | | | 1,216,295 | | |
| Short-Term Investments | | | | | — | | | | | | 68,378,849 | | | | | | — | | | | | | 68,378,849 | | |
| Total Investments, at fair value | | | | $ | — | | | | | $ | 1,675,728,088 | | | | | $ | — | | | | | $ | 1,675,728,088 | | |
| Other Financial Instruments+ | | | | | | | | | | | | | | | | | | | | | | | | | |
| Futures | | | | | 885,208 | | | | | | — | | | | | | — | | | | | | 885,208 | | |
| Total Assets | | | | $ | 885,208 | | | | | $ | 1,675,728,088 | | | | | $ | — | | | | | $ | 1,676,613,296 | | |
| Liabilities Table | | | | | | | | | | | | | | | | | | | | | | | | | |
| Other Financial Instruments+ | | | | | | | | | | | | | | | | | | | | | | | | | |
| Futures | | | | $ | (3,000,235) | | | | | $ | — | | | | | $ | — | | | | | $ | (3,000,235) | | |
| Total Liabilities | | | | $ | (3,000,235) | | | | | $ | — | | | | | $ | — | | | | | $ | (3,000,235) | | |
^
See Note 2, “Significant Accounting Policies” in the Notes to Financial Statements for additional information.
+
Other Financial Instruments may include open forward foreign currency contracts, futures, centrally cleared swaps, OTC swaps and written options. Forward foreign currency contracts, futures and centrally cleared swaps are fair valued at the unrealized appreciation (depreciation) on the instrument. OTC swaps and written options are valued at the fair value of the instrument.
See Accompanying Notes to Financial Statements
PORTFOLIO OF INVESTMENTS
| Voya GNMA Income Fund | as of March 31, 2023 (continued) |
At March 31, 2023, the following futures contracts were outstanding for Voya GNMA Income Fund:
| Description | | | Number
of Contracts | | | Expiration
Date | | | Notional
Amount | | | Unrealized
Appreciation/
(Depreciation) | |
| Long Contracts: | | | | | | | | | | | | | | | | | | | | | | | | | |
| U.S. Treasury Long Bond | | | | | 48 | | | | | | 06/21/23 | | | | | $ | 6,295,500 | | | | | $ | 478 | | |
| U.S. Treasury Ultra Long Bond | | | | | 213 | | | | | | 06/22/23 | | | | | | 30,059,625 | | | | | | 884,730 | | |
| | | | | | | | | | | | | | | | | $ | 36,355,125 | | | | | $ | 885,208 | | |
| Short Contracts: | | | | | | | | | | | | | | | | | | | | | | | | | |
| U.S. Treasury 10-Year Note | | | | | (461) | | | | | | 06/21/23 | | | | | | (52,978,984) | | | | | | (797,288) | | |
| U.S. Treasury 2-Year Note | | | | | (566) | | | | | | 06/30/23 | | | | | | (116,852,469) | | | | | | (3,306) | | |
| U.S. Treasury 5-Year Note | | | | | (1,068) | | | | | | 06/30/23 | | | | | | (116,954,344) | | | | | | (1,905,848) | | |
| U.S. Treasury Ultra 10-Year Note | | | | | (81) | | | | | | 06/21/23 | | | | | | (9,812,391) | | | | | | (293,793) | | |
| | | | | | | | | | | | | | | | | $ | (296,598,188) | | | | | $ | (3,000,235) | | |
A summary of derivative instruments by primary risk exposure is outlined in the following tables.
The fair value of derivative instruments as of March 31, 2023 was as follows:
| Derivatives not accounted for as hedging instruments | | | Location on Statement
of Assets and Liabilities | | | Fair Value | |
| Asset Derivatives | | | | | | | | | | |
| Interest rate contracts | | | Variation margin receivable on futures contracts* | | | | $ | 885,208 | | |
| Total Asset Derivatives | | | | | | | $ | 885,208 | | |
| Liability Derivatives | | | | | | | | | | |
| Interest rate contracts | | | Variation margin payable on futures contracts* | | | | $ | 3,000,235 | | |
| Total Liability Derivatives | | | | | | | $ | 3,000,235 | | |
*
The fair value presented above represents the cumulative unrealized appreciation (depreciation) on futures contracts as reported in the table within the Portfolio of Investments. In the Statement of Assets and Liabilities, only current day’s unsettled variation margin is reported in receivables or payables on futures contracts and the net cumulative unrealized appreciation (depreciation) is included in total distributable earnings (loss).
The effect of derivative instruments on the Fund’s Statement of Operations for the year ended March 31, 2023 was as follows:
| | | | Amount of Realized Gain or (Loss) on
Derivatives Recognized in Income | |
| Derivatives not accounted for as hedging instruments | | | Futures | |
| Interest rate contracts | | | | $ | 18,106,207 | | |
| Total | | | | $ | 18,106,207 | | |
| | | | Change in Unrealized Appreciation or (Depreciation)
on Derivatives Recognized in Income | |
| Derivatives not accounted for as hedging instruments | | | Futures | |
| Interest rate contracts | | | | $ | (7,095,755) | | |
| Total | | | | $ | (7,095,755) | | |
At March 31, 2023, the aggregate cost of securities and other investments and the composition of unrealized appreciation and depreciation of securities and other investments on a tax basis were:
| | Cost for federal income tax purposes was $1,775,936,424. | | | | | | | |
| | Net unrealized depreciation consisted of: | | |
| | Gross Unrealized Appreciation | | | | $ | 6,155,180 | | |
| | Gross Unrealized Depreciation | | | | | (108,478,543) | | |
| | Net Unrealized Depreciation | | | | $ | (102,323,363) | | |
See Accompanying Notes to Financial Statements
PORTFOLIO OF INVESTMENTS
| Voya High Yield Bond Fund | as of March 31, 2023 |
Principal
Amount† | | | Value | | | Percentage
of Net
Assets | |
| CORPORATE BONDS/NOTES: 92.9% | |
| | | | Basic Materials: 6.1% | |
| 302,000 (1) | | | ASP Unifrax Holdings,
Inc., 5.250%, 09/30/2028 | | | | $ | 241,691 | | | | | | 0.1 | | |
| 642,000 (1)(2) | | | ASP Unifrax Holdings,
Inc., 7.500%, 09/30/2029 | | | | | 436,908 | | | | | | 0.1 | | |
| 1,075,000 (1) | | | Cleveland-Cliffs, Inc.,
4.625%, 03/01/2029 | | | | | 987,502 | | | | | | 0.3 | | |
| 585,000 (1)(2) | | | Cleveland-Cliffs, Inc.,
4.875%, 03/01/2031 | | | | | 532,472 | | | | | | 0.1 | | |
| 1,000,000 (1) | | | Coeur Mining, Inc.,
5.125%, 02/15/2029 | | | | | 848,785 | | | | | | 0.2 | | |
| 1,207,000 (1) | | | Consolidated Energy
Finance S.A., 5.625%,
10/15/2028 | | | | | 1,039,565 | | | | | | 0.3 | | |
| 1,132,000 (1) | | | Constellium SE, 5.625%,
06/15/2028 | | | | | 1,070,007 | | | | | | 0.3 | | |
| 755,000 (1) | | | First Quantum Minerals
Ltd., 6.875%, 10/15/2027 | | | | | 728,538 | | | | | | 0.2 | | |
| 1,830,000 (1) | | | HudBay Minerals, Inc.,
4.500%, 04/01/2026 | | | | | 1,692,058 | | | | | | 0.4 | | |
| 1,151,000 (1) | | | Illuminate Buyer LLC /
Illuminate Holdings
IV, Inc., 9.000%,
07/01/2028 | | | | | 1,021,415 | | | | | | 0.3 | | |
| 1,339,000 (1) | | | INEOS Quattro
Finance 2 Plc, 3.375%,
01/15/2026 | | | | | 1,215,037 | | | | | | 0.3 | | |
| 1,396,000 (1)(3) | | | Iris Holdings, Inc., 8.750%
(PIK Rate 9.500%, Cash
Rate 8.750%), 02/15/2026 | | | | | 1,290,431 | | | | | | 0.3 | | |
| 1,339,000 (1) | | | LSF11 A5 Holdco LLC,
6.625%, 10/15/2029 | | | | | 1,127,512 | | | | | | 0.3 | | |
| 1,566,000 (1) | | | Mativ, Inc., 6.875%,
10/01/2026 | | | | | 1,434,530 | | | | | | 0.4 | | |
| 1,283,000 (1) | | | Novelis Corp., 3.875%,
08/15/2031 | | | | | 1,082,493 | | | | | | 0.3 | | |
| 510,000 (1) | | | Novelis Corp., 4.750%,
01/30/2030 | | | | | 469,200 | | | | | | 0.1 | | |
| 1,245,000 (1) | | | Nufarm Australia Ltd. /
Nufarm Americas, Inc.,
5.000%, 01/27/2030 | | | | | 1,098,270 | | | | | | 0.3 | | |
| 793,000 | | | Olin Corp., 5.000%,
02/01/2030 | | | | | 744,334 | | | | | | 0.2 | | |
| 811,000 | | | Olin Corp., 5.125%,
09/15/2027 | | | | | 778,566 | | | | | | 0.2 | | |
| 1,207,000 (1) | | | Olympus Water US
Holding Corp., 6.250%,
10/01/2029 | | | | | 894,528 | | | | | | 0.2 | | |
| 315,000 (1) | | | Olympus Water US
Holding Corp., 7.125%,
10/01/2027 | | | | | 296,068 | | | | | | 0.1 | | |
Principal
Amount† | | | Value | | | Percentage
of Net
Assets | |
| CORPORATE BONDS/NOTES: (continued) | |
| | | | Basic Materials (continued) | |
| 1,275,000 (1) | | | SPCM SA, 3.125%,
03/15/2027 | | | | $ | 1,119,160 | | | | | | 0.3 | | |
| 1,396,000 (1) | | | Taseko Mines Ltd.,
7.000%, 02/15/2026 | | | | | 1,268,139 | | | | | | 0.3 | | |
| 1,471,000 (1) | | | Trinseo Materials
Operating SCA / Trinseo
Materials Finance, Inc.,
5.125%, 04/01/2029 | | | | | 905,820 | | | | | | 0.2 | | |
| 1,226,000 (1) | | | Tronox, Inc., 4.625%,
03/15/2029 | | | | | 1,028,081 | | | | | | 0.3 | | |
| | | | | | | | | 23,351,110 | | | | | | 6.1 | | |
| | | | Communications: 13.4% | |
| 1,170,000 (1) | | | Acuris Finance Us, Inc. /
Acuris Finance SARL,
5.000%, 05/01/2028 | | | | | 919,988 | | | | | | 0.2 | | |
| 1,509,000 (1) | | | Altice France Holding SA,
6.000%, 02/15/2028 | | | | | 964,402 | | | | | | 0.3 | | |
| 1,773,000 (1) | | | Altice France SA/France,
5.500%, 10/15/2029 | | | | | 1,357,331 | | | | | | 0.4 | | |
| 755,000 (1) | | | Altice France SA/France,
8.125%, 02/01/2027 | | | | | 699,583 | | | | | | 0.2 | | |
| 1,038,000 | | | AMC Networks, Inc.,
4.250%, 02/15/2029 | | | | | 639,299 | | | | | | 0.2 | | |
| 1,377,000 (1) | | | Audacy Capital Corp.,
6.500%, 05/01/2027 | | | | | 100,760 | | | | | | 0.0 | | |
| 1,396,000 (1) | | | Beasley Mezzanine
Holdings LLC, 8.625%,
02/01/2026 | | | | | 928,499 | | | | | | 0.2 | | |
| 1,370,000 (1) | | | CCO Holdings LLC / CCO
Holdings Capital Corp.,
4.250%, 01/15/2034 | | | | | 1,072,963 | | | | | | 0.3 | | |
| 1,943,000 | | | CCO Holdings LLC / CCO
Holdings Capital Corp.,
4.500%, 05/01/2032 | | | | | 1,591,142 | | | | | | 0.4 | | |
| 1,226,000 (1) | | | CCO Holdings LLC / CCO
Holdings Capital Corp.,
5.000%, 02/01/2028 | | | | | 1,132,475 | | | | | | 0.3 | | |
| 1,811,000 (1) | | | CCO Holdings LLC / CCO
Holdings Capital Corp.,
5.125%, 05/01/2027 | | | | | 1,713,641 | | | | | | 0.4 | | |
| 491,000 (1)(2) | | | CommScope Tech
Finance LLC, 6.000%,
06/15/2025 | | | | | 462,883 | | | | | | 0.1 | | |
| 302,000 (1) | | | CommScope
Technologies LLC,
5.000%, 03/15/2027 | | | | | 221,185 | | | | | | 0.1 | | |
| 642,000 (1) | | | CommScope, Inc.,
4.750%, 09/01/2029 | | | | | 535,749 | | | | | | 0.1 | | |
| 1,019,000 (1) | | | CommScope, Inc.,
7.125%, 07/01/2028 | | | | | 752,807 | | | | | | 0.2 | | |
See Accompanying Notes to Financial Statements
PORTFOLIO OF INVESTMENTS
| Voya High Yield Bond Fund | as of March 31, 2023 (continued) |
Principal
Amount† | | | Value | | | Percentage
of Net
Assets | |
| CORPORATE BONDS/NOTES: (continued) | |
| | | | Communications (continued) | |
| 736,000 (1) | | | Connect Finco SARL /
Connect US Finco LLC,
6.750%, 10/01/2026 | | | | $ | 692,502 | | | | | | 0.2 | | |
| 1,679,000 (1) | | | CSC Holdings LLC,
4.625%, 12/01/2030 | | | | | 829,510 | | | | | | 0.2 | | |
| 604,000 | | | CSC Holdings LLC,
5.250%, 06/01/2024 | | | | | 583,549 | | | | | | 0.2 | | |
| 2,056,000 (1) | | | CSC Holdings LLC,
5.750%, 01/15/2030 | | | | | 1,084,540 | | | | | | 0.3 | | |
| 575,000 (1) | | | CSC Holdings LLC,
7.500%, 04/01/2028 | | | | | 367,080 | | | | | | 0.1 | | |
| 1,151,000 (1) | | | Directv Financing LLC /
Directv Financing
Co-Obligor, Inc., 5.875%,
08/15/2027 | | | | | 1,043,566 | | | | | | 0.3 | | |
| 1,339,000 | | | DISH DBS Corp., 5.125%,
06/01/2029 | | | | | 714,464 | | | | | | 0.2 | | |
| 868,000 (1) | | | DISH DBS Corp., 5.750%,
12/01/2028 | | | | | 649,372 | | | | | | 0.2 | | |
| 679,000 | | | DISH DBS Corp., 7.375%,
07/01/2028 | | | | | 388,103 | | | | | | 0.1 | | |
| 491,000 (1) | | | DISH Network Corp.,
11.750%, 11/15/2027 | | | | | 476,788 | | | | | | 0.1 | | |
| 943,000 | | | Embarq Corp., 7.995%,
06/01/2036 | | | | | 397,413 | | | | | | 0.1 | | |
| 661,000 (1) | | | GCI LLC, 4.750%,
10/15/2028 | | | | | 571,015 | | | | | | 0.1 | | |
| 1,547,000 (1) | | | Gray Escrow II, Inc.,
5.375%, 11/15/2031 | | | | | 1,028,964 | | | | | | 0.3 | | |
| 529,000 (1) | | | iHeartCommunications,
Inc., 5.250%, 08/15/2027 | | | | | 432,965 | | | | | | 0.1 | | |
| 1,057,000 (1) | | | ION Trading Technologies
Sarl, 5.750%, 05/15/2028 | | | | | 845,906 | | | | | | 0.2 | | |
| 736,000 (1) | | | LCPR Senior Secured
Financing DAC, 5.125%,
07/15/2029 | | | | | 621,144 | | | | | | 0.2 | | |
| 1,151,000 (1) | | | LCPR Senior Secured
Financing DAC, 6.750%,
10/15/2027 | | | | | 1,088,161 | | | | | | 0.3 | | |
| 365,000 (1)(9) | | | Level 3 Financing, Inc.,
10.500%, 05/15/2030 | | | | | 348,575 | | | | | | 0.1 | | |
| 1,754,000 (1) | | | Match Group Holdings II
LLC, 4.625%, 06/01/2028 | | | | | 1,631,220 | | | | | | 0.4 | | |
| 1,113,000 (1) | | | McGraw-Hill Education,
Inc., 8.000%, 08/01/2029 | | | | | 914,057 | | | | | | 0.2 | | |
| 1,264,000 (1) | | | Millennium Escrow Corp.,
6.625%, 08/01/2026 | | | | | 823,193 | | | | | | 0.2 | | |
| 804,000 | | | Netflix, Inc., 5.875%,
11/15/2028 | | | | | 846,893 | | | | | | 0.2 | | |
Principal
Amount† | | | Value | | | Percentage
of Net
Assets | |
| CORPORATE BONDS/NOTES: (continued) | |
| | | | Communications (continued) | |
| 981,000 (4) | | | Paramount Global,
6.250%, 02/28/2057 | | | | $ | 735,093 | | | | | | 0.2 | | |
| 1,453,000 (1) | | | Radiate Holdco LLC /
Radiate Finance, Inc.,
6.500%, 09/15/2028 | | | | | 597,684 | | | | | | 0.2 | | |
| 566,000 (1) | | | Sinclair Television
Group, Inc., 4.125%,
12/01/2030 | | | | | 457,017 | | | | | | 0.1 | | |
| 661,000 (1)(2) | | | Sinclair Television
Group, Inc., 5.500%,
03/01/2030 | | | | | 526,434 | | | | | | 0.1 | | |
| 2,584,000 (1) | | | Sirius XM Radio, Inc.,
5.000%, 08/01/2027 | | | | | 2,421,983 | | | | | | 0.6 | | |
| 1,207,000 (1) | | | Spanish Broadcasting
System, Inc., 9.750%,
03/01/2026 | | | | | 819,209 | | | | | | 0.2 | | |
| 2,377,000 | | | Sprint Corp., 7.125%,
06/15/2024 | | | | | 2,418,529 | | | | | | 0.6 | | |
| 785,000 | | | Sprint Corp., 7.625%,
03/01/2026 | | | | | 830,828 | | | | | | 0.2 | | |
| 1,321,000 (1) | | | Stagwell Global LLC,
5.625%, 08/15/2029 | | | | | 1,159,834 | | | | | | 0.3 | | |
| 604,000 | | | Telecom Italia Capital SA,
6.000%, 09/30/2034 | | | | | 518,685 | | | | | | 0.1 | | |
| 661,000 | | | Telecom Italia Capital SA,
6.375%, 11/15/2033 | | | | | 599,170 | | | | | | 0.2 | | |
| 900,000 (1) | | | Uber Technologies, Inc.,
8.000%, 11/01/2026 | | | | | 923,580 | | | | | | 0.2 | | |
| 547,000 (1) | | | Univision Communications,
Inc., 4.500%, 05/01/2029 | | | | | 460,117 | | | | | | 0.1 | | |
| 2,188,000 (1) | | | Univision
Communications, Inc.,
6.625%, 06/01/2027 | | | | | 2,076,631 | | | | | | 0.5 | | |
| 1,019,000 (1) | | | Urban One, Inc., 7.375%,
02/01/2028 | | | | | 926,679 | | | | | | 0.2 | | |
| 1,151,000 (1) | | | ViaSat, Inc., 5.625%,
09/15/2025 | | | | | 1,092,333 | | | | | | 0.3 | | |
| 302,000 (1) | | | ViaSat, Inc., 5.625%,
04/15/2027 | | | | | 283,850 | | | | | | 0.1 | | |
| 491,000 (1) | | | ViaSat, Inc., 6.500%,
07/15/2028 | | | | | 363,340 | | | | | | 0.1 | | |
| 1,170,000 (1) | | | Viavi Solutions, Inc.,
3.750%, 10/01/2029 | | | | | 1,001,762 | | | | | | 0.3 | | |
| 1,999,000 (1) | | | Virgin Media Vendor
Financing Notes IV DAC,
5.000%, 07/15/2028 | | | | | 1,778,790 | | | | | | 0.5 | | |
| 1,283,000 (1) | | | Vmed O2 UK
Financing I PLC, 4.750%,
07/15/2031 | | | | | 1,101,334 | | | | | | 0.3 | | |
See Accompanying Notes to Financial Statements
PORTFOLIO OF INVESTMENTS
| Voya High Yield Bond Fund | as of March 31, 2023 (continued) |
Principal
Amount† | | | Value | | | Percentage
of Net
Assets | |
| CORPORATE BONDS/NOTES: (continued) | |
| | | | Communications (continued) | |
| 1,679,000 (1) | | | Zayo Group Holdings,
Inc., 6.125%, 03/01/2028 | | | | $ | 1,022,679 | | | | | | 0.3 | | |
| | | | | | | | | 51,587,248 | | | | | | 13.4 | | |
| | | | Consumer, Cyclical: 24.9% | |
| 1,045,000 (1) | | | 1011778 BC ULC / New
Red Finance, Inc.,
4.000%, 10/15/2030 | | | | | 897,028 | | | | | | 0.2 | | |
| 1,622,000 (1) | | | Academy Ltd., 6.000%,
11/15/2027 | | | | | 1,584,073 | | | | | | 0.4 | | |
| 1,453,000 (1) | | | Adams Homes, Inc.,
7.500%, 02/15/2025 | | | | | 1,294,186 | | | | | | 0.3 | | |
| 1,585,000 (1)(2) | | | Adient Global Holdings
Ltd., 4.875%, 08/15/2026 | | | | | 1,529,295 | | | | | | 0.4 | | |
| 725,000 (1) | | | Adient Global Holdings
Ltd., 8.250%, 04/15/2031 | | | | | 747,181 | | | | | | 0.2 | | |
| 1,660,000 (1) | | | Affinity Gaming, 6.875%,
12/15/2027 | | | | | 1,482,246 | | | | | | 0.4 | | |
| 378,000 (1) | | | Allison Transmission, Inc.,
3.750%, 01/30/2031 | | | | | 322,912 | | | | | | 0.1 | | |
| 1,415,000 (1) | | | Allison Transmission, Inc.,
5.875%, 06/01/2029 | | | | | 1,379,342 | | | | | | 0.4 | | |
| 1,425,000 (1) | | | American Airlines, Inc.,
7.250%, 02/15/2028 | | | | | 1,387,188 | | | | | | 0.4 | | |
| 2,226,000 (1) | | | American Airlines, Inc./
AAdvantage Loyalty IP
Ltd., 5.750%, 04/20/2029 | | | | | 2,137,630 | | | | | | 0.6 | | |
| 1,207,000 (1) | | | Arko Corp., 5.125%,
11/15/2029 | | | | | 1,000,493 | | | | | | 0.3 | | |
| 830,000 | | | Asbury Automotive Group,
Inc., 4.500%, 03/01/2028 | | | | | 756,437 | | | | | | 0.2 | | |
| 774,000 | | | Asbury Automotive Group,
Inc., 4.750%, 03/01/2030 | | | | | 693,647 | | | | | | 0.2 | | |
| 1,547,000 | | | Bath & Body Works, Inc.,
6.750%, 07/01/2036 | | | | | 1,384,240 | | | | | | 0.4 | | |
| 233,000 (1) | | | Bath & Body Works, Inc.,
9.375%, 07/01/2025 | | | | | 249,154 | | | | | | 0.1 | | |
| 265,000 (1)(3) | | | BCPE Ulysses
Intermediate, Inc., 7.750%
(PIK Rate 8.500%, Cash
Rate 7.750%), 04/01/2027 | | | | | 208,389 | | | | | | 0.1 | | |
| 1,450,000 (1) | | | Caesars Entertainment,
Inc., 4.625%, 10/15/2029 | | | | | 1,269,526 | | | | | | 0.3 | | |
| 1,094,000 (1) | | | Caesars Entertainment,
Inc., 6.250%, 07/01/2025 | | | | | 1,095,074 | | | | | | 0.3 | | |
| 625,000 (1) | | | Caesars Entertainment,
Inc., 7.000%, 02/15/2030 | | | | | 636,509 | | | | | | 0.2 | | |
| 2,644,000 (1) | | | Carnival Corp., 6.000%,
05/01/2029 | | | | | 2,105,021 | | | | | | 0.5 | | |
| 1,811,000 (1) | | | Carnival Corp., 9.875%,
08/01/2027 | | | | | 1,867,177 | | | | | | 0.5 | | |
Principal
Amount† | | | Value | | | Percentage
of Net
Assets | |
| CORPORATE BONDS/NOTES: (continued) | |
| | | | Consumer, Cyclical (continued) | |
| 1,207,000 (1) | | | CCM Merger, Inc.,
6.375%, 05/01/2026 | | | | $ | 1,179,855 | | | | | | 0.3 | | |
| 981,000 (1) | | | Century Communities,
Inc., 3.875%, 08/15/2029 | | | | | 842,488 | | | | | | 0.2 | | |
| 627,000 (1) | | | Cinemark USA, Inc.,
8.750%, 05/01/2025 | | | | | 640,681 | | | | | | 0.2 | | |
| 1,000,000 (1) | | | Crocs, Inc., 4.125%,
08/15/2031 | | | | | 824,803 | | | | | | 0.2 | | |
| 1,396,000 (2) | | | Delta Air Lines 2020-1
Class A Pass Through
Trust, 4.375%, 04/19/2028 | | | | | 1,298,413 | | | | | | 0.3 | | |
| 344,000 (2) | | | Delta Air Lines 2020-1
Class A Pass Through
Trust, 7.375%, 01/15/2026 | | | | | 358,290 | | | | | | 0.1 | | |
| 900,000 (1) | | | Fertitta Entertainment
LLC / Fertitta
Entertainment Finance
Co., Inc., 6.750%,
01/15/2030 | | | | | 741,267 | | | | | | 0.2 | | |
| 1,113,000 (1) | | | Foot Locker, Inc., 4.000%,
10/01/2029 | | | | | 929,789 | | | | | | 0.2 | | |
| 1,924,000 | | | Ford Motor Co., 6.100%,
08/19/2032 | | | | | 1,867,167 | | | | | | 0.5 | | |
| 1,784,000 | | | Ford Motor Credit Co.
LLC, 2.700%, 08/10/2026 | | | | | 1,589,990 | | | | | | 0.4 | | |
| 2,565,000 | | | Ford Motor Credit Co.
LLC, 4.125%, 08/17/2027 | | | | | 2,353,657 | | | | | | 0.6 | | |
| 1,479,000 | | | Ford Motor Credit Co.
LLC, 4.542%, 08/01/2026 | | | | | 1,404,266 | | | | | | 0.4 | | |
| 1,230,000 | | | Ford Motor Credit Co.
LLC, 5.113%, 05/03/2029 | | | | | 1,156,452 | | | | | | 0.3 | | |
| 1,132,000 (1) | | | Foundation Building
Materials, Inc., 6.000%,
03/01/2029 | | | | | 898,737 | | | | | | 0.2 | | |
| 1,264,000 (1) | | | Gap, Inc./The, 3.875%,
10/01/2031 | | | | | 878,189 | | | | | | 0.2 | | |
| 679,000 (1) | | | Golden Entertainment,
Inc., 7.625%, 04/15/2026 | | | | | 685,383 | | | | | | 0.2 | | |
| 170,000 (2) | | | Goodyear Tire & Rubber
Co/The, 4.875%,
03/15/2027 | | | | | 160,701 | | | | | | 0.0 | | |
| 875,000 (2) | | | Goodyear Tire & Rubber
Co/The, 5.250%,
07/15/2031 | | | | | 756,752 | | | | | | 0.2 | | |
| 1,038,000 (1) | | | Hanesbrands, Inc.,
4.875%, 05/15/2026 | | | | | 984,771 | | | | | | 0.3 | | |
| 793,000 (1) | | | Hilton Domestic
Operating Co., Inc.,
4.000%, 05/01/2031 | | | | | 695,144 | | | | | | 0.2 | | |
See Accompanying Notes to Financial Statements
PORTFOLIO OF INVESTMENTS
| Voya High Yield Bond Fund | as of March 31, 2023 (continued) |
Principal
Amount† | | | Value | | | Percentage
of Net
Assets | |
| CORPORATE BONDS/NOTES: (continued) | |
| | | | Consumer, Cyclical (continued) | |
| 1,339,000 (1) | | | Installed Building
Products, Inc., 5.750%,
02/01/2028 | | | | $ | 1,234,721 | | | | | | 0.3 | | |
| 1,585,000 (1) | | | Interface, Inc., 5.500%,
12/01/2028 | | | | | 1,279,488 | | | | | | 0.3 | | |
| 2,021,000 (1)(2) | | | International Game
Technology PLC, 5.250%,
01/15/2029 | | | | | 1,937,128 | | | | | | 0.5 | | |
| 1,075,000 (1) | | | LBM Acquisition LLC,
6.250%, 01/15/2029 | | | | | 823,983 | | | | | | 0.2 | | |
| 1,471,000 (1) | | | LCM Investments
Holdings II LLC, 4.875%,
05/01/2029 | | | | | 1,232,323 | | | | | | 0.3 | | |
| 1,339,000 (1) | | | Lions Gate Capital
Holdings LLC, 5.500%,
04/15/2029 | | | | | 881,839 | | | | | | 0.2 | | |
| 415,000 | | | M/I Homes, Inc., 3.950%,
02/15/2030 | | | | | 352,399 | | | | | | 0.1 | | |
| 1,113,000 | | | M/I Homes, Inc., 4.950%,
02/01/2028 | | | | | 1,030,976 | | | | | | 0.3 | | |
| 495,000 | | | Macy’s Retail Holdings
LLC, 4.500%, 12/15/2034 | | | | | 360,702 | | | | | | 0.1 | | |
| 340,000 (1) | | | Macy’s Retail
Holdings LLC, 5.875%,
03/15/2030 | | | | | 302,163 | | | | | | 0.1 | | |
| 906,000 (1) | | | Macy’s Retail Holdings
LLC, 6.125%, 03/15/2032 | | | | | 798,358 | | | | | | 0.2 | | |
| 76,000 (1) | | | Mattel, Inc., 3.750%,
04/01/2029 | | | | | 68,360 | | | | | | 0.0 | | |
| 755,000 | | | Mattel, Inc., 5.450%,
11/01/2041 | | | | | 636,465 | | | | | | 0.2 | | |
| 642,000 (1) | | | Melco Resorts Finance
Ltd., 5.250%, 04/26/2026 | | | | | 579,247 | | | | | | 0.2 | | |
| 1,453,000 (1) | | | Melco Resorts Finance
Ltd., 5.375%, 12/04/2029 | | | | | 1,190,733 | | | | | | 0.3 | | |
| 1,019,000 | | | Murphy Oil USA, Inc.,
4.750%, 09/15/2029 | | | | | 929,532 | | | | | | 0.2 | | |
| 321,000 | | | Murphy Oil USA, Inc.,
5.625%, 05/01/2027 | | | | | 311,082 | | | | | | 0.1 | | |
| 1,264,000 (1)(2) | | | NCL Corp. Ltd., 7.750%,
02/15/2029 | | | | | 1,085,068 | | | | | | 0.3 | | |
| 246,000 (1) | | | NCL Corp. Ltd., 8.375%,
02/01/2028 | | | | | 247,065 | | | | | | 0.1 | | |
| 830,000 (1) | | | NCL Finance Ltd.,
6.125%, 03/15/2028 | | | | | 673,437 | | | | | | 0.2 | | |
| 650,000 (1) | | | Penn Entertainment, Inc.,
4.125%, 07/01/2029 | | | | | 542,656 | | | | | | 0.1 | | |
| 650,000 (1) | | | Penn National Gaming,
Inc., 5.625%, 01/15/2027 | | | | | 611,088 | | | | | | 0.2 | | |
Principal
Amount† | | | Value | | | Percentage
of Net
Assets | |
| CORPORATE BONDS/NOTES: (continued) | |
| | | | Consumer, Cyclical (continued) | |
| 2,018,000 (1) | | | PetSmart, Inc. / PetSmart
Finance Corp., 7.750%,
02/15/2029 | | | | $ | 1,983,048 | | | | | | 0.5 | | |
| 1,264,000 (1) | | | Real Hero Merger
Sub 2, Inc., 6.250%,
02/01/2029 | | | | | 935,763 | | | | | | 0.2 | | |
| 550,000 (1) | | | Ritchie Bros Holdings,
Inc., 7.750%, 03/15/2031 | | | | | 577,099 | | | | | | 0.1 | | |
| 2,942,000 (1) | | | Royal Caribbean Cruises
Ltd., 5.375%, 07/15/2027 | | | | | 2,623,896 | | | | | | 0.7 | | |
| 359,000 (1) | | | Royal Caribbean Cruises
Ltd., 7.250%, 01/15/2030 | | | | | 361,567 | | | | | | 0.1 | | |
| 698,000 (1) | | | Royal Caribbean Cruises
Ltd., 11.500%, 06/01/2025 | | | | | 744,899 | | | | | | 0.2 | | |
| 698,000 (1) | | | Royal Caribbean Cruises
Ltd., 11.625%, 08/15/2027 | | | | | 750,350 | | | | | | 0.2 | | |
| 906,000 | | | Sands China Ltd.,
5.625%, 08/08/2025 | | | | | 883,840 | | | | | | 0.2 | | |
| 1,358,000 | | | Sands China Ltd.,
5.900%, 08/08/2028 | | | | | 1,290,265 | | | | | | 0.3 | | |
| 1,245,000 (1) | | | Scientific Games Holdings
L.P./Scientific Games US
FinCo, Inc., 6.625%,
03/01/2030 | | | | | 1,101,369 | | | | | | 0.3 | | |
| 1,094,000 (1) | | | Scientific Games
International, Inc.,
7.000%, 05/15/2028 | | | | | 1,084,127 | | | | | | 0.3 | | |
| 453,000 (1) | | | Scientific Games
International, Inc.,
8.625%, 07/01/2025 | | | | | 464,194 | | | | | | 0.1 | | |
| 1,321,000 | | | Shea Homes L.P. / Shea
Homes Funding Corp.,
4.750%, 04/01/2029 | | | | | 1,154,541 | | | | | | 0.3 | | |
| 1,170,000 (1) | | | Sizzling Platter LLC /
Sizzling Platter Finance
Corp., 8.500%,
11/28/2025 | | | | | 1,050,925 | | | | | | 0.3 | | |
| 1,547,000 (1) | | | Sonic Automotive, Inc.,
4.625%, 11/15/2029 | | | | | 1,297,771 | | | | | | 0.3 | | |
| 378,000 (1) | | | SRS Distribution, Inc.,
6.000%, 12/01/2029 | | | | | 312,655 | | | | | | 0.1 | | |
| 962,000 (1) | | | SRS Distribution, Inc.,
6.125%, 07/01/2029 | | | | | 812,890 | | | | | | 0.2 | | |
| 1,455,000 (1)(2) | | | Staples, Inc., 10.750%,
04/15/2027 | | | | | 1,056,803 | | | | | | 0.3 | | |
| 1,566,000 (1) | | | Station Casinos LLC,
4.500%, 02/15/2028 | | | | | 1,415,155 | | | | | | 0.4 | | |
| 1,358,000 (1) | | | STL Holding Co. LLC,
7.500%, 02/15/2026 | | | | | 1,194,117 | | | | | | 0.3 | | |
See Accompanying Notes to Financial Statements
PORTFOLIO OF INVESTMENTS
| Voya High Yield Bond Fund | as of March 31, 2023 (continued) |
Principal
Amount† | | | Value | | | Percentage
of Net
Assets | |
| CORPORATE BONDS/NOTES: (continued) | |
| | | | Consumer, Cyclical (continued) | |
| 1,283,000 (1) | | | Taylor Morrison
Communities, Inc.,
5.125%, 08/01/2030 | | | | $ | 1,185,508 | | | | | | 0.3 | | |
| 1,302,000 (1) | | | Tempur Sealy
International, Inc.,
3.875%, 10/15/2031 | | | | | 1,088,511 | | | | | | 0.3 | | |
| 1,170,000 (1) | | | United Airlines 2015-1
Class AA Pass Through
Trust, 4.625%, 04/15/2029 | | | | | 1,059,811 | | | | | | 0.3 | | |
| 1,113,000 (2) | | | United Airlines
Holdings, Inc., 4.875%,
01/15/2025 | | | | | 1,086,516 | | | | | | 0.3 | | |
| 510,000 (1) | | | United Airlines, Inc.,
4.375%, 04/15/2026 | | | | | 488,518 | | | | | | 0.1 | | |
| 1,622,000 (1) | | | Victoria’s Secret & Co.,
4.625%, 07/15/2029 | | | | | 1,316,042 | | | | | | 0.3 | | |
| 1,490,000 (1) | | | Viking Cruises Ltd.,
5.875%, 09/15/2027 | | | | | 1,284,529 | | | | | | 0.3 | | |
| 491,000 (1) | | | Viking Cruises Ltd.,
13.000%, 05/15/2025 | | | | | 519,066 | | | | | | 0.1 | | |
| 849,000 (1) | | | White Cap Buyer LLC,
6.875%, 10/15/2028 | | | | | 737,236 | | | | | | 0.2 | | |
| 434,000 (1)(3) | | | White Cap Parent LLC,
8.250% (PIK Rate
9.000%, Cash Rate
8.250%), 03/15/2026 | | | | | 395,278 | | | | | | 0.1 | | |
| 1,094,000 (1) | | | William Carter Co/The,
5.625%, 03/15/2027 | | | | | 1,064,402 | | | | | | 0.3 | | |
| 547,000 (1) | | | Williams Scotsman
International, Inc.,
4.625%, 08/15/2028 | | | | | 498,258 | | | | | | 0.1 | | |
| 1,792,000 (1) | | | Wynn Las Vegas LLC /
Wynn Las Vegas Capital
Corp., 5.250%,
05/15/2027 | | | | | 1,695,555 | | | | | | 0.4 | | |
| 687,000 (1) | | | Wynn Resorts Finance
LLC / Wynn Resorts
Capital Corp., 7.125%,
02/15/2031 | | | | | 697,490 | | | | | | 0.2 | | |
| | | | | | | | | 95,594,350 | | | | | | 24.9 | | |
| | | | Consumer, Non-cyclical: 13.3% | |
| 130,000 (1) | | | 1375209 BC Ltd., 9.000%,
01/30/2028 | | | | | 129,025 | | | | | | 0.0 | | |
| 1,321,000 (1) | | | Acadia Healthcare Co.,
Inc., 5.500%, 07/01/2028 | | | | | 1,280,908 | | | | | | 0.3 | | |
| 1,490,000 (1) | | | ADT Security Corp./The,
4.125%, 08/01/2029 | | | | | 1,330,607 | | | | | | 0.3 | | |
Principal
Amount† | | | Value | | | Percentage
of Net
Assets | |
| CORPORATE BONDS/NOTES: (continued) | |
| | | | Consumer, Non-cyclical (continued) | |
| 1,057,000 (1) | | | Albertsons Cos, Inc. /
Safeway, Inc. / New
Albertsons L.P. /
Albertsons LLC, 3.500%,
03/15/2029 | | | | $ | 920,683 | | | | | | 0.2 | | |
| 529,000 (1) | | | Albertsons Cos, Inc. /
Safeway, Inc. / New
Albertsons L.P. /
Albertsons LLC, 4.875%,
02/15/2030 | | | | | 494,335 | | | | | | 0.1 | | |
| 1,207,000 (1) | | | Albertsons Cos, Inc. /
Safeway, Inc. / New
Albertsons L.P. /
Albertsons LLC, 5.875%,
02/15/2028 | | | | | 1,200,844 | | | | | | 0.3 | | |
| 400,000 (1) | | | Allied Universal
Holdco LLC / Allied
Universal Finance Corp.,
6.000%, 06/01/2029 | | | | | 299,042 | | | | | | 0.1 | | |
| 246,000 (1) | | | Allied Universal Holdco
LLC / Allied Universal
Finance Corp., 6.625%,
07/15/2026 | | | | | 236,652 | | | | | | 0.1 | | |
| 717,000 (1) | | | Allied Universal Holdco
LLC / Allied Universal
Finance Corp., 9.750%,
07/15/2027 | | | | | 639,743 | | | | | | 0.2 | | |
| 1,528,000 (1) | | | Alta Equipment Group,
Inc., 5.625%, 04/15/2026 | | | | | 1,428,703 | | | | | | 0.4 | | |
| 1,377,000 (1) | | | AMN Healthcare, Inc.,
4.625%, 10/01/2027 | | | | | 1,278,087 | | | | | | 0.3 | | |
| 642,000 (1) | | | APi Escrow Corp.,
4.750%, 10/15/2029 | | | | | 565,859 | | | | | | 0.1 | | |
| 529,000 (1) | | | APi Group DE, Inc.,
4.125%, 07/15/2029 | | | | | 454,856 | | | | | | 0.1 | | |
| 359,000 (1) | | | Bausch Health Cos, Inc.,
4.875%, 06/01/2028 | | | | | 212,133 | | | | | | 0.1 | | |
| 510,000 (1) | | | Bausch Health Cos, Inc.,
6.125%, 02/01/2027 | | | | | 330,592 | | | | | | 0.1 | | |
| 231,000 (1) | | | Bausch Health Cos, Inc.,
11.000%, 09/30/2028 | | | | | 171,134 | | | | | | 0.0 | | |
| 1,075,000 (1) | | | BellRing Brands, Inc.,
7.000%, 03/15/2030 | | | | | 1,089,910 | | | | | | 0.3 | | |
| 1,566,000 (1) | | | Cheplapharm Arzneimittel
GmbH, 5.500%,
01/15/2028 | | | | | 1,395,979 | | | | | | 0.4 | | |
| 604,000 (1) | | | CHS/Community Health
Systems, Inc., 4.750%,
02/15/2031 | | | | | 446,537 | | | | | | 0.1 | | |
See Accompanying Notes to Financial Statements
PORTFOLIO OF INVESTMENTS
| Voya High Yield Bond Fund | as of March 31, 2023 (continued) |
Principal
Amount† | | | Value | | | Percentage
of Net
Assets | |
| CORPORATE BONDS/NOTES: (continued) | |
| | | | Consumer, Non-cyclical (continued) | |
| 1,000,000 (1) | | | CHS/Community Health
Systems, Inc., 5.250%,
05/15/2030 | | | | $ | 785,350 | | | | | | 0.2 | | |
| 887,000 (1) | | | CHS/Community Health
Systems, Inc., 5.625%,
03/15/2027 | | | | | 779,620 | | | | | | 0.2 | | |
| 650,000 (1) | | | CHS/Community Health
Systems, Inc., 6.875%,
04/15/2029 | | | | | 403,195 | | | | | | 0.1 | | |
| 1,441,000 (1) | | | CPI CG, Inc., 8.625%,
03/15/2026 | | | | | 1,427,887 | | | | | | 0.4 | | |
| 453,000 (1) | | | DaVita, Inc., 3.750%,
02/15/2031 | | | | | 357,743 | | | | | | 0.1 | | |
| 1,717,000 (1) | | | DaVita, Inc., 4.625%,
06/01/2030 | | | | | 1,467,176 | | | | | | 0.4 | | |
| 1,528,000 | | | Encompass Health Corp.,
4.750%, 02/01/2030 | | | | | 1,390,938 | | | | | | 0.4 | | |
| 415,000 (1) | | | Garda World Security
Corp., 6.000%,
06/01/2029 | | | | | 330,458 | | | | | | 0.1 | | |
| 1,151,000 (1) | | | Garda World Security
Corp., 7.750%,
02/15/2028 | | | | | 1,135,465 | | | | | | 0.3 | | |
| 1,038,000 (1) | | | Graham Holdings Co.,
5.750%, 06/01/2026 | | | | | 1,018,329 | | | | | | 0.3 | | |
| 1,434,000 (1) | | | Jazz Securities DAC,
4.375%, 01/15/2029 | | | | | 1,320,571 | | | | | | 0.3 | | |
| 1,132,000 (1) | | | KeHE Distributors LLC /
KeHE Finance Corp.,
8.625%, 10/15/2026 | | | | | 1,131,400 | | | | | | 0.3 | | |
| 1,170,000 (1) | | | Legends Hospitality
Holding Co. LLC /
Legends Hospitality
Co-Issuer, Inc., 5.000%,
02/01/2026 | | | | | 1,048,180 | | | | | | 0.3 | | |
| 700,000 (1) | | | Medline Borrower L.P.,
3.875%, 04/01/2029 | | | | | 608,062 | | | | | | 0.2 | | |
| 1,396,000 (1) | | | Medline Borrower L.P.,
5.250%, 10/01/2029 | | | | | 1,212,520 | | | | | | 0.3 | | |
| 114,000 (1) | | | ModivCare, Inc., 5.875%,
11/15/2025 | | | | | 109,444 | | | | | | 0.0 | | |
| 868,000 (1)(2) | | | MPH Acquisition Holdings
LLC, 5.750%, 11/01/2028 | | | | | 625,319 | | | | | | 0.2 | | |
| 1,302,000 (1) | | | NESCO Holdings II, Inc.,
5.500%, 04/15/2029 | | | | | 1,179,215 | | | | | | 0.3 | | |
| 811,000 | | | New Albertsons L.P.,
7.450%, 08/01/2029 | | | | | 822,614 | | | | | | 0.2 | | |
| 1,886,000 (1) | | | Organon & Co. / Organon
Foreign Debt Co-Issuer
BV, 5.125%, 04/30/2031 | | | | | 1,675,857 | | | | | | 0.4 | | |
Principal
Amount† | | | Value | | | Percentage
of Net
Assets | |
| CORPORATE BONDS/NOTES: (continued) | |
| | | | Consumer, Non-cyclical (continued) | |
| 1,000,000 (1) | | | PECF USS Intermediate
Holding III Corp., 8.000%,
11/15/2029 | | | | $ | 665,295 | | | | | | 0.2 | | |
| 962,000 (1) | | | Picasso Finance Sub,
Inc., 6.125%, 06/15/2025 | | | | | 956,959 | | | | | | 0.3 | | |
| 736,000 (1) | | | Post Holdings, Inc.,
4.625%, 04/15/2030 | | | | | 660,302 | | | | | | 0.2 | | |
| 1,434,000 (1) | | | Post Holdings, Inc.,
5.625%, 01/15/2028 | | | | | 1,406,654 | | | | | | 0.4 | | |
| 1,000,000 (1) | | | Prime Security Services
Borrower LLC / Prime
Finance, Inc., 6.250%,
01/15/2028 | | | | | 935,940 | | | | | | 0.2 | | |
| 1,566,000 (1) | | | Primo Water Holdings,
Inc., 4.375%, 04/30/2029 | | | | | 1,368,349 | | | | | | 0.4 | | |
| 1,151,000 (1) | | | Simmons Foods, Inc./
Simmons Prepared
Foods, Inc./Simmons Pet
Food, Inc./Simmons Feed,
4.625%, 03/01/2029 | | | | | 936,810 | | | | | | 0.2 | | |
| 585,000 (1) | | | Spectrum Brands, Inc.,
3.875%, 03/15/2031 | | | | | 478,985 | | | | | | 0.1 | | |
| 642,000 (1) | | | Spectrum Brands, Inc.,
5.500%, 07/15/2030 | | | | | 565,511 | | | | | | 0.1 | | |
| 962,000 (1) | | | Teleflex, Inc., 4.250%,
06/01/2028 | | | | | 915,968 | | | | | | 0.2 | | |
| 661,000 | | | Tenet Healthcare Corp.,
4.250%, 06/01/2029 | | | | | 598,608 | | | | | | 0.2 | | |
| 378,000 | | | Tenet Healthcare Corp.,
5.125%, 11/01/2027 | | | | | 363,258 | | | | | | 0.1 | | |
| 1,792,000 (2) | | | Tenet Healthcare Corp.,
6.125%, 10/01/2028 | | | | | 1,719,146 | | | | | | 0.4 | | |
| 1,407,000 (1) | | | Tenet Healthcare Corp.,
6.125%, 06/15/2030 | | | | | 1,389,272 | | | | | | 0.4 | | |
| 1,207,000 | | | Teva Pharmaceutical
Finance Netherlands III
BV, 4.750%, 05/09/2027 | | | | | 1,128,156 | | | | | | 0.3 | | |
| 1,189,000 (1) | | | Triton Water Holdings,
Inc., 6.250%, 04/01/2029 | | | | | 945,267 | | | | | | 0.2 | | |
| 1,019,000 (1) | | | United Natural Foods,
Inc., 6.750%, 10/15/2028 | | | | | 947,986 | | | | | | 0.2 | | |
| 400,000 | | | United Rentals North
America, Inc., 3.750%,
01/15/2032 | | | | | 344,926 | | | | | | 0.1 | | |
| 800,000 | | | United Rentals North
America, Inc., 4.875%,
01/15/2028 | | | | | 765,840 | | | | | | 0.2 | | |
| 238,000 | | | United Rentals North
America, Inc., 5.250%,
01/15/2030 | | | | | 229,306 | | | | | | 0.1 | | |
See Accompanying Notes to Financial Statements
PORTFOLIO OF INVESTMENTS
| Voya High Yield Bond Fund | as of March 31, 2023 (continued) |
Principal
Amount† | | | Value | | | Percentage
of Net
Assets | |
| CORPORATE BONDS/NOTES: (continued) | |
| | | | Consumer, Non-cyclical (continued) | |
| 1,075,000 (1) | | | Varex Imaging Corp.,
7.875%, 10/15/2027 | | | | $ | 1,053,942 | | | | | | 0.3 | | |
| | | | | | | | | 51,111,452 | | | | | | 13.3 | | |
| | | | Energy: 13.5% | |
| 830,000 (1) | | | Antero Midstream
Partners L.P. / Antero
Midstream Finance Corp.,
5.375%, 06/15/2029 | | | | | 782,118 | | | | | | 0.2 | | |
| 1,019,000 (1) | | | Antero Midstream
Partners L.P. / Antero
Midstream Finance Corp.,
5.750%, 03/01/2027 | | | | | 996,888 | | | | | | 0.3 | | |
| 420,000 (1) | | | Antero Resources Corp.,
5.375%, 03/01/2030 | | | | | 391,177 | | | | | | 0.1 | | |
| 717,000 | | | Apache Corp., 5.100%,
09/01/2040 | | | | | 608,751 | | | | | | 0.2 | | |
| 510,000 | | | Apache Corp., 5.250%,
02/01/2042 | | | | | 429,007 | | | | | | 0.1 | | |
| 1,100,000 (1) | | | Archrock Partners L.P. /
Archrock Partners
Finance Corp., 6.250%,
04/01/2028 | | | | | 1,057,056 | | | | | | 0.3 | | |
| 425,000 (1) | | | Archrock Partners L.P. /
Archrock Partners
Finance Corp., 6.875%,
04/01/2027 | | | | | 417,446 | | | | | | 0.1 | | |
| 580,000 (1) | | | Ascent Resources Utica
Holdings LLC / ARU
Finance Corp., 5.875%,
06/30/2029 | | | | | 512,427 | | | | | | 0.1 | | |
| 1,434,000 (1) | | | Atlantica Sustainable
Infrastructure PLC,
4.125%, 06/15/2028 | | | | | 1,288,306 | | | | | | 0.3 | | |
| 1,189,000 (1)(2) | | | Baytex Energy Corp.,
8.750%, 04/01/2027 | | | | | 1,218,648 | | | | | | 0.3 | | |
| 585,000 (1) | | | Chesapeake Energy
Corp., 6.750%,
04/15/2029 | | | | | 581,329 | | | | | | 0.2 | | |
| 1,339,000 (1) | | | Chord Energy Corp.,
6.375%, 06/01/2026 | | | | | 1,327,866 | | | | | | 0.3 | | |
| 1,113,000 (1) | | | CNX Midstream Partners
LP, 4.750%, 04/15/2030 | | | | | 958,627 | | | | | | 0.3 | | |
| 1,490,000 (1) | | | Colgate Energy
Partners III LLC, 5.875%,
07/01/2029 | | | | | 1,412,520 | | | | | | 0.4 | | |
| 1,849,000 (1) | | | Crescent Energy
Finance LLC, 7.250%,
05/01/2026 | | | | | 1,739,761 | | | | | | 0.5 | | |
Principal
Amount† | | | Value | | | Percentage
of Net
Assets | |
| CORPORATE BONDS/NOTES: (continued) | |
| | | | Energy (continued) | |
| 1,792,000 (1) | | | Crestwood Midstream
Partners L.P. / Crestwood
Midstream Finance Corp.,
6.000%, 02/01/2029 | | | | $ | 1,708,215 | | | | | | 0.4 | | |
| 642,000 | | | Delek Logistics Partners
L.P. / Delek Logistics
Finance Corp., 6.750%,
05/15/2025 | | | | | 630,601 | | | | | | 0.2 | | |
| 962,000 (1) | | | Delek Logistics Partners
L.P. / Delek Logistics
Finance Corp., 7.125%,
06/01/2028 | | | | | 881,711 | | | | | | 0.2 | | |
| 529,000 (1) | | | DT Midstream, Inc.,
4.125%, 06/15/2029 | | | | | 464,381 | | | | | | 0.1 | | |
| 962,000 (1) | | | DT Midstream, Inc.,
4.375%, 06/15/2031 | | | | | 839,422 | | | | | | 0.2 | | |
| 1,339,000 (1) | | | Earthstone Energy
Holdings LLC, 8.000%,
04/15/2027 | | | | | 1,300,588 | | | | | | 0.3 | | |
| 1,245,000 (1) | | | Encino Acquisition
Partners Holdings LLC,
8.500%, 05/01/2028 | | | | | 1,090,551 | | | | | | 0.3 | | |
| 1,100,000 (1) | | | Enerflex Ltd., 9.000%,
10/15/2027 | | | | | 1,070,811 | | | | | | 0.3 | | |
| 2,150,000 | | | EnLink Midstream LLC,
5.375%, 06/01/2029 | | | | | 2,071,471 | | | | | | 0.5 | | |
| 510,000 | | | EQM Midstream Partners
L.P., 5.500%, 07/15/2028 | | | | | 463,876 | | | | | | 0.1 | | |
| 222,000 (1) | | | EQM Midstream Partners
L.P., 6.000%, 07/01/2025 | | | | | 219,740 | | | | | | 0.1 | | |
| 906,000 (1) | | | Hess Midstream
Operations L.P., 4.250%,
02/15/2030 | | | | | 810,231 | | | | | | 0.2 | | |
| 830,000 (1) | | | Hess Midstream
Operations L.P., 5.125%,
06/15/2028 | | | | | 788,801 | | | | | | 0.2 | | |
| 340,000 (1) | | | Hess Midstream
Operations L.P., 5.500%,
10/15/2030 | | | | | 316,661 | | | | | | 0.1 | | |
| 679,000 (1) | | | Hilcorp Energy I L.P. /
Hilcorp Finance Co.,
5.750%, 02/01/2029 | | | | | 625,895 | | | | | | 0.2 | | |
| 736,000 (1) | | | Hilcorp Energy I L.P. /
Hilcorp Finance Co.,
6.000%, 04/15/2030 | | | | | 679,622 | | | | | | 0.2 | | |
| 774,000 (1) | | | Hilcorp Energy I L.P. /
Hilcorp Finance Co.,
6.000%, 02/01/2031 | | | | | 715,554 | | | | | | 0.2 | | |
See Accompanying Notes to Financial Statements
PORTFOLIO OF INVESTMENTS
| Voya High Yield Bond Fund | as of March 31, 2023 (continued) |
Principal
Amount† | | | Value | | | Percentage
of Net
Assets | |
| CORPORATE BONDS/NOTES: (continued) | |
| | | | Energy (continued) | |
| 1,509,000 (1) | | | Howard Midstream
Energy Partners LLC,
6.750%, 01/15/2027 | | | | $ | 1,424,466 | | | | | | 0.4 | | |
| 1,713,000 (1) | | | Kinetik Holdings L.P.,
5.875%, 06/15/2030 | | | | | 1,651,332 | | | | | | 0.4 | | |
| 1,792,000 (1) | | | Moss Creek Resources
Holdings, Inc., 7.500%,
01/15/2026 | | | | | 1,663,800 | | | | | | 0.4 | | |
| 736,000 | | | Murphy Oil Corp., 5.875%,
12/01/2027 | | | | | 717,753 | | | | | | 0.2 | | |
| 1,264,000 | | | Murphy Oil Corp., 6.375%,
07/15/2028 | | | | | 1,246,643 | | | | | | 0.3 | | |
| 1,075,000 (1) | | | Nabors Industries Ltd.,
7.500%, 01/15/2028 | | | | | 993,087 | | | | | | 0.3 | | |
| 529,000 | | | Nabors Industries, Inc.,
5.100%, 09/15/2023 | | | | | 528,683 | | | | | | 0.1 | | |
| 453,000 | | | Occidental Petroleum
Corp., 4.625%,
06/15/2045 | | | | | 363,556 | | | | | | 0.1 | | |
| 1,268,000 | | | Occidental Petroleum
Corp., 5.500%,
12/01/2025 | | | | | 1,267,710 | | | | | | 0.3 | | |
| 1,283,000 | | | Occidental Petroleum
Corp., 6.625%,
09/01/2030 | | | | | 1,352,391 | | | | | | 0.4 | | |
| 1,075,000 | | | Occidental Petroleum
Corp., 8.500%,
07/15/2027 | | | | | 1,183,505 | | | | | | 0.3 | | |
| 1,170,000 (1) | | | Precision Drilling Corp.,
6.875%, 01/15/2029 | | | | | 1,062,828 | | | | | | 0.3 | | |
| 1,360,000 | | | Southwestern Energy Co.,
5.375%, 02/01/2029 | | | | | 1,283,371 | | | | | | 0.3 | | |
| 1,396,000 (1) | | | SunCoke Energy, Inc.,
4.875%, 06/30/2029 | | | | | 1,217,073 | | | | | | 0.3 | | |
| 510,000 | | | Sunoco L.P. / Sunoco
Finance Corp., 4.500%,
05/15/2029 | | | | | 468,774 | | | | | | 0.1 | | |
| 1,170,000 | | | Sunoco L.P. / Sunoco
Finance Corp., 4.500%,
04/30/2030 | | | | | 1,059,441 | | | | | | 0.3 | | |
| 710,000 (1) | | | Tallgrass Energy Partners
L.P. / Tallgrass Energy
Finance Corp., 7.500%,
10/01/2025 | | | | | 710,390 | | | | | | 0.2 | | |
| 858,813 (1) | | | Transocean Poseidon
Ltd., 6.875%, 02/01/2027 | | | | | 842,667 | | | | | | 0.2 | | |
| 163,000 (1) | | | Transocean Titan
Financing Ltd., 8.375%,
02/01/2028 | | | | | 167,893 | | | | | | 0.0 | | |
Principal
Amount† | | | Value | | | Percentage
of Net
Assets | |
| CORPORATE BONDS/NOTES: (continued) | |
| | | | Energy (continued) | |
| 472,000 | | | Transocean, Inc., 6.800%,
03/15/2038 | | | | $ | 327,363 | | | | | | 0.1 | | |
| 717,000 (1) | | | Transocean, Inc., 7.500%,
01/15/2026 | | | | | 651,739 | | | | | | 0.2 | | |
| 1,660,000 (1) | | | Weatherford International
Ltd., 8.625%, 04/30/2030 | | | | | 1,699,774 | | | | | | 0.4 | | |
| 1,717,000 | | | Western Midstream
Operating L.P., 5.450%,
04/01/2044 | | | | | 1,499,774 | | | | | | 0.4 | | |
| | | | | | | | | 51,784,071 | | | | | | 13.5 | | |
| | | | Financial: 7.4% | |
| 650,000 (2) | | | Ally Financial, Inc.,
5.750%, 11/20/2025 | | | | | 612,018 | | | | | | 0.2 | | |
| 625,000 | | | Ally Financial, Inc.,
6.700%, 02/14/2033 | | | | | 556,041 | | | | | | 0.1 | | |
| 1,075,000 (1) | | | Aretec Escrow Issuer,
Inc., 7.500%, 04/01/2029 | | | | | 880,231 | | | | | | 0.2 | | |
| 1,264,000 (1) | | | BroadStreet Partners,
Inc., 5.875%, 04/15/2029 | | | | | 1,070,405 | | | | | | 0.3 | | |
| 1,207,000 (1) | | | Burford Capital Global
Finance LLC, 6.875%,
04/15/2030 | | | | | 1,040,180 | | | | | | 0.3 | | |
| 1,207,000 (1) | | | Cushman & Wakefield US
Borrower LLC, 6.750%,
05/15/2028 | | | | | 1,081,684 | | | | | | 0.3 | | |
| 510,000 (1) | | | Freedom Mortgage Corp.,
6.625%, 01/15/2027 | | | | | 392,942 | | | | | | 0.1 | | |
| 925,000 (1) | | | Freedom Mortgage Corp.,
8.250%, 04/15/2025 | | | | | 855,486 | | | | | | 0.2 | | |
| 1,396,000 (1) | | | Ladder Capital Finance
Holdings LLLP / Ladder
Capital Finance Corp.,
4.750%, 06/15/2029 | | | | | 1,010,585 | | | | | | 0.3 | | |
| 1,453,000 (1) | | | LPL Holdings, Inc.,
4.000%, 03/15/2029 | | | | | 1,309,124 | | | | | | 0.3 | | |
| 450,000 (1) | | | Midcap Financial Issuer
Trust, 5.625%, 01/15/2030 | | | | | 356,065 | | | | | | 0.1 | | |
| 1,170,000 (1) | | | Midcap Financial Issuer
Trust, 6.500%, 05/01/2028 | | | | | 996,360 | | | | | | 0.3 | | |
| 1,026,000 (2) | | | MPT Operating
Partnership L.P. / MPT
Finance Corp., 4.625%,
08/01/2029 | | | | | 759,030 | | | | | | 0.2 | | |
| 1,181,000 (2) | | | MPT Operating
Partnership L.P. / MPT
Finance Corp., 5.000%,
10/15/2027 | | | | | 972,678 | | | | | | 0.2 | | |
See Accompanying Notes to Financial Statements
PORTFOLIO OF INVESTMENTS
| Voya High Yield Bond Fund | as of March 31, 2023 (continued) |
Principal
Amount† | | | Value | | | Percentage
of Net
Assets | |
| CORPORATE BONDS/NOTES: (continued) | |
| | | | Financial (continued) | |
| 1,490,000 (1) | | | Nationstar Mortgage
Holdings, Inc., 5.125%,
12/15/2030 | | | | $ | 1,146,510 | | | | | | 0.3 | | |
| 1,490,000 | | | Navient Corp., 4.875%,
03/15/2028 | | | | | 1,254,945 | | | | | | 0.3 | | |
| 811,000 (2) | | | Navient Corp., 5.000%,
03/15/2027 | | | | | 715,375 | | | | | | 0.2 | | |
| 283,000 | | | Navient Corp., 7.250%,
09/25/2023 | | | | | 282,330 | | | | | | 0.1 | | |
| 717,000 | | | OneMain Finance Corp.,
4.000%, 09/15/2030 | | | | | 538,395 | | | | | | 0.1 | | |
| 1,603,000 | | | OneMain Finance Corp.,
5.375%, 11/15/2029 | | | | | 1,350,207 | | | | | | 0.3 | | |
| 491,000 | | | OneMain Finance Corp.,
7.125%, 03/15/2026 | | | | | 472,489 | | | | | | 0.1 | | |
| 1,603,000 (1) | | | Park Intermediate
Holdings LLC / PK
Domestic Property LLC /
PK Finance Co-Issuer,
5.875%, 10/01/2028 | | | | | 1,477,774 | | | | | | 0.4 | | |
| 1,339,000 (1) | | | PRA Group, Inc., 5.000%,
10/01/2029 | | | | | 1,121,962 | | | | | | 0.3 | | |
| 925,000 (1) | | | Realogy Group LLC /
Realogy Co-Issuer Corp.,
5.750%, 01/15/2029 | | | | | 693,288 | | | | | | 0.2 | | |
| 1,264,000 (1) | | | RLJ Lodging Trust L.P.,
4.000%, 09/15/2029 | | | | | 1,056,916 | | | | | | 0.3 | | |
| 95,000 (1) | | | Rocket Mortgage LLC,
2.875%, 10/15/2026 | | | | | 85,126 | | | | | | 0.0 | | |
| 335,000 | | | Service Properties Trust,
4.750%, 10/01/2026 | | | | | 280,054 | | | | | | 0.1 | | |
| 365,000 | | | Service Properties Trust,
5.500%, 12/15/2027 | | | | | 327,055 | | | | | | 0.1 | | |
| 1,811,000 (1) | | | United Wholesale
Mortgage LLC, 5.750%,
06/15/2027 | | | | | 1,613,496 | | | | | | 0.4 | | |
| 529,000 (1) | | | Uniti Group L.P. / Uniti
Fiber Holdings, Inc. / CSL
Capital LLC, 6.000%,
01/15/2030 | | | | | 310,126 | | | | | | 0.1 | | |
| 849,000 (1) | | | Uniti Group L.P. / Uniti
Group Finance, Inc. / CSL
Capital LLC, 6.500%,
02/15/2029 | | | | | 518,956 | | | | | | 0.1 | | |
| 585,000 (1) | | | Uniti Group L.P. / Uniti
Group Finance, Inc. / CSL
Capital LLC, 10.500%,
02/15/2028 | | | | | 567,977 | | | | | | 0.1 | | |
Principal
Amount† | | | Value | | | Percentage
of Net
Assets | |
| CORPORATE BONDS/NOTES: (continued) | |
| | | | Financial (continued) | |
| 962,000 (1) | | | VICI Properties L.P. / VICI
Note Co., Inc., 3.750%,
02/15/2027 | | | | $ | 888,951 | | | | | | 0.2 | | |
| 1,113,000 (1) | | | VistaJet Malta Finance
PLC / XO Management
Holding, Inc., 6.375%,
02/01/2030 | | | | | 993,075 | | | | | | 0.3 | | |
| 1,264,000 (1) | | | XHR L.P., 4.875%,
06/01/2029 | | | | | 1,073,329 | | | | | | 0.3 | | |
| | | | | | | | | 28,661,165 | | | | | | 7.4 | | |
| | | | Industrial: 10.6% | |
| 1,490,000 (1)(3) | | | ARD Finance SA, 6.500%
(PIK Rate 7.250%, Cash
Rate 6.500%), 06/30/2027 | | | | | 1,141,638 | | | | | | 0.3 | | |
| 717,000 | | | Ball Corp., 3.125%,
09/15/2031 | | | | | 594,009 | | | | | | 0.1 | | |
| 615,000 | | | Ball Corp., 6.875%,
03/15/2028 | | | | | 637,152 | | | | | | 0.2 | | |
| 604,000 (1) | | | Bombardier, Inc., 7.500%,
02/01/2029 | | | | | 617,590 | | | | | | 0.2 | | |
| 721,000 (1) | | | Bombardier, Inc., 7.875%,
04/15/2027 | | | | | 730,585 | | | | | | 0.2 | | |
| 1,396,000 (1) | | | Brundage-Bone Concrete
Pumping Holdings, Inc.,
6.000%, 02/01/2026 | | | | | 1,310,460 | | | | | | 0.3 | | |
| 1,113,000 (1) | | | Builders FirstSource, Inc.,
5.000%, 03/01/2030 | | | | | 1,031,799 | | | | | | 0.3 | | |
| 1,225,000 (1) | | | Cargo Aircraft
Management, Inc.,
4.750%, 02/01/2028 | | | | | 1,096,706 | | | | | | 0.3 | | |
| 1,302,000 (1) | | | Cascades, Inc./Cascades
USA, Inc., 5.375%,
01/15/2028 | | | | | 1,237,968 | | | | | | 0.3 | | |
| 1,351,000 (1) | | | Chart Industries, Inc.,
7.500%, 01/01/2030 | | | | | 1,397,569 | | | | | | 0.4 | | |
| 366,000 (1) | | | Chart Industries, Inc.,
9.500%, 01/01/2031 | | | | | 386,480 | | | | | | 0.1 | | |
| 1,038,000 (1) | | | Clean Harbors, Inc.,
6.375%, 02/01/2031 | | | | | 1,060,109 | | | | | | 0.3 | | |
| 1,465,000 (1) | | | Energizer Holdings, Inc.,
4.750%, 06/15/2028 | | | | | 1,320,330 | | | | | | 0.3 | | |
| 1,566,000 (1) | | | Fortress Transportation
and Infrastructure
Investors LLC, 5.500%,
05/01/2028 | | | | | 1,430,635 | | | | | | 0.4 | | |
| 1,415,000 (1) | | | GFL Environmental, Inc.,
4.000%, 08/01/2028 | | | | | 1,286,900 | | | | | | 0.3 | | |
| 679,000 (1) | | | GFL Environmental, Inc.,
4.375%, 08/15/2029 | | | | | 608,622 | | | | | | 0.2 | | |
See Accompanying Notes to Financial Statements
PORTFOLIO OF INVESTMENTS
| Voya High Yield Bond Fund | as of March 31, 2023 (continued) |
Principal
Amount† | | | Value | | | Percentage
of Net
Assets | |
| CORPORATE BONDS/NOTES: (continued) | |
| | | | Industrial (continued) | |
| 566,000 (1) | | | Global Infrastructure
Solutions, Inc., 5.625%,
06/01/2029 | | | | $ | 467,567 | | | | | | 0.1 | | |
| 604,000 (1) | | | Global Infrastructure
Solutions, Inc., 7.500%,
04/15/2032 | | | | | 520,498 | | | | | | 0.1 | | |
| 1,132,000 (1) | | | GrafTech Finance, Inc.,
4.625%, 12/15/2028 | | | | | 945,333 | | | | | | 0.2 | | |
| 1,094,000 (1) | | | Graham Packaging
Co., Inc., 7.125%,
08/15/2028 | | | | | 947,062 | | | | | | 0.2 | | |
| 925,000 | | | Howmet Aerospace, Inc.,
5.900%, 02/01/2027 | | | | | 942,052 | | | | | | 0.2 | | |
| 1,547,000 (1) | | | Imola Merger Corp.,
4.750%, 05/15/2029 | | | | | 1,385,679 | | | | | | 0.4 | | |
| 679,000 (1)(3) | | | Intelligent Packaging
Holdco Issuer LP, 9.000%
(PIK Rate 9.750%, Cash
Rate 9.000%), 01/15/2026 | | | | | 478,743 | | | | | | 0.1 | | |
| 1,339,000 (1) | | | Intelligent Packaging Ltd.
Finco, Inc. / Intelligent
Packaging Ltd. Co-Issuer
LLC, 6.000%, 09/15/2028 | | | | | 1,154,887 | | | | | | 0.3 | | |
| 981,000 (1) | | | Koppers, Inc., 6.000%,
02/15/2025 | | | | | 981,417 | | | | | | 0.3 | | |
| 1,415,000 (1) | | | New Enterprise Stone &
Lime Co., Inc., 9.750%,
07/15/2028 | | | | | 1,352,598 | | | | | | 0.3 | | |
| 1,321,000 (1) | | | PGT Innovations, Inc.,
4.375%, 10/01/2029 | | | | | 1,195,505 | | | | | | 0.3 | | |
| 1,075,000 (1) | | | Roller Bearing Co. of
America, Inc., 4.375%,
10/15/2029 | | | | | 961,222 | | | | | | 0.2 | | |
| 642,000 (1) | | | Rolls-Royce PLC, 3.625%,
10/14/2025 | | | | | 611,505 | | | | | | 0.2 | | |
| 1,189,000 (1) | | | Rolls-Royce PLC, 5.750%,
10/15/2027 | | | | | 1,185,570 | | | | | | 0.3 | | |
| 1,490,000 (1) | | | Sealed Air Corp., 4.000%,
12/01/2027 | | | | | 1,391,809 | | | | | | 0.4 | | |
| 623,000 (1) | | | Sealed Air Corp./Sealed
Air Corp. US, 6.125%,
02/01/2028 | | | | | 630,601 | | | | | | 0.2 | | |
| 453,000 (1) | | | Sensata Technologies BV,
5.000%, 10/01/2025 | | | | | 450,146 | | | | | | 0.1 | | |
| 1,471,000 (1) | | | Sensata Technologies,
Inc., 3.750%, 02/15/2031 | | | | | 1,288,449 | | | | | | 0.3 | | |
| 1,471,000 (1) | | | Standard Industries, Inc./
NJ, 3.375%, 01/15/2031 | | | | | 1,183,889 | | | | | | 0.3 | | |
| 849,000 (1) | | | Standard Industries, Inc./
NJ, 4.375%, 07/15/2030 | | | | | 739,589 | | | | | | 0.2 | | |
Principal
Amount† | | | Value | | | Percentage
of Net
Assets | |
| CORPORATE BONDS/NOTES: (continued) | |
| | | | Industrial (continued) | |
| 981,000 (1) | | | Summit Materials LLC /
Summit Materials
Finance Corp., 5.250%,
01/15/2029 | | | | $ | 928,482 | | | | | | 0.2 | | |
| 717,000 (1) | | | Summit Materials LLC /
Summit Materials
Finance Corp., 6.500%,
03/15/2027 | | | | | 711,776 | | | | | | 0.2 | | |
| 1,094,000 (1) | | | TK Elevator US Newco,
Inc., 5.250%, 07/15/2027 | | | | | 1,034,273 | | | | | | 0.3 | | |
| 811,000 (2) | | | TransDigm, Inc., 4.625%,
01/15/2029 | | | | | 721,822 | | | | | | 0.2 | | |
| 642,000 | | | TransDigm, Inc., 5.500%,
11/15/2027 | | | | | 606,050 | | | | | | 0.2 | | |
| 1,019,000 | | | TransDigm, Inc., 6.375%,
06/15/2026 | | | | | 997,148 | | | | | | 0.3 | | |
| 1,245,000 (1) | | | Weekley Homes LLC /
Weekley Finance Corp.,
4.875%, 09/15/2028 | | | | | 1,051,209 | | | | | | 0.3 | | |
| | | | | | | | | 40,753,433 | | | | | | 10.6 | | |
| | | | Technology: 2.6% | |
| 151,000 | | | CDW LLC / CDW Finance
Corp., 4.125%,
05/01/2025 | | | | | 146,651 | | | | | | 0.0 | | |
| 1,264,000 (1) | | | Condor Merger Sub, Inc.,
7.375%, 02/15/2030 | | | | | 1,060,995 | | | | | | 0.3 | | |
| 1,170,000 (1) | | | Consensus Cloud
Solutions, Inc., 6.500%,
10/15/2028 | | | | | 971,333 | | | | | | 0.2 | | |
| 717,000 (1) | | | Entegris Escrow Corp.,
6.950%, 06/15/2030 | | | | | 695,662 | | | | | | 0.2 | | |
| 472,000 (1)(2) | | | Entegris, Inc., 3.625%,
05/01/2029 | | | | | 407,836 | | | | | | 0.1 | | |
| 2,037,000 (1) | | | NCR Corp., 5.125%,
04/15/2029 | | | | | 1,764,548 | | | | | | 0.5 | | |
| 547,000 (1) | | | Open Text Corp., 3.875%,
12/01/2029 | | | | | 461,063 | | | | | | 0.1 | | |
| 604,000 (1) | | | Open Text Corp., 6.900%,
12/01/2027 | | | | | 623,630 | | | | | | 0.2 | | |
| 1,189,000 (1) | | | Open Text Holdings, Inc.,
4.125%, 02/15/2030 | | | | | 1,021,231 | | | | | | 0.3 | | |
| 1,189,000 (1) | | | Playtika Holding Corp.,
4.250%, 03/15/2029 | | | | | 991,299 | | | | | | 0.3 | | |
| 1,170,000 (1) | | | Rackspace Technology
Global, Inc., 5.375%,
12/01/2028 | | | | | 448,651 | | | | | | 0.1 | | |
| 487,000 (1) | | | Veritas US, Inc. / Veritas
Bermuda Ltd., 7.500%,
09/01/2025 | | | | | 367,084 | | | | | | 0.1 | | |
See Accompanying Notes to Financial Statements
PORTFOLIO OF INVESTMENTS
| Voya High Yield Bond Fund | as of March 31, 2023 (continued) |
Principal
Amount† | | | Value | | | Percentage
of Net
Assets | |
| CORPORATE BONDS/NOTES: (continued) | |
| | | | Technology (continued) | |
| 1,226,000 (1) | | | Virtusa Corp., 7.125%,
12/15/2028 | | | | $ | 964,665 | | | | | | 0.2 | | |
| | | | | | | | | 9,924,648 | | | | | | 2.6 | | |
| | | | Utilities: 1.1% | |
| 1,585,000 (1) | | | Drax Finco PLC, 6.625%,
11/01/2025 | | | | | 1,561,764 | | | | | | 0.4 | | |
| 1,100,000 | | | TransAlta Corp., 7.750%,
11/15/2029 | | | | | 1,157,332 | | | | | | 0.3 | | |
| 547,000 (1) | | | Vistra Operations Co.
LLC, 5.500%, 09/01/2026 | | | | | 531,850 | | | | | | 0.1 | | |
| 1,151,000 (1) | | | Vistra Operations Co.
LLC, 5.625%, 02/15/2027 | | | | | 1,118,571 | | | | | | 0.3 | | |
| | | | | | | | | 4,369,517 | | | | | | 1.1 | | |
| | | | Total Corporate
Bonds/Notes | | | | | | | | | | | | | |
| | | | (Cost $395,122,526) | | | | | 357,136,994 | | | | | | 92.9 | | |
| BANK LOANS: 0.8% | |
| | | | Electronics/Electrical: 0.3% | |
| 1,132,000 | | | AP Core Holdings II, LLC
High-Yield Term Loan B2,
10.340%, (US0001M +
5.500%), 09/01/2027 | | | | | 1,104,643 | | | | | | 0.3 | | |
| | | | | |
| | | | Lodging & Casinos: 0.2% | |
| 906,000 | | | Hilton Domestic Operating
Company, Inc. 2019 Term
Loan B2, 6.642%,
(US0001M + 1.750%),
06/22/2026 | | | | | 906,126 | | | | | | 0.2 | | |
| | | | | |
| | | | Radio & Television: 0.3% | |
| 975,000 | | | Clear Channel Outdoor
Holdings, Inc. Term
Loan B, 8.325%,
(US0003M + 3.500%),
08/21/2026 | | | | | 911,473 | | | | | | 0.3 | | |
| | | | Total Bank Loans
(Cost $2,933,508) | | | | | 2,922,242 | | | | | | 0.8 | | |
| CONVERTIBLE BONDS/NOTES: 0.0% | |
| | | | Communications: 0.0% | |
| 397,000 | | | DISH Network Corp.,
3.375%, 08/15/2026 | | | | | 206,440 | | | | | | 0.0 | | |
| | | | Total Convertible
Bonds/Notes
(Cost $396,360) | | | | | 206,440 | | | | | | 0.0 | | |
| |
| Shares | | | Value | | | Percentage
of Net
Assets | |
| COMMON STOCK: 0.3% | |
| | | | Consumer Staples: 0.3% | |
| 48,000 (5)(6) | | | Southeastern
Grocers, Inc. | | | | $ | 1,056,000 | | | | | | 0.3 | | |
| | | | Total Common Stock
(Cost $338,393) | | | | | 1,056,000 | | | | | | 0.3 | | |
| | | | Total Long-Term
Investments
(Cost $398,790,786) | | | | | 361,321,675 | | | | | | 94.0 | | |
Principal
Amount† | | | Value | | | Percentage
of Net
Assets | |
| SHORT-TERM INVESTMENTS: 6.3% | |
| | | | Commercial Paper: 1.8% | |
| 3,000,000 | | | American Electric
Power Co., Inc., 4.950%,
04/25/2023 | | | | | 2,989,040 | | | | | | 0.8 | | |
| 2,000,000 | | | Dominion
Resources, Inc., 5.070%,
05/01/2023 | | | | | 1,990,965 | | | | | | 0.5 | | |
| 1,800,000 | | | EIDP Inc., 5.140%,
04/03/2023 | | | | | 1,799,232 | | | | | | 0.5 | | |
| | | | Total Commercial Paper
(Cost $6,779,816) | | | | | 6,779,237 | | | | | | 1.8 | | |
| | | | | |
| | | | Repurchase Agreements: 2.1% | |
| 1,954,179 (7) | | | Bank of America Inc.,
Repurchase Agreement
dated 03/31/23, 4.82%,
due 04/03/23
(Repurchase Amount
$1,954,953, collateralized
by various U.S.
Government Agency
Obligations,
1.500%-3.000%, Market
Value plus accrued
interest $1,993,263, due
11/01/49-02/01/51) | | | | | 1,954,179 | | | | | | 0.5 | | |
| 358,694 (7) | | | Citigroup, Inc.,
Repurchase Agreement
dated 03/31/23, 4.81%,
due 04/03/23
(Repurchase Amount
$358,836, collateralized
by various U.S.
Government/U.S.
Government Agency
Obligations,
1.500%-7.000%, Market
Value plus accrued
interest $365,868, due
12/26/24-03/20/53) | | | | | 358,694 | | | | | | 0.1 | | |
See Accompanying Notes to Financial Statements
PORTFOLIO OF INVESTMENTS
| Voya High Yield Bond Fund | as of March 31, 2023 (continued) |
Principal
Amount† | | | Value | | | Percentage
of Net
Assets | |
| SHORT-TERM INVESTMENTS: (continued) | |
| | | | Repurchase Agreements (continued) | |
| 1,954,179 (7) | | | HSBC Securities USA,
Repurchase Agreement
dated 03/31/23, 4.80%,
due 04/03/23
(Repurchase Amount
$1,954,950, collateralized
by various U.S.
Government/U.S.
Government Agency
Obligations,
0.000%-6.500%, Market
Value plus accrued
interest $1,993,263, due
06/15/24-02/15/53) | | | | $ | 1,954,179 | | | | | | 0.5 | | |
| 1,954,179 (7) | | | Jefferies LLC,
Repurchase Agreement
dated 03/31/23, 4.91%,
due 04/03/23
(Repurchase Amount
$1,954,968, collateralized
by various U.S.
Government Agency
Obligations,
0.000%-5.750%, Market
Value plus accrued
interest $1,993,275, due
04/14/23-03/21/28) | | | | | 1,954,179 | | | | | | 0.5 | | |
| 1,954,179 (7) | | | RBC Dominion
Securities Inc.,
Repurchase Agreement
dated 03/31/23, 4.82%,
due 04/03/23
(Repurchase Amount
$1,954,953, collateralized
by various U.S.
Government/U.S.
Government Agency
Obligations,
0.000%-6.375%, Market
Value plus accrued
interest $1,993,263, due
04/06/23-02/20/53) | | | | | 1,954,179 | | | | | | 0.5 | | |
| | | | Total Repurchase
Agreements
(Cost $8,175,410) | | | | | 8,175,410 | | | | | | 2.1 | | |
| |
| Shares | | | | | | Value | | | Percentage
of Net
Assets | |
| | | | Mutual Funds: 2.4% | |
| 9,204,000 (8) | | | Morgan Stanley Institutional
Liquidity Funds -
Government Portfolio
(Institutional Share Class),
4.730% | | | | | | | | | | | | | |
| | | | (Cost $9,204,000) | | | | $ | 9,204,000 | | | | | | 2.4 | | |
| | | | Total Short-Term
Investments | | | | | | | | | | | | | |
| | | | (Cost $24,159,226) | | | | | 24,158,647 | | | | | | 6.3 | | |
| | | | Total Investments in
Securities
(Cost $422,950,012) | | | | $ | 385,480,322 | | | | | | 100.3 | | |
| | | | Liabilities in Excess of
Other Assets | | | | | (1,030,960) | | | | | | (0.3) | | |
| | | | Net Assets | | | | $ | 384,449,362 | | | | | | 100.0 | | |
†
Unless otherwise indicated, principal amount is shown in USD.
(1)
Securities with purchases pursuant to Rule 144A or section 4(a)(2), under the Securities Act of 1933 and may not be resold subject to that rule except to qualified institutional buyers.
(2)
Security, or a portion of the security, is on loan.
(3)
All or a portion of this security is payment-in-kind (“PIK”) which may pay interest or additional principal at the issuer’s discretion. Rates shown are the current rate and possible payment rates.
(4)
Variable rate security. Rate shown is the rate in effect as of March 31, 2023.
(5)
For fair value measurement disclosure purposes, security is categorized as Level 3, whose value was determined using significant unobservable inputs.
(6)
Non-income producing security.
(7)
All or a portion of the security represents securities purchased with cash collateral received for securities on loan.
(8)
Rate shown is the 7-day yield as of March 31, 2023.
(9)
Bond may be called prior to maturity date.
Reference Rate Abbreviations:
| | US0001M | | | 1-month LIBOR | |
| | US0003M | | | 3-month LIBOR | |
See Accompanying Notes to Financial Statements
PORTFOLIO OF INVESTMENTS
| Voya High Yield Bond Fund | as of March 31, 2023 (continued) |
Fair Value Measurements^
The following is a summary of the fair valuations according to the inputs used as of March 31, 2023 in valuing the assets and liabilities:
| | | | Quoted Prices
in Active Markets
for Identical
Investments
(Level 1) | | | Significant
Other
Observable
Inputs
(Level 2) | | | Significant
Unobservable
Inputs
(Level 3) | | | Fair Value
at
March 31, 2023 | |
| Asset Table | | | | | | | | | | | | | | | | | | | | | | | | | |
| Investments, at fair value | | | | | | | | | | | | | | | | | | | | | | | | | |
| Common Stock | | | | | | | | | | | | | | | | | | | | | | | | | |
| Consumer Staples | | | | $ | — | | | | | $ | — | | | | | $ | 1,056,000 | | | | | $ | 1,056,000 | | |
| Total Common Stock | | | | | — | | | | | | — | | | | | | 1,056,000 | | | | | | 1,056,000 | | |
| Corporate Bonds/Notes | | | | | — | | | | | | 357,136,994 | | | | | | — | | | | | | 357,136,994 | | |
| Bank Loans | | | | | — | | | | | | 2,922,242 | | | | | | — | | | | | | 2,922,242 | | |
| Convertible Bonds/Notes | | | | | — | | | | | | 206,440 | | | | | | — | | | | | | 206,440 | | |
| Short-Term Investments | | | | | 9,204,000 | | | | | | 14,954,647 | | | | | | — | | | | | | 24,158,647 | | |
| Total Investments, at fair value | | | | $ | 9,204,000 | | | | | $ | 375,220,322 | | | | | $ | 1,056,000 | | | | | $ | 385,480,322 | | |
^
See Note 2, “Significant Accounting Policies” in the Notes to Financial Statements for additional information.
At March 31, 2023, the aggregate cost of securities and other investments and the composition of unrealized appreciation and depreciation of securities and other investments on a tax basis were:
| | Cost for federal income tax purposes was $424,263,474. | | |
| | Net unrealized depreciation consisted of: | | |
| | Gross Unrealized Appreciation | | | | $ | 2,198,228 | | |
| | Gross Unrealized Depreciation | | | | | (40,981,380) | | |
| | Net Unrealized Depreciation | | | | $ | (38,783,152) | | |
See Accompanying Notes to Financial Statements
PORTFOLIO OF INVESTMENTS
| Voya Intermediate Bond Fund | as of March 31, 2023 |
Principal
Amount† | | | Value | | | Percentage
of Net
Assets | |
| CORPORATE BONDS/NOTES: 30.2% | |
| | | | Basic Materials: 0.9% | |
| 1,725,000 (1) | | | Anglo American Capital
PLC, 2.250%,
03/17/2028 | | | | $ | 1,494,737 | | | | | | 0.0 | | |
| 1,377,000 (1) | | | Anglo American Capital
PLC, 3.625%,
09/11/2024 | | | | | 1,344,613 | | | | | | 0.0 | | |
| 671,000 (1) | | | Anglo American Capital
PLC, 4.875%,
05/14/2025 | | | | | 668,164 | | | | | | 0.0 | | |
| 5,531,000 | | | BHP Billiton Finance
USA Ltd., 4.900%,
02/28/2033 | | | | | 5,645,785 | | | | | | 0.1 | | |
| 4,505,000 | | | Celulosa Arauco y
Constitucion SA,
3.875%, 11/02/2027 | | | | | 4,136,716 | | | | | | 0.1 | | |
| 3,883,000 | | | Dow Chemical Co.,
4.375%, 11/15/2042 | | | | | 3,368,550 | | | | | | 0.0 | | |
| 5,000,000 (1) | | | Equate Petrochemical
BV, 2.625%, 04/28/2028 | | | | | 4,416,090 | | | | | | 0.1 | | |
| 3,000,000 (1)(2) | | | GC Treasury Center
Co. Ltd., 2.980%,
03/18/2031 | | | | | 2,462,313 | | | | | | 0.0 | | |
| 4,410,000 (1) | | | Ingevity Corp., 3.875%,
11/01/2028 | | | | | 3,783,887 | | | | | | 0.1 | | |
| 2,412,000 (2) | | | Inversiones CMPC SA,
4.375%, 04/04/2027 | | | | | 2,292,409 | | | | | | 0.0 | | |
| 536,000 | | | LYB International
Finance III LLC,
3.625%, 04/01/2051 | | | | | 381,852 | | | | | | 0.0 | | |
| 3,682,000 | | | Mosaic Co/The,
5.450%, 11/15/2033 | | | | | 3,705,485 | | | | | | 0.1 | | |
| 2,026,000 (1) | | | Northern Star
Resources Ltd.,
6.125%, 04/11/2033 | | | | | 2,011,918 | | | | | | 0.0 | | |
| 4,325,000 (1) | | | Novelis Corp., 4.750%,
01/30/2030 | | | | | 3,979,000 | | | | | | 0.1 | | |
| 1,138,000 | | | Nutrien Ltd., 5.800%,
03/27/2053 | | | | | 1,173,494 | | | | | | 0.0 | | |
| 1,736,000 (1) | | | OCI NV, 6.700%,
03/16/2033 | | | | | 1,733,599 | | | | | | 0.0 | | |
| 1,325,000 (1) | | | OCP SA, 3.750%,
06/23/2031 | | | | | 1,088,951 | | | | | | 0.0 | | |
| 4,100,000 (2) | | | Olin Corp., 5.000%,
02/01/2030 | | | | | 3,848,383 | | | | | | 0.1 | | |
| 2,100,000 (1) | | | POSCO, 4.500%,
08/04/2027 | | | | | 2,063,203 | | | | | | 0.0 | | |
| 3,492,000 | | | Rio Tinto Finance USA
PLC, 5.000%,
03/09/2033 | | | | | 3,593,060 | | | | | | 0.0 | | |
| 3,754,000 | | | Rio Tinto Finance USA
PLC, 5.125%,
03/09/2053 | | | | | 3,871,341 | | | | | | 0.1 | | |
Principal
Amount† | | | Value | | | Percentage
of Net
Assets | |
| CORPORATE BONDS/NOTES: (continued) | |
| | | | Basic Materials (continued) | |
| 3,189,000 | | | Steel Dynamics, Inc.,
1.650%, 10/15/2027 | | | | $ | 2,740,085 | | | | | | 0.0 | | |
| 2,139,000 | | | Steel Dynamics, Inc.,
2.400%, 06/15/2025 | | | | | 2,019,243 | | | | | | 0.0 | | |
| 2,425,000 | | | Suzano Austria GmbH,
3.750%, 01/15/2031 | | | | | 2,112,230 | | | | | | 0.0 | | |
| 4,825,000 | | | Suzano Austria GmbH,
6.000%, 01/15/2029 | | | | | 4,865,144 | | | | | | 0.1 | | |
| 1,424,000 | | | Teck Resources Ltd.,
6.000%, 08/15/2040 | | | | | 1,441,725 | | | | | | 0.0 | | |
| 536,000 | | | Westlake Corp.,
3.125%, 08/15/2051 | | | | | 341,633 | | | | | | 0.0 | | |
| | | | | | | | | 70,583,610 | | | | | | 0.9 | | |
| | | | Communications: 2.1% | |
| 4,889,000 | | | Amazon.com, Inc.,
2.100%, 05/12/2031 | | | | | 4,181,129 | | | | | | 0.1 | | |
| 4,500,000 | | | Amazon.com, Inc.,
2.875%, 05/12/2041 | | | | | 3,547,946 | | | | | | 0.1 | | |
| 3,444,000 (2) | | | Amazon.com, Inc.,
3.600%, 04/13/2032 | | | | | 3,273,669 | | | | | | 0.0 | | |
| 2,866,000 | | | Amazon.com, Inc.,
4.100%, 04/13/2062 | | | | | 2,526,090 | | | | | | 0.0 | | |
| 3,304,000 | | | Amazon.com, Inc.,
4.550%, 12/01/2027 | | | | | 3,355,679 | | | | | | 0.1 | | |
| 5,300,000 (1)(2) | | | ANGI Group LLC,
3.875%, 08/15/2028 | | | | | 4,033,002 | | | | | | 0.1 | | |
| 1,750,000 | | | AT&T, Inc., 3.500%,
06/01/2041 | | | | | 1,382,603 | | | | | | 0.0 | | |
| 868,000 | | | AT&T, Inc., 3.550%,
09/15/2055 | | | | | 624,157 | | | | | | 0.0 | | |
| 6,752,000 | | | AT&T, Inc., 3.650%,
09/15/2059 | | | | | 4,833,495 | | | | | | 0.1 | | |
| 1,906,000 | | | AT&T, Inc., 3.800%,
12/01/2057 | | | | | 1,418,264 | | | | | | 0.0 | | |
| 649,000 | | | AT&T, Inc., 4.500%,
05/15/2035 | | | | | 608,266 | | | | | | 0.0 | | |
| 3,480,000 | | | AT&T, Inc., 4.900%,
08/15/2037 | | | | | 3,332,153 | | | | | | 0.0 | | |
| 2,314,000 | | | Charter
Communications
Operating LLC / Charter
Communications
Operating Capital,
2.250%, 01/15/2029 | | | | | 1,931,113 | | | | | | 0.0 | | |
| 2,815,000 | | | Charter
Communications
Operating LLC / Charter
Communications
Operating Capital,
3.850%, 04/01/2061 | | | | | 1,758,694 | | | | | | 0.0 | | |
See Accompanying Notes to Financial Statements
PORTFOLIO OF INVESTMENTS
| Voya Intermediate Bond Fund | as of March 31, 2023 (continued) |
Principal
Amount† | | | Value | | | Percentage
of Net
Assets | |
| CORPORATE BONDS/NOTES: (continued) | |
| | | | Communications (continued) | |
| 1,571,000 | | | Charter
Communications
Operating LLC / Charter
Communications
Operating Capital,
3.900%, 06/01/2052 | | | | $ | 1,040,369 | | | | | | 0.0 | | |
| 4,012,000 | | | Comcast Corp.,
1.950%, 01/15/2031 | | | | | 3,340,338 | | | | | | 0.0 | | |
| 4,396,000 | | | Comcast Corp.,
2.650%, 02/01/2030 | | | | | 3,917,888 | | | | | | 0.1 | | |
| 5,558,000 | | | Comcast Corp.,
3.900%, 03/01/2038 | | | | | 4,982,654 | | | | | | 0.1 | | |
| 1,666,000 | | | Comcast Corp.,
3.969%, 11/01/2047 | | | | | 1,403,228 | | | | | | 0.0 | | |
| 1,873,000 | | | Comcast Corp.,
5.350%, 11/15/2027 | | | | | 1,951,228 | | | | | | 0.0 | | |
| 1,366,000 | | | Corning, Inc., 5.450%,
11/15/2079 | | | | | 1,261,851 | | | | | | 0.0 | | |
| 5,200,000 (1) | | | CSC Holdings LLC,
5.750%, 01/15/2030 | | | | | 2,743,000 | | | | | | 0.0 | | |
| 4,655,000 | | | DISH DBS Corp.,
5.125%, 06/01/2029 | | | | | 2,483,815 | | | | | | 0.0 | | |
| 4,420,000 (1) | | | GCI LLC, 4.750%,
10/15/2028 | | | | | 3,818,283 | | | | | | 0.1 | | |
| 4,245,000 (1)(2) | | | Gray Television, Inc.,
7.000%, 05/15/2027 | | | | | 3,558,074 | | | | | | 0.1 | | |
| 5,000,000 (1)(2) | | | Match Group Holdings
II LLC, 3.625%,
10/01/2031 | | | | | 4,074,500 | | | | | | 0.1 | | |
| 2,528,000 | | | Meta Platforms, Inc.,
3.500%, 08/15/2027 | | | | | 2,442,770 | | | | | | 0.0 | | |
| 9,637,000 | | | Meta Platforms, Inc.,
4.450%, 08/15/2052 | | | | | 8,489,095 | | | | | | 0.1 | | |
| 1,769,000 | | | Meta Platforms, Inc.,
4.650%, 08/15/2062 | | | | | 1,565,175 | | | | | | 0.0 | | |
| 2,000,000 (1) | | | Millicom International
Cellular SA, 4.500%,
04/27/2031 | | | | | 1,608,150 | | | | | | 0.0 | | |
| 2,160,000 (1) | | | NBN Co. Ltd., 1.450%,
05/05/2026 | | | | | 1,953,712 | | | | | | 0.0 | | |
| 3,800,000 (1)(2) | | | NBN Co. Ltd., 1.625%,
01/08/2027 | | | | | 3,365,936 | | | | | | 0.1 | | |
| 551,000 (2) | | | Paramount Global,
4.200%, 05/19/2032 | | | | | 472,984 | | | | | | 0.0 | | |
| 3,345,000 | | | Paramount Global,
4.375%, 03/15/2043 | | | | | 2,380,039 | | | | | | 0.0 | | |
| 4,387,000 (2) | | | Paramount Global,
4.950%, 01/15/2031 | | | | | 4,050,501 | | | | | | 0.1 | | |
| 3,632,000 | | | Paramount Global,
4.950%, 05/19/2050 | | | | | 2,721,961 | | | | | | 0.0 | | |
| 608,000 | | | Paramount Global,
5.250%, 04/01/2044 | | | | | 484,405 | | | | | | 0.0 | | |
Principal
Amount† | | | Value | | | Percentage
of Net
Assets | |
| CORPORATE BONDS/NOTES: (continued) | |
| | | | Communications (continued) | |
| 1,814,000 | | | Paramount Global,
5.850%, 09/01/2043 | | | | $ | 1,569,700 | | | | | | 0.0 | | |
| 4,305,000 (1) | | | Sirius XM Radio, Inc.,
5.500%, 07/01/2029 | | | | | 3,922,737 | | | | | | 0.1 | | |
| 4,365,000 | | | Telecom Italia Capital
SA, 7.721%,
06/04/2038 | | | | | 4,047,469 | | | | | | 0.1 | | |
| 5,387,000 | | | Time Warner Cable
LLC, 5.500%,
09/01/2041 | | | | | 4,659,857 | | | | | | 0.1 | | |
| 2,829,000 | | | Time Warner Cable
LLC, 5.875%,
11/15/2040 | | | | | 2,567,210 | | | | | | 0.0 | | |
| 2,569,000 | | | T-Mobile USA, Inc.,
2.050%, 02/15/2028 | | | | | 2,280,571 | | | | | | 0.0 | | |
| 642,000 | | | T-Mobile USA, Inc.,
2.250%, 02/15/2026 | | | | | 597,677 | | | | | | 0.0 | | |
| 1,948,000 | | | T-Mobile USA, Inc.,
2.625%, 02/15/2029 | | | | | 1,718,157 | | | | | | 0.0 | | |
| 2,805,000 | | | T-Mobile USA, Inc.,
3.500%, 04/15/2031 | | | | | 2,524,987 | | | | | | 0.0 | | |
| 5,747,000 | | | T-Mobile USA, Inc.,
3.875%, 04/15/2030 | | | | | 5,397,019 | | | | | | 0.1 | | |
| 1,048,000 | | | T-Mobile USA, Inc.,
4.375%, 04/15/2040 | | | | | 939,955 | | | | | | 0.0 | | |
| 899,000 | | | T-Mobile USA, Inc.,
4.500%, 04/15/2050 | | | | | 783,697 | | | | | | 0.0 | | |
| 1,505,000 | | | T-Mobile USA, Inc.,
5.050%, 07/15/2033 | | | | | 1,513,182 | | | | | | 0.0 | | |
| 3,697,000 | | | T-Mobile USA, Inc.,
5.800%, 09/15/2062 | | | | | 3,835,913 | | | | | | 0.1 | | |
| 1,060,000 | | | Verizon
Communications, Inc.,
2.355%, 03/15/2032 | | | | | 870,132 | | | | | | 0.0 | | |
| 757,000 | | | Verizon
Communications, Inc.,
2.650%, 11/20/2040 | | | | | 541,113 | | | | | | 0.0 | | |
| 2,312,000 | | | Verizon
Communications, Inc.,
3.400%, 03/22/2041 | | | | | 1,840,415 | | | | | | 0.0 | | |
| 3,610,000 | | | Verizon
Communications, Inc.,
3.850%, 11/01/2042 | | | | | 3,022,951 | | | | | | 0.0 | | |
| 895,000 | | | Verizon
Communications, Inc.,
4.400%, 11/01/2034 | | | | | 851,183 | | | | | | 0.0 | | |
| 1,496,000 | | | Verizon
Communications, Inc.,
4.500%, 08/10/2033 | | | | | 1,446,277 | | | | | | 0.0 | | |
| 6,432,000 | | | Verizon
Communications, Inc.,
4.812%, 03/15/2039 | | | | | 6,146,165 | | | | | | 0.1 | | |
See Accompanying Notes to Financial Statements
PORTFOLIO OF INVESTMENTS
| Voya Intermediate Bond Fund | as of March 31, 2023 (continued) |
Principal
Amount† | | | Value | | | Percentage
of Net
Assets | |
| CORPORATE BONDS/NOTES: (continued) | |
| | | | Communications (continued) | |
| 4,085,000 (1) | | | ViaSat, Inc., 5.625%,
04/15/2027 | | | | $ | 3,839,491 | | | | | | 0.1 | | |
| 3,725,000 (1) | | | Vmed O2 UK
Financing I PLC,
4.750%, 07/15/2031 | | | | | 3,197,559 | | | | | | 0.0 | | |
| 2,212,000 | | | Vodafone Group PLC,
5.750%, 02/10/2063 | | | | | 2,193,180 | | | | | | 0.0 | | |
| 4,860,000 (1) | | | Zayo Group Holdings,
Inc., 4.000%,
03/01/2027 | | | | | 3,697,974 | | | | | | 0.1 | | |
| | | | | | | | | 164,920,787 | | | | | | 2.1 | | |
| | | | Consumer, Cyclical: 1.9% | |
| 4,545,000 (1) | | | Allison Transmission,
Inc., 3.750%,
01/30/2031 | | | | | 3,882,634 | | | | | | 0.1 | | |
| 413,740 | | | American Airlines
2015-2 Class AA Pass
Through Trust, 3.600%,
03/22/2029 | | | | | 379,776 | | | | | | 0.0 | | |
| 2,370,259 | | | American Airlines
2016-1 Class AA Pass
Through Trust, 3.575%,
07/15/2029 | | | | | 2,184,491 | | | | | | 0.0 | | |
| 813,035 | | | American Airlines
2016-2 Class A Pass
Through Trust, 3.650%,
12/15/2029 | | | | | 703,654 | | | | | | 0.0 | | |
| 2,424,715 | | | American Airlines
2016-2 Class AA Pass
Through Trust, 3.200%,
12/15/2029 | | | | | 2,180,297 | | | | | | 0.0 | | |
| 3,424,449 | | | American Airlines
2017-2 Class AA Pass
Through Trust, 3.350%,
04/15/2031 | | | | | 3,065,799 | | | | | | 0.0 | | |
| 4,028,000 | | | American Honda
Finance Corp., 4.700%,
01/12/2028 | | | | | 4,070,707 | | | | | | 0.1 | | |
| 4,430,000 | | | Asbury Automotive
Group, Inc., 4.750%,
03/01/2030 | | | | | 3,970,100 | | | | | | 0.1 | | |
| 7,507,000 | | | AutoZone, Inc., 4.750%,
02/01/2033 | | | | | 7,421,802 | | | | | | 0.1 | | |
| 4,405,000 | | | Bath & Body Works,
Inc., 6.750%,
07/01/2036 | | | | | 3,941,550 | | | | | | 0.1 | | |
| 4,955,000 (2) | | | Dana, Inc., 5.625%,
06/15/2028 | | | | | 4,659,186 | | | | | | 0.1 | | |
| 1,196,588 | | | Delta Air Lines 2015-1
Class AA Pass Through
Trust, 3.625%,
01/30/2029 | | | | | 1,105,291 | | | | | | 0.0 | | |
Principal
Amount† | | | Value | | | Percentage
of Net
Assets | |
| CORPORATE BONDS/NOTES: (continued) | |
| | | | Consumer, Cyclical (continued) | |
| 3,970,373 | | | Delta Air Lines 2020-1
Class A Pass Through
Trust, 2.500%,
12/10/2029 | | | | $ | 3,487,860 | | | | | | 0.1 | | |
| 3,950,000 (2) | | | Delta Air Lines 2020-1
Class A Pass Through
Trust, 4.375%,
04/19/2028 | | | | | 3,673,875 | | | | | | 0.1 | | |
| 1,765,049 (1) | | | Delta Air Lines, Inc. /
SkyMiles IP Ltd.,
4.750%, 10/20/2028 | | | | | 1,704,769 | | | | | | 0.0 | | |
| 3,720,000 | | | Ford Motor Credit Co.
LLC, 5.113%,
05/03/2029 | | | | | 3,497,563 | | | | | | 0.1 | | |
| 2,333,000 | | | General Motors Co.,
6.125%, 10/01/2025 | | | | | 2,378,492 | | | | | | 0.0 | | |
| 1,732,000 | | | General Motors
Financial Co., Inc.,
4.350%, 01/17/2027 | | | | | 1,679,736 | | | | | | 0.0 | | |
| 4,340,000 (1) | | | H&E Equipment
Services, Inc., 3.875%,
12/15/2028 | | | | | 3,808,350 | | | | | | 0.1 | | |
| 3,820,000 (1) | | | Harley-Davidson
Financial Services, Inc.,
3.050%, 02/14/2027 | | | | | 3,425,157 | | | | | | 0.1 | | |
| 3,255,000 (1) | | | Harley-Davidson
Financial Services, Inc.,
6.500%, 03/10/2028 | | | | | 3,291,206 | | | | | | 0.0 | | |
| 822,000 (2) | | | Hasbro, Inc., 3.000%,
11/19/2024 | | | | | 793,081 | | | | | | 0.0 | | |
| 672,000 | | | Hasbro, Inc., 3.550%,
11/19/2026 | | | | | 632,328 | | | | | | 0.0 | | |
| 2,901,000 | | | Lowe’s Cos, Inc.,
4.250%, 04/01/2052 | | | | | 2,383,480 | | | | | | 0.0 | | |
| 1,692,000 | | | Lowe’s Cos, Inc.,
4.450%, 04/01/2062 | | | | | 1,383,139 | | | | | | 0.0 | | |
| 2,043,000 | | | Lowe’s Cos, Inc.,
5.750%, 07/01/2053 | | | | | 2,083,606 | | | | | | 0.0 | | |
| 1,554,000 | | | Lowe’s Cos, Inc.,
5.850%, 04/01/2063 | | | | | 1,577,765 | | | | | | 0.0 | | |
| 3,440,000 | | | Macy’s Retail Holdings
LLC, 4.500%,
12/15/2034 | | | | | 2,506,694 | | | | | | 0.0 | | |
| 2,617,000 | | | Magna International,
Inc., 5.500%,
03/21/2033 | | | | | 2,716,478 | | | | | | 0.0 | | |
| 2,932,500 (1) | | | Mileage Plus Holdings
LLC / Mileage Plus
Intellectual Property
Assets Ltd., 6.500%,
06/20/2027 | | | | | 2,925,946 | | | | | | 0.0 | | |
See Accompanying Notes to Financial Statements
PORTFOLIO OF INVESTMENTS
| Voya Intermediate Bond Fund | as of March 31, 2023 (continued) |
Principal
Amount† | | | Value | | | Percentage
of Net
Assets | |
| CORPORATE BONDS/NOTES: (continued) | |
| | | | Consumer, Cyclical (continued) | |
| 4,690,000 (1)(2) | | | Sonic Automotive, Inc.,
4.875%, 11/15/2031 | | | | $ | 3,786,520 | | | | | | 0.1 | | |
| 1,765,000 (2) | | | Target Corp., 2.950%,
01/15/2052 | | | | | 1,278,070 | | | | | | 0.0 | | |
| 6,300,000 | | | Target Corp., 4.400%,
01/15/2033 | | | | | 6,267,585 | | | | | | 0.1 | | |
| 2,474,000 (2) | | | Target Corp., 4.500%,
09/15/2032 | | | | | 2,480,635 | | | | | | 0.0 | | |
| 8,782,000 | | | Target Corp., 4.800%,
01/15/2053 | | | | | 8,636,364 | | | | | | 0.1 | | |
| 4,610,000 (1) | | | Tempur Sealy
International, Inc.,
4.000%, 04/15/2029 | | | | | 4,062,055 | | | | | | 0.1 | | |
| 1,503,000 | | | Toyota Motor Credit
Corp., 1.900%,
01/13/2027 | | | | | 1,370,293 | | | | | | 0.0 | | |
| 1,828,000 | | | Toyota Motor Credit
Corp., 4.450%,
06/29/2029 | | | | | 1,843,588 | | | | | | 0.0 | | |
| 5,032,000 | | | Toyota Motor Credit
Corp., 4.550%,
09/20/2027 | | | | | 5,061,747 | | | | | | 0.1 | | |
| 2,325,000 (1) | | | United Airlines 2015-1
Class AA Pass Through
Trust, 4.625%,
04/15/2029 | | | | | 2,106,035 | | | | | | 0.0 | | |
| 3,863,109 | | | United Airlines 2016-2
Class AA Pass Through
Trust, 2.875%,
04/07/2030 | | | | | 3,447,685 | | | | | | 0.1 | | |
| 777,272 | | | United Airlines 2018-1
Class AA Pass Through
Trust, 3.500%,
09/01/2031 | | | | | 698,733 | | | | | | 0.0 | | |
| 2,896,653 | | | United Airlines 2020-1
Class A Pass Through
Trust, 5.875%,
04/15/2029 | | | | | 2,891,779 | | | | | | 0.0 | | |
| 5,293,506 | | | US Airways 2012-1
Class A Pass Through
Trust, 5.900%,
04/01/2026 | | | | | 5,262,385 | | | | | | 0.1 | | |
| 459,847 | | | US Airways 2012-2
Class A Pass Through
Trust, 4.625%,
12/03/2026 | | | | | 434,979 | | | | | | 0.0 | | |
| 9,092,000 (1) | | | Warnermedia Holdings,
Inc., 3.755%,
03/15/2027 | | | | | 8,569,887 | | | | | | 0.1 | | |
| 1,452,000 (1) | | | Warnermedia Holdings,
Inc., 5.050%,
03/15/2042 | | | | | 1,215,815 | | | | | | 0.0 | | |
Principal
Amount† | | | Value | | | Percentage
of Net
Assets | |
| CORPORATE BONDS/NOTES: (continued) | |
| | | | Consumer, Cyclical (continued) | |
| 2,933,000 (1) | | | Warnermedia Holdings,
Inc., 5.141%,
03/15/2052 | | | | $ | 2,379,678 | | | | | | 0.0 | | |
| | | | | | | | | 143,308,645 | | | | | | 1.9 | | |
| | | | Consumer, Non-cyclical: 5.0% | |
| 3,670,000 | | | AbbVie, Inc., 2.600%,
11/21/2024 | | | | | 3,543,310 | | | | | | 0.1 | | |
| 1,609,000 | | | AbbVie, Inc., 4.050%,
11/21/2039 | | | | | 1,439,312 | | | | | | 0.0 | | |
| 1,789,000 | | | AbbVie, Inc., 4.250%,
11/21/2049 | | | | | 1,580,358 | | | | | | 0.0 | | |
| 7,016,000 | | | AbbVie, Inc., 4.300%,
05/14/2036 | | | | | 6,599,839 | | | | | | 0.1 | | |
| 4,325,000 | | | AbbVie, Inc., 4.400%,
11/06/2042 | | | | | 3,956,198 | | | | | | 0.1 | | |
| 5,481,000 | | | AbbVie, Inc., 4.500%,
05/14/2035 | | | | | 5,316,066 | | | | | | 0.1 | | |
| 1,059,000 | | | AbbVie, Inc., 4.550%,
03/15/2035 | | | | | 1,036,110 | | | | | | 0.0 | | |
| 2,298,000 | | | AbbVie, Inc., 4.625%,
10/01/2042 | | | | | 2,112,490 | | | | | | 0.0 | | |
| 4,305,000 (1) | | | ADT Security Corp./
The, 4.125%,
08/01/2029 | | | | | 3,844,473 | | | | | | 0.1 | | |
| 6,638,000 | | | Aetna, Inc., 4.500%,
05/15/2042 | | | | | 5,971,923 | | | | | | 0.1 | | |
| 2,339,000 | | | Aetna, Inc., 6.625%,
06/15/2036 | | | | | 2,598,613 | | | | | | 0.0 | | |
| 4,460,000 (1) | | | Albertsons Cos, Inc. /
Safeway, Inc. / New
Albertsons L.P. /
Albertsons LLC,
3.500%, 03/15/2029 | | | | | 3,884,812 | | | | | | 0.1 | | |
| 3,100,000 | | | Altria Group, Inc.,
3.700%, 02/04/2051 | | | | | 2,095,609 | | | | | | 0.0 | | |
| 1,362,000 | | | Altria Group, Inc.,
3.875%, 09/16/2046 | | | | | 981,861 | | | | | | 0.0 | | |
| 2,610,000 | | | Amgen, Inc., 2.770%,
09/01/2053 | | | | | 1,671,761 | | | | | | 0.0 | | |
| 3,741,000 | | | Amgen, Inc., 5.250%,
03/02/2033 | | | | | 3,845,545 | | | | | | 0.1 | | |
| 8,933,000 | | | Amgen, Inc., 5.600%,
03/02/2043 | | | | | 9,210,336 | | | | | | 0.1 | | |
| 3,724,000 | | | Amgen, Inc., 5.650%,
03/02/2053 | | | | | 3,879,353 | | | | | | 0.1 | | |
| 3,126,000 | | | Amgen, Inc., 5.750%,
03/02/2063 | | | | | 3,247,363 | | | | | | 0.1 | | |
| 7,238,000 | | | Anheuser-Busch Cos
LLC / Anheuser-Busch
InBev Worldwide, Inc.,
4.700%, 02/01/2036 | | | | | 7,212,428 | | | | | | 0.1 | | |
See Accompanying Notes to Financial Statements
PORTFOLIO OF INVESTMENTS
| Voya Intermediate Bond Fund | as of March 31, 2023 (continued) |
Principal
Amount† | | | Value | | | Percentage
of Net
Assets | |
| CORPORATE BONDS/NOTES: (continued) | |
| | | | Consumer, Non-cyclical (continued) | |
| 8,969,000 | | | Anheuser-Busch Cos
LLC / Anheuser-Busch
InBev Worldwide, Inc.,
4.900%, 02/01/2046 | | | | $ | 8,776,557 | | | | | | 0.1 | | |
| 4,324,000 | | | Anheuser-Busch InBev
Worldwide, Inc.,
5.450%, 01/23/2039 | | | | | 4,545,247 | | | | | | 0.1 | | |
| 862,000 | | | Archer-Daniels-Midland
Co., 4.500%,
08/15/2033 | | | | | 863,519 | | | | | | 0.0 | | |
| 2,017,000 | | | Astrazeneca Finance
LLC, 4.900%,
03/03/2030 | | | | | 2,063,847 | | | | | | 0.0 | | |
| 1,444,000 | | | Avery Dennison Corp.,
5.750%, 03/15/2033 | | | | | 1,503,265 | | | | | | 0.0 | | |
| 1,005,000 | | | BAT Capital Corp.,
3.557%, 08/15/2027 | | | | | 934,933 | | | | | | 0.0 | | |
| 2,393,000 | | | BAT Capital Corp.,
3.734%, 09/25/2040 | | | | | 1,713,036 | | | | | | 0.0 | | |
| 1,771,000 | | | BAT Capital Corp.,
4.390%, 08/15/2037 | | | | | 1,446,569 | | | | | | 0.0 | | |
| 4,315,000 | | | Becton Dickinson &
Co., 4.693%,
02/13/2028 | | | | | 4,335,314 | | | | | | 0.1 | | |
| 2,328,000 | | | Bristol-Myers Squibb
Co., 3.700%,
03/15/2052 | | | | | 1,947,685 | | | | | | 0.0 | | |
| 3,421,000 | | | Bristol-Myers Squibb
Co., 4.125%,
06/15/2039 | | | | | 3,189,523 | | | | | | 0.0 | | |
| 1,221,000 (2) | | | Brown-Forman Corp.,
4.750%, 04/15/2033 | | | | | 1,235,629 | | | | | | 0.0 | | |
| 829,000 (1) | | | Cargill, Inc., 1.700%,
02/02/2031 | | | | | 669,719 | | | | | | 0.0 | | |
| 2,183,000 (1) | | | Cargill, Inc., 2.125%,
04/23/2030 | | | | | 1,867,139 | | | | | | 0.0 | | |
| 5,852,000 (1) | | | Cargill, Inc., 2.125%,
11/10/2031 | | | | | 4,862,486 | | | | | | 0.1 | | |
| 693,000 (1) | | | Cargill, Inc., 4.375%,
04/22/2052 | | | | | 643,683 | | | | | | 0.0 | | |
| 10,987,000 | | | Centene Corp., 3.000%,
10/15/2030 | | | | | 9,261,833 | | | | | | 0.1 | | |
| 3,190,000 | | | Centene Corp., 4.625%,
12/15/2029 | | | | | 3,002,237 | | | | | | 0.0 | | |
| 4,245,000 (2) | | | Central Garden & Pet
Co., 4.125%,
10/15/2030 | | | | | 3,754,702 | | | | | | 0.1 | | |
| 3,471,000 | | | Cigna Corp., 3.250%,
04/15/2025 | | | | | 3,364,697 | | | | | | 0.1 | | |
| 2,781,000 | | | Cigna Corp., 3.400%,
03/15/2050 | | | | | 2,058,184 | | | | | | 0.0 | | |
Principal
Amount† | | | Value | | | Percentage
of Net
Assets | |
| CORPORATE BONDS/NOTES: (continued) | |
| | | | Consumer, Non-cyclical (continued) | |
| 7,297,000 | | | Cigna Corp., 4.800%,
08/15/2038 | | | | $ | 7,076,614 | | | | | | 0.1 | | |
| 1,790,000 | | | Cigna Group/The,
5.400%, 03/15/2033 | | | | | 1,859,765 | | | | | | 0.0 | | |
| 3,345,000 (1) | | | CSL Finance PLC,
4.750%, 04/27/2052 | | | | | 3,156,852 | | | | | | 0.0 | | |
| 1,398,000 (1) | | | CSL Finance PLC,
4.950%, 04/27/2062 | | | | | 1,342,808 | | | | | | 0.0 | | |
| 4,475,000 | | | CVS Health Corp.,
2.700%, 08/21/2040 | | | | | 3,204,902 | | | | | | 0.0 | | |
| 2,465,000 | | | CVS Health Corp.,
3.875%, 07/20/2025 | | | | | 2,421,854 | | | | | | 0.0 | | |
| 3,492,000 | | | CVS Health Corp.,
4.125%, 04/01/2040 | | | | | 3,006,497 | | | | | | 0.0 | | |
| 2,326,000 | | | CVS Health Corp.,
4.780%, 03/25/2038 | | | | | 2,218,991 | | | | | | 0.0 | | |
| 786,000 | | | CVS Health Corp.,
5.125%, 07/20/2045 | | | | | 746,327 | | | | | | 0.0 | | |
| 7,379,000 (1) | | | Danone SA, 2.947%,
11/02/2026 | | | | | 6,976,373 | | | | | | 0.1 | | |
| 4,395,000 (1) | | | DaVita, Inc., 4.625%,
06/01/2030 | | | | | 3,755,527 | | | | | | 0.1 | | |
| 1,778,000 | | | Elevance Health, Inc.,
4.900%, 02/08/2026 | | | | | 1,776,466 | | | | | | 0.0 | | |
| 4,971,000 | | | Eli Lilly & Co., 4.875%,
02/27/2053 | | | | | 5,145,806 | | | | | | 0.1 | | |
| 2,101,000 | | | Eli Lilly & Co., 4.950%,
02/27/2063 | | | | | 2,164,235 | | | | | | 0.0 | | |
| 2,801,000 (1) | | | Fresenius Medical Care
US Finance III, Inc.,
1.875%, 12/01/2026 | | | | | 2,435,344 | | | | | | 0.0 | | |
| 10,098,000 | | | Global Payments, Inc.,
1.200%, 03/01/2026 | | | | | 8,989,126 | | | | | | 0.1 | | |
| 1,760,000 | | | Global Payments, Inc.,
5.950%, 08/15/2052 | | | | | 1,678,194 | | | | | | 0.0 | | |
| 1,917,000 | | | Haleon US Capital LLC,
3.375%, 03/24/2029 | | | | | 1,769,460 | | | | | | 0.0 | | |
| 1,282,000 | | | HCA, Inc., 2.375%,
07/15/2031 | | | | | 1,035,616 | | | | | | 0.0 | | |
| 2,570,000 (1) | | | HCA, Inc., 3.125%,
03/15/2027 | | | | | 2,390,886 | | | | | | 0.0 | | |
| 1,245,000 | | | HCA, Inc., 3.500%,
09/01/2030 | | | | | 1,109,745 | | | | | | 0.0 | | |
| 8,542,000 | | | HCA, Inc., 4.125%,
06/15/2029 | | | | | 8,010,166 | | | | | | 0.1 | | |
| 3,544,000 (1) | | | HCA, Inc., 4.375%,
03/15/2042 | | | | | 2,983,872 | | | | | | 0.0 | | |
| 3,076,000 | | | HCA, Inc., 4.500%,
02/15/2027 | | | | | 3,006,226 | | | | | | 0.0 | | |
| 1,629,000 (1) | | | HCA, Inc., 4.625%,
03/15/2052 | | | | | 1,355,098 | | | | | | 0.0 | | |
See Accompanying Notes to Financial Statements
PORTFOLIO OF INVESTMENTS
| Voya Intermediate Bond Fund | as of March 31, 2023 (continued) |
Principal
Amount† | | | Value | | | Percentage
of Net
Assets | |
| CORPORATE BONDS/NOTES: (continued) | |
| | | | Consumer, Non-cyclical (continued) | |
| 1,449,000 | | | HCA, Inc., 5.250%,
04/15/2025 | | | | $ | 1,449,004 | | | | | | 0.0 | | |
| 2,509,000 (1) | | | Health Care Service
Corp. A Mutual Legal
Reserve Co., 1.500%,
06/01/2025 | | | | | 2,339,122 | | | | | | 0.0 | | |
| 3,305,000 | | | Humana, Inc., 1.350%,
02/03/2027 | | | | | 2,904,262 | | | | | | 0.0 | | |
| 626,000 | | | Humana, Inc., 3.125%,
08/15/2029 | | | | | 567,264 | | | | | | 0.0 | | |
| 4,873,000 | | | Humana, Inc., 4.500%,
04/01/2025 | | | | | 4,832,767 | | | | | | 0.1 | | |
| 3,259,000 | | | Johnson & Johnson,
3.625%, 03/03/2037 | | | | | 3,016,421 | | | | | | 0.0 | | |
| 5,044,000 (1) | | | Kenvue, Inc., 4.900%,
03/22/2033 | | | | | 5,213,412 | | | | | | 0.1 | | |
| 2,085,000 (1) | | | Kenvue, Inc., 5.050%,
03/22/2028 | | | | | 2,155,956 | | | | | | 0.0 | | |
| 3,546,000 (1) | | | Kenvue, Inc., 5.050%,
03/22/2053 | | | | | 3,657,543 | | | | | | 0.1 | | |
| 4,276,000 (1) | | | Kenvue, Inc., 5.100%,
03/22/2043 | | | | | 4,414,825 | | | | | | 0.1 | | |
| 3,660,000 (1) | | | Kenvue, Inc., 5.200%,
03/22/2063 | | | | | 3,796,160 | | | | | | 0.1 | | |
| 4,490,000 | | | Kraft Heinz Foods Co.,
4.625%, 10/01/2039 | | | | | 4,120,493 | | | | | | 0.1 | | |
| 3,255,000 | | | Kraft Heinz Foods Co.,
6.875%, 01/26/2039 | | | | | 3,691,926 | | | | | | 0.1 | | |
| 4,455,000 (1) | | | Lamb Weston Holdings,
Inc., 4.375%,
01/31/2032 | | | | | 4,044,284 | | | | | | 0.1 | | |
| 2,495,000 (1) | | | Mars, Inc., 3.875%,
04/01/2039 | | | | | 2,196,955 | | | | | | 0.0 | | |
| 3,221,000 | | | McKesson Corp.,
5.250%, 02/15/2026 | | | | | 3,230,430 | | | | | | 0.0 | | |
| 4,875,000 (1) | | | Medline Borrower L.P.,
3.875%, 04/01/2029 | | | | | 4,234,717 | | | | | | 0.1 | | |
| 4,079,000 | | | Medtronic Global
Holdings SCA, 4.500%,
03/30/2033 | | | | | 4,084,385 | | | | | | 0.1 | | |
| 3,084,000 | | | Mylan, Inc., 5.200%,
04/15/2048 | | | | | 2,434,976 | | | | | | 0.0 | | |
| 2,889,000 (1) | | | Nestle Holdings, Inc.,
3.900%, 09/24/2038 | | | | | 2,690,932 | | | | | | 0.0 | | |
| 3,573,000 (1) | | | Nestle Holdings, Inc.,
4.125%, 10/01/2027 | | | | | 3,557,272 | | | | | | 0.1 | | |
| 4,220,000 (1) | | | Organon & Co. /
Organon Foreign Debt
Co-Issuer BV, 4.125%,
04/30/2028 | | | | | 3,861,342 | | | | | | 0.1 | | |
| 5,271,000 | | | PayPal Holdings, Inc.,
2.300%, 06/01/2030 | | | | | 4,515,846 | | | | | | 0.1 | | |
Principal
Amount† | | | Value | | | Percentage
of Net
Assets | |
| CORPORATE BONDS/NOTES: (continued) | |
| | | | Consumer, Non-cyclical (continued) | |
| 1,206,000 | | | PayPal Holdings, Inc.,
5.050%, 06/01/2052 | | | | $ | 1,161,326 | | | | | | 0.0 | | |
| 7,861,000 | | | PayPal Holdings, Inc.,
5.250%, 06/01/2062 | | | | | 7,621,497 | | | | | | 0.1 | | |
| 4,442,000 | | | Philip Morris
International, Inc.,
5.375%, 02/15/2033 | | | | | 4,541,126 | | | | | | 0.1 | | |
| 4,410,000 (1) | | | Post Holdings, Inc.,
5.500%, 12/15/2029 | | | | | 4,160,698 | | | | | | 0.1 | | |
| 4,845,000 (1) | | | Prestige Brands, Inc.,
3.750%, 04/01/2031 | | | | | 4,110,932 | | | | | | 0.1 | | |
| 4,380,000 (1) | | | Primo Water Holdings,
Inc., 4.375%,
04/30/2029 | | | | | 3,827,182 | | | | | | 0.1 | | |
| 3,028,000 | | | Reynolds American,
Inc., 5.850%,
08/15/2045 | | | | | 2,734,352 | | | | | | 0.0 | | |
| 2,515,000 (1) | | | Roche Holdings, Inc.,
2.607%, 12/13/2051 | | | | | 1,759,223 | | | | | | 0.0 | | |
| 1,626,000 | | | Royalty Pharma PLC,
1.200%, 09/02/2025 | | | | | 1,475,063 | | | | | | 0.0 | | |
| 2,055,000 | | | Royalty Pharma PLC,
1.750%, 09/02/2027 | | | | | 1,782,083 | | | | | | 0.0 | | |
| 2,010,000 | | | Royalty Pharma PLC,
2.200%, 09/02/2030 | | | | | 1,643,064 | | | | | | 0.0 | | |
| 1,749,000 | | | S&P Global, Inc.,
1.250%, 08/15/2030 | | | | | 1,405,029 | | | | | | 0.0 | | |
| 5,049,000 | | | S&P Global, Inc.,
2.700%, 03/01/2029 | | | | | 4,595,711 | | | | | | 0.1 | | |
| 6,563,000 | | | S&P Global, Inc.,
2.900%, 03/01/2032 | | | | | 5,863,154 | | | | | | 0.1 | | |
| 3,890,000 | | | S&P Global, Inc.,
3.700%, 03/01/2052 | | | | | 3,198,402 | | | | | | 0.0 | | |
| 4,625,000 | | | Tenet Healthcare Corp.,
4.250%, 06/01/2029 | | | | | 4,188,446 | | | | | | 0.1 | | |
| 2,461,000 (1)(2) | | | Triton Container
International Ltd.,
2.050%, 04/15/2026 | | | | | 2,186,293 | | | | | | 0.0 | | |
| 1,814,000 (1) | | | Triton Container
International Ltd.,
3.150%, 06/15/2031 | | | | | 1,444,479 | | | | | | 0.0 | | |
| 1,470,000 | | | UnitedHealth Group,
Inc., 2.750%,
05/15/2040 | | | | | 1,113,151 | | | | | | 0.0 | | |
| 748,000 | | | UnitedHealth Group,
Inc., 3.050%,
05/15/2041 | | | | | 590,351 | | | | | | 0.0 | | |
| 2,117,000 | | | UnitedHealth Group,
Inc., 3.500%,
08/15/2039 | | | | | 1,803,938 | | | | | | 0.0 | | |
See Accompanying Notes to Financial Statements
PORTFOLIO OF INVESTMENTS
| Voya Intermediate Bond Fund | as of March 31, 2023 (continued) |
Principal
Amount† | | | Value | | | Percentage
of Net
Assets | |
| CORPORATE BONDS/NOTES: (continued) | |
| | | | Consumer, Non-cyclical (continued) | |
| 1,590,000 | | | UnitedHealth Group,
Inc., 3.750%,
10/15/2047 | | | | $ | 1,337,819 | | | | | | 0.0 | | |
| 3,087,000 | | | UnitedHealth Group,
Inc., 4.500%,
04/15/2033 | | | | | 3,070,612 | | | | | | 0.0 | | |
| 3,195,000 | | | UnitedHealth Group,
Inc., 5.050%,
04/15/2053 | | | | | 3,233,775 | | | | | | 0.1 | | |
| 4,888,000 | | | UnitedHealth Group,
Inc., 5.200%,
04/15/2063 | | | | | 4,955,561 | | | | | | 0.1 | | |
| 5,057,000 | | | UnitedHealth Group,
Inc., 5.300%,
02/15/2030 | | | | | 5,333,152 | | | | | | 0.1 | | |
| 3,066,000 | | | Utah Acquisition Sub,
Inc., 5.250%,
06/15/2046 | | | | | 2,435,387 | | | | | | 0.0 | | |
| 3,434,000 (2) | | | Viatris, Inc., 2.700%,
06/22/2030 | | | | | 2,792,958 | | | | | | 0.0 | | |
| 10,763,000 | | | Viatris, Inc., 3.850%,
06/22/2040 | | | | | 7,563,756 | | | | | | 0.1 | | |
| 956,000 | | | Viatris, Inc., 4.000%,
06/22/2050 | | | | | 629,857 | | | | | | 0.0 | | |
| | | | | | | | | 385,252,985 | | | | | | 5.0 | | |
| | | | Energy: 3.0% | |
| 3,275,000 (1) | | | Antero Resources
Corp., 5.375%,
03/01/2030 | | | | | 3,050,253 | | | | | | 0.1 | | |
| 9,210,000 | | | Apache Corp., 5.100%,
09/01/2040 | | | | | 7,819,520 | | | | | | 0.1 | | |
| 4,114,000 | | | BP Capital Markets
America, Inc., 2.939%,
06/04/2051 | | | | | 2,858,504 | | | | | | 0.0 | | |
| 3,175,000 (3) | | | BP Capital Markets
PLC, 4.875%,
12/31/2199 | | | | | 2,895,203 | | | | | | 0.0 | | |
| 1,220,000 | | | Canadian Natural
Resources Ltd.,
6.750%, 02/01/2039 | | | | | 1,298,856 | | | | | | 0.0 | | |
| 2,032,000 | | | Cenovus Energy, Inc.,
5.400%, 06/15/2047 | | | | | 1,893,174 | | | | | | 0.0 | | |
| 5,032,000 | | | Coterra Energy, Inc.,
3.900%, 05/15/2027 | | | | | 4,806,057 | | | | | | 0.1 | | |
| 3,975,000 (1) | | | Crestwood Midstream
Partners L.P. /
Crestwood Midstream
Finance Corp., 5.625%,
05/01/2027 | | | | | 3,834,365 | | | | | | 0.1 | | |
| 1,811,000 | | | Diamondback Energy,
Inc., 3.500%,
12/01/2029 | | | | | 1,656,925 | | | | | | 0.0 | | |
Principal
Amount† | | | Value | | | Percentage
of Net
Assets | |
| CORPORATE BONDS/NOTES: (continued) | |
| | | | Energy (continued) | |
| 6,342,000 | | | Diamondback Energy,
Inc., 6.250%,
03/15/2033 | | | | $ | 6,706,141 | | | | | | 0.1 | | |
| 3,702,000 (2) | | | Diamondback Energy,
Inc., 6.250%,
03/15/2053 | | | | | 3,838,280 | | | | | | 0.1 | | |
| 3,845,000 (1) | | | DT Midstream, Inc.,
4.375%, 06/15/2031 | | | | | 3,355,070 | | | | | | 0.1 | | |
| 8,250,000 | | | Ecopetrol SA, 6.875%,
04/29/2030 | | | | | 7,610,955 | | | | | | 0.1 | | |
| 3,450,000 (1) | | | EIG Pearl Holdings
Sarl, 3.545%,
08/31/2036 | | | | | 2,960,756 | | | | | | 0.0 | | |
| 7,100,000 | | | Empresa Nacional del
Petroleo, 3.750%,
08/05/2026 | | | | | 6,624,451 | | | | | | 0.1 | | |
| 400,000 (1) | | | Empresa Nacional del
Petroleo, 3.750%,
08/05/2026 | | | | | 373,209 | | | | | | 0.0 | | |
| 5,373,000 (3) | | | Enbridge, Inc., 5.750%,
07/15/2080 | | | | | 4,793,081 | | | | | | 0.1 | | |
| 3,241,000 (3) | | | Enbridge, Inc., 7.375%,
01/15/2083 | | | | | 3,106,596 | | | | | | 0.1 | | |
| 3,241,000 (3) | | | Enbridge, Inc., 7.625%,
01/15/2083 | | | | | 3,169,656 | | | | | | 0.1 | | |
| 325,000 | | | Energy Transfer L.P.,
4.250%, 04/01/2024 | | | | | 320,933 | | | | | | 0.0 | | |
| 444,000 | | | Energy Transfer L.P.,
4.900%, 03/15/2035 | | | | | 415,232 | | | | | | 0.0 | | |
| 4,946,000 | | | Energy Transfer L.P.,
5.300%, 04/01/2044 | | | | | 4,385,093 | | | | | | 0.1 | | |
| 4,676,000 | | | Energy Transfer L.P.,
5.300%, 04/15/2047 | | | | | 4,106,030 | | | | | | 0.1 | | |
| 1,003,000 | | | Energy Transfer L.P.,
5.350%, 05/15/2045 | | | | | 888,501 | | | | | | 0.0 | | |
| 5,610,000 | | | Energy Transfer L.P.,
5.750%, 02/15/2033 | | | | | 5,751,653 | | | | | | 0.1 | | |
| 2,704,000 | | | Energy Transfer L.P.,
5.800%, 06/15/2038 | | | | | 2,659,545 | | | | | | 0.0 | | |
| 1,263,000 | | | Energy Transfer L.P. /
Regency Energy
Finance Corp., 4.500%,
11/01/2023 | | | | | 1,252,287 | | | | | | 0.0 | | |
| 3,800,000 (1) | | | EnLink Midstream LLC,
6.500%, 09/01/2030 | | | | | 3,846,740 | | | | | | 0.1 | | |
| 3,181,000 | | | Enterprise Products
Operating LLC, 3.950%,
01/31/2060 | | | | | 2,500,832 | | | | | | 0.0 | | |
| 2,292,000 (3) | | | Enterprise Products
Operating LLC, 7.858%,
08/16/2077 | | | | | 2,155,594 | | | | | | 0.0 | | |
See Accompanying Notes to Financial Statements
PORTFOLIO OF INVESTMENTS
| Voya Intermediate Bond Fund | as of March 31, 2023 (continued) |
Principal
Amount† | | | Value | | | Percentage
of Net
Assets | |
| CORPORATE BONDS/NOTES: (continued) | |
| | | | Energy (continued) | |
| 2,642,000 (2) | | | Equinor ASA, 3.125%,
04/06/2030 | | | | $ | 2,478,724 | | | | | | 0.0 | | |
| 731,858 (1) | | | Galaxy Pipeline Assets
Bidco Ltd., 2.160%,
03/31/2034 | | | | | 631,168 | | | | | | 0.0 | | |
| 949,850 (1) | | | Galaxy Pipeline Assets
Bidco Ltd., 2.940%,
09/30/2040 | | | | | 771,740 | | | | | | 0.0 | | |
| 2,875,000 (1)(2) | | | Greensaif Pipelines
Bidco Sarl, 6.129%,
02/23/2038 | | | | | 2,960,379 | | | | | | 0.0 | | |
| 2,875,000 (1) | | | Greensaif Pipelines
Bidco Sarl, 6.510%,
02/23/2042 | | | | | 3,033,166 | | | | | | 0.0 | | |
| 4,045,000 (1) | | | Hilcorp Energy I L.P. /
Hilcorp Finance Co.,
6.000%, 02/01/2031 | | | | | 3,739,556 | | | | | | 0.1 | | |
| 1,295,000 | | | Kinder Morgan Energy
Partners L.P., 4.250%,
09/01/2024 | | | | | 1,280,476 | | | | | | 0.0 | | |
| 546,000 | | | Kinder Morgan, Inc.,
5.050%, 02/15/2046 | | | | | 482,430 | | | | | | 0.0 | | |
| 1,791,000 | | | Kinder Morgan, Inc.,
5.200%, 06/01/2033 | | | | | 1,780,713 | | | | | | 0.0 | | |
| 2,332,000 | | | Kinder Morgan, Inc.,
5.550%, 06/01/2045 | | | | | 2,209,685 | | | | | | 0.0 | | |
| 899,000 | | | Marathon Petroleum
Corp., 5.000%,
09/15/2054 | | | | | 777,909 | | | | | | 0.0 | | |
| 3,850,000 | | | Marathon Petroleum
Corp., 5.125%,
12/15/2026 | | | | | 3,888,380 | | | | | | 0.1 | | |
| 2,897,000 | | | MPLX L.P., 1.750%,
03/01/2026 | | | | | 2,645,435 | | | | | | 0.0 | | |
| 5,080,000 | | | MPLX L.P., 4.000%,
03/15/2028 | | | | | 4,865,223 | | | | | | 0.1 | | |
| 665,000 | | | MPLX L.P., 5.200%,
03/01/2047 | | | | | 596,746 | | | | | | 0.0 | | |
| 2,014,000 | | | MPLX L.P., 5.500%,
02/15/2049 | | | | | 1,876,891 | | | | | | 0.0 | | |
| 1,847,000 (1) | | | Northern Natural Gas
Co., 3.400%,
10/16/2051 | | | | | 1,329,800 | | | | | | 0.0 | | |
| 1,067,000 | | | ONEOK Partners L.P.,
6.125%, 02/01/2041 | | | | | 1,048,684 | | | | | | 0.0 | | |
| 2,785,000 | | | ONEOK Partners L.P.,
6.200%, 09/15/2043 | | | | | 2,734,176 | | | | | | 0.0 | | |
| 907,000 | | | ONEOK, Inc., 3.100%,
03/15/2030 | | | | | 793,421 | | | | | | 0.0 | | |
| 1,900,000 | | | ONEOK, Inc., 5.850%,
01/15/2026 | | | | | 1,929,215 | | | | | | 0.0 | | |
Principal
Amount† | | | Value | | | Percentage
of Net
Assets | |
| CORPORATE BONDS/NOTES: (continued) | |
| | | | Energy (continued) | |
| 274,000 | | | ONEOK, Inc., 6.100%,
11/15/2032 | | | | $ | 283,884 | | | | | | 0.0 | | |
| 5,000,000 (1) | | | Pertamina Persero PT,
2.300%, 02/09/2031 | | | | | 4,126,027 | | | | | | 0.1 | | |
| 750,000 | | | Pertamina Persero PT,
5.625%, 05/20/2043 | | | | | 710,738 | | | | | | 0.0 | | |
| 4,000,000 (1) | | | Petroleos del Peru SA,
4.750%, 06/19/2032 | | | | | 2,977,640 | | | | | | 0.0 | | |
| 2,280,000 | | | Petroleos del Peru SA,
4.750%, 06/19/2032 | | | | | 1,697,255 | | | | | | 0.0 | | |
| 10,350,000 | | | Petroleos Mexicanos,
5.950%, 01/28/2031 | | | | | 7,928,638 | | | | | | 0.1 | | |
| 6,103,000 | | | Petroleos Mexicanos,
6.700%, 02/16/2032 | | | | | 4,862,641 | | | | | | 0.1 | | |
| 2,988,000 | | | Plains All American
Pipeline L.P. / PAA
Finance Corp., 3.550%,
12/15/2029 | | | | | 2,674,755 | | | | | | 0.0 | | |
| 3,468,000 | | | Plains All American
Pipeline L.P. / PAA
Finance Corp., 4.650%,
10/15/2025 | | | | | 3,432,195 | | | | | | 0.1 | | |
| 3,016,000 | | | Plains All American
Pipeline L.P. / PAA
Finance Corp., 4.700%,
06/15/2044 | | | | | 2,374,066 | | | | | | 0.0 | | |
| 1,809,000 | | | Plains All American
Pipeline L.P. / PAA
Finance Corp., 4.900%,
02/15/2045 | | | | | 1,452,138 | | | | | | 0.0 | | |
| 2,025,000 (1) | | | QatarEnergy, 3.300%,
07/12/2051 | | | | | 1,513,991 | | | | | | 0.0 | | |
| 5,250,000 (1) | | | Reliance Industries
Ltd., 2.875%,
01/12/2032 | | | | | 4,368,056 | | | | | | 0.1 | | |
| 5,250,000 (1) | | | Reliance Industries
Ltd., 3.625%,
01/12/2052 | | | | | 3,717,252 | | | | | | 0.1 | | |
| 1,971,000 | | | Sabine Pass
Liquefaction LLC,
4.200%, 03/15/2028 | | | | | 1,894,867 | | | | | | 0.0 | | |
| 4,352,000 | | | Sabine Pass
Liquefaction LLC,
5.000%, 03/15/2027 | | | | | 4,339,814 | | | | | | 0.1 | | |
| 2,136,000 (1) | | | Santos Finance Ltd.,
3.649%, 04/29/2031 | | | | | 1,785,881 | | | | | | 0.0 | | |
| 1,803,000 | | | Targa Resources Corp.,
4.200%, 02/01/2033 | | | | | 1,623,192 | | | | | | 0.0 | | |
| 1,381,000 | | | Targa Resources Corp.,
4.950%, 04/15/2052 | | | | | 1,147,702 | | | | | | 0.0 | | |
See Accompanying Notes to Financial Statements
PORTFOLIO OF INVESTMENTS
| Voya Intermediate Bond Fund | as of March 31, 2023 (continued) |
Principal
Amount† | | | Value | | | Percentage
of Net
Assets | |
| CORPORATE BONDS/NOTES: (continued) | |
| | | | Energy (continued) | |
| 985,000 | | | Targa Resources Corp.,
6.250%, 07/01/2052 | | | | $ | 973,004 | | | | | | 0.0 | | |
| 5,354,000 | | | Targa Resources
Partners L.P. / Targa
Resources Partners
Finance Corp., 4.875%,
02/01/2031 | | | | | 5,015,331 | | | | | | 0.1 | | |
| 2,452,000 | | | TotalEnergies Capital
International SA,
2.986%, 06/29/2041 | | | | | 1,921,633 | | | | | | 0.0 | | |
| 9,065,000 | | | Western Midstream
Operating L.P., 5.300%,
03/01/2048 | | | | | 7,694,825 | | | | | | 0.1 | | |
| 10,875,000 | | | Williams Cos, Inc./The,
4.000%, 09/15/2025 | | | | | 10,626,491 | | | | | | 0.1 | | |
| 2,726,000 | | | Williams Cos, Inc./The,
5.400%, 03/04/2044 | | | | | 2,557,586 | | | | | | 0.0 | | |
| 4,370,000 | | | Williams Cos, Inc./The,
5.650%, 03/15/2033 | | | | | 4,515,726 | | | | | | 0.1 | | |
| | | | | | | | | 229,002,737 | | | | | | 3.0 | | |
| | | | Financial: 8.9% | |
| 4,863,000 (1)(3) | | | ABN AMRO Bank NV,
3.324%, 03/13/2037 | | | | | 3,735,992 | | | | | | 0.1 | | |
| 1,014,000 | | | Alexandria Real Estate
Equities, Inc., 5.150%,
04/15/2053 | | | | | 930,732 | | | | | | 0.0 | | |
| 3,479,000 | | | Alleghany Corp.,
3.250%, 08/15/2051 | | | | | 2,538,850 | | | | | | 0.0 | | |
| 2,563,000 | | | Alleghany Corp.,
3.625%, 05/15/2030 | | | | | 2,416,053 | | | | | | 0.0 | | |
| 123,000 | | | Alleghany Corp.,
4.900%, 09/15/2044 | | | | | 116,486 | | | | | | 0.0 | | |
| 1,957,000 | | | Allstate Corp./The,
1.450%, 12/15/2030 | | | | | 1,523,835 | | | | | | 0.0 | | |
| 5,175,000 | | | Allstate Corp./The,
5.250%, 03/30/2033 | | | | | 5,236,429 | | | | | | 0.1 | | |
| 2,483,000 (3) | | | American Express Co.,
4.420%, 08/03/2033 | | | | | 2,375,587 | | | | | | 0.0 | | |
| 1,264,000 | | | American Homes 4
Rent L.P., 2.375%,
07/15/2031 | | | | | 1,009,194 | | | | | | 0.0 | | |
| 3,707,000 | | | American Homes 4
Rent L.P., 3.625%,
04/15/2032 | | | | | 3,215,194 | | | | | | 0.0 | | |
| 1,551,000 | | | American Homes 4
Rent L.P., 4.300%,
04/15/2052 | | | | | 1,224,120 | | | | | | 0.0 | | |
| 678,000 | | | American International
Group, Inc., 3.900%,
04/01/2026 | | | | | 660,065 | | | | | | 0.0 | | |
| 2,537,000 | | | American Tower Corp.,
3.650%, 03/15/2027 | | | | | 2,411,601 | | | | | | 0.0 | | |
Principal
Amount† | | | Value | | | Percentage
of Net
Assets | |
| CORPORATE BONDS/NOTES: (continued) | |
| | | | Financial (continued) | |
| 1,938,000 | | | American Tower Corp.,
5.650%, 03/15/2033 | | | | $ | 1,996,061 | | | | | | 0.0 | | |
| 4,370,000 | | | Arthur J Gallagher &
Co., 5.750%,
03/02/2053 | | | | | 4,387,507 | | | | | | 0.1 | | |
| 4,433,000 | | | Assurant, Inc., 3.700%,
02/22/2030 | | | | | 3,863,384 | | | | | | 0.1 | | |
| 2,378,000 (1) | | | Aviation Capital Group
LLC, 1.950%,
09/20/2026 | | | | | 2,060,783 | | | | | | 0.0 | | |
| 1,262,000 (1) | | | Aviation Capital Group
LLC, 3.500%,
11/01/2027 | | | | | 1,128,254 | | | | | | 0.0 | | |
| 1,137,000 (1) | | | Aviation Capital Group
LLC, 3.875%,
05/01/2023 | | | | | 1,132,319 | | | | | | 0.0 | | |
| 4,559,000 (1) | | | Aviation Capital Group
LLC, 5.500%,
12/15/2024 | | | | | 4,504,377 | | | | | | 0.1 | | |
| 3,654,000 (1) | | | Aviation Capital Group
LLC, 6.250%,
04/15/2028 | | | | | 3,663,729 | | | | | | 0.1 | | |
| 5,135,000 (1) | | | Avolon Holdings
Funding Ltd., 2.750%,
02/21/2028 | | | | | 4,290,313 | | | | | | 0.1 | | |
| 3,750,000 (1) | | | Banco Nacional de
Panama, 2.500%,
08/11/2030 | | | | | 2,912,738 | | | | | | 0.0 | | |
| 2,000,000 | | | Banco Nacional de
Panama, 2.500%,
08/11/2030 | | | | | 1,553,461 | | | | | | 0.0 | | |
| 4,200,000 | | | Banco Santander SA,
2.746%, 05/28/2025 | | | | | 3,964,385 | | | | | | 0.1 | | |
| 3,200,000 (3) | | | Banco Santander SA,
3.225%, 11/22/2032 | | | | | 2,496,125 | | | | | | 0.0 | | |
| 3,707,000 (1)(3) | | | Bangkok Bank PCL/
Hong Kong, 5.000%,
12/31/2199 | | | | | 3,378,071 | | | | | | 0.1 | | |
| 3,975,000 | | | Bank Hapoalim,
3.255%, 01/21/2032 | | | | | 3,321,113 | | | | | | 0.0 | | |
| 3,454,000 (3) | | | Bank of America Corp.,
1.197%, 10/24/2026 | | | | | 3,104,832 | | | | | | 0.0 | | |
| 8,000,000 (3) | | | Bank of America Corp.,
1.530%, 12/06/2025 | | | | | 7,485,384 | | | | | | 0.1 | | |
| 7,399,000 (3) | | | Bank of America Corp.,
1.734%, 07/22/2027 | | | | | 6,640,828 | | | | | | 0.1 | | |
| 1,968,000 (3) | | | Bank of America Corp.,
1.843%, 02/04/2025 | | | | | 1,910,119 | | | | | | 0.0 | | |
| 1,495,000 (3) | | | Bank of America Corp.,
2.015%, 02/13/2026 | | | | | 1,401,856 | | | | | | 0.0 | | |
| 4,896,000 (3) | | | Bank of America Corp.,
2.087%, 06/14/2029 | | | | | 4,220,029 | | | | | | 0.1 | | |
See Accompanying Notes to Financial Statements
PORTFOLIO OF INVESTMENTS
| Voya Intermediate Bond Fund | as of March 31, 2023 (continued) |
Principal
Amount† | | | Value | | | Percentage
of Net
Assets | |
| CORPORATE BONDS/NOTES: (continued) | |
| | | | Financial (continued) | |
| 3,407,000 (3) | | | Bank of America Corp.,
2.299%, 07/21/2032 | | | | $ | 2,748,273 | | | | | | 0.0 | | |
| 6,179,000 (3) | | | Bank of America Corp.,
2.482%, 09/21/2036 | | | | | 4,696,894 | | | | | | 0.1 | | |
| 4,388,000 (3) | | | Bank of America Corp.,
2.572%, 10/20/2032 | | | | | 3,589,418 | | | | | | 0.1 | | |
| 721,000 (3) | | | Bank of America Corp.,
2.651%, 03/11/2032 | | | | | 602,412 | | | | | | 0.0 | | |
| 3,179,000 (3) | | | Bank of America Corp.,
2.676%, 06/19/2041 | | | | | 2,251,661 | | | | | | 0.0 | | |
| 10,644,000 (3) | | | Bank of America Corp.,
2.687%, 04/22/2032 | | | | | 8,889,285 | | | | | | 0.1 | | |
| 4,396,000 (3) | | | Bank of America Corp.,
2.884%, 10/22/2030 | | | | | 3,827,364 | | | | | | 0.1 | | |
| 3,188,000 (3) | | | Bank of America Corp.,
3.194%, 07/23/2030 | | | | | 2,835,932 | | | | | | 0.0 | | |
| 6,014,000 (3) | | | Bank of America Corp.,
3.419%, 12/20/2028 | | | | | 5,592,458 | | | | | | 0.1 | | |
| 1,815,000 (3) | | | Bank of America Corp.,
3.593%, 07/21/2028 | | | | | 1,707,046 | | | | | | 0.0 | | |
| 8,363,000 (3) | | | Bank of America Corp.,
3.846%, 03/08/2037 | | | | | 7,137,792 | | | | | | 0.1 | | |
| 1,718,000 (3) | | | Bank of America Corp.,
3.970%, 03/05/2029 | | | | | 1,628,515 | | | | | | 0.0 | | |
| 998,000 (3) | | | Bank of America Corp.,
4.083%, 03/20/2051 | | | | | 821,652 | | | | | | 0.0 | | |
| 8,454,000 (3) | | | Bank of America Corp.,
4.271%, 07/23/2029 | | | | | 8,146,284 | | | | | | 0.1 | | |
| 2,013,000 (3) | | | Bank of America Corp.,
4.375%, 12/31/2199 | | | | | 1,716,360 | | | | | | 0.0 | | |
| 2,213,000 (3) | | | Bank of America Corp.,
4.571%, 04/27/2033 | | | | | 2,108,205 | | | | | | 0.0 | | |
| 754,000 (3) | | | Bank of America Corp.,
5.015%, 07/22/2033 | | | | | 746,284 | | | | | | 0.0 | | |
| 4,307,000 (2)(3) | | | Bank of America Corp.,
6.125%, 12/31/2199 | | | | | 4,247,779 | | | | | | 0.1 | | |
| 11,239,000 (3) | | | Bank of Nova Scotia/
The, 4.588%,
05/04/2037 | | | | | 9,916,367 | | | | | | 0.1 | | |
| 2,589,000 | | | Bank of Nova Scotia/
The, 4.850%,
02/01/2030 | | | | | 2,558,882 | | | | | | 0.0 | | |
| 10,038,000 (1) | | | Banque Federative du
Credit Mutuel SA,
4.935%, 01/26/2026 | | | | | 9,928,071 | | | | | | 0.1 | | |
| 2,362,000 (1) | | | Blackstone Holdings
Finance Co. LLC,
1.625%, 08/05/2028 | | | | | 1,965,099 | | | | | | 0.0 | | |
| 4,773,000 (1) | | | Blackstone Holdings
Finance Co. LLC,
2.000%, 01/30/2032 | | | | | 3,630,623 | | | | | | 0.1 | | |
Principal
Amount† | | | Value | | | Percentage
of Net
Assets | |
| CORPORATE BONDS/NOTES: (continued) | |
| | | | Financial (continued) | |
| 11,441,000 (1) | | | Blackstone Holdings
Finance Co. LLC,
6.200%, 04/22/2033 | | | | $ | 12,001,737 | | | | | | 0.2 | | |
| 2,094,000 (1) | | | BPCE SA, 5.150%,
07/21/2024 | | | | | 2,054,860 | | | | | | 0.0 | | |
| 7,020,000 (1) | | | BPCE SA, 5.700%,
10/22/2023 | | | | | 6,967,474 | | | | | | 0.1 | | |
| 946,000 | | | Brighthouse Financial,
Inc., 4.700%,
06/22/2047 | | | | | 692,665 | | | | | | 0.0 | | |
| 3,280,000 (3) | | | Capital One Financial
Corp., 1.878%,
11/02/2027 | | | | | 2,827,499 | | | | | | 0.0 | | |
| 5,432,000 (3) | | | Capital One Financial
Corp., 3.273%,
03/01/2030 | | | | | 4,632,421 | | | | | | 0.1 | | |
| 3,707,000 | | | Chubb INA Holdings,
Inc., 1.375%,
09/15/2030 | | | | | 3,001,502 | | | | | | 0.0 | | |
| 1,971,000 | | | CI Financial Corp.,
4.100%, 06/15/2051 | | | | | 1,196,107 | | | | | | 0.0 | | |
| 2,459,000 (3) | | | Citigroup, Inc., 1.462%,
06/09/2027 | | | | | 2,185,244 | | | | | | 0.0 | | |
| 1,520,000 (1) | | | Commonwealth Bank of
Australia, 3.743%,
09/12/2039 | | | | | 1,162,870 | | | | | | 0.0 | | |
| 7,178,000 (1) | | | Corebridge Financial,
Inc., 3.850%,
04/05/2029 | | | | | 6,560,770 | | | | | | 0.1 | | |
| 4,480,000 (1) | | | Corebridge Financial,
Inc., 3.900%,
04/05/2032 | | | | | 3,883,146 | | | | | | 0.1 | | |
| 9,490,000 (1)(3) | | | Corebridge Financial,
Inc., 6.875%,
12/15/2052 | | | | | 8,478,389 | | | | | | 0.1 | | |
| 2,700,000 (1) | | | Corp Financiera de
Desarrollo SA, 2.400%,
09/28/2027 | | | | | 2,331,369 | | | | | | 0.0 | | |
| 4,068,000 (1) | | | Credit Suisse AG,
6.500%, 08/08/2023 | | | | | 3,910,365 | | | | | | 0.1 | | |
| 1,962,000 | | | Credit Suisse AG/New
York NY, 1.250%,
08/07/2026 | | | | | 1,660,343 | | | | | | 0.0 | | |
| 3,808,000 | | | Credit Suisse AG/New
York NY, 5.000%,
07/09/2027 | | | | | 3,674,720 | | | | | | 0.1 | | |
| 3,222,000 (1)(3) | | | Credit Suisse Group
AG, 2.193%,
06/05/2026 | | | | | 2,876,289 | | | | | | 0.0 | | |
| 2,775,000 (1)(3) | | | Credit Suisse Group
AG, 9.016%,
11/15/2033 | | | | | 3,295,035 | | | | | | 0.0 | | |
See Accompanying Notes to Financial Statements
PORTFOLIO OF INVESTMENTS
| Voya Intermediate Bond Fund | as of March 31, 2023 (continued) |
Principal
Amount† | | | Value | | | Percentage
of Net
Assets | |
| CORPORATE BONDS/NOTES: (continued) | |
| | | | Financial (continued) | |
| 596,000 | | | Crown Castle, Inc.,
2.100%, 04/01/2031 | | | | $ | 487,329 | | | | | | 0.0 | | |
| 2,566,000 | | | Crown Castle, Inc.,
2.900%, 03/15/2027 | | | | | 2,383,290 | | | | | | 0.0 | | |
| 3,580,000 | | | CubeSmart L.P.,
2.250%, 12/15/2028 | | | | | 3,077,650 | | | | | | 0.0 | | |
| 2,407,000 (1)(3) | | | Depository Trust &
Clearing Corp./The,
3.375%, 12/31/2199 | | | | | 1,828,951 | | | | | | 0.0 | | |
| 2,897,000 | | | Discover Bank, 4.250%,
03/13/2026 | | | | | 2,753,078 | | | | | | 0.0 | | |
| 2,404,000 (3) | | | Discover Bank, 4.682%,
08/09/2028 | | | | | 2,200,667 | | | | | | 0.0 | | |
| 4,965,000 | | | First Horizon Bank,
5.750%, 05/01/2030 | | | | | 4,669,112 | | | | | | 0.1 | | |
| 95,000 (3) | | | Goldman Sachs Group,
Inc./The, 3.210%,
04/22/2042 | | | | | 71,709 | | | | | | 0.0 | | |
| 1,030,000 | | | Hartford Financial
Services Group,
Inc./The, 5.950%,
10/15/2036 | | | | | 1,086,761 | | | | | | 0.0 | | |
| 8,526,000 (1) | | | Hartford Financial
Services Group,
Inc./The, 6.989%,
(US0003M + 2.125)%,
02/12/2067 | | | | | 6,896,048 | | | | | | 0.1 | | |
| 2,116,000 (3) | | | HSBC Holdings PLC,
1.589%, 05/24/2027 | | | | | 1,867,156 | | | | | | 0.0 | | |
| 2,569,000 (3) | | | HSBC Holdings PLC,
1.645%, 04/18/2026 | | | | | 2,348,015 | | | | | | 0.0 | | |
| 6,500,000 (3) | | | HSBC Holdings PLC,
2.099%, 06/04/2026 | | | | | 5,973,895 | | | | | | 0.1 | | |
| 6,688,000 (3) | | | HSBC Holdings PLC,
2.206%, 08/17/2029 | | | | | 5,612,785 | | | | | | 0.1 | | |
| 4,759,000 (3) | | | HSBC Holdings PLC,
2.633%, 11/07/2025 | | | | | 4,506,016 | | | | | | 0.1 | | |
| 1,130,000 (3) | | | HSBC Holdings PLC,
2.804%, 05/24/2032 | | | | | 923,460 | | | | | | 0.0 | | |
| 3,307,000 (3) | | | HSBC Holdings PLC,
2.999%, 03/10/2026 | | | | | 3,121,754 | | | | | | 0.0 | | |
| 4,853,000 (3) | | | HSBC Holdings PLC,
4.600%, 12/31/2199 | | | | | 3,636,482 | | | | | | 0.1 | | |
| 4,831,000 (3) | | | HSBC Holdings PLC,
6.000%, 12/31/2199 | | | | | 4,364,230 | | | | | | 0.1 | | |
| 3,552,000 (2)(3) | | | HSBC Holdings PLC,
6.254%, 03/09/2034 | | | | | 3,716,497 | | | | | | 0.1 | | |
| 4,380,000 (3) | | | HSBC Holdings PLC,
6.332%, 03/09/2044 | | | | | 4,636,828 | | | | | | 0.1 | | |
| 7,908,000 (1) | | | Intact Financial Corp.,
5.459%, 09/22/2032 | | | | | 8,004,730 | | | | | | 0.1 | | |
Principal
Amount† | | | Value | | | Percentage
of Net
Assets | |
| CORPORATE BONDS/NOTES: (continued) | |
| | | | Financial (continued) | |
| 3,483,000 | | | Intercontinental
Exchange, Inc.,
2.650%, 09/15/2040 | | | | $ | 2,534,656 | | | | | | 0.0 | | |
| 12,034,000 | | | Intercontinental
Exchange, Inc.,
4.600%, 03/15/2033 | | | | | 11,968,533 | | | | | | 0.2 | | |
| 7,190,000 | | | Invitation Homes
Operating Partnership
L.P., 2.300%,
11/15/2028 | | | | | 6,035,021 | | | | | | 0.1 | | |
| 6,236,000 (3) | | | JPMorgan Chase &
Co., 0.969%,
06/23/2025 | | | | | 5,910,915 | | | | | | 0.1 | | |
| 3,479,000 (3) | | | JPMorgan Chase &
Co., 1.040%,
02/04/2027 | | | | | 3,108,033 | | | | | | 0.0 | | |
| 5,019,000 (3) | | | JPMorgan Chase &
Co., 1.470%,
09/22/2027 | | | | | 4,430,773 | | | | | | 0.1 | | |
| 3,798,000 (3) | | | JPMorgan Chase &
Co., 1.578%,
04/22/2027 | | | | | 3,415,272 | | | | | | 0.1 | | |
| 559,000 (3) | | | JPMorgan Chase &
Co., 1.953%,
02/04/2032 | | | | | 450,071 | | | | | | 0.0 | | |
| 4,472,000 (3) | | | JPMorgan Chase &
Co., 2.069%,
06/01/2029 | | | | | 3,883,514 | | | | | | 0.1 | | |
| 3,784,000 (3) | | | JPMorgan Chase &
Co., 2.182%,
06/01/2028 | | | | | 3,392,540 | | | | | | 0.1 | | |
| 1,361,000 (3) | | | JPMorgan Chase &
Co., 2.301%,
10/15/2025 | | | | | 1,302,162 | | | | | | 0.0 | | |
| 1,531,000 (3) | | | JPMorgan Chase &
Co., 2.595%,
02/24/2026 | | | | | 1,451,890 | | | | | | 0.0 | | |
| 6,475,000 (3) | | | JPMorgan Chase &
Co., 2.947%,
02/24/2028 | | | | | 6,007,551 | | | | | | 0.1 | | |
| 10,000 (3) | | | JPMorgan Chase &
Co., 3.559%,
04/23/2024 | | | | | 9,989 | | | | | | 0.0 | | |
| 4,270,000 (3) | | | JPMorgan Chase &
Co., 3.797%,
07/23/2024 | | | | | 4,248,418 | | | | | | 0.1 | | |
| 755,000 (3) | | | JPMorgan Chase &
Co., 3.960%,
01/29/2027 | | | | | 733,805 | | | | | | 0.0 | | |
| 2,485,000 (3) | | | JPMorgan Chase &
Co., 4.452%,
12/05/2029 | | | | | 2,415,440 | | | | | | 0.0 | | |
See Accompanying Notes to Financial Statements
PORTFOLIO OF INVESTMENTS
| Voya Intermediate Bond Fund | as of March 31, 2023 (continued) |
Principal
Amount† | | | Value | | | Percentage
of Net
Assets | |
| CORPORATE BONDS/NOTES: (continued) | |
| | | | Financial (continued) | |
| 1,287,000 | | | Kite Realty Group L.P.,
4.000%, 10/01/2026 | | | | $ | 1,216,710 | | | | | | 0.0 | | |
| 4,890,000 (1) | | | Ladder Capital Finance
Holdings LLLP / Ladder
Capital Finance Corp.,
4.750%, 06/15/2029 | | | | | 3,539,944 | | | | | | 0.1 | | |
| 1,685,000 (1) | | | Liberty Mutual Group,
Inc., 5.500%,
06/15/2052 | | | | | 1,607,077 | | | | | | 0.0 | | |
| 1,662,000 | | | Life Storage L.P.,
4.000%, 06/15/2029 | | | | | 1,528,556 | | | | | | 0.0 | | |
| 3,503,000 (3) | | | Lloyds Banking Group
PLC, 5.871%,
03/06/2029 | | | | | 3,534,578 | | | | | | 0.1 | | |
| 9,427,000 (3) | | | Lloyds Banking Group
PLC, 8.000%,
12/31/2199 | | | | | 8,708,191 | | | | | | 0.1 | | |
| 5,095,000 (2) | | | Main Street Capital
Corp., 3.000%,
07/14/2026 | | | | | 4,448,264 | | | | | | 0.1 | | |
| 3,087,000 | | | Marsh & McLennan
Cos, Inc., 5.450%,
03/15/2053 | | | | | 3,184,539 | | | | | | 0.0 | | |
| 5,897,000 (1) | | | Metropolitan Life Global
Funding I, 5.150%,
03/28/2033 | | | | | 5,950,404 | | | | | | 0.1 | | |
| 5,813,000 (3) | | | Mitsubishi UFJ
Financial Group, Inc.,
5.441%, 02/22/2034 | | | | | 5,877,869 | | | | | | 0.1 | | |
| 2,508,000 (3) | | | Mitsubishi UFJ
Financial Group, Inc.,
5.475%, 02/22/2031 | | | | | 2,527,588 | | | | | | 0.0 | | |
| 4,554,000 (3) | | | Mizuho Financial
Group, Inc., 5.754%,
05/27/2034 | | | | | 4,661,293 | | | | | | 0.1 | | |
| 3,912,000 (3) | | | Morgan Stanley,
0.790%, 05/30/2025 | | | | | 3,704,823 | | | | | | 0.1 | | |
| 3,075,000 (3) | | | Morgan Stanley,
0.791%, 01/22/2025 | | | | | 2,959,121 | | | | | | 0.0 | | |
| 17,410,000 (3) | | | Morgan Stanley,
1.512%, 07/20/2027 | | | | | 15,486,463 | | | | | | 0.2 | | |
| 3,968,000 (3) | | | Morgan Stanley,
1.593%, 05/04/2027 | | | | | 3,559,032 | | | | | | 0.1 | | |
| 5,414,000 (3) | | | Morgan Stanley,
2.188%, 04/28/2026 | | | | | 5,082,551 | | | | | | 0.1 | | |
| 2,425,000 (3) | | | Morgan Stanley,
2.475%, 01/21/2028 | | | | | 2,217,278 | | | | | | 0.0 | | |
| 1,986,000 (3) | | | Morgan Stanley,
2.720%, 07/22/2025 | | | | | 1,915,305 | | | | | | 0.0 | | |
| 1,722,000 (3) | | | Morgan Stanley,
3.591%, 07/22/2028 | | | | | 1,627,856 | | | | | | 0.0 | | |
Principal
Amount† | | | Value | | | Percentage
of Net
Assets | |
| CORPORATE BONDS/NOTES: (continued) | |
| | | | Financial (continued) | |
| 1,736,000 (3) | | | Morgan Stanley,
3.737%, 04/24/2024 | | | | $ | 1,732,957 | | | | | | 0.0 | | |
| 2,750,000 | | | Morgan Stanley,
3.875%, 01/27/2026 | | | | | 2,685,581 | | | | | | 0.0 | | |
| 3,524,000 | | | Morgan Stanley,
4.000%, 07/23/2025 | | | | | 3,451,708 | | | | | | 0.1 | | |
| 2,439,000 (3) | | | Morgan Stanley,
4.457%, 04/22/2039 | | | | | 2,232,456 | | | | | | 0.0 | | |
| 7,851,000 (3) | | | Morgan Stanley,
5.297%, 04/20/2037 | | | | | 7,408,550 | | | | | | 0.1 | | |
| 12,812,000 (3) | | | Morgan Stanley,
5.948%, 01/19/2038 | | | | | 12,752,856 | | | | | | 0.2 | | |
| 1,334,000 (3) | | | Morgan Stanley,
6.296%, 10/18/2028 | | | | | 1,403,917 | | | | | | 0.0 | | |
| 14,930,000 (3) | | | Morgan Stanley,
6.342%, 10/18/2033 | | | | | 16,319,488 | | | | | | 0.2 | | |
| 5,135,000 | | | MPT Operating
Partnership L.P. / MPT
Finance Corp., 3.500%,
03/15/2031 | | | | | 3,461,504 | | | | | | 0.1 | | |
| 3,230,000 (1) | | | National Australia Bank
Ltd., 6.429%,
01/12/2033 | | | | | 3,330,279 | | | | | | 0.1 | | |
| 4,255,000 (2) | | | Navient Corp., 5.000%,
03/15/2027 | | | | | 3,753,294 | | | | | | 0.1 | | |
| 6,488,000 (1) | | | New York Life Global
Funding, 4.550%,
01/28/2033 | | | | | 6,427,308 | | | | | | 0.1 | | |
| 10,867,000 | | | Northern Trust Corp.,
6.125%, 11/02/2032 | | | | | 11,592,409 | | | | | | 0.2 | | |
| 4,918,000 (1) | | | Northwestern Mutual
Global Funding,
1.700%, 06/01/2028 | | | | | 4,236,282 | | | | | | 0.1 | | |
| 3,376,000 | | | Old Republic
International Corp.,
3.850%, 06/11/2051 | | | | | 2,537,694 | | | | | | 0.0 | | |
| 1,215,000 | | | OneMain Finance
Corp., 4.000%,
09/15/2030 | | | | | 912,344 | | | | | | 0.0 | | |
| 7,000,000 | | | ORIX Corp., 3.250%,
12/04/2024 | | | | | 6,770,368 | | | | | | 0.1 | | |
| 2,613,000 | | | Owl Rock Capital Corp.,
2.875%, 06/11/2028 | | | | | 2,121,375 | | | | | | 0.0 | | |
| 3,592,000 (1) | | | OWL Rock Core
Income Corp., 7.750%,
09/16/2027 | | | | | 3,545,527 | | | | | | 0.1 | | |
| 10,014,000 (3) | | | PartnerRe Finance B
LLC, 4.500%,
10/01/2050 | | | | | 8,326,391 | | | | | | 0.1 | | |
| 2,118,000 | | | Piedmont Operating
Partnership L.P.,
2.750%, 04/01/2032 | | | | | 1,457,521 | | | | | | 0.0 | | |
See Accompanying Notes to Financial Statements
PORTFOLIO OF INVESTMENTS
| Voya Intermediate Bond Fund | as of March 31, 2023 (continued) |
Principal
Amount† | | | Value | | | Percentage
of Net
Assets | |
| CORPORATE BONDS/NOTES: (continued) | |
| | | | Financial (continued) | |
| 1,580,000 | | | Piedmont Operating
Partnership L.P.,
4.450%, 03/15/2024 | | | | $ | 1,494,200 | | | | | | 0.0 | | |
| 2,078,000 (2)(3) | | | PNC Financial Services
Group, Inc./The,
6.000%, 12/31/2199 | | | | | 1,918,117 | | | | | | 0.0 | | |
| 13,076,000 (3) | | | PNC Financial Services
Group, Inc./The,
6.250%, 12/31/2199 | | | | | 12,193,370 | | | | | | 0.2 | | |
| 1,754,000 | | | Principal Financial
Group, Inc., 5.375%,
03/15/2033 | | | | | 1,756,853 | | | | | | 0.0 | | |
| 1,669,000 | | | Principal Financial
Group, Inc., 5.500%,
03/15/2053 | | | | | 1,599,791 | | | | | | 0.0 | | |
| 1,800,000 | | | Prologis L.P., 2.250%,
01/15/2032 | | | | | 1,482,427 | | | | | | 0.0 | | |
| 1,763,000 | | | Prologis L.P., 4.750%,
06/15/2033 | | | | | 1,753,292 | | | | | | 0.0 | | |
| 1,471,000 | | | Prologis L.P., 5.250%,
06/15/2053 | | | | | 1,475,490 | | | | | | 0.0 | | |
| 1,747,000 | | | Public Storage, 1.950%,
11/09/2028 | | | | | 1,535,682 | | | | | | 0.0 | | |
| 726,000 | | | Realty Income Corp.,
3.950%, 08/15/2027 | | | | | 700,413 | | | | | | 0.0 | | |
| 2,498,000 | | | Realty Income Corp.,
4.875%, 06/01/2026 | | | | | 2,487,298 | | | | | | 0.0 | | |
| 1,250,000 | | | Retail Opportunity
Investments
Partnership L.P.,
5.000%, 12/15/2023 | | | | | 1,235,864 | | | | | | 0.0 | | |
| 3,171,000 | | | Rexford Industrial
Realty L.P., 2.150%,
09/01/2031 | | | | | 2,514,978 | | | | | | 0.0 | | |
| 5,055,000 (1) | | | Rocket Mortgage LLC /
Rocket Mortgage
Co-Issuer, Inc., 3.875%,
03/01/2031 | | | | | 4,196,332 | | | | | | 0.1 | | |
| 1,792,000 | | | Sabra Health Care L.P.,
3.200%, 12/01/2031 | | | | | 1,316,308 | | | | | | 0.0 | | |
| 3,082,000 (3) | | | Santander UK Group
Holdings PLC, 2.469%,
01/11/2028 | | | | | 2,714,307 | | | | | | 0.0 | | |
| 972,000 | | | Simon Property Group
L.P., 1.750%,
02/01/2028 | | | | | 837,089 | | | | | | 0.0 | | |
| 1,050,000 | | | Simon Property Group
L.P., 2.450%,
09/13/2029 | | | | | 901,818 | | | | | | 0.0 | | |
| 1,384,000 (3) | | | Truist Financial Corp.,
1.267%, 03/02/2027 | | | | | 1,220,389 | | | | | | 0.0 | | |
Principal
Amount† | | | Value | | | Percentage
of Net
Assets | |
| CORPORATE BONDS/NOTES: (continued) | |
| | | | Financial (continued) | |
| 890,000 (3) | | | Truist Financial Corp.,
4.800%, 12/31/2199 | | | | $ | 780,975 | | | | | | 0.0 | | |
| 3,320,000 (3) | | | Truist Financial Corp.,
5.100%, 12/31/2199 | | | | | 2,923,441 | | | | | | 0.0 | | |
| 3,995,000 (3) | | | Truist Financial Corp.,
5.122%, 01/26/2034 | | | | | 3,899,381 | | | | | | 0.1 | | |
| 2,281,000 | | | Truist Financial Corp.,
5.516%, (US0003M +
0.650)%, 03/15/2028 | | | | | 2,068,622 | | | | | | 0.0 | | |
| 3,180,000 | | | UBS AG, 5.125%,
05/15/2024 | | | | | 3,097,877 | | | | | | 0.0 | | |
| 3,853,000 (1)(3) | | | UBS Group AG,
1.364%, 01/30/2027 | | | | | 3,386,991 | | | | | | 0.1 | | |
| 1,375,000 (1)(3) | | | UBS Group AG,
1.494%, 08/10/2027 | | | | | 1,185,478 | | | | | | 0.0 | | |
| 4,328,000 (1)(3) | | | UBS Group AG,
3.179%, 02/11/2043 | | | | | 3,089,154 | | | | | | 0.0 | | |
| 1,999,000 (1)(3) | | | UBS Group AG,
4.751%, 05/12/2028 | | | | | 1,919,504 | | | | | | 0.0 | | |
| 1,005,000 | | | Ventas Realty L.P.,
5.700%, 09/30/2043 | | | | | 975,523 | | | | | | 0.0 | | |
| 2,994,000 (3) | | | Wells Fargo & Co.,
2.164%, 02/11/2026 | | | | | 2,818,417 | | | | | | 0.0 | | |
| 3,932,000 (3) | | | Wells Fargo & Co.,
2.188%, 04/30/2026 | | | | | 3,687,666 | | | | | | 0.1 | | |
| 5,017,000 (3) | | | Wells Fargo & Co.,
2.393%, 06/02/2028 | | | | | 4,520,957 | | | | | | 0.1 | | |
| 13,580,000 (3) | | | Wells Fargo & Co.,
2.406%, 10/30/2025 | | | | | 12,913,238 | | | | | | 0.2 | | |
| 1,564,000 (3) | | | Wells Fargo & Co.,
3.068%, 04/30/2041 | | | | | 1,167,954 | | | | | | 0.0 | | |
| 2,000,000 | | | XL Group Ltd., 5.250%,
12/15/2043 | | | | | 1,993,410 | | | | | | 0.0 | | |
| | | | | | | | | 680,520,150 | | | | | | 8.9 | | |
| | | | Industrial: 2.2% | |
| 2,571,000 | | | Avnet, Inc., 5.500%,
06/01/2032 | | | | | 2,510,779 | | | | | | 0.0 | | |
| 2,611,000 | | | Avnet, Inc., 6.250%,
03/15/2028 | | | | | 2,659,797 | | | | | | 0.0 | | |
| 4,500,000 | | | Berry Global, Inc.,
1.650%, 01/15/2027 | | | | | 3,943,928 | | | | | | 0.1 | | |
| 3,395,000 | | | Boeing Co/The,
3.250%, 02/01/2028 | | | | | 3,165,119 | | | | | | 0.0 | | |
| 3,884,000 | | | Boeing Co/The,
3.250%, 02/01/2035 | | | | | 3,175,484 | | | | | | 0.0 | | |
| 1,177,000 | | | Boeing Co/The,
3.625%, 02/01/2031 | | | | | 1,079,260 | | | | | | 0.0 | | |
| 791,000 | | | Boeing Co/The,
3.850%, 11/01/2048 | | | | | 592,565 | | | | | | 0.0 | | |
| 3,324,000 | | | Boeing Co/The,
4.875%, 05/01/2025 | | | | | 3,318,875 | | | | | | 0.0 | | |
See Accompanying Notes to Financial Statements
PORTFOLIO OF INVESTMENTS
| Voya Intermediate Bond Fund | as of March 31, 2023 (continued) |
Principal
Amount† | | | Value | | | Percentage
of Net
Assets | |
| CORPORATE BONDS/NOTES: (continued) | |
| | | | Industrial (continued) | |
| 3,715,000 | | | Boeing Co/The,
5.150%, 05/01/2030 | | | | $ | 3,740,155 | | | | | | 0.1 | | |
| 3,126,000 | | | Boeing Co/The,
5.805%, 05/01/2050 | | | | | 3,151,181 | | | | | | 0.0 | | |
| 4,195,000 (1) | | | Builders FirstSource,
Inc., 5.000%,
03/01/2030 | | | | | 3,888,947 | | | | | | 0.1 | | |
| 1,834,000 | | | Burlington Northern
Santa Fe LLC, 3.900%,
08/01/2046 | | | | | 1,561,340 | | | | | | 0.0 | | |
| 1,840,000 | | | Burlington Northern
Santa Fe LLC, 4.050%,
06/15/2048 | | | | | 1,618,156 | | | | | | 0.0 | | |
| 1,165,000 | | | Burlington Northern
Santa Fe LLC, 4.450%,
03/15/2043 | | | | | 1,082,333 | | | | | | 0.0 | | |
| 5,230,000 | | | Burlington Northern
Santa Fe LLC, 4.450%,
01/15/2053 | | | | | 4,902,428 | | | | | | 0.1 | | |
| 2,728,000 | | | Burlington Northern
Santa Fe LLC, 5.150%,
09/01/2043 | | | | | 2,782,109 | | | | | | 0.0 | | |
| 4,300,000 (1) | | | Cascades, Inc./
Cascades USA, Inc.,
5.375%, 01/15/2028 | | | | | 4,088,526 | | | | | | 0.1 | | |
| 1,112,000 | | | CSX Corp., 4.500%,
11/15/2052 | | | | | 1,019,435 | | | | | | 0.0 | | |
| 719,000 | | | CSX Corp., 4.500%,
08/01/2054 | | | | | 643,385 | | | | | | 0.0 | | |
| 2,626,000 | | | CSX Corp., 4.650%,
03/01/2068 | | | | | 2,354,492 | | | | | | 0.0 | | |
| 2,605,020 | | | FedEx Corp. 2020-1
Class AA Pass Through
Trust, 1.875%,
08/20/2035 | | | | | 2,200,105 | | | | | | 0.0 | | |
| 2,396,000 | | | John Deere Capital
Corp., 3.350%,
04/18/2029 | | | | | 2,271,109 | | | | | | 0.0 | | |
| 3,608,000 | | | John Deere Capital
Corp., 4.750%,
01/20/2028 | | | | | 3,685,919 | | | | | | 0.1 | | |
| 2,390,000 (1) | | | Komatsu Finance
America, Inc., 5.499%,
10/06/2027 | | | | | 2,466,295 | | | | | | 0.0 | | |
| 3,142,000 | | | Lockheed Martin Corp.,
5.700%, 11/15/2054 | | | | | 3,584,616 | | | | | | 0.0 | | |
| 1,470,000 | | | Lockheed Martin Corp.,
5.900%, 11/15/2063 | | | | | 1,726,127 | | | | | | 0.0 | | |
| 12,925,000 (1) | | | Misc Capital Two
Labuan Ltd., 3.750%,
04/06/2027 | | | | | 12,230,492 | | | | | | 0.2 | | |
Principal
Amount† | | | Value | | | Percentage
of Net
Assets | |
| CORPORATE BONDS/NOTES: (continued) | |
| | | | Industrial (continued) | |
| 1,224,000 | | | Norfolk Southern Corp.,
4.100%, 05/15/2121 | | | | $ | 868,003 | | | | | | 0.0 | | |
| 2,488,000 | | | Northrop Grumman
Corp., 4.950%,
03/15/2053 | | | | | 2,484,056 | | | | | | 0.0 | | |
| 3,618,000 (1) | | | Penske Truck Leasing
Co. Lp / PTL Finance
Corp., 1.200%,
11/15/2025 | | | | | 3,254,540 | | | | | | 0.0 | | |
| 4,922,000 (1) | | | Penske Truck Leasing
Co. Lp / PTL Finance
Corp., 1.700%,
06/15/2026 | | | | | 4,402,352 | | | | | | 0.1 | | |
| 211,000 | | | Raytheon Technologies
Corp., 3.650%,
08/16/2023 | | | | | 209,258 | | | | | | 0.0 | | |
| 3,933,000 | | | Raytheon Technologies
Corp., 4.450%,
11/16/2038 | | | | | 3,734,461 | | | | | | 0.1 | | |
| 7,750,000 | | | Raytheon Technologies
Corp., 4.500%,
06/01/2042 | | | | | 7,352,692 | | | | | | 0.1 | | |
| 3,431,000 | | | Raytheon Technologies
Corp., 5.150%,
02/27/2033 | | | | | 3,572,630 | | | | | | 0.0 | | |
| 3,630,000 | | | Raytheon Technologies
Corp., 5.375%,
02/27/2053 | | | | | 3,825,959 | | | | | | 0.1 | | |
| 1,176,000 (1) | | | Regal Rexnord Corp.,
6.300%, 02/15/2030 | | | | | 1,185,321 | | | | | | 0.0 | | |
| 1,175,000 (1) | | | Regal Rexnord Corp.,
6.400%, 04/15/2033 | | | | | 1,177,126 | | | | | | 0.0 | | |
| 5,214,000 | | | Republic Services, Inc.,
5.000%, 04/01/2034 | | | | | 5,315,534 | | | | | | 0.1 | | |
| 3,235,000 (1) | | | Sealed Air Corp.,
1.573%, 10/15/2026 | | | | | 2,832,027 | | | | | | 0.0 | | |
| 4,865,000 (1) | | | Sealed Air Corp.,
5.000%, 04/15/2029 | | | | | 4,633,912 | | | | | | 0.1 | | |
| 4,575,000 (1) | | | Sensata Technologies,
Inc., 3.750%,
02/15/2031 | | | | | 4,007,243 | | | | | | 0.1 | | |
| 4,058,000 | | | Silgan Holdings, Inc.,
4.125%, 02/01/2028 | | | | | 3,823,448 | | | | | | 0.1 | | |
| 4,197,000 (1) | | | SMBC Aviation Capital
Finance DAC, 1.900%,
10/15/2026 | | | | | 3,685,718 | | | | | | 0.1 | | |
| 4,925,000 (1) | | | Standard Industries,
Inc./NJ, 4.375%,
07/15/2030 | | | | | 4,290,315 | | | | | | 0.1 | | |
See Accompanying Notes to Financial Statements
PORTFOLIO OF INVESTMENTS
| Voya Intermediate Bond Fund | as of March 31, 2023 (continued) |
Principal
Amount† | | | Value | | | Percentage
of Net
Assets | |
| CORPORATE BONDS/NOTES: (continued) | |
| | | | Industrial (continued) | |
| 3,965,000 (1) | | | Summit Materials LLC /
Summit Materials
Finance Corp., 5.250%,
01/15/2029 | | | | $ | 3,752,734 | | | | | | 0.1 | | |
| 3,534,000 | | | Trane Technologies
Financing Ltd., 5.250%,
03/03/2033 | | | | | 3,655,620 | | | | | | 0.1 | | |
| 5,745,000 (1) | | | TTX Co., 3.600%,
01/15/2025 | | | | | 5,595,846 | | | | | | 0.1 | | |
| 502,000 (1) | | | TTX Co., 4.200%,
07/01/2046 | | | | | 439,860 | | | | | | 0.0 | | |
| 846,000 (1) | | | TTX Co., 5.650%,
12/01/2052 | | | | | 923,165 | | | | | | 0.0 | | |
| 6,080,000 | | | Union Pacific Corp.,
3.500%, 02/14/2053 | | | | | 4,824,227 | | | | | | 0.1 | | |
| 1,956,000 | | | Union Pacific Corp.,
5.150%, 01/20/2063 | | | | | 1,975,880 | | | | | | 0.0 | | |
| 1,322,000 | | | Waste Connections,
Inc., 2.600%,
02/01/2030 | | | | | 1,165,608 | | | | | | 0.0 | | |
| 1,992,000 | | | Waste Management,
Inc., 4.625%,
02/15/2030 | | | | | 1,993,930 | | | | | | 0.0 | | |
| 1,530,000 | | | Waste Management,
Inc., 4.625%,
02/15/2033 | | | | | 1,534,528 | | | | | | 0.0 | | |
| | | | | | | | | 165,958,950 | | | | | | 2.2 | | |
| | | | Technology: 1.4% | |
| 6,740,000 | | | Advanced Micro
Devices, Inc., 3.924%,
06/01/2032 | | | | | 6,479,213 | | | | | | 0.1 | | |
| 7,089,000 | | | Advanced Micro
Devices, Inc., 4.393%,
06/01/2052 | | | | | 6,611,596 | | | | | | 0.1 | | |
| 933,000 | | | Apple, Inc., 1.650%,
02/08/2031 | | | | | 781,148 | | | | | | 0.0 | | |
| 1,937,000 | | | Apple, Inc., 2.850%,
08/05/2061 | | | | | 1,337,909 | | | | | | 0.0 | | |
| 1,040,000 | | | Apple, Inc., 3.450%,
02/09/2045 | | | | | 893,581 | | | | | | 0.0 | | |
| 1,147,000 | | | Apple, Inc., 4.100%,
08/08/2062 | | | | | 1,024,971 | | | | | | 0.0 | | |
| 7,491,000 (1) | | | Broadcom, Inc.,
4.926%, 05/15/2037 | | | | | 6,819,107 | | | | | | 0.1 | | |
| 2,143,000 | | | Dell International LLC /
EMC Corp., 6.020%,
06/15/2026 | | | | | 2,200,484 | | | | | | 0.0 | | |
| 5,131,000 (2) | | | HP, Inc., 2.650%,
06/17/2031 | | | | | 4,188,509 | | | | | | 0.1 | | |
| 1,915,000 | | | Intel Corp., 3.100%,
02/15/2060 | | | | | 1,263,424 | | | | | | 0.0 | | |
Principal
Amount† | | | Value | | | Percentage
of Net
Assets | |
| CORPORATE BONDS/NOTES: (continued) | |
| | | | Technology (continued) | |
| 3,537,000 | | | Intel Corp., 5.125%,
02/10/2030 | | | | $ | 3,603,456 | | | | | | 0.1 | | |
| 4,595,000 | | | Intel Corp., 5.900%,
02/10/2063 | | | | | 4,735,040 | | | | | | 0.1 | | |
| 2,322,000 | | | International Business
Machines Corp.,
3.500%, 05/15/2029 | | | | | 2,182,367 | | | | | | 0.0 | | |
| 2,819,000 | | | KLA Corp., 5.250%,
07/15/2062 | | | | | 2,857,848 | | | | | | 0.0 | | |
| 5,963,000 | | | Kyndryl Holdings, Inc.,
2.050%, 10/15/2026 | | | | | 5,185,641 | | | | | | 0.1 | | |
| 2,946,000 (2) | | | Kyndryl Holdings, Inc.,
2.700%, 10/15/2028 | | | | | 2,469,978 | | | | | | 0.0 | | |
| 2,266,000 | | | Kyndryl Holdings, Inc.,
3.150%, 10/15/2031 | | | | | 1,734,499 | | | | | | 0.0 | | |
| 7,542,000 | | | Microsoft Corp.,
2.921%, 03/17/2052 | | | | | 5,741,136 | | | | | | 0.1 | | |
| 4,533,000 | | | NXP BV / NXP Funding
LLC, 5.350%,
03/01/2026 | | | | | 4,547,676 | | | | | | 0.1 | | |
| 1,628,000 | | | NXP BV / NXP Funding
LLC / NXP USA, Inc.,
3.250%, 11/30/2051 | | | | | 1,089,920 | | | | | | 0.0 | | |
| 1,900,000 | | | NXP BV / NXP Funding
LLC / NXP USA, Inc.,
3.400%, 05/01/2030 | | | | | 1,709,714 | | | | | | 0.0 | | |
| 4,775,000 (1) | | | Open Text Holdings,
Inc., 4.125%,
12/01/2031 | | | | | 3,944,078 | | | | | | 0.1 | | |
| 6,520,000 | | | Oracle Corp., 2.300%,
03/25/2028 | | | | | 5,837,292 | | | | | | 0.1 | | |
| 1,194,000 | | | Oracle Corp., 3.600%,
04/01/2050 | | | | | 848,119 | | | | | | 0.0 | | |
| 2,948,000 | | | Oracle Corp., 3.650%,
03/25/2041 | | | | | 2,277,074 | | | | | | 0.0 | | |
| 4,921,000 | | | Oracle Corp., 3.800%,
11/15/2037 | | | | | 4,091,559 | | | | | | 0.1 | | |
| 297,000 | | | Oracle Corp., 3.850%,
07/15/2036 | | | | | 254,171 | | | | | | 0.0 | | |
| 1,387,000 | | | Oracle Corp., 3.950%,
03/25/2051 | | | | | 1,045,746 | | | | | | 0.0 | | |
| 744,000 | | | Oracle Corp., 4.900%,
02/06/2033 | | | | | 729,032 | | | | | | 0.0 | | |
| 213,000 | | | Oracle Corp., 5.550%,
02/06/2053 | | | | | 203,053 | | | | | | 0.0 | | |
| 2,979,000 | | | Oracle Corp., 6.150%,
11/09/2029 | | | | | 3,174,424 | | | | | | 0.0 | | |
| 2,022,000 | | | Oracle Corp., 6.900%,
11/09/2052 | | | | | 2,269,233 | | | | | | 0.0 | | |
| 4,392,000 | | | QUALCOMM, Inc.,
6.000%, 05/20/2053 | | | | | 4,995,863 | | | | | | 0.1 | | |
See Accompanying Notes to Financial Statements
PORTFOLIO OF INVESTMENTS
| Voya Intermediate Bond Fund | as of March 31, 2023 (continued) |
Principal
Amount† | | | Value | | | Percentage
of Net
Assets | |
| CORPORATE BONDS/NOTES: (continued) | |
| | | | Technology (continued) | |
| 2,799,900 (1) | | | Seagate HDD Cayman,
9.625%, 12/01/2032 | | | | $ | 3,140,640 | | | | | | 0.0 | | |
| 2,305,000 | | | Texas Instruments, Inc.,
3.650%, 08/16/2032 | | | | | 2,190,767 | | | | | | 0.0 | | |
| 910,000 | | | Texas Instruments, Inc.,
4.100%, 08/16/2052 | | | | | 842,117 | | | | | | 0.0 | | |
| 3,354,000 | | | Texas Instruments, Inc.,
4.900%, 03/14/2033 | | | | | 3,491,402 | | | | | | 0.1 | | |
| 3,003,000 | | | Texas Instruments, Inc.,
5.000%, 03/14/2053 | | | | | 3,171,723 | | | | | | 0.0 | | |
| 2,496,000 | | | VMware, Inc., 1.400%,
08/15/2026 | | | | | 2,208,964 | | | | | | 0.0 | | |
| | | | | | | | | 112,172,474 | | | | | | 1.4 | | |
| | | | Utilities: 4.8% | |
| 3,671,000 (1) | | | AEP Texas, Inc.,
3.850%, 10/01/2025 | | | | | 3,544,179 | | | | | | 0.1 | | |
| 2,870,000 | | | AES Corp./The,
1.375%, 01/15/2026 | | | | | 2,584,544 | | | | | | 0.0 | | |
| 2,714,000 (1) | | | AES Corp./The,
3.950%, 07/15/2030 | | | | | 2,436,249 | | | | | | 0.0 | | |
| 2,273,000 | | | Alabama Power Co.,
3.450%, 10/01/2049 | | | | | 1,709,082 | | | | | | 0.0 | | |
| 10,755,000 (1) | | | Alliant Energy Finance
LLC, 3.750%,
06/15/2023 | | | | | 10,719,584 | | | | | | 0.2 | | |
| 1,956,000 | | | American Electric
Power Co., Inc.,
3.250%, 03/01/2050 | | | | | 1,363,562 | | | | | | 0.0 | | |
| 3,377,000 (3) | | | American Electric
Power Co., Inc.,
3.875%, 02/15/2062 | | | | | 2,707,209 | | | | | | 0.0 | | |
| 2,378,000 | | | American Electric
Power Co., Inc.,
5.625%, 03/01/2033 | | | | | 2,461,824 | | | | | | 0.0 | | |
| 2,784,000 (1) | | | American Transmission
Systems, Inc., 2.650%,
01/15/2032 | | | | | 2,346,410 | | | | | | 0.0 | | |
| 4,130,000 (1) | | | American Transmission
Systems, Inc., 5.000%,
09/01/2044 | | | | | 3,930,659 | | | | | | 0.1 | | |
| 1,793,000 | | | Appalachian Power Co.,
4.500%, 03/01/2049 | | | | | 1,550,934 | | | | | | 0.0 | | |
| 9,776,000 | | | Avangrid, Inc., 3.200%,
04/15/2025 | | | | | 9,363,627 | | | | | | 0.1 | | |
| 2,544,000 | | | Avangrid, Inc., 3.800%,
06/01/2029 | | | | | 2,391,087 | | | | | | 0.0 | | |
| 3,010,000 | | | Baltimore Gas and
Electric Co., 2.250%,
06/15/2031 | | | | | 2,541,803 | | | | | | 0.0 | | |
| 2,237,000 | | | Black Hills Corp.,
3.050%, 10/15/2029 | | | | | 1,954,478 | | | | | | 0.0 | | |
Principal
Amount† | | | Value | | | Percentage
of Net
Assets | |
| CORPORATE BONDS/NOTES: (continued) | |
| | | | Utilities (continued) | |
| 1,720,000 | | | Black Hills Corp.,
4.250%, 11/30/2023 | | | | $ | 1,707,970 | | | | | | 0.0 | | |
| 1,893,000 | | | Black Hills Corp.,
4.350%, 05/01/2033 | | | | | 1,741,159 | | | | | | 0.0 | | |
| 1,258,000 | | | CenterPoint Energy
Houston Electric LLC,
4.950%, 04/01/2033 | | | | | 1,285,410 | | | | | | 0.0 | | |
| 2,166,000 (1) | | | Cleveland Electric
Illuminating Co/The,
3.500%, 04/01/2028 | | | | | 2,035,964 | | | | | | 0.0 | | |
| 1,593,000 (3) | | | CMS Energy Corp.,
3.750%, 12/01/2050 | | | | | 1,197,761 | | | | | | 0.0 | | |
| 7,338,000 (3) | | | CMS Energy Corp.,
4.750%, 06/01/2050 | | | | | 6,358,230 | | | | | | 0.1 | | |
| 4,244,000 | | | Connecticut Light and
Power Co/The, 5.250%,
01/15/2053 | | | | | 4,391,779 | | | | | | 0.1 | | |
| 731,000 | | | Consolidated Edison
Co. of New York, Inc.,
5.300%, 03/01/2035 | | | | | 742,731 | | | | | | 0.0 | | |
| 3,004,000 | | | Constellation Energy
Generation LLC,
5.600%, 03/01/2028 | | | | | 3,094,243 | | | | | | 0.1 | | |
| 731,000 (3) | | | Dominion Energy, Inc.,
4.350%, 12/31/2199 | | | | | 608,376 | | | | | | 0.0 | | |
| 4,603,000 | | | Dominion Energy, Inc.,
5.375%, 11/15/2032 | | | | | 4,721,813 | | | | | | 0.1 | | |
| 1,617,000 | | | DTE Electric Co.,
5.200%, 04/01/2033 | | | | | 1,670,601 | | | | | | 0.0 | | |
| 1,081,000 | | | DTE Electric Co.,
5.400%, 04/01/2053 | | | | | 1,134,788 | | | | | | 0.0 | | |
| 1,295,000 | | | Duke Energy Carolinas
LLC, 2.550%,
04/15/2031 | | | | | 1,112,017 | | | | | | 0.0 | | |
| 1,542,000 | | | Duke Energy Carolinas
LLC, 3.700%,
12/01/2047 | | | | | 1,236,644 | | | | | | 0.0 | | |
| 587,000 | | | Duke Energy Carolinas
LLC, 3.750%,
06/01/2045 | | | | | 477,461 | | | | | | 0.0 | | |
| 2,357,000 | | | Duke Energy Carolinas
LLC, 4.000%,
09/30/2042 | | | | | 2,020,415 | | | | | | 0.0 | | |
| 70,000 | | | Duke Energy Carolinas
LLC, 4.250%,
12/15/2041 | | | | | 62,230 | | | | | | 0.0 | | |
| 3,797,000 | | | Duke Energy Carolinas
LLC, 5.350%,
01/15/2053 | | | | | 3,957,454 | | | | | | 0.1 | | |
| 735,000 (3) | | | Duke Energy Corp.,
4.875%, 12/31/2199 | | | | | 707,144 | | | | | | 0.0 | | |
See Accompanying Notes to Financial Statements
PORTFOLIO OF INVESTMENTS
| Voya Intermediate Bond Fund | as of March 31, 2023 (continued) |
Principal
Amount† | | | Value | | | Percentage
of Net
Assets | |
| CORPORATE BONDS/NOTES: (continued) | |
| | | | Utilities (continued) | |
| 4,024,000 | | | Duke Energy Florida
LLC, 2.400%,
12/15/2031 | | | | $ | 3,380,465 | | | | | | 0.1 | | |
| 2,285,000 | | | Duke Energy Florida
LLC, 5.950%,
11/15/2052 | | | | | 2,546,820 | | | | | | 0.0 | | |
| 1,834,000 | | | Duke Energy Indiana
LLC, 2.750%,
04/01/2050 | | | | | 1,215,459 | | | | | | 0.0 | | |
| 1,273,000 | | | Duke Energy Indiana
LLC, 3.250%,
10/01/2049 | | | | | 933,516 | | | | | | 0.0 | | |
| 1,998,000 | | | Duke Energy Indiana
LLC, 5.400%,
04/01/2053 | | | | | 2,037,830 | | | | | | 0.0 | | |
| 1,662,000 | | | Duke Energy Ohio, Inc.,
2.125%, 06/01/2030 | | | | | 1,389,883 | | | | | | 0.0 | | |
| 2,488,000 | | | Duke Energy Ohio, Inc.,
3.700%, 06/15/2046 | | | | | 1,911,590 | | | | | | 0.0 | | |
| 1,258,000 | | | Duke Energy Ohio, Inc.,
5.250%, 04/01/2033 | | | | | 1,295,307 | | | | | | 0.0 | | |
| 1,058,000 | | | Duke Energy Ohio, Inc.,
5.650%, 04/01/2053 | | | | | 1,110,883 | | | | | | 0.0 | | |
| 3,413,000 | | | Duke Energy Progress
LLC, 3.700%,
10/15/2046 | | | | | 2,669,278 | | | | | | 0.0 | | |
| 1,725,000 | | | Duke Energy Progress
LLC, 4.000%,
04/01/2052 | | | | | 1,439,479 | | | | | | 0.0 | | |
| 3,699,000 | | | Duke Energy Progress
LLC, 4.100%,
05/15/2042 | | | | | 3,200,547 | | | | | | 0.1 | | |
| 104,000 | | | Duke Energy Progress
LLC, 4.100%,
03/15/2043 | | | | | 89,933 | | | | | | 0.0 | | |
| 2,505,000 | | | Duke Energy Progress
LLC, 4.200%,
08/15/2045 | | | | | 2,157,674 | | | | | | 0.0 | | |
| 1,257,000 | | | Duke Energy Progress
LLC, 5.250%,
03/15/2033 | | | | | 1,307,360 | | | | | | 0.0 | | |
| 3,110,000 | | | Duke Energy Progress
LLC, 5.350%,
03/15/2053 | | | | | 3,215,708 | | | | | | 0.1 | | |
| 1,645,000 (1) | | | Duquesne Light
Holdings, Inc., 2.532%,
10/01/2030 | | | | | 1,334,245 | | | | | | 0.0 | | |
| 861,000 (1) | | | Enel Finance America
LLC, 7.100%,
10/14/2027 | | | | | 926,062 | | | | | | 0.0 | | |
Principal
Amount† | | | Value | | | Percentage
of Net
Assets | |
| CORPORATE BONDS/NOTES: (continued) | |
| | | | Utilities (continued) | |
| 2,801,000 (1) | | | Enel Finance
International NV,
7.500%, 10/14/2032 | | | | $ | 3,123,887 | | | | | | 0.1 | | |
| 2,487,000 (1) | | | Enel Finance
International NV,
7.750%, 10/14/2052 | | | | | 2,916,440 | | | | | | 0.0 | | |
| 2,695,000 | | | Entergy Arkansas LLC,
2.650%, 06/15/2051 | | | | | 1,749,071 | | | | | | 0.0 | | |
| 706,000 | | | Entergy Arkansas LLC,
3.350%, 06/15/2052 | | | | | 521,875 | | | | | | 0.0 | | |
| 2,090,000 | | | Entergy Arkansas LLC,
4.200%, 04/01/2049 | | | | | 1,794,040 | | | | | | 0.0 | | |
| 1,432,000 | | | Entergy Arkansas LLC,
5.150%, 01/15/2033 | | | | | 1,472,001 | | | | | | 0.0 | | |
| 4,202,000 | | | Entergy Corp., 0.900%,
09/15/2025 | | | | | 3,786,197 | | | | | | 0.1 | | |
| 2,722,000 | | | Entergy Corp., 2.400%,
06/15/2031 | | | | | 2,256,684 | | | | | | 0.0 | | |
| 1,286,000 | | | Entergy Corp., 2.800%,
06/15/2030 | | | | | 1,113,915 | | | | | | 0.0 | | |
| 3,667,000 | | | Entergy Louisiana LLC,
4.200%, 04/01/2050 | | | | | 3,164,985 | | | | | | 0.1 | | |
| 2,172,000 | | | Entergy Texas, Inc.,
4.000%, 03/30/2029 | | | | | 2,106,642 | | | | | | 0.0 | | |
| 1,643,000 | | | Evergy Kansas Central,
Inc., 3.250%,
09/01/2049 | | | | | 1,194,752 | | | | | | 0.0 | | |
| 3,888,000 | | | Evergy Kansas Central,
Inc., 5.700%,
03/15/2053 | | | | | 4,087,066 | | | | | | 0.1 | | |
| 2,216,000 | | | Evergy Metro, Inc.,
2.250%, 06/01/2030 | | | | | 1,879,853 | | | | | | 0.0 | | |
| 2,943,000 | | | Eversource Energy,
0.800%, 08/15/2025 | | | | | 2,678,072 | | | | | | 0.0 | | |
| 2,750,000 | | | Eversource Energy,
1.400%, 08/15/2026 | | | | | 2,465,612 | | | | | | 0.0 | | |
| 4,991,000 | | | Eversource Energy,
2.900%, 03/01/2027 | | | | | 4,660,303 | | | | | | 0.1 | | |
| 3,026,000 | | | Eversource Energy,
5.450%, 03/01/2028 | | | | | 3,137,981 | | | | | | 0.1 | | |
| 5,337,000 | | | Exelon Corp., 5.150%,
03/15/2028 | | | | | 5,434,632 | | | | | | 0.1 | | |
| 2,164,000 | | | Exelon Corp., 5.600%,
03/15/2053 | | | | | 2,207,229 | | | | | | 0.0 | | |
| 1,725,000 | | | Fortis, Inc./Canada,
3.055%, 10/04/2026 | | | | | 1,620,285 | | | | | | 0.0 | | |
| 3,055,000 | | | Georgia Power Co.,
2.200%, 09/15/2024 | | | | | 2,934,379 | | | | | | 0.1 | | |
| 2,124,000 | | | Georgia Power Co.,
5.750%, 04/15/2023 | | | | | 2,124,097 | | | | | | 0.0 | | |
See Accompanying Notes to Financial Statements
PORTFOLIO OF INVESTMENTS
| Voya Intermediate Bond Fund | as of March 31, 2023 (continued) |
Principal
Amount† | | | Value | | | Percentage
of Net
Assets | |
| CORPORATE BONDS/NOTES: (continued) | |
| | | | Utilities (continued) | |
| 2,773,000 | | | Idaho Power Co.,
5.500%, 03/15/2053 | | | | $ | 2,886,677 | | | | | | 0.0 | | |
| 898,000 | | | Inkia Energy Ltd.,
5.875%, 11/09/2027 | | | | | 828,982 | | | | | | 0.0 | | |
| 4,400,000 | | | Interstate Power and
Light Co., 3.250%,
12/01/2024 | | | | | 4,276,872 | | | | | | 0.1 | | |
| 2,383,000 | | | IPALCO Enterprises,
Inc., 4.250%,
05/01/2030 | | | | | 2,195,573 | | | | | | 0.0 | | |
| 1,087,000 (1) | | | Jersey Central Power &
Light Co., 2.750%,
03/01/2032 | | | | | 910,266 | | | | | | 0.0 | | |
| 3,199,000 (1) | | | Jersey Central Power &
Light Co., 4.300%,
01/15/2026 | | | | | 3,142,272 | | | | | | 0.1 | | |
| 1,461,000 | | | Kentucky Utilities Co.,
5.450%, 04/15/2033 | | | | | 1,520,360 | | | | | | 0.0 | | |
| 1,461,000 | | | Louisville Gas and
Electric Co., 5.450%,
04/15/2033 | | | | | 1,519,283 | | | | | | 0.0 | | |
| 4,552,000 | | | Mississippi Power Co.,
4.250%, 03/15/2042 | | | | | 3,889,375 | | | | | | 0.1 | | |
| 271,000 | | | Mississippi Power Co.,
4.750%, 10/15/2041 | | | | | 234,948 | | | | | | 0.0 | | |
| 2,460,000 (1) | | | Monongahela Power
Co., 3.550%,
05/15/2027 | | | | | 2,336,971 | | | | | | 0.0 | | |
| 2,983,000 (1) | | | Narragansett Electric
Co/The, 3.395%,
04/09/2030 | | | | | 2,734,840 | | | | | | 0.0 | | |
| 4,763,000 | | | National Rural Utilities
Cooperative Finance
Corp., 2.400%,
03/15/2030 | | | | | 4,141,191 | | | | | | 0.1 | | |
| 3,798,000 | | | National Rural Utilities
Cooperative Finance
Corp., 2.750%,
04/15/2032 | | | | | 3,249,847 | | | | | | 0.1 | | |
| 3,701,000 | | | National Rural Utilities
Cooperative Finance
Corp., 4.150%,
12/15/2032 | | | | | 3,523,976 | | | | | | 0.1 | | |
| 2,880,000 (3) | | | National Rural Utilities
Cooperative Finance
Corp., 4.750%,
04/30/2043 | | | | | 2,789,827 | | | | | | 0.0 | | |
| 2,571,000 | | | National Rural Utilities
Cooperative Finance
Corp., 5.800%,
01/15/2033 | | | | | 2,740,500 | | | | | | 0.0 | | |
Principal
Amount† | | | Value | | | Percentage
of Net
Assets | |
| CORPORATE BONDS/NOTES: (continued) | |
| | | | Utilities (continued) | |
| 4,273,000 | | | NextEra Energy Capital
Holdings, Inc., 1.875%,
01/15/2027 | | | | $ | 3,866,617 | | | | | | 0.1 | | |
| 1,857,000 | | | NextEra Energy Capital
Holdings, Inc., 2.440%,
01/15/2032 | | | | | 1,541,694 | | | | | | 0.0 | | |
| 5,461,000 (3) | | | NextEra Energy Capital
Holdings, Inc., 3.800%,
03/15/2082 | | | | | 4,532,630 | | | | | | 0.1 | | |
| 3,711,000 | | | NextEra Energy Capital
Holdings, Inc., 4.255%,
09/01/2024 | | | | | 3,678,300 | | | | | | 0.1 | | |
| 4,113,000 | | | NextEra Energy Capital
Holdings, Inc., 5.050%,
02/28/2033 | | | | | 4,127,336 | | | | | | 0.1 | | |
| 5,032,000 | | | NextEra Energy Capital
Holdings, Inc., 5.250%,
02/28/2053 | | | | | 4,969,016 | | | | | | 0.1 | | |
| 4,500,000 | | | NextEra Energy Capital
Holdings, Inc., 6.051%,
03/01/2025 | | | | | 4,580,192 | | | | | | 0.1 | | |
| 4,000,000 | | | NiSource, Inc., 0.950%,
08/15/2025 | | | | | 3,641,593 | | | | | | 0.1 | | |
| 1,998,000 | | | NiSource, Inc., 5.250%,
03/30/2028 | | | | | 2,034,026 | | | | | | 0.0 | | |
| 1,684,000 | | | NSTAR Electric Co.,
1.950%, 08/15/2031 | | | | | 1,373,422 | | | | | | 0.0 | | |
| 2,418,000 | | | Oglethorpe Power
Corp., 3.750%,
08/01/2050 | | | | | 1,865,476 | | | | | | 0.0 | | |
| 1,518,000 | | | Oklahoma Gas and
Electric Co., 5.400%,
01/15/2033 | | | | | 1,566,852 | | | | | | 0.0 | | |
| 2,827,000 | | | ONE Gas, Inc., 1.100%,
03/11/2024 | | | | | 2,715,999 | | | | | | 0.0 | | |
| 1,861,000 | | | Pacific Gas and Electric
Co., 4.250%,
03/15/2046 | | | | | 1,376,082 | | | | | | 0.0 | | |
| 4,188,000 | | | Pacific Gas and Electric
Co., 4.300%,
03/15/2045 | | | | | 3,158,205 | | | | | | 0.1 | | |
| 2,484,000 | | | Pacific Gas and Electric
Co., 4.450%,
04/15/2042 | | | | | 1,953,119 | | | | | | 0.0 | | |
| 2,019,000 | | | Pacific Gas and Electric
Co., 6.750%,
01/15/2053 | | | | | 2,090,990 | | | | | | 0.0 | | |
| 4,558,000 | | | PacifiCorp, 5.350%,
12/01/2053 | | | | | 4,674,742 | | | | | | 0.1 | | |
| 2,473,000 (1) | | | Pennsylvania Electric
Co., 5.150%,
03/30/2026 | | | | | 2,485,720 | | | | | | 0.0 | | |
See Accompanying Notes to Financial Statements
PORTFOLIO OF INVESTMENTS
| Voya Intermediate Bond Fund | as of March 31, 2023 (continued) |
Principal
Amount† | | | Value | | | Percentage
of Net
Assets | |
| CORPORATE BONDS/NOTES: (continued) | |
| | | | Utilities (continued) | |
| 750,000 (1) | | | Perusahaan Listrik
Negara PT, 5.375%,
01/25/2029 | | | | $ | 745,885 | | | | | | 0.0 | | |
| 2,675,000 | | | Perusahaan Listrik
Negara PT, 5.450%,
05/21/2028 | | | | | 2,667,711 | | | | | | 0.0 | | |
| 4,500,000 (1) | | | Perusahaan Listrik
Negara PT, 5.450%,
05/21/2028 | | | | | 4,487,738 | | | | | | 0.1 | | |
| 2,382,000 | | | PPL Electric Utilities
Corp., 5.250%,
05/15/2053 | | | | | 2,469,463 | | | | | | 0.0 | | |
| 2,166,000 | | | Public Service Co. of
Colorado, 5.250%,
04/01/2053 | | | | | 2,209,642 | | | | | | 0.0 | | |
| 1,954,000 | | | Public Service Co. of
New Hampshire,
5.150%, 01/15/2053 | | | | | 1,984,651 | | | | | | 0.0 | | |
| 939,000 | | | Public Service Electric
and Gas Co., 5.125%,
03/15/2053 | | | | | 963,478 | | | | | | 0.0 | | |
| 2,889,000 | | | Public Service
Enterprise Group, Inc.,
0.800%, 08/15/2025 | | | | | 2,646,657 | | | | | | 0.0 | | |
| 1,749,000 | | | Public Service
Enterprise Group, Inc.,
1.600%, 08/15/2030 | | | | | 1,400,489 | | | | | | 0.0 | | |
| 6,396,000 | | | Public Service
Enterprise Group, Inc.,
2.450%, 11/15/2031 | | | | | 5,299,288 | | | | | | 0.1 | | |
| 3,312,000 | | | Public Service
Enterprise Group, Inc.,
5.850%, 11/15/2027 | | | | | 3,445,014 | | | | | | 0.1 | | |
| 6,575,000 (3) | | | Sempra Energy,
4.125%, 04/01/2052 | | | | | 5,316,020 | | | | | | 0.1 | | |
| 4,593,000 | | | South Jersey Industries,
Inc., 5.020%,
04/15/2031 | | | | | 3,901,555 | | | | | | 0.1 | | |
| 813,000 | | | Southern California
Edison Co., 4.050%,
03/15/2042 | | | | | 675,920 | | | | | | 0.0 | | |
| 4,457,000 (3) | | | Southern Co/The,
3.750%, 09/15/2051 | | | | | 3,749,852 | | | | | | 0.1 | | |
| 4,975,000 (3) | | | Southern Co/The,
4.000%, 01/15/2051 | | | | | 4,576,688 | | | | | | 0.1 | | |
| 3,430,000 | | | Southern Co/The,
5.113%, 08/01/2027 | | | | | 3,440,162 | | | | | | 0.1 | | |
| 4,444,000 | | | Southwestern Electric
Power Co., 1.650%,
03/15/2026 | | | | | 4,044,058 | | | | | | 0.1 | | |
Principal
Amount† | | | Value | | | Percentage
of Net
Assets | |
| CORPORATE BONDS/NOTES: (continued) | |
| | | | Utilities (continued) | |
| 1,958,000 | | | Southwestern Electric
Power Co., 5.300%,
04/01/2033 | | | | $ | 1,974,378 | | | | | | 0.0 | | |
| 1,709,000 | | | Tampa Electric Co.,
4.350%, 05/15/2044 | | | | | 1,483,122 | | | | | | 0.0 | | |
| 3,186,000 | | | Tucson Electric Power
Co., 1.500%,
08/01/2030 | | | | | 2,547,371 | | | | | | 0.0 | | |
| 1,078,000 | | | Union Electric Co.,
5.450%, 03/15/2053 | | | | | 1,128,416 | | | | | | 0.0 | | |
| 3,426,000 | | | Virginia Electric and
Power Co., 3.800%,
09/15/2047 | | | | | 2,744,066 | | | | | | 0.0 | | |
| 2,672,000 | | | Virginia Electric and
Power Co., 5.450%,
04/01/2053 | | | | | 2,731,729 | | | | | | 0.0 | | |
| 5,000,000 (1) | | | Vistra Operations Co.
LLC, 4.375%,
05/01/2029 | | | | | 4,433,927 | | | | | | 0.1 | | |
| 4,673,000 | | | WEC Energy Group,
Inc., 1.375%,
10/15/2027 | | | | | 4,055,281 | | | | | | 0.1 | | |
| 2,748,000 | | | WEC Energy Group,
Inc., 2.200%,
12/15/2028 | | | | | 2,395,866 | | | | | | 0.0 | | |
| 927,000 | | | WEC Energy Group,
Inc., 5.000%,
09/27/2025 | | | | | 927,963 | | | | | | 0.0 | | |
| 1,297,000 | | | WEC Energy Group,
Inc., 5.150%,
10/01/2027 | | | | | 1,320,658 | | | | | | 0.0 | | |
| 1,500,000 | | | Wisconsin Electric
Power Co., 1.700%,
06/15/2028 | | | | | 1,309,875 | | | | | | 0.0 | | |
| 3,590,000 | | | Wisconsin Public
Service Corp., 3.671%,
12/01/2042 | | | | | 2,919,992 | | | | | | 0.1 | | |
| | | | | | | | | 365,612,144 | | | | | | 4.8 | | |
| | | | Total Corporate
Bonds/Notes
(Cost $2,506,608,406) | | | | | 2,317,332,482 | | | | | | 30.2 | | |
| COLLATERALIZED MORTGAGE OBLIGATIONS: 16.1% | |
| 1,510,770 | | | Alternative Loan Trust
2004-J7 MI, 4.821%,
(US0001M + 1.020)%,
10/25/2034 | | | | | 1,495,990 | | | | | | 0.0 | | |
| 423,151 | | | Alternative Loan Trust
2005-65CB 2A4,
5.500%, 12/25/2035 | | | | | 303,283 | | | | | | 0.0 | | |
| 512,476 | | | Alternative Loan Trust
2005-6CB 1A3,
5.250%, 04/25/2035 | | | | | 437,055 | | | | | | 0.0 | | |
See Accompanying Notes to Financial Statements
PORTFOLIO OF INVESTMENTS
| Voya Intermediate Bond Fund | as of March 31, 2023 (continued) |
Principal
Amount† | | | Value | | | Percentage
of Net
Assets | |
| COLLATERALIZED MORTGAGE OBLIGATIONS: (continued) | |
| 1,000,158 | | | Alternative Loan Trust
2005-J2 1A12, 5.245%,
(US0001M + 0.400)%,
04/25/2035 | | | | $ | 772,679 | | | | | | 0.0 | | |
| 626,523 | | | Alternative Loan Trust
2006-13T1 A9, 6.000%,
05/25/2036 | | | | | 323,842 | | | | | | 0.0 | | |
| 118,709 | | | Alternative Loan Trust
2006-18CB A10,
5.245%, (US0001M +
0.400)%, 07/25/2036 | | | | | 50,708 | | | | | | 0.0 | | |
| 716,680 | | | Alternative Loan Trust
2006-19CB A28,
5.445%, (US0001M +
0.600)%, 08/25/2036 | | | | | 366,465 | | | | | | 0.0 | | |
| 853,026 | | | Alternative Loan Trust
2007-23CB A3,
5.345%, (US0001M +
0.500)%, 09/25/2037 | | | | | 380,773 | | | | | | 0.0 | | |
| 1,933,929 | | | Alternative Loan Trust
2007-2CB 2A1,
5.445%, (US0001M +
0.600)%, 03/25/2037 | | | | | 851,841 | | | | | | 0.0 | | |
| 829,864 | | | Alternative Loan Trust
2007-3T1 1A11,
6.000%, 04/25/2037 | | | | | 414,930 | | | | | | 0.0 | | |
| 746,847 | | | Alternative Loan Trust
2007-8CB A3, 5.345%,
(US0001M + 0.500)%,
05/25/2037 | | | | | 355,878 | | | | | | 0.0 | | |
| 1,356,107 | | | American Home
Mortgage Assets Trust
2007-4 A4, 5.425%,
(US0001M + 0.290)%,
08/25/2037 | | | | | 1,173,004 | | | | | | 0.0 | | |
| 726,832 (1)(3) | | | Arroyo Mortgage Trust
2019-3 A3, 3.416%,
10/25/2048 | | | | | 671,471 | | | | | | 0.0 | | |
| 535,129 | | | Banc of America
Funding 2007-2 1A16
Trust, 5.445%,
(US0001M + 0.600)%,
03/25/2037 | | | | | 401,187 | | | | | | 0.0 | | |
| 660,831 (4) | | | Banc of America
Mortgage 2007-2 A8
Trust, 6.000%,
05/25/2037 | | | | | 63,966 | | | | | | 0.0 | | |
| 2,733,268 (1) | | | Bayview MSR
Opportunity Master
Fund Trust 2022-2 AF,
5.000%, (SOFR30A +
0.850)%, 12/25/2051 | | | | | 2,497,703 | | | | | | 0.0 | | |
Principal
Amount† | | | Value | | | Percentage
of Net
Assets | |
| COLLATERALIZED MORTGAGE OBLIGATIONS: (continued) | |
| 747,558 (3) | | | Bear Stearns ALT-A
Trust 2005-4 23A1,
3.942%, 05/25/2035 | | | | $ | 688,790 | | | | | | 0.0 | | |
| 961,960 (3) | | | Bear Stearns ALT-A
Trust 2005-7 21A1,
4.015%, 09/25/2035 | | | | | 772,588 | | | | | | 0.0 | | |
| 2,115,180 | | | Bear Stearns Mortgage
Funding Trust
2006-AR5 2A1,
5.035%, (US0001M +
0.190)%, 01/25/2037 | | | | | 1,808,847 | | | | | | 0.0 | | |
| 1,876,220 (1) | | | Bellemeade Re
2019-1A M2 Ltd.,
7.545%, (US0001M +
2.700)%, 03/25/2029 | | | | | 1,881,502 | | | | | | 0.0 | | |
| 13,147,000 (1) | | | Bellemeade RE 2021-3
A M1C Ltd., 6.110%,
(SOFR30A + 1.550)%,
09/25/2031 | | | | | 12,707,443 | | | | | | 0.2 | | |
| 1,000,000 (1) | | | Bellemeade Re 2022-1
M1C Ltd., 8.260%,
(SOFR30A + 3.700)%,
01/26/2032 | | | | | 978,181 | | | | | | 0.0 | | |
| 1,783,723 (1)(3) | | | Chase Mortgage
Finance Corp. 2019-1
B2, 3.898%,
03/25/2050 | | | | | 1,524,325 | | | | | | 0.0 | | |
| 2,084,955 (1)(3) | | | Chase Mortgage
Finance Corp. 2019-1
B3, 3.898%,
03/25/2050 | | | | | 1,664,016 | | | | | | 0.0 | | |
| 986,856 (3) | | | CHL Mortgage
Pass-Through Trust
2004-22 A3, 3.786%,
11/25/2034 | | | | | 879,920 | | | | | | 0.0 | | |
| 456,000 | | | CHL Mortgage
Pass-Through Trust
2007-7 A7, 5.750%,
06/25/2037 | | | | | 245,000 | | | | | | 0.0 | | |
| 794,521 (1)(3) | | | CHNGE Mortgage Trust
2022-1 A1, 3.007%,
01/25/2067 | | | | | 713,841 | | | | | | 0.0 | | |
| 112,101 (1)(3) | | | CIM Trust 2019-INV1
A1, 4.000%,
02/25/2049 | | | | | 106,527 | | | | | | 0.0 | | |
| 260,533 (1)(3) | | | CIM Trust 2019-INV3
A3, 3.500%,
08/25/2049 | | | | | 235,689 | | | | | | 0.0 | | |
| 2,763,522 (1)(3) | | | CIM Trust 2019-J2 B2,
3.772%, 10/25/2049 | | | | | 2,363,577 | | | | | | 0.0 | | |
| 922,030 (1)(3) | | | CIM Trust 2019-J2 B3,
3.772%, 10/25/2049 | | | | | 773,910 | | | | | | 0.0 | | |
See Accompanying Notes to Financial Statements
PORTFOLIO OF INVESTMENTS
| Voya Intermediate Bond Fund | as of March 31, 2023 (continued) |
Principal
Amount† | | | Value | | | Percentage
of Net
Assets | |
| COLLATERALIZED MORTGAGE OBLIGATIONS: (continued) | |
| 2,600,000 (1)(3) | | | CIM Trust 2019-R5 M2,
3.250%, 09/25/2059 | | | | $ | 2,274,110 | | | | | | 0.0 | | |
| 3,098,892 (1)(3) | | | CIM Trust 2020-J1 B3,
3.447%, 07/25/2050 | | | | | 2,497,483 | | | | | | 0.0 | | |
| 733,502 | | | Citicorp Mortgage
Securities Trust
Series 2006-3 1A4,
6.000%, 06/25/2036 | | | | | 644,535 | | | | | | 0.0 | | |
| 642,623 (3) | | | Citigroup Mortgage
Loan Trust 2006-AR9
2A, 4.099%,
11/25/2036 | | | | | 535,692 | | | | | | 0.0 | | |
| 295,842 (3) | | | Citigroup Mortgage
Loan Trust 2007-10
22AA, 3.890%,
09/25/2037 | | | | | 253,213 | | | | | | 0.0 | | |
| 775,982 (1)(3) | | | Citigroup Mortgage
Loan Trust 2015-A B2,
4.500%, 06/25/2058 | | | | | 736,519 | | | | | | 0.0 | | |
| 1,335,721 (1)(3) | | | Citigroup Mortgage
Loan Trust 2021-J2
B2W, 2.769%,
07/25/2051 | | | | | 1,002,348 | | | | | | 0.0 | | |
| 1,501,259 (1)(3) | | | Citigroup Mortgage
Loan Trust 2021-J2
B3W, 2.769%,
07/25/2051 | | | | | 1,042,330 | | | | | | 0.0 | | |
| 4,578,457 (1) | | | Connecticut Avenue
Securities Trust
2020-R02 2B1, 7.845%,
(US0001M + 3.000)%,
01/25/2040 | | | | | 4,294,945 | | | | | | 0.1 | | |
| 2,031,911 (1) | | | Connecticut Avenue
Securities Trust
2020-R02 2M2,
6.845%, (US0001M +
2.000)%, 01/25/2040 | | | | | 2,019,950 | | | | | | 0.0 | | |
| 4,800,000 (1) | | | Connecticut Avenue
Securities Trust
2021-R01 1B1, 7.660%,
(SOFR30A + 3.100)%,
10/25/2041 | | | | | 4,536,572 | | | | | | 0.1 | | |
| 2,000,000 (1) | | | Connecticut Avenue
Securities Trust
2021-R03 1B1, 7.310%,
(SOFR30A + 2.750)%,
12/25/2041 | | | | | 1,841,111 | | | | | | 0.0 | | |
| 13,600,000 (1) | | | Connecticut Avenue
Securities Trust
2022-R01 1B1, 7.710%,
(SOFR30A + 3.150)%,
12/25/2041 | | | | | 12,647,608 | | | | | | 0.2 | | |
Principal
Amount† | | | Value | | | Percentage
of Net
Assets | |
| COLLATERALIZED MORTGAGE OBLIGATIONS: (continued) | |
| 4,440,000 (1) | | | Connecticut Avenue
Securities Trust
2022-R02 2B1, 9.060%,
(SOFR30A + 4.500)%,
01/25/2042 | | | | $ | 4,234,627 | | | | | | 0.1 | | |
| 3,250,000 (1) | | | Connecticut Avenue
Securities Trust
2022-R08 1B1,
10.160%, (SOFR30A +
5.600)%, 07/25/2042 | | | | | 3,281,071 | | | | | | 0.1 | | |
| 399,912 | | | Countrywide Alternative
Loan Trust 2005-53T2
2A6, 5.345%,
(US0001M + 0.500)%,
11/25/2035 | | | | | 202,321 | | | | | | 0.0 | | |
| 692,879 (1) | | | CSMC Series 2008-2R
1A1, 6.000%,
07/25/2037 | | | | | 583,715 | | | | | | 0.0 | | |
| 749,158 (1)(3) | | | CSMC Trust 2015-2 B3,
3.887%, 02/25/2045 | | | | | 701,603 | | | | | | 0.0 | | |
| 53,659,448 (3)(4) | | | Deutsche ALT-A
Securities, Inc. ALT
07-AB1 X, 0.779%,
04/25/2037 | | | | | 1,996,673 | | | | | | 0.0 | | |
| 5,000,000 (1) | | | Eagle RE 2021-2 M1C
Ltd., 8.010%,
(SOFR30A + 3.450)%,
04/25/2034 | | | | | 5,063,508 | | | | | | 0.1 | | |
| 800,000 (1) | | | Fannie Mae
Connecticut Avenue
Securities Trust
2020-SBT1 1M2,
8.495%, (US0001M +
3.650)%, 02/25/2040 | | | | | 799,219 | | | | | | 0.0 | | |
| 2,191,569 (4) | | | Fannie Mae 2008-12
SC, 1.505%,
(-1.000*US0001M +
6.350)%, 03/25/2038 | | | | | 192,574 | | | | | | 0.0 | | |
| 8,191,568 | | | Fannie Mae 2011-99
CZ, 4.500%,
10/25/2041 | | | | | 8,193,774 | | | | | | 0.1 | | |
| 402,875 | | | Fannie Mae 2012-110
CA, 3.000%,
10/25/2042 | | | | | 373,667 | | | | | | 0.0 | | |
| 5,919,751 | | | Fannie Mae 2012-66
EP, 4.000%, 06/25/2042 | | | | | 5,722,773 | | | | | | 0.1 | | |
| 1,292,989 | | | Fannie Mae 2013-116
UB, 4.000%,
11/25/2043 | | | | | 1,221,265 | | | | | | 0.0 | | |
| 1,686,366 | | | Fannie Mae 2013-20
DL, 4.000%,
03/25/2033 | | | | | 1,642,853 | | | | | | 0.0 | | |
See Accompanying Notes to Financial Statements
PORTFOLIO OF INVESTMENTS
| Voya Intermediate Bond Fund | as of March 31, 2023 (continued) |
Principal
Amount† | | | Value | | | Percentage
of Net
Assets | |
| COLLATERALIZED MORTGAGE OBLIGATIONS: (continued) | |
| 14,233,060 (4) | | | Fannie Mae 2016-82
SD, 1.205%,
(-1.000*US0001M +
6.050)%, 11/25/2046 | | | | $ | 1,321,726 | | | | | | 0.0 | | |
| 398,925 | | | Fannie Mae 2016-88
EA, 3.500%,
01/25/2045 | | | | | 391,656 | | | | | | 0.0 | | |
| 8,879,017 (4) | | | Fannie Mae 2018-86
US, 1.745%,
(-1.000*US0001M +
6.590)%, 09/25/2040 | | | | | 1,056,658 | | | | | | 0.0 | | |
| 1,749,575 | | | Fannie Mae
Connecticut Avenue
Securities 2015-C02
1M2, 8.845%,
(US0001M + 4.000)%,
05/25/2025 | | | | | 1,808,751 | | | | | | 0.0 | | |
| 207,917 | | | Fannie Mae
Connecticut Avenue
Securities 2016-C01
2M2, 11.795%,
(US0001M + 6.950)%,
08/25/2028 | | | | | 220,067 | | | | | | 0.0 | | |
| 127,600 (1) | | | Fannie Mae
Connecticut Avenue
Securities 2019-R02
1M2, 7.145%,
(US0001M + 2.300)%,
08/25/2031 | | | | | 127,610 | | | | | | 0.0 | | |
| 2,500,000 (1) | | | Fannie Mae
Connecticut Avenue
Securities 2021-R02
2B1, 7.860%,
(SOFR30A + 3.300)%,
11/25/2041 | | | | | 2,359,202 | | | | | | 0.0 | | |
| 1,250,877 (1) | | | Fannie Mae
Connecticut Avenue
Securities Trust
2019-R01 2M2,
7.295%, (US0001M +
2.450)%, 07/25/2031 | | | | | 1,252,731 | | | | | | 0.0 | | |
| 824,489 (1) | | | Fannie Mae
Connecticut Avenue
Securities Trust
2019-R05 1B1, 8.945%,
(US0001M + 4.100)%,
07/25/2039 | | | | | 833,988 | | | | | | 0.0 | | |
| 908,402 (1) | | | Fannie Mae
Connecticut Avenue
Securities Trust
2020-R01 1M2,
6.895%, (US0001M +
2.050)%, 01/25/2040 | | | | | 911,734 | | | | | | 0.0 | | |
Principal
Amount† | | | Value | | | Percentage
of Net
Assets | |
| COLLATERALIZED MORTGAGE OBLIGATIONS: (continued) | |
| 500,000 (1) | | | Fannie Mae
Connecticut Avenue
Securities Trust
2020-SBT1 2M2,
8.495%, (US0001M +
3.650)%, 02/25/2040 | | | | $ | 503,077 | | | | | | 0.0 | | |
| 3,458 | | | Fannie Mae Grantor
Trust 1998-T2 A6,
5.408%, (US0001M +
0.550)%, 01/25/2032 | | | | | 3,432 | | | | | | 0.0 | | |
| 127,768 (4) | | | Fannie Mae Interest
Strip Series 418 20,
3.000%, 05/25/2043 | | | | | 16,994 | | | | | | 0.0 | | |
| 455,384 (4) | | | Fannie Mae Interest
Strip Series 418 59,
3.000%, 08/25/2028 | | | | | 20,311 | | | | | | 0.0 | | |
| 58,410 | | | Fannie Mae REMIC
Trust 1999-33 Z,
6.000%, 07/25/2029 | | | | | 58,961 | | | | | | 0.0 | | |
| 2,549 (4) | | | Fannie Mae REMIC
Trust 1999-6 SE,
2.977%,
(-1.000*US0001M +
7.685)%, 02/17/2029 | | | | | 11 | | | | | | 0.0 | | |
| 3,406,754 | | | Fannie Mae REMIC
Trust 2002-W9 A4,
6.000%, 08/25/2042 | | | | | 3,481,127 | | | | | | 0.1 | | |
| 634,802 | | | Fannie Mae REMIC
Trust 2003-105 AZ,
5.500%, 10/25/2033 | | | | | 651,707 | | | | | | 0.0 | | |
| 248,889 | | | Fannie Mae REMIC
Trust 2003-45 FJ,
6.162%, (US0001M +
1.500)%, 06/25/2033 | | | | | 255,417 | | | | | | 0.0 | | |
| 740,813 (4) | | | Fannie Mae REMIC
Trust 2003-66 SA,
2.805%,
(-1.000*US0001M +
7.650)%, 07/25/2033 | | | | | 91,982 | | | | | | 0.0 | | |
| 164,696 (4) | | | Fannie Mae REMIC
Trust 2003-74 IO,
6.000%, 08/25/2033 | | | | | 30,730 | | | | | | 0.0 | | |
| 357,162 | | | Fannie Mae REMIC
Trust 2003-84 PZ,
5.000%, 09/25/2033 | | | | | 358,997 | | | | | | 0.0 | | |
| 605,490 | | | Fannie Mae REMIC
Trust 2004-50 VZ,
5.500%, 07/25/2034 | | | | | 618,049 | | | | | | 0.0 | | |
| 12,511 | | | Fannie Mae REMIC
Trust 2004-56 FE,
5.295%, (US0001M +
0.450)%, 10/25/2033 | | | | | 12,444 | | | | | | 0.0 | | |
See Accompanying Notes to Financial Statements
PORTFOLIO OF INVESTMENTS
| Voya Intermediate Bond Fund | as of March 31, 2023 (continued) |
Principal
Amount† | | | Value | | | Percentage
of Net
Assets | |
| COLLATERALIZED MORTGAGE OBLIGATIONS: (continued) | |
| 282,084 | | | Fannie Mae REMIC
Trust 2004-7 Z,
5.500%, 02/25/2034 | | | | $ | 287,775 | | | | | | 0.0 | | |
| 574,530 | | | Fannie Mae REMIC
Trust 2004-75 ZG,
4.500%, 10/25/2034 | | | | | 571,287 | | | | | | 0.0 | | |
| 1,639,804 | | | Fannie Mae REMIC
Trust 2005-25 Z,
5.000%, 04/25/2035 | | | | | 1,657,290 | | | | | | 0.0 | | |
| 77,530 | | | Fannie Mae REMIC
Trust 2006-104 ES,
9.224%,
(-5.000*US0001M +
33.450)%, 11/25/2036 | | | | | 106,946 | | | | | | 0.0 | | |
| 1,227,599 (4) | | | Fannie Mae REMIC
Trust 2006-12 SD,
1.905%,
(-1.000*US0001M +
6.750)%, 10/25/2035 | | | | | 89,938 | | | | | | 0.0 | | |
| 437,042 (4) | | | Fannie Mae REMIC
Trust 2006-123 UI,
1.895%,
(-1.000*US0001M +
6.740)%, 01/25/2037 | | | | | 46,345 | | | | | | 0.0 | | |
| 62,805 (4) | | | Fannie Mae REMIC
Trust 2006-72 HS,
1.855%,
(-1.000*US0001M +
6.700)%, 08/25/2026 | | | | | 1,735 | | | | | | 0.0 | | |
| 15,245 | | | Fannie Mae REMIC
Trust 2007-10 Z,
6.000%, 02/25/2037 | | | | | 15,891 | | | | | | 0.0 | | |
| 2,139,606 (4) | | | Fannie Mae REMIC
Trust 2007-91 AS,
1.555%,
(-1.000*US0001M +
6.400)%, 10/25/2037 | | | | | 220,421 | | | | | | 0.0 | | |
| 996,246 | | | Fannie Mae REMIC
Trust 2009-19 PW,
4.500%, 10/25/2036 | | | | | 984,162 | | | | | | 0.0 | | |
| 4,750,201 (3) | | | Fannie Mae REMIC
Trust 2009-50 HZ,
5.536%, 02/25/2049 | | | | | 4,848,166 | | | | | | 0.1 | | |
| 1,031,859 (4) | | | Fannie Mae REMIC
Trust 2009-90 TS,
1.305%,
(-1.000*US0001M +
6.150)%, 11/25/2039 | | | | | 100,795 | | | | | | 0.0 | | |
| 145,963 (4) | | | Fannie Mae REMIC
Trust 2010-118 GS,
1.105%,
(-1.000*US0001M +
5.950)%, 10/25/2039 | | | | | 369 | | | | | | 0.0 | | |
Principal
Amount† | | | Value | | | Percentage
of Net
Assets | |
| COLLATERALIZED MORTGAGE OBLIGATIONS: (continued) | |
| 2,657,531 (4) | | | Fannie Mae REMIC
Trust 2010-123 SL,
1.225%,
(-1.000*US0001M +
6.070)%, 11/25/2040 | | | | $ | 209,651 | | | | | | 0.0 | | |
| 3,331,722 (4) | | | Fannie Mae REMIC
Trust 2010-41 SB,
1.555%,
(-1.000*US0001M +
6.400)%, 05/25/2040 | | | | | 294,372 | | | | | | 0.0 | | |
| 836,670 (4) | | | Fannie Mae REMIC
Trust 2010-43 VS,
1.605%,
(-1.000*US0001M +
6.450)%, 05/25/2040 | | | | | 76,962 | | | | | | 0.0 | | |
| 4,822,919 | | | Fannie Mae REMIC
Trust 2010-59 PC,
5.000%, 06/25/2040 | | | | | 4,938,786 | | | | | | 0.1 | | |
| 646,182 (4) | | | Fannie Mae REMIC
Trust 2011-102 SA,
1.755%,
(-1.000*US0001M +
6.600)%, 10/25/2041 | | | | | 73,577 | | | | | | 0.0 | | |
| 2,045,987 | | | Fannie Mae REMIC
Trust 2011-30 ZA,
5.000%, 04/25/2041 | | | | | 2,045,326 | | | | | | 0.0 | | |
| 1,742,004 (4) | | | Fannie Mae REMIC
Trust 2011-93 GS,
1.705%,
(-1.000*US0001M +
6.550)%, 04/25/2039 | | | | | 195,607 | | | | | | 0.0 | | |
| 3,029,247 (4) | | | Fannie Mae REMIC
Trust 2012-122 SB,
1.305%,
(-1.000*US0001M +
6.150)%, 11/25/2042 | | | | | 362,506 | | | | | | 0.0 | | |
| 1,467,744 (4) | | | Fannie Mae REMIC
Trust 2012-128 LI,
3.500%, 06/25/2042 | | | | | 90,625 | | | | | | 0.0 | | |
| 3,811,954 (4) | | | Fannie Mae REMIC
Trust 2012-133 AS,
1.355%,
(-1.000*US0001M +
6.200)%, 10/25/2042 | | | | | 406,681 | | | | | | 0.0 | | |
| 548,162 (4) | | | Fannie Mae REMIC
Trust 2012-149 GI,
3.500%, 06/25/2042 | | | | | 48,043 | | | | | | 0.0 | | |
| 234,216 (4) | | | Fannie Mae REMIC
Trust 2012-15 SP,
1.775%,
(-1.000*US0001M +
6.620)%, 06/25/2040 | | | | | 1,059 | | | | | | 0.0 | | |
See Accompanying Notes to Financial Statements
PORTFOLIO OF INVESTMENTS
| Voya Intermediate Bond Fund | as of March 31, 2023 (continued) |
Principal
Amount† | | | Value | | | Percentage
of Net
Assets | |
| COLLATERALIZED MORTGAGE OBLIGATIONS: (continued) | |
| 761,926 (4) | | | Fannie Mae REMIC
Trust 2012-24 HS,
1.705%,
(-1.000*US0001M +
6.550)%, 09/25/2040 | | | | $ | 20,271 | | | | | | 0.0 | | |
| 504,605 (4) | | | Fannie Mae REMIC
Trust 2012-30 QS,
1.755%,
(-1.000*US0001M +
6.600)%, 04/25/2031 | | | | | 3,381 | | | | | | 0.0 | | |
| 477,573 (4) | | | Fannie Mae REMIC
Trust 2012-68 YS,
1.855%,
(-1.000*US0001M +
6.700)%, 07/25/2042 | | | | | 49,903 | | | | | | 0.0 | | |
| 1,068,892 (4) | | | Fannie Mae REMIC
Trust 2013-26 JS,
1.355%,
(-1.000*US0001M +
6.200)%, 10/25/2032 | | | | | 56,911 | | | | | | 0.0 | | |
| 4,241,548 (4) | | | Fannie Mae REMIC
Trust 2013-60 DS,
1.355%,
(-1.000*US0001M +
6.200)%, 06/25/2033 | | | | | 328,290 | | | | | | 0.0 | | |
| 4,119,975 (4) | | | Fannie Mae REMIC
Trust 2013-9 SM,
1.405%,
(-1.000*US0001M +
6.250)%, 02/25/2033 | | | | | 289,202 | | | | | | 0.0 | | |
| 956,246 (4) | | | Fannie Mae REMIC
Trust 2014-17 DS,
1.355%,
(-1.000*US0001M +
6.200)%, 02/25/2043 | | | | | 26,052 | | | �� | | | 0.0 | | |
| 955,044 (4) | | | Fannie Mae REMIC
Trust 2014-28 BS,
1.355%,
(-1.000*US0001M +
6.200)%, 08/25/2043 | | | | | 55,919 | | | | | | 0.0 | | |
| 26,943,623 (4) | | | Fannie Mae REMIC
Trust 2015-79 SA,
1.405%,
(-1.000*US0001M +
6.250)%, 11/25/2045 | | | | | 2,790,365 | | | | | | 0.1 | | |
| 10,946,984 (4) | | | Fannie Mae REMIC
Trust 2015-9 IO,
5.500%, 03/25/2045 | | | | | 2,252,705 | | | | | | 0.0 | | |
| 17,446,956 (4) | | | Fannie Mae REMICS
16-60 SB, 1.255%,
(-1.000*US0001M +
6.100)%, 09/25/2046 | | | | | 1,617,349 | | | | | | 0.0 | | |
Principal
Amount† | | | Value | | | Percentage
of Net
Assets | |
| COLLATERALIZED MORTGAGE OBLIGATIONS: (continued) | |
| 44,191 (4) | | | Fannie Mae REMICS
1997-18 SG, 3.391%,
(-1.000*US0001M +
8.100)%, 03/17/2027 | | | | $ | 1,035 | | | | | | 0.0 | | |
| 3,945 (4) | | | Fannie Mae REMICS
1997-91 FC, 0.824%,
(US0001M + (8.500))%,
11/25/2023 | | | | | 9 | | | | | | 0.0 | | |
| 26 (4) | | | Fannie Mae REMICS
1999-57 SC, 5.041%,
(-1.000*US0001M +
9.750)%, 11/17/2029 | | | | | 1 | | | | | | 0.0 | | |
| 169,945 (4) | | | Fannie Mae REMICS
2001-72 SC, 1.000%,
(-1.000*US0001M +
8.500)%, 12/25/2031 | | | | | 3,604 | | | | | | 0.0 | | |
| 30,119 (4) | | | Fannie Mae REMICS
2001-8 SK, 3.989%,
(-1.000*US0001M +
8.750)%, 03/18/2031 | | | | | 964 | | | | | | 0.0 | | |
| 655,466 (4) | | | Fannie Mae REMICS
2003-49 SW, 2.155%,
(-1.000*US0001M +
7.000)%, 01/25/2033 | | | | | 59,960 | | | | | | 0.0 | | |
| 2,916,078 (4) | | | Fannie Mae REMICS
2004-54 SN, 2.205%,
(-1.000*US0001M +
7.050)%, 07/25/2034 | | | | | 265,114 | | | | | | 0.0 | | |
| 5,897,899 (4) | | | Fannie Mae REMICS
2005-75 ES, 1.205%,
(-1.000*US0001M +
6.050)%, 09/25/2035 | | | | | 499,436 | | | | | | 0.0 | | |
| 497,895 (4) | | | Fannie Mae REMICS
2005-75 SP, 1.905%,
(-1.000*US0001M +
6.750)%, 08/25/2035 | | | | | 32,093 | | | | | | 0.0 | | |
| 1,486,596 (4) | | | Fannie Mae REMICS
2006-56 SM, 1.905%,
(-1.000*US0001M +
6.750)%, 07/25/2036 | | | | | 125,666 | | | | | | 0.0 | | |
| 382,207 (4) | | | Fannie Mae REMICS
2007-21 SB, 1.555%,
(-1.000*US0001M +
6.400)%, 03/25/2037 | | | | | 14,841 | | | | | | 0.0 | | |
| 919,858 (4) | | | Fannie Mae REMICS
2007-52 NS, 1.605%,
(-1.000*US0001M +
6.450)%, 06/25/2037 | | | | | 98,501 | | | | | | 0.0 | | |
| 796,269 (4) | | | Fannie Mae REMICS
2007-85 SM, 1.615%,
(-1.000*US0001M +
6.460)%, 09/25/2037 | | | | | 77,545 | | | | | | 0.0 | | |
See Accompanying Notes to Financial Statements
PORTFOLIO OF INVESTMENTS
| Voya Intermediate Bond Fund | as of March 31, 2023 (continued) |
Principal
Amount† | | | Value | | | Percentage
of Net
Assets | |
| COLLATERALIZED MORTGAGE OBLIGATIONS: (continued) | |
| 245,059 | | | Fannie Mae REMICS
2008-16 Z, 5.500%,
03/25/2038 | | | | $ | 248,474 | | | | | | 0.0 | | |
| 4,677,330 (4) | | | Fannie Mae REMICS
2009-66 SP, 1.255%,
(-1.000*US0001M +
6.100)%, 09/25/2039 | | | | | 315,623 | | | | | | 0.0 | | |
| 3,020,540 (4) | | | Fannie Mae REMICS
2010-1 S, 1.405%,
(-1.000*US0001M +
6.250)%, 02/25/2040 | | | | | 305,254 | | | | | | 0.0 | | |
| 4,773,984 (4) | | | Fannie Mae REMICS
2010-150 SJ, 1.635%,
(-1.000*US0001M +
6.480)%, 01/25/2041 | | | | | 540,955 | | | | | | 0.0 | | |
| 939,711 (4) | | | Fannie Mae REMICS
2010-35 CS, 1.605%,
(-1.000*US0001M +
6.450)%, 04/25/2050 | | | | | 81,074 | | | | | | 0.0 | | |
| 875,861 | | | Fannie Mae REMICS
2011-10 ZC, 5.000%,
02/25/2041 | | | | | 885,323 | | | | | | 0.0 | | |
| 4,914,509 | | | Fannie Mae REMICS
2011-101 DB, 4.000%,
10/25/2041 | | | | | 4,765,603 | | | | | | 0.1 | | |
| 2,906,519 | | | Fannie Mae REMICS
2011-116 ZA, 3.500%,
11/25/2041 | | | | | 2,753,646 | | | | | | 0.1 | | |
| 64,678 | | | Fannie Mae REMICS
2011-127 UY, 3.500%,
12/25/2041 | | | | | 61,816 | | | | | | 0.0 | | |
| 6,187,065 | | | Fannie Mae REMICS
2011-136 PZ, 4.000%,
01/25/2042 | | | | | 6,045,995 | | | | | | 0.1 | | |
| 6,018,467 (4) | | | Fannie Mae REMICS
2011-47 GS, 1.085%,
(-1.000*US0001M +
5.930)%, 06/25/2041 | | | | | 447,005 | | | | | | 0.0 | | |
| 1,836,262 | | | Fannie Mae REMICS
2011-8 ZA, 4.000%,
02/25/2041 | | | | | 1,781,351 | | | | | | 0.0 | | |
| 4,437,708 | | | Fannie Mae REMICS
2011-84 Z, 5.250%,
09/25/2041 | | | | | 4,688,983 | | | | | | 0.1 | | |
| 6,530,310 | | | Fannie Mae REMICS
2011-87 GB, 4.500%,
09/25/2041 | | | | | 6,564,904 | | | | | | 0.1 | | |
| 1,848,292 (4) | | | Fannie Mae REMICS
2012-111 SL, 1.255%,
(-1.000*US0001M +
6.100)%, 05/25/2041 | | | | | 179,408 | | | | | | 0.0 | | |
Principal
Amount† | | | Value | | | Percentage
of Net
Assets | |
| COLLATERALIZED MORTGAGE OBLIGATIONS: (continued) | |
| 3,341,566 | | | Fannie Mae REMICS
2012-111 ZK, 3.500%,
10/25/2042 | | | | $ | 3,129,711 | | | | | | 0.1 | | |
| 3,021,813 (4) | | | Fannie Mae REMICS
2012-120 WI, 3.000%,
11/25/2027 | | | | | 124,104 | | | | | | 0.0 | | |
| 10,088,842 | | | Fannie Mae REMICS
2012-15 PZ, 4.000%,
03/25/2042 | | | | | 9,596,608 | | | | | | 0.1 | | |
| 4,275,782 | | | Fannie Mae REMICS
2012-17 QZ, 4.000%,
03/25/2042 | | | | | 4,144,796 | | | | | | 0.1 | | |
| 3,364,666 | | | Fannie Mae REMICS
2012-2 HE, 4.000%,
02/25/2042 | | | | | 3,293,643 | | | | | | 0.1 | | |
| 931,029 | | | Fannie Mae REMICS
2012-30 AB, 4.000%,
04/25/2042 | | | | | 910,373 | | | | | | 0.0 | | |
| 1,320,003 | | | Fannie Mae REMICS
2012-33 BW, 4.000%,
04/25/2042 | | | | | 1,262,849 | | | | | | 0.0 | | |
| 3,492 | | | Fannie Mae REMICS
2012-44 KW, 3.500%,
05/25/2032 | | | | | 3,658 | | | | | | 0.0 | | |
| 1,861,112 | | | Fannie Mae REMICS
2012-55 PC, 3.500%,
05/25/2042 | | | | | 1,769,940 | | | | | | 0.0 | | |
| 8,396,000 | | | Fannie Mae REMICS
2012-63 MW, 4.000%,
05/25/2034 | | | | | 8,126,824 | | | | | | 0.1 | | |
| 500,000 | | | Fannie Mae REMICS
2012-80 MY, 3.250%,
08/25/2042 | | | | | 445,787 | | | | | | 0.0 | | |
| 14,073,084 | | | Fannie Mae REMICS
2012-94 LZ, 3.500%,
09/25/2042 | | | | | 13,325,759 | | | | | | 0.2 | | |
| 2,424,709 | | | Fannie Mae REMICS
2013-111 BA, 3.000%,
11/25/2033 | | | | | 2,304,106 | | | | | | 0.0 | | |
| 1,403,000 | | | Fannie Mae REMICS
2013-13 BE, 4.000%,
03/25/2043 | | | | | 1,378,760 | | | | | | 0.0 | | |
| 160,809 | | | Fannie Mae REMICS
2013-16 GD, 3.000%,
03/25/2033 | | | | | 156,951 | | | | | | 0.0 | | |
| 3,996,321 (4) | | | Fannie Mae REMICS
2013-40 LS, 1.305%,
(-1.000*US0001M +
6.150)%, 05/25/2043 | | | | | 451,609 | | | | | | 0.0 | | |
| 4,946,444 (4) | | | Fannie Mae REMICS
2013-70 BI, 3.000%,
07/25/2033 | | | | | 452,263 | | | | | | 0.0 | | |
See Accompanying Notes to Financial Statements
PORTFOLIO OF INVESTMENTS
| Voya Intermediate Bond Fund | as of March 31, 2023 (continued) |
Principal
Amount† | | | Value | | | Percentage
of Net
Assets | |
| COLLATERALIZED MORTGAGE OBLIGATIONS: (continued) | |
| 3,983,030 | | | Fannie Mae REMICS
2013-70 JZ, 3.000%,
07/25/2043 | | | | $ | 3,566,284 | | | | | | 0.1 | | |
| 6,313,199 (4) | | | Fannie Mae REMICS
2014-15 SB, 1.805%,
(-1.000*US0001M +
6.650)%, 04/25/2044 | | | | | 793,121 | | | | | | 0.0 | | |
| 970,000 | | | Fannie Mae REMICS
2014-61 PY, 3.500%,
10/25/2044 | | | | | 868,467 | | | | | | 0.0 | | |
| 6,519,864 (4) | | | Fannie Mae REMICS
2014-70 IO, 5.500%,
10/25/2044 | | | | | 1,151,766 | | | | | | 0.0 | | |
| 25,613,762 (4) | | | Fannie Mae REMICS
2014-79 KS, 1.305%,
(-1.000*US0001M +
6.150)%, 12/25/2044 | | | | | 3,098,091 | | | | | | 0.1 | | |
| 18,355,614 | | | Fannie Mae REMICS
2015-20 EZ, 3.500%,
04/25/2045 | | | | | 17,009,381 | | | | | | 0.2 | | |
| 4,237,052 (4) | | | Fannie Mae REMICS
2015-56 IC, 6.000%,
08/25/2045 | | | | | 737,375 | | | | | | 0.0 | | |
| 2,000,000 | | | Fannie Mae REMICS
2015-67 AV, 3.500%,
01/25/2036 | | | | | 1,857,516 | | | | | | 0.0 | | |
| 3,888,199 | | | Fannie Mae REMICS
2015-67 QV, 3.000%,
12/25/2040 | | | | | 3,771,107 | | | | | | 0.1 | | |
| 1,769,278 (4) | | | Fannie Mae REMICS
2015-76 PI, 6.000%,
09/25/2045 | | | | | 291,117 | | | | | | 0.0 | | |
| 15,105,157 (4) | | | Fannie Mae REMICS
2015-86 BS, 0.855%,
(-1.000*US0001M +
5.700)%, 11/25/2045 | | | | | 1,003,301 | | | | | | 0.0 | | |
| 24,775,117 (4) | | | Fannie Mae REMICS
2015-88 IO, 6.500%,
12/25/2045 | | | | | 6,100,176 | | | | | | 0.1 | | |
| 5,361,855 (4) | | | Fannie Mae REMICS
2015-97 BI, 5.500%,
01/25/2046 | | | | | 964,038 | | | | | | 0.0 | | |
| 3,368,446 (4) | | | Fannie Mae REMICS
2016-104 BI, 6.000%,
01/25/2047 | | | | | 639,247 | | | | | | 0.0 | | |
| 5,382,393 (4) | | | Fannie Mae REMICS
2016-52 MI, 4.000%,
12/25/2045 | | | | | 845,499 | | | | | | 0.0 | | |
| 22,395,498 (4) | | | Fannie Mae REMICS
2016-81 CS, 1.255%,
(-1.000*US0001M +
6.100)%, 11/25/2046 | | | | | 1,738,323 | | | | | | 0.0 | | |
Principal
Amount† | | | Value | | | Percentage
of Net
Assets | |
| COLLATERALIZED MORTGAGE OBLIGATIONS: (continued) | |
| 366,792 | | | Fannie Mae REMICS
2016-9 D, 3.000%,
03/25/2046 | | | | $ | 340,436 | | | | | | 0.0 | | |
| 18,614,459 (4) | | | Fannie Mae REMICS
2017-10 SA, 1.255%,
(-1.000*US0001M +
6.100)%, 03/25/2047 | | | | | 1,682,213 | | | | | | 0.0 | | |
| 4,948,813 | | | Fannie Mae REMICS
2017-108 ZD, 3.000%,
01/25/2048 | | | | | 3,953,801 | | | | | | 0.1 | | |
| 4,825,864 | | | Fannie Mae REMICS
2017-54 D, 3.000%,
07/25/2047 | | | | | 4,407,070 | | | | | | 0.1 | | |
| 26,410,398 (4) | | | Fannie Mae REMICS
2018-15 SC, 1.455%,
(-1.000*US0001M +
6.300)%, 03/25/2048 | | | | | 2,788,853 | | | | | | 0.1 | | |
| 3,602,839 | | | Fannie Mae REMICS
2018-26 A, 3.500%,
04/25/2048 | | | | | 3,383,906 | | | | | | 0.1 | | |
| 1,137,512 | | | Fannie Mae REMICS
2018-38 LA, 3.000%,
06/25/2048 | | | | | 1,030,294 | | | | | | 0.0 | | |
| 11,556,400 | | | Fannie Mae REMICS
2018-73 AB, 3.000%,
10/25/2048 | | | | | 10,714,953 | | | | | | 0.2 | | |
| 1,202,835 | | | Fannie Mae REMICS
2018-8 AB, 3.500%,
10/25/2047 | | | | | 1,150,711 | | | | | | 0.0 | | |
| 33,478,188 (4) | | | Fannie Mae REMICS
2018-82 SA, 1.355%,
(-1.000*US0001M +
6.200)%, 11/25/2048 | | | | | 3,276,872 | | | | | | 0.1 | | |
| 7,571,084 (4) | | | Fannie Mae REMICS
2018-86 AS, 1.355%,
(-1.000*US0001M +
6.200)%, 12/25/2048 | | | | | 619,679 | | | | | | 0.0 | | |
| 34,059,147 (4) | | | Fannie Mae REMICS
2018-86 SM, 1.355%,
(-1.000*US0001M +
6.200)%, 12/25/2048 | | | | | 3,101,818 | | | | | | 0.1 | | |
| 29,278,900 (4) | | | Fannie Mae REMICS
2018-91 SB, 1.255%,
(-1.000*US0001M +
6.100)%, 12/25/2058 | | | | | 3,423,431 | | | | | | 0.1 | | |
| 10,020,919 (4) | | | Fannie Mae REMICS
2019-21 AI, 5.000%,
05/25/2059 | | | | | 2,610,748 | | | | | | 0.0 | | |
| 9,296,601 (4) | | | Fannie Mae REMICS
2019-30 SB, 1.255%,
(-1.000*US0001M +
6.100)%, 07/25/2049 | | | | | 908,233 | | | | | | 0.0 | | |
See Accompanying Notes to Financial Statements
PORTFOLIO OF INVESTMENTS
| Voya Intermediate Bond Fund | as of March 31, 2023 (continued) |
Principal
Amount† | | | Value | | | Percentage
of Net
Assets | |
| COLLATERALIZED MORTGAGE OBLIGATIONS: (continued) | |
| 14,670,948 (4) | | | Fannie Mae REMICS
2019-34 BS, 1.205%,
(-1.000*US0001M +
6.050)%, 07/25/2049 | | | | $ | 1,635,672 | | | | | | 0.0 | | |
| 7,649,392 (4) | | | Fannie Mae REMICS
2019-39 SA, 1.255%,
(-1.000*US0001M +
6.100)%, 08/25/2049 | | | | | 712,143 | | | | | | 0.0 | | |
| 52,433,472 (4) | | | Fannie Mae REMICS
2019-41 S, 1.155%,
(-1.000*US0001M +
6.000)%, 08/25/2059 | | | | | 4,929,575 | | | | | | 0.1 | | |
| 5,322,845 (4) | | | Fannie Mae REMICS
2019-47 SB, 1.255%,
(-1.000*US0001M +
6.100)%, 05/25/2040 | | | | | 485,262 | | | | | | 0.0 | | |
| 22,395,951 (4) | | | Fannie Mae REMICS
2020-35 IO, 5.000%,
06/25/2050 | | | | | 3,602,483 | | | | | | 0.1 | | |
| 23,101,773 (4) | | | Fannie Mae REMICS
2020-44 DI, 2.500%,
07/25/2050 | | | | | 3,027,390 | | | | | | 0.1 | | |
| 10,769,238 (4) | | | Fannie Mae REMICS
2020-44 EI, 3.500%,
09/25/2042 | | | | | 1,709,637 | | | | | | 0.0 | | |
| 50,382,739 (4) | | | Fannie Mae REMICS
2021-1 BI, 3.000%,
02/25/2049 | | | | | 7,813,788 | | | | | | 0.1 | | |
| 168,745,485 (4) | | | Fannie Mae REMICS
2021-10 AI, 3.000%,
03/25/2041 | | | | | 18,722,700 | | | | | | 0.3 | | |
| 30,022,848 (4) | | | Fannie Mae REMICS
2021-22 BI, 4.000%,
04/25/2051 | | | | | 5,900,522 | | | | | | 0.1 | | |
| 40,172,793 (4) | | | Fannie Mae REMICS
2021-41 MI, 5.000%,
06/25/2048 | | | | | 7,460,445 | | | | | | 0.1 | | |
| 39,490,298 (4) | | | Fannie Mae REMICS
2021-55 SA, 8.020%,
(-1.000*SOFR30A +
3.150)%, 08/25/2061 | | | | | 983,332 | | | | | | 0.0 | | |
| 85,682,764 (4) | | | Fannie Mae REMICS
2021-77 AI, 3.500%,
11/25/2051 | | | | | 16,803,487 | | | | | | 0.2 | | |
| 27,966,917 (4) | | | Fannie Mae REMICS
2021-8 TI, 4.000%,
03/25/2051 | | | | | 5,451,871 | | | | | | 0.1 | | |
| 17,779,932 (4) | | | Fannie Mae REMICS
2021-81 LI, 2.500%,
11/25/2051 | | | | | 2,605,731 | | | | | | 0.0 | | |
| 68,834,158 (4) | | | Fannie Mae REMICS
2021-93 AI, 3.000%,
01/25/2052 | | | | | 11,187,024 | | | | | | 0.2 | | |
Principal
Amount† | | | Value | | | Percentage
of Net
Assets | |
| COLLATERALIZED MORTGAGE OBLIGATIONS: (continued) | |
| 18,198,255 | | | Fannie Mae REMICS
2022-5 CZ, 2.500%,
02/25/2052 | | | | $ | 11,889,441 | | | | | | 0.2 | | |
| 323 | | | Fannie Mae REMICS
G93-35 ZQ, 6.500%,
11/25/2023 | | | | | 322 | | | | | | 0.0 | | |
| 1,806,947 | | | Fannie Mae REMICS
Trust 2010-53 JZ,
5.000%, 07/25/2040 | | | | | 1,715,469 | | | | | | 0.0 | | |
| 16,635,066 (4) | | | Fannie Mae
Series 2013-44 DI,
3.000%, 05/25/2033 | | | | | 1,511,818 | | | | | | 0.0 | | |
| 980,467 (4) | | | Fannie Mae
Series 2013-72 YS,
1.305%,
(-1.000*US0001M +
6.150)%, 07/25/2033 | | | | | 71,099 | | | | | | 0.0 | | |
| 8,882 (4) | | | FHLMC-GNMA 20 S,
4.055%,
(-1.000*US0001M +
8.900)%, 10/25/2023 | | | | | 74 | | | | | | 0.0 | | |
| 528,007 | | | First Horizon Alternative
Mortgage Securities
Trust 2006-FA8 1A11,
6.000%, 02/25/2037 | | | | | 233,955 | | | | | | 0.0 | | |
| 1,084,701 (1)(3) | | | First Republic Mortgage
Trust 2020-1 B2,
2.884%, 04/25/2050 | | | | | 852,395 | | | | | | 0.0 | | |
| 1,748,917 (1)(3) | | | Flagstar Mortgage Trust
2018-1 B1, 3.951%,
03/25/2048 | | | | | 1,543,718 | | | | | | 0.0 | | |
| 2,280,588 (1)(3) | | | Flagstar Mortgage Trust
2018-1 B3, 3.951%,
03/25/2048 | | | | | 1,961,769 | | | | | | 0.0 | | |
| 1,181,097 (1)(3) | | | Flagstar Mortgage Trust
2018-2 B2, 4.010%,
04/25/2048 | | | | | 1,043,343 | | | | | | 0.0 | | |
| 769,146 (1)(3) | | | Flagstar Mortgage Trust
2018-3INV A3, 4.000%,
05/25/2048 | | | | | 712,002 | | | | | | 0.0 | | |
| 898,838 (1)(3) | | | Flagstar Mortgage Trust
2018-4 B3, 4.205%,
07/25/2048 | | | | | 804,384 | | | | | | 0.0 | | |
| 1,700,937 (1)(3) | | | Flagstar Mortgage Trust
2018-5 B3, 4.496%,
09/25/2048 | | | | | 1,502,451 | | | | | | 0.0 | | |
| 2,827,842 (1)(3) | | | Flagstar Mortgage Trust
2018-6RR B3, 4.923%,
10/25/2048 | | | | | 2,569,996 | | | | | | 0.0 | | |
| 1,374,344 (1)(3) | | | Flagstar Mortgage Trust
2019-2 B2, 4.030%,
12/25/2049 | | | | | 1,212,394 | | | | | | 0.0 | | |
See Accompanying Notes to Financial Statements
PORTFOLIO OF INVESTMENTS
| Voya Intermediate Bond Fund | as of March 31, 2023 (continued) |
Principal
Amount† | | | Value | | | Percentage
of Net
Assets | |
| COLLATERALIZED MORTGAGE OBLIGATIONS: (continued) | |
| 1,936,844 (1)(3) | | | Flagstar Mortgage Trust
2020-1NV B1A,
4.216%, 03/25/2050 | | | | $ | 1,689,686 | | | | | | 0.0 | | |
| 2,344,402 (1)(3) | | | Flagstar Mortgage Trust
2020-1NV B2A,
4.216%, 03/25/2050 | | | | | 2,030,639 | | | | | | 0.0 | | |
| 1,451,314 (1)(3) | | | Flagstar Mortgage Trust
2021-6INV B1, 3.494%,
08/25/2051 | | | | | 1,201,336 | | | | | | 0.0 | | |
| 10,221,249 | | | Freddie Mac 326 350,
3.500%, 03/15/2044 | | | | | 9,619,724 | | | | | | 0.1 | | |
| 5,603,566 (4) | | | Freddie Mac 3510 AS,
1.726%,
(-1.000*US0001M +
6.410)%, 04/15/2037 | | | | | 594,537 | | | | | | 0.0 | | |
| 3,800,968 (4) | | | Freddie Mac 4191 SA,
1.516%,
(-1.000*US0001M +
6.200)%, 03/15/2043 | | | | | 332,304 | | | | | | 0.0 | | |
| 4,861,552 | | | Freddie Mac 4316 XZ,
4.500%, 03/15/2044 | | | | | 4,852,649 | | | | | | 0.1 | | |
| 1,711,398 | | | Freddie Mac Reference
Series R007 ZA,
6.000%, 05/15/2036 | | | | | 1,804,562 | | | | | | 0.0 | | |
| 191,243 | | | Freddie Mac Reference
Series R008 ZA,
6.000%, 07/15/2036 | | | | | 198,263 | | | | | | 0.0 | | |
| 48,049 | | | Freddie Mac REMIC
Trust 2110 PG, 6.000%,
01/15/2029 | | | | | 49,033 | | | | | | 0.0 | | |
| 43,486 | | | Freddie Mac REMIC
Trust 2114 ZM, 6.000%,
01/15/2029 | | | | | 44,244 | | | | | | 0.0 | | |
| 327,896 | | | Freddie Mac REMIC
Trust 2143 ZB, 6.000%,
04/15/2029 | | | | | 338,227 | | | | | | 0.0 | | |
| 146,746 | | | Freddie Mac REMIC
Trust 2541 NE, 5.500%,
12/15/2032 | | | | | 150,801 | | | | | | 0.0 | | |
| 44,982 (4) | | | Freddie Mac REMIC
Trust 2594 IY, 6.000%,
04/15/2033 | | | | | 7,666 | | | | | | 0.0 | | |
| 322,409 | | | Freddie Mac REMIC
Trust 2845 QH,
5.000%, 08/15/2034 | | | | | 326,650 | | | | | | 0.0 | | |
| 66,644 | | | Freddie Mac REMIC
Trust 2861 Z, 5.500%,
09/15/2034 | | | | | 68,059 | | | | | | 0.0 | | |
| 109,817 | | | Freddie Mac REMIC
Trust 2930 ZL, 5.000%,
02/15/2035 | | | | | 110,545 | | | | | | 0.0 | | |
Principal
Amount† | | | Value | | | Percentage
of Net
Assets | |
| COLLATERALIZED MORTGAGE OBLIGATIONS: (continued) | |
| 168,022 | | | Freddie Mac REMIC
Trust 2931 ZY, 5.000%,
02/15/2035 | | | | $ | 170,459 | | | | | | 0.0 | | |
| 3,535,309 (4) | | | Freddie Mac REMIC
Trust 3045 DI, 2.046%,
(-1.000*US0001M +
6.730)%, 10/15/2035 | | | | | 327,404 | | | | | | 0.0 | | |
| 626,258 | | | Freddie Mac REMIC
Trust 3117 ZA, 5.500%,
02/15/2036 | | | | | 635,822 | | | | | | 0.0 | | |
| 593,989 (4) | | | Freddie Mac REMIC
Trust 3171 PS, 1.801%,
(-1.000*US0001M +
6.485)%, 06/15/2036 | | | | | 42,657 | | | | | | 0.0 | | |
| 3,679,710 (4) | | | Freddie Mac REMIC
Trust 3199 S, 1.766%,
(-1.000*US0001M +
6.450)%, 08/15/2036 | | | | | 385,193 | | | | | | 0.0 | | |
| 293,440 | | | Freddie Mac REMIC
Trust 3351 ZC, 5.500%,
07/15/2037 | | | | | 296,675 | | | | | | 0.0 | | |
| 92,800 | | | Freddie Mac REMIC
Trust 3394 ZY, 6.000%,
11/15/2037 | | | | | 96,374 | | | | | | 0.0 | | |
| 156,397 (3)(4) | | | Freddie Mac REMIC
Trust 3524 LA, 5.071%,
03/15/2033 | | | | | 150,985 | | | | | | 0.0 | | |
| 11,412 | | | Freddie Mac REMIC
Trust 3556 NT, 7.784%,
(US0001M + 3.100)%,
03/15/2038 | | | | | 11,654 | | | | | | 0.0 | | |
| 3,342,267 | | | Freddie Mac REMIC
Trust 3639 ZN, 5.500%,
12/15/2034 | | | | | 3,438,076 | | | | | | 0.1 | | |
| 292,820 | | | Freddie Mac REMIC
Trust 3662 ZB, 5.500%,
08/15/2036 | | | | | 307,159 | | | | | | 0.0 | | |
| 218,154 | | | Freddie Mac REMIC
Trust 3724 CM,
5.500%, 06/15/2037 | | | | | 226,737 | | | | | | 0.0 | | |
| 701,799 (4) | | | Freddie Mac REMIC
Trust 3856 KS, 1.866%,
(-1.000*US0001M +
6.550)%, 05/15/2041 | | | | | 75,127 | | | | | | 0.0 | | |
| 282,974 (4) | | | Freddie Mac REMIC
Trust 3925 SD, 1.366%,
(-1.000*US0001M +
6.050)%, 07/15/2040 | | | | | 8,987 | | | | | | 0.0 | | |
| 1,154,738 (4) | | | Freddie Mac REMIC
Trust 3925 SL, 1.366%,
(-1.000*US0001M +
6.050)%, 01/15/2041 | | | | | 24,356 | | | | | | 0.0 | | |
See Accompanying Notes to Financial Statements
PORTFOLIO OF INVESTMENTS
| Voya Intermediate Bond Fund | as of March 31, 2023 (continued) |
Principal
Amount† | | | Value | | | Percentage
of Net
Assets | |
| COLLATERALIZED MORTGAGE OBLIGATIONS: (continued) | |
| 145,667 | | | Freddie Mac REMIC
Trust 4000 PA, 4.500%,
01/15/2042 | | | | $ | 144,290 | | | | | | 0.0 | | |
| 730,378 (4) | | | Freddie Mac REMIC
Trust 4088 CS, 1.316%,
(-1.000*US0001M +
6.000)%, 08/15/2042 | | | | | 78,076 | | | | | | 0.0 | | |
| 4,039,882 (4) | | | Freddie Mac REMIC
Trust 4161 WI, 3.000%,
02/15/2033 | | | | | 346,080 | | | | | | 0.0 | | |
| 1,964,454 (4) | | | Freddie Mac REMIC
Trust 4194 GI, 4.000%,
04/15/2043 | | | | | 318,652 | | | | | | 0.0 | | |
| 2,708,941 | | | Freddie Mac REMIC
Trust 4203 BN, 3.000%,
04/15/2033 | | | | | 2,549,378 | | | | | | 0.0 | | |
| 1,038,878 | | | Freddie Mac REMIC
Trust 4246 ZX, 4.500%,
04/15/2041 | | | | | 1,041,508 | | | | | | 0.0 | | |
| 836,749 (4) | | | Freddie Mac REMIC
Trust 4293 KI, 4.500%,
08/15/2043 | | | | | 101,584 | | | | | | 0.0 | | |
| 5,537,662 | | | Freddie Mac REMIC
Trust 4335 ZX, 4.250%,
05/15/2044 | | | | | 5,373,131 | | | | | | 0.1 | | |
| 7,564,090 | | | Freddie Mac REMIC
Trust 435 XZ, 4.250%,
05/15/2044 | | | | | 7,333,255 | | | | | | 0.1 | | |
| 564,397 | | | Freddie Mac REMIC
Trust 4370 AD, 3.000%,
08/15/2040 | | | | | 554,354 | | | | | | 0.0 | | |
| 2,660,362 (4) | | | Freddie Mac REMIC
Trust 4386 LS, 1.416%,
(-1.000*US0001M +
6.100)%, 09/15/2044 | | | | | 281,472 | | | | | | 0.0 | | |
| 22,850,958 (4) | | | Freddie Mac REMIC
Trust 5103 HI, 4.000%,
05/25/2051 | | | | | 4,452,176 | | | | | | 0.1 | | |
| 1,195 (4) | | | Freddie Mac REMICS
2074 S, 3.991%,
(-1.000*US0001M +
8.700)%, 07/17/2028 | | | | | 7 | | | | | | 0.0 | | |
| 4,874 (4) | | | Freddie Mac REMICS
2232 SA, 3.891%,
(-1.000*US0001M +
8.600)%, 05/17/2030 | | | | | 90 | | | | | | 0.0 | | |
| 4,501 (4) | | | Freddie Mac REMICS
2301 SP, 4.566%,
(-1.000*US0001M +
9.250)%, 04/15/2031 | | | | | 120 | | | | | | 0.0 | | |
Principal
Amount† | | | Value | | | Percentage
of Net
Assets | |
| COLLATERALIZED MORTGAGE OBLIGATIONS: (continued) | |
| 313,730 (4) | | | Freddie Mac REMICS
2993 GS, 1.466%,
(-1.000*US0001M +
6.150)%, 06/15/2025 | | | | $ | 3,004 | | | | | | 0.0 | | |
| 576,561 (4) | | | Freddie Mac REMICS
3006 SI, 2.056%,
(-1.000*US0001M +
6.740)%, 07/15/2035 | | | | | 62,130 | | | | | | 0.0 | | |
| 582,998 (4) | | | Freddie Mac REMICS
3006 YI, 2.056%,
(-1.000*US0001M +
6.740)%, 07/15/2035 | | | | | 58,339 | | | | | | 0.0 | | |
| 3,380,933 (4) | | | Freddie Mac REMICS
3213 JS, 2.516%,
(-1.000*US0001M +
7.200)%, 09/15/2036 | | | | | 436,211 | | | | | | 0.0 | | |
| 6,753,821 (4) | | | Freddie Mac REMICS
3346 SC, 1.866%,
(-1.000*US0001M +
6.550)%, 10/15/2033 | | | | | 604,528 | | | | | | 0.0 | | |
| 824,385 (4) | | | Freddie Mac REMICS
3375 QI, 0.600%,
(-10.000*US0001M +
64.600)%, 10/15/2037 | | | | | 18,974 | | | | | | 0.0 | | |
| 5,558,023 (4) | | | Freddie Mac REMICS
3629 CS, 1.666%,
(-1.000*US0001M +
6.350)%, 01/15/2040 | | | | | 622,116 | | | | | | 0.0 | | |
| 2,143,211 | | | Freddie Mac REMICS
3736 ZP, 4.000%,
10/15/2040 | | | | | 2,046,950 | | | | | | 0.0 | | |
| 1,571,507 | | | Freddie Mac REMICS
3740 KE, 4.000%,
10/15/2040 | | | | | 1,500,411 | | | | | | 0.0 | | |
| 19,441,819 | | | Freddie Mac REMICS
3753 KZ, 4.500%,
11/15/2040 | | | | | 19,474,668 | | | | | | 0.3 | | |
| 4,129,548 | | | Freddie Mac REMICS
3775 GZ, 4.500%,
12/15/2040 | | | | | 3,899,917 | | | | | | 0.1 | | |
| 1,900,000 | | | Freddie Mac REMICS
3820 NC, 4.500%,
03/15/2041 | | | | | 1,908,068 | | | | | | 0.0 | | |
| 825,269 | | | Freddie Mac REMICS
3843 JZ, 5.100%,
04/15/2041 | | | | | 839,169 | | | | | | 0.0 | | |
| 386,441 | | | Freddie Mac REMICS
3848 WX, 5.000%,
04/15/2041 | | | | | 395,770 | | | | | | 0.0 | | |
| 2,650,000 | | | Freddie Mac REMICS
3890 ME, 5.000%,
07/15/2041 | | | | | 2,720,099 | | | | | | 0.1 | | |
See Accompanying Notes to Financial Statements
PORTFOLIO OF INVESTMENTS
| Voya Intermediate Bond Fund | as of March 31, 2023 (continued) |
Principal
Amount† | | | Value | | | Percentage
of Net
Assets | |
| COLLATERALIZED MORTGAGE OBLIGATIONS: (continued) | |
| 2,042,178 | | | Freddie Mac REMICS
3893 PU, 4.000%,
07/15/2041 | | | | $ | 1,985,529 | | | | | | 0.0 | | |
| 3,935,579 | | | Freddie Mac REMICS
3919 BY, 4.000%,
09/15/2041 | | | | | 3,797,048 | | | | | | 0.1 | | |
| 7,663,086 | | | Freddie Mac REMICS
3919 ZB, 4.000%,
09/15/2041 | | | | | 7,393,161 | | | | | | 0.1 | | |
| 3,141,436 | | | Freddie Mac REMICS
3923 GY, 4.000%,
09/15/2041 | | | | | 3,049,907 | | | | | | 0.1 | | |
| 1,372,824 | | | Freddie Mac REMICS
3934 CB, 4.000%,
10/15/2041 | | | | | 1,325,093 | | | | | | 0.0 | | |
| 355,834 | | | Freddie Mac REMICS
3934 KB, 5.000%,
10/15/2041 | | | | | 364,036 | | | | | | 0.0 | | |
| 4,061,025 | | | Freddie Mac REMICS
3982 LZ, 4.000%,
01/15/2042 | | | | | 3,948,583 | | | | | | 0.1 | | |
| 837,359 | | | Freddie Mac REMICS
3997 PB, 4.000%,
02/15/2042 | | | | | 821,250 | | | | | | 0.0 | | |
| 2,740,391 (4) | | | Freddie Mac REMICS
4057 SN, 1.966%,
(-1.000*US0001M +
6.650)%, 12/15/2041 | | | | | 217,880 | | | | | | 0.0 | | |
| 2,633,279 | | | Freddie Mac REMICS
4057 ZB, 3.500%,
06/15/2042 | | | | | 2,497,096 | | | | | | 0.0 | | |
| 12,073,408 | | | Freddie Mac REMICS
4084 TZ, 4.000%,
07/15/2042 | | | | | 11,539,170 | | | | | | 0.2 | | |
| 1,480,856 (4) | | | Freddie Mac REMICS
4090 SN, 2.016%,
(-1.000*US0001M +
6.700)%, 08/15/2032 | | | | | 120,955 | | | | | | 0.0 | | |
| 596,743 | | | Freddie Mac REMICS
4100 JA, 3.500%,
10/15/2041 | | | | | 578,382 | | | | | | 0.0 | | |
| 2,128,000 | | | Freddie Mac REMICS
4193 BP, 4.000%,
04/15/2043 | | | | | 2,026,763 | | | | | | 0.0 | | |
| 2,080,000 | | | Freddie Mac REMICS
4235 QD, 3.000%,
08/15/2033 | | | | | 1,949,427 | | | | | | 0.0 | | |
| 23,633,824 (4) | | | Freddie Mac REMICS
4301 SD, 1.416%,
(-1.000*US0001M +
6.100)%, 07/15/2037 | | | | | 1,899,703 | | | | | | 0.0 | | |
Principal
Amount† | | | Value | | | Percentage
of Net
Assets | |
| COLLATERALIZED MORTGAGE OBLIGATIONS: (continued) | |
| 7,248,611 | | | Freddie Mac REMICS
4310 BZ, 4.000%,
02/15/2044 | | | | $ | 7,010,086 | | | | | | 0.1 | | |
| 2,774,131 | | | Freddie Mac REMICS
4401 BL, 3.500%,
10/15/2034 | | | | | 2,683,368 | | | | | | 0.1 | | |
| 9,180,191 (4) | | | Freddie Mac REMICS
4407 CS, 1.516%,
(-1.000*US0001M +
6.200)%, 06/15/2044 | | | | | 784,076 | | | | | | 0.0 | | |
| 13,562,171 (4) | | | Freddie Mac REMICS
4407 PS, 0.916%,
(-1.000*US0001M +
5.600)%, 06/15/2044 | | | | | 876,811 | | | | | | 0.0 | | |
| 6,370,228 | | | Freddie Mac REMICS
4444 CZ, 3.000%,
02/15/2045 | | | | | 5,589,099 | | | | | | 0.1 | | |
| 12,819,570 (4) | | | Freddie Mac REMICS
4461 AS, 0.916%,
(-1.000*US0001M +
5.600)%, 04/15/2045 | | | | | 974,077 | | | | | | 0.0 | | |
| 3,124,000 | | | Freddie Mac REMICS
4492 VB, 3.500%,
05/15/2035 | | | | | 2,988,144 | | | | | | 0.1 | | |
| 75,144 | | | Freddie Mac REMICS
4500 HC, 3.000%,
11/15/2042 | | | | | 74,003 | | | | | | 0.0 | | |
| 2,913,000 | | | Freddie Mac REMICS
4505 PB, 3.000%,
08/15/2045 | | | | | 2,547,497 | | | | | | 0.0 | | |
| 8,068,266 | | | Freddie Mac REMICS
4545 PL, 3.500%,
01/15/2046 | | | | | 7,359,701 | | | | | | 0.1 | | |
| 11,862,527 (4) | | | Freddie Mac REMICS
4574 ST, 1.316%,
(-1.000*US0001M +
6.000)%, 04/15/2046 | | | | | 1,411,001 | | | | | | 0.0 | | |
| 62,214,491 (4) | | | Freddie Mac REMICS
4585 AS, 1.416%,
(-1.000*US0001M +
6.100)%, 05/15/2046 | | | | | 5,882,281 | | | | | | 0.1 | | |
| 4,203,783 | | | Freddie Mac REMICS
4608 JV, 3.500%,
01/15/2055 | | | | | 3,611,229 | | | | | | 0.1 | | |
| 17,610,753 (4) | | | Freddie Mac REMICS
4611 BS, 1.416%,
(-1.000*US0001M +
6.100)%, 06/15/2041 | | | | | 1,683,861 | | | | | | 0.0 | | |
| 11,021,780 | | | Freddie Mac REMICS
4664 KZ, 3.500%,
02/15/2047 | | | | | 10,299,674 | | | | | | 0.2 | | |
See Accompanying Notes to Financial Statements
PORTFOLIO OF INVESTMENTS
| Voya Intermediate Bond Fund | as of March 31, 2023 (continued) |
Principal
Amount† | | | Value | | | Percentage
of Net
Assets | |
| COLLATERALIZED MORTGAGE OBLIGATIONS: (continued) | |
| 5,719,254 | | | Freddie Mac REMICS
4680 GZ, 3.500%,
03/15/2047 | | | | $ | 5,270,078 | | | | | | 0.1 | | |
| 6,279,866 | | | Freddie Mac REMICS
4682 HZ, 3.500%,
04/15/2047 | | | | | 5,904,862 | | | | | | 0.1 | | |
| 2,240,553 | | | Freddie Mac REMICS
4700 KZ, 3.500%,
07/15/2047 | | | | | 2,038,803 | | | | | | 0.0 | | |
| 4,086,012 | | | Freddie Mac REMICS
4753 VZ, 3.000%,
12/15/2047 | | | | | 3,245,790 | | | | | | 0.1 | | |
| 3,345,509 | | | Freddie Mac REMICS
4755 Z, 3.000%,
02/15/2048 | | | | | 2,923,945 | | | | | | 0.1 | | |
| 35,832,492 | | | Freddie Mac REMICS
4771 HZ, 3.500%,
03/15/2048 | | | | | 32,255,571 | | | | | | 0.4 | | |
| 934,901 | | | Freddie Mac REMICS
4772 VG, 4.500%,
08/15/2036 | | | | | 923,886 | | | | | | 0.0 | | |
| 15,694,212 | | | Freddie Mac REMICS
4776 AZ, 4.000%,
07/15/2047 | | | | | 15,061,803 | | | | | | 0.2 | | |
| 427,446 | | | Freddie Mac REMICS
4787 PY, 4.000%,
05/15/2048 | | | | | 410,390 | | | | | | 0.0 | | |
| 8,422,528 | | | Freddie Mac REMICS
4795 D, 5.000%,
05/15/2048 | | | | | 8,534,401 | | | | | | 0.1 | | |
| 2,177,139 | | | Freddie Mac REMICS
4834 AZ, 3.500%,
10/15/2048 | | | | | 2,063,150 | | | | | | 0.0 | | |
| 35,746,597 (4) | | | Freddie Mac REMICS
4879 DS, 1.416%,
(-1.000*US0001M +
6.100)%, 08/15/2034 | | | | | 2,666,732 | | | | | | 0.1 | | |
| 30,085,923 (4) | | | Freddie Mac REMICS
4892 SA, 1.366%,
(-1.000*US0001M +
6.050)%, 07/15/2049 | | | | | 3,448,277 | | | | | | 0.1 | | |
| 1,632,872 | | | Freddie Mac REMICS
4904 HB, 3.000%,
08/25/2049 | | | | | 1,300,776 | | | | | | 0.0 | | |
| 8,151,067 (4) | | | Freddie Mac REMICS
4906 SQ, 1.205%,
(-1.000*US0001M +
6.050)%, 09/25/2049 | | | | | 934,290 | | | | | | 0.0 | | |
| 606,535 | | | Freddie Mac REMICS
4914 DB, 3.000%,
09/25/2049 | | | | | 462,736 | | | | | | 0.0 | | |
Principal
Amount† | | | Value | | | Percentage
of Net
Assets | |
| COLLATERALIZED MORTGAGE OBLIGATIONS: (continued) | |
| 2,204,555 | | | Freddie Mac REMICS
4941 CZ, 3.000%,
11/25/2049 | | | | $ | 1,901,998 | | | | | | 0.0 | | |
| 3,017,409 | | | Freddie Mac REMICS
4941 WZ, 3.000%,
11/25/2049 | | | | | 2,741,266 | | | | | | 0.1 | | |
| 4,916,352 | | | Freddie Mac REMICS
4950 KE, 2.500%,
12/25/2049 | | | | | 4,380,213 | | | | | | 0.1 | | |
| 56,143,772 (4) | | | Freddie Mac REMICS
4998 AI, 3.500%,
12/25/2049 | | | | | 11,329,611 | | | | | | 0.2 | | |
| 52,951,148 (4) | | | Freddie Mac REMICS
5014 HI, 4.000%,
09/25/2050 | | | | | 10,451,132 | | | | | | 0.2 | | |
| 33,281,062 (4) | | | Freddie Mac REMICS
5019 HI, 3.500%,
10/25/2050 | | | | | 6,002,832 | | | | | | 0.1 | | |
| 24,267,108 (4) | | | Freddie Mac REMICS
5045 BS, 1.640%,
(-1.000*SOFR30A +
6.200)%, 11/25/2050 | | | | | 3,706,192 | | | | | | 0.1 | | |
| 105,758,557 (4) | | | Freddie Mac REMICS
5051 BI, 3.000%,
11/25/2050 | | | | | 17,113,977 | | | | | | 0.2 | | |
| 29,985,853 (4) | | | Freddie Mac REMICS
5072 NI, 3.000%,
01/25/2050 | | | | | 4,943,789 | | | | | | 0.1 | | |
| 47,126,097 (4) | | | Freddie Mac REMICS
5082 IQ, 3.000%,
03/25/2051 | | | | | 7,715,848 | | | | | | 0.1 | | |
| 24,331,249 (4) | | | Freddie Mac REMICS
5113 AI, 4.000%,
06/25/2041 | | | | | 3,886,289 | | | | | | 0.1 | | |
| 72,350,184 (4) | | | Freddie Mac REMICS
5117 IO, 3.000%,
06/25/2051 | | | | | 10,403,132 | | | | | | 0.2 | | |
| 29,030,456 (4) | | | Freddie Mac REMICS
5128 IC, 5.500%,
09/25/2041 | | | | | 5,801,789 | | | | | | 0.1 | | |
| 1,553,544 | | | Freddie Mac REMICS
5228 EC, 4.000%,
02/25/2050 | | | | | 1,461,478 | | | | | | 0.0 | | |
| 12,028,876 | | | Freddie Mac
Series 4348 ZX,
4.250%, 06/15/2044 | | | | | 11,639,193 | | | | | | 0.2 | | |
| 3,793,974 (1) | | | Freddie Mac STACR
Remic Trust
2020-DNA2 M2,
6.695%, (US0001M +
1.850)%, 02/25/2050 | | | | | 3,772,440 | | | | | | 0.1 | | |
See Accompanying Notes to Financial Statements
PORTFOLIO OF INVESTMENTS
| Voya Intermediate Bond Fund | as of March 31, 2023 (continued) |
Principal
Amount† | | | Value | | | Percentage
of Net
Assets | |
| COLLATERALIZED MORTGAGE OBLIGATIONS: (continued) | |
| 1,573,151 (1) | | | Freddie Mac STACR
REMIC Trust
2020-HQA1 M2,
6.745%, (US0001M +
1.900)%, 01/25/2050 | | | | $ | 1,572,485 | | | | | | 0.0 | | |
| 8,740,000 (1) | | | Freddie Mac Stacr
Remic Trust
2020-HQA2 B1,
8.945%, (US0001M +
4.100)%, 03/25/2050 | | | | | 8,861,830 | | | | | | 0.1 | | |
| 3,070,667 (1) | | | Freddie Mac Stacr
Remic Trust
2020-HQA2 M2,
7.945%, (US0001M +
3.100)%, 03/25/2050 | | | | | 3,148,642 | | | | | | 0.1 | | |
| 3,825,000 (1) | | | Freddie Mac STACR
REMIC Trust
2021-DNA6 B1,
7.960%, (SOFR30A +
3.400)%, 10/25/2041 | | | | | 3,595,008 | | | | | | 0.1 | | |
| 1,000,000 (1) | | | Freddie Mac STACR
REMIC Trust
2021-DNA7 M2,
6.360%, (SOFR30A +
1.800)%, 11/25/2041 | | | | | 951,467 | | | | | | 0.0 | | |
| 3,390,000 (1) | | | Freddie Mac STACR
REMIC Trust
2021-HQA1 M2,
6.810%, (SOFR30A +
2.250)%, 08/25/2033 | | | | | 3,267,800 | | | | | | 0.1 | | |
| 6,500,000 (1) | | | Freddie Mac STACR
REMIC Trust
2021-HQA3 M2,
6.660%, (SOFR30A +
2.100)%, 09/25/2041 | | | | | 5,867,965 | | | | | | 0.1 | | |
| 15,000,000 (1) | | | Freddie Mac STACR
REMIC Trust
2021-HQA4 B1,
8.310%, (SOFR30A +
3.750)%, 12/25/2041 | | | | | 13,513,420 | | | | | | 0.2 | | |
| 10,000,000 (1) | | | Freddie Mac STACR
REMIC Trust
2021-HQA4 M2,
6.910%, (SOFR30A +
2.350)%, 12/25/2041 | | | | | 9,029,081 | | | | | | 0.1 | | |
| 13,500,000 (1) | | | Freddie Mac STACR
REMIC Trust
2022-DNA1 B1,
7.960%, (SOFR30A +
3.400)%, 01/25/2042 | | | | | 12,298,285 | | | | | | 0.2 | | |
Principal
Amount† | | | Value | | | Percentage
of Net
Assets | |
| COLLATERALIZED MORTGAGE OBLIGATIONS: (continued) | |
| 9,200,000 (1) | | | Freddie Mac STACR
REMIC Trust
2022-DNA1 M1B,
6.410%, (SOFR30A +
1.850)%, 01/25/2042 | | | | $ | 8,709,117 | | | | | | 0.1 | | |
| 7,000,000 (1) | | | Freddie Mac STACR
REMIC Trust
2022-DNA1 M2,
7.060%, (SOFR30A +
2.500)%, 01/25/2042 | | | | | 6,477,776 | | | | | | 0.1 | | |
| 1,400,000 (1) | | | Freddie Mac STACR
REMIC Trust
2022-DNA4 M2,
9.810%, (SOFR30A +
5.250)%, 05/25/2042 | | | | | 1,414,778 | | | | | | 0.0 | | |
| 2,700,000 (1) | | | Freddie Mac STACR
REMIC Trust
2022-HQA1 M2,
9.810%, (SOFR30A +
5.250)%, 03/25/2042 | | | | | 2,669,552 | | | | | | 0.1 | | |
| 3,500,000 (1) | | | Freddie Mac STACR
REMIC Trust
2022-HQA3 M2,
9.910%, (SOFR30A +
5.350)%, 08/25/2042 | | | | | 3,433,664 | | | | | | 0.1 | | |
| 2,584,784 | | | Freddie Mac Strips 277
30, 3.000%, 09/15/2042 | | | | | 2,360,644 | | | | | | 0.0 | | |
| 5,463,769 (4) | | | Freddie Mac Strips 303
C17, 3.500%,
01/15/2043 | | | | | 863,580 | | | | | | 0.0 | | |
| 815,934 (3)(4) | | | Freddie Mac Strips 344
68, 3.000%, 02/15/2045 | | | | | 95,451 | | | | | | 0.0 | | |
| 257,452 (3)(4) | | | Freddie Mac Strips 344
89, 4.500%, 02/15/2045 | | | | | 44,617 | | | | | | 0.0 | | |
| 3,532,774 (4) | | | Freddie Mac Strips 344
C13, 4.500%,
02/15/2045 | | | | | 701,627 | | | | | | 0.0 | | |
| 5,139,733 (4) | | | Freddie Mac Strips 344
C18, 4.000%,
02/15/2045 | | | | | 943,743 | | | | | | 0.0 | | |
| 2,524,668 (3)(4) | | | Freddie Mac Strips 344
C18, 4.000%,
02/15/2045 | | | | | 403,376 | | | | | | 0.0 | | |
| 3,085,231 (3)(4) | | | Freddie Mac Strips 344
C19, 3.500%,
02/15/2045 | | | | | 393,498 | | | | | | 0.0 | | |
| 5,021,880 (4) | | | Freddie Mac Strips 344
C2, 4.000%,
02/15/2045 | | | | | 916,957 | | | | | | 0.0 | | |
| 4,235,110 (4) | | | Freddie Mac Strips 344
C4, 4.000%,
02/15/2045 | | | | | 762,671 | | | | | | 0.0 | | |
See Accompanying Notes to Financial Statements
PORTFOLIO OF INVESTMENTS
| Voya Intermediate Bond Fund | as of March 31, 2023 (continued) |
Principal
Amount† | | | Value | | | Percentage
of Net
Assets | |
| COLLATERALIZED MORTGAGE OBLIGATIONS: (continued) | |
| 7,177,359 (4) | | | Freddie Mac Strips 344
C5, 3.500%,
02/15/2045 | | | | $ | 1,178,226 | | | | | | 0.0 | | |
| 7,343,371 (4) | | | Freddie Mac Strips 344
C6, 4.000%,
02/15/2045 | | | | | 1,342,149 | | | | | | 0.0 | | |
| 4,046,023 (4) | | | Freddie Mac Strips 344
C7, 4.000%,
02/15/2045 | | | | | 745,748 | | | | | | 0.0 | | |
| 3,676,747 (4) | | | Freddie Mac Strips 344
C9, 3.500%,
02/15/2045 | | | | | 587,563 | | | | | | 0.0 | | |
| 3,203,211 (4) | | | Freddie Mac Strips 344
C9, 3.500%,
02/15/2045 | | | | | 522,244 | | | | | | 0.0 | | |
| 8,642,883 (4) | | | Freddie Mac Strips 347
C14, 3.500%,
02/15/2044 | | | | | 1,470,608 | | | | | | 0.0 | | |
| 5,151,572 (4) | | | Freddie Mac Strips 347
C22, 4.000%,
02/15/2044 | | | | | 932,042 | | | | | | 0.0 | | |
| 5,638,185 (4) | | | Freddie Mac Strips 347
C23, 4.000%,
02/15/2044 | | | | | 1,025,223 | | | | | | 0.0 | | |
| 5,291,126 (4) | | | Freddie Mac Strips 347
C24, 4.000%,
02/15/2044 | | | | | 948,175 | | | | | | 0.0 | | |
| 4,750,487 (4) | | | Freddie Mac Strips 347
C25, 4.000%,
02/15/2044 | | | | | 844,436 | | | | | | 0.0 | | |
| 6,556,273 (4) | | | Freddie Mac Strips 347
C26, 4.000%,
02/15/2044 | | | | | 1,217,514 | | | | | | 0.0 | | |
| 6,088,967 (4) | | | Freddie Mac Strips 347
C28, 4.500%,
02/15/2044 | | | | | 1,227,364 | | | | | | 0.0 | | |
| 9,720,242 (4) | | | Freddie Mac Strips 347
C5, 3.000%,
05/15/2043 | | | | | 1,490,423 | | | | | | 0.0 | | |
| 21,062,123 (4) | | | Freddie Mac Strips 365
C23, 3.500%,
10/15/2047 | | | | | 3,680,454 | | | | | | 0.1 | | |
| 27,141,137 (4) | | | Freddie Mac Strips
Series 311 S1, 1.266%,
(-1.000*US0001M +
5.950)%, 08/15/2043 | | | | | 3,058,771 | | | | | | 0.1 | | |
| 6,000,000 (1) | | | Freddie Mac Structured
Agency Credit Risk
Debt Notes 2021-DNA2
M2, 6.860%,
(SOFR30A + 2.300)%,
08/25/2033 | | | | | 5,914,528 | | | | | | 0.1 | | |
Principal
Amount† | | | Value | | | Percentage
of Net
Assets | |
| COLLATERALIZED MORTGAGE OBLIGATIONS: (continued) | |
| 5,000,000 (1) | | | Freddie Mac Structured
Agency Credit Risk
Debt Notes 2021-DNA7
B1, 8.210%,
(SOFR30A + 3.650)%,
11/25/2041 | | | | $ | 4,706,395 | | | | | | 0.1 | | |
| 2,300,000 (1) | | | Freddie Mac Structured
Agency Credit Risk
Debt Notes 2022-DNA5
M2, 11.310%,
(SOFR30A + 6.750)%,
06/25/2042 | | | | | 2,458,551 | | | | | | 0.0 | | |
| 5,150,000 (1) | | | Freddie Mac Structured
Agency Credit Risk
Debt Notes 2022-HQA2
M2, 10.560%,
(SOFR30A + 6.000)%,
07/25/2042 | | | | | 5,244,738 | | | | | | 0.1 | | |
| 880,959 (3) | | | Freddie Mac Structured
Pass Through
Certificates T-48 1A,
4.412%, 07/25/2033 | | | | | 849,424 | | | | | | 0.0 | | |
| 600,905 (1)(3) | | | Galton Funding
Mortgage Trust 2018-2
A51, 4.500%,
10/25/2058 | | | | | 578,523 | | | | | | 0.0 | | |
| 3,762,839 (1)(3) | | | Galton Funding
Mortgage Trust 2018-2
B2, 4.611%,
10/25/2058 | | | | | 3,463,911 | | | | | | 0.1 | | |
| 1,157,786 (4) | | | Ginnie Mae 2005-37 SI,
1.389%,
(-1.000*US0001M +
6.150)%, 05/20/2035 | | | | | 95,543 | | | | | | 0.0 | | |
| 996,388 (4) | | | Ginnie Mae 2007-23
ST, 1.439%,
(-1.000*US0001M +
6.200)%, 04/20/2037 | | | | | 83,179 | | | | | | 0.0 | | |
| 1,229,130 (4) | | | Ginnie Mae 2007-40
SE, 1.989%,
(-1.000*US0001M +
6.750)%, 07/20/2037 | | | | | 150,978 | | | | | | 0.0 | | |
| 809,617 (4) | | | Ginnie Mae 2007-7 EI,
1.439%,
(-1.000*US0001M +
6.200)%, 02/20/2037 | | | | | 81,838 | | | | | | 0.0 | | |
| 2,868,719 (4) | | | Ginnie Mae 2010-11
SA, 1.692%,
(-1.000*US0001M +
6.420)%, 01/16/2040 | | | | | 302,098 | | | | | | 0.0 | | |
See Accompanying Notes to Financial Statements
PORTFOLIO OF INVESTMENTS
| Voya Intermediate Bond Fund | as of March 31, 2023 (continued) |
Principal
Amount† | | | Value | | | Percentage
of Net
Assets | |
| COLLATERALIZED MORTGAGE OBLIGATIONS: (continued) | |
| 1,257,247 (4) | | | Ginnie Mae 2010-14
SB, 2.039%,
(-1.000*US0001M +
6.800)%, 11/20/2035 | | | | $ | 141,790 | | | | | | 0.0 | | |
| 936,770 (4) | | | Ginnie Mae 2010-99 IT,
5.000%, 08/16/2040 | | | | | 127,395 | | | | | | 0.0 | | |
| 7,574,975 | | | Ginnie Mae 2013-170
ZD, 2.500%,
11/16/2043 | | | | | 6,712,058 | | | | | | 0.1 | | |
| 399,943 | | | Ginnie Mae 2013-69
KA, 1.250%,
08/20/2042 | | | | | 353,690 | | | | | | 0.0 | | |
| 4,436,242 | | | Ginnie Mae 2018-1 LZ,
3.000%, 01/20/2048 | | | | | 3,808,440 | | | | | | 0.1 | | |
| 16,284,718 (4) | | | Ginnie Mae 2018-167
CS, 1.339%,
(-1.000*US0001M +
6.100)%, 12/20/2048 | | | | | 1,637,981 | | | | | | 0.0 | | |
| 298,022 (4) | | | Ginnie Mae
Series 2005-7 AH,
2.042%,
(-1.000*US0001M +
6.770)%, 02/16/2035 | | | | | 26,203 | | | | | | 0.0 | | |
| 5,904,762 (4) | | | Ginnie Mae
Series 2007-17 IC,
1.522%,
(-1.000*US0001M +
6.250)%, 04/16/2037 | | | | | 389,851 | | | | | | 0.0 | | |
| 6,466,763 (4) | | | Ginnie Mae
Series 2007-41 SL,
1.939%,
(-1.000*US0001M +
6.700)%, 07/20/2037 | | | | | 685,838 | | | | | | 0.0 | | |
| 745,271 (4) | | | Ginnie Mae
Series 2008-2 SW,
1.789%,
(-1.000*US0001M +
6.550)%, 01/20/2038 | | | | | 86,232 | | | | | | 0.0 | | |
| 373,144 (4) | | | Ginnie Mae
Series 2008-35 SN,
1.639%,
(-1.000*US0001M +
6.400)%, 04/20/2038 | | | | | 32,570 | | | | | | 0.0 | | |
| 208,089 (4) | | | Ginnie Mae
Series 2008-40 PS,
1.772%,
(-1.000*US0001M +
6.500)%, 05/16/2038 | | | | | 17,880 | | | | | | 0.0 | | |
| 568,795 (4) | | | Ginnie Mae
Series 2009-25 KS,
1.439%,
(-1.000*US0001M +
6.200)%, 04/20/2039 | | | | | 61,441 | | | | | | 0.0 | | |
Principal
Amount† | | | Value | | | Percentage
of Net
Assets | |
| COLLATERALIZED MORTGAGE OBLIGATIONS: (continued) | |
| 420,275 | | | Ginnie Mae
Series 2009-29 PB,
4.750%, 05/20/2039 | | | | $ | 423,880 | | | | | | 0.0 | | |
| 386,376 | | | Ginnie Mae
Series 2009-31 ZL,
4.500%, 05/20/2039 | | | | | 387,020 | | | | | | 0.0 | | |
| 8,594,132 | | | Ginnie Mae
Series 2009-33 ZB,
6.000%, 05/20/2039 | | | | | 8,571,796 | | | | | | 0.1 | | |
| 821,631 | | | Ginnie Mae
Series 2009-34 Z,
4.500%, 05/16/2039 | | | | | 822,092 | | | | | | 0.0 | | |
| 938,925 | | | Ginnie Mae
Series 2009-98 DA,
3.250%, 07/16/2039 | | | | | 905,875 | | | | | | 0.0 | | |
| 2,257,858 | | | Ginnie Mae
Series 2010-108 WL,
4.000%, 04/16/2040 | | | | | 2,201,135 | | | | | | 0.0 | | |
| 1,008,647 (4) | | | Ginnie Mae
Series 2010-116 NS,
1.922%,
(-1.000*US0001M +
6.650)%, 09/16/2040 | | | | | 84,190 | | | | | | 0.0 | | |
| 3,247,785 (4) | | | Ginnie Mae
Series 2010-116 SK,
1.859%,
(-1.000*US0001M +
6.620)%, 08/20/2040 | | | | | 321,919 | | | | | | 0.0 | | |
| 2,952,589 (4) | | | Ginnie Mae
Series 2010-149 HS,
1.372%,
(-1.000*US0001M +
6.100)%, 05/16/2040 | | | | | 65,690 | | | | | | 0.0 | | |
| 340,084 | | | Ginnie Mae
Series 2010-164 MD,
4.000%, 12/20/2040 | | | | | 329,454 | | | | | | 0.0 | | |
| 1,249,176 (4) | | | Ginnie Mae
Series 2010-168 BI,
5.000%, 04/20/2040 | | | | | 200,564 | | | | | | 0.0 | | |
| 749,963 (4) | | | Ginnie Mae
Series 2010-68 MS,
1.089%,
(-1.000*US0001M +
5.850)%, 06/20/2040 | | | | | 71,956 | | | | | | 0.0 | | |
| 1,080,899 | | | Ginnie Mae
Series 2011-52 PA,
4.250%, 02/16/2041 | | | | | 1,066,200 | | | | | | 0.0 | | |
| 1,781,931 (4) | | | Ginnie Mae
Series 2011-72 SA,
0.622%,
(-1.000*US0001M +
5.350)%, 05/16/2041 | | | | | 139,848 | | | | | | 0.0 | | |
See Accompanying Notes to Financial Statements
PORTFOLIO OF INVESTMENTS
| Voya Intermediate Bond Fund | as of March 31, 2023 (continued) |
Principal
Amount† | | | Value | | | Percentage
of Net
Assets | |
| COLLATERALIZED MORTGAGE OBLIGATIONS: (continued) | |
| 228,454 (4) | | | Ginnie Mae
Series 2011-73 LS,
1.929%,
(-1.000*US0001M +
6.690)%, 08/20/2039 | | | | $ | 648 | | | | | | 0.0 | | |
| 222,780 (4) | | | Ginnie Mae
Series 2012-91 QI,
4.500%, 09/20/2041 | | | | | 19,162 | | | | | | 0.0 | | |
| 2,608,751 (4) | | | Ginnie Mae
Series 2013-111 SA,
1.939%,
(-1.000*US0001M +
6.700)%, 07/20/2043 | | | | | 338,171 | | | | | | 0.0 | | |
| 774,730 | | | Ginnie Mae
Series 2013-116 KB,
3.500%, 12/20/2042 | | | | | 753,860 | | | | | | 0.0 | | |
| 3,547,968 (4) | | | Ginnie Mae
Series 2013-167 PI,
5.500%, 11/20/2043 | | | | | 579,052 | | | | | | 0.0 | | |
| 73,460 | | | Ginnie Mae
Series 2013-27 KA,
2.250%, 02/20/2043 | | | | | 66,484 | | | | | | 0.0 | | |
| 302,659 (4) | | | Ginnie Mae
Series 2014-10 GI,
4.500%, 01/16/2029 | | | | | 7,580 | | | | | | 0.0 | | |
| 2,560,733 (4) | | | Ginnie Mae
Series 2014-185 SB,
0.839%,
(-1.000*US0001M +
5.600)%, 12/20/2044 | | | | | 203,545 | | | | | | 0.0 | | |
| 1,728,706 (4) | | | Ginnie Mae
Series 2014-3 QS,
1.389%,
(-1.000*US0001M +
6.150)%, 03/20/2043 | | | | | 98,938 | | | | | | 0.0 | | |
| 4,323,083 (4) | | | Ginnie Mae
Series 2014-3 SU,
1.289%,
(-1.000*US0001M +
6.050)%, 07/20/2039 | | | | | 431,434 | | | | | | 0.0 | | |
| 2,467,668 (4) | | | Ginnie Mae
Series 2014-56 SP,
1.472%,
(-1.000*US0001M +
6.200)%, 12/16/2039 | | | | | 189,294 | | | | | | 0.0 | | |
| 6,269,906 (4) | | | Ginnie Mae
Series 2014-58 SG,
0.872%,
(-1.000*US0001M +
5.600)%, 04/16/2044 | | | | | 399,340 | | | | | | 0.0 | | |
Principal
Amount† | | | Value | | | Percentage
of Net
Assets | |
| COLLATERALIZED MORTGAGE OBLIGATIONS: (continued) | |
| 16,853,723 (4) | | | Ginnie Mae
Series 2015-110 MS,
0.949%,
(-1.000*US0001M +
5.710)%, 08/20/2045 | | | | $ | 1,484,338 | | | | | | 0.0 | | |
| 1,415,751 | | | Ginnie Mae
Series 2015-27 PB,
3.000%, 08/20/2044 | | | | | 1,374,939 | | | | | | 0.0 | | |
| 15,046,990 (4) | | | Ginnie Mae
Series 2016-160 GS,
1.339%,
(-1.000*US0001M +
6.100)%, 11/20/2046 | | | | | 1,732,375 | | | | | | 0.0 | | |
| 399,379 | | | Ginnie Mae
Series 2016-44 JA,
3.500%, 03/20/2046 | | | | | 370,627 | | | | | | 0.0 | | |
| 32,441,290 (4) | | | Ginnie Mae
Series 2016-6 SB,
0.889%,
(-1.000*US0001M +
5.650)%, 01/20/2046 | | | | | 2,930,370 | | | | | | 0.1 | | |
| 7,450,907 (4) | | | Ginnie Mae
Series 2017-101 SA,
1.439%,
(-1.000*US0001M +
6.200)%, 07/20/2047 | | | | | 882,673 | | | | | | 0.0 | | |
| 15,929,676 (4) | | | Ginnie Mae
Series 2017-163 SH,
1.439%,
(-1.000*US0001M +
6.200)%, 11/20/2047 | | | | | 1,988,207 | | | | | | 0.0 | | |
| 332,896 | | | Ginnie Mae
Series 2018-104 HZ,
3.500%, 08/20/2048 | | | | | 284,751 | | | | | | 0.0 | | |
| 1,218,377 | | | Ginnie Mae
Series 2018-120 DE,
3.500%, 09/20/2048 | | | | | 1,139,227 | | | | | | 0.0 | | |
| 199,193 | | | Ginnie Mae
Series 2018-122 GZ,
3.500%, 09/20/2048 | | | | | 178,191 | | | | | | 0.0 | | |
| 1,674,049 | | | Ginnie Mae
Series 2018-126 A,
3.500%, 09/20/2048 | | | | | 1,597,644 | | | | | | 0.0 | | |
| 199,223 | | | Ginnie Mae
Series 2018-147 KZ,
3.750%, 10/20/2048 | | | | | 178,717 | | | | | | 0.0 | | |
| 176,532 | | | Ginnie Mae
Series 2019-100 JB,
3.000%, 08/20/2049 | | | | | 145,894 | | | | | | 0.0 | | |
| 532,322 | | | Ginnie Mae
Series 2019-100 KB,
3.000%, 08/20/2049 | | | | | 439,003 | | | | | | 0.0 | | |
See Accompanying Notes to Financial Statements
PORTFOLIO OF INVESTMENTS
| Voya Intermediate Bond Fund | as of March 31, 2023 (continued) |
Principal
Amount† | | | Value | | | Percentage
of Net
Assets | |
| COLLATERALIZED MORTGAGE OBLIGATIONS: (continued) | |
| 1,349,931 | | | Ginnie Mae
Series 2019-100 MC,
3.000%, 08/20/2049 | | | | $ | 1,053,987 | | | | | | 0.0 | | |
| 21,436,928 (4) | | | Ginnie Mae
Series 2019-159 SM,
1.289%,
(-1.000*US0001M +
6.050)%, 12/20/2049 | | | | | 2,698,470 | | | | | | 0.1 | | |
| 1,081,376 | | | Ginnie Mae
Series 2019-23 NG,
3.500%, 02/20/2049 | | | | | 907,593 | | | | | | 0.0 | | |
| 71,326 | | | Ginnie Mae
Series 2019-54 AB,
3.000%, 04/20/2049 | | | | | 60,048 | | | | | | 0.0 | | |
| 798,785 | | | Ginnie Mae
Series 2019-78 MB,
3.000%, 06/20/2049 | | | | | 654,459 | | | | | | 0.0 | | |
| 416,445 | | | Ginnie Mae
Series 2019-89 KB,
3.000%, 07/20/2049 | | | | | 347,328 | | | | | | 0.0 | | |
| 299,424 | | | Ginnie Mae
Series 2019-89 WB,
3.000%, 07/20/2049 | | | | | 242,743 | | | | | | 0.0 | | |
| 21,815,423 (4) | | | Ginnie Mae
Series 2020-188 PI,
3.500%, 06/20/2050 | | | | | 3,630,955 | | | | | | 0.1 | | |
| 20,896,460 (4) | | | Ginnie Mae
Series 2020-32 SG,
1.339%,
(-1.000*US0001M +
6.100)%, 03/20/2050 | | | | | 2,508,816 | | | | | | 0.0 | | |
| 32,254,603 (4) | | | Ginnie Mae
Series 2020-46 BS,
8.208%,
(-1.000*US0001M +
3.350)%, 04/20/2050 | | | | | 633,659 | | | | | | 0.0 | | |
| 16,690,164 (4) | | | Ginnie Mae
Series 2020-77 JS,
1.339%,
(-1.000*US0001M +
6.100)%, 10/20/2048 | | | | | 1,382,767 | | | | | | 0.0 | | |
| 92,147,979 (4) | | | Ginnie Mae
Series 2021-139 PI,
2.500%, 08/20/2051 | | | | | 12,528,080 | | | | | | 0.2 | | |
| 411,428 (1)(3) | | | GS Mortgage-Backed
Securities Corp. Trust
2019-PJ2 A1, 4.000%,
11/25/2049 | | | | | 388,635 | | | | | | 0.0 | | |
| 2,850,994 (1)(3) | | | GS Mortgage-Backed
Securities Corp. Trust
2019-PJ2 B3, 4.393%,
11/25/2049 | | | | | 2,472,277 | | | | | | 0.0 | | |
Principal
Amount† | | | Value | | | Percentage
of Net
Assets | |
| COLLATERALIZED MORTGAGE OBLIGATIONS: (continued) | |
| 1,082,443 (1)(3) | | | GS Mortgage-Backed
Securities Corp. Trust
2019-PJ3 B1, 3.982%,
03/25/2050 | | | | $ | 962,608 | | | | | | 0.0 | | |
| 1,553,403 (1)(3) | | | GS Mortgage-Backed
Securities Corp. Trust
2020-PJ3 B2A, 3.425%,
10/25/2050 | | | | | 1,268,220 | | | | | | 0.0 | | |
| 948,374 (1)(3) | | | GS Mortgage-Backed
Securities Corp. Trust
2020-PJ3 B4, 3.425%,
10/25/2050 | | | | | 704,463 | | | | | | 0.0 | | |
| 326,640 (1)(3) | | | GS Mortgage-Backed
Securities Trust
2020-PJ1 A1, 3.500%,
05/25/2050 | | | | | 294,406 | | | | | | 0.0 | | |
| 523,868 (1)(3) | | | GS Mortgage-Backed
Securities Trust
2020-PJ1 A4, 3.500%,
05/25/2050 | | | | | 468,074 | | | | | | 0.0 | | |
| 1,306,623 (1)(3) | | | GS Mortgage-Backed
Securities Trust
2020-PJ1 A8, 3.500%,
05/25/2050 | | | | | 1,177,684 | | | | | | 0.0 | | |
| 1,433,357 (1)(3) | | | GS Mortgage-Backed
Securities Trust
2021-GR3 B4, 3.388%,
04/25/2052 | | | | | 916,562 | | | | | | 0.0 | | |
| 116,400 | | | GSR Mortgage Loan
Trust 2007-1F 3A13,
6.000%, 01/25/2037 | | | | | 78,349 | | | | | | 0.0 | | |
| 1,515,995 | | | HarborView Mortgage
Loan Trust 2007-5 A1A,
4.951%, (US0001M +
0.190)%, 09/19/2037 | | | | | 1,288,829 | | | | | | 0.0 | | |
| 60,994 | | | HomeBanc Mortgage
Trust 2004-1 2A,
5.705%, (US0001M +
0.860)%, 08/25/2029 | | | | | 57,121 | | | | | | 0.0 | | |
| 527,278 | | | Impac CMB Trust
Series 2005-1 M1,
5.535%, (US0001M +
0.690)%, 04/25/2035 | | | | | 478,311 | | | | | | 0.0 | | |
| 2,000,000 (1)(3) | | | Imperial Fund Mortgage
Trust 2021-NQM4 M1,
3.446%, 01/25/2057 | | | | | 1,402,858 | | | | | | 0.0 | | |
| 1,600,557 | | | IndyMac INDX
Mortgage Loan Trust
2006-AR2 2A1,
5.265%, (US0001M +
0.420)%, 02/25/2046 | | | | | 1,114,726 | | | | | | 0.0 | | |
See Accompanying Notes to Financial Statements
PORTFOLIO OF INVESTMENTS
| Voya Intermediate Bond Fund | as of March 31, 2023 (continued) |
Principal
Amount† | | | Value | | | Percentage
of Net
Assets | |
| COLLATERALIZED MORTGAGE OBLIGATIONS: (continued) | |
| 59,636 (1)(3) | | | J.P. Morgan Mortgage
Trust 2019-2 A3,
4.000%, 08/25/2049 | | | | $ | 57,615 | | | | | | 0.0 | | |
| 2,221,744 (1)(3) | | | J.P. Morgan Mortgage
Trust 2021-14 B4,
3.160%, 05/25/2052 | | | | | 1,417,763 | | | | | | 0.0 | | |
| 307,652 | | | JP Morgan Alternative
Loan Trust 2005-S1
1A1, 5.500%,
12/25/2035 | | | | | 117,894 | | | | | | 0.0 | | |
| 1,836,742 (3) | | | JP Morgan Mortgage
Trust 2005-A4 B1,
3.701%, 07/25/2035 | | | | | 1,625,052 | | | | | | 0.0 | | |
| 973,794 (1)(3) | | | JP Morgan Mortgage
Trust 2017-1 B4,
3.448%, 01/25/2047 | | | | | 810,576 | | | | | | 0.0 | | |
| 1,322,186 (1)(3) | | | JP Morgan Mortgage
Trust 2017-6 B3,
3.782%, 12/25/2048 | | | | | 1,117,244 | | | | | | 0.0 | | |
| 1,903,484 (1)(3) | | | JP Morgan Mortgage
Trust 2018-1 B1,
3.613%, 06/25/2048 | | | | | 1,641,291 | | | | | | 0.0 | | |
| 1,832,269 (1)(3) | | | JP Morgan Mortgage
Trust 2018-1 B2,
3.613%, 06/25/2048 | | | | | 1,553,381 | | | | | | 0.0 | | |
| 2,421,333 (1)(3) | | | JP Morgan Mortgage
Trust 2018-1 B3,
3.613%, 06/25/2048 | | | | | 2,015,759 | | | | | | 0.0 | | |
| 2,025,796 (1)(3) | | | JP Morgan Mortgage
Trust 2018-4 B2,
3.713%, 10/25/2048 | | | | | 1,760,204 | | | | | | 0.0 | | |
| 2,740,980 (1)(3) | | | JP Morgan Mortgage
Trust 2018-9 B3,
4.223%, 02/25/2049 | | | | | 2,383,910 | | | | | | 0.0 | | |
| 194,665 (1)(3) | | | JP Morgan Mortgage
Trust 2019-1 A3,
4.000%, 05/25/2049 | | | | | 182,414 | | | | | | 0.0 | | |
| 291,702 (1)(3) | | | JP Morgan Mortgage
Trust 2019-8 A15,
3.500%, 03/25/2050 | | | | | 263,114 | | | | | | 0.0 | | |
| 648,230 (1)(3) | | | JP Morgan Mortgage
Trust 2019-8 A5,
3.500%, 03/25/2050 | | | | | 584,902 | | | | | | 0.0 | | |
| 1,873,855 (1)(3) | | | JP Morgan Mortgage
Trust 2019-9 B2A,
3.410%, 05/25/2050 | | | | | 1,538,598 | | | | | | 0.0 | | |
| 1,704,197 (1)(3) | | | JP Morgan Mortgage
Trust 2019-INV1 B3,
4.967%, 10/25/2049 | | | | | 1,551,031 | | | | | | 0.0 | | |
| 37,519 (1)(3) | | | JP Morgan Mortgage
Trust 2019-LTV2 A18,
4.000%, 12/25/2049 | | | | | 37,090 | | | | | | 0.0 | | |
Principal
Amount† | | | Value | | | Percentage
of Net
Assets | |
| COLLATERALIZED MORTGAGE OBLIGATIONS: (continued) | |
| 850,200 (1)(3) | | | JP Morgan Mortgage
Trust 2020-1 A7,
3.500%, 06/25/2050 | | | | $ | 758,803 | | | | | | 0.0 | | |
| 295,763 (1)(3) | | | JP Morgan Mortgage
Trust 2020-2 A15,
3.500%, 07/25/2050 | | | | | 264,394 | | | | | | 0.0 | | |
| 310,631 (1)(3) | | | JP Morgan Mortgage
Trust 2020-3 A15,
3.500%, 08/25/2050 | | | | | 278,228 | | | | | | 0.0 | | |
| 747,457 (1)(3) | | | JP Morgan Mortgage
Trust 2020-3 B2,
3.847%, 08/25/2050 | | | | | 641,237 | | | | | | 0.0 | | |
| 2,023,326 (1)(3) | | | JP Morgan Mortgage
Trust 2020-5 B3,
3.583%, 12/25/2050 | | | | | 1,627,116 | | | | | | 0.0 | | |
| 936,905 (1)(3) | | | JP Morgan Mortgage
Trust 2020-8 B2,
3.501%, 03/25/2051 | | | | | 761,081 | | | | | | 0.0 | | |
| 238,435 (1)(3) | | | JP Morgan Mortgage
Trust 2020-INV1 A3,
3.500%, 08/25/2050 | | | | | 215,124 | | | | | | 0.0 | | |
| 1,691,929,469 (1)(4) | | | L Street Securities
2017-PM1 XIO,
0.000%, 10/25/2048 | | | | | 4,837,142 | | | | | | 0.1 | | |
| 12,002,765 (4) | | | Lehman Mortgage Trust
2006-7 2A4, 1.705%,
(-1.000*US0001M +
6.550)%, 11/25/2036 | | | | | 1,475,521 | | | | | | 0.0 | | |
| 8,448,151 (4) | | | Lehman Mortgage Trust
2006-9 2A5, 1.775%,
(-1.000*US0001M +
6.620)%, 01/25/2037 | | | | | 925,165 | | | | | | 0.0 | | |
| 300,903 (1)(3) | | | MFA 2020-NQM3 A3
Trust, 1.632%,
01/26/2065 | | | | | 278,496 | | | | | | 0.0 | | |
| 4,038,047 | | | Morgan Stanley
Mortgage Loan Trust
2007-13 6A1, 6.000%,
10/25/2037 | | | | | 2,428,430 | | | | | | 0.0 | | |
| 1,000,000 (1)(3) | | | Morgan Stanley
Residential Mortgage
Loan Trust 2020-1 A5A,
2.500%, 12/25/2050 | | | | | 690,924 | | | | | | 0.0 | | |
| 10,200,000 (1) | | | Mortgage
Insurance-Linked Notes
2021-3 M1B, 7.460%,
(SOFR30A + 2.900)%,
02/25/2034 | | | | | 9,953,459 | | | | | | 0.1 | | |
| 2,145,266 (1)(3) | | | New Residential
Mortgage Loan Trust
2017-3A B2, 4.750%,
04/25/2057 | | | | | 2,049,972 | | | | | | 0.0 | | |
See Accompanying Notes to Financial Statements
PORTFOLIO OF INVESTMENTS
| Voya Intermediate Bond Fund | as of March 31, 2023 (continued) |
Principal
Amount† | | | Value | | | Percentage
of Net
Assets | |
| COLLATERALIZED MORTGAGE OBLIGATIONS: (continued) | |
| 709,370 (1)(3) | | | New Residential
Mortgage Loan Trust
2017-6A B2, 4.000%,
08/27/2057 | | | | $ | 660,317 | | | | | | 0.0 | | |
| 1,000,000 (1) | | | Oaktown Re VI Ltd.
2021-1A M1C, 7.560%,
(SOFR30A + 3.000)%,
10/25/2033 | | | | | 972,077 | | | | | | 0.0 | | |
| 6,000,000 (1) | | | Oaktown Re VII Ltd.
2021-2 M1C, 7.910%,
(SOFR30A + 3.350)%,
04/25/2034 | | | | | 5,820,176 | | | | | | 0.1 | | |
| 112,060 (1)(3) | | | OBX 2019-EXP1 1A3
Trust, 4.000%,
01/25/2059 | | | | | 108,215 | | | | | | 0.0 | | |
| 326,953 (1)(3) | | | OBX 2019-INV2 A25
Trust, 4.000%,
05/27/2049 | | | | | 306,481 | | | | | | 0.0 | | |
| 73,655 | | | Prime Mortgage Trust
2007-1 A4, 5.500%,
03/25/2037 | | | | | 61,800 | | | | | | 0.0 | | |
| 1,198,784 (1)(3) | | | Provident Funding
Mortgage Trust 2020-1
B3, 3.254%,
02/25/2050 | | | | | 935,384 | | | | | | 0.0 | | |
| 10,000,000 (1) | | | Radnor RE 2021-1
M1C Ltd., 7.260%,
(SOFR30A + 2.700)%,
12/27/2033 | | | | | 9,892,611 | | | | | | 0.1 | | |
| 768,759 (1)(3) | | | RCKT Mortgage Trust
2019-1 A13, 3.500%,
09/25/2049 | | | | | 685,656 | | | | | | 0.0 | | |
| 34,007,628 (3) | | | Seasoned Credit Risk
Transfer Trust 2017-4
HT, 3.250%, 06/25/2057 | | | | | 31,338,519 | | | | | | 0.4 | | |
| 229,508 (1)(3) | | | Seasoned Credit Risk
Transfer Trust
Series 2016-1 M2,
3.750%, 09/25/2055 | | | | | 207,076 | | | | | | 0.0 | | |
| 8,159,741 | | | Seasoned Credit Risk
Transfer Trust
Series 2018-2, 3.500%,
11/25/2057 | | | | | 7,648,459 | | | | | | 0.1 | | |
| 3,131,374 | | | Seasoned Credit Risk
Transfer Trust
Series 2018-2 HT,
3.000%, 11/25/2057 | | | | | 2,804,506 | | | | | | 0.1 | | |
| 3,414,492 | | | Seasoned Credit Risk
Transfer Trust
Series 2018-3 HT,
3.000%, 08/25/2057 | | | | | 3,046,468 | | | | | | 0.1 | | |
Principal
Amount† | | | Value | | | Percentage
of Net
Assets | |
| COLLATERALIZED MORTGAGE OBLIGATIONS: (continued) | |
| 2,940,076 | | | Seasoned Credit Risk
Transfer Trust
Series 2018-4 HT,
3.000%, 03/25/2058 | | | | $ | 2,621,747 | | | | | | 0.0 | | |
| 2,917,512 | | | Seasoned Credit Risk
Transfer Trust
Series 2019-1 HT,
3.000%, 07/25/2058 | | | | | 2,612,233 | | | | | | 0.0 | | |
| 1,759,529 | | | Seasoned Credit Risk
Transfer Trust
Series 2019-2 HT,
3.000%, 08/25/2058 | | | | | 1,576,336 | | | | | | 0.0 | | |
| 787,487 | | | Seasoned Credit Risk
Transfer Trust
Series 2019-3 HT,
3.000%, 10/25/2058 | | | | | 705,611 | | | | | | 0.0 | | |
| 2,141,175 | | | Seasoned Credit Risk
Transfer Trust
Series 2019-3 MA,
3.500%, 10/25/2058 | | | | | 2,049,659 | | | | | | 0.0 | | |
| 556,733 | | | Seasoned Credit Risk
Transfer Trust
Series 2019-4 M55D,
4.000%, 02/25/2059 | | | | | 533,724 | | | | | | 0.0 | | |
| 32,340,000 | | | Seasoned Loans
Structured Transaction
Trust Series 2019-3
A2C, 2.750%,
11/25/2029 | | | | | 28,717,309 | | | | | | 0.4 | | |
| 970,769 (1)(3) | | | Sequoia Mortgage
Trust 2015-2 B3,
3.767%, 05/25/2045 | | | | | 827,437 | | | | | | 0.0 | | |
| 982,625 (1)(3) | | | Sequoia Mortgage
Trust 2015-3 B3,
3.722%, 07/25/2045 | | | | | 708,654 | | | | | | 0.0 | | |
| 679,344 (1)(3) | | | Sequoia Mortgage
Trust 2017-5 B3,
3.781%, 08/25/2047 | | | | | 602,049 | | | | | | 0.0 | | |
| 171,010 (1)(3) | | | Sequoia Mortgage
Trust 2018-CH1 A19,
4.000%, 03/25/2048 | | | | | 159,481 | | | | | | 0.0 | | |
| 2,387,722 (1)(3) | | | Sequoia Mortgage
Trust 2018-CH1 B2B,
4.445%, 03/25/2048 | | | | | 2,183,870 | | | | | | 0.0 | | |
| 610,603 (1)(3) | | | Sequoia Mortgage
Trust 2019-4 A19,
3.500%, 11/25/2049 | | | | | 544,606 | | | | | | 0.0 | | |
| 131,828 (1)(3) | | | Sequoia Mortgage
Trust 2019-CH2 A1,
4.500%, 08/25/2049 | | | | | 129,777 | | | | | | 0.0 | | |
| 1,884,951 (1)(3) | | | Sequoia Mortgage
Trust 2020-2 B2,
3.640%, 03/25/2050 | | | | | 1,581,301 | | | | | | 0.0 | | |
See Accompanying Notes to Financial Statements
PORTFOLIO OF INVESTMENTS
| Voya Intermediate Bond Fund | as of March 31, 2023 (continued) |
Principal
Amount† | | | Value | | | Percentage
of Net
Assets | |
| COLLATERALIZED MORTGAGE OBLIGATIONS: (continued) | |
| 2,869,336 (1)(3) | | | Sequoia Mortgage
Trust 2020-3 B2,
3.325%, 04/25/2050 | | | | $ | 2,352,065 | | | | | | 0.0 | | |
| 1,126,707 (1)(3) | | | Sequoia Mortgage
Trust 2021-5 A19,
2.500%, 07/25/2051 | | | | | 891,949 | | | | | | 0.0 | | |
| 959,160 (1)(3) | | | Sequoia Mortgage
Trust 2021-5 B3,
3.050%, 07/25/2051 | | | | | 626,865 | | | | | | 0.0 | | |
| 1,729,800 (1)(3) | | | Shellpoint Co-Originator
Trust 2017-2 B2,
3.640%, 10/25/2047 | | | | | 1,567,322 | | | | | | 0.0 | | |
| 1,000,000 (1)(3) | | | Starwood Mortgage
Residential Trust
2022-2 M1, 4.200%,
02/25/2067 | | | | | 703,692 | | | | | | 0.0 | | |
| 2,230,197 (1)(3) | | | TIAA Bank Mortgage
Loan Trust 2018-2 B2,
3.692%, 07/25/2048 | | | | | 1,964,479 | | | | | | 0.0 | | |
| 380,332 (3) | | | Wachovia Mortgage
Loan LLC
Series 2005-B 2A1,
4.160%, 10/20/2035 | | | | | 356,411 | | | | | | 0.0 | | |
| 168,636 (3) | | | WaMu Mortgage Pass
Through Certificates
Series 2006-AR12 2A3,
3.187%, 10/25/2036 | | | | | 148,326 | | | | | | 0.0 | | |
| 2,152,827 (3) | | | WaMu Mortgage
Pass-Through
Certificates
Series 2004-AR4 A6
Trust, 3.470%,
06/25/2034 | | | | | 2,010,853 | | | | | | 0.0 | | |
| 1,207,030 | | | WaMu Mortgage
Pass-Through
Certificates
Series 2005-AR11
A1C3, 5.865%,
(US0001M + 0.510)%,
08/25/2045 | | | | | 1,130,265 | | | | | | 0.0 | | |
| 41,780,627 (3)(4) | | | WaMu Mortgage
Pass-Through
Certificates
Series 2005-AR11 X,
4.250%, 08/25/2045 | | | | | 38,177 | | | | | | 0.0 | | |
| 913,157 | | | WaMu Mortgage
Pass-Through
Certificates
Series 2005-AR13
A1C3, 5.825%,
(US0001M + 0.490)%,
10/25/2045 | | | | | 835,365 | | | | | | 0.0 | | |
Principal
Amount† | | | Value | | | Percentage
of Net
Assets | |
| COLLATERALIZED MORTGAGE OBLIGATIONS: (continued) | |
| 236,886 (3) | | | WaMu Mortgage
Pass-Through
Certificates
Series 2006-AR12 1A1,
3.805%, 10/25/2036 | | | | $ | 208,068 | | | | | | 0.0 | | |
| 503,653 (3) | | | WaMu Mortgage
Pass-Through
Certificates
Series 2006-AR14 1A4,
3.342%, 11/25/2036 | | | | | 419,370 | | | | | | 0.0 | | |
| 600,286 (3) | | | WaMu Mortgage
Pass-Through
Certificates
Series 2006-AR16 2A1,
3.404%, 12/25/2036 | | | | | 506,366 | | | | | | 0.0 | | |
| 1,387,795 (3) | | | WaMu Mortgage
Pass-Through
Certificates
Series 2006-AR16 2A3,
3.404%, 12/25/2036 | | | | | 1,308,675 | | | | | | 0.0 | | |
| 819,292 (3) | | | WaMu Mortgage
Pass-Through
Certificates
Series 2006-AR8 1A4,
3.680%, 08/25/2046 | | | | | 707,629 | | | | | | 0.0 | | |
| 1,145,439 (3) | | | WaMu Mortgage
Pass-Through
Certificates
Series 2007-HY2 1A1,
3.489%, 12/25/2036 | | | | | 998,091 | | | | | | 0.0 | | |
| 319,339 (3) | | | WaMu Mortgage
Pass-Through
Certificates
Series 2007-HY3 1A1,
3.462%, 03/25/2037 | | | | | 246,848 | | | | | | 0.0 | | |
| 1,000,540 | | | Washington Mutual
Mortgage
Pass-Through
Certificates WMALT
Series 2005-10 2A3,
5.745%, (US0001M +
0.900)%, 11/25/2035 | | | | | 854,535 | | | | | | 0.0 | | |
| 896,649 | | | Washington Mutual
Mortgage
Pass-Through
Certificates WMALT
Series 2005-11 A1,
5.750%, 01/25/2036 | | | | | 744,574 | | | | | | 0.0 | | |
See Accompanying Notes to Financial Statements
PORTFOLIO OF INVESTMENTS
| Voya Intermediate Bond Fund | as of March 31, 2023 (continued) |
Principal
Amount† | | | Value | | | Percentage
of Net
Assets | |
| COLLATERALIZED MORTGAGE OBLIGATIONS: (continued) | |
| 587,800 | | | Washington Mutual
Mortgage
Pass-Through
Certificates WMALT
Series 2005-5 CB3,
5.500%, 07/25/2035 | | | | $ | 532,970 | | | | | | 0.0 | | |
| 249,236 | | | Washington Mutual
Mortgage
Pass-Through
Certificates WMALT
Series 2005-8 1A2,
5.500%, 10/25/2035 | | | | | 234,699 | | | | | | 0.0 | | |
| 3,079,628 | | | Washington Mutual
Mortgage
Pass-Through
Certificates WMALT
Series 2006-AR6 2A,
4.098%, (12MTA +
0.960)%, 08/25/2046 | | | | | 1,866,228 | | | | | | 0.0 | | |
| 482,334 | | | Washington Mutual
Mortgage
Pass-Through
Certificates WMALT
Series 2007-OC1 A3,
5.305%, (US0001M +
0.460)%, 01/25/2047 | | | | | 419,399 | | | | | | 0.0 | | |
| 999,251 | | | Washington Mutual
Mortgage
Pass-Through
Certificates WMALT
Series 2007-OC1 A4,
5.485%, (US0001M +
0.640)%, 01/25/2047 | | | | | 878,293 | | | | | | 0.0 | | |
| 410,904 | | | Wells Fargo Alternative
Loan 2007-PA2 2A1,
5.275%, (US0001M +
0.430)%, 06/25/2037 | | | | | 329,610 | | | | | | 0.0 | | |
| 439,548 | | | Wells Fargo Alternative
Loan 2007-PA3 3A1,
6.250%, 07/25/2037 | | | | | 374,706 | | | | | | 0.0 | | |
| 132,726 (3) | | | Wells Fargo Mortgage
Backed Securities
2006-AR4 2A4,
4.637%, 04/25/2036 | | | | | 123,016 | | | | | | 0.0 | | |
| 1,907,562 (1)(3) | | | Wells Fargo Mortgage
Backed Securities
2019-4 B3 Trust,
3.515%, 09/25/2049 | | | | | 1,269,953 | | | | | | 0.0 | | |
| 596,338 (1)(3) | | | WinWater Mortgage
Loan Trust 2015-5 B3,
3.756%, 08/20/2045 | | | | | 547,981 | | | | | | 0.0 | | |
Principal
Amount† | | | Value | | | Percentage
of Net
Assets | |
| COLLATERALIZED MORTGAGE OBLIGATIONS: (continued) | |
| 972,818 (1)(3) | | | WinWater Mortgage
Loan Trust 2015-5 B4,
3.756%, 08/20/2045 | | | | $ | 872,267 | | | | | | 0.0 | | |
| | | | Federal Home Loan Mortgage Corporation: 0.2% | |
| 58,553,338 (4) | | | Freddie Mac REMICS
5072 QI, 3.500%,
10/25/2050 | | | | | 11,859,487 | | | | | | 0.2 | | |
| | | | Total Collateralized
Mortgage Obligations
(Cost $1,389,047,084) | | | | | 1,234,485,297 | | | | | | 16.1 | | |
| U.S. TREASURY OBLIGATIONS: 14.7% | |
| | | | U.S. Treasury Bonds: 0.3% | |
| 58,000 | | | 1.250%, 05/15/2050 | | | | | 33,753 | | | | | | 0.0 | | |
| 2,699,000 | | | 1.375%, 11/15/2040 | | | | | 1,861,361 | | | | | | 0.0 | | |
| 268,000 | | | 1.625%, 11/15/2050 | | | | | 172,023 | | | | | | 0.0 | | |
| 9,469,100 | | | 2.875%, 05/15/2052 | | | | | 8,104,403 | | | | | | 0.1 | | |
| 14,333,300 | | | 3.250%, 05/15/2042 | | | | | 13,232,547 | | | | | | 0.2 | | |
| | | | | | | | | 23,404,087 | | | | | | 0.3 | | |
| | | | U.S. Treasury Notes: 14.4% | |
| 100,000 | | | 0.125%, 10/15/2023 | | | | | 97,569 | | | | | | 0.0 | | |
| 25,162,000 | | | 0.500%, 11/30/2023 | | | | | 24,471,816 | | | | | | 0.3 | | |
| 132,000 | | | 0.625%, 05/15/2030 | | | | | 108,101 | | | | | | 0.0 | | |
| 32,536,700 | | | 0.875%, 01/31/2024 | | | | | 31,509,763 | | | | | | 0.4 | | |
| 8,184,600 | | | 1.250%, 11/30/2026 | | | | | 7,489,389 | | | | | | 0.1 | | |
| 25,131,200 | | | 1.250%, 09/30/2028 | | | | | 22,182,702 | | | | | | 0.3 | | |
| 3,309,100 | | | 1.500%, 01/31/2027 | | | | | 3,047,345 | | | | | | 0.0 | | |
| 17,183,400 | | | 1.500%, 11/30/2028 | | | | | 15,332,493 | | | | | | 0.2 | | |
| 50,000,000 | | | 2.750%, 05/15/2025 | | | | | 48,702,148 | | | | | | 0.6 | | |
| 4,089,400 | | | 2.750%, 08/15/2032 | | | | | 3,849,467 | | | | | | 0.1 | | |
| 47,978,800 | | | 3.500%, 02/15/2033 | | | | | 48,057,515 | | | | | | 0.6 | | |
| 207,980,000 | | | 3.625%, 03/31/2028 | | | | | 208,337,466 | | | | | | 2.7 | | |
| 123,054,000 | | | 3.875%, 03/31/2025 | | | | | 122,686,280 | | | | | | 1.6 | | |
| 194,229,300 | | | 3.875%, 02/15/2043 | | | | | 196,004,676 | | | | | | 2.6 | | |
| 41,567,000 (2) | | | 4.000%, 02/29/2028 | | | | | 42,322,025 | | | | | | 0.6 | | |
| 12,965,000 | | | 4.000%, 02/28/2030 | | | | | 13,309,383 | | | | | | 0.2 | | |
| 96,795,200 | | | 4.000%, 11/15/2052 | | | | | 102,754,154 | | | | | | 1.3 | | |
| 27,258,000 (2) | | | 4.625%, 02/28/2025 | | | | | 27,525,256 | | | | | | 0.4 | | |
| 181,883,000 | | | 4.625%, 03/15/2026 | | | | | 186,039,310 | | | | | | 2.4 | | |
| | | | | | | | | 1,103,826,858 | | | | | | 14.4 | | |
| | | | Total U.S. Treasury
Obligations
(Cost $1,120,493,136) | | | | | 1,127,230,945 | | | | | | 14.7 | | |
| U.S. GOVERNMENT AGENCY OBLIGATIONS: 20.1% | |
| | | | Federal Home Loan Mortgage Corporation: 1.9%(5) | |
| 225,949 | | | 2.500%, 05/01/2030 | | | | | 214,766 | | | | | | 0.0 | | |
| 375,971 | | | 2.500%, 05/01/2030 | | | | | 357,372 | | | | | | 0.0 | | |
| 520,709 | | | 2.500%, 06/01/2030 | | | | | 492,587 | | | | | | 0.0 | | |
| 787,941 | | | 3.000%, 11/01/2042 | | | | | 728,316 | | | | | | 0.0 | | |
| 754,904 | | | 3.000%, 02/01/2043 | | | | | 697,776 | | | | | | 0.0 | | |
| 744,312 | | | 3.000%, 03/01/2045 | | | | | 687,341 | | | | | | 0.0 | | |
See Accompanying Notes to Financial Statements
PORTFOLIO OF INVESTMENTS
| Voya Intermediate Bond Fund | as of March 31, 2023 (continued) |
Principal
Amount† | | | Value | | | Percentage
of Net
Assets | |
| U.S. GOVERNMENT AGENCY OBLIGATIONS: (continued) | |
| | | | Federal Home Loan Mortgage
Corporation (continued) | |
| 983,819 | | | 3.000%, 03/01/2045 | | | | $ | 909,340 | | | | | | 0.0 | | |
| 2,378,263 | | | 3.000%, 04/01/2045 | | | | | 2,195,737 | | | | | | 0.0 | | |
| 2,518,193 | | | 3.000%, 04/01/2045 | | | | | 2,325,971 | | | | | | 0.0 | | |
| 1,117,203 | | | 3.000%, 10/01/2046 | | | | | 1,031,214 | | | | | | 0.0 | | |
| 9,308,480 | | | 3.000%, 10/01/2046 | | | | | 8,547,276 | | | | | | 0.1 | | |
| 4,471,565 | | | 3.000%, 03/01/2048 | | | | | 4,104,492 | | | | | | 0.1 | | |
| 3,522,395 | | | 3.000%, 03/01/2048 | | | | | 3,234,503 | | | | | | 0.1 | | |
| 10,998,436 | | | 3.000%, 08/01/2048 | | | | | 10,046,588 | | | | | | 0.1 | | |
| 3,506,520 | | | 3.500%, 01/01/2045 | | | | | 3,328,949 | | | | | | 0.1 | | |
| 1,212,989 | | | 3.500%, 03/01/2045 | | | | | 1,147,576 | | | | | | 0.0 | | |
| 5,731,568 | | | 3.500%, 12/01/2046 | | | | | 5,424,231 | | | | | | 0.1 | | |
| 9,763,175 | | | 3.500%, 12/01/2046 | | | | | 9,236,602 | | | | | | 0.1 | | |
| 4,236,034 | | | 3.500%, 04/01/2047 | | | | | 4,020,348 | | | | | | 0.1 | | |
| 2,963,578 | | | 3.500%, 07/01/2047 | | | | | 2,803,730 | | | | | | 0.1 | | |
| 2,762,590 | | | 3.500%, 10/01/2047 | | | | | 2,614,288 | | | | | | 0.1 | | |
| 10,804,197 | | | 3.500%, 01/01/2048 | | | | | 10,209,640 | | | | | | 0.1 | | |
| 1,465,782 | | | 3.500%, 03/01/2048 | | | | | 1,381,118 | | | | | | 0.0 | | |
| 26,569,020 | | | 3.500%, 03/01/2048 | | | | | 25,169,209 | | | | | | 0.3 | | |
| 17,604,939 | | | 3.500%, 11/01/2048 | | | | | 16,660,703 | | | | | | 0.2 | | |
| 2,605 | | | 3.552%, (US0012M +
1.773)%, 05/01/2037 | | | | | 2,585 | | | | | | 0.0 | | |
| 304,484 | | | 4.000%, 10/01/2041 | | | | | 298,597 | | | | | | 0.0 | | |
| 591,436 | | | 4.000%, 12/01/2041 | | | | | 580,002 | | | | | | 0.0 | | |
| 1,617,932 | | | 4.000%, 08/01/2044 | | | | | 1,580,618 | | | | | | 0.0 | | |
| 414,400 | | | 4.000%, 07/01/2045 | | | | | 405,008 | | | | | | 0.0 | | |
| 999,785 | | | 4.000%, 09/01/2045 | | | | | 976,729 | | | | | | 0.0 | | |
| 1,273,178 | | | 4.000%, 09/01/2045 | | | | | 1,243,816 | | | | | | 0.0 | | |
| 751,246 | | | 4.000%, 09/01/2045 | | | | | 733,919 | | | | | | 0.0 | | |
| 9,523,264 | | | 4.000%, 11/01/2045 | | | | | 9,303,634 | | | | | | 0.1 | | |
| 1,041,479 | | | 4.000%, 05/01/2046 | | | | | 1,017,352 | | | | | | 0.0 | | |
| 696,968 | | | 4.000%, 05/01/2047 | | | | | 682,549 | | | | | | 0.0 | | |
| 3,513,826 | | | 4.000%, 11/01/2047 | | | | | 3,398,918 | | | | | | 0.1 | | |
| 251,937 | | | 4.000%, 03/01/2048 | | | | | 245,660 | | | | | | 0.0 | | |
| 4,152,284 | | | 4.000%, 06/01/2048 | | | | | 4,087,375 | | | | | | 0.1 | | |
| 147,536 | | | 4.500%, 08/01/2041 | | | | | 146,855 | | | | | | 0.0 | | |
| 423,219 | | | 4.500%, 09/01/2041 | | | | | 426,485 | | | | | | 0.0 | | |
| 392,857 | | | 4.500%, 10/01/2041 | | | | | 395,885 | | | | | | 0.0 | | |
| 1,048,937 | | | 4.500%, 03/01/2044 | | | | | 1,050,546 | | | | | | 0.0 | | |
| 1,813,710 | | | 4.500%, 02/01/2048 | | | | | 1,812,427 | | | | | | 0.0 | | |
| 248,347 | | | 4.500%, 06/01/2048 | | | | | 248,123 | | | | | | 0.0 | | |
| 39,555 | | | 5.000%, 01/01/2041 | | | | | 40,479 | | | | | | 0.0 | | |
| 211,427 | | | 5.000%, 04/01/2041 | | | | | 216,629 | | | | | | 0.0 | | |
| 13,696 | | | 5.500%, 07/01/2037 | | | | | 14,247 | | | | | | 0.0 | | |
| 822,406 | | | 5.500%, 11/01/2038 | | | | | 855,508 | | | | | | 0.0 | | |
| 909 | | | 6.000%, 12/01/2028 | | | | | 930 | | | | | | 0.0 | | |
| 10,739 | | | 6.000%, 01/01/2029 | | | | | 10,983 | | | | | | 0.0 | | |
| 473 | | | 6.500%, 01/01/2024 | | | | | 489 | | | | | | 0.0 | | |
| 2,405 | | | 6.500%, 12/01/2031 | | | | | 2,499 | | | | | | 0.0 | | |
| 234,464 | | | 6.500%, 09/01/2034 | | | | | 244,753 | | | | | | 0.0 | | |
| | | | | | | | | 147,593,273 | | | | | | 1.9 | | |
Principal
Amount† | | | Value | | | Percentage
of Net
Assets | |
| U.S. GOVERNMENT AGENCY OBLIGATIONS: (continued) | |
| | | | Federal National Mortgage
Association: 0.4%(5) | |
| 16,754,306 | | | 3.000%, 12/01/2054 | | | | $ | 15,034,794 | | | | | | 0.2 | | |
| 2,461,391 | | | 3.500%, 01/01/2044 | | | | | 2,334,396 | | | | | | 0.0 | | |
| 23,704 | | | 3.637%, (US0012M +
1.486)%, 07/01/2035 | | | | | 23,252 | | | | | | 0.0 | | |
| 3,108,217 | | | 4.000%,12/01/2046 | | | | | 3,040,342 | | | | | | 0.1 | | |
| 1,094,556 | | | 4.500%, 09/01/2047 | | | | | 1,128,156 | | | | | | 0.0 | | |
| 8,523,205 | | | 5.000%, 08/01/2056 | | | | | 8,826,730 | | | | | | 0.1 | | |
| 64,796 | | | 6.000%, 05/01/2038 | | | | | 66,174 | | | | | | 0.0 | | |
| | | | | | | | | 30,453,844 | | | | | | 0.4 | | |
| | | | Government National Mortgage Association: 3.5% | |
| 9,563,938 | | | 2.500%, 03/20/2051 | | | | | 8,429,743 | | | | | | 0.1 | | |
| 5,614,790 | | | 2.500%, 04/20/2051 | | | | | 4,927,976 | | | | | | 0.1 | | |
| 22,554,934 | | | 2.500%, 04/20/2051 | | | | | 19,967,048 | | | | | | 0.3 | | |
| 7,755,417 | | | 2.500%, 05/20/2051 | | | | | 6,853,084 | | | | | | 0.1 | | |
| 20,093,439 | | | 2.500%, 08/20/2051 | | | | | 17,709,850 | | | | | | 0.2 | | |
| 8,708,357 | | | 2.500%, 09/20/2051 | | | | | 7,673,584 | | | | | | 0.1 | | |
| 34,041,825 | | | 2.500%, 10/20/2051 | | | | | 30,003,537 | | | | | | 0.4 | | |
| 15,039,759 | | | 2.500%, 11/20/2051 | | | | | 13,255,653 | | | | | | 0.2 | | |
| 19,965,227 | | | 2.500%, 12/20/2051 | | | | | 17,591,750 | | | | | | 0.2 | | |
| 26,214,815 | | | 2.500%, 04/20/2052 | | | | | 23,096,750 | | | | | | 0.3 | | |
| 6,084,038 | | | 3.000%, 10/20/2049 | | | | | 5,577,431 | | | | | | 0.1 | | |
| 3,380,175 | | | 3.000%, 11/20/2049 | | | | | 3,098,720 | | | | | | 0.0 | | |
| 2,820,154 | | | 3.000%, 10/20/2051 | | | | | 2,580,149 | | | | | | 0.0 | | |
| 4,683,768 | | | 3.000%, 10/20/2051 | | | | | 4,325,527 | | | | | | 0.1 | | |
| 2,866,075 | | | 3.000%, 11/20/2051 | | | | | 2,646,855 | | | | | | 0.0 | | |
| 623,656 | | | 3.500%, 07/20/2046 | | | | | 585,179 | | | | | | 0.0 | | |
| 3,133,421 | | | 3.500%, 07/20/2046 | | | | | 2,878,779 | | | | | | 0.0 | | |
| 998,324 | | | 3.500%, 10/20/2046 | | | | | 944,138 | | | | | | 0.0 | | |
| 458,297 | | | 3.500%, 02/20/2047 | | | | | 435,690 | | | | | | 0.0 | | |
| 385,679 | | | 3.500%, 03/20/2047 | | | | | 366,652 | | | | | | 0.0 | | |
| 307,230 | | | 3.500%, 07/20/2047 | | | | | 292,513 | | | | | | 0.0 | | |
| 576,855 | | | 3.500%, 08/20/2047 | | | | | 548,399 | | | | | | 0.0 | | |
| 910,701 | | | 3.500%, 09/20/2047 | | | | | 861,269 | | | | | | 0.0 | | |
| 6,407,136 | | | 3.500%, 12/20/2047 | | | | | 6,091,370 | | | | | | 0.1 | | |
| 3,846,717 | | | 3.500%, 01/20/2048 | | | | | 3,657,126 | | | | | | 0.1 | | |
| 5,854,466 | | | 3.500%, 02/20/2048 | | | | | 5,566,091 | | | | | | 0.1 | | |
| 3,316,585 | | | 3.500%, 02/20/2048 | | | | | 3,153,214 | | | | | | 0.0 | | |
| 573,187 | | | 3.500%, 03/20/2048 | | | | | 544,907 | | | | | | 0.0 | | |
| 15,471,743 | | | 3.500%, 03/20/2048 | | | | | 14,708,590 | | | | | | 0.2 | | |
| 117,384 | | | 4.000%, 11/20/2040 | | | | | 116,013 | | | | | | 0.0 | | |
| 686,386 | | | 4.000%, 03/20/2046 | | | | | 671,569 | | | | | | 0.0 | | |
| 8,485,775 | | | 4.000%, 09/20/2047 | | | | | 8,313,223 | | | | | | 0.1 | | |
| 4,113,065 | | | 4.000%, 02/20/2050 | | | | | 4,008,454 | | | | | | 0.1 | | |
| 24,844,000 (6) | | | 4.000%, 04/15/2053 | | | | | 23,920,209 | | | | | | 0.3 | | |
| 148,161 | | | 4.500%, 10/15/2039 | | | | | 149,628 | | | | | | 0.0 | | |
| 108,075 | | | 4.500%, 11/15/2039 | | | | | 109,245 | | | | | | 0.0 | | |
| 120,124 | | | 4.500%, 11/15/2039 | | | | | 121,424 | | | | | | 0.0 | | |
| 38,658 | | | 4.500%, 12/15/2039 | | | | | 39,041 | | | | | | 0.0 | | |
| 7,003,129 | | | 4.500%, 08/20/2040 | | | | | 7,098,291 | | | | | | 0.1 | | |
See Accompanying Notes to Financial Statements
PORTFOLIO OF INVESTMENTS
| Voya Intermediate Bond Fund | as of March 31, 2023 (continued) |
Principal
Amount† | | | Value | | | Percentage
of Net
Assets | |
| U.S. GOVERNMENT AGENCY OBLIGATIONS: (continued) | |
| | | | Government National Mortgage
Association (continued) | |
| 8,184,840 | | | 4.500%, 09/20/2040 | | | | $ | 8,295,308 | | | | | | 0.1 | | |
| 5,383,159 | | | 4.500%, 06/20/2041 | | | | | 5,456,347 | | | | | | 0.1 | | |
| 34,795 | | | 4.500%, 08/20/2041 | | | | | 35,268 | | | | | | 0.0 | | |
| 649,478 | | | 4.500%, 09/15/2047 | | | | | 651,172 | | | | | | 0.0 | | |
| | | | | | | | | 267,356,766 | | | | | | 3.5 | | |
| | | | Uniform Mortgage-Backed
Securities: 14.3% | |
| 19,474,982 | | | 2.000%, 12/01/2050 | | | | | 16,178,216 | | | | | | 0.2 | | |
| 26,484,046 | | | 2.000%, 05/01/2051 | | | | | 21,978,064 | | | | | | 0.3 | | |
| 35,189,265 | | | 2.000%, 05/01/2051 | | | | | 29,202,194 | | | | | | 0.4 | | |
| 12,172,620 | | | 2.000%, 05/01/2051 | | | | | 10,203,490 | | | | | | 0.1 | | |
| 997,345 | | | 2.000%, 07/01/2051 | | | | | 827,355 | | | | | | 0.0 | | |
| 5,153,122 | | | 2.000%, 08/01/2051 | | | | | 4,277,754 | | | | | | 0.1 | | |
| 10,803,684 | | | 2.000%, 08/01/2051 | | | | | 8,964,848 | | | | | | 0.1 | | |
| 20,970,946 | | | 2.000%, 09/01/2051 | | | | | 17,398,068 | | | | | | 0.2 | | |
| 9,868,481 | | | 2.000%, 10/01/2051 | | | | | 8,173,679 | | | | | | 0.1 | | |
| 2,205,478 | | | 2.000%, 11/01/2051 | | | | | 1,831,231 | | | | | | 0.0 | | |
| 983,444 | | | 2.000%, 11/01/2051 | | | | | 816,492 | | | | | | 0.0 | | |
| 17,877,561 | | | 2.000%, 11/01/2051 | | | | | 14,907,197 | | | | | | 0.2 | | |
| 9,226,220 | | | 2.000%, 12/01/2051 | | | | | 7,700,832 | | | | | | 0.1 | | |
| 29,671,459 | | | 2.000%, 12/01/2051 | | | | | 24,606,192 | | | | | | 0.3 | | |
| 5,105,249 | | | 2.000%, 01/01/2052 | | | | | 4,273,418 | | | | | | 0.1 | | |
| 8,998,560 | | | 2.000%, 02/01/2052 | | | | | 7,519,354 | | | | | | 0.1 | | |
| 14,706,946 | | | 2.000%, 02/01/2052 | | | | | 12,289,552 | | | | | | 0.2 | | |
| 8,783,233 | | | 2.000%, 02/01/2052 | | | | | 7,332,360 | | | | | | 0.1 | | |
| 25,285,457 | | | 2.000%, 02/01/2052 | | | | | 20,946,040 | | | | | | 0.3 | | |
| 12,428,753 | | | 2.000%, 02/01/2052 | | | | | 10,385,701 | | | | | | 0.1 | | |
| 12,354,989 | | | 2.000%, 02/01/2052 | | | | | 10,314,286 | | | | | | 0.1 | | |
| 5,121,052 | | | 2.000%, 02/01/2052 | | | | | 4,256,550 | | | | | | 0.1 | | |
| 4,607,634 | | | 2.000%, 02/01/2052 | | | | | 3,850,232 | | | | | | 0.1 | | |
| 27,967,073 | | | 2.000%, 02/01/2052 | | | | | 23,245,950 | | | | | | 0.3 | | |
| 5,539,963 | | | 2.000%, 03/01/2052 | | | | | 4,644,156 | | | | | | 0.1 | | |
| 6,021,676 | | | 2.000%, 03/01/2052 | | | | | 4,996,709 | | | | | | 0.1 | | |
| 4,926,384 | | | 2.000%, 03/01/2052 | | | | | 4,094,766 | | | | | | 0.1 | | |
| 28,567,122 | | | 2.000%, 03/01/2052 | | | | | 23,664,293 | | | | | | 0.3 | | |
| 6,663,595 | | | 2.000%, 04/01/2052 | | | | | 5,568,244 | | | | | | 0.1 | | |
| 717,176 | | | 2.500%, 05/01/2030 | | | | | 678,892 | | | | | | 0.0 | | |
| 1,430,211 | | | 2.500%, 06/01/2030 | | | | | 1,353,905 | | | | | | 0.0 | | |
| 1,074,525 | | | 2.500%, 06/01/2030 | | | | | 1,017,231 | | | | | | 0.0 | | |
| 624,495 | | | 2.500%, 07/01/2030 | | | | | 591,212 | | | | | | 0.0 | | |
| 14,903 | | | 2.500%, 02/01/2050 | | | | | 12,921 | | | | | | 0.0 | | |
| 23,904 | | | 2.500%, 04/01/2050 | | | | | 20,694 | | | | | | 0.0 | | |
| 189,653 | | | 2.500%, 05/01/2050 | | | | | 164,136 | | | | | | 0.0 | | |
| 69,490 | | | 2.500%, 05/01/2050 | | | | | 60,152 | | | | | | 0.0 | | |
| 19,758 | | | 2.500%, 05/01/2050 | | | | | 17,101 | | | | | | 0.0 | | |
| 36,521 | | | 2.500%, 05/01/2050 | | | | | 31,616 | | | | | | 0.0 | | |
| 37,784 | | | 2.500%, 05/01/2050 | | | | | 32,707 | | | | | | 0.0 | | |
| 16,438 | | | 2.500%, 06/01/2050 | | | | | 14,225 | | | | | | 0.0 | | |
| 21,342,635 | | | 2.500%, 06/01/2050 | | | | | 18,679,450 | | | | | | 0.3 | | |
| 1,779,417 | | | 2.500%, 06/01/2050 | | | | | 1,551,584 | | | | | | 0.0 | | |
| 27,869,471 | | | 2.500%, 07/01/2050 | | | | | 24,143,420 | | | | | | 0.3 | | |
Principal
Amount† | | | Value | | | Percentage
of Net
Assets | |
| U.S. GOVERNMENT AGENCY OBLIGATIONS: (continued) | |
| | | | Uniform Mortgage-Backed
Securities (continued) | |
| 245,535 | | | 2.500%, 07/01/2050 | | | | $ | 212,349 | | | | | | 0.0 | | |
| 3,533,517 | | | 2.500%, 07/01/2050 | | | | | 3,061,028 | | | | | | 0.0 | | |
| 24,467,865 | | | 2.500%, 08/01/2050 | | | | | 21,414,565 | | | | | | 0.3 | | |
| 2,004,152 | | | 2.500%, 08/01/2050 | | | | | 1,737,297 | | | | | | 0.0 | | |
| 752,142 | | | 2.500%, 08/01/2050 | | | | | 652,431 | | | | | | 0.0 | | |
| 2,254,530 | | | 2.500%, 08/01/2050 | | | | | 1,951,023 | | | | | | 0.0 | | |
| 108,407 | | | 2.500%, 08/01/2050 | | | | | 93,714 | | | | | | 0.0 | | |
| 28,133 | | | 2.500%, 09/01/2050 | | | | | 24,474 | | | | | | 0.0 | | |
| 874,306 | | | 2.500%, 09/01/2050 | | | | | 756,676 | | | | | | 0.0 | | |
| 1,007,254 | | | 2.500%, 09/01/2050 | | | | | 874,108 | | | | | | 0.0 | | |
| 86,720 | | | 2.500%, 09/01/2050 | | | | | 75,059 | | | | | | 0.0 | | |
| 218,359 | | | 2.500%, 09/01/2050 | | | | | 188,913 | | | | | | 0.0 | | |
| 4,297,735 | | | 2.500%, 10/01/2050 | | | | | 3,719,515 | | | | | | 0.1 | | |
| 4,597,967 | | | 2.500%, 10/01/2050 | | | | | 3,978,288 | | | | | | 0.1 | | |
| 3,756,593 | | | 2.500%, 11/01/2050 | | | | | 3,293,951 | | | | | | 0.1 | | |
| 88,096 | | | 2.500%, 01/01/2051 | | | | | 76,191 | | | | | | 0.0 | | |
| 10,433,908 | | | 2.500%, 02/01/2051 | | | | | 9,005,488 | | | | | | 0.1 | | |
| 24,348,756 | | | 2.500%, 04/01/2051 | | | | | 21,018,107 | | | | | | 0.3 | | |
| 3,624,281 | | | 2.500%, 05/01/2051 | | | | | 3,149,985 | | | | | | 0.0 | | |
| 40,135,649 | | | 2.500%, 06/01/2051 | | | | | 34,688,675 | | | | | | 0.5 | | |
| 4,452,509 | | | 2.500%, 09/01/2051 | | | | | 3,847,199 | | | | | | 0.1 | | |
| 20,138,796 | | | 2.500%, 11/01/2051 | | | | | 17,426,016 | | | | | | 0.2 | | |
| 2,728,932 | | | 2.500%, 12/01/2051 | | | | | 2,377,640 | | | | | | 0.0 | | |
| 17,576,317 | | | 2.500%, 12/01/2051 | | | | | 15,340,781 | | | | | | 0.2 | | |
| 16,970,291 | | | 2.500%, 01/01/2052 | | | | | 14,807,347 | | | | | | 0.2 | | |
| 27,936,513 | | | 2.500%, 01/01/2052 | | | | | 24,271,083 | | | | | | 0.3 | | |
| 12,156,634 | | | 2.500%, 02/01/2052 | | | | | 10,500,313 | | | | | | 0.1 | | |
| 7,578,233 | | | 2.500%, 02/01/2052 | | | | | 6,573,127 | | | | | | 0.1 | | |
| 6,845,758 | | | 2.500%, 02/01/2052 | | | | | 5,936,465 | | | | | | 0.1 | | |
| 4,320,659 | | | 2.500%, 02/01/2052 | | | | | 3,770,312 | | | | | | 0.1 | | |
| 4,557,938 | | | 2.500%, 02/01/2052 | | | | | 3,970,310 | | | | | | 0.1 | | |
| 6,998,614 | | | 2.500%, 03/01/2052 | | | | | 6,089,859 | | | | | | 0.1 | | |
| 31,610,416 | | | 2.500%, 03/01/2052 | | | | | 27,502,129 | | | | | | 0.4 | | |
| 10,463,640 | | | 2.500%, 03/01/2052 | | | | | 9,085,517 | | | | | | 0.1 | | |
| 19,037,573 | | | 2.500%, 04/01/2052 | | | | | 16,530,159 | | | | | | 0.2 | | |
| 983,953 | | | 3.000%, 08/01/2030 | | | | | 943,563 | | | | | | 0.0 | | |
| 505,774 | | | 3.000%, 09/01/2030 | | | | | 484,979 | | | | | | 0.0 | | |
| 741,000 (6) | | | 3.000%, 04/15/2038 | | | | | 702,503 | | | | | | 0.0 | | |
| 1,747,279 | | | 3.000%, 04/01/2043 | | | | | 1,613,257 | | | | | | 0.0 | | |
| 1,584,688 | | | 3.000%, 07/01/2043 | | | | | 1,463,125 | | | | | | 0.0 | | |
| 519,025 | | | 3.000%, 08/01/2043 | | | | | 479,219 | | | | | | 0.0 | | |
| 330,416 | | | 3.000%, 09/01/2043 | | | | | 305,091 | | | | | | 0.0 | | |
| 5,442,976 | | | 3.000%, 04/01/2045 | | | | | 5,023,194 | | | | | | 0.1 | | |
| 1,031,208 | | | 3.000%, 08/01/2046 | | | | | 947,440 | | | | | | 0.0 | | |
| 2,343,230 | | | 3.000%, 08/01/2046 | | | | | 2,152,887 | | | | | | 0.0 | | |
| 722,555 | | | 3.000%, 11/01/2046 | | | | | 664,288 | | | | | | 0.0 | | |
| 1,655,826 | | | 3.000%, 12/01/2046 | | | | | 1,522,250 | | | | | | 0.0 | | |
| 6,590,583 | | | 3.000%, 12/01/2046 | | | | | 6,052,492 | | | | | | 0.1 | | |
| 12,325,597 | | | 3.000%, 01/01/2047 | | | | | 11,308,434 | | | | | | 0.2 | | |
| 2,992,554 | | | 3.000%, 02/01/2047 | | | | | 2,740,649 | | | | | | 0.0 | | |
| 3,547,150 | | | 3.000%, 03/01/2047 | | | | | 3,248,565 | | | | | | 0.0 | | |
See Accompanying Notes to Financial Statements
PORTFOLIO OF INVESTMENTS
| Voya Intermediate Bond Fund | as of March 31, 2023 (continued) |
Principal
Amount† | | | Value | | | Percentage
of Net
Assets | |
| U.S. GOVERNMENT AGENCY OBLIGATIONS: (continued) | |
| | | | Uniform Mortgage-Backed
Securities (continued) | |
| 2,943,982 | | | 3.000%, 07/01/2047 | | | | $ | 2,699,356 | | | | | | 0.0 | | |
| 22,487,645 | | | 3.000%, 10/01/2050 | | | | | 20,316,263 | | | | | | 0.3 | | |
| 2,180,495 | | | 3.000%, 03/01/2051 | | | | | 1,966,527 | | | | | | 0.0 | | |
| 46,434,902 | | | 3.000%, 01/01/2052 | | | | | 41,933,828 | | | | | | 0.6 | | |
| 5,713,287 | | | 3.000%, 01/01/2052 | | | | | 5,196,625 | | | | | | 0.1 | | |
| 6,180,220 | | | 3.000%, 02/01/2052 | | | | | 5,605,235 | | | | | | 0.1 | | |
| 4,772,575 | | | 3.000%, 02/01/2052 | | | | | 4,328,077 | | | | | | 0.1 | | |
| 4,020,809 | | | 3.000%, 02/01/2052 | | | | | 3,651,959 | | | | | | 0.1 | | |
| 6,319,931 | | | 3.000%, 02/01/2052 | | | | | 5,747,551 | | | | | | 0.1 | | |
| 5,843,353 | | | 3.000%, 02/01/2052 | | | | | 5,284,853 | | | | | | 0.1 | | |
| 12,448,723 | | | 3.000%, 02/01/2052 | | | | | 11,278,421 | | | | | | 0.2 | | |
| 11,025,093 | | | 3.000%, 03/01/2052 | | | | | 9,998,247 | | | | | | 0.1 | | |
| 17,696,113 | | | 3.000%, 03/01/2052 | | | | | 15,978,824 | | | | | | 0.2 | | |
| 21,718,261 | | | 3.000%, 05/01/2052 | | | | | 19,610,535 | | | | | | 0.3 | | |
| 47,607,332 | | | 3.000%, 05/01/2052 | | | | | 42,942,210 | | | | | | 0.6 | | |
| 14,889,102 | | | 3.500%, 06/01/2034 | | | | | 14,440,033 | | | | | | 0.2 | | |
| 2,009,115 | | | 3.500%, 10/01/2042 | | | | | 1,918,458 | | | | | | 0.0 | | |
| 924,214 | | | 3.500%, 04/01/2043 | | | | | 882,257 | | | | | | 0.0 | | |
| 2,630,575 | | | 3.500%, 08/01/2043 | | | | | 2,511,289 | | | | | | 0.0 | | |
| 1,618,637 | | | 3.500%, 03/01/2044 | | | | | 1,538,799 | | | | | | 0.0 | | |
| 190,161 | | | 3.500%, 01/01/2046 | | | | | 179,773 | | | | | | 0.0 | | |
| 142,139 | | | 3.500%, 02/01/2046 | | | | | 134,372 | | | | | | 0.0 | | |
| 284,531 | | | 3.500%, 02/01/2046 | | | | | 268,989 | | | | | | 0.0 | | |
| 12,012,259 | | | 3.500%, 08/01/2046 | | | | | 11,355,979 | | | | | | 0.2 | | |
| 783,318 | | | 3.500%, 08/01/2047 | | | | | 740,157 | | | | | | 0.0 | | |
| 1,044,985 | | | 3.500%, 09/01/2047 | | | | | 984,428 | | | | | | 0.0 | | |
| 13,836,780 | | | 3.500%, 11/01/2047 | | | | | 13,095,749 | | | | | | 0.2 | | |
| 403,958 | | | 3.500%, 12/01/2047 | | | | | 382,009 | | | | | | 0.0 | | |
| 928,396 | | | 3.500%, 02/01/2048 | | | | | 874,453 | | | | | | 0.0 | | |
| 849,038 | | | 3.500%, 05/01/2048 | | | | | 800,262 | | | | | | 0.0 | | |
| 8,202,279 | | | 3.500%, 07/01/2048 | | | | | 7,754,109 | | | | | | 0.1 | | |
| 1,991,938 | | | 3.500%, 10/01/2049 | | | | | 1,888,452 | | | | | | 0.0 | | |
| 2,664,417 | | | 3.500%, 02/01/2052 | | | | | 2,495,073 | | | | | | 0.0 | | |
| 107,927 | | | 4.000%, 03/01/2042 | | | | | 105,728 | | | | | | 0.0 | | |
| 885,417 | | | 4.000%, 07/01/2042 | | | | | 867,366 | | | | | | 0.0 | | |
| 114,487 | | | 4.000%, 07/01/2042 | | | | | 112,154 | | | | | | 0.0 | | |
| 309,357 | | | 4.000%, 07/01/2042 | | | | | 302,497 | | | | | | 0.0 | | |
| 446,014 | | | 4.000%, 09/01/2043 | | | | | 439,154 | | | | | | 0.0 | | |
| 8,958,020 | | | 4.000%, 01/01/2045 | | | | | 8,928,872 | | | | | | 0.1 | | |
| 1,071,991 | | | 4.000%, 01/01/2045 | | | | | 1,046,145 | | | | | | 0.0 | | |
| 975,909 | | | 4.000%, 03/01/2045 | | | | | 952,389 | | | | | | 0.0 | | |
| 3,191,801 | | | 4.000%, 05/01/2045 | | | | | 3,115,863 | | | | | | 0.0 | | |
| 930,697 | | | 4.000%, 06/01/2045 | | | | | 908,265 | | | | | | 0.0 | | |
| 926,856 | | | 4.000%, 11/01/2045 | | | | | 911,199 | | | | | | 0.0 | | |
| 2,701,866 | | | 4.000%, 02/01/2046 | | | | | 2,637,661 | | | | | | 0.0 | | |
| 4,629,999 | | | 4.000%, 07/01/2047 | | | | | 4,511,701 | | | | | | 0.1 | | |
| 1,201,779 | | | 4.000%, 08/01/2047 | | | | | 1,169,707 | | | | | | 0.0 | | |
| 412,696 | | | 4.000%, 08/01/2047 | | | | | 401,768 | | | | | | 0.0 | | |
| 491,039 | | | 4.000%, 03/01/2048 | | | | | 477,985 | | | | | | 0.0 | | |
| 98,763 | | | 4.000%, 03/01/2048 | | | | | 96,015 | | | | | | 0.0 | | |
| 3,279,138 | �� | | 4.000%, 09/01/2048 | | | | | 3,211,069 | | | | | | 0.0 | | |
Principal
Amount† | | | Value | | | Percentage
of Net
Assets | |
| U.S. GOVERNMENT AGENCY OBLIGATIONS: (continued) | |
| | | | Uniform Mortgage-Backed
Securities (continued) | |
| 8,723,655 | | | 4.000%, 04/01/2049 | | | | $ | 8,480,902 | | | | | | 0.1 | | |
| 9,621,968 | | | 4.000%, 05/01/2052 | | | | | 9,248,710 | | | | | | 0.1 | | |
| 6,427,985 | | | 4.000%, 06/01/2052 | | | | | 6,213,196 | | | | | | 0.1 | | |
| 28,082,044 | | | 4.000%, 08/01/2052 | | | | | 26,889,739 | | | | | | 0.4 | | |
| 3,546,188 | | | 4.000%, 11/01/2052 | | | | | 3,447,554 | | | | | | 0.1 | | |
| 18,947,000 (6) | | | 4.000%, 04/15/2053 | | | | | 18,122,582 | | | | | | 0.2 | | |
| 1,037,441 | | | 4.250%, 11/01/2043 | | | | | 1,026,301 | | | | | | 0.0 | | |
| 1,401,214 | | | 4.500%, 11/01/2040 | | | | | 1,410,484 | | | | | | 0.0 | | |
| 88,503 | | | 4.500%, 11/01/2040 | | | | | 89,089 | | | | | | 0.0 | | |
| 232,850 | | | 4.500%, 11/01/2040 | | | | | 234,391 | | | | | | 0.0 | | |
| 2,105 | | | 4.500%, 12/01/2040 | | | | | 2,119 | | | | | | 0.0 | | |
| 3,994 | | | 4.500%, 12/01/2040 | | | | | 4,020 | | | | | | 0.0 | | |
| 2,452 | | | 4.500%, 01/01/2041 | | | | | 2,468 | | | | | | 0.0 | | |
| 4,348 | | | 4.500%, 01/01/2041 | | | | | 4,377 | | | | | | 0.0 | | |
| 178,594 | | | 4.500%, 10/01/2041 | | | | | 179,778 | | | | | | 0.0 | | |
| 255,270 | | | 4.500%, 10/01/2044 | | | | | 253,054 | | | | | | 0.0 | | |
| 397,259 | | | 4.500%, 12/01/2045 | | | | | 397,043 | | | | | | 0.0 | | |
| 938,304 | | | 4.500%, 04/01/2047 | | | | | 936,982 | | | | | | 0.0 | | |
| 2,333,587 | | | 4.500%, 04/01/2047 | | | | | 2,333,259 | | | | | | 0.0 | | |
| 1,800,382 | | | 4.500%, 04/01/2047 | | | | | 1,796,174 | | | | | | 0.0 | | |
| 272,557 | | | 4.500%, 04/01/2047 | | | | | 271,299 | | | | | | 0.0 | | |
| 1,091,519 | | | 4.500%, 05/01/2047 | | | | | 1,093,190 | | | | | | 0.0 | | |
| 1,032,152 | | | 4.500%, 05/01/2047 | | | | | 1,033,732 | | | | | | 0.0 | | |
| 968,371 | | | 4.500%, 05/01/2047 | | | | | 960,706 | | | | | | 0.0 | | |
| 947,106 | | | 4.500%, 05/01/2047 | | | | | 947,530 | | | | | | 0.0 | | |
| 785,004 | | | 4.500%, 05/01/2047 | | | | | 784,893 | | | | | | 0.0 | | |
| 396,120 | | | 4.500%, 06/01/2047 | | | | | 395,561 | | | | | | 0.0 | | |
| 836,066 | | | 4.500%, 06/01/2047 | | | | | 835,948 | | | | | | 0.0 | | |
| 604,584 | | | 4.500%, 06/01/2047 | | | | | 603,732 | | | | | | 0.0 | | |
| 1,810,457 | | | 4.500%, 07/01/2047 | | | | | 1,807,906 | | | | | | 0.0 | | |
| 103,433 | | | 4.500%, 08/01/2047 | | | | | 102,842 | | | | | | 0.0 | | |
| 8,451,754 | | | 4.500%, 08/01/2052 | | | | | 8,345,767 | | | | | | 0.1 | | |
| 24,309,182 | | | 4.500%, 10/01/2052 | | | | | 23,839,138 | | | | | | 0.3 | | |
| 1,473,715 | | | 5.000%, 05/01/2042 | | | | | 1,506,392 | | | | | | 0.0 | | |
| 69,551 | | | 5.500%, 03/01/2037 | | | | | 71,454 | | | | | | 0.0 | | |
| 79,475 | | | 5.500%, 06/01/2039 | | | | | 82,584 | | | | | | 0.0 | | |
| 667,182 | | | 5.500%, 10/01/2039 | | | | | 693,307 | | | | | | 0.0 | | |
| 37,758 | | | 6.000%, 09/01/2036 | | | | | 38,578 | | | | | | 0.0 | | |
| 153 | | | 6.500%, 02/01/2028 | | | | | 158 | | | | | | 0.0 | | |
| 448 | | | 6.500%, 09/01/2031 | | | | | 476 | | | | | | 0.0 | | |
| 119 | | | 6.500%, 09/01/2031 | | | | | 123 | | | | | | 0.0 | | |
| 12,447 | | | 6.500%, 11/01/2031 | | | | | 13,027 | | | | | | 0.0 | | |
| 4,888 | | | 6.500%, 04/01/2032 | | | | | 5,073 | | | | | | 0.0 | | |
| 1,091 | | | 6.500%, 08/01/2032 | | | | | 1,132 | | | | | | 0.0 | | |
| 3,527 | | | 6.500%, 08/01/2032 | | | | | 3,641 | | | | | | 0.0 | | |
| 4,202 | | | 7.000%, 12/01/2027 | | | | | 4,213 | | | | | | 0.0 | | |
| 734 | | | 7.000%, 10/01/2031 | | | | | 737 | | | | | | 0.0 | | |
| 525 | | | 7.000%, 03/01/2032 | | | | | 528 | | | | | | 0.0 | | |
| 590 | | | 7.500%, 09/01/2030 | | | | | 618 | | | | | | 0.0 | | |
| 1,690 | | | 7.500%, 09/01/2031 | | | | | 1,756 | | | | | | 0.0 | | |
See Accompanying Notes to Financial Statements
PORTFOLIO OF INVESTMENTS
| Voya Intermediate Bond Fund | as of March 31, 2023 (continued) |
Principal
Amount† | | | Value | | | Percentage
of Net
Assets | |
| U.S. GOVERNMENT AGENCY OBLIGATIONS: (continued) | |
| | | | Uniform Mortgage-Backed
Securities (continued) | |
| 11,403 | | | 7.500%, 02/01/2032 | | | | $ | 11,826 | | | | | | 0.0 | | |
| | | | | | | | | 1,093,977,278 | | | | | | 14.3 | | |
| | | | Total U.S. Government
Agency Obligations
(Cost $1,639,167,877) | | | | | 1,539,381,161 | | | | | | 20.1 | | |
| ASSET-BACKED SECURITIES: 11.5% | |
| | | | Automobile Asset-Backed
Securities: 0.2% | |
| 5,050,000 | | | AmeriCredit Automobile
Receivables Trust
2019-3 D, 2.580%,
09/18/2025 | | | | | 4,889,729 | | | | | | 0.1 | | |
| 550,000 | | | Drive Auto Receivables
Trust 2021-2 D,
1.390%, 03/15/2029 | | | | | 512,383 | | | | | | 0.0 | | |
| 3,250,000 (1) | | | GLS Auto Receivables
Issuer Trust 2021-4 C,
1.940%, 10/15/2027 | | | | | 3,062,459 | | | | | | 0.0 | | |
| 4,550,000 | | | Santander Drive Auto
Receivables Trust
2020-2 D, 2.220%,
09/15/2026 | | | | | 4,449,985 | | | | | | 0.0 | | |
| 6,050,000 (1) | | | Westlake Automobile
Receivables Trust
2021-2A C, 0.890%,
07/15/2026 | | | | | 5,746,456 | | | | | | 0.1 | | |
| | | | | | | | | 18,661,012 | | | | | | 0.2 | | |
| | | | Home Equity Asset-Backed
Securities: 0.1% | |
| 2,843,189 (1)(3) | | | ACE Securities Corp.
Mortgage Loan Trust
Series 2007-D1 A2,
6.336%, 02/25/2038 | | | | | 2,223,692 | | | | | | 0.0 | | |
| 4,715,535 | | | Freddie Mac Structured
Pass Through
Certificates T-31 A7,
5.095%, (US0001M +
0.250)%, 05/25/2031 | | | | | 4,676,145 | | | | | | 0.1 | | |
| 2,722,613 (3) | | | GSAA Trust 2006-7
AF2, 5.995%,
03/25/2046 | | | | | 1,080,721 | | | | | | 0.0 | | |
| 137,778 (3) | | | HSI Asset Loan
Obligation Trust
2007-WF1 A6, 4.488%,
12/25/2036 | | | | | 103,689 | | | | | | 0.0 | | |
| 483,507 | | | Nomura Home Equity
Loan, Inc. Home Equity
Loan Trust
Series 2007-1 2A3,
5.165%, (US0001M +
0.160)%, 02/25/2037 | | | | | 433,001 | | | | | | 0.0 | | |
Principal
Amount† | | | Value | | | Percentage
of Net
Assets | |
| ASSET-BACKED SECURITIES: (continued) | |
| | | | Home Equity Asset-Backed
Securities (continued) | |
| 584,305 | | | Nomura Home Equity
Loan, Inc. Home Equity
Loan Trust
Series 2007-1 2A4A,
5.305%, (US0001M +
0.230)%, 02/25/2037 | | | | $ | 514,609 | | | | | | 0.0 | | |
| 1,049,273 (3) | | | Renaissance Home
Equity Loan Trust
2005-3 AF4, 5.140%,
11/25/2035 | | | | | 1,032,242 | | | | | | 0.0 | | |
| | | | | | | | | 10,064,099 | | | | | | 0.1 | | |
| | | | Other Asset-Backed Securities: 10.1% | |
| 6,800,000 (1) | | | AB BSL CLO 4 Ltd.
2023-4A A, 6.508%,
(TSFR3M + 2.000)%,
04/20/2036 | | | | | 6,804,502 | | | | | | 0.1 | | |
| 9,500,000 (1) | | | AGL CLO 5 Ltd.
2020-5A A1R, 5.968%,
(US0003M + 1.160)%,
07/20/2034 | | | | | 9,313,211 | | | | | | 0.1 | | |
| 6,750,000 (1) | | | AIG CLO 2021-1A C,
6.565%, (US0003M +
1.750)%, 04/22/2034 | | | | | 6,410,677 | | | | | | 0.1 | | |
| 3,000,000 (1) | | | Aimco CLO 11 Ltd.
2020-11A AR, 5.922%,
(US0003M + 1.130)%,
10/17/2034 | | | | | 2,927,184 | | | | | | 0.0 | | |
| 1,037,856 (1)(3)(4)(7) | | | American Homes 4
Rent 2015-SFR1 XS,
3.230%, 04/17/2052 | | | | | — | | | | | | — | | |
| 1,850,000 (1) | | | AMMC CLO 16 Ltd.
2015-16A CR2,
6.742%, (US0003M +
1.950)%, 04/14/2029 | | | | | 1,811,986 | | | | | | 0.0 | | |
| 10,000,000 (1) | | | Apidos CLO XXXV
2021-35A C, 6.458%,
(US0003M + 1.650)%,
04/20/2034 | | | | | 9,388,620 | | | | | | 0.1 | | |
| 4,405,500 (1) | | | Applebee’s Funding
LLC / IHOP Funding
LLC 2019-1A A2I,
4.194%, 06/05/2049 | | | | | 4,319,310 | | | | | | 0.1 | | |
| 2,029,500 (1) | | | Applebee’s Funding
LLC / IHOP Funding
LLC 2019-1A A2II,
4.723%, 06/05/2049 | | | | | 1,903,982 | | | | | | 0.0 | | |
| 719,634 (1) | | | Aqua Finance Trust
2019-A A, 3.140%,
07/16/2040 | | | | | 681,021 | | | | | | 0.0 | | |
See Accompanying Notes to Financial Statements
PORTFOLIO OF INVESTMENTS
| Voya Intermediate Bond Fund | as of March 31, 2023 (continued) |
Principal
Amount† | | | Value | | | Percentage
of Net
Assets | |
| ASSET-BACKED SECURITIES: (continued) | |
| | | | Other Asset-Backed
Securities (continued) | |
| 2,003,682 (1) | | | Aqua Finance Trust
2020-AA A, 1.900%,
07/17/2046 | | | | $ | 1,870,824 | | | | | | 0.0 | | |
| 7,117,500 (1) | | | Arbys Funding LLC
2020-1A A2, 3.237%,
07/30/2050 | | | | | 6,267,090 | | | | | | 0.1 | | |
| 3,890,000 (1) | | | Babson CLO Ltd.
2017-1A A2, 6.145%,
(US0003M + 1.350)%,
07/18/2029 | | | | | 3,820,307 | | | | | | 0.1 | | |
| 6,361,000 (1) | | | Babson CLO Ltd.
2018-3A A2, 6.108%,
(US0003M + 1.300)%,
07/20/2029 | | | | | 6,298,987 | | | | | | 0.1 | | |
| 7,400,000 (1) | | | Ballyrock CLO
2023-23A A1 Ltd.,
6.971%, (TSFR3M +
1.980)%, 04/25/2036 | | | | | 7,353,313 | | | | | | 0.1 | | |
| 3,750,000 (1) | | | Barings Clo Ltd.
2019-4A C, 7.592%,
(US0003M + 2.800)%,
01/15/2033 | | | | | 3,669,664 | | | | | | 0.0 | | |
| 24,000,000 (1) | | | Barings Clo Ltd.
2023-IA A, 6.855%,
(TSFR3M + 1.750)%,
04/20/2036 | | | | | 23,886,816 | | | | | | 0.3 | | |
| 7,469,675 (1) | | | Beacon Container
Finance II LLC 2021-1A
A, 2.250%, 10/22/2046 | | | | | 6,526,899 | | | | | | 0.1 | | |
| 6,500,000 (1) | | | Benefit Street Partners
CLO IV Ltd. 2014-IVA
BRRR, 6.958%,
(US0003M + 2.150)%,
01/20/2032 | | | | | 6,210,704 | | | | | | 0.1 | | |
| 13,900,000 (1) | | | Benefit Street Partners
CLO Ltd. 2021-23A A1,
5.898%, (US0003M +
1.080)%, 04/25/2034 | | | | | 13,520,405 | | | | | | 0.2 | | |
| 4,600,000 (1) | | | Benefit Street Partners
CLO Ltd. 2021-23A C,
7.018%, (US0003M +
2.200)%, 04/25/2034 | | | | | 4,380,033 | | | | | | 0.1 | | |
| 450,000 (1) | | | Benefit Street Partners
CLO VIII Ltd. 2015-8A
A1BR, 6.008%,
(US0003M + 1.200)%,
01/20/2031 | | | | | 433,768 | | | | | | 0.0 | | |
Principal
Amount† | | | Value | | | Percentage
of Net
Assets | |
| ASSET-BACKED SECURITIES: (continued) | |
| | | | Other Asset-Backed
Securities (continued) | |
| 5,000,000 (1) | | | Benefit Street Partners
CLO XIV Ltd. 2018-14A
A2, 5.958%,
(US0003M +
1.150)%, 04/20/2031 | | | | $ | 4,845,200 | | | | | | 0.1 | | |
| 7,550,000 (1) | | | Benefit Street Partners
CLO XVIII Ltd.
2019-18A A1R,
5.962%, (US0003M +
1.170)%, 10/15/2034 | | | | | 7,356,712 | | | | | | 0.1 | | |
| 2,000,000 (1) | | | BlueMountain CLO
2014-2A A2R2 Ltd.,
6.208%, (US0003M +
1.400)%, 10/20/2030 | | | | | 1,976,246 | | | | | | 0.0 | | |
| 5,350,000 (1) | | | BlueMountain CLO Ltd.
2021-28A C, 6.792%,
(US0003M + 2.000)%,
04/15/2034 | | | | | 4,998,789 | | | | | | 0.1 | | |
| 11,880,000 (1) | | | BlueMountain CLO
XXXI Ltd. 2021-31A A1,
5.948%, (US0003M +
1.150)%, 04/19/2034 | | | | | 11,599,893 | | | | | | 0.2 | | |
| 6,435,000 (1) | | | Bojangles Issuer LLC
2020-3A A2, 3.832%,
10/20/2050 | | | | | 5,885,933 | | | | | | 0.1 | | |
| 7,570,000 (1) | | | Broad River Bsl
Funding Clo Ltd.
2020-1A AR, 5.978%,
(US0003M + 1.170)%,
07/20/2034 | | | | | 7,380,250 | | | | | | 0.1 | | |
| 4,400,000 (1) | | | Broad River Bsl
Funding Clo Ltd.
2020-1A CR, 6.808%,
(US0003M + 2.000)%,
07/20/2034 | | | | | 4,082,883 | | | | | | 0.1 | | |
| 6,600,000 (1) | | | California Street CLO
IX L.P. 2012-9A CR3,
7.292%, (US0003M +
2.500)%, 07/16/2032 | | | | | 6,338,508 | | | | | | 0.1 | | |
| 5,000,000 (1) | | | Carlyle Global Market
Strategies CLO 2016-1
Ltd. 2016-1A A1R2,
5.948%, (US0003M +
1.140)%, 04/20/2034 | | | | | 4,882,995 | | | | | | 0.1 | | |
| 3,250,000 (1) | | | Carlyle Global Market
Strategies CLO Ltd.
2014-1A A2R2,
5.922%, (US0003M +
1.130)%, 04/17/2031 | | | | | 3,138,964 | | | | | | 0.0 | | |
See Accompanying Notes to Financial Statements
PORTFOLIO OF INVESTMENTS
| Voya Intermediate Bond Fund | as of March 31, 2023 (continued) |
Principal
Amount† | | | Value | | | Percentage
of Net
Assets | |
| ASSET-BACKED SECURITIES: (continued) | |
| | | | Other Asset-Backed
Securities (continued) | |
| 8,900,000 (1) | | | CARLYLE US CLO
2021-1A A1 Ltd.,
5.932%, (US0003M +
1.140)%, 04/15/2034 | | | | $ | 8,731,478 | | | | | | 0.1 | | |
| 10,000,000 (1) | | | Cedar Funding IV CLO
Ltd. 2014-4A CRR,
6.815%, (US0003M +
2.000)%, 07/23/2034 | | | | | 9,320,970 | | | | | | 0.1 | | |
| 21,700,000 (1) | | | Cedar Funding IV CLO
Ltd.2014-4A ARR,
5.975%, (US0003M +
1.160)%, 07/23/2034 | | | | | 21,062,150 | | | | | | 0.3 | | |
| 12,400,000 (1) | | | Cedar Funding VIII Clo
Ltd. 2017-8A A1R,
5.942%, (US0003M +
1.150)%, 10/17/2034 | | | | | 12,100,565 | | | | | | 0.2 | | |
| 11,200,000 (1) | | | Cedar Funding VIII Clo
Ltd. 2017-8A A2R,
6.242%, (US0003M +
1.450)%, 10/17/2034 | | | | | 10,841,712 | | | | | | 0.1 | | |
| 37,149 | | | Chase Funding Trust
Series 2003-5 2A2,
5.445%, (US0001M +
0.600)%, 07/25/2033 | | | | | 35,130 | | | | | | 0.0 | | |
| 3,000,000 (1) | | | CIFC Funding 2019-6A
A2 Ltd., 6.542%,
(US0003M + 1.750)%,
01/16/2033 | | | | | 2,985,852 | | | | | | 0.0 | | |
| 1,600,000 (1) | | | CIFC Funding Ltd.
2022-1A A, 5.978%,
(TSFR3M + 1.320)%,
04/17/2035 | | | | | 1,570,208 | | | | | | 0.0 | | |
| 2,484,025 (1) | | | CLI Funding VI LLC
2020-1A A, 2.080%,
09/18/2045 | | | | | 2,192,810 | | | | | | 0.0 | | |
| 7,861,667 (1) | | | CLI Funding VIII LLC
2021-1A A, 1.640%,
02/18/2046 | | | | | 6,839,232 | | | | | | 0.1 | | |
| 9,520,213 (1) | | | CLI Funding VIII LLC
2022-1A A1, 2.720%,
01/18/2047 | | | | | 8,320,052 | | | | | | 0.1 | | |
| 4,583,750 (1) | | | DB Master Finance LLC
2019-1A A23, 4.352%,
05/20/2049 | | | | | 4,338,448 | | | | | | 0.1 | | |
| 2,364,250 (1) | | | DB Master Finance LLC
2019-1A A2II, 4.021%,
05/20/2049 | | | | | 2,254,588 | | | | | | 0.0 | | |
| 15,602,500 (1) | | | DB Master Finance LLC
2021-1A A23, 2.791%,
11/20/2051 | | | | | 12,644,753 | | | | | | 0.2 | | |
Principal
Amount† | | | Value | | | Percentage
of Net
Assets | |
| ASSET-BACKED SECURITIES: (continued) | |
| | | | Other Asset-Backed
Securities (continued) | |
| 2,537,375 (1) | | | Domino’s Pizza Master
Issuer LLC 2018-1A
A211, 4.328%,
07/25/2048 | | | | $ | 2,413,568 | | | | | | 0.0 | | |
| 10,864,000 (1) | | | Domino’s Pizza Master
Issuer LLC 2019-1A A2,
3.668%, 10/25/2049 | | | | | 9,695,370 | | | | | | 0.1 | | |
| 11,593,500 (1) | | | Domino’s Pizza Master
Issuer LLC 2021-1A
A2II, 3.151%,
04/25/2051 | | | | | 9,648,719 | | | | | | 0.1 | | |
| 5,616,000 (1) | | | Driven Brands Funding
LLC 2019-1A A2,
4.641%, 04/20/2049 | | | | | 5,298,057 | | | | | | 0.1 | | |
| 5,381,875 (1) | | | Driven Brands Funding
LLC 2021-1A A2,
2.791%, 10/20/2051 | | | | | 4,420,798 | | | | | | 0.1 | | |
| 2,238,375 (1) | | | Driven Brands Funding,
LLC 2018-1A A2,
4.739%, 04/20/2048 | | | | | 2,151,945 | | | | | | 0.0 | | |
| 6,400,000 (1) | | | Dryden 49 Senior Loan
Fund 2017-49A CR,
6.845%, (US0003M +
2.050)%, 07/18/2030 | | | | | 6,077,984 | | | | | | 0.1 | | |
| 11,400,000 (1) | | | Dryden 75 CLO Ltd.
2019-75A CR2,
6.592%, (US0003M +
1.800)%, 04/15/2034 | | | | | 10,498,636 | | | | | | 0.1 | | |
| 8,000,000 (1) | | | Eaton Vance Clo
2015-1A A2R Ltd.,
6.058%, (US0003M +
1.250)%, 01/20/2030 | | | | | 7,715,072 | | | | | | 0.1 | | |
| 4,196,100 (1) | | | Five Guys Holdings,
Inc. 2017-1A A2,
4.600%, 07/25/2047 | | | | | 4,112,234 | | | | | | 0.1 | | |
| 9,400,000 (1) | | | Galaxy XXII CLO Ltd.
2016-22A ARR,
5.992%, (US0003M +
1.200)%, 04/16/2034 | | | | | 9,179,448 | | | | | | 0.1 | | |
| 4,738,125 (1) | | | Goddard Funding LLC
2022-1A A2, 6.864%,
10/30/2052 | | | | | 4,500,461 | | | | | | 0.1 | | |
| 3,308,540 (1) | | | Helios Issuer LLC
2021-A A4, 1.800%,
02/20/2048 | | | | | 2,760,311 | | | | | | 0.0 | | |
| 4,203,820 (1) | | | Helios Issuer, LLC
2018-1A A, 4.870%,
07/20/2048 | | | | | 3,844,004 | | | | | | 0.1 | | |
| 564,535 (1) | | | HERO Funding Trust
2015-2A A, 3.990%,
09/20/2040 | | | | | 544,495 | | | | | | 0.0 | | |
See Accompanying Notes to Financial Statements
PORTFOLIO OF INVESTMENTS
| Voya Intermediate Bond Fund | as of March 31, 2023 (continued) |
Principal
Amount† | | | Value | | | Percentage
of Net
Assets | |
| ASSET-BACKED SECURITIES: (continued) | |
| | | | Other Asset-Backed
Securities (continued) | |
| 539,354 (1) | | | HERO Funding Trust
2016-2A A, 3.750%,
09/20/2041 | | | | $ | 513,825 | | | | | | 0.0 | | |
| 1,353,341 (1) | | | HERO Funding Trust
2016-4A A2, 4.290%,
09/20/2047 | | | | | 1,299,154 | | | | | | 0.0 | | |
| 3,366,582 (1) | | | JG Wentworth XLII LLC
2018-2A A, 3.960%,
10/15/2075 | | | | | 3,078,650 | | | | | | 0.0 | | |
| 2,419,770 (1) | | | JGWPT XXXIII LLC
2014-3A A, 3.500%,
06/15/2077 | | | | | 2,140,868 | | | | | | 0.0 | | |
| 6,000,000 (1) | | | Kayne CLO 6 Ltd.
2019-6A A2, 6.658%,
(US0003M + 1.850)%,
01/20/2033 | | | | | 5,853,318 | | | | | | 0.1 | | |
| 7,130,000 (1) | | | KAYNE CLO I Ltd.
2018-1A CR, 6.542%,
(US0003M + 1.750)%,
07/15/2031 | | | | | 6,762,983 | | | | | | 0.1 | | |
| 6,000,000 (1) | | | LCM 26A A2 Ltd.,
6.058%, (US0003M +
1.250)%, 01/20/2031 | | | | | 5,797,584 | | | | | | 0.1 | | |
| 5,000,000 (1) | | | LCM XVIII L.P. 18A
A2R, 6.028%,
(US0003M + 1.220)%,
04/20/2031 | | | | | 4,825,095 | | | | | | 0.1 | | |
| 11,900,000 (1) | | | LCM XXIV Ltd. 24A CR,
6.708%, (US0003M +
1.900)%, 03/20/2030 | | | | | 11,103,628 | | | | | | 0.1 | | |
| 8,500,121 (1) | | | Loanpal Solar Loan
2021-2GS A Ltd.,
2.220%, 03/20/2048 | | | | | 6,696,582 | | | | | | 0.1 | | |
| 6,150,000 (1) | | | Madison Park Funding
XLVIII Ltd. 2021-48A C,
6.798%, (US0003M +
2.000)%, 04/19/2033 | | | | | 5,891,577 | | | | | | 0.1 | | |
| 6,250,000 (1) | | | Madison Park Funding
XXI Ltd. 2016-21A
ABRR, 6.192%,
(US0003M + 1.400)%,
10/15/2032 | | | | | 6,100,444 | | | | | | 0.1 | | |
| 1,400,000 (1) | | | Madison Park Funding
XXVII Ltd. 2018-27A B,
6.608%, (US0003M +
1.800)%, 04/20/2030 | | | | | 1,326,209 | | | | | | 0.0 | | |
| 752,162 (1) | | | Marlette Funding Trust
2019-2A C, 4.110%,
07/16/2029 | | | | | 749,708 | | | | | | 0.0 | | |
Principal
Amount† | | | Value | | | Percentage
of Net
Assets | |
| ASSET-BACKED SECURITIES: (continued) | |
| | | | Other Asset-Backed
Securities (continued) | |
| 1,100,000 (1)(3) | | | Mill City Mortgage Loan
Trust 2017-1 M2,
3.250%, 11/25/2058 | | | | $ | 1,036,919 | | | | | | 0.0 | | |
| 3,200,000 (1)(3) | | | Mill City Mortgage Loan
Trust 2017-2 M2,
3.250%, 07/25/2059 | | | | | 2,920,939 | | | | | | 0.0 | | |
| 2,482,000 (1)(3) | | | Mill City Mortgage Trust
2015-2 B2, 3.690%,
09/25/2057 | | | | | 2,218,236 | | | | | | 0.0 | | |
| 699,101 (1) | | | Mill City Solar Loan
2019-1A A Ltd.,
4.340%, 03/20/2043 | | | | | 645,170 | | | | | | 0.0 | | |
| 3,555,288 (1) | | | Mill City Solar Loan
2019-2GS A Ltd.,
3.690%, 07/20/2043 | | | | | 3,247,322 | | | | | | 0.0 | | |
| 2,529,602 (1) | | | Mosaic Solar Loan
Trust 2018-1A A,
4.010%, 06/22/2043 | | | | | 2,370,510 | | | | | | 0.0 | | |
| 4,270,091 (1) | | | Mosaic Solar Loan
Trust 2018-2-GS A,
4.200%, 02/22/2044 | | | | | 3,984,794 | | | | | | 0.1 | | |
| 622,445 (1) | | | Mosaic Solar Loan
Trust 2018-2-GS B,
4.740%, 02/22/2044 | | | | | 572,126 | | | | | | 0.0 | | |
| 3,029,614 (1) | | | Mosaic Solar Loan
Trust 2019-2A A,
2.880%, 09/20/2040 | | | | | 2,700,029 | | | | | | 0.0 | | |
| 3,950,652 (1) | | | Mosaic Solar Loan
Trust 2020-1A B,
3.100%, 04/20/2046 | | | | | 3,413,932 | | | | | | 0.0 | | |
| 7,870,734 (1) | | | Mosaic Solar Loan
Trust 2020-2A A,
1.440%, 08/20/2046 | | | | | 6,680,349 | | | | | | 0.1 | | |
| 3,441,574 (1) | | | Mosaic Solar Loan
Trust 2021-1A B,
2.050%, 12/20/2046 | | | | | 2,789,578 | | | | | | 0.0 | | |
| 1,511,065 (1) | | | Mosaic Solar Loans
2017-2A A LLC,
3.820%, 06/22/2043 | | | | | 1,405,067 | | | | | | 0.0 | | |
| 2,000,000 (1) | | | Neuberger Berman
Loan Advisers CLO 47
Ltd. 2022-47A A,
5.932%, (TSFR3M +
1.300)%, 04/14/2035 | | | | | 1,963,396 | | | | | | 0.0 | | |
| 5,750,000 (1) | | | Oak Hill Credit Partners
2021-8A C, 6.695%,
(US0003M + 1.900)%,
01/18/2034 | | | | | 5,416,908 | | | | | | 0.1 | | |
See Accompanying Notes to Financial Statements
PORTFOLIO OF INVESTMENTS
| Voya Intermediate Bond Fund | as of March 31, 2023 (continued) |
Principal
Amount† | | | Value | | | Percentage
of Net
Assets | |
| ASSET-BACKED SECURITIES: (continued) | |
| | | | Other Asset-Backed
Securities (continued) | |
| 3,500,000 (1) | | | Octagon Investment
Partners 32 Ltd.
2017-1A CR, 6.842%,
(US0003M + 2.050)%,
07/15/2029 | | | | $ | 3,337,341 | | | | | | 0.0 | | |
| 4,060,000 (1) | | | Octagon Investment
Partners XV Ltd.
2013-1A A2R, 6.148%,
(US0003M + 1.350)%,
07/19/2030 | | | | | 3,929,106 | | | | | | 0.1 | | |
| 6,000,000 (1) | | | Octagon Investment
Partners XXI Ltd.
2014-1A BR3, 6.619%,
(US0003M + 1.750)%,
02/14/2031 | | | | | 5,637,108 | | | | | | 0.1 | | |
| 7,830,000 (1) | | | OHA Credit Funding
2019-3A AR Ltd.,
5.948%, (US0003M +
1.140)%, 07/02/2035 | | | | | 7,678,082 | | | | | | 0.1 | | |
| 10,250,000 (1) | | | OHA Credit Funding
2020-6A AR Ltd.,
5.948%, (US0003M +
1.140)%, 07/20/2034 | | | | | 10,053,979 | | | | | | 0.1 | | |
| 6,650,000 (1) | | | OHA Credit Funding 4
Ltd. 2019-4A AR,
5.965%, (US0003M +
1.150)%, 10/22/2036 | | | | | 6,514,500 | | | | | | 0.1 | | |
| 7,000,000 (1) | | | OHA Credit Funding 7
Ltd. 2020-7A AR,
5.933%, (TSFR3M +
1.300)%, 02/24/2037 | | | | | 6,862,163 | | | | | | 0.1 | | |
| 6,700,000 (1) | | | OHA Credit Funding 9
Ltd. 2021-9A C,
6.698%, (US0003M +
1.900)%, 07/19/2035 | | | | | 6,377,362 | | | | | | 0.1 | | |
| 10,700,000 (1) | | | OHA Credit Partners
VII Ltd. 2012-7A CR3,
6.715%, (US0003M +
1.800)%, 02/20/2034 | | | | | 10,049,675 | | | | | | 0.1 | | |
| 960,482 (1) | | | Pagaya AI Debt
Selection Trust 2021-3
A, 1.150%, 05/15/2029 | | | | | 943,488 | | | | | | 0.0 | | |
| 2,160,893 (1) | | | Pagaya AI Debt
Selection Trust
2021-HG1 A, 1.220%,
01/16/2029 | | | | | 2,049,723 | | | | | | 0.0 | | |
| 5,397,140 (1) | | | Pagaya AI Debt Trust
2022-1 A, 2.030%,
10/15/2029 | | | | | 5,215,655 | | | | | | 0.1 | | |
Principal
Amount† | | | Value | | | Percentage
of Net
Assets | |
| ASSET-BACKED SECURITIES: (continued) | |
| | | | Other Asset-Backed
Securities (continued) | |
| 5,800,000 (1) | | | Palmer Square CLO
2021-1A B Ltd.,
6.508%, (US0003M +
1.700)%, 04/20/2034 | | | | $ | 5,480,153 | | | | | | 0.1 | | |
| 7,550,000 (1) | | | Palmer Square CLO
2021-3A A2 Ltd.,
6.192%, (US0003M +
1.400)%, 01/15/2035 | | | | | 7,352,870 | | | | | | 0.1 | | |
| 139,347 (3) | | | Popular ABS Mortgage
Pass-Through Trust
2005-D A5, 3.522%,
01/25/2036 | | | | | 136,120 | | | | | | 0.0 | | |
| 4,885,875 (1) | | | Primose Funding LLC
2019-1A A2, 4.475%,
07/30/2049 | | | | | 4,597,980 | | | | | | 0.1 | | |
| 9,150,000 (1) | | | Rockland Park CLO
Ltd. 2021-1A C,
6.708%, (US0003M +
1.900)%, 04/20/2034 | | | | | 8,586,644 | | | | | | 0.1 | | |
| 2,350,000 (1) | | | SoFi Consumer Loan
Program 2021-1 C
Trust, 1.610%,
09/25/2030 | | | | | 2,169,418 | | | | | | 0.0 | | |
| 7,111,417 (1) | | | Sonic Capital LLC
2020-1A A2I, 3.845%,
01/20/2050 | | | | | 6,581,245 | | | | | | 0.1 | | |
| 3,940,000 (1) | | | Sonic Capital LLC
2021-1A A2II, 2.636%,
08/20/2051 | | | | | 3,024,969 | | | | | | 0.0 | | |
| 18,000,000 (1) | | | Sound Point Clo XVI
Ltd. 2017-2A CR,
7.018%, (US0003M +
2.200)%, 07/25/2030 | | | | | 16,848,936 | | | | | | 0.2 | | |
| 9,950,000 (1) | | | Sound Point CLO XXIX
Ltd. 2021-1A C1,
7.118%, (US0003M +
2.300)%, 04/25/2034 | | | | | 9,230,127 | | | | | | 0.1 | | |
| 7,473,719 (1) | | | Sunnova Sol II Issuer
LLC 2020-2A A,
2.730%, 11/01/2055 | | | | | 5,871,584 | | | | | | 0.1 | | |
| 9,139,159 (1) | | | Sunnova Sol III Issuer
LLC 2021-1 A, 2.580%,
04/28/2056 | | | | | 7,166,760 | | | | | | 0.1 | | |
| 4,500,349 (1) | | | Sunrun Athena Issuer
2018-1 A LLC, 5.310%,
04/30/2049 | | | | | 4,341,359 | | | | | | 0.1 | | |
| 4,291,241 (1) | | | Sunrun Jupiter Issuer
2022-1A A LLC,
4.750%, 07/30/2057 | | | | | 4,019,206 | | | | | | 0.1 | | |
See Accompanying Notes to Financial Statements
PORTFOLIO OF INVESTMENTS
| Voya Intermediate Bond Fund | as of March 31, 2023 (continued) |
Principal
Amount† | | | Value | | | Percentage
of Net
Assets | |
| ASSET-BACKED SECURITIES: (continued) | |
| | | | Other Asset-Backed
Securities (continued) | |
| 3,627,094 (1) | | | Sunrun Xanadu Issuer
2019-1A A LLC,
3.980%, 06/30/2054 | | | | $ | 3,274,715 | | | | | | 0.0 | | |
| 8,450,000 (1) | | | Symphony CLO XXVI
Ltd. 2021-26A CR,
6.808%, (US0003M +
2.000)%, 04/20/2033 | | | | | 7,806,972 | | | | | | 0.1 | | |
| 5,888,625 (1) | | | Taco Bell Funding LLC
2018-1A A2II, 4.940%,
11/25/2048 | | | | | 5,687,170 | | | | | | 0.1 | | |
| 13,035,000 (1) | | | Taco Bell Funding LLC
2021-1A A23, 2.542%,
08/25/2051 | | | | | 10,303,690 | | | | | | 0.1 | | |
| 5,000,000 (1) | | | TCW CLO 2017-1A
A2RR Ltd., 6.252%,
(US0003M + 1.450)%,
10/29/2034 | | | | | 4,740,480 | | | | | | 0.1 | | |
| 13,150,000 (1) | | | TCW CLO 2021-1A C
Ltd., 6.708%,
(US0003M + 1.900)%,
03/18/2034 | | | | | 12,197,072 | | | | | | 0.2 | | |
| 10,400,000 (1) | | | TCW CLO 2023-1A
A1N Ltd., 6.861%,
(TSFR3M + 2.070)%,
04/28/2036 | | | | | 10,390,006 | | | | | | 0.1 | | |
| 18,950,000 (1) | | | Texas Debt Capital CLO
2023-IA A Ltd., 6.308%,
(TSFR3M + 1.800)%,
04/20/2036 | | | | | 18,905,619 | | | | | | 0.2 | | |
| 6,026,000 (1) | | | Textainer Marine
Containers Ltd.
2021-3A A, 1.940%,
08/20/2046 | | | | | 5,080,375 | | | | | | 0.1 | | |
| 5,125,000 (1) | | | Textainer Marine
Containers VII Ltd.
2021-1A A, 1.680%,
02/20/2046 | | | | | 4,393,919 | | | | | | 0.1 | | |
| 1,400,000 (1)(3) | | | Towd Point Mortgage
Trust 2015-2 1B1,
3.532%, 11/25/2060 | | | | | 1,328,507 | | | | | | 0.0 | | |
| 2,640,000 (1)(3) | | | Towd Point Mortgage
Trust 2015-2 2B2,
4.320%, 11/25/2057 | | | | | 2,543,745 | | | | | | 0.0 | | |
| 4,346,000 (1)(3) | | | Towd Point Mortgage
Trust 2016-2 M1,
3.000%, 08/25/2055 | | | | | 4,149,361 | | | | | | 0.1 | | |
| 3,200,000 (1)(3) | | | Towd Point Mortgage
Trust 2017-1 M1,
3.750%, 10/25/2056 | | | | | 3,014,455 | | | | | | 0.0 | | |
Principal
Amount† | | | Value | | | Percentage
of Net
Assets | |
| ASSET-BACKED SECURITIES: (continued) | |
| | | | Other Asset-Backed
Securities (continued) | |
| 2,200,000 (1)(3) | | | Towd Point Mortgage
Trust 2017-3 M1,
3.500%, 07/25/2057 | | | | $ | 2,040,874 | | | | | | 0.0 | | |
| 4,500,000 (1) | | | Trafigura Securitisation
Finance PLC 2021-1A
A2, 1.080%,
01/15/2025 | | | | | 4,196,358 | | | | | | 0.1 | | |
| 10,416,500 (1) | | | Triton Container
Finance VIII LLC
2021-1A A, 1.860%,
03/20/2046 | | | | | 8,965,785 | | | | | | 0.1 | | |
| 3,496,275 (1) | | | Wendy’s Funding LLC
2018-1A A2II, 3.884%,
03/15/2048 | | | | | 3,240,562 | | | | | | 0.0 | | |
| 8,449,500 (1) | | | Wendy’s Funding LLC
2021-1A A2II, 2.775%,
06/15/2051 | | | | | 6,842,804 | | | | | | 0.1 | | |
| 10,000,000 (1) | | | Wind River 2021-1A C
CLO Ltd., 6.758%,
(US0003M + 1.950)%,
04/20/2034 | | | | | 9,040,830 | | | | | | 0.1 | | |
| 15,612,250 (1) | | | Zaxby’s Funding LLC
2021-1A A2, 3.238%,
07/30/2051 | | | | | 13,136,634 | | | | | | 0.2 | | |
| | | | | | | | | 775,225,112 | | | | | | 10.1 | | |
| | | | Student Loan Asset-Backed
Securities: 1.1% | |
| 265,915 (1) | | | Commonbond Student
Loan Trust 2016-B,
4.000%, 10/25/2040 | | | | | 239,468 | | | | | | 0.0 | | |
| 768,180 (1) | | | Commonbond Student
Loan Trust 2017-BGS
B, 3.260%, 09/25/2042 | | | | | 689,378 | | | | | | 0.0 | | |
| 1,136,663 (1) | | | Commonbond Student
Loan Trust 2018-AGS
A1, 3.210%,
02/25/2044 | | | | | 1,062,905 | | | | | | 0.0 | | |
| 71,351 (1) | | | Commonbond Student
Loan Trust 2018-A-GS
C, 3.820%, 02/25/2044 | | | | | 60,269 | | | | | | 0.0 | | |
| 1,527,414 (1) | | | Commonbond Student
Loan Trust 2018-CGS
A2, 5.645%,
(US0001M + 0.800)%,
02/25/2046 | | | | | 1,506,055 | | | | | | 0.0 | | |
| 3,565,705 (1) | | | Commonbond Student
Loan Trust 2020-AGS
A, 1.980%, 08/25/2050 | | | | | 3,063,285 | | | | | | 0.1 | | |
See Accompanying Notes to Financial Statements
PORTFOLIO OF INVESTMENTS
| Voya Intermediate Bond Fund | as of March 31, 2023 (continued) |
Principal
Amount† | | | Value | | | Percentage
of Net
Assets | |
| ASSET-BACKED SECURITIES: (continued) | |
| | | | Student Loan Asset-Backed
Securities (continued) | |
| 1,827,321 (1)(3) | | | ELFI Graduate Loan
Program 2021-A B LLC,
2.090%, 12/26/2046 | | | | $ | 1,565,796 | | | | | | 0.0 | | |
| 452,715 (1) | | | Laurel Road Prime
Student Loan Trust
2017-B A4, 3.020%,
08/25/2042 | | | | | 417,234 | | | | | | 0.0 | | |
| 5,290,937 (1) | | | Laurel Road Prime
Student Loan Trust
2020-A AFX, 1.400%,
11/25/2050 | | | | | 4,779,456 | | | | | | 0.1 | | |
| 2,823,278 (1) | | | Navient Private
Education Refi Loan
Trust 2020-DA A,
1.690%, 05/15/2069 | | | | | 2,574,520 | | | | | | 0.0 | | |
| 3,347,342 (1) | | | Navient Private
Education Refi Loan
Trust 2020-GA A,
1.170%, 09/16/2069 | | | | | 2,995,455 | | | | | | 0.0 | | |
| 1,850,000 (1) | | | Navient Private
Education Refi Loan
Trust 2021-F B,
2.120%, 02/18/2070 | | | | | 1,219,449 | | | | | | 0.0 | | |
| 2,700,000 (1) | | | SMB Private Education
Loan Trust 2014-A C,
4.500%, 09/15/2045 | | | | | 2,329,487 | | | | | | 0.0 | | |
| 1,450,000 (1) | | | SMB Private Education
Loan Trust 2017-A B,
3.500%, 06/17/2041 | | | | | 1,334,172 | | | | | | 0.0 | | |
| 13,527,738 (1) | | | SMB Private Education
Loan Trust 2020-PTA
A2A, 1.600%,
09/15/2054 | | | | | 12,102,997 | | | | | | 0.2 | | |
| 3,000,000 (1) | | | SMB Private Education
Loan Trust 2023-A A1A,
5.380%, 01/15/2053 | | | | | 2,999,016 | | | | | | 0.1 | | |
| 3,000,000 (1)(3) | | | SoFi Professional Loan
Program 2017-C B,
3.560%, 07/25/2040 | | | | | 2,822,146 | | | | | | 0.0 | | |
| 3,900,000 (1) | | | SoFi Professional Loan
Program 2017-F BFX
LLC, 3.620%,
01/25/2041 | | | | | 3,492,884 | | | | | | 0.1 | | |
| 3,250,000 (1) | | | Sofi Professional Loan
Program 2018-A B LLC,
3.610%, 02/25/2042 | | | | | 2,954,816 | | | | | | 0.0 | | |
| 8,000,000 (1) | | | Sofi Professional Loan
Program 2018-B BFX
Trust, 3.830%,
08/25/2047 | | | | | 7,271,398 | | | | | | 0.1 | | |
Principal
Amount† | | | Value | | | Percentage
of Net
Assets | |
| ASSET-BACKED SECURITIES: (continued) | |
| | | | Student Loan Asset-Backed
Securities (continued) | |
| 4,115,547 (1) | | | Sofi Professional Loan
Program 2018-C A2FX
Trust, 3.590%,
01/25/2048 | | | | $ | 3,974,358 | | | | | | 0.1 | | |
| 5,800,000 (1) | | | SoFi Professional Loan
Program 2018-C BFX
Trust, 4.130%,
01/25/2048 | | | | | 5,467,786 | | | | | | 0.1 | | |
| 1,922,042 (1) | | | Sofi Professional Loan
Program 2018-D A2FX
Trust, 3.600%,
02/25/2048 | | | | | 1,855,454 | | | | | | 0.0 | | |
| 6,000,000 (1) | | | SoFi Professional Loan
Program 2018-D BFX
Trust, 4.140%,
02/25/2048 | | | | | 5,632,775 | | | | | | 0.1 | | |
| 3,000,000 (1) | | | Sofi Professional Loan
Program 2019-B BFX
LLC, 3.730%,
08/17/2048 | | | | | 2,636,255 | | | | | | 0.0 | | |
| 8,165,926 (1) | | | SoFi Professional Loan
Program 2020-C AFX
Trust, 1.950%,
02/15/2046 | | | | | 7,430,672 | | | | | | 0.1 | | |
| | | | | | | | | 82,477,486 | | | | | | 1.1 | | |
| | | | Total Asset-Backed
Securities
(Cost $954,225,381) | | | | | 886,427,709 | | | | | | 11.5 | | |
COMMERCIAL MORTGAGE-BACKED
SECURITIES: 6.0% | |
| 4,656,000 (1) | | | BANK 2017-BNK4 D,
3.357%, 05/15/2050 | | | | | 3,256,407 | | | | | | 0.0 | | |
| 29,203,742 (3)(4) | | | BANK 2017-BNK4 XA,
1.341%, 05/15/2050 | | | | | 1,199,361 | | | | | | 0.0 | | |
| 167,655,000 (3)(4) | | | BANK 2017-BNK8 XB,
0.184%, 11/15/2050 | | | | | 1,304,113 | | | | | | 0.0 | | |
| 3,600,000 (1) | | | BANK 2017-BNK9 D,
2.800%, 11/15/2054 | | | | | 2,306,486 | | | | | | 0.0 | | |
| 181,982,205 (3)(4) | | | BANK 2018-BNK14 XA,
0.495%, 09/15/2060 | | | | | 3,786,031 | | | | | | 0.1 | | |
| 19,110,000 (1)(3)(4) | | | BANK 2018-BNK14 XD,
1.613%, 09/15/2060 | | | | | 1,351,973 | | | | | | 0.0 | | |
| 23,750,049 (3)(4) | | | BANK 2019-BNK16 XA,
0.941%, 02/15/2052 | | | | | 967,299 | | | | | | 0.0 | | |
| 99,223,037 (3)(4) | | | Bank 2019-BNK19 XA,
0.948%, 08/15/2061 | | | | | 4,563,277 | | | | | | 0.1 | | |
| 1,000,000 (3) | | | BANK 2019-BNK24 C,
3.518%, 11/15/2062 | | | | | 766,647 | | | | | | 0.0 | | |
See Accompanying Notes to Financial Statements
PORTFOLIO OF INVESTMENTS
| Voya Intermediate Bond Fund | as of March 31, 2023 (continued) |
Principal
Amount† | | | Value | | | Percentage
of Net
Assets | |
COMMERCIAL MORTGAGE-BACKED
SECURITIES: (continued) | |
| 6,140,685 (3)(4) | | | BANK 2020-BNK30 XA,
1.313%, 12/15/2053 | | | | $ | 421,514 | | | | | | 0.0 | | |
| 92,840,000 (1)(3)(4) | | | BBCCRE Trust
2015-GTP XA, 0.597%,
08/10/2033 | | | | | 1,198,397 | | | | | | 0.0 | | |
| 8,200,000 (1) | | | BBCMS Trust
2021-AGW E, 7.834%,
(US0001M + 3.150)%,
06/15/2036 | | | | | 7,094,946 | | | | | | 0.1 | | |
| 20,268,444 (3)(4) | | | BBCMS Trust
2021-C10 XA, 1.295%,
07/15/2054 | | | | | 1,445,170 | | | | | | 0.0 | | |
| 10,908,182 (3)(4) | | | BBCMS Trust
2022-C17 XA, 1.152%,
09/15/2055 | | | | | 873,142 | | | | | | 0.0 | | |
| 52,202,259 (3)(4) | | | Benchmark 2019-B12
XA Mortgage Trust,
1.032%, 08/15/2052 | | | | | 2,105,703 | | | | | | 0.0 | | |
| 36,040,403 (3)(4) | | | Benchmark 2019-B9
XA Mortgage Trust,
1.030%, 03/15/2052 | | | | | 1,652,499 | | | | | | 0.0 | | |
| 92,385,854 (3)(4) | | | Benchmark 2020-B17
XA Mortgage Trust,
1.416%, 03/15/2053 | | | | | 5,324,363 | | | | | | 0.1 | | |
| 109,858,406 (3)(4) | | ��� | Benchmark 2020-B19
XA Mortgage Trust,
1.770%, 09/15/2053 | | | | | 8,410,880 | | | | | | 0.1 | | |
| 59,901,676 (3)(4) | | | Benchmark 2020-B20
XA Mortgage Trust,
1.616%, 10/15/2053 | | | | | 4,629,956 | | | | | | 0.1 | | |
| 47,434,883 (3)(4) | | | Benchmark 2020-B21
xa Mortgage Trust,
1.451%, 12/17/2053 | | | | | 3,554,009 | | | | | | 0.1 | | |
| 4,939,038 (3)(4) | | | Benchmark 2021-B28
XA Mortgage Trust,
1.281%, 08/15/2054 | | | | | 351,274 | | | | | | 0.0 | | |
| 1,000,000 (1) | | | BLP Commercial
Mortgage Trust
2023-IND D, 8.067%,
(TSFR1M + 3.240)%,
03/15/2040 | | | | | 978,816 | | | | | | 0.0 | | |
| 11,041,000 (1)(8) | | | BMD2 Re-Remic Trust
2019-FRR1 3AB,
0.000%, 05/25/2052 | | | | | 6,965,975 | | | | | | 0.1 | | |
| 8,000,000 (1)(3) | | | BMD2 Re-Remic Trust
2019-FRR1 5B13,
2.205%, 05/25/2052 | | | | | 5,425,900 | | | | | | 0.1 | | |
| 5,414,000 (1)(3) | | | BMD2 Re-Remic Trust
2019-FRR1 6B10,
2.515%, 05/25/2052 | | | | | 3,752,555 | | | | | | 0.1 | | |
Principal
Amount† | | | Value | | | Percentage
of Net
Assets | |
COMMERCIAL MORTGAGE-BACKED
SECURITIES: (continued) | |
| 5,643,462 (1) | | | BX Commercial
Mortgage Trust
2021-21M E, 6.855%,
(US0001M + 2.171)%,
10/15/2036 | | | | $ | 5,243,176 | | | | | | 0.1 | | |
| 4,000,000 (1) | | | BX Commercial
Mortgage Trust
2021-IRON E, 7.292%,
(TSFR1M + 2.350)%,
02/15/2038 | | | | | 3,670,233 | | | | | | 0.1 | | |
| 3,478,925 (1) | | | BX Commercial
Mortgage Trust
2021-SOAR D, 6.085%,
(US0001M + 1.400)%,
06/15/2038 | | | | | 3,271,054 | | | | | | 0.0 | | |
| 750,108 (1) | | | BX Commercial
Mortgage Trust
2021-VOLT D, 6.334%,
(US0001M + 1.650)%,
09/15/2036 | | | | | 706,859 | | | | | | 0.0 | | |
| 1,500,000 (1) | | | BX Commercial
Mortgage Trust
2021-VOLT F, 7.084%,
(US0001M + 2.400)%,
09/15/2036 | | | | | 1,384,709 | | | | | | 0.0 | | |
| 3,800,000 (1) | | | BX Trust 2021-LBA
EJV, 6.943%,
(TSFR1M + 2.000)%,
02/15/2036 | | | | | 3,448,800 | | | | | | 0.1 | | |
| 1,800,000 (1) | | | BX Trust 2021-LBA EV,
6.943%, (TSFR1M +
2.000)%, 02/15/2036 | | | | | 1,633,642 | | | | | | 0.0 | | |
| 1,000,000 (1) | | | BX Trust 2021-SDMF
E, 6.271%,
(US0001M + 1.587)%,
09/15/2034 | | | | | 928,369 | | | | | | 0.0 | | |
| 976,928 (1) | | | BX Trust 2022-FOX2 C,
6.137%, (TSFR1M +
1.309)%, 04/15/2039 | | | | | 908,397 | | | | | | 0.0 | | |
| 1,180,000 (1) | | | BX Trust 2022-LBA6 C,
6.427%, (TSFR1M +
1.600)%, 01/15/2039 | | | | | 1,123,619 | | | | | | 0.0 | | |
| 1,250,000 (1) | | | BX Trust 2022-LBA6 D,
6.827%, (TSFR1M +
2.000)%, 01/15/2039 | | | | | 1,166,281 | | | | | | 0.0 | | |
| 10,000,000 (1) | | | Cascade Funding
Mortgage Trust
2021-FRR1 AK99,
8.310%, 09/29/2029 | | | | | 5,838,122 | | | | | | 0.1 | | |
See Accompanying Notes to Financial Statements
PORTFOLIO OF INVESTMENTS
| Voya Intermediate Bond Fund | as of March 31, 2023 (continued) |
Principal
Amount† | | | Value | | | Percentage
of Net
Assets | |
COMMERCIAL MORTGAGE-BACKED
SECURITIES: (continued) | |
| 72,136,487 (3)(4) | | | CCUBS Commercial
Mortgage Trust
2017-C1 XA, 1.014%,
11/15/2050 | | | | $ | 2,594,771 | | | | | | 0.0 | | |
| 20,827,465 (3)(4) | | | CD 2016-CD1
Mortgage Trust XA,
1.366%, 08/10/2049 | | | | | 675,138 | | | | | | 0.0 | | |
| 45,113,000 (1)(3)(4) | | | CD 2016-CD1
Mortgage Trust XB,
0.694%, 08/10/2049 | | | | | 877,502 | | | | | | 0.0 | | |
| 26,971,361 (3)(4) | | | CD 2017-CD4
Mortgage Trust XA,
1.226%, 05/10/2050 | | | | | 1,029,282 | | | | | | 0.0 | | |
| 35,879,661 (3)(4) | | | Citigroup Commercial
Mortgage Trust
2016-P4 XA, 1.895%,
07/10/2049 | | | | | 1,616,748 | | | | | | 0.0 | | |
| 69,572,574 (3)(4) | | | Citigroup Commercial
Mortgage Trust
2017-C4 XA, 1.027%,
10/12/2050 | | | | | 2,441,994 | | | | | | 0.0 | | |
| 38,712,138 (3)(4) | | | Citigroup Commercial
Mortgage Trust
2017-P8 XA, 0.871%,
09/15/2050 | | | | | 1,155,968 | | | | | | 0.0 | | |
| 70,513,452 (3)(4) | | | Citigroup Commercial
Mortgage Trust
2018-C5 XA, 0.670%,
06/10/2051 | | | | | 2,064,644 | | | | | | 0.0 | | |
| 7,062,741 (3)(4) | | | COMM 2012-CR4 XA,
1.188%, 10/15/2045 | | | | | 13,438 | | | | | | 0.0 | | |
| 27,260,000 (1)(3)(4) | | | COMM 2012-CR4 XB,
0.401%, 10/15/2045 | | | | | 51,434 | | | | | | 0.0 | | |
| 4,640,000 (1)(3) | | | COMM 2013-CR10 E
Mortgage Trust,
4.867%, 08/10/2046 | | | | | 4,360,683 | | | | | | 0.1 | | |
| 9,645,000 (1)(3) | | | COMM 2013-CR10 F
Mortgage Trust,
4.867%, 08/10/2046 | | | | | 8,298,572 | | | | | | 0.1 | | |
| 93,017,665 (1)(3)(4) | | | COMM 2015-PC1 XA,
0.409%, 07/10/2050 | | | | | 598,820 | | | | | | 0.0 | | |
| 56,302,331 (3)(4) | | | COMM 2016-CR28 XA,
0.640%, 02/10/2049 | | | | | 849,560 | | | | | | 0.0 | | |
| 33,066,943 (3)(4) | | | COMM 2017-COR2 XA,
1.155%, 09/10/2050 | | | | | 1,254,705 | | | | | | 0.0 | | |
| 8,261,000 (1)(3) | | | COMM 2020-CBM F
Mortgage Trust,
3.633%, 02/10/2037 | | | | | 7,142,895 | | | | | | 0.1 | | |
| 4,340,000 (1)(3) | | | CSAIL 2017-CX10 D
Commercial Mortgage
Trust, 4.176%,
11/15/2050 | | | | | 2,935,439 | | | | | | 0.0 | | |
Principal
Amount† | | | Value | | | Percentage
of Net
Assets | |
COMMERCIAL MORTGAGE-BACKED
SECURITIES: (continued) | |
| 8,000,000 (1) | | | CSWF 2021-SOP2 E,
8.051%, (US0001M +
3.367)%, 06/15/2034 | | | | $ | 7,002,898 | | | | | | 0.1 | | |
| 612,792 (1)(7) | | | DBUBS 2011-LC2A F
Mortgage Trust,
4.000%, (US0001M +
3.650)%, 07/10/2044 | | | | | 611,156 | | | | | | 0.0 | | |
| 3,768,102 (1) | | | Extended Stay America
Trust 2021-ESH E,
7.535%, (US0001M +
2.850)%, 07/15/2038 | | | | | 3,571,863 | | | | | | 0.1 | | |
| 15,533,505 | | | Freddie Mac Multifamily
2021-ML08-X-US
Certificates
Sustainability Bonds,
1.846%, 07/25/2037 | | | | | 2,157,397 | | | | | | 0.0 | | |
| 10,245,401 (1)(3)(4) | | | Freddie Mac Multifamily
ML Certificates
2021-ML11 XUS,
0.769%, 03/25/2038 | | | | | 578,142 | | | | | | 0.0 | | |
| 23,383,106 (3)(4) | | | Freddie Mac Multifamily
Structured Pass
Through Certificates
K107 X1, 1.691%,
03/25/2030 | | | | | 2,179,903 | | | | | | 0.0 | | |
| 68,507,996 (3)(4) | | | Freddie Mac Multifamily
Structured Pass
Through Certificates
K109 X1, 1.582%,
04/25/2030 | | | | | 5,920,584 | | | | | | 0.1 | | |
| 101,011,781 (3)(4) | | | Freddie Mac Multifamily
Structured Pass
Through Certificates
K119 X1, 0.930%,
09/25/2030 | | | | | 5,445,813 | | | | | | 0.1 | | |
| 40,967,036 (3)(4) | | | Freddie Mac Multifamily
Structured Pass
Through Certificates
K123 X1, 0.773%,
12/25/2030 | | | | | 1,878,545 | | | | | | 0.0 | | |
| 13,307,063 (3)(4) | | | Freddie Mac Multifamily
Structured Pass
Through Certificates
K-1516 X1, 1.511%,
05/25/2035 | | | | | 1,570,907 | | | | | | 0.0 | | |
| 75,520,138 (3)(4) | | | Freddie Mac Multifamily
Structured Pass
Through
CertificatesK151 X1,
0.375%, 04/25/2030 | | | | | 1,530,959 | | | | | | 0.0 | | |
See Accompanying Notes to Financial Statements
PORTFOLIO OF INVESTMENTS
| Voya Intermediate Bond Fund | as of March 31, 2023 (continued) |
Principal
Amount† | | | Value | | | Percentage
of Net
Assets | |
COMMERCIAL MORTGAGE-BACKED
SECURITIES: (continued) | |
| 5,000,000 (1)(3) | | | FRR Re-REMIC Trust
2018-C1 B725, 2.838%,
02/27/2050 | | | | $ | 4,694,935 | | | | | | 0.1 | | |
| 5,000,000 (1)(3)(9) | | | FRR Re-REMIC Trust
2018-C1 C725,
0.330%, 02/27/2050 | | | | | 4,580,846 | | | | | | 0.1 | | |
| 8,971,340 (1)(3)(9) | | | FRR Re-REMIC Trust
2018-C1 CK43,
0.730%, 02/27/2048 | | | | | 7,485,763 | | | | | | 0.1 | | |
| 11,599,000 (1)(3) | | | GAM RE-REMIC TR
2021-FFR2 BK78,
2.420%, 09/27/2051 | | | | | 8,359,852 | | | | | | 0.1 | | |
| 8,825,000 (1)(8) | | | GAM RE-REMIC TR
2021-FFR2 C730,
0.000%, 09/27/2051 | | | | | 7,405,914 | | | | | | 0.1 | | |
| 10,728,000 (1)(8) | | | GAM RE-REMIC TR
2021-FFR2 CK44,
0.000%, 09/27/2051 | | | | | 8,932,067 | | | | | | 0.1 | | |
| 8,727,000 (1)(3) | | | GAM RE-REMIC TR
2021-FFR2 CK49,
1.040%, 09/27/2051 | | | | | 7,238,853 | | | | | | 0.1 | | |
| 7,409,000 (1)(8) | | | GAM RE-REMIC TR
2021-FFR2 CK78,
0.000%, 09/27/2051 | | | | | 4,321,038 | | | | | | 0.1 | | |
| 8,821,000 (1)(8) | | | GAM RE-REMIC TR
2021-FFR2 D730,
0.000%, 09/27/2051 | | | | | 7,396,826 | | | | | | 0.1 | | |
| 8,724,000 (1)(8) | | | GAM RE-REMIC TR
2021-FFR2 DK49,
0.000%, 09/27/2051 | | | | | 6,811,289 | | | | | | 0.1 | | |
| 12,584,000 (1) | | | GAM Re-REMIC Trust
2021-FRR1 1B,
1.050%, 11/29/2050 | | | | | 8,589,302 | | | | | | 0.1 | | |
| 15,763,000 (1) | | | GAM Re-REMIC Trust
2021-FRR1 2B,
1.320%, 11/29/2050 | | | | | 10,456,331 | | | | | | 0.1 | | |
| 18,282,000 (1)(3) | | | GAM Resecuritization
Trust 2022-FRR3 BK47,
2.030%, 11/27/2050 | | | | | 13,376,140 | | | | | | 0.2 | | |
| 12,445,000 (1)(9) | | | GAM Resecuritization
Trust 2022-FRR3 BK61,
1.200%, 01/29/2052 | | | | | 8,803,119 | | | | | | 0.1 | | |
| 13,548,000 (1)(9) | | | GAM Resecuritization
Trust 2022-FRR3 BK89,
1.830%, 01/27/2052 | | | | | 7,993,712 | | | | | | 0.1 | | |
| 7,076,000 (1)(9) | | | GAM Resecuritization
Trust 2022-FRR3 C728,
0.510%, 08/27/2050 | | | | | 6,148,405 | | | | | | 0.1 | | |
| 7,212,000 (1)(9) | | | GAM Resecuritization
Trust 2022-FRR3
CK47, 0.870%,
05/27/2048 | | | | | 5,797,699 | | | | | | 0.1 | | |
Principal
Amount† | | | Value | | | Percentage
of Net
Assets | |
COMMERCIAL MORTGAGE-BACKED
SECURITIES: (continued) | |
| 8,725,000 (1)(9) | | | GAM Resecuritization
Trust 2022-FRR3
CK61, 1.480%,
11/27/2049 | | | | $ | 5,888,484 | | | | | | 0.1 | | |
| 6,092,000 (1)(3) | | | GAM Resecuritization
Trust 2022-FRR3
CK71, 1.400%,
01/29/2052 | | | | | 4,173,837 | | | | | | 0.1 | | |
| 7,095,000 (1)(9) | | | GAM Resecuritization
Trust 2022-FRR3
CK89, 2.040%,
01/27/2052 | | | | | 3,945,744 | | | | | | 0.1 | | |
| 7,080,000 (1)(9) | | | GAM Resecuritization
Trust 2022-FRR3 D728,
0.560%, 01/29/2052 | | | | | 6,021,415 | | | | | | 0.1 | | |
| 5,698,000 (1)(9) | | | GAM Resecuritization
Trust 2022-FRR3
DK41, 0.620%,
10/27/2047 | | | | | 4,891,880 | | | | | | 0.1 | | |
| 7,208,000 (1)(9) | | | GAM Resecuritization
Trust 2022-FRR3
DK47, 0.970%,
05/27/2048 | | | | | 5,649,465 | | | | | | 0.1 | | |
| 3,796,000 (1)(9) | | | GAM Resecuritization
Trust 2022-FRR3 EK41,
0.610%, 01/29/2052 | | | | | 3,188,189 | | | | | | 0.0 | | |
| 4,400,000 (1) | | | GS Mortgage Securities
Corp. II 2018-RIVR F,
6.784%, (US0001M +
2.100)%, 07/15/2035 | | | | | 2,046,000 | | | | | | 0.0 | | |
| 41,584,634 (3)(4) | | | GS Mortgage Securities
Trust 2013-GC16 XA,
0.983%, 11/10/2046 | | | | | 217,685 | | | | | | 0.0 | | |
| 53,529,177 (3)(4) | | | GS Mortgage Securities
Trust 2014-GC22 XA,
0.935%, 06/10/2047 | | | | | 339,846 | | | | | �� | 0.0 | | |
| 57,497,829 (3)(4) | | | GS Mortgage Securities
Trust 2016-GS4 XA,
0.567%, 11/10/2049 | | | | | 917,019 | | | | | | 0.0 | | |
| 67,472,209 (3)(4) | | | GS Mortgage Securities
Trust 2017-GS6 XA,
1.012%, 05/10/2050 | | | | | 2,276,668 | | | | | | 0.0 | | |
| 500,000 (3) | | | GS Mortgage Securities
Trust 2018-GS9 B,
4.321%, 03/10/2051 | | | | | 452,848 | | | | | | 0.0 | | |
| 77,566,735 (3)(4) | | | GS Mortgage Securities
Trust 2019-GC38 XA,
0.951%, 02/10/2052 | | | | | 3,298,269 | | | | | | 0.0 | | |
See Accompanying Notes to Financial Statements
PORTFOLIO OF INVESTMENTS
| Voya Intermediate Bond Fund | as of March 31, 2023 (continued) |
Principal
Amount† | | | Value | | | Percentage
of Net
Assets | |
COMMERCIAL MORTGAGE-BACKED
SECURITIES: (continued) | |
| 7,345,454 (1)(3) | | | JP Morgan Chase
Commercial Mortgage
Securities Trust
2013-C16 E, 3.744%,
12/15/2046 | | | | $ | 6,546,493 | | | | | | 0.1 | | |
| 76,754,959 (3)(4) | | | JP Morgan Chase
Commercial Mortgage
Securities Trust
2016-JP4 XA, 0.579%,
12/15/2049 | | | | | 1,247,779 | | | | | | 0.0 | | |
| 650,000 (1) | | | JP Morgan Chase
Commercial Mortgage
Securities Trust
2021-NYAH E, 6.524%,
(US0001M + 1.840)%,
06/15/2038 | | | | | 587,496 | | | | | | 0.0 | | |
| 6,363,797 (1)(3) | | | JPMBB Commercial
Mortgage Securities
Trust 2013-C15 D,
5.176%, 11/15/2045 | | | | | 5,947,953 | | | | | | 0.1 | | |
| 6,470,000 (1)(3) | | | JPMBB Commercial
Mortgage Securities
Trust 2013-C17 F,
3.867%, 01/15/2047 | | | | | 3,396,855 | | | | | | 0.0 | | |
| 8,113,022 (3)(4) | | | JPMBB Commercial
Mortgage Securities
Trust 2014-C19 XA,
0.604%, 04/15/2047 | | | | | 37,308 | | | | | | 0.0 | | |
| 1,107,380 (3)(4) | | | JPMBB Commercial
Mortgage Securities
Trust 2015-C28 XA,
0.945%, 10/15/2048 | | | | | 14,955 | | | | | | 0.0 | | |
| 496,412 (1) | | | KIND Trust 2021-KIND
D, 7.242%, (TSFR1M +
2.300)%, 08/15/2038 | | | | | 462,703 | | | | | | 0.0 | | |
| 589,782 (1) | | | Life 2021-BMR F
Mortgage Trust,
7.292%, (TSFR1M +
2.350)%, 03/15/2038 | | | | | 550,509 | | | | | | 0.0 | | |
| 36,672,503 (1)(3)(4) | | | LSTAR Commercial
Mortgage Trust 2017-5
X, 0.795%, 03/10/2050 | | | | | 697,377 | | | | | | 0.0 | | |
| 3,000,000 (1) | | | MBRT 2019-MBR H1,
9.034%, (US0001M +
4.000)%, 11/15/2036 | | | | | 2,903,226 | | | | | | 0.0 | | |
| 10,468,898 (1) | | | Med Trust 2021-MDLN
D, 6.685%,
(US0001M + 2.000)%,
11/15/2038 | | | | | 9,989,691 | | | | | | 0.1 | | |
| 2,093,780 (1) | | | Med Trust 2021-MDLN
F, 8.685%, (US0001M +
4.000)%, 11/15/2038 | | | | | 1,947,212 | | | | | | 0.0 | | |
Principal
Amount† | | | Value | | | Percentage
of Net
Assets | |
COMMERCIAL MORTGAGE-BACKED
SECURITIES: (continued) | |
| 4,340,000 (1)(3) | | | Morgan Stanley Bank of
America Merrill Lynch
Trust 2013-C13 D,
4.896%, 11/15/2046 | | | | $ | 4,011,924 | | | | | | 0.1 | | |
| 64,676,886 (3)(4) | | | Morgan Stanley Bank of
America Merrill Lynch
Trust 2014 C19 XA,
0.954%, 12/15/2047 | | | | | 683,075 | | | | | | 0.0 | | |
| 500,000 (3) | | | Morgan Stanley Bank of
America Merrill Lynch
Trust 2015-C27 B,
4.499%, 12/15/2047 | | | | | 470,760 | | | | | | 0.0 | | |
| 31,575,854 (3)(4) | | | Morgan Stanley Capital
I Trust 2021-L6 XA,
1.226%, 06/15/2054 | | | | | 1,945,556 | | | | | | 0.0 | | |
| 37,543,457 (3)(4) | | | Morgan Stanley Capital
I, Inc. 2017-HR2 XA,
0.850%, 12/15/2050 | | | | | 1,230,168 | | | | | | 0.0 | | |
| 16,840,000 (1) | | | RFM Reremic Trust
2022-FRR1 AB55,
1.040%, 03/28/2049 | | | | | 12,857,813 | | | | | | 0.2 | | |
| 14,290,000 (1)(3) | | | RFM Reremic Trust
2022-FRR1 AB60,
2.450%, 11/08/2049 | | | | | 11,401,361 | | | | | | 0.2 | | |
| 21,500,000 (1)(3) | | | RFM Reremic Trust
2022-FRR1 AB64,
2.300%, 03/01/2050 | | | | | 16,939,163 | | | | | | 0.2 | | |
| 5,260,000 (1)(8) | | | RFM Reremic Trust
2022-FRR1 CK55,
0.000%, 03/28/2049 | | | | | 3,920,829 | | | | | | 0.1 | | |
| 6,590,000 (1)(8) | | | RFM Reremic Trust
2022-FRR1 CK60,
0.000%, 11/08/2049 | | | | | 4,554,431 | | | | | | 0.1 | | |
| 6,190,000 (1)(8) | | | RFM Reremic Trust
2022-FRR1 CK64,
0.000%, 03/01/2050 | | | | | 4,206,032 | | | | | | 0.1 | | |
| 986,016 (1) | | | TTAN 2021-MHC D,
6.435%, (US0001M +
1.750)%, 03/15/2038 | | | | | 938,754 | | | | | | 0.0 | | |
| 1,284,641 (1)(3) | | | WFRBS Commercial
Mortgage Trust
2011-C5 E, 5.420%,
11/15/2044 | | | | | 1,222,718 | | | | | | 0.0 | | |
| 12,946,000 (1)(3) | | | WFRBS Commercial
Mortgage Trust
2013-C11 F, 4.147%,
03/15/2045 | | | | | 7,961,790 | | | | | | 0.1 | | |
| 3,920,000 (1) | | | WFRBS Commercial
Mortgage Trust
2013-C17 E, 3.500%,
12/15/2046 | | | | | 3,535,296 | | | | | | 0.1 | | |
See Accompanying Notes to Financial Statements
PORTFOLIO OF INVESTMENTS
| Voya Intermediate Bond Fund | as of March 31, 2023 (continued) |
Principal
Amount† | | | Value | | | Percentage
of Net
Assets | |
COMMERCIAL MORTGAGE-BACKED
SECURITIES: (continued) | |
| 2,000,000 (1) | | | WFRBS Commercial
Mortgage Trust
2014-C21 D, 3.497%,
08/15/2047 | | | | $ | 1,620,954 | | | | | | 0.0 | | |
| 71,855,062 (3)(4) | | | WFRBS Commercial
Mortgage Trust
2014-C25 XA, 0.789%,
11/15/2047 | | | | | 686,324 | | | | | | 0.0 | | |
| | | | Total Commercial
Mortgage-Backed
Securities
(Cost $513,181,685) | | | | | 457,635,659 | | | | | | 6.0 | | |
| SOVEREIGN BONDS: 0.4% | |
| 1,000,000 | | | Colombia Government
International Bond,
3.125%, 04/15/2031 | | | | | 765,304 | | | | | | 0.0 | | |
| 350,000 | | | Colombia Government
International Bond,
3.875%, 04/25/2027 | | | | | 318,520 | | | | | | 0.0 | | |
| 3,000,000 | | | Mexico Government
International Bond,
3.750%, 04/19/2071 | | | | | 2,002,769 | | | | | | 0.0 | | |
| 1,750,000 | | | Mexico Government
International Bond,
3.771%, 05/24/2061 | | | | | 1,186,905 | | | | | | 0.0 | | |
| 1,375,000 | | | Mexico Government
International Bond,
4.280%, 08/14/2041 | | | | | 1,127,005 | | | | | | 0.0 | | |
| 2,500,000 (1)(2) | | | Morocco Government
International Bond,
2.375%, 12/15/2027 | | | | | 2,206,692 | | | | | | 0.0 | | |
| 1,450,000 (1) | | | Morocco Government
International Bond,
4.000%, 12/15/2050 | | | | | 991,438 | | | | | | 0.0 | | |
| 3,400,000 | | | Oman Government
International Bond,
6.000%, 08/01/2029 | | | | | 3,427,224 | | | | | | 0.1 | | |
| 1,625,000 (1) | | | Oman Government
International Bond,
7.375%, 10/28/2032 | | | | | 1,777,027 | | | | | | 0.0 | | |
| 3,000,000 (2) | | | Panama Government
International Bond,
3.298%, 01/19/2033 | | | | | 2,512,031 | | | | | | 0.1 | | |
| 3,375,000 | | | Peruvian Government
International Bond,
1.862%, 12/01/2032 | | | | | 2,558,274 | | | | | | 0.1 | | |
Principal
Amount† | | | Value | | | Percentage
of Net
Assets | |
| SOVEREIGN BONDS: (continued) | |
| 2,525,000 | | | Peruvian Government
International Bond,
2.780%, 12/01/2060 | | | | $ | 1,511,460 | | | | | | 0.0 | | |
| 8,700,000 | | | Republic of South
Africa Government
International Bond,
4.850%, 09/30/2029 | | | | | 7,828,695 | | | | | | 0.1 | | |
EUR 2,050,000 (1) | | | Romanian Government
International Bond,
2.625%, 12/02/2040 | | | | | 1,293,398 | | | | | | 0.0 | | |
| 2,600,000 (10) | | | Russian Foreign Bond -
Eurobond, 4.250%,
06/23/2027 | | | | | 156,000 | | | | | | 0.0 | | |
| 2,450,000 (1)(2) | | | Saudi Government
International Bond,
3.450%, 02/02/2061 | | | | | 1,737,988 | | | | | | 0.0 | | |
| 500,000 (10) | | | Ukraine Government
International Bond,
7.375%, 09/25/2034 | | | | | 87,375 | | | | | | 0.0 | | |
| 1,500,000 (10) | | | Ukraine Government
International Bond,
7.750%, 09/01/2025 | | | | | 304,744 | | | | | | 0.0 | | |
| 10,400,000 (10) | | | Ukraine Government
International Bond,
7.750%, 09/01/2027 | | | | | 1,928,706 | | | | | | 0.0 | | |
| 1,890,000 (10) | | | Ukraine Government
International Bond,
7.750%, 09/01/2028 | | | | | 356,884 | | | | | | 0.0 | | |
| 850,000 (10) | | | Ukraine Government
International Bond,
7.750%, 09/01/2029 | | | | | 158,965 | | | | | | 0.0 | | |
| 389,000 (10) | | | Ukraine Government
International Bond,
9.750%, 11/01/2030 | | | | | 74,256 | | | | | | 0.0 | | |
| | | | Total Sovereign Bonds
(Cost $57,989,226) | | | | | 34,311,660 | | | | | | 0.4 | | |
| PURCHASED OPTIONS(11): 0.0% | |
| | | | Total Purchased
Options
(Cost $3,092,110) | | | | | 307,240 | | | | | | 0.0 | | |
| | | | Total Long-Term
Investments
(Cost $8,183,804,905) | | | | | 7,597,112,154 | | | | | | 99.0 | | |
| |
See Accompanying Notes to Financial Statements
PORTFOLIO OF INVESTMENTS
| Voya Intermediate Bond Fund | as of March 31, 2023 (continued) |
Principal
Amount† | | | Value | | | Percentage
of Net
Assets | |
| SHORT-TERM INVESTMENTS: 1.6% | |
| | | | Commercial Paper: 0.4% | |
| 25,000,000 | | | American Electric
Power Co., Inc.,
4.960%, 05/08/2023 | | | | $ | 24,859,083 | | | | | | 0.3 | | |
| 1,000,000 | | | EIDP Inc., 5.170%,
04/17/2023 | | | | | 997,536 | | | | | | 0.0 | | |
| 3,750,000 | | | Sherwin-Williams Co.,
5.370%, 04/18/2023 | | | | | 3,740,672 | | | | | | 0.1 | | |
| | | | Total Commercial Paper
(Cost $29,605,500) | | | | | 29,597,291 | | | | | | 0.4 | | |
| | | | Repurchase Agreements: 0.8% | |
| 12,768,139 (12) | | | Cantor Fitzgerald
Securities, Repurchase
Agreement dated
03/31/23, 4.83%, due
04/03/23 (Repurchase
Amount $12,773,208,
collateralized by various
U.S. Government/U.S.
Government Agency
Obligations,
0.000%-9.000%, Market
Value plus accrued
interest $13,023,502,
due 04/25/23-02/20/73) | | | | | 12,768,139 | | | | | | 0.2 | | |
| 8,807,226 (12) | | | Citadel Securities LLC,
Repurchase Agreement
dated 03/31/23, 4.88%,
due 04/03/23
(Repurchase Amount
$8,810,759,
collateralized by various
U.S. Government
Securities,
0.000%-5.375%, Market
Value plus accrued
interest $8,987,024,
due 04/04/23-02/15/53) | | | | | 8,807,226 | | | | | | 0.1 | | |
| 2,065,640 (12) | | | Mirae Asset Securities
USA Inc., Repurchase
Agreement dated
03/31/23, 4.87%, due
04/03/23 (Repurchase
Amount $2,066,467,
collateralized by various
U.S. Government/U.S.
Government Agency
Obligations,
0.000%-8.500%, Market
Value plus accrued
interest $2,107,808,
due 04/04/23-01/20/73) | | | | | 2,065,640 | | | | | | 0.0 | | |
Principal
Amount† | | | Value | | | Percentage
of Net
Assets | |
| SHORT-TERM INVESTMENTS: (continued) | |
| | | | Repurchase Agreements (continued) | |
| 14,000,000 (12) | | | National Bank
Financial, Repurchase
Agreement dated
03/31/23, 4.84%, due
04/03/23 (Repurchase
Amount $14,005,569,
collateralized by various
U.S. Government
Securities,
0.000%-4.768%, Market
Value plus accrued
interest $14,279,994,
due 04/03/23-09/09/49) | | | | $ | 14,000,000 | | | | | | 0.2 | | |
| 18,693,701 (12) | | | RBC Dominion
Securities Inc.,
Repurchase Agreement
dated 03/31/23, 4.82%,
due 04/03/23
(Repurchase Amount
$18,701,107,
collateralized by various
U.S. Government/U.S.
Government Agency
Obligations,
0.000%-6.375%, Market
Value plus accrued
interest $19,067,575,
due 04/06/23-02/20/53) | | | | | 18,693,701 | | | | | | 0.2 | | |
| 8,219,188 (12) | | | State of Wisconsin
Investment Board,
Repurchase Agreement
dated 03/31/23, 4.91%,
due 04/03/23
(Repurchase Amount
$8,222,505,
collateralized by various
U.S. Government
Securities,
0.125%-3.875%, Market
Value plus accrued
interest $8,383,574,
due 07/15/25-02/15/51) | | | | | 8,219,188 | | | | | | 0.1 | | |
| | | | Total Repurchase
Agreements
(Cost $64,553,894) | | | | | 64,553,894 | | | | | | 0.8 | | |
See Accompanying Notes to Financial Statements
PORTFOLIO OF INVESTMENTS
| Voya Intermediate Bond Fund | as of March 31, 2023 (continued) |
Principal
Amount† | | | Value | | | Percentage
of Net
Assets | |
| SHORT-TERM INVESTMENTS: (continued) | |
| | | | Repurchase Agreement: 0.2% | |
| 14,608,000 | | | Deutsche Bank
Repurchase Agreement
dated 03/31/23,
4.800%, due 04/03/23,
$14,613,843 to be
received upon
repurchase
(Collateralized by
$15,337,700, US Govt.
Treasury Note, 2.625%,
Mkt Value plus accrued
int. and principal
$14,900,238 due
03/31/25), 4.800%,
04/03/2023
(Cost $14,608,000) | | | | $ | 14,608,000 | | | | | | 0.2 | | |
| | | | | |
| | | | Time Deposits: 0.2% | |
| 2,000,000 (12) | | | Barclays Bank PLC,
4.840%, 04/03/2023 | | | | | 2,000,000 | | | | | | 0.1 | | |
| 2,000,000 (12) | | | Canadian Imperial Bank
of Commerce, 4.800%,
04/03/2023 | | | | | 2,000,000 | | | | | | 0.0 | | |
| 1,990,000 (12) | | | Credit Agricole,
4.800%, 04/03/2023 | | | | | 1,990,000 | | | | | | 0.0 | | |
| 2,000,000 (12) | | | HSBC Holdings PLC,
4.880%, 04/03/2023 | | | | | 2,000,000 | | | | | | 0.0 | | |
| 2,000,000 (12) | | | Landesbank
Baden-Wurttemberg,
4.820%, 04/03/2023 | | | | | 2,000,000 | | | | | | 0.0 | | |
| 1,500,000 (12) | | | Mizuho Financial Group
Inc., 4.820%,
04/03/2023 | | | | | 1,500,000 | | | | | | 0.0 | | |
| 2,000,000 (12) | | | Royal Bank of Canada,
4.810%, 04/03/2023 | | | | | 2,000,000 | | | | | | 0.1 | | |
| 1,990,000 (12) | | | Svenska
Handelsbanken AB,
4.770%, 04/03/2023 | | | | | 1,990,000 | | | | | | 0.0 | | |
| | | | Total Time Deposits
(Cost $15,480,000) | | | | | 15,480,000 | | | | | | 0.2 | | |
| | | | Total Short-Term
Investments
(Cost $124,247,394) | | | | | 124,239,185 | | | | | | 1.6 | | |
| | | | Total Investments in
Securities
(Cost $8,308,052,299) | | | | $ | 7,721,351,339 | | | | | | 100.6 | | |
| | | | Liabilities in Excess
of Other Assets | | | | | (47,581,514) | | | | | | (0.6) | | |
| | | | Net Assets | | | | $ | 7,673,769,825 | | | | | | 100.0 | | |
| |
†
Unless otherwise indicated, principal amount is shown in USD.
(1)
Securities with purchases pursuant to Rule 144A or section 4(a)(2), under the Securities Act of 1933 and may not be resold subject to that rule except to qualified institutional buyers.
(2)
Security, or a portion of the security, is on loan.
(3)
Variable rate security. Rate shown is the rate in effect as of March 31, 2023.
(4)
Interest only securities represent the right to receive the monthly interest payments on an underlying pool of mortgage loans. Principal amount shown represents the notional amount on which current interest is calculated. Payments of principal on the pool reduce the value of the interest only security.
(5)
The Federal Housing Finance Agency (“FHFA”) placed the Federal Home Loan Mortgage Corporation and Federal National Mortgage Association into conservatorship with FHFA as the conservator. As such, the FHFA oversees the continuing affairs of these companies.
(6)
Represents or includes a TBA transaction.
(7)
For fair value measurement disclosure purposes, security is categorized as Level 3, whose value was determined using significant unobservable inputs.
(8)
Principal only securities represent the right to receive the monthly principal payments on an underlying pool of mortgage loans. No payments of interest on the pool are passed through the principal only security.
(9)
Represents a zero coupon bond. Rate shown reflects the effective yield as of March 31, 2023.
(10)
Defaulted security.
(11)
The tables within the Portfolio of Investments detail open purchased options which are non-income producing securities.
(12)
All or a portion of the security represents securities purchased with cash collateral received for securities on loan.
Currency Abbreviations:
EUR
EU Euro
Reference Rate Abbreviations:
12MTA
12-month Treasury Average
SOFR30A
30-day Secured Overnight Financing Rate
TSFR1M
1-month CME Term Secured Overnight Financing Rate
TSFR3M
3-month CME Term Secured Overnight Financing Rate
US0001M
1-month LIBOR
US0003M
3-month LIBOR
US0012M
12-month LIBOR
See Accompanying Notes to Financial Statements
PORTFOLIO OF INVESTMENTS
| Voya Intermediate Bond Fund | as of March 31, 2023 (continued) |
Fair Value Measurements^
The following is a summary of the fair valuations according to the inputs used as of March 31, 2023 in valuing the assets and liabilities:
| | | | Quoted Prices
in Active Markets
for Identical
Investments
(Level 1) | | | Significant
Other
Observable
Inputs
(Level 2) | | | Significant
Unobservable
Inputs
(Level 3) | | | Fair Value
at
March 31, 2023 | |
| Asset Table | | | | | | | | | | | | | | | | | | | | | | | | | |
| Investments, at fair value | | | | | | | | | | | | | | | | | | | | | | | | | |
| Purchased Options | | | | $ | — | | | | | $ | 307,240 | | | | | $ | — | | | | | $ | 307,240 | | |
| Corporate Bonds/Notes | | | | | — | | | | | | 2,317,332,482 | | | | | | — | | | | | | 2,317,332,482 | | |
| Collateralized Mortgage Obligations | | | | | — | | | | | | 1,234,485,297 | | | | | | — | | | | | | 1,234,485,297 | | |
| Asset-Backed Securities | | | | | — | | | | | | 886,427,709 | | | | | | — | | | | | | 886,427,709 | | |
| U.S. Government Agency Obligations | | | | | — | | | | | | 1,539,381,161 | | | | | | — | | | | | | 1,539,381,161 | | |
| Commercial Mortgage-Backed Securities | | | | | — | | | | | | 457,024,503 | | | | | | 611,156 | | | | | | 457,635,659 | | |
| Sovereign Bonds | | | | | — | | | | | | 34,311,660 | | | | | | — | | | | | | 34,311,660 | | |
| U.S. Treasury Obligations | | | | | — | | | | | | 1,127,230,945 | | | | | | — | | | | | | 1,127,230,945 | | |
| Short-Term Investments | | | | | — | | | | | | 124,239,185 | | | | | | — | | | | | | 124,239,185 | | |
| Total Investments, at fair value | | | | $ | — | | | | | $ | 7,720,740,183 | | | | | $ | 611,156 | | | | | $ | 7,721,351,339 | | |
| Other Financial Instruments+ | | | | | | | | | | | | | | | | | | | | | | | | | |
| Centrally Cleared Swaps | | | | | — | | | | | | 7,886,470 | | | | | | — | | | | | | 7,886,470 | | |
| Forward Premium Swaptions | | | | | — | | | | | | 1,251,890 | | | | | | — | | | | | | 1,251,890 | | |
| Futures | | | | | 12,747,982 | | | | | | — | | | | | | — | | | | | | 12,747,982 | | |
| Total Assets | | | | $ | 12,747,982 | | | | | $ | 7,729,878,543 | | | | | $ | 611,156 | | | | | $ | 7,743,237,681 | | |
| Liabilities Table | | | | | | | | | | | | | | | | | | | | | | | | | |
| Other Financial Instruments+ | | | | | | | | | | | | | | | | | | | | | | | | | |
| Centrally Cleared Swaps | | | | $ | — | | | | | $ | (10,316,537) | | | | | $ | — | | | | | $ | (10,316,537) | | |
| Forward Foreign Currency Contracts | | | | | — | | | | | | (53,555) | | | | | | — | | | | | | (53,555) | | |
| Futures | | | | | (6,184,333) | | | | | | — | | | | | | — | | | | | | (6,184,333) | | |
| Written Options | | | | | — | | | | | | (35,857,987) | | | | | | — | | | | | | (35,857,987) | | |
| Total Liabilities | | | | $ | (6,184,333) | | | | | $ | (46,228,079) | | | | | $ | — | | | | | $ | (52,412,412) | | |
^
See Note 2, “Significant Accounting Policies” in the Notes to Financial Statements for additional information.
+
Other Financial Instruments may include open forward foreign currency contracts, futures, centrally cleared swaps, OTC swaps and written options. Forward foreign currency contracts, futures and centrally cleared swaps are fair valued at the unrealized appreciation (depreciation) on the instrument. OTC swaps and written options are valued at the fair value of the instrument.
At March 31, 2023, the following forward foreign currency contracts were outstanding for Voya Intermediate Bond Fund:
| Currency Purchased | | | Currency Sold | | | Counterparty | | | Settlement Date | | | Unrealized
Appreciation
(Depreciation) | |
| USD 2,502,864 | | | EUR 2,352,139 | | | Standard Chartered Bank | | | | | 05/12/23 | | | | | $ | (53,555) | | |
| | | | | | | | | | | | | | | | | $ | (53,555) | | |
At March 31, 2023, the following futures contracts were outstanding for Voya Intermediate Bond Fund:
| Description | | | Number
of Contracts | | | Expiration
Date | | | Notional
Amount | | | Unrealized
Appreciation/
(Depreciation) | |
| Long Contracts: | | | | | | | | | | | | | | | | | | | | | | | | | |
| U.S. Treasury 10-Year Note | | | | | 730 | | | | | | 06/21/23 | | | | | $ | 83,892,969 | | | | | $ | 271,399 | | |
| U.S. Treasury 2-Year Note | | | | | 894 | | | | | | 06/30/23 | | | | | | 184,569,094 | | | | | | 1,525,497 | | |
| U.S. Treasury Long Bond | | | | | 618 | | | | | | 06/21/23 | | | | | | 81,054,562 | | | | | | 1,091,208 | | |
| U.S. Treasury Ultra Long Bond | | | | | 2,211 | | | | | | 06/22/23 | | | | | | 312,027,375 | | | | | | 9,859,878 | | |
| | | | | | | | | | | | | | | | | $ | 661,544,000 | | | | | $ | 12,747,982 | | |
| Short Contracts: | | | | | | | | | | | | | | | | | | | | | | | | | |
| U.S. Treasury 5-Year Note | | | | | (1,476) | | | | | | 06/30/23 | | | | | | (161,633,531) | | | | | | (1,467,647) | | |
| U.S. Treasury Ultra 10-Year Note | | | | | (1,622) | | | | | | 06/21/23 | | | | | | (196,490,094) | | | | | | (4,716,686) | | |
| | | | | | | | | | | | | | | | | $ | (358,123,625) | | | | | $ | (6,184,333) | | |
See Accompanying Notes to Financial Statements
PORTFOLIO OF INVESTMENTS
| Voya Intermediate Bond Fund | as of March 31, 2023 (continued) |
At March 31, 2023, the following centrally cleared interest rate swaps were outstanding for Voya Intermediate Bond Fund:
Pay/Receive
Floating Rate | | | Floating Rate Index | | | Floating
Rate Index
Payment
Frequency | | | Fixed Rate | | | Fixed Rate
Payment
Frequency | | | Maturity
Date | | | Notional Amount | | | Fair
Value | | | Unrealized
Appreciation/
(Depreciation) | |
| Pay | | | 1-day Secured Overnight
Financing Rate | | | | | Annual | | | | | | 3.255% | | | | | | Annual | | | | | | 02/05/25 | | | | USD 34,084,000 | | | | $ | (118,120) | | | | | $ | (118,120) | | |
| Pay | | | 1-day Secured Overnight
Financing Rate | | | | | Annual | | | | | | 3.270 | | | | | | Annual | | | | | | 02/20/25 | | | | USD 157,310,000 | | | | | (447,773) | | | | | | (447,773) | | |
| Pay | | | 1-day Secured Overnight
Financing Rate | | | | | Annual | | | | | | 2.988 | | | | | | Annual | | | | | | 03/16/33 | | | | USD 7,860,000 | | | | | (1,469) | | | | | | (1,469) | | |
| Pay | | | 1-day Secured Overnight
Financing Rate | | | | | Annual | | | | | | 3.058 | | | | | | Annual | | | | | | 05/10/33 | | | | USD 49,696,000 | | | | | (514,818) | | | | | | (514,818) | | |
| Pay | | | 1-day Secured Overnight
Financing Rate | | | | | Annual | | | | | | 3.085 | | | | | | Annual | | | | | | 05/10/33 | | | | USD 31,806,000 | | | | | (257,666) | | | | | | (257,666) | | |
| Pay | | | 1-day Secured Overnight
Financing Rate | | | | | Annual | | | | | | 3.289 | | | | | | Annual | | | | | | 05/10/33 | | | | USD 43,733,251 | | | | | 399,220 | | | | | | 399,220 | | |
| Pay | | | 1-day Secured Overnight
Financing Rate | | | | | Annual | | | | | | 3.394 | | | | | | Annual | | | | | | 05/10/33 | | | | USD 19,879,000 | | | | | 357,580 | | | | | | 357,580 | | |
| Pay | | | 1-day Secured Overnight
Financing Rate | | | | | Annual | | | | | | 3.475 | | | | | | Annual | | | | | | 05/10/33 | | | | USD 39,757,314 | | | | | 990,737 | | | | | | 990,737 | | |
| Pay | | | 1-day Secured Overnight
Financing Rate | | | | | Annual | | | | | | 3.483 | | | | | | Annual | | | | | | 05/10/33 | | | | USD 59,635,973 | | | | | 1,521,462 | | | | | | 1,521,462 | | |
| Pay | | | 1-day Secured Overnight
Financing Rate | | | | | Annual | | | | | | 3.065 | | | | | | Annual | | | | | | 05/11/33 | | | | USD 44,528,000 | | | | | (434,202) | | | | | | (434,202) | | |
| Pay | | | 1-day Secured Overnight
Financing Rate | | | | | Annual | | | | | | 3.234 | | | | | | Annual | | | | | | 05/11/33 | | | | USD 11,130,000 | | | | | 50,116 | | | | | | 50,116 | | |
| Pay | | | 1-day Secured Overnight
Financing Rate | | | | | Annual | | | | | | 3.111 | | | | | | Annual | | | | | | 05/12/33 | | | | USD 15,903,000 | | | | | (92,182) | | | | | | (92,182) | | |
| Pay | | | 1-day Secured Overnight
Financing Rate | | | | | Annual | | | | | | 3.139 | | | | | | Annual | | | | | | 05/12/33 | | | | USD 25,841,220 | | | | | (89,632) | | | | | | (89,632) | | |
| Pay | | | 1-day Secured Overnight
Financing Rate | | | | | Annual | | | | | | 3.164 | | | | | | Annual | | | | | | 05/12/33 | | | | USD 23,855,000 | | | | | (32,171) | | | | | | (32,171) | | |
| Pay | | | 1-day Secured Overnight
Financing Rate | | | | | Annual | | | | | | 3.200 | | | | | | Annual | | | | | | 05/12/33 | | | | USD 31,806,000 | | | | | 54,226 | | | | | | 54,226 | | |
| Pay | | | 1-day Secured Overnight
Financing Rate | | | | | Annual | | | | | | 3.212 | | | | | | Annual | | | | | | 05/12/33 | | | | USD 22,742,313 | | | | | 62,312 | | | | | | 62,312 | | |
| Pay | | | 1-day Secured Overnight
Financing Rate | | | | | Annual | | | | | | 3.214 | | | | | | Annual | | | | | | 05/12/33 | | | | USD 21,866,844 | | | | | 64,018 | | | | | | 64,018 | | |
| Pay | | | 1-day Secured Overnight
Financing Rate | | | | | Annual | | | | | | 3.216 | | | | | | Annual | | | | | | 05/12/33 | | | | USD 21,866,843 | | | | | 67,735 | | | | | | 67,735 | | |
| Pay | | | 1-day Secured Overnight
Financing Rate | | | | | Annual | | | | | | 3.233 | | | | | | Annual | | | | | | 05/12/33 | | | | USD 25,843,000 | | | | | 116,262 | | | | | | 116,262 | | |
| Pay | | | 1-day Secured Overnight
Financing Rate | | | | | Annual | | | | | | 3.610 | | | | | | Annual | | | | | | 05/12/33 | | | | USD 9,940,000 | | | | | 361,727 | | | | | | 361,727 | | |
| Pay | | | 1-day Secured Overnight
Financing Rate | | | | | Annual | | | | | | 3.621 | | | | | | Annual | | | | | | 05/12/33 | | | | USD 17,892,000 | | | | | 667,812 | | | | | | 667,812 | | |
See Accompanying Notes to Financial Statements
PORTFOLIO OF INVESTMENTS
| Voya Intermediate Bond Fund | as of March 31, 2023 (continued) |
Pay/Receive
Floating Rate | | | Floating Rate Index | | | Floating
Rate Index
Payment
Frequency | | | Fixed Rate | | | Fixed Rate
Payment
Frequency | | | Maturity
Date | | | Notional Amount | | | Fair
Value | | | Unrealized
Appreciation/
(Depreciation) | |
| Pay | | | 1-day Secured Overnight
Financing Rate | | | | | Annual | | | | | | 3.674 | | | | | | Annual | | | | | | 05/12/33 | | | | USD 38,167,000 | | | | | 1,594,913 | | | | | | 1,594,913 | | |
| Pay | | | 1-day Secured Overnight
Financing Rate | | | | | Annual | | | | | | 3.456 | | | | | | Annual | | | | | | 05/17/33 | | | | USD 30,216,000 | | | | | 712,203 | | | | | | 712,203 | | |
| Pay | | | 1-day Secured Overnight
Financing Rate | | | | | Annual | | | | | | 3.275 | | | | | | Annual | | | | | | 09/11/33 | | | | USD 43,667,000 | | | | | 606,437 | | | | | | 606,437 | | |
| Pay | | | 1-day Secured Overnight
Financing Rate | | | | | Annual | | | | | | 3.067 | | | | | | Annual | | | | | | 09/13/33 | | | | USD 18,777,000 | | | | | (65,205) | | | | | | (65,205) | | |
| Pay | | | 1-day Secured Overnight
Financing Rate | | | | | Annual | | | | | | 3.075 | | | | | | Annual | | | | | | 09/13/33 | | | | USD 23,581,000 | | | | | (65,230) | | | | | | (65,230) | | |
| Pay | | | 1-day Secured Overnight
Financing Rate | | | | | Annual | | | | | | 3.163 | | | | | | Annual | | | | | | 09/13/33 | | | | USD 4,366,000 | | | | | 20,012 | | | | | | 20,012 | | |
| Pay | | | 1-day Secured Overnight
Financing Rate | | | | | Annual | | | | | | 3.174 | | | | | | Annual | | | | | | 09/13/33 | | | | USD 21,832,000 | | | | | 120,061 | | | | | | 120,061 | | |
| Pay | | | 1-day Secured Overnight
Financing Rate | | | | | Annual | | | | | | 2.843 | | | | | | Annual | | | | | | 06/16/53 | | | | USD 6,113,000 | | | | | (110,508) | | | | | | (110,508) | | |
| Receive | | | 1-day Secured Overnight
Financing Rate | | | | | Annual | | | | | | 3.437 | | | | | | Annual | | | | | | 02/20/25 | | | | USD 91,764,000 | | | | | 116,754 | | | | | | 116,754 | | |
| Receive | | | 1-day Secured Overnight
Financing Rate | | | | | Annual | | | | | | 3.586 | | | | | | Annual | | | | | | 02/20/25 | | | | USD 49,814,000 | | | | | (6,465) | | | | | | (6,465) | | |
| Receive | | | 1-day Secured Overnight
Financing Rate | | | | | Annual | | | | | | 3.657 | | | | | | Annual | | | | | | 02/20/25 | | | | USD 31,988,000 | | | | | (25,512) | | | | | | (25,512) | | |
| Receive | | | 1-day Secured Overnight
Financing Rate | | | | | Annual | | | | | | 3.180 | | | | | | Annual | | | | | | 05/11/33 | | | | USD 133,188,000 | | | | | 2,883 | | | | | | 2,883 | | |
| Receive | | | 1-day Secured Overnight
Financing Rate | | | | | Annual | | | | | | 3.252 | | | | | | Annual | | | | | | 05/11/33 | | | | USD 7,156,000 | | | | | (43,115) | | | | | | (43,115) | | |
| Receive | | | 1-day Secured Overnight
Financing Rate | | | | | Annual | | | | | | 3.275 | | | | | | Annual | | | | | | 05/11/33 | | | | USD 19,879,000 | | | | | (159,512) | | | | | | (159,512) | | |
| Receive | | | 1-day Secured Overnight
Financing Rate | | | | | Annual | | | | | | 3.337 | | | | | | Annual | | | | | | 05/11/33 | | | | USD 32,601,000 | | | | | (431,648) | | | | | | (431,648) | | |
| Receive | | | 1-day Secured Overnight
Financing Rate | | | | | Annual | | | | | | 3.392 | | | | | | Annual | | | | | | 05/11/33 | | | | USD 18,288,000 | | | | | (327,201) | | | | | | (327,201) | | |
| Receive | | | 1-day Secured Overnight
Financing Rate | | | | | Annual | | | | | | 3.408 | | | | | | Annual | | | | | | 05/11/33 | | | | USD 23,457,000 | | | | | (451,859) | | | | | | (451,859) | | |
| Receive | | | 1-day Secured Overnight
Financing Rate | | | | | Annual | | | | | | 3.302 | | | | | | Annual | | | | | | 05/12/33 | | | | USD 16,300,000 | | | | | (168,850) | | | | | | (168,850) | | |
| Receive | | | 1-day Secured Overnight
Financing Rate | | | | | Annual | | | | | | 3.311 | | | | | | Annual | | | | | | 05/12/33 | | | | USD 21,071,000 | | | | | (233,150) | | | | | | (233,150) | | |
| Receive | | | 1-day Secured Overnight
Financing Rate | | | | | Annual | | | | | | 3.314 | | | | | | Annual | | | | | | 05/12/33 | | | | USD 9,940,000 | | | | | (112,701) | | | | | | (112,701) | | |
| Receive | | | 1-day Secured Overnight
Financing Rate | | | | | Annual | | | | | | 3.421 | | | | | | Annual | | | | | | 05/12/33 | | | | USD 35,782,000 | | | | | (729,427) | | | | | | (729,427) | | |
| Receive | | | 1-day Secured Overnight
Financing Rate | | | | | Annual | | | | | | 3.483 | | | | | | Annual | | | | | | 05/12/33 | | | | USD 33,794,000 | | | | | (866,019) | | | | | | (866,019) | | |
See Accompanying Notes to Financial Statements
PORTFOLIO OF INVESTMENTS
| Voya Intermediate Bond Fund | as of March 31, 2023 (continued) |
Pay/Receive
Floating Rate | | | Floating Rate Index | | | Floating
Rate Index
Payment
Frequency | | | Fixed Rate | | | Fixed Rate
Payment
Frequency | | | Maturity
Date | | | Notional Amount | | | Fair
Value | | | Unrealized
Appreciation/
(Depreciation) | |
| Receive | | | 1-day Secured Overnight
Financing Rate | | | | | Annual | | | | | | 3.598 | | | | | | Annual | | | | | | 05/12/33 | | | | USD 21,868,000 | | | | | (773,073) | | | | | | (773,073) | | |
| Receive | | | 1-day Secured Overnight
Financing Rate | | | | | Annual | | | | | | 3.643 | | | | | | Annual | | | | | | 05/12/33 | | | | USD 55,661,000 | | | | | (2,178,532) | | | | | | (2,178,532) | | |
| Receive | | | 1-day Secured Overnight
Financing Rate | | | | | Annual | | | | | | 3.689 | | | | | | Annual | | | | | | 05/12/33 | | | | USD 21,866,000 | | | | | (941,984) | | | | | | (941,984) | | |
| Receive | | | 1-day Secured Overnight
Financing Rate | | | | | Annual | | | | | | 3.184 | | | | | | Annual | | | | | | 09/13/33 | | | | USD6 ,549,000 | | | | | (41,534) | | | | | | (41,534) | | |
| Receive | | | 1-day Secured Overnight
Financing Rate | | | | | Annual | | | | | | 3.236 | | | | | | Annual | | | | | | 09/13/33 | | | | USD 5,328,000 | | | | | (57,179) | | | | | | (57,179) | | |
| Receive | | | 1-day Secured Overnight
Financing Rate | | | | | Annual | | | | | | 3.240 | | | | | | Annual | | | | | | 09/13/33 | | | | USD 5,677,000 | | | | | (62,635) | | | | | | (62,635) | | |
| Receive | | | 1-day Secured Overnight
Financing Rate | | | | | Annual | | | | | | 3.353 | | | | | | Annual | | | | | | 09/13/33 | | | | USD 22,707,000 | | | | | (464,230) | | | | | | (464,230) | | |
| Receive | | | 1-day Secured Overnight
Financing Rate | | | | | Annual | | | | | | 2.950 | | | | | | Annual | | | | | | 06/16/53 | | | | USD 1,747,000 | | | | | (4,779) | | | | | | (4,779) | | |
| Receive | | | 1-day Secured Overnight
Financing Rate | | | | | Annual | | | | | | 2.956 | | | | | | Annual | | | | | | 06/16/53 | | | | USD 2,183,000 | | | | | (8,156) | | | | | | (8,156) | | |
| | | | | | | | | | | | | | | | | | | | | | | | | | | | | | | | | | | $ | (2,430,067) | | | | | $ | (2,430,067) | | |
| |
At March 31, 2023, the following OTC purchased foreign currency options were outstanding for Voya Intermediate Bond Fund:
| Description | | | Counterparty | | | Expiration
Date | | | Exercise
Price | | | Notional Amount | | | Cost | | | Fair Value | |
| Call JPY vs. Put USD | | | BNP Paribas | | | 02/27/25 | | | 107.500 | | | USD 19,009,400 | | | | $ | 942,866 | | | | | $ | 303,741 | | |
| Put USD vs. Call JPY | | | Goldman Sachs International | | | 04/13/23 | | | 120.000 | | | USD 71,026,000 | | | | | 805,577 | | | | | | 1,334 | | |
| Put USD vs. Call JPY | | | Morgan Stanley Capital
Services LLC | | | 04/13/23 | | | 120.000 | | | USD 115,267,000 | | | | | 1,343,667 | | | | | | 2,165 | | |
| | | | | | | | | | | | | | | | | $ | 3,092,110 | | | | | $ | 307,240 | | |
At March 31, 2023, the following OTC written interest rate swaptions were outstanding for Voya Intermediate Bond Fund:
| Description | | | Counterparty | | | Pay/Receive
Exercise Rate | | | Exercise
Rate | | | Floating Rate
Index | | | Expiration
Date | | | Notional
Amount | | | Premiums
Received | | | Fair Value | |
Call on 10-Year Interest Rate Swap(1) | | | Bank of America N.A. | | | Pay | | | 3.550% | | | 1-day Secured
Overnight Financing
Rate | | | 09/11/23 | | | USD 43,667,000 | | | | $ | 1,181,192 | | | | | $ | (2,054,244) | | |
Call on 10-Year Interest Rate Swap(1) | | | Barclays Bank PLC | | | Pay | | | 3.790% | | | 1-day Secured
Overnight Financing
Rate | | | 05/10/23 | | | USD 159,030,000 | | | | | 4,588,016 | | | | | | (8,057,809) | | |
Call on 10-Year Interest Rate Swap(1) | | | Citibank N.A. | | | Pay | | | 3.540% | | | 1-day Secured
Overnight Financing
Rate | | | 09/11/23 | | | USD 87,334,000 | | | | | 2,362,385 | | | | | | (4,056,248) | | |
Call on 10-Year Interest Rate Swap(1) | | | Goldman Sachs
International | | | Pay | | | 3.460% | | | 1-day Secured
Overnight Financing
Rate | | | 08/21/23 | | | USD 79,516,000 | | | | | 2,007,779 | | | | | | (3,168,403) | | |
Call on 10-Year Interest Rate Swap(1) | | | Goldman Sachs
International | | | Pay | | | 3.570% | | | 1-day Secured
Overnight Financing
Rate | | | 09/07/23 | | | USD 43,667,000 | | | | | 1,166,455 | | | | | | (2,094,727) | | |
See Accompanying Notes to Financial Statements
PORTFOLIO OF INVESTMENTS
| Voya Intermediate Bond Fund | as of March 31, 2023 (continued) |
| Description | | | Counterparty | | | Pay/Receive
Exercise Rate | | | Exercise
Rate | | | Floating Rate
Index | | | Expiration
Date | | | Notional
Amount | | | Premiums
Received | | | Fair Value | |
Call on 10-Year Interest Rate Swap(1) | | | JPMorgan Chase
Bank N.A. | | | Pay | | | 2.995% | | | 1-day Secured
Overnight Financing
Rate | | | 06/07/23 | | | USD 79,516,000 | | | | | 2,437,165 | | | | | | (941,702) | | |
Call on 1-Year Interest
Rate Swap(1) | | | Barclays Bank PLC | | | Pay | | | 4.170% | | | 1-day Secured
Overnight Financing
Rate | | | 02/16/24 | | | USD 262,182,000 | | | | | 1,233,566 | | | | | | (2,135,096) | | |
Call on 1-Year Interest
Rate Swap(1) | | | Morgan Stanley Capital
Services LLC | | | Pay | | | 3.520% | | | 1-day Secured
Overnight Financing
Rate | | | 01/24/24 | | | USD 524,367,000 | | | | | 2,282,307 | | | | | | (2,363,915) | | |
Call on 30-Year Interest Rate Swap(1) | | | Morgan Stanley Capital
Services LLC | | | Pay | | | 2.994% | | | 1-day Secured
Overnight Financing
Rate | | | 06/14/23 | | | USD 21,832,000 | | | | | 942,597 | | | | | | (775,318) | | |
Put on 10-Year Interest Rate Swap(2) | | | Bank of America N.A. | | | Receive | | | 3.550% | | | 1-day Secured
Overnight Financing
Rate | | | 09/11/23 | | | USD 43,667,000 | | | | | 1,181,192 | | | | | | (529,044) | | |
Put on 10-Year Interest Rate Swap(2) | | | Barclays Bank PLC | | | Receive | | | 3.790% | | | 1-day Secured
Overnight Financing
Rate | | | 05/10/23 | | | USD 159,030,000 | | | | | 4,588,016 | | | | | | (198,133) | | |
Put on 10-Year Interest Rate Swap(2) | | | Citibank N.A. | | | Receive | | | 3.540% | | | 1-day Secured
Overnight Financing
Rate | | | 09/11/23 | | | USD 87,334,000 | | | | | 2,362,385 | | | | | | (1,078,433) | | |
Put on 10-Year Interest Rate Swap(2) | | | Goldman Sachs
International | | | Receive | | | 3.460% | | | 1-day Secured
Overnight Financing
Rate | | | 08/21/23 | | | USD 79,516,000 | | | | | 2,007,779 | | | | | | (1,060,163) | | |
Put on 10-Year Interest Rate Swap(2) | | | Goldman Sachs
International | | | Receive | | | 3.570% | | | 1-day Secured
Overnight Financing
Rate | | | 09/07/23 | | | USD 43,667,000 | | | | | 1,166,455 | | | | | | (500,257) | | |
Put on 10-Year Interest Rate Swap(2) | | | JPMorgan Chase
Bank N.A. | | | Receive | | | 2.995% | | | 1-day Secured
Overnight Financing
Rate | | | 06/07/23 | | | USD 79,516,000 | | | | | 2,437,165 | | | | | | (2,068,124) | | |
Put on 1-Year Interest
Rate Swap(2) | | | Barclays Bank PLC | | | Receive | | | 4.170% | | | 1-day Secured
Overnight Financing
Rate | | | 02/16/24 | | | USD 262,182,000 | | | | | 1,233,566 | | | | | | (822,536) | | |
Put on 1-Year Interest
Rate Swap(2) | | | Morgan Stanley Capital
Services LLC | | | Receive | | | 3.520% | | | 1-day Secured
Overnight Financing
Rate | | | 01/24/24 | | | USD 524,367,000 | | | | | 2,282,307 | | | | | | (3,330,901) | | |
Put on 30-Year Interest Rate Swap(2) | | | Morgan Stanley Capital
Services LLC | | | Receive | | | 2.994% | | | 1-day Secured
Overnight Financing
Rate | | | 06/14/23 | | | USD 21,832,000 | | | | | 942,597 | | | | | | (622,934) | | |
| | | | | | | | | | | | | | | | | | | | | | | $ | 36,402,924 | | | | | $ | (35,857,987) | | |
| |
At March 31, 2023, the following OTC purchased forward premium swaptions were outstanding for Voya Intermediate Bond Fund:
| Description | | | Counterparty | | | Exercise
Rate(3) | | | Pay/Receive
Exercise Rate | | | Floating Rate
Index | | | Expiration
Date | | | Notional
Amount | | | Premium
receivable/
(payable) at
expiration(4) | | | Unrealized
Appreciation/
(Depreciation) | |
| Call on 30-Year Interest Rate Swap | | | Barclays Bank PLC | | | 0.000% | | | Receive | | | 1-day Secured
Overnight Financing
Rate | | | 06/14/27 | | | USD 39,935,000 | | | | $ | (6,988,625) | | | | | $ | 315,179 | | |
| Call on 30-Year Interest Rate Swap | | | Barclays Bank PLC | | | 0.000% | | | Receive | | | 1-day Secured
Overnight Financing
Rate | | | 05/28/27 | | | USD 66,490,400 | | | | | (11,768,801) | | | | | | 437,003 | | |
Put on 30-Year Interest
Rate Swap | | | Barclays Bank PLC | | | 0.000% | | | Pay | | | 1-day Secured
Overnight Financing
Rate | | | 05/25/27 | | | USD 61,700,000 | | | | | (11,106,000) | | | | | | 248,443 | | |
| | | | | | | | | | | | | | | | | | | | | | | $ | (29,863,426) | | | | | $ | 1,000,625 | | |
See Accompanying Notes to Financial Statements
PORTFOLIO OF INVESTMENTS
| Voya Intermediate Bond Fund | as of March 31, 2023 (continued) |
At March 31, 2023, the following OTC written forward premium swaptions were outstanding for Voya Intermediate Bond Fund:
| Description | | | Counterparty | | | Exercise
Rate(3) | | | Pay/Receive
Exercise Rate | | | Floating Rate
Index | | | Expiration
Date | | | Notional
Amount | | | Premium
receivable/
(payable) at
expiration(4) | | | Unrealized
Appreciation/
(Depreciation) | |
| Call on 5-Year Interest Rate Swap | | | Bank of America N.A. | | | 0.000% | | | Pay | | | 1-day Secured
Overnight Financing
Rate | | | 03/27/28 | | | USD 21,832,000 | | | | $ | 925,677 | | | | | $ | 955 | | |
| Call on 5-Year Interest Rate Swap | | | Morgan Stanley Capital
Services LLC | | | 0.000% | | | Pay | | | 1-day Secured
Overnight Financing
Rate | | | 03/14/28 | | | USD 43,667,000 | | | | | 1,902,872 | | | | | | 75,887 | | |
| Put on 5-Year Interest Rate Swap | | | Bank of America N.A. | | | 0.000% | | | Receive | | | 1-day Secured
Overnight Financing
Rate | | | 03/27/28 | | | USD 21,832,000 | | | | | 925,677 | | | | | | 19,599 | | |
| Put on 5-Year Interest Rate Swap | | | Morgan Stanley Capital
Services LLC | | | 0.000% | | | Receive | | | 1-day Secured
Overnight Financing
Rate | | | 03/14/28 | | | USD 43,667,000 | | | | | 1,902,872 | | | | | | 154,824 | | |
| | | | | | | | | | | | | | | | | | | | | | | $ | 5,657,098 | | | | | $ | 251,265 | | |
(1)
Fund pays the exercise rate semi-annually and receives the floating rate index quarterly.
(2)
Fund receives the exercise rate semi-annually and pays the floating rate index quarterly.
(3)
Forward premium swaption exercise rates represent the premium price on each respective swaption contract. Final exercise rate will be determined at the expiration of each respective swaption contract.
(4)
Forward premium swaptions include premiums receivable/(payable) that have extended settlement dates. Premiums are not exchanged until the expiration date of each respective forward premium swaption contract.
Currency Abbreviations
EUR – EU Euro
USD – United States Dollar
A summary of derivative instruments by primary risk exposure is outlined in the following tables.
The fair value of derivative instruments as of March 31, 2023 was as follows:
| Derivatives not accounted for as hedging instruments | | | Location on Statement
of Assets and Liabilities | | | Fair Value | |
| Asset Derivatives | | | | | |
| Foreign exchange contracts | | | Investments in securities at value* | | | | $ | 307,240 | | |
| Interest rate contracts | | | Unrealized appreciation on forward premium swaptions | | | | | 1,251,890 | | |
| Interest rate contracts | | | Variation margin receivable on futures contracts** | | | | | 12,747,982 | | |
| Interest rate contracts | | | Variation margin receivable on centrally cleared swaps** | | | | | 7,886,470 | | |
| Total Asset Derivatives | | | | | | | $ | 22,193,582 | | |
| Liability Derivatives | | | | | |
| Foreign exchange contracts | | | Unrealized depreciation on forward foreign currency contracts | | | | $ | 53,555 | | |
| Interest rate contracts | | | Variation margin payable on futures contracts** | | | | | 6,184,333 | | |
| Interest rate contracts | | | Variation margin payable on centrally cleared swaps** | | | | | 10,316,537 | | |
| Interest rate contracts | | | Written options, at fair value | | | | | 35,857,987 | | |
| Total Liability Derivatives | | | | | | | $ | 52,412,412 | | |
*
Includes purchased options.
**
The fair value presented above represents the cumulative unrealized appreciation (depreciation) on futures contracts and centrally cleared swaps as reported in the tables within the Portfolio of Investments. In the Statement of Assets and Liabilities, only current day’s unsettled variation margin is reported in receivables or payables on futures contracts and centrally cleared swaps and the net cumulative unrealized appreciation (depreciation) is included in total distributable earnings (loss).
See Accompanying Notes to Financial Statements
PORTFOLIO OF INVESTMENTS
| Voya Intermediate Bond Fund | as of March 31, 2023 (continued) |
The effect of derivative instruments on the Fund’s Statement of Operations for the year ended March 31, 2023 was as follows:
Amount of Realized Gain or (Loss) on Derivatives Recognized in Income
Derivatives not accounted for as
hedging instruments | | | Investments* | | | Forward foreign
currency contracts | | | Futures | | | Swaps | | | Written options | | | Total | |
| Credit contracts | | | | $ | — | | | | | $ | — | | | | | $ | — | | | | | $ | (807,519) | | | | | $ | — | | | | | $ | (807,519) | | |
| Equity contracts | | | | | — | | | | | | — | | | | | | (520,262) | | | | | | — | | | | | | — | | | | | | (520,262) | | |
| Foreign exchange contracts | | | | | (2,818,986) | | | | | | 443,072 | | | | | | — | | | | | | — | | | | | | 5,253,707 | | | | | | 2,877,793 | | |
| Interest rate contracts | | | | | 524,360 | | | | | | — | | | | | | (129,235,487) | | | | | | (17,735,178) | | | | | | 10,729,793 | | | | | | (135,716,512) | | |
| Total | | | | $ | (2,294,626) | | | | | $ | 443,072 | | | | | $ | (129,755,749) | | | | | $ | (18,542,697) | | | | | $ | 15,983,500 | | | | | $ | (134,166,500) | | |
Change in Unrealized Appreciation or (Depreciation) on Derivatives Recognized in Income
Derivatives not accounted for as
hedging instruments | | | Investments* | | | Forward foreign
currency contracts | | | Futures | | | Swaps | | | Written options | | | Total | |
| Credit contracts | | | | $ | — | | | | | $ | — | | | | | $ | — | | | | | $ | (1,040,371) | | | | | $ | — | | | | | $ | (1,040,371) | | |
| Foreign exchange contracts | | | | | (691,429) | | | | | | (199,744) | | | | | | — | | | | | | — | | | | | | (1,968,260) | | | | | | (2,859,433) | | |
| Interest rate contracts | | | | | 1,000,625 | | | | | | — | | | | | | 15,007,298 | | | | | | (1,596,059) | | | | | | 1,310,758 | | | | | | 15,722,622 | | |
| Total | | | | $ | 309,196 | | | | | $ | (199,744) | | | | | $ | 15,007,298 | | | | | $ | (2,636,430) | | | | | $ | (657,502) | | | | | $ | 11,822,818 | | |
*
Amounts recognized for purchased options are included in net realized gain (loss) on investments and net change in unrealized appreciation or depreciation on investments.
The following is a summary by counterparty of the fair value of OTC derivative instruments subject to Master Netting Agreements and collateral pledged (received), if any, at March 31, 2023:
| | | | Bank of
America N.A. | | | Barclays
Bank PLC | | | BNP
Paribas | | | Citibank
N.A. | | | Goldman
Sachs
International | | | JPMorgan
Chase
Bank N.A. | | | Morgan
Stanley Capital
Services LLC | | | Standard
Chartered
Bank | | | Totals | |
| Assets: | | | | | | | | | | | | | | | | | | | | | | | | | | | | | | | | | | | | | | | | | | | | | | | | | | | | | | | |
| Purchased options | | | | $ | — | | | | | $ | — | | | | | $ | 303,741 | | | | | $ | — | | | | | $ | 1,334 | | | | | $ | — | | | | | $ | 2,165 | | | | | $ | — | | | | | $ | 307,240 | | |
| Forward premium swaptions | | | | | 20,554 | | | | | | 1,000,625 | | | | | | — | | | | | | — | | | | | | — | | | | | | — | | | | | | 230,711 | | | | | | — | | | | | | 1,251,890 | | |
| Total Assets | | | | $ | 20,554 | | | | | $ | 1,000,625 | | | | | $ | 303,741 | | | | | $ | — | | | | | $ | 1,334 | | | | | $ | — | | | | | $ | 232,876 | | | | | $ | — | | | | | $ | 1,559,130 | | |
| Liabilities: | | | | | | | | | | | | | | | | | | | | | | | | | | | | | | | | | | | | | | | | | | | | | | | | | | | | | | | |
| Forward foreign currency contracts | | | | $ | — | | | | | $ | — | | | | | $ | — | | | | | $ | — | | | | | $ | — | | | | | $ | — | | | | | $ | — | | | | | $ | 53,555 | | | | | $ | 53,555 | | |
| Written options | | | | | 2,583,288 | | | | | | 11,213,574 | | | | | | — | | | | | | 5,134,681 | | | | | | 6,823,549 | | | | | | 3,009,827 | | | | | | 7,093,068 | | | | | | — | | | | | | 35,857,987 | | |
| Total Liabilities | | | | $ | 2,583,288 | | | | | $ | 11,213,574 | | | | | $ | — | | | | | $ | 5,134,681 | | | | | $ | 6,823,549 | | | | | $ | 3,009,827 | | | | | $ | 7,093,068 | | | | | $ | 53,555 | | | | | $ | 35,911,542 | | |
Net OTC derivative instruments
by counterparty, at fair
value | | | | $ | (2,562,734) | | | | | $ | (10,212,949) | | | | | $ | 303,741 | | | | | $ | (5,134,681) | | | | | $ | (6,822,215) | | | | | $ | (3,009,827) | | | | | $ | (6,860,192) | | | | | $ | (53,555) | | | | | $ | (34,352,412) | | |
Total collateral pledged by the
Fund/(Received from
counterparty) | | | | $ | 2,562,734 | | | | | $ | 10,212,949 | | | | | $ | (290,000) | | | | | $ | 5,134,681 | | | | | $ | 6,800,000 | | | | | $ | 3,009,827 | | | | | $ | 6,860,192 | | | | | $ | — | | | | | $ | 34,290,383 | | |
Net Exposure(1)(2) | | | | $ | — | | | | | $ | — | | | | | $ | 13,741 | | | | | $ | — | | | | | $ | (22,215) | | | | | $ | — | | | | | $ | — | | | | | $ | (53,555) | | | | | $ | (62,029) | | |
(1)
Positive net exposure represents amounts due from each respective counterparty. Negative exposure represents amounts due from the Fund. Please refer to Note 2 for additional details regarding counterparty credit risk and credit related contingent features.
(2)
At March 31, 2023, the Fund had pledged $2,620,000, $10,380,000, $5,460,000, $3,860,000 and $10,120,000 in cash collateral to Bank of America N.A., Barclays Bank PLC, Citibank N.A., JPMorgan Chase Bank N.A. and Morgan Stanley Capital Services LLC, respectively. Excess cash collateral is not shown for financial reporting purposes.
See Accompanying Notes to Financial Statements
PORTFOLIO OF INVESTMENTS
| Voya Intermediate Bond Fund | as of March 31, 2023 (continued) |
At March 31, 2023, the aggregate cost of securities and other investments and the composition of unrealized appreciation and depreciation of securities and other investments on a tax basis were:
Cost for federal income tax purposes was $8,324,586,917.
Net unrealized depreciation consisted of:
| | Gross Unrealized Appreciation | | | | $ | 53,462,445 | | |
| | Gross Unrealized Depreciation | | | | | (687,234,904) | | |
| | Net Unrealized Depreciation | | | | $ | (633,772,459) | | |
See Accompanying Notes to Financial Statements
PORTFOLIO OF INVESTMENTS
| Voya Short Duration High Income Fund | as of March 31, 2023 |
Principal
Amount† | | | Value | | | Percentage
of Net
Assets | |
| CORPORATE BONDS/NOTES: 97.5% | |
| | | | Basic Materials: 5.6% | |
| 500,000 (1) | | | Arconic Corp., 6.000%,
05/15/2025 | | | | $ | 501,250 | | | | | | 1.9 | | |
| 500,000 (1) | | | INEOS Finance PLC, 6.750%,
05/15/2028 | | | | | 483,248 | | | | | | 1.9 | | |
| 500,000 (1) | | | SCIL IV LLC / SCIL USA
Holdings LLC, 5.375%,
11/01/2026 | | | | | 457,318 | | | | | | 1.8 | | |
| | | | | | | | | 1,441,816 | | | | | | 5.6 | | |
| | | | Communications: 21.9% | |
| 100,000 | | | AMC Networks, Inc., 5.000%,
04/01/2024 | | | | | 98,745 | | | | | | 0.4 | | |
| 500,000 (1) | | | Clear Channel Outdoor
Holdings, Inc., 5.125%,
08/15/2027 | | | | | 449,270 | | | | | | 1.7 | | |
| 1,000,000 (1) | | | Connect Finco SARL /
Connect US Finco LLC,
6.750%, 10/01/2026 | | | | | 940,900 | | | | | | 3.7 | | |
| 100,000 (1) | | | Consensus Cloud Solutions,
Inc., 6.000%, 10/15/2026 | | | | | 86,966 | | | | | | 0.3 | | |
| 500,000 (1) | | | Directv Financing LLC /
Directv Financing Co-Obligor,
Inc., 5.875%, 08/15/2027 | | | | | 453,330 | | | | | | 1.8 | | |
| 1,000,000 (1) | | | DISH DBS Corp., 5.250%,
12/01/2026 | | | | | 799,770 | | | | | | 3.1 | | |
| 500,000 (1) | | | Gen Digital, Inc., 6.750%,
09/30/2027 | | | | | 503,125 | | | | | | 1.9 | | |
| 900,000 (1) | | | Millennium Escrow Corp.,
6.625%, 08/01/2026 | | | | | 586,134 | | | | | | 2.3 | | |
| 500,000 | | | Sprint LLC, 7.875%,
09/15/2023 | | | | | 504,147 | | | | | | 2.0 | | |
| 500,000 (1) | | | Townsquare Media, Inc.,
6.875%, 02/01/2026 | | | | | 473,455 | | | | | | 1.8 | | |
| 500,000 (1) | | | Uber Technologies, Inc.,
7.500%, 05/15/2025 | | | | | 506,902 | | | | | | 2.0 | | |
| 250,000 (1) | | | Univision Communications,
Inc., 6.625%, 06/01/2027 | | | | | 237,275 | | | | | | 0.9 | | |
| | | | | | | | | 5,640,019 | | | | | | 21.9 | | |
| | | | Consumer, Cyclical: 16.9% | |
| 500,000 (1) | | | Delta Air Lines, Inc., 7.000%,
05/01/2025 | | | | | 512,961 | | | | | | 2.0 | | |
| 500,000 | | | Goodyear Tire & Rubber
Co/The, 9.500%, 05/31/2025 | | | | | 514,352 | | | | | | 2.0 | | |
| 500,000 | | | MGM Resorts International,
6.750%, 05/01/2025 | | | | | 504,395 | | | | | | 2.0 | | |
| 850,000 (1) | | | Mileage Plus Holdings LLC /
Mileage Plus Intellectual
Property Assets Ltd., 6.500%,
06/20/2027 | | | | | 848,100 | | | | | | 3.3 | | |
| 700,000 (1) | | | SeaWorld Parks &
Entertainment, Inc., 8.750%,
05/01/2025 | | | | | 719,600 | | | | | | 2.8 | | |
Principal
Amount† | | | Value | | | Percentage
of Net
Assets | |
| CORPORATE BONDS/NOTES: (continued) | |
| | | | Consumer, Cyclical (continued) | |
| 500,000 (1) | | | Six Flags Theme Parks, Inc.,
7.000%, 07/01/2025 | | | | $ | 505,620 | | | | | | 2.0 | | |
| 500,000 (1) | | | Taylor Morrison Communities,
Inc. / Taylor Morrison
Holdings II, Inc., 5.625%,
03/01/2024 | | | | | 497,107 | | | | | | 1.9 | | |
| 250,000 (1) | | | Wynn Las Vegas LLC / Wynn
Las Vegas Capital Corp.,
5.500%, 03/01/2025 | | | | | 245,608 | | | | | | 0.9 | | |
| | | | | | | | | 4,347,743 | | | | | | 16.9 | | |
| | | | Consumer, Non-cyclical: 8.2% | |
| 500,000 (1) | | | Albion Financing 2SARL,
8.750%, 04/15/2027 | | | | | 434,284 | | | | | | 1.7 | | |
| 500,000 (1) | | | APX Group, Inc., 6.750%,
02/15/2027 | | | | | 498,052 | | | | | | 1.9 | | |
| 500,000 | | | HCA, Inc., 5.375%,
02/01/2025 | | | | | 500,532 | | | | | | 2.0 | | |
| 750,000 (1) | | | RP Escrow Issuer LLC,
5.250%, 12/15/2025 | | | | | 569,010 | | | | | | 2.2 | | |
| 100,000 (1) | | | Shift4 Payments LLC / Shift4
Payments Finance Sub, Inc.,
4.625%, 11/01/2026 | | | | | 94,120 | | | | | | 0.4 | | |
| | | | | | | | | 2,095,998 | | | | | | 8.2 | | |
| | | | Energy: 13.6% | |
| 500,000 (1) | | | CVR Energy, Inc., 5.250%,
02/15/2025 | | | | | 480,567 | | | | | | 1.8 | | |
| 500,000 (1) | | | Delek Logistics Partners L.P. /
Delek Logistics Finance Corp.,
7.125%, 06/01/2028 | | | | | 458,270 | | | | | | 1.8 | | |
| 650,000 (1) | | | Martin Midstream Partners
L.P. / Martin Midstream
Finance Corp., 11.500%,
02/15/2028 | | | | | 623,044 | | | | | | 2.4 | | |
| 500,000 (1) | | | New Fortress Energy, Inc.,
6.500%, 09/30/2026 | | | | | 460,458 | | | | | | 1.8 | | |
| 500,000 (1) | | | New Fortress Energy, Inc.,
6.750%, 09/15/2025 | | | | | 481,780 | | | | | | 1.9 | | |
| 500,000 | | | PBF Holding Co. LLC / PBF
Finance Corp., 7.250%,
06/15/2025 | | | | | 496,905 | | | | | | 1.9 | | |
| 600,000 (1) | | | Sunnova Energy Corp.,
5.875%, 09/01/2026 | | | | | 509,241 | | | | | | 2.0 | | |
| | | | | | | | | 3,510,265 | | | | | | 13.6 | | |
| | | | Financial: 17.7% | |
| 500,000 | | | AerCap Ireland Capital DAC /
AerCap Global Aviation Trust,
6.500%, 07/15/2025 | | | | | 504,023 | | | | | | 2.0 | | |
| 500,000 | | | Air Lease Corp., 5.850%,
12/15/2027 | | | | | 503,078 | | | | | | 2.0 | | |
See Accompanying Notes to Financial Statements
PORTFOLIO OF INVESTMENTS
| Voya Short Duration High Income Fund | as of March 31, 2023 (continued) |
Principal
Amount† | | | Value | | | Percentage
of Net
Assets | |
| CORPORATE BONDS/NOTES: (continued) | |
| | | | Financial (continued) | |
| 125,000 (1) | | | Bread Financial Holdings, Inc.,
7.000%, 01/15/2026 | | | | $ | 110,659 | | | | | | 0.4 | | |
| 500,000 (1) | | | HAT Holdings I LLC / HAT
Holdings II LLC, 3.375%,
06/15/2026 | | | | | 434,340 | | | | | | 1.7 | | |
| 900,000 (1) | | | LD Holdings Group LLC,
6.500%, 11/01/2025 | | | | | 568,134 | | | | | | 2.2 | | |
| 500,000 | | | Navient Corp., 6.125%,
03/25/2024 | | | | | 493,795 | | | | | | 1.9 | | |
| 500,000 (1) | | | Park Intermediate Holdings
LLC / PK Domestic Property
LLC / PK Finance Co-Issuer,
7.500%, 06/01/2025 | | | | | 502,281 | | | | | | 2.0 | | |
| 500,000 (1) | | | PennyMac Financial Services,
Inc., 5.375%, 10/15/2025 | | | | | 467,525 | | | | | | 1.8 | | |
| 500,000 (1) | | | United Wholesale Mortgage
LLC, 5.500%, 11/15/2025 | | | | | 473,790 | | | | | | 1.8 | | |
| 500,000 (1) | | | VistaJet Malta Finance PLC /
XO Management Holding,
Inc., 7.875%, 05/01/2027 | | | | | 483,983 | | | | | | 1.9 | | |
| | | | | | | | | 4,541,608 | | | | | | 17.7 | | |
| | | | Industrial: 10.2% | |
| 400,000 (1) | | | Fortress Transportation and
Infrastructure Investors LLC,
9.750%, 08/01/2027 | | | | | 422,416 | | | | | | 1.6 | | |
| 500,000 (1) | | | LSB Industries, Inc., 6.250%,
10/15/2028 | | | | | 445,480 | | | | | | 1.7 | | |
| 500,000 (1) | | | Spirit AeroSystems, Inc.,
7.500%, 04/15/2025 | | | | | 500,490 | | | | | | 1.9 | | |
| 500,000 (1) | | | TransDigm, Inc., 6.750%,
08/15/2028 | | | | | 505,625 | | | | | | 2.0 | | |
| 250,000 (1) | | | Triumph Group, Inc., 9.000%,
03/15/2028 | | | | | 250,575 | | | | | | 1.0 | | |
| 500,000 (1) | | | WESCO Distribution, Inc.,
7.125%, 06/15/2025 | | | | | 508,710 | | | | | | 2.0 | | |
| | | | | | | | | 2,633,296 | | | | | | 10.2 | | |
| | | | Technology: 1.5% | |
| 500,000 (1) | | | Veritas US, Inc. / Veritas
Bermuda Ltd., 7.500%,
09/01/2025 | | | | | 376,882 | | | | | | 1.5 | | |
| | | | | |
| | | | Utilities: 1.9% | |
| 500,000 (1) | | | Calpine Corp., 5.250%,
06/01/2026 | | | | | 488,033 | | | | | | 1.9 | | |
| | | | Total Corporate Bonds/Notes
(Cost $25,366,797) | | | | | 25,075,660 | | | | | | 97.5 | | |
| Shares | | | Value | | | Percentage
of Net
Assets | |
| SHORT-TERM INVESTMENTS: 0.5% | |
| | | | Mutual Funds: 0.5% | |
| 138,488 (2) | | | BlackRock Liquidity Funds,
FedFund, Institutional Class,
4.720%
(Cost $138,488) | | | | $ | 138,488 | | | | | | 0.5 | | |
| | | | Total Short-Term Investments
(Cost $138,488) | | | | | 138,488 | | | | | | 0.5 | | |
| | | | Total Investments in
Securities
(Cost $25,505,285) | | | | $ | 25,214,148 | | | | | | 98.0 | | |
| | | | Assets in Excess of Other
Liabilities | | | | | 517,037 | | | | | | 2.0 | | |
| | | | Net Assets | | | | $ | 25,731,185 | | | | | | 100.0 | | |
†
Unless otherwise indicated, principal amount is shown in USD.
(1)
Securities with purchases pursuant to Rule 144A or section 4(a)(2), under the Securities Act of 1933 and may not be resold subject to that rule except to qualified institutional buyers.
(2)
Rate shown is the 7-day yield as of March 31, 2023.
See Accompanying Notes to Financial Statements
PORTFOLIO OF INVESTMENTS
| Voya Short Duration High Income Fund | as of March 31, 2023 (continued) |
Fair Value Measurements^
The following is a summary of the fair valuations according to the inputs used as of March 31, 2023 in valuing the assets and liabilities:
| | | | Quoted Prices
in Active Markets
for Identical
Investments
(Level 1) | | | Significant
Other
Observable
Inputs
(Level 2) | | | Significant
Unobservable
Inputs
(Level 3) | | | Fair Value
at
March 31, 2023 | |
| Asset Table | | | | | | | | | | | | | | | | | | | | | | | | | |
| Investments, at fair value | | | | | | | | | | | | | | | | | | | | | | | | | |
| Corporate Bonds/Notes | | | | $ | — | | | | | $ | 25,075,660 | | | | | $ | — | | | | | $ | 25,075,660 | | |
| Short-Term Investments | | | | | 138,488 | | | | | | — | | | | | | — | | | | | | 138,488 | | |
| Total Investments, at fair value | | | | $ | 138,488 | | | | | $ | 25,075,660 | | | | | $ | — | | | | | $ | 25,214,148 | | |
^
See Note 2, “Significant Accounting Policies” in the Notes to Financial Statements for additional information.
At March 31, 2023, the aggregate cost of securities and other investments and the composition of unrealized appreciation and depreciation of securities and other investments on a tax basis were:
| | Cost of investments for federal income tax purposes is the same as for financial statement purposes. | |
| | Net unrealized depreciation consisted of: | | | | | | | |
| | Gross Unrealized Appreciation | | | | $ | 129,193 | | |
| | Gross Unrealized Depreciation | | | | | (420,330) | | |
| | Net Unrealized Depreciation | | | | $ | (291,137) | | |
See Accompanying Notes to Financial Statements
PORTFOLIO OF INVESTMENTS
| Voya Short Term Bond Fund | as of March 31, 2023 |
| | Principal Amount† | | | | | | Value | | | Percentage
of Net
Assets | |
| | CORPORATE BONDS/NOTES: 38.0% | |
| | | | | Basic Materials: 0.4% | |
| | 350,000 (1) | | | Albemarle Corp., 4.650%,
06/01/2027 | | | | $ | 344,643 | | | | | | 0.1 | | |
| | 600,000 | | | Freeport-McMoRan, Inc.,
4.550%, 11/14/2024 | | | | | 597,237 | | | | | | 0.1 | | |
| | 300,000 (2) | | | International Flavors &
Fragrances, Inc., 1.832%,
10/15/2027 | | | | | 254,869 | | | | | | 0.1 | | |
| | 227,000 | | | Nucor Corp., 2.000%,
06/01/2025 | | | | | 213,620 | | | | | | 0.1 | | |
| | 59,000 | | | Nutrien Ltd., 4.900%,
03/27/2028 | | | | | 59,027 | | | | | | 0.0 | | |
| | | | | | | | | | 1,469,396 | | | | | | 0.4 | | |
| | | | | Communications: 2.0% | |
| | 230,000 (1) | | | Alibaba Group Holding Ltd.,
2.800%, 06/06/2023 | | | | | 229,036 | | | | | | 0.1 | | |
| | 160,000 | | | AMC Networks, Inc., 5.000%,
04/01/2024 | | | | | 157,992 | | | | | | 0.0 | | |
| | 351,000 | | | AT&T, Inc., 1.700%,
03/25/2026 | | | | | 323,085 | | | | | | 0.1 | | |
| | 501,000 | | | Bell Telephone Co. of Canada
or Bell Canada/The, 0.750%,
03/17/2024 | | | | | 478,848 | | | | | | 0.1 | | |
| | 759,000 | | | British Telecommunications
PLC, 4.500%, 12/04/2023 | | | | | 754,188 | | | | | | 0.2 | | |
| | 337,000 | | | Comcast Corp., 5.250%,
11/07/2025 | | | | | 344,514 | | | | | | 0.1 | | |
| | 425,000 | | | DISH DBS Corp., 5.875%,
11/15/2024 | | | | | 379,440 | | | | | | 0.1 | | |
| | 400,000 | | | Fox Corp., 3.050%, 04/07/2025 | | | | | 384,874 | | | | | | 0.1 | | |
| | 626,000 | | | Fox Corp., 4.030%, 01/25/2024 | | | | | 619,374 | | | | | | 0.2 | | |
| | 523,000 | | | Meta Platforms, Inc., 3.500%,
08/15/2027 | | | | | 505,368 | | | | | | 0.1 | | |
| | 75,000 | | | Motorola Solutions, Inc.,
4.000%, 09/01/2024 | | | | | 73,718 | | | | | | 0.0 | | |
| | 671,000 (2) | | | NTT Finance Corp., 0.583%,
03/01/2024 | | | | | 643,550 | | | | | | 0.2 | | |
| | 423,000 (2) | | | NTT Finance Corp., 4.142%,
07/26/2024 | | | | | 419,285 | | | | | | 0.1 | | |
| | 527,000 (2) | | | Sky Ltd., 3.750%, 09/16/2024 | | | | | 517,027 | | | | | | 0.1 | | |
| | 386,000 | | | T-Mobile USA, Inc., 2.250%,
02/15/2026 | | | | | 359,351 | | | | | | 0.1 | | |
| | 255,000 | | | T-Mobile USA, Inc., 2.625%,
04/15/2026 | | | | | 238,245 | | | | | | 0.1 | | |
| | 481,000 | | | T-Mobile USA, Inc., 3.750%,
04/15/2027 | | | | | 462,679 | | | | | | 0.1 | | |
| | 180,000 (1) | | | T-Mobile USA, Inc., 4.950%,
03/15/2028 | | | | | 181,814 | | | | | | 0.0 | | |
| | 300,000 (2) | | | Univision Communications,
Inc., 5.125%, 02/15/2025 | | | | | 295,010 | | | | | | 0.1 | | |
| | Principal Amount† | | | | | | Value | | | Percentage
of Net
Assets | |
| | CORPORATE BONDS/NOTES: (continued) | |
| | | | | Communications (continued) | |
| | 416,000 | | | Verizon Communications, Inc.,
0.850%, 11/20/2025 | | | | $ | 378,880 | | | | | | 0.1 | | |
| | | | | | | | | | 7,746,278 | | | | | | 2.0 | | |
| | | | | Consumer, Cyclical: 3.9% | |
| | 325,000 (2) | | | 7-Eleven, Inc., 0.950%,
02/10/2026 | | | | | 292,377 | | | | | | 0.1 | | |
| | 20,719 | | | American Airlines 2016-1
Class AA Pass Through Trust,
3.575%, 07/15/2029 | | | | | 19,095 | | | | | | 0.0 | | |
| | 544,000 | | | American Axle &
Manufacturing, Inc., 6.250%,
03/15/2026 | | | | | 522,911 | | | | | | 0.1 | | |
| | 450,000 (2) | | | Avient Corp., 5.750%,
05/15/2025 | | | | | 445,697 | | | | | | 0.1 | | |
| | 591,000 (2) | | | BMW US Capital LLC, 1.250%,
08/12/2026 | | | | | 530,549 | | | | | | 0.1 | | |
| | 615,000 (2) | | | BMW US Capital LLC, 3.250%,
04/01/2025 | | | | | 598,599 | | | | | | 0.2 | | |
| | 870,000 (2) | | | Daimler Trucks Finance North
America LLC, 3.500%,
04/07/2025 | | | | | 843,819 | | | | | | 0.2 | | |
| | 400,000 (2) | | | Dana Financing Luxembourg
Sarl, 5.750%, 04/15/2025 | | | | | 395,520 | | | | | | 0.1 | | |
| | 297,899 | | | Delta Air Lines 2015-1 Class B
Pass Through Trust, 4.250%,
01/30/2025 | | | | | 295,094 | | | | | | 0.1 | | |
| | 160,000 | | | Delta Air Lines 2019-1 Class A
Pass Through Trust, 3.404%,
10/25/2025 | | | | | 153,993 | | | | | | 0.0 | | |
| | 114,567 | | | Delta Air Lines 2020-1 Class A
Pass Through Trust, 2.500%,
12/10/2029 | | | | | 100,644 | | | | | | 0.0 | | |
| | 500,000 | | | Ford Motor Credit Co. LLC,
4.389%, 01/08/2026 | | | | | 475,110 | | | | | | 0.1 | | |
| | 400,000 | | | Ford Motor Credit Co. LLC,
5.584%, 03/18/2024 | | | | | 396,500 | | | | | | 0.1 | | |
| | 861,000 | | | General Motors Financial Co.,
Inc., 1.700%, 08/18/2023 | | | | | 847,859 | | | | | | 0.2 | | |
| | 370,000 | | | General Motors Financial Co.,
Inc., 3.800%, 04/07/2025 | | | | | 359,964 | | | | | | 0.1 | | |
| | 439,000 | | | General Motors Financial Co.,
Inc., 5.250%, 03/01/2026 | | | | | 439,462 | | | | | | 0.1 | | |
| | 190,000 (2) | | | Harley-Davidson Financial
Services, Inc., 3.050%,
02/14/2027 | | | | | 170,361 | | | | | | 0.1 | | |
| | 800,000 (2) | | | Hilton Domestic Operating Co.,
Inc., 5.375%, 05/01/2025 | | | | | 800,500 | | | | | | 0.2 | | |
See Accompanying Notes to Financial Statements
PORTFOLIO OF INVESTMENTS
| Voya Short Term Bond Fund | as of March 31, 2023 (continued) |
| | Principal Amount† | | | | | | Value | | | Percentage
of Net
Assets | |
| | CORPORATE BONDS/NOTES: (continued) | |
| | | | | Consumer, Cyclical (continued) | |
| | 644,000 | | | Honda Motor Co. Ltd.,
2.534%, 03/10/2027 | | | | $ | 603,707 | | | | | | 0.2 | | |
| | 505,000 (2) | | | Hyundai Capital America,
1.300%, 01/08/2026 | | | | | 453,727 | | | | | | 0.1 | | |
| | 900,000 (2) | | | International Game Technology
PLC, 4.125%, 04/15/2026 | | | | | 869,535 | | | | | | 0.2 | | |
| | 800,000 | | | Lennar Corp., 4.500%,
04/30/2024 | | | | | 790,658 | | | | | | 0.2 | | |
| | 227,000 | | | Lowe’s Cos, Inc., 3.350%,
04/01/2027 | | | | | 217,790 | | | | | | 0.1 | | |
| | 900,000 (2) | | | Mattel, Inc., 3.375%,
04/01/2026 | | | | | 848,043 | | | | | | 0.2 | | |
| | 320,450 (2) | | | Mileage Plus Holdings LLC /
Mileage Plus Intellectual
Property Assets Ltd., 6.500%,
06/20/2027 | | | | | 319,734 | | | | | | 0.1 | | |
| | 1,002,000 | | | Ross Stores, Inc., 4.600%,
04/15/2025 | | | | | 1,000,474 | | | | | | 0.3 | | |
| | 900,000 (2) | | | Taylor Morrison Communities,
Inc. / Taylor Morrison
Holdings II, Inc., 5.625%,
03/01/2024 | | | | | 894,793 | | | | | | 0.2 | | |
| | 231,000 | | | Toyota Motor Credit Corp.,
4.625%, 01/12/2028 | | | | | 234,340 | | | | | | 0.1 | | |
| | 400,000 | | | TRI Pointe Group, Inc. / TRI
Pointe Homes, Inc., 5.875%,
06/15/2024 | | | | | 398,382 | | | | | | 0.1 | | |
| | 122,234 | | | United Airlines 2020-1 Class A
Pass Through Trust, 5.875%,
04/15/2029 | | | | | 122,029 | | | | | | 0.0 | | |
| | 152,827 | | | US Airways 2012-1 Class A
Pass Through Trust, 5.900%,
04/01/2026 | | | | | 151,928 | | | | | | 0.0 | | |
| | 677,000 (2) | | | Warnermedia Holdings, Inc.,
3.755%, 03/15/2027 | | | | | 638,123 | | | | | | 0.2 | | |
| | | | | | | | | | 15,231,317 | | | | | | 3.9 | | |
| | | | | Consumer, Non-cyclical: 3.1% | |
| | 481,000 | | | Amgen, Inc., 3.200%,
11/02/2027 | | | | | 455,026 | | | | | | 0.1 | | |
| | 634,000 | | | Amgen, Inc., 5.250%,
03/02/2025 | | | | | 641,293 | | | | | | 0.2 | | |
| | 481,000 | | | Becton Dickinson & Co.,
4.693%, 02/13/2028 | | | | | 483,264 | | | | | | 0.1 | | |
| | 363,000 | | | Boston Scientific Corp.,
1.900%, 06/01/2025 | | | | | 343,300 | | | | | | 0.1 | | |
| | 494,000 | | | Bunge Ltd. Finance Corp.,
1.630%, 08/17/2025 | | | | | 457,315 | | | | | | 0.1 | | |
| | 194,000 (2) | | | Cargill, Inc., 3.500%,
04/22/2025 | | | | | 189,340 | | | | | | 0.1 | | |
| | Principal Amount† | | | | | | Value | | | Percentage
of Net
Assets | |
| | CORPORATE BONDS/NOTES: (continued) | |
| | | | | Consumer, Non-cyclical (continued) | |
| | 237,000 (2) | | | Cargill, Inc., 3.625%,
04/22/2027 | | | | $ | 230,006 | | | | | | 0.1 | | |
| | 800,000 | | | Cigna Corp., 1.250%,
03/15/2026 | | | | | 725,449 | | | | | | 0.2 | | |
| | 283,000 (2) | | | CSL Finance PLC, 3.850%,
04/27/2027 | | | | | 276,076 | | | | | | 0.1 | | |
| | 481,000 | | | Diageo Capital PLC, 5.300%,
10/24/2027 | | | | | 500,231 | | | | | | 0.1 | | |
| | 566,000 (2) | | | Element Fleet Management
Corp., 3.850%, 06/15/2025 | | | | | 540,824 | | | | | | 0.1 | | |
| | 327,000 (2) | | | GE HealthCare Technologies,
Inc., 5.600%, 11/15/2025 | | | | | 331,138 | | | | | | 0.1 | | |
| | 829,000 | | | Global Payments, Inc., 1.200%,
03/01/2026 | | | | | 737,967 | | | | | | 0.2 | | |
| | 900,000 | | | HCA, Inc., 5.875%, 02/15/2026 | | | | | 913,817 | | | | | | 0.2 | | |
| | 541,000 (2) | | | Health Care Service Corp. A
Mutual Legal Reserve Co.,
1.500%, 06/01/2025 | | | | | 504,370 | | | | | | 0.1 | | |
| | 233,000 (1)(2) | | | Kenvue, Inc., 5.500%,
03/22/2025 | | | | | 236,959 | | | | | | 0.1 | | |
| | 539,000 | | | Laboratory Corp. of America
Holdings, 3.600%, 02/01/2025 | | | | | 524,632 | | | | | | 0.1 | | |
| | 203,000 | | | Mylan, Inc., 4.200%,
11/29/2023 | | | | | 200,857 | | | | | | 0.1 | | |
| | 535,000 | | | PerkinElmer, Inc., 0.850%,
09/15/2024 | | | | | 502,508 | | | | | | 0.1 | | |
| | 906,000 | | | Royalty Pharma PLC, 0.750%,
09/02/2023 | | | | | 883,551 | | | | | | 0.2 | | |
| | 504,000 | | | S&P Global, Inc., 2.450%,
03/01/2027 | | | | | 472,993 | | | | | | 0.1 | | |
| | 1,049,000 (2) | | | Triton Container International
Ltd., 1.150%, 06/07/2024 | | | | | 987,010 | | | | | | 0.3 | | |
| | 594,000 | | | Viatris, Inc., 1.650%,
06/22/2025 | | | | | 545,063 | | | | | | 0.1 | | |
| | 327,000 | | | Zoetis, Inc., 5.400%,
11/14/2025 | | | | | 332,694 | | | | | | 0.1 | | |
| | | | | | | | | | 12,015,683 | | | | | | 3.1 | | |
| | | | | Energy: 1.5% | |
| | 375,000 | | | Baker Hughes Holdings LLC /
Baker Hughes Co-Obligor, Inc.,
2.061%, 12/15/2026 | | | | | 339,782 | | | | | | 0.1 | | |
| | 571,000 | | | Canadian Natural Resources
Ltd., 2.050%, 07/15/2025 | | | | | 533,840 | | | | | | 0.1 | | |
| | 668,000 | | | Enbridge, Inc., 0.550%,
10/04/2023 | | | | | 650,583 | | | | | | 0.2 | | |
| | 358,000 | | | EnLink Midstream Partners
L.P., 4.150%, 06/01/2025 | | | | | 347,588 | | | | | | 0.1 | | |
| | 243,000 | | | Equinor ASA, 2.875%,
04/06/2025 | | | | | 235,655 | | | | | | 0.1 | | |
See Accompanying Notes to Financial Statements
PORTFOLIO OF INVESTMENTS
| Voya Short Term Bond Fund | as of March 31, 2023 (continued) |
| | Principal Amount† | | | | | | Value | | | Percentage
of Net
Assets | |
| | CORPORATE BONDS/NOTES: (continued) | |
| | | | | Energy (continued) | |
| | 430,000 | | | Kinder Morgan, Inc., 1.750%,
11/15/2026 | | | | $ | 387,848 | | | | | | 0.1 | | |
| | 825,000 | | | Occidental Petroleum Corp.,
3.500%, 06/15/2025 | | | | | 803,591 | | | | | | 0.2 | | |
| | 347,000 | | | Ovintiv Exploration, Inc.,
5.375%, 01/01/2026 | | | | | 347,860 | | | | | | 0.1 | | |
| | 497,000 | | | Phillips 66, 3.850%,
04/09/2025 | | | | | 486,503 | | | | | | 0.1 | | |
| | 209,000 | | | Pioneer Natural Resources
Co., 0.550%, 05/15/2023 | | | | | 207,843 | | | | | | 0.0 | | |
| | 449,000 | | | Pioneer Natural Resources
Co., 1.125%, 01/15/2026 | | | | | 408,291 | | | | | | 0.1 | | |
| | 300,000 | | | TransCanada PipeLines Ltd.,
1.000%, 10/12/2024 | | | | | 281,424 | | | | | | 0.1 | | |
| | 801,000 | | | Williams Cos, Inc./The,
4.550%, 06/24/2024 | | | | | 795,392 | | | | | | 0.2 | | |
| | | | | | | | | | 5,826,200 | | | | | | 1.5 | | |
| | | | | Financial: 18.4% | |
| | 427,000 | | | AerCap Ireland Capital DAC /
AerCap Global Aviation Trust,
1.650%, 10/29/2024 | | | | | 399,717 | | | | | | 0.1 | | |
| | 604,000 | | | Ally Financial, Inc., 3.875%,
05/21/2024 | | | | | 580,687 | | | | | | 0.1 | | |
| | 329,000 | | | American Express Co.,
2.500%, 07/30/2024 | | | | | 317,854 | | | | | | 0.1 | | |
| | 481,000 | | | American Express Co.,
5.850%, 11/05/2027 | | | | | 505,024 | | | | | | 0.1 | | |
| | 394,000 | | | American Tower Corp.,
3.650%, 03/15/2027 | | | | | 374,525 | | | | | | 0.1 | | |
| | 481,000 | | | Ameriprise Financial, Inc.,
2.875%, 09/15/2026 | | | | | 449,551 | | | | | | 0.1 | | |
| | 766,000 | | | Ameriprise Financial, Inc.,
3.000%, 04/02/2025 | | | | | 737,248 | | | | | | 0.2 | | |
| | 760,000 (2) | | | Aviation Capital Group LLC,
5.500%, 12/15/2024 | | | | | 750,894 | | | | | | 0.2 | | |
| | 517,000 (2) | | | Avolon Holdings Funding Ltd.,
4.375%, 05/01/2026 | | | | | 485,648 | | | | | | 0.1 | | |
| | 1,556,000 (3) | | | Bank of America Corp.,
0.810%, 10/24/2024 | | | | | 1,512,634 | | | | | | 0.4 | | |
| | 1,266,000 (3) | | | Bank of America Corp.,
0.976%, 04/22/2025 | | | | | 1,206,737 | | | | | | 0.3 | | |
| | 1,016,000 (3) | | | Bank of America Corp.,
1.319%, 06/19/2026 | | | | | 929,489 | | | | | | 0.2 | | |
| | 1,000,000 (3) | | | Bank of America Corp.,
1.530%, 12/06/2025 | | | | | 935,673 | | | | | | 0.2 | | |
| | 215,000 (3) | | | Bank of America Corp.,
1.658%, 03/11/2027 | | | | | 194,818 | | | | | | 0.1 | | |
| | 481,000 (3) | | | Bank of America Corp.,
1.734%, 07/22/2027 | | | | | 431,712 | | | | | | 0.1 | | |
| | Principal Amount† | | | | | | Value | | | Percentage
of Net
Assets | |
| | CORPORATE BONDS/NOTES: (continued) | |
| | | | | Financial (continued) | |
| | 329,000 (3) | | | Bank of America Corp.,
2.015%, 02/13/2026 | | | | $ | 308,502 | | | | | | 0.1 | | |
| | 34,000 (3) | | | Bank of America Corp.,
3.419%, 12/20/2028 | | | | | 31,617 | | | | | | 0.0 | | |
| | 54,000 (3) | | | Bank of America Corp.,
3.705%, 04/24/2028 | | | | | 51,088 | | | | | | 0.0 | | |
| | 341,000 (3) | | | Bank of America Corp.,
4.376%, 04/27/2028 | | | | | 330,125 | | | | | | 0.1 | | |
| | 206,000 (3) | | | Bank of New York Mellon
Corp./The, 4.414%, 07/24/2026 | | | | | 203,370 | | | | | | 0.1 | | |
| | 539,000 | | | Bank of Nova Scotia/The,
0.700%, 04/15/2024 | | | | | 514,294 | | | | | | 0.1 | | |
| | 534,000 | | | Bank of Nova Scotia/The,
1.450%, 01/10/2025 | | | | | 500,854 | | | | | | 0.1 | | |
| | 735,000 | | | Bank of Nova Scotia/The,
3.450%, 04/11/2025 | | | | | 713,261 | | | | | | 0.2 | | |
| | 337,000 (2) | | | Blackstone Holdings Finance
Co. LLC, 5.900%, 11/03/2027 | | | | | 344,064 | | | | | | 0.1 | | |
| | 595,000 (2) | | | BPCE SA, 5.700%, 10/22/2023 | | | | | 590,548 | | | | | | 0.2 | | |
| | 1,010,000 | | | Brookfield Finance, Inc.,
4.000%, 04/01/2024 | | | | | 990,006 | | | | | | 0.3 | | |
| | 437,000 | | | Canadian Imperial Bank of
Commerce, 3.300%,
04/07/2025 | | | | | 423,316 | | | | | | 0.1 | | |
| | 210,000 | | | Canadian Imperial Bank of
Commerce, 3.945%,
08/04/2025 | | | | | 204,209 | | | | | | 0.1 | | |
| | 284,000 (3) | | | Capital One Financial Corp.,
1.878%, 11/02/2027 | | | | | 244,820 | | | | | | 0.1 | | |
| | 539,000 (3) | | | Capital One Financial Corp.,
4.166%, 05/09/2025 | | | | | 522,404 | | | | | | 0.1 | | |
| | 332,000 (3) | | | Capital One Financial Corp.,
5.468%, 02/01/2029 | | | | | 323,865 | | | | | | 0.1 | | |
| | 366,000 (3) | | | Citigroup, Inc., 1.678%,
05/15/2024 | | | | | 364,517 | | | | | | 0.1 | | |
| | 615,000 (2) | | | CNO Global Funding, 1.650%,
01/06/2025 | | | | | 575,938 | | | | | | 0.1 | | |
| | 550,000 (2)(3) | | | Cooperatieve Rabobank UA,
1.339%, 06/24/2026 | | | | | 502,773 | | | | | | 0.1 | | |
| | 457,000 (2) | | | Corebridge Financial, Inc.,
3.650%, 04/05/2027 | | | | | 428,723 | | | | | | 0.1 | | |
| | 121,000 | | | Credit Suisse AG/New York NY,
2.950%, 04/09/2025 | | | | | 112,595 | | | | | | 0.0 | | |
| | 1,500,000 | | | Credit Suisse AG/New York NY,
3.625%, 09/09/2024 | | | | | 1,429,155 | | | | | | 0.4 | | |
| | 338,000 (2)(3) | | | Danske Bank A/S, 3.773%,
03/28/2025 | | | | | 330,049 | | | | | | 0.1 | | |
See Accompanying Notes to Financial Statements
PORTFOLIO OF INVESTMENTS
| Voya Short Term Bond Fund | as of March 31, 2023 (continued) |
| | Principal Amount† | | | | | | Value | | | Percentage
of Net
Assets | |
| | CORPORATE BONDS/NOTES: (continued) | |
| | | | | Financial (continued) | |
| | 311,000 (2)(3) | | | Danske Bank A/S, 4.298%,
04/01/2028 | | | | $ | 293,878 | | | | | | 0.1 | | |
| | 801,000 (3) | | | Deutsche Bank AG/New York
NY, 2.222%, 09/18/2024 | | | | | 779,058 | | | | | | 0.2 | | |
| | 853,000 | | | Discover Financial Services,
3.950%, 11/06/2024 | | | | | 813,994 | | | | | | 0.2 | | |
| | 561,000 (2)(3) | | | DNB Bank ASA, 2.968%,
03/28/2025 | | | | | 547,698 | | | | | | 0.1 | | |
| | 636,000 (2)(3) | | | DNB Bank ASA, 5.896%,
10/09/2026 | | | | | 642,218 | | | | | | 0.2 | | |
| | 469,000 | | | Equinix, Inc., 1.250%,
07/15/2025 | | | | | 430,043 | | | | | | 0.1 | | |
| | 859,000 | | | Federal Realty Investment
Trust, 3.950%, 01/15/2024 | | | | | 848,542 | | | | | | 0.2 | | |
| | 1,430,000 (2) | | | Federation des Caisses
Desjardins du Quebec,
2.050%, 02/10/2025 | | | | | 1,346,443 | | | | | | 0.3 | | |
| | 432,000 (2) | | | Five Corners Funding Trust,
4.419%, 11/15/2023 | | | | | 429,379 | | | | | | 0.1 | | |
| | 600,000 (2) | | | GA Global Funding Trust,
3.850%, 04/11/2025 | | | | | 581,523 | | | | | | 0.1 | | |
| | 257,000 (3) | | | Goldman Sachs Group, Inc./
The, 0.925%, 10/21/2024 | | | | | 250,126 | | | | | | 0.1 | | |
| | 319,000 (3) | | | Goldman Sachs Group, Inc./
The, 2.640%, 02/24/2028 | | | | | 291,277 | | | | | | 0.1 | | |
| | 292,000 | | | Hanover Insurance Group, Inc./
The, 4.500%, 04/15/2026 | | | | | 288,814 | | | | | | 0.1 | | |
| | 300,000 (2) | | | HAT Holdings I LLC / HAT
Holdings II LLC, 3.375%,
06/15/2026 | | | | | 260,604 | | | | | | 0.1 | | |
| | 1,123,000 (3) | | | HSBC Holdings PLC, 0.732%,
08/17/2024 | | | | | 1,099,932 | | | | | | 0.3 | | |
| | 321,000 (3) | | | HSBC Holdings PLC, 1.162%,
11/22/2024 | | | | | 311,590 | | | | | | 0.1 | | |
| | 467,000 (3) | | | HSBC Holdings PLC, 1.589%,
05/24/2027 | | | | | 412,080 | | | | | | 0.1 | | |
| | 1,000,000 (3) | | | HSBC Holdings PLC, 1.645%,
04/18/2026 | | | | | 913,980 | | | | | | 0.2 | | |
| | 407,000 (3) | | | HSBC Holdings PLC, 2.633%,
11/07/2025 | | | | | 385,364 | | | | | | 0.1 | | |
| | 535,000 (3) | | | ING Groep NV, 4.017%,
03/28/2028 | | | | | 506,725 | | | | | | 0.1 | | |
| | 642,000 | | | Jackson Financial, Inc.,
1.125%, 11/22/2023 | | | | | 622,962 | | | | | | 0.2 | | |
| | 1,340,000 (3) | | | JPMorgan Chase & Co.,
0.824%, 06/01/2025 | | | | | 1,270,512 | | | | | | 0.3 | | |
| | 1,120,000 (3) | | | JPMorgan Chase & Co.,
0.969%, 06/23/2025 | | | | | 1,061,614 | | | | | | 0.3 | | |
| | 609,000 (3) | | | JPMorgan Chase & Co.,
1.470%, 09/22/2027 | | | | | 537,625 | | | | | | 0.1 | | |
| | Principal Amount† | | | | | | Value | | | Percentage
of Net
Assets | |
| | CORPORATE BONDS/NOTES: (continued) | |
| | | | | Financial (continued) | |
| | 376,000 (3) | | | JPMorgan Chase & Co.,
1.578%, 04/22/2027 | | | | $ | 338,110 | | | | | | 0.1 | | |
| | 897,000 (3) | | | JPMorgan Chase & Co.,
2.083%, 04/22/2026 | | | | | 839,818 | | | | | | 0.2 | | |
| | 32,000 (3) | | | JPMorgan Chase & Co.,
2.301%, 10/15/2025 | | | | | 30,617 | | | | | | 0.0 | | |
| | 152,000 (3) | | | JPMorgan Chase & Co.,
2.595%, 02/24/2026 | | | | | 144,146 | | | | | | 0.0 | | |
| | 481,000 (3) | | | JPMorgan Chase & Co.,
2.947%, 02/24/2028 | | | | | 446,275 | | | | | | 0.1 | | |
| | 1,000,000 (3) | | | JPMorgan Chase & Co.,
3.797%, 07/23/2024 | | | | | 994,946 | | | | | | 0.3 | | |
| | 17,000 (3) | | | JPMorgan Chase & Co.,
3.960%, 01/29/2027 | | | | | 16,523 | | | | | | 0.0 | | |
| | 1,411,000 (3) | | | JPMorgan Chase & Co.,
5.546%, 12/15/2025 | | | | | 1,421,427 | | | | | | 0.4 | | |
| | 297,000 | | | KeyBank NA/Cleveland OH,
4.390%, 12/14/2027 | | | | | 271,441 | | | | | | 0.1 | | |
| | 664,000 (3) | | | Lloyds Banking Group PLC,
0.695%, 05/11/2024 | | | | | 659,849 | | | | | | 0.2 | | |
| | 491,000 (3) | | | Lloyds Banking Group PLC,
3.870%, 07/09/2025 | | | | | 477,515 | | | | | | 0.1 | | |
| | 1,047,000 (2) | | | LSEGA Financing PLC,
0.650%, 04/06/2024 | | | | | 996,805 | | | | | | 0.3 | | |
| | 1,024,000 | | | Marsh & McLennan Cos, Inc.,
4.050%, 10/15/2023 | | | | | 1,021,268 | | | | | | 0.3 | | |
| | 406,000 (3) | | | Mitsubishi UFJ Financial
Group, Inc., 0.848%,
09/15/2024 | | | | | 396,901 | | | | | | 0.1 | | |
| | 404,000 (3) | | | Mitsubishi UFJ Financial
Group, Inc., 0.962%,
10/11/2025 | | | | | 376,505 | | | | | | 0.1 | | |
| | 400,000 | | | Mitsubishi UFJ Financial
Group, Inc., 1.412%,
07/17/2025 | | | | | 367,051 | | | | | | 0.1 | | |
| | 491,000 (3) | | | Mitsubishi UFJ Financial
Group, Inc., 1.538%,
07/20/2027 | | | | | 434,889 | | | | | | 0.1 | | |
| | 316,000 (3) | | | Mitsubishi UFJ Financial
Group, Inc., 4.788%,
07/18/2025 | | | | | 313,064 | | | | | | 0.1 | | |
| | 896,000 (3) | | | Mitsubishi UFJ Financial
Group, Inc., 5.719%,
02/20/2026 | | | | | 898,927 | | | | | | 0.2 | | |
| | 400,000 (3) | | | Mizuho Financial Group, Inc.,
0.849%, 09/08/2024 | | | | | 391,684 | | | | | | 0.1 | | |
| | 200,000 (3) | | | Mizuho Financial Group, Inc.,
2.555%, 09/13/2025 | | | | | 191,040 | | | | | | 0.0 | | |
See Accompanying Notes to Financial Statements
PORTFOLIO OF INVESTMENTS
| Voya Short Term Bond Fund | as of March 31, 2023 (continued) |
| | Principal Amount† | | | | | | Value | | | Percentage
of Net
Assets | |
| | CORPORATE BONDS/NOTES: (continued) | |
| | | | | Financial (continued) | |
| | 1,037,000 | | | Mizuho Financial Group, Inc.,
5.588%, (US0003M +
0.630)%, 05/25/2024 | | | | $ | 1,032,260 | | | | | | 0.3 | | |
| | 1,463,000 (1)(3) | | | Morgan Stanley, 0.790%,
05/30/2025 | | | | | 1,385,520 | | | | | | 0.4 | | |
| | 1,097,000 (3) | | | Morgan Stanley, 0.791%,
01/22/2025 | | | | | 1,055,660 | | | | | | 0.3 | | |
| | 1,086,000 (3) | | | Morgan Stanley, 1.164%,
10/21/2025 | | | | | 1,014,857 | | | | | | 0.3 | | |
| | 613,000 (3) | | | Morgan Stanley, 1.512%,
07/20/2027 | | | | | 545,273 | | | | | | 0.1 | | |
| | 481,000 (3) | | | Morgan Stanley, 1.593%,
05/04/2027 | | | | | 431,425 | | | | | | 0.1 | | |
| | 426,000 (3) | | | Morgan Stanley, 2.475%,
01/21/2028 | | | | | 389,510 | | | | | | 0.1 | | |
| | 139,000 (3) | | | Morgan Stanley, 2.720%,
07/22/2025 | | | | | 134,052 | | | | | | 0.0 | | |
| | 329,000 | | | Morgan Stanley, 4.000%,
07/23/2025 | | | | | 322,251 | | | | | | 0.1 | | |
| | 374,000 | | | National Australia Bank
Ltd./New York, 3.500%,
06/09/2025 | | | | | 362,317 | | | | | | 0.1 | | |
| | 487,000 | | | National Bank of Canada,
0.750%, 08/06/2024 | | | | | 459,147 | | | | | | 0.1 | | |
| | 258,000 (2) | | | Nationwide Building Society,
1.500%, 10/13/2026 | | | | | 225,551 | | | | | | 0.1 | | |
| | 1,200,000 (3) | | | NatWest Group PLC, 2.359%,
05/22/2024 | | | | | 1,193,790 | | | | | | 0.3 | | |
| | 398,000 (3) | | | NatWest Group PLC, 4.269%,
03/22/2025 | | | | | 390,741 | | | | | | 0.1 | | |
| | 900,000 | | | Navient Corp., 6.750%,
06/25/2025 | | | | | 875,590 | | | | | | 0.2 | | |
| | 403,000 (2) | | | Nordea Bank Abp, 0.625%,
05/24/2024 | | | | | 382,908 | | | | | | 0.1 | | |
| | 374,000 (2) | | | Nordea Bank Abp, 3.600%,
06/06/2025 | | | | | 361,142 | | | | | | 0.1 | | |
| | 520,000 (1)(2) | | | Nordea Bank Abp, 5.375%,
09/22/2027 | | | | | 522,852 | | | | | | 0.1 | | |
| | 804,000 | | | Old Republic International
Corp., 4.875%, 10/01/2024 | | | | | 793,702 | | | | | | 0.2 | | |
| | 600,000 | | | OneMain Finance Corp.,
6.875%, 03/15/2025 | | | | | 582,000 | | | | | | 0.1 | | |
| | 198,000 (2) | | | Pacific Life Global Funding II,
1.200%, 06/24/2025 | | | | | 182,115 | | | | | | 0.0 | | |
| | 255,000 (2) | | | Pacific Life Global Funding II,
1.375%, 04/14/2026 | | | | | 228,884 | | | | | | 0.1 | | |
| | 275,000 | | | Royal Bank of Canada,
1.150%, 07/14/2026 | | | | | 246,769 | | | | | | 0.1 | | |
| | 533,000 | | | Royal Bank of Canada,
1.600%, 01/21/2025 | | | | | 502,682 | | | | | | 0.1 | | |
| | Principal Amount† | | | | | | Value | | | Percentage
of Net
Assets | |
| | CORPORATE BONDS/NOTES: (continued) | |
| | | | | Financial (continued) | |
| | 210,000 | | | Royal Bank of Canada,
5.442%, (US0003M +
0.660)%, 10/05/2023 | | | | $ | 209,914 | | | | | | 0.1 | | |
| | 506,000 | | | Sixth Street Specialty Lending,
Inc., 3.875%, 11/01/2024 | | | | | 482,922 | | | | | | 0.1 | | |
| | 810,000 (1)(2) | | | Skandinaviska Enskilda
Banken AB, 0.650%,
09/09/2024 | | | | | 759,539 | | | | | | 0.2 | | |
| | 534,000 (2) | | | Skandinaviska Enskilda
Banken AB, 3.700%,
06/09/2025 | | | | | 518,390 | | | | | | 0.1 | | |
| | 544,000 (2)(3) | | | Societe Generale SA, 2.226%,
01/21/2026 | | | | | 501,938 | | | | | | 0.1 | | |
| | 950,000 (2) | | | Starwood Property Trust, Inc.,
3.625%, 07/15/2026 | | | | | 790,296 | | | | | | 0.2 | | |
| | 394,000 | | | Sumitomo Mitsui Financial
Group, Inc., 1.474%,
07/08/2025 | | | | | 361,038 | | | | | | 0.1 | | |
| | 750,000 | | | Sumitomo Mitsui Financial
Group, Inc., 2.696%,
07/16/2024 | | | | | 724,124 | | | | | | 0.2 | | |
| | 535,000 (2) | | | Sumitomo Mitsui Trust Bank
Ltd., 0.800%, 09/16/2024 | | | | | 503,438 | | | | | | 0.1 | | |
| | 533,000 (2) | | | Svenska Handelsbanken AB,
3.650%, 06/10/2025 | | | | | 516,225 | | | | | | 0.1 | | |
| | 447,000 (2) | | | Swedbank AB, 3.356%,
04/04/2025 | | | | | 431,311 | | | | | | 0.1 | | |
| | 535,000 | | | Toronto-Dominion Bank/The,
0.700%, 09/10/2024 | | | | | 503,269 | | | | | | 0.1 | | |
| | 533,000 (1) | | | Toronto-Dominion Bank/The,
1.450%, 01/10/2025 | | | | | 501,778 | | | | | | 0.1 | | |
| | 519,000 | | | Toronto-Dominion Bank/The,
3.766%, 06/06/2025 | | | | | 505,529 | | | | | | 0.1 | | |
| | 315,000 (3) | | | Truist Financial Corp., 4.873%,
01/26/2029 | | | | | 307,430 | | | | | | 0.1 | | |
| | 515,000 (2) | | | UBS AG/London, 0.700%,
08/09/2024 | | | | | 481,518 | | | | | | 0.1 | | |
| | 1,000,000 (2)(3) | | | UBS Group AG, 1.008%,
07/30/2024 | | | | | 980,264 | | | | | | 0.3 | | |
| | 451,000 (2)(3) | | | UBS Group AG, 4.488%,
05/12/2026 | | | | | 435,328 | | | | | | 0.1 | | |
| | 539,000 (2)(3) | | | UBS Group AG, 4.490%,
08/05/2025 | | | | | 526,136 | | | | | | 0.1 | | |
| | 900,000 (2) | | | VICI Properties L.P. / VICI Note
Co., Inc., 3.500%, 02/15/2025 | | | | | 854,067 | | | | | | 0.2 | | |
| | 700,000 (2) | | | VICI Properties L.P. / VICI Note
Co., Inc., 4.625%, 06/15/2025 | | | | | 677,669 | | | | | | 0.2 | | |
| | 200,000 (2) | | | VICI Properties L.P. / VICI Note
Co., Inc., 5.625%, 05/01/2024 | | | | | 198,500 | | | | | | 0.1 | | |
See Accompanying Notes to Financial Statements
PORTFOLIO OF INVESTMENTS
| Voya Short Term Bond Fund | as of March 31, 2023 (continued) |
| | Principal Amount† | | | | | | Value | | | Percentage
of Net
Assets | |
| | CORPORATE BONDS/NOTES: (continued) | |
| | | | | Financial (continued) | |
| | 88,000 (3) | | | Wells Fargo & Co., 2.164%,
02/11/2026 | | | | $ | 82,839 | | | | | | 0.0 | | |
| | 503,000 (3) | | | Wells Fargo & Co., 2.188%,
04/30/2026 | | | | | 471,744 | | | | | | 0.1 | | |
| | 399,000 (3) | | | Wells Fargo & Co., 2.406%,
10/30/2025 | | | | | 379,410 | | | | | | 0.1 | | |
| | | | | | | | | | 72,132,700 | | | | | | 18.4 | | |
| | | | | Industrial: 1.9% | |
| | 481,000 | | | Avnet, Inc., 6.250%,
03/15/2028 | | | | | 489,989 | | | | | | 0.1 | | |
| | 600,000 | | | Ball Corp., 4.875%,
03/15/2026 | | | | | 596,160 | | | | | | 0.1 | | |
| | 830,000 | | | Boeing Co/The, 4.875%,
05/01/2025 | | | | | 828,720 | | | | | | 0.2 | | |
| | 900,000 (2) | | | Brundage-Bone Concrete
Pumping Holdings, Inc.,
6.000%, 02/01/2026 | | | | | 844,852 | | | | | | 0.2 | | |
| | 433,000 (2) | | | Graphic Packaging
International LLC, 0.821%,
04/15/2024 | | | | | 412,722 | | | | | | 0.1 | | |
| | 665,000 | | | Huntington Ingalls Industries,
Inc., 0.670%, 08/16/2023 | | | | | 654,012 | | | | | | 0.2 | | |
| | 481,000 | | | Lockheed Martin Corp.,
5.100%, 11/15/2027 | | | | | 499,802 | | | | | | 0.1 | | |
| | 136,000 (2) | | | Owens-Brockway Glass
Container, Inc., 5.875%,
08/15/2023 | | | | | 135,923 | | | | | | 0.0 | | |
| | 226,000 | | | Raytheon Technologies Corp.,
5.000%, 02/27/2026 | | | | | 229,536 | | | | | | 0.1 | | |
| | 700,000 | | | Republic Services, Inc.,
2.500%, 08/15/2024 | | | | | 678,337 | | | | | | 0.2 | | |
| | 300,000 (2) | | | Sealed Air Corp., 5.500%,
09/15/2025 | | | | | 296,717 | | | | | | 0.1 | | |
| | 350,000 (2) | | | SMBC Aviation Capital
Finance DAC, 1.900%,
10/15/2026 | | | | | 307,363 | | | | | | 0.1 | | |
| | 829,000 | | | Teledyne Technologies, Inc.,
0.950%, 04/01/2024 | | | | | 794,839 | | | | | | 0.2 | | |
| | 750,000 (2) | | | TransDigm, Inc., 8.000%,
12/15/2025 | | | | | 764,531 | | | | | | 0.2 | | |
| | | | | | | | | | 7,533,503 | | | | | | 1.9 | | |
| | | | | Technology: 3.4% | |
| | 481,000 | | | Broadcom, Inc., 3.459%,
09/15/2026 | | | | | 459,948 | | | | | | 0.1 | | |
| | 900,000 | | | CDW LLC / CDW Finance
Corp., 5.500%, 12/01/2024 | | | | | 899,851 | | | | | | 0.2 | | |
| | 332,000 | | | CGI, Inc., 1.450%, 09/14/2026 | | | | | 298,437 | | | | | | 0.1 | | |
| | Principal Amount† | | | | | | Value | | | Percentage
of Net
Assets | |
| | CORPORATE BONDS/NOTES: (continued) | |
| | | | | Technology (continued) | |
| | 992,000 | | | Fidelity National Information
Services, Inc., 0.600%,
03/01/2024 | | | | $ | 948,961 | | | | | | 0.3 | | |
| | 308,000 | | | Fidelity National Information
Services, Inc., 4.700%,
07/15/2027 | | | | | 303,547 | | | | | | 0.1 | | |
| | 941,000 | | | Fiserv, Inc., 2.750%,
07/01/2024 | | | | | 913,293 | | | | | | 0.2 | | |
| | 481,000 | | | Fiserv, Inc., 5.450%,
03/02/2028 | | | | | 491,507 | | | | | | 0.1 | | |
| | 954,000 | | | HP, Inc., 2.200%, 06/17/2025 | | | | | 899,558 | | | | | | 0.2 | | |
| | 660,000 | | | Intel Corp., 4.875%,
02/10/2026 | | | | | 668,695 | | | | | | 0.2 | | |
| | 514,000 | | | International Business
Machines Corp., 4.000%,
07/27/2025 | | | | | 508,434 | | | | | | 0.1 | | |
| | 441,000 | | | International Business
Machines Corp., 4.500%,
02/06/2026 | | | | | 440,406 | | | | | | 0.1 | | |
| | 308,000 | | | International Business
Machines Corp., 6.500%,
01/15/2028 | | | | | 335,493 | | | | | | 0.1 | | |
| | 505,000 | | | Kyndryl Holdings, Inc., 2.050%,
10/15/2026 | | | | | 439,166 | | | | | | 0.1 | | |
| | 900,000 | | | Microchip Technology, Inc.,
4.250%, 09/01/2025 | | | | | 886,536 | | | | | | 0.2 | | |
| | 909,000 | | | NetApp, Inc., 1.875%,
06/22/2025 | | | | | 848,026 | | | | | | 0.2 | | |
| | 832,000 | | | NXP BV / NXP Funding LLC /
NXP USA, Inc., 2.700%,
05/01/2025 | | | | | 790,062 | | | | | | 0.2 | | |
| | 447,000 | | | Oracle Corp., 1.650%,
03/25/2026 | | | | | 410,849 | | | | | | 0.1 | | |
| | 282,000 | | | Oracle Corp., 2.500%,
04/01/2025 | | | | | 270,107 | | | | | | 0.1 | | |
| | 570,000 | | | Oracle Corp., 2.650%,
07/15/2026 | | | | | 532,825 | | | | | | 0.1 | | |
| | 615,000 | | | Take-Two Interactive Software,
Inc., 3.550%, 04/14/2025 | | | | | 599,270 | | | | | | 0.2 | | |
| | 703,000 | | | VMware, Inc., 1.000%,
08/15/2024 | | | | | 663,685 | | | | | | 0.2 | | |
| | 380,000 | | | VMware, Inc., 1.400%,
08/15/2026 | | | | | 336,301 | | | | | | 0.1 | | |
| | 262,000 | | | Workday, Inc., 3.500%,
04/01/2027 | | | | | 250,849 | | | | | | 0.1 | | |
| | | | | | | | | | 13,195,806 | | | | | | 3.4 | | |
See Accompanying Notes to Financial Statements
PORTFOLIO OF INVESTMENTS
| Voya Short Term Bond Fund | as of March 31, 2023 (continued) |
| | Principal Amount† | | | | | | Value | | | Percentage
of Net
Assets | |
| | CORPORATE BONDS/NOTES: (continued) | |
| | | | | Utilities: 3.4% | |
| | 467,000 (2) | | | AEP Texas, Inc., 3.850%,
10/01/2025 | | | | $ | 450,867 | | | | | | 0.1 | | |
| | 360,000 | | | AES Corp./The, 1.375%,
01/15/2026 | | | | | 324,194 | | | | | | 0.1 | | |
| | 269,000 (2) | | | AES Corp./The, 3.300%,
07/15/2025 | | | | | 255,391 | | | | | | 0.1 | | |
| | 522,000 | | | Alabama Power Co., 3.750%,
09/01/2027 | | | | | 508,088 | | | | | | 0.1 | | |
| | 497,000 (1) | | | American Electric Power Co.,
Inc., 0.750%, 11/01/2023 | | | | | 485,327 | | | | | | 0.1 | | |
| | 507,000 | | | American Electric Power Co.,
Inc., 2.031%, 03/15/2024 | | | | | 490,707 | | | | | | 0.1 | | |
| | 258,000 (2) | | | Aquarion Co., 4.000%,
08/15/2024 | | | | | 255,260 | | | | | | 0.1 | | |
| | 152,000 | | | Arizona Public Service Co.,
3.350%, 06/15/2024 | | | | | 148,825 | | | | | | 0.0 | | |
| | 282,000 | | | Avangrid, Inc., 3.200%,
04/15/2025 | | | | | 270,105 | | | | | | 0.1 | | |
| | 363,000 | | | Black Hills Corp., 1.037%,
08/23/2024 | | | | | 341,779 | | | | | | 0.1 | | |
| | 524,000 (3) | | | DTE Energy Co., 4.220%,
11/01/2024 | | | | | 518,433 | | | | | | 0.1 | | |
| | 930,000 (2) | | | East Ohio Gas Co/The,
1.300%, 06/15/2025 | | | | | 854,023 | | | | | | 0.2 | | |
| | 497,000 (2) | | | Enel Finance International NV,
6.800%, 10/14/2025 | | | | | 514,094 | | | | | | 0.1 | | |
| | 835,000 | | | Entergy Corp., 0.900%,
09/15/2025 | | | | | 752,374 | | | | | | 0.2 | | |
| | 303,000 | | | Eversource Energy, 2.900%,
03/01/2027 | | | | | 282,923 | | | | | | 0.1 | | |
| | 478,000 | | | Interstate Power and Light Co.,
3.250%, 12/01/2024 | | | | | 464,624 | | | | | | 0.1 | | |
| | 317,000 | | | IPALCO Enterprises, Inc.,
3.700%, 09/01/2024 | | | | | 308,231 | | | | | | 0.1 | | |
| | 376,000 | | | National Rural Utilities
Cooperative Finance Corp.,
1.875%, 02/07/2025 | | | | | 356,807 | | | | | | 0.1 | | |
| | 359,000 | | | NextEra Energy Capital
Holdings, Inc., 1.875%,
01/15/2027 | | | | | 324,857 | | | | | | 0.1 | | |
| | 327,000 | | | NextEra Energy Capital
Holdings, Inc., 4.625%,
07/15/2027 | | | | | 326,359 | | | | | | 0.1 | | |
| | 440,000 | | | NextEra Energy Capital
Holdings, Inc., 4.900%,
02/28/2028 | | | | | 443,257 | | | | | | 0.1 | | |
| | 559,000 | | | NiSource, Inc., 0.950%,
08/15/2025 | | | | | 508,913 | | | | | | 0.1 | | |
| | 377,000 (2) | | | NRG Energy, Inc., 3.750%,
06/15/2024 | | | | | 365,902 | | | | | | 0.1 | | |
| | Principal Amount† | | | | | | Value | | | Percentage
of Net
Assets | |
| | CORPORATE BONDS/NOTES: (continued) | |
| | | | | Utilities (continued) | |
| | 883,000 | | | OGE Energy Corp., 0.703%,
05/26/2023 | | | | $ | 876,857 | | | | | | 0.2 | | |
| | 703,626 | | | PG&E Wildfire Recovery
Funding LLC, 3.594%,
06/01/2032 | | | | | 672,435 | | | | | | 0.2 | | |
| | 180,000 | | | Public Service Electric and
Gas Co., 3.750%, 03/15/2024 | | | | | 176,273 | | | | | | 0.1 | | |
| | 153,000 | | | Public Service Enterprise
Group, Inc., 5.850%,
11/15/2027 | | | | | 159,145 | | | | | | 0.0 | | |
| | 255,000 | | | Southern Co. Gas Capital
Corp., 3.250%, 06/15/2026 | | | | | 244,543 | | | | | | 0.1 | | |
| | 1,378,000 | | | Southern Co/The, 0.600%,
02/26/2024 | | | | | 1,318,809 | | | | | | 0.3 | | |
| | 317,000 (2) | | | Trans-Allegheny Interstate
Line Co., 3.850%, 06/01/2025 | | | | | 308,600 | | | | | | 0.1 | | |
| | 46,000 | | | WEC Energy Group, Inc.,
5.000%, 09/27/2025 | | | | | 46,048 | | | | | | 0.0 | | |
| | 64,000 | | | WEC Energy Group, Inc.,
5.150%, 10/01/2027 | | | | | 65,167 | | | | | | 0.0 | | |
| | | | | | | | | | 13,419,217 | | | | | | 3.4 | | |
| | | | | Total Corporate
Bonds/Notes
(Cost $155,056,730) | | | | | 148,570,100 | | | | | | 38.0 | | |
| | COLLATERALIZED MORTGAGE OBLIGATIONS: 6.1% | |
| | 1,000,000 (2) | | | Connecticut Avenue
Securities Trust 2021-R01
1M2, 6.110%, (SOFR30A +
1.550)%, 10/25/2041 | | | | | 972,051 | | | | | | 0.3 | | |
| | 75,609 | | | Fannie Mae Interest Strip
Series 404 8, 3.000%,
05/25/2040 | | | | | 70,595 | | | | | | 0.0 | | |
| | 215 | | | Fannie Mae REMIC Trust
2010-137 XP, 4.500%,
10/25/2040 | | | | | 214 | | | | | | 0.0 | | |
| | 12,655 | | | Fannie Mae REMIC Trust
2010-54 LC, 3.000%,
04/25/2040 | | | | | 12,365 | | | | | | 0.0 | | |
| | 358,390 | | | Fannie Mae REMICS
2013-114 NA, 3.000%,
08/25/2032 | | | | | 347,308 | | | | | | 0.1 | | |
| | 951,303 | | | Freddie Mac 3049 XF,
5.034%, (US0001M +
0.350)%, 05/15/2033 | | | | | 940,332 | | | | | | 0.2 | | |
| | 133,844 | | | Freddie Mac REMIC Trust
2103 TE, 6.000%,
12/15/2028 | | | | | 137,440 | | | | | | 0.0 | | |
See Accompanying Notes to Financial Statements
PORTFOLIO OF INVESTMENTS
| Voya Short Term Bond Fund | as of March 31, 2023 (continued) |
| | Principal Amount† | | | | | | Value | | | Percentage
of Net
Assets | |
| | COLLATERALIZED MORTGAGE OBLIGATIONS: (continued) | |
| | 455,858 | | | Freddie Mac REMICS 3255 FA,
4.964%, (US0001M + 0.280)%,
12/15/2036 | | | | $ | 446,567 | | | | | | 0.1 | | |
| | 26,715 | | | Freddie Mac REMICS 3747 FA,
5.184%, (US0001M + 0.500)%,
10/15/2040 | | | | | 26,350 | | | | | | 0.0 | | |
| | 1,400,000 (2) | | | Freddie Mac STACR REMIC
Trust 2021-HQA1 M2, 6.810%,
(SOFR30A + 2.250)%,
08/25/2033 | | | | | 1,349,534 | | | | | | 0.4 | | |
| | 226,986 (2) | | | Freddie Mac Structured
Agency Credit Risk Debt Notes
2020-HQA5 M2, 7.160%,
(SOFR30A + 2.600)%,
11/25/2050 | | | | | 227,321 | | | | | | 0.1 | | |
| | 800,000 (2) | | | Freddie Mac Structured
Agency Credit Risk Debt Notes
2021-DNA2 M2, 6.860%,
(SOFR30A + 2.300)%,
08/25/2033 | | | | | 788,604 | | | | | | 0.2 | | |
| | 900,000 (2) | | | Freddie Mac Structured
Agency Credit Risk Debt Notes
2022-DNA2 M1B, 6.960%,
(SOFR30A + 2.400)%,
02/25/2042 | | | | | 875,424 | | | | | | 0.2 | | |
| | 3,916,523 | | | Ginnie Mae 2015-H32 FH,
5.226%, (US0001M + 0.660)%,
12/20/2065 | | | | | 3,902,098 | | | | | | 1.0 | | |
| | 339,947 | | | Ginnie Mae Series 2010-H03
FA, 5.185%, (US0001M +
0.550)%, 03/20/2060 | | | | | 338,627 | | | | | | 0.1 | | |
| | 29,080 | | | Ginnie Mae Series 2010-H10
FC, 5.635%, (US0001M +
1.000)%, 05/20/2060 | | | | | 29,139 | | | | | | 0.0 | | |
| | 1,879,162 | | | Ginnie Mae Series 2010-H11
FA, 5.635%, (US0001M +
1.000)%, 06/20/2060 | | | | | 1,883,706 | | | | | | 0.5 | | |
| | 228,338 | | | Ginnie Mae Series 2011-H03
FA, 5.066%, (US0001M +
0.500)%, 01/20/2061 | | | | | 227,236 | | | | | | 0.1 | | |
| | 66,052 | | | Ginnie Mae Series 2011-H05
FA, 5.066%, (US0001M +
0.500)%, 12/20/2060 | | | | | 65,754 | | | | | | 0.0 | | |
| | 98,853 | | | Ginnie Mae Series 2011-H05
FB, 5.066%, (US0001M +
0.500)%, 12/20/2060 | | | | | 98,317 | | | | | | 0.0 | | |
| | 495,024 | | | Ginnie Mae Series 2011-H06
FA, 5.016%, (US0001M +
0.450)%, 02/20/2061 | | | | | 492,159 | | | | | | 0.1 | | |
| | Principal Amount† | | | | | | Value | | | Percentage
of Net
Assets | |
| | COLLATERALIZED MORTGAGE OBLIGATIONS: (continued) | |
| | 45,414 | | | Ginnie Mae Series 2011-H07
FA, 5.066%, (US0001M +
0.500)%, 02/20/2061 | | | | $ | 45,172 | | | | | | 0.0 | | |
| | 111,529 | | | Ginnie Mae Series 2011-H08
FD, 5.066%, (US0001M +
0.500)%, 02/20/2061 | | | | | 110,973 | | | | | | 0.0 | | |
| | 396,053 | | | Ginnie Mae Series 2011-H08
FG, 5.046%, (US0001M +
0.480)%, 03/20/2061 | | | | | 393,884 | | | | | | 0.1 | | |
| | 545,045 | | | Ginnie Mae Series 2011-H09
AF, 5.066%, (US0001M +
0.500)%, 03/20/2061 | | | | | 542,501 | | | | | | 0.1 | | |
| | 42,395 | | | Ginnie Mae Series 2011-H11
FB, 5.066%, (US0001M +
0.500)%, 04/20/2061 | | | | | 42,197 | | | | | | 0.0 | | |
| | 127,435 | | | Ginnie Mae Series 2012-H18
NA, 5.086%, (US0001M +
0.520)%, 08/20/2062 | | | | | 126,760 | | | | | | 0.0 | | |
| | 1,250,540 | | | Ginnie Mae Series 2012-H23
SA, 5.096%, (US0001M +
0.530)%, 10/20/2062 | | | | | 1,246,667 | | | | | | 0.3 | | |
| | 668,480 | | | Ginnie Mae Series 2012-H23
WA, 5.086%, (US0001M +
0.520)%, 10/20/2062 | | | | | 664,795 | | | | | | 0.2 | | |
| | 327,429 | | | Ginnie Mae Series 2014-3 EP,
2.750%, 02/16/2043 | | | | | 305,888 | | | | | | 0.1 | | |
| | 211,750 (3) | | | Ginnie Mae Series 2014-53
JM, 7.012%, 04/20/2039 | | | | | 222,920 | | | | | | 0.1 | | |
| | 3,782,628 | | | Ginnie Mae Series 2016-H16
FE, 3.155%, (US0012M +
0.380)%, 06/20/2066 | | | | | 3,746,110 | | | | | | 1.0 | | |
| | 1,249,676 | | | Ginnie Mae Series 2017-H06
FE, 5.116%, (US0001M +
0.550)%, 02/20/2067 | | | | | 1,242,716 | | | | | | 0.3 | | |
| | 1,089,386 | | | Ginnie Mae Series 2017-H07
FG, 5.026%, (US0001M +
0.460)%, 02/20/2067 | | | | | 1,083,163 | | | | | | 0.3 | | |
| | 1,054,971 (2)(3) | | | JP Morgan Mortgage Trust
2021-INV6 A3, 2.500%,
04/25/2052 | | | | | 837,498 | | | | | | 0.2 | | |
| | | | | Total Collateralized
Mortgage Obligations
(Cost $24,171,677) | | | | | 23,842,385 | | | | | | 6.1 | | |
| | U.S. TREASURY OBLIGATIONS: 25.4% | |
| | | | | U.S. Treasury Notes: 25.4% | |
| | 27,813,000 | | | 0.125%, 01/15/2024 | | | | | 26,831,881 | | | | | | 6.9 | | |
| | 97,000 | | | 3.625%, 03/31/2028 | | | | | 97,167 | | | | | | 0.0 | | |
| | 4,818,000 | | | 3.875%, 03/31/2025 | | | | | 4,803,603 | | | | | | 1.2 | | |
| | 2,264,000 (1) | | | 4.000%, 02/29/2028 | | | | | 2,305,123 | | | | | | 0.6 | | |
See Accompanying Notes to Financial Statements
PORTFOLIO OF INVESTMENTS
| Voya Short Term Bond Fund | as of March 31, 2023 (continued) |
| | Principal Amount† | | | | | | Value | | | Percentage
of Net
Assets | |
| | U.S. TREASURY OBLIGATIONS: (continued) | |
| | | | | U.S. Treasury Notes (continued) | |
| | 1,369,000 (1) | | | 4.625%, 02/28/2025 | | | | $ | 1,382,423 | | | | | | 0.3 | | |
| | 62,635,000 | | | 4.625%, 03/15/2026 | | | | | 64,066,307 | | | | | | 16.4 | | |
| | | | | Total U.S. Treasury
Obligations
(Cost $98,162,385) | | | | | 99,486,504 | | | | | | 25.4 | | |
| | COMMERCIAL MORTGAGE-BACKED SECURITIES: 7.6% | |
| | 604,500 (2) | | | AREIT 2019-CRE3 C Trust,
6.674%, (TSFR1M +
2.015)%, 09/14/2036 | | | | | 574,254 | | | | | | 0.1 | | |
| | 4,000,000 (2) | | | BBCMS Trust 2021-AGW E,
7.834%, (US0001M +
3.150)%, 06/15/2036 | | | | | 3,460,949 | | | | | | 0.9 | | |
| | 1,000,000 (2) | | | BDS 2018-FL8 E, 7.011%,
(US0001M + 2.250)%,
01/18/2036 | | | | | 918,577 | | | | | | 0.2 | | |
| | 2,917,000 (2) | | | BHMS 2018-ATLS C, 6.584%,
(US0001M + 1.900)%,
07/15/2035 | | | | | 2,771,401 | | | | | | 0.7 | | |
| | 343,613 (2) | | | BX 2021-MFM1 B, 5.892%,
(TSFR1M + 1.065)%,
01/15/2034 | | | | | 330,642 | | | | | | 0.1 | | |
| | 1,550,000 (2) | | | BX Trust 2021-ARIA C,
6.330%, (US0001M +
1.646)%, 10/15/2036 | | | | | 1,453,057 | | | | | | 0.4 | | |
| | 1,453,188 (2) | | | BX Trust 2022-PSB A,
7.278%, (TSFR1M + 2.451)%,
08/15/2039 | | | | | 1,447,748 | | | | | | 0.4 | | |
| | 2,000,000 (2)(3) | | | COMM 2013-CCRE11 C
Mortgage Trust, 5.118%,
08/10/2050 | | | | | 1,953,797 | | | | | | 0.5 | | |
| | 120,000 (2)(3) | | | COMM 2013-CR10 E
Mortgage Trust, 4.867%,
08/10/2046 | | | | | 112,776 | | | | | | 0.0 | | |
| | 800,000 (2) | | | CSWF 2021-SOP2 D,
7.001%, (US0001M + 2.317)%,
06/15/2034 | | | | | 708,776 | | | | | | 0.2 | | |
| | 2,200,000 (2)(4) | | | FREMF 2019-KG01 C
Mortgage Trust, 0.000%,
05/25/2029 | | | | | 1,249,290 | | | | | | 0.3 | | |
| | 548,000 (2) | | | GAM Re-REMIC Trust
2021-FRR1 1B, 1.050%,
11/29/2050 | | | | | 374,041 | | | | | | 0.1 | | |
| | 710,000 (2) | | | GAM Re-REMIC Trust
2021-FRR1 2B, 1.320%,
11/29/2050 | | | | | 470,976 | | | | | | 0.1 | | |
| | 5,052 | | | Ginnie Mae 2015-183 AC,
2.350%, 07/16/2056 | | | | | 5,003 | | | | | | 0.0 | | |
| | Principal Amount† | | | | | | Value | | | Percentage
of Net
Assets | |
| | COMMERCIAL MORTGAGE-BACKED
SECURITIES: (continued) | |
| | 3,396 | | | Ginnie Mae 2016-110 AB,
2.000%, 05/16/2049 | | | | $ | 3,370 | | | | | | 0.0 | | |
| | 65,075 | | | Ginnie Mae 2017-100 AB,
2.300%, 04/16/2052 | | | | | 62,089 | | | | | | 0.0 | | |
| | 16,448 | | | Ginnie Mae 2017-51 AB,
2.350%, 04/16/2057 | | | | | 16,044 | | | | | | 0.0 | | |
| | 3,757 | | | Ginnie Mae 2017-69 AB,
2.350%, 05/16/2053 | | | | | 3,699 | | | | | | 0.0 | | |
| | 4,559 | | | Ginnie Mae 2017-70 A,
2.500%, 10/16/2057 | | | | | 4,508 | | | | | | 0.0 | | |
| | 61,235 | | | Ginnie Mae 2017-86 AB,
2.300%, 11/16/2051 | | | | | 59,026 | | | | | | 0.0 | | |
| | 27,317 | | | Ginnie Mae 2017-89 A,
2.500%, 08/16/2057 | | | | | 26,870 | | | | | | 0.0 | | |
| | 7,748 | | | Ginnie Mae 2018-41 A,
2.400%, 09/16/2058 | | | | | 7,623 | | | | | | 0.0 | | |
| | 330,000 (2) | | | GS Mortgage Securities Corp.
Trust 2017-GPTX B, 3.104%,
05/10/2034 | | | | | 285,799 | | | | | | 0.1 | | |
| | 1,039,000 (2)(3) | | | GS Mortgage Securities Corp.
Trust 2017-SLP E, 4.600%,
10/10/2032 | | | | | 970,585 | | | | | | 0.3 | | |
| | 1,070,000 (2) | | | GS Mortgage Securities Corp.
Trust 2019-70P C, 6.184%,
(US0001M + 1.500)%,
10/15/2036 | | | | | 965,103 | | | | | | 0.2 | | |
| | 190,000 (2) | | | GSCG Trust 2019-600C A,
2.936%, 09/06/2034 | | | | | 167,165 | | | | | | 0.0 | | |
| | 330,000 (2) | | | Houston Galleria Mall Trust
2015-HGLR A1A2, 3.087%,
03/05/2037 | | | | | 305,809 | | | | | | 0.1 | | |
| | 210,000 (3) | | | JP Morgan Chase Commercial
Mortgage Securities Trust
2013-C10 C, 4.347%,
12/15/2047 | | | | | 195,749 | | | | | | 0.1 | | |
| | 360,000 (2) | | | JP Morgan Chase Commercial
Mortgage Securities Trust
2018-WPT CFX, 4.950%,
07/05/2033 | | | | | 301,860 | | | | | | 0.1 | | |
| | 100,000 (2)(3) | | | JP Morgan Chase Commercial
Mortgage Securities Trust
2020-LOOP E, 3.862%,
12/05/2038 | | | | | 69,709 | | | | | | 0.0 | | |
| | 1,100,000 (2)(3) | | | JPMBB Commercial Mortgage
Securities Trust 2013-C15 D,
5.176%, 11/15/2045 | | | | | 1,028,120 | | | | | | 0.3 | | |
See Accompanying Notes to Financial Statements
PORTFOLIO OF INVESTMENTS
| Voya Short Term Bond Fund | as of March 31, 2023 (continued) |
| | Principal Amount† | | | | | | Value | | | Percentage
of Net
Assets | |
| | COMMERCIAL MORTGAGE-BACKED
SECURITIES: (continued) | |
| | 1,000,000 (2)(3) | | | JPMBB Commercial Mortgage
Securities Trust 2013-C17 E,
3.867%, 01/15/2047 | | | | $ | 782,564 | | | | | | 0.2 | | |
| | 820,000 (3) | | | JPMBB Commercial Mortgage
Securities Trust 2014-C19 C,
4.635%, 04/15/2047 | | | | | 776,098 | | | | | | 0.2 | | |
| | 1,000,000 (2)(3) | | | LSTAR Commercial Mortgage
Trust 2016-4 F, 4.611%,
03/10/2049 | | | | | 666,770 | | | | | | 0.2 | | |
| | 172,173 | | | Morgan Stanley Capital I Trust
2017-H1 A2, 3.089%,
06/15/2050 | | | | | 165,869 | | | | | | 0.0 | | |
| | 423,036 (2) | | | Ready Capital Mortgage
Financing 2020-FL4 A LLC,
6.995%, (US0001M + 2.150)%,
02/25/2035 | | | | | 423,418 | | | | | | 0.1 | | |
| | 2,000,000 (2) | | | SMRT 2022-MINI F, 8.178%,
(TSFR1M + 3.350)%,
01/15/2039 | | | | | 1,795,317 | | | | | | 0.5 | | |
| | 5,000,000 (2)(3) | | | UBS-Barclays Commercial
Mortgage Trust 2013-C6 C,
4.102%, 04/10/2046 | | | | | 4,631,108 | | | | | | 1.2 | | |
| | | | | Total Commercial
Mortgage-Backed Securities
(Cost $32,133,222) | | | | | 29,545,559 | | | | | | 7.6 | | |
| | ASSET-BACKED SECURITIES: 18.6% | |
| | | | | Automobile Asset-Backed Securities: 3.3% | |
| | 400,000 | | | AmeriCredit Automobile
Receivables Trust 2020-1 C,
1.590%, 10/20/2025 | | | | | 389,964 | | | | | | 0.1 | | |
| | 371,745 | | | AmeriCredit Automobile
Receivables Trust 2020-2 B,
0.970%, 02/18/2026 | | | | | 366,042 | | | | | | 0.1 | | |
| | 1,100,000 | | | AmeriCredit Automobile
Receivables Trust 2021-3 A3,
0.760%, 08/18/2026 | | | | | 1,055,251 | | | | | | 0.3 | | |
| | 700,000 | | | AmeriCredit Automobile
Receivables Trust 2021-3 B,
1.170%, 08/18/2027 | | | | | 648,030 | | | | | | 0.2 | | |
| | 750,000 | | | Americredit Automobile
Receivables Trust 2023-1 A3,
5.620%, 11/18/2027 | | | | | 761,266 | | | | | | 0.2 | | |
| | 55,221 | | | BMW Vehicle Owner Trust
2020-A A3, 0.480%,
10/25/2024 | | | | | 54,656 | | | | | | 0.0 | | |
| | 56,658 | | | Carmax Auto Owner Trust
2019-2 A4, 2.770%,
12/16/2024 | | | | | 56,496 | | | | | | 0.0 | | |
| | Principal Amount† | | | | | | Value | | | Percentage
of Net
Assets | | |
| | ASSET-BACKED SECURITIES: (continued) | | |
| | | | | Automobile Asset-Backed
Securities (continued) | | |
| | 150,000 | | | CarMax Auto Owner Trust
2021-2 B, 1.030%,
12/15/2026 | | | | $ | 138,167 | | | | | | 0.0 | | | |
| | 300,000 | | | CarMax Auto Owner Trust
2022-1 B, 1.950%,
09/15/2027 | | | | | 277,062 | | | | | | 0.1 | | | |
| | 700,000 | | | Carvana Auto Receivables
Trust 2022-P1 A3, 3.350%,
02/10/2027 | | | | | 675,877 | | | | | | 0.2 | | | |
| | 1,210,177 | | | Drive Auto Receivables Trust
2021-2 B, 0.580%, 12/15/2025 | | | | | 1,201,902 | | | | | | 0.3 | | | |
| | 878,867 | | | Exeter Automobile Receivables
Trust 2021-3A B, 0.690%,
01/15/2026 | | | | | 868,765 | | | | | | 0.2 | | | |
| | 900,000 | | | Ford Credit Auto Owner Trust
2022-A B, 1.910%, 07/15/2027 | | | | | 835,846 | | | | | | 0.2 | | | |
| | 264,416 | | | GM Financial Automobile
Leasing Trust 2019-4 A4,
1.760%, 01/16/2025 | | | | | 262,474 | | | | | | 0.1 | | �� | |
| | 450,000 | | | GM Financial Automobile
Leasing Trust 2023-1 A4,
5.160%, 01/20/2027 | | | | | 452,659 | | | | | | 0.1 | | | |
| | 400,000 | | | GM Financial Consumer
Automobile Receivables Trust
2022-4 B, 5.500%, 08/16/2028 | | | | | 408,105 | | | | | | 0.1 | | | |
| | 550,000 | | | GM Financial Consumer
Automobile Receivables Trust
2023-1 A3, 4.660%,
02/16/2028 | | | | | 552,174 | | | | | | 0.1 | | | |
| | 99,340 | | | Honda Auto Receivables
2020-2 A3 Owner Trust,
0.820%, 07/15/2024 | | | | | 98,355 | | | | | | 0.0 | | | |
| | 1,050,000 | | | Hyundai Auto Receivables
Trust 2021-C B, 1.490%,
12/15/2027 | | | | | 954,962 | | | | | | 0.3 | | | |
| | 323,287 (2) | | | JPMorgan Chase Bank NA -
CACLN 2021-3 B, 0.760%,
02/26/2029 | | | | | 306,813 | | | | | | 0.1 | | | |
| | 1,350,000 (2) | | | Oscar US Funding XIII LLC
2021-2A A3, 0.860%,
09/10/2025 | | | | | 1,294,033 | | | | | | 0.3 | | | |
| | 994,827 | | | Santander Drive Auto
Receivables Trust 2021-3 B,
0.600%, 12/15/2025 | | | | | 990,180 | | | | | | 0.3 | | | |
| | 169,335 | | | Toyota Auto Receivables
2019-C A4 Owner Trust,
1.880%, 11/15/2024 | | | | | 168,478 | | | | | | 0.0 | | | |
| | | | | | | | | | 12,817,557 | | | | | | 3.3 | | | | | |
See Accompanying Notes to Financial Statements
PORTFOLIO OF INVESTMENTS
| Voya Short Term Bond Fund | as of March 31, 2023 (continued) |
| | Principal Amount† | | | | | | Value | | | Percentage
of Net
Assets | |
| | ASSET-BACKED SECURITIES: (continued) | |
| | | | | Credit Card Asset-Backed Securities: 0.2% | |
| | 800,000 (2) | | | CARDS II Trust 2021-1A A,
0.602%, 04/15/2027 | | | | $ | 764,204 | | | | | | 0.2 | | |
| | | | | | |
| | | | | Other Asset-Backed Securities: 14.3% | |
| | 550,000 (2) | | | AB BSL CLO 4 Ltd. 2023-4A A,
6.508%, (TSFR3M + 2.000)%,
04/20/2036 | | | | | 550,364 | | | | | | 0.1 | | |
| | 600,000 (2) | | | Allegany Park CLO Ltd.
2019-1A AR, 5.939%,
(TSFR3M + 1.300)%,
01/20/2035 | | | | | 583,707 | | | | | | 0.1 | | |
| | 400,000 (2) | | | ARES XLVI CLO Ltd. 2017-46A
A2, 6.022%, (US0003M +
1.230)%, 01/15/2030 | | | | | 389,049 | | | | | | 0.1 | | |
| | 250,000 (2) | | | Babson CLO Ltd. 2017-1A A2,
6.145%, (US0003M + 1.350)%,
07/18/2029 | | | | | 245,521 | | | | | | 0.1 | | |
| | 1,900,000 (2) | | | Ballyrock CLO 17 Ltd.
2021-17A A1B, 6.208%,
(US0003M + 1.400)%,
10/20/2034 | | | | | 1,840,182 | | | | | | 0.5 | | |
| | 500,000 (2) | | | Barings Clo Ltd. 2019-4A A1,
6.122%, (US0003M + 1.330)%,
01/15/2033 | | | | | 494,252 | | | | | | 0.1 | | |
| | 2,900,000 (2) | | | BDS 2021-FL10 E Ltd.,
8.111%, (US0001M + 3.350)%,
12/16/2036 | | | | | 2,718,705 | | | | | | 0.7 | | |
| | 2,000,000 (2) | | | Benefit Street Partners CLO
XX Ltd. 2020-20A AR, 5.962%,
(US0003M + 1.170)%,
07/15/2034 | | | | | 1,955,020 | | | | | | 0.5 | | |
| | 2,500,000 (2) | | | BlueMountain CLO XXXII Ltd.
2021-32A A, 5.962%,
(US0003M + 1.170)%,
10/15/2034 | | | | | 2,436,242 | | | | | | 0.6 | | |
| | 4,000,000 (2) | | | BRSP 2021-FL1 B Ltd.,
6.661%, (US0001M + 1.900)%,
08/19/2038 | | | | | 3,803,003 | | | | | | 1.0 | | |
| | 450,000 (2) | | | Carlyle US Clo 2017-2A CR
Ltd., 6.208%, (US0003M +
1.400)%, 07/20/2031 | | | | | 441,888 | | | | | | 0.1 | | |
| | 500,000 (2) | | | Carlyle US CLO 2020-2A A1R
Ltd., 5.958%, (US0003M +
1.140)%, 01/25/2035 | | | | | 487,319 | | | | | | 0.1 | | |
| | 800,000 (2) | | | Carlyle US Clo 2021-4A A2
Ltd., 6.208%, (US0003M +
1.400)%, 04/20/2034 | | | | | 779,302 | | | | | | 0.2 | | |
| | Principal Amount† | | | | | | Value | | | Percentage
of Net
Assets | |
| | ASSET-BACKED SECURITIES: (continued) | |
| | | | | Other Asset-Backed Securities (continued) | |
| | 500,000 (2) | | | Cedar Funding IV CLO
Ltd.2014-4A ARR, 5.975%,
(US0003M + 1.160)%,
07/23/2034 | | | | $ | 485,303 | | | | | | 0.1 | | |
| | 600,000 (2) | | | CIFC Funding 2019-6A A1
Ltd., 6.122%, (US0003M +
1.330)%, 01/16/2033 | | | | | 594,713 | | | | | | 0.2 | | |
| | 250,000 (2) | | | CIFC Funding 2019-6A A2
Ltd., 6.542%, (US0003M +
1.750)%, 01/16/2033 | | | | | 248,821 | | | | | | 0.1 | | |
| | 500,000 (2) | | | CIFC Funding 2020-2A AR
Ltd., 5.978%, (US0003M +
1.170)%, 10/20/2034 | | | | | 489,671 | | | | | | 0.1 | | |
| | 2,750,000 (2) | | | CIFC Funding 2020-IA A1R
Ltd., 5.942%, (US0003M +
1.150)%, 07/15/2036 | | | | | 2,695,671 | | | | | | 0.7 | | |
| | 2,481,118 | | | CNH Equipment Trust 2021-B
A3, 0.440%, 08/17/2026 | | | | | 2,375,534 | | | | | | 0.6 | | |
| | 650,000 | | | CNH Equipment Trust 2021-C
A3, 0.810%, 12/15/2026 | | | | | 616,555 | | | | | | 0.2 | | |
| | 233,974 (2) | | | Deer Creek Clo Ltd. 2017-1A
A, 5.988%, (US0003M +
1.180)%, 10/20/2030 | | | | | 231,978 | | | | | | 0.1 | | |
| | 347,313 (2) | | | Dryden XXVIII Senior Loan
Fund 2013-28A A1LR, 6.064%,
(US0003M + 1.200)%,
08/15/2030 | | | | | 345,047 | | | | | | 0.1 | | |
| | 250,000 (2) | | | Eaton Vance Clo 2015-1A A2R
Ltd., 6.058%, (US0003M +
1.250)%, 01/20/2030 | | | | | 241,096 | | | | | | 0.1 | | |
| | 254,598 (2) | | | Elevation CLO 2014-2A A1R
Ltd., 6.124%, (TSFR3M +
1.230)%, 10/15/2029 | | | | | 253,059 | | | | | | 0.1 | | |
| | 250,000 (2) | | | Elmwood CLO IX Ltd. 2021-2A
A, 5.938%, (US0003M +
1.130)%, 07/20/2034 | | | | | 244,602 | | | | | | 0.1 | | |
| | 400,000 (2) | | | HGI CRE CLO 2021-FL3 A
Ltd., 6.258%, (SOFR30A +
1.700)%, 04/20/2037 | | | | | 393,162 | | | | | | 0.1 | | |
| | 2,500,000 | | | John Deere Owner Trust
2021-B A3, 0.520%,
03/16/2026 | | | | | 2,392,788 | | | | | | 0.6 | | |
| | 450,000 | | | John Deere Owner Trust
2022-A A4, 2.490%,
01/16/2029 | | | | | 428,662 | | | | | | 0.1 | | |
See Accompanying Notes to Financial Statements
PORTFOLIO OF INVESTMENTS
| Voya Short Term Bond Fund | as of March 31, 2023 (continued) |
| | Principal Amount† | | | | | | Value | | | Percentage
of Net
Assets | |
| | ASSET-BACKED SECURITIES: (continued) | |
| | | | | Other Asset-Backed Securities (continued) | |
| | 750,000 (2) | | | Kayne CLO 6 Ltd. 2019-6A A1,
6.188%, (US0003M + 1.380)%,
01/20/2033 | | | | $ | 743,098 | | | | | | 0.2 | | |
| | 500,000 (2) | | | Kayne CLO 7 Ltd. 2020-7A A1,
5.992%, (US0003M + 1.200)%,
04/17/2033 | | | | | 492,789 | | | | | | 0.1 | | |
| | 2,600,000 (2) | | | Kubota Credit Owner Trust
2021-2A A3, 0.560%,
11/17/2025 | | | | | 2,473,982 | | | | | | 0.6 | | |
| | 1,100,000 (2) | | | Kubota Credit Owner Trust
2023-1A A3, 5.020%,
06/15/2027 | | | | | 1,101,032 | | | | | | 0.3 | | |
| | 2,750,000 (2) | | | Magnetite XXVI Ltd. 2020-26A
A2R, 6.218%, (US0003M +
1.400)%, 07/25/2034 | | | | | 2,671,631 | | | | | | 0.7 | | |
| | 500,000 (2) | | | Marble Point CLO XIV Ltd.
2018-2A A1R, 6.088%,
(US0003M + 1.280)%,
01/20/2032 | | | | | 492,606 | | | | | | 0.1 | | |
| | 152,581 (2) | | | Marlette Funding Trust
2021-1A B, 1.000%,
06/16/2031 | | | | | 151,404 | | | �� | | | 0.0 | | |
| | 1,575,000 (2) | | | MF1 Multifamily Housing
Mortgage Loan Trust
2021-FL6 C, 6.559%,
(US0001M + 1.850)%,
07/16/2036 | | | | | 1,484,848 | | | | | | 0.4 | | |
| | 340,000 (2) | | | Neuberger Berman Loan
Advisers CLO 35 Ltd.
2019-35A A1, 6.138%,
(US0003M + 1.340)%,
01/19/2033 | | | | | 335,794 | | | | | | 0.1 | | |
| | 400,000 (2) | | | Oaktree CLO Ltd. 2021-1A A1,
5.952%, (US0003M + 1.160)%,
07/15/2034 | | | | | 391,210 | | | | | | 0.1 | | |
| | 1,550,000 (2) | | | OCP CLO 2020-19A AR Ltd.,
5.958%, (US0003M + 1.150)%,
10/20/2034 | | | | | 1,512,445 | | | | | | 0.4 | | |
| | 400,000 (2) | | | OCP CLO 2021-22A A Ltd.,
5.988%, (US0003M + 1.180)%,
12/02/2034 | | | | | 389,622 | | | | | | 0.1 | | |
| | 300,000 (2) | | | Octagon 61 Ltd. 2023-2A A,
6.358%, (TSFR3M + 1.850)%,
04/20/2036 | | | | | 300,225 | | | | | | 0.1 | | |
| | 250,000 (2) | | | Octagon Investment Partners
XV Ltd. 2013-1A A2R, 6.148%,
(US0003M + 1.350)%,
07/19/2030 | | | | | 241,940 | | | | | | 0.1 | | |
| | Principal Amount† | | | | | | Value | | | Percentage
of Net
Assets | |
| | ASSET-BACKED SECURITIES: (continued) | |
| | | | | Other Asset-Backed Securities (continued) | |
| | 600,000 (2) | | | Octagon Loan Funding Ltd.
2014-1A ARR, 6.095%,
(US0003M + 1.180)%,
11/18/2031 | | | | $ | 591,803 | | | | | | 0.1 | | |
| | 3,700,000 (2) | | | OHA Credit Partners XIII Ltd.
2016-13A AR, 5.985%,
(US0003M + 1.170)%,
10/25/2034 | | | | | 3,612,299 | | | | | | 0.9 | | |
| | 3,000,000 (2) | | | OHA Credit Partners XVI
2021-16A A, 5.945%,
(US0003M + 1.150)%,
10/18/2034 | | | | | 2,941,380 | | | | | | 0.7 | | |
| | 500,000 (2) | | | OHA Loan Funding 2015-1A
AR3 Ltd., 5.948%,
(US0003M + 1.150)%,
01/19/2037 | | | | | 489,080 | | | | | | 0.1 | | |
| | 474,622 (2) | | | Palmer Square CLO 2015-2A
A1R2 Ltd., 5.908%,
(US0003M + 1.100)%,
07/20/2030 | | | | | 470,901 | | | | | | 0.1 | | |
| | 1,650,000 (2) | | | Palmer Square CLO 2019-1A
A1R Ltd., 6.019%,
(US0003M + 1.150)%,
11/14/2034 | | | | | 1,613,040 | | | | | | 0.4 | | |
| | 350,000 (2) | | | PFS Financing Corp. 2021-B
A, 0.770%, 08/15/2026 | | | | | 327,328 | | | | | | 0.1 | | |
| | 600,000 (2) | | | PFS Financing Corp. 2022-D
A, 4.270%, 08/15/2027 | | | | | 589,853 | | | | | | 0.1 | | |
| | 410,000 (2) | | | Sound Point CLO XXV Ltd.
2019-4A A1R, 5.940%,
(TSFR3M + 1.280)%,
04/25/2033 | | | | | 396,087 | | | | | | 0.1 | | |
| | 500,000 (2) | | | THL Credit Wind River
2019-1A AR CLO Ltd., 5.968%,
(US0003M + 1.160)%,
07/20/2034 | | | | | 485,302 | | | | | | 0.1 | | |
| | 1,650,000 (2) | | | Trafigura Securitisation
Finance PLC 2021-1A A2,
1.080%, 01/15/2025 | | | | | 1,538,665 | | | | | | 0.4 | | |
| | 300,000 (2) | | | Wellman Park CLO Ltd.
2021-1A A, 5.892%,
(US0003M + 1.100)%,
07/15/2034 | | | | | 293,434 | | | | | | 0.1 | | |
| | 1,250,000 (2) | | | Wind River 2022-1A A CLO
Ltd., 6.169%, (TSFR3M +
1.530)%, 07/20/2035 | | | | | 1,226,163 | | | | | | 0.3 | | |
| | | | | | | | | | 56,119,177 | | | | | | 14.3 | | |
See Accompanying Notes to Financial Statements
PORTFOLIO OF INVESTMENTS
| Voya Short Term Bond Fund | as of March 31, 2023 (continued) |
| | Principal Amount† | | | | | | Value | | | Percentage
of Net
Assets | |
| | ASSET-BACKED SECURITIES: (continued) | |
| | | | | Student Loan Asset-Backed Securities: 0.8% | |
| | 440 (2) | | | DRB Prime Student Loan Trust
2017-A A2B, 2.850%,
05/27/2042 | | | | $ | 439 | | | | | | 0.0 | | |
| | 26,441 (2) | | | Laurel Road Prime Student
Loan Trust 2018-B A2FX,
3.540%, 05/26/2043 | | | | | 25,929 | | | | | | 0.0 | | |
| | 268,928 (2) | | | Navient Private Education
Loan Trust 2014-AA A3,
6.284%, (US0001M + 1.600)%,
10/15/2031 | | | | | 268,239 | | | | | | 0.1 | | |
| | 198,882 (2) | | | Navient Private Education Refi
Loan Trust 2019-FA A2,
2.600%, 08/15/2068 | | | | | 184,097 | | | | | | 0.0 | | |
| | 61,873 (2) | | | Navient Private Education Refi
Loan Trust 2020-GA A,
1.170%, 09/16/2069 | | | | | 55,369 | | | | | | 0.0 | | |
| | 109,765 (2) | | | Navient Private Education Refi
Loan Trust 2021-A A, 0.840%,
05/15/2069 | | | | | 96,068 | | | | | | 0.0 | | |
| | 1,610,182 (2) | | | Navient Private Education Refi
Loan Trust 2021-EA A,
0.970%, 12/16/2069 | | | | | 1,368,616 | | | | | | 0.4 | | |
| | 380,697 (2) | | | Navient Private Education Refi
Loan Trust 2021-F A, 1.110%,
02/18/2070 | | | | | 321,508 | | | | | | 0.1 | | |
| | 387,938 (2) | | | Sofi Professional Loan
Program 2018-A A2B LLC,
2.950%, 02/25/2042 | | | | | 375,221 | | | | | | 0.1 | | |
| | 441,084 (2) | | | SoFi Professional Loan
Program 2021-B AFX Trust,
1.140%, 02/15/2047 | | | | | 369,057 | | | | | | 0.1 | | |
| | | | | | | | | | 3,064,543 | | | | | | 0.8 | | |
| | | | | Total Asset-Backed
Securities
(Cost $75,367,469) | | | | | 72,765,481 | | | | | | 18.6 | | |
| | U.S. GOVERNMENT AGENCY OBLIGATIONS: 0.1% | |
| | | | | Federal Home Loan Mortgage
Corporation: 0.1%(5) | |
| | 11,646 | | | 5.500%, 01/01/2037 | | | | | 11,785 | | | | | | 0.0 | | |
| | 17,957 | | | 5.500%, 08/01/2038 | | | | | 18,173 | | | | | | 0.0 | | |
| | 5,411 | | | 5.500%, 10/01/2038 | | | | | 5,476 | | | | | | 0.0 | | |
| | 281 | | | 5.500%, 10/01/2038 | | | | | 284 | | | | | | 0.0 | | |
| | 121,919 | | | 5.500%, 11/01/2038 | | | | | 126,827 | | | | | | 0.1 | | |
| | 96,964 | | | 5.500%, 02/01/2039 | | | | | 98,127 | | | | | | 0.0 | | |
| | | | | | | | | | 260,672 | | | | | | 0.1 | | |
| | Principal Amount† | | | | | | Value | | | Percentage
of Net
Assets | |
| | U.S. GOVERNMENT AGENCY OBLIGATIONS: (continued) | |
| | | | | Uniform Mortgage-Backed Securities: 0.0% | |
| | 6,014 | | | 5.000%, 03/01/2027 | | | | $ | 6,061 | | | | | | 0.0 | | |
| | 92,107 | | | 5.000%, 05/01/2042 | | | | | 94,149 | | | | | | 0.0 | | |
| | | | | | | | | | 100,210 | | | | | | 0.0 | | |
| | | | | Total U.S. Government
Agency Obligations
(Cost $374,397) | | | | | 360,882 | | | | | | 0.1 | | |
| | | | | Total Long-Term
Investments | | | | | | | | | | | | | |
| | | | | (Cost $385,265,880) | | | | | 374,570,911 | | | | | | 95.8 | | |
| | SHORT-TERM INVESTMENTS: 7.6% | |
| | | | | Commercial Paper: 5.9% | |
| | 2,000,000 | | | American Electric Power Co.,
Inc., 4.950%, 04/25/2023 | | | | | 1,992,693 | | | | | | 0.5 | | |
| | 3,000,000 | | | Berkshire Hathaway, Inc.,
4.970%, 04/14/2023 | | | | | 2,993,986 | | | | | | 0.8 | | |
| | 3,000,000 | | | Dominion Resources, Inc.,
5.070%, 05/01/2023 | | | | | 2,986,448 | | | | | | 0.7 | | |
| | 3,700,000 | | | EIDP Inc., 5.140%, 04/03/2023 | | | | | 3,698,421 | | | | | | 0.9 | | |
| | 3,000,000 | | | EIDP Inc., 5.110%, 06/06/2023 | | | | | 2,971,419 | | | | | | 0.7 | | |
| | 2,400,000 | | | Fiserv, Inc., 5.220%,
04/04/2023 | | | | | 2,398,643 | | | | | | 0.6 | | |
| | 3,000,000 | | | Keurig Dr Pepper, Inc., 5.240%,
04/04/2023 | | | | | 2,998,377 | | | | | | 0.8 | | |
| | 1,500,000 | | | McCormick & Co., Inc.,
5.290%, 04/28/2023 | | | | | 1,493,835 | | | | | | 0.4 | | |
| | 2,000,000 | | | Parker-Hannifin Corp., 5.340%,
06/20/2023 | | | | | 1,975,731 | | | | | | 0.5 | | |
| | | | | Total Commercial Paper | | | | | | | | | | | | | |
| | | | | (Cost $23,510,972) | | | | | 23,509,553 | | | | | | 5.9 | | |
| | | | | | |
| | | | | Repurchase Agreements: 1.3% | |
| | 1,183,850 (6) | | | Bank of America Inc.,
Repurchase Agreement dated
03/31/23, 4.82%, due 04/03/23
(Repurchase Amount
$1,184,319, collateralized by
various U.S. Government
Agency Obligations, 1.500%-
3.000%, Market Value plus
accrued interest $1,207,527,
due 11/01/49-02/01/51) | | | | | 1,183,850 | | | | | | 0.3 | | |
See Accompanying Notes to Financial Statements
PORTFOLIO OF INVESTMENTS
| Voya Short Term Bond Fund | as of March 31, 2023 (continued) |
| | Principal Amount† | | | | | | Value | | | Percentage
of Net
Assets | |
| | SHORT-TERM INVESTMENTS: (continued) | |
| | | | | Repurchase Agreements (continued) | |
| | 206,612 (6) | | | Citigroup, Inc., Repurchase
Agreement dated 03/31/23,
4.81%, due 04/03/23
(Repurchase Amount
$206,694, collateralized by
various U.S. Government/U.S.
Government Agency
Obligations, 1.500%-7.000%,
Market Value plus accrued
interest $210,744, due
12/26/24-03/20/53) | | | | $ | 206,612 | | | | | | 0.1 | | |
| | 1,183,850 (6) | | | HSBC Securities USA,
Repurchase Agreement dated
03/31/23, 4.80%, due 04/03/23
(Repurchase Amount
$1,184,317, collateralized by
various U.S. Government/U.S.
Government Agency
Obligations, 0.000%-6.500%,
Market Value plus accrued
interest $1,207,527, due
06/15/24-02/15/53) | | | | | 1,183,850 | | | | | | 0.3 | | |
| | 1,183,850 (6) | | | Jefferies LLC, Repurchase
Agreement dated 03/31/23,
4.91%, due 04/03/23
(Repurchase Amount
$1,184,328, collateralized by
various U.S. Government
Agency Obligations,
0.000%-5.750%, Market Value
plus accrued interest
$1,207,535, due
04/14/23-03/21/28) | | | | | 1,183,850 | | | | | | 0.3 | | |
| | 1,183,850 (6) | | | RBC Dominion Securities Inc.,
Repurchase Agreement dated
03/31/23, 4.82%, due 04/03/23
(Repurchase Amount
$1,184,319, collateralized by
various U.S. Government/U.S.
Government Agency
Obligations, 0.000%-6.375%,
Market Value plus accrued
interest $1,207,527, due
04/06/23-02/20/53) | | | | | 1,183,850 | | | | | | 0.3 | | |
| | | | | Total Repurchase
Agreements
(Cost $4,942,012) | | | | | 4,942,012 | | | | | | 1.3 | | |
| |
| Shares | | | Value | | | Percentage
of Net
Assets | | | | |
| SHORT-TERM INVESTMENTS: (continued) | | | | |
| | | | Mutual Funds: 0.4% | | | | | | | | | | |
| 1,485,000 (7) | | | Morgan Stanley Institutional
Liquidity Funds - Government
Portfolio (Institutional Share
Class), 4.730% | | | | | | | | | | | | | | | | |
| | | | (Cost $1,485,000) | | | | $ | 1,485,000 | | | | | | 0.4 | | | | | |
| | | | Total Short-Term
Investments
(Cost $29,937,984) | | | | | 29,936,565 | | | | | | 7.6 | | | | | |
| | | | Total Investments in
Securities | | | | | | | | | | | | | | | | |
| | | | (Cost $415,203,864) | | | | $ | 404,507,476 | | | | | | 103.4 | | | | | |
| | | | Liabilities in Excess of
Other Assets | | | | | (13,173,950) | | | | | | (3.4) | | | | | |
| | | | Net Assets | | | | $ | 391,333,526 | | | | | | 100.0 | | | | | |
†
Unless otherwise indicated, principal amount is shown in USD.
(1)
Security, or a portion of the security, is on loan.
(2)
Securities with purchases pursuant to Rule 144A or section 4(a)(2), under the Securities Act of 1933 and may not be resold subject to that rule except to qualified institutional buyers.
(3)
Variable rate security. Rate shown is the rate in effect as of March 31, 2023.
(4)
Principal only securities represent the right to receive the monthly principal payments on an underlying pool of mortgage loans. No payments of interest on the pool are passed through the principal only security.
(5)
The Federal Housing Finance Agency (“FHFA”) placed the Federal Home Loan Mortgage Corporation and Federal National Mortgage Association into conservatorship with FHFA as the conservator. As such, the FHFA oversees the continuing affairs of these companies.
(6)
All or a portion of the security represents securities purchased with cash collateral received for securities on loan.
(7)
Rate shown is the 7-day yield as of March 31, 2023.
Reference Rate Abbreviations:
SOFR30A
30-day Secured Overnight Financing Rate
TSFR1M
1-month CME Term Secured Overnight Financing Rate
TSFR3M
3-month CME Term Secured Overnight Financing Rate
US0001M
1-month LIBOR
US0003M
3-month LIBOR
US0012M
12-month LIBOR
See Accompanying Notes to Financial Statements
PORTFOLIO OF INVESTMENTS
| Voya Short Term Bond Fund | as of March 31, 2023 (continued) |
Fair Value Measurements^
The following is a summary of the fair valuations according to the inputs used as of March 31, 2023 in valuing the assets and liabilities:
| | | | Quoted Prices
in Active Markets
for Identical
Investments
(Level 1) | | | Significant
Other
Observable
Inputs
(Level 2) | | | Significant
Unobservable
Inputs
(Level 3) | | | Fair Value
at
March 31, 2023 | |
| Asset Table | | | | | | | | | | | | | | | | | | | | | | | | | |
| Investments, at fair value | | | | | | | | | | | | | | | | | | | | | | | | | |
| Corporate Bonds/Notes | | | | $ | — | | | | | $ | 148,570,100 | | | | | $ | — | | | | | $ | 148,570,100 | | |
| Collateralized Mortgage Obligations | | | | | — | | | | | | 23,842,385 | | | | | | — | | | | | | 23,842,385 | | |
| Asset-Backed Securities | | | | | — | | | | | | 72,765,481 | | | | | | — | | | | | | 72,765,481 | | |
| Commercial Mortgage-Backed Securities | | | | | — | | | | | | 29,545,559 | | | | | | — | | | | | | 29,545,559 | | |
| U.S. Government Agency Obligations | | | | | — | | | | | | 360,882 | | | | | | — | | | | | | 360,882 | | |
| U.S. Treasury Obligations | | | | | — | | | | | | 99,486,504 | | | | | | — | | | | | | 99,486,504 | | |
| Short-Term Investments | | | | | 1,485,000 | | | | | | 28,451,565 | | | | | | — | | | | | | 29,936,565 | | |
| Total Investments, at fair value | | | | $ | 1,485,000 | | | | | $ | 403,022,476 | | | | | $ | — | | | | | $ | 404,507,476 | | |
| Other Financial Instruments+ | | | | | | | | | | | | | | | | | | | | | | | | | |
| Futures | | | | | 1,671,150 | | | | | | — | | | | | | — | | | | | | 1,671,150 | | |
| Total Assets | | | | $ | 3,156,150 | | | | | $ | 403,022,476 | | | | | $ | — | | | | | $ | 406,178,626 | | |
| Liabilities Table | | | | | | | | | | | | | | | | | | | | | | | | | |
| Other Financial Instruments+ | | | | | | | | | | | | | | | | | | | | | | | | | |
| Futures | | | | $ | (461,023) | | | | | $ | — | | | | | $ | — | | | | | $ | (461,023) | | |
| Total Liabilities | | | | $ | (461,023) | | | | | $ | — | | | | | $ | — | | | | | $ | (461,023) | | |
^
See Note 2, “Significant Accounting Policies” in the Notes to Financial Statements for additional information.
+
Other Financial Instruments may include open forward foreign currency contracts, futures, centrally cleared swaps, OTC swaps and written options. Forward foreign currency contracts, futures and centrally cleared swaps are fair valued at the unrealized appreciation (depreciation) on the instrument. OTC swaps and written options are valued at the fair value of the instrument.
At March 31, 2023, the following futures contracts were outstanding for Voya Short Term Bond Fund:
| Description | | | Number
of Contracts | | | Expiration
Date | | | Notional
Amount | | | Unrealized
Appreciation/
(Depreciation) | |
| Long Contracts: | | | | | | | | | | | | | | | | | | | | | | | | | |
| U.S. Treasury 2-Year Note | | | | | 692 | | | | | | 06/30/23 | | | | | $ | 142,865,562 | | | | | $ | 1,671,150 | | |
| | | | | | | | | | | | | | | | | $ | 142,865,562 | | | | | $ | 1,671,150 | | |
| Short Contracts: | | | | | | | | | | | | | | | | | | | | | | | | | |
| U.S. Treasury 10-Year Note | | | | | (13) | | | | | | 06/21/23 | | | | | | (1,493,984) | | | | | | (9,575) | | |
| U.S. Treasury 5-Year Note | | | | | (209) | | | | | | 06/30/23 | | | | | | (22,887,133) | | | | | | (451,448) | | |
| | | | | | | | | | | | | | | | | $ | (24,381,117) | | | | | $ | (461,023) | | |
See Accompanying Notes to Financial Statements
PORTFOLIO OF INVESTMENTS
| Voya Short Term Bond Fund | as of March 31, 2023 (continued) |
A summary of derivative instruments by primary risk exposure is outlined in the following tables.
The fair value of derivative instruments as of March 31, 2023 was as follows:
| Derivatives not accounted for as hedging instruments | | | Location on Statement
of Assets and Liabilities | | | Fair Value | |
| Asset Derivatives | | | | | | | | | | |
| Interest rate contracts | | | Variation margin receivable on futures contracts* | | | | $ | 1,671,150 | | |
| Total Asset Derivatives | | | | | | | $ | 1,671,150 | | |
| Liability Derivatives | | | | | | | | | | |
| Interest rate contracts | | | Variation margin payable on futures contracts* | | | | $ | 461,023 | | |
| Total Liability Derivatives | | | | | | | $ | 461,023 | | |
*
The fair value presented above represents the cumulative unrealized appreciation (depreciation) on futures contracts and centrally cleared swaps as reported in the tables within the Portfolio of Investments. In the Statement of Assets and Liabilities, only current day’s unsettled variation margin is reported in receivables or payables on futures contracts and centrally cleared swaps and the net cumulative unrealized appreciation (depreciation) is included in total distributable earnings (loss).
The effect of derivative instruments on the Fund’s Statement of Operations for the year ended March 31, 2023 was as follows:
Amount of Realized Gain or (Loss) on Derivatives Recognized in Income
| Derivatives not accounted for as hedging instruments | | | Futures | | | Swaps | | | Total | |
| Credit contracts | | | | $ | — | | | | | $ | (130,992) | | | | | $ | (130,992) | | |
| Equity contracts | | | | | (10,727) | | | | | | — | | | | | | (10,727) | | |
| Interest rate contracts | | | | | (6,094,095) | | | | | | — | | | | | | (6,094,095) | | |
| Total | | | | $ | (6,104,822) | | | | | $ | (130,992) | | | | | $ | (6,235,814) | | |
Change in Unrealized Appreciation or (Depreciation) on Derivatives Recognized in Income
| Derivatives not accounted for as hedging instruments | | | Futures | | | Swaps | | | Total | |
| Credit contracts | | | | $ | — | | | | | $ | — | | | | | $ | — | | |
| Interest rate contracts | | | | | 2,375,076 | | | | | | — | | | | | | 2,375,076 | | |
| Total | | | | $ | 2,375,076 | | | | | $ | — | | | | | $ | 2,375,076 | | |
At March 31, 2023, the aggregate cost of securities and other investments and the composition of unrealized appreciation and depreciation of securities and other investments on a tax basis were:
| | Cost for federal income tax purposes was $416,936,164. | | | | | | | |
| | Net unrealized depreciation consisted of: | | | | | | | |
| | Gross Unrealized Appreciation | | | | $ | 1,612,002 | | |
| | Gross Unrealized Depreciation | | | | | (12,830,562) | | |
| | Net Unrealized Depreciation | | | | $ | (11,218,560) | | |
See Accompanying Notes to Financial Statements
| Voya Strategic Income | PORTFOLIO OF INVESTMENTS |
| Opportunities Fund | as of March 31, 2023 |
Principal
Amount† | | | Value | | | Percentage
of Net
Assets | |
| CORPORATE BONDS/NOTES: 21.9% | |
| | | | Basic Materials: 1.4% | |
| 200,000 (1) | | | ASP Unifrax Holdings, Inc.,
5.250%, 09/30/2028 | | | | $ | 160,060 | | | | | | 0.0 | | |
| 425,000 (1)(2) | | | ASP Unifrax Holdings, Inc.,
7.500%, 09/30/2029 | | | | | 289,230 | | | | | | 0.0 | | |
| 2,825,000 (1) | | | Braskem Netherlands
Finance BV, 7.250%,
02/13/2033 | | | | | 2,716,944 | | | | | | 0.2 | | |
| 1,350,000 | | | Celulosa Arauco y
Constitucion SA, 3.875%,
11/02/2027 | | | | | 1,239,638 | | | | | | 0.1 | | |
| 1,500,000 (1) | | | Celulosa Arauco y
Constitucion SA, 4.250%,
04/30/2029 | | | | | 1,381,174 | | | | | | 0.1 | | |
| 660,000 (1) | | | Cleveland-Cliffs, Inc.,
4.625%, 03/01/2029 | | | | | 606,280 | | | | | | 0.0 | | |
| 350,000 (1)(2) | | | Cleveland-Cliffs, Inc.,
4.875%, 03/01/2031 | | | | | 318,573 | | | | | | 0.0 | | |
| 625,000 (1) | | | Coeur Mining, Inc., 5.125%,
02/15/2029 | | | | | 530,491 | | | | | | 0.0 | | |
| 600,000 (1) | | | Consolidated Energy
Finance S.A., 5.625%,
10/15/2028 | | | | | 516,768 | | | | | | 0.0 | | |
| 625,000 (1) | | | Constellium SE, 5.625%,
06/15/2028 | | | | | 590,772 | | | | | | 0.0 | | |
| 1,900,000 (1) | | | Corp Nacional del Cobre de
Chile, 5.125%, 02/02/2033 | | | | | 1,920,774 | | | | | | 0.1 | | |
| 1,000,000 (1) | | | Equate Petrochemical BV,
2.625%, 04/28/2028 | | | | | 883,218 | | | | | | 0.1 | | |
| 600,000 (1) | | | First Quantum Minerals Ltd.,
6.875%, 10/15/2027 | | | | | 578,971 | | | | | | 0.0 | | |
| 1,800,000 (1) | | | GC Treasury Center Co.
Ltd., 4.400%, 03/30/2032 | | | | | 1,619,931 | | | | | | 0.1 | | |
| 1,200,000 (1) | | | HudBay Minerals, Inc.,
4.500%, 04/01/2026 | | | | | 1,109,546 | | | | | | 0.1 | | |
| 685,000 (1) | | | Illuminate Buyer LLC /
Illuminate Holdings IV, Inc.,
9.000%, 07/01/2028 | | | | | 607,880 | | | | | | 0.0 | | |
| 800,000 (1) | | | INEOS Quattro Finance 2
Plc, 3.375%, 01/15/2026 | | | | | 725,937 | | | | | | 0.1 | | |
| 200,000 | | | Inversiones CMPC SA,
4.375%, 04/04/2027 | | | | | 190,084 | | | | | | 0.0 | | |
| 925,000 (1)(3) | | | Iris Holdings, Inc., 8.750%
(PIK Rate 9.500%, Cash
Rate 8.750)%, 02/15/2026 | | | | | 855,049 | | | | | | 0.1 | | |
| 825,000 (1) | | | LSF11 A5 Holdco LLC,
6.625%, 10/15/2029 | | | | | 694,695 | | | | | | 0.1 | | |
| 925,000 (1) | | | Mativ, Inc., 6.875%,
10/01/2026 | | | | | 847,344 | | | | | | 0.1 | | |
| 765,000 (1) | | | Novelis Corp., 3.875%,
08/15/2031 | | | | | 645,446 | | | | | | 0.0 | | |
Principal
Amount† | | | Value | | | Percentage
of Net
Assets | |
| CORPORATE BONDS/NOTES: (continued) | |
| | | | Basic Materials (continued) | |
| 315,000 (1) | | | Novelis Corp., 4.750%,
01/30/2030 | | | | $ | 289,800 | | | | | | 0.0 | | |
| 675,000 (1) | | | Nufarm Australia Ltd. /
Nufarm Americas, Inc.,
5.000%, 01/27/2030 | | | | | 595,448 | | | | | | 0.0 | | |
| 325,000 (1) | | | OCP SA, 3.750%,
06/23/2031 | | | | | 267,101 | | | | | | 0.0 | | |
| 490,000 | | | Olin Corp., 5.000%,
02/01/2030 | | | | | 459,929 | | | | | | 0.0 | | |
| 485,000 | | | Olin Corp., 5.125%,
09/15/2027 | | | | | 465,603 | | | | | | 0.0 | | |
| 800,000 (1) | | | Olympus Water US Holding
Corp., 6.250%, 10/01/2029 | | | | | 592,893 | | | | | | 0.0 | | |
| 200,000 (1)(2) | | | Olympus Water US Holding
Corp., 7.125%, 10/01/2027 | | | | | 187,980 | | | | | | 0.0 | | |
| 1,100,000 (1) | | | POSCO, 4.500%,
08/04/2027 | | | | | 1,080,725 | | | | | | 0.1 | | |
| 600,000 (1) | | | SPCM SA, 3.125%,
03/15/2027 | | | | | 526,663 | | | | | | 0.0 | | |
| 1,350,000 | | | Suzano Austria GmbH,
5.000%, 01/15/2030 | | | | | 1,286,975 | | | | | | 0.1 | | |
| 200,000 | | | Suzano Austria GmbH,
6.000%, 01/15/2029 | | | | | 201,664 | | | | | | 0.0 | | |
| 700,000 (1) | | | Taseko Mines Ltd., 7.000%,
02/15/2026 | | | | | 635,887 | | | | | | 0.0 | | |
| 825,000 (1) | | | Trinseo Materials Operating
SCA / Trinseo Materials
Finance, Inc., 5.125%,
04/01/2029 | | | | | 508,023 | | | | | | 0.0 | | |
| 750,000 (1) | | | Tronox, Inc., 4.625%,
03/15/2029 | | | | | 628,924 | | | | | | 0.0 | | |
| | | | | | | | | 26,756,420 | | | | | | 1.4 | | |
| | | | Communications: 1.9% | |
| 700,000 (1) | | | Acuris Finance Us, Inc. /
Acuris Finance SARL,
5.000%, 05/01/2028 | | | | | 550,420 | | | | | | 0.0 | | |
| 1,000,000 (1) | | | Altice France Holding SA,
6.000%, 02/15/2028 | | | | | 639,100 | | | | | | 0.1 | | |
| 1,000,000 (1) | | | Altice France SA/France,
5.500%, 10/15/2029 | | | | | 765,556 | | | | | | 0.1 | | |
| 575,000 (1) | | | Altice France SA/France,
8.125%, 02/01/2027 | | | | | 532,795 | | | | | | 0.0 | | |
| 625,000 | | | AMC Networks, Inc.,
4.250%, 02/15/2029 | | | | | 384,934 | | | | | | 0.0 | | |
| 875,000 (1) | | | Beasley Mezzanine
Holdings LLC, 8.625%,
02/01/2026 | | | | | 581,975 | | | | | | 0.0 | | |
| 825,000 (1) | | | CCO Holdings LLC / CCO
Holdings Capital Corp.,
4.250%, 01/15/2034 | | | | | 646,128 | | | | | | 0.1 | | |
See Accompanying Notes to Financial Statements
| Voya Strategic Income | PORTFOLIO OF INVESTMENTS |
| Opportunities Fund | as of March 31, 2023 (continued) |
Principal
Amount† | | | Value | | | Percentage
of Net
Assets | |
| CORPORATE BONDS/NOTES: (continued) | |
| | | | Communications (continued) | |
| 1,190,000 | | | CCO Holdings LLC / CCO
Holdings Capital Corp.,
4.500%, 05/01/2032 | | | | $ | 974,503 | | | | | | 0.1 | | |
| 755,000 (1) | | | CCO Holdings LLC / CCO
Holdings Capital Corp.,
5.000%, 02/01/2028 | | | | | 697,405 | | | | | | 0.1 | | |
| 1,090,000 (1) | | | CCO Holdings LLC / CCO
Holdings Capital Corp.,
5.125%, 05/01/2027 | | | | | 1,031,402 | | | | | | 0.1 | | |
| 3,016,000 | | | Comcast Corp., 2.937%,
11/01/2056 | | | | | 2,011,112 | | | | | | 0.1 | | |
| 325,000 (1) | | | CommScope Tech Finance
LLC, 6.000%, 06/15/2025 | | | | | 306,389 | | | | | | 0.0 | | |
| 200,000 (1) | | | CommScope Technologies
LLC, 5.000%, 03/15/2027 | | | | | 146,480 | | | | | | 0.0 | | |
| 375,000 (1) | | | CommScope, Inc., 4.750%,
09/01/2029 | | | | | 312,937 | | | | | | 0.0 | | |
| 675,000 (1) | | | CommScope, Inc., 7.125%,
07/01/2028 | | | | | 498,670 | | | | | | 0.0 | | |
| 450,000 (1) | | | Connect Finco SARL /
Connect US Finco LLC,
6.750%, 10/01/2026 | | | | | 423,405 | | | | | | 0.0 | | |
| 800,000 (1) | | | CSC Holdings LLC, 4.625%,
12/01/2030 | | | | | 395,240 | | | | | | 0.0 | | |
| 325,000 | | | CSC Holdings LLC, 5.250%,
06/01/2024 | | | | | 313,995 | | | | | | 0.0 | | |
| 1,300,000 (1) | | | CSC Holdings LLC, 5.750%,
01/15/2030 | | | | | 685,750 | | | | | | 0.1 | | |
| 400,000 (1) | | | CSC Holdings LLC, 7.500%,
04/01/2028 | | | | | 255,360 | | | | | | 0.0 | | |
| 675,000 (1) | | | Directv Financing LLC /
Directv Financing
Co-Obligor, Inc., 5.875%,
08/15/2027 | | | | | 611,995 | | | | | | 0.0 | | |
| 950,000 | | | DISH DBS Corp., 5.125%,
06/01/2029 | | | | | 506,901 | | | | | | 0.0 | | |
| 275,000 (1) | | | DISH DBS Corp., 5.250%,
12/01/2026 | | | | | 219,937 | | | | | | 0.0 | | |
| 425,000 (1) | | | DISH DBS Corp., 5.750%,
12/01/2028 | | | | | 317,953 | | | | | | 0.0 | | |
| 525,000 | | | DISH DBS Corp., 7.375%,
07/01/2028 | | | | | 300,079 | | | | | | 0.0 | | |
| 600,000 | | | Embarq Corp., 7.995%,
06/01/2036 | | | | | 252,861 | | | | | | 0.0 | | |
| 375,000 (1) | | | GCI LLC, 4.750%,
10/15/2028 | | | | | 323,949 | | | | | | 0.0 | | |
| 900,000 (1) | | | Gray Escrow II, Inc.,
5.375%, 11/15/2031 | | | | | 598,621 | | | | | | 0.0 | | |
| 275,000 (1) | | | iHeartCommunications, Inc.,
5.250%, 08/15/2027 | | | | | 225,077 | | | | | | 0.0 | | |
Principal
Amount† | | | Value | | | Percentage
of Net
Assets | |
| CORPORATE BONDS/NOTES: (continued) | |
| | | | Communications (continued) | |
| 600,000 (1) | | | ION Trading Technologies
Sarl, 5.750%, 05/15/2028 | | | | $ | 480,174 | | | | | | 0.0 | | |
| 450,000 (1) | | | LCPR Senior Secured
Financing DAC, 5.125%,
07/15/2029 | | | | | 379,775 | | | | | | 0.0 | | |
| 720,000 (1) | | | LCPR Senior Secured
Financing DAC, 6.750%,
10/15/2027 | | | | | 680,692 | | | | | | 0.1 | | |
| 248,000 (1)(16) | | | Level 3 Financing, Inc.,
10.500%, 05/15/2030 | | | | | 236,840 | | | | | | 0.0 | | |
| 1,025,000 (1) | | | Match Group Holdings II
LLC, 4.625%, 06/01/2028 | | | | | 953,250 | | | | | | 0.1 | | |
| 655,000 (1) | | | McGraw-Hill Education, Inc.,
8.000%, 08/01/2029 | | | | | 537,922 | | | | | | 0.0 | | |
| 825,000 (1) | | | Millennium Escrow Corp.,
6.625%, 08/01/2026 | | | | | 537,290 | | | | | | 0.0 | | |
| 440,000 | | | Netflix, Inc., 5.875%,
11/15/2028 | | | | | 463,474 | | | | | | 0.0 | | |
| 475,000 (4) | | | Paramount Global, 6.250%,
02/28/2057 | | | | | 355,932 | | | | | | 0.0 | | |
| 3,650,000 (4) | | | Paramount Global, 6.375%,
03/30/2062 | | | | | 2,896,658 | | | | | | 0.2 | | |
| 875,000 (1) | | | Radiate Holdco LLC /
Radiate Finance, Inc.,
6.500%, 09/15/2028 | | | | | 359,927 | | | | | | 0.0 | | |
| 325,000 (1) | | | Sinclair Television Group,
Inc., 4.125%, 12/01/2030 | | | | | 262,421 | | | | | | 0.0 | | |
| 460,000 (1)(2) | | | Sinclair Television Group,
Inc., 5.500%, 03/01/2030 | | | | | 366,353 | | | | | | 0.0 | | |
| 1,625,000 (1) | | | Sirius XM Radio, Inc.,
5.000%, 08/01/2027 | | | | | 1,523,113 | | | | | | 0.1 | | |
| 625,000 (1) | | | Spanish Broadcasting
System, Inc., 9.750%,
03/01/2026 | | | | | 424,197 | | | | | | 0.0 | | |
| 1,350,000 | | | Sprint Corp., 7.125%,
06/15/2024 | | | | | 1,373,586 | | | | | | 0.1 | | |
| 375,000 | | | Sprint Corp., 7.625%,
03/01/2026 | | | | | 396,893 | | | | | | 0.0 | | |
| 790,000 (1) | | | Stagwell Global LLC,
5.625%, 08/15/2029 | | | | | 693,618 | | | | | | 0.1 | | |
| 375,000 | | | Telecom Italia Capital SA,
6.000%, 09/30/2034 | | | | | 322,031 | | | | | | 0.0 | | |
| 405,000 | | | Telecom Italia Capital SA,
6.375%, 11/15/2033 | | | | | 367,116 | | | | | | 0.0 | | |
| 550,000 (1) | | | Uber Technologies, Inc.,
8.000%, 11/01/2026 | | | | | 564,410 | | | | | | 0.0 | | |
| 325,000 (1) | | | Univision Communications,
Inc., 4.500%, 05/01/2029 | | | | | 273,379 | | | | | | 0.0 | | |
| 1,330,000 (1) | | | Univision Communications,
Inc., 6.625%, 06/01/2027 | | | | | 1,262,303 | | | | | | 0.1 | | |
See Accompanying Notes to Financial Statements
| Voya Strategic Income | PORTFOLIO OF INVESTMENTS |
| Opportunities Fund | as of March 31, 2023 (continued) |
Principal
Amount† | | | Value | | | Percentage
of Net
Assets | |
| CORPORATE BONDS/NOTES: (continued) | |
| | | | Communications (continued) | |
| 625,000 (1) | | | Urban One, Inc., 7.375%,
02/01/2028 | | | | $ | 568,375 | | | | | | 0.0 | | |
| 600,000 (1) | | | ViaSat, Inc., 5.625%,
09/15/2025 | | | | | 569,418 | | | | | | 0.0 | | |
| 140,000 (1) | | | ViaSat, Inc., 5.625%,
04/15/2027 | | | | | 131,586 | | | | | | 0.0 | | |
| 325,000 (1) | | | ViaSat, Inc., 6.500%,
07/15/2028 | | | | | 240,500 | | | | | | 0.0 | | |
| 625,000 (1) | | | Viavi Solutions, Inc.,
3.750%, 10/01/2029 | | | | | 535,129 | | | | | | 0.0 | | |
| 1,300,000 (1) | | | Virgin Media Vendor
Financing Notes IV DAC,
5.000%, 07/15/2028 | | | | | 1,156,792 | | | | | | 0.1 | | |
| 765,000 (1) | | | Vmed O2 UK Financing I
PLC, 4.750%, 07/15/2031 | | | | | 656,680 | | | | | | 0.1 | | |
| 1,075,000 (1) | | | Zayo Group Holdings, Inc.,
6.125%, 03/01/2028 | | | | | 654,783 | | | | | | 0.1 | | |
| | | | | | | | | 35,735,546 | | | | | | 1.9 | | |
| | | | Consumer, Cyclical: 3.3% | |
| 575,000 (1) | | | 1011778 BC ULC / New Red
Finance, Inc., 4.000%,
10/15/2030 | | | | | 493,580 | | | | | | 0.0 | | |
| 970,000 (1) | | | Academy Ltd., 6.000%,
11/15/2027 | | | | | 947,319 | | | | | | 0.1 | | |
| 870,000 (1) | | | Adams Homes, Inc.,
7.500%, 02/15/2025 | | | | | 774,908 | | | | | | 0.1 | | |
| 900,000 (1) | | | Adient Global Holdings Ltd.,
4.875%, 08/15/2026 | | | | | 868,369 | | | | | | 0.1 | | |
| 500,000 (1) | | | Adient Global Holdings Ltd.,
8.250%, 04/15/2031 | | | | | 515,297 | | | | | | 0.0 | | |
| 975,000 (1) | | | Affinity Gaming, 6.875%,
12/15/2027 | | | | | 870,597 | | | | | | 0.1 | | |
| 175,000 (1) | | | Allison Transmission, Inc.,
3.750%, 01/30/2031 | | | | | 149,496 | | | | | | 0.0 | | |
| 800,000 (1) | | | Allison Transmission, Inc.,
5.875%, 06/01/2029 | | | | | 779,840 | | | | | | 0.1 | | |
| 865,000 (1) | | | American Airlines, Inc.,
7.250%, 02/15/2028 | | | | | 842,047 | | | | | | 0.1 | | |
| 1,350,000 (1) | | | American Airlines, Inc./
AAdvantage Loyalty IP Ltd.,
5.750%, 04/20/2029 | | | | | 1,296,406 | | | | | | 0.1 | | |
| 725,000 (1) | | | Arko Corp., 5.125%,
11/15/2029 | | | | | 600,959 | | | | | | 0.0 | | |
| 500,000 | | | Asbury Automotive Group,
Inc., 4.500%, 03/01/2028 | | | | | 455,685 | | | | | | 0.0 | | |
| 475,000 | | | Asbury Automotive Group,
Inc., 4.750%, 03/01/2030 | | | | | 425,688 | | | | | | 0.0 | | |
| 1,025,000 | | | Bath & Body Works, Inc.,
6.750%, 07/01/2036 | | | | | 917,160 | | | | | | 0.1 | | |
Principal
Amount† | | | Value | | | Percentage
of Net
Assets | |
| CORPORATE BONDS/NOTES: (continued) | |
| | | | Consumer, Cyclical (continued) | |
| 150,000 (1)(3) | | | BCPE Ulysses Intermediate,
Inc., 7.750% (PIK Rate
8.500%, Cash Rate
7.750)%, 04/01/2027 | | | | $ | 117,956 | | | | | | 0.0 | | |
| 925,000 (1)(2) | | | Caesars Entertainment, Inc.,
4.625%, 10/15/2029 | | | | | 809,870 | | | | | | 0.1 | | |
| 665,000 (1) | | | Caesars Entertainment, Inc.,
6.250%, 07/01/2025 | | | | | 665,653 | | | | | | 0.0 | | |
| 400,000 (1) | | | Caesars Entertainment, Inc.,
7.000%, 02/15/2030 | | | | | 407,366 | | | | | | 0.0 | | |
| 1,595,000 (1) | | | Carnival Corp., 6.000%,
05/01/2029 | | | | | 1,269,859 | | | | | | 0.1 | | |
| 1,090,000 (1) | | | Carnival Corp., 9.875%,
08/01/2027 | | | | | 1,123,812 | | | | | | 0.1 | | |
| 650,000 (1) | | | CCM Merger, Inc., 6.375%,
05/01/2026 | | | | | 635,382 | | | | | | 0.0 | | |
| 600,000 (1) | | | Century Communities, Inc.,
3.875%, 08/15/2029 | | | | | 515,283 | | | | | | 0.0 | | |
| 395,000 (1) | | | Cinemark USA, Inc.,
8.750%, 05/01/2025 | | | | | 403,619 | | | | | | 0.0 | | |
| 575,000 (1) | | | Crocs, Inc., 4.125%,
08/15/2031 | | | | | 474,262 | | | | | | 0.0 | | |
| 750,000 (2) | | | Delta Air Lines 2020-1
Class A Pass Through Trust,
4.375%, 04/19/2028 | | | | | 697,571 | | | | | | 0.1 | | |
| 200,000 (2) | | | Delta Air Lines 2020-1
Class A Pass Through Trust,
7.375%, 01/15/2026 | | | | | 208,308 | | | | | | 0.0 | | |
| 280,782 (1) | | | Delta Air Lines, Inc. /
SkyMiles IP Ltd., 4.750%,
10/20/2028 | | | | | 271,193 | | | | | | 0.0 | | |
| 575,000 (1) | | | Fertitta Entertainment LLC /
Fertitta Entertainment
Finance Co., Inc., 6.750%,
01/15/2030 | | | | | 473,587 | | | | | | 0.0 | | |
| 665,000 (1) | | | Foot Locker, Inc., 4.000%,
10/01/2029 | | | | | 555,534 | | | | | | 0.0 | | |
| 700,000 (2) | | | Ford Motor Co., 6.100%,
08/19/2032 | | | | | 679,323 | | | | | | 0.1 | | |
| 1,400,000 | | | Ford Motor Credit Co. LLC,
2.700%, 08/10/2026 | | | | | 1,247,750 | | | | | | 0.1 | | |
| 1,700,000 | | | Ford Motor Credit Co. LLC,
4.125%, 08/17/2027 | | | | | 1,559,929 | | | | | | 0.1 | | |
| 1,225,000 | | | Ford Motor Credit Co. LLC,
4.542%, 08/01/2026 | | | | | 1,163,101 | | | | | | 0.1 | | |
| 600,000 | | | Ford Motor Credit Co. LLC,
5.113%, 05/03/2029 | | | | | 564,123 | | | | | | 0.0 | | |
| 700,000 (1) | | | Foundation Building
Materials, Inc., 6.000%,
03/01/2029 | | | | | 555,756 | | | | | | 0.0 | | |
See Accompanying Notes to Financial Statements
| Voya Strategic Income | PORTFOLIO OF INVESTMENTS |
| Opportunities Fund | as of March 31, 2023 (continued) |
Principal
Amount† | | | Value | | | Percentage
of Net
Assets | |
| CORPORATE BONDS/NOTES: (continued) | |
| | | | Consumer, Cyclical (continued) | |
| 700,000 (1) | | | Gap, Inc./The, 3.875%,
10/01/2031 | | | | $ | 486,339 | | | | | | 0.0 | | |
| 495,000 (1) | | | Golden Entertainment, Inc.,
7.625%, 04/15/2026 | | | | | 499,653 | | | | | | 0.0 | | |
| 115,000 (2) | | | Goodyear Tire & Rubber
Co/The, 4.875%,
03/15/2027 | | | | | 108,710 | | | | | | 0.0 | | |
| 500,000 (2) | | | Goodyear Tire & Rubber
Co/The, 5.250%,
07/15/2031 | | | | | 432,430 | | | | | | 0.0 | | |
| 600,000 (1)(2) | | | Hanesbrands, Inc., 4.875%,
05/15/2026 | | | | | 569,232 | | | | | | 0.0 | | |
| 425,000 (1) | | | Hilton Domestic Operating
Co., Inc., 4.000%,
05/01/2031 | | | | | 372,555 | | | | | | 0.0 | | |
| 2,920,000 | | | Home Depot, Inc./The,
3.625%, 04/15/2052 | | | | | 2,353,946 | | | | | | 0.1 | | |
| 725,000 (1) | | | Installed Building Products,
Inc., 5.750%, 02/01/2028 | | | | | 668,538 | | | | | | 0.0 | | |
| 955,000 (1) | | | Interface, Inc., 5.500%,
12/01/2028 | | | | | 770,922 | | | | | | 0.1 | | |
| 1,100,000 (1)(2) | | | International Game
Technology PLC, 5.250%,
01/15/2029 | | | | | 1,054,350 | | | | | | 0.1 | | |
| 700,000 (1) | | | LBM Acquisition LLC,
6.250%, 01/15/2029 | | | | | 536,547 | | | | | | 0.0 | | |
| 850,000 (1) | | | LCM Investments Holdings II
LLC, 4.875%, 05/01/2029 | | | | | 712,083 | | | | | | 0.1 | | |
| 850,000 (1) | | | Lions Gate Capital Holdings
LLC, 5.500%, 04/15/2029 | | | | | 559,793 | | | | | | 0.0 | | |
| 2,183,000 | | | Lowe’s Cos, Inc., 4.450%,
04/01/2062 | | | | | 1,784,511 | | | | | | 0.1 | | |
| 265,000 | | | M/I Homes, Inc., 3.950%,
02/15/2030 | | | | | 225,026 | | | | | | 0.0 | | |
| 685,000 | | | M/I Homes, Inc., 4.950%,
02/01/2028 | | | | | 634,518 | | | | | | 0.0 | | |
| 305,000 | | | Macy’s Retail Holdings LLC,
4.500%, 12/15/2034 | | | | | 222,250 | | | | | | 0.0 | | |
| 210,000 (1) | | | Macy’s Retail Holdings LLC,
5.875%, 03/15/2030 | | | | | 186,630 | | | | | | 0.0 | | |
| 540,000 (1) | | | Macy’s Retail Holdings LLC,
6.125%, 03/15/2032 | | | | | 475,843 | | | | | | 0.0 | | |
| 400,000 | | | Mattel, Inc., 5.450%,
11/01/2041 | | | | | 337,200 | | | | | | 0.0 | | |
| 800,000 (1) | | | Melco Resorts Finance Ltd.,
5.375%, 12/04/2029 | | | | | 655,600 | | | | | | 0.0 | | |
| 150,000 (1) | | | Murphy Oil USA, Inc.,
3.750%, 02/15/2031 | | | | | 126,529 | | | | | | 0.0 | | |
| 450,000 | | | Murphy Oil USA, Inc.,
4.750%, 09/15/2029 | | | | | 410,490 | | | | | | 0.0 | | |
Principal
Amount† | | | Value | | | Percentage
of Net
Assets | |
| CORPORATE BONDS/NOTES: (continued) | |
| | | | Consumer, Cyclical (continued) | |
| 165,000 | | | Murphy Oil USA, Inc.,
5.625%, 05/01/2027 | | | | $ | 159,902 | | | | | | 0.0 | | |
| 810,000 (1)(2) | | | NCL Corp. Ltd., 7.750%,
02/15/2029 | | | | | 695,336 | | | | | | 0.1 | | |
| 150,000 (1) | | | NCL Corp. Ltd., 8.375%,
02/01/2028 | | | | | 150,649 | | | | | | 0.0 | | |
| 500,000 (1)(2) | | | NCL Finance Ltd., 6.125%,
03/15/2028 | | | | | 405,685 | | | | | | 0.0 | | |
| 400,000 (1) | | | Penn Entertainment, Inc.,
4.125%, 07/01/2029 | | | | | 333,942 | | | | | | 0.0 | | |
| 400,000 (1) | | | Penn National Gaming, Inc.,
5.625%, 01/15/2027 | | | | | 376,054 | | | | | | 0.0 | | |
| 1,250,000 (1) | | | PetSmart, Inc. / PetSmart
Finance Corp., 7.750%,
02/15/2029 | | | | | 1,228,350 | | | | | | 0.1 | | |
| 825,000 (1) | | | Real Hero Merger Sub 2,
Inc., 6.250%, 02/01/2029 | | | | | 610,763 | | | | | | 0.0 | | |
| 310,000 (1) | | | Ritchie Bros Holdings, Inc.,
7.750%, 03/15/2031 | | | | | 325,274 | | | | | | 0.0 | | |
| 1,785,000 (1) | | | Royal Caribbean Cruises
Ltd., 5.375%, 07/15/2027 | | | | | 1,591,997 | | | | | | 0.1 | | |
| 215,000 (1) | | | Royal Caribbean Cruises
Ltd., 7.250%, 01/15/2030 | | | | | 216,537 | | | | | | 0.0 | | |
| 420,000 (1) | | | Royal Caribbean Cruises
Ltd., 11.625%, 08/15/2027 | | | | | 451,500 | | | | | | 0.0 | | |
| 850,000 (1)(2) | | | Scientific Games Holdings
L.P./Scientific Games US
FinCo, Inc., 6.625%,
03/01/2030 | | | | | 751,939 | | | | | | 0.1 | | |
| 665,000 (1) | | | Scientific Games
International, Inc., 7.000%,
05/15/2028 | | | | | 658,998 | | | | | | 0.0 | | |
| 325,000 (1) | | | Scientific Games
International, Inc., 8.625%,
07/01/2025 | | | | | 333,031 | | | | | | 0.0 | | |
| 795,000 | | | Shea Homes L.P. / Shea
Homes Funding Corp.,
4.750%, 04/01/2029 | | | | | 694,822 | | | | | | 0.1 | | |
| 675,000 (1) | | | Sizzling Platter LLC /
Sizzling Platter Finance
Corp., 8.500%, 11/28/2025 | | | | | 606,303 | | | | | | 0.0 | | |
| 930,000 (1)(2) | | | Sonic Automotive, Inc.,
4.625%, 11/15/2029 | | | | | 780,173 | | | | | | 0.1 | | |
| 275,000 (1) | | | SRS Distribution, Inc.,
6.000%, 12/01/2029 | | | | | 227,461 | | | | | | 0.0 | | |
| 625,000 (1) | | | SRS Distribution, Inc.,
6.125%, 07/01/2029 | | | | | 528,125 | | | | | | 0.0 | | |
| 1,000,000 (1)(2) | | | Staples, Inc., 10.750%,
04/15/2027 | | | | | 726,325 | | | | | | 0.1 | | |
See Accompanying Notes to Financial Statements
| Voya Strategic Income | PORTFOLIO OF INVESTMENTS |
| Opportunities Fund | as of March 31, 2023 (continued) |
Principal
Amount† | | | Value | | | Percentage
of Net
Assets | |
| CORPORATE BONDS/NOTES: (continued) | |
| | | | Consumer, Cyclical (continued) | |
| 975,000 (1) | | | Station Casinos LLC,
4.500%, 02/15/2028 | | | | $ | 881,083 | | | | | | 0.1 | | |
| 700,000 (1) | | | STL Holding Co. LLC,
7.500%, 02/15/2026 | | | | | 615,524 | | | | | | 0.0 | | |
| 675,000 (1) | | | Taylor Morrison
Communities, Inc., 5.125%,
08/01/2030 | | | | | 623,709 | | | | | | 0.0 | | |
| 675,000 (1) | | | Tempur Sealy International,
Inc., 3.875%, 10/15/2031 | | | | | 564,320 | | | | | | 0.0 | | |
| 710,000 (1) | | | United Airlines 2015-1
Class AA Pass Through
Trust, 4.625%, 04/15/2029 | | | | | 643,133 | | | | | | 0.0 | | |
| 680,000 (2) | | | United Airlines Holdings,
Inc., 4.875%, 01/15/2025 | | | | | 663,819 | | | | | | 0.0 | | |
| 315,000 (1) | | | United Airlines, Inc.,
4.375%, 04/15/2026 | | | | | 301,732 | | | | | | 0.0 | | |
| 1,025,000 (1) | | | Victoria’s Secret & Co.,
4.625%, 07/15/2029 | | | | | 831,654 | | | | | | 0.1 | | |
| 950,000 (1) | | | Viking Cruises Ltd., 5.875%,
09/15/2027 | | | | | 818,995 | | | | | | 0.1 | | |
| 255,000 (1) | | | Viking Cruises Ltd.,
13.000%, 05/15/2025 | | | | | 269,576 | | | | | | 0.0 | | |
| 1,956,000 (1) | | | Warnermedia Holdings, Inc.,
5.141%, 03/15/2052 | | | | | 1,586,993 | | | | | | 0.1 | | |
| 525,000 (1) | | | White Cap Buyer LLC,
6.875%, 10/15/2028 | | | | | 455,888 | | | | | | 0.0 | | |
| 275,000 (1)(3) | | | White Cap Parent LLC,
8.250% (PIK Rate 9.000%,
Cash Rate 8.250)%,
03/15/2026 | | | | | 250,464 | | | | | | 0.0 | | |
| 670,000 (1) | | | William Carter Co/The,
5.625%, 03/15/2027 | | | | | 651,873 | | | | | | 0.0 | | |
| 275,000 (1) | | | Williams Scotsman
International, Inc., 4.625%,
08/15/2028 | | | | | 250,495 | | | | | | 0.0 | | |
| 1,000,000 (1) | | | Wynn Las Vegas LLC /
Wynn Las Vegas Capital
Corp., 5.250%, 05/15/2027 | | | | | 946,180 | | | | | | 0.1 | | |
| 440,000 (1)(2) | | | Wynn Resorts Finance
LLC / Wynn Resorts Capital
Corp., 7.125%, 02/15/2031 | | | | | 446,719 | | | | | | 0.0 | | |
| | | | | | | | | 61,175,606 | | | | | | 3.3 | | |
| | | | Consumer, Non-cyclical: 1.7% | |
| 77,000 (1) | | | 1375209 BC Ltd., 9.000%,
01/30/2028 | | | | | 76,423 | | | | | | 0.0 | | |
| 750,000 (1) | | | Acadia Healthcare Co., Inc.,
5.500%, 07/01/2028 | | | | | 727,237 | | | | | | 0.1 | | |
| 805,000 (1) | | | ADT Security Corp./The,
4.125%, 08/01/2029 | | | | | 718,885 | | | | | | 0.1 | | |
Principal
Amount† | | | Value | | | Percentage
of Net
Assets | |
| CORPORATE BONDS/NOTES: (continued) | |
| | | | Consumer, Non-cyclical (continued) | |
| 650,000 (1) | | | Albertsons Cos, Inc. /
Safeway, Inc. / New
Albertsons L.P. / Albertsons
LLC, 3.500%, 03/15/2029 | | | | $ | 566,172 | | | | | | 0.0 | | |
| 330,000 (1) | | | Albertsons Cos, Inc. /
Safeway, Inc. / New
Albertsons L.P. / Albertsons
LLC, 4.875%, 02/15/2030 | | | | | 308,375 | | | | | | 0.0 | | |
| 730,000 (1) | | | Albertsons Cos, Inc. /
Safeway, Inc. / New
Albertsons L.P. / Albertsons
LLC, 5.875%, 02/15/2028 | | | | | 726,277 | | | | | | 0.1 | | |
| 300,000 (1) | | | Allied Universal Holdco LLC /
Allied Universal Finance
Corp., 6.000%, 06/01/2029 | | | | | 224,281 | | | | | | 0.0 | | |
| 150,000 (1) | | | Allied Universal Holdco LLC /
Allied Universal Finance
Corp., 6.625%, 07/15/2026 | | | | | 144,300 | | | | | | 0.0 | | |
| 450,000 (1) | | | Allied Universal Holdco LLC /
Allied Universal Finance
Corp., 9.750%, 07/15/2027 | | | | | 401,512 | | | | | | 0.0 | | |
| 825,000 (1) | | | Alta Equipment Group, Inc.,
5.625%, 04/15/2026 | | | | | 771,387 | | | | | | 0.1 | | |
| 875,000 (1) | | | AMN Healthcare, Inc.,
4.625%, 10/01/2027 | | | | | 812,147 | | | | | | 0.1 | | |
| 450,000 (1) | | | APi Escrow Corp., 4.750%,
10/15/2029 | | | | | 396,630 | | | | | | 0.0 | | |
| 300,000 (1) | | | APi Group DE, Inc., 4.125%,
07/15/2029 | | | | | 257,952 | | | | | | 0.0 | | |
| 225,000 (1) | | | Bausch Health Cos, Inc.,
4.875%, 06/01/2028 | | | | | 132,952 | | | | | | 0.0 | | |
| 310,000 (1) | | | Bausch Health Cos, Inc.,
6.125%, 02/01/2027 | | | | | 200,948 | | | | | | 0.0 | | |
| 137,000 (1) | | | Bausch Health Cos, Inc.,
11.000%, 09/30/2028 | | | | | 101,495 | | | | | | 0.0 | | |
| 675,000 (1) | | | BellRing Brands, Inc.,
7.000%, 03/15/2030 | | | | | 684,362 | | | | | | 0.0 | | |
| 225,000 | | | Centene Corp., 2.625%,
08/01/2031 | | | | | 182,522 | | | | | | 0.0 | | |
| 975,000 | | | Centene Corp., 4.625%,
12/15/2029 | | | | | 917,612 | | | | | | 0.1 | | |
| 1,000,000 (1) | | | Cheplapharm Arzneimittel
GmbH, 5.500%, 01/15/2028 | | | | | 891,430 | | | | | | 0.1 | | |
| 350,000 (1) | | | CHS/Community Health
Systems, Inc., 4.750%,
02/15/2031 | | | | | 258,755 | | | | | | 0.0 | | |
| 600,000 (1) | | | CHS/Community Health
Systems, Inc., 5.250%,
05/15/2030 | | | | | 471,210 | | | | | | 0.0 | | |
See Accompanying Notes to Financial Statements
| Voya Strategic Income | PORTFOLIO OF INVESTMENTS |
| Opportunities Fund | as of March 31, 2023 (continued) |
Principal
Amount† | | | Value | | | Percentage
of Net
Assets | |
| CORPORATE BONDS/NOTES: (continued) | |
| | | | Consumer, Non-cyclical (continued) | |
| 550,000 (1) | | | CHS/Community Health
Systems, Inc., 5.625%,
03/15/2027 | | | | $ | 483,417 | | | | | | 0.0 | | |
| 400,000 (1) | | | CHS/Community Health
Systems, Inc., 6.875%,
04/15/2029 | | | | | 248,120 | | | | | | 0.0 | | |
| 765,000 (1) | | | CPI CG, Inc., 8.625%,
03/15/2026 | | | | | 758,039 | | | | | | 0.1 | | |
| 275,000 (1) | | | DaVita, Inc., 3.750%,
02/15/2031 | | | | | 217,173 | | | | | | 0.0 | | |
| 950,000 (1) | | | DaVita, Inc., 4.625%,
06/01/2030 | | | | | 811,775 | | | | | | 0.1 | | |
| 825,000 | | | Encompass Health Corp.,
4.750%, 02/01/2030 | | | | | 750,998 | | | | | | 0.1 | | |
| 250,000 (1) | | | Garda World Security Corp.,
6.000%, 06/01/2029 | | | | | 199,071 | | | | | | 0.0 | | |
| 650,000 (1) | | | Garda World Security Corp.,
7.750%, 02/15/2028 | | | | | 641,227 | | | | | | 0.0 | | |
| 575,000 (1) | | | Graham Holdings Co.,
5.750%, 06/01/2026 | | | | | 564,103 | | | | | | 0.0 | | |
| 800,000 (1) | | | Jazz Securities DAC,
4.375%, 01/15/2029 | | | | | 736,720 | | | | | | 0.1 | | |
| 599,000 (1) | | | KeHE Distributors LLC /
KeHE Finance Corp.,
8.625%, 10/15/2026 | | | | | 598,683 | | | | | | 0.0 | | |
| 700,000 (1) | | | Legends Hospitality Holding
Co. LLC / Legends
Hospitality Co-Issuer, Inc.,
5.000%, 02/01/2026 | | | | | 627,116 | | | | | | 0.0 | | |
| 450,000 (1) | | | Medline Borrower L.P.,
3.875%, 04/01/2029 | | | | | 390,897 | | | | | | 0.0 | | |
| 825,000 (1)(2) | | | Medline Borrower L.P.,
5.250%, 10/01/2029 | | | | | 716,568 | | | | | | 0.0 | | |
| 555,000 (1)(2) | | | MPH Acquisition Holdings
LLC, 5.750%, 11/01/2028 | | | | | 399,830 | | | | | | 0.0 | | |
| 850,000 (1) | | | NESCO Holdings II, Inc.,
5.500%, 04/15/2029 | | | | | 769,841 | | | | | | 0.1 | | |
| 400,000 | | | New Albertsons L.P.,
7.450%, 08/01/2029 | | | | | 405,728 | | | | | | 0.0 | | |
| 1,100,000 (1) | | | Organon & Co. / Organon
Foreign Debt Co-Issuer BV,
5.125%, 04/30/2031 | | | | | 977,435 | | | | | | 0.1 | | |
| 630,000 (1) | | | PECF USS Intermediate
Holding III Corp., 8.000%,
11/15/2029 | | | | | 419,136 | | | | | | 0.0 | | |
| 568,000 (1) | | | Picasso Finance Sub, Inc.,
6.125%, 06/15/2025 | | | | | 565,023 | | | | | | 0.0 | | |
| 425,000 (1) | | | Post Holdings, Inc., 4.625%,
04/15/2030 | | | | | 381,289 | | | | | | 0.0 | | |
Principal
Amount† | | | Value | | | Percentage
of Net
Assets | |
| CORPORATE BONDS/NOTES: (continued) | |
| | | | Consumer, Non-cyclical (continued) | |
| 1,000,000 (1) | | | Post Holdings, Inc.,
5.625%, 01/15/2028 | | | | $ | 980,930 | | | | | | 0.1 | | |
| 575,000 (1) | | | Prime Security Services
Borrower LLC / Prime
Finance, Inc., 6.250%,
01/15/2028 | | | | | 538,166 | | | | | | 0.0 | | |
| 875,000 (1) | | | Primo Water Holdings, Inc.,
4.375%, 04/30/2029 | | | | | 764,563 | | | | | | 0.1 | | |
| 675,000 (1) | | | Simmons Foods, Inc./
Simmons Prepared Foods,
Inc./Simmons Pet Food,
Inc./Simmons Feed,
4.625%, 03/01/2029 | | | | | 549,389 | | | | | | 0.0 | | |
| 355,000 (1) | | | Spectrum Brands, Inc.,
3.875%, 03/15/2031 | | | | | 290,666 | | | | | | 0.0 | | |
| 375,000 (1) | | | Spectrum Brands, Inc.,
5.500%, 07/15/2030 | | | | | 330,322 | | | | | | 0.0 | | |
| 605,000 (1) | | | Teleflex, Inc., 4.250%,
06/01/2028 | | | | | 576,051 | | | | | | 0.0 | | |
| 410,000 | | | Tenet Healthcare Corp.,
4.250%, 06/01/2029 | | | | | 371,300 | | | | | | 0.0 | | |
| 225,000 | | | Tenet Healthcare Corp.,
5.125%, 11/01/2027 | | | | | 216,225 | | | | | | 0.0 | | |
| 1,075,000 (2) | | | Tenet Healthcare Corp.,
6.125%, 10/01/2028 | | | | | 1,031,296 | | | | | | 0.1 | | |
| 845,000 (1) | | | Tenet Healthcare Corp.,
6.125%, 06/15/2030 | | | | | 834,353 | | | | | | 0.1 | | |
| 725,000 (1) | | | Triton Water Holdings, Inc.,
6.250%, 04/01/2029 | | | | | 576,382 | | | | | | 0.0 | | |
| 675,000 (1) | | | United Natural Foods, Inc.,
6.750%, 10/15/2028 | | | | | 627,959 | | | | | | 0.0 | | |
| 255,000 | | | United Rentals North
America, Inc., 3.750%,
01/15/2032 | | | | | 219,890 | | | | | | 0.0 | | |
| 495,000 | | | United Rentals North
America, Inc., 4.875%,
01/15/2028 | | | | | 473,864 | | | | | | 0.0 | | |
| 125,000 | | | United Rentals North
America, Inc., 5.250%,
01/15/2030 | | | | | 120,434 | | | | | | 0.0 | | |
| 600,000 (1) | | | Varex Imaging Corp.,
7.875%, 10/15/2027 | | | | | 588,247 | | | | | | 0.0 | | |
| | | | | | | | | 30,725,090 | | | | | | 1.7 | | |
| | | | Energy: 3.3% | |
| 510,000 (1) | | | Antero Midstream Partners
L.P. / Antero Midstream
Finance Corp., 5.375%,
06/15/2029 | | | | | 480,578 | | | | | | 0.0 | | |
See Accompanying Notes to Financial Statements
| Voya Strategic Income | PORTFOLIO OF INVESTMENTS |
| Opportunities Fund | as of March 31, 2023 (continued) |
Principal
Amount† | | | Value | | | Percentage
of Net
Assets | |
| CORPORATE BONDS/NOTES: (continued) | |
| | | | Energy (continued) | |
| 625,000 (1) | | | Antero Midstream Partners
L.P. / Antero Midstream
Finance Corp., 5.750%,
03/01/2027 | | | | $ | 611,437 | | | | | | 0.0 | | |
| 265,000 (1) | | | Antero Resources Corp.,
5.375%, 03/01/2030 | | | | | 246,814 | | | | | | 0.0 | | |
| 425,000 | | | Apache Corp., 5.100%,
09/01/2040 | | | | | 360,836 | | | | | | 0.0 | | |
| 325,000 | | | Apache Corp., 5.250%,
02/01/2042 | | | | | 273,387 | | | | | | 0.0 | | |
| 650,000 (1) | | | Archrock Partners L.P. /
Archrock Partners Finance
Corp., 6.250%, 04/01/2028 | | | | | 624,624 | | | | | | 0.0 | | |
| 250,000 (1) | | | Archrock Partners L.P. /
Archrock Partners Finance
Corp., 6.875%, 04/01/2027 | | | | | 245,556 | | | | | | 0.0 | | |
| 285,000 (1) | | | Ascent Resources Utica
Holdings LLC / ARU Finance
Corp., 5.875%, 06/30/2029 | | | | | 251,796 | | | | | | 0.0 | | |
| 800,000 (1) | | | Atlantica Sustainable
Infrastructure PLC, 4.125%,
06/15/2028 | | | | | 718,720 | | | | | | 0.0 | | |
| 675,000 (1)(2) | | | Baytex Energy Corp.,
8.750%, 04/01/2027 | | | | | 691,831 | | | | | | 0.0 | | |
| 825,000 | | | Cenovus Energy, Inc.,
5.250%, 06/15/2037 | | | | | 780,476 | | | | | | 0.1 | | |
| 350,000 (1) | | | Chesapeake Energy Corp.,
6.750%, 04/15/2029 | | | | | 347,804 | | | | | | 0.0 | | |
| 820,000 (1) | | | Chord Energy Corp.,
6.375%, 06/01/2026 | | | | | 813,182 | | | | | | 0.1 | | |
| 575,000 (1) | | | CNX Midstream Partners LP,
4.750%, 04/15/2030 | | | | | 495,247 | | | | | | 0.0 | | |
| 825,000 (1) | | | Colgate Energy Partners III
LLC, 5.875%, 07/01/2029 | | | | | 782,100 | | | | | | 0.1 | | |
| 1,025,000 (1) | | | Crescent Energy Finance
LLC, 7.250%, 05/01/2026 | | | | | 964,443 | | | | | | 0.1 | | |
| 1,050,000 (1) | | | Crestwood Midstream
Partners L.P. / Crestwood
Midstream Finance Corp.,
6.000%, 02/01/2029 | | | | | 1,000,907 | | | | | | 0.1 | | |
| 350,000 | | | Delek Logistics Partners L.P. /
Delek Logistics Finance
Corp., 6.750%, 05/15/2025 | | | | | 343,786 | | | | | | 0.0 | | |
| 525,000 (1) | | | Delek Logistics Partners L.P. /
Delek Logistics Finance
Corp., 7.125%, 06/01/2028 | | | | | 481,183 | | | | | | 0.0 | | |
| 162,000 | | | Devon Energy Corp.,
4.500%, 01/15/2030 | | | | | 154,871 | | | | | | 0.0 | | |
| 275,000 (1) | | | DT Midstream, Inc., 4.125%,
06/15/2029 | | | | | 241,408 | | | | | | 0.0 | | |
Principal
Amount† | | | Value | | | Percentage
of Net
Assets | |
| CORPORATE BONDS/NOTES: (continued) | |
| | | | Energy (continued) | |
| 575,000 (1) | | | DT Midstream, Inc., 4.375%,
06/15/2031 | | | | $ | 501,734 | | | | | | 0.0 | | |
| 810,000 (1) | | | Earthstone Energy Holdings
LLC, 8.000%, 04/15/2027 | | | | | 786,763 | | | | | | 0.1 | | |
| 2,500,000 | | | Ecopetrol SA, 6.875%,
04/29/2030 | | | | | 2,306,350 | | | | | | 0.1 | | |
| 3,175,000 | | | Ecopetrol SA, 8.875%,
01/13/2033 | | | | | 3,216,275 | | | | | | 0.2 | | |
| 1,450,000 (1) | | | EIG Pearl Holdings Sarl,
3.545%, 08/31/2036 | | | | | 1,244,376 | | | | | | 0.1 | | |
| 500,000 | | | Empresa Nacional del
Petroleo, 3.750%,
08/05/2026 | | | | | 466,511 | | | | | | 0.0 | | |
| 1,200,000 | | | Empresa Nacional del
Petroleo, 5.250%,
11/06/2029 | | | | | 1,147,500 | | | | | | 0.1 | | |
| 340,000 (1) | | | Empresa Nacional del
Petroleo, 5.250%,
11/06/2029 | | | | | 325,125 | | | | | | 0.0 | | |
| 825,000 (1) | | | Encino Acquisition Partners
Holdings LLC, 8.500%,
05/01/2028 | | | | | 722,655 | | | | | | 0.0 | | |
| 675,000 (1) | | | Enerflex Ltd., 9.000%,
10/15/2027 | | | | | 657,089 | | | | | | 0.0 | | |
| 5,725,000 (4) | | | Energy Transfer L.P.,
7.125%, 12/31/2199 | | | | | 4,829,038 | | | | | | 0.3 | | |
| 1,225,000 (2) | | | EnLink Midstream LLC,
5.375%, 06/01/2029 | | | | | 1,180,257 | | | | | | 0.1 | | |
| 285,000 | | | EQM Midstream Partners
L.P., 5.500%, 07/15/2028 | | | | | 259,225 | | | | | | 0.0 | | |
| 131,000 (1) | | | EQM Midstream Partners
L.P., 6.000%, 07/01/2025 | | | | | 129,666 | | | | | | 0.0 | | |
| 725,000 (1) | | | Greensaif Pipelines Bidco
Sarl, 6.129%, 02/23/2038 | | | | | 746,530 | | | | | | 0.0 | | |
| 725,000 (1) | | | Greensaif Pipelines Bidco
Sarl, 6.510%, 02/23/2042 | | | | | 764,885 | | | | | | 0.1 | | |
| 560,000 (1) | | | Hess Midstream Operations
L.P., 4.250%, 02/15/2030 | | | | | 500,805 | | | | | | 0.0 | | |
| 505,000 (1) | | | Hess Midstream Operations
L.P., 5.125%, 06/15/2028 | | | | | 479,933 | | | | | | 0.0 | | |
| 205,000 (1) | | | Hess Midstream Operations
L.P., 5.500%, 10/15/2030 | | | | | 190,928 | | | | | | 0.0 | | |
| 400,000 (1) | | | Hilcorp Energy I L.P. /
Hilcorp Finance Co.,
5.750%, 02/01/2029 | | | | | 368,716 | | | | | | 0.0 | | |
| 400,000 (1) | | | Hilcorp Energy I L.P. /
Hilcorp Finance Co.,
6.000%, 04/15/2030 | | | | | 369,360 | | | | | | 0.0 | | |
See Accompanying Notes to Financial Statements
| Voya Strategic Income | PORTFOLIO OF INVESTMENTS |
| Opportunities Fund | as of March 31, 2023 (continued) |
Principal
Amount† | | | Value | | | Percentage
of Net
Assets | |
| CORPORATE BONDS/NOTES: (continued) | |
| | | | Energy (continued) | |
| 475,000 (1) | | | Hilcorp Energy I L.P. /
Hilcorp Finance Co.,
6.000%, 02/01/2031 | | | | $ | 439,132 | | | | | | 0.0 | | |
| 920,000 (1) | | | Howard Midstream Energy
Partners LLC, 6.750%,
01/15/2027 | | | | | 868,462 | | | | | | 0.1 | | |
| 925,000 (1) | | | Kinetik Holdings L.P.,
5.875%, 06/15/2030 | | | | | 891,700 | | | | | | 0.1 | | |
| 1,050,000 (1) | | | Moss Creek Resources
Holdings, Inc., 7.500%,
01/15/2026 | | | | | 974,883 | | | | | | 0.1 | | |
| 400,000 | | | Murphy Oil Corp., 5.875%,
12/01/2027 | | | | | 390,083 | | | | | | 0.0 | | |
| 700,000 | | | Murphy Oil Corp., 6.375%,
07/15/2028 | | | | | 690,388 | | | | | | 0.0 | | |
| 675,000 (1) | | | Nabors Industries Ltd.,
7.500%, 01/15/2028 | | | | | 623,566 | | | | | | 0.0 | | |
| 255,000 | | | Nabors Industries, Inc.,
5.100%, 09/15/2023 | | | | | 254,847 | | | | | | 0.0 | | |
| 275,000 | | | Occidental Petroleum Corp.,
4.625%, 06/15/2045 | | | | | 220,702 | | | | | | 0.0 | | |
| 765,000 | | | Occidental Petroleum Corp.,
5.500%, 12/01/2025 | | | | | 764,825 | | | | | | 0.1 | | |
| 775,000 | | | Occidental Petroleum Corp.,
6.625%, 09/01/2030 | | | | | 816,916 | | | | | | 0.1 | | |
| 650,000 | | | Occidental Petroleum Corp.,
8.500%, 07/15/2027 | | | | | 715,608 | | | | | | 0.0 | | |
| 2,100,000 (1) | | | Pertamina Persero PT,
2.300%, 02/09/2031 | | | | | 1,732,931 | | | | | | 0.1 | | |
| 1,000,000 | | | Petroleos del Peru SA,
4.750%, 06/19/2032 | | | | | 744,410 | | | | | | 0.0 | | |
| 6,450,000 | | | Petroleos Mexicanos,
5.950%, 01/28/2031 | | | | | 4,941,035 | | | | | | 0.3 | | |
| 33,000 | | | Petroleos Mexicanos,
6.700%, 02/16/2032 | | | | | 26,293 | | | | | | 0.0 | | |
| 4,700,000 (1)(2) | | | Petroleos Mexicanos,
10.000%, 02/07/2033 | | | | | 4,508,681 | | | | | | 0.3 | | |
| 675,000 (1) | | | Precision Drilling Corp.,
6.875%, 01/15/2029 | | | | | 613,170 | | | | | | 0.0 | | |
| 1,625,000 (1) | | | Reliance Industries Ltd.,
2.875%, 01/12/2032 | | | | | 1,352,017 | | | | | | 0.1 | | |
| 1,700,000 (1) | | | Reliance Industries Ltd.,
3.625%, 01/12/2052 | | | | | 1,203,682 | | | | | | 0.1 | | |
| 875,000 | | | Southwestern Energy Co.,
5.375%, 02/01/2029 | | | | | 825,698 | | | | | | 0.1 | | |
| 855,000 (1) | | | SunCoke Energy, Inc.,
4.875%, 06/30/2029 | | | | | 745,414 | | | | | | 0.0 | | |
| 315,000 | | | Sunoco L.P. / Sunoco
Finance Corp., 4.500%,
05/15/2029 | | | | | 289,537 | | | | | | 0.0 | | |
Principal
Amount† | | | Value | | | Percentage
of Net
Assets | |
| CORPORATE BONDS/NOTES: (continued) | |
| | | | Energy (continued) | |
| 705,000 | | | Sunoco L.P. / Sunoco
Finance Corp., 4.500%,
04/30/2030 | | | | $ | 638,381 | | | | | | 0.0 | | |
| 400,000 (1) | | | Tallgrass Energy Partners
L.P. / Tallgrass Energy
Finance Corp., 7.500%,
10/01/2025 | | | | | 400,220 | | | | | | 0.0 | | |
| 568,750 (1) | | | Transocean Poseidon Ltd.,
6.875%, 02/01/2027 | | | | | 558,058 | | | | | | 0.0 | | |
| 95,000 (1) | | | Transocean Titan Financing
Ltd., 8.375%, 02/01/2028 | | | | | 97,852 | | | | | | 0.0 | | |
| 275,000 | | | Transocean, Inc., 6.800%,
03/15/2038 | | | | | 190,730 | | | | | | 0.0 | | |
| 475,000 (1) | | | Transocean, Inc., 7.500%,
01/15/2026 | | | | | 431,766 | | | | | | 0.0 | | |
| 1,025,000 (1) | | | Weatherford International
Ltd., 8.625%, 04/30/2030 | | | | | 1,049,559 | | | | | | 0.1 | | |
| 975,000 | | | Western Midstream
Operating L.P., 5.450%,
04/01/2044 | | | | | 851,648 | | | | | | 0.1 | | |
| | | | | | | | | 60,956,901 | | | | | | 3.3 | | |
| | | | Financial: 6.5% | |
| 475,000 (2) | | | Ally Financial, Inc., 5.750%,
11/20/2025 | | | | | 447,244 | | | | | | 0.0 | | |
| 375,000 | | | Ally Financial, Inc., 6.700%,
02/14/2033 | | | | | 333,625 | | | | | | 0.0 | | |
| 3,624,000 | | | American Express Co.,
3.950%, 08/01/2025 | | | | | 3,555,919 | | | | | | 0.2 | | |
| 625,000 (1) | | | Aretec Escrow Issuer, Inc.,
7.500%, 04/01/2029 | | | | | 511,762 | | | | | | 0.0 | | |
| 1,250,000 | | | Banco Nacional de Panama,
2.500%, 08/11/2030 | | | | | 970,913 | | | | | | 0.1 | | |
| 1,628,000 (1)(4) | | | Bangkok Bank PCL/Hong
Kong, 5.000%, 12/31/2199 | | | | | 1,483,545 | | | | | | 0.1 | | |
| 2,100,000 | | | Bank Hapoalim, 3.255%,
01/21/2032 | | | | | 1,754,550 | | | | | | 0.1 | | |
| 7,636,000 (4) | | | Bank of America Corp.,
1.530%, 12/06/2025 | | | | | 7,144,799 | | | | | | 0.4 | | |
| 10,000,000 (4) | | | Bank of America Corp.,
3.384%, 04/02/2026 | | | | | 9,594,767 | | | | | | 0.5 | | |
| 346,000 (4) | | | Bank of America Corp.,
3.846%, 03/08/2037 | | | | | 295,310 | | | | | | 0.0 | | |
| 197,000 (4) | | | Bank of America Corp.,
4.375%, 12/31/2199 | | | | | 167,970 | | | | | | 0.0 | | |
| 825,000 (1) | | | BroadStreet Partners, Inc.,
5.875%, 04/15/2029 | | | | | 698,643 | | | | | | 0.1 | | |
| 625,000 (1) | | | Burford Capital Global
Finance LLC, 6.875%,
04/15/2030 | | | | | 538,618 | | | | | | 0.0 | | |
See Accompanying Notes to Financial Statements
| Voya Strategic Income | PORTFOLIO OF INVESTMENTS |
| Opportunities Fund | as of March 31, 2023 (continued) |
Principal
Amount† | | | Value | | | Percentage
of Net
Assets | |
| CORPORATE BONDS/NOTES: (continued) | |
| | | | Financial (continued) | |
| 5,076,000 (4) | | | Capital One Financial Corp.,
4.166%, 05/09/2025 | | | | $ | 4,919,711 | | | | | | 0.3 | | |
| 5,992,000 (1)(4) | | | Corebridge Financial, Inc.,
6.875%, 12/15/2052 | | | | | 5,353,268 | | | | | | 0.3 | | |
| 700,000 (1) | | | Cushman & Wakefield US
Borrower LLC, 6.750%,
05/15/2028 | | | | | 627,323 | | | | | | 0.0 | | |
| 3,627,000 (1)(4) | | | Danske Bank A/S, 6.466%,
01/09/2026 | | | | | 3,632,825 | | | | | | 0.2 | | |
| 255,000 (1) | | | Freedom Mortgage Corp.,
6.625%, 01/15/2027 | | | | | 196,471 | | | | | | 0.0 | | |
| 527,000 (1) | | | Freedom Mortgage Corp.,
8.250%, 04/15/2025 | | | | | 487,396 | | | | | | 0.0 | | |
| 10,000,000 (4) | | | JPMorgan Chase & Co.,
2.083%, 04/22/2026 | | | | | 9,362,518 | | | | | | 0.5 | | |
| 3,198,000 (4) | | | JPMorgan Chase & Co.,
5.717%, 09/14/2033 | | | | | 3,278,553 | | | | | | 0.2 | | |
| 825,000 (1) | | | Ladder Capital Finance
Holdings LLLP / Ladder
Capital Finance Corp.,
4.750%, 06/15/2029 | | | | | 597,230 | | | | | | 0.0 | | |
| 7,906,000 (4) | | | Lloyds Banking Group PLC,
8.000%, 12/31/2199 | | | | | 7,303,167 | | | | | | 0.4 | | |
| 800,000 (1) | | | LPL Holdings, Inc., 4.000%,
03/15/2029 | | | | | 720,784 | | | | | | 0.1 | | |
| 400,000 (1) | | | Midcap Financial Issuer
Trust, 5.625%, 01/15/2030 | | | | | 316,502 | | | | | | 0.0 | | |
| 515,000 (1) | | | Midcap Financial Issuer
Trust, 6.500%, 05/01/2028 | | | | | 438,569 | | | | | | 0.0 | | |
| 10,000,000 (4) | | | Morgan Stanley, 0.985%,
12/10/2026 | | | | | 8,921,260 | | | | | | 0.5 | | |
| 10,000,000 (4) | | | Morgan Stanley, 2.188%,
04/28/2026 | | | | | 9,387,792 | | | | | | 0.5 | | |
| 8,714,000 (4) | | | Morgan Stanley, 4.679%,
07/17/2026 | | | | | 8,607,070 | | | | | | 0.5 | | |
| 535,000 (2) | | | MPT Operating Partnership
L.P. / MPT Finance Corp.,
4.625%, 08/01/2029 | | | | | 395,790 | | | | | | 0.0 | | |
| 675,000 (2) | | | MPT Operating Partnership
L.P. / MPT Finance Corp.,
5.000%, 10/15/2027 | | | | | 555,933 | | | | | | 0.0 | | |
| 2,591,000 | | | Nasdaq, Inc., 3.950%,
03/07/2052 | | | | | 2,016,838 | | | | | | 0.1 | | |
| 850,000 (1) | | | Nationstar Mortgage
Holdings, Inc., 5.125%,
12/15/2030 | | | | | 654,049 | | | | | | 0.0 | | |
| 875,000 | | | Navient Corp., 4.875%,
03/15/2028 | | | | | 736,964 | | | | | | 0.1 | | |
| 475,000 | | | Navient Corp., 5.000%,
03/15/2027 | | | | | 418,993 | | | | | | 0.0 | | |
Principal
Amount† | | | Value | | | Percentage
of Net
Assets | |
| CORPORATE BONDS/NOTES: (continued) | |
| | | | Financial (continued) | |
| 165,000 | | | Navient Corp., 7.250%,
09/25/2023 | | | | $ | 164,610 | | | | | | 0.0 | | |
| 756,000 | | | Northern Trust Corp.,
6.125%, 11/02/2032 | | | | | 806,466 | | | | | | 0.1 | | |
| 425,000 | | | OneMain Finance Corp.,
4.000%, 09/15/2030 | | | | | 319,132 | | | | | | 0.0 | | |
| 950,000 | | | OneMain Finance Corp.,
5.375%, 11/15/2029 | | | | | 800,185 | | | | | | 0.1 | | |
| 225,000 | | | OneMain Finance Corp.,
7.125%, 03/15/2026 | | | | | 216,518 | | | | | | 0.0 | | |
| 900,000 (1) | | | Park Intermediate Holdings
LLC / PK Domestic Property
LLC / PK Finance Co-Issuer,
5.875%, 10/01/2028 | | | | | 829,692 | | | | | | 0.1 | | |
| 1,235,000 (2)(4) | | | PNC Financial Services
Group, Inc./The, 6.000%,
12/31/2199 | | | | | 1,139,978 | | | | | | 0.1 | | |
| 7,777,000 (4) | | | PNC Financial Services
Group, Inc./The, 6.250%,
12/31/2199 | | | | | 7,252,052 | | | | | | 0.4 | | |
| 700,000 (1) | | | PRA Group, Inc., 5.000%,
10/01/2029 | | | | | 586,537 | | | | | | 0.0 | | |
| 575,000 (1) | | | Realogy Group LLC /
Realogy Co-Issuer Corp.,
5.750%, 01/15/2029 | | | | | 430,962 | | | | | | 0.0 | | |
| 700,000 (1) | | | RLJ Lodging Trust L.P.,
4.000%, 09/15/2029 | | | | | 585,317 | | | | | | 0.0 | | |
| 205,000 | | | Service Properties Trust,
4.750%, 10/01/2026 | | | | | 171,376 | | | | | | 0.0 | | |
| 220,000 | | | Service Properties Trust,
5.500%, 12/15/2027 | | | | | 197,129 | | | | | | 0.0 | | |
| 529,000 (4) | | | Truist Financial Corp.,
4.800%, 12/31/2199 | | | | | 464,198 | | | | | | 0.0 | | |
| 773,000 (4) | | | Truist Financial Corp.,
5.100%, 12/31/2199 | | | | | 680,669 | | | | | | 0.0 | | |
| 1,000,000 (1) | | | United Wholesale
Mortgage LLC, 5.750%,
06/15/2027 | | | | | 890,942 | | | | | | 0.1 | | |
| 325,000 (1) | | | Uniti Group L.P. / Uniti
Fiber Holdings, Inc. / CSL
Capital LLC, 6.000%,
01/15/2030 | | | | | 190,531 | | | | | | 0.0 | | |
| 500,000 (1) | | | Uniti Group L.P. / Uniti
Group Finance, Inc. / CSL
Capital LLC, 6.500%,
02/15/2029 | | | | | 305,628 | | | | | | 0.0 | | |
| 350,000 (1) | | | Uniti Group L.P. / Uniti
Group Finance, Inc. / CSL
Capital LLC, 10.500%,
02/15/2028 | | | | | 339,815 | | | | | | 0.0 | | |
See Accompanying Notes to Financial Statements
| Voya Strategic Income | PORTFOLIO OF INVESTMENTS |
| Opportunities Fund | as of March 31, 2023 (continued) |
Principal
Amount† | | | Value | | | Percentage
of Net
Assets | |
| CORPORATE BONDS/NOTES: (continued) | |
| | | | Financial (continued) | |
| 700,000 (1) | | | VistaJet Malta Finance
PLC / XO Management
Holding, Inc., 6.375%,
02/01/2030 | | | | $ | 624,576 | | | | | | 0.0 | | |
| 7,000,000 (4) | | | Wells Fargo & Co.,
4.540%, 08/15/2026 | | | | | 6,877,460 | | | | | | 0.4 | | |
| 725,000 (1) | | | XHR L.P., 4.875%,
06/01/2029 | | | | | 615,636 | | | | | | 0.0 | | |
| | | | | | | | | 120,916,080 | | | | | | 6.5 | | |
| | | | Industrial: 1.5% | |
| 1,025,000 (1)(3) | | | ARD Finance SA, 6.500%
(PIK Rate 7.250%, Cash
Rate 6.500)%, 06/30/2027 | | | | | 785,355 | | | | | | 0.1 | | |
| 375,000 (2) | | | Ball Corp., 3.125%,
09/15/2031 | | | | | 310,674 | | | | | | 0.0 | | |
| 335,000 | | | Ball Corp., 6.875%,
03/15/2028 | | | | | 347,067 | | | | | | 0.0 | | |
| 330,000 (1) | | | Bombardier, Inc., 7.500%,
02/01/2029 | | | | | 337,425 | | | | | | 0.0 | | |
| 405,000 (1) | | | Bombardier, Inc., 7.875%,
04/15/2027 | | | | | 410,384 | | | | | | 0.0 | | |
| 775,000 (1) | | | Brundage-Bone Concrete
Pumping Holdings, Inc.,
6.000%, 02/01/2026 | | | | | 727,512 | | | | | | 0.1 | | |
| 200,000 (1) | | | Builders FirstSource, Inc.,
4.250%, 02/01/2032 | | | | | 174,458 | | | | | | 0.0 | | |
| 475,000 (1) | | | Builders FirstSource, Inc.,
5.000%, 03/01/2030 | | | | | 440,346 | | | | | | 0.0 | | |
| 725,000 (1) | | | Cargo Aircraft Management,
Inc., 4.750%, 02/01/2028 | | | | | 649,071 | | | | | | 0.0 | | |
| 775,000 (1) | | | Cascades, Inc./Cascades
USA, Inc., 5.375%,
01/15/2028 | | | | | 736,885 | | | | | | 0.1 | | |
| 815,000 (1) | | | Chart Industries, Inc.,
7.500%, 01/01/2030 | | | | | 843,093 | | | | | | 0.1 | | |
| 225,000 (1) | | | Chart Industries, Inc.,
9.500%, 01/01/2031 | | | | | 237,590 | | | | | | 0.0 | | |
| 625,000 (1) | | | Clean Harbors, Inc.,
6.375%, 02/01/2031 | | | | | 638,312 | | | | | | 0.0 | | |
| 800,000 (1) | | | Energizer Holdings, Inc.,
4.750%, 06/15/2028 | | | | | 720,999 | | | | | | 0.1 | | |
| 775,000 (1) | | | Fortress Transportation and
Infrastructure Investors LLC,
5.500%, 05/01/2028 | | | | | 708,009 | | | | | | 0.0 | | |
| 875,000 (1) | | | GFL Environmental, Inc.,
4.000%, 08/01/2028 | | | | | 795,786 | | | | | | 0.1 | | |
| 425,000 (1) | | | GFL Environmental, Inc.,
4.375%, 08/15/2029 | | | | | 380,949 | | | | | | 0.0 | | |
Principal
Amount† | | | Value | | | Percentage
of Net
Assets | |
| CORPORATE BONDS/NOTES: (continued) | |
| | | | Industrial (continued) | |
| 325,000 (1) | | | Global Infrastructure
Solutions, Inc., 5.625%,
06/01/2029 | | | | $ | 268,479 | | | | | | 0.0 | | |
| 350,000 (1) | | | Global Infrastructure
Solutions, Inc., 7.500%,
04/15/2032 | | | | | 301,613 | | | | | | 0.0 | | |
| 625,000 (1) | | | GrafTech Finance, Inc.,
4.625%, 12/15/2028 | | | | | 521,937 | | | | | | 0.0 | | |
| 725,000 (1) | | | Graham Packaging Co.,
Inc., 7.125%, 08/15/2028 | | | | | 627,624 | | | | | | 0.0 | | |
| 550,000 | | | Howmet Aerospace, Inc.,
5.900%, 02/01/2027 | | | | | 560,139 | | | | | | 0.0 | | |
| 935,000 (1) | | | Imola Merger Corp.,
4.750%, 05/15/2029 | | | | | 837,498 | | | | | | 0.1 | | |
| 400,000 (1)(3) | | | Intelligent Packaging Holdco
Issuer LP, 9.000% (PIK Rate
9.750%, Cash Rate
9.000)%, 01/15/2026 | | | | | 282,028 | | | | | | 0.0 | | |
| 725,000 (1) | | | Intelligent Packaging Ltd.
Finco, Inc. / Intelligent
Packaging Ltd. Co-Issuer
LLC, 6.000%, 09/15/2028 | | | | | 625,313 | | | | | | 0.0 | | |
| 600,000 (1) | | | Koppers, Inc., 6.000%,
02/15/2025 | | | | | 600,255 | | | | | | 0.0 | | |
| 3,425,000 (1) | | | Misc Capital Two Labuan
Ltd., 3.750%, 04/06/2027 | | | | | 3,240,962 | | | | | | 0.2 | | |
| 800,000 (1) | | | New Enterprise Stone &
Lime Co., Inc., 9.750%,
07/15/2028 | | | | | 764,720 | | | | | | 0.1 | | |
| 790,000 (1) | | | PGT Innovations, Inc.,
4.375%, 10/01/2029 | | | | | 714,950 | | | | | | 0.1 | | |
| 575,000 (1) | | | Roller Bearing Co. of
America, Inc., 4.375%,
10/15/2029 | | | | | 514,142 | | | | | | 0.0 | | |
| 400,000 (1) | | | Rolls-Royce PLC, 3.625%,
10/14/2025 | | | | | 381,000 | | | | | | 0.0 | | |
| 800,000 (1) | | | Rolls-Royce PLC, 5.750%,
10/15/2027 | | | | | 797,692 | | | | | | 0.1 | | |
| 875,000 (1) | | | Sealed Air Corp., 4.000%,
12/01/2027 | | | | | 817,338 | | | | | | 0.1 | | |
| 375,000 (1) | | | Sealed Air Corp./Sealed Air
Corp. US, 6.125%,
02/01/2028 | | | | | 379,575 | | | | | | 0.0 | | |
| 280,000 (1) | | | Sensata Technologies BV,
5.000%, 10/01/2025 | | | | | 278,236 | | | | | | 0.0 | | |
| 895,000 (1) | | | Sensata Technologies, Inc.,
3.750%, 02/15/2031 | | | | | 783,931 | | | | | | 0.1 | | |
See Accompanying Notes to Financial Statements
| Voya Strategic Income | PORTFOLIO OF INVESTMENTS |
| Opportunities Fund | as of March 31, 2023 (continued) |
Principal
Amount† | | | Value | | | Percentage
of Net
Assets | |
| CORPORATE BONDS/NOTES: (continued) | |
| | | | Industrial (continued) | |
| 890,000 (1) | | | Standard Industries,
Inc./NJ, 3.375%,
01/15/2031 | | | | $ | 716,289 | | | | | | 0.1 | | |
| 510,000 (1) | | | Standard Industries,
Inc./NJ, 4.375%,
07/15/2030 | | | | | 444,276 | | | | | | 0.0 | | |
| 585,000 (1) | | | Summit Materials LLC /
Summit Materials Finance
Corp., 5.250%, 01/15/2029 | | | | | 553,682 | | | | | | 0.0 | | |
| 445,000 (1) | | | Summit Materials LLC /
Summit Materials Finance
Corp., 6.500%, 03/15/2027 | | | | | 441,758 | | | | | | 0.0 | | |
| 300,000 (1) | | | TK Elevator US Newco, Inc.,
5.250%, 07/15/2027 | | | | | 283,622 | | | | | | 0.0 | | |
| 425,000 | | | TransDigm, Inc., 4.625%,
01/15/2029 | | | | | 378,267 | | | | | | 0.0 | | |
| 500,000 | | | TransDigm, Inc., 5.500%,
11/15/2027 | | | | | 472,001 | | | | | | 0.0 | | |
| 575,000 | | | TransDigm, Inc., 6.375%,
06/15/2026 | | | | | 562,669 | | | | | | 0.0 | | |
| 760,000 (1) | | | Weekley Homes LLC /
Weekley Finance Corp.,
4.875%, 09/15/2028 | | | | | 641,702 | | | | | | 0.0 | | |
| | | | | | | | | 27,035,613 | | | | | | 1.5 | | |
| | | | Technology: 0.4% | |
| 820,000 (1) | | | Condor Merger Sub, Inc.,
7.375%, 02/15/2030 | | | | | 688,303 | | | | | | 0.1 | | |
| 625,000 (1) | | | Consensus Cloud Solutions,
Inc., 6.500%, 10/15/2028 | | | | | 518,874 | | | | | | 0.0 | | |
| 345,000 (1) | | | Entegris Escrow Corp.,
6.950%, 06/15/2030 | | | | | 334,733 | | | | | | 0.0 | | |
| 275,000 (1)(2) | | | Entegris, Inc., 3.625%,
05/01/2029 | | | | | 237,617 | | | | | | 0.0 | | |
| 1,175,000 (1) | | | NCR Corp., 5.125%,
04/15/2029 | | | | | 1,017,842 | | | | | | 0.1 | | |
| 175,000 (1) | | | Open Text Corp., 3.875%,
02/15/2028 | | | | | 156,406 | | | | | | 0.0 | | |
| 300,000 (1) | | | Open Text Corp., 3.875%,
12/01/2029 | | | | | 252,868 | | | | | | 0.0 | | |
| 650,000 (1) | | | Open Text Holdings, Inc.,
4.125%, 02/15/2030 | | | | | 558,285 | | | | | | 0.0 | | |
| 2,291,000 | | | Oracle Corp., 3.800%,
11/15/2037 | | | | | 1,904,849 | | | | | | 0.1 | | |
| 1,253,000 | | | Oracle Corp., 3.950%,
03/25/2051 | | | | | 944,715 | | | | | | 0.1 | | |
| 600,000 (1) | | | Playtika Holding Corp.,
4.250%, 03/15/2029 | | | | | 500,235 | | | | | | 0.0 | | |
| 775,000 (1) | | | Rackspace Technology
Global, Inc., 5.375%,
12/01/2028 | | | | | 297,184 | | | | | | 0.0 | | |
Principal
Amount† | | | Value | | | Percentage
of Net
Assets | |
| CORPORATE BONDS/NOTES: (continued) | |
| | | | Technology (continued) | |
| 310,000 (1) | | | Veritas US, Inc. / Veritas
Bermuda Ltd., 7.500%,
09/01/2025 | | | | $ | 233,667 | | | | | | 0.0 | | |
| 750,000 (1) | | | Virtusa Corp., 7.125%,
12/15/2028 | | | | | 590,129 | | | | | | 0.0 | | |
| | | | | | | | | 8,235,707 | | | | | | 0.4 | | |
| | | | Utilities: 1.9% | |
| 1,325,000 (1) | | | AES Panama Generation
Holdings SRL, 4.375%,
05/31/2030 | | | | | 1,140,772 | | | | | | 0.1 | | |
| 1,250,000 (1) | | | Comision Federal de
Electricidad, 4.688%,
05/15/2029 | | | | | 1,122,325 | | | | | | 0.1 | | |
| 4,028,000 (4) | | | Dominion Energy, Inc.,
4.650%, 12/31/2199 | | | | | 3,558,899 | | | | | | 0.2 | | |
| 800,000 (1) | | | Drax Finco PLC, 6.625%,
11/01/2025 | | | | | 788,272 | | | | | | 0.0 | | |
| 1,343,000 (4) | | | Duke Energy Corp., 4.875%,
12/31/2199 | | | | | 1,292,100 | | | | | | 0.1 | | |
| 714,000 | | | Duke Energy Florida LLC,
5.950%, 11/15/2052 | | | | | 795,811 | | | | | | 0.0 | | |
| 1,266,000 | | | Duke Energy Indiana LLC,
3.250%, 10/01/2049 | | | | | 928,382 | | | | | | 0.1 | | |
| 625,000 | | | Inkia Energy Ltd., 5.875%,
11/09/2027 | | | | | 576,964 | | | | | | 0.0 | | |
| 4,907,000 (4) | | | National Rural Utilities
Cooperative Finance Corp.,
4.750%, 04/30/2043 | | | | | 4,753,362 | | | | | | 0.3 | | |
| 2,875,000 (4) | | | NextEra Energy Capital
Holdings, Inc., 5.650%,
05/01/2079 | | | | | 2,544,566 | | | | | | 0.1 | | |
| 3,464,000 | | | NextEra Energy Capital
Holdings, Inc., 6.051%,
03/01/2025 | | | | | 3,525,730 | | | | | | 0.2 | | |
| 1,525,000 (1) | | | Perusahaan Listrik
Negara PT, 3.875%,
07/17/2029 | | | | | 1,382,912 | | | | | | 0.1 | | |
| 2,950,000 | | | Perusahaan Listrik
Negara PT, 5.450%,
05/21/2028 | | | | | 2,941,961 | | | | | | 0.2 | | |
| 2,950,000 | | | South Jersey Industries,
Inc., 5.020%, 04/15/2031 | | | | | 2,505,898 | | | | | | 0.1 | | |
| 3,625,000 (4) | | | Southern Co/The, 4.000%,
01/15/2051 | | | | | 3,334,773 | | | | | | 0.2 | | |
| 2,538,000 (4) | | | Southern Co/The, 4.475%,
08/01/2024 | | | | | 2,508,883 | | | | | | 0.1 | | |
| 675,000 | | | TransAlta Corp., 7.750%,
11/15/2029 | | | | | 710,181 | | | | | | 0.0 | | |
| 300,000 (1) | | | Vistra Operations Co. LLC,
5.500%, 09/01/2026 | | | | | 291,691 | | | | | | 0.0 | | |
See Accompanying Notes to Financial Statements
| Voya Strategic Income | PORTFOLIO OF INVESTMENTS |
| Opportunities Fund | as of March 31, 2023 (continued) |
Principal
Amount† | | | Value | | | Percentage
of Net
Assets | |
| CORPORATE BONDS/NOTES: (continued) | |
| | | | Utilities (continued) | |
| 625,000 (1) | | | Vistra Operations Co.
LLC, 5.625%, 02/15/2027 | | | | $ | 607,391 | | | | | | 0.0 | | |
| | | | | | | | | 35,310,873 | | | | | | 1.9 | | |
| | | | Total Corporate
Bonds/Notes | | | | | | | | | | | | | |
| | | | (Cost $442,836,195) | | | | | 406,847,836 | | | | | | 21.9 | | |
| COLLATERALIZED MORTGAGE OBLIGATIONS: 26.1% | |
| 212,494 (4) | | | Adjustable Rate
Mortgage Trust 2006-2
1A1, 4.004%, 05/25/2036 | | | | | 181,744 | | | | | | 0.0 | | |
| 1,208,073 (1)(4) | | | Agate Bay Mortgage Trust
2015-2 B3, 3.620%,
03/25/2045 | | | | | 1,107,897 | | | | | | 0.1 | | |
| 475,938 (1)(4) | | | Agate Bay Mortgage Trust
2015-4 B3, 3.515%,
06/25/2045 | | | | | 393,568 | | | | | | 0.0 | | |
| 1,571,490 (1)(4) | | | Agate Bay Mortgage Trust
2016-1 B3, 3.658%,
12/25/2045 | | | | | 1,333,251 | | | | | | 0.1 | | |
| 1,000,000 (1)(4) | | | Agate Bay Mortgage Trust
2016-1 B4, 3.658%,
12/25/2045 | | | | | 863,043 | | | | | | 0.1 | | |
| 1,137,085 (1)(4) | | | Agate Bay Mortgage Trust
2016-2 B4, 3.762%,
03/25/2046 | | | | | 766,349 | | | | | | 0.0 | | |
| 389,876 | | | Alternative Loan Trust
2004-J7 MI, 4.821%,
(US0001M + 1.020)%,
10/25/2034 | | | | | 386,062 | | | | | | 0.0 | | |
| 324,033 | | | Alternative Loan Trust
2005-10CB 1A2, 5.295%,
(US0001M + 0.450)%,
05/25/2035 | | | | | 244,492 | | | | | | 0.0 | | |
| 321,245 | | | Alternative Loan Trust
2005-23CB A15, 5.500%,
07/25/2035 | | | | | 272,709 | | | | | | 0.0 | | |
| 35,445 | | | Alternative Loan Trust
2005-6CB 1A3, 5.250%,
04/25/2035 | | | | | 30,229 | | | | | | 0.0 | | |
| 174,607 | | | Alternative Loan Trust
2005-J2 1A12, 5.245%,
(US0001M + 0.400)%,
04/25/2035 | | | | | 134,893 | | | | | | 0.0 | | |
| 30,562 | | | Alternative Loan Trust
2006-13T1 A9, 6.000%,
05/25/2036 | | | | | 15,797 | | | | | | 0.0 | | |
| 474,837 | | | Alternative Loan Trust
2006-18CB A10, 5.245%,
(US0001M + 0.400)%,
07/25/2036 | | | | | 202,830 | | | | | | 0.0 | | |
Principal
Amount† | | | Value | | | Percentage
of Net
Assets | |
| COLLATERALIZED MORTGAGE OBLIGATIONS: (continued) | |
| 113,860 | | | Alternative Loan Trust
2006-19CB A12, 5.245%,
(US0001M + 0.400)%,
08/25/2036 | | | | $ | 56,596 | | | | | | 0.0 | | |
| 482,170 | | | Alternative Loan Trust
2006-19CB A28, 5.445%,
(US0001M + 0.600)%,
08/25/2036 | | | | | 246,551 | | | | | | 0.0 | | |
| 839,694 | | | Alternative Loan Trust
2006-27CB A5, 6.000%,
11/25/2036 | | | | | 476,877 | | | | | | 0.0 | | |
| 254,352 | | | Alternative Loan Trust
2006-HY11 A1, 5.085%,
(US0001M + 0.120)%,
06/25/2036 | | | | | 223,842 | | | | | | 0.0 | | |
| 832,321 | | | Alternative Loan Trust
2007-15CB A5, 5.750%,
07/25/2037 | | | | | 523,980 | | | | | | 0.0 | | |
| 120,937 | | | Alternative Loan Trust
2007-2CB 2A1, 5.445%,
(US0001M + 0.600)%,
03/25/2037 | | | | | 53,269 | | | | | | 0.0 | | |
| 178,872 | | | Alternative Loan Trust
2007-HY8C A1, 5.165%,
(US0001M + 0.320)%,
09/25/2047 | | | | | 151,451 | | | | | | 0.0 | | |
| 548,015 | | | Alternative Loan Trust
2007-OA4 A1, 5.185%,
(US0001M + 0.170)%,
05/25/2047 | | | | | 456,625 | | | | | | 0.0 | | |
| 484,555 (1)(4) | | | Arroyo Mortgage Trust
2019-3 A3, 3.416%,
10/25/2048 | | | | | 447,647 | | | | | | 0.0 | | |
| 283,918 | | | Banc of America Funding
2007-2 1A16 Trust, 5.445%,
(US0001M + 0.600)%,
03/25/2037 | | | | | 212,854 | | | | | | 0.0 | | |
| 1,460,420 | | | Banc of America Funding
2007-C 7A1 Trust, 5.181%,
(US0001M + 0.210)%,
05/20/2047 | | | | | 1,274,371 | | | | | | 0.1 | | |
| 155,875 (4) | | | Bear Stearns ALT-A Trust
2005-3 4A3, 3.720%,
04/25/2035 | | | | | 151,755 | | | | | | 0.0 | | |
| 391,393 (4) | | | Bear Stearns ALT-A Trust
2006-6 31A1, 3.722%,
11/25/2036 | | | | | 218,384 | | | | | | 0.0 | | |
| 562,775 (4) | | | Bear Stearns ALT-A Trust
2006-6 32A1, 3.732%,
11/25/2036 | | | | | 295,099 | | | | | | 0.0 | | |
See Accompanying Notes to Financial Statements
| Voya Strategic Income | PORTFOLIO OF INVESTMENTS |
| Opportunities Fund | as of March 31, 2023 (continued) |
Principal
Amount† | | | Value | | | Percentage
of Net
Assets | |
| COLLATERALIZED MORTGAGE OBLIGATIONS: (continued) | |
| 104,709 (4) | | | Bear Stearns Structured
Products, Inc. Trust 2007-R6
1A1, 3.947%, 01/26/2036 | | | | $ | 81,554 | | | | | | 0.0 | | |
| 1,219,543 (1) | | | Bellemeade Re 2019-1A M2
Ltd., 7.545%, (US0001M +
2.700)%, 03/25/2029 | | | | | 1,222,976 | | | | | | 0.1 | | |
| 2,100,000 (1) | | | Bellemeade RE 2021-3 A
M1C Ltd., 6.110%,
(SOFR30A + 1.550)%,
09/25/2031 | | | | | 2,029,789 | | | | | | 0.1 | | |
| 136,560 (1)(4) | | | Chase Home Lending
Mortgage Trust 2019-ATR2
A3, 3.500%, 07/25/2049 | | | | | 123,555 | | | | | | 0.0 | | |
| 928,539 (1)(4) | | | Chase Mortgage Finance
Corp. 2019-1 B2, 3.898%,
03/25/2050 | | | | | 793,506 | | | | | | 0.1 | | |
| 1,207,862 (1)(4) | | | Chase Mortgage Finance
Corp. 2019-1 B3, 3.898%,
03/25/2050 | | | | | 964,002 | | | | | | 0.1 | | |
| 310,536 (4) | | | Chase Mortgage Finance
Trust Series 2006-A1 2A3,
4.015%, 09/25/2036 | | | | | 262,975 | | | | | | 0.0 | | |
| 41,220 (4) | | | CHL Mortgage
Pass-Through Trust 2004-22
A3, 3.786%, 11/25/2034 | | | | | 36,753 | | | | | | 0.0 | | |
| 258,143 | | | CHL Mortgage
Pass-Through Trust
2005-HYB9 2A1, 5.512%,
(US0012M + 1.750)%,
02/20/2036 | | | | | 225,363 | | | | | | 0.0 | | |
| 1,986,303 (1)(4) | | | CHNGE Mortgage Trust
2022-1 A1, 3.007%,
01/25/2067 | | | | | 1,784,603 | | | | | | 0.1 | | |
| 152,866 (1)(4) | | | CIM Trust 2019-INV1 A1,
4.000%, 02/25/2049 | | | | | 145,264 | | | | | | 0.0 | | |
| 172,709 (1)(4) | | | CIM Trust 2019-INV2 A3,
4.000%, 05/25/2049 | | | | | 162,412 | | | | | | 0.0 | | |
| 173,689 (1)(4) | | | CIM Trust 2019-INV3 A15,
3.500%, 08/25/2049 | | | | | 156,683 | | | | | | 0.0 | | |
| 260,533 (1)(4) | | | CIM Trust 2019-INV3 A3,
3.500%, 08/25/2049 | | | | | 235,689 | | | | | | 0.0 | | |
| 1,612,803 (1)(4) | | | CIM Trust 2019-J1 B3,
3.941%, 08/25/2049 | | | | | 1,391,605 | | | | | | 0.1 | | |
| 2,995,658 (1)(4) | | | CIM Trust 2019-J2 B2,
3.772%, 10/25/2049 | | | | | 2,562,117 | | | | | | 0.1 | | |
| 1,882,785 (1)(4) | | | CIM Trust 2019-J2 B3,
3.772%, 10/25/2049 | | | | | 1,580,325 | | | | | | 0.1 | | |
| 1,225,408 (1)(4) | | | CIM Trust 2020-J2 B3,
2.758%, 01/25/2051 | | | | | 876,769 | | | | | | 0.1 | | |
| 1,826,351 (1)(4) | | | CIM Trust 2021-J3 B3,
2.619%, 06/25/2051 | | | | | 1,259,607 | | | | | | 0.1 | | |
Principal
Amount† | | | Value | | | Percentage
of Net
Assets | |
| COLLATERALIZED MORTGAGE OBLIGATIONS: (continued) | |
| 391,839 | | | Citicorp Mortgage
Securities Trust
Series 2006-3 1A4, 6.000%,
06/25/2036 | | | | $ | 344,312 | | | | | | 0.0 | | |
| 74,198 (4) | | | Citigroup Mortgage Loan
Trust 2006-AR2 1A1,
4.287%, 03/25/2036 | | | | | 56,765 | | | | | | 0.0 | | |
| 32,905 (4) | | | Citigroup Mortgage Loan
Trust 2006-AR9 2A, 4.099%,
11/25/2036 | | | | | 27,429 | | | | | | 0.0 | | |
| 172,441 (1)(4) | | | Citigroup Mortgage Loan
Trust 2015-A B2, 4.500%,
06/25/2058 | | | | | 163,671 | | | | | | 0.0 | | |
| 71,076 (4) | | | Citigroup Mortgage Loan
Trust, Inc. 2005-4 A,
4.193%, 08/25/2035 | | | | | 68,777 | | | | | | 0.0 | | |
| 248,847 | | | Citigroup Mortgage Loan
Trust, Inc. 2005-9 22A2,
6.000%, 11/25/2035 | | | | | 242,793 | | | | | | 0.0 | | |
| 286,778 (1) | | | Connecticut Avenue
Securities Trust 2019-R07
1M2, 6.945%, (US0001M +
2.100)%, 10/25/2039 | | | | | 287,693 | | | | | | 0.0 | | |
| 3,540,000 (1) | | | Connecticut Avenue
Securities Trust 2020-R02
2B1, 7.845%, (US0001M +
3.000)%, 01/25/2040 | | | | | 3,320,792 | | | | | | 0.2 | | |
| 1,544,790 (1) | | | Connecticut Avenue
Securities Trust 2020-R02
2M2, 6.845%, (US0001M +
2.000)%, 01/25/2040 | | | | | 1,535,697 | | | | | | 0.1 | | |
| 2,500,000 (1) | | | Connecticut Avenue
Securities Trust 2022-R01
1B1, 7.710%, (SOFR30A +
3.150)%, 12/25/2041 | | | | | 2,324,928 | | | | | | 0.1 | | |
| 2,000,000 (1) | | | Connecticut Avenue
Securities Trust 2022-R02
2B1, 9.060%, (SOFR30A +
4.500)%, 01/25/2042 | | | | | 1,907,490 | | | | | | 0.1 | | |
| 750,000 (1) | | | Connecticut Avenue
Securities Trust 2022-R04
1B1, 9.810%, (SOFR30A +
5.250)%, 03/25/2042 | | | | | 763,579 | | | | | | 0.0 | | |
| 19,395 | | | Countrywide Alternative
Loan Trust 2005-53T2 2A6,
5.345%, (US0001M +
0.500)%, 11/25/2035 | | | | | 9,812 | | | | | | 0.0 | | |
| 295,506 (1)(4) | | | CSMC 2017-HL1 A12 Trust,
3.500%, 06/25/2047 | | | | | 267,772 | | | | | | 0.0 | | |
See Accompanying Notes to Financial Statements
| Voya Strategic Income | PORTFOLIO OF INVESTMENTS |
| Opportunities Fund | as of March 31, 2023 (continued) |
Principal
Amount† | | | Value | | | Percentage
of Net
Assets | |
| COLLATERALIZED MORTGAGE OBLIGATIONS: (continued) | |
| 1,690,915 (1)(4)(5) | | | CSMC 2019-AFC1 A3 Trust,
2.877% (Step Rate @
3.877% on 08/01/2023),
07/25/2049 | | | | $ | 1,566,153 | | | | | | 0.1 | | |
| 2,969,575 (1)(4) | | | CSMC 2021-AFC1 M1
Trust, 2.193%, 03/25/2056 | | | | | 1,806,701 | | | | | | 0.1 | | |
| 295,025 | | | CSMC Series 2007-2 3A6,
5.400%, 03/25/2037 | | | | | 164,137 | | | | | | 0.0 | | |
| 431,127 (1)(4) | | | CSMC Trust 2013-7 A11,
3.500%, 08/25/2043 | | | | | 390,813 | | | | | | 0.0 | | |
| 6,100,461 (1)(4) | | | Deephaven Residential
Mortgage Trust 2022-2 A1,
4.300%, 03/25/2067 | | | | | 5,795,894 | | | | | | 0.3 | | |
| 383,855 | | | Deutsche ALT-A Securities,
Inc. ALT 2007-AB1 A1,
5.145%, (US0001M +
0.300)%, 04/25/2037 | | | | | 265,371 | | | | | | 0.0 | | |
| 82,502 (1)(4) | | | Deutsche Mortgage
Securities, Inc. Re-REMIC
Trust Certificates
Series 2007-WM1 A1,
3.484%, 06/27/2037 | | | | | 70,790 | | | | | | 0.0 | | |
| 938,336 (1)(4) | | | Ellington Financial Mortgage
Trust 2022-2 A1, 4.299%,
04/25/2067 | | | | | 899,139 | | | | | | 0.1 | | |
| 1,700,000 (1) | | | Fannie Mae Connecticut
Avenue Securities Trust
2020-SBT1 1M2, 8.495%,
(US0001M + 3.650)%,
02/25/2040 | | | | | 1,698,340 | | | | | | 0.1 | | |
| 382,624 (6) | | | Fannie Mae 2007-18 BS,
1.755%,
(-1.000*US0001M +
6.600)%, 06/25/2035 | | | | | 40,108 | | | | | | 0.0 | | |
| 1,421,622 (6) | | | Fannie Mae 2008-94 SI,
0.655%,
(-1.000*US0001M +
5.500)%, 04/25/2036 | | | | | 115,073 | | | | | | 0.0 | | |
| 155,089 | | | Fannie Mae 2010-15 FD,
5.585%, (US0001M +
0.740)%, 03/25/2040 | | | | | 155,376 | | | | | | 0.0 | | |
| 401,913 | | | Fannie Mae 2011-47 GF,
5.415%, (US0001M +
0.570)%, 06/25/2041 | | | | | 398,807 | | | | | | 0.0 | | |
| 47,128 | | | Fannie Mae 2012-10 UF,
5.395%, (US0001M +
0.550)%, 02/25/2042 | | | | | 46,498 | | | | | | 0.0 | | |
| 158,920 (6) | | | Fannie Mae 2012-84 KI,
6.000%, (US0001M +
6.000)%, 08/25/2042 | | | | | 31,342 | | | | | | 0.0 | | |
| 357,752 (6) | | | Fannie Mae 2012-93 IL,
3.000%, 09/25/2027 | | | | | 13,883 | | | | | | 0.0 | | |
Principal
Amount† | | | Value | | | Percentage
of Net
Assets | |
| COLLATERALIZED MORTGAGE OBLIGATIONS: (continued) | |
| 2,309,067 (6) | | | Fannie Mae 2013-67 AI,
3.000%, 07/25/2028 | | | | $ | 94,111 | | | | | | 0.0 | | |
| 29,071,708 (6) | | | Fannie Mae 2018-86 US,
1.355%,
(-1.000*US0001M +
6.200)%, 12/25/2048 | | | | | 2,394,462 | | | | | | 0.1 | | |
| 39,352 | | | Fannie Mae Connecticut
Avenue Securities
2014-CO4 1M2, 9.745%,
(US0001M + 4.900)%,
11/25/2024 | | | | | 41,017 | | | | | | 0.0 | | |
| 505,475 | | | Fannie Mae Connecticut
Avenue Securities 2015-C02
1M2, 8.845%, (US0001M +
4.000)%, 05/25/2025 | | | | | 522,572 | | | | | | 0.0 | | |
| 1,020,000 | | | Fannie Mae Connecticut
Avenue Securities 2018-C05
1B1, 9.095%, (US0001M +
4.250)%, 01/25/2031 | | | | | 1,075,773 | | | | | | 0.1 | | |
| 167,922 (1) | | | Fannie Mae Connecticut
Avenue Securities 2019-R02
1M2, 7.145%, (US0001M +
2.300)%, 08/25/2031 | | | | | 167,935 | | | | | | 0.0 | | |
| 103,047 (1) | | | Fannie Mae Connecticut
Avenue Securities
2019-RO3 1M2, 6.995%,
(US0001M + 2.150)%,
09/25/2031 | | | | | 103,057 | | | | | | 0.0 | | |
| 489,070 (1) | | | Fannie Mae Connecticut
Avenue Securities Trust
2019-R01 2M2, 7.295%,
(US0001M + 2.450)%,
07/25/2031 | | | | | 489,795 | | | | | | 0.0 | | |
| 824,489 (1) | | | Fannie Mae Connecticut
Avenue Securities Trust
2019-R05 1B1, 8.945%,
(US0001M + 4.100)%,
07/25/2039 | | | | | 833,988 | | | | | | 0.1 | | |
| 1,197,439 (1) | | | Fannie Mae Connecticut
Avenue Securities Trust
2020-R01 1M2, 6.895%,
(US0001M + 2.050)%,
01/25/2040 | | | | | 1,201,831 | | | | | | 0.1 | | |
| 3,898,000 (1) | | | Fannie Mae Connecticut
Avenue Securities Trust
2020-SBT1 2M2, 8.495%,
(US0001M + 3.650)%,
02/25/2040 | | | | | 3,921,992 | | | | | | 0.2 | | |
| 17,917,859 (6) | | | Fannie Mae Interest Strip
427 C18, 3.500%,
03/25/2039 | | | | | 2,514,893 | | | | | | 0.1 | | |
See Accompanying Notes to Financial Statements
| Voya Strategic Income | PORTFOLIO OF INVESTMENTS |
| Opportunities Fund | as of March 31, 2023 (continued) |
Principal
Amount† | | | Value | | | Percentage
of Net
Assets | |
| COLLATERALIZED MORTGAGE OBLIGATIONS: (continued) | |
| 31,610,492 (6) | | | Fannie Mae Interest Strip
427 C38, 3.000%,
04/25/2049 | | | | $ | 5,644,793 | | | | | | 0.3 | | |
| 436,634 (6) | | | Fannie Mae Interest Strip
Series 346 6, 5.000%,
10/25/2033 | | | | | 68,694 | | | | | | 0.0 | | |
| 86,684 (6) | | | Fannie Mae REMIC Trust
2000-26 SP, 3.655%,
(-1.000*US0001M +
8.500)%, 08/25/2030 | | | | | 5,956 | | | | | | 0.0 | | |
| 94,515 (6) | | | Fannie Mae REMIC Trust
2002-13 SR, 1.755%,
(-1.000*US0001M +
6.600)%, 03/25/2032 | | | | | 4,753 | | | | | | 0.0 | | |
| 90,110 (6) | | | Fannie Mae REMIC Trust
2004-64 SW, 2.205%,
(-1.000*US0001M +
7.050)%, 08/25/2034 | | | | | 6,576 | | | | | | 0.0 | | |
| 43,705 (6) | | | Fannie Mae REMIC Trust
2004-66 SE, 1.655%,
(-1.000*US0001M +
6.500)%, 09/25/2034 | | | | | 3,188 | | | | | | 0.0 | | |
| 222,304 (6) | | | Fannie Mae REMIC Trust
2009-25 SN, 1.705%,
(-1.000*US0001M +
6.550)%, 04/25/2039 | | | | | 22,750 | | | | | | 0.0 | | |
| 8,880,584 (6) | | | Fannie Mae REMIC Trust
2012-66 IB, 0.050%,
(-1.000*US0001M +
6.050)%, 06/25/2042 | | | | | 19,342 | | | | | | 0.0 | | |
| 195,706 (6) | | | Fannie Mae REMIC Trust
2013-116 SC, 1.355%,
(-1.000*US0001M +
6.200)%, 04/25/2033 | | | | | 3,576 | | | | | | 0.0 | | |
| 1,107,650 (6) | | | Fannie Mae REMICS
2004-53 UC, 2.705%,
(-1.000*US0001M +
7.550)%, 07/25/2034 | | | | | 140,132 | | | | | | 0.0 | | |
| 723,716 (6) | | | Fannie Mae REMICS
2005-59 NS, 1.905%,
(-1.000*US0001M +
6.750)%, 05/25/2035 | | | | | 25,023 | | | | | | 0.0 | | |
| 96,390 | | | Fannie Mae REMICS
2006-46 SP, 6.434%,
(-3.667*US0001M +
24.200)%, 06/25/2036 | | | | | 122,326 | | | | | | 0.0 | | |
| 3,241,766 (6) | | | Fannie Mae REMICS
2007-22 SD, 1.555%,
(-1.000*US0001M +
6.400)%, 03/25/2037 | | | | | 336,000 | | | | | | 0.0 | | |
Principal
Amount† | | | Value | | | Percentage
of Net
Assets | |
| COLLATERALIZED MORTGAGE OBLIGATIONS: (continued) | |
| 3,223,711 (6) | | | Fannie Mae REMICS
2007-30 IE, 1.895%,
(-1.000*US0001M +
6.740)%, 04/25/2037 | | | | $ | 429,036 | | | | | | 0.0 | | |
| 1,889,354 (6) | | | Fannie Mae REMICS
2007-55 S, 1.915%,
(-1.000*US0001M +
6.760)%, 06/25/2037 | | | | | 190,676 | | | | | | 0.0 | | |
| 276,045 (6) | | | Fannie Mae REMICS
2011-123 SD, 1.755%,
(-1.000*US0001M +
6.600)%, 08/25/2039 | | | | | 1,112 | | | | | | 0.0 | | |
| 8,462,397 (6) | | | Fannie Mae REMICS
2012-111 UI, 3.000%,
10/25/2027 | | | | | 351,358 | | | | | | 0.0 | | |
| 665,259 (6) | | | Fannie Mae REMICS
2012-121 DI, 2.500%,
11/25/2027 | | | | | 23,538 | | | | | | 0.0 | | |
| 6,846,419 (6) | | | Fannie Mae REMICS
2012-128 KI, 3.000%,
11/25/2027 | | | | | 302,509 | | | | | | 0.0 | | |
| 7,184,146 (6) | | | Fannie Mae REMICS
2012-133 NS, 1.305%,
(-1.000*US0001M +
6.150)%, 12/25/2042 | | | | | 854,718 | | | | | | 0.1 | | |
| 1,575,059 (6) | | | Fannie Mae REMICS
2012-148 IB, 3.500%,
01/25/2028 | | | | | 74,426 | | | | | | 0.0 | | |
| 3,872,876 (6) | | | Fannie Mae REMICS
2012-150 PS, 1.305%,
(-1.000*US0001M +
6.150)%, 01/25/2043 | | | | | 426,788 | | | | | | 0.0 | | |
| 7,110,180 (6) | | | Fannie Mae REMICS
2013-1 LI, 2.500%,
02/25/2028 | | | | | 276,269 | | | | | | 0.0 | | |
| 1,485,812 (6) | | | Fannie Mae REMICS
2013-137 PI, 5.000%,
10/25/2041 | | | | | 290,213 | | | | | | 0.0 | | |
| 7,104,148 (6) | | | Fannie Mae REMICS
2013-19 JS, 1.355%,
(-1.000*US0001M +
6.200)%, 10/25/2041 | | | | | 377,848 | | | | | | 0.0 | | |
| 1,263,434 (6) | | | Fannie Mae REMICS
2013-2 NI, 4.000%,
02/25/2043 | | | | | 180,026 | | | | | | 0.0 | | |
| 2,813,099 (6) | | | Fannie Mae REMICS
2013-21 KI, 3.000%,
03/25/2028 | | | | | 116,495 | | | | | | 0.0 | | |
See Accompanying Notes to Financial Statements
| Voya Strategic Income | PORTFOLIO OF INVESTMENTS |
| Opportunities Fund | as of March 31, 2023 (continued) |
Principal
Amount† | | | Value | | | Percentage
of Net
Assets | |
| COLLATERALIZED MORTGAGE OBLIGATIONS: (continued) | |
| 4,050,145 (6) | | | Fannie Mae REMICS
2013-32 EI, 2.500%,
04/25/2033 | | | | $ | 307,935 | | | | | | 0.0 | | |
| 1,063,540 (6) | | | Fannie Mae REMICS
2013-41 BI, 3.000%,
05/25/2028 | | | | | 49,693 | | | | | | 0.0 | | |
| 1,283,143 (6) | | | Fannie Mae REMICS
2013-69 PI, 3.000%,
04/25/2033 | | | | | 86,331 | | | | | | 0.0 | | |
| 3,057,068 (6) | | | Fannie Mae REMICS
2013-97 JS, 1.305%,
(-1.000*US0001M +
6.150)%, 04/25/2038 | | | | | 252,344 | | | | | | 0.0 | | |
| 8,845,864 (6) | | | Fannie Mae REMICS
2015-40 AI, 6.000%,
05/25/2037 | | | | | 1,630,309 | | | | | | 0.1 | | |
| 6,121,444 (6) | | | Fannie Mae REMICS
2016-19 SB, 1.255%,
(-1.000*US0001M +
6.100)%, 04/25/2046 | | | | | 503,563 | | | | | | 0.0 | | |
| 1,964,533 (6) | | | Fannie Mae REMICS
2016-4 BI, 4.000%,
02/25/2046 | | | | | 355,293 | | | | | | 0.0 | | |
| 1,377,139 (6) | | | Fannie Mae REMICS
2016-61 PI, 4.500%,
01/25/2046 | | | | | 229,929 | | | | | | 0.0 | | |
| 13,884,314 (6) | | | Fannie Mae REMICS
2017-16 SG, 1.205%,
(-1.000*US0001M +
6.050)%, 03/25/2047 | | | | | 1,629,703 | | | | | | 0.1 | | |
| 9,147,841 (6) | | | Fannie Mae REMICS
2019-15 AI, 4.000%,
04/25/2059 | | | | | 1,905,234 | | | | | | 0.1 | | |
| 14,306,707 (6) | | | Fannie Mae REMICS
2019-17 SA, 1.255%,
(-1.000*US0001M +
6.100)%, 04/25/2049 | | | | | 1,235,903 | | | | | | 0.1 | | |
| 12,616,566 (6) | | | Fannie Mae REMICS
2019-8 SB, 1.255%,
(-1.000*US0001M +
6.100)%, 03/25/2049 | | | | | 1,091,288 | | | | | | 0.1 | | |
| 13,458,879 (6) | | | Fannie Mae REMICS
2020-47 PI, 4.000%,
07/25/2050 | | | | | 2,691,602 | | | | | | 0.2 | | |
| 19,599,988 (6) | | | Fannie Mae REMICS
2020-49 SB, 1.255%,
(-1.000*US0001M +
6.100)%, 07/25/2050 | | | | | 3,052,155 | | | | | | 0.2 | | |
| 16,541,351 (6) | | | Fannie Mae REMICS
2020-52 AI, 4.000%,
08/25/2050 | | | | | 2,692,355 | | | | | | 0.2 | | |
Principal
Amount† | | | Value | | | Percentage
of Net
Assets | |
| COLLATERALIZED MORTGAGE OBLIGATIONS: (continued) | |
| 39,847,581 (6) | | | Fannie Mae REMICS
2020-64 IO, 3.000%,
09/25/2050 | | | | $ | 7,388,152 | | | | | | 0.4 | | |
| 22,709,906 (6) | | | Fannie Mae REMICS
2020-65 CI, 4.000%,
09/25/2050 | | | | | 4,120,111 | | | | | | 0.2 | | |
| 23,009,386 (6) | | | Fannie Mae REMICS
2020-67 JI, 4.000%,
09/25/2050 | | | | | 4,558,199 | | | | | | 0.3 | | |
| 17,393,135 (6) | | | Fannie Mae REMICS
2021-18 IY, 4.500%,
08/25/2049 | | | | | 3,973,495 | | | | | | 0.2 | | |
| 21,469,803 (6) | | | Fannie Mae REMICS
2021-2 GI, 4.000%,
05/25/2051 | | | | | 4,266,402 | | | | | | 0.2 | | |
| 19,386,139 (6) | | | Fannie Mae REMICS
2021-2 PI, 2.000%,
02/25/2051 | | | | | 1,995,946 | | | | | | 0.1 | | |
| 40,159,852 (6) | | | Fannie Mae REMICS
2021-65 KI, 3.500%,
10/25/2051 | | | | | 6,959,987 | | | | | | 0.4 | | |
| 319,995 | | | Fannie Mae Series 2006-11
FA, 5.145%, (US0001M +
0.300)%, 03/25/2036 | | | | | 316,283 | | | | | | 0.0 | | |
| 63,983 | | | First Horizon Alternative
Mortgage Securities Trust
2006-FA8 1A7, 6.000%,
02/25/2037 | | | | | 28,350 | | | | | | 0.0 | | |
| 176,839 (1)(4) | | | Flagstar Mortgage Trust
2017-2 A7, 3.500%,
10/25/2047 | | | | | 163,217 | | | | | | 0.0 | | |
| 612,121 (1)(4) | | | Flagstar Mortgage Trust
2018-1 B3, 3.951%,
03/25/2048 | | | | | 526,549 | | | | | | 0.0 | | |
| 4,467,082 (1)(4) | | | Flagstar Mortgage Trust
2018-2 B2, 4.010%,
04/25/2048 | | | | | 3,946,078 | | | | | | 0.2 | | |
| 784,203 (1)(4) | | | Flagstar Mortgage Trust
2018-3INV A3, 4.000%,
05/25/2048 | | | | | 725,941 | | | | | | 0.0 | | |
| 3,595,352 (1)(4) | | | Flagstar Mortgage Trust
2018-4 B3, 4.205%,
07/25/2048 | | | | | 3,217,534 | | | | | | 0.2 | | |
| 905,717 (1)(4) | | | Flagstar Mortgage Trust
2018-5 B3, 4.496%,
09/25/2048 | | | | | 800,027 | | | | | | 0.1 | | |
| 247,157 (1)(4) | | | Flagstar Mortgage Trust
2018-6RR 1A7, 4.000%,
10/25/2048 | | | | | 230,141 | | | | | | 0.0 | | |
See Accompanying Notes to Financial Statements
| Voya Strategic Income | PORTFOLIO OF INVESTMENTS |
| Opportunities Fund | as of March 31, 2023 (continued) |
Principal
Amount† | | | Value | | | Percentage
of Net
Assets | |
| COLLATERALIZED MORTGAGE OBLIGATIONS: (continued) | |
| 3,414,035 (1)(4) | | | Flagstar Mortgage Trust
2018-6RR B1, 4.923%,
10/25/2048 | | | | $ | 3,178,664 | | | | | | 0.2 | | |
| 1,395,745 (1)(4) | | | Flagstar Mortgage Trust
2019-2 B1, 4.030%,
12/25/2049 | | | | | 1,251,076 | | | | | | 0.1 | | |
| 1,954,043 (1)(4) | | | Flagstar Mortgage Trust
2019-2 B2, 4.030%,
12/25/2049 | | | | | 1,723,783 | | | | | | 0.1 | | |
| 3,301,975 (1)(4) | | | Flagstar Mortgage Trust
2020-1NV B2A, 4.216%,
03/25/2050 | | | | | 2,860,054 | | | | | | 0.2 | | |
| 2,830,264 (1)(4) | | | Flagstar Mortgage Trust
2020-1NV B3, 4.216%,
03/25/2050 | | | | | 2,399,681 | | | | | | 0.1 | | |
| 3,666,940 (1)(4) | | | Flagstar Mortgage Trust
2021-2 B3, 2.783%,
04/25/2051 | | | | | 2,588,874 | | | | | | 0.1 | | |
| 889,819 (6) | | | Freddie Mac 2009-70 PS,
1.905%,
(-1.000*US0001M +
6.750)%, 01/25/2037 | | | | | 98,627 | | | | | | 0.0 | | |
| 224,136 (6) | | | Freddie Mac 2525 SM,
3.316%,
(-1.000*US0001M +
8.000)%, 02/15/2032 | | | | | 25,762 | | | | | | 0.0 | | |
| 210,742 (6) | | | Freddie Mac 2981 CS,
2.036%,
(-1.000*US0001M +
6.720)%, 05/15/2035 | | | | | 15,776 | | | | | | 0.0 | | |
| 236,955 (6) | | | Freddie Mac 2989 HS,
2.466%,
(-1.000*US0001M +
7.150)%, 08/15/2034 | | | | | 42,808 | | | | | | 0.0 | | |
| 107,707 (6) | | | Freddie Mac 3018 SM,
2.516%,
(-1.000*US0001M +
7.200)%, 08/15/2035 | | | | | 13,067 | | | | | | 0.0 | | |
| 1,333,725 (6) | | | Freddie Mac 3222 SN,
1.916%,
(-1.000*US0001M +
6.600)%, 09/15/2036 | | | | | 126,588 | | | | | | 0.0 | | |
| 219,860 (4)(6) | | | Freddie Mac 324 144,
6.000%, 06/15/2039 | | | | | 44,622 | | | | | | 0.0 | | |
| 423,814 (6) | | | Freddie Mac 3523 SA,
1.316%,
(-1.000*US0001M +
6.000)%, 09/15/2036 | | | | | 33,163 | | | | | | 0.0 | | |
| 372,767 (6) | | | Freddie Mac 3582 MS,
1.466%,
(-1.000*US0001M +
6.150)%, 10/15/2039 | | | | | 34,258 | | | | | | 0.0 | | |
Principal
Amount† | | | Value | | | Percentage
of Net
Assets | |
| COLLATERALIZED MORTGAGE OBLIGATIONS: (continued) | |
| 532,355 (6) | | | Freddie Mac 3688 BI,
5.000%, 07/15/2040 | | | | $ | 85,689 | | | | | | 0.0 | | |
| 2,113,831 (6) | | | Freddie Mac 4186 IA,
3.000%, 03/15/2033 | | | | | 189,674 | | | | | | 0.0 | | |
| 76,823 (6) | | | Freddie Mac 4333 AI,
5.500%, 02/15/2044 | | | | | 13,304 | | | | | | 0.0 | | |
| 12,220,183 (6) | | | Freddie Mac 4813 IO,
5.500%, 08/15/2048 | | | | | 2,433,299 | | | | | | 0.1 | | |
| 1,227 (6) | | | Freddie Mac REMIC Trust
2266 S, 3.866%,
(-1.000*US0001M +
8.550)%, 11/15/2030 | | | | | 42 | | | | | | 0.0 | | |
| 106,241 (6) | | | Freddie Mac REMIC Trust
2374 S, 3.416%,
(-1.000*US0001M +
8.100)%, 06/15/2031 | | | | | 10,595 | | | | | | 0.0 | | |
| 55,102 (6) | | | Freddie Mac REMIC Trust
2417 SY, 3.716%,
(-1.000*US0001M +
8.400)%, 12/15/2031 | | | | | 6,717 | | | | | | 0.0 | | |
| 111,118 (6) | | | Freddie Mac REMIC Trust
2577 SA, 2.766%,
(-1.000*US0001M +
7.450)%, 02/15/2033 | | | | | 12,030 | | | | | | 0.0 | | |
| 52,269 (6) | | | Freddie Mac REMIC Trust
2981 SU, 3.116%,
(-1.000*US0001M +
7.800)%, 05/15/2030 | | | | | 4,342 | | | | | | 0.0 | | |
| 127,480 | | | Freddie Mac REMIC Trust
3031 BP, 8.000%,
(-6.723*US0001M +
44.975)%, 08/15/2035 | | | | | 124,260 | | | | | | 0.0 | | |
| 394,879 (6) | | | Freddie Mac REMIC Trust
3049 PI, 1.966%,
(-1.000*US0001M +
6.650)%, 10/15/2035 | | | | | 40,912 | | | | | | 0.0 | | |
| 48,666 (7) | | | Freddie Mac REMIC Trust
3151 PO, 0.000%,
05/15/2036 | | | | | 40,138 | | | | | | 0.0 | | |
| 149,537 (6) | | | Freddie Mac REMIC Trust
3624 TS, 0.116%,
(-1.000*US0001M +
4.800)%, 01/15/2040 | | | | | 7,202 | | | | | | 0.0 | | |
| 111,182 (6) | | | Freddie Mac REMIC Trust
4261 ID, 6.500%,
06/15/2032 | | | | | 8,639 | | | | | | 0.0 | | |
| 397,888 (6) | | | Freddie Mac REMIC Trust
4287 CI, 4.500%,
07/15/2041 | | | | | 42,381 | | | | | | 0.0 | | |
See Accompanying Notes to Financial Statements
| Voya Strategic Income | PORTFOLIO OF INVESTMENTS |
| Opportunities Fund | as of March 31, 2023 (continued) |
Principal
Amount† | | | Value | | | Percentage
of Net
Assets | |
| COLLATERALIZED MORTGAGE OBLIGATIONS: (continued) | |
| 1,059,151 (6) | | | Freddie Mac REMICS 2781
SB, 2.466%,
(-1.000*US0001M +
7.150)%, 04/15/2034 | | | | $ | 105,926 | | | | | | 0.0 | | |
| 227,125 | | | Freddie Mac REMICS 2921
PF, 5.034%, (US0001M +
0.350)%, 01/15/2035 | | | | | 224,770 | | | | | | 0.0 | | |
| 2,652,151 (6) | | | Freddie Mac REMICS 3128
JI, 1.946%,
(-1.000*US0001M +
6.630)%, 03/15/2036 | | | | | 278,961 | | | | | | 0.0 | | |
| 1,233,263 (6) | | | Freddie Mac REMICS 3298
S, 1.426%,
(-1.000*US0001M +
6.110)%, 04/15/2037 | | | | | 101,087 | | | | | | 0.0 | | |
| 2,018,023 (6) | | | Freddie Mac REMICS 4097
IC, 2.500%, 08/15/2027 | | | | | 68,195 | | | | | | 0.0 | | |
| 805,554 (6) | | | Freddie Mac REMICS 4116
IL, 4.500%, 05/15/2042 | | | | | 96,771 | | | | | | 0.0 | | |
| 7,092,972 (6) | | | Freddie Mac REMICS 4120
TI, 2.500%, 10/15/2027 | | | | | 259,074 | | | | | | 0.0 | | |
| 970,120 (6) | | | Freddie Mac REMICS 4136
QI, 3.000%, 11/15/2032 | | | | | 49,361 | | | | | | 0.0 | | |
| 584,127 (6) | | | Freddie Mac REMICS 4143
IK, 4.000%, 10/15/2041 | | | | | 43,023 | | | | | | 0.0 | | |
| 11,935,298 (6) | | | Freddie Mac REMICS 4146
SA, 1.466%,
(-1.000*US0001M +
6.150)%, 12/15/2042 | | | | | 1,428,370 | | | | | | 0.1 | | |
| 507,023 (6) | | | Freddie Mac REMICS 4153
YI, 3.000%, 09/15/2042 | | | | | 15,185 | | | | | | 0.0 | | |
| 1,684,063 (6) | | | Freddie Mac REMICS 4157
IH, 3.500%, 01/15/2043 | | | | | 258,833 | | | | | | 0.0 | | |
| 916,289 (6) | | | Freddie Mac REMICS 4162
DI, 2.000%, 02/15/2028 | | | | | 26,968 | | | | | | 0.0 | | |
| 3,401,380 (6) | | | Freddie Mac REMICS 4182
IL, 3.000%, 03/15/2028 | | | | | 156,099 | | | | | | 0.0 | | |
| 231,565 (6) | | | Freddie Mac REMICS 4266
LI, 3.500%, 06/15/2028 | | | | | 2,822 | | | | | | 0.0 | | |
| 24,153,209 (6) | | | Freddie Mac REMICS 4273
PS, 1.416%,
(-1.000*US0001M +
6.100)%, 11/15/2043 | | | | | 2,146,368 | | | | | | 0.1 | | |
| 1,696,187 (6) | | | Freddie Mac REMICS 4290
EI, 5.000%, 12/15/2043 | | | | | 312,378 | | | | | | 0.0 | | |
| 1,046,048 | | | Freddie Mac REMICS 4385
LS, 14.191%,
(-2.333*US0001M +
9.333)%, 07/15/2037 | | | | | 772,640 | | | | | | 0.0 | | |
| 1,868,329 (6) | | | Freddie Mac REMICS 4494
LI, 5.000%, 12/15/2043 | | | | | 198,666 | | | | | | 0.0 | | |
Principal
Amount† | | | Value | | | Percentage
of Net
Assets | |
| COLLATERALIZED MORTGAGE OBLIGATIONS: (continued) | |
| 6,486,191 (6) | | | Freddie Mac REMICS 4618
SA, 1.316%,
(-1.000*US0001M +
6.000)%, 09/15/2046 | | | | $ | 809,644 | | | | | | 0.1 | | |
| 1,570,779 | | | Freddie Mac REMICS 4625
BI, 3.500%, 06/15/2046 | | | | | 260,867 | | | | | | 0.0 | | |
| 1,755,404 (6) | | | Freddie Mac REMICS 4708
KI, 4.500%, 11/15/2046 | | | | | 260,680 | | | | | | 0.0 | | |
| 20,974,796 (6) | | | Freddie Mac REMICS 4903
NS, 1.255%,
(-1.000*US0001M +
6.100)%, 08/25/2049 | | | | | 2,393,127 | | | | | | 0.1 | | |
| 11,573,494 (6) | | | Freddie Mac REMICS 4909
SJ, 1.205%,
(-1.000*US0001M +
6.050)%, 09/25/2049 | | | | | 1,579,375 | | | | | | 0.1 | | |
| 4,580,088 (6) | | | Freddie Mac REMICS 4910
SD, 1.366%,
(-1.000*US0001M +
6.050)%, 06/15/2049 | | | | | 599,483 | | | | | | 0.0 | | |
| 14,515,505 (6) | | | Freddie Mac REMICS 4910
SH, 1.205%,
(-1.000*US0001M +
6.050)%, 09/25/2049 | | | | | 1,928,314 | | | | | | 0.1 | | |
| 18,621,887 (6) | | | Freddie Mac REMICS 4924
SY, 1.205%,
(-1.000*US0001M +
6.050)%, 10/25/2049 | | | | | 2,592,655 | | | | | | 0.1 | | |
| 13,812,025 (6) | | | Freddie Mac REMICS 4967
IQ, 4.000%, 02/25/2050 | | | | | 2,759,470 | | | | | | 0.2 | | |
| 36,962,591 (6) | | | Freddie Mac REMICS 4974
I, 4.000%, 04/25/2050 | | | | | 7,180,353 | | | | | | 0.4 | | |
| 33,498,936 (6) | | | Freddie Mac REMICS 5010
MI, 3.000%, 09/25/2050 | | | | | 5,072,566 | | | | | | 0.3 | | |
| 19,977,366 (6) | | | Freddie Mac REMICS 5036
CI, 4.000%, 12/25/2049 | | | | | 3,938,506 | | | | | | 0.2 | | |
| 27,328,282 (6) | | | Freddie Mac REMICS 5049
UI, 3.000%, 12/25/2050 | | | | | 4,943,194 | | | | | | 0.3 | | |
| 10,954,710 (6) | | | Freddie Mac REMICS 5052
BI, 5.000%, 12/25/2050 | | | | | 2,433,242 | | | | | | 0.1 | | |
| 14,126,286 (6) | | | Freddie Mac REMICS 5074
GI, 2.000%, 02/25/2051 | | | | | 1,575,789 | | | | | | 0.1 | | |
| 23,627,229 (6) | | | Freddie Mac REMICS 5081
CI, 2.000%, 03/25/2051 | | | | | 2,475,895 | | | | | | 0.1 | | |
| 16,798,578 (6) | | | Freddie Mac REMICS 5133
CI, 4.500%, 07/25/2039 | | | | | 2,823,701 | | | | | | 0.2 | | |
| 10,911,366 (6) | | | Freddie Mac REMICS 5142
LI, 2.500%, 09/25/2051 | | | | | 1,747,741 | | | | | | 0.1 | | |
| 9,791,552 (6) | | | Freddie Mac REMICS 5261
IC, 4.000%, 01/25/2050 | | | | | 1,802,347 | | | | | | 0.1 | | |
See Accompanying Notes to Financial Statements
| Voya Strategic Income | PORTFOLIO OF INVESTMENTS |
| Opportunities Fund | as of March 31, 2023 (continued) |
Principal
Amount† | | | Value | | | Percentage
of Net
Assets | |
| COLLATERALIZED MORTGAGE OBLIGATIONS: (continued) | |
| 18,123,190 (6) | | | Freddie Mac REMICS 538
CI, 4.000%, 07/25/2050 | | | | $ | 3,593,921 | | | | | | 0.2 | | |
| 376,994 | | | Freddie Mac REMICS Trust
3740 FB, 5.184%,
(US0001M + 0.500)%,
10/15/2040 | | | | | 369,412 | | | | | | 0.0 | | |
| 811,545 (1) | | | Freddie Mac STACR Remic
Trust 2020-DNA2 M2,
6.695%, (US0001M +
1.850)%, 02/25/2050 | | | | | 806,939 | | | | | | 0.1 | | |
| 979,509 (1) | | | Freddie Mac STACR REMIC
Trust 2020-HQA1 M2,
6.745%, (US0001M +
1.900)%, 01/25/2050 | | | | | 979,094 | | | | | | 0.1 | | |
| 5,100,000 (1) | | | Freddie Mac STACR REMIC
Trust 2021-DNA6 B1,
7.960%, (SOFR30A +
3.400)%, 10/25/2041 | | | | | 4,793,344 | | | | | | 0.3 | | |
| 2,500,000 (1) | | | Freddie Mac STACR REMIC
Trust 2021-HQA3 M2,
6.660%, (SOFR30A +
2.100)%, 09/25/2041 | | | | | 2,256,910 | | | | | | 0.1 | | |
| 6,100,000 (1) | | | Freddie Mac STACR REMIC
Trust 2021-HQA4 B1,
8.310%, (SOFR30A +
3.750)%, 12/25/2041 | | | | | 5,495,458 | | | | | | 0.3 | | |
| 5,000,000 (1) | | | Freddie Mac STACR REMIC
Trust 2021-HQA4 M2,
6.910%, (SOFR30A +
2.350)%, 12/25/2041 | | | | | 4,514,541 | | | | | | 0.3 | | |
| 3,800,000 (1) | | | Freddie Mac STACR REMIC
Trust 2022-DNA1 B1,
7.960%, (SOFR30A +
3.400)%, 01/25/2042 | | | | | 3,461,740 | | | | | | 0.2 | | |
| 2,500,000 (1) | | | Freddie Mac STACR REMIC
Trust 2022-DNA1 M1B,
6.410%, (SOFR30A +
1.850)%, 01/25/2042 | | | | | 2,366,608 | | | | | | 0.1 | | |
| 3,000,000 (1) | | | Freddie Mac STACR REMIC
Trust 2022-DNA1 M2,
7.060%, (SOFR30A +
2.500)%, 01/25/2042 | | | | | 2,776,190 | | | | | | 0.2 | | |
| 3,400,000 (1) | | | Freddie Mac STACR REMIC
Trust 2022-DNA3 M2,
8.910%, (SOFR30A +
4.350)%, 04/25/2042 | | | | | 3,345,966 | | | | | | 0.2 | | |
| 2,500,000 (1) | | | Freddie Mac STACR REMIC
Trust 2022-DNA4 M2,
9.810%, (SOFR30A +
5.250)%, 05/25/2042 | | | | | 2,526,390 | | | | | | 0.1 | | |
Principal
Amount† | | | Value | | | Percentage
of Net
Assets | |
| COLLATERALIZED MORTGAGE OBLIGATIONS: (continued) | |
| 1,000,000 (1) | | | Freddie Mac STACR REMIC
Trust 2022-DNA6 M2,
10.310%, (SOFR30A +
5.750)%, 09/25/2042 | | | | $ | 1,035,593 | | | | | | 0.1 | | |
| 1,200,000 (1) | | | Freddie Mac STACR REMIC
Trust 2022-HQA1 M2,
9.810%, (SOFR30A +
5.250)%, 03/25/2042 | | | | | 1,186,467 | | | | | | 0.1 | | |
| 3,000,000 (1) | | | Freddie Mac STACR REMIC
Trust 2022-HQA3 M2,
9.910%, (SOFR30A +
5.350)%, 08/25/2042 | | | | | 2,943,140 | | | | | | 0.2 | | |
| 918,700 (6) | | | Freddie Mac Strips 287 IO,
3.000%, 10/15/2027 | | | | | 36,779 | | | | | | 0.0 | | |
| 741,535 (6) | | | Freddie Mac Strips
Series 224 IO, 6.000%,
03/01/2033 | | | | | 128,694 | | | | | | 0.0 | | |
| 355,528 (6) | | | Freddie Mac Strips
Series 237 S23, 2.416%,
(-1.000*US0001M +
7.100)%, 05/15/2036 | | | | | 45,568 | | | | | | 0.0 | | |
| 422,099 (6) | | | Freddie Mac Strips
Series 260 33, 4.000%,
05/15/2039 | | | | | 66,632 | | | | | | 0.0 | | |
| 1,840,000 | | | Freddie Mac Structured
Agency Credit Risk Debt
Notes 2018-DNA1 B1,
7.995%, (US0001M +
3.150)%, 07/25/2030 | | | | | 1,855,010 | | | | | | 0.1 | | |
| 3,000,000 (1) | | | Freddie Mac Structured
Agency Credit Risk Debt
Notes 2021-DNA2 M2,
6.860%, (SOFR30A +
2.300)%, 08/25/2033 | | | | | 2,957,264 | | | | | | 0.2 | | |
| 2,300,000 (1) | | | Freddie Mac Structured
Agency Credit Risk Debt
Notes 2021-DNA7 B1,
8.210%, (SOFR30A +
3.650)%, 11/25/2041 | | | | | 2,164,942 | | | | | | 0.1 | | |
| 2,500,000 (1) | | | Freddie Mac Structured
Agency Credit Risk Debt
Notes 2022-DNA5 M2,
11.310%, (SOFR30A +
6.750)%, 06/25/2042 | | | | | 2,672,338 | | | | | | 0.2 | | |
| 1,577,100 (1)(4) | | | Galton Funding Mortgage
Trust 2018-2 B2, 4.611%,
10/25/2058 | | | | | 1,451,812 | | | | | | 0.1 | | |
| 2,352,827 (1)(4) | | | Galton Funding Mortgage
Trust 2019-1 B1, 4.250%,
02/25/2059 | | | | | 2,128,401 | | | | | | 0.1 | | |
See Accompanying Notes to Financial Statements
| Voya Strategic Income | PORTFOLIO OF INVESTMENTS |
| Opportunities Fund | as of March 31, 2023 (continued) |
Principal
Amount† | | | Value | | | Percentage
of Net
Assets | |
| COLLATERALIZED MORTGAGE OBLIGATIONS: (continued) | |
| 1,886,566 (1)(4) | | | Galton Funding Mortgage
Trust 2019-1 B2, 4.500%,
02/25/2059 | | | | $ | 1,710,978 | | | | | | 0.1 | | |
| 3,282,221 (6) | | | Ginnie Mae 2007-59 SC,
1.739%,
(-1.000*US0001M +
6.500)%, 07/20/2037 | | | | | 370,650 | | | | | | 0.0 | | |
| 107,384 (6) | | | Ginnie Mae 2011-101 EI,
6.000%,
(-19.355*US0001M +
109.161)%, 10/16/2039 | | | | | 24,810 | | | | | | 0.0 | | |
| 18,287,214 (6) | | | Ginnie Mae 2013-130 SB,
0.388%,
(-1.000*US0001M +
5.050)%, 09/16/2043 | | | | | 764,294 | | | | | | 0.0 | | |
| 7,618,372 (6) | | | Ginnie Mae 2014-58 SM,
1.372%,
(-1.000*US0001M +
6.100)%, 04/16/2044 | | | | | 826,374 | | | | | | 0.1 | | |
| 43,357,843 (6) | | | Ginnie Mae 2021-194 IK,
3.000%, 11/20/2051 | | | | | 7,184,915 | | | | | | 0.4 | | |
| 279,509 (6) | | | Ginnie Mae Series 2008-40
SA, 1.672%,
(-1.000*US0001M +
6.400)%, 05/16/2038 | | | | | 21,891 | | | | | | 0.0 | | |
| 497,756 (6) | | | Ginnie Mae Series 2009-116
SJ, 1.752%,
(-1.000*US0001M +
6.480)%, 12/16/2039 | | | | | 56,317 | | | | | | 0.0 | | |
| 556,814 (6) | | | Ginnie Mae Series 2010-143
JI, 4.000%, 08/16/2039 | | | | | 30,127 | | | | | | 0.0 | | |
| 884,061 (6) | | | Ginnie Mae Series 2010-4
IP, 5.000%, 01/16/2039 | | | | | 64,662 | | | | | | 0.0 | | |
| 467,507 (6) | | | Ginnie Mae Series 2010-4
SL, 1.672%,
(-1.000*US0001M +
6.400)%, 01/16/2040 | | | | | 51,568 | | | | | | 0.0 | | |
| 26,186 (6) | | | Ginnie Mae Series 2010-98
QS, 1.839%,
(-1.000*US0001M +
6.600)%, 01/20/2040 | | | | | 238 | | | | | | 0.0 | | |
| 1,349,433 (6) | | | Ginnie Mae Series 2011-101
BI, 0.650%,
(-1.000*US0001M +
6.650)%, 11/20/2037 | | | | | 30,563 | | | | | | 0.0 | | |
| 1,413,004 (6) | | | Ginnie Mae Series 2011-124
KI, 4.000%, 08/20/2039 | | | | | 75,862 | | | | | | 0.0 | | |
| 3,800,219 (6) | | | Ginnie Mae Series 2011-25
AS, 1.299%,
(-1.000*US0001M +
6.060)%, 02/20/2041 | | | | | 315,954 | | | | | | 0.0 | | |
Principal
Amount† | | | Value | | | Percentage
of Net
Assets | |
| COLLATERALIZED MORTGAGE OBLIGATIONS: (continued) | |
| 1,432,420 (6) | | | Ginnie Mae Series 2012-148
IP, 3.500%, 04/20/2041 | | | | $ | 56,026 | | | | | | 0.0 | | |
| 14,906 (6) | | | Ginnie Mae Series 2012-149
BI, 3.500%, 10/20/2041 | | | | | 1,347 | | | | | | 0.0 | | |
| 1,738,866 (6) | | | Ginnie Mae Series 2012-39
PI, 4.000%, 03/16/2042 | | | | | 172,689 | | | | | | 0.0 | | |
| 1,789,903 (6) | | | Ginnie Mae Series 2013-103
DS, 1.389%,
(-1.000*US0001M +
6.150)%, 07/20/2043 | | | | | 194,990 | | | | | | 0.0 | | |
| 68,390 (6) | | | Ginnie Mae Series 2013-134
DS, 1.339%,
(-1.000*US0001M +
6.100)%, 09/20/2043 | | | | | 7,332 | | | | | | 0.0 | | |
| 170,888 (6) | | | Ginnie Mae Series 2013-44
LI, 4.500%, 01/16/2043 | | | | | 21,114 | | | | | | 0.0 | | |
| 701,570 (6) | | | Ginnie Mae Series 2013-81
IO, 4.500%, 01/16/2040 | | | | | 52,968 | | | | | | 0.0 | | |
| 1,884,051 (6) | | | Ginnie Mae Series 2014-84
PI, 4.500%, 04/20/2043 | | | | | 210,859 | | | | | | 0.0 | | |
| 1,711,813 (6) | | | Ginnie Mae Series 2015-132
BI, 4.000%, 11/20/2044 | | | | | 209,406 | | | | | | 0.0 | | |
| 15,389,525 (6) | | | Ginnie Mae Series 2015-144
SA, 1.439%,
(-1.000*US0001M +
6.200)%, 10/20/2045 | | | | | 1,984,932 | | | | | | 0.1 | | |
| 2,764,429 (6) | | | Ginnie Mae Series 2015-69
IL, 0.200%,
(-1.000*US0001M +
6.700)%, 07/20/2034 | | | | | 20,197 | | | | | | 0.0 | | |
| 180,554 (6) | | | Ginnie Mae Series 2015-98
IU, 4.000%, 08/20/2044 | | | | | 24,121 | | | | | | 0.0 | | |
| 5,876,569 (6) | | | Ginnie Mae Series 2016-66
ES, 1.289%,
(-1.000*US0001M +
6.050)%, 05/20/2046 | | | | | 667,715 | | | | | | 0.0 | | |
| 397,506 (6) | | | Ginnie Mae Series 2016-8
PI, 4.000%, 10/20/2044 | | | | | 47,053 | | | | | | 0.0 | | |
| 5,583,040 (6) | | | Ginnie Mae Series 2018-153
SQ, 1.439%,
(-1.000*US0001M +
6.200)%, 11/20/2048 | | | | | 527,228 | | | | | | 0.0 | | |
| 13,767,192 (6) | | | Ginnie Mae Series 2018-93
SJ, 1.439%,
(-1.000*US0001M +
6.200)%, 07/20/2048 | | | | | 1,367,468 | | | | | | 0.1 | | |
| 153,591 (6) | | | Ginnie Mae Series 2019-111
TI, 5.000%, 09/20/2049 | | | | | 25,059 | | | | | | 0.0 | | |
| 97,165 (6) | | | Ginnie Mae Series 2019-86
GI, 6.500%, 07/20/2049 | | | | | 17,548 | | | | | | 0.0 | | |
See Accompanying Notes to Financial Statements
| Voya Strategic Income | PORTFOLIO OF INVESTMENTS |
| Opportunities Fund | as of March 31, 2023 (continued) |
Principal
Amount† | | | Value | | | Percentage
of Net
Assets | |
| COLLATERALIZED MORTGAGE OBLIGATIONS: (continued) | |
| 343,493 (6) | | | Ginnie Mae Series 2019-86
HI, 5.500%, 07/20/2049 | | �� | | $ | 65,708 | | | | | | 0.0 | | |
| 11,409,523 (6) | | | Ginnie Mae Series 2019-89
SC, 1.339%,
(-1.000*US0001M +
6.100)%, 07/20/2049 | | | | | 1,396,250 | | | | | | 0.1 | | |
| 2,301,125 (1)(4) | | | GS Mortage-Backed
Securities Trust 2020-PJ1
B2, 3.641%, 05/25/2050 | | | | | 1,915,740 | | | | | | 0.1 | | |
| 1,479,646 (1)(4) | | | GS Mortgage-Backed
Securities Corp. Trust
2019-PJ1 B3, 4.075%,
08/25/2049 | | | | | 1,248,330 | | | | | | 0.1 | | |
| 82,286 (1)(4) | | | GS Mortgage-Backed
Securities Corp. Trust
2019-PJ2 A1, 4.000%,
11/25/2049 | | | | | 77,727 | | | | | | 0.0 | | |
| 3,685,218 (1)(4) | | | GS Mortgage-Backed
Securities Corp. Trust
2019-PJ2 B2, 4.393%,
11/25/2049 | | | | | 3,306,895 | | | | | | 0.2 | | |
| 3,801,325 (1)(4) | | | GS Mortgage-Backed
Securities Corp. Trust
2019-PJ2 B3, 4.393%,
11/25/2049 | | | | | 3,296,369 | | | | | | 0.2 | | |
| 451,018 (1)(4) | | | GS Mortgage-Backed
Securities Corp. Trust
2019-PJ3 B1, 3.982%,
03/25/2050 | | | | | 401,087 | | | | | | 0.0 | | |
| 460,018 (1)(4) | | | GS Mortgage-Backed
Securities Corp. Trust
2019-PJ3 B2, 3.982%,
03/25/2050 | | | | | 401,300 | | | | | | 0.0 | | |
| 1,752,595 (1)(4) | | | GS Mortgage-Backed
Securities Corp. Trust
2020-PJ3 B4, 3.425%,
10/25/2050 | | | | | 1,301,847 | | | | | | 0.1 | | |
| 1,669,408 (1)(4) | | | GS Mortgage-Backed
Securities Corp. Trust
2021-PJ3 B3, 2.652%,
08/25/2051 | | | | | 1,167,072 | | | | | | 0.1 | | |
| 3,815,000 (1)(4) | | | GS Mortgage-Backed
Securities Corp. Trust
2021-PJ4 B3, 2.618%,
09/25/2051 | | | | | 2,576,994 | | | | | | 0.1 | | |
| 4,940,765 (1)(4) | | | GS Mortgage-Backed
Securities Corp. Trust
2021-PJ5 B3, 2.588%,
10/25/2051 | | | | | 3,490,463 | | | | | | 0.2 | | |
| 264,423 (1)(4) | | | GS Mortgage-Backed
Securities Trust 2020-PJ1
A1, 3.500%, 05/25/2050 | | | | | 238,329 | | | | | | 0.0 | | |
Principal
Amount† | | | Value | | | Percentage
of Net
Assets | |
| COLLATERALIZED MORTGAGE OBLIGATIONS: (continued) | |
| 419,965 (1)(4) | | | GS Mortgage-Backed
Securities Trust 2020-PJ1
A4, 3.500%, 05/25/2050 | | | | $ | 375,238 | | | | | | 0.0 | | |
| 1,057,743 (1)(4) | | | GS Mortgage-Backed
Securities Trust 2020-PJ1
A8, 3.500%, 05/25/2050 | | | | | 953,363 | | | | | | 0.1 | | |
| 3,603,378 (1)(4) | | | GS Mortgage-Backed
Securities Trust 2020-PJ1
B3, 3.641%, 05/25/2050 | | | | | 2,892,933 | | | | | | 0.2 | | |
| 973,392 (1)(4) | | | GS Mortgage-Backed
Securities Trust 2021-GR3
B3, 3.388%, 04/25/2052 | | | | | 701,127 | | | | | | 0.0 | | |
| 973,748 (1)(4) | | | GS Mortgage-Backed
Securities Trust 2021-GR3
B4, 3.388%, 04/25/2052 | | | | | 622,665 | | | | | | 0.0 | | |
| 2,571,093 (1)(4) | | | GS Mortgage-Backed
Securities Trust 2021-PJ9
A4, 2.500%, 02/26/2052 | | | | | 2,037,884 | | | | | | 0.1 | | |
| 2,496,215 (1)(4) | | | GS Mortgage-Backed
Securities Trust 2022-NQM1
A4, 4.000%, 05/25/2062 | | | | | 2,272,308 | | | | | | 0.1 | | |
| 336,888 | | | HarborView Mortgage Loan
Trust 2007-5 A1A, 4.951%,
(US0001M + 0.190)%,
09/19/2037 | | | | | 286,407 | | | | | | 0.0 | | |
| 4,769,000 (1) | | | Home RE 2019-1 M2 Ltd.,
8.095%, (US0001M +
3.250)%, 05/25/2029 | | | | | 4,810,365 | | | | | | 0.3 | | |
| 1,135 | | | HomeBanc Mortgage Trust
2004-1 2A, 5.705%,
(US0001M + 0.860)%,
08/25/2029 | | | | | 1,063 | | | | | | 0.0 | | |
| 2,600,000 (1)(4) | | | Imperial Fund Mortgage
Trust 2021-NQM4 M1,
3.446%, 01/25/2057 | | | | | 1,823,715 | | | | | | 0.1 | | |
| 2,334,030 (1)(4)(5) | | | Imperial Fund Mortgage
Trust 2022-NQM3 A1,
4.380% (Step Rate @
5.380% on 04/01/2026),
05/25/2067 | | | | | 2,244,376 | | | | | | 0.1 | | |
| 53,584 | | | IndyMac INDX Mortgage
Loan Trust 2006-AR2 1A1B,
5.265%, (US0001M +
0.420)%, 04/25/2046 | | | | | 43,501 | | | | | | 0.0 | | |
| 81,321 (1)(4) | | | J.P. Morgan Mortgage Trust
2019-2 A3, 4.000%,
08/25/2049 | | | | | 78,565 | | | | | | 0.0 | | |
| 1,046,050 (1)(4) | | | J.P. Morgan Mortgage Trust
2019-2 B1, 4.476%,
08/25/2049 | | | | | 980,301 | | | | | | 0.1 | | |
See Accompanying Notes to Financial Statements
| Voya Strategic Income | PORTFOLIO OF INVESTMENTS |
| Opportunities Fund | as of March 31, 2023 (continued) |
Principal
Amount† | | | Value | | | Percentage
of Net
Assets | |
| COLLATERALIZED MORTGAGE OBLIGATIONS: (continued) | |
| 2,534,483 (1)(4) | | | J.P. Morgan Mortgage Trust
2019-2 B2, 4.476%,
08/25/2049 | | | | $ | 2,211,307 | | | | | | 0.1 | | |
| 1,448,232 (1)(4) | | | J.P. Morgan Mortgage Trust
2019-LTV1 B2, 4.635%,
06/25/2049 | | | | | 1,365,833 | | | | | | 0.1 | | |
| 2,430,792 (1)(4) | | | J.P. Morgan Mortgage Trust
2021-14 B4, 3.160%,
05/25/2052 | | | | | 1,551,163 | | | | | | 0.1 | | |
| 945,404 (1)(4) | | | J.P. Morgan Mortgage Trust
2022-5 A9, 2.800%,
09/25/2052 | | | | | 776,883 | | | | | | 0.0 | | |
| 1,553,516 (4) | | | JP Morgan Mortgage Trust
2005-A4 B1, 3.701%,
07/25/2035 | | | | | 1,374,469 | | | | | | 0.1 | | |
| 71,012 | | | JP Morgan Mortgage Trust
2005-S3 1A10, 6.000%,
01/25/2036 | | | | | 36,794 | | | | | | 0.0 | | |
| 155,171 | | | JP Morgan Mortgage Trust
2006-S2 1A18, 6.000%,
07/25/2036 | | | | | 90,556 | | | | | | 0.0 | | |
| 395,583 | | | JP Morgan Mortgage Trust
2006-S3 1A30, 6.500%,
08/25/2036 | | | | | 166,691 | | | | | | 0.0 | | |
| 784,352 (1)(4) | | | JP Morgan Mortgage Trust
2014-5 B3, 2.780%,
10/25/2029 | | | | | 688,797 | | | | | | 0.0 | | |
| 463,921 (1)(4) | | | JP Morgan Mortgage Trust
2016-1 B3, 3.799%,
05/25/2046 | | | | | 417,517 | | | | | | 0.0 | | |
| 2,095,000 (1)(4) | | | JP Morgan Mortgage Trust
2016-1 B4, 3.799%,
05/25/2046 | | | | | 1,487,215 | | | | | | 0.1 | | |
| 373,387 (1)(4) | | | JP Morgan Mortgage Trust
2016-4 A13, 3.500%,
10/25/2046 | | | | | 340,002 | | | | | | 0.0 | | |
| 820,383 (1)(4) | | | JP Morgan Mortgage Trust
2017-1 B4, 3.448%,
01/25/2047 | | | | | 682,877 | | | | | | 0.0 | | |
| 1,333,628 (1)(4) | | | JP Morgan Mortgage Trust
2017-3 B1, 3.748%,
08/25/2047 | | | | | 1,195,261 | | | | | | 0.1 | | |
| 1,850,724 (1)(4) | | | JP Morgan Mortgage Trust
2017-5 B1, 3.300%,
10/26/2048 | | | | | 1,675,117 | | | | | | 0.1 | | |
| 528,875 (1)(4) | | | JP Morgan Mortgage Trust
2017-6 B3, 3.782%,
12/25/2048 | | | | | 446,898 | | | | | | 0.0 | | |
| 1,493,302 (1)(4) | | | JP Morgan Mortgage Trust
2017-6 B4, 3.782%,
12/25/2048 | | | | | 1,250,693 | | | | | | 0.1 | | |
Principal
Amount† | | | Value | | | Percentage
of Net
Assets | |
| COLLATERALIZED MORTGAGE OBLIGATIONS: (continued) | |
| 1,023,941 (1)(4) | | | JP Morgan Mortgage Trust
2017-6 B5, 3.782%,
12/25/2048 | | | | $ | 755,961 | | | | | | 0.0 | | |
| 2,169,005 (1)(4) | | | JP Morgan Mortgage Trust
2018-1 B2, 3.613%,
06/25/2048 | | | | | 1,838,864 | | | | | | 0.1 | | |
| 2,216,810 (1)(4) | | | JP Morgan Mortgage Trust
2018-3 B3, 3.711%,
09/25/2048 | | | | | 1,889,096 | | | | | | 0.1 | | |
| 445,035 (1)(4) | | | JP Morgan Mortgage Trust
2018-4 B2, 3.713%,
10/25/2048 | | | | | 386,688 | | | | | | 0.0 | | |
| 1,806,458 (1)(4) | | | JP Morgan Mortgage Trust
2018-5 A13, 3.500%,
10/25/2048 | | | | | 1,571,118 | | | | | | 0.1 | | |
| 106,654 (1)(4) | | | JP Morgan Mortgage Trust
2018-6 1A10, 3.500%,
12/25/2048 | | | | | 95,190 | | | | | | 0.0 | | |
| 169,143 (1)(4) | | | JP Morgan Mortgage Trust
2018-8 A3, 4.000%,
01/25/2049 | | | | | 158,479 | | | | | | 0.0 | | |
| 7,760,079 (1)(4) | | | JP Morgan Mortgage Trust
2018-8 B1, 4.047%,
01/25/2049 | | | | | 6,726,026 | | | | | | 0.4 | | |
| 3,616,488 (1)(4) | | | JP Morgan Mortgage Trust
2018-8 B2, 4.047%,
01/25/2049 | | | | | 3,114,904 | | | | | | 0.2 | | |
| 917,223 (1)(4) | | | JP Morgan Mortgage Trust
2018-9 B2, 4.223%,
02/25/2049 | | | | | 815,140 | | | | | | 0.1 | | |
| 1,812,818 (1)(4) | | | JP Morgan Mortgage Trust
2018-9 B3, 4.223%,
02/25/2049 | | | | | 1,576,660 | | | | | | 0.1 | | |
| 211,592 (1)(4) | | | JP Morgan Mortgage Trust
2019-1 A3, 4.000%,
05/25/2049 | | | | | 198,276 | | | | | | 0.0 | | |
| 462,762 (1)(4) | | | JP Morgan Mortgage Trust
2019-5 A3, 4.000%,
11/25/2049 | | | | | 435,348 | | | | | | 0.0 | | |
| 2,778,534 (1)(4) | | | JP Morgan Mortgage Trust
2019-5 B1, 4.482%,
11/25/2049 | | | | | 2,607,097 | | | | | | 0.1 | | |
| 4,636,297 (1)(4) | | | JP Morgan Mortgage Trust
2019-5 B2, 4.482%,
11/25/2049 | | | | | 4,265,971 | | | | | | 0.2 | | |
| 115,936 (1)(4) | | | JP Morgan Mortgage Trust
2019-6 A3, 3.500%,
12/25/2049 | | | | | 105,852 | | | | | | 0.0 | | |
| 6,043,318 (1)(4) | | | JP Morgan Mortgage Trust
2019-6 B2, 4.234%,
12/25/2049 | | | | | 5,582,223 | | | | | | 0.3 | | |
See Accompanying Notes to Financial Statements
| Voya Strategic Income | PORTFOLIO OF INVESTMENTS |
| Opportunities Fund | as of March 31, 2023 (continued) |
Principal
Amount† | | | Value | | | Percentage
of Net
Assets | |
| COLLATERALIZED MORTGAGE OBLIGATIONS: (continued) | |
| 919,422 (1)(4) | | | JP Morgan Mortgage Trust
2019-7 B3A, 3.250%,
02/25/2050 | | | | $ | 743,730 | | | | | | 0.0 | | |
| 453,759 (1)(4) | | | JP Morgan Mortgage Trust
2019-8 A15, 3.500%,
03/25/2050 | | | | | 409,288 | | | | | | 0.0 | | |
| 931,724 (1)(4) | | | JP Morgan Mortgage Trust
2019-8 B3A, 3.416%,
03/25/2050 | | | | | 775,473 | | | | | | 0.0 | | |
| 3,708,808 (1)(4) | | | JP Morgan Mortgage Trust
2019-INV1 B2, 4.967%,
10/25/2049 | | | | | 3,440,507 | | | | | | 0.2 | | |
| 276,031 (1)(4) | | | JP Morgan Mortgage Trust
2019-INV2 A15, 3.500%,
02/25/2050 | | | | | 249,549 | | | | | | 0.0 | | |
| 3,952,207 (1)(4) | | | JP Morgan Mortgage Trust
2019-INV3 B3, 4.382%,
05/25/2050 | | | | | 3,399,693 | | | | | | 0.2 | | |
| 41,896 (1)(4) | | | JP Morgan Mortgage Trust
2019-LTV2 A18, 4.000%,
12/25/2049 | | | | | 41,417 | | | | | | 0.0 | | |
| 1,837,328 (1)(4) | | | JP Morgan Mortgage Trust
2019-LTV2 B2, 4.685%,
12/25/2049 | | | | | 1,737,681 | | | | | | 0.1 | | |
| 1,862,472 (1)(4) | | | JP Morgan Mortgage Trust
2019-LTV2 B3, 4.685%,
12/25/2049 | | | | | 1,751,283 | | | | | | 0.1 | | |
| 2,633,646 (1)(4) | | | JP Morgan Mortgage Trust
2019-LTV3 B2, 4.395%,
03/25/2050 | | | | | 2,331,298 | | | | | | 0.1 | | |
| 6,130,241 (1)(4) | | | JP Morgan Mortgage Trust
2019-LTV3 B3, 4.395%,
03/25/2050 | | | | | 5,352,593 | | | | | | 0.3 | | |
| 295,763 (1)(4) | | | JP Morgan Mortgage Trust
2020-2 A15, 3.500%,
07/25/2050 | | | | | 264,394 | | | | | | 0.0 | | |
| 2,921,623 (1)(4) | | | JP Morgan Mortgage Trust
2020-3 B2, 3.847%,
08/25/2050 | | | | | 2,506,436 | | | | | | 0.1 | | |
| 4,709,102 (1)(4) | | | JP Morgan Mortgage Trust
2020-4 B1, 3.649%,
11/25/2050 | | | | | 3,994,281 | | | | | | 0.2 | | |
| 1,695,277 (1)(4) | | | JP Morgan Mortgage Trust
2020-4 B2, 3.649%,
11/25/2050 | | | | | 1,397,575 | | | | | | 0.1 | | |
| 156,661 (1)(4) | | | JP Morgan Mortgage Trust
2020-LTV1 A15, 3.500%,
06/25/2050 | | | | | 150,506 | | | | | | 0.0 | | |
| 809,311 (1)(4) | | | JP Morgan Mortgage Trust
2020-LTV1 A5, 3.500%,
06/25/2050 | | | | | 777,843 | | | | | | 0.1 | | |
Principal
Amount† | | | Value | | | Percentage
of Net
Assets | |
| COLLATERALIZED MORTGAGE OBLIGATIONS: (continued) | |
| 2,474,094 (1)(4) | | | JP Morgan Mortgage Trust
2022-2 B3, 3.133%,
08/25/2052 | | | | $ | 1,744,284 | | | | | | 0.1 | | |
| 569,684 (1)(4) | | | JP Morgan Trust 2015-3 B3,
3.595%, 05/25/2045 | | | | | 507,342 | | | | | | 0.0 | | |
| 1,327,529 (1)(4) | | | JP Morgan Trust 2015-3 B4,
3.595%, 05/25/2045 | | | | | 925,007 | | | | | | 0.1 | | |
| 1,221,277,201 (1)(6) | | | L Street Securities
2017-PM1 XIO, 0.000%,
10/25/2048 | | | | | 3,494,429 | | | | | | 0.2 | | |
| 72,027 | | | Lehman XS Trust
Series 2005-5N 1A2,
5.205%, (US0001M +
0.360)%, 11/25/2035 | | | | | 67,248 | | | | | | 0.0 | | |
| 1,822,544 (1)(4) | | | Mello Mortgage Capital
Acceptance 2021-MTG3 B3,
2.901%, 07/01/2051 | | | | | 1,333,513 | | | | | | 0.1 | | |
| 2,805,569 (1)(4) | | | Mello Mortgage Capital
Acceptance 2022-INV1 B3,
3.324%, 03/25/2052 | | | | | 1,994,758 | | | | | | 0.1 | | |
| 2,000,000 (1)(4) | | | MFA 2021-INV2 M1 Trust,
3.199%, 11/25/2056 | | | | | 1,438,853 | | | | | | 0.1 | | |
| 655,000 | | | Morgan Stanley Mortgage
Loan Trust 2005-5AR 1B1,
6.645%, (US0001M +
1.800)%, 09/25/2035 | | | | | 630,548 | | | | | | 0.0 | | |
| 999,825 | | | Morgan Stanley Mortgage
Loan Trust 2006-9AR A2,
5.145%, (US0001M +
0.150)%, 08/25/2036 | | | | | 294,458 | | | | | | 0.0 | | |
| 6,000,000 (1) | | | Mortgage Insurance-Linked
Notes 2021-3 M1B, 7.460%,
(SOFR30A + 2.900)%,
02/25/2034 | | | | | 5,854,976 | | | | | | 0.3 | | |
| 335,198 (1)(4) | | | New Residential Mortgage
Loan Trust 2017-3A B2,
4.750%, 04/25/2057 | | | | | 320,308 | | | | | | 0.0 | | |
| 1,300,000 (1) | | | Oaktown Re VII Ltd. 2021-2
M1C, 7.910%, (SOFR30A +
3.350)%, 04/25/2034 | | | | | 1,261,038 | | | | | | 0.1 | | |
| 225,932 (1)(4) | | | OBX 2019-EXP3 1A9 Trust,
3.500%, 10/25/2059 | | | | | 209,478 | | | | | | 0.0 | | |
| 373,660 (1)(4) | | | OBX 2019-INV2 A25 Trust,
4.000%, 05/27/2049 | | | | | 350,264 | | | | | | 0.0 | | |
| 279,568 (1)(4) | | | OBX 2020-INV1 A21 Trust,
3.500%, 12/25/2049 | | | | | 248,950 | | | | | | 0.0 | | |
| 1,876,550 (1)(4) | | | OBX 2022-J1 A14 Trust,
2.500%, 02/25/2052 | | | | | 1,482,707 | | | | | | 0.1 | | |
See Accompanying Notes to Financial Statements
| Voya Strategic Income | PORTFOLIO OF INVESTMENTS |
| Opportunities Fund | as of March 31, 2023 (continued) |
Principal
Amount† | | | Value | | | Percentage
of Net
Assets | |
| COLLATERALIZED MORTGAGE OBLIGATIONS: (continued) | |
| 2,500,000 (1)(4)(5) | | | OBX 2022-NQM4 A1B
Trust, 3.900% (Step Rate @
4.900% on 04/01/2026),
04/25/2062 | | | | $ | 2,207,071 | | | | | | 0.1 | | |
| 2,193,324 (1)(4) | | | Oceanview Mortgage Trust
2021-1 B3, 2.724%,
05/25/2051 | | | | | 1,535,843 | | | | | | 0.1 | | |
| 2,871,798 (1)(4) | | | Onslow Bay Mortgage Loan
Trust 2021-NQM4 A1,
1.957%, 10/25/2061 | | | | | 2,343,788 | | | | | | 0.1 | | |
| 17,888 | | | Prime Mortgage Trust
2007-1 A4, 5.500%,
03/25/2037 | | | | | 15,009 | | | | | | 0.0 | | |
| 153,559 (1)(4) | | | PSMC 2019-3 A12 Trust,
3.500%, 11/25/2049 | | | | | 147,268 | | | | | | 0.0 | | |
| 6,856,000 (1) | | | Radnor RE 2021-1 M1C
Ltd., 7.260%, (SOFR30A +
2.700)%, 12/27/2033 | | | | | 6,782,374 | | | | | | 0.4 | | |
| 3,559,065 (1)(4) | | | RCKT Mortgage Trust
2019-1 B1A, 3.830%,
09/25/2049 | | | | | 3,236,600 | | | | | | 0.2 | | |
| 2,310,805 (1)(4) | | | RCKT Mortgage Trust
2019-1 B2A, 3.830%,
09/25/2049 | | | | | 2,088,319 | | | | | | 0.1 | | |
| 1,559,678 (1)(4) | | | RCKT Mortgage Trust
2020-1 B2A, 3.470%,
02/25/2050 | | | | | 1,306,011 | | | | | | 0.1 | | |
| 2,556,097 (1)(4) | | | RCKT Mortgage Trust
2021-4 A21, 2.500%,
09/25/2051 | | | | | 2,023,516 | | | | | | 0.1 | | |
| 5,429,747 (1)(4) | | | RCKT Mortgage Trust
2021-6 B3, 2.796%,
12/25/2051 | | | | | 3,593,894 | | | | | | 0.2 | | |
| 962,280 (1)(4) | | | RCKT Mortgage Trust
2022-3 A21, 3.000%,
05/25/2052 | | | | | 795,555 | | | | | | 0.1 | | |
| 884,023 (1) | | | Sequoia Mortgage Trust
2013-9 B2, 3.500%,
07/25/2043 | | | | | 819,652 | | | | | | 0.1 | | |
| 558,828 (1)(4) | | | Sequoia Mortgage Trust
2015-1 B1, 3.913%,
01/25/2045 | | | | | 532,102 | | | | | | 0.0 | | |
| 1,383,134 (1)(4) | | | Sequoia Mortgage Trust
2017-1 B2, 3.605%,
02/25/2047 | | | | | 1,229,588 | | | | | | 0.1 | | |
| 1,108,548 (1)(4) | | | Sequoia Mortgage Trust
2018-6 B1, 4.168%,
07/25/2048 | | | | | 1,001,339 | | | | | | 0.1 | | |
| 528,647 (1)(4) | | | Sequoia Mortgage Trust
2018-CH1 B2B, 4.445%,
03/25/2048 | | | | | 483,514 | | | | | | 0.0 | | |
Principal
Amount† | | | Value | | | Percentage
of Net
Assets | |
| COLLATERALIZED MORTGAGE OBLIGATIONS: (continued) | |
| 1,621,668 (1)(4) | | | Sequoia Mortgage Trust
2019-2 B2, 4.261%,
06/25/2049 | | | | $ | 1,471,952 | | | | | | 0.1 | | |
| 1,533,432 (1)(4) | | | Sequoia Mortgage Trust
2019-2 B3, 4.261%,
06/25/2049 | | | | | 1,344,248 | | | | | | 0.1 | | |
| 1,996,761 (1)(4) | | | Sequoia Mortgage Trust
2019-5 B2, 3.719%,
12/25/2049 | | | | | 1,722,994 | | | | | | 0.1 | | |
| 1,997,679 (1)(4) | | | Sequoia Mortgage Trust
2019-5 B3, 3.719%,
12/25/2049 | | | | | 1,689,989 | | | | | | 0.1 | | |
| 838,316 (1)(4) | | | Sequoia Mortgage Trust
2019-CH1 B2B, 4.861%,
03/25/2049 | | | | | 820,920 | | | | | | 0.1 | | |
| 92,837 (1)(4) | | | Sequoia Mortgage Trust
2019-CH2 A1, 4.500%,
08/25/2049 | | | | | 91,392 | | | | | | 0.0 | | |
| 185,962 (1)(4) | | | Sequoia Mortgage Trust
2019-CH3 A13, 4.000%,
09/25/2049 | | | | | 175,595 | | | | | | 0.0 | | |
| 1,865,742 (1)(4) | | | Sequoia Mortgage Trust
2019-CH3 B1B, 4.503%,
09/25/2049 | | | | | 1,698,030 | | | | | | 0.1 | | |
| 189,994 (1)(4) | | | Sequoia Mortgage Trust
2020-1 A1, 3.500%,
02/25/2050 | | | | | 170,908 | | | | | | 0.0 | | |
| 1,416,794 (1)(4) | | | Sequoia Mortgage Trust
2020-2 B3, 3.640%,
03/25/2050 | | | | | 1,149,355 | | | | | | 0.1 | | |
| 553,217 (1)(4) | | | Sequoia Mortgage Trust
2021-3 B3, 2.651%,
05/25/2051 | | | | | 390,819 | | | | | | 0.0 | | |
| 1,203,746 (1)(4) | | | Sequoia Mortgage Trust
2021-5 B3, 3.050%,
07/25/2051 | | | | | 786,715 | | | | | | 0.1 | | |
| 1,088,074 (1)(4) | | | Sequoia Mortgage Trust
2022-1 B3, 2.947%,
02/25/2052 | | | | | 708,600 | | | | | | 0.0 | | |
| 2,185,603 (1)(4) | | | Shellpoint Co-Originator
Trust 2017-2 B2, 3.640%,
10/25/2047 | | | | | 1,980,311 | | | | | | 0.1 | | |
| 2,897,416 (1)(4) | | | Shellpoint Co-Originator
Trust 2017-2 B3, 3.640%,
10/25/2047 | | | | | 2,598,154 | | | | | | 0.1 | | |
| 2,000,000 (1)(4) | | | Starwood Mortgage
Residential Trust 2022-2 M1,
4.200%, 02/25/2067 | | | | | 1,407,383 | | | | | | 0.1 | | |
| 26,331 (4) | | | Structured Adjustable Rate
Mortgage Loan Trust 2005-4
3A1, 4.708%, 03/25/2035 | | | | | 23,388 | | | | | | 0.0 | | |
See Accompanying Notes to Financial Statements
| Voya Strategic Income | PORTFOLIO OF INVESTMENTS |
| Opportunities Fund | as of March 31, 2023 (continued) |
Principal
Amount† | | | Value | | | Percentage
of Net
Assets | |
| COLLATERALIZED MORTGAGE OBLIGATIONS: (continued) | |
| 2,472,212 (1)(4) | | | UWM Mortgage Trust
2021-INV4 B3, 3.228%,
12/25/2051 | | | | $ | 1,713,164 | | | | | | 0.1 | | |
| 56,371 (4) | | | WaMu Mortgage Pass
Through Certificates
Series 2006-AR12 2A3,
3.187%, 10/25/2036 | | | | | 49,582 | | | | | | 0.0 | | |
| 121,442 (4) | | | WaMu Mortgage
Pass-Through Certificates
Series 2004-AR4 A6 Trust,
3.470%, 06/25/2034 | | | | | 113,433 | | | | | | 0.0 | | |
| 822,549 (4) | | | WaMu Mortgage
Pass-Through Certificates
Series 2004-AR7 A6,
3.495%, 07/25/2034 | | | | | 763,371 | | | | | | 0.0 | | |
| 65,739,711 (4)(6) | | | WaMu Mortgage
Pass-Through Certificates
Series 2005-AR1 X Trust,
0.229%, 01/25/2045 | | | | | 661 | | | | | | 0.0 | | |
| 139,278 (4) | | | WaMu Mortgage
Pass-Through Certificates
Series 2005-AR10 1A3,
3.847%, 09/25/2035 | | | | | 121,693 | | | | | | 0.0 | | |
| 24,248,088 (4)(6) | | | WaMu Mortgage
Pass-Through Certificates
Series 2005-AR2 X Trust,
0.148%, 01/25/2045 | | | | | 244 | | | | | | 0.0 | | |
| 11,678 (4) | | | WaMu Mortgage
Pass-Through Certificates
Series 2006-AR12 1A1,
3.805%, 10/25/2036 | | | | | 10,257 | | | | | | 0.0 | | |
| 74,736 (4) | | | WaMu Mortgage
Pass-Through Certificates
Series 2006-AR14 1A3,
3.342%, 11/25/2036 | | | | | 62,230 | | | | | | 0.0 | | |
| 287,218 (4) | | | WaMu Mortgage
Pass-Through Certificates
Series 2006-AR14 1A4,
3.342%, 11/25/2036 | | | | | 239,154 | | | | | | 0.0 | | |
| 40,661 (4) | | | WaMu Mortgage
Pass-Through Certificates
Series 2006-AR8 1A4,
3.680%, 08/25/2046 | | | | | 35,120 | | | | | | 0.0 | | |
| 70,439 (4) | | | WaMu Mortgage
Pass-Through Certificates
Series 2007-HY2 1A1,
3.489%, 12/25/2036 | | | | | 61,378 | | | | | | 0.0 | | |
| 368,235 (4) | | | WaMu Mortgage
Pass-Through Certificates
Series 2007-HY3 1A1,
3.462%, 03/25/2037 | | | | | 284,644 | | | | | | 0.0 | | |
Principal
Amount† | | | Value | | | Percentage
of Net
Assets | |
| COLLATERALIZED MORTGAGE OBLIGATIONS: (continued) | |
| 45,115 (4) | | | WaMu Mortgage
Pass-Through Certificates
Series 2007-HY7 2A2,
3.366%, 07/25/2037 | | | | $ | 37,062 | | | | | | 0.0 | | |
| 432,052 | | | Washington Mutual
Mortgage Pass-Through
Certificates WMALT
Series 2005-10 2A3,
5.745%, (US0001M +
0.900)%, 11/25/2035 | | | | | 369,004 | | | | | | 0.0 | | |
| 458,111 | | | Washington Mutual
Mortgage Pass-Through
Certificates WMALT
Series 2005-10 2A9,
6.000%, 11/25/2035 | | | | | 436,488 | | | | | | 0.0 | | |
| 411,905 | | | Washington Mutual
Mortgage Pass-Through
Certificates WMALT
Series 2005-11 A1, 5.750%,
01/25/2036 | | | | | 342,044 | | | | | | 0.0 | | |
| 517,764 | | | Washington Mutual
Mortgage Pass-Through
Certificates WMALT
Series 2005-5 CB3, 5.500%,
07/25/2035 | | | | | 469,467 | | | | | | 0.0 | | |
| 96,173 | | | Washington Mutual
Mortgage Pass-Through
Certificates WMALT
Series 2005-8 1A2, 5.500%,
10/25/2035 | | | | | 90,563 | | | | | | 0.0 | | |
| 602,130 | | | Washington Mutual
Mortgage Pass-Through
Certificates WMALT
Series 2006-5 2CB2,
5.445%, (US0001M +
0.600)%, 07/25/2036 | | | | | 341,991 | | | | | | 0.0 | | |
| 1,626,151 | | | Washington Mutual
Mortgage Pass-Through
Certificates WMALT
Series 2006-AR5 3A Trust,
4.078%, (12MTA + 0.940)%,
07/25/2046 | | | | | 981,006 | | | | | | 0.1 | | |
| 656,271 | | | Washington Mutual
Mortgage Pass-Through
Certificates WMALT
Series 2006-AR6 2A,
4.098%, (12MTA + 0.960)%,
08/25/2046 | | �� | | | 397,694 | | | | | | 0.0 | | |
See Accompanying Notes to Financial Statements
| Voya Strategic Income | PORTFOLIO OF INVESTMENTS |
| Opportunities Fund | as of March 31, 2023 (continued) |
Principal
Amount† | | | Value | | | Percentage
of Net
Assets | |
| COLLATERALIZED MORTGAGE OBLIGATIONS: (continued) | |
| 20,292 | | | Wells Fargo Alternative Loan
2007-PA2 2A1, 5.275%,
(US0001M + 0.430)%,
06/25/2037 | | | | $ | 16,277 | | | | | | 0.0 | | |
| 435,505 (4) | | | Wells Fargo Mortgage
Backed Securities
2006-AR12 1A1, 4.093%,
09/25/2036 | | | | | 385,351 | | | | | | 0.0 | | |
| 90,296 (4) | | | Wells Fargo Mortgage
Backed Securities
2007-AR7 A1, 4.330%,
12/28/2037 | | | | | 77,593 | | | | | | 0.0 | | |
| 1,344,784 (1)(4) | | | Wells Fargo Mortgage
Backed Securities 2018-1
B3, 3.639%, 07/25/2047 | | | | | 1,130,895 | | | | | | 0.1 | | |
| 1,496,127 (1)(4) | | | Wells Fargo Mortgage
Backed Securities 2019-4
B3 Trust, 3.515%,
09/25/2049 | | | | | 996,041 | | | | | | 0.1 | | |
| 1,895,985 (1)(4) | | | Wells Fargo Mortgage
Backed Securities 2020-1
B3 Trust, 3.368%,
12/25/2049 | | | | | 1,539,434 | | | | | | 0.1 | | |
| 2,801,339 (1)(4) | | | Wells Fargo Mortgage
Backed Securities 2020-4
B2 Trust, 3.161%,
07/25/2050 | | | | | 2,300,762 | | | | | | 0.1 | | |
| 1,934,582 (1)(4) | | | Wells Fargo Mortgage
Backed Securities 2021-1
B3 Trust, 2.711%,
12/25/2050 | | | | | 1,279,543 | | | | | | 0.1 | | |
| 389,127 (1)(4) | | | WinWater Mortgage Loan
Trust 2015-5 B4, 3.756%,
08/20/2045 | | | | | 348,907 | | | | | | 0.0 | | |
| | | | Total Collateralized
Mortgage Obligations | | | | | | | | | | | | | |
| | | | (Cost $552,304,313) | | | | | 483,999,970 | | | | | | 26.1 | | |
| SOVEREIGN BONDS: 3.6% | |
BRL 9,850,000 | | | Brazil Notas do Tesouro
Nacional Serie B, 6.000%,
05/15/2055 | | | | | 7,892,161 | | | | | | 0.4 | | |
BRL 10,600,000 | | | Brazil Notas do Tesouro
Nacional Series B, 6.000%,
08/15/2050 | | | | | 8,351,796 | | | | | | 0.4 | | |
| 1,000,000 | | | Colombia Government
International Bond, 5.200%,
05/15/2049 | | | | | 700,364 | | | | | | 0.0 | | |
| 3,000,000 | | | Colombia Government
International Bond, 7.500%,
02/02/2034 | | | | | 2,954,544 | | | | | | 0.2 | | |
Principal
Amount† | | | Value | | | Percentage
of Net
Assets | |
| SOVEREIGN BONDS: (continued) | |
MXN 385,750,000 | | | Mexican Bonos, 7.750%,
05/29/2031 | | | | $ | 20,098,817 | | | | | | 1.1 | | |
| 1,200,000 (2) | | | Mexico Government
International Bond, 3.250%,
04/16/2030 | | | | | 1,077,322 | | | | | | 0.1 | | |
| 700,000 | | | Mexico Government
International Bond, 3.750%,
04/19/2071 | | | | | 467,313 | | | | | | 0.0 | | |
| 1,600,000 | | | Mexico Government
International Bond, 4.500%,
04/22/2029 | | | | | 1,564,896 | | | | | | 0.1 | | |
| 600,000 | | | Oman Government
International Bond, 6.000%,
08/01/2029 | | | | | 604,804 | | | | | | 0.0 | | |
| 500,000 (1) | | | Oman Government
International Bond, 6.750%,
10/28/2027 | | | | | 523,317 | | | | | | 0.0 | | |
| 1,300,000 (1) | | | Oman Government
International Bond, 7.375%,
10/28/2032 | | | | | 1,421,621 | | | | | | 0.1 | | |
| 600,000 | | | Panama Government
International Bond,
3.160%, 01/23/2030 | | | | | 528,117 | | | | | | 0.0 | | |
| 1,200,000 (2) | | | Panama Government
International Bond,
3.298%, 01/19/2033 | | | | | 1,004,813 | | | | | | 0.1 | | |
ZAR 300,750,000 | | | Republic of South Africa
Government Bond,
8.875%, 02/28/2035 | | | | | 14,497,822 | | | | | | 0.8 | | |
| 3,365,000 | | | Republic of South Africa
Government International
Bond, 4.850%, 09/30/2029 | | | | | 3,027,995 | | | | | | 0.2 | | |
| 800,000 (8) | | | Russian Foreign Bond -
Eurobond, 4.375%,
03/21/2029 | | | | | 48,000 | | | | | | 0.0 | | |
| 1,075,000 (1)(2) | | | Serbia International Bond,
6.500%, 09/26/2033 | | | | | 1,070,051 | | | | | | 0.1 | | |
| 450,000 (8) | | | Ukraine Government
International Bond, 7.375%,
09/25/2034 | | | | | 78,638 | | | | | | 0.0 | | |
| 975,000 (8) | | | Ukraine Government
International Bond, 7.750%,
09/01/2025 | | | | | 198,083 | | | | | | 0.0 | | |
| 4,550,000 (8) | | | Ukraine Government
International Bond, 7.750%,
09/01/2027 | | | | | 843,809 | | | | | | 0.0 | | |
| | | | Total Sovereign Bonds | | | | | | | | | | | | | |
| | | | (Cost $71,226,169) | | | | | 66,954,283 | | | | | | 3.6 | | |
| |
See Accompanying Notes to Financial Statements
| Voya Strategic Income | PORTFOLIO OF INVESTMENTS |
| Opportunities Fund | as of March 31, 2023 (continued) |
Principal
Amount† | | | Value | | | Percentage
of Net
Assets | |
| COMMERCIAL MORTGAGE-BACKED SECURITIES: 18.7% | |
| 555,000 (4) | | | BANK 2017-BNK4 C,
4.372%, 05/15/2050 | | | | $ | 465,239 | | | | | | 0.0 | | |
| 5,320,000 (1)(4)(6) | | | BANK 2017-BNK4 XE,
1.481%, 05/15/2050 | | | | | 247,436 | | | | | | 0.0 | | |
| 4,380,000 (1) | | | BANK 2017-BNK6 D,
3.100%, 07/15/2060 | | | | | 2,961,829 | | | | | | 0.2 | | |
| 1,600,000 (1)(4) | | | BANK 2017-BNK6 E,
2.628%, 07/15/2060 | | | | | 811,936 | | | | | | 0.0 | | |
| 16,600,000 (1)(4)(6) | | | BANK 2017-BNK6 XE,
1.500%, 07/15/2060 | | | | | 871,908 | | | | | | 0.0 | | |
| 49,742,555 (4)(6) | | | BANK 2019-BN17 XA,
1.009%, 04/15/2052 | | | | | 2,347,764 | | | | | | 0.1 | | |
| 9,886,293 (4)(6) | | | BANK 2019-BNK16 XA,
0.941%, 02/15/2052 | | | | | 402,652 | | | | | | 0.0 | | |
| 28,964,122 (4)(6) | | | Bank 2019-BNK19 XA,
0.948%, 08/15/2061 | | | | | 1,332,063 | | | | | | 0.1 | | |
| 57,976,729 (4)(6) | | | BANK 2019-BNK22 XA,
0.594%, 11/15/2062 | | | | | 1,811,323 | | | | | | 0.1 | | |
| 1,500,000 (4) | | | BANK 2019-BNK24 C,
3.518%, 11/15/2062 | | | | | 1,149,971 | | | | | | 0.1 | | |
| 10,698,609 (4)(6) | | | BBCMS Trust 2021-C10
XA, 1.295%, 07/15/2054 | | | | | 762,827 | | | | | | 0.0 | | |
| 102,729,263 (4)(6) | | | Benchmark 2018-B7 XA
Mortgage Trust, 0.425%,
05/15/2053 | | | | | 1,793,699 | | | | | | 0.1 | | |
| 52,613,401 (4)(6) | | | Benchmark 2019-B10 XA
Mortgage Trust, 1.220%,
03/15/2062 | | | | | 2,621,721 | | | | | | 0.1 | | |
| 42,285,000 (1)(4)(6) | | | BENCHMARK 2019-B10
XB Mortgage Trust, 0.899%,
03/15/2062 | | | | | 1,961,739 | | | | | | 0.1 | | |
| 42,085,320 (4)(6) | | | Benchmark 2019-B12 XA
Mortgage Trust, 1.032%,
08/15/2052 | | | | | 1,697,612 | | | | | | 0.1 | | |
| 3,090,000 (1) | | | Benchmark 2019-B9 D
Mortgage Trust, 3.000%,
03/15/2052 | | | | | 1,952,750 | | | | | | 0.1 | | |
| 7,330,000 (1)(4)(6) | | | Benchmark 2019-B9 XD
Mortgage Trust, 2.001%,
03/15/2052 | | | | | 689,624 | | | | | | 0.0 | | |
| 17,449,256 (4)(6) | | | Benchmark 2021-B24 XA
Mortgage Trust, 1.150%,
03/15/2054 | | | | | 1,039,976 | | | | | | 0.1 | | |
| 9,879,067 (4)(6) | | | Benchmark 2021-B28 XA
Mortgage Trust, 1.281%,
08/15/2054 | | | | | 702,619 | | | | | | 0.0 | | |
| 1,000,000 (1) | | | BLP Commercial Mortgage
Trust 2023-IND D, 8.067%,
(TSFR1M + 3.240)%,
03/15/2040 | | | | | 978,816 | | | | | | 0.1 | | |
Principal
Amount† | | | Value | | | Percentage
of Net
Assets | |
COMMERCIAL MORTGAGE-BACKED
SECURITIES: (continued) | |
| 2,653,000 (1)(7) | | | BMD2 Re-Remic Trust
2019-FRR1 3AB, 0.000%,
05/25/2052 | | | | $ | 1,673,828 | | | | | | 0.1 | | |
| 8,069,000 (1)(4) | | | BMD2 Re-Remic Trust
2019-FRR1 5B13, 2.205%,
05/25/2052 | | | | | 5,472,698 | | | | | | 0.3 | | |
| 3,002,000 (1)(4) | | | BMD2 Re-Remic Trust
2019-FRR1 6B10, 2.515%,
05/25/2052 | | | | | 2,080,748 | | | | | | 0.1 | | |
| 4,500,000 (1) | | | BPR Trust 2021-WILL D,
9.684%, (US0001M +
5.000)%, 06/15/2038 | | | | | 4,175,742 | | | | | | 0.2 | | |
| 5,289,582 (1) | | | BX Commercial Mortgage
Trust 2021-21M E, 6.855%,
(US0001M + 2.171)%,
10/15/2036 | | | | | 4,914,396 | | | | | | 0.3 | | |
| 3,474,004 (1) | | | BX Commercial Mortgage
Trust 2021-SOAR D,
6.085%, (US0001M +
1.400)%, 06/15/2038 | | | | | 3,266,427 | | | | | | 0.2 | | |
| 750,000 (1) | | | BX Commercial Mortgage
Trust 2021-VOLT D, 6.334%,
(US0001M + 1.650)%,
09/15/2036 | | | | | 706,758 | | | | | | 0.0 | | |
| 1,500,000 (1) | | | BX Commercial Mortgage
Trust 2021-VOLT F, 7.084%,
(US0001M + 2.400)%,
09/15/2036 | | | | | 1,384,708 | | | | | | 0.1 | | |
| 3,500,000 (1) | | | BX Trust 2021-LBA EJV,
6.943%, (TSFR1M +
2.000)%, 02/15/2036 | | | | | 3,176,526 | | | | | | 0.2 | | |
| 3,500,000 (1) | | | BX Trust 2021-LBA EV,
6.943%, (TSFR1M +
2.000)%, 02/15/2036 | | | | | 3,176,526 | | | | | | 0.2 | | |
| 1,000,000 (1) | | | BX Trust 2021-SDMF D,
6.071%, (US0001M +
1.387)%, 09/15/2034 | | | | | 940,404 | | | | | | 0.1 | | |
| 1,500,000 (1) | | | BX Trust 2021-SDMF E,
6.271%, (US0001M +
1.587)%, 09/15/2034 | | | | | 1,392,553 | | | | | | 0.1 | | |
| 976,928 (1) | | | BX Trust 2022-FOX2 C,
6.137%, (TSFR1M +
1.309)%, 04/15/2039 | | | | | 908,397 | | | | | | 0.0 | | |
| 1,180,000 (1) | | | BX Trust 2022-LBA6 C,
6.427%, (TSFR1M +
1.600)%, 01/15/2039 | | | | | 1,123,619 | | | | | | 0.1 | | |
| 1,000,000 (1) | | | BX Trust 2022-LBA6 D,
6.827%, (TSFR1M +
2.000)%, 01/15/2039 | | | | | 933,024 | | | | | | 0.1 | | |
See Accompanying Notes to Financial Statements
| Voya Strategic Income | PORTFOLIO OF INVESTMENTS |
| Opportunities Fund | as of March 31, 2023 (continued) |
Principal
Amount† | | | Value | | | Percentage
of Net
Assets | |
COMMERCIAL MORTGAGE-BACKED
SECURITIES: (continued) | |
| 1,500,000 (1) | | | BX Trust 2022-VAMF F,
8.126%, (TSFR1M +
3.299)%, 01/15/2039 | | | | $ | 1,385,727 | | | | | | 0.1 | | |
| 7,000,000 (1) | | | BX Trust 2023-LIFE C,
5.884%, 02/15/2028 | | | | | 6,740,535 | | | | | | 0.4 | | |
| 91,204,551 (4)(6) | | | Cantor Commercial Real
Estate Lending 2019-CF1
XA, 1.132%, 05/15/2052 | | | | | 4,318,303 | | | | | | 0.2 | | |
| 37,776,692 (4)(6) | | | Cantor Commercial Real
Estate Lending 2019-CF2
XA, 1.193%, 11/15/2052 | | | | | 2,010,372 | | | | | | 0.1 | | |
| 6,811,396 (4)(6) | | | CD 2016-CD1 Mortgage
Trust XA, 1.366%,
08/10/2049 | | | | | 220,797 | | | | | | 0.0 | | |
| 14,660,000 (1)(4)(6) | | | CD 2016-CD1 Mortgage
Trust XB, 0.694%,
08/10/2049 | | | | | 285,155 | | | | | | 0.0 | | |
| 1,000,000 (1)(4) | | | Citigroup Commercial
Mortgage Trust 2013-GC17
D, 5.115%, 11/10/2046 | | | | | 891,738 | | | | | | 0.0 | | |
| 4,126,000 (1)(4) | | | Citigroup Commercial
Mortgage Trust 2014-GC19
E, 4.589%, 03/11/2047 | | | | | 3,728,071 | | | | | | 0.2 | | |
| 6,540,000 (1)(4) | | | Citigroup Commercial
Mortgage Trust 2016-P4 E,
4.692%, 07/10/2049 | | | | | 4,163,981 | | | | | | 0.2 | | |
| 5,790,000 (1)(4) | | | Citigroup Commercial
Mortgage Trust 2016-P4 F,
4.692%, 07/10/2049 | | | | | 3,300,899 | | | | | | 0.2 | | |
| 8,661,000 (1) | | | Citigroup Commercial
Mortgage Trust 2016-P5 D,
3.000%, 10/10/2049 | | | | | 6,085,541 | | | | | | 0.3 | | |
| 23,250,923 (4)(6) | | | Citigroup Commercial
Mortgage Trust 2017-C4
XA, 1.027%, 10/12/2050 | | | | | 816,106 | | | | | | 0.0 | | |
| 33,576,166 (4)(6) | | | Citigroup Commercial
Mortgage Trust 2019-C7
XA, 0.866%, 12/15/2072 | | | | | 1,436,288 | | | | | | 0.1 | | |
| 40,323,889 (4)(6) | | | Citigroup Commercial
Mortgage Trust 2019-GC41
XA, 1.041%, 08/10/2056 | | | | | 1,791,822 | | | | | | 0.1 | | |
| 937,796 (4)(6) | | | COMM 2012-CR3 XA,
1.228%, 10/15/2045 | | | | | 1,995 | | | | | | 0.0 | | |
| 196,233 (4)(6) | | | COMM 2012-CR4 XA,
1.188%, 10/15/2045 | | | | | 373 | | | | | | 0.0 | | |
| 5,641,868 (1)(4)(6) | | | COMM 2012-LTRT XA,
0.788%, 10/05/2030 | | | | | 65,714 | | | | | | 0.0 | | |
| 1,670,000 (1)(4) | | | COMM 2013-CR10 E
Mortgage Trust, 4.867%,
08/10/2046 | | | | | 1,569,470 | | | | | | 0.1 | | |
Principal
Amount† | | | Value | | | Percentage
of Net
Assets | |
COMMERCIAL MORTGAGE-BACKED
SECURITIES: (continued) | |
| 3,460,000 (1)(4) | | | COMM 2013-CR10 F
Mortgage Trust, 4.867%,
08/10/2046 | | | | $ | 2,976,989 | | | | | | 0.2 | | |
| 9,580,472 (4)(6) | | | COMM 2016-COR1 XA,
1.307%, 10/10/2049 | | | | | 321,004 | | | | | | 0.0 | | |
| 2,000,000 (4) | | | COMM 2016-CR28 C
Mortgage Trust, 4.605%,
02/10/2049 | | | | | 1,820,413 | | | | | | 0.1 | | |
| 2,299,832 (4)(6) | | | COMM 2016-CR28 XA,
0.640%, 02/10/2049 | | | | | 34,703 | | | | | | 0.0 | | |
| 19,615,676 (4)(6) | | | COMM 2017-COR2 XA,
1.155%, 09/10/2050 | | | | | 744,305 | | | | | | 0.0 | | |
| 5,725,000 (1)(4) | | | COMM 2020-CBM F
Mortgage Trust, 3.633%,
02/10/2037 | | | | | 4,950,136 | | | | | | 0.3 | | |
| 2,792,000 (1) | | | CSAIL 2020-C19 E
Commercial Mortgage
Trust, 2.500%, 03/15/2053 | | | | | 1,396,617 | | | | | | 0.1 | | |
| 568,000 (1) | | | CSWF 2021-SOP2 D,
7.001%, (US0001M +
2.317)%, 06/15/2034 | | | | | 503,231 | | | | | | 0.0 | | |
| 1,432,000 (1) | | | CSWF 2021-SOP2 E,
8.051%, (US0001M +
3.367)%, 06/15/2034 | | | | | 1,253,519 | | | | | | 0.1 | | |
| 220,270 (1)(9) | | | DBUBS 2011-LC2A F
Mortgage Trust, 4.000%,
(US0001M + 3.650)%,
07/10/2044 | | | | | 219,683 | | | | | | 0.0 | | |
| 7,759,844 (1) | | | EQUS 2021-EQAZ C
Mortgage Trust, 6.034%,
(US0001M + 1.350)%,
10/15/2038 | | | | | 7,292,417 | | | | | | 0.4 | | |
| 976,192 (1) | | | Extended Stay America
Trust 2021-ESH E, 7.535%,
(US0001M + 2.850)%,
07/15/2038 | | | | | 925,353 | | | | | | 0.0 | | |
| 1,952,384 (1) | | | Extended Stay America
Trust 2021-ESH F, 8.385%,
(US0001M + 3.700)%,
07/15/2038 | | | | | 1,838,565 | | | | | | 0.1 | | |
| 2,400,000 (1)(4) | | | Fontainebleau Miami Beach
Trust 2019-FBLU F, 3.963%,
12/10/2036 | | | | | 2,196,470 | | | | | | 0.1 | | |
| 20,066,393 (4)(6) | | | Freddie Mac Multifamily
Structured Pass Through
Certificates K109 X1,
1.582%, 04/25/2030 | | | | | 1,734,174 | | | | | | 0.1 | | |
See Accompanying Notes to Financial Statements
| Voya Strategic Income | PORTFOLIO OF INVESTMENTS |
| Opportunities Fund | as of March 31, 2023 (continued) |
Principal
Amount† | | | Value | | | Percentage
of Net
Assets | |
COMMERCIAL MORTGAGE-BACKED
SECURITIES: (continued) | |
| 2,440,206 (4)(6) | | | Freddie Mac Multifamily
Structured Pass Through
Certificates K-1521 X1,
0.980%, 08/25/2036 | | | | $ | 203,442 | | | | | | 0.0 | | |
| 14,878,000 (1)(7) | | | FREMF 2019-KG01 C
Mortgage Trust, 0.000%,
05/25/2029 | | | | | 8,448,604 | | | | | | 0.5 | | |
| 189,331,096 (1)(6) | | | FREMF 2019-KG01 X2A
Mortgage Trust, 0.100%,
04/25/2029 | | | | | 636,418 | | | | | | 0.0 | | |
| 21,120,000 (1)(6) | | | FREMF 2019-KG01 X2B
Mortgage Trust, 0.100%,
05/25/2029 | | | | | 91,606 | | | | | | 0.0 | | |
| 2,000,000 (1)(4) | | | FRR Re-REMIC Trust
2018-C1 B725, 2.838%,
02/27/2050 | | | | | 1,877,974 | | | | | | 0.1 | | |
| 1,268,740 (1)(4)(10) | | | FRR Re-REMIC Trust
2018-C1 C725, 0.330%,
02/27/2050 | | | | | 1,162,380 | | | | | | 0.1 | | |
| 2,975,000 (1)(4) | | | GAM RE-REMIC TR
2021-FFR2 BK78, 2.420%,
09/27/2051 | | | | | 2,144,199 | | | | | | 0.1 | | |
| 2,263,000 (1)(7) | | | GAM RE-REMIC TR
2021-FFR2 C730, 0.000%,
09/27/2051 | | | | | 1,899,103 | | | | | | 0.1 | | |
| 2,751,000 (1)(7) | | | GAM RE-REMIC TR
2021-FFR2 CK44, 0.000%,
09/27/2051 | | | | | 2,290,466 | | | | | | 0.1 | | |
| 2,238,000 (1)(4) | | | GAM RE-REMIC TR
2021-FFR2 CK49, 1.040%,
09/27/2051 | | | | | 1,856,371 | | | | | | 0.1 | | |
| 1,900,000 (1)(7) | | | GAM RE-REMIC TR
2021-FFR2 CK78, 0.000%,
09/27/2051 | | | | | 1,108,108 | | | | | | 0.1 | | |
| 2,263,000 (1)(7) | | | GAM RE-REMIC TR
2021-FFR2 D730, 0.000%,
09/27/2051 | | | | | 1,897,633 | | | | | | 0.1 | | |
| 2,237,000 (1)(7) | | | GAM RE-REMIC TR
2021-FFR2 DK49, 0.000%,
09/27/2051 | | | | | 1,746,544 | | | | | | 0.1 | | |
| 3,000,000 (1)(7) | | | GAM Re-REMIC Trust
2021-FRR1 2D, 0.000%,
11/29/2050 | | | | | 1,558,420 | | | | | | 0.1 | | |
| 4,690,000 (1)(4) | | | GAM Resecuritization Trust
2022-FRR3 BK47, 2.030%,
11/27/2050 | | | | | 3,431,468 | | | | | | 0.2 | | |
| 3,192,000 (1)(10) | | | GAM Resecuritization Trust
2022-FRR3 BK61, 1.200%,
01/29/2052 | | | | | 2,257,899 | | | | | | 0.1 | | |
Principal
Amount† | | | Value | | | Percentage
of Net
Assets | |
COMMERCIAL MORTGAGE-BACKED
SECURITIES: (continued) | |
| 3,476,000 (1)(10) | | | GAM Resecuritization Trust
2022-FRR3 BK89, 1.830%,
01/27/2052 | | | | $ | 2,050,941 | | | | | | 0.1 | | |
| 1,815,000 (1)(10) | | | GAM Resecuritization Trust
2022-FRR3 C728, 0.510%,
08/27/2050 | | | | | 1,577,071 | | | | | | 0.1 | | |
| 1,850,000 (1)(10) | | | GAM Resecuritization Trust
2022-FRR3 CK47, 0.870%,
05/27/2048 | | | | | 1,487,208 | | | | | | 0.1 | | |
| 2,238,000 (1)(10) | | | GAM Resecuritization Trust
2022-FRR3 CK61, 1.480%,
11/27/2049 | | | | | 1,510,421 | | | | | | 0.1 | | |
| 1,563,000 (1)(4) | | | GAM Resecuritization Trust
2022-FRR3 CK71, 1.400%,
01/29/2052 | | | | | 1,070,865 | | | | | | 0.1 | | |
| 1,820,000 (1)(10) | | | GAM Resecuritization Trust
2022-FRR3 CK89, 2.040%,
01/27/2052 | | | | | 1,012,157 | | | | | | 0.1 | | |
| 1,816,000 (1)(10) | | | GAM Resecuritization Trust
2022-FRR3 D728, 0.560%,
01/29/2052 | | | | | 1,544,476 | | | | | | 0.1 | | |
| 1,462,000 (1)(10) | | | GAM Resecuritization Trust
2022-FRR3 DK41, 0.620%,
10/27/2047 | | | | | 1,255,165 | | | | | | 0.1 | | |
| 1,849,000 (1)(10) | | | GAM Resecuritization Trust
2022-FRR3 DK47, 0.970%,
05/27/2048 | | ��� | | | 1,449,204 | | | | | | 0.1 | | |
| 974,000 (1)(10) | | | GAM Resecuritization Trust
2022-FRR3 EK41, 0.610%,
01/29/2052 | | | | | 818,044 | | | | | | 0.0 | | |
| 5,000,000 (1) | | | Great Wolf Trust
2019-WOLF C, 6.575%,
(TSFR1M + 1.633)%,
12/15/2036 | | | | | 4,861,824 | | | | | | 0.3 | | |
| 2,000,000 (1) | | | GS Mortgage Securities
Corp. II 2018-RIVR F,
6.784%, (US0001M +
2.100)%, 07/15/2035 | | | | | 930,000 | | | | | | 0.0 | | |
| 10,000,000 (1) | | | GS Mortgage Securities
Corp. II 2021-ARDN B,
6.334%, (US0001M +
1.650)%, 11/15/2036 | | | | | 9,647,661 | | | | | | 0.5 | | |
| 1,464,112 (1)(4) | | | GS Mortgage Securities
Trust 2012-GCJ7 E,
5.000%, 05/10/2045 | | | | | 1,046,813 | | | | | | 0.1 | | |
| 500,000 (4) | | | GS Mortgage Securities
Trust 2018-GS9 B, 4.321%,
03/10/2051 | | | | | 452,847 | | | | | | 0.0 | | |
See Accompanying Notes to Financial Statements
| Voya Strategic Income | PORTFOLIO OF INVESTMENTS |
| Opportunities Fund | as of March 31, 2023 (continued) |
Principal
Amount† | | | Value | | | Percentage
of Net
Assets | |
COMMERCIAL MORTGAGE-BACKED
SECURITIES: (continued) | |
| 15,258,804 (4)(6) | | | GS Mortgage Securities
Trust 2019-GC38 XA,
0.951%, 02/10/2052 | | | | $ | 648,830 | | | | | | 0.0 | | |
| 40,548,856 (4)(6) | | | GS Mortgage Securities
Trust 2019-GC40 XA,
1.077%, 07/10/2052 | | | | | 1,750,346 | | | | | | 0.1 | | |
| 660,000 | | | GS Mortgage Securities
Trust 2019-GSA1 B,
3.511%, 11/10/2052 | | | | | 545,848 | | | | | | 0.0 | | |
| 81,796,164 (4)(6) | | | GS Mortgage Securities
Trust 2019-GSA1 XA,
0.810%, 11/10/2052 | | | | | 3,373,932 | | | | | | 0.2 | | |
| 180,000 (1)(4) | | | IMT Trust 2017-APTS EFX,
3.497%, 06/15/2034 | | | | | 168,162 | | | | | | 0.0 | | |
| 1,750,000 (1) | | | INTOWN 2022-STAY D
Mortgage Trust, 8.961%,
(TSFR1M + 4.134)%,
08/15/2039 | | | | | 1,707,709 | | | | | | 0.1 | | |
| 5,910,000 (1)(4) | | | J.P. Morgan Chase
Commercial Mortgage
Securities Trust 2018-WPT
FFX, 5.364%, 07/05/2033 | | | | | 4,450,230 | | | | | | 0.2 | | |
| 4,050,000 (1) | | | J.P. Morgan Chase
Commercial Mortgage
Securities Trust 2019-MFP E,
6.844%, (US0001M +
2.160)%, 07/15/2036 | | | | | 3,804,100 | | | | | | 0.2 | | |
| 2,000,000 (4) | | | JP Morgan Chase
Commercial Mortgage
Securities Trust 2013-C10 D,
4.347%, 12/15/2047 | | | | | 1,739,111 | | | | | | 0.1 | | |
| 7,470,000 (1)(4) | | | JP Morgan Chase
Commercial Mortgage
Securities Trust 2013-C13 F,
3.986%, 01/15/2046 | | | | | 6,299,051 | | | | | | 0.3 | | |
| 3,810,000 (1)(4) | | | JP Morgan Chase
Commercial Mortgage
Securities Trust
2020-LOOP E, 3.862%,
12/05/2038 | | | | | 2,655,919 | | | | | | 0.1 | | |
| 675,000 (1) | | | JP Morgan Chase
Commercial Mortgage
Securities Trust
2021-NYAH E, 6.524%,
(US0001M + 1.840)%,
06/15/2038 | | | | | 610,092 | | | | | | 0.0 | | |
| 1,000,000 (1)(4) | | | JPMBB Commercial
Mortgage Securities Trust
2013-C15 D, 5.176%,
11/15/2045 | | | | | 934,655 | | | | | | 0.1 | | |
Principal
Amount† | | | Value | | | Percentage
of Net
Assets | |
COMMERCIAL MORTGAGE-BACKED
SECURITIES: (continued) | |
| 2,549,000 (1)(4) | | | JPMBB Commercial
Mortgage Securities Trust
2013-C17 D, 4.884%,
01/15/2047 | | | | $ | 2,344,591 | | | | | | 0.1 | | |
| 9,560,000 (1)(4) | | | JPMBB Commercial
Mortgage Securities Trust
2013-C17 E, 3.867%,
01/15/2047 | | | | | 7,481,315 | | | | | | 0.4 | | |
| 2,200,000 (1)(4) | | | JPMBB Commercial
Mortgage Securities Trust
2013-C17 F, 3.867%,
01/15/2047 | | | | | 1,155,036 | | | | | | 0.1 | | |
| 1,000,000 (1)(4) | | | JPMBB Commercial
Mortgage Securities Trust
2014-C19 D, 4.635%,
04/15/2047 | | | | | 902,432 | | | | | | 0.0 | | |
| 1,405,000 (4) | | | JPMBB Commercial
Mortgage Securities Trust
2014-C21 C, 4.644%,
08/15/2047 | | | | | 1,233,772 | | | | | | 0.1 | | |
| 43,589,984 (4)(6) | | | JPMBB Commercial
Mortgage Securities Trust
2015-C27 XA, 1.134%,
02/15/2048 | | | | | 690,298 | | | | | | 0.0 | | |
| 43,902,044 (4)(6) | | | JPMBB Commercial
Mortgage Securities Trust
2015-C28 XA, 0.945%,
10/15/2048 | | | | | 592,880 | | | | | | 0.0 | | |
| 496,412 (1) | | | KIND Trust 2021-KIND D,
7.242%, (TSFR1M +
2.300)%, 08/15/2038 | | | | | 462,703 | | | | | | 0.0 | | |
| 10,081,404 (1)(4)(6) | | | LSTAR Commercial
Mortgage Trust 2017-5 X,
0.795%, 03/10/2050 | | | | | 191,711 | | | | | | 0.0 | | |
| 4,472,490 (1) | | | MBRT 2019-MBR H1,
9.034%, (US0001M +
4.000)%, 11/15/2036 | | | | | 4,328,216 | | | | | | 0.2 | | |
| 9,970,379 (1) | | | Med Trust 2021-MDLN D,
6.685%, (US0001M +
2.000)%, 11/15/2038 | | | | | 9,513,991 | | | | | | 0.5 | | |
| 5,250,000 (1) | | | MHP 2021-STOR F, 6.884%,
(US0001M + 2.200)%,
07/15/2038 | | | | | 4,793,806 | | | | | | 0.3 | | |
| 3,109,307 (1) | | | MHP 2022-MHIL E, 7.438%,
(TSFR1M + 2.611)%,
01/15/2027 | | | | | 2,886,356 | | | | | | 0.2 | | |
See Accompanying Notes to Financial Statements
| Voya Strategic Income | PORTFOLIO OF INVESTMENTS |
| Opportunities Fund | as of March 31, 2023 (continued) |
Principal
Amount† | | | Value | | | Percentage
of Net
Assets | |
COMMERCIAL MORTGAGE-BACKED
SECURITIES: (continued) | |
| 10,102,373 (4)(6) | | | Morgan Stanley Bank of
America Merrill Lynch Trust
2013-C13 XA, 0.920%,
11/15/2046 | | | | $ | 20,599 | | | | | | 0.0 | | |
| 12,125,191 (4)(6) | | | Morgan Stanley Bank of
America Merrill Lynch Trust
2014 C19 XA, 0.954%,
12/15/2047 | | | | | 128,058 | | | | | | 0.0 | | |
| 1,500,000 (1)(4) | | | Morgan Stanley Bank of
America Merrill Lynch Trust
2014-C15 D, 4.891%,
04/15/2047 | | | | | 1,374,202 | | | | | | 0.1 | | |
| 5,287,000 | | | Morgan Stanley Bank of
America Merrill Lynch Trust
2015-C25 D, 3.068%,
10/15/2048 | | | | | 4,207,677 | | | | | | 0.2 | | |
| 560,000 (1) | | | Morgan Stanley Bank of
America Merrill Lynch Trust
2015-C26 D, 3.060%,
10/15/2048 | | | | | 428,669 | | | | | | 0.0 | | |
| 15,021,294 (4)(6) | | | Morgan Stanley Bank of
America Merrill Lynch Trust
2017-C34 XA, 0.774%,
11/15/2052 | | | | | 410,856 | | | | | | 0.0 | | |
| 5,970,000 (1)(9) | | | Morgan Stanley Capital I
Trust 2011-C1 K, 4.193%,
09/15/2047 | | | | | 5,970,000 | | | | | | 0.3 | | |
| 4,268,000 (1)(9) | | | Morgan Stanley Capital I
Trust 2011-C1 L, 4.193%,
09/15/2047 | | | | | 1,422,951 | | | | | | 0.1 | | |
| 2,021,315 (1)(9) | | | Morgan Stanley Capital I
Trust 2011-C1 M, 4.193%,
09/15/2047 | | | | | — | | | | | | — | | |
| 4,841,000 (1)(4) | | | Morgan Stanley Capital I
Trust 2016-BNK2 D,
3.000%, 11/15/2049 | | | | | 3,213,281 | | | | | | 0.2 | | |
| 25,660,000 (1)(4)(6) | | | Morgan Stanley Capital I
Trust 2018-L1 XD, 1.792%,
10/15/2051 | | | | | 2,095,235 | | | | | | 0.1 | | |
| 22,317,535 (4)(6) | | | Morgan Stanley Capital I
Trust 2021-L6 XA, 1.226%,
06/15/2054 | | | | | 1,375,102 | | | | | | 0.1 | | |
| 31,002,774 (4)(6) | | | Morgan Stanley Capital I,
Inc. 2017-HR2 XA, 0.850%,
12/15/2050 | | | | | 1,015,852 | | | | | | 0.1 | | |
| 13,000,000 (1) | | | Prima Capital CRE
Securitization 2019-7A D
Ltd., 4.250%, 12/25/2050 | | | | | 10,687,140 | | | | | | 0.6 | | |
| 7,030,000 (1) | | | RFM Reremic Trust
2022-FRR1 AB55, 1.040%,
03/28/2049 | | | | | 5,367,603 | | | | | | 0.3 | | |
Principal
Amount† | | | Value | | | Percentage
of Net
Assets | |
COMMERCIAL MORTGAGE-BACKED
SECURITIES: (continued) | |
| 5,950,000 (1)(4) | | | RFM Reremic Trust
2022-FRR1 AB60, 2.450%,
11/08/2049 | | | | $ | 4,747,243 | | | | | | 0.3 | | |
| 8,960,000 (1)(4) | | | RFM Reremic Trust
2022-FRR1 AB64, 2.300%,
03/01/2050 | | | | | 7,059,298 | | | | | | 0.4 | | |
| 2,190,000 (1)(7) | | | RFM Reremic Trust
2022-FRR1 CK55, 0.000%,
03/28/2049 | | | | | 1,632,436 | | | | | | 0.1 | | |
| 2,750,000 (1)(7) | | | RFM Reremic Trust
2022-FRR1 CK60, 0.000%,
11/08/2049 | | | | | 1,900,559 | | | | | | 0.1 | | |
| 2,580,000 (1)(7) | | | RFM Reremic Trust
2022-FRR1 CK64, 0.000%,
03/01/2050 | | | | | 1,753,079 | | | | | | 0.1 | | |
| 3,000,000 (1) | | | SMRT 2022-MINI E,
7.528%, (TSFR1M +
2.700)%, 01/15/2039 | | | | | 2,711,363 | | | | | | 0.1 | | |
| 986,016 (1) | | | TTAN 2021-MHC D,
6.435%, (US0001M +
1.750)%, 03/15/2038 | | | | | 938,754 | | | | | | 0.1 | | |
| 1,000,000 (1)(4) | | | UBS Commercial Mortgage
Trust 2017-C5, 4.427%,
11/15/2050 | | | | | 731,226 | | | | | | 0.0 | | |
| 22,287,619 (4)(6) | | | UBS Commercial Mortgage
Trust 2019-C16 XA, 1.532%,
04/15/2052 | | | | | 1,348,249 | | | | | | 0.1 | | |
| 5,940,000 (1) | | | Wells Fargo Commercial
Mortgage Trust 2015-NXS3
D, 3.153%, 09/15/2057 | | | | | 4,636,877 | | | | | | 0.2 | | |
| 78,780,000 (4)(6) | | | Wells Fargo Commercial
Mortgage Trust 2016-NXS6
XB, 0.578%, 11/15/2049 | | | | | 1,405,888 | | | | | | 0.1 | | |
| 19,184,567 (4)(6) | | | Wells Fargo Commercial
Mortgage Trust 2017-C40
XA, 0.870%, 10/15/2050 | | | | | 566,022 | | | | | | 0.0 | | |
| 37,308,471 (4)(6) | | | Wells Fargo Commercial
Mortgage Trust 2019-C52
XA, 1.604%, 08/15/2052 | | | | | 2,573,714 | | | | | | 0.1 | | |
| 2,500,000 (1) | | | Wells Fargo Commercial
Mortgage Trust 2021-C59 C,
2.500%, 04/15/2054 | | | | | 1,209,794 | | | | | | 0.1 | | |
| 19,181,521 (4)(6) | | | Wells Fargo Commercial
Mortgage Trust 2021-C59 E,
1.533%, 04/15/2054 | | | | | 1,586,460 | | | | | | 0.1 | | |
| 1,500,000 (1)(4) | | | WFLD 2014-MONT D
Mortgage Trust, 3.755%,
08/10/2031 | | | | | 1,073,274 | | | | | | 0.1 | | |
See Accompanying Notes to Financial Statements
| Voya Strategic Income | PORTFOLIO OF INVESTMENTS |
| Opportunities Fund | as of March 31, 2023 (continued) |
Principal
Amount† | | | Value | | | Percentage
of Net
Assets | |
COMMERCIAL MORTGAGE-BACKED
SECURITIES: (continued) | |
| 9,230,000 (1)(4) | | | WFRBS Commercial
Mortgage Trust 2013-C11
E, 4.147%, 03/15/2045 | | | | $ | 6,460,985 | | | | | | 0.3 | | |
| 960,000 (1)(4) | | | WFRBS Commercial
Mortgage Trust 2013-C11
F, 4.147%, 03/15/2045 | | | | | 590,400 | | | | | | 0.0 | | |
| 8,000,000 (1)(4) | | | WFRBS Commercial
Mortgage Trust 2013-C17
D, 5.029%, 12/15/2046 | | | | | 7,418,110 | | | | | | 0.4 | | |
| 760,000 (1) | | | WFRBS Commercial
Mortgage Trust 2013-C17
E, 3.500%, 12/15/2046 | | | | | 685,414 | | | | | | 0.0 | | |
| 21,966,329 (4)(6) | | | WFRBS Commercial
Mortgage
Trust 2013-UBS1 XA,
0.903%, 03/15/2046 | | | | | 62,349 | | | | | | 0.0 | | |
| 1,900,000 (1) | | | WFRBS Commercial
Mortgage Trust 2014-C21
D, 3.497%, 08/15/2047 | | | | | 1,539,906 | | | | | | 0.1 | | |
| | | | Total Commercial
Mortgage-Backed
Securities | | | | | | | | | | | | | |
| | | | (Cost $396,566,085) | | | | | 347,889,373 | | | | | | 18.7 | | |
| U.S. TREASURY OBLIGATIONS: 1.7% | |
| | | | U.S. Treasury Notes: 1.7% | |
| 684,000 | | | 0.125%, 01/15/2024 | | | | | 659,872 | | | | | | 0.0 | | |
| 3,600,000 | | | 0.250%, 06/15/2024 | | | | | 3,424,570 | | | | | | 0.2 | | |
| 858,000 | | | 0.375%, 09/30/2027 | | | | | 742,170 | | | | | | 0.1 | | |
| 3,638,200 | | | 0.500%, 11/30/2023 | | | | | 3,538,406 | | | | | | 0.2 | | |
| 6,348,300 | | | 0.875%, 01/31/2024 | | | | | 6,147,932 | | | | | | 0.3 | | |
| 1,867,100 | | | 1.500%, 01/31/2027 | | | | | 1,719,409 | | | | | | 0.1 | | |
| 94,000 | | | 2.750%, 08/15/2032 | | | | | 88,485 | | | | | | 0.0 | | |
| 4,434,000 | | | 2.875%, 06/15/2025 | | | | | 4,330,425 | | | | | | 0.2 | | |
| 529,900 | | | 3.500%, 02/15/2033 | | | | | 530,769 | | | | | | 0.0 | | |
| 7,537,000 | | | 4.000%, 02/29/2028 | | | | | 7,673,903 | | | | | | 0.4 | | |
| 2,669,000 | | | 4.000%, 02/28/2030 | | | | | 2,739,895 | | | | | | 0.2 | | |
| 20,000 | | | 4.000%, 11/15/2052 | | | | | 21,231 | | | | | | 0.0 | | |
| 220,000 | | | 4.625%, 02/28/2025 | | | | | 222,157 | | | | | | 0.0 | | |
| | | | Total U.S. Treasury
Obligations | | | | | | | | | | | | | |
| | | | (Cost $32,331,696) | | | | | 31,839,224 | | | | | | 1.7 | | |
| ASSET-BACKED SECURITIES: 14.8% | |
| | | | Automobile Asset-Backed
Securities: 0.7% | |
| 2,450,000 | | | AmeriCredit Automobile
Receivables Trust
2019-3 D, 2.580%,
09/18/2025 | | | | | 2,372,245 | | | | | | 0.1 | | |
Principal
Amount† | | | Value | | | Percentage
of Net
Assets | |
| ASSET-BACKED SECURITIES: (continued) | |
| | | | Automobile Asset-Backed
Securities (continued) | |
| 4,400,000 | | | AmeriCredit Automobile
Receivables Trust
2020-1 D, 1.800%,
12/18/2025 | | | | $ | 4,198,207 | | | | | | 0.2 | | |
| 3,000,000 | | | Carmax Auto Owner Trust
2019-2 D, 3.410%,
10/15/2025 | | | | | 2,984,294 | | | | | | 0.2 | | |
| 1,495,122 | | | Santander Drive Auto
Receivables Trust
2019-2 D, 3.220%,
07/15/2025 | | | | | 1,487,274 | | | | | | 0.1 | | |
| 1,662,943 | | | Santander Drive Auto
Receivables Trust
2019-3 D, 2.680%,
10/15/2025 | | | | | 1,655,082 | | | | | | 0.1 | | |
| | | | | | | | | 12,697,102 | | | | | | 0.7 | | |
| | | | Home Equity Asset-Backed
Securities: 0.5% | |
| 2,211,369 (1)(4) | | | ACE Securities Corp.
Mortgage Loan Trust
Series 2007-D1 A2,
6.336%, 02/25/2038 | | | | | 1,729,539 | | | | | | 0.1 | | |
| 2,826,752 (1) | | | ACE Securities Corp.
Mortgage Loan Trust
Series 2007-D1 A3,
7.250%, 02/25/2038 | | | | | 2,208,703 | | | | | | 0.1 | | |
| 310,010 | | | GSAA Home Equity Trust
2006-3 A3, 5.445%,
(US0001M + 0.300)%,
03/25/2036 | | | | | 165,589 | | | | | | 0.0 | | |
| 1,948,502 (4) | | | GSAA Home Equity Trust
2006-4 4A3, 3.641%,
03/25/2036 | | | | | 1,235,518 | | | | | | 0.1 | | |
| 840,173 | | | GSAA Home Equity Trust
2007-1 1A1, 5.005%,
(US0001M + 0.080)%,
02/25/2037 | | | | | 255,354 | | | | | | 0.0 | | |
| 841,861 (4) | | | GSAA Trust 2006-7 AF2,
5.995%, 03/25/2046 | | | | | 334,170 | | | | | | 0.0 | | |
| 754,085 (4) | | | Morgan Stanley Mortgage
Loan Trust 2007-10XS A2,
6.250%, 02/25/2037 | | | | | 359,585 | | | | | | 0.0 | | |
| 355,021 | | | Nomura Home Equity Loan,
Inc. Home Equity Loan Trust
Series 2007-1 2A4A,
5.305%, (US0001M +
0.230)%, 02/25/2037 | | | | | 312,674 | | | | | | 0.0 | | |
See Accompanying Notes to Financial Statements
| Voya Strategic Income | PORTFOLIO OF INVESTMENTS |
| Opportunities Fund | as of March 31, 2023 (continued) |
Principal
Amount† | | | Value | | | Percentage
of Net
Assets | |
| ASSET-BACKED SECURITIES: (continued) | |
| | | | Home Equity Asset-Backed
Securities (continued) | |
| 3,382,879 (4) | | | Renaissance Home Equity
Loan Trust 2004-4 MF2,
5.818%, 02/25/2035 | | | | $ | 2,897,529 | | | | | | 0.2 | | |
| | | | | | | | | 9,498,661 | | | | | | 0.5 | | |
| | | | Other Asset-Backed Securities: 12.6% | |
| 3,089,000 (1)(4) | | | Ajax Mortgage Loan Trust
2019-D A2, 3.500%,
09/25/2065 | | | | | 2,820,708 | | | | | | 0.2 | | |
| 4,234,000 (1) | | | Ajax Mortgage Loan Trust
2019-F A2, 3.500%,
07/25/2059 | | | | | 3,887,099 | | | | | | 0.2 | | |
| 2,500,000 (1) | | | AMMC CLO 16 Ltd.
2015-16A CR2, 6.742%,
(US0003M + 1.950)%,
04/14/2029 | | | | | 2,448,630 | | | | | | 0.1 | | |
| 2,000,000 (1) | | | AMMC CLO XI Ltd.
2012-11A CR2, 6.702%,
(US0003M + 1.900)%,
04/30/2031 | | | | | 1,879,380 | | | | | | 0.1 | | |
| 2,700,000 (1) | | | Apidos CLO XXIV 2016-24A
BRR, 6.858%, (US0003M +
2.050)%, 10/20/2030 | | | | | 2,572,555 | | | | | | 0.1 | | |
| 2,900,000 (1) | | | Apidos CLO XXXIII
2020-33A CR, 6.716%,
(US0003M + 1.900)%,
10/24/2034 | | | | | 2,722,218 | | | | | | 0.1 | | |
| 1,633,500 (1) | | | Applebee’s Funding LLC /
IHOP Funding LLC 2019-1A
A2I, 4.194%, 06/05/2049 | | | | | 1,601,542 | | | | | | 0.1 | | |
| 742,500 (1) | | | Applebee’s Funding LLC /
IHOP Funding LLC 2019-1A
A2II, 4.723%, 06/05/2049 | | | | | 696,579 | | | | | | 0.0 | | |
| 353,275 (1) | | | Aqua Finance Trust 2019-A A,
3.140%, 07/16/2040 | | | | | 334,319 | | | | | | 0.0 | | |
| 500,000 (1) | | | Arbor Realty Commercial
Real Estate Notes
2021-FL4 D Ltd., 7.584%,
(US0001M + 2.900)%,
11/15/2036 | | | | | 473,814 | | | | | | 0.0 | | |
| 750,000 (1) | | | Atrium CDO Corp. 12A CR,
6.465%, (US0003M +
1.650)%, 04/22/2027 | | | | | 731,541 | | | | | | 0.0 | | |
| 2,500,000 (1) | | | Atrium XIV LLC 14A A2BR,
2.304%, 08/23/2030 | | | | | 2,240,000 | | | | | | 0.1 | | |
| 2,000,000 (1) | | | Babson CLO Ltd. 2018-3A C,
6.708%, (US0003M +
1.900)%, 07/20/2029 | | | | | 1,939,324 | | | | | | 0.1 | | |
Principal
Amount† | | | Value | | | Percentage
of Net
Assets | |
| ASSET-BACKED SECURITIES: (continued) | |
| | | | Other Asset-Backed
Securities (continued) | |
| 2,000,000 (1) | | | Benefit Street Partners
CLO V-B Ltd. 2018-5BA B,
6.958%, (US0003M +
2.150)%, 04/20/2031 | | | | $ | 1,906,042 | | | | | | 0.1 | | |
| 1,000,000 (1) | | | BlueMountain CLO 2013-2A
CR, 6.765%, (US0003M +
1.950)%, 10/22/2030 | | | | | 942,185 | | | | | | 0.1 | | |
| 1,000,000 (1) | | | BlueMountain CLO 2015-4
CR Ltd., 6.708%,
(US0003M + 1.900)%,
04/20/2030 | | | | | 933,104 | | | | | | 0.1 | | |
| 1,250,000 (1) | | | BlueMountain CLO Ltd.
2021-28A C, 6.792%,
(US0003M + 2.000)%,
04/15/2034 | | | | | 1,167,941 | | | | | | 0.1 | | |
| 2,000,000 (1) | | | BlueMountain CLO XXIX
Ltd. 2020-29A CR, 6.918%,
(US0003M + 2.100)%,
07/25/2034 | | | | | 1,881,384 | | | | | | 0.1 | | |
| 1,881,000 (1) | | | Bojangles Issuer LLC
2020-3A A2, 3.832%,
10/20/2050 | | | | | 1,720,503 | | | | | | 0.1 | | |
| 4,000,000 (1) | | | Bristol Park CLO Ltd.
2016-1A CR, 6.742%,
(US0003M + 1.950)%,
04/15/2029 | | | | | 3,802,392 | | | | | | 0.2 | | |
| 750,000 (1) | | | Buttermilk Park CLO Ltd.
2018-1A C, 6.892%,
(US0003M + 2.100)%,
10/15/2031 | | | | | 711,695 | | | | | | 0.0 | | |
| 1,000,000 (1) | | | Carlyle Global Market
Strategies CLO 2014-3RA B
Ltd., 6.715%, (US0003M +
1.900)%, 07/27/2031 | | | | | 927,047 | | | | | | 0.0 | | |
| 1,500,000 (1) | | | Carlyle US CLO 2016-4A
BR Ltd., 6.908%,
(US0003M + 2.100)%,
10/20/2027 | | | | | 1,457,919 | | | | | | 0.1 | | |
| 4,600,000 (1) | | | CARLYLE US CLO 2017-3A
BR Ltd., 6.808%,
(US0003M + 2.000)%,
07/20/2029 | | | | | 4,356,200 | | | | | | 0.2 | | |
| 1,000,000 (1) | | | Cent CLO C17A BR Ltd.,
6.652%, (US0003M +
1.850)%, 04/30/2031 | | | | | 939,257 | | | | | | 0.1 | | |
See Accompanying Notes to Financial Statements
| Voya Strategic Income | PORTFOLIO OF INVESTMENTS |
| Opportunities Fund | as of March 31, 2023 (continued) |
Principal
Amount† | | | Value | | | Percentage
of Net
Assets | |
| ASSET-BACKED SECURITIES: (continued) | |
| | | | Other Asset-Backed
Securities (continued) | |
| 5,900,000 (1) | | | CIFC Funding 2015-4A BR2
Ltd., 6.708%, (US0003M +
1.900)%, 04/20/2034 | | | | $ | 5,516,264 | | | | | | 0.3 | | |
| 5,500,000 (1) | | | CIFC Funding 2019-2A CR
Ltd., 6.892%, (US0003M +
2.100)%, 04/17/2034 | | | | | 5,236,753 | | | | | | 0.3 | | |
| 805,533 | | | Countrywide Asset-Backed
Certificates 2005-AB2 M1,
5.550%, (US0001M +
0.705)%, 09/25/2035 | | | | | 748,875 | | | | | | 0.0 | | |
| 5,000,000 (1) | | | Crown City CLO V 2023-1
A3, 8.108%, (TSFR3M +
3.600)%, 04/20/2034 | | | | | 4,990,960 | | | | | | 0.3 | | |
| 820,250 (1) | | | DB Master Finance LLC
2019-1A A23, 4.352%,
05/20/2049 | | | | | 776,354 | | | | | | 0.0 | | |
| 434,250 (1) | | | DB Master Finance LLC
2019-1A A2II, 4.021%,
05/20/2049 | | | | | 414,108 | | | | | | 0.0 | | |
| 4,048,750 (1) | | | DB Master Finance LLC
2021-1A A23, 2.791%,
11/20/2051 | | | | | 3,281,233 | | | | | | 0.2 | | |
| 3,000,000 (1) | | | Dewolf Park CLO Ltd.
2017-1A DR, 7.642%,
(US0003M + 2.850)%,
10/15/2030 | | | | | 2,781,330 | | | | | | 0.1 | | |
| 562,500 (1) | | | Domino’s Pizza Master
Issuer LLC 2015-1A A1II,
4.474%, 10/25/2045 | | | | | 544,378 | | | | | | 0.0 | | |
| 1,045,000 (1) | | | Domino’s Pizza Master
Issuer LLC 2017-1A A23,
4.118%, 07/25/2047 | | | | | 989,196 | | | | | | 0.1 | | |
| 2,259,700 (1) | | | Domino’s Pizza Master
Issuer LLC 2018-1A A2I,
4.116%, 07/25/2048 | | | | | 2,173,925 | | | | | | 0.1 | | |
| 3,443,500 (1) | | | Domino’s Pizza Master
Issuer LLC 2019-1A A2,
3.668%, 10/25/2049 | | | | | 3,073,086 | | | | | | 0.2 | | |
| 2,112,000 (1) | | | Driven Brands Funding LLC
2019-1A A2, 4.641%,
04/20/2049 | | | | | 1,992,432 | | | | | | 0.1 | | |
| 1,446,375 (1) | | | Driven Brands Funding LLC
2022-1A A2, 7.393%,
10/20/2052 | | | | | 1,462,048 | | | | | | 0.1 | | |
| 1,190,625 (1) | | | Driven Brands Funding, LLC
2018-1A A2, 4.739%,
04/20/2048 | | | | | 1,144,652 | | | | | | 0.1 | | |
Principal
Amount† | | | Value | | | Percentage
of Net
Assets | |
| ASSET-BACKED SECURITIES: (continued) | |
| | | | Other Asset-Backed
Securities (continued) | |
| 2,750,000 (1) | | | Dryden 30 Senior Loan
Fund 2013-30A DR,
7.464%, (US0003M +
2.600)%, 11/15/2028 | | | | $ | 2,573,409 | | | | | | 0.1 | | |
| 1,750,000 (1) | | | Dryden 55 CLO Ltd.
2018-55A C, 6.692%,
(US0003M + 1.900)%,
04/15/2031 | | | | | 1,638,460 | | | | | | 0.1 | | |
| 5,000,000 (1) | | | Dryden 75 CLO Ltd.
2019-75A CR2, 6.592%,
(US0003M + 1.800)%,
04/15/2034 | | | | | 4,604,665 | | | | | | 0.2 | | |
| 6,000,000 (1) | | | Dryden 86 CLO Ltd.
2020-86A DR, 7.992%,
(US0003M + 3.200)%,
07/17/2034 | | | | | 5,617,758 | | | | | | 0.3 | | |
| 3,038,725 (1) | | | Five Guys Holdings, Inc.
2017-1A A2, 4.600%,
07/25/2047 | | | | | 2,977,991 | | | | | | 0.2 | | |
| 840,764 (1) | | | Helios Issuer, LLC 2018-1A
A, 4.870%, 07/20/2048 | | | | | 768,801 | | | | | | 0.0 | | |
| 3,170,483 (1) | | | Helios Issuer, LLC 2018-1A
B, 7.710%, 07/20/2048 | | | | | 2,702,026 | | | | | | 0.1 | | |
| 1,750,000 (1) | | | Invesco US CLO 2023-1A
A1R Ltd., 8.520%,
(TSFR3M + 0.000)%,
04/22/2035 | | | | | 1,734,246 | | | | | | 0.1 | | |
| 967,139 (1) | | | JG Wentworth XLII LLC
2018-2A B, 4.700%,
10/15/2077 | | | | | 864,525 | | | | | | 0.0 | | |
| 1,600,000 (1) | | | Kayne CLO 10 Ltd.
2021-10A C, 6.565%,
(US0003M + 1.750)%,
04/23/2034 | | | | | 1,522,918 | | | | | | 0.1 | | |
| 1,710,000 (1) | | | KAYNE CLO I Ltd. 2018-1A
CR, 6.542%, (US0003M +
1.750)%, 07/15/2031 | | | | | 1,621,978 | | | | | | 0.1 | | |
| 1,350,000 (1) | | | LCM XVIII L.P. 18A CR,
6.658%, (US0003M +
1.850)%, 04/20/2031 | | | | | 1,245,001 | | | | | | 0.1 | | |
| 1,000,000 (1) | | | LCM XX L.P. 20A-CR,
6.758%, (US0003M +
1.950)%, 10/20/2027 | | | | | 979,585 | | | | | | 0.1 | | |
| 2,800,000 (1) | | | LCM XXIV Ltd. 24A CR,
6.708%, (US0003M +
1.900)%, 03/20/2030 | | | | | 2,612,618 | | | | | | 0.1 | | |
See Accompanying Notes to Financial Statements
| Voya Strategic Income | PORTFOLIO OF INVESTMENTS |
| Opportunities Fund | as of March 31, 2023 (continued) |
Principal
Amount† | | | Value | | | Percentage
of Net
Assets | |
| ASSET-BACKED SECURITIES: (continued) | |
| | | | Other Asset-Backed
Securities (continued) | |
| 808,099 (1) | | | LCSS Financing 2018-A A
LLC, 4.700%, 12/15/2062 | | | | $ | 692,267 | | | | | | 0.0 | | |
| 1,000,000 (1) | | | Madison Park Funding XIII
Ltd. 2014-13A CR2,
6.698%, (US0003M +
1.900)%, 04/19/2030 | | | | | 970,686 | | | | | | 0.1 | | |
| 2,500,000 (1) | | | Madison Park Funding XIX
Ltd. 2015-19A B1R2,
6.665%, (US0003M +
1.850)%, 01/22/2028 | | | | | 2,441,387 | | | | | | 0.1 | | |
| 1,000,000 (1) | | | Magnetite VIII Ltd. 2014-8A
CR2, 6.642%, (US0003M +
1.850)%, 04/15/2031 | | | | | 957,362 | | | | | | 0.1 | | |
| 358,172 (1) | | | Marlette Funding Trust
2019-2A C, 4.110%,
07/16/2029 | | | | | 357,004 | | | | | | 0.0 | | |
| 646,152 (1) | | | Marlette Funding Trust
2019-3A C, 3.790%,
09/17/2029 | | | | | 643,963 | | | | | | 0.0 | | |
| 4,900,000 (1) | | | Marlette Funding Trust
2023-1A A, 6.070%,
04/15/2033 | | | | | 4,898,896 | | | | | | 0.3 | | |
| 7,000,000 (1) | | | MF1 Multifamily Housing
Mortgage Loan Trust
2021-FL6 D, 7.259%,
(US0001M + 2.550)%,
07/16/2036 | | | | | 6,526,521 | | | | | | 0.4 | | |
| 1,563,318 (1) | | | Mill City Solar Loan
2019-2GS A Ltd., 3.690%,
07/20/2043 | | | | | 1,427,900 | | | | | | 0.1 | | |
| 518,432 (1) | | | Mosaic Solar Loan Trust
2018-1A A, 4.010%,
06/22/2043 | | | | | 485,827 | | | | | | 0.0 | | |
| 745,979 (1) | | | Mosaic Solar Loan Trust
2018-2-GS B, 4.740%,
02/22/2044 | | | | | 685,673 | | | | | | 0.0 | | |
| 1,173,289 (1) | | | Mosaic Solar Loan Trust
2019-1A A, 4.370%,
12/21/2043 | | | | | 1,106,084 | | | | | | 0.1 | | |
| 504,936 (1) | | | Mosaic Solar Loan Trust
2019-2A A, 2.880%,
09/20/2040 | | | | | 450,005 | | | | | | 0.0 | | |
| 906,639 (1) | | | Mosaic Solar Loans
2017-2A A LLC, 3.820%,
06/22/2043 | | | | | 843,040 | | | | | | 0.0 | | |
| 3,500,000 (1) | | | Neuberger Berman Loan
Advisers CLO 24 Ltd.
2017-24A CR, 6.748%,
(US0003M + 1.950)%,
04/19/2030 | | | | | 3,346,619 | | | | | | 0.2 | | |
Principal
Amount† | | | Value | | | Percentage
of Net
Assets | |
| ASSET-BACKED SECURITIES: (continued) | |
| | | | Other Asset-Backed
Securities (continued) | |
| 7,700,000 (1) | | | Neuberger Berman Loan
Advisers CLO 30 Ltd.
2018-30A CR, 6.558%,
(US0003M + 1.750)%,
01/20/2031 | | | | $ | 7,404,181 | | | | | | 0.4 | | |
| 2,300,000 (1) | | | Neuberger Berman Loan
Advisers CLO 33 Ltd.
2019-33A CR, 6.692%,
(US0003M + 1.900)%,
10/16/2033 | | | | | 2,175,158 | | | | | | 0.1 | | |
| 4,750,000 (1) | | | Neuberger Berman Loan
Advisers Clo 44 Ltd.
2021-44A C, 6.692%,
(US0003M + 1.900)%,
10/16/2034 | | | | | 4,459,243 | | | | | | 0.2 | | |
| 6,000,000 (1) | | | Oaktree CLO Ltd. 2021-1A
C, 6.742%, (US0003M +
1.950)%, 07/15/2034 | | | | | 5,600,736 | | | | | | 0.3 | | |
| 2,500,000 (1) | | | Oaktree CLO Ltd. 2021-1A
D, 8.042%, (US0003M +
3.250)%, 07/15/2034 | | | | | 2,285,390 | | | | | | 0.1 | | |
| 7,470,000 (1) | | | Octagon Investment
Partners 31 Ltd. 2017-1A
CR, 6.858%, (US0003M +
2.050)%, 07/20/2030 | | | | | 7,255,536 | | | | | | 0.4 | | |
| 4,500,000 (1) | | | Octagon Investment
Partners 32 Ltd. 2017-1A
CR, 6.842%, (US0003M +
2.050)%, 07/15/2029 | | | | | 4,290,867 | | | | | | 0.2 | | |
| 600,000 (1) | | | Octagon Investment
Partners 33 Ltd. 2017-1A B,
6.658%, (US0003M +
1.850)%, 01/20/2031 | | | | | 565,708 | | | | | | 0.0 | | |
| 4,500,000 (1) | | | Octagon Investment
Partners XIV Ltd. 2012-1A
BRR, 6.892%, (US0003M +
2.100)%, 07/15/2029 | | | | | 4,324,302 | | | | | | 0.2 | | |
| 1,500,000 (1) | | | OHA Credit Funding 9 Ltd.
2021-9A C, 6.698%,
(US0003M + 1.900)%,
07/19/2035 | | | | | 1,427,768 | | | | | | 0.1 | | |
| 5,000,000 (1) | | | Palmer Square CLO
2020-3A CR Ltd., 7.814%,
(US0003M + 2.950)%,
11/15/2031 | | | | | 4,693,915 | | | | | | 0.3 | | |
| 4,250,000 (1) | | | Palmer Square Loan
Funding 2021-2A C Ltd.,
7.315%, (US0003M +
2.400)%, 05/20/2029 | | | | | 4,085,525 | | | | | | 0.2 | | |
See Accompanying Notes to Financial Statements
| Voya Strategic Income | PORTFOLIO OF INVESTMENTS |
| Opportunities Fund | as of March 31, 2023 (continued) |
Principal
Amount† | | | Value | | | Percentage
of Net
Assets | |
| ASSET-BACKED SECURITIES: (continued) | |
| | | | Other Asset-Backed
Securities (continued) | |
| 133,987 (4) | | | Popular ABS Mortgage
Pass-Through Trust 2005-D
A5, 3.522%, 01/25/2036 | | | | $ | 130,885 | | | | | | 0.0 | | |
| 2,370,375 (1) | | | Primose Funding LLC
2019-1A A2, 4.475%,
07/30/2049 | | | | | 2,230,703 | | | | | | 0.1 | | |
| 1,100,000 (1) | | | Recette Clo Ltd. 2015-1A
CRR, 6.558%, (US0003M +
1.750)%, 04/20/2034 | | | | | 1,021,988 | | | | | | 0.1 | | |
| 2,050,000 (1) | | | Rockland Park CLO Ltd.
2021-1A C, 6.708%,
(US0003M + 1.900)%,
04/20/2034 | | | | | 1,923,784 | | | | | | 0.1 | | |
| 3,270,000 (1) | | | Shackleton 2019-15A CR
CLO Ltd., 6.942%,
(US0003M + 2.150)%,
01/15/2032 | | | | | 3,104,659 | | | | | | 0.2 | | |
| 1,800,000 (1) | | | SoFi Consumer Loan
Program 2023-1S A Trust,
5.810%, 05/15/2031 | | | | | 1,801,976 | | | | | | 0.1 | | |
| 1,899,625 (1) | | | Sonic Capital LLC 2020-1A
A2I, 3.845%, 01/20/2050 | | | | | 1,758,004 | | | | | | 0.1 | | |
| 4,682,730 (1) | | | Sunnova Sol Issuer LLC
2020-1A A, 3.350%,
02/01/2055 | | | | | 4,020,184 | | | | | | 0.2 | | |
| 1,800,140 (1) | | | Sunrun Athena Issuer
2018-1 A LLC, 5.310%,
04/30/2049 | | | | | 1,736,544 | | | | | | 0.1 | | |
| 3,493,834 (1) | | | Sunrun Atlas Issuer 2019-2
A LLC, 3.610%, 02/01/2055 | | | | | 3,120,059 | | | | | | 0.2 | | |
| 5,564,467 (1) | | | Sunrun Jupiter Issuer
2022-1A A LLC, 4.750%,
07/30/2057 | | | | | 5,211,718 | | | | | | 0.3 | | |
| 1,053,250 (1) | | | Taco Bell Funding LLC
2018-1A A2II, 4.940%,
11/25/2048 | | | | | 1,017,217 | | | | | | 0.1 | | |
| 1,000,000 (1) | | | TCI-Flatiron Clo 2017-1A C
Ltd., 6.727%, (US0003M +
1.850)%, 11/18/2030 | | | | | 948,689 | | | | | | 0.1 | | |
| 2,250,000 (1) | | | TCI-Flatiron Clo 2018-1A
CR Ltd., 6.552%,
(US0003M + 1.750)%,
01/29/2032 | | | | | 2,133,644 | | | | | | 0.1 | | |
| 4,100,000 (1) | | | TCW CLO 2020-1A DRR
Ltd., 8.208%, (US0003M +
3.400)%, 04/20/2034 | | | | | 3,735,182 | | | | | | 0.2 | | |
| 3,100,000 (1) | | | TCW CLO 2021-1A C Ltd.,
6.708%, (US0003M +
1.900)%, 03/18/2034 | | | | | 2,875,355 | | | | | | 0.2 | | |
Principal
Amount† | | | Value | | | Percentage
of Net
Assets | |
| ASSET-BACKED SECURITIES: (continued) | |
| | | | Other Asset-Backed
Securities (continued) | |
| 2,000,000 (1) | | | THL Credit Wind River
2014-1 CRR CLO Ltd.,
6.745%, (US0003M +
1.950)%, 07/18/2031 | | | | $ | 1,821,450 | | | | | | 0.1 | | |
| 2,000,000 (1)(4) | | | Towd Point Mortgage Trust
2015-6 M2, 3.750%,
04/25/2055 | | | | | 1,895,434 | | | | | | 0.1 | | |
| 1,500,000 (1) | | | Upland CLO Ltd. 2016-1A
BR, 6.658%, (US0003M +
1.850)%, 04/20/2031 | | | | | 1,414,679 | | | | | | 0.1 | | |
| 2,100,000 (1) | | | Upstart Securitization
Trust 2023-1 A, 6.590%,
02/20/2033 | | | | | 2,092,465 | | | | | | 0.1 | | |
| 1,227,013 (1) | | | Wendy’s Funding LLC
2018-1A A2II, 3.884%,
03/15/2048 | | | | | 1,137,271 | | | | | | 0.1 | | |
| 3,085,500 (1) | | | Wendy’s Funding LLC
2019-1A A2I, 3.783%,
06/15/2049 | | | | | 2,908,284 | | | | | | 0.2 | | |
| | | | | | | | | 234,124,690 | | | | | | 12.6 | | |
| | | | Student Loan Asset-Backed
Securities: 1.0% | |
| 63,570 (1) | | | Commonbond Student
Loan Trust 2018-CGS C,
4.350%, 02/25/2046 | | | | | 58,612 | | | | | | 0.0 | | |
| 213,861 (1) | | | ELFI Graduate Loan
Program 2018-A B LLC,
4.000%, 08/25/2042 | | | | | 194,758 | | | | | | 0.0 | | |
| 665,992 (1)(4) | | | ELFI Graduate Loan
Program 2019-A B LLC,
2.940%, 03/25/2044 | | | | | 606,195 | | | | | | 0.0 | | |
| 1,092,294 (1) | | | Laurel Road Prime
Student Loan Trust
2018-B BFX, 3.720%,
05/26/2043 | | | | | 1,019,234 | | | | | | 0.1 | | |
| 4,000,000 (1) | | | SMB Private Education
Loan Trust 2014-A C,
4.500%, 09/15/2045 | | | | | 3,451,092 | | | | | | 0.2 | | |
| 1,000,000 (1) | | | SMB Private Education
Loan Trust 2017-A B,
3.500%, 06/17/2041 | | | | | 920,119 | | | | | | 0.1 | | |
| 2,250,000 (1)(4) | | | SoFi Professional Loan
Program 2017-A B LLC,
3.440%, 03/26/2040 | | | | | 2,148,990 | | | | | | 0.1 | | |
| 1,000,000 (1)(4) | | | SoFi Professional Loan
Program 2017-A C,
4.430%, 03/26/2040 | | | | | 918,449 | | | | | | 0.0 | | |
See Accompanying Notes to Financial Statements
| Voya Strategic Income | PORTFOLIO OF INVESTMENTS |
| Opportunities Fund | as of March 31, 2023 (continued) |
Principal
Amount† | | | Value | | | Percentage
of Net
Assets | |
| ASSET-BACKED SECURITIES: (continued) | |
| | | | Student Loan Asset-Backed
Securities (continued) | |
| 1,000,000 (1)(4) | | | SoFi Professional Loan
Program 2017-C C,
4.210%, 07/25/2040 | | | | $ | 892,720 | | | | | | 0.0 | | |
| 1,000,000 (1) | | | SoFi Professional Loan
Program 2017-E C LLC,
4.160%, 11/26/2040 | | | | | 900,608 | | | | | | 0.0 | | |
| 1,000,000 (1) | | | SoFi Professional Loan
Program 2018-D BFX
Trust, 4.140%,
02/25/2048 | | | | | 938,796 | | | | | | 0.1 | | |
| 2,000,000 (1) | | | Sofi Professional Loan
Program 2019-B BFX
LLC, 3.730%, 08/17/2048 | | | | | 1,757,503 | | | | | | 0.1 | | |
| 3,000,000 (1) | | | Sofi Professional Loan
Program 2019-C BFX
LLC, 3.050%, 11/16/2048 | | | | | 2,499,558 | | | | | | 0.1 | | |
| 4,400,000 (1) | | | SoFi Professional Loan
Program 2020-B BFX
Trust, 2.730%, 05/15/2046 | | | | | 3,527,921 | | | | | | 0.2 | | |
| | | | | | | | | 19,834,555 | | | | | | 1.0 | | |
| | | | Total Asset-Backed
Securities | | | | | | | | | | | | | |
| | | | (Cost $295,472,921) | | | | | 276,155,008 | | | | | | 14.8 | | |
| BANK LOANS: 8.2% | |
| | | | Aerospace & Defense: 0.2% | |
| 265,257 | | | ADS Tactical, Inc. 2021
Term Loan B, 10.590%,
(US0001M + 5.750)%,
03/19/2026 | | | | | 244,699 | | | | | | 0.0 | | |
| 600,000 | | | Amentum Government
Services Holdings LLC
2022 Term Loan, 8.906%,
(TSFR1M + 4.000)%,
02/15/2029 | | | | | 588,375 | | | | | | 0.0 | | |
| 193,784 | | | Geo Group, Inc. (The)
2022 Tranche 1 Term Loan,
11.932%, (TSFR1M +
7.125)%, 03/23/2027 | | | | | 196,605 | | | | | | 0.0 | | |
| 1,244,314 | | | Peraton Corp. Term
Loan B, 8.590%,
(US0001M + 3.750)%,
02/01/2028 | | | | | 1,229,693 | | | | | | 0.1 | | |
| 695,000 | | | Setanta Aircraft Leasing
Designated Activity
Compa Term Loan B,
7.159%, (US0003M +
2.000)%, 11/05/2028 | | | | | 696,086 | | | | | | 0.1 | | |
Principal
Amount† | | | Value | | | Percentage
of Net
Assets | |
| BANK LOANS: (continued) | |
| | | | Aerospace & Defense (continued) | |
| 199,496 | | | Vertex Aerospace Services
Corp. 2021 First Lien Term
Loan, 8.340%, (US0001M +
3.500)%, 12/06/2028 | | | | $ | 198,748 | | | | | | 0.0 | | |
| | | | | | | | | 3,154,206 | | | | | | 0.2 | | |
| | | | Air Transport: 0.1% | |
| 1,484,867 | | | United Airlines, Inc. 2021
Term Loan B, 8.568%,
(US0003M + 3.750)%,
04/21/2028 | | | | | 1,478,975 | | | | | | 0.1 | | |
| | | | | |
| | | | Auto Components: 0.0% | |
| 616,289 | | | Broadstreet Partners, Inc.
2020 Term Loan B, 7.840%,
(US0001M + 3.000)%,
01/27/2027 | | | | | 603,963 | | | | | | 0.0 | | |
| | | | | |
| | | | Automotive: 0.3% | |
| 610,953 | | | Autokiniton US Holdings,
Inc. 2021 Term Loan B,
9.422%, (TSFR1M +
4.500)%, 04/06/2028 | | | | | 594,610 | | | | | | 0.1 | | |
| 400,000 | | | Belron Finance US LLC
2021 USD Term Loan B,
7.300%, (US0003M +
2.425)%, 04/13/2028 | | | | | 400,000 | | | | | | 0.0 | | |
| 650,000 | | | Clarios Global LP 2021 USD
Term Loan B, 8.109%,
(US0001M + 3.250)%,
04/30/2026 | | | | | 647,969 | | | | | | 0.1 | | |
| 372,032 | | | Dealer Tire Financial, LLC
Term Loan B2, 9.307%,
(TSFR1M + 4.500)%,
12/14/2027 | | | | | 370,288 | | | | | | 0.0 | | |
| 763,196 | | | Gates Global LLC 2021
Term Loan B3, 7.407%,
(US0001M + 2.500)%,
03/31/2027 | | | | | 760,453 | | | | | | 0.1 | | |
| 536,317 | | | Holley Purchaser, Inc. 2021
Term Loan, 8.672%,
(US0003M + 3.750)%,
11/17/2028 | | | | | 450,953 | | | | | | 0.0 | | |
| 346,785 | | | IXS Holdings, Inc. 2021
Term Loan B, 9.120%,
(SOFRRATE + 4.250)%,
03/05/2027 | | | | | 288,265 | | | | | | 0.0 | | |
See Accompanying Notes to Financial Statements
| Voya Strategic Income | PORTFOLIO OF INVESTMENTS |
| Opportunities Fund | as of March 31, 2023 (continued) |
Principal
Amount† | | | Value | | | Percentage
of Net
Assets | |
| BANK LOANS: (continued) | |
| | | | Automotive (continued) | |
| 442,120 | | | Les Schwab Tire Centers
Term Loan B, 8.064%,
(US0003M + 3.250)%,
11/02/2027 | | | | $ | 439,357 | | | | | | 0.0 | | |
| 322,575 | | | Rough Country, LLC 2021
Term Loan, 8.340%,
(US0001M + 3.500)%,
07/28/2028 | | | | | 303,220 | | | | | | 0.0 | | |
| 398,669 | | | Truck Hero, Inc. 2021 Term
Loan B, 8.590%,
(US0001M + 3.750)%,
01/31/2028 | | | | | 356,417 | | | | | | 0.0 | | |
| 468,706 | | | Wand NewCo 3, Inc. 2020
Term Loan, 7.590%,
(US0001M + 2.750)%,
02/05/2026 | | | | | 461,299 | | | | | | 0.0 | | |
| | | | | | | | | 5,072,831 | | | | | | 0.3 | | |
| | | | Basic Materials: 0.1% | |
| 135,000 | | | INEOS Quattro Holdings UK
Ltd. 2023 USD Term Loan,
8.380%, (TSFR1M +
3.750)%, 03/01/2030 | | | | | 134,494 | | | | | | 0.0 | | |
| 710,000 | | | Ineos US Finance LLC 2023
USD Term Loan B, 8.130%,
(TSFR1M + 3.500)%,
02/15/2030 | | | | | 706,228 | | | | | | 0.1 | | |
| 648,375 | | | Iris Holding, Inc. 2022 Term
Loan 1L, 9.620%,
(SOFRRATE + 4.750)%,
06/15/2028 | | | | | 557,062 | | | | | | 0.0 | | |
| 605,000 | | | Starfruit Finco B.V 2023
Term Loan, 8.630%,
(TSFR1M + 4.000)%,
03/02/2028 | | | | | 604,244 | | | | | | 0.0 | | |
| 398,000 | | | U.S. Silica Company 2023
Term Loan B, 9.380%,
(TSFR1M + 4.750)%,
03/01/2030 | | | | | 387,553 | | | | | | 0.0 | | |
| | | | | | | | | 2,389,581 | | | | | | 0.1 | | |
| | | | Beverage & Tobacco: 0.1% | |
| – | | | City Brewing Company, LLC
Closing Date Term Loan,
8.330%, (US0003M +
3.500)%, 04/05/2028 | | | | | — | | | | | | — | | |
| 461,512 | | | Naked Juice LLC Term
Loan, 8.248%, (SOFRRATE +
3.250)%, 01/24/2029 | | | | | 410,073 | | | | | | 0.0 | | |
Principal
Amount† | | | Value | | | Percentage
of Net
Assets | |
| BANK LOANS: (continued) | |
| | | | Beverage & Tobacco (continued) | |
| 592,619 | | | Triton Water Holdings, Inc
Term Loan, 8.659%,
(US0003M + 3.500)%,
03/31/2028 | | | | $ | 535,284 | | | | | | 0.1 | | |
| | | | | | | | | 945,357 | | | | | | 0.1 | | |
| | | | Building & Development: 0.4% | |
| 491,094 | | | American Builders &
Contractors Supply Co., Inc.
2019 Term Loan, 6.907%,
(TSFR1M + 2.000)%,
01/15/2027 | | | | | 489,674 | | | | | | 0.0 | | |
| 1,130,688 | | | Chamberlain Group Inc
Term Loan B, 8.090%,
(US0001M + 3.250)%,
11/03/2028 | | | | | 1,088,287 | | | | | | 0.1 | | |
| 839,635 | | | Core & Main LP 2021 Term
Loan B, 7.367%,
(TSFR1M + 2.500)%,
07/27/2028 | | | | | 834,387 | | | | | | 0.1 | | |
| 101,076 | | | Empire Today, LLC 2021
Term Loan, 9.709%,
(US0001M + 5.000)%,
04/03/2028 | | | | | 79,681 | | | | | | 0.0 | | |
| 404 | | | Foley Products Company,
LLC 2021 Term Loan,
9.798%, (SOFRRATE +
4.750)%, 12/29/2028 | | | | | 400 | | | | | | 0.0 | | |
| 555,113 | | | Foundation Building
Materials Holding Company
LLC 2021 Term Loan,
8.075%, (US0003M +
3.250)%, 01/31/2028 | | | | | 540,735 | | | | | | 0.0 | | |
| 42,096 (11) | | | IPS Corporation 2021
Delayed Draw Term Loan,
8.130%, (TSFR1M +
3.500)%, 10/02/2028 | | | | | 39,430 | | | | | | 0.0 | | |
| 234,719 | | | IPS Corporation 2021 Term
Loan, 8.352%, (US0001M +
3.500)%, 10/02/2028 | | | | | 219,853 | | | | | | 0.0 | | |
| 743,737 | | | LHS Borrower, LLC 2022
Term Loan B, 9.657%,
(SOFRRATE + 4.750)%,
02/16/2029 | | | | | 604,287 | | | | | | 0.1 | | |
| 498,741 | | | Quikrete Holdings, Inc. 2021
Term Loan B1, 7.840%,
(US0001M + 3.000)%,
03/18/2029 | | | | | 493,878 | | | | | | 0.0 | | |
See Accompanying Notes to Financial Statements
| Voya Strategic Income | PORTFOLIO OF INVESTMENTS |
| Opportunities Fund | as of March 31, 2023 (continued) |
Principal
Amount† | | | Value | | | Percentage
of Net
Assets | |
| BANK LOANS: (continued) | |
| | | | Building & Development (continued) | |
| 446,563 | | | Smyrna Ready Mix
Concrete, LLC Term Loan B,
9.041%, (TSFR1M +
4.250)%, 04/02/2029 | | | | $ | 445,447 | | | | | | 0.0 | | |
| 436,077 | | | Specialty Building Products
Holdings, LLC 2021 Term
Loan B, 8.095%,
(US0001M + 3.250)%,
10/15/2028 | | | | | 411,314 | | | | | | 0.0 | | |
| 398,987 | | | SRS Distribution Inc. 2021
Term Loan B, 8.340%,
(US0001M + 3.500)%,
06/02/2028 | | | | | 385,522 | | | | | | 0.0 | | |
| 447,785 | | | Standard Industries Inc.
2021 Term Loan B, 7.116%,
(US0001M + 2.250)%,
09/22/2028 | | | | | 446,385 | | | | | | 0.0 | | |
| 796,566 | | | White Cap Buyer LLC Term
Loan B, 8.557%,
(TSFR1M + 3.750)%,
10/19/2027 | | | | | 788,352 | | | | | | 0.1 | | |
| | | | | | | | | 6,867,632 | | | | | | 0.4 | | |
| | | | Business Equipment &
Services: 0.6% | |
| 457,970 | | | AlixPartners, LLP 2021 USD
Term Loan B, 7.609%,
(US0001M + 2.750)%,
02/04/2028 | | | | | 457,029 | | | | | | 0.0 | | |
| 768,300 | | | Allied Universal Holdco LLC
2021 USD Incremental Term
Loan B, 8.657%,
(TSFR1M + 3.750)%,
05/12/2028 | | | | | 730,365 | | | | | | 0.1 | | |
| 657,894 | | | APX Group, Inc. 2021 Term
Loan B, 8.255%,
(US0003M + 3.250)%,
07/10/2028 | | | | | 657,071 | | | | | | 0.1 | | |
| 515,313 | | | Ascend Learning, LLC 2021
Term Loan, 8.306%,
(TSFR1M + 3.500)%,
12/11/2028 | | | | | 478,060 | | | | | | 0.0 | | |
| 435,942 | | | Belfor Holdings Inc. Term
Loan B, 8.852%,
(US0001M + 4.000)%,
04/06/2026 | | | | | 435,669 | | | | | | 0.0 | | |
| 160,000 | | | DG Investment Intermediate
Holdings 2, Inc. 2021 2nd
Lien Term Loan, 11.590%,
(US0001M + 6.750)%,
03/30/2029 | | | | | 141,650 | | | | | | 0.0 | | |
Principal
Amount† | | | Value | | | Percentage
of Net
Assets | |
| BANK LOANS: (continued) | |
| | | | Business Equipment &
Services (continued) | |
| 650,870 | | | DG Investment Intermediate
Holdings 2, Inc. 2021 Term
Loan, 8.557%, (US0001M +
3.750)%, 03/31/2028 | | | | $ | 634,598 | | | | | | 0.1 | | |
| 465,243 | | | Endure Digital Inc. Term
Loan, 8.219%, (US0003M +
3.500)%, 02/10/2028 | | | | | 433,839 | | | | | | 0.0 | | |
| 475,197 | | | Ensono, LP 2021 Term
Loan, 8.909%, (US0003M +
3.750)%, 05/26/2028 | | | | | 440,745 | | | | | | 0.0 | | |
| 372,813 | | | Garda World Security
Corporation 2022 Term
Loan B, 9.009%,
(TSFR1M + 4.250)%,
02/01/2029 | | | | | 362,871 | | | | | | 0.0 | | |
| 750,000 | | | Garda World Security
Corporation 2022 Term
Loan B, 9.120%,
(SOFRRATE + 4.250)%,
10/30/2026 | | | | | 745,000 | | | | | | 0.1 | | |
| 292,180 | | | Gloves Buyer, Inc. 2021
Term Loan, 8.840%,
(US0001M + 4.000)%,
12/29/2027 | | | | | 270,267 | | | | | | 0.0 | | |
| 256,724 | | | Intrado Corporation 2017
Term Loan, 8.825%,
(US0003M + 4.000)%,
10/10/2024 | | | | | 228,163 | | | | | | 0.0 | | |
| 551,600 | | | ION Trading Finance Limited
2021 USD Term Loan,
9.909%, (US0003M +
4.750)%, 04/03/2028 | | | | | 521,722 | | | | | | 0.0 | | |
| 601,063 | | | KUEHG Corp. 2018
Incremental Term Loan,
8.909%, (US0003M +
3.750)%, 02/21/2025 | | | | | 591,797 | | | | | | 0.0 | | |
| 458,705 | | | Paysafe Holdings (US) Corp
USD Term Loan B1,
7.590%, (US0001M +
2.750)%, 06/28/2028 | | | | | 444,944 | | | | | | 0.0 | | |
| 75,000 | | | Pre-Paid Legal Services,
Inc. 2021 2nd Lien Term
Loan, 11.840%,
(US0001M + 7.000)%,
12/14/2029 | | | | | 65,625 | | | | | | 0.0 | | |
| 350,970 | | | Pre-Paid Legal Services,
Inc. 2021 Term Loan,
8.590%, (US0001M +
3.750)%, 12/15/2028 | | | | | 346,188 | | | | | | 0.0 | | |
See Accompanying Notes to Financial Statements
| Voya Strategic Income | PORTFOLIO OF INVESTMENTS |
| Opportunities Fund | as of March 31, 2023 (continued) |
Principal
Amount† | | | Value | | | Percentage
of Net
Assets | |
| BANK LOANS: (continued) | |
| | | | Business Equipment &
Services (continued) | |
| 244,324 | | | Red Ventures, LLC 2023
Term Loan B, 7.807%,
(TSFR1M + 1.500)%,
02/24/2030 | | | | $ | 242,644 | | | | | | 0.0 | | |
| 350,000 | | | Renaissance Holding Corp.
2022 Incremental Term
Loan, 9.234%, (TSFR1M +
4.500)%, 04/01/2027 | | | | | 349,475 | | | | | | 0.0 | | |
| 50,880 | | | Service Logic Acquisition,
Inc Term Loan, 8.825%,
(US0003M + 4.000)%,
10/29/2027 | | | | | 50,244 | | | | | | 0.0 | | |
| 520,127 | | | Skopima Merger Sub Inc.
Term Loan B, 8.840%,
(US0001M + 4.000)%,
05/12/2028 | | | | | 486,319 | | | | | | 0.0 | | |
| 1,022,156 | | | Staples, Inc. 7 Year Term
Loan, 9.814%, (US0003M +
5.000)%, 04/16/2026 | | | | | 941,296 | | | | | | 0.1 | | |
| 500,000 | | | Verifone Systems, Inc. 2018
1st Lien Term Loan,
8.958%, (US0003M +
4.000)%, 08/20/2025 | | | | | 432,625 | | | | | | 0.0 | | |
| 969,287 | | | Verscend Holding Corp.
2021 Term Loan B, 8.840%,
(US0001M + 4.000)%,
08/27/2025 | | | | | 969,651 | | | | | | 0.1 | | |
| 273,066 | | | Virtusa Corporation First
Lien Term Loan B, 8.590%,
(US0001M + 3.750)%,
02/11/2028 | | | | | 270,250 | | | | | | 0.0 | | |
| 194,871 | | | Yak Access, LLC 1L
Take-Back Debt, 11.815%,
(TSFR6M + 6.400)%,
09/11/2023 | | | | | 157,845 | | | | | | 0.0 | | |
| | | | | | | | | 11,885,952 | | | | | | 0.6 | | |
| | | | Cable & Satellite Television: 0.2% | |
| 454,778 | | | Atlantic Broadband Finance,
LLC 2021 Term Loan,
7.340%, (US0001M +
2.500)%, 09/01/2028 | | | | | 449,591 | | | | | | 0.0 | | |
| 941,016 | | | DirecTV Financing, LLC
Term Loan, 9.840%,
(US0001M + 5.000)%,
08/02/2027 | | | | | 907,963 | | | | | | 0.1 | | |
Principal
Amount† | | | Value | | | Percentage
of Net
Assets | |
| BANK LOANS: (continued) | |
| | | | Cable & Satellite Television (continued) | |
| 2,147,551 | | | Telesat Canada Term Loan
B5, 7.580%, (US0003M +
2.750)%, 12/07/2026 | | | | $ | 1,138,202 | | | | | | 0.1 | | |
| 750,000 | | | UPC Financing Partnership
2021 USD Term Loan AX,
7.609%, (US0001M +
2.925)%, 01/31/2029 | | | | | 740,062 | | | | | | 0.0 | | |
| 650,000 | | | Virgin Media Bristol LLC
2020 USD Term Loan Q,
7.934%, (US0001M +
3.250)%, 01/31/2029 | | | | | 644,661 | | | | | | 0.0 | | |
| 330,813 | | | WideOpenWest Finance
LLC 2021 Term Loan B,
7.898%, (TSFR1M +
3.000)%, 12/20/2028 | | | | | 326,347 | | | | | | 0.0 | | |
| | | | | | | | | 4,206,826 | | | | | | 0.2 | | |
| | | | Chemicals & Plastics: 0.2% | |
| 115,000 | | | CPC Acquisition Corp
Second Lien Term Loan,
12.910%, (US0003M +
7.750)%, 12/29/2028 | | | | | 66,125 | | | | | | 0.0 | | |
| 504 | | | Hexion Holdings
Corporation 2022 USD Term
Loan, 9.454%, (SOFRRATE +
4.500)%, 03/15/2029 | | | | | 454 | | | | | | 0.0 | | |
| 303,406 | | | INEOS Styrolution US
Holding LLC 2021 USD
Term Loan B, 7.590%,
(US0001M + 2.750)%,
01/29/2026 | | | | | 300,846 | | | | | | 0.0 | | |
| 421,189 | | | Ineos US Finance LLC 2021
USD Term Loan B, 7.306%,
(TSFR1M + 2.500)%,
11/08/2028 | | | | | 407,062 | | | | | | 0.0 | | |
| 368,279 | | | Lonza Group AG USD Term
Loan B, 9.159%,
(US0003M + 4.000)%,
07/03/2028 | | | | | 342,806 | | | | | | 0.0 | | |
| 697,328 | | | LSF11 A5 Holdco LLC Term
Loan, 8.422%, (SOFRRATE +
3.500)%, 10/15/2028 | | | | | 676,931 | | | | | | 0.1 | | |
| 281,067 | | | Olympus Water US Holding
Corporation 2021 USD Term
Loan B, 8.938%,
(US0003M + 3.750)%,
11/09/2028 | | | | | 266,663 | | | | | | 0.0 | | |
See Accompanying Notes to Financial Statements
| Voya Strategic Income | PORTFOLIO OF INVESTMENTS |
| Opportunities Fund | as of March 31, 2023 (continued) |
Principal
Amount† | | | Value | | | Percentage
of Net
Assets | |
| BANK LOANS: (continued) | |
| | | | Chemicals & Plastics (continued) | |
| 461,114 | | | PQ Corporation 2021 Term
Loan B, 7.325%,
(US0003M + 2.500)%,
06/09/2028 | | | | $ | 457,944 | | | | | | 0.1 | | |
| 300,000 | | | Tronox Finance LLC 2021
Term Loan B, 7.078%,
(US0003M + 2.250)%,
03/10/2028 | | | | | 294,000 | | | | | | 0.0 | | |
| | | | | | | | | 2,812,831 | | | | | | 0.2 | | |
| | | | Clothing/Textiles: 0.0% | |
| 535,950 | | | ABG Intermediate Holdings
2 LLC 2021 Term Loan B1,
8.407%, (SOFRRATE +
3.500)%, 12/21/2028 | | | | | 528,581 | | | | | | 0.0 | | |
| | | | | |
| | | | Communications: 0.2% | |
| 847,804 | | | Charter Communications
Operating, LLC 2019 Term
Loan B2, 6.557%,
(TSFR1M + 1.750)%,
02/01/2027 | | | | | 841,180 | | | | | | 0.1 | | |
| 455,000 | | | Crown Subsea
Communications
Holding,Inc. 2023
Incremental Term Loan,
9.880%, (TSFR1M +
5.250)%, 04/27/2027 | | | | | 451,019 | | | | | | 0.0 | | |
| 399,000 | | | Go Daddy Operating
Company, LLC 2022 Term
Loan B5, 7.880%,
(TSFR1M + 3.250)%,
11/09/2029 | | | | | 399,471 | | | | | | 0.0 | | |
| 123,484 (3) | | | GTT Communications, Inc.
2022 Holdco Term Loan,
13.998% (PIK Rate 0.000%,
Cash Rate 0.000)%,
06/30/2028 | | | | | 66,475 | | | | | | 0.0 | | |
| 154,191 | | | GTT Communications, Inc.
2022 Opco Term Loan,
11.907%, (TSFR1M +
7.100)%, 12/30/2027 | | | | | 126,899 | | | | | | 0.0 | | |
| 673,656 | | | Maxar Technologies, Inc.
2022 Term Loan B 1L,
9.120%, (SOFRRATE +
4.250)%, 06/14/2029 | | | | | 674,399 | | | | | | 0.1 | | |
| 495,000 | | | Uber Technologies, Inc.
2023 Term Loan B, 7.380%,
(TSFR1M + 2.750)%,
02/28/2030 | | | | | 494,588 | | | | | | 0.0 | | |
| | | | | | | | | 3,054,031 | | | | | | 0.2 | | |
Principal
Amount† | | | Value | | | Percentage
of Net
Assets | |
| BANK LOANS: (continued) | |
| | | | Consumer, Cyclical: 0.2% | |
| 260,000 | | | American Airlines, Inc. 2023
Term Loan B, 7.380%,
(TSFR1M + 2.750)%,
02/15/2028 | | | | $ | 254,678 | | | | | | 0.0 | | |
| 190,024 | | | Avient Corp. 2022 Term
Loan B, 8.120%,
(SOFRRATE + 3.250)%,
08/29/2029 | | | | | 190,340 | | | | | | 0.0 | | |
| 225,000 | | | BBB Industries 2022 Term
Loan B 1L, 10.120%,
(SOFRRATE + 5.250)%,
07/25/2029 | | | | | 215,226 | | | | | | 0.0 | | |
| 79,800 | | | Bombardier Recreational
Products, Inc. 2022
Incremental Term Loan B3,
8.370%, (SOFRRATE +
3.500)%, 12/13/2029 | | | | | 79,800 | | | | | | 0.0 | | |
| 475,000 | | | Caesars Entertainment
Corp Term Loan B, 7.880%,
(TSFR1M + 3.250)%,
02/06/2030 | | | | | 473,219 | | | | | | 0.1 | | |
| 706,450 | | | Flutter Entertainment 2022
Term Loan B 1L, 8.120%,
(SOFRRATE + 3.250)%,
07/22/2028 | | | | | 708,443 | | | | | | 0.1 | | |
| 250,000 | | | Formula One Holdings
Limited. Term Loan B,
8.120%, (SOFRRATE +
3.250)%, 01/15/2030 | | | | | 250,156 | | | | | | 0.0 | | |
| 423,938 | | | GVC Holdings (Gibraltar)
Limited 2022 Term Loan B,
8.130%, (TSFR1M +
3.500)%, 10/31/2029 | | | | | 424,931 | | | | | | 0.0 | | |
| 215,000 | | | Hanesbrands, Inc. 2023
Term Loan B, 8.380%,
(TSFR1M + 3.750)%,
03/08/2030 | | | | | 214,463 | | | | | | 0.0 | | |
| 258,050 | | | Penn National Gaming, Inc.
2022 Term Loan B 1L,
7.620%, (SOFRRATE +
2.750)%, 05/03/2029 | | | | | 258,030 | | | | | | 0.0 | | |
| 180,000 | | | Topgolf Callaway Brands
Corp. Term Loan B, 8.130%,
(TSFR1M + 3.500)%,
03/09/2030 | | | | | 179,175 | | | | | | 0.0 | | |
| | | | | | | | | 3,248,461 | | | | | | 0.2 | | |
See Accompanying Notes to Financial Statements
| Voya Strategic Income | PORTFOLIO OF INVESTMENTS |
| Opportunities Fund | as of March 31, 2023 (continued) |
Principal
Amount† | | | Value | | | Percentage
of Net
Assets | |
| BANK LOANS: (continued) | |
| | | | Consumer, Non-cyclical: 0.2% | |
| 77,221 | | | Alvogen Pharma US, Inc.
2022 Extended Term Loan,
12.548%, (US0003M +
7.500)%, 06/30/2025 | | | | $ | 67,954 | | | | | | 0.0 | | |
| 560,763 | | | Bausch + Lomb Corp. 1st
Lien Term Loan B, 8.120%,
(SOFRRATE + 3.250)%,
05/10/2027 | | | | | 546,086 | | | | | | 0.1 | | |
| 465,000 | | | Corgi Bidco, Inc. 2022 Term
Loan 1L, 9.870%,
(SOFRRATE + 5.000)%,
10/15/2029 | | | | | 437,100 | | | | | | 0.0 | | |
| 185,000 | | | Fugue Finance B.V. 2023
USD Term Loan B, 9.130%,
(TSFR1M + 4.500)%,
01/25/2028 | | | | | 185,462 | | | | | | 0.0 | | |
| 205,670 | | | Indy US Bidco, LLC 2023
USD Incremental Fifth
Amendment Term Loan,
10.880%, (TSFR1M +
6.250)%, 03/06/2028 | | | | | 181,504 | | | | | | 0.0 | | |
| 424,330 | | | Indy US Bidco, LLC 2023
USD Incremental Term
Loan B, 10.880%,
(TSFR1M + 6.250)%,
03/06/2028 | | | | | 374,471 | | | | | | 0.0 | | |
| 550,000 | | | Neptune Bidco US Inc 2022
USD Term Loan B, 9.870%,
(SOFRRATE + 5.000)%,
04/11/2029 | | | | | 489,500 | | | | | | 0.0 | | |
| 673,313 | | | Refresco / Pegasus 2022 TL
B 1L, 9.120%, (SOFRRATE +
4.250)%, 07/12/2029 | | | | | 663,634 | | | | | | 0.1 | | |
| 273,625 | | | Sabre GLBL Inc. 2022 1st
Lien Term Loan B, 9.870%,
(SOFRRATE + 5.000)%,
06/30/2028 | | | | | 236,002 | | | | | | 0.0 | | |
| | | | | | | | | 3,181,713 | | | | | | 0.2 | | |
| | | | Containers & Glass Products: 0.3% | |
| 146,530 | | | Albea Beauty Holdings S.A
2018 USD Term Loan B2,
7.909%, (US0003M +
2.750)%, 04/22/2024 | | | | | 140,302 | | | | | | 0.0 | | |
| 509,605 | | | Altium Packaging LLC 2021
Term Loan B, 7.600%,
(US0001M + 2.750)%,
02/03/2028 | | | | | 503,660 | | | | | | 0.0 | | |
Principal
Amount† | | | Value | | | Percentage
of Net
Assets | |
| BANK LOANS: (continued) | |
| | | | Containers & Glass Products (continued) | |
| 1,039,625 | | | Charter NEX US, Inc. 2021
Term Loan, 8.556%,
(TSFR1M + 3.750)%,
12/01/2027 | | | | $ | 1,028,579 | | | | | | 0.1 | | |
| 625,275 | | | Clydesdale Acquisition
Holdings Inc Term Loan,
9.082%, (TSFR1M +
4.175)%, 04/13/2029 | | | | | 612,485 | | | | | | 0.1 | | |
| 249,364 | | | Graham Packaging
Company Inc. 2021 Term
Loan, 7.840%, (US0001M +
3.000)%, 08/04/2027 | | | | | 247,462 | | | | | | 0.0 | | |
| 421,759 | | | Plastipak Packaging, Inc.
2021 Term Loan B, 7.375%,
(US0001M + 2.500)%,
12/01/2028 | | | | | 420,309 | | | | | | 0.0 | | |
| 636,938 | | | Pretium PKG Holdings, Inc.
2021 1st Lien Term Loan,
8.843%, (US0003M +
4.000)%, 10/02/2028 | | | | | 505,683 | | | | | | 0.1 | | |
| 205,000 | | | Pretium PKG Holdings, Inc.
2021 2nd Lien Term Loan,
11.648%, (US0003M +
6.750)%, 10/01/2029 | | | | | 131,648 | | | | | | 0.0 | | |
| 436,169 | | | Pro Mach Group, Inc. 2021
Term Loan B, 8.840%,
(US0001M + 4.000)%,
08/31/2028 | | | | | 434,806 | | | | | | 0.0 | | |
| 489,899 | | | Reynolds Consumer
Products LLC Term Loan,
6.657%, (TSFR1M +
1.750)%, 02/04/2027 | | | | | 486,685 | | | | | | 0.0 | | |
| 344,111 | | | Reynolds Group Holdings
Inc. 2021 Term Loan B,
8.090%, (US0001M +
3.250)%, 09/24/2028 | | | | | 339,994 | | | | | | 0.0 | | |
| 494,125 | | | Titan Acquisition Limited
2018 Term Loan B, 8.151%,
(US0003M + 3.000)%,
03/28/2025 | | | | | 469,934 | | | | | | 0.0 | | |
| 483,844 | | | TricorBraun Holdings, Inc.
2021 Term Loan, 8.090%,
(US0001M + 3.250)%,
03/03/2028 | | | | | 473,865 | | | | | | 0.0 | | |
| 363,748 | | | Trident TPI Holdings, Inc.
2021 Incremental Term
Loan, 9.159%, (US0003M +
4.000)%, 09/15/2028 | | | | | 353,973 | | | | | | 0.0 | | |
| | | | | | | | | 6,149,385 | | | | | | 0.3 | | |
See Accompanying Notes to Financial Statements
| Voya Strategic Income | PORTFOLIO OF INVESTMENTS |
| Opportunities Fund | as of March 31, 2023 (continued) |
Principal
Amount† | | | Value | | | Percentage
of Net
Assets | |
| BANK LOANS: (continued) | |
| | | | Drugs: 0.1% | |
| 612,375 | | | Amneal Pharmaceuticals
LLC 2018 Term Loan B,
8.375%, (US0001M +
3.500)%, 05/04/2025 | | | | $ | 583,096 | | | | | | 0.0 | | |
| 993,983 | | | Jazz Financing Lux S.a.r.l.
USD Term Loan, 8.340%,
(US0001M + 3.500)%,
05/05/2028 | | | | | 991,395 | | | | | | 0.1 | | |
| 367,068 | | | Organon & Co USD Term
Loan, 8.000%, (US0003M +
3.000)%, 06/02/2028 | | | | | 367,527 | | | | | | 0.0 | | |
| | | | | | | | | 1,942,018 | | | | | | 0.1 | | |
| | | | Electronics/Electrical: 0.8% | |
| 254,975 | | | Altar Bidco, Inc. 2021 Term
Loan, 6.635%, (SOFRRATE +
3.100)%, 02/01/2029 | | | | | 243,899 | | | | | | 0.0 | | |
| 384,343 | | | AP Core Holdings II, LLC
Amortization Term Loan B1,
10.340%, (US0001M +
5.500)%, 09/01/2027 | | | | | 376,176 | | | | | | 0.0 | | |
| 324,225 | | | Atlas Purchaser, Inc. 2021
Term Loan, 10.385%,
(US0003M + 5.250)%,
05/08/2028 | | | | | 225,944 | | | | | | 0.0 | | |
| 801,992 | | | Banff Merger Sub Inc 2021
USD Term Loan, 8.590%,
(US0001M + 3.750)%,
10/02/2025 | | | | | 792,426 | | | | | | 0.1 | | |
| 425,650 | | | Cloudera, Inc. 2021 Term
Loan, 8.590%, (US0001M +
3.750)%, 10/08/2028 | | | | | 402,239 | | | | | | 0.0 | | |
| 483,747 | | | CoreLogic, Inc. Term Loan,
8.375%, (US0001M +
3.500)%, 06/02/2028 | | | | | 413,906 | | | | | | 0.0 | | |
| 250,000 | | | Creation Technologies Inc.
2021 Term Loan, 10.282%,
(US0003M + 5.500)%,
10/05/2028 | | | | | 217,500 | | | | | | 0.0 | | |
| 509,863 | | | Delta TopCo, Inc. 2020 Term
Loan B, 8.656%,
(TSFR1M + 3.750)%,
12/01/2027 | | | | | 473,960 | | | | | | 0.0 | | |
| 250,000 | | | Epicor Software Corporation
2020 Term Loan, 8.090%,
(US0001M + 3.250)%,
07/30/2027 | | | | | 246,198 | | | | | | 0.0 | | |
| 269,288 | | | GoTo Group, Inc. Term
Loan B, 9.590%,
(US0001M + 4.750)%,
08/31/2027 | | | | | 155,899 | | | | | | 0.0 | | |
Principal
Amount† | | | Value | | | Percentage
of Net
Assets | |
| BANK LOANS: (continued) | |
| | | | Electronics/Electrical (continued) | |
| 212,807 | | | Grab Holdings Inc Term
Loan B, 9.350%,
(US0001M + 4.500)%,
01/29/2026 | | | | $ | 213,073 | | | | | | 0.0 | | |
| 1,033,189 | | | Greeneden U.S. Holdings II,
LLC 2020 USD Term Loan
B4, 8.840%, (US0001M +
4.000)%, 12/01/2027 | | | | | 1,021,566 | | | | | | 0.1 | | |
| 413,571 | | | Helios Software Holdings,
Inc. 2021 USD Term Loan B,
8.626%, (TSFR1M +
3.750)%, 03/11/2028 | | | | | 404,008 | | | | | | 0.0 | | |
| 459,608 | | | Hyland Software, Inc. 2018
1st Lien Term Loan,
8.340%, (US0001M +
3.500)%, 07/01/2024 | | | | | 454,265 | | | | | | 0.0 | | |
| 605,858 | | | Informatica LLC 2021 USD
Term Loan B, 7.602%,
(US0001M + 2.750)%,
10/27/2028 | | | | | 602,576 | | | | | | 0.1 | | |
| 1,063,217 | | | Ingram Micro Inc. 2021 Term
Loan B, 8.601%,
(US0003M + 3.500)%,
06/30/2028 | | | | | 1,056,306 | | | | | | 0.1 | | |
| 150,000 | | | Ivanti Software, Inc. 2021
2nd Lien Term Loan,
12.212%, (US0003M +
7.250)%, 12/01/2028 | | | | | 91,200 | | | | | | 0.0 | | |
| 930,986 | | | Ivanti Software, Inc. 2021
Term Loan B, 9.212%,
(US0003M + 4.250)%,
12/01/2027 | | | | | 764,476 | | | | | | 0.1 | | |
| 710,159 | | | Magenta Buyer LLC 2021
USD 1st Lien Term Loan,
9.580%, (US0003M +
4.750)%, 07/27/2028 | | | | | 585,881 | | | | | | 0.1 | | |
| 375,000 | | | Magenta Buyer LLC 2021
USD 2nd Lien Term Loan,
13.080%, (US0003M +
8.250)%, 07/27/2029 | | | | | 275,625 | | | | | | 0.0 | | |
| 498,744 | | | McAfee, LLC 2022 USD
Term Loan B, 8.515%,
(TSFR1M + 3.750)%,
03/01/2029 | | | | | 471,521 | | | | | | 0.0 | | |
| 262,350 | | | Mediaocean LLC 2021 Term
Loan, 8.407%, (US0001M +
3.500)%, 12/15/2028 | | | | | 248,511 | | | | | | 0.0 | | |
See Accompanying Notes to Financial Statements
| Voya Strategic Income | PORTFOLIO OF INVESTMENTS |
| Opportunities Fund | as of March 31, 2023 (continued) |
Principal
Amount† | | | Value | | | Percentage
of Net
Assets | |
| BANK LOANS: (continued) | |
| | | | Electronics/Electrical (continued) | |
| 280,000 | | | MH Sub I, LLC 2021 2nd
Lien Term Loan, 11.057%,
(TSFR1M + 6.250)%,
02/23/2029 | | | | $ | 258,440 | | | | | | 0.0 | | |
| 509,850 | | | Mitchell International, Inc.
2021 Term Loan B, 8.502%,
(US0001M + 3.750)%,
10/15/2028 | | | | | 484,118 | | | | | | 0.0 | | |
| 471,590 | | | Optiv Security, Inc. 1st Lien
Term Loan, 8.090%,
(US0003M + 3.250)%,
02/01/2024 | | | | | 464,163 | | | | | | 0.0 | | |
| 880,099 | | | Rackspace Technology
Global, Inc. 2021 Term
Loan, 7.595%, (US0003M +
2.750)%, 02/15/2028 | | | | | 475,254 | | | | | | 0.0 | | |
| 166,667 | | | RealPage, Inc 1st Lien Term
Loan, 7.840%, (US0001M +
3.000)%, 04/24/2028 | | | | | 162,037 | | | | | | 0.0 | | |
| 867,199 | | | Redstone Buyer LLC 2021
Term Loan, 9.568%,
(US0003M + 4.750)%,
04/27/2028 | | | | | 688,610 | | | | | | 0.1 | | |
| 400,000 | | | Rocket Software, Inc. 2018
Term Loan, 9.443%,
(US0003M + 4.250)%,
11/28/2025 | | | | | 393,250 | | | | | | 0.0 | | |
| 303,411 | | | SkillSoft Corporation 2021
Term Loan, 10.098%,
(TSFR1M + 5.250)%,
07/14/2028 | | | | | 258,355 | | | | | | 0.0 | | |
| 538,589 | | | Sovos Compliance, LLC
2021 Term Loan, 9.340%,
(US0001M + 4.500)%,
08/11/2028 | | | | | 510,986 | | | | | | 0.0 | | |
| 498,659 | | | Symantec Corporation 2021
Term Loan B, 6.907%,
(TSFR1M + 2.000)%,
09/12/2029 | | | | | 493,735 | | | | | | 0.0 | | |
| 598,286 | | | Travelport Finance
(Luxembourg) S.a.r.l. 2021
Consented Term Loan,
10.159%, (US0003M +
6.750)%, 05/29/2026 | | | | | 344,014 | | | | | | 0.0 | | |
| 992,462 | | | Ultimate Software Group Inc
(The) 2021 Term Loan,
8.032%, (US0003M +
3.250)%, 05/04/2026 | | | | | 968,359 | | | | | | 0.1 | | |
Principal
Amount† | | | Value | | | Percentage
of Net
Assets | |
| BANK LOANS: (continued) | |
| | | | Electronics/Electrical (continued) | |
| 200,000 | | | Watlow Electric
Manufacturing Company
Term Loan B, 8.688%,
(TSFR1M + 3.750)%,
03/02/2028 | | | | $ | 197,750 | | | | | | 0.0 | | |
| 240,058 | | | Xperi Corporation 2020
Term Loan B, 8.340%,
(US0001M + 3.500)%,
06/08/2028 | | | | | 237,358 | | | | | | 0.0 | | |
| | | | | | | | | 15,673,584 | | | | | | 0.8 | | |
| | | | Energy: 0.1% | |
| 405,000 | | | Brazos Delaware II, LLC
2023 Term Loan B, 8.380%,
(TSFR1M + 3.750)%,
02/01/2030 | | | | | 396,731 | | | | | | 0.0 | | |
| 625,921 | | | Oryx Midstream Services
Permian Basin LLC 2023
Incremental Term Loan,
8.063%, (TSFR1M +
3.250)%, 10/05/2028 | | | | | 616,923 | | | | | | 0.1 | | |
| 300,000 | | | Profrac Services, LLC 2022
Term Loan, 12.630%,
(TSFR1M + 8.000)%,
03/04/2025 | | | | | 297,750 | | | | | | 0.0 | | |
| 190,000 | | | Whitewater Whistler
Holdings, LLC 2023 Term
Loan B, 7.880%,
(TSFR1M + 3.250)%,
02/15/2030 | | | | | 189,525 | | | | | | 0.0 | | |
| | | | | | | | | 1,500,929 | | | | | | 0.1 | | |
| | | | Equipment Leasing: 0.0% | |
| 286,375 | | | Albion Financing 3 SARL
USD Term Loan, 10.065%,
(US0003M + 5.250)%,
08/17/2026 | | | | | 278,142 | | | | | | 0.0 | | |
| 431,031 | | | Rent-A-Center, Inc. 2021
First Lien Term Loan B,
8.125%, (US0003M +
3.250)%, 02/17/2028 | | | | | 427,798 | | | | | | 0.0 | | |
| | | | | | | | | 705,940 | | | | | | 0.0 | | |
| | | | Financial: 0.1% | |
| 483,788 | | | AmWINS Group, Inc. 2023
Incremental Term Loan B,
7.380%, (TSFR1M +
2.750)%, 02/19/2028 | | | | | 477,286 | | | | | | 0.0 | | |
See Accompanying Notes to Financial Statements
| Voya Strategic Income | PORTFOLIO OF INVESTMENTS |
| Opportunities Fund | as of March 31, 2023 (continued) |
Principal
Amount† | | | Value | | | Percentage
of Net
Assets | |
| BANK LOANS: (continued) | |
| | | | Financial (continued) | |
| 1,000,000 | | | Hub International Limited
2022 Term Loan B, 8.870%,
(SOFRRATE + 4.000)%,
11/10/2029 | | | | $ | 998,625 | | | | | | 0.1 | | |
| 498,747 | | | USI, Inc. 2022 Incremental
Term Loan, 8.380%,
(TSFR1M + 3.750)%,
11/14/2029 | | | | | 498,124 | | | | | | 0.0 | | |
| 230,000 | | | Walker & Dunlop, Inc. 2022
Incremental Term Loan B,
7.870%, (SOFRRATE +
3.000)%, 12/18/2028 | | | | | 227,700 | | | | | | 0.0 | | |
| | | | | | | | | 2,201,735 | | | | | | 0.1 | | |
| | | | Financial Intermediaries: 0.5% | |
| 769,639 | | | Advisor Group, Inc. 2021
Term Loan, 9.340%,
(US0001M + 4.500)%,
07/31/2026 | | | | | 759,744 | | | | | | 0.1 | | |
| 290,000 | | | AqGen Ascensus, Inc. 2021
2nd Lien Term Loan,
11.313%, (US0001M +
6.500)%, 08/02/2029 | | | | | 261,000 | | | | | | 0.0 | | |
| 533,263 | | | AqGen Island Holdings, Inc.
Term Loan, 8.601%,
(US0003M + 3.500)%,
08/02/2028 | | | | | 519,265 | | | | | | 0.0 | | |
| 561,450 | | | Castlelake Aviation Limited
Term Loan B, 7.616%,
(US0003M + 2.750)%,
10/22/2026 | | | | | 556,818 | | | | | | 0.0 | | |
| 684,982 | | | Citadel Securities LP 2021
Term Loan B, 7.306%,
(TSFR1M + 2.500)%,
02/02/2028 | | | | | 680,187 | | | | | | 0.1 | | |
| 209,516 | | | Cushman & Wakefield U.S.
Borrower, LLC 2020 Term
Loan B, 7.590%,
(US0001M + 2.750)%,
08/21/2025 | | | | | 204,016 | | | | | | 0.0 | | |
| 85,316 | | | Cushman & Wakefield U.S.
Borrower, LLC 2023 Term
Loan, 8.157%, (TSFR1M +
3.250)%, 01/31/2030 | | | | | 83,183 | | | | | | 0.0 | | |
| 383,832 | | | Deerfield Dakota Holding,
LLC 2020 USD Term Loan
B, 8.559%, (TSFR1M +
3.750)%, 04/09/2027 | | | | | 372,637 | | | | | | 0.0 | | |
| 1,089,805 | | | Edelman Financial Center,
LLC 2021 Term Loan B,
8.590%, (US0001M +
3.750)%, 04/07/2028 | | | | | 1,053,251 | | | | | | 0.1 | | |
Principal
Amount† | | | Value | | | Percentage
of Net
Assets | |
| BANK LOANS: (continued) | |
| | | | Financial Intermediaries (continued) | |
| 606,757 | | | First Eagle Holdings, Inc.
2020 Term Loan B, 7.659%,
(US0003M + 2.500)%,
02/01/2027 | | | | $ | 591,968 | | | | | | 0.0 | | |
| 383,038 | | | Focus Financial Partners,
LLC 2021 Term Loan,
7.307%, (TSFR1M +
2.500)%, 06/30/2028 | | | | | 377,703 | | | | | | 0.0 | | |
| 506,031 | | | HighTower Holdings LLC
2021 Term Loan B, 8.815%,
(US0003M + 4.000)%,
04/21/2028 | | | | | 479,465 | | | | | | 0.0 | | |
| 564,887 | | | Jane Street Group, LLC
2021 Term Loan, 7.590%,
(US0001M + 2.750)%,
01/26/2028 | | | | | 556,979 | | | | | | 0.0 | | |
| 489,893 | | | Trans Union, LLC 2019 Term
Loan B5, 6.590%,
(US0001M + 1.750)%,
11/16/2026 | | | | | 486,919 | | | | | | 0.0 | | |
| 1,110,166 | | | Trans Union, LLC 2021 Term
Loan B6, 7.090%,
(US0001M + 2.250)%,
12/01/2028 | | | | | 1,105,067 | | | | | | 0.1 | | |
| 618,750 | | | VFH Parent LLC 2022 Term
Loan B, 7.859%,
(SOFRRATE + 3.000)%,
01/13/2029 | | | | | 600,187 | | | | | | 0.1 | | |
| | | | | | | | | 8,688,389 | | | | | | 0.5 | | |
| | | | Food Products: 0.2% | |
| 484,810 | | | 8th Avenue Food &
Provisions, Inc. 2018 1st
Lien Term Loan, 8.609%,
(US0001M + 3.750)%,
10/01/2025 | | | | | 431,481 | | | | | | 0.0 | | |
| 679,650 | | | 8th Avenue Food &
Provisions, Inc. 2021
Incremental Term Loan,
9.609%, (US0001M +
4.750)%, 10/01/2025 | | | | | 607,012 | | | | | | 0.1 | | |
| 285,000 | | | BCPE North Star US
HoldCo 2, Inc. 2021 2nd
Lien Term Loan, 12.409%,
(US0003M + 7.250)%,
06/08/2029 | | | | | 257,213 | | | | | | 0.0 | | |
| 404,034 | | | CHG PPC Parent LLC 2021
Term Loan, 7.852%,
(US0001M + 3.000)%,
12/08/2028 | | | | | 400,499 | | | | | | 0.0 | | |
See Accompanying Notes to Financial Statements
| Voya Strategic Income | PORTFOLIO OF INVESTMENTS |
| Opportunities Fund | as of March 31, 2023 (continued) |
Principal
Amount† | | | Value | | | Percentage
of Net
Assets | |
| BANK LOANS: (continued) | |
| | | | Food Products (continued) | |
| 555,038 | | | IRB Holding Corp 2022
Term Loan B, 7.737%,
(SOFRRATE + 3.000)%,
12/15/2027 | | | | $ | 546,105 | | | | | | 0.1 | | |
| 472,625 | | | Primary Products Finance
LLC Term Loan, 8.743%,
(US0003M + 4.000)%,
03/31/2029 | | | | | 467,013 | | | | | | 0.0 | | |
| 387,634 | | | Sigma Bidco B.V. 2018 USD
Term Loan B2, 7.460%,
(TSFR1M + 3.000)%,
07/02/2025 | | | | | 372,613 | | | | | | 0.0 | | |
| 511,571 | | | Weber-Stephen Products
LLC Term Loan B, 8.090%,
(US0001M + 3.250)%,
10/30/2027 | | | | | 444,428 | | | | | | 0.0 | | |
| | | | | | | | | 3,526,364 | | | | | | 0.2 | | |
| | | | Food Service: 0.1% | |
| 736,675 | | | 1011778 B.C. Unlimited
Liability Company Term
Loan B4, 6.590%,
(US0001M + 1.750)%,
11/19/2026 | | | | | 729,861 | | | | | | 0.0 | | |
| 744,361 | | | Fertitta Entertainment, LLC
2022 Term Loan B, 8.807%,
(SOFRRATE + 4.000)%,
01/27/2029 | | | | | 734,358 | | | | | | 0.1 | | |
| 481,077 | | | Flynn Restaurant Group LP
2021 Term Loan B, 9.090%,
(US0001M + 4.250)%,
12/01/2028 | | | | | 470,252 | | | | | | 0.0 | | |
| 732,471 | | | US Foods, Inc. 2019 Term
Loan B, 6.807%,
(US0001M + 2.000)%,
09/13/2026 | | | | | 730,042 | | | | | | 0.0 | | |
| | | | | | | | | 2,664,513 | | | | | | 0.1 | | |
| | | | Health Care: 0.5% | |
| 119,903 (11) | | | Athenahealth, Inc. 2022
Delayed Draw Term loan,
8.370%, (SOFRRATE +
3.500)%, 02/15/2029 | | | | | 111,810 | | | | | | 0.0 | | |
| 976,032 | | | Athenahealth, Inc. 2022
Term Loan, 8.259%,
(TSFR1M + 3.500)%,
02/15/2029 | | | | | 910,149 | | | | | | 0.1 | | |
| 416,138 | | | Bella Holding Company, LLC
2021 Term Loan B, 8.657%,
(TSFR1M + 3.750)%,
05/10/2028 | | | | | 403,133 | | | | | | 0.0 | | |
Principal
Amount† | | | Value | | | Percentage
of Net
Assets | |
| BANK LOANS: (continued) | |
| | | | Health Care (continued) | |
| 720,875 | | | CHG Healthcare Services
Inc. 2021 Term Loan,
8.109%, (US0001M +
3.250)%, 09/29/2028 | | | | $ | 714,511 | | | | | | 0.1 | | |
| 940,856 | | | Global Medical Response,
Inc. 2020 Term Loan B,
9.236%, (US0003M +
4.250)%, 10/02/2025 | | | | | 670,360 | | | | | | 0.1 | | |
| 432,353 | | | Hunter Holdco 3 Limited
USD Term Loan B, 9.409%,
(US0003M + 4.250)%,
08/19/2028 | | | | | 425,327 | | | | | | 0.0 | | |
| 376,453 | | | ICON Luxembourg S.A.R.L.
LUX Term Loan, 7.410%,
(TSFR1M + 2.250)%,
07/03/2028 | | | | | 376,179 | | | | | | 0.0 | | |
| 546,293 | | | Medical Solutions Holdings,
Inc. 2021 1st Lien Term
Loan, 8.241%, (TSFR1M +
3.250)%, 11/01/2028 | | | | | 531,270 | | | | | | 0.0 | | |
| 1,296,900 | | | Medline Borrower, LP USD
Term Loan B, 8.090%,
(US0001M + 3.250)%,
10/23/2028 | | | | | 1,266,009 | | | | | | 0.1 | | |
| 150,000 | | | National Mentor Holdings,
Inc. 2021 2nd Lien Term
Loan, 12.248%, (TSFR1M +
7.250)%, 03/02/2029 | | | | | 90,750 | | | | | | 0.0 | | |
| 554,403 | | | National Mentor Holdings,
Inc. 2021 Term Loan,
8.766%, (US0003M +
3.750)%, 03/02/2028 | | | | | 427,999 | | | | | | 0.0 | | |
| 23,743 | | | National Mentor Holdings,
Inc. 2021 Term Loan C,
8.748%, (TSFR1M +
3.750)%, 03/02/2028 | | | | | 18,330 | | | | | | 0.0 | | |
| 216,150 | | | New Trojan Parent, Inc. 1st
Lien Term Loan, 7.971%,
(US0001M + 3.250)%,
01/06/2028 | | | | | 147,703 | | | | | | 0.0 | | |
| 253,635 | | | Pacific Dental Services,LLC
2021 Term Loan, 8.279%,
(US0001M + 3.500)%,
05/05/2028 | | | | | 252,129 | | | | | | 0.0 | | |
| 99,728 | | | PRA Health Sciences, Inc.
US Term Loan, 7.409%,
(US0003M + 2.250)%,
07/03/2028 | | | | | 99,655 | | | | | | 0.0 | | |
See Accompanying Notes to Financial Statements
| Voya Strategic Income | PORTFOLIO OF INVESTMENTS |
| Opportunities Fund | as of March 31, 2023 (continued) |
Principal
Amount† | | | Value | | | Percentage
of Net
Assets | |
| BANK LOANS: (continued) | |
| | | | Health Care (continued) | |
| 500,000 | | | Select Medical Corporation
2017 Term Loan B, 7.350%,
(US0001M + 2.500)%,
03/06/2025 | | | | $ | 498,958 | | | | | | 0.0 | | |
| 635,000 | | | Sotera Health Holdings, LLC
2021 Term Loan, 7.575%,
(US0003M + 2.750)%,
12/11/2026 | | | | | 613,966 | | | | | | 0.0 | | |
| 732,544 | | | Surgery Center Holdings,
Inc. 2021 Term Loan,
8.460%, (US0001M +
3.750)%, 08/31/2026 | | | | | 729,173 | | | | | | 0.1 | | |
| 409,223 | | | US Anesthesia Partners Inc
2021 Term Loan, 8.912%,
(US0001M + 4.250)%,
10/01/2028 | | | | | 395,192 | | | | | | 0.0 | | |
| 295,450 | | | Virgin Pulse, Inc. 2021 Term
Loan, 8.840%, (US0001M +
4.000)%, 04/06/2028 | | | | | 244,485 | | | | | | 0.0 | | |
| | | | | | | | | 8,927,088 | | | | | | 0.5 | | |
| | | | Home Furnishings: 0.1% | |
| 522,050 | | | Conair Holdings, LLC Term
Loan B, 8.909%, (US0003M +
3.750)%, 05/17/2028 | | | | | 463,319 | | | | | | 0.0 | | |
| 491,884 | | | Illuminate Merger Sub Corp.
Term Loan, 8.340%,
(US0001M + 3.500)%,
07/21/2028 | | | | | 468,274 | | | | | | 0.0 | | |
| 979,690 | | | Prime Security Services
Borrower, LLC 2021 Term
Loan, 7.517%, (US0003M +
2.750)%, 09/23/2026 | | | | | 977,793 | | | | | | 0.1 | | |
| 523,622 | | | Solis IV BV USD Term Loan
B1, 8.373%, (TSFR1M +
3.500)%, 02/26/2029 | | | | | 473,485 | | | | | | 0.0 | | |
| | | | | | | | | 2,382,871 | | | | | | 0.1 | | |
| | | | Industrial: 0.2% | |
| 900,000 | | | Berry Global, Inc. 1st Lien
Term Loan, 6.608%,
(US0001M + 1.750)%,
07/01/2026 | | | | | 898,313 | | | | | | 0.1 | | |
| 390,000 | | | Chart Industries, Inc. 2022
Term Loan B, 8.620%,
(SOFRRATE + 3.750)%,
12/07/2029 | | | | | 387,075 | | | | | | 0.0 | | |
| 299,250 | | | Oscar AcquisitionCo, LLC
Term Loan B, 9.370%,
(SOFRRATE + 4.500)%,
04/30/2029 | | | | | 289,244 | | | | | | 0.0 | | |
Principal
Amount† | | | Value | | | Percentage
of Net
Assets | |
| BANK LOANS: (continued) | |
| | | | Industrial (continued) | |
| 572,125 | | | Project Castle, Inc. Term
Loan B 1L, 10.370%,
(SOFRRATE + 5.500)%,
06/01/2029 | | | | $ | 490,597 | | | | | | 0.0 | | |
| 380,566 | | | STG Logistics, Inc. 2022 TL
1L, 10.870%, (SOFRRATE +
6.000)%, 03/24/2028 | | | | | 364,392 | | | | | | 0.0 | | |
| 748,125 | | | Transdigm, Inc. 2022 Term
Loan H, 7.880%, (TSFR1M +
3.250)%, 02/22/2027 | | | | | 749,808 | | | | | | 0.1 | | |
| 299,233 | | | Tutor Perini Corporation
Term Loan B, 9.608%,
(US0001M + 4.750)%,
08/18/2027 | | | | | 277,538 | | | | | | 0.0 | | |
| | | | | | | | | 3,456,967 | | | | | | 0.2 | | |
| | | | Industrial Equipment: 0.1% | |
| 474,425 | | | Alliance Laundry Systems
LLC Term Loan B, 8.306%,
(US0003M + 3.500)%,
10/08/2027 | | | | | 471,361 | | | | | | 0.0 | | |
| 495,818 | | | Kenan Advantage Group,
Inc. 2021 Term Loan B,
8.590%, (US0001M +
3.750)%, 03/24/2026 | | | | | 492,534 | | | | | | 0.0 | | |
| 494,975 | | | Madison IAQ LLC Term
Loan, 8.302%, (US0003M +
3.250)%, 06/21/2028 | | | | | 471,649 | | | | | | 0.0 | | |
| 200,000 | | | SPX Flow, Inc. 2022 Term
Loan, 9.407%, (TSFR1M +
4.500)%, 04/05/2029 | | | | | 191,750 | | | | | | 0.0 | | |
| 655,505 | | | Vertical US Newco Inc Term
Loan B, 8.602%, (US0006M +
3.500)%, 07/30/2027 | | | | | 640,288 | | | | | | 0.1 | | |
| | | | | | | | | 2,267,582 | | | | | | 0.1 | | |
| | | | Insurance: 0.3% | |
| 671,334 | | | Acrisure, LLC 2020 Term
Loan B, 8.359%, (US0001M +
3.500)%, 02/15/2027 | | | | | 650,355 | | | | | | 0.1 | | |
| 457,630 | | | Acrisure, LLC 2021 First
Lien Term Loan B, 9.090%,
(US0001M + 4.250)%,
02/15/2027 | | | | | 449,812 | | | | | | 0.0 | | |
| 490,929 | | | Alliant Holdings
Intermediate, LLC 2021
Term Loan B4, 8.279%,
(US0001M + 3.500)%,
11/06/2027 | | | | | 485,918 | | | | | | 0.0 | | |
See Accompanying Notes to Financial Statements
| Voya Strategic Income | PORTFOLIO OF INVESTMENTS |
| Opportunities Fund | as of March 31, 2023 (continued) |
Principal
Amount† | | | Value | | | Percentage
of Net
Assets | |
| BANK LOANS: (continued) | |
| | | | Insurance (continued) | |
| 402,105 | | | AmWINS Group, Inc. 2021
Term Loan B, 7.109%,
(US0001M + 2.250)%,
02/19/2028 | | | | $ | 397,945 | | | | | | 0.0 | | |
| 386,918 | | | Aretec Group, Inc. 2018
Term Loan, 9.157%,
(TSFR1M + 4.250)%,
10/01/2025 | | | | | 385,286 | | | | | | 0.0 | | |
| 496,154 | | | AssuredPartners, Inc. 2020
Term Loan B, 8.340%,
(US0001M + 3.500)%,
02/12/2027 | | | | | 492,071 | | | | | | 0.0 | | |
| 377,283 | | | AssuredPartners, Inc. 2021
Term Loan B, 8.340%,
(US0001M + 3.500)%,
02/12/2027 | | | | | 374,217 | | | | | | 0.0 | | |
| 381,150 | | | AssuredPartners, Inc. 2022
Term Loan, 8.291%,
(TSFR1M + 3.500)%,
02/12/2027 | | | | | 377,497 | | | | | | 0.0 | | |
| 640,875 | | | NFP Corp. 2020 Term Loan,
8.090%, (US0001M +
3.250)%, 02/15/2027 | | | | | 626,589 | | | | | | 0.1 | | |
| 817,839 | | | OneDigital Borrower LLC
2021 Term Loan, 9.157%,
(SOFRRATE + 4.250)%,
11/16/2027 | | | | | 789,215 | | | | | | 0.1 | | |
| | | | | | | | | 5,028,905 | | | | | | 0.3 | | |
| | | | Leisure Good/Activities/Movies: 0.3% | |
| 390,746 (3) | | | 24 Hour Fitness Worldwide,
Inc. 2021 Delayed Draw
Term Loan, 13.953%,
(US0003M + 9.000)% (PIK
Rate 1.575%, Cash Rate
9.000)%, 09/29/2025 | | | | | 351,671 | | | | | | 0.0 | | |
| 367,539 (3) | | | 24 Hour Fitness Worldwide,
Inc. 2021 Exit Delayed Draw
Term Loan, 19.051%,
(US0003M + 14.000)% (PIK
Rate 12.000%, Cash Rate
3.000)%, 09/29/2026 | | | | | 202,147 | | | | | | 0.0 | | |
| 1,077,754 | | | Alterra Mountain Company
2021 Series B-2 Consenting
Term Loan, 8.340%,
(US0001M + 3.500)%,
08/17/2028 | | | | | 1,075,060 | | | | | | 0.1 | | |
| 796,328 | | | AppLovin Corporation 2021
Term Loan B, 7.907%,
(TSFR1M + 3.100)%,
10/25/2028 | | | | | 793,342 | | | | | | 0.1 | | |
Principal
Amount† | | | Value | | | Percentage
of Net
Assets | |
| BANK LOANS: (continued) | |
| | | | Leisure Good/Activities/
Movies (continued) | |
| 492,386 | | | Bombardier Recreational
Products, Inc. 2020 Term
Loan, 6.859%, (US0001M +
2.000)%, 05/24/2027 | | | | $ | 480,261 | | | | | | 0.0 | | |
| 1,019,935 | | | CWGS Group, LLC 2021
Term Loan B, 7.218%,
(US0001M + 2.500)%,
06/03/2028 | | | | | 942,164 | | | | | | 0.1 | | |
| 564,563 | | | Hayward Industries, Inc.
2021 Term Loan, 7.340%,
(US0001M + 2.500)%,
05/30/2028 | | | | | 551,155 | | | | | | 0.0 | | |
| 327,832 | | | MajorDrive Holdings IV LLC
Term Loan B, 9.000%,
(US0003M + 4.000)%,
06/01/2028 | | | | | 311,850 | | | | | | 0.0 | | |
| 491,228 | | | Playtika Holding Corp 2021
Term Loan, 6.405%,
(US0001M + 3.500)%,
03/13/2028 | | | | | 488,684 | | | | | | 0.0 | | |
| 661,675 | | | Scientific Games Holdings
LP 2022 USD Term Loan B,
8.103%, (TSFR1M +
3.500)%, 04/04/2029 | | | | | 653,610 | | | | | | 0.0 | | |
| | | | | | | | | 5,849,944 | | | | | | 0.3 | | |
| | | | Lodging & Casinos: 0.2% | |
| 415,243 | | | Aimbridge Acquisition Co.,
Inc. 2019 Term Loan B,
8.590%, (US0001M +
3.750)%, 02/02/2026 | | | | | 397,595 | | | | | | 0.0 | | |
| 1,471 | | | Century Casinos, Inc 2022
Term Loan, 10.870%,
(SOFRRATE + 6.000)%,
04/02/2029 | | | | | 1,416 | | | | | | 0.0 | | |
| 350,000 | | | Hilton Domestic Operating
Company, Inc. 2019 Term
Loan B2, 6.642%,
(US0001M + 1.750)%,
06/22/2026 | | | | | 350,049 | | | | | | 0.0 | | |
| 736,263 | | | Hilton Grand Vacations
Borrower LLC 2021 Term
Loan B, 7.840%,
(US0001M + 3.000)%,
08/02/2028 | | | | | 736,263 | | | | | | 0.1 | | |
| 694,750 | | | Scientific Games
International, Inc. 2022 USD
Term Loan, 7.960%,
(TSFR1M + 3.000)%,
04/14/2029 | | | | | 690,191 | | | | | | 0.1 | | |
See Accompanying Notes to Financial Statements
| Voya Strategic Income | PORTFOLIO OF INVESTMENTS |
| Opportunities Fund | as of March 31, 2023 (continued) |
Principal
Amount† | | | Value | | | Percentage
of Net
Assets | |
| BANK LOANS: (continued) | |
| | | | Lodging & Casinos (continued) | |
| 491,055 | | | Station Casinos LLC 2020
Term Loan B, 7.100%,
(US0001M + 2.250)%,
02/08/2027 | | | | $ | 487,986 | | | | | | 0.0 | | |
| 718,211 | | | Twin River Worldwide
Holdings, Inc. 2021 Term
Loan B, 7.959%, (US0001M +
3.250)%, 10/02/2028 | | | | | 687,867 | | | | | | 0.0 | | |
| | | | | | | | | 3,351,367 | | | | | | 0.2 | | |
| | | | Mortgage REITs: 0.0% | |
| 366,673 | | | BIFM CA Buyer Inc. Term
Loan B, 8.340%, (US0001M +
3.500)%, 06/01/2026 | | | | | 360,715 | | | | | | 0.0 | | |
| | | | | |
| | | | Oil & Gas: 0.1% | |
| 322,563 | | | ITT Holdings LLC 2021 Term
Loan, 7.556%, (TSFR1M +
2.750)%, 07/10/2028 | | | | | 315,507 | | | | | | 0.0 | | |
| 466,373 | | | NorthRiver Midstream
Finance LP 2018 Term Loan
B, 8.004%, (US0003M +
3.250)%, 10/01/2025 | | | | | 465,935 | | | | | | 0.0 | | |
| 551,832 | | | TransMontaigne Operating
Company L.P. Term Loan B,
8.310%, (US0001M +
3.500)%, 11/17/2028 | | | | | 545,452 | | | | | | 0.0 | | |
| 598,184 | | | Traverse Midstream
Partners LLC 2017 Term
Loan, 8.726%, (TSFR1M +
3.750)%, 02/16/2028 | | | | | 588,463 | | | | | | 0.1 | | |
| 535,032 | | | Waterbridge Midstream
Operating LLC Term Loan B,
10.568%, (US0003M +
5.750)%, 06/22/2026 | | | | | 527,048 | | | | | | 0.0 | | |
| | | | | | | | | 2,442,405 | | | | | | 0.1 | | |
| | | | Publishing: 0.0% | |
| 522,555 | | | Cengage Learning, Inc.
2021 Term Loan B, 9.880%,
(US0003M + 4.750)%,
07/14/2026 | | | | | 486,162 | | | | | | 0.0 | | |
| 302,228 | | | Houghton Mifflin Harcourt
Publishing Company 2022
Term Loan, 10.157%,
(TSFR1M + 5.250)%,
04/09/2029 | | | | | 271,722 | | | | | | 0.0 | | |
| | | | | | | | | 757,884 | | | | | | 0.0 | | |
| | | | Radio & Television: 0.2% | |
| 897,046 | | | Clear Channel Outdoor
Holdings, Inc. Term Loan B,
8.325%, (US0003M +
3.500)%, 08/21/2026 | | | | | 838,598 | | | | | | 0.1 | | |
Principal
Amount† | | | Value | | | Percentage
of Net
Assets | |
| BANK LOANS: (continued) | |
| | | | Radio & Television (continued) | |
| 199,490 | | | CMG Media Corporation
2021 Term Loan, 8.659%,
(US0003M + 3.500)%,
12/17/2026 | | | | $ | 177,172 | | | | | | 0.0 | | |
| 2,764,859 | | | Diamond Sports Group, LLC
2022 2nd Lien Term Loan,
7.880%, (TSFR1M +
3.250)%, 08/24/2026 | | | | | 184,554 | | | | | | 0.0 | | |
| 227,083 | | | Gray Television, Inc. 2021
Term Loan D, 7.662%,
(US0001M + 3.000)%,
12/01/2028 | | | | | 221,075 | | | | | | 0.0 | | |
| 552,363 | | | iHeartCommunications, Inc.
2020 Term Loan, 7.840%,
(US0001M + 3.000)%,
05/01/2026 | | | | | 491,027 | | | | | | 0.0 | | |
| 1,030,000 | | | Univision Communications
Inc. 2021 First Lien Term
Loan B, 8.090%, (US0001M +
3.250)%, 03/15/2026 | | | | | 1,026,689 | | | | | | 0.1 | | |
| | | | | | | | | 2,939,115 | | | | | | 0.2 | | |
| | | | Rail Industries: 0.0% | |
| 736,709 | | | Genesee & Wyoming Inc.
(New) Term Loan, 6.998%,
(US0003M + 2.000)%,
12/30/2026 | | | | | 733,151 | | | | | | 0.0 | | |
| | | | | |
| | | | Retailers (Except Food & Drug): 0.3% | |
| 995 | | | AI Aqua Merger Sub, Inc.
2021 1st Lien Term Loan B,
8.657%, (TSFR1M +
3.750)%, 07/31/2028 | | | | | 960 | | | | | | 0.0 | | |
| 1,138,919 | | | Great Outdoors Group, LLC
2021 Term Loan B1,
8.590%, (US0001M +
3.750)%, 03/06/2028 | | | | | 1,126,581 | | | | | | 0.1 | | |
| 923,622 | | | Harbor Freight Tools USA,
Inc. 2021 Term Loan B,
7.590%, (US0001M +
2.750)%, 10/19/2027 | | | | | 899,377 | | | | | | 0.1 | | |
| 283,274 | | | Jo-Ann Stores, Inc. 2021
Term Loan B1, 9.572%,
(US0003M + 4.750)%,
07/07/2028 | | | | | 159,105 | | | | | | 0.0 | | |
| 430,771 | | | Leslies Poolmart, Inc. 2021
Term Loan B, 7.659%,
(US0001M + 2.500)%,
03/09/2028 | | | | | 425,617 | | | | | | 0.0 | | |
See Accompanying Notes to Financial Statements
| Voya Strategic Income | PORTFOLIO OF INVESTMENTS |
| Opportunities Fund | as of March 31, 2023 (continued) |
Principal
Amount† | | | Value | | | Percentage
of Net
Assets | |
| BANK LOANS: (continued) | |
| | | | Retailers (Except Food &
Drug) (continued) | |
| 756,525 | | | Michaels Companies, Inc.
2021 Term Loan B, 9.409%,
(US0003M + 4.250)%,
04/15/2028 | | | | $ | 697,354 | | | | | | 0.0 | | |
| 543,480 | | | Petco Animal Supplies, Inc.
2021 Term Loan B, 8.410%,
(TSFR1M + 3.250)%,
03/03/2028 | | | | | 534,455 | | | | | | 0.0 | | |
| 820,388 | | | Pilot Travel Centers LLC
2021 Term Loan B, 6.907%,
(TSFR1M + 2.000)%,
08/04/2028 | | | | | 817,824 | | | | | | 0.1 | | |
| 545,118 | | | Restoration Hardware, Inc.
Term Loan B, 7.340%,
(US0001M + 2.500)%,
10/20/2028 | | | | | 511,814 | | | | | | 0.0 | | |
| | | | | | | | | 5,173,087 | | | | | | 0.3 | | |
| | | | Surface Transport: 0.1% | |
| 480,459 | | | American Trailer World Corp.
Term Loan B, 8.657%,
(TSFR1M + 3.750)%,
03/03/2028 | | | | | 418,480 | | | | | | 0.0 | | |
| 781,485 | | | LaserShip, Inc. 2021 Term
Loan, 9.659%, (US0003M +
4.500)%, 05/07/2028 | | | | | 675,008 | | | | | | 0.0 | | |
| 716,815 | | | Worldwide Express
Operations, LLC 2021 1st
Lien Term Loan, 9.159%,
(US0003M + 4.000)%,
07/26/2028 | | | | | 692,399 | | | | | | 0.1 | | |
| 170,000 | | | Worldwide Express
Operations, LLC 2021 2nd
Lien Term Loan, 12.159%,
(US0003M + 7.000)%,
07/26/2029 | | | | | 140,037 | | | | | | 0.0 | | |
| | | | | | | | | 1,925,924 | | | | | | 0.1 | | |
| | | | Technology: 0.4% | |
| 525,000 | | | Applied Systems, Inc. 2022
Extended 1st Lien Term
Loan, 9.370%, (SOFRRATE +
4.500)%, 09/18/2026 | | | | | 524,891 | | | | | | 0.0 | | |
| 1,683,475 | | | Avaya 2022 Term Loan 1L,
14.870%, (SOFRRATE +
10.000)%, 12/15/2027 | | | | | 433,495 | | | | | | 0.0 | | |
| 416,483 | | | Avaya, Inc. 2023 DIP Term
Loan, 12.630%, (TSFR1M +
8.000)%, 08/15/2023 | | | | | 431,059 | | | | | | 0.0 | | |
Principal
Amount† | | | Value | | | Percentage
of Net
Assets | |
| BANK LOANS: (continued) | |
| | | | Technology (continued) | |
| 582,735 | | | Bright Bidco B.V. 2022 Exit
Term Loan, 12.676%,
10/31/2027 | | | | $ | 588,563 | | | | | | 0.1 | | |
| 610,000 | | | CDK Global 2022 Term
Loan B 1L, 9.370%,
(SOFRRATE + 4.500)%,
07/06/2029 | | | | | 609,292 | | | | | | 0.1 | | |
| 200,000 | | | ECI Macola Max Holding,
LLC 2020 Term Loan,
8.943%, (US0003M +
3.750)%, 11/09/2027 | | | | | 197,500 | | | | | | 0.0 | | |
| 415,000 | | | Entegris, Inc. 2023 Term
Loan B, 7.623%, (TSFR1M +
2.750)%, 07/06/2029 | | | | | 415,324 | | | | | | 0.0 | | |
| 547,250 | | | MKS Instruments, Inc. 2022
USD Term Loan B 1L,
7.620%, (SOFRRATE +
2.750)%, 08/17/2029 | | | | | 545,084 | | | | | | 0.0 | | |
| 820,000 | | | Open Text Corporation 2022
Term Loan B, 8.370%,
(SOFRRATE + 3.500)%,
08/24/2029 | | | | | 818,719 | | | | | | 0.1 | | |
| 370,000 | | | Renaissance Holding Corp.
2023 Term Loan B, 9.380%,
(TSFR1M + 4.750)%,
03/15/2030 | | | | | 359,594 | | | | | | 0.0 | | |
| 298,385 | | | SS&C Technologies Inc.
2022 Term Loan B6,
6.880%, (TSFR1M +
2.250)%, 03/22/2029 | | | | | 296,840 | | | | | | 0.0 | | |
| 449,661 | | | SS&C Technologies Inc.
2022 Term Loan B7,
6.880%, (TSFR1M +
2.250)%, 03/22/2029 | | | | | 447,332 | | | | | | 0.0 | | |
| 450,000 | | | Tibco Software Inc. 2022
USD Term Loan, 9.498%,
(TSFR1M + 4.500)%,
03/30/2029 | | | | | 408,134 | | | | | | 0.0 | | |
| 868,026 | | | Veritas US Inc. 2021 USD
Term Loan B, 9.840%,
(US0001M + 5.000)%,
09/01/2025 | | | | | 661,869 | | | | | | 0.1 | | |
| | | | | | | | | 6,737,696 | | | | | | 0.4 | | |
| | | | Telecommunications: 0.4% | |
| 376,421 | | | Altice Financing SA 2022
USD Term Loan, 9.566%,
(TSFR1M + 5.000)%,
10/31/2027 | | | | | 373,598 | | | | | | 0.0 | | |
See Accompanying Notes to Financial Statements
| Voya Strategic Income | PORTFOLIO OF INVESTMENTS |
| Opportunities Fund | as of March 31, 2023 (continued) |
Principal
Amount† | | | Value | | | Percentage
of Net
Assets | |
| BANK LOANS: (continued) | |
| | | | Telecommunications (continued) | |
| 661,909 | | | Asurion LLC 2018 Term
Loan B7, 7.840%,
(US0001M + 3.000)%,
11/03/2024 | | | | $ | 661,427 | | | | | | 0.0 | | |
| 330,000 | | | Asurion LLC 2021 2nd Lien
Term Loan B3, 10.090%,
(US0001M + 5.250)%,
01/31/2028 | | | | | 276,684 | | | | | | 0.0 | | |
| 497,925 | | | Avaya, Inc. 2020 Term Loan
B, 9.443%, (US0003M +
4.250)%, 12/15/2027 | | | | | 125,104 | | | | | | 0.0 | | |
| 1,075,332 | | | CCI Buyer, Inc. Term Loan,
8.898%, (TSFR1M +
4.000)%, 12/17/2027 | | | | | 1,063,504 | | | | | | 0.1 | | |
| 436,630 | | | CenturyLink, Inc. 2020 Term
Loan B, 7.172%, (TSFR1M +
2.250)%, 03/15/2027 | | | | | 290,723 | | | | | | 0.0 | | |
| 764,945 | | | CommScope, Inc. 2019
Term Loan B, 8.090%,
(US0001M + 3.250)%,
04/06/2026 | | | | | 737,853 | | | | | | 0.1 | | |
| 946,981 | | | Connect Finco Sarl 2021
Term Loan B, 8.340%,
(US0001M + 3.500)%,
12/11/2026 | | | | | 942,541 | | | | | | 0.1 | | |
| 149,724 | | | Cyxtera DC Holdings, Inc.
Term Loan B, 7.820%,
(US0003M + 3.000)%,
05/01/2024 | | | | | 122,250 | | | | | | 0.0 | | |
| 211,324 | | | Global Tel*Link Corporation
2018 1st Lien Term Loan,
9.076%, (US0003M +
4.250)%, 11/29/2025 | | | | | 186,064 | | | | | | 0.0 | | |
| 250,538 | | | GOGO Intermediate
Holdings LLC Term Loan B,
8.697%, (TSFR1M +
3.750)%, 04/30/2028 | | | | | 249,128 | | | | | | 0.0 | | |
| 397,752 | | | Intelsat Jackson Holdings
S.A. 2021 Exit Term Loan B,
9.082%, (SOFRRATE +
4.250)%, 02/01/2029 | | | | | 394,064 | | | | | | 0.0 | | |
| 268,650 | | | Venga Finance Sarl 2021
USD Term Loan B,
9.703%, (US0003M +
4.750)%, 06/28/2029 | | | | | 256,561 | | | | | | 0.0 | | |
Principal
Amount† | | | Value | | | Percentage
of Net
Assets | |
| BANK LOANS: (continued) | |
| | | | Telecommunications (continued) | |
| 370,944 | | | ViaSat, Inc. Term Loan,
9.422%, (TSFR1M +
4.500)%, 03/02/2029 | | | | $ | 362,597 | | | | | | 0.0 | | |
| 960,597 | | | Zayo Group Holdings, Inc.
USD Term Loan, 7.840%,
(US0001M + 3.000)%,
03/09/2027 | | | | | 780,886 | | | | | | 0.1 | | |
| | | | | | | | | 6,822,984 | | | | | | 0.4 | | |
| | | | Utilities: 0.0% | |
| 260,171 | | | Nautilus Power, LLC Term
Loan B, 9.090%, (US0001M +
4.250)%, 05/16/2024 | | | | | 183,420 | | | | | | 0.0 | | |
| | | | Total Bank Loans | | | | | | | | | | | | | |
| | | | (Cost $161,824,264) | | | | | 151,824,902 | | | | | | 8.2 | | |
| CONVERTIBLE BONDS/NOTES: 0.0% | |
| | | | Communications: 0.0% | |
| 210,000 | | | DISH Network Corp.,
3.375%, 08/15/2026 | | | | | 109,200 | | | | | | 0.0 | | |
| | | | Total Convertible Bonds/
Notes | | | | | | | | | | | | | |
| | | | (Cost $205,803) | | | | | 109,200 | | | | | | 0.0 | | |
| U.S. GOVERNMENT AGENCY OBLIGATIONS: 0.0% | |
| | | | Uniform Mortgage-Backed
Securities: 0.0% | |
| 3,047 | | | 5.500%,10/01/2039 | | | | | 3,166 | | | | | | 0.0 | | |
| | | | Total U.S. Government
Agency Obligations
(Cost $3,264) | | | | | 3,166 | | | | | | 0.0 | | |
| |
| Shares | | | | | | Value | | | Percentage
of Net
Assets | |
| COMMON STOCK: 0.0% | |
| | | | Consumer Discretionary: 0.0% | |
| 142,000 (9)(12) | | | 24 Hour Fitness Worldwide,
Inc. | | | | | 852 | | | | | | 0.0 | | |
| | | | | |
| | | | Consumer Staples: 0.0% | |
| 2,038 (9)(12) | | | Save-A-Lot, Inc. / Moran
Foods | | | | | 678 | | | | | | 0.0 | | |
| | | | Total Common Stock | | | | | | | | | | | | | |
| | | | (Cost $290,412) | | | | | 1,530 | | | | | | 0.0 | | |
See Accompanying Notes to Financial Statements
| Voya Strategic Income | PORTFOLIO OF INVESTMENTS |
| Opportunities Fund | as of March 31, 2023 (continued) |
| Shares | | | | | | Value | | | Percentage
of Net
Assets | |
| PREFERRED STOCK: 0.0% | |
| | | | Consumer Discretionary: 0.0% | |
| 189,193 (9)(12) | | | 24 Hour Fitness
Worldwide, Inc. | | | | $ | 946 | | | | | | 0.0 | | |
| | | | | |
| | | | Information Technology: 0.0% | |
| 2,393 (9)(12) | | | Riverbed Technology,
Inc. | | | | | 24 | | | | | | 0.0 | | |
| | | | Total Preferred Stock | | | | | | | | | | | | | |
| | | | (Cost $267,309) | | | | | 970 | | | | | | 0.0 | | |
| WARRANTS: —% | |
| | | | Communication Services: —% | |
| 26,686 (9)(12) | | | Cineworld Group PLC | | | | | — | | | | | | — | | |
| | | | Total Warrants | | | | | | | | | | | | | |
| | | | (Cost $—) | | | | | — | | | | | | — | | |
| EQUITIES AND OTHER ASSETS: 0.0% | |
| | | | Business Equipment &
Services: 0.0% | |
| 5,366 (9) | | | Yak Access, LLC
Series A Common
Equity | | | | | 268 | | | | | | 0.0 | | |
| 137,359 (9) | | | Yak Access, LLC
Series A Preferred
Equity | | | | | 68,679 | | | | | | 0.0 | | |
| 1,157 (9) | | | Yak Access, LLC
Series B Common
Equity | | | | | 58 | | | | | | 0.0 | | |
| 175,362 (9) | | | Yak Access, LLC
Series B-1 Preferred
Equity | | | | | 7,015 | | | | | | 0.0 | | |
| 4,957 (9) | | | Yak Access, LLC
Series B-2 Preferred
Equity | | | | | 50 | | | | | | 0.0 | | |
| | | | | | | | | 76,070 | | | | | | 0.0 | | |
| | | | Telecommunications: 0.0% | |
| 3,256 (9) | | | GTT Communications,
Inc. | | | | | 40,700 | | | | | | 0.0 | | |
| | | | Total Equities and Other
Assets | | | | | | | | | | | | | |
| | | | (Cost $108,494) | | | | | 116,770 | | | | | | 0.0 | | |
| |
| | | | | | | Value | | | Percentage
of Net
Assets | |
| PURCHASED OPTIONS (13): 0.0% | |
| | | | Total Purchased Options | | | | | | | | | | | | | |
| | | | (Cost $2,918,451) | | | | | 887,792 | | | | | | 0.0 | | |
| | | | Total Long-Term
Investments | | | | | | | | | | | | | |
| | | | (Cost $1,956,355,377) | | | | | 1,766,630,024 | | | | | | 95.0 | | |
Principal
Amount† | | | | | | Value | | | Percentage
of Net
Assets | |
| SHORT-TERM INVESTMENTS: 3.8% | |
| | | | Commercial Paper: 0.3% | |
| 5,000,000 | | | McCormick & Co., Inc.,
5.290%, 04/28/2023 | | | | | | | | | | | | | |
| | | | (Cost $4,980,417) | | | | $ | 4,979,452 | | | | | | 0.3 | | |
| | | | | |
| | | | Repurchase Agreements: 1.1% | |
| 4,776,786 (14) | | | Bank of America Inc.,
Repurchase Agreement dated
03/31/23, 4.82%, due 04/03/23
(Repurchase Amount
$4,778,678, collateralized by
various U.S. Government
Agency Obligations, 1.500%-
3.000%, Market Value plus
accrued interest $4,872,322,
due 11/01/49-02/01/51) | | | | | 4,776,786 | | | | | | 0.3 | | |
| 3,034,806 (14) | | | Cantor Fitzgerald Securities,
Repurchase Agreement dated
03/31/23, 4.83%, due 04/03/23
(Repurchase Amount
$3,036,011, collateralized by
various U.S. Government/U.S.
Government Agency
Obligations, 0.000%-9.000%,
Market Value plus accrued
interest $3,095,502, due
04/25/23-02/20/73) | | | | | 3,034,806 | | | | | | 0.2 | | |
| 2,144,898 (14) | | | Citadel Securities LLC,
Repurchase Agreement dated
03/31/23, 4.88%, due 04/03/23
(Repurchase Amount
$2,145,758, collateralized by
various U.S. Government
Securities, 0.000%-5.375%,
Market Value plus accrued
interest $2,188,686, due
04/04/23-02/15/53) | | | | | 2,144,898 | | | | | | 0.1 | | |
| 447,657 (14) | | | Citigroup, Inc., Repurchase
Agreement dated 03/31/23,
4.81%, due 04/03/23
(Repurchase Amount
$447,834, collateralized by
various U.S. Government/U.S.
Government Agency
Obligations, 1.500%-7.000%,
Market Value plus accrued
interest $456,610, due
12/26/24-03/20/53) | | | | | 447,657 | | | | | | 0.0 | | |
See Accompanying Notes to Financial Statements
| Voya Strategic Income | PORTFOLIO OF INVESTMENTS |
| Opportunities Fund | as of March 31, 2023 (continued) |
Principal
Amount† | | | | | | Value | | | Percentage
of Net
Assets | |
| SHORT-TERM INVESTMENTS: (continued) | |
| | | | Repurchase Agreements (continued) | |
| 4,776,786 (14) | | | Jefferies LLC, Repurchase
Agreement dated 03/31/23,
4.91%, due 04/03/23
(Repurchase Amount
$4,778,714, collateralized by
various U.S. Government
Agency Obligations,
0.000%-5.750%, Market Value
plus accrued interest
$4,872,352, due
04/14/23-03/21/28) | | | | $ | 4,776,786 | | | | | | 0.2 | | |
| 4,776,786 (14) | | | RBC Dominion Securities Inc.,
Repurchase Agreement dated
03/31/23, 4.82%, due 04/03/23
(Repurchase Amount
$4,778,678, collateralized by
various U.S. Government/U.S.
Government Agency
Obligations, 0.000%-6.375%,
Market Value plus accrued
interest $4,872,322, due
04/06/23-02/20/53) | | | | | 4,776,786 | | | | | | 0.3 | | |
| | | | Total Repurchase Agreements | | | | | | | | | | | | | |
| | | | (Cost $19,957,719) | | | | | 19,957,719 | | | | | | 1.1 | | |
| |
| Shares | | | | | | Value | | | Percentage
of Net
Assets | |
| SHORT-TERM INVESTMENTS: 3.8% | |
| | | | Mutual Funds: 2.4% | |
| 8,990,719 (15) | | | BlackRock Liquidity Funds,
FedFund, Institutional Class,
4.720% | | | | | 8,990,719 | | | | | | 0.5 | | |
| 35,919,000 (15) | | | Morgan Stanley
Institutional Liquidity
Funds - Government
Portfolio (Institutional
Share Class), 4.730% | | | | | 35,919,000 | | | | | | 1.9 | | |
| | | | Total Mutual Funds | | | | | | | | | | | | | |
| | | | (Cost $44,909,719) | | | | | 44,909,719 | | | | | | 2.4 | | |
| | | | Total Short-Term
Investments | | | | | | | | | | | | | |
| | | | (Cost $69,847,855) | | | | | 69,846,890 | | | | | | 3.8 | | |
| | | | Total Investments in
Securities
(Cost $2,026,203,232) | | | | $ | 1,836,476,914 | | | | | | 98.8 | | |
| | | | Assets in Excess of
Other Liabilities | | | | | 23,025,912 | | | | | | 1.2 | | |
| | | | Net Assets | | | | $ | 1,859,502,826 | | | | | | 100.0 | | |
†
Unless otherwise indicated, principal amount is shown in USD.
(1)
Securities with purchases pursuant to Rule 144A or section 4(a)(2), under the Securities Act of 1933 and may not be resold subject to that rule except to qualified institutional buyers.
(2)
Security, or a portion of the security, is on loan.
(3)
All or a portion of this security is payment-in-kind (“PIK”) which may pay interest or additional principal at the issuer’s discretion. Rates shown are the current rate and possible
payment rates.
(4)
Variable rate security. Rate shown is the rate in effect as of March 31, 2023.
(5)
Step-up bond that pays an initial coupon rate for the first period and then a higher coupon rate for the following periods. Rates shown reflect the current and next coupon rate as of March 31, 2023.
(6)
Interest only securities represent the right to receive the monthly interest payments on an underlying pool of mortgage loans. Principal amount shown represents the notional amount on which current interest is calculated. Payments of principal on the pool reduce the value of the interest only security.
(7)
Principal only securities represent the right to receive the monthly principal payments on an underlying pool of mortgage loans. No payments of interest on the pool are passed through the principal only security.
(8)
Defaulted security.
(9)
For fair value measurement disclosure purposes, security is categorized as Level 3, whose value was determined using significant unobservable inputs.
(10)
Represents a zero coupon bond. Rate shown reflects the effective yield as of March 31, 2023.
(11)
All or a portion of this holding is subject to unfunded loan commitments. Please refer to Note 10 for additional details.
(12)
Non-income producing security.
(13)
The tables within the Portfolio of Investments detail open purchased options which are non-income producing securities.
(14)
All or a portion of the security represents securities purchased with cash collateral received for securities on loan.
(15)
Rate shown is the 7-day yield as of March 31, 2023.
(16)
Bond may be called prior to maturity date.
Currency Abbreviations:
BRL
Brazilian Real
MXN
Mexican Peso
ZAR
South African Rand
Reference Rate Abbreviations:
12MTA
12-month Treasury Average
SOFRRATE
1-day Secured Overnight Financing Rate
SOFR30A
30-day Secured Overnight Financing Rate
TSFR1M
1-month CME Term Secured Overnight Financing Rate
TSFR3M
3-month CME Term Secured Overnight Financing Rate
US0001M
1-month LIBOR
US0003M
3-month LIBOR
US0006M
6-month LIBOR
US0012M
12-month LIBOR
See Accompanying Notes to Financial Statements
| Voya Strategic Income | PORTFOLIO OF INVESTMENTS |
| Opportunities Fund | as of March 31, 2023 (continued) |
Fair Value Measurements^
The following is a summary of the fair valuations according to the inputs used as of March 31, 2023 in valuing the assets and liabilities:
| | | | Quoted Prices
in Active Markets
for Identical
Investments
(Level 1) | | | Significant
Other
Observable
Inputs
(Level 2) | | | Significant
Unobservable
Inputs
(Level 3) | | | Fair Value
at
March 31, 2023 | |
| Asset Table | | | | | | | | | | | | | | | | | | | | | | | | | |
| Investments, at fair value | | | | | | | | | | | | | | | | | | | | | | | | | |
| Common Stock | | | | | | | | | | | | | | | | | | | | | | | | | |
| Consumer Discretionary | | | | $ | — | | | | | $ | — | | | | | $ | 852 | | | | | $ | 852 | | |
| Consumer Staples | | | | | — | | | | | | — | | | | | | 678 | | | | | | 678 | | |
| Total Common Stock | | | | | — | | | | | | — | | | | | | 1,530 | | | | | | 1,530 | | |
| Preferred Stock | | | | | — | | | | | | — | | | | | | 970 | | | | | | 970 | | |
| Warrants | | | | | — | | | | | | — | | | | | | — | | | | | | — | | |
| Purchased Options | | | | | — | | | | | | 887,792 | | | | | | — | | | | | | 887,792 | | |
| Corporate Bonds/Notes | | | | | — | | | | | | 406,847,836 | | | | | | — | | | | | | 406,847,836 | | |
| Collateralized Mortgage Obligations | | | | | — | | | | | | 483,999,970 | | | | | | — | | | | | | 483,999,970 | | |
| Asset-Backed Securities | | | | | — | | | | | | 276,155,008 | | | | | | — | | | | | | 276,155,008 | | |
| Commercial Mortgage-Backed Securities | | | | | — | | | | | | 340,276,739 | | | | | | 7,612,634 | | | | | | 347,889,373 | | |
| Sovereign Bonds | | | | | — | | | | | | 66,954,283 | | | | | | — | | | | | | 66,954,283 | | |
| Convertible Bonds/Notes | | | | | — | | | | | | 109,200 | | | | | | — | | | | | | 109,200 | | |
| U.S. Government Agency Obligations | | | | | — | | | | | | 3,166 | | | | | | — | | | | | | 3,166 | | |
| U.S. Treasury Obligations | | | | | — | | | | | | 31,839,224 | | | | | | — | | | | | | 31,839,224 | | |
| Bank Loans | | | | | — | | | | | | 151,824,902 | | | | | | — | | | | | | 151,824,902 | | |
| Equities and Other Assets | | | | | — | | | | | | — | | | | | | 116,770 | | | | | | 116,770 | | |
| Short-Term Investments | | | | | 44,909,719 | | | | | | 24,937,171 | | | | | | — | | | | | | 69,846,890 | | |
| Total Investments, at fair value | | | | $ | 44,909,719 | | | | | $ | 1,783,835,291 | | | | | $ | 7,731,904 | | | | | $ | 1,836,476,914 | | |
| Other Financial Instruments+ | | | | | | | | | | | | | | | | | | | | | | | | | |
| Centrally Cleared Swaps | | | | | — | | | | | | 4,937,253 | | | | | | — | | | | | | 4,937,253 | | |
| Forward Foreign Currency Contracts | | | | | — | | | | | | 2,732,415 | | | | | | — | | | | | | 2,732,415 | | |
| Forward Premium Swaptions | | | | | — | | | | | | 519,018 | | | | | | — | | | | | | 519,018 | | |
| Futures | | | | | 4,930,037 | | | | | | — | | | | | | — | | | | | | 4,930,037 | | |
| Total Assets | | | | $ | 49,839,756 | | | | | $ | 1,792,023,977 | | | | | $ | 7,731,904 | | | | | $ | 1,849,595,637 | | |
| Liabilities Table | | | | | | | | | | | | | | | | | | | | | | | | | |
| Other Financial Instruments+ | | | | | | | | | | | | | | | | | | | | | | | | | |
| Centrally Cleared Swaps | | | | $ | — | | | | | $ | (8,832,811) | | | | | $ | — | | | | | $ | (8,832,811) | | |
| Forward Foreign Currency Contracts | | | | | — | | | | | | (3,679,059) | | | | | | — | | | | | | (3,679,059) | | |
| Futures | | | | | (14,825,255) | | | | | | — | | | | | | — | | | | | | (14,825,255) | | |
| Volatility Swaps | | | | | — | | | | | | (263) | | | | | | — | | | | | | (263) | | |
| Written Options | | | | | — | | | | | | (21,851,529) | | | | | | — | | | | | | (21,851,529) | | |
| Total Liabilities | | | | $ | (14,825,255) | | | | | $ | (34,363,662) | | | | | $ | — | | | | | $ | (49,188,917) | | |
^
See Note 2, “Significant Accounting Policies” in the Notes to Financial Statements for additional information.
+
Other Financial Instruments may include open forward foreign currency contracts, futures, centrally cleared swaps, OTC swaps and written options. Forward foreign currency contracts, futures and centrally cleared swaps are fair valued at the unrealized appreciation (depreciation) on the instrument. OTC swaps and written options are valued at the fair value of the instrument.
See Accompanying Notes to Financial Statements
| Voya Strategic Income | PORTFOLIO OF INVESTMENTS |
| Opportunities Fund | as of March 31, 2023 (continued) |
At March 31, 2023, the following forward foreign currency contracts were outstanding for Voya Strategic Income Opportunities Fund:
| Currency Purchased | | | Currency Sold | | | Counterparty | | | Settlement
Date | | | Unrealized
Appreciation
(Depreciation) | |
| CAD 24,267,630 | | | USD 17,739,557 | | | Bank of America N.A. | | | | | 05/12/23 | | | | | $ | 227,065 | | |
| CHF 12,549,701 | | | USD 13,720,319 | | | Bank of America N.A. | | | | | 05/12/23 | | | | | | 53,037 | | |
| AUD 20,305,176 | | | USD 13,639,189 | | | Bank of America N.A. | | | | | 05/12/23 | | | | | | (47,455) | | |
| USD 30,843,172 | | | MXN 565,586,659 | | | Bank of America N.A. | | | | | 05/12/23 | | | | | | (309,486) | | |
| USD 12,273,550 | | | GBP 9,900,116 | | | Barclays Bank PLC | | | | | 05/12/23 | | | | | | 51,093 | | |
| ZAR 61,112,874 | | | USD 3,420,728 | | | BNP Paribas | | | | | 04/04/23 | | | | | | 11,616 | | |
| ZAR 60,886,996 | | | USD 3,411,598 | | | BNP Paribas | | | | | 04/04/23 | | | | | | 8,059 | | |
| ZAR 76,577,816 | | | USD 4,314,832 | | | BNP Paribas | | | | | 04/05/23 | | | | | | (13,915) | | |
| ZAR 61,318,165 | | | USD 3,450,146 | | | BNP Paribas | | | | | 04/05/23 | | | | | | (6,273) | | |
| USD 18,889,154 | | | JPY 2,456,083,396 | | | BNP Paribas | | | | | 05/12/23 | | | | | | 279,803 | | |
| GBP 19,473,836 | | | USD 24,005,158 | | | BNP Paribas | | | | | 05/12/23 | | | | | | 36,795 | | |
| NZD 28,589,355 | | | USD 17,918,378 | | | BNP Paribas | | | | | 05/12/23 | | | | | | 84,907 | | |
| USD 18,791,866 | | | AUD 28,102,462 | | | BNP Paribas | | | | | 05/12/23 | | | | | | (19,160) | | |
| JPY 2,355,959,034 | | | USD 17,844,642 | | | BNP Paribas | | | | | 05/12/23 | | | | | | 45,674 | | |
| MXN 169,900,173 | | | USD 9,124,656 | | | BNP Paribas | | | | | 05/12/23 | | | | | | 233,489 | | |
| USD 11,276,435 | | | GBP 9,256,870 | | | BNP Paribas | | | | | 05/12/23 | | | | | | (151,884) | | |
| NZD 14,359,528 | | | USD 9,000,461 | | | BNP Paribas | | | | | 05/12/23 | | | | | | (21,069) | | |
| JPY 1,143,293,714 | | | USD 8,735,865 | | | BNP Paribas | | | | | 05/12/23 | | | | | | (73,311) | | |
| USD 8,729,481 | | | JPY 1,139,447,946 | | | BNP Paribas | | | | | 05/12/23 | | | | | | 96,067 | | |
| CAD 20,582,051 | | | USD 15,083,450 | | | BNP Paribas | | | | | 05/12/23 | | | | | | 154,540 | | |
| JPY 1,246,871,398 | | | USD 9,618,946 | | | BNP Paribas | | | | | 05/12/23 | | | | | | (171,601) | | |
| USD 12,538,606 | | | GBP 10,199,429 | | | BNP Paribas | | | | | 05/12/23 | | | | | | (53,375) | | |
| MXN 110,103,895 | | | USD 5,924,810 | | | BNP Paribas | | | | | 05/12/23 | | | | | | 139,741 | | |
| USD 4,298,071 | | | ZAR 76,577,816 | | | BNP Paribas | | | | | 05/19/23 | | | | | | 13,986 | | |
| USD 3,436,711 | | | ZAR 61,318,165 | | | BNP Paribas | | | | | 05/19/23 | | | | | | 6,315 | | |
| USD 3,397,913 | | | ZAR 60,886,996 | | | BNP Paribas | | | | | 05/19/23 | | | | | | (7,979) | | |
| USD 3,406,919 | | | ZAR 61,112,874 | | | BNP Paribas | | | | | 05/19/23 | | | | | | (11,607) | | |
| USD 586,516 | | | MXN 10,933,918 | | | Brown Brothers Harriman & Co. | | | | | 05/12/23 | | | | | | (15,728) | | |
| EUR 10,797,972 | | | USD 11,804,052 | | | Brown Brothers Harriman & Co. | | | | | 05/12/23 | | | | | | (68,291) | | |
| USD 2,807,192 | | | EUR 2,574,792 | | | Citibank N.A. | | | | | 05/12/23 | | | | | | 8,784 | | |
| ZAR 1,778 | | | USD 100 | | | Goldman Sachs International | | | | | 04/05/23 | | | | | | — | | |
| GBP 9,384,530 | | | USD 11,488,542 | | | Goldman Sachs International | | | | | 05/12/23 | | | | | | 97,385 | | |
| MXN 54,967,100 | | | USD 2,913,785 | | | Goldman Sachs International | | | | | 05/12/23 | | | | | | 113,817 | | |
| USD 18,359,044 | | | NZD 29,385,049 | | | Goldman Sachs International | | | | | 05/12/23 | | | | | | (145,306) | | |
| CHF 10,970,411 | | | USD 11,957,502 | | | Goldman Sachs International | | | | | 05/12/23 | | | | | | 82,574 | | |
| EUR 11,839,462 | | | USD 12,787,211 | | | Goldman Sachs International | | | | | 05/12/23 | | | | | | 80,491 | | |
| CAD 24,589,443 | | | USD 17,914,768 | | | Goldman Sachs International | | | | | 05/12/23 | | | | | | 290,109 | | |
| USD 15,631,486 | | | CAD 21,198,405 | | | Goldman Sachs International | | | | | 05/12/23 | | | | | | (62,824) | | |
| USD 15,742,006 | | | BRL 82,555,801 | | | HSBC Bank USA N.A. | | | | | 05/12/23 | | | | | | (437,622) | | |
| USD 16,338,662 | | | CAD 22,082,986 | | | JPMorgan Chase Bank N.A. | | | | | 05/12/23 | | | | | | (10,551) | | |
| USD 13,592,957 | | | AUD 20,422,433 | | | Morgan Stanley Capital Services LLC | | | | | 05/12/23 | | | | | | (77,266) | | |
| CHF 1,381,922 | | | USD 1,517,586 | | | Morgan Stanley Capital Services LLC | | | | | 05/12/23 | | | | | | (921) | | |
| CAD 20,611,192 | | | USD 15,107,634 | | | Morgan Stanley Capital Services LLC | | | | | 05/12/23 | | | | | | 151,931 | | |
| GBP 9,159,003 | | | USD 11,259,369 | | | Morgan Stanley Capital Services LLC | | | | | 05/12/23 | | | | | | 48,127 | | |
| USD 43,191 | | | SEK 454,692 | | | Morgan Stanley Capital Services LLC | | | | | 05/12/23 | | | | | | (711) | | |
| USD 13,404,702 | | | CHF 12,266,106 | | | Morgan Stanley Capital Services LLC | | | | | 05/12/23 | | | | | | (57,407) | | |
| USD 22,225 | | | CAD 30,457 | | | Morgan Stanley Capital Services LLC | | | | | 05/12/23 | | | | | | (324) | | |
See Accompanying Notes to Financial Statements
| Voya Strategic Income | PORTFOLIO OF INVESTMENTS |
| Opportunities Fund | as of March 31, 2023 (continued) |
| Currency Purchased | | | Currency Sold | | | Counterparty | | | Settlement
Date | | | Unrealized
Appreciation
(Depreciation) | |
| NZD 30,116,252 | | | USD 18,831,090 | | | Morgan Stanley Capital Services LLC | | | | | 05/12/23 | | | | | | 1,400 | | |
| MXN 51,257,352 | | | USD 2,690,528 | | | Morgan Stanley Capital Services LLC | | | | | 05/12/23 | | | | | | 132,740 | | |
| USD 15,545,279 | | | NZD 24,880,607 | | | Morgan Stanley Capital Services LLC | | | | | 05/12/23 | | | | | | (13,223) | | |
| JPY 8,976,593 | | | USD 68,049 | | | Morgan Stanley Capital Services LLC | | | | | 05/12/23 | | | | | | (35) | | |
| EUR 13,810,224 | | | USD 15,010,318 | | | Morgan Stanley Capital Services LLC | | | | | 05/12/23 | | | | | | (697) | | |
| USD 3,185,824 | | | CHF 2,899,608 | | | Morgan Stanley Capital Services LLC | | | | | 05/12/23 | | | | | | 3,490 | | |
| USD 18,870,512 | | | NZD 30,336,542 | | | Morgan Stanley Capital Services LLC | | | | | 05/12/23 | | | | | | (99,731) | | |
| USD 10,362,573 | | | GBP 8,465,154 | | | Morgan Stanley Capital Services LLC | | | | | 05/12/23 | | | | | | (88,313) | | |
| USD 26,425,248 | | | EUR 24,493,788 | | | Morgan Stanley Capital Services LLC | | | | | 05/12/23 | | | | | | (195,790) | | |
| NZD 139,911 | | | USD 86,106 | | | Standard Chartered Bank | | | | | 05/12/23 | | | | | | 1,384 | | |
| USD 64,087 | | | AUD 96,350 | | | Standard Chartered Bank | | | | | 05/12/23 | | | | | | (407) | | |
| USD 15,123,259 | | | CAD 20,662,516 | | | Standard Chartered Bank | | | | | 05/12/23 | | | | | | (174,304) | | |
| NZD 10,503,118 | | | USD 6,554,040 | | | Standard Chartered Bank | | | | | 05/12/23 | | | | | | 13,838 | | |
| JPY 1,132,258,690 | | | USD 8,684,550 | | | Standard Chartered Bank | | | | | 05/12/23 | | | | | | (105,608) | | |
| AUD 12,738,677 | | | USD 8,569,219 | | | Standard Chartered Bank | | | | | 05/12/23 | | | | | | (42,294) | | |
| EUR 516,600 | | | USD 552,946 | | | Standard Chartered Bank | | | | | 05/12/23 | | | | | | 8,519 | | |
| AUD 27,165,458 | | | USD 18,094,314 | | | State Street Bank and Trust Co. | | | | | 05/12/23 | | | | | | 89,507 | | |
| USD 8,958,376 | | | NZD 14,485,619 | | | State Street Bank and Trust Co. | | | | | 05/12/23 | | | | | | (99,865) | | |
| USD 3,881,044 | | | MXN 72,947,470 | | | State Street Bank and Trust Co. | | | | | 05/12/23 | | | | | | (136,921) | | |
| NZD 104,366 | | | USD 64,828 | | | State Street Bank and Trust Co. | | | | | 05/12/23 | | | | | | 435 | | |
| USD 6,611,366 | | | MXN 124,168,164 | | | State Street Bank and Trust Co. | | | | | 05/12/23 | | | | | | (227,849) | | |
| USD 8,824,762 | | | JPY 1,161,080,652 | | | State Street Bank and Trust Co. | | | | | 05/12/23 | | | | | | 27,440 | | |
| USD 9,548,445 | | | CAD 13,085,796 | | | State Street Bank and Trust Co. | | | | | 05/12/23 | | | | | | (139,668) | | |
| USD 8,794,935 | | | AUD 13,164,131 | | | State Street Bank and Trust Co. | | | | | 05/12/23 | | | | | | (16,778) | | |
| EUR 3,509,895 | | | USD 3,817,920 | | | State Street Bank and Trust Co. | | | | | 05/12/23 | | | | | | (3,196) | | |
| EUR 6,007,214 | | | USD 6,459,874 | | | State Street Bank and Trust Co. | | | | | 05/12/23 | | | | | | 69,059 | | |
| USD 8,505,177 | | | AUD 12,638,339 | | | State Street Bank and Trust Co. | | | | | 05/12/23 | | | | | | 45,416 | | |
| USD 7,088,411 | | | EUR 6,627,249 | | | State Street Bank and Trust Co. | | | | | 05/12/23 | | | | | | (114,405) | | |
| NZD 2,697,326 | | | USD 1,672,623 | | | State Street Bank and Trust Co. | | | | | 05/12/23 | | | | | | 14,087 | | |
| EUR 16,388 | | | USD 17,445 | | | State Street Bank and Trust Co. | | | | | 05/12/23 | | | | | | 367 | | |
| USD 91,034 | | | GBP 75,377 | | | State Street Bank and Trust Co. | | | | | 05/12/23 | | | | | | (2,024) | | |
| CHF 105,154 | | | USD 113,965 | | | State Street Bank and Trust Co. | | | | | 05/12/23 | | | | | | 1,441 | | |
| USD 6,452,654 | | | CAD 8,834,627 | | | State Street Bank and Trust Co. | | | | | 05/12/23 | | | | | | (88,092) | | |
| USD 2,167,281 | | | NZD 3,497,924 | | | State Street Bank and Trust Co. | | | | | 05/12/23 | | | | | | (20,063) | | |
| USD 19,283,442 | | | CAD 26,513,248 | | | State Street Bank and Trust Co. | | | | | 05/12/23 | | | | | | (345,730) | | |
| CHF 3,584,930 | | | USD 3,936,835 | | | State Street Bank and Trust Co. | | | | | 05/12/23 | | | | | | 7,887 | | |
| | | | | | | | | | | | | | | | | $ | (946,644) | | |
| |
At March 31, 2023, the following futures contracts were outstanding for Voya Strategic Income Opportunities Fund:
| Description | | | Number
of Contracts | | | Expiration
Date | | | Notional
Amount | | | Unrealized
Appreciation/
(Depreciation) | |
| Long Contracts: | | | | | | | | | | | | | | | | | | | | | | | | | |
| U.S. Treasury 5-Year Note | | | | | 2,176 | | | | | | 06/30/23 | | | | | $ | 238,289,000 | | | | | $ | 4,687,823 | | |
| U.S. Treasury Ultra 10-Year Note | | | | | 203 | | | | | | 06/21/23 | | | | | | 24,591,547 | | | | | | 242,214 | | |
| U.S. Treasury Ultra Long Bond | | | | | 33 | | | | | | 06/22/23 | | | | | | 4,657,125 | | | | | | (60,597) | | |
| | | | | | | | | | | | | | | | | $ | 267,537,672 | | | | | $ | 4,869,440 | | |
See Accompanying Notes to Financial Statements
| Voya Strategic Income | PORTFOLIO OF INVESTMENTS |
| Opportunities Fund | as of March 31, 2023 (continued) |
| Description | | | Number
of Contracts | | | Expiration
Date | | | Notional
Amount | | | Unrealized
Appreciation/
(Depreciation) | |
| Short Contracts: | | | | | | | | | | | | | | | | | | | | | | | | | |
| U.S. Treasury 10-Year Note | | | | | (4,113) | | | | | | 06/21/23 | | | | | | (472,673,672) | | | | | | (11,756,042) | | |
| U.S. Treasury 2-Year Note | | | | | (328) | | | | | | 06/30/23 | | | | | | (67,716,625) | | | | | | (717,885) | | |
| U.S. Treasury Long Bond | | | | | (484) | | | | | | 06/21/23 | | | | | | (63,479,625) | | | | | | (2,290,731) | | |
| | | | | | | | | | | | | | | | | $ | (603,869,922) | | | | | $ | (14,764,658) | | |
| |
At March 31, 2023, the following centrally cleared credit default swaps were outstanding for Voya Strategic Income Opportunities Fund:
Centrally Cleared Credit Default Swaps on Corporate and Sovereign Issues — Buy Protection(1)
| Reference Entity/Obligation | | | Buy/Sell
Protection | | | (Pay)/
Receive
Financing
Rate (%)(2) | | | Termination
Date | | | Notional
Amount(3) | | | Fair
Value(4) | | | Unrealized
Appreciation/
(Depreciation) | |
| Prudential Financial Inc. 3.50%, due 05/15/2024 | | | | | Buy | | | | | | (1.000) | | | | | | 12/20/24 | | | | | | USD 15,120,000 | | | | | $ | (92,969) | | | | | $ | 61,101 | | |
| | | | | | | | | | | | | | | | | | | | | | | | | | | | | $ | (92,969) | | | | | $ | 61,101 | | |
(1)
If a Fund is a buyer of protection and a credit event occurs, as defined under the terms of that particular swap agreement, a Fund will either i) receive from the seller of protection an amount equal to the notional amount of the swap and deliver the referenced obligation, other deliverable obligations or underlying securities comprising the referenced index or ii) receive a net settlement amount in the form of cash or securities equal to the notional amount of the swap less the recovery value of the referenced obligation or underlying securities comprising the referenced index.
(2)
Payments made quarterly.
(3)
The maximum amount of future payments (undiscounted) that a Fund as seller of protection could be required to make or receive as a buyer of credit protection under a credit default swap agreement would be an amount equal to the notional amount of the agreement.
(4)
The fair values for credit default swap agreements serve as an indicator of the current status of the payment/performance risk and represent the likelihood or risk of default for the credit derivative. Increasing fair values, in absolute terms, when compared to the notional amount of the agreement, represent a deterioration of the referenced obligation’s credit soundness and a greater likelihood or risk of default or other credit event occurring.
At March 31, 2023, the following centrally cleared interest rate swaps were outstanding for Voya Strategic Income Opportunities Fund:
Pay/Receive
Floating Rate | | | Floating Rate Index | | | Floating
Rate Index
Payment
Frequency | | | Fixed
Rate | | | Fixed Rate
Payment
Frequency | | | Maturity
Date | | | Notional
Amount | | | Fair
Value | | | Unrealized
Appreciation/
(Depreciation) | |
| Pay | | | 28-day MXN TIIE-BANXICO | | | Monthly | | | 8.735% | | | Monthly | | | 03/16/28 | | | MXN 281,333,000 | | | | $ | 112,800 | | | | | $ | 112,800 | | |
| Pay | | | 1-day Secured Overnight Financing Rate | | | Annual | | | 3.391 | | | Annual | | | 08/25/24 | | | USD 160,000,000 | | | | | (2,750,870) | | | | | | (2,750,870) | | |
| Pay | | | 1-day Secured Overnight Financing Rate | | | Annual | | | 3.255 | | | Annual | | | 02/05/25 | | | USD 8,780,000 | | | | | (30,428) | | | | | | (30,428) | | |
| Pay | | | 1-day Secured Overnight Financing Rate | | | Annual | | | 3.270 | | | Annual | | | 02/20/25 | | | USD 40,521,000 | | | | | (115,341) | | | | | | (115,341) | | |
| Pay | | | 1-day Secured Overnight Financing Rate | | | Annual | | | 2.988 | | | Annual | | | 03/16/33 | | | USD 3,806,000 | | | | | (711) | | | | | | (711) | | |
| Pay | | | 1-day Secured Overnight Financing Rate | | | Annual | | | 3.058 | | | Annual | | | 05/10/33 | | | USD 30,935,000 | | | | | (320,466) | | | | | | (320,466) | | |
| Pay | | | 1-day Secured Overnight Financing Rate | | | Annual | | | 3.085 | | | Annual | | | 05/10/33 | | | USD 19,799,000 | | | | | (160,395) | | | | | | (160,395) | | |
| Pay | | | 1-day Secured Overnight Financing Rate | | | Annual | | | 3.289 | | | Annual | | | 05/10/33 | | | USD 27,222,874 | | | | | 248,505 | | | | | | 248,505 | | |
| Pay | | | 1-day Secured Overnight Financing Rate | | | Annual | | | 3.394 | | | Annual | | | 05/10/33 | | | USD 12,374,000 | | | | | 222,581 | | | | | | 222,581 | | |
| Pay | | | 1-day Secured Overnight Financing Rate | | | Annual | | | 3.475 | | | Annual | | | 05/10/33 | | | USD 24,748,215 | | | | | 616,716 | | | | | | 616,716 | | |
| Pay | | | 1-day Secured Overnight Financing Rate | | | Annual | | | 3.483 | | | Annual | | | 05/10/33 | | | USD 37,122,323 | | | | | 947,083 | | | | | | 947,083 | | |
| Pay | | | 1-day Secured Overnight Financing Rate | | | Annual | | | 3.065 | | | Annual | | | 05/11/33 | | | USD 27,718,000 | | | | | (270,284) | | | | | | (270,284) | | |
| Pay | | | 1-day Secured Overnight Financing Rate | | | Annual | | | 3.234 | | | Annual | | | 05/11/33 | | | USD 6,930,000 | | | | | 31,204 | | | | | | 31,204 | | |
| Pay | | | 1-day Secured Overnight Financing Rate | | | Annual | | | 3.111 | | | Annual | | | 05/12/33 | | | USD 9,899,500 | | | | | (57,383) | | | | | | (57,383) | | |
| Pay | | | 1-day Secured Overnight Financing Rate | | | Annual | | | 3.139 | | | Annual | | | 05/12/33 | | | USD 16,085,764 | | | | | (55,794) | | | | | | (55,794) | | |
| Pay | | | 1-day Secured Overnight Financing Rate | | | Annual | | | 3.164 | | | Annual | | | 05/12/33 | | | USD 14,849,000 | | | | | (20,025) | | | | | | (20,025) | | |
| Pay | | | 1-day Secured Overnight Financing Rate | | | Annual | | | 3.200 | | | Annual | | | 05/12/33 | | | USD 19,799,000 | | | | | 33,755 | | | | | | 33,755 | | |
See Accompanying Notes to Financial Statements
| Voya Strategic Income | PORTFOLIO OF INVESTMENTS |
| Opportunities Fund | as of March 31, 2023 (continued) |
Pay/Receive
Floating Rate | | | Floating Rate Index | | | Floating
Rate Index
Payment
Frequency | | | Fixed
Rate | | | Fixed Rate
Payment
Frequency | | | Maturity
Date | | | Notional
Amount | | | Fair
Value | | | Unrealized
Appreciation/
(Depreciation) | |
| Pay | | | 1-day Secured Overnight Financing Rate | | | Annual | | | 3.212 | | | Annual | | | 05/12/33 | | | USD 14,156,299 | | | | | 38,787 | | | | | | 38,787 | | |
| Pay | | | 1-day Secured Overnight Financing Rate | | | Annual | | | 3.214 | | | Annual | | | 05/12/33 | | | USD 13,611,351 | | | | | 39,849 | | | | | | 39,849 | | |
| Pay | | | 1-day Secured Overnight Financing Rate | | | Annual | | | 3.216 | | | Annual | | | 05/12/33 | | | USD 13,611,350 | | | | | 42,163 | | | | | | 42,163 | | |
| Pay | | | 1-day Secured Overnight Financing Rate | | | Annual | | | 3.233 | | | Annual | | | 05/12/33 | | | USD 16,086,000 | | | | | 72,368 | | | | | | 72,368 | | |
| Pay | | | 1-day Secured Overnight Financing Rate | | | Annual | | | 3.610 | | | Annual | | | 05/12/33 | | | USD 6,187,000 | | | | | 225,151 | | | | | | 225,151 | | |
| Pay | | | 1-day Secured Overnight Financing Rate | | | Annual | | | 3.621 | | | Annual | | | 05/12/33 | | | USD 11,137,000 | | | | | 415,684 | | | | | | 415,684 | | |
| Pay | | | 1-day Secured Overnight Financing Rate | | | Annual | | | 3.674 | | | Annual | | | 05/12/33 | | | USD 23,758,000 | | | | | 992,793 | | | | | | 992,793 | | |
| Pay | | | 1-day Secured Overnight Financing Rate | | | Annual | | | 3.456 | | | Annual | | | 05/17/33 | | | USD 18,809,000 | | | | | 443,335 | | | | | | 443,335 | | |
| Pay | | | 1-day Secured Overnight Financing Rate | | | Annual | | | 3.275 | | | Annual | | | 09/11/33 | | | USD 21,146,000 | | | | | 293,671 | | | | | | 293,671 | | |
| Pay | | | 1-day Secured Overnight Financing Rate | | | Annual | | | 3.067 | | | Annual | | | 09/13/33 | | | USD 9,093,000 | | | | | (31,576) | | | | | | (31,576) | | |
| Pay | | | 1-day Secured Overnight Financing Rate | | | Annual | | | 3.075 | | | Annual | | | 09/13/33 | | | USD 11,419,000 | | | | | (31,587) | | | | | | (31,587) | | |
| Pay | | | 1-day Secured Overnight Financing Rate | | | Annual | | | 3.163 | | | Annual | | | 09/13/33 | | | USD 2,115,000 | | | | | 9,695 | | | | | | 9,695 | | |
| Pay | | | 1-day Secured Overnight Financing Rate | | | Annual | | | 3.174 | | | Annual | | | 09/13/33 | | | USD 10,573,000 | | | | | 58,144 | | | | | | 58,144 | | |
| Pay | | | 1-day Secured Overnight Financing Rate | | | Annual | | | 2.843 | | | Annual | | | 06/16/53 | | | USD 2,960,000 | | | | | (53,510) | | | | | | (53,510) | | |
| Receive | | | 1-day Secured Overnight Financing Rate | | | Annual | | | 3.437 | | | Annual | | | 02/20/25 | | | USD 23,637,000 | | | | | 30,074 | | | | | | 30,074 | | |
| Receive | | | 1-day Secured Overnight Financing Rate | | | Annual | | | 3.586 | | | Annual | | | 02/20/25 | | | USD 12,832,000 | | | | | (1,665) | | | | | | (1,665) | | |
| Receive | | | 1-day Secured Overnight Financing Rate | | | Annual | | | 3.657 | | | Annual | | | 02/20/25 | | | USD 8,239,000 | | | | | (6,571) | | | | | | (6,571) | | |
| Receive | | | 1-day Secured Overnight Financing Rate | | | Annual | | | 3.180 | | | Annual | | | 05/11/33 | | | USD 82,907,000 | | | | | 1,794 | | | | | | 1,794 | | |
| Receive | | | 1-day Secured Overnight Financing Rate | | | Annual | | | 3.252 | | | Annual | | | 05/11/33 | | | USD 4,455,000 | | | | | (26,841) | | | | | | (26,841) | | |
| Receive | | | 1-day Secured Overnight Financing Rate | | | Annual | | | 3.275 | | | Annual | | | 05/11/33 | | | USD 12,374,000 | | | | | (99,291) | | | | | | (99,291) | | |
| Receive | | | 1-day Secured Overnight Financing Rate | | | Annual | | | 3.337 | | | Annual | | | 05/11/33 | | | USD 20,294,000 | | | | | (268,699) | | | | | | (268,699) | | |
| Receive | | | 1-day Secured Overnight Financing Rate | | | Annual | | | 3.392 | | | Annual | | | 05/11/33 | | | USD 11,384,000 | | | | | (203,678) | | | | | | (203,678) | | |
| Receive | | | 1-day Secured Overnight Financing Rate | | | Annual | | | 3.408 | | | Annual | | | 05/11/33 | | | USD 14,601,000 | | | | | (281,263) | | | | | | (281,263) | | |
| Receive | | | 1-day Secured Overnight Financing Rate | | | Annual | | | 3.302 | | | Annual | | | 05/12/33 | | | USD 10,147,000 | | | | | (105,112) | | | | | | (105,112) | | |
| Receive | | | 1-day Secured Overnight Financing Rate | | | Annual | | | 3.311 | | | Annual | | | 05/12/33 | | | USD 13,117,000 | | | | | (145,139) | | | | | | (145,139) | | |
| Receive | | | 1-day Secured Overnight Financing Rate | | | Annual | | | 3.314 | | | Annual | | | 05/12/33 | | | USD 6,187,000 | | | | | (70,149) | | | | | | (70,149) | | |
| Receive | | | 1-day Secured Overnight Financing Rate | | | Annual | | | 3.421 | | | Annual | | | 05/12/33 | | | USD 22,273,000 | | | | | (454,042) | | | | | | (454,042) | | |
| Receive | | | 1-day Secured Overnight Financing Rate | | | Annual | | | 3.483 | | | Annual | | | 05/12/33 | | | USD 21,036,000 | | | | | (539,077) | | | | | | (539,077) | | |
| Receive | | | 1-day Secured Overnight Financing Rate | | | Annual | | | 3.598 | | | Annual | | | 05/12/33 | | | USD 13,612,000 | | | | | (481,209) | | | | | | (481,209) | | |
| Receive | | | 1-day Secured Overnight Financing Rate | | | Annual | | | 3.643 | | | Annual | | | 05/12/33 | | | USD 34,648,000 | | | | | (1,356,098) | | | | | | (1,356,098) | | |
| Receive | | | 1-day Secured Overnight Financing Rate | | | Annual | | | 3.689 | | | Annual | | | 05/12/33 | | | USD 13,612,000 | | | | | (586,403) | | | | | | (586,403) | | |
| Receive | | | 1-day Secured Overnight Financing Rate | | | Annual | | | 3.184 | | | Annual | | | 09/13/33 | | | USD 3,172,000 | | | | | (20,117) | | | | | | (20,117) | | |
| Receive | | | 1-day Secured Overnight Financing Rate | | | Annual | | | 3.236 | | | Annual | | | 09/13/33 | | | USD 2,580,000 | | | | | (27,688) | | | | | | (27,688) | | |
| Receive | | | 1-day Secured Overnight Financing Rate | | | Annual | | | 3.240 | | | Annual | | | 09/13/33 | | | USD 2,749,000 | | | | | (30,330) | | | | | | (30,330) | | |
| Receive | | | 1-day Secured Overnight Financing Rate | | | Annual | | | 3.353 | | | Annual | | | 09/13/33 | | | USD 10,996,000 | | | | | (224,806) | | | | | | (224,806) | | |
| Receive | | | 1-day Secured Overnight Financing Rate | | | Annual | | | 2.950 | | | Annual | | | 06/16/53 | | | USD 846,000 | | | | | (2,314) | | | | | | (2,314) | | |
| Receive | | | 1-day Secured Overnight Financing Rate | | | Annual | | | 2.956 | | | Annual | | | 06/16/53 | | | USD 1,057,000 | | | | | (3,949) | | | | | | (3,949) | | |
| | | | | | | | | | | | | | | | | | | | | | | $ | (3,956,659) | | | | | $ | (3,956,659) | | |
| |
At March 31, 2023, the following OTC volatility swaps were outstanding for Voya Strategic Income Opportunities Fund:
Pay/Receive
Volatility(1) | | | Reference Entity | | | Volatility
Strike Rate | | | Counterparty | | | Maturity
Date | | | Currency | | | Notional
Amount | | | Fair Value | | | Unrealized
Appreciation
(Depreciation) | |
| Receive | | | USD vs. CNH Spot
Exchange Rate | | | 6.350% | | | Morgan Stanley Capital Services LLC | | | 06/16/23 | | | USD | | | 44,252,000 | | | $(263) | | | $(263) | |
| | | | | | | | | | | | | | | | | | | | | | $(263) | | | $(263) | |
See Accompanying Notes to Financial Statements
| Voya Strategic Income | PORTFOLIO OF INVESTMENTS |
| Opportunities Fund | as of March 31, 2023 (continued) |
At March 31, 2023, the following OTC purchased foreign currency dual digital options were outstanding for Voya Strategic Income Opportunities Fund:
| Description | | | Counterparty | | | Expiration
Date | | | Exercise
Price | | | Notional Amount | | | Cost | | | Fair Value | |
| AUD/USD & USD/JPY Dual Digital | | | Barclays Bank PLC | | | | | 05/30/23 | | | | 0.60 & 125 | | | USD 2,386,000 | | | | $ | 45,334 | | | | | $ | 2,603 | | |
| AUD/USD & USD/JPY Dual Digital | | | Goldman Sachs International | | | | | 05/30/23 | | | | 0.6375 & 131.5 | | | USD 1,045,000 | | | | | 60,767 | | | | | | 44,871 | | |
| USD/CNH & USD/JPY Dual Digital | | | BNP Paribas | | | | | 05/30/23 | | | | 7.2 & 131.5 | | | USD 894,000 | | | | | 61,686 | | | | | | 7,048 | | |
| | | | | | | | | | | | | | | | | | | | $ | 167,787 | | | | | $ | 54,522 | | |
At March 31, 2023, the following OTC purchased foreign currency options were outstanding for Voya Strategic Income Opportunities Fund:
| Description | | | Counterparty | | | Expiration
Date | | | Exercise
Price | | | Notional Amount | | | Cost | | | Fair Value | |
| Call JPY vs. Put USD | | | BNP Paribas | | | | | 02/27/25 | | | | 107.500 | | | USD 12,280,000 | | | | $ | 609,088 | | | | | $ | 196,216 | | |
| Call USD vs. Put JPY | | | Bank of America N.A. | | | | | 09/09/32 | | | | 140.000 | | | USD 15,517,000 | | | | | 276,203 | | | | | | 127,369 | | |
| Call USD vs. Put JPY | | | BNP Paribas | | | | | 09/09/32 | | | | 140.000 | | | USD 15,517,000 | | | | | 296,064 | | | | | | 127,369 | | |
| Put USD vs. Call JPY | | | Goldman Sachs International | | | | | 04/13/23 | | | | 120.000 | | | USD 36,413,000 | | | | | 412,996 | | | | | | 684 | | |
| Put USD vs. Call JPY | | | Morgan Stanley Capital Services LLC | | | | | 04/13/23 | | | | 120.000 | | | USD 59,233,000 | | | | | 690,479 | | | | | | 1,113 | | |
| Put USD vs. Call JPY | | | BNP Paribas | | | | | 06/23/23 | | | | 130.000 | | | USD 17,945,000 | | | | | 87,572 | | | | | | 23,890 | | |
| Put USD vs. Call JPY | | | Goldman Sachs International | | | | | 07/07/23 | | | | 115.000 | | | USD 2,095,300 | | | | | 188,577 | | | | | | 91,424 | | |
| Put USD vs. Call MXN | | | Goldman Sachs International | | | | | 06/28/23 | | | | 18.060 | | | USD 17,910,000 | | | | | 189,685 | | | | | | 265,206 | | |
| | | | | | | | | | | | | | | | | | | | $ | 2,750,664 | | | | | $ | 833,271 | | |
At March 31, 2023, the following OTC written foreign currency options were outstanding for Voya Strategic Income Opportunities Fund:
| Description | | | Counterparty | | | Expiration
Date | | | Exercise
Price | | | Notional Amount | | | Premiums
Received | | | Fair Value | |
| Call EUR vs. Put MXN | | | Goldman Sachs International | | | | | 09/14/23 | | | | 21.000 | | | EUR 15,000,000 | | | | $ | 554,905 | | | | | $ | (347,366) | | |
| Call USD vs. Put JPY | | | Bank of America N.A. | | | | | 09/09/27 | | | | 140.000 | | | USD 15,517,000 | | | | | 439,441 | | | | | | (177,908) | | |
| Call USD vs. Put JPY | | | BNP Paribas | | | | | 09/09/27 | | | | 140.000 | | | USD 15,517,000 | | | | | 425,166 | | | | | | (177,908) | | |
| Call USD vs. Put MXN | | | Morgan Stanley Capital Services LLC | | | | | 04/26/23 | | | | 20.600 | | | USD 21,107,000 | | | | | 668,501 | | | | | | (5,467) | | |
| Call USD vs. Put MXN | | | Goldman Sachs International | | | | | 06/28/23 | | | | 19.600 | | | USD 17,910,000 | | | | | 193,267 | | | | | | (136,558) | | |
| Call USD vs. Put MXN | | | Bank of America N.A. | | | | | 08/31/23 | | | | 18.750 | | | USD 42,307,000 | | | | | 1,310,248 | �� | | | | | (1,171,973) | | |
| Put USD vs. Call MXN | | | Morgan Stanley Capital Services LLC | | | | | 04/26/23 | | | | 20.000 | | | USD 21,107,000 | | | | | 427,839 | | | | | | (2,210,403) | | |
| Put USD vs. Call MXN | | | Morgan Stanley Capital Services LLC | | | | | 06/28/23 | | | | 17.450 | | | USD 17,910,000 | | | | | 79,108 | | | | | | (79,108) | | |
| | | | | | | | | | | | | | | | | | | | $ | 4,098,475 | | | | | $ | (4,306,691) | | |
At March 31, 2023, the following OTC written interest rate swaptions were outstanding for Voya Strategic Income Opportunities Fund:
| Description | | | Counterparty | | | Pay/
Receive
Exercise
Rate | | | Exercise
Rate | | | Floating
Rate
Index | | | Expiration
Date | | | Notional
Amount | | | Premiums
Received | | | Fair Value | |
Call on 10-Year Interest Rate Swap (2) | | | Bank of America N.A. | | | Pay | | | | | 3.550% | | | | 1-day Secured
Overnight Financing
Rate | | | | | 09/11/23 | | | | USD 21,146,000 | | | | $ | 571,999 | | | | | $ | (994,780) | | |
Call on 10-Year Interest Rate Swap (2) | | | Barclays Bank PLC | | | Pay | | | | | 3.790% | | | | 1-day Secured
Overnight Financing
Rate | | | | | 05/10/23 | | | | USD 98,993,000 | | | | | 2,855,948 | | | | | | (5,015,825) | | |
Call on 10-Year Interest Rate Swap (2) | | | Citibank N.A. | | | Pay | | | | | 3.540% | | | | 1-day Secured
Overnight Financing
Rate | | | | | 09/11/23 | | | | USD 42,292,000 | | | | | 1,143,999 | | | | | | (1,964,262) | | |
See Accompanying Notes to Financial Statements
| Voya Strategic Income | PORTFOLIO OF INVESTMENTS |
| Opportunities Fund | as of March 31, 2023 (continued) |
| Description | | | Counterparty | | | Pay/
Receive
Exercise
Rate | | | Exercise
Rate | | | Floating
Rate
Index | | | Expiration
Date | | | Notional
Amount | | | Premiums
Received | | | Fair Value | |
Call on 10-Year Interest Rate Swap (2) | | | Goldman Sachs
International | | | Pay | | | | | 3.460% | | | | 1-day Secured
Overnight Financing
Rate | | | | | 08/21/23 | | | | USD 49,496,000 | | | | | 1,249,774 | | | | | | (1,972,223) | | |
Call on 10-Year Interest Rate Swap (2) | | | Goldman Sachs
International | | | Pay | | | | | 3.570% | | | | 1-day Secured
Overnight Financing
Rate | | | | | 09/07/23 | | | | USD 21,146,000 | | | | | 564,863 | | | | | | (1,014,384) | | |
Call on 10-Year Interest Rate Swap (2) | | | JPMorgan Chase
Bank N.A. | | | Pay | | | | | 2.995% | | | | 1-day Secured
Overnight Financing
Rate | | | | | 06/07/23 | | | | USD 49,496,000 | | | | | 1,517,052 | | | | | | (586,178) | | |
Call on 1-Year Interest Rate Swap (2) | | | Barclays Bank PLC | | | Pay | | | | | 4.170% | | | | 1-day Secured
Overnight Financing
Rate | | | | | 02/16/24 | | | | USD 67,535,000 | | | | | 317,752 | | | | | | (549,975) | | |
Call on 1-Year Interest Rate Swap (2) | | | Morgan Stanley Capital
Services LLC | | | Pay | | | | | 3.520% | | | | 1-day Secured
Overnight Financing
Rate | | | | | 01/24/24 | | | | USD 135,070,000 | | | | | 587,892 | | | | | | (608,913) | | |
Call on 30-Year Interest Rate Swap (2) | | | Morgan Stanley Capital
Services LLC | | | Pay | | | | | 2.994% | | | | 1-day Secured
Overnight Financing
Rate | | | | | 06/14/23 | | | | USD 10,573,000 | | | | | 456,489 | | | | | | (375,478) | | |
Put on 10-Year Interest Rate Swap (3) | | | Bank of America N.A. | | | Receive | | | | | 3.550% | | | | 1-day Secured
Overnight Financing
Rate | | | | | 09/11/23 | | | | USD 21,146,000 | | | | | 571,999 | | | | | | (256,193) | | |
Put on 10-Year Interest Rate Swap (3) | | | Barclays Bank PLC | | | Receive | | | | | 3.790% | | | | 1-day Secured
Overnight Financing
Rate | | | | | 05/10/23 | | | | USD 98,993,000 | | | | | 2,855,948 | | | | | | (123,334) | | |
Put on 10-Year Interest Rate Swap (3) | | | Citibank N.A. | | | Receive | | | | | 3.540% | | | | 1-day Secured
Overnight Financing
Rate | | | | | 09/11/23 | | | | USD 42,292,000 | | | | | 1,143,999 | | | | | | (522,237) | | |
Put on 10-Year Interest Rate Swap (3) | | | Goldman Sachs
International | | | Receive | | | | | 3.460% | | | | 1-day Secured
Overnight Financing
Rate | | | | | 08/21/23 | | | | USD 49,496,000 | | | | | 1,249,774 | | | | | | (659,915) | | |
Put on 10-Year Interest Rate Swap (3) | | | Goldman Sachs
International | | | Receive | | | | | 3.570% | | | | 1-day Secured
Overnight Financing
Rate | | | | | 09/07/23 | | | | USD 21,146,000 | | | | | 564,863 | | | | | | (242,252) | | |
Put on 10-Year Interest Rate Swap (3) | | | JPMorgan Chase
Bank N.A. | | | Receive | | | | | 2.995% | | | | 1-day Secured
Overnight Financing
Rate | | | | | 06/07/23 | | | | USD 49,496,000 | | | | | 1,517,053 | | | | | | (1,287,337) | | |
Put on 1-Year Interest Rate Swap (3) | | | Barclays Bank PLC | | | Receive | | | | | 4.170% | | | | 1-day Secured
Overnight Financing
Rate | | | | | 02/16/24 | | | | USD 67,535,000 | | | | | 317,752 | | | | | | (211,876) | | |
Put on 1-Year Interest Rate Swap (3) | | | Morgan Stanley Capital
Services LLC | | | Receive | | | | | 3.520% | | | | 1-day Secured
Overnight Financing
Rate | | | | | 01/24/24 | | | | USD 135,070,000 | | | | | 587,892 | | | | | | (857,996) | | |
Put on 30-Year Interest Rate Swap (3) | | | Morgan Stanley Capital
Services LLC | | | Receive | | | | | 2.994% | | | | 1-day Secured
Overnight Financing
Rate | | | | | 06/14/23 | | | | USD 10,573,000 | | | | | 456,489 | | | | | | (301,680) | | |
| | | | | | | | | | | | | | | | | | | | | | | | | | | | | $ | 18,531,537 | | | | | $ | (17,544,838) | | |
| |
See Accompanying Notes to Financial Statements
| Voya Strategic Income | PORTFOLIO OF INVESTMENTS |
| Opportunities Fund | as of March 31, 2023 (continued) |
At March 31, 2023, the following OTC purchased forward premium swaptions were outstanding for Voya Strategic Income Opportunities Fund:
| Description | | | Counterparty | | | Exercise
Rate(4) | | | Pay/
Receive
Exercise
Rate | | | Floating
Rate
Index | | | Expiration
Date | | | Notional
Amount | | | Premium
receivable/
(payable)
at expiration(5) | | | Unrealized
Appreciation/
(Depreciation) | |
| Call on 30-Year Interest Rate Swap | | | Barclays Bank PLC | | | | | 0.000% | | | | Receive | | | 1-day Secured
Overnight Financing
Rate | | | | | 06/14/27 | | | | USD 22,958,000 | | | | $ | (4,017,650) | | | | | $ | 181,192 | | |
| Put on 30-Year Interest Rate Swap | | | Barclays Bank PLC | | | | | 0.000% | | | | Pay | | | 1-day Secured
Overnight Financing
Rate | | | | | 05/25/27 | | | | USD 53,680,100 | | | | | (9,662,418) | | | | | | 216,149 | | |
| | | | | | | | | | | | | | | | | | | | | | | | | | | | | $ | (13,680,068) | | | | | $ | 397,341 | | |
At March 31, 2023, the following OTC written forward premium swaptions were outstanding for Voya Strategic Income Opportunities Fund:
| Description | | | Counterparty | | | Exercise
Rate(4) | | | Pay/
Receive
Exercise
Rate | | | Floating
Rate
Index | | | Expiration
Date | | | Notional
Amount | | | Premium
receivable/
(payable)
at expiration(5) | | | Unrealized
Appreciation/
(Depreciation) | |
| Call on 5-Year Interest Rate Swap | | | Bank of America N.A. | | | | | 0.000% | | | | Pay | | | 1-day Secured
Overnight Financing
Rate | | | | | 03/27/28 | | | | USD 10,573,000 | | | | $ | 448,295 | | | | | $ | 463 | | |
| Call on 5-Year Interest Rate Swap | | | Morgan Stanley Capital
Services LLC | | | | | 0.000% | | | | Pay | | | 1-day Secured
Overnight Financing
Rate | | | | | 03/14/28 | | | | USD 21,146,000 | | | | | 921,477 | | | | | | 36,749 | | |
| Put on 5-Year Interest Rate Swap | | | Bank of America N.A. | | | | | 0.000% | | | | Receive | | | 1-day Secured
Overnight Financing
Rate | | | | | 03/27/28 | | | | USD 10,573,000 | | | | | 448,295 | | | | | | 9,491 | | |
| Put on 5-Year Interest Rate Swap | | | Morgan Stanley Capital
Services LLC | | | | | 0.000% | | | | Receive | | | 1-day Secured
Overnight Financing
Rate | | | | | 03/14/28 | | | | USD 21,146,000 | | | | | 921,477 | | | | | | 74,974 | | |
| | | | | | | | | | | | | | | | | | | | | | | | | | | | | $ | 2,739,544 | | | | | $ | 121,677 | | |
(1)
Payments made at maturity date.
(2)
Fund pays the exercise rate semi-annually and receives the floating rate index quarterly.
(3)
Fund receives the exercise rate semi-annually and pays the floating rate index quarterly.
(4)
Forward premium swaption exercise rates represent the premium price on each respective swaption contract. Final exercise rate will be determined at the expiration of each respective swaption contract.
(5)
Forward premium swaptions include premiums receivable/(payable) that have extended settlement dates. Premiums are not exchanged until the expiration date of each respective forward premium swaption contract.
Currency Abbreviations
AUD – Australian Dollar
BRL – Brazilian Real
CAD – Canadian Dollar
CHF – Swiss Franc
EUR – EU Euro
GBP – British Pound
JPY – Japanese Yen
MXN – Mexican Peso
NZD – New Zealand Dollar
SEK – Swedish Krona
USD – United States Dollar
ZAR – South African Rand
See Accompanying Notes to Financial Statements
| Voya Strategic Income | PORTFOLIO OF INVESTMENTS |
| Opportunities Fund | as of March 31, 2023 (continued) |
A summary of derivative instruments by primary risk exposure is outlined in the following tables.
The fair value of derivative instruments as of March 31, 2023 was as follows:
| Derivatives not accounted for as hedging instruments | | | Location on Statement
of Assets and Liabilities | | | Fair Value | |
| Asset Derivatives | | | | | | | | | | |
| Foreign exchange contracts | | | Investments in securities at value* | | | | $ | 887,793 | | |
| Foreign exchange contracts | | | Unrealized appreciation on forward foreign currency contracts | | | | | 2,732,415 | | |
| Interest rate contracts | | | Unrealized appreciation on forward premium swaptions | | | | | 519,018 | | |
| Interest rate contracts | | | Variation margin receivable on futures contracts** | | | | | 4,930,037 | | |
| Interest rate contracts | | | Variation margin receivable on centrally cleared swaps** | | | | | 4,937,253 | | |
| Total Asset Derivatives | | | | | | | $ | 14,006,516 | | |
| Liability Derivatives | | | | | | | | | | |
| Foreign exchange contracts | | | Unrealized depreciation on forward foreign currency contracts | | | | $ | 3,679,059 | | |
| Interest rate contracts | | | Variation margin payable on futures contracts** | | | | | 14,825,255 | | |
| Interest rate contracts | | | Variation margin payable on centrally cleared swaps** | | | | | 8,832,811 | | |
| Foreign exchange contracts | | | Unrealized depreciation on OTC swap agreements | | | | | 263 | | |
| Interest rate contracts | | | Written options, at fair value | | | | | 17,544,838 | | |
| Foreign exchange contracts | | | Written options, at fair value | | | | | 4,306,691 | | |
| Total Liability Derivatives | | | | | | | $ | 49,188,917 | | |
*
Includes purchased options.
**
The fair value presented above represents the cumulative unrealized appreciation (depreciation) on futures contracts and centrally cleared swaps as reported in the tables within the Portfolio of Investments. In the Statement of Assets and Liabilities, only current day’s unsettled variation margin is reported in receivables or payables on futures contracts and centrally cleared swaps and the net cumulative unrealized appreciation (depreciation) is included in total distributable earnings (loss).
The effect of derivative instruments on the Fund’s Statement of Operations for the year ended March 31, 2023 was as follows:
Amount of Realized Gain or (Loss) on Derivatives Recognized in Income
Derivatives not accounted for as
hedging instruments | | | Investments* | | | Forward foreign
currency contracts | | | Futures | | | Swaps | | | Written
options | | | Total | |
| Credit contracts | | | | $ | — | | | | | $ | — | | | | | $ | — | | | | | $ | (3,637,677) | | | | | $ | — | | | | | $ | (3,637,677) | | |
| Equity contracts | | | | | — | | | | | | — | | | | | | (277,109) | | | | | | — | | | | | | — | | | | | | (277,109) | | |
| Foreign exchange contracts | | | | | (2,244,167) | | | | | | (7,229,584) | | | | | | — | | | | | | 289,711 | | | | | | 5,665,328 | | | | | | (3,518,712) | | |
| Interest rate contracts | | | | | 1,284,602 | | | | | | — | | | | | | 28,458,854 | | | | | | (13,942,442) | | | | | | 11,236,672 | | | | | | 27,037,686 | | |
| Total | | | | $ | (959,565) | | | | | $ | (7,229,584) | | | | | $ | 28,181,745 | | | | | $ | (17,290,408) | | | | | $ | 16,902,000 | | | | | $ | 19,604,188 | | |
Change in Unrealized Appreciation or (Depreciation) on Derivatives Recognized in Income
Derivatives not accounted for as
hedging instruments | | | Investments* | | | Forward foreign
currency contracts | | | Futures | | | Swaps | | | Written
options | | | Total | |
| Credit contracts | | | | $ | — | | | | | $ | — | | | | | $ | — | | | | | $ | (598,370) | | | | | $ | — | | | | | $ | (598,370) | | |
| Foreign exchange contracts | | | | | (1,026,446) | | | | | | 442,762 | | | | | | — | | | | | | (71,550) | | | | | | (1,346,365) | | | | | | (2,001,599) | | |
| Interest rate contracts | | | | | 397,341 | | | | | | — | | | | | | (11,726,093) | | | | | | (3,219,178) | | | | | | 1,450,638 | | | | | | (13,097,292) | | |
| Total | | | | $ | (629,105) | | | | | $ | 442,762 | | | | | $ | (11,726,093) | | | | | $ | (3,889,098) | | | | | $ | 104,273 | | | | | $ | (15,697,261) | | |
*
Amounts recognized for purchased options are included in net realized gain (loss) on investments and in net change in unrealized appreciation or depreciation on investments.
See Accompanying Notes to Financial Statements
| Voya Strategic Income | PORTFOLIO OF INVESTMENTS |
| Opportunities Fund | as of March 31, 2023 (continued) |
The following is a summary by counterparty of the fair value of OTC derivative instruments subject to Master Netting Agreements and collateral pledged (received), if any, at March 31, 2023:
| | | | Bank of
America
N.A. | | | Barclays
Bank
PLC | | | BNP
Paribas | | | Brown
Brothers
Harriman &
Co. | | | Citibank
N.A. | | | Goldman
Sachs
International | | | HSBC
Bank
USA
N.A. | | | JPMorgan
Chase
Bank
N.A. | | | Morgan
Stanley
Capital
Services
LLC | | | Standard
Chartered
Bank | | | State
Street
Bank
and
Trust Co. | | | Totals | |
| Assets: | | | | | | | | | | | | | | | | | | | | | | | | | | | | | | | | | | | | | | | | | | | | | | | | | | | | | | | | | | | | | | | | | | | | | | | | | |
| Purchased options | | | | $ | 127,369 | | | | | $ | 2,603 | | | | | $ | 354,523 | | | | | $ | — | | | | | $ | — | | | | | $ | 402,185 | | | | | $ | — | | | | | $ | — | | | | | $ | 1,113 | | | | | $ | — | | | | | $ | — | | | | | $ | 887,793 | | |
| Forward premium swaptions | | | | | 9,954 | | | | | | 397,341 | | | | | | — | | | | | | — | | | | | | — | | | | | | — | | | | | | — | | | | | | — | | | | | | 111,723 | | | | | | — | | | | | | — | | | | | | 519,018 | | |
| Forward foreign currency contracts | | | | | 280,102 | | | | | | 51,093 | | | | | | 1,110,992 | | | | | | — | | | | | | 8,784 | | | | | | 664,376 | | | | | | — | | | | | | — | | | | | | 337,688 | | | | | | 23,741 | | | | | | 255,639 | | | | | | 2,732,415 | | |
| Total Assets | | | | $ | 417,425 | | | | | $ | 451,037 | | | | | $ | 1,465,515 | | | | | $ | — | | | | | $ | 8,784 | | | | | $ | 1,066,561 | | | | | $ | — | | | | | $ | — | | | | | $ | 450,524 | | | | | $ | 23,741 | | | | | $ | 255,639 | | | | | $ | 4,139,226 | | |
| Liabilities: | | | | | | | | | | | | | | | | | | | | | | | | | | | | | | | | | | | | | | | | | | | | | | | | | �� | | | | | | | | | | | | | | | | | | | | | | | | |
| Forward foreign currency contracts | | | | $ | 356,941 | | | | | $ | — | | | | | $ | 530,174 | | | | | $ | 84,019 | | | | | $ | — | | | | | $ | 208,130 | | | | | $ | 437,622 | | | | | $ | 10,551 | | | | | $ | 534,418 | | | | | $ | 322,613 | | | | | $ | 1,194,591 | | | | | $ | 3,679,059 | | |
| Volatility swaps | | | | | — | | | | | | — | | | | | | — | | | | | | — | | | | | | — | | | | | | — | | | | | | — | | | | | | — | | | | | | 263 | | | | | | — | | | | | | — | | | | | | 263 | | |
| Written options | | | | | 2,600,853 | | | | | | 5,901,011 | | | | | | 177,908 | | | | | | — | | | | | | 2,486,499 | | | | | | 4,372,698 | | | | | | | | | | | | 1,873,515 | | | | | | 4,439,045 | | | | | | — | | | | | | — | | | | | | 21,851,529 | | |
| Total Liabilities | | | | $ | 2,957,794 | | | | | $ | 5,901,011 | | | | | $ | 708,082 | | | | | $ | 84,019 | | | | | $ | 2,486,499 | | | | | $ | 4,580,828 | | | | | $ | 437,622 | | | | | $ | 1,884,066 | | | | | $ | 4,973,726 | | | | | $ | 322,613 | | | | | $ | 1,194,591 | | | | | $ | 25,530,851 | | |
| Net OTC derivative instruments by counterparty, at fair value | | | | $ | (2,540,369) | | | | | $ | (5,449,974) | | | | | $ | 757,433 | | | | | $ | (84,019) | | | | | $ | (2,477,715) | | | | | $ | (3,514,267) | | | | | $ | (437,622) | | | | | $ | (1,884,066) | | | | | $ | (4,523,202) | | | | | $ | (298,872) | | | | | $ | (938,952) | | | | | $ | (21,391,625) | | |
Total cash collateral pledged
by the Fund/(Received
from counterparty) | | | | $ | 2,540,369 | | | | | $ | 5,449,974 | | | | | $ | (420,000) | | | | | $ | — | | | | | $ | 2,477,715 | | | | | $ | 3,514,267 | | | | | $ | — | | | | | $ | 1,884,066 | | | | | $ | 4,523,202 | | | | | $ | — | | | | | $ | 600,000 | | | | | $ | 20,569,593 | | |
Net Exposure(1)(2)(3) | | | | $ | — | | | | | $ | — | | | | | $ | 337,433 | | | | | $ | (84,019) | | | | | $ | — | | | | | $ | — | | | | | $ | (437,622) | | | | | $ | — | | | | | $ | — | | | | | $ | (298,872) | | | | | $ | (338,952) | | | | | $ | (822,032) | | |
(1)
Positive net exposure represents amounts due from each respective counterparty. Negative exposure represents amounts due from the Fund. Please refer to Note 2 for additional details regarding counterparty credit risk and credit related contingent features.
(2)
At March 31, 2023, the Fund had pledged $2,690,000, $5,740,000, $2,990,000, $4,150,000, $2,260,000, and $6,150,000 in cash collateral to Bank of America N.A., Barclays Bank PLC, Citibank N.A., Goldman Sachs International, JPMorgan Chase Bank N.A., and Morgan Stanley Capital Services LLC , respectively. Excess cash collateral is not shown for financial reporting purposes.
At March 31, 2023, the aggregate cost of securities and other investments and the composition of unrealized appreciation and depreciation of securities and other investments on a tax basis were:
| | Cost for federal income tax purposes was $1,997,268,849. | | |
| | Net unrealized depreciation consisted of: | |
| | Gross Unrealized Appreciation | | | | $ | 30,022,393 | | |
| | Gross Unrealized Depreciation | | | | | (225,939,053) | | |
| | Net Unrealized Depreciation | | | | $ | (195,916,660) | | |
See Accompanying Notes to Financial Statements
TAX INFORMATION (Unaudited)
Dividends and distributions paid during the year or period ended March 31, 2023 were as follows:
| Fund Name | | | Type | | | Per Share Amount | |
| Voya GNMA Income Fund | |
| Class A | | | NII | | | | $ | 0.1944 | | |
| Class C | | | NII | | | | $ | 0.1369 | | |
| Class I | | | NII | | | | $ | 0.2175 | | |
| Class R6 | | | NII | | | | $ | 0.2189 | | |
| Class W | | | NII | | | | $ | 0.2140 | | |
| Voya High Yield Bond Fund | |
| Class A | | | NII | | | | $ | 0.3627 | | |
| Class C | | | NII | | | | $ | 0.3155 | | |
| Class I | | | NII | | | | $ | 0.3908 | | |
| Class R | | | NII | | | | $ | 0.3503 | | |
| Class R6 | | | NII | | | | $ | 0.3960 | | |
| Class W | | | NII | | | | $ | 0.3853 | | |
| All Classes | | | STCG | | | | $ | 0.0414 | | |
| All Classes | | | LTCG | | | | $ | 0.0502 | | |
| Voya Intermediate Bond Fund | |
| Class A | | | NII | | | | $ | 0.2519 | | |
| Class C | | | NII | | | | $ | 0.1852 | | |
| Class I | | | NII | | | | $ | 0.2807 | | |
| Class R | | | NII | | | | $ | 0.2301 | | |
| Class R6 | | | NII | | | | $ | 0.2849 | | |
| Fund Name | | | Type | | | Per Share Amount | |
| Voya Intermediate Bond Fund (continued) | |
| Class W | | | NII | | | | $ | 0.2737 | | |
| Voya Short Duration High Income Fund(1) | |
| Class A | | | NII | | | | $ | 0.0993 | | |
| Class I | | | NII | | | | $ | 0.1029 | | |
| Class R6 | | | NII | | | | $ | 0.1025 | | |
| Voya Short Term Bond Fund | |
| Class A | | | NII | | | | $ | 0.2083 | | |
| Class C | | | NII | | | | $ | 0.1383 | | |
| Class I | | | NII | | | | $ | 0.2356 | | |
| Class R | | | NII | | | | $ | 0.1855 | | |
| Class R6 | | | NII | | | | $ | 0.2391 | | |
| Class W | | | NII | | | | $ | 0.2323 | | |
| Voya Strategic Income Opportunities Fund | |
| Class A | | | NII | | | | $ | 0.3261 | | |
| Class C | | | NII | | | | $ | 0.2527 | | |
| Class I | | | NII | | | | $ | 0.3550 | | |
| Class R | | | NII | | | | $ | 0.2998 | | |
| Class R6 | | | NII | | | | $ | 0.3598 | | |
| Class W | | | NII | | | | $ | 0.3471 | | |
NII – Net investment income
STCG – Short-term capital gain
LTCG – Long-term capital gain
(1)
Commenced operations on February 9, 2023.
Pursuant to Internal Revenue Code Section 871(k)(1), the Funds designate the following percentages of net investment income distributions as interest-related dividends:
| | Voya GNMA Income Fund | | | | | 100.00% | | |
| | Voya High Yield Bond Fund | | | | | 98.44% | | |
| | Voya Intermediate Bond Fund | | | | | 99.06% | | |
| | Voya Short Duration High Income Fund | | | | | 93.20% | | |
| | Voya Short Term Bond Fund | | | | | 99.85% | | |
| | Voya Strategic Income Opportunities Fund | | | | | 99.82% | | |
The Funds designate the following percentages of short-term capital gain distributions as short-term capital gain dividends as defined in Internal Revenue Code Section 871(k)(2):
| | Voya High Yield Bond Fund | | | | | 100.00% | | |
The Funds designate the following amount of long-term capital gain distributions as 20% rate long-term capital gain dividends under Internal Revenue Code Section 852(b)(3)(C):
| | Voya High Yield Bond Fund | | | | $ | 3,451,344 | | |
TAX INFORMATION (Unaudited)
Above figures may differ from those cited elsewhere in this report due to differences in the calculation of income and gains under U.S. generally accepted accounting principles (book) purposes and Internal Revenue Service (tax) purposes.
Shareholders are strongly advised to consult their own tax advisers with respect to the tax consequences of their investments in the Funds. In January, shareholders, excluding corporate shareholders, receive an IRS 1099-DIV regarding the federal tax status of the dividends and distributions they received in the calendar year.
TRUSTEE AND OFFICER INFORMATION (Unaudited)
The business and affairs of the Trust are managed under the direction of the Board. A Trustee, who is not an interested person of the Trust, as defined in the 1940 Act, is an independent trustee (“Independent Trustee”). The Trustees and Officers of the Trust are listed below. The Statement of Additional Information includes additional information about Trustees of the Trust and is available, without charge, upon request at (800) 992-0180.
| Name, Address and Year of Birth | | | Position(s)
Held with the
Trust | | | Term of Office and
Length of Time
Served(1) | | | Principal
Occupation(s) –
During the Past 5 Years | | | Number of
funds in
Fund
Complex
Overseen
by
Trustee(2) | | | Other Board Positions
Held by Trustee | |
| Independent Trustees: | | | | | | | | | | | | | | | | |
Colleen D. Baldwin
(1960)
7337 East Doubletree Ranch Rd.
Suite 100
Scottsdale, Arizona 85258 | | | Chairperson Trustee | | | January 2020 – Present November 2007 – Present | | | President, Glantuam Partners, LLC, a business consulting firm (January 2009 – Present). | | | 138 | | | Stanley Global Engineering (2020 – Present). | |
John V. Boyer
(1953)
7337 East Doubletree Ranch Rd.
Suite 100
Scottsdale, Arizona 85258 | | | Trustee | | | January 2005 – Present | | | Retired. Formerly, President and Chief Executive Officer, Bechtler Arts Foundation, an arts and education foundation (January 2008 – December 2019). | | | 138 | | | None. | |
Patricia W. Chadwick
(1948)
7337 East Doubletree Ranch Rd.
Suite 100
Scottsdale, Arizona 85258 | | | Trustee | | | January 2006 – Present | | | Consultant and President, Ravengate Partners LLC, a consulting firm that provides advice regarding financial markets and the global economy (January 2000 – Present). | | | 138 | | | The Royce Funds (22 funds) (December 2009 – Present). AMICA Mutual Insurance Company (1992 – Present). | |
Martin J. Gavin
(1950)
7337 East Doubletree Ranch Rd. Suite 100
Scottsdale, Arizona 85258 | | | Trustee | | | August 2015 – Present | | | Retired. | | | 138 | | | None. | |
Joseph E. Obermeyer
(1957)
7337 East Doubletree Ranch Rd.
Suite 100
Scottsdale, Arizona 85258 | | | Trustee | | | May 2013 – Present | | | President, Obermeyer & Associates, Inc., a provider of financial and economic consulting services (November 1999 – Present). | | | 138 | | | None. | |
Sheryl K. Pressler
(1950)
7337 East Doubletree Ranch Rd.
Suite 100
Scottsdale, Arizona 85258 | | | Trustee | | | January 2006 – Present | | | Consultant (May 2001 – Present). | | | 138 | | | Centerra Gold Inc. (May 2008 – Present). | |
Christopher P. Sullivan
(1954)
7337 East Doubletree Ranch Rd.
Suite 100
Scottsdale, Arizona 85258 | | | Trustee | | | October 2015 – Present | | | Retired. | | | 138 | | | None. | |
(1)
Trustees serve until their successors are duly elected and qualified. The tenure of each Trustee who is not an “interested person” as defined in the 1940 Act, of each Fund (“Independent Trustee”) is subject to the Board’s retirement policy which states that each duly elected or appointed Independent Trustee shall retire from and cease to be a member of the Board of Trustees at the close of business on December 31 of the calendar year in which the Independent Trustee attains the age of 75. A majority vote of the Board’s other Independent Trustees may extend the retirement date of an Independent Trustee if the retirement would trigger a requirement to hold a meeting of shareholders of the Trust under applicable law, whether for the purposes of appointing a successor to the Independent Trustee or otherwise comply under applicable law, in which case the extension would apply until such time as the shareholder meeting can be held or is no longer required (as determined by a vote of a majority of the other Independent Trustees).
TRUSTEE AND OFFICER INFORMATION (Unaudited) (continued)
(2)
For the purposes of this table, “Fund Complex” means the Voya family of funds including the following investment companies: Voya Asia Pacific High Dividend Equity Income Fund; Voya Balanced Portfolio, Inc.; Voya Credit Income Fund; Voya Emerging Markets High Dividend Equity Fund; Voya Equity Trust; Voya Funds Trust; Voya Global Advantage and Premium Opportunity Fund; Voya Global Equity Dividend and Premium Opportunity Fund; Voya Government Money Market Portfolio; Voya Infrastructure, Industrials and Materials Fund; Voya Intermediate Bond Portfolio; Voya Investors Trust; Voya Mutual Funds; Voya Partners, Inc.; Voya Separate Portfolios Trust; Voya Strategic Allocation Portfolios, Inc.; Voya Variable Funds; Voya Variable Insurance Trust; Voya Variable Portfolios, Inc.; and Voya Variable Products Trust. The number of funds in the Fund Complex is as of April 30, 2023.
TRUSTEE AND OFFICER INFORMATION (Unaudited) (continued)
| Name, Address and Year of Birth | | | Position(s) Held
With the Trust | | | Term of Office and
Length of Time Served(1) | | | Principal Occupation(s) –
During the Past 5 Years | |
Andy Simonoff
(1973)
5780 Powers Ferry Road NW
Atlanta, Georgia 30327 | | | President and Chief Executive Officer | | | January 2023 – Present | | | Director, President and Chief Executive Officer, Voya Funds Services, LLC, Voya Capital, LLC and Voya Investments, LLC (January 1, 2023 – Present); Managing Director, Chief Strategy and Transformation Officer, Voya Investment Management (January 2020 – Present). Formerly, Managing Director, Head of Business Management, Voya Investment Management (March 2019 – January 2020); Managing Director, Head of Business Management, Fixed Income, Voya Investment Management (November 2015 – March 2019). | |
Jonathan Nash
(1967)
230 Park Avenue
New York, New York 10169 | | | Executive Vice President and Chief Investment Risk Officer | | | March 2020 – Present | | | Executive Vice President and Chief Investment Risk Officer, Voya Investments, LLC (March 2020 – Present); Senior Vice President, Investment Risk Management, Voya Investment Management (March 2017 – Present). Formerly, Vice President, Voya Investments, LLC (September 2018 – March 2020). | |
James M. Fink
(1958)
5780 Powers Ferry Road NW
Atlanta, Georgia 30327 | | | Executive Vice President | | | March 2018 – Present | | | Senior Vice President, Voya Investments Distributor, LLC (April 2018 – Present); Managing Director, Voya Investments, LLC, Voya Capital, LLC, and Voya Funds Services, LLC (March 2018 – Present); Chief Administrative Officer, Voya Investment Management (September 2017 – Present). | |
Steven Hartstein
(1963)
230 Park Avenue
New York, New York 10169 | | | Chief Compliance Officer | | | December 2022 – Present | | | Senior Vice President, Voya Investment Management (December 2022 – Present). Formerly, Head of Funds Compliance, Brighthouse Financial, Inc. and Chief Compliance Officer – Brighthouse Funds and Brighthouse Investment Advisers, LLC (March 2017 – December 2022). | |
Todd Modic
(1967)
7337 East Doubletree Ranch Rd.
Suite 100
Scottsdale, Arizona 85258 | | | Senior Vice President, Chief/Principal Financial Officer and Assistant Secretary | | | March 2005 – Present | | | Director and Senior Vice President, Voya Capital, LLC, and Voya Funds Services, LLC (September 2022 – Present); Director, Voya Investments, LLC (September 2022 – Present); Senior Vice President, Voya Investments, LLC (April 2005 – Present). Formerly, President, Voya Funds Services, LLC (March 2018 – September 2022). | |
Kimberly A. Anderson
(1964)
7337 East Doubletree Ranch Rd.
Suite 100
Scottsdale, Arizona 85258 | | | Senior Vice President | | | November 2003 – Present | | | Senior Vice President, Voya Investments, LLC (September 2003 – Present). | |
Sara M. Donaldson
(1959)
7337 East Doubletree Ranch Rd.
Suite 100
Scottsdale, Arizona 85258 | | | Senior Vice President | | | June 2022 – Present | | | Senior Vice President, Voya Investments, LLC (February 2022 – Present); Senior Vice President, Head of Active Ownership, Voya Investment Management (September 2021 – Present). Formerly, Vice President, Voya Investments, LLC (October 2015 – February 2022); Vice President, Head of Proxy Voting, Voya Investment Management (October 2015 – August 2021). | |
Andrew K. Schlueter
(1976)
7337 East Doubletree Ranch Rd.
Suite 100
Scottsdale, Arizona 85258 | | | Senior Vice President | | | June 2022 – Present | | | Senior Vice President, Head of Investment Operations Support, Voya Investment Management (April 2023 – Present); Vice President, Voya Investments Distributor, LLC (April 2018 – Present); Vice President, Voya Investments, LLC and Voya Funds Services, LLC (March 2018 – Present); Formerly, Senior Vice President, Head of Mutual Fund Operations, Voya Investment Management (March 2022 – March 2023); Vice President, Head of Mutual Fund Operations, Voya Investment Management (February 2018 – February 2022); Vice President, Voya Investment Management (March 2014 – February 2018). | |
TRUSTEE AND OFFICER INFORMATION (Unaudited) (continued)
| Name, Address and Year of Birth | | | Position(s) Held
With the Trust | | | Term of Office and
Length of Time Served(1) | | | Principal Occupation(s) –
During the Past 5 Years | |
Joanne F. Osberg
(1982)
7337 East Doubletree Ranch Rd.
Suite 100
Scottsdale, Arizona 85258 | | | Senior Vice President Secretary | | | March 2023 – Present September 2020 – Present | | | Senior Vice President and Chief Counsel, Voya Investment Management – Mutual Fund Legal Department, Senior Vice President and Secretary, Voya Investments, LLC, Voya Capital, LLC, and Voya Funds Services, LLC (March 2023 – Present). Formerly, Secretary, Voya Capital, LLC (August 2022 – March 2023); Vice President and Secretary, Voya Investments, LLC and Voya Funds Services, LLC, Vice President and Senior Counsel, Voya Investment Management – Mutual Fund Legal Department (September 2020 – March 2023). Vice President and Counsel, Voya Investment Management – Mutual Fund Legal Department (January 2013 – September 2020). | |
Robert Terris
(1970)
5780 Powers Ferry Road NW
Atlanta, Georgia 30327 | | | Senior Vice President | | | May 2006 – Present | | | Senior Vice President, Voya Investments Distributor, LLC (April 2018 – Present); Senior Vice President, Head of Investment Services, Voya Investments, LLC (April 2018 – Present); Senior Vice President, Head of Investment Services, Voya Funds Services, LLC (March 2006 – Present). Formerly, Senior Vice President, Head of Division Operations, Voya Investments, LLC (October 2015 – April 2018). | |
Fred Bedoya
(1973)
7337 East Doubletree Ranch Rd.
Suite 100
Scottsdale, Arizona 85258 | | | Vice President Principal Accounting Officer and Treasurer | | | September 2012 – Present | | | Vice President, Voya Investments, LLC (October 2015 – Present); Vice President, Voya Funds Services, LLC (July 2012 – Present). | |
Robyn L. Ichilov
(1967)
7337 East Doubletree Ranch Rd.
Suite 100
Scottsdale, Arizona 85258 | | | Vice President | | | October 2000 – Present | | | Vice President, Voya Investments, LLC (August 1997 – Present); Vice President, Voya Funds Services, LLC (November 1995 – Present). | |
Jason Kadavy
(1976)
7337 East Doubletree Ranch Rd.
Suite 100
Scottsdale, Arizona 85258 | | | Vice President | | | September 2012 – Present | | | Vice President, Voya Investments, LLC (October 2015 – Present); Vice President, Voya Funds Services, LLC (July 2007 – Present). | |
Erica McKenna
(1972)
7337 East Doubletree Ranch Rd.
Suite 100
Scottsdale, Arizona 85258 | | | Vice President | | | June 2022 – Present | | | Vice President, Head of Mutual Fund Compliance, and Chief Compliance Officer, Voya Investments, LLC (May 2022 – Present). Formerly, Vice President, Fund Compliance Manager, Voya Investments, LLC (March 2021 – May 2022); Assistant Vice President, Fund Compliance Manager, Voya Investments, LLC (December 2016 – March 2021). | |
Craig Wheeler
(1969)
7337 East Doubletree Ranch Rd.
Suite 100
Scottsdale, Arizona 85258 | | | Vice President | | | May 2013 – Present | | | Vice President – Director of Tax, Voya Investments, LLC (October 2015 – Present). | |
Nicholas C.D. Ward
(1993)
7337 East Doubletree Ranch Rd.
Suite 100
Scottsdale, Arizona 85258 | | | Assistant Vice President and Assistant Secretary | | | June 2022 – Present | | | Counsel, Voya Investment Management – Mutual Fund Legal Department (November 2021 – Present). Formerly, Associate, Dechert LLP (October 2018 – November 2021). | |
Gizachew Wubishet
(1976)
7337 East Doubletree Ranch Rd.
Suite 100
Scottsdale, Arizona 85258 | | | Assistant Vice President and Assistant Secretary | | | June 2022 – Present | | | Assistant Vice President and Counsel, Voya Investment Management – Mutual Fund Legal Department (May 2019 – Present). Formerly, Attorney, Ropes & Gray LLP (October 2011 – April 2019). | |
TRUSTEE AND OFFICER INFORMATION (Unaudited) (continued)
| Name, Address and Year of Birth | | | Position(s) Held
With the Trust | | | Term of Office and
Length of Time Served(1) | | | Principal Occupation(s) –
During the Past 5 Years | |
Monia Piacenti
(1976)
One Orange Way
Windsor, Connecticut 06095 | | | Anti-Money Laundering Officer | | | June 2018 – Present | | | Compliance Consultant, Voya Financial, Inc. (January 2019 – Present); Anti-Money Laundering Officer, Voya Investments Distributor, LLC, Voya Investment Management and Voya Investment Management Trust Co. (June 2018 – Present); Formerly, Senior Compliance Officer, Voya Investment Management (December 2009 – December 2018). | |
(1)
The Officers hold office until the next annual meeting of the Board of Trustees and until their successors shall have been elected and qualified.
ADVISORY AND SUB-ADVISORY CONTRACT APPROVAL DISCUSSION (Unaudited)
BOARD CONSIDERATION AND APPROVAL OF INVESTMENT MANAGEMENT CONTRACT AND SUB-ADVISORY CONTRACT
At a meeting held on November 17, 2022, the Board of Trustees (“Board”) of Voya Funds Trust (the “Trust”), including a majority of the Board members who have no direct or indirect interest in the investment management and sub-advisory contracts, and who are not “interested persons” of Voya GNMA Income Fund, Voya High Yield Bond Fund, Voya Intermediate Bond Fund, Voya Short Term Bond Fund, and Voya Strategic Income Opportunities Fund, each a series of the Trust (the “Funds”), as such term is defined under the Investment Company Act of 1940, as amended (the “Independent Trustees”), considered and approved the renewal of the investment management contracts (the “Management Contracts”) between Voya Investments, LLC (the “Manager”) and the Trust, on behalf of the Funds, and the sub-advisory contracts (the “Sub-Advisory Contracts,” and together with the Management Contracts, the “Contracts”) with Voya Investment Management Co. LLC, the sub-adviser to each Fund (the “Sub-Adviser”), for an additional one-year period ending November 30, 2023.
In addition to the Board meeting on November 17, 2022, the Independent Trustees also held meetings outside the presence of representatives of the Manager and Sub-Adviser (collectively, such persons are referred to herein as “management”) on October 12-13, 2022, and November 15, 2022. At those meetings, the Board members reviewed and considered materials related to the proposed continuance of the Contracts that they had requested and believed to be relevant to the renewal of the Contracts in light of their own business judgment and the legal advice furnished to them by K&L Gates LLP, their independent legal counsel. The Board also considered information furnished to it throughout the year at meetings of the Board and its committees, including information regarding performance, expenses, and other relevant matters. While the Board considered the renewal of the management contracts and sub-advisory contracts for all of the applicable investment companies in the Voya family of funds at the same meetings, the Board considered each Voya fund’s investment management and sub-advisory relationships separately.
The Board has established a Contracts Committee and two Investment Review Committees (the “IRCs”), each of which includes only Independent Trustees as members. The Contracts Committee meets several times throughout the year to provide oversight with respect to the management and sub-advisory contracts approval and renewal process for the Voya funds, among other functions, and each IRC meets several times throughout the year with respect to each Voya fund (assigned to that
IRC) to provide oversight regarding the investment performance of the sub-advisers, as well as the Manager’s role in monitoring the sub-advisers.
The Contracts Committee oversees, and annually recommends Board approval of updates to, a methodology guide for the Voya funds (“Methodology Guide”), which sets out a framework pursuant to which the Independent Trustees request, and management provides, certain information that the Independent Trustees deem to be important or potentially relevant to the contracts renewal process for the Voya funds. The Independent Trustees retain the services of an independent consultant with experience in the mutual fund industry to assist the Contracts Committee in developing and recommending to the Board: (1) a selected peer group of investment companies for each Fund (“Selected Peer Group”) based on that Fund’s particular attributes, such as fund type and size, fund category (as determined by Morningstar, Inc., an independent provider of mutual fund data (“Morningstar”)), sales channels and structure and the Fund share class being compared to the Selected Peer Group; and (2) updates to the Methodology Guide with respect to the content and format of various data prepared in connection with the renewal process, including, but not limited to, investment performance, fee structure, and expense information. In addition, the Independent Trustees periodically have retained an independent firm to test and verify the accuracy of certain information presented to the Board for a representative sample of the Voya funds.
The Manager or Sub-Adviser may not have been able to, or opted not to, provide information in response to certain information requests, in which case the Board conducted its evaluation based on the information that was provided. In such cases, the Board determined that the omission of any such information was not material to its considerations. Additionally, the Board considered the impact of significant periods of market volatility that occurred during and after the period for which information was requested in conducting its evaluation of the Manager and Sub-Adviser.
Provided below is an overview of certain material factors that the Board considered at its meetings regarding the renewal of the Contracts and the compensation to be paid thereunder. The Board members did not identify any particular information or factor that was most relevant to its consideration.
Nature, Extent and Quality of Services
The Manager oversees, subject to the authority of the Board, and is responsible for the provision of, all investment advisory and portfolio management services for the Funds, but may delegate certain of these
ADVISORY AND SUB-ADVISORY CONTRACT APPROVAL DISCUSSION (Unaudited) (continued)
responsibilities to one or more sub-advisers. In addition, the Manager provides administrative services reasonably necessary for the operation of the Funds as set forth in the Management Contracts, including oversight of the Funds’ operations and risk management and the oversight of their various other service providers.
The Board considered the “manager-of-managers” structure of the Voya funds that has been developed by the Manager pursuant to which the Manager selects, subject to the Board’s approval, sub-advisers to provide day-to-day management services to all or a portion of each Voya fund. The Board recognized that the Manager is responsible for monitoring the Sub-Adviser’s investment program, performance, developments, ongoing operations, and compliance with applicable regulations and investment policies and restrictions with respect to the Funds under this manager-of-managers arrangement. The Board also considered the techniques and resources that the Manager has developed to provide this ongoing due diligence and oversight with respect to the sub-advisers and to recommend appropriate changes in investment strategies, sub-advisers, or allocation among sub-advisers in an effort to improve a Voya fund’s performance. In connection with the Manager’s performance of these duties, the Board considered that the Manager has developed an oversight process formulated by its Manager Research & Selection Group that reviews, among other matters, performance data, the Sub-Adviser’s management team, portfolio data and attribution analysis related to the Sub-Adviser through various means, including, but not limited to, in-person meetings, on-site or virtual visits, and telephonic meetings with the Sub-Adviser.
Further, the Board considered periodic compliance reports it receives from the Trust’s Chief Compliance Officer evaluating, among other related matters, whether the regulatory compliance systems and procedures of the Manager and Sub-Adviser are reasonably designed to ensure compliance with the federal securities laws and whether the investment policies and restrictions for each Fund are complied with on a consistent basis.
The Board considered the portfolio management team assigned by the Sub-Adviser to the Funds and the level of resources committed to the Funds (and other relevant funds in the Voya funds) by the Manager and Sub-Adviser, and whether those resources are sufficient to provide high-quality services to the Funds.
Based on their deliberations and the materials presented to them, the Board concluded that the nature, extent and quality of the overall services provided by the Manager and Sub-Adviser under the Contracts were appropriate.
Fund Performance
In assessing the investment management and sub-advisory relationships, the Board placed emphasis on the investment returns of each Fund, including its investment performance over certain time periods compared to the Fund’s Morningstar category and primary benchmark, a broad-based securities market index identified in the Fund’s prospectus. The Board also considered information from the Manager Research & Selection Group and received reports summarizing a separate analysis of each Fund’s performance and risk, including risk-adjusted investment return information, from the Trust’s Chief Investment Risk Officer.
Economies of Scale
When evaluating the reasonableness of the management fee schedules, the Board considered whether economies of scale have been or likely will be realized by the Manager and Sub-Adviser as a Fund grows larger and the extent to which any such economies are shared with the Fund. In this regard, the Board noted any breakpoints in the management fee schedules that will result in a lower management fee rate when a Fund achieves sufficient asset levels to receive a breakpoint discount. The Board also considered that, while some of the Funds do not have management fee breakpoints, they may have fee waiver and expense reimbursement arrangements. The Board considered the extent to which economies of scale realized by the Manager or the Sub-Adviser could be shared with each Fund through such fee waivers, expense reimbursements or other expense reductions. In evaluating these matters, the Board also considered periodic management reports, Selected Peer Group comparisons, and industry information regarding economies of scale. In the case of sub-advisory fees, the Board considered that breakpoints, if any, would inure to the benefit of the Manager.
Information Regarding Services, Performance, and Fee Schedules Offered to Other Clients
The Board considered comparative information regarding the nature of services, performance, and fee schedules offered by the Manager and Sub-Adviser to other clients with similar investment objectives, if applicable, including other registered investment companies and relevant institutional accounts. When the fee schedules offered to or the performance of such other clients differed materially from a Fund, the Board took into account the underlying rationale provided by the Manager or Sub-Adviser, as applicable, for these differences.
ADVISORY AND SUB-ADVISORY CONTRACT APPROVAL DISCUSSION (Unaudited) (continued)
Fee Schedules, Profitability, and Fall-out Benefits
The Board reviewed and considered the contractual management fee schedule and net management fee rate payable by each Fund to the Manager compared to the Fund’s Selected Peer Group. The Board also considered the compensation payable by the Manager to the Sub-Adviser for sub-advisory services for each Fund, including the portion of the contractual and net management fee rates that are paid to the Sub-Adviser, as compared to the compensation paid to the Manager. In addition, the Board considered any fee waivers, expense limitations, and/or recoupment arrangements that apply to the fees payable by the Funds, including whether the Manager intends to propose any changes thereto. For each Fund, the Board separately determined that the fees payable to the Manager and the fee schedule payable to the Sub-Adviser are reasonable for the services that each performs, which were considered in light of the nature, extent and quality of the services that each has performed and is expected to perform.
For each Fund, the Board considered information on revenues, costs and profits or losses realized by the Manager and the Voya-affiliated Sub-Adviser related to their services to the Fund. In analyzing the profitability of the Manager and its affiliates in connection with services they render to a Fund, the Board took into account the sub-advisory fee rate payable by the Manager to the Sub-Adviser. The Board also considered the profitability of the Manager and its affiliated Sub-Adviser attributable to servicing each Fund both with and without taking into account the profitability of the distributor of the Funds and any revenue sharing payments made by the Manager.
Although the Methodology Guide establishes a framework for profit calculation, the Board recognized that there is no uniform methodology within the asset management industry for determining profitability for this purpose. The Board also recognized that the use of different reasonable methodologies can give rise to dramatically different reported profit and loss results with respect to the Manager and the Voya-affiliated Sub-Adviser, as well as other industry participants with whom the profits of the Manager and its affiliated Sub-Adviser could be compared. In addition, the Board recognized that management’s calculations regarding its costs incurred in establishing the infrastructure necessary for the Funds’ operations may not be fully reflected in the expenses allocated to each Fund in determining profitability. The Board also recognized that the information presented may not portray all of the costs borne by the Manager or reflect all of the risks associated with offering and managing a mutual fund complex in the current regulatory and market environment, including entrepreneurial, regulatory, legal and operational risks.
The Board also considered that the Manager and the Voya-affiliated Sub-Adviser are entitled to earn a reasonable level of profits for the services that they provide to the Funds. The Board also considered information regarding the potential fall-out benefits to the Manager and Sub-Adviser and their respective affiliates from their association with the Funds, including their ability to engage in soft-dollar transactions on behalf of the Funds. Following its reviews, the Board determined that the Manager’s and the Voya-affiliated Sub-Adviser’s profitability with respect to their services to the Funds and the Manager and Sub-Adviser’s potential fall-out benefits were not unreasonable.
Fund-by-Fund Analysis
Set forth below are certain of the specific factors that the Board considered at its October 12-13, 2022, November 15, 2022, and/or November 17, 2022 meetings in relation to approving each Fund’s Contracts and the conclusions reached by the Board. These specific factors are in addition to those considerations discussed above. In each case, the Fund’s performance was compared to its Morningstar category, as well as its primary benchmark. The performance data provided to the Board primarily was for various periods ended March 31, 2022. In addition, the Board also considered at its October 12-13, 2022, November 15, 2022, and/or November 17, 2022 meetings certain additional data regarding each Fund’s more recent performance, asset levels and asset flows. Each Fund’s management fee rate and expense ratio were compared to the management fee rates and expense ratios of the funds in its Selected Peer Group. With respect to the quintile rankings noted below, the first quintile represents the range of funds with the highest performance or the lowest management fee rate or expense ratio, as applicable, and the fifth quintile represents the range of funds with the lowest performance or the highest management fee rate or expense ratio, as applicable.
Voya GNMA Income Fund
In considering whether to approve the renewal of the Contracts for Voya GNMA Income Fund, the Board considered that, based on performance data for the periods ended March 31, 2022: (1) the Fund is ranked in the first quintile of its Morningstar category for the year-to-date and ten-year periods, the second quintile for the one-year and five-year periods, and the third quintile for the three-year period; and (2) the Fund outperformed its primary benchmark for all periods presented.
In considering the fees payable under the Contracts for the Fund, the Board took into account the factors described above and also considered: (1) the economies of scale benefits to the Fund and its shareholders from breakpoint
ADVISORY AND SUB-ADVISORY CONTRACT APPROVAL DISCUSSION (Unaudited) (continued)
discounts applicable to the Fund’s management fee rate, which result in lower fees at higher asset levels; and (2) the pricing structure (including the net expense ratio to be borne by shareholders) of the Fund, as compared to its Selected Peer Group, including that: (a) the net management fee rate for the Fund is ranked in the fifth quintile of net management fee rates of the funds in its Selected Peer Group; (b) the contractual management fee rate for the Fund is ranked in the fourth quintile of contractual management fee rates of the funds in its Selected Peer Group; and (c) the net expense ratio for the Fund is ranked in the third quintile of net expense ratios of the funds in its Selected Peer Group. In analyzing this fee data, the Board took into account management’s representations regarding its belief that the Fund’s pricing is competitive.
Voya High Yield Bond Fund
In considering whether to approve the renewal of the Contracts for Voya High Yield Bond Fund, the Board considered that, based on performance data for the periods ended March 31, 2022: (1) the Fund is ranked in the first quintile of its Morningstar category for the ten-year period, the second quintile for the five-year period, the third quintile for the one-year and three-year periods, and the fourth quintile for the year-to-date period; and (2) the Fund underperformed its primary benchmark for all periods presented, with the exception of the year-to-date and one-year periods, during which it outperformed.
In considering the fees payable under the Contracts for the Fund, the Board took into account the factors described above and also considered: (1) the economies of scale benefits to the Fund and its shareholders from breakpoint discounts applicable to the Fund’s management fee rate, which result in lower fees at higher asset levels; and (2) the pricing structure (including the net expense ratio to be borne by shareholders) of the Fund, as compared to its Selected Peer Group, including that: (a) the net management fee rate for the Fund is ranked in the fourth quintile of net management fee rates of the funds in its Selected Peer Group; (b) the contractual management fee rate for the Fund is ranked in the fourth quintile of contractual management fee rates of the funds in its Selected Peer Group; and (c) the net expense ratio for the Fund is ranked in the third quintile of net expense ratios of the funds in its Selected Peer Group. In analyzing this fee data, the Board took into account management’s representations regarding the competitiveness of the Fund’s management fee rate and net expense ratio.
Voya Intermediate Bond Fund
In considering whether to approve the renewal of the Contracts for Voya Intermediate Bond Fund, the Board
considered that, based on performance data for the periods ended March 31, 2022: (1) the Fund is ranked in the second quintile of its Morningstar category for the five-year and ten-year periods, the third quintile for the three-year period, and the fourth quintile for the year-to date and one-year periods; and (2) the Fund outperformed its primary benchmark for all periods presented, with the exception of the year-to-date and one-year periods, during which it underperformed. In analyzing this performance data, the Board took into account management’s representations regarding: (1) the competitiveness of the Fund’s performance during certain periods; and (2) the negative impact of the significant increase in interest rates on the Fund’s performance.
In considering the fees payable under the Contracts for the Fund, the Board took into account the factors described above and also considered: (1) the fairness of the compensation under a Management Contract with a level fee rate that does not include breakpoints; and (2) the pricing structure (including the net expense ratio to be borne by shareholders) of the Fund, as compared to its Selected Peer Group, including that: (a) the net management fee rate for the Fund is ranked in the first quintile of net management fee rates of the funds in its Selected Peer Group; (b) the contractual management fee rate for the Fund is ranked in the first quintile of contractual management fee rates of the funds in its Selected Peer Group; and (c) the net expense ratio for the Fund is ranked in the first quintile of net expense ratios of the funds in its Selected Peer Group.
Voya Short Term Bond Fund
In considering whether to approve the renewal of the Contracts for Voya Short Term Bond Fund, the Board considered that, based on performance data for the periods ended March 31, 2022: (1) the Fund is ranked in the second quintile of its Morningstar category for the one-year period, and the third quintile for the year-to-date, three-year and five-year periods; and (2) the Fund outperformed its primary benchmark for all periods presented, with the exception of the year-to-date period, during which it underperformed.
In considering the fees payable under the Contracts for the Fund, the Board took into account the factors described above and also considered: (1) the fairness of the compensation under a Management Contract with a level fee rate that does not include breakpoints; and (2) the pricing structure (including the net expense ratio to be borne by shareholders) of the Fund, as compared to its Selected Peer Group, including that: (a) the net management fee rate for the Fund is ranked in the second quintile of net management fee rates of the funds in its
ADVISORY AND SUB-ADVISORY CONTRACT APPROVAL DISCUSSION (Unaudited) (continued)
Selected Peer Group; (b) the contractual management fee rate for the Fund is ranked in the first quintile of contractual management fee rates of the funds in its Selected Peer Group; and (c) the net expense ratio for the Fund is ranked in the first quintile of net expense ratios of the funds in its Selected Peer Group.
Voya Strategic Income Opportunities Fund
In considering whether to approve the renewal of the Contracts for Voya Strategic Income Opportunities Fund, the Board considered that, based on performance data for the periods ended March 31, 2022: (1) the Fund is ranked in the second quintile of its Morningstar category for the five-year period, the third quintile for the year-to-date period, and the fourth quintile for the one-year and three-year periods; and (2) the Fund outperformed its primary benchmark for the three-year and five-year periods and underperformed for the year-to-date and one-year periods. In analyzing this performance data, the Board took into account: (1) management’s representations regarding the impact of stock selection and sector allocation on the Fund’s performance; (2) management’s representations regarding the competitiveness of the Fund’s performance during certain periods; and (3) management’s confidence in the Fund’s ability to deliver long-term performance.
In considering the fees payable under the Contracts for the Fund, the Board took into account the factors described above and also considered: (1) the fairness of the compensation under a Management Contract with a level fee rate that does not include breakpoints; and (2) the pricing structure (including the net expense ratio to be borne by shareholders) of the Fund, as compared to its Selected Peer Group, including that: (a) the net management fee rate for the Fund is ranked in the second quintile of net management fee rates of the funds in its Selected Peer Group; (b) the contractual management fee rate for the Fund is ranked in the second quintile of contractual management fee rates of the funds in its Selected Peer Group; and (c) the net expense ratio for the Fund is ranked in the third quintile of net expense ratios of the funds in its Selected Peer Group.
Board Conclusions
After its deliberation, the Board concluded that, in its business judgment, the terms of the Contracts are fair and reasonable to each Fund and that approval of the continuation of the Contracts is in the best interests of each Fund and its shareholders. In doing so, the Board reviewed all factors it considered to be material, including those discussed above. Within the context of its overall conclusions regarding the Contracts, and based on the information provided and management’s related representations, the Board concluded that it was satisfied
with management’s responses relating to each Fund’s investment performance and the fees payable under the Contracts. During this renewal process, each Board member may have accorded different weight to various factors in reaching his or her conclusions. Based on these conclusions and other factors, the Board voted to renew the Contracts for each Fund for the year ending November 30, 2023.
BOARD CONSIDERATION AND APPROVAL OF NEW MANAGEMENT AND SUB-ADVISORY CONTRACTS FOR VOYA SHORT DURATION HIGH INCOME FUND
Pursuant to Section 15(c) of the Investment Company Act of 1940, as amended (the “1940 Act”), Voya Short Duration High Income Fund (the “Fund”), a series of Voya Funds Trust (“VFT”), can enter into a new investment management or sub-advisory contract only if the Board of Trustees of VFT (the “Board”), including a majority of the Board members who have no direct or indirect interest in the investment management and sub-advisory contracts, and who are not “interested persons” of the Fund, as such term is defined under the 1940 Act (the “Independent Trustees”), determines to approve the new arrangements. Thus, at its meeting held on November 17, 2022, the Board considered the initial approval of the investment management contract (the “Management Contract”) with Voya Investments, LLC (“VIL” or the “Adviser”) and the sub-advisory contract (the “Sub-Advisory Contract”) between VIL and the sub-adviser, Voya Investment Management Co. LLC (“Voya IM” or the “Sub-Adviser”) (together, the “Management and Sub-Advisory Contracts”) for the Fund.
In determining whether to initially approve the Management Contract and Sub-Advisory Contract for the Fund, the Board requested, received, evaluated and discussed such information and supporting materials related to that information as it deemed necessary for an informed determination of whether the Management and Sub-Advisory Contracts should be approved. Provided below is a general overview of the Board’s contract approval process that it followed, as well as a discussion of certain specific factors that the Board considered. While the Board gave its attention to information furnished at the request of the Independent Trustees that was most relevant to its considerations, discussed below are some of the primary matters relevant to the Board’s consideration as to whether to approve the Management and Sub-Advisory Contracts.
The materials provided to the Board in support of the Fund and the Fund’s Management Contract included the following: (1) a memorandum and presentation materials presenting management’s rationale for proposing the launch of the Fund that discuss, among other things, the
ADVISORY AND SUB-ADVISORY CONTRACT APPROVAL DISCUSSION (Unaudited) (continued)
experience and expertise of VIL in the management of other funds within the Voya funds complex with similar investment objectives and strategies; (2) information about the Fund’s proposed investment objective and strategies and anticipated portfolio characteristics; (3) Fund Analysis and Comparison Tables sheets for the Fund that compare the Fund’s proposed fee structure to its comparable selected peer group (“SPG”) and/or Morningstar category median and/or average; (4) supporting documentation, including copies of the forms of Management and Sub-Advisory Contracts for the Fund; (5) a memorandum provided by counsel to the Independent Trustees summarizing the guidelines relevant to the Board’s consideration of the approvals of the Management Contracts; (6) a memorandum and other information provided in response to Section 15(c) requests to the Adviser and Sub-Adviser by counsel to the Independent Trustees on behalf of the Board; and (7) other information relevant to the Board’s evaluation. In addition, the Board considered the information provided periodically throughout the year in presentations to the Board by VIL in the context of VIL’s oversight and management of the other funds in the Voya funds complex.
The Board’s consideration of whether to approve the Management Contract with VIL on behalf of the Fund took into account several factors, including, but not limited to, the following: (1) the nature, extent and quality of the services to be provided by VIL to the Fund under the proposed Management Contract; (2) VIL’s experience as a manager-of-managers overseeing sub-advisers to other funds within the Voya funds complex; (3) the fairness of the compensation under the proposed Management Contract in light of the services to be provided to the Fund; (4) the costs for the services to be provided by VIL, including that the proposed management fee would not be subject to breakpoint discounts; (5) the pricing structure (including the estimated expense ratio to be borne by shareholders) of the Fund, including that: (a) the proposed management fee for the Fund is below the average and median management fees of the funds in the Fund’s SPG, and (b) the estimated expense ratio for the Fund is below the average and median expense ratios of the funds in the Fund’s SPG; (6) the projected profitability of VIL; (7) the personnel, operations, financial condition, and investment management capabilities, methodologies and resources of VIL, including its management team’s expertise in the management of other Voya funds; (8) VIL’s compliance capabilities, as demonstrated by, among other things, its policies and procedures designed to prevent violations of the Federal securities laws, which had previously been approved by the Board in connection with their oversight of other funds in the Voya funds complex; (9) the information that had been provided by VIL at regular Board meetings,
and in anticipation of the November 17, 2022 meeting, with respect to its capabilities in overseeing similar asset allocation products; and (10) “fall-out benefits” to VIL and its affiliates that were anticipated to arise from VIL’s management of the Fund.
In reviewing the proposed Sub-Advisory Contract with Voya IM, the Board considered a number of factors, including, but not limited to, the following: (1) VIL’s view of the reputation of Voya IM and its sub-advisory services; (2) Voya IM’s strength and reputation in the industry; (3) the information that had been provided by Voya IM in advance of the November 17, 2022 meeting at which Voya IM presented with respect to its sub-advisory services; (4) the nature, extent and quality of the services to be provided by Voya IM under the proposed Sub-Advisory Contract; (5) the personnel, operations, financial condition, and investment management capabilities, methodologies and resources of Voya IM; (6) the fairness of the compensation under the Sub-Advisory Contract in light of the services to be provided by Voya IM as the Fund’s Sub-Adviser; (7) Voya IM’s operations and compliance program, including its policies and procedures intended to prevent violation of the Federal securities laws, which had been reviewed and evaluated by VFT’s Chief Compliance Officer; (8) Voya IM’s financial condition; (9) the appropriateness of the selection of Voya IM in light of the Fund’s investment objective and prospective investor base; and (10) Voya IM’s Code of Ethics, which was previously approved by the Board.
With respect to the nature and quality of services to be provided by the Adviser and Sub-Adviser, the Board was mindful of the “manager-of-managers” platform that has been developed by the Adviser. The Board recognized that the Adviser would be responsible for monitoring the investment program, performance, and developments/ on-going operations of the Sub-Adviser under this manager-of-managers arrangement. The Board also considered the techniques and resources that the Adviser has developed to provide ongoing oversight of the nature, extent and quality of the services the Sub-Adviser provides to the Fund and the Sub-Adviser’s compliance with applicable laws and regulations. The Board was previously advised that to assist in the selection and monitoring of sub-advisers, the Adviser has developed an oversight process formulated by its Manager Research & Selection Group (“MR&S”), which analyzes both qualitative (such as in-person meetings and telephonic meetings with sub-advisers and research on sub-advisers) and quantitative information (such as performance data, portfolio data and attribution analysis) about the sub-advisers.
The Board considered that MR&S also typically provides reports to the Investment Review Committees (“IRCs”) at
ADVISORY AND SUB-ADVISORY CONTRACT APPROVAL DISCUSSION (Unaudited) (continued)
their meetings prior to sub-adviser presentations. In addition, the Board considered that MR&S prepares periodic due diligence reports regarding sub-advisers based on on-site visits and information and analysis which team members use to attempt to gain and maintain an in-depth understanding of the sub-advisers’ investment processes and to try to identify issues that may be relevant to a sub-adviser’s services to a Voya fund and/or its performance. The Board also considered that MR&S provides written reports on these due diligence analyses to the pertinent IRC. The Board considered the resources that management has committed to its services as a manager-of-managers, including resources for reporting to the Board and the IRCs to assist them with their assessment investment performance on an on-going basis throughout the year. This includes the appointment of a Chief Investment Risk Officer and his staff, who report directly to the Board and who have developed attribution analyses and other metrics used by the IRCs to analyze the key factors underlying investment performance for the funds in the Voya family of funds.
The Board also considered that MR&S has developed, based on guidance from the IRCs, a methodology for monitoring the performance of sub-advisers. The Board also recognized that MR&S provides the IRCs with regular updates on the Voya funds and alerts the IRCs to potential issues as they arise. The Board also considered that the Adviser regularly monitors performance, personnel, compliance and other issues that may arise on a day-to-day basis regarding sub-advisers and considered that, if issues are identified either through formal or informal processes, they are brought before the IRCs and the Board for consideration and action and the Adviser consistently makes its resources available to the Board and the IRCs to assist with addressing any issues that arise.
The Board considered that the Fund also can benefit from the services of the Adviser’s Investment Risk Management Department (the “IRMD”), under the leadership of the Chief Investment Risk Officer, the costs of which are shared by the Voya funds and the Adviser. The Board considered that the IRMD regularly presents written materials and reports to the IRCs that focus on the investment risks of the Voya funds. The Board also
considered that the IRMD provides the IRCs with analyses that are developed to assist the IRCs in identifying performance trends and other areas over consecutive periods. The Board considered that the services to be provided by the IRMD are meant to provide an additional perspective for the benefit of the IRCs, which may vary from the perspective of MR&S. The Board also considered the techniques used by the Adviser to monitor sub-adviser performance.
The Board also considered the extent of benefits provided to the Fund’s shareholders, beyond investment management services, from being part of the Voya family of funds. The Board also took into account the Adviser’s ongoing efforts to reduce the expenses of the Voya funds through renegotiated arrangements with the Voya funds’ service providers.
The Board reviewed the performance for accounts, including a prior fund, managed by the Sub-Adviser that were substantially similar in strategy to the strategy the Sub-Adviser will use for the Fund, noting that the accounts may not be subject to the same 1940 Act restrictions as the Fund.
After its deliberation, the Board concluded that, in its business judgment, the terms of the Management and Sub-Advisory Contracts are fair and reasonable to the Fund and that approval of the Management and Sub-Advisory Contracts is in the best interests of the Fund and its shareholders. In doing so, the Board reviewed all factors it considered to be material, including those discussed above. Within the context of its overall conclusions regarding the Management and Sub-Advisory Contracts, and based on the information provided and management’s related representations, the Board concluded that it was satisfied with management’s responses relating to the Fund’s investment performance and the fees payable under the Management and Sub-Advisory Contracts. During this approval process, different Board members may have given different weight to different individual factors and related conclusions. Based on these conclusions and other factors, the Board voted to approve the Management and Sub-Advisory Contracts for the Fund for the year ending November 30, 2024.
ADDITIONAL INFORMATION (Unaudited)
Investment Adviser
Voya Investments, LLC
7337 East Doubletree Ranch Road, Suite 100
Scottsdale, Arizona 85258
Distributor
Voya Investments Distributor, LLC
7337 East Doubletree Ranch Road, Suite 100
Scottsdale, Arizona 85258
Transfer Agent
BNY Mellon Investment Servicing (U.S.) Inc.
301 Bellevue Parkway
Wilmington, Delaware 19809
Independent Registered Public Accounting Firm
Ernst & Young LLP
200 Clarendon Street
Boston, Massachusetts 02116
Custodian
The Bank of New York Mellon
225 Liberty Street
New York, New York 10286
Legal Counsel
Ropes & Gray LLP
Prudential Tower
800 Boylston Street
Boston, Massachusetts 02199
For more complete information, or to obtain a prospectus on any Voya mutual fund, please call your financial advisor or Voya Investments Distributor, LLC at (800) 992-0180 or log on to www.voyainvestments.com. The prospectus should be read carefully before investing. Consider the fund’s investment objectives, risks, charges and expenses carefully before investing. The prospectus contains this information and other information about the fund.
RETIREMENT | INVESTMENTS | INSURANCE
voyainvestments.com
Annual Report
March 31, 2023
Voya Government Money Market Fund
Classes A, C, I, and W
| | | As permitted by regulations adopted by the U.S. Securities and Exchange Commission, paper copies of the fund’s annual and semi-annual shareholder reports, like this annual report, are not sent by mail, unless you specifically request paper copies of the reports. Instead, the reports will be made available on the Voya funds’ website (https://individuals.voya.com/literature), and you will be notified by mail each time a report is posted and provided with a website link to access the report. | | |
| | | If you already elected to receive shareholder reports electronically, you need not take any action. You may elect to receive shareholder reports and other communications from the fund electronically anytime by contacting your financial intermediary (such as a broker-dealer or bank) or, if you are a direct investor, by calling 1-800-992-0180 or by sending an e-mail request to Voyaim_literature@voya.com. | | |
| | | You may elect to receive all future reports in paper free of charge. If you received this document in the mail, please follow the instructions to elect to continue receiving paper copies of your shareholder reports. If you received this document through a financial intermediary, you can contact your financial intermediary to request that you continue to receive paper copies of your shareholder reports. If you invest directly with us, you can call 1-800-992-0180 or send an email request to Voyaim_literature@voya.com to let the fund know you wish to continue receiving paper copies of your shareholder reports. Your election to receive reports in paper will apply to all funds held in your account if you invest through your financial intermediary or all funds held with the Voya funds complex if you invest directly with the funds. | | |
| | | This report is submitted for general information to shareholders of the Voya mutual funds. It is not authorized for distribution to prospective shareholders unless accompanied or preceded by a prospectus which includes details regarding the fund’s investment objectives, risks, charges, expenses and other information. This information should be read carefully. | | |
| | | | | E-Delivery Sign-up – details inside | |
| | | | | | | 1 | | |
| | | | | | | 2 | | |
| | | | | | | 3 | | |
| | | | | | | 4 | | |
| | | | | | | 6 | | |
| | | | | | | 7 | | |
| | | | | | | 8 | | |
| | | | | | | 9 | | |
| | | | | | | 16 | | |
| | | | | | | 18 | | |
| | | | | | | 19 | | |
| | | | | | | 24 | | |
| | | | | | Go Paperless with E-Delivery! | | | | | |
| | | Sign up now for on-line prospectuses, fund reports, and proxy statements. | | |
| | | Just go to individuals.voya.com/page/e-delivery, follow the directions and complete the quick 5 Steps to Enroll. | | |
| | | You will be notified by e-mail when these communications become available on the internet. | | |
PROXY VOTING INFORMATION
A description of the policies and procedures that the Fund uses to determine how to vote proxies related to portfolio securities is available: (1) without charge, upon request, by calling Shareholder Services toll-free at (800) 992-0180; (2) on the Fund’s website at www.voyainvestments.com; and (3) on the U.S. Securities and Exchange Commission’s (“SEC’s”) website at www.sec.gov. Information regarding how the Fund voted proxies related to portfolio securities during the most recent 12-month period ended June 30 is available without charge on the Fund’s website at www.voyainvestments.com and on the SEC’s website at www.sec.gov.
PORTFOLIO HOLDINGS
The Fund files its complete schedule of portfolio holdings with the SEC monthly on Form N-MFP. The Fund’s Forms N-MFP are available on the SEC’s website at www.sec.gov or the monthly schedule of portfolio holdings are also available at: www.voyainvestments.com and without charge upon request from the Fund by calling Shareholder Services toll-free at (800) 992-0180.
Please note that your investment: is not a bank deposit, is not insured or guaranteed by the Federal Deposit Insurance Corporation (“FDIC”), the Federal Reserve Board or any other government agency. Although the Fund seeks to preserve the value of your investment at $1.00 per share, it is possible to lose money by investing in the Fund. There is no guarantee that the Fund will achieve its investment objective. The Fund’s sponsor has no legal obligation to provide financial support to the Fund, and you should not expect that the sponsor will provide financial support to the Fund at any time.
[This Page Intentionally Left Blank]
| Portfolio Managers’ Report | Voya Government Money Market Fund |
| | Investment Type Allocation
as of March 31, 2023
(as a percentage of net assets) | |
| | | | | | | | | | |
| | U.S. Treasury Repurchase Agreement | | | | | 35.1% | | | |
| | U.S. Treasury Debt | | | | | 31.4 | | | |
| | U.S. Government Agency Debt | | | | | 15.3 | | | |
| | Assets in Excess of Other Liabilities | | | | | 18.2 | | | |
| | Net Assets | | | | | 100.0% | | | |
| | Portfolio holdings are subject to change daily. | |
Performance Update: Preservation of capital, limiting interest rate risk and keeping an excess liquidity cushion were our primary objectives for the Fund during the Fund’s fiscal year. Maximizing the yield and the total return of the Fund remained a secondary objective. The Fund outperformed it’s benchmark before the deduction of fees and operating expenses and benefited from its high liquidity and by maintaining a very short weighted average maturity (“WAM”) to take advantage of the multiple large Federal Open Market Committee (“FOMC”) rate increases during the period. Exposure to floating rate US agency securities tied to secured overnight financing rate (“SOFR”) and US Treasury securities tied to 3-month T-Bills further added to performance.
Portfolio Specifics: The year saw the FOMC implement a total of eight increases in the Fed funds rate, moving from a range of 0.25 – 0.50% in April 2022 to 4.75 – 5.00% by the end of March 2023. In early February, Fed Chair Jerome Powell commented that the central bank’s efforts to tame inflation will “likely...take quite a bit of time. It’s not going to be smooth. So, we think we’re going to have to do further increases, and we think we’ll have to hold policy at a restrictive level for some time.” However, the collapse of Silicon Valley Bank in March may have moderated the Fed’s aggressive rate-hike plans. Powell indicated then that rate cuts later in 2023 were not the central bank’s baseline expectation but noted that the FOMC had contemplated pausing rate hikes, given the turbulence in the banking sector.
The Fund ended the period with a very short weighted average maturity (“WAM”), in an effort to maximize yield in a rising-rate environment.
Current Strategy & Outlook: For now, most investors expect a steady pace of rate cuts to start later in 2023 as the Fed attempts to maneuver a soft economic landing. We disagree. We believe the Fed will implement one more rate hike of 25 basis points in May 2023 before pausing for an extended period, followed by rate cuts starting during the fourth quarter as the economy moves toward a potential recession. Accordingly, we are maintaining a very short WAM unless the market starts to price longer-term money market maturities positioned for higher rates and/or a long pause by the FOMC.
The Fund’s strategy seeks to add incremental yield to take advantage of an additional rate hike and higher short-term rates for the near to medium term. We plan on maintaining our exposure to U.S. agency and US Treasury floating rate notes in order to add incremental yield over repo and interest rate sensitivity to higher rates.
Principal Risk Factors: Although the Fund seeks to preserve the value of your investment at $1.00 per share, it is possible to lose money by investing in the Fund.
You could lose money by investing in the Fund. Although the Fund seeks to preserve the value of your investment at $1.00 per share, it cannot guarantee it will do so. An investment in the Fund is not insured or guaranteed by the Federal Deposit Insurance Corporation or any other government agency. The Fund’s sponsor has no legal obligation to provide financial support to the Fund, and you should not expect that the sponsor will provide financial support to the Fund at any time.
The views expressed in this commentary are informed opinions. They should not be considered promises or advice. The views expressed reflect those of the portfolio managers, only through the end of the period as stated on the cover. The portfolio managers’ views are subject to change at any time based on market and other conditions.
Portfolio holdings and characteristics are subject to change and may not be representative of current holdings and characteristics. Fund holdings are subject to change daily. The outlook for this Fund may differ from that presented for other Voya mutual funds. This report contains statements that may be “forward-looking” statements. Actual results may differ materially from those projected in the “forward-looking” statements. The Fund’s performance returns shown reflect applicable fee waivers and/or expense limits in effect during this period. Absent such fee waivers/expense limitations, if any, performance would have been lower. Performance for the different classes of shares will vary based on differences in fees associated with each class.
SHAREHOLDER EXPENSE EXAMPLE (Unaudited)
As a shareholder of the Fund, you incur two types of costs: (1) transaction costs, including sales charges (loads) on purchase payments, redemption fees, and exchange fees, and (2) ongoing costs, including management fees, distribution and/or service (12b-1) fees, and other Fund expenses. These Examples are intended to help you understand your ongoing costs (in dollars) of investing in the Fund and to compare these costs with the ongoing costs of investing in other mutual funds.
The Examples are based on an investment of $1,000 invested at the beginning of the period and held for the entire period from October 1, 2022 to March 31, 2023. The Fund’s expenses are shown without the imposition of any sales charges or fees. Expenses would have been higher if such charges were included.
Actual Expenses
The left section of the table shown below, “Actual Fund Return,” provides information about actual account values and actual expenses. You may use the information in this section, together with the amount you invested, to estimate the expenses that you paid over the period. Simply divide your account value by $1,000 (for example, an $8,600 account value divided by $1,000 = 8.6), then multiply the result by the number in the first section under the heading entitled “Expenses Paid During the Period” to estimate the expenses you paid on your account during this period.
Hypothetical Example for Comparison Purposes
The right section of the table shown below, “Hypothetical (5% return before expenses)” provides information about hypothetical account values and hypothetical expenses based on the Fund’s actual expense ratio and an assumed rate of return of 5% per year before expenses, which is not the Fund’s actual return. The hypothetical account values and expenses may not be used to estimate the actual ending account balance or expenses you paid for the period. You may use this information to compare the ongoing costs of investing in the Fund and other mutual funds. To do so, compare this 5% hypothetical example with the 5% hypothetical examples that appear in the shareholder reports of the other mutual funds.
Please note that the expenses shown in the table are meant to highlight your ongoing costs only and do not reflect any transactional costs, such as sales charges (loads), redemption fees, or exchange fees. Therefore, the hypothetical section of the table is useful in comparing ongoing costs only, and will not help you determine the relative total costs of owning different mutual funds. In addition, if these transactional costs were included, your costs would have been higher.
| | | | Actual Fund Return | | | Hypothetical (5% return before expenses) | |
| | | | Beginning
Account
Value
October 1,
2022 | | | Ending
Account
Value
March 31,
2023 | | | Annualized
Expense
Ratio* | | | Expenses Paid
During the
Period Ended
March 31,
2023** | | | Beginning
Account
Value
October 1,
2022 | | | Ending
Account
Value
March 31,
2023 | | | Annualized
Expense
Ratio* | | | Expenses Paid
During the
Period Ended
March 31,
2023** | |
| Class A | | | | $ | 1,000.00 | | | | | $ | 1,019.00 | | | | | | 0.39% | | | | | $ | 1.96 | | | | | $ | 1,000.00 | | | | | $ | 1,022.99 | | | | | | 0.39% | | | | | $ | 1.97 | | |
| Class C | | | | | 1,000.00 | | | | | | 1,013.90 | | | | | | 1.23 | | | | | | 6.18 | | | | | | 1,000.00 | | | | | | 1,018.80 | | | | | | 1.23 | | | | | | 6.19 | | |
| Class I | | | | | 1,000.00 | | | | | | 1,019.00 | | | | | | 0.39 | | | | | | 1.96 | | | | | | 1,000.00 | | | | | | 1,022.99 | | | | | | 0.39 | | | | | | 1.97 | | |
| Class W | | | | | 1,000.00 | | | | | | 1,019.00 | | | | | | 0.39 | | | | | | 1.96 | | | | | | 1,000.00 | | | | | | 1,022.99 | | | | | | 0.39 | | | | | | 1.97 | | |
*
The annualized expense ratios reflect waivers of 0.01%, 0.18%, 0.01% and 0.01% of management, distribution and shareholder servicing fees for Classes A, C, I and W, respectively, in order to maintain a net yield of not less than zero (Note 4).
**
Expenses are equal to the Fund’s annualized expense ratios multiplied by the average account value over the period, multiplied by 182/365 to reflect the most recent fiscal half-year.
REPORT OF INDEPENDENT REGISTERED PUBLIC ACCOUNTING FIRM
To the Shareholders of Voya Government Money Market Fund and the Board of Trustees of Voya Funds Trust
Opinion on the Financial Statements
We have audited the accompanying statement of assets and liabilities of Voya Government Money Market Fund (the “Fund”) (one of the funds constituting Voya Funds Trust (the “Trust”)), including the portfolio of investments, as of March 31, 2023, and the related statement of operations for the year then ended, the statements of changes in net assets for each of the two years in the period then ended, the financial highlights for each of the four years in the period then ended and the related notes (collectively referred to as the “financial statements”). In our opinion, the financial statements present fairly, in all material respects, the financial position of the Fund (one of the funds constituting Voya Funds Trust) at March 31, 2023, the results of its operations for the year then ended, the changes in its net assets for each of the two years in the period then ended and its financial highlights for each of the four years in the period then ended, in conformity with U.S. generally accepted accounting principles.
The financial highlights for the year ended March 31, 2019, were audited by another independent registered public accounting firm whose report, dated May 23, 2019, expressed an unqualified opinion on those financial highlights.
Basis for Opinion
These financial statements are the responsibility of the Trust’s management. Our responsibility is to express an opinion on the Fund’s financial statements based on our audits. We are a public accounting firm registered with the Public Company Accounting Oversight Board (United States) (“PCAOB”) and are required to be independent with respect to the Trust in accordance with the U.S. federal securities laws and the applicable rules and regulations of the Securities and Exchange Commission and the PCAOB.
We conducted our audits in accordance with the standards of the PCAOB. Those standards require that we plan and perform the audit to obtain reasonable assurance about whether the financial statements are free of material misstatement, whether due to error or fraud. The Trust is not required to have, nor were we engaged to perform, an audit of the Trust’s internal control over financial reporting. As part of our audits, we are required to obtain an understanding of internal control over financial reporting, but not for the purpose of expressing an opinion on the effectiveness of the Trust’s internal control over financial reporting. Accordingly, we express no such opinion.
Our audits included performing procedures to assess the risks of material misstatement of the financial statements, whether due to error or fraud, and performing procedures that respond to those risks. Such procedures included examining, on a test basis, evidence regarding the amounts and disclosures in the financial statements. Our procedures included confirmation of securities owned as of March 31, 2023, by correspondence with the custodian, brokers and others; when replies were not received from brokers and others, we performed other auditing procedures. Our audits also included evaluating the accounting principles used and significant estimates made by management, as well as evaluating the overall presentation of the financial statements. We believe that our audits provide a reasonable basis for our opinion.
We have served as the auditor of one or more Voya investment companies since 2019.
Boston, Massachusetts
May 30, 2023
statement of assets and liabilities as of March 31, 2023
| | ASSETS: | | | | | | | |
| | Short-term investments at amortized cost | | | | $ | 129,402,738 | | |
| | Repurchase agreements | | | | | 97,502,000 | | |
| | Cash | | | | | 14,349 | | |
| | Receivables: | | | | | | | |
| | Investment securities sold | | ��� | | | 42,415,590 | | |
| | Fund shares sold | | | | | 8,799,862 | | |
| | Dividends | | | | | 9,881 | | |
| | Interest | | | | | 869,364 | | |
| | Prepaid expenses | | | | | 43,699 | | |
| | Reimbursement due from Investment Adviser | | | | | 43,838 | | |
| | Other assets | | | | | 20,452 | | |
| | Total assets | | | | | 279,121,773 | | |
| | LIABILITIES: | | | | | | | |
| | Income distribution payable | | | | | 1,782 | | |
| | Payable for fund shares redeemed | | | | | 1,463,301 | | |
| | Payable for investment management fees | | | | | 82,017 | | |
| | Payable for distribution and shareholder service fees | | | | | 1,875 | | |
| | Payable to trustees under the deferred compensation plan (Note 5) | | | | | 20,452 | | |
| | Payable for trustee fees | | | | | 84 | | |
| | Other accrued expenses and liabilities | | | | | 242,506 | | |
| | Total liabilities | | | | | 1,812,017 | | |
| | NET ASSETS | | | | $ | 277,309,756 | | |
| | NET ASSETS WERE COMPRISED OF: | | | | | | | |
| | Paid-in capital | | | | $ | 277,368,984 | | |
| | Total distributable loss | | | | | (59,228) | | |
| | NET ASSETS | | | | $ | 277,309,756 | | |
See Accompanying Notes to Financial Statements
statement of assets and liabilities as of March 31, 2023 (continued)
| | Class A | | | | | | | |
| | Net assets | | | | $ | 217,392,179 | | |
| | Shares authorized | | | | | unlimited | | |
| | Par value | | | | $ | 0.001 | | |
| | Shares outstanding | | | | | 217,433,122 | | |
| | Net asset value and redemption price per share† | | | | $ | 1.00 | | |
| | Class C | | | | | | | |
| | Net assets | | | | $ | 2,219,877 | | |
| | Shares authorized | | | | | unlimited | | |
| | Par value | | | | $ | 0.001 | | |
| | Shares outstanding | | | | | 2,220,283 | | |
| | Net asset value and redemption price per share† | | | | $ | 1.00 | | |
| | Class I | | | | | | | |
| | Net assets | | | | $ | 56,465,783 | | |
| | Shares authorized | | | | | unlimited | | |
| | Par value | | | | $ | 0.001 | | |
| | Shares outstanding | | | | | 56,476,182 | | |
| | Net asset value and redemption price per share | | | | $ | 1.00 | | |
| | Class W | | | | | | | |
| | Net assets | | | | $ | 1,231,917 | | |
| | Shares authorized | | | | | unlimited | | |
| | Par value | | | | $ | 0.001 | | |
| | Shares outstanding | | | | | 1,232,143 | | |
| | Net asset value and redemption price per share | | | | $ | 1.00 | | |
†
Redemption price per share may be reduced for any applicable contingent deferred sales charges.
See Accompanying Notes to Financial Statements
STATEMENT OF OPERATIONS for the year ended March 31, 2023
| | INVESTMENT INCOME: | | | | | | | |
| | Dividends | | | | $ | 50,882 | | |
| | Interest | | | | | 7,277,851 | | |
| | Total investment income | | | | | 7,328,733 | | |
| | EXPENSES: | | | | | | | |
| | Investment management fees | | | | | 849,978 | | |
| | Distribution and shareholder service fees: | | | | | | | |
| | Class C | | | | | 21,868 | | |
| | Transfer agent fees: | | | | | | | |
| | Class A | | | | | 404,790 | | |
| | Class C | | | | | 4,653 | | |
| | Class I | | | | | 37,722 | | |
| | Class W | | | | | 2,287 | | |
| | Shareholder reporting expense | | | | | 16,425 | | |
| | Registration fees | | | | | 67,101 | | |
| | Professional fees | | | | | 28,665 | | |
| | Custody and accounting expense | | | | | 14,600 | | |
| | Trustee fees | | | | | 3,650 | | |
| | Miscellaneous expense | | | | | 12,840 | | |
| | Total expenses | | | | | 1,464,579 | | |
| | Waived and reimbursed fees | | | | | (499,026) | | |
| | Net expenses | | | | | 965,553 | | |
| | Net investment income | | | | | 6,363,180 | | |
| | REALIZED AND UNREALIZED GAIN (LOSS): | | | | | | | |
| | Net realized loss on investments | | | | | (4,142) | | |
| | Increase in net assets resulting from operations | | | | $ | 6,359,038 | | |
See Accompanying Notes to Financial Statements
STATEMENTS OF CHANGES IN NET ASSETS
| | | | Year Ended
March 31, 2023 | | | Year Ended
March 31, 2022 | |
| FROM OPERATIONS: | | | | | | | | | | | | | |
| Net investment income | | | | $ | 6,363,180 | | | | | $ | — | | |
| Net realized gain (loss) | | | | | (4,142) | | | | | | 135,524 | | |
| Increase in net assets resulting from operations | | | | | 6,359,038 | | | | | | 135,524 | | |
| FROM DISTRIBUTIONS TO SHAREHOLDERS: | | | | | | | | | | | | | |
| Total distributions (excluding return of capital): | | | | | | | | | | | | | |
| Class A | | | | | (5,001,800) | | | | | | (148,550) | | |
| Class C | | | | | (35,525) | | | | | | (2,129) | | |
| Class I | | | | | (1,290,155) | | | | | | (42,621) | | |
| Class W | | | | | (36,370) | | | | | | (313) | | |
| Total distributions | | | | | (6,363,850) | | | | | | (193,613) | | |
| FROM CAPITAL SHARE TRANSACTIONS: | | | | | | | | | | | | | |
| Net proceeds from sale of shares | | | | | 1,140,832,736 | | | | | | 1,095,071,009 | | |
| Reinvestment of distributions | | | | | 6,347,946 | | | | | | 193,061 | | |
| | | | | | 1,147,180,682 | | | | | | 1,095,264,070 | | |
| Cost of shares redeemed | | | | | (1,070,424,026) | | | | | | (1,099,422,799) | | |
| Net increase (decrease) in net assets resulting from capital share transactions | | | | | 76,756,656 | | | | | | (4,158,729) | | |
| Net increase (decrease) in net assets | | | | | 76,751,844 | | | | | | (4,216,818) | | |
| NET ASSETS: | | | | | | | | | | | | | |
| Beginning of year or period | | | | | 200,557,912 | | | | | | 204,774,730 | | |
| End of year or period | | | | $ | 277,309,756 | | | | | $ | 200,557,912 | | |
See Accompanying Notes to Financial Statements
Selected data for a share of beneficial interest outstanding throughout each year or period.
| | | | | | | | | | Income (loss)
from
investment
operations | | | | | | | | | Less Distributions | | | | | | Ratios to average net assets | | | Supplemental
Data | |
| | | | Net asset value, beginning of year
or period | | | Net investment income (loss) | | | Net realized and unrealized
gain (loss) | | | Total from investment operations | | | From net investment income | | | From net realized gains | | | From return of capital | | | Total distributions | | | Payment by affiliate | | | Net asset value, end of year or
period | | | Total Return(1) | | | Expenses before
reductions/additions(2)(3) | | | Expenses net of fee waivers
and/or recoupments if any(2)(3) | | | Expenses net of all
reductions/additions(2)(3) | | | Net investment income (loss)(2)(3) | | | Net assets, end of year or period | | | Portfolio turnover rate | |
Year or
period ended | | | ($) | | | ($) | | | ($) | | | ($) | | | ($) | | | ($) | | | ($) | | | ($) | | | ($) | | | ($) | | | (%) | | | (%) | | | (%) | | | (%) | | | (%) | | | ($000’s) | | | (%) | |
| Class A | | | | | | | | | | | | | | | | | | | | | | | | | | | | | | | | | | | | | | | | | | | | | | | | | | | | | | | | | | | | | | | | | | | | | | | | | | | | | | | | | | | | | | | | | | | | | | | | | | | | | | | |
| 03-31-23 | | | | | 1.00 | | | | | | 0.03 | | | | | | (0.01) | | | | | | 0.02 | | | | | | 0.02 | | | | — | | | | | — | | | | | | 0.02 | | | | | | — | | | | | | 1.00 | | | | | | 2.48 | | | | | | 0.62 | | | | | | 0.39(4) | | | | | | 0.39 | | | | | | 2.63 | | | | | | 217,392 | | | | | | — | | |
| 03-31-22 | | | | | 1.00 | | | | | | (0.00)*• | | | | | | 0.00* | | | | | | 0.00* | | | | — | | | | | 0.00* | | | | | | — | | | | | | 0.00* | | | | | | — | | | | | | 1.00 | | | | | | 0.09 | | | | | | 0.64 | | | | | | 0.05(5) | | | | | | 0.05 | | | | | | (0.00)* | | | | | | 156,626 | | | | | | — | | |
| 03-31-21 | | | | | 1.00 | | | | | | 0.00*• | | | | | | 0.00* | | | | | | 0.00* | | | | | | 0.00* | | | | | | 0.00* | | | | | | — | | | | | | 0.00* | | | | | | — | | | | | | 1.00 | | | | | | 0.04 | | | | | | 0.68 | | | | | | 0.11(6) | | | | | | 0.11 | | | | | | 0.01 | | | | | | 156,808 | | | | | | — | | |
| 03-31-20 | | | | | 1.00 | | | | | | 0.02 | | | | | | 0.00* | | | | | | 0.02 | | | | | | 0.02 | | | | | | 0.00* | | | | | | — | | | | | | 0.02 | | | | | | — | | | | | | 1.00 | | | | | | 1.61 | | | | | | 0.63 | | | | | | 0.41(7) | | | | | | 0.41 | | | | | | 1.49 | | | | | | 161,828 | | | | | | — | | |
| 03-31-19 | | | | | 1.00 | | | | | | 0.02 | | | | | | 0.00* | | | | | | 0.02 | | | | | | 0.02 | | | | | | 0.00* | | | | | | — | | | | | | 0.02 | | | | | | — | | | | | | 1.00 | | | | | | 1.76 | | | | | | 0.57 | | | | | | 0.40 | | | | | | 0.40 | | | | | | 1.75 | | | | | | 157,178 | | | | | | — | | |
| Class C | | | | | | | | | | | | | | | | | | | | | | | | | | | | | | | | | | | | | | | | | | | | | | | | | | | | | | | | | | | | | | | | | | | | | | | | | | | | | | | | | | | | | | | | | | | | | | | | | | | | | | | |
| 03-31-23 | | | | | 1.00 | | | | | | 0.02• | | | | | | 0.00* | | | | | | 0.02 | | | | | | 0.02 | | | | — | | | | | — | | | | | | 0.02 | | | | | | — | | | | | | 1.00 | | | | | | 1.63 | | | | | | 1.62 | | | | | | 1.23(4) | | | | | | 1.23 | | | | | | 1.62 | | | | | | 2,220 | | | | | | — | | |
| 03-31-22 | | | | | 1.00 | | | | | | —• | | | | | | 0.00* | | | | | | 0.00 | | | | — | | | | | 0.00* | | | | | | — | | | | | | 0.00* | | | | | | — | | | | | | 1.00 | | | | | | 0.09 | | | | | | 1.64 | | | | | | 0.05(5) | | | | | | 0.05 | | | | | | 0.00 | | | | | | 2,015 | | | | | | — | | |
| 03-31-21 | | | | | 1.00 | | | | | | 0.00*• | | | | | | 0.00* | | | | | | 0.00* | | | | | | 0.00* | | | | | | 0.00* | | | | | | — | | | | | | 0.00* | | | | | | — | | | | | | 1.00 | | | | | | 0.03 | | | | | | 1.68 | | | | | | 0.11(6) | | | | | | 0.11 | | | | | | 0.01 | | | | | | 2,321 | | | | | | — | | |
| 03-31-20 | | | | | 1.00 | | | | | | 0.01 | | | | | | 0.00* | | | | | | 0.01 | | | | | | 0.01 | | | | | | 0.00* | | | | | | — | | | | | | 0.01 | | | | | | — | | | | | | 1.00 | | | | | | 0.65 | | | | | | 1.63 | | | | | | 1.41(7) | | | | | | 1.41 | | | | | | 0.56 | | | | | | 2,870 | | | | | | — | | |
| 03-31-19 | | | | | 1.00 | | | | | | 0.01 | | | | | | 0.00* | | | | | | 0.01 | | | | | | 0.01 | | | | | | 0.00* | | | | | | — | | | | | | 0.01 | | | | | | — | | | | | | 1.00 | | | | | | 0.75 | | | | | | 1.57 | | | | | | 1.40 | | | | | | 1.40 | | | | | | 0.74 | | | | | | 4,256 | | | | | | — | | |
| Class I | | | | | | | | | | | | | | | | | | | | | | | | | | | | | | | | | | | | | | | | | | | | | | | | | | | | | | | | | | | | | | | | | | | | | | | | | | | | | | | | | | | | | | | | | | | | | | | | | | | | | | | |
| 03-31-23 | | | | | 1.00 | | | | | | 0.03 | | | | | | (0.01) | | | | | | 0.02 | | | | | | 0.02 | | | | — | | | | | — | | | | | | 0.02 | | | | | | — | | | | | | 1.00 | | | | | | 2.48 | | | | | | 0.49 | | | | | | 0.39(4) | | | | | | 0.39 | | | | | | 2.63 | | | | | | 56,466 | | | | | | — | | |
| 03-31-22 | | | | | 1.00 | | | | | | (0.00)*• | | | | | | 0.00* | | | | | | 0.00* | | | | — | | | | | 0.00* | | | | | | — | | | | | | 0.00* | | | | | | — | | | | | | 1.00 | | | | | | 0.09 | | | | | | 0.50 | | | | | | 0.05(5) | | | | | | 0.05 | | | | | | (0.00)* | | | | | | 41,745 | | | | | | — | | |
| 03-31-21 | | | | | 1.00 | | | | | | 0.00*• | | | | | | 0.00* | | | | | | 0.00* | | | | | | 0.00* | | | | | | 0.00* | | | | | | — | | | | | | 0.00* | | | | | | — | | | | | | 1.00 | | | | | | 0.03 | | | | | | 0.57 | | | | | | 0.11(6) | | | | | | 0.11 | | | | | | 0.01 | | | | | | 45,260 | | | | | | — | | |
| 03-31-20 | | | | | 1.00 | | | | | | 0.02 | | | | | | 0.00* | | | | | | 0.02 | | | | | | 0.02 | | | | | | 0.00* | | | | | | — | | | | | | 0.02 | | | | | | — | | | | | | 1.00 | | | | | | 1.63 | | | | | | 0.61 | | | | | | 0.41(7) | | | | | | 0.41 | | | | | | 1.53 | | | | | | 43,994 | | | | | | — | | |
| 03-31-19 | | | | | 1.00 | | | | | | 0.02 | | | | | | 0.00* | | | | | | 0.02 | | | | | | 0.02 | | | | | | 0.00* | | | | | | — | | | | | | 0.02 | | | | | | — | | | | | | 1.00 | | | | | | 1.76 | | | | | | 0.57 | | | | | | 0.40 | | | | | | 0.40 | | | | | | 1.72 | | | | | | 39,581 | | | | | | — | | |
| Class W | | | | | | | | | | | | | | | | | | | | | | | | | | | | | | | | | | | | | | | | | | | | | | | | | | | | | | | | | | | | | | | | | | | | | | | | | | | | | | | | | | | | | | | | | | | | | | | | | | | | | | | |
| 03-31-23 | | | | | 1.00 | | | | | | 0.03• | | | | | | (0.01) | | | | | | 0.02 | | | | | | 0.02 | | | | — | | | | | — | | | | | | 0.02 | | | | | | — | | | | | | 1.00 | | | | | | 2.50 | | | | | | 0.62 | | | | | | 0.39(4) | | | | | | 0.39 | | | | | | 3.37 | | | | | | 1,232 | | | | | | — | | |
| 03-31-22 | | | | | 1.00 | | | | | | 0.00*• | | | | | | 0.00* | | | | | | 0.00* | | | | — | | | | | 0.00* | | | | | | — | | | | | | 0.00* | | | | | | — | | | | | | 1.00 | | | | | | 0.09 | | | | | | 0.64 | | | | | | 0.05(5) | | | | | | 0.05 | | | | | | 0.00* | | | | | | 173 | | | | | | — | | |
| 03-31-21 | | | | | 1.00 | | | | | | 0.00*• | | | | | | 0.00* | | | | | | 0.00* | | | | | | 0.00* | | | | | | 0.00* | | | | | | — | | | | | | 0.00* | | | | | | — | | | | | | 1.00 | | | | | | 0.04 | | | | | | 0.68 | | | | | | 0.11(6) | | | | | | 0.11 | | | | | | 0.01 | | | | | | 386 | | | | | | — | | |
| 03-31-20 | | | | | 1.00 | | | | | | 0.02 | | | | | | 0.00* | | | | | | 0.02 | | | | | | 0.02 | | | | | | 0.00* | | | | | | — | | | | | | 0.02 | | | | | | — | | | | | | 1.00 | | | | | | 1.61 | | | | | | 0.63 | | | | | | 0.41(7) | | | | | | 0.41 | | | | | | 1.52 | | | | | | 236 | | | | | | — | | |
| 03-31-19 | | | | | 1.00 | | | | | | 0.02 | | | | | | 0.00* | | | | | | 0.02 | | | | | | 0.02 | | | | | | 0.00* | | | | | | — | | | | | | 0.02 | | | | | | — | | | | | | 1.00 | | | | | | 1.76 | | | | | | 0.57 | | | | | | 0.40 | | | | | | 0.40 | | | | | | 1.82 | | | | | | 269 | | | | | | — | | |
(1)
Total return is calculated assuming reinvestment of all dividends, capital gain distributions and return of capital distributions, if any, at net asset value and excluding the deduction of sales charges or contingent deferred sales charges, if applicable. Total return for periods less than one year is not annualized.
(2)
Annualized for periods less than one year.
(3)
Ratios reflect operating expenses of a Fund. Expenses before reductions/additions do not reflect amounts reimbursed or recouped by the Investment Adviser and/or Distributor or reductions from brokerage service arrangements or other expense offset arrangements and do not represent the amount paid by a Fund during periods when reimbursements or reductions occur. Expenses net of fee waivers reflect expenses after reimbursement by the Investment Adviser and/or Distributor or recoupment of previously reimbursed fees by the Investment Adviser, but prior to reductions from brokerage service arrangements or other expense offset arrangements. Expenses net of all reductions/additions represent the net expenses paid by a Fund. Net investment income (loss) is net of all such additions or reductions.
(4)
Expense ratios reflect waivers of 0.01%, 0.18%, 0.01% and 0.01% of management fees, distribution and shareholder servicing fees for Classes A, C, I, and W, respectively, in order to maintain a net yield of not less than zero.
(5)
Expense ratios reflect waivers of 0.35%, 1.35%, 0.35% and 0.35% of management fees, distribution and shareholder servicing fees for Classes A, C, I, and W, respectively, in order to maintain a net yield of not less than zero.
(6)
Expense ratios reflect waivers of 0.30%, 1.30%, 0.30% and 0.30% of management fees, distribution and shareholder servicing fees for Classes A, C, I, and W, respectively, in order to maintain a net yield of not less than zero.
(7)
Expense ratios reflect waivers of 0.01%, 0.01%, 0.01% and 0.01% of management fees, distribution and shareholder servicing fees for Classes A, C, I and W, respectively, in order to maintain a net yield of not less than zero.
•
Calculated using average number of shares outstanding throughout the year or period.
*
Amount is less than $0.005 or 0.005% or more than $(0.005) or (0.005)%.
See Accompanying Notes to Financial Statements
NOTES TO FINANCIAL STATEMENTS as of March 31, 2023
NOTE 1 — ORGANIZATION
Voya Funds Trust (the “Trust”) is a Delaware statutory trust and is registered as an open-end management investment company under the Investment Company Act of 1940, as amended (“1940 Act”). The Trust was organized on August 6, 1998 and was established under a Trust Instrument dated July 30, 1998. It consists of nine separately managed series. This report is for Voya Government Money Market Fund (“Government Money Market” or the “Fund”), a diversified series of the Trust.
The Fund offers the following classes of shares: Class A, Class C, Class I and Class W. The separate classes of shares differ principally in the applicable sales charges (if any), distribution fees and shareholder servicing fees, as well as differences in the amount of waiver fees and reimbursement of expenses, if any. Generally, shareholders of each class also bear certain expenses that pertain to that particular class. All shareholders are allocated the common expenses of a fund and earn income and realized gains/losses from a fund pro rata based on the daily ending net assets of each class, without discrimination between share classes. Expenses that are specific to a fund or a class are charged directly to that fund or class. Other operating expenses shared by several funds are generally allocated among those funds based on average net assets. Dividends are determined separately for each class based on income and expenses allocated to each class. Realized gain distributions are allocated to each class pro rata based on the shares outstanding of each class on the date of distribution. Differences in per share dividend rates generally result from the differences in separate class expenses, including distribution and shareholder servicing fees, if applicable, as well as differences in the amount of waiver of fees and reimbursement of expenses between the share classes, if any.
Class C shares, along with their pro rata reinvested dividend shares, automatically convert to Class A shares 8 years after purchase.
Voya Investments, LLC (“Voya Investments” or the “Investment Adviser”), an Arizona limited liability company, serves as the Investment Adviser to the Fund. Voya Investment Management Co. LLC (“Voya IM”), a Delaware limited liability company, serves as the sub-adviser to the Fund. Voya Investments Distributor, LLC (“VID” or the “Distributor”), a Delaware limited liability company, serves as the principal underwriter to the Fund.
NOTE 2 — SIGNIFICANT ACCOUNTING POLICIES
The following significant accounting policies are consistently followed by the Fund in the preparation of its financial statements. The Fund is considered an
investment company under U.S. generally accepted accounting principles (“GAAP”) and follows the accounting and reporting guidance applicable to investment companies.
A. Security Valuation. The Fund is open for business every day the New York Stock Exchange (“NYSE”) opens for regular trading (each such day, a “Business Day”). The net asset value (“NAV”) per share for each class of the Fund is determined each Business Day as of the close of the regular trading session (“Market Close”), as determined by the Consolidated Tape Association (“CTA”), the central distributor of transaction prices for exchange-traded securities (normally 4:00 p.m. Eastern time unless otherwise designated by the CTA). The data reflected on the consolidated tape provided by the CTA is generated by various market centers, including all securities exchanges, electronic communications networks, and third-market broker-dealers. The NAV per share of each class of the Fund is calculated by taking the value of the Fund’s assets attributable to that class, subtracting the Fund’s liabilities attributable to that class, and dividing by the number of shares of that class that are outstanding. On days when the Fund is closed for business, Fund shares will not be priced and the Fund does not transact purchase and redemption orders. To the extent the Fund’s assets are traded in other markets on days when the Fund does not price its shares, the value of the Fund’s assets will likely change and you will not be able to purchase or redeem shares of the Fund.
The Fund uses the amortized cost method to value its portfolio securities and seeks to maintain a constant NAV of $1.00 per share, although there may be circumstances under which this goal cannot be achieved. The amortized cost method involves valuing a security at its cost and amortizing any discount or premium over the period until maturity, regardless of the impact of fluctuating interest rates or the market value of the security. Although the Fund’s Board of Trustees (“Board”) has established procedures designed to stabilize, to the extent reasonably possible, the share price of the Fund, there can be no assurance that the Fund’s NAV can be maintained at $1.00 per share.
Each investment asset or liability of the Fund is assigned a level at measurement date based on the significance and source of the inputs to its valuation. Quoted prices in active markets for identical securities are classified as “Level 1,” inputs other than quoted prices for an asset or liability that are observable are classified as “Level 2” and significant unobservable inputs, including the sub-adviser’s or pricing committee’s judgment about the assumptions that a market participant would use in pricing an asset or liability are classified as “Level 3.” The inputs used for valuing
NOTES TO FINANCIAL STATEMENTS as of March 31, 2023 (continued)
NOTE 2 — SIGNIFICANT ACCOUNTING POLICIES (continued)
securities are not necessarily an indication of the risks associated with investing in those securities. Short-term securities of sufficient credit quality are generally considered to be Level 2 securities under applicable accounting rules. A table summarizing the Fund’s investments under these levels of classification is included within the Portfolio of Investments.
The Board has delegated to the Investment Adviser responsibility for overseeing the implementation of the Fund’s valuation procedures. The Board has also designated the Investment Adviser, as the valuation designee, to make fair value determinations in good faith. In determining the fair value of the Fund’s assets, the Investment Adviser, pursuant to its fair valuation policy, may consider inputs from pricing service providers, broker-dealers, or the Fund’s sub-adviser(s).
GAAP requires a reconciliation of the beginning to ending balances for reported fair values that presents changes attributable to total realized and unrealized gains or losses, purchases and sales, and transfers in or out of the Level 3 category during the period. A reconciliation of Level 3 investments within the Portfolio of investments is presented only when the Fund has a significant amount of Level 3 investments.
B. Securities Transactions and Revenue Recognition. Securities transactions are accounted for on the trade date. Realized gains and losses are reported on the basis of identified cost of securities sold. Interest income is recorded on an accrual basis. Premium amortization and discount accretion are determined by the effective yield method.
C. Distributions to Shareholders. The Fund records distributions to its shareholders on the ex-dividend date. Dividends are declared daily from net investment income and paid monthly. The Fund distributes capital gains, if any, annually. The Fund may make distributions on a more frequent basis to comply with the distribution requirements of the Internal Revenue Code. The characteristics of income and gains to be distributed are determined in accordance with income tax regulations, which may differ from U.S. GAAP for investment companies.
D. Federal Income Taxes. It is the policy of the Fund to comply with the requirements of subchapter M of the Internal Revenue Code that are applicable to regulated investment companies and to distribute substantially all of its net investment income and any net realized capital gains to its shareholders. Therefore, a federal income tax or excise tax provision is not required. Management has considered the sustainability of the Fund’s tax positions
taken on federal income tax returns for all open tax years in making this determination. No capital gain distributions shall be made until the capital loss carryforwards have been fully utilized.
The Fund may utilize equalization accounting for tax purposes, whereby a portion of redemption payments are treated as distributions of income or gain.
E. Use of Estimates. The preparation of financial statements in conformity with GAAP requires management to make estimates and assumptions that affect the reported amounts of assets and liabilities and disclosure of contingent assets and liabilities at the date of the financial statements and the reported amounts of increases and decreases in net assets from operations during the reporting period. Actual results could differ from those estimates.
F. Repurchase Agreements. The Fund may invest in repurchase agreements only with government securities dealers recognized by the Board of Governors of the Federal Reserve System. Under such agreements, the seller of the security agrees to repurchase it at a mutually agreed upon time and price. The resale price is in excess of the purchase price and reflects an agreed upon interest rate for the period of time the agreement is outstanding. The period of the repurchase agreements is generally short, from overnight to one week (although it may extend over a number of months), while the underlying securities generally have longer maturities. The Fund will receive, as collateral, securities acceptable to it whose market value is equal to at least 100% of the carrying amount of the repurchase agreements, plus accrued interest, being invested by the Fund. The underlying collateral is valued daily on a mark to market basis to assure that the value, including accrued interest is at least equal to the repurchase price. There would be potential loss to the Fund in the event the Fund is delayed or prevented from exercising its right to dispose of the collateral, and it might incur disposition costs in liquidating the collateral.
Repurchase agreements are entered into by the Fund under Master Repurchase Agreements (“MRA”) which permit the Fund, under certain circumstances, including an event of default (such as bankruptcy or insolvency), to offset receivables or payables under the MRA with collateral held and/or pledged by the counterparty and create one single net payment due to or from the Fund. Please refer to the table within the Portfolio of Investments for open repurchase agreements subject to the MRA on a net basis at March 31, 2023.
G. Restricted Securities. The Fund may invest in restricted securities which include those sold under Rule 144A of the Securities Act of 1933, as amended
NOTES TO FINANCIAL STATEMENTS as of March 31, 2023 (continued)
NOTE 2 — SIGNIFICANT ACCOUNTING POLICIES (continued)
(“1933 Act”) or securities offered pursuant to Section 4(a)(2) of the 1933 Act, and/or are subject to legal or contractual restrictions on resale and may not be publicly sold without registration under the 1933 Act.
Restricted securities are fair valued using market quotations when readily available. In the absence of market quotations, the securities are valued based upon their fair value determined in good faith under procedures approved by the Board.
Securities that are not registered for sale to the public under the 1933 Act are referred to as “restricted securities.” These securities may be sold in private placement transactions between issuers and their purchasers and may be neither listed on an exchange nor traded in other established markets. Many times these securities are subject to legal or contractual restrictions on resale. As a result of the absence of a public trading market, the prices of these securities may be more volatile, less liquid and more difficult to value than publicly traded securities. The price realized from the sale of these securities could be less than the amount originally paid or less than their fair value if they are resold in privately negotiated transactions. In addition, these securities may not be subject to disclosure and other investment protection requirements that are afforded to publicly traded securities. Certain investments may include investment in smaller, less seasoned issuers, which may involve greater risk.
H. Indemnifications. In the normal course of business, the Trust may enter into contracts that provide certain indemnifications. The Trust’s maximum exposure under these arrangements is dependent on future claims that may be made against the Fund and, therefore, cannot be estimated; however, based on experience, management considers risk of loss from such claims remote.
NOTE 3 — INVESTMENT MANAGEMENT FEES
The Fund has entered into an investment management agreement (“Management Agreement”) with the Investment Adviser. The Investment Adviser has overall responsibility for the management of the Fund. The Investment Adviser oversees all investment advisory and portfolio management services for the Fund and assists in managing and supervising all aspects of the general day-to-day business activities and operations of the Fund, including custodial, transfer agency, dividend disbursing, accounting, auditing, compliance and related services. This Management Agreement compensates the Investment Adviser with a management fee, computed
daily and payable monthly, at an annual rate of 0.35% of the Fund’s average daily net assets.
The Investment Adviser has entered into a sub-advisory agreement with Voya IM. Voya IM provides investment advice for the Fund and is paid by the Investment Adviser based on the average daily net assets of the Fund. Subject to such policies as the Board or the Investment Adviser may determine, Voya IM manages the Fund’s assets in accordance with the Fund’s investment objectives, policies, and limitations.
NOTE 4 — DISTRIBUTION AND SERVICE FEES
Class C shares of the Fund have a service and distribution plan (the “Plan”), whereby the Distributor is paid an annual fee at the rate of 1.00% for Class C shares of the value of average daily net assets of the class for expenses incurred in the distribution and/or shareholder servicing of the Fund’s Class C shares. Pursuant to the Plan, the Distributor is entitled to a payment each month for the distribution and promotion of the Fund’s Class C shares, including expenses incurred in printing prospectuses and reports used for sales purposes, expenses incurred in preparing and printing sales literature and other such distribution related expenses, including any distribution or shareholder servicing fees paid to securities dealers who have executed a distribution agreement with the Distributor.
The Distributor and Investment Adviser have contractually agreed to waive a portion of their distribution and/or shareholder servicing fees and management fees, as applicable, and to reimburse certain expenses to the extent necessary to assist the Fund in maintaining a net yield of not less than zero through August 1, 2023. There is no guarantee the Fund will maintain such a yield. Distribution and shareholder servicing fees waived are not subject to recoupment. Management fees waived or expenses reimbursed are subject to possible recoupment by the Investment Adviser within three years subject to certain restrictions. For the year ended March 31, 2023, the Distributor waived $3,587 of class specific distribution and/or shareholder servicing fees and the Investment Adviser waived or reimbursed $25,222 of management fees and/or certain expenses to assist the Fund in maintaining a net yield of not less than zero. The class specific waiver was comprised of the following amounts:
| | | | Distribution Fee | | | Shareholder
Servicing Fee | |
| Class C | | | | $ | 3,105 | | | | | $ | 482 | | |
Termination or modification of this obligation requires approval by the Board. Please note that these waivers or reimbursements are in addition to existing contractual expense limitations.
NOTES TO FINANCIAL STATEMENTS as of March 31, 2023 (continued)
NOTE 4 — DISTRIBUTION AND SERVICE FEES (continued)
As of March 31, 2023, amounts of waived and/or reimbursed fees that are subject to possible recoupment by the Investment Adviser, and the related expiration dates are as follows:
| | March 31, | | |
| | 2024 | | | 2025 | | | 2026 | | | Total | |
| | $651,190 | | | | $ | 745,440 | | | | | $ | 25,222 | | | | | $ | 1,421,852 | | |
The Distributor may also retain the proceeds of the contingent deferred sales charge paid by shareholders upon certain redemptions for Class C shares. For the year ended March 31, 2023, the Distributor retained the following amounts in sales charges:
| | | | Class C | |
| Contingent Deferred Sales Charges: | | | | $ | 307 | | |
NOTE 5 — OTHER TRANSACTIONS WITH AFFILIATES AND RELATED PARTIES
At March 31, 2023, the following direct or indirect, wholly-owned subsidiaries of Voya Financial, Inc. owned more than 5% of the Fund:
| Subsidiary | | | Percentage | |
| Voya Institutional Trust Company | | | | | 23.04% | | |
| Voya Investments Distributor, LLC | | | | | 11.02 | | |
| Voya Retirement Insurance and Annuity Company | | | | | 27.66 | | |
The Fund has adopted a deferred compensation plan (the “DC Plan”), which allows eligible independent trustees, as described in the DC Plan, to defer the receipt of all or a portion of the trustees’ fees that they are entitled to receive from the Fund. For purposes of determining the amount owed to the trustee under the DC Plan, the amounts deferred are invested in shares of the funds selected by the trustee (the “Notional Funds”). When the Fund purchases shares of the Notional Funds, which are all advised by Voya Investments, in amounts equal to the trustees’ deferred fees, this results in a Fund asset equal to the deferred compensation liability. Such assets, if applicable, are included as a component of “Other assets” on the accompanying Statement of Assets and Liabilities. Deferral of trustees’ fees under the DC Plan will not affect net assets of the Fund, and will not materially affect the Fund’s assets, liabilities or net investment income per share. Amounts will be deferred until distributed in accordance with the DC Plan.
The Fund may pay per account fees to affiliates of Voya Investments for recordkeeping services provided on certain assets. For the year ended March 31, 2023, the per account fees for affiliated recordkeeping services paid by the Fund were $186,964.
NOTE 6 — EXPENSE LIMITATION AGREEMENT
Pursuant to a written expense limitation agreement (“Expense Limitation Agreement”) between the Investment Adviser and the Trust, on behalf of the Fund, the Investment Adviser has agreed to limit expenses of the Fund, excluding interest, taxes, investment-related costs, leverage expenses, extraordinary expenses and acquired fund fees and expenses to the levels listed below:
| Class A | | | Class C | | | Class I | | | Class W | |
| 0.40% | | | 1.40% | | | 0.40% | | | 0.40% | |
The Investment Adviser may at a later date recoup from the Fund for fees waived and/or other expenses reimbursed by the Investment Adviser during the previous 36 months, but only if, after such recoupment, the Fund’s expense ratio does not exceed the percentage described above. Waived and reimbursed fees net of any recoupment by the Investment Adviser of such waived and reimbursed fees are reflected on the accompanying Statement of Operations. Amounts payable by the Investment Adviser are reflected on the accompanying Statement of Assets and Liabilities.
As of March 31, 2023, the amounts of waived and/or reimbursed fees that are subject to possible recoupment by the Investment Adviser, and the related expiration dates are as follows:
| | March 31, | | |
| | 2024 | | | 2025 | | | 2026 | | | Total | |
| | $369,161 | | | | $ | 209,753 | | | | | $ | 207,322 | | | | | $ | 786,236 | | |
In addition to the above waived and/or reimbursed fees, the amount of class specific fees waived or reimbursed that are subject to possible recoupment by the Investment Adviser, and the related expiration dates as of March 31, 2023 are as follows:
| | | | March 31, | | | | | | | |
| | | | 2024 | | | 2025 | | | 2026 | | | Total | |
| Class A | | | | $ | 184,848 | | | | | $ | 230,726 | | | | | $ | 258,466 | | | | | $ | 674,040 | | |
| Class C | | | | | 2,910 | | | | | | 3,050 | | | | | | 2,972 | | | | | | 8,932 | | |
| Class W | | | | | 385 | | | | | | 452 | | | | | | 1,457 | | | | | | 2,294 | | |
The Expense Limitation Agreement is contractual through August 1, 2023 and shall renew automatically for one-year terms. Termination or modification of this obligation requires approval by the Board.
NOTE 7 — LINE OF CREDIT
Effective June 13, 2022, the Fund, in addition to certain other funds managed by the Investment Adviser, entered into a 364-day unsecured committed revolving line of credit agreement (the “Credit Agreement”) with The Bank of New York Mellon (“BNY”) for an aggregate amount of $400,000,000 through June 12, 2023. The proceeds may
NOTES TO FINANCIAL STATEMENTS as of March 31, 2023 (continued)
NOTE 7 — LINE OF CREDIT (continued)
be used only to finance temporarily: (1) the purchase or sale of investment securities; or (2) the repurchase or redemption of shares of the Fund or certain other funds managed by the Investment Adviser. The funds to which the line of credit is available pay a commitment fee equal to 0.15% per annum on the daily unused portion of the committed line amount payable quarterly in arrears. Prior to June 13, 2022, the predecessor line of credit was for an
aggregate amount of $400,000,000 and the funds to which the line of credit was available paid a commitment fee equal to 0.15% per annum on the daily unused portion of the committed line amount through June 13, 2022. Borrowings under the Credit Agreement accrue interest at the federal funds rate plus a specified margin. Repayments generally must be made within 60 days after the date of a revolving credit advance. During the year ended March 31, 2023, the Fund did not utilize the line of credit.
NOTE 8 — CAPITAL SHARES
Transactions in capital shares and dollars were as follows:
| | | | Shares
sold | | | Shares
issued
in merger | | | Reinvestment
of
distributions | | | Shares
redeemed | | | Net increase
(decrease)
in shares
outstanding | | | Shares
sold | | | Proceeds
from
shares
issued in
merger | | | Reinvestment
of
distributions | | | Shares
redeemed | | | Net
increase
(decrease) | |
Year or
period ended | | | # | | | # | | | # | | | # | | | # | | | ($) | | | ($) | | | ($) | | | ($) | | | ($) | |
| Class A | | | | | | | | | | | | | | | | | | | | | | | | | | | | | | | | | | | | | | | | | | | | | | | | | | | | | | | | | | | | | |
| 3/31/2023 | | | | | 1,112,542,488 | | | | | | — | | | | | | 4,989,049 | | | | | | (1,056,761,685) | | | | | | 60,769,852 | | | | | | 1,112,542,488 | | | | | | — | | | | | | 4,989,049 | | | | | | (1,056,761,685) | | | | | | 60,769,852 | | |
| 3/31/2022 | | | | | 1,082,229,317 | | | | | | — | | | | | | 148,086 | | | | | | (1,082,514,007) | | | | | | (136,604) | | | | | | 1,082,229,317 | | | | | | — | | | | | | 148,086 | | | | | | (1,082,514,007) | | | | | | (136,604) | | |
| Class C | | | | | | | | | | | | | | | | | | | | | | | | | | | | | | | | | | | | | | | | | | | | | | | | | | | | | | | | | | | | | |
| 3/31/2023 | | | | | 672,786 | | | | | | — | | | | | | 35,247 | | | | | | (502,725) | | | | | | 205,308 | | | | | | 672,786 | | | | | | — | | | | | | 35,247 | | | | | | (502,725) | | | | | | 205,308 | | |
| 3/31/2022 | | | | | 1,064,174 | | | | | | — | | | | | | 2,089 | | | | | | (1,371,981) | | | | | | (305,718) | | | | | | 1,064,174 | | | | | | — | | | | | | 2,089 | | | | | | (1,371,981) | | | | | | (305,718) | | |
| Class I | | | | | | | | | | | | | | | | | | | | | | | | | | | | | | | | | | | | | | | | | | | | | | | | | | | | | | | | | | | | | |
| 3/31/2023 | | | | | 25,864,127 | | | | | | — | | | | | | 1,287,280 | | | | | | (12,429,103) | | | | | | 14,722,304 | | | | | | 25,864,127 | | | | | | — | | | | | | 1,287,280 | | | | | | (12,429,103) | | | | | | 14,722,304 | | |
| 3/31/2022 | | | | | 11,682,107 | | | | | | — | | | | | | 42,573 | | | | | | (15,228,373) | | | | | | (3,503,693) | | | | | | 11,682,107 | | | | | | — | | | | | | 42,573 | | | | | | (15,228,373) | | | | | | (3,503,693) | | |
| Class W | | | | | | | | | | | | | | | | | | | | | | | | | | | | | | | | | | | | | | | | | | | | | | | | | | | | | | | | | | | | | |
| 3/31/2023 | | | | | 1,753,335 | | | | | | — | | | | | | 36,370 | | | | | | (730,513) | | | | | | 1,059,192 | | | | | | 1,753,335 | | | | | | — | | | | | | 36,370 | | | | | | (730,513) | | | | | | 1,059,192 | | |
| 3/31/2022 | | | | | 95,411 | | | | | | — | | | | | | 313 | | | | | | (308,438) | | | | | | (212,714) | | | | | | 95,411 | | | | | | — | | | | | | 313 | | | | | | (308,438) | | | | | | (212,714) | | |
NOTE 9 — FEDERAL INCOME TAXES
The amount of distributions from net investment income and net realized capital gains are determined in accordance with federal income tax regulations, which may differ from GAAP for investment companies. These book/tax differences may be either temporary or permanent. Permanent differences are reclassified within the capital accounts based on their federal tax-basis treatment; temporary differences are not reclassified. Key differences include the treatment of capital loss carryforwards and de minimis distributions in excess of net investment income.
The following permanent tax differences have been reclassified as of March 31, 2023:
| | Paid-in
Capital | | | Distributable
Earnings | |
| | $(14,179) | | | | $ | 14,179 | | |
Dividends paid by the Fund from net investment income and distributions of net realized short-term capital gains are, for federal income tax purposes, taxable as ordinary income to shareholders.
The tax composition of dividends and distributions to shareholders was as follows:
| | Year Ended
March 31, 2023 | | | Year Ended
March 31, 2022 | |
| | Ordinary
Income | | | Ordinary
Income | |
| | $6,363,850 | | | | $ | 193,613 | | |
NOTES TO FINANCIAL STATEMENTS as of March 31, 2023 (continued)
NOTE 9 — FEDERAL INCOME TAXES (continued)
The tax-basis components of distributable earnings and the capital loss carryforwards which may be used to offset future realized capital gains for federal income tax purposes as of March 31, 2023 were:
| | Unrealized
Appreciation/
(Depreciation) | | | Capital Loss Carryforwards | | | Other | | | Total
Distributable
Earnings/
(Loss) | |
| | Amount | | | Character | | | Expiration | |
| | $(754) | | | | $ | (56,692) | | | | Short-term | | | | | None | | | | | $ | (1,782) | | | | | $ | (59,228) | | |
The Fund’s major tax jurisdictions are U.S. federal and Arizona state.
As of March 31, 2023, no provision for income tax is required in the Fund’s financial statements as a result of tax positions taken on federal and state income tax returns for open tax years. The Fund’s federal and state income and federal excise tax returns for tax years for which the applicable statutes of limitations have not expired are subject to examination by the Internal Revenue Service and state department of revenue. Generally, the preceding four tax years remain subject to examination by these jurisdictions.
NOTE 10 — LONDON INTERBANK OFFERED RATE (“LIBOR”)
In 2017, the UK Financial Conduct Authority announced its intention to cease compelling banks to provide the quotations needed to sustain LIBOR after 2021. On March 5, 2021, ICE Benchmark Administration, the administrator of LIBOR, stated that non-U.S. dollar LIBOR reference rates and the one-week and two-month LIBOR reference rates ceased to be provided or no longer be representative immediately after December 31, 2021 and the remaining more commonly used LIBOR settings will cease to be provided or no longer be representative immediately after June 30, 2023. In addition, global regulators have announced that, with limited exceptions, no new LIBOR-based contracts should be entered into after 2021. Actions by regulators have resulted in the establishment of alternative reference rates to LIBOR in most major currencies (e.g., the Secured Overnight Financing Rate for U.S. Dollar LIBOR and the Sterling Overnight Interbank Average Rate for Sterling LIBOR).
Discontinuance of LIBOR and adoption/implementation of alternative rates pose a number of risks, including among others whether any substitute rate will experience the market participation and liquidity necessary to provide a workable substitute for LIBOR; the effect on parties’ existing contractual arrangements, hedging transactions, and investment strategies generally from a conversion from LIBOR to alternative rates; the effect on the Fund’s existing investments (including, for example, fixed-income
investments, senior loans, CLOs and CDOs, and derivatives transactions), including the possibility that some of those investments may terminate or their terms may be adjusted to the disadvantage of the Fund; and the risk of general market disruption during the period of the conversion. It is difficult to predict at this time the likely impact of the transition away from LIBOR on the Fund.
NOTE 11 — MARKET DISRUPTION
The Fund is subject to the risk that geopolitical events will disrupt securities markets and adversely affect global economies and markets. Due to the increasing interdependence among global economies and markets, conditions in one country, market, or region might adversely impact markets, issuers and/or foreign exchange rates in other countries, including the United States. Wars, terrorism, global health crises and pandemics, and other geopolitical events that have led, and in the future may continue to lead, to increased market volatility and may have adverse short- or long-term effects on U.S. and global economies and markets generally. For example, the COVID-19 pandemic has resulted, and may continue to result, in significant market volatility, exchange suspensions and closures, declines in global financial markets, higher default rates, supply chain disruptions, and a substantial economic downturn in economies throughout the world. Natural and environmental disasters and systemic market dislocations are also highly disruptive to economies and markets. In addition, military action by Russia in Ukraine has, and may continue to, adversely affect global energy and financial markets and therefore could affect the value of the Fund’s investments, including beyond the Fund’s direct exposure to Russian issuers or nearby geographic regions. The extent and duration of the military action, sanctions and resulting market disruptions are impossible to predict and could be substantial. Those events as well as other changes in foreign (non-U.S.) and domestic economic, social, and political conditions also could adversely affect individual issuers or related groups of issuers, securities markets, interest rates, credit ratings, inflation, investor sentiment, and other factors affecting the Fund’s investments. Any of these occurrences could disrupt the operations of the Fund and of the Fund’s service providers.
NOTE 12 — OTHER ACCOUNTING PRONOUNCEMENTS
In June 2022, the FASB issued Accounting Standards Update (ASU), ASU 2022-03, Fair Value Measurement (Topic 820) — Fair Value Measurement of Equity Securities Subject to Contractual Sale Restrictions, which clarifies that a contractual restriction on the sale of an equity security is not considered part of the unit of account
NOTES TO FINANCIAL STATEMENTS as of March 31, 2023 (continued)
NOTE 12 — OTHER ACCOUNTING PRONOUNCEMENTS (continued)
of the equity security and, therefore, is not considered in measuring fair value. The amendments under this ASU are effective for fiscal years beginning after December 15, 2023; however, early adoption is permitted. Management expects that the adoption of the guidance will not have a material impact on the fund’s financial statements.
NOTE 13 — SUBSEQUENT EVENTS
Dividends. Subsequent to March 31, 2023, the Fund declared dividends from net investment income of:
| | | | Per Share
Amount | | | Payable
Date | | | Record
Date | |
| Class A | | | $0.0037 | | | May 1, 2023 | | | Daily | |
| Class C | | | $0.0029 | | | May 1, 2023 | | | Daily | |
| Class I | | | $0.0037 | | | May 1, 2023 | | | Daily | |
| Class W | | | $0.0037 | | | May 1, 2023 | | | Daily | |
Line of Credit Renewal: Effective June 13, 2023, the funds to which the Credit Agreement is available will enter into a renewed Credit Agreement with BNY for an aggregate amount of $400,000,000 and will continue to pay a commitment fee equal to 0.15% per annum on the daily unused portion of the committed line amount payable quarterly in arrears.
The Fund has evaluated events occurring after the Statement of Assets and Liabilities date through the date that the financial statements were issued (“subsequent events”) to determine whether any subsequent events necessitated adjustment to or disclosure in the financial statements. Other than the above, no such subsequent events were identified.
PORTFOLIO OF INVESTMENTS
| Voya Government Money Market Fund | as of March 31, 2023 |
Principal
Amount† | | | Value | | | Percentage
of Net
Assets | |
| U.S. GOVERNMENT AGENCY DEBT: 15.3% | |
| 4,000,000 | | | Federal Farm Credit Banks
Funding Corp., 5.210%,
(FEDL01 + 0.380)%,
05/11/2023 | | | | $ | 4,001,490 | | | | | | 1.4 | | |
| 7,000,000 | | | Federal Home Loan Bank
Discount Notes, 4.860%,
05/30/2023 | | | | | 6,944,532 | | | | | | 2.5 | | |
| 300,000 | | | Federal Home Loan Bank
Discount Notes, 5.080%,
08/22/2023 | | | | | 294,101 | | | | | | 0.1 | | |
| 150,000 | | | Federal Home Loan Bank
Discount Notes, 5.100%,
01/12/2024 | | | | | 144,221 | | | | | | 0.1 | | |
| 3,000,000 (1) | | | Federal Home Loan Banks,
3.000%, 04/28/2023 | | | | | 2,995,704 | | | | | | 1.1 | | |
| 3,500,000 | | | Federal Home Loan Banks,
4.850%, (SOFRRATE +
0.030)%, 04/14/2023 | | | | | 3,500,000 | | | | | | 1.3 | | |
| 5,000,000 | | | Federal Home Loan Banks,
4.850%, (SOFRRATE +
0.030)%, 05/18/2023 | | | | | 5,000,000 | | | | | | 1.8 | | |
| 1,500,000 | | | Federal Home Loan Banks,
4.880%, (SOFRRATE +
0.060)%, 04/18/2023 | | | | | 1,500,001 | | | | | | 0.5 | | |
| 6,000,000 | | | Federal Home Loan Banks,
4.885%, (SOFRRATE +
0.065)%, 06/21/2023 | | | | | 6,000,000 | | | | | | 2.2 | | |
| 12,000,000 | | | Federal Home Loan Banks,
4.940%, (SOFRRATE +
0.120)%, 09/06/2023 | | | | | 12,000,000 | | | | | | 4.3 | | |
| | | | Total U.S. Government
Agency Debt
(Cost $42,380,049) | | | | | 42,380,049 | | | | | | 15.3 | | |
| U.S. TREASURY DEBT: 31.4% | |
| 87,000,000 | | | United States Treasury
Floating Rate Note, 4.760%,
(USBMMY3M + 0.029)%,
07/31/2023 | | | | | 87,022,689 | | | | | | 31.4 | | |
| | | | Total U.S. Treasury Debt
(Cost $87,022,689) | | | | | 87,022,689 | | | | | | 31.4 | | |
Principal
Amount† | | | Value | | | Percentage
of Net
Assets | |
| U.S. TREASURY REPURCHASE AGREEMENT: 35.1% | |
| 97,502,000 | | | Deutsche Bank Repurchase
Agreement dated 03/31/23,
4.800%, due 04/03/23,
$97,541,001 to be received
upon repo (Collateralized by
$105,463,850, Various U.S.
Govt. Agn. Obli. , 0.000%,
Mkt Value plus accrued int.
and pri. $100,361,658 due
09/07/23-04/15/30), 4.800%,
04/03/2023 | | | | $ | 97,502,000 | | | | | | 35.1 | | |
| | | | Total U.S. Treasury
Repurchase Agreement
(Cost $97,502,000) | | | | | 97,502,000 | | | | | | 35.1 | | |
| | | | Total Investments in
Securities
(Cost $226,904,738) | | | | $ | 226,904,738 | | | | | | 81.8 | | |
| | | | Assets in Excess of Other
Liabilities | | | | | 50,405,018 | | | | | | 18.2 | | |
| | | | Net Assets | | | | $ | 277,309,756 | | | | | | 100.0 | | |
| |
†
Unless otherwise indicated, principal amount is shown in USD.
(1)
Variable rate security. Rate shown is the rate in effect as of March 31, 2023.
Reference Rate Abbreviations:
FEDL01
Federal Funds Effective Rate
SOFRRATE
1-day Secured Overnight Financing Rate
USBMMY3M
U.S. Treasury 3-month Bill Money Market Yield
See Accompanying Notes to Financial Statements
PORTFOLIO OF INVESTMENTS
| Voya Government Money Market Fund | as of March 31, 2023 (continued) |
Fair Value Measurements^
The following is a summary of the fair valuations according to the inputs used as of March 31, 2023 in valuing the assets and liabilities:
| | | | Quoted Prices
in Active Markets
for Identical
Investments
(Level 1) | | | Significant
Other
Observable
Inputs
(Level 2) | | | Significant
Unobservable
Inputs
(Level 3) | | | Fair Value
at
March 31, 2023 | |
| Asset Table | | | | | | | | | | | | | | | | | | | | | | | | | |
| Investments, at fair value | | | | | | | | | | | | | | | | | | | | | | | | | |
| U.S. Government Agency Debt | | | | $ | — | | | | | $ | 42,380,049 | | | | | $ | — | | | | | $ | 42,380,049 | | |
| U.S. Treasury Debt | | | | | — | | | | | | 87,022,689 | | | | | | — | | | | | | 87,022,689 | | |
| U.S. Treasury Repurchase Agreement | | | | | — | | | | | | 97,502,000 | | | | | | — | | | | | | 97,502,000 | | |
| Total Investments, at fair value | | | | $ | — | | | | | $ | 226,904,738 | | | | | $ | — | | | | | $ | 226,904,738 | | |
The following table is a summary of the Fund’s treasury repurchase agreement by counterparty which is subject to offset under a MRA as of March 31, 2023:
| Counterparty | | | U.S. Treasury
Repurchase
Agreement,
at fair value | | | Fair Value of
Non-Cash Collateral
Received Including
Accrued Interest(1) | | | Net Amount | |
| Deutsche Bank | | | $97,502,000 | | | | $ | (97,502,000) | | | | | $ | — | | |
| Totals | | | $97,502,000 | | | | $ | (97,502,000) | | | | | $ | — | | |
(1)
Collateral with a fair value of $100,361,658 has been pledged in connection with the above treasury repurchase agreement. Excess collateral received from the individual counterparty is not shown for financial reporting purposes.
At March 31, 2023, the aggregate cost of securities and other investments and the composition of unrealized appreciation and depreciation of securities and other investments on a tax basis were:
| | Cost for federal income tax purposes was $226,905,492. | | |
| | Net unrealized depreciation consisted of: | | |
| | Gross Unrealized Appreciation | | | | $ | — | | |
| | Gross Unrealized Depreciation | | | | | (754) | | |
| | Net Unrealized Depreciation | | | | $ | (754) | | |
See Accompanying Notes to Financial Statements
TAX INFORMATION (Unaudited)
Dividends and distributions paid during the year ended March 31, 2023 were as follows:
| Fund Name | | | Type | | | Per Share Amount | |
| Voya Government Money Market Fund | | | | | | | | | | |
| Class A | | | NII | | | | $ | 0.0245 | | |
| Class C | | | NII | | | | $ | 0.0162 | | |
| Class I | | | NII | | | | $ | 0.0245 | | |
| Class W | | | NII | | | | $ | 0.0247 | | |
NII – Net investment income
Pursuant to Internal Revenue Code Section 871(k)(1), Voya Government Money Market Fund designates 99.52% of net investment income distributions as interest-related dividends.
Above figures may differ from those cited elsewhere in this report due to differences in the calculation of income and gains under U.S. generally accepted accounting principles (book) purposes and Internal Revenue Service (tax) purposes.
Shareholders are strongly advised to consult their own tax advisers with respect to the tax consequences of their investments in the Fund. In January, shareholders, excluding corporate shareholders, receive an IRS 1099-DIV regarding the federal tax status of the dividends and distributions they received in the calendar year.
TRUSTEE AND OFFICER INFORMATION (Unaudited)
The business and affairs of the Trust are managed under the direction of the Board. A Trustee, who is not an interested person of the Trust, as defined in the 1940 Act, is an independent trustee (“Independent Trustee”). The Trustees and Officers of the Trust are listed below. The Statement of Additional Information includes additional information about Trustees of the Trust and is available, without charge, upon request at (800) 992-0180.
Name, Address and Year of
Birth | | | Position(s)
Held with
the Trust | | | Term of Office and
Length of Time
Served(1) | | | Principal
Occupation(s) –
During the Past 5 Years | | | Number of
funds in
Fund
Complex
Overseen
by
Trustee(2) | | | Other Board Positions
Held by Trustee | |
| Independent Trustees: | | | | | | | | | | | | | | | | |
Colleen D. Baldwin
(1960)
7337 East Doubletree Ranch Rd.
Suite 100
Scottsdale, Arizona 85258 | | | Chairperson Trustee | | | January 2020 – Present November 2007 – Present | | | President, Glantuam Partners, LLC, a business consulting firm (January 2009 – Present). | | | 138 | | | Stanley Global Engineering (2020 – Present). | |
John V. Boyer
(1953)
7337 East Doubletree Ranch Rd.
Suite 100
Scottsdale, Arizona 85258 | | | Trustee | | | January 2005 – Present | | | Retired. Formerly, President and Chief Executive Officer, Bechtler Arts Foundation, an arts and education foundation (January 2008 – December 2019). | | | 138 | | | None. | |
Patricia W. Chadwick
(1948)
7337 East Doubletree Ranch Rd.
Suite 100
Scottsdale, Arizona 85258 | | | Trustee | | | January 2006 – Present | | | Consultant and President, Ravengate Partners LLC, a consulting firm that provides advice regarding financial markets and the global economy (January 2000 – Present). | | | 138 | | | The Royce Funds
(22 funds) (December 2009 – Present). AMICA Mutual Insurance Company (1992 – Present). | |
Martin J. Gavin
(1950)
7337 East Doubletree Ranch Rd. Suite 100
Scottsdale, Arizona 85258 | | | Trustee | | | August 2015 – Present | | | Retired. | | | 138 | | | None. | |
Joseph E. Obermeyer
(1957)
7337 East Doubletree Ranch Rd.
Suite 100
Scottsdale, Arizona 85258 | | | Trustee | | | May 2013 – Present | | | President, Obermeyer & Associates, Inc., a provider of financial and economic consulting services (November 1999 – Present). | | | 138 | | | None. | |
Sheryl K. Pressler
(1950)
7337 East Doubletree Ranch Rd.
Suite 100
Scottsdale, Arizona 85258 | | | Trustee | | | January 2006 – Present | | | Consultant (May 2001 – Present). | | | 138 | | | Centerra Gold Inc. (May 2008 – Present). | |
Christopher P. Sullivan
(1954)
7337 East Doubletree Ranch Rd.
Suite 100
Scottsdale, Arizona 85258 | | | Trustee | | | October 2015 – Present | | | Retired. | | | 138 | | | None. | |
(1)
Trustees serve until their successors are duly elected and qualified. The tenure of each Trustee who is not an “interested person” as defined in the 1940 Act, of each Fund (“Independent Trustee”) is subject to the Board’s retirement policy which states that each duly elected or appointed Independent Trustee shall retire from and cease to be a member of the Board of Trustees at the close of business on December 31 of the calendar year in which the Independent Trustee attains the age of 75. A majority vote of the Board’s other Independent Trustees may extend the retirement date of an Independent Trustee if the retirement would trigger a requirement to hold a meeting of shareholders of the Trust under applicable law, whether for the purposes of appointing a successor to the Independent Trustee or otherwise comply under applicable law, in which case the extension would apply until such time as the shareholder meeting can be held or is no longer required (as determined by a vote of a majority of the other Independent Trustees).
TRUSTEE AND OFFICER INFORMATION (Unaudited) (continued)
(2)
For the purposes of this table, “Fund Complex” means the Voya family of funds including the following investment companies: Voya Asia Pacific High Dividend Equity Income Fund; Voya Balanced Portfolio, Inc.; Voya Credit Income Fund; Voya Emerging Markets High Dividend Equity Fund; Voya Equity Trust; Voya Funds Trust; Voya Global Advantage and Premium Opportunity Fund; Voya Global Equity Dividend and Premium Opportunity Fund; Voya Government Money Market Portfolio; Voya Infrastructure, Industrials and Materials Fund; Voya Intermediate Bond Portfolio; Voya Investors Trust; Voya Mutual Funds; Voya Partners, Inc.; Voya Separate Portfolios Trust; Voya Strategic Allocation Portfolios, Inc.; Voya Variable Funds; Voya Variable Insurance Trust; Voya Variable Portfolios, Inc.; and Voya Variable Products Trust. The number of funds in the Fund Complex is as of April 30, 2023.
TRUSTEE AND OFFICER INFORMATION (Unaudited) (continued)
Name, Address and Year of
Birth | | | Position(s) Held With
the Trust | | | Term of Office and
Length of Time Served(1) | | | Principal Occupation(s) –
During the Past 5 Years | |
Andy Simonoff
(1973)
5780 Powers Ferry Road NW
Atlanta, Georgia 30327 | | | President and Chief Executive Officer | | | January 2023 – Present | | | Director, President and Chief Executive Officer, Voya Funds Services, LLC, Voya Capital, LLC and Voya Investments, LLC (January 1, 2023 – Present); Managing Director, Chief Strategy and Transformation Officer, Voya Investment Management (January 2020 – Present). Formerly, Managing Director, Head of Business Management, Voya Investment Management (March 2019 – January 2020); Managing Director, Head of Business Management, Fixed Income, Voya Investment Management (November 2015 – March 2019). | |
Jonathan Nash
(1967)
230 Park Avenue
New York, New York 10169 | | | Executive Vice President and Chief Investment Risk Officer | | | March 2020 – Present | | | Executive Vice President and Chief Investment Risk Officer, Voya Investments, LLC (March 2020 – Present); Senior Vice President, Investment Risk Management, Voya Investment Management (March 2017 – Present). Formerly, Vice President, Voya Investments, LLC (September 2018 – March 2020). | |
James M. Fink
(1958)
5780 Powers Ferry Road NW
Atlanta, Georgia 30327 | | | Executive Vice President | | | March 2018 – Present | | | Senior Vice President, Voya Investments Distributor, LLC (April 2018 – Present); Managing Director, Voya Investments, LLC, Voya Capital, LLC, and Voya Funds Services, LLC (March 2018 – Present); Chief Administrative Officer, Voya Investment Management (September 2017 – Present). | |
Steven Hartstein
(1963)
230 Park Avenue
New York, New York 10169 | | | Chief Compliance Officer | | | December 2022 – Present | | | Senior Vice President, Voya Investment Management (December 2022 – Present). Formerly, Head of Funds Compliance, Brighthouse Financial, Inc. and Chief Compliance Officer – Brighthouse Funds and Brighthouse Investment Advisers, LLC (March 2017- December 2022). | |
Todd Modic
(1967)
7337 East Doubletree Ranch Rd.
Suite 100
Scottsdale, Arizona 85258 | | | Senior Vice President, Chief/Principal Financial Officer and Assistant Secretary | | | March 2005 – Present | | | Director and Senior Vice President, Voya Capital, LLC, and Voya Funds Services, LLC (September 2022 – Present); Director, Voya Investments, LLC (September 2022 – Present); Senior Vice President, Voya Investments, LLC (April 2005 – Present). Formerly, President, Voya Funds Services, LLC (March 2018 – September 2022). | |
Kimberly A. Anderson
(1964)
7337 East Doubletree Ranch Rd.
Suite 100
Scottsdale, Arizona 85258 | | | Senior Vice President | | | November 2003 – Present | | | Senior Vice President, Voya Investments, LLC (September 2003 – Present). | |
Sara M. Donaldson
(1959)
7337 East Doubletree Ranch Rd.
Suite 100
Scottsdale, Arizona 85258 | | | Senior Vice President | | | June 2022 – Present | | | Senior Vice President, Voya Investments, LLC (February 2022 – Present); Senior Vice President, Head of Active Ownership, Voya Investment Management (September 2021 – Present). Formerly, Vice President, Voya Investments, LLC (October 2015 – February 2022); Vice President, Head of Proxy Voting, Voya Investment Management (October 2015 – August 2021). | |
Andrew K. Schlueter
(1976)
7337 East Doubletree Ranch Rd.
Suite 100
Scottsdale, Arizona 85258 | | | Senior Vice President | | | June 2022 – Present | | | Senior Vice President, Head of Investment Operations Support, Voya Investment Management (April 2023 – Present); Vice President, Voya Investments Distributor, LLC (April 2018 – Present); Vice President, Voya Investments, LLC and Voya Funds Services, LLC (March 2018-Present); Formerly, Senior Vice President, Head of Mutual Fund Operations, Voya Investment Management (March 2022 – March 2023); Vice President, Head of Mutual Fund Operations, Voya Investment Management (February 2018 – February 2022); Vice President, Voya Investment Management (March 2014 – February 2018). | |
TRUSTEE AND OFFICER INFORMATION (Unaudited) (continued)
Name, Address and Year of
Birth | | | Position(s) Held With
the Trust | | | Term of Office and
Length of Time Served(1) | | | Principal Occupation(s) –
During the Past 5 Years | |
Joanne F. Osberg
(1982)
7337 East Doubletree Ranch Rd.
Suite 100
Scottsdale, Arizona 85258 | | | Senior Vice President Secretary | | | March 2023 – Present September 2020 – Present | | | Senior Vice President and Chief Counsel, Voya Investment Management – Mutual Fund Legal Department, Senior Vice President and Secretary, Voya Investments, LLC, Voya Capital, LLC, and Voya Funds Services, LLC (March 2023 – Present). Formerly, Secretary, Voya Capital, LLC (August 2022 – March 2023); Vice President and Secretary, Voya Investments, LLC and Voya Funds Services, LLC, Vice President and Senior Counsel, Voya Investment Management – Mutual Fund Legal Department (September 2020 – March 2023). Vice President and Counsel, Voya Investment Management – Mutual Fund Legal Department (January 2013 – September 2020). | |
Robert Terris
(1970)
5780 Powers Ferry Road NW
Atlanta, Georgia 30327 | | | Senior Vice President | | | May 2006 – Present | | | Senior Vice President, Voya Investments Distributor, LLC (April 2018 – Present); Senior Vice President, Head of Investment Services, Voya Investments, LLC (April 2018 – Present); Senior Vice President, Head of Investment Services, Voya Funds Services, LLC (March 2006 – Present). Formerly, Senior Vice President, Head of Division Operations, Voya Investments, LLC (October 2015 – April 2018). | |
Fred Bedoya
(1973)
7337 East Doubletree Ranch Rd.
Suite 100
Scottsdale, Arizona 85258 | | | Vice President Principal Accounting Officer and Treasurer | | | September 2012 – Present | | | Vice President, Voya Investments, LLC (October 2015 – Present); Vice President, Voya Funds Services, LLC (July 2012 – Present). | |
Robyn L. Ichilov
(1967)
7337 East Doubletree Ranch Rd.
Suite 100
Scottsdale, Arizona 85258 | | | Vice President | | | October 2000 – Present | | | Vice President, Voya Investments, LLC (August 1997 – Present); Vice President, Voya Funds Services, LLC (November 1995 – Present). | |
Jason Kadavy
(1976)
7337 East Doubletree Ranch Rd.
Suite 100
Scottsdale, Arizona 85258 | | | Vice President | | | September 2012 – Present | | | Vice President, Voya Investments, LLC (October 2015 – Present); Vice President, Voya Funds Services, LLC (July 2007 – Present). | |
Erica McKenna
(1972)
7337 East Doubletree Ranch Rd.
Suite 100
Scottsdale, Arizona 85258 | | | Vice President | | | June 2022 – Present | | | Vice President, Head of Mutual Fund Compliance, and Chief Compliance Officer, Voya Investments, LLC (May 2022 – Present). Formerly, Vice President, Fund Compliance Manager, Voya Investments, LLC (March 2021 – May 2022); Assistant Vice President, Fund Compliance Manager, Voya Investments, LLC (December 2016 – March 2021). | |
Craig Wheeler
(1969)
7337 East Doubletree Ranch Rd.
Suite 100
Scottsdale, Arizona 85258 | | | Vice President | | | May 2013 – Present | | | Vice President – Director of Tax, Voya Investments, LLC (October 2015 – Present). | |
Nicholas C.D. Ward
(1993)
7337 East Doubletree Ranch Rd.
Suite 100
Scottsdale, Arizona 85258 | | | Assistant Vice President and Assistant Secretary | | | June 2022 – Present | | | Counsel, Voya Investment Management – Mutual Fund Legal Department (November 2021 – Present). Formerly, Associate, Dechert LLP (October 2018 – November 2021). | |
Gizachew Wubishet
(1976)
7337 East Doubletree Ranch Rd.
Suite 100
Scottsdale, Arizona 85258 | | | Assistant Vice President and Assistant Secretary | | | June 2022 – Present | | | Assistant Vice President and Counsel, Voya Investment Management – Mutual Fund Legal Department (May 2019 – Present). Formerly, Attorney, Ropes & Gray LLP (October 2011 – April 2019). | |
TRUSTEE AND OFFICER INFORMATION (Unaudited) (continued)
Name, Address and Year of
Birth | | | Position(s) Held With
the Trust | | | Term of Office and
Length of Time Served(1) | | | Principal Occupation(s) –
During the Past 5 Years | |
Monia Piacenti
(1976)
One Orange Way
Windsor, Connecticut 06095 | | | Anti-Money Laundering Officer | | | June 2018 – Present | | | Compliance Consultant, Voya Financial, Inc. (January 2019 – Present); Anti-Money Laundering Officer, Voya Investments Distributor, LLC, Voya Investment Management and Voya Investment Management Trust Co. (June 2018 – Present); Formerly, Senior Compliance Officer, Voya Investment Management (December 2009 – December 2018). | |
(1)
The Officers hold office until the next annual meeting of the Board of Trustees and until their successors shall have been elected and qualified.
ADVISORY AND SUB-ADVISORY CONTRACT APPROVAL DISCUSSION (Unaudited)
BOARD CONSIDERATION AND APPROVAL OF INVESTMENT MANAGEMENT CONTRACT AND SUB-ADVISORY CONTRACT
At a meeting held on November 17, 2022, the Board of Trustees (“Board”) of Voya Funds Trust (the “Trust”), including a majority of the Board members who have no direct or indirect interest in the investment management and sub-advisory contracts, and who are not “interested persons” of Voya Government Money Market Fund, a series of the Trust (the “Fund”), as such term is defined under the Investment Company Act of 1940, as amended (the “Independent Trustees”), considered and approved the renewal of the investment management contract (the “Management Contract”) between Voya Investments, LLC (the “Manager”) and the Trust, on behalf of the Fund, and the sub-advisory contract (the “Sub-Advisory Contract,” and together with the Management Contract, the “Contracts”) with Voya Investment Management Co. LLC, the sub-adviser to the Fund (the “Sub-Adviser”), for an additional one-year period ending November 30, 2023.
In addition to the Board meeting on November 17, 2022, the Independent Trustees also held meetings outside the presence of representatives of the Manager and Sub-Adviser (collectively, such persons are referred to herein as “management”) on October 12-13, 2022, and November 15, 2022. At those meetings, the Board members reviewed and considered materials related to the proposed continuance of the Contracts that they had requested and believed to be relevant to the renewal of the Contracts in light of their own business judgment and the legal advice furnished to them by K&L Gates LLP, their independent legal counsel. The Board also considered information furnished to it throughout the year at meetings of the Board and its committees, including information regarding performance, expenses, and other relevant matters. While the Board considered the renewal of the management contracts and sub-advisory contracts for all of the applicable investment companies in the Voya family of funds at the same meetings, the Board considered each Voya fund’s investment management and sub-advisory relationships separately.
The Board has established a Contracts Committee and two Investment Review Committees (the “IRCs”), each of which includes only Independent Trustees as members. The Contracts Committee meets several times throughout the year to provide oversight with respect to the management and sub-advisory contracts approval and renewal process for the Voya funds, among other functions, and each IRC meets several times throughout the year with respect to each Voya fund (assigned to that IRC) to provide oversight regarding the investment performance of the sub-advisers, as well as the Manager’s role in monitoring the sub-advisers.
The Contracts Committee oversees, and annually recommends Board approval of updates to, a methodology guide for the Voya funds (“Methodology Guide”), which sets out a framework pursuant to which the Independent Trustees request, and management provides, certain information that the Independent Trustees deem to be important or potentially relevant to the contracts renewal process for the Voya funds. The Independent Trustees retain the services of an independent consultant with experience in the mutual fund industry to assist the Contracts Committee in developing and recommending to the Board: (1) a selected peer group of investment companies for the Fund (“Selected Peer Group”) based on the Fund’s particular attributes, such as fund type and size, fund category (as determined by Morningstar, Inc., an independent provider of mutual fund data (“Morningstar”)), sales channels and structure and the Fund share class being compared to the Selected Peer Group; and (2) updates to the Methodology Guide with respect to the content and format of various data prepared in connection with the renewal process, including, but not limited to, investment performance, fee structure, and expense information. In addition, the Independent Trustees periodically have retained an independent firm to test and verify the accuracy of certain information presented to the Board for a representative sample of the Voya funds.
The Manager or Sub-Adviser may not have been able to, or opted not to, provide information in response to certain information requests, in which case the Board conducted its evaluation based on the information that was provided. In such cases, the Board determined that the omission of any such information was not material to its considerations. Additionally, the Board considered the impact of significant periods of market volatility that occurred during and after the period for which information was requested in conducting its evaluation of the Manager and Sub-Adviser.
Provided below is an overview of certain material factors that the Board considered at its meetings regarding the renewal of the Contracts and the compensation to be paid thereunder. The Board members did not identify any particular information or factor that was most relevant to its consideration.
Nature, Extent and Quality of Services
The Manager oversees, subject to the authority of the Board, and is responsible for the provision of, all investment advisory and portfolio management services for the Fund, but may delegate certain of these responsibilities to one or more sub-advisers. In addition, the Manager provides administrative services reasonably necessary for the operation of the Fund as set forth in the
ADVISORY AND SUB-ADVISORY CONTRACT APPROVAL DISCUSSION (Unaudited) (continued)
Management Contract, including oversight of the Fund’s operations and risk management and the oversight of its various other service providers.
The Board considered the “manager-of-managers” structure of the Voya funds that has been developed by the Manager pursuant to which the Manager selects, subject to the Board’s approval, sub-advisers to provide day-to-day management services to all or a portion of each Voya fund. The Board recognized that the Manager is responsible for monitoring the Sub-Adviser’s investment program, performance, developments, ongoing operations, and compliance with applicable regulations and investment policies and restrictions with respect to the Fund under this manager-of-managers arrangement. The Board also considered the techniques and resources that the Manager has developed to provide this ongoing due diligence and oversight with respect to the sub-advisers and to recommend appropriate changes in investment strategies, sub-advisers, or allocation among sub-advisers in an effort to improve a Voya fund’s performance. In connection with the Manager’s performance of these duties, the Board considered that the Manager has developed an oversight process formulated by its Manager Research & Selection Group that reviews, among other matters, performance data, the Sub-Adviser’s management team, portfolio data and attribution analysis related to the Sub-Adviser through various means, including, but not limited to, in-person meetings, on-site or virtual visits, and telephonic meetings with the Sub-Adviser.
Further, the Board considered periodic compliance reports it receives from the Trust’s Chief Compliance Officer evaluating, among other related matters, whether the regulatory compliance systems and procedures of the Manager and Sub-Adviser are reasonably designed to ensure compliance with the federal securities laws and whether the investment policies and restrictions for the Fund are complied with on a consistent basis.
The Board considered the portfolio management team assigned by the Sub-Adviser to the Fund and the level of resources committed to the Fund (and other relevant funds in the Voya funds) by the Manager and Sub-Adviser, and whether those resources are sufficient to provide high-quality services to the Fund.
Based on their deliberations and the materials presented to them, the Board concluded that the nature, extent and quality of the overall services provided by the Manager and Sub-Adviser under the Contracts were appropriate.
Fund Performance
In assessing the investment management and sub-advisory relationships, the Board placed emphasis on
the investment returns of the Fund, including its investment performance over certain time periods compared to the Fund’s Morningstar category and primary benchmark, a broad-based securities market index identified in the Fund’s prospectus. The Board also considered information from the Manager Research & Selection Group and received reports summarizing a separate analysis of the Fund’s performance and risk, including risk-adjusted investment return information, from the Trust’s Chief Investment Risk Officer.
Economies of Scale
When evaluating the reasonableness of the management fee schedule, the Board considered whether economies of scale have been or likely will be realized by the Manager and Sub-Adviser as the Fund grows larger and the extent to which any such economies are shared with the Fund. The Board considered that, while the Fund does not have management fee breakpoints, it has fee waiver and expense reimbursement arrangements. The Board considered the extent to which economies of scale realized by the Manager could be shared with the Fund through such fee waivers, expense reimbursements or other expense reductions. In evaluating these matters, the Board also considered periodic management reports, Selected Peer Group comparisons, and industry information regarding economies of scale.
Information Regarding Services, Performance, and Fee Schedules Offered to Other Clients
The Board considered comparative information regarding the nature of services, performance, and fee schedules offered by the Manager and Sub-Adviser to other clients with similar investment objectives, if applicable, including other registered investment companies and relevant institutional accounts. When the fee schedules offered to or the performance of such other clients differed materially from the Fund, the Board took into account the underlying rationale provided by the Manager or Sub-Adviser, as applicable, for these differences.
Fee Schedules, Profitability, and Fall-out Benefits
The Board reviewed and considered the contractual management fee schedule and net management fee rate payable by the Fund to the Manager compared to the Fund’s Selected Peer Group. The Board also considered the compensation payable by the Manager to the Sub-Adviser for sub-advisory services for the Fund, including the portion of the contractual and net management fee rates that are paid to the Sub-Adviser, as compared to the compensation paid to the Manager. In addition, the Board considered the fee waivers, expense limitations, and/ recoupment arrangements that apply to
ADVISORY AND SUB-ADVISORY CONTRACT APPROVAL DISCUSSION (Unaudited) (continued)
the fees payable by the Fund, including whether the Manager intends to propose any changes thereto. The Board separately determined that the fees payable to the Manager and the fee schedule payable to the Sub-Adviser are reasonable for the services that each performs, which were considered in light of the nature, extent and quality of the services that each has performed and is expected to perform.
The Board considered information on revenues, costs and profits or losses realized by the Manager and the Voya-affiliated Sub-Adviser related to their services to the Fund. In analyzing the profitability of the Manager and its affiliates in connection with services they render to a Fund, the Board took into account the sub-advisory fee rate payable by the Manager to the Sub-Adviser. The Board also considered the profitability of the Manager and its affiliated Sub-Adviser attributable to servicing the Fund both with and without taking into account the profitability of the distributor of the Fund and any revenue sharing payments made by the Manager.
Although the Methodology Guide establishes a framework for profit calculation, the Board recognized that there is no uniform methodology within the asset management industry for determining profitability for this purpose. The Board also recognized that the use of different reasonable methodologies can give rise to dramatically different reported profit and loss results with respect to the Manager and the Voya-affiliated Sub-Adviser, as well as other industry participants with whom the profits of the Manager and its affiliated Sub-Adviser could be compared. In addition, the Board recognized that management’s calculations regarding its costs incurred in establishing the infrastructure necessary for the Fund’s operations may not be fully reflected in the expenses allocated to the Fund in determining profitability. The Board also recognized that the information presented may not portray all of the costs borne by the Manager or reflect all of the risks associated with offering and managing a mutual fund complex in the current regulatory and market environment, including entrepreneurial, regulatory, legal and operational risks.
The Board also considered that the Manager and the Voya-affiliated Sub-Adviser are entitled to earn a reasonable level of profits for the services that they provide to the Fund. The Board also considered information regarding the potential fall-out benefits to the Manager and Sub-Adviser and their respective affiliates from their association with the Fund, including their ability to engage in soft-dollar transactions on behalf of the Fund. Following its reviews, the Board determined that the Manager’s and the Voya-affiliated Sub-Adviser’s profitability with respect to their services to the Fund and the Manager and Sub-Adviser’s potential fall-out benefits were not unreasonable.
Fund Analysis
Set forth below are certain of the specific factors that the Board considered at its October 12-13, 2022, November 15, 2022, and/or November 17, 2022 meetings in relation to approving the Fund’s Contracts and the conclusions reached by the Board. These specific factors are in addition to those considerations discussed above. The Fund’s performance was compared to its Morningstar category, as well as its primary benchmark. The performance data provided to the Board primarily was for various periods ended March 31, 2022. In addition, the Board also considered at its October 12-13, 2022, November 15, 2022, and/or November 17, 2022 meetings certain additional data regarding the Fund’s more recent performance, asset levels and asset flows. The Fund’s management fee rate and expense ratio were compared to the management fee rates and expense ratios of the funds in its Selected Peer Group. With respect to the quintile rankings noted below, the first quintile represents the range of funds with the highest performance or the lowest management fee rate or expense ratio, as applicable, and the fifth quintile represents the range of funds with the lowest performance or the highest management fee rate or expense ratio, as applicable.
In considering whether to approve the renewal of the Contracts for Voya Government Money Market Fund, the Board considered that, based on performance data for the periods ended March 31, 2022: (1) the Fund outperformed its Morningstar category average for the one-year and three-year periods, and its performance was equal to the performance of its Morningstar category average for the year-to-date, five-year and ten-year periods; and (2) the Fund underperformed its primary benchmark for all periods presented, with the exception of the one-year and three-year periods, during which it outperformed.
In considering the fees payable under the Contracts for the Fund, the Board took into account the factors described above and also considered: (1) the fairness of the compensation under a Management Contract with a level fee rate that does not include breakpoints; and (2) the pricing structure (including the net expense ratio to be borne by shareholders) of the Fund, as compared to its Selected Peer Group, including that: (a) the net management fee rate for the Fund is ranked in the second quintile of net management fee rates of the funds in its Selected Peer Group; (b) the contractual management fee rate for the Fund is ranked in the fourth quintile of contractual management fee rates of the funds in its Selected Peer Group; and (c) the net expense ratio for the Fund is ranked in the first quintile of net expense ratios of the funds in its Selected Peer Group.
ADVISORY AND SUB-ADVISORY CONTRACT APPROVAL DISCUSSION (Unaudited) (continued)
Board Conclusions
After its deliberation, the Board concluded that, in its business judgment, the terms of the Contracts are fair and reasonable to the Fund and that approval of the continuation of the Contracts is in the best interests of the Fund and its shareholders. In doing so, the Board reviewed all factors it considered to be material, including those discussed above. Within the context of its overall conclusions regarding the Contracts, and based on the information provided and management’s related
representations, the Board concluded that it was satisfied with management’s responses relating to the Fund’s investment performance and the fees payable under the Contracts. During this renewal process, each Board member may have accorded different weight to various factors in reaching his or her conclusions. Based on these conclusions and other factors, the Board voted to renew the Contracts for the Fund for the year ending November 30, 2023.
Investment Adviser
Voya Investments, LLC
7337 East Doubletree Ranch Road, Suite 100
Scottsdale, Arizona 85258
Distributor
Voya Investments Distributor, LLC
7337 East Doubletree Ranch Road, Suite 100
Scottsdale, Arizona 85258
Transfer Agent
BNY Mellon Investment Servicing (U.S.) Inc.
301 Bellevue Parkway
Wilmington, Delaware 19809
Independent Registered Public Accounting Firm
Ernst & Young LLP
200 Clarendon Street
Boston, Massachusetts 02116
Custodian
The Bank of New York Mellon
225 Liberty Street
New York, New York 10286
Legal Counsel
Ropes & Gray LLP
Prudential Tower
800 Boylston Street
Boston, Massachusetts 02199
For more complete information, or to obtain a prospectus on any Voya mutual fund, please call your financial advisor or Voya Investments Distributor, LLC at (800) 992-0180 or log on to www.voyainvestments.com. The prospectus should be read carefully before investing. Consider the fund’s investment objectives, risks, charges and expenses carefully before investing. The prospectus contains this information and other information about the fund.
RETIREMENT | INVESTMENTS | INSURANCE
voyainvestments.com
Annual Report
March 31, 2023
■
Voya VACS Series EMCD Fund (formerly, Voya Emerging Markets Corporate Debt Fund)
■
Voya VACS Series EMHCD Fund
■
Voya VACS Series HYB Fund
■
Voya VACS Series SC Fund
| | | As permitted by regulations adopted by the U.S. Securities and Exchange Commission, paper copies of the fund’s annual and semi-annual shareholder reports, like this annual report, are not sent by mail, unless you specifically request paper copies of the reports. Instead, the reports will be made available on the Voya funds’ website (https://individuals.voya.com/literature), and you will be notified by mail each time a report is posted and provided with a website link to access the report. | | |
| | | If you already elected to receive shareholder reports electronically, you need not take any action. You may elect to receive shareholder reports and other communications from the fund electronically anytime by contacting your financial intermediary (such as a broker-dealer or bank) or, if you are a direct investor, by calling 1-800-992-0180 or by sending an e-mail request to Voyaim_literature@voya.com. | | |
| | | You may elect to receive all future reports in paper free of charge. If you received this document in the mail, please follow the instructions to elect to continue receiving paper copies of your shareholder reports. If you received this document through a financial intermediary, you can contact your financial intermediary to request that you continue to receive paper copies of your shareholder reports. If you invest directly with us, you can call 1-800-992-0180 or send an email request to Voyaim_literature@voya.com to let each fund know you wish to continue receiving paper copies of your shareholder reports. Your election to receive reports in paper will apply to all funds held in your account if you invest through your financial intermediary or all funds held with the Voya funds complex if you invest directly with the funds. | | |
| | | This report is submitted for general information to shareholders of the Voya mutual funds. It is not authorized for distribution to prospective shareholders unless accompanied or preceded by a prospectus which includes details regarding the funds’ investment objectives, risks, charges, expenses and other information. This information should be read carefully. | | |
| | | | | E-Delivery Sign-up – details inside | |
| | | | | | | 2 | | |
| | | | | | | 10 | | |
| | | | | | | 11 | | |
| | | | | | | 12 | | |
| | | | | | | 13 | | |
| | | | | | | 14 | | |
| | | | | | | 16 | | |
| | | | | | | 17 | | |
| | | | | | | 28 | | |
| | | | | | | 68 | | |
| | | | | | | 69 | | |
| | | | | | | 73 | | |
| | | | | | Go Paperless with E-Delivery! | | | | | |
| | | Sign up now for on-line prospectuses, fund reports, and proxy statements. | | |
| | | Just go to individuals.voya.com/page/e-delivery, follow the directions and complete the quick 5 Steps to Enroll. | | |
| | | You will be notified by e-mail when these communications become available on the internet. | | |
PROXY VOTING INFORMATION
A description of the policies and procedures that the Funds use to determine how to vote proxies related to portfolio securities is available: (1) without charge, upon request, by calling Shareholder Services toll-free at (800) 992-0180; (2) on the Funds’ website at www.voyainvestments.com; and (3) on the U.S. Securities and Exchange Commission’s (“SEC’s”) website at www.sec.gov. Information regarding how the Funds voted proxies related to portfolio securities during the most recent 12-month period ended June 30 is available without charge on the Funds’ website at www.voyainvestments.com and on the SEC’s website at www.sec.gov.
QUARTERLY PORTFOLIO HOLDINGS
The Funds file their complete schedule of portfolio holdings with the SEC for the first and third quarters of each fiscal year on Form NPORT-P. The Funds’ Forms NPORT-P are available on the SEC’s website at www.sec.gov. Each Fund’s complete schedule of portfolio holdings is available at: www.voyainvestments.com and without charge upon request from the Fund by calling Shareholder Services toll-free at (800) 992-0180.
[This Page Intentionally Left Blank]
| | | Index | | | | Description | | |
| | | Bloomberg High Yield Bond — 2% Issuer Constrained Composite Index | | | | An index that includes all fixed income securities having a maximum quality rating of Ba1, a minimum amount outstanding of $150 million, and at least one year to maturity. | | |
| | | Bloomberg U.S. Securitized MBS/ABS/CMBS Index | | | | An index of asset-backed securities, collateralized mortgage-backed securities (ERISA eligible), and fixed-rate mortgage-backed securities. | | |
| | | JP Morgan Corporate Emerging Markets Bond Index Diversified | | | | A liquid global benchmark for US-dollar corporate emerging market bonds. The Corporate Emerging Markets Bond Index (“CEMBI”) Diversified limits the weights of those index countries with larger corporate debt stocks by only including a specified portion of these countries’ eligible current face amounts of debt outstanding. The CEMBI Diversified results in well-distributed, balanced weightings for countries included in the index. | | |
| | | JP Morgan Emerging Markets Bond Index Global Diversified | | | | Tracks total returns for US dollar-denominated debt instruments issued by emerging market sovereign and quasi-sovereign entities: Brady bonds, loans, and Eurobonds. It limits the weights of those index countries with larger debt stocks by only including specified portions of these countries’ eligible current face amounts of debt outstanding. | | |
| Portfolio Managers’ Report | Voya VACS Series EMCD Fund |
| | Geographic Diversification
as of March 31, 2023
(as a percentage of net assets) | |
| | | | | | |
| | South Korea | | | 7.9% | |
| | Mexico | | | 7.4% | |
| | Israel | | | 6.0% | |
| | India | | | 5.9% | |
| | Brazil | | | 5.5% | |
| | United Arab Emirates | | | 5.4% | |
| | Chile | | | 5.0% | |
| | Saudi Arabia | | | 4.8% | |
| | Colombia | | | 4.6% | |
| | Macau | | | 3.8% | |
| | Countries between 0.2% – 3.7%^ | | | 34.3% | |
| | Assets in Excess of Other Liabilities* | | | 9.4% | |
| | Net Assets | | | 100.0% | |
| | *
Includes short-term investments. | |
| | ^
Includes 22 countries, which each represents 0.2% – 3.7% of net assets. | |
| | Portfolio holdings are subject to change daily. | |
Performance: For the year ended March 31, 2023, the Fund’s shares returned -1.27%, compared to the JP Morgan Corporate Emerging Markets Bond Index Diversified (the “Index” or “JPM CEMBI”), which returned -2.15% for the same period.
Portfolio Specifics: Emerging markets (“EM”) debt posted another quarter of positive returns despite a pullback in spreads in late February and through March. EM continued its rally from last year, with spreads tightening through late February around stronger global growth prospects and China’s continued reopening. Spreads retreated late in the quarter, however, amidst elevated inflation fears and several bank failures in the United States.
The Fund outperformed its benchmark, the JPM CEMBI, for the one-year period ending March 31, 2023. The main contributors to outperformance included the Fund’s allocation to Russian sovereign and corporate bonds, which rebounded strongly over the period, as well as underweight positioning to distressed names such as Pakistan. Other contributors included its underweight Ukraine, and overweights in Saudi Arabia and Chile. Detractors included the Fund’s allocations to China, South Korea, and United Arab Emirates.
| | Top Ten Holdings
as of March 31, 2023*
(as a percentage of net assets) | |
| | | | | | |
| | Sands China Ltd., 5.900%,
08/08/28 | | | 1.7% | |
| | Melco Resorts Finance Ltd., 5.750%,
07/21/28 | | | 1.4% | |
| | Saudi Arabian Oil Co., 2.250%, 11/24/30 | | | 1.3% | |
| | Ecopetrol SA, 8.875%, 01/13/33 | | | 1.2% | |
| | Finance Department Government of Sharjah, 6.500%, 11/23/32 | | | 1.1% | |
| | Medco Bell Pte Ltd., 6.375%, 01/30/27 | | | 1.1% | |
| | JSW Steel Ltd., 5.050%, 04/05/32 | | | 1.0% | |
| | Teva Pharmaceutical Finance Netherlands III BV, 8.125%, 09/15/31 | | | 1.0% | |
| | POSCO, 5.625%, 01/17/26 | | | 1.0% | |
| | Banco de Credito del Peru S.A., 3.125%,
07/01/30 | | | 1.0% | |
| | *
Excludes short-term investments. | |
| | Portfolio holdings are subject to change daily. | |
*
Effective November 17, 2022, the Fund changed its name from “Voya Emerging Markets Corporate Debt Fund” to “Voya VACS Series EMCD Fund.” In conjunction with the name change, the Fund’s shares are no longer designated as “Class P.”
The views expressed in this commentary are informed opinions. They should not be considered promises or advice. The views expressed reflect those of the portfolio managers, only through the end of the period as stated on the cover. The portfolio managers’ views are subject to change at any time based on market and other conditions.
Portfolio holdings and characteristics are subject to change and may not be representative of current holdings and characteristics. Fund holdings are subject to change daily. The outlook for this Fund may differ from that presented for other Voya mutual funds. This report contains statements that may be “forward-looking” statements. Actual results may differ materially from those projected in the “forward-looking” statements. The Fund's performance returns shown reflect applicable fee waivers and/or expense limits in effect during this period. Absent such fee waivers/expense limitations, if any, performance would have been lower. Performance for the different classes of shares will vary based on differences in fees associated with each class. An index has no cash in its portfolio and imposes no sales charges. An investor cannot invest directly in an index.
| Voya VACS Series EMCD Fund | Portfolio Managers’ Report |
| | | Average Annual Total Returns for the Periods Ended March 31, 2023 | | |
| | | | | | 1 Year | | | 5 Year | | | 10 year | | |
| | | Voya VACS Series EMCD Fund | | | | | -1.27% | | | | | | 1.88% | | | | | | 3.04% | | | |
| | | JPM CEMBI | | | | | -2.15% | | | | | | 1.59% | | | | | | 2.89% | | | |
| | | | | | | | | | | | |
Based on a $10,000 initial investment, the graph and table above illustrate the total return of Voya VACS Series EMCD Fund against the index indicated. The index is unmanaged, has no cash in its portfolio and imposes no sales charges. An investor cannot invest directly in an index.
The performance graph and table do not reflect the deduction of taxes that a shareholder will pay on Fund distributions or the redemption of Fund shares.
The performance shown includes, if applicable, the effect of fee waivers and/or expense reimbursements by the Investment Adviser and/or other service providers, which have the effect of increasing total net return. Had all fees
and expenses been considered, the total net returns would have been lower.
Performance data represents past performance and is no assurance of future results. Investment return and principal value of an investment in the Fund will fluctuate. Shares, when sold, may be worth more or less than their original cost. The Fund’s current performance may be lower or higher than the performance data shown. Please log on to www.voyainvestments.com or call (800) 992-0180 to get performance through the most recent month end.
Fund holdings are subject to change daily.
| Portfolio Managers’ Report | Voya VACS Series EMHCD Fund |
| | Geographic Diversification
as of March 31, 2023
(as a percentage of net assets) | |
| | | | | | |
| | Mexico | | | 8.9% | |
| | Indonesia | | | 7.0% | |
| | Chile | | | 5.3% | |
| | Panama | | | 4.5% | |
| | Saudi Arabia | | | 4.4% | |
| | United Arab Emirates | | | 3.5% | |
| | Dominican Republic | | | 3.2% | |
| | Oman | | | 3.0% | |
| | South Africa | | | 3.1% | |
| | Colombia | | | 2.8% | |
| | Countries between 0.0% – 2.7%^ | | | 47.8% | |
| | Assets in Excess of Other Liabilities* | | | 6.5% | |
| | Net Assets | | | 100.0% | |
| | *
Includes short-term investments. | |
| | ^
Includes 43 countries, which each represents 0.0% – 2.7% of net assets. | |
| | Portfolio holdings are subject to change daily. | |
Performance: For the period since inception on February 17, 2023 through March 31, 2023, the Fund’s shares returned 0.98% compared to the JP Morgan Emerging Markets Bond Index Global Diversified (the “Index” or “JPM EMBI”), which returned 0.80% for the same period.
Portfolio Specifics: Emerging markets (“EM”) debt posted another quarter of positive returns despite a pullback in spreads in late February and through March. EM continued its rally from last year, with spreads tightening through late February around stronger global growth prospects and China’s continued reopening. Spreads retreated late in the quarter, however, amidst elevated inflation fears and several bank failures in the United States.
The Fund outperformed its benchmark for the period February 17 through March 31, 2023. Outperformance was driven by underweight positioning in Egypt, Pakistan, and Bolivia. Top detractors included overweight positioning in Panama, Indonesia, and Mexico. From an asset allocation perspective, the Fund’s underweight sovereigns was additive, while its overweight quasi-sovereigns and EM corporates detracted. From a quality standpoint,| | Top Ten Holdings
as of March 31, 2023*
(as a percentage of net assets) | |
| | | | | | |
| | Uruguay Government International Bond, 5.750%, 10/28/34 | | | 1.8% | |
| | Saudi Government International Bond, 3.450%, 02/02/61 | | | 1.5% | |
| | Bahrain Government International Bond, 7.375%, 05/14/30 | | | 1.5% | |
| | MDGH GMTN RSC Ltd., 5.500%, 04/28/33 | | | 1.4% | |
| | Republic of South Africa Government International Bond, 4.300%, 10/12/28 | | | 1.3% | |
| | Petronas Capital Ltd., 4.800%, 04/21/60 | | | 1.2% | |
| | OQ SAOC, 5.125%, 05/06/28 | | | 1.2% | |
| | Indonesia Government International Bond, 8.500%, 10/12/35 | | | 1.2% | |
| | Philippine Government International Bond, 5.000%, 07/17/33 | | | 1.1% | |
| | Saudi Government International Bond, 5.500%, 10/25/32 | | | 1.1% | |
| | *
Excludes short-term investments. | |
| | Portfolio holdings are subject to change daily. | |
Current Strategy & Outlook: Continuing the trend from much of 2022, we believe external factors such as the U.S. growth outlook and developed market central banks’ attempts to combat high inflation continue to drive EM asset prices. The U.S. growth path is certainly the primary near term driver, while downside risks have increased following the banking stress in both the U.S. and Europe. China’s reopening appears to be maintaining its momentum driven by the services sector and a bottoming of the housing market, while also providing an increased optimism regarding the EM and global growth outlook. With that said, EM Purchasing Managers’ Index (“PMI”) is showing a mixed picture, with growth expected to be more muted in Latin America and Central and Eastern Europe, while pockets of southeast Asia and India holding up better. We believe the organization of the Petroleum Exporting Countries (“OPEC”) decisions to cut output should offset signs of weak demand and provide a floor to oil prices at levels that are supportive for exporters. In our opinion, absolute yields remain attractive relative to long term historical levels despite the recent rally, but we do expect defaults to pick up across distressed issuers. EM Hard Currency spreads screen more attractive after the widening later in the period, but we continue to favor an up-in-quality bias in the near term.
The views expressed in this commentary are informed opinions. They should not be considered promises or advice. The views expressed reflect those of the portfolio managers, only through the end of the period as stated on the cover. The portfolio managers’ views are subject to change at any time based on market and other conditions.
Portfolio holdings and characteristics are subject to change and may not be representative of current holdings and characteristics. Fund holdings are subject to change daily. The outlook for this Fund may differ from that presented for other Voya mutual funds. This report contains statements that may be “forward-looking” statements. Actual results may differ materially from those projected in the “forward-looking” statements. The Fund’s performance returns shown reflect applicable fee waivers and/or expense limits in effect during this period. Absent such fee waivers/expense limitations, if any, performance would have been lower. Performance for the different classes of shares will vary based on differences in fees associated with each class. An index has no cash in its portfolio and imposes no sales charges. An investor cannot invest directly in an index.
| Voya VACS Series EMHCD Fund | Portfolio Managers’ Report |
| | | Cumulative Total Returns for the Period Ended March 31, 2023 | | |
| | | | | | | | | | | | Since
Inception
February 17,
2023 | | |
| | | Voya VACS Series EMHCD Fund | | | | | | | | | | | 0.98% | | | |
| | | JPM EMBI(1) | | | | | | | | | | | 0.80% | | | |
| | | | | | | | | |
Based on a $10,000 initial investment, the graph and table above illustrate the total return of Voya VACS Series EMHCD Fund against the index indicated. The index is unmanaged, has no cash in its portfolio and imposes no sales charges. An investor cannot invest directly in an index.
The Fund’s performance is shown both with and without the imposition of sales charges.
The performance graph and table do not reflect the deduction of taxes that a shareholder will pay on Fund distributions or the redemption of Fund shares.
The performance shown includes, if applicable, the effect of fee waivers and/or expense reimbursements by the Investment Adviser and/or other service providers, which have the effect of increasing total net return. Had all fees and expenses been considered, the total net returns would have been lower.
Performance data represents past performance and is no assurance of future results. Investment return and principal value of an investment in the Fund will fluctuate. Shares, when sold, may be worth more or less than their original cost. The Fund’s current performance may be lower or higher than the performance data shown. Please log on to www.voyainvestments.com or call (800) 992-0180 to get performance through the most recent month end.
It is important to note that the Fund has a limited operating history. Performance over a longer period of time may be more meaningful than short-term performance.
Fund holdings are subject to change daily.
(1)
Since inception performance for the index is shown as of February 17, 2023.
| Portfolio Managers’ Report | Voya VACS Series HYB Fund |
| | Investment Type Allocation
as of March 31, 2023
(as a percentage of net assets) | |
| | | | | | |
| | Corporate Bonds/Notes | | | 93.0% | |
| | Bank Loans | | | 1.0% | |
| | Common Stock | | | 0.3% | |
| | Convertible Bonds/Notes | | | 0.1% | |
| | Assets in Excess of Other Liabilities | | | 5.6% | |
| | Net Assets | | | 100.0% | |
| | Portfolio holdings are subject to change daily. | |
Performance: For the period since inception on February 24, 2023, through March 31, 2023, the Fund’s shares provided a total return of 1.86% compared to the Bloomberg High Yield — 2% Issuer Constrained Composite, which returned 1.53% for the same period.
Portfolio Specifics: Financial markets came under pressure during the period due to the failure of three regional U.S. banks, with two being taken into receivership by the FDIC. The banking crisis had spread across the Atlantic, as Credit Suisse was acquired by UBS in a government-backed deal. These developments heightened recession concerns and worsened the outlook for lending, as rates rallied to end the period lower. Spreads for the high yield (“HY”) bond market widened 36 basis points (“bp”) on an option-adjusted basis (OAS) to 455 bp.
Within the Fund, security selection in retailers, as well as security selection in healthcare and pharmaceuticals and an underweight to wirelines, contributed to relative performance. By contrast, the Fund experienced detractions from security selection in media and entertainment, cable and satellite and chemicals.
Current Strategy & Outlook: In our opinion, strains in parts of the financial system are likely to cause the Fed to trim its tightening plans. We believe quick action by regulators has largely addressed concerns of systemic risk in the banking system. In our view, bank balance sheets are generally healthy, and the lack of fundamental consumer and corporate imbalances should limit the severity of any sort of economic downturn that may materialize.
| | Top Ten Holdings
as of March 31, 2023
(as a percentage of net assets) | |
| | | | | | |
| | Royal Caribbean Cruises Ltd., 5.375%,
07/15/27 | | | 0.7% | |
| | Sirius XM Radio, Inc., 5.000%, 08/01/27 | | | 0.6% | |
| | Sprint Corp., 7.125%, 06/15/24 | | | 0.6% | |
| | Ford Motor Credit Co. LLC, 4.125%,
08/17/27 | | | 0.6% | |
| | American Airlines, Inc./AAdvantage Loyalty IP Ltd., 5.750%, 04/20/29 | | | 0.6% | |
| | Carnival Corp., 6.000%, 05/01/29 | | | 0.6% | |
| | Univision Communications, Inc., 6.625%, 06/01/27 | | | 0.5% | |
| | EnLink Midstream LLC, 5.375%, 06/01/29 | | | 0.5% | |
| | PetSmart, Inc. / PetSmart Finance Corp., 7.750%, 02/15/29 | | | 0.5% | |
| | International Game Technology PLC, 5.250%, 01/15/29 | | | 0.5% | |
| | Portfolio holdings are subject to change daily. | |
We believe the HY market would be able to reasonably navigate a mild recessionary outcome with no broad contagion risk from the banking fallout. In terms of sector positioning, we remain positive on the energy sector and are looking to add some exposure after trimming exposure early in the year on tight valuations. Our view is shaped by a positive surprise from Organization of the Petroleum Exporting Countries to support prices in the near term and ongoing structural tailwinds given capital discipline of energy companies and underinvestment in the sector. Additionally, we also remain overweight building materials due to favorable supply and demand dynamics in the housing sector, despite the increase in mortgage rates. With the widening in spreads in March, valuations appear more attractive, and the fundamental health of HY issuers remains generally adequate. Nonetheless, we expect dispersion in performance among borrowers to continue and pockets of stress to emerge as the cycle matures. As such, our focus will be on security selection and finding pockets of value in an increasingly dispersed market.
*
Effective May 1, 2023, Mohamed Basma, CFA was added as a portfolio manager for the Fund and Richard Cumberledge, CFA was removed as a portfolio manager for the Fund.
The views expressed in this commentary are informed opinions. They should not be considered promises or advice. The views expressed reflect those of the portfolio managers, only through the end of the period as stated on the cover. The portfolio managers’ views are subject to change at any time based on market and other conditions.
Portfolio holdings and characteristics are subject to change and may not be representative of current holdings and characteristics. Fund holdings are subject to change daily. The outlook for this Fund may differ from that presented for other Voya mutual funds. This report contains statements that may be “forward-looking” statements. Actual results may differ materially from those projected in the “forward-looking” statements. The Fund’s performance returns shown reflect applicable fee waivers and/or expense limits in effect during this period. Absent such fee waivers/expense limitations, if any, performance would have been lower. Performance for the different classes of shares will vary based on differences in fees associated with each class. An index has no cash in its portfolio and imposes no sales charges. An investor cannot invest directly in an index.
| Voya VACS Series HYB Fund | Portfolio Managers’ Report |
| | | Cumulative Total Returns for the Period Ended March 31, 2023 | | |
| | | | | | | | | | | | Since
Inception
February 24,
2023 | | |
| | | Voya VACS Series HYB Fund | | | | | | | | | | | 1.86% | | | |
| | | Bloomberg High Yield Bond – 2% Issuer Constrained Composite(1) | | | | | 1.53% | | | |
| | | | | | | | | |
Based on a $10,000 initial investment, the graph and table above illustrate the total return of Voya VACS Series HYB Fund against the index indicated. The index is unmanaged, has no cash in its portfolio and imposes no sales charges. An investor cannot invest directly in an index.
The Fund’s performance is shown both with and without the imposition of sales charges.
The performance graph and table do not reflect the deduction of taxes that a shareholder will pay on Fund distributions or the redemption of Fund shares.
The performance shown includes, if applicable, the effect of fee waivers and/or expense reimbursements by the Investment Adviser and/or other service providers, which have the effect of increasing total net return. Had all fees and expenses been considered, the total net returns would have been lower.
Performance data represents past performance and is no assurance of future results. Investment return and principal value of an investment in the Fund will fluctuate. Shares, when sold, may be worth more or less than their original cost. The Fund’s current performance may be lower or higher than the performance data shown. Please log on to www.voyainvestments.com or call (800) 992-0180 to get performance through the most recent month end.
It is important to note that the Fund has a limited operating history. Performance over a longer period of time may be more meaningful than short-term performance.
Fund holdings are subject to change daily.
(1)
Since inception performance for the index is shown as of February 24, 2023.
| Portfolio Managers’ Report | Voya VACS Series SC Fund |
| | Investment Type Allocation
as of March 31, 2023
(as a percentage of net assets) | |
| | | | | | |
| | Commercial Mortgage-Backed Securities | | | 40.9% | |
| | Collateralized Mortgage Obligations | | | 30.1% | |
| | Asset-Backed Securities | | | 23.0% | |
| | Assets in Excess of Other Liabilities* | | | 6.0% | |
| | Net Assets | | | 100.0% | |
| | *
Includes short-term investments. | |
| | Portfolio holdings are subject to change daily. | |
Performance: For the period since inception on March 3, 2023, through March 31, 2023, the Fund’s shares provided a total return of 0.35% compared to the Bloomberg U.S. Securitized MBS/ABS/CMBS Index (the “Index” or “Bloomberg U.S. Securitized”), which returned 2.26% for the same period.
Portfolio Specifics: Financial markets came under pressure during the period due to the failure of three regional U.S. banks, with two being taken into receivership by the FDIC. The banking crisis had spread across the Atlantic, as Credit Suisse was acquired by UBS in a government-backed deal. These developments heightened recession concerns and worsened the outlook for lending, as rates rallied to end the period lower. Yield spreads across securitized credit widened in March due to the stress in the banking sector. This was especially acute within commercial mortgage-backed securities (“CMBS”) where spreads were wider across the credit curve.
Within the Fund, allocations to CMBS and non-agency residential mortgage-backed securities (“RMBS”) detracted from performance. Security selection within CMBS also weighed on returns during the month of March as more credit sensitive tranches of the structure were impacted to a greater degree. By contrast, the Fund experienced contributions from its allocation to asset backed securities (“ABS”), though selection within ABS proved more challenging, driven by allocations to off-index collateralized loan obligations (“CLOs”).
| | Top Ten Holdings
as of March 31, 2023*
(as a percentage of net assets) | |
| | | | | | |
| | RFM Reremic Trust 2022-FRR1 AB64, 2.300%, 03/01/50 | | | 2.1% | |
| | RFM Reremic Trust 2022-FRR1 AB55, 1.040%, 03/28/49 | | | 1.6% | |
| | RFM Reremic Trust 2022-FRR1 AB60, 2.450%, 11/08/49 | | | 1.4% | |
| | Freddie Mac STACR REMIC Trust 2022-DNA1 B1, 7.960%, 01/25/42 | | | 1.2% | |
| | Freddie Mac Structured Agency Credit Risk Debt Notes 2022-DNA2 B1, 9.310%, 02/25/42 | | | 1.2% | |
| | WFRBS Commercial Mortgage Trust 2013-C14 D, 3.975%, 06/15/46 | | | 1.1% | |
| | LSTAR Commercial Mortgage Trust 2016-4 F, 4.611%, 03/10/49 | | | 1.1% | |
| | Series RR 2014-1 F Trust, 05/25/47 | | | 1.1% | |
| | Prima Capital CRE Securitization 2019-7A D Ltd., 4.250%, 12/25/50 | | | 1.1% | |
| | GAM Resecuritization Trust 2022-FRR3 BK47, 2.030%, 11/27/50 | | | 0.9% | |
| | *
Excludes short-term investments. | |
| | Portfolio holdings are subject to change daily. | |
We remain relatively defensive, with a preference for higher quality, and consumer-related risk. CMBS, in our opinion, also looks attractive for investors willing to accept a certain level of risk. Commercial real estate (“CRE”) will likely face difficult refinancing conditions going forward, and this will test more subordinated CMBS tranches. However, in a departure from the previous, long-standing paradigm of “location, location, location”, we believe property type has emerged as the key dimension that will likely drive future credit performance. In CMBS, our preference is tilted toward multi-family properties, and away from office. Our outlooks for ABS and RMBS are more constructive. Within ABS, we focus on the consumer-oriented products that provide access to a unique combination of fixed income attributes: U.S. centric, diverse mix of sub-sectors, wide array of forms of consumer credit, housed in robust structures that command liquidity with relatively short spread durations and an income component. Time tested performance and efficient capital regimes should contribute to favorable liquidity from a broad range of investor types over the long term. Turning to mortgage credit, housing markets have definitively slowed, with real implications for economic activity in recent quarters. However, the decline in prices and related activity has proven healthy, helping undermine inflation and correct excesses in home prices in certain areas. Mortgage credit behavior has remained stable throughout the slowdown, well underpinned by strong underwriting and regulatory oversight, historically high tappable equity, a burgeoning millennial demographic, affinity for home ownership, a low-rate mortgage base for most holders and a still strong labor market.
The views expressed in this commentary are informed opinions. They should not be considered promises or advice. The views expressed reflect those of the portfolio managers, only through the end of the period as stated on the cover. The portfolio managers’ views are subject to change at any time based on market and other conditions.
Portfolio holdings and characteristics are subject to change and may not be representative of current holdings and characteristics. Fund holdings are subject to change daily. The outlook for this Fund may differ from that presented for other Voya mutual funds. This report contains statements that may be “forward-looking” statements. Actual results may differ materially from those projected in the “forward-looking” statements. The Fund’s performance returns shown reflect applicable fee waivers and/or expense limits in effect during this period. Absent such fee waivers/expense limitations, if any, performance would have been lower. Performance for the different classes of shares will vary based on differences in fees associated with each class. An index has no cash in its portfolio and imposes no sales charges. An investor cannot invest directly in an index.
| Voya VACS Series SC Fund | Portfolio Managers’ Report |
| | | Cumulative Total Returns for the Period Ended March 31, 2023 | | |
| | | | | | | | | | | | Since
Inception
March 3,
2023 | | |
| | | Voya VACS Series SC Fund | | | | | | | | | | | 0.35% | | | |
| | | Bloomberg U.S. Securitized(1) | | | | | | | | | | | 2.26% | | | |
| | | | | | | | | |
Based on a $10,000 initial investment, the graph and table above illustrate the total return of Voya VACS Series SC Fund against the index indicated. The index is unmanaged, has no cash in its portfolio and imposes no sales charges. An investor cannot invest directly in an index.
The Fund’s performance is shown both with and without the imposition of sales charges.
The performance graph and table do not reflect the deduction of taxes that a shareholder will pay on Fund distributions or the redemption of Fund shares.
The performance shown includes, if applicable, the effect of fee waivers and/or expense reimbursements by the Investment Adviser and/or other service providers, which have the effect of increasing total net return. Had all fees and expenses been considered, the total net returns would have been lower.
Performance data represents past performance and is no assurance of future results. Investment return and principal value of an investment in the Fund will fluctuate. Shares, when sold, may be worth more or less than their original cost. The Fund’s current performance may be lower or higher than the performance data shown. Please log on to www.voyainvestments.com or call (800) 992-0180 to get performance through the most recent month end.
It is important to note that the Fund has a limited operating history. Performance over a longer period of time may be more meaningful than short-term performance.
Fund holdings are subject to change daily.
(1)
Since inception performance for the index is shown as of March 3, 2023.
SHAREHOLDER EXPENSE EXAMPLES (Unaudited)
As a shareholder of a Fund, you incur two types of costs: (1) transaction costs, including sales charges (loads) on purchase payments, redemption fees, and exchange fees, and (2) ongoing costs, including management fees, distribution and/or service (12b-1) fees, and other Fund expenses. These Examples are intended to help you understand your ongoing costs (in dollars) of investing in a Fund and to compare these costs with the ongoing costs of investing in other mutual funds.
The Examples are based on an investment of $1,000 invested at the beginning of the period and held for the entire period from October 1, 2022 to March 31, 2023. The Funds’ expenses are shown without the imposition of any sales charges or fees. Expenses would have been higher if such charges were included.
Actual Expenses
The left section of the table shown below, “Actual Fund Return,” provides information about actual account values and actual expenses. You may use the information in this section, together with the amount you invested, to estimate the expenses that you paid over the period. Simply divide your account value by $1,000 (for example, an $8,600 account value divided by $1,000 = 8.6), then multiply the result by the number in the first section under the heading entitled “Expenses Paid During the Period” to estimate the expenses you paid on your account during this period.
Hypothetical Example for Comparison Purposes
The right section of the table shown below, “Hypothetical (5% return before expenses)” provides information about hypothetical account values and hypothetical expenses based on a Fund’s actual expense ratio and an assumed rate of return of 5% per year before expenses, which is not the Fund’s actual return. The hypothetical account values and expenses may not be used to estimate the actual ending account balance or expenses you paid for the period. You may use this information to compare the ongoing costs of investing in each Fund and other mutual funds. To do so, compare this 5% hypothetical example with the 5% hypothetical examples that appear in the shareholder reports of the other mutual funds.
Please note that the expenses shown in the table are meant to highlight your ongoing costs only and do not reflect any transactional costs, such as sales charges (loads), redemption fees, or exchange fees. Therefore, the hypothetical section of the table is useful in comparing ongoing costs only, and will not help you determine the relative total costs of owning different mutual funds. In addition, if these transactional costs were included, your costs would have been higher.
| | | | Actual Fund Return | | | Hypothetical (5% return before expenses) | |
| | | | Beginning
Account
Value
October 1,
2022 | | | Ending
Account
Value
March 31,
2023 | | | Annualized
Expense
Ratio | | | Expenses Paid
During the
Period Ended
March 31,
2023* | | | Beginning
Account
Value
October 1,
2022 | | | Ending
Account
Value
March 31,
2023 | | | Annualized
Expense
Ratio | | | Expenses Paid
During the
Period Ended
March 31,
2023* | |
| Voya VACS Series EMCD Fund | | | | $ | 1,000.00 | | | | | $ | 1,081.50 | | | | | | 0.10% | | | | | $ | 0.52 | | | | | $ | 1,000.00 | | | | | $ | 1,024.43 | | | | | | 0.10% | | | | | $ | 0.50 | | |
| Voya VACS Series EMHCD Fund(1) | | | | | 1,000.00 | | | | | | 1,009.80 | | | | | | 0.08% | | | | | | 0.09 | | | | | | 1,000.00 | | | | | | 1,024.53 | | | | | | 0.08% | | | | | | 0.40 | | |
| Voya VACS Series HYB Fund(2) | | | | | 1,000.00 | | | | | | 1,018.60 | | | | | | 0.07% | | | | | | 0.07 | | | | | | 1,000.00 | | | | | | 1,024.58 | | | | | | 0.07% | | | | | | 0.35 | | |
| Voya VACS Series SC Fund(3) | | | | | 1,000.00 | | | | | | 1,003.50 | | | | | | 0.05% | | | | | | 0.04 | | | | | | 1,000.00 | | | | | | 1,024.68 | | | | | | 0.05% | | | | | | 0.25 | | |
*
Expenses are equal to each Fund’s respective annualized expense ratios multiplied by the average account value over the period, multiplied by 182/365 to reflect the most recent fiscal half-year.
(1)
Commencement of operations was February 17, 2023. Expenses paid for the actual Fund’s return reflect the 43-day period ended March 31, 2023.
(2)
Commencement of operations was February 24, 2023. Expenses paid for the actual Fund’s return reflect the 36-day period ended March 31, 2023.
(3)
Commencement of operations was March 3, 2023. Expenses paid for the actual Fund’s return reflect the 29-day period ended March 31, 2023.
REPORT OF INDEPENDENT REGISTERED PUBLIC ACCOUNTING FIRM
To the Shareholders of Voya VACS Series EMCD Fund (formerly, Voya Emerging Markets Corporate Debt Fund), Voya VACS Series EMHCD Fund, Voya VACS Series HYB Fund and Voya VACS Series SC Fund and the Board of Trustees of Voya Separate Portfolios Trust and Voya Funds Trust
Opinion on the Financial Statements
We have audited the accompanying statements of assets and liabilities of Voya VACS Series EMCD Fund (formerly, Voya Emerging Markets Corporate Debt Fund), Voya VACS Series EMHCD Fund, Voya VACS Series HYB Fund and Voya VACS Series SC Fund (collectively referred to as the “Funds”) (each a fund constituting Voya Separate Portfolios Trust, Voya Separate Portfolios Trust, Voya Funds Trust and Voya Separate Portfolios Trust, respectively (collectively referred to as the “Registrants”)), including the portfolios of investments, as of March 31, 2023, and the related statements of operations and changes in net assets and the financial highlights for each of the periods indicated in the table below and the related notes (collectively referred to as the “financial statements”). In our opinion, the financial statements present fairly, in all material respects, the financial position of each of the Funds at March 31, 2023 and the results of their operations, changes in net assets and financial highlights for each of the periods indicated in the table below, in conformity with U.S. generally accepted accounting principles.
Individual fund constituting
the Registrants | | | Statement of Operations | | | Statements of changes in
net assets | | | Financial highlights | |
| Voya VACS Series EMCD Fund (formerly, Voya Emerging Markets Corporate Debt Fund) | | | For the year ended March 31, 2023 | | | For each of the two years in the period ended March 31, 2023 | | | For each of the four years in the period ended March 31, 2023 | |
| Voya VACS Series EMHCD Fund | | | For the period from February 17, 2023 (commencement of operations) through March 31, 2023 | |
| Voya VACS Series HYB Fund | | | For the period from February 24, 2023 (commencement of operations) through March 31, 2023 | |
| Voya VACS Series SC Fund | | | For the period from March 3, 2023 (commencement of operations) through March 31, 2023 | |
The financial highlights for the year ended March 31, 2019 were audited by another independent registered public accounting firm whose report, dated May 23, 2019, expressed an unqualified opinion on those financial highlights.
Basis for Opinion
These financial statements are the responsibility of the Registrants’ management. Our responsibility is to express an opinion on each of the Funds’ financial statements based on our audits. We are a public accounting firm registered with the Public Company Accounting Oversight Board (United States) (“PCAOB”) and are required to be independent with respect to the Registrants in accordance with the U.S. federal securities laws and the applicable rules and regulations of the Securities and Exchange Commission and the PCAOB.
We conducted our audits in accordance with the standards of the PCAOB. Those standards require that we plan and perform the audit to obtain reasonable assurance about whether the financial statements are free of material misstatement, whether due to error or fraud. The Registrants are not required to have, nor were we engaged to perform, an audit of the Registrants’ internal control over financial reporting. As part of our audits, we are required to obtain an understanding of internal control over financial reporting but not for the purpose of expressing an opinion on the effectiveness of the Registrants’ internal control over financial reporting. Accordingly, we express no such opinion.
Our audits included performing procedures to assess the risks of material misstatement of the financial statements, whether due to error or fraud, and performing procedures that respond to those risks. Such procedures included examining, on a test basis, evidence regarding the amounts and disclosures in the financial statements. Our procedures included confirmation of securities owned as of March 31, 2023, by correspondence with the custodian, brokers and others; when replies were not received from brokers and others, we performed other auditing procedures. Our audits also included evaluating the accounting principles used and significant estimates made by management, as well as evaluating the overall presentation of the financial statements. We believe that our audits provide a reasonable basis for our opinion.
We have served as the auditor of one or more Voya investment companies since 2019.
Boston, Massachusetts
May 30, 2023
STATEMENTS OF ASSETS AND LIABILITIES as of March 31, 2023
| | | | Voya VACS Series
EMCD Fund | | | Voya VACS Series
EMHCD Fund | | | Voya VACS Series
HYB Fund | | | Voya VACS Series
SC Fund | |
| ASSETS: | | | | | | | | | | | | | | | | | | | | | | | | | |
| Investments in securities at fair value+* | | | | $ | 83,988,102 | | | | | $ | 132,504,091 | | | | | $ | 116,952,217 | | | | | $ | 222,323,670 | | |
| Short-term investments at fair value† | | | | | 12,542,035 | | | | | | 10,162,867 | | | | | | — | | | | | | 12,591,633 | | |
| Cash | | | | | 602,367 | | | | | | 297,570 | | | | | | 5,413,209 | | | | | | 922 | | |
| Cash collateral for futures contracts | | | | | 219,040 | | | | | | 353,735 | | | | | | — | | | | | | 1,058,680 | | |
| Receivables: | | | | | | | | | | | | | | | | | | | | | | | | | |
| Investment securities sold | | | | | 3,989,901 | | | | | | 4,336,327 | | | | | | — | | | | | | — | | |
| Fund shares sold | | | | | — | | | | | | 468 | | | | | | 308,311 | | | | | | 1,776 | | |
| Dividends | | | | | 8,520 | | | | | | 18,504 | | | | | | — | | | | | | 18,844 | | |
| Interest | | | | | 1,061,109 | | | | | | 1,761,211 | | | | | | 2,052,616 | | | | | | 993,140 | | |
| Prepaid expenses | | | | | 7,097 | | | | | | 5,951 | | | | | | 992 | | | | | | 992 | | |
| Prepaid offering expense | | | | | — | | | | | | 31,260 | | | | | | 31,836 | | | | | | 32,603 | | |
| Reimbursement due from Investment Adviser | | | | | — | | | | | | — | | | | | | — | | | | | | 3,165 | | |
| Other assets | | | | | 2,923 | | | | | | — | | | | | | — | | | | | | — | | |
| Total assets | | | | | 102,421,094 | | | | | | 149,471,984 | | | | | | 124,759,181 | | | | | | 237,025,425 | | |
| LIABILITIES: | | | | | | | | | | | | | | | | | | | | | | | | | |
| Income distribution payable | | | | | — | | | | | | — | | | | | | — | | | | | | 434,588 | | |
| Payable for investment securities purchased | | | | | 4,907,094 | | | | | | 7,708,521 | | | | | | 499,002 | | | | | | — | | |
| Payable for fund shares redeemed | | | | | — | | | | | | 1,300 | | | | | | 1,867 | | | | | | 5,254 | | |
| Payable upon receipt of securities loaned | | | | | 4,672,984 | | | | | | — | | | | | | — | | | | | | — | | |
| Variation margin payable on futures contracts | | | | | 16,547 | | | | | | 41,790 | | | | | | — | | | | | | 104,171 | | |
| Payable to trustees under the deferred compensation plan (Note 5) | | | | | 2,923 | | | | | | — | | | | | | — | | | | | | — | | |
| Payable for trustee fees | | | | | 458 | | | | | | 316 | | | | | | 278 | | | | | | 528 | | |
| Payable for foreign capital gains tax | | | | | 61,827 | | | | | | — | | | | | | — | | | | | | — | | |
| Other accrued expenses and liabilities | | | | | 48,806 | | | | | | 17,018 | | | | | | 12,090 | | | | | | 17,849 | | |
| Total liabilities | | | | | 9,710,639 | | | | | | 7,768,945 | | | | | | 513,237 | | | | | | 562,390 | | |
| NET ASSETS | | | | $ | 92,710,455 | | | | | $ | 141,703,039 | | | | | $ | 124,245,944 | | | | | $ | 236,463,035 | | |
| NET ASSETS WERE COMPRISED OF: | | | | | | | | | | | | | | | | | | | | | | | | | |
| Paid-in capital | | | | $ | 109,821,126 | | | | | $ | 141,300,207 | | | | | $ | 122,924,225 | | | | | $ | 236,546,979 | | |
| Total distributable earnings (loss) | | | | | (17,110,671) | | | | | | 402,832 | | | | | | 1,321,719 | | | | | | (83,944) | | |
| NET ASSETS | | | | $ | 92,710,455 | | | | | $ | 141,703,039 | | | | | $ | 124,245,944 | | | | | $ | 236,463,035 | | |
+
Including securities loaned at value | | | | $ | 4,505,929 | | | | | $ | — | | | | | $ | — | | | | | $ | — | | |
*
Cost of investments in securities | | | | $ | 91,734,363 | | | | | $ | 131,943,041 | | | | | $ | 115,625,783 | | | | | $ | 220,995,253 | | |
†
Cost of short-term investments | | | | $ | 12,542,882 | | | | | $ | 10,163,968 | | | | | $ | — | | | | | $ | 12,592,794 | | |
| Net assets | | | | $ | 92,710,455 | | | | | $ | 141,703,039 | | | | | $ | 124,245,944 | | | | | $ | 236,463,035 | | |
| Shares authorized | | | | | unlimited | | | | | | unlimited | | | | | | unlimited | | | | | | unlimited | | |
| Par value | | | | $ | 0.001 | | | | | $ | 0.001 | | | | | $ | 0.001 | | | | | $ | 0.001 | | |
| Shares outstanding | | | | | 11,248,702 | | | | | | 14,129,850 | | | | | | 12,291,392 | | | | | | 23,654,679 | | |
| Net asset value and redemption price per share | | | | $ | 8.24 | | | | | $ | 10.03 | | | | | $ | 10.11 | | | | | $ | 10.00 | | |
See Accompanying Notes to Financial Statements
STATEMENTS OF OPERATIONS for the year ended March 31, 2023
| | | | Voya VACS Series
EMCD Fund | | | Voya VACS Series
EMHCD Fund | | | Voya VACS Series
HYB Fund | | | Voya VACS Series
SC Fund | |
| | | | | | | | | | February 17, 2023(1)
to March 31, 2023 | | | February 24, 2023(1)
to March 31, 2023 | | | March 3, 2023(1)
to March 31, 2023 | |
| INVESTMENT INCOME: | | | | | | | | | | | | | | | | | | | | | | | | | |
| Dividends | | | | $ | 68,995 | | | | | $ | 18,505 | | | | | $ | — | | | | | $ | 18,844 | | |
| Interest, net of foreign taxes withheld* | | | | | 4,581,582 | | | | | | 950,928 | | | | | | 926,362 | | | | | | 856,007 | | |
| Securities lending income, net | | | | | 16,975 | | | | | | — | | | | | | — | | | | | | — | | |
| Total investment income | | | | | 4,667,552 | | | | | | 969,433 | | | | | | 926,362 | | | | | | 874,851 | | |
| EXPENSES: | | | | | | | | | | | | | | | | | | | | | | | | | |
| Investment management fees | | | | | 552,736 | | | | | | — | | | | | | — | | | | | | — | | |
| Transfer agent fees(2) | | | | | 249 | | | | | | 21 | | | | | | 15 | | | | | | 23 | | |
| Shareholder reporting expense | | | | | 547 | | | | | | 156 | | | | | | — | | | | | | 494 | | |
| Registration fees | | | | | 25,853 | | | | | | 49 | | | | | | 8 | | | | | | 8 | | |
| Professional fees | | | | | 30,035 | | | | | | 3,120 | | | | | | 2,046 | | | | | | 3,848 | | |
| Custody and accounting expense | | | | | 23,950 | | | | | | 2,964 | | | | | | 2,145 | | | | | | 3,510 | | |
| Trustee fees | | | | | 4,579 | | | | | | 468 | | | | | | 330 | | | | | | 494 | | |
| Offering expense | | | | | — | | | | | | 3,740 | | | | | | 3,165 | | | | | | 2,397 | | |
| Miscellaneous expense | | | | | 7,269 | | | | | | 970 | | | | | | 330 | | | | | | 494 | | |
| Interest expense | | | | | — | | | | | | 121 | | | | | | — | | | | | | — | | |
| Total expenses | | | | | 645,218 | | | | | | 11,609 | | | | | | 8,039 | | | | | | 11,268 | | |
| Waived and reimbursed fees | | | | | (552,736) | | | | | | — | | | | | | — | | | | | | (3,164) | | |
| Net expenses | | | | | 92,482 | | | | | | 11,609 | | | | | | 8,039 | | | | | | 8,104 | | |
| Net investment income | | | | | 4,575,070 | | | | | | 957,824 | | | | | | 918,323 | | | | | | 866,747 | | |
| REALIZED AND UNREALIZED GAIN (LOSS): | | | | | | | | | | | | | | | | | | | | | | | | | |
| Net realized gain (loss) on: | | | | | | | | | | | | | | | | | | | | | | | | | |
| Investments | | | | | (9,545,143) | | | | | | (14,110) | | | | | | (4,715) | | | | | | — | | |
| Futures | | | | | 439,573 | | | | | | 151,437 | | | | | | — | | | | | | (10,231) | | |
| Net realized gain (loss) | | | | | (9,105,570) | | | | | | 137,327 | | | | | | (4,715) | | | | | | (10,231) | | |
| Net change in unrealized appreciation (depreciation) on: | | | | | | | | | | | | | | | | | | | | | | | | | |
| Investments (net of foreign capital gains taxes accrued)# | | | | | 3,311,901 | | | | | | 559,949 | | | | | | 1,326,434 | | | | | | 1,327,256 | | |
| Futures | | | | | (274,813) | | | | | | (299,404) | | | | | | — | | | | | | (1,447,042) | | |
| Net change in unrealized appreciation (depreciation) | | | | | 3,037,088 | | | | | | 260,545 | | | | | | 1,326,434 | | | | | | (119,786) | | |
| Net realized and unrealized gain (loss) | | | | | (6,068,482) | | | | | | 397,872 | | | | | | 1,321,719 | | | | | | (130,017) | | |
Increase (decrease) in net assets resulting from
operations | | | | $ | (1,493,412) | | | | | $ | 1,355,696 | | | | | $ | 2,240,042 | | | | | $ | 736,730 | | |
*
Foreign taxes withheld | | | | $ | — | | | | | $ | 120 | | | | | $ | — | | | | | $ | — | | |
#
Change in foreign capital gains taxes accrued | | | | $ | 9,190 | | | | | $ | — | | | | | $ | — | | | | | $ | — | | |
(1)
Commencement of operations.
(2)
Prior to November 18, 2022, Voya VACS Series EMCD Fund had a Class P shares designation.
See Accompanying Notes to Financial Statements
STATEMENTS OF CHANGES IN NET ASSETS
| | | | Voya VACS Series EMCD Fund | | | Voya VACS Series
EMHCD Fund | | | Voya VACS Series
HYB Fund | |
| | | | Year Ended
March 31, 2023 | | | Year Ended
March 31, 2022 | | | February 17, 2023(1)
to March 31, 2023 | | | February 24, 2023(1)
to March 31, 2023 | |
| FROM OPERATIONS: | | | | | | | | | | | | | | | | | | | | | | | | | |
| Net investment income | | | | $ | 4,575,070 | | | | | $ | 4,810,970 | | | | | $ | 957,824 | | | | | $ | 918,323 | | |
| Net realized gain (loss) | | | | | (9,105,570) | | | | | | 1,549,340 | | | | | | 137,327 | | | | | | (4,715) | | |
| Net change in unrealized appreciation (depreciation) | | | | | 3,037,088 | | | | | | (15,386,404) | | | | | | 260,545 | | | | | | 1,326,434 | | |
| Increase (decrease) in net assets resulting from operations | | | | | (1,493,412) | | | | | | (9,026,094) | | | | | | 1,355,696 | | | | | | 2,240,042 | | |
| FROM DISTRIBUTIONS TO SHAREHOLDERS: | | | | | | | | | | | | | | | | | | | | | | | | | |
| Total distributions (excluding return of capital)(2) | | | | | (4,740,003) | | | | | | (7,007,377) | | | | | | (952,864) | | | | | | (918,323) | | |
| Total distributions | | | | | (4,740,003) | | | | | | (7,007,377) | | | | | | (952,864) | | | | | | (918,323) | | |
| FROM CAPITAL SHARE TRANSACTIONS: | | | | | | | | | | | | | | | | | | | | | | | | | |
| Net proceeds from sale of shares | | | | | — | | | | | | 900,000 | | | | | | 140,354,256 | | | | | | 122,013,715 | | |
| Reinvestment of distributions | | | | | 4,740,003 | | | | | | 7,007,377 | | | | | | 952,864 | | | | | | 918,323 | | |
| | | | | | 4,740,003 | | | | | | 7,907,377 | | | | | | 141,307,120 | | | | | | 122,932,038 | | |
| Cost of shares redeemed | | | | | (2,999,993) | | | | | | — | | | | | | (6,913) | | | | | | (7,813) | | |
| Net increase in net assets resulting from capital share transactions | | | | | 1,740,010 | | | | | | 7,907,377 | | | | | | 141,300,207 | | | | | | 122,924,225 | | |
| Net increase (decrease) in net assets | | | | | (4,493,405) | | | | | | (8,126,094) | | | | | | 141,703,039 | | | | | | 124,245,944 | | |
| NET ASSETS: | | | | | | | | | | | | | | | | | | | | | | | | | |
| Beginning of year or period | | | | | 97,203,860 | | | | | | 105,329,954 | | | | | | — | | | | | | — | | |
| End of year or period | | | | $ | 92,710,455 | | | | | $ | 97,203,860 | | | | | $ | 141,703,039 | | | | | $ | 124,245,944 | | |
(1)
Commencement of operations.
(2)
Prior to November 18, 2022, Voya VACS Series EMCD Fund had a Class P shares designation.
See Accompanying Notes to Financial Statements
STATEMENTS OF CHANGES IN NET ASSETS
| | | | Voya VACS Series
SC Fund | |
| | | | March 3, 2023(1)
to March 31, 2023 | |
| FROM OPERATIONS: | | | | | | | |
| Net investment income | | | | $ | 866,747 | | |
| Net realized loss | | | | | (10,231) | | |
| Net change in unrealized appreciation (depreciation) | | | | | (119,786) | | |
| Increase in net assets resulting from operations | | | | | 736,730 | | |
| FROM DISTRIBUTIONS TO SHAREHOLDERS: | | | | | | | |
| Total distributions (excluding return of capital): | | | | | (820,674) | | |
| Total distributions | | | | | (820,674) | | |
| FROM CAPITAL SHARE TRANSACTIONS: | | | | | | | |
| Net proceeds from sale of shares | | | | | 236,189,763 | | |
| Reinvestment of distributions | | | | | 386,086 | | |
| | | | | | 236,575,849 | | |
| Cost of shares redeemed | | | | | (28,870) | | |
| Net increase in net assets resulting from capital share transactions | | | | | 236,546,979 | | |
| Net increase in net assets | | | | | 236,463,035 | | |
| NET ASSETS: | | | | | | | |
| Beginning of year or period | | | | | — | | |
| End of year or period | | | | $ | 236,463,035 | | |
(1)
Commencement of operations.
See Accompanying Notes to Financial Statements
Selected data for a share of beneficial interest outstanding throughout each year or period.
| | | | | | | | | | Income (loss)
from
investment
operations | | | | | | | | | Less Distributions | | | | | | Ratios to average net assets | | | Supplemental
Data | |
| | | | Net asset value, beginning of year
or period | | | Net investment income (loss) | | | Net realized and unrealized
gain (loss) | | | Total from investment operations | | | From net investment income | | | From net realized gains | | | From return of capital | | | Total distributions | | | Payment by affiliate | | | Net asset value, end of year
or period | | | Total Return(1) | | | Expenses before
reductions/additions(2)(3) | | | Expenses net of fee waivers
and/or recoupments if any(2)(3) | | | Expenses net of all
reductions/additions(2)(3) | | | Net investment income (loss)(2)(3) | | | Net assets, end of year or period | | | Portfolio turnover rate | |
Year or
period ended | | | ($) | | | ($) | | | ($) | | | ($) | | | ($) | | | ($) | | | ($) | | | ($) | | | ($) | | | ($) | | | (%) | | | (%) | | | (%) | | | (%) | | | (%) | | | ($000’s) | | | (%) | |
| Voya VACS Series EMCD Fund | | | | | | | | | | | | | | | | | | | | | | | | | | | | | | | | | | | | | | | | | | | | | | | | | | | | | | | | | | | | | | | | | | | | | | | | | | | | | | | | | | | | | | | | |
| 03-31-23(4) | | | | | 8.79 | | | | | | 0.41• | | | | | | (0.53) | | | | | | (0.12) | | | | | | 0.41 | | | | 0.02 | | | — | | | | | 0.43 | | | | | | — | | | | | | 8.24 | | | | | | (1.27) | | | | | | 0.71 | | | | 0 .10 | | | 0 .10 | | | 5 .00 | | | | | 92,710 | | | | | | 101 | | |
| 03-31-22 | | | | | 10.27 | | | | | | 0.46• | | | | | | (1.28) | | | | | | (0.82) | | | | | | 0.45 | | | | 0.21 | | | — | | | | | 0.66 | | | | | | — | | | | | | 8.79 | | | | | | (8.54) | | | | | | 1.02 | | | | 0 .07 | | | 0 .07 | | | 4 .54 | | | | | 97,204 | | | | | | 35 | | |
| 03-31-21 | | | | | 8.84 | | | | | | 0.47• | | | | | | 1.44 | | | | | | 1.91 | | | | | | 0.48 | | | | — | | | — | | | | | 0.48 | | | | | | — | | | | | | 10.27 | | | | | | 21.79 | | | | | | 1.03 | | | | 0 .08 | | | 0 .08 | | | 4 .63 | | | | | 105,330 | | | | | | 48 | | |
| 03-31-20 | | | | | 9.77 | | | | | | 0.49• | | | | | | (0.90) | | | | | | (0.41) | | | | | | 0.49 | | | | — | | | 0.03 | | | | | 0.52 | | | | | | — | | | | | | 8.84 | | | | | | (4.70) | | | | | | 1.04 | | | | 0 .09 | | | 0 .09 | | | 4 .87 | | | | | 90,701 | | | | | | 50 | | |
| 03-31-19 | | | �� | | 9.82 | | | | | | 0.48 | | | | | | (0.04) | | | | | | 0.44 | | | | | | 0.49 | | | | — | | | — | | | | | 0.49 | | | | | | — | | | | | | 9.77 | | | | | | 4.74 | | | | | | 1.05 | | | | 0 .10 | | | 0 .10 | | | 5 .01 | | | | | 96,445 | | | | | | 69 | | |
| Voya VACS Series EMHCD Fund | | | | | | | | | | | | | | | | | | | | | | | | | | | | | | | | | | | | | | | | | | | | | | | | | | | | | | | | | | | | | | | | | | | | | | | | | | | | | | | | | | | | | | | | |
02-17-23(5) -
03-31-23 | | | | | 10.00 | | | | | | 0.07• | | | | | | 0.03 | | | | | | 0.10 | | | | | | 0.07 | | | | — | | | — | | | | | 0.07 | | | | | | — | | | | | | 10.03 | | | | | | 0.98 | | | | | | 0.08 | | | | 0 .08 | | | 0 .08 | | | 6 .43 | | | | | 141,703 | | | | | | 14 | | |
| Voya VACS Series HYB Fund | | | | | | | | | | | | | | | | | | | | | | | | | | | | | | | | | | | | | | | | | | | | | | | | | | | | | | | | | | | | | | | | | | | | | | | | | | | | | | | | | | | | | | | | |
02-24-23(5) -
03-31-23 | | | | | 10.00 | | | | | | 0.08• | | | | | | 0.11 | | | | | | 0.19 | | | | | | 0.08 | | | | — | | | — | | | | | 0.08 | | | | | | — | | | | | | 10.11 | | | | | | 1.86 | | | | | | 0.07 | | | | 0 .07 | | | 0 .07 | | | 8 .38 | | | | | 124,241 | | | | | | 2 | | |
| Voya VACS Series SC Fund | | | | | | | | | | | | | | | | | | | | | | | | | | | | | | | | | | | | | | | | | | | | | | | | | | | | | | | | | | | | | | | | | | | | | | | | | | | | | | | | | | | | | | | | |
03-03-23(5) -
03-31-23 | | | | | 10.00 | | | | | | 0.04• | | | | | | (0.01) | | | | | | 0.03 | | | | | | 0.03 | | | | — | | | — | | | | | 0.03 | | | | | | — | | | | | | 10.00 | | | | | | 0.35 | | | | | | 0.07 | | | | 0 .05 | | | 0 .05 | | | 5 .17 | | | | | 236,463 | | | | | | — | | |
(1)
Total return is calculated assuming reinvestment of all dividends, capital gain distributions and return of capital distributions, if any, at net asset value and excluding the deduction of sales charges or contingent deferred sales charges, if applicable. Total return for periods less than one year is not annualized.
(2)
Annualized for periods less than one year.
(3)
Ratios reflect operating expenses of a Fund. Expenses before reductions/additions do not reflect amounts reimbursed or recouped by the Investment Adviser and/or Distributor or reductions from brokerage service arrangements or other expense offset arrangements and do not represent the amount paid by a Fund during periods when reimbursements or reductions occur. Expenses net of fee waivers reflect expenses after reimbursement by the Investment Adviser and/or Distributor or recoupment of previously reimbursed fees by the Investment Adviser, but prior to reductions from brokerage service arrangements or other expense offset arrangements. Expenses net of all reductions/additions represent the net expenses paid by a Fund. Net investment income (loss) is net of all such additions or reductions.
(4)
Prior to November 18, 2022, Voya VACS Series EMCD Fund had a Class P shares designation.
(5)
Commencement of operations.
•
Calculated using average number of shares outstanding throughout the year or period.
See Accompanying Notes to Financial Statements
NOTES TO FINANCIAL STATEMENTS as of March 31, 2023
NOTE 1 — ORGANIZATION
Voya Funds Trust is a Delaware statutory trust and is registered as an open-end management investment company under the Investment Company Act of 1940, as amended (“1940 Act”). It was organized on August 6, 1998 and was established under a Trust Instrument dated July 30, 1998. It consists of nine separately managed series. This report is for Voya VACS Series HYB Fund (“HYB”), a diversified series of Voya Funds Trust.
Voya Separate Portfolios Trust is a Delaware statutory trust and is registered as an open-end management investment company under the Investment Company Act of 1940, as amended (“1940 Act”). It was organized on March 2, 2007 and was established under a Declaration of Trust dated March 2, 2007. It consists of fifteen separately managed series. This report is for Voya VACS Series EMCD Fund (“EMCD”), Voya VACS Series EMHCD Fund (“EMHCD”), and Voya Series SC Fund (“SC”), each a diversified series of Voya Separate Portfolios Trust, except EMHCD, which is non-diversified. Prior to November 18, 2022, EMCD was known as Voya Emerging Markets Corporate Debt Fund.
Voya Funds Trust and Voya Separate Portfolios Trust are each a “Trust” and collectively referred to as the “Trusts.” HYB, EMCD, EMHCD and SC are each a “Fund” and collectively referred as the “Funds.” The investment objective of the Funds is described in each Fund’s Prospectus.
The Funds’ shares are not registered under the Securities Act of 1933 (the “1933 Act”) because the shares are issued solely in private placement transactions that do not involve any “public offering” within the meaning of Section 4(2) of the 1933 Act. Investments in a Fund may only be made by “accredited investors,” as defined in Regulation D under the 1933 Act.
The Funds do not have a share class designation. Prior to November 18, 2022, EMCD had a Class P shares designation. All shareholders are allocated the common expenses of a fund and earn income and realized gains/losses from a fund. Expenses that are specific to a fund are charged directly to that fund. Other operating expenses shared by several funds are generally allocated among those funds based on average net assets.
Voya Investments, LLC (“Voya Investments” or the “Investment Adviser”), an Arizona limited liability company, serves as the Investment Adviser to the Funds. Voya Investment Management Co. LLC (“Voya IM”), a Delaware limited liability company, serves as the sub-adviser to the Funds. Voya Investments Distributor, LLC (“VID” or the “Distributor”), a Delaware limited liability company, serves as the principal underwriter to the Funds.
NOTE 2 — SIGNIFICANT ACCOUNTING POLICIES
The following significant accounting policies are consistently followed by the Funds in the preparation of their financial statements. Each Fund is considered an investment company under U.S. generally accepted accounting principles (“GAAP”) and follows the accounting and reporting guidance applicable to investment companies.
A. Security Valuation. Each Fund is open for business every day the New York Stock Exchange (“NYSE”) opens for regular trading (each such day, a “Business Day”). The net asset value (“NAV”) per share for each class of each Fund is determined each Business Day as of the close of the regular trading session (“Market Close”), as determined by the Consolidated Tape Association (“CTA”), the central distributor of transaction prices for exchange-traded securities (normally 4:00 p.m. Eastern time unless otherwise designated by the CTA). The NAV per share of each class of each Fund is calculated by taking the value of the Fund’s assets attributable to that class, subtracting the Fund’s liabilities attributable to that class, and dividing by the number of shares of that class that are outstanding. On days when a Fund is closed for business, Fund shares will not be priced and a Fund does not transact purchase and redemption orders. To the extent each Fund’s assets are traded in other markets on days when a Fund does not price its shares, the value of a Fund’s assets will likely change and you will not be able to purchase or redeem shares of a Fund.
Portfolio securities for which market quotations are readily available are valued at market value. Investments in open-end registered investment companies that do not trade on an exchange are valued at the end of day NAV per share. The prospectuses of the open-end registered investment companies in which each Fund may invest explain the circumstances under which they will use fair value pricing and the effects of using fair value pricing. Foreign securities’ prices are converted into U.S. dollar amounts using the applicable exchange rates as of Market Close.
When a market quotation for a portfolio security is not readily available or is deemed unreliable (for example when trading has been halted or there are unexpected market closures or other material events that would suggest that the market quotation is unreliable) and for purposes of determining the value of other Fund assets, the asset is priced at its fair value. The Board has designated the Investment Adviser, as the valuation designee, to make fair value determinations in good faith. In determining the fair value of each Fund’s assets, the Investment Adviser, pursuant to its fair valuation policy, may consider inputs from pricing service providers,
NOTES TO FINANCIAL STATEMENTS as of March 31, 2023 (continued)
NOTE 2 — SIGNIFICANT ACCOUNTING POLICIES (continued)
broker-dealers, or the Fund’s sub-adviser(s). Issuer specific events, transaction price, position size, nature and duration of restrictions on disposition of the security, market trends, bid/ask quotes of brokers and other market data may be reviewed in the course of making a good faith determination of an asset’s fair value. Because trading hours for certain foreign securities end before Market Close, closing market quotations may become unreliable. The prices of foreign securities will generally be adjusted based on inputs from an independent pricing service that are intended to reflect valuation changes through the NYSE close. Because of the inherent uncertainties of fair valuation, the values used to determine each Fund’s NAV may materially differ from the value received upon actual sale of those investments. Thus, fair valuation may have an unintended dilutive or accretive effect on the value of shareholders’ investments in each Fund.
Each Fund’s’ financial instruments are valued at the close of the NYSE and are reported at fair value, which GAAP defines as the price that would be received to sell an asset or paid to transfer a liability in an orderly transaction between market participants at the measurement date.
Various valuation techniques and inputs are used to determine the fair value of financial instruments. GAAP establishes the following fair value hierarchy that categorizes the inputs used to measure fair value:
Level 1 — quoted prices (unadjusted) in active markets for identical financial instruments that the fund can access at the reporting date.
Level 2 — inputs other than Level 1 quoted prices that are observable, either directly or indirectly (including, but not limited to, quoted prices for similar financial instruments in active markets, quoted prices for identical or similar financial instruments in inactive markets, interest rates and yield curves, implied volatilities, and credit spreads).
Level 3 — unobservable inputs (including the fund’s own assumptions in determining fair value).
Observable inputs are developed using market data, such as publicly available information about actual events or transactions, and reflect the assumptions that market participants would use to price the financial instrument. Unobservable inputs are those for which market data are not available and are developed using the best information available about the assumptions that market participants would use to price the financial instrument. GAAP requires valuation techniques to maximize the use of relevant observable inputs and minimize the use of unobservable inputs. When multiple inputs are used to derive fair value, the financial instrument is assigned to the level within the
fair value hierarchy based on the lowest-level input that is significant to the fair value of the financial instrument. Input levels are not necessarily an indication of the risk or liquidity associated with financial instruments at that level but rather the degree of judgment used in determining those values.
A table summarizing each Fund’s investments under these levels of classification is included within each Portfolio of Investments.
Each investment asset or liability of the Funds is assigned a level at measurement date based on the significance and source of the inputs to its valuation. Quoted prices in active markets for identical securities are classified as “Level 1,” inputs other than quoted prices for an asset or liability that are observable are classified as “Level 2” and significant unobservable inputs, including the sub-adviser’s or Pricing Committee’s judgment about the assumptions that a market participant would use in pricing an asset or liability are classified as “Level 3.” The inputs used for valuing securities are not necessarily an indication of the risks associated with investing in those securities. Short-term securities of sufficient credit quality are generally considered to be Level 2 securities under applicable accounting rules. A table summarizing each Fund’s investments under these levels of classification is included within the Portfolios of Investments.
GAAP requires a reconciliation of the beginning to ending balances for reported fair values that presents changes attributable to total realized and unrealized gains or losses, purchases and sales, and transfers in or out of the Level 3 category during the period. A reconciliation of Level 3 investments within the Portfolio of Investments is presented only when a Fund has a significant amount of Level 3 investments.
B. Securities Transactions and Revenue Recognition. Securities transactions are accounted for on the trade date. Realized gains and losses are reported on the basis of identified cost of securities sold. Interest income is recorded on an accrual basis. Dividend income is recorded on the ex-dividend date, or for certain foreign securities, when the information becomes available to the Funds. Premium amortization and discount accretion are determined by the effective yield method.
C. Foreign Currency Translation. The books and records of the Funds are maintained in U.S. dollars. Any foreign currency amounts are translated into U.S. dollars on the following basis:
(1)
Market value of investment securities, other assets and liabilities — at the exchange rates prevailing at Market Close.
NOTES TO FINANCIAL STATEMENTS as of March 31, 2023 (continued)
NOTE 2 — SIGNIFICANT ACCOUNTING POLICIES (continued)
(2)
Purchases and sales of investment securities, income and expenses — at the rates of exchange prevailing on the respective dates of such transactions.
Although the net assets and the market values are presented at the foreign exchange rates at Market Close, the Funds do not isolate the portion of the results of operations resulting from changes in foreign exchange rates on investments from the fluctuations arising from changes in market prices of securities held. Such fluctuations are included with the net realized and unrealized gains or losses from investments. For securities that are subject to foreign withholding tax upon disposition, liabilities are recorded on the Statements of Assets and Liabilities for the estimated tax withholding based on the securities’ current market values. Upon disposition, realized gains or losses on such securities are recorded net of foreign withholding tax.
Reported net realized foreign exchange gains or losses arise from sales of foreign currencies, currency gains or losses realized between the trade and settlement dates on securities transactions, the difference between the amounts of dividends, interest, and foreign withholding taxes recorded on the Funds’ books, and the U.S. dollar equivalent of the amounts actually received or paid. Net unrealized foreign exchange gains and losses arise from changes in the value of assets and liabilities other than investments in securities, resulting from changes in the exchange rate. Foreign security and currency transactions may involve certain considerations and risks not typically associated with investing in U.S. companies and U.S. government securities. These risks include, but are not limited to revaluation of currencies and future adverse political and economic developments which could cause securities and their markets to be less liquid and prices more volatile than those of comparable U.S. companies and U.S. government securities. The foregoing risks are even greater with respect to securities of issuers in emerging markets.
D. Risk Exposures and the Use of Derivative Instruments. Each Fund’s investment objectives permit them to enter into various types of derivatives contracts, including, but not limited to, forward foreign currency exchange contracts, futures, purchased options, written options, and swaps. In doing so, the Funds will employ strategies in differing combinations to permit them to increase or decrease the level of risk, or change the level or types of exposure to risk factors. This may allow each
Fund to pursue its objectives more quickly, and efficiently than if they were to make direct purchases or sales of securities capable of affecting a similar response to market or credit factors.
In pursuit of their investment objectives, each Fund may seek to increase or decrease their exposure to the following market or credit risk factors:
Credit Risk. The price of a bond or other debt instrument is likely to fall if the issuer’s actual or perceived financial health deteriorates, whether because of broad economic or issuer-specific reasons. In certain cases, the issuer could be late in paying interest or principal, or could fail to pay its financial obligations altogether.
Foreign Exchange Rate Risk. To the extent that each Fund invests directly in foreign (non-U.S.) currencies or in securities denominated in, or that trade in, foreign (non-U.S.) currencies, it is subject to the risk that those foreign (non-U.S.) currencies will decline in value relative to the U.S. dollar or, in the case of hedging positions, that the U.S. dollar will decline in value relative to the currency being hedged by a Fund through foreign currency exchange transactions.
Currency rates may fluctuate significantly over short periods of time. Currency rates may be affected by changes in market interest rates, intervention (or the failure to intervene) by U.S. or foreign governments, central banks or supranational entities such as the International Monetary Fund, by the imposition of currency controls, or other political or economic developments in the United States or abroad.
Interest Rate Risk. With bonds and other fixed rate debt instruments, a rise in market interest rates generally causes values to fall; conversely, values generally rise as market interest rates fall. The higher the credit quality of the instrument, and the longer its maturity or duration, the more sensitive it is likely to be to interest rate risk. As of the date of this report, the United States experiences a rising market interest rate environment, which may increase a Fund’s exposure to risks associated with rising market interest rates. Rising market interest rates have unpredictable effects on the markets and may expose fixed-income and related markets to heightened volatility. For a fund that invests in fixed-income securities, an increase in market interest rates may lead to increased redemptions and increased portfolio turnover, which could reduce liquidity for certain investments, adversely affect values, and increase costs. If dealer capacity in fixed-income markets is insufficient for market conditions, it may further inhibit liquidity and increase volatility in the
NOTES TO FINANCIAL STATEMENTS as of March 31, 2023 (continued)
NOTE 2 — SIGNIFICANT ACCOUNTING POLICIES (continued)
fixed-income markets. Further, recent and potential changes in government policy may affect interest rates.
Risks of Investing in Derivatives. Each Fund’s use of derivatives can result in losses due to unanticipated changes in the market or credit risk factors and the overall market. In instances where the Funds are using derivatives to decrease, or hedge, exposures to market or credit risk factors for securities held by a Fund, there are also risks that those derivatives may not perform as expected resulting in losses for the combined or hedged positions. Derivative instruments are subject to a number of risks, including the risk of changes in the market price of the underlying securities, credit risk with respect to the counterparty, risk of loss due to changes in market interest rates and liquidity and volatility risk. The amounts required to purchase certain derivatives may be small relative to the magnitude of exposure assumed by a Fund. Therefore, the purchase of certain derivatives may have an economic leveraging effect on a Fund and exaggerate any increase or decrease in the NAV. Derivatives may not perform as expected, so a Fund may not realize the intended benefits. When used for hedging purposes, the change in value of a derivative may not correlate as expected with the currency, security or other risk being hedged. When used as an alternative or substitute for direct cash investments, the return provided by the derivative may not provide the same return as direct cash investment. In addition, given their complexity, derivatives expose a Fund to the risk of improper valuation.
Generally, derivatives are sophisticated financial instruments whose performance is derived, at least in part, from the performance of an underlying asset or assets. Derivatives include, among other things, swap agreements, options, forwards and futures. Investments in derivatives are generally negotiated OTC with a single counterparty and as a result are subject to credit risks related to the counterparty’s ability or willingness to perform its obligations; any deterioration in the counterparty’s creditworthiness could adversely affect the value of the derivative. In addition, derivatives and their underlying securities may experience periods of illiquidity which could cause a Fund to hold a security it might otherwise sell, or to sell a security it otherwise might hold at inopportune times or at an unanticipated price. A manager might imperfectly judge the direction of the market. For instance, if a derivative is used as a hedge to offset investment risk in another security, the hedge might not correlate to the market’s movements and may have unexpected or undesired results such as a loss or a reduction in gains.
Counterparty Credit Risk and Credit Related Contingent Features. Certain derivative positions are subject to counterparty credit risk, which is the risk that the counterparty will not fulfill its obligation to the Funds. Each Fund’s derivative counterparties are financial institutions who are subject to market conditions that may weaken their financial position. The Fund intends to enter into financial transactions with counterparties that they believe to be creditworthy at the time of the transaction. To reduce this risk, the Fund generally enters into master netting arrangements, established within the Fund’s International Swap and Derivatives Association, Inc. (“ISDA”) Master Agreements (“Master Agreements”). These agreements are with select counterparties and they govern transactions, including certain OTC derivative and forward foreign currency contracts, entered into by the Fund and the counterparty. The Master Agreements maintain provisions for general obligations, representations, agreements, collateral, and events of default or termination. The occurrence of a specified event of termination may give a counterparty the right to terminate all of its contracts and affect settlement of all outstanding transactions under the applicable Master Agreement.
Each Fund may also enter into collateral agreements with certain counterparties to further mitigate credit risk associated with OTC derivative and forward foreign currency contracts. Subject to established minimum levels, collateral is generally determined based on the net aggregate unrealized gain or loss on contracts with a certain counterparty. Collateral pledged to or from the Funds is held in a segregated account by a third-party agent and can be in the form of cash or debt securities issued by the U.S. government or related agencies.
Each Fund’s Master Agreements with derivative counterparties have credit related contingent features that if triggered would allow their derivatives counterparties to close out and demand payment or additional collateral to cover their exposure from the Fund. Credit related contingent features are established between a Fund and its derivatives counterparties to reduce the risk that the Fund will not fulfill their payment obligations to their counterparties. These triggering features include, but are not limited to, a percentage decrease in a Fund’s net assets and or a percentage decrease in the Fund’s NAV, which could cause the Fund to accelerate payment of any net liability owed to the counterparty. The contingent features are established within each Fund’s Master Agreements.
E. Foreign Currency Transactions and Futures Contracts. Each Fund may enter into foreign currency exchange transactions to convert to and from different foreign currencies and to and from the U.S. dollar in
NOTES TO FINANCIAL STATEMENTS as of March 31, 2023 (continued)
NOTE 2 — SIGNIFICANT ACCOUNTING POLICIES (continued)
connection with the planned purchases or sales of securities. The Fund either enters into these transactions on a spot basis at the spot rate prevailing in the foreign currency exchange market or use forward foreign currency contracts to purchase or sell foreign currencies. When the contract is fulfilled or closed, gains or losses are realized. Until then, the gain or loss is included in unrealized appreciation or depreciation. Risks may arise upon entering into forward contracts from the potential inability of counterparties to meet the terms of their forward contracts and from unanticipated movements in the value of foreign currencies relative to the U.S. dollar.
Each Fund may enter into futures contracts involving foreign currency, interest rates, securities and securities indices. The Funds intend to limit its use of futures contracts and futures options to “bona fide hedging” transactions, as such term is defined in applicable regulations, interpretations and practice. A futures contract obligates the seller of the contract to deliver and the purchaser of the contract to take delivery of the type of foreign currency, financial instrument or security called for in the contract at a specified future time for a specified price.
Upon entering into a futures contract, each Fund is required to deposit either cash or securities (initial margin) in an amount equal to a certain percentage of the contract value. Subsequent payments (variation margin) are made or received by a Fund each day. The variation margin payments are equal to the daily changes in the contract value and are recorded as unrealized gains and losses and, if any, shown as variation margin receivable or payable on futures contracts on the Statement of Assets and Liabilities. Open futures contracts, if any, are reported on a table within each Fund’s Portfolio of Investments. Securities held in collateralized accounts to cover initial margin requirements, if any, on open futures contracts are footnoted in the Portfolio of Investments. Cash collateral held by the broker to cover initial margin requirements on open futures contracts are noted in each Fund’s Statement of Assets and Liabilities. The net change in unrealized appreciation and depreciation is reported in each Fund’s Statement of Operations. Realized gains (losses) are reported in the Fund’s Statement of Operations at the closing or expiration of futures contracts.
Futures contracts are exposed to the market risk factor of the underlying financial instrument. During the year ended March 31, 2023, EMCD, EMHCD, and SC had purchased and sold futures contracts on various bonds and notes to gain exposure to different parts of the yield curve while maintaining overall duration. Additional associated risks of
entering into futures contracts include the possibility that there may be an illiquid market where a Fund is unable to liquidate the contract or enter into an offsetting position and, if used for hedging purposes, the risk that the price of the contract will correlate imperfectly with the prices of the Fund’s securities. With futures, there is minimal counterparty credit risk to a Fund since futures are exchange traded and the exchange’s clearinghouse, as counterparty to all exchange traded futures, guarantees the futures against default.
During the year ended March 31, 2023, the Funds had average notional values on futures contracts purchased and sold as disclosed below:
| | | | Purchased | | | Sold | |
| EMCD | | | | $ | 19,697,055 | | | | | $ | 14,996,610 | | |
| EMHCD | | | | | 21,808,414 | | | | | | 21,688,703 | | |
| SC | | | | | 7,381,500 | | | | | | 88,957,469 | | |
Please refer to the tables within the Portfolio of Investments for open futures contracts at March 31, 2023. HYB did not enter into any futures contracts during the year ended March 31, 2023.
F. Distributions to Shareholders. Each Fund records distributions to the shareholders on the ex-dividend date. The Funds distribute capital gains, if any, annually. The Funds declare dividends daily and pay dividends monthly. The characteristics of income and gains to be distributed are determined in accordance with income tax regulations, which may differ from GAAP for investment companies.
G. Federal Income Taxes. It is the policy of each Fund to comply with the requirements of subchapter M of the Internal Revenue Code that are applicable to regulated investment companies and to distribute substantially all of its net investment income and any net realized capital gains to its shareholders. Therefore, a federal income tax or excise tax provision is not required. Management has considered the sustainability of a Fund’s tax positions taken on federal income tax returns for all open tax years in making this determination. No capital gain distributions shall be made until the capital loss carryforwards have been fully utilized.
Each Fund may utilize equalization accounting for tax purposes, whereby a portion of redemption payments are treated as distributions of income or gain.
H. Use of Estimates. The preparation of financial statements in conformity with GAAP requires management to make estimates and assumptions that affect the reported amounts of assets and liabilities and disclosure of contingent assets and liabilities at the date of the financial statements and the reported amounts of increases and decreases in net assets from operations during the reporting period. Actual results could differ from those estimates.
NOTES TO FINANCIAL STATEMENTS as of March 31, 2023 (continued)
NOTE 2 — SIGNIFICANT ACCOUNTING POLICIES (continued)
I. Restricted Securities. Each Fund may invest in restricted securities which include those sold under Rule 144A of the Securities Act of 1933, as amended (“1933 Act”) or securities offered pursuant to Section 4(a)(2) of the 1933 Act, and/or are subject to legal or contractual restrictions on resale and may not be publicly sold without registration under the 1933 Act. Restricted securities are fair valued using market quotations when readily available. In the absence of market quotations, the securities are valued based upon their fair value determined in good faith under procedures approved by the Board.
Securities that are not registered for sale to the public under the 1933 Act are referred to as “restricted securities.” These securities may be sold in private placement transactions between issuers and their purchasers and may be neither listed on an exchange nor traded in other established markets. Many times these securities are subject to legal or contractual restrictions on resale. As a result of the absence of a public trading market, the prices of these securities may be more volatile, less liquid and more difficult to value than publicly traded securities. The price realized from the sale of these securities could be less than the amount originally paid or less than their fair value if they are resold in privately negotiated transactions. In addition, these securities may not be subject to disclosure and other investment protection requirements that are afforded to publicly traded securities. Certain investments may include investment in smaller, less seasoned issuers, which may involve greater risk.
J. Offering Costs. Costs incurred with the offering of EMHCD, HYB and SC are deferred and amortized over a twelve month period on a straight-line basis starting at the commencement of operations.
K. Indemnifications. In the normal course of business, the Trusts may enter into contracts that provide certain indemnifications. The Trusts’ maximum exposure under these arrangements is dependent on future claims that may be made against the Funds and, therefore, cannot be estimated; however, based on experience, management considers risk of loss from such claims remote.
NOTE 3 — INVESTMENT TRANSACTIONS
For the year ended March 31, 2023, the cost of purchases and the proceeds from the sales of securities excluding short-term and U.S. government securities, were as follows:
| | | | Purchases | | | Sales | |
| EMCD | | | | $ | 84,441,727 | | | | | $ | 86,865,486 | | |
| EMHCD | | | | | 149,374,911 | | | | | | 17,931,416 | | |
| HYB | | | | | 118,046,390 | | | | | | 2,884,126 | | |
| SC | | | | | 201,766,564 | | | | | | 849,814 | | |
U.S. government securities not included above were as follows:
| | | | Purchases | | | Sales | |
| EMCD | | | | $ | 325,000 | | | | | $ | 329,518 | | |
| EMHCD | | | | | 475,000 | | | | | | 481,603 | | |
| SC | | | | | 20,085,470 | | | | | | 20,138 | | |
NOTE 4 — INVESTMENT MANAGEMENT FEES
Each Fund has entered into an investment management agreement (“Management Agreement”) with the Investment Adviser. The Investment Adviser has overall responsibility for the management of the Funds. The Investment Adviser oversees all investment advisory and portfolio management services for the Funds and assists in managing and supervising all aspects of the general day-to-day business activities and operations of the Funds, including custodial, transfer agency, dividend disbursing, accounting, auditing, compliance and related services.
There is no management fee charged per the Management Agreement for EMHCD, HYB, SC and, effective November 18, 2022, EMCD. Prior to November 18, 2022, for EMCD, the Management Agreement compensated the Investment Adviser with a management fee, computed daily and payable monthly, based on the average daily net assets of the Fund, at an annual rate of 0.95%, which was fully waived for the Class P shares. The management fee waiver for Class P shares was not eligible for recoupment.
The Investment Adviser has entered into a sub-advisory agreement with Voya IM with respect to each Fund. Voya IM provides investment advice for the Funds and is paid by the Investment Adviser based on the average daily net assets of each respective Fund. Subject to such policies as the Board or the Investment Adviser may determine, Voya IM manages the Funds’ assets in accordance with the Funds’ investment objectives, policies, and limitations.
NOTES TO FINANCIAL STATEMENTS as of March 31, 2023 (continued)
NOTE 5 — OTHER TRANSACTIONS WITH AFFILIATES AND RELATED PARTIES
At March 31, 2023, the following direct or indirect, wholly-owned subsidiaries of Voya Financial, Inc. or affiliated investment companies owned more than 5% of the following Funds:
Subsidiary/Affiliated Investment
Company | | | Fund | | | Percentage | |
| Voya Intermediate Bond Portfolio | | | EMCD | | | | | 95.20% | | |
| | | | EMHCD | | | | | 84.14 | | |
| | | | HYB | | | | | 59.48 | | |
| | | | SC | | | | | 52.85 | | |
| Voya Investment Management Co. LLC | | | EMHCD | | | | | 11.09 | | |
| | | | HYB | | | | | 26.19 | | |
| | | | SC | | | | | 39.68 | | |
The Funds have adopted a deferred compensation plan (the “DC Plan”), which allows eligible independent trustees, as described in the DC Plan, to defer the receipt of all or a portion of the trustees’ fees that they are entitled to receive from the Funds. For purposes of determining the amount owed to the trustee under the DC Plan, the amounts deferred are invested in shares of the funds selected by the trustee (the “Notional Funds”). When the Funds purchase shares of the Notional Funds, which are all advised by Voya Investments, in amounts equal to the trustees’ deferred fees, this results in a Fund asset equal to the deferred compensation liability. Such assets, if applicable, are included as a component of “Other assets” on the accompanying Statements of Assets and Liabilities. Deferral of trustees’ fees under the DC Plan will not affect net assets of the Funds, and will not materially affect the Funds’ assets, liabilities or net investment income per share. Amounts will be deferred until distributed in accordance with the DC Plan.
The Funds may pay per account fees to affiliates of Voya Investments for recordkeeping services provided on certain assets. For the year ended March 31, 2023, the Funds did not pay any amounts for affiliated recordkeeping services.
The Funds may engage in purchase and sale transactions with funds that have a common investment adviser (or affiliated investment adviser), a common sub-adviser and/or common officers or trustees. For the period ended March 31, 2023, HYB and SC engaged in such transactions amounting to $117,543,432 and $221,875,254 of in-kind purchases, respectively.
NOTE 6 — EXPENSE LIMITATION AGREEMENT
Pursuant to a written expense limitation agreement (“Expense Limitation Agreement”) between the Investment
Adviser and the Trusts, on behalf of each Fund, the Investment Adviser has agreed to limit expenses of each Fund, excluding interest, taxes, investment-related costs, leverage expenses, extraordinary expenses and acquired fund fees and expenses to the levels listed below:
| Fund | | | Expense Limit | |
| EMCD | | | | | 0.15% | | |
| EMHCD | | | | | 0.15% | | |
| HYB | | | | | 0.15% | | |
| SC | | | | | 0.05% | | |
The Investment Adviser may at a later date recoup from the Fund for fees waived and/or other expenses reimbursed by the Investment Adviser during the previous 36 months, but only if, after such recoupment, the Fund’s expense ratio does not exceed the percentage described above. Waived and reimbursed fees net of any recoupment by the Investment Adviser of such waived and reimbursed fees are reflected on the accompanying Statements of Operations. Amounts payable by the Investment Adviser are reflected on the accompanying Statements of Assets and Liabilities.
As of March 31, 2023, the amounts of waived and/or reimbursed fees that are subject to possible recoupment by the Investment Adviser and the related expiration dates are as follows:
| | | | March 31, | | |
| | | | 2024 | | | 2025 | | | 2026 | | | Total | |
| SC | | | | $ | — | | | | | $ | — | | | | | $ | 3,165 | | | | | $ | 3,165 | | |
The Expense Limitation Agreement is contractual through August 1, 2024 and shall renew automatically for one-year terms. Termination or modification of this obligation requires approval by the Board.
NOTE 7 — LINE OF CREDIT
Effective on June 13, 2022 for EMCD, and on January 19, 2023 for EMHCD, HYB, and SC, in addition to certain other funds managed by the Investment Adviser, each Fund entered into a 364-day unsecured committed revolving line of credit agreement (the “Credit Agreement”) with The Bank of New York Mellon (“BNY”) for an aggregate amount of $400,000,000 through June 12, 2023. The proceeds may be used only to finance temporarily: (1) the purchase or sale of investment securities; or (2) the repurchase or redemption of shares of the Fund or certain other funds managed by the Investment Adviser. The funds to which the line of credit is available pay a commitment fee equal to 0.15% per annum on the daily unused portion of the committed line amount payable quarterly in arrears. Prior to June 13, 2022, the predecessor line of credit was for an aggregate amount of $400,000,000 and the funds to which the line of credit for EMCD was available paid a
NOTES TO FINANCIAL STATEMENTS as of March 31, 2023 (continued)
NOTE 7 — LINE OF CREDIT (continued)
commitment fee equal to 0.15% per annum on the daily unused portion of the committed line amount through June 13, 2022.
Borrowings under the Credit Agreement accrue interest at the federal funds rate plus a specified margin. Repayments generally must be made within 60 days after the date of a revolving credit advance.
The following Fund utilized the line of credit during the year ended March 31, 2023:
| Fund | | | Days
Utilized | | | Approximate
Average Daily
Balance For
Days Utilized | | | Approximate
Weighted
Average Interest
Rate For Days
Utilized | |
| EMHCD | | | | | 1 | | | | | $ | 781,000 | | | | | | 5.58% | | |
NOTE 8 — CAPITAL SHARES
Transactions in capital shares and dollars are as follows:
| | | | Shares
sold | | | Shares
issued
in
merger | | | Reinvestment
of
distributions | | | Shares
redeemed | | | Net increase
(decrease)
in shares
outstanding | | | Shares
sold | | | Proceeds
from
shares
issued in
merger | | | Reinvestment
of
distributions | | | Shares
redeemed | | | Net
increase
(decrease) | |
Year or
period ended | | | # | | | # | | | # | | | # | | | # | | | ($) | | | ($) | | | ($) | | | ($) | | | ($) | |
| EMCD(1) | | | | | | | | | | | | | | | | | | | | | | | | | | | | | | | | | | | | | | | | | | | | | | | | | | | | | | | | | | | | | |
| 3/31/2023 | | | | | — | | | | | | — | | | | | | 579,354 | | | | | | (386,597) | | | | | | 192,757 | | | | | | — | | | | | | — | | | | | | 4,740,003 | | | | | | (2,999,993) | | | | | | 1,740,010 | | |
| 3/31/2022 | | | | | 93,071 | | | | | | — | | | | | | 704,164 | | | | | | — | | | | | | 797,235 | | | | | | 900,000 | | | | | | — | | | | | | 7,007,377 | | | | | | — | | | | | | 7,907,377 | | |
| EMHCD | | | | | | | | | | | | | | | | | | | | | | | | | | | | | | | | | | | | | | | | | | | | | | | | | | | | | | | | | | | | | |
2/17/2023(2) -
3/31/2023 | | | | | 14,035,444 | | | | | | — | | | | | | 95,098 | | | | | | (692) | | | | | | 14,129,850 | | | | | | 140,354,256 | | | | | | — | | | | | | 952,864 | | | | | | (6,913) | | | | | | 141,300,207 | | |
| HYB | | | | | | | | | | | | | | | | | | | | | | | | | | | | | | | | | | | | | | | | | | | | | | | | | | | | | | | | | | | | | |
2/24/2023(2) -
3/31/2023 | | | | | 12,201,299 | | | | | | — | | | | | | 90,872 | | | | | | (779) | | | | | | 12,291,392 | | | | | | 122,013,715 | | | | | | — | | | | | | 918,323 | | | | | | (7,813) | | | | | | 122,924,225 | | |
| SC | | | | | | | | | | | | | | | | | | | | | | | | | | | | | | | | | | | | | | | | | | | | | | | | | | | | | | | | | | | | | |
3/3/2023(2) -
3/31/2023 | | | | | 23,618,952 | | | | | | — | | | | | | 38,608 | | | | | | (2,881) | | | | | | 23,654,679 | | | | | | 236,189,763 | | | | | | — | | | | | | 386,086 | | | | | | (28,870) | | | | | | 236,546,979 | | |
(1)
Prior to November 18, 2022, EMCD had a Class P shares designation.
(2)
Commencement of operations.
NOTE 9 — SECURITIES LENDING
Under a Master Securities Lending Agreement (the “Agreement”) with BNY, the Funds can lend their securities to approved brokers, dealers and other financial institutions. Loans are collateralized by cash and U.S. government securities. The collateral is equal to at least 105% of the market value of non-U.S. securities loaned and 102% of the market value of U.S. securities loaned. The market value of the loaned securities is determined at the close of business of the Funds at their last sale price or official closing price on the principal exchange or system on which they are traded and any additional collateral is delivered to the Fund on the next business day. The cash collateral received is invested in approved investments as defined in the Securities Lending Agreement with BNY (the “Agreement”). The Funds bear the risk of loss with respect to the investment of collateral with the following exception: BNY provides the Funds indemnification from loss with respect to the investment of collateral to the extent the cash collateral is invested in overnight repurchase agreements.
Cash collateral received in connection with securities lending is invested in cash equivalents, money market
funds, repurchase agreements with maturities of not more than 99 days that are collateralized with U.S. Government securities, or certain short-term investments that have a remaining maturity of 190 days or less (“Permitted Investments”). Short-term investments include: securities, units, shares or other participations in short-term investment funds, pools or trusts; commercial paper, notes, bonds or other debt obligations, certificates of deposit, time deposits and other bank obligations and asset-backed commercial paper backed by diversified receivables and repurchase-backed programs. Permitted Investments are subject to certain guidelines established by the Adviser regarding liquidity, diversification, credit quality and average credit life/duration requirements. The securities purchased with cash collateral received are reflected in the Portfolio of Investments under Short-Term Investments.
Generally, in the event of counterparty default, the Funds have the right to use the collateral to offset losses incurred. The Agreement contains certain guarantees by BNY in the event of counterparty default and/or a borrower’s failure to return a loaned security; however, there would be a potential loss to the Funds in the event the Funds are delayed or prevented from exercising its right to dispose of
NOTES TO FINANCIAL STATEMENTS as of March 31, 2023 (continued)
NOTE 9 — SECURITIES LENDING (continued)
the collateral. Engaging in securities lending could have a leveraging effect, which may intensify the credit, market and other risks associated with investing in a fund.
The following tables represent a summary of each respective Fund’s securities lending agreements by counterparty which are subject to offset under the Agreement as of March 31, 2023:
EMCD
| Counterparty | | | Securities
Loaned
at Value | | | Cash
Collateral
Received(1) | | | Net
Amount | |
| Barclays Capital Inc. | | | | $ | 446,008 | | | | | $ | (446,008) | | | | | $ | — | | |
| Counterparty | | | Securities
Loaned
at Value | | | Cash
Collateral
Received(1) | | | Net
Amount | |
| BNP Paribas Prime Brokerage Intl Ltd | | | | | 899,752 | | | | | | (899,752) | | | | | | — | | |
| Goldman Sachs International | | | | | 884,066 | | | | | | (884,066) | | | | | | | | |
| Goldman Sachs & Co. LLC | | | | | 441,831 | | | | | | (441,831) | | | | | | — | | |
| J.P. Morgan Securities LLC | | | | | 510,590 | | | | | | (510,590) | | | | | | — | | |
| Morgan Stanley & Co. LLC | | | | | 773,142 | | | | | | (773,142) | | | | | | — | | |
| NatWest Markets Securities Inc. | | | | | 550,540 | | | | | | (550,540) | | | | | | — | | |
| Total | | | | $ | 4,505,929 | | | | | $ | (4,505,929) | | | | | $ | — | | |
| |
(1)
Cash Collateral with a fair value of $4,672,984 has been received in connection with the above securities lending transactions. Excess cash collateral received from the individual counterparty is not shown for financial reporting purposes.
NOTE 10 — FEDERAL INCOME TAXES
The amount of distributions from net investment income and net realized capital gains are determined in accordance with federal income tax regulations, which may differ from GAAP for investment companies. These book/tax differences may be either temporary or permanent. Permanent differences are reclassified within the capital accounts based on their federal tax-basis treatment; temporary differences are not reclassified. Key differences include the treatment of capital loss carryforwards, futures contracts, paydowns and perpetual preferred securities.
Dividends paid by the Funds from net investment income and distributions of net realized short-term capital gains are, for federal income tax purposes, taxable as ordinary income to shareholders.
The tax composition of dividends and distributions to shareholders was as follows:
| | | | Year or Period Ended March 31, 2023 | | | Year Ended March 31, 2022 | |
| | | | Ordinary
Income | | | Long-term
Capital Gain | | | Ordinary
Income | | | Long-term
Capital Gain | |
| EMCD | | | | $ | 4,565,018 | | | | | $ | 174,985 | | | | | $ | 4,859,024 | | | | | $ | 2,148,353 | | |
| EMHCD | | | | | 952,864 | | | | | | — | | | | | | — | | | | | | — | | |
| HYB | | | | | 918,323 | | | | | | — | | | | | | — | | | | | | — | | |
| SC | | | | | 820,674 | | | | | | — | | | | | | — | | | | | | — | | |
The tax-basis components of distributable earnings and the capital loss carryforwards which may be used to offset future realized capital gains for federal income tax purposes as of March 31, 2023 were:
| | | | Undistributed
Ordinary
Income | | | Unrealized
Appreciation/
(Depreciation) | | | Capital Loss Carryforwards | | | Other | | | Total
Distributable
Earnings/(Loss) | |
| | Amount | | | Character | | | Expiration | |
| EMCD | | | | $ | 98,167 | | | | | $ | (7,767,552) | | | | | $ | (428,773) | | | | | | Short-term | | | | | | None | | | | | $ | (61,827) | | | | | $ | (17,110,671) | | |
| | | | | | | | | | | | | | | | | | (8,950,686) | | | | | | Long-term | | | | | | None | | | | | | | | | | | | | | |
| | | | | | | | | | | | | | | | | $ | (9,379,459) | | | | | | | | | | | | | | | | | | | | | | | | | | |
| EMHCD | | | | | 4,959 | | | | | | 559,950 | | | | | | (73,296) | | | | | | Short-term | | | | | | None | | | | | | — | | | | | | 402,832 | | |
| | | | | | | | | | | | | | | | | | (88,781) | | | | | | Long-term | | | | | | None | | | | | | | | | | | | | | |
| | | | | | | | | | | | | | | | | $ | (162,077) | | | | | | | | | | | | | | | | | | | | | | | | | | |
| HYB | | | | | — | | | | | | 1,326,434 | | | | | | (4,715) | | | | | | Short-term | | | | | | None | | | | | | — | | | | | | 1,321,719 | | |
| SC | | | | | 480,945 | | | | | | 1,327,256 | | | | | | (583,193) | | | | | | Short-term | | | | | | None | | | | | | (434,588) | | | | | | (83,944) | | |
| | | | | | | | | | | | | | | | | | (874,364) | | | | | | Long-term | | | | | | None | | | | | | | | | | | | | | |
| | | | | | | | | | | | | | | | | $ | (1,457,557) | | | | | | | | | | | | | | | | | | | | | | | | | | |
The Funds’ major tax jurisdictions are U.S. federal and Arizona state.
NOTES TO FINANCIAL STATEMENTS as of March 31, 2023 (continued)
NOTE 10 — FEDERAL INCOME TAXES (continued)
As of March 31, 2023, no provision for income tax is required in the Funds’ financial statements as a result of tax positions taken on federal and state income tax returns for open tax years. The Funds’ federal and state income and federal excise tax returns for tax years for which the applicable statutes of limitations have not expired are subject to examination by the Internal Revenue Service and state department of revenue. Generally, the preceding four tax years remain subject to examination by these jurisdictions.
NOTE 11 — LONDON INTERBANK OFFERED RATE (“LIBOR”)
In 2017, the UK Financial Conduct Authority announced its intention to cease compelling banks to provide the quotations needed to sustain LIBOR after 2021. On March 5, 2021, ICE Benchmark Administration, the administrator of LIBOR, stated that non-U.S. dollar LIBOR reference rates and the one-week and two-month LIBOR reference rates ceased to be provided or no longer be representative immediately after December 31, 2021 and the remaining more commonly used LIBOR settings ceased to be provided or no longer be representative immediately after June 30, 2023. In addition, global regulators have announced that, with limited exceptions, no new LIBOR-based contracts should be entered into after 2021. Actions by regulators have resulted in the establishment of alternative reference rates to LIBOR in most major currencies (e.g., the Secured Overnight Financing Rate for U.S. Dollar LIBOR and the Sterling Overnight Interbank Average Rate for Sterling LIBOR).
Discontinuance of LIBOR and adoption/implementation of alternative rates pose a number of risks, including among others whether any substitute rate will experience the market participation and liquidity necessary to provide a workable substitute for LIBOR; the effect on parties’ existing contractual arrangements, hedging transactions, and investment strategies generally from a conversion from LIBOR to alternative rates; the effect on a Fund’s existing investments (including, for example, fixed-income investments, senior loans, CLOs and CDOs, and derivatives transactions), including the possibility that some of those investments may terminate or their terms may be adjusted to the disadvantage of the Fund; and the risk of general market disruption during the period of the conversion. It is difficult to predict at this time the likely impact of the transition away from LIBOR on each Fund.
NOTE 12 — LIQUIDITY
Consistent with Rule 22e-4 under the 1940 Act, the Funds have established a liquidity risk management program to govern their approach to managing liquidity risk (the “Program”). The Board has approved the designation of the Funds’ Investment Adviser, Voya Investments, as the program administrator (the “Program Administrator”). The Program Administrator is responsible for implementing and
monitoring the Program and has formed a Liquidity Risk Management Committee (the “Committee”) to assess and review, on an ongoing basis, each Fund’s liquidity risk.
The Program includes a number of elements that support the management and assessment of liquidity risk, including an annual assessment of liquidity risk factors and the periodic classification (or re- classification, as necessary) of a Fund’s investments into buckets (highly liquid, moderately liquid, less liquid and illiquid) that reflect the Committee’s assessment of the investments’ liquidity under current market conditions. The Committee also utilizes Fund-specific data, including information regarding a Fund’s shareholder base, characteristics of its investments, access to borrowing arrangements and historical redemptions to determine whether a Fund will be able to meet its redemption obligations in a timely manner.
During the period covered by the annual assessment, January 1, 2022 through December 31, 2022, the Program supported EMCD’s ability to honor redemption requests in a timely manner and the Program Administrator’s management of EMCD’s liquidity risk, including during any periods of market volatility and net redemptions.
There can be no assurance that the Program will achieve its objectives under all circumstances in the future. Please refer to each Fund’s prospectus for more information regarding each Fund’s exposure to liquidity risk and other risks.
NOTE 13 — MARKET DISRUPTION
Each Fund is subject to the risk that geopolitical events will disrupt securities markets and adversely affect global economies and markets. Due to the increasing interdependence among global economies and markets, conditions in one country, market, or region might adversely impact markets, issuers and/or foreign exchange rates in other countries, including the United States. Wars, terrorism, global health crises and pandemics, and other geopolitical events that have led, and in the future may continue to lead, to increased market volatility and may have adverse short- or long-term effects on U.S. and global economies and markets generally. For example, the COVID-19 pandemic has resulted, and may continue to result, in significant market volatility, exchange suspensions and closures, declines in global financial
NOTES TO FINANCIAL STATEMENTS as of March 31, 2023 (continued)
NOTE 13 — MARKET DISRUPTION (continued)
markets, higher default rates, supply chain disruptions, and a substantial economic downturn in economies throughout the world. Natural and environmental disasters and systemic market dislocations are also highly disruptive to economies and markets. In addition, military action by Russia in Ukraine has, and may continue to, adversely affect global energy and financial markets and therefore could affect the value of a Fund’s investments, including beyond a Fund’s direct exposure to Russian issuers or nearby geographic regions. The extent and duration of the military action, sanctions and resulting market disruptions are impossible to predict and could be substantial. Those events as well as other changes in foreign (non-U.S.) and domestic economic, social, and political conditions also could adversely affect individual issuers or related groups of issuers, securities markets, interest rates, credit ratings, inflation, investor sentiment, and other factors affecting the Fund’s investments. Any of these occurrences could disrupt the operations of the Funds and of the Funds service providers.
NOTE 14 — OTHER ACCOUNTING PRONOUNCEMENTS
In June 2022, the FASB issued Accounting Standards Update (ASU), ASU 2022-03, Fair Value Measurement (Topic 820) — Fair Value Measurement of Equity Securities Subject to Contractual Sale Restrictions, which clarifies that a contractual restriction on the sale of an equity security is not considered part of the unit of account
of the equity security and, therefore, is not considered in measuring fair value. The amendments under this ASU are effective for fiscal years beginning after December 15, 2023; however, early adoption is permitted. Management expects that the adoption of the guidance will not have a material impact on the Funds’ financial statements.
NOTE 15 — SUBSEQUENT EVENTS
Dividends. Subsequent to March 31, 2023, the Funds declared dividends from net investment income of:
| | | | Per Share
Amount | | | Payable
Date | | | Record
Date | |
| EMCD | | | | $ | 0.0361 | | | | May 1, 2023 | | | | | Daily | | |
| EMHCD | | | | $ | 0.0540 | | | | May 1, 2023 | | | | | Daily | | |
| HYB | | | | $ | 0.0683 | | | | May 1, 2023 | | | | | Daily | | |
| SC | | | | $ | 0.0413 | | | | May 1, 2023 | | | | | Daily | | |
Line of Credit Renewal: Effective June 13, 2023, the funds to which the Credit Agreement is available will enter into a renewed Credit Agreement with BNY for an aggregate amount of $400,000,000 and will continue to pay a commitment fee equal to 0.15% per annum on the daily unused portion of the committed line amount payable quarterly in arrears.
The Funds have evaluated events occurring after the Statements of Assets and Liabilities date through the date that the financial statements were issued (“subsequent events”) to determine whether any subsequent events necessitated adjustment to or disclosure in the financial statements. Other than the above, no such subsequent events were identified.
PORTFOLIO OF INVESTMENTS
| Voya VACS Series EMCD Fund | as of March 31, 2023 |
Principal
Amount† | | | | | | Value | | | Percentage
of Net
Assets | |
| CORPORATE BONDS/NOTES: 88.8% | |
| | | | Argentina: 1.5% | |
| 510,000 (1) | | | Arcor SAIC, 8.250%,
10/09/2027 | | | | $ | 516,893 | | | | | | 0.6 | | |
| 1,100,000 (1) | | | YPF SA, 8.500%,
06/27/2029 | | | | | 833,217 | | | | | | 0.9 | | |
| | | | | | | | | 1,350,110 | | | | | | 1.5 | | |
| | | | Brazil: 5.5% | |
| 750,000 (2) | | | Banco do Brasil SA/Cayman,
9.000%, 12/31/2199 | | | | | 738,938 | | | | | | 0.8 | | |
| 750,000 (1) | | | Braskem Netherlands
Finance BV, 7.250%,
02/13/2033 | | | | | 721,312 | | | | | | 0.8 | | |
| 675,000 (1) | | | CSN Resources SA,
4.625%, 06/10/2031 | | | | | 520,370 | | | | | | 0.6 | | |
| 250,000 | | | Fibria Overseas Finance
Ltd., 5.500%, 01/17/2027 | | | | | 251,223 | | | | | | 0.3 | | |
| 950,000 (1)(3) | | | JBS USA LUX SA / JBS USA
Food Co. / JBS USA
Finance, Inc., 3.625%,
01/15/2032 | | | | | 788,234 | | | | | | 0.9 | | |
| 600,000 | | | Minerva Luxembourg SA,
4.375%, 03/18/2031 | | | | | 493,139 | | | | | | 0.5 | | |
| 475,000 (1) | | | Minerva Luxembourg SA,
4.375%, 03/18/2031 | | | | | 390,402 | | | | | | 0.4 | | |
| 900,000 (3) | | | Nexa Resources SA,
6.500%, 01/18/2028 | | | | | 876,930 | | | | | | 0.9 | | |
| 300,000 (1) | | | Suzano Austria GmbH,
7.000%, 03/16/2047 | | | | | 310,215 | | | | | | 0.3 | | |
| | | | | | | | | 5,090,763 | | | | | | 5.5 | | |
| | | | Chile: 5.0% | |
| 475,000 (1) | | | Antofagasta PLC, 5.625%,
05/13/2032 | | | | | 472,934 | | | | | | 0.5 | | |
| 525,000 (1) | | | ATP Tower Holdings LLC /
Andean Tower Partners
Colombia SAS / Andean
Telecom Par, 4.050%,
04/27/2026 | | | | | 451,848 | | | | | | 0.5 | | |
| 800,000 | | | Banco de Credito e
Inversiones SA, 2.875%,
10/14/2031 | | | | | 648,600 | | | | | | 0.7 | | |
| 600,000 (1) | | | Celulosa Arauco y
Constitucion SA, 4.200%,
01/29/2030 | | | | | 545,831 | | | | | | 0.6 | | |
| 200,000 | | | Celulosa Arauco y
Constitucion SA, 5.500%,
11/02/2047 | | | | | 175,587 | | | | | | 0.2 | | |
| 370,000 (1) | | | Cia Cervecerias Unidas SA,
3.350%, 01/19/2032 | | | | | 313,923 | | | | | | 0.3 | | |
| 350,000 (1) | | | Corp Nacional del Cobre de
Chile, 5.125%, 02/02/2033 | | | | | 353,827 | | | | | | 0.4 | | |
Principal
Amount† | | | | | | Value | | | Percentage
of Net
Assets | |
| CORPORATE BONDS/NOTES: (continued) | |
| | | | Chile (continued) | |
| 630,000 | | | Engie Energia Chile SA,
3.400%, 01/28/2030 | | | | $ | 514,941 | | | | | | 0.6 | | |
| 575,000 (1) | | | Inversiones CMPC SA,
3.000%, 04/06/2031 | | | | | 476,963 | | | | | | 0.5 | | |
| 800,000 | | | Telefonica Moviles
Chile SA, 3.537%,
11/18/2031 | | | | | 638,672 | | | | | | 0.7 | | |
| | | | | | | | | 4,593,126 | | | | | | 5.0 | | |
| | | | China: 2.2% | |
| 650,000 | | | Alibaba Group Holding Ltd.,
3.600%, 11/28/2024 | | | | | 635,590 | | | | | | 0.7 | | |
| 600,000 (1) | | | ENN Clean Energy
International Investment Ltd.,
3.375%, 05/12/2026 | | | | | 540,247 | | | | | | 0.6 | | |
| 950,000 (1) | | | Tencent Holdings Ltd.,
3.595%, 01/19/2028 | | | | | 897,578 | | | | | | 0.9 | | |
| | | | | | | | | 2,073,415 | | | | | | 2.2 | | |
| | | | Colombia: 4.6% | |
| 750,000 (2) | | | Bancolombia SA, 4.625%,
12/18/2029 | | | | | 630,746 | | | | | | 0.7 | | |
| 975,000 | | | Ecopetrol SA, 6.875%,
04/29/2030 | | | | | 899,477 | | | | | | 1.0 | | |
| 1,100,000 | | | Ecopetrol SA, 8.875%,
01/13/2033 | | | | | 1,114,300 | | | | | | 1.2 | | |
| 625,000 (1) | | | Geopark Ltd., 5.500%,
01/17/2027 | | | | | 525,000 | | | | | | 0.6 | | |
| 450,000 (1) | | | Millicom International
Cellular SA, 5.125%,
01/15/2028 | | | | | 402,386 | | | | | | 0.4 | | |
| 800,000 | | | Oleoducto Central SA,
4.000%, 07/14/2027 | | | | | 684,908 | | | | | | 0.7 | | |
| | | | | | | | | 4,256,817 | | | | | | 4.6 | | |
| | | | Ghana: 0.3% | |
| 424,000 (1) | | | Tullow Oil PLC, 10.250%,
05/15/2026 | | | | | 327,298 | | | | | | 0.3 | | |
| | | | | |
| | | | Guatemala: 1.5% | |
| 750,000 (1) | | | Central American Bottling
Corp. / CBC Bottling Holdco
SL / Beliv Holdco SL,
5.250%, 04/27/2029 | | | | | 697,811 | | | | | | 0.8 | | |
| 800,000 (1) | | | CT Trust, 5.125%,
02/03/2032 | | | | | 670,000 | | | | | | 0.7 | | |
| | | | | | | | | 1,367,811 | | | | | | 1.5 | | |
| | | | Hong Kong: 3.2% | |
| 600,000 (1) | | | CK Hutchison International
21 Ltd., 2.500%, 04/15/2031 | | | | | 515,869 | | | | | | 0.6 | | |
See Accompanying Notes to Financial Statements
PORTFOLIO OF INVESTMENTS
| Voya VACS Series EMCD Fund | as of March 31, 2023 (continued) |
Principal
Amount† | | | | | | Value | | | Percentage
of Net
Assets | |
| CORPORATE BONDS/NOTES: (continued) | |
| | | | Hong Kong (continued) | |
| 650,000 (1) | | | Lenovo Group Ltd., 5.831%,
01/27/2028 | | | | $ | 654,620 | | | | | | 0.7 | | |
| 635,000 (1) | | | Lenovo Group Ltd., 6.536%,
07/27/2032 | | | | | 645,530 | | | | | | 0.7 | | |
| 550,000 (1)(2)(3) | | | Standard Chartered PLC,
6.170%, 01/09/2027 | | | | | 552,584 | | | | | | 0.6 | | |
| 550,000 (1)(2) | | | Standard Chartered PLC,
6.301%, 01/09/2029 | | | | | 562,590 | | | | | | 0.6 | | |
| | | | | | | | | 2,931,193 | | | | | | 3.2 | | |
| | | | India: 5.2% | |
| 450,000 | | | Adani Ports & Special
Economic Zone Ltd.,
4.375%, 07/03/2029 | | | | | 340,451 | | | | | | 0.4 | | |
| 800,000 (1) | | | Bharti Airtel International
Netherlands BV, 5.350%,
05/20/2024 | | | | | 802,113 | | | | | | 0.9 | | |
| 1,200,000 (1)(3) | | | JSW Steel Ltd., 5.050%,
04/05/2032 | | | | | 983,418 | | | | | | 1.0 | | |
| 525,000 (1)(2) | | | Network i2i Ltd., 3.975%,
12/31/2199 | | | | | 462,282 | | | | | | 0.5 | | |
| 535,000 (1) | | | Reliance Industries Ltd.,
2.875%, 01/12/2032 | | | | | 445,126 | | | | | | 0.5 | | |
| 720,000 (1) | | | Reliance Industries Ltd.,
3.667%, 11/30/2027 | | | | | 681,391 | | | | | | 0.7 | | |
| 700,000 (1) | | | Summit Digitel Infrastructure
Ltd., 2.875%, 08/12/2031 | | | | | 547,118 | | | | | | 0.6 | | |
| 550,000 (1) | | | Vedanta Resources
Finance II PLC, 8.950%,
03/11/2025 | | | | | 340,134 | | | | | | 0.4 | | |
| 300,000 (1) | | | Vedanta Resources
Finance II PLC, 13.875%,
01/21/2024 | | | | | 240,382 | | | | | | 0.2 | | |
| | | | | | | | | 4,842,415 | | | | | | 5.2 | | |
| | | | Indonesia: 2.6% | |
| 1,100,000 (1) | | | Medco Bell Pte Ltd., 6.375%,
01/30/2027 | | | | | 991,834 | | | | | | 1.1 | | |
| 800,000 (1) | | | Pertamina Persero PT,
3.100%, 01/21/2030 | | | | | 710,196 | | | | | | 0.8 | | |
| 250,000 (1) | | | Perusahaan Listrik Negara
PT, 4.125%, 05/15/2027 | | | | | 239,625 | | | | | | 0.2 | | |
| 600,000 (3) | | | Perusahaan Perseroan
Persero PT Perusahaan
Listrik Negara, 3.000%,
06/30/2030 | | | | | 515,865 | | | | | | 0.5 | | |
| | | | | | | | | 2,457,520 | | | | | | 2.6 | | |
| | | | Israel: 6.0% | |
| 1,000,000 (1)(3) | | | Altice Financing SA, 5.750%,
08/15/2029 | | | | | 795,905 | | | | | | 0.9 | | |
Principal
Amount† | | | | | | Value | | | Percentage
of Net
Assets | |
| CORPORATE BONDS/NOTES: (continued) | |
| | | | Israel (continued) | |
| 925,000 | | | Bank Hapoalim, 3.255%,
01/21/2032 | | | | $ | 772,837 | | | | | | 0.8 | | |
| 800,000 (1)(2) | | | Bank Leumi Le-Israel BM,
3.275%, 01/29/2031 | | | | | 698,312 | | | | | | 0.8 | | |
| 825,000 (1) | | | Israel Discount Bank Ltd.,
5.375%, 01/26/2028 | | | | | 813,386 | | | | | | 0.9 | | |
| 500,000 (1) | | | Israel Electric Corp. Ltd.,
4.250%, 08/14/2028 | | | | | 470,729 | | | | | | 0.5 | | |
| 600,000 (1)(2) | | | Mizrahi Tefahot Bank Ltd.,
3.077%, 04/07/2031 | | | | | 511,500 | | | | | | 0.5 | | |
| 575,000 (3) | | | Teva Pharmaceutical
Finance Netherlands III BV,
5.125%, 05/09/2029 | | | | | 521,414 | | | | | | 0.6 | | |
| 900,000 | | | Teva Pharmaceutical
Finance Netherlands III BV,
8.125%, 09/15/2031 | | | | | 945,856 | | | | | | 1.0 | | |
| | | | | | | | | 5,529,939 | | | | | | 6.0 | | |
| | | | Kazakhstan: 0.9% | |
| 500,000 | | | KazMunayGas National Co.
JSC, 3.500%, 04/14/2033 | | | | | 376,170 | | | | | | 0.4 | | |
| 500,000 | | | KazMunayGas National Co.
JSC, 6.375%, 10/24/2048 | | | | | 417,200 | | | | | | 0.5 | | |
| | | | | | | | | 793,370 | | | | | | 0.9 | | |
| | | | Kuwait: 2.0% | |
| 550,000 (1) | | | Equate Petrochemical BV,
2.625%, 04/28/2028 | | | | | 485,770 | | | | | | 0.5 | | |
| 575,000 | | | Equate Petrochemical BV,
4.250%, 11/03/2026 | | | | | 559,159 | | | | | | 0.6 | | |
| 900,000 (1)(2) | | | NBK Tier 1 Financing 2 Ltd.,
4.500%, 12/31/2199 | | | | | 818,604 | | | | | | 0.9 | | |
| | | | | | | | | 1,863,533 | | | | | | 2.0 | | |
| | | | Macau: 3.8% | |
| 1,500,000 (1) | | | Melco Resorts Finance Ltd.,
5.750%, 07/21/2028 | | | | | 1,299,000 | | | | | | 1.4 | | |
| 675,000 | | | MGM China Holdings Ltd.,
4.750%, 02/01/2027 | | | | | 605,397 | | | | | | 0.7 | | |
| 1,675,000 | | | Sands China Ltd., 5.900%,
08/08/2028 | | | | | 1,591,454 | | | | | | 1.7 | | |
| | | | | | | | | 3,495,851 | | | | | | 3.8 | | |
| | | | Malaysia: 1.6% | |
| 375,000 (1) | | | CIMB Bank Bhd, 2.125%,
07/20/2027 | | | | | 340,952 | | | | | | 0.4 | | |
| 650,000 (1) | | | Genm Capital Labuan Ltd.,
3.882%, 04/19/2031 | | | | | 505,762 | | | | | | 0.5 | | |
| 725,000 (1) | | | Misc Capital Two Labuan
Ltd., 3.750%, 04/06/2027 | | | | | 686,043 | | | | | | 0.7 | | |
| | | | | | | | | 1,532,757 | | | | | | 1.6 | | |
See Accompanying Notes to Financial Statements
PORTFOLIO OF INVESTMENTS
| Voya VACS Series EMCD Fund | as of March 31, 2023 (continued) |
Principal
Amount† | | | | | | Value | | | Percentage
of Net
Assets | |
| CORPORATE BONDS/NOTES: (continued) | |
| | | | Mexico: 7.4% | |
| 950,000 (1) | | | Alpek SAB de CV, 4.250%,
09/18/2029 | | | | $ | 855,785 | | | | | | 0.9 | | |
| 600,000 (2) | | | Banco Mercantil del Norte
SA/Grand Cayman, 7.500%,
12/31/2199 | | | | | 519,250 | | | | | | 0.6 | | |
| 500,000 (1)(2) | | | Banco Mercantil del Norte
SA/Grand Cayman, 7.500%,
12/31/2199 | | | | | 432,709 | | | | | | 0.5 | | |
| 850,000 (1) | | | Cemex SAB de CV, 5.200%,
09/17/2030 | | | | | 784,797 | | | | | | 0.8 | | |
| 750,000 (1)(2) | | | Cemex SAB de CV, 9.125%,
12/31/2199 | | | | | 752,028 | | | | | | 0.8 | | |
| 650,000 (1) | | | GCC SAB de CV, 3.614%,
04/20/2032 | | | | | 545,975 | | | | | | 0.6 | | |
| 500,000 (1)(2) | | | Grupo Bimbo SAB de CV,
5.950%, 12/31/2199 | | | | | 499,954 | | | | | | 0.5 | | |
| 500,000 (1) | | | Industrias Penoles SAB de
CV, 4.750%, 08/06/2050 | | | | | 392,292 | | | | | | 0.4 | | |
| 675,000 | | | Petroleos Mexicanos,
6.875%, 08/04/2026 | | | | | 641,449 | | | | | | 0.7 | | |
| 875,000 (1) | | | Petroleos Mexicanos,
10.000%, 02/07/2033 | | | | | 839,382 | | | | | | 0.9 | | |
| 625,000 (1) | | | Sigma Finance Netherlands
BV, 4.875%, 03/27/2028 | | | | | 609,391 | | | | | | 0.7 | | |
| | | | | | | | | 6,873,012 | | | | | | 7.4 | | |
| | | | Morocco: 0.5% | |
| 500,000 | | | OCP SA, 6.875%,
04/25/2044 | | | | | 455,748 | | | | | | 0.5 | | |
| | | | | |
| | | | Oman: 1.0% | |
| 450,000 (1) | | | OQ SAOC, 5.125%,
05/06/2028 | | | | | 429,266 | | | | | | 0.4 | | |
| 550,000 (1) | | | Oryx Funding Ltd., 5.800%,
02/03/2031 | | | | | 529,199 | | | | | | 0.6 | | |
| | | | | | | | | 958,465 | | | | | | 1.0 | | |
| | | | Panama: 1.7% | |
| 825,000 (1) | | | AES Panama Generation
Holdings SRL, 4.375%,
05/31/2030 | | | | | 710,292 | | | | | | 0.8 | | |
| 1,000,000 | | | C&W Senior Financing DAC,
6.875%, 09/15/2027 | | | | | 895,474 | | | | | | 0.9 | | |
| | | | | | | | | 1,605,766 | | | | | | 1.7 | | |
| | | | Peru: 1.0% | |
| 1,000,000 (2) | | | Banco de Credito del Peru
S.A., 3.125%, 07/01/2030 | | | | | 901,014 | | | | | | 1.0 | | |
| | | | | |
Principal
Amount† | | | | | | Value | | | Percentage
of Net
Assets | |
| CORPORATE BONDS/NOTES: (continued) | |
| | | | Poland: 0.8% | |
| 785,000 (1) | | | Canpack SA / Canpack US
LLC, 3.125%, 11/01/2025 | | | | $ | 714,350 | | | | | | 0.8 | | |
| | | | | |
| | | | Qatar: 1.8% | |
| 700,000 | | | Commercial Bank PSQC/
THE, 4.500%, 12/31/2049 | | | | | 624,724 | | | | | | 0.7 | | |
| 650,000 (1) | | | Ooredoo International
Finance Ltd., 2.625%,
04/08/2031 | | | | | 564,678 | | | | | | 0.6 | | |
| 650,000 (1) | | | QatarEnergy, 3.300%,
07/12/2051 | | | | | 485,973 | | | | | | 0.5 | | |
| | | | | | | | | 1,675,375 | | | | | | 1.8 | | |
| | | | Russia: 0.2% | |
| 1,000,000 (1)(2)(4)(5) | | | Alfa Bank AO Via Alfa Bond
Issuance PLC, 5.950%,
04/15/2030 | | | | | 100,625 | | | | | | 0.1 | | |
| 500,000 (1)(2)(5) | | | Sovcombank Via SovCom
Capital DAC, 7.750%,
12/31/2199 | | | | | 43,437 | | | | | | 0.1 | | |
| | | | | | | | | 144,062 | | | | | | 0.2 | | |
| | | | Saudi Arabia: 4.8% | |
| 400,000 (1) | | | Arabian Centres Sukuk II
Ltd., 5.625%, 10/07/2026 | | | | | 369,892 | | | | | | 0.4 | | |
| 525,000 (1) | | | EIG Pearl Holdings Sarl,
3.545%, 08/31/2036 | | | | | 450,550 | | | | | | 0.5 | | |
| 650,000 | | | EIG Pearl Holdings Sarl,
4.387%, 11/30/2046 | | | | | 514,894 | | | | | | 0.5 | | |
| 350,000 (1) | | | Greensaif Pipelines Bidco
Sarl, 6.129%, 02/23/2038 | | | | | 360,394 | | | | | | 0.4 | | |
| 325,000 (1) | | | Greensaif Pipelines Bidco
Sarl, 6.510%, 02/23/2042 | | | | | 342,880 | | | | | | 0.4 | | |
| 1,400,000 (1) | | | Saudi Arabian Oil Co.,
2.250%, 11/24/2030 | | | | | 1,183,918 | | | | | | 1.3 | | |
| 700,000 | | | Saudi Arabian Oil Co.,
2.875%, 04/16/2024 | | | | | 685,089 | | | | | | 0.7 | | |
| 600,000 | | | Saudi Electricity Global
Sukuk Co. 2, 5.060%,
04/08/2043 | | | | | 586,980 | | | | | | 0.6 | | |
| | | | | | | | | 4,494,597 | | ��� | | | | 4.8 | | |
| | | | Singapore: 0.8% | |
| 800,000 (1)(2) | | | Oversea-Chinese Banking
Corp. Ltd., 1.832%,
09/10/2030 | | | | | 734,284 | | | | | | 0.8 | | |
| | | | | |
| | | | South Africa: 3.7% | |
| 600,000 | | | AngloGold Ashanti Holdings
PLC, 3.375%, 11/01/2028 | | | | | 534,031 | | | | | | 0.6 | | |
See Accompanying Notes to Financial Statements
PORTFOLIO OF INVESTMENTS
| Voya VACS Series EMCD Fund | as of March 31, 2023 (continued) |
Principal
Amount† | | | | | | Value | | | Percentage
of Net
Assets | |
| CORPORATE BONDS/NOTES: (continued) | |
| | | | South Africa (continued) | |
| 400,000 | | | AngloGold Ashanti Holdings
PLC, 6.500%, 04/15/2040 | | | | $ | 391,471 | | | | | | 0.4 | | |
| 875,000 (1) | | | Bidvest Group UK PLC/The,
3.625%, 09/23/2026 | | | | | 794,867 | | | | | | 0.9 | | |
| 400,000 | | | Bidvest Group UK PLC/The,
3.625%, 09/23/2026 | | | | | 363,368 | | | | | | 0.4 | | |
| 775,000 (1) | | | Gold Fields Orogen Holdings
BVI Ltd., 5.125%,
05/15/2024 | | | | | 772,469 | | | | | | 0.8 | | |
| 625,000 | | | Sasol Financing USA LLC,
4.375%, 09/18/2026 | | | | | 565,669 | | | | | | 0.6 | | |
| | | | | | | | | 3,421,875 | | | | | | 3.7 | | |
| | | | South Korea: 7.9% | |
| 700,000 (1) | | | Kookmin Bank, 2.500%,
11/04/2030 | | | | | 570,545 | | | | | | 0.6 | | |
| 550,000 (1)(2) | | | Kookmin Bank, 4.350%,
12/31/2199 | | | | | 522,428 | | | | | | 0.6 | | |
| 650,000 (1) | | | Korea Electric Power Corp.,
3.625%, 06/14/2025 | | | | | 634,452 | | | | | | 0.7 | | |
| 500,000 (1) | | | Korea National Oil Corp.,
4.750%, 04/03/2026 | | | | | 497,415 | | | | | | 0.5 | | |
| 675,000 (1) | | | Korea National Oil Corp.,
4.875%, 04/03/2028 | | | | | 678,414 | | | | | | 0.7 | | |
| 550,000 (1) | | | KT Corp., 4.000%,
08/08/2025 | | | | | 538,616 | | | | | | 0.6 | | |
| 925,000 (1) | | | POSCO, 5.625%,
01/17/2026 | | | | | 936,150 | | | | | | 1.0 | | |
| 675,000 (1) | | | POSCO, 5.750%,
01/17/2028 | | | | | 697,069 | | | | | | 0.7 | | |
| 200,000 (1) | | | POSCO, 5.875%,
01/17/2033 | | | | | 213,787 | | | | | | 0.2 | | |
| 425,000 (1)(2) | | | Shinhan Financial Group Co.
Ltd., 2.875%, 12/31/2199 | | | | | 359,210 | | | | | | 0.4 | | |
| 700,000 (1) | | | SK Hynix, Inc., 2.375%,
01/19/2031 | | | | | 524,521 | | | | | | 0.6 | | |
| 450,000 (1) | | | Woori Bank, 4.875%,
01/26/2028 | | | | | 451,420 | | | | | | 0.5 | | |
| 725,000 (1) | | | Woori Bank Co. Ltd.,
4.750%, 04/30/2024 | | | | | 718,493 | | | | | | 0.8 | | |
| | | | | | | | | 7,342,520 | | | | | | 7.9 | | |
| | | | Taiwan: 0.7% | |
| 650,000 (1)(3) | | | TSMC Global Ltd., 4.625%,
07/22/2032 | | | | | 655,743 | | | | | | 0.7 | | |
| | | | | |
| | | | Thailand: 2.8% | |
| 500,000 (1) | | | Bangkok Bank PCL/Hong
Kong, 4.450%, 09/19/2028 | | | | | 492,532 | | | | | | 0.5 | | |
Principal
Amount† | | | | | | Value | | | Percentage
of Net
Assets | |
| CORPORATE BONDS/NOTES: (continued) | |
| | | | Thailand (continued) | |
| 800,000 (1)(2) | | | Bangkok Bank PCL/Hong
Kong, 5.000%, 12/31/2199 | | | | $ | 729,015 | | | | | | 0.8 | | |
| 725,000 (1) | | | GC Treasury Center Co.
Ltd., 4.400%, 03/30/2032 | | | | | 652,472 | | | | | | 0.7 | | |
| 1,000,000 (1) | | | PTTEP Treasury Center Co.
Ltd., 3.903%, 12/06/2059 | | | | | 705,335 | | | | | | 0.8 | | |
| | | | | | | | | 2,579,354 | | | | | | 2.8 | | |
| | | | Turkey: 2.2% | |
| 250,000 (1) | | | Akbank TAS, 6.800%,
02/06/2026 | | | | | 242,475 | | | | | | 0.3 | | |
| 550,000 (1) | | | Turk Telekomunikasyon AS,
6.875%, 02/28/2025 | | | | | 529,186 | | | | | | 0.6 | | |
| 550,000 | | | Turkiye Is Bankasi AS,
6.125%, 04/25/2024 | | | | | 545,339 | | | | | | 0.6 | | |
| 700,000 (1) | | | Turkiye Sise ve Cam
Fabrikalari AS, 6.950%,
03/14/2026 | | | | | 688,709 | | | | | | 0.7 | | |
| | | | | | | | | 2,005,709 | | | | | | 2.2 | | |
| | | | United Arab Emirates: 4.3% | |
| 700,000 | | | DP World Ltd., 6.850%,
07/02/2037 | | | | | 781,159 | | | | | | 0.9 | | |
| 650,000 (2) | | | Emirates NBD Bank PJSC,
6.125%, 12/31/2199 | | | | | 634,884 | | | | | | 0.7 | | |
| 401,154 | | | Galaxy Pipeline Assets
Bidco Ltd., 1.750%,
09/30/2027 | | | | | 374,049 | | | | | | 0.4 | | |
| 465,728 (1) | | | Galaxy Pipeline Assets
Bidco Ltd., 2.160%,
03/31/2034 | | | | | 401,652 | | | | | | 0.4 | | |
| 379,940 (1) | | | Galaxy Pipeline Assets
Bidco Ltd., 2.940%,
09/30/2040 | | | | | 308,696 | | | | | | 0.3 | | |
| 500,000 | | | MAF Global Securities Ltd.,
4.750%, 05/07/2024 | | | | | 495,410 | | | | | | 0.5 | | |
| 525,000 (1) | | | MDGH GMTN RSC Ltd.,
5.500%, 04/28/2033 | | | | | 558,661 | | | | | | 0.6 | | |
| 511,130 (1) | | | Sweihan PV Power Co.
PJSC, 3.625%, 01/31/2049 | | | | | 420,529 | | | | | | 0.5 | | |
| | | | | | | | | 3,975,040 | | | | | | 4.3 | | |
| | | | United Kingdom: 1.3% | |
| 750,000 (2) | | | HSBC Holdings PLC,
7.390%, 11/03/2028 | | | | | 798,893 | | | | | | 0.8 | | |
| 450,000 (2)(3) | | | HSBC Holdings PLC,
8.000%, 12/31/2199 | | | | | 449,955 | | | | | | 0.5 | | |
| | | | | | | | | 1,248,848 | | | | | | 1.3 | | |
| | | | Total Corporate
Bonds/Notes
(Cost $90,068,484) | | | | | 82,291,680 | | | | | | 88.8 | | |
| |
See Accompanying Notes to Financial Statements
PORTFOLIO OF INVESTMENTS
| Voya VACS Series EMCD Fund | as of March 31, 2023 (continued) |
Principal
Amount† | | | | | | Value | | | Percentage
of Net
Assets | |
| SOVEREIGN BONDS: 1.8% | |
| | | | India: 0.7% | |
| 675,000 (1) | | | Export-Import Bank of India,
5.500%, 01/18/2033 | | | | $ | 675,238 | | | | | | 0.7 | | |
| | | | | |
| | | | United Arab Emirates: 1.1% | |
| 1,000,000 (1) | | | Finance Department
Government of Sharjah,
6.500%, 11/23/2032 | | | | | 1,021,184 | | | | | | 1.1 | | |
| | | | Total Sovereign Bonds
(Cost $1,665,879) | | | | | 1,696,422 | | | | | | 1.8 | | |
| | | | Total Long-Term
Investments
(Cost $91,734,363) | | | | | 83,988,102 | | | | | | 90.6 | | |
| SHORT-TERM INVESTMENTS: 13.5% | |
| | | | Commercial Paper: 6.5% | |
| 1,000,000 | | | Agilent Technologies, Inc.,
4.890%, 04/06/2023 | | | | | 999,152 | | | | | | 1.1 | | |
| 1,000,000 | | | Dollar General Corp.,
4.990%, 04/03/2023 | | | | | 999,577 | | | | | | 1.1 | | |
| 1,000,000 | | | Dominion Energy, Inc.,
5.040%, 04/03/2023 | | | | | 999,578 | | | | | | 1.1 | | |
| 1,000,000 | | | Duke Energy, 5.090%,
04/04/2023 | | | | | 999,434 | | | | | | 1.1 | | |
| 1,000,000 | | | Equifax, Inc., 5.200%,
04/06/2023 | | | | | 999,148 | | | | | | 1.0 | | |
| 1,000,000 | | | Medtronic, Inc., 5.300%,
04/06/2023 | | | | | 999,162 | | | | | | 1.1 | | |
| | | | Total Commercial Paper
(Cost $5,996,898) | | | | | 5,996,051 | | | | | | 6.5 | | |
| | | | | |
| | | | Repurchase Agreements: 5.0% | |
| 1,117,089 (6) | | | Bank of America Inc.,
Repurchase Agreement
dated 03/31/23, 4.82%, due
04/03/23 (Repurchase
Amount $1,117,532,
collateralized by various U.S.
Government Agency
Obligations, 1.500%-3.000%,
Market Value plus accrued
interest $1,139,431, due
11/01/49-02/01/51) | | | | | 1,117,089 | | | | | | 1.2 | | |
Principal
Amount† | | | | | | Value | | | Percentage
of Net
Assets | |
| SHORT-TERM INVESTMENTS: (continued) | |
| | | | Repurchase Agreements (continued) | |
| 204,628 (6) | | | Citigroup, Inc., Repurchase
Agreement dated 03/31/23,
4.81%, due 04/03/23
(Repurchase Amount
$204,709, collateralized by
various U.S. Government/
U.S. Government Agency
Obligations, 1.500%-7.000%,
Market Value plus accrued
interest $208,721, due
12/26/24-03/20/53) | | | | $ | 204,628 | | | | | | 0.2 | | |
| 1,117,089 (6) | | | HSBC Securities USA,
Repurchase Agreement
dated 03/31/23, 4.80%, due
04/03/23 (Repurchase
Amount $1,117,530,
collateralized by various U.S.
Government/U.S.
Government Agency
Obligations, 0.000%-6.500%,
Market Value plus accrued
interest $1,139,431, due
06/15/24-02/15/53) | | | | | 1,117,089 | | | | | | 1.2 | | |
| 1,117,089 (6) | | | Jefferies LLC, Repurchase
Agreement dated 03/31/23,
4.91%, due 04/03/23
(Repurchase Amount
$1,117,540, collateralized by
various U.S. Government
Agency Obligations,
0.000%-5.750%, Market
Value plus accrued interest
$1,139,438, due
04/14/23-03/21/28) | | | | | 1,117,089 | | | | | | 1.2 | | |
See Accompanying Notes to Financial Statements
PORTFOLIO OF INVESTMENTS
| Voya VACS Series EMCD Fund | as of March 31, 2023 (continued) |
Principal
Amount† | | | | | | Value | | | Percentage
of Net
Assets | |
| SHORT-TERM INVESTMENTS: (continued) | |
| | | | Repurchase Agreements (continued) | |
| 1,117,089 (6) | | | RBC Dominion Securities
Inc., Repurchase Agreement
dated 03/31/23, 4.82%, due
04/03/23 (Repurchase
Amount $1,117,532,
collateralized by various U.S.
Government/U.S.
Government Agency
Obligations, 0.000%-6.375%,
Market Value plus accrued
interest $1,139,431, due
04/06/23-02/20/53) | | | | $ | 1,117,089 | | | | | | 1.2 | | |
| | | | Total Repurchase
Agreements
(Cost $4,672,984) | | | | | 4,672,984 | | | | | | 5.0 | | |
| |
| Shares | | | | | | Value | | | Percentage
of Net
Assets | |
| | | | Mutual Funds: 2.0% | |
1,873,000 (7) | | | Morgan Stanley Institutional
Liquidity Funds -
Government Portfolio
(Institutional Share Class),
4.730%
(Cost $1,873,000) | | | | | 1,873,000 | | | | | | 2.0 | | |
| | | | Total Short-Term
Investments
(Cost $12,542,882) | | | | | 12,542,035 | | | | | | 13.5 | | |
| | | | Total Investments in
Securities
(Cost $104,277,245) | | | | $ | 96,530,137 | | | | | | 104.1 | | |
| | | | Liabilities in Excess of
Other Assets | | | | | (3,819,682) | | | | | | (4.1) | | |
| | | | Net Assets | | | | $ | 92,710,455 | | | | | | 100.0 | | |
†
Unless otherwise indicated, principal amount is shown in USD.
(1)
Securities with purchases pursuant to Rule 144A or section 4(a)(2), under the Securities Act of 1933 and may not be resold subject to that rule except to qualified institutional buyers.
(2)
Variable rate security. Rate shown is the rate in effect as of March 31, 2023.
(3)
Security, or a portion of the security, is on loan.
(4)
Defaulted security.
(5)
Restricted security as to resale, excluding Rule 144A securities. As of March 31, 2023, the Fund held restricted securities with a fair value of $144,062 or 0.2% of net assets. Please refer to the table below for additional details.
(6)
All or a portion of the security represents securities purchased with cash collateral received for securities on loan.
(7)
Rate shown is the 7-day yield as of March 31, 2023.
| Sector Diversification | | | Percentage
of Net Assets | |
| Financial | | | | | 19.8% | | |
| Energy | | | | | 18.7 | | |
| Basic Materials | | | | | 14.9 | | |
| Consumer, Non-cyclical | | | | | 8.7 | | |
| Communications | | | | | 8.5 | | |
| Consumer, Cyclical | | | | | 5.6 | | |
| Utilities | | | | | 5.1 | | |
| Industrial | | | | | 4.8 | | |
| Technology | | | | | 2.7 | | |
| Sovereign Bonds | | | | | 1.8 | | |
| Short-Term Investments | | | | | 13.5 | | |
| Liabilities in Excess of Other Assets | | | | | (4.1) | | |
| Net Assets | | | | | 100.0% | | |
Portfolio holdings are subject to change daily.
See Accompanying Notes to Financial Statements
PORTFOLIO OF INVESTMENTS
| Voya VACS Series EMCD Fund | as of March 31, 2023 (continued) |
Fair Value Measurements^
The following is a summary of the fair valuations according to the inputs used as of March 31, 2023 in valuing the assets and liabilities:
| | | | Quoted Prices
in Active Markets
for Identical
Investments
(Level 1) | | | Significant
Other
Observable
Inputs
(Level 2) | | | Significant
Unobservable
Inputs
(Level 3) | | | Fair Value
at
March 31, 2023 | |
| Asset Table | | | | | | | | | | | | | | | | | | | | | | | | | |
| Investments, at fair value | | | | | | | | | | | | | | | | | | | | | | | | | |
| Corporate Bonds/Notes | | | | $ | — | | | | | $ | 82,291,680 | | | | | $ | — | | | | | $ | 82,291,680 | | |
| Sovereign Bonds | | | | | — | | | | | | 1,696,422 | | | | | | — | | | | | | 1,696,422 | | |
| Short-Term Investments | | | | | 1,873,000 | | | | | | 10,669,035 | | | | | | — | | | | | | 12,542,035 | | |
| Total Investments, at fair value | | | | $ | 1,873,000 | | | | | $ | 94,657,137 | | | | | $ | — | | | | | $ | 96,530,137 | | |
| Other Financial Instruments+ | | | | | | | | | | | | | | | | | | | | | | | | | |
| Futures | | | | | 183,353 | | | | | | — | | | | | | — | | | | | | 183,353 | | |
| Total Assets | | | | $ | 2,056,353 | | | | | $ | 94,657,137 | | | | | $ | — | | | | | $ | 96,713,490 | | |
| Liabilities Table | | | | | | | | | | | | | | | | | | | | | | | | | |
| Other Financial Instruments+ | | | | | | | | | | | | | | | | | | | | | | | | | |
| Futures | | | | $ | (322,981) | | | | | $ | — | | | | | $ | — | | | | | $ | (322,981) | | |
| Total Liabilities | | | | $ | (322,981) | | | | | $ | — | | | | | $ | — | | | | | $ | (322,981) | | |
^
See Note 2, “Significant Accounting Policies” in the Notes to Financial Statements for additional information.
+
Other Financial Instruments may include open forward foreign currency contracts, futures, centrally cleared swaps, OTC swaps and written options. Forward foreign currency contracts, futures and centrally cleared swaps are fair valued at the unrealized appreciation (depreciation) on the instrument. OTC swaps and written options are valued at the fair value of the instrument.
At March 31, 2023, Voya VACS Series EMCD Fund held the following restricted securities:
| Security | | | Acquisition Date | | | Acquisition Cost | | | Fair Value | |
| Alfa Bank AO Via Alfa Bond Issuance PLC | | | | | 11/21/2019 | | | | | $ | 1,005,425 | | | | | $ | 100,625 | | |
| Sovcombank Via SovCom Capital DAC | | | | | 1/30/2020 | | | | | | 500,000 | | | | | | 43,437 | | |
| | | | | | | | | | | $ | 1,505,425 | | | | | $ | 144,062 | | |
At March 31, 2023, the following futures contracts were outstanding for Voya VACS Series EMCD Fund:
| Description | | | Number
of Contracts | | | Expiration
Date | | | Notional
Amount | | | Unrealized
Appreciation/
(Depreciation) | |
| Long Contracts: | | | | | | | | | | | | | | | | | | | |
| U.S. Treasury 2-Year Note | | | 58 | | | 06/30/23 | | | | $ | 11,974,281 | | | | | $ | 138,983 | | |
| U.S. Treasury 5-Year Note | | | 22 | | | 06/30/23 | | | | | 2,409,172 | | | | | | 32,362 | | |
| U.S. Treasury Ultra Long Bond | | | 17 | | | 06/22/23 | | | | | 2,399,125 | | | | | | 12,008 | | |
| | | | | | | | | | | $ | 16,782,578 | | | | | $ | 183,353 | | |
| Short Contracts: | | | | | | | | | | | | | | | | | | | |
| U.S. Treasury 10-Year Note | | | (46) | | | 06/21/23 | | | | | (5,286,407) | | | | | | (90,369) | | |
| U.S. Treasury Long Bond | | | (5) | | | 06/21/23 | | | | | (655,781) | | | | | | (24,761) | | |
| U.S. Treasury Ultra 10-Year Note | | | (58) | | | 06/21/23 | | | | | (7,026,156) | | | | | | (207,851) | | |
| | | | | | | | | | | $ | (12,968,344) | | | | | $ | (322,981) | | |
See Accompanying Notes to Financial Statements
PORTFOLIO OF INVESTMENTS
| Voya VACS Series EMCD Fund | as of March 31, 2023 (continued) |
A summary of derivative instruments by primary risk exposure is outlined in the following tables.
The fair value of derivative instruments as of March 31, 2023 was as follows:
| Derivatives not accounted for as hedging instruments | | | Location on Statement
of Assets and Liabilities | | | Fair Value | |
| Asset Derivatives | | | | | | | | | | |
| Interest rate contracts | | | Variation margin receivable on futures contracts* | | | | $ | 183,353 | | |
| Total Asset Derivatives | | | | | | | $ | 183,353 | | |
| Liability Derivatives | | | | | | | | | | |
| Interest rate contracts | | | Variation margin payable on futures contracts* | | | | $ | 322,981 | | |
| Total Liability Derivatives | | | | | | | $ | 322,981 | | |
*
The fair value presented above represents the cumulative unrealized appreciation (depreciation) on futures contracts as reported in the table within the Portfolio of Investments. In the Statement of Assets and Liabilities, only current day’s unsettled variation margin is reported in receivables or payables on futures contracts and the net cumulative unrealized appreciation (depreciation) is included in total distributable earnings (loss).
The effect of derivative instruments on the Fund’s Statement of Operations for the year ended March 31, 2023 was as follows:
| | | | Amount of Realized Gain or (Loss) on
Derivatives Recognized in Income | |
| Derivatives not accounted for as hedging instruments | | | Futures | |
| Interest rate contracts | | | | $ | 439,573 | | |
| Total | | | | $ | 439,573 | | |
| | | | Change in Unrealized Appreciation or (Depreciation)
on Derivatives Recognized in Income | |
| Derivatives not accounted for as hedging instruments | | | Futures | |
| Interest rate contracts | | | | $ | (274,813) | | |
| Total | | | | $ | (274,813) | | |
At March 31, 2023, the aggregate cost of securities and other investments and the composition of unrealized appreciation and depreciation of securities and other investments on a tax basis were:
| | Cost for federal income tax purposes was $104,158,062. | | |
| | Net unrealized depreciation consisted of: | | |
| | Gross Unrealized Appreciation | | | | $ | 764,147 | | |
| | Gross Unrealized Depreciation | | | | | (8,531,699) | | |
| | Net Unrealized Depreciation | | | | $ | (7,767,552) | | |
See Accompanying Notes to Financial Statements
PORTFOLIO OF INVESTMENTS
| Voya VACS Series EMHCD Fund | as of March 31, 2023 |
| | Principal Amount† | | | | | | Value | | | Percentage
of Net
Assets | |
| | CORPORATE BONDS/NOTES: 34.5% | |
| | | | | Brazil: 0.8% | |
| | 1,150,000 (1) | | | Braskem Netherlands Finance
BV, 7.250%, 02/13/2033 | | | | $ | 1,106,012 | | | | | | 0.8 | | |
| | | | | | |
| | | | | Chile: 4.4% | |
| | 900,000 (1) | | | Corp Nacional del Cobre de
Chile, 3.750%, 01/15/2031 | | | | | 828,921 | | | | | | 0.6 | | |
| | 1,150,000 (1) | | | Corp Nacional del Cobre de
Chile, 4.250%, 07/17/2042 | | | | | 968,973 | | | | | | 0.7 | | |
| | 750,000 (1) | | | Corp Nacional del Cobre de
Chile, 4.500%, 08/01/2047 | | | | | 645,046 | | | | | | 0.4 | | |
| | 550,000 (1) | | | Corp Nacional del Cobre de
Chile, 5.125%, 02/02/2033 | | | | | 556,013 | | | | | | 0.4 | | |
| | 400,000 (1) | | | Empresa de Transporte de
Pasajeros Metro SA, 3.693%,
09/13/2061 | | | | | 277,381 | | | | | | 0.2 | | |
| | 700,000 (1) | | | Empresa Nacional del
Petroleo, 3.450%, 09/16/2031 | | | | | 580,231 | | | | | | 0.4 | | |
| | 1,500,000 (1) | | | Empresa Nacional del
Petroleo, 3.750%, 08/05/2026 | | | | | 1,399,532 | | | | | | 1.0 | | |
| | 300,000 (1) | | | Empresa Nacional del
Petroleo, 4.500%, 09/14/2047 | | | | | 230,912 | | | | | | 0.1 | | |
| | 990,000 | | | Engie Energia Chile SA,
3.400%, 01/28/2030 | | | | | 809,194 | | | | | | 0.6 | | |
| | | | | | | | | | 6,296,203 | | | | | | 4.4 | | |
| | | | | China: 0.6% | |
| | 900,000 (1) | | | ENN Clean Energy
International Investment Ltd.,
3.375%, 05/12/2026 | | | | | 810,370 | | | | | | 0.6 | | |
| | | | | | |
| | | | | Guatemala: 0.6% | |
| | 290,000 (1) | | | Central American Bottling
Corp. / CBC Bottling Holdco
SL / Beliv Holdco SL, 5.250%,
04/27/2029 | | | | | 269,820 | | | | | | 0.2 | | |
| | 700,000 (1) | | | CT Trust, 5.125%, 02/03/2032 | | | | | 586,250 | | | | | | 0.4 | | |
| | | | | | | | | | 856,070 | | | | | | 0.6 | | |
| | | | | Indonesia: 4.5% | |
| | 750,000 (1) | | | Hutama Karya Persero PT,
3.750%, 05/11/2030 | | | | | 682,703 | | | | | | 0.5 | | |
| | 750,000 (1) | | | Pertamina Persero PT, 3.100%,
01/21/2030 | | | | | 665,809 | | | | | | 0.5 | | |
| | 1,000,000 (1) | | | Pertamina Persero PT, 3.650%,
07/30/2029 | | | | | 930,000 | | | | | | 0.7 | | |
| | 1,000,000 | | | Pertamina Persero PT, 5.625%,
05/20/2043 | | | | | 947,650 | | | | | | 0.7 | | |
| | 1,500,000 (1) | | | Perusahaan Listrik Negara PT,
4.125%, 05/15/2027 | | | | | 1,437,750 | | | | | | 1.0 | | |
| | Principal Amount† | | | | | | Value | | | Percentage
of Net
Assets | |
| | CORPORATE BONDS/NOTES: (continued) | |
| | | | | Indonesia (continued) | |
| | 750,000 | | | Perusahaan Listrik Negara PT,
4.125%, 05/15/2027 | | | | $ | 718,875 | | | | | | 0.5 | | |
| | 500,000 (1) | | | Perusahaan Listrik Negara PT,
6.250%, 01/25/2049 | | | | | 485,578 | | | | | | 0.3 | | |
| | 550,000 | | | Perusahaan Perseroan Persero
PT Perusahaan Listrik Negara,
3.000%, 06/30/2030 | | | | | 472,876 | | | | | | 0.3 | | |
| | | | | | | | | | 6,341,241 | | | | | | 4.5 | | |
| | | | | Israel: 0.5% | |
| | 750,000 (1) | | | Israel Electric Corp. Ltd.,
3.750%, 02/22/2032 | | | | | 654,887 | | | | | | 0.5 | | |
| | | | | | |
| | | | | Kazakhstan: 0.8% | |
| | 1,000,000 (1) | | | KazMunayGas National Co.
JSC, 3.500%, 04/14/2033 | | | | | 752,341 | | | | | | 0.5 | | |
| | 500,000 | | | KazMunayGas National Co.
JSC, 5.750%, 04/19/2047 | | | | | 392,220 | | | | | | 0.3 | | |
| | | | | | | | | | 1,144,561 | | | | | | 0.8 | | |
| | | | | Malaysia: 1.9% | |
| | 825,000 (1) | | | Misc Capital Two Labuan Ltd.,
3.750%, 04/06/2027 | | | | | 780,670 | | | | | | 0.5 | | |
| | 300,000 | | | Petronas Capital Ltd., 2.480%,
01/28/2032 | | | | | 255,700 | | | | | | 0.2 | | |
| | 1,750,000 (1) | | | Petronas Capital Ltd., 4.800%,
04/21/2060 | | | | | 1,670,796 | | | | | | 1.2 | | |
| | | | | | | | | | 2,707,166 | | | | | | 1.9 | | |
| | | | | Mexico: 6.1% | |
| | 750,000 (1) | | | Banco Nacional de Comercio
Exterior SNC/Cayman Islands,
4.375%, 10/14/2025 | | | | | 728,177 | | | | | | 0.5 | | |
| | 1,100,000 (1)(2) | | | Cemex SAB de CV, 9.125%,
12/31/2199 | | | | | 1,102,974 | | | | | | 0.8 | | |
| | 500,000 (1) | | | Comision Federal de
Electricidad, 4.677%,
02/09/2051 | | | | | 336,552 | | | | | | 0.2 | | |
| | 425,000 (1) | | | Comision Federal de
Electricidad, 4.688%,
05/15/2029 | | | | | 381,591 | | | | | | 0.3 | | |
| | 1,000,000 (1) | | | Comision Federal de
Electricidad, 6.264%,
02/15/2052 | | | | | 835,089 | | | | | | 0.6 | | |
| | 350,000 | | | Petroleos Mexicanos, 5.500%,
06/27/2044 | | | | | 206,365 | | | | | | 0.2 | | |
| | 1,000,000 | | | Petroleos Mexicanos, 6.500%,
03/13/2027 | | | | | 909,668 | | | | | | 0.6 | | |
| | 500,000 | | | Petroleos Mexicanos, 6.500%,
01/23/2029 | | | | | 430,257 | | | | | | 0.3 | | |
See Accompanying Notes to Financial Statements
PORTFOLIO OF INVESTMENTS
| Voya VACS Series EMHCD Fund | as of March 31, 2023 (continued) |
| | Principal Amount† | | | | | | Value | | | Percentage
of Net
Assets | |
| | CORPORATE BONDS/NOTES: (continued) | |
| | | | | Mexico (continued) | |
| | 235,000 | | | Petroleos Mexicanos, 6.700%,
02/16/2032 | | | | $ | 187,239 | | | | | | 0.1 | | |
| | 500,000 | | | Petroleos Mexicanos, 6.750%,
09/21/2047 | | | | | 325,405 | | | | | | 0.2 | | |
| | 1,275,000 | | | Petroleos Mexicanos, 6.875%,
08/04/2026 | | | | | 1,211,626 | | | | | | 0.9 | | |
| | 1,000,000 | | | Petroleos Mexicanos, 6.950%,
01/28/2060 | | | | | 647,162 | | | | | | 0.5 | | |
| | 1,375,000 (1) | | | Petroleos Mexicanos,
10.000%, 02/07/2033 | | | | | 1,319,029 | | | | | | 0.9 | | |
| | | | | | | | | | 8,621,134 | | | | | | 6.1 | | |
| | | | | Nigeria: 0.3% | |
| | 675,000 | | | Republic of Nigeria, 7.875%,
02/16/2032 | | | | | 510,881 | | | | | | 0.3 | | |
| | | | | | |
| | | | | Oman: 1.6% | |
| | 1,750,000 (1) | | | OQ SAOC, 5.125%,
05/06/2028 | | | | | 1,669,369 | | | | | | 1.2 | | |
| | 700,000 (1) | | | Oryx Funding Ltd., 5.800%,
02/03/2031 | | | | | 673,525 | | | | | | 0.4 | | |
| | | | | | | | | | 2,342,894 | | | | | | 1.6 | | |
| | | | | Panama: 2.1% | |
| | 1,000,000 (1) | | | AES Panama Generation
Holdings SRL, 4.375%,
05/31/2030 | | | | | 860,960 | | | | | | 0.6 | | |
| | 1,425,000 | | | Banco Nacional de Panama,
2.500%, 08/11/2030 | | | | | 1,106,841 | | | | | | 0.8 | | |
| | 1,200,000 (1) | | | Empresa de Transmision
Electrica SA, 5.125%,
05/02/2049 | | | | | 964,031 | | | | | | 0.7 | | |
| | | | | | | | | | 2,931,832 | | | | | | 2.1 | | |
| | | | | Peru: 1.0% | |
| | 400,000 (1) | | | Corp Financiera de Desarrollo
SA, 2.400%, 09/28/2027 | | | | | 345,388 | | | | | | 0.3 | | |
| | 250,000 | | | Petroleos del Peru SA,
4.750%, 06/19/2032 | | | | | 186,102 | | | | | | 0.1 | | |
| | 1,400,000 (1) | | | Petroleos del Peru SA,
5.625%, 06/19/2047 | | | | | 907,900 | | | | | | 0.6 | | |
| | | | | | | | | | 1,439,390 | | | | | | 1.0 | | |
| | | | | Qatar: 0.7% | |
| | 1,350,000 (1) | | | QatarEnergy, 3.300%,
07/12/2051 | | | | | 1,009,327 | | | | | | 0.7 | | |
| | | | | | |
| | | | | Saudi Arabia: 1.4% | |
| | 1,000,000 (1) | | | EIG Pearl Holdings Sarl,
4.387%, 11/30/2046 | | | | | 792,145 | | | | | | 0.6 | | |
| | Principal Amount† | | | | | | Value | | | Percentage
of Net
Assets | |
| | CORPORATE BONDS/NOTES: (continued) | |
| | | | | Saudi Arabia (continued) | |
| | 550,000 (1) | | | Greensaif Pipelines Bidco Sarl,
6.129%, 02/23/2038 | | | | $ | 566,333 | | | | | | 0.4 | | |
| | 550,000 (1) | | | Greensaif Pipelines Bidco Sarl,
6.510%, 02/23/2042 | | | | | 580,258 | | | | | | 0.4 | | |
| | | | | | | | | | 1,938,736 | | | | | | 1.4 | | |
| | | | | South Africa: 1.1% | |
| | 650,000 | | | AngloGold Ashanti Holdings
PLC, 3.375%, 11/01/2028 | | | | | 578,534 | | | | | | 0.4 | | |
| | 1,000,000 (1) | | | Eskom Holdings SOC Ltd.,
6.350%, 08/10/2028 | | | | | 947,750 | | | | | | 0.7 | | |
| | | | | | | | | | 1,526,284 | | | | | | 1.1 | | |
| | | | | South Korea: 2.1% | |
| | 775,000 (1) | | | Korea National Oil Corp.,
4.750%, 04/03/2026 | | | | | 770,993 | | | | | | 0.5 | | |
| | 1,000,000 (1) | | | Korea National Oil Corp.,
4.875%, 04/03/2028 | | | | | 1,005,057 | | | | | | 0.7 | | |
| | 1,000,000 (1) | | | POSCO, 5.750%, 01/17/2028 | | | | | 1,032,694 | | | | | | 0.7 | | |
| | 225,000 (1) | | | POSCO, 5.875%, 01/17/2033 | | | | | 240,511 | | | | | | 0.2 | | |
| | | | | | | | | | 3,049,255 | | | | | | 2.1 | | |
| | | | | Thailand: 0.5% | |
| | 850,000 (1) | | | GC Treasury Center Co. Ltd.,
4.400%, 03/30/2032 | | | | | 764,967 | | | | | | 0.5 | | |
| | | | | | |
| | | | | United Arab Emirates: 2.5% | |
| | 750,000 | | | DP World Crescent Ltd.,
3.875%, 07/18/2029 | | | | | 708,169 | | | | | | 0.5 | | |
| | 443,550 (1) | | | Galaxy Pipeline Assets Bidco
Ltd., 2.160%, 03/31/2034 | | | | | 382,526 | | | | | | 0.3 | | |
| | 593,656 (1) | | | Galaxy Pipeline Assets Bidco
Ltd., 2.940%, 09/30/2040 | | | | | 482,338 | | | | | | 0.3 | | |
| | 1,850,000 (1) | | | MDGH GMTN RSC Ltd.,
5.500%, 04/28/2033 | | | | | 1,968,616 | | | | | | 1.4 | | |
| | | | | | | | | | 3,541,649 | | | | | | 2.5 | | |
| | | | | United Kingdom: 0.9% | |
| | 1,150,000 (2) | | | HSBC Holdings PLC, 7.390%,
11/03/2028 | | | | | 1,224,969 | | | | | | 0.9 | | |
| | | | | | |
| | | | | Venezuela: 0.1% | |
| | 1,000,000 (3) | | | Petroleos de Venezuela SA,
9.000%, 11/17/2021 | | | | | 46,250 | | | | | | 0.0 | | |
| | 1,750,000 (3) | | | Petroleos de Venezuela SA,
9.750%, 05/17/2035 | | | | | 87,500 | | | | | | 0.1 | | |
| | | | | | | | | | 133,750 | | | | | | 0.1 | | |
| | | | | Total Corporate Bonds/Notes
(Cost $48,821,619) | | | | | 48,951,578 | | | | | | 34.5 | | |
| |
See Accompanying Notes to Financial Statements
PORTFOLIO OF INVESTMENTS
| Voya VACS Series EMHCD Fund | as of March 31, 2023 (continued) |
| | Principal Amount† | | | | | | Value | | | Percentage
of Net
Assets | |
| | SOVEREIGN BONDS: 59.0% | |
| | | | | Angola: 0.8% | |
| | 750,000 (1) | | | Angolan Government
International Bond, 8.000%,
11/26/2029 | | | | $ | 645,300 | | | | | | 0.5 | | |
| | 500,000 (1) | | | Angolan Government
International Bond, 9.500%,
11/12/2025 | | | | | 497,280 | | | | | | 0.3 | | |
| | | | | | | | | | 1,142,580 | | | | | | 0.8 | | |
| | | | | Argentina: 1.5% | |
| | 1,883,777 (2)(4) | | | Argentine Republic
Government International
Bond, 0.500% (Step Rate @
0.750% on 07/09/2023),
07/09/2030 | | | | | 550,401 | | | | | | 0.4 | | |
| | 374,111 | | | Argentine Republic
Government International
Bond, 1.000%, 07/09/2029 | | | | | 105,608 | | | | | | 0.1 | | |
| | 4,906,220 (4) | | | Argentine Republic
Government International
Bond, 1.500% (Step Rate @
3.625% on 07/09/2023),
07/09/2035 | | | | | 1,287,543 | | | | | | 0.9 | | |
| | 701,019 (4) | | | Argentine Republic
Government International
Bond, 3.875% (Step Rate @
4.250% on 07/09/2023),
01/09/2038 | | | | | 220,873 | | | | | | 0.1 | | |
| | | | | | | | | | 2,164,425 | | | | | | 1.5 | | |
| | | | | Bahrain: 1.5% | |
| | 2,000,000 | | | Bahrain Government
International Bond, 7.375%,
05/14/2030 | | | | | 2,071,942 | | | | | | 1.5 | | |
| | | | | | |
| | | | | Brazil: 0.6% | |
| | 1,000,000 | | | Brazilian Government
International Bond, 5.625%,
02/21/2047 | | | | | 844,626 | | | | | | 0.6 | | |
| | | | | | |
| | | | | Chile: 0.9% | |
| | 1,000,000 | | | Chile Government International
Bond, 3.500%, 01/31/2034 | | | | | 892,415 | | | | | | 0.6 | | |
| | 500,000 | | | Chile Government International
Bond, 4.000%, 01/31/2052 | | | | | 407,079 | | | | | | 0.3 | | |
| | | | | | | | | | 1,299,494 | | | | | | 0.9 | | |
| | | | | Colombia: 2.8% | |
| | 500,000 | | | Colombia Government
International Bond, 3.000%,
01/30/2030 | | | | | 393,420 | | | | | | 0.3 | | |
| | Principal Amount† | | | | | | Value | | | Percentage
of Net
Assets | |
| | SOVEREIGN BONDS: (continued) | |
| | | | | Colombia (continued) | |
| | 1,500,000 | | | Colombia Government
International Bond, 3.250%,
04/22/2032 | | | | $ | 1,119,940 | | | | | | 0.8 | | |
| | 1,000,000 | | | Colombia Government
International Bond, 4.125%,
05/15/2051 | | | | | 618,682 | | | | | | 0.4 | | |
| | 750,000 | | | Colombia Government
International Bond, 5.000%,
06/15/2045 | | | | | 526,100 | | | | | | 0.3 | | |
| | 400,000 | | | Colombia Government
International Bond, 5.200%,
05/15/2049 | | | | | 280,146 | | | | | | 0.2 | | |
| | 500,000 | | | Colombia Government
International Bond, 6.125%,
01/18/2041 | | | | | 410,518 | | | | | | 0.3 | | |
| | 664,000 | | | Colombia Government
International Bond, 8.000%,
04/20/2033 | | | | | 681,254 | | | | | | 0.5 | | |
| | | | | | | | | | 4,030,060 | | | | | | 2.8 | | |
| | | | | Costa Rica: 1.1% | |
| | 1,500,000 | | | Costa Rica Government
International Bond, 6.125%,
02/19/2031 | | | | | 1,494,705 | | | | | | 1.1 | | |
| | | | | | |
| | | | | Dominican Republic: 3.2% | |
| | 700,000 (1) | | | Dominican Republic
International Bond, 4.875%,
09/23/2032 | | | | | 596,143 | | | | | | 0.4 | | |
| | 500,000 (1) | | | Dominican Republic
International Bond, 5.300%,
01/21/2041 | | | | | 390,991 | | | | | | 0.3 | | |
| | 1,700,000 | | | Dominican Republic
International Bond, 5.875%,
01/30/2060 | | | | | 1,306,112 | | | | | | 0.9 | | |
| | 925,000 | | | Dominican Republic
International Bond, 6.000%,
07/19/2028 | | | | | 906,090 | | | | | | 0.7 | | |
| | 500,000 (1) | | | Dominican Republic
International Bond, 6.000%,
02/22/2033 | | | | | 459,508 | | | | | | 0.3 | | |
| | 500,000 (1) | | | Dominican Republic
International Bond, 6.875%,
01/29/2026 | | | | | 508,850 | | | | | | 0.4 | | |
| | 300,000 (1) | | | Dominican Republic
International Bond, 7.050%,
02/03/2031 | | | | | 305,355 | | | | | | 0.2 | | |
| | | | | | | | | | 4,473,049 | | | | | | 3.2 | | |
See Accompanying Notes to Financial Statements
PORTFOLIO OF INVESTMENTS
| Voya VACS Series EMHCD Fund | as of March 31, 2023 (continued) |
| | Principal Amount† | | | | | | Value | | | Percentage
of Net
Assets | |
| | SOVEREIGN BONDS: (continued) | |
| | | | | Ecuador: 0.8% | |
| | 717,550 (1)(4) | | | Ecuador Government
International Bond, 1.500%
(Step Rate @ 2.500% on
07/31/2023), 07/31/2040 | | | | $ | 217,848 | | | | | | 0.1 | | |
| | 1,807,845 (1)(4) | | | Ecuador Government
International Bond, 2.500%
(Step Rate @ 3.500% on
07/31/2023), 07/31/2035 | | | | | 609,741 | | | | | | 0.4 | | |
| | 800,850 (1)(2)(4) | | | Ecuador Government
International Bond, 5.500%
(Step Rate @ 6.000% on
07/31/2023), 07/31/2030 | | | | | 376,272 | | | | | | 0.3 | | |
| | | | | | | | | | 1,203,861 | | | | | | 0.8 | | |
| | | | | Egypt: 1.7% | |
| | 1,000,000 | | | Egypt Government
International Bond, 5.800%,
09/30/2027 | | | | | 703,915 | | | | | | 0.5 | | |
| | 500,000 (1) | | | Egypt Government
International Bond, 7.500%,
02/16/2061 | | | | | 271,808 | | | | | | 0.2 | | |
| | 1,750,000 (1) | | | Egypt Government
International Bond, 8.700%,
03/01/2049 | | | | | 1,028,608 | | | | | | 0.7 | | |
| | 600,000 (1) | | | Egypt Government
International Bond, 8.875%,
05/29/2050 | | | | | 355,627 | | | | | | 0.3 | | |
| | | | | | | | | | 2,359,958 | | | | | | 1.7 | | |
| | | | | El Salvador: 0.4% | |
| | 1,000,000 (1) | | | El Salvador Government
International Bond, 6.375%,
01/18/2027 | | | | | 563,811 | | | | | | 0.4 | | |
| | | | | | |
| | | | | Gabon: 0.3% | |
| | 500,000 (1) | | | Gabon Government
International Bond, 6.625%,
02/06/2031 | | | | | 382,725 | | | | | | 0.3 | | |
| | | | | | |
| | | | | Ghana: 0.9% | |
| | 750,000 (3) | | | Ghana Government
International Bond, 7.875%,
03/26/2027 | | | | | 278,813 | | | | | | 0.2 | | |
| | 2,000,000 (3) | | | Ghana Government
International Bond, 7.875%,
02/11/2035 | | | | | 703,100 | | | | | | 0.5 | | |
| | 1,000,000 (3) | | | Ghana Government
International Bond, 8.750%,
03/11/2061 | | | | | 340,000 | | | | | | 0.2 | | |
| | | | | | | | | | 1,321,913 | | | | | | 0.9 | | |
| | Principal Amount† | | | | | | Value | | | Percentage
of Net
Assets | |
| | SOVEREIGN BONDS: (continued) | |
| | | | | Guatemala: 0.6% | |
| | 860,000 (1) | | | Guatemala Government Bond,
5.250%, 08/10/2029 | | | | $ | 840,407 | | | | | | 0.6 | | |
| | | | | | |
| | | | | Honduras: 0.3% | |
| | 250,000 | | | Honduras Government
International Bond, 5.625%,
06/24/2030 | | | | | 198,396 | | | | | | 0.2 | | |
| | 200,000 | | | Honduras Government
International Bond, 6.250%,
01/19/2027 | | | | | 178,934 | | | | | | 0.1 | | |
| | | | | | | | | | 377,330 | | | | | | 0.3 | | |
| | | | | Hungary: 1.6% | |
| | 1,750,000 (1) | | | Hungary Government
International Bond, 3.125%,
09/21/2051 | | | | | 1,079,776 | | | | | | 0.7 | | |
| | 700,000 (1) | | | Hungary Government
International Bond, 5.500%,
06/16/2034 | | | | | 675,825 | | | | | | 0.5 | | |
| | 500,000 | | | Hungary Government
International Bond, 7.625%,
03/29/2041 | | | | | 563,787 | | | | | | 0.4 | | |
| | | | | | | | | | 2,319,388 | | | | | | 1.6 | | |
| | | | | India: 1.0% | |
| | 500,000 | | | Export-Import Bank of India,
2.250%, 01/13/2031 | | | | | 401,418 | | | | | | 0.3 | | |
| | 1,000,000 (1) | | | Export-Import Bank of India,
5.500%, 01/18/2033 | | | | | 1,000,352 | | | | | | 0.7 | | |
| | | | | | | | | | 1,401,770 | | | | | | 1.0 | | |
| | | | | Indonesia: 2.5% | |
| | 300,000 | | | Indonesia Government
International Bond, 4.750%,
02/11/2029 | | | | | 303,969 | | | | | | 0.2 | | |
| | 1,250,000 | | | Indonesia Government
International Bond, 5.250%,
01/17/2042 | | | | | 1,225,084 | | | | | | 0.9 | | |
| | 320,000 | | | Indonesia Government
International Bond, 5.450%,
09/20/2052 | | | | | 324,800 | | | | | | 0.2 | | |
| | 1,250,000 | | | Indonesia Government
International Bond, 8.500%,
10/12/2035 | | | | | 1,628,173 | | | | | | 1.2 | | |
| | | | | | | | | | 3,482,026 | | | | | | 2.5 | | |
| | | | | Ivory Coast: 0.7% | |
| | 1,044,654 (2) | | | Ivory Coast Government
International Bond, 5.750%,
12/31/2032 | | | | | 978,054 | | | | | | 0.7 | | |
| | | | | | |
See Accompanying Notes to Financial Statements
PORTFOLIO OF INVESTMENTS
| Voya VACS Series EMHCD Fund | as of March 31, 2023 (continued) |
| | Principal Amount† | | | | | | Value | | | Percentage
of Net
Assets | |
| | SOVEREIGN BONDS: (continued) | |
| | | | | Jamaica: 0.9% | |
| | 600,000 | | | Jamaica Government
International Bond, 7.875%,
07/28/2045 | | | | $ | 705,169 | | | | | | 0.5 | | |
| | 500,000 | | | Jamaica Government
International Bond, 8.000%,
03/15/2039 | | | | | 604,426 | | | | | | 0.4 | | |
| | | | | | | | | | 1,309,595 | | | | | | 0.9 | | |
| | | | | Jordan: 0.6% | |
| | 1,000,000 (1) | | | Jordan Government
International Bond, 5.850%,
07/07/2030 | | | | | 893,589 | | | | | | 0.6 | | |
| | | | | | |
| | | | | Kazakhstan: 0.7% | |
| | 900,000 (1) | | | Kazakhstan Government
International Bond, 6.500%,
07/21/2045 | | | | | 940,455 | | | | | | 0.7 | | |
| | | | | | |
| | | | | Kenya: 0.6% | |
| | 500,000 (1) | | | Kenya Government
International Bond, 6.875%,
06/24/2024 | | | | | 463,390 | | | | | | 0.3 | | |
| | 500,000 | | | Kenya Government
International Bond, 7.250%,
02/28/2028 | | | | | 411,282 | | | | | | 0.3 | | |
| | | | | | | | | | 874,672 | | | | | | 0.6 | | |
| | | | | Lebanon: 0.2% | |
| | 2,000,000 (3) | | | Lebanon Government
International Bond, 6.100%,
10/04/2022 | | | | | 131,500 | | | | | | 0.1 | | |
| | 2,000,000 (3) | | | Lebanon Government
International Bond, 6.850%,
03/23/2027 | | | | | 133,350 | | | | | | 0.1 | | |
| | | | | | | | | | 264,850 | | | | | | 0.2 | | |
| | | | | Malaysia: 0.7% | |
| | 1,250,000 (1) | | | Malaysia Wakala Sukuk Bhd,
3.075%, 04/28/2051 | | | | | 975,825 | | | | | | 0.7 | | |
| | | | | | |
| | | | | Mexico: 2.8% | |
| | 940,000 | | | Mexico Government
International Bond, 3.250%,
04/16/2030 | | | | | 843,902 | | | | | | 0.6 | | |
| | 750,000 | | | Mexico Government
International Bond, 4.350%,
01/15/2047 | | | | | 594,813 | | | | | | 0.4 | | |
| | 1,000,000 | | | Mexico Government
International Bond, 4.500%,
04/22/2029 | | | | | 978,060 | | | | | | 0.7 | | |
| | Principal Amount† | | | | | | Value | | | Percentage
of Net
Assets | |
| | SOVEREIGN BONDS: (continued) | |
| | | | | Mexico (continued) | |
| | 1,550,000 | | | Mexico Government
International Bond, 4.875%,
05/19/2033 | | | | $ | 1,485,883 | | | | | | 1.1 | | |
| | | | | | | | | | 3,902,658 | | | | | | 2.8 | | |
| | | | | Morocco: 0.5% | |
| | 425,000 (1) | | | Morocco Government
International Bond, 3.000%,
12/15/2032 | | | | | 343,700 | | | | | | 0.3 | | |
| | 500,000 (1) | | | Morocco Government
International Bond, 4.000%,
12/15/2050 | | | | | 341,875 | | | | | | 0.2 | | |
| | | | | | | | | | 685,575 | | | | | | 0.5 | | |
| | | | | Nigeria: 1.7% | |
| | 1,000,000 | | | Nigeria Government
International Bond, 6.500%,
11/28/2027 | | | | | 817,420 | | | | | | 0.6 | | |
| | 1,500,000 (1) | | | Nigeria Government
International Bond, 7.375%,
09/28/2033 | | | | | 1,066,425 | | | | | | 0.7 | | |
| | 500,000 | | | Nigeria Government
International Bond, 7.696%,
02/23/2038 | | | | | 336,855 | | | | | | 0.2 | | |
| | 300,000 | | | Nigeria Government
International Bond, 7.875%,
02/16/2032 | | | | | 227,058 | | | | | | 0.2 | | |
| | | | | | | | | | 2,447,758 | | | | | | 1.7 | | |
| | | | | Oman: 1.4% | |
| | 500,000 (1) | | | Oman Government
International Bond, 5.375%,
03/08/2027 | | | | | 495,623 | | | | | | 0.3 | | |
| | 800,000 | | | Oman Government
International Bond, 6.000%,
08/01/2029 | | | | | 806,405 | | | | | | 0.6 | | |
| | 750,000 (1) | | | Oman Government
International Bond, 6.500%,
03/08/2047 | | | | | 692,701 | | | | | | 0.5 | | |
| | | | | | | | | | 1,994,729 | | | | | | 1.4 | | |
| | | | | Panama: 2.4% | |
| | 750,000 | | | Panama Government
International Bond, 3.298%,
01/19/2033 | | | | | 628,008 | | | | | | 0.5 | | |
| | 500,000 | | | Panama Government
International Bond, 4.500%,
04/16/2050 | | | | | 382,070 | | | | | | 0.3 | | |
| | 1,000,000 | | | Panama Government
International Bond, 4.500%,
01/19/2063 | | | | | 723,855 | | | | | | 0.5 | | |
See Accompanying Notes to Financial Statements
PORTFOLIO OF INVESTMENTS
| Voya VACS Series EMHCD Fund | as of March 31, 2023 (continued) |
| | Principal Amount† | | | | | | Value | | | Percentage
of Net
Assets | |
| | SOVEREIGN BONDS: (continued) | |
| | | | | Panama (continued) | |
| | 1,000,000 | | | Panama Government
International Bond, 6.400%,
02/14/2035 | | | | $ | 1,044,933 | | | | | | 0.7 | | |
| | 550,000 | | | Panama Government
International Bond, 6.700%,
01/26/2036 | | | | | 583,455 | | | | | | 0.4 | | |
| | | | | | | | | | 3,362,321 | | | | | | 2.4 | | |
| | | | | Paraguay: 0.9% | |
| | 750,000 | | | Paraguay Government
International Bond, 5.000%,
04/15/2026 | | | | | 746,348 | | | | | | 0.5 | | |
| | 650,000 | | | Paraguay Government
International Bond, 5.600%,
03/13/2048 | | | | | 579,456 | | | | | | 0.4 | | |
| | | | | | | | | | 1,325,804 | | | | | | 0.9 | | |
| | | | | Peru: 0.9% | |
| | 500,000 | | | Peruvian Government
International Bond, 2.780%,
12/01/2060 | | | | | 299,299 | | | | | | 0.2 | | |
| | 500,000 | | | Peruvian Government
International Bond, 2.783%,
01/23/2031 | | | | | 428,009 | | | | | | 0.3 | | |
| | 500,000 | | | Peruvian Government
International Bond, 5.625%,
11/18/2050 | | | | | 505,178 | | | | | | 0.4 | | |
| | | | | | | | | | 1,232,486 | | | | | | 0.9 | | |
| | | | | Philippines: 2.4% | |
| | 1,550,000 | | | Philippine Government
International Bond, 5.000%,
07/17/2033 | | | | | 1,577,071 | | | | | | 1.1 | | |
| | 750,000 | | | Philippine Government
International Bond, 5.500%,
01/17/2048 | | | | | 767,086 | | | | | | 0.5 | | |
| | 1,000,000 | | | Philippine Government
International Bond, 5.950%,
10/13/2047 | | | | | 1,081,148 | | | | | | 0.8 | | |
| | | | | | | | | | 3,425,305 | | | | | | 2.4 | | |
| | | | | Poland: 1.9% | |
| | 1,400,000 | | | Republic of Poland
Government International
Bond, 4.875%, 10/04/2033 | | | | | 1,395,590 | | | | | | 1.0 | | |
| | 1,225,000 | | | Republic of Poland
Government International
Bond, 5.750%, 11/16/2032 | | | | | 1,304,625 | | | | | | 0.9 | | |
| | | | | | | | | | 2,700,215 | | | | | | 1.9 | | |
| | | | | Qatar: 1.4% | |
| | 750,000 (1) | | | Qatar Government
International Bond, 3.750%,
04/16/2030 | | | | | 734,142 | | | | | | 0.5 | | |
| | Principal Amount† | | | | | | Value | | | Percentage
of Net
Assets | |
| | SOVEREIGN BONDS: (continued) | |
| | | | | Qatar (continued) | |
| | 750,000 (1) | | | Qatar Government
International Bond, 4.400%,
04/16/2050 | | | | $ | 695,861 | | | | | | 0.5 | | |
| | 500,000 (1) | | | Qatar Government
International Bond, 4.817%,
03/14/2049 | | | | | 491,270 | | | | | | 0.4 | | |
| | | | | | | | | | 1,921,273 | | | | | | 1.4 | | |
| | | | | Republic Of Serbia: 1.0% | |
| | 1,500,000 | | | Serbia International Bond,
2.125%, 12/01/2030 | | | | | 1,142,032 | | | | | | 0.8 | | |
| | 275,000 (1) | | | Serbia International Bond,
6.500%, 09/26/2033 | | | | | 273,734 | | | | | | 0.2 | | |
| | | | | | | | | | 1,415,766 | | | | | | 1.0 | | |
| | | | | Romania: 2.0% | |
| | 1,500,000 (1) | | | Romanian Government
International Bond, 3.000%,
02/14/2031 | | | | | 1,237,452 | | | | | | 0.9 | | |
| | 1,500,000 (1) | | | Romanian Government
International Bond, 3.625%,
03/27/2032 | | | | | 1,269,321 | | | | | | 0.9 | | |
| | 400,000 | | | Romanian Government
International Bond, 5.125%,
06/15/2048 | | | | | 335,000 | | | | | | 0.2 | | |
| | | | | | | | | | 2,841,773 | | | | | | 2.0 | | |
| | | | | Russia: 0.0% | |
| | 1,000,000 (3) | | | Russian Foreign Bond -
Eurobond, 5.250%,
06/23/2047 | | | | | 60,000 | | | | | | 0.0 | | |
| | | | | | |
| | | | | Saudi Arabia: 3.0% | |
| | 3,000,000 | | | Saudi Government
International Bond, 3.450%,
02/02/2061 | | | | | 2,128,149 | | | | | | 1.5 | | |
| | 800,000 | | | Saudi Government
International Bond, 3.750%,
01/21/2055 | | | | | 616,821 | | | | | | 0.4 | | |
| | 1,475,000 (1) | | | Saudi Government
International Bond, 5.500%,
10/25/2032 | | | | | 1,575,888 | | | | | | 1.1 | | |
| | | | | | | | | | 4,320,858 | | | | | | 3.0 | | |
| | | | | Senegal: 0.3% | |
| | 500,000 | | | Senegal Government
International Bond, 6.250%,
05/23/2033 | | | | | 398,948 | | | | | | 0.3 | | |
See Accompanying Notes to Financial Statements
PORTFOLIO OF INVESTMENTS
| Voya VACS Series EMHCD Fund | as of March 31, 2023 (continued) |
| | Principal Amount† | | | | | | Value | | | Percentage
of Net
Assets | |
| | SOVEREIGN BONDS: (continued) | |
| | | | | South Africa: 2.0% | |
| | 2,000,000 | | | Republic of South Africa
Government International
Bond, 4.300%, 10/12/2028 | | | | $ | 1,798,850 | | | | | | 1.3 | | |
| | 500,000 | | | Republic of South Africa
Government International
Bond, 5.750%, 09/30/2049 | | | | | 368,478 | | | | | | 0.3 | | |
| | 800,000 | | | Republic of South Africa
Government International
Bond, 6.300%, 06/22/2048 | | | | | 639,491 | | | | | | 0.4 | | |
| | | | | | | | | | 2,806,819 | | | | | | 2.0 | | |
| | | | | Sri Lanka: 0.8% | |
| | 500,000 (1)(3) | | | Sri Lanka Government
International Bond, 5.875%,
07/25/2022 | | | | | 196,043 | | | | | | 0.1 | | |
| | 2,000,000 (1)(3) | | | Sri Lanka Government
International Bond, 6.825%,
07/18/2026 | | | | | 742,547 | | | | | | 0.5 | | |
| | 750,000 (3) | | | Sri Lanka Government
International Bond, 7.550%,
03/28/2030 | | | | | 269,970 | | | | | | 0.2 | | |
| | | | | | | | | | 1,208,560 | | | | | | 0.8 | | |
| | | | | Turkey: 2.7% | |
| | 950,000 | | | Turkey Government
International Bond, 4.875%,
10/09/2026 | | | | | 859,038 | | | | | | 0.6 | | |
| | 500,000 | | | Turkey Government
International Bond, 5.125%,
02/17/2028 | | | | | 438,410 | | | | | | 0.3 | | |
| | 750,000 | | | Turkey Government
International Bond, 6.000%,
01/14/2041 | | | | | 567,547 | | | | | | 0.4 | | |
| | 1,000,000 | | | Turkey Government
International Bond, 7.625%,
04/26/2029 | | | | | 954,058 | | | | | | 0.7 | | |
| | 1,000,000 | | | Turkey Government
International Bond, 9.875%,
01/15/2028 | | | | | 1,043,560 | | | | | | 0.7 | | |
| | | | | | | | | | 3,862,613 | | | | | | 2.7 | | |
| | | | | Ukraine: 0.6% | |
| | 1,111,000 (3) | | | Ukraine Government
International Bond, 7.253%,
03/15/2035 | | | | | 194,572 | | | | | | 0.1 | | |
| | 650,000 (3) | | | Ukraine Government
International Bond, 7.375%,
09/25/2034 | | | | | 113,588 | | | | | | 0.1 | | |
| | 346,000 (1)(3) | | | Ukraine Government
International Bond, 7.750%,
09/01/2024 | | | | | 77,626 | | | | | | 0.1 | | |
| | Principal Amount† | | | | | | Value | | | Percentage
of Net
Assets | |
| | SOVEREIGN BONDS: (continued) | |
| | | | | Ukraine (continued) | |
| | 346,000 (1)(3) | | | Ukraine Government
International Bond, 7.750%,
09/01/2025 | | | | $ | 70,294 | | | | | | 0.1 | | |
| | 346,000 (1)(3) | | | Ukraine Government
International Bond, 7.750%,
09/01/2026 | | | | | 64,889 | | | | | | 0.0 | | |
| | 346,000 (1)(3) | | | Ukraine Government
International Bond, 7.750%,
09/01/2027 | | | | | 64,167 | | | | | | 0.0 | | |
| | 346,000 (1)(3) | | | Ukraine Government
International Bond, 7.750%,
09/01/2028 | | | | | 65,334 | | | | | | 0.1 | | |
| | 225,000 (1)(3) | | | Ukraine Government
International Bond, 7.750%,
09/01/2029 | | | | | 42,079 | | | | | | 0.0 | | |
| | 500,000 (3) | | | Ukraine Government
International Bond, 9.750%,
11/01/2030 | | | | | 95,445 | | | | | | 0.1 | | |
| | | | | | | | | | 787,994 | | | | | | 0.6 | | |
| | | | | United Arab Emirates: 1.0% | |
| | 1,400,000 (1) | | | Finance Department
Government of Sharjah,
6.500%, 11/23/2032 | | | | | 1,429,658 | | | | | | 1.0 | | |
| | | | | | |
| | | | | Uruguay: 1.9% | |
| | 123,334 | | | Uruguay Government
International Bond, 4.375%,
10/27/2027 | | | | | 123,701 | | | | | | 0.1 | | |
| | 51,825 | | | Uruguay Government
International Bond, 4.375%,
01/23/2031 | | | | | 51,594 | | | | | | 0.0 | | |
| | 2,312,164 | | | Uruguay Government
International Bond, 5.750%,
10/28/2034 | | | | | 2,535,202 | | | | | | 1.8 | | |
| | | | | | | | | | 2,710,497 | | | | | | 1.9 | | |
| | | | | Venezuela: 0.1% | |
| | 1,250,000 (3) | | | Venezuela Government
International Bond, 9.250%,
09/15/2027 | | | | | 134,375 | | | | | | 0.1 | | |
| | | | | | |
| | | | | Zambia: 0.4% | |
| | 750,000 (1)(3) | | | Zambia Government
International Bond, 8.500%,
04/14/2024 | | | | | 342,188 | | | | | | 0.2 | | |
| | 500,000 (1)(3) | | | Zambia Government
International Bond, 8.970%,
07/30/2027 | | | | | 223,230 | | | | | | 0.2 | | |
| | | | | | | | | | 565,418 | | | | | | 0.4 | | |
See Accompanying Notes to Financial Statements
PORTFOLIO OF INVESTMENTS
| Voya VACS Series EMHCD Fund | as of March 31, 2023 (continued) |
| | Principal Amount† | | | | | | Value | | | Percentage
of Net
Assets | |
| | SOVEREIGN BONDS: (continued) | |
| | | | | Zambia (continued) | |
| | | | | Total Sovereign Bonds | | | | | | | | | | | | | |
| | | | | (Cost $83,121,422) | | | | $ | 83,552,513 | | | | | | 59.0 | | |
| | | | | Total Long-Term Investments | | | | | | | | | | | | | |
| | | | | (Cost $131,943,041) | | | | | 132,504,091 | | | | | | 93.5 | | |
| | SHORT-TERM INVESTMENTS: 7.2% | |
| | | | | Commercial Paper: 5.5% | |
| | 1,300,000 | | | Agilent Technologies, Inc.,
4.890%, 04/06/2023 | | | | | 1,298,897 | | | | | | 0.9 | | |
| | 1,300,000 | | | Dollar General Corp., 4.990%,
04/03/2023 | | | | | 1,299,450 | | | | | | 0.9 | | |
| | 1,300,000 | | | Dominion Energy, Inc., 5.040%,
04/03/2023 | | | | | 1,299,452 | | | | | | 1.0 | | |
| | 1,300,000 | | | Duke Energy, 5.090%,
04/04/2023 | | | | | 1,299,265 | | | | | | 0.9 | | |
| | 1,300,000 | | | Equifax, Inc., 5.200%,
04/06/2023 | | | | | 1,298,893 | | | | | | 0.9 | | |
| | 1,300,000 | | | Medtronic, Inc., 5.300%,
04/06/2023 | | | | | 1,298,910 | | | | | | 0.9 | | |
| | | | | Total Commercial Paper | | | | | | ��� | | | | | | | |
| | | | | (Cost $7,795,968) | | | | | 7,794,867 | | | | | | 5.5 | | |
| | Shares | | | Value | | | Percentage
of Net
Assets | |
| | | | | Mutual Funds: 1.7% | |
| | 2,368,000 (5) | | | Morgan Stanley Institutional
Liquidity Funds - Government
Portfolio (Institutional Share
Class), 4.730% | | | | | | | | | | | | | |
| | | | | (Cost $2,368,000) | | | | | 2,368,000 | | | | | | 1.7 | | |
| | | | | Total Short-Term
Investments | | | | | | | | | | | | | |
| | | | | (Cost $10,163,968) | | | | | 10,162,867 | | | | | | 7.2 | | |
| | | | | Total Investments in
Securities
(Cost $142,107,009) | | | | $ | 142,666,958 | | | | | | 100.7 | | |
| | | | | Liabilities in Excess of
Other Assets | | | | | (963,919) | | | | | | (0.7) | | |
| | | | | Net Assets | | | | $ | 141,703,039 | | | | | | 100.0 | | |
| |
†
Unless otherwise indicated, principal amount is shown in USD.
(1)
Securities with purchases pursuant to Rule 144A or section 4(a)(2), under the Securities Act of 1933 and may not be resold subject to that rule except to qualified institutional buyers.
(2)
Variable rate security. Rate shown is the rate in effect as of March 31, 2023.
(3)
Defaulted security.
(4)
Step-up bond that pays an initial coupon rate for the first period and then a higher coupon rate for the following periods. Rates shown reflect the current and next coupon rate as of March 31, 2023.
(5)
Rate shown is the 7-day yield as of March 31, 2023.
| Sector Diversification | | | Percentage
of Net Assets | |
| Sovereign Bonds | | | | | 59.0% | | |
| Energy | | | | | 15.2 | | |
| Utilities | | | | | 7.3 | | |
| Basic Materials | | | | | 4.7 | | |
| Financial | | | | | 3.8 | | |
| Industrial | | | | | 1.5 | | |
| Consumer, Non-cyclical | | | | | 1.2 | | |
| Communications | | | | | 0.4 | | |
| Corporate Bonds/Notes | | | | | 0.4 | | |
| Short-Term Investments | | | | | 7.2 | | |
| Liabilities in Excess of Other Assets | | | | | (0.7) | | |
| Net Assets | | | | | 100.0% | | |
| | | |
| Portfolio holdings are subject to change daily. | |
See Accompanying Notes to Financial Statements
PORTFOLIO OF INVESTMENTS
| Voya VACS Series EMHCD Fund | as of March 31, 2023 (continued) |
Fair Value Measurements^
The following is a summary of the fair valuations according to the inputs used as of March 31, 2023 in valuing the assets and liabilities:
| | | | Quoted Prices
in Active Markets
for Identical
Investments
(Level 1) | | | Significant
Other
Observable
Inputs
(Level 2) | | | Significant
Unobservable
Inputs
(Level 3) | | | Fair Value
at
March 31, 2023 | |
| Asset Table | | | | | | | | | | | | | | | | | | | | | | | | | |
| Investments, at fair value | | | | | | | | | | | | | | | | | | | | | | | | | |
| Corporate Bonds/Notes | | | | $ | — | | | | | $ | 48,951,578 | | | | | $ | — | | | | | $ | 48,951,578 | | |
| Sovereign Bonds | | | | | — | | | | | | 83,552,513 | | | | | | — | | | | | | 83,552,513 | | |
| Short-Term Investments | | | | | 2,368,000 | | | | | | 7,794,867 | | | | | | — | | | | | | 10,162,867 | | |
| Total Investments, at fair value | | | | $ | 2,368,000 | | | | | $ | 140,298,958 | | | | | $ | — | | | | | $ | 142,666,958 | | |
| Other Financial Instruments+ | | | | | | | | | | | | | | | | | | | | | | | | | |
| Futures | | | | | 284,834 | | | | | | — | | | | | | — | | | | | | 284,834 | | |
| Total Assets | | | | $ | 2,652,834 | | | | | $ | 140,298,958 | | | | | $ | — | | | | | $ | 142,951,792 | | |
| Liabilities Table | | | | | | | | | | | | | | | | | | | | | | | | | |
| Other Financial Instruments+ | | | | | | | | | | | | | | | | | | | | | | | | | |
| Futures | | | | $ | (584,238) | | | | | $ | — | | | | | $ | — | | | | | $ | (584,238) | | |
| Total Liabilities | | | | $ | (584,238) | | | | | $ | — | | | | | $ | — | | | | | $ | (584,238) | | |
At March 31, 2023, the following futures contracts were outstanding for Voya VACS Series EMHCD Fund:
| Description | | | Number
of Contracts | | | Expiration
Date | | | Notional
Amount | | | Unrealized
Appreciation/
(Depreciation) | |
| Long Contracts: | | | | | | | | | | | | | | | | | | | |
| U.S. Treasury 2-Year Note | | | 44 | | | 06/30/23 | | | | $ | 9,083,937 | | | | | $ | 102,458 | | |
| U.S. Treasury 5-Year Note | | | 93 | | | 06/30/23 | | | | | 10,184,227 | | | | | | 182,376 | | |
| U.S. Treasury Ultra Long Bond | | | 18 | | | 06/22/23 | | | | | 2,540,250 | | | | | | (59,605) | | |
| | | | | | | | | | | $ | 21,808,414 | | | | | $ | 225,229 | | |
| Short Contracts: | | | | | | | | | | | | | | | | | | | |
| U.S. Treasury 10-Year Note | | | (64) | | | 06/21/23 | | | | | (7,355,000) | | | | | | (136,406) | | |
| U.S. Treasury Long Bond | | | (16) | | | 06/21/23 | | | | | (2,098,500) | | | | | | (52,128) | | |
| U.S. Treasury Ultra 10-Year Note | | | (101) | | | 06/21/23 | | | | | (12,235,203) | | | | | | (336,099) | | |
| | | | | | | | | | | $ | (21,688,703) | | | | | $ | (524,633) | | |
A summary of derivative instruments by primary risk exposure is outlined in the following tables.
The fair value of derivative instruments as of March 31, 2023 was as follows:
| Derivatives not accounted for as hedging instruments | | | Location on Statement
of Assets and Liabilities | | | Fair Value | |
| Asset Derivatives | | | | | | | | | | |
| Interest rate contracts | | | Variation margin receivable on futures contracts* | | | | $ | 284,834 | | |
| Total Asset Derivatives | | | | | | | $ | 284,834 | | |
| Liability Derivatives | | | | | | | | | | |
| Interest rate contracts | | | Variation margin payable on futures contracts* | | | | $ | 584,238 | | |
| Total Liability Derivatives | | | | | | | $ | 584,238 | | |
*
The fair value presented above represents the cumulative unrealized appreciation (depreciation) on futures contracts as reported in the table within the Portfolio of Investments. In the Statement of Assets and Liabilities, only current day’s unsettled variation margin is reported in receivables or payables on futures contracts and the net cumulative unrealized appreciation (depreciation) is included in total distributable earnings (loss).
See Accompanying Notes to Financial Statements
PORTFOLIO OF INVESTMENTS
| Voya VACS Series EMHCD Fund | as of March 31, 2023 (continued) |
The effect of derivative instruments on the Fund’s Statement of Operations for the year ended March 31, 2023 was as follows:
| | | | Amount of Realized Gain or (Loss) on
Derivatives Recognized in Income | |
| Derivatives not accounted for as hedging instruments | | | Futures | |
| Interest rate contracts | | | $151,437 | |
| Total | | | $151,437 | |
| | | | Change in Unrealized Appreciation or (Depreciation)
on Derivatives Recognized in Income | |
| Derivatives not accounted for as hedging instruments | | | Futures | |
| Interest rate contracts | | | | $ | (299,404) | | |
| Total | | | | $ | (299,404) | | |
At March 31, 2023, the aggregate cost of securities and other investments and the composition of unrealized appreciation and depreciation of securities and other investments on a tax basis were:
| | Cost for federal income tax purposes was $141,807,604. | | |
| | Net unrealized appreciation consisted of: | | |
| | Gross Unrealized Appreciation | | | | $ | 2,052,323 | | |
| | Gross Unrealized Depreciation | | | | | (1,492,373) | | |
| | Net Unrealized Appreciation | | | | $ | 559,950 | | |
See Accompanying Notes to Financial Statements
PORTFOLIO OF INVESTMENTS
| Voya VACS Series HYB Fund | as of March 31, 2023 |
Principal
Amount† | | | Value | | | Percentage
of Net
Assets | |
| CORPORATE BONDS/NOTES: 93.0% | |
| | | | Basic Materials: 5.9% | |
| 98,000 (1) | | | ASP Unifrax Holdings, Inc.,
5.250%, 09/30/2028 | | | | $ | 78,429 | | | | | | 0.1 | | |
| 208,000 (1) | | | ASP Unifrax Holdings, Inc.,
7.500%, 09/30/2029 | | | | | 141,553 | | | | | | 0.1 | | |
| 350,000 (1) | | | Cleveland-Cliffs, Inc., 4.625%,
03/01/2029 | | | | | 321,512 | | | | | | 0.3 | | |
| 190,000 (1) | | | Cleveland-Cliffs, Inc., 4.875%,
03/01/2031 | | | | | 172,940 | | | | | | 0.1 | | |
| 325,000 (1) | | | Coeur Mining, Inc., 5.125%,
02/15/2029 | | | | | 275,855 | | | | | | 0.2 | | |
| 393,000 (1) | | | Consolidated Energy Finance
S.A., 5.625%, 10/15/2028 | | | | | 338,483 | | | | | | 0.3 | | |
| 368,000 (1) | | | Constellium SE, 5.625%,
06/15/2028 | | | | | 347,847 | | | | | | 0.3 | | |
| 245,000 (1) | | | First Quantum Minerals Ltd.,
6.875%, 10/15/2027 | | | | | 236,413 | | | | | | 0.2 | | |
| 595,000 (1) | | | HudBay Minerals, Inc., 4.500%,
04/01/2026 | | | | | 550,150 | | | | | | 0.4 | | |
| 374,000 (1) | | | Illuminate Buyer LLC /
Illuminate Holdings IV, Inc.,
9.000%, 07/01/2028 | | | | | 331,893 | | | | | | 0.3 | | |
| 436,000 (1) | | | INEOS Quattro Finance 2 Plc,
3.375%, 01/15/2026 | | | | | 395,636 | | | | | | 0.3 | | |
| 454,000 (1)(2) | | | Iris Holdings, Inc., 8.750% (PIK
Rate 9.500%, Cash Rate
8.750)%, 02/15/2026 | | | | | 419,668 | | | | | | 0.3 | | |
| 436,000 (1) | | | LSF11 A5 Holdco LLC,
6.625%, 10/15/2029 | | | | | 367,136 | | | | | | 0.3 | | |
| 509,000 (1) | | | Mativ, Inc., 6.875%, 10/01/2026 | | | | | 466,268 | | | | | | 0.4 | | |
| 417,000 (1) | | | Novelis Corp., 3.875%,
08/15/2031 | | | | | 351,831 | | | | | | 0.3 | | |
| 165,000 (1) | | | Novelis Corp., 4.750%,
01/30/2030 | | | | | 151,800 | | | | | | 0.1 | | |
| 405,000 (1) | | | Nufarm Australia Ltd. / Nufarm
Americas, Inc., 5.000%,
01/27/2030 | | | | | 357,269 | | | | | | 0.3 | | |
| 257,000 | | | Olin Corp., 5.000%, 02/01/2030 | | | | | 241,228 | | | | | | 0.2 | | |
| 264,000 | | | Olin Corp., 5.125%, 09/15/2027 | | | | | 253,442 | | | | | | 0.2 | | |
| 393,000 (1) | | | Olympus Water US Holding
Corp., 6.250%, 10/01/2029 | | | | | 291,259 | | | | | | 0.2 | | |
| 280,000 (1) | | | SPCM SA, 3.125%,
03/15/2027 | | | | | 245,776 | | | | | | 0.2 | | |
| 454,000 (1) | | | Taseko Mines Ltd., 7.000%,
02/15/2026 | | | | | 412,418 | | | | | | 0.3 | | |
| 479,000 (1) | | | Trinseo Materials Operating
SCA / Trinseo Materials
Finance, Inc., 5.125%,
04/01/2029 | | | | | 294,961 | | | | | | 0.2 | | |
Principal
Amount† | | | Value | | | Percentage
of Net
Assets | |
| CORPORATE BONDS/NOTES: (continued) | |
| | | | Basic Materials (continued) | |
| 399,000 (1) | | | Tronox, Inc., 4.625%,
03/15/2029 | | | | $ | 334,587 | | | | | | 0.3 | | |
| | | | | | | | | 7,378,354 | | | | | | 5.9 | | |
| | | | Communications: 13.4% | |
| 380,000 (1) | | | Acuris Finance Us, Inc. / Acuris
Finance SARL, 5.000%,
05/01/2028 | | | | | 298,800 | | | | | | 0.2 | | |
| 491,000 (1) | | | Altice France Holding SA,
6.000%, 02/15/2028 | | | | | 313,798 | | | | | | 0.3 | | |
| 577,000 (1) | | | Altice France SA/France,
5.500%, 10/15/2029 | | | | | 441,726 | | | | | | 0.4 | | |
| 245,000 (1) | | | Altice France SA/France,
8.125%, 02/01/2027 | | | | | 227,017 | | | | | | 0.2 | | |
| 337,000 | | | AMC Networks, Inc., 4.250%,
02/15/2029 | | | | | 207,557 | | | | | | 0.2 | | |
| 448,000 (1) | | | Audacy Capital Corp., 6.500%,
05/01/2027 | | | | | 32,782 | | | | | | 0.0 | | |
| 454,000 (1) | | | Beasley Mezzanine Holdings
LLC, 8.625%, 02/01/2026 | | | | | 301,962 | | | | | | 0.2 | | |
| 445,000 (1) | | | CCO Holdings LLC / CCO
Holdings Capital Corp.,
4.250%, 01/15/2034 | | | | | 348,517 | | | | | | 0.3 | | |
| 632,000 | | | CCO Holdings LLC / CCO
Holdings Capital Corp.,
4.500%, 05/01/2032 | | | | | 517,551 | | | | | | 0.4 | | |
| 399,000 (1) | | | CCO Holdings LLC / CCO
Holdings Capital Corp.,
5.000%, 02/01/2028 | | | | | 368,562 | | | | | | 0.3 | | |
| 589,000 (1) | | | CCO Holdings LLC / CCO
Holdings Capital Corp.,
5.125%, 05/01/2027 | | | | | 557,335 | | | | | | 0.4 | | |
| 159,000 (1) | | | CommScope Tech Finance
LLC, 6.000%, 06/15/2025 | | | | | 149,895 | | | | | | 0.1 | | |
| 98,000 (1) | | | CommScope Technologies
LLC, 5.000%, 03/15/2027 | | | | | 71,775 | | | | | | 0.1 | | |
| 208,000 (1) | | | CommScope, Inc., 4.750%,
09/01/2029 | | | | | 173,576 | | | | | | 0.1 | | |
| 331,000 (1) | | | CommScope, Inc., 7.125%,
07/01/2028 | | | | | 244,533 | | | | | | 0.2 | | |
| 239,000 (1) | | | Connect Finco SARL / Connect
US Finco LLC, 6.750%,
10/01/2026 | | | | | 224,875 | | | | | | 0.2 | | |
| 546,000 (1) | | | CSC Holdings LLC, 4.625%,
12/01/2030 | | | | | 269,751 | | | | | | 0.2 | | |
| 196,000 | | | CSC Holdings LLC, 5.250%,
06/01/2024 | | | | | 189,363 | | | | | | 0.2 | | |
| 669,000 (1) | | | CSC Holdings LLC, 5.750%,
01/15/2030 | | | | | 352,898 | | | | | | 0.3 | | |
See Accompanying Notes to Financial Statements
PORTFOLIO OF INVESTMENTS
| Voya VACS Series HYB Fund | as of March 31, 2023 (continued) |
Principal
Amount† | | | Value | | | Percentage
of Net
Assets | |
| CORPORATE BONDS/NOTES: (continued) | |
| | | | Communications (continued) | |
| 374,000 (1) | | | Directv Financing LLC / Directv
Financing Co-Obligor, Inc.,
5.875%, 08/15/2027 | | | | $ | 339,091 | | | | | | 0.3 | | |
| 436,000 | | | DISH DBS Corp., 5.125%,
06/01/2029 | | | | | 232,641 | | | | | | 0.2 | | |
| 282,000 (1) | | | DISH DBS Corp., 5.750%,
12/01/2028 | | | | | 210,971 | | | | | | 0.2 | | |
| 221,000 | | | DISH DBS Corp., 7.375%,
07/01/2028 | | | | | 126,319 | | | | | | 0.1 | | |
| 159,000 (1) | | | DISH Network Corp., 11.750%,
11/15/2027 | | | | | 154,398 | | | | | | 0.1 | | |
| 307,000 | | | Embarq Corp., 7.995%,
06/01/2036 | | | | | 129,381 | | | | | | 0.1 | | |
| 214,000 (1) | | | GCI LLC, 4.750%, 10/15/2028 | | | | | 184,867 | | | | | | 0.2 | | |
| 503,000 (1) | | | Gray Escrow II, Inc., 5.375%,
11/15/2031 | | | | | 334,563 | | | | | | 0.3 | | |
| 171,000 (1) | | | iHeartCommunications, Inc.,
5.250%, 08/15/2027 | | | | | 139,957 | | | | | | 0.1 | | |
| 343,000 (1) | | | ION Trading Technologies Sarl,
5.750%, 05/15/2028 | | | | | 274,500 | | | | | | 0.2 | | |
| 239,000 (1) | | | LCPR Senior Secured
Financing DAC, 5.125%,
07/15/2029 | | | | | 201,703 | | | | | | 0.2 | | |
| 374,000 (1) | | | LCPR Senior Secured
Financing DAC, 6.750%,
10/15/2027 | | | | | 353,582 | | | | | | 0.3 | | |
| 117,000 (1)(3) | | | Level 3 Financing, Inc.,
10.500%, 05/15/2030 | | | | | 111,735 | | | | | | 0.1 | | |
| 571,000 (1) | | | Match Group Holdings II LLC,
4.625%, 06/01/2028 | | | | | 531,030 | | | | | | 0.4 | | |
| 362,000 (1) | | | McGraw-Hill Education, Inc.,
8.000%, 08/01/2029 | | | | | 297,294 | | | | | | 0.2 | | |
| 411,000 (1) | | | Millennium Escrow Corp.,
6.625%, 08/01/2026 | | | | | 267,668 | | | | | | 0.2 | | |
| 261,000 | | | Netflix, Inc., 5.875%,
11/15/2028 | | | | | 274,924 | | | | | | 0.2 | | |
| 319,000 (4) | | | Paramount Global, 6.250%,
02/28/2057 | | | | | 239,036 | | | | | | 0.2 | | |
| 472,000 (1) | | | Radiate Holdco LLC / Radiate
Finance, Inc., 6.500%,
09/15/2028 | | | | | 194,155 | | | | | | 0.2 | | |
| 184,000 (1) | | | Sinclair Television Group, Inc.,
4.125%, 12/01/2030 | | | | | 148,571 | | | | | | 0.1 | | |
| 214,000 (1) | | | Sinclair Television Group, Inc.,
5.500%, 03/01/2030 | | | | | 170,434 | | | | | | 0.1 | | |
| 841,000 (1) | | | Sirius XM Radio, Inc., 5.000%,
08/01/2027 | | | | | 788,269 | | | | | | 0.6 | | |
| 393,000 (1) | | | Spanish Broadcasting System,
Inc., 9.750%, 03/01/2026 | | | | | 266,735 | | | | | | 0.2 | | |
| 773,000 | | | Sprint Corp., 7.125%,
06/15/2024 | | | | | 786,505 | | | | | | 0.6 | | |
Principal
Amount† | | | Value | | | Percentage
of Net
Assets | |
| CORPORATE BONDS/NOTES: (continued) | |
| | | | Communications (continued) | |
| 255,000 | | | Sprint Corp., 7.625%,
03/01/2026 | | | | $ | 269,887 | | | | | | 0.2 | | |
| 429,000 (1) | | | Stagwell Global LLC, 5.625%,
08/15/2029 | | | | | 376,661 | | | | | | 0.3 | | |
| 196,000 | | | Telecom Italia Capital SA,
6.000%, 09/30/2034 | | | | | 168,315 | | | | | | 0.1 | | |
| 214,000 | | | Telecom Italia Capital SA,
6.375%, 11/15/2033 | | | | | 193,982 | | | | | | 0.2 | | |
| 290,000 (1) | | | Uber Technologies, Inc.,
8.000%, 11/01/2026 | | | | | 297,598 | | | | | | 0.2 | | |
| 178,000 (1) | | | Univision Communications,
Inc., 4.500%, 05/01/2029 | | | | | 149,727 | | | | | | 0.1 | | |
| 712,000 (1) | | | Univision Communications,
Inc., 6.625%, 06/01/2027 | | | | | 675,759 | | | | | | 0.5 | | |
| 331,000 (1) | | | Urban One, Inc., 7.375%,
02/01/2028 | | | | | 301,011 | | | | | | 0.2 | | |
| 374,000 (1) | | | ViaSat, Inc., 5.625%,
09/15/2025 | | | | | 354,937 | | | | | | 0.3 | | |
| 98,000 (1) | | | ViaSat, Inc., 5.625%,
04/15/2027 | | | | | 92,110 | | | | | | 0.1 | | |
| 159,000 (1) | | | ViaSat, Inc., 6.500%,
07/15/2028 | | | | | 117,660 | | | | | | 0.1 | | |
| 380,000 (1) | | | Viavi Solutions, Inc., 3.750%,
10/01/2029 | | | | | 325,359 | | | | | | 0.3 | | |
| 651,000 (1) | | | Virgin Media Vendor Financing
Notes IV DAC, 5.000%,
07/15/2028 | | | | | 579,286 | | | | | | 0.5 | | |
| 417,000 (1) | | | Vmed O2 UK Financing I PLC,
4.750%, 07/15/2031 | | | | | 357,955 | | | | | | 0.3 | | |
| 546,000 (1) | | | Zayo Group Holdings, Inc.,
6.125%, 03/01/2028 | | | | | 332,569 | | | | | | 0.3 | | |
| | | | | | | | | 16,643,418 | | | | | | 13.4 | | |
| | | | Consumer, Cyclical: 25.0% | |
| 340,000 (1) | | | 1011778 BC ULC / New Red
Finance, Inc., 4.000%,
10/15/2030 | | | | | 291,856 | | | | | | 0.2 | | |
| 528,000 (1) | | | Academy Ltd., 6.000%,
11/15/2027 | | | | | 515,654 | | | | | | 0.4 | | |
| 472,000 (1) | | | Adams Homes, Inc., 7.500%,
02/15/2025 | | | | | 420,410 | | | | | | 0.3 | | |
| 515,000 (1) | | | Adient Global Holdings Ltd.,
4.875%, 08/15/2026 | | | | | 496,900 | | | | | | 0.4 | | |
| 235,000 (1) | | | Adient Global Holdings Ltd.,
8.250%, 04/15/2031 | | | | | 242,190 | | | | | | 0.2 | | |
| 540,000 (1) | | | Affinity Gaming, 6.875%,
12/15/2027 | | | | | 482,177 | | | | | | 0.4 | | |
| 122,000 (1) | | | Allison Transmission, Inc.,
3.750%, 01/30/2031 | | | | | 104,220 | | | | | | 0.1 | | |
| 460,000 (1) | | | Allison Transmission, Inc.,
5.875%, 06/01/2029 | | | | | 448,408 | | | | | | 0.4 | | |
See Accompanying Notes to Financial Statements
PORTFOLIO OF INVESTMENTS
| Voya VACS Series HYB Fund | as of March 31, 2023 (continued) |
Principal
Amount† | | | Value | | | Percentage
of Net
Assets | |
| CORPORATE BONDS/NOTES: (continued) | |
| | | | Consumer, Cyclical (continued) | |
| 455,000 (1) | | | American Airlines, Inc.,
7.250%, 02/15/2028 | | | | $ | 442,927 | | | | | | 0.4 | | |
| 719,000 (1) | | | American Airlines, Inc./
AAdvantage Loyalty IP Ltd.,
5.750%, 04/20/2029 | | | | | 690,456 | | | | | | 0.6 | | |
| 393,000 (1) | | | Arko Corp., 5.125%,
11/15/2029 | | | | | 325,761 | | | | | | 0.3 | | |
| 270,000 | | | Asbury Automotive Group, Inc.,
4.500%, 03/01/2028 | | | | | 246,070 | | | | | | 0.2 | | |
| 251,000 | | | Asbury Automotive Group, Inc.,
4.750%, 03/01/2030 | | | | | 224,942 | | | ��� | | | 0.2 | | |
| 503,000 | | | Bath & Body Works, Inc.,
6.750%, 07/01/2036 | | | | | 450,079 | | | | | | 0.4 | | |
| 75,000 (1) | | | Bath & Body Works, Inc.,
9.375%, 07/01/2025 | | | | | 80,200 | | | | | | 0.1 | | |
| 85,000 (1)(2) | | | BCPE Ulysses Intermediate,
Inc., 7.750% (PIK Rate
8.500%, Cash Rate 7.750)%,
04/01/2027 | | | | | 66,842 | | | | | | 0.1 | | |
| 460,000 (1) | | | Caesars Entertainment, Inc.,
4.625%, 10/15/2029 | | | | | 402,746 | | | | | | 0.3 | | |
| 356,000 (1) | | | Caesars Entertainment, Inc.,
6.250%, 07/01/2025 | | | | | 356,350 | | | | | | 0.3 | | |
| 205,000 (1) | | | Caesars Entertainment, Inc.,
7.000%, 02/15/2030 | | | | | 208,775 | | | | | | 0.2 | | |
| 861,000 (1) | | | Carnival Corp., 6.000%,
05/01/2029 | | | | | 685,485 | | | | | | 0.6 | | |
| 589,000 (1) | | | Carnival Corp., 9.875%,
08/01/2027 | | | | | 607,271 | | | | | | 0.5 | | |
| 393,000 (1) | | | CCM Merger, Inc., 6.375%,
05/01/2026 | | | | | 384,161 | | | | | | 0.3 | | |
| 319,000 (1) | | | Century Communities, Inc.,
3.875%, 08/15/2029 | | | | | 273,959 | | | | | | 0.2 | | |
| 203,000 (1) | | | Cinemark USA, Inc., 8.750%,
05/01/2025 | | | | | 207,430 | | | | | | 0.2 | | |
| 325,000 (1) | | | Crocs, Inc., 4.125%,
08/15/2031 | | | | | 268,061 | | | | | | 0.2 | | |
| 454,000 | | | Delta Air Lines 2020-1 Class A
Pass Through Trust, 4.375%,
04/19/2028 | | | | | 422,263 | | | | | | 0.3 | | |
| 111,000 | | | Delta Air Lines 2020-1 Class A
Pass Through Trust, 7.375%,
01/15/2026 | | | | | 115,611 | | | | | | 0.1 | | |
| 290,000 (1) | | | Fertitta Entertainment LLC /
Fertitta Entertainment Finance
Co., Inc., 6.750%, 01/15/2030 | | | | | 238,853 | | | | | | 0.2 | | |
| 362,000 (1) | | | Foot Locker, Inc., 4.000%,
10/01/2029 | | | | | 302,411 | | | | | | 0.2 | | |
| 626,000 | | | Ford Motor Co., 6.100%,
08/19/2032 | | | | | 607,509 | | | | | | 0.5 | | |
| 581,000 | | | Ford Motor Credit Co. LLC,
2.700%, 08/10/2026 | | | | | 517,816 | | | | | | 0.4 | | |
Principal
Amount† | | | Value | | | Percentage
of Net
Assets | |
| CORPORATE BONDS/NOTES: (continued) | |
| | | | Consumer, Cyclical (continued) | |
| 835,000 | | | Ford Motor Credit Co. LLC,
4.125%, 08/17/2027 | | | | $ | 766,200 | | | | | | 0.6 | | |
| 481,000 | | | Ford Motor Credit Co. LLC,
4.542%, 08/01/2026 | | | | | 456,695 | | | | | | 0.4 | | |
| 400,000 | | | Ford Motor Credit Co. LLC,
5.113%, 05/03/2029 | | | | | 376,082 | | | | | | 0.3 | | |
| 368,000 (1) | | | Foundation Building Materials,
Inc., 6.000%, 03/01/2029 | | | | | 292,169 | | | | | | 0.2 | | |
| 411,000 (1) | | | Gap, Inc./The, 3.875%,
10/01/2031 | | | | | 285,550 | | | | | | 0.2 | | |
| 221,000 (1) | | | Golden Entertainment, Inc.,
7.625%, 04/15/2026 | | | | | 223,077 | | | | | | 0.2 | | |
| 55,000 | | | Goodyear Tire & Rubber
Co/The, 4.875%, 03/15/2027 | | | | | 51,992 | | | | | | 0.0 | | |
| 285,000 | | | Goodyear Tire & Rubber
Co/The, 5.250%, 07/15/2031 | | | | | 246,485 | | | | | | 0.2 | | |
| 337,000 (1) | | | Hanesbrands, Inc., 4.875%,
05/15/2026 | | | | | 319,719 | | | | | | 0.3 | | |
| 257,000 (1) | | | Hilton Domestic Operating Co.,
Inc., 4.000%, 05/01/2031 | | | | | 225,286 | | | | | | 0.2 | | |
| 436,000 (1) | | | Installed Building Products,
Inc., 5.750%, 02/01/2028 | | | | | 402,045 | | | | | | 0.3 | | |
| 515,000 (1) | | | Interface, Inc., 5.500%,
12/01/2028 | | | | | 415,733 | | | | | | 0.3 | | |
| 657,000 (1) | | | International Game Technology
PLC, 5.250%, 01/15/2029 | | | | | 629,735 | | | | | | 0.5 | | |
| 350,000 (1) | | | LBM Acquisition LLC, 6.250%,
01/15/2029 | | | | | 268,273 | | | | | | 0.2 | | |
| 479,000 (1) | | | LCM Investments Holdings II
LLC, 4.875%, 05/01/2029 | | | | | 401,280 | | | | | | 0.3 | | |
| 436,000 (1) | | | Lions Gate Capital Holdings
LLC, 5.500%, 04/15/2029 | | | | | 287,141 | | | | | | 0.2 | | |
| 135,000 | | | M/I Homes, Inc., 3.950%,
02/15/2030 | | | | | 114,636 | | | | | | 0.1 | | |
| 362,000 | | | M/I Homes, Inc., 4.950%,
02/01/2028 | | | | | 335,322 | | | | | | 0.3 | | |
| 160,000 | | | Macy’s Retail Holdings LLC,
4.500%, 12/15/2034 | | | | | 116,590 | | | | | | 0.1 | | |
| 110,000 (1) | | | Macy’s Retail Holdings LLC,
5.875%, 03/15/2030 | | | | | 97,759 | | | | | | 0.1 | | |
| 294,000 (1) | | | Macy’s Retail Holdings LLC,
6.125%, 03/15/2032 | | | | | 259,070 | | | | | | 0.2 | | |
| 24,000 (1) | | | Mattel, Inc., 3.750%,
04/01/2029 | | | | | 21,587 | | | | | | 0.0 | | |
| 245,000 | | | Mattel, Inc., 5.450%,
11/01/2041 | | | | | 206,535 | | | | | | 0.2 | | |
| 208,000 (1) | | | Melco Resorts Finance Ltd.,
5.250%, 04/26/2026 | | | | | 187,669 | | | | | | 0.2 | | |
| 472,000 (1) | | | Melco Resorts Finance Ltd.,
5.375%, 12/04/2029 | | | | | 386,804 | | | | | | 0.3 | | |
| 331,000 | | | Murphy Oil USA, Inc., 4.750%,
09/15/2029 | | | | | 301,938 | | | | | | 0.2 | | |
See Accompanying Notes to Financial Statements
PORTFOLIO OF INVESTMENTS
| Voya VACS Series HYB Fund | as of March 31, 2023 (continued) |
Principal
Amount† | | | Value | | | Percentage
of Net
Assets | |
| CORPORATE BONDS/NOTES: (continued) | |
| | | | Consumer, Cyclical (continued) | |
| 104,000 | | | Murphy Oil USA, Inc., 5.625%,
05/01/2027 | | | | $ | 100,787 | | | | | | 0.1 | | |
| 411,000 (1) | | | NCL Corp. Ltd., 7.750%,
02/15/2029 | | | | | 352,819 | | | | | | 0.3 | | |
| 79,000 (1) | | | NCL Corp. Ltd., 8.375%,
02/01/2028 | | | | | 79,342 | | | | | | 0.1 | | |
| 270,000 (1) | | | NCL Finance Ltd., 6.125%,
03/15/2028 | | | | | 219,070 | | | | | | 0.2 | | |
| 210,000 (1) | | | Penn Entertainment, Inc.,
4.125%, 07/01/2029 | | | | | 175,320 | | | | | | 0.1 | | |
| 210,000 (1) | | | Penn National Gaming, Inc.,
5.625%, 01/15/2027 | | | | | 197,428 | | | | | | 0.2 | | |
| 657,000 (1) | | | PetSmart, Inc. / PetSmart
Finance Corp., 7.750%,
02/15/2029 | | | | | 645,621 | | | | | | 0.5 | | |
| 411,000 (1) | | | Real Hero Merger Sub 2, Inc.,
6.250%, 02/01/2029 | | | | | 304,271 | | | | | | 0.2 | | |
| 175,000 (1) | | | Ritchie Bros Holdings, Inc.,
7.750%, 03/15/2031 | | | | | 183,622 | | | | | | 0.1 | | |
| 958,000 (1) | | | Royal Caribbean Cruises Ltd.,
5.375%, 07/15/2027 | | | | | 854,416 | | | | | | 0.7 | | |
| 116,000 (1) | | | Royal Caribbean Cruises Ltd.,
7.250%, 01/15/2030 | | | | | 116,829 | | | | | | 0.1 | | |
| 227,000 (1) | | | Royal Caribbean Cruises Ltd.,
11.500%, 06/01/2025 | | | | | 242,252 | | | | | | 0.2 | | |
| 227,000 (1) | | | Royal Caribbean Cruises Ltd.,
11.625%, 08/15/2027 | | | | | 244,025 | | | | | | 0.2 | | |
| 294,000 | | | Sands China Ltd., 5.625%,
08/08/2025 | | | | | 286,809 | | | | | | 0.2 | | |
| 442,000 | | | Sands China Ltd., 5.900%,
08/08/2028 | | | | | 419,954 | | | | | | 0.3 | | |
| 405,000 (1) | | | Scientific Games Holdings
L.P./Scientific Games US
FinCo, Inc., 6.625%,
03/01/2030 | | | | | 358,277 | | | | | | 0.3 | | |
| 356,000 (1) | | | Scientific Games International,
Inc., 7.000%, 05/15/2028 | | | | | 352,787 | | | | | | 0.3 | | |
| 147,000 (1) | | | Scientific Games International,
Inc., 8.625%, 07/01/2025 | | | | | 150,632 | | | | | | 0.1 | | |
| 429,000 | | | Shea Homes L.P. / Shea
Homes Funding Corp., 4.750%,
04/01/2029 | | | | | 374,942 | | | | | | 0.3 | | |
| 380,000 (1) | | | Sizzling Platter LLC / Sizzling
Platter Finance Corp., 8.500%,
11/28/2025 | | | | | 341,326 | | | | | | 0.3 | | |
| 503,000 (1) | | | Sonic Automotive, Inc.,
4.625%, 11/15/2029 | | | | | 421,964 | | | | | | 0.3 | | |
| 122,000 (1) | | | SRS Distribution, Inc., 6.000%,
12/01/2029 | | | | | 100,910 | | | | | | 0.1 | | |
Principal
Amount† | | | Value | | | Percentage
of Net
Assets | |
| CORPORATE BONDS/NOTES: (continued) | |
| | | | Consumer, Cyclical (continued) | |
| 313,000 (1) | | | SRS Distribution, Inc., 6.125%,
07/01/2029 | | | | $ | 264,485 | | | | | | 0.2 | | |
| 470,000 (1) | | | Staples, Inc., 10.750%,
04/15/2027 | | | | | 341,373 | | | | | | 0.3 | | |
| 509,000 (1) | | | Station Casinos LLC, 4.500%,
02/15/2028 | | | | | 459,971 | | | | | | 0.4 | | |
| 442,000 (1) | | | STL Holding Co. LLC, 7.500%,
02/15/2026 | | | | | 388,659 | | | | | | 0.3 | | |
| 417,000 (1) | | | Taylor Morrison Communities,
Inc., 5.125%, 08/01/2030 | | | | | 385,313 | | | | | | 0.3 | | |
| 423,000 (1) | | | Tempur Sealy International,
Inc., 3.875%, 10/15/2031 | | | | | 353,641 | | | | | | 0.3 | | |
| 380,000 (1) | | | United Airlines 2015-1
Class AA Pass Through Trust,
4.625%, 04/15/2029 | | | | | 344,212 | | | | | | 0.3 | | |
| 362,000 | | | United Airlines Holdings, Inc.,
4.875%, 01/15/2025 | | | | | 353,386 | | | | | | 0.3 | | |
| 165,000 (1) | | | United Airlines, Inc., 4.375%,
04/15/2026 | | | | | 158,050 | | | | | | 0.1 | | |
| 528,000 (1) | | | Victoria’s Secret & Co.,
4.625%, 07/15/2029 | | | | | 428,403 | | | | | | 0.3 | | |
| 485,000 (1) | | | Viking Cruises Ltd., 5.875%,
09/15/2027 | | | | | 418,119 | | | | | | 0.3 | | |
| 159,000 (1) | | | Viking Cruises Ltd., 13.000%,
05/15/2025 | | | | | 168,088 | | | | | | 0.1 | | |
| 276,000 (1) | | | White Cap Buyer LLC, 6.875%,
10/15/2028 | | | | | 239,667 | | | | | | 0.2 | | |
| 141,000 (1)(2) | | | White Cap Parent LLC, 8.250%
(PIK Rate 9.000%, Cash Rate
8.250)%, 03/15/2026 | | | | | 128,420 | | | | | | 0.1 | | |
| 356,000 (1) | | | William Carter Co/The,
5.625%, 03/15/2027 | | | | | 346,368 | | | | | | 0.3 | | |
| 178,000 (1) | | | Williams Scotsman
International, Inc., 4.625%,
08/15/2028 | | | | | 162,139 | | | | | | 0.1 | | |
| 583,000 (1) | | | Wynn Las Vegas LLC / Wynn
Las Vegas Capital Corp.,
5.250%, 05/15/2027 | | | | | 551,623 | | | | | | 0.4 | | |
| 223,000 (1) | | | Wynn Resorts Finance LLC /
Wynn Resorts Capital Corp.,
7.125%, 02/15/2031 | | | | | 226,405 | | | | | | 0.2 | | |
| | | | | | | | | 31,044,890 | | | | | | 25.0 | | |
| | | | Consumer, Non-cyclical: 13.3% | |
| 42,000 (1) | | | 1375209 BC Ltd., 9.000%,
01/30/2028 | | | | | 41,685 | | | | | | 0.0 | | |
| 429,000 (1) | | | Acadia Healthcare Co., Inc.,
5.500%, 07/01/2028 | | | | | 415,980 | | | | | | 0.3 | | |
See Accompanying Notes to Financial Statements
PORTFOLIO OF INVESTMENTS
| Voya VACS Series HYB Fund | as of March 31, 2023 (continued) |
Principal
Amount† | | | Value | | | Percentage
of Net
Assets | |
| CORPORATE BONDS/NOTES: (continued) | |
| | | | Consumer, Non-cyclical (continued) | |
| 485,000 (1) | | | ADT Security Corp./The,
4.125%, 08/01/2029 | | | | $ | 433,117 | | | | | | 0.3 | | |
| 343,000 (1) | | | Albertsons Cos, Inc. / Safeway,
Inc. / New Albertsons L.P. /
Albertsons LLC, 3.500%,
03/15/2029 | | | | | 298,765 | | | | | | 0.2 | | |
| 171,000 (1) | | | Albertsons Cos, Inc. / Safeway,
Inc. / New Albertsons L.P. /
Albertsons LLC, 4.875%,
02/15/2030 | | | | | 159,794 | | | | | | 0.1 | | |
| 393,000 (1) | | | Albertsons Cos, Inc. / Safeway,
Inc. / New Albertsons L.P. /
Albertsons LLC, 5.875%,
02/15/2028 | | | | | 390,996 | | | | | | 0.3 | | |
| 79,000 (1) | | | Allied Universal Holdco LLC /
Allied Universal Finance Corp.,
6.625%, 07/15/2026 | | | | | 75,998 | | | | | | 0.1 | | |
| 233,000 (1) | | | Allied Universal Holdco LLC /
Allied Universal Finance Corp.,
9.750%, 07/15/2027 | | | | | 207,894 | | | | | | 0.2 | | |
| 497,000 (1) | | | Alta Equipment Group, Inc.,
5.625%, 04/15/2026 | | | | | 464,702 | | | | | | 0.4 | | |
| 448,000 (1) | | | AMN Healthcare, Inc., 4.625%,
10/01/2027 | | | | | 415,819 | | | | | | 0.3 | | |
| 208,000 (1) | | | APi Escrow Corp., 4.750%,
10/15/2029 | | | | | 183,331 | | | | | | 0.1 | | |
| 171,000 (1) | | | APi Group DE, Inc., 4.125%,
07/15/2029 | | | | | 147,033 | | | | | | 0.1 | | |
| 116,000 (1) | | | Bausch Health Cos, Inc.,
4.875%, 06/01/2028 | | | | | 68,544 | | | | | | 0.1 | | |
| 160,000 (1) | | | Bausch Health Cos, Inc.,
6.125%, 02/01/2027 | | | | | 103,715 | | | | | | 0.1 | | |
| 74,000 (1) | | | Bausch Health Cos, Inc.,
11.000%, 09/30/2028 | | | | | 54,822 | | | | | | 0.0 | | |
| 350,000 (1) | | | BellRing Brands, Inc., 7.000%,
03/15/2030 | | | | | 354,855 | | | | | | 0.3 | | |
| 509,000 (1) | | | Cheplapharm Arzneimittel
GmbH, 5.500%, 01/15/2028 | | | | | 453,738 | | | | | | 0.4 | | |
| 196,000 (1) | | | CHS/Community Health
Systems, Inc., 4.750%,
02/15/2031 | | | | | 144,903 | | | | | | 0.1 | | |
| 325,000 (1) | | | CHS/Community Health
Systems, Inc., 5.250%,
05/15/2030 | | | | | 255,239 | | | | | | 0.2 | | |
| 288,000 (1) | | | CHS/Community Health
Systems, Inc., 5.625%,
03/15/2027 | | | | | 253,135 | | | | | | 0.2 | | |
| 215,000 (1) | | | CHS/Community Health
Systems, Inc., 6.875%,
04/15/2029 | | | | | 133,365 | | | | | | 0.1 | | |
Principal
Amount† | | | Value | | | Percentage
of Net
Assets | |
| CORPORATE BONDS/NOTES: (continued) | |
| | | | Consumer, Non-cyclical (continued) | |
| 469,000 (1) | | | CPI CG, Inc., 8.625%,
03/15/2026 | | | | $ | 464,732 | | | | | | 0.4 | | |
| 147,000 (1) | | | DaVita, Inc., 3.750%,
02/15/2031 | | | | | 116,089 | | | | | | 0.1 | | |
| 558,000 (1) | | | DaVita, Inc., 4.625%,
06/01/2030 | | | | | 476,811 | | | | | | 0.4 | | |
| 497,000 | | | Encompass Health Corp.,
4.750%, 02/01/2030 | | | | | 452,419 | | | | | | 0.4 | | |
| 135,000 (1) | | | Garda World Security Corp.,
6.000%, 06/01/2029 | | | | | 107,498 | | | | | | 0.1 | | |
| 374,000 (1) | | | Garda World Security Corp.,
7.750%, 02/15/2028 | | | | | 368,952 | | | | | | 0.3 | | |
| 337,000 (1) | | | Graham Holdings Co., 5.750%,
06/01/2026 | | | | | 330,613 | | | | | | 0.3 | | |
| 466,000 (1) | | | Jazz Securities DAC, 4.375%,
01/15/2029 | | | | | 429,139 | | | | | | 0.3 | | |
| 368,000 (1) | | | KeHE Distributors LLC / KeHE
Finance Corp., 8.625%,
10/15/2026 | | | | | 367,805 | | | | | | 0.3 | | |
| 380,000 (1) | | | Legends Hospitality Holding
Co. LLC / Legends Hospitality
Co-Issuer, Inc., 5.000%,
02/01/2026 | | | | | 340,434 | | | | | | 0.3 | | |
| 230,000 (1) | | | Medline Borrower L.P., 3.875%,
04/01/2029 | | | | | 199,792 | | | | | | 0.2 | | |
| 454,000 (1) | | | Medline Borrower L.P., 5.250%,
10/01/2029 | | | | | 394,330 | | | | | | 0.3 | | |
| 36,000 (1) | | | ModivCare, Inc., 5.875%,
11/15/2025 | | | | | 34,561 | | | | | | 0.0 | | |
| 282,000 (1) | | | MPH Acquisition Holdings LLC,
5.750%, 11/01/2028 | | | | | 203,157 | | | | | | 0.2 | | |
| 423,000 (1) | | | NESCO Holdings II, Inc.,
5.500%, 04/15/2029 | | | | | 383,109 | | | | | | 0.3 | | |
| 264,000 | | | New Albertsons L.P., 7.450%,
08/01/2029 | | | | | 267,780 | | | | | | 0.2 | | |
| 614,000 (1) | | | Organon & Co. / Organon
Foreign Debt Co-Issuer BV,
5.125%, 04/30/2031 | | | | | 545,587 | | | | | | 0.4 | | |
| 325,000 (1) | | | PECF USS Intermediate
Holding III Corp., 8.000%,
11/15/2029 | | | | | 216,221 | | | | | | 0.2 | | |
| 313,000 (1) | | | Picasso Finance Sub, Inc.,
6.125%, 06/15/2025 | | | | | 311,360 | | | | | | 0.3 | | |
| 239,000 (1) | | | Post Holdings, Inc., 4.625%,
04/15/2030 | | | | | 214,419 | | | | | | 0.2 | | |
| 466,000 (1) | | | Post Holdings, Inc., 5.625%,
01/15/2028 | | | | | 457,113 | | | | | | 0.4 | | |
| 325,000 (1) | | | Prime Security Services
Borrower LLC / Prime Finance,
Inc., 6.250%, 01/15/2028 | | | | | 304,181 | | | | | | 0.2 | | |
See Accompanying Notes to Financial Statements
PORTFOLIO OF INVESTMENTS
| Voya VACS Series HYB Fund | as of March 31, 2023 (continued) |
Principal
Amount† | | | Value | | | Percentage
of Net
Assets | |
| CORPORATE BONDS/NOTES: (continued) | |
| | | | Consumer, Non-cyclical (continued) | |
| 509,000 (1) | | | Primo Water Holdings, Inc.,
4.375%, 04/30/2029 | | | | $ | 444,757 | | | | | | 0.4 | | |
| 374,000 (1) | | | Simmons Foods, Inc./Simmons
Prepared Foods, Inc./Simmons
Pet Food, Inc./Simmons Feed,
4.625%, 03/01/2029 | | | | | 304,402 | | | | | | 0.2 | | |
| 190,000 (1) | | | Spectrum Brands, Inc.,
3.875%, 03/15/2031 | | | | | 155,568 | | | | | | 0.1 | | |
| 208,000 (1) | | | Spectrum Brands, Inc.,
5.500%, 07/15/2030 | | | | | 183,219 | | | | | | 0.1 | | |
| 313,000 (1) | | | Teleflex, Inc., 4.250%,
06/01/2028 | | | | | 298,023 | | | | | | 0.2 | | |
| 214,000 | | | Tenet Healthcare Corp.,
4.250%, 06/01/2029 | | | | | 193,801 | | | | | | 0.2 | | |
| 122,000 | | | Tenet Healthcare Corp.,
5.125%, 11/01/2027 | | | | | 117,242 | | | | | | 0.1 | | |
| 583,000 | | | Tenet Healthcare Corp.,
6.125%, 10/01/2028 | | | | | 559,298 | | | | | | 0.5 | | |
| 458,000 (1) | | | Tenet Healthcare Corp.,
6.125%, 06/15/2030 | | | | | 452,229 | | | | | | 0.4 | | |
| 393,000 | | | Teva Pharmaceutical Finance
Netherlands III BV, 4.750%,
05/09/2027 | | | | | 367,328 | | | | | | 0.3 | | |
| 386,000 (1) | | | Triton Water Holdings, Inc.,
6.250%, 04/01/2029 | | | | | 306,874 | | | | | | 0.2 | | |
| 331,000 (1) | | | United Natural Foods, Inc.,
6.750%, 10/15/2028 | | | | | 307,933 | | | | | | 0.2 | | |
| 130,000 | | | United Rentals North America,
Inc., 3.750%, 01/15/2032 | | | | | 112,101 | | | | | | 0.1 | | |
| 260,000 | | | United Rentals North America,
Inc., 4.875%, 01/15/2028 | | | | | 248,898 | | | | | | 0.2 | | |
| 77,000 | | | United Rentals North America,
Inc., 5.250%, 01/15/2030 | | | | | 74,187 | | | | | | 0.1 | | |
| 350,000 (1) | | | Varex Imaging Corp., 7.875%,
10/15/2027 | | | | | 343,144 | | | | | | 0.3 | | |
| | | | | | | | | 16,512,536 | | | | | | 13.3 | | |
| | | | Energy: 13.6% | |
| 270,000 (1) | | | Antero Midstream Partners
L.P. / Antero Midstream
Finance Corp., 5.375%,
06/15/2029 | | | | | 254,424 | | | | | | 0.2 | | |
| 331,000 (1) | | | Antero Midstream Partners
L.P. / Antero Midstream
Finance Corp., 5.750%,
03/01/2027 | | | | | 323,817 | | | | | | 0.3 | | |
| 135,000 (1) | | | Antero Resources Corp.,
5.375%, 03/01/2030 | | | | | 125,736 | | | | | | 0.1 | | |
| 233,000 | | | Apache Corp., 5.100%,
09/01/2040 | | | | | 197,823 | | | | | | 0.2 | | |
| 165,000 | | | Apache Corp., 5.250%,
02/01/2042 | | | | | 138,796 | | | | | | 0.1 | | |
Principal
Amount† | | | Value | | | Percentage
of Net
Assets | |
| CORPORATE BONDS/NOTES: (continued) | |
| | | | Energy (continued) | |
| 360,000 (1) | | | Archrock Partners L.P. /
Archrock Partners Finance
Corp., 6.250%, 04/01/2028 | | | | $ | 345,946 | | | | | | 0.3 | | |
| 135,000 (1) | | | Archrock Partners L.P. /
Archrock Partners Finance
Corp., 6.875%, 04/01/2027 | | | | | 132,600 | | | | | | 0.1 | | |
| 190,000 (1) | | | Ascent Resources Utica
Holdings LLC / ARU Finance
Corp., 5.875%, 06/30/2029 | | | | | 167,864 | | | | | | 0.1 | | |
| 466,000 (1) | | | Atlantica Sustainable
Infrastructure PLC, 4.125%,
06/15/2028 | | | | | 418,654 | | | | | | 0.3 | | |
| 386,000 (1) | | | Baytex Energy Corp., 8.750%,
04/01/2027 | | | | | 395,625 | | | | | | 0.3 | | |
| 190,000 (1) | | | Chesapeake Energy Corp.,
6.750%, 04/15/2029 | | | | | 188,808 | | | | | | 0.2 | | |
| 436,000 (1) | | | Chord Energy Corp., 6.375%,
06/01/2026 | | | | | 432,375 | | | | | | 0.4 | | |
| 362,000 (1) | | | CNX Midstream Partners LP,
4.750%, 04/15/2030 | | | | | 311,791 | | | | | | 0.3 | | |
| 485,000 (1) | | | Colgate Energy Partners III
LLC, 5.875%, 07/01/2029 | | | | | 459,780 | | | | | | 0.4 | | |
| 601,000 (1) | | | Crescent Energy Finance LLC,
7.250%, 05/01/2026 | | | | | 565,493 | | | | | | 0.5 | | |
| 583,000 (1) | | | Crestwood Midstream Partners
L.P. / Crestwood Midstream
Finance Corp., 6.000%,
02/01/2029 | | | | | 555,742 | | | | | | 0.4 | | |
| 208,000 | | | Delek Logistics Partners L.P. /
Delek Logistics Finance Corp.,
6.750%, 05/15/2025 | | | | | 204,307 | | | | | | 0.2 | | |
| 313,000 (1) | | | Delek Logistics Partners L.P. /
Delek Logistics Finance Corp.,
7.125%, 06/01/2028 | | | | | 286,877 | | | | | | 0.2 | | |
| 171,000 (1) | | | DT Midstream, Inc., 4.125%,
06/15/2029 | | | | | 150,112 | | | | | | 0.1 | | |
| 313,000 (1) | | | DT Midstream, Inc., 4.375%,
06/15/2031 | | | | | 273,118 | | | | | | 0.2 | | |
| 436,000 (1) | | | Earthstone Energy Holdings
LLC, 8.000%, 04/15/2027 | | | | | 423,492 | | | | | | 0.3 | | |
| 405,000 (1) | | | Encino Acquisition Partners
Holdings LLC, 8.500%,
05/01/2028 | | | | | 354,758 | | | | | | 0.3 | | |
| 355,000 (1) | | | Enerflex Ltd., 9.000%,
10/15/2027 | | | | | 345,580 | | | | | | 0.3 | | |
| 700,000 | | | EnLink Midstream LLC,
5.375%, 06/01/2029 | | | | | 674,433 | | | | | | 0.5 | | |
| 165,000 | | | EQM Midstream Partners L.P.,
5.500%, 07/15/2028 | | | | | 150,077 | | | | | | 0.1 | | |
| 72,000 (1) | | | EQM Midstream Partners L.P.,
6.000%, 07/01/2025 | | | | | 71,267 | | | | | | 0.1 | | |
See Accompanying Notes to Financial Statements
PORTFOLIO OF INVESTMENTS
| Voya VACS Series HYB Fund | as of March 31, 2023 (continued) |
Principal
Amount† | | | Value | | | Percentage
of Net
Assets | |
| CORPORATE BONDS/NOTES: (continued) | |
| | | | Energy (continued) | |
| 294,000 (1) | | | Hess Midstream Operations
L.P., 4.250%, 02/15/2030 | | | | $ | 262,923 | | | | | | 0.2 | | |
| 270,000 (1) | | | Hess Midstream Operations
L.P., 5.125%, 06/15/2028 | | | | | 256,598 | | | | | | 0.2 | | |
| 110,000 (1) | | | Hess Midstream Operations
L.P., 5.500%, 10/15/2030 | | | | | 102,449 | | | | | | 0.1 | | |
| 221,000 (1) | | | Hilcorp Energy I L.P. / Hilcorp
Finance Co., 5.750%,
02/01/2029 | | | | | 203,716 | | | | | | 0.2 | | |
| 239,000 (1) | | | Hilcorp Energy I L.P. / Hilcorp
Finance Co., 6.000%,
04/15/2030 | | | | | 220,693 | | | | | | 0.2 | | |
| 251,000 (1) | | | Hilcorp Energy I L.P. / Hilcorp
Finance Co., 6.000%,
02/01/2031 | | | | | 232,047 | | | | | | 0.2 | | |
| 491,000 (1) | | | Howard Midstream Energy
Partners LLC, 6.750%,
01/15/2027 | | | | | 463,494 | | | | | | 0.4 | | |
| 557,000 (1) | | | Kinetik Holdings L.P., 5.875%,
06/15/2030 | | | | | 536,948 | | | | | | 0.4 | | |
| 583,000 (1) | | | Moss Creek Resources
Holdings, Inc., 7.500%,
01/15/2026 | | | | | 541,292 | | | | | | 0.4 | | |
| 239,000 | | | Murphy Oil Corp., 5.875%,
12/01/2027 | | | | | 233,075 | | | | | | 0.2 | | |
| 411,000 | | | Murphy Oil Corp., 6.375%,
07/15/2028 | | | | | 405,356 | | | | | | 0.3 | | |
| 350,000 (1) | | | Nabors Industries Ltd.,
7.500%, 01/15/2028 | | | | | 323,331 | | | | | | 0.3 | | |
| 171,000 | | | Nabors Industries, Inc.,
5.100%, 09/15/2023 | | | | | 170,897 | | | | | | 0.1 | | |
| 147,000 | | | Occidental Petroleum Corp.,
4.625%, 06/15/2045 | | | | | 117,975 | | | | | | 0.1 | | |
| 412,000 | | | Occidental Petroleum Corp.,
5.500%, 12/01/2025 | | | | | 411,906 | | | | | | 0.3 | | |
| 417,000 | | | Occidental Petroleum Corp.,
6.625%, 09/01/2030 | | | | | 439,553 | | | | | | 0.4 | | |
| 350,000 | | | Occidental Petroleum Corp.,
8.500%, 07/15/2027 | | | | | 385,327 | | | | | | 0.3 | | |
| 380,000 (1) | | | Precision Drilling Corp.,
6.875%, 01/15/2029 | | | | | 345,192 | | | | | | 0.3 | | |
| 445,000 | | | Southwestern Energy Co.,
5.375%, 02/01/2029 | | | | | 419,926 | | | | | | 0.3 | | |
| 454,000 (1) | | | SunCoke Energy, Inc., 4.875%,
06/30/2029 | | | | | 395,810 | | | | | | 0.3 | | |
| 165,000 | | | Sunoco L.P. / Sunoco Finance
Corp., 4.500%, 05/15/2029 | | | | | 151,662 | | | | | | 0.1 | | |
| 380,000 | | | Sunoco L.P. / Sunoco Finance
Corp., 4.500%, 04/30/2030 | | | | | 344,092 | | | | | | 0.3 | | |
| 230,000 (1) | | | Tallgrass Energy Partners L.P. /
Tallgrass Energy Finance
Corp., 7.500%, 10/01/2025 | | | | | 230,126 | | | | | | 0.2 | | |
Principal
Amount† | | | Value | | | Percentage
of Net
Assets | |
| CORPORATE BONDS/NOTES: (continued) | |
| | | | Energy (continued) | |
| 278,688 (1) | | | Transocean Poseidon Ltd.,
6.875%, 02/01/2027 | | | | $ | 273,448 | | | | | | 0.2 | | |
| 52,000 (1) | | | Transocean Titan Financing
Ltd., 8.375%, 02/01/2028 | | | | | 53,561 | | | | | | 0.0 | | |
| 153,000 | | | Transocean, Inc., 6.800%,
03/15/2038 | | | | | 106,115 | | | | | | 0.1 | | |
| 233,000 (1) | | | Transocean, Inc., 7.500%,
01/15/2026 | | | | | 211,792 | | | | | | 0.2 | | |
| 540,000 (1) | | | Weatherford International Ltd.,
8.625%, 04/30/2030 | | | | | 552,938 | | | | | | 0.4 | | |
| 558,000 | | | Western Midstream Operating
L.P., 5.450%, 04/01/2044 | | | | | 487,405 | | | | | | 0.4 | | |
| | | | | | | | | 16,828,942 | | | | | | 13.6 | | |
| | | | Financial: 7.5% | |
| 210,000 | | | Ally Financial, Inc., 5.750%,
11/20/2025 | | | | | 197,729 | | | | | | 0.2 | | |
| 205,000 | | | Ally Financial, Inc., 6.700%,
02/14/2033 | | | | | 182,381 | | | | | | 0.1 | | |
| 350,000 (1) | | | Aretec Escrow Issuer, Inc.,
7.500%, 04/01/2029 | | | | | 286,587 | | | | | | 0.2 | | |
| 411,000 (1) | | | BroadStreet Partners, Inc.,
5.875%, 04/15/2029 | | | | | 348,051 | | | | | | 0.3 | | |
| 393,000 (1) | | | Burford Capital Global Finance
LLC, 6.875%, 04/15/2030 | | | | | 338,683 | | | | | | 0.3 | | |
| 393,000 (1) | | | Cushman & Wakefield US
Borrower LLC, 6.750%,
05/15/2028 | | | | | 352,197 | | | | | | 0.3 | | |
| 165,000 (1) | | | Freedom Mortgage Corp.,
6.625%, 01/15/2027 | | | | | 127,128 | | | | | | 0.1 | | |
| 300,000 (1) | | | Freedom Mortgage Corp.,
8.250%, 04/15/2025 | | | | | 277,455 | | | | | | 0.2 | | |
| 454,000 (1) | | | Ladder Capital Finance
Holdings LLLP / Ladder Capital
Finance Corp., 4.750%,
06/15/2029 | | | | | 328,657 | | | | | | 0.3 | | |
| 472,000 (1) | | | LPL Holdings, Inc., 4.000%,
03/15/2029 | | | | | 425,263 | | | | | | 0.3 | | |
| 214,000 (1) | | | Midcap Financial Issuer Trust,
5.625%, 01/15/2030 | | | | | 169,329 | | | | | | 0.1 | | |
| 380,000 (1) | | | Midcap Financial Issuer Trust,
6.500%, 05/01/2028 | | | | | 323,604 | | | | | | 0.3 | | |
| 334,000 | | | MPT Operating Partnership
L.P. / MPT Finance Corp.,
4.625%, 08/01/2029 | | | | | 247,091 | | | | | | 0.2 | | |
| 384,000 | | | MPT Operating Partnership
L.P. / MPT Finance Corp.,
5.000%, 10/15/2027 | | | | | 316,264 | | | | | | 0.3 | | |
| 485,000 (1) | | | Nationstar Mortgage Holdings,
Inc., 5.125%, 12/15/2030 | | | | | 373,193 | | | | | | 0.3 | | |
| 485,000 | | | Navient Corp., 4.875%,
03/15/2028 | | | | | 408,489 | | | | | | 0.3 | | |
See Accompanying Notes to Financial Statements
PORTFOLIO OF INVESTMENTS
| Voya VACS Series HYB Fund | as of March 31, 2023 (continued) |
Principal
Amount† | | | Value | | | Percentage
of Net
Assets | |
| CORPORATE BONDS/NOTES: (continued) | |
| | | | Financial (continued) | |
| 264,000 | | | Navient Corp., 5.000%,
03/15/2027 | | | | $ | 232,872 | | | | | | 0.2 | | |
| 92,000 | | | Navient Corp., 7.250%,
09/25/2023 | | | | | 91,782 | | | | | | 0.1 | | |
| 233,000 | | | OneMain Finance Corp.,
4.000%, 09/15/2030 | | | | | 174,960 | | | | | | 0.1 | | |
| 522,000 | | | OneMain Finance Corp.,
5.375%, 11/15/2029 | | | | | 439,681 | | | | | | 0.3 | | |
| 159,000 | | | OneMain Finance Corp.,
7.125%, 03/15/2026 | | | | | 153,006 | | | | | | 0.1 | | |
| 522,000 (1) | | | Park Intermediate Holdings
LLC / PK Domestic Property
LLC / PK Finance Co-Issuer,
5.875%, 10/01/2028 | | | | | 481,221 | | | | | | 0.4 | | |
| 436,000 (1) | | | PRA Group, Inc., 5.000%,
10/01/2029 | | | | | 365,329 | | | | | | 0.3 | | |
| 300,000 (1) | | | Realogy Group LLC / Realogy
Co-Issuer Corp., 5.750%,
01/15/2029 | | | | | 224,850 | | | | | | 0.2 | | |
| 411,000 (1) | | | RLJ Lodging Trust L.P.,
4.000%, 09/15/2029 | | | | | 343,665 | | | | | | 0.3 | | |
| 30,000 (1) | | | Rocket Mortgage LLC, 2.875%,
10/15/2026 | | | | | 26,882 | | | | | | 0.0 | | |
| 110,000 | | | Service Properties Trust,
4.750%, 10/01/2026 | | | | | 91,958 | | | | | | 0.1 | | |
| 115,000 | | | Service Properties Trust,
5.500%, 12/15/2027 | | | | | 103,045 | | | | | | 0.1 | | |
| 589,000 (1) | | | United Wholesale Mortgage
LLC, 5.750%, 06/15/2027 | | | | | 524,765 | | | | | | 0.4 | | |
| 171,000 (1) | | | Uniti Group L.P. / Uniti Fiber
Holdings, Inc. / CSL Capital
LLC, 6.000%, 01/15/2030 | | | | | 100,249 | | | | | | 0.1 | | |
| 276,000 (1) | | | Uniti Group L.P. / Uniti Group
Finance, Inc. / CSL Capital
LLC, 6.500%, 02/15/2029 | | | | | 168,706 | | | | | | 0.1 | | |
| 190,000 (1) | | | Uniti Group L.P. / Uniti Group
Finance, Inc. / CSL Capital
LLC, 10.500%, 02/15/2028 | | | | | 184,471 | | | | | | 0.1 | | |
| 313,000 (1) | | | VICI Properties L.P. / VICI Note
Co., Inc., 3.750%, 02/15/2027 | | | | | 289,232 | | | | | | 0.2 | | |
| 362,000 (1) | | | VistaJet Malta Finance PLC /
XO Management Holding, Inc.,
6.375%, 02/01/2030 | | | | | 322,995 | | | | | | 0.3 | | |
| 411,000 (1) | | | XHR L.P., 4.875%, 06/01/2029 | | | | | 349,002 | | | | | | 0.3 | | |
| | | | | | | | | 9,370,772 | | | | | | 7.5 | | |
| | | | Industrial: 10.6% | |
| 485,000 (1)(2) | | | ARD Finance SA, 6.500% (PIK
Rate 7.250%, Cash Rate
6.500)%, 06/30/2027 | | | | | 371,607 | | | | | | 0.3 | | |
| 233,000 | | | Ball Corp., 3.125%, 09/15/2031 | | | | | 193,032 | | | | | | 0.1 | | |
Principal
Amount† | | | Value | | | Percentage
of Net
Assets | |
| CORPORATE BONDS/NOTES: (continued) | |
| | | | Industrial (continued) | |
| 200,000 | | | Ball Corp., 6.875%, 03/15/2028 | | | | $ | 207,204 | | | | | | 0.2 | | |
| 196,000 (1) | | | Bombardier, Inc., 7.500%,
02/01/2029 | | | | | 200,410 | | | | | | 0.2 | | |
| 234,000 (1) | | | Bombardier, Inc., 7.875%,
04/15/2027 | | | | | 237,111 | | | | | | 0.2 | | |
| 454,000 (1) | | | Brundage-Bone Concrete
Pumping Holdings, Inc.,
6.000%, 02/01/2026 | | | | | 426,181 | | | | | | 0.3 | | |
| 362,000 (1) | | �� | Builders FirstSource, Inc.,
5.000%, 03/01/2030 | | | | | 335,590 | | | | | | 0.3 | | |
| 390,000 (1) | | | Cargo Aircraft Management,
Inc., 4.750%, 02/01/2028 | | | | | 349,155 | | | | | | 0.3 | | |
| 423,000 (1) | | | Cascades, Inc./Cascades USA,
Inc., 5.375%, 01/15/2028 | | | | | 402,197 | | | | | | 0.3 | | |
| 439,000 (1) | | | Chart Industries, Inc., 7.500%,
01/01/2030 | | | | | 454,132 | | | | | | 0.4 | | |
| 119,000 (1) | | | Chart Industries, Inc., 9.500%,
01/01/2031 | | | | | 125,659 | | | | | | 0.1 | | |
| 337,000 (1) | | | Clean Harbors, Inc., 6.375%,
02/01/2031 | | | | | 344,178 | | | | | | 0.3 | | |
| 400,000 (1) | | | Energizer Holdings, Inc.,
4.750%, 06/15/2028 | | | | | 360,500 | | | | | | 0.3 | | |
| 509,000 (1) | | | Fortress Transportation and
Infrastructure Investors LLC,
5.500%, 05/01/2028 | | | | | 465,002 | | | | | | 0.4 | | |
| 460,000 (1) | | | GFL Environmental, Inc.,
4.000%, 08/01/2028 | | | | | 418,356 | | | | | | 0.3 | | |
| 221,000 (1) | | | GFL Environmental, Inc.,
4.375%, 08/15/2029 | | | | | 198,093 | | | | | | 0.2 | | |
| 184,000 (1) | | | Global Infrastructure Solutions,
Inc., 5.625%, 06/01/2029 | | | | | 152,001 | | | | | | 0.1 | | |
| 196,000 (1) | | | Global Infrastructure Solutions,
Inc., 7.500%, 04/15/2032 | | | | | 168,903 | | | | | | 0.1 | | |
| 368,000 (1) | | | GrafTech Finance, Inc.,
4.625%, 12/15/2028 | | | | | 307,317 | | | | | | 0.2 | | |
| 356,000 (1) | | | Graham Packaging Co., Inc.,
7.125%, 08/15/2028 | | | | | 308,185 | | | | | | 0.2 | | |
| 300,000 | | | Howmet Aerospace, Inc.,
5.900%, 02/01/2027 | | | | | 305,530 | | | | | | 0.2 | | |
| 503,000 (1) | | | Imola Merger Corp., 4.750%,
05/15/2029 | | | | | 450,547 | | | | | | 0.4 | | |
| 221,000 (1)(2) | | | Intelligent Packaging Holdco
Issuer LP, 9.000% (PIK Rate
9.750%, Cash Rate 9.000)%,
01/15/2026 | | | | | 155,820 | | | | | | 0.1 | | |
| 436,000 (1) | | | Intelligent Packaging Ltd.
Finco, Inc. / Intelligent
Packaging Ltd. Co-Issuer LLC,
6.000%, 09/15/2028 | | | | | 376,050 | | | | | | 0.3 | | |
See Accompanying Notes to Financial Statements
PORTFOLIO OF INVESTMENTS
| Voya VACS Series HYB Fund | as of March 31, 2023 (continued) |
Principal
Amount† | | | Value | | | Percentage
of Net
Assets | |
| CORPORATE BONDS/NOTES: (continued) | |
| | | | Industrial (continued) | |
| 319,000 (1) | | | Koppers, Inc., 6.000%,
02/15/2025 | | | | $ | 319,136 | | | | | | 0.3 | | |
| 460,000 (1) | | | New Enterprise Stone & Lime
Co., Inc., 9.750%, 07/15/2028 | | | | | 439,714 | | | | | | 0.3 | | |
| 429,000 (1) | | | PGT Innovations, Inc., 4.375%,
10/01/2029 | | | | | 388,245 | | | | | | 0.3 | | |
| 350,000 (1) | | | Roller Bearing Co. of America,
Inc., 4.375%, 10/15/2029 | | | | | 312,956 | | | | | | 0.2 | | |
| 208,000 (1) | | | Rolls-Royce PLC, 3.625%,
10/14/2025 | | | | | 198,120 | | | | | | 0.2 | | |
| 386,000 (1) | | | Rolls-Royce PLC, 5.750%,
10/15/2027 | | | | | 384,886 | | | | | | 0.3 | | |
| 485,000 (1) | | | Sealed Air Corp., 4.000%,
12/01/2027 | | | | | 453,039 | | | | | | 0.4 | | |
| 202,000 (1) | | | Sealed Air Corp./Sealed Air
Corp. US, 6.125%, 02/01/2028 | | | | | 204,464 | | | | | | 0.2 | | |
| 147,000 (1) | | | Sensata Technologies BV,
5.000%, 10/01/2025 | | | | | 146,074 | | | | | | 0.1 | | |
| 479,000 (1) | | | Sensata Technologies, Inc.,
3.750%, 02/15/2031 | | | | | 419,556 | | | | | | 0.3 | | |
| 479,000 (1) | | | Standard Industries, Inc./NJ,
3.375%, 01/15/2031 | | | | | 385,509 | | | | | | 0.3 | | |
| 276,000 (1) | | | Standard Industries, Inc./NJ,
4.375%, 07/15/2030 | | | | | 240,432 | | | | | | 0.2 | | |
| 319,000 (1) | | | Summit Materials LLC /
Summit Materials Finance
Corp., 5.250%, 01/15/2029 | | | | | 301,922 | | | | | | 0.2 | | |
| 233,000 (1) | | | Summit Materials LLC /
Summit Materials Finance
Corp., 6.500%, 03/15/2027 | | | | | 231,302 | | | | | | 0.2 | | |
| 356,000 (1) | | | TK Elevator US Newco, Inc.,
5.250%, 07/15/2027 | | | | | 336,564 | | | | | | 0.3 | | |
| 264,000 | | | TransDigm, Inc., 4.625%,
01/15/2029 | | | | | 234,971 | | | | | | 0.2 | | |
| 208,000 | | | TransDigm, Inc., 5.500%,
11/15/2027 | | | | | 196,353 | | | | | | 0.2 | | |
| 331,000 | | | TransDigm, Inc., 6.375%,
06/15/2026 | | | | | 323,902 | | | | | | 0.3 | | |
| 405,000 (1) | | | Weekley Homes LLC / Weekley
Finance Corp., 4.875%,
09/15/2028 | | | | | 341,959 | | | | | | 0.3 | | |
| | | | | | | | | 13,171,864 | | | | | | 10.6 | | |
| | | | Technology: 2.6% | |
| 49,000 | | | CDW LLC / CDW Finance
Corp., 4.125%, 05/01/2025 | | | | | 47,589 | | | | | | 0.0 | | |
| 411,000 (1) | | | Condor Merger Sub, Inc.,
7.375%, 02/15/2030 | | | | | 344,991 | | | | | | 0.3 | | |
| 380,000 (1) | | | Consensus Cloud Solutions,
Inc., 6.500%, 10/15/2028 | | | | | 315,475 | | | | | | 0.2 | | |
Principal
Amount† | | | Value | | | Percentage
of Net
Assets | |
| CORPORATE BONDS/NOTES: (continued) | |
| | | | Technology (continued) | |
| 233,000 (1) | | | Entegris Escrow Corp.,
6.950%, 06/15/2030 | | | | $ | 226,066 | | | | | | 0.2 | | |
| 153,000 (1) | | | Entegris, Inc., 3.625%,
05/01/2029 | | | | | 132,201 | | | | | | 0.1 | | |
| 663,000 (1) | | | NCR Corp., 5.125%,
04/15/2029 | | | | | 574,323 | | | | | | 0.5 | | |
| 178,000 (1) | | | Open Text Corp., 3.875%,
12/01/2029 | | | | | 150,035 | | | | | | 0.1 | | |
| 196,000 (1) | | | Open Text Corp., 6.900%,
12/01/2027 | | | | | 202,370 | | | | | | 0.2 | | |
| 386,000 (1) | | | Open Text Holdings, Inc.,
4.125%, 02/15/2030 | | | | | 331,535 | | | | | | 0.3 | | |
| 386,000 (1) | | | Playtika Holding Corp.,
4.250%, 03/15/2029 | | | | | 321,818 | | | | | | 0.3 | | |
| 380,000 (1) | | | Rackspace Technology Global,
Inc., 5.375%, 12/01/2028 | | | | | 145,716 | | | | | | 0.1 | | |
| 158,000 (1) | | | Veritas US, Inc. / Veritas
Bermuda Ltd., 7.500%,
09/01/2025 | | | | | 119,095 | | | | | | 0.1 | | |
| 399,000 (1) | | | Virtusa Corp., 7.125%,
12/15/2028 | | | | | 313,949 | | | | | | 0.2 | | |
| | | | | | | | | 3,225,163 | | | | | | 2.6 | | |
| | | | Utilities: 1.1% | |
| 515,000 (1) | | | Drax Finco PLC, 6.625%,
11/01/2025 | | | | | 507,450 | | | | | | 0.4 | | |
| 360,000 | | | TransAlta Corp., 7.750%,
11/15/2029 | | | | | 378,763 | | | | | | 0.3 | | |
| 178,000 (1) | | | Vistra Operations Co. LLC,
5.500%, 09/01/2026 | | | | | 173,070 | | | | | | 0.1 | | |
| 374,000 (1) | | | Vistra Operations Co. LLC,
5.625%, 02/15/2027 | | | | | 363,463 | | | | | | 0.3 | | |
| | | | | | | | | 1,422,746 | | | | | | 1.1 | | |
| | | | Total Corporate
Bonds/Notes
(Cost $114,252,430) | | | | | 115,598,685 | | | | | | 93.0 | | |
| BANK LOANS: 0.8% | |
| | | | Electronics/Electrical: 0.3% | |
| 368,000 | | | AP Core Holdings II, LLC
High-Yield Term Loan B2,
10.340%, (US0001M +
5.500)%, 09/01/2027 | | | | | 359,107 | | | | | | 0.3 | | |
| | | | | |
| | | | Lodging & Casinos: 0.2% | |
| 294,000 | | | Hilton Domestic Operating
Company, Inc. 2019 Term Loan
B2, 6.642%, (US0001M +
1.750)%, 06/22/2026 | | | | | 294,041 | | | | | | 0.2 | | |
See Accompanying Notes to Financial Statements
PORTFOLIO OF INVESTMENTS
| Voya VACS Series HYB Fund | as of March 31, 2023 (continued) |
Principal
Amount† | | | Value | | | Percentage
of Net
Assets | |
| BANK LOANS: (continued) | |
| | | | Radio & Television: 0.3% | |
| 325,000 | | | Clear Channel Outdoor
Holdings, Inc. Term Loan B,
8.325%, (US0003M +
3.500)%, 08/21/2026 | | | | $ | 303,824 | | | | | | 0.3 | | |
| | | | Total Bank Loans
(Cost $958,386) | | | | | 956,972 | | | | | | 0.8 | | |
| CONVERTIBLE BONDS/NOTES: 0.0% | |
| | | | Communications: 0.0% | |
| 128,000 | | | DISH Network Corp., 3.375%,
08/15/2026 | | | | | 66,560 | | | | | | 0.0 | | |
| | | | Total Convertible
Bonds/Notes
(Cost $84,967) | | | | | 66,560 | | | | | | 0.0 | | |
| |
| Shares | | | | | | Value | | | Percentage
of Net
Assets | |
| COMMON STOCK: 0.3% | |
| | | | Consumer Staples: 0.3% | |
| 15,000 (5)(6) | | | Southeastern Grocers, Inc. | | | | | 330,000 | | | | | | 0.3 | | |
| | | | Total Common Stock
(Cost $330,000) | | | | | 330,000 | | | | | | 0.3 | | |
| | | | Total Investments in
Securities
(Cost $115,625,783) | | | | $ | 116,952,217 | | | | | | 94.1 | | |
| | | | Assets in Excess of Other
Liabilities | | | | | 7,293,727 | | | | | | 5.9 | | |
| | | | Net Assets | | | | $ | 124,245,944 | | | | | | 100.0 | | |
†
Unless otherwise indicated, principal amount is shown in USD.
(1)
Securities with purchases pursuant to Rule 144A or section 4(a)(2), under the Securities Act of 1933 and may not be resold subject to that rule except to qualified institutional buyers.
(2)
All or a portion of this security is payment-in-kind (“PIK”) which may pay interest or additional principal at the issuer’s discretion. Rates shown are the current rate and possible
payment rates.
(3)
Bond may be called prior to maturity date.
(4)
Variable rate security. Rate shown is the rate in effect as of March 31, 2023.
(5)
For fair value measurement disclosure purposes, security is categorized as Level 3, whose value was determined using significant unobservable inputs.
(6)
Non-income producing security.
Reference Rate Abbreviations:
| | US0001M | | | 1-month LIBOR | |
| | US0003M | | | 3-month LIBOR | |
Fair Value Measurements^
The following is a summary of the fair valuations according to the inputs used as of March 31, 2023 in valuing the assets and liabilities:
| | | | Quoted Prices
in Active Markets
for Identical
Investments
(Level 1) | | | Significant
Other
Observable
Inputs
(Level 2) | | | Significant
Unobservable
Inputs
(Level 3) | | | Fair Value
at
March 31, 2023 | |
| Asset Table | | | | | | | | | | | | | | | | | | | | | | | | | |
| Investments, at fair value | | | | | | | | | | | | | | | | | | | | | | | | | |
| Common Stock | | | | | | | | | | | | | | | | | | | | | | | | | |
| Consumer Staples | | | | $ | — | | | | | $ | — | | | | | $ | 330,000 | | | | | $ | 330,000 | | |
| Total Common Stock | | | | | — | | | | | | — | | | | | | 330,000 | | | | | | 330,000 | | |
| Corporate Bonds/Notes | | | | | — | | | | | | 115,598,685 | | | | | | — | | | | | | 115,598,685 | | |
| Bank Loans | | | | | — | | | | | | 956,972 | | | | | | — | | | | | | 956,972 | | |
| Convertible Bonds/Notes | | | | | — | | | | | | 66,560 | | | | | | — | | | | | | 66,560 | | |
| Total Investments, at fair value | | | | $ | — | | | | | $ | 116,662,217 | | | | | $ | 330,000 | | | | | $ | 116,952,217 | | |
^
See Note 2, “Significant Accounting Policies” in the Notes to Financial Statements for additional information.
See Accompanying Notes to Financial Statements
PORTFOLIO OF INVESTMENTS
| Voya VACS Series HYB Fund | as of March 31, 2023 (continued) |
At March 31, 2023, the aggregate cost of securities and other investments for federal income tax purposes was the same as for financial statement purposes. The composition of unrealized appreciation and depreciation of securities and other investments was:
| | Gross Unrealized Appreciation | | | | $ | 2,302,432 | | |
| | Gross Unrealized Depreciation | | | | | (975,998) | | |
| | Net Unrealized Appreciation | | | | $ | 1,326,434 | | |
See Accompanying Notes to Financial Statements
PORTFOLIO OF INVESTMENTS
| Voya VACS Series SC Fund | as of March 31, 2023 |
Principal
Amount† | | | Value | | | Percentage
of Net
Assets | |
| COLLATERALIZED MORTGAGE OBLIGATIONS: 30.1% | |
| 422,109 (1)(2) | | | Agate Bay Mortgage Trust
2015-1 B4, 3.674%,
01/25/2045 | | | | $ | 323,444 | | | | | | 0.1 | | |
| 374,495 (1)(2) | | | Agate Bay Mortgage Trust
2016-2 B3, 3.762%,
03/25/2046 | | | | | 346,435 | | | | | | 0.2 | | |
| 584,017 (1)(2) | | | Bayview MSR Opportunity
Master Fund Trust 2021-5
B3A, 3.489%, 11/25/2051 | | | | | 430,266 | | | | | | 0.2 | | |
| 747,175 (1)(2) | | | Bayview MSR Opportunity
Master Fund Trust 2021-6
B3A, 3.392%, 10/25/2051 | | | | | 556,030 | | | | | | 0.2 | | |
| 612,459 (1)(2) | | | Bayview MSR Opportunity
Master Fund Trust 2022-2
B3A, 3.411%, 12/25/2051 | | | | | 439,382 | | | | | | 0.2 | | |
| 433,225 (1) | | | Bear Stearns ALT-A Trust
2005-9 26A1, 3.613%,
11/25/2035 | | | | | 284,498 | | | | | | 0.1 | | |
| 536,172 (1)(2) | | | CIM Trust 2019-INV3 B1A,
4.687%, 08/25/2049 | | | | | 497,647 | | | | | | 0.2 | | |
| 447,179 (1)(2) | | | Citigroup Mortgage Loan
Trust 2021-J3 B3W, 2.858%,
09/25/2051 | | | | | 312,115 | | | | | | 0.1 | | |
| 602,296 (2) | | | Connecticut Avenue
Securities Trust 2020-R02
2B1, 7.845%, (US0001M +
3.000)%, 01/25/2040 | | | | | 565,000 | | | | | | 0.2 | | |
| 1,054,019 (2) | | | Connecticut Avenue
Securities Trust 2022-R01
1B1, 7.710%, (SOFR30A +
3.150)%, 12/25/2041 | | | | | 980,207 | | | | | | 0.4 | | |
| 451,722 (2) | | | Connecticut Avenue
Securities Trust 2022-R02
2B1, 9.060%, (SOFR30A +
4.500)%, 01/25/2042 | | | | | 430,828 | | | | | | 0.2 | | |
| 1,761,717 (2) | | | Connecticut Avenue
Securities Trust 2023-R02
1B1, 10.118%, (SOFR30A +
5.550)%, 01/25/2043 | | | | | 1,757,259 | | | | | | 0.7 | | |
| 602,296 (1)(2) | | | Deephaven Residential
Mortgage Trust 2021-4 M1,
3.257%, 11/25/2066 | | | | | 416,057 | | | | | | 0.2 | | |
| 301,148 (2) | | | Eagle RE 2021-2 M1C Ltd.,
8.010%, (SOFR30A +
3.450)%, 04/25/2034 | | | | | 304,973 | | | | | | 0.1 | | |
| 873,330 (2) | | | Fannie Mae Connecticut
Avenue Securities Trust
2020-SBT1 1M2, 8.495%,
(US0001M + 3.650)%,
02/25/2040 | | | | | 872,477 | | | | | | 0.4 | | |
Principal
Amount† | | | Value | | | Percentage
of Net
Assets | |
| COLLATERALIZED MORTGAGE OBLIGATIONS: (continued) | |
| 301,148 (2) | | | Fannie Mae Connecticut
Avenue Securities 2021-R02
2B1, 7.860%, (SOFR30A +
3.300)%, 11/25/2041 | | | | $ | 284,188 | | | | | | 0.1 | | |
| 416,041 (1)(2) | | | Flagstar Mortgage Trust
2018-4 B3, 4.205%,
07/25/2048 | | | | | 372,321 | | | | | | 0.2 | | |
| 1,594,470 (1)(2) | | | Flagstar Mortgage Trust
2019-1INV B2A, 4.539%,
10/25/2049 | | | | | 1,441,748 | | | | | | 0.6 | | |
| 1,420,506 (1)(2) | | | Flagstar Mortgage Trust
2020-1NV B2A, 4.216%,
03/25/2050 | | | | | 1,230,392 | | | | | | 0.5 | | |
| 707,987 (1)(2) | | | Flagstar Mortgage Trust
2020-1NV B3, 4.216%,
03/25/2050 | | | | | 600,277 | | | | | | 0.3 | | |
| 366,593 (2) | | | Freddie Mac STACR Remic
Trust 2020-DNA2 M2,
6.695%, (US0001M +
1.850)%, 02/25/2050 | | | | | 364,512 | | | | | | 0.2 | | |
| 329,850 (2) | | | Freddie Mac STACR REMIC
Trust 2020-DNA5 M2,
7.360%, (SOFR30A +
2.800)%, 10/25/2050 | | | | | 333,744 | | | | | | 0.1 | | |
| 336,264 (2) | | | Freddie Mac Stacr Remic
Trust 2020-HQA2 M2,
7.945%, (US0001M +
3.100)%, 03/25/2050 | | | | | 344,803 | | | | | | 0.1 | | |
| 1,174,478 (2) | | | Freddie Mac STACR REMIC
Trust 2021-DNA6 B1,
7.960%, (SOFR30A +
3.400)%, 10/25/2041 | | | | | 1,103,858 | | | | | | 0.5 | | |
| 602,296 (2) | | | Freddie Mac STACR REMIC
Trust 2021-HQA1 M2,
6.810%, (SOFR30A +
2.250)%, 08/25/2033 | | | | | 580,585 | | | | | | 0.2 | | |
| 1,505,741 (2) | | | Freddie Mac STACR REMIC
Trust 2021-HQA4 B1,
8.310%, (SOFR30A +
3.750)%, 12/25/2041 | | | | | 1,356,514 | | | | | | 0.6 | | |
| 3,011,482 (2) | | | Freddie Mac STACR REMIC
Trust 2022-DNA1 B1,
7.960%, (SOFR30A +
3.400)%, 01/25/2042 | | | | | 2,743,412 | | | | | | 1.2 | | |
| 903,444 (2) | | | Freddie Mac STACR REMIC
Trust 2022-DNA4 M2,
9.810%, (SOFR30A +
5.250)%, 05/25/2042 | | | | | 912,981 | | | | | | 0.4 | | |
See Accompanying Notes to Financial Statements
PORTFOLIO OF INVESTMENTS
| Voya VACS Series SC Fund | as of March 31, 2023 (continued) |
Principal
Amount† | | | Value | | | Percentage
of Net
Assets | |
| COLLATERALIZED MORTGAGE OBLIGATIONS: (continued) | |
| 481,837 (2) | | | Freddie Mac Structured
Agency Credit Risk Debt
Notes 2021-DNA2 M2,
6.860%, (SOFR30A +
2.300)%, 08/25/2033 | | | | $ | 474,973 | | | | | | 0.2 | | |
| 903,444 (2) | | | Freddie Mac Structured
Agency Credit Risk Debt
Notes 2021-DNA7 B1,
8.210%, (SOFR30A +
3.650)%, 11/25/2041 | | | | | 850,393 | | | | | | 0.4 | | |
| 2,845,850 (2) | | | Freddie Mac Structured
Agency Credit Risk Debt
Notes 2022-DNA2 B1,
9.310%, (SOFR30A +
4.750)%, 02/25/2042 | | | | | 2,715,087 | | | | | | 1.2 | | |
| 1,505,741 (2) | | | Freddie Mac Structured
Agency Credit Risk Debt
Notes 2022-DNA2 M1B,
6.960%, (SOFR30A +
2.400)%, 02/25/2042 | | | | | 1,464,625 | | | | | | 0.6 | | |
| 1,656,315 (2) | | | Freddie Mac Structured
Agency Credit Risk Debt
Notes 2022-DNA2 M2,
8.310%, (SOFR30A +
3.750)%, 02/25/2042 | | | | | 1,598,791 | | | | | | 0.7 | | |
| 498,304 (1)(2) | | | GCAT 2022-INV3 B1 Trust,
4.612%, 08/25/2052 | | | | | 444,542 | | | | | | 0.2 | | |
| 1,045,277 (1)(2) | | | GCAT 2023-NQM1 A2 Trust,
4.250%, 10/25/2057 | | | | | 934,663 | | | | | | 0.4 | | |
| 1,029,303 (1)(2) | | | GS Mortgage-Backed
Securities Corp. Trust
2019-PJ3 B2, 3.982%,
03/25/2050 | | | | | 897,920 | | | | | | 0.4 | | |
| 881,423 (1)(2) | | | GS Mortgage-Backed
Securities Corp. Trust
2019-PJ3 B3, 3.982%,
03/25/2050 | | | | | 752,049 | | | | | | 0.3 | | |
| 631,068 (1)(2) | | | GS Mortgage-Backed
Securities Trust 2020-PJ1
B3, 3.641%, 05/25/2050 | | | | | 506,646 | | | | | | 0.2 | | |
| 1,286,651 (1)(2) | | | GS Mortgage-Backed
Securities Trust 2022-PJ5
B3, 2.994%, 10/25/2052 | | | | | 930,348 | | | | | | 0.4 | | |
| 952,027 (1)(2) | | | GS Mortgage-Backed
Securities Trust 2022-PJ6
A24, 3.000%, 01/25/2053 | | | | | 787,079 | | | | | | 0.3 | | |
| 1,204,593 (2) | | | Home RE 2019-1 M2 Ltd.,
8.095%, (US0001M +
3.250)%, 05/25/2029 | | | | | 1,215,041 | | | | | | 0.5 | | |
| 739,805 (1)(2) | | | Hundred Acre Wood Trust
2021-INV3 B3, 3.327%,
12/25/2051 | | | | | 543,264 | | | | | | 0.2 | | |
Principal
Amount† | | | Value | | | Percentage
of Net
Assets | |
| COLLATERALIZED MORTGAGE OBLIGATIONS: (continued) | |
| 451,722 (1)(2) | | | Imperial Fund Mortgage
Trust 2021-NQM4 M1,
3.446%, 01/25/2057 | | | | $ | 316,851 | | | | | | 0.1 | | |
| 711,104 | | | IndyMac INDX Mortgage
Loan Trust 2006-AR2 2A1,
5.265%, (US0001M +
0.420)%, 02/25/2046 | | | | | 495,256 | | | | | | 0.2 | | |
| 298,407 (1)(2) | | | J.P. Morgan Mortgage Trust
2019-LTV1 B2, 4.635%,
06/25/2049 | | | | | 281,429 | | | | | | 0.1 | | |
| 439,217 (1)(2) | | | J.P. Morgan Mortgage Trust
2021-14 B4, 3.160%,
05/25/2052 | | | | | 280,278 | | | | | | 0.1 | | |
| 498,766 (1)(2) | | | J.P. Morgan Mortgage Trust
2022-1 B3, 3.095%,
07/25/2052 | | | | | 351,618 | | | | | | 0.2 | | |
| 1,200,110 (1)(2) | | | J.P. Morgan Mortgage Trust
2022-6 B3, 3.308%,
11/25/2052 | | | | | 881,714 | | | | | | 0.4 | | |
| 1,074,377 (1)(2) | | | J.P. Morgan Mortgage Trust
2023-2 A15B, 5.500%,
07/25/2053 | | | | | 1,042,608 | | | | | | 0.4 | | |
| 299,144 (1)(2) | | | J.P. Morgan Mortgage Trust
2023-2 A3A, 5.000%,
07/25/2053 | | | | | 292,343 | | | | | | 0.1 | | |
| 797,491 (1)(2) | | | J.P. Morgan Mortgage Trust
2023-2 B3, 5.840%,
07/25/2053 | | | | | 714,320 | | | | | | 0.3 | | |
| 334,762 (1)(2) | | | JP Morgan Mortgage Trust
2014-1 B5, 3.688%,
01/25/2044 | | | | | 288,282 | | | | | | 0.1 | | |
| 988,227 (1)(2) | | | JP Morgan Mortgage Trust
2017-1 B4, 3.448%,
01/25/2047 | | | | | 822,589 | | | | | | 0.4 | | |
| 395,259 (1)(2) | | | JP Morgan Mortgage Trust
2017-4 B2, 3.868%,
11/25/2048 | | | | | 339,926 | | | | | | 0.1 | | |
| 399,856 (1)(2) | | | JP Morgan Mortgage Trust
2017-6 B4, 3.782%,
12/25/2048 | | | | | 334,894 | | | | | | 0.1 | | |
| 432,330 (1)(2) | | | JP Morgan Mortgage Trust
2018-3 B2, 3.711%,
09/25/2048 | | | | | 375,113 | | | | | | 0.2 | | |
| 612,579 (1)(2) | | | JP Morgan Mortgage Trust
2018-3 B3, 3.711%,
09/25/2048 | | | | | 522,021 | | | | | | 0.2 | | |
| 616,498 (1)(2) | | | JP Morgan Mortgage Trust
2018-4 B2, 3.713%,
10/25/2048 | | | | | 535,672 | | | | | | 0.2 | | |
See Accompanying Notes to Financial Statements
PORTFOLIO OF INVESTMENTS
| Voya VACS Series SC Fund | as of March 31, 2023 (continued) |
Principal
Amount† | | | Value | | | Percentage
of Net
Assets | |
| COLLATERALIZED MORTGAGE OBLIGATIONS: (continued) | |
| 544,549 (1)(2) | | | JP Morgan Mortgage Trust
2018-8 B1, 4.047%,
01/25/2049 | | | | $ | 471,986 | | | | | | 0.2 | | |
| 576,636 (1)(2) | | | JP Morgan Mortgage Trust
2019-5 B2, 4.482%,
11/25/2049 | | | | | 530,577 | | | | | | 0.2 | | |
| 559,979 (1)(2) | | | JP Morgan Mortgage Trust
2019-6 B2, 4.234%,
12/25/2049 | | | | | 517,254 | | | | | | 0.2 | | |
| 829,539 (1)(2) | | | JP Morgan Mortgage Trust
2019-7 B3A, 3.250%,
02/25/2050 | | | | | 671,022 | | | | | | 0.3 | | |
| 835,308 (1)(2) | | | JP Morgan Mortgage Trust
2019-8 B3A, 3.416%,
03/25/2050 | | | | | 695,225 | | | | | | 0.3 | | |
| 727,675 (1)(2) | | | JP Morgan Mortgage Trust
2019-9 B2A, 3.410%,
05/25/2050 | | | | | 597,484 | | | | | | 0.3 | | |
| 891,629 (1)(2) | | | JP Morgan Mortgage Trust
2019-HYB1 B1, 4.483%,
10/25/2049 | | | | | 822,035 | | | | | | 0.4 | | |
| 486,131 (1)(2) | | | JP Morgan Mortgage Trust
2019-INV1 B2, 4.967%,
10/25/2049 | | | | | 450,964 | | | | | | 0.2 | | |
| 991,834 (1)(2) | | | JP Morgan Mortgage Trust
2019-INV3 B3, 4.382%,
05/25/2050 | | | | | 853,176 | | | | | | 0.4 | | |
| 560,880 (1)(2) | | | JP Morgan Mortgage Trust
2019-LTV2 B2, 4.685%,
12/25/2049 | | | | | 530,460 | | | | | | 0.2 | | |
| 560,880 (1)(2) | | | JP Morgan Mortgage Trust
2019-LTV2 B3, 4.685%,
12/25/2049 | | | | | 527,395 | | | | | | 0.2 | | |
| 710,042 (1)(2) | | | JP Morgan Mortgage Trust
2019-LTV3 B3, 4.395%,
03/25/2050 | | | | | 619,970 | | | | | | 0.3 | | |
| 422,054 (1)(2) | | | JP Morgan Mortgage Trust
2020-3 B2, 3.847%,
08/25/2050 | | | | | 362,076 | | | | | | 0.2 | | |
| 439,623 (1)(2) | | | JP Morgan Mortgage Trust
2020-4 B1, 3.649%,
11/25/2050 | | | | | 372,890 | | | | | | 0.2 | | |
| 708,842 (1)(2) | | | JP Morgan Mortgage Trust
2020-5 B1, 3.583%,
12/25/2050 | | | | | 609,773 | | | | | | 0.3 | | |
| 423,221 (1)(2) | | | JP Morgan Mortgage Trust
2020-8 B3, 3.501%,
03/25/2051 | | | | | 338,209 | | | | | | 0.1 | | |
| 381,243 (1)(2) | | | JP Morgan Mortgage Trust
2021-INV6 A3, 2.500%,
04/25/2052 | | | | | 302,653 | | | | | | 0.1 | | |
| 454,303 (1)(2) | | | JP Morgan Trust 2015-1 B3,
5.695%, 12/25/2044 | | | | | 426,069 | | | | | | 0.2 | | |
Principal
Amount† | | | Value | | | Percentage
of Net
Assets | |
| COLLATERALIZED MORTGAGE OBLIGATIONS: (continued) | |
| 577,083 (1)(2) | | | Mello Mortgage Capital
Acceptance 2018-MTG2 B2,
4.362%, 10/25/2048 | | | | $ | 522,449 | | | | | | 0.2 | | |
| 735,200 (1)(2) | | | Mello Mortgage Capital
Acceptance 2022-INV1 B3,
3.324%, 03/25/2052 | | | | | 522,727 | | | | | | 0.2 | | |
| 1,050,706 (1)(2) | | | MFA 2021-INV2 M1 Trust,
3.199%, 11/25/2056 | | | | | 755,906 | | | | | | 0.3 | | |
| 534,063 (1)(2) | | | New Residential Mortgage
Loan Trust 2017-6A B2,
4.000%, 08/27/2057 | | | | | 497,133 | | | | | | 0.2 | | |
| 1,144,363 (2) | | | Oaktown Re VII Ltd. 2021-2
M1C, 7.910%, (SOFR30A +
3.350)%, 04/25/2034 | | | | | 1,110,066 | | | | | | 0.5 | | |
| 423,840 (1)(2) | | | OBX 2022-J1 A14 Trust,
2.500%, 02/25/2052 | | | | | 334,886 | | | | | | 0.1 | | |
| 1,136,077 (1)(2) | | | Oceanview Mortgage Trust
2021-5 B3, 2.977%,
10/25/2051 | | | | | 758,916 | | | | | | 0.3 | | |
| 873,330 (2) | | | Radnor RE 2021-1 M1C Ltd.,
7.260%, (SOFR30A +
2.700)%, 12/27/2033 | | | | | 863,951 | | | | | | 0.4 | | |
| 389,545 (1)(2) | | | RCKT Mortgage Trust
2019-1 B1A, 3.830%,
09/25/2049 | | | | | 354,251 | | | | | | 0.2 | | |
| 570,017 (1)(2) | | | RCKT Mortgage Trust
2020-1 B2A, 3.470%,
02/25/2050 | | | | | 477,309 | | | | | | 0.2 | | |
| 548,399 (1)(2) | | | Sequoia Mortgage Trust
2017-2 B2, 3.560%,
02/25/2047 | | | | | 485,231 | | | | | | 0.2 | | |
| 761,475 (1)(2) | | | Sequoia Mortgage Trust
2017-5 B3, 3.781%,
08/25/2047 | | | | | 674,836 | | | | | | 0.3 | | |
| 405,316 (1)(2) | | | Sequoia Mortgage Trust
2019-2 B3, 4.261%,
06/25/2049 | | | | | 355,311 | | | | | | 0.2 | | |
| 490,274 (1)(2) | | | Sequoia Mortgage Trust
2019-CH2 B2B, 4.925%,
08/25/2049 | | | | | 474,464 | | | | | | 0.2 | | |
| 858,249 (1)(2) | | | Sequoia Mortgage Trust
2019-CH3 B1B, 4.503%,
09/25/2049 | | | | | 781,100 | | | | | | 0.3 | | |
| 505,398 (1)(2) | | | Sequoia Mortgage Trust
2019-CH3 B2B, 4.503%,
09/25/2049 | | | | | 479,261 | | | | | | 0.2 | | |
| 709,117 (1)(2) | | | Sequoia Mortgage Trust
2020-2 B3, 3.640%,
03/25/2050 | | | | | 575,261 | | | | | | 0.2 | | |
| 570,762 (1)(2) | | | Sequoia Mortgage Trust
2020-3 B3, 3.325%,
04/25/2050 | | | | | 452,447 | | | | | | 0.2 | | |
See Accompanying Notes to Financial Statements
PORTFOLIO OF INVESTMENTS
| Voya VACS Series SC Fund | as of March 31, 2023 (continued) |
Principal
Amount† | | | Value | | | Percentage
of Net
Assets | |
| COLLATERALIZED MORTGAGE OBLIGATIONS: (continued) | |
| 740,476 (1)(2) | | | Sequoia Mortgage Trust
2021-7 B3, 2.866%,
11/25/2051 | | | | $ | 513,678 | | | | | | 0.2 | | |
| 608,079 (1)(2) | | | Sequoia Mortgage Trust
2023-1 B2, 5.159%,
01/25/2053 | | | | | 545,278 | | | | | | 0.2 | | |
| 2,730,209 (3) | | | Series RR 2014-1 F Trust,
0.000%, 05/25/2047 | | | | | 2,483,897 | | | | | | 1.1 | | |
| 390,694 (1)(2) | | | Shellpoint Co-Originator
Trust 2017-2 B3, 3.640%,
10/25/2047 | | | | | 350,341 | | | | | | 0.2 | | |
| 384,027 (1)(2) | | | STAR 2021-1 A3 Trust,
1.528%, 05/25/2065 | | | | | 330,607 | | | | | | 0.1 | | |
| 903,444 (1)(2) | | | Starwood Mortgage
Residential Trust 2020-1,
2.878%, 02/25/2050 | | | | | 756,622 | | | | | | 0.3 | | |
| 602,296 (1)(2) | | | Starwood Mortgage
Residential Trust 2020-3 A2,
2.240%, 04/25/2065 | | | | | 524,070 | | | | | | 0.2 | | |
| 752,870 (2) | | | Starwood Mortgage
Residential Trust 2020-INV1
M1, 2.501%, 11/25/2055 | | | | | 621,596 | | | | | | 0.3 | | |
| 1,131,433 (1) | | | TBW Mortgage-Backed Trust
2006-6 A5B, 6.540%,
01/25/2037 | | | | | 279,447 | | | | | | 0.1 | | |
| 579,530 (1)(2) | | | UWM Mortgage Trust
2021-INV1 B1, 3.161%,
08/25/2051 | | | | | 456,751 | | | | | | 0.2 | | |
| 439,493 (1)(2) | | | UWM Mortgage Trust
2021-INV4 B3, 3.228%,
12/25/2051 | | | | | 304,555 | | | | | | 0.1 | | |
| 1,436,355 (1)(2) | | | UWM Mortgage Trust
2021-INV5 B3, 3.240%,
01/25/2052 | | | | | 1,000,548 | | | | | | 0.4 | | |
| 335,619 (1)(2) | | | Verus Securitization Trust
2021-3 A1, 1.046%,
06/25/2066 | | | | | 281,124 | | | | | | 0.1 | | |
| 604,089 (1)(2) | | | Wells Fargo Mortgage
Backed Securities 2020-1 B3
Trust, 3.368%, 12/25/2049 | | | | | 490,487 | | | | | | 0.2 | | |
| | | | Total Collateralized
Mortgage Obligations
(Cost $71,151,069) | | | | | 71,290,012 | | | | | | 30.1 | | |
| COMMERCIAL MORTGAGE-BACKED SECURITIES: 40.9% | |
| 776,962 (2) | | | Arbor Multifamily Mortgage
Securities Trust 2020-MF3 D,
2.000%, 10/15/2054 | | | | | 444,997 | | | | | | 0.2 | | |
| 1,701,186 (2) | | | Arbor Multifamily Mortgage
Securities Trust 2020-MF3 E,
2.000%, 10/15/2054 | | | | | 924,427 | | | | | | 0.4 | | |
| 1,054,000 (2) | | | AREIT 2019-CRE3 D Trust,
7.424%, (TSFR1M +
2.650)%, 09/14/2036 | | | | | 981,082 | | | | | | 0.4 | | |
Principal
Amount† | | | Value | | | Percentage
of Net
Assets | |
COMMERCIAL MORTGAGE-BACKED
SECURITIES: (continued) | |
| 662,526 (2) | | | BANK 2017-BNK4 D,
3.357%, 05/15/2050 | | | | $ | 463,371 | | | | | | 0.2 | | |
| 1,710,522 (2) | | | BANK 2017-BNK4 E,
3.357%, 05/15/2050 | | | | | 996,145 | | | | | | 0.4 | | |
| 6,369,284 (1)(2)(4) | | | BANK 2017-BNK8 XE,
1.296%, 11/15/2050 | | | | | 307,012 | | | | | | 0.1 | | |
| 15,857,958 (1)(4) | | | BANK 2020-BNK27 XA,
1.159%, 04/15/2063 | | | | | 965,766 | | | | | | 0.4 | | |
| 5,342,295 (1)(4) | | | BANK 2020-BNK30 XA,
1.313%, 12/15/2053 | | | | | 366,710 | | | | | | 0.2 | | |
| 4,458,205 (1)(4) | | | BANK 2021-BNK31 XA,
1.324%, 02/15/2054 | | | | | 319,711 | | | | | | 0.1 | | |
| 13,768,920 (1)(4) | | | Barclays Commercial
Mortgage Trust 2019-C4 XA,
1.552%, 08/15/2052 | | | | | 960,118 | | | | | | 0.4 | | |
| 5,710,974 (1)(2)(4) | | | Benchmark 2018-B5 XD
Mortgage Trust, 1.500%,
07/15/2051 | | | | | 363,329 | | | | | | 0.2 | | |
| 6,050,392 (1)(4) | | | BENCHMARK 2019-B10 XA
Mortgage Trust, 1.220%,
03/15/2062 | | | | | 301,490 | | | | | | 0.1 | | |
| 4,489,366 (1)(2)(4) | | | Benchmark 2019-B14 XD
Mortgage Trust, 1.274%,
12/15/2062 | | | | | 315,474 | | | | | | 0.1 | | |
| 1,841,521 (2) | | | Benchmark 2020-B18 AGNF
Mortgage Trust, 4.139%,
07/15/2053 | | | | | 1,583,332 | | | | | | 0.7 | | |
| 6,801,316 (1)(4) | | | Benchmark 2020-B18 XA
Mortgage Trust, 1.788%,
07/15/2053 | | | | | 512,128 | | | | | | 0.2 | | |
| 4,795,656 (1)(4) | | | Benchmark 2020-B22 XA
Mortgage Trust, 1.515%,
01/15/2054 | | | | | 423,025 | | | | | | 0.2 | | |
| 5,540,203 (1)(4) | | | Benchmark 2021-B23 XA
Mortgage Trust, 1.271%,
02/15/2054 | | | | | 358,716 | | | | | | 0.2 | | |
| 10,382,521 (1)(4) | | | Benchmark 2021-B25 XA
Mortgage Trust, 1.100%,
04/15/2054 | | | | | 634,775 | | | | | | 0.3 | | |
| 1,981,555 (2)(3) | | | BMD2 Re-Remic Trust
2019-FRR1 3AB, 0.000%,
05/25/2052 | | | | | 1,250,200 | | | | | | 0.5 | | |
| 1,008,846 (2)(3) | | | BMD2 Re-Remic Trust
2019-FRR1 4A, 0.000%,
05/25/2052 | | | | | 630,430 | | | | | | 0.3 | | |
| 2,537,173 (1)(2) | | | BMD2 Re-Remic Trust
2019-FRR1 6B10, 2.515%,
05/25/2052 | | | | | 1,758,567 | | | | | | 0.7 | | |
| 1,505,741 (2) | | | BPR Trust 2021-WILL E,
11.434%, (US0001M +
6.750)%, 06/15/2038 | | | | | 1,375,310 | | | | | | 0.6 | | |
See Accompanying Notes to Financial Statements
PORTFOLIO OF INVESTMENTS
| Voya VACS Series SC Fund | as of March 31, 2023 (continued) |
Principal
Amount† | | | Value | | | Percentage
of Net
Assets | |
COMMERCIAL MORTGAGE-BACKED
SECURITIES: (continued) | |
| 723,659 (2) | | | BX Commercial Mortgage
Trust 2019-IMC D, 6.584%,
(US0001M + 1.900)%,
04/15/2034 | | | | $ | 685,374 | | | | | | 0.3 | | |
| 602,296 (2) | | | BX Commercial Mortgage
Trust 2021-VOLT F, 7.084%,
(US0001M + 2.400)%,
09/15/2036 | | | | | 556,003 | | | | | | 0.2 | | |
| 2,689,253 (2) | | | Cascade Funding Mortgage
Trust 2021-FRR1 CK98,
9.760%, 08/29/2029 | | | | | 1,441,818 | | | | | | 0.6 | | |
| 5,318,769 (1)(4) | | | CD 2019-CD8 XA Mortgage
Trust, 1.403%, 08/15/2057 | | | | | 342,288 | | | | | | 0.1 | | |
| 846,226 (1)(2) | | | Citigroup Commercial
Mortgage Trust 2014-GC19
E, 4.589%, 03/11/2047 | | | | | 764,612 | | | | | | 0.3 | | |
| 1,274,158 (1)(2) | | | Citigroup Commercial
Mortgage Trust 2016-P4 E,
4.692%, 07/10/2049 | | | | | 811,249 | | | | | | 0.3 | | |
| 605,308 (1)(2) | | | Citigroup Commercial
Mortgage Trust 2016-P4 F,
4.692%, 07/10/2049 | | | | | 345,088 | | | | | | 0.1 | | |
| 1,550,913 (2) | | | Citigroup Commercial
Mortgage Trust 2016-P5 D,
3.000%, 10/10/2049 | | | | | 1,089,729 | | | | | | 0.5 | | |
| 6,220,215 (1)(2)(4) | | | Citigroup Commercial
Mortgage Trust 2017-P8 XE,
1.260%, 09/15/2050 | | | | | 293,878 | | | | | | 0.1 | | |
| 674,572 (1)(2) | | | Citigroup Commercial
Mortgage Trust 2018-C6 D,
5.064%, 11/10/2051 | | | | | 462,918 | | | | | | 0.2 | | |
| 370,412 (1)(2) | | | COMM 2013-CR10 F
Mortgage Trust, 4.867%,
08/10/2046 | | | | | 318,703 | | | | | | 0.1 | | |
| 548,090 (1)(2) | | | COMM 2020-CBM F
Mortgage Trust, 3.633%,
02/10/2037 | | | | | 473,907 | | | | | | 0.2 | | |
| 4,450,765 (1)(4) | | | Freddie Mac Multifamily
Structured Pass Through
Certificates K107 X1,
1.691%, 03/25/2030 | | | | | 414,925 | | | | | | 0.2 | | |
| 7,416,911 (1)(4) | | | Freddie Mac Multifamily
Structured Pass Through
Certificates K122 X1,
0.881%, 11/25/2030 | | | | | 382,887 | | | | | | 0.2 | | |
| 8,945,182 (1)(4) | | | Freddie Mac Multifamily
Structured Pass Through
Certificates K123 X1,
0.773%, 12/25/2030 | | | | | 410,182 | | | | | | 0.2 | | |
Principal
Amount† | | | Value | | | Percentage
of Net
Assets | |
COMMERCIAL MORTGAGE-BACKED
SECURITIES: (continued) | |
| 3,921,626 (1)(4) | | | Freddie Mac Multifamily
Structured Pass Through
Certificates K-1521 X1,
0.980%, 08/25/2036 | | | | $ | 326,949 | | | | | | 0.1 | | |
| 6,637,004 (1)(4) | | | Freddie Mac Multifamily
Structured Pass Through
Certificates KG01 X3,
3.124%, 05/25/2029 | | | | | 1,026,760 | | | | | | 0.4 | | |
| 1,455,653 (2)(3) | | | FREMF 2016-K57 D
Mortgage Trust, 0.000%,
08/25/2049 | | | | | 1,053,268 | | | | | | 0.4 | | |
| 692,641 (2)(3) | | | FREMF 2019-KG01 C
Mortgage Trust, 0.000%,
05/25/2029 | | | | | 393,322 | | | | | | 0.2 | | |
| 2,134,237 (1)(2) | | | GAM RE-REMIC TR
2021-FFR2 BK78, 2.420%,
09/27/2051 | | | | | 1,538,228 | | | | | | 0.7 | | |
| 1,624,694 (2)(3) | | | GAM RE-REMIC TR
2021-FFR2 C730, 0.000%,
09/27/2051 | | | | | 1,363,438 | | | | | | 0.6 | | |
| 1,974,628 (2)(3) | | | GAM RE-REMIC TR
2021-FFR2 CK44, 0.000%,
09/27/2051 | | | | | 1,644,063 | | | | | | 0.7 | | |
| 1,606,324 (1)(2) | | | GAM RE-REMIC TR
2021-FFR2 CK49, 1.040%,
09/27/2051 | | | | | 1,332,410 | | | | | | 0.6 | | |
| 1,362,997 (2)(3) | | | GAM RE-REMIC TR
2021-FFR2 CK78, 0.000%,
09/27/2051 | | | | | 794,920 | | | | | | 0.3 | | |
| 1,623,791 (2)(3) | | | GAM RE-REMIC TR
2021-FFR2 D730, 0.000%,
09/27/2051 | | | | | 1,361,626 | | | | | | 0.6 | | |
| 1,605,421 (2)(3) | | | GAM RE-REMIC TR
2021-FFR2 DK49, 0.000%,
09/27/2051 | | | | | 1,253,437 | | | | | | 0.5 | | |
| 903,444 (2) | | | GAM Re-REMIC Trust
2021-FRR1 1B, 1.050%,
11/29/2050 | | | | | 616,652 | | | | | | 0.3 | | |
| 2,235,423 (2)(3) | | | GAM Re-REMIC Trust
2021-FRR1 1C, 0.000%,
11/29/2050 | | | | | 1,487,975 | | | | | | 0.6 | | |
| 3,356,899 (2)(3) | | | GAM Re-REMIC Trust
2021-FRR1 1D, 0.000%,
11/29/2050 | | | | | 2,176,075 | | | | | | 0.9 | | |
| 1,505,741 (2)(3) | | | GAM Re-REMIC Trust
2021-FRR1 1E, 0.000%,
11/29/2050 | | | | | 828,755 | | | | | | 0.4 | | |
See Accompanying Notes to Financial Statements
PORTFOLIO OF INVESTMENTS
| Voya VACS Series SC Fund | as of March 31, 2023 (continued) |
Principal
Amount† | | | Value | | | Percentage
of Net
Assets | |
COMMERCIAL MORTGAGE-BACKED
SECURITIES: (continued) | |
| 1,505,741 (2) | | | GAM Re-REMIC Trust
2021-FRR1 2B, 1.320%,
11/29/2050 | | | | $ | 998,828 | | | | | | 0.4 | | |
| 2,415,208 (2)(3) | | | GAM Re-REMIC Trust
2021-FRR1 2C, 0.000%,
11/29/2050 | | | | | 1,502,654 | | | | | | 0.6 | | |
| 4,818,371 (2)(3) | | | GAM RE-REMIC Trust
2022-FRR3 DK89, 0.000%,
01/27/2052 | | | | | 2,184,521 | | | | | | 0.9 | | |
| 2,992,509 (1)(2) | | | GAM Resecuritization Trust
2022-FRR3 BK47, 2.030%,
11/27/2050 | | | | | 2,189,488 | | | | | | 0.9 | | |
| 2,036,364 (2)(5) | | | GAM Resecuritization Trust
2022-FRR3 BK61, 1.200%,
01/29/2052 | | | | | 1,440,446 | | | | | | 0.6 | | |
| 2,216,752 (2)(5) | | | GAM Resecuritization Trust
2022-FRR3 BK89, 1.830%,
01/27/2052 | | | | | 1,307,948 | | | | | | 0.6 | | |
| 1,158,216 (2)(5) | | | GAM Resecuritization Trust
2022-FRR3 C728, 0.510%,
08/27/2050 | | | | | 1,006,385 | | | | | | 0.4 | | |
| 1,178,995 (2)(5) | | | GAM Resecuritization Trust
2022-FRR3 CK47, 0.870%,
05/27/2048 | | | | | 947,790 | | | | | | 0.4 | | |
| 1,428,647 (2)(5) | | | GAM Resecuritization Trust
2022-FRR3 CK61, 1.480%,
11/27/2049 | | | | | 964,191 | | | | | | 0.4 | | |
| 996,800 (1)(2) | | | GAM Resecuritization Trust
2022-FRR3 CK71, 1.400%,
01/29/2052 | | | | | 682,942 | | | | | | 0.3 | | |
| 1,161,227 (2)(5) | | | GAM Resecuritization Trust
2022-FRR3 CK89, 2.040%,
01/27/2052 | | | | | 645,793 | | | | | | 0.3 | | |
| 1,159,119 (2)(5) | | | GAM Resecuritization Trust
2022-FRR3 D728, 0.560%,
01/29/2052 | | | | | 985,810 | | | | | | 0.4 | | |
| 931,752 (2)(5) | | | GAM Resecuritization Trust
2022-FRR3 DK41, 0.620%,
10/27/2047 | | | | | 799,933 | | | | | | 0.3 | | |
| 1,178,694 (2)(5) | | | GAM Resecuritization Trust
2022-FRR3 DK47, 0.970%,
05/27/2048 | | | | | 923,833 | | | | | | 0.4 | | |
| 621,570 (2)(5) | | | GAM Resecuritization Trust
2022-FRR3 EK41, 0.610%,
01/29/2052 | | | | | 522,045 | | | | | | 0.2 | | |
| 653,492 (2) | | | GS Mortgage Securities
Trust 2019-GC39 D, 3.000%,
05/10/2052 | | | | | 416,370 | | | | | | 0.2 | | |
| 542,067 (2) | | | GS Mortgage Securities
Trust 2021-GSA3 D, 2.250%,
12/15/2054 | | | | | 277,748 | | | | | | 0.1 | | |
Principal
Amount† | | | Value | | | Percentage
of Net
Assets | |
COMMERCIAL MORTGAGE-BACKED
SECURITIES: (continued) | |
| 1,760,000 (1)(2) | | | J.P. Morgan Chase
Commercial Mortgage
Securities Trust 2019-ICON
E, 5.220%, 01/05/2034 | | | | $ | 1,662,601 | | | | | | 0.7 | | |
| 401,000 (1)(2) | | | JP Morgan Chase
Commercial Mortgage
Securities Trust 2020-LOOP
E, 3.862%, 12/05/2038 | | | | | 279,534 | | | | | | 0.1 | | |
| 1,069,076 (1)(2) | | | JPMBB Commercial
Mortgage Securities Trust
2013-C17 D, 4.884%,
01/15/2047 | | | | | 983,345 | | | | | | 0.4 | | |
| 3,914,926 (1)(2) | | | LSTAR Commercial
Mortgage Trust 2016-4 F,
4.611%, 03/10/2049 | | | | | 2,610,356 | | | | | | 1.1 | | |
| 1,490,683 (1)(2) | | | Morgan Stanley Bank of
America Merrill Lynch Trust
2015-C26 E, 4.368%,
10/15/2048 | | | | | 1,082,544 | | | | | | 0.5 | | |
| 2,367,326 (1)(2) | | | Morgan Stanley Bank of
America Merrill Lynch Trust
2015-C26 F, 4.368%,
10/15/2048 | | | | | 1,597,598 | | | | | | 0.7 | | |
| 1,099,191 (2)(6) | | | Morgan Stanley Capital I
Trust 2011-C1 K, 4.193%,
09/15/2047 | | | | | 1,099,191 | | | | | | 0.5 | | |
| 782,985 (2)(6) | | | Morgan Stanley Capital I
Trust 2011-C1 L, 4.193%,
09/15/2047 | | | | | 261,047 | | | | | | 0.1 | | |
| 478,826 (1)(2) | | | Morgan Stanley Capital I
Trust 2016-BNK2 D, 3.000%,
11/15/2049 | | | | | 317,827 | | | | | | 0.1 | | |
| 12,138,842 (1)(4) | | | Morgan Stanley Capital I
Trust 2019-H7 XA, 1.298%,
07/15/2052 | | | | | 676,129 | | | | | | 0.3 | | |
| 4,684,360 (1)(2)(4) | | | Morgan Stanley Capital I,
Inc. 2017-HR2 XD, 1.590%,
12/15/2050 | | | | | 297,448 | | | | | | 0.1 | | |
| 653,492 (2) | | | Prima Capital CRE
Securitization 2019-7A C
Ltd., 3.250%, 12/25/2050 | | | | | 603,328 | | | | | | 0.3 | | |
| 3,011,482 (2) | | | Prima Capital CRE
Securitization 2019-7A D
Ltd., 4.250%, 12/25/2050 | | | | | 2,475,702 | | | | | | 1.1 | | |
| 4,842,462 (2)(5) | | | RFM Reremic Trust
2022-FRR1 AB55, 1.040%,
03/28/2049 | | | | | 3,697,356 | | | | | | 1.6 | | |
| 4,104,649 (1)(2) | | | RFM Reremic Trust
2022-FRR1 AB60, 2.450%,
11/08/2049 | | | | | 3,274,918 | | | | | | 1.4 | | |
See Accompanying Notes to Financial Statements
PORTFOLIO OF INVESTMENTS
| Voya VACS Series SC Fund | as of March 31, 2023 (continued) |
Principal
Amount† | | | Value | | | Percentage
of Net
Assets | |
COMMERCIAL MORTGAGE-BACKED
SECURITIES: (continued) | |
| 6,179,560 (1)(2) | | | RFM Reremic Trust
2022-FRR1 AB64, 2.300%,
03/01/2050 | | | | $ | 4,868,678 | | | | | | 2.1 | | |
| 1,508,752 (2)(3) | | | RFM Reremic Trust
2022-FRR1 CK55, 0.000%,
03/28/2049 | | | | | 1,124,631 | | | | | | 0.5 | | |
| 1,897,233 (2)(3) | | | RFM Reremic Trust
2022-FRR1 CK60, 0.000%,
11/08/2049 | | | | | 1,311,201 | | | | | | 0.6 | | |
| 1,776,774 (2)(3) | | | RFM Reremic Trust
2022-FRR1 CK64, 0.000%,
03/01/2050 | | | | | 1,207,297 | | | | | | 0.5 | | |
| 1,000,000 (1)(2) | | | SG Commercial Mortgage
Securities Trust 2020-COVE
E, 3.728%, 03/15/2037 | | | | | 896,472 | | | | | | 0.4 | | |
| 1,505,741 (2)(3) | | | TPI RE-REMIC Trust
2022-FRR1 AK34, 0.000%,
07/25/2046 | | | | | 1,475,597 | | | | | | 0.6 | | |
| 9,624,891 (1)(4) | | | Wells Fargo Commercial
Mortgage Trust 2017-C40
XA, 0.870%, 10/15/2050 | | | | | 283,973 | | | | | | 0.1 | | |
| 6,163,594 (1)(4) | | | Wells Fargo Commercial
Mortgage Trust 2021-C60
XA, 1.536%, 08/15/2054 | | | | | 522,101 | | | | | | 0.2 | | |
| 4,333,522 (1)(2) | | | WFRBS Commercial
Mortgage Trust 2013-C14 D,
3.975%, 06/15/2046 | | | | | 2,621,816 | | | | | | 1.1 | | |
| 1,549,708 (2) | | | WFRBS Commercial
Mortgage Trust 2013-C17 E,
3.500%, 12/15/2046 | | | | | 1,397,622 | | | | | | 0.6 | | |
| | | | Total Commercial
Mortgage-Backed Securities
(Cost $95,840,720) | | | | | 96,652,591 | | | | | | 40.9 | | |
| ASSET-BACKED SECURITIES: 23.0% | |
| | | | Automobile Asset-Backed Securities: 1.1% | |
| 542,000 | | | Americredit Automobile
Receivables Trust 2019-2 D,
2.990%, 06/18/2025 | | | | | 529,925 | | | | | | 0.2 | | |
| 1,009,000 | | | AmeriCredit Automobile
Receivables Trust 2019-3 D,
2.580%, 09/18/2025 | | | | | 976,977 | | | | | | 0.4 | | |
| 708,000 | | | AmeriCredit Automobile
Receivables Trust 2020-2 D,
2.130%, 03/18/2026 | | | | | 666,634 | | | | | | 0.3 | | |
| 452,000 (2) | | | Tesla Auto Lease Trust
2020-A E, 4.640%,
08/20/2024 | | | | | 451,465 | | | | | | 0.2 | | |
| | | | | | | | | 2,625,001 | | | | | | 1.1 | | |
Principal
Amount† | | | Value | | | Percentage
of Net
Assets | |
| ASSET-BACKED SECURITIES: (continued) | |
| | | | Other Asset-Backed Securities: 19.1% | |
| 416,600 (2) | | | AIG CLO 2019-2A DR Ltd.,
7.868%, (US0003M +
3.050)%, 10/25/2033 | | | | $ | 382,313 | | | | | | 0.2 | | |
| 903,444 (1)(2) | | | Ajax Mortgage Loan Trust
2019-D A2, 3.500%,
09/25/2065 | | | | | 824,976 | | | | | | 0.3 | | |
| 451,722 (2) | | | Ajax Mortgage Loan Trust
2019-F A2, 3.500%,
07/25/2059 | | | | | 414,711 | | | | | | 0.2 | | |
| 327,690 (2) | | | Applebee’s Funding LLC /
IHOP Funding LLC 2019-1A
A2II, 4.723%, 06/05/2049 | | | | | 307,423 | | | | | | 0.1 | | |
| 1,747,000 (2) | | | Aqua Finance Trust 2017-A
B, 2.400%, 07/17/2046 | | | | | 1,453,392 | | | | | | 0.6 | | |
| 836,550 (2) | | | Arbys Funding LLC 2020-1A
A2, 3.237%, 07/30/2050 | | | | | 736,598 | | | | | | 0.3 | | |
| 1,041,500 (2) | | | Atrium XIV LLC 14A A2BR,
2.304%, 08/23/2030 | | | | | 933,184 | | | | | | 0.4 | | |
| 937,350 (2) | | | Babson CLO Ltd. 2018-3A
B2R, 2.268%, 07/20/2029 | | | | | 853,901 | | | | | | 0.4 | | |
| 1,041,500 (2) | | | Benefit Street Partners
CLO XVIII Ltd. 2019-18A
DR, 8.192%, (US0003M +
3.400)%, 10/15/2034 | | | | | 954,176 | | | | | | 0.4 | | |
| 781,125 (2) | | | BlueMountain CLO XXX Ltd.
2020-30A CR, 6.808%,
(TSFR3M + 2.150)%,
04/15/2035 | | | | | 714,070 | | | | | | 0.3 | | |
| 1,371,150 (2) | | | Bojangles Issuer LLC
2020-3A A2, 3.832%,
10/20/2050 | | | | | 1,254,156 | | | | | | 0.5 | | |
| 840,412 (2) | | | CLI Funding VIII LLC
2021-1A A, 1.640%,
02/18/2046 | | | | | 731,114 | | | | | | 0.3 | | |
| 556,308 (2) | | | Domino’s Pizza Master
Issuer LLC 2018-1A A211,
4.328%, 07/25/2048 | | | | | 529,163 | | | | | | 0.2 | | |
| 418,428 (2) | | | Domino’s Pizza Master
Issuer LLC 2018-1A A2I,
4.116%, 07/25/2048 | | | | | 402,545 | | | | | | 0.2 | | |
| 394,790 (2) | | | Domino’s Pizza Master
Issuer LLC 2019-1A A2,
3.668%, 10/25/2049 | | | | | 352,323 | | | | | | 0.1 | | |
| 615,458 (2) | | | Driven Brands Funding LLC
2022-1A A2, 7.393%,
10/20/2052 | | | | | 622,127 | | | | | | 0.3 | | |
See Accompanying Notes to Financial Statements
PORTFOLIO OF INVESTMENTS
| Voya VACS Series SC Fund | as of March 31, 2023 (continued) |
Principal
Amount† | | | Value | | | Percentage
of Net
Assets | |
| ASSET-BACKED SECURITIES: (continued) | |
| | | | Other Asset-Backed Securities (continued) | |
| 1,197,725 (2) | | | Dryden 86 CLO Ltd.
2020-86A DR, 7.992%,
(US0003M + 3.200)%,
07/17/2034 | | | | $ | 1,121,422 | | | | | | 0.5 | | |
| 916,520 (2) | | | Dryden Senior Loan Fund
2021-92A E, 11.415%,
(US0003M + 6.500)%,
11/20/2034 | | | | | 816,497 | | | | | | 0.3 | | |
| 445,220 (2) | | | Five Guys Holdings, Inc.
2017-1A A2, 4.600%,
07/25/2047 | | | | | 436,322 | | | | | | 0.2 | | |
| 937,350 (2) | | | Galaxy XXIII CLO Ltd.
2017-23A DR, 8.216%,
(US0003M + 3.400)%,
04/24/2029 | | | | | 886,632 | | | | | | 0.4 | | |
| 676,305 (2) | | | Goddard Funding LLC
2022-1A A2, 6.864%,
10/30/2052 | | | | | 642,382 | | | | | | 0.3 | | |
| 678,000 (2) | | | Greystone Commercial Real
Estate Notes 2021-FL3 E,
7.692%, (TSFR1M +
2.750)%, 07/15/2039 | | | | | 617,594 | | | | | | 0.3 | | |
| 446,899 (2) | | | Helios Issuer LLC 2020-AA
A, 2.980%, 06/20/2047 | | | | | 396,997 | | | | | | 0.2 | | |
| 572,589 (2) | | | Helios Issuer, LLC 2018-1A
B, 7.710%, 07/20/2048 | | | | | 487,986 | | | | | | 0.2 | | |
| 535,448 (2) | | | Loanpal Solar Loan Ltd.
2020-3GS B, 3.450%,
12/20/2047 | | | | | 414,323 | | | | | | 0.2 | | |
| 1,041,500 (2) | | | Magnetite XXVI Ltd.
2020-26A DR, 7.668%,
(US0003M + 2.850)%,
07/25/2034 | | | | | 996,716 | | | | | | 0.4 | | |
| 1,747,000 (2) | | | Marlette Funding Trust
2023-1A A, 6.070%,
04/15/2033 | | | | | 1,746,606 | | | | | | 0.7 | | |
| 542,067 (1)(2) | | | Mill City Mortgage Trust
2015-2 B2, 3.690%,
09/25/2057 | | | | | 484,461 | | | | | | 0.2 | | |
| 448,010 (2) | | | Mill City Solar Loan
2019-2GS A Ltd., 3.690%,
07/20/2043 | | | | | 409,203 | | | | | | 0.2 | | |
| 303,628 (2) | | | Mosaic Solar Loan Trust
2018-1A A, 4.010%,
06/22/2043 | | | | | 284,532 | | | | | | 0.1 | | |
| 386,670 (2) | | | Mosaic Solar Loan Trust
2020-1A B, 3.100%,
04/20/2046 | | | | | 334,139 | | | | | | 0.1 | | |
| 297,017 (2) | | | Mosaic Solar Loan Trust
2023-1A B, 6.920%,
06/20/2053 | | | | | 293,478 | | | | | | 0.1 | | |
Principal
Amount† | | | Value | | | Percentage
of Net
Assets | |
| ASSET-BACKED SECURITIES: (continued) | |
| | | | Other Asset-Backed Securities (continued) | |
| 625,004 (2) | | | Oaktree CLO 2020-1A ER
Ltd., 11.302%, (US0003M +
6.510)%, 07/15/2034 | | | | $ | 554,545 | | | | | | 0.2 | | |
| 624,900 (2) | | | Oaktree CLO Ltd. 2021-1A
D, 8.042%, (US0003M +
3.250)%, 07/15/2034 | | | | | 571,256 | | | | | | 0.2 | | |
| 1,249,800 (2) | | | OHA Credit Partners XVI
2021-16A D, 7.645%,
(US0003M + 2.850)%,
10/18/2034 | | | | | 1,193,472 | | | | | | 0.5 | | |
| 791,540 (2) | | | Palmer Square CLO Ltd.
2021-2A E, 11.142%,
(US0003M + 6.350)%,
07/15/2034 | | | | | 724,636 | | | | | | 0.3 | | |
| 650,937 (2) | | | Palmer Square Loan
Funding 2021-2A D Ltd.,
9.915%, (US0003M +
5.000)%, 05/20/2029 | | | | | 588,150 | | | | | | 0.2 | | |
| 647,000 (2) | | | SoFi Consumer Loan
Program 2023-1S A Trust,
5.810%, 05/15/2031 | | | | | 647,710 | | | | | | 0.3 | | |
| 937,350 (2) | | | Sound Point Clo XIV Ltd.
2016-3A DR, 8.465%,
(US0003M + 3.650)%,
01/23/2029 | | | | | 922,376 | | | | | | 0.4 | | |
| 2,299,425 (2) | | | Sunnova Helios Issuer II LLC
2021-B B, 2.010%,
07/20/2048 | | | | | 1,841,505 | | | | | | 0.8 | | |
| 1,132,809 (2) | | | Sunnova Sol II Issuer LLC
2020-2A A, 2.730%,
11/01/2055 | | | | | 889,970 | | | | | | 0.4 | | |
| 997,331 (2) | | | Sunrun Atlas Issuer 2019-2
A LLC, 3.610%, 02/01/2055 | | | | | 890,635 | | | | | | 0.4 | | |
| 1,973,971 (2) | | | Sunrun Jupiter Issuer
2022-1A A LLC, 4.750%,
07/30/2057 | | | | | 1,848,835 | | | | | | 0.8 | | |
| 460,143 (2) | | | Sunrun Xanadu Issuer
2019-1A A LLC, 3.980%,
06/30/2054 | | | | | 415,439 | | | | | | 0.2 | | |
| 874,860 (2) | | | Symphony CLO XIV Ltd.
2014-14A DR, 7.892%,
(US0003M + 3.100)%,
07/14/2026 | | | | | 874,815 | | | | | | 0.4 | | |
| 1,458,100 (2) | | | Symphony Static CLO I Ltd.
2021-1A D, 7.568%,
(US0003M + 2.750)%,
10/25/2029 | | | | | 1,361,183 | | | | | | 0.6 | | |
| 416,600 (2) | | | TCW CLO 2017-1A DRR
Ltd., 8.472%, (US0003M +
3.670)%, 10/29/2034 | | | | | 380,053 | | | | | | 0.2 | | |
See Accompanying Notes to Financial Statements
PORTFOLIO OF INVESTMENTS
| Voya VACS Series SC Fund | as of March 31, 2023 (continued) |
Principal
Amount† | | | Value | | | Percentage
of Net
Assets | |
| ASSET-BACKED SECURITIES: (continued) | |
| | | | Other Asset-Backed Securities (continued) | |
| 1,249,800 (2) | | | TCW CLO 2020-1A DRR
Ltd., 8.208%, (US0003M +
3.400)%, 04/20/2034 | | | | $ | 1,138,593 | | | | | | 0.5 | | |
| 416,600 (2) | | | THL Credit Wind River
2014-1 CRR CLO Ltd.,
6.745%, (US0003M +
1.950)%, 07/18/2031 | | | | | 379,408 | | | | | | 0.1 | | |
| 1,041,500 (2) | | | THL Credit Wind River
2017-3A CR Clo Ltd.,
7.292%, (US0003M +
2.500)%, 04/15/2035 | | | | | 976,673 | | | | | | 0.4 | | |
| 576,056 (2) | | | TIF Funding II LLC 2021-1A
A, 1.650%, 02/20/2046 | | | | | 486,725 | | | | | | 0.2 | | |
| 331,263 (1)(2) | | | Towd Point Mortgage Trust
2015-2 2B2, 4.320%,
11/25/2057 | | | | | 319,185 | | | | | | 0.1 | | |
| 738,000 (2) | | | Trafigura Securitisation
Finance PLC 2021-1A B,
1.780%, 01/15/2025 | | | | | 670,140 | | | | | | 0.3 | | |
| 749,490 (2) | | | Triton Container Finance VIII
LLC 2021-1A B, 2.580%,
03/20/2046 | | | | | 626,940 | | | | | | 0.3 | | |
| 333,280 (2) | | | Venture 33 CLO Ltd.
2018-33A CR, 7.072%,
(US0003M + 2.280)%,
07/15/2031 | | | | | 308,940 | | | | | | 0.1 | | |
| 1,127,424 (2) | | | Venture XXI CLO Ltd.
2015-21A DR, 7.592%,
(US0003M + 2.800)%,
07/15/2027 | | | | | 1,092,634 | | | | | | 0.5 | | |
| 658,240 (2) | | | Vivint Solar Financing VII
LLC 2020-1A A, 2.210%,
07/31/2051 | | | | | 518,115 | | | | | | 0.2 | | |
| 1,716,499 (2) | | | Wingstop Funding LLC
2020-1A A2, 2.841%,
12/05/2050 | | | | | 1,511,563 | | | | | | 0.6 | | |
| 1,942,932 (2) | | | Zaxby’s Funding LLC
2021-1A A2, 3.238%,
07/30/2051 | | | | | 1,634,844 | | | | | | 0.7 | | |
| | | | | | | | | 45,203,802 | | | | | | 19.1 | | |
| | | | Student Loan Asset-Backed
Securities: 2.8% | |
| 312,158 (2) | | | Laurel Road Prime Student
Loan Trust 2019-A BFX,
3.000%, 10/25/2048 | | | | | 288,212 | | | | | | 0.1 | | |
| 790,000 (2) | | | SMB Private Education
Loan Trust 2014-A C,
4.500%, 09/15/2045 | | | | | 681,591 | | | | | | 0.3 | | |
Principal
Amount† | | | Value | | | Percentage
of Net
Assets | |
| ASSET-BACKED SECURITIES: (continued) | |
| | | | Student Loan Asset-Backed
Securities (continued) | |
| 459,000 (1)(2) | | | SoFi Professional Loan
Program 2017-A C, 4.430%,
03/26/2040 | | | | $ | 421,568 | | | | | | 0.2 | | |
| 376,000 (1)(2) | | | SoFi Professional Loan
Program 2017-C C, 4.210%,
07/25/2040 | | | | | 335,663 | | | | | | 0.1 | | |
| 376,000 (2) | | | SoFi Professional Loan
Program 2017-D BFX
LLC, 3.610%, 09/25/2040 | | | | | 336,836 | | | | | | 0.2 | | |
| 1,205,000 (2) | | | SoFi Professional Loan
Program 2017-F BFX
LLC, 3.620%, 01/25/2041 | | | | | 1,079,212 | | | | | | 0.5 | | |
| 602,000 (2) | | | SoFi Professional Loan
Program 2018-C BFX
Trust, 4.130%, 01/25/2048 | | | | | 567,518 | | | | | | 0.2 | | |
| 632,000 (2) | | | SoFi Professional Loan
Program 2018-D BFX
Trust, 4.140%, 02/25/2048 | | | | | 593,319 | | | | | | 0.3 | | |
| 1,521,000 (2) | | | SoFi Professional Loan
Program 2020-B BFX
Trust, 2.730%, 05/15/2046 | | | | | 1,219,538 | | | | | | 0.5 | | |
| 1,235,000 (2) | | | SoFi Professional Loan
Program 2020-C BFX
Trust, 3.360%, 02/15/2046 | | | | | 1,028,807 | | | | | | 0.4 | | |
| | | | | | | | | 6,552,264 | | | | | | 2.8 | | |
| | | | Total Asset-Backed
Securities
(Cost $54,003,464) | | | | | 54,381,067 | | | | | | 23.0 | | |
| | | | Total Long-Term
Investments
(Cost $220,995,253) | | | | | 222,323,670 | | | | | | 94.0 | | |
| SHORT-TERM INVESTMENTS: 5.3% | |
| | | | Commercial Paper: 3.6% | |
| 3,500,000 | | | Agilent Technologies, Inc.,
4.890%, 04/06/2023 | | | | | 3,497,031 | | | | | | 1.5 | | |
| 2,000,000 | | | Dominion Energy, Inc.,
5.040%, 04/03/2023 | | | | | 1,999,157 | | | | | | 0.8 | | |
| 3,000,000 | | | Equifax, Inc., 5.200%,
04/06/2023 | | | | | 2,997,445 | | | | | | 1.3 | | |
| | | | Total Commercial Paper
(Cost $8,494,794) | | | | | 8,493,633 | | | | | | 3.6 | | |
See Accompanying Notes to Financial Statements
PORTFOLIO OF INVESTMENTS
| Voya VACS Series SC Fund | as of March 31, 2023 (continued) |
| Shares | | | Value | | | Percentage
of Net
Assets | |
| SHORT-TERM INVESTMENTS: (continued) | |
| | | | Mutual Funds: 1.7% | |
| 4,098,000 (7) | | | Morgan Stanley Institutional
Liquidity Funds -
Government Portfolio
(Institutional
Share Class), 4.730%
(Cost $4,098,000) | | | | $ | 4,098,000 | | | | | | 1.7 | | |
| | | | Total Short-Term
Investments
(Cost $12,592,794) | | | | | 12,591,633 | | | | | | 5.3 | | |
| | | | Total Investments in
Securities
(Cost $233,588,047) | | | | $ | 234,915,303 | | | | | | 99.3 | | |
| | | | Assets in Excess of
Other Liabilities | | | | | 1,547,732 | | | | | | 0.7 | | |
| | | | Net Assets | | | | $ | 236,463,035 | | | | | | 100.0 | | |
†
Unless otherwise indicated, principal amount is shown in USD.
(1)
Variable rate security. Rate shown is the rate in effect as of March 31, 2023.
(2)
Securities with purchases pursuant to Rule 144A or section 4(a)(2), under the Securities Act of 1933 and may not be resold subject to that rule except to qualified institutional buyers.
(3)
Principal only securities represent the right to receive the monthly principal payments on an underlying pool of mortgage loans. No payments of interest on the pool are passed through the principal only security.
(4)
Interest only securities represent the right to receive the monthly interest payments on an underlying pool of mortgage loans. Principal amount shown represents the notional amount on which current interest is calculated. Payments of principal on the pool reduce the value of the interest only security.
(5)
Represents a zero coupon bond. Rate shown reflects the effective yield as of March 31, 2023.
(6)
For fair value measurement disclosure purposes, security is categorized as Level 3, whose value was determined using significant unobservable inputs.
(7)
Rate shown is the 7-day yield as of March 31, 2023.
Reference Rate Abbreviations:
SOFR30A
30-day Secured Overnight Financing Rate
TSFR1M
1-month CME Term Secured Overnight Financing Rate
TSFR3M
3-month CME Term Secured Overnight Financing Rate
US0001M
1-month LIBOR
US0003M
3-month LIBOR
Fair Value Measurements^
The following is a summary of the fair valuations according to the inputs used as of March 31, 2023 in valuing the assets and liabilities:
| | | | Quoted Prices
in Active Markets
for Identical
Investments
(Level 1) | | | Significant
Other
Observable
Inputs
(Level 2) | | | Significant
Unobservable
Inputs
(Level 3) | | | Fair Value
at
March 31, 2023 | |
| Asset Table | | | | | | | | | | | | | | | | | | | | | | | | | |
| Investments, at fair value | | | | | | | | | | | | | | | | | | | | | | | | | |
| Collateralized Mortgage Obligations | | | | $ | — | | | | | $ | 71,290,012 | | | | | $ | — | | | | | $ | 71,290,012 | | |
| Asset-Backed Securities | | | | | — | | | | | | 54,381,067 | | | | | | — | | | | | | 54,381,067 | | |
| Commercial Mortgage-Backed Securities | | | | | — | | | | | | 95,292,353 | | | | | | 1,360,238 | | | | | | 96,652,591 | | |
| Short-Term Investments | | | | | 4,098,000 | | | | | | 8,493,633 | | | | | | — | | | | | | 12,591,633 | | |
| Total Investments, at fair value | | | | $ | 4,098,000 | | | | | $ | 229,457,065 | | | | | $ | 1,360,238 | | | | | $ | 234,915,303 | | |
| Other Financial Instruments+ | | | | | | | | | | | | | | | | | | | | | | | | | |
| Futures | | | | | 233,882 | | | | | | — | | | | | | — | | | | | | 233,882 | | |
| Total Assets | | | | $ | 4,331,882 | | | | | $ | 229,457,065 | | | | | $ | 1,360,238 | | | | | $ | 235,149,185 | | |
| Liabilities Table | | | | | | | | | | | | | | | | | | | | | | | | | |
| Other Financial Instruments+ | | | | | | | | | | | | | | | | | | | | | | | | | |
| Futures | | | | $ | (1,680,924) | | | | | $ | — | | | | | $ | — | | | | | $ | (1,680,924) | | |
| Total Liabilities | | | | $ | (1,680,924) | | | | | $ | — | | | | | $ | — | | | | | $ | (1,680,924) | | |
^
See Note 2, “Significant Accounting Policies” in the Notes to Financial Statements for additional information.
+
Other Financial Instruments may include open forward foreign currency contracts, futures, centrally cleared swaps, OTC swaps and written options. Forward foreign currency contracts, futures and centrally cleared swaps are fair valued at the unrealized appreciation (depreciation) on the instrument. OTC swaps and written options are valued at the fair value of the instrument.
See Accompanying Notes to Financial Statements
PORTFOLIO OF INVESTMENTS
| Voya VACS Series SC Fund | as of March 31, 2023 (continued) |
At March 31, 2023, the following futures contracts were outstanding for Voya VACS Series SC Fund:
| Description | | | Number
of Contracts | | | Expiration
Date | | | Notional
Amount | | | Unrealized
Appreciation/
(Depreciation) | |
| Long Contracts: | | | | | | | | | | | | | | | | | | | |
| U.S. Treasury Long Bond | | | 24 | | | 06/21/23 | | | | $ | 3,147,750 | | | | | $ | 83,199 | | |
| U.S. Treasury Ultra Long Bond | | | 30 | | | 06/22/23 | | | | | 4,233,750 | | | | | | 150,683 | | |
| | | | | | | | | | | $ | 7,381,500 | | | | | $ | 233,882 | | |
| Short Contracts: | | | | | | | | | | | | | | | | | | | |
| U.S. Treasury 10-Year Note | | | (27) | | | 06/21/23 | | | | | (3,102,891) | | | | | | (103,415) | | |
| U.S. Treasury 2-Year Note | | | (116) | | | 06/30/23 | | | | | (23,948,563) | | | | | | (47,207) | | |
| U.S. Treasury 5-Year Note | | | (510) | | | 06/30/23 | | | | | (55,848,984) | | | | | | (1,305,980) | | |
| U.S. Treasury Ultra 10-Year Note | | | (50) | | | 06/21/23 | | | | | (6,057,031) | | | | | | (224,322) | | |
| | | | | | | | | | | $ | (88,957,469) | | | | | $ | (1,680,924) | | |
A summary of derivative instruments by primary risk exposure is outlined in the following tables.
The fair value of derivative instruments as of March 31, 2023 was as follows:
| Derivatives not accounted for as hedging instruments | | | Location on Statement
of Assets and Liabilities | | | Fair Value | |
| Asset Derivatives | | | | | | | | | | |
| Interest rate contracts | | | Variation margin receivable on futures contracts* | | | | $ | 233,882 | | |
| Total Asset Derivatives | | | | | | | $ | 233,882 | | |
| Liability Derivatives | | | | | | | | | | |
| Interest rate contracts | | | Variation margin payable on futures contracts* | | | | $ | 1,680,924 | | |
| Total Liability Derivatives | | | | | | | $ | 1,680,924 | | |
*
The fair value presented above represents the cumulative unrealized appreciation (depreciation) on futures contracts as reported in the table within the Portfolio of Investments . In the Statement of Assets and Liabilities, only current day’s unsettled variation margin is reported in receivables or payables on futures contracts and the net cumulative unrealized appreciation (depreciation) is included in total distributable earnings (loss).
The effect of derivative instruments on the Fund’s Statement of Operations for the year ended March 31, 202 3 was as follows:
| | | | Amount of Realized Gain or (Loss)
on Derivatives Recognized in Income | |
| Derivatives not accounted for as hedging instruments | | | Futures | |
| Interest rate contracts | | | | $ | (10,231) | | |
| Total | | | | $ | (10,231) | | |
| | | | Change in Unrealized Appreciation or (Depreciation)
on Derivatives Recognized in Income | |
| Derivatives not accounted for as hedging instruments | | | Futures | |
| Interest rate contracts | | | | $ | (1,447,042) | | |
| Total | | | | $ | (1,447,042) | | |
At March 31, 2023, the aggregate cost of securities and other investments and the composition of unrealized appreciation and depreciation of securities and other investments on a tax basis were:
| | Cost for federal income tax purposes was $232,141,005. | | | | | | | |
| | Net unrealized appreciation consisted of: | | | | | | | |
| | Gross Unrealized Appreciation | | | | $ | 2,643,736 | | |
| | Gross Unrealized Depreciation | | | | | (1,316,480) | | |
| | Net Unrealized Appreciation | | | | $ | 1,327,256 | | |
See Accompanying Notes to Financial Statements
TAX INFORMATION (Unaudited)
Dividends and distributions paid during the year or period ended March 31, 2023 were as follows:
| Fund Name | | | Type | | | Per Share
Amount | |
| Voya VACS Series EMCD Fund(1) | | | NII | | | | $ | 0.4091 | | |
| | | | LTCG | | | | $ | 0.0159 | | |
| Voya VACS Series EMHCD Fund(2) | | | NII | | | | $ | 0.0678 | | |
| Voya VACS Series HYB Fund(3) | | | NII | | | | $ | 0.0754 | | |
| Voya VACS Series SC Fund(4) | | | NII | | | | $ | 0.0348 | | |
NII – Net investment income
LTCG – Long-term capital gain
(1)
Formerly, Voya Emerging Markets Corporate Debt Fund. Fund had a Class P shares designation prior to November 18, 2022.
(2)
Commenced operations on February 17, 2023.
(3)
Commenced operations on February 24, 2023.
(4)
Commenced operations on March 3, 2023.
Voya VACS Series EMCD Fund designates $174,985 of long-term capital gain distributions as 20% rate long-term capital gain dividends under Internal Revenue Code Section 852(b)(3)(C).
Above figures may differ from those cited elsewhere in this report due to differences in the calculation of income and gains under U.S. generally accepted accounting principles (book) purposes and Internal Revenue Service (tax) purposes.
Shareholders are strongly advised to consult their own tax advisers with respect to the tax consequences of their investments in the Funds. In January, shareholders, excluding corporate shareholders, receive an IRS 1099-DIV regarding the federal tax status of the dividends and distributions they received in the calendar year.
TRUSTEE AND OFFICER INFORMATION (Unaudited)
The business and affairs of each Trust are managed under the direction of the Board. A Trustee, who is not an interested person of a Trust, as defined in the 1940 Act, is an independent trustee (“Independent Trustee”). The Trustees and Officers of the Trust are listed below. The Statement of Additional Information includes additional information about Trustees of the Trust and is available, without charge, upon request at (800) 992-0180.
Name, Address and
Year of Birth | | | Position(s)
Held with the
Trust | | | Term of Office and
Length of Time
Served(1) | | | Principal
Occupation(s) –
During the Past 5 Years | | | Number of
funds in
Fund
Complex
Overseen
by
Trustee(2) | | | Other Board Positions
Held by Trustee | |
| Independent Trustees: | | | | | | | | | | | | | | | | |
Colleen D. Baldwin (1960)
7337 East Doubletree Ranch Rd.
Suite 100
Scottsdale, Arizona 85258 | | | Chairperson Trustee | | | January 2020 –
Present VFT – November 2007 –
Present VSPT – July 2007 –
Present | | | President, Glantuam Partners, LLC, a business consulting firm (January 2009 – Present). | | | 138 | | | Stanley Global Engineering (2020 – Present). | |
John V. Boyer (1953)
7337 East Doubletree Ranch Rd.
Suite 100
Scottsdale, Arizona 85258 | | | Trustee | | | VFT – January 2005 –
Present VSPT – May 2007 – Present | | | Retired. Formerly, President and Chief Executive Officer, Bechtler Arts Foundation, an arts and education foundation (January 2008 – December 2019). | | | 138 | | | None. | |
Patricia W. Chadwick (1948)
7337 East Doubletree Ranch Rd.
Suite 100
Scottsdale, Arizona 85258 | | | Trustee | | | VFT – January 2006 –
Present VSPT – May 2007 –
Present | | | Consultant and President, Ravengate Partners LLC, a consulting firm that provides advice regarding financial markets and the global economy (January 2000 – Present). | | | 138 | | | The Royce Funds (22 funds) (December 2009 – Present). AMICA Mutual Insurance Company (1992 – Present). | |
Martin J. Gavin (1950)
7337 East Doubletree Ranch Rd. Suite 100
Scottsdale, Arizona 85258 | | | Trustee | | | August 2015 – Present | | | Retired. | | | 138 | | | None. | |
Joseph E. Obermeyer (1957)
7337 East Doubletree Ranch Rd.
Suite 100
Scottsdale, Arizona 85258 | | | Trustee | | | May 2013 – Present | | | President, Obermeyer & Associates, Inc., a provider of financial and economic consulting services (November 1999 – Present). | | | 138 | | | None. | |
Sheryl K. Pressler (1950)
7337 East Doubletree Ranch Rd.
Suite 100
Scottsdale, Arizona 85258 | | | Trustee | | | VFT – January 2006 –
Present VSPT – May 2007 –
Present | | | Consultant (May 2001 – Present). | | | 138 | | | Centerra Gold Inc. (May 2008 – Present). | |
Christopher P. Sullivan (1954)
7337 East Doubletree Ranch Rd.
Suite 100
Scottsdale, Arizona 85258 | | | Trustee | | | October 2015 – Present | | | Retired. | | | 138 | | | None. | |
(1)
Trustees serve until their successors are duly elected and qualified. The tenure of each Trustee who is not an “interested person” as defined in the 1940 Act, of each Fund (“Independent Trustee”) is subject to the Board’s retirement policy which states that each duly elected or appointed Independent Trustee shall retire from and cease to be a member of the Board of Trustees at the close of business on December 31 of the calendar year in which the Independent Trustee attains the age of 75. A majority vote of the Board’s other Independent Trustees may extend the retirement date of an Independent Trustee if the retirement would trigger a requirement to hold a meeting of shareholders of the Trust under applicable law, whether for the purposes of appointing a successor to the Independent Trustee or otherwise comply under applicable law, in which case the extension would apply until such time as the shareholder meeting can be held or is no longer required (as determined by a vote of a majority of the other Independent Trustees).
TRUSTEE AND OFFICER INFORMATION (Unaudited) (continued)
(2)
For the purposes of this table, “Fund Complex” means the Voya family of funds including the following investment companies: Voya Asia Pacific High Dividend Equity Income Fund; Voya Balanced Portfolio, Inc.; Voya Credit Income Fund; Voya Emerging Markets High Dividend Equity Fund; Voya Equity Trust; Voya Funds Trust; Voya Global Advantage and Premium Opportunity Fund; Voya Global Equity Dividend and Premium Opportunity Fund; Voya Government Money Market Portfolio; Voya Infrastructure, Industrials and Materials Fund; Voya Intermediate Bond Portfolio; Voya Investors Trust; Voya Mutual Funds; Voya Partners, Inc.; Voya Separate Portfolios Trust; Voya Strategic Allocation Portfolios, Inc.; Voya Variable Funds; Voya Variable Insurance Trust; Voya Variable Portfolios, Inc.; and Voya Variable Products Trust. The number of funds in the Fund Complex is as of April 30, 2023.
TRUSTEE AND OFFICER INFORMATION (Unaudited) (continued)
Name, Address and
Year of Birth | | | Position(s) Held
With the Trust | | | Term of Office and
Length of Time Served(1) | | | Principal Occupation(s) –
During the Past 5 Years | |
Andy Simonoff (1973)
5780 Powers Ferry Road NW
Atlanta, Georgia 30327 | | | President and Chief Executive Officer | | | January 2023 – Present | | | Director, President and Chief Executive Officer, Voya Funds Services, LLC, Voya Capital, LLC and Voya Investments, LLC (January 1, 2023 – Present); Managing Director, Chief Strategy and Transformation Officer, Voya Investment Management (January 2020 – Present). Formerly, Managing Director, Head of Business Management, Voya Investment Management (March 2019 – January 2020); Managing Director, Head of Business Management, Fixed Income, Voya Investment Management (November 2015 – March 2019). | |
Jonathan Nash (1967)
230 Park Avenue
New York, New York 10169 | | | Executive Vice President and Chief Investment Risk Officer | | | March 2020 – Present | | | Executive Vice President and Chief Investment Risk Officer, Voya Investments, LLC (March 2020 – Present); Senior Vice President, Investment Risk Management, Voya Investment Management (March 2017 – Present). Formerly, Vice President, Voya Investments, LLC (September 2018 – March 2020). | |
James M. Fink (1958)
5780 Powers Ferry Road NW
Atlanta, Georgia 30327 | | | Executive Vice President | | | March 2018 – Present | | | Senior Vice President, Voya Investments Distributor, LLC (April 2018 – Present); Managing Director, Voya Investments, LLC, Voya Capital, LLC, and Voya Funds Services, LLC (March 2018 − Present); Chief Administrative Officer, Voya Investment Management (September 2017 – Present). | |
Steven Hartstein (1963)
230 Park Avenue
New York, New York 10169 | | | Chief Compliance Officer | | | December 2022 – Present | | | Senior Vice President, Voya Investment Management (December 2022 – Present). Formerly, Head of Funds Compliance, Brighthouse Financial, Inc. and Chief Compliance Officer – Brighthouse Funds and Brighthouse Investment Advisers, LLC (March 2017 – December 2022). | |
Todd Modic (1967)
7337 East Doubletree Ranch Rd.
Suite 100
Scottsdale, Arizona 85258 | | | Senior Vice President, Chief/Principal Financial Officer and Assistant Secretary | | | VFT – March 2005 –
Present VSPT – March 2007 –
Present | | | Director and Senior Vice President, Voya Capital, LLC, and Voya Funds Services, LLC (September 2022 – Present); Director, Voya Investments, LLC (September 2022 – Present); Senior Vice President, Voya Investments, LLC (April 2005 – Present). Formerly, President, Voya Funds Services, LLC (March 2018 – September 2022). | |
Kimberly A. Anderson (1964)
7337 East Doubletree Ranch Rd.
Suite 100
Scottsdale, Arizona 85258 | | | Senior Vice President | | | VFT – November 2003 –
Present VSPT – March 2007 –
Present | | | Senior Vice President, Voya Investments, LLC (September 2003 − Present). | |
Sara M. Donaldson (1959)
7337 East Doubletree Ranch Rd.
Suite 100
Scottsdale, Arizona 85258 | | | Senior Vice President | | | June 2022 – Present | | | Senior Vice President, Voya Investments, LLC (February 2022 – Present); Senior Vice President, Head of Active Ownership, Voya Investment Management (September 2021 – Present). Formerly, Vice President, Voya Investments, LLC (October 2015 – February 2022); Vice President, Head of Proxy Voting, Voya Investment Management (October 2015 – August 2021). | |
Andrew K. Schlueter (1976)
7337 East Doubletree Ranch Rd.
Suite 100
Scottsdale, Arizona 85258 | | | Senior Vice President | | | June 2022 – Present | | | Senior Vice President, Head of Investment Operations Support, Voya Investment Management (April 2023 – Present); Vice President, Voya Investments Distributor, LLC (April 2018 – Present); Vice President, Voya Investments, LLC and Voya Funds Services, LLC (March 2018 – Present); Formerly, Senior Vice President, Head of Mutual Fund Operations, Voya Investment Management (March 2022 – March 2023); Vice President, Head of Mutual Fund Operations, Voya Investment Management (February 2018 – February 2022); Vice President, Voya Investment Management (March 2014 – February 2018). | |
TRUSTEE AND OFFICER INFORMATION (Unaudited) (continued)
Name, Address and
Year of Birth | | | Position(s) Held
With the Trust | | | Term of Office and
Length of Time Served(1) | | | Principal Occupation(s) –
During the Past 5 Years | |
Joanne F. Osberg (1982)
7337 East Doubletree Ranch Rd.
Suite 100
Scottsdale, Arizona 85258 | | | Senior Vice President Secretary | | | March 2023 – Present September 2020 – Present | | | Senior Vice President and Chief Counsel, Voya Investment Management – Mutual Fund Legal Department, Senior Vice President and Secretary, Voya Investments, LLC, Voya Capital, LLC, and Voya Funds Services, LLC (March 2023 – Present). Formerly, Secretary, Voya Capital, LLC (August 2022 – March 2023); Vice President and Secretary, Voya Investments, LLC and Voya Funds Services, LLC, Vice President and Senior Counsel, Voya Investment Management – Mutual Fund Legal Department (September 2020 – March 2023). Vice President and Counsel, Voya Investment Management – Mutual Fund Legal Department (January 2013 – September 2020). | |
Robert Terris (1970)
5780 Powers Ferry Road NW
Atlanta, Georgia 30327 | | | Senior Vice President | | | VFT – May 2006 – Present VSPT – March 2007 –
Present | | | Senior Vice President, Voya Investments Distributor, LLC (April 2018 – Present); Senior Vice President, Head of Investment Services, Voya Investments, LLC (April 2018 – Present); Senior Vice President, Head of Investment Services, Voya Funds Services, LLC (March 2006 – Present). Formerly, Senior Vice President, Head of Division Operations, Voya Investments, LLC (October 2015 – April 2018). | |
Fred Bedoya (1973)
7337 East Doubletree Ranch Rd.
Suite 100
Scottsdale, Arizona 85258 | | | Vice President Principal Accounting Officer and Treasurer | | | September 2012 – Present | | | Vice President, Voya Investments, LLC (October 2015 – Present); Vice President, Voya Funds Services, LLC (July 2012 − Present). | |
Robyn L. Ichilov (1967)
7337 East Doubletree Ranch Rd.
Suite 100
Scottsdale, Arizona 85258 | | | Vice President | | | VFT – October 2000 –
Present VSPT – March 2007 –
Present | | | Vice President, Voya Investments, LLC (August 1997 – Present); Vice President, Voya Funds Services, LLC (November 1995 − Present). | |
Jason Kadavy (1976)
7337 East Doubletree Ranch Rd.
Suite 100
Scottsdale, Arizona 85258 | | | Vice President | | | September 2012 – Present | | | Vice President, Voya Investments, LLC (October 2015 – Present); Vice President, Voya Funds Services, LLC (July 2007 – Present). | |
Erica McKenna (1972)
7337 East Doubletree Ranch Rd.
Suite 100
Scottsdale, Arizona 85258 | | | Vice President | | | June 2022 – Present | | | Vice President, Head of Mutual Fund Compliance, and Chief Compliance Officer, Voya Investments, LLC (May 2022 – Present). Formerly, Vice President, Fund Compliance Manager, Voya Investments, LLC (March 2021 – May 2022); Assistant Vice President, Fund Compliance Manager, Voya Investments, LLC (December 2016 – March 2021). | |
Craig Wheeler (1969)
7337 East Doubletree Ranch Rd.
Suite 100
Scottsdale, Arizona 85258 | | | Vice President | | | May 2013 – Present | | | Vice President – Director of Tax, Voya Investments, LLC (October 2015 – Present). | |
Nicholas C.D. Ward (1993)
7337 East Doubletree Ranch Rd.
Suite 100
Scottsdale, Arizona 85258 | | | Assistant Vice President and Assistant Secretary | | | June 2022 – Present | | | Counsel, Voya Investment Management – Mutual Fund Legal Department (November 2021 – Present). Formerly, Associate, Dechert LLP (October 2018 – November 2021). | |
Gizachew Wubishet (1976)
7337 East Doubletree Ranch Rd.
Suite 100
Scottsdale, Arizona 85258 | | | Assistant Vice President and Assistant Secretary | | | June 2022 – Present | | | Assistant Vice President and Counsel, Voya Investment Management – Mutual Fund Legal Department (May 2019 – Present). Formerly, Attorney, Ropes & Gray LLP (October 2011 − April 2019). | |
Monia Piacenti (1976)
One Orange Way
Windsor, Connecticut 06095 | | | Anti-Money Laundering Officer | | | June 2018 – Present | | | Compliance Consultant, Voya Financial, Inc. (January 2019 – Present); Anti-Money Laundering Officer, Voya Investments Distributor, LLC, Voya Investment Management and Voya Investment Management Trust Co. (June 2018 – Present); Formerly, Senior Compliance Officer, Voya Investment Management (December 2009 – December 2018). | |
(1)
The Officers hold office until the next annual meeting of the Board of Trustees and until their successors shall have been elected and qualified.
ADVISORY AND SUB-ADVISORY CONTRACT APPROVAL DISCUSSION (Unaudited)
BOARD CONSIDERATION AND APPROVAL OF INVESTMENT MANAGEMENT CONTRACT AND SUB-ADVISORY CONTRACT
At a meeting held on November 17, 2022, the Board of Trustees (“Board”) of Voya Separate Portfolios Trust (the “Trust”), including a majority of the Board members who have no direct or indirect interest in the investment management and sub-advisory contracts, and who are not “interested persons” of Voya VACS Series EMCD Fund (formerly, Voya Emerging Markets Corporate Debt Fund), a series of the Trust (the “Fund”), as such term is defined under the Investment Company Act of 1940, as amended (the “Independent Trustees”), considered and approved the renewal of the investment management contract (the “Management Contract”) between Voya Investments, LLC (the “Manager”) and the Trust, on behalf of the Fund, and the sub-advisory contract (the “Sub-Advisory Contract,” and together with the Management Contract, the “Contracts”) with Voya Investment Management Co. LLC, the sub-adviser to the Fund (the “Sub-Adviser”), for an additional one-year period ending November 30, 2023.
In addition to the Board meeting on November 17, 2022, the Independent Trustees also held meetings outside the presence of representatives of the Manager and Sub-Adviser (collectively, such persons are referred to herein as “management”) on October 12-13, 2022, and November 15, 2022. At those meetings, the Board members reviewed and considered materials related to the proposed continuance of the Contracts that they had requested and believed to be relevant to the renewal of the Contracts in light of their own business judgment and the legal advice furnished to them by K&L Gates LLP, their independent legal counsel. The Board also considered information furnished to it throughout the year at meetings of the Board and its committees, including information regarding performance, expenses, and other relevant matters. While the Board considered the renewal of the management contracts and sub-advisory contracts for all of the applicable investment companies in the Voya family of funds at the same meetings, the Board considered each Voya fund’s investment management and sub-advisory relationships separately.
The Board has established a Contracts Committee and two Investment Review Committees (the “IRCs”), each of which includes only Independent Trustees as members. The Contracts Committee meets several times throughout the year to provide oversight with respect to the management and sub-advisory contracts approval and renewal process for the Voya funds, among other functions, and each IRC meets several times throughout the year with respect to each Voya fund (assigned to that IRC) to provide oversight regarding the investment
performance of the sub-advisers, as well as the Manager’s role in monitoring the sub-advisers.
The Contracts Committee oversees, and annually recommends Board approval of updates to, a methodology guide for the Voya funds (“Methodology Guide”), which sets out a framework pursuant to which the Independent Trustees request, and management provides, certain information that the Independent Trustees deem to be important or potentially relevant to the contracts renewal process for the Voya funds. The Independent Trustees retain the services of an independent consultant with experience in the mutual fund industry to assist the Contracts Committee in developing and recommending to the Board: (1) a selected peer group of investment companies for the Fund (“Selected Peer Group”) based on the Fund’s particular attributes, such as fund type and size, fund category (as determined by Morningstar, Inc., an independent provider of mutual fund data (“Morningstar”)), sales channels and structure and the Fund share class being compared to the Selected Peer Group; and (2) updates to the Methodology Guide with respect to the content and format of various data prepared in connection with the renewal process, including, but not limited to, investment performance, fee structure, and expense information. In addition, the Independent Trustees periodically have retained an independent firm to test and verify the accuracy of certain information presented to the Board for a representative sample of the Voya funds.
The Manager or Sub-Adviser may not have been able to, or opted not to, provide information in response to certain information requests, in which case the Board conducted its evaluation based on the information that was provided. In such cases, the Board determined that the omission of any such information was not material to its considerations. Additionally, the Board considered the impact of significant periods of market volatility that occurred during and after the period for which information was requested in conducting its evaluation of the Manager and Sub-Adviser.
Provided below is an overview of certain material factors that the Board considered at its meetings regarding the renewal of the Contracts and the compensation to be paid thereunder. The Board members did not identify any particular information or factor that was most relevant to its consideration.
Nature, Extent and Quality of Services
The Manager oversees, subject to the authority of the Board, and is responsible for the provision of, all investment advisory and portfolio management services for the Fund, but may delegate certain of these
ADVISORY AND SUB-ADVISORY CONTRACT APPROVAL DISCUSSION (Unaudited) (continued)
responsibilities to one or more sub-advisers. In addition, the Manager provides administrative services reasonably necessary for the operation of the Fund as set forth in the Management Contract, including oversight of the Fund’s operations and risk management and the oversight of its various other service providers.
The Board considered the “manager-of-managers” structure of the Voya funds that has been developed by the Manager pursuant to which the Manager selects, subject to the Board’s approval, sub-advisers to provide day-to-day management services to all or a portion of each Voya fund. The Board recognized that the Manager is responsible for monitoring the Sub-Adviser’s investment program, performance, developments, ongoing operations, and compliance with applicable regulations and investment policies and restrictions with respect to the Fund under this manager-of-managers arrangement. The Board also considered the techniques and resources that the Manager has developed to provide this ongoing due diligence and oversight with respect to the sub-advisers and to recommend appropriate changes in investment strategies, sub-advisers, or allocation among sub-advisers in an effort to improve a Voya fund’s performance. In connection with the Manager’s performance of these duties, the Board considered that the Manager has developed an oversight process formulated by its Manager Research & Selection Group that reviews, among other matters, performance data, the Sub-Adviser’s management team, portfolio data and attribution analysis related to the Sub-Adviser through various means, including, but not limited to, in-person meetings, on-site or virtual visits, and telephonic meetings with the Sub-Adviser.
Further, the Board considered periodic compliance reports it receives from the Trust’s Chief Compliance Officer evaluating, among other related matters, whether the regulatory compliance systems and procedures of the Manager and Sub-Adviser are reasonably designed to ensure compliance with the federal securities laws and whether the investment policies and restrictions for the Fund are complied with on a consistent basis.
The Board considered the portfolio management team assigned by the Sub-Adviser to the Fund and the level of resources committed to the Fund (and other relevant funds in the Voya funds) by the Manager and Sub-Adviser, and whether those resources are sufficient to provide high-quality services to the Fund.
Based on their deliberations and the materials presented to them, the Board concluded that the nature, extent and quality of the overall services provided by the Manager and Sub-Adviser under the Contracts were appropriate.
Fund Performance
In assessing the investment management and sub-advisory relationships, the Board placed emphasis on the investment returns of the Fund, including its investment performance over certain time periods compared to the Fund’s Morningstar category and primary benchmark, a broad-based securities market index identified in the Fund’s prospectus. The Board also considered information from the Manager Research & Selection Group and received reports summarizing a separate analysis of the Fund’s performance and risk, including risk-adjusted investment return information, from the Trust’s Chief Investment Risk Officer.
Economies of Scale
When evaluating the reasonableness of the management fee schedule, the Board considered whether economies of scale have been or likely will be realized by the Manager and Sub-Adviser as the Fund grows larger and the extent to which any such economies are shared with the Fund. The Board considered that, while the Fund does not have management fee breakpoints, it has fee waiver and expense reimbursement arrangements. The Board considered the extent to which economies of scale realized by the Manager could be shared with the Fund through such fee waivers, expense reimbursements or other expense reductions. In evaluating these matters, the Board also considered periodic management reports, Selected Peer Group comparisons, and industry information regarding economies of scale.
Information Regarding Services, Performance, and Fee Schedules Offered to Other Clients
The Board considered comparative information regarding the nature of services, performance, and fee schedules offered by the Manager and Sub-Adviser to other clients with similar investment objectives, if applicable, including other registered investment companies and relevant institutional accounts. When the fee schedules offered to or the performance of such other clients differed materially from the Fund, the Board took into account the underlying rationale provided by the Manager or Sub-Adviser, as applicable, for these differences.
Fee Schedules, Profitability, and Fall-out Benefits
The Board reviewed and considered the contractual management fee schedule and net management fee rate payable by the Fund to the Manager compared to the Fund’s Selected Peer Group. The Board also considered the compensation payable by the Manager to the Sub-Adviser for sub-advisory services for the Fund, including the portion of the contractual and net
ADVISORY AND SUB-ADVISORY CONTRACT APPROVAL DISCUSSION (Unaudited) (continued)
management fee rates that are paid to the Sub-Adviser, as compared to the compensation paid to the Manager. In addition, the Board considered the fee waivers, expense limitations, and recoupment arrangements that apply to the fees payable by the Fund, including whether the Manager intends to propose any changes thereto. The Board separately determined that the fees payable to the Manager and the fee schedule payable to the Sub-Adviser are reasonable for the services that each performs, which were considered in light of the nature, extent and quality of the services that each has performed and is expected to perform.
The Board considered information on revenues, costs and profits or losses realized by the Manager and the Voya-affiliated Sub-Adviser related to their services to the Fund. In analyzing the profitability of the Manager and its affiliates in connection with services they render to the Fund, the Board took into account the sub-advisory fee rate payable by the Manager to the Sub-Adviser. The Board also considered the profitability of the Manager and its affiliated Sub-Adviser attributable to servicing the Fund both with and without taking into account the profitability of the distributor of the Fund and any revenue sharing payments made by the Manager.
Although the Methodology Guide establishes a framework for profit calculation, the Board recognized that there is no uniform methodology within the asset management industry for determining profitability for this purpose. The Board also recognized that the use of different reasonable methodologies can give rise to dramatically different reported profit and loss results with respect to the Manager and the Voya-affiliated Sub-Adviser, as well as other industry participants with whom the profits of the Manager and its affiliated Sub-Adviser could be compared. In addition, the Board recognized that management’s calculations regarding its costs incurred in establishing the infrastructure necessary for the Fund’s operations may not be fully reflected in the expenses allocated to the Fund in determining profitability. The Board also recognized that the information presented may not portray all of the costs borne by the Manager or reflect all of the risks associated with offering and managing a mutual fund complex in the current regulatory and market environment, including entrepreneurial, regulatory, legal and operational risks.
The Board also considered that the Manager and the Voya-affiliated Sub-Adviser are entitled to earn a reasonable level of profits for the services that they provide to the Fund. The Board also considered information regarding the potential fall-out benefits to the Manager and Sub-Adviser and their respective affiliates from their association with the Fund, including their ability to engage in soft-dollar transactions on behalf of the Fund. Following
its reviews, the Board determined that the Manager’s and the Voya-affiliated Sub-Adviser’s profitability with respect to their services to the Fund and the Manager and Sub-Adviser’s potential fall-out benefits were not unreasonable.
Fund Analysis
Set forth below are certain of the specific factors that the Board considered at its October 12-13, 2022, November 15, 2022, and/or November 17, 2022 meetings in relation to approving the Fund’s Contracts and the conclusions reached by the Board. These specific factors are in addition to those considerations discussed above. The Fund’s performance was compared to its Morningstar category, as well as its primary benchmark. The performance data provided to the Board primarily was for various periods ended March 31, 2022. In addition, the Board also considered at its October 12-13, 2022, November 15, 2022, and/or November 17, 2022 meetings certain additional data regarding the Fund’s more recent performance, asset levels and asset flows. The Fund’s management fee rate and expense ratio were compared to the management fee rates and expense ratios of the funds in its Selected Peer Group. With respect to the quintile rankings noted below, the first quintile represents the range of funds with the highest performance or the lowest management fee rate or expense ratio, as applicable, and the fifth quintile represents the range of funds with the lowest performance or the highest management fee rate or expense ratio, as applicable.
In considering whether to approve the renewal of the Contracts for the Fund, the Board considered that, based on performance data for the periods ended March 31, 2022: (1) the Fund is ranked in the first quintile of its Morningstar category for the three-year and five-year periods, the fourth quintile for the one-year period, and the fifth quintile for the year-to-date period; and (2) the Fund outperformed its primary benchmark for the three-year and five-year periods and underperformed for the year-to-date and one-year periods. In analyzing this performance data, the Board took into account management’s representations regarding the competitiveness of the Fund’s performance during certain periods.
In considering the fees payable under the Contracts for the Fund, the Board took into account the factors described above and also considered: (1) the fairness of the compensation under a Management Contract with a level fee rate that does not include breakpoints; and (2) the pricing structure (including the net expense ratio to be borne by shareholders) of the Fund, as compared to its Selected Peer Group, including that: (a) the net management fee rate for the Fund is ranked in the first
ADVISORY AND SUB-ADVISORY CONTRACT APPROVAL DISCUSSION (Unaudited) (continued)
quintile of net management fee rates of the funds in its Selected Peer Group; (b) the contractual management fee rate for the Fund is ranked in the fifth quintile of contractual management fee rates of the funds in its Selected Peer Group; and (c) the net expense ratio for the Fund is ranked in the first quintile of net expense ratios of the funds in its Selected Peer Group. In analyzing this fee data, the Board took into account management’s representations regarding the competitiveness of the Fund’s management fee rate and net expense ratio.
Board Conclusions
After its deliberation, the Board concluded that, in its business judgment, the terms of the Contracts are fair and reasonable to the Fund and that approval of the continuation of the Contracts is in the best interests of the Fund and its shareholders. In doing so, the Board reviewed all factors it considered to be material, including those discussed above. Within the context of its overall conclusions regarding the Contracts, and based on the information provided and management’s related representations, the Board concluded that it was satisfied with management’s responses relating to the Fund’s investment performance and the fees payable under the Contracts. During this renewal process, each Board member may have accorded different weight to various factors in reaching his or her conclusions. Based on these conclusions and other factors, the Board voted to renew the Contracts for the Fund for the year ending November 30, 2023.
BOARD CONSIDERATION AND APPROVAL OF NEW MANAGEMENT CONTRACTS AND SUB-ADVISORY CONTRACTS FOR NEW FUNDS
Pursuant to Section 15(c) of the Investment Company Act of 1940, as amended (the “1940 Act”), Voya VACS Series EMHCD Fund (“Series EMHCD Fund”), a series of Voya Separate Portfolios Trust (“VSPT”); Voya VACS Series HYB Fund (“Series HYB Fund”), a series of Voya Funds Trust (“VFT”); and Voya VACS Series SC Fund (“Series SC Fund”), a series of VSPT (each, a “VACS Fund” and collectively, the “VACS Series Funds”) can enter into a new investment management or sub-advisory contract only if the Boards of Trustees (the “Board”) of VSPT and VFT (together, the “Registrants”), including a majority of the Board members who have no direct or indirect interest in the investment management and sub-advisory contracts, and who are not “interested persons” of the VACS Series Funds, as such term is defined under the 1940 Act (the “Independent Trustees”), determines to approve the new arrangements. Thus, at its meeting held on November 17, 2022, the Board considered the initial approval of the investment management
contracts (the “Management Contracts”) with Voya Investments, LLC (“VIL” or the “Adviser”) and the sub-advisory contracts (the “Sub-Advisory Contracts”) between VIL and the sub-adviser, Voya Investment Management Co. LLC (“Voya IM” or the “Sub-Adviser”) (together, the “Contracts”) for the VACS Series Funds.
In determining whether to initially approve the Contracts for the VACS Series Funds, the Board requested, received, evaluated and discussed such information and supporting materials related to that information as it deemed necessary for an informed determination of whether the Contracts should be approved. Provided below is a general overview of the Board’s contract approval process that it followed, as well as a discussion of certain specific factors that the Board considered. While the Board gave its attention to information furnished at the request of the Independent Trustees that was most relevant to its considerations, discussed below are some of the primary matters relevant to the Board’s consideration as to whether to approve the Contracts.
The materials provided to the Board in support of each VACS Fund and the VACS Series Funds’ Contracts included the following: (1) a memorandum and presentation materials presenting management’s rationale for proposing the launch of the VACS Series Funds that discuss, among other things, VIL’s experience and expertise in the management of other funds within the Voya funds complex with similar investment objectives and strategies, including the existing VACS Series Funds; (2) information about the VACS Series Funds’ proposed investment objective and strategies and anticipated portfolio characteristics; (3) Fund Analysis and Comparison Tables sheets for the VACS Series Funds that compare the VACS Series Funds’ proposed fee structure to its comparable selected peer group (“SPG”) and Morningstar/Lipper category medians; (4) supporting documentation, including copies of the forms of Contracts for the VACS Series Funds; (5) a memorandum provided by counsel to the Independent Trustees summarizing the guidelines relevant to the Board’s consideration of the approvals of the Management Contracts; (6) a memorandum and other information provided in response to Section 15(c) requests to the Adviser and Sub-Advisers by counsel to the Independent Trustees on behalf of the Board; and (7) other information relevant to the Board’s evaluation. In addition, the Board considered the information provided periodically throughout the year in presentations to the Board by VIL in the context of VIL’s oversight and management of other funds in the Voya funds complex.
The Board’s consideration of whether to approve the Management Contracts with VIL on behalf of each VACS
ADVISORY AND SUB-ADVISORY CONTRACT APPROVAL DISCUSSION (Unaudited) (continued)
Fund took into account several factors including, but not limited to, the following: (1) the nature, extent and quality of the services to be provided by VIL to the VACS Series Funds under the proposed Management Contracts; (2) VIL’s experience as a manager-of-managers overseeing sub-advisers to other funds within the Voya funds complex; (3) the fairness of the compensation under the proposed Management Contracts in light of the services to be provided to the VACS Series Funds; (4) the costs for the services to be provided by VIL, including that the proposed management fee would not be subject to breakpoint discounts; (5) the pricing structure (including the estimated expense ratio to be borne by shareholders) of the VACS Series Funds, including that: (a) the proposed management fee for each VACS Fund is below the average and median management fees of the funds in the Fund’s SPG, and (b) the estimated net annual operating expenses for each VACS Fund are below the average and median expense ratios of the funds in the Fund’s SPG; (6) management’s representations that the VACS Series Funds’ management fee structure is consistent within the VACS Series Funds suite; (7) the projected profitability of VIL; (8) the personnel, operations, financial condition, and investment management capabilities, methodologies and resources of VIL, including its management team’s expertise in the management of other series of the Registrants; (9) VIL’s compliance capabilities, as demonstrated by, among other things, its policies and procedures designed to prevent violations of the Federal securities laws, which had previously been approved by the Board in connection with their oversight of other funds in the Voya funds complex; (10) the information that had been provided by VIL at regular Board meetings, and in anticipation of the November 17, 2022 meeting, as well as the annual contract renewal Board meetings regarding existing series of the Voya funds, with respect to its capabilities in overseeing similar asset allocation products; and (11) “fall-out benefits” to VIL and its affiliates that were anticipated to arise from VIL’s management of the VACS Series Funds.
In reviewing the proposed Sub-Advisory Contracts with Voya IM, the Board considered a number of factors, including, but not limited to, the following: (1) VIL’s view of the reputation of Voya IM, including its strength and reputation in the industry, and its sub-advisory services; (2) the information that had been provided by Voya IM in advance of the November 17, 2022 meeting at which Voya IM presented with respect to its sub-advisory services; (3) the nature, extent and quality of the services to be provided by Voya IM under the proposed Sub-Advisory Contracts; (5) the personnel, operations, financial condition, and investment management capabilities, methodologies and resources of Voya IM; (6) the fairness
of the compensation under the Sub-Advisory Contracts in light of the services to be provided by Voya IM as the VACS Series Funds’ Sub-Adviser; (7) Voya IM’s operations and compliance program, including its policies and procedures intended to prevent violation of the Federal securities laws, which had been reviewed and evaluated by the Chief Compliance Officer of the Registrants; (8) Voya IM’s financial condition; (9) the appropriateness of the selection of Voya IM in light of the VACS Series Funds’ investment objectives and prospective investor base; and (10) Voya IM’s Code of Ethics, which was previously approved by the Board.
With respect to the nature, extent and quality of services to be provided by the Adviser and Sub-Adviser, the Board was mindful of the “manager-of-managers” platform that has been developed by the Adviser. The Board recognized that the Adviser would be responsible for monitoring the investment program, performance, and developments/ on-going operations of the Sub-Adviser under this manager-of-managers arrangement. The Board also considered the techniques and resources that the Adviser has developed to provide ongoing oversight of the nature, extent and quality of the services the Sub-Adviser provides to the VACS Series Funds and the Sub-Adviser’s compliance with applicable laws and regulations. The Board was previously advised that to assist in the selection and monitoring of sub-advisers, the Adviser has developed an oversight process formulated by its Manager Research & Selection Group (“MR&S”), which analyzes both qualitative (such as in-person meetings and telephonic meetings with sub-advisers and research on sub-advisers) and quantitative information (such as performance data, portfolio data and attribution analysis) about the sub-advisers.
The Board considered that MR&S also typically provides reports to the Investment Review Committees (“IRCs”) at their meetings prior to sub-adviser presentations. In addition, the Board considered that MR&S prepares periodic due diligence reports regarding sub-advisers based on on-site visits and information and analysis which team members use to attempt to gain and maintain an in-depth understanding of the sub-advisers’ investment processes and to try to identify issues that may be relevant to a sub-adviser’s services to a Voya fund and/or its performance. The Board also considered that MR&S provides written reports on these due diligence analyses to the pertinent IRC. The Board considered the resources that Management has committed to its services as a manager-of-managers, including resources for reporting to the Board and the IRCs to assist them with their assessment investment performance on an on-going basis throughout the year. This includes the appointment of a Chief Investment Risk Officer and his staff, who report
ADVISORY AND SUB-ADVISORY CONTRACT APPROVAL DISCUSSION (Unaudited) (continued)
directly to the Board and who have developed attribution analyses and other metrics used by the IRCs to analyze the key factors underlying investment performance for the funds in the Voya family of funds.
The Board also considered that MR&S has developed, based on guidance from the IRCs, a methodology for monitoring the performance of sub-advisers. The Board also recognized that MR&S provides the IRCs with regular updates on the Voya funds and alerts the IRCs to potential issues as they arise. The Board also considered that the Adviser regularly monitors performance, personnel, compliance and other issues that may arise on a day-to-day basis regarding sub-advisers and considered that, if issues are identified either through formal or informal processes, they are brought before the IRCs and the Board for consideration and action and the Adviser consistently makes its resources available to the Board and the IRCs to assist with addressing any issues that arise. Because each VACS Fund was similar to a predecessor fund, the Board also considered performance information from that predecessor fund, which was managed by the investment management team with similar investment processes.
The Board considered that the VACS Series Funds also can benefit from the services of the Adviser’s Investment Risk Management Department (the “IRMD”), under the leadership of the Chief Investment Risk Officer, the costs of which are shared by the Voya funds and the Adviser. The Board considered that the IRMD regularly presents written materials and reports to the IRCs that focus on the investment risks of the Voya funds. The Board also considered that the IRMD provides the IRCs with analyses
that are developed to assist the IRCs in identifying performance trends and other areas over consecutive periods. The Board considered that the services to be provided by the IRMD are meant to provide an additional perspective for the benefit of the IRCs, which may vary from the perspective of MR&S. The Board also considered the techniques used by the Adviser to monitor sub-adviser performance.
The Board also considered the extent of benefits provided to the VACS Series Funds’ shareholders, beyond investment management services, from being part of the Voya family of funds. The Board also took into account the Adviser’s ongoing efforts to reduce the expenses of the Voya funds through renegotiated arrangements with the Voya funds’ service providers.
After its deliberation, the Board concluded that, in its business judgment, the terms of the Contracts with respect to each VACS Fund are fair and reasonable to the VACS Series Funds and that approval of the Contracts is in the best interests of each VACS Fund and its shareholders. In doing so, the Board reviewed all factors it considered to be material, including those discussed above. Within the context of its overall conclusions regarding the Contracts, and based on the information provided and management’s related representations, the Board concluded that it was satisfied with management’s responses relating to the fees payable by each VACS Fund under the Contracts. During this approval process, different Board members may have given different weight to different individual factors and related conclusions. Based on these conclusions and other factors, the Board voted to approve the Contracts for each VACS Fund.
Investment Adviser
Voya Investments, LLC
7337 East Doubletree Ranch Road, Suite 100
Scottsdale, Arizona 85258
Distributor
Voya Investments Distributor, LLC
7337 East Doubletree Ranch Road, Suite 100
Scottsdale, Arizona 85258
Transfer Agent
BNY Mellon Investment Servicing (U.S.) Inc.
301 Bellevue Parkway
Wilmington, Delaware 19809
Independent Registered Public Accounting Firm
Ernst & Young LLP
200 Clarendon Street
Boston, Massachusetts 02116
Custodian
The Bank of New York Mellon
225 Liberty Street
New York, New York 10286
Legal Counsel
Ropes & Gray LLP
Prudential Tower
800 Boylston Street
Boston, Massachusetts 02119
For more complete information, or to obtain a prospectus on any Voya mutual fund, please call your financial advisor or Voya Investments Distributor, LLC at (800) 992-0180 or log on to www.voyainvestments.com. The prospectus should be read carefully before investing. Consider the fund’s investment objectives, risks, charges and expenses carefully before investing. The prospectus contains this information and other information about the fund.
RETIREMENT | INVESTMENTS | INSURANCE
voyainvestments.com

Annual Report March 31, 2023 Voya Floating Rate Fund Classes A, C, I, R and W |
As permitted by regulations adopted by the U.S. Securities and Exchange Commission, paper copies of the fund’s annual and semi-annual shareholder reports, like this annual report, will no longer be sent by mail, unless you specifically request paper copies of the reports. Instead, the reports will be made available on the Voya funds’ website (https://individuals.voya.com/literature), and you will be notified by mail each time a report is posted and provided with a website link to access the report. If you already elected to receive shareholder reports electronically, you need not take any action. You may elect to receive shareholder reports and other communications from the fund electronically anytime by contacting your financial intermediary (such as a broker-dealer or bank) or, if you are a direct investor, by calling 1-800-992-0180 or by sending an e-mail request to Voyaim_literature@voya.com. You may elect to receive all future reports in paper free of charge. If you received this document in the mail, please follow the instructions to elect to continue receiving paper copies of your shareholder reports. If you received this document through a financial intermediary, you can contact your financial intermediary to request that you continue to receive paper copies of your shareholder reports. If you invest directly with us, you can call 1-800-992-0180 or send an email request to Voyaim_literature@voya.com to let the fund know you wish to continue receiving paper copies of your shareholder reports. Your election to receive reports in paper will apply to all funds held in your account if you invest through your financial intermediary or all funds held with the Voya funds complex if you invest directly with the funds. |
| |
| This report is submitted for general information to shareholders of the Voya mutual funds. It is not authorized for distribution to prospective shareholders unless accompanied or preceded by a prospectus which includes details regarding the fund’s investment objectives, risks, charges, expenses and other information. This information should be read carefully. |
| |
 E-Delivery Sign-up — details inside E-Delivery Sign-up — details inside
|
INVESTMENT MANAGEMENT voyainvestments.com |  |
TABLE OF CONTENTS
| Go Paperless with E-Delivery! | |
Sign up now for on-line prospectuses, fund reports, and proxy statements. Just go to www.individuals.voya.com/page/e-delivery, follow the directions and complete the quick 5 Steps to Enroll. You will be notified by e-mail when these communications become available on the internet. |
PROXY VOTING INFORMATION
A description of the policies and procedures that the Fund uses to determine how to vote proxies related to portfolio securities is available: (1) without charge, upon request, by calling Shareholder Services toll-free at (800) 992-0180; (2) on the Fund’s website at www.voyainvestments.com; and (3) on the U.S. Securities and Exchange Commission’s (“SEC’s”) website at www.sec.gov. Information regarding how the Fund voted proxies related to portfolio securities during the most recent 12-month period ended June 30 is available without charge on the Fund’s website at www.voyainvestments.com and on the SEC’s website at www.sec.gov.
QUARTERLY PORTFOLIO HOLDINGS
The Fund files its complete schedule of portfolio holdings with the SEC for the first and third quarters of each fiscal year on Form NPORT-P. The Fund’s Forms NPORT-P are available on the SEC’s website at www.sec.gov. The Fund’s complete schedule of portfolio holdings is available at: www.voyainvestments.com and without charge upon request from the Fund by calling Shareholder Services toll-free at (800) 992-0180.
Benchmark Descriptions
| Index | Description |
| The S&P/LSTA Leveraged Loan Index | An unmanaged total return index that captures accrued interest, repayments, and market value changes. It represents a broad cross section of leveraged loans syndicated in the United States, including dollar-denominated loans to overseas issuers. Standard & Poor’s (“S&P”) and the Loan Syndications and Trading Association (“LSTA”) conceived the index to establish a performance benchmark for the syndicated leveraged loan industry. |
2
| Voya Floating Rate Fund | Portfolio Managers’ Report |
| | Ratings Distribution
as of March 31, 2023 | |
| | BB or above | | 28.40% | |
| | B | | 61.60% | |
| | CCC or below | | 8.28% | |
| | Not rated* | | 1.72% | |
| | Loan ratings apply to the underlying holdings of the Fund and not the Fund itself. Ratings distribution shows the percentage of the Fund’s loan commitments (excluding cash and foreign cash) that are rated in each ratings category, based upon the categories provided by Standard & Poor. Ratings distribution is based on Standard & Poor’s senior secured facility ratings. The Standard & Poor’s rating scale is as follows, from excellent (high grade) to poor (including default): AAA to D, with intermediate ratings offered at each level between AA and CCC. Anything lower than a BBB- rating is considered a non-investment grade or junk bond. Any security that is not rated by Standard & Poor’s is placed in the NR (Not Rated) category. Ratings can change from time to time, and current ratings may not fully reflect the actual credit condition or risks posed by a loan. * Not rated includes loans to non-U.S. borrowers (which are typically unrated) and loans for which the rating has been withdrawn. | |
Voya Floating Rate Fund (the “Fund”) seeks to provide investors with a high level of current income. The Fund is managed by Mohamed Basma, CFA, and Randall Parrish, CFA Portfolio Managers* of Voya Investment Management Co. LLC – the Sub-Adviser.
Performance: For the year ended March 31, 2023, the Fund’s Class A shares, excluding sales charges, provided a total return of -1.28% compared to the S&P/LSTA Leveraged Loan Index (the “Index” or “S&P/LSTA Leveraged Loan”), which returned 2.54% for the same period.
Portfolio Specifics: The Fund’s fiscal period was marked by high inflation, geopolitical tension, peak hawkishness in central bank policy, recession concerns and rising global bond yields. The yield on the 10-year US Treasury notes increased by more than 300 basis points (“bp”), creating a notable reset in financial asset valuations and upending a prolonged period of low yields and excess liquidity. Nearly all risk assets felt the pain, but duration-sensitive assets bore the brunt of it. However, given the floating rate nature of loans, the U.S. loan market fared considerably better relative to other asset classes. The Index returned 2.54% during the fiscal year with higher interest returns, driven by rising base rates and stable nominal spreads, partially offset by sharp market value declines. For context, the average Index bid price closed out the period at 93.38, representing a 422 bp drop from the end of the prior fiscal period.
Although loans delivered a positive return, the path was less straightforward with various challenges along the way. Borrowers faced an increasingly difficult economic backdrop, putting both technical and fundamental factors under pressure, and causing performance dispersion at the rating and sector level. Unsurprisingly, higher-rated loans outperformed their riskier counterparts, with returns for BB, B and CCC rated loans coming in at 5.15%, 2.51%, and -7.92%, respectively. The stark difference between ratings reflects growing uncertainty around earnings growth and higher financing costs from aggressive hiking plans, as investors began to weigh the implications on issuer fundamental factors.
Amid the difficult macro conditions, market technical factors became less supportive. Starting with supply, new issuance was constrained by broad uncertainty and volatility. Following strong issuance in the prior fiscal period, total new issue volume was just $165 billion. The pullback was exacerbated by a handful of large deals that were shelved during syndication, leaving the various underwritten loans as hung deals on bank balance sheets. In general, the difficult economic backdrop, higher financing costs and notable declines in secondary trading levels were not supportive for the syndication of new loans. In contrast, investor demand for the asset class was highly mixed during the period. Collateralized loan obligations — the predominant buyers of loans — again proved to be the primary component of measurable demand, as managers found creative solutions to ink deals, such as tapping into the secondary loan market to build portfolios via “print-and-sprint” transactions and issuing shorter-dated or static structures. Total volumes amounted to a robust $131.3 billion during the period. Meanwhile, the other measurable sources of demand for loans — mutual funds and exchange-traded funds — experienced net outflows for the period, to the tune of $43.4 billion. Macro uncertainties and general investor unease, together with a more competitive yield opportunity set across other asset classes, outweighed any demand tailwind from the strong rise in short-term rates, which historically has been a positive driver of retail flows.
| | TOP TEN LOAN ISSUERS
AS OF MARCH 31, 2023
AS A PERCENTAGE OF: | |
| | | |
| | | NET
ASSETS | |
| | Moran Foods | 1.1% | |
| | United Airlines, Inc. | 0.9% | |
| | Asurion, LLC | 0.7% | |
| | Peraton Holding Corp | 0.7% | |
| | Nautilus Power, LLC | 0.7% | |
| | Acrisure, LLC | 0.7% | |
| | Citadel Securities LP | 0.7% | |
| | Great Outdoors Group, LLC | 0.7% | |
| | Ineos US Finance LLC | 0.6% | |
| | DirecTV Financing, LLC | 0.6% | |
Class I shares of the Fund underperformed the Index during the fiscal period on a NAV basis. By ratings, the Fund was negatively impacted by exposure to a few loans in the defaulted loan category, selection in B, as well as selection and overweight to D rated loans. From an industry perspective, selection in software was the primary drag, although the bulk of impact was concentrated in a single issuer. Additional but smaller impacts included overweights to the following sectors: trading companies and distributors, media and IT services. At the issuer level, the primary relative laggards were overweights to Avaya Inc., Diamond Sports Group, LLC, Yak Mat, Riverbed Technology, Inc. and Logmein, Inc. Each company experienced challenges related to weak earnings and liquidity challenges, with the former three filing for Chapter 11 bankruptcy during the period. In contrast, the Fund benefited from selection and underweight to entertainment, as well as selection and overweight to food products. The primary issuer-level contribution was due to the avoidance of Cineworld, which defaulted during the period. Away from loan-level performance, the Fund was weighed down by its exposure to high yield (“HY”) bonds, as the HY bond market underperformed loans during the timeframe (-3.34% return for the Bloomberg U.S. Corporate High Yield Index).
Current Strategy & Outlook: In the short term, we expect leveraged finance markets to remain impacted by a myriad of macro developments, evolving U.S. Federal Reserve policy, inflation and payroll data, fallout from regional banks and tighter financial conditions and most importantly, in our opinion, — corporate fundamental factors, first quarter 2023 earnings and forward guidance. Loan fundamental factors, while in our view are still favorable, are showing signs of deterioration especially across lower-rated issuers. In our
3
| Voya Floating Rate Fund | Portfolio Managers’ Report |
opinion, while overall metrics look favorable versus pre-pandemic levels, the market will be acutely focused on the impact of “higher for longer” rates environment (if sustained) and secondary impact from tighter credit conditions (regional banks), both of which will be a key focus during the next round of quarterly earnings. Unsurprisingly, loans have become more heavily correlated to movements in macro sentiment than is typical for the asset class given the recent developments that have impacted broad risk sentiment. As a result, careful credit selection and monitoring continues to be warranted, as risks remain skewed to the downside.
| * | Effective May 1, 2023, Randall Parrish, CFA was added as a portfolio manager for the Fund and Kelly Byrne was removed as a portfolio manager for the Fund. Effective April 30, 2023, Jeffrey A. Bakalar no longer serves as a portfolio manager for the Fund. Effective October 4, 2022, Mohamed Basma, CFA was added as a portfolio manager to the Fund. |
The views expressed in this commentary are informed opinions. They should not be considered promises or advice. The views expressed reflect those of the portfolio managers, only through the end of the period as stated on the cover. The portfolio managers’ views are subject to change at any time based on market and other conditions.
Portfolio holdings and characteristics are subject to change and may not be representative of current holdings and characteristics. Fund holdings are subject to change daily. The outlook for this Fund may differ from that presented for other Voya mutual funds. This report contains statements that may be “forward-looking” statements. Actual results may differ materially from those projected in the “forward-looking” statements. The Fund’s performance returns shown reflect applicable fee waivers and/or expense limits in effect during this period. Absent such fee waivers/expense limitations, if any, performance would have been lower. Performance for the different classes of shares will vary based on differences in fees associated with each class. An index has no cash in its portfolio and imposes no sales charges. An investor cannot invest directly in an index.
The commentary provided was based in part upon attribution analysis from FactSet and is for informational purposes only and is not intended as investment advice. The commentary may reference current holdings as well as holdings that may have been sold during the period. Performance figures for individual sectors and individual holdings in FactSet attribution are gross of fees. Results are on a gross of fees basis.
The attribution analysis from FactSet compares loan level performance of the portfolio to the index. FactSet attribution does not include any other fund performance attribution impact (e.g., structural impacts, intraday trade prices, fee income, cash, etc). Further, certain assumptions are made in FactSet’s model for the calculation of daily total returns for loans in the portfolio, including how FactSet accrues income and calculates coupon, both of which may have an impact on the derived total return used in the attribution analysis. FactSet obtains daily weights and returns for the index directly from S&P/LCD. The calculated returns used in the attribution analysis are not accounting-based returns. Investment performance presented differs from actual performance and was not constructed according to the input, calculation, presentation, and disclosure requirements of the Global Investment Performance Standards (GIPS). Attribution analysis is intended only to directionally understand drivers of performance and is not intended to convey unintended precision or accuracy. FactSet attribution results can vary, even for historical periods, from previously run attribution reports for those same periods. These variances can be a result of changes to FactSet’s system, improvements or revisions to calculation methodology, or data reconciliation efforts. Voya IM believes that attribution and statements based on attribution are directionally useful for understanding performance, but Voya IM does not represent that such information is accurate or complete.
4
| Voya Floating Rate Fund | Portfolio Managers’ Report |
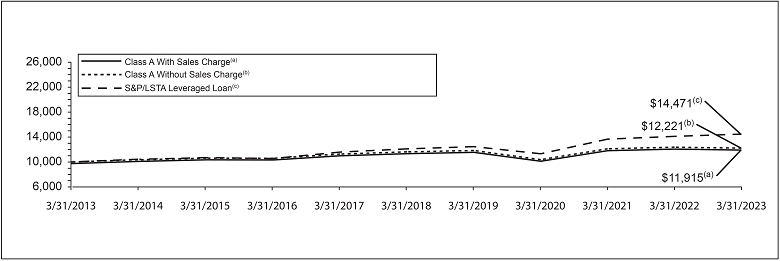
| Average Annual Total Returns for the Periods Ended March 31, 2023 |
| | 1 Year | | 5 Year | | 10 Year | |
| Including Sales Charge: | | | | | | |
| Class A(1) | -3.75% | | 0.50% | | 1.77% | |
| Class C(2) | -2.95% | | 0.20% | | 1.25% | |
| Class I | -1.03% | | 1.24% | | 2.28% | |
| Class R | -1.53% | | 0.73% | | 1.76% | |
| Class W | -1.04% | | 1.21% | | 2.27% | |
| Excluding Sales Charge: | | | | | | |
| Class A | -1.28% | | 1.00% | | 2.02% | |
| Class C | -2.03% | | 0.20% | | 1.25% | |
| Class I | -1.03% | | 1.24% | | 2.28% | |
| Class R | -1.53% | | 0.73% | | 1.76% | |
| Class W | -1.04% | | 1.21% | | 2.27% | |
| S&P/LSTA Leveraged Loan | 2.54% | | 3.63% | | 3.76% | |
Based on a $10,000 initial investment, the graph and table above illustrate the total return of Voya Floating Rate Fund against the index indicated. The index is unmanaged, has no cash in its portfolio and imposes no sales charges. An investor cannot invest directly in an index.
The Fund’s performance is shown both with and without the imposition of sales charges.
The performance graph and table do not reflect the deduction of taxes that a shareholder will pay on Fund distributions or the redemption of Fund shares.
The performance shown includes, if applicable, the effect of fee waivers and/or expense reimbursements by the Investment Adviser and/or other service providers, which have the effect of increasing total net return. Had all fees and expenses been considered, the total net returns would have been lower.
Performance data represents past performance and is no assurance of future results. Investment return and principal value of an investment in the Fund will fluctuate. Shares, when sold, may be worth more or less than their original cost. The Fund’s current performance may be lower or higher than the performance data shown. Please log on to www.voyainvestments.com or call (800) 992-0180 to get performance through the most recent month end.
Fund holdings are subject to change daily.
| (1) | Reflects deduction of the maximum Class A sales charge of 2.50%. |
| (2) | Reflects deduction of the Class C deferred sales charge of 1% for the 1 year return. |
5
SHAREHOLDER EXPENSE EXAMPLE (unaudited)
As a shareholder of the Fund, you incur two types of costs: (1) transaction costs, including sales charges (loads) on purchase payments, redemption fees and exchange fees, and (2) ongoing costs, including management fees, distribution and/or service (12b-1) fees, and other Fund expenses. These Examples are intended to help you understand your ongoing costs (in dollars) of investing in the Fund and to compare these costs with the ongoing costs of investing in other mutual funds.
The Examples are based on an investment of $1,000 invested at the beginning of the period and held for the entire period from October 1, 2022 to March 31, 2023. The Fund’s expenses are shown without the imposition of any sales charges or fees. Expenses would have been higher if such charges were included.
Actual Expenses
The left section of the table shown below, “Actual Fund Return,” provides information about actual account values and actual expenses. You may use the information in this section, together with the amount you invested, to estimate the expenses that you paid over the period. Simply divide your account value by $1,000 (for example, an $8,600 account value divided by $1,000 = 8.6), then multiply the result by the number in the first section under the heading entitled “Expenses Paid During the Period” to estimate the expenses you paid on your account during this period.
Hypothetical Example for Comparison Purposes
The right section of the table shown below, “Hypothetical (5% return before expenses),” provides information about hypothetical account values and hypothetical expenses based on the Fund’s actual expense ratio and an assumed rate of return of 5% per year before expenses, which is not the Fund’s actual return. The hypothetical account values and expenses may not be used to estimate the actual ending account balance or expenses you paid for the period. You may use this information to compare the ongoing costs of investing in the Fund and other mutual funds. To do so, compare this 5%hypothetical example with the 5% hypothetical examples that appear in the shareholder reports of the other mutual funds.
Please note that the expenses shown in the table are meant to highlight your ongoing costs only and do not reflect any transactional costs, such as sales charges (loads), redemption fees or exchange fees. Therefore, the hypothetical section of the table is useful in comparing ongoing costs only, and will not help you determine the relative total costs of owning different mutual funds. In addition, if these transactional costs were included, your costs would have been higher.
| | | Actual Fund Return | | Hypothetical (5% return before expenses) |
| | | Beginning
Account Value
October 1, 2022 | | Ending
Account Value
March 31, 2023 | | Annualized
Expense Ratio | | Expenses Paid
During the
Period Ended
March 31, 2023* | | Beginning
Account Value
October 1, 2022 | | Ending
Account Value
March 31, 2023 | | Annualized
Expense Ratio | | Expenses Paid
During the
Period Ended
March 31, 2023* |
| Class A | | $ | 1,000.00 | | | $ | 1,050.10 | | | | 1.06 | % | | $ | 5.42 | | | $ | 1,000.00 | | | $ | 1,019.65 | | | | 1.06 | % | | $ | 5.34 | |
| Class C | | | 1,000.00 | | | | 1,044.90 | | | | 1.81 | | | | 9.23 | | | | 1,000.00 | | | | 1,015.91 | | | | 1.81 | | | | 9.10 | |
| Class I | | | 1,000.00 | | | | 1,051.40 | | | | 0.81 | | | | 4.14 | | | | 1,000.00 | | | | 1,020.89 | | | | 0.81 | | | | 4.08 | |
| Class R | | | 1,000.00 | | | | 1,047.60 | | | | 1.31 | | | | 6.69 | | | | 1,000.00 | | | | 1,018.40 | | | | 1.31 | | | | 6.59 | |
| Class W | | | 1,000.00 | | | | 1,050.00 | | | | 0.81 | | | | 4.14 | | | | 1,000.00 | | | | 1,020.89 | | | | 0.81 | | | | 4.08 | |
| * | Expenses are equal to the Fund’s annualized expense ratios multiplied by the average account value over the period, multiplied by 182/365 to reflect the most recent fiscal half-year. |
6
REPORT OF INDEPENDENT REGISTERED PUBLIC ACCOUNTING FIRM
To the Shareholders of Voya Floating Rate Fund and the Board of Trustees of Voya Funds Trust
Opinion on the Financial Statements
We have audited the accompanying statement of assets and liabilities of Voya Floating Rate Fund (the “Fund”) (one of the funds constituting Voya Funds Trust (the “Trust”)), including the portfolio of investments, as of March 31, 2023, and the related statement of operations for the year then ended, the statements of changes in net assets for each of the two years in the period then ended, the financial highlights for each of the four years in the period then ended and the related notes (collectively referred to as the “financial statements”). In our opinion, the financial statements present fairly, in all material respects, the financial position of the Fund (one of the funds constituting Voya Funds Trust) at March 31, 2023, the results of its operations for the year then ended, the changes in its net assets for each of the two years in the period then ended and its financial highlights for each of the four years in the period then ended, in conformity with U.S. generally accepted accounting principles.
The financial highlights for the year ended March 31, 2019, were audited by another independent registered public accounting firm whose report, dated May 23, 2019, expressed an unqualified opinion on those financial highlights.
Basis for Opinion
These financial statements are the responsibility of the Trust’s management. Our responsibility is to express an opinion on the Fund’s financial statements based on our audits. We are a public accounting firm registered with the Public Company Accounting Oversight Board (United States) (“PCAOB”) and are required to be independent with respect to the Trust in accordance with the U.S. federal securities laws and the applicable rules and regulations of the Securities and Exchange Commission and the PCAOB.
We conducted our audits in accordance with the standards of the PCAOB. Those standards require that we plan and perform the audit to obtain reasonable assurance about whether the financial statements are free of material misstatement, whether due to error or fraud. The Trust is not required to have, nor were we engaged to perform, an audit of the Trust’s internal control over financial reporting. As part of our audits, we are required to obtain an understanding of internal control over financial reporting, but not for the purpose of expressing an opinion on the effectiveness of the Trust’s internal control over financial reporting. Accordingly, we express no such opinion.
Our audits included performing procedures to assess the risks of material misstatement of the financial statements, whether due to error or fraud, and performing procedures that respond to those risks. Such procedures included examining, on a test basis, evidence regarding the amounts and disclosures in the financial statements. Our procedures included confirmation of securities owned as of March 31, 2023, by correspondence with the custodian, brokers and others; when replies were not received from brokers and others, we performed other auditing procedures. Our audits also included evaluating the accounting principles used and significant estimates made by management, as well as evaluating the overall presentation of the financial statements. We believe that our audits provide a reasonable basis for our opinion.

We have served as the auditor of one or more Voya investment companies since 2019.
Boston, Massachusetts
May 30, 2023
7
STATEMENT OF ASSETS AND LIABILITIES as of March 31, 2023
| ASSETS: | | | | |
| Investments in securities at fair value (Cost $273,852,270) | | $ | 253,309,968 | |
| Cash | | | 2,103,982 | |
| Receivables: | | | | |
| Investment securities sold | | | 8,769,505 | |
| Fund shares sold | | | 1,010,440 | |
| Interest | | | 1,876,075 | |
| Dividend | | | 39,071 | |
| Prepaid structuring fee (Note 7) | | | 24,123 | |
| Prepaid expenses | | | 47,614 | |
| Reimbursement due from Investment Adviser | | | 41,473 | |
| Other assets | | | 39,709 | |
| Total assets | | | 267,261,960 | |
| LIABILITIES: | | | | |
| Notes payable | | | 500,000 | |
| Payable for investment securities purchased | | | 7,840,760 | |
| Payable for fund shares redeemed | | | 489,002 | |
| Income distribution payable | | | 51,078 | |
| Payable for investment management fees | | | 141,113 | |
| Payable for distribution and shareholder service fees | | | 50,733 | |
| Payable for trustee fees | | | 27,704 | |
| Payable to trustees under the deferred compensation plan (Note 8) | | | 39,709 | |
| Payable for commitment fees on line of credit (Note 7) | | | 52,522 | |
| Unfunded loan commitments (Note 9) | | | 230,965 | |
| Other accrued expenses and liabilities | | | 749,096 | |
| Total liabilities | | | 10,172,682 | |
| NET ASSETS | | $ | 257,089,278 | |
| NET ASSETS WERE COMPRISED OF: | | | | |
| Paid-in capital | | | 483,603,167 | |
| Total distributable loss | | | (226,513,889 | ) |
| NET ASSETS | | $ | 257,089,278 | |
See Accompanying Notes to Financial Statements
8
STATEMENT OF ASSETS AND LIABILITIES as of March 31, 2023 (continued)
| Class A: | | | | |
| Net assets | | $ | 33,686,187 | |
| Shares authorized | | | unlimited | |
| Par value | | $ | 0.001 | |
| Shares outstanding | | | 4,065,720 | |
| Net asset value and redemption price per share(2) | | $ | 8.29 | |
| Maximum offering price per share (2.50%)(1) | | $ | 8.50 | |
| | | | | |
| Class C: | | | | |
| Net assets | | $ | 6,743,253 | |
| Shares authorized | | | unlimited | |
| Par value | | $ | 0.001 | |
| Shares outstanding | | | 813,960 | |
| Net asset value and redemption price per share(2) | | $ | 8.28 | |
| | | | | |
| Class I: | | | | |
| Net assets | | $ | 116,954,022 | |
| Shares authorized | | | unlimited | |
| Par value | | $ | 0.001 | |
| Shares outstanding | | | 14,102,835 | |
| Net asset value and redemption price per share | | $ | 8.29 | |
| | | | | |
| Class R: | | | | |
| Net assets | | $ | 88,958,567 | |
| Shares authorized | | | unlimited | |
| Par value | | $ | 0.001 | |
| Shares outstanding | | | 10,756,284 | |
| Net asset value and redemption price per share | | $ | 8.27 | |
| | | | | |
| Class W: | | | | |
| Net assets | | $ | 10,747,249 | |
| Shares authorized | | | unlimited | |
| Par value | | $ | 0.001 | |
| Shares outstanding | | | 1,294,602 | |
| Net asset value and redemption price per share | | $ | 8.30 | |
| (1) | Maximum offering price is computed at 100/97.50 of net asset value. On purchases of $100,000 or more, the offering price is reduced. |
| (2) | Redemption price per share may be reduced for any applicable contingent deferred sales charge. |
See Accompanying Notes to Financial Statements
9
STATEMENT OF OPERATIONS for the year ended March 31, 2023
| INVESTMENT INCOME: | | | | |
| Interest | | $ | 26,142,353 | |
| Dividend | | | 865,649 | |
| Total investment income | | | 27,008,002 | |
| | | | | |
| EXPENSES: | | | | |
| Investment management fees | | | 2,386,966 | |
| Distribution and shareholder service fees: | | | | |
| Class A | | | 90,878 | |
| Class C | | | 77,597 | |
| Class R | | | 501,186 | |
| Transfer agent fees: | | | | |
| Class A | | | 41,295 | |
| Class C | | | 8,815 | |
| Class I | | | 50,593 | |
| Class R | | | 113,872 | |
| Class W | | | 14,051 | |
| Shareholder reporting expense | | | 10,950 | |
| Custody and accounting expense | | | 219,000 | |
| Registration fees | | | 121,718 | |
| Professional fees | | | 49,275 | |
| Trustees fees | | | 3,650 | |
| Commitment fees on line of credit (Note 7) | | | 148,784 | |
| Miscellaneous expense | | | 72,205 | |
| Structuring Fee (Note 7) | | | 163,359 | |
| Interest expense | | | 102,549 | |
| Total expenses | | | 4,176,743 | |
| Waived and reimbursed fees | | | (795,364 | ) |
| Net expenses | | | 3,381,379 | |
| Net investment income | | | 23,626,623 | |
| | | | | |
| REALIZED AND UNREALIZED GAIN (LOSS): | | | | |
| Net realized loss on investments | | | (21,570,125 | ) |
| Net change in unrealized appreciation (depreciation) on Investments | | | (12,909,447 | ) |
| Net realized and unrealized loss | | | (34,479,572 | ) |
| Decrease in net assets resulting from operations | | | (10,852,949 | ) |
See Accompanying Notes to Financial Statements
10
STATEMENTS OF CHANGES IN NET ASSETS
| | | Year Ended | | | Year Ended | |
| | | March 31, 2023 | | | March 31, 2022 | |
| FROM OPERATIONS: | | | | | | | | |
| Net investment income | | $ | 23,626,623 | | | $ | 18,646,837 | |
| Net realized loss | | | (21,570,125 | ) | | | (3,991,011 | ) |
| Net change in unrealized appreciation (depreciation) | | | (12,909,447 | ) | | | (4,050,628 | ) |
| Net increase (decrease) in net assets resulting from operations | | | (10,852,949 | ) | | | 10,605,198 | |
| FROM DISTRIBUTIONS TO SHAREHOLDERS: | | | | | | | | |
| Total distributions (excluding return of capital): | | | | | | | | |
| Class A | | | (2,220,292 | ) | | | (1,594,693 | ) |
| Class C | | | (411,867 | ) | | | (295,898 | ) |
| Class I | | | (10,054,986 | ) | | | (8,279,050 | ) |
| Class P(1) | | | (2,878,797 | ) | | | (4,674,962 | ) |
| Class R | | | (5,900,552 | ) | | | (2,930,331 | ) |
| Class W | | | (787,192 | ) | | | (416,280 | ) |
| Total distributions | | | (22,253,686 | ) | | | (18,191,214 | ) |
| FROM CAPITAL SHARE TRANSACTIONS: | | | | | | | | |
| Net proceeds from sale of shares | | | 88,312,943 | | | | 200,165,448 | |
| Reinvestment of distributions | | | 21,736,937 | | | | 17,562,082 | |
| | | | 110,049,880 | | | | 217,727,530 | |
| Cost of shares redeemed | | | (305,895,536 | ) | | | (213,682,601 | ) |
| Net increase (decrease) in net assets resulting from capital share transactions | | | (195,845,656 | ) | | | 4,044,929 | |
| Net decrease in net assets | | | (228,952,291 | ) | | | (3,541,087 | ) |
| NET ASSETS: | | | | | | | | |
| Beginning of year or period | | | 486,041,569 | | | | 489,582,656 | |
| End of year or period | | $ | 257,089,278 | | | $ | 486,041,569 | |
| (1) | Class P liquidated on March 24, 2023. |
See Accompanying Notes to Financial Statements
11
FINANCIAL HIGHLIGHTS
Selected data for a share of beneficial interest outstanding throughout each year or period.
| | | | | | Income (loss)
from investment
operations | | | | | Less Distributions | | | | | | | | | | | Ratios to average net assets | | Supplemental
data |
| | | Net asset
value,
beginning
of year
or period | | Net
investment
income
(loss) | | Net
realized
and
unrealized
gain (loss) | | Total from
investment
operations | | From net
investment
income | | From net
realized
gains | | From
return of
capital | | Total
distributions | | Net
asset
value,
end of
year or
period | | Total
return(1) | | Expenses
before
reductions/
additions(2)(3) | | Expenses,
net of fee
waivers
and/ or
recoupments,
if any(2)(3) | | Expenses,
net of all
reductions/
additions(2)(3) | | Net
investment
income
(loss)(2)(3) | | Net
assets,
end of
year or
period | | Portfolio
Turnover |
| Year or period ended | | ($) | | ($) | | ($) | | ($) | | ($) | | ($) | | ($) | | ($) | | ($) | | (%) | | (%) | | (%) | | (%) | | (%) | | ($000’s) | | (%) |
| Class A | | | | | | | | | | | | | | | | | | | | | | | | | | | | | | | | | | | | | | | | | | | | | | | | | | | | | | | | | | | | | | | | |
| 03-31-23 | | | 8.94 | | | | 0.55 | * | | | (0.68 | ) | | | (0.13 | ) | | | 0.52 | | | | — | | | | — | | | | 0.52 | | | | 8.29 | | | | (1.28 | ) | | | 1.26 | | | | 1.06 | | | | 1.06 | | | | 6.48 | | | | 33,686 | | | | 38 | |
| 03-31-22 | | | 9.04 | | | | 0.30 | * | | | (0.11 | ) | | | 0.19 | | | | 0.29 | | | | — | | | | — | | | | 0.29 | | | | 8.94 | | | | 2.15 | | | | 1.20 | | | | 1.02 | | | | 1.02 | | | | 3.37 | | | | 41,990 | | | | 89 | |
| 03-31-21 | | | 8.00 | | | | 0.29 | * | | | 1.03 | | | | 1.32 | | | | 0.28 | | | | — | | | | — | | | | 0.28 | | | | 9.04 | | | | 16.69 | | | | 1.34 | | | | 1.13 | | | | 1.13 | | | | 3.35 | | | | 39,518 | | | | 60 | |
| 03-31-20 | | | 9.59 | | | | 0.46 | | | | (1.58 | ) | | | (1.12 | ) | | | 0.47 | | | | — | | | | — | | | | 0.47 | | | | 8.00 | | | | (12.34 | ) | | | 1.18 | | | | 1.10 | | | | 1.10 | | | | 4.83 | | | | 52,014 | | | | 52 | |
| 03-31-19 | | | 9.86 | | | | 0.46 | | | | (0.28 | ) | | | 0.18 | | | | 0.45 | | | | — | | | | — | | | | 0.45 | | | | 9.59 | | | | 1.90 | | | | 1.14 | | | | 1.05 | | | | 1.05 | | | | 4.75 | | | | 59,614 | | | | 58 | |
| Class C | | | | | | | | | | | | | | | | | | | | | | | | | | | | | | | | | | | | | | | | | | | | | | | | | | | | | | | | | | | | | | | | |
| 03-31-23 | | | 8.93 | | | | 0.48 | * | | | (0.67 | ) | | | (0.19 | ) | | | 0.46 | | | | — | | | | — | | | | 0.46 | | | | 8.28 | | | | (2.03 | ) | | | 2.01 | | | | 1.81 | | | | 1.81 | | | | 5.69 | | | | 6,743 | | | | 38 | |
| 03-31-22 | | | 9.04 | | | | 0.23 | * | | | (0.11 | ) | | | 0.12 | | | | 0.23 | | | | — | | | | — | | | | 0.23 | | | | 8.93 | | | | 1.27 | | | | 1.95 | | | | 1.77 | | | | 1.77 | | | | 2.59 | | | | 9,658 | | | | 89 | |
| 03-31-21 | | | 8.00 | | | | 0.23 | * | | | 1.03 | | | | 1.26 | | | | 0.22 | | | | — | | | | — | | | | 0.22 | | | | 9.04 | | | | 15.83 | | | | 2.09 | | | | 1.88 | | | | 1.88 | | | | 2.59 | | | | 14,914 | | | | 60 | |
| 03-31-20 | | | 9.59 | | | | 0.38 | | | | (1.58 | ) | | | (1.20 | ) | | | 0.39 | | | | — | | | | — | | | | 0.39 | | | | 8.00 | | | | (13.00 | ) | | | 1.93 | | | | 1.85 | | | | 1.85 | | | | 4.12 | | | | 20,446 | | | | 52 | |
| 03-31-19 | | | 9.87 | | | | 0.38 | * | | | (0.28 | ) | | | 0.10 | | | | 0.38 | | | | — | | | | — | | | | 0.38 | | | | 9.59 | | | | 1.04 | | | | 1.89 | | | | 1.80 | | | | 1.80 | | | | 3.93 | | | | 39,455 | | | | 58 | |
| Class I | | | | | | | | | | | | | | | | | | | | | | | | | | | | | | | | | | | | | | | | | | | | | | | | | | | | | | | | | | | | | | | | |
| 03-31-23 | | | 8.94 | | | | 0.55 | * | | | (0.65 | ) | | | (0.10 | ) | | | 0.55 | | | | — | | | | — | | | | 0.55 | | | | 8.29 | | | | (1.03 | ) | | | 0.92 | | | | 0.81 | | | | 0.81 | | | | 6.50 | | | | 116,954 | | | | 38 | |
| 03-31-22 | | | 9.04 | | | | 0.33 | * | | | (0.11 | ) | | | 0.22 | | | | 0.32 | | | | — | | | | — | | | | 0.32 | | | | 8.94 | | | | 2.41 | | | | 0.85 | | | | 0.77 | | | | 0.77 | | | | 3.60 | | | | 225,339 | | | | 89 | |
| 03-31-21 | | | 8.00 | | | | 0.31 | * | | | 1.03 | | | | 1.34 | | | | 0.30 | | | | — | | | | — | | | | 0.30 | | | | 9.04 | | | | 16.97 | | | | 1.00 | | | | 0.88 | | | | 0.88 | | | | 3.61 | | | | 235,804 | | | | 60 | |
| 03-31-20 | | | 9.59 | | | | 0.48 | | | | (1.58 | ) | | | (1.10 | ) | | | 0.49 | | | | — | | | | — | | | | 0.49 | | | | 8.00 | | | | (12.12 | ) | | | 0.88 | | | | 0.85 | | | | 0.85 | | | | 5.15 | | | | 427,504 | | | | 52 | |
| 03-31-19 | | | 9.87 | | | | 0.48 | | | | (0.28 | ) | | | 0.20 | | | | 0.48 | | | | — | | | | — | | | | 0.48 | | | | 9.59 | | | | 2.07 | | | | 0.80 | | | | 0.80 | | | | 0.80 | | | | 4.93 | | | | 1,160,464 | | | | 58 | |
| Class R | | | | | | | | | | | | | | | | | | | | | | | | | | | | | | | | | | | | | | | | | | | | | | | | | | | | | | | | | | | | | | | | |
| 03-31-23 | | | 8.92 | | | | 0.53 | * | | | (0.68 | ) | | | (0.15 | ) | | | 0.50 | | | | — | | | | — | | | | 0.50 | | | | 8.27 | | | | (1.53 | ) | | | 1.51 | | | | 1.31 | | | | 1.31 | | | | 6.26 | | | | 88,959 | | | | 38 | |
| 03-31-22 | | | 9.03 | | | | 0.28 | * | | | (0.12 | ) | | | 0.16 | | | | 0.27 | | | | — | | | | — | | | | 0.27 | | | | 8.92 | | | | 1.78 | | | | 1.45 | | | | 1.27 | | | | 1.27 | | | | 3.12 | | | | 109,837 | | | | 89 | |
| 03-31-21 | | | 7.99 | | | | 0.27 | * | | | 1.03 | | | | 1.30 | | | | 0.26 | | | | — | | | | — | | | | 0.26 | | | | 9.03 | | | | 16.42 | | | | 1.59 | | | | 1.38 | | | | 1.38 | | | | 3.08 | | | | 91,934 | | | | 60 | |
| 03-31-20 | | | 9.58 | | | | 0.43 | | | | (1.58 | ) | | | (1.15 | ) | | | 0.44 | | | | — | | | | — | | | | 0.44 | | | | 7.99 | | | | (12.57 | ) | | | 1.43 | | | | 1.35 | | | | 1.35 | | | | 4.60 | | | | 99,774 | | | | 52 | |
| 03-31-19 | | | 9.85 | | | | 0.44 | * | | | (0.28 | ) | | | 0.16 | | | | 0.43 | | | | — | | | | — | | | | 0.43 | | | | 9.58 | | | | 1.65 | | | | 1.39 | | | | 1.30 | | | | 1.30 | | | | 4.48 | | | | 139,026 | | | | 58 | |
| Class W | | | | | | | | | | | | | | | | | | | | | | | | | | | | | | | | | | | | | | | | | | | | | | | | | | | | | | | | | | | | | | | | |
| 03-31-23 | | | 8.95 | | | | 0.57 | * | | | (0.67 | ) | | | (0.10 | ) | | | 0.55 | | | | — | | | | — | | | | 0.55 | | | | 8.30 | | | | (1.04 | ) | | | 1.01 | | | | 0.81 | | | | 0.81 | | | | 6.76 | | | | 10,747 | | | | 38 | |
| 03-31-22 | | | 9.06 | | | | 0.33 | * | | | (0.12 | ) | | | 0.21 | | | | 0.32 | | | | — | | | | — | | | | 0.32 | | | | 8.95 | | | | 2.29 | | | | 0.95 | | | | 0.77 | | | | 0.77 | | | | 3.62 | | | | 12,984 | | | | 89 | |
| 03-31-21 | | | 8.01 | | | | 0.32 | * | | | 1.03 | | | | 1.35 | | | | 0.30 | | | | — | | | | — | | | | 0.30 | | | | 9.06 | | | | 17.08 | | | | 1.09 | | | | 0.88 | | | | 0.88 | | | | 3.69 | | | | 11,426 | | | | 60 | |
| 03-31-20 | | | 9.60 | | | | 0.48 | | | | (1.58 | ) | | | (1.10 | ) | | | 0.49 | | | | — | | | | — | | | | 0.49 | | | | 8.01 | | | | (12.10 | ) | | | 0.93 | | | | 0.85 | | | | 0.85 | | | | 5.11 | | | | 35,543 | | | | 52 | |
| 03-31-19 | | | 9.89 | | | | 0.46 | * | | | (0.27 | ) | | | 0.19 | | | | 0.48 | | | | — | | | | — | | | | 0.48 | | | | 9.60 | | | | 1.96 | | | | 0.89 | | | | 0.80 | | | | 0.80 | | | | 4.60 | | | | 52,642 | | | | 58 | |
| (1) | Total return is calculated assuming reinvestment of all dividends, capital gain distributions and return of capital distributions, if any, at net asset value and excluding the deduction of sales charges or contingent deferred sales charges, if applicable. Total return for periods less than one year is not annualized. |
| (2) | Annualized for periods less than one year. |
| (3) | Ratios reflect operating expenses of a Fund. Expenses before reductions/additions do not reflect amounts reimbursed by the Investment Adviser and/or Distributor or reductions from brokerage service arrangements or other expense offset arrangements and do not represent the amount paid by a Fund during periods when reimbursements or reductions occur. Expenses net of fee waivers reflect expenses after reimbursement by an Investment Adviser and/or Distributor but prior to reductions from brokerage service arrangements or other expense offset arrangements. Expenses net of all reductions/additions represent the net expenses paid by a Fund. Net investment income (loss) is net of all such additions or reductions. |
| * | Calculated using average number of shares outstanding throughout the period. |
See Accompanying Notes to Financial Statements
12
NOTES TO FINANCIAL STATEMENTS as of March 31, 2023
NOTE 1 — ORGANIZATION
Voya Funds Trust (the “Trust”) is a Delaware statutory trust and is registered as an open-end management investment company under the Investment Company Act of 1940, as amended (“1940 Act”). The Trust was organized on August 6, 1998 and was established under a Trust Instrument dated July 30, 1998. It consists of nine separately managed series. This report is for Voya Floating Rate Fund (“Floating Rate” or the “Fund”), a diversified series of the Trust.
The Fund offers the following classes of shares: Class A, Class C, Class I, Class R and Class W. The separate classes of shares differ principally in the applicable sales charges (if any), transfer agent fees, distribution fees, shareholder servicing fees, as well as differences in the amount of waiver of fees and reimbursement of expenses, if any. Generally, shareholders of each class also bear certain expenses that pertain to that particular class. All shareholders bear the common expenses of a fund and earn income and realized gains/losses from a fund pro rata based on the daily ending net assets of each class, without distinction between share classes. Differences in per share dividend rates generally result from the differences in separate class expenses, including distribution, and shareholder servicing fees, if applicable, as well as differences in the amount of waiver of fees and reimbursement of expenses between the share classes, if any.
Class C shares, along with their pro rata reinvested dividend shares, automatically convert to Class A shares 8 years after purchase.
Voya Investments, LLC (“Voya Investments” or the “Investment Adviser”), an Arizona limited liability company, serves as the Investment Adviser to the Fund. Voya Investment Management Co. LLC (“Voya IM”), a Delaware limited liability company, serves as the sub-adviser to the Fund. Voya Investments Distributor, LLC (“VID” or the “Distributor”), a Delaware limited liability company, serves as the principal underwriter to the Fund.
NOTE 2 — SIGNIFICANT ACCOUNTING POLICIES
The following significant accounting policies are consistently followed by the Fund in the preparation of its financial statements. The Fund is considered an investment company under U.S. generally accepted accounting principles (“GAAP”) and follows the accounting and reporting guidance applicable to investment companies.
A. Loan and Other Security Valuation. The Fund is open for business every day the New York Stock Exchange (“NYSE”) opens for regular trading (each such day, a “Business Day”). The net asset value (“NAV”) per share for
each class of the Fund is determined each Business Day as of the close of the regular trading session (“Market Close”), as determined by the Consolidated Tape Association (“CTA”), the central distributor of transaction prices for exchange-traded securities (normally 4:00 p.m. Eastern time unless otherwise designated by the CTA). The NAV per share of each class of the Fund is calculated by taking the value of the Fund’s assets attributable to that class, subtracting the Fund’s liabilities attributable to that class, and dividing by the number of shares of that class that are outstanding. On days when the Fund is closed for business, Fund shares will not be priced and the Fund does not transact purchase and redemption orders. To the extent the Fund’s assets are traded in other markets on days when the Fund does not price its shares, the value of the Fund’s assets will likely change and you will not be able to purchase or redeem shares of the Fund.
Portfolio securities for which market quotations are readily available are valued at market value. Investments in open-end registered investment companies that do not trade on an exchange are valued at the end of day NAV per share. The prospectuses of the open-end registered investment companies in which the Fund may invest explain the circumstances under which they will use fair value pricing and the effects of using fair value pricing. Foreign securities’ prices are converted into U.S. dollar amounts using the applicable exchange rates as of Market Close.
When a market quotation for a portfolio security is not readily available or is deemed unreliable (for example when trading has been halted or there are unexpected market closures or other material events that would suggest that the market quotation is unreliable) and for purposes of determining the value of other Fund assets, the asset is priced at its fair value. The Board has designated the Investment Adviser, as the valuation designee, to make fair value determinations in good faith. In determining the fair value of the Fund’s assets, the Investment Adviser, pursuant to its fair valuation policy, may consider inputs from pricing service providers, broker-dealers, or the Fund’s sub-adviser(s). Issuer specific events, transaction price, position size, nature and duration of restrictions on disposition of the security, market trends, bid/ask quotes of brokers and other market data may be reviewed in the course of making a good faith determination of an asset’s fair value. Because trading hours for certain foreign securities end before Market Close, closing market quotations may become unreliable. The prices of foreign securities will generally be adjusted based on inputs from an independent pricing service that are intended to reflect valuation changes through the NYSE close. Because of the inherent uncertainties of fair valuation, the values used to determine the Fund’s NAV may materially differ from the value received upon actual sale of those investments.
13
NOTES TO FINANCIAL STATEMENTS as of March 31, 2023 (continued)
NOTE 2 — SIGNIFICANT ACCOUNTING POLICIES (continued)
Thus, fair valuation may have an unintended dilutive or accretive effect on the value of shareholders’ investments in the Fund.
The Fund’s financial instruments are valued at the close of the NYSE and are reported at fair value, which GAAP defines as the price that would be received to sell an asset or paid to transfer a liability in an orderly transaction between market participants at the measurement date.
Various valuation techniques and inputs are used to determine the fair value of financial instruments. GAAP establishes the following fair value hierarchy that categorizes the inputs used to measure fair value:
Level 1—quoted prices (unadjusted) in active markets for identical financial instruments that the fund can access at the reporting date.
Level 2—inputs other than Level 1 quoted prices that are observable, either directly or indirectly (including, but not limited to, quoted prices for similar financial instruments in active markets, quoted prices for identical or similar financial instruments in inactive markets, interest rates and yield curves, implied volatilities, and credit spreads).
Level 3—unobservable inputs (including the fund’s own assumptions in determining fair value).
Observable inputs are developed using market data, such as publicly available information about actual events or transactions, and reflect the assumptions that market participants would use to price the financial instrument. Unobservable inputs are those for which market data are not available and are developed using the best information available about the assumptions that market participants would use to price the financial instrument. GAAP requires valuation techniques to maximize the use of relevant observable inputs and minimize the use of unobservable inputs. When multiple inputs are used to derive fair value, the financial instrument is assigned to the level within the fair value hierarchy based on the lowest-level input that is significant to the fair value of the financial instrument. Input levels are not necessarily an indication of the risk or liquidity associated with financial instruments at that level but rather the degree of judgment used in determining those values.
A table summarizing the Fund’s investments under these levels of classification is included within the Portfolio of Investments.
Each investment asset or liability of the Fund is assigned a level at measurement date based on the significance and source of the inputs to its valuation. Quoted prices in active markets for identical securities are classified as “Level 1,” inputs other than quoted prices for an asset
or liability that are observable are classified as “Level 2” and unobservable inputs, including the sub-adviser’s or Pricing Committee’s judgment about the assumptions that a market participant would use in pricing an asset or liability are classified as “Level 3.” The inputs used for valuing securities are not necessarily an indication of the risks associated with investing in those securities. Short-term securities of sufficient credit quality are generally considered to be Level 2 securities under applicable accounting rules. A table summarizing the Fund’s investments under these levels of classification is included within the Portfolio of Investments.
GAAP requires a reconciliation of the beginning to ending balances for reported fair values that presents changes attributable to total realized and unrealized gains or losses, purchases and sales, and transfers in or out of the Level 3 category during the period. A reconciliation of Level 3 investments within the Portfolio of Investments is presented only when the Fund has a significant amount of Level 3 investments.
B. Security Transactions and Revenue Recognition. Security transactions and senior loans are accounted for on trade date (date the order to buy or sell is executed). Realized gains or losses are reported on the basis of identified cost of securities sold. Interest income is recorded on an accrual basis at the then-current loan rate. The accrual of interest on loans is partially or fully discontinued when, in the opinion of management, there is an indication that the borrower may be unable to meet payments as they become due. If determined to be uncollectible, unpaid accrued interest is also written off. Cash collections on non-accrual loans are generally applied as a reduction to the recorded investment of the loan. Loans are generally returned to accrual status only after all past due amounts have been received and the borrower has demonstrated sustained performance. Premium amortization and discount accretion are deferred and recognized over the lives of the respective loans. Arrangement fees received on revolving credit facilities, which represent non-refundable fees or purchase discounts associated with the acquisition of loans, are deferred and recognized using the effective yield method over the lives of the respective loans. No such fees are recognized on loans which have been placed on non-accrual status. Arrangement fees associated with all other loans, except revolving credit facilities, are treated as discounts and are accreted as described above. Dividend income is recorded on the ex-dividend date. Amendment fees are earned as compensation for evaluating and accepting changes to an original loan agreement and are recognized when received. Amendment fees and other fees earned are reported as other income on the Statement of Operations.
14
NOTES TO FINANCIAL STATEMENTS as of March 31, 2023 (continued)
NOTE 2 — SIGNIFICANT ACCOUNTING POLICIES (continued)
C. Distributions to Shareholders. The Fund declares and goes ex-dividend daily and pays dividends monthly from net investment income. Distributions from capital gains, if any, are declared and paid annually. The Fund may make additional distributions to comply with the distribution requirements of the Internal Revenue Code. The character and amounts of income and gains to be distributed are determined in accordance with federal income tax regulations, which may differ from GAAP for investment companies. Distributions in excess of net investment income and/or net realized capital gains for tax purposes are reported as return of capital. The Fund records distributions to its shareholders on the ex-dividend date.
D. When-Issued and Delayed-Delivery Transactions. Securities purchased or sold on a when-issued, delayed-delivery or forward purchase commitment basis may have extended settlement periods. The value of the security so purchased is subject to market fluctuations during this period. Due to the nature of the loan market, the actual settlement date may not be certain at the time of the purchase or sale for some of the loans. Interest income on such loans is not accrued until settlement date.
E. Federal Income Taxes. It is the policy of the Fund to comply with the requirements of subchapter M of the Internal Revenue Code that are applicable to regulated investment companies and to distribute substantially all of its net investment income and any net realized capital gains to its shareholders. Therefore, a federal income tax or excise tax provision is not required. Management has considered the sustainability of the Fund’s tax positions taken on federal income tax returns for all open tax years in making this determination. No capital gain distributions shall be made until the capital loss carryforwards have been fully utilized.
The Fund may utilize equalization accounting for tax purposes, whereby a portion of redemption payments are treated as distributions of income or gain.
F. Use of Estimates. The preparation of financial statements in conformity with GAAP requires management to make estimates and assumptions that affect the reported amounts of assets and liabilities and disclosure of contingent assets and liabilities at the date of the financial statements and the reported amounts of increases and decreases in net assets from operations during the reporting period. Actual results could differ from those estimates.
G. Foreign Currency Translation. The books and records of the Fund are maintained in U.S. dollars. Any
foreign currency amounts are translated into U.S. dollars on the following basis:
| (1) | Market value of investment securities, other assets and liabilities — at the exchange rates prevailing at Market Close. |
| (2) | Purchases and sales of investment securities, income and expenses — at the rates of exchange prevailing on the respective dates of such transactions. |
Although the net assets and the market values are presented at the foreign exchange rates at Market Close, the Fund does not isolate the portion of the results of operations resulting from changes in foreign exchange rates on investments from the fluctuations arising from changes in market prices of securities held. Such fluctuations are included with the net realized and unrealized gains or losses from investments. For securities, which are subject to foreign withholding tax upon disposition, liabilities are recorded on the Statement of Assets and Liabilities for the estimated tax withholding based on the securities current market value. Upon disposition, realized gains or losses on such securities are recorded net of foreign withholding tax.
Reported net realized foreign exchange gains or losses arise from sales of foreign currencies, currency gains or losses realized between the trade and settlement dates on securities transactions, the difference between the amounts of dividends, interest, and foreign withholding taxes recorded on the Fund’s books, and the U.S. dollar equivalent of the amounts actually received or paid. Net unrealized foreign exchange gains and losses arise from changes in the value of assets and liabilities other than investments in securities, resulting from changes in the exchange rate. Foreign security and currency transactions may involve certain considerations and risks not typically associated with investing in U.S. companies and the U.S. government. These risks include, but are not limited to, revaluation of currencies and future adverse political and economic developments which could cause securities and their markets to be less liquid and prices more volatile than those of comparable U.S. companies and U.S. government securities. The foregoing risks are even greater with respect to securities of issuers in emerging markets.
H. Indemnifications. In the normal course of business, the Trust may enter into contracts that provide certain indemnifications. The Trust’s maximum exposure under these arrangements is dependent on future claims that may be made against the Fund and, therefore, cannot be estimated; however, management believes based on experience, the risk of loss from such claims is considered remote.
15
NOTES TO FINANCIAL STATEMENTS as of March 31, 2023 (continued)
NOTE 3 — INVESTMENTS
For the year ended March 31, 2023, the cost of purchases and the proceeds from principal repayment and sales of investments, excluding short-term investments, totaled $136,776,619 and $334,070,804, respectively.
The loans acquired by the Fund typically take the form of a direct lending relationship with the borrower acquired through an assignment of another lender’s interest in a loan. The lead lender in a typical corporate loan syndicate administers the loan and monitors collateral. In the event that the lead lender becomes insolvent, enters Federal Deposit Insurance Corporation (“FDIC”) receivership or, if not FDIC insured, enters into bankruptcy, the Fund may incur certain costs and delays in realizing payment, or may suffer a loss of principal and/or interest.
NOTE 4 — INVESTMENT MANAGEMENT FEES
The Fund has entered into an investment management agreement (“Management Agreement”) with the Investment Adviser. The Investment Adviser has overall responsibility for the management of the Fund. The Investment Adviser oversees all investment advisory and portfolio management services for the Fund and assists in managing and supervising all aspects of the general day-to-day business activities and operations of the Fund, including custodial, transfer agency, dividend disbursing, accounting, auditing, compliance and related services. This Management Agreement compensates the Investment Adviser with a management fee, computed daily and payable monthly, at an annual rate of 0.650% on the first $300 million; 0.625% on the next $200 million; and 0.600% thereafter, of the Fund’s average daily net assets.
Effective January 1, 2023, the Investment Adviser has agreed to waive 0.02% of the management fee through August 1, 2024. Any fees waived or reimbursed in relation to this waiver are not eligible for recoupment. Termination or modification of this obligation requires approval by the Board.
The Investment Adviser has entered into a sub-advisory agreement with Voya IM. Voya IM provides investment advice for the Fund and is paid by the Investment Adviser based on the average daily net assets of the Fund. Subject to such policies as the Board or the Investment Adviser may determine, Voya IM manages the Fund’s assets in accordance with the Fund’s investment objectives, policies, and limitations.
NOTE 5 — DISTRIBUTION AND SERVICE FEES
Class A, Class C and Class R share of the Fund each has a distribution and/or distribution and service plan (the “Plan”), whereby the Distributor is compensated by
the Fund for expenses incurred in the distribution and/or shareholder servicing of the Fund’s shares (“Distribution and/or Service Fees”). Pursuant to the Plan, the Distributor is entitled to payment each month for expenses incurred in the distribution and promotion of the Fund’s shares, including expenses incurred in printing prospectuses and reports used for sales purposes, expenses incurred in preparing and printing sales literature and other such distribution related expenses, including any Distribution and/or Service Fees paid to securities dealers who have executed a distribution agreement with the Distributor. In addition, the Fund has a shareholder service plan for Class A and Class C shares (together with the Plan referenced above, the “Plans”). Under the Plans, each class of shares of the Fund pays the Distributor a Distribution and/ or Service Fee based on average daily net assets at the following annual rates:
| | Class A | | Class C | | Class R | |
| | 0.25% | | 1.00% | | 0.50% | |
The Distributor may also retain the proceeds of the initial sales charge paid by shareholders upon the purchase of Class A shares of the Fund and the contingent deferred sales charge paid by shareholders upon certain redemptions for Class A and Class C shares. For the year ended March 31, 2023, the Distributor retained the following amounts:
| | | Class A | | Class R |
| Initial Sales Charges | | $ | 3,424 | | | $ | — | |
| Contingent Deferred Sales Charges | | | — | | | | 633 | |
NOTE 6 — EXPENSE LIMITATION AGREEMENT
Pursuant to a written expense limitation agreement (“Expense Limitation Agreement”) with the Fund, the Investment Adviser has agreed to limit expenses, excluding interest, taxes, investment-related costs, leverage expenses, extraordinary expenses, and acquired fund fees and expenses, to the levels listed below:
Maximum Operating Expense Limit(1)
(as a percentage of average daily net assets)
Class A — 1.00%
Class C — 1.75%
Class I — 0.75%
Class R — 1.25%
Class W — 0.75%
| (1). | Pursuant to a side letter agreement through August 1, 2023, the Investment Adviser has further lowered expenses to 0.95%, 1.70%, 0.70%, 1.20% and 0.70% for Class A, Class C, Class I, Class R and Class W, respectively. Any fees waived pursuant to the side letter agreement shall not be eligible for recoupment. Termination or modification of this obligation requires approval by the Board. |
Unless otherwise specified above and with the exception of the non-recoupable management fee waiver for the Fund,
16
NOTES TO FINANCIAL STATEMENTS as of March 31, 2023 (continued)
NOTE 6 — EXPENSE LIMITATION AGREEMENT (continued)
the Investment Adviser may at a later date recoup from the Fund for fees waived and/or other expenses assumed by the Investment Adviser during the previous 36 months, but only if, after such recoupment, the Fund’s expense ratio does not exceed the percentage described above. Waived and reimbursed fees net of any recoupment by the Investment Adviser of such waived and reimbursed fees are reflected on the accompanying Statement of Operations. Amounts payable by the Investment Adviser are reflected on the accompanying Statement of Assets and Liabilities.
As of March 31, 2023, the amounts of waived and/or reimbursed fees that are subject to possible recoupment by the Investment Adviser and the related expiration dates are as follows:
| March 31, | | |
| 2024 | | 2025 | | 2026 | | Total |
| $483,309 | | $— | | $— | | $483,309 |
As of March 31, 2023, the amount of class specific fees waived or reimbursed that are subject to possible recoupment by the Investment Adviser and the related expiration dates are as follows:
| | | March 31, | | | |
| | | 2024 | | 2025 | | 2026 | | Total |
| Class A | | | $31,824 | | | | $— | | | | $— | | | | $31,824 | |
| Class C | | | 13,636 | | | | — | | | | — | | | | 13,636 | |
| Class R | | | 69,455 | | | | — | | | | — | | | | 69,455 | |
| Class W | | | 12,533 | | | | — | | | | — | | | | 12,533 | |
The amounts subject to possible recoupment listed in the tables above were waived or reimbursed prior to January 1, 2021, which was the effective date of the non-recoupable side letter agreement.
The Expense Limitation Agreement is contractual through August 1, 2023 and shall renew automatically for one-year terms. Termination or modification of this obligation requires approval by the Board.
NOTE 7 — LINE OF CREDIT
Effective May 25, 2022, the Fund has entered into an unsecured committed revolving line of credit agreement (the “Credit Agreement”) with State Street Bank and Trust Company (“SSB”) for an aggregate amount of $100,000,000, through May 24, 2023. The proceeds may be used only: (1) for cash management purposes; or (2) to temporarily finance the redemption of shares of an investor in the Fund. The Fund pays a commitment fee equal to 0.15% per annum on the daily unused portion of the committed line amount payable quarterly in arrears of $148,784 and a structuring fee of $163,058
which is expensed over a year. Prior to May 25, 2022, the aggregate amount was $100,000,000 and the commitment fee was equal to 0.15% per annum on the daily unused portion of the committed line amount payable quarterly in arrears through May 25, 2022. Generally, borrowings under the Credit Agreement accrue interest at the higher of the federal funds rate and the overnight bank funding rate, plus a specified margin and 0.10%. Repayments generally must be made within 45 days after the date of a revolving credit advance.
The Fund utilized the line of credit during the year ended March 31, 2023, as below:
Days
Utilized | | Approximate
Average Daily
Balance For
Days Utilized | | Approximate
Weighted
Average Interest
Rate For Days
Utilized |
| 89 | | $8,895,506 | | 2.12% |
NOTE 8 — OTHER TRANSACTIONS WITH AFFILIATES AND RELATED PARTIES
At March 31, 2023, the following direct or indirect, wholly-owned subsidiaries of Voya Financial, Inc. owned more than 5% of the Fund:
| Subsidiary | | Percentage |
| Voya Institutional Trust Company | | 36.56% |
The Fund has adopted a deferred compensation plan (the “DC Plan”), which allows eligible independent trustees, as described in the DC Plan, to defer the receipt of all or a portion of the trustees’ fees that they are entitled to receive from the Fund. For purposes of determining the amount owed to the trustee under the DC Plan, the amounts deferred are invested in shares of the funds selected by the trustee (the “Notional Funds”). When the Fund purchases shares of the Notional Funds, which are all advised by Voya Investments, in amounts equal to the trustees’ deferred fees, this results in a Fund asset equal to the deferred compensation liability. Such assets, if applicable, are included as a component of “Other assets” on the accompanying Statement of Assets and Liabilities. Deferral of trustees’ fees under the DC Plan will not affect net assets of the Fund, and will not materially affect the Fund’s assets, liabilities or net investment income per share. Amounts will be deferred until distributed in accordance with the DC Plan.
The Fund may pay per account fees to affiliates of Voya Investments for recordkeeping services provided on certain assets. For the year ended March 31, 2023, the per account fees for affiliated recordkeeping services paid by the Fund were $134,776.
The Fund may engage in purchase and sale transactions with funds that have a common investment adviser (or affiliated investment adviser), a common sub-adviser
17
NOTES TO FINANCIAL STATEMENTS as of March 31, 2023 (continued)
NOTE 8 — OTHER TRANSACTIONS WITH AFFILIATES AND RELATED PARTIES (continued)
and/ or common officers or trustees. These interfund transactions are made pursuant to Rule 17a-7 under the1940 Act and in accordance with the “Rule 17a-7 Policy” adopted by the Board. For the year ended March 31, 2023, the Fund engaged in such transactions amounting to $2,038,561 in purchases and $4,937,472 in sales, resulting in a net realized loss of $(151,900).
NOTE 9 — UNFUNDED LOAN COMMITMENTS
The Fund may enter into credit agreements, all or a portion of which may be unfunded. The Fund is obligated to fund these loan commitments at the borrower’s discretion.
NOTE 10 — CAPITAL SHARES
Transactions in capital shares and dollars were as follows:
Funded and unfunded portions of the credit agreements are presented within the Portfolio of Investments. At March 31, 2023 the Fund had the following unfunded loan commitments:
| | | Unfunded Loan
Commitment |
| Athenahealth, Inc. 2022 Delayed Draw Term Loan | | | $ | 179,884 | |
| IPS Corporation 2021 Delayed Draw Term Loan | | | | 51,081 | |
| | | | $ | 230,965 | |
| |
| | | Shares
sold | | | Reinvestment
of
distributions | | Shares
redeemed | | Net increase
(decrease)
in shares
outstanding | | Shares
sold | | Reinvestment
of
distributions | | Shares
redeemed | | Net increase
(decrease) |
| Year or period ended | | # | | | # | | # | | # | | ($) | | ($) | | ($) | | ($) |
| Class A | | | | | | | | | | | | | | | | | | | | | | | | | | | | | | | | |
| 03-31-23 | | | 573,399 | | | | 249,450 | | | | (1,456,250 | ) | | | (633,401 | ) | | | 4,904,872 | | | | 2,083,167 | | | | (12,312,445 | ) | | | (5,324,406 | ) |
| 03-31-22 | | | 2,807,222 | | | | 166,299 | | | | (2,645,969 | ) | | | 327,552 | | | | 25,486,720 | | | | 1,504,356 | | | | (23,735,826 | ) | | | 3,255,250 | |
| Class C | | | | | | | | | | | | | | | | | | | | | | | | | | | | | | | | |
| 03-31-23 | | | 168,424 | | | | 45,196 | | | | (480,806 | ) | | | (267,186 | ) | | | 1,441,713 | | | | 377,266 | | | | (4,088,327 | ) | | | (2,269,348 | ) |
| 03-31-22 | | | 286,932 | | | | 30,341 | | | | (885,874 | ) | | | (568,601 | ) | | | 2,593,297 | | | | 274,709 | | | | (8,030,902 | ) | | | (5,162,896 | ) |
| Class I | | | | | | | | | | | | | | | | | | | | | | | | | | | | | | | | |
| 03-31-23 | | | 7,929,585 | | | | 1,182,486 | | | | (20,227,255 | ) | | | (11,115,184 | ) | | | 66,613,524 | | | | 9,899,009 | | | | (170,300,201 | ) | | | (93,787,668 | ) |
| 03-31-22 | | | 11,313,808 | | | | 858,414 | | | | (13,035,476 | ) | | | (863,254 | ) | | | 102,408,364 | | | | 7,767,659 | | | | (117,079,536 | ) | | | (6,903,513 | ) |
| Class P (1) | | | | | | | | | | | | | | | | | | | | | | | | | | | | | | | | |
| 03-31-23 | | | 498 | | | | 320,838 | | | | (10,009,923 | ) | | | (9,688,587 | ) | | | 4,080 | | | | 2,700,960 | | | | (83,216,320 | ) | | | (80,511,280 | ) |
| 03-31-22 | | | 4,017,588 | | | | 518,285 | | | | (5,493,305 | ) | | | (957,432 | ) | | | 36,364,970 | | | | 4,674,700 | | | | (49,120,082 | ) | | | (8,080,412 | ) |
| Class R | | | | | | | | | | | | | | | | | | | | | | | | | | | | | | | | |
| 03-31-23 | | | 1,484,278 | | | | 708,077 | | | | (3,751,074 | ) | | | (1,558,719 | ) | | | 12,839,002 | | | | 5,900,444 | | | | (31,468,699 | ) | | | (12,729,253 | ) |
| 03-31-22 | | | 3,100,886 | | | | 324,372 | | | | (1,296,530 | ) | | | 2,128,728 | | | | 28,008,280 | | | | 2,930,129 | | | | (11,715,549 | ) | | | 19,222,860 | |
| Class W | | | | | | | | | | | | | | | | | | | | | | | | | | | | | | | | |
| 03-31-23 | | | 288,496 | | | | 92,762 | | | | (537,377 | ) | | | (156,119 | ) | | | 2,509,752 | | | | 776,091 | | | | (4,509,544 | ) | | | (1,223,701 | ) |
| 03-31-22 | | | 585,613 | | | | 45,293 | | | | (441,949 | ) | | | 188,957 | | | | 5,303,817 | | | | 410,529 | | | | (4,000,706 | ) | | | 1,713,640 | |
| | |
| (1) | Share class was fully redeemed on March 24, 2023. |
NOTE 11 — FEDERAL INCOME TAXES
The amount of distributions from net investment income and net realized capital gains are determined in accordance with federal income tax regulations, which may differ from GAAP for investment companies. These book/tax differences may be either temporary or permanent. Permanent differences are reclassified within the capital accounts based on their federal tax-basis treatment; temporary differences are not reclassified. Key differences include capital loss carryforwards and wash sale deferrals.
Dividends paid by the Fund from net investment income and distributions of net realized short-term capital gains are, for federal income tax purposes, taxable as ordinary income to shareholders.
18
NOTES TO FINANCIAL STATEMENTS as of March 31, 2023 (continued)
NOTE 11 — FEDERAL INCOME TAXES (continued)
The tax composition of dividends and distributions to shareholders was as follows:
Year Ended
March 31, 2023 | | Year Ended
March 31, 2022 |
| Ordinary Income | | Ordinary Income |
| $22,253,686 | | $18,191,214 |
The tax-basis components of distributable earnings and the capital loss carryforwards which may be used to offset future realized capital gains for federal income tax purposes as of March 31, 2023 were:
| Undistributed | | Unrealized | | | | | | | | Total |
| Ordinary | | Appreciation/ | | Capital Loss Carryforwards | | Distributable |
| Income | | (Depreciation) | | Amount | | | Character | | Expiration | | Other | | Earnings/(Loss) |
| $3,426,242 | | $(21,307,650) | | $ | (47,239,094) | | | Short-term | | None | | $(51,078) | | $(226,513,889) |
| | | | | | (161,342,309) | | | Long-term | | None | | | | |
| | | | | $ | (208,581,403) | | | | | | | | | |
The Fund’s major tax jurisdictions are U.S. federal and Arizona state.
As of March 31, 2023, no provision for income tax is required in the Fund’s financial statements as a result of tax positions taken on federal and state income tax returns for open tax years. The Fund’s federal and state income and federal excise tax returns for tax years for which the applicable statutes of limitations have not expired are subject to examination by the Internal Revenue Service and state department of revenue. Generally, the preceding four tax years remain subject to examination by these jurisdictions.
NOTE 12 — LONDON INTERBANK OFFERED RATE (“LIBOR”)
In 2017, the UK Financial Conduct Authority announced its intention to cease compelling banks to provide the quotations needed to sustain LIBOR after 2021. On March 5, 2021, ICE Benchmark Administration, the administrator of LIBOR, stated that non-U.S. dollar LIBOR reference rates and the one-week and two-month LIBOR reference rates ceased to be provided or no longer be representative immediately after December 31, 2021 and the remaining more commonly used LIBOR settings will cease to be provided or no longer be representative immediately after June 30, 2023. In addition, global regulators have announced that, with limited exceptions, no new LIBOR-based contracts should be entered into after 2021. Actions by regulators have resulted in the establishment of alternative reference rates to LIBOR in most major currencies (e.g., the Secured Overnight Financing Rate for U.S. Dollar LIBOR and the Sterling Overnight Interbank Average Rate for Sterling LIBOR).
Discontinuance of LIBOR and adoption/implementation of alternative rates pose a number of risks, including among others whether any substitute rate will experience the market participation and liquidity necessary to provide a workable substitute for LIBOR; the effect on parties’ existing contractual arrangements, hedging transactions, and investment strategies generally from a conversion from LIBOR to alternative rates; the effect on the Fund’s existing investments (including, for example,
fixed-income investments, senior loans, CLOs and CDOs, and derivatives transactions), including the possibility that some of those investments may terminate or their terms adjusted to the disadvantage of the Fund; and the risk of general market disruption during the period of the conversion. It is difficult to predict at this time the likely impact of the transition away from LIBOR on the Fund.
NOTE 13 — LIQUIDITY
Consistent with Rule 22e-4 under the 1940 Act, the Fund has established a liquidity risk management program to govern its approach to managing liquidity risk (the “Program”). The Board has approved the designation of the Fund’s Investment Adviser, Voya Investments, as the program administrator (the “Program Administrator”). The Program Administrator is responsible for implementing and monitoring the Program and has formed a Liquidity Risk Management Committee (the “Committee”) to assess and review, on an ongoing basis, the Fund’s liquidity risk.
The Program includes a number of elements that support the management and assessment of liquidity risk, including an annual assessment of liquidity risk factors and the periodic classification (or re-classification, as necessary) of the Fund’s investments into buckets (highly liquid, moderately liquid, less liquid and illiquid) that reflect the Committee’s assessment of the investments’ liquidity under current market conditions. The Committee also utilizes Fund-specific data, including information
19
NOTES TO FINANCIAL STATEMENTS as of March 31, 2023 (continued)
NOTE 13 — LIQUIDITY (continued)
regarding the Fund’s shareholder base, characteristics of its investments, access to borrowing arrangements and historical redemptions to determine whether the Fund will be able to meet its redemption obligations in a timely manner.
During the period covered by the annual assessment, January 1, 2022 through December 31, 2022, the Program supported the Fund’s ability to honor redemption requests in a timely manner and the Program Administrator’s management of the Fund’s liquidity risk, including during any periods of market volatility and net redemptions.
There can be no assurance that the Program will achieve its objectives under all circumstances in the future. Please refer to the Fund’s prospectus for more information regarding the Fund’s exposure to liquidity risk and other risks.
NOTE 14 — MARKET DISRUPTION
The Fund is subject to the risk that geopolitical events will disrupt securities markets and adversely affect global economies and markets. Due to the increasing interdependence among global economies and markets, conditions in one country, market, or region might adversely impact markets, issuers and/or foreign exchange rates in other countries, including the United States. Wars, terrorism, global health crises and pandemics, and other geopolitical events that have led, and in the future may continue to lead, to increased market volatility and may have adverse short- or long-term effects on U.S. and global economies and markets generally. For example, the COVID-19 pandemic has resulted, and may continue to result, in significant market volatility, exchange suspensions and closures, declines in global financial markets, higher default rates, supply chain disruptions, and a substantial economic downturn in economies throughout the world. Natural and environmental disasters and systemic market dislocations are also highly disruptive to economies and markets.
In addition, military action by Russia in Ukraine has, and may continue to, adversely affect global energy and financial markets and therefore could affect the value of the Fund’s investments, including beyond the Fund’s direct exposure to Russian issuers or nearby geographic regions. The extent and duration of the military action, sanctions and resulting market disruptions are impossible
to predict and could be substantial. Those events as well as other changes in foreign (non-U.S.) and domestic economic, social, and political conditions also could adversely affect individual issuers or related groups of issuers, securities markets, interest rates, credit ratings, inflation, investor sentiment, and other factors affecting the Fund’s investments. Any of these occurrences could disrupt the operations of the Fund and of the Fund’s service providers.
NOTE 15 — OTHER ACCOUNTING PRONOUNCEMENTS
In June 2022, the FASB issued Accounting Standards Update (ASU), ASU 2022-03, Fair Value Measurement (Topic 820) — Fair Value Measurement of Equity Securities Subject to Contractual Sale Restrictions, which clarifies that a contractual restriction on the sale of an equity security is not considered part of the unit of account of the equity security and, therefore, is not considered in measuring fair value. The amendments under this ASU are effective for fiscal years beginning after December 15, 2023; however, early adoption is permitted. Management expects that the adoption of the guidance will not have a material impact on the fund’s financial statements.
NOTE 16 — SUBSEQUENT EVENTS
Dividends: Subsequent to March 31, 2023, the Fund declared dividends from net investment income of:
| | | Per Share
Amount | | Payable
Date | | Record
Date |
| Class A | | $0.0565 | | May 1, 2023 | | Daily |
| Class C | | $0.0514 | | May 1, 2023 | | Daily |
| Class I | | $0.0582 | | May 1, 2023 | | Daily |
| Class R | | $0.0548 | | May 1, 2023 | | Daily |
| Class W | | $0.0582 | | May 1, 2023 | | Daily |
Line of Credit Renewal: Effective May 25, 2023, the revolving Credit Agreement with State Street Bank and Trust Company was renewed for another 364 days.
The Fund has evaluated events occurring after the Statement of Assets and Liabilities date through the date that the financial statements were issued (“subsequent events”) to determine whether any subsequent events necessitated adjustment to or disclosure in the financial statements. Other than above, no such subsequent events were identified.
20
| VOYA FLOATING RATE FUND | PORTFOLIO OF INVESTMENTS
AS OF MARCH 31, 2023 |
| | |
Principal
Amount† | | | | Borrower/Tranche
Description | | Fair Value | | | Percentage
of Net
Assets |
| | | | | | | | | | | | | | |
| LOANS*: 91.6% | | | | | | | | |
| | | | | | | | | | | | | | |
| | | | | | Advertising: 0.0% | | | | | | | | |
| | 555 | | | | Dotdash Meredith Inc Term Loan B, 8.668%, (TSFR1M + 4.000%), 12/01/28 | | $ | 498 | | | | 0.0 | |
| | | | | | | | | | | | | | |
| | | | | | Aerospace & Defense: 1.9% | | | | | | | | |
| | 1,500,000 | | | | AAdvantage Loyalty IP Ltd. 2021 Term Loan, 9.558%, (US0003M + 4.750%), 04/20/28 | | | 1,524,792 | | | | 0.6 | |
| | 265,014 | | | | ADS Tactical, Inc. 2021 Term Loan B, 10.590%, (US0001M + 5.750%), 03/19/26 | | | 244,475 | | | | 0.1 | |
| | 895,477 | | | | Amentum Government Services Holdings LLC 2022 Term Loan, 8.906%, (TSFR1M + 4.000%), 02/15/29 | | | 878,128 | | | | 0.3 | |
| | 285,489 | | | | Geo Group, Inc. (The) 2022 Tranche 1 Term Loan, 11.932%, (TSFR1M + 7.125%), 03/23/27 | | | 289,644 | | | | 0.1 | |
| | 1,758,732 | | | | Peraton Corp. Term Loan B, 8.590%, (US0001M + 3.750%), 02/01/28 | | | 1,738,067 | | | | 0.7 | |
| | 299,244 | | | | Vertex Aerospace Services Corp. 2021 First Lien Term Loan, 8.340%, (US0001M + 3.500%), 12/06/28 | | | 298,122 | | | | 0.1 | |
| | | | | | | | | 4,973,228 | | | | 1.9 | |
| | | | | | | | | | | | | | |
| | | | | | Air Transport: 0.9% | | | | | | | | |
| | 2,219,830 | | | | United Airlines, Inc. 2021 Term Loan B, 8.568%, (US0003M + 3.750%), 04/21/28 | | | 2,211,044 | | | | 0.9 | |
| | | | | | | | | | | | | | |
| | | | | | Automotive: 3.9% | | | | | | | | |
| | 835,814 | | | | Autokiniton US Holdings, Inc. 2021 Term Loan B, 9.422%, (US0001M + 4.500%), 04/06/28 | | | 813,456 | | | | 0.3 | |
| | 318,276 | | | | Avis Budget Car Rental, LLC 2022 Term Loan C, 8.407%, (TSFR1M + 3.500%), 03/16/29 | | | 318,475 | | | | 0.1 | |
| | 598,473 | | | | Belron Finance US LLC 2021 USD Term Loan B, 7.300%, (US0003M + 2.425%), 04/13/28 | | | 598,474 | | | | 0.2 | |
| | 1,000,000 | | | | Clarios Global LP 2021 USD Term Loan B, 8.109%, (US0001M + 3.250%), 04/30/26 | | | 996,875 | | | | 0.4 | |
| | 452,155 | | | | Dealer Tire Financial, LLC Term Loan B2, 9.307%, (TSFR1M + 4.500%), 12/14/27 | | | 450,035 | | | | 0.2 | |
| | 775,025 | | | | Gates Global LLC 2021 Term Loan B3, 7.407%, (US0001M + 2.500%), 03/31/27 | | | 772,239 | | | | 0.3 | |
| | 698,136 | | | | Holley Purchaser, Inc. 2021 Term Loan, 8.672%, (US0003M + 3.750%), 11/17/28 | | | 581,446 | | | | 0.2 | |
| | 445,866 | | | | IXS Holdings, Inc. 2020 Term Loan B, 6.000%, (US0003M + 5.000%), 03/05/27 | | | 370,626 | | | | 0.2 | |
| | 858,708 | | | | Les Schwab Tire Centers Term Loan B, 8.064%, (US0003M + 3.250%), 11/02/27 | | | 853,341 | | | | 0.3 | |
| | 608,234 | | | | Mister Car Wash Holdings, Inc. 2019 Term Loan B, 7.991%, (US0001M + 3.000%), 05/14/26 | | | 606,080 | | | | 0.2 | |
| | 483,863 | | | | RC Buyer, Inc. 2021 Term Loan, 8.340%, (US0003M + 3.500%), 07/28/28 | | | 454,831 | | | | 0.2 | |
Principal
Amount† | | | | Borrower/Tranche
Description | | Fair Value | | | Percentage
of Net
Assets |
| | | | | | | | | | | | | | |
| LOANS*: (continued) | | | | | | | | |
| | | | | | | | | | | | | | |
| | | | | | Automotive: (continued) | | | | | | | | |
| | 1,122,086 | | | | Truck Hero, Inc. 2021 Term Loan B, 8.590%, (US0001M + 3.750%), 01/31/28 | | $ | 1,003,165 | | | | 0.4 | |
| | 969,925 | | | | Wand NewCo 3, Inc. 2020 Term Loan, 7.590%, (US0001M + 3.000%), 02/05/26 | | | 954,596 | | | | 0.4 | |
| | 1,605,550 | | | | Wheel Pros, LLC 2021 Term Loan, 9.316%, (US0003M + 4.500%), 05/11/28 | | | 1,153,320 | | | | 0.5 | |
| | | | | | | | | 9,926,959 | | | | 3.9 | |
| | | | | | | | | | | | | | |
| | | | | | Basic Materials: 1.0% | | | | | | | | |
| | 385,000 | | | | Axalta Coating Systems Dutch Holding B.V 2022 USD Term Loan B4, 7.300%, (SOFRRATE + 3.000%), 12/20/29 | | | 386,155 | | | | 0.1 | |
| | 970,125 | | | | Iris Holdings, Inc. 2022 Term Loan 1L, 7.272%, (TSFR1M + 4.750%), 06/28/28 | | | 833,499 | | | | 0.3 | |
| | 905,000 | | | | Starfruit Finco B.V 2023 Term Loan, 8.802%, (TSFR1M + 4.000%), 03/02/28 | | | 903,869 | | | | 0.4 | |
| | 597,000 | | | | U.S. Silica Company 2023 Term Loan B, 9.552%, (TSFR1M + 4.750%), 03/15/30 | | | 581,329 | | | | 0.2 | |
| | | | | | | | | 2,704,852 | | | | 1.0 | |
| | | | | | | | | | | | | | |
| | | | | | Beverage & Tobacco: 0.7% | | | | | | | | |
| | 365,000 | | | | Naked Juice LLC 2nd Lien Term Loan, 10.998%, (SOFRRATE + 6.000%), 01/24/30 | | | 279,453 | | | | 0.1 | |
| | 610,388 | | | | Naked Juice LLC Term Loan, 8.248%, (SOFRRATE + 3.250%), 01/24/29 | | | 542,355 | | | | 0.2 | |
| | 948,034 | | | | Triton Water Holdings, Inc Term Loan, 8.659%, (US0003M + 3.500%), 03/31/28 | | | 856,312 | | | | 0.4 | |
| | | | | | | | | 1,678,120 | | | | 0.7 | |
| | | | | | | | | | | | | | |
| | | | | | Brokers, Dealers & Investment Houses: 0.3% | | |
| | 847,143 | | | | Forest City Enterprises, L.P. 2019 Term Loan B, 8.340%, (US0001M + 3.500%), 12/08/25 | | | 732,249 | | | | 0.3 | |
| | | | | | | | | | | | | | |
| | | | | | Building & Development: 3.9% | | | | | | | | |
| | 364,449 | | | | Aegion Corporation Term Loan, 9.590%, (US0003M + 4.750%), 05/17/28 | | | 356,933 | | | | 0.1 | |
| | 497,423 | | | | American Builders & Contractors Supply Co., Inc. 2019 Term Loan, 6.907%, (SOFRRATE + 2.000%), 01/15/27 | | | 495,985 | | | | 0.2 | |
| | 1,232,500 | | | | Applecaramel Buyer, LLC Term Loan B, 8.557%, (TSFR1M + 3.750%), 10/19/27 | | | 1,219,790 | | | | 0.5 | |
| | 1,223,259 | | | | Chamberlain Group Inc Term Loan B, 8.090%, (US0001M + 3.250%), 11/03/28 | | | 1,177,387 | | | | 0.5 | |
| | 427,806 | | | | Cornerstone Building Brands, Inc. 2021 Term Loan B, 7.934%, (US0001M + 3.250%), 04/12/28 | | | 379,677 | | | | 0.1 | |
See Accompanying Notes to Financial Statements
21
| VOYA FLOATING RATE FUND | PORTFOLIO OF INVESTMENTS
AS OF MARCH 31, 2023 (CONTINUED) |
| | |
Principal
Amount† | | | | Borrower/Tranche
Description | | Fair Value | | | Percentage
of Net
Assets |
| | | | | | | | | | | | | | |
| LOANS*: (continued) | | | | | | | | |
| | | | | | | | | | | | | | |
| | | | | | Building & Development: (continued) | | | |
| | 944,130 | | | | CP Atlas Buyer, Inc. 2021 Term Loan B, 8.407%, (US0001M + 3.500%), 11/23/27 | | $ | 842,111 | | | | 0.3 | |
| | 287,686 | | | | Empire Today, LLC 2021 Term Loan B, 9.709%, (US0001M + 5.000%), 04/03/28 | | | 226,792 | | | | 0.1 | |
| | 849,862 | | | | Foundation Building Materials Holding Company LLC 2021 Term Loan, 8.075%, (US0003M + 3.250%), 01/31/28 | | | 827,851 | | | | 0.3 | |
| | 51,081 | | (1) | | IPS Corporation 2021 Delayed Draw Term Loan, 7.132%, (US0003M + 3.500%), 10/02/28 | | | 47,845 | | | | 0.0 | |
| | 284,814 | | | | IPS Corporation 2021 Term Loan, 8.352%, (US0001M + 3.500%), 10/02/28 | | | 266,776 | | | | 0.1 | |
| | 270,838 | | | | Kodiak Building Partners Inc. Term Loan B, 8.393%, (US0003M + 3.250%), 03/12/28 | | | 260,682 | | | | 0.1 | |
| | 391 | | | | Latham Pool Products, Inc. 2022 Term Loan B, 8.728%, (SOFRRATE + 3.750%), 02/23/29 | | | 363 | | | | 0.0 | |
| | 525,022 | | | | LBM Acquisition LLC Term Loan B, 8.960%, (US0006M + 3.750%), 12/17/27 | | | 496,333 | | | | 0.2 | |
| | 910,800 | | | | LHS Borrower, LLC 2022 Term Loan B, 9.657%, (SOFRRATE + 4.750%), 02/16/29 | | | 740,025 | | | | 0.3 | |
| | 418,674 | | | | Northstar Group Services, INC. 2020 Term Loan B, 10.422%, (US0001M + 5.500%), 11/12/26 | | | 414,488 | | | | 0.2 | |
| | 992,481 | | | | Quikrete Holdings, Inc. 2021 Term Loan B1, 7.840%, (US0001M + 3.000%), 06/11/28 | | | 982,805 | | | | 0.4 | |
| | 675,076 | | | | Smyrna Ready Mix Concrete, LLC Term Loan B, 9.041%, (TSFR1M + 4.250%), 04/02/29 | | | 673,388 | | | | 0.3 | |
| | 566,141 | | | | Specialty Building Products Holdings, LLC 2021 Term Loan B, 8.095%, (US0001M + 3.250%), 10/15/28 | | | 533,992 | | | | 0.2 | |
| | | | | | | | | 9,943,223 | | | | 3.9 | |
| | | | | | | | | | | | | | |
| | | | | | Business Equipment & Services: 7.6% | | | | | |
| | 492,500 | | | | Allied Universal Holdco LLC 2021 USD Incremental Term Loan B, 8.657%, (TSFR1M + 3.750%), 05/12/28 | | | 468,183 | | | | 0.2 | |
| | 375,250 | | | | Anticimex International AB 2021 USD Term Loan B1, 8.453%, (US0003M + 3.500%), 11/16/28 | | | 371,497 | | | | 0.1 | |
| | 983,756 | | | | APX Group, Inc. 2021 Term Loan B, 8.255%, (US0001M + 3.250%), 07/10/28 | | | 982,527 | | | | 0.4 | |
| | 997,375 | | | | Ascend Learning, LLC 2021 Term Loan, 8.306%, (TSFR1M + 3.500%), 12/11/28 | | | 925,273 | | | | 0.4 | |
| | 518,385 | | | | Belfor Holdings Inc. Term Loan B, 8.852%, (US0001M + 4.000%), 04/06/26 | | | 518,061 | | | | 0.2 | |
| | 250,000 | | | | Colorado Buyer Inc Term Loan B, 7.820%, (US0001M + 3.000%), 05/01/24 | | | 204,125 | | | | 0.1 | |
Principal
Amount† | | | | Borrower/Tranche
Description | | Fair Value | | | Percentage
of Net
Assets |
| | | | | | | | | | | | | | |
| LOANS*: (continued) | | | | | | | | |
| | | | | | | | | | | | | | |
| | | | | | Business Equipment & Services: (continued) | | |
| | 225,000 | | | | DG Investment Intermediate Holdings 2, Inc. 2021 2nd Lien Term Loan, 11.590%, (US0001M + 6.750%), 03/30/29 | | $ | 199,195 | | | | 0.1 | |
| | 570,143 | | | | DG Investment Intermediate Holdings 2, Inc. 2021 Term Loan, 8.557%, (US0001M + 3.750%), 03/31/28 | | | 555,890 | | | | 0.2 | |
| | 593,846 | | | | Endure Digital Inc. Term Loan, 8.219%, (US0001M + 3.500%), 02/10/28 | | | 553,761 | | | | 0.2 | |
| | 565,091 | | | | Ensono, LP 2021 Term Loan, 8.909%, (US0003M + 3.750%), 05/26/28 | | | 524,122 | | | | 0.2 | |
| | 448,872 | | | | Garda World Security Corporation 2022 Term Loan B, 9.009%, (SOFRRATE + 4.250%), 02/01/29 | | | 436,902 | | | | 0.2 | |
| | 488,704 | | | | Gloves Buyer, Inc. 2021 Term Loan, 8.840%, (US0001M + 4.000%), 12/29/27 | | | 452,051 | | | | 0.2 | |
| | 749,732 | | | | Indy US Bidco, LLC 2021 USD Term Loan, 8.590%, (US0001M + 3.750%), 03/05/28 | | | 636,335 | | | | 0.2 | |
| | 65,292 | | | | Indy US Bidco, LLC 2023 USD Fifth Amendment Incremental Term Loan, 11.052%, (TSFR1M + 6.250%), 03/06/28 | | | 56,926 | | | | 0.0 | |
| | 134,708 | | | | Indy US Bidco, LLC 2023 USD Incremental Term Loan B, 10.892%, (TSFR1M + 6.250%), 03/06/28 | | | 118,880 | | | | 0.0 | |
| | 395,859 | | | | Intrado Corporation 2017 Term Loan, 8.825%, (US0001M + 4.000%), 10/10/24 | | | 351,820 | | | | 0.1 | |
| | 240,000 | | | | Intrado Corporation 2023 Term Loan B, 8.642%, (TSFR1M + 4.000%), 01/31/30 | | | 235,725 | | | | 0.1 | |
| | 810,563 | | | | ION Trading Finance Limited 2021 USD Term Loan, 9.909%, (US0003M + 4.750%), 04/03/28 | | | 766,657 | | | | 0.3 | |
| | 837,288 | | | | KUEHG Corp. 2018 Incremental Term Loan, 8.909%, (US0001M + 3.750%), 02/21/25 | | | 824,380 | | | | 0.3 | |
| | 548,556 | | | | Learning Care Group, Inc. 2018 1st Lien Term Loan, 8.082%, (US0003M + 3.250%), 03/13/25 | | | 538,957 | | | | 0.2 | |
| | 1,073,221 | | | | Milano Acquisition Corp Term Loan B, 8.998%, (US0003M + 4.000%), 10/01/27 | | | 1,022,914 | | | | 0.4 | |
| | 733,453 | | | | Paysafe Holdings (US) Corp USD Term Loan B1, 7.590%, (US0001M + 2.750%), 06/28/28 | | | 711,449 | | | | 0.3 | |
| | 765,313 | | | | PECF USS Intermediate Holding III Corporation Term Loan B, 9.090%, (US0001M + 4.250%), 12/15/28 | | | 647,646 | | | | 0.3 | |
| | 100,000 | | | | Pre-Paid Legal Services, Inc. 2021 2nd Lien Term Loan, 11.840%, (US0003M + 7.000%), 12/14/29 | | | 87,500 | | | | 0.0 | |
| | 542,763 | | | | Pre-Paid Legal Services, Inc. 2021 Term Loan, 8.590%, (US0001M + 3.750%), 12/15/28 | | | 535,368 | | | | 0.2 | |
See Accompanying Notes to Financial Statements
22
| VOYA FLOATING RATE FUND | PORTFOLIO OF INVESTMENTS
AS OF MARCH 31, 2023 (CONTINUED) |
| | |
Principal
Amount† | | | | Borrower/Tranche
Description | | Fair Value | | | Percentage
of Net
Assets |
| | | | | | | | | | | | | | |
| LOANS*: (continued) | | | | | | | | |
| | | | | | | | | | | | | | |
| | | | | | Business Equipment & Services: (continued) | | |
| | 598,492 | | | | Renaissance Holding Corp. 2022 Incremental Term Loan, 9.234%, (SOFRRATE + 4.500%), 03/30/29 | | $ | 597,595 | | | | 0.2 | |
| | 550,000 | | | | Renaissance Holding Corp. 2023 Term Loan B, 9.552%, (TSFR1M + 4.750%), 03/15/30 | | | 534,531 | | | | 0.2 | |
| | 361,433 | | | | Rockwood Service Corporation 2020 Term Loan, 9.090%, (US0001M + 4.250%), 01/23/27 | | | 360,642 | | | | 0.1 | |
| | 866,133 | | | | Skopima Merger Sub Inc. Term Loan B, 8.840%, (US0001M + 4.000%), 05/12/28 | | | 809,834 | | | | 0.3 | |
| | 1,313,245 | | | | Staples, Inc. 7 Year Term Loan, 9.814%, (US0003M + 5.000%), 04/16/26 | | | 1,209,358 | | | | 0.5 | |
| | 1,087,113 | | | | Verifone Systems, Inc. 2018 1st Lien Term Loan, 8.958%, (US0003M + 4.000%), 08/20/25 | | | 940,625 | | | | 0.4 | |
| | 987,353 | | | | Verscend Holding Corp. 2021 Term Loan B, 8.840%, (US0001M + 4.000%), 08/27/25 | | | 987,723 | | | | 0.4 | |
| | 381,250 | | | | VM Consolidated, Inc. 2021 Term Loan B, 8.090%, (US0006M + 3.250%), 03/24/28 | | | 381,429 | | | | 0.2 | |
| | 1,363,016 | | | | Yak Access, LLC 1L Take-Back Debt, 11.815%, (TSFR6M + 6.400%), 09/11/23 | | | 1,104,043 | | | | 0.4 | |
| | | | | | | | | 19,651,924 | | | | 7.6 | |
| | | | | | | | | | | | | | |
| | | | | | Cable & Satellite Television: 2.4% | | | | | | | | |
| | 663,300 | | | | Cogeco Financing 2 LP 2021 Incremental Term Loan B, 7.340%, (US0001M + 2.500%), 09/01/28 | | | 655,734 | | | | 0.2 | |
| | 1,664,831 | | | | DirecTV Financing, LLC Term Loan, 9.840%, (US0001M + 5.000%), 08/02/27 | | | 1,606,353 | | | | 0.6 | |
| | 498,737 | | | | Radiate Holdco, LLC 2021 Term Loan B, 8.090%, (US0001M + 3.250%), 09/25/26 | | | 410,211 | | | | 0.2 | |
| | 2,479,765 | | | | Telesat Canada Term Loan B5, 7.580%, (US0003M + 2.750%), 12/07/26 | | | 1,314,276 | | | | 0.5 | |
| | 750,000 | | | | UPC Financing Partnership 2021 USD Term Loan AX, 7.609%, (US0001M + 2.925%), 01/31/29 | | | 740,063 | | | | 0.3 | |
| | 750,000 | | | | Virgin Media Bristol LLC 2020 USD Term Loan Q, 7.934%, (US0001M + 3.250%), 01/31/29 | | | 743,840 | | | | 0.3 | |
| | 295,000 | | | | Virgin Media Bristol LLC 2023 USD Term Loan Y, 8.113%, (TSFR1M + 3.250%), 02/28/31 | | | 291,589 | | | | 0.1 | |
| | 434,500 | | | | WideOpenWest Finance LLC 2021 Term Loan B, 7.898%, (TSFR1M + 3.000%), 12/20/28 | | | 428,634 | | | | 0.2 | |
| | | | | | | | | 6,190,700 | | | | 2.4 | |
| | | | | | | | | | | | | | |
| | | | | | Chemicals & Plastics: 2.2% | | | | | | | | |
| | 259,439 | | | | Avantor Funding, Inc. 2021 Term Loan B5, 7.090%, (US0001M + 2.250%), 11/08/27 | | | 259,581 | | | | 0.1 | |
| | 3,077 | | | | Hexion Holdings Corporation 2022 USD Term Loan, 9.454%, (SOFRRATE + 4.500%), 03/15/29 | | | 2,774 | | | | 0.0 | |
Principal
Amount† | | | | Borrower/Tranche
Description | | Fair Value | | | Percentage
of Net
Assets |
| | | | | | | | | | | | | | |
| LOANS*: (continued) | | | | | | | | |
| | | | | | | | | | | | | | |
| | | | | | Chemicals & Plastics: (continued) | | | | | | | | |
| | 430,771 | | | | INEOS Styrolution US Holding LLC 2021 USD Term Loan B, 7.590%, (US0001M + 2.750%), 01/29/26 | | $ | 427,136 | | | | 0.2 | |
| | 583,478 | | | | Ineos US Finance LLC 2021 USD Term Loan B, 7.306%, (US0001M + 2.500%), 11/08/28 | | | 575,091 | | | | 0.2 | |
| | 1,100,000 | | | | Ineos US Finance LLC 2023 USD Term Loan B, 8.302%, (TSFR1M + 3.500%), 02/10/30 | | | 1,094,157 | | | | 0.4 | |
| | 412,702 | | | | Lonza Group AG USD Term Loan B, 9.159%, (US0003M + 4.000%), 07/03/28 | | | 384,157 | | | | 0.1 | |
| | 190,000 | | | | NIC Acquisition Corp. Second Lien Term Loan, 12.910%, (US0003M + 7.750%), 12/29/28 | | | 109,250 | | | | 0.0 | |
| | 431,442 | | | | Olympus Water US Holding Corporation 2021 USD Term Loan B, 8.938%, (US0003M + 3.750%), 11/09/28 | | | 409,331 | | | | 0.2 | |
| | 494,632 | | | | PMHC II, Inc. 2022 Term Loan B, 9.076%, (TSFR1M + 4.250%), 04/23/29 | | | 438,986 | | | | 0.2 | |
| | 530,257 | | | | Sparta U.S. HoldCo LLC 2021 Term Loan, 7.919%, (US0001M + 3.250%), 08/02/28 | | | 524,733 | | | | 0.2 | |
| | 422,590 | | | | Trinseo Materials Operating S.C.A. 2018 Term Loan, 6.852%, (US0001M + 2.000%), 09/06/24 | | | 417,722 | | | | 0.2 | |
| | 500,000 | | | | Tronox Finance LLC 2021 Term Loan B, 7.078%, (SOFRRATE + 2.250%), 03/10/28 | | | 490,000 | | | | 0.2 | |
| | 497,481 | | | | W.R. Grace & Co.-Conn. 2021 Term Loan B, 8.938%, (US0003M + 3.750%), 09/22/28 | | | 494,890 | | | | 0.2 | |
| | | | | | | | | 5,627,808 | | | | 2.2 | |
| | | | | | | | | | | | | | |
| | | | | | Clothing/Textiles: 0.5% | | | | | | | | |
| | 699,713 | | | | ABG Intermediate Holdings 2 LLC 2021 Term Loan B1, 8.407%, (SOFRRATE + 3.600%), 12/21/28 | | | 690,091 | | | | 0.2 | |
| | 712,500 | | | | Crocs, Inc. Term Loan B, 8.407%, (SOFRRATE + 3.500%), 02/20/29 | | | 711,292 | | | | 0.3 | |
| | | | | | | | | 1,401,383 | | | | 0.5 | |
| | | | | | | | | | | | | | |
| | | | | | Communications: 1.0% | | | | | | | | |
| | 330,763 | | | | Charter Communications Operating, LLC 2019 Term Loan B2, 6.557%, (TSFR1M + 1.750%), 02/01/27 | | | 328,179 | | | | 0.1 | |
| | 598,500 | | | | Go Daddy Operating Company, LLC 2022 Term Loan B5, 7.379%, (TSFR1M + 3.250%), 10/21/29 | | | 599,207 | | | | 0.2 | |
| | 65,691 | | (2) | | GTT Communications, Inc. 2022 Holdco Term Loan, 13.998% (PIK Rate 0.000%, Cash Rate 0.000%), 06/30/28 | | | 35,801 | | | | 0.0 | |
| | 81,632 | | | | GTT Communications, Inc. 2022 Opco Term Loan, 11.907%, (TSFR1M + 4.618%), 12/30/27 | | | 67,754 | | | | 0.0 | |
See Accompanying Notes to Financial Statements
23
| VOYA FLOATING RATE FUND | PORTFOLIO OF INVESTMENTS
AS OF MARCH 31, 2023 (CONTINUED) |
| | |
Principal
Amount† | | | | Borrower/Tranche
Description | | Fair Value | | | Percentage
of Net
Assets |
| | | | | | | | | | | | | | |
| LOANS*: (continued) | | | | | | | | |
| | | | | | | | | | | | | | |
| | | | | | Communications: (continued) | | | | | | | | |
| | 922,154 | | | | Maxar Technologies, Inc. 2022 Term Loan B 1L, 5.936%, (TSFR1M + 4.250%), 06/14/29 | | $ | 923,171 | | | | 0.4 | |
| | 733,163 | | | | Uber Technologies, Inc. 2023 Term Loan B, 7.659%, (TSFR1M + 2.750%), 02/28/30 | | | 732,552 | | | | 0.3 | |
| | | | | | | | | 2,686,664 | | | | 1.0 | |
| | | | | | | | | | | | | | |
| | | | | | Consumer, Cyclical: 2.2% | | | | | | | | |
| | 443,888 | | | | American Axle and Manufacturing, Inc. 2022 Term Loan B, 7.800%, (SOFRRATE + 3.500%), 12/06/29 | | | 441,945 | | | | 0.2 | |
| | 279,300 | | | | BBB Industries LLC 2022 Term Loan, 7.772%, (TSFR1M + 5.250%), 07/25/29 | | | 267,168 | | | | 0.1 | |
| | 907,725 | | | | Bombardier Recreational Products, Inc. 2022 Incremental Term Loan B, 8.142%, (TSFR1M + 3.500%), 12/13/29 | | | 907,725 | | | | 0.3 | |
| | 720,000 | | | | Caesars Entertainment Corp Term Loan B, 7.892%, (TSFR1M + 3.250%), 01/20/30 | | | 717,300 | | | | 0.3 | |
| | 345,000 | | | | Formula One Holdings Limited. Term Loan B, 7.379%, (TSFR1M + 3.250%), 01/15/30 | | | 345,216 | | | | 0.1 | |
| | 325,000 | | | | Hanesbrands, Inc. 2023 Term Loan B, 8.392%, (TSFR1M + 3.750%), 02/14/30 | | | 324,187 | | | | 0.1 | |
| | 1,015,895 | | | | Hayward Industries, Inc. 2022 Term Loan, 7.550%, (TSFR1M + 3.250%), 05/30/28 | | | 991,344 | | | | 0.4 | |
| | 492,547 | | | | MOTION FINCO SARL USD TERM LOAN B1, 8.409%, (US0003M + 3.250%), 11/12/26 | | | 485,774 | | | | 0.2 | |
| | 367,225 | | | | Penn National Gaming, Inc. 2022 Term Loan B 1L, 3.831%, (TSFR1M + 2.750%), 05/03/29 | | | 367,196 | | | | 0.1 | |
| | 150,000 | | | | Sally Holdings, LLC 2023 Term Loan B, 7.409%, (TSFR1M + 2.500%), 02/28/30 | | | 149,625 | | | | 0.1 | |
| | 507,450 | | | | Stars Group Holdings B.V. 2022 USD Term Loan B, 7.608%, (TSFR1M + 3.250%), 07/22/28 | | | 508,882 | | | | 0.2 | |
| | 270,000 | | | | Topgolf Callaway Brands Corp. Term Loan B, 8.302%, (TSFR1M + 3.500%), 03/08/30 | | | 268,763 | | | | 0.1 | |
| | | | | | | | | 5,775,125 | | | | 2.2 | |
| | | | | | | | | | | | | | |
| | | | | | Consumer, Non-cyclical: 1.8% | | | | | | | | |
| | 878,363 | | | | Bausch + Lomb Corp. 1st Lien Term Loan B, 4.331%, (TSFR1M + 3.250%), 05/10/27 | | | 855,374 | | | | 0.3 | |
| | 724,800 | | | | CoreLogic, Inc. TL B 1L, 8.375%, (US0001M + 3.500%), 06/02/28 | | | 620,157 | | | | 0.2 | |
| | 645,000 | | | | Covetrus, Inc. 2022 1st Lien Term Loan, 9.413%, (TSFR3M + 5.000%), 10/13/29 | | | 606,300 | | | | 0.2 | |
| | 280,000 | | | | Fugue Finance B.V. 2023 USD Term Loan B, 9.142%, (TSFR1M + 4.500%), 01/25/28 | | | 280,700 | | | | 0.1 | |
| | 410,000 | | | | Kingpin Intermediate Holdings LLC 2023 Term Loan B, 8.142%, (TSFR1M + 3.500%), 02/28/28 | | | 410,000 | | | | 0.2 | |
Principal
Amount† | | | | Borrower/Tranche
Description | | Fair Value | | | Percentage
of Net
Assets |
| | | | | | | | | | | | | | |
| LOANS*:(continued) | | | | | | | | |
| | | | | | | | | | | | | | |
| | | | | | Consumer, Non-cyclical: (continued) | | | | | | | | |
| | 755,000 | | | | Neptune Bidco US Inc 2022 USD Term Loan B, 9.129%, (TSFR1M + 5.000%), 04/11/29 | | $ | 671,950 | | | | 0.3 | |
| | 398,000 | | | | Sabre GLBL, Inc. 2022 Term Loan B2 1L, 8.042%, (TSFR1M + 5.000%), 06/30/28 | | | 343,275 | | | | 0.1 | |
| | 957,600 | | | | SUNSHINE INVESTMENTS B V 2022 USD TERM LOAN, 5.331%, (TSFR1M + 4.250%), 07/12/29 | | | 943,834 | | | | 0.4 | |
| | | | | | | | | 4,731,590 | | | | 1.8 | |
| | | | | | | | | | | | | | |
| | | | | | Containers & Glass Products: 3.2% | | | | | | | | |
| | 676,529 | | | | Altium Packaging LLC 2021 Term Loan B, 7.600%, (US0001M + 2.750%), 02/03/28 | | | 668,635 | | | | 0.3 | |
| | 935,746 | | | | Charter NEX US, Inc. 2021 Term Loan, 8.556%, (TSFR1M + 3.750%), 12/01/27 | | | 925,804 | | | | 0.4 | |
| | 903,175 | | | | Clydesdale Acquisition Holdings Inc Term Loan B, 9.082%, (TSFR1M + 4.175%), 04/13/29 | | | 884,701 | | | | 0.3 | |
| | 299,237 | | | | Graham Packaging Company Inc. 2021 Term Loan, 7.840%, (US0001M + 3.000%), 08/04/27 | | | 296,955 | | | | 0.1 | |
| | 584,634 | | | | Plastipak Packaging, Inc. 2021 Term Loan B, 7.375%, (US0001M + 2.500%), 12/01/28 | | | 582,624 | | | | 0.2 | |
| | 955,077 | | | | Pretium PKG Holdings, Inc. 2021 1st Lien Term Loan, 8.843%, (US0003M + 4.000%), 10/02/28 | | | 758,263 | | | | 0.3 | |
| | 280,000 | | | | Pretium PKG Holdings, Inc. 2021 2nd Lien Term Loan, 11.648%, (US0003M + 6.750%), 10/01/29 | | | 179,813 | | | | 0.1 | |
| | 1,027,290 | | | | Pro Mach Group, Inc. 2021 Term Loan B, 8.840%, (US0001M + 4.000%), 08/31/28 | | | 1,024,080 | | | | 0.4 | |
| | 618,041 | | | | Reynolds Group Holdings Inc. 2021 Term Loan B, 8.090%, (US0001M + 3.500%), 09/24/28 | | | 610,647 | | | | 0.2 | |
| | 1,240,209 | | | | Titan Acquisition Limited 2018 Term Loan B, 8.151%, (US0003M + 3.000%), 03/28/25 | | | 1,179,491 | | | | 0.5 | |
| | 641,834 | | | | TricorBraun Holdings, Inc. 2021 Term Loan, 8.090%, (US0001M + 3.250%), 03/03/28 | | | 628,596 | | | | 0.2 | |
| | 433,476 | | | | Trident TPI Holdings, Inc. 2021 Incremental Term Loan, 9.159%, (US0003M + 4.000%), 09/15/28 | | | 421,826 | | | | 0.2 | |
| | | | | | | | | 8,161,435 | | | | 3.2 | |
| | | | | | | | | | |
| | | | | | Cosmetics/Toiletries: 0.2% | | | | | | | | |
| | 396,387 | | | | Anastasia Parent, LLC 2018 Term Loan B, 8.909%, (US0003M + 3.750%), 08/11/25 | | | 319,422 | | | | 0.1 | |
| | 266,680 | | | | Olaplex, Inc 2022 Term Loan, 8.392%, (SOFRRATE + 3.750%), 02/23/29 | | | 239,345 | | | | 0.1 | |
| | | | | | | | | 558,767 | | | | 0.2 | |
See Accompanying Notes to Financial Statements
24
| VOYA FLOATING RATE FUND | PORTFOLIO OF INVESTMENTS
AS OF MARCH 31, 2023 (CONTINUED) |
| | |
Principal
Amount† | | | | Borrower/Tranche
Description | | Fair Value | | | Percentage
of Net
Assets |
| | | | | | | | | | | | | | |
| LOANS*: (continued) | | | | | | | | |
| | | | | | | | | | | | | | |
| | | | | | Drugs: 0.8% | | | | | | | | |
| | 979,319 | | | | Amneal Pharmaceuticals LLC 2018 Term Loan B, 8.375%, (US0001M + 3.500%), 05/04/25 | | $ | 932,496 | | | | 0.3 | |
| | 1,215,201 | | | | Jazz Financing Lux S.a.r.l. USD Term Loan, 8.340%, (US0001M + 3.500%), 05/05/28 | | | 1,212,036 | | | | 0.5 | |
| | | | | | | | | 2,144,532 | | | | 0.8 | |
| | | | | | | | | | | | | | |
| | | | | | Ecological Services & Equipment: 0.3% | | | | | | | | |
| | 711,000 | | | | Clean Harbors Inc. 2021 Incremental Term Loan B, 6.859%, (US0001M + 2.000%), 10/08/28 | | | 714,301 | | | | 0.3 | |
| | | | | | | | | | | | | | |
| | | | | | Electronics/Electrical: 11.1% | | | | | | | | |
| | 422,128 | | | | ABC Financial Services, Inc. 1st Lien Term Loan, 9.102%, (US0001M + 4.250%), 01/02/25 | | | 409,991 | | | | 0.2 | |
| | 605,169 | | | | Altar Bidco, Inc. 2021 Term Loan, 6.635%, (SOFRRATE + 3.100%), 02/01/29 | | | 578,882 | | | | 0.2 | |
| | 527,980 | | | | AP Core Holdings II, LLC Amortization Term Loan B1, 10.340%, (US0001M + 5.500%), 09/01/27 | | | 516,761 | | | | 0.2 | |
| | 293,155 | | | | AP Core Holdings II, LLC High- Yield Term Loan B2, 10.340%, (US0001M + 5.500%), 09/01/27 | | | 286,070 | | | | 0.1 | |
| | 352,145 | | | | Atlas Purchaser, Inc. 2021 Term Loan, 10.385%, (US0003M + 5.250%), 05/08/28 | | | 245,401 | | | | 0.1 | |
| | 1,491,243 | | | | Banff Merger Sub Inc 2021 USD Term Loan, 8.590%, (US0001M + 3.750%), 10/02/25 | | | 1,473,457 | | | | 0.6 | |
| | 614,061 | | | | CentralSquare Technologies, LLC 2018 1st Lien Term Loan, 8.909%, (US0003M + 3.750%), 08/29/25 | | | 541,602 | | | | 0.2 | |
| | 879,859 | | | | Cloudera, Inc. 2021 Term Loan, 8.590%, (US0001M + 3.750%), 10/08/28 | | | 831,467 | | | | 0.3 | |
| | 399,938 | | | | ConnectWise, LLC 2021 Term Loan B, 8.340%, (US0003M + 3.500%), 09/29/28 | | | 387,815 | | | | 0.2 | |
| | 389,781 | | | | Constant Contact Inc Term Loan, 8.806%, (US0003M + 4.000%), 02/10/28 | | | 369,155 | | | | 0.1 | |
| | 445,475 | | | | Cornerstone OnDemand, Inc. 2021 Term Loan, 8.602%, (US0001M + 3.750%), 10/16/28 | | | 412,621 | | | | 0.2 | |
| | 271,067 | | | | Creation Technologies Inc. 2021 Term Loan, 10.282%, (US0003M + 5.500%), 10/05/28 | | | 235,828 | | | | 0.1 | |
| | 768,935 | | | | Delta TopCo, Inc. 2020 Term Loan B, 8.656%, (TSFR1M + 3.750%), 12/01/27 | | | 714,789 | | | | 0.3 | |
| | 433,169 | | | | EagleView Technology Corporation 2018 Add On Term Loan B, 8.659%, (US0003M + 3.500%), 08/14/25 | | | 373,500 | | | | 0.1 | |
| | 300,000 | | | | Grab Holdings Inc Term Loan B, 9.350%, (US0003M + 4.500%), 01/29/26 | | | 300,375 | | | | 0.1 | |
Principal
Amount† | | | | Borrower/Tranche
Description | | Fair Value | | | Percentage
of Net
Assets |
| | | | | | | | | | | | | | |
| LOANS*: (continued) | | | | | | | | |
| | | | | | | | | | | | | | |
| | | | | | Electronics/Electrical: (continued) | | | | | | | | |
| | 1,148,092 | | | | Greeneden U.S. Holdings II, LLC 2020 USD Term Loan B, 8.840%, (US0001M + 4.000%), 12/01/27 | | $ | 1,135,176 | | | | 0.4 | |
| | 545,429 | | | | Helios Software Holdings, Inc. 2021 USD Term Loan B, 8.626%, (TSFR1M + 3.750%), 03/11/28 | | | 532,815 | | | | 0.2 | |
| | 721,465 | | | | Hyland Software, Inc. 2018 1st Lien Term Loan, 8.340%, (US0001M + 3.500%), 07/01/24 | | | 713,078 | | | | 0.3 | |
| | 855,364 | | | | II-VI Incorporated 2022 Term Loan B, 7.590%, (US0001M + 2.750%), 07/02/29 | | | 848,949 | | | | 0.3 | |
| | 464,419 | | | | Imperva, Inc. 1st Lien Term Loan, 8.859%, (US0003M + 4.000%), 01/12/26 | | | 408,979 | | | | 0.2 | |
| | 1,368,871 | | | | Imperva, Inc. 2nd Lien Term Loan, 12.651%, (US0003M + 7.750%), 01/11/27 | | | 1,016,387 | | | | 0.4 | |
| | 1,007,811 | | | | Informatica LLC 2021 USD Term Loan B, 7.602%, (US0001M + 2.750%), 10/27/28 | | | 1,002,352 | | | | 0.4 | |
| | 402,726 | | | | Ingram Micro Inc. 2021 Term Loan B, 8.601%, (US0003M + 3.500%), 06/30/28 | | | 400,108 | | | | 0.2 | |
| | 150,000 | | | | Ivanti Software, Inc. 2021 2nd Lien Term Loan, 12.212%, (US0003M + 7.250%), 12/01/28 | | | 91,200 | | | | 0.0 | |
| | 254,800 | | | | Ivanti Software, Inc. 2021 Add On Term Loan B, 8.984%, (US0003M + 4.000%), 12/01/27 | | | 208,140 | | | | 0.1 | |
| | 1,223,166 | | | | Ivanti Software, Inc. 2021 Term Loan B, 9.212%, (US0003M + 4.250%), 12/01/27 | | | 1,004,398 | | | | 0.4 | |
| | 402,159 | | | | LogMeIn, Inc. Term Loan B, 9.590%, (US0001M + 4.750%), 08/31/27 | | | 232,821 | | | | 0.1 | |
| | 1,029,365 | | | | Magenta Buyer LLC 2021 USD 1st Lien Term Loan, 9.580%, (US0003M + 4.750%), 07/27/28 | | | 849,226 | | | | 0.3 | |
| | 560,000 | | | | Magenta Buyer LLC 2021 USD 2nd Lien Term Loan, 13.080%, (US0003M + 8.250%), 07/27/29 | | | 423,733 | | | | 0.2 | |
| | 997,487 | | | | McAfee, LLC 2022 USD Term Loan B, 8.515%, (TSFR1M + 3.750%), 03/01/29 | | | 943,042 | | | | 0.4 | |
| | 365,000 | | | | MH Sub I, LLC 2021 2nd Lien Term Loan, 11.057%, (TSFR1M + 6.250%), 02/23/29 | | | 336,895 | | | | 0.1 | |
| | 777,150 | | | | Mitchell International, Inc. 2021 Term Loan B, 8.502%, (US0001M + 3.750%), 10/15/28 | | | 737,928 | | | | 0.3 | |
| | 498,659 | | | | NortonLifeLock Inc. 2022 Term Loan B, 6.907%, (TSFR1M + 2.000%), 09/12/29 | | | 493,735 | | | | 0.2 | |
| | 769,679 | | | | Optiv Security, Inc. 1st Lien Term Loan, 8.090%, (US0003M + 3.250%), 02/01/24 | | | 757,557 | | | | 0.3 | |
| | 425,783 | | | | Panther Commercial Holdings L.P Term Loan, 9.075%, (US0003M + 4.500%), 01/07/28 | | | 397,575 | | | | 0.2 | |
| | 1,141 | | | | Planview Parent, Inc. Term Loan, 9.159%, (US0003M + 4.000%), 12/17/27 | | | 1,085 | | | | 0.0 | |
See Accompanying Notes to Financial Statements
25
| VOYA FLOATING RATE FUND | PORTFOLIO OF INVESTMENTS
AS OF MARCH 31, 2023 (CONTINUED) |
| | |
Principal
Amount† | | | | Borrower/Tranche
Description | | Fair Value | | | Percentage
of Net
Assets |
| | | | | | | | | | | |
| LOANS*: (continued) | | | | | | |
| | | | | | | | | | | | | | |
| | | | | | Electronics/Electrical: (continued) | | | | | | | | |
| | 987,500 | | | | Proofpoint, Inc. 1st Lien Term Loan, 8.090%, (US0003M + 3.250%), 08/31/28 | | $ | 967,287 | | | | 0.4 | |
| | 485,000 | | | | Quest Software US Holdings Inc. 2022 2nd Lien Term Loan, 12.326%, (SOFRRATE + 7.500%), 02/01/30 | | | 303,731 | | | | 0.1 | |
| | 1,472,717 | | | | Quest Software US Holdings Inc. 2022 Term Loan, 9.076%, (SOFRRATE + 4.250%), 02/01/29 | | | 1,208,364 | | | | 0.5 | |
| | 1,575,294 | | | | Rackspace Technology Global, Inc. 2021 Term Loan B, 7.595%, (US0003M + 2.750%), 02/15/28 | | | 850,659 | | | | 0.3 | |
| | 1,054,317 | | | | Redstone Buyer LLC 2021 Term Loan, 9.568%, (US0003M + 4.750%), 04/27/28 | | | 837,193 | | | | 0.3 | |
| | 1,457,081 | | (2),(3) | | Riverbed Technology, Inc. 2021 PIK Exit Term Loan, 12.840%, (US0003M + 6.000%) (PIK Rate 2.000%, Cash Rate 10.840%), 12/07/26 | | | 480,837 | | | | 0.2 | |
| | 600,000 | | | | Rocket Software, Inc. 2018 Term Loan, 6.622%, (US0001M + 4.250%), 11/28/25 | | | 589,875 | | | | 0.2 | |
| | 363,729 | | | | SonicWall US Holdings Inc. 1st Lien Term Loan, 8.708%, (US0003M + 3.750%), 05/16/25 | | | 359,001 | | | | 0.1 | |
| | 1,000,000 | | (2) | | Travelport Finance (Luxembourg) S.a.r.l. 2021 Consented Term Loan, 11.480%, (US0003M + 1.750%) (PIK Rate 1.750%, Cash Rate 9.730%), 05/29/26 | | | 575,000 | | | | 0.2 | |
| | 1,493,706 | | | | Ultimate Software Group Inc (The) 2021 Term Loan, 8.032%, (US0003M + 3.250%), 05/04/26 | | | 1,457,430 | | | | 0.6 | |
| | 332,421 | | | | Watlow Electric Manufacturing Company Term Loan B, 8.688%, (TSFR1M + 3.750%), 03/02/28 | | | 328,681 | | | | 0.1 | |
| | 382,834 | | | | Xperi Corporation 2020 Term Loan B, 8.340%, (US0001M + 3.500%), 06/08/28 | | | 378,527 | | | | 0.1 | |
| | | | | | | | | 28,549,478 | | | | 11.1 | |
| | | | | | | | | | | | | | |
| | | | | | Energy: 1.1% | | | | | | | | |
| | 615,000 | | | | Brazos Delaware II, LLC 2023 Term Loan B, 8.392%, (TSFR1M + 3.750%), 02/11/30 | | | 602,443 | | | | 0.2 | |
| | 409,275 | | | | M6 ETX Holdings II Midco LLC 2022 Term Loan B 1L, 7.542%, (TSFR1M + 4.500%), 09/19/29 | | | 405,012 | | | | 0.2 | |
| | 860,641 | | | | Oryx Midstream Services Permian Basin LLC Term Loan B, 8.063%, (TSFR1M + 3.250%), 10/05/28 | | | 848,270 | | | | 0.3 | |
| | 459,188 | | | | Profrac Services, LLC 2022 Term Loan, 11.892%, (TSFR1M + 8.000%), 03/04/25 | | | 455,744 | | | | 0.2 | |
| | 199,500 | | | | UGI Energy Services, LLC 2023 Term Loan B, 8.052%, (TSFR1M + 3.250%), 02/22/30 | | | 197,754 | | | | 0.1 | |
| | 290,000 | | | | Whitewater Whistler Holdings, LLC 2023 Term Loan B, 8.159%, (TSFR1M + 3.250%), 02/15/30 | | | 289,275 | | | | 0.1 | |
| | | | | | | | | 2,798,498 | | | | 1.1 | |
Principal
Amount† | | | | Borrower/Tranche
Description | | Fair Value | | | Percentage
of Net
Assets | |
| | | | | | | | | | | | | | |
| LOANS*: (continued) | | | | | | | | |
| | | | | | | | | | | | | | |
| | | | | | Equipment Leasing: 0.4% | | | | | | | | |
| | 375,250 | | | | Albion Financing 3 SARL USD Term Loan, 10.065%, (US0003M + 5.250%), 08/17/26 | | $ | 364,462 | | | | 0.2 | |
| | 588,083 | | | | Rent-A-Center, Inc. 2021 First Lien Term Loan B, 8.125%, (US0003M + 3.250%), 02/17/28 | | | 583,672 | | | | 0.2 | |
| | | | | | | | | 948,134 | | | | 0.4 | |
| | | | | | | | | | | | | | |
| | | | | | Financial: 1.5% | | | | | | | | |
| | 585,000 | | | | Alliant Holdings Intermediate, LLC 2023 Term Loan B5, 8.142%, (TSFR1M + 3.500%), 11/05/27 | | | 579,424 | | | | 0.2 | |
| | 1,336,650 | | | | AmWINS Group, Inc. 2023 Incremental Term Loan B, 7.392%, (TSFR1M + 2.750%), 02/08/30 | | | 1,318,688 | | | | 0.5 | |
| | 1,496,250 | | | | Hub International Limited 2022 Term Loan B, 8.129%, (TSFR1M + 4.000%), 11/10/29 | | | 1,494,193 | | | | 0.6 | |
| | 345,000 | | | | Walker & Dunlop, Inc. 2022 Incremental Term Loan B, 7.300%, (SOFRRATE + 3.000%), 12/17/29 | | | 341,550 | | | | 0.2 | |
| | | | | | | | | 3,733,855 | | | | 1.5 | |
| | | | | | | | | | | | | | |
| | | | | | Financial Intermediaries: 4.5% | | | | | | | | |
| | 439,773 | | | | Advisor Group, Inc. 2021 Term Loan, 9.340%, (US0001M + 4.500%), 07/31/26 | | | 434,118 | | | | 0.2 | |
| | 246,448 | | | | AllSpring Buyer LLC Term Loan B, 8.163%, (US0003M + 3.000%), 11/01/28 | | | 245,935 | | | | 0.1 | |
| | 295,000 | | | | AqGen Ascensus, Inc. 2021 2nd Lien Term Loan, 11.313%, (US0003M + 6.500%), 08/02/29 | | | 265,500 | | | | 0.1 | |
| | 765,332 | | | | AqGen Island Holdings, Inc. Term Loan, 8.601%, (US0003M + 3.500%), 08/02/28 | | | 745,242 | | | | 0.3 | |
| | 733,825 | | | | Castlelake Aviation Limited Term Loan B, 7.616%, (US0003M + 2.750%), 10/22/26 | | | 727,771 | | | | 0.3 | |
| | 1,720,643 | | | | Citadel Securities LP 2021 Term Loan B, 7.306%, (TSFR1M + 2.500%), 02/02/28 | | | 1,708,598 | | | | 0.7 | |
| | 281,336 | | | | Cushman & Wakefield U.S. Borrower, LLC 2020 Term Loan B, 7.590%, (US0001M + 2.750%), 08/21/25 | | | 273,951 | | | | 0.1 | |
| | 586,435 | | | | Deerfield Dakota Holding, LLC 2020 USD Term Loan B, 8.559%, (TSFR1M + 3.750%), 04/09/27 | | | 569,331 | | | | 0.2 | |
| | 1,477,444 | | | | Edelman Financial Center, LLC 2021 Term Loan B, 8.590%, (US0001M + 3.500%), 04/07/28 | | | 1,427,887 | | | | 0.5 | |
| | 878,122 | | | | First Eagle Holdings, Inc. 2020 Term Loan B, 7.659%, (US0003M + 2.500%), 02/01/27 | | | 856,718 | | | | 0.3 | |
| | 438,544 | | | | Focus Financial Partners, LLC 2021 Term Loan, 7.307%, (TSFR1M + 2.500%), 06/30/28 | | | 432,435 | | | | 0.2 | |
| | 547,250 | | | | Focus Financial Partners, LLC 2022 Term Loan B5, 7.550%, (TSFR1M + 3.250%), 06/30/28 | | | 543,146 | | | | 0.2 | |
See Accompanying Notes to Financial Statements
26
| VOYA FLOATING RATE FUND | PORTFOLIO OF INVESTMENTS
AS OF MARCH 31, 2023 (CONTINUED) |
| | |
Principal
Amount† | | | | Borrower/Tranche
Description | | Fair Value | | | Percentage
of Net
Assets |
| | | | | | | | | | | | | | |
| LOANS*: (continued) | | | | | | | | |
| | | | | | | | | | | | | | |
| | | | | | Financial Intermediaries: (continued) | | | | | | | | |
| | 698,106 | | | | HighTower Holdings LLC 2021 Term Loan B, 8.815%, (US0003M + 4.000%), 04/21/28 | | $ | 661,456 | | | | 0.3 | |
| | 1,264,379 | | | | Jane Street Group, LLC 2021 Term Loan, 7.590%, (US0001M + 2.750%), 01/26/28 | | | 1,246,678 | | | | 0.5 | |
| | 579,891 | | | | Trans Union, LLC 2021 Term Loan B6, 7.090%, (US0001M + 2.250%), 12/01/28 | | | 577,218 | | | | 0.2 | |
| | 811,800 | | | | VFH Parent LLC 2022 Term Loan B, 7.859%, (SOFRRATE + 3.000%), 01/13/29 | | | 787,446 | | | | 0.3 | |
| | | | | | | | | 11,503,430 | | | | 4.5 | |
| | | | | | | | | | | | | | |
| | | | | | Food Products: 2.0% | | | | | | | | |
| | 974,555 | | | | 8th Avenue Food & Provisions, Inc. 2018 1st Lien Term Loan, 8.609%, (US0001M + 3.750%), 10/01/25 | | | 867,354 | | | | 0.3 | |
| | 542,984 | | | | 8th Avenue Food & Provisions, Inc. 2021 Incremental Term Loan, 9.609%, (US0001M + 4.750%), 10/01/25 | | | 484,953 | | | | 0.2 | |
| | 660,000 | | | | BCPE North Star US HoldCo 2, Inc. 2021 2nd Lien Term Loan, 12.409%, (US0003M + 7.250%), 06/08/29 | | | 595,650 | | | | 0.2 | |
| | 636,684 | | | | CHG PPC Parent LLC 2021 Term Loan, 7.852%, (US0001M + 3.000%), 12/08/28 | | | 631,113 | | | | 0.3 | |
| | 802,024 | | | | IRB Holding Corp 2022 Term Loan B, 7.737%, (SOFRRATE + 3.000%), 12/15/27 | | | 789,116 | | | | 0.3 | |
| | 970,000 | | (3),(4) | | NPC International, Inc. 2nd Lien Term Loan, 1.000%, 04/18/25 | | | — | | | | 0.0 | |
| | 733,517 | | | | Primary Products Finance LLC Term Loan, 8.743%, (US0003M + 4.000%), 03/31/29 | | | 724,806 | | | | 0.3 | |
| | 572,580 | | | | Sigma Bidco B.V. 2018 USD Term Loan B, 7.460%, (TSFR1M + 3.000%), 07/02/25 | | | 550,393 | | | | 0.2 | |
| | 664,430 | | | | Weber-Stephen Products LLC Term Loan B, 8.090%, (US0001M + 3.250%), 10/30/27 | | | 577,224 | | | | 0.2 | |
| | | | | | | | | 5,220,609 | | | | 2.0 | |
| | | | | | | | | | | | | | |
| | | | | | Food Service: 0.8% | | | | | | | | |
| | 982,234 | | | | 1011778 B.C. Unlimited Liability Company Term Loan B4, 6.590%, (US0001M + 1.750%), 11/19/26 | | | 973,148 | | | | 0.4 | |
| | 497,487 | | | | Fertitta Entertainment, LLC 2022 Term Loan B, 8.807%, (SOFRRATE + 4.000%), 01/27/29 | | | 490,802 | | | | 0.2 | |
| | 614,706 | | | | Flynn Restaurant Group LP 2021 Term Loan B, 9.090%, (US0001M + 4.250%), 12/01/28 | | | 600,876 | | | | 0.2 | |
| | | | | | | | | 2,064,826 | | | | 0.8 | |
Principal
Amount† | | | | Borrower/Tranche
Description | | Fair Value | | | Percentage
of Net
Assets |
| | | | | | | | | | | | | | |
| LOANS*: (continued) | | | | | | | | |
| | | | | | | | | | | | | | |
| | | | | | Food/Drug Retailers: 1.3% | | | | | | | | |
| | 431,155 | | | | EG Finco Limited 2018 USD Term Loan, 9.159%, (US0003M + 4.000%), 02/07/25 | | $ | 413,486 | | | | 0.2 | |
| | 1,241,117 | | | | Moran Foods, LLC 2022 Extended 2nd Lien Term Loan, 14.376%, (TSFR3M + 4.680%), 12/31/26 | | | 897,700 | | | | 0.4 | |
| | 1,524,627 | | | | Moran Foods, LLC 2022 Extended Term Loan, 12.126%, (TSFR3M + 4.680%), 06/30/26 | | | 1,387,410 | | | | 0.5 | |
| | 728,030 | | | | Moran Foods, LLC Incremental FLSO Loan, 11.930%, (TSFR3M + 4.680%), 06/30/26 | | | 589,704 | | | | 0.2 | |
| | | | | | | | | 3,288,300 | | | | 1.3 | |
| | | | | | | | | | | | | | |
| | | | | | Forest Products: 0.1% | | | | | | | | |
| | 355,910 | | | | Spa Holdings 3 Oy USD Term Loan B, 8.851%, (US0003M + 3.750%), 02/04/28 | | | 348,791 | | | | 0.1 | |
| | | | | | | | | | | | | | |
| | | | | | Health Care: 6.0% | | | | | | | | |
| | 359,989 | | | | ADMI Corp. 2021 Term Loan B2, 8.215%, (US0001M + 3.375%), 12/23/27 | | | 333,890 | | | | 0.1 | |
| | 179,884 | | (1) | | Athenahealth, Inc. 2022 Delayed Draw Term loan, 8.142%, (SOFRRATE + 3.500%), 02/15/29 | | | 167,742 | | | | 0.1 | |
| | 1,464,285 | | | | Athenahealth, Inc. 2022 Term Loan B, 8.259%, (TSFR1M + 3.500%), 02/15/29 | | | 1,365,446 | | | | 0.5 | |
| | 847,000 | | | | Bausch Health Companies Inc. 2022 Term Loan B, 9.993%, (TSFR1M + 5.250%), 02/01/27 | | | 633,794 | | | | 0.2 | |
| | 443,763 | | | | Carestream Dental Equipment, Inc 2021 Term Loan, 9.340%, (US0001M + 4.500%), 09/01/24 | | | 411,960 | | | | 0.2 | |
| | 398,980 | | | | CCRR Parent, Inc Term Loan B, 8.600%, (US0001M + 3.750%), 03/06/28 | | | 391,001 | | | | 0.2 | |
| | 960,375 | | | | CHG Healthcare Services Inc. 2021 Term Loan, 8.109%, (US0001M + 3.250%), 09/29/28 | | | 951,897 | | | | 0.4 | |
| | 490,856 | | | | Commerce Merger Sub, Inc. 2017 1st Lien Term Loan, 8.090%, (US0006M + 3.250%), 06/28/24 | | | 488,709 | | | | 0.2 | |
| | 723,088 | | | | Curia Global, Inc. 2021 Term Loan, 8.526%, (US0003M + 3.750%), 08/30/26 | | | 620,952 | | | | 0.2 | |
| | 492,604 | | | | DaVita, Inc. 2020 Term Loan B, 6.590%, (US0001M + 1.750%), 08/12/26 | | | 486,177 | | | | 0.2 | |
| | 494,811 | | | | GoodRx, Inc. 1st Lien Term Loan, 7.590%, (US0001M + 2.750%), 10/10/25 | | | 492,440 | | | | 0.2 | |
| | 123,371 | | | | Greenway Health, LLC 2017 1st Lien Term Loan, 8.960%, (US0001M + 3.750%), 02/16/24 | | | 91,294 | | | | 0.0 | |
| | 256,641 | | | | Heartland Dental, LLC 2021 Incremental Term Loan, 8.840%, (US0001M + 4.000%), 04/30/25 | | | 242,739 | | | | 0.1 | |
| | 398,997 | | | | Medical Solutions Holdings, Inc. 2021 1st Lien Term Loan, 8.241%, (TSFR1M + 3.250%), 11/01/28 | | | 388,025 | | | | 0.1 | |
See Accompanying Notes to Financial Statements
27
| VOYA FLOATING RATE FUND | PORTFOLIO OF INVESTMENTS
AS OF MARCH 31, 2023 (CONTINUED) |
| | |
Principal
Amount† | | | | Borrower/Tranche
Description | | Fair Value | | | Percentage
of Net
Assets | |
| | | | | | | | | | | | | | |
| LOANS*: (continued) | | | | | | | | |
| | | | | | | | | | | | | | |
| | | | | | Health Care: (continued) | | | | | | | | |
| | 1,079,100 | | | | Medline Borrower, LP USD Term Loan B, 8.090%, (US0001M + 3.250%), 10/23/28 | | $ | 1,053,397 | | | | 0.4 | |
| | 150,000 | | | | National Mentor Holdings, Inc. 2021 2nd Lien Term Loan, 12.248%, (US0003M + 7.250%), 03/02/29 | | | 90,750 | | | | 0.0 | |
| | 28,622 | | | | National Mentor Holdings, Inc. 2021 Term Loan C, 8.748%, (US0003M + 3.750%), 03/02/28 | | | 22,097 | | | | 0.0 | |
| | 829,297 | | | | National Mentor Holdings, Inc. 2021 Term Loan, 8.766%, (US0003M + 3.750%), 03/02/28 | | | 640,217 | | | | 0.2 | |
| | 375,682 | | | | Pacific Dental Services, LLC 2021 Term Loan, 8.279%, (US0001M + 3.500%), 05/05/28 | | | 373,451 | | | | 0.1 | |
| | 749,675 | | | | Packaging Coordinators Midco, Inc. 2020 1st Lien Term Loan, 8.659%, (US0003M + 3.750%), 11/30/27 | | | 734,869 | | | | 0.3 | |
| | 442,764 | | | | Parexel International Corporation 2021 1st Lien Term Loan, 8.090%, (US0001M + 3.250%), 11/15/28 | | | 438,233 | | | | 0.2 | |
| | 600,079 | | | | Pathway Vet Alliance LLC 2021 Term Loan, 8.602%, (US0001M + 3.750%), 03/31/27 | | | 528,605 | | | | 0.2 | |
| | 267,975 | | | | Perrigo Investments, LLC Term Loan B, 7.291%, (TSFR1M + 2.500%), 04/20/29 | | | 266,635 | | | | 0.1 | |
| | 463,218 | | | | Phoenix Guarantor Inc 2020 Term Loan B, 8.090%, (US0001M + 3.250%), 03/05/26 | | | 452,072 | | | | 0.2 | |
| | 296,631 | | | | Pluto Acquisition I, Inc. 2021 1st Lien Term Loan, 8.953%, (US0003M + 4.000%), 06/22/26 | | | 212,462 | | | | 0.1 | |
| | 285,234 | | | | Press Ganey Holdings, Inc. 2022 Incremental Term Loan, 8.557%, (TSFR1M + 3.750%), 07/24/26 | | | 268,120 | | | | 0.1 | |
| | 432,803 | | | | RegionalCare Hospital Partners Holdings, Inc. 2018 Term Loan B, 8.575%, (US0001M + 3.750%), 11/16/25 | | | 413,259 | | | | 0.2 | |
| | 252,254 | | | | RxBenefits, Inc. 2020 Term Loan, 9.198%, (US0003M + 4.500%), 12/20/27 | | | 245,948 | | | | 0.1 | |
| | 1,035,000 | | | | Sotera Health Holdings, LLC 2021 Term Loan, 7.575%, (US0003M + 2.750%), 12/11/26 | | | 1,000,716 | | | | 0.4 | |
| | 950,566 | | | | Surgery Center Holdings, Inc. 2021 Term Loan, 8.460%, (US0001M + 3.750%), 08/31/26 | | | 946,192 | | | | 0.4 | |
| | 451,060 | | | | U.S. Anesthesia Partners, Inc. 2021 Term Loan, 8.912%, (US0001M + 4.250%), 10/01/28 | | | 435,595 | | | | 0.2 | |
| | 283,113 | | | | Virgin Pulse, Inc. 2021 Term Loan, 8.840%, (US0001M + 4.000%), 04/06/28 | | | 234,276 | | | | 0.1 | |
| | | | | | | | | 15,422,960 | | | | 6.0 | |
| Principal Amount† | | | | Borrower/Tranche
Description | | Fair Value | | | Percentage
of Net
Assets |
| | | | | | | | | | | | | | |
| LOANS*: (continued) | | | | | | | | |
| | | | | | | | | | | | | | |
| | | | | | Home Furnishings: 0.8% | | | | | | | | |
| | 753,525 | | | | Conair Holdings, LLC Term Loan B, 8.909%, (US0003M + 3.750%), 05/17/28 | | $ | 668,754 | | | | 0.3 | |
| | 610,384 | | | | Illuminate Merger Sub Corp. 1st Lien Term Loan, 8.340%, (US0001M + 3.500%), 07/21/28 | | | 581,086 | | | | 0.2 | |
| | 898,188 | | | | Solis IV BV USD Term Loan B1, 8.373%, (TSFR1M + 3.500%), 02/26/29 | | | 812,186 | | | | 0.3 | |
| | | | | | | | | 2,062,026 | | | | 0.8 | |
| | | | | | | | | | | | | | |
| | | | | | Industrial: 1.7% | | | | | | | | |
| | 600,000 | | | | Berry Global, Inc. 2021 Term Loan Z, 1.845%, (US0001M + 1.750%), 07/01/26 | | | 598,875 | | | | 0.2 | |
| | 363,175 | | | | Brown Group Holding LLC 2022 Term Loan B2 1L, 5.436%, (TSFR1M + 3.750%), 07/02/29 | | | 363,856 | | | | 0.2 | |
| | 625,000 | | | | Chart Industries, Inc. 2022 Term Loan B, 8.050%, (SOFRRATE + 3.750%), 12/07/29 | | | 620,312 | | | | 0.2 | |
| | 497,500 | | | | Oscar AcquisitionCo, LLC Term Loan B, 8.800%, (SOFRRATE + 4.500%), 04/29/29 | | | 480,865 | | | | 0.2 | |
| | 860,675 | | | | Project Castle, Inc. Term Loan B 1L, 7.186%, (SOFRRATE + 5.500%), 06/01/29 | | | 738,029 | | | | 0.3 | |
| | 578,578 | | | | ST GEO WARE + TR CO OF CAL INC 2022 TERM LOAN, 1.081%, (TSFR1M + 1.000%), 03/24/28 | | | 553,988 | | | | 0.2 | |
| | 455,000 | | | | TransDigm, Inc. 2023 Term Loan I, 8.159%, (TSFR1M + 3.250%), 08/24/28 | | | 454,400 | | | | 0.2 | |
| | 498,721 | | | | Tutor Perini Corporation Term Loan B, 9.608%, (US0001M + 4.750%), 08/18/27 | | | 462,564 | | | | 0.2 | |
| | | | | | | | | 4,272,889 | | | | 1.7 | |
| | | | | | | | | | | | | | |
| | | | | | Industrial Equipment: 1.4% | | | | | | | | |
| | 492,361 | | | | Alliance Laundry Systems LLC Term Loan B, 8.306%, (US0003M + 3.500%), 10/08/27 | | | 489,181 | | | | 0.2 | |
| | 381,150 | | | | Clark Equipment Company 2022 Term Loan B, 7.498%, (TSFR1M + 2.500%), 04/20/29 | | | 381,269 | | | | 0.1 | |
| | 375,000 | | | | Crown Subsea Communications Holding, Inc. 2021 Term Loan, 9.530%, (US0003M + 4.750%), 04/27/27 | | | 370,156 | | | | 0.1 | |
| | 310,000 | | | | Crown Subsea Communications Holding, Inc. 2023 Incremental Term Loan, 10.052%, (TSFR1M + 5.250%), 04/27/27 | | | 307,288 | | | | 0.1 | |
| | 299,029 | | | | Kenan Advantage Group, Inc. 2021 Term Loan B1, 8.590%, (US0001M + 3.750%), 03/24/26 | | | 297,048 | | | | 0.1 | |
| | 493,719 | | | | Madison IAQ LLC Term Loan, 8.302%, (US0003M + 3.250%), 06/21/28 | | | 470,452 | | | | 0.2 | |
| | 450,000 | | | | SPX Flow, Inc. 2022 Term Loan, 9.407%, (TSFR1M + 4.500%), 04/05/29 | | | 431,438 | | | | 0.2 | |
| | 934,226 | | | | Vertical US Newco Inc Term Loan B, 8.602%, (US0006M + 3.500%), 07/30/27 | | | 912,539 | | | | 0.4 | |
| | | | | | | | | 3,659,371 | | | | 1.4 | |
See Accompanying Notes to Financial Statements
28
| VOYA FLOATING RATE FUND | PORTFOLIO OF INVESTMENTS
AS OF MARCH 31, 2023 (CONTINUED) |
| | |
Principal
Amount† | | | | Borrower/Tranche
Description | | Fair Value | | | Percentage
of Net
Assets |
| | | | | | | | | | | | | | |
| LOANS*: (continued) | | | | | | | | |
| | | | | | | | | | | | | | |
| | | | | | Insurance: 2.3% | | | | | | | | |
| | 769,344 | | | | Acrisure, LLC 2020 Term Loan B, 8.359%, (US0001M + 3.500%), 02/15/27 | | $ | 745,303 | | | | 0.3 | |
| | 723,014 | | | | Acrisure, LLC 2021 First Lien Term Loan B, 9.090%, (US0001M + 4.250%), 02/15/27 | | | 710,663 | | | | 0.3 | |
| | 262,219 | | | | Acrisure, LLC 2021 Incremental Term Loan B, 8.602%, (US0001M + 3.750%), 02/15/27 | | | 256,647 | | | | 0.1 | |
| | 733,317 | | | | Aretec Group, Inc. 2018 Term Loan, 9.157%, (TSFR1M + 4.250%), 10/01/25 | | | 730,223 | | | | 0.3 | |
| | 372,452 | | | | IMA Financial Group, Inc. Term Loan, 8.352%, (US0001M + 3.750%), 11/01/28 | | | 363,140 | | | | 0.1 | |
| | 897,762 | | | | NFP Corp. 2020 Term Loan, 8.090%, (US0001M + 3.250%), 02/15/27 | | | 877,749 | | | | 0.3 | |
| | 1,104,343 | | | | OneDigital Borrower LLC 2021 Term Loan, 9.157%, (SOFRRATE + 4.250%), 11/16/27 | | | 1,065,691 | | | | 0.4 | |
| | 1,204,240 | | | | Sedgwick Claims Management Services, Inc. 2023 Term Loan B, 8.626%, (TSFR1M + 3.750%), 02/17/28 | | | 1,191,696 | | | | 0.5 | |
| | | | | | | | | 5,941,112 | | | | 2.3 | |
| | | | | | | | | | | | | | |
| | | | | | Leisure Good/Activities/Movies: 3.1% | | | | | |
| | 685,502 | | (2) | | 24 Hour Fitness Worldwide, Inc. 2021 Delayed Draw Term Loan, 13.735% (PIK Rate 7.000%, Cash Rate 6.735%), 09/29/25 | | | 616,952 | | | | 0.2 | |
| | 1,124,339 | | (2) | | 24 Hour Fitness Worldwide, Inc. 2021 Exit Delayed Draw Term Loan, 18.735% (PIK Rate 12.000%, Cash Rate 6.735%), 09/29/26 | | | 618,387 | | | | 0.2 | |
| | 349,904 | | | | Alterra Mountain Company 2021 Series B-2 Consenting Term Loan, 8.340%, (US0001M + 3.500%), 08/17/28 | | | 349,029 | | | | 0.1 | |
| | 947,298 | | | | AppLovin Corporation 2021 Term Loan B, 7.907%, (TSFR1M + 3.100%), 10/25/28 | | | 943,746 | | | | 0.4 | |
| | 461,611 | | | | ClubCorp Club Operations, Inc. 2017 Incremental Term Loan, 7.893%, (US0003M + 2.750%), 09/18/24 | | | 442,425 | | | | 0.2 | |
| | 1,107,326 | | | | CWGS Group, LLC 2021 Term Loan B, 7.218%, (US0001M + 2.500%), 06/03/28 | | | 1,022,892 | | | | 0.4 | |
| | 493,932 | | | | MajorDrive Holdings IV LLC Term Loan B, 9.000%, (US0003M + 4.000%), 06/01/28 | | | 469,853 | | | | 0.2 | |
| | 645,063 | | | | Playtika Holding Corp 2021 Term Loan, 6.405%, (US0001M + 2.750%), 03/13/28 | | | 641,722 | | | | 0.3 | |
| | 489,873 | | | | PUG LLC USD Term Loan, 8.340%, (US0001M + 3.500%), 02/12/27 | | | 357,608 | | | | 0.1 | |
| | 573,562 | | | | RV Retailer, LLC Term Loan B, 8.554%, (SOFRRATE + 3.750%), 02/08/28 | | | 496,131 | | | | 0.2 | |
| | 275,406 | | | | Samsonite International S.A. 2020 Incremental Term Loan B2, 7.840%, (US0003M + 3.000%), 04/25/25 | | | 275,372 | | | | 0.1 | |
Principal
Amount† | | | | Borrower/Tranche
Description | | Fair Value | | | Percentage
of Net
Assets | |
| | | | | | | | | | | | | | |
| LOANS*: (continued) | | | | | | | | |
| | | | | | | | | | | | | | |
| | | | | | Leisure Good/Activities/Movies: (continued) | | | | |
| | 890,525 | | | | Scientific Games Holdings LP 2022 USD Term Loan B, 8.103%, (TSFR1M + 3.500%), 04/04/29 | | $ | 879,671 | | | | 0.4 | |
| | 509,978 | | | | SRAM, LLC 2021 Term Loan B, 7.590%, (US0001M + 2.750%), 05/18/28 | | | 504,878 | | | | 0.2 | |
| | 295,255 | | | | The Knot Worldwide Inc. 2022 Term Loan, 9.420%, (TSFR1M + 4.500%), 12/19/25 | | | 294,886 | | | | 0.1 | |
| | | | | | | | | 7,913,552 | | | | 3.1 | |
| | | | | | | | | | | | | | |
| | | | | | Lodging & Casinos: 1.6% | | | | | | | | |
| | 734,648 | | | | Arches Buyer Inc. 2021 Term Loan B, 8.157%, (US0001M + 3.250%), 12/06/27 | | | 694,931 | | | | 0.3 | |
| | 789,203 | | | | Hilton Grand Vacations Borrower LLC 2021 Term Loan B, 7.840%, (US0001M + 3.000%), 08/02/28 | | | 789,203 | | | | 0.3 | |
| | 500,000 | | | | Hilton Worldwide Finance, LLC 2019 Term Loan B2, 6.642%, (US0001M + 1.750%), 06/22/26 | | | 500,070 | | | | 0.2 | |
| | 992,500 | | | | Scientific Games International, Inc. 2022 USD Term Loan, 7.960%, (TSFR1M + 3.000%), 04/14/29 | | | 985,987 | | | | 0.4 | |
| | 249,350 | | | | Station Casinos LLC 2020 Term Loan B, 7.100%, (US0001M + 2.250%), 02/08/27 | | | 247,791 | | | | 0.1 | |
| | 926,011 | | | | Twin River Worldwide Holdings, Inc. 2021 Term Loan B, 7.959%, (US0001M + 3.250%), 10/02/28 | | | 886,888 | | | | 0.3 | |
| | | | | | | | | 4,104,870 | | | | 1.6 | |
| | | | | | | | | | | | | | |
| | | | | | Mortgage REITs: 0.2% | | | | | | | | |
| | 481,508 | | | | BIFM CA Buyer Inc. Term Loan B, 8.340%, (US0001M + 3.500%), 06/01/26 | | | 473,683 | | | | 0.2 | |
| | | | | | | | | | | | | | |
| | | | | | Oil & Gas: 1.6% | | | | | | | | |
| | 150,529 | | | | Glass Mountain Pipeline Holdings, LLC 2021 Exit Term Loan, 9.340%, (US0001M + 4.500%), 10/28/27 | | | 138,487 | | | | 0.0 | |
| | 478,919 | | | | ITT Holdings LLC 2021 Term Loan, 7.556%, (US0001M + 2.750%), 07/10/28 | | | 468,442 | | | | 0.2 | |
| | 474,480 | | | | Medallion Midland Acquisition, LLC 2021 Term Loan, 8.626%, (US0001M + 3.750%), 10/18/28 | | | 469,142 | | | | 0.2 | |
| | 663,280 | | | | NorthRiver Midstream Finance LP 2018 Term Loan B, 8.004%, (US0003M + 3.250%), 10/01/25 | | | 662,658 | | | | 0.3 | |
| | 671,416 | | | | TransMontaigne Operating Company L.P. Term Loan B, 8.310%, (US0003M + 3.500%), 11/17/28 | | | 663,653 | | | | 0.3 | |
| | 904,570 | | | | Traverse Midstream Partners LLC 2017 Term Loan, 8.726%, (TSFR1M + 3.750%), 09/27/24 | | | 894,394 | | | | 0.3 | |
| | 725,934 | | | | Waterbridge Midstream Operating LLC Term Loan B, 10.568%, (US0003M + 5.750%), 06/22/26 | | | 715,102 | | | | 0.3 | |
| | | | | | | | | 4,011,878 | | | | 1.6 | |
See Accompanying Notes to Financial Statements
29
| VOYA FLOATING RATE FUND | PORTFOLIO OF INVESTMENTS
AS OF MARCH 31, 2023 (CONTINUED) |
| | |
Principal
Amount† | | | | Borrower/Tranche
Description | | Fair Value | | | Percentage
of Net
Assets |
| | | | | | | | | | | |
| LOANS*: (continued) | | | | | | |
| | | | | | | | | | | | | | |
| | | | | | Publishing: 0.5% | | | | | | | | |
| | 883,370 | | | | Cengage Learning, Inc. 2021 Term Loan B, 9.880%, (US0003M + 4.750%), 07/14/26 | | $ | 821,850 | | | | 0.3 | |
| | 448,424 | | | | McGraw-Hill Global Education Holdings, LLC 2021 Term Loan, 9.822%, (US0006M + 4.750%), 07/28/28 | | | 420,157 | | | | 0.2 | |
| | | | | | | | | 1,242,007 | | | | 0.5 | |
| | | | | | | | | | | | | | |
| | | | | | Radio & Television: 2.0% | | | | | | | | |
| | 1,369,933 | | | | Clear Channel Outdoor Holdings, Inc. Term Loan B, 8.325%, (US0003M + 3.500%), 08/21/26 | | | 1,280,674 | | | | 0.5 | |
| | 398,070 | | | | CMG Media Corporation 2021 Term Loan, 8.659%, (US0003M + 3.500%), 12/17/26 | | | 353,535 | | | | 0.1 | |
| | 4,767,826 | | (3),(5),(6) | | Diamond Sports Group, LLC 2022 2nd Lien Term Loan, 8.052%, (TSFR1M + 3.250%), 08/24/26 | | | 318,252 | | | | 0.1 | |
| | 166,667 | | | | Entercom Media Corp. 2019 Term Loan, 7.331%, (US0001M + 2.500%), 11/18/24 | | | 107,778 | | | | 0.1 | |
| | 392,720 | | | | Gray Television, Inc. 2021 Term Loan D, 7.662%, (US0001M + 3.000%), 12/01/28 | | | 382,329 | | | | 0.2 | |
| | 280,000 | | | | iHeartCommunications, Inc. 2020 Incremental Term Loan, 8.090%, (US0001M + 3.250%), 05/01/26 | | | 248,990 | | | | 0.1 | |
| | 608,849 | | | | iHeartCommunications, Inc. 2020 Term Loan, 7.840%, (US0001M + 3.000%), 05/01/26 | | | 541,242 | | | | 0.2 | |
| | 483,699 | | | | NASCAR Holdings, Inc Term Loan B, 7.340%, (US0001M + 2.500%), 10/19/26 | | | 484,441 | | | | 0.2 | |
| | 1,332,908 | | | | Univision Communications Inc. 2021 First Lien Term Loan B, 8.090%, (US0001M + 3.250%), 03/15/26 | | | 1,328,624 | | | | 0.5 | |
| | | | | | | | | 5,045,865 | | | | 2.0 | |
| | | | | | | | | | | | | | |
| | | | | | Retailers (Except Food & Drug): 3.4% | | |
| | 464,012 | | | | AI Aqua Merger Sub, Inc. 2021 1st Lien Term Loan B, 8.657%, (TSFR1M + 3.750%), 07/31/28 | | | 447,772 | | | | 0.2 | |
| | 600,244 | | | | CNT Holdings I Corp 2020 Term Loan, 8.125%, (TSFR1M + 3.500%), 11/08/27 | | | 590,940 | | | | 0.2 | |
| | 1,691,270 | | | | Great Outdoors Group, LLC 2021 Term Loan B1, 8.590%, (US0001M + 3.750%), 03/06/28 | | | 1,672,948 | | | | 0.7 | |
| | 1,065,700 | | | | Harbor Freight Tools USA, Inc. 2021 Term Loan B, 7.590%, (US0001M + 2.750%), 10/19/27 | | | 1,037,726 | | | | 0.4 | |
| | 495,296 | | | | Jo-Ann Stores, Inc. 2021 Term Loan B1, 9.572%, (US0003M + 4.750%), 07/07/28 | | | 278,191 | | | | 0.1 | |
| | 508,433 | | | | Leslies Poolmart, Inc. 2021 Term Loan B, 7.659%, (US0003M + 2.500%), 03/09/28 | | | 502,350 | | | | 0.2 | |
| | 1,056,926 | | | | Michaels Companies, Inc. 2021 Term Loan B, 9.409%, (US0003M + 4.250%), 04/15/28 | | | 974,260 | | | | 0.4 | |
| | 969,181 | | | | Petco Health and Wellness Company, Inc. 2021 Term Loan B, 8.410%, (US0003M + 3.250%), 03/03/28 | | | 953,085 | | | | 0.3 | |
Principal
Amount† | | | | Borrower/Tranche
Description | | Fair Value | | | Percentage
of Net
Assets |
| | | | | | | | | | | | | | |
| LOANS*: (continued) | | | | | | | | |
| | | | | | | | | | | | | | |
| | | | | | Retailers (Except Food & Drug): (continued) | |
| | 1,228,125 | | | | Pilot Travel Centers LLC 2021 Term Loan B, 6.907%, (TSFR1M + 2.000%), 08/04/28 | | $ | 1,224,287 | | | | 0.5 | |
| | 991,123 | | | | Restoration Hardware, Inc. Term Loan B, 7.340%, (US0001M + 2.500%), 10/20/28 | | | 930,572 | | | | 0.3 | |
| | 253,613 | | | | Victorias Secret & Co. Term Loan B, 8.236%, (US0003M + 3.250%), 08/02/28 | | | 251,711 | | | | 0.1 | |
| | | | | | | | | 8,863,842 | | | | 3.4 | |
| | | | | | | | | | | | | | |
| | | | | | Surface Transport: 1.1% | | | | | | | | |
| | 747,292 | | | | American Trailer World Corp. Term Loan B, 8.657%, (TSFR1M + 3.750%), 03/03/28 | | | 650,892 | | | | 0.3 | |
| | 909,189 | | | | LaserShip, Inc. 2021 Term Loan, 9.659%, (US0003M + 4.500%), 05/07/28 | | | 785,312 | | | | 0.3 | |
| | 386,172 | | | | Savage Enterprises LLC 2021 Term Loan B, 8.100%, (US0001M + 3.250%), 09/15/28 | | | 385,207 | | | | 0.1 | |
| | 878,875 | | | | Worldwide Express Operations, LLC 2021 1st Lien Term Loan, 9.159%, (US0003M + 4.000%), 07/26/28 | | | 848,939 | | | | 0.3 | |
| | 250,000 | | | | Worldwide Express Operations, LLC 2021 2nd Lien Term Loan, 12.159%, (US0003M + 7.000%), 07/26/29 | | | 205,937 | | | | 0.1 | |
| | | | | | | | | 2,876,287 | | | | 1.1 | |
| | | | | | | | | | | | | | |
| | | | | | Technology: 3.9% | | | | | | | | |
| | 721,179 | | | | Applied Systems, Inc. 2022 Extended 1st Lien Term Loan, 8.800%, (SOFRRATE + 4.500%), 09/18/26 | | | 721,029 | | | | 0.3 | |
| | 2,586,104 | | (3),(5),(6) | | Avaya 2022 Term Loan 1L, 11.686%, (TSFR1M + 10.000%), 12/15/27 | | | 665,922 | | | | 0.3 | |
| | 747,235 | | (3),(5),(6) | | Avaya, Inc. 2020 Term Loan B, 9.443%, (US0003M + 4.250%), 12/15/27 | | | 187,743 | | | | 0.1 | |
| | 636,416 | | | | Avaya, Inc. 2023 DIP Term Loan, 12.642%, (TSFR1M + 8.000%), 08/14/23 | | | 658,690 | | | | 0.2 | |
| | 867,574 | | | | Bright Bidco B.V. 2022 Exit Term Loan, 12.676%, 10/31/27 | | | 769,249 | | | | 0.3 | |
| | 912,713 | | | | CDK Global, Inc. 2022 USD Term Loan B, 9.409%, (TSFR3M + 4.500%), 07/06/29 | | | 911,653 | | | | 0.3 | |
| | 300,000 | | | | ECI Macola Max Holding, LLC 2020 Term Loan, 8.943%, (US0003M + 3.750%), 11/09/27 | | | 296,250 | | | | 0.1 | |
| | 462,963 | | | | Misys (Finastra) - TL B 1L, 8.325%, (US0003M + 3.500%), 06/13/24 | | | 435,667 | | | | 0.2 | |
| | 1,487,525 | | | | MKS Instruments, Inc. 2022 Term Loan B 1L, 5.792%, (TSFR1M + 2.750%), 08/17/29 | | | 1,481,637 | | | | 0.6 | |
| | 332,489 | | | | RealPage, Inc. Term Loan B 1L, 7.635%, (US0001M + 3.000%), 04/24/28 | | | 323,254 | | | | 0.1 | |
| | 397,847 | | | | SS&C Technologies Inc. 2022 Term Loan B6, 7.052%, (TSFR1M + 2.250%), 03/22/29 | | | 395,787 | | | | 0.1 | |
| | 599,548 | | | | SS&C Technologies Inc. 2022 Term Loan B7, 7.052%, (TSFR1M + 2.250%), 03/22/29 | | | 596,443 | | | | 0.2 | |
See Accompanying Notes to Financial Statements
30
| VOYA FLOATING RATE FUND | PORTFOLIO OF INVESTMENTS
AS OF MARCH 31, 2023 (CONTINUED) |
| | |
Principal
Amount† | | | | Borrower/Tranche
Description | | Fair Value | | | Percentage
of Net
Assets |
| | | | | | | | | | | | | | |
| LOANS*: (continued) | | | | | | | | |
| | | | | | | | | | | | | | |
| | | | | | Technology: (continued) | | | | | | | | |
| | 730,000 | | | | Tibco Software Inc. 2022 USD Term Loan, 9.498%, (TSFR1M + 4.500%), 03/30/29 | | $ | 662,084 | | | | 0.3 | |
| | 1,253,450 | | | | Veritas US Inc. 2021 USD Term Loan B, 9.840%, (US0003M + 5.000%), 09/01/25 | | | 955,755 | | | | 0.4 | |
| | 477,041 | | | | Virtusa Corporation 2022 Incremental Term Loan, 8.657%, (SOFRRATE + 3.750%), 02/15/29 | | | 471,773 | | | | 0.2 | |
| | 410,000 | | | | World Wide Technology Holding Co. LLC Term Loan, 8.052%, (TSFR1M + 3.250%), 03/01/30 | | | 409,487 | | | | 0.2 | |
| | | | | | | | | 9,942,423 | | | | 3.9 | |
| | | | | | | | | | | | | | |
| | | | | | Telecommunications: 3.5% | | | | | | | | |
| | 641,247 | | | | Altice Financing SA 2022 USD Term Loan, 9.566%, (TSFR1M + 5.000%), 10/31/27 | | | 636,438 | | | | 0.2 | |
| | 499,016 | | | | Altice France S.A. USD Term Loan B11, 7.575%, (US0003M + 2.750%), 07/31/25 | | | 491,921 | | | | 0.2 | |
| | 967,514 | | | | Asurion LLC 2020 Term Loan B8, 8.090%, (US0001M + 3.250%), 12/23/26 | | | 902,207 | | | | 0.3 | |
| | 530,000 | | | | Asurion LLC 2021 2nd Lien Term Loan B3, 10.090%, (US0001M + 5.250%), 01/31/28 | | | 444,372 | | | | 0.2 | |
| | 462,640 | | | | Asurion LLC 2021 Term Loan B9, 8.090%, (US0001M + 3.250%), 07/31/27 | | | 425,629 | | | | 0.1 | |
| | 431,852 | | | | Cablevision Lightpath LLC Term Loan B, 7.934%, (US0001M + 3.250%), 11/30/27 | | | 428,397 | | | | 0.2 | |
| | 979,906 | | | | CCI Buyer, Inc. Term Loan, 8.898%, (TSFR1M + 4.000%), 12/17/27 | | | 969,127 | | | | 0.4 | |
| | 318,498 | | | | CenturyLink, Inc. 2020 Term Loan B, 7.172%, (US0001M + 2.250%), 03/15/27 | | | 212,066 | | | | 0.1 | |
| | 748,062 | | | | CommScope, Inc. 2019 Term Loan B, 8.090%, (US0001M + 3.250%), 04/06/26 | | | 721,568 | | | | 0.3 | |
| | 310,794 | | | | Global Tel*Link Corporation 2018 1st Lien Term Loan, 9.076%, (US0003M + 4.250%), 11/29/25 | | | 273,644 | | | | 0.1 | |
| | 378,263 | | | | GOGO Intermediate Holdings LLC Term Loan B, 8.697%, (US0003M + 3.750%), 04/30/28 | | | 376,135 | | | | 0.1 | |
| | 596,493 | | | | Intelsat Jackson Holdings S.A. 2021 Exit Term Loan B, 9.082%, (SOFRRATE + 4.500%), 02/01/29 | | | 590,963 | | | | 0.2 | |
| | 287,580 | | | | Securus Technologies Holdings, Inc. 2017 1st Lien Term Loan, 9.659%, (US0003M + 4.500%), 11/01/24 | | | 206,578 | | | | 0.1 | |
| | 298,500 | | | | Venga Finance Sarl 2021 USD Term Loan B, 9.703%, (US0003M + 4.750%), 06/28/29 | | | 285,068 | | | | 0.1 | |
| | 509,894 | | | | ViaSat, Inc. Term Loan, 9.422%, (TSFR1M + 4.500%), 03/02/29 | | | 498,421 | | | | 0.2 | |
| | 1,472,765 | | | | Zayo Group Holdings, Inc. USD Term Loan, 7.840%, (US0001M + 3.000%), 03/09/27 | | | 1,197,236 | | | | 0.5 | |
| | 450,000 | | | | Ziggo Financing Partnership USD Term Loan I, 7.184%, (US0001M + 2.500%), 04/30/28 | | | 445,078 | | | | 0.2 | |
| | | | | | | | | 9,104,848 | | | | 3.5 | |
Principal
Amount† | | | | Borrower/Tranche
Description | | Fair Value | | | Percentage
of Net
Assets |
| | | | | | | | | | | | | | |
| LOANS*: (continued) | | | | | | | |
| | | | | | | | | | | | | | |
| | | | | | Utilities: 0.9% | | | | | | | | |
| | 2,453,615 | | | | Nautilus Power, LLC Term Loan B, 9.090%, (US0001M + 4.250%), 05/16/24 | | $ | 1,729,798 | | | | 0.7 | |
| | 487,575 | | | | Tiger Acquisition, LLC 2021 Term Loan, 8.157%, (TSFR1M + 3.250%), 06/01/28 | | | 477,214 | | | | 0.2 | |
| | | | | | | | | 2,207,012 | | | | 0.9 | |
| | | | | | | | | | | | | | |
| | | | | | Total Loans
(Cost $253,273,071) | | | 235,414,948 | | | | 91.6 | |
| | | | | | | | | | | | | | |
| CORPORATE BONDS/NOTES: 6.1% | | | | | | | | |
| | | | | | | | | | | | | | |
| | | | | | Basic Materials: 0.3% | | | | | | | | |
| | 500,000 | | # | | INEOS Quattro Finance 2 Plc, 3.375%, 01/15/26 | | | 453,710 | | | | 0.2 | |
| | 500,000 | | # | | LSF11 A5 Holdco LLC, 6.625%, 10/15/29 | | | 421,028 | | | | 0.1 | |
| | | | | | | | | 874,738 | | | | 0.3 | |
| | | | | | | | | | | | | | |
| | | | | | Communications: 0.5% | | | | | | | | |
| | 500,000 | | # | | CommScope, Inc., 4.750%, 09/01/29 | | | 417,250 | | | | 0.1 | |
| | 500,000 | | # | | LCPR Senior Secured Financing DAC, 6.750%, 10/15/27 | | | 472,703 | | | | 0.2 | |
| | 500,000 | | # | | ViaSat, Inc., 5.625%, 04/15/27 | | | 469,950 | | | | 0.2 | |
| | | | | | | | | 1,359,903 | | | | 0.5 | |
| | | | | | | | | | | | | | |
| | | | | | Consumer, Cyclical: 1.6% | | | | | | | | |
| | 500,000 | | | | Delta Air Lines 2020-1 Class A Pass Through Trust, 4.375%, 04/19/28 | | | 465,047 | | | | 0.2 | |
| | 500,000 | | | | Ford Motor Credit Co. LLC, 4.125%, 08/17/27 | | | 458,802 | | | | 0.2 | |
| | 500,000 | | # | | Gap, Inc./The, 3.875%, 10/01/31 | | | 347,385 | | | | 0.1 | |
| | 220,000 | | # | | Macy's Retail Holdings LLC, 5.875%, 03/15/30 | | | 195,517 | | | | 0.1 | |
| | 500,000 | | # | | Sonic Automotive, Inc., 4.625%, 11/15/29 | | | 419,448 | | | | 0.1 | |
| | 500,000 | | # | | SRS Distribution, Inc., 6.125%, 07/01/29 | | | 422,500 | | | | 0.2 | |
| | 500,000 | | # | | Taylor Morrison Communities, Inc., 5.750%, 01/15/28 | | | 492,328 | | | | 0.2 | |
| | 500,000 | | # | | Tempur Sealy International, Inc., 3.875%, 10/15/31 | | | 418,015 | | | | 0.1 | |
| | 500,000 | | # | | Williams Scotsman International, Inc., 4.625%, 08/15/28 | | | 455,446 | | | | 0.2 | |
| | 500,000 | | # | | Wynn Las Vegas LLC / Wynn Las Vegas Capital Corp., 5.250%, 05/15/27 | | | 473,090 | | | | 0.2 | |
| | | | | | | | | 4,147,578 | | | | 1.6 | |
| | | | | | | | | | | | | | |
| | | | | | Consumer, Non-cyclical: 0.7% | | | | | | | | |
| | 500,000 | | # | | ADT Security Corp./The, 4.125%, 08/01/29 | | | 446,512 | | | | 0.2 | |
| | 500,000 | | # | | Albertsons Cos, Inc. / Safeway, Inc. / New Albertsons L.P. / Albertsons LLC, 4.875%, 02/15/30 | | | 467,235 | | | | 0.2 | |
| | 500,000 | | # | | Primo Water Holdings, Inc., 4.375%, 04/30/29 | | | 436,893 | | | | 0.1 | |
| | 500,000 | | | | Teva Pharmaceutical Finance Netherlands III BV, 4.750%, 05/09/27 | | | 467,339 | | | | 0.2 | |
| | | | | | | | | 1,817,979 | | | | 0.7 | |
See Accompanying Notes to Financial Statements
31
| VOYA FLOATING RATE FUND | PORTFOLIO OF INVESTMENTS
AS OF MARCH 31, 2023 (CONTINUED) |
| | |
Principal
Amount† | | | | Borrower/Tranche
Description | | Fair Value | | | Percentage
of Net
Assets |
| | | | | | | | | | | |
| CORPORATE BONDS/NOTES: (continued) | | | | | | |
| | | | | | | | | | | | | | |
| | | | | | Energy: 1.1% | | | | | | | | |
| | 500,000 | | # | | Archrock Partners L.P. / Archrock Partners Finance Corp., 6.250%, 04/01/28 | | $ | 480,480 | | | | 0.2 | |
| | 500,000 | | # | | Atlantica Sustainable Infrastructure PLC, 4.125%, 06/15/28 | | | 449,200 | | | | 0.2 | |
| | 500,000 | | # | | Hess Midstream Operations L.P., 4.250%, 02/15/30 | | | 447,147 | | | | 0.2 | |
| | 500,000 | | # | | Hilcorp Energy I L.P. / Hilcorp Finance Co., 6.000%, 04/15/30 | | | 461,700 | | | | 0.2 | |
| | 500,000 | | # | | SunCoke Energy, Inc., 4.875%, 06/30/29 | | | 435,914 | | | | 0.1 | |
| | 500,000 | | | | Sunoco L.P. / Sunoco Finance Corp., 4.500%, 05/15/29 | | | 459,583 | | | | 0.2 | |
| | | | | | | | | 2,734,024 | | | | 1.1 | |
| | | | | | | | | | | | | | |
| | | | | | Financial: 0.7% | | | | | | | | |
| | 500,000 | | # | | Cushman & Wakefield US Borrower LLC, 6.750%, 05/15/28 | | | 448,088 | | | | 0.2 | |
| | 500,000 | | | | OneMain Finance Corp., 5.375%, 11/15/29 | | | 421,150 | | | | 0.2 | |
| | 500,000 | | # | | PRA Group, Inc., 5.000%, 10/01/29 | | | 418,955 | | | | 0.1 | |
| | 500,000 | | # | | United Wholesale Mortgage LLC, 5.750%, 06/15/27 | | | 445,471 | | | | 0.2 | |
| | | | | | | | | 1,733,664 | | | | 0.7 | |
| | | | | | | | | | | | | | |
| | | | | | Industrial: 0.8% | | | | | | | | |
| | 500,000 | | # | | Cargo Aircraft Management, Inc., 4.750%, 02/01/28 | | | 447,635 | | | | 0.1 | |
| | 250,000 | | # | | Cascades, Inc./Cascades USA, Inc., 5.375%, 01/15/28 | | | 237,705 | | | | 0.1 | |
| | 500,000 | | # | | PGT Innovations, Inc., 4.375%, 10/01/29 | | | 452,500 | | | | 0.2 | |
| | 500,000 | | # | | Rolls-Royce PLC, 5.750%, 10/15/27 | | | 498,557 | | | | 0.2 | |
| | 500,000 | | # | | Standard Industries, Inc./NJ, 4.750%, 01/15/28 | | | 467,798 | | | | 0.2 | |
| | | | | | | | | 2,104,195 | | | | 0.8 | |
| | | | | | | | | | | | | | |
| | | | | | Technology: 0.4% | | | | | | | | |
| | 550,000 | | # | | Entegris Escrow Corp., 6.950%, 06/15/30 | | | 533,632 | | | | 0.2 | |
| | 500,000 | | # | | Open Text Corp., 3.875%, 12/01/29 | | | 421,447 | | | | 0.2 | |
| | | | | | | | | 955,079 | | | | 0.4 | |
| | | | | | | | | | | | | | |
| | | | | | Total Corporate Bonds/Notes
(Cost $16,327,225) | | | 15,727,160 | | | | 6.1 | |
| | | | | | | | | | | | | | |
| | Shares | | | | | | | Value | | | | Percentage
of Net
Assets |
| | | | | | | | | | | | | | |
| EQUITIES AND OTHER ASSETS: 0.8% | | | | | | | | |
| | | | | | | | | | | | | | |
| | 408,271 | | (4),(7) | | 24 Hour Fitness Worldwide, Inc. | | | 2,450 | | | | 0.0 | |
| | 544,388 | | (4),(7) | | 24 Hour Fitness Worldwide, Inc. - Preferred | | | 2,722 | | | | 0.0 | |
| | 50,201 | | (4) | | Cineworld Group PLC | | | – | | | | 0.0 | |
| | 69,381 | | (7) | | Cumulus Media, Inc. Class-A | | | 256,016 | | | | 0.1 | |
| | 1,674 | | (4) | | GTT Communications, Inc. | | | 20,925 | | | | 0.0 | |
| Shares | | | | | | Value | | | Percentage
of Net
Assets |
| | | | | | | | | | | | | | |
| EQUITIES AND OTHER ASSETS: (continued) | | | | | | | | |
| | | | | | | | | | | | | | |
| | 7,543 | | (4),(7) | | Harvey Gulf International Marine LLC | | $ | 173,489 | | | | 0.1 | |
| | 4,783 | | (4),(7) | | Harvey Gulf International Marine LLC - Warrants | | | 110,009 | | | | 0.0 | |
| | 7,471 | | (4),(7) | | iQor | | | 5,603 | | | | 0.0 | |
| | 102,480 | | (4),(7) | | Longview Power LLC | | | 1,229,760 | | | | 0.5 | |
| | 6,829 | | (4) | | Riverbed Technology, Inc. | | | 69 | | | | 0.0 | |
| | 88,701 | | (4),(7) | | Save-A-Lot, Inc. / Moran Foods | | | 29,537 | | | | 0.0 | |
| | 42,856 | | (4),(7) | | The Oneida Group (formerly EveryWare Global, Inc.) | | | 428 | | | | 0.0 | |
| | 24,491 | | (4) | | Yak Access, LLC Series A Common Equity | | | 1,224 | | | | 0.0 | |
| | 580,823 | | (4) | | Yak Access, LLC Series A Preferred Equity | | | 290,412 | | | | 0.1 | |
| | 5,388 | | (4) | | Yak Access, LLC Series B Common Equity | | | 269 | | | | 0.0 | |
| | 1,117,890 | | (4) | | Yak Access, LLC Series B-1 Preferred Equity | | | 44,716 | | | | 0.0 | |
| | 23,080 | | (4) | | Yak Access, LLC Series B-2 Preferred Equity | | | 231 | | | | 0.0 | |
| | | | | | | | | | | | | | |
| | | | | | Total Equities and Other Assets
(Cost $4,251,974) | | | 2,167,860 | | | | 0.8 | |
| | | | | | Total Investments
(Cost $273,852,270) | | $ | 253,309,968 | | | | 98.5 | |
| | | | | | Assets in Excess of Other Liabilities | | | 3,779,310 | | | | 1.5 | |
| | | | | | Net Assets | | $ | 257,089,278 | | | | 100.0 | |
| * | Loans, while exempt from registration under the Securities Act of 1933, as amended, contain certain restrictions on resale and cannot be sold publicly. These loans bear interest (unless otherwise noted) at rates that float periodically at a margin above the London Inter-Bank Offered Rate (“LIBOR”) and other short-term rates. |
| † | Unless otherwise indicated, principal amount is shown in USD. |
| # | Securities with purchases pursuant to Rule 144A or section 4(2), under the Securities Act of 1933 and may not be resold subject to that rule except to qualified institutional buyers. |
| (1) | All or a portion of this holding is subject to unfunded loan commitments. Please refer to Note 9 for additional details. |
| (2) | All or a portion of this Loan is payment-in-kind ("PIK") which may pay interest or additional principal at the issuer's discretion. Rates shown are the current rate and possible payment rates. |
| (3) | Loan is not accruing income because the borrower has missed or is expected to miss principal and/or interest payments. The rate shown is the contractual interest rate. |
| (4) | For fair value measurement disclosure purposes, security is categorized as Level 3, whose value was determined using significant unobservable inputs. |
| (5) | Defaulted loan. Currently, the borrower is partially or fully in default with respect to principal and/or interest payments. |
| (6) | The borrower has filed for protection in federal bankruptcy court. |
| (7) | Non-income producing security. |
See Accompanying Notes to Financial Statements
32
| VOYA FLOATING RATE FUND | PORTFOLIO OF INVESTMENTS
AS OF MARCH 31, 2023 (CONTINUED) |
| | |
| Reference Rate Abbreviations: |
| SOFRRATE | 1-day Secured Overnight Financing Rate |
| TSFR1M | 1-month CME Term Secured Overnight Financing Rate |
| TSFR3M | 3-month CME Term Secured Overnight Financing Rate |
| US0001M | 1-month LIBOR |
| US0003M | 3-month LIBOR |
| US0006M | 6-month LIBOR |
Fair Value Measurements^
The following is a summary of the fair valuations according to the inputs used as of March 31, 2023 in valuing the assets and liabilities:
| | | Quoted Prices in
Active Markets
for Identical
Investments
(Level 1) | | | Significant
Other
Observable
Inputs
(Level 2) | | | Significant
Unobservable
Inputs
(Level 3) | | | Fair Value
at
March 31, 2023 | |
| Asset Table | | | | | | | | | | | | | | | | |
| Investments, at fair value | | | | | | | | | | | | | | | | |
| Loans | | $ | — | | | $ | 235,414,948 | | | $ | — | | | $ | 235,414,948 | |
| Equities and Other Assets | | | 256,016 | | | | — | | | | 1,911,844 | | | | 2,167,860 | |
| Corporate Bonds/Notes | | | — | | | | 15,727,160 | | | | — | | | | 15,727,160 | |
| Total Investments, at fair value | | $ | 256,016 | | | $ | 251,142,108 | | | $ | 1,911,844 | | | $ | 253,309,968 | |
| ^ | See Note 2, “Significant Accounting Policies” in the Notes to Financial Statements for additional information. |
At March 31, 2023, the aggregate cost of securities and other investments and the composition of unrealized appreciation and depreciation of securities and other investments on a tax basis were:
| Cost for federal income tax purposes was $274,617,618. | | | | |
| | | | | |
| Net unrealized depreciation consisted of: | | | | |
| Gross Unrealized Appreciation | | $ | 1,454,018 | |
| Gross Unrealized Depreciation | | | (22,761,668 | ) |
| Net Unrealized Depreciation | | $ | (21,307,650 | ) |
See Accompanying Notes to Financial Statements
33
TAX INFORMATION (Unaudited)
Dividends and distributions paid during the year ended March 31, 2023 were as follows:
| Fund Name | | Type | | Per Share Amount |
| Voya Floating Rate Fund | | | | |
| Class A | | NII | | $0.5241 |
| Class C | | NII | | $0.4607 |
| Class I | | NII | | $0.5452 |
| Class R | | NII | | $0.5030 |
| Class W | | NII | | $0.5452 |
NII — Net investment income
Pursuant to Internal Revenue Code Section 871(k)(1), Voya Floating Rate Fund designates 95.04% of net investment income distributions as interest-related dividends.
Above figures may differ from those cited elsewhere in this report due to differences in the calculation of income and gains under U.S. generally accepted accounting principles (book) purposes and Internal Revenue Service (tax) purposes.
Shareholders are strongly advised to consult their own tax advisers with respect to the tax consequences of their investments in the Fund. In January, shareholders, excluding corporate shareholders, receive an IRS 1099-DIV regarding the federal tax status of the dividends and distributions they received in the calendar year.
34
TRUSTEE AND OFFICER INFORMATION (Unaudited)
The business and affairs of the Trust are managed under the direction of the Board. A Trustee, who is not an interested person of the Trust, as defined in the 1940 Act, is an independent trustee (“Independent Trustee”). The Trustees and Officers of the Trust are listed below. The Statement of Additional Information includes additional information about Trustees of the Trust and is available, without charge, upon request at (800) 992-0180.
Name, Address and Year of
Birth | | Position(s)
Held with
the Trust | | Term of Office
and Length of
Time Served (1) | | Principal Occupation(s) –
During the Past 5 Years | | Number of funds
in Fund Complex
Overseen by Trustee (2) | | Other Board Positions
Held by Trustee |
| Independent Trustees: | | | | | | | | | | |
| | | | | | | | | | | |
Colleen D. Baldwin
(1960)
7337 East Doubletree Ranch Rd.
Suite 100
Scottsdale, Arizona 85258 | | Chairperson Trustee | | January 2020 – Present July 2007 – Present | | President, Glantuam Partners, LLC, a business consulting firm (January 2009 – Present). | | 138 | | Stanley Global Engineering
(2020 – Present). |
| | | | | | | | | | | |
John V. Boyer
(1953)
7337 East Doubletree Ranch Rd.
Suite 100
Scottsdale, Arizona 85258 | | Trustee | | May 2007 – Present | | Retired. Formerly, President and Chief Executive Officer, Bechtler Arts Foundation, an arts and education foundation (January 2008 – December 2019). | | 138 | | None. |
| | | | | | | | | | | |
Patricia W. Chadwick
(1948)
7337 East Doubletree Ranch Rd.
Suite 100
Scottsdale, Arizona 85258 | | Trustee | | May 2007 – Present | | Consultant and President, Ravengate Partners LLC, a consulting firm that provides advice regarding financial markets and the global economy (January 2000 – Present). | | 138 | | The Royce Funds (22 funds) (December 2009 – Present). AMICA Mutual Insurance Company
(1992 – Present). |
| | | | | | | | | | | |
Martin J. Gavin
(1950)
7337 East Doubletree Ranch Rd.
Suite 100
Scottsdale, Arizona 85258 | | Trustee | | August 2015 – Present | | Retired. | | 138 | | None. |
| | | | | | | | | | | |
Joseph E. Obermeyer
(1957)
7337 East Doubletree Ranch Rd.
Suite 100
Scottsdale, Arizona 85258 | | Trustee | | May 2013 – Present | | President, Obermeyer & Associates, Inc., a provider of financial and economic consulting services
(November 1999 – Present). | | 138 | | None. |
| | | | | | | | | | | |
Sheryl K. Pressler
(1950)
7337 East Doubletree Ranch Rd.
Suite 100
Scottsdale, Arizona 85258 | | Trustee | | May 2007 – Present | | Consultant (May 2001 – Present). | | 138 | | Centerra Gold Inc.
(May 2008 – Present). |
| | | | | | | | | | | |
Christopher P. Sullivan
(1954)
7337 East Doubletree Ranch Rd.
Suite 100
Scottsdale, Arizona 85258 | | Trustee | | October 2015 – Present | | Retired. | | 138 | | None. |
| (1) | Trustees serve until their successors are duly elected and qualified. The tenure of each Trustee who is not an “interested person” as defined in the 1940 Act, of each Fund (“Independent Trustee”) is subject to the Board’s retirement policy which states that each duly elected or appointed Independent Trustee shall retire from and cease to be a member of the Board of Trustees at the close of business on December 31 of the calendar year in which the Independent Trustee attains the age of 75. A majority vote of the Board’s other Independent Trustees may extend the retirement date of an Independent Trustee if the retirement would trigger a requirement to hold a meeting of shareholders of the Trust under applicable law, whether for the purposes of appointing a successor to the Independent Trustee or otherwise comply under applicable law, in which case the extension would apply until such time as the shareholder meeting can be held or is no longer required (as determined by a vote of a majority of the other Independent Trustees). |
| | |
| (2) | For the purposes of this table, “Fund Complex” means the Voya family of funds including the following investment companies: Voya Asia Pacific High Dividend Equity Income Fund; Voya Balanced Portfolio, Inc.; Voya Credit Income Fund; Voya Emerging Markets High Dividend Equity Fund; Voya Equity Trust; Voya Funds Trust; Voya Global Advantage and Premium Opportunity Fund; Voya Global Equity Dividend and Premium Opportunity Fund; Voya Government Money Market Portfolio; Voya Infrastructure, Industrials and Materials Fund; Voya Intermediate Bond Portfolio; Voya Investors Trust; Voya Mutual Funds; Voya Partners, Inc.; Voya Separate Portfolios Trust; Voya Strategic Allocation Portfolios, Inc.; Voya Variable Funds; Voya Variable Insurance Trust; Voya Variable Portfolios, Inc.; and Voya Variable Products Trust. The number of funds in the Fund Complex is as of April 30, 2023. |
35
TRUSTEE AND OFFICER INFORMATION (Unaudited) (continued)
| Name, Address and Year of Birth | | Position(s) Held
with the Trust | | Term of Office and
Length of Time Served (1) | | Principal Occupation(s) –
During the Past 5 Years |
Andy Simonoff
(1973)
5780 Powers Ferry Road NW
Atlanta, Georgia 30327 | | President and Chief Executive Officer | | January 2023 - Present | | Director, President and Chief Executive Officer, Voya Funds Services, LLC, Voya Capital, LLC and Voya Investments, LLC (January 1, 2023 – Present); Managing Director, Chief Strategy and Transformation Officer, Voya Investment Management (January 2020 – Present). Formerly, Managing Director, Head of Business Management, Voya Investment Management (March 2019 – January 2020); Managing Director, Head of Business Management, Fixed Income, Voya Investment Management (November 2015 – March 2019). |
| | | | | | | |
Jonathan Nash
(1967)
230 Park Avenue
New York, New York 10169 | | Executive Vice President and Chief Investment Risk Officer | | March 2020 – Present | | Executive Vice President and Chief Investment Risk Officer, Voya Investments, LLC (March 2020 – Present); Senior Vice President, Investment Risk Management, Voya Investment Management (March 2017 – Present). Formerly, Vice President, Voya Investments, LLC (September 2018 – March 2020). |
| | | | | | | |
James M. Fink
(1958)
5780 Powers Ferry Road NW
Atlanta, Georgia 30327 | | Executive Vice President | | March 2018 - Present | | Senior Vice President, Voya Investments Distributor, LLC (April 2018 – Present); Managing Director, Voya Investments, LLC, Voya Capital, LLC, and Voya Funds Services, LLC (March 2018 – Present); Chief Administrative Officer, Voya Investment Management (September 2017 – Present). |
| | | | | | | |
Steven Hartstein
(1963)
230 Park Avenue
New York, New York 10169 | | Chief Compliance Officer | | December 2022 - Present | | Senior Vice President, Voya Investment Management (December 2022 – Present). Formerly, Head of Funds Compliance, Brighthouse Financial, Inc. and Chief Compliance Officer – Brighthouse Funds and Brighthouse Investment Advisers, LLC (March 2017- December 2022). |
| | | | | | | |
Todd Modic
(1967)
7337 East Doubletree Ranch Rd.
Suite 100
Scottsdale, Arizona 85258 | | Senior Vice President, Chief/ Principal Financial Officer and Assistant Secretary | | March 2007 - Present | | Director and Senior Vice President, Voya Capital, LLC, and Voya Funds Services, LLC (September 2022 – Present); Director, Voya Investments, LLC (September 2022 – Present); Senior Vice President, Voya Investments, LLC (April 2005 – Present). Formerly, President, Voya Funds Services, LLC (March 2018 – September 2022). |
| | | | | | | |
Kimberly A. Anderson
(1964)
7337 East Doubletree Ranch Rd.
Suite 100
Scottsdale, Arizona 85258 | | Senior Vice President | | March 2007 - Present | | Senior Vice President, Voya Investments, LLC (September 2003 – Present). |
| | | | | | | |
Sara M. Donaldson
(1959)
7337 East Doubletree Ranch Rd.
Suite 100
Scottsdale, Arizona 85258 | | Senior Vice President | | June 2022 – Present | | Senior Vice President, Voya Investments, LLC (February 2022 – Present); Senior Vice President, Head of Active Ownership, Voya Investment Management (September 2021 – Present). Formerly, Vice President, Voya Investments, LLC (October 2015 – February 2022); Vice President, Head of Proxy Voting, Voya Investment Management (October 2015 – August 2021). |
| | | | | | | |
Andrew K. Schlueter
(1976)
7337 East Doubletree Ranch Rd.
Suite 100
Scottsdale, Arizona 85258 | | Senior Vice President | | June 2022 - Present | | Senior Vice President, Head of Investment Operations Support, Voya Investment Management (April 2023 – Present); Vice President, Voya Investments Distributor, LLC (April 2018 – Present); Vice President, Voya Investments, LLC and Voya Funds Services, LLC (March 2018-Present); Formerly, Senior Vice President, Head of Mutual Fund Operations, Voya Investment Management (March 2022 – March 2023); Vice President, Head of Mutual Fund Operations, Voya Investment Management (February 2018 – February 2022); Vice President, Voya Investment Management (March 2014 – February 2018). |
| | | | | | | |
Joanne F. Osberg
(1982)
7337 East Doubletree Ranch Rd.
Suite 100
Scottsdale, Arizona 85258 | | Senior Vice President Secretary | | March 2023 – Present September 2020 - Present | | Senior Vice President and Chief Counsel, Voya Investment Management – Mutual Fund Legal Department, Senior Vice President and Secretary, Voya Investments, LLC, Voya Capital, LLC, and Voya Funds Services, LLC (March 2023 – Present). Formerly, Secretary, Voya Capital, LLC (August 2022 – March 2023); Vice President and Secretary, Voya Investments, LLC and Voya Funds Services, LLC, Vice President and Senior Counsel, Voya Investment Management – Mutual Fund Legal Department (September 2020 – March 2023). Vice President and Counsel, Voya Investment Management – Mutual Fund Legal Department (January 2013 – September 2020). |
| | | | | | | |
Robert Terris
(1970)
5780 Powers Ferry Road NW
Atlanta, Georgia 30327 | | Senior Vice President | | March 2007 - Present | | Senior Vice President, Voya Investments Distributor, LLC (April 2018 – Present); Senior Vice President, Head of Investment Services, Voya Investments, LLC (April 2018 – Present); Senior Vice President, Head of Investment Services, Voya Funds Services, LLC (March 2006 – Present). Formerly, Senior Vice President, Head of Division Operations, Voya Investments, LLC (October 2015 – April 2018). |
36
TRUSTEE AND OFFICER INFORMATION (Unaudited) (continued)
| Name, Address and Year of Birth | | Position(s) Held
with the Trust | | Term of Office and
Length of Time Served (1) | | Principal Occupation(s) –
During the Past 5 Years |
Fred Bedoya
(1973)
7337 East Doubletree Ranch Rd.
Suite 100
Scottsdale, Arizona 85258 | | Vice President Principal Accounting Officer and Treasurer | | September 2012 – Present | | Vice President, Voya Investments, LLC (October 2015 – Present); Vice President, Voya Funds Services, LLC (July 2012 – Present). |
| | | | | | | |
Robyn L. Ichilov
(1967)
7337 East Doubletree Ranch Rd.
Suite 100
Scottsdale, Arizona 85258 | | Vice President | | March 2007 - Present | | Vice President, Voya Investments, LLC (August 1997 – Present); Vice President, Voya Funds Services, LLC (November 1995 – Present). |
| | | | | | | |
Jason Kadavy
(1976)
7337 East Doubletree Ranch Rd.
Suite 100
Scottsdale, Arizona 85258 | | Vice President | | September 2012 - Present | | Vice President, Voya Investments, LLC (October 2015 – Present); Vice President, Voya Funds Services, LLC (July 2007 – Present). |
| | | | | | | |
Erica McKenna
(1972)
7337 East Doubletree Ranch Rd.
Suite 100
Scottsdale, Arizona 85258 | | Vice President | | June 2022 – Present | | Vice President, Head of Mutual Fund Compliance, and Chief Compliance Officer, Voya Investments, LLC (May 2022 – Present). Formerly, Vice President, Fund Compliance Manager, Voya Investments, LLC (March 2021 – May 2022); Assistant Vice President, Fund Compliance Manager, Voya Investments, LLC (December 2016 – March 2021). |
| | | | | | | |
Craig Wheeler
(1969)
7337 East Doubletree Ranch Rd.
Suite 100
Scottsdale, Arizona 85258 | | Vice President | | May 2013 - Present | | Vice President – Director of Tax, Voya Investments, LLC (October 2015 – Present). |
| | | | | | | |
Nicholas C.D. Ward
(1993)
7337 East Doubletree Ranch Rd.
Suite 100
Scottsdale, Arizona 85258 | | Assistant Vice President and Assistant Secretary | | June 2022 - Present | | Counsel, Voya Investment Management – Mutual Fund Legal Department (November 2021 – Present). Formerly, Associate, Dechert LLP (October 2018 – November 2021). |
| | | | | | | |
Gizachew Wubishet
(1976)
7337 East Doubletree Ranch Rd.
Suite 100
Scottsdale, Arizona 85258 | | Assistant Vice President and Assistant Secretary | | June 2022 - Present | | Assistant Vice President and Counsel, Voya Investment Management – Mutual Fund Legal Department (May 2019 – Present). Formerly, Attorney, Ropes & Gray LLP (October 2011 – April 2019). |
| | | | | | | |
Monia Piacenti
(1976)
One Orange Way
Windsor, Connecticut 06095 | | Anti-Money Laundering Officer | | June 2018 - Present | | Compliance Consultant, Voya Financial, Inc. (January 2019 – Present); Anti-Money Laundering Officer, Voya Investments Distributor, LLC, Voya Investment Management and Voya Investment Management Trust Co. (June 2018 – Present); Formerly, Senior Compliance Officer, Voya Investment Management (December 2009 – December 2018). |
| (1) | Officers hold office until the next annual meeting of the Board of Trustees and until their successors shall have been elected and qualified. |
37
ADVISORY AND SUB-ADVISORY CONTRACT APPROVAL DISCUSSION (Unaudited)
BOARD CONSIDERATION AND APPROVAL OF INVESTMENT MANAGEMENT CONTRACT AND SUB-ADVISORY CONTRACT
At a meeting held on November 17, 2022, the Board of Trustees (“Board”) of Voya Funds Trust (the “Trust”), including a majority of the Board members who have no direct or indirect interest in the investment management and sub-advisory contracts, and who are not “interested persons” of Voya Floating Rate Fund, a series of the Trust (the “Fund”), as such term is defined under the Investment Company Act of 1940, as amended (the “Independent Trustees”), considered and approved the renewal of the investment management contract (the “Management Contract”) between Voya Investments, LLC (the “Manager”) and the Trust, on behalf of the Fund, and the sub-advisory contract (the “Sub-Advisory Contracts,” and together with the Management Contract, the “Contracts”) with Voya Investment Management Co. LLC, the sub-adviser to the Fund (the “Sub-Adviser”), for an additional one-year period ending November 30, 2023.
In addition to the Board meeting on November 17, 2022, the Independent Trustees also held meetings outside the presence of representatives of the Manager and Sub-Adviser (collectively, such persons are referred to herein as “management”) on October 12-13, 2022, and November 15, 2022. At those meetings, the Board members reviewed and considered materials related to the proposed continuance of the Contracts that they had requested and believed to be relevant to the renewal of the Contracts in light of their own business judgment and the legal advice furnished to them by K&L Gates LLP, their independent legal counsel. The Board also considered information furnished to it throughout the year at meetings of the Board and its committees, including information regarding performance, expenses, and other relevant matters. While the Board considered the renewal of the management contracts and sub-advisory contracts for all of the applicable investment companies in the Voya family of funds at the same meetings, the Board considered each Voya fund’s investment management and sub-advisory relationships separately.
The Board has established a Contracts Committee and two Investment Review Committees (the “IRCs”), each of which includes only Independent Trustees as members. The Contracts Committee meets several times throughout the year to provide oversight with respect to the management and sub-advisory contracts approval and renewal process for the Voya funds, among other functions, and each IRC meets several times throughout the year with respect to each Voya fund (assigned to that IRC) to provide oversight regarding the investment performance of the sub-advisers, as well as the Manager’s role in monitoring the sub-advisers.
The Contracts Committee oversees, and annually recommends Board approval of updates to, a methodology guide for the Voya funds (“Methodology Guide”), which sets out a framework pursuant to which the Independent Trustees request, and management provides, certain information that the Independent Trustees deem to be important or potentially relevant to the contracts renewal process for the Voya funds. The Independent Trustees retain the services of an independent consultant with experience in the mutual fund industry to assist the Contracts Committee in developing and recommending to the Board: (1) a selected peer group of investment companies for the Fund (“Selected Peer Group”) based on the Fund’s particular attributes, such as fund type and size, fund category (as determined by Morningstar, Inc., an independent provider of mutual fund data (“Morningstar”)), sales channels and structure and the Fund share class being compared to the Selected Peer Group; and (2) updates to the Methodology Guide with respect to the content and format of various data prepared in connection with the renewal process, including, but not limited to, investment performance, fee structure, and expense information. In addition, the Independent Trustees periodically have retained an independent firm to test and verify the accuracy of certain information presented to the Board for a representative sample of the Voya funds.
The Manager or Sub-Adviser may not have been able to, or opted not to, provide information in response to certain information requests, in which case the Board conducted its evaluation based on the information that was provided. In such cases, the Board determined that the omission of any such information was not material to its considerations. Additionally, the Board considered the impact of significant periods of market volatility that occurred during and after the period for which information was requested in conducting its evaluation of the Manager and Sub-Adviser.
Provided below is an overview of certain material factors that the Board considered at its meetings regarding the renewal of the Contracts and the compensation to be paid thereunder. The Board members did not identify any particular information or factor that was most relevant to its consideration.
Nature, Extent and Quality of Services
The Manager oversees, subject to the authority of the Board, and is responsible for the provision of, all investment advisory and portfolio management services for the Fund, but may delegate certain of these responsibilities to one or more sub-advisers. In addition, the Manager provides administrative services reasonably necessary for the operation of the Fund as set forth in the
38
ADVISORY AND SUB-ADVISORY CONTRACT APPROVAL DISCUSSION (Unaudited) (continued)
Management Contract, including oversight of the Fund’s operations and risk management and the oversight of its various other service providers.
The Board considered the “manager-of-managers” structure of the Voya funds that has been developed by the Manager pursuant to which the Manager selects, subject to the Board’s approval, sub-advisers to provide day-to-day management services to all or a portion of each Voya fund. The Board recognized that the Manager is responsible for monitoring the Sub-Adviser’s investment program, performance, developments, ongoing operations, and compliance with applicable regulations and investment policies and restrictions with respect to the Fund under this manager-of-managers arrangement. The Board also considered the techniques and resources that the Manager has developed to provide this ongoing due diligence and oversight with respect to the sub-advisers and to recommend appropriate changes in investment strategies, sub-advisers, or allocation among sub-advisers in an effort to improve a Voya fund’s performance. In connection with the Manager’s performance of these duties, the Board considered that the Manager has developed an oversight process formulated by its Manager Research & Selection Group that reviews, among other matters, performance data, the Sub-Adviser’s management team, portfolio data and attribution analysis related to the Sub-Adviser through various means, including, but not limited to, in-person meetings, on-site or virtual visits, and telephonic meetings with the Sub-Adviser.
Further, the Board considered periodic compliance reports it receives from the Trust’s Chief Compliance Officer evaluating, among other related matters, whether the regulatory compliance systems and procedures of the Manager and Sub-Adviser are reasonably designed to ensure compliance with the federal securities laws and whether the investment policies and restrictions for the Fund are complied with on a consistent basis.
The Board considered the portfolio management team assigned by the Sub-Adviser to the Fund and the level of resources committed to the Fund (and other relevant funds in the Voya funds) by the Manager and Sub-Adviser, and whether those resources are sufficient to provide high-quality services to the Fund.
Based on their deliberations and the materials presented to them, the Board concluded that the nature, extent and quality of the overall services provided by the Manager and Sub-Adviser under the Contracts were appropriate.
Fund Performance
In assessing the investment management and sub-advisory relationships, the Board placed emphasis on the investment returns of the Fund, including its investment performance over certain time periods compared to the Fund’s Morningstar category and primary benchmark, a broad-based securities market index identified in the Fund’s prospectus. The Board also considered information from the Manager Research & Selection Group and received reports summarizing a separate analysis of the Fund’s performance and risk, including risk-adjusted investment return information, from the Trust’s Chief Investment Risk Officer.
Economies of Scale
When evaluating the reasonableness of the management fee schedule, the Board considered whether economies of scale have been or likely will be realized by the Manager and Sub-Adviser as the Fund grows larger and the extent to which any such economies are shared with the Fund. In this regard, the Board noted the breakpoints in the management fee schedule that will result in a lower management fee rate when the Fund achieves sufficient asset levels to receive a breakpoint discount. The Board also considered that, in addition to the management fee breakpoints, the Fund has fee waiver and expense reimbursement arrangements. The Board considered the extent to which economies of scale realized by the Manager or the Sub-Adviser could be shared with the Fund through such fee waivers, expense reimbursements or other expense reductions. In evaluating these matters, the Board also considered periodic management reports, Selected Peer Group comparisons, and industry information regarding economies of scale.
Information Regarding Services, Performance, and Fee Schedules Offered to Other Clients
The Board considered comparative information regarding the nature of services, performance, and fee schedules offered by the Manager and Sub-Adviser to other clients with similar investment objectives, if applicable, including other registered investment companies and relevant institutional accounts. When the fee schedules offered to or the performance of such other clients differed materially from the Fund, the Board took into account the underlying rationale provided by the Manager or Sub-Adviser, as applicable, for these differences.
39
ADVISORY AND SUB-ADVISORY CONTRACT APPROVAL DISCUSSION (Unaudited) (continued)
Fee Schedules, Profitability, and Fall-out Benefits
The Board reviewed and considered the contractual management fee schedule and net management fee rate payable by the Fund to the Manager compared to the Fund’s Selected Peer Group The Board also considered the compensation payable by the Manager to the Sub-Adviser for sub-advisory services for the Fund, including the portion of the contractual and net management fee rates that are paid to the Sub-Adviser, as compared to the compensation paid to the Manager. In addition, the Board considered the fee waivers, expense limitations, and recoupment arrangements that apply to the fees payable by the Fund, including whether the Manager intends to propose any changes thereto. The Board separately determined that the fees payable to the Manager and the fee schedule payable to the Sub-Adviser are reasonable for the services that each performs, which were considered in light of the nature, extent and quality of the services that each has performed and is expected to perform.
The Board considered information on revenues, costs and profits or losses realized by the Manager and the Voya-affiliated Sub-Adviser related to their services to the Fund. In analyzing the profitability of the Manager and its affiliates in connection with services they render to a Fund, the Board took into account the sub-advisory fee rate payable by the Manager to the Sub-Adviser. The Board also considered the profitability of the Manager and its affiliated Sub-Adviser attributable to servicing the Fund both with and without taking into account the profitability of the distributor of the Fund and any revenue sharing payments made by the Manager.
Although the Methodology Guide establishes a framework for profit calculation, the Board recognized that there is no uniform methodology within the asset management industry for determining profitability for this purpose. The Board also recognized that the use of different reasonable methodologies can give rise to dramatically different reported profit and loss results with respect to the Manager and the Voya-affiliated Sub-Adviser, as well as other industry participants with whom the profits of the Manager and its affiliated Sub-Adviser could be compared. In addition, the Board recognized that management’s calculations regarding its costs incurred in establishing the infrastructure necessary for the Fund’s operations may not be fully reflected in the expenses allocated to the Fund in determining profitability. The Board also recognized that the information presented may not portray all of the costs borne by the Manager or reflect all of the risks associated with offering and managing a mutual fund complex in the current regulatory and market
environment, including entrepreneurial, regulatory, legal and operational risks.
The Board also considered that the Manager and the Voya-affiliated Sub-Adviser are entitled to earn a reasonable level of profits for the services that they provide to the Fund. The Board also considered information regarding the potential fall-out benefits to the Manager and Sub-Adviser and their respective affiliates from their association with the Fund, including their ability to engage in soft-dollar transactions on behalf of the Fund. Following its reviews, the Board determined that the Manager’s and the Voya-affiliated Sub-Adviser’s profitability with respect to their services to the Fund and the Manager and Sub-Adviser’s potential fall-out benefits were not unreasonable.
Fund Analysis
Set forth below are certain of the specific factors that the Board considered at its October 12-13, 2022, November 15, 2022, and/or November 17, 2022 meetings in relation to approving the Fund’s Contracts and the conclusions reached by the Board. These specific factors are in addition to those considerations discussed above. The Fund’s performance was compared to its Morningstar category, as well as its primary benchmark. The performance data provided to the Board primarily was for various periods ended March 31, 2022. In addition, the Board also considered at its October 12-13, 2022, November 15, 2022, and/or November 17, 2022 meetings certain additional data regarding the Fund’s more recent performance, asset levels and asset flows. The Fund’s management fee rate and expense ratio were compared to the management fee rates and expense ratios of the funds in its Selected Peer Group. With respect to the quintile rankings noted below, the first quintile represents the range of funds with the highest performance or the lowest management fee rate or expense ratio, as applicable, and the fifth quintile represents the range of funds with the lowest performance or the highest management fee rate or expense ratio, as applicable.
In considering whether to approve the renewal of the Contracts for the Fund, the Board considered that, based on performance data for the periods ended March 31, 2022: (1) the Fund is ranked in the third quintile of its Morningstar category for the year-to-date and one-year periods, the fourth quintile for the ten-year period, and the fifth quintile for the three-year and five-year periods; and (2) the Fund underperformed its primary benchmark for all periods presented. In analyzing this performance data, the Board took into account management’s representations regarding: (1) the competitiveness of
40
ADVISORY AND SUB-ADVISORY CONTRACT APPROVAL DISCUSSION (Unaudited) (continued)
the Fund’s performance during certain periods; (2) the impact of security selection and sector positioning on the Fund’s performance; (3) recent changes to the Fund’s investment strategy and the Board’s consideration that it is reasonable to provide more time for the purpose of evaluating any impact on performance; and (4) its confidence in the Sub-Adviser’s ability to execute the Fund’s investment strategy.
In considering the fees payable under the Contracts for the Fund, the Board took into account the factors described above and also considered: (1) the economies of scale benefits to the Fund and its shareholders from breakpoint discounts applicable to the Fund’s management fee rate, which result in lower fees at higher asset levels.; and (2) the pricing structure (including the net expense ratio to be borne by shareholders) of the Fund, as compared to its Selected Peer Group, including that: (a) the net management fee rate for the Fund is ranked in the first quintile of net management fee rates of the funds in its Selected Peer Group; (b) the contractual management fee rate for the Fund is ranked in the second quintile of contractual management fee rates of the funds in its Selected Peer Group; and (c) the net expense ratio for the Fund is ranked in the third quintile of net expense ratios of the funds in its Selected Peer Group.
Board Conclusions
After its deliberation, the Board concluded that, in its business judgment, the terms of the Contracts are fair and reasonable to the Fund and that approval of the continuation of the Contracts is in the best interests of the Fund and its shareholders. In doing so, the Board reviewed all factors it considered to be material, including those discussed above. Within the context of its overall conclusions regarding the Contracts, and based on the information provided and management’s related representations, the Board concluded that it was satisfied with management’s responses relating to the Fund’s investment performance and the fees payable under the Contracts. During this renewal process, each Board member may have accorded different weight to various factors in reaching his or her conclusions. Based on these conclusions and other factors, the Board voted to renew the Contracts for the Fund for the year ending November 30, 2023.
41
Investment Adviser
Voya Investments, LLC
7337 East Doubletree Ranch Road, Suite 100
Scottsdale, Arizona 85258
Distributor
Voya Investments Distributor, LLC
7337 East Doubletree Ranch Road, Suite 100
Scottsdale, Arizona 85258
Transfer Agent
BNY Mellon Investment Servicing (U.S.) Inc.
301 Bellevue Parkway
Wilmington, Delaware 19809
Independent Registered Public Accounting Firm
Ernst & Young LLP
200 Clarendon Street
Boston, Massachusetts, 02116
Custodian
State Street Bank and Trust Company
801 Pennsylvania Avenue
Kansas City, Missouri 64105
Legal Counsel
Ropes & Gray LLP
Prudential Tower
800 Boylston Street
Boston, Massachusetts 02199
For more complete information, or to obtain a prospectus on any Voya mutual fund, please call your financial advisor or Voya Investments Distributor, LLC at (800) 992-0180 or log on to www.voyainvestments.com. The prospectus should be read carefully before investing. Consider the fund’s investment objectives, risks, charges and expenses carefully before investing. The prospectus contains this information and other information about the fund.
RETIREMENT | INVESTMENTS | INSURANCE voyainvestments.com |  |
| | |
| | 163061 (0323-052523) |
Item 2. Code of Ethics.
As of the end of the period covered by this report, Registrant had adopted a code of ethics, as defined in Item 2 of Form N-CSR, that applies to the Registrant’s principal executive officer and principal financial officer. There were no amendments to the Code during the period covered by the report. The Registrant did not grant any waivers, including implicit waivers, from any provisions of the Code during the period covered by this report. The code of ethics is filed herewith pursuant to Item 13(a)(1), Ex-99.CODE ETH.
Item 3. Audit Committee Financial Expert.
The Board of Trustees has determined that Colleen D. Baldwin, Martin J. Gavin, and Joseph E. Obermeyer are audit committee financial experts, as defined in Item 3 of Form N-CSR. Ms. Baldwin, Mr. Gavin, and Mr. Obermeyer are “independent” for purposes of Item 3 of Form N-CSR.
Item 4. Principal Accountant Fees and Services.
Below are the amount of fees that Ernst & Young LLP (“EY”), the Registrant’s current Independent Registered Public Accounting Firm, billed and paid to the Fund during the Fund’s fiscal years ended March 31, 2023 and March 31, 2022.
| (a) | Audit Fees: The aggregate fees billed and paid for each of the last two fiscal years for professional services rendered by Ernst & Young LLP (“EY”), the principal accountant for the audit of the registrant’s annual financial statements or services that are normally provided by the accountant in connection with statutory and regulatory filings or engagements for those fiscal years were $227,340 for the year ended March 31, 2023 and $173,700 for the year ended March 31, 2022. |
| (b) | Audit-Related Fees: The aggregate fees billed and paid in each of the last two fiscal years for assurance and related services by EY that are reasonably related to the performance of the audit of the registrant’s financial statements and are not reported under paragraph (a) of this Item were $0 for the year ended March 31, 2023 and $0 for the year ended March 31, 2022. |
| (c) | Tax Fees: The aggregate fees billed and paid in each of the last two fiscal years for professional services rendered by EY for tax compliance, tax advice, and tax planning were $61,300 for the year ended March 31, 2023 and $61,300 for the year ended March 31, 2022. Such services included review of excise distribution calculations (if applicable), preparation of the Registrants’ federal, state, and excise tax returns, tax services related to mergers and routine consulting. |
| (d) | All Other Fees: The aggregate fees billed and paid in each of the last two fiscal years for products and services provided by EY, other than the services reported in paragraphs (a) through (c) of this Item were $0 for the year ended March 31, 2023 and $0 for the year ended March 31, 2022. |
| (e)(1) | Audit Committee Pre-Approval Policies and Procedures |
Appendix A
AUDIT AND NON-AUDIT SERVICES
PRE-APPROVAL POLICY
| I. | Statement of Principles |
Under the Sarbanes-Oxley Act of 2002 (the “Act”), the Audit Committee of the Board of Directors or Trustees (the “Committee”) of the Voya funds (each a “Fund,” collectively, the “Funds”) set out on Exhibit A to this Audit and Non-Audit Services Pre-Approval Policy (“Policy”) is responsible for the oversight of the work of the Funds’ independent auditors. As part of its responsibilities, the Committee must pre-approve the audit and non-audit services performed by the auditors in order to assure that the provision of these services does not impair the auditors’ independence from the Funds. The Committee has adopted, and the Board has ratified, this Policy, which sets out the procedures and conditions under which the services of the independent auditors may be pre-approved.
Under Securities and Exchange Commission (“SEC”) rules promulgated in accordance with the Act, the Funds may establish two different approaches to pre-approving audit and non-audit services. The Committee may approve services without consideration of specific case-by-case services (“general pre-approval”) or it may pre-approve specific services (“specific pre-approval”). The Committee believes that the combination of these approaches contemplated in this Policy results in an effective and efficient method for pre-approving audit and non-audit services to be performed by the Funds’ independent auditors. Under this Policy, services that are not of a type that may receive general pre-approval require specific pre-approval by the Committee. Any proposed services that exceed pre-approved cost levels or budgeted amounts will also require the Committee’s specific pre-approval.
For both types of approval, the Committee considers whether the subject services are consistent with the SEC’s rules on auditor independence and that such services are compatible with maintaining the auditors independence. The Committee also considers whether a particular audit firm is in the best position to provide effective and efficient services to the Funds. Reasons that the auditors are in the best position include the auditors’ familiarity with the Funds’ business, personnel, culture, accounting systems, risk profile, and other factors, and whether the services will enhance the Funds’ ability to manage and control risk or improve audit quality. Such factors will be considered as a whole, with no one factor being determinative.
The appendices attached to this Policy describe the audit, audit-related, tax-related, and other services that have the Committee’s general pre-approval. For any service that has been approved through general pre-approval, the general pre-approval will remain in place for a period 12 months from the date of pre-approval, unless the Committee determines that a different period is appropriate. The Committee will annually review and pre-approve the services that may be provided by the independent auditors without specific pre-approval. The Committee will revise the list of services subject to general pre-approval as appropriate. This Policy does not serve as a delegation to Fund management of the Committee’s duty to pre-approve services performed by the Funds’ independent auditors.
The annual audit services engagement terms and fees are subject to the Committee’s specific pre-approval. Audit services are those services that are normally provided by auditors in connection with statutory and regulatory filings or engagements or those that generally only independent auditors can reasonably provide. They include the Funds’ annual financial statement audit and procedures that the independent auditors must perform in order to form an opinion on the Funds’ financial statements (e.g., information systems and procedural reviews and testing). The Committee will monitor the audit services engagement and approve any changes in terms, conditions or fees deemed by the Committee to be necessary or appropriate.
The Committee may grant general pre-approval to other audit services, such as statutory audits and services associated with SEC registration statements, periodic reports and other documents filed with the SEC or issued in connection with securities offerings.
The Committee has pre-approved the audit services listed on Appendix A. The Committee must specifically approve all audit services not listed on Appendix A.
| III. | Audit-related Services |
Audit-related services are assurance and related services that are reasonably related to the performance of the audit or the review of the Funds’ financial statements or are traditionally performed by the independent auditors. The Committee believes that the provision of audit-related services will not impair the independent auditors’ independence, and therefore may grant pre-approval to audit-related services. Audit-related services include accounting consultations related to accounting, financial reporting or disclosure matters not classified as “audit services;” assistance with understanding and implementing new accounting and financial reporting guidance from rulemaking authorities; agreed-upon or expanded audit procedures relating to accounting and/or billing records required to respond to or comply with financial, accounting or regulatory reporting matters; and assistance with internal control reporting requirements under Form N-CEN or Form N-CSR.
The Committee has pre-approved the audit-related services listed on Appendix B. The Committee must specifically approve all audit-related services not listed on Appendix B.
The Committee believes the independent auditors can provide tax services to the Funds, including tax compliance, tax planning, and tax advice, without compromising the auditors’ independence. Therefore, the Committee may grant general pre-approval with respect to tax services historically provided by the Funds’ independent auditors that do not, in the Committee’s view, impair auditor independence and that are consistent with the SEC’s rules on auditor independence.
The Committee will not grant pre-approval if the independent auditors initially recommends a transaction the sole business purpose of which is tax avoidance and the tax treatment of which may not be supported in the Internal Revenue Code and related regulations. The Committee may consult outside counsel to determine that tax planning and reporting positions are consistent with this Policy.
The Committee has pre-approved the tax-related services listed on Appendix C. The Committee must specifically approve all tax-related services not listed on Appendix C.
The Committee believes it may grant approval of non-audit services that are permissible services for independent auditors to a Fund. The Committee has determined to grant general pre-approval to other services that it believes are routine and recurring, do not impair auditor independence, and are consistent with SEC rules on auditor independence.
The Committee has pre-approved the non-audit services listed on Appendix D. The Committee must specifically approve all non-audit services not listed on Appendix D.
A list of the SEC’s prohibited non-audit services is attached to this Policy as Appendix E. The SEC’s rules and relevant guidance should be consulted to determine the precise definitions of these impermissible services and the applicability of exceptions to certain of the SEC’s prohibitions.
| VI. | Pre-approval of Fee levels and Budgeted Amounts |
The Committee will annually establish pre-approval fee levels or budgeted amounts for audit, audit-related, tax and non-audit services to be provided to the Funds by the independent auditors. Any proposed services exceeding these levels or amounts require the Committee’s specific pre-approval. The Committee considers fees for audit and non-audit services when deciding whether to pre-approve services. The Committee may determine, for a pre-approval period of 12 months, the appropriate ratio between the total amount of fees for the Fund’s audit, audit-related, and tax services (including fees for services provided to Fund affiliates that are subject to pre-approval), and the total amount of fees for certain permissible non-audit services for the Fund classified as other services (including any such services provided to Fund affiliates that are subject to pre-approval).
Requests or applications for services to be provided by the independent auditors will be submitted to management. If management determines that the services do not fall within those services generally pre-approved by the Committee and set out in the appendices to these procedures, management will submit the services to the Committee or its delagee. Any such submission will include a detailed description of the services to be rendered. Notwithstanding this paragraph, the Committee will, on a quarterly basis, receive from the independent auditors a list of services provided for the previous calendar quarter on a cumulative basis by the auditors during the Pre-Approval Period.
The Committee may delegate pre-approval authority to one or more of the Committee’s members. Any member or members to whom such pre-approval authority is delegated must report any pre-approval decisions, including any pre-approved services, to the Committee at its next scheduled meeting. The Committee will identify any member to whom pre-approval authority is delegated in writing. The member will retain such authority for a period of 12 months from the date of pre-approval unless the Committee determines that a different period is appropriate. The period of delegated authority may be terminated by the Committee or at the option of the member.
| IX. | Additional Requirements |
The Committee will take any measures the Committee deems necessary or appropriate to oversee the work of the independent auditors and to assure the auditors’ independence from the Funds. This may include reviewing a formal written statement from the independent auditors delineating all relationships between the auditors and the Funds, consistent with Independence Standards Board No. 1, and discussing with the auditors their methods and procedures for ensuring independence.
Last Approved: November 17, 2022
Appendix A
Pre-Approved Audit Services for the Pre-Approval Period January 1, 2023 through December 31, 2023
| Service |
| | The Fund(s) | Fee Range |
| Statutory audits or financial audits (including tax services associated with audit services) | √ | As presented to Audit Committee1 |
| Services associated with SEC registration statements, periodic reports and other documents filed with the SEC or other documents issued in connection with securities offerings (e.g., consents), and assistance in responding to SEC comment letters. | √ | Not to exceed $9,750 per filing |
| Consultations by Fund management with respect to accounting or disclosure treatment of transactions or events and/or the actual or potential effect of final or proposed rules, standards or interpretations by the SEC, Financial Accounting Standards Board, or other regulatory or standard setting bodies. | √ | Not to exceed $8,000 during the Pre-Approval Period |
| Seed capital audit and related review and issuance of consent on the N-2 registration statement | √ | Not to exceed $14,750 per audit |
| Audit of summary portfolio of investments | √ | Not to exceed $840 per fund |
| 1 | For new Funds launched during the Pre-Approval Period, the fee ranges pre-approved will be the same as those for existing Funds, pro-rated in accordance with inception dates as provided in the auditors’ Proposal or any Engagement Letter covering the period at issue. Fees in the Engagement Letter will be controlling. |
Appendix B
Pre-Approved Audit-Related Services for the Pre-Approval Period January 1, 2023 through December 31, 2023
| Service |
| | The Fund(s) | Fund Affiliates | Fee Range |
| Services related to Fund mergers (Excludes tax services - See Appendix C for tax services associated with Fund mergers) | √ | √ | Not to exceed $10,000 per merger |
| Consultations by Fund management with respect to accounting or disclosure treatment of transactions or events and/or the actual or potential effect of final or proposed rules, standards or interpretations by the SEC, Financial Accounting Standards Board, or other regulatory or standard setting bodies. [Note: Under SEC rules some consultations may be “audit” services and others may be “audit-related” services.] | √ | | Not to exceed $5,000 per occurrence during the Pre-Approval Period |
| Review of the Funds’ semi-annual and quarterly financial statements | √ | | Not to exceed $2,700 per set of financial statements per fund |
| Reports to regulatory or government agencies related to the annual engagement | √ | | Up to $5,000 per occurrence during the Pre-Approval Period |
| Regulatory compliance assistance | √ | √ | Not to exceed $5,000 per quarter |
| Training courses | | √ | Not to exceed $5,000 per course |
Appendix C
Pre-Approved Tax Services for the Pre-Approval Period January 1, 2023 through December 31, 2023
| Service |
| | The Fund(s) | Fund Affiliates | Fee Range |
| Preparation of federal and state income tax returns and federal excise tax returns for the Funds including assistance and review with excise tax distributions (Funds fees) | √ | | As presented to Audit Committee2 |
| Review of IRC Sections 851(b) and 817(h) diversification testing on a real-time basis | √ | | As presented to Audit Committee2 |
| Tax assistance and advice regarding statutory, regulatory or administrative developments | √ | √ | Not to exceed $5,000 for the Funds or for the Funds’ investment adviser during the Pre-Approval Period |
| 2 | For new Funds launched during the Pre-Approval Period, the fee ranges pre-approved will be the same as those for existing Funds, pro-rated in accordance with inception dates as provided in the auditors’ Proposal or any Engagement Letter covering the period at issue. Fees in the Engagement Letter will be controlling. |
Appendix C, continued Pre-Approved Tax Services for the Pre-Approval Period January 1, 2023 through December 31, 2023
| Service |
| | The Fund(s) | Fund Affiliates | Fee Range |
| Tax and technology training sessions | | √ | Not to exceed $5,000 per course during the Pre-Approval Period |
| Tax services associated with Fund mergers | √ | √ | Not to exceed $4,000 per fund per merger during the Pre-Approval Period |
| Tax compliance services related to return preparation for the Funds (Adviser Fees) | | √ | As presented to Audit Committee3 |
| Other tax-related assistance and consultation, including, without limitation, assistance in evaluating derivative financial instruments and international tax issues, qualification and distribution issues, year-end reporting for 1099’s, tax compliance services in foreign jurisdictions and similar routine tax consultations as requested. | √ | | Not to exceed $300,000 during the Pre-Approval Period |
| EU Reclaims IRS Closing Agreement Filings | √ | | $20,000 per Fund first closing agreement, $5,000 for subsequent closing agreements for same Fund |
| 3 | For new Funds launched during the Pre-Approval Period, the fee ranges pre-approved will be the same as those for existing Funds, pro-rated in accordance with inception dates as provided in the auditors’ Proposal or any Engagement Letter covering the period at issue. Fees in the Engagement Letter will be controlling. |
Appendix D
Pre-Approved Other Services for the Pre-Approval Period January 1, 2023 through December 31, 2023
| Service |
| | The Fund(s) | Fund Affiliates | Fee Range |
| Agreed-upon procedures for Class B share 12b-1 programs | | √ | Not to exceed $60,000 during the Pre-Approval Period |
Security counts performed pursuant to Rule 17f-2 of the 1940 Act (i.e., counts for Funds holding securities with affiliated sub-custodians) Cost to be borne 50% by the Funds and 50% by Voya Investments, LLC. | √ | √ | Not to exceed $5,700 per Fund during the Pre-Approval Period |
| Agreed upon procedures for 15 (c) FACT Books | √ | | Not to exceed $50,000 during the Pre-Approval Period |
Appendix E
Prohibited Non-Audit Services
Dated: January 1, 2023 to December 31, 2023
| ● | Bookkeeping or other services related to the accounting records or financial statements of the Funds |
| ● | Financial information systems design and implementation |
| ● | Appraisal or valuation services, fairness opinions, or contribution-in-kind reports |
| ● | Internal audit outsourcing services |
| ● | Broker-dealer, investment adviser, or investment banking services |
| ● | Expert services unrelated to the audit |
| ● | Any other service that the Public Company Accounting Oversight Board determines, by regulation, is impermissible |
EXHIBIT A
VOYA ASIA PACIFIC HIGH DIVIDEND EQUITY INCOME FUND
VOYA BALANCED PORTFOLIO, INC.
VOYA CREDIT INCOME FUND
VOYA EMERGING MARKETS HIGH DIVIDEND EQUITY FUND
VOYA EQUITY TRUST
VOYA FUNDS TRUST
VOYA GLOBAL ADVANTAGE AND PREMIUM OPPORTUNITY FUND
VOYA GLOBAL EQUITY DIVIDEND AND PREMIUM OPPORTUNITY FUND
VOYA INFRASTRUCTURE, INDUSTRIALS, AND MATERIALS FUND
VOYA INTERMEDIATE BOND PORTFOLIO
VOYA INVESTORS TRUST
VOYA GOVERNMENT MONEY MARKET PORTFOLIO
VOYA MUTUAL FUNDS
VOYA PARTNERS, INC.
VOYA SEPARATE PORTFOLIOS TRUST
VOYA STRATEGIC ALLOCATIONS PORTFOLIOS, INC.
VOYA VARIABLE FUNDS
VOYA VARIABLE INSURANCE TRUST
VOYA VARIABLE PORTFOLIOS INC,
VOYA VARIABLE PRODUCTS TRUST
| (e)(2) | Percentage of services referred to in 4(b) – (4)(d) that were approved by the audit committee |
100% of the services were approved by the audit committee.
| (f) | Percentage of hours expended attributable to work performed by other than full time employees of EY if greater than 50% |
Not applicable.
| (g) | Non-Audit Fees: The following table presents (i) the aggregate non-audit fees (i.e., fees for audit-related, tax, and other services) billed and paid to the Registrant by the independent registered public accounting firm for the Registrant’s fiscal years ended March 31, 2023 and March 31, 2022; and (ii) the aggregate non-audit fees billed to the investment adviser, or any of its affiliates that provide ongoing services to the registrant, by the independent registered public accounting firm for the same time periods. |
| Registrant/Investment Adviser | | 2023 | | | 2022 | |
| Voya Funds Trust | | $ | 61,300 | | | $ | 61,300 | |
| Voya Investments, LLC (1) | | $ | 12,786,749 | | | $ | 12,427,919 | |
__________________________________
(1) The Registrant’s investment adviser and any of its affiliates, which are subsidiaries of Voya Financial, Inc.
| (h) | Principal Accountants Independence: The Registrant’s Audit committee has considered whether the provision of non-audit services that were rendered to the registrant’s investment adviser and any entity controlling, controlled by, or under common control with the investment adviser that provides ongoing services to the registrant that were not pre-approved pursuant to Rule 2-01(c)(7)(ii) of Regulation S-X is compatible with maintaining EY’s independence. |
Item 5. Audit Committee of Listed Registrants.
Not applicable.
Item 6. Schedule of Investments.
| (a) | Schedule is included as part of the report to shareholders filed under Item 1 of this Form. |
Item 7. Disclosure of Proxy Voting Policies and Procedures for Closed-End Management Investment Companies.
Not applicable.
Item 8. Portfolio Managers of Closed-End Management Investment Companies.
Not applicable.
Item 9. Purchases of Equity Securities by Closed-End Management Investment Company and Affiliated Purchasers.
Not applicable.
Item 10. Submission of Matters to a Vote of Security Holders.
Not applicable.
Item 11. Controls and Procedures.
| (a) | Based on our evaluation conducted within 90 days of the filing date, hereof, the design and operation of the registrant’s disclosure controls and procedures are effective to ensure that material information relating to the registrant is made known to the certifying officers by others within the appropriate entities, particularly during the period in which Forms N-CSR are being prepared, and the registrant’s disclosure controls and procedures allow timely preparation and review of the information for the registrant’s Form N-CSR and the officer certifications of such Form N-CSR. |
| (b) | There were no significant changes in the registrant’s internal controls that occurred during the second fiscal quarter of the period covered by this report that has materially affected, or is reasonably likely to materially affect, the registrant’s internal control over financial reporting. |
Item 12. Disclosure of Securities Lending Activities for Closed-End Management Investment Companies.
Not applicable.
Item 13. Exhibits.
(a)(2)(1) Not applicable.
(a)(2)(3) Not applicable.
SIGNATURES
Pursuant to the requirements of the Securities Exchange Act of 1934 and the Investment Company Act of 1940, the registrant has duly caused this report to be signed on its behalf by the undersigned, thereunto duly authorized.
(Registrant): Voya Funds Trust
| By | /s/ Andy Simonoff | |
| | Andy Simonoff | |
| | Chief Executive Officer | |
Date: June 7, 2023
Pursuant to the requirements of the Securities Exchange Act of 1934 and the Investment Company Act of 1940, this report has been signed below by the following persons on behalf of the registrant and in the capacities and on the dates indicated.
| By | /s/ Andy Simonoff | |
| | Andy Simonoff | |
| | Chief Executive Officer | |
Date: June 7, 2023
| By | /s/ Todd Modic | |
| | Todd Modic | |
| | Senior Vice President and Chief Financial Officer | |
Date: June 7, 2023
![[MISSING IMAGE: ing_cov.jpg]](https://capedge.com/proxy/N-CSR/0001104659-23-068834/ing_cov.jpg)
![[MISSING IMAGE: ing_e.jpg]](https://capedge.com/proxy/N-CSR/0001104659-23-068834/ing_e.jpg)
![[MISSING IMAGE: voya_covinvmgt.jpg]](https://capedge.com/proxy/N-CSR/0001104659-23-068834/voya_covinvmgt.jpg)
![[MISSING IMAGE: lc_gnmaincome-bw.jpg]](https://capedge.com/proxy/N-CSR/0001104659-23-068834/lc_gnmaincome-bw.jpg)
![[MISSING IMAGE: lc_highyieldbond-bw.jpg]](https://capedge.com/proxy/N-CSR/0001104659-23-068834/lc_highyieldbond-bw.jpg)
![[MISSING IMAGE: lc_intermediatebond-bw.jpg]](https://capedge.com/proxy/N-CSR/0001104659-23-068834/lc_intermediatebond-bw.jpg)
![[MISSING IMAGE: lc_shortdurationhighinc-bw.jpg]](https://capedge.com/proxy/N-CSR/0001104659-23-068834/lc_shortdurationhighinc-bw.jpg)
![[MISSING IMAGE: lc_shorttermbond-bw.jpg]](https://capedge.com/proxy/N-CSR/0001104659-23-068834/lc_shorttermbond-bw.jpg)
![[MISSING IMAGE: lc_strategicincomeoppor-bw.jpg]](https://capedge.com/proxy/N-CSR/0001104659-23-068834/lc_strategicincomeoppor-bw.jpg)
![[MISSING IMAGE: sg_ernetyoungllp-bw.jpg]](https://capedge.com/proxy/N-CSR/0001104659-23-068834/sg_ernetyoungllp-bw.jpg)
![[MISSING IMAGE: lg_voya-r.jpg]](https://capedge.com/proxy/N-CSR/0001104659-23-068834/lg_voya-r.jpg)
![[MISSING IMAGE: sg_ernstyoungllp-bw.jpg]](https://capedge.com/proxy/N-CSR/0001104659-23-068834/sg_ernstyoungllp-bw.jpg)
![[MISSING IMAGE: lc_corp-bw.jpg]](https://capedge.com/proxy/N-CSR/0001104659-23-068834/lc_corp-bw.jpg)
![[MISSING IMAGE: lc_hard-bw.jpg]](https://capedge.com/proxy/N-CSR/0001104659-23-068834/lc_hard-bw.jpg)
![[MISSING IMAGE: lc_local-bw.jpg]](https://capedge.com/proxy/N-CSR/0001104659-23-068834/lc_local-bw.jpg)
![[MISSING IMAGE: lc_secu-bw.jpg]](https://capedge.com/proxy/N-CSR/0001104659-23-068834/lc_secu-bw.jpg)